Insights on Southern Poverty The newsletter of the University of Kentucky Center for Poverty Research An equal opportunity institution Vol. 4 No. 1, Spring 2006 In this issue... Full versions of all articles are available at www.ukcpr.org Richard C. Fording, Sanford F. Schram, and Joe Soss With the introduction of Temporary Assistance for Needy Families (TANF) in 1996, state policymakers were given significant freedom to craft their own approaches to public assistance. Devo- lution of authority from the Federal to state government has been accompa- nied by a significant decentralization of policymaking authority within states, as well. TANF’s emphasis on flexible ser- vices and sanctioning virtually ensured that decision making would be given to local implementers, including case man- agers, in the new world of welfare service delivery. However, many states have fur- ther expanded local discretion in TANF implementation by pursuing “second-or- der” devolution – formal transfers of state control to county governments and/or to local public/private governance boards. Several studies have examined the characteristics of sanctioned families, us- ing either surveys of TANF recipients or state administrative data. The findings indicate that sanctioned clients often ex- hibit the characteristics of long-term wel- fare recipients. Despite this progress in analyzing sanctions, the literature has paid surprisingly little attention to the decentralized implementation processes at the heart of welfare reform. As a re- sult, the consequences of dispersed local implementation remain unknown in our understanding of sanction processes and outcomes. To answer questions about the effect of sanctions, we examined outcomes in Florida, which stands as a leader in wel- fare decentralization and second-order devolution. Relying on administrative records provided by the Florida Depart- ment of Children and Families, we con- ducted a series of analyses which exam- ined the relationship between individual sanction outcomes and (1) individual cli- ent traits, (2) local social and economic conditions, and (3) the local political en- vironment. Our results suggest that a sig- nificant amount of local variation exists in sanctioning outcomes across the state of Florida, even after taking into account the characteristics of TANF clients. Moreover, local patterns are not random but are systematically related to selected characteristics of the local community, including ideological tendencies. State and local sanctioning rates in Florida Along with many other states, Flori- da employs immediate, full-family sanc- tions, which result in loss of TANF ben- efits and a reduction of Food Stamp benefits to the fullest extent permitted by Federal law. In addition to having a rel- atively strict written policy, Florida ap- pears to enforce sanctions frequently, as well. From 2000 through the first quarter of 2004, an average of 3215 TANF cli- ents were sanctioned each month, com- prising, on average, approximately 36% of TANF exits. In contrast, the most re- cent data reported by the federal govern- ment (for fiscal year 2002) show that na- tionally, approximately 7% of all case closings were due to sanctions. To examine local variation in TANF sanctioning, we observed sanctioning outcomes for the 24 cohorts of clients en- tering TANF from January 2001 through December 2002, limiting our observa- tion to the first 12 months of the first TANF spell for each cohort. Based on these calculations, the average sanction rate across all 66 counties was 39%. This means that for the 24 cohorts, at least 39% were sanctioned off TANF during their first TANF spell. As we anticipat- ed, there has been significant variation in county sanction rates during our study period. For example, four counties sanc- tioned clients at a rate of less than 30% in our sample, with the lowest sanction rate Devolution, discretion, and variation in local TANF sanctioning (Continues on page 3) Devolution, discretion, and variation in local TANF sanctioning ................................... 1 Letter from the director............................ 2 Does space matter in the employment of local TANF recipients?............................ 5 Young investigator awards ..................... 7 Fertility trends, maternal characteristics, and poverty in the American South ........ 8 Examining educational experiences of children in the American South............... 10

Welcome message from author
This document is posted to help you gain knowledge. Please leave a comment to let me know what you think about it! Share it to your friends and learn new things together.
Transcript
Insights on Southern PovertyThe newsletter of the
University of Kentucky Center for Poverty Research
An equal opportunity institution
Vol. 4 No. 1, Spring 2006
In this issue...
Full versions of all articles are available at
www.ukcpr.org
Richard C. Fording, Sanford F. Schram, and Joe Soss
With the introduction of Temporary Assistance for Needy Families (TANF) in 1996, state policymakers were given significant freedom to craft their own approaches to public assistance. Devo-lution of authority from the Federal to state government has been accompa-nied by a significant decentralization of policymaking authority within states, as well. TANF’s emphasis on flexible ser-vices and sanctioning virtually ensured that decision making would be given to local implementers, including case man-agers, in the new world of welfare service delivery. However, many states have fur-ther expanded local discretion in TANF implementation by pursuing “second-or-der” devolution – formal transfers of state control to county governments and/or to local public/private governance boards.
Several studies have examined the characteristics of sanctioned families, us-ing either surveys of TANF recipients or state administrative data. The findings indicate that sanctioned clients often ex-hibit the characteristics of long-term wel-fare recipients. Despite this progress in analyzing sanctions, the literature has paid surprisingly little attention to the decentralized implementation processes at the heart of welfare reform. As a re-sult, the consequences of dispersed local implementation remain unknown in our understanding of sanction processes and outcomes.
To answer questions about the effect of sanctions, we examined outcomes in Florida, which stands as a leader in wel-fare decentralization and second-order
devolution. Relying on administrative records provided by the Florida Depart-ment of Children and Families, we con-ducted a series of analyses which exam-ined the relationship between individual sanction outcomes and (1) individual cli-ent traits, (2) local social and economic conditions, and (3) the local political en-vironment. Our results suggest that a sig-nificant amount of local variation exists in sanctioning outcomes across the state of Florida, even after taking into account the characteristics of TANF clients. Moreover, local patterns are not random but are systematically related to selected characteristics of the local community, including ideological tendencies.
State and local sanctioning rates in Florida
Along with many other states, Flori-da employs immediate, full-family sanc-tions, which result in loss of TANF ben-efits and a reduction of Food Stamp benefits to the fullest extent permitted by Federal law. In addition to having a rel-atively strict written policy, Florida ap-pears to enforce sanctions frequently, as well. From 2000 through the first quarter of 2004, an average of 3215 TANF cli-ents were sanctioned each month, com-prising, on average, approximately 36% of TANF exits. In contrast, the most re-cent data reported by the federal govern-ment (for fiscal year 2002) show that na-tionally, approximately 7% of all case closings were due to sanctions.
To examine local variation in TANF sanctioning, we observed sanctioning outcomes for the 24 cohorts of clients en-tering TANF from January 2001 through December 2002, limiting our observa-
tion to the first 12 months of the first TANF spell for each cohort. Based on these calculations, the average sanction rate across all 66 counties was 39%. This means that for the 24 cohorts, at least 39% were sanctioned off TANF during their first TANF spell. As we anticipat-ed, there has been significant variation in county sanction rates during our study period. For example, four counties sanc-tioned clients at a rate of less than 30% in our sample, with the lowest sanction rate
Devolution, discretion, and variation in local TANF sanctioning
(Continues on page 3)
Devolution, discretion, and variation in local TANF sanctioning ................................... 1
Letter from the director ............................ 2
Does space matter in the employment oflocal TANF recipients? ............................ 5
Young investigator awards ..................... 7
Fertility trends, maternal characteristics,and poverty in the American South ........ 8
Examining educational experiences of children in the American South ............... 10
The UKCenter for
Poverty ResearchDirector
James P. ZiliakGatton Endowed Chair in
MicroeconomicsUniversity of Kentucky
Associate DirectorChristopher Bollinger
Associate Professor of EconomicsUniversity of Kentucky
National Advisory BoardRebecca Blank
University of Michigan National Poverty Center
Sheldon DanzigerUniversity of Michigan National Poverty CenterKathleen Mullan Harris
University of North Carolina Chapel Hill
Donald OellerichOffice of Assistant Secretary for
Planning and Evaluation William RodgersRutgers Univeristy
Seth SandersUniversity of Maryland
Don WinsteadFlorida Department of Children and Families
Executive CommitteeUniversity of Kentucky
Richard FordingDepartment of Political Science
Colleen HeflinMartin School of Public Policy and
AdministrationMary Secret
College of Social WorkKenneth R. Troske
Department of EconomicsJulie Zimmerman
Department of Community and Leadership Development
The UK Center for Poverty Re-search is sponsored through a grant by the Office of the Assistant Secretary for Planning and Evalu-ation, U.S. Department of Health and Human Services
Letter from the directorBy James P. Ziliak
I am pleased to announce that the core funding underwriting the UK Cen-ter for Poverty Research (UKCPR) was renewed this past fall by the Office of As-sistant Secretary for Planning and Evalu-ation (ASPE) in the U.S. Department of Health and Human Services. The 3-year grant was awarded to UKCPR after a na-tionwide competition for proposals for Area Poverty Research Centers. Other recipients of these grants were the Insti-tute for Research on Poverty at the Uni-versity of Wisconsin and the West Coast Poverty Research Center at the Univer-sity of Washington.
The UKCPR, which was established by ASPE in 2002, will continue to target its research, mentoring, and dissemina-tion efforts on the issues of poverty and inequality, and their correlates among the citizens residing in the 16 states com-prising the southern United States.
The funds support core operations along with our major internal and ex-ternal research programs including the Regional Small Grants Program; the HBCU, 1890, and Tribal Colleges and Universities Small Grants Program; the Emerging Scholars Program; the Internal Research Support Program; the Gradu-ate Student Research Program; the Sem-inar Series; and our newsletter Insights on Southern Poverty, among others.
We encourage you to visit our web-site at http://www.ukcpr.org to learn more about the Center’s activities. A new addition to the site is a publicly avail-able and downloadable dataset contain-ing economic and political data on all 50 states and the District of Columbia, span-ning 1980–2004. Included in this Excel file are data on employment, population, unemployment, participation in AFDC/TANF, food stamps, SSI, and other pro-grams, food insecurity, minimum wages, EITC parameters, political party of the Governor, among others.
In this first newsletter after reautho-rization we focus attention on research projects funded by the Center over the
past two years through the auspices of our Internal Grants Program and Re-gional Small Grants Program.
We lead with an article by UKCPR Faculty Affiliate Richard Fording, and colleagues Sanford Schram and Joe Soss, which examines variation in sanctioning against Temporary Assistance for Needy Families (TANF) recipients in Florida counties. Their research indicates that relinquishment of enforcement author-ity to local officials affects the level of sanctioning against recipients. Among the findings is a variation in sanctioning rates based on the local political ideology.
An article by Shiferaw Gurmu, Keith Ihlanfeldt, and William Smith exam-ines the effect of locale on employment among TANF recipients. The authors were interested in work requirements for those receiving government assistance and investigated how job access and place-based influences affect employ-ment probability among those receiving welfare. They relate that important vari-ables to consider in employment include age, education, and size of the family.
Leonard Lopoo’s research looks at the relationship between fertility and a family’s economic well being in the South. Specifically, he examines the characteristics of mothers in the region and if these characteristics leave women in the South vulnerable to poverty. Dif-ferences in Southern mothers as com-pared to the rest of the country include younger childbearing age, lower educa-tion, and a higher likelihood to be of mi-nority status.
Maryah Fram, Julie Miller-Cribbs, and Lee Van Horn examined the charac-teristics of Southern public grade schools to explain gaps in achievement compared to other regions. They examine the effects of child-, classroom-, and school-level fac-tors as it relates to the quality of educa-tion. The authors show, among oth-er findings, that black children are more likely to attend schools with a high per-centage of students living in poverty.
Visit us online at www.ukcpr.org
Insights on Southern Poverty �
at 22%. In contrast, three counties sanc-tioned at a rate of at least 50%, with the maximum sanction rate at 53%.
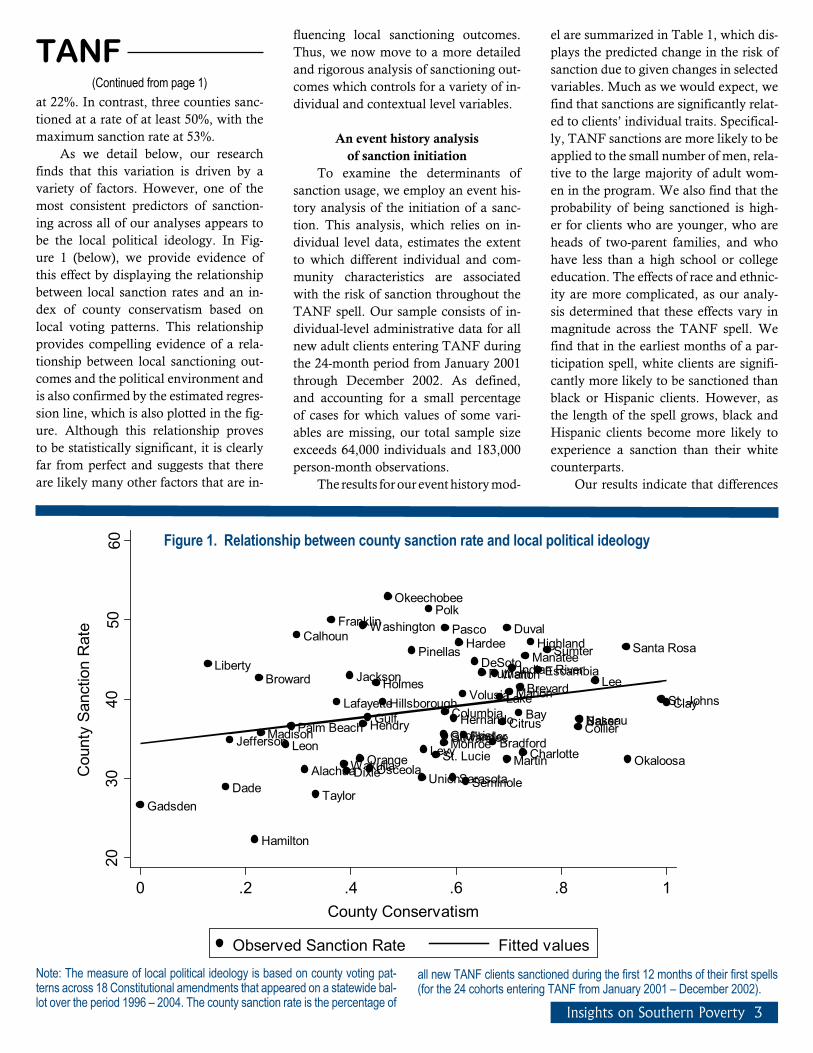
As we detail below, our research finds that this variation is driven by a variety of factors. However, one of the most consistent predictors of sanction-ing across all of our analyses appears to be the local political ideology. In Fig-ure 1 (below), we provide evidence of this effect by displaying the relationship between local sanction rates and an in-dex of county conservatism based on local voting patterns. This relationship provides compelling evidence of a rela-tionship between local sanctioning out-comes and the political environment and is also confirmed by the estimated regres-sion line, which is also plotted in the fig-ure. Although this relationship proves to be statistically significant, it is clearly far from perfect and suggests that there are likely many other factors that are in-
fluencing local sanctioning outcomes. Thus, we now move to a more detailed and rigorous analysis of sanctioning out-comes which controls for a variety of in-dividual and contextual level variables.
An event history analysis of sanction initiation
To examine the determinants of sanction usage, we employ an event his-tory analysis of the initiation of a sanc-tion. This analysis, which relies on in-dividual level data, estimates the extent to which different individual and com-munity characteristics are associated with the risk of sanction throughout the TANF spell. Our sample consists of in-dividual-level administrative data for all new adult clients entering TANF during the 24-month period from January 2001 through December 2002. As defined, and accounting for a small percentage of cases for which values of some vari-ables are missing, our total sample size exceeds 64,000 individuals and 183,000 person-month observations.
The results for our event history mod-
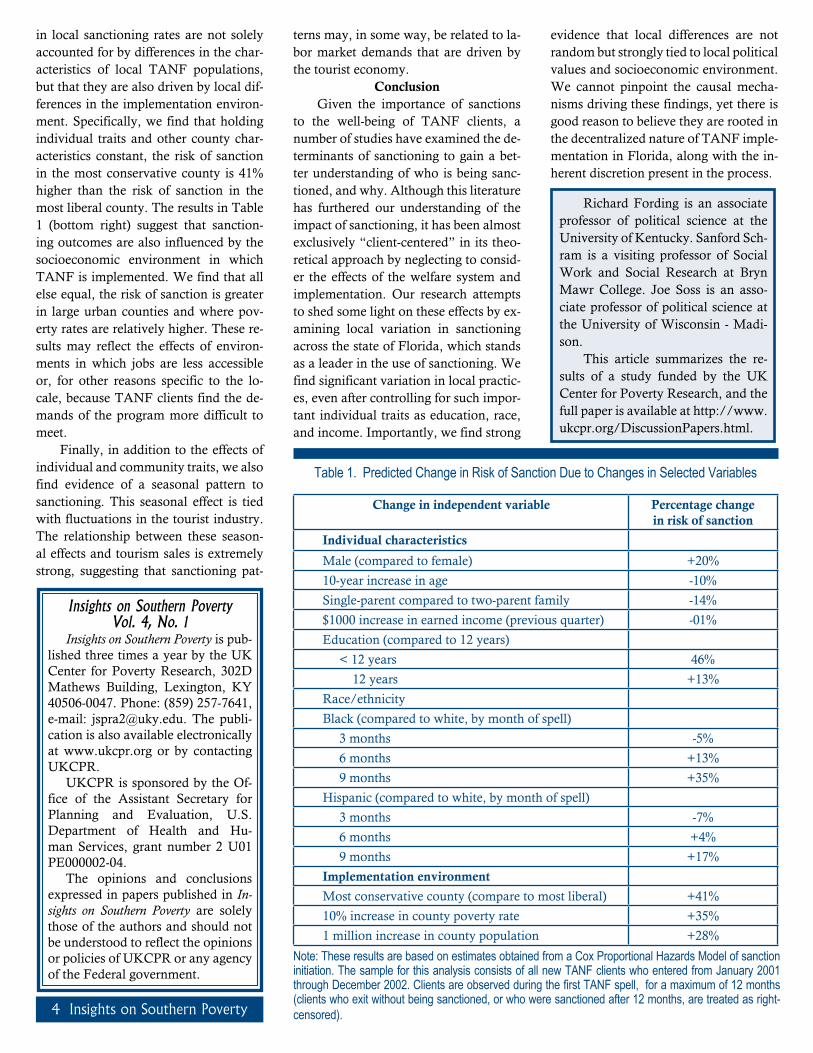
el are summarized in Table 1, which dis-plays the predicted change in the risk of sanction due to given changes in selected variables. Much as we would expect, we find that sanctions are significantly relat-ed to clients’ individual traits. Specifical-ly, TANF sanctions are more likely to be applied to the small number of men, rela-tive to the large majority of adult wom-en in the program. We also find that the probability of being sanctioned is high-er for clients who are younger, who are heads of two-parent families, and who have less than a high school or college education. The effects of race and ethnic-ity are more complicated, as our analy-sis determined that these effects vary in magnitude across the TANF spell. We find that in the earliest months of a par-ticipation spell, white clients are signifi-cantly more likely to be sanctioned than black or Hispanic clients. However, as the length of the spell grows, black and Hispanic clients become more likely to experience a sanction than their white counterparts.
Our results indicate that differences
TANF(Continued from page 1)
Alachua
BakerBay
Bradford
BrevardBroward
Calhoun
Charlotte
CitrusClay
CollierColumbia
Dade
DeSoto
Dixie
Duval
Escambia
Flagler
Franklin
Gadsden
GilchristGulf
Hamilton
Hardee
Hendry Hernando
Highland
HillsboroughHolmes
Indian RiverJackson
Jefferson
Lafayette LakeLee
Leon Levy
Liberty
Madison
Manatee
Marion
MartinMonroe
Nassau
Okaloosa
Okeechobee
OrangeOsceola
Palm Beach
Pasco
Pinellas
Polk
Putnam
St. Johns
St. Lucie
Santa Rosa
SarasotaSeminole
Sumter
Suwannee
TaylorUnion
Volusia
Wakulla
Walton
Washington
2030
4050
60
Cou
nty
Sanc
tion
Rat
e
0 .2 .4 .6 .8 1County Conservatism
Observed Sanction Rate Fitted values
Note: The measure of local political ideology is based on county voting pat-terns across 18 Constitutional amendments that appeared on a statewide bal-lot over the period 1996 – 2004. The county sanction rate is the percentage of
all new TANF clients sanctioned during the first 12 months of their first spells (for the 24 cohorts entering TANF from January 2001 – December 2002).
Figure 1. Relationship between county sanction rate and local political ideology
Insights on Southern PovertyVol. 4, No. 1
Insights on Southern Poverty is pub-lished three times a year by the UK Center for Poverty Research, 302D Mathews Building, Lexington, KY 40506-0047. Phone: (859) 257-7641, e-mail: [email protected]. The publi-cation is also available electronically at www.ukcpr.org or by contacting UKCPR.
UKCPR is sponsored by the Of-fice of the Assistant Secretary for Planning and Evaluation, U.S. Department of Health and Hu-man Services, grant number 2 U01 PE000002-04.
The opinions and conclusions expressed in papers published in In-sights on Southern Poverty are solely those of the authors and should not be understood to reflect the opinions or policies of UKCPR or any agency of the Federal government.
4 Insights on Southern Poverty
in local sanctioning rates are not solely accounted for by differences in the char-acteristics of local TANF populations, but that they are also driven by local dif-ferences in the implementation environ-ment. Specifically, we find that holding individual traits and other county char-acteristics constant, the risk of sanction in the most conservative county is 41% higher than the risk of sanction in the most liberal county. The results in Table 1 (bottom right) suggest that sanction-ing outcomes are also influenced by the socioeconomic environment in which TANF is implemented. We find that all else equal, the risk of sanction is greater in large urban counties and where pov-erty rates are relatively higher. These re-sults may reflect the effects of environ-ments in which jobs are less accessible or, for other reasons specific to the lo-cale, because TANF clients find the de-mands of the program more difficult to meet.
Finally, in addition to the effects of individual and community traits, we also find evidence of a seasonal pattern to sanctioning. This seasonal effect is tied with fluctuations in the tourist industry. The relationship between these season-al effects and tourism sales is extremely strong, suggesting that sanctioning pat-
terns may, in some way, be related to la-bor market demands that are driven by the tourist economy.
ConclusionGiven the importance of sanctions
to the well-being of TANF clients, a number of studies have examined the de-terminants of sanctioning to gain a bet-ter understanding of who is being sanc-tioned, and why. Although this literature has furthered our understanding of the impact of sanctioning, it has been almost exclusively “client-centered” in its theo-retical approach by neglecting to consid-er the effects of the welfare system and implementation. Our research attempts to shed some light on these effects by ex-amining local variation in sanctioning across the state of Florida, which stands as a leader in the use of sanctioning. We find significant variation in local practic-es, even after controlling for such impor-tant individual traits as education, race, and income. Importantly, we find strong
evidence that local differences are not random but strongly tied to local political values and socioeconomic environment. We cannot pinpoint the causal mecha-nisms driving these findings, yet there is good reason to believe they are rooted in the decentralized nature of TANF imple-mentation in Florida, along with the in-herent discretion present in the process.
Richard Fording is an associate professor of political science at the University of Kentucky. Sanford Sch-ram is a visiting professor of Social Work and Social Research at Bryn Mawr College. Joe Soss is an asso-ciate professor of political science at the University of Wisconsin - Madi-son.
This article summarizes the re-sults of a study funded by the UK Center for Poverty Research, and the full paper is available at http://www.ukcpr.org/DiscussionPapers.html.
Table 1. Predicted Change in Risk of Sanction Due to Changes in Selected Variables
Note: These results are based on estimates obtained from a Cox Proportional Hazards Model of sanction initiation. The sample for this analysis consists of all new TANF clients who entered from January 2001 through December 2002. Clients are observed during the first TANF spell, for a maximum of 12 months (clients who exit without being sanctioned, or who were sanctioned after 12 months, are treated as right-censored).
Change in independent variable Percentage change in risk of sanction
Individual characteristics
Male (compared to female) +20%
10-year increase in age -10%
Single-parent compared to two-parent family -14%
$1000 increase in earned income (previous quarter) -01%
Education (compared to 12 years)
< 12 years 46%
12 years +13%
Race/ethnicity
Black (compared to white, by month of spell)
3 months -5%
6 months +13%
9 months +35%
Hispanic (compared to white, by month of spell)
3 months -7%
6 months +4%
9 months +17%
Implementation environment
Most conservative county (compare to most liberal) +41%
10% increase in county poverty rate +35%
1 million increase in county population +28%
Insights on Southern Poverty �
Does space matter in the employment of TANF recipients?
offers nearby job opportunities. Not ac-counting for self-selection attributes all the unobserved influences of individual motivation to job accessibility and leads to biased estimates of the effect of job ac-cess.
There are two approaches toward dealing with self-selection: 1) conduct a random assignment experiment or iden-tify a natural experiment where location is random, and 2) rely upon panel esti-mation techniques that control both for observed factors and for unobservable factors affecting employment decisions. We use both panel techniques and a nat-ural experiment to study the factors af-fecting the employment probability of Temporary Assistance for Needy Fami-lies (TANF) recipients living within the metropolitan Atlanta area. In this article we focus on the panel analysis where we use data on the quarterly employment experience of individual TANF recipi-ents that contains both individual and place-level variables. We find substantial evidence that individual and family char-acteristics are important determinants of the employment probability of welfare recipients. The age and education of the recipient and the number of children and adults in the family are all found to be important determinants of employment. Space (neighborhood effects and job ac-cess), on the other hand, is found to be relatively unimportant. This confirms the findings of other recent studies that have focused on the employment of wel-fare recipients.
BackgroundTwo hypotheses relate the employ-
ment probability of low skill workers to their residential locations – the spatial mismatch hypothesis and the neighbor-hood effects hypothesis. The spatial mis-match hypothesis states that job subur-banization has reduced the employment opportunities of central city low-skill res-idents, because they have been unable to shift their labor supply from the cen-tral city to the suburbs. For a review of this literature see, for example, Ihlanfeldt
and Sjoquist (1998). Neighborhood ef-fects encompass a variety of mechanisms that link the neighborhood setting to in-dividual behaviors and opportunities. Examples include peer group influences, role model effects, and informal sources of job market information. While many other examples could be identified, the basic idea is well known – poor neigh-borhoods result in individual behaviors that are detrimental to both the person and society.
Research that is relevant to our proj-ect includes studies based on the U.S. Department of Housing and Urban De-velopment’s demonstration “Moving to Opportunity” (MTO). In MTO public housing residents with children were eli-gible to participate in a lottery that ran-domly assigned them to one of three groups – a control group (remained in public housing), a Section 8 group (giv-en a Section 8 voucher, without a loca-tion restriction), and an experimental group (received a Section 8 voucher that required finding housing within a census tract with low poverty (i.e., less than 10 percent)). The majority of the MTO par-ticipants were receiving welfare at the time of assignment. The motivation be-hind MTO was that its randomized de-sign would minimize bias resulting from the self-selection of residential location (Katz et al. 2001; Kling et al. 2004). The MTO studies found no significant dif-ferences in employment or earnings be-tween the control and experimental groups, suggesting that nothing about place has an important effect on the la-bor market outcomes of housing assis-tance recipients.
MethodsTo construct our data we started
with administrative TANF records from the Georgia Department of Human Re-sources. From the TANF records, we obtain both individual and family char-acteristics on a quarterly basis. We geo-located the TANF records by address
By Shiferaw Gurmu, Keith R. Ihlanfeldt, and William J. Smith
The Personal Responsibility and Work Opportunity Reconciliation Act of 1996 imposed stringent work require-ments and time limits on welfare recipi-ents that intensified interest in the factors that affect the employment of recipients, including economic, demographic, and policy factors. The demographic factors frequently discussed in the literature can be roughly divided into two broad cat-egories – family/individual-based and place-based. Individual characteristics include education attainment, training, and experience as well as the recipient’s motivation, attitude, and family struc-ture. Place-based influences comprise job accessibility and neighborhood ef-fects. Job access refers to the nearness of compatible job openings, which can re-flect fluctuations in the overall economy. Neighborhood effects encompass a vari-ety of potential environmental influences that may alter a person’s willingness or ability to work.
The existing evidence on the effects of individual and place variables on the employment of welfare recipients, and low-skill workers generally, is limit-ed because few studies have adequately dealt with the fact that residential loca-tion is self-selected. For example, recip-ients more motivated to work may per-form better in job interviews and may be more likely to seek a place to live that
Shiferaw Gurmu is an associ-ate professor of economics at Geor-gia State University. Keith Ihlanfeldt is an eminent scholar of economics at Florida State University. William Smith is a senior research associate at Georgia State.
This article summarizes the re-sults of a study funded by the UK Center for Poverty Research, and the full paper is available at http://www.ukcpr.org/DiscussionPapers.html.
6 Insights on Southern Poverty
and attach neighborhood attributes. From the Georgia Department of Labor, we obtain earnings and the work history information for each TANF case head. The panel includes all females living in the Atlanta MSA who were TANF case heads and 15 to 65 years old in the first quarter of 1999. The data for our main analysis are based on 13,679 TANF re-cipients (about 85 percent nonwhite). In-dividuals were followed over 16 quar-ters – from the first quarter of 1999 to the fourth quarter of 2002.
We specify and estimate static and dynamic probit models of employment choice of TANF recipients. We explain the full-time employment status of indi-vidual TANF recipients during a given quarter in terms of job accessibility, labor market competition, childcare, neigh-borhood characteristics, and individu-al characteristics. Individual character-istics include age, whether the recipient graduated from high school, number of children under the age of 18, and wheth-er welfare benefits had been received for eight consecutive quarters prior to the first quarter of 1999.
Childcare accessibility is measured by two variables – one to account for ac-cess to formal childcare (the number of childcare workers working in the indi-vidual’s neighborhood) and the other to account for the availability of informal childcare (presence of other adults within the household). The neighborhood and transit variables include the poverty rate of the individual’s block group, whether the individual resides within a quarter of a mile of a transit line, and whether the individual lives in public housing. Our job access measures are constructed for all-jobs as well as for each major industry grouping.
ResultsData analysis showed that about
25% of the TANF recipients are em-ployed full time during any given quar-ter, regardless of race. The typical recipi-ent is nonwhite, in her middle 30s, and lacks a high school diploma. Half of the whites and 67% of the nonwhites are long-term recipients of welfare benefits. Family structure also differs between
the races, with nonwhites having on av-erage more children than whites. There is, however, little difference in the pro-portion of cases with two or more adults present in the household.
The residential locations of non-whites and whites are markedly different. Nonwhite recipients are much more cen-trally located, with 62% living in the cen-tral county in comparison to only 10% of the whites. Neighborhoods of nonwhites are characterized by inferior job access, greater competition for jobs, and a high-er poverty rate (almost three times high-er). On average, nonwhites experienced decreased accessibility to job growth in seven of the nine industry groupings, whereas their white counterparts expe-rienced decreased accessibility on only four industry categories. Nonwhites are also about four times more likely to live in public housing than whites. However, the neighborhoods of nonwhites do offer two advantages over those occupied by whites – access to formal childcare and to public transit are better in the non-whites’ neighborhoods.
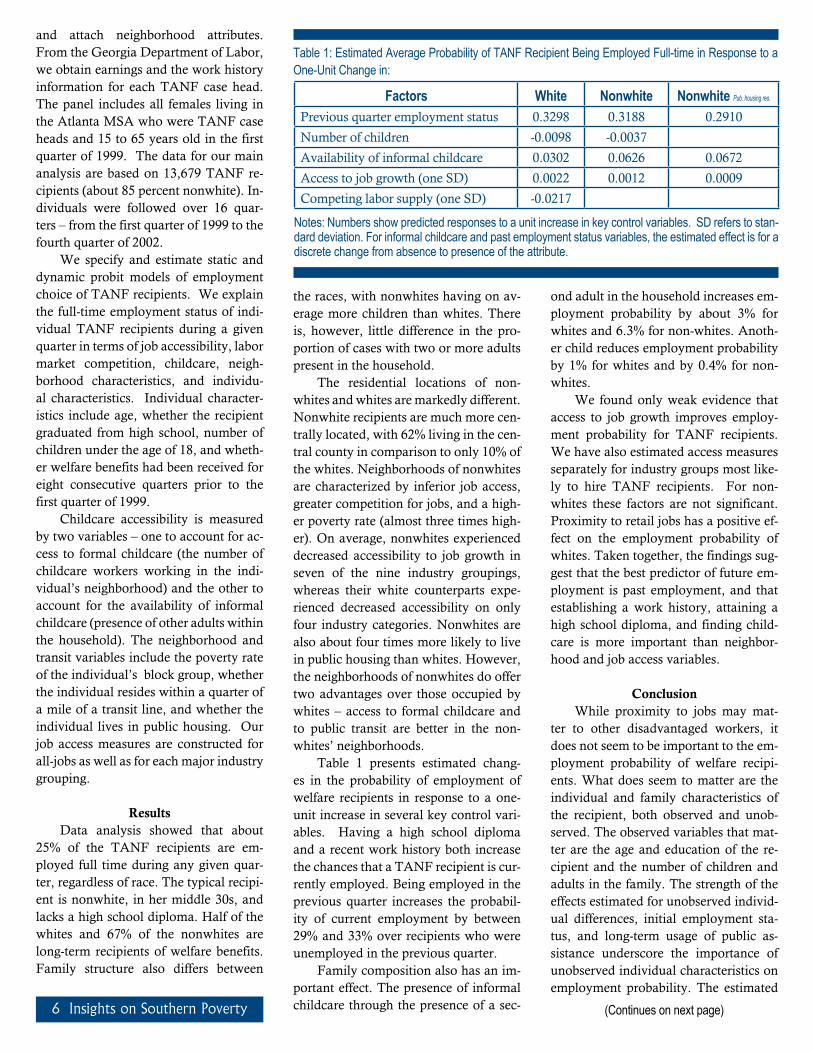
Table 1 presents estimated chang-es in the probability of employment of welfare recipients in response to a one-unit increase in several key control vari-ables. Having a high school diploma and a recent work history both increase the chances that a TANF recipient is cur-rently employed. Being employed in the previous quarter increases the probabil-ity of current employment by between 29% and 33% over recipients who were unemployed in the previous quarter.
Family composition also has an im-portant effect. The presence of informal childcare through the presence of a sec-
ond adult in the household increases em-ployment probability by about 3% for whites and 6.3% for non-whites. Anoth-er child reduces employment probability by 1% for whites and by 0.4% for non-whites.
We found only weak evidence that access to job growth improves employ-ment probability for TANF recipients. We have also estimated access measures separately for industry groups most like-ly to hire TANF recipients. For non-whites these factors are not significant. Proximity to retail jobs has a positive ef-fect on the employment probability of whites. Taken together, the findings sug-gest that the best predictor of future em-ployment is past employment, and that establishing a work history, attaining a high school diploma, and finding child-care is more important than neighbor-hood and job access variables.
ConclusionWhile proximity to jobs may mat-
ter to other disadvantaged workers, it does not seem to be important to the em-ployment probability of welfare recipi-ents. What does seem to matter are the individual and family characteristics of the recipient, both observed and unob-served. The observed variables that mat-ter are the age and education of the re-cipient and the number of children and adults in the family. The strength of the effects estimated for unobserved individ-ual differences, initial employment sta-tus, and long-term usage of public as-sistance underscore the importance of unobserved individual characteristics on employment probability. The estimated
Table 1: Estimated Average Probability of TANF Recipient Being Employed Full-time in Response to a One-Unit Change in:
Factors White Nonwhite Nonwhite Pub. housing res.
Previous quarter employment status 0.3298 0.3188 0.2910
Number of children -0.0098 -0.0037
Availability of informal childcare 0.0302 0.0626 0.0672
Access to job growth (one SD) 0.0022 0.0012 0.0009
Competing labor supply (one SD) -0.0217
Notes: Numbers show predicted responses to a unit increase in key control variables. SD refers to stan-dard deviation. For informal childcare and past employment status variables, the estimated effect is for a discrete change from absence to presence of the attribute.
(Continues on next page)
Insights on Southern Poverty �
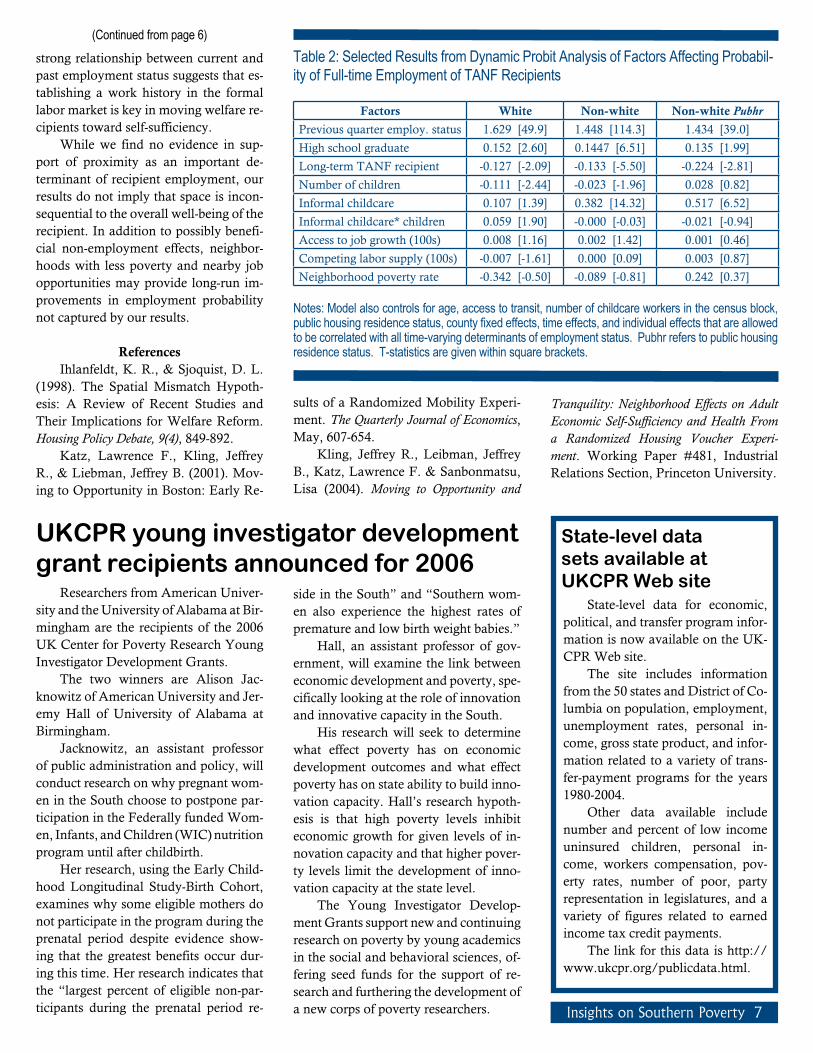
strong relationship between current and past employment status suggests that es-tablishing a work history in the formal labor market is key in moving welfare re-cipients toward self-sufficiency.
While we find no evidence in sup-port of proximity as an important de-terminant of recipient employment, our results do not imply that space is incon-sequential to the overall well-being of the recipient. In addition to possibly benefi-cial non-employment effects, neighbor-hoods with less poverty and nearby job opportunities may provide long-run im-provements in employment probability not captured by our results.
ReferencesIhlanfeldt, K. R., & Sjoquist, D. L.
(1998). The Spatial Mismatch Hypoth-esis: A Review of Recent Studies and Their Implications for Welfare Reform. Housing Policy Debate, 9(4), 849-892.
Katz, Lawrence F., Kling, Jeffrey R., & Liebman, Jeffrey B. (2001). Mov-ing to Opportunity in Boston: Early Re-
sults of a Randomized Mobility Experi-ment. The Quarterly Journal of Economics, May, 607-654.
Kling, Jeffrey R., Leibman, Jeffrey B., Katz, Lawrence F. & Sanbonmatsu, Lisa (2004). Moving to Opportunity and
(Continued from page 6)
UKCPR young investigator developmentgrant recipients announced for 2006
Researchers from American Univer-sity and the University of Alabama at Bir-mingham are the recipients of the 2006 UK Center for Poverty Research Young Investigator Development Grants.
The two winners are Alison Jac-knowitz of American University and Jer-emy Hall of University of Alabama at Birmingham.
Jacknowitz, an assistant professor of public administration and policy, will conduct research on why pregnant wom-en in the South choose to postpone par-ticipation in the Federally funded Wom-en, Infants, and Children (WIC) nutrition program until after childbirth.
Her research, using the Early Child-hood Longitudinal Study-Birth Cohort, examines why some eligible mothers do not participate in the program during the prenatal period despite evidence show-ing that the greatest benefits occur dur-ing this time. Her research indicates that the “largest percent of eligible non-par-ticipants during the prenatal period re-
side in the South” and “Southern wom-en also experience the highest rates of premature and low birth weight babies.”
Hall, an assistant professor of gov-ernment, will examine the link between economic development and poverty, spe-cifically looking at the role of innovation and innovative capacity in the South.
His research will seek to determine what effect poverty has on economic development outcomes and what effect poverty has on state ability to build inno-vation capacity. Hall’s research hypoth-esis is that high poverty levels inhibit economic growth for given levels of in-novation capacity and that higher pover-ty levels limit the development of inno-vation capacity at the state level.
The Young Investigator Develop-ment Grants support new and continuing research on poverty by young academics in the social and behavioral sciences, of-fering seed funds for the support of re-search and furthering the development of a new corps of poverty researchers.
State-level data sets available atUKCPR Web site
State-level data for economic, political, and transfer program infor-mation is now available on the UK-CPR Web site.
The site includes information from the 50 states and District of Co-lumbia on population, employment, unemployment rates, personal in-come, gross state product, and infor-mation related to a variety of trans-fer-payment programs for the years 1980-2004.
Other data available include number and percent of low income uninsured children, personal in-come, workers compensation, pov-erty rates, number of poor, party representation in legislatures, and a variety of figures related to earned income tax credit payments.
The link for this data is http://www.ukcpr.org/publicdata.html.
Factors White Non-white Non-white Pubhr
Previous quarter employ. status 1.629 [49.9] 1.448 [114.3] 1.434 [39.0]
High school graduate 0.152 [2.60] 0.1447 [6.51] 0.135 [1.99]
Long-term TANF recipient -0.127 [-2.09] -0.133 [-5.50] -0.224 [-2.81]
Number of children -0.111 [-2.44] -0.023 [-1.96] 0.028 [0.82]
Informal childcare 0.107 [1.39] 0.382 [14.32] 0.517 [6.52]
Informal childcare* children 0.059 [1.90] -0.000 [-0.03] -0.021 [-0.94]
Access to job growth (100s) 0.008 [1.16] 0.002 [1.42] 0.001 [0.46]
Competing labor supply (100s) -0.007 [-1.61] 0.000 [0.09] 0.003 [0.87]
Neighborhood poverty rate -0.342 [-0.50] -0.089 [-0.81] 0.242 [0.37]
Table 2: Selected Results from Dynamic Probit Analysis of Factors Affecting Probabil-ity of Full-time Employment of TANF Recipients
Notes: Model also controls for age, access to transit, number of childcare workers in the census block, public housing residence status, county fixed effects, time effects, and individual effects that are allowed to be correlated with all time-varying determinants of employment status. Pubhr refers to public housing residence status. T-statistics are given within square brackets.
Tranquility: Neighborhood Effects on Adult Economic Self-Sufficiency and Health From a Randomized Housing Voucher Experi-ment. Working Paper #481, Industrial Relations Section, Princeton University.
� Insights on Southern Poverty
Fertility trends, maternal characteristics, and poverty in the American South
By Leonard M. Lopoo
Since at least the early 1800s when Thomas Malthus developed the first eco-nomic theory of fertility, social scientists have worked to understand the relation-ship between fertility and a family’s eco-nomic well-being. Social scientists have shown that single motherhood often leads to poverty (Duncan and Rodgers 1991; Eggebeen and Lichter 1991) and that over the course of the last 40 years there has been considerable growth in single motherhood among women with poor economic prospects (Ellwood and Jencks 2004). McLanahan (2004) argues that women in the United States are now following two different trajectories. High socioeconomic status women are de-laying childbearing. These women are more likely to work and are less likely to divorce, advancing their economic posi-tion. Low socioeconomic status women continue to have children at a relatively young age, are less likely to work, and are more likely to divorce. The evidence suggests a large and growing division be-tween the “haves” and “have-nots” in the United States and that family struc-ture decisions play a large role in the eco-nomic well-being of these families.
Poverty is not randomly distribut-ed in the United States. In 2003, 35.9 million people, 12.5% of the population, were poor. Nine of the ten states (in-cluding the District of Columbia) with the highest proportion of poor people were located in the southern Census re-gion (DeNavas-Walt, Proctor, and Lee
2004). Given the links researchers have established between family structure de-cisions and poverty, as well as the dis-proportionate number of low-income families in the America South, this arti-cle asks about characteristics of mothers in the American South and if they leave these women and their families vulner-able to poverty (Lopoo, 2005).
Fertility PatternsI begin by describing the age-specific
fertility patterns of women in the different parts of the United States using Nation-al Center for Health Statistics (NCHS) birth certificate data for all children born between 1990 and 1999. Next, I model the relationship between poverty and the average characteristics of women who gave birth in 1998 using data from the June 1998 Current Population Survey (CPS). Finally, I simulate poverty rates in the nine Census divisions in the Unit-ed States (focusing on the southern divi-sions), comparing the poverty rates in a particular division to what they would be if maternal characteristics had been the same as those found in the New England Census division, the division with the lowest poverty rates.
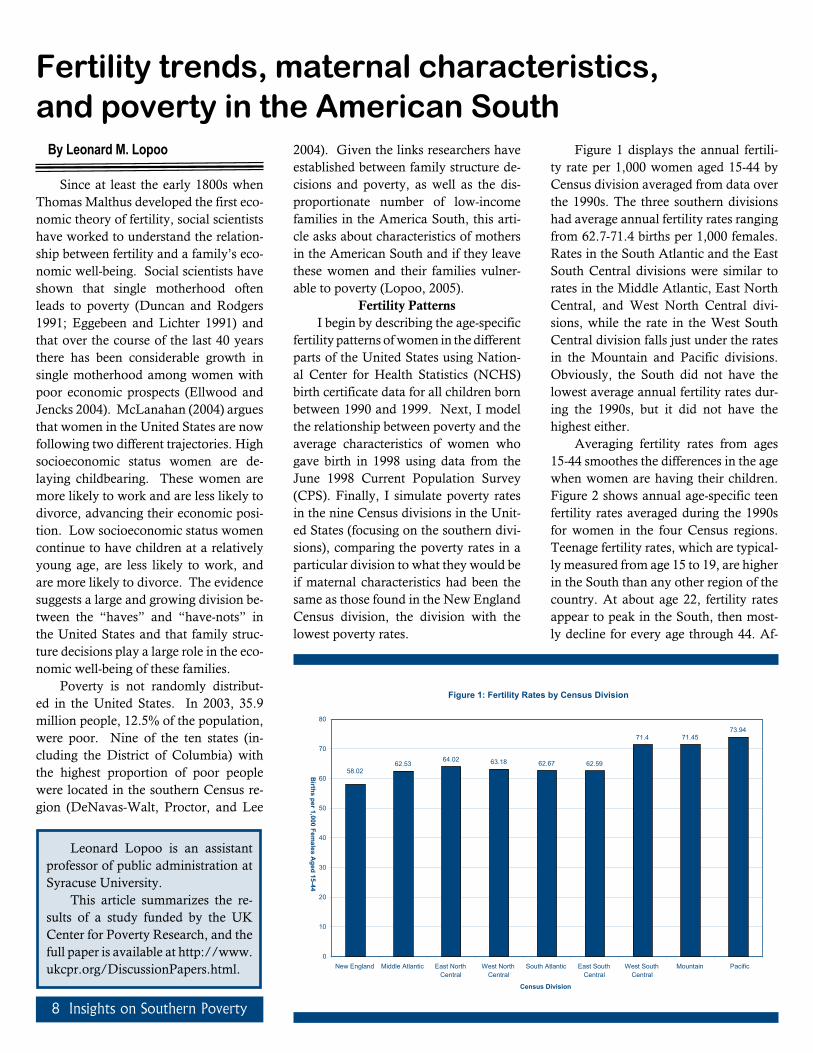
Figure 1 displays the annual fertili-ty rate per 1,000 women aged 15-44 by Census division averaged from data over the 1990s. The three southern divisions had average annual fertility rates ranging from 62.7-71.4 births per 1,000 females. Rates in the South Atlantic and the East South Central divisions were similar to rates in the Middle Atlantic, East North Central, and West North Central divi-sions, while the rate in the West South Central division falls just under the rates in the Mountain and Pacific divisions. Obviously, the South did not have the lowest average annual fertility rates dur-ing the 1990s, but it did not have the highest either.
Averaging fertility rates from ages 15-44 smoothes the differences in the age when women are having their children. Figure 2 shows annual age-specific teen fertility rates averaged during the 1990s for women in the four Census regions. Teenage fertility rates, which are typical-ly measured from age 15 to 19, are higher in the South than any other region of the country. At about age 22, fertility rates appear to peak in the South, then most-ly decline for every age through 44. Af-
Leonard Lopoo is an assistant professor of public administration at Syracuse University.
This article summarizes the re-sults of a study funded by the UK Center for Poverty Research, and the full paper is available at http://www.ukcpr.org/DiscussionPapers.html.
Figure 1: Fertility Rates by Census Division
58.0262.53
64.02 63.18 62.67 62.59
71.4 71.4573.94
0
10
20
30
40
50
60
70
80
New England Middle Atlantic East NorthCentral
West NorthCentral
South Atlantic East SouthCentral
West SouthCentral
Mountain Pacific
Census Division
Births
per1,000Fem
alesA
ged15-44
Insights on Southern Poverty �
ter age 28, the fertility rates in the South are lower than any other region until age 41. These rates demonstrate that while average fertility rates in the South are no different from the rest of the country, the age profile of fertility in the South is much different, particularly compared to the Northeast and the Midwest, with southern women having their children at younger ages.
For women who had a child in 1998 in the nine different Census divisions, one of the most striking regional differ-ences is the education level for women in the Northeast and Midwest compared to those in the South and West. Mothers in the New England division had nearly 1.5 more years of education at the birth of their child than those in the West South Central division. Nearly 72% of mothers in the New England division were mar-ried when they had their child in 1998 compared to around 66% in the southern divisions. Mothers in the New England division also had fewer children but the differences here are much smaller. As expected, the mothers in the South are much more likely to be African Amer-ican and the mothers in the West are more likely to be Hispanic.
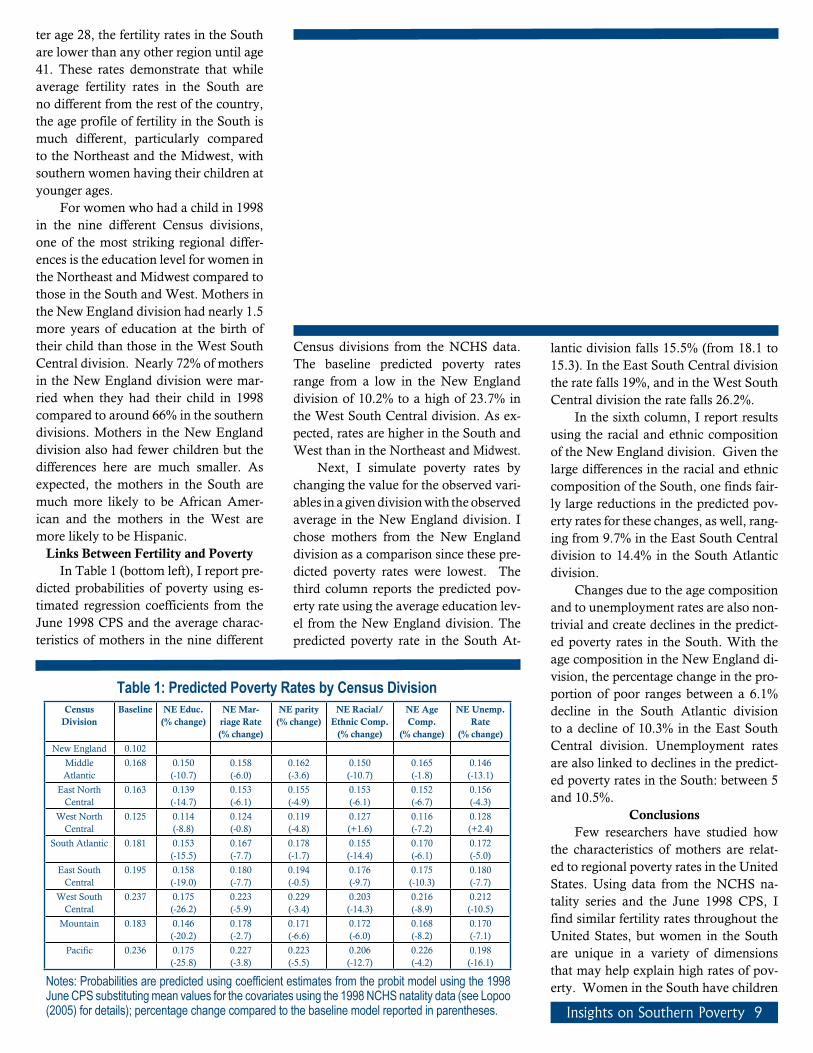
Links Between Fertility and PovertyIn Table 1 (bottom left), I report pre-
dicted probabilities of poverty using es-timated regression coefficients from the June 1998 CPS and the average charac-teristics of mothers in the nine different
Census divisions from the NCHS data. The baseline predicted poverty rates range from a low in the New England division of 10.2% to a high of 23.7% in the West South Central division. As ex-pected, rates are higher in the South and West than in the Northeast and Midwest.
Next, I simulate poverty rates by changing the value for the observed vari-ables in a given division with the observed average in the New England division. I chose mothers from the New England division as a comparison since these pre-dicted poverty rates were lowest. The third column reports the predicted pov-erty rate using the average education lev-el from the New England division. The predicted poverty rate in the South At-
lantic division falls 15.5% (from 18.1 to 15.3). In the East South Central division the rate falls 19%, and in the West South Central division the rate falls 26.2%.
In the sixth column, I report results using the racial and ethnic composition of the New England division. Given the large differences in the racial and ethnic composition of the South, one finds fair-ly large reductions in the predicted pov-erty rates for these changes, as well, rang-ing from 9.7% in the East South Central division to 14.4% in the South Atlantic division.
Changes due to the age composition and to unemployment rates are also non-trivial and create declines in the predict-ed poverty rates in the South. With the age composition in the New England di-vision, the percentage change in the pro-portion of poor ranges between a 6.1% decline in the South Atlantic division to a decline of 10.3% in the East South Central division. Unemployment rates are also linked to declines in the predict-ed poverty rates in the South: between 5 and 10.5%.
ConclusionsFew researchers have studied how
the characteristics of mothers are relat-ed to regional poverty rates in the United States. Using data from the NCHS na-tality series and the June 1998 CPS, I find similar fertility rates throughout the United States, but women in the South are unique in a variety of dimensions that may help explain high rates of pov-erty. Women in the South have children
Census Division
Baseline NE Educ.(% change)
NE Mar-riage Rate (% change)
NE parity(% change)
NE Racial/Ethnic Comp.
(% change)
NE Age Comp.
(% change)
NE Unemp. Rate
(% change)
New England 0.102
Middle Atlantic
0.168 0.150(-10.7)
0.158(-6.0)
0.162(-3.6)
0.150(-10.7)
0.165(-1.8)
0.146(-13.1)
East North Central
0.163 0.139(-14.7)
0.153(-6.1)
0.155(-4.9)
0.153(-6.1)
0.152(-6.7)
0.156(-4.3)
West North Central
0.125 0.114(-8.8)
0.124(-0.8)
0.119(-4.8)
0.127(+1.6)
0.116(-7.2)
0.128(+2.4)
South Atlantic 0.181 0.153(-15.5)
0.167(-7.7)
0.178(-1.7)
0.155(-14.4)
0.170(-6.1)
0.172(-5.0)
East South Central
0.195 0.158(-19.0)
0.180(-7.7)
0.194(-0.5)
0.176(-9.7)
0.175(-10.3)
0.180(-7.7)
West South Central
0.237 0.175(-26.2)
0.223(-5.9)
0.229(-3.4)
0.203(-14.3)
0.216(-8.9)
0.212(-10.5)
Mountain 0.183 0.146(-20.2)
0.178(-2.7)
0.171(-6.6)
0.172(-6.0)
0.168(-8.2)
0.170(-7.1)
Pacific 0.236 0.175(-25.8)
0.227(-3.8)
0.223(-5.5)
0.206(-12.7)
0.226(-4.2)
0.198(-16.1)
Notes: Probabilities are predicted using coefficient estimates from the probit model using the 1998 June CPS substituting mean values for the covariates using the 1998 NCHS natality data (see Lopoo (2005) for details); percentage change compared to the baseline model reported in parentheses.
Table 1: Predicted Poverty Rates by Census Division
10 Insights on Southern Poverty
at younger ages than those in the Mid-west and Northeast. These mothers also tend to have much lower levels of edu-cation and are more likely to be African American or Hispanic.
These findings also suggest that giv-en the sizeable differences in education between the regions, an increase in ed-ucational attainment among mothers in the South to the level of those in the New England division would reduce southern poverty rates between 16 and 26%.
This analysis provides some direc-tion for policy makers, suggesting that changes in maternal education may re-duce poverty rates appreciably. The Per-sonal Responsibility and Work Opportu-nity Reconciliation Act of 1996 set goals
to delay the fertility of young women. These results suggest that any program that delays fertility and increases educa-tional attainment might reduce poverty.
ReferencesDeNavas-Walt, Carmen, Bernadette
D. Proctor, and Cheryl Hill Lee. 2005. Current Population Reports, P60-229. “In-come, Poverty, and Health Insurance Coverage in the United States: 2004.” Washington, DC: U. S. Government Printing Office.
Duncan, Greg J. and Willard Rod-gers. 1991. “Has Children’s Poverty Be-come More Persistent?” American Socio-logical Review 56(4): 538-50.
Eggebeen, David J. and Daniel L.
Lichter. 1991. “Race, Family Structure, and Changing Poverty Among Ameri-can Children.” American Sociological Re-view 56(6): 801-817.
Ellwood, David and Christopher Jencks. 2004. “The Spread of Single-Par-ent Families in the United States since 1960.” In The Future of the Family, ed-ited by Daniel P. Moynihan, Timothy M. Smeeding and Lee Rainwater. New York: Russell Sage Foundation.
Lopoo, Leonard M. 2005. Poverty and Fertility in the American South. UK Center for Poverty Research Discussion Paper DP2005-01.
McLanahan, Sara. 2004. “Children and the Second Demographic Transi-tion.” Demography 41(4): 607-627.
Poverty, race, and the contexts of achievement Examining educational experiences of children in the American South
By Maryah Stella FramJulie Miller-Cribbsand Lee Van Horn
Race and class gaps in academic achievement of children have historical-ly been thought to be connected to school segregation, particularly in the South. Relative to the nation, the South is char-acterized by high levels of poverty, a large African American population, and poor performance in many domains of educa-tional quality. Thus, in the South, there is a heightened need to understand racial achievement gaps in order to improve the effectiveness of education as a path-way to opportunity. While some scholars have focused on cultural or attitudinal explanations for poor and minority chil-dren’s under-achievement (e.g. Murray 1984), the mainstream of research has ac-knowledged the need for more structural or contextual explanations (Duncan & Brooks-Gunn, 1997; Wilson, 1987). Re-cently, greater attention has been paid to understanding academic achievement in its more proximal school social context. Studies addressing “peer group effects” explore the idea that a child’s social ties
in school somehow influence that child’s individual learning (Hoxby 2000). Oth-er studies focus on classroom processes such as a heightened emphasis on basic skills learning, and others still on school-level factors such as the extent of racial integration. Research has provided some support for each of these ideas, but com-plexities of accounting for various fac-tors make it unclear how much impact race or class concentration may have on learning. In this research we attempt to account for these various influences by examining the effect of child-, class-room-, and school-level factors on aca-demic achievement among public school children in the South.
MethodThe data for this study comes from
the first two years of Early Childhood Longitudinal Study Kindergarten Co-hort (ECLS-K). ECLS-K tracks the edu-cational development of a nationally rep-resentative cohort of children, beginning with kindergarten entry in fall of 1998. ECLS-K data was collected from mul-tiple sources, including students, par-ents, teachers, and school administra-tors. This study includes measures at the child/family, classroom, and school levels.
We considered a subset of the ECLS-K cohort, limited first to students attend-ing school in the South, as identified by the Census region used in the ECLS-K sampling. We further restrict our data analysis to students attending public schools; those who are white, black, or Hispanic; and those who neither change classrooms during kindergarten, nor change schools between kindergarten and first grade. These restrictions sup-port our analytic focus on children in the South, while also allowing us to attend to the race distinctions most salient to is-sues of segregation and minority status.
MeasuresWe measured reading skills, child
and family variables commonly thought to affect child learning, classroom vari-ables, and school variables. Reading skills assessments were conducted during the fall and spring of kindergarten and in the spring of first grade. Child and family variables include information from par-ent interview data, child date of birth and school start date, education attainment of the mother, family socio-economic status, number of parents in household, teenage childbearing, and choice of resi-dence and school by parents. Classroom
Insights on Southern Poverty 11
variables identify materials availabili-ty, organization, and teacher character-istics. Rural and non-rural schools were contrasted. The proportions of minority students and free-lunch eligible students were also examined.
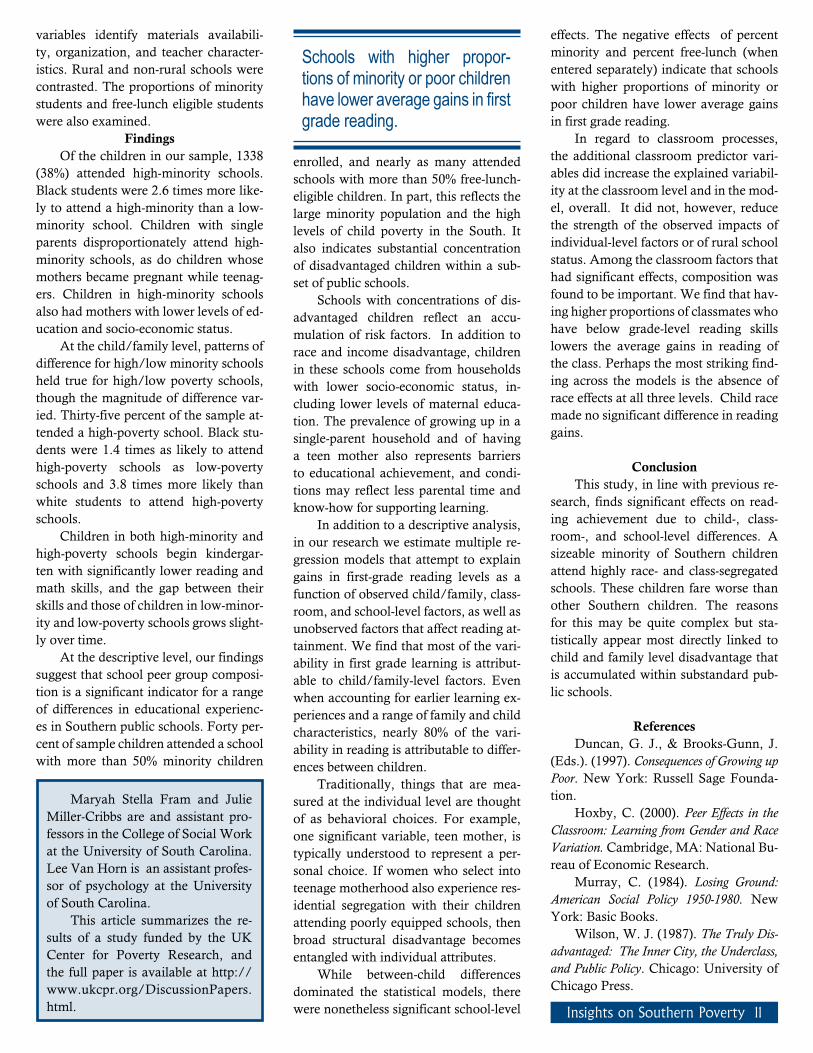
FindingsOf the children in our sample, 1338
(38%) attended high-minority schools. Black students were 2.6 times more like-ly to attend a high-minority than a low-minority school. Children with single parents disproportionately attend high-minority schools, as do children whose mothers became pregnant while teenag-ers. Children in high-minority schools also had mothers with lower levels of ed-ucation and socio-economic status.
At the child/family level, patterns of difference for high/low minority schools held true for high/low poverty schools, though the magnitude of difference var-ied. Thirty-five percent of the sample at-tended a high-poverty school. Black stu-dents were 1.4 times as likely to attend high-poverty schools as low-poverty schools and 3.8 times more likely than white students to attend high-poverty schools.
Children in both high-minority and high-poverty schools begin kindergar-ten with significantly lower reading and math skills, and the gap between their skills and those of children in low-minor-ity and low-poverty schools grows slight-ly over time.
At the descriptive level, our findings suggest that school peer group composi-tion is a significant indicator for a range of differences in educational experienc-es in Southern public schools. Forty per-cent of sample children attended a school with more than 50% minority children
enrolled, and nearly as many attended schools with more than 50% free-lunch-eligible children. In part, this reflects the large minority population and the high levels of child poverty in the South. It also indicates substantial concentration of disadvantaged children within a sub-set of public schools.
Schools with concentrations of dis-advantaged children reflect an accu-mulation of risk factors. In addition to race and income disadvantage, children in these schools come from households with lower socio-economic status, in-cluding lower levels of maternal educa-tion. The prevalence of growing up in a single-parent household and of having a teen mother also represents barriers to educational achievement, and condi-tions may reflect less parental time and know-how for supporting learning.
In addition to a descriptive analysis, in our research we estimate multiple re-gression models that attempt to explain gains in first-grade reading levels as a function of observed child/family, class-room, and school-level factors, as well as unobserved factors that affect reading at-tainment. We find that most of the vari-ability in first grade learning is attribut-able to child/family-level factors. Even when accounting for earlier learning ex-periences and a range of family and child characteristics, nearly 80% of the vari-ability in reading is attributable to differ-ences between children.
Traditionally, things that are mea-sured at the individual level are thought of as behavioral choices. For example, one significant variable, teen mother, is typically understood to represent a per-sonal choice. If women who select into teenage motherhood also experience res-idential segregation with their children attending poorly equipped schools, then broad structural disadvantage becomes entangled with individual attributes.
While between-child differences dominated the statistical models, there were nonetheless significant school-level
effects. The negative effects of percent minority and percent free-lunch (when entered separately) indicate that schools with higher proportions of minority or poor children have lower average gains in first grade reading.
In regard to classroom processes, the additional classroom predictor vari-ables did increase the explained variabil-ity at the classroom level and in the mod-el, overall. It did not, however, reduce the strength of the observed impacts of individual-level factors or of rural school status. Among the classroom factors that had significant effects, composition was found to be important. We find that hav-ing higher proportions of classmates who have below grade-level reading skills lowers the average gains in reading of the class. Perhaps the most striking find-ing across the models is the absence of race effects at all three levels. Child race made no significant difference in reading gains.
ConclusionThis study, in line with previous re-
search, finds significant effects on read-ing achievement due to child-, class-room-, and school-level differences. A sizeable minority of Southern children attend highly race- and class-segregated schools. These children fare worse than other Southern children. The reasons for this may be quite complex but sta-tistically appear most directly linked to child and family level disadvantage that is accumulated within substandard pub-lic schools.
ReferencesDuncan, G. J., & Brooks-Gunn, J.
(Eds.). (1997). Consequences of Growing up Poor. New York: Russell Sage Founda-tion.
Hoxby, C. (2000). Peer Effects in the Classroom: Learning from Gender and Race Variation. Cambridge, MA: National Bu-reau of Economic Research.
Murray, C. (1984). Losing Ground: American Social Policy 1950-1980. New York: Basic Books.
Wilson, W. J. (1987). The Truly Dis-advantaged: The Inner City, the Underclass, and Public Policy. Chicago: University of Chicago Press.
Maryah Stella Fram and Julie Miller-Cribbs are and assistant pro-fessors in the College of Social Work at the University of South Carolina. Lee Van Horn is an assistant profes-sor of psychology at the University of South Carolina.
This article summarizes the re-sults of a study funded by the UK Center for Poverty Research, and the full paper is available at http://www.ukcpr.org/DiscussionPapers.html.
Schools with higher propor-tions of minority or poor children have lower average gains in first grade reading.

Insights on Southern PovertyUniversity of KentuckyUK Center for Poverty Research302D Mathews BuildingLexington, KY 40506-0047
Phone: (859) 257-7641Fax: (859) 257-6959
Related Documents