Determination of fiber/matrix interface debond growth parameters from cyclic loading of single fiber composites Andrejs Pupurs 1,2 , Janis Varna 1 , Povl Brøndsted 3 , Stergios Goutianos 3 1 Luleå University of Technology, S-97187 Luleå, Sweden 2 Swerea SICOMP, SE-94126 Piteå, Sweden 3 Technical University of Denmark, Risø Campus, DK-4000 Roskilde, Denmark 6 th International Conference on Composites Testing and Model Identification (CompTest 2013) 22-24 April 2013, Aalborg, Denmark.

Welcome message from author
This document is posted to help you gain knowledge. Please leave a comment to let me know what you think about it! Share it to your friends and learn new things together.
Transcript

Determination of fiber/matrix interface debond growth parameters from cyclic loading of
single fiber composites Andrejs Pupurs1,2, Janis Varna1, Povl Brøndsted3, Stergios Goutianos3
1Luleå University of Technology, S-97187 Luleå, Sweden 2Swerea SICOMP, SE-94126 Piteå, Sweden
3Technical University of Denmark, Risø Campus, DK-4000 Roskilde, Denmark
6th International Conference on Composites Testing and Model Identification (CompTest 2013) 22-24 April 2013, Aalborg, Denmark.
2
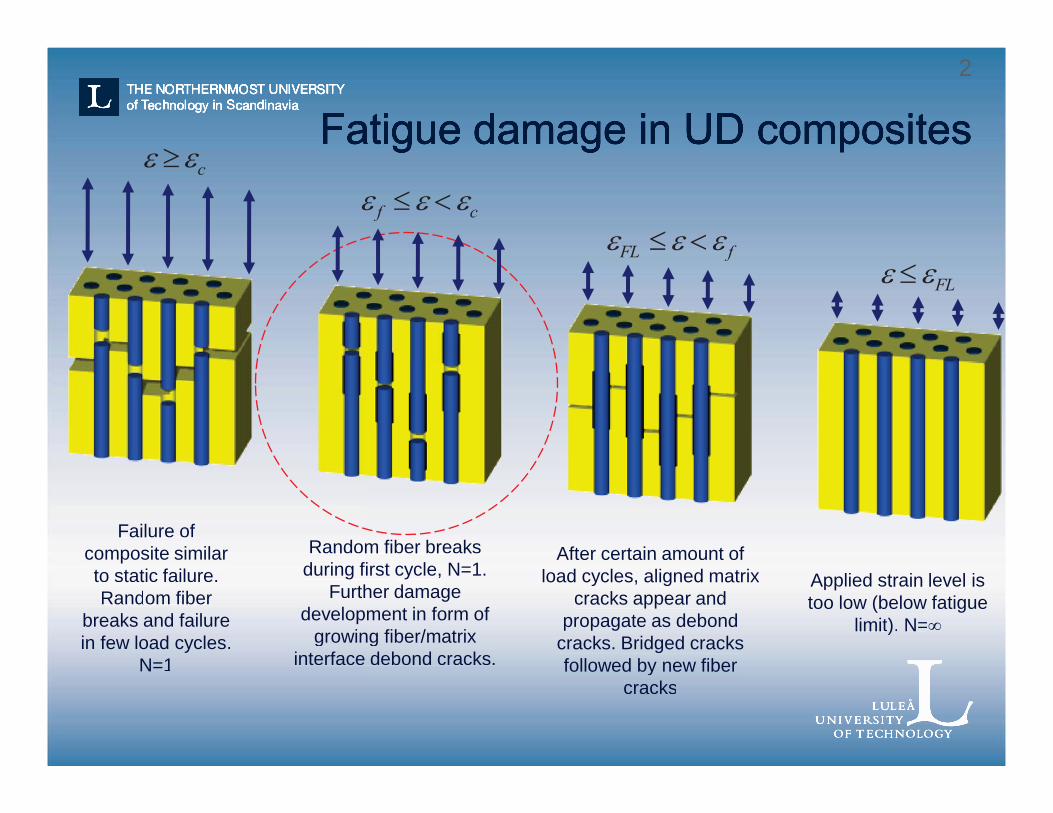
Fatigue damage in UD composites
Failure of composite similar to static failure. Random fiber
breaks and failure in few load cycles.
N=1
Applied strain level is too low (below fatigue
limit). N=∞
Random fiber breaks during first cycle, N=1.
Further damage development in form of
growing fiber/matrix interface debond cracks.
After certain amount of load cycles, aligned matrix
cracks appear and propagate as debond
cracks. Bridged cracks followed by new fiber
cracks
2
Failure of composite similar to static failure. Random fiber
breaks and failure in few load cycles.
N=1
Applied strain level is too low (below fatigue
limit). N=∞
Random fiber breaks during first cycle, N=1.
Further damage development in form of
growing fiber/matrix interface debond cracks.
After certain amount of load cycles, aligned matrix
cracks appear and propagate as debond
cracks. Bridged cracks followed by new fiber
cracks
c
FL
f c
FL f

3
Objective
• To focus on fiber/matrix interface debond growth in tension-tension fatigue
• To use fracture mechanics (energy release rate) for the debond growth analysis
• To calculate the energy release rate and to determine its dependence on debond length and to describe it by simple fitting function
• Using experimental data and the calculated energy release rate to evaluate whether a power law can describe the debond length growth rate in cyclic loading
• To determine material constants in this power law, if it is applicable

4 Debond growth in tension-
tension fatigue
ld
mIIGB
dNdA
ldn ld / rf
mII
dn GBdNdl *
B* B 2 rf2where
dA – increase of the crack surface area
GII G( max ) G( min )
max 0min 0
dN – increase of number of applied load cycles
mKBdNdAmax
min
Paris law:
)(Nfld
B, m – material constants
K – stress intensity factor range

5
Determination of power law parameters
• Proper values of Paris law parameters m and B can only be found if experimental data of ld=f(N) are available.
• Experimental measurements of debond growth in fatigue is complicated for UD composites.
• Single fiber (SF) composite with transparent matrix, is a convenient tool to measure debond crack growth in cyclic loading.
• Analytical and FEM calculations of GII for SF composites are necessary to account for the stress state.
• Proper vam and B cexperimeavailable.
• Experimegrowth in composite
• Single fibtranspareto measucyclic load
• Analyticalfor SF comaccount fo
mII
dn GBdNdl *

6
Concentric cylinder model
Lf
ld
Lf
z z
fiber break
debonded fiber region
z
T
F M

7
Long and short debonds
• Long debonds • Debond growth in self-
similar manner • Analytical model for GII
calculation
d) Plateau stress-state in bonded fiber region.
c) Debond tip region with stress singularity.
b) Plateau stress-state in debonded fiber region.
a) Very complex stress state at the fiber break.
Stress state regions
• Short debonds • Strong interaction
between stress states in regions a) and c)
• Numerical methods for GII calculation
ld
F M

8
Analytical solution. Energy release rate for long debonds
• J.A. Nairn, Y.C. Liu, On the use of energy methods for interpretation of results of single-fiber fragmentation experiments, Composite Interfaces, vol.4, pp. 241-267, 1996.
2
4Tkk
rEG f
zmthmechmf
fz
II
21
2dQ
dE
k fz
mf
zrm f
zmm
fzm
frf
z
fzr
th dQ
dE
k2
12
m
mf
r
fr
EEd
111 1
2
22 d
Ed f
z
fzr
1
221dE
Q fz
fzr
Em = 3 [GPa] Em = 3.5 [GPa] Em = 4 [GPa]
m = 0.3 0.997427 0.997011 0.996598
1.014151 1.016443 1.018716 mk
thk

9
Numerical calculation of energy release rate for short debonds
• Energy release rate calculation using Virtual Crack Closure Technique (VCCT)
• Calculations performed using FEM software ANSYS
uz z
r
fiber break
sym
met
ry a
xis
T
oute
r bou
ndar
y
GII (ld ) limdld 0
12dld
uldld
ld dld
z dld rzld z dz
Lf
Symmetry b.c.
10
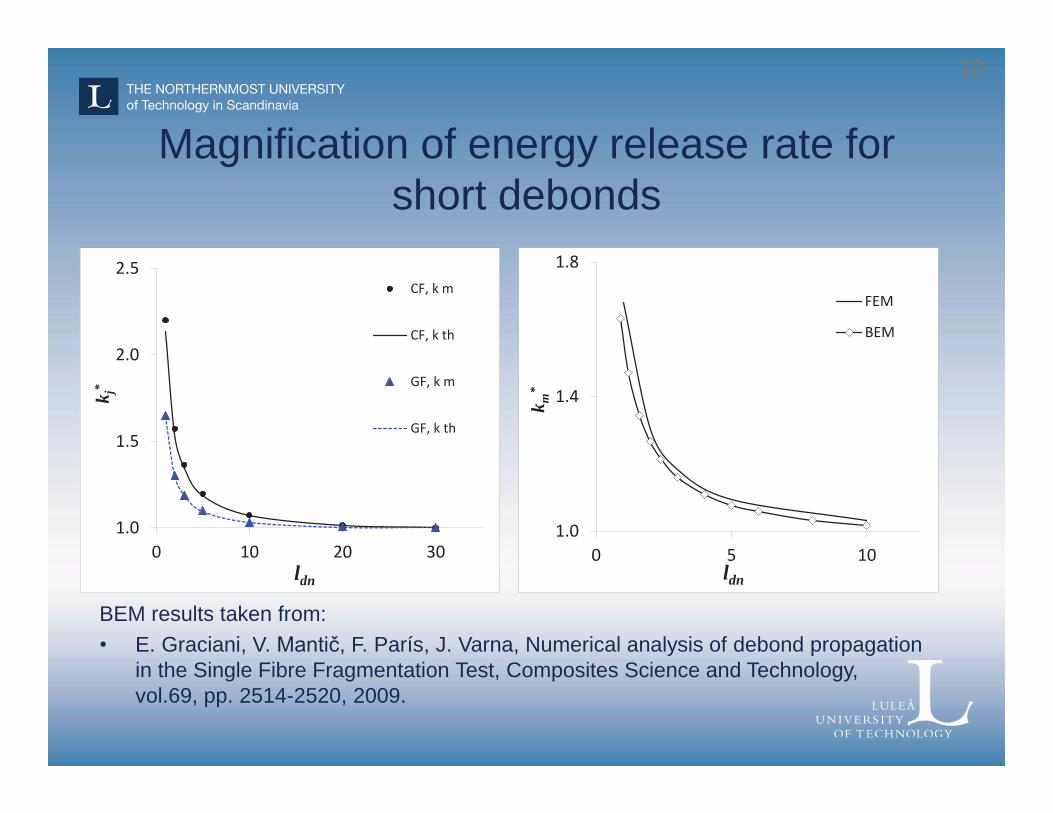
Magnification of energy release rate for short debonds
BEM results taken from: • E. Graciani, V. Mantič, F. París, J. Varna, Numerical analysis of debond propagation
in the Single Fibre Fragmentation Test, Composites Science and Technology, vol.69, pp. 2514-2520, 2009.
1.0
1.4
1.8
0 5 10k m
*
ldn
FEM
BEM
1.0
1.5
2.0
2.5
0 10 20 30
k j*
ldn
CF, k m
CF, k th
GF, k m
GF, k th

11
General expression for energy release rate
• Long debonds:
2
4Tkk
rEG f
zmthmechmf
fz
II
km km* (ldn)km kth kth
* (ldn)kth
)()()( 0**
dndnthdnm lklklk
30 ;1
301 ;1 321
20
dn
dndndn
l
llaala
k
• Short debonds:
• Fitting the whole range:
GII (ldn)rf Ez
f k02(ldn)4
( mechmax )2 ( mech
min )2 2( m zf ) T( mech
maxmechmin )
• Energy release rate change in one load cycle:
12
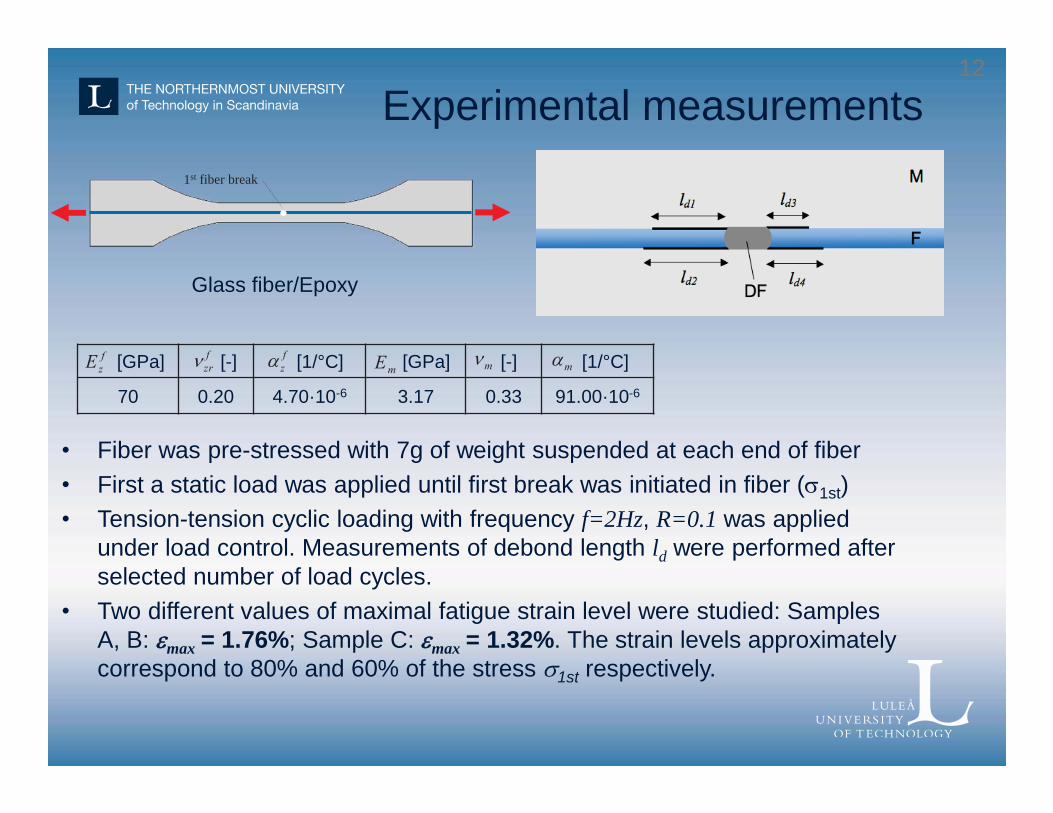
Experimental measurements
• Fiber was pre-stressed with 7g of weight suspended at each end of fiber • First a static load was applied until first break was initiated in fiber ( 1st) • Tension-tension cyclic loading with frequency f=2Hz, R=0.1 was applied
under load control. Measurements of debond length ld were performed after selected number of load cycles.
• Two different values of maximal fatigue strain level were studied: Samples A, B: max = 1.76%; Sample C: max = 1.32%. The strain levels approximately correspond to 80% and 60% of the stress 1st respectively.
[GPa] [-] [1/°C] [GPa] [-] [1/°C]
70 0.20 4.70·10-6 3.17 0.33 91.00·10-6
Ezf
zrf
zf Em m m
1st fiber break
Glass fiber/Epoxy

13
Experimental results. Debond growth in cyclic loading
0
20
40
60
80
1 10 100 1000 10000 100000
l d (
m)
N
ld1 Sample Ald2 SampleAld3 Sample Ald4 Sample Ald1 Sample Bld2 Sample Bld3 Sample Bld4 Sample B
N=1000
N=5000
N=10000
N=1
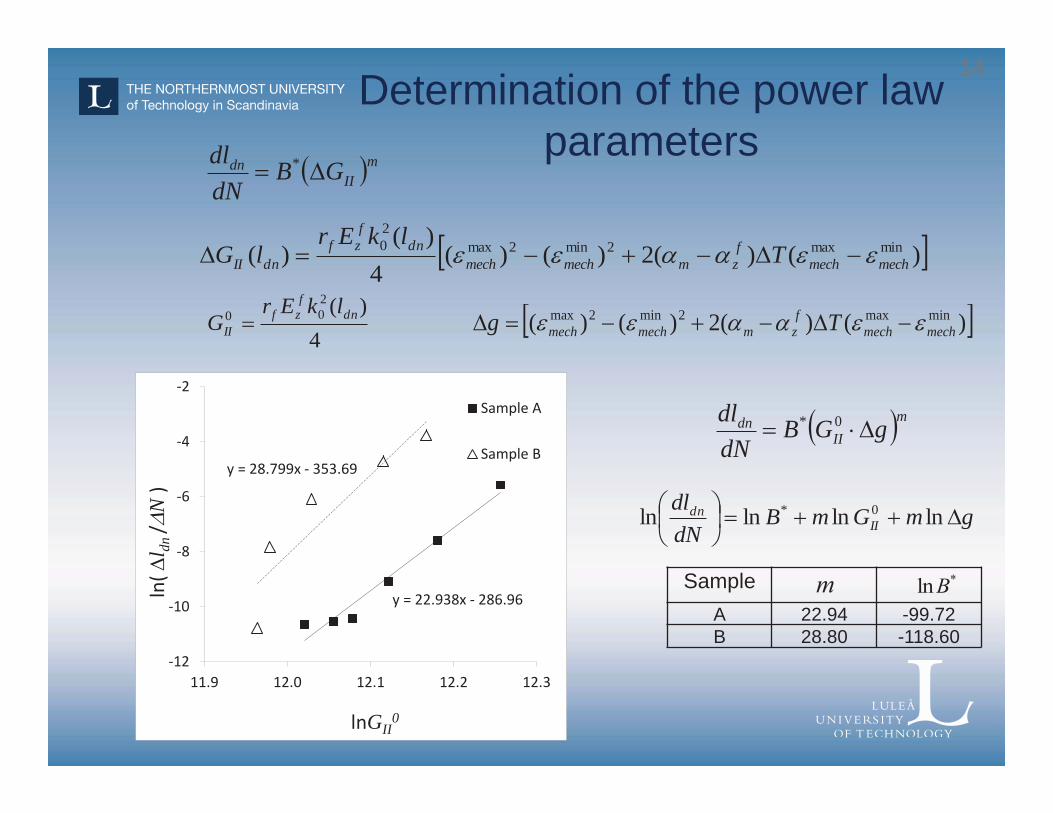
14 Determination of the power law
parameters
)()(2)()(4
)()( minmax2min2max
20
mechmechf
zmmechmechdn
fzf
dnII TlkEr
lG
4)(2
00 dnf
zfII
lkErG )()(2)()( minmax2min2max
mechmechf
zmmechmech Tg
mII
dn gGBdNdl 0*
gmGmBdNdl
IIdn lnlnlnln 0*
y = 22.938x - 286.96
y = 28.799x - 353.69
-12
-10
-8
-6
-4
-2
11.9 12.0 12.1 12.2 12.3
ln(
l dn /
N )
lnGII0
Sample A
Sample B
Sample A 22.94 -99.72 B 28.80 -118.60
m lnB*
mII
dn GBdNdl *

15
0
2
4
6
8
10
0 20000 40000 60000 80000 100000
l dn
N
Sample A experimental
Sample A modeling
Sample B experimantal
Sample B modeling
Sample C experimental
Sample C modeling
Validation of power law parameters
16
Conclusions
• The strain energy release rate in Mode II for debond growth was analyzed combining analytical solution for long debonds and FEM solution for short debonds.
• Using the quantified debond length versus number of cycles data it was shown that the power law with respect to the strain energy release rate change is applicable for debond growth characterization in tension-tension fatigue.
• Simulations showed that the obtained parameters give acceptable predictions for cases, when the debond grows as well as when it does not grow.
• Being material properties the power law parameters determined in this study using single fiber composites can also be applied for the case of UD composites made of the same material system

17
Related papers
• A. Pupurs, S. Goutianos, P. Brøndsted, J. Varna, Interface debond crack growth in tension-tension cyclic loading of single fiber polymer composites, Composites Part A, vol.44, pp. 86-94, 2013.
• A. Pupurs, J. Varna, FEM modeling of fiber/matrix debond growth in tension-tension cyclic loading of unidirectional composites, International Journal of Damage Mechanics, In Press, 2013. (available online)

Thank you for your attention!
Related Documents


![Z l e j h ] j Z f f Z .01. .01. « K L J G K L J M F ?. < B ... · K l j m d l m h ] j Z f f q _ l Z I. g b l _ e v g Z b k d Z-Характеристика учебного предмета,](https://static.cupdf.com/doc/110x72/602d5d9edb46b31fcd5b256b/z-l-e-j-h-j-z-f-f-z-01-01-k-l-j-g-k-l-j-m-f-b-k-l-j-m-d-l-m.jpg)
![F : L ? F : L B D : = J : F F G K B K L ? F · 22 M > D 004.4+004.8+004.9 ; ; D 32.973 34 F Z l _ f Z l b d Z i j h ] j Z f f g k b k l _ f: f _ ` \ m a. k [. g Z m q. k l. / 34 I.](https://static.cupdf.com/doc/110x72/5e7e1fac4094c071fd248c46/f-l-f-l-b-d-j-f-f-g-k-b-k-l-f-22-m-d-004400480049-d.jpg)
![J Z [ h q Z y i j h ] j Z f f Z i h m q [ g h f m i j ^ f l m « J …...в диалоге с учителем вырабатывать критерии оценки и определять](https://static.cupdf.com/doc/110x72/5e2c6e286ab53d1da1630916/j-z-h-q-z-y-i-j-h-j-z-f-f-z-i-h-m-q-g-h-f-m-i-j-f-l-m-j-.jpg)
![I J H = J : F F : m q [ g h f m i j ^ f l m K E M R : G B ... · 3 K l j m d l m j Z j h ] j Z f f u q _ [ g h ] h j _ ^ f _ l Z I. I h y k g b l _ e v g Z a Z i b k d Z - Характеристика](https://static.cupdf.com/doc/110x72/5f7708ee5e83fb5d303acf51/i-j-h-j-f-f-m-q-g-h-f-m-i-j-f-l-m-k-e-m-r-g-b-3-k-l-j-m-d-l-m-j.jpg)

![Z g b y ( l m q j ` ^ g b) « ` ^ m g Z j h ^ g Z y Z d Z ^ f b …...2.1 P _ e Z a h \ Z l _ e v g h c j h ] j Z f f u Z e Z \ j b Z l 43.03.02 m j b a f Основная образовательная](https://static.cupdf.com/doc/110x72/5f090ead7e708231d42506c6/z-g-b-y-l-m-q-j-g-b-m-g-z-j-h-g-z-y-z-d-z-f-b-21-p-e-z.jpg)

![J Z [ h q Z y i j h ] j Z f f Z i h m q [ g h f m i j ^ f ...ustan.ucoz.ru/Rabohie_pr/SmirNP/rabochaja_program...распределять работу при коллективной](https://static.cupdf.com/doc/110x72/5f835a47f9e3201385672e82/j-z-h-q-z-y-i-j-h-j-z-f-f-z-i-h-m-q-g-h-f-m-i-j-f-ustanucozrurabohieprsmirnprabochajaprogram.jpg)
![2 3 I e Z g b j m f u a m e v l Z l d m j k Z m j h q g h ... · 3 ПОЯСНИТЕЛЬНАЯ ЗАПИСКА J Z [ h q Z y i j h ] j Z f f Z i h d m j k m \ g _ m j h q g h c ^ _](https://static.cupdf.com/doc/110x72/60379dc731ba1924a7293bd2/2-3-i-e-z-g-b-j-m-f-u-a-m-e-v-l-z-l-d-m-j-k-z-m-j-h-q-g-h-3-.jpg)
![I j h ] j m q [ g h f l Z F m a u d Z e v g u c j m f g l...2 K l j m d l m j j h ] j Z f f _ [ g h ] j _ ^ f _ l Z I. I h y k g b l _ e v g Z i b k d Z - Характеристика](https://static.cupdf.com/doc/110x72/5fe839f98909dd004a353a5d/i-j-h-j-m-q-g-h-f-l-z-f-m-a-u-d-z-e-v-g-u-c-j-m-f-g-l-2-k-l-j-m-d-l-m-j.jpg)