46 DAFTAR PUSTAKA 1. Billings PG, Blatt W, Carr T, Chambers J, Kaplan B. American lung association lung disease at glance: respiratory distress syndrome (RDS) [homepage on the Internet], c2008 [updated 2008 Mar 12; cited 2015 Jan 22]. Available from: http://www.lung.org/assets/documents/publications/lung-disease- data/LDD_2008.pdf . 2. Hameed NN, Al-Janabi MK, Al-Reda YI. Respiratory distress in full term newborns. The Iraqi Postgraduate Medical Journal 2007;6:233-9. 3. Anggraini A, Sumadiono, Wandita S. Faktor risiko kematian neonatus dengan penyakit membran hialin. Sari Pediatri 2013;15:75-80. 4. Tobing R. Kelainan kardiovaskular pada sindrom gawat nafas neonatus. Sari Pediatri 2004;6:40-6. 5. Hermansen CL, Lorah KN. Respiratory distress in the newborn. American family physician 2007;76:987-94. 6. Gerten KA, Conrod DV, Bay RC. Caesarean delivery and respiratory distress syndrome: does labor make a difference? . Am J Obstet Gynecolo 2005;193(3 pt2):1061-4. 7. Ainsworth SB. Pathophysiology of neonatal RDS: implications for early treatment strategies. Treat Respir Med 2005:423-37. 8. Liu J, Yang N, Liu Y. High risk factors of respiratory distress syndrome in term neonates: a retrospective case control study. Balkan Med J 2014;31:64-8. 9. Azis AL. Pedoman diagnosis dan terapi bagian/smf kesehatan anak. Surabaya: RSU Dokter Sutomo, 2006. 10. Alya D. Faktor-faktor yang berhubungan dengan bayi berat lahir rendah (BBLR) di rumah sakit ibu dan anak banda aceh tahun 2013. Aceh: Stikes U'budiyah, 2014.

Welcome message from author
This document is posted to help you gain knowledge. Please leave a comment to let me know what you think about it! Share it to your friends and learn new things together.
Transcript

46
DAFTAR PUSTAKA
1. Billings PG, Blatt W, Carr T, Chambers J, Kaplan B. American lung
association lung disease at glance: respiratory distress syndrome (RDS)
[homepage on the Internet], c2008 [updated 2008 Mar 12; cited 2015 Jan
22]. Available from:
http://www.lung.org/assets/documents/publications/lung-disease-
data/LDD_2008.pdf.
2. Hameed NN, Al-Janabi MK, Al-Reda YI. Respiratory distress in full term
newborns. The Iraqi Postgraduate Medical Journal 2007;6:233-9.
3. Anggraini A, Sumadiono, Wandita S. Faktor risiko kematian neonatus
dengan penyakit membran hialin. Sari Pediatri 2013;15:75-80.
4. Tobing R. Kelainan kardiovaskular pada sindrom gawat nafas neonatus.
Sari Pediatri 2004;6:40-6.
5. Hermansen CL, Lorah KN. Respiratory distress in the newborn. American
family physician 2007;76:987-94.
6. Gerten KA, Conrod DV, Bay RC. Caesarean delivery and respiratory
distress syndrome: does labor make a difference? . Am J Obstet Gynecolo
2005;193(3 pt2):1061-4.
7. Ainsworth SB. Pathophysiology of neonatal RDS: implications for early
treatment strategies. Treat Respir Med 2005:423-37.
8. Liu J, Yang N, Liu Y. High risk factors of respiratory distress syndrome in
term neonates: a retrospective case control study. Balkan Med J
2014;31:64-8.
9. Azis AL. Pedoman diagnosis dan terapi bagian/smf kesehatan anak.
Surabaya: RSU Dokter Sutomo, 2006.
10. Alya D. Faktor-faktor yang berhubungan dengan bayi berat lahir rendah
(BBLR) di rumah sakit ibu dan anak banda aceh tahun 2013. Aceh: Stikes
U'budiyah, 2014.
47
11. Tamad N, Supriyanto, Rosanti TI. Hubungan berat badan lahir rendah
dengan kejadian sindrom distress respirasi pada bayi di RSUD. Prof.
Margono Soekarjo. Mandala of Health 2011;5.
12. Andrews KM, Brouillette DB, Brouillette RT. Mortality, infant. Elsevier
Academic Press 2008;Encyclopedia of Infant and Early Childhood
Development 2:343-58.
13. Dani C, Reali MF, Bertini G, Wiechmann L, Spagnolo A, Tangucci M, et
al. Risk factors for the development of respiratory distress syndrome and
transient tachypnoea in newborn infants. Eur Respir J 1999;14:155-9.
14. Anadkat JS, Kuzniewicz MW, Chaudhari BP, Cole FS, Hamvas A.
Increased risk for respiratory distress among white, male, late preterm and
term infants. Journal of Perinatology 2012;32:780-5.
15. Greenough A, Murthy V. Respiratory distress syndrome. Fetal and
Maternal Medicine Review 2008;19:203-25.
16. Tjahjono, Putranto BE, Kasno, Prasetyo A, Sadhana U, Wijaya I. Pedoman
kuliah mahasiswa patologi anatomi, 3rd ed. Semarang: Badan Penerbit
Universitas Diponegoro, 2013.
17. Behrman RE, Kliegman RM,Arvin AM. Janin dan bayi neonatus, 18th ed.
In: Wahab S, editor. Jakarta: EGC, 2007:533-72.
18. Warren J, Anderson J. Core concepts: respiratory distress syndrome
[homepage on the Internet]. 2009 [cited 2015 Feb 4]. Available from:
http://neoreviews.aappublications.org/content/10/7/e351.full.pdf.
19. Ikawati Z. Respiratory distress syndrome (gangguan gagal nafas)
[homepage on the Internet], 2009 [cited 2015 Feb 4]. Available from:
http://zulliesikawati.staff.ugm.ac.id/wp-content/uploads/respiratory-
distress-syndrome.pdf
20. Grappone L, Messina F. Hyaline membrane disease or respiratory distress
syndrome? a new approach for an old disease. Journal of Pediatric and
Neonatal Individualized Medicine 2014;3:1-7.

48
21. Bermansyah E. Pencitraan pada kegawatan neonatus. Pendidikan
kedokteran berkelanjutan II. Continuing Medical Education IDAI Jaya, 1
ed. IDAI Jakarta, 2005:59-74.
22. World Health Organization. World health statistic indicator [homepage on
the Internet]. Geneva, Switzerland, 2010 [cited 2015 Jan 22]. Available
from:
http://www.who.int/gho/publications/world_health_statistics/EN_WHS10
_Full.pdf.
23. Wibowo B, Hanafiah MJ. Bayi dengan berat badan lahir rendah, 3 ed. In:
Wiknjosastro H, Saifuddin AB, Rachimhadhi T, editor. Ilmu Kebidanan.
Jakarta: Yayasan Bina Pustaka Sarwono Prawirohardjo, 2007:771-2.
24. Wibowo B, Hanafiah MJ Pre-eklampsia dan eklampsia 3ed. In:
Wiknjosastro H, Saifuddin AB, Rachimhadhi T editor. Ilmu Kebidanan.
Jakarta: Yayasan Bina Pustaka Sarwono Prawirohardjo, 2007:281-2.
25. Sun H, Xu F, Xiong H, Kang W, Bai Q, Zhang Y, et al. Characteristics of
respiratory distress syndrome in infants of different gestational ages. Lung
2013;191:425-33.
26. Putra Y, Kardana M, Artana D, Putra J. Karakteristik dan luaran bayi berat
lahir sangat rendah yang lahir di RSUP Sanglah Denpasar. Medicina
2012;43:77-82.
27. Wijayarini. Safe mothehood penanganan eklampsia. Jakarta: EGC, 2002.
28. Wibowo B, Hanafiah MJ. Perdarahan antepartum, 3 ed. In: Wiknjosastro
H, Saifuddin AB, Rachimhadhi T, editor. Ilmu Kebidanan. Jakarta:
Yayasan Bina Pustaka Sarwono Prawirohardjo, 2007:362-3.
29. Hathaway WE. Current pediatric diagnosis & treatment: Appleton-
Century-Crofts and Fleschner Publishing Company, 1991.
30. Pettker CM, Buhimschi IA, Magloire LK, Sfakianaki AK, Hamar BD,
Buhimschi CS. Value of placental microbial evaluation in diagnosing
intra-amniotic infection. Obstetrics & Gynecology 2007;109:739-49.

49
31. Liu J, Shi Y, Dong JY, Zheng T, Li JY, Lu LL, et al. Clinical
characteristics, diagnosis and management of respiratory distress
syndrome in full term neonates. Chin Med J (Engl) 2010;123:2640-4.
32. Atmoko BD. Keluaran perinatal pengelolaan konservatif kehamilan belum
genap bulan dan ketuban pecah dini Bagian Obstetri dan Ginekologi
Fakultas Kedokteran Universitas Diponegoro. Semarang: Universitas
Diponegoro, 2000.
33. Wibowo B, Hanafiah MJ. Kelainan dalam lamanya kehamilan, 3 ed. In:
Wiknjosastro H, Saifuddin AB, Rachimhadhi T, editor. Ilmu Kebidanan.
Jakarta: Yayasan Bina Pustaka Sarwono Prawirohardjo, 2007:312-4.
34. EuroNeoNet. Annual report for very low gestational age infants 2010
[homepage on the Internet]. Barakaldo, Spain: The ENS Project, 2010
[cited 2015 Jan 22] Available from:
http://www.euroneostat.org/paginas/publicas/euroneo/euroNeoNet/Docum
ents/ENNGeneralReport2006-2011.pdf.
35. Sweet DG, Carnielli V, Greisen G, Hallman M, Ozek E, Plavka R, et al.
European consensus guidelines on the management of neonatal respiratory
distress syndrome in preterm infants - 2013 update. Neonatology
2013;103:353-68.
36. Roberts D, Dalziel S. Antenatal corticosteroid for accelerating fetal lung
maturation for women at risk of preterm birth. [Cochrane review].
Oxford: John Wiley and Son, ltd, 2006.
37. Baud O, Foix L'Helias L, Kaminski M, Audibert F, Jarreau PH, Papiernik
F, et al. Antenatal glucorticoid treatment and cystic periventricular
lekomalacia in very premature infants. N Engl J Med 1999;341:1190-6.
38. Seaborn T, Simard M, Provost PR. Sex hormone metabolism in lung
development and maturation. Trends Endocrinol Metab 2010;21:729-38.
39. Bresson E, Seaborn T, Cote M, Cormier G, Provost PR, Piedboeuf B, et al.
Gene expression profile of androgen modulated genes in the murine fetal
developing lung. Reprod Biol Endocrinol 2010;8:2.

50
40. Greenough A. Acute respiratory distress syndrome, 2 ed. In: Greenough A,
Milner AD, editor. Neonatal Respiratory Disorders. London: Arnold,
2005:396-8.
41. Jain L, Eaton DC. Physiology of fetal lung fluid clearance and the effect of
labor. Semin Perinatol 2006;30:34-43.
42. Madiyono B, Moeslichan Mz, Sastroasmoro S, Budiman I, Purwanto SH.
Perkiraan besar sampel, 5 ed. In: Sastroasmoro S, Ismail S, editor. Dasar-
dasar metodologi penelitian klinis. Jakarta Sagung Seto, 2014:352-73.
43. Agashe US, Borade A, Gulawani S, Dhongade R. Influence of maternal
risk factors in pulmonary maturity in preterm newborn. Pediatric Oncall
[serial on the internet] 2013 [cited 2015 Jun 25];10. Available from:
http://www.pediatriconcall.com/Journal/Article/FullText.aspx?artid=549&
type=J&tid=&imgid=&reportid=53&tbltype=.
44. Gilbert WM, Danielsen B. Pregnancy outcomes associated with
intrauterine growth restriction. Am J Obstet Gynecolo 2003;188:1596-99.
45. Miracle X, Di Renzo GC, Stark A, Fanaroff A, Estrany XC, and Saling E.
Guideline for the use of antenatal corticosteroids for fetal maturation J
Perinat Med 2008;36:191-6.

51
Lampiran 1. Ethical Clearance

52
Lampiran 2. Surat izin pengambilan data penelitian

53
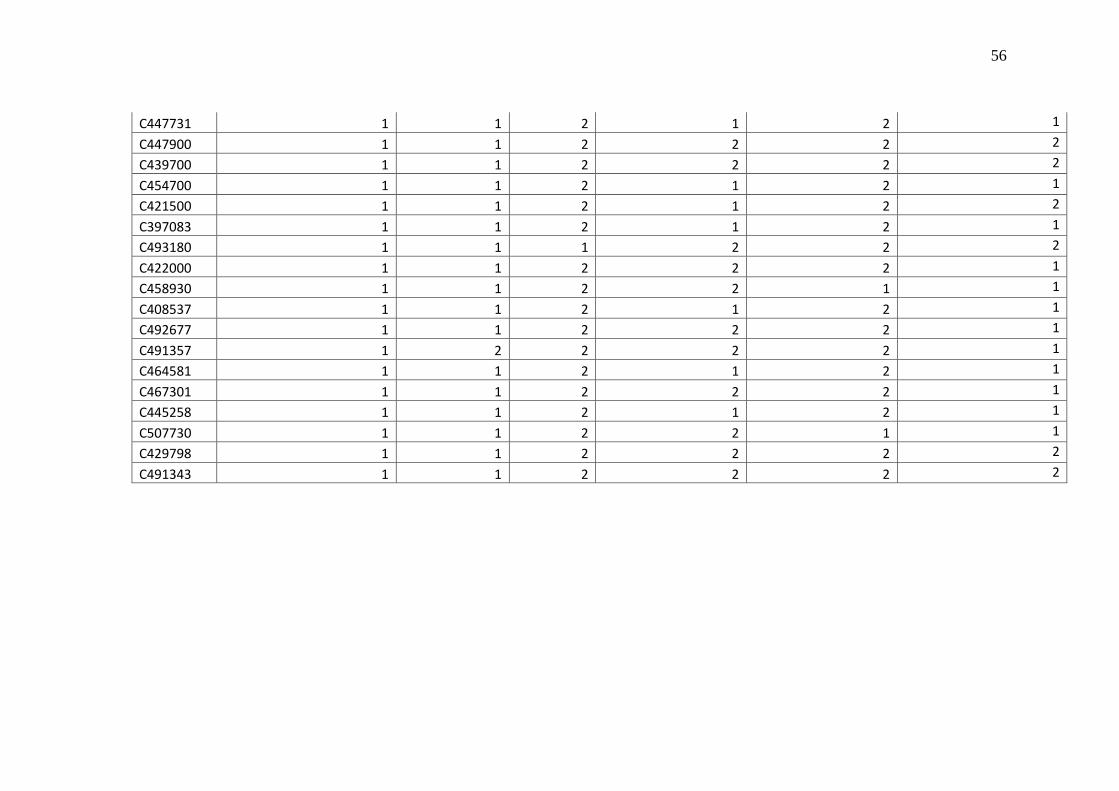
Lampiran 3. Spreadsheet
Nomor CM Penyakit Membran Hialin
1. Ya 2. Tidak
Masa gestasi 1. Kurang bulan 2. Cukup bulan
Preeklamsia 1. Ya
2. Tidak
Berat lahir 1. 999-1.499 gram
2. 1500-2.500 gram
Ketuban Pecah Dini 1. >6jam 2. <6jam
Tanpa Pemberian ANS 1. Tidak
2. Ya
C464964 2 1 2 2 1 2
C463944 2 2 1 2 2 1
C455665 2 2 2 2 2 1
C466185 2 1 2 2 1 1
C462954 2 1 2 2 1 1
C463516 2 1 2 1 2 1
C471096 2 2 1 2 2 1
C470996 2 2 2 2 2 1
C466476 2 2 2 2 2 1
C460057 2 1 1 1 2 1
C460427 2 1 2 2 1 1
C459467 2 2 1 2 2 1
C471418 2 1 2 2 2 1
C458238 2 1 1 2 2 1
C461148 2 1 2 2 2 1
C459649 2 1 2 2 2 1
C461274 2 1 2 2 2 2
C463094 2 1 1 2 2 1
C464774 2 1 1 2 2 2
C460635 2 1 2 2 2 1

54
C462775 2 1 2 2 2 1
C460770 2 2 2 2 2 2
C458082 2 1 1 2 2 1
C464061 2 1 2 2 2 1
C461752 2 2 1 2 2 1
C460793 2 1 1 1 2 1
C466503 2 1 2 2 2 1
C458023 2 1 1 1 2 2
C472123 2 1 2 2 1 1
C464449 2 2 2 2 2 1
C465049 2 1 2 1 2 1
C455549 2 1 1 2 2 1
C465959 2 1 2 2 2 1
C460771 2 2 2 2 2 2
C464963 2 1 2 2 2 2
C450909 2 2 1 2 2 1
C445258 2 1 2 1 2 1
C450909 2 2 1 2 2 1
C471050 2 1 2 1 1 1
C505540 2 1 2 2 2 1
C447840 2 1 2 2 2 1
C505465 2 1 2 2 2 1
C506585 2 2 2 2 2 1
C509655 2 1 2 1 2 1
C397159 1 1 2 1 2 2

55
C397314 1 1 1 2 2 1
C510284 1 2 2 2 2 1
C429543 1 1 2 1 2 1
C450375 1 1 2 2 1 2
C420855 1 1 1 1 2 1
C424436 1 1 2 1 2 1
C453965 1 1 2 2 2 1
C445817 1 1 2 2 1 2
C390817 1 1 2 2 2 1
C448866 1 1 2 2 2 1
C426758 1 1 2 1 2 1
C466338 1 1 1 2 2 1
C447147 1 1 2 1 2 1
C426759 1 1 2 1 2 1
C416138 1 1 2 1 1 1
C428868 1 1 2 2 2 1
C420739 1 1 2 2 2 1
C467375 1 1 2 2 2 2
C429783 1 2 2 2 2 1
C443884 1 1 2 2 2 1
C437003 1 1 2 2 2 1
C437752 1 1 1 1 2 1
C463992 1 2 2 2 2 1
C432521 1 1 1 1 2 1
C416821 1 1 2 1 2 2
56
C447731 1 1 2 1 2 1
C447900 1 1 2 2 2 2
C439700 1 1 2 2 2 2
C454700 1 1 2 1 2 1
C421500 1 1 2 1 2 2
C397083 1 1 2 1 2 1
C493180 1 1 1 2 2 2
C422000 1 1 2 2 2 1
C458930 1 1 2 2 1 1
C408537 1 1 2 1 2 1
C492677 1 1 2 2 2 1
C491357 1 2 2 2 2 1
C464581 1 1 2 1 2 1
C467301 1 1 2 2 2 1
C445258 1 1 2 1 2 1
C507730 1 1 2 2 1 1
C429798 1 1 2 2 2 2
C491343 1 1 2 2 2 2

57
Lampiran 4. Hasil Analisis SPSS
1. Karakteristik Subyek Penelitian
1.1.Karakteristik bayi (TABEL 5)
1.1.1. Berat lahir
Descriptives
PMH Statistic Std.
Error
Berat
Lahir
Ya
Mean 1610,45 66,456
95% Confidence Interval for
Mean
Lower
Bound
1476,43
Upper
Bound
1744,48
5% Trimmed Mean 1600,51
Median 1600,00
Variance 194320,71
9
Std. Deviation 440,818
Minimum 1000
Maximum 2400
Range 1400
Interquartile Range 680
Skewness ,527 ,357
Kurtosis -,798 ,702
Tidak
Mean 1892,39 60,761
95% Confidence Interval for
Mean
Lower
Bound
1769,85
Upper
Bound
2014,92
5% Trimmed Mean 1911,49
Median 1950,00
Variance 162445,91
7
Std. Deviation 403,046
Minimum 850

58
Maximum 2450
Range 1600
Interquartile Range 558
Skewness -,621 ,357
Kurtosis -,386 ,702
Ranks
PMH N Mean
Rank
Sum of
Ranks
Berat
Lahir
Ya 44 36,14 1590,00
Tidak 44 52,86 2326,00
Total 88
Tests of Normality
PMH Kolmogorov-Smirnova Shapiro-Wilk
Statistic df Sig. Statistic df Sig.
Berat
Lahir
Ya ,124 44 ,087 ,918 44 ,004
Tidak ,120 44 ,120 ,941 44 ,027
a. Lilliefors Significance Correction
Test Statisticsa
Berat
Lahir
Mann-Whitney U 600,000
Wilcoxon W 1590,000
Z -3,076
Asymp. Sig. (2-
tailed)
,002
a. Grouping Variable: PMH
1.1.2. Jenis Kelamin
Jenis Kelamin * PMH Crosstabulation
PMH Total
Ya Tidak
Jenis
Kelamin Laki-laki
Count 28 20 48
Expected Count 24,0 24,0 48,0

59
% within Jenis
Kelamin
58,3% 41,7% 100,0%
Perempuan
Count 16 24 40
Expected Count 20,0 20,0 40,0
% within Jenis
Kelamin
40,0% 60,0% 100,0%
Total
Count 44 44 88
Expected Count 44,0 44,0 88,0
% within Jenis
Kelamin
50,0% 50,0% 100,0%
Chi-Square Tests
Value df Asymp. Sig.
(2-sided)
Exact Sig.
(2-sided)
Exact Sig.
(1-sided)
Pearson Chi-Square 2,933a 1 ,087
Continuity Correctionb 2,246 1 ,134
Likelihood Ratio 2,950 1 ,086
Fisher's Exact Test ,134 ,067
Linear-by-Linear
Association
2,900 1 ,089
N of Valid Cases 88
a. 0 cells (,0%) have expected count less than 5. The minimum expected count is 20,00.
b. Computed only for a 2x2 table
1.1.3. Anak Ke-
Anak_Ke * PMH Crosstabulation
PMH Total
Ya Tidak
Anak_K
e
Satu
Count 23 19 42
Expected Count 21,0 21,0 42,0
% within
Anak_Ke
54,8% 45,2% 100,0%
Dua
Count 11 17 28
Expected Count 14,0 14,0 28,0
% within
Anak_Ke
39,3% 60,7% 100,0%

60
Lebih dari
dua
Count 10 8 18
Expected Count 9,0 9,0 18,0
% within
Anak_Ke
55,6% 44,4% 100,0%
Total
Count 44 44 88
Expected Count 44,0 44,0 88,0
% within
Anak_Ke
50,0% 50,0% 100,0%
Chi-Square Tests
Value df Asymp. Sig.
(2-sided)
Pearson Chi-Square 1,889a 2 ,389
Likelihood Ratio 1,900 2 ,387
Linear-by-Linear
Association
,074 1 ,786
N of Valid Cases 88
a. 0 cells (,0%) have expected count less than 5. The
minimum expected count is 9,00.
1.2.Karakteristik Ibu (TABEL 6)
1.2.1. Usia Ibu
Tests of Normality
PMH Kolmogorov-Smirnova Shapiro-Wilk
Statistic df Sig. Statistic df Sig.
Usia Ibu Ya ,096 44 ,200
* ,952 44 ,066
Tidak ,105 44 ,200* ,957 44 ,100
*. This is a lower bound of the true significance.
a. Lilliefors Significance Correction
Group Statistics
PMH N Mean Std. Deviation Std. Error
Mean
Usia Ibu Ya 44 29,00 7,579 1,143
Tidak 44 27,80 6,607 ,996

61
Independent Samples Test
Levene's
Test for
Equality of
Variances
t-test for Equality of Means
F Sig. t df Sig. (2-
tailed)
Mean
Differenc
e
Std. Error
Differenc
e
95%
Confidence
Interval of the
Difference
Low
er
Upper
Usi
a
Ibu
Equal variances assumed
,924 ,339 ,795 86 ,429 1,205 1,516 -
1,80
9
4,218
Equal variances not assumed
,795 84,43
0
,429 1,205 1,516 -
1,81
0
4,219
1.2.2. Masa Gestasi
Tests of Normality
PMH Kolmogorov-Smirnova Shapiro-Wilk
Statistic df Sig. Statistic df Sig.
Masa Gestasi Ya ,092 44 ,200
* ,968 44 ,256
Tidak ,126 44 ,078 ,926 44 ,008
*. This is a lower bound of the true significance.
a. Lilliefors Significance Correction
Group Statistics
PMH N Mean Std. Deviation Std. Error
Mean
Masa Gestasi Ya 44 31,30 3,702 ,558
Tidak 44 34,00 3,140 ,473
Independent Samples Test

62
Levene's
Test for
Equality of
Variances
t-test for Equality of Means
F Sig. t df Sig.
(2-
tailed)
Mean
Differe
nce
Std.
Error
Diffe
rence
95% Confidence
Interval of the
Difference
Lowe
r
Upper
Masa Gestasi
Equal variances
assumed
1,737 ,191 -3,696 86 ,000 -2,705 ,732 -
4,159
-1,250
Equal variances
not assumed
-3,696 83,77
4
,000 -2,705 ,732 -
4,160
-1,249
1.2.3. Pendidikan Ibu
Pendidikan Ibu * PMH Crosstabulation
PMH Total
Ya Tidak
Pendidikan
Ibu
Sarjana/Sederaja
t
Count 5 7 12
Expected Count 6,0 6,0 12,0
% within Pendidikan
Ibu
41,7% 58,3% 100,0%
SMA/Sederajat
Count 27 27 54
Expected Count 27,0 27,0 54,0
% within Pendidikan
Ibu
50,0% 50,0% 100,0%
SMP/Sederajat
Count 9 6 15
Expected Count 7,5 7,5 15,0
% within Pendidikan
Ibu
60,0% 40,0% 100,0%
SD/Sederajat
Count 3 4 7
Expected Count 3,5 3,5 7,0
% within Pendidikan
Ibu
42,9% 57,1% 100,0%
Total Count 44 44 88
Expected Count 44,0 44,0 88,0

63
% within Pendidikan
Ibu
50,0% 50,0% 100,0%
Test Statisticsa
Pendidikan
Ibu
Most Extreme
Differences
Absolute ,045
Positive ,023
Negative -,045
Kolmogorov-Smirnov Z ,213
Asymp. Sig. (2-tailed) 1,000
a. Grouping Variable: PMH
1.2.4. Pekerjaan Ibu
Pekerjaan Ibu * PMH Crosstabulation
PMH Total
Ya Tidak
Pekerjaan
Ibu
PNS
Count 2 3 5
Expected Count 2,5 2,5 5,0
% within Pekerjaan
Ibu
40,0% 60,0% 100,0%
Swasta
Count 11 9 20
Expected Count 10,0 10,0 20,0
% within Pekerjaan
Ibu
55,0% 45,0% 100,0%
Informal
Count 2 0 2
Expected Count 1,0 1,0 2,0
% within Pekerjaan
Ibu
100,0% 0,0% 100,0%
Tidak
bekerja
Count 29 32 61
Expected Count 30,5 30,5 61,0
% within Pekerjaan
Ibu
47,5% 52,5% 100,0%
Total Count 44 44 88
Expected Count 44,0 44,0 88,0

64
% within Pekerjaan
Ibu
50,0% 50,0% 100,0%
Test Statisticsa
Pekerjaan
Ibu
Most Extreme
Differences
Absolute ,068
Positive ,068
Negative -,023
Kolmogorov-Smirnov Z ,320
Asymp. Sig. (2-tailed) 1,000
a. Grouping Variable: PMH
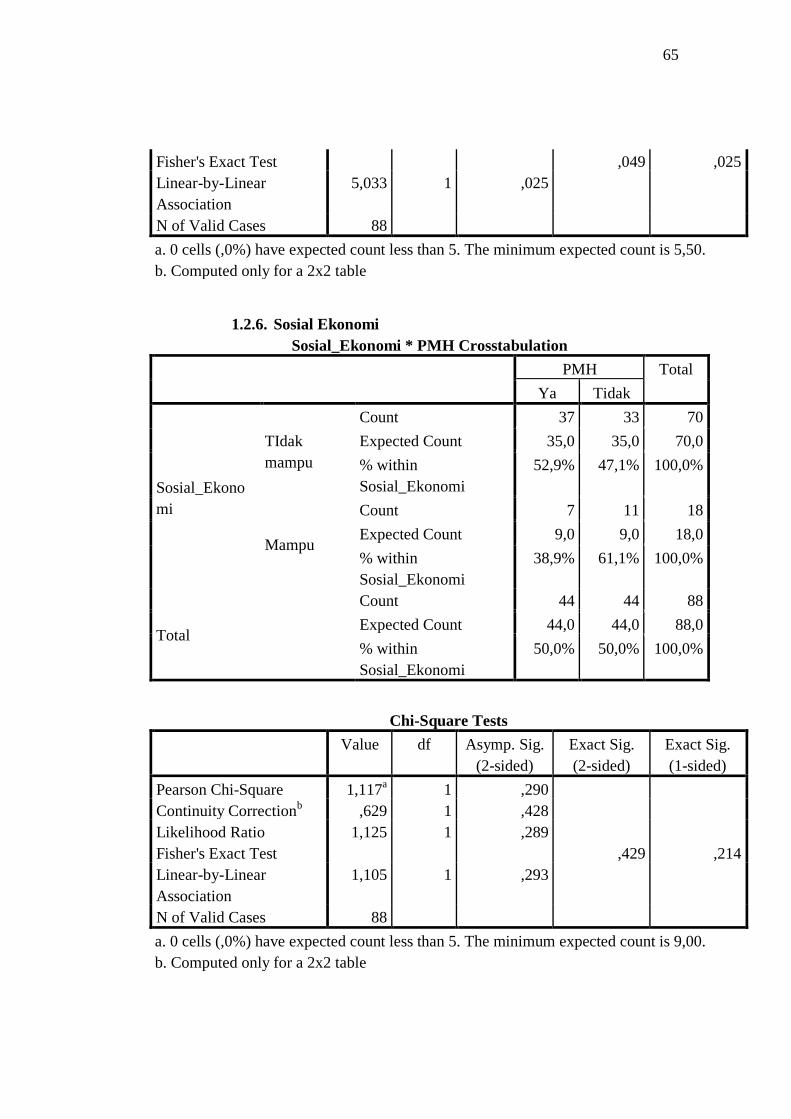
1.2.5. Penyakit Kehamilan
Penyakit Kehamilan * PMH Crosstabulation
PMH Total
Ya Tidak
Penyakit
Kehamilan
Ada
Count 2 9 11
Expected Count 5,5 5,5 11,0
% within Penyakit
Kehamilan
18,2% 81,8% 100,0%
Tidak ada
Count 42 35 77
Expected Count 38,5 38,5 77,0
% within Penyakit
Kehamilan
54,5% 45,5% 100,0%
Total
Count 44 44 88
Expected Count 44,0 44,0 88,0
% within Penyakit
Kehamilan
50,0% 50,0% 100,0%
Chi-Square Tests
Value df Asymp. Sig.
(2-sided)
Exact Sig.
(2-sided)
Exact Sig.
(1-sided)
Pearson Chi-Square 5,091a 1 ,024
Continuity Correctionb 3,740 1 ,053
Likelihood Ratio 5,455 1 ,020
65
Fisher's Exact Test ,049 ,025
Linear-by-Linear
Association
5,033 1 ,025
N of Valid Cases 88
a. 0 cells (,0%) have expected count less than 5. The minimum expected count is 5,50.
b. Computed only for a 2x2 table
1.2.6. Sosial Ekonomi
Sosial_Ekonomi * PMH Crosstabulation
PMH Total
Ya Tidak
Sosial_Ekono
mi
TIdak
mampu
Count 37 33 70
Expected Count 35,0 35,0 70,0
% within
Sosial_Ekonomi
52,9% 47,1% 100,0%
Mampu
Count 7 11 18
Expected Count 9,0 9,0 18,0
% within
Sosial_Ekonomi
38,9% 61,1% 100,0%
Total
Count 44 44 88
Expected Count 44,0 44,0 88,0
% within
Sosial_Ekonomi
50,0% 50,0% 100,0%
Chi-Square Tests
Value df Asymp. Sig.
(2-sided)
Exact Sig.
(2-sided)
Exact Sig.
(1-sided)
Pearson Chi-Square 1,117a 1 ,290
Continuity Correctionb ,629 1 ,428
Likelihood Ratio 1,125 1 ,289
Fisher's Exact Test ,429 ,214
Linear-by-Linear
Association
1,105 1 ,293
N of Valid Cases 88
a. 0 cells (,0%) have expected count less than 5. The minimum expected count is 9,00.
b. Computed only for a 2x2 table

66
1.2.7. Derajat PMH (TABEL 7)
Derajat_PMH * PMH Crosstabulation
PMH Total
Ya
Derajat_PM
H
I
Count 7 7
Expected Count 7,0 7,0
% within
Derajat_PMH
100,0% 100,0%
II
Count 13 13
Expected Count 13,0 13,0
% within
Derajat_PMH
100,0% 100,0%
III
Count 17 17
Expected Count 17,0 17,0
% within
Derajat_PMH
100,0% 100,0%
IV
Count 7 7
Expected Count 7,0 7,0
% within
Derajat_PMH
100,0% 100,0%
Total
Count 44 44
Expected Count 44,0 44,0
% within
Derajat_PMH
100,0% 100,0%
2. Analisis Inferensial
2.1.Faktor Janin (TABEL 8)
2.1.1. Masa Gestasi
Klasifikasi_Masa_Gestasi * PMH Crosstabulation
PMH Total
Ya Tidak
Klasifikasi_Masa_Gesta
si
Kurang bulan
Count 40 31 71
Expected Count 35,5 35,5 71,0
% within
Klasifikasi_Masa_Gestasi
56,3% 43,7% 100,0%
Cukup bulan Count 4 13 17

67
Expected Count 8,5 8,5 17,0
% within
Klasifikasi_Masa_Gestasi
23,5% 76,5% 100,0%
Total
Count 44 44 88
Expected Count 44,0 44,0 88,0
% within
Klasifikasi_Masa_Gestasi
50,0% 50,0% 100,0%
Chi-Square Tests
Value df Asymp. Sig.
(2-sided)
Exact Sig. (2-
sided)
Exact Sig. (1-
sided)
Pearson Chi-Square 5,906a 1 ,015
Continuity Correctionb 4,666 1 ,031
Likelihood Ratio 6,161 1 ,013
Fisher's Exact Test ,029 ,014
Linear-by-Linear
Association
5,838 1 ,016
N of Valid Cases 88
a. 0 cells (,0%) have expected count less than 5. The minimum expected count is 8,50.
b. Computed only for a 2x2 table
Risk Estimate
Value 95% Confidence
Interval
Lower Upper
Odds Ratio for Klasifikasi_Masa_Gestasi (Kurang bulan /
Cukup bulan)
4,194 1,244 14,131
For cohort PMH = Ya 2,394 ,992 5,779
For cohort PMH = Tidak ,571 ,393 ,829
N of Valid Cases 88
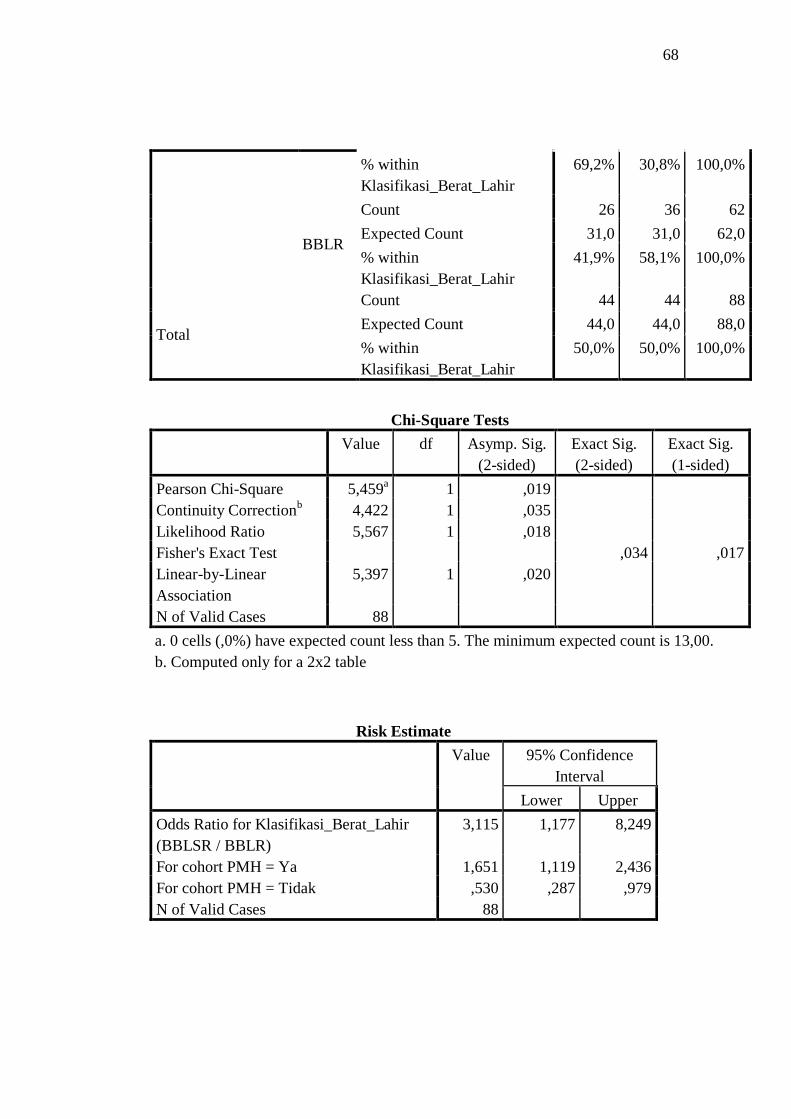
2.1.2. Berat Lahir
Klasifikasi_Berat_Lahir * PMH Crosstabulation
PMH Total
Ya Tidak
Klasifikasi_Berat_La
hir
BBLS
R
Count 18 8 26
Expected Count 13,0 13,0 26,0
68
% within
Klasifikasi_Berat_Lahir
69,2% 30,8% 100,0%
BBLR
Count 26 36 62
Expected Count 31,0 31,0 62,0
% within
Klasifikasi_Berat_Lahir
41,9% 58,1% 100,0%
Total
Count 44 44 88
Expected Count 44,0 44,0 88,0
% within
Klasifikasi_Berat_Lahir
50,0% 50,0% 100,0%
Chi-Square Tests
Value df Asymp. Sig.
(2-sided)
Exact Sig.
(2-sided)
Exact Sig.
(1-sided)
Pearson Chi-Square 5,459a 1 ,019
Continuity Correctionb 4,422 1 ,035
Likelihood Ratio 5,567 1 ,018
Fisher's Exact Test ,034 ,017
Linear-by-Linear
Association
5,397 1 ,020
N of Valid Cases 88
a. 0 cells (,0%) have expected count less than 5. The minimum expected count is 13,00.
b. Computed only for a 2x2 table
Risk Estimate
Value 95% Confidence
Interval
Lower Upper
Odds Ratio for Klasifikasi_Berat_Lahir
(BBLSR / BBLR)
3,115 1,177 8,249
For cohort PMH = Ya 1,651 1,119 2,436
For cohort PMH = Tidak ,530 ,287 ,979
N of Valid Cases 88

69
2.1.3. Tanpa Pemberian ANS
Tanpa_pemberian_ANS * PMH Crosstabulation
PMH Total
Ya Tidak
Tanpa_pemberian_A
NS
Tidak
Count 33 37 70
Expected Count 35,0 35,0 70,0
% within
Tanpa_pemberian_AN
S
47,1% 52,9% 100,0%
Ya
Count 11 7 18
Expected Count 9,0 9,0 18,0
% within
Tanpa_pemberian_AN
S
61,1% 38,9% 100,0%
Total
Count 44 44 88
Expected Count 44,0 44,0 88,0
% within
Tanpa_pemberian_AN
S
50,0% 50,0% 100,0%
Chi-Square Tests
Value df Asymp. Sig.
(2-sided)
Exact Sig.
(2-sided)
Exact Sig.
(1-sided)
Pearson Chi-Square 1,117a 1 ,290
Continuity Correctionb ,629 1 ,428
Likelihood Ratio 1,125 1 ,289
Fisher's Exact Test ,429 ,214
Linear-by-Linear
Association
1,105 1 ,293
N of Valid Cases 88
a. 0 cells (0,0%) have expected count less than 5. The minimum expected count is 9,00.
b. Computed only for a 2x2 table
Risk Estimate
Value 95% Confidence
Interval
Lower Upper

70
Odds Ratio for
Tanpa_pemberian_AN
S (Tidak / Ya)
,568 ,197 1,634
For cohort PMH = Ya ,771 ,495 1,203
For cohort PMH =
Tidak
1,359 ,731 2,526
N of Valid Cases 88
2.2.Faktor Ibu (TABEL 8)
2.2.1 Ketuban Pecah Dini
Ketuban Pecah Dini * PMH Crosstabulation
PMH Total
Ya Tidak
Ketuban Pecah Dini
>6jam
Count 5 6 11
Expected Count 5,5 5,5 11,0
% within Lama Ketuban
Pecah
45,5% 54,5% 100,0%
<6jam
Count 39 38 77
Expected Count 38,5 38,5 77,0
% within Lama Ketuban
Pecah
50,6% 49,4% 100,0%
Total
Count 44 44 88
Expected Count 44,0 44,0 88,0
% within Lama Ketuban
Pecah
50,0% 50,0% 100,0%
Chi-Square Tests
Value df Asymp. Sig.
(2-sided)
Exact Sig.
(2-sided)
Exact Sig.
(1-sided)
Pearson Chi-Square ,104a 1 ,747
Continuity Correctionb ,000 1 1,000
Likelihood Ratio ,104 1 ,747
Fisher's Exact Test 1,000 ,500
Linear-by-Linear
Association
,103 1 ,749
N of Valid Cases 88
a. 0 cells (,0%) have expected count less than 5. The minimum expected count is 5,50.

71
b. Computed only for a 2x2 table
Risk Estimate
Value 95% Confidence
Interval
Lower Upper
Odds Ratio for Lama Ketuban Pecah (>6jam /
<6jam)
,812 ,228 2,886
For cohort PMH = Ya ,897 ,453 1,778
For cohort PMH = Tidak 1,105 ,616 1,984
N of Valid Cases 88
2.2.2 Preeklamsia
Preeklamsia * PMH Crosstabulation
PMH Total
Ya Tidak
Preeklamsia
Ya
Count 6 14 20
Expected Count 10,0 10,0 20,0
% within
Preeklamsia
30,0% 70,0% 100,0%
Tidak
Count 38 30 68
Expected Count 34,0 34,0 68,0
% within
Preeklamsia
55,9% 44,1% 100,0%
Total
Count 44 44 88
Expected Count 44,0 44,0 88,0
% within
Preeklamsia
50,0% 50,0% 100,0%
Chi-Square Tests
Value df Asymp. Sig.
(2-sided)
Exact Sig.
(2-sided)
Exact Sig.
(1-sided)
Pearson Chi-Square 4,141a 1 ,042
Continuity Correctionb 3,171 1 ,075
Likelihood Ratio 4,235 1 ,040
Fisher's Exact Test ,073 ,037

72
Linear-by-Linear
Association
4,094 1 ,043
N of Valid Cases 88
a. 0 cells (,0%) have expected count less than 5. The minimum expected count is 10,00.
b. Computed only for a 2x2 table
Risk Estimate
Value 95% Confidence
Interval
Lower Upper
Odds Ratio for Preeklamsia (Ya /
Tidak)
,338 ,116 ,986
For cohort PMH = Ya ,537 ,266 1,083
For cohort PMH = Tidak 1,587 1,072 2,349
N of Valid Cases 88
3. Analisis multivariate (TABEL 9)
Case Processing Summary
Unweighted Casesa N Percent
Selected Cases
Included in
Analysis
88 100,0
Missing Cases 0 ,0
Total 88 100,0
Unselected Cases 0 ,0
Total 88 100,0
a. If weight is in effect, see classification table for the
total number of cases.
Dependent Variable
Encoding
Original
Value
Internal
Value
Ya 0
Tidak 1
Categorical Variables Codings

73
Frequenc
y
Parameter
coding
(1)
Klasifikasi_Masa_Gest
asi
Kurang
bulan
71 -,500
Cukup bulan 17 ,500
Preeklamsia Ya 20 -,500
Tidak 68 ,500
Klasifikasi_Berat_Lahi
r
BBLSR 26 -,500
BBLR 62 ,500
Classification Tablea,b
Observed Predicted
PMH Percentage
Correct Ya Tidak
Step 0
PMH Ya 0 44 ,0
Tidak 0 44 100,0
Overall
Percentage
50,0
a. Constant is included in the model.
b. The cut value is ,500
Variables in the Equation
B S.E. Wald df Sig. Exp(B)
Step 0 Constant ,000 ,213 ,000 1 1,000 1,000
Variables not in the Equation
Score df Sig.
Step 0 Variables
Klasifikasi_Berat_Lahi
r(1)
5,459 1 ,019
PREEKLAMPSIA(1) 4,141 1 ,042
Klasifikasi_Masa_Gest
asi(1)
5,906 1 ,015
Overall Statistics 11,840 3 ,008
Block 1: Method = Backward Stepwise (Likelihood Ratio)

74
Omnibus Tests of Model Coefficients
Chi-square df Sig.
Step 1
Step 12,678 3 ,005
Block 12,678 3 ,005
Model 12,678 3 ,005
Step 2a
Step -2,512 1 ,113
Block 10,166 2 ,006
Model 10,166 2 ,006
a. A negative Chi-squares value indicates that the
Chi-squares value has decreased from the
previous step.
Model Summary
Step -2 Log
likelihood
Cox & Snell
R Square
Nagelkerke
R Square
1 109,316a ,134 ,179
2 111,828a ,109 ,145
a. Estimation terminated at iteration number 4
because parameter estimates changed by less than
,001.
Classification Tablea
Observed Predicted
PMH Percentage
Correct Ya Tidak
Step 1
PMH Ya 37 7 84,1
Tidak 26 18 40,9
Overall
Percentage
62,5
Step 2
PMH Ya 15 29 34,1
Tidak 5 39 88,6
Overall
Percentage
61,4
a. The cut value is ,500
Variables in the Equation

75
B S.E. Wald df Sig. Exp(
B)
95% C.I.for
EXP(B)
Lower Upper
Step 1a
Klasifikasi_Berat_Lahi
r(1)
,957 ,538 3,173 1 ,075 2,605 ,908 7,470
PREEKLAMPSIA(1) -1,083 ,582 3,464 1 ,063 ,338 ,108 1,059
Klasifikasi_Masa_Gest
asi(1)
1,004 ,659 2,325 1 ,127 2,730 ,751 9,928
Constant ,428 ,391 1,199 1 ,274 1,535
Step 2a
Klasifikasi_Berat_Lahi
r(1)
1,211 ,516 5,504 1 ,019 3,356 1,220 9,227
PREEKLAMPSIA(1) -1,175 ,571 4,236 1 ,040 ,309 ,101 ,945
Constant ,072 ,299 ,058 1 ,809 1,075
a. Variable(s) entered on step 1: Klasifikasi_Berat_Lahir, PREEKLAMPSIA,
Klasifikasi_Masa_Gestasi.
Model if Term Removed
Variable Model Log
Likelihood
Change in -2
Log
Likelihood
df Sig. of the
Change
Step 1
Klasifikasi_Berat_Lahi
r
-56,330 3,344 1 ,067
PREEKLAMPSIA -56,504 3,692 1 ,055
Klasifikasi_Masa_Gest
asi
-55,914 2,512 1 ,113
Step 2
Klasifikasi_Berat_Lahi
r
-58,880 5,931 1 ,015
PREEKLAMPSIA -58,213 4,599 1 ,032
Variables not in the Equation
Score df Sig.
Step 2a
Variables Klasifikasi_Masa_Gest
asi(1)
2,423 1 ,120
Overall Statistics 2,423 1 ,120
a. Variable(s) removed on step 2: Klasifikasi_Masa_Gestasi.

76
Lampiran 5. Dokumentasi penelitian

77
Lampiran 6. Biodata mahasiswa
IDENTITAS
Nama : Fardiansyah Dwiristyan
NIM : 22010111110133
Tempat/Tanggal lahir : Surabaya/9 Juli 1992
Jenis Kelamin : Laki-laki
Alamat : Perumahan pantai mentari B23 Surabaya
Nomor HP : 081329144151
Email : [email protected]
RIWAYAT PENDIDIKAN FORMAL
1. SD : SD Muhammadiyah 1-2 Surabaya
SD Muhammadiyah 10 Banjarmasin Lulus Tahun : 2005
2. SMP : SMPN 1 Surabaya Lulus Tahun : 2008
3. SMA : SMAN 1 Surabaya Lulus Tahun : 2011
4. FK UNDIP : Masuk Tahun : 2011
Related Documents