Studia Psychologica, Vol. 62, No. 1, 2020, 23-43 https://doi.org/10.31577/sp.2020.01.789 Cross-Cultural Differences in Cognitive Style, Individualism/Collectivism and Map Reading between Central European and East Asian University Students David Lacko 1, 2 , Čeněk Šašinka 2 , Jiří Čeněk 2, 3 , Zdeněk Stachoň 2 , Wei-lun Lu 2 1 Department of Psychology, Faculty of Arts, Masaryk University, Arna Nováka 1/1, 602 00 Brno, Czech Republic 2 The Division of Information and Library Studies, Faculty of Arts, Masaryk University, Arna Nováka 1/1, 602 00 Brno, Czech Republic 3 Department of Social Development, Faculty of Regional Development and International Studies, Mendel University, třída Generála Píky 2005/7, 613 00 Brno, Czech Republic The article examines cross-cultural differences encountered in the cognitive processing of specific cartographic stimuli. We conducted a comparative experimental study on 98 participants from two differ- ent cultures, the first group comprising Czechs (N = 53) and the second group comprising Chinese (N = 22) and Taiwanese (N = 23). The findings suggested that the Central European participants were less collectivistic, used similar cognitive style and categorized multivariate point symbols on a map more analytically than the Asian participants. The findings indicated that culture indeed influenced human perception and cognition of spatial information. The entire research model was also verified at an indi- vidual level through structural equation modelling (SEM). Path analysis suggested that individualism and collectivism was a weak predictor of the analytic/holistic cognitive style. Path analysis also showed that cognitive style considerably predicted categorization in map point symbols. Key words: cognitive style, cross-cultural differences, categorization, individualism/collectivism, analytic/ holistic Correspondence concerning this article should be addressed to David Lacko, Department of Psychology, Faculty of Arts, Masaryk University, Arna Nováka 1/1, 602 00 Brno, Czech Republic. E-mail: [email protected] ORCID https://orcid.org/0000-0002-2904-8118 Received March 21, 2019 Introduction The objectives of the study were 1) to explore the cross-cultural differences between Cen- tral European and East Asian populations at three distinct levels and 2) to examine how these levels were connected. The presented research examined whether the selected populations differed in the degree of individu- alism/collectivism and the cognitive style measured by the Compound Figure Test (CFT), and whether cultural differences mani- fested during cartographic task solving, spe- cifically in the categorization of multivariate point symbols. The theory of analytic and holistic (A/H) cog- nition postulates the existence of distinct cog- nitive and perceptual styles – relatively stable ways of cognitive processing (for review, see Masuda, 2017; Nisbett & Masuda, 2003; Nisbett & Miyamoto, 2005; Nisbett, Peng, Choi, & Norenzayan, 2001). The majority of research in this field focuses on comparing the charac-

Welcome message from author
This document is posted to help you gain knowledge. Please leave a comment to let me know what you think about it! Share it to your friends and learn new things together.
Transcript

Studia Psychologica, Vol. 62, No. 1, 2020, 23-43https://doi.org/10.31577/sp.2020.01.789
Cross-Cultural Differences in Cognitive Style,Individualism/Collectivism and Map Reading betweenCentral European and East Asian University Students
David Lacko1, 2, Čeněk Šašinka2, Jiří Čeněk2, 3, Zdeněk Stachoň2, Wei-lun Lu2
1 Department of Psychology, Faculty of Arts, Masaryk University, Arna Nováka 1/1, 602 00 Brno, Czech Republic2 The Division of Information and Library Studies, Faculty of Arts, Masaryk University, Arna Nováka 1/1, 602 00Brno, Czech Republic3 Department of Social Development, Faculty of Regional Development and International Studies, Mendel University,třída Generála Píky 2005/7, 613 00 Brno, Czech Republic
The article examines cross-cultural differences encountered in the cognitive processing of specif iccartographic stimuli. We conducted a comparative experimental study on 98 participants from two differ-ent cultures, the first group comprising Czechs (N = 53) and the second group comprising Chinese (N =22) and Taiwanese (N = 23). The findings suggested that the Central European participants were lesscollectivistic, used similar cognitive style and categorized multivariate point symbols on a map moreanalytically than the Asian participants. The f indings indicated that culture indeed influenced humanperception and cognition of spatial information. The entire research model was also verified at an indi-vidual level through structural equation modelling (SEM). Path analysis suggested that individualism andcollectivism was a weak predictor of the analytic/holistic cognitive style. Path analysis also showed thatcognitive style considerably predicted categorization in map point symbols.
Key words: cognitive style, cross-cultural differences, categorization, individualism/collectivism, analytic/holistic
Correspondence concerning this article should be addressed to David Lacko, Department of Psychology,Faculty of Arts , Masaryk Univers ity, Arna Nováka 1/1, 602 00 Brno, Czech Republic . E-mail:[email protected] https://orcid.org/0000-0002-2904-8118Received March 21, 2019
Introduction
The objectives of the study were 1) to explorethe cross-cultural differences between Cen-tral European and East Asian populations atthree distinct levels and 2) to examine howthese levels were connected. The presentedresearch examined whether the selectedpopulations differed in the degree of individu-alism/collectivism and the cognitive stylemeasured by the Compound Figure Test
(CFT), and whether cultural differences mani-fested during cartographic task solving, spe-cifically in the categorization of multivariatepoint symbols.
The theory of analytic and holistic (A/H) cog-nition postulates the existence of distinct cog-nitive and perceptual styles – relatively stableways of cognitive processing (for review, seeMasuda, 2017; Nisbett & Masuda, 2003;Nisbett & Miyamoto, 2005; Nisbett, Peng, Choi,& Norenzayan, 2001). The majority of researchin this field focuses on comparing the charac-
24 Studia Psychologica, Vol. 62, No. 1, 2020, 23-43
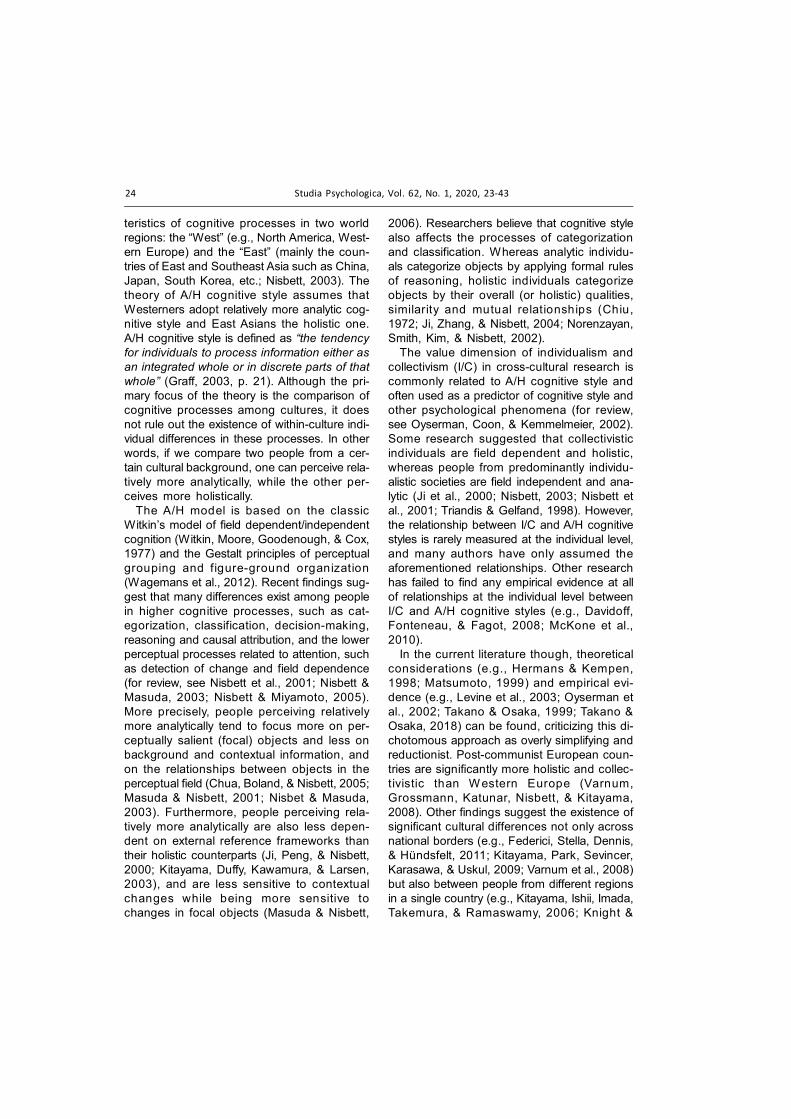
teristics of cognitive processes in two worldregions: the “West” (e.g., North America, West-ern Europe) and the “East” (mainly the coun-tries of East and Southeast Asia such as China,Japan, South Korea, etc.; Nisbett, 2003). Thetheory of A/H cognitive style assumes thatWesterners adopt relatively more analytic cog-nitive style and East Asians the holistic one.A/H cognitive style is defined as “the tendencyfor individuals to process information either asan integrated whole or in discrete parts of thatwhole” (Graff, 2003, p. 21). Although the pri-mary focus of the theory is the comparison ofcognitive processes among cultures, it doesnot rule out the existence of within-culture indi-vidual differences in these processes. In otherwords, if we compare two people from a cer-tain cultural background, one can perceive rela-tively more analytically, while the other per-ceives more holistically.
The A/H model is based on the classicWitkin’s model of field dependent/independentcognition (Witkin, Moore, Goodenough, & Cox,1977) and the Gestalt principles of perceptualgrouping and figure-ground organization(Wagemans et al., 2012). Recent findings sug-gest that many differences exist among peoplein higher cognitive processes, such as cat-egorization, classification, decision-making,reasoning and causal attribution, and the lowerperceptual processes related to attention, suchas detection of change and field dependence(for review, see Nisbett et al., 2001; Nisbett &Masuda, 2003; Nisbett & Miyamoto, 2005).More precisely, people perceiving relativelymore analytically tend to focus more on per-ceptually salient (focal) objects and less onbackground and contextual information, andon the relationships between objects in theperceptual field (Chua, Boland, & Nisbett, 2005;Masuda & Nisbett, 2001; Nisbet & Masuda,2003). Furthermore, people perceiving rela-tively more analytically are also less depen-dent on external reference frameworks thantheir holistic counterparts (Ji, Peng, & Nisbett,2000; Kitayama, Duffy, Kawamura, & Larsen,2003), and are less sensitive to contextualchanges while being more sensitive tochanges in focal objects (Masuda & Nisbett,
2006). Researchers believe that cognitive stylealso affects the processes of categorizationand classification. Whereas analytic individu-als categorize objects by applying formal rulesof reasoning, holistic individuals categorizeobjects by their overall (or holistic) qualities,similarity and mutual relationships (Chiu,1972; Ji, Zhang, & Nisbett, 2004; Norenzayan,Smith, Kim, & Nisbett, 2002).
The value dimension of individualism andcollectivism (I/C) in cross-cultural research iscommonly related to A/H cognitive style andoften used as a predictor of cognitive style andother psychological phenomena (for review,see Oyserman, Coon, & Kemmelmeier, 2002).Some research suggested that collectivisticindividuals are field dependent and holistic,whereas people from predominantly individu-alistic societies are field independent and ana-lytic (Ji et al., 2000; Nisbett, 2003; Nisbett etal., 2001; Triandis & Gelfand, 1998). However,the relationship between I/C and A/H cognitivestyles is rarely measured at the individual level,and many authors have only assumed theaforementioned relationships. Other researchhas failed to find any empirical evidence at allof relationships at the individual level betweenI/C and A/H cognitive styles (e.g., Davidoff,Fonteneau, & Fagot, 2008; McKone et al.,2010).
In the current literature though, theoreticalconsiderations (e.g., Hermans & Kempen,1998; Matsumoto, 1999) and empirical evi-dence (e.g., Levine et al., 2003; Oyserman etal., 2002; Takano & Osaka, 1999; Takano &Osaka, 2018) can be found, criticizing this di-chotomous approach as overly simplifying andreductionist. Post-communist European coun-tries are significantly more holistic and collec-tivistic than Western Europe (Varnum,Grossmann, Katunar, Nisbett, & Kitayama,2008). Other findings suggest the existence ofsignificant cultural differences not only acrossnational borders (e.g., Federici, Stella, Dennis,& Hündsfelt, 2011; Kitayama, Park, Sevincer,Karasawa, & Uskul, 2009; Varnum et al., 2008)but also between people from different regionsin a single country (e.g., Kitayama, Ishii, Imada,Takemura, & Ramaswamy, 2006; Knight &

Studia Psychologica, Vol. 62, No. 1, 2020, 23-43 25
Nisbett, 2007; Uskul, Kitayama, & Nisbett,2008).
These critical findings suggest that the di-chotomous model of cognitive styles might beoverly reductionist. An alternative model wasproposed by Kozhevnikov, Evans, and Kosslyn(2014). Their model is based on an oldermodel by Nosal (1990). It emphasizes the eco-logical nature of cognitive style that is viewedas a pattern of cognitive adaptation to the envi-ronment. Cognitive style is in this model envi-ronmentally dependent, flexible and task spe-cific. This model is hierarchical in the form of acognitive-style matrix organizing cognitivestyles on two axes: a) levels of information pro-cessing (perception, concept formation,higher-order processing, metacognitive pro-cessing), and b) cognitive style families (con-text dependence and independence, rule-based and intuitive processing, internal andexternal locus, integration and compartmen-talization). According to this model, variouscomponents of cognitive style would not haveto be inevitably (cor)related – a specific envi-ronment could, for example, elicit developmentof local processing (analytic characteristic) andfocus on holistic regions of the map (holisticcharacteristic). This theoretical model mightexplain the absence of correlations betweenvarious facets of cognitive style reported insome studies (e.g., Hakim, Simons, Zhao, &Wan, 2017; Kster, Castel, Gruber, & Kärtner,2017).
It should be noted that the number of empiri-cal studies that extend beyond the East-Westdichotomy and explore the nature of cognitivestyle and related factors in other cultural re-gions, such as Central Europe, is rather lim-ited (with the exception of, for example,Cieślikowska, 2006; Čeněk, 2015; Kolman,Noorderhaven, Hofstede, & Dienes, 2003;Stachoň et al., 2018; Varnum et al., 2008). Thecurrent research suggests that the people ofCentral Europe are rather moderately analyti-cal in cognitive style and relatively, althoughnot extremely, individualistic.
As mentioned above, the study employedcartographic tasks and stimuli in order to ex-plore the manifestation of cognitive style. This
follows research that has evaluated carto-graphic visualization methods that began withthe publication The Look of Maps (Robinson,1952). These methods gradually developedinto the complex field of cognitive cartography.Subsequent to cognitive cartography, map-psychology research was later introduced byMontello (2002). This approach uses mapsas stimuli in order to understand human per-ception and cognition. Examples of map-psy-chology research include studies on the influ-ence of alignment and rotation on memory(Tversky, 1981) and the influence of cognitivestyle while working with bivariate risk maps(Šašinka et al., 2018). Categorization in carto-graphic stimuli was part of the work ofLewandowski et al. (1993), and research con-ducted around the same time anticipatedcross-cultural differences in map reading (e.g.,MacEachren, 1995; Wood, 1984) that was ulti-mately observed (e.g., Angsüsser, 2014;Stachoň et al., 2018; Stachoň et al., 2019). Fromthe cross-cultural perspective, especially inA/H theory, a most interesting study was con-ducted by McCleary (1975), who examined thecategorization of map point symbols. The au-thor found differences in the clustering of dotsymbols and identified two user groups fromthese findings: atomists and generalists, whoanalogously correspond to the concept of A/Hcognitive style. Nevertheless, another study(Sadahiro, 1997) did not confirm this group-ing, even though the author also discoveredindividual differences in the clustering of dotsymbols in maps (cf. Sadahiro, 1997).
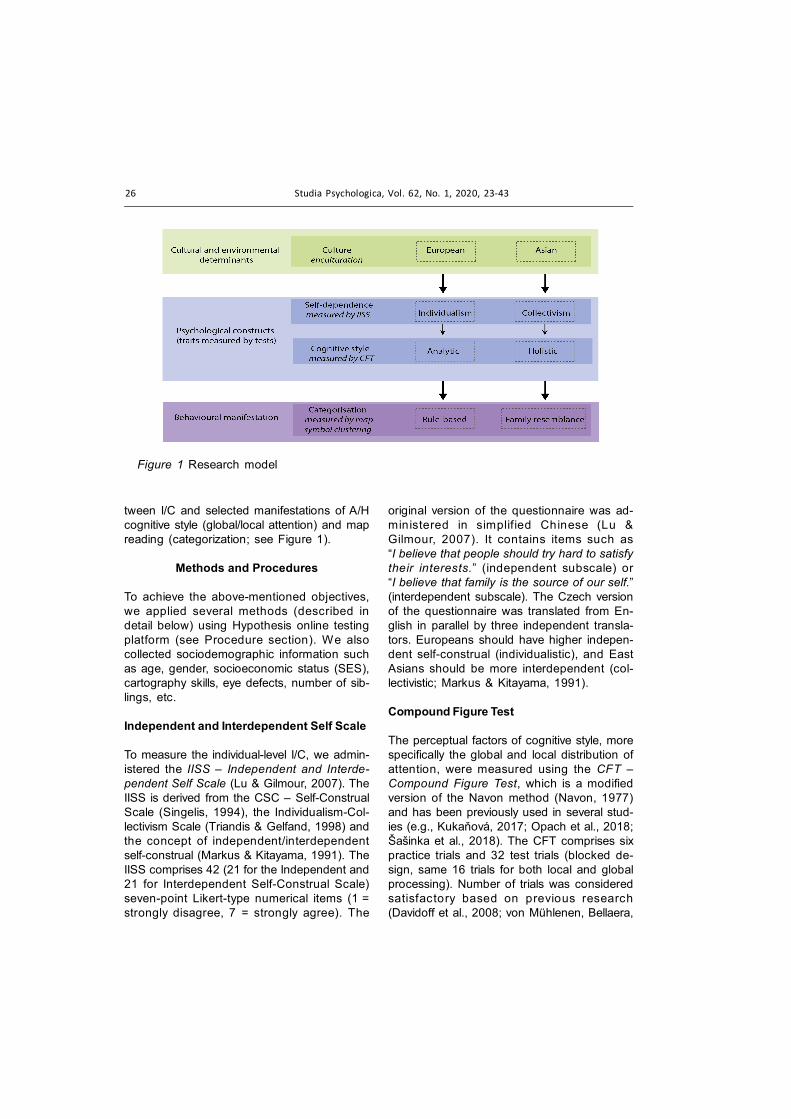
Consequently, the objective of this researchwas to further investigate the nature and mani-festation of cognitive style in relation to vari-ables such as individualism/collectivism in theculture of Central Europe (Czechia), comparedto typical Eastern Asian cultures (China andTaiwan) – specifically, 1) to analyze cross-cul-tural differences between these two samplesin I/C, visual perception (global versus localdistribution of attention) and categorization(clustering) in map stimuli, and 2) to verify theentire theoretical model of relationships be-tween I/C and A/H cognitive styles at an indi-vidual level and estimate the relationship be-
26 Studia Psychologica, Vol. 62, No. 1, 2020, 23-43
tween I/C and selected manifestations of A/Hcognitive style (global/local attention) and mapreading (categorization; see Figure 1).
Methods and Procedures
To achieve the above-mentioned objectives,we applied several methods (described indetail below) using Hypothesis online testingplatform (see Procedure section). We alsocollected sociodemographic information suchas age, gender, socioeconomic status (SES),cartography skills, eye defects, number of sib-lings, etc.
Independent and Interdependent Self Scale
To measure the individual-level I/C, we admin-istered the IISS – Independent and Interde-pendent Self Scale (Lu & Gilmour, 2007). TheIISS is derived from the CSC – Self-ConstrualScale (Singelis, 1994), the Individualism-Col-lectivism Scale (Triandis & Gelfand, 1998) andthe concept of independent/interdependentself-construal (Markus & Kitayama, 1991). TheIISS comprises 42 (21 for the Independent and21 for Interdependent Self-Construal Scale)seven-point Likert-type numerical items (1 =strongly disagree, 7 = strongly agree). The
original version of the questionnaire was ad-ministered in simplified Chinese (Lu &Gilmour, 2007). It contains items such as“I believe that people should try hard to satisfytheir interests.” (independent subscale) or“I believe that family is the source of our self.”(interdependent subscale). The Czech versionof the questionnaire was translated from En-glish in parallel by three independent transla-tors. Europeans should have higher indepen-dent self-construal (individualistic), and EastAsians should be more interdependent (col-lectivistic; Markus & Kitayama, 1991).
Compound Figure Test
The perceptual factors of cognitive style, morespecifically the global and local distribution ofattention, were measured using the CFT –Compound Figure Test, which is a modifiedversion of the Navon method (Navon, 1977)and has been previously used in several stud-ies (e.g., Kukaňová, 2017; Opach et al., 2018;Šašinka et al., 2018). The CFT comprises sixpractice trials and 32 test trials (blocked de-sign, same 16 trials for both local and globalprocessing). Number of trials was consideredsatisfactory based on previous research(Davidoff et al., 2008; von Mühlenen, Bellaera,
Figure 1 Research model

Studia Psychologica, Vol. 62, No. 1, 2020, 23-43 27
Singh, & Srinivasa, 2018). Each trial involvespresenting one “Navon figure” – a large num-ber composed of copies of a smaller differentnumber (Figure 2). In the local trial, participantswere asked to identify the small numbers asquickly as possible. In the global trial, they wererequired to identify the large number. Partici-pants used computer mouse to respond. Re-action time and correct identification weremeasured in each trial. The average reactiontime and average success rate was calculatedseparately for the local (local reaction time,indicating analytic processing) and global (glo-bal reaction time, indicating holistic process-ing) trials.
The main output of the CFT is the global pre-cedence score, which is computed as the dif-ference between the absolute global and lo-cal reaction times (e.g., Gerlach & Poirel, 2018;McKone et al., 2010). High values of the globalprecedence score indicate a holistic cognitivestyle (global precedence), low or even nega-tive values indicate an analytic cognitive style(local precedence). According to previous re-search, people should generally perceive glo-bal features more quickly than local features(Navon, 1977). Furthermore, analytic perceiv-
ers should be relatively quicker in local andrelatively slower in global tasks than holisticperceivers (Peterson & Deary, 2006).
Categorization of Multivariate Map Symbols
Map reading and understanding is consideredas a part of visual literacy (Peña, 2017). In ad-dition, the maps represent the complex stimuli,which enable the user not only to understandthe presented information but also to derivethe additional information (Morita, 2004), there-fore we used the cartographic stimuli. The car-tographic visualization of multiple phenomenais known as multivariate mapping. Multivari-ate point symbols are one possible multivari-ate mapping method (Slocum, McMaster,Kessler, & Howard, 2005). We created spe-cific cartographic tasks for purposes of ourexperiment. Categorization was measured withCMMS – Categorization of Multivariate MapSymbols, which is based on previous re-search in categorization (Chiu, 1972; Ji et al.,2004; Norenzayan et al., 2002) and on the re-lationship between cognitive style and mapreading (e.g., Herman et al., 2019; Kubíček etal., 2016; Opach, Popelka, Doležalová, & Rod,2018; Stachoň et al., 2018; Šašinka et al.,2018). The CMMS measures a specific com-ponent of categorization, namely clustering (cf.McCleary, 1975; Sadahiro, 1997).
The method comprised three practice trialsand twenty test trials. The administration tookbetween 15 and 30 minutes. In each trial, afictional map comprising multiple territorialunits was presented. Each territorial unit con-tained one map symbol (Figure 3).
The map symbols contained informationabout the four attributes of a particular spatialunit, namely food costs (originally blue color,top left position), housing costs (originally redcolor, top right position), transport costs (origi-nally yellow color, bottom left position) andcosts of leisure activities (originally green color,bottom right position), which were indicatedby the color and size of the map symbol com-ponents (Figure 4). The position and color ofthe abovementioned attributes were kept con-stant, only their size was manipulated.
Figure 2 Example of the Navon figure usedin the CFT

28 Studia Psychologica, Vol. 62, No. 1, 2020, 23-43
Figure 3 Territorial unit and map symbol in CMMS
Figure 4 Multivariate map symbol (descriptions were in Czech and traditional/simplified Chi-nese languages)
Studia Psychologica, Vol. 62, No. 1, 2020, 23-43 29
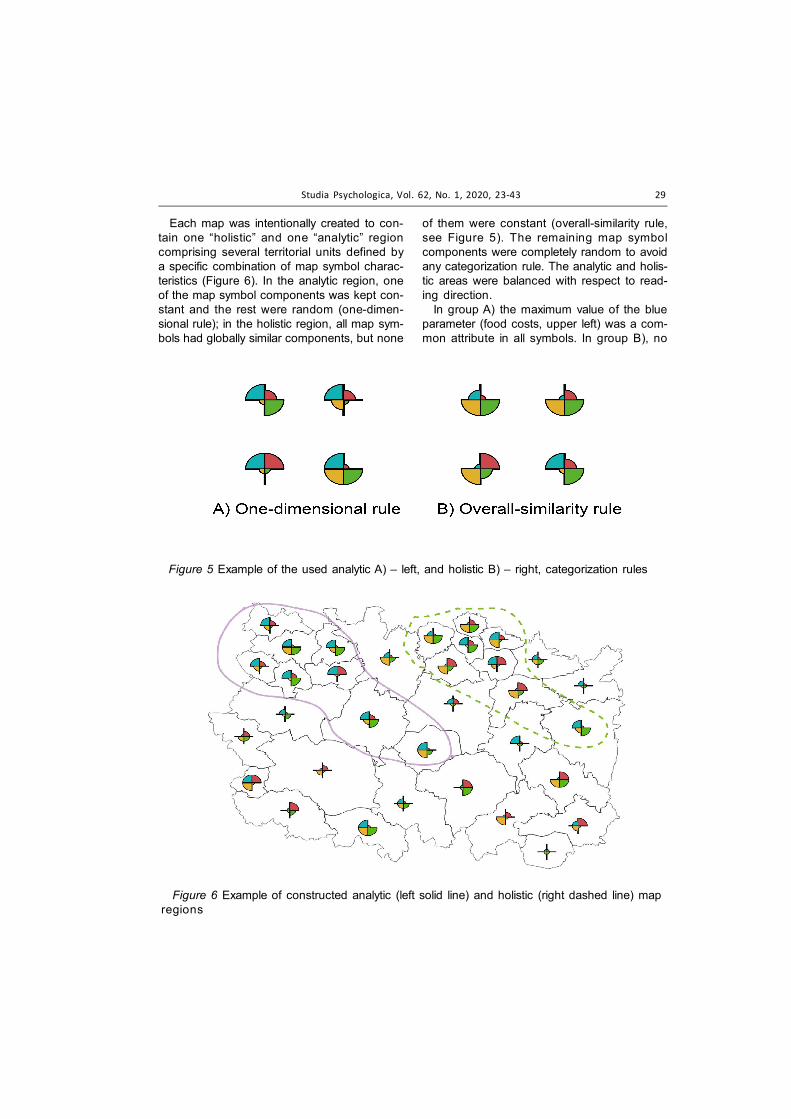
Each map was intentionally created to con-tain one “holistic” and one “analytic” regioncomprising several territorial units defined bya specific combination of map symbol charac-teristics (Figure 6). In the analytic region, oneof the map symbol components was kept con-stant and the rest were random (one-dimen-sional rule); in the holistic region, all map sym-bols had globally similar components, but none
of them were constant (overall-similarity rule,see Figure 5). The remaining map symbolcomponents were completely random to avoidany categorization rule. The analytic and holis-tic areas were balanced with respect to read-ing direction.
In group A) the maximum value of the blueparameter (food costs, upper left) was a com-mon attribute in all symbols. In group B), no
Figure 5 Example of the used analytic A) – left, and holistic B) – right, categorization rules
Figure 6 Example of constructed analytic (left solid line) and holistic (right dashed line) mapregions

30 Studia Psychologica, Vol. 62, No. 1, 2020, 23-43
specific attribute was common to any symbol;they shared overall similarity and equal distri-bution of values in different parameters (2xmaximum, 1x medium, and 1x minimum). Al-ternative map symbols were created accord-ing to principles published by Norenzayan etal. (2002).
Participants were asked to identify and marka continuous map region comprising at leastfour territorial units that, according to theirjudgment, belonged together. The CMMS re-ported each trial result as a value between -1 and 1, where a negative value is definedas a holistic categorization and a positivevalue is defined as an analytic categorization.This value represented the agreement be-tween the predetermined holistic and ana-lytic regions and the real marked areas.A value of ±1 represented total agreement,while 0 did not represent any agreement.A control value, calculated as the ratio ofmarked territorial units within the predeter-mined areas to the sum of all marked territo-rial units, was also reported to exclude par-ticipants who had incorrectly marked only anegligible number of predetermined areas.A value of .60 and higher was considered avalid response, and therefore 40% or lessmarked territorial units beyond predeterminedareas. For example, if a trial consists of 10analytic, 10 holistic and 30 random areas anda participant marks out 11 areas (7 analyticand 4 random), his/her control value is valid(analytic marked areas/all marked areas =7/11 = .636) and his/her score is .70 (analyticmarked areas/all analytic areas = 7/10 = .70).
From the research mentioned above, wehypothesized that people with a holistic cogni-tive style will show a tendency to mark out ho-listic regions and people with an analytic cog-nitive style will mark out analytic regions. Analo-gously, we also assumed that East Asians willmark out the holistic area more often (and theanalytic area less often) than Czechs.
Research Sample
Before data were collected, a power analysisin G*Power (v. 3.1.9.2) was conducted. Setting
power at .80 and effect size f at .280 was suffi-cient to test at least 104 participants (52 fromeach culture).1
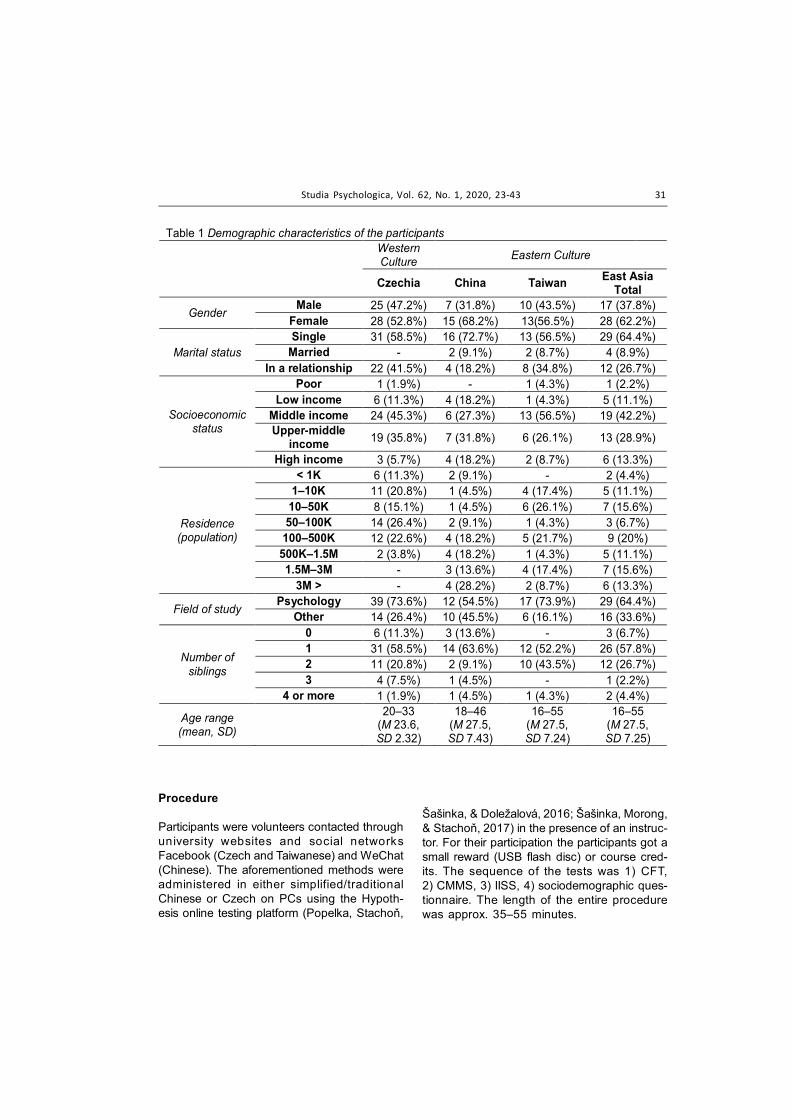
We gathered data from 103 participants. Fiveparticipants were excluded from further dataanalysis because of missing data. Out of theremaining 98 participants, 53 participantswere Central Europeans (Czech), and 45 par-ticipants were East Asians (22 Chinese, 23Taiwanese). All participants were universitystudents, the majority (57.1%) were womenand most of them studied psychology (69.4%).The age range was 16–55 years (M = 25.4,SD = 5.52). From previous studies it seemsthat several demographic variables are relevantto cognitive style, therefore, we gathered infor-mation about cartographic skills and experi-ence (Ooms et al., 2016), SES (Grossmann &Varnum, 2011), marital status (Bartoš, 2010),size of residence (Jha & Singh, 2011), numberof siblings (based on the number of familymembers in residence, see Grossmann &Varnum, 2011) or field of study (Choi, Koo &Choi, 2007). The detailed descriptive charac-teristics of the sample are shown in Table 1.
Our research sample was consequentlyadequate for testing the hypotheses in the firstsection of results (Cross-Cultural Differences).In the second section (Relationship betweenSociocultural, Perception and Cognitive Fac-tors), however, with respect to the sample size,more demanding methods of statistical analy-sis were used, such as SEM, specifically pathanalysis. The sample size was relatively inad-equate in this case (according to Ding, Velicer,& Harlow, 1995, the minimum sample size forconducting SEM is about 100–150). The re-sults of SEM therefore needed to be interpretedcautiously. Normality tests were performed forall subscales of the methods used. Non-para-metric statistics were used, where the datawere not normally distributed.
1 The value of f was selected from previous cross-cultural research using the Navon method, in whichthe effect sizes were .229–.886 (M = .410, SD =.216; e.g., Fu, Dienes, Shang, & Fu, 2013; McKoneet al., 2010; Tan, 2016). We selected the middleeffect size value f = .280.
Studia Psychologica, Vol. 62, No. 1, 2020, 23-43 31
Procedure
Participants were volunteers contacted throughuniversity websites and social networksFacebook (Czech and Taiwanese) and WeChat(Chinese). The aforementioned methods wereadministered in either simplified/traditionalChinese or Czech on PCs using the Hypoth-esis online testing platform (Popelka, Stachoň,
Šašinka, & Doležalová, 2016; Šašinka, Morong,& Stachoň, 2017) in the presence of an instruc-tor. For their participation the participants got asmall reward (USB flash disc) or course cred-its. The sequence of the tests was 1) CFT,2) CMMS, 3) IISS, 4) sociodemographic ques-tionnaire. The length of the entire procedurewas approx. 35–55 minutes.
Table 1 Demographic characteristics of the participants
Western Culture Eastern Culture
Czechia China Taiwan East Asia Total
Gender Male 25 (47.2%) 7 (31.8%) 10 (43.5%) 17 (37.8%)
Female 28 (52.8%) 15 (68.2%) 13(56.5%) 28 (62.2%)
Marital status Single 31 (58.5%) 16 (72.7%) 13 (56.5%) 29 (64.4%)
Married - 2 (9.1%) 2 (8.7%) 4 (8.9%) In a relationship 22 (41.5%) 4 (18.2%) 8 (34.8%) 12 (26.7%)
Socioeconomic status
Poor 1 (1.9%) - 1 (4.3%) 1 (2.2%) Low income 6 (11.3%) 4 (18.2%) 1 (4.3%) 5 (11.1%)
Middle income 24 (45.3%) 6 (27.3%) 13 (56.5%) 19 (42.2%) Upper-middle
income 19 (35.8%) 7 (31.8%) 6 (26.1%) 13 (28.9%)
High income 3 (5.7%) 4 (18.2%) 2 (8.7%) 6 (13.3%)
Residence (population)
< 1K 6 (11.3%) 2 (9.1%) - 2 (4.4%) 1–10K 11 (20.8%) 1 (4.5%) 4 (17.4%) 5 (11.1%)
10–50K 8 (15.1%) 1 (4.5%) 6 (26.1%) 7 (15.6%) 50–100K 14 (26.4%) 2 (9.1%) 1 (4.3%) 3 (6.7%)
100–500K 12 (22.6%) 4 (18.2%) 5 (21.7%) 9 (20%) 500K–1.5M 2 (3.8%) 4 (18.2%) 1 (4.3%) 5 (11.1%) 1.5M–3M - 3 (13.6%) 4 (17.4%) 7 (15.6%)
3M > - 4 (28.2%) 2 (8.7%) 6 (13.3%)
Field of study Psychology 39 (73.6%) 12 (54.5%) 17 (73.9%) 29 (64.4%)
Other 14 (26.4%) 10 (45.5%) 6 (16.1%) 16 (33.6%)
Number of siblings
0 6 (11.3%) 3 (13.6%) - 3 (6.7%) 1 31 (58.5%) 14 (63.6%) 12 (52.2%) 26 (57.8%) 2 11 (20.8%) 2 (9.1%) 10 (43.5%) 12 (26.7%) 3 4 (7.5%) 1 (4.5%) - 1 (2.2%)
4 or more 1 (1.9%) 1 (4.5%) 1 (4.3%) 2 (4.4%)
Age range (mean, SD)
20–33 (M 23.6, SD 2.32)
18–46 (M 27.5, SD 7.43)
16–55 (M 27.5, SD 7.24)
16–55 (M 27.5, SD 7.25)
32 Studia Psychologica, Vol. 62, No. 1, 2020, 23-43
Results
The data were processed with IBM SPSS Sta-tistics (v. 25), IBM SPSS Amos (v. 25) and R(v. 3.4.4, Lavaan and SemTools packages). Theresults are presented in two sections: Cross-Cultural Differences and Relationship betweenSociocultural, Perceptual and Cognitive Fac-tors. Analysis of the differences between Tai-wanese and Chinese participants and alsothe individual differences between relevantsociocultural variables (e.g., SES, gender,number of siblings, age) were also performed,with no significant differences found in any ofthe variables. Because of these results, wecombined Taiwanese and Chinese partici-pants into a single “Chinese/Taiwanese” groupfor any subsequent statistical analysis.
Cross-Cultural Differences
The IISS Questionnaire had a satisfactory reli-ability in both the independent α = .895 (Czechversion α = .815, Chinese version α = .929)and interdependent α = .872 (Czech versionα = .795, Chinese version α = .906) subscales.Furthermore, the subscales did not correlate
with each other (Spearman partial rs = .155,p = .177, culture was a control variable).
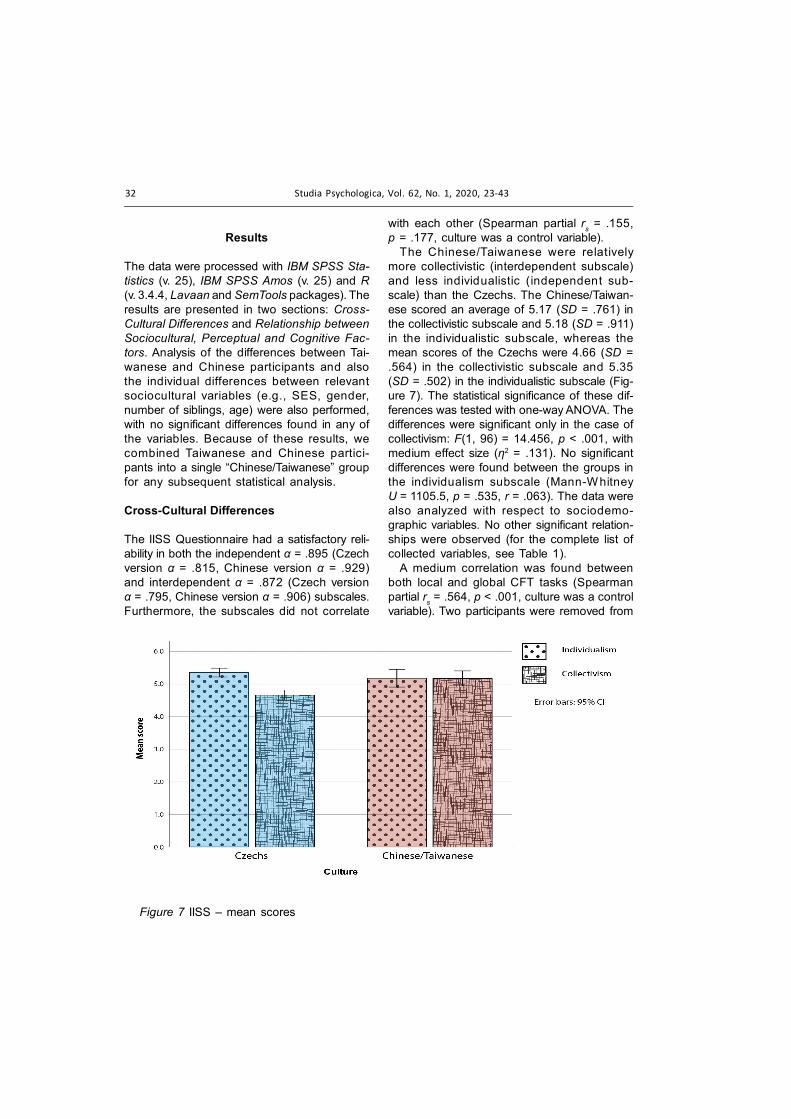
The Chinese/Taiwanese were relativelymore collectivistic (interdependent subscale)and less individualistic (independent sub-scale) than the Czechs. The Chinese/Taiwan-ese scored an average of 5.17 (SD = .761) inthe collectivistic subscale and 5.18 (SD = .911)in the individualistic subscale, whereas themean scores of the Czechs were 4.66 (SD =.564) in the collectivistic subscale and 5.35(SD = .502) in the individualistic subscale (Fig-ure 7). The statistical significance of these dif-ferences was tested with one-way ANOVA. Thedifferences were significant only in the case ofcollectivism: F(1, 96) = 14.456, p < .001, withmedium effect size (η2 = .131). No significantdifferences were found between the groups inthe individualism subscale (Mann-WhitneyU = 1105.5, p = .535, r = .063). The data werealso analyzed with respect to sociodemo-graphic variables. No other significant relation-ships were observed (for the complete list ofcollected variables, see Table 1).
A medium correlation was found betweenboth local and global CFT tasks (Spearmanpartial rs = .564, p < .001, culture was a controlvariable). Two participants were removed from
Figure 7 IISS – mean scores

Studia Psychologica, Vol. 62, No. 1, 2020, 23-43 33
further analysis because of their high errorrates (more than four errors in each task).
The results suggest that all participants hadsignificantly quicker reaction times in the glo-bal task than in the local task (W ilcoxonsigned-rank test Z = -6.634, p < .001, r = -.677).The findings also show that Czechs werequicker than Chinese/Taiwanese in both localand global tasks. The average reaction time ofthe Czech participants in the global task was0.99 sec. (SD = .209) compared to the Chi-nese/Taiwanese participants with an averagereaction time of 1.66 sec. (SD = .466). A similarpattern was observed in the local task, wherethe average reaction time of the trial solutionwas 1.13 sec. (SD = .144) for the Czechs and1.77 s (SD = .387) for the Chinese/Taiwaneseparticipants (Figure 8). Czechs were signifi-cantly quicker in both the global (U = 204, p <.001, r = -.711) and local (F(1, 95) = 121.960, p< .001, η2 = .562) tasks, with large effect sizes.
These differences in reaction times, how-ever, cannot be interpreted in the A/H paradigmas any difference in cognitive style but ratheras differences in the emphasis that bothgroups placed on the speed of the CFT solu-tion (Kukaňová, 2017; Yates et al., 2010). Wealso calculated the global precedence score
using the aforementioned procedure of differ-ence, specifically by subtracting the local re-action times from global reaction times. Al-though the Czech participants had a relativelyhigher global precedence score (M = .139,SD = .210) than the Chinese/Taiwanese par-ticipants (M = .108, SD = .574), this differencewas not significant (U = 949, p = .083, r =-.175) (Figure 9).
The final method applied was CMMS. Fourparticipants were removed from further analy-sis because of their high error rate (partici-pants that marked less than three territorialunits into one continuous map region). Theresults on a scale between -1 (holistic) to 1(analytic) show that Czechs categorized inmaps more analytically (M = .044, SD = .360)and East Asians categorized in maps moreholistically (M = -.063, SD = .172) (Figure 10).This cultural difference was statistically sig-nificant (U = 795, p = .021), with a small effectsize (r = -.235). However, the results show thatboth groups used a similar cognitive style tocategorize map symbols and only small differ-ences in cognitive strategies were found. More-over, both groups scored relatively close to zero,which is probably caused by using various cat-egorization strategies across different trials,
Figure 8 CFT – mean reaction times

34 Studia Psychologica, Vol. 62, No. 1, 2020, 23-43
because absolute scores were higher for bothCzechs (M = .461, SD = .183) and Asians (M =.247, SD = .148).
Relationship between Sociocultural, Percep-tual and Cognitive Factors
We performed a Spearman partial correlationand a path analysis (type of SEM) to verify the
research model at individual level in order toobtain an improved and deeper understand-ing of the phenomena under scrutiny and theirmutual relationships.
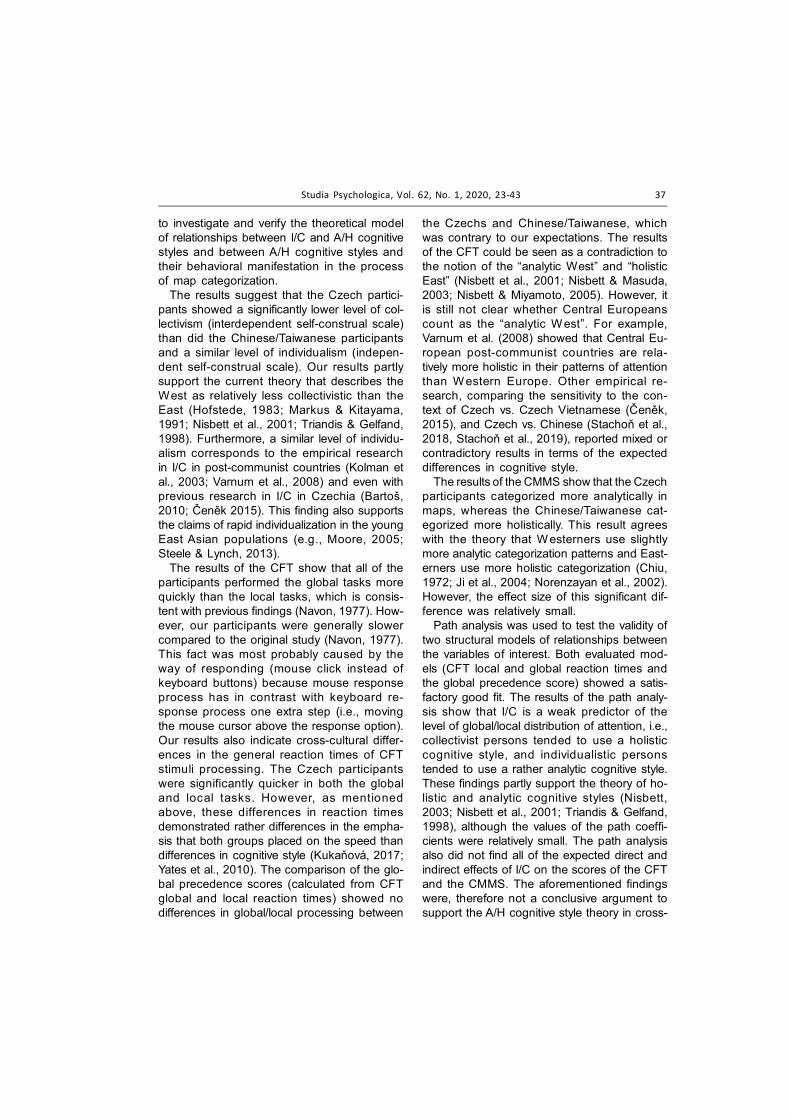
Using a non-parametric Spearman partialcorrelation with culture as control variable, onlyweak correlations were found between theCMMS scores and the CFT global reactiontimes (rs = .222, p = .035) and between the
Figure 10 CMMS – Cross-cultural differences in map categorization (High value = analytic,low value = holistic).
Figure 9 CFT – Mean global precedence scores (higher values mean higher global prece-dence)
Studia Psychologica, Vol. 62, No. 1, 2020, 23-43 35
CMMS scores and the CFT global precedencescores (rs = -.216, p = .040). The whole corre-lation matrix is shown in Table 2:
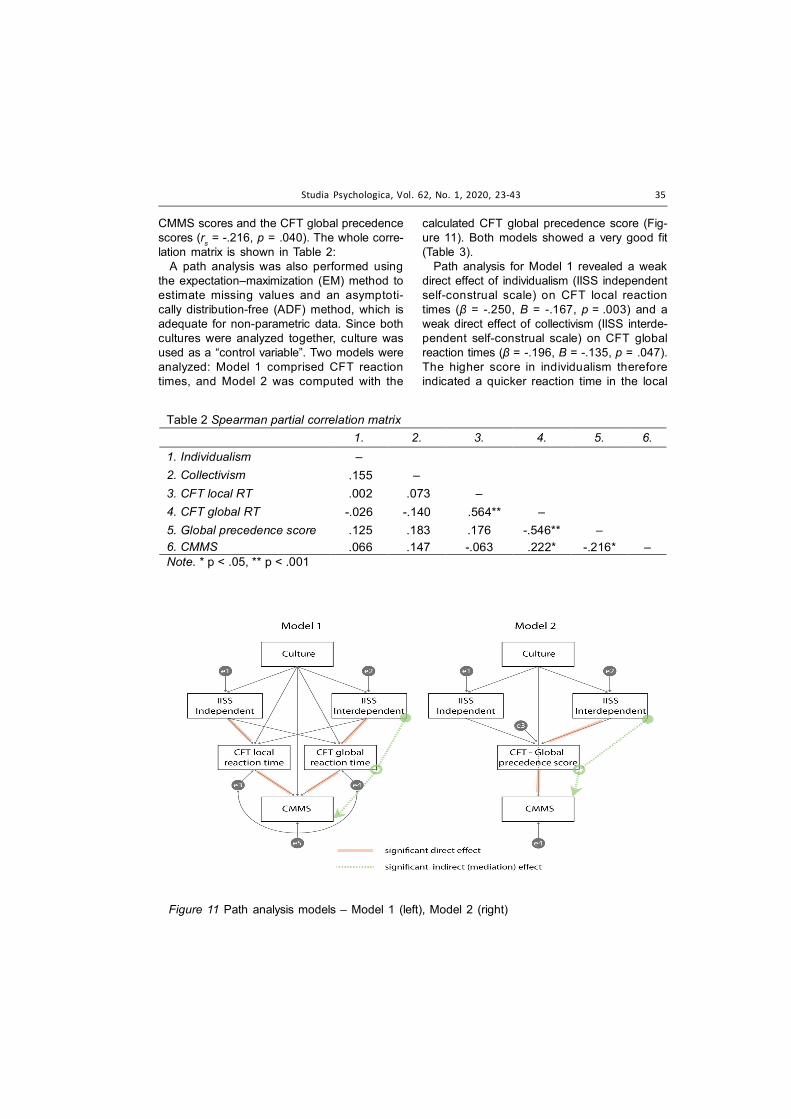
A path analysis was also performed usingthe expectation–maximization (EM) method toestimate missing values and an asymptoti-cally distribution-free (ADF) method, which isadequate for non-parametric data. Since bothcultures were analyzed together, culture wasused as a “control variable”. Two models wereanalyzed: Model 1 comprised CFT reactiontimes, and Model 2 was computed with the
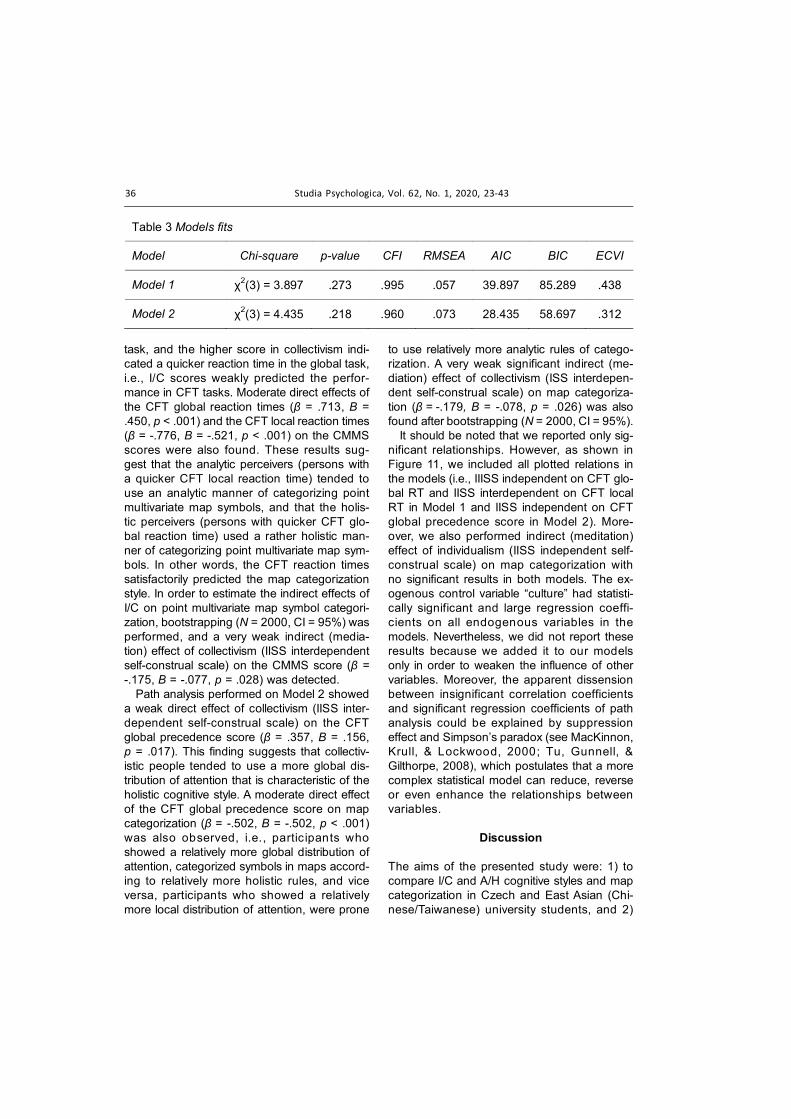
calculated CFT global precedence score (Fig-ure 11). Both models showed a very good fit(Table 3).
Path analysis for Model 1 revealed a weakdirect effect of individualism (IISS independentself-construal scale) on CFT local reactiontimes (β = -.250, B = -.167, p = .003) and aweak direct effect of collectivism (IISS interde-pendent self-construal scale) on CFT globalreaction times (β = -.196, B = -.135, p = .047).The higher score in individualism thereforeindicated a quicker reaction time in the local
Figure 11 Path analysis models – Model 1 (left), Model 2 (right)
Table 2 Spearman partial correlation matrix 1. 2. 3. 4. 5. 6. 1. Individualism – 2. Collectivism .155 – 3. CFT local RT .002 .073 – 4. CFT global RT -.026 -.140 .564** – 5. Global precedence score .125 .183 .176 -.546** – 6. CMMS .066 .147 -.063 .222* -.216* – Note. * p < .05, ** p < .001
36 Studia Psychologica, Vol. 62, No. 1, 2020, 23-43
task, and the higher score in collectivism indi-cated a quicker reaction time in the global task,i.e., I/C scores weakly predicted the perfor-mance in CFT tasks. Moderate direct effects ofthe CFT global reaction times (β = .713, B =.450, p < .001) and the CFT local reaction times(β = -.776, B = -.521, p < .001) on the CMMSscores were also found. These results sug-gest that the analytic perceivers (persons witha quicker CFT local reaction time) tended touse an analytic manner of categorizing pointmultivariate map symbols, and that the holis-tic perceivers (persons with quicker CFT glo-bal reaction time) used a rather holistic man-ner of categorizing point multivariate map sym-bols. In other words, the CFT reaction timessatisfactorily predicted the map categorizationstyle. In order to estimate the indirect effects ofI/C on point multivariate map symbol categori-zation, bootstrapping (N = 2000, CI = 95%) wasperformed, and a very weak indirect (media-tion) effect of collectivism (IISS interdependentself-construal scale) on the CMMS score (β =-.175, B = -.077, p = .028) was detected.
Path analysis performed on Model 2 showeda weak direct effect of collectivism (IISS inter-dependent self-construal scale) on the CFTglobal precedence score (β = .357, B = .156,p = .017). This finding suggests that collectiv-istic people tended to use a more global dis-tribution of attention that is characteristic of theholistic cognitive style. A moderate direct effectof the CFT global precedence score on mapcategorization (β = -.502, B = -.502, p < .001)was also observed, i.e., partic ipants whoshowed a relatively more global distribution ofattention, categorized symbols in maps accord-ing to relatively more holistic rules, and viceversa, participants who showed a relativelymore local distribution of attention, were prone
to use relatively more analytic rules of catego-rization. A very weak significant indirect (me-diation) effect of collectivism (ISS interdepen-dent self-construal scale) on map categoriza-tion (β = -.179, B = -.078, p = .026) was alsofound after bootstrapping (N = 2000, CI = 95%).
It should be noted that we reported only sig-nificant relationships. However, as shown inFigure 11, we included all plotted relations inthe models (i.e., IIISS independent on CFT glo-bal RT and IISS interdependent on CFT localRT in Model 1 and IISS independent on CFTglobal precedence score in Model 2). More-over, we also performed indirect (meditation)effect of individualism (IISS independent self-construal scale) on map categorization withno significant results in both models. The ex-ogenous control variable “culture” had statisti-cally significant and large regression coeffi-cients on all endogenous variables in themodels. Nevertheless, we did not report theseresults because we added it to our modelsonly in order to weaken the influence of othervariables. Moreover, the apparent dissensionbetween insignificant correlation coefficientsand significant regression coefficients of pathanalysis could be explained by suppressioneffect and Simpson’s paradox (see MacKinnon,Krull, & Lockwood, 2000; Tu, Gunnell, &Gilthorpe, 2008), which postulates that a morecomplex statistical model can reduce, reverseor even enhance the relationships betweenvariables.
Discussion
The aims of the presented study were: 1) tocompare I/C and A/H cognitive styles and mapcategorization in Czech and East Asian (Chi-nese/Taiwanese) university students, and 2)
Table 3 Models fits
Model Chi-square p-value CFI RMSEA AIC BIC ECVI
Model 1 χ2(3) = 3.897 .273 .995 .057 39.897 85.289 .438
Model 2 χ2(3) = 4.435 .218 .960 .073 28.435 58.697 .312
Studia Psychologica, Vol. 62, No. 1, 2020, 23-43 37
to investigate and verify the theoretical modelof relationships between I/C and A/H cognitivestyles and between A/H cognitive styles andtheir behavioral manifestation in the processof map categorization.
The results suggest that the Czech partici-pants showed a significantly lower level of col-lectivism (interdependent self-construal scale)than did the Chinese/Taiwanese participantsand a similar level of individualism (indepen-dent self-construal scale). Our results partlysupport the current theory that describes theWest as relatively less collectivistic than theEast (Hofstede, 1983; Markus & Kitayama,1991; Nisbett et al., 2001; Triandis & Gelfand,1998). Furthermore, a similar level of individu-alism corresponds to the empirical researchin I/C in post-communist countries (Kolman etal., 2003; Varnum et al., 2008) and even withprevious research in I/C in Czechia (Bartoš,2010; Čeněk 2015). This finding also supportsthe claims of rapid individualization in the youngEast Asian populations (e.g., Moore, 2005;Steele & Lynch, 2013).
The results of the CFT show that all of theparticipants performed the global tasks morequickly than the local tasks, which is consis-tent with previous findings (Navon, 1977). How-ever, our participants were generally slowercompared to the original study (Navon, 1977).This fact was most probably caused by theway of responding (mouse click instead ofkeyboard buttons) because mouse responseprocess has in contrast with keyboard re-sponse process one extra step (i.e., movingthe mouse cursor above the response option).Our results also indicate cross-cultural differ-ences in the general reaction times of CFTstimuli processing. The Czech participantswere significantly quicker in both the globaland local tasks. However, as mentionedabove, these differences in reaction timesdemonstrated rather differences in the empha-sis that both groups placed on the speed thandifferences in cognitive style (Kukaňová, 2017;Yates et al., 2010). The comparison of the glo-bal precedence scores (calculated from CFTglobal and local reaction times) showed nodifferences in global/local processing between
the Czechs and Chinese/Taiwanese, whichwas contrary to our expectations. The resultsof the CFT could be seen as a contradiction tothe notion of the “analytic West” and “holisticEast” (Nisbett et al., 2001; Nisbett & Masuda,2003; Nisbett & Miyamoto, 2005). However, itis still not clear whether Central Europeanscount as the “analytic West”. For example,Varnum et al. (2008) showed that Central Eu-ropean post-communist countries are rela-tively more holistic in their patterns of attentionthan Western Europe. Other empirical re-search, comparing the sensitivity to the con-text of Czech vs. Czech Vietnamese (Čeněk,2015), and Czech vs. Chinese (Stachoň et al.,2018, Stachoň et al., 2019), reported mixed orcontradictory results in terms of the expecteddifferences in cognitive style.
The results of the CMMS show that the Czechparticipants categorized more analytically inmaps, whereas the Chinese/Taiwanese cat-egorized more holistically. This result agreeswith the theory that Westerners use slightlymore analytic categorization patterns and East-erners use more holistic categorization (Chiu,1972; Ji et al., 2004; Norenzayan et al., 2002).However, the effect size of this significant dif-ference was relatively small.
Path analysis was used to test the validity oftwo structural models of relationships betweenthe variables of interest. Both evaluated mod-els (CFT local and global reaction times andthe global precedence score) showed a satis-factory good fit. The results of the path analy-sis show that I/C is a weak predictor of thelevel of global/local distribution of attention, i.e.,collectivist persons tended to use a holisticcognitive style, and individualistic personstended to use a rather analytic cognitive style.These findings partly support the theory of ho-listic and analytic cognitive styles (Nisbett,2003; Nisbett et al., 2001; Triandis & Gelfand,1998), although the values of the path coeffi-cients were relatively small. The path analysisalso did not find all of the expected direct andindirect effects of I/C on the scores of the CFTand the CMMS. The aforementioned findingswere, therefore not a conclusive argument tosupport the A/H cognitive style theory in cross-
38 Studia Psychologica, Vol. 62, No. 1, 2020, 23-43
cultural context (cf. Nisbet et al., 2001). As withseveral other studies that did not find any rela-tionship between I/C and A/H cognitive style(e.g., Davidoff et al., 2008; McKone et al., 2010;Takano & Osaka, 1999), it may be possiblethat this relationship could be different fromwhat researchers expect, or perhaps even non-existent. Our findings of unconvincing yet sig-nificant relationships could also be explainedin theoretical arguments, which maintain thatthe I/C and A/H cognitive styles only manifestat a cultural (i.e., cross-cultural comparison)not individual level (i.e., SEM and path analy-sis; cf. Na et al., 2010). Nevertheless, we wouldlike to emphasize that the sample size was, inthis case, relatively inadequate for SEM, there-fore its results should be understood as onlyexploratory.
The concept of I/C and its measurement withself-report scales have recently been subjectto disagreement from many scholars. This criti-cism mainly cites the lack of concurrent, dis-criminant and construct validity, insufficientconceptualization, a reductionist and dichoto-mous approach and insufficient psychometriccharacteristics in questionnaires (for review,see Levine et al., 2003; Matsumoto, 1999;Oyserman et al., 2002; Vignoles et al., 2016).For example, if the individual level of I/C can besignificantly influenced by priming, then itmeans that I/C is not as stable in time as it isgenerally assumed (Gardner, Gabriel, & Lee,1999; Oyserman & Lee, 2008). Moreover, ac-cording to the results of meta-analytical stud-ies and systematic reviews, the West shouldnot be described as strictly individualistic northe East as purely collectivistic (Levine et al.,2003; Oyserman et al., 2002; Takano & Osaka,1999; Takano & Osaka, 2018). Most recently,for example, Hakim et al. (2017) compared thelevels of individualism and collectivism ofAmerican and Asian international students andfound, contrary to expectations, that Americanswere significantly more collectivistic, whereasthe Asian students were significantly more in-dividualistic.
Path analysis also found that global/localdistribution of attention had a moderate pre-dictive power on categorization in both of the
tested models, i.e., analytic perceivers (definedby the CFT global precedence score) usedanalytic categorization in maps, whereas ho-listic perceivers used holistic categorization.This finding is consistent with the researchtheory (Chiu, 1972; Ji et al., 2004; Norenzayanet al., 2002) and the empirical research(Kubíček et al., 2016; Šašinka et al., 2018;Stachoň et al., 2019). Consequently, the cog-nitive style that is characterized as a percep-tual process is presumably manifested inhigher cognitive processes, such as map read-ing and categorization.
Conclusions
The article describes cross-cultural differ-ences in western and eastern cultures, be-tween Czech and Chinese/Taiwanese univer-sity students, respectively. The theoretical back-ground of the research was based on thetheory of analytic and holistic cognitive stylesand the dimensions of individualism and col-lectivism. Two main objectives were defined:first, to identify the possible cross-cultural dif-ferences and similarities between Czechs andChinese/Taiwanese, and second, to verify theentire research model and the relationshipsbetween A/H cognitive style and I/C at individuallevels. For this purpose, we also developed anew method (CMMS) in order to study how A/Hcognitive style was manifested during catego-rization in map reading. The results suggestthat cross-cultural differences exist betweenboth cultures, especially at the level of collec-tivism (Czechs were less collectivist than theChinese/Taiwanese) and categorization inmap reading (Czechs used more analytic andless holistic categorization). Neither individualdifferences (e.g., SES, gender, age) nor differ-ences in cognitive style measured by the CFTbetween Czech and East Asians were found.The findings also indicate that I/C is a weakpredictor of A/H cognitive style and that A/H cog-nitive style moderately predicts categorizationin map reading.
These results contradict the East-West di-chotomy and suggest that the culture of Cen-tral Europe (specifically Czechia) is much more
Studia Psychologica, Vol. 62, No. 1, 2020, 23-43 39
similar to the East than expected from the lit-erature. However, more cross-cultural researchof typically Western, typically Eastern and Cen-tral European cultures is needed for an im-proved understanding of the real influence ofculture on human perception and cognition inregions outside the East-West dichotomy.Based on the presented results, future re-search should focus on verification of Nisbett’s(2001) vs. Kozhevnikov’s (2014) models ofcognitive styles. Above all, specify the numberof cognitive style families, investigate the sta-bility/flexibility of cognitive styles, and inspectthe developmental aspects (e.g., children ofdifferent age) of cognitive style and its adap-tive nature (e.g., research on expatriates dur-ing the process of cultural adaptation) is alsosuggested.
Acknowledgement
This publication was supported by the CzechScience Foundation (GC19-09265J: The influ-ence of socio-cultural factors and writing sys-tem on perception and cognition of complexvisual stimuli).
References
Angsüsser, S. (2014). Possible reasons for size dif-ferences between point symbols in German andChinese city maps. In T. Bandrova & M. Konecny(Eds.), Proceedings of the 5th International Con-ference on Cartography & GIS (pp. 268–277),Sofia: Bulgarian Cartographic Association. https://cartography495gis.com/docsbca/5ICCandGIS_Proceedings.pdf
Bartoš, F. (2010). Individualismus a kolektivismus včeské populaci a jejich souvislost s narcismem.Sociólogia, 42(2), 134–160.
Čeněk, J. (2015). Cultural dimension of individualismand collectivism and its perceptual and cognitivecorrelates in cross-cultural research. The Jour-nal of Education, Culture and Society, 6(2), 210–225. https://doi.org/10.15503/jecs20152.210.225
Chiu, L. H. (1972). A Cross-cultural comparison ofcognitive styles in Chinese and American children.International Journal of Psychology, 7(4), 235–242. https://doi.org/10.1080/00207597208246604
Choi, I., Koo, M., & Choi, J. (2007). Individual differ-ences in analytic versus holistic thinking. Personal-
ity and Social Psychology Bulletin, 33(5), 691–705. https://doi.org/10.1177/0146167206298568
Choi, I., & Nisbett, R. (1998). Situational salience andcultural differences in the correspondence biasand actor-observer bias. Personality and SocialPsychology Bulletin, 24(9), 949–960. https://doi.org/10.1177/0146167298249003
Choi, I., Nisbett, R., & Norenzayan, A. (1999). Causalattribution across cultures: Variation and univer-sality. Psychological Bulletin, 125(1), 47–63.https://doi.org/10.1037/0033-2909.125.1.47
Chua, H., Boland, J., & Nisbett, R. (2005). Culturalvariation in eye movements during scene percep-tion. Proceedings of the National Academy ofSciences of the United States of America, 102(35),12629–12633. https://doi.org/10.1073/pnas.0506162102
Cieślikowska, D. (2006). Object and context in per-ception and memory: Polish-Chinese research onanalytic and holistic cognitive styles. StudiaPsychologiczne (Psychological Studies), 44(1),80–99.
Cohen, N., & Ariely, T. (2011). Field research in con-flict environments: Methodological challenges andsnowball sampling. Journal of Peace Research,48(4), 423–435. https://doi.org/10.1177/0022343311405698
Davidoff, J., Fonteneau, E, & Fagot, J. (2008). Localand global processing: Observations from a re-mote culture. Cognition, 108(3), 702–709. https://doi.org/10.1016/j.cognition.2008.06.004
Ding, L., Velicer, W., & Harlow, L. (1995). Effect ofestimation methods, number of indicators per fac-tor and improper solutions on structural equationmodeling fit indices. Structural Equation Model-ing, 2(2), 119–143. https://doi.org/10.1080/10705519509540000
Federici, S., Stella, A., Dennis, J., & Hündsfelt, T.(2011). West vs. West like East vs. West? A com-parison between Italian and US American contextsensitivity and fear of isolation. Cognitive Pro-cessing, 12(2), 203–208. https://doi.org/10.1007/s10339-010-0374-8
Fu, Q., Dienes, Z., Shang, J., & Fu, X. (2013). Wholearns more? Cultural differences in implicit se-quence learning. PLoS ONE, 8(8), e71625. https://doi.org/10.1371/journal.pone.0071625
Gardner, W., Gabriel, S., & Lee, A. (1999). “I” valuefreedom, but “we” value relationships: Self-construal priming mirrors cultural differences injudgment. Psychological Science, 10(4), 321–326.https://doi.org/10.1111/1467-9280.00162
Gerlach, Ch., & Poirel, N. (2018). Navon’s classicalparadigm concerning local and global processingrelates systematically to visual object classifica-

40 Studia Psychologica, Vol. 62, No. 1, 2020, 23-43
tion performance. Scientific Reports, 8(1), 324.https://doi.org/10.1038/s41598-017-18664-5
Graff, M. (2003). Learning from web-based instruc-tional systems and cognitive style. British Journalof Educational Technology, 34(4), 407–418. https://doi.org/10.1111/1467-8535.00338
Grossmann, I., & Varnum, M. (2011). Social class,culture, and cognition. Social Psychological andPersonality Science, 2(1), 81–89. https://doi.org/10.1177/1948550610377119
Hakim, N., Simons, D., Zhao, H., & Wan, X. (2017).Do Easterners and Westerners differ in visualcognition? A preregistered examination of threevisual cognition tasks. Social Psychological andPersonality Science, 8(2), 1–11. https://doi.org/10.1177/1948550616667613
Herman, L., Juřík, V., Stachoň, Z., Vrbík, D., Russnák,J., & Řezník, T. (2018). Evaluation of user perfor-mance in interactive and static 3D maps. ISPRSInternational Journal of Geo-Information, 7(11),1–25. https://doi.org/10.3390/ijgi7110415
Hermans, H., & Kempen, H. (1998). Moving cultures:The perilous problems of cultural dichotomies in aglobalizing world. American Psychologist, 53(10),1111–1120. https://doi.org/10.1037/0003-066X.53.10.1111
Hofstede, G. (1983). The cultural relativity of organi-zational practices and theories. Journal of Inter-national Business Studies, 14(2), 75–89. https://doi.org/10.1057/palgrave.jibs.8490867
Jha, S. D., & Singh, K. (2011). An analysis of indi-vidualism-collectivism across Northern India. Jour-nal of the Indian Academy of Applied Psychology,37(1), 149–156.
Ji, L., Peng, K., & Nisbett, R. (2000). Culture, control,and perception of relationships in the environment.Journal of Personality and Social Psychology.78(5), 943–955. https://doi.org/10.1037//0022-3514.78.5.943
Ji, L., Zhang, Z., & Nisbett, R. (2004). Is it culture oris it language? Examination of language effects incross-cultural research on categorization. Jour-nal of Personality and Social Psychology, 87(2),57–65. https://doi.org/10.1037/0022-3514.87.1.57
Kitayama, S., Duffy, S., Kawamura, T., & Larsen, J.T. (2003). Perceiving an object and its context indifferent cultures: A cultural look at new look. Psy-chological Science, 14(3), 201–206. https://doi.org/10.1111/1467-9280.02432
Kitayama, S., Ishii, K., Imada, T., Takemura, K., &Ramaswamy, J. (2006). Voluntary settlement andthe spirit of independence: Evidence from Japan’s“Northern frontier.” Journal of Personality andSocial Psychology, 91(3), 369–384. https://doi.org/10.1037/0022-3514.91.3.369
Kitayama, S., Park, H., Sevincer, A., Karasawa, M.,& Uskul, A. (2009). A cultural task analysis of im-plicit independence: Comparing North America,Western Europe, and East Asia. Journal of Per-sonality and Social Psychology, 97(2), 236–255.https://doi.org/10.1037/a0015999
Knight, K., & Nisbett, R. (2007). Culture, class, andcognition: Evidence from Italy. Journal of Cogni-tion and Culture, 7(3), 283–291. https://doi.org/10.1163/156853707X208512
Kolman, L., Noorderhaven, N., Hofstede, G., Dienes,E. (2003). Crosscultural differences in CentralEurope. Journal of Managerial Psychology,18(1), 76–88. https://doi.org/10.1108/02683940310459600
Köster, M., Castel, J., Gruber, T., & Kärtner, J. (2017).Visual cortical networks align with behavioralmeasures of context-sensitivity in early childhood.NeuroImage, 163(2017), 413–418. https://doi.org/10.1016/j.neuroimage.2017.08.008
Kozhevnikov, M., Evans, C., & Kosslyn, S. M. (2014).Cognitive style as environmentally sensitive indi-vidual differences in cognition: A modern synthe-sis and applications in education, business, andmanagement. Psychological Science in the Pub-lic Interest, 15(1), 3–33. https://doi.org/10.1177/1529100614525555
Kubíček, P., Šašinka, Č., Stachoň, Z., Štěrba, Z.,Apeltauer, J., & Urbánek, T. (2016). Cartographicdesign and usability of visual variables for linearfeatures. The Cartographic Journal, 54(1), 91–102. https://doi.org/10.1080/00087041.2016.1168141
Kukaňová, M. (2017). Porovnání dvou typůvizualizací z hlediska percepční a kognitivnízátěže a kognitivních schopností jedince. [Com-parison of the two types of visualization in termsof perceptual and cognitive load, and personalcognitive abilities]. [Doctoral Dissertation]. Brno:Masaryk University. https://is.muni.cz/auth/th/djk1o/
Levine, T., Bresnahan, M., Park, H., Lapinski, M.,Wittenbaum, G., Shearman, S., … & Ohashi, R.(2003). Self-construal scales lack validity. HumanCommunication Research, 29(2), 210–252. https://doi.org/10.1111/j.1468-2958.2003.tb00837.x
Lewandowsky, S., Herrmann, D. J., Behrens, J. T.,Li, S., Pickle, L., & Jobe, J. B. (1993). Perception ofclusters in statistical maps. Applied CognitivePsychology, 7(6), 533–551. https://doi.org/10.1002/acp.2350070606
Lu, L., & Gilmour, R. (2007). Developing a new mea-sure of independent and interdependent views ofthe self. Journal of Research in Personality, 41(1),249–257. https://doi.org/10.1016/j.jrp.2006.09.005
Studia Psychologica, Vol. 62, No. 1, 2020, 23-43 41
MacEachren, A. (1995). How maps work: Repre-sentation, visualization, and design. New York:Guilford Press.
MacKinnon, D. P., Krull, J. L., & Lockwood, C. M.(2000). Equivalence of the mediation, confound-ing and suppression effect. Prevention Science:The Official Journal of the Society for PreventionResearch, 1(4), 173–181. https://doi.org/10.1023/A:1026595011371
Markus, H., & Kitayama, S. (1991). Culture and theself: Implications for cognition, emotion, and moti-vation. Psychological Review, 98(2), 224–253.https://doi.org/10.1037/0033-295X.98.2.224
Masuda, T. (2017). Culture and attention: Recentempirical findings and new directions in culturalpsychology. Social and Personality PsychologyCompass, 11(12), e12363. https://doi.org/10.1111/spc3.12363
Masuda, T., & Kitayama, S. (2004). Perceived-in-duced constraint and attitude attribution in Japanand in the US: A case for cultural dependence ofthe correspondence bias. Journal of Experimen-tal Social Psychology, 40(3), 409–416. https://doi.org/10.1016/j.jesp.2003.08.004
Masuda, T., & Nisbett, R. (2001). Attending holisti-cally versus analytically: Comparing the contextsensitivity of Japanese and Americans. Journalof Personality and Social Psychology, 81(5), 922–934. https://doi.org/10.1037//0022-3514.81.5.922
Masuda, T., & Nisbett, R. (2006). Culture and changeblindness. Cognitive Science, 30(2), 381–399.http://dx.doi.org/10.1207/s15516709cog0000_63
Matsumoto, D. (1999). Culture and self: An empiricalassessment of Markus and Kitayama’s theory ofindependent and interdependent self-construals.Asian Journal of Social Psychology, 2(3), 289–310. https://doi.org/10.1111/1467-839X.00042
McCleary, G. (1975). In pursuit of the map user. In J.Kavaliunas (Ed.), Proceedings of the InternationalSymposium on Computer-Assisted Cartography:Auto Carto II (pp. 238–250), Washington: U.S.Department of Commerce, Bureau of the Census.http://cartogis.org/docs/proceedings/archive/auto-carto-2/pdf/auto-carto-2.pdf
McKone, E., Davies, A., Fernando, F., Aalders, R.Leung, H., Wickramariyaratne, T., & Platow, M.(2010). Asia has the global advantage: Race andvisual attention. Vision Research, 50(16), 1540–1549. https://doi.org/10.1016/j.visres.2010.05.010
Miyamoto, Y., & Kitayama, S. (2002). Cultural varia-tion in correspondence bias: The critical role ofattitude diagnosticity of socially constrained be-havior. Journal of Personality and Social Psychol-
ogy, 83(5), 1239–1248. https://doi.org/10.1037/0022-3514.83.5.1239
Montello, D. R., (2002). Cognitive map-design re-search in the twentieth century: Theoretical andempirical approaches. Cartography and Geo-graphic Information Science, 29(3), 283–304.https://doi.org/10.1559/152304002782008503
Morita, T. (2004). Ubiquitous mapping in Tokyo. In-ternational joint workshop on ubiquitous, perva-sive and Internet mapping (UPIMap2004), Tokyo,Japan. https://www.geospatialweb.com/www.ubimap.net/upimap2004/html/papers/UPIMap04-A-01-Morita.pdf
Moore, R. (2005). Generation Ku: Individualism andChina’s millennial youth. Ethnology, 44(4), 357–376. http://doi.org/10.2307/3774095
Morris, M., & Peng, K. (1994). Culture and cause:American and Chinese attributions for social andphysical events. Journal of Personality and So-cial Psychology, 67(6), 949–971. https://doi.org/10.1037/0022-3514.67.6.949
Na, J., Grossmann, I., Varnum, M., Kitayama, S.,Gonzalez, R., & Nisbett, R. (2010). Cultural differ-ences are not always reducible to individual dif-ferences. Proceedings of the National Academyof Sciences of the United States of America,107(14), 6192–6197. https://doi.org/10.1073/pnas.1001911107
Navon, D. (1977). Forest before trees: The prece-dence of global features in visual perception. Cog-nitive Psychology, 9(3), 353–383. https://doi.org/10.1016/0010-0285(77)90012-3
Nelson, E., Dow, D., Lukinbeal, C., & Farley, R. (1997).Visual search processes and the multivariate pointsymbol. Cartographica, 34(4), 19–33. http://doi.org/10.3138/15T3-3222-X25H-35JU
Nisbett, R. (2003). The Geography of thought: HowAsians and Westerners think differently… andwhy. New York: The Free Press.
Nisbett, R., & Masuda, T. (2003). Culture and point ofview. Proceedings of the National Academy ofSciences, 100(19), 11163–11170. https://doi.org/10.1073/pnas.1934527100
Nisbett, R., & Miyamoto, Y. (2005). The Influence ofculture: Holistic versus analytic perception. Trendsin Cognitive Sciences, 9(10), 467–473. https://doi.org/10.1016/j.tics.2005.08.004
Nisbett, R., Peng, K., Choi, I., & Norenzayan, A. (2001).Culture and systems of thought: Holistic versusanalytic cognition. Psychological Review, 108(2),291–310. https://doi.org/10.1037/0033-295x.108.2.291
Norenzayan, A., Smith, E., Kim, B. & Nisbett, R. (2002).Cultural preferences for formal versus intuitive

42 Studia Psychologica, Vol. 62, No. 1, 2020, 23-43
reasoning. Cognitive Science, 26(5), 653–684.https://doi.org/10.1207/s15516709cog2605_4
Nosal, C. S. (1990). Psychologiczne modele umysłu.[Psychological models of the mind]. Warsaw: PWN.
Ooms, K., De Maeyer, P., Dupont, L., Van der Veken,N., Van de Weghe, N., & Verplaetse, S. (2016).Education in cartography: What is the status ofyoung people’s map-reading skills? Cartographyand Geographic Information Science, 43(2), 134–153. https://doi.org/10.1080/15230406.2015.1021713
Opach, T., Popelka, S., Doležalová, J., & Rød, J. K.(2018). Star and polyline glyphs in a grid plot andon a map display: Which perform better? Cartog-raphy and Geographic Information Science, 45(5),400–419. https://doi.org/10.1080/15230406.2017.1364169
Oyserman, D., & Lee, S. (2008). Does culture influ-ence what and how we think? Effects of primingindividualism and collectivism. Psychological Bul-letin, 134(2), 311–342. https://doi.org/10.1037/0033-2909.134.2.311
Oyserman, D., Coon, H., & Kemmelmeier, M. (2002).Rethinking individualism and collectivism: Evalua-tion of theoretical assumptions and meta-analy-ses. Psychological Bulletin, 128(1), 3–72. https://doi.org/10.1037/0033-2909.128.1.3
Peña, E. (2017). Mapping visual literacy [DoctoralDissertation]. Vancouver: The University of Brit-ish Columbia. http://doi.org/10.14288/1.0368982
Peterson, E., & Deary, I. (2006). Examining thewholistic-analytic style using preferences in earlyinformation processing. Personality and IndividualDifferences, 41(1), 3–14. https://doi.org/10.1016/j.paid.2005.12.010
Popelka, S., Stachoň, Z., Šašinka, Č., & Doležalová,J. (2016). EyeTribe tracker data accuracy evalua-tion and its interconnection with Hypothesis soft-ware for cartographic purposes. ComputationalIntelligence and Neuroscience, 2016, 1–14. https://doi.org/10.1155/2016/9172506
Robinson, A. (1952). The look of maps: An exami-nation of cartographic design. Madison: Univer-sity of Wisconsin Press.
Sadahiro, Y. (1997). Cluster perception in the distri-bution of point objects. Cartographica, 34(1), 49–62. https://doi.org/10.3138/Y308-2422-8615-1233
Šašinka, Č., Morong, K., & Stachoň, Z. (2017). TheHypothesis platform: An online tool for experimen-tal research into work with maps and behavior inelectronic environments. ISPRS International Jour-nal of Geo-Information, 6(12), 1–22. https://doi.org/10.3390/ijgi6120407
Šašinka, Č., Stachoň, Z., Kubíček, P., Tamm, S., Matas,A., & Kukaňová, M. (2018). The Impact of global/
local bias on task-solving in map-related tasksemploying extrinsic and intrinsic visualization ofrisk uncertainty maps. The Cartographic Journal,55(4), 1–17. https://doi.org/10.1080/00087041.2017.1414018
Singelis, T. (1994). The measurement of indepen-dent and interdependent self-construal. Person-ality and Social Psychology Bulletin, 20(5), 580–591. https://doi.org/10.1177/0146167294205014
Slocum, T. A., McMaster, R. B., Kessler, F. C., &Howard, H. H. (2005). Thematic cartography andgeographic visualization. New Jersey: PearsonPrentice Hall.
Stachoň, Z., Šašinka, Č., Čeněk, J., Štěrba, Z.,Angsuesser, S., Fabrikant, S., ... & Morong, K.(2019). Cross-cultural differences in figure-groundperception of cartographic stimuli. Cartography andGeographic Information Science, 46(1), 82–94.https://doi.org/10.1080/15230406.2018.1470575
Stachoň, Z., Šašinka, Č., Čeněk, J., Angsüsser, S.,Kubíček, P., Štěrba, Z., & Bilíková. M., (2018). Ef-fect of size, shape and map background in carto-graphic visualization: Experimental study on Czechand Chinese populations. ISPRS InternationalJournal of Geo-Information, 7(427), 1–15. https://doi.org/10.3390/ijgi7110427
Steele, L., & Lynch, S. (2013). The pursuit of happi-ness in China: Individualism, collectivism, and sub-jective well-being during China’s economic andsocial transformation. Social Indicators Research,114(2), 441–451. https://doi.org/10.1007/s11205-012-0154-1
Takano, Y., & Osaka, E. (1999). An unsupported com-mon view: Comparing Japan and the US on indi-vidualism/collectivism. Asian Journal of SocialPsychology, 2(3), 311–341. https://doi.org/10.1111/1467-839X.00043
Takano, Y., & Osaka, E. (2018). Comparing Japanand the United States on individualism/collectiv-ism: A follow-up review. Asian Journal of SocialPsychology, 21(4), 301–3016. https://doi.org/10.1111/ajsp.12322
Tan, Y. (2016). East-West cultural differencies inVisual Attention Tasks: Identifying multiplemechanism and developing a predictive model[Doctoral dissertation]. Michigan: Michigan Tech-nological University. https://digitalcommons.mtu.edu/etdr/141
Triandis, H., & Gelfand, M. (1998). Converging mea-surement of horizontal and vertical individualismand collectivism. Journal of Personality and So-cial Psychology, 74(1), 118–128. https://doi.org/10.1037/0022-3514.74.1.118
Tu, Y. K., Gunnell, D., & Gilthorpe, M. S. (2008).Simpson’s Paradox, Lord’s Paradox, and Suppres-

Studia Psychologica, Vol. 62, No. 1, 2020, 23-43 43
sion effects are the same phenomenon – the re-versal paradox. Emerging Themes in Epidemiol-ogy, 5(2), 1–9. https://doi.org/10.1186/1742-7622-5-2
Tversky, B. (1981). Distortions in memory for maps.Cognitive Psychology, 13(3), 407–433. https://doi.org/10.1016/0010-0285(81)90016-5
Uskul, A., Kitayama, S., & Nisbett, R. (2008).Ecocultural basis of cognition: Farmers and fish-ermen are more holistic than herders. Proceed-ings of the National Academy of Sciences of theUnited States of America, 105(25), 8552–8556.https://doi.org/10.1073/pnas.0803874105
Varnum, M., Grossmann, I., Katunar, D., Nisbett, R.,& Kitayama, S. (2008). Holism in a European cul-tural context: Differences in cognitive style be-tween Central and East Europeans and Western-ers. Journal of Cognition and Culture, 8(3), 321–333. https://doi.org/10.1163/156853708X358209
Vignoles, V., Owe, E., Becker, M., Smith, P.,Easterbrook, M., Brown, R., … & Bond, M. (2016).Beyond the ‘east-west’ dichotomy: Global varia-tion in cultural models of selfhood. Journal of Ex-perimental Psychology: General, 145(8), 966–1000. https://doi.org/10.1037/xge0000175
von Mühlenen, A., Bellaera, L., Singh, A., & Srinivasa,N. (2018). The effect of sadness on global-localprocessing. Attention, Perception, & Psychophys-ics, 80(5), 1072–1082. https://doi.org/10.3758/s13414-018-1534-7
Wagemans, J., Elder, J., Kubovy, M., Pamer, M.,Peterson, M., Sing, M., & von der Heydt (2012). ACentury of Gestalt psychology in visual percep-tion: I. Perceptual grouping and figure-ground or-ganization. Psychological Bulletin, 138(6), 1172–1217. https://doi.org/10.1037/a0029333
Witkin, H., Moore, C., Goodenough, D., & Cox, P.(1977). Field dependent and field independentcognitive styles and their educational implications.Review of Educational Research, 47(1), 1–64.https://doi.org/10.3102/00346543047001001
Wood, D. (1984). Cultured symbols: Thoughts on thecultural context of cartographic symbols.Cartographica, 21(4), 9–37. https://doi.org/10.3138/B88T-68X3-L0J1-0226
Yates, J., Ji, L-J., Oka, T., Lee, J-W., Shinotsuka, H.,& Sieck, W. (2010). Indecisiveness and culture:Incidence, values, and thoroughness. Journal ofCross-cultural Psychology, 41(3), 428–444. https://doi.org/10.1177/0022022109359692
Related Documents