Cross-cultural differences in cognitive performance and Spearman’s hypothesis: g or c? Michelle Helms-Lorenz, Fons J.R. Van de Vijver * , Ype H. Poortinga Department of Psychology, Tilburg University, P.O. Box 90153, 5000 LE Tilburg, The Netherlands Received 16 September 2000; received in revised form 26 March 2002; accepted 4 April 2002 Abstract Common tests of Spearman’s hypothesis, according to which performance differences between cultural groups on cognitive tests increase with their g loadings, confound cognitive complexity and verbal–cultural aspects. The present study attempts to disentangle these components. Two intelligence batteries and a computer-assisted elementary cognitive test battery were administered to 474 second-generation migrant and 747 majority-group pupils in the Netherlands, with ages ranging from 6 to 12 years. Theoretical complexity measures were derived from Carroll [Human cognitive abilities. A survey of factor-analytic studies. Cambridge: Cambridge Univ. Press] and Fischer [Psychol. Rev. 87 (1980) 477]. Cultural loadings of all subtests were rated by 25 third-year psychology students. Verbal loading was operationalized as the number of words in a subtest. A factor analysis of the subtest loadings on the first principal component, the theoretical complexity measures, and the ratings of cultural loading revealed two virtually unrelated factors, representing cognitive ( g) and cultural complexity (c). The findings suggest that performance differences between majority-group members and migrant pupils are better predicted by c than by g. D 2003 Elsevier Science Inc. All rights reserved. Keywords: ‘‘g’’; Intelligence; Minority groups; Cognitive complexity; Cultural complexity; Spearman’s hypothesis 0160-2896/03/$ – see front matter D 2003 Elsevier Science Inc. All rights reserved. PII:S0160-2896(02)00111-3 * Corresponding author. Tel.: +31-13-466-2528; fax: +31-13-466-2370. E-mail address: [email protected] (F.J.R. Van de Vijver). Intelligence 31 (2003) 9 – 29

Welcome message from author
This document is posted to help you gain knowledge. Please leave a comment to let me know what you think about it! Share it to your friends and learn new things together.
Transcript
Cross-cultural differences in cognitive performance
and Spearman’s hypothesis:
g or c?
Michelle Helms-Lorenz, Fons J.R. Van de Vijver*, Ype H. Poortinga
Department of Psychology, Tilburg University, P.O. Box 90153, 5000 LE Tilburg, The Netherlands
Received 16 September 2000; received in revised form 26 March 2002; accepted 4 April 2002
Abstract
Common tests of Spearman’s hypothesis, according to which performance differences between
cultural groups on cognitive tests increase with their g loadings, confound cognitive complexity and
verbal–cultural aspects. The present study attempts to disentangle these components. Two
intelligence batteries and a computer-assisted elementary cognitive test battery were administered
to 474 second-generation migrant and 747 majority-group pupils in the Netherlands, with ages
ranging from 6 to 12 years. Theoretical complexity measures were derived from Carroll [Human
cognitive abilities. A survey of factor-analytic studies. Cambridge: Cambridge Univ. Press] and
Fischer [Psychol. Rev. 87 (1980) 477]. Cultural loadings of all subtests were rated by 25 third-year
psychology students. Verbal loading was operationalized as the number of words in a subtest. A
factor analysis of the subtest loadings on the first principal component, the theoretical complexity
measures, and the ratings of cultural loading revealed two virtually unrelated factors, representing
cognitive ( g) and cultural complexity (c). The findings suggest that performance differences between
majority-group members and migrant pupils are better predicted by c than by g.
D 2003 Elsevier Science Inc. All rights reserved.
Keywords: ‘‘g’’; Intelligence; Minority groups; Cognitive complexity; Cultural complexity; Spearman’s
hypothesis
0160-2896/03/$ – see front matter D 2003 Elsevier Science Inc. All rights reserved.
PII: S0160 -2896 (02 )00111 -3
* Corresponding author. Tel.: +31-13-466-2528; fax: +31-13-466-2370.
E-mail address: [email protected] (F.J.R. Van de Vijver).
Intelligence 31 (2003) 9–29
1. Introduction
Spearman (1927, p. 379) was the first to observe that tests with a higher g saturation tended
to reveal larger performance differences between ethnic groups. The g saturation of a test
refers to its cognitive complexity. Elaborating on these observations, Jensen (1985) formu-
lated ‘‘Spearman’s hypothesis’’ (SH), which predicts larger performance differences between
ethnic groups on tests as their g loading increases. Performance differences are measured by
effect sizes, such as Cohen’s d. A test’s g loading is usually represented by its loading on the
first factor of the intertest correlation matrix or by its loading on the first factor of the second-
order g factor derived from hierarchical factor analysis (i.e., the general factor among the
obliquely rotated first-order factors). A less common measure of g is the use of correlations
with tests that are known to have a high g loading. For example, Jensen (1993) has used
Raven’s Standard Progressive Matrices to calibrate tests of unknown g loadings.
In the discussion of studies on SH, a distinction can be made between studies that (1)
directly test SH, (2) propose and test alternative explanations of SH, (3) refute alternative
explanations of SH, and (4) test the generalizability of SH.
1.1. Direct hypothesis tests
Jensen (1998) gives an overview of research into SH based on paper-and-pencil tests and
reaction time (RT) tests, most frequently employing samples of African–Americans (AA) and
European–Americans (EA). In many studies, SH was strongly supported (e.g., Jensen, 1982,
1984, 1985, 1993; Jensen & Reynolds, 1982; Naglieri & Jensen, 1987; Peoples, Fagan, &
Drotar, 1995; Vernon & Jensen, 1984). Differences between the ethnic groups correlated
significantly positive with the test’s g loading.
1.2. Studies supporting alternative explanations of SH
Evidence for the role of cultural bias in the explanation of EA–AA differences comes from
Montie and Fagan (1988). In addition to large mean differences favoring EA preschool
children (3-year-olds) tested with the third revision of the Stanford–Binet test, these authors
found that performances were larger on some items relative to others (Significant Race�Item
interactions), but that these differences were not in line with SH. They concluded that test bias
might have contributed to the racial differences in IQ.
1.3. Studies refuting alternative explanations of SH
Jensen (1993) refuted motivational effects as an alternative explanation of EA–AA
differences. AA showed faster movement times (MTs) and slower RTs than EA in elementary
cognitive tests. According to Jensen, it is difficult to see why EAwould be more motivated in
RT-related processes and less motivated in MT-related processes as both refer to processes
that immediately follow each other in the tests studied and together do not take more than a
few seconds.
M. Helms-Lorenz et al. / Intelligence 31 (2003) 9–2910
Strategy differences between AA and EA can also be envisaged as an explanation of SH.
Jensen (1993) addressed this question by examining RT/MT ratios. If the two groups show
strategy differences, this should be expressed in different ratios (e.g., depending on the
strategy used, the decision about which button to press can be measured by the RT and the
MT). Results indicated that RT and MTwere positively correlated, and that the MT/RT ratios
of the two ethnic groups were similar for elementary cognitive tests but somewhat different
for the Math Verification Test, which consists of single-digit addition, subtraction, and
multiplication problems; the AA children showed shorter MTs. Jensen argues that it is very
unlikely that such strategy differences, if they exist and would be replicable, completely
explain the correlations between g and performance differences. Because the evidence is
derived entirely from studies involving elementary cognitive tests, the generalization to more
complex tests is not known.
There has been some debate in the literature as to whether SH reflects statistical artifacts.
Some authors have argued that selecting two groups from a homogeneous population on the
basis of their total test scores (as implicitly done in the comparison of AA and EA) inevitably
leads to a confirmation of SH (e.g., Roskam & Ellis, 1992; Schonemann, 1992). However, it
has been pointed out by Dolan (1997) that such a confirmation is not a mathematical
necessity and can only be expected under unrealistic sampling schemes. Similarly, Braden
(1989) found a nonsignificant correlation between g loadings and the performance differences
of deaf and hearing children.
Finally, Jensen (1985) has addressed test bias as an explanation of SH. He quotes evidence
from a study by McGurk (1975), who found that EA–AA differences are larger for
nonverbal than for verbal tests. This study refutes the argument that the style of language
in tests, supposedly favoring EA, contributes to performance differences. The most extensive
study on the role of cultural factors in EA–AA differences has been reported by the same
author (McGurk, 1951, 1953a,b; data were reanalyzed by Jensen & McGurk, 1987). A panel
of ‘‘78 judges, including professors of psychology and sociology, educators, professional
workers in counseling and guidance’’ (p. 295) were asked to classify items from well-known
group-administered intelligence tests as ‘‘least cultural,’’ ‘‘neutral,’’ or ‘‘most cultural.’’ The
analyses revealed that the removal of presumably biased items did not affect the size of the
observed EA–AA difference and that the item bias did not favor either statistical group.
Also, the EA–AA differences were smaller for the cultural than for the less cultural items.
McGurk’s study suffers from two problems. The first has to do with the items that were
used. An inspection of the items that were rated as least cultural, such as verbal analogies,
verbal opposites, and clock problems, suggests that at least some of the items contain fairly
strong cultural elements. Jensen and McGurk (p. 301) scrutinized the raters’ implicit
rationale for rating cultural loading; in their view, cultural loading was mainly related to
the ‘‘distinction between the recall of past-learned information and the mental manipulation
of simple and familiar information that is provided in the test item itself.’’ However, the
distinction between the recall of past information and reasoning is a poor rendering of
cultural loading. A test of the influence of cultural loading on ethnic performance differ-
ences requires a test battery without a confounding link between cultural loadings and
mental transformations.
M. Helms-Lorenz et al. / Intelligence 31 (2003) 9–29 11

The second problem is statistical. The authors tested item bias (differential item function-
ing), using an ANOVA of an Item�Race�Subjects Design. There are three difficulties with
the analysis: (a) the dependent variable is dichotomous, which affects Types I and II error
probabilities; (b) the analysis should be carried out per item (instead of for all items at once).
In the design used by the authors, the number of biased items is probably underestimated; (c)
the authors should have added ability (sum score) as an additional independent variable (cf.
Holland & Wainer, 1993; Lord, 1980; Mellenbergh, 1982; Van de Vijver & Leung, 1997). In
sum, McGurk’s study does not constitute an adequate test of the role of cultural loading as an
alternative explanation of SH.
1.4. Studies of the generalizability of SH
Jensen has originally proposed SH as a description of the patterning of EA–AA differ-
ences. Racial characteristics were taken as the main distinction. There is no reason as to why
the SH should be restricted to these groups. A few studies addressed the generalizability of
SH to other ethnic groups. Lynn and Owen (1993), testing SH in South Africa among a group
of Whites, Blacks, and Indians, found ambiguous results. The difference between the Whites
and Blacks was >2 S.D. for 8 of the 10 subtests administered. The mean difference of Indians
and Whites was 1 S.D. The relationship between the Black g (i.e., the g loading as found in a
factor analysis of the data on the data of the Blacks) and performance differences between
these groups was 0.62 (P<.05), thereby supporting SH. However, when the White g was
used, no significant correlations were obtained. Similarly, the correlations between both the
White and the Indian g and White–Indian differences were not significant.
Nagoshi, Johnson, DeFries, Wilson, and Vandenberg (1984) administered 15 mental
tests to 5333 Americans of Japanese, Chinese, and European ancestry. Of the six
reported correlations between g loading and ethnic group differences in test scores, only
two were significant.
Jensen and Whang (1994) studied performance differences among Chinese–Americans
and AA using Raven’s Standard Progressive Matrices (as g measure) and 12 chronometric
variables derived from the Math Verification Test. The Raven performances were signific-
antly different for the groups (0.32 S.D.). The performances of the groups on the
chronometric variables differed significantly (effect sizes for addition, subtraction, and
multiplication were 0.47, 0.45, and 0.23, respectively) and these differences were related
to g. However, the group differences in the chronometric tasks were larger than would be
expected from the group difference in g. The Chinese pupils presumably had an advantage in
speed of information processing, specifically the speed of retrieval of numerical information
from memory possibly caused by extensive practice effects.
Finally, Te Nijenhuis and Van der Flier (1997) administered the General Aptitude Test
Battery tests to Dutch majority-group members (n=806) and migrants (n=1332), who on
average had lived 11.2 years in the Netherlands. The sample consisted of adults, mainly
males, applying for blue-collar jobs at the Dutch Railways and regional bus companies. In
comparison to majority-group members, these migrant groups have a lower level of mastery
of the Dutch language and lower education levels. In each ethnic group, Te Nijenhuis and Van
M. Helms-Lorenz et al. / Intelligence 31 (2003) 9–2912
der Flier found significant, positive correlations between g loadings (taken from the Dutch
norms study) and standardized group differences, which were explained in terms of SH.
1.5. Towards a new interpretation
Because there is so much evidence to support SH and there are so few studies that have
successfully addressed alternative interpretations, SH seems to be unequivocally supported:
‘‘Since SH has been consistently borne out in many independent sets of appropriate data, and
no contrary data have been found, it may legitimately claim the status of empirical fact’’
(Jensen, 1992, p. 232, 1993, p. 48).
We question the validity of this conclusion and contend that a g loading often is not a pure
measure of test complexity. A g loading may tap additional factors, such as knowledge of the
language and culture of the test designer. Depending on the composition of the test battery,
this ‘‘confounding’’ can be expected to be more salient in culturally more entrenched tests,
particularly when the groups to be tested have a different knowledge of the linguistic and
cultural background required by the tests. In empirical studies employing common intel-
ligence tests, the first principal component often confounds cognitive complexity with
cultural and linguistic complexity. Clearly, an adequate test of SH should disentangle these
two components.
Differential mastery of the testing language by cultural groups creates a spurious
correlation between g and intergroup performance differences, if complex tests require more
linguistic skills than do simple tests. A number of studies of SH have reported large g
loadings for verbal tests (e.g., Peoples et al., 1995; Sandoval, 1982; Thorndike, Hagen, &
Sattler, 1986). Similarly, in Carroll’s (1993) model of cognitive abilities, crystallized
intelligence, predominated by linguistic components, has a high loading on general intel-
ligence. Tentative evidence for the influence of linguistic factors in testing SH can also be
found in the earlier mentioned study by Te Nijenhuis and Van der Flier (1997). Their two
samples, a Turkish–Dutch group (of first-generation migrants) and a group of native Dutch,
had undoubtedly mastered the testing language (Dutch) to different degrees. The score
differences between the samples were regressed on g. The vocabulary, arithmetic reasoning,
and computation subtests had equally high g loadings (of about 0.7; see their Fig. 1), but
revealed unequal group differences in performance levels. While arithmetic reasoning and
computation were close to the regression line, vocabulary was 0.77 S.D. above it.
In the present study, we examine the cultural loading of test materials. Cultural loading is
the generic term for implicit and explicit references to a specific cultural context, usually the
culture of the test author, in the instrument or its administration (Van de Vijver & Poortinga,
1992). These loadings can create intergroup test score differences that are unrelated to the
construct intended to be measured by the test. Like other forms of bias, cultural loading is not
an inherent property of an instrument but a characteristic of an intergroup comparison (Van de
Vijver & Leung, 1997); the same test may yield valid differences in a comparison of Dutch
and Belgian individuals and may be affected by cultural loadings when comparing Dutch and
British individuals. Cultural loadings can emanate from the item content, the medium and
format of the stimuli and responses, and test administration.
M. Helms-Lorenz et al. / Intelligence 31 (2003) 9–29 13

The present study examines SH in mental tests administered to majority-group and migrant
primary school children in the Netherlands. An attempt is made to decompose g in verbal–
cultural aspects and cognitive complexity. The relative contribution of complexity and
verbal–cultural factors to observed cross-cultural performance differences are compared.
2. Method
2.1. Participants
A sample of 1221 primary school children, age 6–12 years, were selected from different
regions in the Netherlands (the 6- and 7-year-old children were combined in the analyses).
The sample consisted of Dutch majority-group members (n=747) and a group of second-
generation migrants (n=474). In both cultural groups, half were boys and half were girls. The
majority of the participants were tested in urban regions where migrants mainly reside. In
Table 1, the country of birth of the parents of the migrants is listed. Whereas the Surinamese
and Antilleans make up 36% of the migrant population (Martens & Veenman, 1999), they
only formed 10% of our sample; for migrants from Turkey, these figures are 26% and 31%
and, for the Moroccans, 22% and 44%, respectively.
Not all migrant children speak Dutch when they enter school. The first language of pupils
from Moroccan descent is usually one of three Berber dialects or Arabic, while Turkish pupils
speak Turkish (or in a few cases Kurdish) as their first language. Compared to Turks and
Moroccans, children from Surinam and the Netherlands Antilles tend to have fewer language
problems because of the widespread usage of Dutch as home language.
Dutch is the language of education, except for some lessons in the native language and
culture (about 2.5 h/week). Special Islamic schools allot more time to learning the own
language and culture. From these schools, 75 pupils were included in the study.
No first-generation migrants were involved in the study. Restricting the study to second-
generation children ensured that all children studied had followed a known (and across
cultural groups equal) number of years of Dutch education, and had sufficient command of
Dutch for the test administration. Yet, there is evidence that substantial differences in
Table 1
Country of birth of the migrants’ parents (percentages)
Birth country Percentage
Mother Father
The Netherlands 7.9 4.4
Morocco 42.4 42.4
Turkey 29.3 29.7
Surinam or Netherlands Antilles 9.9 10.6
Elsewhere 10.4 12.5
Unknown 0.4
M. Helms-Lorenz et al. / Intelligence 31 (2003) 9–2914
knowledge of the Dutch lexicon between majority-group pupils and migrant pupils remain
throughout the primary school period, even for second-generation children (Verhoeven, 2001).
2.2. Instruments
A computer-assisted cognitive ability test battery, named the Tilburgse Allochtonen en
Autochtonen Reactie Tijd Test (TAART), was administered. The battery has been developed
to assess simple cognitive processes, with little influence of cultural and linguistic knowledge
(Helms-Lorenz & Van de Vijver, 1995; Van de Vijver & Willemse, 1991). It runs on IBM
compatible computers and uses the mouse as response device. The whole battery consists of
nine subtests; results of the only two subtests that were administered to all age groups are
reported here.
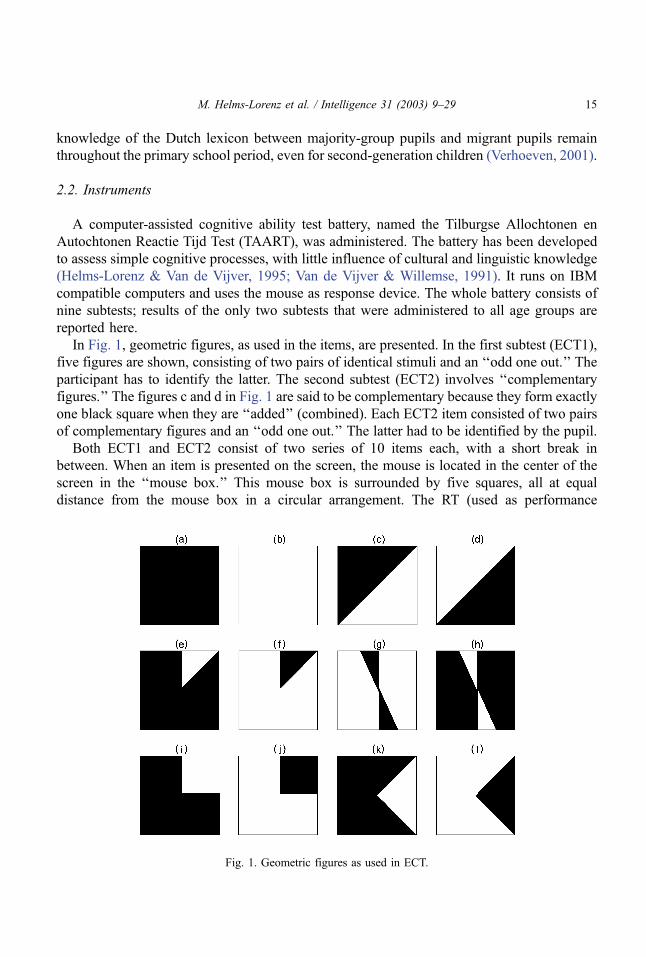
In Fig. 1, geometric figures, as used in the items, are presented. In the first subtest (ECT1),
five figures are shown, consisting of two pairs of identical stimuli and an ‘‘odd one out.’’ The
participant has to identify the latter. The second subtest (ECT2) involves ‘‘complementary
figures.’’ The figures c and d in Fig. 1 are said to be complementary because they form exactly
one black square when they are ‘‘added’’ (combined). Each ECT2 item consisted of two pairs
of complementary figures and an ‘‘odd one out.’’ The latter had to be identified by the pupil.
Both ECT1 and ECT2 consist of two series of 10 items each, with a short break in
between. When an item is presented on the screen, the mouse is located in the center of the
screen in the ‘‘mouse box.’’ This mouse box is surrounded by five squares, all at equal
distance from the mouse box in a circular arrangement. The RT (used as performance
Fig. 1. Geometric figures as used in ECT.
M. Helms-Lorenz et al. / Intelligence 31 (2003) 9–29 15

measure) is defined as the time elapsed between stimulus onset and the moment the pupil
moves the mouse outside the borders of the mouse box. In order to ensure that the pupil
identifies the target figure before starting to move the mouse, the squares become gray and
only the borders remain visible, once the mouse leaves the box. Pupils were instructed to
respond fast without making any errors.
Both subtests have four practice items. The computer gives feedback about correctness of
responses (a face appears on the screen that is either happy or sad). The practice items are
administered again if one or more incorrect responses are given. The actual testing starts
when the four exercise items have been solved correctly.
Incorrect responses are treated as missing values in the data. In an analysis that is not
further documented here, the proportion of errors was found to be small and similar for
majority-group members and migrants. The internal consistencies of ECT1 and ECT2 (based
on RTs) were 0.89 and 0.90, respectively.
Two individually administered intelligence batteries were also used: the Revised Amster-
damse Kinder Intelligentie Test (RAKIT) (Bleichrodt, Drenth, Zaal, & Resing, 1987) and the
Revised Snijders–Oomen Nonverbal Intelligence Test (SON-R) (Laros & Tellegen, 1991).
The reliability and validity of both batteries have been shown in nationwide samples; the
manuals provide age-specific norm tables. The COTAN, the committee that evaluates
psychological tests in the Netherlands, gave favorable ratings to both batteries (Evers, Van
Vliet-Mulder, & Ter Laak, 1992). Furthermore, studies among migrant children have
demonstrated the suitability of the tests for assessing these groups.
The SON-R (Laros & Tellegen, 1991) was originally intended for use with children that
have a hearing impairment. Because the administration is nonverbal, it may also be an
adequate test in populations with low proficiency in the testing language. Because of time
constraints, a selection of four (out of seven) subtests were administered: categories, analogies
(both abstract reasoning tests), situations (concrete reasoning), and mosaics (spatial relations).
The categories subtest consists of three series of nine items, all in multiple-choice format.
Three drawings of objects with a common characteristic (e.g., three different drawings of
dogs) are given on a page. On the next page, there are five drawings. The pupil has to point to
the two drawings that belong to the same category (e.g., a mouse, a dog, a pencil, and
building blocks).
Analogies uses geometric figures that are presented in the format a:b::c:? The last figure
has to be chosen from four alternatives depicted at the bottom of the page. The pupil has to
discover the principle behind the change within the first pair of figures and apply it to the
second pair. The test consists of three series of 11 items.
Situations, a multiple-choice test to assess concrete reasoning, also has three series of
11 items. Each item consists of a drawing with one or more missing parts. For example, the
situation drawing can be a man walking with a leash in his hand; the object at the end of the
leash is absent. The alternatives to choose from are a chicken, a dog, a frog, and a cat (each
with a leash tied around its neck).
The mosaics test is similar to Koh’s Blocks used in the Wechsler scales. It is a performance
test in which patterns are to be copied using white/red squares. The test has 20 items. Each
mosaic pattern consists of nine fields and a field corresponds to one square.
M. Helms-Lorenz et al. / Intelligence 31 (2003) 9–2916
The internal consistencies for the current sample were 0.88 for categories, 0.89 for
mosaics, 0.90 for situations, and 0.92 for analogies.
The short version of the RAKIT (Bleichrodt et al., 1987) was administered, consisting of
six tests. Exclusion is a multiple-choice test. The pupil has to choose one figure, among four
abstract figures (the page is divided into four quadrants), that does not follow the rule applied
to the other three figures. The test administration ends when the last item (50) is reached or
when four successive items are solved incorrectly. The test measures logical reasoning,
especially inductive thinking.
In word meaning, measuring active and passive vocabulary, a word is read aloud by the
experimenter and from an array of four figures the pupil has to pick the one that depicts the
word. The test administration ends when the last of the 60 items is reached or when four
successive items are solved incorrectly.
Discs is a performance test that utilizes discs and a board with protruding pins. Three discs
fit on each pattern of pins. The discs have two, three, or four holes, and are to be placed over
the corresponding pin formations. The pin patterns are arranged in three rows each to
accommodate nine discs. This test is meant to measure pattern recognition and matching,
speed and accuracy, eye-hand coordination, and spatial orientation.
Learning names measures the ability to learn paired associates. The test booklet has
12 drawings of cats and butterflies. The pupil is shown a drawing while a name is read
out aloud by the test administrator. Additional standardized cues are given in the form of
an additional name or adjective to facilitate the learning process. The administrator reads
the names and shows each time the corresponding page of the booklet; the pupil is
requested to remember the names. Then the pupil is asked to reproduce the name with
each drawing. Feedback is given about the correctness of each response. The series is
repeated. The number of items administered ranges from 2�10 to 2�12 depending on the
age of the pupil.
Hidden figures consists of a complex drawing depicted on the top half of a page. The
bottom half of the page depicts six drawings. One of these six drawings forms part of the big
drawing. The pupil is requested to identify the hidden pattern. The total number of items is
50; each age group starts at a different item. The test administration ends after five failures.
This task requires visual analysis, pattern recognition, matching, and the ability to ignore
distracting, irrelevant stimuli.
Finally, idea production has five test items. The pupil is asked to generate in a short,
specified period of time as many words or names of objects or situations as possible, that
belong to a broad category such as ‘‘things you can eat.’’ The easier items at the beginning of
the test are not given to the older age groups.
2.3. Procedure
All tests were administered individually. The administration time of ECT lasted
5–10 min/subtest. About half of the pupils completed the RAKIT and the other half the
shortened version of SON-R. The SON-R took about 45 min and the RAKIT about 50 min
to administer.
M. Helms-Lorenz et al. / Intelligence 31 (2003) 9–29 17
3. Results
3.1. Subtest characteristics
In this section, we present scores for various characteristics that were derived for
each subtest.
3.1.1. Measures of g loadings
In line with one of Jensen’s operationalizations, g loadings of the subtests were determined
using principal component analysis. Because pupils completed the ECTs and either the
RAKIT or SON-R, two separate analyses were needed. For both cultural groups, a principal
components analysis was carried out, extracting one factor. The subtest scores were
standardized per age group (to correct for age effects). The analysis of the SON-R and
ECTs (based on six subtest scores per pupil) produced eigenvalues of 2.67 for the majority-
group members and 3.00 for the migrants, explaining 45% and 50% of the variance,
respectively. The same analysis for the RAKIT and ECTs (based on eight subtest scores per
pupil) revealed eigenvalues of 2.58 for the majority-group and 2.50 for the migrant group
(explaining 32% and 31% of the variance). The agreement of the factor loadings in the
majority-group and migrant sample was very high: a congruence coefficient, often labeled
‘‘Tucker’s f’’ and originally due to Burt (1948), was 0.99 for the SON-R and ECTs, and 0.98
for the RAKIT and ECTs. These values strongly suggest factorial similarity in both cultural
groups. In the remainder, the first factor is referred to respectively as migrants’ and majority-
group’s g; the mean of the loadings in the two groups is labeled Jensen’s g. Factor loadings
are presented in Table 2.
3.2. Theoretically based complexity measures
A first complexity measure of each subtest was based on Carroll’s (1993, p. 626)
model of the structure of cognitive abilities, which synthesizes existing factor-analytic
work. The order of the lower-order factors in the model ranks the strength of their
relationship with g (p. 625). The first factor, fluid intelligence, has the strongest and the
last (eighth) factor, processing speed, has the weakest relationship with g. Rank order
numbers were used as theoretically based complexity ratings (see Table 2) and are referred
to as Carroll’s g.
A second measure was based on a theoretical analysis of complexity rules. Intratest
complexity rules, usually based on cognitive process analysis, have been discussed by various
authors (e.g., Laros & Tellegen, 1991; Pellegrino & Glaser, 1979; Schorr, Kiernan, & Bower,
1981; Spelberg, 1987; Tanzer, Gittler, & Ellis, 1995). However, to our knowledge, no
theoretical analyses have been conducted to determine complexity rules across tests.
Therefore, we relied on Fischer’s (1980) skill theory, which is a neo-Piagetian model of
cognitive development. According to the theory, children develop skills of gradually
increasing complexity. Skills can be broken down into elementary building blocks. Ten
developmental levels of increasing skill complexity are postulated. Skills of a lower level are
M. Helms-Lorenz et al. / Intelligence 31 (2003) 9–2918
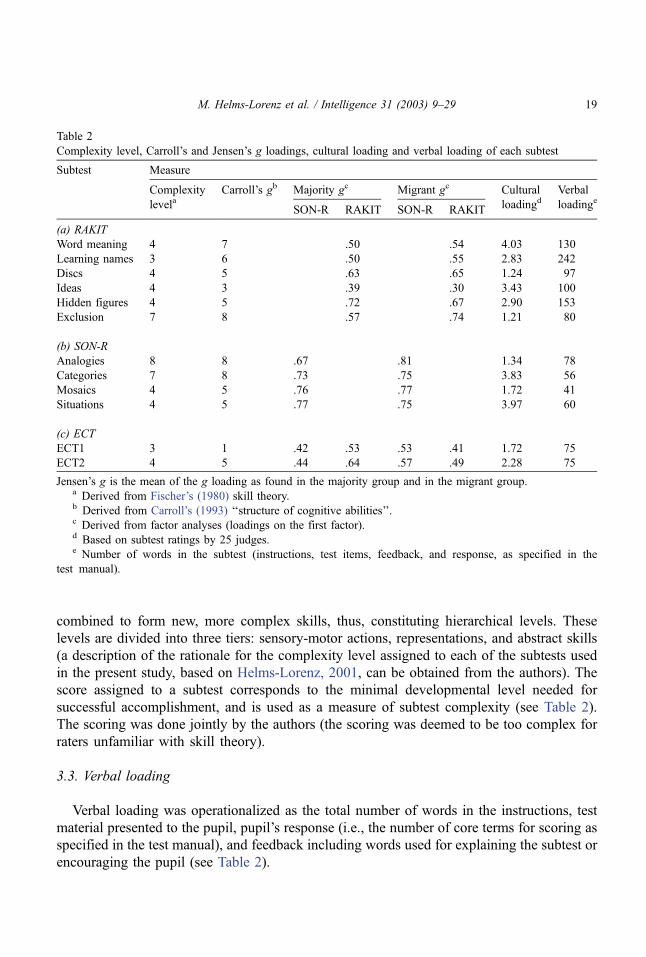
combined to form new, more complex skills, thus, constituting hierarchical levels. These
levels are divided into three tiers: sensory-motor actions, representations, and abstract skills
(a description of the rationale for the complexity level assigned to each of the subtests used
in the present study, based on Helms-Lorenz, 2001, can be obtained from the authors). The
score assigned to a subtest corresponds to the minimal developmental level needed for
successful accomplishment, and is used as a measure of subtest complexity (see Table 2).
The scoring was done jointly by the authors (the scoring was deemed to be too complex for
raters unfamiliar with skill theory).
3.3. Verbal loading
Verbal loading was operationalized as the total number of words in the instructions, test
material presented to the pupil, pupil’s response (i.e., the number of core terms for scoring as
specified in the test manual), and feedback including words used for explaining the subtest or
encouraging the pupil (see Table 2).
Table 2
Complexity level, Carroll’s and Jensen’s g loadings, cultural loading and verbal loading of each subtest
Subtest Measure
Complexity Carroll’s gb Majority gc Migrant gc Cultural Verbal
levela SON-R RAKIT SON-R RAKIT loadingd loadinge
(a) RAKIT
Word meaning 4 7 .50 .54 4.03 130
Learning names 3 6 .50 .55 2.83 242
Discs 4 5 .63 .65 1.24 97
Ideas 4 3 .39 .30 3.43 100
Hidden figures 4 5 .72 .67 2.90 153
Exclusion 7 8 .57 .74 1.21 80
(b) SON-R
Analogies 8 8 .67 .81 1.34 78
Categories 7 8 .73 .75 3.83 56
Mosaics 4 5 .76 .77 1.72 41
Situations 4 5 .77 .75 3.97 60
(c) ECT
ECT1 3 1 .42 .53 .53 .41 1.72 75
ECT2 4 5 .44 .64 .57 .49 2.28 75
Jensen’s g is the mean of the g loading as found in the majority group and in the migrant group.a Derived from Fischer’s (1980) skill theory.b Derived from Carroll’s (1993) ‘‘structure of cognitive abilities’’.c Derived from factor analyses (loadings on the first factor).d Based on subtest ratings by 25 judges.e Number of words in the subtest (instructions, test items, feedback, and response, as specified in the
test manual).
M. Helms-Lorenz et al. / Intelligence 31 (2003) 9–29 19
3.4. Measure of cultural loading
The cultural loading of all subtests was rated by 25 third-year psychology students, who
had followed at least two courses in cross-cultural psychology. The ratings were gathered
in two sessions. In the first session, the cultural loading of each subtest was rated on a
scale of 0–5 (0=none, 1=very low, 2=low, 3=moderate, 4=high, and 5=very high). Cultural
loading was defined for the raters as ‘‘the extent to which the test contains cultural
elements.’’ A score of zero had to be assigned if no cultural elements were judged to be
present in the subtest (i.e., the subtest could be applied to all cultural groups without
adaptations). During the second session, a week later, the items were rated. Figure subtests
were not rated at item level, because the items of these subtests do not appear to vary in
cultural loading.
The means of the cultural loading ratings of each subtest are given in Table 2. The overall
interrater reliability (internal consistency) was .94; the intraclass correlation (absolute
agreement) was .88. The reliability of the subtest level ratings was .86 (intraclass correlation:
.72) and of the means derived from the item level ratings .89 (intraclass correlation: .85).
Correlations between ratings for subtests and items were larger than .90 for all subtests. In
conclusion, the interrater agreement was good.
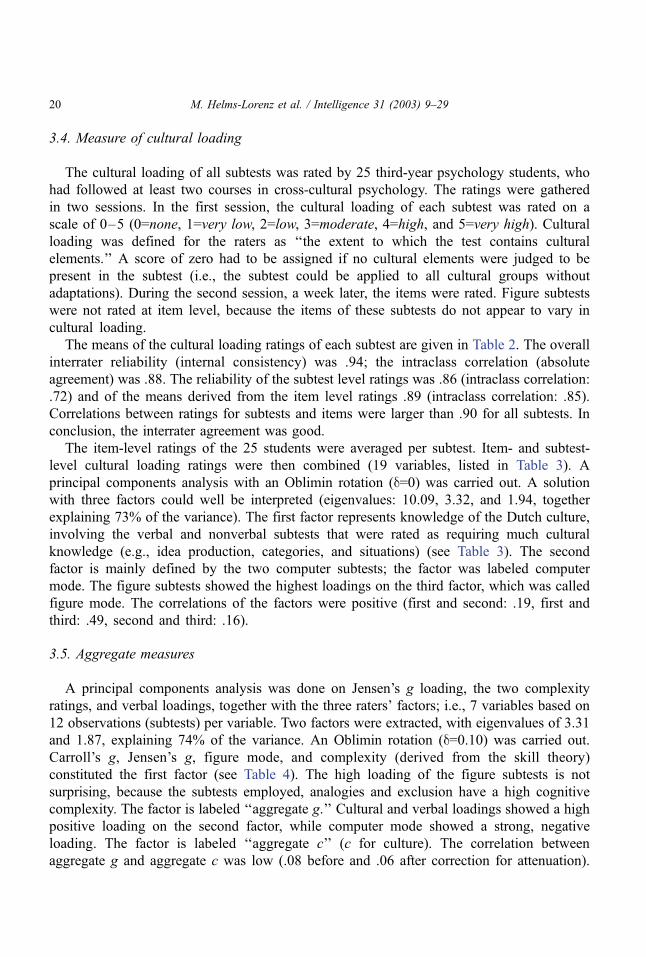
The item-level ratings of the 25 students were averaged per subtest. Item- and subtest-
level cultural loading ratings were then combined (19 variables, listed in Table 3). A
principal components analysis with an Oblimin rotation (d=0) was carried out. A solution
with three factors could well be interpreted (eigenvalues: 10.09, 3.32, and 1.94, together
explaining 73% of the variance). The first factor represents knowledge of the Dutch culture,
involving the verbal and nonverbal subtests that were rated as requiring much cultural
knowledge (e.g., idea production, categories, and situations) (see Table 3). The second
factor is mainly defined by the two computer subtests; the factor was labeled computer
mode. The figure subtests showed the highest loadings on the third factor, which was called
figure mode. The correlations of the factors were positive (first and second: .19, first and
third: .49, second and third: .16).
3.5. Aggregate measures
A principal components analysis was done on Jensen’s g loading, the two complexity
ratings, and verbal loadings, together with the three raters’ factors; i.e., 7 variables based on
12 observations (subtests) per variable. Two factors were extracted, with eigenvalues of 3.31
and 1.87, explaining 74% of the variance. An Oblimin rotation (d=0.10) was carried out.
Carroll’s g, Jensen’s g, figure mode, and complexity (derived from the skill theory)
constituted the first factor (see Table 4). The high loading of the figure subtests is not
surprising, because the subtests employed, analogies and exclusion have a high cognitive
complexity. The factor is labeled ‘‘aggregate g.’’ Cultural and verbal loadings showed a high
positive loading on the second factor, while computer mode showed a strong, negative
loading. The factor is labeled ‘‘aggregate c’’ (c for culture). The correlation between
aggregate g and aggregate c was low (.08 before and .06 after correction for attenuation).
M. Helms-Lorenz et al. / Intelligence 31 (2003) 9–2920
This low correlation and the absence of high secondary loadings of the measures demonstrate
that g and c were well distinguishable in the present battery.1
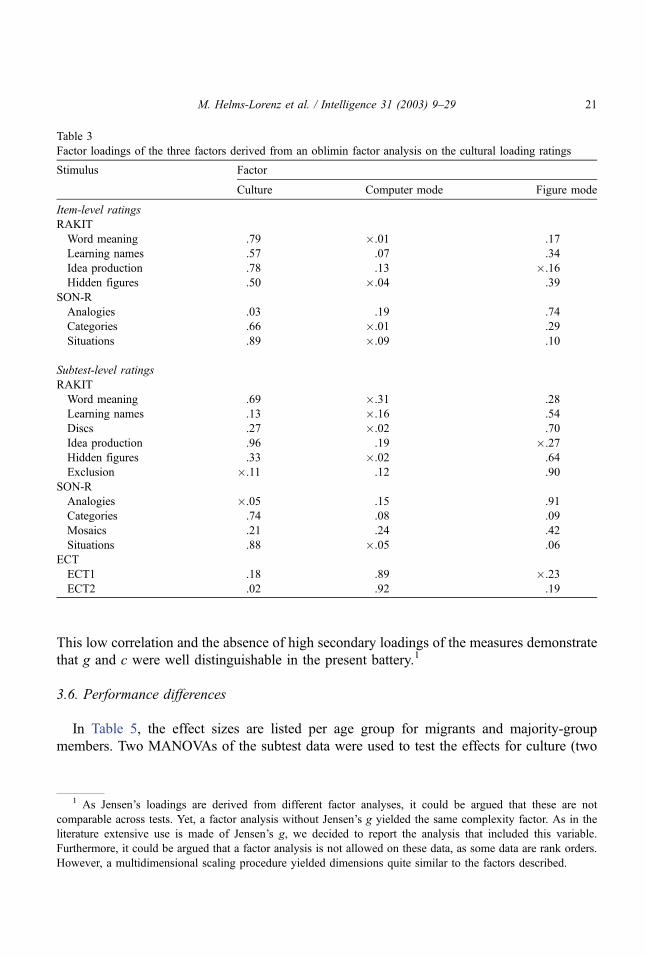
3.6. Performance differences
In Table 5, the effect sizes are listed per age group for migrants and majority-group
members. Two MANOVAs of the subtest data were used to test the effects for culture (two
Table 3
Factor loadings of the three factors derived from an oblimin factor analysis on the cultural loading ratings
Stimulus Factor
Culture Computer mode Figure mode
Item-level ratings
RAKIT
Word meaning .79 �.01 .17
Learning names .57 .07 .34
Idea production .78 .13 �.16
Hidden figures .50 �.04 .39
SON-R
Analogies .03 .19 .74
Categories .66 �.01 .29
Situations .89 �.09 .10
Subtest-level ratings
RAKIT
Word meaning .69 �.31 .28
Learning names .13 �.16 .54
Discs .27 �.02 .70
Idea production .96 .19 �.27
Hidden figures .33 �.02 .64
Exclusion �.11 .12 .90
SON-R
Analogies �.05 .15 .91
Categories .74 .08 .09
Mosaics .21 .24 .42
Situations .88 �.05 .06
ECT
ECT1 .18 .89 �.23
ECT2 .02 .92 .19
1 As Jensen’s loadings are derived from different factor analyses, it could be argued that these are not
comparable across tests. Yet, a factor analysis without Jensen’s g yielded the same complexity factor. As in the
literature extensive use is made of Jensen’s g, we decided to report the analysis that included this variable.
Furthermore, it could be argued that a factor analysis is not allowed on these data, as some data are rank orders.
However, a multidimensional scaling procedure yielded dimensions quite similar to the factors described.
M. Helms-Lorenz et al. / Intelligence 31 (2003) 9–29 21

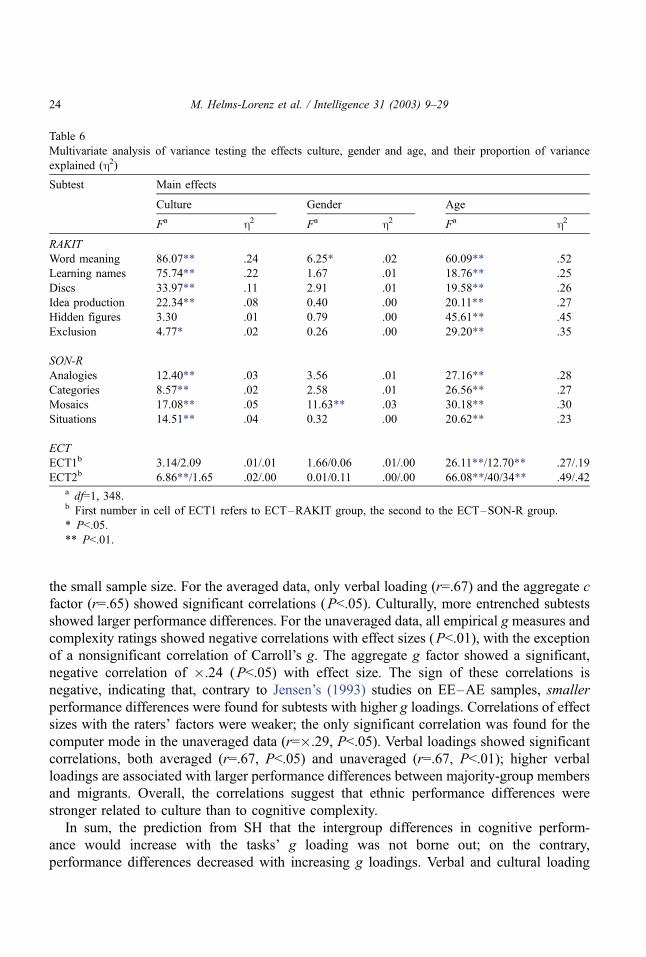
levels), gender (two levels), and age (six levels); separate analyses of the intelligence
batteries were necessary because no participants had taken all subtests (Table 6). Ten out of
12 subtests showed a significant main effect for culture (P<.05); majority-group members
invariably obtained higher scores. The RAKIT showed the largest ethnic differences; culture
explained on average 11% of the variance; for the SON-R and the two ECTs, these figures
were 4% and 1%. Main effects for age were found for all subtests (P<.01), with older pupils
showing better performance. Age effects were larger than culture and gender effects,
explaining on average 33% of the variance. Two subtests (word meaning and mosaics)
revealed a main effect for gender (P<.05); both showed higher scores for males. Overall,
however, gender differences were small, explaining on average <1%. A few univariate
interactions were significant; these are not further considered because the effects were neither
substantial nor of primary interest here.
3.7. Correlations between subtest characteristics and effect sizes
Correlations were computed between effect sizes and various subtest characteristics:
empirical g measures (majority groups’, migrants’, and Jensen’s g), theoretical complexity
measures (Carroll’s g and Fischer’s complexity), the three raters’ factors (cultural factor,
computer mode, and figure mode), and verbal loading. Correlations were computed for two
types of effect sizes. First, the effect sizes averaged over age groups were calculated. Next,
each age group was treated as an independent replication, thereby constituting 72 observa-
tions (6 age groups�12 subtests) (‘‘unaveraged data’’). As can be seen in Table 7, the
averaged and unaveraged data yielded a largely similar pattern of findings; the major
difference was the smaller number of significant correlations for the averaged data, due to
Table 4
Rotated factor loadings of the second order factor analysis (pattern matrix)
Measure Factor
Aggregate g Aggregate c
Complexitya .87 (.88) �.26 (�.31)
Carroll’s gb .86 (.86) .22 (.18)
Jensen’s gc .83 (.81) �.12 (�.05)
Figure moded .80 (.78) .33 (.31)
Cultural factord .06 (.11) .74 (.73)
Verbal loadinge �.33 (�.34) .72 (.73)
Computer moded �.39 (�.41) �.85 (�.84)
Values between parentheses refer to loadings after correction for attenuation of Jensen’s g.a Derived from Fischer’s (1980) skill theory.b Derived from Carroll’s (1993) structure of cognitive abilities.c Derived from factor loadings on first common factor (majority group and migrants combined).d Three factors derived from student ratings.e Number of words in the subtest (instructions, test items, feedback, and response, as specified in the
test manual).
M. Helms-Lorenz et al. / Intelligence 31 (2003) 9–2922
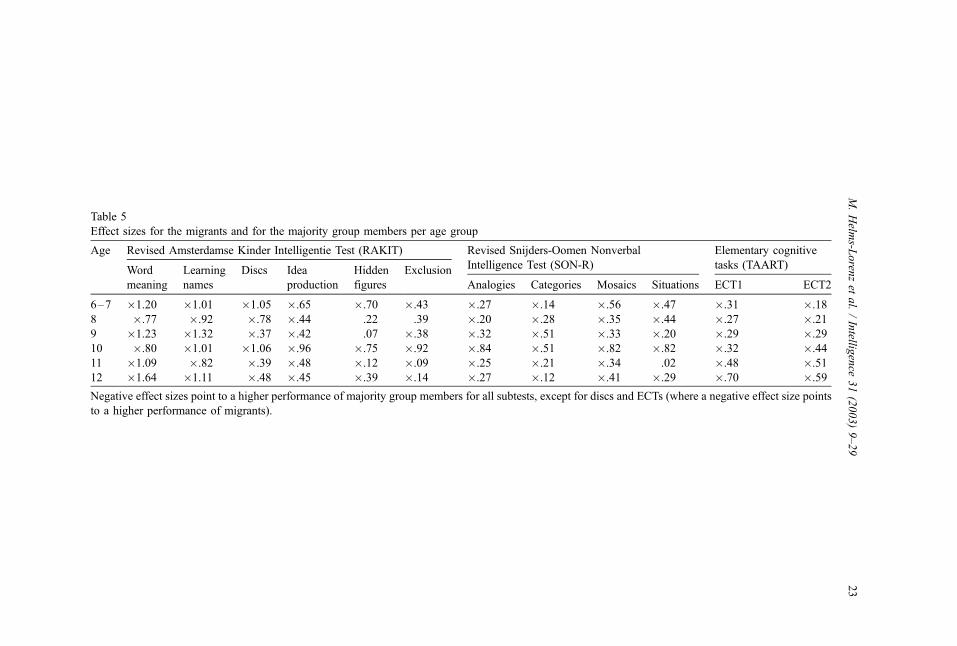
Table 5
Effect sizes for the migrants and for the majority group members per age group
Age Revised Amsterdamse Kinder Intelligentie Test (RAKIT) Revised Snijders-Oomen Nonverbal Elementary cognitive
Intelligence Test (SON-R) tasks (TAART)Word
meaning
Learning
names
Discs Idea
production
Hidden
figures
Exclusion
Analogies Categories Mosaics Situations ECT1 ECT2
6–7 �1.20 �1.01 �1.05 �.65 �.70 �.43 �.27 �.14 �.56 �.47 �.31 �.18
8 �.77 �.92 �.78 �.44 .22 .39 �.20 �.28 �.35 �.44 �.27 �.21
9 �1.23 �1.32 �.37 �.42 .07 �.38 �.32 �.51 �.33 �.20 �.29 �.29
10 �.80 �1.01 �1.06 �.96 �.75 �.92 �.84 �.51 �.82 �.82 �.32 �.44
11 �1.09 �.82 �.39 �.48 �.12 �.09 �.25 �.21 �.34 .02 �.48 �.51
12 �1.64 �1.11 �.48 �.45 �.39 �.14 �.27 �.12 �.41 �.29 �.70 �.59
Negative effect sizes point to a higher performance of majority group members for all subtests, except for discs and ECTs (where a negative effect size points
to a higher performance of migrants).
M.Helm
s-Loren
zet
al./Intellig
ence
31(2003)9–29
23
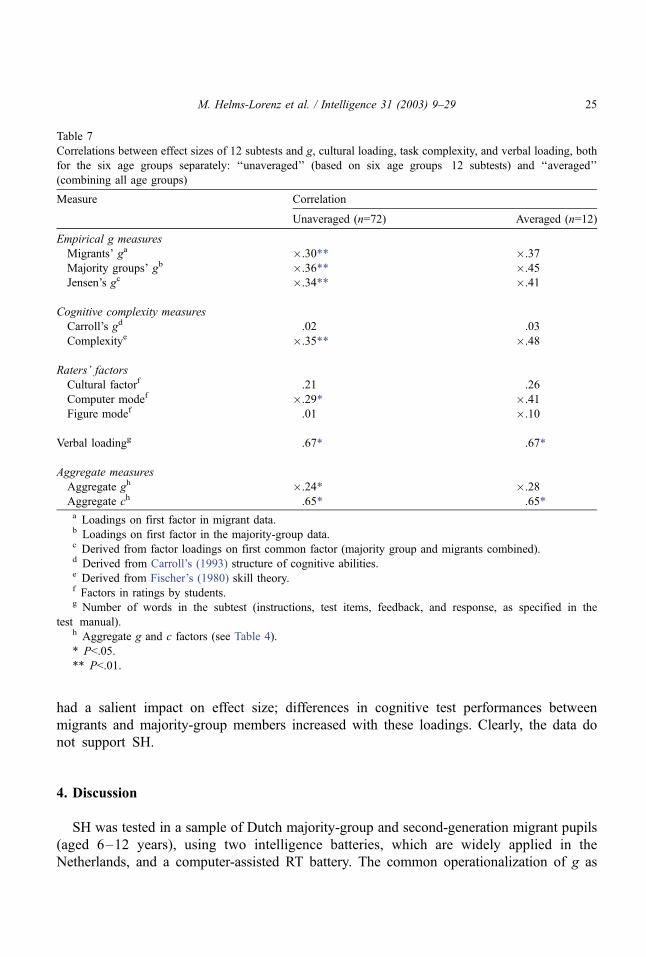
the small sample size. For the averaged data, only verbal loading (r=.67) and the aggregate c
factor (r=.65) showed significant correlations (P<.05). Culturally, more entrenched subtests
showed larger performance differences. For the unaveraged data, all empirical g measures and
complexity ratings showed negative correlations with effect sizes (P<.01), with the exception
of a nonsignificant correlation of Carroll’s g. The aggregate g factor showed a significant,
negative correlation of �.24 (P<.05) with effect size. The sign of these correlations is
negative, indicating that, contrary to Jensen’s (1993) studies on EE–AE samples, smaller
performance differences were found for subtests with higher g loadings. Correlations of effect
sizes with the raters’ factors were weaker; the only significant correlation was found for the
computer mode in the unaveraged data (r=�.29, P<.05). Verbal loadings showed significant
correlations, both averaged (r=.67, P<.05) and unaveraged (r=.67, P<.01); higher verbal
loadings are associated with larger performance differences between majority-group members
and migrants. Overall, the correlations suggest that ethnic performance differences were
stronger related to culture than to cognitive complexity.
In sum, the prediction from SH that the intergroup differences in cognitive perform-
ance would increase with the tasks’ g loading was not borne out; on the contrary,
performance differences decreased with increasing g loadings. Verbal and cultural loading
Table 6
Multivariate analysis of variance testing the effects culture, gender and age, and their proportion of variance
explained (h2)
Subtest Main effects
Culture Gender Age
Fa h2 Fa h2 Fa h2
RAKIT
Word meaning 86.07** .24 6.25* .02 60.09** .52
Learning names 75.74** .22 1.67 .01 18.76** .25
Discs 33.97** .11 2.91 .01 19.58** .26
Idea production 22.34** .08 0.40 .00 20.11** .27
Hidden figures 3.30 .01 0.79 .00 45.61** .45
Exclusion 4.77* .02 0.26 .00 29.20** .35
SON-R
Analogies 12.40** .03 3.56 .01 27.16** .28
Categories 8.57** .02 2.58 .01 26.56** .27
Mosaics 17.08** .05 11.63** .03 30.18** .30
Situations 14.51** .04 0.32 .00 20.62** .23
ECT
ECT1b 3.14/2.09 .01/.01 1.66/0.06 .01/.00 26.11**/12.70** .27/.19
ECT2b 6.86**/1.65 .02/.00 0.01/0.11 .00/.00 66.08**/40/34** .49/.42a df=1, 348.b First number in cell of ECT1 refers to ECT–RAKIT group, the second to the ECT–SON-R group.
* P<.05.
** P<.01.
M. Helms-Lorenz et al. / Intelligence 31 (2003) 9–2924
had a salient impact on effect size; differences in cognitive test performances between
migrants and majority-group members increased with these loadings. Clearly, the data do
not support SH.
4. Discussion
SH was tested in a sample of Dutch majority-group and second-generation migrant pupils
(aged 6–12 years), using two intelligence batteries, which are widely applied in the
Netherlands, and a computer-assisted RT battery. The common operationalization of g as
Table 7
Correlations between effect sizes of 12 subtests and g, cultural loading, task complexity, and verbal loading, both
for the six age groups separately: ‘‘unaveraged’’ (based on six age groups�12 subtests) and ‘‘averaged’’
(combining all age groups)
Measure Correlation
Unaveraged (n=72) Averaged (n=12)
Empirical g measures
Migrants’ ga �.30** �.37
Majority groups’ gb �.36** �.45
Jensen’s gc �.34** �.41
Cognitive complexity measures
Carroll’s gd .02 .03
Complexitye �.35** �.48
Raters’ factors
Cultural factorf .21 .26
Computer modef �.29* �.41
Figure modef .01 �.10
Verbal loadingg .67* .67*
Aggregate measures
Aggregate gh �.24* �.28
Aggregate ch .65* .65*a Loadings on first factor in migrant data.b Loadings on first factor in the majority-group data.c Derived from factor loadings on first common factor (majority group and migrants combined).d Derived from Carroll’s (1993) structure of cognitive abilities.e Derived from Fischer’s (1980) skill theory.f Factors in ratings by students.g Number of words in the subtest (instructions, test items, feedback, and response, as specified in the
test manual).h Aggregate g and c factors (see Table 4).
* P<.05.
** P<.01.
M. Helms-Lorenz et al. / Intelligence 31 (2003) 9–29 25
the loading on the first factor as a test of SH was questioned because it confounds cognitive
complexity and verbal–cultural loading. An attempt was made to disentangle these two
components. Theoretically based measures of cognitive complexity were derived from
Carroll’s (1993) model of cognitive abilities and Fischer’s (1980) skill theory. Cultural
loadings of subtests were assessed by ratings of the test materials by 25 senior psychology
students. The verbal loading of a subtest was operationalized as the number of words in the
subtest. A factor analysis of all test aspects revealed two slightly correlated factors, named g
and c. There was tentative evidence that cultural complexity (c) was at least as important as
cognitive complexity (g) in the explanation of performance differences of majority-group and
migrant children.
Our results are at variance with common findings in the literature on SH. The major
departure involves the failure to find a positive contribution of cognitive complexity to the
prediction of cross-cultural performance differences. Two possible explanations can be
envisaged to explain the discrepancy. The first involves the composition of the test battery.
It could be argued that the batteries employed in the present study are poorly suited for testing
SH. In our view, this argument is implausible. The test battery was composed of both
elementary cognitive transformations and more common cognitive tests in order to obtain a
broad coverage of the intellectual domain. Furthermore, the batteries used in this study were
selected to minimize effects of cultural bias. All batteries employed were originally designed
for multicultural use and attempt to assess cognitive skills with a minimal reliance on
acquaintance with the Dutch language and culture. Finally, an adequate test of SH assumes
that g and c are unrelated, as was very much the case in our data.
Looking at common intelligence batteries, one cannot escape the impression that the g–c
relationship will often be positive because tests that require extensive verbal processing (these
may include figure tests) are often the cognitively more complex subtests in intelligence
batteries. This introduces a spurious, positive relation between cognitive complexity and
verbal processing, which complicates the interpretation of observed g loadings and challenges
their adequacy to test SH.
Second, it could be argued that the external validity of the present findings is limited to the
Netherlands or western Europe and that results can perhaps not be generalized to other ethnic
comparisons. Although some characteristics of the migrant groups studied are specific to
western Europe, such as the high prevalence of Mediterranean, Islamic groups, other
characteristics are common to minority groups, such as a lower level of education, SES,
income, and higher level of unemployment than the majority group (Martens & Veenman,
1999). The samples studied here have the underprivileged position shared by many migrants
and minorities. Moreover, the IQ difference of about 1 S.D. that is often found between AA
and EA is not far from the difference of 0.7 S.D. for the SON-R and 1.1 S.D. for the RAKIT
of the present study.
In sum, our instruments and samples offered an adequate framework for testing SH that
is not too dissimilar from the North American context in which most tests of SH took
place. It remains to be determined in future studies to what extent the prominent role of
cultural factors in the explanation of performance differences is replicable. The present
study clearly underscores the need to ‘‘purify’’ g measures and to disentangle cognitive
M. Helms-Lorenz et al. / Intelligence 31 (2003) 9–2926
complexity and cultural entrenchment in tests of SH. Theoretically, the two factors, g and c,
need not be related. However, in common test batteries, the relationship will often be
positive because verbal tests are often the more complex tests. In our battery, this
relationship did not hold. For example, one of the subtests with the largest cognitive
complexity, Exclusion, showed a low verbal–cultural loading. The choice of testing
instruments is essential in testing SH, because the outcome may critically depend on the
g–c relationship in the test battery.
Acknowledgements
We would like to thank John B. Carroll, Arthur Jensen, Keith Widaman, and an
anonymous reviewer for their comments on an earlier version.
References
Bleichrodt, N., Drenth, P. J. D., Zaal, J. N., & Resing, W. C. M. (1987). RAKIT Handleiding, Revisie Amsterdamse
Kinder Intelligentie test. Lisse, The Netherlands: Swets and Zeitlinger.
Braden, J. P. (1989). Fact or artifact? An empirical test of Spearman’s hypothesis. Intelligence, 13, 149–155.
Burt, C. (1948). The factorial study of temperamental traits.British Journal of Psychology, Statistical Section, 1,
178–203.
Carroll, J. B. (1993). Human cognitive abilities. A survey of factor-analytic studies. Cambridge: Cambridge
Univ. Press.
Dolan, C. (1997). A note on Schonemann’s refutation of Spearman’s hypothesis. Multivariate Behavioral Re-
search, 32, 319–325.
Evers, A., Van Vliet-Mulder, J. C., & Ter Laak, J. (1992). Documentatie van Tests en Testresearch in Nederland.
Amsterdam: Nederlands Instituut voor Psychologen (NIP).
Fischer, K. W. (1980). A theory of cognitive development: the control and construction of hierarchies of skills.-
Psychological Review, 87, 477–531.
Helms-Lorenz, M. (2001). Assessing cultural influences on cognitive test performance: a study with migrant
children in the Netherlands. Tilburg University.
Helms-Lorenz, M., & Van de Vijver, F. J. R. (1995). Cognitive assessment in education in a multicultural society.
European Journal of Psychological Assessment, 11, 158–169.
Holland, P.W., & H. Wainer (Eds.) (1993). Differential item functioning. Hillsdale, NJ: Erlbaum.
Jensen, A. R. (1982). Reaction time and psychometric g. In H. J. Eysenck (Ed.), A model for intelligence. Berlin:
Springer.
Jensen, A. R. (1984). The Black–White difference on the K-ABC: implications for future tests. Journal of Special
Education, 18, 377–408.
Jensen, A. R. (1985). The nature of Black–White difference on various psychometric tests: Spearman’s hypoth-
esis. Behavioral and Brain Sciences, 8, 193–263.
Jensen, A. R. (1992). The importance of intraindividual variation in reaction time. Personality and Individual
Differences, 3, 925–928.
Jensen, A. R. (1993). Spearman’s hypothesis tested with chronometric information processing tasks. Intelligence,
17, 47–77.
Jensen, A. R. (1998). The g factor. The science of mental ability. Westport, CT: Praeger.
Jensen, A. R., & McGurk, F. C. J. (1987). Black–White bias in ‘‘cultural’’ and ‘‘noncultural’’ test items. Person-
ality and Individual Differences, 8, 295–301.
M. Helms-Lorenz et al. / Intelligence 31 (2003) 9–29 27
Jensen, A. R., & Reynolds, C. R. (1982). Race, social class, and ability patterns on the WISC-R. Personality and
Individual Differences, 3, 423–438.
Jensen, A. R., & Whang, P. A. (1994). Speed of accessing arithmetic facts in long-term memory: a com-
parison of Chinese–American and Anglo–American children. Contemporary Educational Psychology, 19,
1–12.
Laros, J. A., & Tellegen, P. J. (1991). Construction and validation of the SON-R 5 1/2–17, the Snijders–Oomen
non-verbal intelligence test. Groningen, The Netherlands: Wolters-Noordhoff.
Lord, F. M. (1980). Applications of item response theory to practical testing problems. Hillsdale, NJ: Erlbaum.
Lynn, R., & Owen, K. (1993). Spearman’s hypothesis and test score differences between Whites, Indians, and
Blacks in South Africa. Journal of General Psychology, 121, 27–36.
Martens, E. P., & Veenman, J. (1999). De sociaal-economische positie van etnische minderheden. In H. M. A. G.
Smeets, E. P. Martens, & J. Veenman (Eds.), Jaarboek minderheden (pp. 107–138). Houten, The Netherlands:
Bohn Stafleu Van Loghum.
McGurk, F. C. J. (1951). Comparison of the performance of Negro and White high school seniors on cultural and
non-cultural psychological test questions. Washington, DC: Catholic University of America Press.
McGurk, F. C. J. (1953a). On White and Negro test performance and socioeconomic factors. Journal of Abnormal
and Social Psychology, 48, 448–450.
McGurk, F. C. J. (1953b). Socioeconomic status and culturally-weighted test scores of Negro subjects. Journal of
Applied Psychology, 37, 276–277.
McGurk, F. C. J. (1975). Race differences—twenty years later. Homo, 26, 219–239.
Mellenbergh, G. J. (1982). Contingency table models for assessing item bias. Journal of Educational Statistics, 7,
105–118.
Montie, J. E., & Fagan, J. F. (1988). Racial differences in IQ: item analysis of the Stanford–Binet at 3 years.
Intelligence, 12, 315–332.
Naglieri, J. A., & Jensen, A. R. (1987). Comparison of Black–White differences on the WISC-R and the K-ABC:
Spearman’s hypothesis. Intelligence, 11, 21–43.
Nagoshi, C. T., Johnson, R. C., DeFries, J. C., Wilson, J. R., & Vandenberg, S. G. (1984). Group differences and
principal-component loadings in the Hawaii family study of cognition: a test of the generality of ‘‘Spearman’s
hypothesis’’. Personality and Individual Differences, 5, 751–753.
Pellegrino, J. W., & Glaser, R. (1979). Cognitive correlates and components in the analysis of individual differ-
ences.Intelligence, 3, 187–214.
Peoples, C. E., Fagen, J. F., & Drotar, D. (1995). The influence of race on 3-year-old children’s performances on
the Standford–Binet fourth edition. Intelligence, 21, 69–82.
Roskam, E. E., & Ellis, J. (1992). Commentary on Guttman: the irrelevance of factor analysis for the study of
group differences. Multivariate Behavioral Research, 27, 205–218.
Sandoval, J. (1982). The WISC-R factorial validity for minority groups and Spearman’s hypothesis. Journal of
School Psychology, 20, 198–204.
Schorr, D., Kiernan, R., & Bower, G. (1981). Analysis versus synthesis in block design tests. Stanford, CA:
Stanford University.
Schonemann, P. H. (1992). Extensions of Guttman’s results from g to PC1. Multivariate Behavioral Research, 27,
219–223.
Spearman, C. (1927). The abilities of man. New York: Macmillan.
Spelberg, H. C. L. (1987). Grenzen testen. Groningen, The Netherlands: Foundation of Child Studies.
Tanzer, N. K., Gittler, G., & Ellis, B. B. (1995). Cross-cultural validation of item complexity in a LLTM-calibrated
spatial ability test. European Journal of Psychological Assessment, 11, 170–183.
Te Nijenhuis, J., & Van der Flier, H. (1997). Comparability of GATB scores for immigrants and majority group
members: some Dutch findings. Journal of Applied Psychology, 82, 675–687.
Thorndike, R. L., Hagen, E. P., & Sattler, J. M. (1986). Stanford–Binet intelligence scale. (4th ed.). Riverside,
CA: DLM Teaching Resources.
Van de Vijver, F. J. R., & Leung, K. (1997). Methods and data analysis of comparative research. In J. W. Berry,
M. Helms-Lorenz et al. / Intelligence 31 (2003) 9–2928

Y. H. Poortinga, & J. Pandey (Eds.), Handbook of cross-cultural psychology, vol. 1 (2nd ed., pp. 257–300).
Boston: Allyn and Bacon.
Van de Vijver, F. J. R., & Poortinga, Y. H. (1992). Testing in culturally heterogeneous populations: when are
cultural loadings undesirable? European Journal of Psychological Assessment, 8, 17–24.
Van de Vijver, F. J. R., & Willemse, G. R. (1991). Are reaction time tasks better suited for ethnic minorities than
paper-and-pencil tests? In N. Bleichrodt, & P. J. D. Drenth (Eds.), Contemporary issues in cross-cultural
psychology (pp. 450–464). Lisse, The Netherlands: Swets and Zeitlinger.
Verhoeven, L. (2001). Detectie van taalachterstand. In N. Bleichrodt, & F. J. R. Van de Vijver (Eds.), Diagnostiek
bij allochtonen (pp. 180–204). Lisse, The Netherlands: Swets and Zeitlinger.
Vernon, P. A., & Jensen, A. R. (1984). Individual and group differences in intelligence and speed of information
processes. Personality and Individual Differences, 5, 411–423.
M. Helms-Lorenz et al. / Intelligence 31 (2003) 9–29 29
Related Documents