1 Using Cognitive Models to Evaluate Ethnicity and Gender Differences Andrea Gotzmann Mary Roduta Roberts Cecilia Brito Alves Mark J. Gierl Centre for Research in Applied Measurement and Evaluation University of Alberta Paper Presented at the Session “Measuring Differential Performance” Annual Meeting of the American Educational Research Association San Diego, CA April 2009

Welcome message from author
This document is posted to help you gain knowledge. Please leave a comment to let me know what you think about it! Share it to your friends and learn new things together.
Transcript
1
Using Cognitive Models to Evaluate Ethnicity and Gender Differences
Andrea Gotzmann
Mary Roduta Roberts
Cecilia Brito Alves
Mark J. Gierl
Centre for Research in Applied Measurement and Evaluation University of Alberta
Paper Presented at the Session “Measuring Differential Performance”
Annual Meeting of the American Educational Research
Association
San Diego, CA
April 2009
2
Abstract
Differences in total test score for gender and ethnic subgroups are widely studied. The
Attribute Hierarchy Method (AHM; Leighton & Gierl, 2007a), a diagnostic testing
procedure, is used to evaluate differences for gender and ethnicity in the current study.
A model-data-fit statistic, the Hierarchy Consistency Index (HCI, Cui & Leighton, 2008),
is applied to gender, ethnicity, and gender by ethnicity comparisons for several cognitive
models in Critical Reading and Mathematics. HCI values varied for the different ethnic
and gender subgroups comparisons. This study enhances the evaluation of group
performance and may assist with improving cognitive models.
3
Using Cognitive Models to Evaluate Ethnicity and Gender Differences
Educational testing has increased dramatically due to the No Child Left Behind
(NCLB, 2001) legislation which requires each state to test students in Grades 3 through
8 in English/Language Arts (E/LA) and Mathematics. The NCLB mandate also requires
states show 100% proficiency in E/LA and Mathematics by 2014 and to report growth
for various subgroups (e.g., ethnic, gender, special education; Linn, Baker &
Betebenner, 2002). In light of these requirements, diagnostic assessments are being
used to assist with meeting these goals. Diagnostic assessments provide enhanced
information required to improve student learning. Diagnostic assessments provide
feedback to students and teachers about strengths and weaknesses of specific learning
objectives. To ensure valid results for all students on these assessments, the question
of test fairness must be addressed.
Gender and ethnic test/item score differences are typically assessed using
Differential Item Functioning (DIF) statistical procedures (e.g., Dorans, Schmitt, and
Bleistein, 1992; Parshall, and Miller, 1995; Schmitt, 1988; Shepard, Camilli, & Williams,
1985; Zwick and Ercikan, 1989). DIF is said to occur when the probabilistic differences
in item scores occur after controlling for overall ability. DIF analyses are typically
conducted for large-scale assessments. Unfortunately, there is no consensus on which
DIF procedure works well for all student populations and it usually requires large sample
sizes. In addition, many studies that have attempted to confirm, through content
reviews, which items would indicated DIF and which group would be favored, have
shown little success (e.g., Gierl, Khaliq & Boughton, 1999; Angoff, 1993; Camilli &
4
Shepard, 1994; Engelhard, Hansche & Rutledge, 1990; Gierl & McEwen, 1998; O’Neill
& McPeek, 1993).
There are several limitations to using DIF analysis in a diagnostic framework to
identify test score differences: (1) information is gained mainly at the item level, (2)
explanations about why the differences occur has been limited, (3) linking test
performance to cognitive models has been lacking, and (4) most DIF analyses only
focus on two groups. A similar method of confirming test fairness is needed in the
context of diagnostic assessment. To address these limitations, we present a new
method for examining group differences using a cognitive diagnostic assessment (CDA)
framework, as evaluated using the attribute hierarchy method (AHM).
Purpose of Study
The purpose of this study is to examine the differences in average Hierarchy
Consistency Index (HCI; a model-data fit index) across subgroups to determine if
differences occur for various cognitive models. In this study, average HCI values for six
cognitive models will be presented for two content areas comparing gender and
ethnicity both separately and together.
Attribute Hierarchy Method
The AHM is a cognitively-based psychometric procedure used to classify
examinees’ test item responses into a set of attribute patterns associated with a
cognitive model of task performance. Cognitive attributes in the AHM are described as
the procedural or declarative knowledge needed to perform a task in a specific domain
(Leighton, Gierl, & Hunka, 2004). The AHM is a two-stage procedure where the first
stage involves cognitive model specification and the second stage involves a
5
psychometric analysis of student responses to yield model-based diagnostic information
about student mastery of cognitive skills.
Stage 1: Specification of the Cognitive Model
An AHM analysis begins with the specification of a cognitive model of task
performance. A cognitive model in educational measurement refers to a “simplified
description of human problem solving on standardized educational tasks, which helps to
characterize the knowledge and skills students at different levels of learning have
acquired and to facilitate the explanation and prediction of students’ performance”
(Leighton & Gierl, 2007, p. 6). These cognitive skills, conceptualized as attributes in the
AHM framework, are specified at a small grain size in order to generate specific
diagnostic inferences. Theories of task performance can be used to develop cognitive
models in a subject domain. However, the availability of these theories in education is
limited. Therefore, other means are used to generate cognitive models. One method
uses results from a task analysis of representative test items from a content domain. A
task analysis can be used to create a cognitive model, where the knowledge and
procedures used to solve the test item are specified. Another method involves having
examinees think aloud as they solve test items to identify the actual knowledge,
processes, and strategies elicited by the task (Ericsson & Simon, 1993; Leighton &
Gierl, 2007). A cognitive model derived from a task analysis can be validated and, if
required, modified using examinee verbal reports collected from think aloud studies.
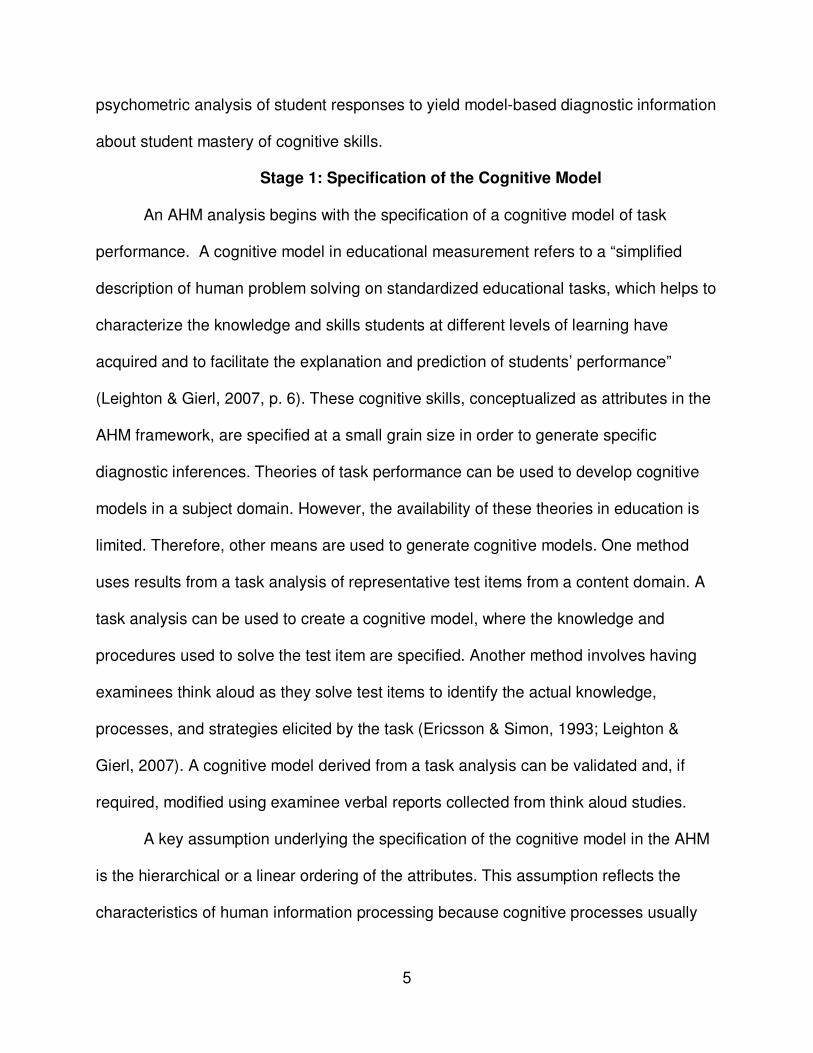
A key assumption underlying the specification of the cognitive model in the AHM
is the hierarchical or a linear ordering of the attributes. This assumption reflects the
characteristics of human information processing because cognitive processes usually
6
do not work in isolation but function within a network of interrelated competencies and
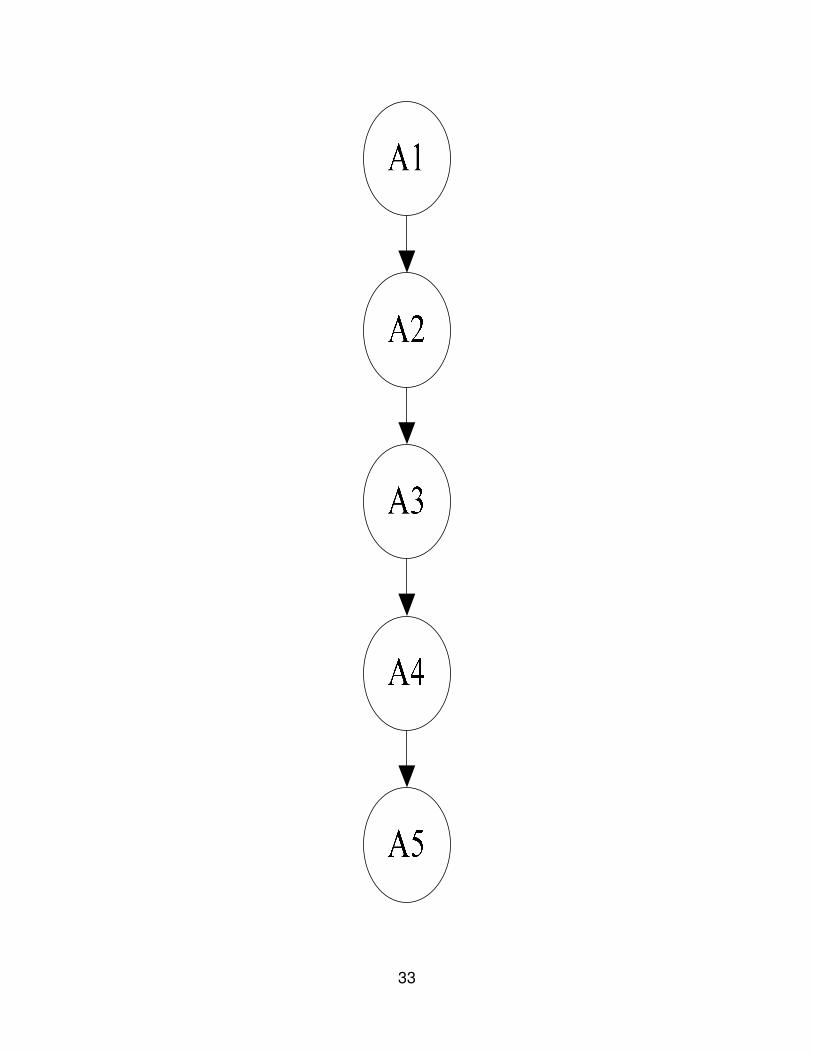
skills (Kuhn, 2001). For example (see Figure 1 for graphical representation), five
attributes are linearly ordered with attribute 1 conceptualized as the simplest and
attribute 5 as the most complex. If an examinee possesses attribute 3, then it is
expected that this examinee also possesses the pre-requisite attributes, in this case
attributes 1 and 2. The cognitive model has direct implications for item development as
the items that measure each attribute must maintain the linear ordering in the model
while also measuring increasingly complex cognitive processes.
Any method used to create cognitive models requires a review of the cognitive
skills needed to solve test items. The first step would be to ensure the breadth and
depth of all cognitive skills that are desirable for a diagnostic assessment. Once all
required areas have specified the necessary cognitive skills, these skills would be
categorized into meaningful sub-content areas that teachers can use to provide
diagnostic feedback. Within each of the sub-content areas, separate cognitive models
can be created that are linearly related and narrow in scope to identify a student’s
strengths and weaknesses in their cognitive development. The next step in the creation
of cognitive diagnostic assessment is to evaluate how well the students’ actual
response data fit the expected structure from the cognitive models.
Stage 2: Psychometric Evaluation of the Cognitive Model
The AHM is a cognitive diagnostic assessment procedure and, within this
framework, a model-data fit index is available to evaluate the accuracy of the fit
between the cognitive model and the examinees’ observed response data. For the
AHM, the model-data fit index is called the Hierarchy Consistency Index (HCI; Cui &
7
Leighton, 2008). The HCI can be used to evaluate a cognitive model for the entire
student sample, but also for several subgroups as well as sub-categorized subgroups.
For these different types of analyses (as compared to DIF analyses), the unit of analysis
will shift from comparing subgroups by item to calculating model-data fit for individual
students for a set of items that align to the cognitive model. This approach permits
different types of comparisons not previously possible in the context of large-scale
assessment. For example, a student that is female and Hispanic can only be classified
in one group for most DIF analyses. But, with the HCI statistics, examinees can be
placed in several categories at the same time. So, for instance, students that are
Hispanic female can be compared to students that are Hispanic male.
Hierarchy Consistency Index
The HCI statistic can provide meaningful information on the fit of each cognitive
model, relative to examinees’ observed responses overall, and for each type of
subgroup.
The HCI is an index that evaluates the fit between of each student observed
response data relative to the cognitive model. The HCI for examinee � is calculated as
follows:
���� = 1 −2 ∑ ∑ ���(1 − ���)���������������
���
where,
�������� � includes items that are correctly answered by student �,
��� is student �′� score (1 or 0) to item �, where item � belongs to �������� �,
�� includes items that require the subset of attributes measured by item �,
��� is student �′� score (1 or 0) to item � where item � belongs to ��, and
8
��� is the total number of comparisons for all the items that are correctly answered by
student � (Cui & Leighton, 2008).
The HCI values are calculated for each student and the average taken across
students for each cognitive model. HCI values range from -1 to +1 where an HCI of 0.70
or higher indicates good model-data fit (Cui & Leighton, 2008). This index is not
statistically affected by overall ability (i.e., perfect and non-perfect scores both result in
an HCI of 1.00). Slips occur when an examinee responds to an item in the model
correctly but does not respond correctly to other pre-requisite items linked to cognitive
skills (i.e., attribute 3 was answered correctly but not attribute 1 and 2; see Figure 1).
The number of slips related to the number of combinations of possible attribute
response patterns in the cognitive model indicates how well a student’s response fits
the cognitive model. Therefore, the HCI index provides a summary of the student
responses match with the cognitive model.
The HCI values can be used to provide supporting evidence for the accuracy of
the cognitive model for multiple subgroups. Because the HCI is calculated for each
student, identification of students who do not fit the model (i.e., poor HCI < 0.70) can be
calculated. In addition, cognitive models that have good model-data fit overall, can be
evaluated for several subgroups to ensure validity for all examinees.
Methods
Source of information
A random sample of 5000 examinees from The College Board PSAT 2006
administration was used for this study. Individual HCI values were calculated for the
entire sample. In addition, overall average HCI values, and average HCI values for
9
groups subdivided by gender, ethnicity, and gender by ethnicity were computed.
Cognitive models for two content areas were created in Critical Reading and
Mathematics. For each model, items that measured the skill in the models, as
determined by content experts, were included in the analyses.
The sample was sub-categorized for gender as follows: Females (N = 2668) and
Male (N = 2332). The sub-categories for different ethnic groups were as follows:
American-Indian (N = 35), Asian (N = 322), African-American (N = 784), Mexican-
American (N = 321), Puerto Rican (N = 95), Other Hispanic (e.g., ancestry from different
Latino background; N = 412), White (N = 2854), and Other (e.g., ancestry from mixed
ethnicity or other ethnic group not listed; N = 177). The sample was also sub-
categorized gender-by-ethnicity as follows: American Indian Females (N = 17),
American Indian Males (N = 18), Asian Females (N = 170), Asian Males (N = 152),
African-American Females (N = 412), African-American Males (N = 372), Mexican-
American Females (N = 188), Mexican-American Males (N = 133), Puerto Rican
Females (N = 52), Puerto Rican Males (N = 43), Other Hispanic Females (N = 232),
Other Hispanic Males (N= 180), White Females (N = 1503), White Males (N = 1351),
Other Females (N = 94), and Other Males (N = 83).
Procedures
This study was conducted in three stages. First, cognitive models were created
for each sub-content area in Critical Reading and Mathematics. For example, Critical
Reading had four sub-categories: Author’s Craft, Comprehending Ideas, Determining
Meaning, and Reasoning and Inferencing. Mathematics had four sub-categories:
Algebra, Data and Probability, Geometry and Measurement, and Number and
10
Operations. There were a total of 54 linear cognitive models across Critical Reading and
Mathematics, but only six models will be presented in this paper. The six models were
selected based on whether the overall average HCI values were high, moderate, or low,
and whether the average HCI had high, moderate, or low variability. Second, content
experts mapped existing items from the test to the skills in each cognitive model. Third,
individual student HCIs were calculated for each cognitive model. The HCI results for
each cognitive model were aggregated overall and by gender, ethnicity, and gender-by-
ethnicity.
Stage 1: Developing the Cognitive Models
For PSAT Critical Reading and Mathematics, stage 1 was completed in two
steps. In the first step, the authors of this manuscript developed preliminary cognitive
models. This development work was undertaken so the content specialists would have
a starting point for creating their cognitive models. To create the preliminary cognitive
models, three College Board research papers—Developing Skill Categories for the SAT
Math Section by O’Callaghan, Morley & Schwartz (2004), Toward a Construct of Critical
Reading for the New SAT by VanderVeen (2004), and the Performance Category
Descriptions for the Critical Reading, Mathematics, and Writing Sections of the SAT
(2007), also known as the SAT Scale Anchoring Study—provided the starting points for
creating the preliminary models. O’Callaghan et. al. (2004) and VanderVeen (2004)
described several cognitive skill categories identified by content specialists, after
reviewing large numbers of previously administered SAT Critical Reading and
Mathematics items. Their cognitive skill categories ranged from simple to complex. The
11
authors created preliminary cognitive models with linear ordering of cognitive skills to
assist content experts in the second step.
In the second step in Stage #1, five content specialists nominated by The
College Board (two Critical Reading and three Mathematics) reviewed our preliminary
cognitive models with the intention of making appropriate modifications, given a
particular emphasis on the identification of the appropriate skills and on the ordering of
these skills. They were also asked to evaluate the skills in each cognitive model for its
measurability and instructional relevance. That is, the content specialists were
instructed to modify our initial models in light of the characteristics required of cognitive
models for CDA (e.g., measurability, grain size, and instructional relevance). All five
content specialists had extensive reading and mathematics backgrounds as well as
teaching and test development experience.
The content specialists scrutinized the wording of each skill descriptor to ensure
it would be clear and meaningful to teachers. Any relevant, measurable, and
instructionally relevant process skills were also added to the cognitive models. In total,
54 cognitive models were created in PSAT Critical Reading and Mathematics. Each of
the cognitive models being discussed in this paper are shown in Figures 2A, 2B, 3A, 3B,
4A, and 4B. For each of the cognitive models only one item was mapped to each
cognitive skill as indicated below.
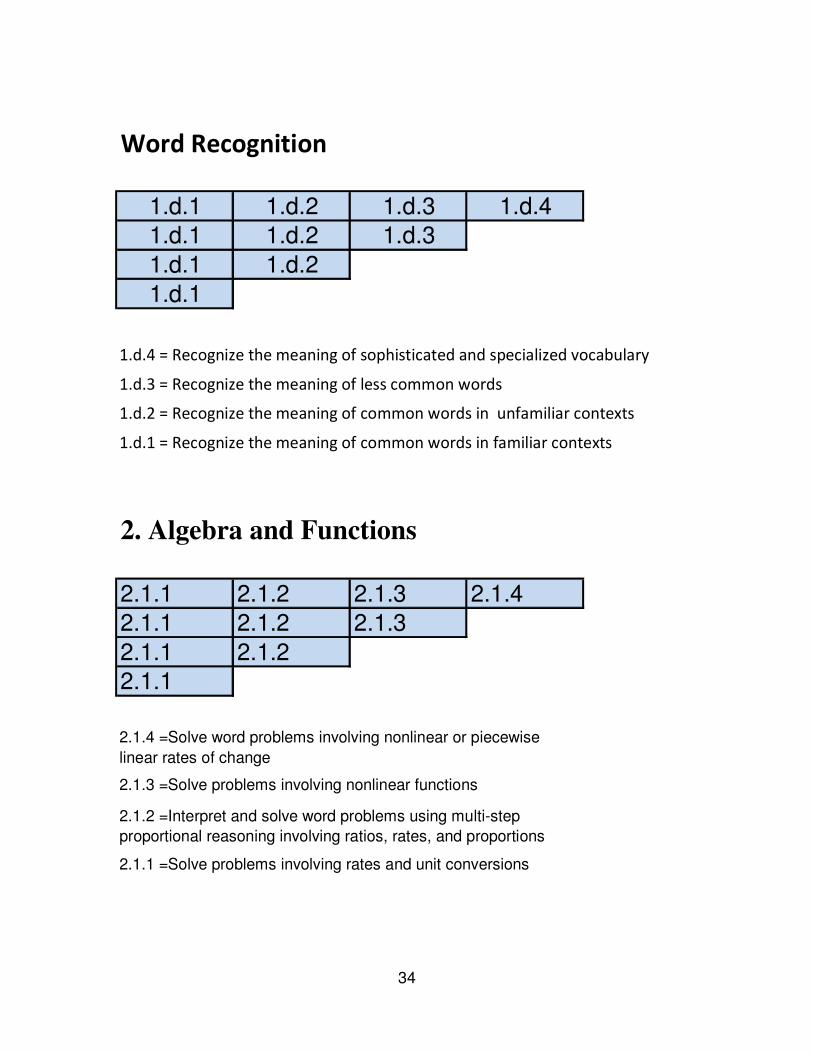
Figure 2A shows the cognitive model “Word Recognition “under the subcategory
of Determining Meaning for Critical Reading . There were two items mapped to two of
the cognitive skills 1.d.1 and 1.d.3. Figure 2B shows the cognitive model for
Mathematics under the category of Algebra and Functions which is not currently
12
labeled. There were two items mapped to two of the cognitive skills 2.1.1 and 2.1.2.
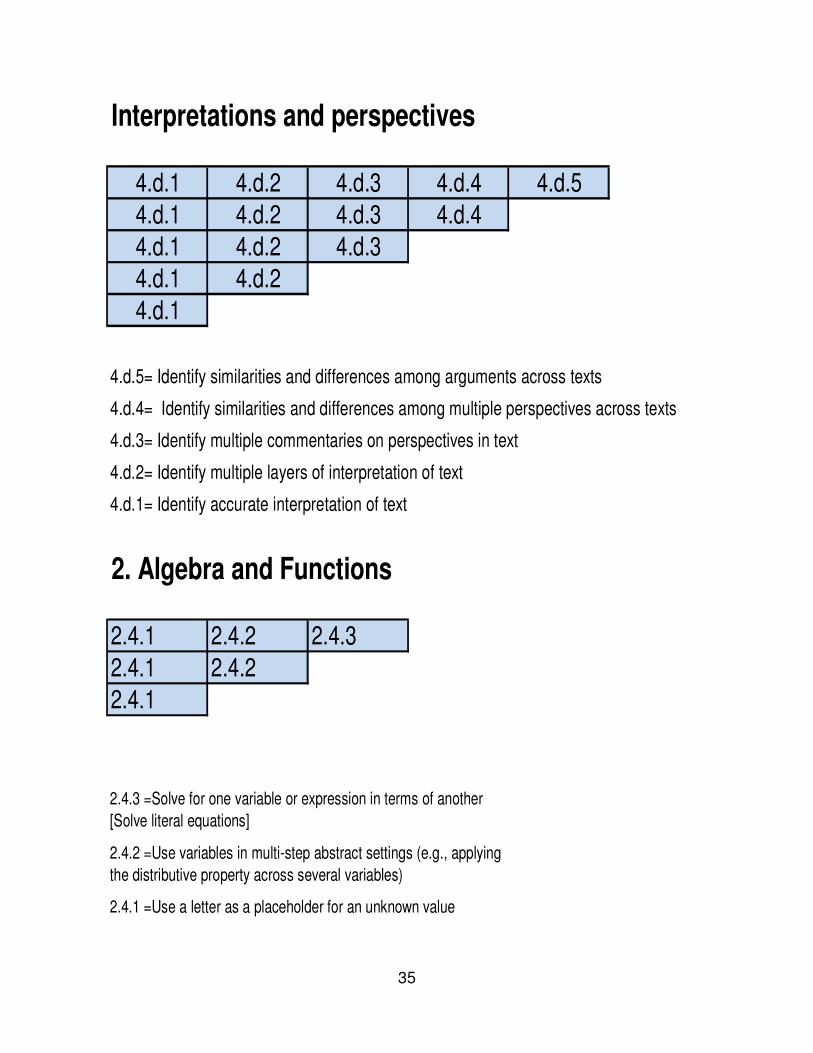
Figure 3A shows the cognitive model for Critical Reading under the category of
Reasoning and Inferencing labeled Interpretations and perspectives. There were three
items mapped to three cognitive skills 4.d.1, 4.d.3, and 4.d.4. Figure 3B shows the
cognitive model for Mathematics under the category of Algebra and Functions which is
not currently labeled. There were three items mapped to three of the cognitive skills
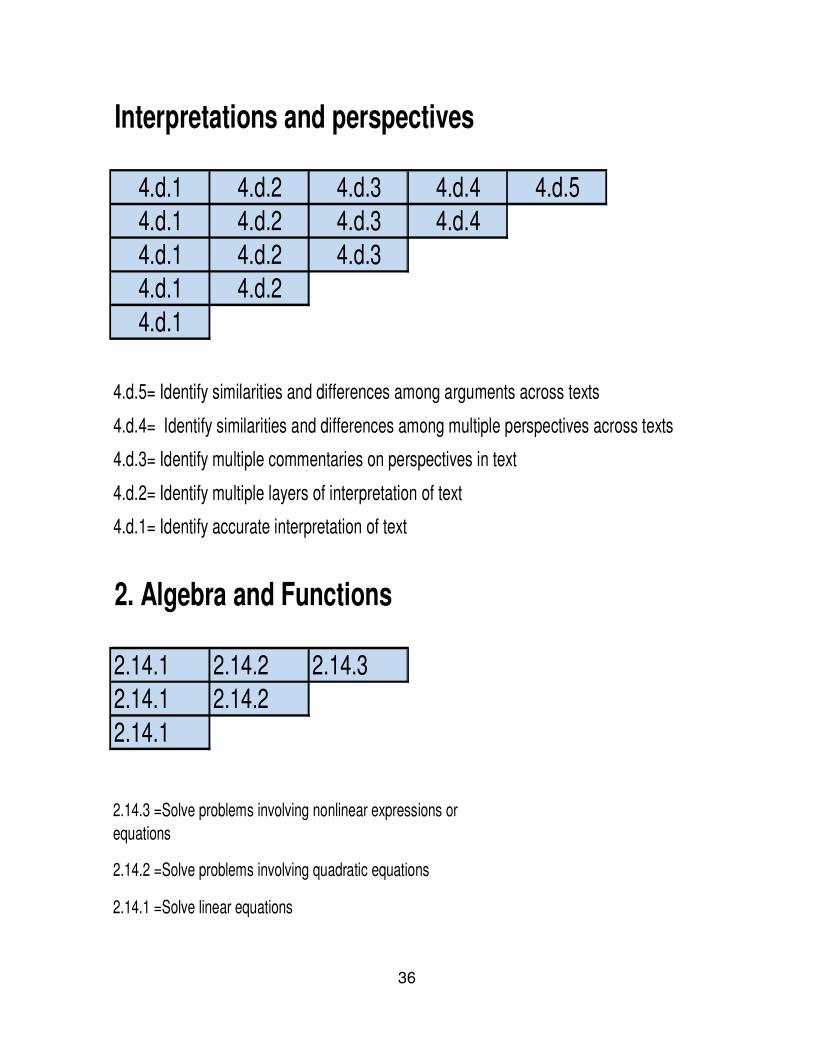
2.4.1, 2.4.2, and 2.4.3. Figure 4A shows the cognitive model for Critical Reading under
the category of Reasoning and Inferencing labeled Interpretations and Perspectives
which is the same cognitive model as shown in Figure 3A. However, in this case
different items were mapped to the model, where 4.d.1 and 4.d.3 are represented by
two items. Figure 4B shows the cognitive model for Mathematics under the category of
Algebra and Functions which is not currently labeled. There were two items mapped to
two of the cognitive skills 2.14.1 and 2.14.3.
Stage 2: Mapping items to each Cognitive model
In the second stage, existing items were mapped from the 2006 PSAT
administration to each of the linear cognitive models. A set of items was provided to the
content experts in Critical Reading and Mathematics and they aligned the items to the
skills in each cognitive model created in stage 1. Unfortunately since this task was to
use existing items and map them to the cognitive models created, many cognitive skills
are not represented by items. However, for this study we used the incomplete cognitive
models as a starting point to evaluate how well each of the cognitive models fits the
items and student response data.
13
Stage 3: HCI Calculations and Model Evaluations
In the third stage, individual HCI values were calculated for the sample of 5000
students. Several macros were created in SAS to calculate the HCI values for each
examinee for each cognitive model. Average overall HCI values, by gender, by
ethnicity, and gender by ethnicity were also calculated. There were six models selected,
three for Critical Reading and three for Mathematic. One model had a high average HCI
value with low variability, one model with a moderate average HCI value with moderate
variability, and one model with low average HCI value with high variability. These types
of cognitive models were selected to show how the information could be used to
evaluate and compare various outcomes with good fitting and poor fitting models.
For each model, overall average HCI values and standard deviations were
calculated for the sample of 5000 students as well as average HCI, for gender (Females
and Males), ethnicity (American Indian, Asian, African-American, Mexican-American,
Puerto Rican, Other Hispanic, White, Other), and gender-by-ethnicity (American Indian
Females, American Indian Males, Asian Females, Asian Males, African-American
Females, African-American Males, Mexican-American Females, Mexican-American
Males, Puerto Rican Females, Puerto Rican Males, Other Hispanic Females, Other
Hispanic Males, White Females, White Males, Other Females and Other Males).
Results
The average HCI values for our six cognitive models are presented in two tables
for Critical Reading and Mathematics. There are three types of cognitive models
presented: high average HCI low variability, moderate average HCI moderate variability,
and low average HCI high variability. For each type of model, the table includes the
14
average HCI value for the overall sample, by gender and by ethnicity, while the second
table shows the gender by ethnicity average HCI values. Each of the cognitive models
was evaluated using the criterion of HCI values greater than 0.70 indicating good
model-data fit as outlined by Cui and Leighton (2008). In addition, the largest HCI value
differences between the Females and Males for each ethnic group are illustrated
graphically in Figures 5-10 for each cognitive model with a comparison group that
shows no differences.
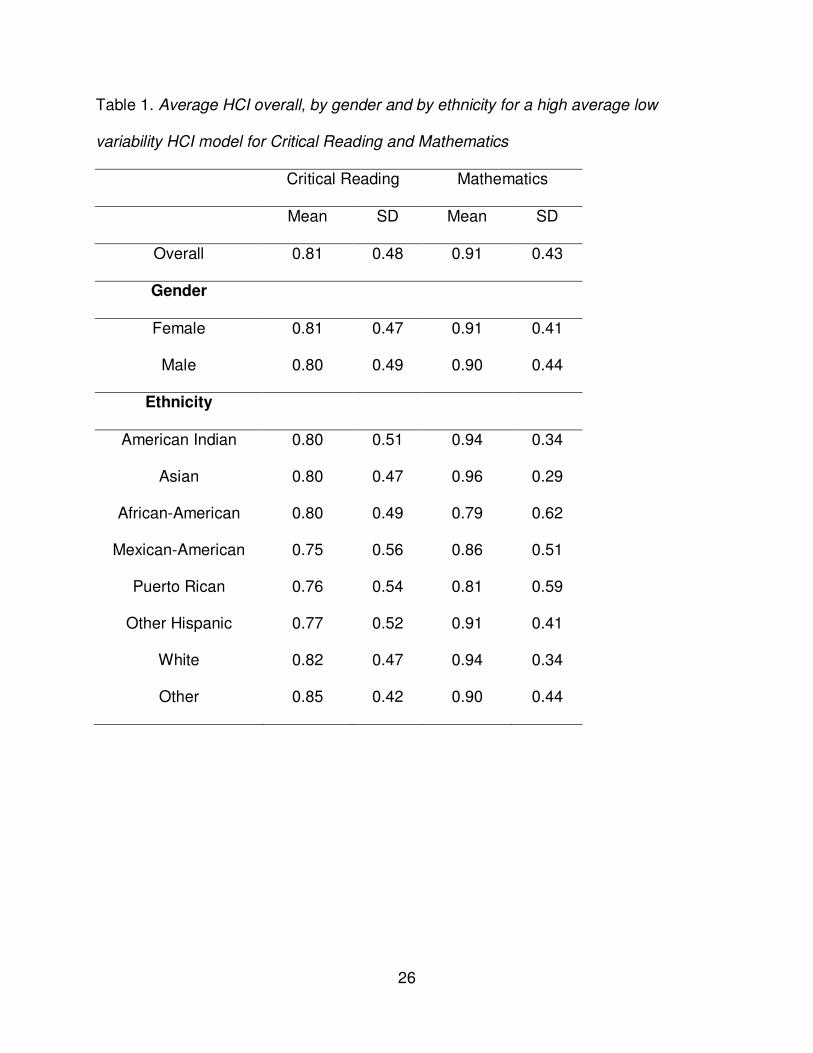
Model 1: High average HCI low variability hierarchies
The average HCI values for the models in Critical Reading and Mathematics are
shown in Table 1 for gender and ethnicity separately. The overall average HCI for
Critical Reading and Mathematics was 0.81 (0.48 SD) and 0.91 (0.43 SD) respectively.
The average HCI values for the Critical Reading and Mathematics models were similar
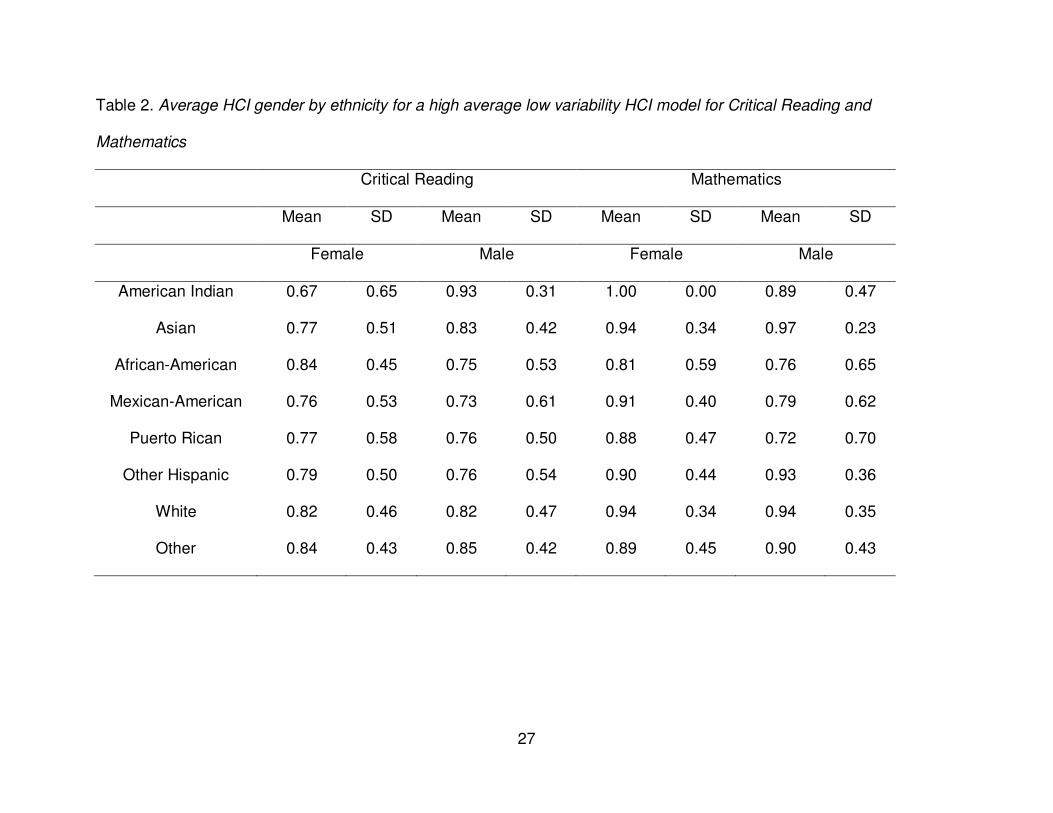
for Females and Males. The average HCI values for the first model (high average HCI
low variability) for Critical Reading and Mathematics are shown in Table 2 for gender-
by-ethnicity (graphically represented in Figures 5 and 6).
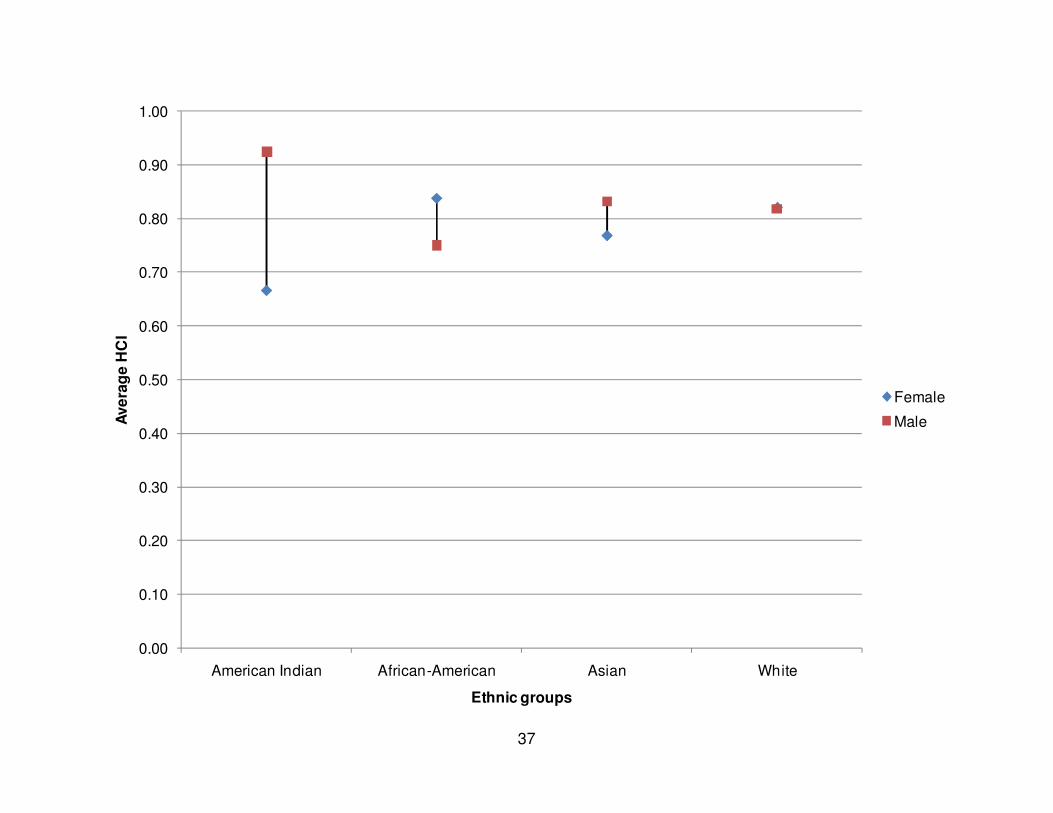
Critical Reading
The average overall HCI values for the Critical Reading model (shown in Table 1)
was similar to the average HCI values obtained for the American Indian, Asian, African-
American, White and Other ethnic groups, but was slightly lower for the Mexican-
American, Puerto Rican and Other Hispanic ethnic groups. Differences between the
Females and Males (shown in Table 2) were the larger for the American Indian, Asian,
and African-American ethnic groups, and smaller for the Mexican-American, Puerto
Rican, Other Hispanic, White, and Other ethnic groups. Figure 5 illustrates these
15
differences, with larger difference occurring between Males and Females are for the
American Indian ethnic group, and African-American and Asian groups showing smaller
differences. This figure also shows no differences for the White ethnic group.
The pattern of Male respondents fitting the model better than the Female
respondents is consistent for most of the ethnic groups, except the African-American
ethnic group. In addition, the American Indian Female group shows that the model is
below the 0.70 threshold and does not fit for this subgroup. Overall, for the Critical
Reading model, the largest gap is between the American Indian Females and Males,
where the model-data fit was better for the Males than for the Females.
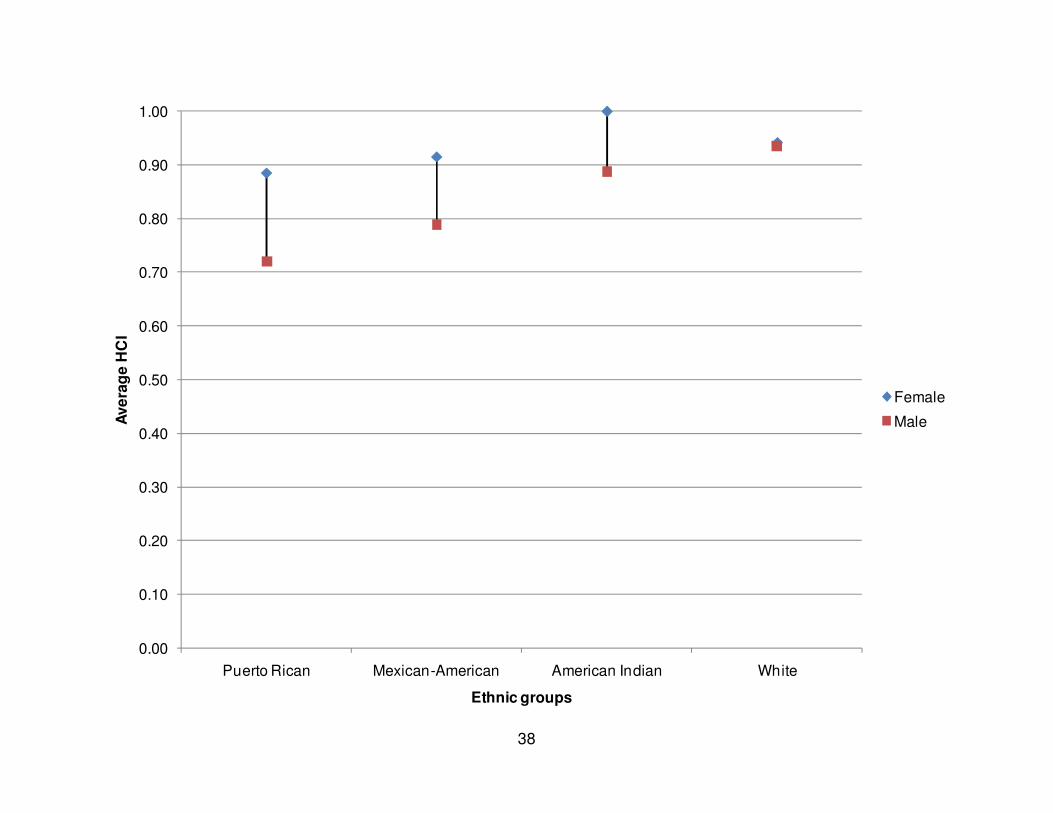
Mathematics
The average HCI values for the Mathematics model (shown in Table 1) was
similar to the overall average HCI values for the Other Hispanic and Other ethnic
groups, higher for the American Indian, Asian, and White ethnic groups, and lower for
the African-American, Mexican-American, Puerto Rican ethnic groups. For the
Mathematics model (shown in Table 2) the differences between the Females and Males
were larger for the American Indian, African-American, Mexican-American, Puerto
Rican ethnic groups, and smaller for the Asian, Other Hispanic, White and Other ethnic
groups. As shown in Figure 6 larger differences between Males and Female are for the
Puerto Rican ethnic group, with smaller differences for the Mexican-American and
American Indian groups.
This cognitive model has better fit for the Female respondents than for the Male
respondents in these ethnic groups. The White ethnic group shows no differences.
There are no subgroups that are below the 0.70 HCI threshold. Overall, for the
16
Mathematics model, the largest gap is between the African-American Females and
Males, where the model-data fit was better for the Males than the Females. In addition,
no subgroups had model-data fit below 0.70.
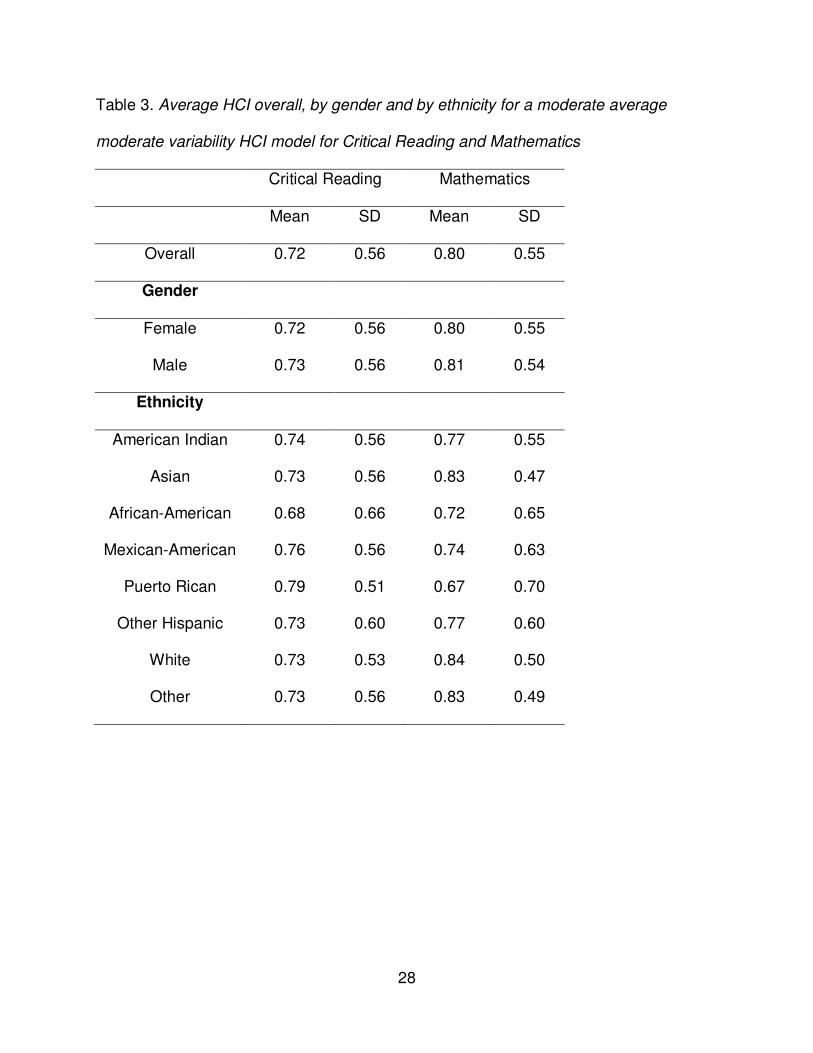
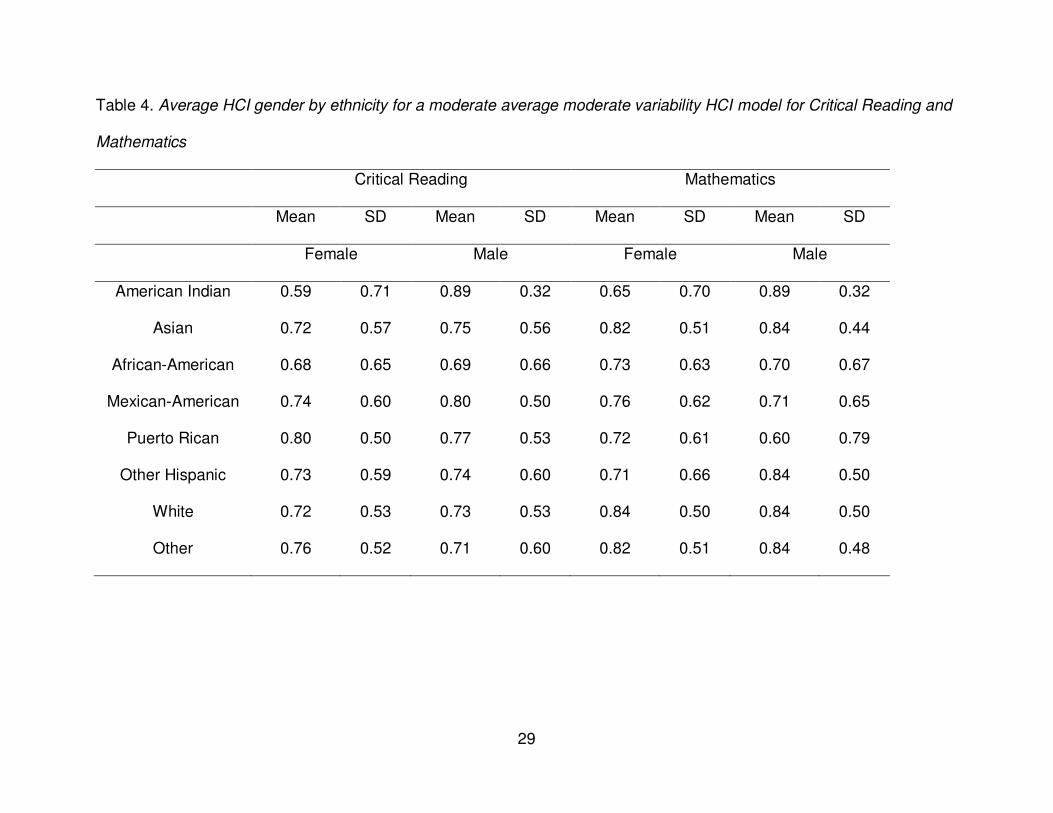
Model 2: Moderate average HCI moderate variability hierarchies
The average HCI values for the second model for Critical Reading and
Mathematics are shown in Table 3 for gender and ethnicity separately. The overall
average HCI for Critical Reading and Mathematics were 0.72 (0.56 SD) and 0.80 (0.55
SD) respectively. The average HCI values for the Critical Reading and Mathematics
models were similar for Females and Males. The average HCI values for the second
model (moderate average HCI moderate variability) for Critical Reading and
Mathematics are shown in Table 4 for gender-by-ethnicity (graphically represented in
Figures 7 and 8).
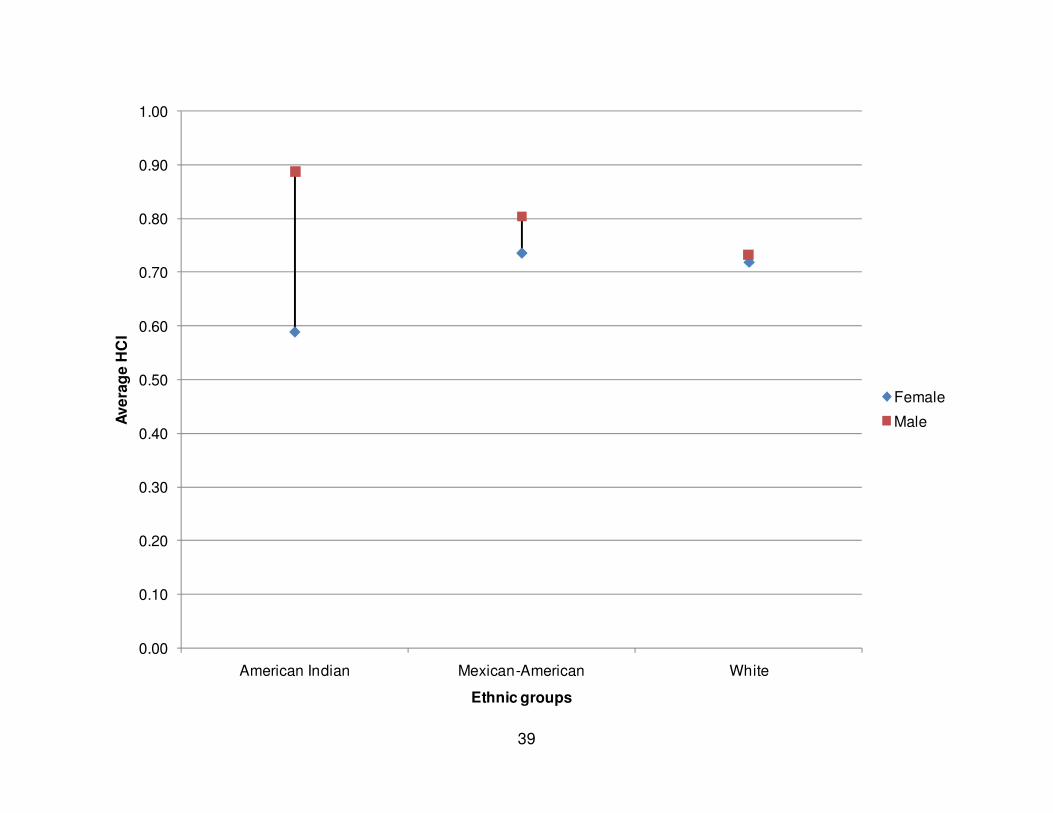
Critical Reading
The average HCI values for Critical Reading (shown in Table 3) was similar to
the overall average HCI values for the American Indian, Asian, Other Hispanic, White
and Other ethnic groups, but was lower for the African-American ethnic group, and
higher for the Mexican-American, and Puerto Rican ethnic groups. The differences
between the Females and Males (shown in Table 4) were larger for the American Indian
ethnic group and smaller differences for the Asian, African-American, Mexican-
American, Puerto Rican, Other Hispanic, White, and Other ethnic groups. As shown in
Figure 7, larger differences between the Males and Females are for the American
Indian ethnic group and a smaller difference for the Mexican-American subgroup.
17
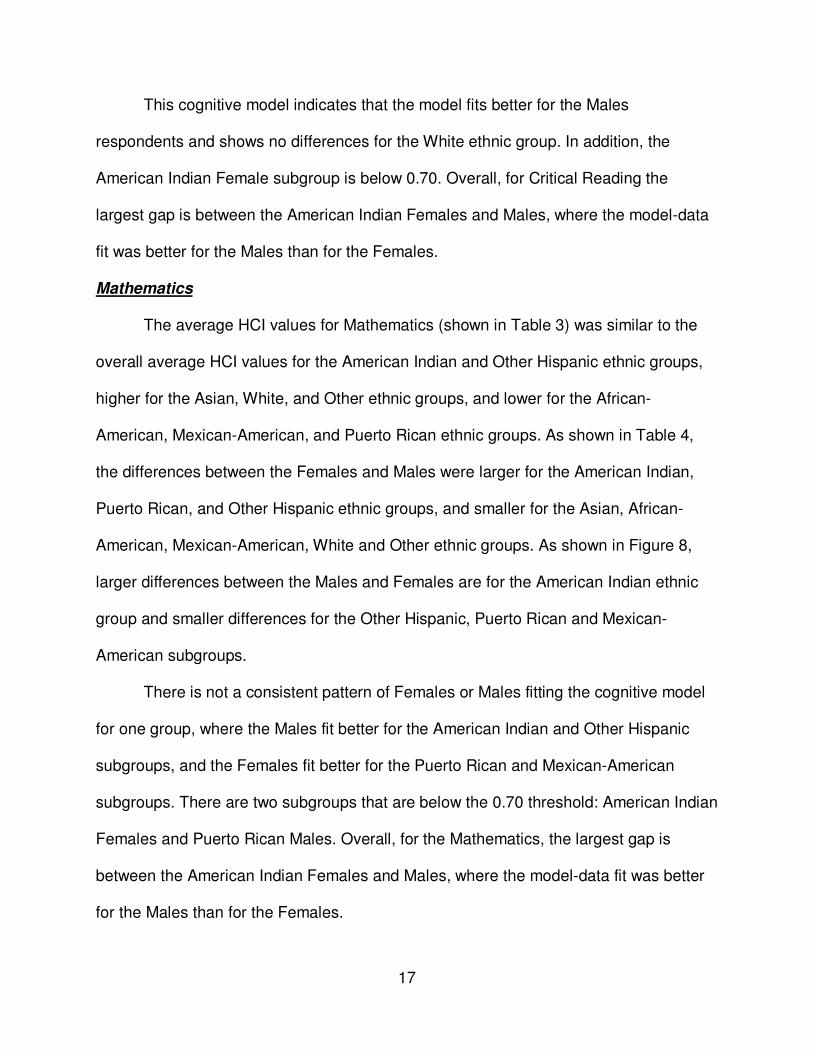
This cognitive model indicates that the model fits better for the Males
respondents and shows no differences for the White ethnic group. In addition, the
American Indian Female subgroup is below 0.70. Overall, for Critical Reading the
largest gap is between the American Indian Females and Males, where the model-data
fit was better for the Males than for the Females.
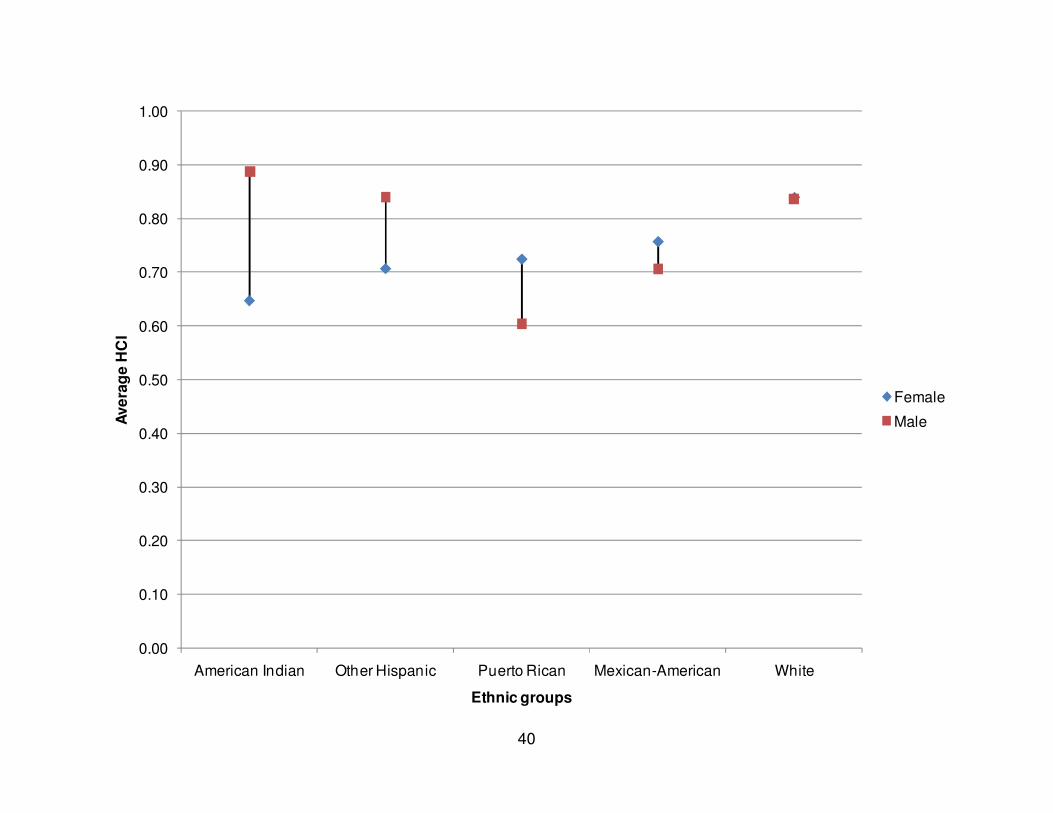
Mathematics
The average HCI values for Mathematics (shown in Table 3) was similar to the
overall average HCI values for the American Indian and Other Hispanic ethnic groups,
higher for the Asian, White, and Other ethnic groups, and lower for the African-
American, Mexican-American, and Puerto Rican ethnic groups. As shown in Table 4,
the differences between the Females and Males were larger for the American Indian,
Puerto Rican, and Other Hispanic ethnic groups, and smaller for the Asian, African-
American, Mexican-American, White and Other ethnic groups. As shown in Figure 8,
larger differences between the Males and Females are for the American Indian ethnic
group and smaller differences for the Other Hispanic, Puerto Rican and Mexican-
American subgroups.
There is not a consistent pattern of Females or Males fitting the cognitive model
for one group, where the Males fit better for the American Indian and Other Hispanic
subgroups, and the Females fit better for the Puerto Rican and Mexican-American
subgroups. There are two subgroups that are below the 0.70 threshold: American Indian
Females and Puerto Rican Males. Overall, for the Mathematics, the largest gap is
between the American Indian Females and Males, where the model-data fit was better
for the Males than for the Females.
18
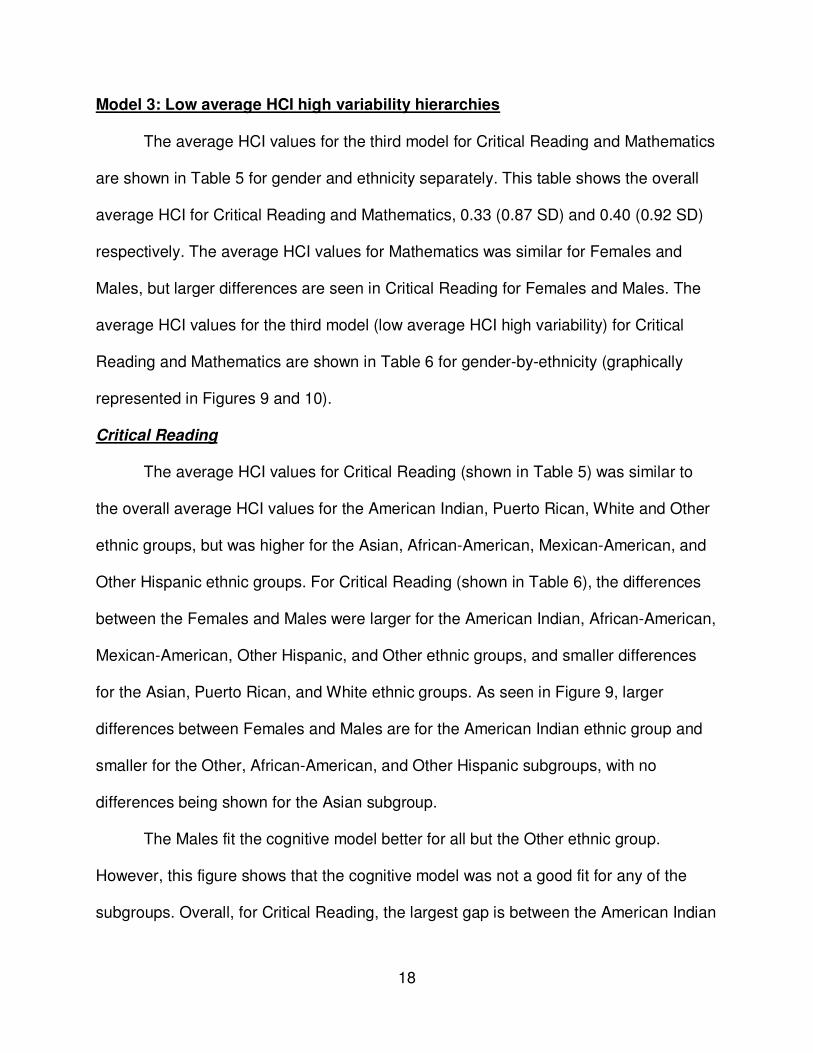
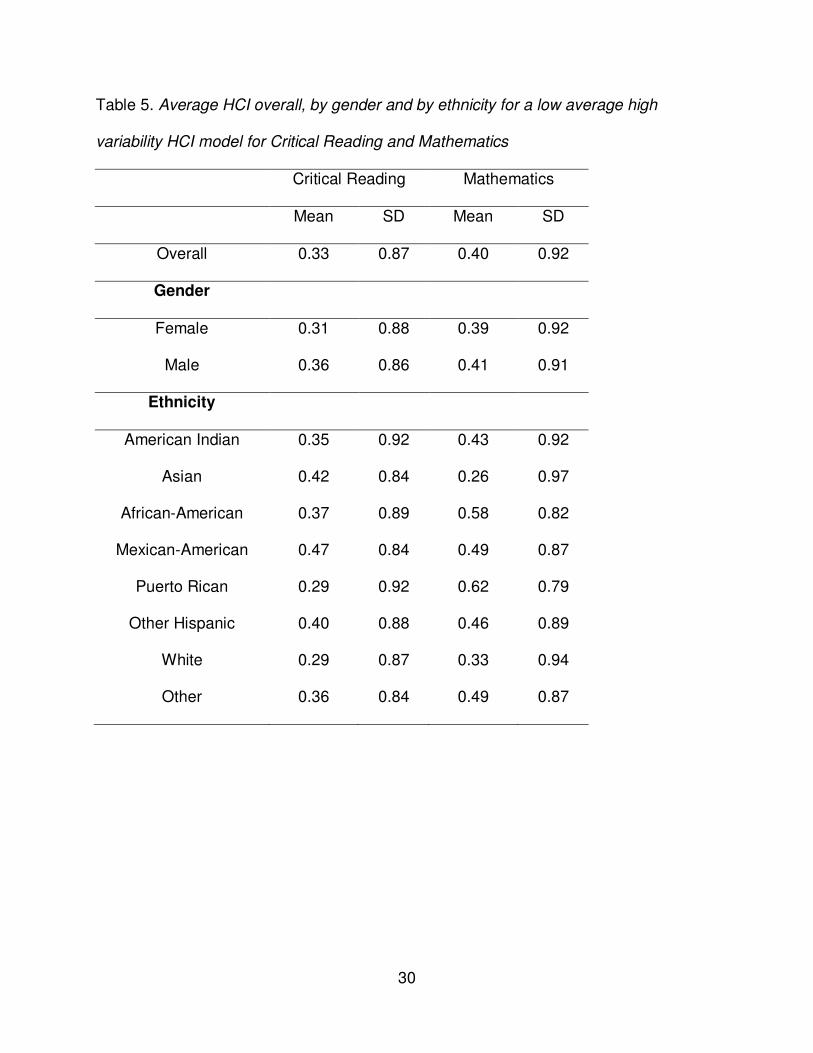
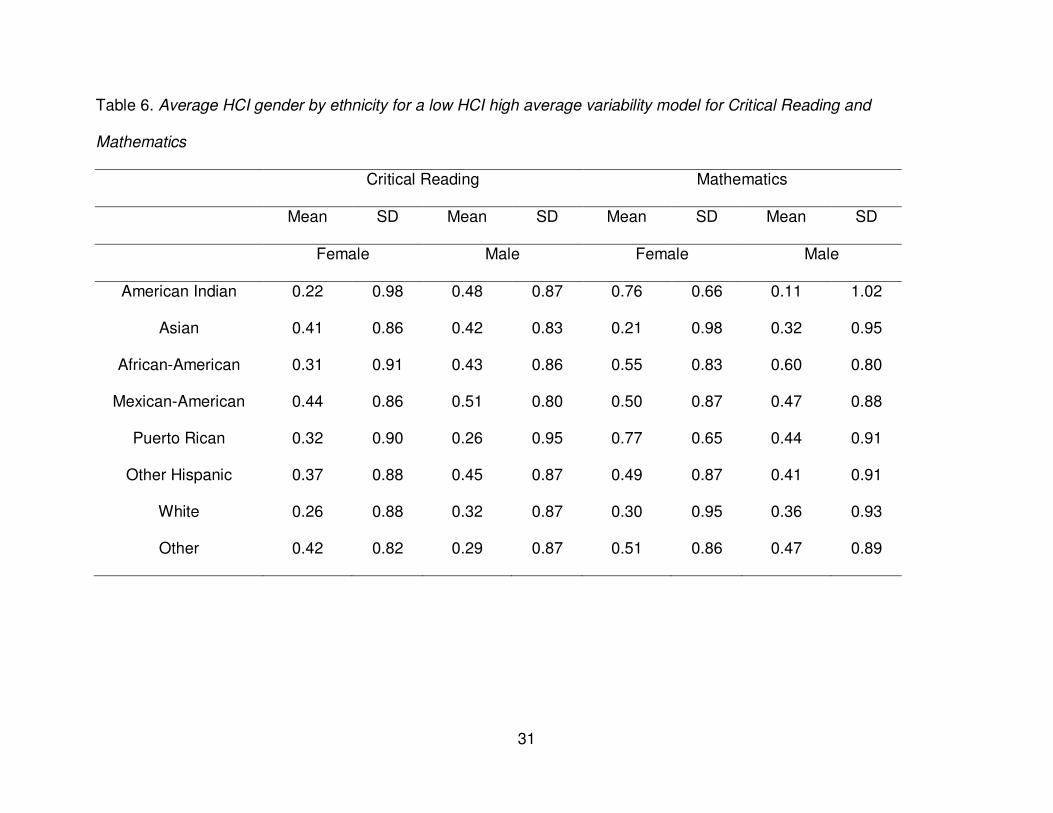
Model 3: Low average HCI high variability hierarchies
The average HCI values for the third model for Critical Reading and Mathematics
are shown in Table 5 for gender and ethnicity separately. This table shows the overall
average HCI for Critical Reading and Mathematics, 0.33 (0.87 SD) and 0.40 (0.92 SD)
respectively. The average HCI values for Mathematics was similar for Females and
Males, but larger differences are seen in Critical Reading for Females and Males. The
average HCI values for the third model (low average HCI high variability) for Critical
Reading and Mathematics are shown in Table 6 for gender-by-ethnicity (graphically
represented in Figures 9 and 10).
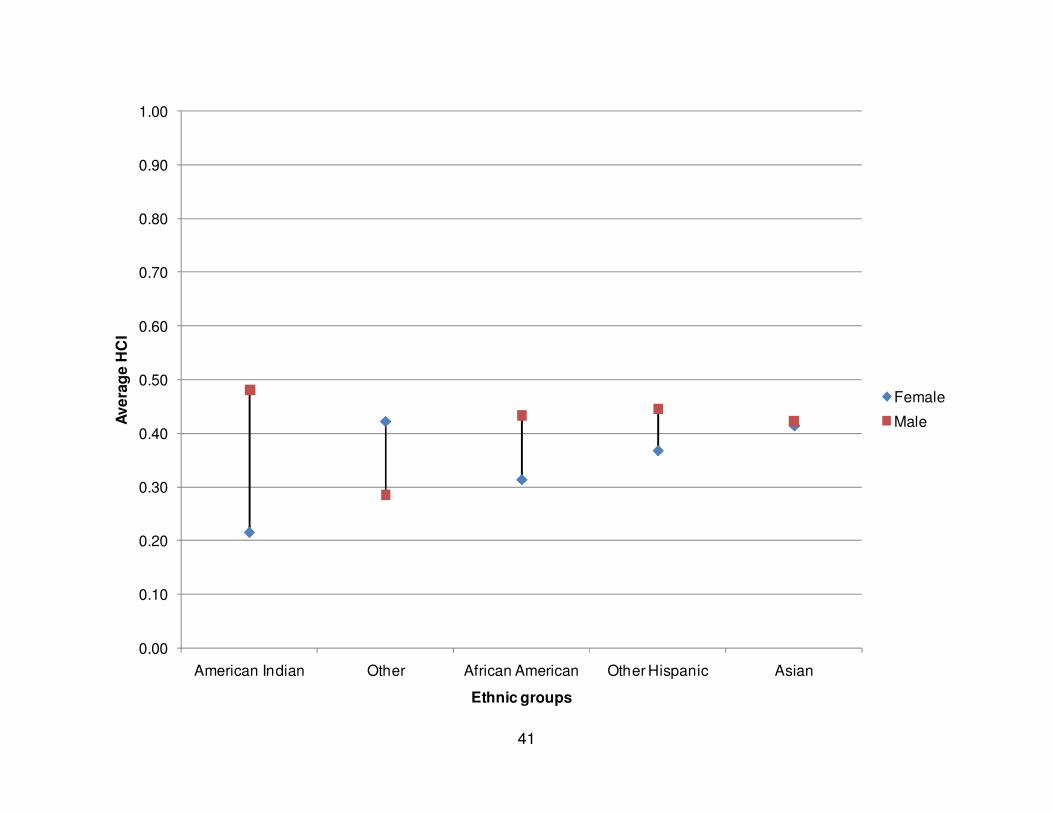
Critical Reading
The average HCI values for Critical Reading (shown in Table 5) was similar to
the overall average HCI values for the American Indian, Puerto Rican, White and Other
ethnic groups, but was higher for the Asian, African-American, Mexican-American, and
Other Hispanic ethnic groups. For Critical Reading (shown in Table 6), the differences
between the Females and Males were larger for the American Indian, African-American,
Mexican-American, Other Hispanic, and Other ethnic groups, and smaller differences
for the Asian, Puerto Rican, and White ethnic groups. As seen in Figure 9, larger
differences between Females and Males are for the American Indian ethnic group and
smaller for the Other, African-American, and Other Hispanic subgroups, with no
differences being shown for the Asian subgroup.
The Males fit the cognitive model better for all but the Other ethnic group.
However, this figure shows that the cognitive model was not a good fit for any of the
subgroups. Overall, for Critical Reading, the largest gap is between the American Indian
19
Females and Males, where the model-data fit was better for the Males than for the
Females.
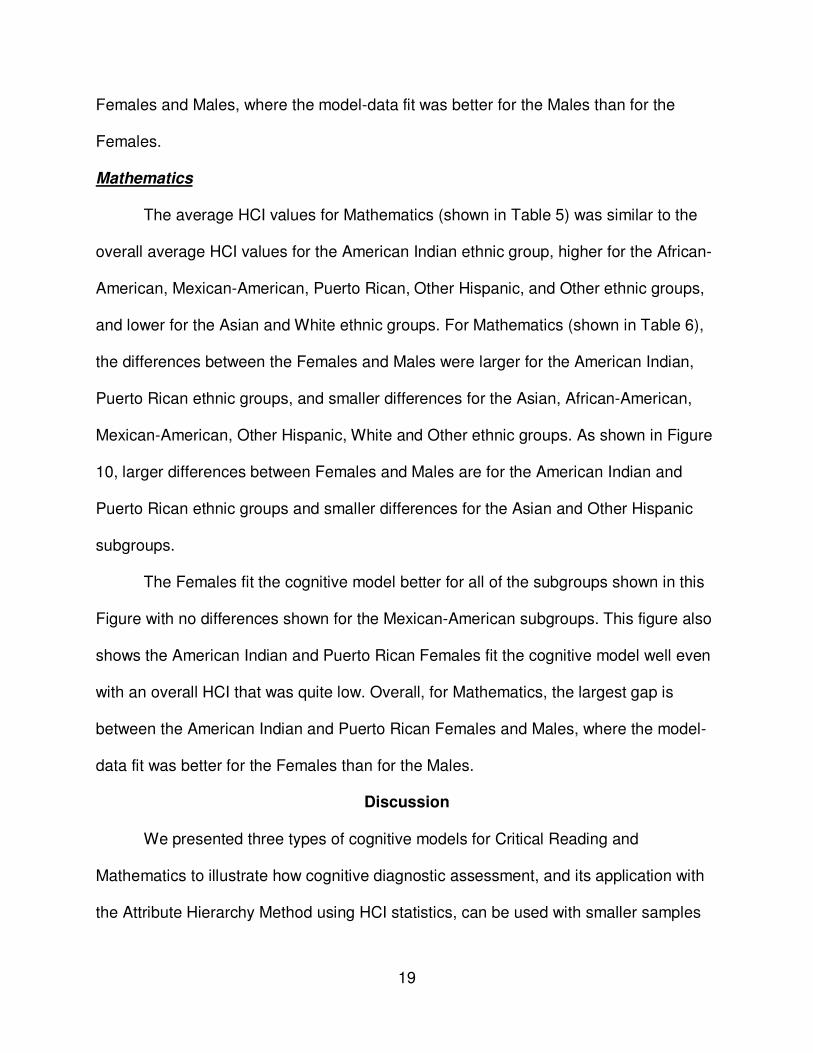
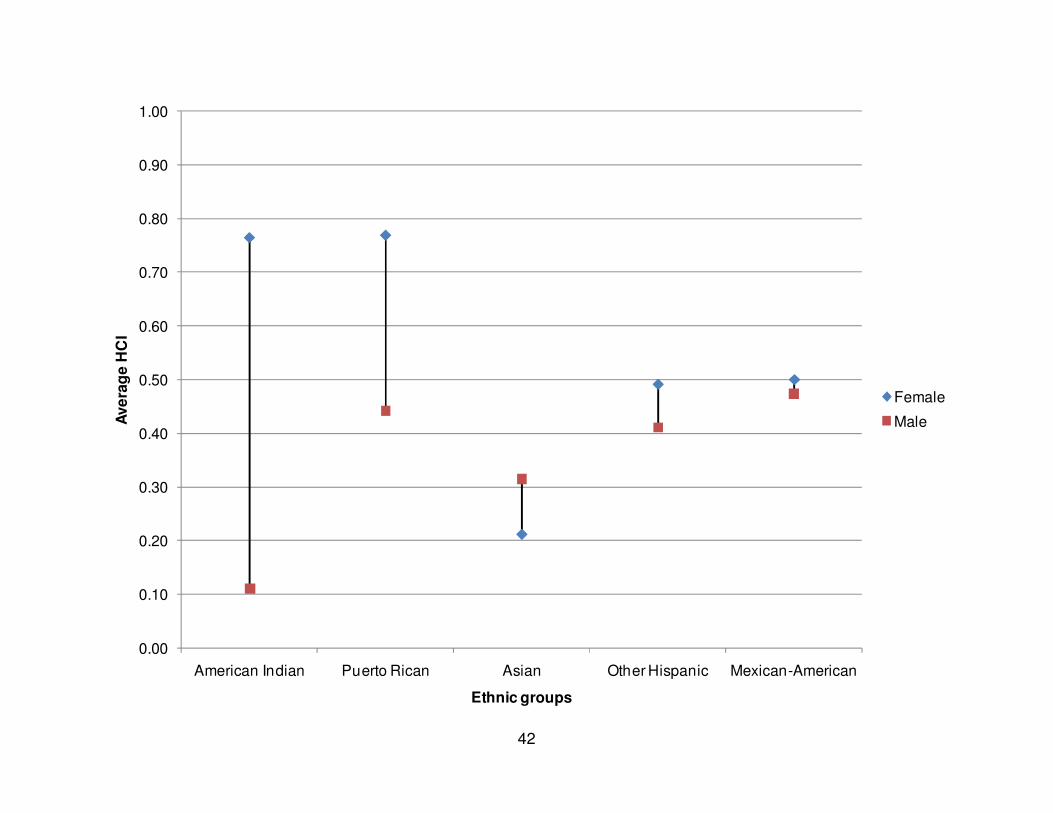
Mathematics
The average HCI values for Mathematics (shown in Table 5) was similar to the
overall average HCI values for the American Indian ethnic group, higher for the African-
American, Mexican-American, Puerto Rican, Other Hispanic, and Other ethnic groups,
and lower for the Asian and White ethnic groups. For Mathematics (shown in Table 6),
the differences between the Females and Males were larger for the American Indian,
Puerto Rican ethnic groups, and smaller differences for the Asian, African-American,
Mexican-American, Other Hispanic, White and Other ethnic groups. As shown in Figure
10, larger differences between Females and Males are for the American Indian and
Puerto Rican ethnic groups and smaller differences for the Asian and Other Hispanic
subgroups.
The Females fit the cognitive model better for all of the subgroups shown in this
Figure with no differences shown for the Mexican-American subgroups. This figure also
shows the American Indian and Puerto Rican Females fit the cognitive model well even
with an overall HCI that was quite low. Overall, for Mathematics, the largest gap is
between the American Indian and Puerto Rican Females and Males, where the model-
data fit was better for the Females than for the Males.
Discussion
We presented three types of cognitive models for Critical Reading and
Mathematics to illustrate how cognitive diagnostic assessment, and its application with
the Attribute Hierarchy Method using HCI statistics, can be used with smaller samples
20
to study group differences and evaluate model-data fit. In this study, average HCI
statistics were presented overall for each cognitive model, separated by gender,
separated by ethnic groups, and by gender-by-ethnicity. Each type of model showed
some differences either by gender, ethnicity, or a cross of gender-by-ethnicity (largely
these differences were seen with the American Indian examinees for Females and
Males). HCI differences were found between many of the ethnic group-by-gender
comparisons with the White ethnic group showing less variation.
Typically, HCI values are evaluated for a particular model over the entire sample
of examinees. This paper illustrates how these statistics can also be used to evaluate
cognitive models to ensure model-data fit for subgroups of the student population. For
cognitive models that have a high overall HCI, the average HCI may not be adequate
for some subgroups. Said another way, even when the overall HCI is adequate (i.e.,
above 0.70) the cognitive model may not fit for all examinees and the calculation of HCI
values for specific, identifiable sbugroups can show this disparity. Conversely, when the
overall HCI is poor (i.e., below 0.70), the cognitive model can demonstrate how various
subgroups can still fit the model (e.g., American Indian and Puerto Rican Females, see
Figure 10). In other words, the cognitive model can be adequate for some examinees
but not others in any diagnostic analysis.
Creating good cognitive models that can be directly applied to the AHM is still at
an early stage. However, with the use of the HCI statistic, the assumptions that all
examinees fit the same type of model can be evaluated directly. The type of evaluation
described and illustrated in this paper may help with identifying subgroups of students
who do not fit the model.
21
These results also show how model-data fit statistics, like the HCI, can be used
with smaller sample sizes to determine how students’ observed response data fit with a
theoretical cognitive model. The examples shown in this paper demonstrate how gender
and ethnicity can be examined at a fine level of detail. However, this same technique
can be used with other types of populations, such as Language English Proficiency
(LEP), special education, accommodations, and Braille test-takers, and other special
populations. Because each HCI is calculated by student, information can be used
individually or collectively to evaluate student’s cognitive understanding in comparison
to cognitive models that have been developed to probe this understanding. This study
can be used as a new way of evaluating cognitive models and ensuring that the model
fits the data for subgroups, as a parallel process to large scale assessment with DIF
analyses. Fairness in diagnostic assessment is important as it is for large-scale
assessment. The model-data fit index presented in this paper provides some evidence
that can be used in diagnostic assessment to evaluate the underlying cognitive models.
Limitations and Future Directions
This study is preliminary and only demonstrates how the HCI statistics could be
used to further the field of cognitive diagnostic assessment. There are a number of
limitations to this study that should be examined in future studies. For example, the
number of attributes represented in each model was small and, often, attributes were
measured by only one item. Examining a full model with more cognitive skills would be
helpful to evaluate if more consistent HCI values across both gender and ethnicity and
gender-by-ethnicity can be found. Other types of background information such as LEP,
special education, accommodations, or other desirable information could be examined.
22
The items used in this study were retro-fit to each of the models. A complete cognitive
model is desired and the use of only retro-fitted items may be a limitation in this study
because each cognitive model may not be fully represented. Finally, a statistical test of
significance would be helpful to look at the difference between groups (i.e., t-test, One-
way ANOVA, Two-Way ANOVA). Since HCI data are largely bimodal and do not meet
most of the statistical assumptions (equal N, equal variances) new or different tests of
statistical significance would be required.
In summary, this paper outlines a new way of looking at differences between
gender and ethnic groups as well as examining gender by ethnicity differences using
model-data fit. These procedures may assist with creating well-defined cognitive
models, confirm or modify cognitive models, and ensure that the models work for most,
if not all, types of subgroups that are of interest.
23
References
Angoff, W. H. (1993). Perspectives on differential item functioning methodology. In P.
W. Holland, & H. Wainer (Eds.). Differential item functioning (pp. 2-24). Hillsdale,
NJ: Lawrence Erlbaum.
Camilli, G., & Shepard, L. A. (1994). Methods for identifying biased test items.
Thousand Oaks, CA: Sage.
The College Board. (2007). Performance category descriptions for the critical reading,
mathematics, and writing sections of the Scholastic Assessment Test. New York,
NY: The College Board. (Unpublished internal memo).
Cui, Y., & Leighton, J. P. The hierarchy consistency index: Evaluating person fit for
cognitive diagnostic assessment. Paper presented at the National Council on
Measurement in Education, 2008. New York: NY.
Dorans, N. J., Schmitt, A. P., & Bleistein, C. A. (1992). The standardization approach to
assessing comprehensive differential item functioning. Journal of Educational
Measurement, 29, 309-319.
Engelhard Jr., G., Hansche, L., & Rutledge, K. E. (1990). Accuracy of bias review
judges in identifying differential item functioning on teacher certification tests.
Applied Measurement in Education, 3, 347-360.
Ericsson, K. A. & Simon, H. A. (1993). Protocol analysis: Verbal reports as data.
Cambridge, MA: MIT Press.
Gierl, M. J., Khaliq, S., & Boughton, K. (1999). Gender differential item functioning in
mathematics and science: Prevalence and policy implications. Paper presented
24
at the annual meeting of the Canadian Society for the Study of Education,
Sherbrooke, Quebec.
Gierl, M. J., & McEwen, N. (1998). Differential item functioning on the Alberta Education
Social Studies 30 diploma exams. Paper presented at the annual meeting of the
Canadian Society for Studies in Education, Ottawa, Ontario, Canada.
Kuhn, D. (2001). Why development does (and does not) occur: Evidence from the
domain of inductive reasoning. In J. L. McClelland & R. Siegler (Eds.),
Mechanisms of cognitive development: Behavioral and neural perspectives (pp.
221-249). Hillsdale, NJ: Erlbaum.
Leighton, J.P., & Gierl, M.J. (2007b). Defining and evaluating models of cognition used
in educational measurement to make inferences about examinees’ thinking
processes. Educational Measurement: Issues and Practice, 26, 3–16.
Leighton, J. P., Gierl, M. J., & Hunka, S. M. (2004). The attribute hierarchy model for
cognitive assessment: A variation on Tatsuoka's rule-space approach. Journal of
Educational Measurement, 41, 205-237.
Linn, R. L., Baker, E. L., & Betebenner, D. W. (2002). Accountability systems:
Implications of requirements of the No Child Left Behind Act of 2001. Educational
Researcher, 31(6), 3-16.
No Child Left Behind Act of 2001, Pub. L. No. 107-110, 115 Stat. 1425 (2002).
O’Callaghan, R.K., Morley, M.E., & Schwartz, A. (2004). Developing skill categories for
the SAT Math section. Paper presented at the meeting of the National Council on
Measurement in Education, San Diego, CA.
25
O’Neill, K. A., & McPeek, W. M. (1993). Item and test characteristics that are associated
with differential item functioning. In P. W. Holland & H. Wainer (Eds.), Differential
item functioning (pp. 255-276). Hillsdale, NJ: Lawrence Erlbaum.
Parshall, C. G., & Miller, T. R. (1995). Exact versus asymptotic Mantel-Haenszel DIF
statistics: A comparison of performance under small-sample conditions. Journal
of Educational Measurement, 32, 302-316.
Schmitt, A. P. (1988). Language and cultural characteristics that explain differential item
functioning for Hispanic examinees on the Scholastic Aptitude Test. Journal of
Educational Measurement, 25, 1-13.
Shepard, L. A., Camilli, G., & Williams, D. M. (1985). Validity of approximation
techniques for detecting item bias. Journal of Educational Measurement, 22, 77-
105.
VanderVeen, A. (2004). Toward a construct of Critical Reading for the new SAT. Paper
presented at the meeting of the National Council on Measurement in Education,
San Diego, CA.
Zwick, R., & Ercikan, K. (1989). Analysis of differential item functioning in the NAEP
history assessment. Journal of Educational Measurement, 26, 55-66.
26
Table 1. Average HCI overall, by gender and by ethnicity for a high average low
variability HCI model for Critical Reading and Mathematics
Critical Reading Mathematics
Mean SD Mean SD
Overall 0.81 0.48 0.91 0.43
Gender
Female 0.81 0.47 0.91 0.41
Male 0.80 0.49 0.90 0.44
Ethnicity
American Indian 0.80 0.51 0.94 0.34
Asian 0.80 0.47 0.96 0.29
African-American 0.80 0.49 0.79 0.62
Mexican-American 0.75 0.56 0.86 0.51
Puerto Rican 0.76 0.54 0.81 0.59
Other Hispanic 0.77 0.52 0.91 0.41
White 0.82 0.47 0.94 0.34
Other 0.85 0.42 0.90 0.44
27
Table 2. Average HCI gender by ethnicity for a high average low variability HCI model for Critical Reading and
Mathematics
Critical Reading Mathematics
Mean SD Mean SD Mean SD Mean SD
Female Male Female Male
American Indian 0.67 0.65 0.93 0.31 1.00 0.00 0.89 0.47
Asian 0.77 0.51 0.83 0.42 0.94 0.34 0.97 0.23
African-American 0.84 0.45 0.75 0.53 0.81 0.59 0.76 0.65
Mexican-American 0.76 0.53 0.73 0.61 0.91 0.40 0.79 0.62
Puerto Rican 0.77 0.58 0.76 0.50 0.88 0.47 0.72 0.70
Other Hispanic 0.79 0.50 0.76 0.54 0.90 0.44 0.93 0.36
White 0.82 0.46 0.82 0.47 0.94 0.34 0.94 0.35
Other 0.84 0.43 0.85 0.42 0.89 0.45 0.90 0.43
28
Table 3. Average HCI overall, by gender and by ethnicity for a moderate average
moderate variability HCI model for Critical Reading and Mathematics
Critical Reading Mathematics
Mean SD Mean SD
Overall 0.72 0.56 0.80 0.55
Gender
Female 0.72 0.56 0.80 0.55
Male 0.73 0.56 0.81 0.54
Ethnicity
American Indian 0.74 0.56 0.77 0.55
Asian 0.73 0.56 0.83 0.47
African-American 0.68 0.66 0.72 0.65
Mexican-American 0.76 0.56 0.74 0.63
Puerto Rican 0.79 0.51 0.67 0.70
Other Hispanic 0.73 0.60 0.77 0.60
White 0.73 0.53 0.84 0.50
Other 0.73 0.56 0.83 0.49
29
Table 4. Average HCI gender by ethnicity for a moderate average moderate variability HCI model for Critical Reading and
Mathematics
Critical Reading Mathematics
Mean SD Mean SD Mean SD Mean SD
Female Male Female Male
American Indian 0.59 0.71 0.89 0.32 0.65 0.70 0.89 0.32
Asian 0.72 0.57 0.75 0.56 0.82 0.51 0.84 0.44
African-American 0.68 0.65 0.69 0.66 0.73 0.63 0.70 0.67
Mexican-American 0.74 0.60 0.80 0.50 0.76 0.62 0.71 0.65
Puerto Rican 0.80 0.50 0.77 0.53 0.72 0.61 0.60 0.79
Other Hispanic 0.73 0.59 0.74 0.60 0.71 0.66 0.84 0.50
White 0.72 0.53 0.73 0.53 0.84 0.50 0.84 0.50
Other 0.76 0.52 0.71 0.60 0.82 0.51 0.84 0.48
30
Table 5. Average HCI overall, by gender and by ethnicity for a low average high
variability HCI model for Critical Reading and Mathematics
Critical Reading Mathematics
Mean SD Mean SD
Overall 0.33 0.87 0.40 0.92
Gender
Female 0.31 0.88 0.39 0.92
Male 0.36 0.86 0.41 0.91
Ethnicity
American Indian 0.35 0.92 0.43 0.92
Asian 0.42 0.84 0.26 0.97
African-American 0.37 0.89 0.58 0.82
Mexican-American 0.47 0.84 0.49 0.87
Puerto Rican 0.29 0.92 0.62 0.79
Other Hispanic 0.40 0.88 0.46 0.89
White 0.29 0.87 0.33 0.94
Other 0.36 0.84 0.49 0.87
31
Table 6. Average HCI gender by ethnicity for a low HCI high average variability model for Critical Reading and
Mathematics
Critical Reading Mathematics
Mean SD Mean SD Mean SD Mean SD
Female Male Female Male
American Indian 0.22 0.98 0.48 0.87 0.76 0.66 0.11 1.02
Asian 0.41 0.86 0.42 0.83 0.21 0.98 0.32 0.95
African-American 0.31 0.91 0.43 0.86 0.55 0.83 0.60 0.80
Mexican-American 0.44 0.86 0.51 0.80 0.50 0.87 0.47 0.88
Puerto Rican 0.32 0.90 0.26 0.95 0.77 0.65 0.44 0.91
Other Hispanic 0.37 0.88 0.45 0.87 0.49 0.87 0.41 0.91
White 0.26 0.88 0.32 0.87 0.30 0.95 0.36 0.93
Other 0.42 0.82 0.29 0.87 0.51 0.86 0.47 0.89
32
Figure Captions
Figure 1. Example attribute cognitive model.
Figure 2A.Critical Reading cognitive model for high HCI, low variability.
Figure 2B. Mathematics cognitive model for high HCI, low variability.
Figure 3A. Critical Reading cognitive model for moderate HCI, moderate variability.
Figure 3B. Mathematics cognitive model for moderate HCI, moderate variability.
Figure 4A. Critical Reading cognitive model for low HCI, high variability.
Figure 4B. Mathematics cognitive model for low HCI, high variability.
Figure 5. Average HCI values for a high HCI, low variability Critical Reading model for
gender by ethnic groups.
Figure 6. Average HCI values for a high HCI, low variability Mathematics model for
gender by ethnic groups.
Figure 7. Average HCI values for a moderate HCI, moderate variability Critical Reading
model for gender by ethnic groups.
Figure 8. Average HCI values for a moderate HCI, moderate variability Mathematics
model for gender by ethnic groups.
Figure 9. Average HCI values for a low HCI, high variability Critical Reading model for
gender by ethnic groups.
Figure 10. Average HCI values for a low HCI, high variability Mathematics model for
gender by ethnic groups.
33
34
Word Recognition
1.d.1 1.d.2 1.d.3 1.d.4
1.d.1 1.d.2 1.d.3
1.d.1 1.d.2
1.d.1
1.d.4 = Recognize the meaning of sophisticated and specialized vocabulary
1.d.3 = Recognize the meaning of less common words
1.d.2 = Recognize the meaning of common words in unfamiliar contexts
1.d.1 = Recognize the meaning of common words in familiar contexts
2. Algebra and Functions
2.1.1 2.1.2 2.1.3 2.1.4
2.1.1 2.1.2 2.1.3
2.1.1 2.1.2
2.1.1
2.1.4 =Solve word problems involving nonlinear or piecewise
linear rates of change
2.1.3 =Solve problems involving nonlinear functions
2.1.2 =Interpret and solve word problems using multi-step
proportional reasoning involving ratios, rates, and proportions
2.1.1 =Solve problems involving rates and unit conversions
35
Interpretations and perspectives
4.d.1 4.d.2 4.d.3 4.d.4 4.d.5
4.d.1 4.d.2 4.d.3 4.d.4
4.d.1 4.d.2 4.d.3
4.d.1 4.d.2
4.d.1
4.d.5= Identify similarities and differences among arguments across texts
4.d.4= Identify similarities and differences among multiple perspectives across texts
4.d.3= Identify multiple commentaries on perspectives in text
4.d.2= Identify multiple layers of interpretation of text
4.d.1= Identify accurate interpretation of text
2. Algebra and Functions
2.4.1 2.4.2 2.4.3
2.4.1 2.4.2
2.4.1
2.4.3 =Solve for one variable or expression in terms of another
[Solve literal equations]
2.4.2 =Use variables in multi-step abstract settings (e.g., applying
the distributive property across several variables)
2.4.1 =Use a letter as a placeholder for an unknown value
36
Interpretations and perspectives
4.d.1 4.d.2 4.d.3 4.d.4 4.d.5
4.d.1 4.d.2 4.d.3 4.d.4
4.d.1 4.d.2 4.d.3
4.d.1 4.d.2
4.d.1
4.d.5= Identify similarities and differences among arguments across texts
4.d.4= Identify similarities and differences among multiple perspectives across texts
4.d.3= Identify multiple commentaries on perspectives in text
4.d.2= Identify multiple layers of interpretation of text
4.d.1= Identify accurate interpretation of text
2. Algebra and Functions
2.14.1 2.14.2 2.14.3
2.14.1 2.14.2
2.14.1
2.14.3 =Solve problems involving nonlinear expressions or
equations
2.14.2 =Solve problems involving quadratic equations
2.14.1 =Solve linear equations
37
0.00
0.10
0.20
0.30
0.40
0.50
0.60
0.70
0.80
0.90
1.00
American Indian African-American Asian White
Ave
rag
e H
CI
Ethnic groups
Female
Male
38
0.00
0.10
0.20
0.30
0.40
0.50
0.60
0.70
0.80
0.90
1.00
Puerto Rican Mexican-American American Indian White
Ave
rag
e H
CI
Ethnic groups
Female
Male
39
0.00
0.10
0.20
0.30
0.40
0.50
0.60
0.70
0.80
0.90
1.00
American Indian Mexican-American White
Ave
rag
e H
CI
Ethnic groups
Female
Male
40
0.00
0.10
0.20
0.30
0.40
0.50
0.60
0.70
0.80
0.90
1.00
American Indian Other Hispanic Puerto Rican Mexican-American White
Ave
rag
e H
CI
Ethnic groups
Female
Male
41
0.00
0.10
0.20
0.30
0.40
0.50
0.60
0.70
0.80
0.90
1.00
American Indian Other African American Other Hispanic Asian
Ave
rag
e H
CI
Ethnic groups
Female
Male
42
0.00
0.10
0.20
0.30
0.40
0.50
0.60
0.70
0.80
0.90
1.00
American Indian Puerto Rican Asian Other Hispanic Mexican-American
Ave
rag
e H
CI
Ethnic groups
Female
Male
Related Documents