2019 ANNUAL REPORT

Welcome message from author
This document is posted to help you gain knowledge. Please leave a comment to let me know what you think about it! Share it to your friends and learn new things together.
Transcript
2019 ANNUALREPORT
READING THIS REPORT IN THE CONTEXT OF COVID-19As you will see, we have adopted a new approach to Amatil’s 2019 Annual Report. We have combined our Annual and Sustainability Reports for the first time, building on our commitment to move towards integrated reporting, and to showcase the year that was for our company, our people and all of our stakeholders.
At the time of publication of this 2019 Annual Report1 (“Report”), the world is responding to the COVID-19 pandemic and the duration, impacts and severity are continuing, with many unknowns.
At Coca-Cola Amatil, protecting the health and safety of our people and those we work with will always be our overriding priority. At the time of finalising this Report we are monitoring on a daily basis the status and impacts of COVID-19, to respond and adjust across all of our geographies and adapt to new work rhythms and operations – to remain focused on business continuity and our customers during this challenging time.
We have cancelled large gatherings and implemented physical distancing measures designed to protect our people, whether they work in our field-based sales teams, front-line manufacturing and distribution operations, or in an office-based environment. We have suspended all international and non-essential domestic travel and implemented measures to ensure we can equip our teams to work virtually where possible, and safely in all other situations.
Amatil’s Annual General Meeting of Shareholders scheduled for 26 May 2020 will also be conducted virtually, to discourage physical attendance for the protection of all our people and our investor community.
We will continue to align with advice from the World Health Organisation and the relevant Government Authorities in our countries of operation.
Given the significant uncertainty around the duration and impacts of the COVID-19 pandemic, on 17 March 2020 Amatil withdrew the earnings guidance, which was previously issued to the market on 20 February 2020.
This Report reflects our results and achievements for 2019. The strategies, priorities, shareholder value proposition and outlook statements were relevant and appropriate at the time of being issued within the 2019 Financial and Statutory Reports, but COVID-19 will cause all of them to change.
Amatil has a strong balance sheet and low net debt levels, ensuring we are well positioned to navigate this event. We have been implementing contingency plans to mitigate the impacts of COVID-19 on our workforce and operations. We will continue to evolve our response and assess the impact of this global pandemic as its effect on our business becomes clearer.
Our latest updates to the market can be found on our website at www.ccamatil.com.
We thank our many customers, brand and business partners across all regions for working with us in partnership to continue to meet the needs of our customers and protect the communities in which we operate.
COVID-19 & OUR 2019 REPORTAN IMPORTANT MESSAGE
1 Print date as at 14 April 2020.
BEING
A SU
STAIN
ABLE
BUSIN
ESSTH
E VALU
E W
E CREATEPERFO
RMA
NCE
& O
UTLO
OK
GO
VERNA
NCE
& RISK
SFIN
AN
CIAL &
STATUTO
RY REPO
RTS
OTH
ER IN
FORM
ATION
OU
R BU
SINESS
1
ANNUAL GENERAL MEETINGCoca-Cola Amatil’s AGM will be held virtually via our online platform at https://agmlive.link/CCL20 on 26 May 2020 at 10.00am (AEST).
ABN 26 004 139 397
OUR BUSINESS
01 COVID-19 & Our 2019 Report02 Who We Are04 Where We Operate06 2019 Highlights08 Chairman’s Review10 Group Managing Director’s Review
THE VALUE WE CREATE
12 Strategy and Long-term Value Creation14 Our Shareholder Value Proposition16 Thriving Customers20 Committed Partners24 Engaged People28 Delighted Consumers32 Better Environment38 Stakeholders
PERFORMANCE & OUTLOOK
40 Group Performance46 Australian Beverages50 New Zealand & Fiji52 Alcohol & Coffee54 Indonesia & Papua New Guinea57 Corporate & Services
BEING A SUSTAINABLE BUSINESS
58 Sustainability Strategy61 Sustainability Goals and Progress
GOVERNANCE & RISKS
62 Corporate Governance64 Board of Directors66 Group Leadership Team68 Business and Sustainability Risks
FINANCIAL & STATUTORY REPORTS
70 Directors’ Report (including Remuneration Report)99 Financial Report150 Independent Auditor’s Report
OTHER INFORMATION
155 Independent Limited Assurance Report 156 Shareholder Information159 Five-year Financial History160 Glossary161 Directories & Calendar of Events
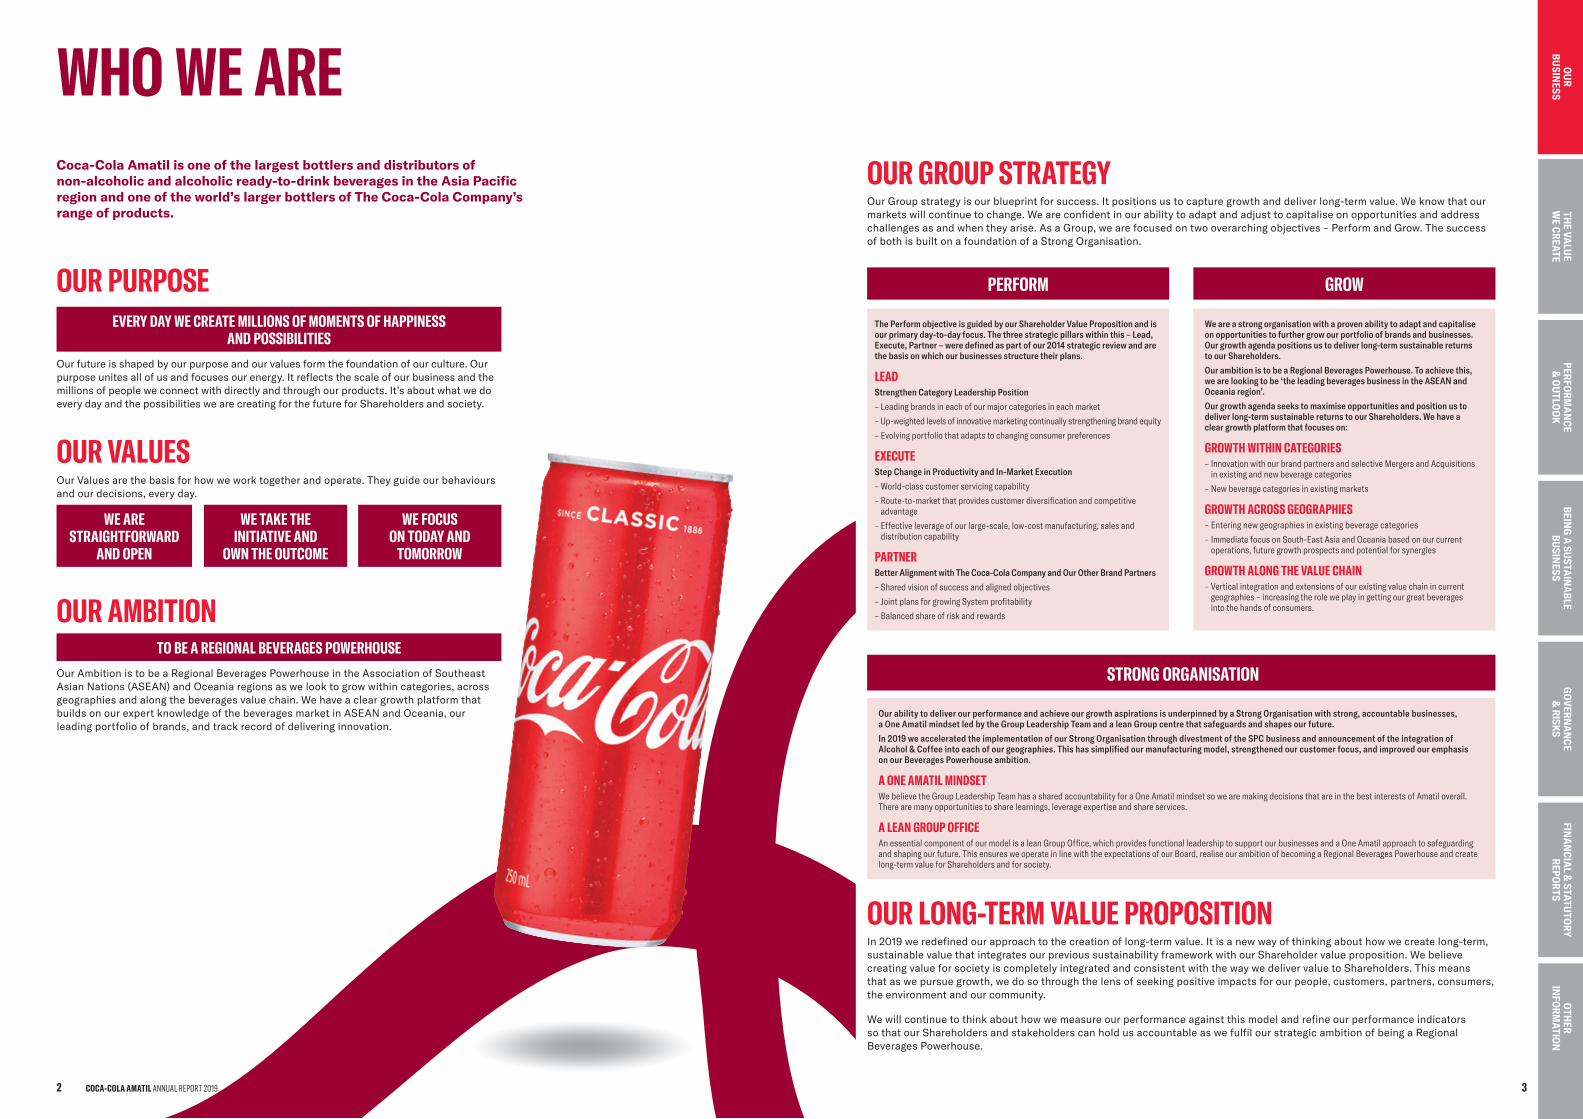
OUR GROUP STRATEGYOur Group strategy is our blueprint for success. It positions us to capture growth and deliver long-term value. We know that our markets will continue to change. We are confident in our ability to adapt and adjust to capitalise on opportunities and address challenges as and when they arise. As a Group, we are focused on two overarching objectives – Perform and Grow. The success of both is built on a foundation of a Strong Organisation.
PERFORM GROW
The Perform objective is guided by our Shareholder Value Proposition and is our primary day-to-day focus. The three strategic pillars within this – Lead, Execute, Partner – were defined as part of our 2014 strategic review and are the basis on which our businesses structure their plans.
LEADStrengthen Category Leadership Position
– Leading brands in each of our major categories in each market
– Up-weighted levels of innovative marketing continually strengthening brand equity
– Evolving portfolio that adapts to changing consumer preferences
EXECUTEStep Change in Productivity and In-Market Execution
– World-class customer servicing capability
– Route-to-market that provides customer diversification and competitive advantage
– Effective leverage of our large-scale, low-cost manufacturing, sales and distribution capability
PARTNERBetter Alignment with The Coca-Cola Company and Our Other Brand Partners
– Shared vision of success and aligned objectives
– Joint plans for growing System profitability
– Balanced share of risk and rewards
We are a strong organisation with a proven ability to adapt and capitalise on opportunities to further grow our portfolio of brands and businesses. Our growth agenda positions us to deliver long-term sustainable returns to our Shareholders.
Our ambition is to be a Regional Beverages Powerhouse. To achieve this, we are looking to be ‘the leading beverages business in the ASEAN and Oceania region’.
Our growth agenda seeks to maximise opportunities and position us to deliver long-term sustainable returns to our Shareholders. We have a clear growth platform that focuses on:
GROWTH WITHIN CATEGORIES– Innovation with our brand partners and selective Mergers and Acquisitions
in existing and new beverage categories
– New beverage categories in existing markets
GROWTH ACROSS GEOGRAPHIES– Entering new geographies in existing beverage categories
– Immediate focus on South-East Asia and Oceania based on our currentoperations, future growth prospects and potential for synergies
GROWTH ALONG THE VALUE CHAIN– Vertical integration and extensions of our existing value chain in current
geographies – increasing the role we play in getting our great beverages into the hands of consumers.
STRONG ORGANISATION
Our ability to deliver our performance and achieve our growth aspirations is underpinned by a Strong Organisation with strong, accountable businesses, a One Amatil mindset led by the Group Leadership Team and a lean Group centre that safeguards and shapes our future.
In 2019 we accelerated the implementation of our Strong Organisation through divestment of the SPC business and announcement of the integration of Alcohol & Coffee into each of our geographies. This has simplified our manufacturing model, strengthened our customer focus, and improved our emphasis on our Beverages Powerhouse ambition.
A ONE AMATIL MINDSETWe believe the Group Leadership Team has a shared accountability for a One Amatil mindset so we are making decisions that are in the best interests of Amatil overall. There are many opportunities to share learnings, leverage expertise and share services.
A LEAN GROUP OFFICEAn essential component of our model is a lean Group Office, which provides functional leadership to support our businesses and a One Amatil approach to safeguarding and shaping our future. This ensures we operate in line with the expectations of our Board, realise our ambition of becoming a Regional Beverages Powerhouse and create long-term value for Shareholders and for society.
OUR LONG-TERM VALUE PROPOSITIONIn 2019 we redefined our approach to the creation of long-term value. It is a new way of thinking about how we create long-term, sustainable value that integrates our previous sustainability framework with our Shareholder value proposition. We believe creating value for society is completely integrated and consistent with the way we deliver value to Shareholders. This means that as we pursue growth, we do so through the lens of seeking positive impacts for our people, customers, partners, consumers, the environment and our community.
We will continue to think about how we measure our performance against this model and refine our performance indicators so that our Shareholders and stakeholders can hold us accountable as we fulfil our strategic ambition of being a Regional Beverages Powerhouse.
WHO WE ARE
OUR PURPOSEEVERY DAY WE CREATE MILLIONS OF MOMENTS OF HAPPINESS
AND POSSIBILITIESOur future is shaped by our purpose and our values form the foundation of our culture. Our purpose unites all of us and focuses our energy. It reflects the scale of our business and the millions of people we connect with directly and through our products. It’s about what we do every day and the possibilities we are creating for the future for Shareholders and society.
OUR VALUESOur Values are the basis for how we work together and operate. They guide our behaviours and our decisions, every day.
WE ARE STRAIGHTFORWARD
AND OPEN
WE TAKE THE INITIATIVE AND
OWN THE OUTCOME
WE FOCUS ON TODAY AND
TOMORROW
OUR AMBITIONTO BE A REGIONAL BEVERAGES POWERHOUSE
Our Ambition is to be a Regional Beverages Powerhouse in the Association of Southeast Asian Nations (ASEAN) and Oceania regions as we look to grow within categories, across geographies and along the beverages value chain. We have a clear growth platform that builds on our expert knowledge of the beverages market in ASEAN and Oceania, our leading portfolio of brands, and track record of delivering innovation.
Coca-Cola Amatil is one of the largest bottlers and distributors of non-alcoholic and alcoholic ready-to-drink beverages in the Asia Pacific region and one of the world’s larger bottlers of The Coca-Cola Company’s range of products.
COCA-COLA AMATIL ANNUAL REPORT 20192 3
BEING
A SU
STAIN
ABLE
BUSIN
ESSTH
E VALU
E W
E CREATEPERFO
RMA
NCE
& O
UTLO
OK
GO
VERNA
NCE
& RISK
SFIN
AN
CIAL &
STATUTO
RY REPO
RTS
OTH
ER IN
FORM
ATION
OU
R BU
SINESS
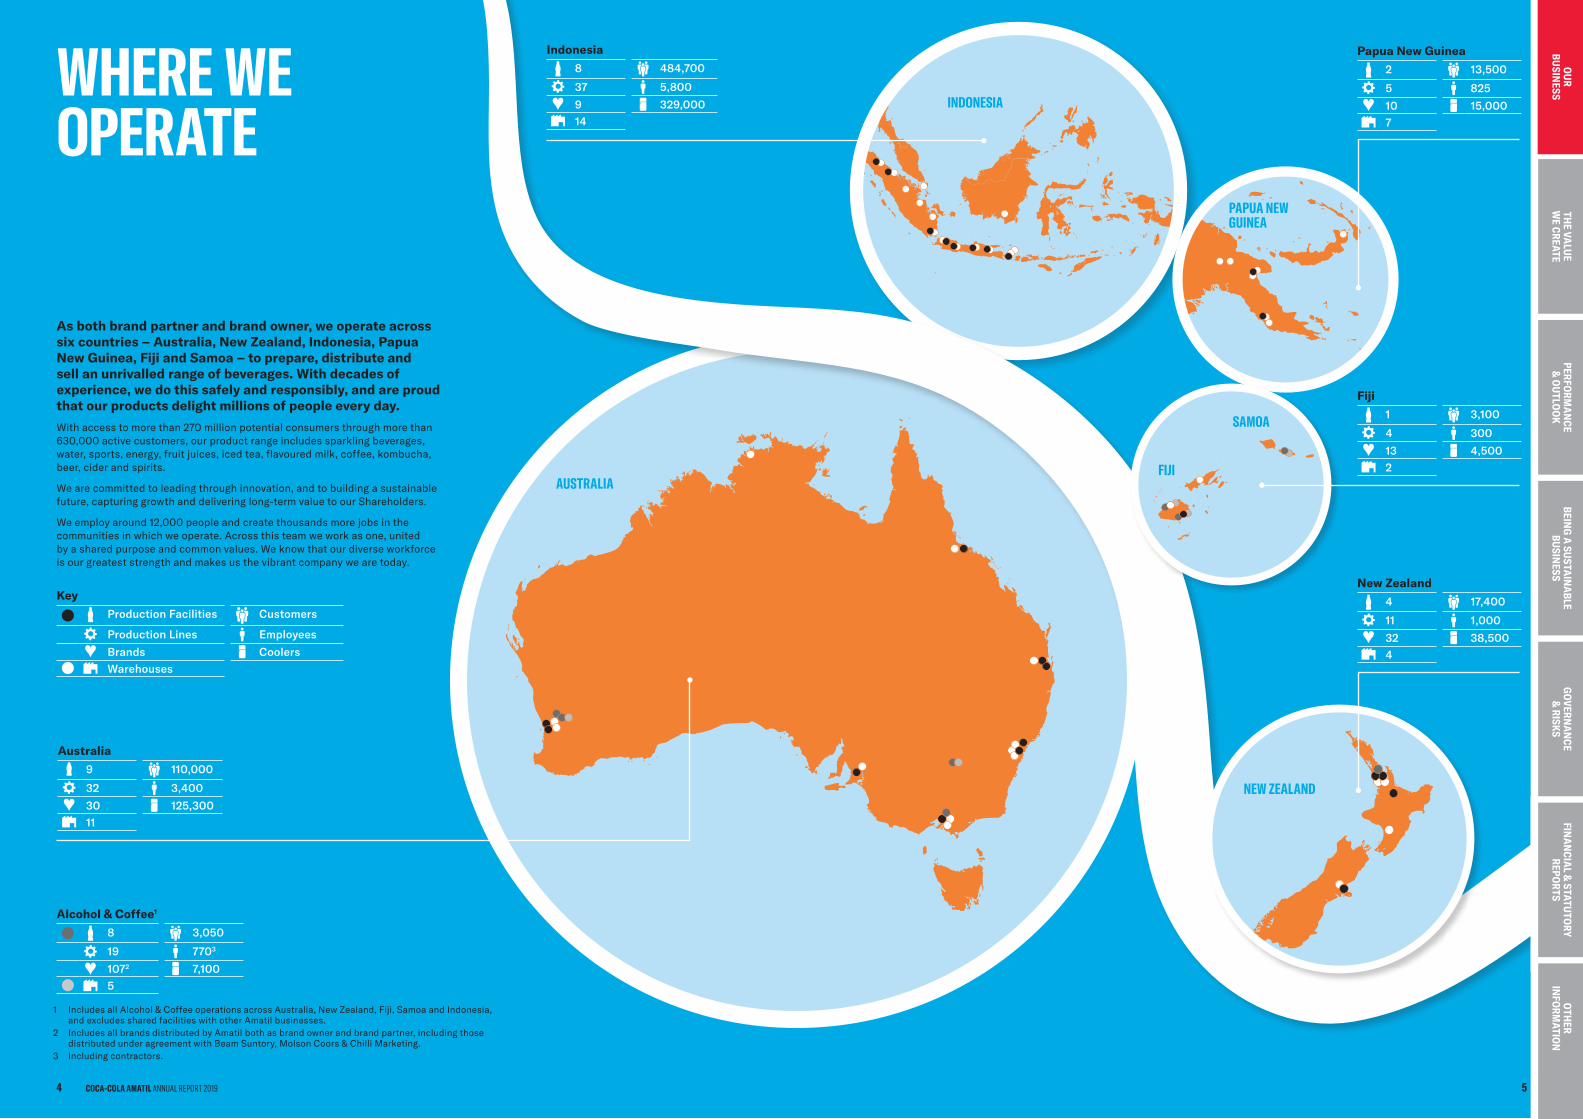
INDONESIA
New Zealand
4 17,400
11 1,000
32 38,500 4
Fiji
1 3,100
4 300
13 4,500 2
Papua New Guinea
2 13,500
5 825
10 15,0007
FIJI
SAMOA
PAPUA NEW GUINEA
NEW ZEALAND
Australia
9 110,000
32 3,400
30 125,300 11
Alcohol & Coffee1
8 3,050
19 7703
1072 7,1005
WHERE WE OPERATE
As both brand partner and brand owner, we operate across six countries – Australia, New Zealand, Indonesia, Papua New Guinea, Fiji and Samoa – to prepare, distribute and sell an unrivalled range of beverages. With decades of experience, we do this safely and responsibly, and are proud that our products delight millions of people every day.
With access to more than 270 million potential consumers through more than 630,000 active customers, our product range includes sparkling beverages, water, sports, energy, fruit juices, iced tea, flavoured milk, coffee, kombucha, beer, cider and spirits.
We are committed to leading through innovation, and to building a sustainable future, capturing growth and delivering long-term value to our Shareholders.
We employ around 12,000 people and create thousands more jobs in the communities in which we operate. Across this team we work as one, united by a shared purpose and common values. We know that our diverse workforce is our greatest strength and makes us the vibrant company we are today.
Key
Production Facilities Customers
Production Lines Employees
Brands CoolersWarehouses
Indonesia
8 484,700
37 5,800
9 329,000 14
AUSTRALIA
1 Includes all Alcohol & Coffee operations across Australia, New Zealand, Fiji, Samoa and Indonesia, and excludes shared facilities with other Amatil businesses.
2 Includes all brands distributed by Amatil both as brand owner and brand partner, including those distributed under agreement with Beam Suntory, Molson Coors & Chilli Marketing.
3 Including contractors.
COCA-COLA AMATIL ANNUAL REPORT 20194 5
BEING
A SU
STAIN
ABLE
BUSIN
ESSTH
E VALU
E W
E CREATEPERFO
RMA
NCE
& O
UTLO
OK
GO
VERNA
NCE
& RISK
SFIN
AN
CIAL &
STATUTO
RY REPO
RTS
OTH
ER IN
FORM
ATION
OU
R BU
SINESS
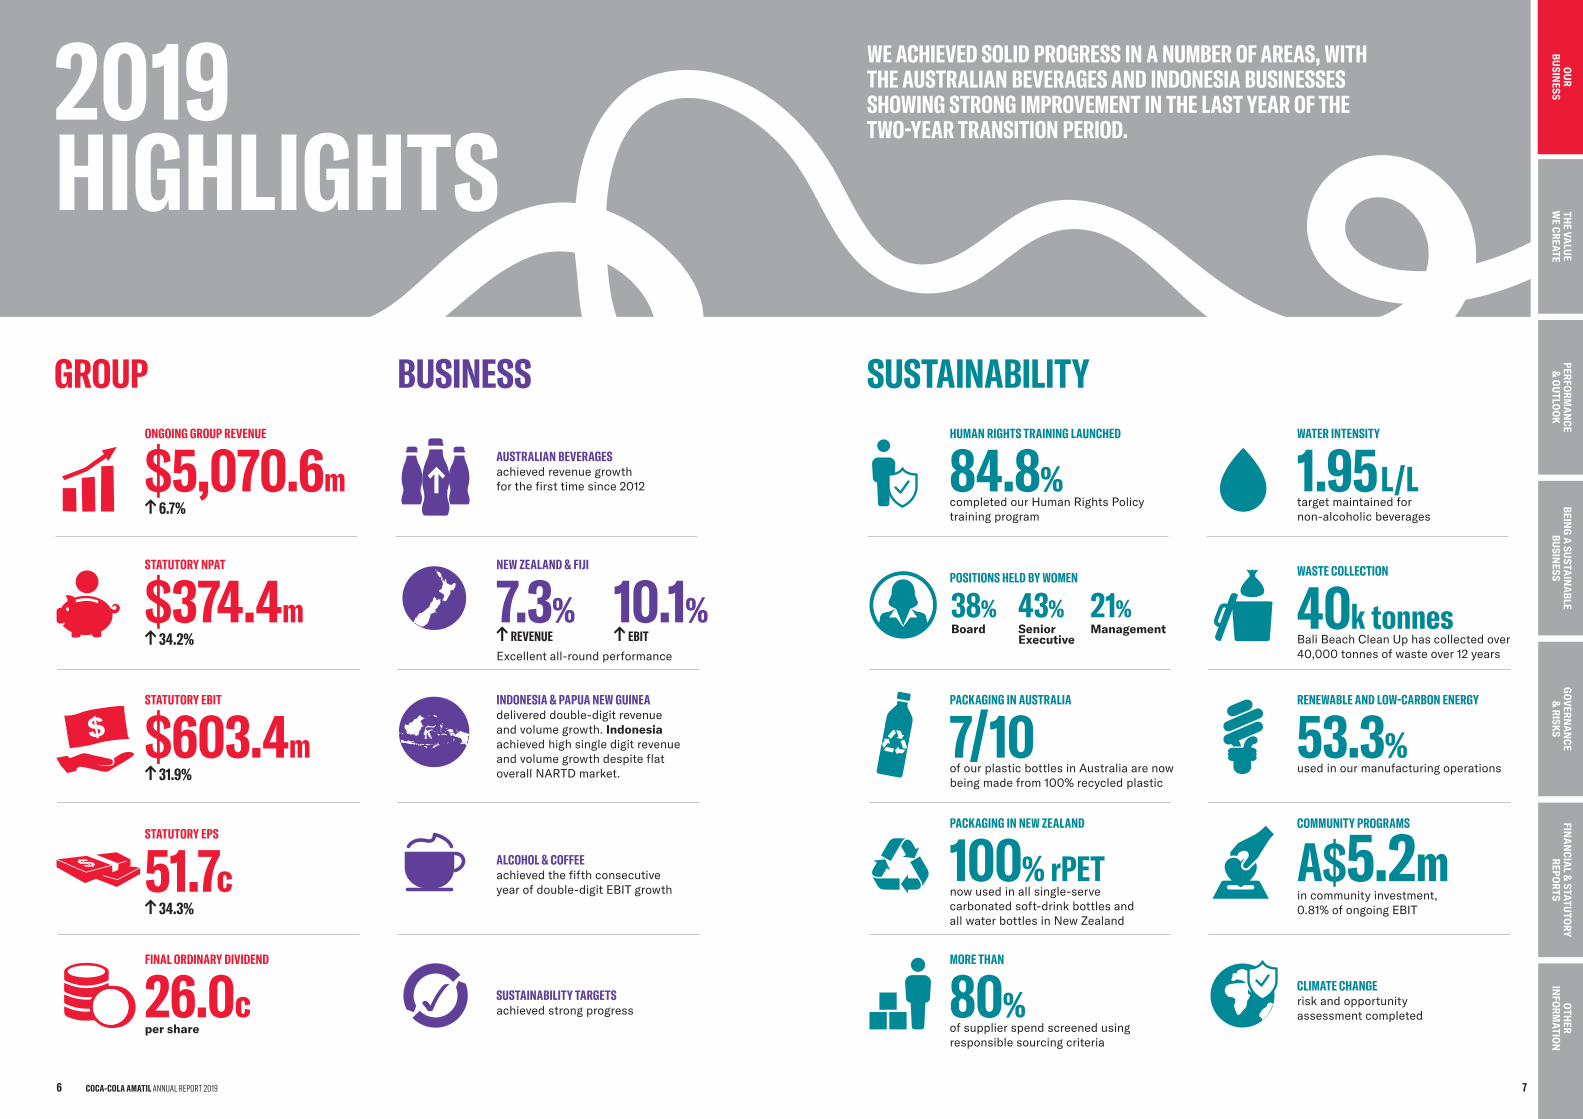
SUSTAINABILITYHUMAN RIGHTS TRAINING LAUNCHED
84.8% completed our Human Rights Policy training program
MORE THAN
80% of supplier spend screened using responsible sourcing criteria
COMMUNITY PROGRAMS
A$5.2min community investment, 0.81% of ongoing EBIT
RENEWABLE AND LOW-CARBON ENERGY
53.3% used in our manufacturing operations
WASTE COLLECTION
40k tonnesBali Beach Clean Up has collected over 40,000 tonnes of waste over 12 years
PACKAGING IN AUSTRALIA
7/10of our plastic bottles in Australia are now being made from 100% recycled plastic
PACKAGING IN NEW ZEALAND
100% rPETnow used in all single-serve carbonated soft-drink bottles and all water bottles in New Zealand
CLIMATE CHANGErisk and opportunity assessment completed
WE ACHIEVED SOLID PROGRESS IN A NUMBER OF AREAS, WITH THE AUSTRALIAN BEVERAGES AND INDONESIA BUSINESSES SHOWING STRONG IMPROVEMENT IN THE LAST YEAR OF THE TWO-YEAR TRANSITION PERIOD.
POSITIONS HELD BY WOMEN
38%Board
43%Senior Executive
21%Management
WATER INTENSITY
1.95 L/Ltarget maintained for non-alcoholic beverages
2019HIGHLIGHTS
GROUP BUSINESS
SUSTAINABILITY TARGETS achieved strong progress
Excellent all-round performance
ALCOHOL & COFFEE achieved the fifth consecutive year of double-digit EBIT growth
INDONESIA & PAPUA NEW GUINEAdelivered double-digit revenue and volume growth. Indonesia achieved high single digit revenue and volume growth despite flat overall NARTD market.
ONGOING GROUP REVENUE
$5,070.6m 6.7%
STATUTORY NPAT
$374.4m 34.2%
STATUTORY EBIT
$603.4m 31.9%
STATUTORY EPS
51.7c 34.3%
FINAL ORDINARY DIVIDEND
26.0cper share
AUSTRALIAN BEVERAGES achieved revenue growth for the first time since 2012
NEW ZEALAND & FIJI
7.3% REVENUE
10.1% EBIT
COCA-COLA AMATIL ANNUAL REPORT 20196 7
BEING
A SU
STAIN
ABLE
BUSIN
ESSTH
E VALU
E W
E CREATEPERFO
RMA
NCE
& O
UTLO
OK
GO
VERNA
NCE
& RISK
SFIN
AN
CIAL &
STATUTO
RY REPO
RTS
OTH
ER IN
FORM
ATION
OU
R BU
SINESS
IN EARLY 2019 WE IMPLEMENTED A COCA-COLA BOTTLER SYSTEM FIRST WITH A 100 PER CENT RECYCLED PET PLASTIC BOTTLE FOR CARBONATED BEVERAGES.
Committed PartnersWe are delighted with the strong performance of the Coca-Cola Trademark across our markets. This is a strong demonstration of the success and strength of our partnership with The Coca-Cola Company. The Coca-Cola System is unique, and we are a proud partner in this System.
Amatil is proud to partner with a number brand partners in non-alcoholic ready-to-drink, alcoholic and hot beverages industries. Each relationship is different and we work closely with our partners to ensure we grow our businesses together. We are committed to successful business partnerships built on trust and shared value.
We continued to focus on innovation and new product development through our partnership with Beam Suntory across Australia and New Zealand, and the successful launches of Roku premium gin and the Koyomi range of new-to-world Shochu-based drinks.
Delighted ConsumersConsumer wellbeing continues to be a priority for Coca-Cola Amatil as we provide consumer choice based on their preferences.
We achieved substantial reduction in sugar content across our portfolio in Australia and New Zealand. Measured as grams per 100ml, so far we have achieved reductions of 8.8 per cent in Australia and 5.3 per cent in New Zealand versus a 2016 baseline.
In Indonesia we launched new products such as Sprite Waterlymon with sugar content lower than regular Sprite and introduced small packs (200ml) for popular products such as Frestea Green Honey and Refresh Strawberry. Overall, we’ve delivered a 7.8 per cent reduction in sugar grams per 100ml across our portfolio in Indonesia since 2016.
In Fiji we made changes to our portfolio to include Coca-Cola No Sugar, reformulated Diet Coke and reduced sugar content in a range of alcoholic and non-alcoholic ready-to-drink brands.
Across the Pacific we set a roadmap for sugar reduction through to 2022, which includes reformulations of various Fanta and Sprite options in Fiji including Fanta Pineapple, Fanta Orange and in Samoa, Sprite.
Engaged PeopleWe strive to achieve and maintain a zero-harm workplace where safety is everyone’s responsibility. For Coca-Cola Amatil, a safe workplace is the result of both our ‘safety first’ culture and a clearly defined set of requirements for all employees.
Overall, we believe our people feel engaged, included and developed. This is evidenced by our 2019 employee engagement scores. Indonesia recorded a significant increase of six percentage points to 81 per cent, Papua New Guinea and Australia recorded impressive increases of 15 and 12 percentage points respectively. New Zealand continues to produce Amatil’s leading engagement scores, achieving 87 per cent in 2019.
We are heading in the right direction in relation to gender diversity, with 43 per cent of our senior executive roles being held by women compared to 34 per cent in 2018. This is good progress but there is more to do.
Better EnvironmentInspired by The Coca-Cola Company’s launch of a World Without Waste, in early 2019 we implemented a Coca-Cola Bottler System first with a 100 per cent recycled PET plastic bottle for carbonated beverages. This innovation was developed by our team at Eastern Creek in NSW, Australia and is an innovation which our peers in the global Coca-Cola System are now keen to replicate.
As a result of innovations such as this, we are now producing all single-serve and water bottles in 100 per cent recycled plastic in Australia and New Zealand. Additionally, we are involved in the operation of all planned and operational container deposit schemes across Australia, and we continue to manage the Fijian based collection scheme Mission Pacific. In 2019 we celebrated our eleventh year supporting the Bali Beach Clean-Up program.
Plastic continues to have a valuable role to play in our packaging mix. It is efficient to transport and has a low carbon footprint when compared to other packaging formats. Finding a solution to the impact of plastics on the environment is of global importance, and a key priority for Amatil.
Moreover, our 2019 Operating and Financial Review recognised the importance of disclosing climate related risks and opportunities in line with the recommendations of the Task Force on Climate Related Financial Disclosures. We will continue to improve our assessment of climate risk, management and disclosure approaches in line with these recommendations.
Board Update Board renewal is an ongoing and important exercise. It ensures the Board has the right mix of skills and experience to meet the Company’s strategic objectives and future challenges, and that our Shareholders are represented by a diverse and experienced Board.
In November 2019 we announced the appointment of Penelope (Penny) Winn to the Board, replacing Julie Coates. Penny has extensive experience in the retail and fast-moving consumer goods sectors, alongside expertise in complex logistics and supply chains.
Creating value together The Board is committed to delivering long-term sustainable value for our customers, our people, partners, consumers, the environment and our shareholders.
Like many organisations across the globe, Amatil is continuing to work through the constantly changing impacts of COVID-19, with the safety and wellbeing of our people, our consumers, our customers and our communities our overriding priority. We will continue to evolve our response and assess the impact of this global pandemic as its effect on our business becomes clearer.
On behalf of the Board, I would like to take this opportunity to thank all of our teams across all our geographies for their dedication and contribution during the year.
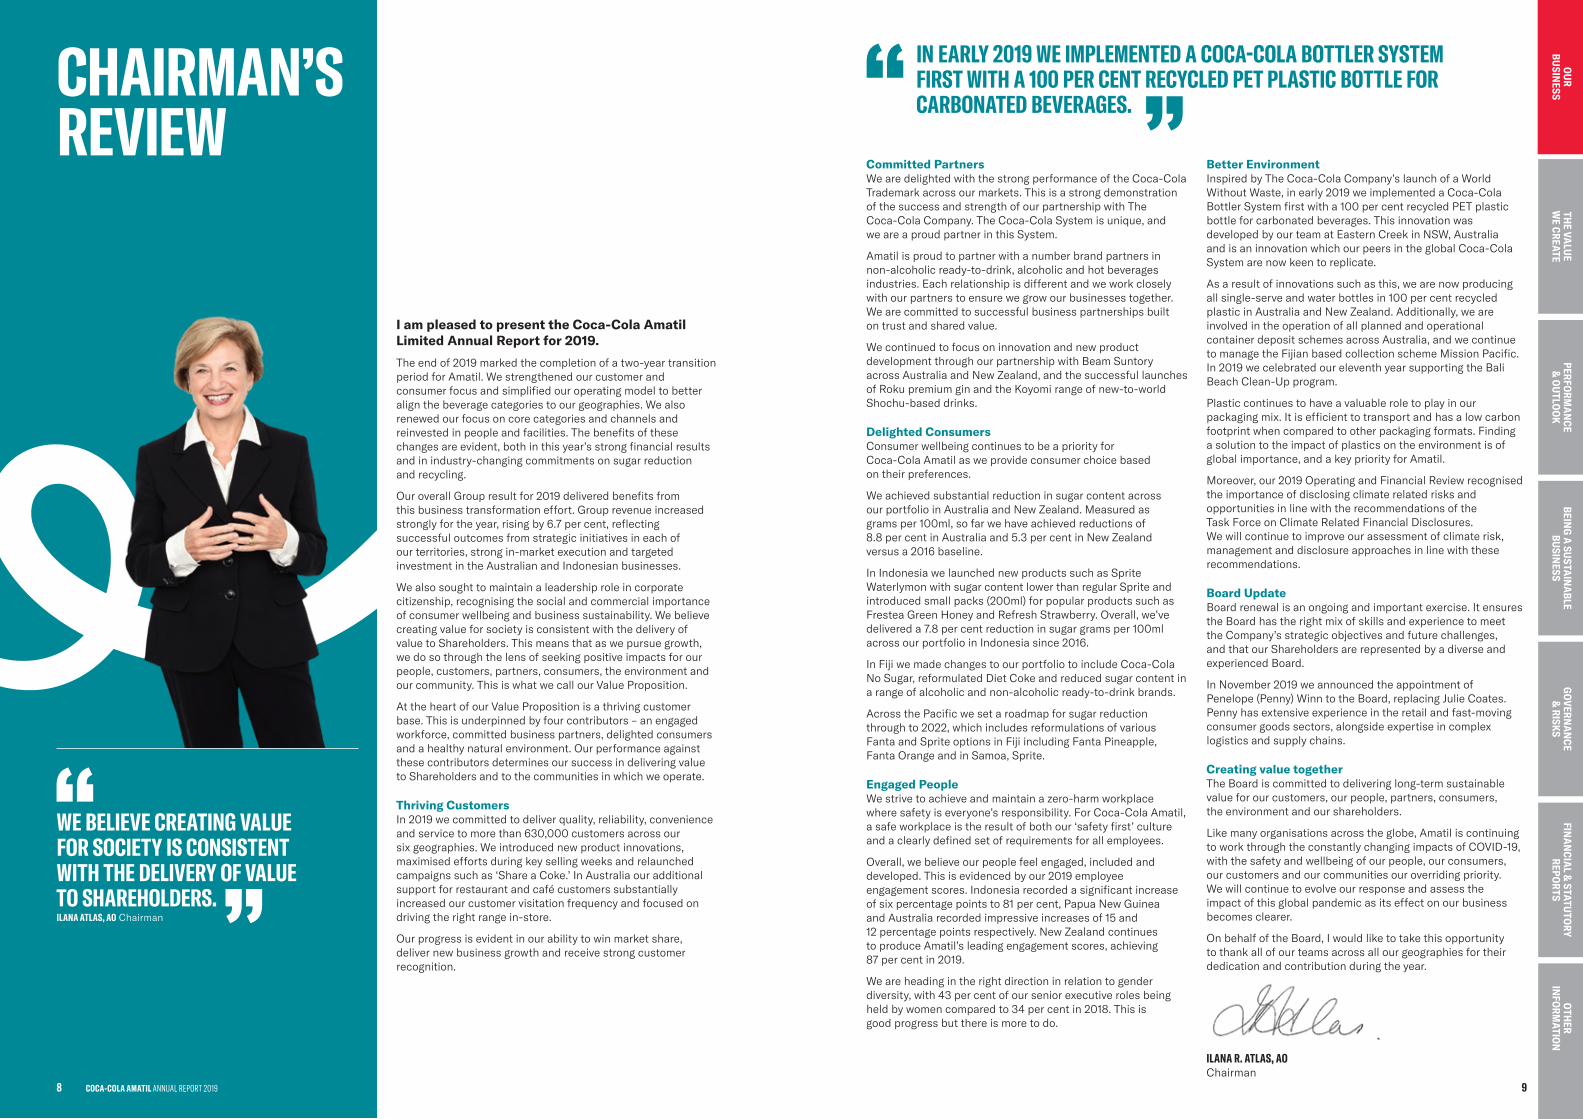
ILANA R. ATLAS, AOChairman
CHAIRMAN’S REVIEW
I am pleased to present the Coca-Cola Amatil Limited Annual Report for 2019.
The end of 2019 marked the completion of a two-year transition period for Amatil. We strengthened our customer and consumer focus and simplified our operating model to better align the beverage categories to our geographies. We also renewed our focus on core categories and channels and reinvested in people and facilities. The benefits of these changes are evident, both in this year’s strong financial results and in industry-changing commitments on sugar reduction and recycling.
Our overall Group result for 2019 delivered benefits from this business transformation effort. Group revenue increased strongly for the year, rising by 6.7 per cent, reflecting successful outcomes from strategic initiatives in each of our territories, strong in-market execution and targeted investment in the Australian and Indonesian businesses.
We also sought to maintain a leadership role in corporate citizenship, recognising the social and commercial importance of consumer wellbeing and business sustainability. We believe creating value for society is consistent with the delivery of value to Shareholders. This means that as we pursue growth, we do so through the lens of seeking positive impacts for our people, customers, partners, consumers, the environment and our community. This is what we call our Value Proposition.
At the heart of our Value Proposition is a thriving customer base. This is underpinned by four contributors – an engaged workforce, committed business partners, delighted consumers and a healthy natural environment. Our performance against these contributors determines our success in delivering value to Shareholders and to the communities in which we operate.
Thriving CustomersIn 2019 we committed to deliver quality, reliability, convenience and service to more than 630,000 customers across our six geographies. We introduced new product innovations, maximised efforts during key selling weeks and relaunched campaigns such as ‘Share a Coke.’ In Australia our additional support for restaurant and café customers substantially increased our customer visitation frequency and focused on driving the right range in-store.
Our progress is evident in our ability to win market share, deliver new business growth and receive strong customer recognition.
WE BELIEVE CREATING VALUE FOR SOCIETY IS CONSISTENT WITH THE DELIVERY OF VALUE TO SHAREHOLDERS. ILANA ATLAS, AO Chairman
9
BEING
A SU
STAIN
ABLE
BUSIN
ESSTH
E VALU
E W
E CREATEPERFO
RMA
NCE
& O
UTLO
OK
GO
VERNA
NCE
& RISK
SFIN
AN
CIAL &
STATUTO
RY REPO
RTS
OTH
ER IN
FORM
ATION
OU
R BU
SINESS
8 COCA-COLA AMATIL ANNUAL REPORT 2019
AUSTRALIAN BEVERAGES PERFORMED WELL IN 2019, WITH REVENUE GROWTH OF 2.4 PER CENT – THE FIRST FULL-YEAR NET REVENUE INCREASE SINCE 2012.
Underlying volumes in water were solid, despite cessation of sales of the low value, low margin Peats Ridge range in Officeworks. We increased distribution of Mount Franklin water in the state immediate consumption channel, and increased ranging in Convenience and Petroleum. We also held value share in water in the combined Grocery, and Convenience and Petroleum market.
I am pleased to report that our New Zealand & Fiji segment had another very strong year with increases of 7.3 per cent in revenue and 10.1 per cent in EBIT. In New Zealand we continued to see strong momentum with revenue and volume growth and high single digit earnings growth. In Fiji, we delivered solid profit growth against a backdrop of challenging economic conditions and adverse weather conditions.
Indonesia & Papua New Guinea delivered double-digit revenue and volume growth as well as strong EBIT growth. The Indonesia business demonstrated that it was able to achieve high single digit revenue and volume growth against the backdrop of a market where volume was flat. We continued to see very strong momentum in Papua New Guinea, with double-digit volume, revenue and EBIT growth, underpinned by continued strong demand for sparkling.
Alcohol & Coffee delivered its fifth consecutive year of double-digit EBIT growth. Spirits and premix had another strong year with value share gains in rum, vodka and gin. We felt competitive pressures in some beer segments including in our business in Samoa. This impact, along with the measles outbreak in the last quarter, caused challenging trading conditions in that region. Our coffee business grew revenue and volume benefitting from strong growth delivered in the grocery channel through the bean, capsule and ground segments.
Corporate & Services delivered reduced earnings for the year due to property sales and investments in Group capabilities and IT platforms. SPC is no longer included in this segment as the business was sold in mid-2019 for a total consideration of $49.6 million resulting in a gain from disposal of $13.8 million (after tax).
Safety Our unrelenting focus on safety and wellbeing continued throughout the year. Since 2012 we have reduced total injuries by 69 per cent, however, in 2019 we saw a 26 per cent increase in the total number of injuries from 105 injuries in 2018 to 132 in 2019. Reviews have been conducted and improvement plans are in place. There is always more to be done and we continue to share learnings across our operations and geographies.
Amatil X We expanded Amatil X, our emerging possibilities platform, into Indonesia in April 2019 through a partnership with Digitaraya, an established local accelerator program powered by Google Developers Launchpad, to support its Fast Moving Consumer Goods cohort.
In December 2019 Amatil X announced a further partnership, with Artesian Venture Partners to establish a multi-million-dollar fund targeting early stage start-ups focused on delivering value for customers, strengthening Amatil’s capabilities, and exploring new growth opportunities. The first investment from this fund – for New Zealand-based start-up Aider – supports delivery of an artificial intelligence digital assistant to improve sales outcomes in small and medium enterprises in hospitality and retail.
Executive Team We reduced the size of the Group Leadership Team during 2019 by consolidating responsibilities in line with our regional beverages powerhouse ambition and focus on a lean Group Office, with the departure of our Managing Director of Alcohol & Coffee, Shane Richardson, our Director of Group Public Affairs, Communications and Sustainability, Liz McNamara, and our Group Director, Partners and Growth, Chris Sullivan. We thank Shane, Liz and Chris for their commitment to Amatil over many years and wish them all the best for the future.
I also want to recognise the outstanding contribution and dedication of all of our people in each of our businesses and locations. Their passion for our brands and our customers is inspiring.
Outlook Given the significant uncertainty in relation to the duration and impact of the COVID-19 pandemic, on 17 March 2020 we withdrew our earnings guidance, which was provided to the market on 20 February 2020.
Amatil has a strong balance sheet and low net debt levels, ensuring we are well positioned to navigate this event. We have been implementing contingency plans to mitigate the impacts of COVID-19. We remain committed to keeping our Shareholders informed, while we focus on sustaining our operations and our commitments to our workforce.
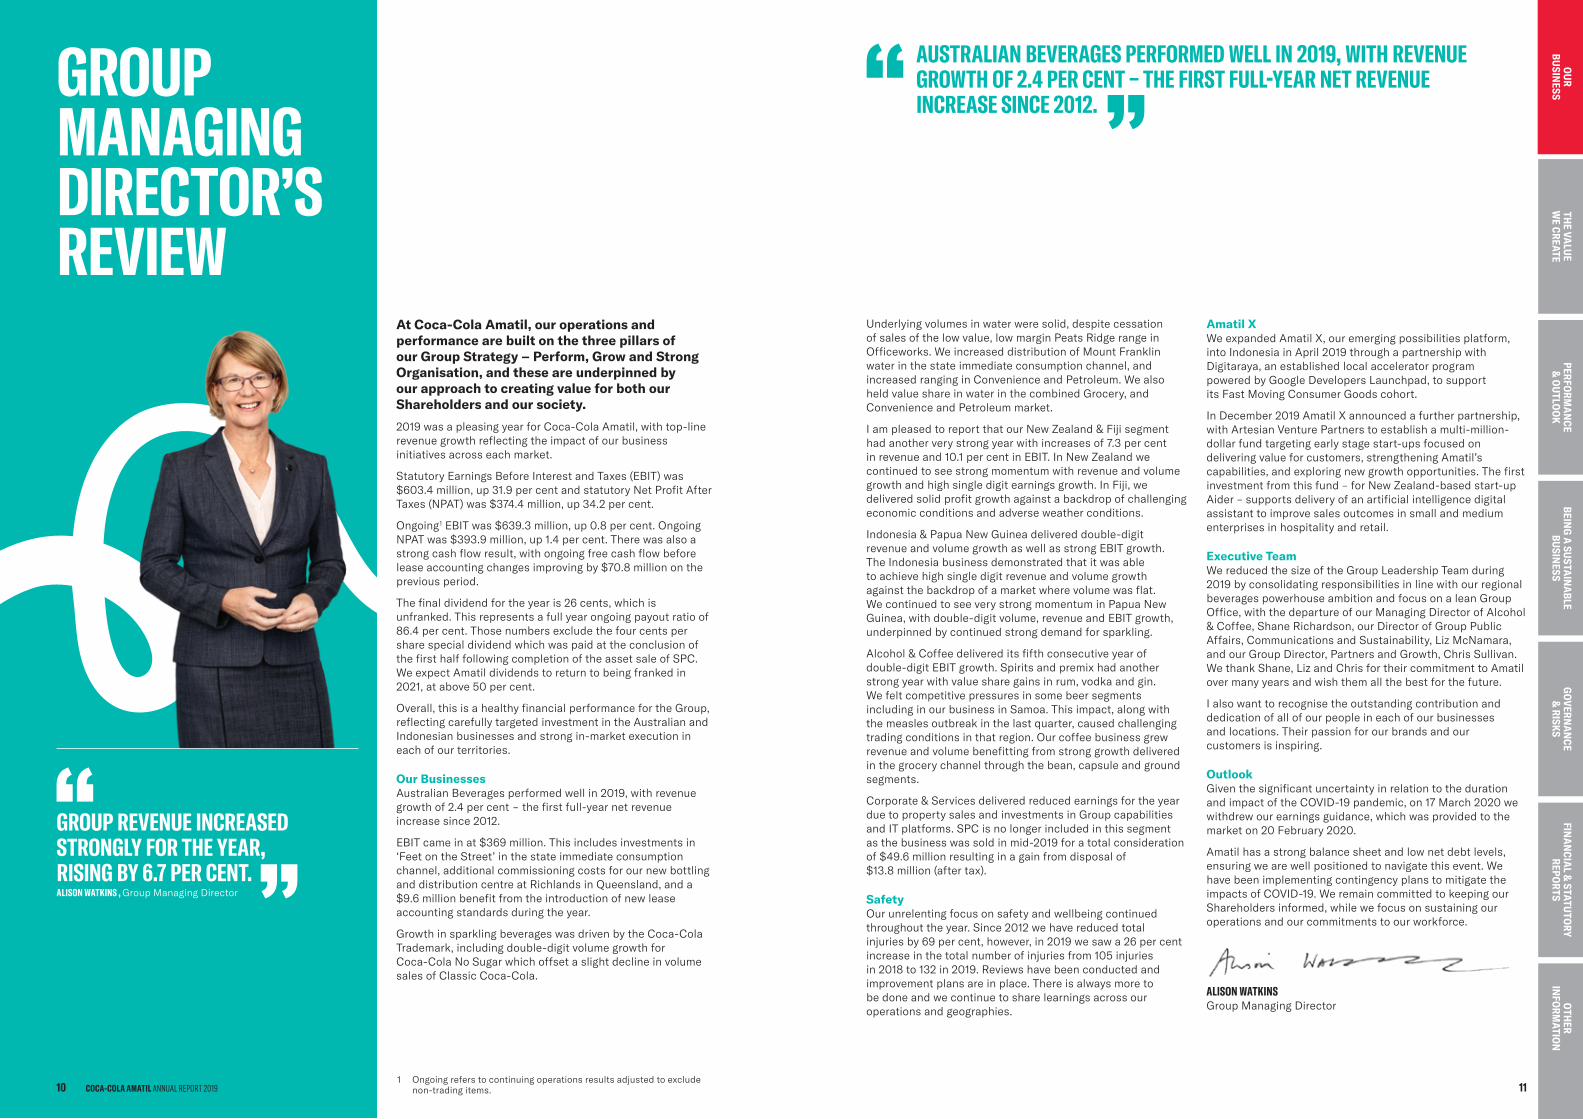
ALISON WATKINSGroup Managing Director
GROUP MANAGING DIRECTOR’S REVIEW
GROUP REVENUE INCREASED STRONGLY FOR THE YEAR, RISING BY 6.7 PER CENT.ALISON WATKINS , Group Managing Director
At Coca-Cola Amatil, our operations and performance are built on the three pillars of our Group Strategy – Perform, Grow and Strong Organisation, and these are underpinned by our approach to creating value for both our Shareholders and our society.
2019 was a pleasing year for Coca-Cola Amatil, with top-line revenue growth reflecting the impact of our business initiatives across each market.
Statutory Earnings Before Interest and Taxes (EBIT) was $603.4 million, up 31.9 per cent and statutory Net Profit After Taxes (NPAT) was $374.4 million, up 34.2 per cent.
Ongoing1 EBIT was $639.3 million, up 0.8 per cent. Ongoing NPAT was $393.9 million, up 1.4 per cent. There was also a strong cash flow result, with ongoing free cash flow before lease accounting changes improving by $70.8 million on the previous period.
The final dividend for the year is 26 cents, which is unfranked. This represents a full year ongoing payout ratio of 86.4 per cent. Those numbers exclude the four cents per share special dividend which was paid at the conclusion of the first half following completion of the asset sale of SPC. We expect Amatil dividends to return to being franked in 2021, at above 50 per cent.
Overall, this is a healthy financial performance for the Group, reflecting carefully targeted investment in the Australian and Indonesian businesses and strong in-market execution in each of our territories.
Our Businesses Australian Beverages performed well in 2019, with revenue growth of 2.4 per cent - the first full-year net revenue increase since 2012.
EBIT came in at $369 million. This includes investments in ‘Feet on the Street’ in the state immediate consumption channel, additional commissioning costs for our new bottling and distribution centre at Richlands in Queensland, and a $9.6 million benefit from the introduction of new lease accounting standards during the year.
Growth in sparkling beverages was driven by the Coca-Cola Trademark, including double-digit volume growth for Coca-Cola No Sugar which offset a slight decline in volume sales of Classic Coca-Cola.
1 Ongoing refers to continuing operations results adjusted to exclude non-trading items. 11
BEING
A SU
STAIN
ABLE
BUSIN
ESSTH
E VALU
E W
E CREATEPERFO
RMA
NCE
& O
UTLO
OK
GO
VERNA
NCE
& RISK
SFIN
AN
CIAL &
STATUTO
RY REPO
RTS
OTH
ER IN
FORM
ATION
OU
R BU
SINESS
COCA-COLA AMATIL ANNUAL REPORT 201910
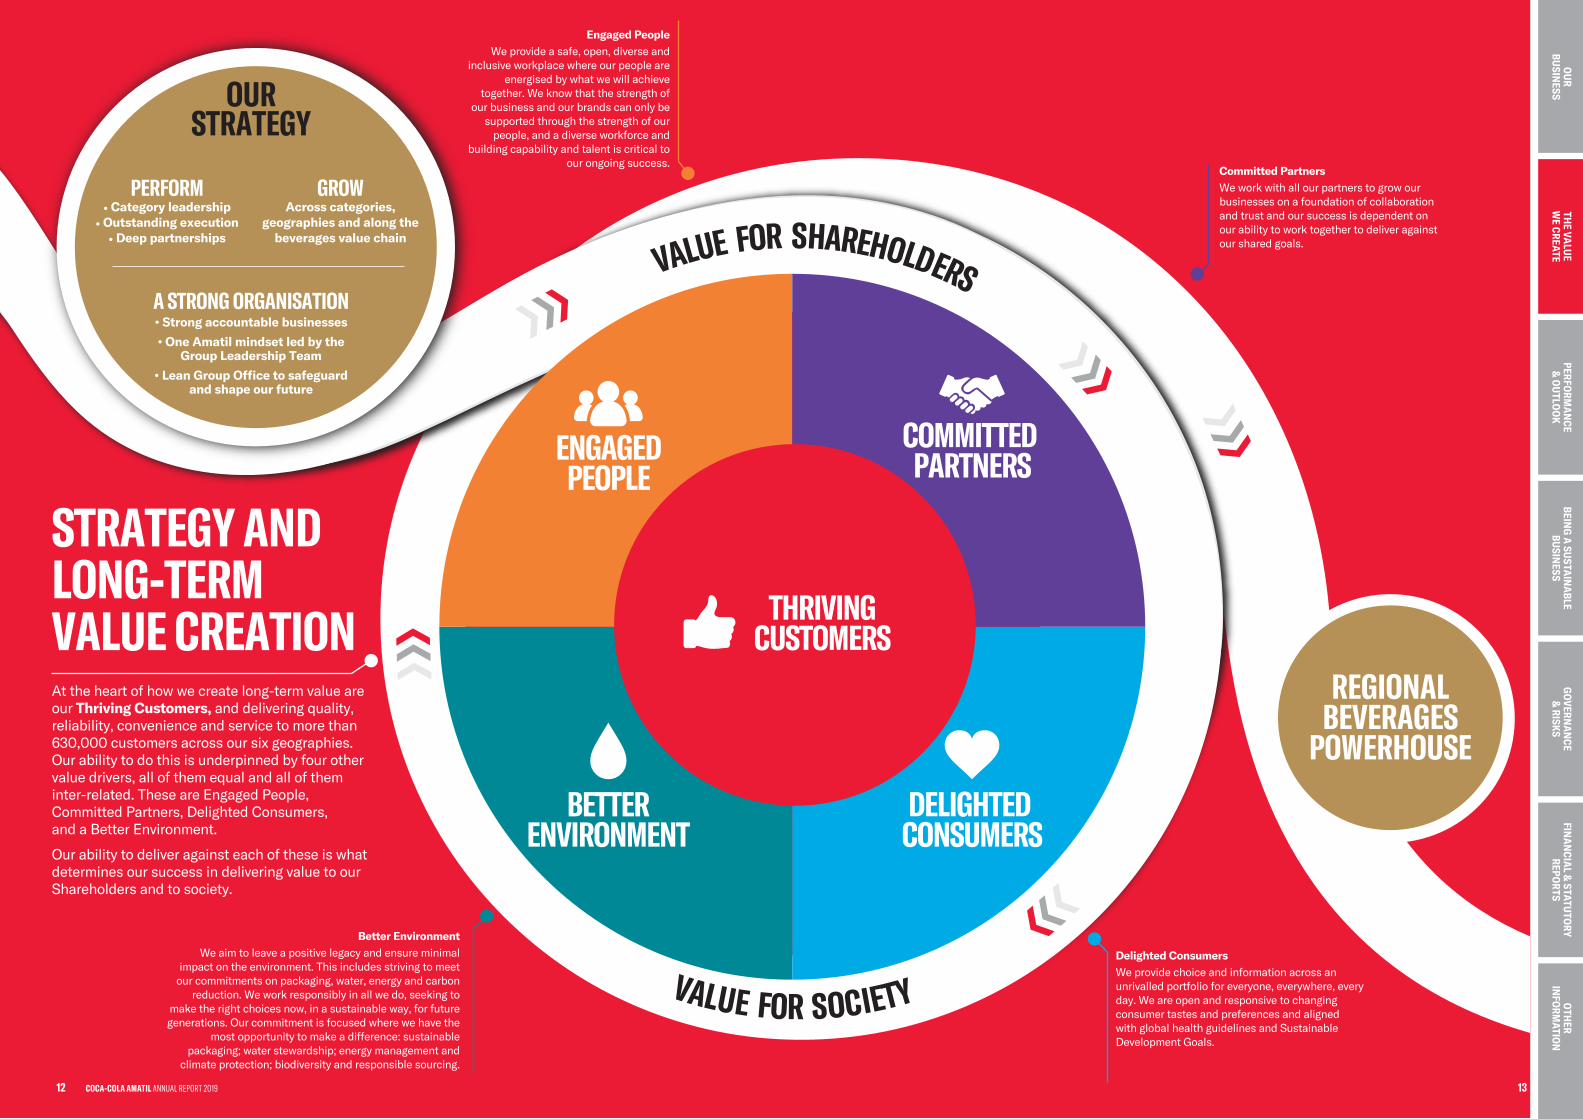
STRATEGY AND LONG-TERM VALUE CREATIONAt the heart of how we create long-term value are our Thriving Customers, and delivering quality, reliability, convenience and service to more than 630,000 customers across our six geographies. Our ability to do this is underpinned by four other value drivers, all of them equal and all of them inter-related. These are Engaged People, Committed Partners, Delighted Consumers, and a Better Environment.
Our ability to deliver against each of these is what determines our success in delivering value to our Shareholders and to society.
VALUE FOR SOCIETY
VALUE FOR SHAREHOLDERS
COMMITTED PARTNERS
DELIGHTED CONSUMERS
ENGAGEDPEOPLE
BETTERENVIRONMENT
THRIVINGCUSTOMERS
REGIONAL BEVERAGES
POWERHOUSE
Engaged People We provide a safe, open, diverse and
inclusive workplace where our people are energised by what we will achieve
together. We know that the strength of our business and our brands can only be
supported through the strength of our people, and a diverse workforce and
building capability and talent is critical to our ongoing success.
Committed Partners We work with all our partners to grow our businesses on a foundation of collaboration and trust and our success is dependent on our ability to work together to deliver against our shared goals.
Delighted Consumers We provide choice and information across an unrivalled portfolio for everyone, everywhere, every day. We are open and responsive to changing consumer tastes and preferences and aligned with global health guidelines and Sustainable Development Goals.
Better Environment We aim to leave a positive legacy and ensure minimal
impact on the environment. This includes striving to meet our commitments on packaging, water, energy and carbon
reduction. We work responsibly in all we do, seeking to make the right choices now, in a sustainable way, for future generations. Our commitment is focused where we have the
most opportunity to make a difference: sustainable packaging; water stewardship; energy management and
climate protection; biodiversity and responsible sourcing.
OUR STRATEGY
GROWAcross categories,
geographies and along thebeverages value chain
A STRONG ORGANISATION• Strong accountable businesses
• One Amatil mindset led by theGroup Leadership Team
• Lean Group Office to safeguardand shape our future
PERFORM• Category leadership
• Outstanding execution• Deep partnerships
BEING
A SU
STAIN
ABLE
BUSIN
ESSPERFO
RMA
NCE
& O
UTLO
OK
GO
VERNA
NCE
& RISK
SFIN
AN
CIAL &
STATUTO
RY REPO
RTS
OTH
ER IN
FORM
ATION
13
THE VA
LUE
WE CREATE
OU
R BU
SINESS
12 COCA-COLA AMATIL ANNUAL REPORT 2019
Growth opportunities including Indonesia and Alcohol & Coffee providing upsideOur developed markets are supported by our strong market position in our Alcohol & Coffee business.
In Indonesia, our geographic and customer reach, combined with our multi-category approach, makes us unique and positions us well to capture the growth we expect in this market.
EBIT DRIVERSRevenue growth and continuous cost focus across the GroupRevenue growth and continuous cost focus form the foundations of our business plans. These are two important building blocks underpinning our ability to grow earnings and cash flow.
Appropriate EBIT targets We have set medium-term EBIT targets for each of our businesses which reflect the market and our position within it. Our near-term targets take account of our recent performance and plans.
EPS DRIVERSCapexWe allocate modest capex for our developed markets with the view to maximising returns for our Shareholders. Indonesia remains an exciting growth market and we are investing in this market to maximise its potential.
Working capital managementOur focus on effective and efficient management of working capital resources drives strong cash generation particularly across our Australia and New Zealand businesses.
Bolt-on acquisitions and capital management initiatives Our priorities for cash are to create value for our Shareholders by investing in revenue growth plans, operational efficiencies and selective bolt-on acquisitions in existing and new beverage categories that strengthen our market leadership and our portfolio of beverages. Furthermore, we seek opportunities for vertical integration and extensions across the value chain.
The Board regularly reviews our capital structure to ensure it remains appropriate for our business. It is important that we maximise Shareholder returns while also providing sufficient funds to support the needs of the business.
SHAREHOLDER VALUE CREATIONMid-single digit EPS growthThe aggregation of all these elements underpins our expectation to deliver mid-single digit ongoing EPS growth in 2020 and over the medium term.
Attractive dividendsAfter investing to support and maintain the long-term growth prospects of the business, we pay our Shareholders attractive dividends. Our dividend policy is a payout ratio of above 80 per cent over the medium term.
Strong balance sheet and return on capital employedWe expect that our balance sheet will remain conservative with flexibility to fund future growth opportunities.
We expect to maintain a strong return on capital employed.
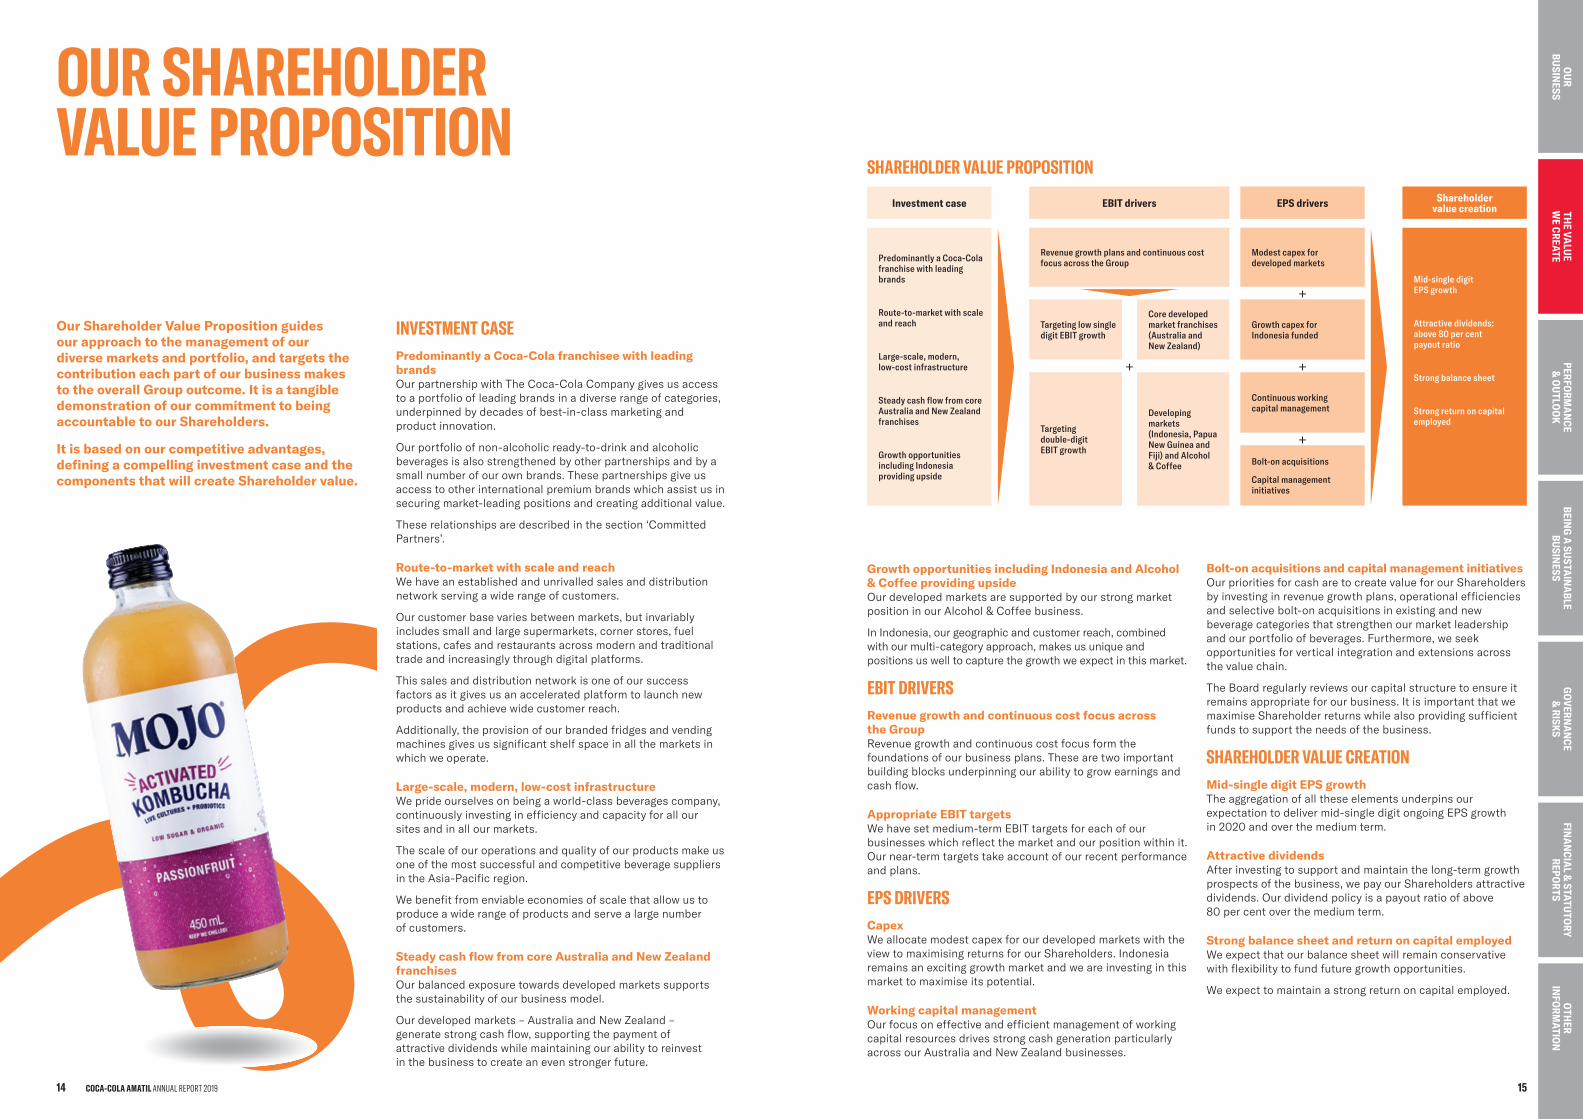
SHAREHOLDER VALUE PROPOSITION
Investment case EBIT drivers EPS drivers Shareholder value creation
Predominantly a Coca-Cola franchise with leading brands
Route-to-market with scale and reach
Large-scale, modern, low-cost infrastructure
Steady cash flow from core Australia and New Zealand franchises
Growth opportunities including Indonesia providing upside
Revenue growth plans and continuous cost focus across the Group
Modest capex for developed markets
Mid-single digit EPS growth
Attractive dividends: above 80 per cent payout ratio
Strong balance sheet
Strong return on capital employed
+
Targeting low single digit EBIT growth
Core developed market franchises (Australia and New Zealand)
Growth capex for Indonesia funded
+ +
Targeting double-digit EBIT growth
Developing markets (Indonesia, Papua New Guinea and Fiji) and Alcohol & Coffee
Continuous working capital management
+Bolt-on acquisitions
Capital management initiatives
OUR SHAREHOLDER VALUE PROPOSITION
INVESTMENT CASEPredominantly a Coca-Cola franchisee with leading brandsOur partnership with The Coca-Cola Company gives us access to a portfolio of leading brands in a diverse range of categories, underpinned by decades of best-in-class marketing and product innovation.
Our portfolio of non-alcoholic ready-to-drink and alcoholic beverages is also strengthened by other partnerships and by a small number of our own brands. These partnerships give us access to other international premium brands which assist us in securing market-leading positions and creating additional value.
These relationships are described in the section ‘Committed Partners’.
Route-to-market with scale and reachWe have an established and unrivalled sales and distribution network serving a wide range of customers.
Our customer base varies between markets, but invariably includes small and large supermarkets, corner stores, fuel stations, cafes and restaurants across modern and traditional trade and increasingly through digital platforms.
This sales and distribution network is one of our success factors as it gives us an accelerated platform to launch new products and achieve wide customer reach.
Additionally, the provision of our branded fridges and vending machines gives us significant shelf space in all the markets in which we operate.
Large-scale, modern, low-cost infrastructure We pride ourselves on being a world-class beverages company, continuously investing in efficiency and capacity for all our sites and in all our markets.
The scale of our operations and quality of our products make us one of the most successful and competitive beverage suppliers in the Asia-Pacific region.
We benefit from enviable economies of scale that allow us to produce a wide range of products and serve a large number of customers.
Steady cash flow from core Australia and New Zealand franchisesOur balanced exposure towards developed markets supports the sustainability of our business model.
Our developed markets – Australia and New Zealand – generate strong cash flow, supporting the payment of attractive dividends while maintaining our ability to reinvest in the business to create an even stronger future.
Our Shareholder Value Proposition guides our approach to the management of our diverse markets and portfolio, and targets the contribution each part of our business makes to the overall Group outcome. It is a tangible demonstration of our commitment to being accountable to our Shareholders.
It is based on our competitive advantages, defining a compelling investment case and the components that will create Shareholder value.
COCA-COLA AMATIL ANNUAL REPORT 201914 15
BEING
A SU
STAIN
ABLE
BUSIN
ESSPERFO
RMA
NCE
& O
UTLO
OK
GO
VERNA
NCE
& RISK
SFIN
AN
CIAL &
STATUTO
RY REPO
RTS
OTH
ER IN
FORM
ATION
THE VA
LUE
WE CREATE
OU
R BU
SINESS
OUR COMMITMENTAt the heart of how we create long-term value are our Thriving Customers, and delivering quality, reliability, convenience and service to more than 630,000 customers across our six geographies.
In 2019, we demonstrated our commitment to customers by:
— creating value through a total beverage portfolio
— maximising the key selling weeks when beverages are most in demand
— increased focus and investment in small stores to maximise beverages potential
— joint value creation
— servicing customers efficiently from order to delivery.
OUR APPROACHCreating value for customers through a total beverage portfolioIn 2019 we introduced new product innovations and focused on growing our core range of non-alcoholic ready-to-drink, alcohol and coffee beverages. This, supported by other initiatives in revenue growth management and route-to-market, drove results with our customers across our six geographies.
By refining our strategies to align by category and channel, we helped our customers excite shoppers and grow their businesses. In established categories, we experienced progress in all regions, and saw a return to volume and revenue growth in the Coca-Cola Trademark in Australia. In the Australian market we also grew still beverages faster than the overall category, which supported value creation for our customers.
For our customers in Indonesia, we drove volume-led growth across core categories with water and value-added dairy the main contributors of volume growth in still beverages.
In alcohol, strong performance in the spirits and premix segment was driven by Canadian Club and innovation such as Koyomi and Roku Gin.
In coffee, we saw strong revenue and volume growth in the grocery channel in bean, capsule and ground segments with our national account customers growing strongly.
Maximising the key selling weeks when beverages are most in demandPeak selling periods, including Christmas, Easter and Football Finals in Australia, are critical to success in the market. In these weeks, shoppers on average spend more within the beverage category, and a higher number of shoppers enter the category.
In 2019 we relaunched the popular ‘Share a Coke’ campaign, Coca-Cola’s largest global campaign. The success of this campaign, combined with targeted execution and revenue growth management initiatives, delivered strong performance of the Coca-Cola Trademark across the 2019 festive and summer periods.
In alcohol, key selling weeks were also distinct opportunities for our brands to increase their profile. In our Coors Beer brand, we focused activation for the American Superbowl event and in Magners Cider, St Patricks Day was a key selling period. Canadian Club was once again official partner of the Australian Open, and the summer festive period is always a perfect opportunity to profile our spirits portfolio for celebrations with family and friends or for gifting.
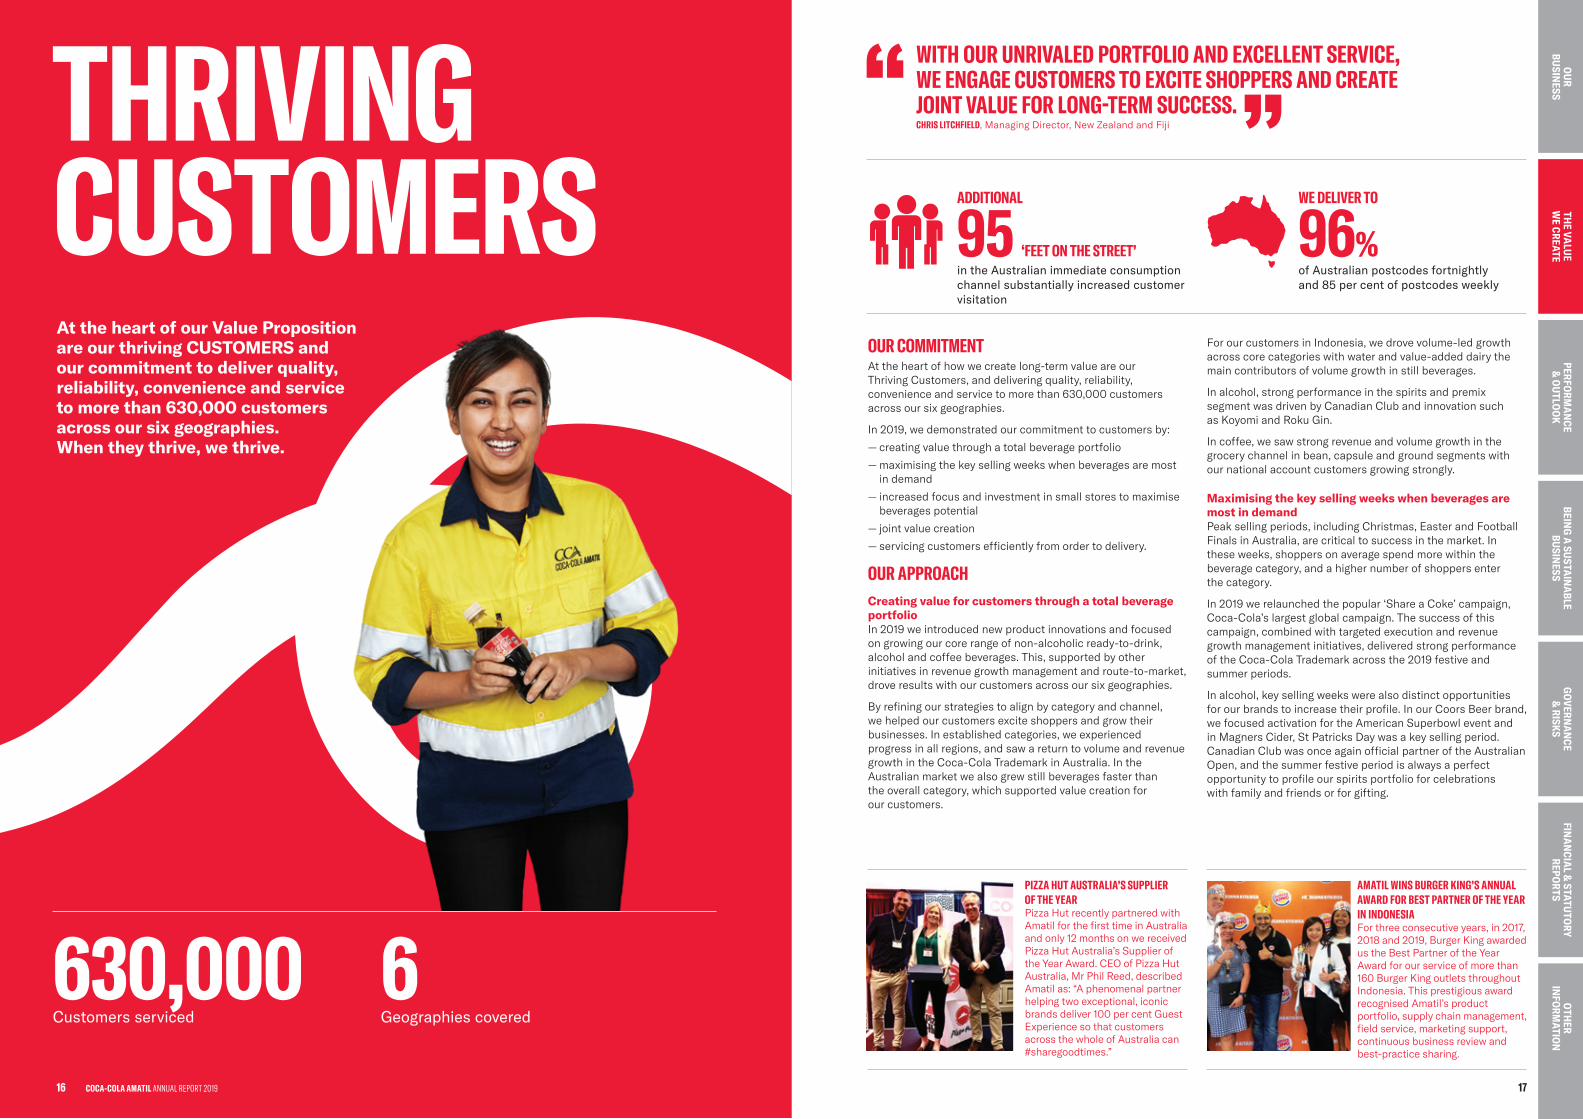
WITH OUR UNRIVALED PORTFOLIO AND EXCELLENT SERVICE, WE ENGAGE CUSTOMERS TO EXCITE SHOPPERS AND CREATE JOINT VALUE FOR LONG-TERM SUCCESS. CHRIS LITCHFIELD, Managing Director, New Zealand and Fiji
PIZZA HUT AUSTRALIA’S SUPPLIER OF THE YEAR Pizza Hut recently partnered with Amatil for the first time in Australia and only 12 months on we received Pizza Hut Australia’s Supplier of the Year Award. CEO of Pizza Hut Australia, Mr Phil Reed, described Amatil as: “A phenomenal partner helping two exceptional, iconic brands deliver 100 per cent Guest Experience so that customers across the whole of Australia can #sharegoodtimes.”
AMATIL WINS BURGER KING’S ANNUAL AWARD FOR BEST PARTNER OF THE YEAR IN INDONESIAFor three consecutive years, in 2017, 2018 and 2019, Burger King awarded us the Best Partner of the Year Award for our service of more than 160 Burger King outlets throughout Indonesia. This prestigious award recognised Amatil’s product portfolio, supply chain management, field service, marketing support, continuous business review and best-practice sharing.
ADDITIONAL
95 ‘FEET ON THE STREET’in the Australian immediate consumption channel substantially increased customer visitation
WE DELIVER TO
96% of Australian postcodes fortnightly and 85 per cent of postcodes weekly
THRIVING CUSTOMERSAt the heart of our Value Proposition are our thriving CUSTOMERS and our commitment to deliver quality, reliability, convenience and service to more than 630,000 customers across our six geographies. When they thrive, we thrive.
630,000Customers serviced
6Geographies covered
17
BEING
A SU
STAIN
ABLE
BUSIN
ESSTH
E VALU
E W
E CREATEPERFO
RMA
NCE
& O
UTLO
OK
GO
VERNA
NCE
& RISK
SFIN
AN
CIAL &
STATUTO
RY REPO
RTS
OTH
ER IN
FORM
ATION
OU
R BU
SINESS
THE VA
LUE
WE CREATE
OU
R BU
SINESS
16 COCA-COLA AMATIL ANNUAL REPORT 2019
OUR PROGRESSOur progress is evident in our ability to win in the market, deliver new business growth and receive strong customer recognition.
In Australia, Pizza Hut recently partnered with Amatil for the first time in Australia. After only one year of service with Pizza Hut, we were honoured to receive their Supplier of the Year Award. This followed business wins with Red Rooster, Oporto, Bankwest Stadium, Hilton Hotels and Amatil becoming the first principal partner of the new Sydney Zoo. Our focus on driving the right range in small stores has resulted in an increase in core ranging points, the top 20 products relevant to the state immediate consumption channel in Australia.
Our New Zealand business was recognised as the number one supplier in the categories of Head office, Field, Delivery and National Contact Centre through the Coalface survey with a Net Promoter Score of 64.
The New Zealand team created new customer partnerships throughout 2019 and were recognised through multiple customer and industry awards including the Thirsty Liquor and Black Bull Liquor Key Account Manager of the Year, Countdown awards for Account Manager of the Year and Integrated Supplier Planner of the Year, CRM awards for Outbound Business to Business, Inbound Sales for our Customer Service Team, Favourite Outbound Customer Sales Rep of the Year, and New Zealand Association of Convenience Stores awards for Best Service to Stores, Best Administration Support and Best Delivery Service to Stores.
The Fiji group continued to strive in managing customer relationships and secured the Sofitel Group contract along with other key major local players in the cinema, Supermarket and Petroleum channels.
In 2019 the Indonesian team established new business partnerships which included KFC, Pizza Hut, Texas Chicken, Boga Group, Marriot Starwood Hotel Group, Lotteria, Lotte Cinema, Platinum Cinema, and Hanamasa. The team was also awarded Burger King’s Partner of the Year award for the third consecutive year in Indonesia.
In Papua New Guinea, we have increased penetration by driving availability through our prime distribution partners while developing new complimentary ones. This has had a significant impact in delivering a double-digit growth performance.
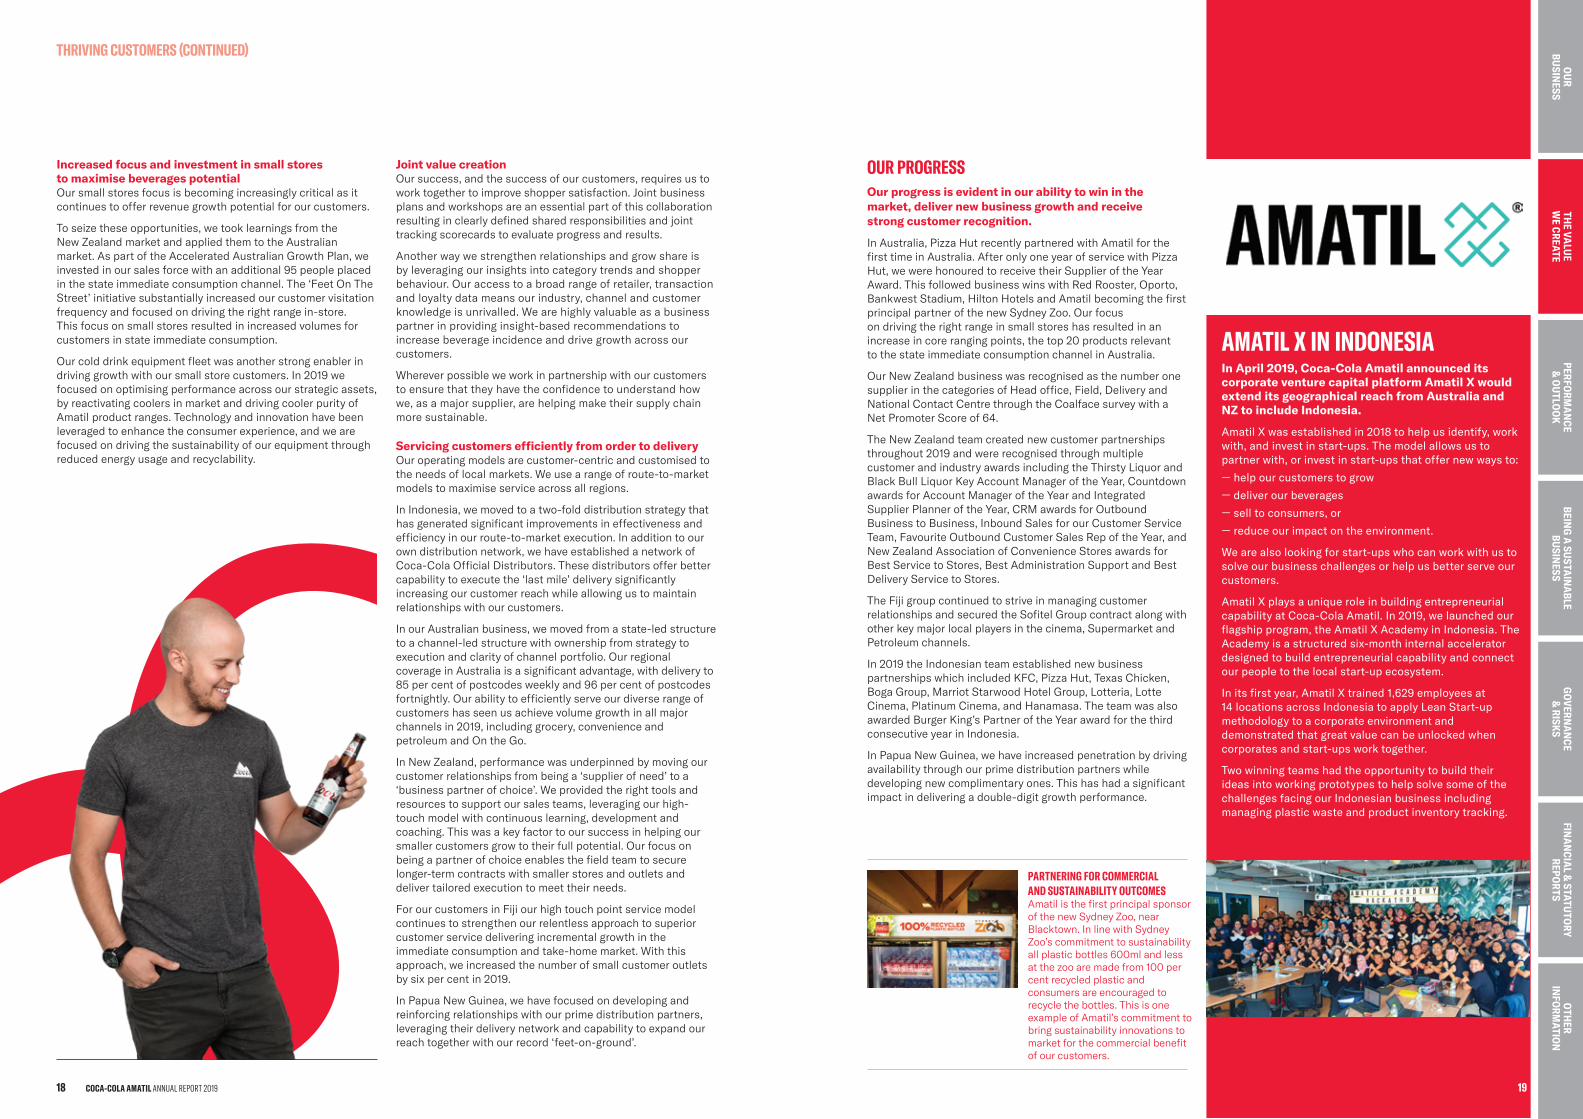
AMATIL X IN INDONESIAIn April 2019, Coca-Cola Amatil announced its corporate venture capital platform Amatil X would extend its geographical reach from Australia and NZ to include Indonesia.
Amatil X was established in 2018 to help us identify, work with, and invest in start-ups. The model allows us to partner with, or invest in start-ups that offer new ways to:
— help our customers to grow
— deliver our beverages
— sell to consumers, or
— reduce our impact on the environment.
We are also looking for start-ups who can work with us to solve our business challenges or help us better serve our customers.
Amatil X plays a unique role in building entrepreneurial capability at Coca-Cola Amatil. In 2019, we launched our flagship program, the Amatil X Academy in Indonesia. The Academy is a structured six-month internal accelerator designed to build entrepreneurial capability and connect our people to the local start-up ecosystem.
In its first year, Amatil X trained 1,629 employees at 14 locations across Indonesia to apply Lean Start-up methodology to a corporate environment and demonstrated that great value can be unlocked when corporates and start-ups work together.
Two winning teams had the opportunity to build their ideas into working prototypes to help solve some of the challenges facing our Indonesian business including managing plastic waste and product inventory tracking.
PARTNERING FOR COMMERCIAL AND SUSTAINABILITY OUTCOMESAmatil is the first principal sponsor of the new Sydney Zoo, near Blacktown. In line with Sydney Zoo’s commitment to sustainability all plastic bottles 600ml and less at the zoo are made from 100 per cent recycled plastic and consumers are encouraged to recycle the bottles. This is one example of Amatil’s commitment to bring sustainability innovations to market for the commercial benefit of our customers.
THRIVING CUSTOMERS (CONTINUED)
Increased focus and investment in small stores to maximise beverages potentialOur small stores focus is becoming increasingly critical as it continues to offer revenue growth potential for our customers.
To seize these opportunities, we took learnings from the New Zealand market and applied them to the Australian market. As part of the Accelerated Australian Growth Plan, we invested in our sales force with an additional 95 people placed in the state immediate consumption channel. The ‘Feet On The Street’ initiative substantially increased our customer visitation frequency and focused on driving the right range in-store. This focus on small stores resulted in increased volumes for customers in state immediate consumption.
Our cold drink equipment fleet was another strong enabler in driving growth with our small store customers. In 2019 we focused on optimising performance across our strategic assets, by reactivating coolers in market and driving cooler purity of Amatil product ranges. Technology and innovation have been leveraged to enhance the consumer experience, and we are focused on driving the sustainability of our equipment through reduced energy usage and recyclability.
Joint value creationOur success, and the success of our customers, requires us to work together to improve shopper satisfaction. Joint business plans and workshops are an essential part of this collaboration resulting in clearly defined shared responsibilities and joint tracking scorecards to evaluate progress and results.
Another way we strengthen relationships and grow share is by leveraging our insights into category trends and shopper behaviour. Our access to a broad range of retailer, transaction and loyalty data means our industry, channel and customer knowledge is unrivalled. We are highly valuable as a business partner in providing insight-based recommendations to increase beverage incidence and drive growth across our customers.
Wherever possible we work in partnership with our customers to ensure that they have the confidence to understand how we, as a major supplier, are helping make their supply chain more sustainable.
Servicing customers efficiently from order to deliveryOur operating models are customer-centric and customised to the needs of local markets. We use a range of route-to-market models to maximise service across all regions.
In Indonesia, we moved to a two-fold distribution strategy that has generated significant improvements in effectiveness and efficiency in our route-to-market execution. In addition to our own distribution network, we have established a network of Coca-Cola Official Distributors. These distributors offer better capability to execute the ‘last mile’ delivery significantly increasing our customer reach while allowing us to maintain relationships with our customers.
In our Australian business, we moved from a state-led structure to a channel-led structure with ownership from strategy to execution and clarity of channel portfolio. Our regional coverage in Australia is a significant advantage, with delivery to 85 per cent of postcodes weekly and 96 per cent of postcodes fortnightly. Our ability to efficiently serve our diverse range of customers has seen us achieve volume growth in all major channels in 2019, including grocery, convenience and petroleum and On the Go.
In New Zealand, performance was underpinned by moving our customer relationships from being a ‘supplier of need’ to a ‘business partner of choice’. We provided the right tools and resources to support our sales teams, leveraging our high-touch model with continuous learning, development and coaching. This was a key factor to our success in helping our smaller customers grow to their full potential. Our focus on being a partner of choice enables the field team to secure longer-term contracts with smaller stores and outlets and deliver tailored execution to meet their needs.
For our customers in Fiji our high touch point service model continues to strengthen our relentless approach to superior customer service delivering incremental growth in the immediate consumption and take-home market. With this approach, we increased the number of small customer outlets by six per cent in 2019.
In Papua New Guinea, we have focused on developing and reinforcing relationships with our prime distribution partners, leveraging their delivery network and capability to expand our reach together with our record ‘feet-on-ground’.
COCA-COLA AMATIL ANNUAL REPORT 201918
BEING
A SU
STAIN
ABLE
BUSIN
ESSTH
E VALU
E W
E CREATEPERFO
RMA
NCE
& O
UTLO
OK
GO
VERNA
NCE
& RISK
SFIN
AN
CIAL &
STATUTO
RY REPO
RTS
OTH
ER IN
FORM
ATION
OU
R BU
SINESS
19
THE VA
LUE
WE CREATE
OU
R BU
SINESS
OUR COMMITMENTWe have a long and proud history of working closely with brand partners to bottle, package, sell and distribute a leading range of brands and products.
In addition to brand partners, we have valued partnerships throughout our value chain, including with suppliers. We have made public sustainability goals to be achieved by the end of 2020, being to ensure 80 per cent of spend with suppliers is covered by responsible sourcing assessments.
We request our supplier partners to follow Coca-Cola Amatil’s Responsible Sourcing Guidelines as well as The Coca-Cola Company’s Supplier Guiding Principles. Environmental and social sustainability criteria is also an important part of supplier sustainability assessments covering most of Coca-Cola Amatil’s key suppliers.
We will keep looking for more opportunities to grow within these existing partnerships, as well as opportunities for new relationships with organisations that share our thirst for making possibilities a reality.
OUR APPROACHOur relationship with The Coca-Cola Company Coca-Cola Amatil has a long-standing relationship with The Coca-Cola Company, which is both a Shareholder and brand owner. We are proud to have been a Coca-Cola bottler and distributor since 1965.
Our relationship with The Coca-Cola Company has evolved over the years, driven by the need for agility, responsiveness and proximity to the customer and consumer. Our relationship is marked by a new level of financial and strategic alignment as well as a shared vision of growth that positions us to win in increasingly competitive and fast-paced operating environments.
We prepare, import, sell and distribute a range of products of The Coca-Cola Company and its affiliates and have a range of different agreements with them, reflecting the nature of those products and our role in different markets.
Our relationship with The Coca-Cola Company and its affiliates is governed in our various markets by bottlers’, distributors’ and license agreements which set out the respective rights and responsibilities of Coca-Cola Amatil and The Coca-Cola Company or its relevant affiliate. These agreements are typically 10 years in duration and have consistently been extended or renewed.
Our agreements relating to Indonesia, Papua New Guinea, Fiji and Samoa are due for renewal or extension during 2020.
Our agreements with The Coca-Cola Company and its affiliates provide us exclusive rights to prepare, package, sell or distribute the relevant trademarked products of The Coca-Cola Company and its affiliate in a territory. Our agreements contain obligations in relation to production and marketing requirements of The Coca-Cola Company.
The Coca-Cola Company and its affiliates take overall responsibility for the consumer marketing of their products, for product innovation and research and development, and the supply of proprietary concentrates and beverage bases to Coca-Cola Amatil.
Coca-Cola Amatil is responsible for determining the pricing of products offered to customers.
Raw Materials and Concentrates The raw materials we use in our beverages include water, sugar and other sweeteners, carbon dioxide gas, glass and PET bottles, aluminium cans, closures and other packaging materials. We also purchase concentrate and beverage bases from The Coca-Cola Company which constitutes our largest individual product input cost. The price of concentrate and beverage base has historically been determined annually on a country by country basis. Concentrate and beverage base are priced and paid in the local currency of each Coca-Cola Amatil territory except in Papua New Guinea where it is priced in Kina and paid in USD.
Marketing Coca-Cola Amatil and The Coca-Cola Company’s affiliates work together on marketing activities on a country by country basis, with expenditure allocated annually and subject to revision throughout the year. The Coca-Cola Company’s marketing focuses on consumer awareness and advertising, while our marketing focuses on sales and point of sale execution, customer service, and our range of packaging options. We are also focused on increasing the number of points of sale through investing in distribution and cold drink equipment.
Restrictions & Consents Generally, our arrangements with The Coca-Cola Company prohibit us from producing, promoting or selling any non-alcoholic beverage without The Coca-Cola Company’s consent. However, with The Coca-Cola Company’s consent, we own outright and distribute the following brands: Mount Franklin, Kirks, Deep Spring, Bisleri Chinotto, L&P and Pump (in New Zealand). We are also required to gain consent from The Coca-Cola Company for distributing or storing any products, other than those of The Coca-Cola Company, in vehicles or equipment that has The Coca-Cola Company branding.
Coca-Cola System Benefits Over the past years we have worked to broaden and deepen our relationship with The Coca-Cola Company to unlock many of the benefits that come with being part of the Coca-Cola System.
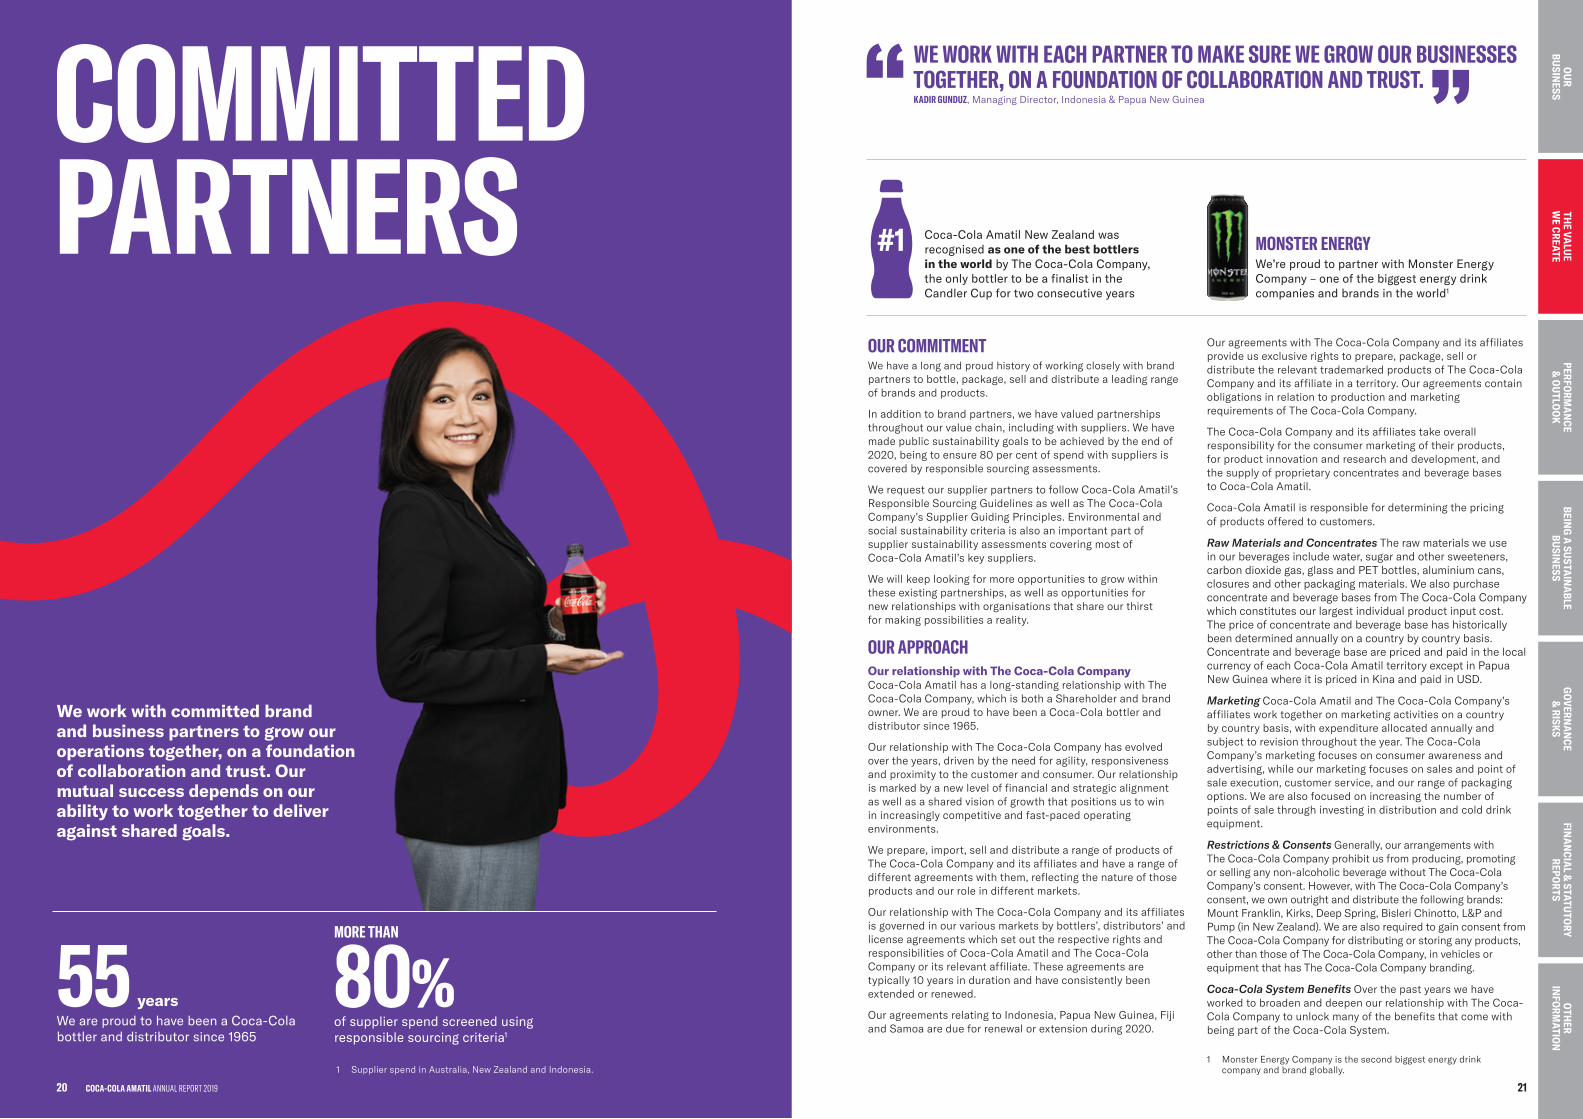
WE WORK WITH EACH PARTNER TO MAKE SURE WE GROW OUR BUSINESSES TOGETHER, ON A FOUNDATION OF COLLABORATION AND TRUST. KADIR GUNDUZ, Managing Director, Indonesia & Papua New Guinea
Coca-Cola Amatil New Zealand was recognised as one of the best bottlers in the world by The Coca-Cola Company, the only bottler to be a finalist in the Candler Cup for two consecutive years
MONSTER ENERGYWe’re proud to partner with Monster Energy Company – one of the biggest energy drink companies and brands in the world1
COMMITTED PARTNERS
We work with committed brand and business partners to grow our operations together, on a foundation of collaboration and trust. Our mutual success depends on our ability to work together to deliver against shared goals.
MORE THAN
80%of supplier spend screened using responsible sourcing criteria1
55 yearsWe are proud to have been a Coca-Cola bottler and distributor since 1965
1 Supplier spend in Australia, New Zealand and Indonesia.1 Monster Energy Company is the second biggest energy drink
company and brand globally.
21
BEING
A SU
STAIN
ABLE
BUSIN
ESSTH
E VALU
E W
E CREATEPERFO
RMA
NCE
& O
UTLO
OK
GO
VERNA
NCE
& RISK
SFIN
AN
CIAL &
STATUTO
RY REPO
RTS
OTH
ER IN
FORM
ATION
OU
R BU
SINESS
THE VA
LUE
WE CREATE
OU
R BU
SINESS
20 COCA-COLA AMATIL ANNUAL REPORT 2019
Rancilio In 2005, Grinders Coffee commenced a long-term relationship with Rancilio Group and remains a key trading partner for Rancilio professional coffee machines in Australia. A leading coffee equipment manufacturer, Rancilio Group is most widely acclaimed for technologically advanced coffee machines, both traditional and fully automatic, as well as instant and electronic doser grinders.
OUR PROGRESSWe work closely with all partners to leverage the unique strength of each partnership.
Non-Alcoholic BeveragesCore to what we do is our long and proud relationship with The Coca-Cola Company (TCCC).
TCCC is the global leader in beverages, with 133 years of experience and home to more than 500 brands across carbonated drinks, waters, juice, energy and sports drinks, dairy and plant-based beverages, and ready-to-drink teas and coffees. It is at the centre of the world’s largest beverage distribution system, with consumers in almost every country.
Over the past five years we have worked to broaden and deepen our relationship with TCCC to unlock many of the benefits that come with being part of the Coca-Cola System.
In addition to access to leading iconic beverages we have had access to new products via a strong innovation pipeline and a strengthened Merger and Acquisition capability.
This has grown our network across the System, improved our knowledge and talent sharing with the bottler community, increased our access to data and insights and enabled us to leverage the work being done across the System in relation to responsible sourcing.
Alcoholic BeveragesWe continued to focus on innovation and new product development through our partnership with Beam Suntory across Australia and New Zealand, and the successful launches of Roku premium gin and the Koyomi range of new-to-world Shochu-based drinks. We also built our category leadership position in bourbon and new age whiskey.
In the beer and cider categories, we worked closely with our partners to leverage opportunities across all categories. In beer and cider, our success continues to be driven by premium beer brands Coors, Blue Moon and Miller. With Australian Beer Company, Feral, Abro and C&C Group, we are also focused on growing our craft beer and our cider portfolios and working closely to take advantage of significant opportunities across categories where we can leverage our distribution and footprint.
Partnering with suppliers and responsible sourcingIn 2019 over 80 per cent of suppliers, by share of spend,1 were assessed through responsible sourcing assessments that measure performance against the Coca-Cola Company’s Supplier Guiding Principles or Amatil’s Responsible Sourcing Guidelines. We apply a tiered approach, which includes partnering with independent third parties to assess suppliers in different risk procurement categories.
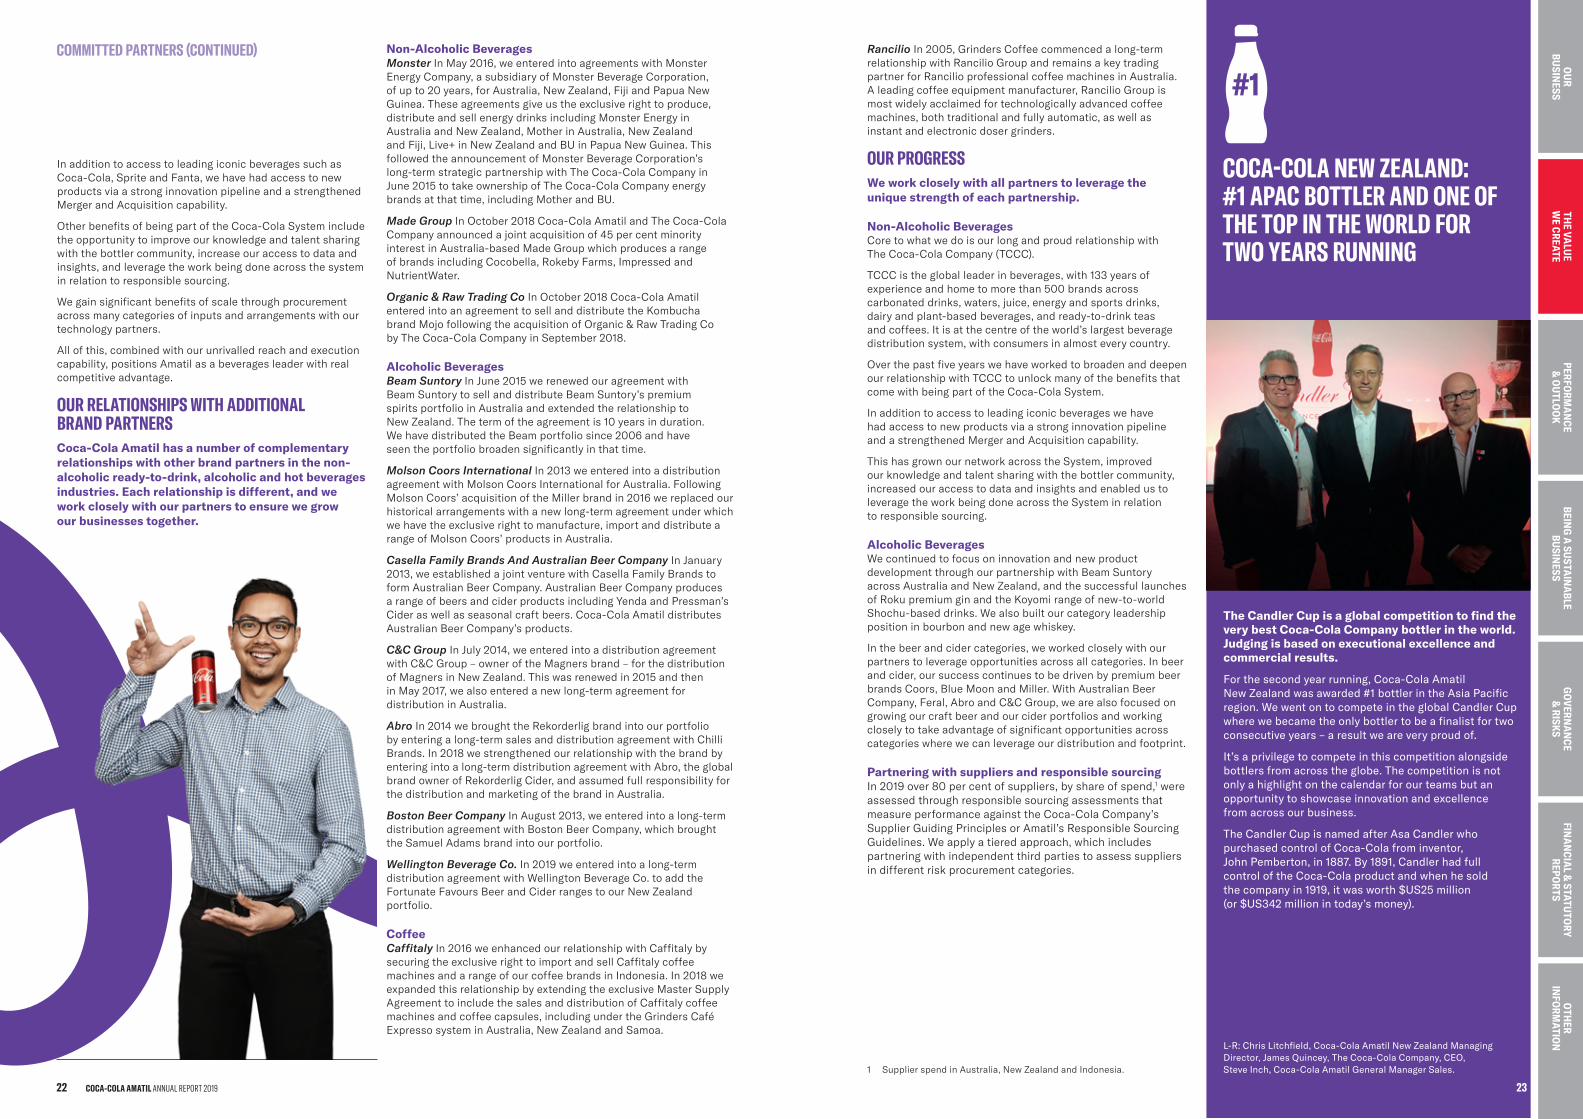
The Candler Cup is a global competition to find the very best Coca-Cola Company bottler in the world. Judging is based on executional excellence and commercial results.
For the second year running, Coca-Cola Amatil New Zealand was awarded #1 bottler in the Asia Pacific region. We went on to compete in the global Candler Cup where we became the only bottler to be a finalist for two consecutive years – a result we are very proud of.
It’s a privilege to compete in this competition alongside bottlers from across the globe. The competition is not only a highlight on the calendar for our teams but an opportunity to showcase innovation and excellence from across our business.
The Candler Cup is named after Asa Candler who purchased control of Coca-Cola from inventor, John Pemberton, in 1887. By 1891, Candler had full control of the Coca-Cola product and when he sold the company in 1919, it was worth $US25 million (or $US342 million in today’s money).
L-R: Chris Litchfield, Coca-Cola Amatil New Zealand Managing Director, James Quincey, The Coca-Cola Company, CEO, Steve Inch, Coca-Cola Amatil General Manager Sales.
COCA-COLA NEW ZEALAND: #1 APAC BOTTLER AND ONE OF THE TOP IN THE WORLD FOR TWO YEARS RUNNING
1 Supplier spend in Australia, New Zealand and Indonesia.
In addition to access to leading iconic beverages such as Coca-Cola, Sprite and Fanta, we have had access to new products via a strong innovation pipeline and a strengthened Merger and Acquisition capability.
Other benefits of being part of the Coca-Cola System include the opportunity to improve our knowledge and talent sharing with the bottler community, increase our access to data and insights, and leverage the work being done across the system in relation to responsible sourcing.
We gain significant benefits of scale through procurement across many categories of inputs and arrangements with our technology partners.
All of this, combined with our unrivalled reach and execution capability, positions Amatil as a beverages leader with real competitive advantage.
OUR RELATIONSHIPS WITH ADDITIONAL BRAND PARTNERSCoca-Cola Amatil has a number of complementary relationships with other brand partners in the non-alcoholic ready-to-drink, alcoholic and hot beverages industries. Each relationship is different, and we work closely with our partners to ensure we grow our businesses together.
COMMITTED PARTNERS (CONTINUED) Non-Alcoholic BeveragesMonster In May 2016, we entered into agreements with Monster Energy Company, a subsidiary of Monster Beverage Corporation, of up to 20 years, for Australia, New Zealand, Fiji and Papua New Guinea. These agreements give us the exclusive right to produce, distribute and sell energy drinks including Monster Energy in Australia and New Zealand, Mother in Australia, New Zealand and Fiji, Live+ in New Zealand and BU in Papua New Guinea. This followed the announcement of Monster Beverage Corporation’s long-term strategic partnership with The Coca-Cola Company in June 2015 to take ownership of The Coca-Cola Company energy brands at that time, including Mother and BU.
Made Group In October 2018 Coca-Cola Amatil and The Coca-Cola Company announced a joint acquisition of 45 per cent minority interest in Australia-based Made Group which produces a range of brands including Cocobella, Rokeby Farms, Impressed and NutrientWater.
Organic & Raw Trading Co In October 2018 Coca-Cola Amatil entered into an agreement to sell and distribute the Kombucha brand Mojo following the acquisition of Organic & Raw Trading Co by The Coca-Cola Company in September 2018.
Alcoholic BeveragesBeam Suntory In June 2015 we renewed our agreement with Beam Suntory to sell and distribute Beam Suntory’s premium spirits portfolio in Australia and extended the relationship to New Zealand. The term of the agreement is 10 years in duration. We have distributed the Beam portfolio since 2006 and have seen the portfolio broaden significantly in that time.
Molson Coors International In 2013 we entered into a distribution agreement with Molson Coors International for Australia. Following Molson Coors’ acquisition of the Miller brand in 2016 we replaced our historical arrangements with a new long-term agreement under which we have the exclusive right to manufacture, import and distribute a range of Molson Coors’ products in Australia.
Casella Family Brands And Australian Beer Company In January 2013, we established a joint venture with Casella Family Brands to form Australian Beer Company. Australian Beer Company produces a range of beers and cider products including Yenda and Pressman’s Cider as well as seasonal craft beers. Coca-Cola Amatil distributes Australian Beer Company’s products.
C&C Group In July 2014, we entered into a distribution agreement with C&C Group – owner of the Magners brand – for the distribution of Magners in New Zealand. This was renewed in 2015 and then in May 2017, we also entered a new long-term agreement for distribution in Australia.
Abro In 2014 we brought the Rekorderlig brand into our portfolio by entering a long-term sales and distribution agreement with Chilli Brands. In 2018 we strengthened our relationship with the brand by entering into a long-term distribution agreement with Abro, the global brand owner of Rekorderlig Cider, and assumed full responsibility for the distribution and marketing of the brand in Australia.
Boston Beer Company In August 2013, we entered into a long-term distribution agreement with Boston Beer Company, which brought the Samuel Adams brand into our portfolio.
Wellington Beverage Co. In 2019 we entered into a long-term distribution agreement with Wellington Beverage Co. to add the Fortunate Favours Beer and Cider ranges to our New Zealand portfolio.
CoffeeCaffitaly In 2016 we enhanced our relationship with Caffitaly by securing the exclusive right to import and sell Caffitaly coffee machines and a range of our coffee brands in Indonesia. In 2018 we expanded this relationship by extending the exclusive Master Supply Agreement to include the sales and distribution of Caffitaly coffee machines and coffee capsules, including under the Grinders Café Expresso system in Australia, New Zealand and Samoa.
COCA-COLA AMATIL ANNUAL REPORT 201922
BEING
A SU
STAIN
ABLE
BUSIN
ESSTH
E VALU
E W
E CREATEPERFO
RMA
NCE
& O
UTLO
OK
GO
VERNA
NCE
& RISK
SFIN
AN
CIAL &
STATUTO
RY REPO
RTS
OTH
ER IN
FORM
ATION
OU
R BU
SINESS
23
THE VA
LUE
WE CREATE
OU
R BU
SINESS
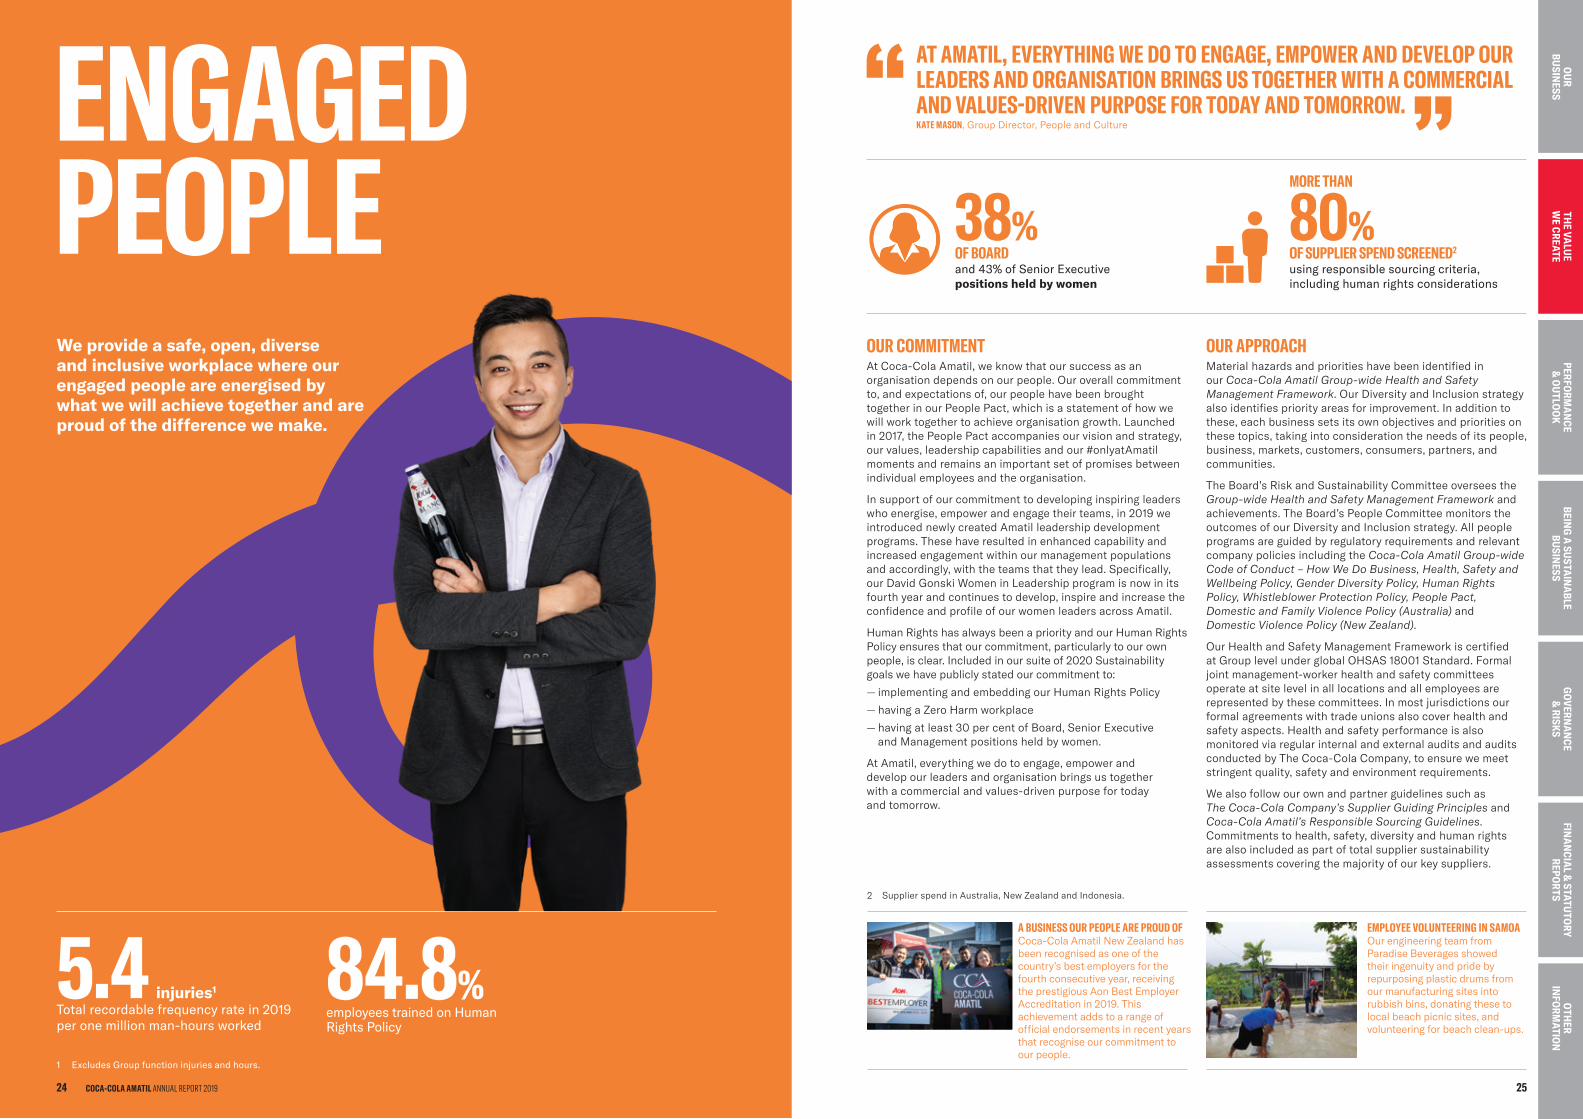
38% OF BOARD and 43% of Senior Executive positions held by women
MORE THAN
80%OF SUPPLIER SPEND SCREENED2 using responsible sourcing criteria, including human rights considerations
OUR COMMITMENTAt Coca-Cola Amatil, we know that our success as an organisation depends on our people. Our overall commitment to, and expectations of, our people have been brought together in our People Pact, which is a statement of how we will work together to achieve organisation growth. Launched in 2017, the People Pact accompanies our vision and strategy, our values, leadership capabilities and our #onlyatAmatil moments and remains an important set of promises between individual employees and the organisation.
In support of our commitment to developing inspiring leaders who energise, empower and engage their teams, in 2019 we introduced newly created Amatil leadership development programs. These have resulted in enhanced capability and increased engagement within our management populations and accordingly, with the teams that they lead. Specifically, our David Gonski Women in Leadership program is now in its fourth year and continues to develop, inspire and increase the confidence and profile of our women leaders across Amatil.
Human Rights has always been a priority and our Human Rights Policy ensures that our commitment, particularly to our own people, is clear. Included in our suite of 2020 Sustainability goals we have publicly stated our commitment to:
— implementing and embedding our Human Rights Policy
— having a Zero Harm workplace
— having at least 30 per cent of Board, Senior Executive and Management positions held by women.
At Amatil, everything we do to engage, empower and develop our leaders and organisation brings us together with a commercial and values-driven purpose for today and tomorrow.
OUR APPROACHMaterial hazards and priorities have been identified in our Coca-Cola Amatil Group-wide Health and Safety Management Framework. Our Diversity and Inclusion strategy also identifies priority areas for improvement. In addition to these, each business sets its own objectives and priorities on these topics, taking into consideration the needs of its people, business, markets, customers, consumers, partners, and communities.
The Board’s Risk and Sustainability Committee oversees the Group-wide Health and Safety Management Framework and achievements. The Board’s People Committee monitors the outcomes of our Diversity and Inclusion strategy. All people programs are guided by regulatory requirements and relevant company policies including the Coca-Cola Amatil Group-wide Code of Conduct – How We Do Business, Health, Safety and Wellbeing Policy, Gender Diversity Policy, Human Rights Policy, Whistleblower Protection Policy, People Pact, Domestic and Family Violence Policy (Australia) and Domestic Violence Policy (New Zealand).
Our Health and Safety Management Framework is certified at Group level under global OHSAS 18001 Standard. Formal joint management-worker health and safety committees operate at site level in all locations and all employees are represented by these committees. In most jurisdictions our formal agreements with trade unions also cover health and safety aspects. Health and safety performance is also monitored via regular internal and external audits and audits conducted by The Coca-Cola Company, to ensure we meet stringent quality, safety and environment requirements.
We also follow our own and partner guidelines such as The Coca-Cola Company’s Supplier Guiding Principles and Coca-Cola Amatil’s Responsible Sourcing Guidelines. Commitments to health, safety, diversity and human rights are also included as part of total supplier sustainability assessments covering the majority of our key suppliers.
A BUSINESS OUR PEOPLE ARE PROUD OFCoca-Cola Amatil New Zealand has been recognised as one of the country’s best employers for the fourth consecutive year, receiving the prestigious Aon Best Employer Accreditation in 2019. This achievement adds to a range of official endorsements in recent years that recognise our commitment to our people.
EMPLOYEE VOLUNTEERING IN SAMOAOur engineering team from Paradise Beverages showed their ingenuity and pride by repurposing plastic drums from our manufacturing sites into rubbish bins, donating these to local beach picnic sites, and volunteering for beach clean-ups.
AT AMATIL, EVERYTHING WE DO TO ENGAGE, EMPOWER AND DEVELOP OUR LEADERS AND ORGANISATION BRINGS US TOGETHER WITH A COMMERCIAL AND VALUES-DRIVEN PURPOSE FOR TODAY AND TOMORROW. KATE MASON, Group Director, People and Culture
2 Supplier spend in Australia, New Zealand and Indonesia.
ENGAGED PEOPLEWe provide a safe, open, diverse and inclusive workplace where our engaged people are energised by what we will achieve together and are proud of the difference we make.
84.8%employees trained on Human Rights Policy
5.4 injuries1
Total recordable frequency rate in 2019 per one million man-hours worked
1 Excludes Group function injuries and hours.
COCA-COLA AMATIL ANNUAL REPORT 201924 25
BEING
A SU
STAIN
ABLE
BUSIN
ESSTH
E VALU
E W
E CREATEPERFO
RMA
NCE
& O
UTLO
OK
GO
VERNA
NCE
& RISK
SFIN
AN
CIAL &
STATUTO
RY REPO
RTS
OTH
ER IN
FORM
ATION
OU
R BU
SINESS
THE VA
LUE
WE CREATE
OU
R BU
SINESS
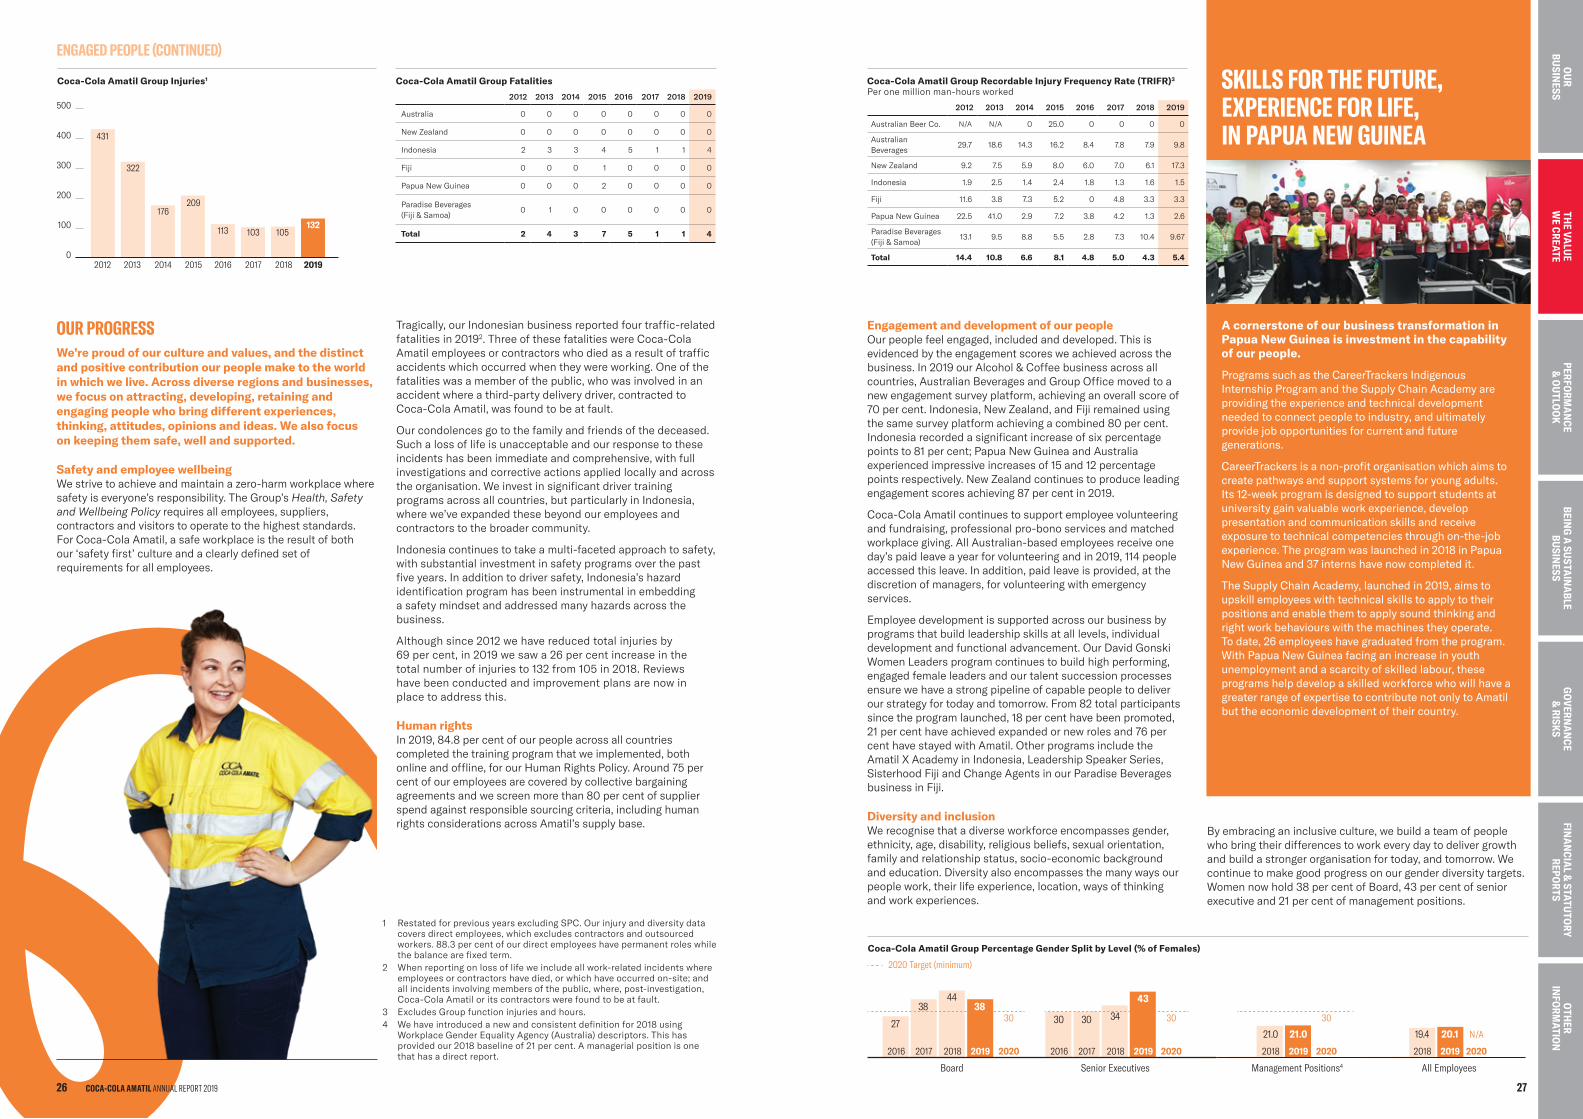
Engagement and development of our peopleOur people feel engaged, included and developed. This is evidenced by the engagement scores we achieved across the business. In 2019 our Alcohol & Coffee business across all countries, Australian Beverages and Group Office moved to a new engagement survey platform, achieving an overall score of 70 per cent. Indonesia, New Zealand, and Fiji remained using the same survey platform achieving a combined 80 per cent. Indonesia recorded a significant increase of six percentage points to 81 per cent; Papua New Guinea and Australia experienced impressive increases of 15 and 12 percentage points respectively. New Zealand continues to produce leading engagement scores achieving 87 per cent in 2019.
Coca-Cola Amatil continues to support employee volunteering and fundraising, professional pro-bono services and matched workplace giving. All Australian-based employees receive one day’s paid leave a year for volunteering and in 2019, 114 people accessed this leave. In addition, paid leave is provided, at the discretion of managers, for volunteering with emergency services.
Employee development is supported across our business by programs that build leadership skills at all levels, individual development and functional advancement. Our David Gonski Women Leaders program continues to build high performing, engaged female leaders and our talent succession processes ensure we have a strong pipeline of capable people to deliver our strategy for today and tomorrow. From 82 total participants since the program launched, 18 per cent have been promoted, 21 per cent have achieved expanded or new roles and 76 per cent have stayed with Amatil. Other programs include the Amatil X Academy in Indonesia, Leadership Speaker Series, Sisterhood Fiji and Change Agents in our Paradise Beverages business in Fiji.
Diversity and inclusionWe recognise that a diverse workforce encompasses gender, ethnicity, age, disability, religious beliefs, sexual orientation, family and relationship status, socio-economic background and education. Diversity also encompasses the many ways our people work, their life experience, location, ways of thinking and work experiences.
SKILLS FOR THE FUTURE, EXPERIENCE FOR LIFE, IN PAPUA NEW GUINEA
Coca-Cola Amatil Group Recordable Injury Frequency Rate (TRIFR)3
Per one million man-hours worked
2012 2013 2014 2015 2016 2017 2018 2019
Australian Beer Co. N/A N/A 0 25.0 0 0 0 0
Australian Beverages
29.7 18.6 14.3 16.2 8.4 7.8 7.9 9.8
New Zealand 9.2 7.5 5.9 8.0 6.0 7.0 6.1 17.3
Indonesia 1.9 2.5 1.4 2.4 1.8 1.3 1.6 1.5
Fiji 11.6 3.8 7.3 5.2 0 4.8 3.3 3.3
Papua New Guinea 22.5 41.0 2.9 7.2 3.8 4.2 1.3 2.6
Paradise Beverages (Fiji & Samoa)
13.1 9.5 8.8 5.5 2.8 7.3 10.4 9.67
Total 14.4 10.8 6.6 8.1 4.8 5.0 4.3 5.4
Coca-Cola Amatil Group Percentage Gender Split by Level (% of Females)
All EmployeesManagement Positions4Senior ExecutivesBoard
2019
2020 Target (minimum)
2016 2017 2018 20192016 2017 2018 20192018 20192018
27
3844
38
2020
30
2020
30
2020
30
2020
N/A
30 30 34
43
21.0 21.0 19.4 20.1
By embracing an inclusive culture, we build a team of people who bring their differences to work every day to deliver growth and build a stronger organisation for today, and tomorrow. We continue to make good progress on our gender diversity targets. Women now hold 38 per cent of Board, 43 per cent of senior executive and 21 per cent of management positions.
A cornerstone of our business transformation in Papua New Guinea is investment in the capability of our people.
Programs such as the CareerTrackers Indigenous Internship Program and the Supply Chain Academy are providing the experience and technical development needed to connect people to industry, and ultimately provide job opportunities for current and future generations.
CareerTrackers is a non-profit organisation which aims to create pathways and support systems for young adults. Its 12-week program is designed to support students at university gain valuable work experience, develop presentation and communication skills and receive exposure to technical competencies through on-the-job experience. The program was launched in 2018 in Papua New Guinea and 37 interns have now completed it.
The Supply Chain Academy, launched in 2019, aims to upskill employees with technical skills to apply to their positions and enable them to apply sound thinking and right work behaviours with the machines they operate. To date, 26 employees have graduated from the program. With Papua New Guinea facing an increase in youth unemployment and a scarcity of skilled labour, these programs help develop a skilled workforce who will have a greater range of expertise to contribute not only to Amatil but the economic development of their country.
Tragically, our Indonesian business reported four traffic-related fatalities in 20192. Three of these fatalities were Coca-Cola Amatil employees or contractors who died as a result of traffic accidents which occurred when they were working. One of the fatalities was a member of the public, who was involved in an accident where a third-party delivery driver, contracted to Coca-Cola Amatil, was found to be at fault.
Our condolences go to the family and friends of the deceased. Such a loss of life is unacceptable and our response to these incidents has been immediate and comprehensive, with full investigations and corrective actions applied locally and across the organisation. We invest in significant driver training programs across all countries, but particularly in Indonesia, where we’ve expanded these beyond our employees and contractors to the broader community.
Indonesia continues to take a multi-faceted approach to safety, with substantial investment in safety programs over the past five years. In addition to driver safety, Indonesia’s hazard identification program has been instrumental in embedding a safety mindset and addressed many hazards across the business.
Although since 2012 we have reduced total injuries by 69 per cent, in 2019 we saw a 26 per cent increase in the total number of injuries to 132 from 105 in 2018. Reviews have been conducted and improvement plans are now in place to address this.
Human rightsIn 2019, 84.8 per cent of our people across all countries completed the training program that we implemented, both online and offline, for our Human Rights Policy. Around 75 per cent of our employees are covered by collective bargaining agreements and we screen more than 80 per cent of supplier spend against responsible sourcing criteria, including human rights considerations across Amatil’s supply base.
OUR PROGRESSWe’re proud of our culture and values, and the distinct and positive contribution our people make to the world in which we live. Across diverse regions and businesses, we focus on attracting, developing, retaining and engaging people who bring different experiences, thinking, attitudes, opinions and ideas. We also focus on keeping them safe, well and supported.
Safety and employee wellbeingWe strive to achieve and maintain a zero-harm workplace where safety is everyone’s responsibility. The Group’s Health, Safety and Wellbeing Policy requires all employees, suppliers, contractors and visitors to operate to the highest standards. For Coca-Cola Amatil, a safe workplace is the result of both our ‘safety first’ culture and a clearly defined set of requirements for all employees.
1 Restated for previous years excluding SPC. Our injury and diversity data covers direct employees, which excludes contractors and outsourced workers. 88.3 per cent of our direct employees have permanent roles while the balance are fixed term.
2 When reporting on loss of life we include all work-related incidents where employees or contractors have died, or which have occurred on-site; and all incidents involving members of the public, where, post-investigation, Coca-Cola Amatil or its contractors were found to be at fault.
3 Excludes Group function injuries and hours.4 We have introduced a new and consistent definition for 2018 using
Workplace Gender Equality Agency (Australia) descriptors. This has provided our 2018 baseline of 21 per cent. A managerial position is one that has a direct report.
Coca-Cola Amatil Group Fatalities
2012 2013 2014 2015 2016 2017 2018 2019
Australia 0 0 0 0 0 0 0 0
New Zealand 0 0 0 0 0 0 0 0
Indonesia 2 3 3 4 5 1 1 4
Fiji 0 0 0 1 0 0 0 0
Papua New Guinea 0 0 0 2 0 0 0 0
Paradise Beverages (Fiji & Samoa)
0 1 0 0 0 0 0 0
Total 2 4 3 7 5 1 1 4
Coca-Cola Amatil Group Injuries1
0
100
200
300
400
500
132
20192018201720162015201420132012
105103113
209176
322
431
ENGAGED PEOPLE (CONTINUED)
COCA-COLA AMATIL ANNUAL REPORT 201926 27
BEING
A SU
STAIN
ABLE
BUSIN
ESSTH
E VALU
E W
E CREATEPERFO
RMA
NCE
& O
UTLO
OK
GO
VERNA
NCE
& RISK
SFIN
AN
CIAL &
STATUTO
RY REPO
RTS
OTH
ER IN
FORM
ATION
OU
R BU
SINESS
THE VA
LUE
WE CREATE
OU
R BU
SINESS
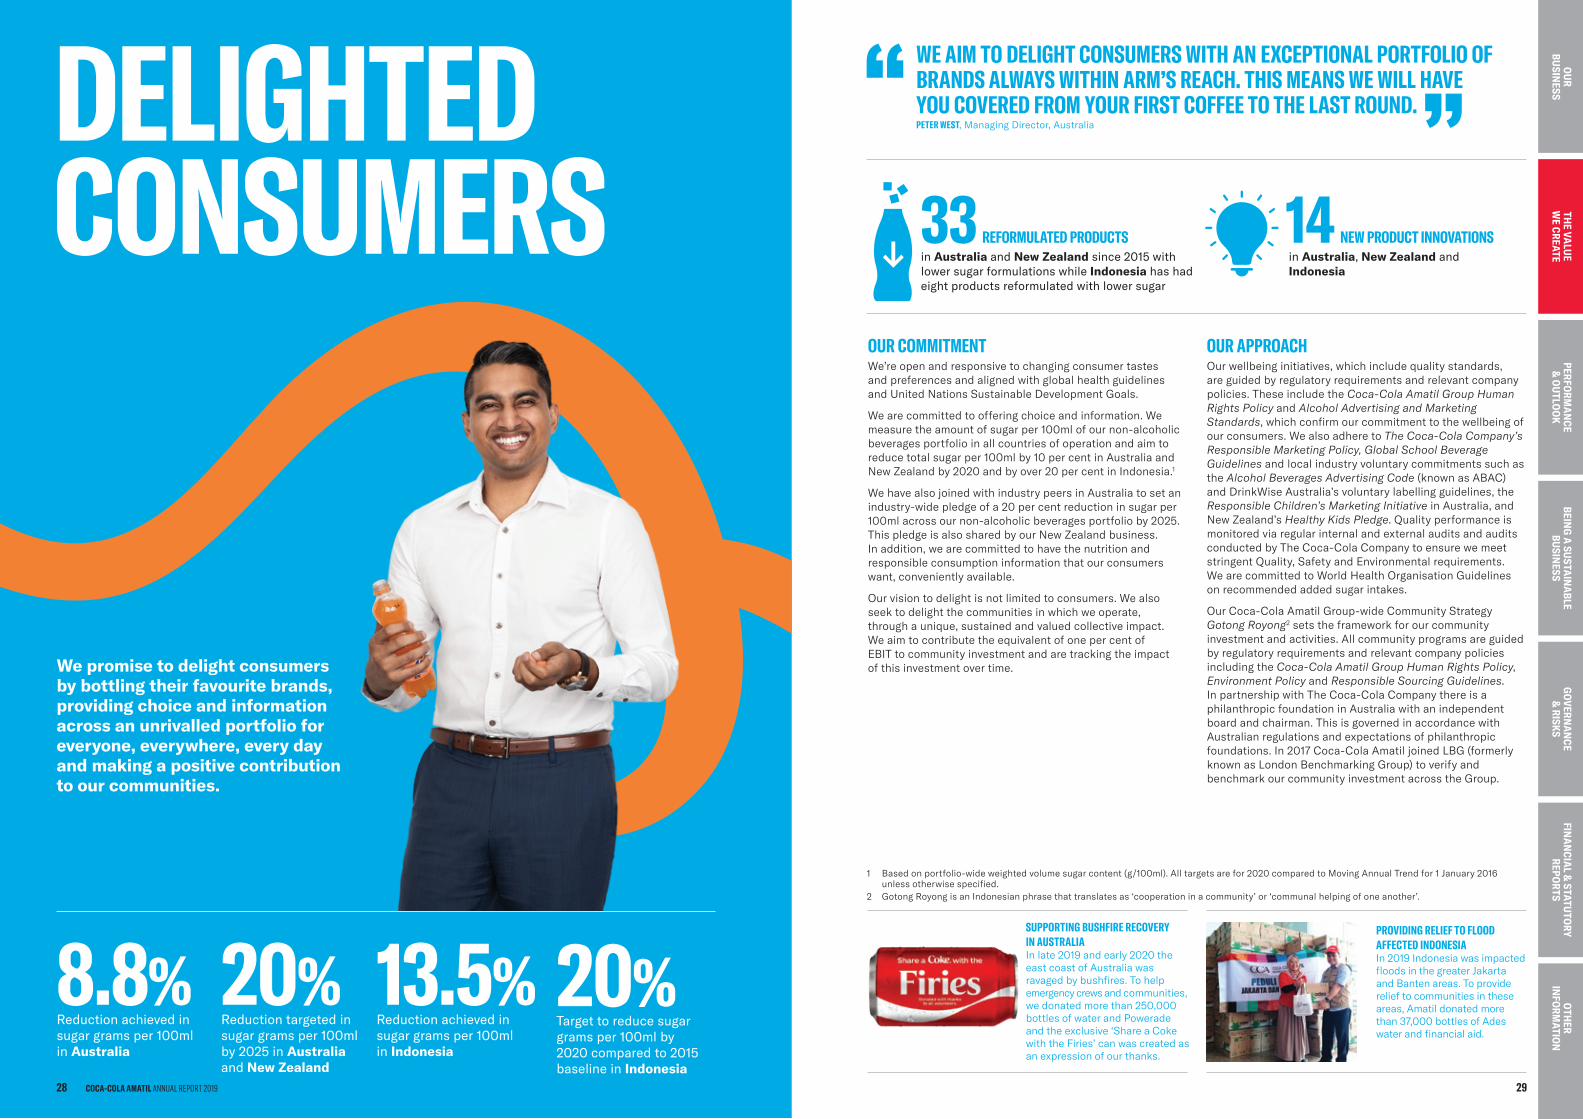
OUR COMMITMENTWe’re open and responsive to changing consumer tastes and preferences and aligned with global health guidelines and United Nations Sustainable Development Goals.
We are committed to offering choice and information. We measure the amount of sugar per 100ml of our non-alcoholic beverages portfolio in all countries of operation and aim to reduce total sugar per 100ml by 10 per cent in Australia and New Zealand by 2020 and by over 20 per cent in Indonesia.1
We have also joined with industry peers in Australia to set an industry-wide pledge of a 20 per cent reduction in sugar per 100ml across our non-alcoholic beverages portfolio by 2025. This pledge is also shared by our New Zealand business. In addition, we are committed to have the nutrition and responsible consumption information that our consumers want, conveniently available.
Our vision to delight is not limited to consumers. We also seek to delight the communities in which we operate, through a unique, sustained and valued collective impact. We aim to contribute the equivalent of one per cent of EBIT to community investment and are tracking the impact of this investment over time.
OUR APPROACHOur wellbeing initiatives, which include quality standards, are guided by regulatory requirements and relevant company policies. These include the Coca-Cola Amatil Group Human Rights Policy and Alcohol Advertising and Marketing Standards, which confirm our commitment to the wellbeing of our consumers. We also adhere to The Coca-Cola Company’s Responsible Marketing Policy, Global School Beverage Guidelines and local industry voluntary commitments such as the Alcohol Beverages Advertising Code (known as ABAC) and DrinkWise Australia’s voluntary labelling guidelines, the Responsible Children’s Marketing Initiative in Australia, and New Zealand’s Healthy Kids Pledge. Quality performance is monitored via regular internal and external audits and audits conducted by The Coca-Cola Company to ensure we meet stringent Quality, Safety and Environmental requirements. We are committed to World Health Organisation Guidelines on recommended added sugar intakes.
Our Coca-Cola Amatil Group-wide Community Strategy Gotong Royong2 sets the framework for our community investment and activities. All community programs are guided by regulatory requirements and relevant company policies including the Coca-Cola Amatil Group Human Rights Policy, Environment Policy and Responsible Sourcing Guidelines. In partnership with The Coca-Cola Company there is a philanthropic foundation in Australia with an independent board and chairman. This is governed in accordance with Australian regulations and expectations of philanthropic foundations. In 2017 Coca-Cola Amatil joined LBG (formerly known as London Benchmarking Group) to verify and benchmark our community investment across the Group.
WE AIM TO DELIGHT CONSUMERS WITH AN EXCEPTIONAL PORTFOLIO OF BRANDS ALWAYS WITHIN ARM’S REACH. THIS MEANS WE WILL HAVE YOU COVERED FROM YOUR FIRST COFFEE TO THE LAST ROUND.PETER WEST, Managing Director, Australia
33 REFORMULATED PRODUCTSin Australia and New Zealand since 2015 with lower sugar formulations while Indonesia has had eight products reformulated with lower sugar
14 NEW PRODUCT INNOVATIONS in Australia, New Zealand and Indonesia
1 Based on portfolio-wide weighted volume sugar content (g/100ml). All targets are for 2020 compared to Moving Annual Trend for 1 January 2016 unless otherwise specified.
2 Gotong Royong is an Indonesian phrase that translates as ‘cooperation in a community’ or ‘communal helping of one another’.
SUPPORTING BUSHFIRE RECOVERY IN AUSTRALIAIn late 2019 and early 2020 the east coast of Australia was ravaged by bushfires. To help emergency crews and communities, we donated more than 250,000 bottles of water and Powerade and the exclusive ‘Share a Coke with the Firies’ can was created as an expression of our thanks.
PROVIDING RELIEF TO FLOOD AFFECTED INDONESIAIn 2019 Indonesia was impacted floods in the greater Jakarta and Banten areas. To provide relief to communities in these areas, Amatil donated more than 37,000 bottles of Ades water and financial aid.
DELIGHTED CONSUMERS
We promise to delight consumers by bottling their favourite brands, providing choice and information across an unrivalled portfolio for everyone, everywhere, every day and making a positive contribution to our communities.
8.8%Reduction achieved in sugar grams per 100ml in Australia
13.5%Reduction achieved in sugar grams per 100ml in Indonesia
20%Reduction targeted in sugar grams per 100ml by 2025 in Australia and New Zealand
20%Target to reduce sugar grams per 100ml by 2020 compared to 2015 baseline in Indonesia
COCA-COLA AMATIL ANNUAL REPORT 201928 29
BEING
A SU
STAIN
ABLE
BUSIN
ESSTH
E VALU
E W
E CREATEPERFO
RMA
NCE
& O
UTLO
OK
GO
VERNA
NCE
& RISK
SFIN
AN
CIAL &
STATUTO
RY REPO
RTS
OTH
ER IN
FORM
ATION
OU
R BU
SINESS
THE VA
LUE
WE CREATE
OU
R BU
SINESS
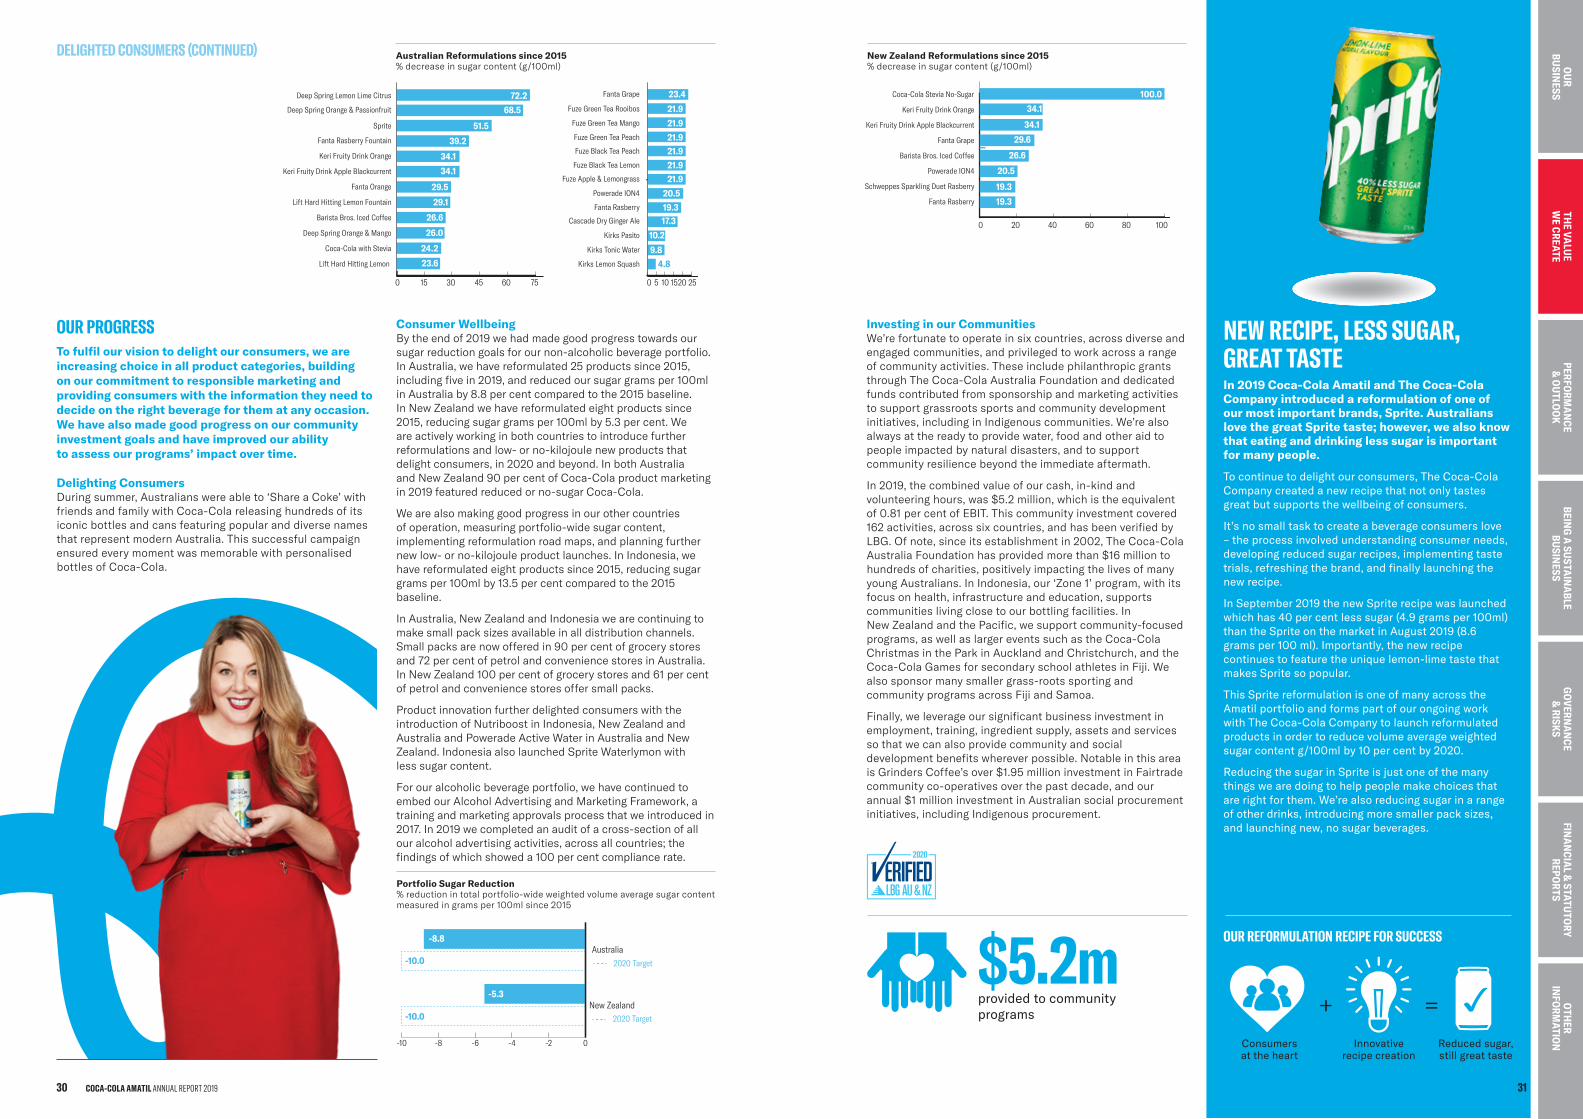
Investing in our CommunitiesWe’re fortunate to operate in six countries, across diverse and engaged communities, and privileged to work across a range of community activities. These include philanthropic grants through The Coca-Cola Australia Foundation and dedicated funds contributed from sponsorship and marketing activities to support grassroots sports and community development initiatives, including in Indigenous communities. We’re also always at the ready to provide water, food and other aid to people impacted by natural disasters, and to support community resilience beyond the immediate aftermath.
In 2019, the combined value of our cash, in-kind and volunteering hours, was $5.2 million, which is the equivalent of 0.81 per cent of EBIT. This community investment covered 162 activities, across six countries, and has been verified by LBG. Of note, since its establishment in 2002, The Coca-Cola Australia Foundation has provided more than $16 million to hundreds of charities, positively impacting the lives of many young Australians. In Indonesia, our ‘Zone 1’ program, with its focus on health, infrastructure and education, supports communities living close to our bottling facilities. In New Zealand and the Pacific, we support community-focused programs, as well as larger events such as the Coca-Cola Christmas in the Park in Auckland and Christchurch, and the Coca-Cola Games for secondary school athletes in Fiji. We also sponsor many smaller grass-roots sporting and community programs across Fiji and Samoa.
Finally, we leverage our significant business investment in employment, training, ingredient supply, assets and services so that we can also provide community and social development benefits wherever possible. Notable in this area is Grinders Coffee’s over $1.95 million investment in Fairtrade community co-operatives over the past decade, and our annual $1 million investment in Australian social procurement initiatives, including Indigenous procurement.
+ =Consumers at the heart
Innovative recipe creation
Reduced sugar, still great taste
OUR REFORMULATION RECIPE FOR SUCCESS
New Zealand Reformulations since 2015% decrease in sugar content (g/100ml)
$5.2mprovided to community programs
0 20 40 60 80 100
100.0
34.1
34.1
29.6
26.6
20.5
19.3
19.3
Coca-Cola Stevia No-Sugar
Keri Fruity Drink Orange
Keri Fruity Drink Apple Blackcurrent
Fanta Grape
Barista Bros. Iced Coffee
Powerade ION4
Schweppes Sparkling Duet Rasberry
Fanta Rasberry
NEW RECIPE, LESS SUGAR, GREAT TASTEIn 2019 Coca-Cola Amatil and The Coca-Cola Company introduced a reformulation of one of our most important brands, Sprite. Australians love the great Sprite taste; however, we also know that eating and drinking less sugar is important for many people.
To continue to delight our consumers, The Coca-Cola Company created a new recipe that not only tastes great but supports the wellbeing of consumers.
It’s no small task to create a beverage consumers love – the process involved understanding consumer needs,developing reduced sugar recipes, implementing tastetrials, refreshing the brand, and finally launching thenew recipe.
In September 2019 the new Sprite recipe was launched which has 40 per cent less sugar (4.9 grams per 100ml) than the Sprite on the market in August 2019 (8.6 grams per 100 ml). Importantly, the new recipe continues to feature the unique lemon-lime taste that makes Sprite so popular.
This Sprite reformulation is one of many across the Amatil portfolio and forms part of our ongoing work with The Coca-Cola Company to launch reformulated products in order to reduce volume average weighted sugar content g/100ml by 10 per cent by 2020.
Reducing the sugar in Sprite is just one of the many things we are doing to help people make choices that are right for them. We’re also reducing sugar in a range of other drinks, introducing more smaller pack sizes, and launching new, no sugar beverages.
Consumer WellbeingBy the end of 2019 we had made good progress towards our sugar reduction goals for our non-alcoholic beverage portfolio. In Australia, we have reformulated 25 products since 2015, including five in 2019, and reduced our sugar grams per 100ml in Australia by 8.8 per cent compared to the 2015 baseline. In New Zealand we have reformulated eight products since 2015, reducing sugar grams per 100ml by 5.3 per cent. We are actively working in both countries to introduce further reformulations and low- or no-kilojoule new products that delight consumers, in 2020 and beyond. In both Australia and New Zealand 90 per cent of Coca-Cola product marketing in 2019 featured reduced or no-sugar Coca-Cola.
We are also making good progress in our other countries of operation, measuring portfolio-wide sugar content, implementing reformulation road maps, and planning further new low- or no-kilojoule product launches. In Indonesia, we have reformulated eight products since 2015, reducing sugar grams per 100ml by 13.5 per cent compared to the 2015 baseline.
In Australia, New Zealand and Indonesia we are continuing to make small pack sizes available in all distribution channels. Small packs are now offered in 90 per cent of grocery stores and 72 per cent of petrol and convenience stores in Australia. In New Zealand 100 per cent of grocery stores and 61 per cent of petrol and convenience stores offer small packs.
Product innovation further delighted consumers with the introduction of Nutriboost in Indonesia, New Zealand and Australia and Powerade Active Water in Australia and New Zealand. Indonesia also launched Sprite Waterlymon with less sugar content.
For our alcoholic beverage portfolio, we have continued to embed our Alcohol Advertising and Marketing Framework, a training and marketing approvals process that we introduced in 2017. In 2019 we completed an audit of a cross-section of all our alcohol advertising activities, across all countries; the findings of which showed a 100 per cent compliance rate.
OUR PROGRESSTo fulfil our vision to delight our consumers, we are increasing choice in all product categories, building on our commitment to responsible marketing and providing consumers with the information they need to decide on the right beverage for them at any occasion. We have also made good progress on our community investment goals and have improved our ability to assess our programs’ impact over time.
Delighting ConsumersDuring summer, Australians were able to ‘Share a Coke’ with friends and family with Coca-Cola releasing hundreds of its iconic bottles and cans featuring popular and diverse names that represent modern Australia. This successful campaign ensured every moment was memorable with personalised bottles of Coca-Cola.
New Zealand
Australia
-10 -8 -6 -4 -2 0
-5.3
-8.8
-10.0
-10.0 2020 Target
2020 Target
Portfolio Sugar Reduction% reduction in total portfolio-wide weighted volume average sugar content measured in grams per 100ml since 2015
Australian Reformulations since 2015% decrease in sugar content (g/100ml)
DELIGHTED CONSUMERS (CONTINUED)
0 15 30 45 60 75 0 5 10 1520 25
72.2 23.4
21.9
21.9
21.921.921.921.9
20.519.317.3
10.2
9.84.8
68.5
51.5
39.2
34.1
34.1
29.5
29.1
26.6
26.0
24.2
23.6
Deep Spring Lemon Lime Citrus
Deep Spring Orange & Passionfruit
Sprite
Fanta Rasberry Fountain
Keri Fruity Drink Orange
Keri Fruity Drink Apple Blackcurrent
Fanta Orange
Lift Hard Hitting Lemon Fountain
Barista Bros. Iced Coffee
Deep Spring Orange & Mango
Coca-Cola with Stevia
Lift Hard Hitting Lemon
Fanta Grape
Fuze Green Tea Rooibos
Fuze Green Tea Mango
Fuze Green Tea Peach
Fuze Black Tea Peach
Fuze Black Tea Lemon
Fuze Apple & Lemongrass
Powerade ION4
Fanta Rasberry
Cascade Dry Ginger Ale
Kirks Pasito
Kirks Tonic Water
Kirks Lemon Squash
COCA-COLA AMATIL ANNUAL REPORT 201930 31
BEING
A SU
STAIN
ABLE
BUSIN
ESSTH
E VALU
E W
E CREATEPERFO
RMA
NCE
& O
UTLO
OK
GO
VERNA
NCE
& RISK
SFIN
AN
CIAL &
STATUTO
RY REPO
RTS
OTH
ER IN
FORM
ATION
OU
R BU
SINESS
THE VA
LUE
WE CREATE
OU
R BU
SINESS
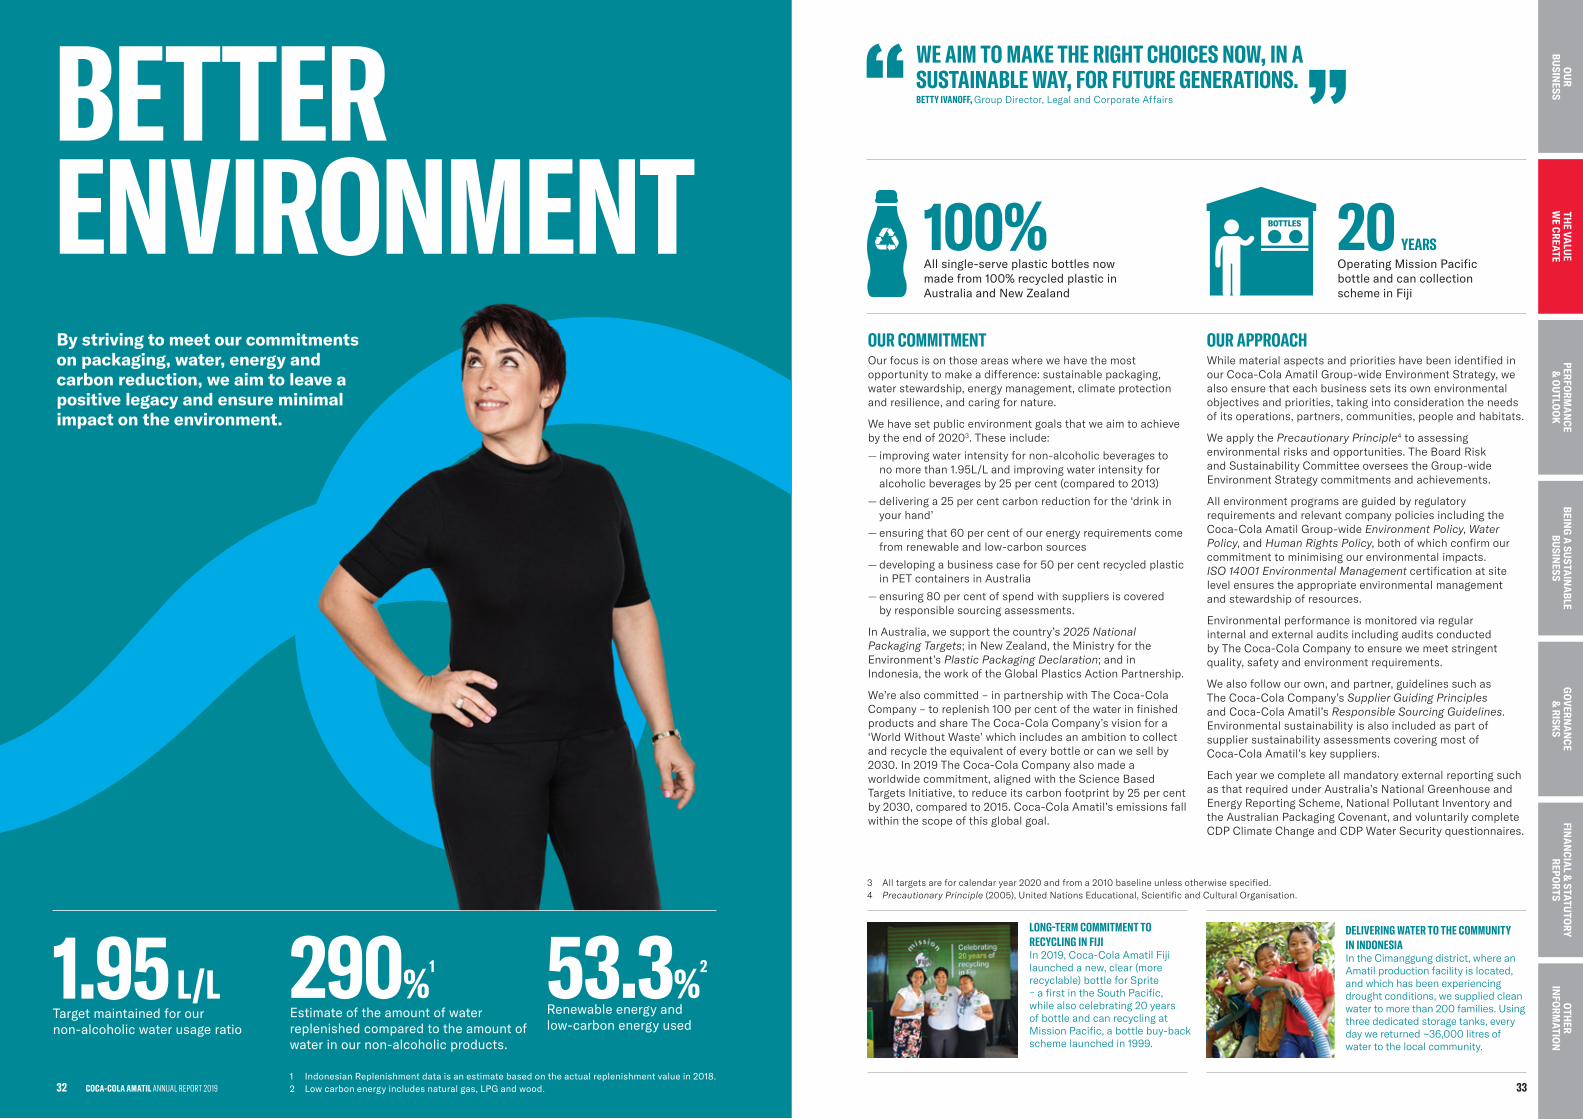
OUR COMMITMENTOur focus is on those areas where we have the most opportunity to make a difference: sustainable packaging, water stewardship, energy management, climate protection and resilience, and caring for nature.
We have set public environment goals that we aim to achieve by the end of 20203. These include:
— improving water intensity for non-alcoholic beverages to no more than 1.95L/L and improving water intensity for alcoholic beverages by 25 per cent (compared to 2013)
— delivering a 25 per cent carbon reduction for the ‘drink in your hand’
— ensuring that 60 per cent of our energy requirements come from renewable and low-carbon sources
— developing a business case for 50 per cent recycled plastic in PET containers in Australia
— ensuring 80 per cent of spend with suppliers is covered by responsible sourcing assessments.
In Australia, we support the country’s 2025 National Packaging Targets; in New Zealand, the Ministry for the Environment’s Plastic Packaging Declaration; and in Indonesia, the work of the Global Plastics Action Partnership.
We’re also committed – in partnership with The Coca-Cola Company – to replenish 100 per cent of the water in finished products and share The Coca-Cola Company’s vision for a ‘World Without Waste’ which includes an ambition to collect and recycle the equivalent of every bottle or can we sell by 2030. In 2019 The Coca-Cola Company also made a worldwide commitment, aligned with the Science Based Targets Initiative, to reduce its carbon footprint by 25 per cent by 2030, compared to 2015. Coca-Cola Amatil’s emissions fall within the scope of this global goal.
OUR APPROACHWhile material aspects and priorities have been identified in our Coca-Cola Amatil Group-wide Environment Strategy, we also ensure that each business sets its own environmental objectives and priorities, taking into consideration the needs of its operations, partners, communities, people and habitats.
We apply the Precautionary Principle4 to assessing environmental risks and opportunities. The Board Risk and Sustainability Committee oversees the Group-wide Environment Strategy commitments and achievements.
All environment programs are guided by regulatory requirements and relevant company policies including the Coca-Cola Amatil Group-wide Environment Policy, Water Policy, and Human Rights Policy, both of which confirm our commitment to minimising our environmental impacts. ISO 14001 Environmental Management certification at site level ensures the appropriate environmental management and stewardship of resources.
Environmental performance is monitored via regular internal and external audits including audits conducted by The Coca-Cola Company to ensure we meet stringent quality, safety and environment requirements.
We also follow our own, and partner, guidelines such as The Coca-Cola Company’s Supplier Guiding Principles and Coca-Cola Amatil’s Responsible Sourcing Guidelines. Environmental sustainability is also included as part of supplier sustainability assessments covering most of Coca-Cola Amatil’s key suppliers.
Each year we complete all mandatory external reporting such as that required under Australia’s National Greenhouse and Energy Reporting Scheme, National Pollutant Inventory and the Australian Packaging Covenant, and voluntarily complete CDP Climate Change and CDP Water Security questionnaires.
LONG-TERM COMMITMENT TO RECYCLING IN FIJIIn 2019, Coca-Cola Amatil Fiji launched a new, clear (more recyclable) bottle for Sprite – a first in the South Pacific,while also celebrating 20 yearsof bottle and can recycling atMission Pacific, a bottle buy-backscheme launched in 1999.
WE AIM TO MAKE THE RIGHT CHOICES NOW, IN A SUSTAINABLE WAY, FOR FUTURE GENERATIONS.BETTY IVANOFF, Group Director, Legal and Corporate Affairs
100%All single-serve plastic bottles now made from 100% recycled plastic in Australia and New Zealand
20 YEARSOperating Mission Pacific bottle and can collection scheme in Fiji
3 All targets are for calendar year 2020 and from a 2010 baseline unless otherwise specified.4 Precautionary Principle (2005), United Nations Educational, Scientific and Cultural Organisation.
DELIVERING WATER TO THE COMMUNITY IN INDONESIAIn the Cimanggung district, where an Amatil production facility is located, and which has been experiencing drought conditions, we supplied clean water to more than 200 families. Using three dedicated storage tanks, every day we returned ~36,000 litres of water to the local community.
BETTER ENVIRONMENTBy striving to meet our commitments on packaging, water, energy and carbon reduction, we aim to leave a positive legacy and ensure minimal impact on the environment.
1.95 L/LTarget maintained for our non-alcoholic water usage ratio
53.3%2
Renewable energy and low-carbon energy used
290%1
Estimate of the amount of water replenished compared to the amount of water in our non-alcoholic products.
1 Indonesian Replenishment data is an estimate based on the actual replenishment value in 2018.2 Low carbon energy includes natural gas, LPG and wood. 33
BEING
A SU
STAIN
ABLE
BUSIN
ESSTH
E VALU
E W
E CREATEPERFO
RMA
NCE
& O
UTLO
OK
GO
VERNA
NCE
& RISK
SFIN
AN
CIAL &
STATUTO
RY REPO
RTS
OTH
ER IN
FORM
ATION
OU
R BU
SINESS
THE VA
LUE
WE CREATE
OU
R BU
SINESS
32 COCA-COLA AMATIL ANNUAL REPORT 2019
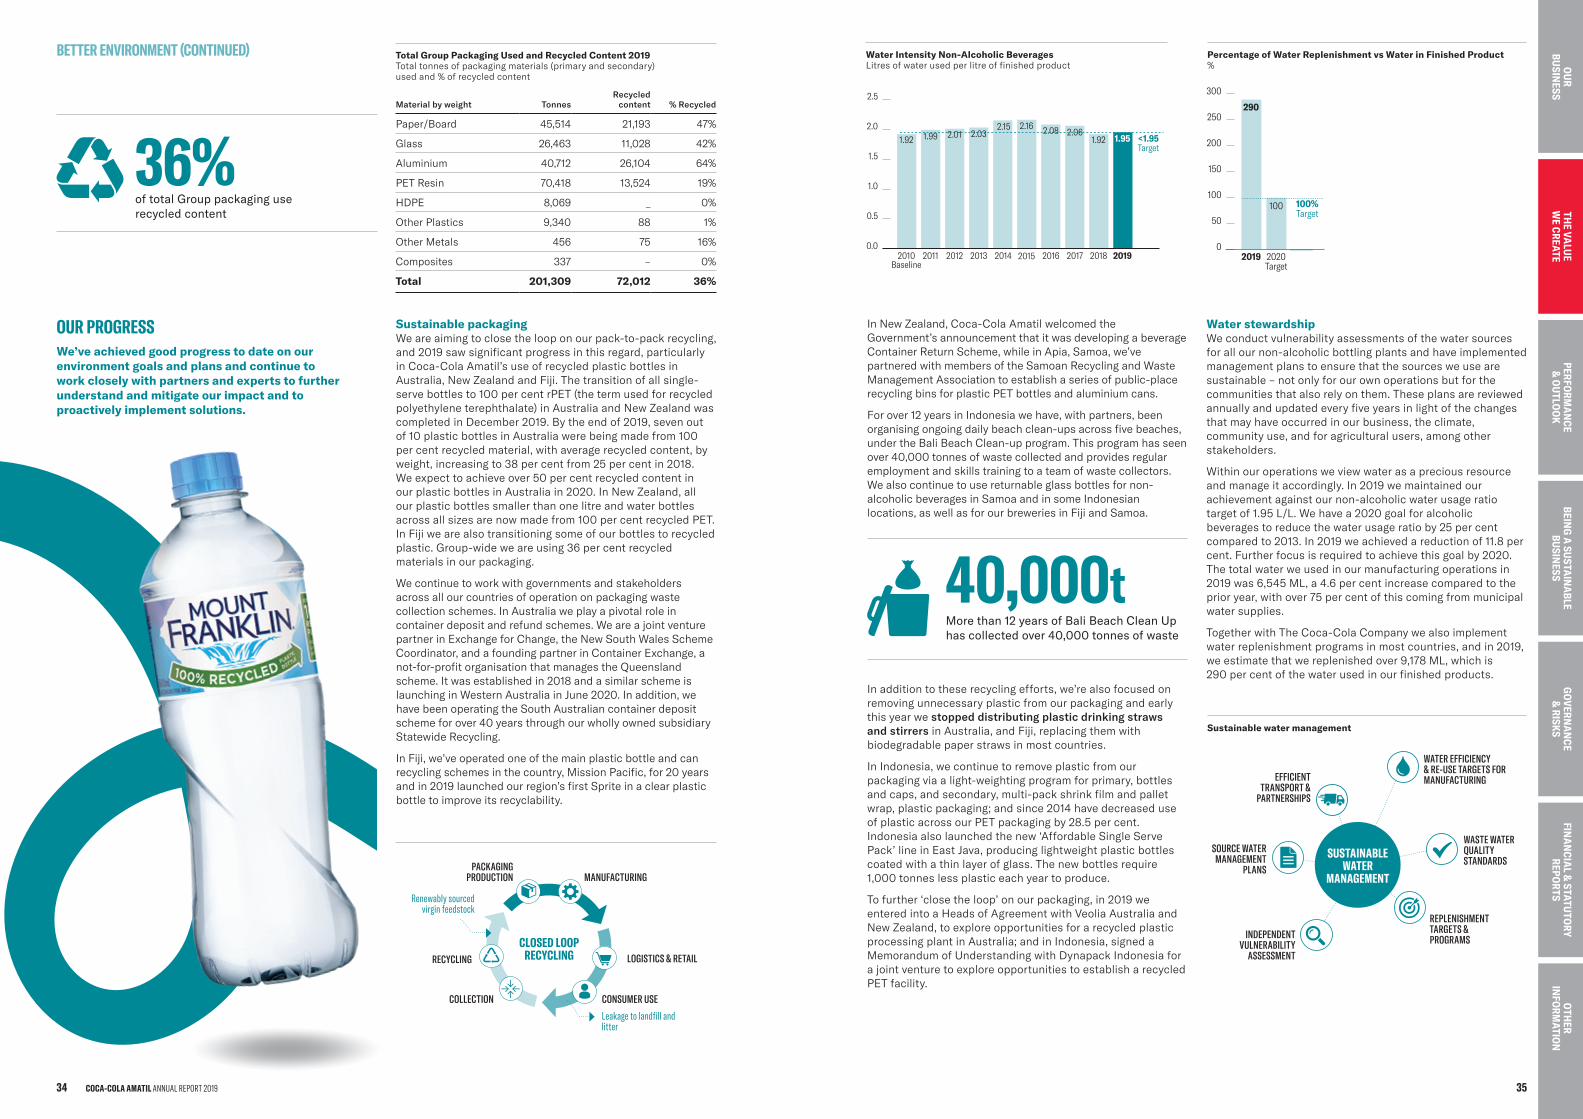
In New Zealand, Coca-Cola Amatil welcomed the Government’s announcement that it was developing a beverage Container Return Scheme, while in Apia, Samoa, we’ve partnered with members of the Samoan Recycling and Waste Management Association to establish a series of public-place recycling bins for plastic PET bottles and aluminium cans.
For over 12 years in Indonesia we have, with partners, been organising ongoing daily beach clean-ups across five beaches, under the Bali Beach Clean-up program. This program has seen over 40,000 tonnes of waste collected and provides regular employment and skills training to a team of waste collectors. We also continue to use returnable glass bottles for non-alcoholic beverages in Samoa and in some Indonesian locations, as well as for our breweries in Fiji and Samoa.
In addition to these recycling efforts, we’re also focused on removing unnecessary plastic from our packaging and early this year we stopped distributing plastic drinking straws and stirrers in Australia, and Fiji, replacing them with biodegradable paper straws in most countries.
In Indonesia, we continue to remove plastic from our packaging via a light-weighting program for primary, bottles and caps, and secondary, multi-pack shrink film and pallet wrap, plastic packaging; and since 2014 have decreased use of plastic across our PET packaging by 28.5 per cent. Indonesia also launched the new ‘Affordable Single Serve Pack’ line in East Java, producing lightweight plastic bottles coated with a thin layer of glass. The new bottles require 1,000 tonnes less plastic each year to produce.
To further ‘close the loop’ on our packaging, in 2019 we entered into a Heads of Agreement with Veolia Australia and New Zealand, to explore opportunities for a recycled plastic processing plant in Australia; and in Indonesia, signed a Memorandum of Understanding with Dynapack Indonesia for a joint venture to explore opportunities to establish a recycled PET facility.
Water stewardshipWe conduct vulnerability assessments of the water sources for all our non-alcoholic bottling plants and have implemented management plans to ensure that the sources we use are sustainable – not only for our own operations but for the communities that also rely on them. These plans are reviewed annually and updated every five years in light of the changes that may have occurred in our business, the climate, community use, and for agricultural users, among other stakeholders.
Within our operations we view water as a precious resource and manage it accordingly. In 2019 we maintained our achievement against our non-alcoholic water usage ratio target of 1.95 L/L. We have a 2020 goal for alcoholic beverages to reduce the water usage ratio by 25 per cent compared to 2013. In 2019 we achieved a reduction of 11.8 per cent. Further focus is required to achieve this goal by 2020. The total water we used in our manufacturing operations in 2019 was 6,545 ML, a 4.6 per cent increase compared to the prior year, with over 75 per cent of this coming from municipal water supplies.
Together with The Coca-Cola Company we also implement water replenishment programs in most countries, and in 2019, we estimate that we replenished over 9,178 ML, which is 290 per cent of the water used in our finished products.
Water Intensity Non-Alcoholic BeveragesLitres of water used per litre of finished product
0.0
0.5
1.0
1.5
2.0
2.5
2019201820172016201520142013201220112010Baseline
1.92 1.99 2.01 2.032.15 2.16 2.08 2.06
1.92 1.95 <1.95Target
Percentage of Water Replenishment vs Water in Finished Product%
0
50
100
150
200
250
300
2020Target
2019
290
100
1.95
100%Target
Sustainable water management
EFFICIENT TRANSPORT &
PARTNERSHIPS
INDEPENDENT VULNERABILITY
ASSESSMENT
WATER EFFICIENCY & RE-USE TARGETS FOR MANUFACTURING
WASTE WATER QUALITY STANDARDS
REPLENISHMENT TARGETS & PROGRAMS
SOURCE WATER MANAGEMENT
PLANS
SUSTAINABLE WATER
MANAGEMENT
40,000tMore than 12 years of Bali Beach Clean Up has collected over 40,000 tonnes of waste
Sustainable packagingWe are aiming to close the loop on our pack-to-pack recycling, and 2019 saw significant progress in this regard, particularly in Coca-Cola Amatil’s use of recycled plastic bottles in Australia, New Zealand and Fiji. The transition of all single-serve bottles to 100 per cent rPET (the term used for recycled polyethylene terephthalate) in Australia and New Zealand was completed in December 2019. By the end of 2019, seven out of 10 plastic bottles in Australia were being made from 100 per cent recycled material, with average recycled content, by weight, increasing to 38 per cent from 25 per cent in 2018. We expect to achieve over 50 per cent recycled content in our plastic bottles in Australia in 2020. In New Zealand, all our plastic bottles smaller than one litre and water bottles across all sizes are now made from 100 per cent recycled PET. In Fiji we are also transitioning some of our bottles to recycled plastic. Group-wide we are using 36 per cent recycled materials in our packaging.
We continue to work with governments and stakeholders across all our countries of operation on packaging waste collection schemes. In Australia we play a pivotal role in container deposit and refund schemes. We are a joint venture partner in Exchange for Change, the New South Wales Scheme Coordinator, and a founding partner in Container Exchange, a not-for-profit organisation that manages the Queensland scheme. It was established in 2018 and a similar scheme is launching in Western Australia in June 2020. In addition, we have been operating the South Australian container deposit scheme for over 40 years through our wholly owned subsidiary Statewide Recycling.
In Fiji, we’ve operated one of the main plastic bottle and can recycling schemes in the country, Mission Pacific, for 20 years and in 2019 launched our region’s first Sprite in a clear plastic bottle to improve its recyclability.
OUR PROGRESSWe’ve achieved good progress to date on our environment goals and plans and continue to work closely with partners and experts to further understand and mitigate our impact and to proactively implement solutions.
Total Group Packaging Used and Recycled Content 2019Total tonnes of packaging materials (primary and secondary) used and % of recycled content
Material by weight TonnesRecycled
content % Recycled
Paper/Board 45,514 21,193 47%
Glass 26,463 11,028 42%
Aluminium 40,712 26,104 64%
PET Resin 70,418 13,524 19%
HDPE 8,069 _ 0%
Other Plastics 9,340 88 1%
Other Metals 456 75 16%
Composites 337 – 0%
Total 201,309 72,012 36%
CLOSED LOOP RECYCLING
PACKAGING PRODUCTION
COLLECTION
MANUFACTURING
LOGISTICS & RETAIL
CONSUMER USE
Leakage to landfill and litter
RECYCLING
Renewably sourced virgin feedstock
BETTER ENVIRONMENT (CONTINUED)
36%of total Group packaging use recycled content
COCA-COLA AMATIL ANNUAL REPORT 201934 35
BEING
A SU
STAIN
ABLE
BUSIN
ESSTH
E VALU
E W
E CREATEPERFO
RMA
NCE
& O
UTLO
OK
GO
VERNA
NCE
& RISK
SFIN
AN
CIAL &
STATUTO
RY REPO
RTS
OTH
ER IN
FORM
ATION
OU
R BU
SINESS
THE VA
LUE
WE CREATE
OU
R BU
SINESS
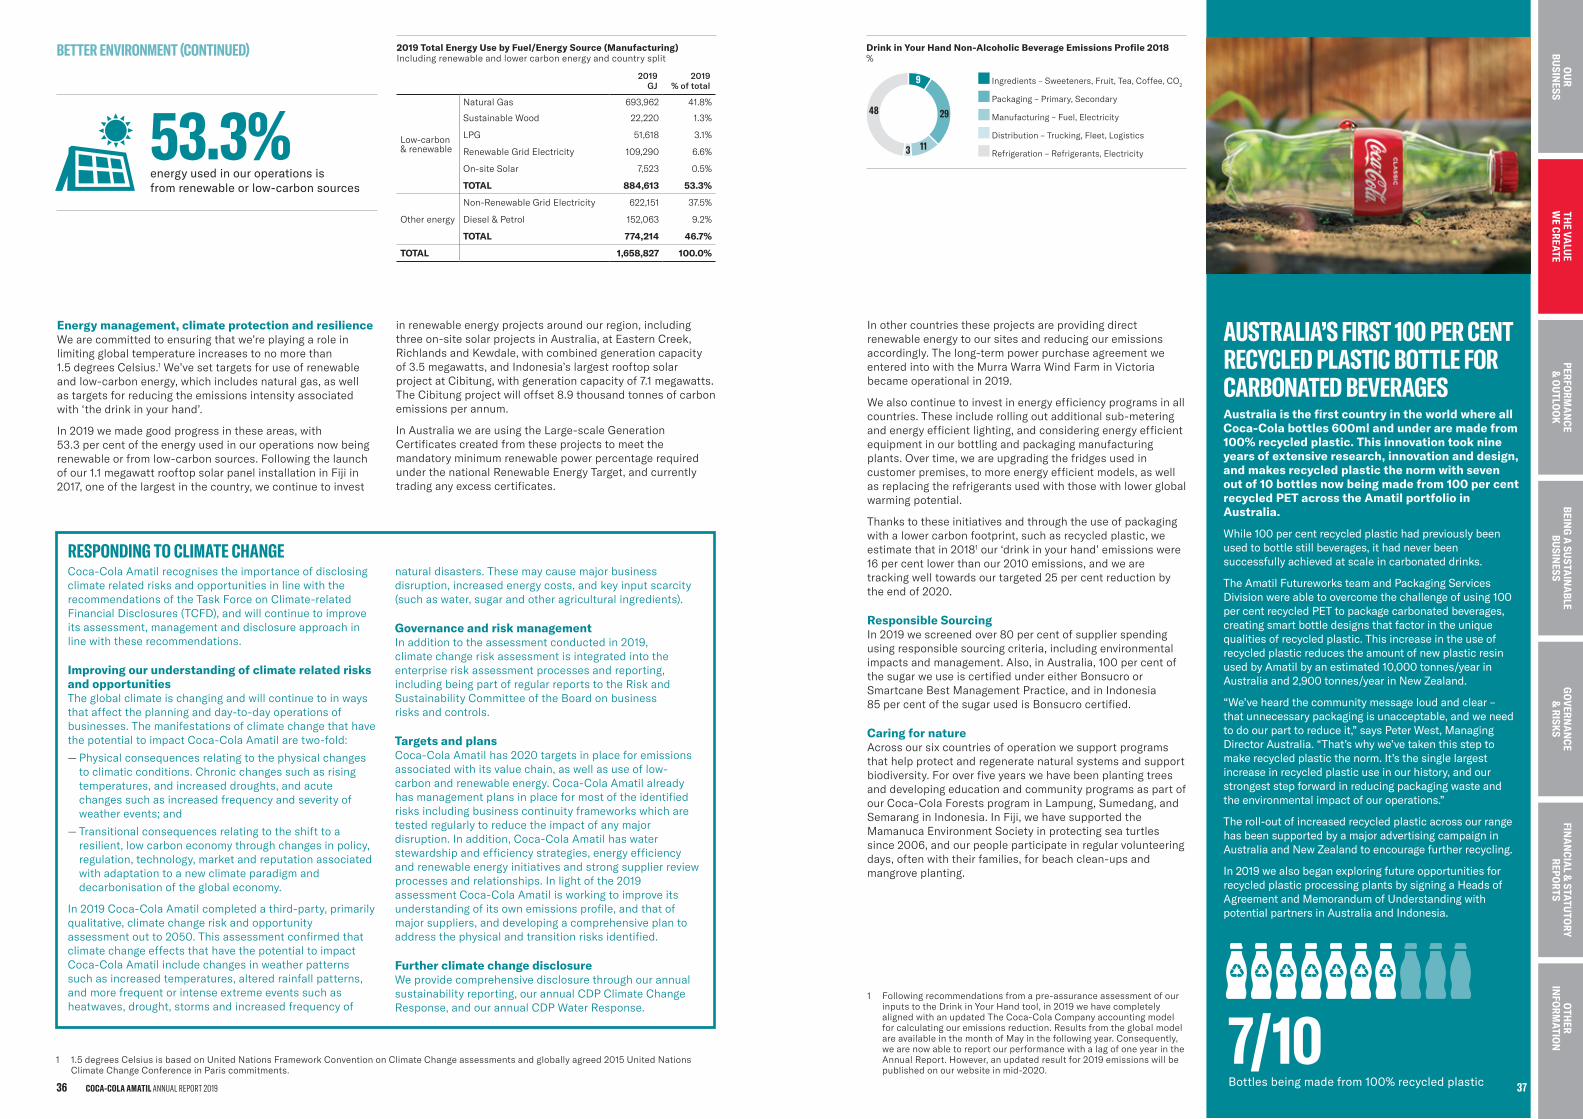
Drink in Your Hand Non-Alcoholic Beverage Emissions Profile 2018%
9
29
113
48
Ingredients – Sweeteners, Fruit, Tea, Coffee, CO2
Packaging – Primary, Secondary
Manufacturing – Fuel, Electricity
Distribution – Trucking, Fleet, Logistics
Refrigeration – Refrigerants, Electricity
1 Following recommendations from a pre-assurance assessment of our inputs to the Drink in Your Hand tool, in 2019 we have completely aligned with an updated The Coca-Cola Company accounting model for calculating our emissions reduction. Results from the global model are available in the month of May in the following year. Consequently, we are now able to report our performance with a lag of one year in the Annual Report. However, an updated result for 2019 emissions will be published on our website in mid-2020.
AUSTRALIA’S FIRST 100 PER CENT RECYCLED PLASTIC BOTTLE FOR CARBONATED BEVERAGESAustralia is the first country in the world where all Coca-Cola bottles 600ml and under are made from 100% recycled plastic. This innovation took nine years of extensive research, innovation and design, and makes recycled plastic the norm with seven out of 10 bottles now being made from 100 per cent recycled PET across the Amatil portfolio in Australia.
While 100 per cent recycled plastic had previously been used to bottle still beverages, it had never been successfully achieved at scale in carbonated drinks.
The Amatil Futureworks team and Packaging Services Division were able to overcome the challenge of using 100 per cent recycled PET to package carbonated beverages, creating smart bottle designs that factor in the unique qualities of recycled plastic. This increase in the use of recycled plastic reduces the amount of new plastic resin used by Amatil by an estimated 10,000 tonnes/year in Australia and 2,900 tonnes/year in New Zealand.
“We’ve heard the community message loud and clear – that unnecessary packaging is unacceptable, and we need to do our part to reduce it,” says Peter West, Managing Director Australia. “That’s why we’ve taken this step to make recycled plastic the norm. It’s the single largest increase in recycled plastic use in our history, and our strongest step forward in reducing packaging waste and the environmental impact of our operations.”
The roll-out of increased recycled plastic across our range has been supported by a major advertising campaign in Australia and New Zealand to encourage further recycling.
In 2019 we also began exploring future opportunities for recycled plastic processing plants by signing a Heads of Agreement and Memorandum of Understanding with potential partners in Australia and Indonesia.
7/10Bottles being made from 100% recycled plastic
In other countries these projects are providing direct renewable energy to our sites and reducing our emissions accordingly. The long-term power purchase agreement we entered into with the Murra Warra Wind Farm in Victoria became operational in 2019.
We also continue to invest in energy efficiency programs in all countries. These include rolling out additional sub-metering and energy efficient lighting, and considering energy efficient equipment in our bottling and packaging manufacturing plants. Over time, we are upgrading the fridges used in customer premises, to more energy efficient models, as well as replacing the refrigerants used with those with lower global warming potential.
Thanks to these initiatives and through the use of packaging with a lower carbon footprint, such as recycled plastic, we estimate that in 20181 our ‘drink in your hand’ emissions were 16 per cent lower than our 2010 emissions, and we are tracking well towards our targeted 25 per cent reduction by the end of 2020.
Responsible SourcingIn 2019 we screened over 80 per cent of supplier spending using responsible sourcing criteria, including environmental impacts and management. Also, in Australia, 100 per cent of the sugar we use is certified under either Bonsucro or Smartcane Best Management Practice, and in Indonesia 85 per cent of the sugar used is Bonsucro certified.
Caring for natureAcross our six countries of operation we support programs that help protect and regenerate natural systems and support biodiversity. For over five years we have been planting trees and developing education and community programs as part of our Coca-Cola Forests program in Lampung, Sumedang, and Semarang in Indonesia. In Fiji, we have supported the Mamanuca Environment Society in protecting sea turtles since 2006, and our people participate in regular volunteering days, often with their families, for beach clean-ups and mangrove planting.
Energy management, climate protection and resilienceWe are committed to ensuring that we’re playing a role in limiting global temperature increases to no more than 1.5 degrees Celsius.1 We’ve set targets for use of renewable and low-carbon energy, which includes natural gas, as well as targets for reducing the emissions intensity associated with ‘the drink in your hand’.
In 2019 we made good progress in these areas, with 53.3 per cent of the energy used in our operations now being renewable or from low-carbon sources. Following the launch of our 1.1 megawatt rooftop solar panel installation in Fiji in 2017, one of the largest in the country, we continue to invest
in renewable energy projects around our region, including three on-site solar projects in Australia, at Eastern Creek, Richlands and Kewdale, with combined generation capacity of 3.5 megawatts, and Indonesia’s largest rooftop solar project at Cibitung, with generation capacity of 7.1 megawatts. The Cibitung project will offset 8.9 thousand tonnes of carbon emissions per annum.
In Australia we are using the Large-scale Generation Certificates created from these projects to meet the mandatory minimum renewable power percentage required under the national Renewable Energy Target, and currently trading any excess certificates.
RESPONDING TO CLIMATE CHANGECoca-Cola Amatil recognises the importance of disclosing climate related risks and opportunities in line with the recommendations of the Task Force on Climate-related Financial Disclosures (TCFD), and will continue to improve its assessment, management and disclosure approach in line with these recommendations.
Improving our understanding of climate related risks and opportunitiesThe global climate is changing and will continue to in ways that affect the planning and day-to-day operations of businesses. The manifestations of climate change that have the potential to impact Coca-Cola Amatil are two-fold:
— Physical consequences relating to the physical changes to climatic conditions. Chronic changes such as rising temperatures, and increased droughts, and acute changes such as increased frequency and severity of weather events; and
— Transitional consequences relating to the shift to a resilient, low carbon economy through changes in policy, regulation, technology, market and reputation associated with adaptation to a new climate paradigm and decarbonisation of the global economy.
In 2019 Coca-Cola Amatil completed a third-party, primarily qualitative, climate change risk and opportunity assessment out to 2050. This assessment confirmed that climate change effects that have the potential to impact Coca-Cola Amatil include changes in weather patterns such as increased temperatures, altered rainfall patterns, and more frequent or intense extreme events such as heatwaves, drought, storms and increased frequency of
natural disasters. These may cause major business disruption, increased energy costs, and key input scarcity (such as water, sugar and other agricultural ingredients).
Governance and risk managementIn addition to the assessment conducted in 2019, climate change risk assessment is integrated into the enterprise risk assessment processes and reporting, including being part of regular reports to the Risk and Sustainability Committee of the Board on business risks and controls.
Targets and plansCoca-Cola Amatil has 2020 targets in place for emissions associated with its value chain, as well as use of low-carbon and renewable energy. Coca-Cola Amatil already has management plans in place for most of the identified risks including business continuity frameworks which are tested regularly to reduce the impact of any major disruption. In addition, Coca-Cola Amatil has water stewardship and efficiency strategies, energy efficiency and renewable energy initiatives and strong supplier review processes and relationships. In light of the 2019 assessment Coca-Cola Amatil is working to improve its understanding of its own emissions profile, and that of major suppliers, and developing a comprehensive plan to address the physical and transition risks identified.
Further climate change disclosureWe provide comprehensive disclosure through our annual sustainability reporting, our annual CDP Climate Change Response, and our annual CDP Water Response.
2019 Total Energy Use by Fuel/Energy Source (Manufacturing)Including renewable and lower carbon energy and country split
2019 GJ
2019 % of total
Low-carbon & renewable
Natural Gas 693,962 41.8%
Sustainable Wood 22,220 1.3%
LPG 51,618 3.1%
Renewable Grid Electricity 109,290 6.6%
On-site Solar 7,523 0.5%
TOTAL 884,613 53.3%
Other energy
Non-Renewable Grid Electricity 622,151 37.5%
Diesel & Petrol 152,063 9.2%
TOTAL 774,214 46.7%
TOTAL 1,658,827 100.0%
BETTER ENVIRONMENT (CONTINUED)
53.3%energy used in our operations is from renewable or low-carbon sources
1 1.5 degrees Celsius is based on United Nations Framework Convention on Climate Change assessments and globally agreed 2015 United Nations Climate Change Conference in Paris commitments.
COCA-COLA AMATIL ANNUAL REPORT 201936
BEING
A SU
STAIN
ABLE
BUSIN
ESSTH
E VALU
E W
E CREATEPERFO
RMA
NCE
& O
UTLO
OK
GO
VERNA
NCE
& RISK
SFIN
AN
CIAL &
STATUTO
RY REPO
RTS
OTH
ER IN
FORM
ATION
OU
R BU
SINESS
37
THE VA
LUE
WE CREATE
OU
R BU
SINESS
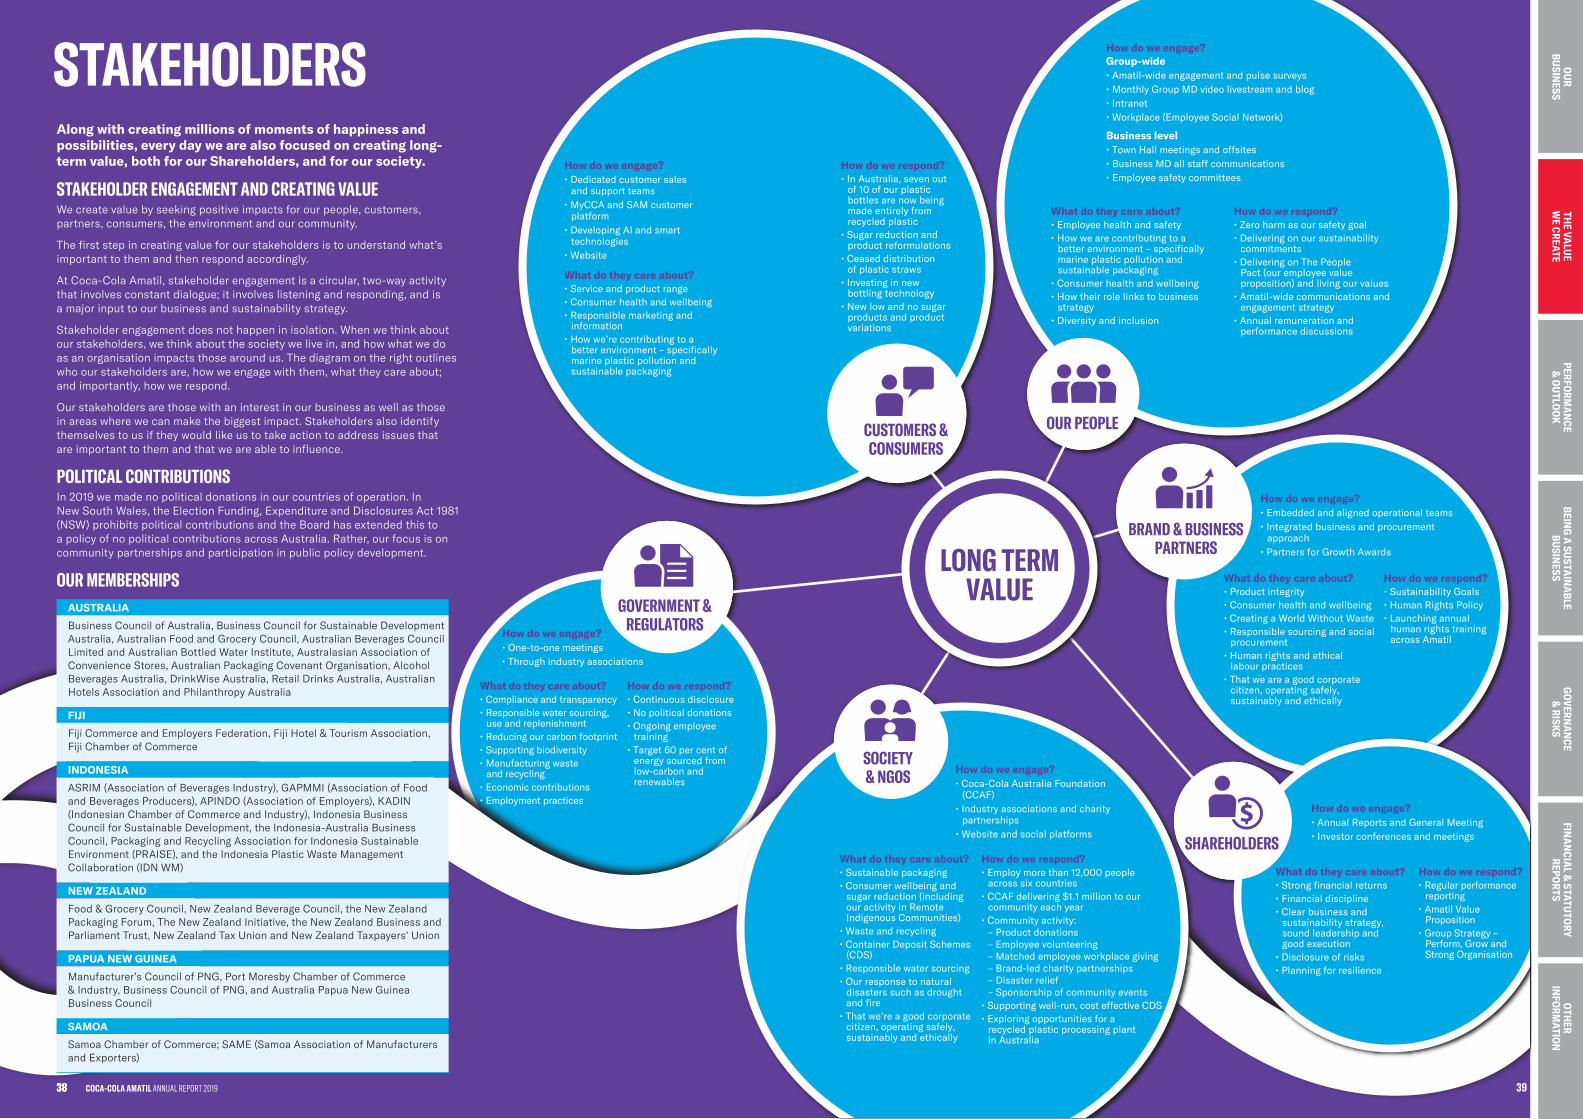
How do we engage?• Coca-Cola Australia Foundation
(CCAF)• Industry associations and charity
partnerships• Website and social platforms
What do they care about?• Sustainable packaging• Consumer wellbeing and
sugar reduction (including our activity in Remote Indigenous Communities)
• Waste and recycling• Container Deposit Schemes
(CDS)• Responsible water sourcing• Our response to natural
disasters such as drought and fire
• That we’re a good corporate citizen, operating safely, sustainably and ethically
How do we respond?• Employ more than 12,000 people
across six countries• CCAF delivering $1.1 million to our
community each year• Community activity:
– Product donations– Employee volunteering– Matched employee workplace giving– Brand-led charity partnerships– Disaster relief– Sponsorship of community events
• Supporting well-run, cost effective CDS• Exploring opportunities for a
recycled plastic processing plant in Australia
How do we engage?• Dedicated customer sales
and support teams• MyCCA and SAM customer
platform• Developing AI and smart
technologies• Website
What do they care about?• Service and product range• Consumer health and wellbeing• Responsible marketing and
information• How we’re contributing to a
better environment – specifically marine plastic pollution and sustainable packaging
How do we respond?• In Australia, seven out
of 10 of our plastic bottles are now being made entirely from recycled plastic
• Sugar reduction and product reformulations
• Ceased distribution of plastic straws
• Investing in new bottling technology
• New low and no sugar products and product variations
How do we engage?Group-wide• Amatil-wide engagement and pulse surveys• Monthly Group MD video livestream and blog• Intranet• Workplace (Employee Social Network)
Business level• Town Hall meetings and offsites• Business MD all staff communications • Employee safety committees
What do they care about?• Employee health and safety• How we are contributing to a
better environment – specifically marine plastic pollution and sustainable packaging
• Consumer health and wellbeing• How their role links to business
strategy• Diversity and inclusion
How do we respond?• Zero harm as our safety goal• Delivering on our sustainability
commitments• Delivering on The People
Pact (our employee value proposition) and living our values
• Amatil-wide communications and engagement strategy
• Annual remuneration and performance discussions
How do we engage?• One-to-one meetings• Through industry associations
What do they care about?• Compliance and transparency • Responsible water sourcing,
use and replenishment• Reducing our carbon footprint• Supporting biodiversity• Manufacturing waste
and recycling• Economic contributions• Employment practices
How do we respond?• Continuous disclosure • No political donations• Ongoing employee
training• Target 60 per cent of
energy sourced from low-carbon and renewables
How do we engage?• Embedded and aligned operational teams• Integrated business and procurement
approach• Partners for Growth Awards
What do they care about?• Product integrity• Consumer health and wellbeing• Creating a World Without Waste• Responsible sourcing and social
procurement • Human rights and ethical
labour practices• That we are a good corporate
citizen, operating safely, sustainably and ethically
How do we respond?• Sustainability Goals• Human Rights Policy• Launching annual
human rights training across Amatil
LONG TERM VALUE
CUSTOMERS & CONSUMERS
OUR PEOPLE
BRAND & BUSINESS PARTNERS
GOVERNMENT & REGULATORS
SOCIETY& NGOS
How do we engage?• Annual Reports and General Meeting• Investor conferences and meetings
What do they care about?• Strong financial returns• Financial discipline• Clear business and
sustainability strategy, sound leadership and good execution
• Disclosure of risks• Planning for resilience
How do we respond?• Regular performance
reporting • Amatil Value
Proposition• Group Strategy –
Perform, Grow and Strong Organisation
SHAREHOLDERS
38 COCA-COLA AMATIL ANNUAL REPORT 2019
STAKEHOLDERSAlong with creating millions of moments of happiness and possibilities, every day we are also focused on creating long- term value, both for our Shareholders, and for our society.
STAKEHOLDER ENGAGEMENT AND CREATING VALUEWe create value by seeking positive impacts for our people, customers, partners, consumers, the environment and our community.
The first step in creating value for our stakeholders is to understand what’s important to them and then respond accordingly.
At Coca-Cola Amatil, stakeholder engagement is a circular, two-way activity that involves constant dialogue; it involves listening and responding, and is a major input to our business and sustainability strategy.
Stakeholder engagement does not happen in isolation. When we think about our stakeholders, we think about the society we live in, and how what we do as an organisation impacts those around us. The diagram on the right outlines who our stakeholders are, how we engage with them, what they care about; and importantly, how we respond.
Our stakeholders are those with an interest in our business as well as those in areas where we can make the biggest impact. Stakeholders also identify themselves to us if they would like us to take action to address issues that are important to them and that we are able to influence.
POLITICAL CONTRIBUTIONSIn 2019 we made no political donations in our countries of operation. In New South Wales, the Election Funding, Expenditure and Disclosures Act 1981 (NSW) prohibits political contributions and the Board has extended this to a policy of no political contributions across Australia. Rather, our focus is on community partnerships and participation in public policy development.
OUR MEMBERSHIPSAUSTRALIA
Business Council of Australia, Business Council for Sustainable Development Australia, Australian Food and Grocery Council, Australian Beverages Council Limited and Australian Bottled Water Institute, Australasian Association of Convenience Stores, Australian Packaging Covenant Organisation, Alcohol Beverages Australia, DrinkWise Australia, Retail Drinks Australia, Australian Hotels Association and Philanthropy Australia
FIJI
Fiji Commerce and Employers Federation, Fiji Hotel & Tourism Association, Fiji Chamber of Commerce
INDONESIA
ASRIM (Association of Beverages Industry), GAPMMI (Association of Food and Beverages Producers), APINDO (Association of Employers), KADIN (Indonesian Chamber of Commerce and Industry), Indonesia Business Council for Sustainable Development, the Indonesia-Australia Business Council, Packaging and Recycling Association for Indonesia Sustainable Environment (PRAISE), and the Indonesia Plastic Waste Management Collaboration (IDN WM)
NEW ZEALAND
Food & Grocery Council, New Zealand Beverage Council, the New Zealand Packaging Forum, The New Zealand Initiative, the New Zealand Business and Parliament Trust, New Zealand Tax Union and New Zealand Taxpayers’ Union
PAPUA NEW GUINEA
Manufacturer’s Council of PNG, Port Moresby Chamber of Commerce & Industry, Business Council of PNG, and Australia Papua New Guinea Business Council
SAMOA
Samoa Chamber of Commerce; SAME (Samoa Association of Manufacturers and Exporters)
BEING
A SU
STAIN
ABLE
BUSIN
ESSPERFO
RMA
NCE
& O
UTLO
OK
GO
VERNA
NCE
& RISK
SFIN
AN
CIAL &
STATUTO
RY REPO
RTS
OTH
ER IN
FORM
ATION
39
THE VA
LUE
WE CREATE
OU
R BU
SINESS
38
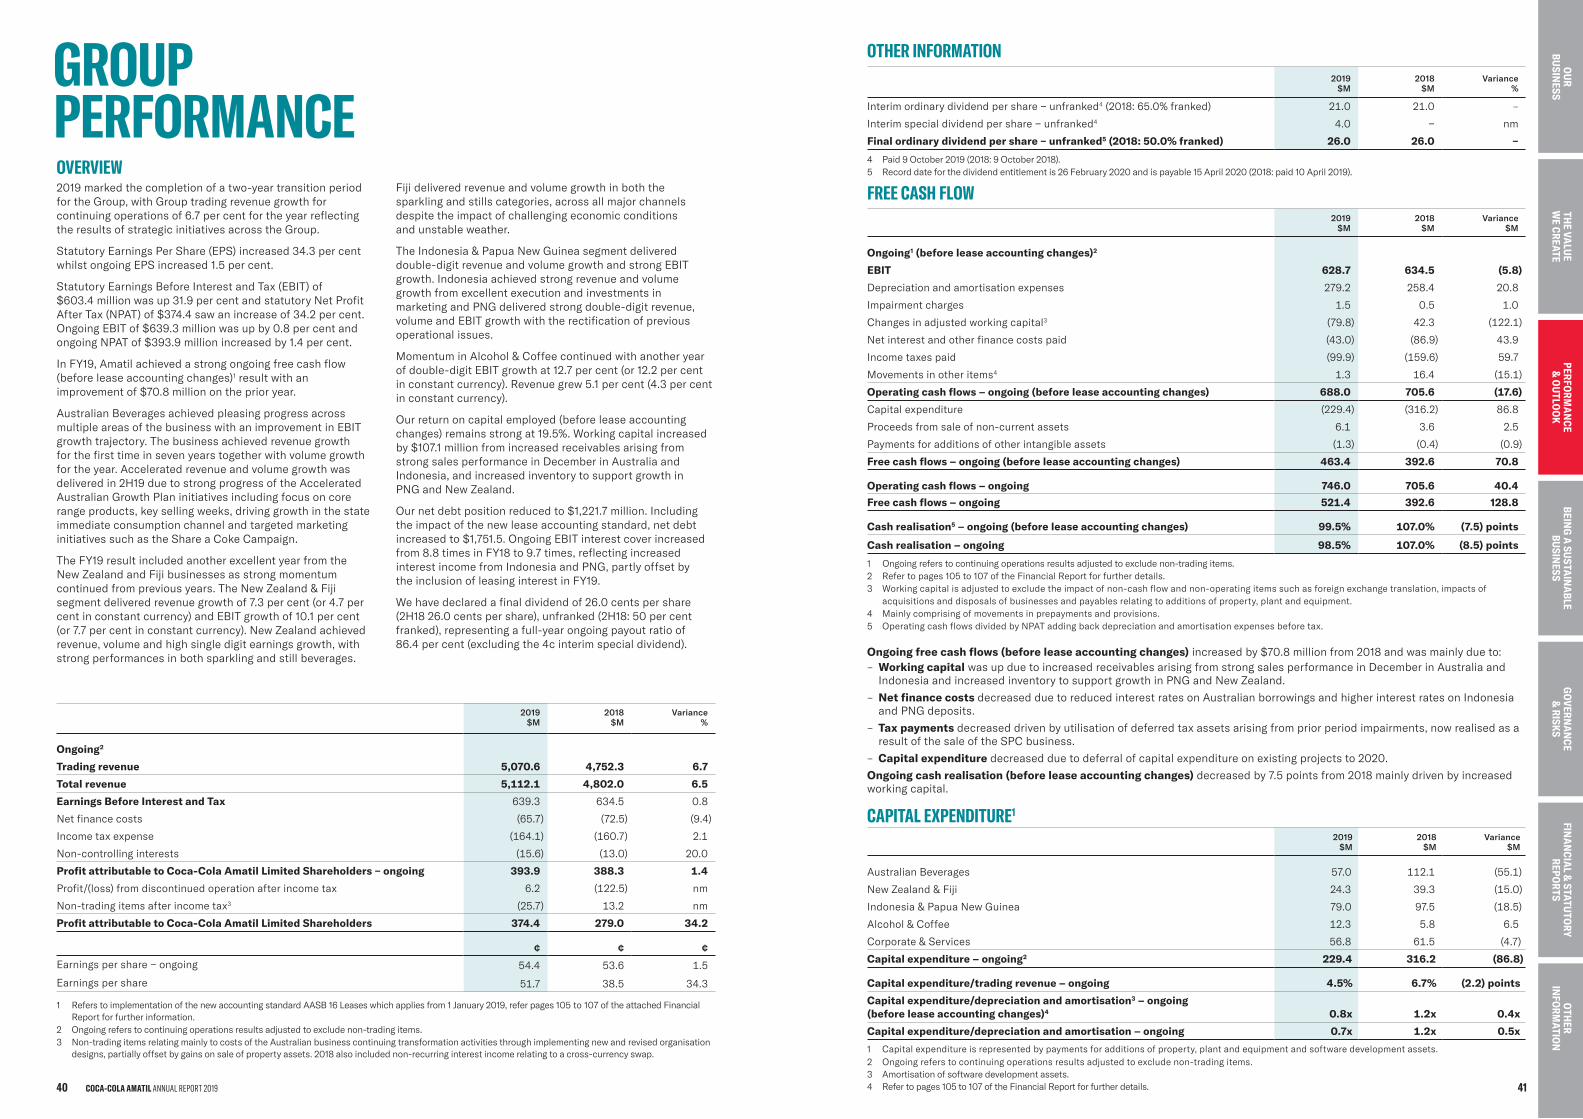
OVERVIEW2019 marked the completion of a two-year transition period for the Group, with Group trading revenue growth for continuing operations of 6.7 per cent for the year reflecting the results of strategic initiatives across the Group.
Statutory Earnings Per Share (EPS) increased 34.3 per cent whilst ongoing EPS increased 1.5 per cent.
Statutory Earnings Before Interest and Tax (EBIT) of $603.4 million was up 31.9 per cent and statutory Net Profit After Tax (NPAT) of $374.4 saw an increase of 34.2 per cent. Ongoing EBIT of $639.3 million was up by 0.8 per cent and ongoing NPAT of $393.9 million increased by 1.4 per cent.
In FY19, Amatil achieved a strong ongoing free cash flow (before lease accounting changes)1 result with an improvement of $70.8 million on the prior year.
Australian Beverages achieved pleasing progress across multiple areas of the business with an improvement in EBIT growth trajectory. The business achieved revenue growth for the first time in seven years together with volume growth for the year. Accelerated revenue and volume growth was delivered in 2H19 due to strong progress of the Accelerated Australian Growth Plan initiatives including focus on core range products, key selling weeks, driving growth in the state immediate consumption channel and targeted marketing initiatives such as the Share a Coke Campaign.
The FY19 result included another excellent year from the New Zealand and Fiji businesses as strong momentum continued from previous years. The New Zealand & Fiji segment delivered revenue growth of 7.3 per cent (or 4.7 per cent in constant currency) and EBIT growth of 10.1 per cent (or 7.7 per cent in constant currency). New Zealand achieved revenue, volume and high single digit earnings growth, with strong performances in both sparkling and still beverages.
Fiji delivered revenue and volume growth in both the sparkling and stills categories, across all major channels despite the impact of challenging economic conditions and unstable weather.
The Indonesia & Papua New Guinea segment delivered double-digit revenue and volume growth and strong EBIT growth. Indonesia achieved strong revenue and volume growth from excellent execution and investments in marketing and PNG delivered strong double-digit revenue, volume and EBIT growth with the rectification of previous operational issues.
Momentum in Alcohol & Coffee continued with another year of double-digit EBIT growth at 12.7 per cent (or 12.2 per cent in constant currency). Revenue grew 5.1 per cent (4.3 per cent in constant currency).
Our return on capital employed (before lease accounting changes) remains strong at 19.5%. Working capital increased by $107.1 million from increased receivables arising from strong sales performance in December in Australia and Indonesia, and increased inventory to support growth in PNG and New Zealand.
Our net debt position reduced to $1,221.7 million. Including the impact of the new lease accounting standard, net debt increased to $1,751.5. Ongoing EBIT interest cover increased from 8.8 times in FY18 to 9.7 times, reflecting increased interest income from Indonesia and PNG, partly offset by the inclusion of leasing interest in FY19.
We have declared a final dividend of 26.0 cents per share (2H18 26.0 cents per share), unfranked (2H18: 50 per cent franked), representing a full-year ongoing payout ratio of 86.4 per cent (excluding the 4c interim special dividend).
GROUP PERFORMANCE
2019$M
2018 $M
Variance%
Ongoing2
Trading revenue 5,070.6 4,752.3 6.7
Total revenue 5,112.1 4,802.0 6.5
Earnings Before Interest and Tax 639.3 634.5 0.8
Net finance costs (65.7) (72.5) (9.4)
Income tax expense (164.1) (160.7) 2.1
Non-controlling interests (15.6) (13.0) 20.0
Profit attributable to Coca-Cola Amatil Limited Shareholders − ongoing 393.9 388.3 1.4
Profit/(loss) from discontinued operation after income tax 6.2 (122.5) nm
Non-trading items after income tax3 (25.7) 13.2 nm
Profit attributable to Coca-Cola Amatil Limited Shareholders 374.4 279.0 34.2
¢ ¢ ¢
Earnings per share − ongoing 54.4 53.6 1.5
Earnings per share 51.7 38.5 34.3
2019$M
2018 $M
Variance%
Interim ordinary dividend per share − unfranked4 (2018: 65.0% franked) 21.0 21.0 –
Interim special dividend per share − unfranked4 4.0 − nm
Final ordinary dividend per share − unfranked5 (2018: 50.0% franked) 26.0 26.0 −
4 Paid 9 October 2019 (2018: 9 October 2018).5 Record date for the dividend entitlement is 26 February 2020 and is payable 15 April 2020 (2018: paid 10 April 2019).
FREE CASH FLOW2019
$M2018
$MVariance
$M
Ongoing1 (before lease accounting changes)2
EBIT 628.7 634.5 (5.8)
Depreciation and amortisation expenses 279.2 258.4 20.8
Impairment charges 1.5 0.5 1.0
Changes in adjusted working capital3 (79.8) 42.3 (122.1)
Net interest and other finance costs paid (43.0) (86.9) 43.9
Income taxes paid (99.9) (159.6) 59.7
Movements in other items4 1.3 16.4 (15.1)
Operating cash flows – ongoing (before lease accounting changes) 688.0 705.6 (17.6)
Capital expenditure (229.4) (316.2) 86.8
Proceeds from sale of non-current assets 6.1 3.6 2.5
Payments for additions of other intangible assets (1.3) (0.4) (0.9)
Free cash flows – ongoing (before lease accounting changes) 463.4 392.6 70.8
Operating cash flows – ongoing 746.0 705.6 40.4
Free cash flows – ongoing 521.4 392.6 128.8
Cash realisation5 – ongoing (before lease accounting changes) 99.5% 107.0% (7.5) points
Cash realisation – ongoing 98.5% 107.0% (8.5) points
1 Ongoing refers to continuing operations results adjusted to exclude non-trading items.2 Refer to pages 105 to 107 of the Financial Report for further details.3 Working capital is adjusted to exclude the impact of non-cash flow and non-operating items such as foreign exchange translation, impacts of
acquisitions and disposals of businesses and payables relating to additions of property, plant and equipment.4 Mainly comprising of movements in prepayments and provisions. 5 Operating cash flows divided by NPAT adding back depreciation and amortisation expenses before tax.
Ongoing free cash flows (before lease accounting changes) increased by $70.8 million from 2018 and was mainly due to:– Working capital was up due to increased receivables arising from strong sales performance in December in Australia and
Indonesia and increased inventory to support growth in PNG and New Zealand.
– Net finance costs decreased due to reduced interest rates on Australian borrowings and higher interest rates on Indonesiaand PNG deposits.
– Tax payments decreased driven by utilisation of deferred tax assets arising from prior period impairments, now realised as aresult of the sale of the SPC business.
– Capital expenditure decreased due to deferral of capital expenditure on existing projects to 2020.
Ongoing cash realisation (before lease accounting changes) decreased by 7.5 points from 2018 mainly driven by increased working capital.
CAPITAL EXPENDITURE1 2019
$M2018
$MVariance
$M
Australian Beverages 57.0 112.1 (55.1)
New Zealand & Fiji 24.3 39.3 (15.0)
Indonesia & Papua New Guinea 79.0 97.5 (18.5)
Alcohol & Coffee 12.3 5.8 6.5
Corporate & Services 56.8 61.5 (4.7)
Capital expenditure – ongoing2 229.4 316.2 (86.8)
Capital expenditure/trading revenue – ongoing 4.5% 6.7% (2.2) points
Capital expenditure/depreciation and amortisation3 – ongoing (before lease accounting changes)4 0.8x 1.2x 0.4x
Capital expenditure/depreciation and amortisation – ongoing 0.7x 1.2x 0.5x
1 Capital expenditure is represented by payments for additions of property, plant and equipment and software development assets. 2 Ongoing refers to continuing operations results adjusted to exclude non-trading items.3 Amortisation of software development assets.4 Refer to pages 105 to 107 of the Financial Report for further details.
OTHER INFORMATION
1 Refers to implementation of the new accounting standard AASB 16 Leases which applies from 1 January 2019, refer pages 105 to 107 of the attached Financial Report for further information.
2 Ongoing refers to continuing operations results adjusted to exclude non-trading items.3 Non-trading items relating mainly to costs of the Australian business continuing transformation activities through implementing new and revised organisation
designs, partially offset by gains on sale of property assets. 2018 also included non-recurring interest income relating to a cross-currency swap.
COCA-COLA AMATIL ANNUAL REPORT 201940 41
BEING
A SU
STAIN
ABLE
BUSIN
ESSTH
E VALU
E W
E CREATEG
OVERN
AN
CE &
RISKS
FINA
NCIA
L & STATU
TORY
REPOR
TSO
THER
INFO
RMATIO
NO
UR
BUSIN
ESSPERFO
RMA
NCE
& O
UTLO
OK
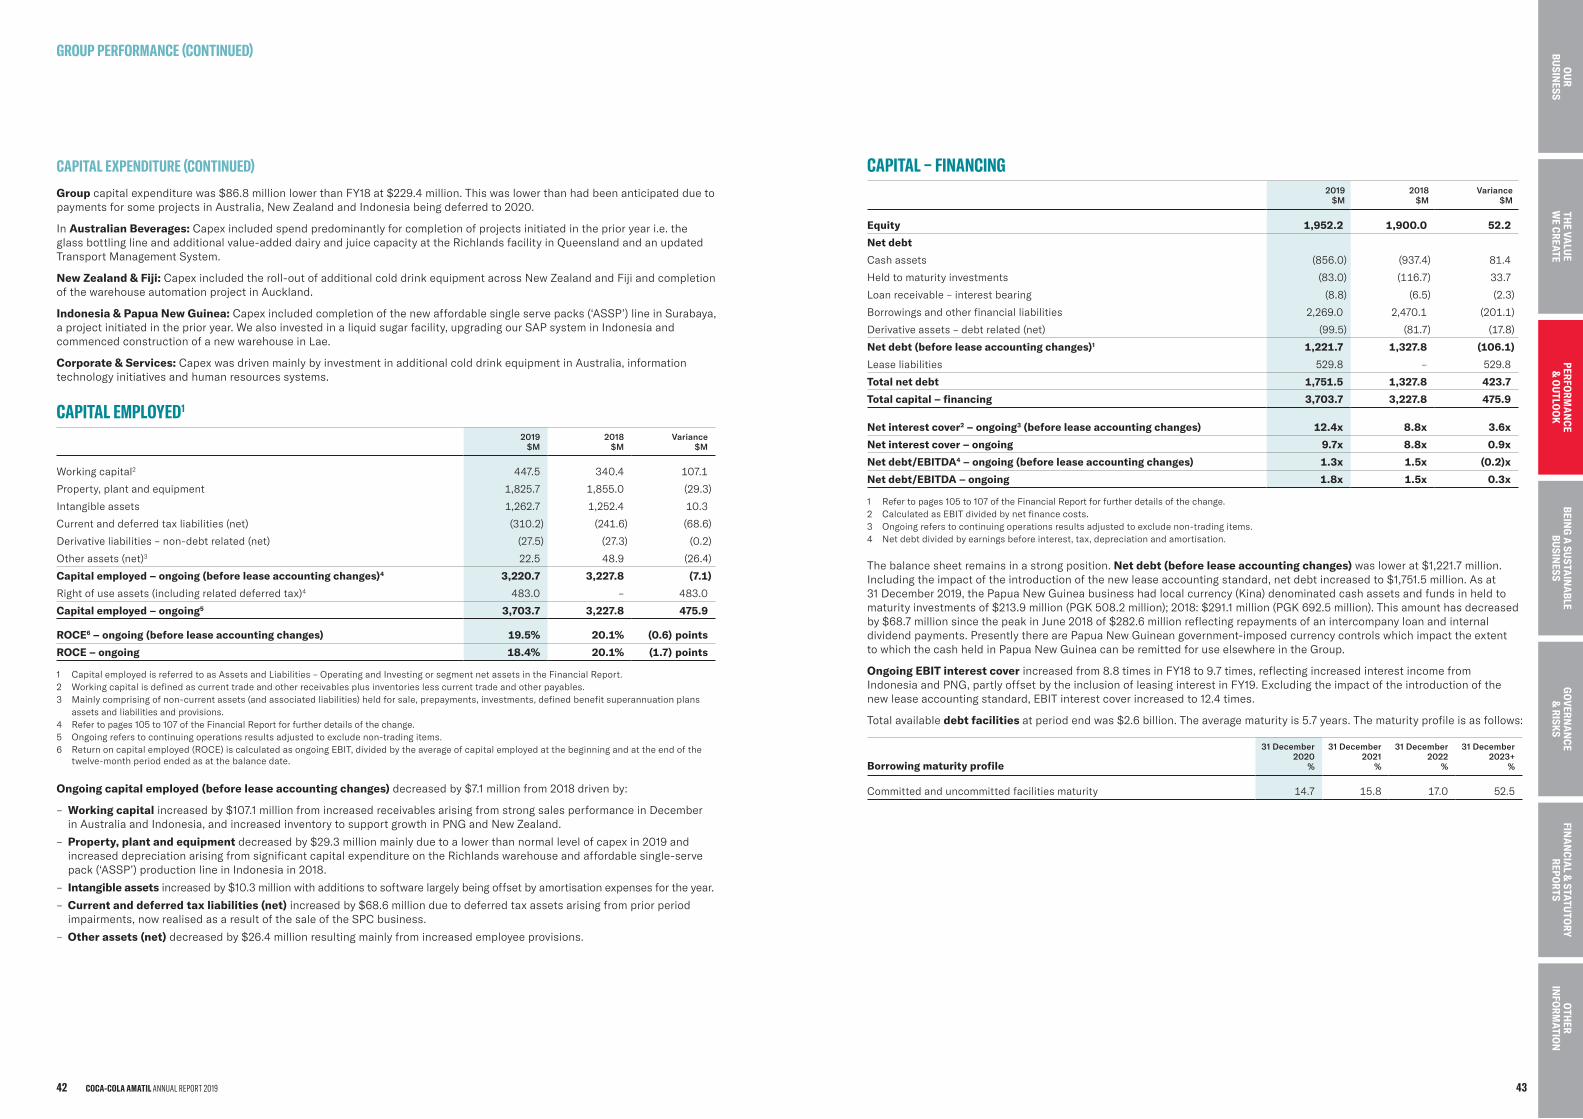
CAPITAL – FINANCING2019
$M2018
$MVariance
$M
Equity 1,952.2 1,900.0 52.2
Net debt
Cash assets (856.0) (937.4) 81.4
Held to maturity investments (83.0) (116.7) 33.7
Loan receivable – interest bearing (8.8) (6.5) (2.3)
Borrowings and other financial liabilities 2,269.0 2,470.1 (201.1)
Derivative assets – debt related (net) (99.5) (81.7) (17.8)
Net debt (before lease accounting changes)1 1,221.7 1,327.8 (106.1)
Lease liabilities 529.8 – 529.8
Total net debt 1,751.5 1,327.8 423.7
Total capital – financing 3,703.7 3,227.8 475.9
Net interest cover2 – ongoing3 (before lease accounting changes) 12.4x 8.8x 3.6x
Net interest cover – ongoing 9.7x 8.8x 0.9x
Net debt/EBITDA4 – ongoing (before lease accounting changes) 1.3x 1.5x (0.2)x
Net debt/EBITDA – ongoing 1.8x 1.5x 0.3x
1 Refer to pages 105 to 107 of the Financial Report for further details of the change.2 Calculated as EBIT divided by net finance costs.3 Ongoing refers to continuing operations results adjusted to exclude non-trading items. 4 Net debt divided by earnings before interest, tax, depreciation and amortisation.
The balance sheet remains in a strong position. Net debt (before lease accounting changes) was lower at $1,221.7 million. Including the impact of the introduction of the new lease accounting standard, net debt increased to $1,751.5 million. As at 31 December 2019, the Papua New Guinea business had local currency (Kina) denominated cash assets and funds in held to maturity investments of $213.9 million (PGK 508.2 million); 2018: $291.1 million (PGK 692.5 million). This amount has decreased by $68.7 million since the peak in June 2018 of $282.6 million reflecting repayments of an intercompany loan and internal dividend payments. Presently there are Papua New Guinean government-imposed currency controls which impact the extent to which the cash held in Papua New Guinea can be remitted for use elsewhere in the Group.
Ongoing EBIT interest cover increased from 8.8 times in FY18 to 9.7 times, reflecting increased interest income from Indonesia and PNG, partly offset by the inclusion of leasing interest in FY19. Excluding the impact of the introduction of the new lease accounting standard, EBIT interest cover increased to 12.4 times.
Total available debt facilities at period end was $2.6 billion. The average maturity is 5.7 years. The maturity profile is as follows:
Borrowing maturity profile
31 December 2020
%
31 December 2021
%
31 December 2022
%
31 December 2023+
%
Committed and uncommitted facilities maturity 14.7 15.8 17.0 52.5
GROUP PERFORMANCE (CONTINUED)
Group capital expenditure was $86.8 million lower than FY18 at $229.4 million. This was lower than had been anticipated due to payments for some projects in Australia, New Zealand and Indonesia being deferred to 2020.
In Australian Beverages: Capex included spend predominantly for completion of projects initiated in the prior year i.e. the glass bottling line and additional value-added dairy and juice capacity at the Richlands facility in Queensland and an updated Transport Management System.
New Zealand & Fiji: Capex included the roll-out of additional cold drink equipment across New Zealand and Fiji and completion of the warehouse automation project in Auckland.
Indonesia & Papua New Guinea: Capex included completion of the new affordable single serve packs (‘ASSP’) line in Surabaya, a project initiated in the prior year. We also invested in a liquid sugar facility, upgrading our SAP system in Indonesia and commenced construction of a new warehouse in Lae.
Corporate & Services: Capex was driven mainly by investment in additional cold drink equipment in Australia, information technology initiatives and human resources systems.
CAPITAL EMPLOYED1
2019$M
2018 $M
Variance$M
Working capital2 447.5 340.4 107.1
Property, plant and equipment 1,825.7 1,855.0 (29.3)
Intangible assets 1,262.7 1,252.4 10.3
Current and deferred tax liabilities (net) (310.2) (241.6) (68.6)
Derivative liabilities – non-debt related (net) (27.5) (27.3) (0.2)
Other assets (net)3 22.5 48.9 (26.4)
Capital employed – ongoing (before lease accounting changes)4 3,220.7 3,227.8 (7.1)
Right of use assets (including related deferred tax)4 483.0 – 483.0
Capital employed – ongoing5 3,703.7 3,227.8 475.9
ROCE6 – ongoing (before lease accounting changes) 19.5% 20.1% (0.6) points
ROCE – ongoing 18.4% 20.1% (1.7) points
1 Capital employed is referred to as Assets and Liabilities – Operating and Investing or segment net assets in the Financial Report.2 Working capital is defined as current trade and other receivables plus inventories less current trade and other payables.3 Mainly comprising of non-current assets (and associated liabilities) held for sale, prepayments, investments, defined benefit superannuation plans
assets and liabilities and provisions.4 Refer to pages 105 to 107 of the Financial Report for further details of the change.5 Ongoing refers to continuing operations results adjusted to exclude non-trading items.6 Return on capital employed (ROCE) is calculated as ongoing EBIT, divided by the average of capital employed at the beginning and at the end of the
twelve-month period ended as at the balance date.
Ongoing capital employed (before lease accounting changes) decreased by $7.1 million from 2018 driven by:
– Working capital increased by $107.1 million from increased receivables arising from strong sales performance in Decemberin Australia and Indonesia, and increased inventory to support growth in PNG and New Zealand.
– Property, plant and equipment decreased by $29.3 million mainly due to a lower than normal level of capex in 2019 andincreased depreciation arising from significant capital expenditure on the Richlands warehouse and affordable single-servepack (‘ASSP’) production line in Indonesia in 2018.
– Intangible assets increased by $10.3 million with additions to software largely being offset by amortisation expenses for the year.
– Current and deferred tax liabilities (net) increased by $68.6 million due to deferred tax assets arising from prior periodimpairments, now realised as a result of the sale of the SPC business.
– Other assets (net) decreased by $26.4 million resulting mainly from increased employee provisions.
CAPITAL EXPENDITURE (CONTINUED)
COCA-COLA AMATIL ANNUAL REPORT 201942 43
BEING
A SU
STAIN
ABLE
BUSIN
ESSTH
E VALU
E W
E CREATEG
OVERN
AN
CE &
RISKS
FINA
NCIA
L & STATU
TORY
REPOR
TSO
THER
INFO
RMATIO
NO
UR
BUSIN
ESSPERFO
RMA
NCE
& O
UTLO
OK
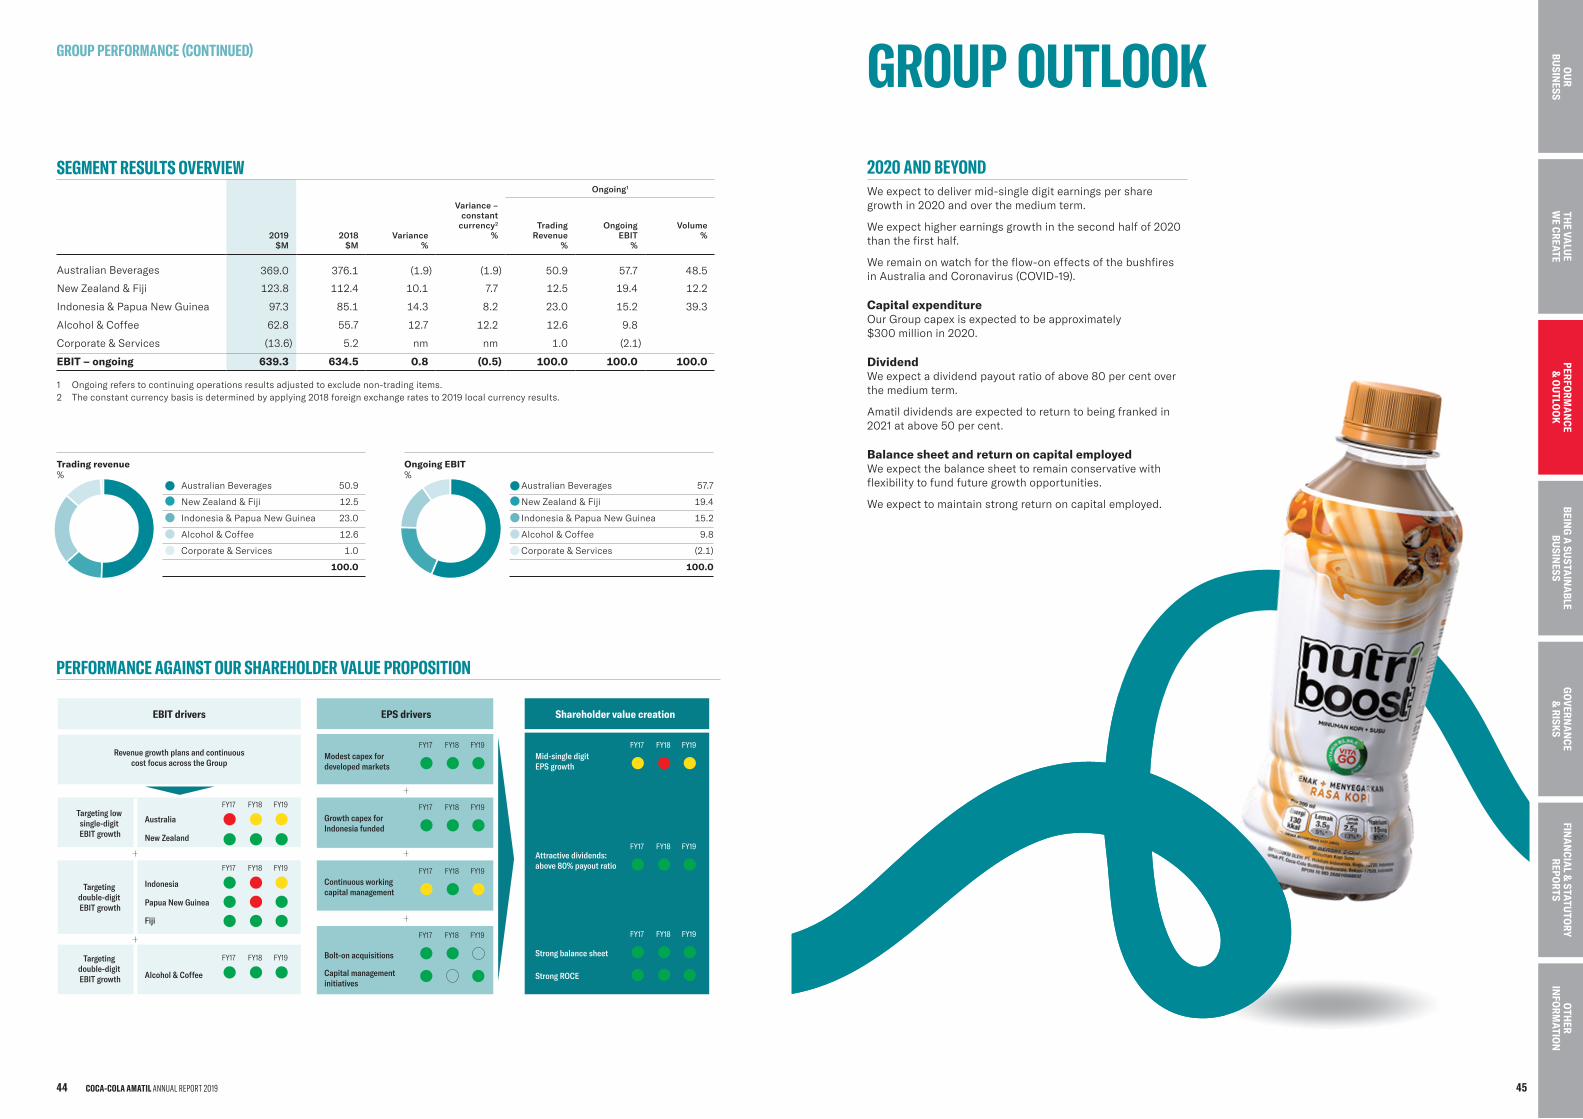
GROUP OUTLOOK
EBIT drivers
Revenue growth plans and continuouscost focus across the Group
Targeting low single-digit EBIT growth
Modest capex for developed markets
Growth capex for Indonesia funded
Continuous workingcapital management
Bolt-on acquisitions
Capital management initiatives
Australia
New Zealand
Indonesia
Papua New Guinea
Fiji
Alcohol & Coffee
Targeting double-digit EBIT growth
Mid-single digitEPS growth
Attractive dividends: above 80% payout ratio
Strong balance sheet
FY17 FY18 FY19
Strong ROCE
Targeting double-digit EBIT growth
EPS drivers Shareholder value creation
FY17 FY18 FY19
FY17 FY18 FY19FY17 FY18 FY19
FY17 FY18 FY19
FY17 FY18 FY19
FY17 FY18 FY19
FY17 FY18 FY19
FY17 FY18 FY19
FY17 FY18 FY19
PERFORMANCE AGAINST OUR SHAREHOLDER VALUE PROPOSITION
Trading revenue %
Australian Beverages 50.9
New Zealand & Fiji 12.5
Indonesia & Papua New Guinea 23.0
Alcohol & Coffee 12.6
Corporate & Services 1.0
100.0
Ongoing EBIT %
Australian Beverages 57.7
New Zealand & Fiji 19.4
Indonesia & Papua New Guinea 15.2
Alcohol & Coffee 9.8
Corporate & Services (2.1)
100.0
GROUP PERFORMANCE (CONTINUED)
SEGMENT RESULTS OVERVIEWOngoing1
2019 $M
2018 $M
Variance%
Variance –constant
currency2
%Trading
Revenue%
Ongoing EBIT
%
Volume%
Australian Beverages 369.0 376.1 (1.9) (1.9) 50.9 57.7 48.5
New Zealand & Fiji 123.8 112.4 10.1 7.7 12.5 19.4 12.2
Indonesia & Papua New Guinea 97.3 85.1 14.3 8.2 23.0 15.2 39.3
Alcohol & Coffee 62.8 55.7 12.7 12.2 12.6 9.8
Corporate & Services (13.6) 5.2 nm nm 1.0 (2.1)
EBIT – ongoing 639.3 634.5 0.8 (0.5) 100.0 100.0 100.0
1 Ongoing refers to continuing operations results adjusted to exclude non-trading items.2 The constant currency basis is determined by applying 2018 foreign exchange rates to 2019 local currency results.
2020 AND BEYOND We expect to deliver mid-single digit earnings per share growth in 2020 and over the medium term.
We expect higher earnings growth in the second half of 2020 than the first half.
We remain on watch for the flow-on effects of the bushfires in Australia and Coronavirus (COVID-19).
Capital expenditureOur Group capex is expected to be approximately $300 million in 2020.
Dividend We expect a dividend payout ratio of above 80 per cent over the medium term.
Amatil dividends are expected to return to being franked in 2021 at above 50 per cent.
Balance sheet and return on capital employedWe expect the balance sheet to remain conservative with flexibility to fund future growth opportunities.
We expect to maintain strong return on capital employed.
COCA-COLA AMATIL ANNUAL REPORT 201944 45
BEING
A SU
STAIN
ABLE
BUSIN
ESSTH
E VALU
E W
E CREATEG
OVERN
AN
CE &
RISKS
FINA
NCIA
L & STATU
TORY
REPOR
TSO
THER
INFO
RMATIO
NO
UR
BUSIN
ESSPERFO
RMA
NCE
& O
UTLO
OK
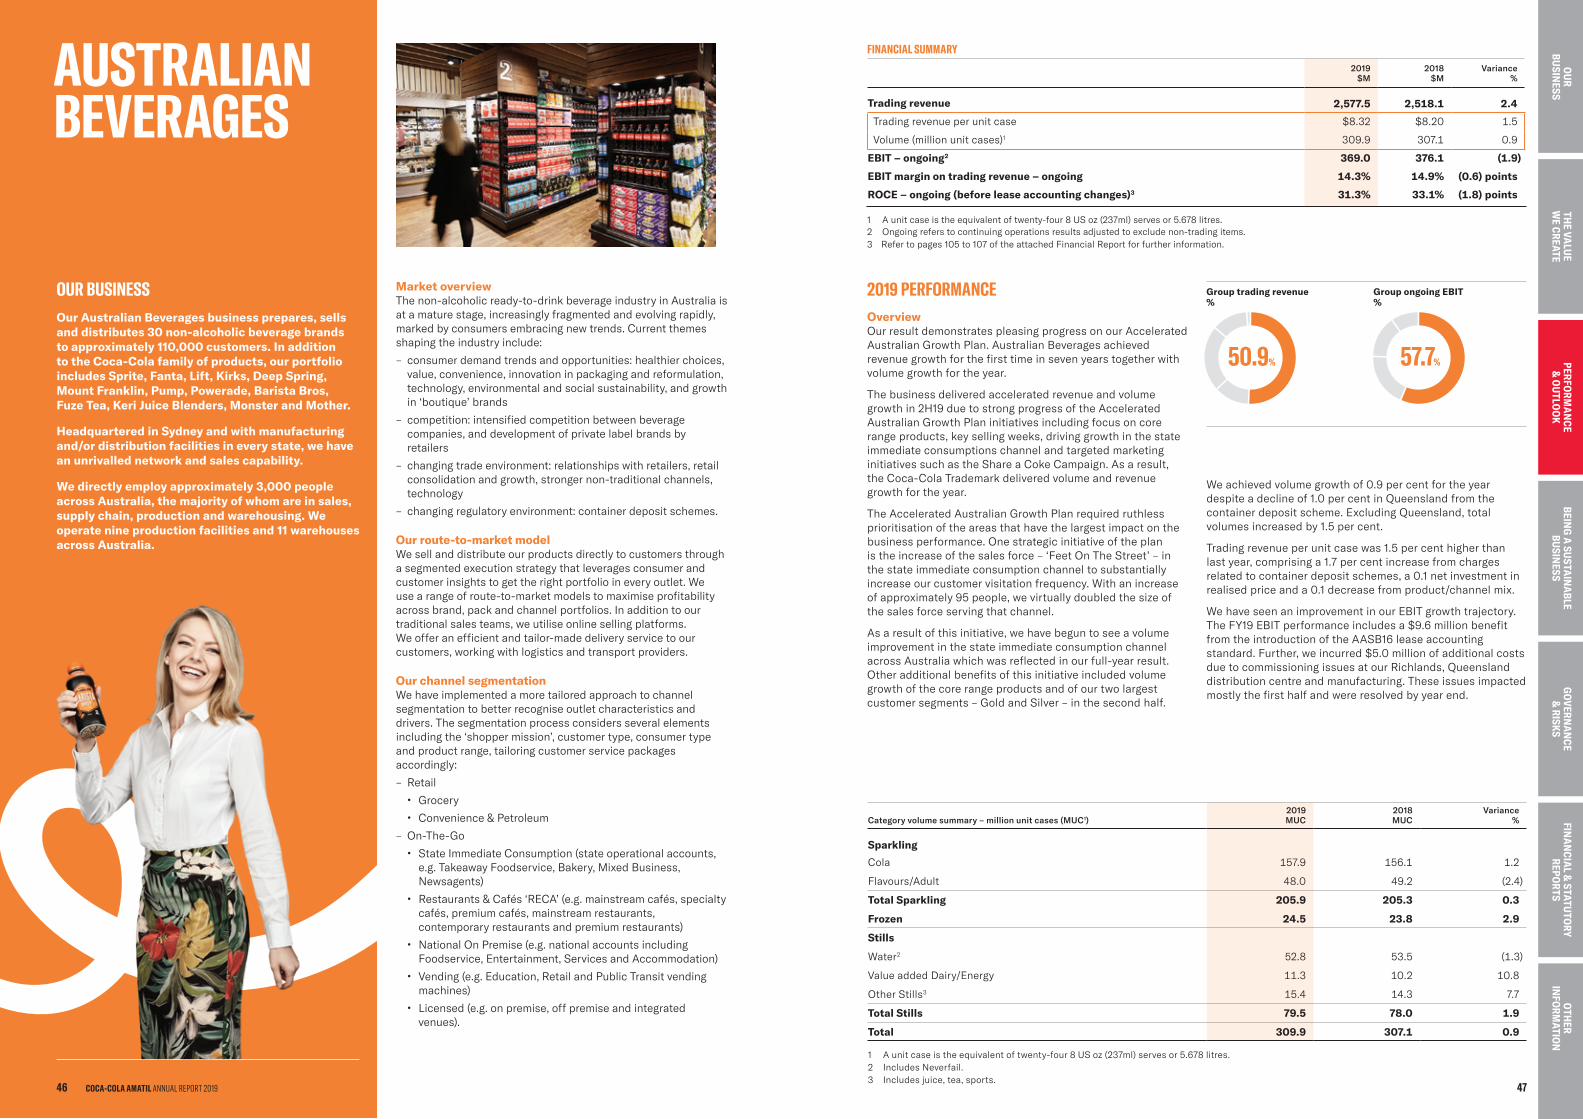
Market overviewThe non-alcoholic ready-to-drink beverage industry in Australia is at a mature stage, increasingly fragmented and evolving rapidly, marked by consumers embracing new trends. Current themes shaping the industry include:
– consumer demand trends and opportunities: healthier choices,value, convenience, innovation in packaging and reformulation,technology, environmental and social sustainability, and growthin ‘boutique’ brands
– competition: intensified competition between beveragecompanies, and development of private label brands byretailers
– changing trade environment: relationships with retailers, retailconsolidation and growth, stronger non-traditional channels,technology
– changing regulatory environment: container deposit schemes.
Our route-to-market modelWe sell and distribute our products directly to customers through a segmented execution strategy that leverages consumer and customer insights to get the right portfolio in every outlet. We use a range of route-to-market models to maximise profitability across brand, pack and channel portfolios. In addition to our traditional sales teams, we utilise online selling platforms. We offer an efficient and tailor-made delivery service to our customers, working with logistics and transport providers.
Our channel segmentationWe have implemented a more tailored approach to channel segmentation to better recognise outlet characteristics and drivers. The segmentation process considers several elements including the ‘shopper mission’, customer type, consumer type and product range, tailoring customer service packages accordingly:
– Retail
Ʌ Grocery
Ʌ Convenience & Petroleum
– On-The-Go
Ʌ State Immediate Consumption (state operational accounts,e.g. Takeaway Foodservice, Bakery, Mixed Business,Newsagents)
Ʌ Restaurants & Cafés ‘RECA’ (e.g. mainstream cafés, specialty cafés, premium cafés, mainstream restaurants, contemporary restaurants and premium restaurants)
Ʌ National On Premise (e.g. national accounts including Foodservice, Entertainment, Services and Accommodation)
Ʌ Vending (e.g. Education, Retail and Public Transit vending machines)
Ʌ Licensed (e.g. on premise, off premise and integrated venues).
OUR BUSINESSOur Australian Beverages business prepares, sells and distributes 30 non-alcoholic beverage brands to approximately 110,000 customers. In addition to the Coca-Cola family of products, our portfolio includes Sprite, Fanta, Lift, Kirks, Deep Spring, Mount Franklin, Pump, Powerade, Barista Bros, Fuze Tea, Keri Juice Blenders, Monster and Mother.
Headquartered in Sydney and with manufacturing and/or distribution facilities in every state, we have an unrivalled network and sales capability.
We directly employ approximately 3,000 people across Australia, the majority of whom are in sales, supply chain, production and warehousing. We operate nine production facilities and 11 warehouses across Australia.
2019 PERFORMANCEOverviewOur result demonstrates pleasing progress on our Accelerated Australian Growth Plan. Australian Beverages achieved revenue growth for the first time in seven years together with volume growth for the year.
The business delivered accelerated revenue and volume growth in 2H19 due to strong progress of the Accelerated Australian Growth Plan initiatives including focus on core range products, key selling weeks, driving growth in the state immediate consumptions channel and targeted marketing initiatives such as the Share a Coke Campaign. As a result, the Coca-Cola Trademark delivered volume and revenue growth for the year.
The Accelerated Australian Growth Plan required ruthless prioritisation of the areas that have the largest impact on the business performance. One strategic initiative of the plan is the increase of the sales force – ‘Feet On The Street’ – in the state immediate consumption channel to substantially increase our customer visitation frequency. With an increase of approximately 95 people, we virtually doubled the size of the sales force serving that channel.
As a result of this initiative, we have begun to see a volume improvement in the state immediate consumption channel across Australia which was reflected in our full-year result. Other additional benefits of this initiative included volume growth of the core range products and of our two largest customer segments – Gold and Silver – in the second half.
AUSTRALIAN BEVERAGES
FINANCIAL SUMMARY
2019$M
2018 $M
Variance%
Trading revenue 2,577.5 2,518.1 2.4
Trading revenue per unit case $8.32 $8.20 1.5
Volume (million unit cases)1 309.9 307.1 0.9
EBIT – ongoing2 369.0 376.1 (1.9)
EBIT margin on trading revenue – ongoing 14.3% 14.9% (0.6) points
ROCE – ongoing (before lease accounting changes)3 31.3% 33.1% (1.8) points
1 A unit case is the equivalent of twenty-four 8 US oz (237ml) serves or 5.678 litres.2 Ongoing refers to continuing operations results adjusted to exclude non-trading items. 3 Refer to pages 105 to 107 of the attached Financial Report for further information.
Group trading revenue %
50.9% 57.7%
Group ongoing EBIT %
We achieved volume growth of 0.9 per cent for the year despite a decline of 1.0 per cent in Queensland from the container deposit scheme. Excluding Queensland, total volumes increased by 1.5 per cent.
Trading revenue per unit case was 1.5 per cent higher than last year, comprising a 1.7 per cent increase from charges related to container deposit schemes, a 0.1 net investment in realised price and a 0.1 decrease from product/channel mix.
We have seen an improvement in our EBIT growth trajectory. The FY19 EBIT performance includes a $9.6 million benefit from the introduction of the AASB16 lease accounting standard. Further, we incurred $5.0 million of additional costs due to commissioning issues at our Richlands, Queensland distribution centre and manufacturing. These issues impacted mostly the first half and were resolved by year end.
Category volume summary – million unit cases (MUC1)2019MUC
2018MUC
Variance%
Sparkling
Cola 157.9 156.1 1.2
Flavours/Adult 48.0 49.2 (2.4)
Total Sparkling 205.9 205.3 0.3
Frozen 24.5 23.8 2.9
Stills
Water2 52.8 53.5 (1.3)
Value added Dairy/Energy 11.3 10.2 10.8
Other Stills3 15.4 14.3 7.7
Total Stills 79.5 78.0 1.9
Total 309.9 307.1 0.9
1 A unit case is the equivalent of twenty-four 8 US oz (237ml) serves or 5.678 litres.2 Includes Neverfail.3 Includes juice, tea, sports.
COCA-COLA AMATIL ANNUAL REPORT 201946 47
BEING
A SU
STAIN
ABLE
BUSIN
ESSTH
E VALU
E W
E CREATEG
OVERN
AN
CE &
RISKS
FINA
NCIA
L & STATU
TORY
REPOR
TSO
THER
INFO
RMATIO
NO
UR
BUSIN
ESSPERFO
RMA
NCE
& O
UTLO
OK
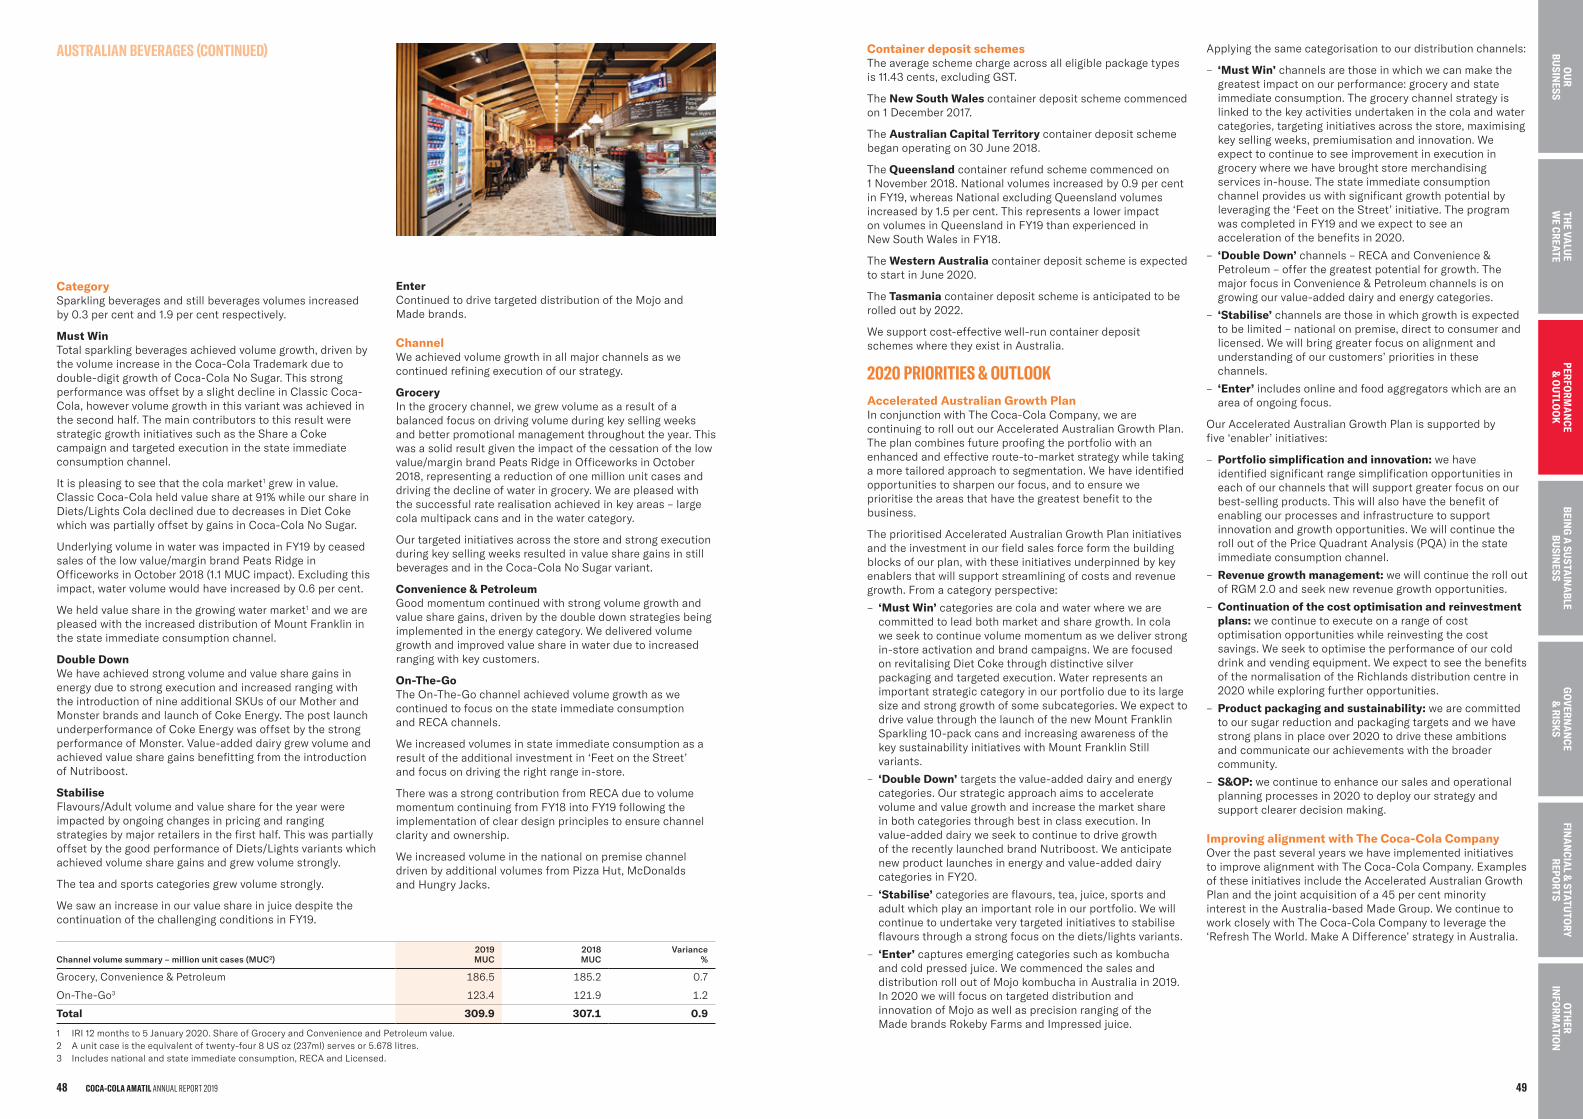
EnterContinued to drive targeted distribution of the Mojo and Made brands.
Channel We achieved volume growth in all major channels as we continued refining execution of our strategy.
GroceryIn the grocery channel, we grew volume as a result of a balanced focus on driving volume during key selling weeks and better promotional management throughout the year. This was a solid result given the impact of the cessation of the low value/margin brand Peats Ridge in Officeworks in October 2018, representing a reduction of one million unit cases and driving the decline of water in grocery. We are pleased with the successful rate realisation achieved in key areas – large cola multipack cans and in the water category.
Our targeted initiatives across the store and strong execution during key selling weeks resulted in value share gains in still beverages and in the Coca-Cola No Sugar variant.
Convenience & PetroleumGood momentum continued with strong volume growth and value share gains, driven by the double down strategies being implemented in the energy category. We delivered volume growth and improved value share in water due to increased ranging with key customers.
On-The-Go The On-The-Go channel achieved volume growth as we continued to focus on the state immediate consumption and RECA channels.
We increased volumes in state immediate consumption as a result of the additional investment in ‘Feet on the Street’ and focus on driving the right range in-store.
There was a strong contribution from RECA due to volume momentum continuing from FY18 into FY19 following the implementation of clear design principles to ensure channel clarity and ownership.
We increased volume in the national on premise channel driven by additional volumes from Pizza Hut, McDonalds and Hungry Jacks.
Category Sparkling beverages and still beverages volumes increased by 0.3 per cent and 1.9 per cent respectively.
Must WinTotal sparkling beverages achieved volume growth, driven by the volume increase in the Coca-Cola Trademark due to double-digit growth of Coca-Cola No Sugar. This strong performance was offset by a slight decline in Classic Coca-Cola, however volume growth in this variant was achieved in the second half. The main contributors to this result were strategic growth initiatives such as the Share a Coke campaign and targeted execution in the state immediate consumption channel.
It is pleasing to see that the cola market1 grew in value. Classic Coca-Cola held value share at 91% while our share in Diets/Lights Cola declined due to decreases in Diet Coke which was partially offset by gains in Coca-Cola No Sugar.
Underlying volume in water was impacted in FY19 by ceased sales of the low value/margin brand Peats Ridge in Officeworks in October 2018 (1.1 MUC impact). Excluding this impact, water volume would have increased by 0.6 per cent.
We held value share in the growing water market1 and we are pleased with the increased distribution of Mount Franklin in the state immediate consumption channel.
Double DownWe have achieved strong volume and value share gains in energy due to strong execution and increased ranging with the introduction of nine additional SKUs of our Mother and Monster brands and launch of Coke Energy. The post launch underperformance of Coke Energy was offset by the strong performance of Monster. Value-added dairy grew volume and achieved value share gains benefitting from the introduction of Nutriboost.
StabiliseFlavours/Adult volume and value share for the year were impacted by ongoing changes in pricing and ranging strategies by major retailers in the first half. This was partially offset by the good performance of Diets/Lights variants which achieved volume share gains and grew volume strongly.
The tea and sports categories grew volume strongly.
We saw an increase in our value share in juice despite the continuation of the challenging conditions in FY19.
Container deposit schemesThe average scheme charge across all eligible package types is 11.43 cents, excluding GST.
The New South Wales container deposit scheme commenced on 1 December 2017.
The Australian Capital Territory container deposit scheme began operating on 30 June 2018.
The Queensland container refund scheme commenced on 1 November 2018. National volumes increased by 0.9 per cent in FY19, whereas National excluding Queensland volumes increased by 1.5 per cent. This represents a lower impact on volumes in Queensland in FY19 than experienced in New South Wales in FY18.
The Western Australia container deposit scheme is expected to start in June 2020.
The Tasmania container deposit scheme is anticipated to be rolled out by 2022.
We support cost-effective well-run container deposit schemes where they exist in Australia.
2020 PRIORITIES & OUTLOOKAccelerated Australian Growth PlanIn conjunction with The Coca-Cola Company, we are continuing to roll out our Accelerated Australian Growth Plan. The plan combines future proofing the portfolio with an enhanced and effective route-to-market strategy while taking a more tailored approach to segmentation. We have identified opportunities to sharpen our focus, and to ensure we prioritise the areas that have the greatest benefit to the business.
The prioritised Accelerated Australian Growth Plan initiatives and the investment in our field sales force form the building blocks of our plan, with these initiatives underpinned by key enablers that will support streamlining of costs and revenue growth. From a category perspective:
– ‘Must Win’ categories are cola and water where we are committed to lead both market and share growth. In cola we seek to continue volume momentum as we deliver strong in-store activation and brand campaigns. We are focused on revitalising Diet Coke through distinctive silver packaging and targeted execution. Water represents an important strategic category in our portfolio due to its large size and strong growth of some subcategories. We expect to drive value through the launch of the new Mount Franklin Sparkling 10-pack cans and increasing awareness of the key sustainability initiatives with Mount Franklin Still variants.
– ‘Double Down’ targets the value-added dairy and energy categories. Our strategic approach aims to accelerate volume and value growth and increase the market share in both categories through best in class execution. In value-added dairy we seek to continue to drive growth of the recently launched brand Nutriboost. We anticipate new product launches in energy and value-added dairy categories in FY20.
– ‘Stabilise’ categories are flavours, tea, juice, sports and adult which play an important role in our portfolio. We will continue to undertake very targeted initiatives to stabilise flavours through a strong focus on the diets/lights variants.
– ‘Enter’ captures emerging categories such as kombucha and cold pressed juice. We commenced the sales and distribution roll out of Mojo kombucha in Australia in 2019. In 2020 we will focus on targeted distribution and innovation of Mojo as well as precision ranging of the Made brands Rokeby Farms and Impressed juice.
Applying the same categorisation to our distribution channels:
– ‘Must Win’ channels are those in which we can make the greatest impact on our performance: grocery and state immediate consumption. The grocery channel strategy is linked to the key activities undertaken in the cola and water categories, targeting initiatives across the store, maximising key selling weeks, premiumisation and innovation. We expect to continue to see improvement in execution in grocery where we have brought store merchandising services in-house. The state immediate consumption channel provides us with significant growth potential by leveraging the ‘Feet on the Street’ initiative. The program was completed in FY19 and we expect to see an acceleration of the benefits in 2020.
– ‘Double Down’ channels – RECA and Convenience & Petroleum – offer the greatest potential for growth. The major focus in Convenience & Petroleum channels is on growing our value-added dairy and energy categories.
– ‘Stabilise’ channels are those in which growth is expected to be limited – national on premise, direct to consumer and licensed. We will bring greater focus on alignment and understanding of our customers’ priorities in these channels.
– ‘Enter’ includes online and food aggregators which are an area of ongoing focus.
Our Accelerated Australian Growth Plan is supported by five ‘enabler’ initiatives:
– Portfolio simplification and innovation: we have identified significant range simplification opportunities in each of our channels that will support greater focus on our best-selling products. This will also have the benefit of enabling our processes and infrastructure to support innovation and growth opportunities. We will continue the roll out of the Price Quadrant Analysis (PQA) in the state immediate consumption channel.
– Revenue growth management: we will continue the roll out of RGM 2.0 and seek new revenue growth opportunities.
– Continuation of the cost optimisation and reinvestment plans: we continue to execute on a range of cost optimisation opportunities while reinvesting the cost savings. We seek to optimise the performance of our cold drink and vending equipment. We expect to see the benefits of the normalisation of the Richlands distribution centre in 2020 while exploring further opportunities.
– Product packaging and sustainability: we are committed to our sugar reduction and packaging targets and we have strong plans in place over 2020 to drive these ambitions and communicate our achievements with the broader community.
– S&OP: we continue to enhance our sales and operational planning processes in 2020 to deploy our strategy and support clearer decision making.
Improving alignment with The Coca-Cola Company Over the past several years we have implemented initiatives to improve alignment with The Coca-Cola Company. Examples of these initiatives include the Accelerated Australian Growth Plan and the joint acquisition of a 45 per cent minority interest in the Australia-based Made Group. We continue to work closely with The Coca-Cola Company to leverage the ‘Refresh The World. Make A Difference’ strategy in Australia.
AUSTRALIAN BEVERAGES (CONTINUED)
Channel volume summary – million unit cases (MUC2)2019MUC
2018MUC
Variance%
Grocery, Convenience & Petroleum 186.5 185.2 0.7
On-The-Go3 123.4 121.9 1.2
Total 309.9 307.1 0.9
1 IRI 12 months to 5 January 2020. Share of Grocery and Convenience and Petroleum value.2 A unit case is the equivalent of twenty-four 8 US oz (237ml) serves or 5.678 litres.3 Includes national and state immediate consumption, RECA and Licensed.
COCA-COLA AMATIL ANNUAL REPORT 201948 49
BEING
A SU
STAIN
ABLE
BUSIN
ESSTH
E VALU
E W
E CREATEG
OVERN
AN
CE &
RISKS
FINA
NCIA
L & STATU
TORY
REPOR
TSO
THER
INFO
RMATIO
NO
UR
BUSIN
ESSPERFO
RMA
NCE
& O
UTLO
OK
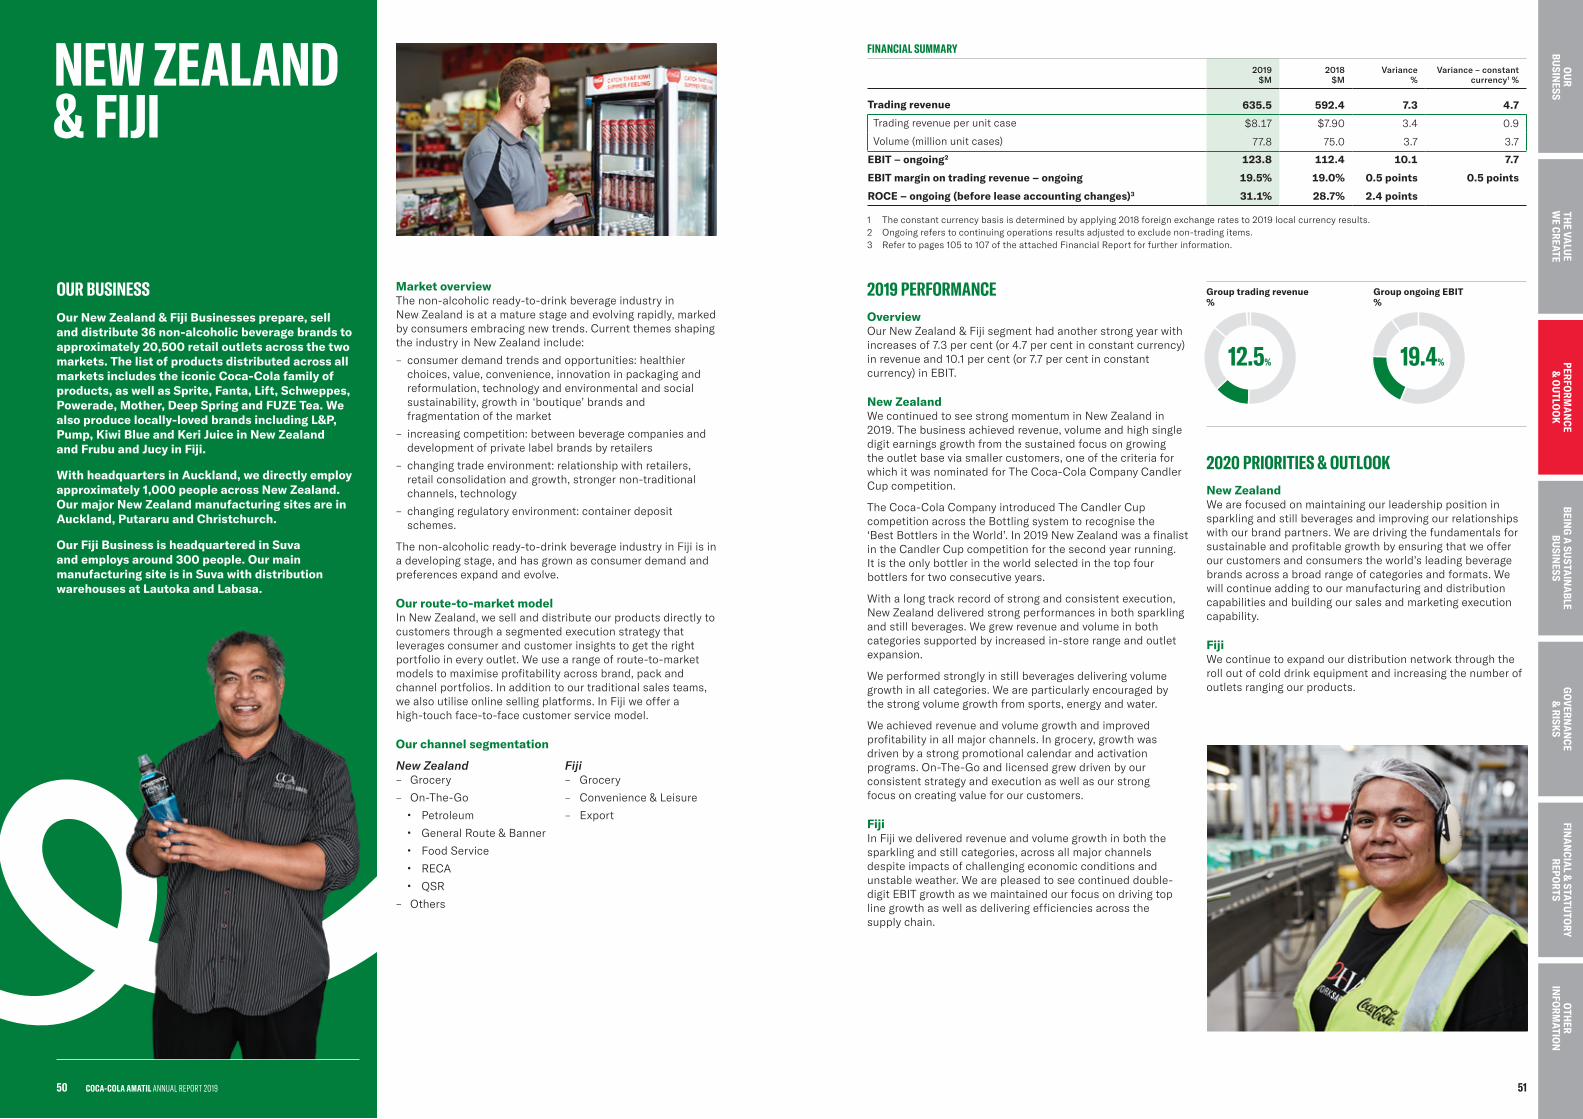
NEW ZEALAND & FIJI
Market overviewThe non-alcoholic ready-to-drink beverage industry in New Zealand is at a mature stage and evolving rapidly, marked by consumers embracing new trends. Current themes shaping the industry in New Zealand include:
– consumer demand trends and opportunities: healthier choices, value, convenience, innovation in packaging and reformulation, technology and environmental and social sustainability, growth in ‘boutique’ brands and fragmentation of the market
– increasing competition: between beverage companies and development of private label brands by retailers
– changing trade environment: relationship with retailers, retail consolidation and growth, stronger non-traditional channels, technology
– changing regulatory environment: container deposit schemes.
The non-alcoholic ready-to-drink beverage industry in Fiji is in a developing stage, and has grown as consumer demand and preferences expand and evolve.
Our route-to-market model In New Zealand, we sell and distribute our products directly to customers through a segmented execution strategy that leverages consumer and customer insights to get the right portfolio in every outlet. We use a range of route-to-market models to maximise profitability across brand, pack and channel portfolios. In addition to our traditional sales teams, we also utilise online selling platforms. In Fiji we offer a high-touch face-to-face customer service model.
Our channel segmentation
New Zealand Fiji – Grocery – Grocery
– On-The-Go – Convenience & Leisure
Ʌ Petroleum – Export
Ʌ General Route & Banner
Ʌ Food Service
Ʌ RECA
Ʌ QSR
– Others
OUR BUSINESSOur New Zealand & Fiji Businesses prepare, sell and distribute 36 non-alcoholic beverage brands to approximately 20,500 retail outlets across the two markets. The list of products distributed across all markets includes the iconic Coca-Cola family of products, as well as Sprite, Fanta, Lift, Schweppes, Powerade, Mother, Deep Spring and FUZE Tea. We also produce locally-loved brands including L&P, Pump, Kiwi Blue and Keri Juice in New Zealand and Frubu and Jucy in Fiji.
With headquarters in Auckland, we directly employ approximately 1,000 people across New Zealand. Our major New Zealand manufacturing sites are in Auckland, Putararu and Christchurch.
Our Fiji Business is headquartered in Suva and employs around 300 people. Our main manufacturing site is in Suva with distribution warehouses at Lautoka and Labasa.
FINANCIAL SUMMARY
2019$M
2018 $M
Variance%
Variance – constant currency1 %
Trading revenue 635.5 592.4 7.3 4.7
Trading revenue per unit case $8.17 $7.90 3.4 0.9
Volume (million unit cases) 77.8 75.0 3.7 3.7
EBIT – ongoing2 123.8 112.4 10.1 7.7
EBIT margin on trading revenue – ongoing 19.5% 19.0% 0.5 points 0.5 points
ROCE – ongoing (before lease accounting changes)3 31.1% 28.7% 2.4 points
1 The constant currency basis is determined by applying 2018 foreign exchange rates to 2019 local currency results.2 Ongoing refers to continuing operations results adjusted to exclude non-trading items.3 Refer to pages 105 to 107 of the attached Financial Report for further information.
2019 PERFORMANCEOverviewOur New Zealand & Fiji segment had another strong year with increases of 7.3 per cent (or 4.7 per cent in constant currency) in revenue and 10.1 per cent (or 7.7 per cent in constant currency) in EBIT.
New Zealand We continued to see strong momentum in New Zealand in 2019. The business achieved revenue, volume and high single digit earnings growth from the sustained focus on growing the outlet base via smaller customers, one of the criteria for which it was nominated for The Coca-Cola Company Candler Cup competition.
The Coca-Cola Company introduced The Candler Cup competition across the Bottling system to recognise the ‘Best Bottlers in the World’. In 2019 New Zealand was a finalist in the Candler Cup competition for the second year running. It is the only bottler in the world selected in the top four bottlers for two consecutive years.
With a long track record of strong and consistent execution, New Zealand delivered strong performances in both sparkling and still beverages. We grew revenue and volume in both categories supported by increased in-store range and outlet expansion.
We performed strongly in still beverages delivering volume growth in all categories. We are particularly encouraged by the strong volume growth from sports, energy and water.
We achieved revenue and volume growth and improved profitability in all major channels. In grocery, growth was driven by a strong promotional calendar and activation programs. On-The-Go and licensed grew driven by our consistent strategy and execution as well as our strong focus on creating value for our customers.
FijiIn Fiji we delivered revenue and volume growth in both the sparkling and still categories, across all major channels despite impacts of challenging economic conditions and unstable weather. We are pleased to see continued double-digit EBIT growth as we maintained our focus on driving top line growth as well as delivering efficiencies across the supply chain.
2020 PRIORITIES & OUTLOOKNew Zealand We are focused on maintaining our leadership position in sparkling and still beverages and improving our relationships with our brand partners. We are driving the fundamentals for sustainable and profitable growth by ensuring that we offer our customers and consumers the world’s leading beverage brands across a broad range of categories and formats. We will continue adding to our manufacturing and distribution capabilities and building our sales and marketing execution capability.
Fiji We continue to expand our distribution network through the roll out of cold drink equipment and increasing the number of outlets ranging our products.
12.5% 19.4%
Group trading revenue %
Group ongoing EBIT %
51
BEING
A SU
STAIN
ABLE
BUSIN
ESSTH
E VALU
E W
E CREATEG
OVERN
AN
CE &
RISKS
FINA
NCIA
L & STATU
TORY
REPOR
TSO
THER
INFO
RMATIO
N
COCA-COLA AMATIL ANNUAL REPORT 201950
OU
R BU
SINESS
PERFORM
AN
CE &
OU
TLOO
K
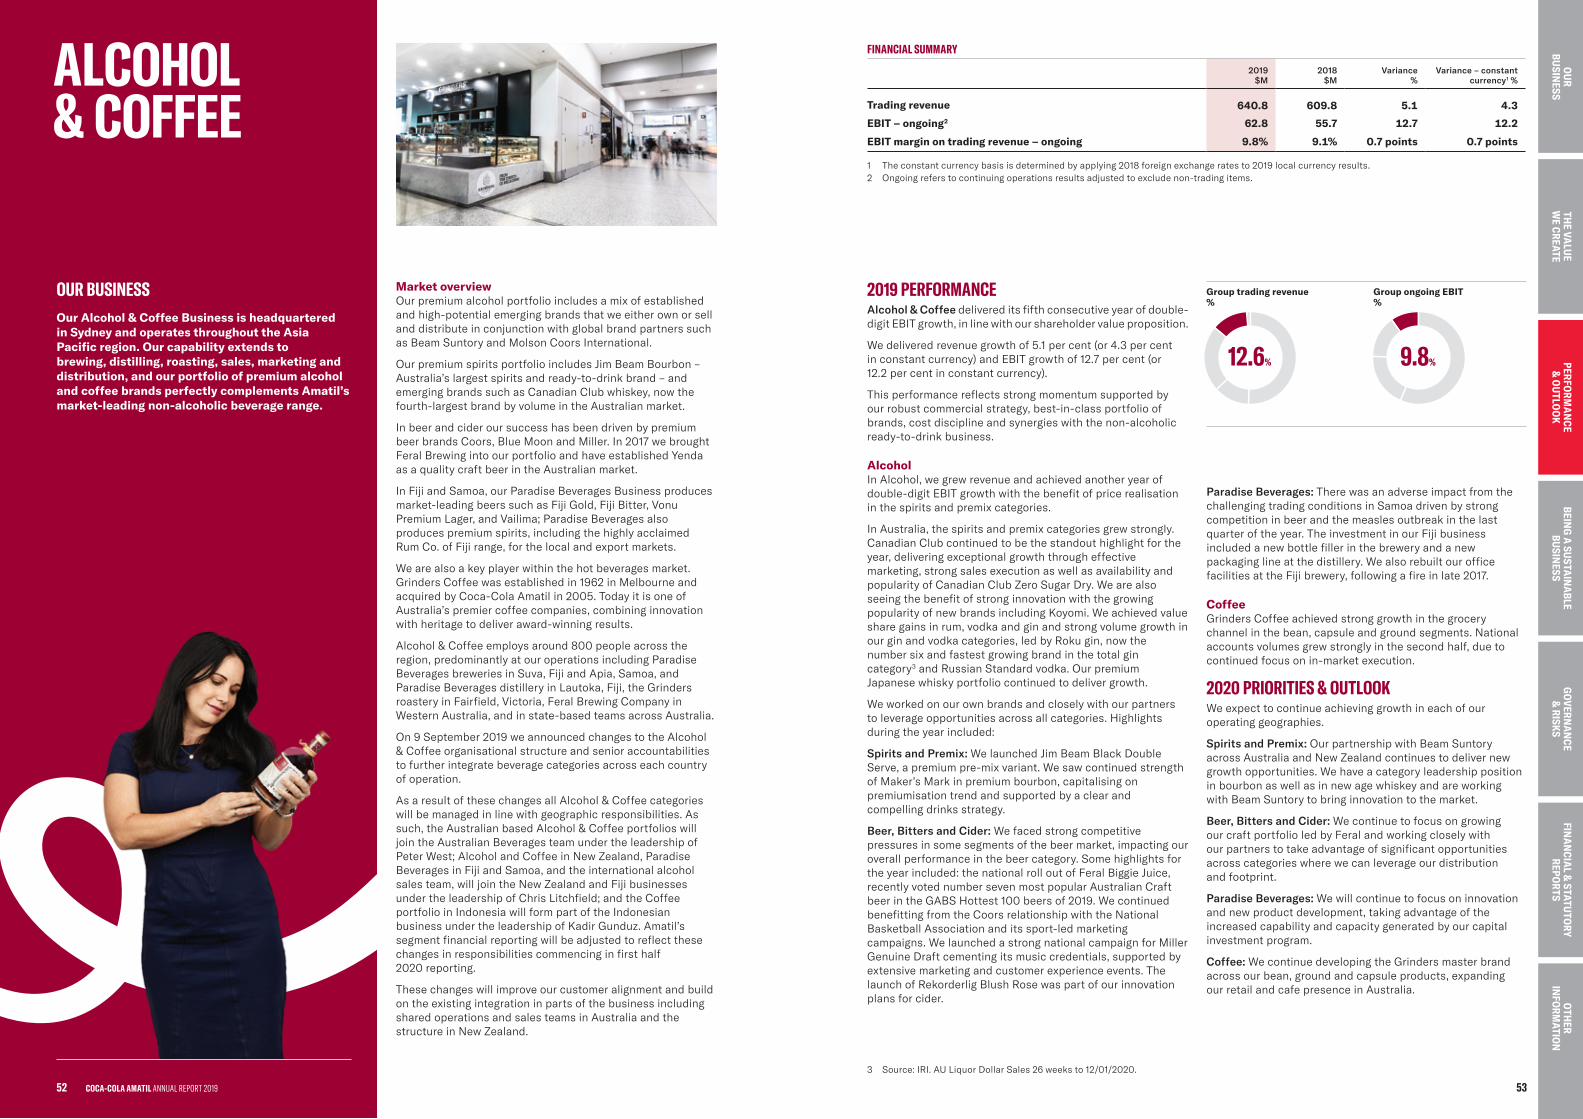
Market overview Our premium alcohol portfolio includes a mix of established and high-potential emerging brands that we either own or sell and distribute in conjunction with global brand partners such as Beam Suntory and Molson Coors International.
Our premium spirits portfolio includes Jim Beam Bourbon – Australia’s largest spirits and ready-to-drink brand – and emerging brands such as Canadian Club whiskey, now the fourth-largest brand by volume in the Australian market.
In beer and cider our success has been driven by premium beer brands Coors, Blue Moon and Miller. In 2017 we brought Feral Brewing into our portfolio and have established Yenda as a quality craft beer in the Australian market.
In Fiji and Samoa, our Paradise Beverages Business produces market-leading beers such as Fiji Gold, Fiji Bitter, Vonu Premium Lager, and Vailima; Paradise Beverages also produces premium spirits, including the highly acclaimed Rum Co. of Fiji range, for the local and export markets.
We are also a key player within the hot beverages market. Grinders Coffee was established in 1962 in Melbourne and acquired by Coca-Cola Amatil in 2005. Today it is one of Australia’s premier coffee companies, combining innovation with heritage to deliver award-winning results.
Alcohol & Coffee employs around 800 people across the region, predominantly at our operations including Paradise Beverages breweries in Suva, Fiji and Apia, Samoa, and Paradise Beverages distillery in Lautoka, Fiji, the Grinders roastery in Fairfield, Victoria, Feral Brewing Company in Western Australia, and in state-based teams across Australia.
On 9 September 2019 we announced changes to the Alcohol & Coffee organisational structure and senior accountabilities to further integrate beverage categories across each country of operation.
As a result of these changes all Alcohol & Coffee categories will be managed in line with geographic responsibilities. As such, the Australian based Alcohol & Coffee portfolios will join the Australian Beverages team under the leadership of Peter West; Alcohol and Coffee in New Zealand, Paradise Beverages in Fiji and Samoa, and the international alcohol sales team, will join the New Zealand and Fiji businesses under the leadership of Chris Litchfield; and the Coffee portfolio in Indonesia will form part of the Indonesian business under the leadership of Kadir Gunduz. Amatil’s segment financial reporting will be adjusted to reflect these changes in responsibilities commencing in first half 2020 reporting.
These changes will improve our customer alignment and build on the existing integration in parts of the business including shared operations and sales teams in Australia and the structure in New Zealand.
OUR BUSINESSOur Alcohol & Coffee Business is headquartered in Sydney and operates throughout the Asia Pacific region. Our capability extends to brewing, distilling, roasting, sales, marketing and distribution, and our portfolio of premium alcohol and coffee brands perfectly complements Amatil’s market-leading non-alcoholic beverage range.
2019 PERFORMANCEAlcohol & Coffee delivered its fifth consecutive year of double-digit EBIT growth, in line with our shareholder value proposition.
We delivered revenue growth of 5.1 per cent (or 4.3 per cent in constant currency) and EBIT growth of 12.7 per cent (or 12.2 per cent in constant currency).
This performance reflects strong momentum supported by our robust commercial strategy, best-in-class portfolio of brands, cost discipline and synergies with the non-alcoholic ready-to-drink business.
AlcoholIn Alcohol, we grew revenue and achieved another year of double-digit EBIT growth with the benefit of price realisation in the spirits and premix categories.
In Australia, the spirits and premix categories grew strongly. Canadian Club continued to be the standout highlight for the year, delivering exceptional growth through effective marketing, strong sales execution as well as availability and popularity of Canadian Club Zero Sugar Dry. We are also seeing the benefit of strong innovation with the growing popularity of new brands including Koyomi. We achieved value share gains in rum, vodka and gin and strong volume growth in our gin and vodka categories, led by Roku gin, now the number six and fastest growing brand in the total gin category3 and Russian Standard vodka. Our premium Japanese whisky portfolio continued to deliver growth.
We worked on our own brands and closely with our partners to leverage opportunities across all categories. Highlights during the year included:
Spirits and Premix: We launched Jim Beam Black Double Serve, a premium pre-mix variant. We saw continued strength of Maker’s Mark in premium bourbon, capitalising on premiumisation trend and supported by a clear and compelling drinks strategy.
Beer, Bitters and Cider: We faced strong competitive pressures in some segments of the beer market, impacting our overall performance in the beer category. Some highlights for the year included: the national roll out of Feral Biggie Juice, recently voted number seven most popular Australian Craft beer in the GABS Hottest 100 beers of 2019. We continued benefitting from the Coors relationship with the National Basketball Association and its sport-led marketing campaigns. We launched a strong national campaign for Miller Genuine Draft cementing its music credentials, supported by extensive marketing and customer experience events. The launch of Rekorderlig Blush Rose was part of our innovation plans for cider.
Paradise Beverages: There was an adverse impact from the challenging trading conditions in Samoa driven by strong competition in beer and the measles outbreak in the last quarter of the year. The investment in our Fiji business included a new bottle filler in the brewery and a new packaging line at the distillery. We also rebuilt our office facilities at the Fiji brewery, following a fire in late 2017.
CoffeeGrinders Coffee achieved strong growth in the grocery channel in the bean, capsule and ground segments. National accounts volumes grew strongly in the second half, due to continued focus on in-market execution.
2020 PRIORITIES & OUTLOOKWe expect to continue achieving growth in each of our operating geographies.
Spirits and Premix: Our partnership with Beam Suntory across Australia and New Zealand continues to deliver new growth opportunities. We have a category leadership position in bourbon as well as in new age whiskey and are working with Beam Suntory to bring innovation to the market.
Beer, Bitters and Cider: We continue to focus on growing our craft portfolio led by Feral and working closely with our partners to take advantage of significant opportunities across categories where we can leverage our distribution and footprint.
Paradise Beverages: We will continue to focus on innovation and new product development, taking advantage of the increased capability and capacity generated by our capital investment program.
Coffee: We continue developing the Grinders master brand across our bean, ground and capsule products, expanding our retail and cafe presence in Australia.
3 Source: IRI. AU Liquor Dollar Sales 26 weeks to 12/01/2020.
ALCOHOL & COFFEE
FINANCIAL SUMMARY
2019$M
2018 $M
Variance%
Variance – constant currency1 %
Trading revenue 640.8 609.8 5.1 4.3
EBIT – ongoing2 62.8 55.7 12.7 12.2
EBIT margin on trading revenue – ongoing 9.8% 9.1% 0.7 points 0.7 points
1 The constant currency basis is determined by applying 2018 foreign exchange rates to 2019 local currency results.2 Ongoing refers to continuing operations results adjusted to exclude non-trading items.
12.6% 9.8%
Group trading revenue %
Group ongoing EBIT %
53
BEING
A SU
STAIN
ABLE
BUSIN
ESSTH
E VALU
E W
E CREATEG
OVERN
AN
CE &
RISKS
FINA
NCIA
L & STATU
TORY
REPOR
TSO
THER
INFO
RMATIO
N
52 COCA-COLA AMATIL ANNUAL REPORT 2019
OU
R BU
SINESS
PERFORM
AN
CE &
OU
TLOO
K
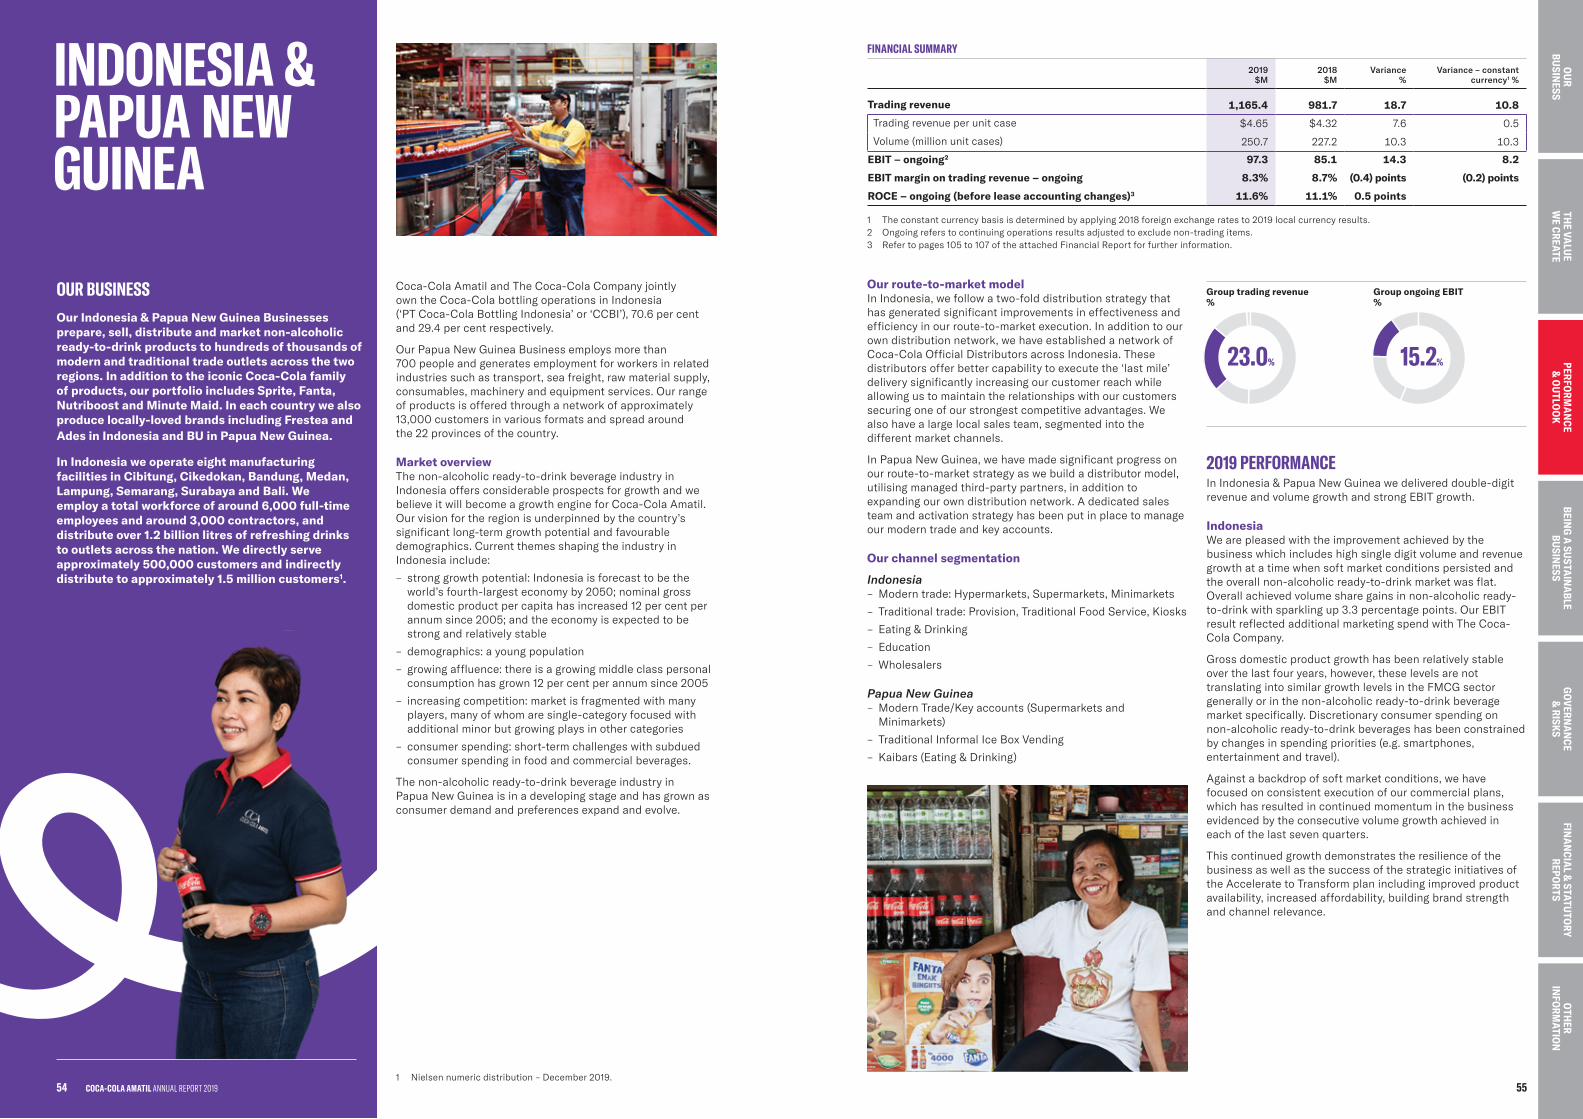
INDONESIA & PAPUA NEW GUINEA
Coca-Cola Amatil and The Coca-Cola Company jointly own the Coca-Cola bottling operations in Indonesia (‘PT Coca-Cola Bottling Indonesia’ or ‘CCBI’), 70.6 per cent and 29.4 per cent respectively.
Our Papua New Guinea Business employs more than 700 people and generates employment for workers in related industries such as transport, sea freight, raw material supply, consumables, machinery and equipment services. Our range of products is offered through a network of approximately 13,000 customers in various formats and spread around the 22 provinces of the country.
Market overviewThe non-alcoholic ready-to-drink beverage industry in Indonesia offers considerable prospects for growth and we believe it will become a growth engine for Coca-Cola Amatil. Our vision for the region is underpinned by the country’s significant long-term growth potential and favourable demographics. Current themes shaping the industry in Indonesia include:
– strong growth potential: Indonesia is forecast to be the world’s fourth-largest economy by 2050; nominal gross domestic product per capita has increased 12 per cent per annum since 2005; and the economy is expected to be strong and relatively stable
– demographics: a young population
– growing affluence: there is a growing middle class personal consumption has grown 12 per cent per annum since 2005
– increasing competition: market is fragmented with many players, many of whom are single-category focused with additional minor but growing plays in other categories
– consumer spending: short-term challenges with subdued consumer spending in food and commercial beverages.
The non-alcoholic ready-to-drink beverage industry in Papua New Guinea is in a developing stage and has grown as consumer demand and preferences expand and evolve.
OUR BUSINESSOur Indonesia & Papua New Guinea Businesses prepare, sell, distribute and market non-alcoholic ready-to-drink products to hundreds of thousands of modern and traditional trade outlets across the two regions. In addition to the iconic Coca-Cola family of products, our portfolio includes Sprite, Fanta, Nutriboost and Minute Maid. In each country we also produce locally-loved brands including Frestea and Ades in Indonesia and BU in Papua New Guinea.
In Indonesia we operate eight manufacturing facilities in Cibitung, Cikedokan, Bandung, Medan, Lampung, Semarang, Surabaya and Bali. We employ a total workforce of around 6,000 full-time employees and around 3,000 contractors, and distribute over 1.2 billion litres of refreshing drinks to outlets across the nation. We directly serve approximately 500,000 customers and indirectly distribute to approximately 1.5 million customers1.
Our route-to-market model In Indonesia, we follow a two-fold distribution strategy that has generated significant improvements in effectiveness and efficiency in our route-to-market execution. In addition to our own distribution network, we have established a network of Coca-Cola Official Distributors across Indonesia. These distributors offer better capability to execute the ‘last mile’ delivery significantly increasing our customer reach while allowing us to maintain the relationships with our customers securing one of our strongest competitive advantages. We also have a large local sales team, segmented into the different market channels.
In Papua New Guinea, we have made significant progress on our route-to-market strategy as we build a distributor model, utilising managed third-party partners, in addition to expanding our own distribution network. A dedicated sales team and activation strategy has been put in place to manage our modern trade and key accounts.
Our channel segmentation
Indonesia – Modern trade: Hypermarkets, Supermarkets, Minimarkets
– Traditional trade: Provision, Traditional Food Service, Kiosks
– Eating & Drinking
– Education
– Wholesalers
Papua New Guinea – Modern Trade/Key accounts (Supermarkets and Minimarkets)
– Traditional Informal Ice Box Vending
– Kaibars (Eating & Drinking)
2019 PERFORMANCEIn Indonesia & Papua New Guinea we delivered double-digit revenue and volume growth and strong EBIT growth.
IndonesiaWe are pleased with the improvement achieved by the business which includes high single digit volume and revenue growth at a time when soft market conditions persisted and the overall non-alcoholic ready-to-drink market was flat. Overall achieved volume share gains in non-alcoholic ready-to-drink with sparkling up 3.3 percentage points. Our EBIT result reflected additional marketing spend with The Coca-Cola Company.
Gross domestic product growth has been relatively stable over the last four years, however, these levels are not translating into similar growth levels in the FMCG sector generally or in the non-alcoholic ready-to-drink beverage market specifically. Discretionary consumer spending on non-alcoholic ready-to-drink beverages has been constrained by changes in spending priorities (e.g. smartphones, entertainment and travel).
Against a backdrop of soft market conditions, we have focused on consistent execution of our commercial plans, which has resulted in continued momentum in the business evidenced by the consecutive volume growth achieved in each of the last seven quarters.
This continued growth demonstrates the resilience of the business as well as the success of the strategic initiatives of the Accelerate to Transform plan including improved product availability, increased affordability, building brand strength and channel relevance.
FINANCIAL SUMMARY
2019$M
2018 $M
Variance%
Variance – constant currency1 %
Trading revenue 1,165.4 981.7 18.7 10.8
Trading revenue per unit case $4.65 $4.32 7.6 0.5
Volume (million unit cases) 250.7 227.2 10.3 10.3
EBIT – ongoing2 97.3 85.1 14.3 8.2
EBIT margin on trading revenue – ongoing 8.3% 8.7% (0.4) points (0.2) points
ROCE – ongoing (before lease accounting changes)3 11.6% 11.1% 0.5 points
1 The constant currency basis is determined by applying 2018 foreign exchange rates to 2019 local currency results.2 Ongoing refers to continuing operations results adjusted to exclude non-trading items.3 Refer to pages 105 to 107 of the attached Financial Report for further information.
1 Nielsen numeric distribution – December 2019.
23.0% 15.2%
Group trading revenue %
Group ongoing EBIT %
55
BEING
A SU
STAIN
ABLE
BUSIN
ESSTH
E VALU
E W
E CREATEG
OVERN
AN
CE &
RISKS
FINA
NCIA
L & STATU
TORY
REPOR
TSO
THER
INFO
RMATIO
N
COCA-COLA AMATIL ANNUAL REPORT 201954
OU
R BU
SINESS
PERFORM
AN
CE &
OU
TLOO
K
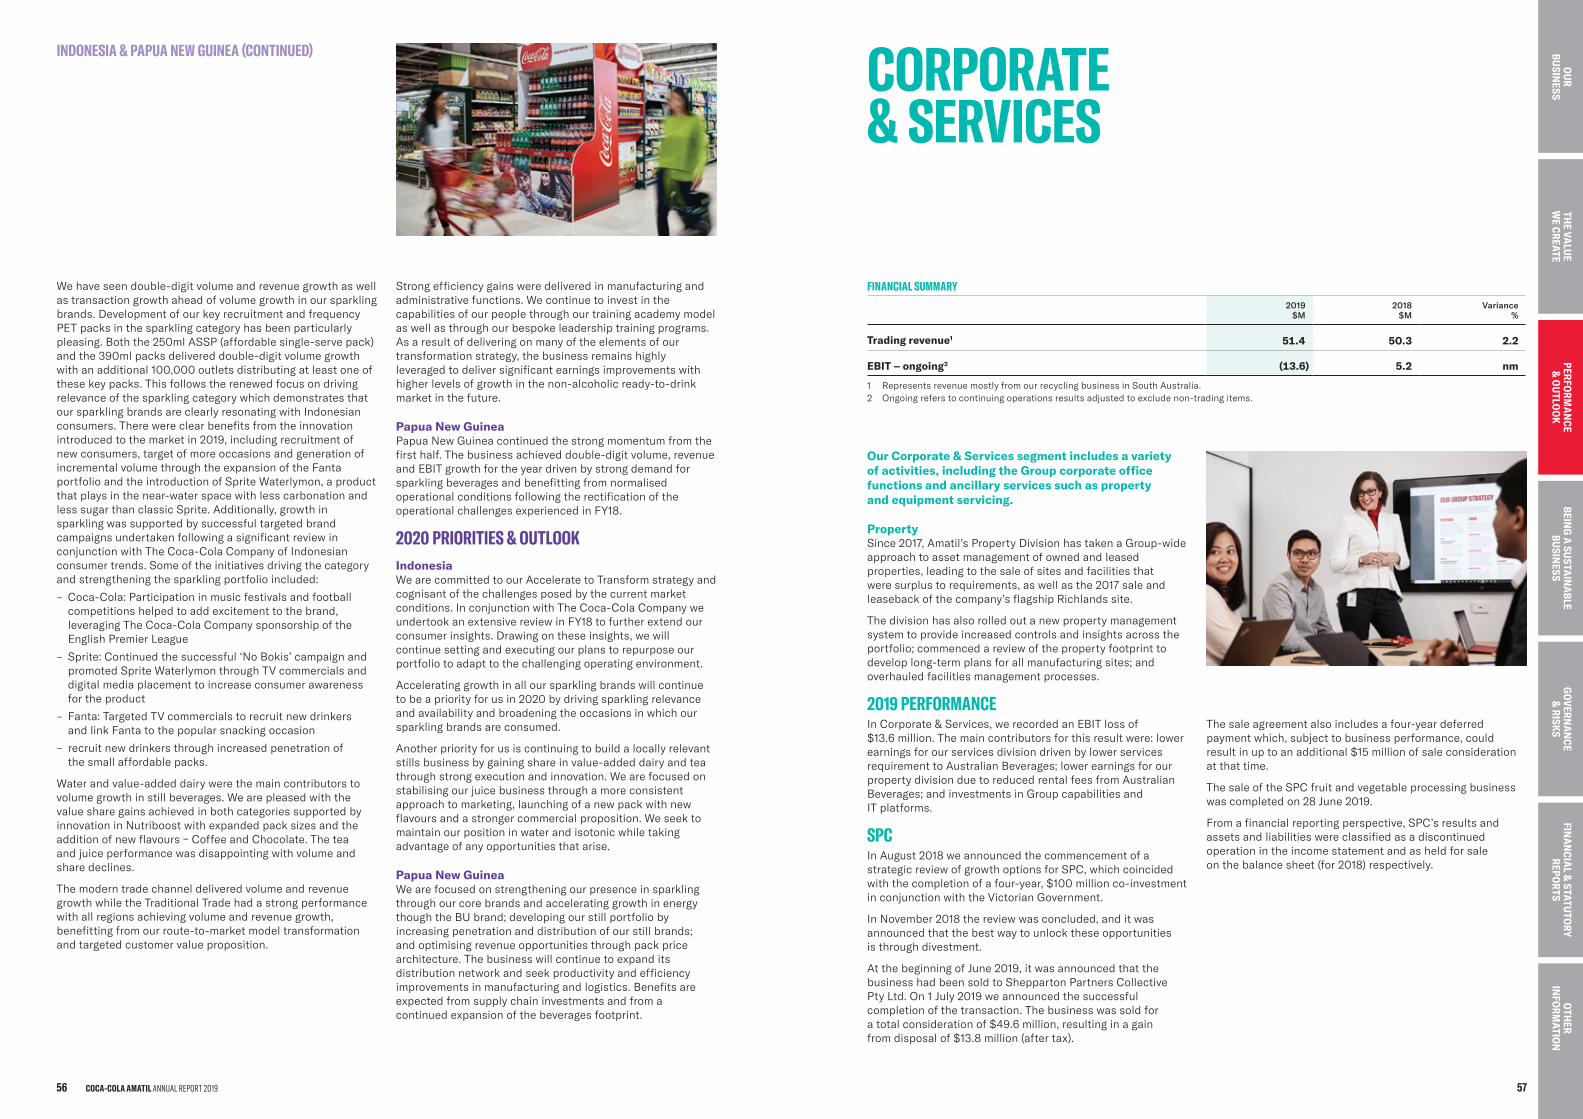
Strong efficiency gains were delivered in manufacturing and administrative functions. We continue to invest in the capabilities of our people through our training academy model as well as through our bespoke leadership training programs. As a result of delivering on many of the elements of our transformation strategy, the business remains highly leveraged to deliver significant earnings improvements with higher levels of growth in the non-alcoholic ready-to-drink market in the future.
Papua New GuineaPapua New Guinea continued the strong momentum from the first half. The business achieved double-digit volume, revenue and EBIT growth for the year driven by strong demand for sparkling beverages and benefitting from normalised operational conditions following the rectification of the operational challenges experienced in FY18.
2020 PRIORITIES & OUTLOOKIndonesiaWe are committed to our Accelerate to Transform strategy and cognisant of the challenges posed by the current market conditions. In conjunction with The Coca-Cola Company we undertook an extensive review in FY18 to further extend our consumer insights. Drawing on these insights, we will continue setting and executing our plans to repurpose our portfolio to adapt to the challenging operating environment.
Accelerating growth in all our sparkling brands will continue to be a priority for us in 2020 by driving sparkling relevance and availability and broadening the occasions in which our sparkling brands are consumed.
Another priority for us is continuing to build a locally relevant stills business by gaining share in value-added dairy and tea through strong execution and innovation. We are focused on stabilising our juice business through a more consistent approach to marketing, launching of a new pack with new flavours and a stronger commercial proposition. We seek to maintain our position in water and isotonic while taking advantage of any opportunities that arise.
Papua New Guinea We are focused on strengthening our presence in sparkling through our core brands and accelerating growth in energy though the BU brand; developing our still portfolio by increasing penetration and distribution of our still brands; and optimising revenue opportunities through pack price architecture. The business will continue to expand its distribution network and seek productivity and efficiency improvements in manufacturing and logistics. Benefits are expected from supply chain investments and from a continued expansion of the beverages footprint.
We have seen double-digit volume and revenue growth as well as transaction growth ahead of volume growth in our sparkling brands. Development of our key recruitment and frequency PET packs in the sparkling category has been particularly pleasing. Both the 250ml ASSP (affordable single-serve pack) and the 390ml packs delivered double-digit volume growth with an additional 100,000 outlets distributing at least one of these key packs. This follows the renewed focus on driving relevance of the sparkling category which demonstrates that our sparkling brands are clearly resonating with Indonesian consumers. There were clear benefits from the innovation introduced to the market in 2019, including recruitment of new consumers, target of more occasions and generation of incremental volume through the expansion of the Fanta portfolio and the introduction of Sprite Waterlymon, a product that plays in the near-water space with less carbonation and less sugar than classic Sprite. Additionally, growth in sparkling was supported by successful targeted brand campaigns undertaken following a significant review in conjunction with The Coca-Cola Company of Indonesian consumer trends. Some of the initiatives driving the category and strengthening the sparkling portfolio included:
– Coca-Cola: Participation in music festivals and football competitions helped to add excitement to the brand, leveraging The Coca-Cola Company sponsorship of the English Premier League
– Sprite: Continued the successful ‘No Bokis’ campaign and promoted Sprite Waterlymon through TV commercials and digital media placement to increase consumer awareness for the product
– Fanta: Targeted TV commercials to recruit new drinkers and link Fanta to the popular snacking occasion
– recruit new drinkers through increased penetration of the small affordable packs.
Water and value-added dairy were the main contributors to volume growth in still beverages. We are pleased with the value share gains achieved in both categories supported by innovation in Nutriboost with expanded pack sizes and the addition of new flavours – Coffee and Chocolate. The tea and juice performance was disappointing with volume and share declines.
The modern trade channel delivered volume and revenue growth while the Traditional Trade had a strong performance with all regions achieving volume and revenue growth, benefitting from our route-to-market model transformation and targeted customer value proposition.
INDONESIA & PAPUA NEW GUINEA (CONTINUED) CORPORATE & SERVICES
FINANCIAL SUMMARY
2019$M
2018 $M
Variance%
Trading revenue1 51.4 50.3 2.2
EBIT – ongoing2 (13.6) 5.2 nm
1 Represents revenue mostly from our recycling business in South Australia.2 Ongoing refers to continuing operations results adjusted to exclude non-trading items.
Our Corporate & Services segment includes a variety of activities, including the Group corporate office functions and ancillary services such as property and equipment servicing.
PropertySince 2017, Amatil’s Property Division has taken a Group-wide approach to asset management of owned and leased properties, leading to the sale of sites and facilities that were surplus to requirements, as well as the 2017 sale and leaseback of the company’s flagship Richlands site.
The division has also rolled out a new property management system to provide increased controls and insights across the portfolio; commenced a review of the property footprint to develop long-term plans for all manufacturing sites; and overhauled facilities management processes.
2019 PERFORMANCEIn Corporate & Services, we recorded an EBIT loss of $13.6 million. The main contributors for this result were: lower earnings for our services division driven by lower services requirement to Australian Beverages; lower earnings for our property division due to reduced rental fees from Australian Beverages; and investments in Group capabilities and IT platforms.
SPCIn August 2018 we announced the commencement of a strategic review of growth options for SPC, which coincided with the completion of a four-year, $100 million co-investment in conjunction with the Victorian Government.
In November 2018 the review was concluded, and it was announced that the best way to unlock these opportunities is through divestment.
At the beginning of June 2019, it was announced that the business had been sold to Shepparton Partners Collective Pty Ltd. On 1 July 2019 we announced the successful completion of the transaction. The business was sold for a total consideration of $49.6 million, resulting in a gain from disposal of $13.8 million (after tax).
The sale agreement also includes a four-year deferred payment which, subject to business performance, could result in up to an additional $15 million of sale consideration at that time.
The sale of the SPC fruit and vegetable processing business was completed on 28 June 2019.
From a financial reporting perspective, SPC’s results and assets and liabilities were classified as a discontinued operation in the income statement and as held for sale on the balance sheet (for 2018) respectively.
COCA-COLA AMATIL ANNUAL REPORT 201956 57
BEING
A SU
STAIN
ABLE
BUSIN
ESSTH
E VALU
E W
E CREATEG
OVERN
AN
CE &
RISKS
FINA
NCIA
L & STATU
TORY
REPOR
TSO
THER
INFO
RMATIO
NO
UR
BUSIN
ESSPERFO
RMA
NCE
& O
UTLO
OK
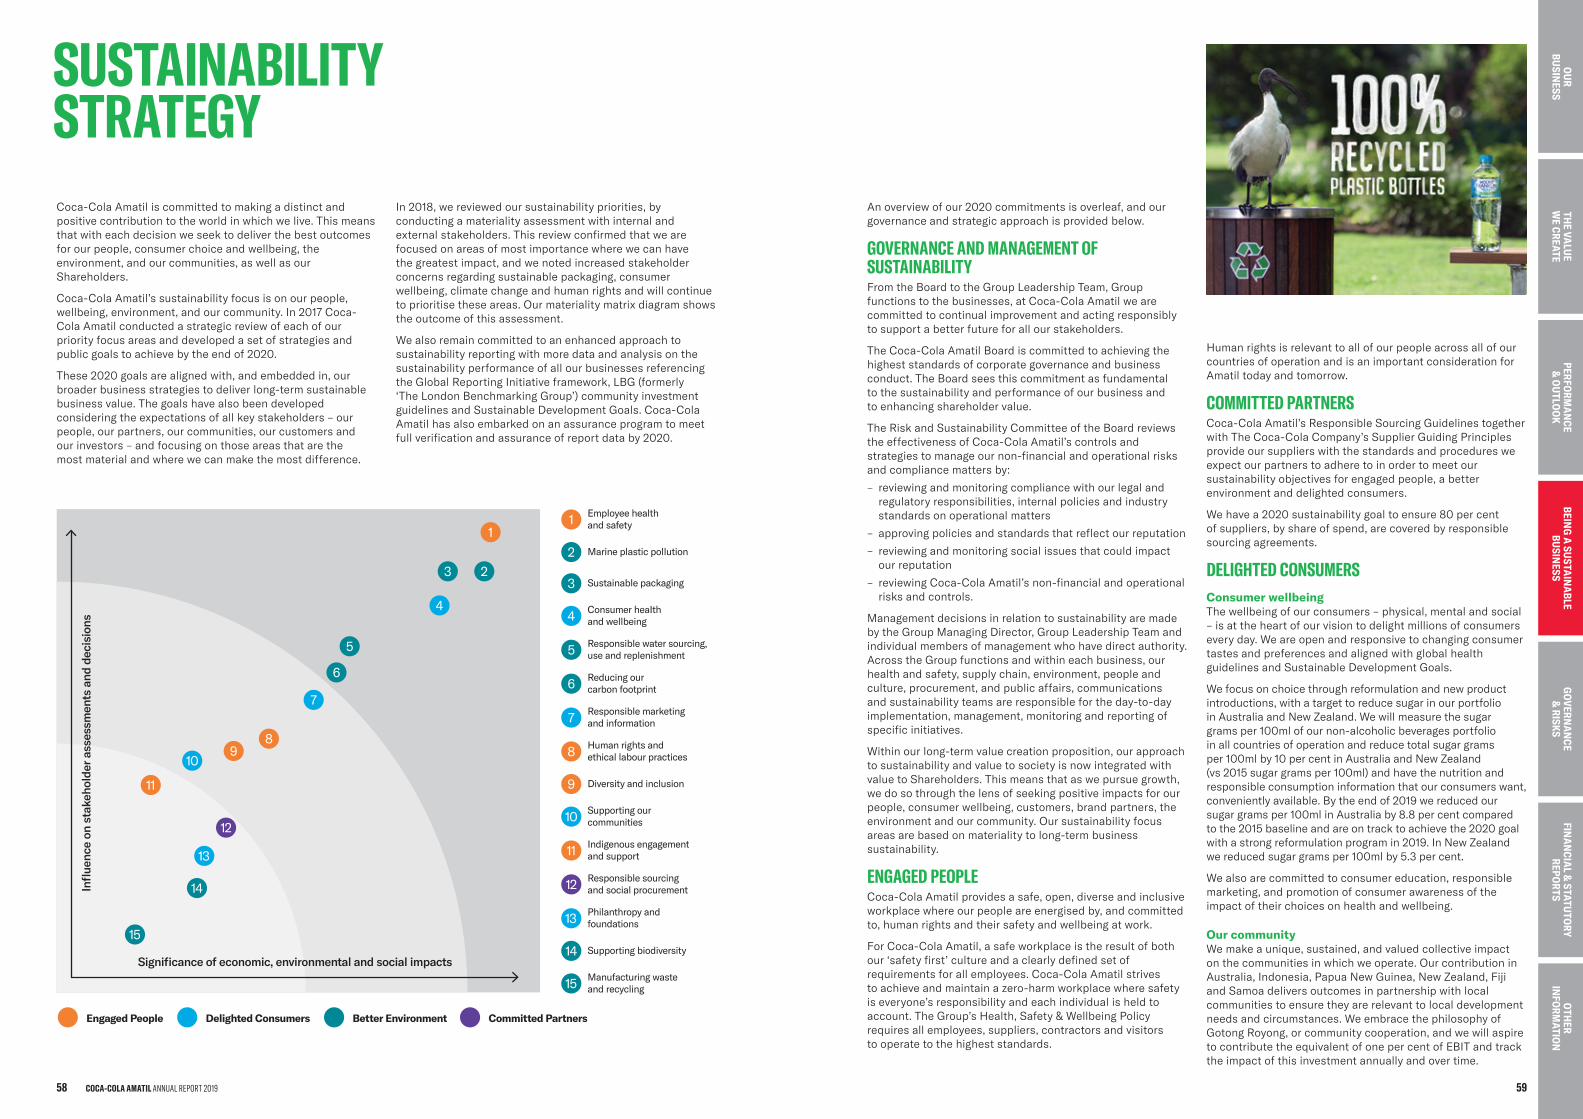
SUSTAINABILITY STRATEGY Coca-Cola Amatil is committed to making a distinct and positive contribution to the world in which we live. This means that with each decision we seek to deliver the best outcomes for our people, consumer choice and wellbeing, the environment, and our communities, as well as our Shareholders.
Coca-Cola Amatil’s sustainability focus is on our people, wellbeing, environment, and our community. In 2017 Coca-Cola Amatil conducted a strategic review of each of our priority focus areas and developed a set of strategies and public goals to achieve by the end of 2020.
These 2020 goals are aligned with, and embedded in, our broader business strategies to deliver long-term sustainable business value. The goals have also been developed considering the expectations of all key stakeholders – our people, our partners, our communities, our customers and our investors – and focusing on those areas that are the most material and where we can make the most difference.
In 2018, we reviewed our sustainability priorities, by conducting a materiality assessment with internal and external stakeholders. This review confirmed that we are focused on areas of most importance where we can have the greatest impact, and we noted increased stakeholder concerns regarding sustainable packaging, consumer wellbeing, climate change and human rights and will continue to prioritise these areas. Our materiality matrix diagram shows the outcome of this assessment.
We also remain committed to an enhanced approach to sustainability reporting with more data and analysis on the sustainability performance of all our businesses referencing the Global Reporting Initiative framework, LBG (formerly ‘The London Benchmarking Group’) community investment guidelines and Sustainable Development Goals. Coca-Cola Amatil has also embarked on an assurance program to meet full verification and assurance of report data by 2020.
An overview of our 2020 commitments is overleaf, and our governance and strategic approach is provided below.
GOVERNANCE AND MANAGEMENT OF SUSTAINABILITYFrom the Board to the Group Leadership Team, Group functions to the businesses, at Coca-Cola Amatil we are committed to continual improvement and acting responsibly to support a better future for all our stakeholders.
The Coca-Cola Amatil Board is committed to achieving the highest standards of corporate governance and business conduct. The Board sees this commitment as fundamental to the sustainability and performance of our business and to enhancing shareholder value.
The Risk and Sustainability Committee of the Board reviews the effectiveness of Coca-Cola Amatil’s controls and strategies to manage our non-financial and operational risks and compliance matters by:
– reviewing and monitoring compliance with our legal and regulatory responsibilities, internal policies and industry standards on operational matters
– approving policies and standards that reflect our reputation
– reviewing and monitoring social issues that could impact our reputation
– reviewing Coca-Cola Amatil’s non-financial and operational risks and controls.
Management decisions in relation to sustainability are made by the Group Managing Director, Group Leadership Team and individual members of management who have direct authority. Across the Group functions and within each business, our health and safety, supply chain, environment, people and culture, procurement, and public affairs, communications and sustainability teams are responsible for the day-to-day implementation, management, monitoring and reporting of specific initiatives.
Within our long-term value creation proposition, our approach to sustainability and value to society is now integrated with value to Shareholders. This means that as we pursue growth, we do so through the lens of seeking positive impacts for our people, consumer wellbeing, customers, brand partners, the environment and our community. Our sustainability focus areas are based on materiality to long-term business sustainability.
ENGAGED PEOPLECoca-Cola Amatil provides a safe, open, diverse and inclusive workplace where our people are energised by, and committed to, human rights and their safety and wellbeing at work.
For Coca-Cola Amatil, a safe workplace is the result of both our ‘safety first’ culture and a clearly defined set of requirements for all employees. Coca-Cola Amatil strives to achieve and maintain a zero-harm workplace where safety is everyone’s responsibility and each individual is held to account. The Group’s Health, Safety & Wellbeing Policy requires all employees, suppliers, contractors and visitors to operate to the highest standards.
Human rights is relevant to all of our people across all of our countries of operation and is an important consideration for Amatil today and tomorrow.
COMMITTED PARTNERSCoca-Cola Amatil’s Responsible Sourcing Guidelines together with The Coca-Cola Company’s Supplier Guiding Principles provide our suppliers with the standards and procedures we expect our partners to adhere to in order to meet our sustainability objectives for engaged people, a better environment and delighted consumers.
We have a 2020 sustainability goal to ensure 80 per cent of suppliers, by share of spend, are covered by responsible sourcing agreements.
DELIGHTED CONSUMERSConsumer wellbeingThe wellbeing of our consumers – physical, mental and social – is at the heart of our vision to delight millions of consumers every day. We are open and responsive to changing consumer tastes and preferences and aligned with global health guidelines and Sustainable Development Goals.
We focus on choice through reformulation and new product introductions, with a target to reduce sugar in our portfolio in Australia and New Zealand. We will measure the sugar grams per 100ml of our non-alcoholic beverages portfolio in all countries of operation and reduce total sugar grams per 100ml by 10 per cent in Australia and New Zealand (vs 2015 sugar grams per 100ml) and have the nutrition and responsible consumption information that our consumers want, conveniently available. By the end of 2019 we reduced our sugar grams per 100ml in Australia by 8.8 per cent compared to the 2015 baseline and are on track to achieve the 2020 goal with a strong reformulation program in 2019. In New Zealand we reduced sugar grams per 100ml by 5.3 per cent.
We also are committed to consumer education, responsible marketing, and promotion of consumer awareness of the impact of their choices on health and wellbeing.
Our communityWe make a unique, sustained, and valued collective impact on the communities in which we operate. Our contribution in Australia, Indonesia, Papua New Guinea, New Zealand, Fiji and Samoa delivers outcomes in partnership with local communities to ensure they are relevant to local development needs and circumstances. We embrace the philosophy of Gotong Royong, or community cooperation, and we will aspire to contribute the equivalent of one per cent of EBIT and track the impact of this investment annually and over time.
3
4
2
1
5
6
7
89
10
11
12
13
14
15
Infl
uenc
e on
sta
keho
lder
ass
essm
ents
and
dec
isio
ns
Significance of economic, environmental and social impacts
1 Employee health and safety
2 Marine plastic pollution
3 Sustainable packaging
4 Consumer heaIthand wellbeing
5 Responsible water sourcing, use and replenishment
6 Reducing our carbon footprint
7 Responsible marketingand information
8 Human rights and ethical labour practices
9 Diversity and inclusion
10 Supporting our communities
11 Indigenous engagementand support
12 Responsible sourcingand social procurement
13 Philanthropy and foundations
14 Supporting biodiversity
15 Manufacturing wasteand recycling
Engaged People Delighted Consumers Better Environment Committed Partners
COCA-COLA AMATIL ANNUAL REPORT 201958 59
THE VA
LUE
WE CREATE
PERFORM
AN
CE &
OU
TLOO
KFIN
AN
CIAL &
STATUTO
RY REPO
RTS
OTH
ER IN
FORM
ATION
BEING
A SU
STAIN
ABLE
BUSIN
ESSG
OVERN
AN
CE &
RISKS
OU
R BU
SINESS
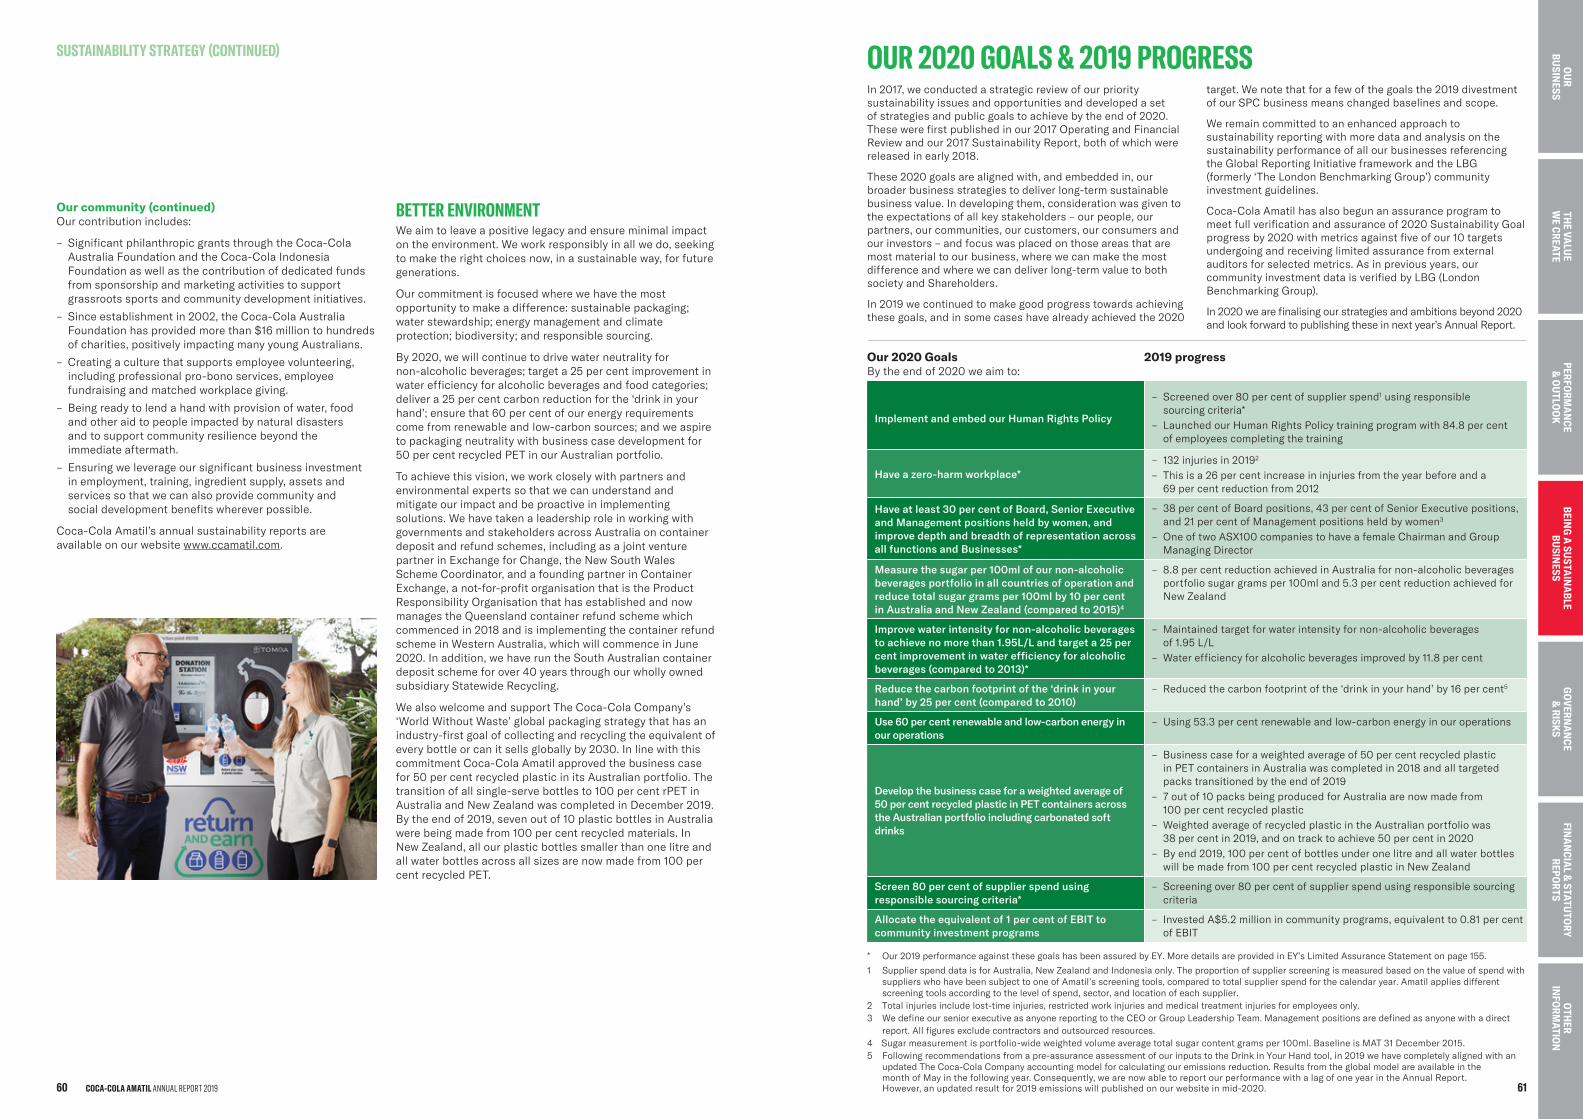
OUR 2020 GOALS & 2019 PROGRESSIn 2017, we conducted a strategic review of our priority sustainability issues and opportunities and developed a set of strategies and public goals to achieve by the end of 2020. These were first published in our 2017 Operating and Financial Review and our 2017 Sustainability Report, both of which were released in early 2018.
These 2020 goals are aligned with, and embedded in, our broader business strategies to deliver long-term sustainable business value. In developing them, consideration was given to the expectations of all key stakeholders – our people, our partners, our communities, our customers, our consumers and our investors – and focus was placed on those areas that are most material to our business, where we can make the most difference and where we can deliver long-term value to both society and Shareholders.
In 2019 we continued to make good progress towards achieving these goals, and in some cases have already achieved the 2020
target. We note that for a few of the goals the 2019 divestment of our SPC business means changed baselines and scope.
We remain committed to an enhanced approach to sustainability reporting with more data and analysis on the sustainability performance of all our businesses referencing the Global Reporting Initiative framework and the LBG (formerly ‘The London Benchmarking Group’) community investment guidelines.
Coca-Cola Amatil has also begun an assurance program to meet full verification and assurance of 2020 Sustainability Goal progress by 2020 with metrics against five of our 10 targets undergoing and receiving limited assurance from external auditors for selected metrics. As in previous years, our community investment data is verified by LBG (London Benchmarking Group).
In 2020 we are finalising our strategies and ambitions beyond 2020 and look forward to publishing these in next year’s Annual Report.
Our 2020 Goals By the end of 2020 we aim to:
2019 progress
Implement and embed our Human Rights Policy
– Screened over 80 per cent of supplier spend1 using responsiblesourcing criteria*
– Launched our Human Rights Policy training program with 84.8 per centof employees completing the training
Have a zero-harm workplace*– 132 injuries in 20192
– This is a 26 per cent increase in injuries from the year before and a69 per cent reduction from 2012
Have at least 30 per cent of Board, Senior Executive and Management positions held by women, and improve depth and breadth of representation across all functions and Businesses*
– 38 per cent of Board positions, 43 per cent of Senior Executive positions,and 21 per cent of Management positions held by women3
– One of two ASX100 companies to have a female Chairman and GroupManaging Director
Measure the sugar per 100ml of our non-alcoholic beverages portfolio in all countries of operation and reduce total sugar grams per 100ml by 10 per cent in Australia and New Zealand (compared to 2015)4
– 8.8 per cent reduction achieved in Australia for non-alcoholic beveragesportfolio sugar grams per 100ml and 5.3 per cent reduction achieved forNew Zealand
Improve water intensity for non-alcoholic beverages to achieve no more than 1.95L/L and target a 25 per cent improvement in water efficiency for alcoholic beverages (compared to 2013)*
– Maintained target for water intensity for non-alcoholic beveragesof 1.95 L/L
– Water efficiency for alcoholic beverages improved by 11.8 per cent
Reduce the carbon footprint of the ‘drink in your hand’ by 25 per cent (compared to 2010)
– Reduced the carbon footprint of the ‘drink in your hand’ by 16 per cent5
Use 60 per cent renewable and low-carbon energy in our operations
– Using 53.3 per cent renewable and low-carbon energy in our operations
Develop the business case for a weighted average of 50 per cent recycled plastic in PET containers across the Australian portfolio including carbonated soft drinks
– Business case for a weighted average of 50 per cent recycled plasticin PET containers in Australia was completed in 2018 and all targetedpacks transitioned by the end of 2019
– 7 out of 10 packs being produced for Australia are now made from100 per cent recycled plastic
– Weighted average of recycled plastic in the Australian portfolio was38 per cent in 2019, and on track to achieve 50 per cent in 2020
– By end 2019, 100 per cent of bottles under one litre and all water bottleswill be made from 100 per cent recycled plastic in New Zealand
Screen 80 per cent of supplier spend using responsible sourcing criteria*
– Screening over 80 per cent of supplier spend using responsible sourcingcriteria
Allocate the equivalent of 1 per cent of EBIT to community investment programs
– Invested A$5.2 million in community programs, equivalent to 0.81 per centof EBIT
* Our 2019 performance against these goals has been assured by EY. More details are provided in EY’s Limited Assurance Statement on page 155.
1
2 3
Supplier spend data is for Australia, New Zealand and Indonesia only. The proportion of supplier screening is measured based on the value of spend with suppliers who have been subject to one of Amatil’s screening tools, compared to total supplier spend for the calendar year. Amatil applies different screening tools according to the level of spend, sector, and location of each supplier. Total injuries include lost-time injuries, restricted work injuries and medical treatment injuries for employees only.We define our senior executive as anyone reporting to the CEO or Group Leadership Team. Management positions are defined as anyone with a direct report. All figures exclude contractors and outsourced resources.
4 Sugar measurement is portfolio-wide weighted volume average total sugar content grams per 100ml. Baseline is MAT 31 December 2015.5 Following recommendations from a pre-assurance assessment of our inputs to the Drink in Your Hand tool, in 2019 we have completely aligned with an
updated The Coca-Cola Company accounting model for calculating our emissions reduction. Results from the global model are available in the month of May in the following year. Consequently, we are now able to report our performance with a lag of one year in the Annual Report. However, an updated result for 2019 emissions will published on our website in mid-2020.
SUSTAINABILITY STRATEGY (CONTINUED)
Our community (continued)Our contribution includes:
– Significant philanthropic grants through the Coca-ColaAustralia Foundation and the Coca-Cola IndonesiaFoundation as well as the contribution of dedicated fundsfrom sponsorship and marketing activities to supportgrassroots sports and community development initiatives.
– Since establishment in 2002, the Coca-Cola AustraliaFoundation has provided more than $16 million to hundredsof charities, positively impacting many young Australians.
– Creating a culture that supports employee volunteering,including professional pro-bono services, employeefundraising and matched workplace giving.
– Being ready to lend a hand with provision of water, foodand other aid to people impacted by natural disastersand to support community resilience beyond theimmediate aftermath.
– Ensuring we leverage our significant business investmentin employment, training, ingredient supply, assets andservices so that we can also provide community andsocial development benefits wherever possible.
Coca-Cola Amatil’s annual sustainability reports are available on our website www.ccamatil.com.
BETTER ENVIRONMENTWe aim to leave a positive legacy and ensure minimal impact on the environment. We work responsibly in all we do, seeking to make the right choices now, in a sustainable way, for future generations.
Our commitment is focused where we have the most opportunity to make a difference: sustainable packaging; water stewardship; energy management and climate protection; biodiversity; and responsible sourcing.
By 2020, we will continue to drive water neutrality for non-alcoholic beverages; target a 25 per cent improvement in water efficiency for alcoholic beverages and food categories; deliver a 25 per cent carbon reduction for the ‘drink in your hand’; ensure that 60 per cent of our energy requirements come from renewable and low-carbon sources; and we aspire to packaging neutrality with business case development for 50 per cent recycled PET in our Australian portfolio.
To achieve this vision, we work closely with partners and environmental experts so that we can understand and mitigate our impact and be proactive in implementing solutions. We have taken a leadership role in working with governments and stakeholders across Australia on container deposit and refund schemes, including as a joint venture partner in Exchange for Change, the New South Wales Scheme Coordinator, and a founding partner in Container Exchange, a not-for-profit organisation that is the Product Responsibility Organisation that has established and now manages the Queensland container refund scheme which commenced in 2018 and is implementing the container refund scheme in Western Australia, which will commence in June 2020. In addition, we have run the South Australian container deposit scheme for over 40 years through our wholly owned subsidiary Statewide Recycling.
We also welcome and support The Coca-Cola Company’s ‘World Without Waste’ global packaging strategy that has an industry-first goal of collecting and recycling the equivalent of every bottle or can it sells globally by 2030. In line with this commitment Coca-Cola Amatil approved the business case for 50 per cent recycled plastic in its Australian portfolio. The transition of all single-serve bottles to 100 per cent rPET in Australia and New Zealand was completed in December 2019. By the end of 2019, seven out of 10 plastic bottles in Australia were being made from 100 per cent recycled materials. In New Zealand, all our plastic bottles smaller than one litre and all water bottles across all sizes are now made from 100 per cent recycled PET.
COCA-COLA AMATIL ANNUAL REPORT 201960 61
BEING
A SU
STAIN
ABLE
BUSIN
ESSTH
E VALU
E W
E CREATEPERFO
RMA
NCE
& O
UTLO
OK
FINA
NCIA
L & STATU
TORY
REPOR
TSO
THER
INFO
RMATIO
NO
UR
BUSIN
ESSBEIN
G A
SUSTA
INA
BLE BU
SINESS
GO
VERNA
NCE
& RISK
S
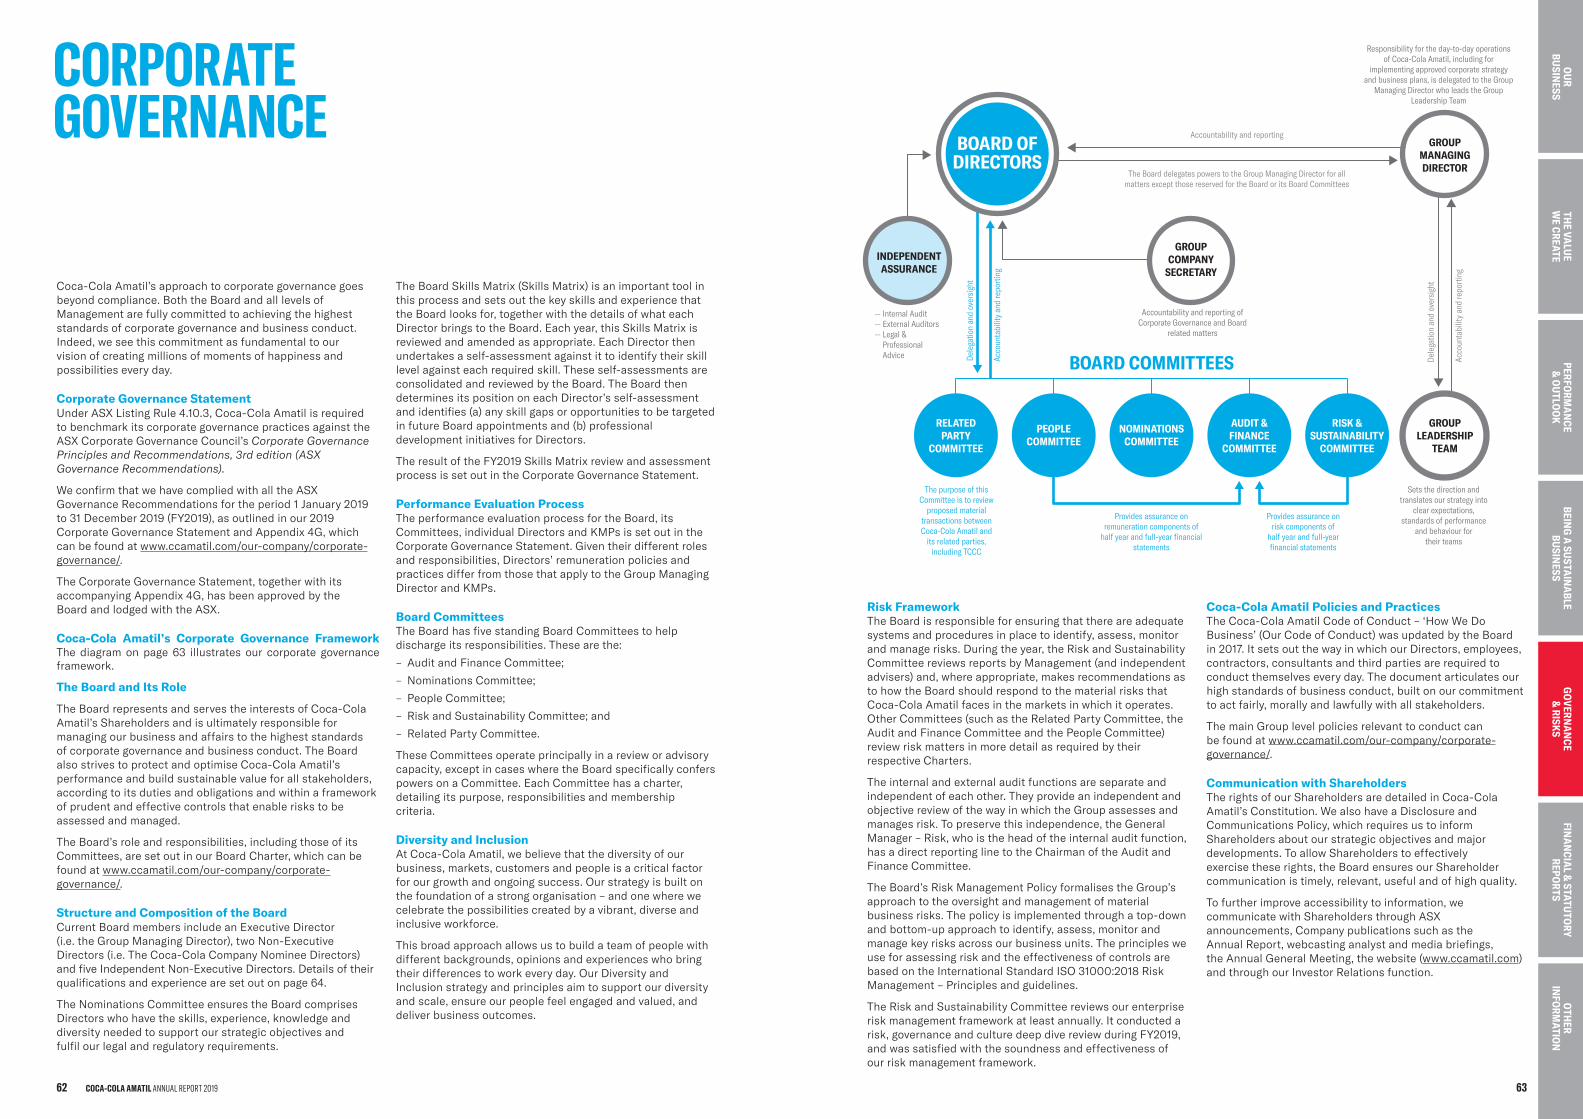
CORPORATE GOVERNANCE
Coca-Cola Amatil’s approach to corporate governance goes beyond compliance. Both the Board and all levels of Management are fully committed to achieving the highest standards of corporate governance and business conduct. Indeed, we see this commitment as fundamental to our vision of creating millions of moments of happiness and possibilities every day.
Corporate Governance StatementUnder ASX Listing Rule 4.10.3, Coca-Cola Amatil is required to benchmark its corporate governance practices against the ASX Corporate Governance Council’s Corporate Governance Principles and Recommendations, 3rd edition (ASX Governance Recommendations).
We confirm that we have complied with all the ASX Governance Recommendations for the period 1 January 2019 to 31 December 2019 (FY2019), as outlined in our 2019 Corporate Governance Statement and Appendix 4G, which can be found at www.ccamatil.com/our-company/corporate-governance/.
The Corporate Governance Statement, together with its accompanying Appendix 4G, has been approved by the Board and lodged with the ASX.
Coca-Cola Amatil’s Corporate Governance Framework The diagram on page 63 illustrates our corporate governance framework.
The Board and Its Role
The Board represents and serves the interests of Coca-Cola Amatil’s Shareholders and is ultimately responsible for managing our business and affairs to the highest standards of corporate governance and business conduct. The Board also strives to protect and optimise Coca-Cola Amatil’s performance and build sustainable value for all stakeholders, according to its duties and obligations and within a framework of prudent and effective controls that enable risks to be assessed and managed.
The Board’s role and responsibilities, including those of its Committees, are set out in our Board Charter, which can be found at www.ccamatil.com/our-company/corporate-governance/.
Structure and Composition of the BoardCurrent Board members include an Executive Director (i.e. the Group Managing Director), two Non-Executive Directors (i.e. The Coca-Cola Company Nominee Directors) and five Independent Non-Executive Directors. Details of their qualifications and experience are set out on page 64.
The Nominations Committee ensures the Board comprises Directors who have the skills, experience, knowledge and diversity needed to support our strategic objectives and fulfil our legal and regulatory requirements.
The Board Skills Matrix (Skills Matrix) is an important tool in this process and sets out the key skills and experience that the Board looks for, together with the details of what each Director brings to the Board. Each year, this Skills Matrix is reviewed and amended as appropriate. Each Director then undertakes a self-assessment against it to identify their skill level against each required skill. These self-assessments are consolidated and reviewed by the Board. The Board then determines its position on each Director’s self-assessment and identifies (a) any skill gaps or opportunities to be targeted in future Board appointments and (b) professional development initiatives for Directors.
The result of the FY2019 Skills Matrix review and assessment process is set out in the Corporate Governance Statement.
Performance Evaluation ProcessThe performance evaluation process for the Board, its Committees, individual Directors and KMPs is set out in the Corporate Governance Statement. Given their different roles and responsibilities, Directors’ remuneration policies and practices differ from those that apply to the Group Managing Director and KMPs.
Board CommitteesThe Board has five standing Board Committees to help discharge its responsibilities. These are the:
– Audit and Finance Committee;
– Nominations Committee;
– People Committee;
– Risk and Sustainability Committee; and
– Related Party Committee.
These Committees operate principally in a review or advisory capacity, except in cases where the Board specifically confers powers on a Committee. Each Committee has a charter, detailing its purpose, responsibilities and membership criteria.
Diversity and InclusionAt Coca-Cola Amatil, we believe that the diversity of our business, markets, customers and people is a critical factor for our growth and ongoing success. Our strategy is built on the foundation of a strong organisation – and one where we celebrate the possibilities created by a vibrant, diverse and inclusive workforce.
This broad approach allows us to build a team of people with different backgrounds, opinions and experiences who bring their differences to work every day. Our Diversity and Inclusion strategy and principles aim to support our diversity and scale, ensure our people feel engaged and valued, and deliver business outcomes.
Risk FrameworkThe Board is responsible for ensuring that there are adequate systems and procedures in place to identify, assess, monitor and manage risks. During the year, the Risk and Sustainability Committee reviews reports by Management (and independent advisers) and, where appropriate, makes recommendations as to how the Board should respond to the material risks that Coca-Cola Amatil faces in the markets in which it operates. Other Committees (such as the Related Party Committee, the Audit and Finance Committee and the People Committee) review risk matters in more detail as required by their respective Charters.
The internal and external audit functions are separate and independent of each other. They provide an independent and objective review of the way in which the Group assesses and manages risk. To preserve this independence, the General Manager – Risk, who is the head of the internal audit function, has a direct reporting line to the Chairman of the Audit and Finance Committee.
The Board’s Risk Management Policy formalises the Group’s approach to the oversight and management of material business risks. The policy is implemented through a top-down and bottom-up approach to identify, assess, monitor and manage key risks across our business units. The principles we use for assessing risk and the effectiveness of controls are based on the International Standard ISO 31000:2018 Risk Management – Principles and guidelines.
The Risk and Sustainability Committee reviews our enterprise risk management framework at least annually. It conducted a risk, governance and culture deep dive review during FY2019, and was satisfied with the soundness and effectiveness of our risk management framework.
Coca-Cola Amatil Policies and PracticesThe Coca-Cola Amatil Code of Conduct – ‘How We Do Business’ (Our Code of Conduct) was updated by the Board in 2017. It sets out the way in which our Directors, employees, contractors, consultants and third parties are required to conduct themselves every day. The document articulates our high standards of business conduct, built on our commitment to act fairly, morally and lawfully with all stakeholders.
The main Group level policies relevant to conduct can be found at www.ccamatil.com/our-company/corporate-governance/.
Communication with ShareholdersThe rights of our Shareholders are detailed in Coca-Cola Amatil’s Constitution. We also have a Disclosure and Communications Policy, which requires us to inform Shareholders about our strategic objectives and major developments. To allow Shareholders to effectively exercise these rights, the Board ensures our Shareholder communication is timely, relevant, useful and of high quality.
To further improve accessibility to information, we communicate with Shareholders through ASX announcements, Company publications such as the Annual Report, webcasting analyst and media briefings, the Annual General Meeting, the website (www.ccamatil.com) and through our Investor Relations function.
BOARD OF DIRECTORS
INDEPENDENTASSURANCE
RELATED PARTY
COMMITTEE
PEOPLECOMMITTEE
NOMINATIONS COMMITTEE
AUDIT & FINANCE
COMMITTEE
RISK & SUSTAINABILITY
COMMITTEE
GROUP LEADERSHIP
TEAM
GROUP COMPANY
SECRETARY
GROUP MANAGING DIRECTOR
Accountability and reporting
The Board delegates powers to the Group Managing Director for all matters except those reserved for the Board or its Board Committees
The purpose of this Committee is to review
proposed material transactions between Coca-Cola Amatil and
its related parties, including TCCC
Provides assurance on remuneration components of
half year and full-year financial statements
Provides assurance on risk components of
half year and full-year financial statements
Sets the direction and translates our strategy into
clear expectations, standards of performance
and behaviour for their teams
Responsibility for the day-to-day operations of Coca-Cola Amatil, including for
implementing approved corporate strategy and business plans, is delegated to the Group
Managing Director who leads the Group Leadership Team
— Internal Audit— External Auditors— Legal &
Professional Advice De
lega
tion
and
over
sigh
t
Acco
unta
bilit
y an
d re
port
ing
Dele
gatio
n an
d ov
ersi
ght
Acco
unta
bilit
y an
d re
port
ing
Accountability and reporting of Corporate Governance and Board
related matters
BOARD COMMITTEES
COCA-COLA AMATIL ANNUAL REPORT 201962 63
BEING
A SU
STAIN
ABLE
BUSIN
ESSTH
E VALU
E W
E CREATEPERFO
RMA
NCE
& O
UTLO
OK
FINA
NCIA
L & STATU
TORY
REPOR
TSO
THER
INFO
RMATIO
NO
UR
BUSIN
ESSG
OVERN
AN
CE &
RISKS
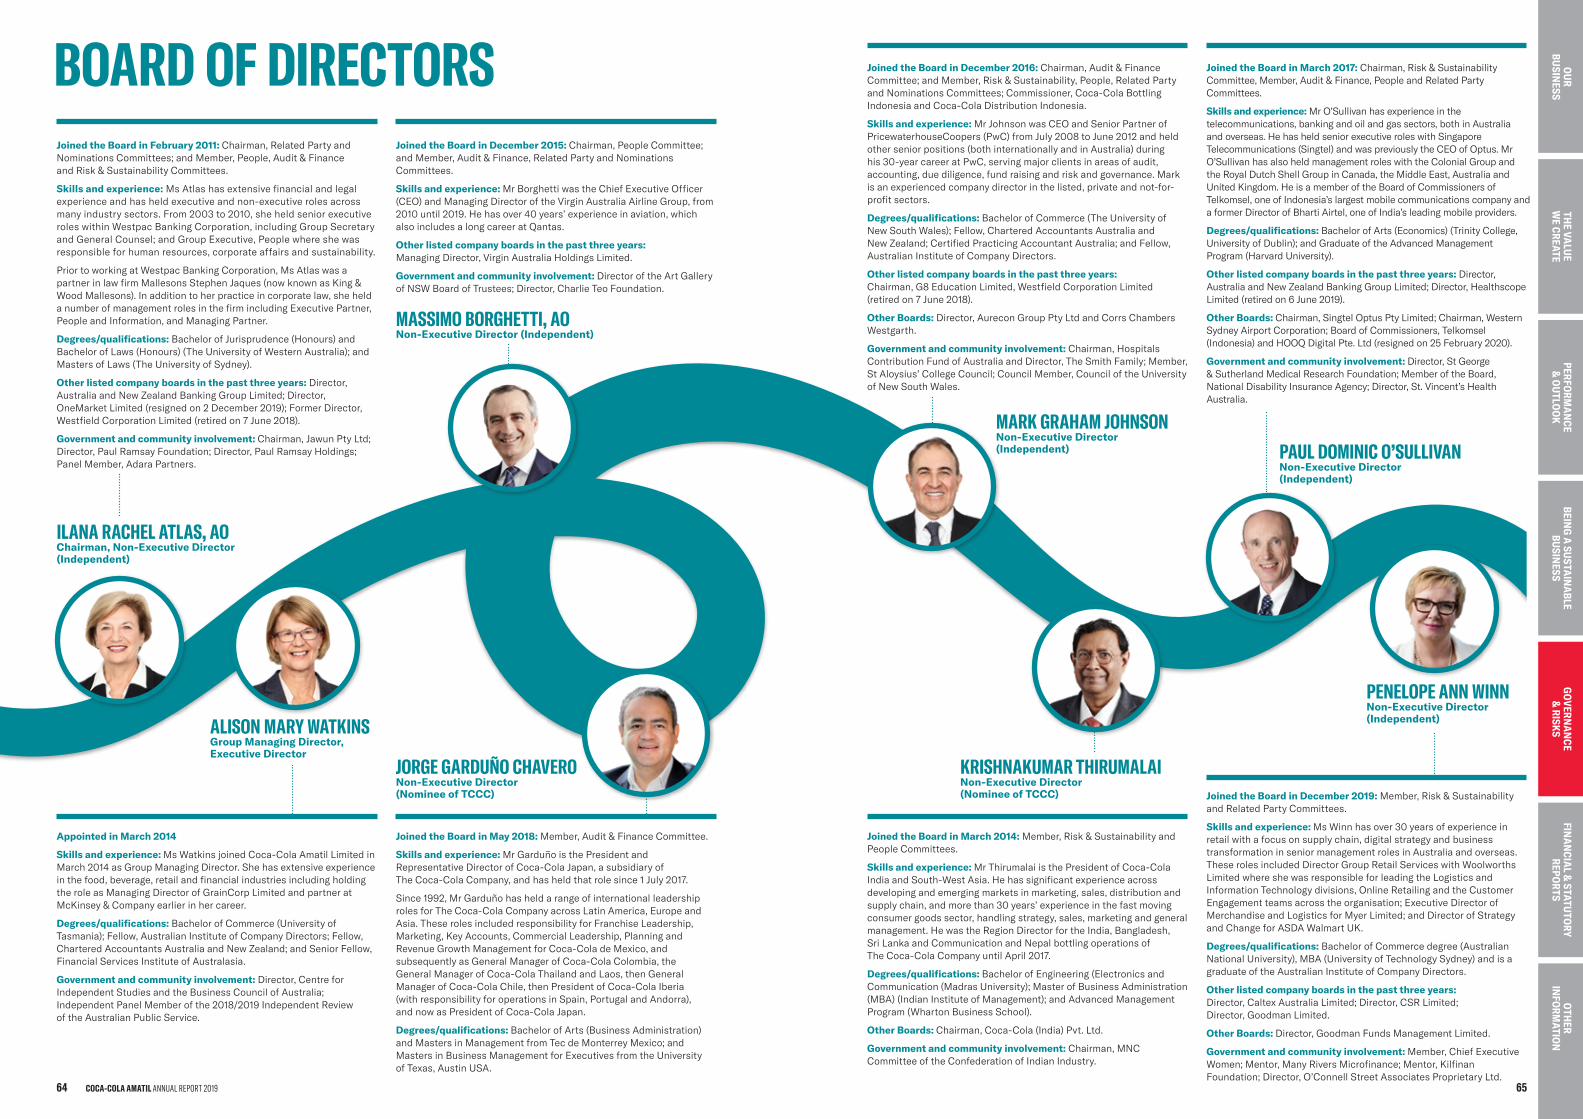
BOARD OF DIRECTORSJoined the Board in February 2011: Chairman, Related Party and Nominations Committees; and Member, People, Audit & Finance and Risk & Sustainability Committees.
Skills and experience: Ms Atlas has extensive financial and legal experience and has held executive and non-executive roles across many industry sectors. From 2003 to 2010, she held senior executive roles within Westpac Banking Corporation, including Group Secretary and General Counsel; and Group Executive, People where she was responsible for human resources, corporate affairs and sustainability.
Prior to working at Westpac Banking Corporation, Ms Atlas was a partner in law firm Mallesons Stephen Jaques (now known as King & Wood Mallesons). In addition to her practice in corporate law, she held a number of management roles in the firm including Executive Partner, People and Information, and Managing Partner.
Degrees/qualifications: Bachelor of Jurisprudence (Honours) and Bachelor of Laws (Honours) (The University of Western Australia); and Masters of Laws (The University of Sydney).
Other listed company boards in the past three years: Director, Australia and New Zealand Banking Group Limited; Director, OneMarket Limited (resigned on 2 December 2019); Former Director, Westfield Corporation Limited (retired on 7 June 2018).
Government and community involvement: Chairman, Jawun Pty Ltd; Director, Paul Ramsay Foundation; Director, Paul Ramsay Holdings; Panel Member, Adara Partners.
Appointed in March 2014
Skills and experience: Ms Watkins joined Coca-Cola Amatil Limited in March 2014 as Group Managing Director. She has extensive experience in the food, beverage, retail and financial industries including holding the role as Managing Director of GrainCorp Limited and partner at McKinsey & Company earlier in her career.
Degrees/qualifications: Bachelor of Commerce (University of Tasmania); Fellow, Australian Institute of Company Directors; Fellow, Chartered Accountants Australia and New Zealand; and Senior Fellow, Financial Services Institute of Australasia.
Government and community involvement: Director, Centre for Independent Studies and the Business Council of Australia; Independent Panel Member of the 2018/2019 Independent Review of the Australian Public Service.
Joined the Board in December 2016: Chairman, Audit & Finance Committee; and Member, Risk & Sustainability, People, Related Party and Nominations Committees; Commissioner, Coca-Cola Bottling Indonesia and Coca-Cola Distribution Indonesia.
Skills and experience: Mr Johnson was CEO and Senior Partner of PricewaterhouseCoopers (PwC) from July 2008 to June 2012 and held other senior positions (both internationally and in Australia) during his 30-year career at PwC, serving major clients in areas of audit, accounting, due diligence, fund raising and risk and governance. Mark is an experienced company director in the listed, private and not-for-profit sectors.
Degrees/qualifications: Bachelor of Commerce (The University of New South Wales); Fellow, Chartered Accountants Australia and New Zealand; Certified Practicing Accountant Australia; and Fellow, Australian Institute of Company Directors.
Other listed company boards in the past three years: Chairman, G8 Education Limited, Westfield Corporation Limited (retired on 7 June 2018).
Other Boards: Director, Aurecon Group Pty Ltd and Corrs Chambers Westgarth.
Government and community involvement: Chairman, Hospitals Contribution Fund of Australia and Director, The Smith Family; Member, St Aloysius’ College Council; Council Member, Council of the University of New South Wales.
Joined the Board in March 2014: Member, Risk & Sustainability and People Committees.
Skills and experience: Mr Thirumalai is the President of Coca-Cola India and South-West Asia. He has significant experience across developing and emerging markets in marketing, sales, distribution and supply chain, and more than 30 years’ experience in the fast moving consumer goods sector, handling strategy, sales, marketing and general management. He was the Region Director for the India, Bangladesh, Sri Lanka and Communication and Nepal bottling operations of The Coca-Cola Company until April 2017.
Degrees/qualifications: Bachelor of Engineering (Electronics and Communication (Madras University); Master of Business Administration (MBA) (Indian Institute of Management); and Advanced Management Program (Wharton Business School).
Other Boards: Chairman, Coca-Cola (India) Pvt. Ltd.
Government and community involvement: Chairman, MNC Committee of the Confederation of Indian Industry.
Joined the Board in March 2017: Chairman, Risk & Sustainability Committee, Member, Audit & Finance, People and Related Party Committees.
Skills and experience: Mr O’Sullivan has experience in the telecommunications, banking and oil and gas sectors, both in Australia and overseas. He has held senior executive roles with Singapore Telecommunications (Singtel) and was previously the CEO of Optus. Mr O’Sullivan has also held management roles with the Colonial Group and the Royal Dutch Shell Group in Canada, the Middle East, Australia and United Kingdom. He is a member of the Board of Commissioners of Telkomsel, one of Indonesia’s largest mobile communications company and a former Director of Bharti Airtel, one of India’s leading mobile providers.
Degrees/qualifications: Bachelor of Arts (Economics) (Trinity College, University of Dublin); and Graduate of the Advanced Management Program (Harvard University).
Other listed company boards in the past three years: Director, Australia and New Zealand Banking Group Limited; Director, Healthscope Limited (retired on 6 June 2019).
Other Boards: Chairman, Singtel Optus Pty Limited; Chairman, Western Sydney Airport Corporation; Board of Commissioners, Telkomsel (Indonesia) and HOOQ Digital Pte. Ltd (resigned on 25 February 2020).
Government and community involvement: Director, St George & Sutherland Medical Research Foundation; Member of the Board, National Disability Insurance Agency; Director, St. Vincent’s Health Australia.
Joined the Board in December 2019: Member, Risk & Sustainability and Related Party Committees.
Skills and experience: Ms Winn has over 30 years of experience in retail with a focus on supply chain, digital strategy and business transformation in senior management roles in Australia and overseas. These roles included Director Group Retail Services with Woolworths Limited where she was responsible for leading the Logistics and Information Technology divisions, Online Retailing and the Customer Engagement teams across the organisation; Executive Director of Merchandise and Logistics for Myer Limited; and Director of Strategy and Change for ASDA Walmart UK.
Degrees/qualifications: Bachelor of Commerce degree (Australian National University), MBA (University of Technology Sydney) and is a graduate of the Australian Institute of Company Directors.
Other listed company boards in the past three years: Director, Caltex Australia Limited; Director, CSR Limited; Director, Goodman Limited.
Other Boards: Director, Goodman Funds Management Limited.
Government and community involvement: Member, Chief Executive Women; Mentor, Many Rivers Microfinance; Mentor, Kilfinan Foundation; Director, O’Connell Street Associates Proprietary Ltd.
Joined the Board in May 2018: Member, Audit & Finance Committee.
Skills and experience: Mr Garduño is the President and Representative Director of Coca-Cola Japan, a subsidiary of The Coca-Cola Company, and has held that role since 1 July 2017.
Since 1992, Mr Garduño has held a range of international leadership roles for The Coca-Cola Company across Latin America, Europe and Asia. These roles included responsibility for Franchise Leadership, Marketing, Key Accounts, Commercial Leadership, Planning and Revenue Growth Management for Coca-Cola de Mexico, and subsequently as General Manager of Coca-Cola Colombia, the General Manager of Coca-Cola Thailand and Laos, then General Manager of Coca-Cola Chile, then President of Coca-Cola Iberia (with responsibility for operations in Spain, Portugal and Andorra), and now as President of Coca-Cola Japan.
Degrees/qualifications: Bachelor of Arts (Business Administration) and Masters in Management from Tec de Monterrey Mexico; and Masters in Business Management for Executives from the University of Texas, Austin USA.
Joined the Board in December 2015: Chairman, People Committee; and Member, Audit & Finance, Related Party and Nominations Committees.
Skills and experience: Mr Borghetti was the Chief Executive Officer (CEO) and Managing Director of the Virgin Australia Airline Group, from 2010 until 2019. He has over 40 years’ experience in aviation, which also includes a long career at Qantas.
Other listed company boards in the past three years: Managing Director, Virgin Australia Holdings Limited.
Government and community involvement: Director of the Art Gallery of NSW Board of Trustees; Director, Charlie Teo Foundation.
MASSIMO BORGHETTI, AONon-Executive Director (Independent)
ILANA RACHEL ATLAS, AOChairman, Non-Executive Director (Independent)
MARK GRAHAM JOHNSON Non-Executive Director (Independent)
KRISHNAKUMAR THIRUMALAINon-Executive Director (Nominee of TCCC)
JORGE GARDUÑO CHAVERONon-Executive Director (Nominee of TCCC)
ALISON MARY WATKINSGroup Managing Director, Executive Director
PAUL DOMINIC O’SULLIVAN Non-Executive Director (Independent)
PENELOPE ANN WINNNon-Executive Director (Independent)
COCA-COLA AMATIL ANNUAL REPORT 201964 65
BEING
A SU
STAIN
ABLE
BUSIN
ESSTH
E VALU
E W
E CREATEPERFO
RMA
NCE
& O
UTLO
OK
FINA
NCIA
L & STATU
TORY
REPOR
TSO
THER
INFO
RMATIO
NO
UR
BUSIN
ESSG
OVERN
AN
CE &
RISKS
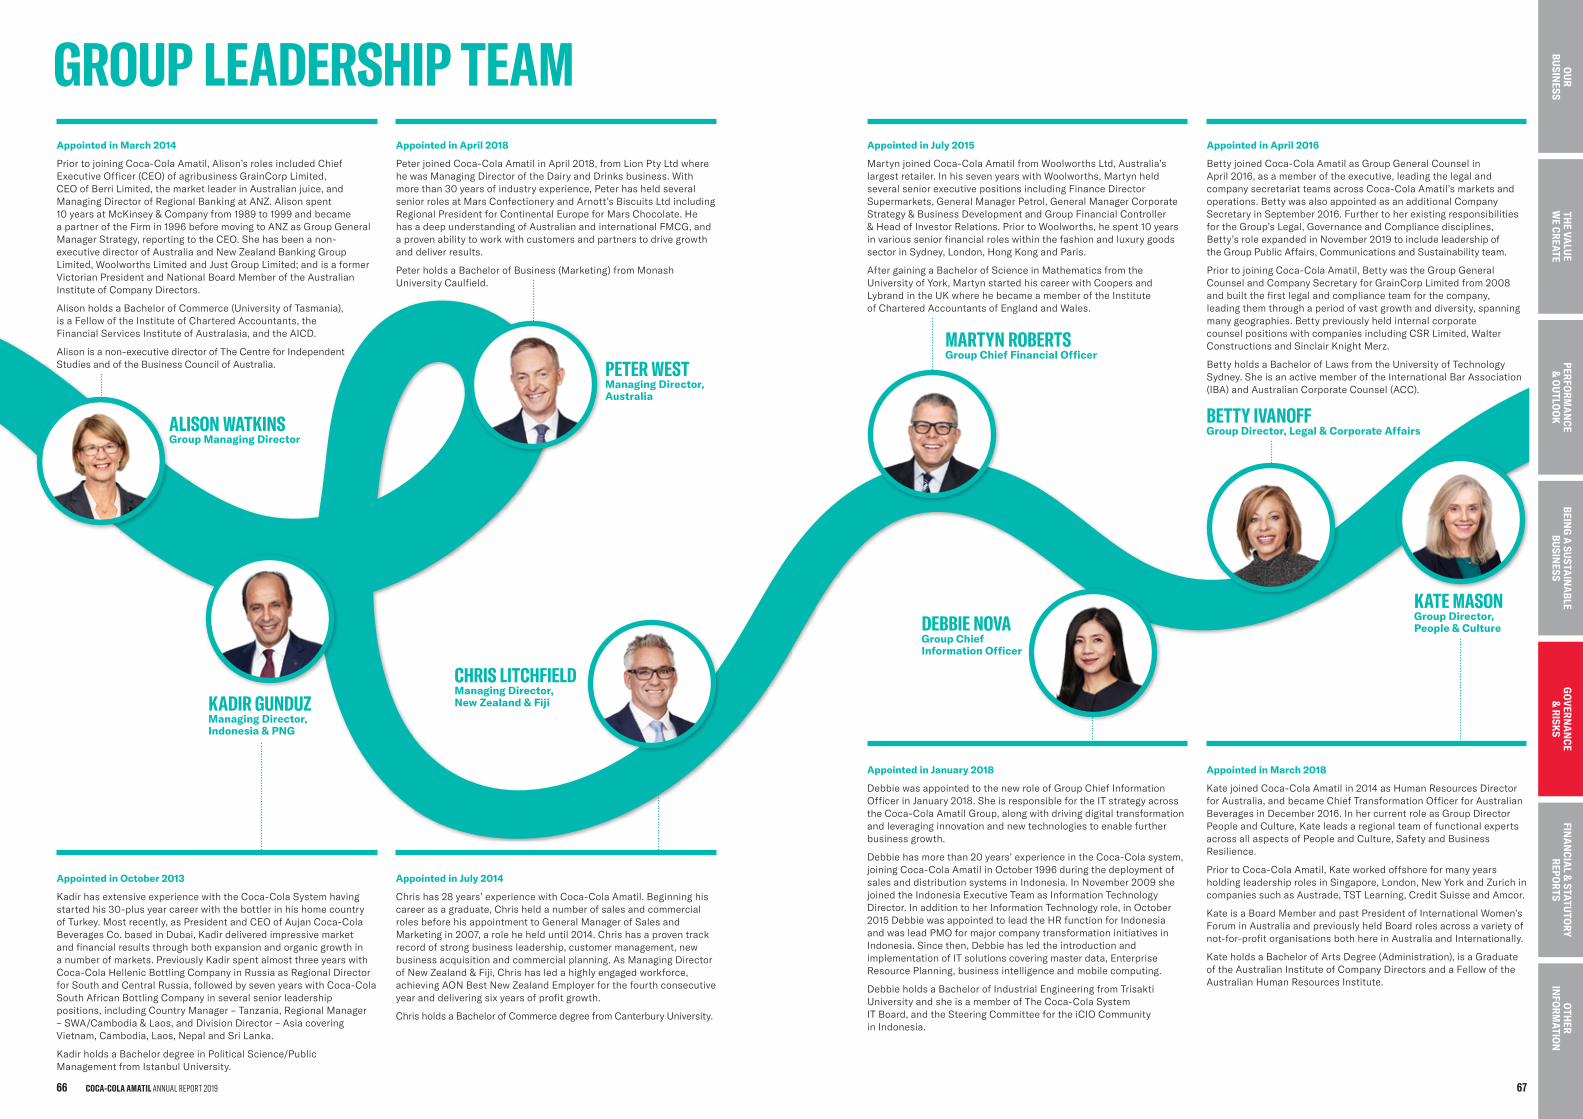
BETTY IVANOFFGroup Director, Legal & Corporate Affairs
GROUP LEADERSHIP TEAM Appointed in March 2014
Prior to joining Coca-Cola Amatil, Alison’s roles included Chief Executive Officer (CEO) of agribusiness GrainCorp Limited, CEO of Berri Limited, the market leader in Australian juice, and Managing Director of Regional Banking at ANZ. Alison spent 10 years at McKinsey & Company from 1989 to 1999 and became a partner of the Firm in 1996 before moving to ANZ as Group General Manager Strategy, reporting to the CEO. She has been a non-executive director of Australia and New Zealand Banking Group Limited, Woolworths Limited and Just Group Limited; and is a former Victorian President and National Board Member of the Australian Institute of Company Directors.
Alison holds a Bachelor of Commerce (University of Tasmania), is a Fellow of the Institute of Chartered Accountants, the Financial Services Institute of Australasia, and the AICD.
Alison is a non-executive director of The Centre for Independent Studies and of the Business Council of Australia.
Appointed in April 2018
Peter joined Coca-Cola Amatil in April 2018, from Lion Pty Ltd where he was Managing Director of the Dairy and Drinks business. With more than 30 years of industry experience, Peter has held several senior roles at Mars Confectionery and Arnott’s Biscuits Ltd including Regional President for Continental Europe for Mars Chocolate. He has a deep understanding of Australian and international FMCG, and a proven ability to work with customers and partners to drive growth and deliver results.
Peter holds a Bachelor of Business (Marketing) from Monash University Caulfield.
Appointed in July 2015
Martyn joined Coca-Cola Amatil from Woolworths Ltd, Australia’s largest retailer. In his seven years with Woolworths, Martyn held several senior executive positions including Finance Director Supermarkets, General Manager Petrol, General Manager Corporate Strategy & Business Development and Group Financial Controller & Head of Investor Relations. Prior to Woolworths, he spent 10 years in various senior financial roles within the fashion and luxury goods sector in Sydney, London, Hong Kong and Paris.
After gaining a Bachelor of Science in Mathematics from the University of York, Martyn started his career with Coopers and Lybrand in the UK where he became a member of the Institute of Chartered Accountants of England and Wales.
Appointed in October 2013
Kadir has extensive experience with the Coca-Cola System having started his 30-plus year career with the bottler in his home country of Turkey. Most recently, as President and CEO of Aujan Coca-Cola Beverages Co. based in Dubai, Kadir delivered impressive market and financial results through both expansion and organic growth in a number of markets. Previously Kadir spent almost three years with Coca-Cola Hellenic Bottling Company in Russia as Regional Director for South and Central Russia, followed by seven years with Coca-Cola South African Bottling Company in several senior leadership positions, including Country Manager – Tanzania, Regional Manager – SWA/Cambodia & Laos, and Division Director – Asia covering Vietnam, Cambodia, Laos, Nepal and Sri Lanka.
Kadir holds a Bachelor degree in Political Science/Public Management from Istanbul University.
Appointed in July 2014
Chris has 28 years’ experience with Coca-Cola Amatil. Beginning his career as a graduate, Chris held a number of sales and commercial roles before his appointment to General Manager of Sales and Marketing in 2007, a role he held until 2014. Chris has a proven track record of strong business leadership, customer management, new business acquisition and commercial planning. As Managing Director of New Zealand & Fiji, Chris has led a highly engaged workforce, achieving AON Best New Zealand Employer for the fourth consecutive year and delivering six years of profit growth.
Chris holds a Bachelor of Commerce degree from Canterbury University.
Appointed in March 2018
Kate joined Coca-Cola Amatil in 2014 as Human Resources Director for Australia, and became Chief Transformation Officer for Australian Beverages in December 2016. In her current role as Group Director People and Culture, Kate leads a regional team of functional experts across all aspects of People and Culture, Safety and Business Resilience.
Prior to Coca-Cola Amatil, Kate worked offshore for many years holding leadership roles in Singapore, London, New York and Zurich in companies such as Austrade, TST Learning, Credit Suisse and Amcor.
Kate is a Board Member and past President of International Women’s Forum in Australia and previously held Board roles across a variety of not-for-profit organisations both here in Australia and Internationally.
Kate holds a Bachelor of Arts Degree (Administration), is a Graduate of the Australian Institute of Company Directors and a Fellow of the Australian Human Resources Institute.
Appointed in April 2016
Betty joined Coca-Cola Amatil as Group General Counsel in April 2016, as a member of the executive, leading the legal and company secretariat teams across Coca-Cola Amatil’s markets and operations. Betty was also appointed as an additional Company Secretary in September 2016. Further to her existing responsibilities for the Group’s Legal, Governance and Compliance disciplines, Betty’s role expanded in November 2019 to include leadership of the Group Public Affairs, Communications and Sustainability team.
Prior to joining Coca-Cola Amatil, Betty was the Group General Counsel and Company Secretary for GrainCorp Limited from 2008 and built the first legal and compliance team for the company, leading them through a period of vast growth and diversity, spanning many geographies. Betty previously held internal corporate counsel positions with companies including CSR Limited, Walter Constructions and Sinclair Knight Merz.
Betty holds a Bachelor of Laws from the University of Technology Sydney. She is an active member of the International Bar Association (IBA) and Australian Corporate Counsel (ACC).
Appointed in January 2018
Debbie was appointed to the new role of Group Chief Information Officer in January 2018. She is responsible for the IT strategy across the Coca-Cola Amatil Group, along with driving digital transformation and leveraging innovation and new technologies to enable further business growth.
Debbie has more than 20 years’ experience in the Coca-Cola system, joining Coca-Cola Amatil in October 1996 during the deployment of sales and distribution systems in Indonesia. In November 2009 she joined the Indonesia Executive Team as Information Technology Director. In addition to her Information Technology role, in October 2015 Debbie was appointed to lead the HR function for Indonesia and was lead PMO for major company transformation initiatives in Indonesia. Since then, Debbie has led the introduction and implementation of IT solutions covering master data, Enterprise Resource Planning, business intelligence and mobile computing.
Debbie holds a Bachelor of Industrial Engineering from Trisakti University and she is a member of The Coca-Cola System IT Board, and the Steering Committee for the iCIO Community in Indonesia.
ALISON WATKINSGroup Managing Director
MARTYN ROBERTSGroup Chief Financial Officer
DEBBIE NOVAGroup Chief Information Officer
KADIR GUNDUZManaging Director, Indonesia & PNG
PETER WESTManaging Director, Australia
KATE MASONGroup Director, People & Culture
CHRIS LITCHFIELDManaging Director, New Zealand & Fiji
COCA-COLA AMATIL ANNUAL REPORT 201966 67
BEING
A SU
STAIN
ABLE
BUSIN
ESSTH
E VALU
E W
E CREATEPERFO
RMA
NCE
& O
UTLO
OK
FINA
NCIA
L & STATU
TORY
REPOR
TSO
THER
INFO
RMATIO
NO
UR
BUSIN
ESSG
OVERN
AN
CE &
RISKS
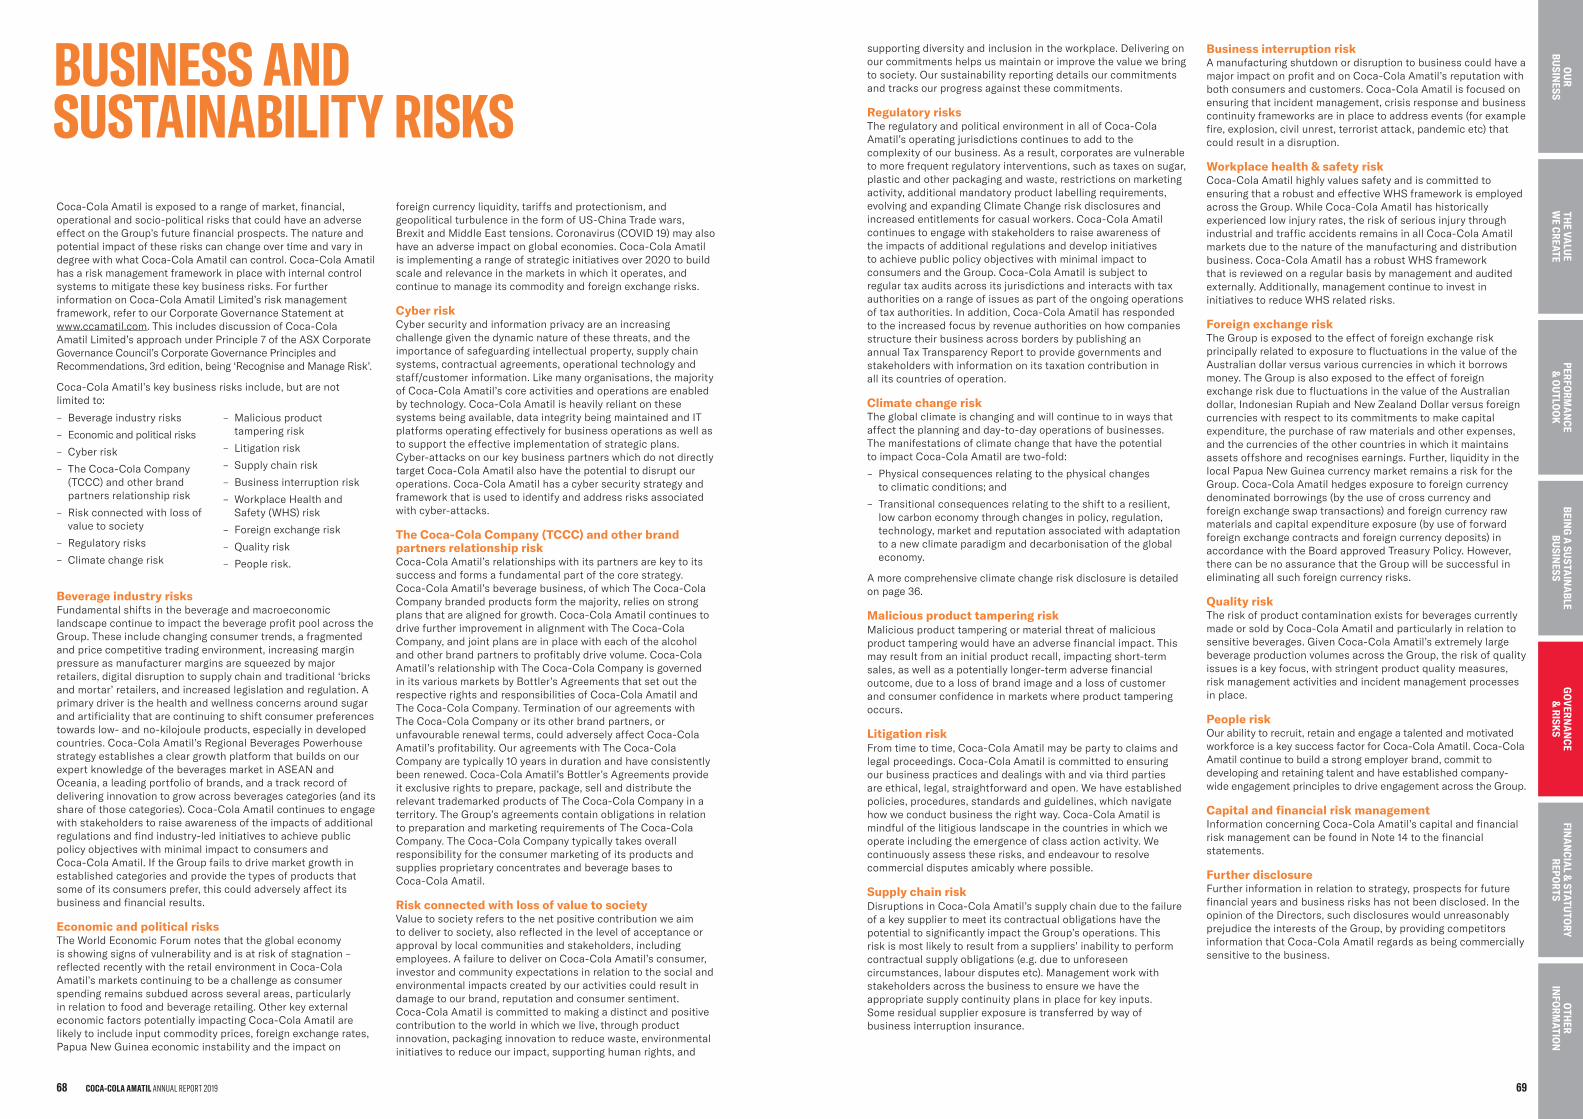
BUSINESS AND SUSTAINABILITY RISKS
foreign currency liquidity, tariffs and protectionism, and geopolitical turbulence in the form of US-China Trade wars, Brexit and Middle East tensions. Coronavirus (COVID 19) may also have an adverse impact on global economies. Coca-Cola Amatil is implementing a range of strategic initiatives over 2020 to build scale and relevance in the markets in which it operates, and continue to manage its commodity and foreign exchange risks.
Cyber riskCyber security and information privacy are an increasing challenge given the dynamic nature of these threats, and the importance of safeguarding intellectual property, supply chain systems, contractual agreements, operational technology and staff/customer information. Like many organisations, the majority of Coca-Cola Amatil’s core activities and operations are enabled by technology. Coca-Cola Amatil is heavily reliant on these systems being available, data integrity being maintained and IT platforms operating effectively for business operations as well as to support the effective implementation of strategic plans. Cyber-attacks on our key business partners which do not directly target Coca-Cola Amatil also have the potential to disrupt our operations. Coca-Cola Amatil has a cyber security strategy and framework that is used to identify and address risks associated with cyber-attacks.
The Coca-Cola Company (TCCC) and other brand partners relationship riskCoca-Cola Amatil’s relationships with its partners are key to its success and forms a fundamental part of the core strategy. Coca-Cola Amatil’s beverage business, of which The Coca-Cola Company branded products form the majority, relies on strong plans that are aligned for growth. Coca-Cola Amatil continues to drive further improvement in alignment with The Coca-Cola Company, and joint plans are in place with each of the alcohol and other brand partners to profitably drive volume. Coca-Cola Amatil’s relationship with The Coca-Cola Company is governed in its various markets by Bottler’s Agreements that set out the respective rights and responsibilities of Coca-Cola Amatil and The Coca-Cola Company. Termination of our agreements with The Coca-Cola Company or its other brand partners, or unfavourable renewal terms, could adversely affect Coca-Cola Amatil’s profitability. Our agreements with The Coca-Cola Company are typically 10 years in duration and have consistently been renewed. Coca-Cola Amatil’s Bottler’s Agreements provide it exclusive rights to prepare, package, sell and distribute the relevant trademarked products of The Coca-Cola Company in a territory. The Group’s agreements contain obligations in relation to preparation and marketing requirements of The Coca-Cola Company. The Coca-Cola Company typically takes overall responsibility for the consumer marketing of its products and supplies proprietary concentrates and beverage bases to Coca-Cola Amatil.
Risk connected with loss of value to societyValue to society refers to the net positive contribution we aim to deliver to society, also reflected in the level of acceptance or approval by local communities and stakeholders, including employees. A failure to deliver on Coca-Cola Amatil’s consumer, investor and community expectations in relation to the social and environmental impacts created by our activities could result in damage to our brand, reputation and consumer sentiment. Coca-Cola Amatil is committed to making a distinct and positive contribution to the world in which we live, through product innovation, packaging innovation to reduce waste, environmental initiatives to reduce our impact, supporting human rights, and
Business interruption risk A manufacturing shutdown or disruption to business could have a major impact on profit and on Coca-Cola Amatil’s reputation with both consumers and customers. Coca-Cola Amatil is focused on ensuring that incident management, crisis response and business continuity frameworks are in place to address events (for example fire, explosion, civil unrest, terrorist attack, pandemic etc) that could result in a disruption.
Workplace health & safety risk Coca-Cola Amatil highly values safety and is committed to ensuring that a robust and effective WHS framework is employed across the Group. While Coca-Cola Amatil has historically experienced low injury rates, the risk of serious injury through industrial and traffic accidents remains in all Coca-Cola Amatil markets due to the nature of the manufacturing and distribution business. Coca-Cola Amatil has a robust WHS framework that is reviewed on a regular basis by management and audited externally. Additionally, management continue to invest in initiatives to reduce WHS related risks.
Foreign exchange risk The Group is exposed to the effect of foreign exchange risk principally related to exposure to fluctuations in the value of the Australian dollar versus various currencies in which it borrows money. The Group is also exposed to the effect of foreign exchange risk due to fluctuations in the value of the Australian dollar, Indonesian Rupiah and New Zealand Dollar versus foreign currencies with respect to its commitments to make capital expenditure, the purchase of raw materials and other expenses, and the currencies of the other countries in which it maintains assets offshore and recognises earnings. Further, liquidity in the local Papua New Guinea currency market remains a risk for the Group. Coca-Cola Amatil hedges exposure to foreign currency denominated borrowings (by the use of cross currency and foreign exchange swap transactions) and foreign currency raw materials and capital expenditure exposure (by use of forward foreign exchange contracts and foreign currency deposits) in accordance with the Board approved Treasury Policy. However, there can be no assurance that the Group will be successful in eliminating all such foreign currency risks.
Quality risk The risk of product contamination exists for beverages currently made or sold by Coca-Cola Amatil and particularly in relation to sensitive beverages. Given Coca-Cola Amatil’s extremely large beverage production volumes across the Group, the risk of quality issues is a key focus, with stringent product quality measures, risk management activities and incident management processes in place.
People riskOur ability to recruit, retain and engage a talented and motivated workforce is a key success factor for Coca-Cola Amatil. Coca-Cola Amatil continue to build a strong employer brand, commit to developing and retaining talent and have established company-wide engagement principles to drive engagement across the Group.
Capital and financial risk management Information concerning Coca-Cola Amatil’s capital and financial risk management can be found in Note 14 to the financial statements.
Further disclosure Further information in relation to strategy, prospects for future financial years and business risks has not been disclosed. In the opinion of the Directors, such disclosures would unreasonably prejudice the interests of the Group, by providing competitors information that Coca-Cola Amatil regards as being commercially sensitive to the business.
Coca-Cola Amatil is exposed to a range of market, financial, operational and socio-political risks that could have an adverse effect on the Group’s future financial prospects. The nature and potential impact of these risks can change over time and vary in degree with what Coca-Cola Amatil can control. Coca-Cola Amatil has a risk management framework in place with internal control systems to mitigate these key business risks. For further information on Coca-Cola Amatil Limited’s risk management framework, refer to our Corporate Governance Statement at www.ccamatil.com. This includes discussion of Coca-Cola Amatil Limited’s approach under Principle 7 of the ASX Corporate Governance Council’s Corporate Governance Principles and Recommendations, 3rd edition, being ‘Recognise and Manage Risk’.
Coca-Cola Amatil’s key business risks include, but are not limited to:
– Beverage industry risks
– Economic and political risks
– Cyber risk
– The Coca-Cola Company(TCCC) and other brandpartners relationship risk
– Risk connected with loss ofvalue to society
– Regulatory risks
– Climate change risk
– Malicious producttampering risk
– Litigation risk
– Supply chain risk
– Business interruption risk
– Workplace Health andSafety (WHS) risk
– Foreign exchange risk
– Quality risk
– People risk.
Beverage industry risksFundamental shifts in the beverage and macroeconomic landscape continue to impact the beverage profit pool across the Group. These include changing consumer trends, a fragmented and price competitive trading environment, increasing margin pressure as manufacturer margins are squeezed by major retailers, digital disruption to supply chain and traditional ‘bricks and mortar’ retailers, and increased legislation and regulation. A primary driver is the health and wellness concerns around sugar and artificiality that are continuing to shift consumer preferences towards low- and no-kilojoule products, especially in developed countries. Coca-Cola Amatil’s Regional Beverages Powerhouse strategy establishes a clear growth platform that builds on our expert knowledge of the beverages market in ASEAN and Oceania, a leading portfolio of brands, and a track record of delivering innovation to grow across beverages categories (and its share of those categories). Coca-Cola Amatil continues to engage with stakeholders to raise awareness of the impacts of additional regulations and find industry-led initiatives to achieve public policy objectives with minimal impact to consumers and Coca-Cola Amatil. If the Group fails to drive market growth in established categories and provide the types of products that some of its consumers prefer, this could adversely affect its business and financial results.
Economic and political risksThe World Economic Forum notes that the global economy is showing signs of vulnerability and is at risk of stagnation – reflected recently with the retail environment in Coca-Cola Amatil’s markets continuing to be a challenge as consumer spending remains subdued across several areas, particularly in relation to food and beverage retailing. Other key external economic factors potentially impacting Coca-Cola Amatil are likely to include input commodity prices, foreign exchange rates, Papua New Guinea economic instability and the impact on
supporting diversity and inclusion in the workplace. Delivering on our commitments helps us maintain or improve the value we bring to society. Our sustainability reporting details our commitments and tracks our progress against these commitments.
Regulatory risksThe regulatory and political environment in all of Coca-Cola Amatil’s operating jurisdictions continues to add to the complexity of our business. As a result, corporates are vulnerable to more frequent regulatory interventions, such as taxes on sugar, plastic and other packaging and waste, restrictions on marketing activity, additional mandatory product labelling requirements, evolving and expanding Climate Change risk disclosures and increased entitlements for casual workers. Coca-Cola Amatil continues to engage with stakeholders to raise awareness of the impacts of additional regulations and develop initiatives to achieve public policy objectives with minimal impact to consumers and the Group. Coca-Cola Amatil is subject to regular tax audits across its jurisdictions and interacts with tax authorities on a range of issues as part of the ongoing operations of tax authorities. In addition, Coca-Cola Amatil has responded to the increased focus by revenue authorities on how companies structure their business across borders by publishing an annual Tax Transparency Report to provide governments and stakeholders with information on its taxation contribution in all its countries of operation.
Climate change risk The global climate is changing and will continue to in ways that affect the planning and day-to-day operations of businesses. The manifestations of climate change that have the potential to impact Coca-Cola Amatil are two-fold:
– Physical consequences relating to the physical changesto climatic conditions; and
– Transitional consequences relating to the shift to a resilient,low carbon economy through changes in policy, regulation,technology, market and reputation associated with adaptationto a new climate paradigm and decarbonisation of the globaleconomy.
A more comprehensive climate change risk disclosure is detailed on page 36.
Malicious product tampering risk Malicious product tampering or material threat of malicious product tampering would have an adverse financial impact. This may result from an initial product recall, impacting short-term sales, as well as a potentially longer-term adverse financial outcome, due to a loss of brand image and a loss of customer and consumer confidence in markets where product tampering occurs.
Litigation riskFrom time to time, Coca-Cola Amatil may be party to claims and legal proceedings. Coca-Cola Amatil is committed to ensuring our business practices and dealings with and via third parties are ethical, legal, straightforward and open. We have established policies, procedures, standards and guidelines, which navigate how we conduct business the right way. Coca-Cola Amatil is mindful of the litigious landscape in the countries in which we operate including the emergence of class action activity. We continuously assess these risks, and endeavour to resolve commercial disputes amicably where possible.
Supply chain risk Disruptions in Coca-Cola Amatil’s supply chain due to the failure of a key supplier to meet its contractual obligations have the potential to significantly impact the Group’s operations. This risk is most likely to result from a suppliers’ inability to perform contractual supply obligations (e.g. due to unforeseen circumstances, labour disputes etc). Management work with stakeholders across the business to ensure we have the appropriate supply continuity plans in place for key inputs. Some residual supplier exposure is transferred by way of business interruption insurance.
COCA-COLA AMATIL ANNUAL REPORT 201968 69
THE VA
LUE
WE CREATE
GO
VERNA
NCE
& RISK
SFIN
AN
CIAL &
STATUTO
RY REPO
RTS
OTH
ER IN
FORM
ATION
GO
VERNA
NCE
& RISK
SO
UR
BUSIN
ESSPERFO
RMA
NCE
& O
UTLO
OK
BEING
A SU
STAIN
ABLE
BUSIN
ESS
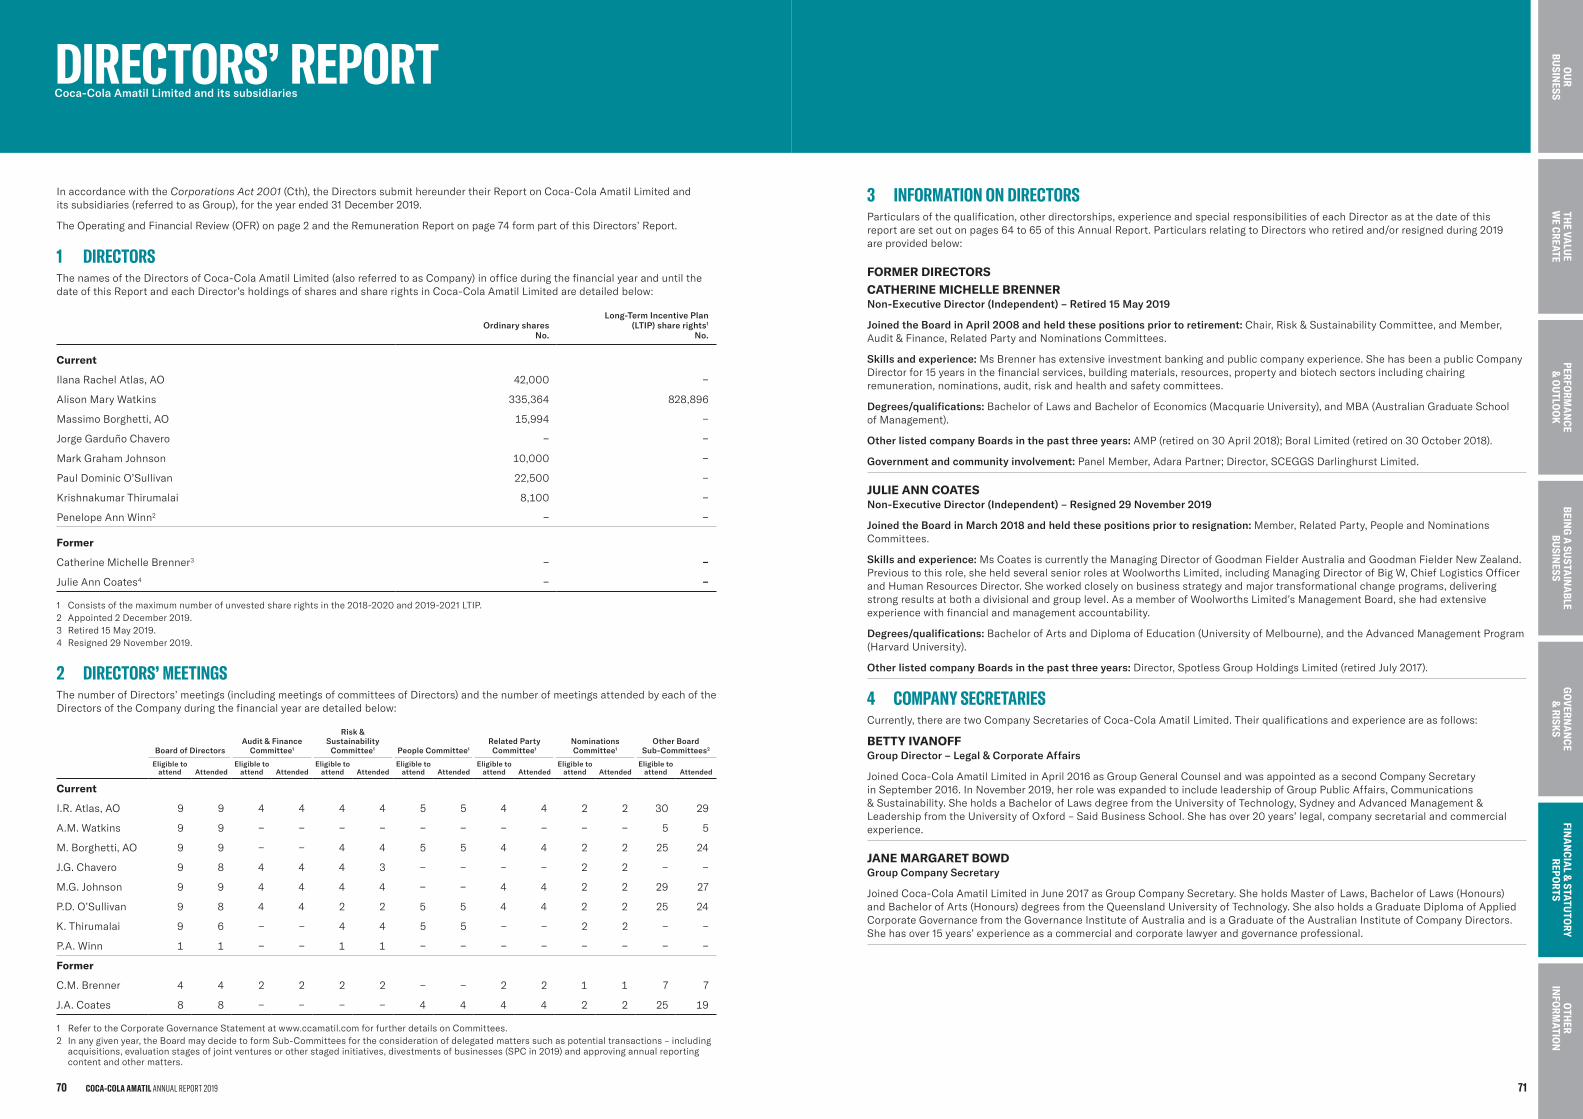
DIRECTORS’ REPORT Coca-Cola Amatil Limited and its subsidiaries
In accordance with the Corporations Act 2001 (Cth), the Directors submit hereunder their Report on Coca-Cola Amatil Limited and its subsidiaries (referred to as Group), for the year ended 31 December 2019.
The Operating and Financial Review (OFR) on page 2 and the Remuneration Report on page 74 form part of this Directors’ Report.
1 DIRECTORSThe names of the Directors of Coca-Cola Amatil Limited (also referred to as Company) in office during the financial year and until the date of this Report and each Director’s holdings of shares and share rights in Coca-Cola Amatil Limited are detailed below:
Ordinary sharesNo.
Long-Term Incentive Plan(LTIP) share rights1
No.
Current
Ilana Rachel Atlas, AO 42,000 −
Alison Mary Watkins 335,364 828,896
Massimo Borghetti, AO 15,994 −
Jorge Garduño Chavero − −
Mark Graham Johnson 10,000 −
Paul Dominic O’Sullivan 22,500 −
Krishnakumar Thirumalai 8,100 −
Penelope Ann Winn2 − −
Former
Catherine Michelle Brenner3 − −
Julie Ann Coates4 − −
1 Consists of the maximum number of unvested share rights in the 2018-2020 and 2019-2021 LTIP.2 Appointed 2 December 2019.3 Retired 15 May 2019.4 Resigned 29 November 2019.
2 DIRECTORS’MEETINGSThe number of Directors’ meetings (including meetings of committees of Directors) and the number of meetings attended by each of the Directors of the Company during the financial year are detailed below:
Board of DirectorsAudit & Finance
Committee1
Risk & Sustainability
Committee1 People Committee1Related Party Committee1
Nominations Committee1
Other Board Sub-Committees2
Eligible to attend Attended
Eligible to attend Attended
Eligible to attend Attended
Eligible to attend Attended
Eligible to attend Attended
Eligible to attend Attended
Eligible to attend Attended
Current
I.R. Atlas, AO 9 9 4 4 4 4 5 5 4 4 2 2 30 29
A.M. Watkins 9 9 − − − − − − − − − − 5 5
M. Borghetti, AO 9 9 − − 4 4 5 5 4 4 2 2 25 24
J.G. Chavero 9 8 4 4 4 3 − − − − 2 2 − −
M.G. Johnson 9 9 4 4 4 4 − − 4 4 2 2 29 27
P.D. O’Sullivan 9 8 4 4 2 2 5 5 4 4 2 2 25 24
K. Thirumalai 9 6 − − 4 4 5 5 − − 2 2 − −
P.A. Winn 1 1 − − 1 1 − − − − − − − −
Former
C.M. Brenner 4 4 2 2 2 2 − − 2 2 1 1 7 7
J.A. Coates 8 8 − − − − 4 4 4 4 2 2 25 19
1 Refer to the Corporate Governance Statement at www.ccamatil.com for further details on Committees.2 In any given year, the Board may decide to form Sub-Committees for the consideration of delegated matters such as potential transactions – including
acquisitions, evaluation stages of joint ventures or other staged initiatives, divestments of businesses (SPC in 2019) and approving annual reporting content and other matters.
3 INFORMATIONONDIRECTORSParticulars of the qualification, other directorships, experience and special responsibilities of each Director as at the date of this report are set out on pages 64 to 65 of this Annual Report. Particulars relating to Directors who retired and/or resigned during 2019 are provided below:
FORMER DIRECTORSCATHERINE MICHELLE BRENNER Non-Executive Director (Independent) – Retired 15 May 2019
Joined the Board in April 2008 and held these positions prior to retirement: Chair, Risk & Sustainability Committee, and Member, Audit & Finance, Related Party and Nominations Committees.
Skills and experience: Ms Brenner has extensive investment banking and public company experience. She has been a public Company Director for 15 years in the financial services, building materials, resources, property and biotech sectors including chairing remuneration, nominations, audit, risk and health and safety committees.
Degrees/qualifications: Bachelor of Laws and Bachelor of Economics (Macquarie University), and MBA (Australian Graduate School of Management).
Other listed company Boards in the past three years: AMP (retired on 30 April 2018); Boral Limited (retired on 30 October 2018).
Government and community involvement: Panel Member, Adara Partner; Director, SCEGGS Darlinghurst Limited.
JULIE ANN COATES Non-Executive Director (Independent) – Resigned 29 November 2019
Joined the Board in March 2018 and held these positions prior to resignation: Member, Related Party, People and Nominations Committees.
Skills and experience: Ms Coates is currently the Managing Director of Goodman Fielder Australia and Goodman Fielder New Zealand. Previous to this role, she held several senior roles at Woolworths Limited, including Managing Director of Big W, Chief Logistics Officer and Human Resources Director. She worked closely on business strategy and major transformational change programs, delivering strong results at both a divisional and group level. As a member of Woolworths Limited’s Management Board, she had extensive experience with financial and management accountability.
Degrees/qualifications: Bachelor of Arts and Diploma of Education (University of Melbourne), and the Advanced Management Program (Harvard University).
Other listed company Boards in the past three years: Director, Spotless Group Holdings Limited (retired July 2017).
4 COMPANYSECRETARIESCurrently, there are two Company Secretaries of Coca-Cola Amatil Limited. Their qualifications and experience are as follows:
BETTY IVANOFF Group Director – Legal & Corporate Affairs
Joined Coca-Cola Amatil Limited in April 2016 as Group General Counsel and was appointed as a second Company Secretary in September 2016. In November 2019, her role was expanded to include leadership of Group Public Affairs, Communications & Sustainability. She holds a Bachelor of Laws degree from the University of Technology, Sydney and Advanced Management & Leadership from the University of Oxford – Said Business School. She has over 20 years’ legal, company secretarial and commercial experience.
JANE MARGARET BOWD Group Company Secretary
Joined Coca-Cola Amatil Limited in June 2017 as Group Company Secretary. She holds Master of Laws, Bachelor of Laws (Honours) and Bachelor of Arts (Honours) degrees from the Queensland University of Technology. She also holds a Graduate Diploma of Applied Corporate Governance from the Governance Institute of Australia and is a Graduate of the Australian Institute of Company Directors. She has over 15 years’ experience as a commercial and corporate lawyer and governance professional.
COCA-COLA AMATIL ANNUAL REPORT 201970 71
BEING
A SU
STAIN
ABLE
BUSIN
ESSTH
E VALU
E W
E CREATEPERFO
RMA
NCE
& O
UTLO
OK
GO
VERNA
NCE
& RISK
SFIN
AN
CIAL &
STATUTO
RY REPO
RTS
OTH
ER IN
FORM
ATION
OU
R BU
SINESS
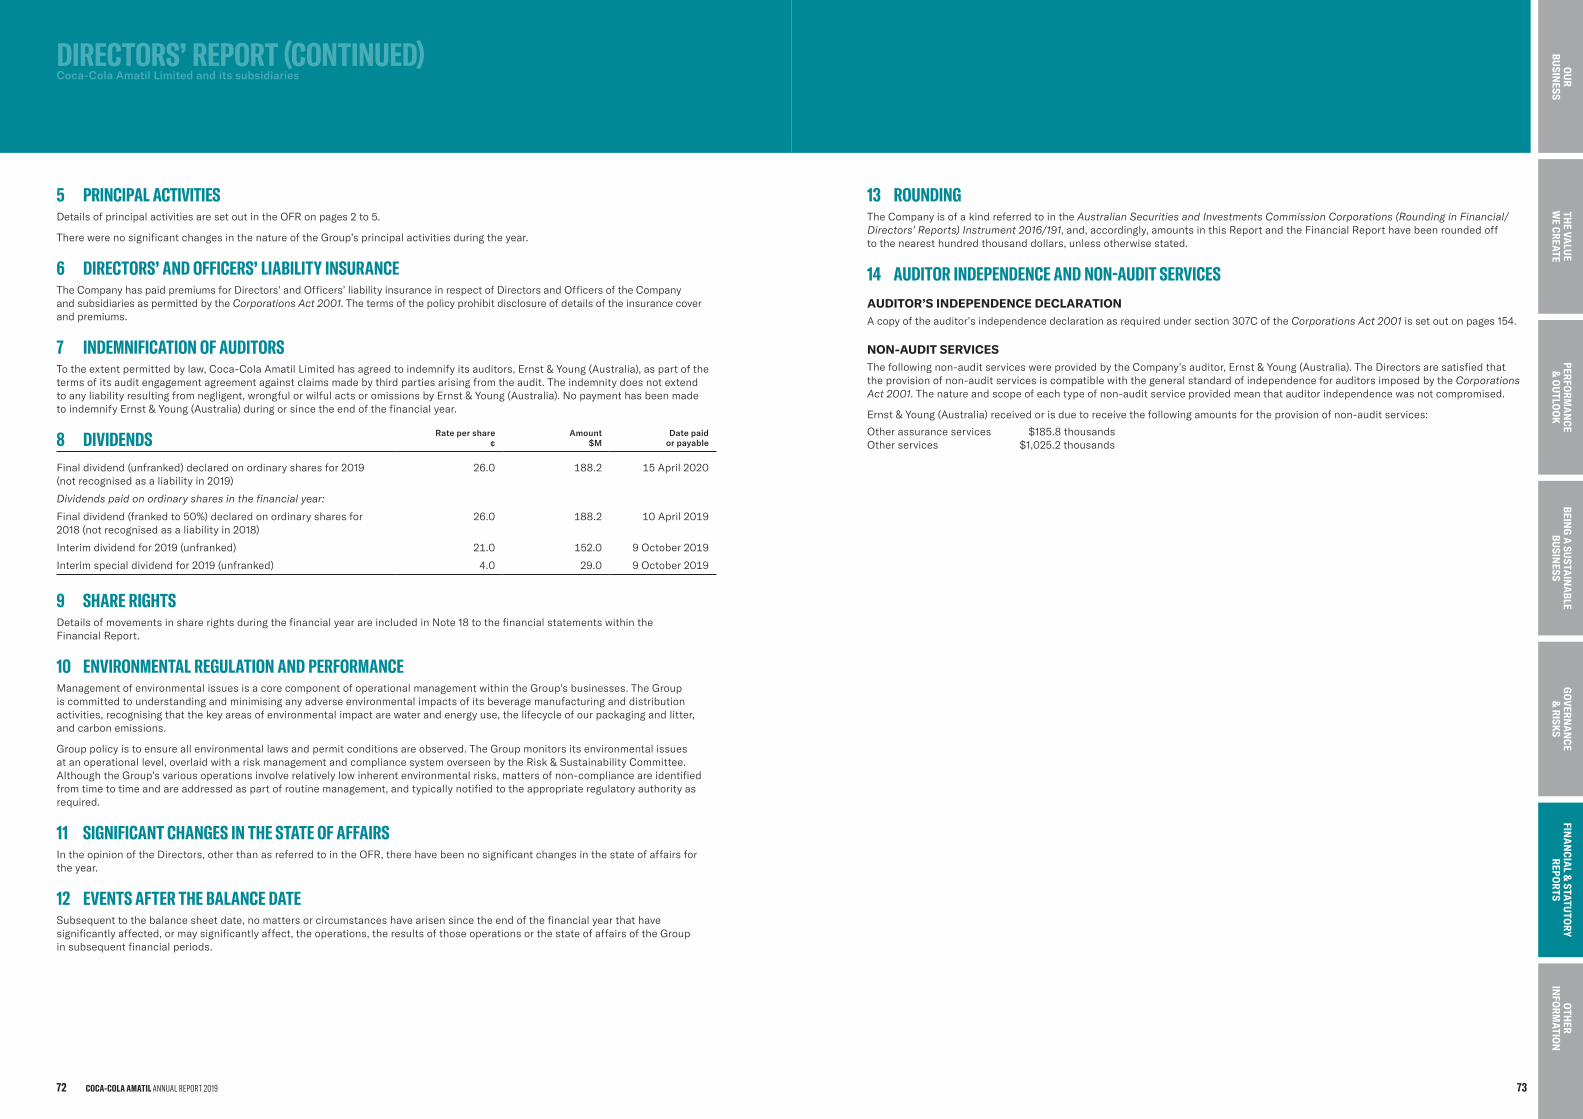
13 ROUNDINGThe Company is of a kind referred to in the Australian Securities and Investments Commission Corporations (Rounding in Financial/Directors’ Reports) Instrument 2016/191, and, accordingly, amounts in this Report and the Financial Report have been rounded off to the nearest hundred thousand dollars, unless otherwise stated.
14 AUDITORINDEPENDENCEANDNON-AUDITSERVICESAUDITOR’S INDEPENDENCE DECLARATIONA copy of the auditor’s independence declaration as required under section 307C of the Corporations Act 2001 is set out on pages 154.
NON-AUDIT SERVICESThe following non-audit services were provided by the Company’s auditor, Ernst & Young (Australia). The Directors are satisfied that the provision of non-audit services is compatible with the general standard of independence for auditors imposed by the Corporations Act 2001. The nature and scope of each type of non-audit service provided mean that auditor independence was not compromised.
Ernst & Young (Australia) received or is due to receive the following amounts for the provision of non-audit services:
Other assurance services $185.8 thousandsOther services $1,025.2 thousands
DIRECTORS’REPORT(CONTINUED) Coca-Cola Amatil Limited and its subsidiaries
5 PRINCIPALACTIVITIESDetails of principal activities are set out in the OFR on pages 2 to 5.
There were no significant changes in the nature of the Group’s principal activities during the year.
6 DIRECTORS’ANDOFFICERS’LIABILITYINSURANCEThe Company has paid premiums for Directors’ and Officers’ liability insurance in respect of Directors and Officers of the Company and subsidiaries as permitted by the Corporations Act 2001. The terms of the policy prohibit disclosure of details of the insurance cover and premiums.
7 INDEMNIFICATIONOFAUDITORSTo the extent permitted by law, Coca-Cola Amatil Limited has agreed to indemnify its auditors, Ernst & Young (Australia), as part of the terms of its audit engagement agreement against claims made by third parties arising from the audit. The indemnity does not extend to any liability resulting from negligent, wrongful or wilful acts or omissions by Ernst & Young (Australia). No payment has been made to indemnify Ernst & Young (Australia) during or since the end of the financial year.
8 DIVIDENDS Rate per share¢
Amount$M
Date paidor payable
Final dividend (unfranked) declared on ordinary shares for 2019 (not recognised as a liability in 2019)
26.0 188.2 15 April 2020
Dividends paid on ordinary shares in the financial year:
Final dividend (franked to 50%) declared on ordinary shares for 2018 (not recognised as a liability in 2018)
26.0 188.2 10 April 2019
Interim dividend for 2019 (unfranked) 21.0 152.0 9 October 2019
Interim special dividend for 2019 (unfranked) 4.0 29.0 9 October 2019
9 SHARERIGHTSDetails of movements in share rights during the financial year are included in Note 18 to the financial statements within the Financial Report.
10 ENVIRONMENTALREGULATIONANDPERFORMANCEManagement of environmental issues is a core component of operational management within the Group’s businesses. The Group is committed to understanding and minimising any adverse environmental impacts of its beverage manufacturing and distribution activities, recognising that the key areas of environmental impact are water and energy use, the lifecycle of our packaging and litter, and carbon emissions.
Group policy is to ensure all environmental laws and permit conditions are observed. The Group monitors its environmental issues at an operational level, overlaid with a risk management and compliance system overseen by the Risk & Sustainability Committee. Although the Group’s various operations involve relatively low inherent environmental risks, matters of non-compliance are identified from time to time and are addressed as part of routine management, and typically notified to the appropriate regulatory authority as required.
11 SIGNIFICANTCHANGESINTHESTATEOFAFFAIRSIn the opinion of the Directors, other than as referred to in the OFR, there have been no significant changes in the state of affairs for the year.
12 EVENTSAFTERTHEBALANCEDATESubsequent to the balance sheet date, no matters or circumstances have arisen since the end of the financial year that have significantly affected, or may significantly affect, the operations, the results of those operations or the state of affairs of the Group in subsequent financial periods.
COCA-COLA AMATIL ANNUAL REPORT 201972 73
BEING
A SU
STAIN
ABLE
BUSIN
ESSTH
E VALU
E W
E CREATEPERFO
RMA
NCE
& O
UTLO
OK
GO
VERNA
NCE
& RISK
SFIN
AN
CIAL &
STATUTO
RY REPO
RTS
OTH
ER IN
FORM
ATION
OU
R BU
SINESS
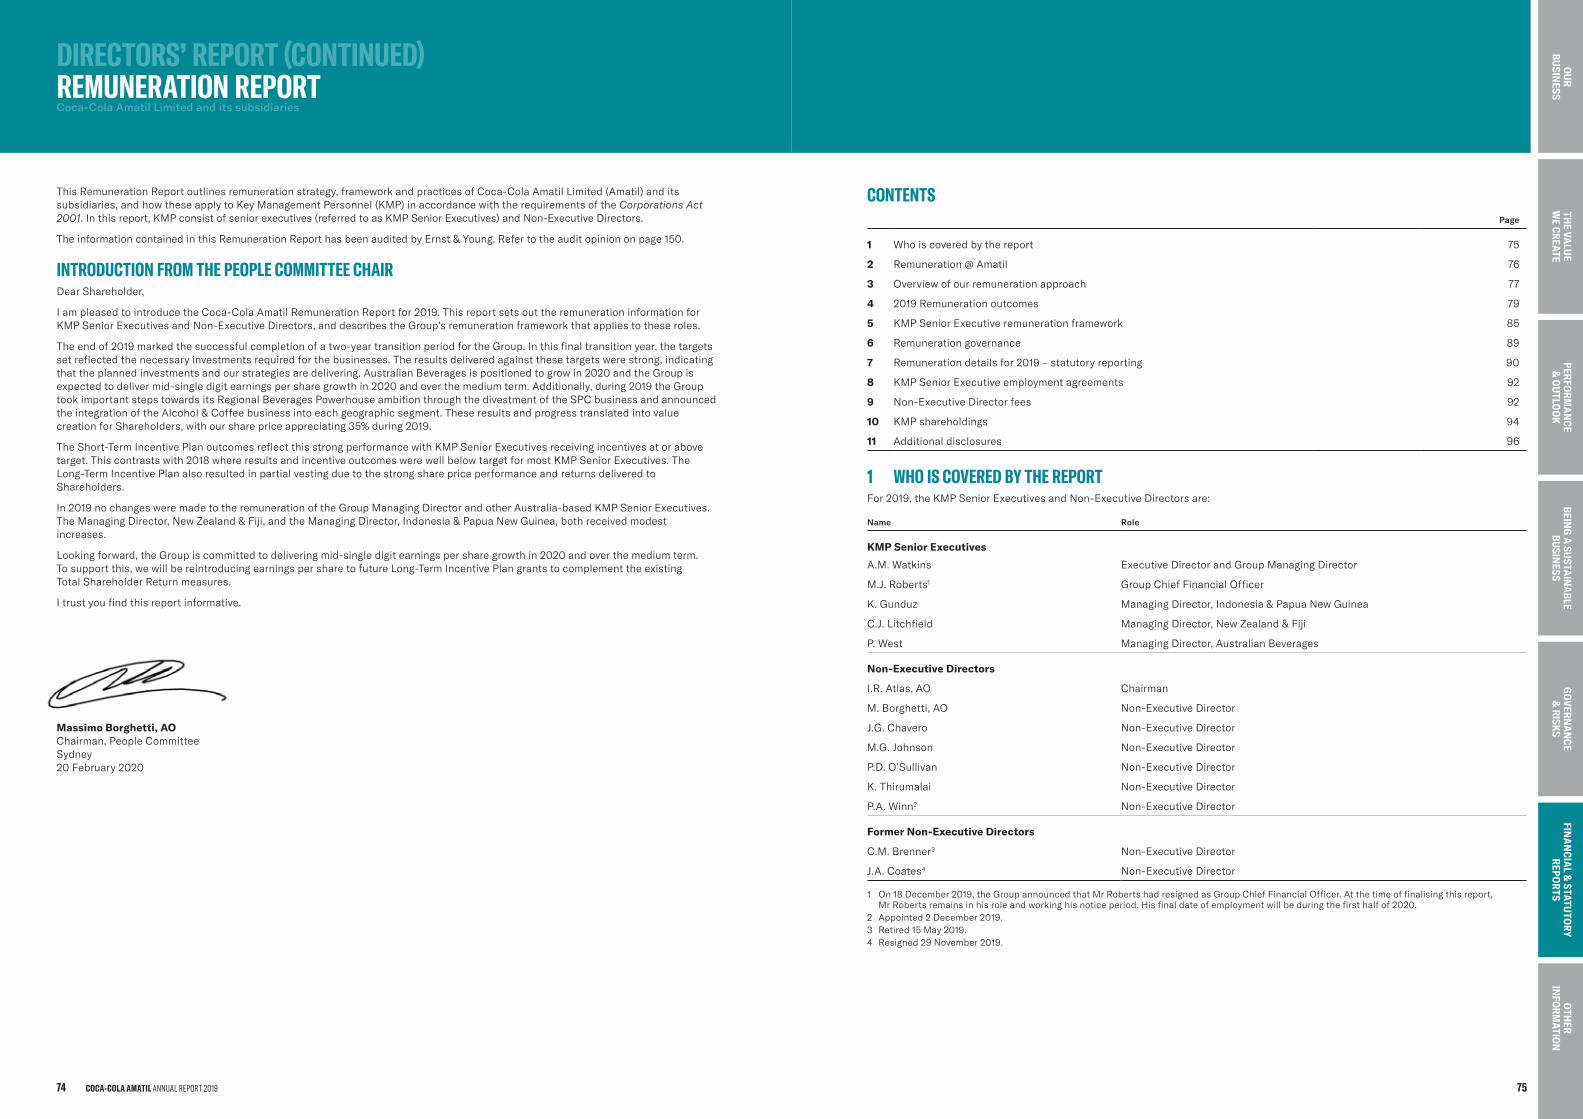
CONTENTSPage
1 Who is covered by the report 75
2 Remuneration @ Amatil 76
3 Overview of our remuneration approach 77
4 2019 Remuneration outcomes 79
5 KMP Senior Executive remuneration framework 85
6 Remuneration governance 89
7 Remuneration details for 2019 – statutory reporting 90
8 KMP Senior Executive employment agreements 92
9 Non-Executive Director fees 92
10 KMP shareholdings 94
11 Additional disclosures 96
1 WHOISCOVEREDBYTHEREPORTFor 2019, the KMP Senior Executives and Non-Executive Directors are:
Name Role
KMP Senior Executives
A.M. Watkins Executive Director and Group Managing Director
M.J. Roberts1 Group Chief Financial Officer
K. Gunduz Managing Director, Indonesia & Papua New Guinea
C.J. Litchfield Managing Director, New Zealand & Fiji
P. West Managing Director, Australian Beverages
Non-Executive Directors
I.R. Atlas, AO Chairman
M. Borghetti, AO Non-Executive Director
J.G. Chavero Non-Executive Director
M.G. Johnson Non-Executive Director
P.D. O’Sullivan Non-Executive Director
K. Thirumalai Non-Executive Director
P.A. Winn2 Non-Executive Director
Former Non-Executive Directors
C.M. Brenner3 Non-Executive Director
J.A. Coates4 Non-Executive Director
1 On 18 December 2019, the Group announced that Mr Roberts had resigned as Group Chief Financial Officer. At the time of finalising this report, Mr Roberts remains in his role and working his notice period. His final date of employment will be during the first half of 2020.
2 Appointed 2 December 2019.3 Retired 15 May 2019.4 Resigned 29 November 2019.
DIRECTORS’REPORT(CONTINUED) REMUNERATIONREPORTCoca-Cola Amatil Limited and its subsidiaries
This Remuneration Report outlines remuneration strategy, framework and practices of Coca-Cola Amatil Limited (Amatil) and its subsidiaries, and how these apply to Key Management Personnel (KMP) in accordance with the requirements of the Corporations Act 2001. In this report, KMP consist of senior executives (referred to as KMP Senior Executives) and Non-Executive Directors.
The information contained in this Remuneration Report has been audited by Ernst & Young. Refer to the audit opinion on page 150.
INTRODUCTIONFROMTHEPEOPLECOMMITTEECHAIRDear Shareholder,
I am pleased to introduce the Coca-Cola Amatil Remuneration Report for 2019. This report sets out the remuneration information for KMP Senior Executives and Non-Executive Directors, and describes the Group’s remuneration framework that applies to these roles.
The end of 2019 marked the successful completion of a two-year transition period for the Group. In this final transition year, the targets set reflected the necessary investments required for the businesses. The results delivered against these targets were strong, indicating that the planned investments and our strategies are delivering. Australian Beverages is positioned to grow in 2020 and the Group is expected to deliver mid-single digit earnings per share growth in 2020 and over the medium term. Additionally, during 2019 the Group took important steps towards its Regional Beverages Powerhouse ambition through the divestment of the SPC business and announced the integration of the Alcohol & Coffee business into each geographic segment. These results and progress translated into value creation for Shareholders, with our share price appreciating 35% during 2019.
The Short-Term Incentive Plan outcomes reflect this strong performance with KMP Senior Executives receiving incentives at or above target. This contrasts with 2018 where results and incentive outcomes were well below target for most KMP Senior Executives. The Long-Term Incentive Plan also resulted in partial vesting due to the strong share price performance and returns delivered to Shareholders.
In 2019 no changes were made to the remuneration of the Group Managing Director and other Australia-based KMP Senior Executives. The Managing Director, New Zealand & Fiji, and the Managing Director, Indonesia & Papua New Guinea, both received modest increases.
Looking forward, the Group is committed to delivering mid-single digit earnings per share growth in 2020 and over the medium term. To support this, we will be reintroducing earnings per share to future Long-Term Incentive Plan grants to complement the existing Total Shareholder Return measures.
I trust you find this report informative.
Massimo Borghetti, AO Chairman, People Committee Sydney 20 February 2020
COCA-COLA AMATIL ANNUAL REPORT 201974 75
BEING
A SU
STAIN
ABLE
BUSIN
ESSTH
E VALU
E W
E CREATEPERFO
RMA
NCE
& O
UTLO
OK
GO
VERNA
NCE
& RISK
SFIN
AN
CIAL &
STATUTO
RY REPO
RTS
OTH
ER IN
FORM
ATION
OU
R BU
SINESS
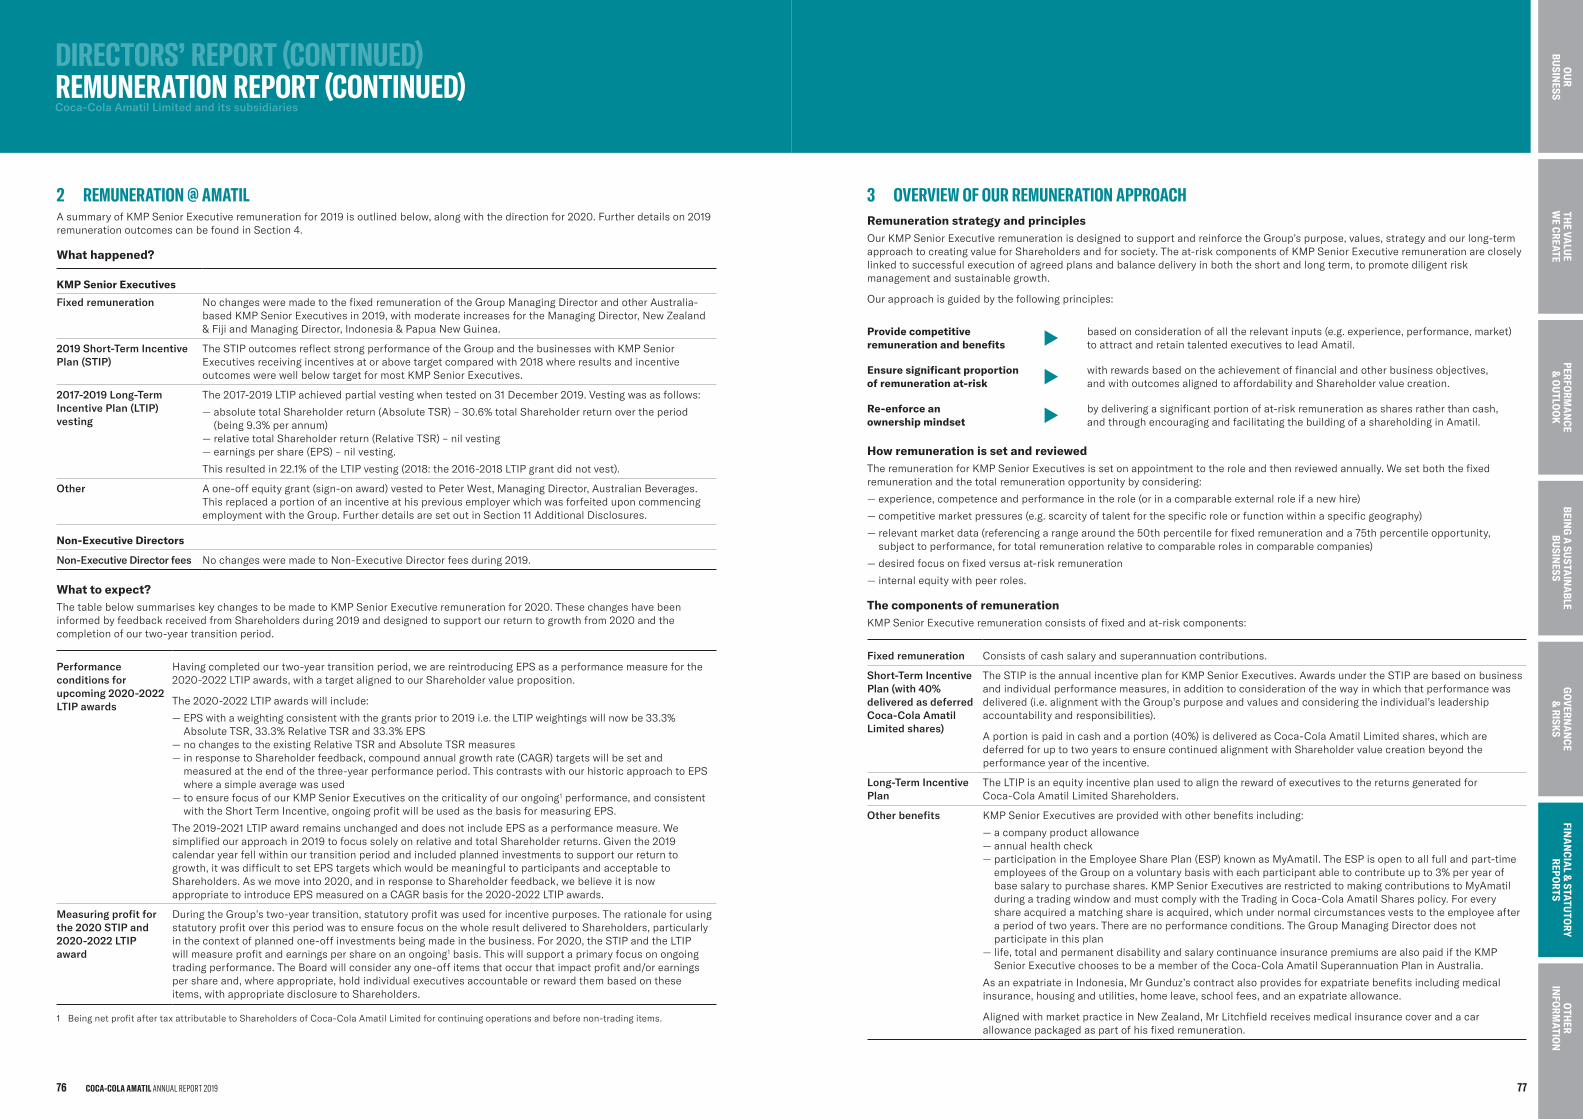
3 OVERVIEWOFOURREMUNERATIONAPPROACHRemuneration strategy and principlesOur KMP Senior Executive remuneration is designed to support and reinforce the Group’s purpose, values, strategy and our long-term approach to creating value for Shareholders and for society. The at-risk components of KMP Senior Executive remuneration are closely linked to successful execution of agreed plans and balance delivery in both the short and long term, to promote diligent risk management and sustainable growth.
Our approach is guided by the following principles:
Provide competitive remuneration and benefits based on consideration of all the relevant inputs (e.g. experience, performance, market)
to attract and retain talented executives to lead Amatil.
Ensure significant proportion of remuneration at-risk with rewards based on the achievement of financial and other business objectives,
and with outcomes aligned to affordability and Shareholder value creation.
Re-enforce an ownership mindset by delivering a significant portion of at-risk remuneration as shares rather than cash,
and through encouraging and facilitating the building of a shareholding in Amatil.
How remuneration is set and reviewedThe remuneration for KMP Senior Executives is set on appointment to the role and then reviewed annually. We set both the fixed remuneration and the total remuneration opportunity by considering:
— experience, competence and performance in the role (or in a comparable external role if a new hire)
— competitive market pressures (e.g. scarcity of talent for the specific role or function within a specific geography)
— relevant market data (referencing a range around the 50th percentile for fixed remuneration and a 75th percentile opportunity, subject to performance, for total remuneration relative to comparable roles in comparable companies)
— desired focus on fixed versus at-risk remuneration
— internal equity with peer roles.
The components of remuneration KMP Senior Executive remuneration consists of fixed and at-risk components:
Fixed remuneration Consists of cash salary and superannuation contributions.
Short-Term Incentive Plan (with 40% delivered as deferred Coca-Cola Amatil Limited shares)
The STIP is the annual incentive plan for KMP Senior Executives. Awards under the STIP are based on business and individual performance measures, in addition to consideration of the way in which that performance was delivered (i.e. alignment with the Group’s purpose and values and considering the individual’s leadership accountability and responsibilities).
A portion is paid in cash and a portion (40%) is delivered as Coca-Cola Amatil Limited shares, which are deferred for up to two years to ensure continued alignment with Shareholder value creation beyond the performance year of the incentive.
Long-Term Incentive Plan
The LTIP is an equity incentive plan used to align the reward of executives to the returns generated for Coca-Cola Amatil Limited Shareholders.
Other benefits KMP Senior Executives are provided with other benefits including:
— a company product allowance — annual health check — participation in the Employee Share Plan (ESP) known as MyAmatil. The ESP is open to all full and part-time employees of the Group on a voluntary basis with each participant able to contribute up to 3% per year of base salary to purchase shares. KMP Senior Executives are restricted to making contributions to MyAmatil during a trading window and must comply with the Trading in Coca-Cola Amatil Shares policy. For every share acquired a matching share is acquired, which under normal circumstances vests to the employee after a period of two years. There are no performance conditions. The Group Managing Director does not participate in this plan — life, total and permanent disability and salary continuance insurance premiums are also paid if the KMP Senior Executive chooses to be a member of the Coca-Cola Amatil Superannuation Plan in Australia.
As an expatriate in Indonesia, Mr Gunduz’s contract also provides for expatriate benefits including medical insurance, housing and utilities, home leave, school fees, and an expatriate allowance.
Aligned with market practice in New Zealand, Mr Litchfield receives medical insurance cover and a car allowance packaged as part of his fixed remuneration.
DIRECTORS’REPORT(CONTINUED) REMUNERATIONREPORT(CONTINUED)Coca-Cola Amatil Limited and its subsidiaries
2 REMUNERATION@AMATILA summary of KMP Senior Executive remuneration for 2019 is outlined below, along with the direction for 2020. Further details on 2019 remuneration outcomes can be found in Section 4.
What happened?
KMP Senior Executives
Fixed remuneration No changes were made to the fixed remuneration of the Group Managing Director and other Australia-based KMP Senior Executives in 2019, with moderate increases for the Managing Director, New Zealand & Fiji and Managing Director, Indonesia & Papua New Guinea.
2019 Short-Term Incentive Plan (STIP)
The STIP outcomes reflect strong performance of the Group and the businesses with KMP Senior Executives receiving incentives at or above target compared with 2018 where results and incentive outcomes were well below target for most KMP Senior Executives.
2017-2019 Long-Term Incentive Plan (LTIP) vesting
The 2017-2019 LTIP achieved partial vesting when tested on 31 December 2019. Vesting was as follows:
— absolute total Shareholder return (Absolute TSR) – 30.6% total Shareholder return over the period (being 9.3% per annum) — relative total Shareholder return (Relative TSR) – nil vesting — earnings per share (EPS) – nil vesting.
This resulted in 22.1% of the LTIP vesting (2018: the 2016-2018 LTIP grant did not vest).
Other A one-off equity grant (sign-on award) vested to Peter West, Managing Director, Australian Beverages. This replaced a portion of an incentive at his previous employer which was forfeited upon commencing employment with the Group. Further details are set out in Section 11 Additional Disclosures.
Non-Executive Directors
Non-Executive Director fees No changes were made to Non-Executive Director fees during 2019.
What to expect?The table below summarises key changes to be made to KMP Senior Executive remuneration for 2020. These changes have been informed by feedback received from Shareholders during 2019 and designed to support our return to growth from 2020 and the completion of our two-year transition period.
Performance conditions for upcoming 2020-2022 LTIP awards
Having completed our two-year transition period, we are reintroducing EPS as a performance measure for the 2020-2022 LTIP awards, with a target aligned to our Shareholder value proposition.
The 2020-2022 LTIP awards will include:
— EPS with a weighting consistent with the grants prior to 2019 i.e. the LTIP weightings will now be 33.3% Absolute TSR, 33.3% Relative TSR and 33.3% EPS — no changes to the existing Relative TSR and Absolute TSR measures — in response to Shareholder feedback, compound annual growth rate (CAGR) targets will be set and measured at the end of the three-year performance period. This contrasts with our historic approach to EPS where a simple average was used — to ensure focus of our KMP Senior Executives on the criticality of our ongoing1 performance, and consistent with the Short Term Incentive, ongoing profit will be used as the basis for measuring EPS.
The 2019-2021 LTIP award remains unchanged and does not include EPS as a performance measure. We simplified our approach in 2019 to focus solely on relative and total Shareholder returns. Given the 2019 calendar year fell within our transition period and included planned investments to support our return to growth, it was difficult to set EPS targets which would be meaningful to participants and acceptable to Shareholders. As we move into 2020, and in response to Shareholder feedback, we believe it is now appropriate to introduce EPS measured on a CAGR basis for the 2020-2022 LTIP awards.
Measuring profit for the 2020 STIP and 2020-2022 LTIP award
During the Group’s two-year transition, statutory profit was used for incentive purposes. The rationale for using statutory profit over this period was to ensure focus on the whole result delivered to Shareholders, particularly in the context of planned one-off investments being made in the business. For 2020, the STIP and the LTIP will measure profit and earnings per share on an ongoing1 basis. This will support a primary focus on ongoing trading performance. The Board will consider any one-off items that occur that impact profit and/or earnings per share and, where appropriate, hold individual executives accountable or reward them based on these items, with appropriate disclosure to Shareholders.
1 Being net profit after tax attributable to Shareholders of Coca-Cola Amatil Limited for continuing operations and before non-trading items.
COCA-COLA AMATIL ANNUAL REPORT 201976 77
BEING
A SU
STAIN
ABLE
BUSIN
ESSTH
E VALU
E W
E CREATEPERFO
RMA
NCE
& O
UTLO
OK
GO
VERNA
NCE
& RISK
SFIN
AN
CIAL &
STATUTO
RY REPO
RTS
OTH
ER IN
FORM
ATION
OU
R BU
SINESS
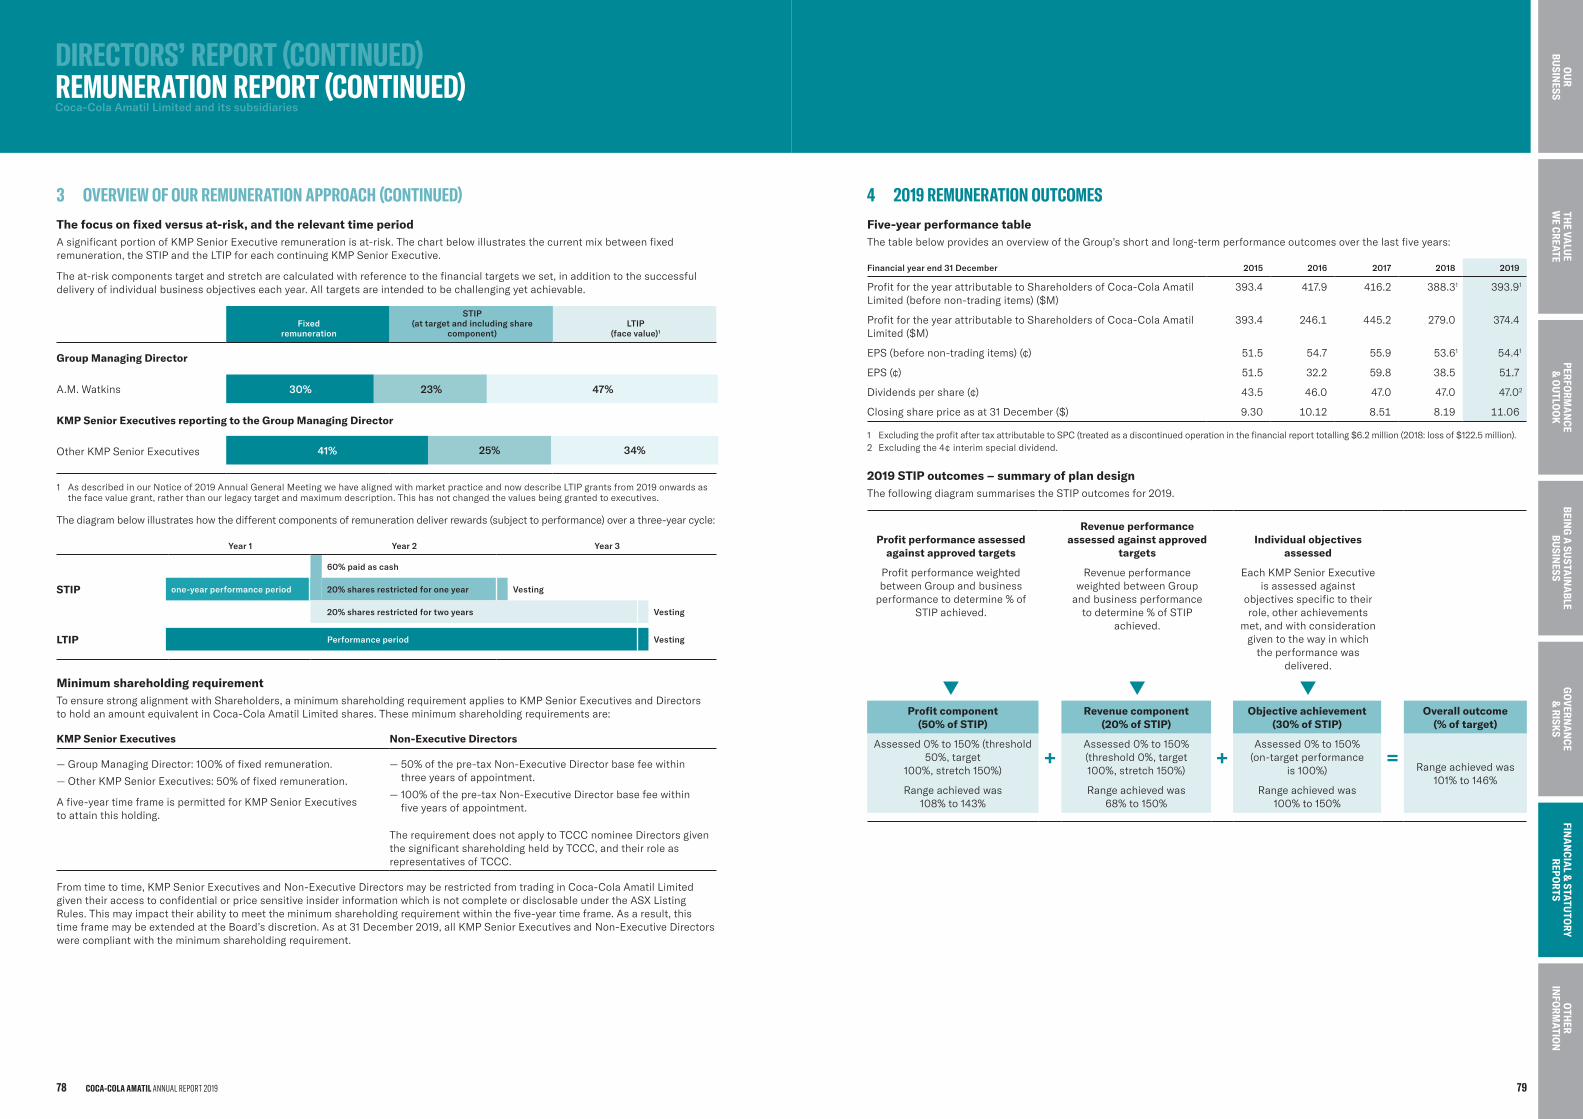
4 2019REMUNERATIONOUTCOMESFive-year performance table The table below provides an overview of the Group’s short and long-term performance outcomes over the last five years:
Financial year end 31 December 2015 2016 2017 2018 2019
Profit for the year attributable to Shareholders of Coca-Cola Amatil Limited (before non-trading items) ($M)
393.4 417.9 416.2 388.31 393.91
Profit for the year attributable to Shareholders of Coca-Cola Amatil Limited ($M)
393.4 246.1 445.2 279.0 374.4
EPS (before non-trading items) (¢) 51.5 54.7 55.9 53.61 54.41
EPS (¢) 51.5 32.2 59.8 38.5 51.7
Dividends per share (¢) 43.5 46.0 47.0 47.0 47.02
Closing share price as at 31 December ($) 9.30 10.12 8.51 8.19 11.06
1 Excluding the profit after tax attributable to SPC (treated as a discontinued operation in the financial report totalling $6.2 million (2018: loss of $122.5 million).2 Excluding the 4¢ interim special dividend.
2019 STIP outcomes – summary of plan designThe following diagram summarises the STIP outcomes for 2019.
Profit performance assessed against approved targets
Revenue performance assessed against approved
targets Individual objectives
assessed
Profit performance weighted between Group and business
performance to determine % of STIP achieved.
Revenue performance weighted between Group
and business performance to determine % of STIP
achieved.
Each KMP Senior Executive is assessed against
objectives specific to their role, other achievements
met, and with consideration given to the way in which
the performance was delivered.
Profit component
(50% of STIP)
+
Revenue component (20% of STIP)
+
Objective achievement (30% of STIP)
=
Overall outcome (% of target)
Assessed 0% to 150% (threshold 50%, target
100%, stretch 150%)
Assessed 0% to 150% (threshold 0%, target 100%, stretch 150%)
Assessed 0% to 150% (on-target performance
is 100%) Range achieved was 101% to 146%
Range achieved was 108% to 143%
Range achieved was 68% to 150%
Range achieved was 100% to 150%
DIRECTORS’REPORT(CONTINUED) REMUNERATIONREPORT(CONTINUED)Coca-Cola Amatil Limited and its subsidiaries
3 OVERVIEWOFOURREMUNERATIONAPPROACH(CONTINUED)The focus on fixed versus at-risk, and the relevant time periodA significant portion of KMP Senior Executive remuneration is at-risk. The chart below illustrates the current mix between fixed remuneration, the STIP and the LTIP for each continuing KMP Senior Executive.
The at-risk components target and stretch are calculated with reference to the financial targets we set, in addition to the successful delivery of individual business objectives each year. All targets are intended to be challenging yet achievable.
Fixed remuneration
STIP(at target and including share
component)LTIP
(face value)1
Group Managing Director
A.M. Watkins 30% 23% 47%
KMP Senior Executives reporting to the Group Managing Director
Other KMP Senior Executives 41% 25% 34%
1 As described in our Notice of 2019 Annual General Meeting we have aligned with market practice and now describe LTIP grants from 2019 onwards as the face value grant, rather than our legacy target and maximum description. This has not changed the values being granted to executives.
The diagram below illustrates how the different components of remuneration deliver rewards (subject to performance) over a three-year cycle:
Year 1 Year 2 Year 3
60% paid as cash
STIP one-year performance period 20% shares restricted for one year Vesting
20% shares restricted for two years Vesting
LTIP Performance period Vesting
Minimum shareholding requirementTo ensure strong alignment with Shareholders, a minimum shareholding requirement applies to KMP Senior Executives and Directors to hold an amount equivalent in Coca-Cola Amatil Limited shares. These minimum shareholding requirements are:
KMP Senior Executives Non-Executive Directors
— Group Managing Director: 100% of fixed remuneration.
— Other KMP Senior Executives: 50% of fixed remuneration.
A five-year time frame is permitted for KMP Senior Executives to attain this holding.
— 50% of the pre-tax Non-Executive Director base fee within three years of appointment.
— 100% of the pre-tax Non-Executive Director base fee within five years of appointment.
The requirement does not apply to TCCC nominee Directors given the significant shareholding held by TCCC, and their role as representatives of TCCC.
From time to time, KMP Senior Executives and Non-Executive Directors may be restricted from trading in Coca-Cola Amatil Limited given their access to confidential or price sensitive insider information which is not complete or disclosable under the ASX Listing Rules. This may impact their ability to meet the minimum shareholding requirement within the five-year time frame. As a result, this time frame may be extended at the Board’s discretion. As at 31 December 2019, all KMP Senior Executives and Non-Executive Directors were compliant with the minimum shareholding requirement.
COCA-COLA AMATIL ANNUAL REPORT 201978 79
BEING
A SU
STAIN
ABLE
BUSIN
ESSTH
E VALU
E W
E CREATEPERFO
RMA
NCE
& O
UTLO
OK
GO
VERNA
NCE
& RISK
SFIN
AN
CIAL &
STATUTO
RY REPO
RTS
OTH
ER IN
FORM
ATION
OU
R BU
SINESS
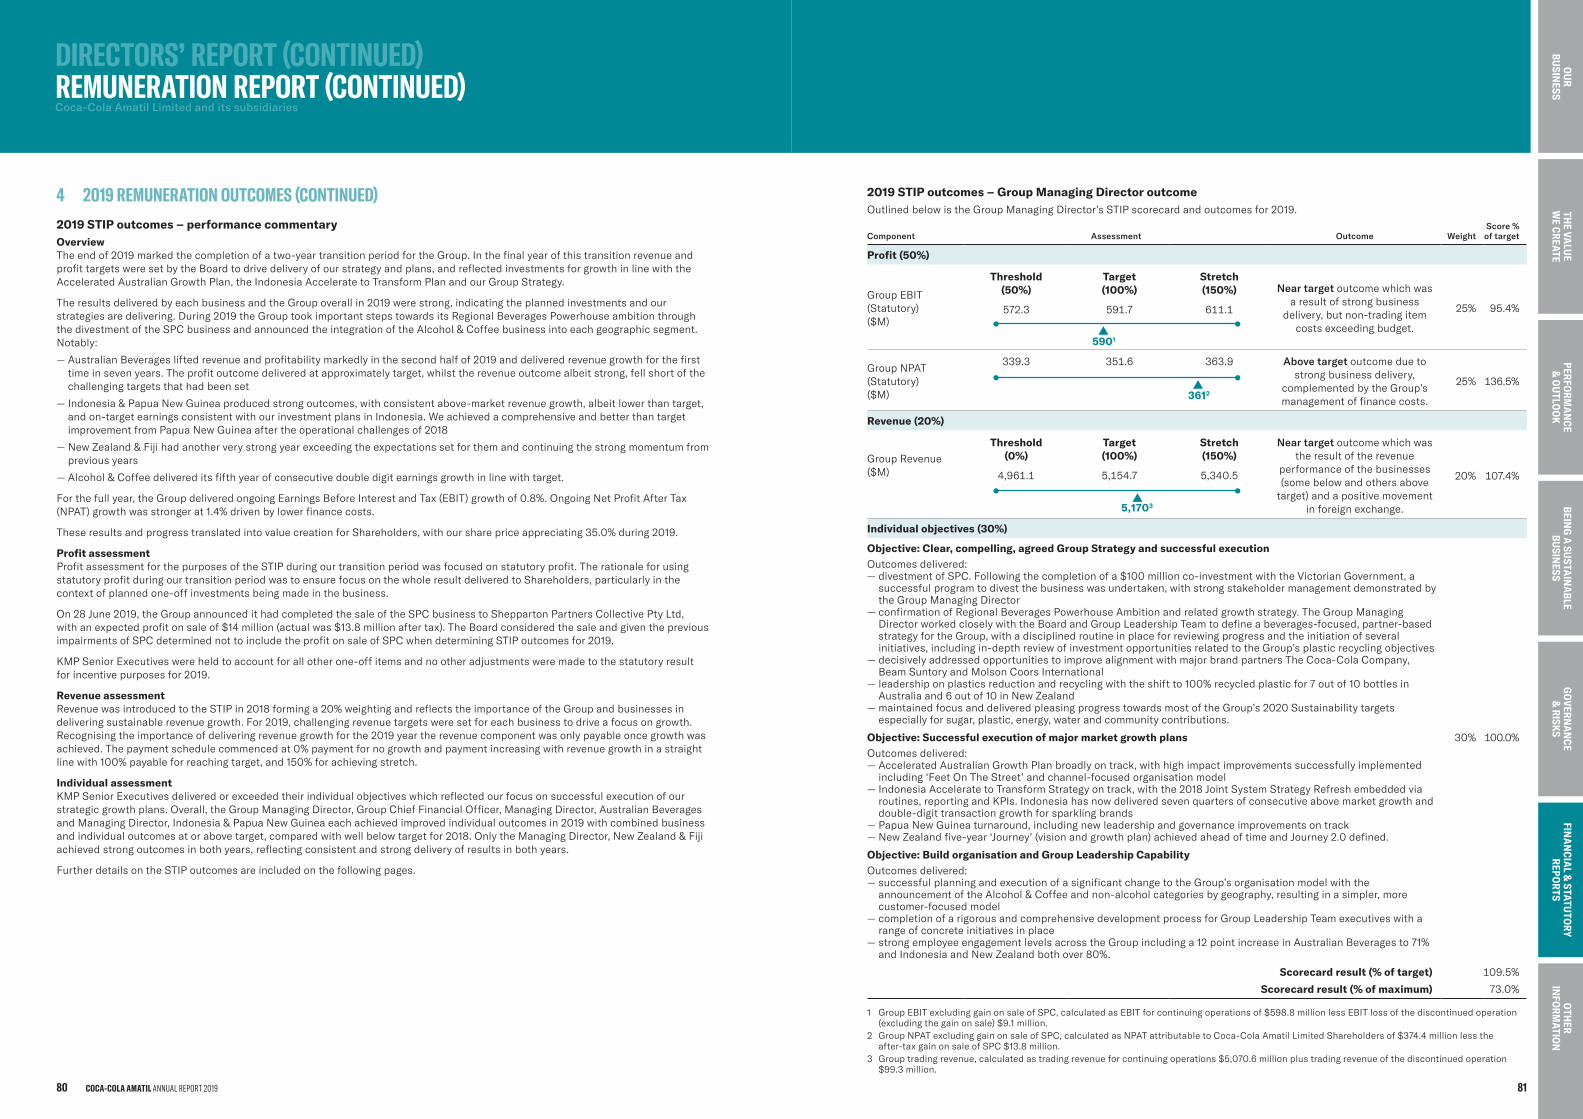
2019 STIP outcomes – Group Managing Director outcomeOutlined below is the Group Managing Director’s STIP scorecard and outcomes for 2019.
Component Assessment Outcome WeightScore %
of target
Profit (50%)
Group EBIT (Statutory) ($M)
Threshold (50%)
Target (100%)
Stretch (150%) Near target outcome which was
a result of strong business delivery, but non-trading item
costs exceeding budget.
25% 95.4%572.3 591.7 611.1
Group NPAT (Statutory) ($M)
339.3 351.6 363.9 Above target outcome due to strong business delivery,
complemented by the Group’s management of finance costs.
25% 136.5%
Revenue (20%)
Group Revenue ($M)
Threshold (0%)
Target (100%)
Stretch (150%)
Near target outcome which was the result of the revenue
performance of the businesses (some below and others above
target) and a positive movement in foreign exchange.
20% 107.4%4,961.1 5,154.7 5,340.5
Individual objectives (30%)
Objective: Clear, compelling, agreed Group Strategy and successful executionOutcomes delivered:
— divestment of SPC. Following the completion of a $100 million co-investment with the Victorian Government, a successful program to divest the business was undertaken, with strong stakeholder management demonstrated by the Group Managing Director — confirmation of Regional Beverages Powerhouse Ambition and related growth strategy. The Group Managing Director worked closely with the Board and Group Leadership Team to define a beverages-focused, partner-based strategy for the Group, with a disciplined routine in place for reviewing progress and the initiation of several initiatives, including in-depth review of investment opportunities related to the Group’s plastic recycling objectives — decisively addressed opportunities to improve alignment with major brand partners The Coca-Cola Company, Beam Suntory and Molson Coors International — leadership on plastics reduction and recycling with the shift to 100% recycled plastic for 7 out of 10 bottles in Australia and 6 out of 10 in New Zealand — maintained focus and delivered pleasing progress towards most of the Group’s 2020 Sustainability targets especially for sugar, plastic, energy, water and community contributions.
Objective: Successful execution of major market growth plansOutcomes delivered:
— Accelerated Australian Growth Plan broadly on track, with high impact improvements successfully implemented including ‘Feet On The Street’ and channel-focused organisation model — Indonesia Accelerate to Transform Strategy on track, with the 2018 Joint System Strategy Refresh embedded via routines, reporting and KPIs. Indonesia has now delivered seven quarters of consecutive above market growth and double-digit transaction growth for sparkling brands — Papua New Guinea turnaround, including new leadership and governance improvements on track — New Zealand five-year ‘Journey’ (vision and growth plan) achieved ahead of time and Journey 2.0 defined.
30% 100.0%
Objective: Build organisation and Group Leadership CapabilityOutcomes delivered:
— successful planning and execution of a significant change to the Group’s organisation model with the announcement of the Alcohol & Coffee and non-alcohol categories by geography, resulting in a simpler, more customer-focused model — completion of a rigorous and comprehensive development process for Group Leadership Team executives with a range of concrete initiatives in place — strong employee engagement levels across the Group including a 12 point increase in Australian Beverages to 71% and Indonesia and New Zealand both over 80%.
Scorecard result (% of target)
Scorecard result (% of maximum)
109.5%
73.0%
1 Group EBIT excluding gain on sale of SPC, calculated as EBIT for continuing operations of $598.8 million less EBIT loss of the discontinued operation (excluding the gain on sale) $9.1 million.
2 Group NPAT excluding gain on sale of SPC, calculated as NPAT attributable to Coca-Cola Amatil Limited Shareholders of $374.4 million less the after-tax gain on sale of SPC $13.8 million.
3 Group trading revenue, calculated as trading revenue for continuing operations $5,070.6 million plus trading revenue of the discontinued operation $99.3 million.
5901
3612
5,1703
DIRECTORS’REPORT(CONTINUED) REMUNERATIONREPORT(CONTINUED)Coca-Cola Amatil Limited and its subsidiaries
4 2019REMUNERATIONOUTCOMES(CONTINUED)2019 STIP outcomes – performance commentaryOverviewThe end of 2019 marked the completion of a two-year transition period for the Group. In the final year of this transition revenue and profit targets were set by the Board to drive delivery of our strategy and plans, and reflected investments for growth in line with the Accelerated Australian Growth Plan, the Indonesia Accelerate to Transform Plan and our Group Strategy.
The results delivered by each business and the Group overall in 2019 were strong, indicating the planned investments and our strategies are delivering. During 2019 the Group took important steps towards its Regional Beverages Powerhouse ambition through the divestment of the SPC business and announced the integration of the Alcohol & Coffee business into each geographic segment. Notably:
— Australian Beverages lifted revenue and profitability markedly in the second half of 2019 and delivered revenue growth for the first time in seven years. The profit outcome delivered at approximately target, whilst the revenue outcome albeit strong, fell short of the challenging targets that had been set
— Indonesia & Papua New Guinea produced strong outcomes, with consistent above-market revenue growth, albeit lower than target, and on-target earnings consistent with our investment plans in Indonesia. We achieved a comprehensive and better than target improvement from Papua New Guinea after the operational challenges of 2018
— New Zealand & Fiji had another very strong year exceeding the expectations set for them and continuing the strong momentum from previous years
— Alcohol & Coffee delivered its fifth year of consecutive double digit earnings growth in line with target.
For the full year, the Group delivered ongoing Earnings Before Interest and Tax (EBIT) growth of 0.8%. Ongoing Net Profit After Tax (NPAT) growth was stronger at 1.4% driven by lower finance costs.
These results and progress translated into value creation for Shareholders, with our share price appreciating 35.0% during 2019.
Profit assessmentProfit assessment for the purposes of the STIP during our transition period was focused on statutory profit. The rationale for using statutory profit during our transition period was to ensure focus on the whole result delivered to Shareholders, particularly in the context of planned one-off investments being made in the business.
On 28 June 2019, the Group announced it had completed the sale of the SPC business to Shepparton Partners Collective Pty Ltd, with an expected profit on sale of $14 million (actual was $13.8 million after tax). The Board considered the sale and given the previous impairments of SPC determined not to include the profit on sale of SPC when determining STIP outcomes for 2019.
KMP Senior Executives were held to account for all other one-off items and no other adjustments were made to the statutory result for incentive purposes for 2019.
Revenue assessmentRevenue was introduced to the STIP in 2018 forming a 20% weighting and reflects the importance of the Group and businesses in delivering sustainable revenue growth. For 2019, challenging revenue targets were set for each business to drive a focus on growth. Recognising the importance of delivering revenue growth for the 2019 year the revenue component was only payable once growth was achieved. The payment schedule commenced at 0% payment for no growth and payment increasing with revenue growth in a straight line with 100% payable for reaching target, and 150% for achieving stretch.
Individual assessmentKMP Senior Executives delivered or exceeded their individual objectives which reflected our focus on successful execution of our strategic growth plans. Overall, the Group Managing Director, Group Chief Financial Officer, Managing Director, Australian Beverages and Managing Director, Indonesia & Papua New Guinea each achieved improved individual outcomes in 2019 with combined business and individual outcomes at or above target, compared with well below target for 2018. Only the Managing Director, New Zealand & Fiji achieved strong outcomes in both years, reflecting consistent and strong delivery of results in both years.
Further details on the STIP outcomes are included on the following pages.
COCA-COLA AMATIL ANNUAL REPORT 201980 81
BEING
A SU
STAIN
ABLE
BUSIN
ESSTH
E VALU
E W
E CREATEPERFO
RMA
NCE
& O
UTLO
OK
GO
VERNA
NCE
& RISK
SFIN
AN
CIAL &
STATUTO
RY REPO
RTS
OTH
ER IN
FORM
ATION
OU
R BU
SINESS
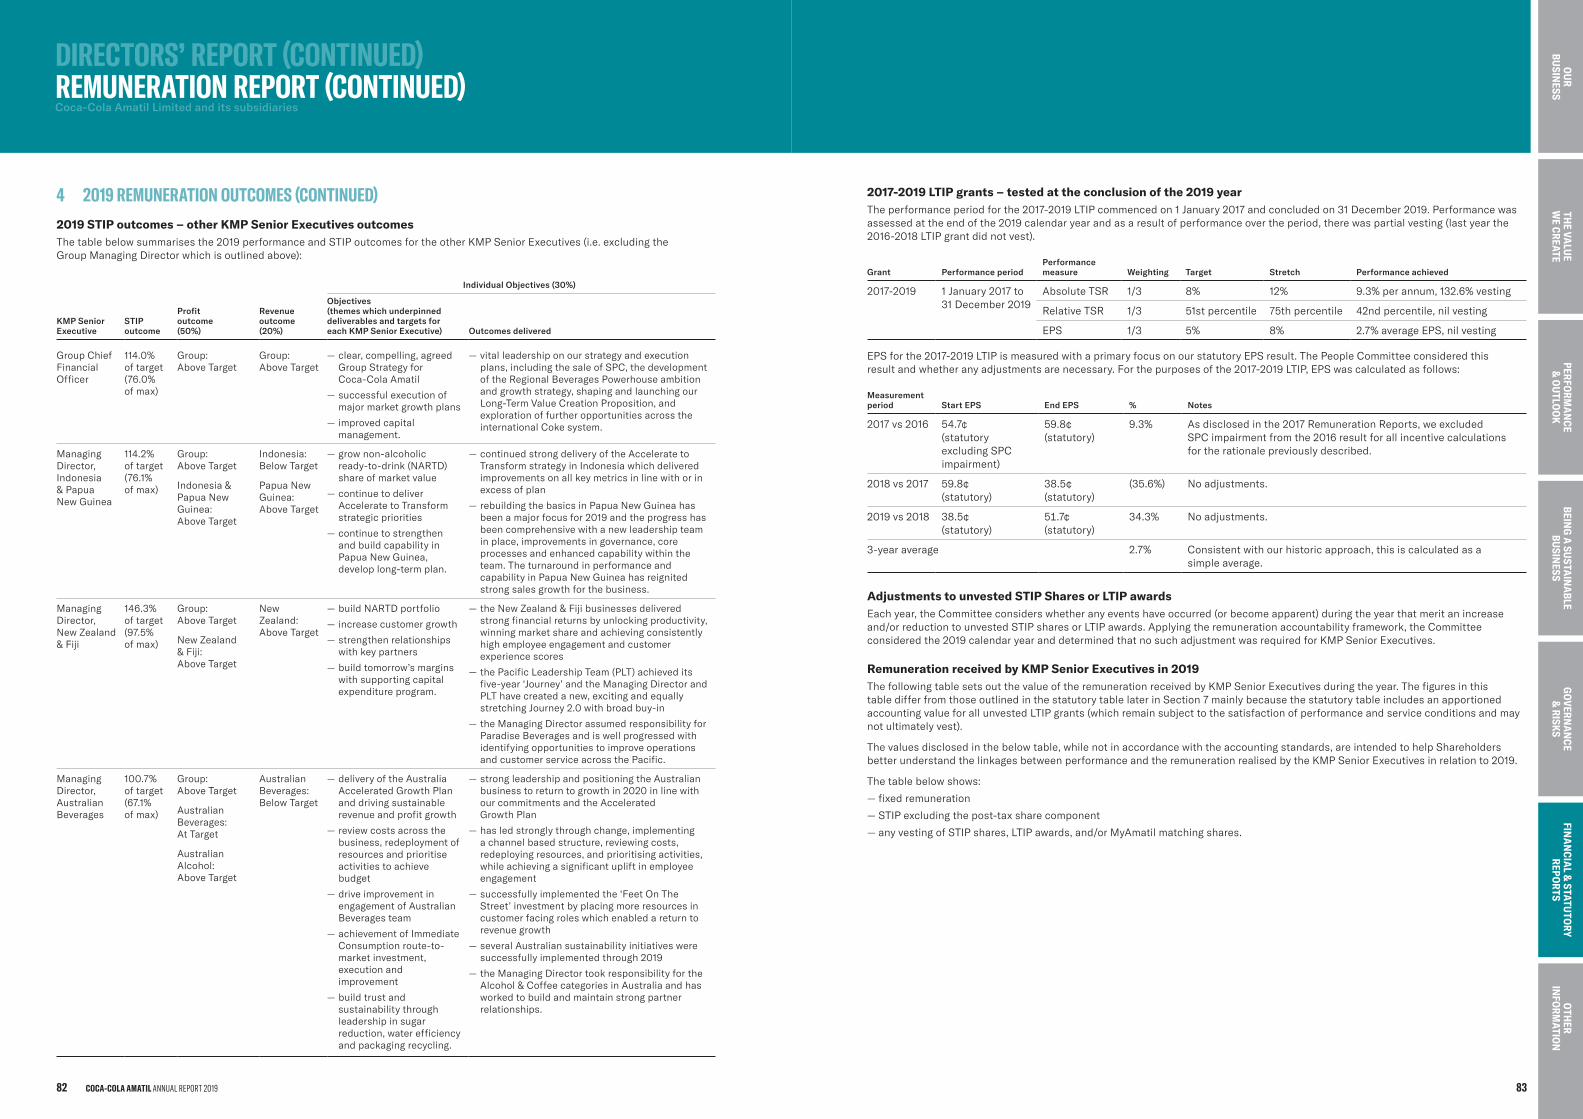
2017-2019 LTIP grants – tested at the conclusion of the 2019 year The performance period for the 2017-2019 LTIP commenced on 1 January 2017 and concluded on 31 December 2019. Performance was assessed at the end of the 2019 calendar year and as a result of performance over the period, there was partial vesting (last year the 2016-2018 LTIP grant did not vest).
Grant Performance periodPerformance measure Weighting Target Stretch Performance achieved
2017-2019 1 January 2017 to 31 December 2019
Absolute TSR 1/3 8% 12% 9.3% per annum, 132.6% vesting
Relative TSR 1/3 51st percentile 75th percentile 42nd percentile, nil vesting
EPS 1/3 5% 8% 2.7% average EPS, nil vesting
EPS for the 2017-2019 LTIP is measured with a primary focus on our statutory EPS result. The People Committee considered this result and whether any adjustments are necessary. For the purposes of the 2017-2019 LTIP, EPS was calculated as follows:
Measurement period Start EPS End EPS % Notes
2017 vs 2016 54.7¢ (statutory excluding SPC impairment)
59.8¢ (statutory)
9.3% As disclosed in the 2017 Remuneration Reports, we excluded SPC impairment from the 2016 result for all incentive calculations for the rationale previously described.
2018 vs 2017 59.8¢ (statutory)
38.5¢ (statutory)
(35.6%) No adjustments.
2019 vs 2018 38.5¢ (statutory)
51.7¢ (statutory)
34.3% No adjustments.
3-year average 2.7% Consistent with our historic approach, this is calculated as a simple average.
Adjustments to unvested STIP Shares or LTIP awardsEach year, the Committee considers whether any events have occurred (or become apparent) during the year that merit an increase and/or reduction to unvested STIP shares or LTIP awards. Applying the remuneration accountability framework, the Committee considered the 2019 calendar year and determined that no such adjustment was required for KMP Senior Executives.
Remuneration received by KMP Senior Executives in 2019The following table sets out the value of the remuneration received by KMP Senior Executives during the year. The figures in this table differ from those outlined in the statutory table later in Section 7 mainly because the statutory table includes an apportioned accounting value for all unvested LTIP grants (which remain subject to the satisfaction of performance and service conditions and may not ultimately vest).
The values disclosed in the below table, while not in accordance with the accounting standards, are intended to help Shareholders better understand the linkages between performance and the remuneration realised by the KMP Senior Executives in relation to 2019.
The table below shows:
— fixed remuneration
— STIP excluding the post-tax share component
— any vesting of STIP shares, LTIP awards, and/or MyAmatil matching shares.
DIRECTORS’REPORT(CONTINUED) REMUNERATIONREPORT(CONTINUED)Coca-Cola Amatil Limited and its subsidiaries
4 2019REMUNERATIONOUTCOMES(CONTINUED)2019 STIP outcomes – other KMP Senior Executives outcomesThe table below summarises the 2019 performance and STIP outcomes for the other KMP Senior Executives (i.e. excluding the Group Managing Director which is outlined above):
Individual Objectives (30%)
KMP Senior Executive
STIP outcome
Profit outcome (50%)
Revenue outcome (20%)
Objectives(themes which underpinned deliverables and targets for each KMP Senior Executive) Outcomes delivered
Group Chief Financial Officer
114.0% of target (76.0% of max)
Group: Above Target
Group: Above Target
— clear, compelling, agreed Group Strategy for Coca-Cola Amatil
— successful execution of major market growth plans
— improved capital management.
— vital leadership on our strategy and execution plans, including the sale of SPC, the development of the Regional Beverages Powerhouse ambition and growth strategy, shaping and launching our Long-Term Value Creation Proposition, and exploration of further opportunities across the international Coke system.
Managing Director, Indonesia & Papua New Guinea
114.2% of target (76.1% of max)
Group: Above Target
Indonesia & Papua New Guinea: Above Target
Indonesia: Below Target
Papua New Guinea: Above Target
— grow non-alcoholic ready-to-drink (NARTD) share of market value
— continue to deliver Accelerate to Transform strategic priorities
— continue to strengthen and build capability in Papua New Guinea, develop long-term plan.
— continued strong delivery of the Accelerate to Transform strategy in Indonesia which delivered improvements on all key metrics in line with or in excess of plan
— rebuilding the basics in Papua New Guinea has been a major focus for 2019 and the progress has been comprehensive with a new leadership team in place, improvements in governance, core processes and enhanced capability within the team. The turnaround in performance and capability in Papua New Guinea has reignited strong sales growth for the business.
Managing Director, New Zealand & Fiji
146.3% of target (97.5% of max)
Group: Above Target
New Zealand & Fiji: Above Target
New Zealand: Above Target
— build NARTD portfolio
— increase customer growth
— strengthen relationships with key partners
— build tomorrow’s margins with supporting capital expenditure program.
— the New Zealand & Fiji businesses delivered strong financial returns by unlocking productivity, winning market share and achieving consistently high employee engagement and customer experience scores
— the Pacific Leadership Team (PLT) achieved its five-year ‘Journey’ and the Managing Director and PLT have created a new, exciting and equally stretching Journey 2.0 with broad buy-in
— the Managing Director assumed responsibility for Paradise Beverages and is well progressed with identifying opportunities to improve operations and customer service across the Pacific.
Managing Director, Australian Beverages
100.7% of target (67.1% of max)
Group: Above Target
Australian Beverages: At Target
Australian Alcohol: Above Target
Australian Beverages: Below Target
— delivery of the Australia Accelerated Growth Plan and driving sustainable revenue and profit growth
— review costs across the business, redeployment of resources and prioritise activities to achieve budget
— drive improvement in engagement of Australian Beverages team
— achievement of Immediate Consumption route-to-market investment, execution and improvement
— build trust and sustainability through leadership in sugar reduction, water efficiency and packaging recycling.
— strong leadership and positioning the Australian business to return to growth in 2020 in line with our commitments and the Accelerated Growth Plan
— has led strongly through change, implementing a channel based structure, reviewing costs, redeploying resources, and prioritising activities, while achieving a significant uplift in employee engagement
— successfully implemented the ‘Feet On The Street’ investment by placing more resources in customer facing roles which enabled a return to revenue growth
— several Australian sustainability initiatives were successfully implemented through 2019
— the Managing Director took responsibility for the Alcohol & Coffee categories in Australia and has worked to build and maintain strong partner relationships.
COCA-COLA AMATIL ANNUAL REPORT 201982 83
BEING
A SU
STAIN
ABLE
BUSIN
ESSTH
E VALU
E W
E CREATEPERFO
RMA
NCE
& O
UTLO
OK
GO
VERNA
NCE
& RISK
SFIN
AN
CIAL &
STATUTO
RY REPO
RTS
OTH
ER IN
FORM
ATION
OU
R BU
SINESS
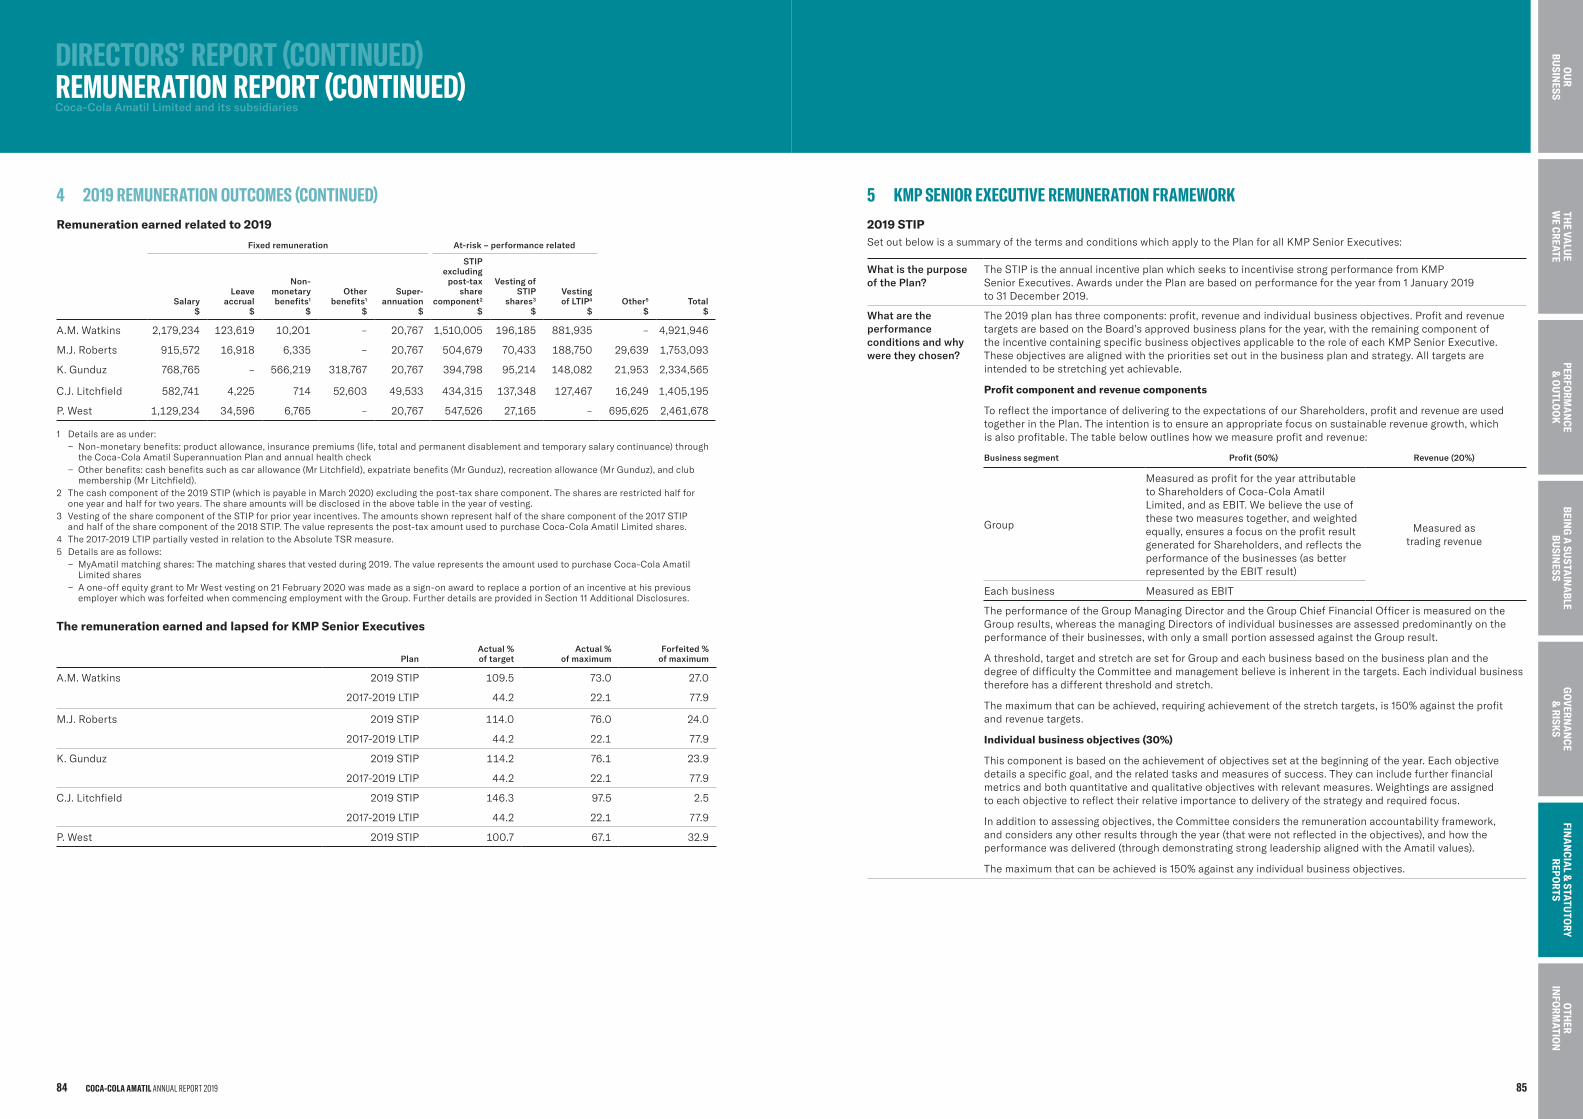
5 KMPSENIOREXECUTIVEREMUNERATIONFRAMEWORK2019 STIPSet out below is a summary of the terms and conditions which apply to the Plan for all KMP Senior Executives:
What is the purpose of the Plan?
The STIP is the annual incentive plan which seeks to incentivise strong performance from KMP Senior Executives. Awards under the Plan are based on performance for the year from 1 January 2019 to 31 December 2019.
What are the performance conditions and why were they chosen?
The 2019 plan has three components: profit, revenue and individual business objectives. Profit and revenue targets are based on the Board’s approved business plans for the year, with the remaining component of the incentive containing specific business objectives applicable to the role of each KMP Senior Executive. These objectives are aligned with the priorities set out in the business plan and strategy. All targets are intended to be stretching yet achievable.
Profit component and revenue components
To reflect the importance of delivering to the expectations of our Shareholders, profit and revenue are used together in the Plan. The intention is to ensure an appropriate focus on sustainable revenue growth, which is also profitable. The table below outlines how we measure profit and revenue:
Business segment Profit (50%) Revenue (20%)
Group
Measured as profit for the year attributable to Shareholders of Coca-Cola Amatil Limited, and as EBIT. We believe the use of these two measures together, and weighted equally, ensures a focus on the profit result generated for Shareholders, and reflects the performance of the businesses (as better represented by the EBIT result)
Measured as trading revenue
Each business Measured as EBIT
The performance of the Group Managing Director and the Group Chief Financial Officer is measured on the Group results, whereas the managing Directors of individual businesses are assessed predominantly on the performance of their businesses, with only a small portion assessed against the Group result.
A threshold, target and stretch are set for Group and each business based on the business plan and the degree of difficulty the Committee and management believe is inherent in the targets. Each individual business therefore has a different threshold and stretch.
The maximum that can be achieved, requiring achievement of the stretch targets, is 150% against the profit and revenue targets.
Individual business objectives (30%)
This component is based on the achievement of objectives set at the beginning of the year. Each objective details a specific goal, and the related tasks and measures of success. They can include further financial metrics and both quantitative and qualitative objectives with relevant measures. Weightings are assigned to each objective to reflect their relative importance to delivery of the strategy and required focus.
In addition to assessing objectives, the Committee considers the remuneration accountability framework, and considers any other results through the year (that were not reflected in the objectives), and how the performance was delivered (through demonstrating strong leadership aligned with the Amatil values).
The maximum that can be achieved is 150% against any individual business objectives.
DIRECTORS’REPORT(CONTINUED) REMUNERATIONREPORT(CONTINUED)Coca-Cola Amatil Limited and its subsidiaries
4 2019REMUNERATIONOUTCOMES(CONTINUED)Remuneration earned related to 2019
Fixed remuneration At-risk – performance related
Salary$
Leave accrual
$
Non-monetary benefits1
$
Other benefits1
$
Super-annuation
$
STIP excluding
post-tax share
component2
$
Vesting of STIP
shares3
$
Vestingof LTIP4
$Other5
$Total
$
A.M. Watkins 2,179,234 123,619 10,201 – 20,767 1,510,005 196,185 881,935 – 4,921,946
M.J. Roberts 915,572 16,918 6,335 – 20,767 504,679 70,433 188,750 29,639 1,753,093
K. Gunduz 768,765 – 566,219 318,767 20,767 394,798 95,214 148,082 21,953 2,334,565
C.J. Litchfield 582,741 4,225 714 52,603 49,533 434,315 137,348 127,467 16,249 1,405,195
P. West 1,129,234 34,596 6,765 – 20,767 547,526 27,165 – 695,625 2,461,678
1 Details are as under:− Non-monetary benefits: product allowance, insurance premiums (life, total and permanent disablement and temporary salary continuance) through
the Coca-Cola Amatil Superannuation Plan and annual health check − Other benefits: cash benefits such as car allowance (Mr Litchfield), expatriate benefits (Mr Gunduz), recreation allowance (Mr Gunduz), and club
membership (Mr Litchfield).2 The cash component of the 2019 STIP (which is payable in March 2020) excluding the post-tax share component. The shares are restricted half for
one year and half for two years. The share amounts will be disclosed in the above table in the year of vesting.3 Vesting of the share component of the STIP for prior year incentives. The amounts shown represent half of the share component of the 2017 STIP
and half of the share component of the 2018 STIP. The value represents the post-tax amount used to purchase Coca-Cola Amatil Limited shares.4 The 2017-2019 LTIP partially vested in relation to the Absolute TSR measure. 5 Details are as follows:
− MyAmatil matching shares: The matching shares that vested during 2019. The value represents the amount used to purchase Coca-Cola Amatil Limited shares
− A one-off equity grant to Mr West vesting on 21 February 2020 was made as a sign-on award to replace a portion of an incentive at his previous employer which was forfeited when commencing employment with the Group. Further details are provided in Section 11 Additional Disclosures.
The remuneration earned and lapsed for KMP Senior Executives
PlanActual %of target
Actual %of maximum
Forfeited %of maximum
A.M. Watkins 2019 STIP 109.5 73.0 27.0
2017-2019 LTIP 44.2 22.1 77.9
M.J. Roberts 2019 STIP 114.0 76.0 24.0
2017-2019 LTIP 44.2 22.1 77.9
K. Gunduz 2019 STIP 114.2 76.1 23.9
2017-2019 LTIP 44.2 22.1 77.9
C.J. Litchfield 2019 STIP 146.3 97.5 2.5
2017-2019 LTIP 44.2 22.1 77.9
P. West 2019 STIP 100.7 67.1 32.9
COCA-COLA AMATIL ANNUAL REPORT 201984 85
BEING
A SU
STAIN
ABLE
BUSIN
ESSTH
E VALU
E W
E CREATEPERFO
RMA
NCE
& O
UTLO
OK
GO
VERNA
NCE
& RISK
SFIN
AN
CIAL &
STATUTO
RY REPO
RTS
OTH
ER IN
FORM
ATION
OU
R BU
SINESS
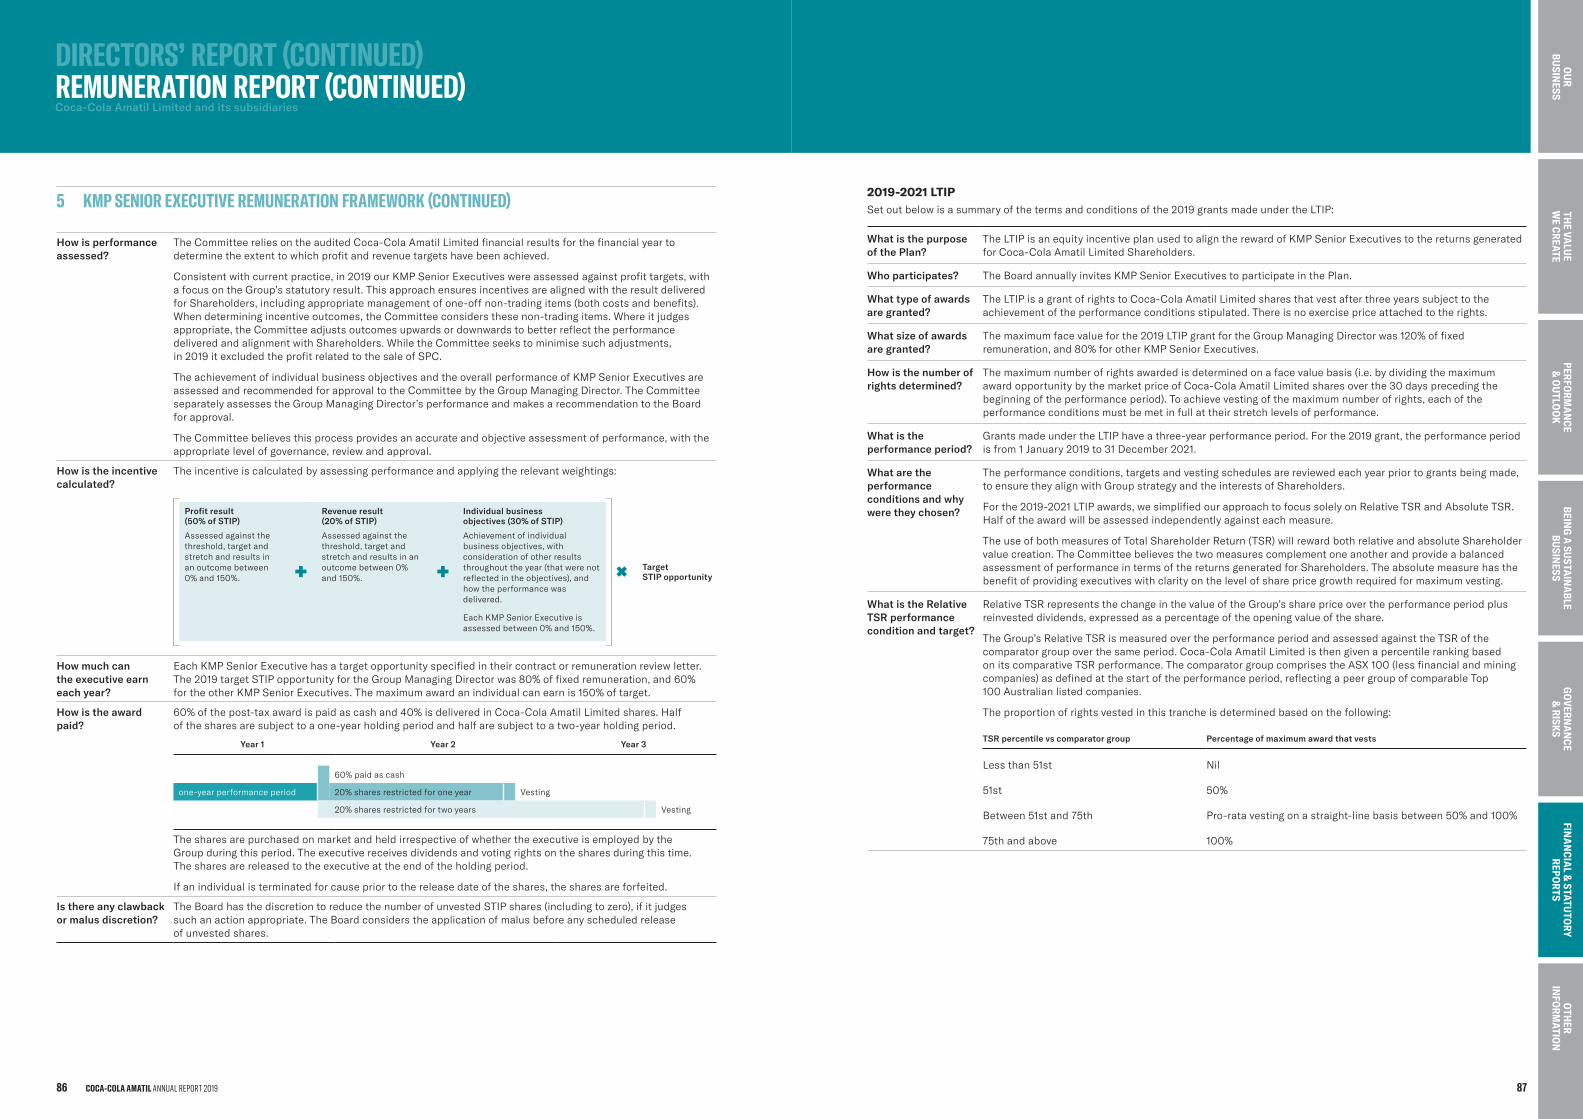
DIRECTORS’REPORT(CONTINUED) REMUNERATIONREPORT(CONTINUED)Coca-Cola Amatil Limited and its subsidiaries
2019-2021 LTIP Set out below is a summary of the terms and conditions of the 2019 grants made under the LTIP:
What is the purpose of the Plan?
The LTIP is an equity incentive plan used to align the reward of KMP Senior Executives to the returns generated for Coca-Cola Amatil Limited Shareholders.
Who participates? The Board annually invites KMP Senior Executives to participate in the Plan.
What type of awards are granted?
The LTIP is a grant of rights to Coca-Cola Amatil Limited shares that vest after three years subject to the achievement of the performance conditions stipulated. There is no exercise price attached to the rights.
What size of awards are granted?
The maximum face value for the 2019 LTIP grant for the Group Managing Director was 120% of fixed remuneration, and 80% for other KMP Senior Executives.
How is the number of rights determined?
The maximum number of rights awarded is determined on a face value basis (i.e. by dividing the maximum award opportunity by the market price of Coca-Cola Amatil Limited shares over the 30 days preceding the beginning of the performance period). To achieve vesting of the maximum number of rights, each of the performance conditions must be met in full at their stretch levels of performance.
What is the performance period?
Grants made under the LTIP have a three-year performance period. For the 2019 grant, the performance period is from 1 January 2019 to 31 December 2021.
What are the performance conditions and why were they chosen?
The performance conditions, targets and vesting schedules are reviewed each year prior to grants being made, to ensure they align with Group strategy and the interests of Shareholders.
For the 2019-2021 LTIP awards, we simplified our approach to focus solely on Relative TSR and Absolute TSR. Half of the award will be assessed independently against each measure.
The use of both measures of Total Shareholder Return (TSR) will reward both relative and absolute Shareholder value creation. The Committee believes the two measures complement one another and provide a balanced assessment of performance in terms of the returns generated for Shareholders. The absolute measure has the benefit of providing executives with clarity on the level of share price growth required for maximum vesting.
What is the Relative TSR performance condition and target?
Relative TSR represents the change in the value of the Group’s share price over the performance period plus reinvested dividends, expressed as a percentage of the opening value of the share.
The Group’s Relative TSR is measured over the performance period and assessed against the TSR of the comparator group over the same period. Coca-Cola Amatil Limited is then given a percentile ranking based on its comparative TSR performance. The comparator group comprises the ASX 100 (less financial and mining companies) as defined at the start of the performance period, reflecting a peer group of comparable Top 100 Australian listed companies.
The proportion of rights vested in this tranche is determined based on the following:
TSR percentile vs comparator group Percentage of maximum award that vests
Less than 51st Nil
51st 50%
Between 51st and 75th Pro-rata vesting on a straight-line basis between 50% and 100%
75th and above 100%
5 KMPSENIOREXECUTIVEREMUNERATIONFRAMEWORK(CONTINUED)
How is performance assessed?
The Committee relies on the audited Coca-Cola Amatil Limited financial results for the financial year to determine the extent to which profit and revenue targets have been achieved.
Consistent with current practice, in 2019 our KMP Senior Executives were assessed against profit targets, with a focus on the Group’s statutory result. This approach ensures incentives are aligned with the result delivered for Shareholders, including appropriate management of one-off non-trading items (both costs and benefits). When determining incentive outcomes, the Committee considers these non-trading items. Where it judges appropriate, the Committee adjusts outcomes upwards or downwards to better reflect the performance delivered and alignment with Shareholders. While the Committee seeks to minimise such adjustments, in 2019 it excluded the profit related to the sale of SPC.
The achievement of individual business objectives and the overall performance of KMP Senior Executives are assessed and recommended for approval to the Committee by the Group Managing Director. The Committee separately assesses the Group Managing Director’s performance and makes a recommendation to the Board for approval.
The Committee believes this process provides an accurate and objective assessment of performance, with the appropriate level of governance, review and approval.
How is the incentive calculated?
The incentive is calculated by assessing performance and applying the relevant weightings:
Profit result (50% of STIP)
Assessed against the threshold, target and stretch and results in an outcome between 0% and 150%.
Revenue result (20% of STIP)
Assessed against the threshold, target and stretch and results in an outcome between 0% and 150%.
Individual business objectives (30% of STIP)
Achievement of individual business objectives, with consideration of other results throughout the year (that were not reflected in the objectives), and how the performance was delivered.
Each KMP Senior Executive is assessed between 0% and 150%.
TargetSTIP opportunity
How much can the executive earn each year?
Each KMP Senior Executive has a target opportunity specified in their contract or remuneration review letter. The 2019 target STIP opportunity for the Group Managing Director was 80% of fixed remuneration, and 60% for the other KMP Senior Executives. The maximum award an individual can earn is 150% of target.
How is the award paid?
60% of the post-tax award is paid as cash and 40% is delivered in Coca-Cola Amatil Limited shares. Half of the shares are subject to a one-year holding period and half are subject to a two-year holding period.
Year 1 Year 2 Year 3
60% paid as cash
one-year performance period 20% shares restricted for one year Vesting
20% shares restricted for two years Vesting
The shares are purchased on market and held irrespective of whether the executive is employed by the Group during this period. The executive receives dividends and voting rights on the shares during this time. The shares are released to the executive at the end of the holding period.
If an individual is terminated for cause prior to the release date of the shares, the shares are forfeited.
Is there any clawback or malus discretion?
The Board has the discretion to reduce the number of unvested STIP shares (including to zero), if it judges such an action appropriate. The Board considers the application of malus before any scheduled release of unvested shares.
COCA-COLA AMATIL ANNUAL REPORT 201986 87
BEING
A SU
STAIN
ABLE
BUSIN
ESSTH
E VALU
E W
E CREATEPERFO
RMA
NCE
& O
UTLO
OK
GO
VERNA
NCE
& RISK
SFIN
AN
CIAL &
STATUTO
RY REPO
RTS
OTH
ER IN
FORM
ATION
OU
R BU
SINESS
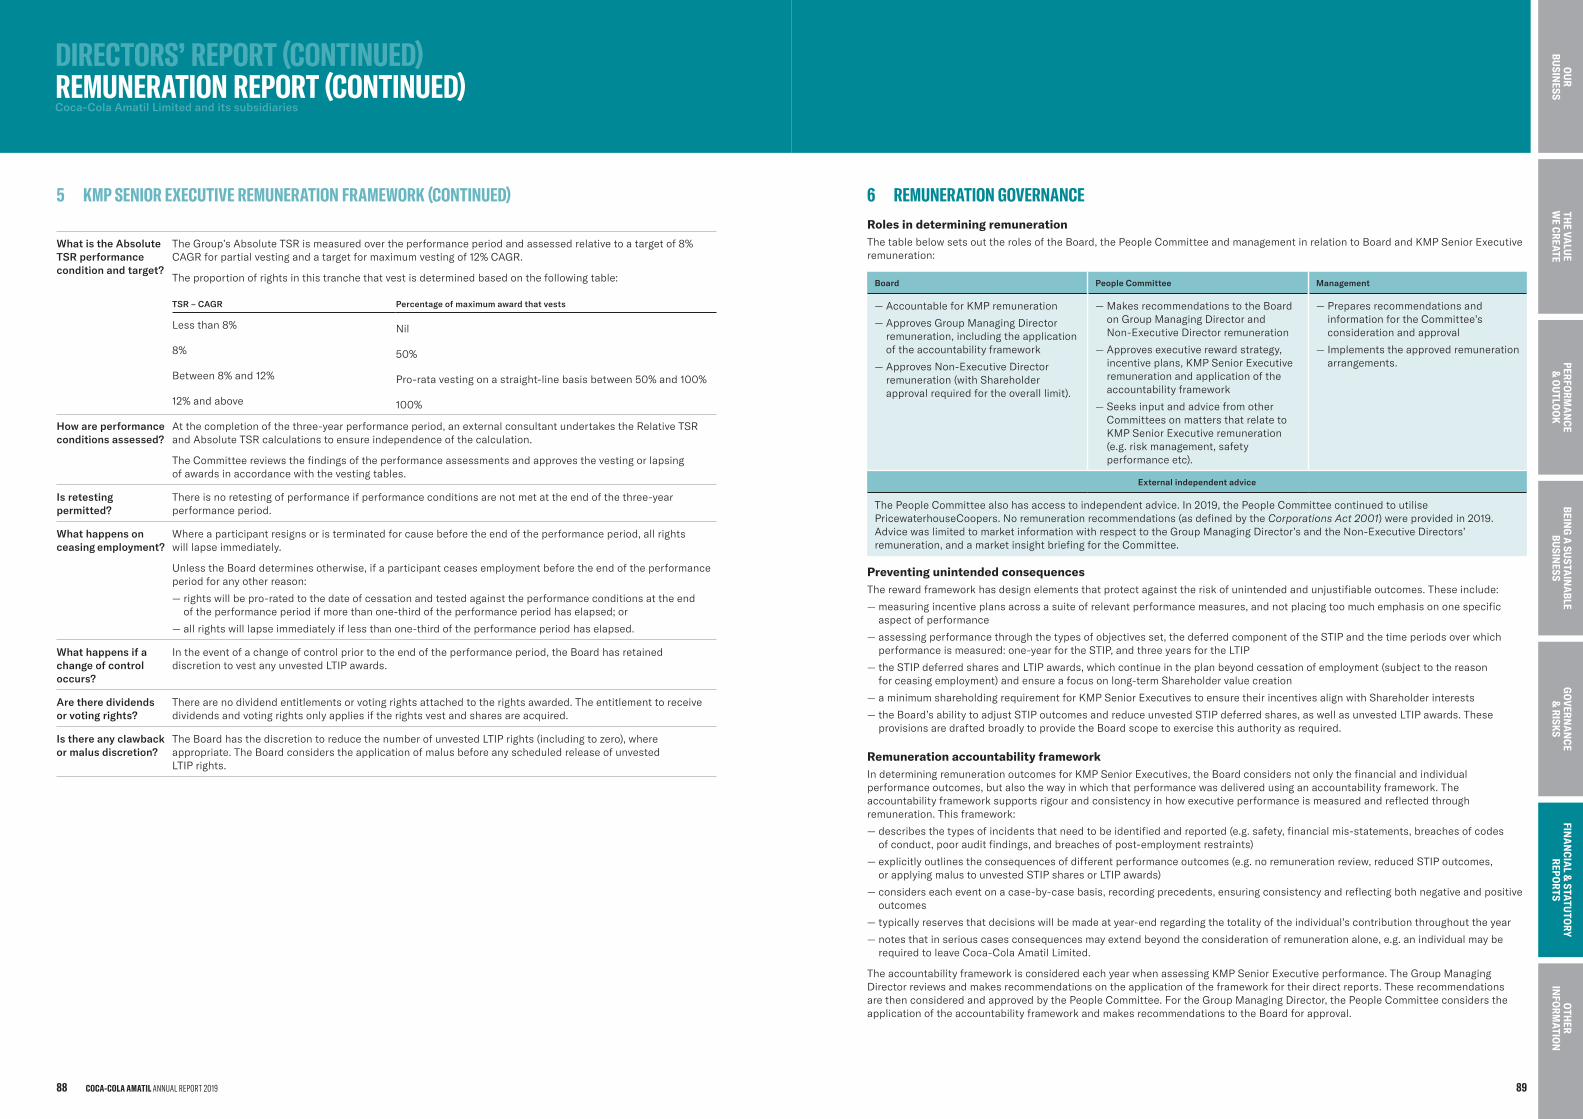
6 REMUNERATIONGOVERNANCERoles in determining remunerationThe table below sets out the roles of the Board, the People Committee and management in relation to Board and KMP Senior Executive remuneration:
Board People Committee Management
— Accountable for KMP remuneration
— Approves Group Managing Director remuneration, including the application of the accountability framework
— Approves Non-Executive Director remuneration (with Shareholder approval required for the overall limit).
— Makes recommendations to the Board on Group Managing Director and Non-Executive Director remuneration
— Approves executive reward strategy, incentive plans, KMP Senior Executive remuneration and application of the accountability framework
— Seeks input and advice from other Committees on matters that relate to KMP Senior Executive remuneration (e.g. risk management, safety performance etc).
— Prepares recommendations and information for the Committee’s consideration and approval
— Implements the approved remuneration arrangements.
External independent advice
The People Committee also has access to independent advice. In 2019, the People Committee continued to utilise PricewaterhouseCoopers. No remuneration recommendations (as defined by the Corporations Act 2001) were provided in 2019. Advice was limited to market information with respect to the Group Managing Director’s and the Non-Executive Directors’ remuneration, and a market insight briefing for the Committee.
Preventing unintended consequences The reward framework has design elements that protect against the risk of unintended and unjustifiable outcomes. These include:
— measuring incentive plans across a suite of relevant performance measures, and not placing too much emphasis on one specific aspect of performance
— assessing performance through the types of objectives set, the deferred component of the STIP and the time periods over which performance is measured: one-year for the STIP, and three years for the LTIP
— the STIP deferred shares and LTIP awards, which continue in the plan beyond cessation of employment (subject to the reason for ceasing employment) and ensure a focus on long-term Shareholder value creation
— a minimum shareholding requirement for KMP Senior Executives to ensure their incentives align with Shareholder interests
— the Board’s ability to adjust STIP outcomes and reduce unvested STIP deferred shares, as well as unvested LTIP awards. These provisions are drafted broadly to provide the Board scope to exercise this authority as required.
Remuneration accountability frameworkIn determining remuneration outcomes for KMP Senior Executives, the Board considers not only the financial and individual performance outcomes, but also the way in which that performance was delivered using an accountability framework. The accountability framework supports rigour and consistency in how executive performance is measured and reflected through remuneration. This framework:
— describes the types of incidents that need to be identified and reported (e.g. safety, financial mis-statements, breaches of codes of conduct, poor audit findings, and breaches of post-employment restraints)
— explicitly outlines the consequences of different performance outcomes (e.g. no remuneration review, reduced STIP outcomes, or applying malus to unvested STIP shares or LTIP awards)
— considers each event on a case-by-case basis, recording precedents, ensuring consistency and reflecting both negative and positive outcomes
— typically reserves that decisions will be made at year-end regarding the totality of the individual’s contribution throughout the year
— notes that in serious cases consequences may extend beyond the consideration of remuneration alone, e.g. an individual may be required to leave Coca-Cola Amatil Limited.
The accountability framework is considered each year when assessing KMP Senior Executive performance. The Group Managing Director reviews and makes recommendations on the application of the framework for their direct reports. These recommendations are then considered and approved by the People Committee. For the Group Managing Director, the People Committee considers the application of the accountability framework and makes recommendations to the Board for approval.
DIRECTORS’REPORT(CONTINUED) REMUNERATIONREPORT(CONTINUED)Coca-Cola Amatil Limited and its subsidiaries
What is the Absolute TSR performance condition and target?
The Group’s Absolute TSR is measured over the performance period and assessed relative to a target of 8% CAGR for partial vesting and a target for maximum vesting of 12% CAGR.
The proportion of rights in this tranche that vest is determined based on the following table:
TSR – CAGR Percentage of maximum award that vests
Less than 8% Nil
8% 50%
Between 8% and 12% Pro-rata vesting on a straight-line basis between 50% and 100%
12% and above 100%
How are performance conditions assessed?
At the completion of the three-year performance period, an external consultant undertakes the Relative TSR and Absolute TSR calculations to ensure independence of the calculation.
The Committee reviews the findings of the performance assessments and approves the vesting or lapsing of awards in accordance with the vesting tables.
Is retesting permitted?
There is no retesting of performance if performance conditions are not met at the end of the three-year performance period.
What happens on ceasing employment?
Where a participant resigns or is terminated for cause before the end of the performance period, all rights will lapse immediately.
Unless the Board determines otherwise, if a participant ceases employment before the end of the performance period for any other reason:
— rights will be pro-rated to the date of cessation and tested against the performance conditions at the end of the performance period if more than one-third of the performance period has elapsed; or
— all rights will lapse immediately if less than one-third of the performance period has elapsed.
What happens if a change of control occurs?
In the event of a change of control prior to the end of the performance period, the Board has retained discretion to vest any unvested LTIP awards.
Are there dividends or voting rights?
There are no dividend entitlements or voting rights attached to the rights awarded. The entitlement to receive dividends and voting rights only applies if the rights vest and shares are acquired.
Is there any clawback or malus discretion?
The Board has the discretion to reduce the number of unvested LTIP rights (including to zero), where appropriate. The Board considers the application of malus before any scheduled release of unvested LTIP rights.
5 KMPSENIOREXECUTIVEREMUNERATIONFRAMEWORK(CONTINUED)
COCA-COLA AMATIL ANNUAL REPORT 201988 89
BEING
A SU
STAIN
ABLE
BUSIN
ESSTH
E VALU
E W
E CREATEPERFO
RMA
NCE
& O
UTLO
OK
GO
VERNA
NCE
& RISK
SFIN
AN
CIAL &
STATUTO
RY REPO
RTS
OTH
ER IN
FORM
ATION
OU
R BU
SINESS
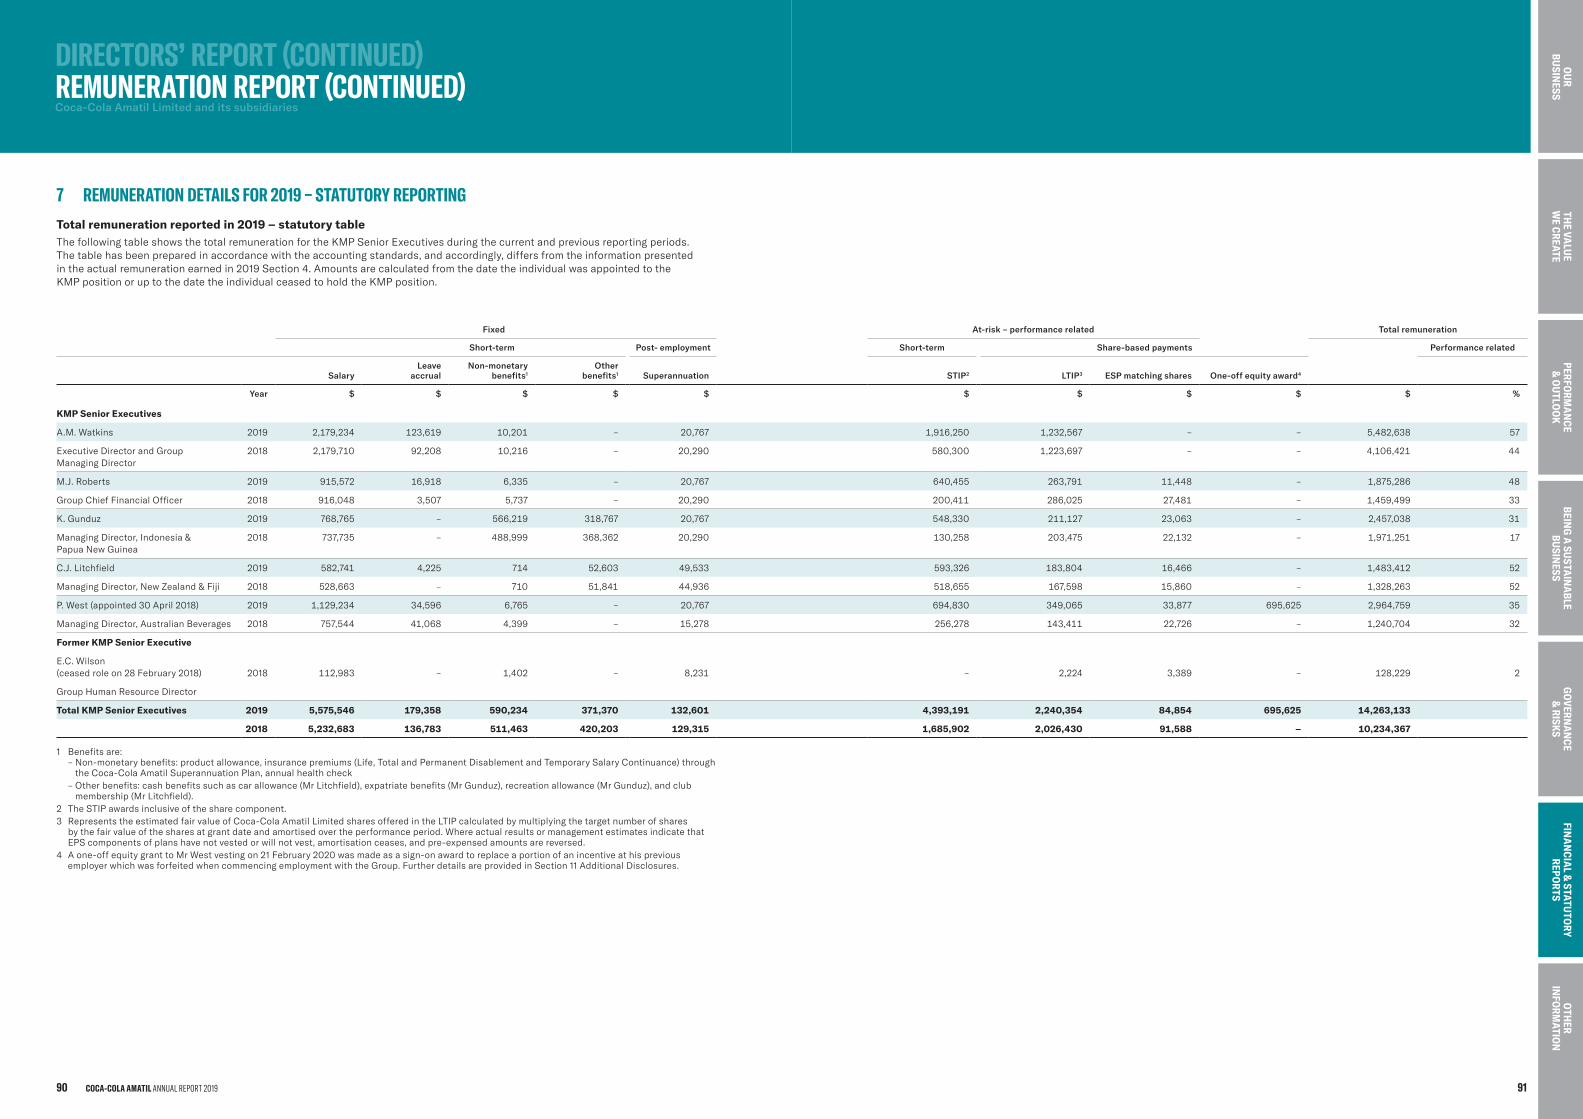
DIRECTORS’REPORT(CONTINUED) REMUNERATIONREPORT(CONTINUED)Coca-Cola Amatil Limited and its subsidiaries
7 REMUNERATIONDETAILSFOR2019–STATUTORYREPORTINGTotal remuneration reported in 2019 – statutory table The following table shows the total remuneration for the KMP Senior Executives during the current and previous reporting periods. The table has been prepared in accordance with the accounting standards, and accordingly, differs from the information presented in the actual remuneration earned in 2019 Section 4. Amounts are calculated from the date the individual was appointed to the KMP position or up to the date the individual ceased to hold the KMP position.
Fixed At-risk – performance related Total remuneration
Short-term Post- employment Short-term Share-based payments Performance related
Salary
Leave accrual
Non-monetary benefits1
Other benefits1 Superannuation
STIP2
LTIP3 ESP matching shares One-off equity award4
Year $ $ $ $ $ $ $ $ $ $ %
KMP Senior Executives
A.M. Watkins 2019 2,179,234 123,619 10,201 – 20,767 1,916,250 1,232,567 – – 5,482,638 57
Executive Director and Group Managing Director
2018 2,179,710 92,208 10,216 – 20,290 580,300 1,223,697 – – 4,106,421 44
M.J. Roberts 2019 915,572 16,918 6,335 – 20,767 640,455 263,791 11,448 – 1,875,286 48
Group Chief Financial Officer 2018 916,048 3,507 5,737 – 20,290 200,411 286,025 27,481 – 1,459,499 33
K. Gunduz 2019 768,765 – 566,219 318,767 20,767 548,330 211,127 23,063 – 2,457,038 31
Managing Director, Indonesia & Papua New Guinea
2018 737,735 – 488,999 368,362 20,290 130,258 203,475 22,132 – 1,971,251 17
C.J. Litchfield 2019 582,741 4,225 714 52,603 49,533 593,326 183,804 16,466 – 1,483,412 52
Managing Director, New Zealand & Fiji 2018 528,663 – 710 51,841 44,936 518,655 167,598 15,860 – 1,328,263 52
P. West (appointed 30 April 2018) 2019 1,129,234 34,596 6,765 – 20,767 694,830 349,065 33,877 695,625 2,964,759 35
Managing Director, Australian Beverages 2018 757,544 41,068 4,399 – 15,278 256,278 143,411 22,726 – 1,240,704 32
Former KMP Senior Executive
E.C. Wilson (ceased role on 28 February 2018) 2018 112,983 – 1,402 – 8,231 – 2,224 3,389 – 128,229 2
Group Human Resource Director
Total KMP Senior Executives 2019 5,575,546 179,358 590,234 371,370 132,601 4,393,191 2,240,354 84,854 695,625 14,263,133
2018 5,232,683 136,783 511,463 420,203 129,315 1,685,902 2,026,430 91,588 – 10,234,367
1 Benefits are: – Non-monetary benefits: product allowance, insurance premiums (Life, Total and Permanent Disablement and Temporary Salary Continuance) through
the Coca-Cola Amatil Superannuation Plan, annual health check– Other benefits: cash benefits such as car allowance (Mr Litchfield), expatriate benefits (Mr Gunduz), recreation allowance (Mr Gunduz), and club
membership (Mr Litchfield).2 The STIP awards inclusive of the share component.3 Represents the estimated fair value of Coca-Cola Amatil Limited shares offered in the LTIP calculated by multiplying the target number of shares
by the fair value of the shares at grant date and amortised over the performance period. Where actual results or management estimates indicate that EPS components of plans have not vested or will not vest, amortisation ceases, and pre-expensed amounts are reversed.
4 A one-off equity grant to Mr West vesting on 21 February 2020 was made as a sign-on award to replace a portion of an incentive at his previous employer which was forfeited when commencing employment with the Group. Further details are provided in Section 11 Additional Disclosures.
COCA-COLA AMATIL ANNUAL REPORT 201990 91
BEING
A SU
STAIN
ABLE
BUSIN
ESSTH
E VALU
E W
E CREATEPERFO
RMA
NCE
& O
UTLO
OK
GO
VERNA
NCE
& RISK
SFIN
AN
CIAL &
STATUTO
RY REPO
RTS
OTH
ER IN
FORM
ATION
OU
R BU
SINESS
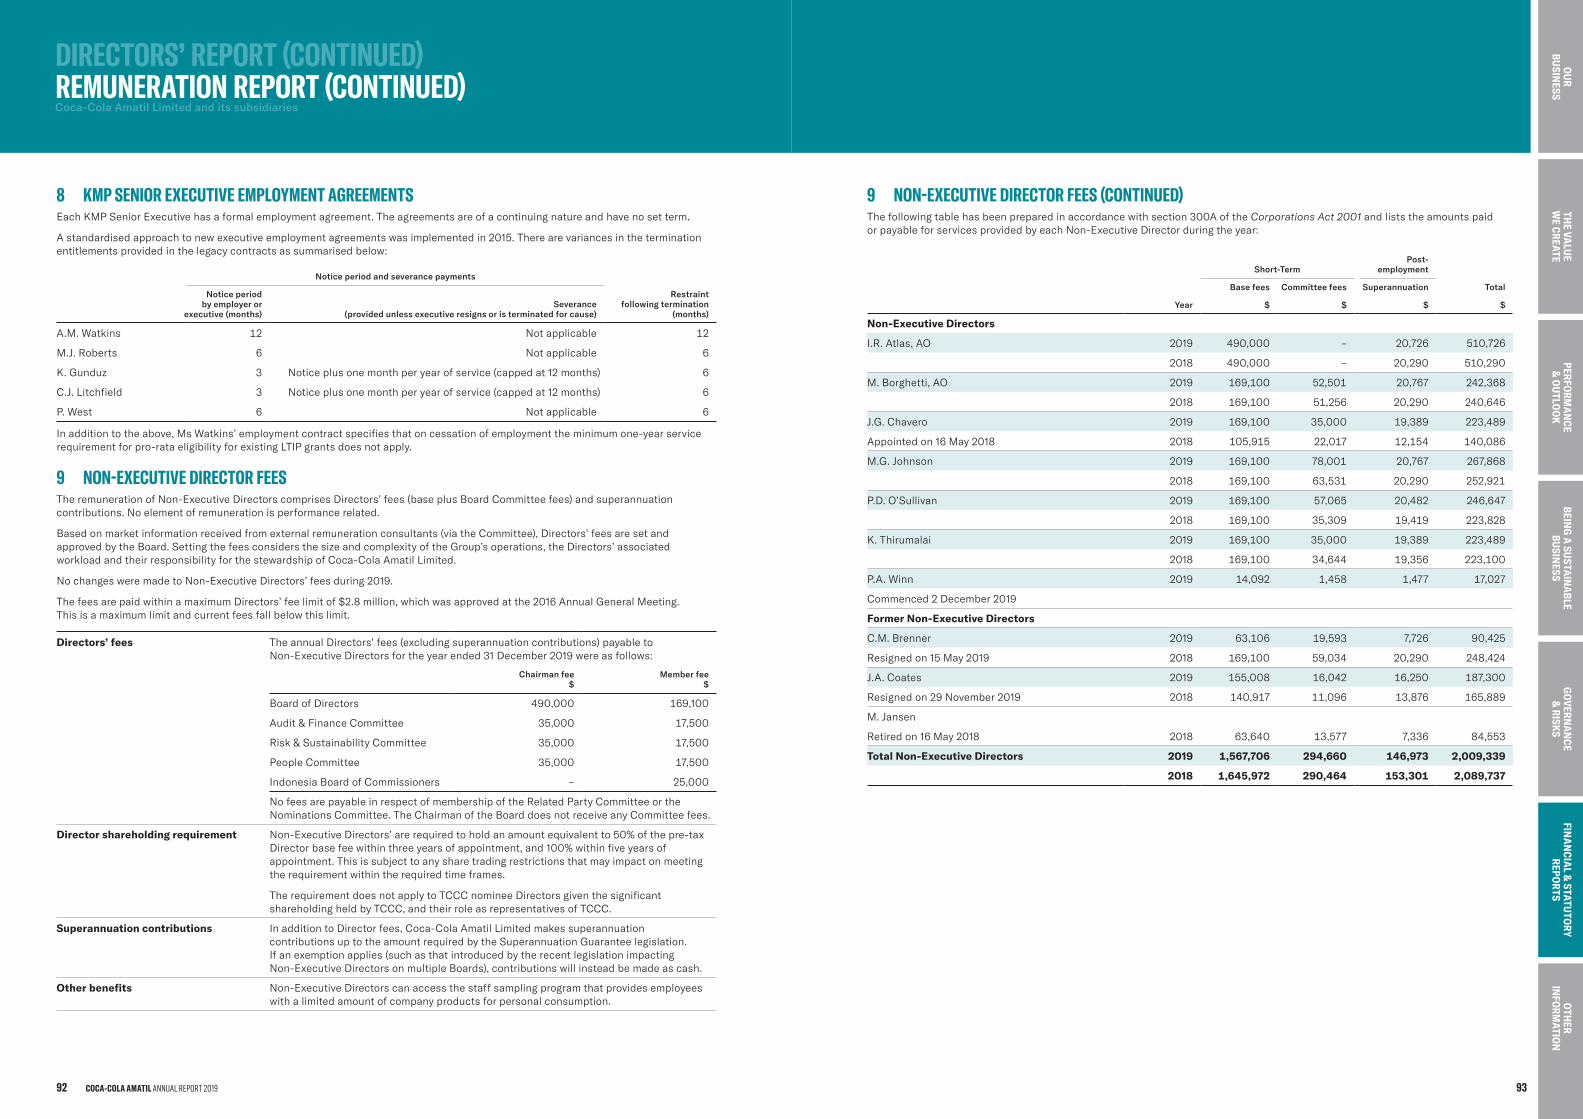
8 KMPSENIOREXECUTIVEEMPLOYMENTAGREEMENTSEach KMP Senior Executive has a formal employment agreement. The agreements are of a continuing nature and have no set term.
A standardised approach to new executive employment agreements was implemented in 2015. There are variances in the termination entitlements provided in the legacy contracts as summarised below:
Notice period and severance payments
Notice period by employer or
executive (months)Severance
(provided unless executive resigns or is terminated for cause)
Restraint following termination
(months)
A.M. Watkins 12 Not applicable 12
M.J. Roberts 6 Not applicable 6
K. Gunduz 3 Notice plus one month per year of service (capped at 12 months) 6
C.J. Litchfield 3 Notice plus one month per year of service (capped at 12 months) 6
P. West 6 Not applicable 6
In addition to the above, Ms Watkins’ employment contract specifies that on cessation of employment the minimum one-year service requirement for pro-rata eligibility for existing LTIP grants does not apply.
9 NON-EXECUTIVEDIRECTORFEESThe remuneration of Non-Executive Directors comprises Directors’ fees (base plus Board Committee fees) and superannuation contributions. No element of remuneration is performance related.
Based on market information received from external remuneration consultants (via the Committee), Directors’ fees are set and approved by the Board. Setting the fees considers the size and complexity of the Group’s operations, the Directors’ associated workload and their responsibility for the stewardship of Coca-Cola Amatil Limited.
No changes were made to Non-Executive Directors’ fees during 2019.
The fees are paid within a maximum Directors’ fee limit of $2.8 million, which was approved at the 2016 Annual General Meeting. This is a maximum limit and current fees fall below this limit.
Directors’ fees The annual Directors’ fees (excluding superannuation contributions) payable to Non-Executive Directors for the year ended 31 December 2019 were as follows:
Chairman fee $
Member fee $
Board of Directors 490,000 169,100
Audit & Finance Committee 35,000 17,500
Risk & Sustainability Committee 35,000 17,500
People Committee 35,000 17,500
Indonesia Board of Commissioners – 25,000
No fees are payable in respect of membership of the Related Party Committee or the Nominations Committee. The Chairman of the Board does not receive any Committee fees.
Director shareholding requirement Non-Executive Directors’ are required to hold an amount equivalent to 50% of the pre-tax Director base fee within three years of appointment, and 100% within five years of appointment. This is subject to any share trading restrictions that may impact on meeting the requirement within the required time frames.
The requirement does not apply to TCCC nominee Directors given the significant shareholding held by TCCC, and their role as representatives of TCCC.
Superannuation contributions In addition to Director fees, Coca-Cola Amatil Limited makes superannuation contributions up to the amount required by the Superannuation Guarantee legislation. If an exemption applies (such as that introduced by the recent legislation impacting Non-Executive Directors on multiple Boards), contributions will instead be made as cash.
Other benefits Non-Executive Directors can access the staff sampling program that provides employees with a limited amount of company products for personal consumption.
DIRECTORS’REPORT(CONTINUED) REMUNERATIONREPORT(CONTINUED)Coca-Cola Amatil Limited and its subsidiaries
9 NON-EXECUTIVEDIRECTORFEES(CONTINUED)The following table has been prepared in accordance with section 300A of the Corporations Act 2001 and lists the amounts paid or payable for services provided by each Non-Executive Director during the year:
Short-TermPost-
employment
Base fees Committee fees Superannuation Total
Year $ $ $ $
Non-Executive Directors
I.R. Atlas, AO 2019 490,000 – 20,726 510,726
2018 490,000 – 20,290 510,290
M. Borghetti, AO 2019 169,100 52,501 20,767 242,368
2018 169,100 51,256 20,290 240,646
J.G. Chavero 2019 169,100 35,000 19,389 223,489
Appointed on 16 May 2018 2018 105,915 22,017 12,154 140,086
M.G. Johnson 2019 169,100 78,001 20,767 267,868
2018 169,100 63,531 20,290 252,921
P.D. O’Sullivan 2019 169,100 57,065 20,482 246,647
2018 169,100 35,309 19,419 223,828
K. Thirumalai 2019 169,100 35,000 19,389 223,489
2018 169,100 34,644 19,356 223,100
P.A. Winn 2019 14,092 1,458 1,477 17,027
Commenced 2 December 2019
Former Non-Executive Directors
C.M. Brenner 2019 63,106 19,593 7,726 90,425
Resigned on 15 May 2019 2018 169,100 59,034 20,290 248,424
J.A. Coates 2019 155,008 16,042 16,250 187,300
Resigned on 29 November 2019 2018 140,917 11,096 13,876 165,889
M. Jansen
Retired on 16 May 2018 2018 63,640 13,577 7,336 84,553
Total Non-Executive Directors 2019 1,567,706 294,660 146,973 2,009,339
2018 1,645,972 290,464 153,301 2,089,737
COCA-COLA AMATIL ANNUAL REPORT 201992 93
BEING
A SU
STAIN
ABLE
BUSIN
ESSTH
E VALU
E W
E CREATEPERFO
RMA
NCE
& O
UTLO
OK
GO
VERNA
NCE
& RISK
SFIN
AN
CIAL &
STATUTO
RY REPO
RTS
OTH
ER IN
FORM
ATION
OU
R BU
SINESS
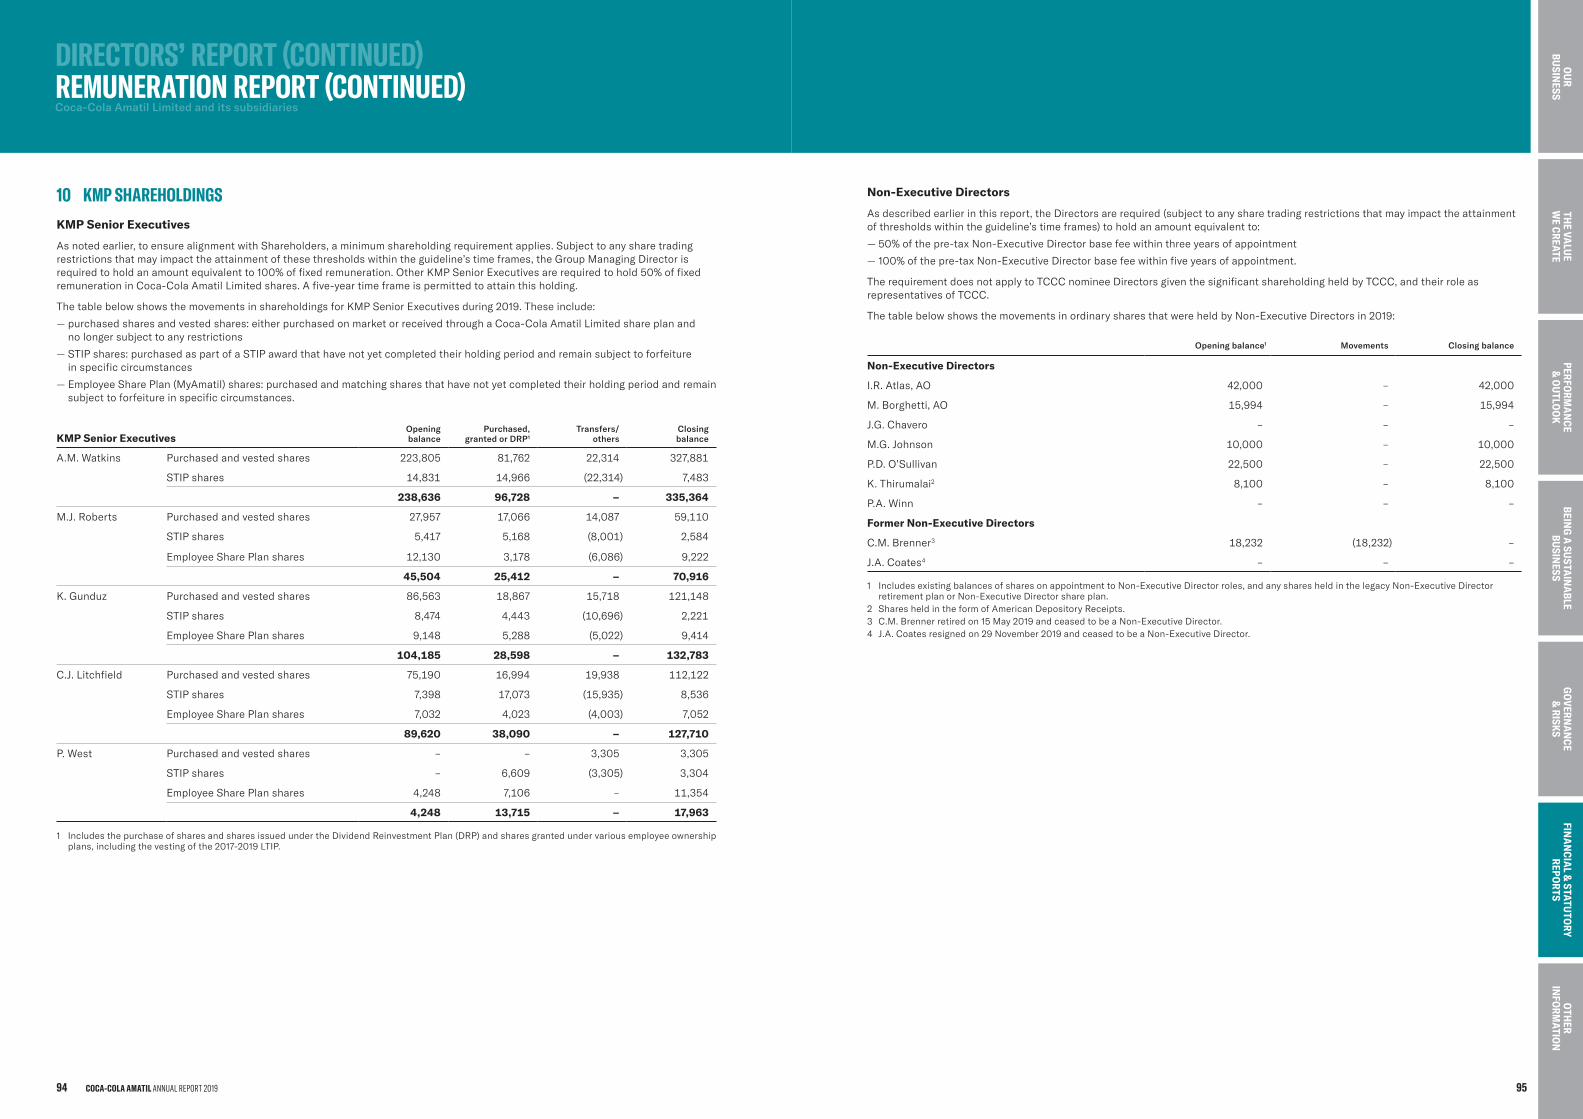
DIRECTORS’REPORT(CONTINUED) REMUNERATIONREPORT(CONTINUED)Coca-Cola Amatil Limited and its subsidiaries
10 KMPSHAREHOLDINGSKMP Senior Executives
As noted earlier, to ensure alignment with Shareholders, a minimum shareholding requirement applies. Subject to any share trading restrictions that may impact the attainment of these thresholds within the guideline’s time frames, the Group Managing Director is required to hold an amount equivalent to 100% of fixed remuneration. Other KMP Senior Executives are required to hold 50% of fixed remuneration in Coca-Cola Amatil Limited shares. A five-year time frame is permitted to attain this holding.
The table below shows the movements in shareholdings for KMP Senior Executives during 2019. These include:
— purchased shares and vested shares: either purchased on market or received through a Coca-Cola Amatil Limited share plan and no longer subject to any restrictions
— STIP shares: purchased as part of a STIP award that have not yet completed their holding period and remain subject to forfeiture in specific circumstances
— Employee Share Plan (MyAmatil) shares: purchased and matching shares that have not yet completed their holding period and remain subject to forfeiture in specific circumstances.
KMP Senior ExecutivesOpening balance
Purchased, granted or DRP1
Transfers/ others
Closing balance
A.M. Watkins Purchased and vested shares 223,805 81,762 22,314 327,881
STIP shares 14,831 14,966 (22,314) 7,483
238,636 96,728 – 335,364
M.J. Roberts Purchased and vested shares 27,957 17,066 14,087 59,110
STIP shares 5,417 5,168 (8,001) 2,584
Employee Share Plan shares 12,130 3,178 (6,086) 9,222
45,504 25,412 – 70,916
K. Gunduz Purchased and vested shares 86,563 18,867 15,718 121,148
STIP shares 8,474 4,443 (10,696) 2,221
Employee Share Plan shares 9,148 5,288 (5,022) 9,414
104,185 28,598 – 132,783
C.J. Litchfield Purchased and vested shares 75,190 16,994 19,938 112,122
STIP shares 7,398 17,073 (15,935) 8,536
Employee Share Plan shares 7,032 4,023 (4,003) 7,052
89,620 38,090 – 127,710
P. West Purchased and vested shares – – 3,305 3,305
STIP shares – 6,609 (3,305) 3,304
Employee Share Plan shares 4,248 7,106 – 11,354
4,248 13,715 – 17,963
1 Includes the purchase of shares and shares issued under the Dividend Reinvestment Plan (DRP) and shares granted under various employee ownership plans, including the vesting of the 2017-2019 LTIP.
Non-Executive Directors
As described earlier in this report, the Directors are required (subject to any share trading restrictions that may impact the attainment of thresholds within the guideline’s time frames) to hold an amount equivalent to:
— 50% of the pre-tax Non-Executive Director base fee within three years of appointment
— 100% of the pre-tax Non-Executive Director base fee within five years of appointment.
The requirement does not apply to TCCC nominee Directors given the significant shareholding held by TCCC, and their role as representatives of TCCC.
The table below shows the movements in ordinary shares that were held by Non-Executive Directors in 2019:
Opening balance1 Movements Closing balance
Non-Executive Directors
I.R. Atlas, AO 42,000 – 42,000
M. Borghetti, AO 15,994 – 15,994
J.G. Chavero – – –
M.G. Johnson 10,000 – 10,000
P.D. O’Sullivan 22,500 – 22,500
K. Thirumalai2 8,100 – 8,100
P.A. Winn – – –
Former Non-Executive Directors
C.M. Brenner3 18,232 (18,232) –
J.A. Coates4 – – –
1 Includes existing balances of shares on appointment to Non-Executive Director roles, and any shares held in the legacy Non-Executive Director retirement plan or Non-Executive Director share plan.
2 Shares held in the form of American Depository Receipts.3 C.M. Brenner retired on 15 May 2019 and ceased to be a Non-Executive Director.4 J.A. Coates resigned on 29 November 2019 and ceased to be a Non-Executive Director.
COCA-COLA AMATIL ANNUAL REPORT 201994 95
BEING
A SU
STAIN
ABLE
BUSIN
ESSTH
E VALU
E W
E CREATEPERFO
RMA
NCE
& O
UTLO
OK
GO
VERNA
NCE
& RISK
SFIN
AN
CIAL &
STATUTO
RY REPO
RTS
OTH
ER IN
FORM
ATION
OU
R BU
SINESS
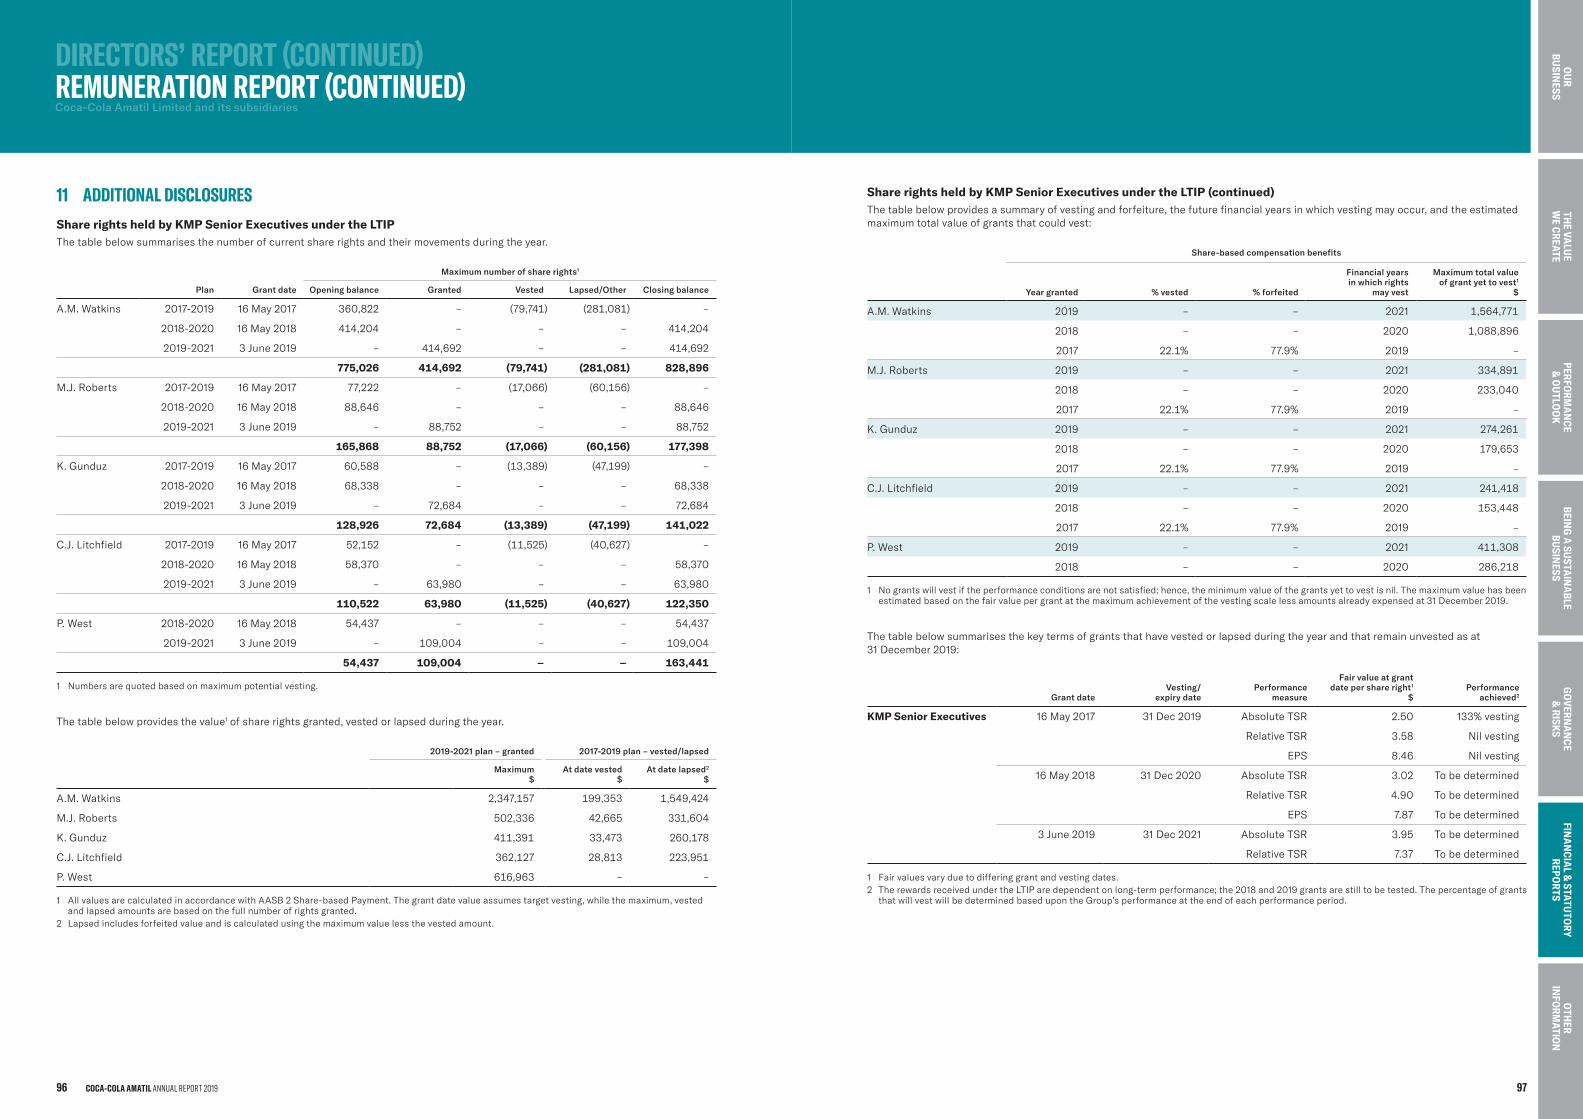
DIRECTORS’REPORT(CONTINUED) REMUNERATIONREPORT(CONTINUED)Coca-Cola Amatil Limited and its subsidiaries
11 ADDITIONALDISCLOSURESShare rights held by KMP Senior Executives under the LTIP The table below summarises the number of current share rights and their movements during the year.
Maximum number of share rights1
Plan Grant date Opening balance Granted Vested Lapsed/Other Closing balance
A.M. Watkins 2017-2019 16 May 2017 360,822 – (79,741) (281,081) –
2018-2020 16 May 2018 414,204 – – – 414,204
2019-2021 3 June 2019 – 414,692 – – 414,692
775,026 414,692 (79,741) (281,081) 828,896
M.J. Roberts 2017-2019 16 May 2017 77,222 – (17,066) (60,156) –
2018-2020 16 May 2018 88,646 – – – 88,646
2019-2021 3 June 2019 – 88,752 – – 88,752
165,868 88,752 (17,066) (60,156) 177,398
K. Gunduz 2017-2019 16 May 2017 60,588 – (13,389) (47,199) –
2018-2020 16 May 2018 68,338 – – – 68,338
2019-2021 3 June 2019 – 72,684 – – 72,684
128,926 72,684 (13,389) (47,199) 141,022
C.J. Litchfield 2017-2019 16 May 2017 52,152 – (11,525) (40,627) –
2018-2020 16 May 2018 58,370 – – – 58,370
2019-2021 3 June 2019 – 63,980 – – 63,980
110,522 63,980 (11,525) (40,627) 122,350
P. West 2018-2020 16 May 2018 54,437 – – – 54,437
2019-2021 3 June 2019 – 109,004 – – 109,004
54,437 109,004 – – 163,441
1 Numbers are quoted based on maximum potential vesting.
The table below provides the value1 of share rights granted, vested or lapsed during the year.
2019-2021 plan – granted 2017-2019 plan – vested/lapsed
Maximum $
At date vested $
At date lapsed2
$
A.M. Watkins 2,347,157 199,353 1,549,424
M.J. Roberts 502,336 42,665 331,604
K. Gunduz 411,391 33,473 260,178
C.J. Litchfield 362,127 28,813 223,951
P. West 616,963 – –
1 All values are calculated in accordance with AASB 2 Share-based Payment. The grant date value assumes target vesting, while the maximum, vested and lapsed amounts are based on the full number of rights granted.
2 Lapsed includes forfeited value and is calculated using the maximum value less the vested amount.
Share rights held by KMP Senior Executives under the LTIP (continued) The table below provides a summary of vesting and forfeiture, the future financial years in which vesting may occur, and the estimated maximum total value of grants that could vest:
Share-based compensation benefits
Year granted % vested % forfeited
Financial years in which rights
may vest
Maximum total value of grant yet to vest1
$
A.M. Watkins 2019 – – 2021 1,564,771
2018 – – 2020 1,088,896
2017 22.1% 77.9% 2019 –
M.J. Roberts 2019 – – 2021 334,891
2018 – – 2020 233,040
2017 22.1% 77.9% 2019 –
K. Gunduz 2019 – – 2021 274,261
2018 – – 2020 179,653
2017 22.1% 77.9% 2019 –
C.J. Litchfield 2019 – – 2021 241,418
2018 – – 2020 153,448
2017 22.1% 77.9% 2019 –
P. West 2019 – – 2021 411,308
2018 – – 2020 286,218
1 No grants will vest if the performance conditions are not satisfied; hence, the minimum value of the grants yet to vest is nil. The maximum value has been estimated based on the fair value per grant at the maximum achievement of the vesting scale less amounts already expensed at 31 December 2019.
The table below summarises the key terms of grants that have vested or lapsed during the year and that remain unvested as at 31 December 2019:
Grant dateVesting/
expiry datePerformance
measure
Fair value at grant date per share right1
$Performance
achieved2
KMP Senior Executives 16 May 2017 31 Dec 2019 Absolute TSR 2.50 133% vesting
Relative TSR 3.58 Nil vesting
EPS 8.46 Nil vesting
16 May 2018 31 Dec 2020 Absolute TSR 3.02 To be determined
Relative TSR 4.90 To be determined
EPS 7.87 To be determined
3 June 2019 31 Dec 2021 Absolute TSR 3.95 To be determined
Relative TSR 7.37 To be determined
1 Fair values vary due to differing grant and vesting dates.2 The rewards received under the LTIP are dependent on long-term performance; the 2018 and 2019 grants are still to be tested. The percentage of grants
that will vest will be determined based upon the Group’s performance at the end of each performance period.
COCA-COLA AMATIL ANNUAL REPORT 201996 97
BEING
A SU
STAIN
ABLE
BUSIN
ESSTH
E VALU
E W
E CREATEPERFO
RMA
NCE
& O
UTLO
OK
GO
VERNA
NCE
& RISK
SFIN
AN
CIAL &
STATUTO
RY REPO
RTS
OTH
ER IN
FORM
ATION
OU
R BU
SINESS
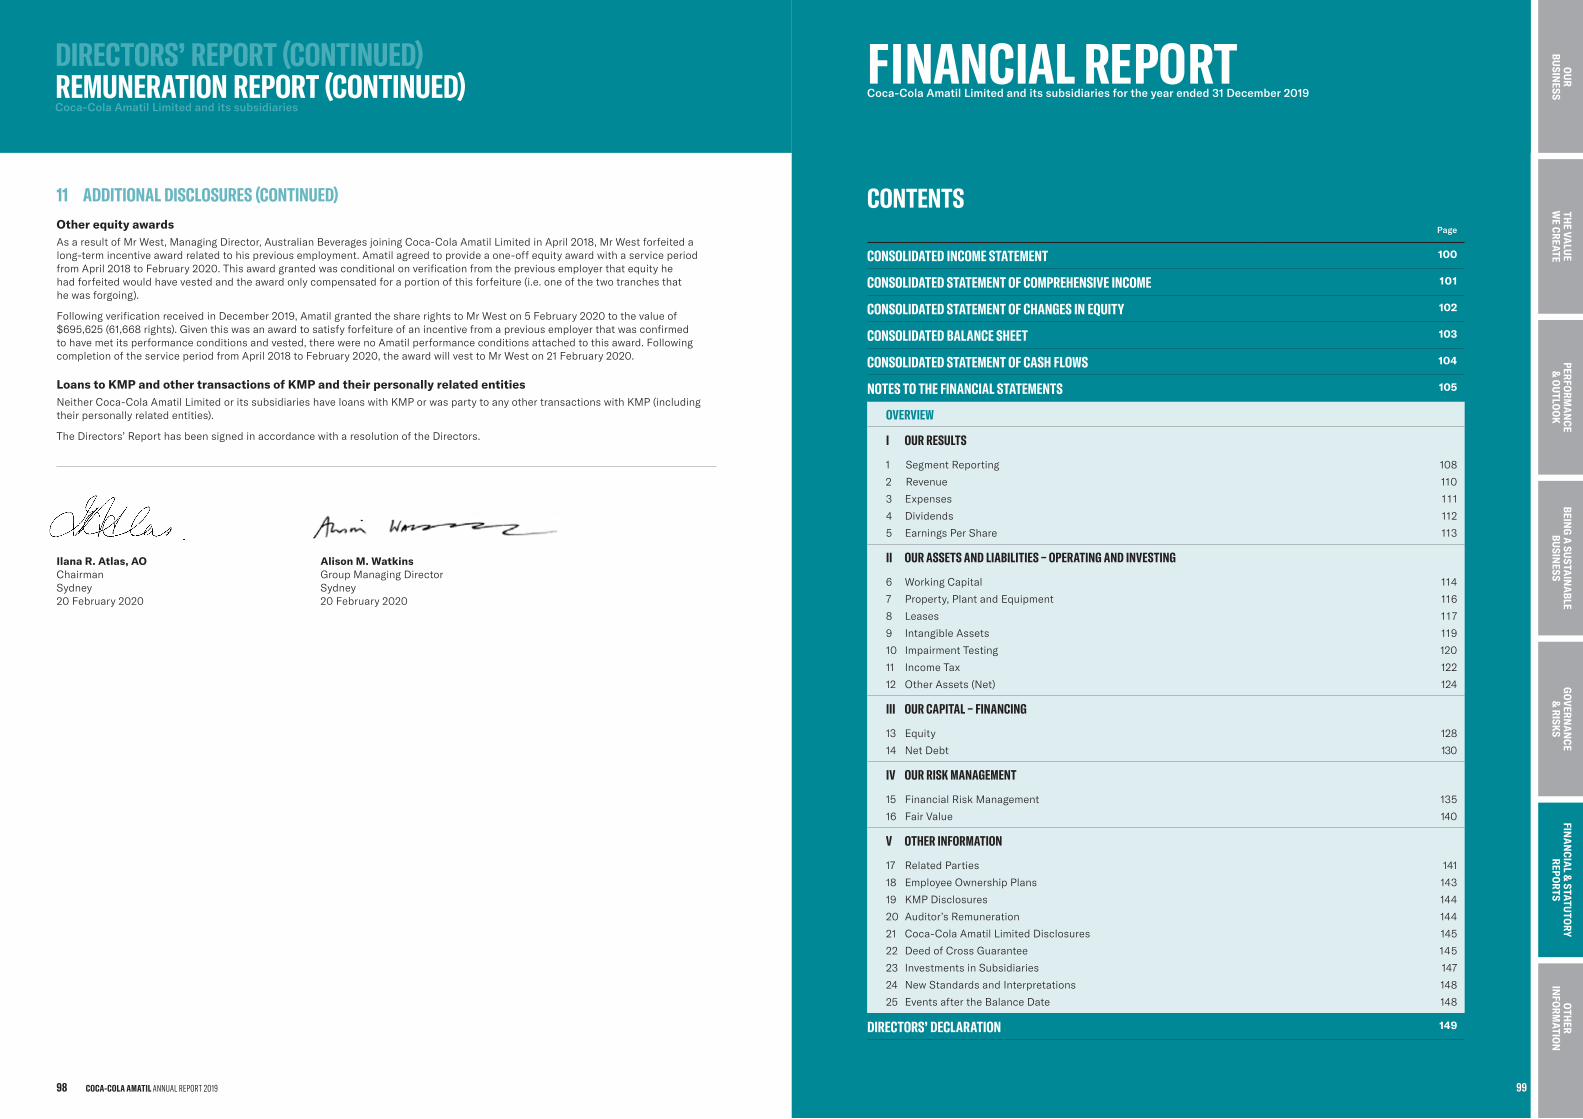
DIRECTORS’ REPORT (CONTINUED) REMUNERATION REPORT (CONTINUED)Coca-Cola Amatil Limited and its subsidiaries
11 ADDITIONAL DISCLOSURES (CONTINUED)Other equity awardsAs a result of Mr West, Managing Director, Australian Beverages joining Coca-Cola Amatil Limited in April 2018, Mr West forfeited a long-term incentive award related to his previous employment. Amatil agreed to provide a one-off equity award with a service period from April 2018 to February 2020. This award granted was conditional on verification from the previous employer that equity he had forfeited would have vested and the award only compensated for a portion of this forfeiture (i.e. one of the two tranches that he was forgoing).
Following verification received in December 2019, Amatil granted the share rights to Mr West on 5 February 2020 to the value of $695,625 (61,668 rights). Given this was an award to satisfy forfeiture of an incentive from a previous employer that was confirmed to have met its performance conditions and vested, there were no Amatil performance conditions attached to this award. Following completion of the service period from April 2018 to February 2020, the award will vest to Mr West on 21 February 2020.
Loans to KMP and other transactions of KMP and their personally related entitiesNeither Coca-Cola Amatil Limited or its subsidiaries have loans with KMP or was party to any other transactions with KMP (including their personally related entities).
The Directors’ Report has been signed in accordance with a resolution of the Directors.
Ilana R. Atlas, AO Alison M. Watkins Chairman Group Managing Director Sydney Sydney 20 February 2020 20 February 2020
COCA-COLA AMATIL ANNUAL REPORT 201998 99
BEING
A SU
STAIN
ABLE
BUSIN
ESSTH
E VALU
E W
E CREATEPERFO
RMA
NCE
& O
UTLO
OK
GO
VERNA
NCE
& RISK
SFIN
AN
CIAL &
STATUTO
RY REPO
RTS
OTH
ER IN
FORM
ATION
OU
R BU
SINESS
FINANCIAL REPORT Coca-Cola Amatil Limited and its subsidiaries for the year ended 31 December 2019
CONTENTS Page
CONSOLIDATED INCOME STATEMENT 100
CONSOLIDATED STATEMENT OF COMPREHENSIVE INCOME 101
CONSOLIDATED STATEMENT OF CHANGES IN EQUITY 102
CONSOLIDATED BALANCE SHEET 103
CONSOLIDATED STATEMENT OF CASH FLOWS 104
NOTES TO THE FINANCIAL STATEMENTS 105
OVERVIEW
I OUR RESULTS
1 Segment Reporting
2 Revenue
3 Expenses
4 Dividends
5 Earnings Per Share
108
110
1 11
112
113
II OUR ASSETS AND LIABILITIES – OPERATING AND INVESTING
6 Working Capital
7 Property, Plant and Equipment
8 Leases
9 Intangible Assets
10 Impairment Testing
11 Income Tax
12 Other Assets (Net)
114
116
117
119
120
122
124
III OUR CAPITAL – FINANCING
13 Equity
14 Net Debt
128
130
IV OUR RISK MANAGEMENT
15 Financial Risk Management
16 Fair Value
135
140
V OTHER INFORMATION
17 Related Parties
18 Employee Ownership Plans
19 KMP Disclosures
20 Auditor’s Remuneration
21 Coca-Cola Amatil Limited Disclosures
22 Deed of Cross Guarantee
23 Investments in Subsidiaries
24 New Standards and Interpretations
25 Events after the Balance Date
141
143
144
144
145
145
147
148
148
DIRECTORS’ DECLARATION 149
99
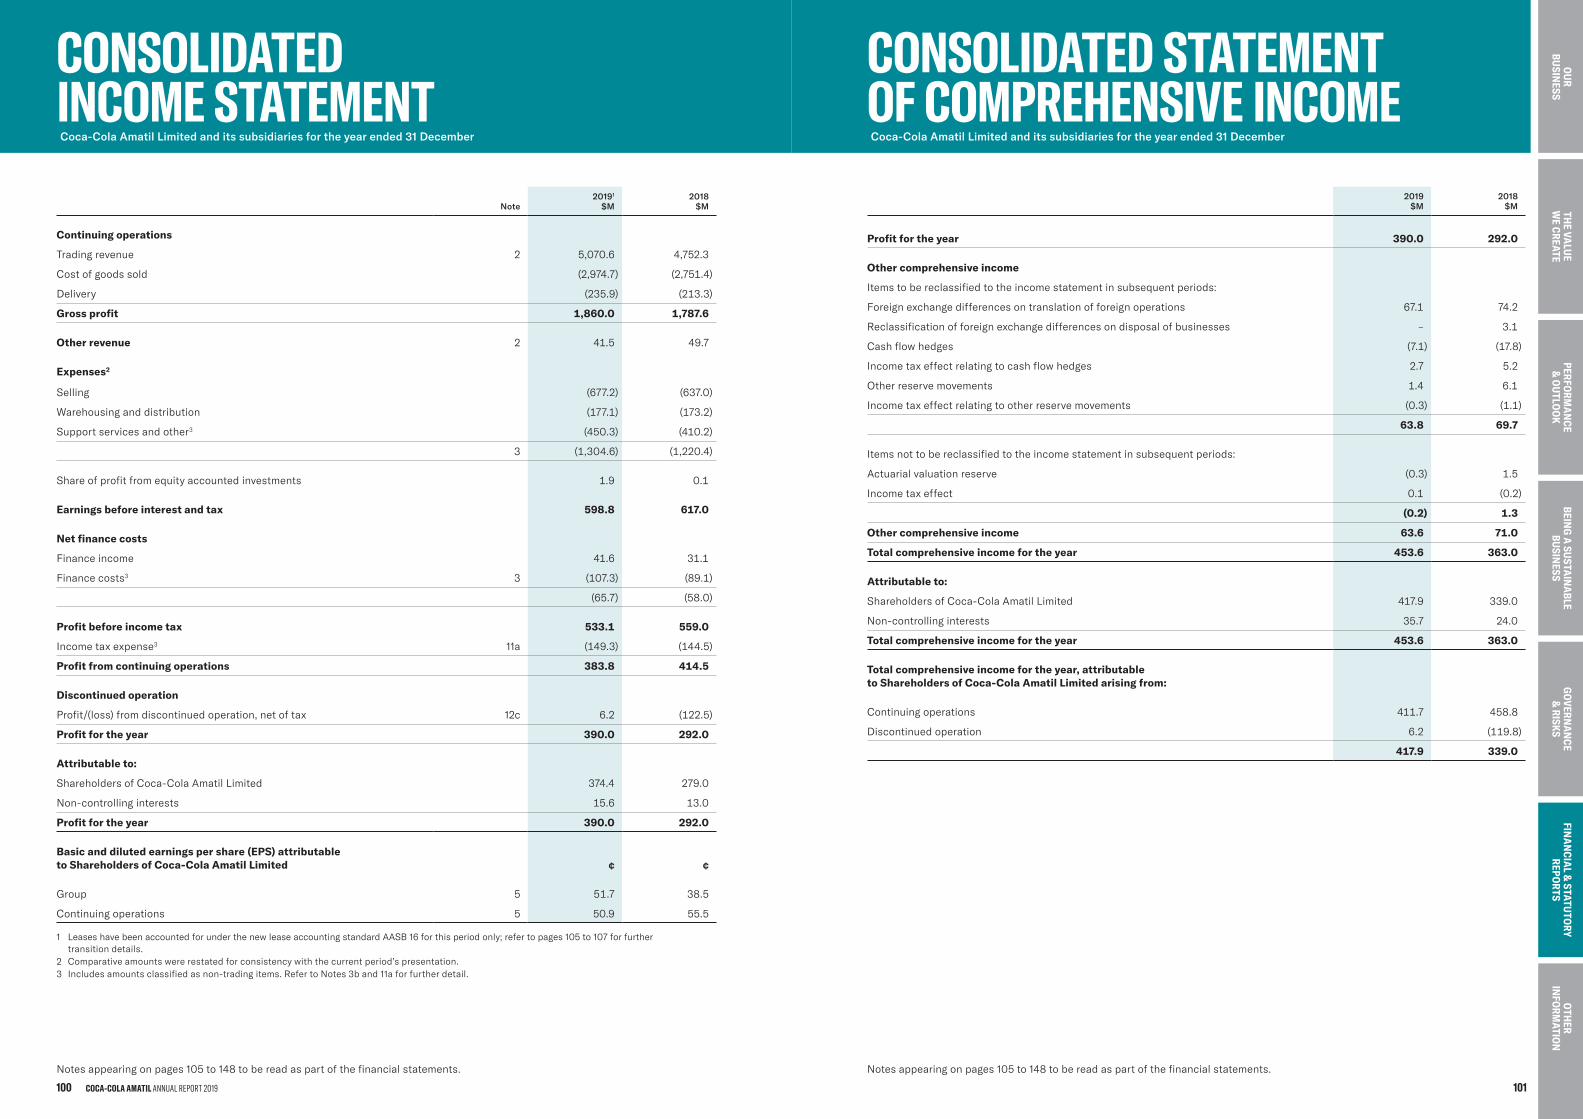
CONSOLIDATED INCOME STATEMENTCoca-Cola Amatil Limited and its subsidiaries for the year ended 31 December
Note20191
$M2018
$M
Continuing operations
Tradingrevenue 2 5,070.6 4,752.3
Costofgoodssold (2,974.7) (2,751.4)
Delivery (235.9) (213.3)
Gross profit 1,860.0 1,787.6
Other revenue 2 41.5 49.7
Expenses2
Selling (677.2) (637.0)
Warehousinganddistribution (177.1) (173.2)
Supportservicesandother3 (450.3) (410.2)
3 (1,304.6) (1,220.4)
Shareofprofitfromequityaccountedinvestments 1.9 0.1
Earnings before interest and tax 598.8 617.0
Net finance costs
Financeincome 41.6 31.1
Financecosts3 3 (107.3) (89.1)
(65.7) (58.0)
Profit before income tax 533.1 559.0
Incometaxexpense3 11a (149.3) (144.5)
Profit from continuing operations 383.8 414.5
Discontinued operation
Profit/(loss)fromdiscontinuedoperation,netoftax 12c 6.2 (122.5)
Profit for the year 390.0 292.0
Attributable to:
ShareholdersofCoca-ColaAmatilLimited 374.4 279.0
Non-controllinginterests 15.6 13.0
Profit for the year 390.0 292.0
Basic and diluted earnings per share (EPS) attributable to Shareholders of Coca-Cola Amatil Limited ¢ ¢
Group 5 51.7 38.5
Continuingoperations 5 50.9 55.5
1 LeaseshavebeenaccountedforunderthenewleaseaccountingstandardAASB16forthisperiodonly;refertopages105to107forfurthertransitiondetails.
2 Comparativeamountswererestatedforconsistencywiththecurrentperiod’spresentation.3 Includesamountsclassifiedasnon-tradingitems.RefertoNotes3band11aforfurtherdetail.
CONSOLIDATED STATEMENT OF COMPREHENSIVE INCOMECoca-Cola Amatil Limited and its subsidiaries for the year ended 31 December
2019 $M
2018 $M
Profit for the year 390.0 292.0
Other comprehensive income
Itemstobereclassifiedtotheincomestatementinsubsequentperiods:
Foreignexchangedifferencesontranslationofforeignoperations 67.1 74.2
Reclassificationofforeignexchangedifferencesondisposalofbusinesses – 3.1
Cashflowhedges (7.1) (17.8)
Incometaxeffectrelatingtocashflowhedges 2.7 5.2
Otherreservemovements 1.4 6.1
Incometaxeffectrelatingtootherreservemovements (0.3) (1.1)
63.8 69.7
Itemsnottobereclassifiedtotheincomestatementinsubsequentperiods:
Actuarialvaluationreserve (0.3) 1.5
Incometaxeffect 0.1 (0.2)
(0.2) 1.3
Other comprehensive income 63.6 71.0
Total comprehensive income for the year 453.6 363.0
Attributable to:
ShareholdersofCoca-ColaAmatilLimited 417.9 339.0
Non-controllinginterests 35.7 24.0
Total comprehensive income for the year 453.6 363.0
Total comprehensive income for the year, attributable to Shareholders of Coca-Cola Amatil Limited arising from:
Continuingoperations 411.7 458.8
Discontinuedoperation 6.2 (119.8)
417.9 339.0
COCA-COLA AMATIL ANNUAL REPORT 2019100 101
BEING
A SU
STAIN
ABLE
BUSIN
ESSTH
E VALU
E W
E CREATEPERFO
RMA
NCE
& O
UTLO
OK
GO
VERNA
NCE
& RISK
SFIN
AN
CIAL &
STATUTO
RY REPO
RTS
OTH
ER IN
FORM
ATION
OU
R BU
SINESS
Notesappearingonpages105to148tobereadaspartofthefinancialstatements. Notesappearingonpages105to148tobereadaspartofthefinancialstatements.
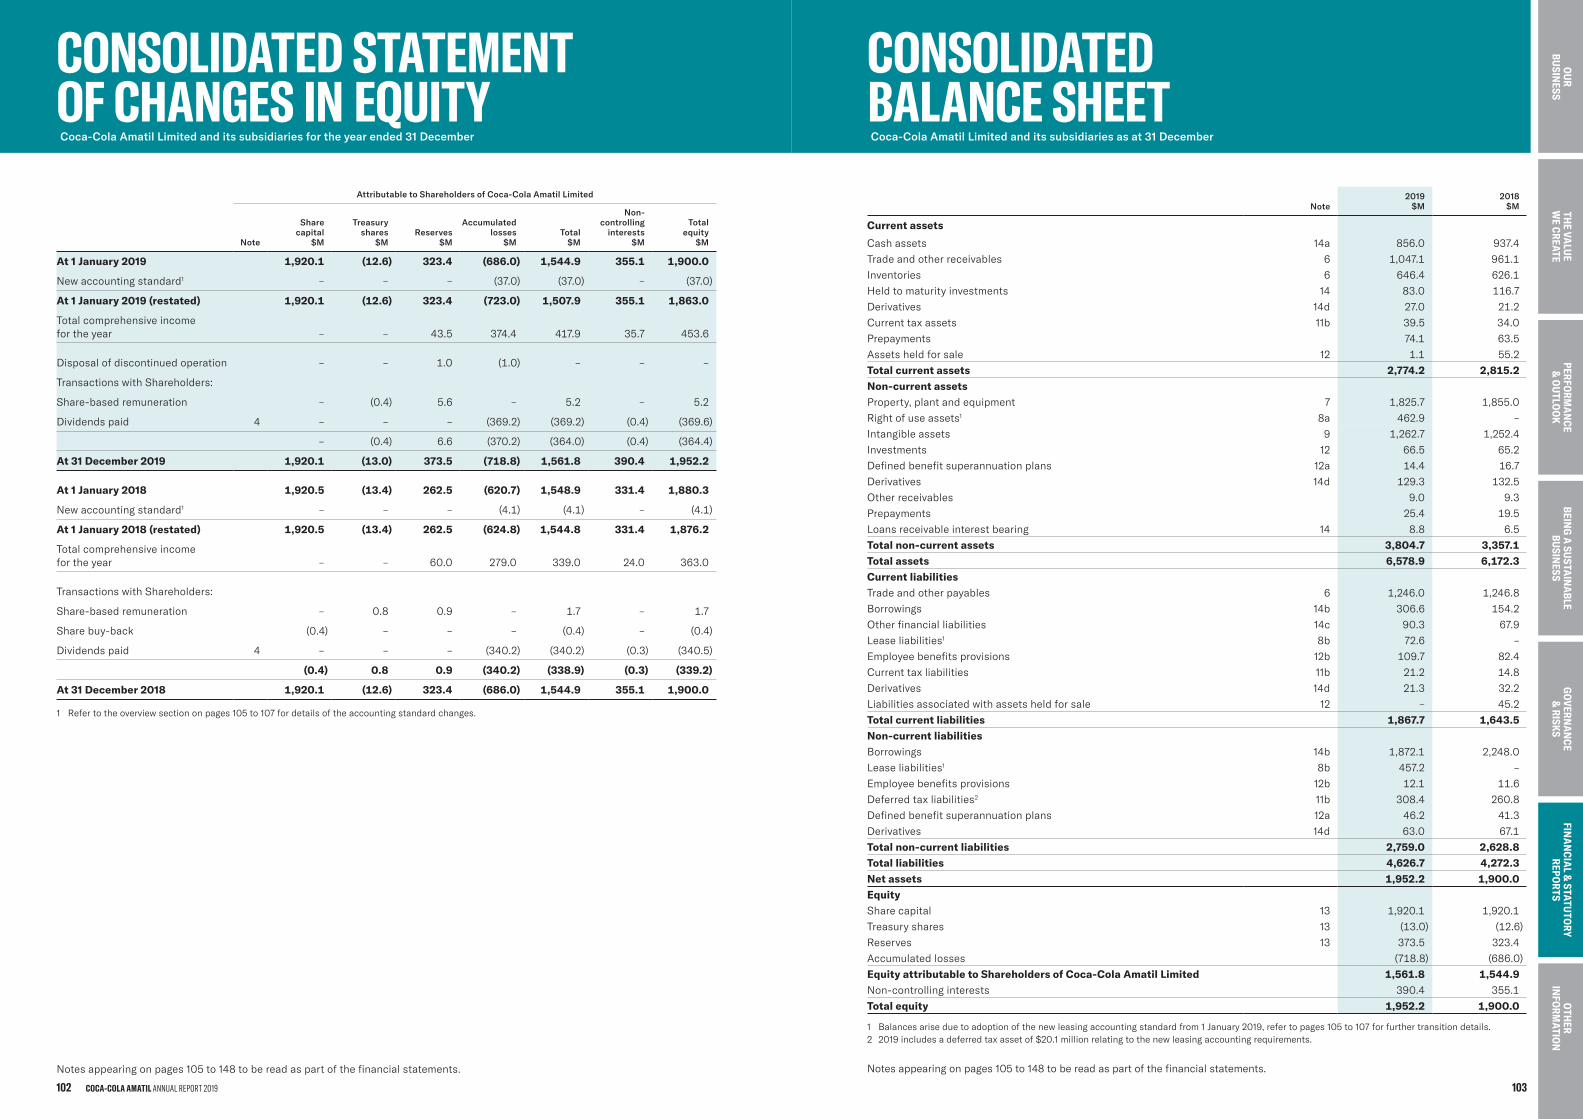
CONSOLIDATED STATEMENT OF CHANGES IN EQUITYCoca-Cola Amatil Limited and its subsidiaries for the year ended 31 December
Attributable to Shareholders of Coca-Cola Amatil Limited
Note
Sharecapital
$M
Treasuryshares
$MReserves
$M
Accumulatedlosses
$MTotal
$M
Non-controlling
interests$M
Totalequity
$M
At 1 January 2019 1,920.1 (12.6) 323.4 (686.0) 1,544.9 355.1 1,900.0
Newaccountingstandard1 – – – (37.0) (37.0) – (37.0)
At 1 January 2019 (restated) 1,920.1 (12.6) 323.4 (723.0) 1,507.9 355.1 1,863.0
Totalcomprehensiveincomefor the year – – 43.5 374.4 417.9 35.7 453.6
Disposalofdiscontinuedoperation – – 1.0 (1.0) – – –
TransactionswithShareholders:
Share-basedremuneration – (0.4) 5.6 – 5.2 – 5.2
Dividendspaid 4 – – – (369.2) (369.2) (0.4) (369.6)
– (0.4) 6.6 (370.2) (364.0) (0.4) (364.4)
At 31 December 2019 1,920.1 (13.0) 373.5 (718.8) 1,561.8 390.4 1,952.2
At 1 January 2018 1,920.5 (13.4) 262.5 (620.7) 1,548.9 331.4 1,880.3
Newaccountingstandard1 – – – (4.1) (4.1) – (4.1)
At 1 January 2018 (restated) 1,920.5 (13.4) 262.5 (624.8) 1,544.8 331.4 1,876.2
Totalcomprehensiveincomefor the year – – 60.0 279.0 339.0 24.0 363.0
TransactionswithShareholders:
Share-basedremuneration – 0.8 0.9 – 1.7 – 1.7
Sharebuy-back (0.4) – – – (0.4) – (0.4)
Dividendspaid 4 – – – (340.2) (340.2) (0.3) (340.5)
(0.4) 0.8 0.9 (340.2) (338.9) (0.3) (339.2)
At 31 December 2018 1,920.1 (12.6) 323.4 (686.0) 1,544.9 355.1 1,900.0
1 Refertotheoverviewsectiononpages105to107fordetailsoftheaccountingstandardchanges.
Note2019
$M2018
$M
Current assets
Cashassets 14a 856.0 937.4
Tradeandotherreceivables 6 1,047.1 961.1
Inventories 6 646.4 626.1
Heldtomaturityinvestments 14 83.0 116.7
Derivatives 14d 27.0 21.2
Currenttaxassets 11b 39.5 34.0
Prepayments 74.1 63.5
Assetsheldforsale 12 1.1 55.2
Total current assets 2,774.2 2,815.2Non-current assetsProperty,plantandequipment 7 1,825.7 1,855.0
Rightofuseassets1 8a 462.9 –
Intangibleassets 9 1,262.7 1,252.4
Investments 12 66.5 65.2
Definedbenefitsuperannuationplans 12a 14.4 16.7
Derivatives 14d 129.3 132.5
Otherreceivables 9.0 9.3
Prepayments 25.4 19.5
Loansreceivableinterestbearing 14 8.8 6.5
Total non-current assets 3,804.7 3,357.1Total assets 6,578.9 6,172.3Current liabilitiesTradeandotherpayables 6 1,246.0 1,246.8
Borrowings 14b 306.6 154.2
Otherfinancialliabilities 14c 90.3 67.9
Leaseliabilities1 8b 72.6 –
Employeebenefitsprovisions 12b 109.7 82.4
Currenttaxliabilities 11b 21.2 14.8
Derivatives 14d 21.3 32.2
Liabilitiesassociatedwithassetsheldforsale 12 – 45.2
Total current liabilities 1,867.7 1,643.5Non-current liabilitiesBorrowings 14b 1,872.1 2,248.0
Leaseliabilities1 8b 457.2 –
Employeebenefitsprovisions 12b 12.1 11.6
Deferredtaxliabilities2 11b 308.4 260.8
Definedbenefitsuperannuationplans 12a 46.2 41.3
Derivatives 14d 63.0 67.1
Total non-current liabilities 2,759.0 2,628.8Total liabilities 4,626.7 4,272.3Net assets 1,952.2 1,900.0EquitySharecapital 13 1,920.1 1,920.1
Treasuryshares 13 (13.0) (12.6)
Reserves 13 373.5 323.4
Accumulatedlosses (718.8) (686.0)
Equity attributable to Shareholders of Coca-Cola Amatil Limited 1,561.8 1,544.9Non-controllinginterests 390.4 355.1
Total equity 1,952.2 1,900.0
CONSOLIDATED BALANCE SHEETCoca-Cola Amatil Limited and its subsidiaries as at 31 December
COCA-COLA AMATIL ANNUAL REPORT 2019102 103
BEING
A SU
STAIN
ABLE
BUSIN
ESSTH
E VALU
E W
E CREATEPERFO
RMA
NCE
& O
UTLO
OK
GO
VERNA
NCE
& RISK
SFIN
AN
CIAL &
STATUTO
RY REPO
RTS
OTH
ER IN
FORM
ATION
OU
R BU
SINESS
Notesappearingonpages105to148tobereadaspartofthefinancialstatements.
1 Balancesariseduetoadoptionofthenewleasingaccountingstandardfrom1January2019,refertopages105to107forfurthertransitiondetails. 2 2019includesadeferredtaxassetof$20.1millionrelatingtothenewleasingaccountingrequirements.
Notesappearingonpages105to148tobereadaspartofthefinancialstatements.
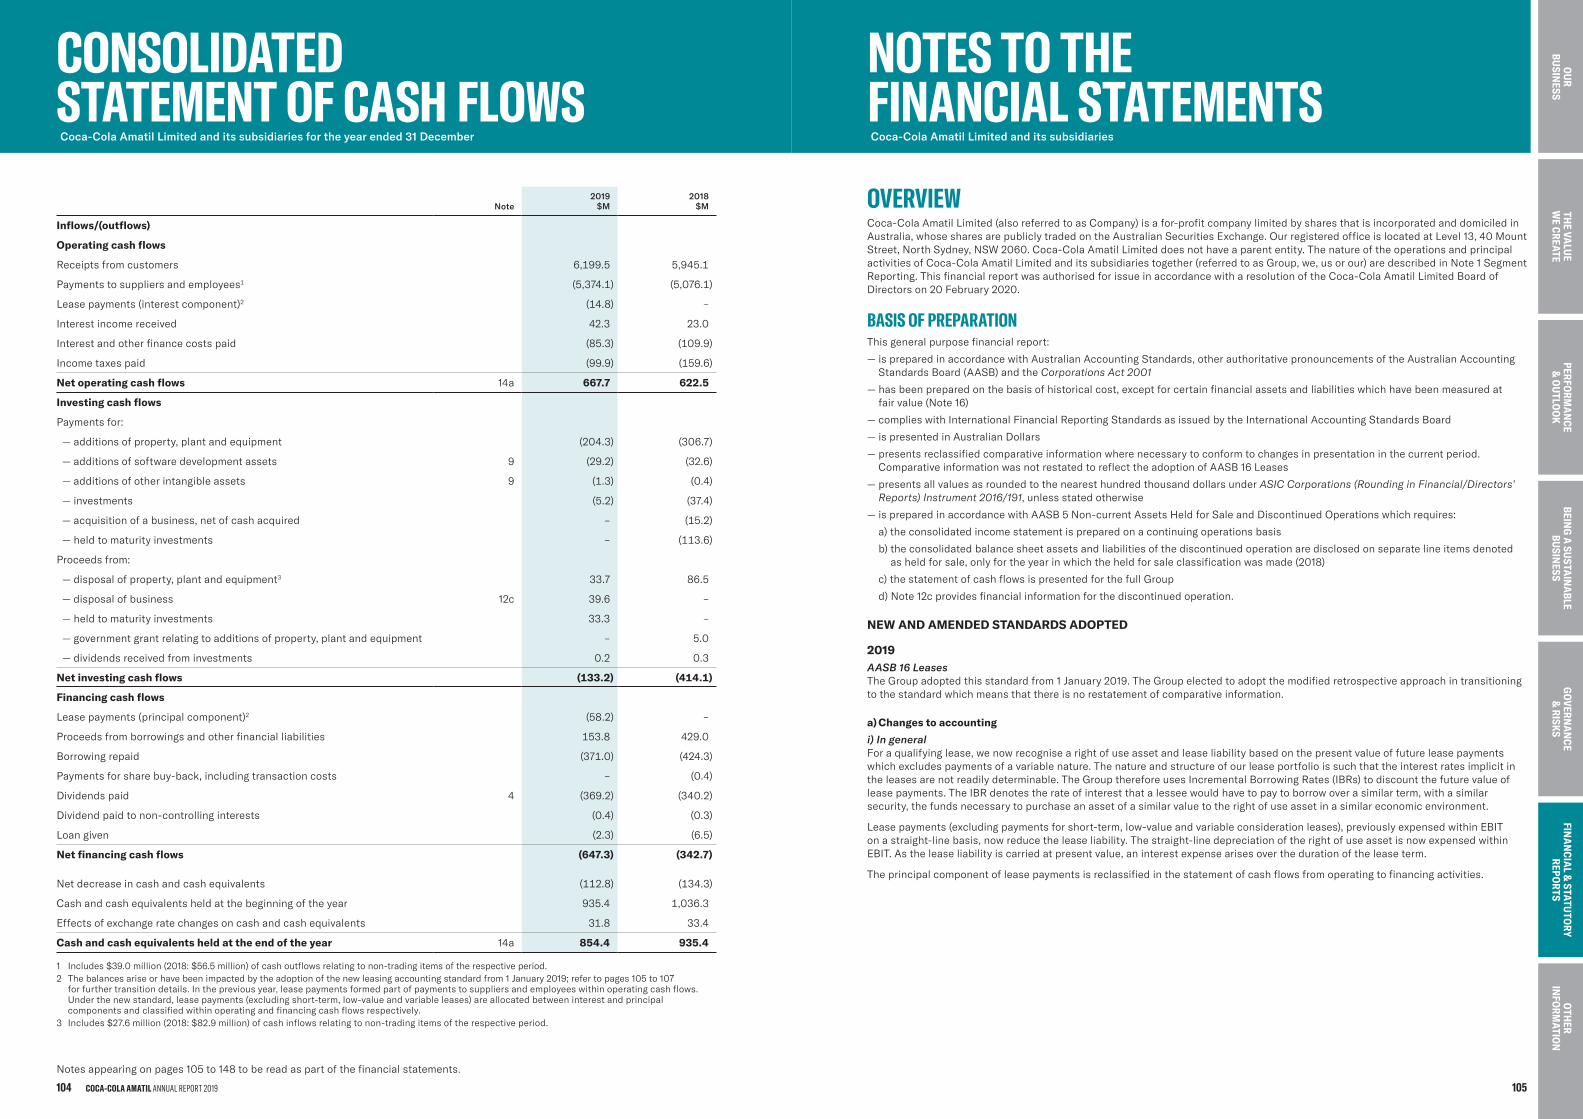
Note2019
$M2018
$M
Inflows/(outflows)
Operating cash flows
Receiptsfromcustomers 6,199.5 5,945.1
Paymentstosuppliersandemployees1 (5,374.1) (5,076.1)
Leasepayments(interestcomponent)2 (14.8) –
Interestincomereceived 42.3 23.0
Interestandotherfinancecostspaid (85.3) (109.9)
Incometaxespaid (99.9) (159.6)
Net operating cash flows 14a 667.7 622.5
Investing cash flows
Paymentsfor:
— additionsofproperty,plantandequipment (204.3) (306.7)
— additionsofsoftwaredevelopmentassets 9 (29.2) (32.6)
— additionsofotherintangibleassets 9 (1.3) (0.4)
— investments (5.2) (37.4)
— acquisitionofabusiness,netofcashacquired – (15.2)
— heldtomaturityinvestments – (113.6)
Proceedsfrom:
— disposalofproperty,plantandequipment3 33.7 86.5
— disposalofbusiness 12c 39.6 –
— heldtomaturityinvestments 33.3 –
— governmentgrantrelatingtoadditionsofproperty,plantandequipment – 5.0
— dividendsreceivedfrominvestments 0.2 0.3
Net investing cash flows (133.2) (414.1)
Financing cash flows
Leasepayments(principalcomponent)2 (58.2) –
Proceedsfromborrowingsandotherfinancialliabilities 153.8 429.0
Borrowingrepaid (371.0) (424.3)
Paymentsforsharebuy-back,includingtransactioncosts – (0.4)
Dividendspaid 4 (369.2) (340.2)
Dividendpaidtonon-controllinginterests (0.4) (0.3)
Loangiven (2.3) (6.5)
Net financing cash flows (647.3) (342.7)
Netdecreaseincashandcashequivalents (112.8) (134.3)
Cashandcashequivalentsheldatthebeginningoftheyear 935.4 1,036.3
Effectsofexchangeratechangesoncashandcashequivalents 31.8 33.4
Cash and cash equivalents held at the end of the year 14a 854.4 935.4
1 Includes$39.0million(2018:$56.5million)ofcashoutflowsrelatingtonon-tradingitemsoftherespectiveperiod.2 Thebalancesariseorhavebeenimpactedbytheadoptionofthenewleasingaccountingstandardfrom1January2019;refertopages105to107for furthertransitiondetails.Inthepreviousyear,leasepaymentsformedpartofpaymentstosuppliersandemployeeswithinoperatingcashflows.Underthenewstandard,leasepayments(excludingshort-term,low-valueandvariableleases)areallocatedbetweeninterestandprincipalcomponentsandclassifiedwithinoperatingandfinancingcashflowsrespectively.
3 Includes$27.6million(2018:$82.9million)ofcashinflowsrelatingtonon-tradingitemsoftherespectiveperiod.
NOTES TO THE FINANCIAL STATEMENTS Coca-Cola Amatil Limited and its subsidiaries
CONSOLIDATED STATEMENT OF CASH FLOWSCoca-Cola Amatil Limited and its subsidiaries for the year ended 31 December
OVERVIEWCoca-ColaAmatilLimited(alsoreferredtoasCompany)isafor-profitcompanylimitedbysharesthatisincorporatedanddomiciledinAustralia,whosesharesarepubliclytradedontheAustralianSecuritiesExchange.OurregisteredofficeislocatedatLevel13,40MountStreet,NorthSydney,NSW2060.Coca-ColaAmatilLimiteddoesnothaveaparententity.ThenatureoftheoperationsandprincipalactivitiesofCoca-ColaAmatilLimitedanditssubsidiariestogether(referredtoasGroup,we,usorour)aredescribedinNote1SegmentReporting.ThisfinancialreportwasauthorisedforissueinaccordancewitharesolutionoftheCoca-ColaAmatilLimitedBoardofDirectorson20February2020.
BASIS OF PREPARATIONThisgeneralpurposefinancialreport:
— ispreparedinaccordancewithAustralianAccountingStandards,otherauthoritativepronouncementsoftheAustralianAccountingStandardsBoard(AASB)andtheCorporations Act 2001
— hasbeenpreparedonthebasisofhistoricalcost,exceptforcertainfinancialassetsandliabilitieswhichhavebeenmeasuredatfair value(Note16)
— complieswithInternationalFinancialReportingStandardsasissuedbytheInternationalAccountingStandardsBoard
— ispresentedinAustralianDollars
— presentsreclassifiedcomparativeinformationwherenecessarytoconformtochangesinpresentationinthecurrentperiod.ComparativeinformationwasnotrestatedtoreflecttheadoptionofAASB16Leases
— presentsallvaluesasroundedtothenearesthundredthousanddollarsunderASIC Corporations (Rounding in Financial/Directors’ Reports) Instrument 2016/191,unlessstatedotherwise
— ispreparedinaccordancewithAASB5Non-currentAssetsHeldforSaleandDiscontinuedOperationswhichrequires:
a) theconsolidatedincomestatementispreparedonacontinuingoperationsbasis
b) theconsolidatedbalancesheetassetsandliabilitiesofthediscontinuedoperationaredisclosedonseparatelineitemsdenotedasheldforsale,onlyfortheyearinwhichtheheldforsaleclassificationwasmade(2018)
c) thestatementofcashflowsispresentedforthefullGroup
d) Note12cprovidesfinancialinformationforthediscontinuedoperation.
NEW AND AMENDED STANDARDS ADOPTED
2019AASB 16 LeasesTheGroupadoptedthisstandardfrom1January2019.TheGroupelectedtoadoptthemodifiedretrospectiveapproachintransitioningtothestandardwhichmeansthatthereisnorestatementofcomparativeinformation.
a) Changes to accounting
i) In generalForaqualifyinglease,wenowrecognisearightofuseassetandleaseliabilitybasedonthepresentvalueoffutureleasepaymentswhichexcludespaymentsofavariablenature.Thenatureandstructureofourleaseportfolioissuchthattheinterestratesimplicitintheleasesarenotreadilydeterminable.TheGroupthereforeusesIncrementalBorrowingRates(IBRs)todiscountthefuturevalueofleasepayments.TheIBRdenotestherateofinterestthatalesseewouldhavetopaytoborrowoverasimilarterm,withasimilarsecurity,thefundsnecessarytopurchaseanassetofasimilarvaluetotherightofuseassetinasimilareconomicenvironment.
Leasepayments(excludingpaymentsforshort-term,low-valueandvariableconsiderationleases),previouslyexpensedwithinEBITon a straight-linebasis,nowreducetheleaseliability.Thestraight-linedepreciationoftherightofuseassetisnowexpensedwithinEBIT.Astheleaseliabilityiscarriedatpresentvalue,aninterestexpensearisesoverthedurationoftheleaseterm.
Theprincipalcomponentofleasepaymentsisreclassifiedinthestatementofcashflowsfromoperatingtofinancingactivities.
COCA-COLA AMATIL ANNUAL REPORT 2019104 105
BEING
A SU
STAIN
ABLE
BUSIN
ESSTH
E VALU
E W
E CREATEPERFO
RMA
NCE
& O
UTLO
OK
GO
VERNA
NCE
& RISK
SFIN
AN
CIAL &
STATUTO
RY REPO
RTS
OTH
ER IN
FORM
ATION
OU
R BU
SINESS
Notesappearingonpages105to148tobereadaspartofthefinancialstatements.
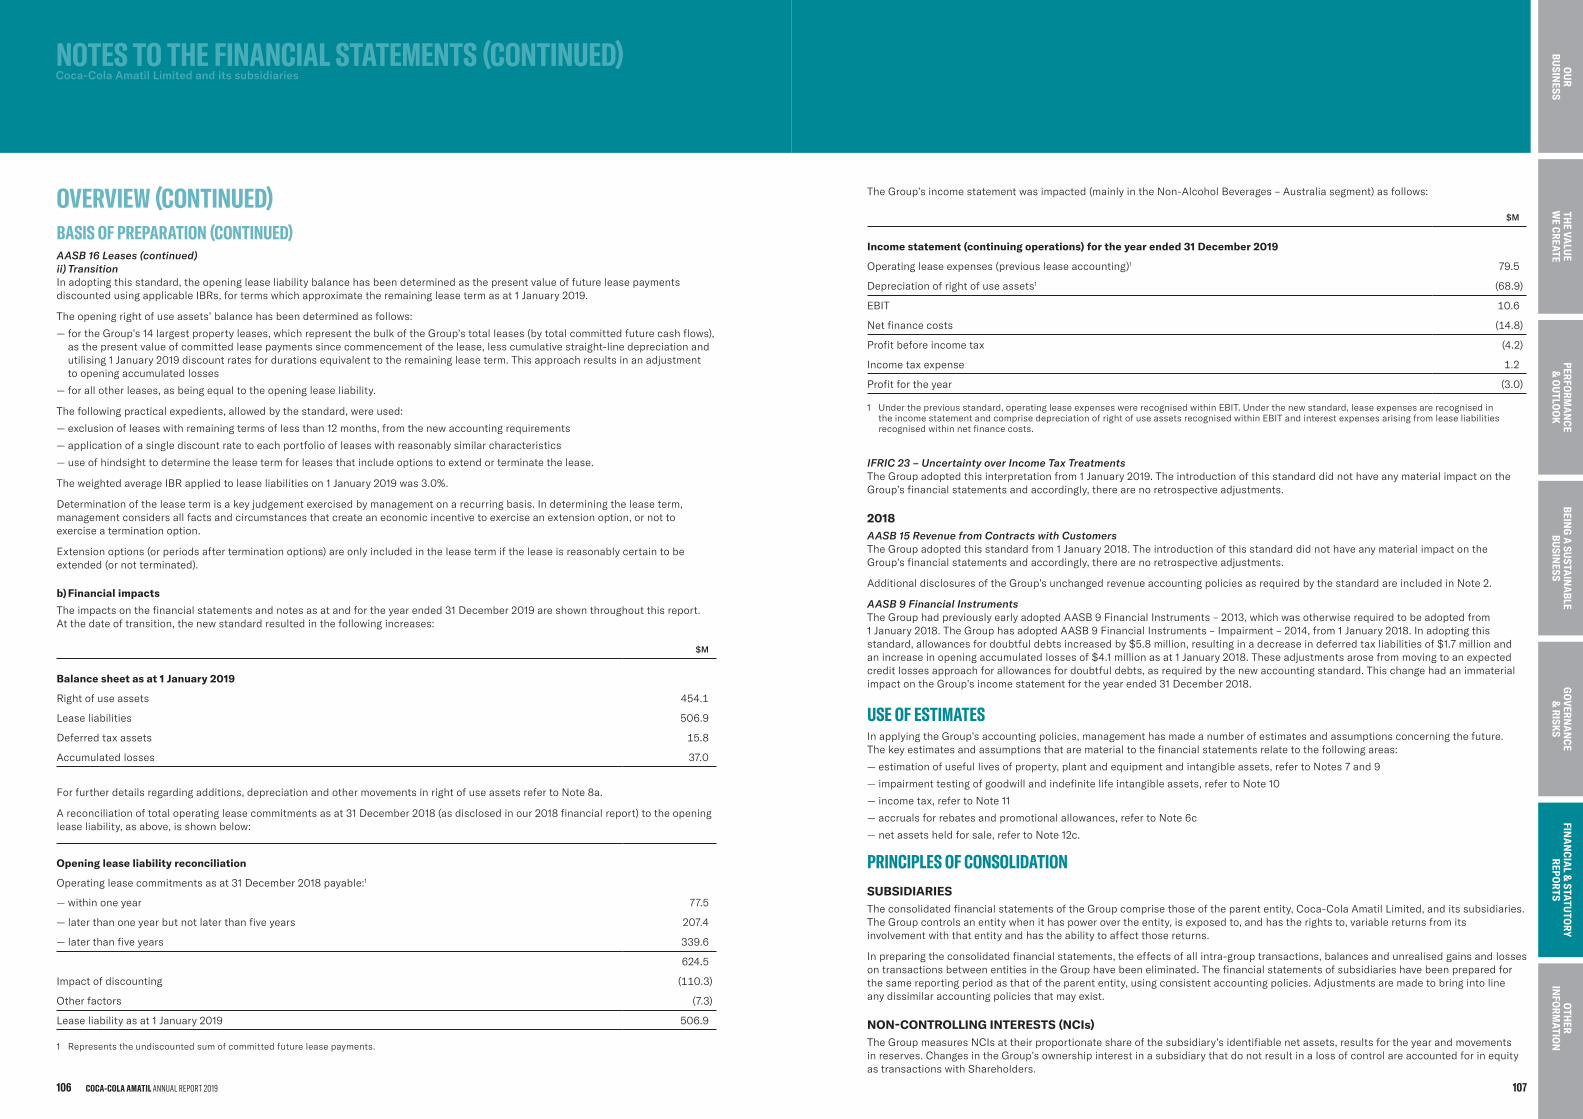
AASB 16 Leases (continued)ii) TransitionInadoptingthisstandard,theopeningleaseliabilitybalancehasbeendeterminedasthepresentvalueoffutureleasepaymentsdiscountedusingapplicableIBRs,fortermswhichapproximatetheremainingleasetermasat1January2019.
Theopeningrightofuseassets’balancehasbeendeterminedasfollows:
— fortheGroup’s14largestpropertyleases,whichrepresentthebulkoftheGroup’stotalleases(bytotalcommittedfuturecashflows),asthepresentvalueofcommittedleasepaymentssincecommencementofthelease,lesscumulativestraight-linedepreciationandutilising1January2019discountratesfordurationsequivalenttotheremainingleaseterm.Thisapproachresultsinanadjustmentto openingaccumulatedlosses
— forallotherleases,asbeingequaltotheopeningleaseliability.
Thefollowingpracticalexpedients,allowedbythestandard,wereused:
— exclusionofleaseswithremainingtermsoflessthan12months,fromthenewaccountingrequirements
— applicationofasinglediscountratetoeachportfolioofleaseswithreasonablysimilarcharacteristics
— useofhindsighttodeterminetheleasetermforleasesthatincludeoptionstoextendorterminatethelease.
TheweightedaverageIBRappliedtoleaseliabilitieson1January2019was3.0%.
Determinationoftheleasetermisakeyjudgementexercisedbymanagementonarecurringbasis.Indeterminingtheleaseterm,managementconsidersallfactsandcircumstancesthatcreateaneconomicincentivetoexerciseanextensionoption,ornottoexerciseaterminationoption.
Extensionoptions(orperiodsafterterminationoptions)areonlyincludedintheleasetermiftheleaseisreasonablycertaintobeextended(ornotterminated).
b) Financial impacts
Theimpactsonthefinancialstatementsandnotesasatandfortheyearended31December2019areshownthroughoutthisreport.At thedateoftransition,thenewstandardresultedinthefollowingincreases:
$M
Balance sheet as at 1 January 2019
Rightofuseassets 454.1
Leaseliabilities 506.9
Deferredtaxassets 15.8
Accumulatedlosses 37.0
Forfurtherdetailsregardingadditions,depreciationandothermovementsinrightofuseassetsrefertoNote8a.
Areconciliationoftotaloperatingleasecommitmentsasat31December2018(asdisclosedinour2018financialreport)totheopeningleaseliability,asabove,isshownbelow:
Opening lease liability reconciliation
Operatingleasecommitmentsasat31December2018payable:1
— withinoneyear 77.5
— laterthanoneyearbutnotlaterthanfiveyears 207.4
— laterthanfiveyears 339.6
624.5
Impactofdiscounting (110.3)
Otherfactors (7.3)
Leaseliabilityasat1January2019 506.9
1 Representstheundiscountedsumofcommittedfutureleasepayments.
TheGroup’sincomestatementwasimpacted(mainlyintheNon-AlcoholBeverages–Australiasegment)asfollows:
$M
Income statement (continuing operations) for the year ended 31 December 2019
Operatingleaseexpenses(previousleaseaccounting)1 79.5
Depreciationofrightofuseassets1 (68.9)
EBIT 10.6
Netfinancecosts (14.8)
Profitbeforeincometax (4.2)
Incometaxexpense 1.2
Profitfortheyear (3.0)
1 Underthepreviousstandard,operatingleaseexpenseswererecognisedwithinEBIT.Underthenewstandard,leaseexpensesarerecognisedinthe incomestatementandcomprisedepreciationofrightofuseassetsrecognisedwithinEBITandinterestexpensesarisingfromleaseliabilitiesrecognisedwithinnetfinancecosts.
IFRIC 23 – Uncertainty over Income Tax TreatmentsTheGroupadoptedthisinterpretationfrom1January2019.TheintroductionofthisstandarddidnothaveanymaterialimpactontheGroup’sfinancialstatementsandaccordingly,therearenoretrospectiveadjustments.
2018AASB 15 Revenue from Contracts with CustomersTheGroupadoptedthisstandardfrom1January2018.TheintroductionofthisstandarddidnothaveanymaterialimpactontheGroup’sfinancialstatementsandaccordingly,therearenoretrospectiveadjustments.
AdditionaldisclosuresoftheGroup’sunchangedrevenueaccountingpoliciesasrequiredbythestandardareincludedinNote2.
AASB 9 Financial InstrumentsTheGrouphadpreviouslyearlyadoptedAASB9FinancialInstruments–2013,whichwasotherwiserequiredtobeadoptedfrom1 January2018.TheGrouphasadoptedAASB9FinancialInstruments–Impairment–2014,from1January2018.Inadoptingthisstandard,allowancesfordoubtfuldebtsincreasedby$5.8million,resultinginadecreaseindeferredtaxliabilitiesof$1.7millionandan increaseinopeningaccumulatedlossesof$4.1millionasat1January2018.Theseadjustmentsarosefrommovingtoanexpectedcreditlossesapproachforallowancesfordoubtfuldebts,asrequiredbythenewaccountingstandard.ThischangehadanimmaterialimpactontheGroup’sincomestatementfortheyearended31December2018.
USE OF ESTIMATESInapplyingtheGroup’saccountingpolicies,managementhasmadeanumberofestimatesandassumptionsconcerningthefuture.The keyestimatesandassumptionsthatarematerialtothefinancialstatementsrelatetothefollowingareas:
— estimationofusefullivesofproperty,plantandequipmentandintangibleassets,refertoNotes7and9
— impairmenttestingofgoodwillandindefinitelifeintangibleassets,refertoNote10
— incometax,refertoNote11
— accrualsforrebatesandpromotionalallowances,refertoNote6c
— netassetsheldforsale,refertoNote12c.
PRINCIPLES OF CONSOLIDATIONSUBSIDIARIESTheconsolidatedfinancialstatementsoftheGroupcomprisethoseoftheparententity,Coca-ColaAmatilLimited,anditssubsidiaries.TheGroupcontrolsanentitywhenithaspowerovertheentity,isexposedto,andhastherightsto,variablereturnsfromitsinvolvementwiththatentityandhastheabilitytoaffectthosereturns.
Inpreparingtheconsolidatedfinancialstatements,theeffectsofallintra-grouptransactions,balancesandunrealisedgainsandlossesontransactionsbetweenentitiesintheGrouphavebeeneliminated.Thefinancialstatementsofsubsidiarieshavebeenpreparedforthesamereportingperiodasthatoftheparententity,usingconsistentaccountingpolicies.Adjustmentsaremadetobringintolineany dissimilaraccountingpoliciesthatmayexist.
NON-CONTROLLING INTERESTS (NCIs)TheGroupmeasuresNCIsattheirproportionateshareofthesubsidiary’sidentifiablenetassets,resultsfortheyearandmovementsin reserves.ChangesintheGroup’sownershipinterestinasubsidiarythatdonotresultinalossofcontrolareaccountedforinequityastransactionswithShareholders.
NOTESTOTHEFINANCIALSTATEMENTS(CONTINUED) Coca-Cola Amatil Limited and its subsidiaries
OVERVIEW(CONTINUED)BASISOFPREPARATION(CONTINUED)
COCA-COLA AMATIL ANNUAL REPORT 2019106 107
BEING
A SU
STAIN
ABLE
BUSIN
ESSTH
E VALU
E W
E CREATEPERFO
RMA
NCE
& O
UTLO
OK
GO
VERNA
NCE
& RISK
SFIN
AN
CIAL &
STATUTO
RY REPO
RTS
OTH
ER IN
FORM
ATION
OU
R BU
SINESS
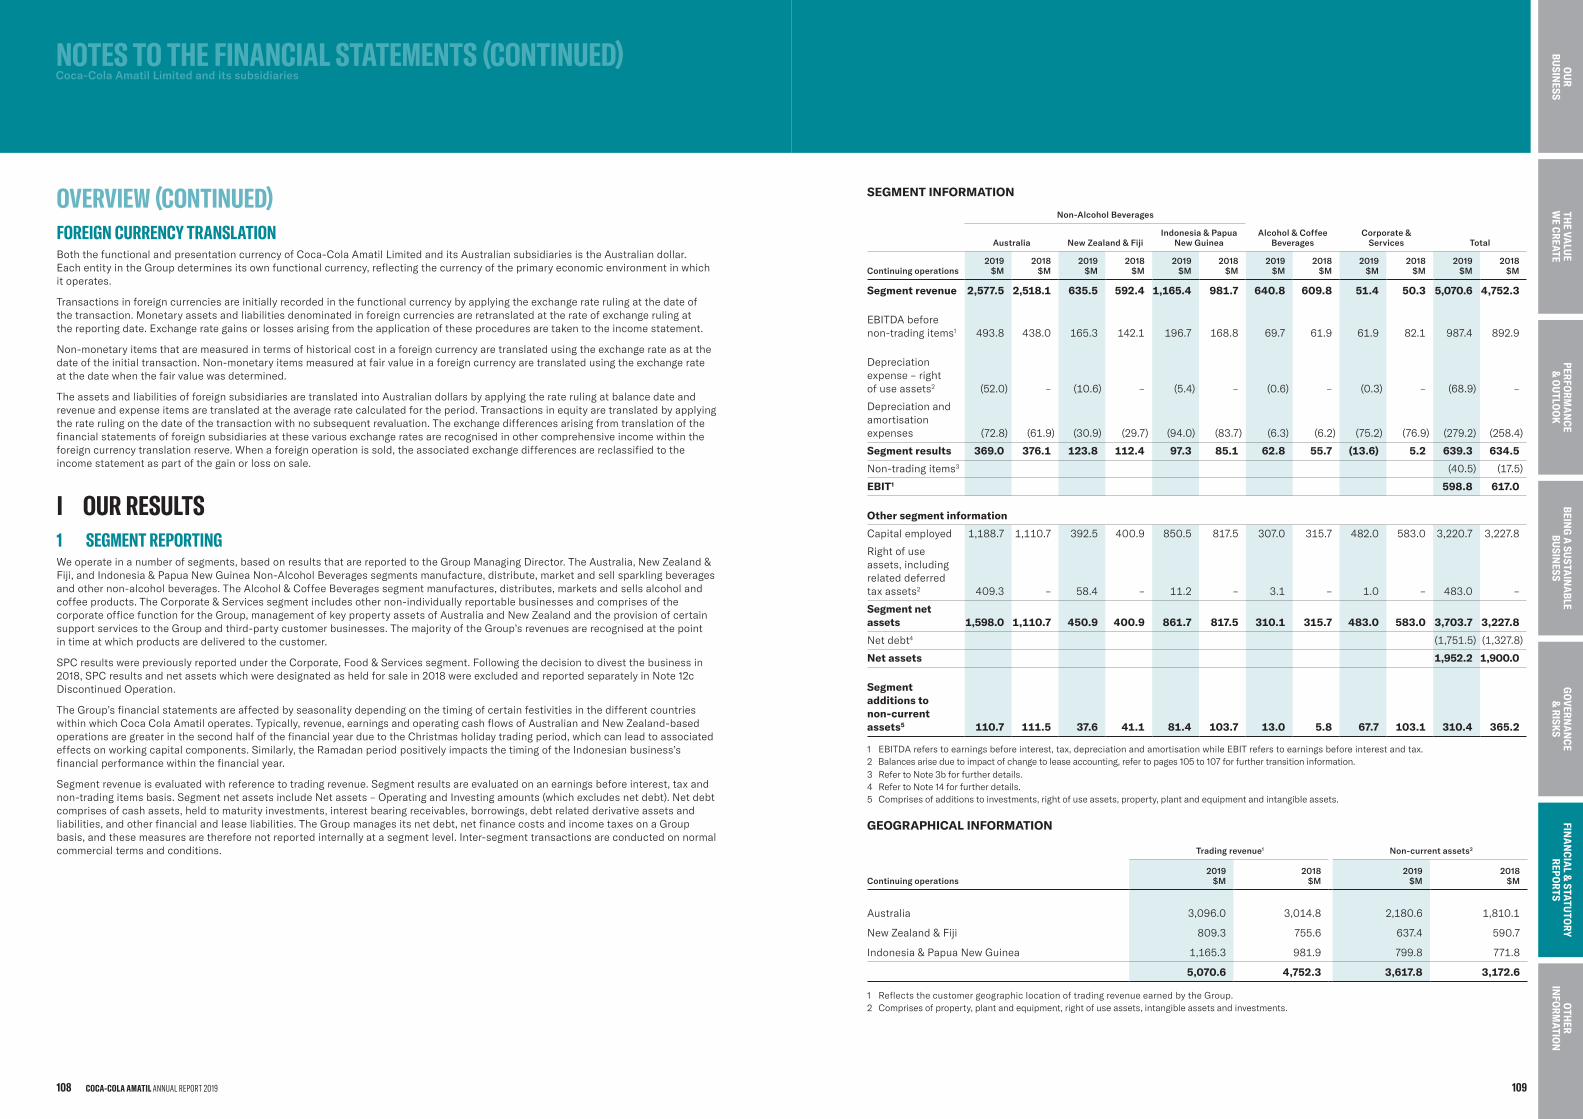
FOREIGN CURRENCY TRANSLATIONBoththefunctionalandpresentationcurrencyofCoca-ColaAmatilLimitedanditsAustraliansubsidiariesistheAustraliandollar.Each entityintheGroupdeterminesitsownfunctionalcurrency,reflectingthecurrencyoftheprimaryeconomicenvironmentinwhichitoperates.
Transactionsinforeigncurrenciesareinitiallyrecordedinthefunctionalcurrencybyapplyingtheexchangeraterulingatthedateofthe transaction.Monetaryassetsandliabilitiesdenominatedinforeigncurrenciesareretranslatedattherateofexchangerulingatthe reportingdate.Exchangerategainsorlossesarisingfromtheapplicationoftheseproceduresaretakentotheincomestatement.
Non-monetaryitemsthataremeasuredintermsofhistoricalcostinaforeigncurrencyaretranslatedusingtheexchangerateasatthedateoftheinitialtransaction.Non-monetaryitemsmeasuredatfairvalueinaforeigncurrencyaretranslatedusingtheexchangerateatthedatewhenthefairvaluewasdetermined.
TheassetsandliabilitiesofforeignsubsidiariesaretranslatedintoAustraliandollarsbyapplyingtheraterulingatbalancedateandrevenueandexpenseitemsaretranslatedattheaverageratecalculatedfortheperiod.Transactionsinequityaretranslatedbyapplyingtheraterulingonthedateofthetransactionwithnosubsequentrevaluation.Theexchangedifferencesarisingfromtranslationofthefinancialstatementsofforeignsubsidiariesatthesevariousexchangeratesarerecognisedinothercomprehensiveincomewithintheforeigncurrencytranslationreserve.Whenaforeignoperationissold,theassociatedexchangedifferencesarereclassifiedtotheincomestatementaspartofthegainorlossonsale.
I OUR RESULTS1 SEGMENTREPORTINGWeoperateinanumberofsegments,basedonresultsthatarereportedtotheGroupManagingDirector.TheAustralia,NewZealand&Fiji,andIndonesia&PapuaNewGuineaNon-AlcoholBeveragessegmentsmanufacture,distribute,marketandsellsparklingbeveragesandothernon-alcoholbeverages.TheAlcohol&CoffeeBeveragessegmentmanufactures,distributes,marketsandsellsalcoholandcoffeeproducts.TheCorporate&Servicessegmentincludesothernon-individuallyreportablebusinessesandcomprisesofthecorporateofficefunctionfortheGroup,managementofkeypropertyassetsofAustraliaandNewZealandandtheprovisionofcertainsupportservicestotheGroupandthird-partycustomerbusinesses.ThemajorityoftheGroup’srevenuesarerecognisedatthepointin timeatwhichproductsaredeliveredtothecustomer.
SPCresultswerepreviouslyreportedundertheCorporate,Food&Servicessegment.Followingthedecisiontodivestthebusinessin2018,SPCresultsandnetassetswhichweredesignatedasheldforsalein2018wereexcludedandreportedseparatelyinNote12cDiscontinuedOperation.
TheGroup’sfinancialstatementsareaffectedbyseasonalitydependingonthetimingofcertainfestivitiesinthedifferentcountrieswithinwhichCocaColaAmatiloperates.Typically,revenue,earningsandoperatingcashflowsofAustralianandNewZealand-basedoperationsaregreaterinthesecondhalfofthefinancialyearduetotheChristmasholidaytradingperiod,whichcanleadtoassociatedeffectsonworkingcapitalcomponents.Similarly,theRamadanperiodpositivelyimpactsthetimingoftheIndonesianbusiness’sfinancialperformancewithinthefinancialyear.
Segmentrevenueisevaluatedwithreferencetotradingrevenue.Segmentresultsareevaluatedonanearningsbeforeinterest,taxandnon-tradingitemsbasis.SegmentnetassetsincludeNetassets–OperatingandInvestingamounts(whichexcludesnetdebt).Netdebtcomprisesofcashassets,heldtomaturityinvestments,interestbearingreceivables,borrowings,debtrelatedderivativeassetsandliabilities,andotherfinancialandleaseliabilities.TheGroupmanagesitsnetdebt,netfinancecostsandincometaxesonaGroupbasis,andthesemeasuresarethereforenotreportedinternallyatasegmentlevel.Inter-segmenttransactionsareconductedonnormalcommercialtermsandconditions.
SEGMENT INFORMATION
Non-Alcohol Beverages
Australia New Zealand & FijiIndonesia & Papua
New GuineaAlcohol & Coffee
BeveragesCorporate &
Services Total
Continuing operations2019
$M2018
$M2019
$M2018
$M2019
$M2018
$M2019
$M2018
$M2019
$M2018
$M2019
$M2018
$M
Segment revenue 2,577.5 2,518.1 635.5 592.4 1,165.4 981.7 640.8 609.8 51.4 50.3 5,070.6 4,752.3
EBITDAbeforenon-tradingitems1 493.8 438.0 165.3 142.1 196.7 168.8 69.7 61.9 61.9 82.1 987.4 892.9
Depreciationexpense–rightof useassets2 (52.0) – (10.6) – (5.4) – (0.6) – (0.3) – (68.9) –
Depreciationandamortisationexpenses (72.8) (61.9) (30.9) (29.7) (94.0) (83.7) (6.3) (6.2) (75.2) (76.9) (279.2) (258.4)
Segment results 369.0 376.1 123.8 112.4 97.3 85.1 62.8 55.7 (13.6) 5.2 639.3 634.5
Non-tradingitems3 (40.5) (17.5)
EBIT1 598.8 617.0
Other segment information
Capitalemployed 1,188.7 1,110.7 392.5 400.9 850.5 817.5 307.0 315.7 482.0 583.0 3,220.7 3,227.8
Rightofuseassets,includingrelateddeferredtaxassets2 409.3 – 58.4 – 11.2 – 3.1 – 1.0 – 483.0 –
Segment net assets 1,598.0 1,110.7 450.9 400.9 861.7 817.5 310.1 315.7 483.0 583.0 3,703.7 3,227.8
Netdebt4 (1,751.5) (1,327.8)
Net assets 1,952.2 1,900.0
Segment additions to non-current assets5 110.7 111.5 37.6 41.1 81.4 103.7 13.0 5.8 67.7 103.1 310.4 365.2
1 EBITDAreferstoearningsbeforeinterest,tax,depreciationandamortisationwhileEBITreferstoearningsbeforeinterestandtax. 2 Balancesariseduetoimpactofchangetoleaseaccounting,refertopages105to107forfurthertransitioninformation.3 RefertoNote3bforfurtherdetails.4 RefertoNote14forfurtherdetails.5 Comprisesofadditionstoinvestments,rightofuseassets,property,plantandequipmentandintangibleassets.
GEOGRAPHICAL INFORMATION
Trading revenue1 Non-current assets2
Continuing operations2019
$M2018
$M2019
$M2018
$M
Australia 3,096.0 3,014.8 2,180.6 1,810.1
NewZealand&Fiji 809.3 755.6 637.4 590.7
Indonesia&PapuaNewGuinea 1,165.3 981.9 799.8 771.8
5,070.6 4,752.3 3,617.8 3,172.6
1 ReflectsthecustomergeographiclocationoftradingrevenueearnedbytheGroup.2 Comprisesofproperty,plantandequipment,rightofuseassets,intangibleassetsandinvestments.
NOTESTOTHEFINANCIALSTATEMENTS(CONTINUED) Coca-Cola Amatil Limited and its subsidiaries
OVERVIEW(CONTINUED)
COCA-COLA AMATIL ANNUAL REPORT 2019108 109
BEING
A SU
STAIN
ABLE
BUSIN
ESSTH
E VALU
E W
E CREATEPERFO
RMA
NCE
& O
UTLO
OK
GO
VERNA
NCE
& RISK
SFIN
AN
CIAL &
STATUTO
RY REPO
RTS
OTH
ER IN
FORM
ATION
OU
R BU
SINESS
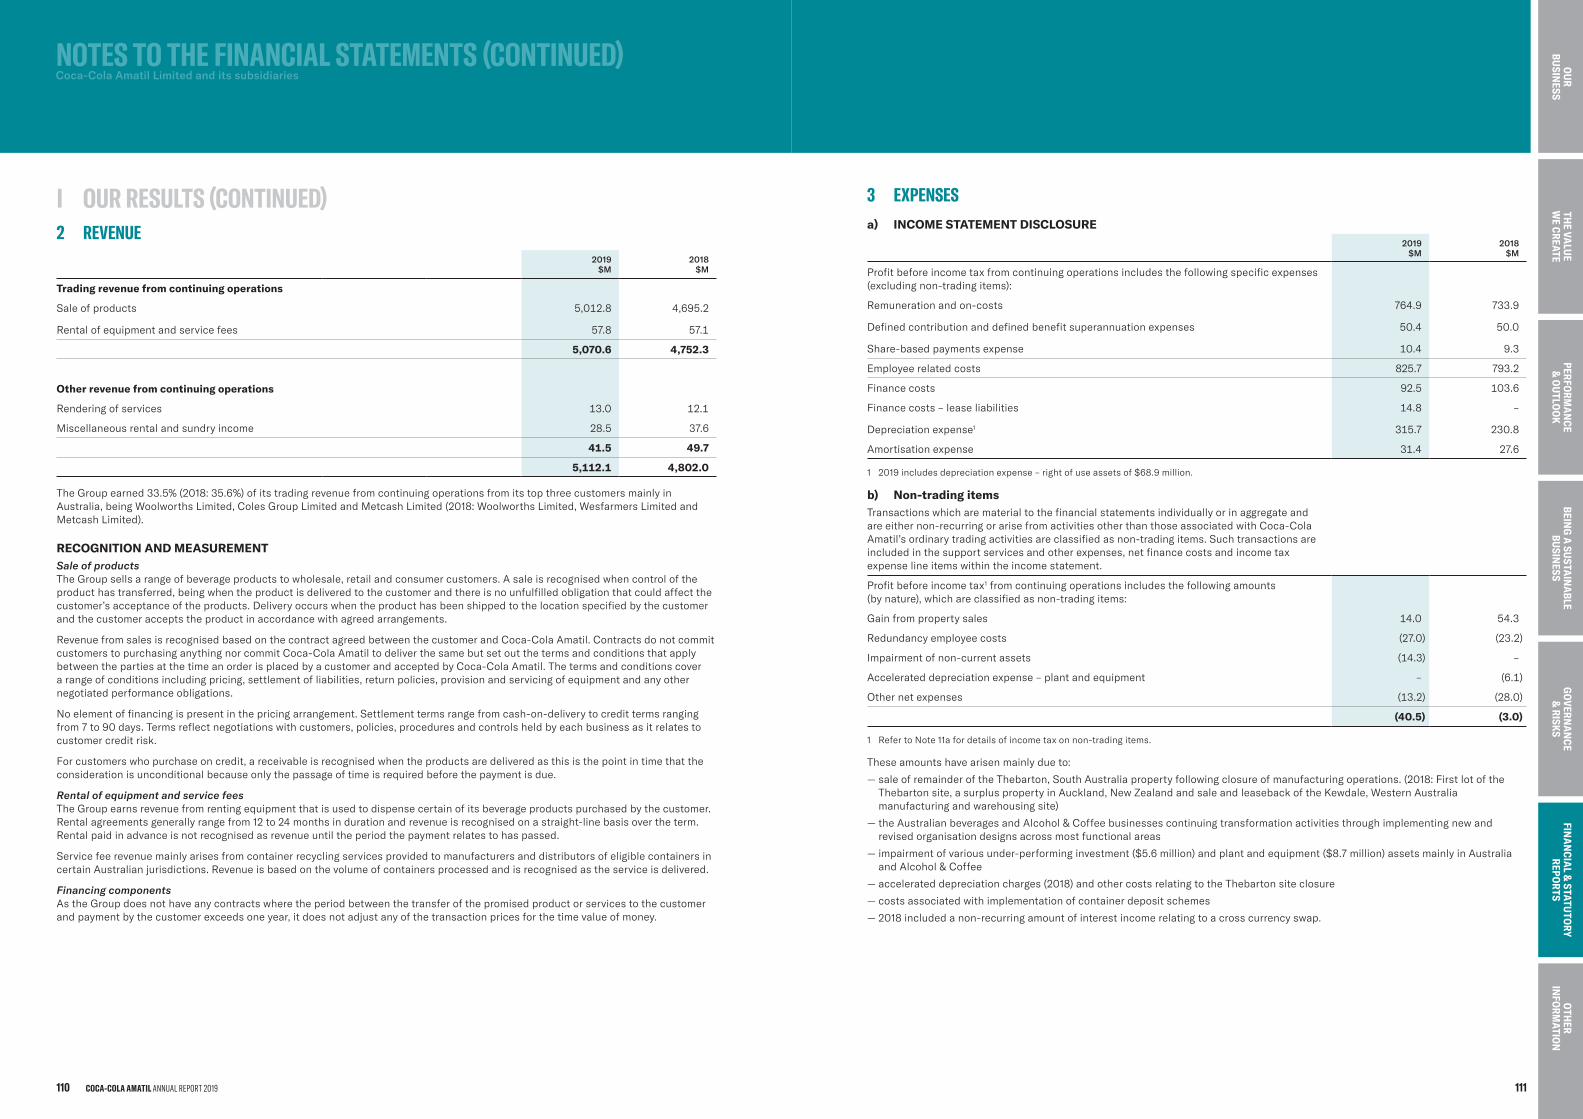
2 REVENUE2019
$M2018
$M
Trading revenue from continuing operations
Saleofproducts 5,012.8 4,695.2
Rentalofequipmentandservicefees 57.8 57.1
5,070.6 4,752.3
Other revenue from continuing operations
Renderingofservices 13.0 12.1
Miscellaneousrentalandsundryincome 28.5 37.6
41.5 49.7
5,112.1 4,802.0
TheGroupearned33.5%(2018:35.6%)ofitstradingrevenuefromcontinuingoperationsfromitstopthreecustomersmainlyinAustralia,beingWoolworthsLimited,ColesGroupLimitedandMetcashLimited(2018:WoolworthsLimited,WesfarmersLimitedandMetcashLimited).
RECOGNITION AND MEASUREMENTSale of productsTheGroupsellsarangeofbeverageproductstowholesale,retailandconsumercustomers.Asaleisrecognisedwhencontroloftheproducthastransferred,beingwhentheproductisdeliveredtothecustomerandthereisnounfulfilledobligationthatcouldaffectthecustomer’sacceptanceoftheproducts.Deliveryoccurswhentheproducthasbeenshippedtothelocationspecifiedbythecustomerandthecustomeracceptstheproductinaccordancewithagreedarrangements.
RevenuefromsalesisrecognisedbasedonthecontractagreedbetweenthecustomerandCoca-ColaAmatil.ContractsdonotcommitcustomerstopurchasinganythingnorcommitCoca-ColaAmatiltodeliverthesamebutsetoutthetermsandconditionsthatapplybetweenthepartiesatthetimeanorderisplacedbyacustomerandacceptedbyCoca-ColaAmatil.Thetermsandconditionscovera rangeofconditionsincludingpricing,settlementofliabilities,returnpolicies,provisionandservicingofequipmentandanyothernegotiatedperformanceobligations.
Noelementoffinancingispresentinthepricingarrangement.Settlementtermsrangefromcash-on-deliverytocredittermsrangingfrom7to90days.Termsreflectnegotiationswithcustomers,policies,proceduresandcontrolsheldbyeachbusinessasitrelatestocustomercreditrisk.
Forcustomerswhopurchaseoncredit,areceivableisrecognisedwhentheproductsaredeliveredasthisisthepointintimethattheconsiderationisunconditionalbecauseonlythepassageoftimeisrequiredbeforethepaymentisdue.
Rental of equipment and service feesTheGroupearnsrevenuefromrentingequipmentthatisusedtodispensecertainofitsbeverageproductspurchasedbythecustomer.Rentalagreementsgenerallyrangefrom12to24monthsindurationandrevenueisrecognisedonastraight-linebasisovertheterm.Rentalpaidinadvanceisnotrecognisedasrevenueuntiltheperiodthepaymentrelatestohaspassed.
ServicefeerevenuemainlyarisesfromcontainerrecyclingservicesprovidedtomanufacturersanddistributorsofeligiblecontainersincertainAustralianjurisdictions.Revenueisbasedonthevolumeofcontainersprocessedandisrecognisedastheserviceisdelivered.
Financing componentsAstheGroupdoesnothaveanycontractswheretheperiodbetweenthetransferofthepromisedproductorservicestothecustomerandpaymentbythecustomerexceedsoneyear,itdoesnotadjustanyofthetransactionpricesforthetimevalueofmoney.
3 EXPENSESa) INCOME STATEMENT DISCLOSURE
2019$M
2018$M
Profitbeforeincometaxfromcontinuingoperationsincludesthefollowingspecificexpenses(excludingnon-tradingitems):
Remunerationandon-costs 764.9 733.9
Definedcontributionanddefinedbenefitsuperannuationexpenses 50.4 50.0
Share-basedpaymentsexpense 10.4 9.3
Employeerelatedcosts 825.7 793.2
Financecosts 92.5 103.6
Financecosts–leaseliabilities 14.8 –
Depreciationexpense1 315.7 230.8
Amortisationexpense 31.4 27.6
1 2019includesdepreciationexpense–rightofuseassetsof$68.9million.
b) Non-trading itemsTransactionswhicharematerialtothefinancialstatementsindividuallyorinaggregateandareeithernon-recurringorarisefromactivitiesotherthanthoseassociatedwithCoca-ColaAmatil’sordinarytradingactivitiesareclassifiedasnon-tradingitems.Suchtransactionsareincludedinthesupportservicesandotherexpenses,netfinancecostsandincometaxexpenselineitemswithintheincomestatement.
Profitbeforeincometax1fromcontinuingoperationsincludesthefollowingamounts(bynature),whichareclassifiedasnon-tradingitems:
Gainfrompropertysales 14.0 54.3
Redundancyemployeecosts (27.0) (23.2)
Impairmentofnon-currentassets (14.3) –
Accelerateddepreciationexpense–plantandequipment – (6.1)
Othernetexpenses (13.2) (28.0)
(40.5) (3.0)
1 RefertoNote11afordetailsofincometaxonnon-tradingitems.
Theseamountshavearisenmainlydueto:
— saleofremainderoftheThebarton,SouthAustraliapropertyfollowingclosureofmanufacturingoperations.(2018:FirstlotoftheThebartonsite,asurpluspropertyinAuckland,NewZealandandsaleandleasebackoftheKewdale,WesternAustraliamanufacturingandwarehousingsite)
— theAustralianbeveragesandAlcohol&Coffeebusinessescontinuingtransformationactivitiesthroughimplementingnewandrevisedorganisationdesignsacrossmostfunctionalareas
— impairmentofvariousunder-performinginvestment($5.6million)andplantandequipment($8.7million)assetsmainlyinAustraliaandAlcohol&Coffee
— accelerateddepreciationcharges(2018)andothercostsrelatingtotheThebartonsiteclosure
— costsassociatedwithimplementationofcontainerdepositschemes
— 2018includedanon-recurringamountofinterestincomerelatingtoacrosscurrencyswap.
NOTESTOTHEFINANCIALSTATEMENTS(CONTINUED) Coca-Cola Amatil Limited and its subsidiaries
I OURRESULTS(CONTINUED)
COCA-COLA AMATIL ANNUAL REPORT 2019110 111
BEING
A SU
STAIN
ABLE
BUSIN
ESSTH
E VALU
E W
E CREATEPERFO
RMA
NCE
& O
UTLO
OK
GO
VERNA
NCE
& RISK
SFIN
AN
CIAL &
STATUTO
RY REPO
RTS
OTH
ER IN
FORM
ATION
OU
R BU
SINESS
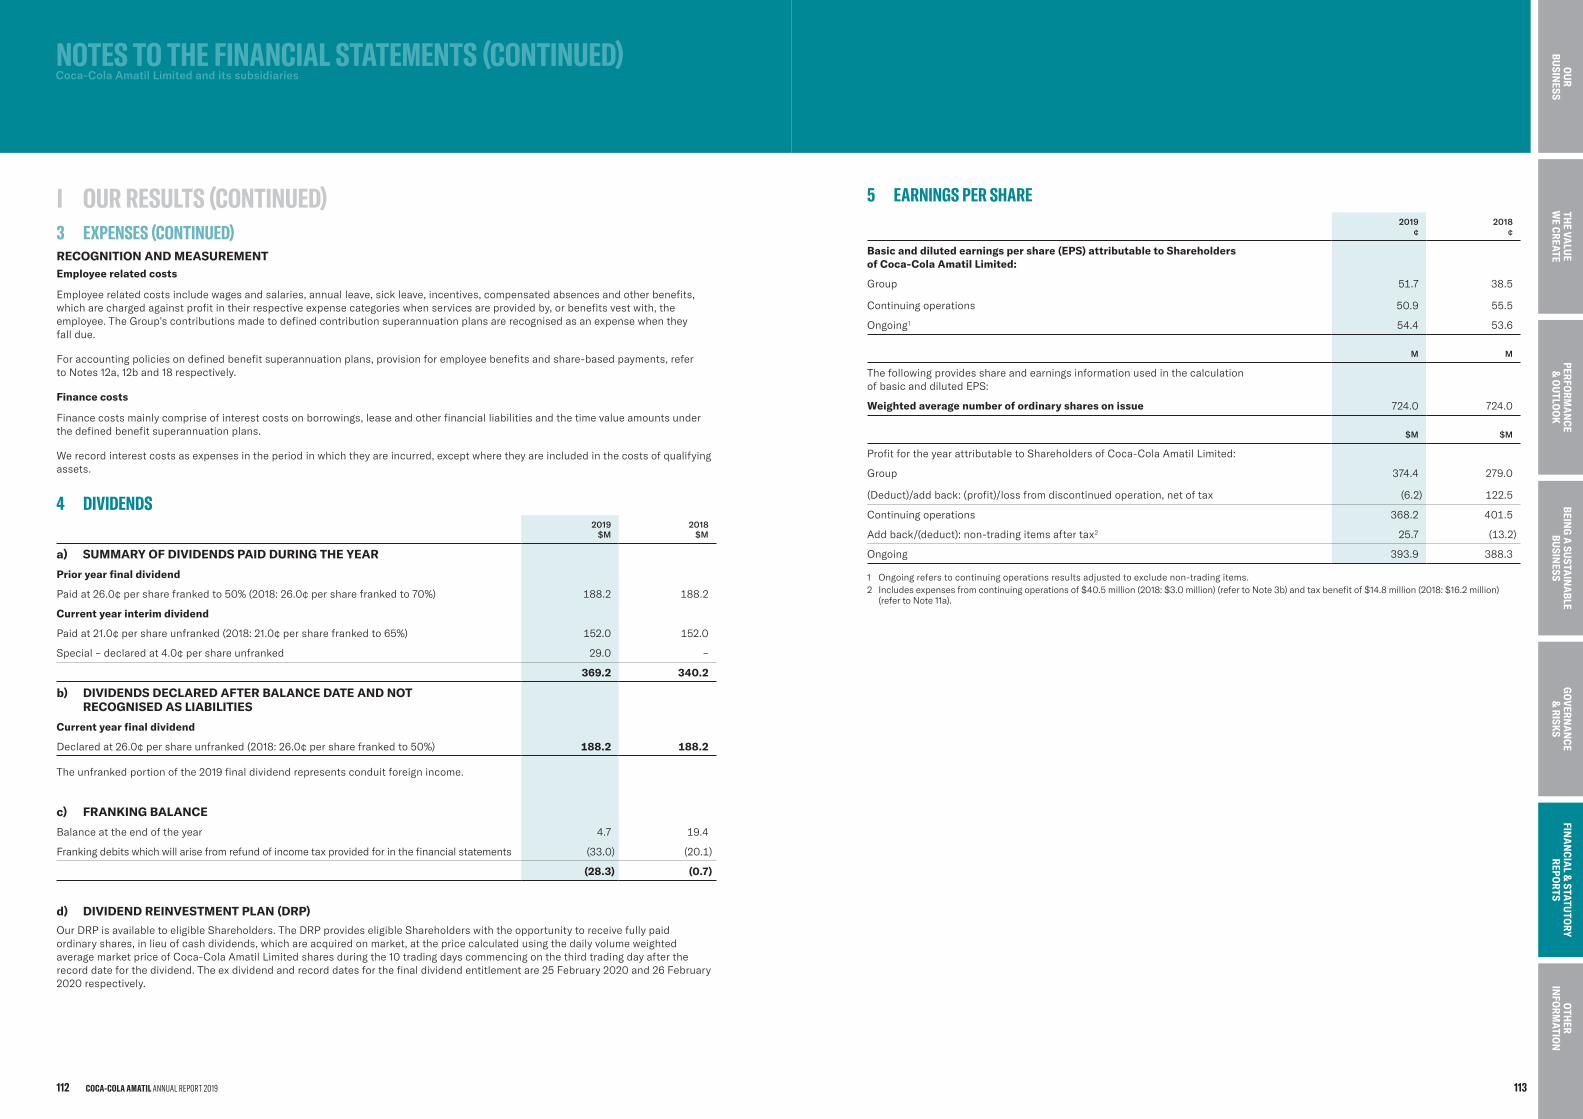
RECOGNITION AND MEASUREMENTEmployee related costs
Employeerelatedcostsincludewagesandsalaries,annualleave,sickleave,incentives,compensatedabsencesandotherbenefits,whicharechargedagainstprofitintheirrespectiveexpensecategorieswhenservicesareprovidedby,orbenefitsvestwith,theemployee.TheGroup’scontributionsmadetodefinedcontributionsuperannuationplansarerecognisedasanexpensewhentheyfall due.
Foraccountingpoliciesondefinedbenefitsuperannuationplans,provisionforemployeebenefitsandshare-basedpayments,referto Notes12a,12band18respectively.
Finance costs
Financecostsmainlycompriseofinterestcostsonborrowings,leaseandotherfinancialliabilitiesandthetimevalueamountsunderthedefinedbenefitsuperannuationplans.
Werecordinterestcostsasexpensesintheperiodinwhichtheyareincurred,exceptwheretheyareincludedinthecostsofqualifyingassets.
4 DIVIDENDS2019
$M2018
$M
a) SUMMARY OF DIVIDENDS PAID DURING THE YEAR
Prior year final dividend
Paidat26.0¢persharefrankedto50%(2018:26.0¢persharefrankedto70%) 188.2 188.2
Current year interim dividend
Paidat21.0¢pershareunfranked(2018:21.0¢persharefrankedto65%) 152.0 152.0
Special–declaredat4.0¢pershareunfranked 29.0 –
369.2 340.2
b) DIVIDENDS DECLARED AFTER BALANCE DATE AND NOTRECOGNISED AS LIABILITIES
Current year final dividend
Declaredat26.0¢pershareunfranked(2018:26.0¢persharefrankedto50%) 188.2 188.2
Theunfrankedportionofthe2019finaldividendrepresentsconduitforeignincome.
c) FRANKING BALANCE
Balanceattheendoftheyear 4.7 19.4
Frankingdebitswhichwillarisefromrefundofincometaxprovidedforinthefinancialstatements (33.0) (20.1)
(28.3) (0.7)
d) DIVIDEND REINVESTMENT PLAN (DRP)
OurDRPisavailabletoeligibleShareholders.TheDRPprovideseligibleShareholderswiththeopportunitytoreceivefullypaidordinaryshares,inlieuofcashdividends,whichareacquiredonmarket,atthepricecalculatedusingthedailyvolumeweightedaveragemarketpriceofCoca-ColaAmatilLimitedsharesduringthe10tradingdayscommencingonthethirdtradingdayaftertherecorddateforthedividend.Theexdividendandrecorddatesforthefinaldividendentitlementare25February2020and26February2020respectively.
5 EARNINGSPERSHARE2019
¢2018
¢
Basic and diluted earnings per share (EPS) attributable to Shareholders of Coca-Cola Amatil Limited:
Group 51.7 38.5
Continuingoperations 50.9 55.5
Ongoing1 54.4 53.6
M M
Thefollowingprovidesshareandearningsinformationusedinthecalculationofbasicand dilutedEPS:
Weighted average number of ordinary shares on issue 724.0 724.0
$M $M
ProfitfortheyearattributabletoShareholdersofCoca-ColaAmatilLimited:
Group 374.4 279.0
(Deduct)/addback:(profit)/lossfromdiscontinuedoperation,netoftax (6.2) 122.5
Continuingoperations 368.2 401.5
Addback/(deduct):non-tradingitemsaftertax2 25.7 (13.2)
Ongoing 393.9 388.3
1 Ongoingreferstocontinuingoperationsresultsadjustedtoexcludenon-tradingitems.2 Includesexpensesfromcontinuingoperationsof$40.5million(2018:$3.0million)(refertoNote3b)andtaxbenefitof$14.8million(2018:$16.2million)(refertoNote11a).
NOTESTOTHEFINANCIALSTATEMENTS(CONTINUED) Coca-Cola Amatil Limited and its subsidiaries
I OURRESULTS(CONTINUED)3 EXPENSES(CONTINUED)
COCA-COLA AMATIL ANNUAL REPORT 2019112 113
BEING
A SU
STAIN
ABLE
BUSIN
ESSTH
E VALU
E W
E CREATEPERFO
RMA
NCE
& O
UTLO
OK
GO
VERNA
NCE
& RISK
SFIN
AN
CIAL &
STATUTO
RY REPO
RTS
OTH
ER IN
FORM
ATION
OU
R BU
SINESS
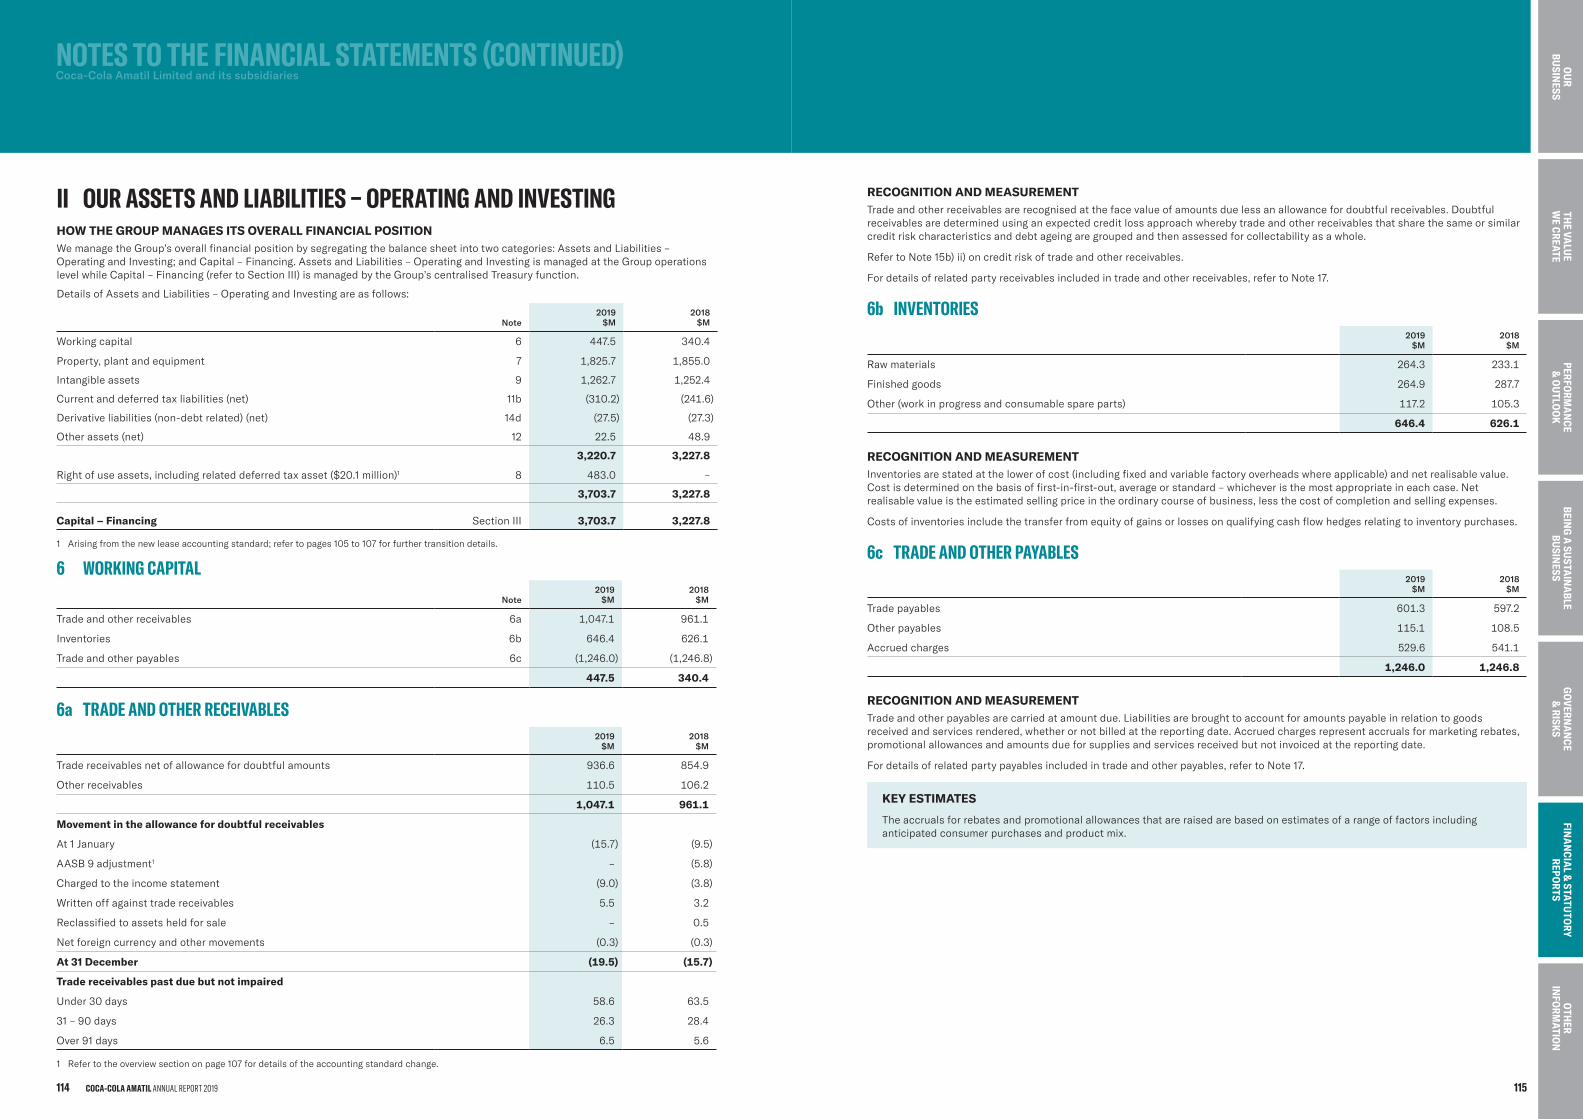
II OURASSETSANDLIABILITIES–OPERATINGANDINVESTINGHOW THE GROUP MANAGES ITS OVERALL FINANCIAL POSITIONWemanagetheGroup’soverallfinancialpositionbysegregatingthebalancesheetintotwocategories:AssetsandLiabilities–OperatingandInvesting;andCapital–Financing.AssetsandLiabilities–OperatingandInvestingismanagedattheGroupoperationslevelwhileCapital–Financing(refertoSectionIII)ismanagedbytheGroup’scentralisedTreasuryfunction.
DetailsofAssetsandLiabilities–OperatingandInvestingareasfollows:
Note2019
$M2018
$M
Workingcapital 6 447.5 340.4
Property,plantandequipment 7 1,825.7 1,855.0
Intangibleassets 9 1,262.7 1,252.4
Currentanddeferredtaxliabilities(net) 11b (310.2) (241.6)
Derivativeliabilities(non-debtrelated)(net) 14d (27.5) (27.3)
Otherassets(net) 12 22.5 48.9
3,220.7 3,227.8
Rightofuseassets,includingrelateddeferredtaxasset($20.1million)1 8 483.0 –
3,703.7 3,227.8
Capital – Financing SectionIII 3,703.7 3,227.8
1 Arisingfromthenewleaseaccountingstandard;refertopages105to107forfurthertransitiondetails.
6 WORKINGCAPITAL
Note2019
$M2018
$M
Tradeandotherreceivables 6a 1,047.1 961.1
Inventories 6b 646.4 626.1
Tradeandotherpayables 6c (1,246.0) (1,246.8)
447.5 340.4
6a TRADE AND OTHER RECEIVABLES2019
$M2018
$M
Tradereceivablesnetofallowancefordoubtfulamounts 936.6 854.9
Otherreceivables 110.5 106.2
1,047.1 961.1
Movement in the allowance for doubtful receivables
At1January (15.7) (9.5)
AASB9adjustment1 – (5.8)
Chargedtotheincomestatement (9.0) (3.8)
Writtenoffagainsttradereceivables 5.5 3.2
Reclassifiedtoassetsheldforsale – 0.5
Netforeigncurrencyandothermovements (0.3) (0.3)
At 31 December (19.5) (15.7)
Trade receivables past due but not impaired
Under30days 58.6 63.5
31–90days 26.3 28.4
Over91days 6.5 5.6
1 Refertotheoverviewsectiononpage107fordetailsoftheaccountingstandardchange.
RECOGNITION AND MEASUREMENTTradeandotherreceivablesarerecognisedatthefacevalueofamountsduelessanallowancefordoubtfulreceivables.Doubtfulreceivablesaredeterminedusinganexpectedcreditlossapproachwherebytradeandotherreceivablesthatsharethesameorsimilarcreditriskcharacteristicsanddebtageingaregroupedandthenassessedforcollectabilityasawhole.
RefertoNote15b)ii)oncreditriskoftradeandotherreceivables.
Fordetailsofrelatedpartyreceivablesincludedintradeandotherreceivables,refertoNote17.
6b INVENTORIES2019
$M2018
$M
Rawmaterials 264.3 233.1
Finishedgoods 264.9 287.7
Other(workinprogressandconsumablespareparts) 117.2 105.3
646.4 626.1
RECOGNITION AND MEASUREMENTInventoriesarestatedatthelowerofcost(includingfixedandvariablefactoryoverheadswhereapplicable)andnetrealisablevalue.Costisdeterminedonthebasisoffirst-in-first-out,averageorstandard–whicheveristhemostappropriateineachcase.Netrealisablevalueistheestimatedsellingpriceintheordinarycourseofbusiness,lessthecostofcompletionandsellingexpenses.
Costsofinventoriesincludethetransferfromequityofgainsorlossesonqualifyingcashflowhedgesrelatingtoinventorypurchases.
6c TRADE AND OTHER PAYABLES2019
$M2018
$M
Tradepayables 601.3 597.2
Otherpayables 115.1 108.5
Accruedcharges 529.6 541.1
1,246.0 1,246.8
RECOGNITION AND MEASUREMENTTradeandotherpayablesarecarriedatamountdue.Liabilitiesarebroughttoaccountforamountspayableinrelationtogoodsreceivedandservicesrendered,whetherornotbilledatthereportingdate.Accruedchargesrepresentaccrualsformarketingrebates,promotionalallowancesandamountsdueforsuppliesandservicesreceivedbutnotinvoicedatthereportingdate.
Fordetailsofrelatedpartypayablesincludedintradeandotherpayables,refertoNote17.
KEY ESTIMATES
Theaccrualsforrebatesandpromotionalallowancesthatareraisedarebasedonestimatesofarangeoffactorsincludinganticipatedconsumerpurchasesandproductmix.
NOTESTOTHEFINANCIALSTATEMENTS(CONTINUED) Coca-Cola Amatil Limited and its subsidiaries
COCA-COLA AMATIL ANNUAL REPORT 2019114 115
BEING
A SU
STAIN
ABLE
BUSIN
ESSTH
E VALU
E W
E CREATEPERFO
RMA
NCE
& O
UTLO
OK
GO
VERNA
NCE
& RISK
SFIN
AN
CIAL &
STATUTO
RY REPO
RTS
OTH
ER IN
FORM
ATION
OU
R BU
SINESS
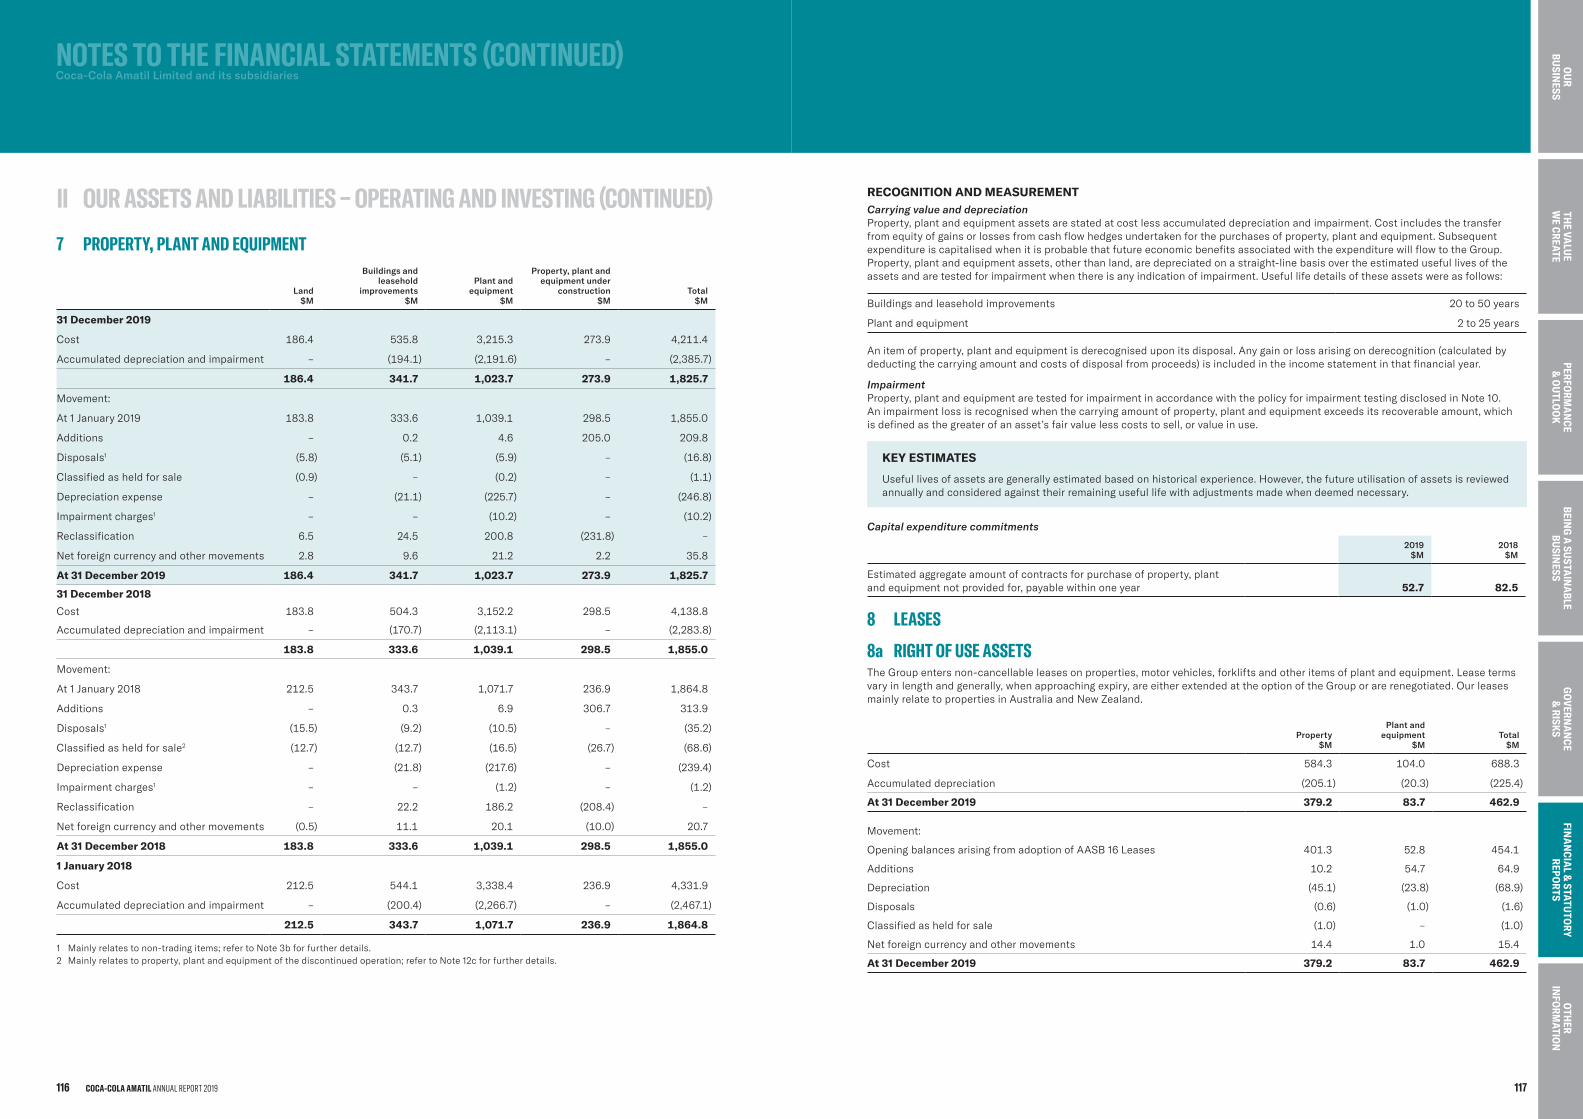
7 PROPERTY,PLANTANDEQUIPMENT
Land$M
Buildings and leasehold
improvements$M
Plant and equipment
$M
Property, plant and equipment under
construction$M
Total$M
31 December 2019
Cost 186.4 535.8 3,215.3 273.9 4,211.4
Accumulateddepreciationandimpairment – (194.1) (2,191.6) – (2,385.7)
186.4 341.7 1,023.7 273.9 1,825.7
Movement:
At1January2019 183.8 333.6 1,039.1 298.5 1,855.0
Additions – 0.2 4.6 205.0 209.8
Disposals1 (5.8) (5.1) (5.9) – (16.8)
Classifiedasheldforsale (0.9) – (0.2) – (1.1)
Depreciationexpense – (21.1) (225.7) – (246.8)
Impairmentcharges1 – – (10.2) – (10.2)
Reclassification 6.5 24.5 200.8 (231.8) –
Netforeigncurrencyandothermovements 2.8 9.6 21.2 2.2 35.8
At 31 December 2019 186.4 341.7 1,023.7 273.9 1,825.7
31 December 2018
Cost 183.8 504.3 3,152.2 298.5 4,138.8
Accumulateddepreciationandimpairment – (170.7) (2,113.1) – (2,283.8)
183.8 333.6 1,039.1 298.5 1,855.0
Movement:
At1January2018 212.5 343.7 1,071.7 236.9 1,864.8
Additions – 0.3 6.9 306.7 313.9
Disposals1 (15.5) (9.2) (10.5) – (35.2)
Classifiedasheldforsale2 (12.7) (12.7) (16.5) (26.7) (68.6)
Depreciationexpense – (21.8) (217.6) – (239.4)
Impairmentcharges1 – – (1.2) – (1.2)
Reclassification – 22.2 186.2 (208.4) –
Netforeigncurrencyandothermovements (0.5) 11.1 20.1 (10.0) 20.7
At 31 December 2018 183.8 333.6 1,039.1 298.5 1,855.0
1 January 2018
Cost 212.5 544.1 3,338.4 236.9 4,331.9
Accumulateddepreciationandimpairment – (200.4) (2,266.7) – (2,467.1)
212.5 343.7 1,071.7 236.9 1,864.8
1 Mainlyrelatestonon-tradingitems;refertoNote3bforfurtherdetails.2 Mainlyrelatestoproperty,plantandequipmentofthediscontinuedoperation;refertoNote12cforfurtherdetails.
RECOGNITION AND MEASUREMENTCarrying value and depreciationProperty,plantandequipmentassetsarestatedatcostlessaccumulateddepreciationandimpairment.Costincludesthetransferfromequityofgainsorlossesfromcashflowhedgesundertakenforthepurchasesofproperty,plantandequipment.SubsequentexpenditureiscapitalisedwhenitisprobablethatfutureeconomicbenefitsassociatedwiththeexpenditurewillflowtotheGroup.Property,plantandequipmentassets,otherthanland,aredepreciatedonastraight-linebasisovertheestimatedusefullivesoftheassetsandaretestedforimpairmentwhenthereisanyindicationofimpairment.Usefullifedetailsoftheseassetswereasfollows:
Buildingsandleaseholdimprovements 20to50years
Plantandequipment 2to25years
Anitemofproperty,plantandequipmentisderecogniseduponitsdisposal.Anygainorlossarisingonderecognition(calculatedbydeductingthecarryingamountandcostsofdisposalfromproceeds)isincludedintheincomestatementinthatfinancialyear.
ImpairmentProperty,plantandequipmentaretestedforimpairmentinaccordancewiththepolicyforimpairmenttestingdisclosedinNote10.An impairmentlossisrecognisedwhenthecarryingamountofproperty,plantandequipmentexceedsitsrecoverableamount,whichis definedasthegreaterofanasset’sfairvaluelesscoststosell,orvalueinuse.
KEY ESTIMATES
Usefullivesofassetsaregenerallyestimatedbasedonhistoricalexperience.However,thefutureutilisationofassetsisreviewedannuallyandconsideredagainsttheirremainingusefullifewithadjustmentsmadewhendeemednecessary.
Capital expenditure commitments
2019 $M
2018 $M
Estimatedaggregateamountofcontractsforpurchaseofproperty,plantandequipmentnotprovidedfor,payablewithinoneyear 52.7 82.5
8 LEASES
8a RIGHT OF USE ASSETSTheGroupentersnon-cancellableleasesonproperties,motorvehicles,forkliftsandotheritemsofplantandequipment.Leasetermsvaryinlengthandgenerally,whenapproachingexpiry,areeitherextendedattheoptionoftheGrouporarerenegotiated.OurleasesmainlyrelatetopropertiesinAustraliaandNewZealand.
Property$M
Plant and equipment
$MTotal
$M
Cost 584.3 104.0 688.3
Accumulateddepreciation (205.1) (20.3) (225.4)
At 31 December 2019 379.2 83.7 462.9
Movement:
OpeningbalancesarisingfromadoptionofAASB16Leases 401.3 52.8 454.1
Additions 10.2 54.7 64.9
Depreciation (45.1) (23.8) (68.9)
Disposals (0.6) (1.0) (1.6)
Classifiedasheldforsale (1.0) – (1.0)
Netforeigncurrencyandothermovements 14.4 1.0 15.4
At 31 December 2019 379.2 83.7 462.9
NOTESTOTHEFINANCIALSTATEMENTS(CONTINUED) Coca-Cola Amatil Limited and its subsidiaries
II OURASSETSANDLIABILITIES–OPERATINGANDINVESTING(CONTINUED)
COCA-COLA AMATIL ANNUAL REPORT 2019116 117
BEING
A SU
STAIN
ABLE
BUSIN
ESSTH
E VALU
E W
E CREATEPERFO
RMA
NCE
& O
UTLO
OK
GO
VERNA
NCE
& RISK
SFIN
AN
CIAL &
STATUTO
RY REPO
RTS
OTH
ER IN
FORM
ATION
OU
R BU
SINESS
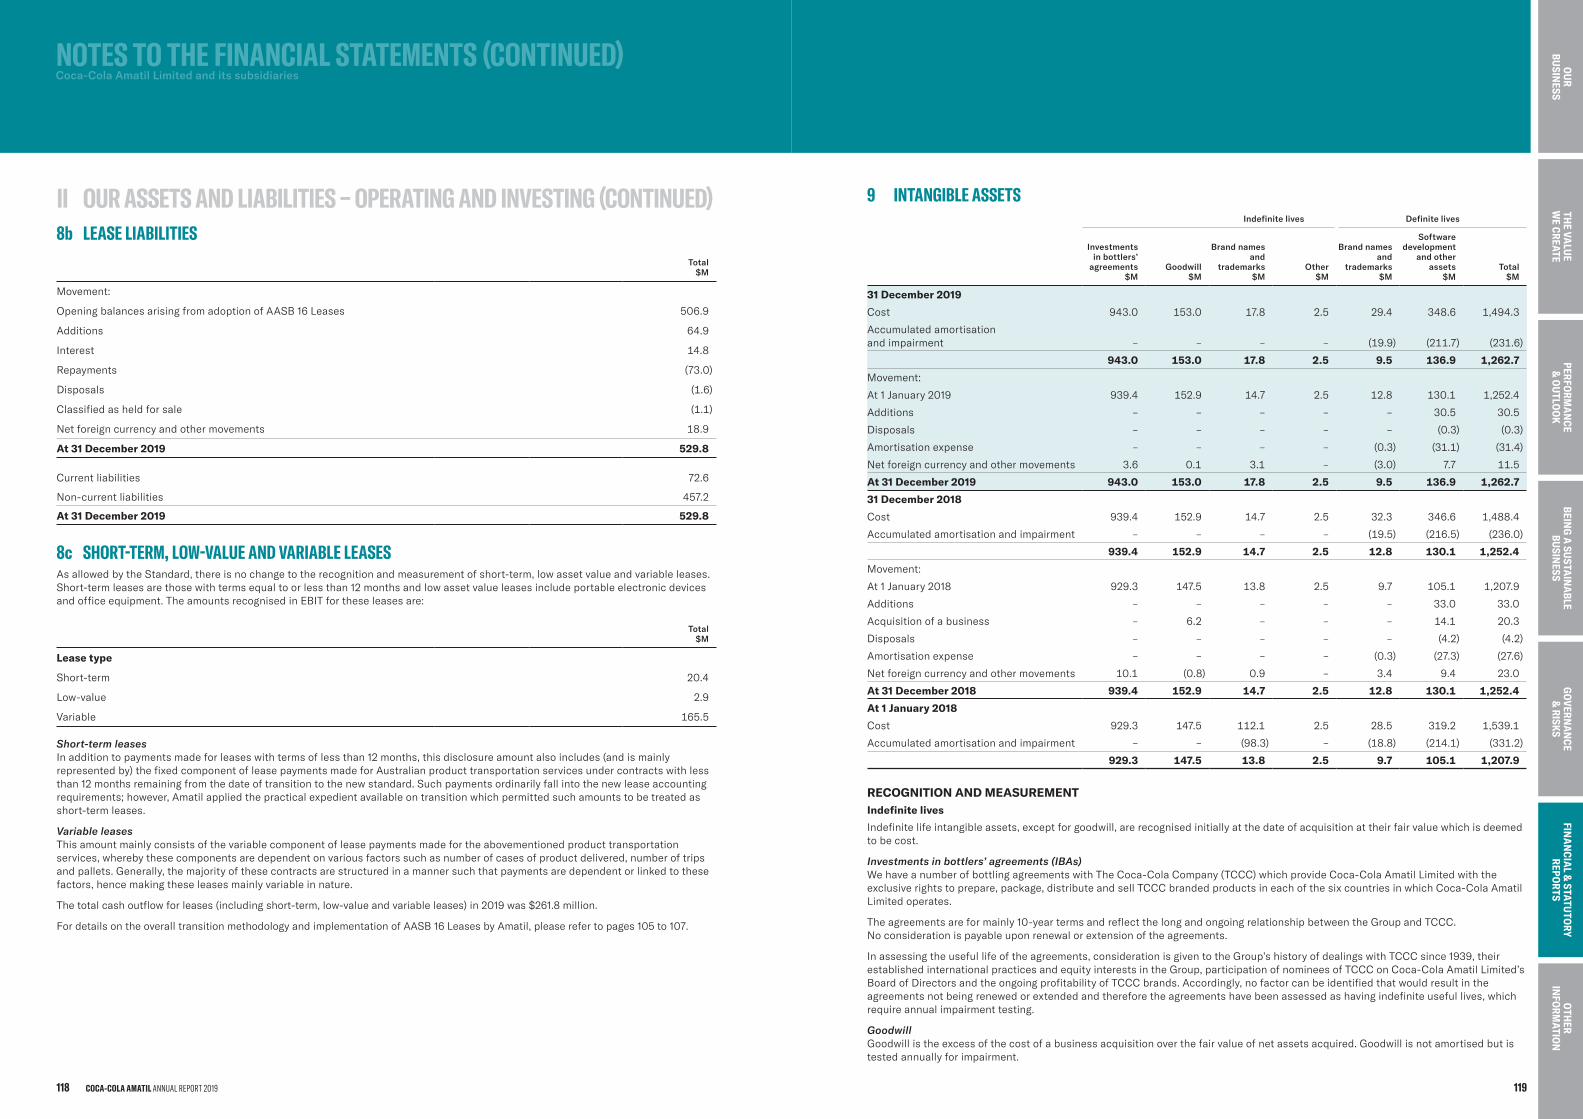
8b LEASE LIABILITIESTotal
$M
Movement:
OpeningbalancesarisingfromadoptionofAASB16Leases 506.9
Additions 64.9
Interest 14.8
Repayments (73.0)
Disposals (1.6)
Classifiedasheldforsale (1.1)
Netforeigncurrencyandothermovements 18.9
At 31 December 2019 529.8
Currentliabilities 72.6
Non-currentliabilities 457.2
At 31 December 2019 529.8
8c SHORT-TERM,LOW-VALUEANDVARIABLELEASESAsallowedbytheStandard,thereisnochangetotherecognitionandmeasurementofshort-term,lowassetvalueandvariableleases.Short-termleasesarethosewithtermsequaltoorlessthan12monthsandlowassetvalueleasesincludeportableelectronicdevicesandofficeequipment.TheamountsrecognisedinEBITfortheseleasesare:
Total$M
Lease type
Short-term 20.4
Low-value 2.9
Variable 165.5
Short-term leasesInadditiontopaymentsmadeforleaseswithtermsoflessthan12months,thisdisclosureamountalsoincludes(andismainlyrepresentedby)thefixedcomponentofleasepaymentsmadeforAustralianproducttransportationservicesundercontractswithlessthan12monthsremainingfromthedateoftransitiontothenewstandard.Suchpaymentsordinarilyfallintothenewleaseaccountingrequirements;however,Amatilappliedthepracticalexpedientavailableontransitionwhichpermittedsuchamountstobetreatedasshort-termleases.
Variable leasesThisamountmainlyconsistsofthevariablecomponentofleasepaymentsmadefortheabovementionedproducttransportationservices,wherebythesecomponentsaredependentonvariousfactorssuchasnumberofcasesofproductdelivered,numberoftripsandpallets.Generally,themajorityofthesecontractsarestructuredinamannersuchthatpaymentsaredependentorlinkedtothesefactors,hencemakingtheseleasesmainlyvariableinnature.
Thetotalcashoutflowforleases(includingshort-term,low-valueandvariableleases)in2019was$261.8million.
FordetailsontheoveralltransitionmethodologyandimplementationofAASB16LeasesbyAmatil,pleaserefertopages105to107.
9 INTANGIBLEASSETSIndefinite lives Definite lives
Investments in bottlers’
agreements $M
Goodwill$M
Brand names and
trademarks$M
Other$M
Brand names and
trademarks$M
Software development
and other assets
$MTotal
$M
31 December 2019
Cost 943.0 153.0 17.8 2.5 29.4 348.6 1,494.3
Accumulatedamortisationandimpairment – – – – (19.9) (211.7) (231.6)
943.0 153.0 17.8 2.5 9.5 136.9 1,262.7
Movement:
At1January2019 939.4 152.9 14.7 2.5 12.8 130.1 1,252.4
Additions – – – – – 30.5 30.5
Disposals – – – – – (0.3) (0.3)
Amortisationexpense – – – – (0.3) (31.1) (31.4)
Netforeigncurrencyandothermovements 3.6 0.1 3.1 – (3.0) 7.7 11.5
At 31 December 2019 943.0 153.0 17.8 2.5 9.5 136.9 1,262.7
31 December 2018
Cost 939.4 152.9 14.7 2.5 32.3 346.6 1,488.4
Accumulatedamortisationandimpairment – – – – (19.5) (216.5) (236.0)
939.4 152.9 14.7 2.5 12.8 130.1 1,252.4
Movement:
At1January2018 929.3 147.5 13.8 2.5 9.7 105.1 1,207.9
Additions – – – – – 33.0 33.0
Acquisitionofabusiness – 6.2 – – – 14.1 20.3
Disposals – – – – – (4.2) (4.2)
Amortisationexpense – – – – (0.3) (27.3) (27.6)
Netforeigncurrencyandothermovements 10.1 (0.8) 0.9 – 3.4 9.4 23.0
At 31 December 2018 939.4 152.9 14.7 2.5 12.8 130.1 1,252.4
At 1 January 2018
Cost 929.3 147.5 112.1 2.5 28.5 319.2 1,539.1
Accumulatedamortisationandimpairment – – (98.3) – (18.8) (214.1) (331.2)
929.3 147.5 13.8 2.5 9.7 105.1 1,207.9
RECOGNITION AND MEASUREMENTIndefinite lives
Indefinitelifeintangibleassets,exceptforgoodwill,arerecognisedinitiallyatthedateofacquisitionattheirfairvaluewhichisdeemedtobecost.
Investments in bottlers’ agreements (IBAs)WehaveanumberofbottlingagreementswithTheCoca-ColaCompany(TCCC)whichprovideCoca-ColaAmatilLimitedwiththeexclusiverightstoprepare,package,distributeandsellTCCCbrandedproductsineachofthesixcountriesinwhichCoca-ColaAmatilLimitedoperates.
Theagreementsareformainly10-yeartermsandreflectthelongandongoingrelationshipbetweentheGroupandTCCC.Noconsiderationispayableuponrenewalorextensionoftheagreements.
Inassessingtheusefullifeoftheagreements,considerationisgiventotheGroup’shistoryofdealingswithTCCCsince1939,theirestablishedinternationalpracticesandequityinterestsintheGroup,participationofnomineesofTCCConCoca-ColaAmatilLimited’sBoardofDirectorsandtheongoingprofitabilityofTCCCbrands.Accordingly,nofactorcanbeidentifiedthatwouldresultintheagreementsnotbeingrenewedorextendedandthereforetheagreementshavebeenassessedashavingindefiniteusefullives,whichrequireannualimpairmenttesting.
GoodwillGoodwillistheexcessofthecostofabusinessacquisitionoverthefairvalueofnetassetsacquired.Goodwillisnotamortisedbutistestedannuallyforimpairment.
NOTESTOTHEFINANCIALSTATEMENTS(CONTINUED) Coca-Cola Amatil Limited and its subsidiaries
II OURASSETSANDLIABILITIES–OPERATINGANDINVESTING(CONTINUED)
COCA-COLA AMATIL ANNUAL REPORT 2019118 119
BEING
A SU
STAIN
ABLE
BUSIN
ESSTH
E VALU
E W
E CREATEPERFO
RMA
NCE
& O
UTLO
OK
GO
VERNA
NCE
& RISK
SFIN
AN
CIAL &
STATUTO
RY REPO
RTS
OTH
ER IN
FORM
ATION
OU
R BU
SINESS
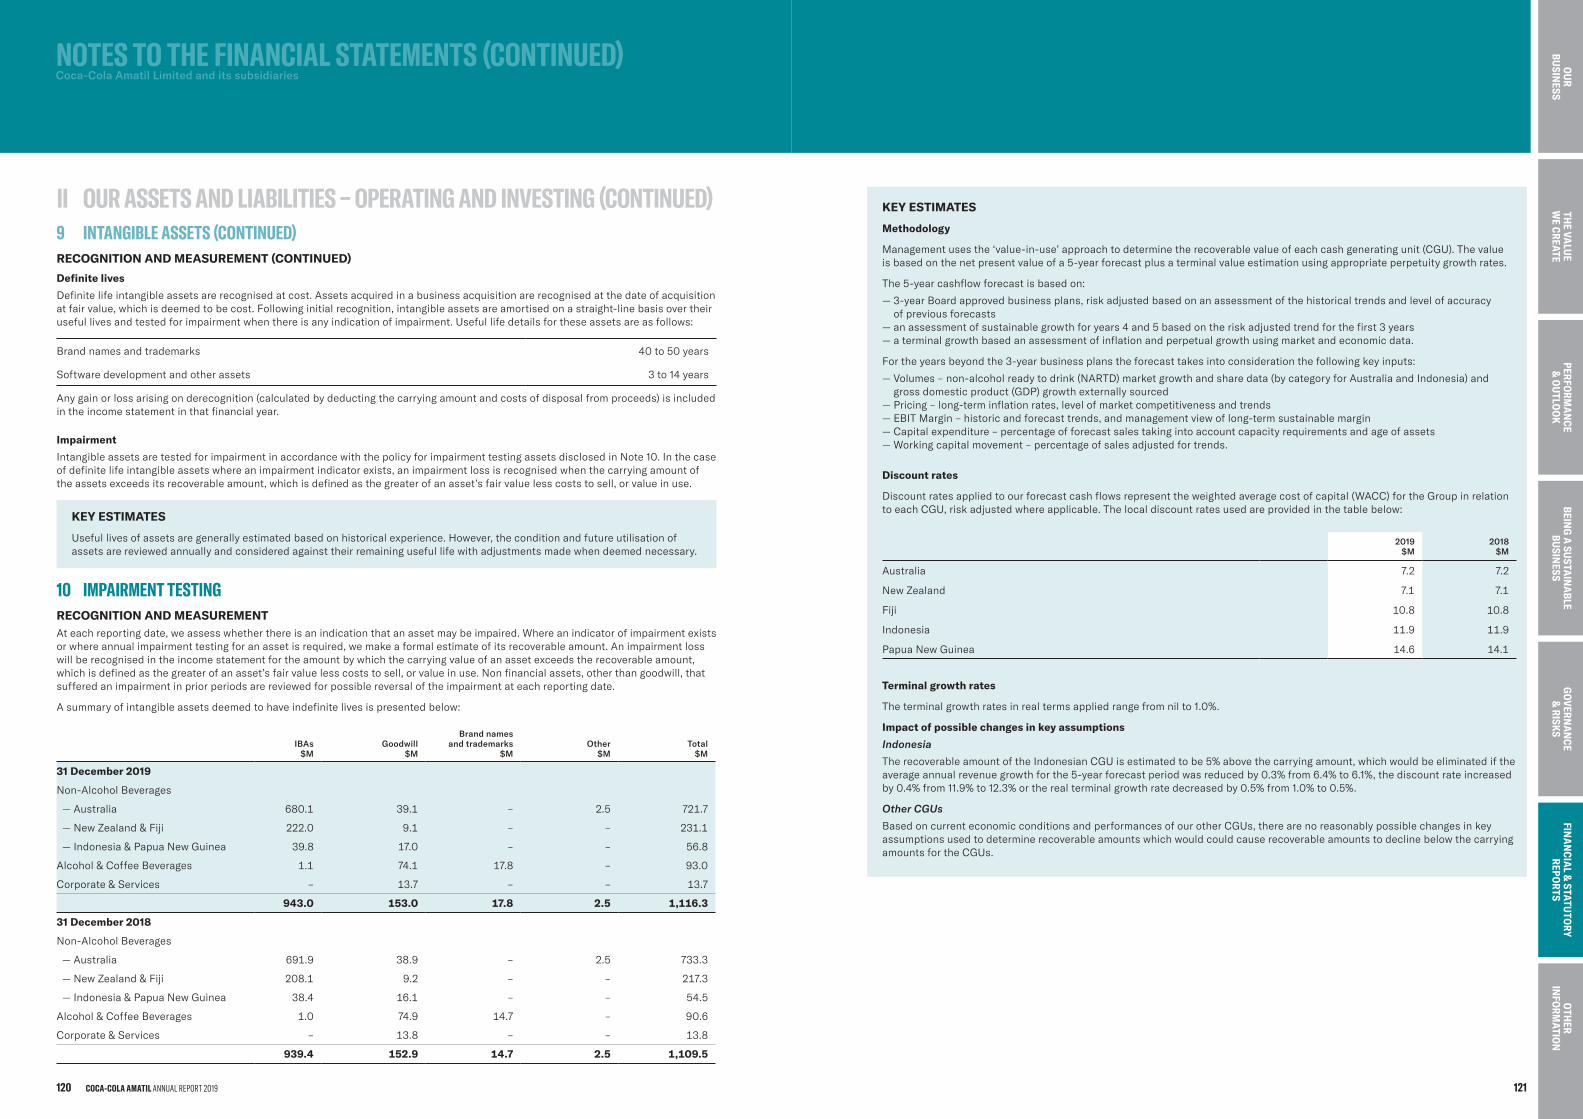
Definite lives
Definitelifeintangibleassetsarerecognisedatcost.Assetsacquiredinabusinessacquisitionarerecognisedatthedateofacquisitionatfairvalue,whichisdeemedtobecost.Followinginitialrecognition,intangibleassetsareamortisedonastraight-linebasisovertheirusefullivesandtestedforimpairmentwhenthereisanyindicationofimpairment.Usefullifedetailsfortheseassetsareasfollows:
Brandnamesandtrademarks 40to50years
Softwaredevelopmentandotherassets 3to14years
Anygainorlossarisingonderecognition(calculatedbydeductingthecarryingamountandcostsofdisposalfromproceeds)isincludedintheincomestatementinthatfinancialyear.
Impairment
IntangibleassetsaretestedforimpairmentinaccordancewiththepolicyforimpairmenttestingassetsdisclosedinNote10.Inthecaseofdefinitelifeintangibleassetswhereanimpairmentindicatorexists,animpairmentlossisrecognisedwhenthecarryingamountoftheassetsexceedsitsrecoverableamount,whichisdefinedasthegreaterofanasset’sfairvaluelesscoststosell,orvalueinuse.
KEY ESTIMATES
Usefullivesofassetsaregenerallyestimatedbasedonhistoricalexperience.However,theconditionandfutureutilisationofassetsarereviewedannuallyandconsideredagainsttheirremainingusefullifewithadjustmentsmadewhendeemednecessary.
10 IMPAIRMENTTESTINGRECOGNITION AND MEASUREMENTAteachreportingdate,weassesswhetherthereisanindicationthatanassetmaybeimpaired.Whereanindicatorofimpairmentexistsorwhereannualimpairmenttestingforanassetisrequired,wemakeaformalestimateofitsrecoverableamount.Animpairmentlosswillberecognisedintheincomestatementfortheamountbywhichthecarryingvalueofanassetexceedstherecoverableamount,whichisdefinedasthegreaterofanasset’sfairvaluelesscoststosell,orvalueinuse.Nonfinancialassets,otherthangoodwill,thatsufferedanimpairmentinpriorperiodsarereviewedforpossiblereversaloftheimpairmentateachreportingdate.
Asummaryofintangibleassetsdeemedtohaveindefinitelivesispresentedbelow:
IBAs$M
Goodwill$M
Brand names and trademarks
$MOther
$MTotal
$M
31 December 2019
Non-AlcoholBeverages
— Australia 680.1 39.1 – 2.5 721.7
— NewZealand&Fiji 222.0 9.1 – – 231.1
— Indonesia&PapuaNewGuinea 39.8 17.0 – – 56.8
Alcohol&CoffeeBeverages 1.1 74.1 17.8 – 93.0
Corporate&Services – 13.7 – – 13.7
943.0 153.0 17.8 2.5 1,116.3
31 December 2018
Non-AlcoholBeverages
— Australia 691.9 38.9 – 2.5 733.3
— NewZealand&Fiji 208.1 9.2 – – 217.3
— Indonesia&PapuaNewGuinea 38.4 16.1 – – 54.5
Alcohol&CoffeeBeverages 1.0 74.9 14.7 – 90.6
Corporate&Services – 13.8 – – 13.8
939.4 152.9 14.7 2.5 1,109.5
KEY ESTIMATES
Methodology
Managementusesthe‘value-in-use’approachtodeterminetherecoverablevalueofeachcashgeneratingunit(CGU).Thevalueisbasedonthenetpresentvalueofa5-yearforecastplusaterminalvalueestimationusingappropriateperpetuitygrowthrates.
The5-yearcashflowforecastisbasedon:
— 3-yearBoardapprovedbusinessplans,riskadjustedbasedonanassessmentofthehistoricaltrendsandlevelofaccuracyof previousforecasts— anassessmentofsustainablegrowthforyears4and5basedontheriskadjustedtrendforthefirst3years— aterminalgrowthbasedanassessmentofinflationandperpetualgrowthusingmarketandeconomicdata.
Fortheyearsbeyondthe3-yearbusinessplanstheforecasttakesintoconsiderationthefollowingkeyinputs:
— Volumes–non-alcoholreadytodrink(NARTD)marketgrowthandsharedata(bycategoryforAustraliaandIndonesia)andgross domesticproduct(GDP)growthexternallysourced— Pricing–long-terminflationrates,levelofmarketcompetitivenessandtrends— EBITMargin–historicandforecasttrends,andmanagementviewoflong-termsustainablemargin— Capitalexpenditure–percentageofforecastsalestakingintoaccountcapacityrequirementsandageofassets— Workingcapitalmovement–percentageofsalesadjustedfortrends.
Discount rates
Discountratesappliedtoourforecastcashflowsrepresenttheweightedaveragecostofcapital(WACC)fortheGroupinrelationtoeachCGU,riskadjustedwhereapplicable.Thelocaldiscountratesusedareprovidedinthetablebelow:
2019 $M
2018 $M
Australia 7.2 7.2
NewZealand 7.1 7.1
Fiji 10.8 10.8
Indonesia 11.9 11.9
PapuaNewGuinea 14.6 14.1
Terminal growth rates
Theterminalgrowthratesinrealtermsappliedrangefromnilto1.0%.
Impact of possible changes in key assumptions
Indonesia
TherecoverableamountoftheIndonesianCGUisestimatedtobe5%abovethecarryingamount,whichwouldbeeliminatediftheaverageannualrevenuegrowthforthe5-yearforecastperiodwasreducedby0.3%from6.4%to6.1%,thediscountrateincreasedby 0.4%from11.9%to12.3%ortherealterminalgrowthratedecreasedby0.5%from1.0%to0.5%.
Other CGUs
BasedoncurrenteconomicconditionsandperformancesofourotherCGUs,therearenoreasonablypossiblechangesinkeyassumptionsusedtodeterminerecoverableamountswhichwouldcouldcauserecoverableamountstodeclinebelowthecarryingamountsfortheCGUs.
NOTESTOTHEFINANCIALSTATEMENTS(CONTINUED) Coca-Cola Amatil Limited and its subsidiaries
II OURASSETSANDLIABILITIES–OPERATINGANDINVESTING(CONTINUED)9 INTANGIBLEASSETS(CONTINUED)RECOGNITION AND MEASUREMENT (CONTINUED)
COCA-COLA AMATIL ANNUAL REPORT 2019120 121
BEING
A SU
STAIN
ABLE
BUSIN
ESSTH
E VALU
E W
E CREATEPERFO
RMA
NCE
& O
UTLO
OK
GO
VERNA
NCE
& RISK
SFIN
AN
CIAL &
STATUTO
RY REPO
RTS
OTH
ER IN
FORM
ATION
OU
R BU
SINESS
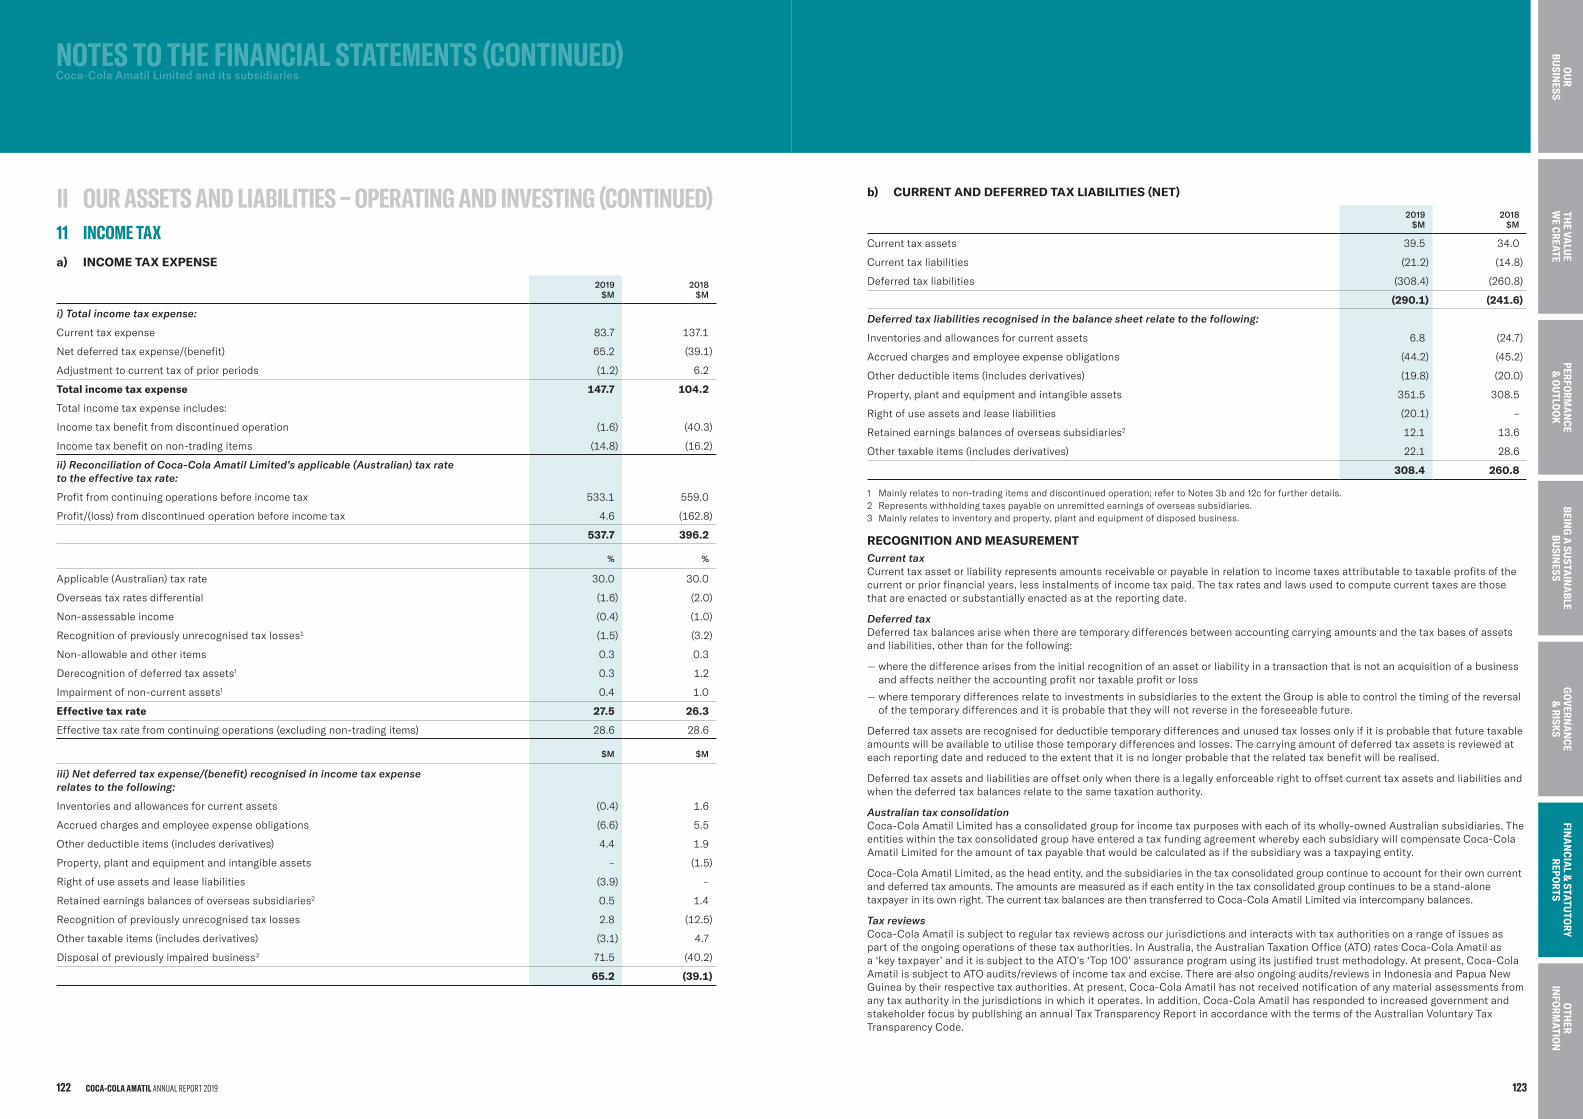
11 INCOMETAXa) INCOME TAX EXPENSE
2019 $M
2018 $M
i) Total income tax expense:
Currenttaxexpense 83.7 137.1
Netdeferredtaxexpense/(benefit) 65.2 (39.1)
Adjustmenttocurrenttaxofpriorperiods (1.2) 6.2
Total income tax expense 147.7 104.2
Totalincometaxexpenseincludes:
Incometaxbenefitfromdiscontinuedoperation (1.6) (40.3)
Incometaxbenefitonnon-tradingitems (14.8) (16.2)
ii) Reconciliation of Coca-Cola Amatil Limited’s applicable (Australian) tax rateto the effective tax rate:
Profitfromcontinuingoperationsbeforeincometax 533.1 559.0
Profit/(loss)fromdiscontinuedoperationbeforeincometax 4.6 (162.8)
537.7 396.2
% %
Applicable(Australian)taxrate 30.0 30.0
Overseastaxratesdifferential (1.6) (2.0)
Non-assessableincome (0.4) (1.0)
Recognitionofpreviouslyunrecognisedtaxlosses1 (1.5) (3.2)
Non-allowableandotheritems 0.3 0.3
Derecognitionofdeferredtaxassets1 0.3 1.2
Impairmentofnon-currentassets1 0.4 1.0
Effective tax rate 27.5 26.3
Effectivetaxratefromcontinuingoperations(excludingnon-tradingitems) 28.6 28.6
$M $M
iii) Net deferred tax expense/(benefit) recognised in income tax expenserelates to the following:
Inventoriesandallowancesforcurrentassets (0.4) 1.6
Accruedchargesandemployeeexpenseobligations (6.6) 5.5
Otherdeductibleitems(includesderivatives) 4.4 1.9
Property,plantandequipmentandintangibleassets – (1.5)
Rightofuseassetsandleaseliabilities (3.9) –
Retainedearningsbalancesofoverseassubsidiaries2 0.5 1.4
Recognitionofpreviouslyunrecognisedtaxlosses 2.8 (12.5)
Othertaxableitems(includesderivatives) (3.1) 4.7
Disposalofpreviouslyimpairedbusiness3 71.5 (40.2)
65.2 (39.1)
b) CURRENT AND DEFERRED TAX LIABILITIES (NET)
2019 $M
2018 $M
Currenttaxassets 39.5 34.0
Currenttaxliabilities (21.2) (14.8)
Deferredtaxliabilities (308.4) (260.8)
(290.1) (241.6)
Deferred tax liabilities recognised in the balance sheet relate to the following:
Inventoriesandallowancesforcurrentassets 6.8 (24.7)
Accruedchargesandemployeeexpenseobligations (44.2) (45.2)
Otherdeductibleitems(includesderivatives) (19.8) (20.0)
Property,plantandequipmentandintangibleassets 351.5 308.5
Rightofuseassetsandleaseliabilities (20.1) –
Retainedearningsbalancesofoverseassubsidiaries2 12.1 13.6
Othertaxableitems(includesderivatives) 22.1 28.6
308.4 260.8
1 Mainlyrelatestonon-tradingitemsanddiscontinuedoperation;refertoNotes3band12cforfurtherdetails.2 Representswithholdingtaxespayableonunremittedearningsofoverseassubsidiaries.3 Mainlyrelatestoinventoryandproperty,plantandequipmentofdisposedbusiness.
RECOGNITION AND MEASUREMENTCurrent taxCurrenttaxassetorliabilityrepresentsamountsreceivableorpayableinrelationtoincometaxesattributabletotaxableprofitsofthecurrentorpriorfinancialyears,lessinstalmentsofincometaxpaid.Thetaxratesandlawsusedtocomputecurrenttaxesarethosethatareenactedorsubstantiallyenactedasatthereportingdate.
Deferred taxDeferredtaxbalancesarisewhentherearetemporarydifferencesbetweenaccountingcarryingamountsandthetaxbasesofassetsandliabilities,otherthanforthefollowing:
— wherethedifferencearisesfromtheinitialrecognitionofanassetorliabilityinatransactionthatisnotanacquisitionofabusinessandaffectsneithertheaccountingprofitnortaxableprofitorloss
— wheretemporarydifferencesrelatetoinvestmentsinsubsidiariestotheextenttheGroupisabletocontrolthetimingofthereversalofthetemporarydifferencesanditisprobablethattheywillnotreverseintheforeseeablefuture.
Deferredtaxassetsarerecognisedfordeductibletemporarydifferencesandunusedtaxlossesonlyifitisprobablethatfuturetaxableamountswillbeavailabletoutilisethosetemporarydifferencesandlosses.Thecarryingamountofdeferredtaxassetsisreviewedateachreportingdateandreducedtotheextentthatitisnolongerprobablethattherelatedtaxbenefitwillberealised.
Deferredtaxassetsandliabilitiesareoffsetonlywhenthereisalegallyenforceablerighttooffsetcurrenttaxassetsandliabilitiesandwhenthedeferredtaxbalancesrelatetothesametaxationauthority.
Australian tax consolidationCoca-ColaAmatilLimitedhasaconsolidatedgroupforincometaxpurposeswitheachofitswholly-ownedAustraliansubsidiaries.TheentitieswithinthetaxconsolidatedgrouphaveenteredataxfundingagreementwherebyeachsubsidiarywillcompensateCoca-ColaAmatilLimitedfortheamountoftaxpayablethatwouldbecalculatedasifthesubsidiarywasataxpayingentity.
Coca-ColaAmatilLimited,astheheadentity,andthesubsidiariesinthetaxconsolidatedgroupcontinuetoaccountfortheirowncurrentanddeferredtaxamounts.Theamountsaremeasuredasifeachentityinthetaxconsolidatedgroupcontinuestobeastand-alonetaxpayerinitsownright.ThecurrenttaxbalancesarethentransferredtoCoca-ColaAmatilLimitedviaintercompanybalances.
Tax reviewsCoca-ColaAmatilissubjecttoregulartaxreviewsacrossourjurisdictionsandinteractswithtaxauthoritiesonarangeofissuesaspartoftheongoingoperationsofthesetaxauthorities.InAustralia,theAustralianTaxationOffice(ATO)ratesCoca-ColaAmatilasa ‘keytaxpayer’anditissubjecttotheATO’s‘Top100’assuranceprogramusingitsjustifiedtrustmethodology.Atpresent,Coca-ColaAmatilissubjecttoATOaudits/reviewsofincometaxandexcise.Therearealsoongoingaudits/reviewsinIndonesiaandPapuaNewGuineabytheirrespectivetaxauthorities.Atpresent,Coca-ColaAmatilhasnotreceivednotificationofanymaterialassessmentsfromanytaxauthorityinthejurisdictionsinwhichitoperates.Inaddition,Coca-ColaAmatilhasrespondedtoincreasedgovernmentandstakeholderfocusbypublishinganannualTaxTransparencyReportinaccordancewiththetermsoftheAustralianVoluntaryTaxTransparencyCode.
NOTESTOTHEFINANCIALSTATEMENTS(CONTINUED) Coca-Cola Amatil Limited and its subsidiaries
II OURASSETSANDLIABILITIES–OPERATINGANDINVESTING(CONTINUED)
COCA-COLA AMATIL ANNUAL REPORT 2019122 123
BEING
A SU
STAIN
ABLE
BUSIN
ESSTH
E VALU
E W
E CREATEPERFO
RMA
NCE
& O
UTLO
OK
GO
VERNA
NCE
& RISK
SFIN
AN
CIAL &
STATUTO
RY REPO
RTS
OTH
ER IN
FORM
ATION
OU
R BU
SINESS
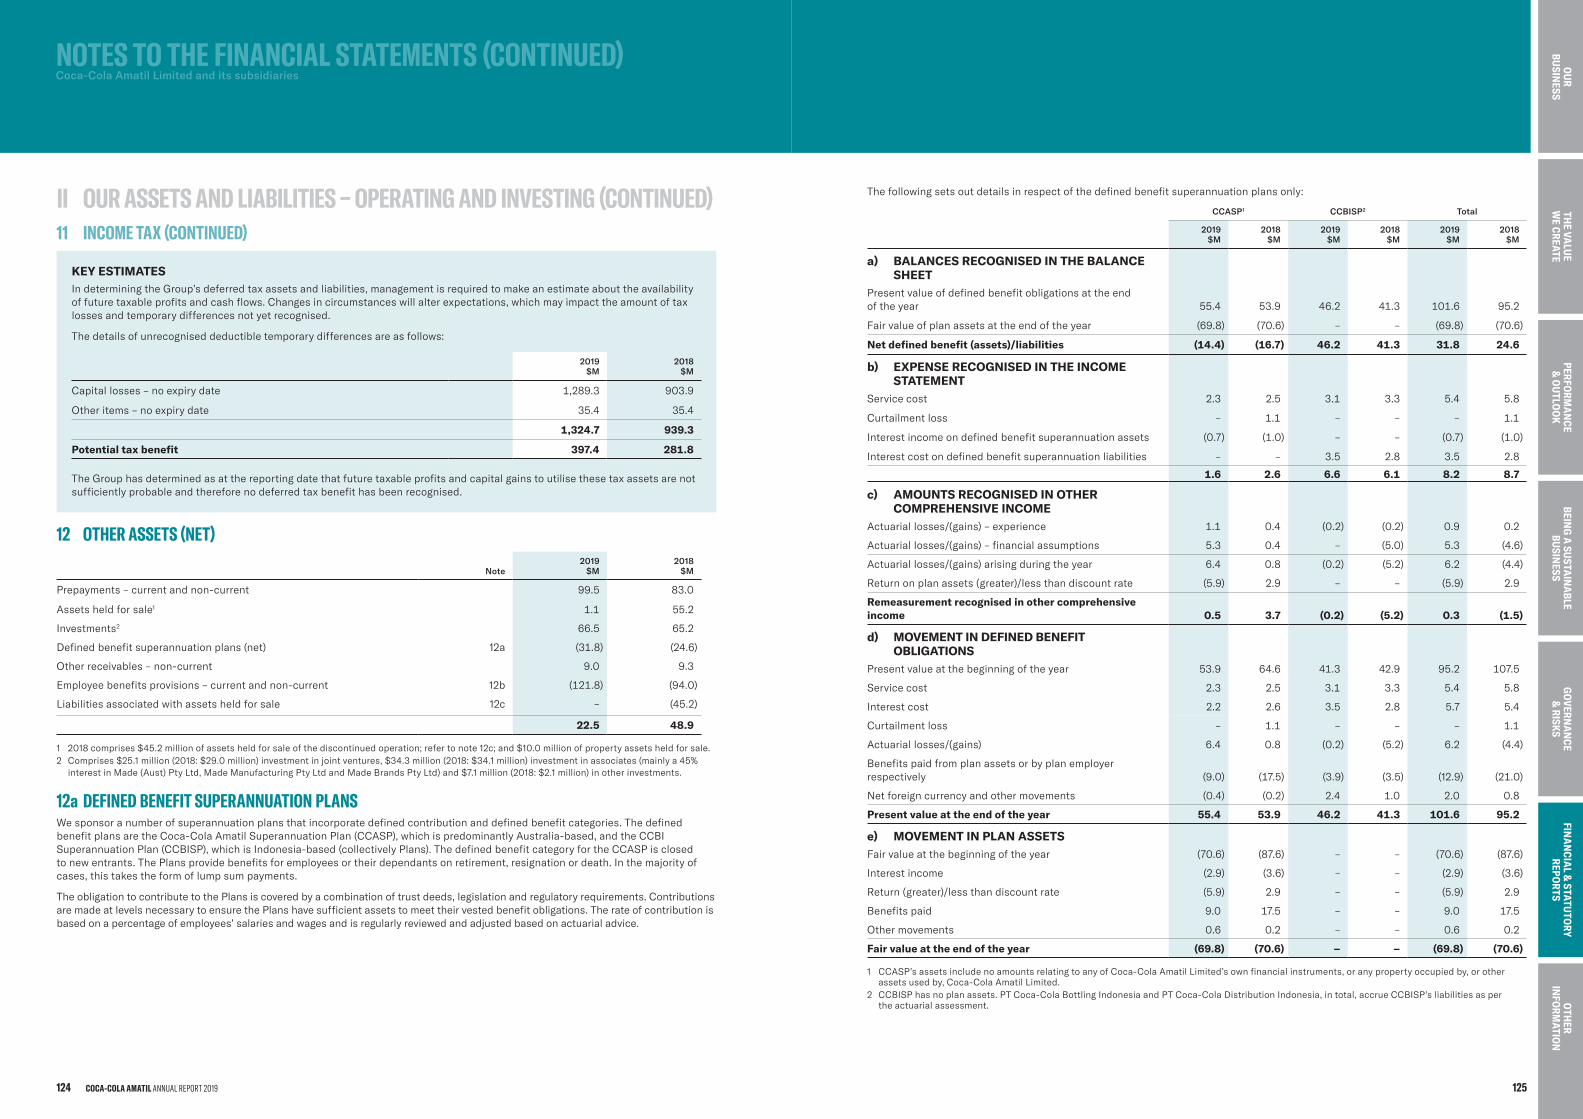
KEY ESTIMATES IndeterminingtheGroup’sdeferredtaxassetsandliabilities,managementisrequiredtomakeanestimateabouttheavailabilityoffuturetaxableprofitsandcashflows.Changesincircumstanceswillalterexpectations,whichmayimpacttheamountoftaxlossesandtemporarydifferencesnotyetrecognised.
Thedetailsofunrecogniseddeductibletemporarydifferencesareasfollows:
2019 $M
2018 $M
Capitallosses–noexpirydate 1,289.3 903.9
Otheritems–noexpirydate 35.4 35.4
1,324.7 939.3
Potential tax benefit 397.4 281.8
TheGrouphasdeterminedasatthereportingdatethatfuturetaxableprofitsandcapitalgainstoutilisethesetaxassetsarenotsufficientlyprobableandthereforenodeferredtaxbenefithasbeenrecognised.
12 OTHERASSETS(NET)
Note2019
$M2018
$M
Prepayments–currentandnon-current 99.5 83.0
Assetsheldforsale1 1.1 55.2
Investments2 66.5 65.2
Definedbenefitsuperannuationplans(net) 12a (31.8) (24.6)
Otherreceivables–non-current 9.0 9.3
Employeebenefitsprovisions–currentandnon-current 12b (121.8) (94.0)
Liabilitiesassociatedwithassetsheldforsale 12c – (45.2)
22.5 48.9
1 2018comprises$45.2millionofassetsheldforsaleofthediscontinuedoperation;refertonote12c;and$10.0millionofpropertyassetsheldforsale.2 Comprises$25.1million(2018:$29.0million)investmentinjointventures,$34.3million(2018:$34.1million)investmentinassociates(mainlya45%interestinMade(Aust)PtyLtd,MadeManufacturingPtyLtdandMadeBrandsPtyLtd)and$7.1million(2018:$2.1million)inotherinvestments.
12a DEFINED BENEFIT SUPERANNUATION PLANSWesponsoranumberofsuperannuationplansthatincorporatedefinedcontributionanddefinedbenefitcategories.ThedefinedbenefitplansaretheCoca-ColaAmatilSuperannuationPlan(CCASP),whichispredominantlyAustralia-based,andtheCCBISuperannuationPlan(CCBISP),whichisIndonesia-based(collectivelyPlans).ThedefinedbenefitcategoryfortheCCASPisclosedto newentrants.ThePlansprovidebenefitsforemployeesortheirdependantsonretirement,resignationordeath.Inthemajorityofcases,thistakestheformoflumpsumpayments.
TheobligationtocontributetothePlansiscoveredbyacombinationoftrustdeeds,legislationandregulatoryrequirements.ContributionsaremadeatlevelsnecessarytoensurethePlanshavesufficientassetstomeettheirvestedbenefitobligations.Therateofcontributionisbasedonapercentageofemployees’salariesandwagesandisregularlyreviewedandadjustedbasedonactuarialadvice.
Thefollowingsetsoutdetailsinrespectofthedefinedbenefitsuperannuationplansonly:
CCASP1 CCBISP2 Total
2019$M
2018$M
2019$M
2018$M
2019$M
2018$M
a) BALANCES RECOGNISED IN THE BALANCESHEET
Presentvalueofdefinedbenefitobligationsattheendof the year 55.4 53.9 46.2 41.3 101.6 95.2
Fairvalueofplanassetsattheendoftheyear (69.8) (70.6) – – (69.8) (70.6)
Net defined benefit (assets)/liabilities (14.4) (16.7) 46.2 41.3 31.8 24.6
b) EXPENSE RECOGNISED IN THE INCOMESTATEMENT
Servicecost 2.3 2.5 3.1 3.3 5.4 5.8
Curtailmentloss – 1.1 – – – 1.1
Interestincomeondefinedbenefitsuperannuationassets (0.7) (1.0) – – (0.7) (1.0)
Interestcostondefinedbenefitsuperannuationliabilities – – 3.5 2.8 3.5 2.8
1.6 2.6 6.6 6.1 8.2 8.7
c) AMOUNTS RECOGNISED IN OTHERCOMPREHENSIVE INCOME
Actuariallosses/(gains)–experience 1.1 0.4 (0.2) (0.2) 0.9 0.2
Actuariallosses/(gains)–financialassumptions 5.3 0.4 – (5.0) 5.3 (4.6)
Actuariallosses/(gains)arisingduringtheyear 6.4 0.8 (0.2) (5.2) 6.2 (4.4)
Returnonplanassets(greater)/lessthandiscountrate (5.9) 2.9 – – (5.9) 2.9
Remeasurement recognised in other comprehensive income 0.5 3.7 (0.2) (5.2) 0.3 (1.5)
d) MOVEMENT IN DEFINED BENEFITOBLIGATIONS
Presentvalueatthebeginningoftheyear 53.9 64.6 41.3 42.9 95.2 107.5
Servicecost 2.3 2.5 3.1 3.3 5.4 5.8
Interestcost 2.2 2.6 3.5 2.8 5.7 5.4
Curtailmentloss – 1.1 – – – 1.1
Actuariallosses/(gains) 6.4 0.8 (0.2) (5.2) 6.2 (4.4)
Benefitspaidfromplanassetsorbyplanemployerrespectively (9.0) (17.5) (3.9) (3.5) (12.9) (21.0)
Netforeigncurrencyandothermovements (0.4) (0.2) 2.4 1.0 2.0 0.8
Present value at the end of the year 55.4 53.9 46.2 41.3 101.6 95.2
e) MOVEMENT IN PLAN ASSETSFairvalueatthebeginningoftheyear (70.6) (87.6) – – (70.6) (87.6)
Interestincome (2.9) (3.6) – – (2.9) (3.6)
Return(greater)/lessthandiscountrate (5.9) 2.9 – – (5.9) 2.9
Benefitspaid 9.0 17.5 – – 9.0 17.5
Othermovements 0.6 0.2 – – 0.6 0.2
Fair value at the end of the year (69.8) (70.6) – – (69.8) (70.6)
1 CCASP’sassetsincludenoamountsrelatingtoanyofCoca-ColaAmatilLimited’sownfinancialinstruments,oranypropertyoccupiedby,orotherassetsusedby,Coca-ColaAmatilLimited.
2 CCBISPhasnoplanassets.PTCoca-ColaBottlingIndonesiaandPTCoca-ColaDistributionIndonesia,intotal,accrueCCBISP’sliabilitiesasperthe actuarialassessment.
NOTESTOTHEFINANCIALSTATEMENTS(CONTINUED) Coca-Cola Amatil Limited and its subsidiaries
II OURASSETSANDLIABILITIES–OPERATINGANDINVESTING(CONTINUED)11 INCOMETAX(CONTINUED)
COCA-COLA AMATIL ANNUAL REPORT 2019124 125
BEING
A SU
STAIN
ABLE
BUSIN
ESSTH
E VALU
E W
E CREATEPERFO
RMA
NCE
& O
UTLO
OK
GO
VERNA
NCE
& RISK
SFIN
AN
CIAL &
STATUTO
RY REPO
RTS
OTH
ER IN
FORM
ATION
OU
R BU
SINESS
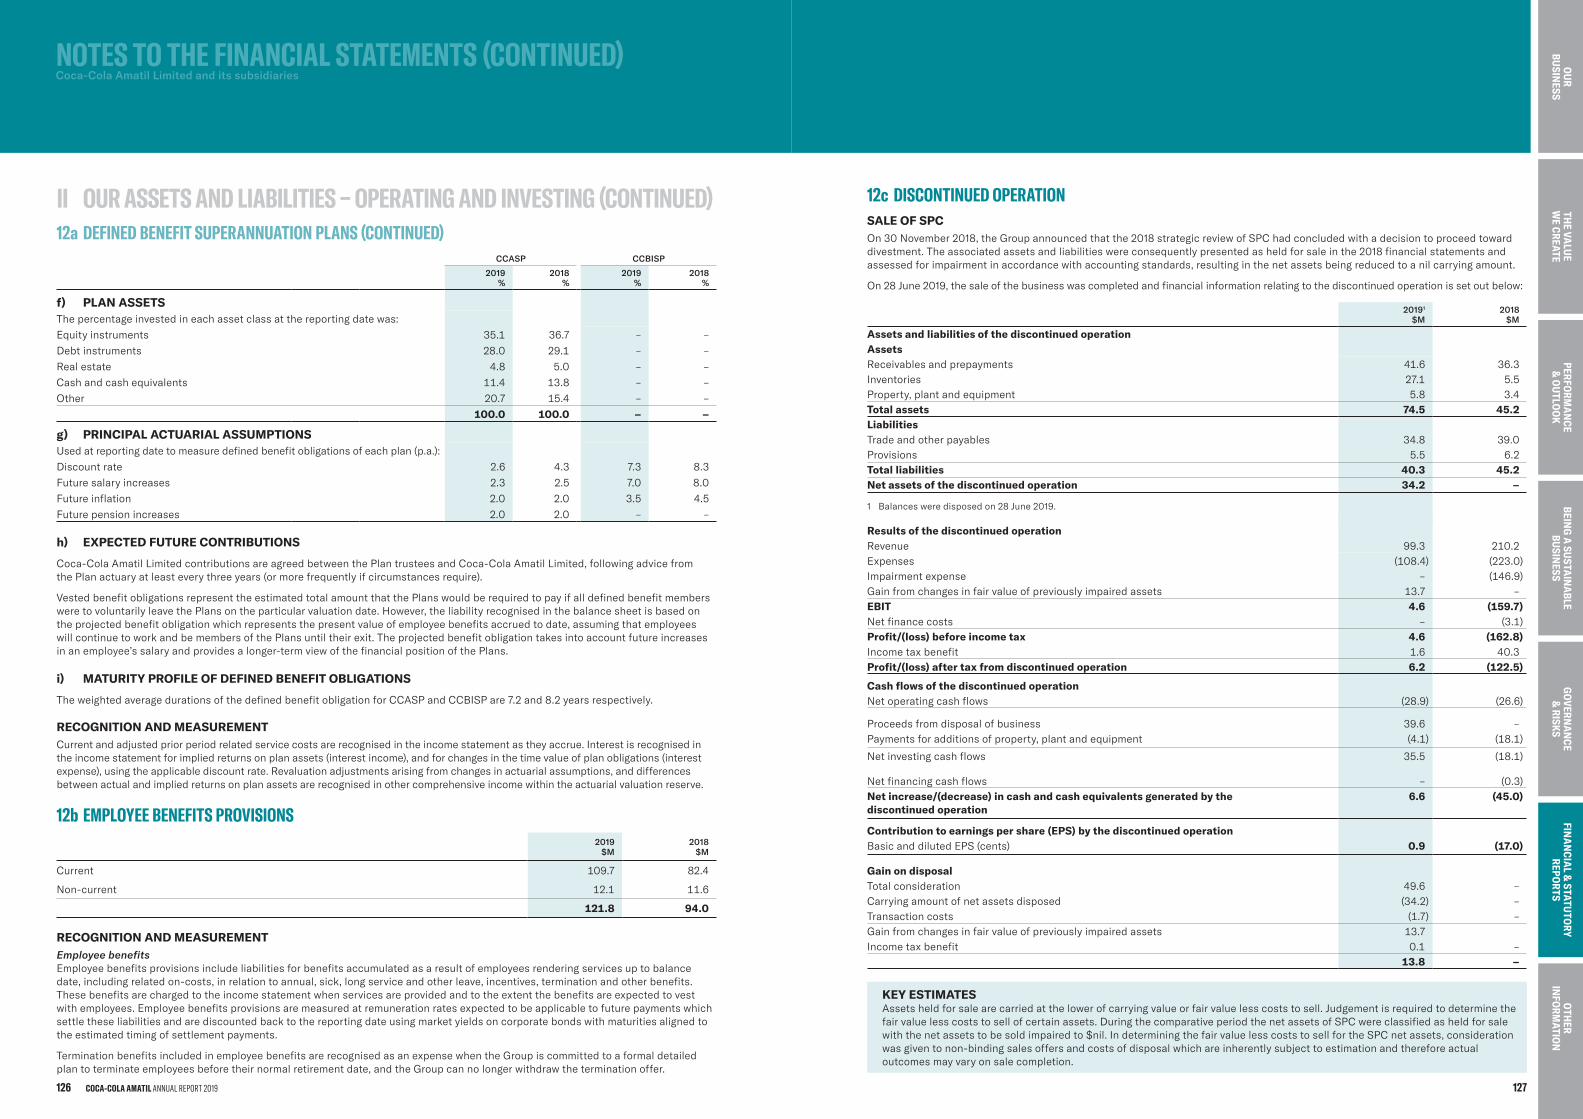
CCASP CCBISP
2019%
2018%
2019%
2018%
f) PLAN ASSETSThepercentageinvestedineachassetclassatthereportingdatewas:
Equityinstruments 35.1 36.7 – –
Debtinstruments 28.0 29.1 – –
Realestate 4.8 5.0 – –
Cashandcashequivalents 11.4 13.8 – –
Other 20.7 15.4 – –
100.0 100.0 – –
g) PRINCIPAL ACTUARIAL ASSUMPTIONSUsedatreportingdatetomeasuredefinedbenefitobligationsofeachplan(p.a.):
Discountrate 2.6 4.3 7.3 8.3
Futuresalaryincreases 2.3 2.5 7.0 8.0
Futureinflation 2.0 2.0 3.5 4.5
Futurepensionincreases 2.0 2.0 – –
h) EXPECTED FUTURE CONTRIBUTIONS
Coca-ColaAmatilLimitedcontributionsareagreedbetweenthePlantrusteesandCoca-ColaAmatilLimited,followingadvicefromthePlanactuaryatleasteverythreeyears(ormorefrequentlyifcircumstancesrequire).
VestedbenefitobligationsrepresenttheestimatedtotalamountthatthePlanswouldberequiredtopayifalldefinedbenefitmembersweretovoluntarilyleavethePlansontheparticularvaluationdate.However,theliabilityrecognisedinthebalancesheetisbasedontheprojectedbenefitobligationwhichrepresentsthepresentvalueofemployeebenefitsaccruedtodate,assumingthatemployeeswillcontinuetoworkandbemembersofthePlansuntiltheirexit.Theprojectedbenefitobligationtakesintoaccountfutureincreasesinanemployee’ssalaryandprovidesalonger-termviewofthefinancialpositionofthePlans.
i) MATURITY PROFILE OF DEFINED BENEFIT OBLIGATIONS
TheweightedaveragedurationsofthedefinedbenefitobligationforCCASPandCCBISPare7.2and8.2yearsrespectively.
RECOGNITION AND MEASUREMENTCurrentandadjustedpriorperiodrelatedservicecostsarerecognisedintheincomestatementastheyaccrue.Interestisrecognisedintheincomestatementforimpliedreturnsonplanassets(interestincome),andforchangesinthetimevalueofplanobligations(interestexpense),usingtheapplicablediscountrate.Revaluationadjustmentsarisingfromchangesinactuarialassumptions,anddifferencesbetweenactualandimpliedreturnsonplanassetsarerecognisedinothercomprehensiveincomewithintheactuarialvaluationreserve.
12b EMPLOYEE BENEFITS PROVISIONS2019
$M2018
$M
Current 109.7 82.4
Non-current 12.1 11.6
121.8 94.0
RECOGNITION AND MEASUREMENTEmployee benefitsEmployeebenefitsprovisionsincludeliabilitiesforbenefitsaccumulatedasaresultofemployeesrenderingservicesuptobalancedate,includingrelatedon-costs,inrelationtoannual,sick,longserviceandotherleave,incentives,terminationandotherbenefits.Thesebenefitsarechargedtotheincomestatementwhenservicesareprovidedandtotheextentthebenefitsareexpectedtovestwithemployees.Employeebenefitsprovisionsaremeasuredatremunerationratesexpectedtobeapplicabletofuturepaymentswhichsettletheseliabilitiesandarediscountedbacktothereportingdateusingmarketyieldsoncorporatebondswithmaturitiesalignedtotheestimatedtimingofsettlementpayments.
TerminationbenefitsincludedinemployeebenefitsarerecognisedasanexpensewhentheGroupiscommittedtoaformaldetailedplantoterminateemployeesbeforetheirnormalretirementdate,andtheGroupcannolongerwithdrawtheterminationoffer.
12c DISCONTINUED OPERATIONSALE OF SPCOn30November2018,theGroupannouncedthatthe2018strategicreviewofSPChadconcludedwithadecisiontoproceedtowarddivestment.Theassociatedassetsandliabilitieswereconsequentlypresentedasheldforsaleinthe2018financialstatementsandassessedforimpairmentinaccordancewithaccountingstandards,resultinginthenetassetsbeingreducedtoanilcarryingamount.
On28June2019,thesaleofthebusinesswascompletedandfinancialinformationrelatingtothediscontinuedoperationissetoutbelow:
20191 $M
2018 $M
Assets and liabilities of the discontinued operation AssetsReceivablesandprepayments 41.6 36.3Inventories 27.1 5.5Property,plantandequipment 5.8 3.4Total assets 74.5 45.2LiabilitiesTradeandotherpayables 34.8 39.0Provisions 5.5 6.2Total liabilities 40.3 45.2Net assets of the discontinued operation 34.2 –
1 Balancesweredisposedon28June2019.
Results of the discontinued operationRevenue 99.3 210.2Expenses (108.4) (223.0)Impairmentexpense – (146.9)Gainfromchangesinfairvalueofpreviouslyimpairedassets 13.7 –EBIT 4.6 (159.7)Netfinancecosts – (3.1)Profit/(loss) before income tax 4.6 (162.8)Incometaxbenefit 1.6 40.3Profit/(loss) after tax from discontinued operation 6.2 (122.5)
Cash flows of the discontinued operationNetoperatingcashflows (28.9) (26.6)
Proceedsfromdisposalofbusiness 39.6 –Paymentsforadditionsofproperty,plantandequipment (4.1) (18.1)
Netinvestingcashflows 35.5 (18.1)
Netfinancingcashflows – (0.3)Net increase/(decrease) in cash and cash equivalents generated by the discontinued operation
6.6 (45.0)
Contribution to earnings per share (EPS) by the discontinued operationBasicanddilutedEPS(cents) 0.9 (17.0)
Gain on disposalTotalconsideration 49.6 –Carryingamountofnetassetsdisposed (34.2) –Transactioncosts (1.7) –Gainfromchangesinfairvalueofpreviouslyimpairedassets 13.7Incometaxbenefit 0.1 –
13.8 –
KEY ESTIMATES Assetsheldforsalearecarriedatthelowerofcarryingvalueorfairvaluelesscoststosell.Judgementisrequiredtodeterminethefairvaluelesscoststosellofcertainassets.DuringthecomparativeperiodthenetassetsofSPCwereclassifiedasheldforsalewiththenetassetstobesoldimpairedto$nil.IndeterminingthefairvaluelesscoststosellfortheSPCnetassets,considerationwasgiventonon-bindingsalesoffersandcostsofdisposalwhichareinherentlysubjecttoestimationandthereforeactualoutcomesmayvaryonsalecompletion.
NOTESTOTHEFINANCIALSTATEMENTS(CONTINUED) Coca-Cola Amatil Limited and its subsidiaries
II OURASSETSANDLIABILITIES–OPERATINGANDINVESTING(CONTINUED)12a DEFINEDBENEFITSUPERANNUATIONPLANS(CONTINUED)
COCA-COLA AMATIL ANNUAL REPORT 2019126 127
BEING
A SU
STAIN
ABLE
BUSIN
ESSTH
E VALU
E W
E CREATEPERFO
RMA
NCE
& O
UTLO
OK
GO
VERNA
NCE
& RISK
SFIN
AN
CIAL &
STATUTO
RY REPO
RTS
OTH
ER IN
FORM
ATION
OU
R BU
SINESS
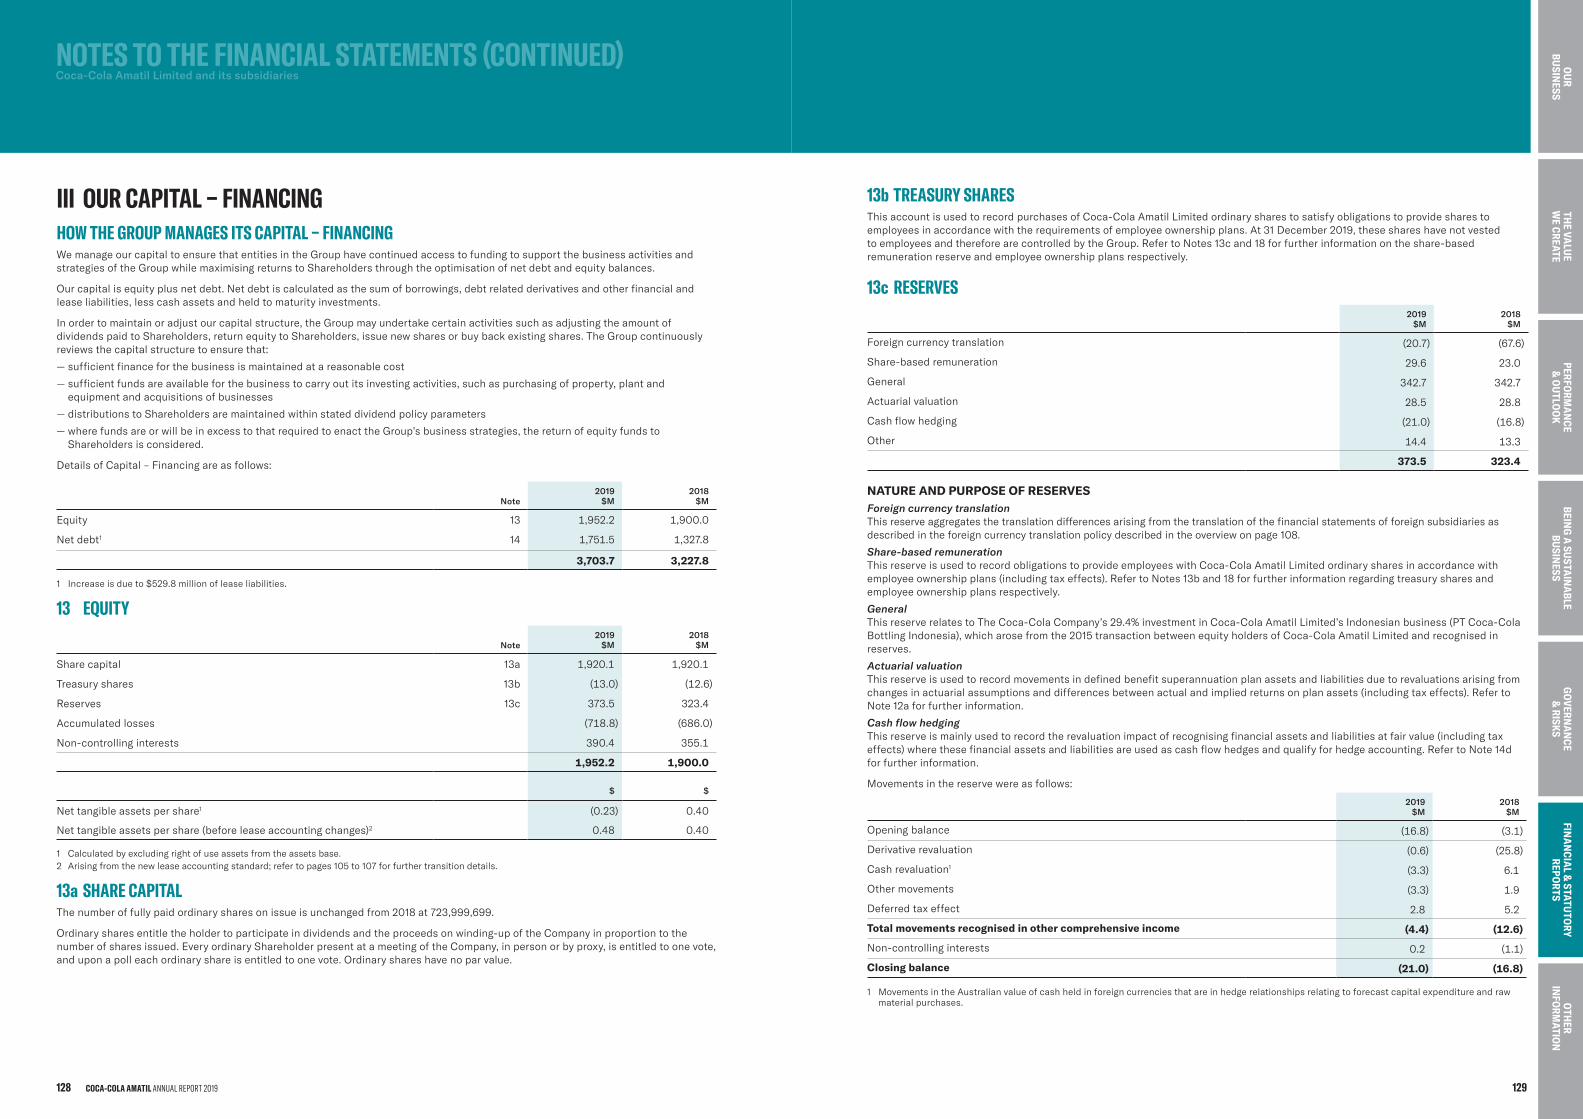
III OURCAPITAL–FINANCINGHOWTHEGROUPMANAGESITSCAPITAL–FINANCINGWemanageourcapitaltoensurethatentitiesintheGrouphavecontinuedaccesstofundingtosupportthebusinessactivitiesandstrategiesoftheGroupwhilemaximisingreturnstoShareholdersthroughtheoptimisationofnetdebtandequitybalances.
Ourcapitalisequityplusnetdebt.Netdebtiscalculatedasthesumofborrowings,debtrelatedderivativesandotherfinancialandleaseliabilities,lesscashassetsandheldtomaturityinvestments.
Inordertomaintainoradjustourcapitalstructure,theGroupmayundertakecertainactivitiessuchasadjustingtheamountofdividendspaidtoShareholders,returnequitytoShareholders,issuenewsharesorbuybackexistingshares.TheGroupcontinuouslyreviewsthecapitalstructuretoensurethat:
— sufficientfinanceforthebusinessismaintainedatareasonablecost
— sufficientfundsareavailableforthebusinesstocarryoutitsinvestingactivities,suchaspurchasingofproperty,plantandequipmentandacquisitionsofbusinesses
— distributionstoShareholdersaremaintainedwithinstateddividendpolicyparameters
— wherefundsareorwillbeinexcesstothatrequiredtoenacttheGroup’sbusinessstrategies,thereturnofequityfundstoShareholdersisconsidered.
DetailsofCapital–Financingareasfollows:
Note2019
$M2018
$M
Equity 13 1,952.2 1,900.0
Netdebt1 14 1,751.5 1,327.8
3,703.7 3,227.8
1 Increaseisdueto$529.8millionofleaseliabilities.
13 EQUITY
Note2019
$M2018
$M
Sharecapital 13a 1,920.1 1,920.1
Treasuryshares 13b (13.0) (12.6)
Reserves 13c 373.5 323.4
Accumulatedlosses (718.8) (686.0)
Non-controllinginterests 390.4 355.1
1,952.2 1,900.0
$ $
Nettangibleassetspershare1 (0.23) 0.40
Nettangibleassetspershare(beforeleaseaccountingchanges)2 0.48 0.40
1 Calculatedbyexcludingrightofuseassetsfromtheassetsbase.2 Arisingfromthenewleaseaccountingstandard;refertopages105to107forfurthertransitiondetails.
13a SHARE CAPITALThenumberoffullypaidordinarysharesonissueisunchangedfrom2018at723,999,699.
Ordinarysharesentitletheholdertoparticipateindividendsandtheproceedsonwinding-upoftheCompanyinproportiontothenumberofsharesissued.EveryordinaryShareholderpresentatameetingoftheCompany,inpersonorbyproxy,isentitledtoonevote,anduponapolleachordinaryshareisentitledtoonevote.Ordinaryshareshavenoparvalue.
13b TREASURY SHARESThisaccountisusedtorecordpurchasesofCoca-ColaAmatilLimitedordinarysharestosatisfyobligationstoprovidesharestoemployeesinaccordancewiththerequirementsofemployeeownershipplans.At31December2019,theseshareshavenotvestedto employeesandthereforearecontrolledbytheGroup.RefertoNotes13cand18forfurtherinformationontheshare-basedremunerationreserveandemployeeownershipplansrespectively.
13c RESERVES2019
$M2018
$M
Foreigncurrencytranslation (20.7) (67.6)
Share-basedremuneration 29.6 23.0
General 342.7 342.7
Actuarialvaluation 28.5 28.8
Cashflowhedging (21.0) (16.8)
Other 14.4 13.3
373.5 323.4
NATURE AND PURPOSE OF RESERVESForeign currency translation Thisreserveaggregatesthetranslationdifferencesarisingfromthetranslationofthefinancialstatementsofforeignsubsidiariesasdescribedintheforeigncurrencytranslationpolicydescribedintheoverviewonpage108.
Share-based remuneration ThisreserveisusedtorecordobligationstoprovideemployeeswithCoca-ColaAmatilLimitedordinarysharesinaccordancewithemployeeownershipplans(includingtaxeffects).RefertoNotes13band18forfurtherinformationregardingtreasurysharesandemployeeownershipplansrespectively.
GeneralThisreserverelatestoTheCoca-ColaCompany’s29.4%investmentinCoca-ColaAmatilLimited’sIndonesianbusiness(PTCoca-ColaBottlingIndonesia),whicharosefromthe2015transactionbetweenequityholdersofCoca-ColaAmatilLimitedandrecognisedinreserves.
Actuarial valuationThisreserveisusedtorecordmovementsindefinedbenefitsuperannuationplanassetsandliabilitiesduetorevaluationsarisingfromchangesinactuarialassumptionsanddifferencesbetweenactualandimpliedreturnsonplanassets(includingtaxeffects).RefertoNote12aforfurtherinformation.
Cash flow hedging Thisreserveismainlyusedtorecordtherevaluationimpactofrecognisingfinancialassetsandliabilitiesatfairvalue(includingtaxeffects)wherethesefinancialassetsandliabilitiesareusedascashflowhedgesandqualifyforhedgeaccounting.RefertoNote14dforfurtherinformation.
Movementsinthereservewereasfollows:
2019 $M
2018 $M
Openingbalance (16.8) (3.1)
Derivativerevaluation (0.6) (25.8)
Cashrevaluation1 (3.3) 6.1
Othermovements (3.3) 1.9
Deferredtaxeffect 2.8 5.2
Total movements recognised in other comprehensive income (4.4) (12.6)
Non-controllinginterests 0.2 (1.1)
Closing balance (21.0) (16.8)
1 MovementsintheAustralianvalueofcashheldinforeigncurrenciesthatareinhedgerelationshipsrelatingtoforecastcapitalexpenditureandrawmaterialpurchases.
NOTESTOTHEFINANCIALSTATEMENTS(CONTINUED) Coca-Cola Amatil Limited and its subsidiaries
COCA-COLA AMATIL ANNUAL REPORT 2019128 129
BEING
A SU
STAIN
ABLE
BUSIN
ESSTH
E VALU
E W
E CREATEPERFO
RMA
NCE
& O
UTLO
OK
GO
VERNA
NCE
& RISK
SFIN
AN
CIAL &
STATUTO
RY REPO
RTS
OTH
ER IN
FORM
ATION
OU
R BU
SINESS
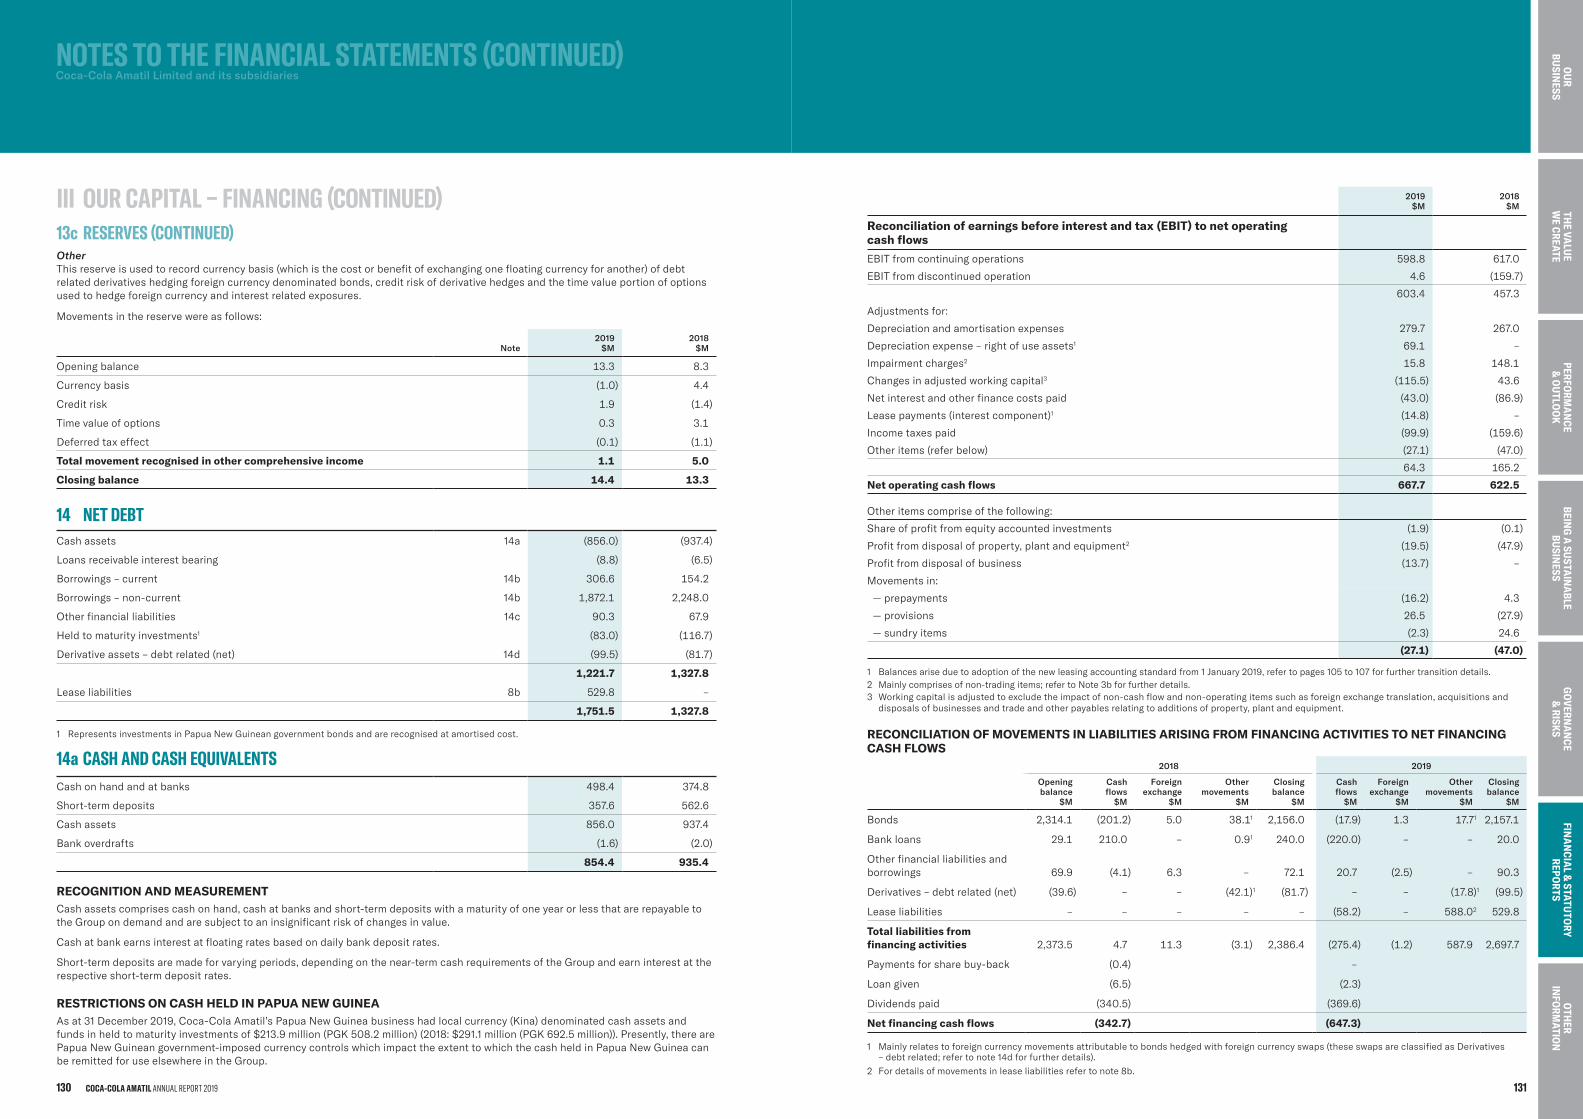
OtherThisreserveisusedtorecordcurrencybasis(whichisthecostorbenefitofexchangingonefloatingcurrencyforanother)ofdebtrelatedderivativeshedgingforeigncurrencydenominatedbonds,creditriskofderivativehedgesandthetimevalueportionofoptionsusedtohedgeforeigncurrencyandinterestrelatedexposures.
Movementsinthereservewereasfollows:
Note2019
$M2018
$M
Openingbalance 13.3 8.3
Currencybasis (1.0) 4.4
Creditrisk 1.9 (1.4)
Timevalueofoptions 0.3 3.1
Deferredtaxeffect (0.1) (1.1)
Total movement recognised in other comprehensive income 1.1 5.0
Closing balance 14.4 13.3
14 NETDEBTCashassets 14a (856.0) (937.4)
Loansreceivableinterestbearing (8.8) (6.5)
Borrowings–current 14b 306.6 154.2
Borrowings–non-current 14b 1,872.1 2,248.0
Otherfinancialliabilities 14c 90.3 67.9
Heldtomaturityinvestments1 (83.0) (116.7)
Derivativeassets–debtrelated(net) 14d (99.5) (81.7)
1,221.7 1,327.8
Leaseliabilities 8b 529.8 –
1,751.5 1,327.8
1 RepresentsinvestmentsinPapuaNewGuineangovernmentbondsandarerecognisedatamortisedcost.
14a CASH AND CASH EQUIVALENTSCashonhandandatbanks 498.4 374.8
Short-termdeposits 357.6 562.6
Cashassets 856.0 937.4
Bankoverdrafts (1.6) (2.0)
854.4 935.4
RECOGNITION AND MEASUREMENTCashassetscomprisescashonhand,cashatbanksandshort-termdepositswithamaturityofoneyearorlessthatarerepayabletotheGroupondemandandaresubjecttoaninsignificantriskofchangesinvalue.
Cashatbankearnsinterestatfloatingratesbasedondailybankdepositrates.
Short-termdepositsaremadeforvaryingperiods,dependingonthenear-termcashrequirementsoftheGroupandearninterestattherespectiveshort-termdepositrates.
RESTRICTIONS ON CASH HELD IN PAPUA NEW GUINEA Asat31December2019,Coca-ColaAmatil’sPapuaNewGuineabusinesshadlocalcurrency(Kina)denominatedcashassetsandfundsinheldtomaturityinvestmentsof$213.9million(PGK508.2million)(2018:$291.1million(PGK692.5million)).Presently,therearePapuaNewGuineangovernment-imposedcurrencycontrolswhichimpacttheextenttowhichthecashheldinPapuaNewGuineacanberemittedforuseelsewhereintheGroup.
2019 $M
2018 $M
Reconciliation of earnings before interest and tax (EBIT) to net operating cash flows
EBITfromcontinuingoperations 598.8 617.0
EBITfromdiscontinuedoperation 4.6 (159.7)
603.4 457.3
Adjustmentsfor:
Depreciationandamortisationexpenses 279.7 267.0
Depreciationexpense–rightofuseassets1 69.1 –
Impairmentcharges2 15.8 148.1
Changesinadjustedworkingcapital3 (115.5) 43.6
Netinterestandotherfinancecostspaid (43.0) (86.9)
Leasepayments(interestcomponent)1 (14.8) –
Incometaxespaid (99.9) (159.6)
Otheritems(referbelow) (27.1) (47.0)
64.3 165.2
Net operating cash flows 667.7 622.5
Otheritemscompriseofthefollowing:
Shareofprofitfromequityaccountedinvestments (1.9) (0.1)
Profitfromdisposalofproperty,plantandequipment2 (19.5) (47.9)
Profitfromdisposalofbusiness (13.7) –
Movementsin:
— prepayments (16.2) 4.3
— provisions 26.5 (27.9)
— sundryitems (2.3) 24.6
(27.1) (47.0)
1 Balancesariseduetoadoptionofthenewleasingaccountingstandardfrom1January2019,refertopages105to107forfurthertransitiondetails. 2 Mainlycomprisesofnon-tradingitems;refertoNote3bforfurtherdetails.3 Workingcapitalisadjustedtoexcludetheimpactofnon-cashflowandnon-operatingitemssuchasforeignexchangetranslation,acquisitionsanddisposalsofbusinessesandtradeandotherpayablesrelatingtoadditionsofproperty,plantandequipment.
RECONCILIATION OF MOVEMENTS IN LIABILITIES ARISING FROM FINANCING ACTIVITIES TO NET FINANCING CASH FLOWS
2018 2019
Openingbalance
$M
Cashflows
$M
Foreignexchange
$M
Othermovements
$M
Closingbalance
$M
Cash flows
$M
Foreign exchange
$M
Other movements
$M
Closingbalance
$M
Bonds 2,314.1 (201.2) 5.0 38.11 2,156.0 (17.9) 1.3 17.71 2,157.1
Bankloans 29.1 210.0 – 0.91 240.0 (220.0) – – 20.0
Otherfinancialliabilitiesandborrowings 69.9 (4.1) 6.3 – 72.1 20.7 (2.5) – 90.3
Derivatives–debtrelated(net) (39.6) – – (42.1)1 (81.7) – – (17.8)1 (99.5)
Leaseliabilities – – – – – (58.2) – 588.02 529.8
Total liabilities from financing activities 2,373.5 4.7 11.3 (3.1) 2,386.4 (275.4) (1.2) 587.9 2,697.7
Paymentsforsharebuy-back (0.4) –
Loangiven (6.5) (2.3)
Dividendspaid (340.5) (369.6)
Net financing cash flows (342.7) (647.3)
1 Mainlyrelatestoforeigncurrencymovementsattributabletobondshedgedwithforeigncurrencyswaps(theseswapsareclassifiedasDerivatives–debtrelated;refertonote14dforfurtherdetails).
2 Fordetailsofmovementsinleaseliabilitiesrefertonote8b.
NOTESTOTHEFINANCIALSTATEMENTS(CONTINUED) Coca-Cola Amatil Limited and its subsidiaries
III OURCAPITAL–FINANCING(CONTINUED)13cRESERVES(CONTINUED)
COCA-COLA AMATIL ANNUAL REPORT 2019130 131
BEING
A SU
STAIN
ABLE
BUSIN
ESSTH
E VALU
E W
E CREATEPERFO
RMA
NCE
& O
UTLO
OK
GO
VERNA
NCE
& RISK
SFIN
AN
CIAL &
STATUTO
RY REPO
RTS
OTH
ER IN
FORM
ATION
OU
R BU
SINESS
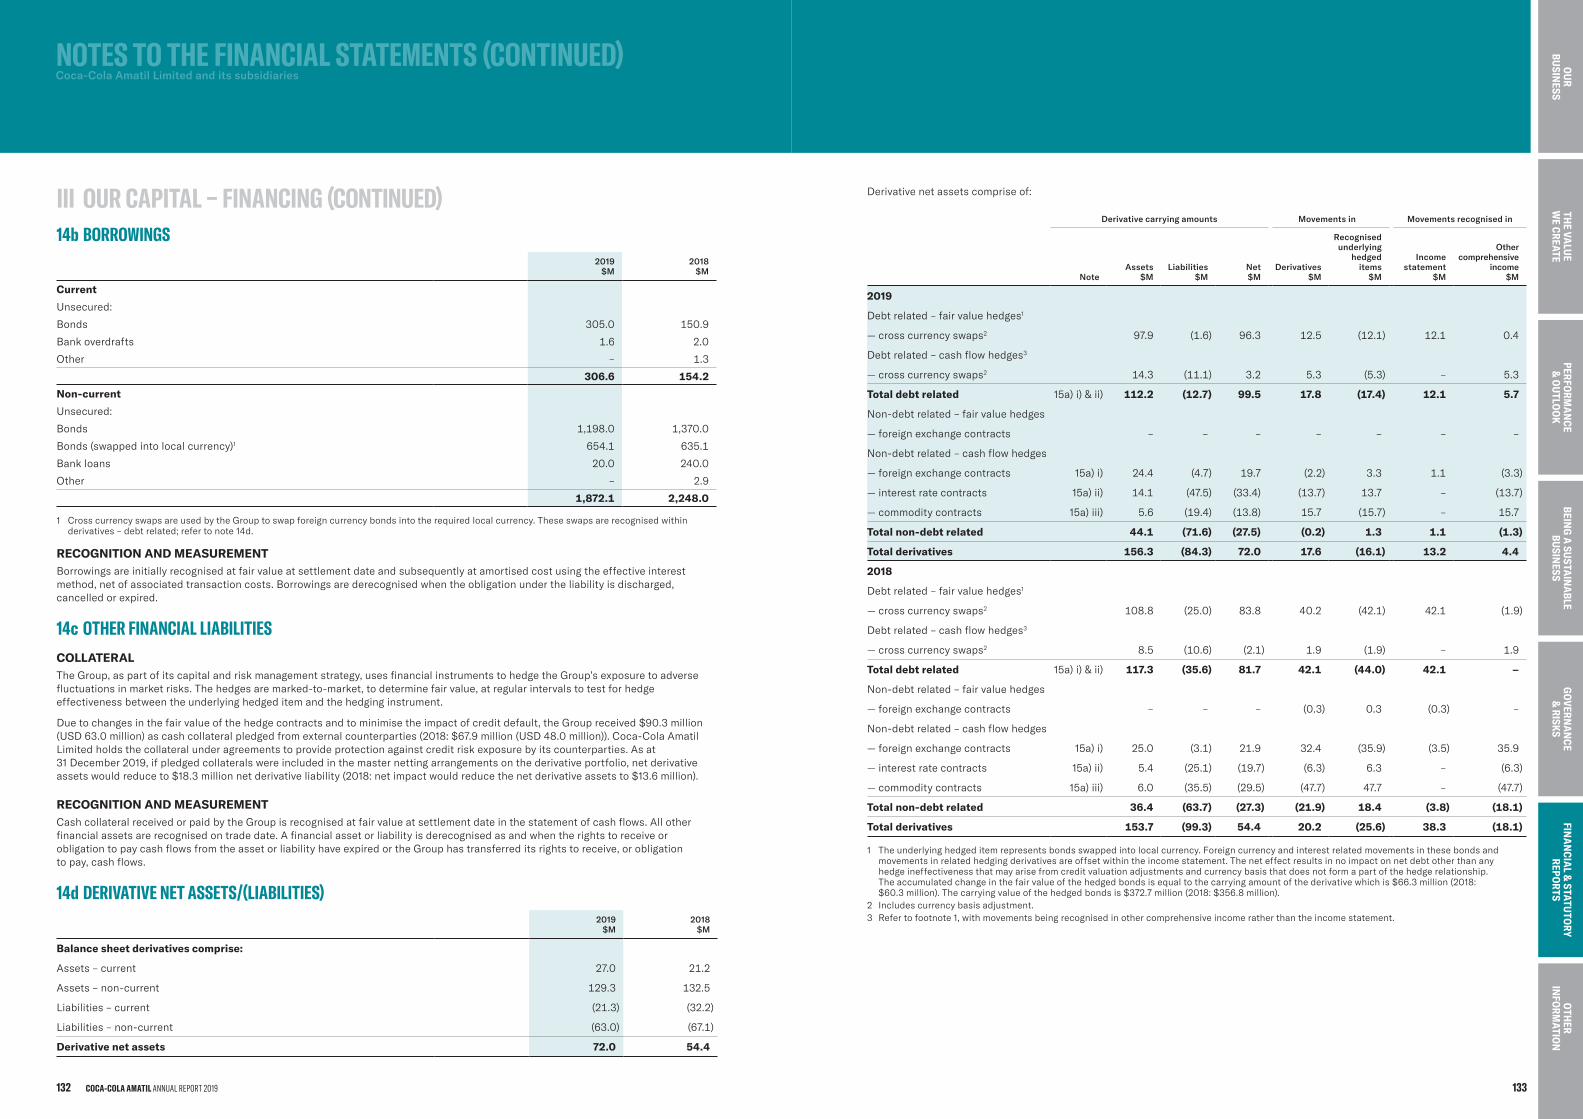
14b BORROWINGS2019
$M2018
$M
Current
Unsecured:
Bonds 305.0 150.9
Bankoverdrafts 1.6 2.0
Other – 1.3
306.6 154.2
Non-current
Unsecured:
Bonds 1,198.0 1,370.0
Bonds(swappedintolocalcurrency)1 654.1 635.1
Bankloans 20.0 240.0
Other – 2.9
1,872.1 2,248.0
1 CrosscurrencyswapsareusedbytheGrouptoswapforeigncurrencybondsintotherequiredlocalcurrency.Theseswapsarerecognisedwithinderivatives–debtrelated;refertonote14d.
RECOGNITION AND MEASUREMENTBorrowingsareinitiallyrecognisedatfairvalueatsettlementdateandsubsequentlyatamortisedcostusingtheeffectiveinterestmethod,netofassociatedtransactioncosts.Borrowingsarederecognisedwhentheobligationundertheliabilityisdischarged,cancelledorexpired.
14c OTHER FINANCIAL LIABILITIESCOLLATERALTheGroup,aspartofitscapitalandriskmanagementstrategy,usesfinancialinstrumentstohedgetheGroup’sexposuretoadversefluctuationsinmarketrisks.Thehedgesaremarked-to-market,todeterminefairvalue,atregularintervalstotestforhedgeeffectivenessbetweentheunderlyinghedgeditemandthehedginginstrument.
Duetochangesinthefairvalueofthehedgecontractsandtominimisetheimpactofcreditdefault,theGroupreceived$90.3million(USD63.0million)ascashcollateralpledgedfromexternalcounterparties(2018:$67.9million(USD48.0million)).Coca-ColaAmatilLimitedholdsthecollateralunderagreementstoprovideprotectionagainstcreditriskexposurebyitscounterparties.Asat31 December2019,ifpledgedcollateralswereincludedinthemasternettingarrangementsonthederivativeportfolio,netderivativeassetswouldreduceto$18.3millionnetderivativeliability(2018:netimpactwouldreducethenetderivativeassetsto$13.6million).
RECOGNITION AND MEASUREMENTCashcollateralreceivedorpaidbytheGroupisrecognisedatfairvalueatsettlementdateinthestatementofcashflows.Allotherfinancialassetsarerecognisedontradedate.AfinancialassetorliabilityisderecognisedasandwhentherightstoreceiveorobligationtopaycashflowsfromtheassetorliabilityhaveexpiredortheGrouphastransferreditsrightstoreceive,orobligationtopay,cashflows.
14dDERIVATIVENETASSETS/(LIABILITIES)2019
$M2018
$M
Balance sheet derivatives comprise:
Assets–current 27.0 21.2
Assets–non-current 129.3 132.5
Liabilities–current (21.3) (32.2)
Liabilities–non-current (63.0) (67.1)
Derivative net assets 72.0 54.4
Derivativenetassetscompriseof:
Derivative carrying amounts Movements in Movements recognised in
NoteAssets
$MLiabilities
$MNet$M
Derivatives$M
Recognisedunderlying
hedged items
$M
Incomestatement
$M
Othercomprehensive
income$M
2019
Debtrelated–fairvaluehedges1
— crosscurrencyswaps2 97.9 (1.6) 96.3 12.5 (12.1) 12.1 0.4
Debtrelated–cashflowhedges3
— crosscurrencyswaps2 14.3 (11.1) 3.2 5.3 (5.3) – 5.3
Total debt related 15a)i)&ii) 112.2 (12.7) 99.5 17.8 (17.4) 12.1 5.7
Non-debtrelated–fairvaluehedges
— foreignexchangecontracts – – – – – – –
Non-debtrelated–cashflowhedges
— foreignexchangecontracts 15a)i) 24.4 (4.7) 19.7 (2.2) 3.3 1.1 (3.3)
— interestratecontracts 15a)ii) 14.1 (47.5) (33.4) (13.7) 13.7 – (13.7)
— commoditycontracts 15a)iii) 5.6 (19.4) (13.8) 15.7 (15.7) – 15.7
Total non-debt related 44.1 (71.6) (27.5) (0.2) 1.3 1.1 (1.3)
Total derivatives 156.3 (84.3) 72.0 17.6 (16.1) 13.2 4.4
2018
Debtrelated–fairvaluehedges1
— crosscurrencyswaps2 108.8 (25.0) 83.8 40.2 (42.1) 42.1 (1.9)
Debtrelated–cashflowhedges3
— crosscurrencyswaps2 8.5 (10.6) (2.1) 1.9 (1.9) – 1.9
Total debt related 15a)i)&ii) 117.3 (35.6) 81.7 42.1 (44.0) 42.1 –
Non-debtrelated–fairvaluehedges
— foreignexchangecontracts – – – (0.3) 0.3 (0.3) –
Non-debtrelated–cashflowhedges
— foreignexchangecontracts 15a)i) 25.0 (3.1) 21.9 32.4 (35.9) (3.5) 35.9
— interestratecontracts 15a)ii) 5.4 (25.1) (19.7) (6.3) 6.3 – (6.3)
— commoditycontracts 15a)iii) 6.0 (35.5) (29.5) (47.7) 47.7 – (47.7)
Total non-debt related 36.4 (63.7) (27.3) (21.9) 18.4 (3.8) (18.1)
Total derivatives 153.7 (99.3) 54.4 20.2 (25.6) 38.3 (18.1)
1 Theunderlyinghedgeditemrepresentsbondsswappedintolocalcurrency.Foreigncurrencyandinterestrelatedmovementsinthesebondsandmovementsinrelatedhedgingderivativesareoffsetwithintheincomestatement.Theneteffectresultsinnoimpactonnetdebtotherthananyhedge ineffectivenessthatmayarisefromcreditvaluationadjustmentsandcurrencybasisthatdoesnotformapartofthehedgerelationship.The accumulatedchangeinthefairvalueofthehedgedbondsisequaltothecarryingamountofthederivativewhichis$66.3million(2018:$60.3 million).Thecarryingvalueofthehedgedbondsis$372.7million(2018:$356.8million).
2 Includescurrencybasisadjustment.3 Refertofootnote1,withmovementsbeingrecognisedinothercomprehensiveincomeratherthantheincomestatement.
NOTESTOTHEFINANCIALSTATEMENTS(CONTINUED) Coca-Cola Amatil Limited and its subsidiaries
III OURCAPITAL–FINANCING(CONTINUED)
COCA-COLA AMATIL ANNUAL REPORT 2019132 133
BEING
A SU
STAIN
ABLE
BUSIN
ESSTH
E VALU
E W
E CREATEPERFO
RMA
NCE
& O
UTLO
OK
GO
VERNA
NCE
& RISK
SFIN
AN
CIAL &
STATUTO
RY REPO
RTS
OTH
ER IN
FORM
ATION
OU
R BU
SINESS
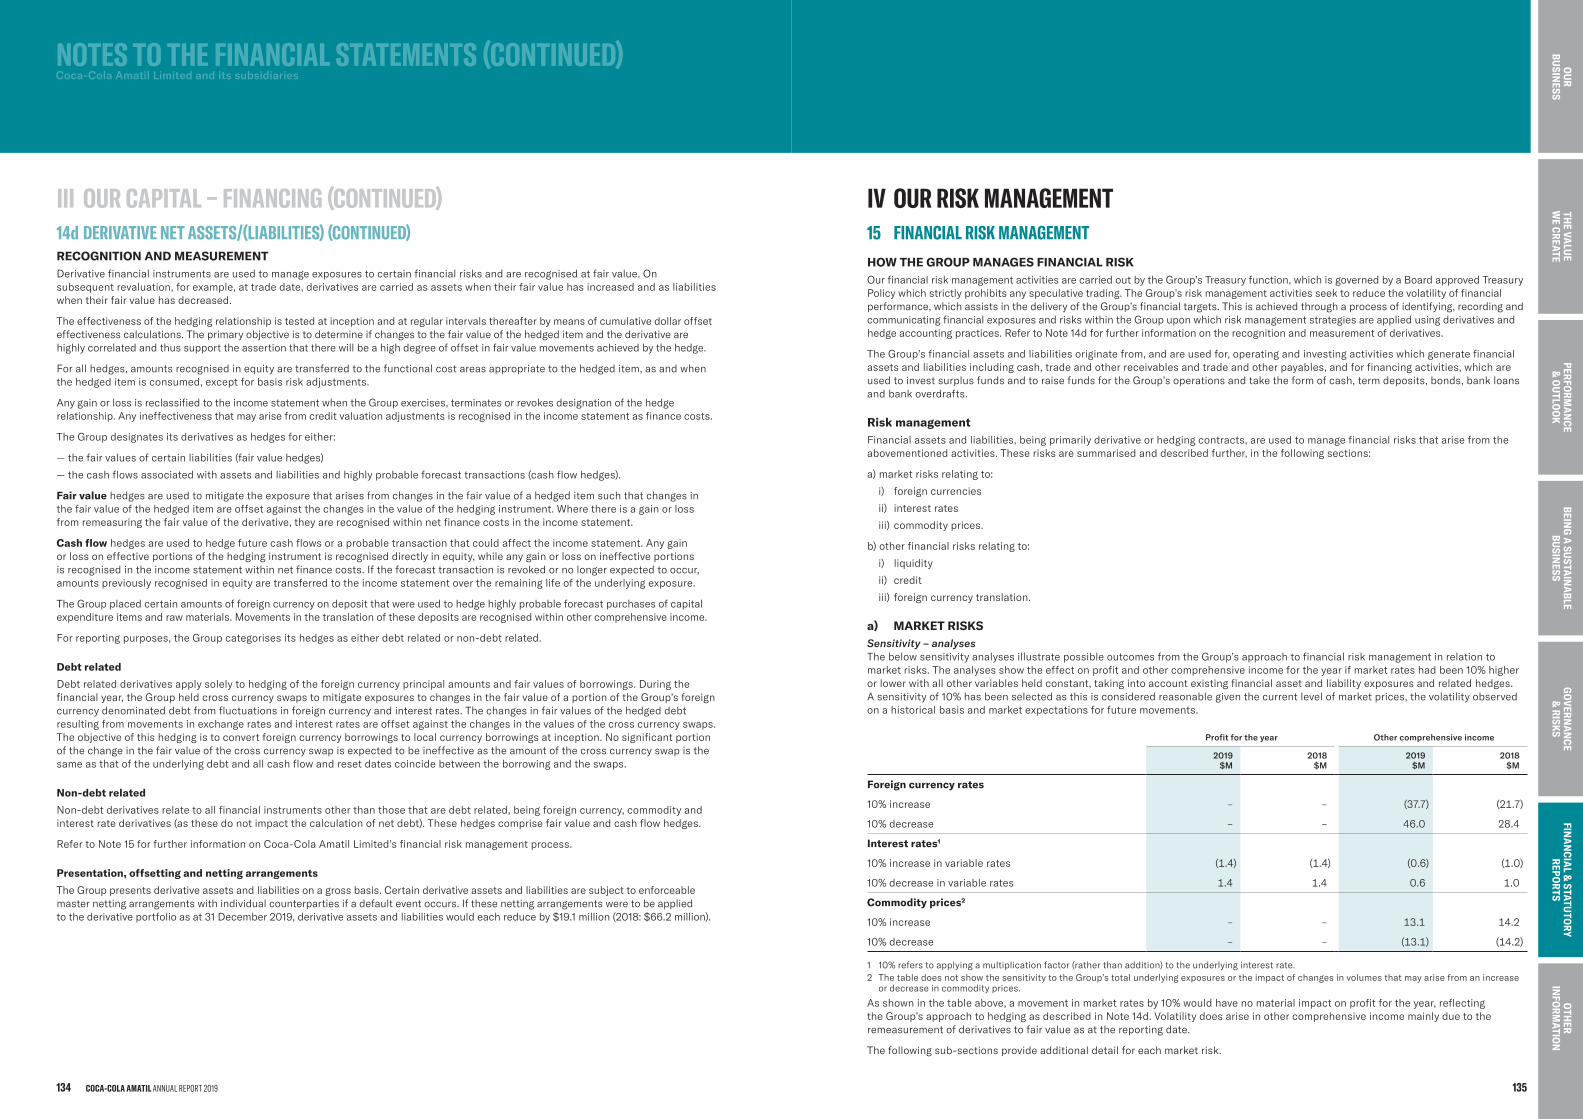
RECOGNITION AND MEASUREMENTDerivativefinancialinstrumentsareusedtomanageexposurestocertainfinancialrisksandarerecognisedatfairvalue.Onsubsequentrevaluation,forexample,attradedate,derivativesarecarriedasassetswhentheirfairvaluehasincreasedandasliabilitieswhentheirfairvaluehasdecreased.
Theeffectivenessofthehedgingrelationshipistestedatinceptionandatregularintervalsthereafterbymeansofcumulativedollaroffseteffectivenesscalculations.Theprimaryobjectiveistodetermineifchangestothefairvalueofthehedgeditemandthederivativearehighlycorrelatedandthussupporttheassertionthattherewillbeahighdegreeofoffsetinfairvaluemovementsachievedbythehedge.
Forallhedges,amountsrecognisedinequityaretransferredtothefunctionalcostareasappropriatetothehedgeditem,asandwhenthehedgeditemisconsumed,exceptforbasisriskadjustments.
AnygainorlossisreclassifiedtotheincomestatementwhentheGroupexercises,terminatesorrevokesdesignationofthehedgerelationship.Anyineffectivenessthatmayarisefromcreditvaluationadjustmentsisrecognisedintheincomestatementasfinancecosts.
TheGroupdesignatesitsderivativesashedgesforeither:
— thefairvaluesofcertainliabilities(fairvaluehedges)
— thecashflowsassociatedwithassetsandliabilitiesandhighlyprobableforecasttransactions(cashflowhedges).
Fair valuehedgesareusedtomitigatetheexposurethatarisesfromchangesinthefairvalueofahedgeditemsuchthatchangesinthefairvalueofthehedgeditemareoffsetagainstthechangesinthevalueofthehedginginstrument.Wherethereisagainorlossfromremeasuringthefairvalueofthederivative,theyarerecognisedwithinnetfinancecostsintheincomestatement.
Cash flowhedgesareusedtohedgefuturecashflowsoraprobabletransactionthatcouldaffecttheincomestatement.Anygainor lossoneffectiveportionsofthehedginginstrumentisrecogniseddirectlyinequity,whileanygainorlossonineffectiveportionsis recognisedintheincomestatementwithinnetfinancecosts.Iftheforecasttransactionisrevokedornolongerexpectedtooccur,amountspreviouslyrecognisedinequityaretransferredtotheincomestatementovertheremaininglifeoftheunderlyingexposure.
TheGroupplacedcertainamountsofforeigncurrencyondepositthatwereusedtohedgehighlyprobableforecastpurchasesofcapitalexpenditureitemsandrawmaterials.Movementsinthetranslationofthesedepositsarerecognisedwithinothercomprehensiveincome.
Forreportingpurposes,theGroupcategorisesitshedgesaseitherdebtrelatedornon-debtrelated.
Debt related
Debtrelatedderivativesapplysolelytohedgingoftheforeigncurrencyprincipalamountsandfairvaluesofborrowings.Duringthefinancialyear,theGroupheldcrosscurrencyswapstomitigateexposurestochangesinthefairvalueofaportionoftheGroup’sforeigncurrencydenominateddebtfromfluctuationsinforeigncurrencyandinterestrates.Thechangesinfairvaluesofthehedgeddebtresultingfrommovementsinexchangeratesandinterestratesareoffsetagainstthechangesinthevaluesofthecrosscurrencyswaps.Theobjectiveofthishedgingistoconvertforeigncurrencyborrowingstolocalcurrencyborrowingsatinception.Nosignificantportionofthechangeinthefairvalueofthecrosscurrencyswapisexpectedtobeineffectiveastheamountofthecrosscurrencyswapisthesameasthatoftheunderlyingdebtandallcashflowandresetdatescoincidebetweentheborrowingandtheswaps.
Non-debt related
Non-debtderivativesrelatetoallfinancialinstrumentsotherthanthosethataredebtrelated,beingforeigncurrency,commodityandinterestratederivatives(asthesedonotimpactthecalculationofnetdebt).Thesehedgescomprisefairvalueandcashflowhedges.
RefertoNote15forfurtherinformationonCoca-ColaAmatilLimited’sfinancialriskmanagementprocess.
Presentation, offsetting and netting arrangements
TheGrouppresentsderivativeassetsandliabilitiesonagrossbasis.Certainderivativeassetsandliabilitiesaresubjecttoenforceablemasternettingarrangementswithindividualcounterpartiesifadefaulteventoccurs.Ifthesenettingarrangementsweretobeappliedto thederivativeportfolioasat31December2019,derivativeassetsandliabilitieswouldeachreduceby$19.1million(2018:$66.2million).
IV OUR RISK MANAGEMENT15 FINANCIALRISKMANAGEMENTHOW THE GROUP MANAGES FINANCIAL RISKOurfinancialriskmanagementactivitiesarecarriedoutbytheGroup’sTreasuryfunction,whichisgovernedbyaBoardapprovedTreasuryPolicywhichstrictlyprohibitsanyspeculativetrading.TheGroup’sriskmanagementactivitiesseektoreducethevolatilityoffinancialperformance,whichassistsinthedeliveryoftheGroup’sfinancialtargets.Thisisachievedthroughaprocessofidentifying,recordingandcommunicatingfinancialexposuresandriskswithintheGroupuponwhichriskmanagementstrategiesareappliedusingderivativesandhedgeaccountingpractices.RefertoNote14dforfurtherinformationontherecognitionandmeasurementofderivatives.
TheGroup’sfinancialassetsandliabilitiesoriginatefrom,andareusedfor,operatingandinvestingactivitieswhichgeneratefinancialassetsandliabilitiesincludingcash,tradeandotherreceivablesandtradeandotherpayables,andforfinancingactivities,whichareusedtoinvestsurplusfundsandtoraisefundsfortheGroup’soperationsandtaketheformofcash,termdeposits,bonds,bankloansandbankoverdrafts.
Risk managementFinancialassetsandliabilities,beingprimarilyderivativeorhedgingcontracts,areusedtomanagefinancialrisksthatarisefromtheabovementionedactivities.Theserisksaresummarisedanddescribedfurther,inthefollowingsections:
a) marketrisksrelatingto:
i) foreigncurrencies
ii) interestrates
iii) commodityprices.
b) otherfinancialrisksrelatingto:
i) liquidity
ii) credit
iii) foreigncurrencytranslation.
a) MARKET RISKSSensitivity – analysesThebelowsensitivityanalysesillustratepossibleoutcomesfromtheGroup’sapproachtofinancialriskmanagementinrelationtomarketrisks.Theanalysesshowtheeffectonprofitandothercomprehensiveincomefortheyearifmarketrateshadbeen10%higherorlowerwithallothervariablesheldconstant,takingintoaccountexistingfinancialassetandliabilityexposuresandrelatedhedges.A sensitivityof10%hasbeenselectedasthisisconsideredreasonablegiventhecurrentlevelofmarketprices,thevolatilityobservedonahistoricalbasisandmarketexpectationsforfuturemovements.
Profit for the year Other comprehensive income
2019$M
2018$M
2019$M
2018$M
Foreign currency rates
10%increase – – (37.7) (21.7)
10%decrease – – 46.0 28.4
Interest rates1
10%increaseinvariablerates (1.4) (1.4) (0.6) (1.0)
10%decreaseinvariablerates 1.4 1.4 0.6 1.0
Commodity prices2
10%increase – – 13.1 14.2
10%decrease – – (13.1) (14.2)
1 10%referstoapplyingamultiplicationfactor(ratherthanaddition)totheunderlyinginterestrate.2 ThetabledoesnotshowthesensitivitytotheGroup’stotalunderlyingexposuresortheimpactofchangesinvolumesthatmayarisefromanincreaseordecreaseincommodityprices.
Asshowninthetableabove,amovementinmarketratesby10%wouldhavenomaterialimpactonprofitfortheyear,reflectingthe Group’sapproachtohedgingasdescribedinNote14d.Volatilitydoesariseinothercomprehensiveincomemainlyduetotheremeasurementofderivativestofairvalueasatthereportingdate.
Thefollowingsub-sectionsprovideadditionaldetailforeachmarketrisk.
NOTESTOTHEFINANCIALSTATEMENTS(CONTINUED) Coca-Cola Amatil Limited and its subsidiaries
III OURCAPITAL–FINANCING(CONTINUED)14dDERIVATIVENETASSETS/(LIABILITIES)(CONTINUED)
COCA-COLA AMATIL ANNUAL REPORT 2019134 135
BEING
A SU
STAIN
ABLE
BUSIN
ESSTH
E VALU
E W
E CREATEPERFO
RMA
NCE
& O
UTLO
OK
GO
VERNA
NCE
& RISK
SFIN
AN
CIAL &
STATUTO
RY REPO
RTS
OTH
ER IN
FORM
ATION
OU
R BU
SINESS
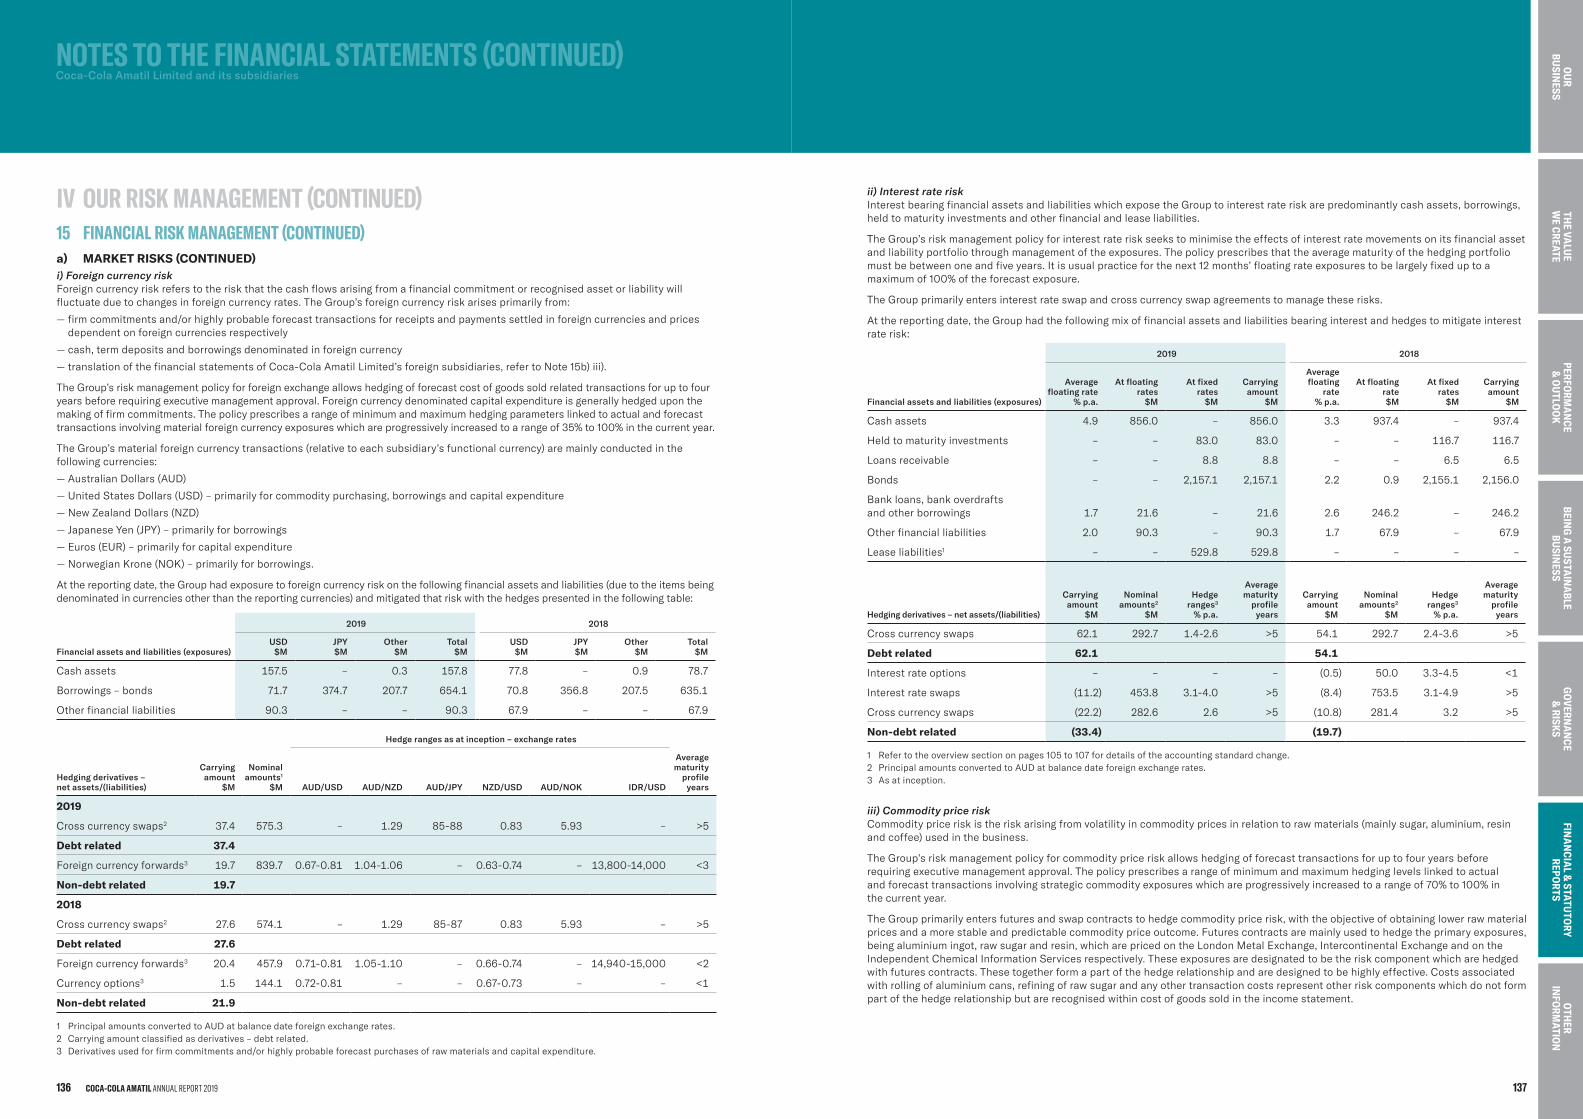
i) Foreign currency riskForeigncurrencyriskreferstotheriskthatthecashflowsarisingfromafinancialcommitmentorrecognisedassetorliabilitywillfluctuateduetochangesinforeigncurrencyrates.TheGroup’sforeigncurrencyriskarisesprimarilyfrom:
— firmcommitmentsand/orhighlyprobableforecasttransactionsforreceiptsandpaymentssettledinforeigncurrenciesandpricesdependentonforeigncurrenciesrespectively
— cash,termdepositsandborrowingsdenominatedinforeigncurrency
— translationofthefinancialstatementsofCoca-ColaAmatilLimited’sforeignsubsidiaries,refertoNote15b)iii).
TheGroup’sriskmanagementpolicyforforeignexchangeallowshedgingofforecastcostofgoodssoldrelatedtransactionsforuptofouryearsbeforerequiringexecutivemanagementapproval.Foreigncurrencydenominatedcapitalexpenditureisgenerallyhedgeduponthemakingoffirmcommitments.Thepolicyprescribesarangeofminimumandmaximumhedgingparameterslinkedtoactualandforecasttransactionsinvolvingmaterialforeigncurrencyexposureswhichareprogressivelyincreasedtoarangeof35%to100%inthecurrentyear.
TheGroup’smaterialforeigncurrencytransactions(relativetoeachsubsidiary’sfunctionalcurrency)aremainlyconductedinthefollowingcurrencies:
— AustralianDollars(AUD)
— UnitedStatesDollars(USD)–primarilyforcommoditypurchasing,borrowingsandcapitalexpenditure
— NewZealandDollars(NZD)
— JapaneseYen(JPY)–primarilyforborrowings
— Euros(EUR)–primarilyforcapitalexpenditure
— NorwegianKrone(NOK)–primarilyforborrowings.
Atthereportingdate,theGrouphadexposuretoforeigncurrencyriskonthefollowingfinancialassetsandliabilities(duetotheitemsbeingdenominatedincurrenciesotherthanthereportingcurrencies)andmitigatedthatriskwiththehedgespresentedinthefollowingtable:
2019 2018
Financial assets and liabilities (exposures)USD
$MJPY$M
Other$M
Total$M
USD$M
JPY$M
Other$M
Total$M
Cashassets 157.5 – 0.3 157.8 77.8 – 0.9 78.7
Borrowings–bonds 71.7 374.7 207.7 654.1 70.8 356.8 207.5 635.1
Otherfinancialliabilities 90.3 – – 90.3 67.9 – – 67.9
Hedge ranges as at inception – exchange rates
Hedging derivatives –net assets/(liabilities)
Carryingamount
$M
Nominalamounts1
$M AUD/USD AUD/NZD AUD/JPY NZD/USD AUD/NOK IDR/USD
Averagematurity
profileyears
2019
Crosscurrencyswaps2 37.4 575.3 – 1.29 85-88 0.83 5.93 – >5
Debt related 37.4
Foreigncurrencyforwards3 19.7 839.7 0.67-0.81 1.04-1.06 – 0.63-0.74 – 13,800-14,000 <3
Non-debt related 19.7
2018
Crosscurrencyswaps2 27.6 574.1 – 1.29 85-87 0.83 5.93 – >5
Debt related 27.6
Foreigncurrencyforwards3 20.4 457.9 0.71-0.81 1.05-1.10 – 0.66-0.74 – 14,940-15,000 <2
Currencyoptions3 1.5 144.1 0.72-0.81 – – 0.67-0.73 – – <1
Non-debt related 21.9
1 PrincipalamountsconvertedtoAUDatbalancedateforeignexchangerates.2 Carryingamountclassifiedasderivatives–debtrelated.3 Derivativesusedforfirmcommitmentsand/orhighlyprobableforecastpurchasesofrawmaterialsandcapitalexpenditure.
ii) Interest rate riskInterestbearingfinancialassetsandliabilitieswhichexposetheGrouptointerestrateriskarepredominantlycashassets,borrowings,heldtomaturityinvestmentsandotherfinancialandleaseliabilities.
TheGroup’sriskmanagementpolicyforinterestrateriskseekstominimisetheeffectsofinterestratemovementsonitsfinancialassetandliabilityportfoliothroughmanagementoftheexposures.Thepolicyprescribesthattheaveragematurityofthehedgingportfoliomustbebetweenoneandfiveyears.Itisusualpracticeforthenext12months’floatingrateexposurestobelargelyfixeduptoamaximumof100%oftheforecastexposure.
TheGroupprimarilyentersinterestrateswapandcrosscurrencyswapagreementstomanagetheserisks.
Atthereportingdate,theGrouphadthefollowingmixoffinancialassetsandliabilitiesbearinginterestandhedgestomitigateinterestraterisk:
2019 2018
Financial assets and liabilities (exposures)
Averagefloating rate
% p.a.
At floatingrates
$M
At fixedrates
$M
Carryingamount
$M
Averagefloating
rate% p.a.
At floatingrate$M
At fixedrates
$M
Carryingamount
$M
Cashassets 4.9 856.0 – 856.0 3.3 937.4 – 937.4
Heldtomaturityinvestments – – 83.0 83.0 – – 116.7 116.7
Loansreceivable – – 8.8 8.8 – – 6.5 6.5
Bonds – – 2,157.1 2,157.1 2.2 0.9 2,155.1 2,156.0
Bankloans,bankoverdraftsand otherborrowings 1.7 21.6 – 21.6 2.6 246.2 – 246.2
Otherfinancialliabilities 2.0 90.3 – 90.3 1.7 67.9 – 67.9
Leaseliabilities1 – – 529.8 529.8 – – – –
Hedging derivatives – net assets/(liabilities)
Carryingamount
$M
Nominalamounts2
$M
Hedgeranges3
% p.a.
Average maturity
profileyears
Carryingamount
$M
Nominalamounts2
$M
Hedgeranges3
% p.a.
Average maturity
profileyears
Crosscurrencyswaps 62.1 292.7 1.4-2.6 >5 54.1 292.7 2.4-3.6 >5
Debt related 62.1 54.1
Interestrateoptions – – – – (0.5) 50.0 3.3-4.5 <1
Interestrateswaps (11.2) 453.8 3.1-4.0 >5 (8.4) 753.5 3.1-4.9 >5
Crosscurrencyswaps (22.2) 282.6 2.6 >5 (10.8) 281.4 3.2 >5
Non-debt related (33.4) (19.7)
1 Refertotheoverviewsectiononpages105to107fordetailsoftheaccountingstandardchange.2 PrincipalamountsconvertedtoAUDatbalancedateforeignexchangerates.3 Asatinception.
iii) Commodity price riskCommoditypriceriskistheriskarisingfromvolatilityincommoditypricesinrelationtorawmaterials(mainlysugar,aluminium,resinandcoffee)usedinthebusiness.
TheGroup’sriskmanagementpolicyforcommoditypriceriskallowshedgingofforecasttransactionsforuptofouryearsbeforerequiringexecutivemanagementapproval.Thepolicyprescribesarangeofminimumandmaximumhedginglevelslinkedtoactualand forecasttransactionsinvolvingstrategiccommodityexposureswhichareprogressivelyincreasedtoarangeof70%to100%inthe currentyear.
TheGroupprimarilyentersfuturesandswapcontractstohedgecommoditypricerisk,withtheobjectiveofobtaininglowerrawmaterialpricesandamorestableandpredictablecommoditypriceoutcome.Futurescontractsaremainlyusedtohedgetheprimaryexposures,beingaluminiumingot,rawsugarandresin,whicharepricedontheLondonMetalExchange,IntercontinentalExchangeandontheIndependentChemicalInformationServicesrespectively.Theseexposuresaredesignatedtobetheriskcomponentwhicharehedgedwithfuturescontracts.Thesetogetherformapartofthehedgerelationshipandaredesignedtobehighlyeffective.Costsassociatedwithrollingofaluminiumcans,refiningofrawsugarandanyothertransactioncostsrepresentotherriskcomponentswhichdonotformpartofthehedgerelationshipbutarerecognisedwithincostofgoodssoldintheincomestatement.
NOTESTOTHEFINANCIALSTATEMENTS(CONTINUED) Coca-Cola Amatil Limited and its subsidiaries
IV OURRISKMANAGEMENT(CONTINUED)15 FINANCIALRISKMANAGEMENT(CONTINUED)a) MARKET RISKS (CONTINUED)
COCA-COLA AMATIL ANNUAL REPORT 2019136 137
BEING
A SU
STAIN
ABLE
BUSIN
ESSTH
E VALU
E W
E CREATEPERFO
RMA
NCE
& O
UTLO
OK
GO
VERNA
NCE
& RISK
SFIN
AN
CIAL &
STATUTO
RY REPO
RTS
OTH
ER IN
FORM
ATION
OU
R BU
SINESS
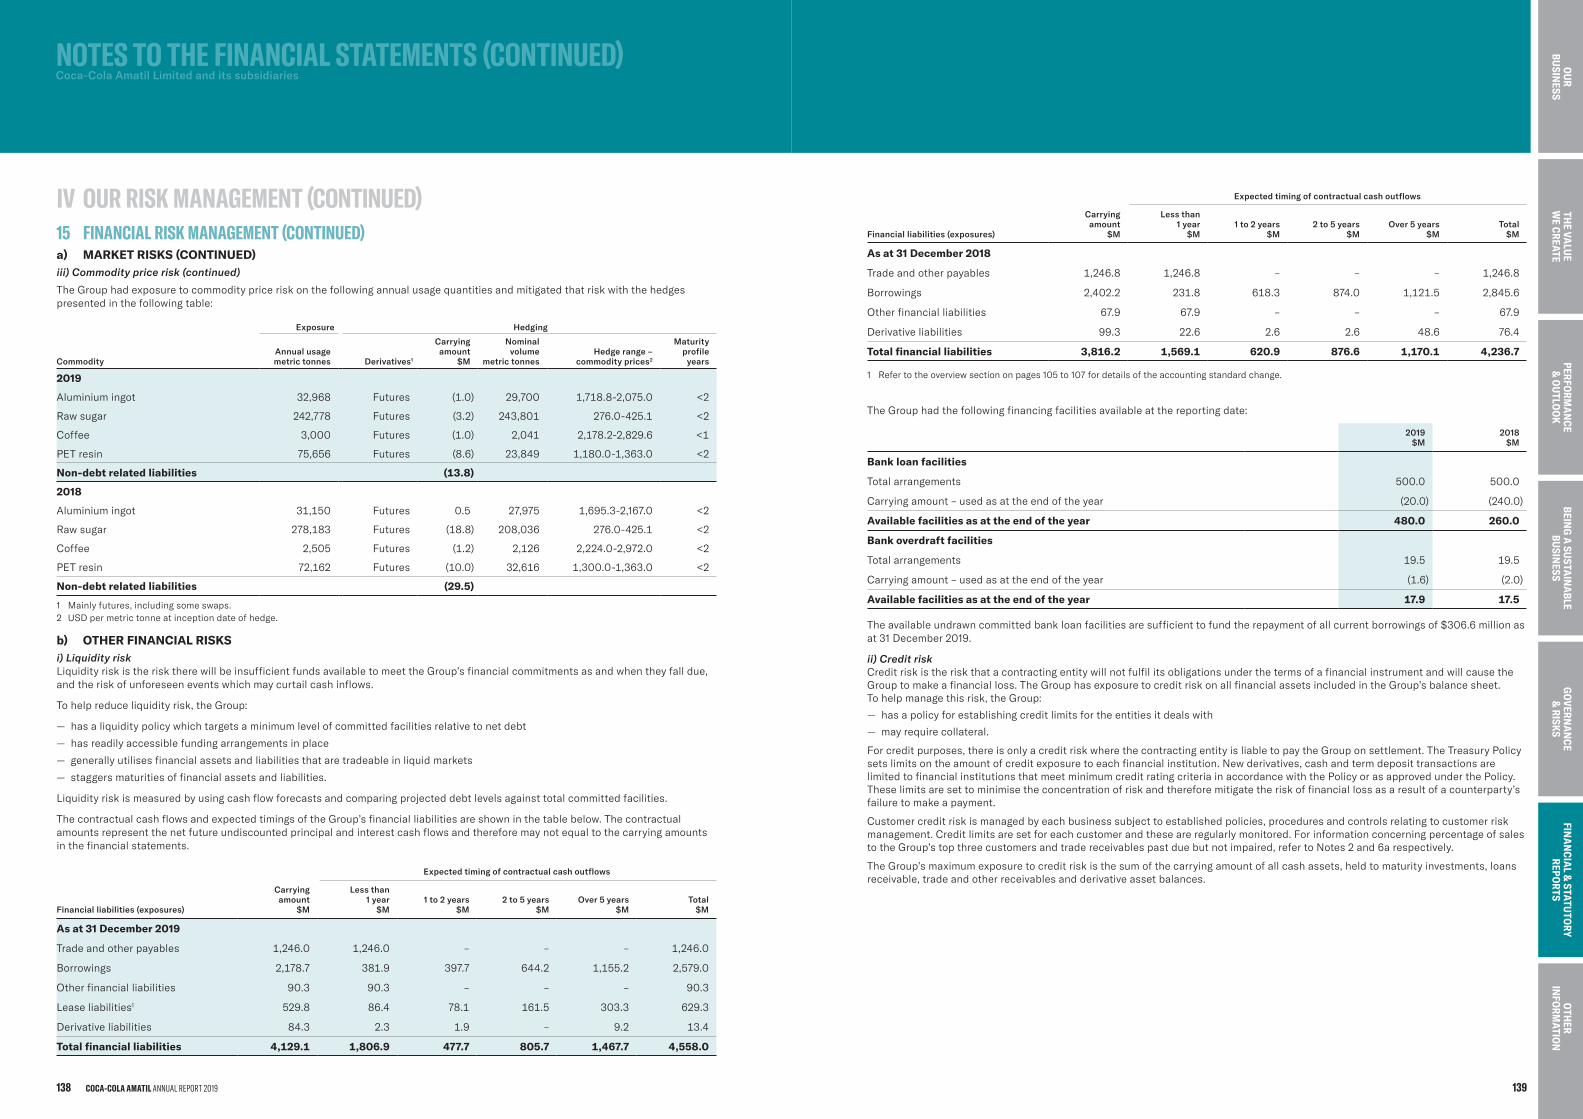
TheGrouphadexposuretocommoditypriceriskonthefollowingannualusagequantitiesandmitigatedthatriskwiththehedgespresentedinthefollowingtable:
Exposure Hedging
CommodityAnnual usagemetric tonnes Derivatives1
Carryingamount
$M
Nominalvolume
metric tonnesHedge range –
commodity prices2
Maturityprofile
years
2019
Aluminiumingot 32,968 Futures (1.0) 29,700 1,718.8-2,075.0 <2
Rawsugar 242,778 Futures (3.2) 243,801 276.0-425.1 <2
Coffee 3,000 Futures (1.0) 2,041 2,178.2-2,829.6 <1
PETresin 75,656 Futures (8.6) 23,849 1,180.0-1,363.0 <2
Non-debt related liabilities (13.8)
2018
Aluminiumingot 31,150 Futures 0.5 27,975 1,695.3-2,167.0 <2
Rawsugar 278,183 Futures (18.8) 208,036 276.0-425.1 <2
Coffee 2,505 Futures (1.2) 2,126 2,224.0-2,972.0 <2
PETresin 72,162 Futures (10.0) 32,616 1,300.0-1,363.0 <2
Non-debt related liabilities (29.5)
1 Mainlyfutures,includingsomeswaps.2 USDpermetrictonneatinceptiondateofhedge.
b) OTHER FINANCIAL RISKSi) Liquidity riskLiquidityriskistherisktherewillbeinsufficientfundsavailabletomeettheGroup’sfinancialcommitmentsasandwhentheyfalldue,andtheriskofunforeseeneventswhichmaycurtailcashinflows.
Tohelpreduceliquidityrisk,theGroup:
— hasaliquiditypolicywhichtargetsaminimumlevelofcommittedfacilitiesrelativetonetdebt
— hasreadilyaccessiblefundingarrangementsinplace
— generallyutilisesfinancialassetsandliabilitiesthataretradeableinliquidmarkets
— staggersmaturitiesoffinancialassetsandliabilities.
Liquidityriskismeasuredbyusingcashflowforecastsandcomparingprojecteddebtlevelsagainsttotalcommittedfacilities.
ThecontractualcashflowsandexpectedtimingsoftheGroup’sfinancialliabilitiesareshowninthetablebelow.Thecontractualamountsrepresentthenetfutureundiscountedprincipalandinterestcashflowsandthereforemaynotequaltothecarryingamountsinthefinancialstatements.
Expected timing of contractual cash outflows
Financial liabilities (exposures)
Carryingamount
$M
Less than1 year
$M1 to 2 years
$M2 to 5 years
$MOver 5 years
$MTotal
$M
As at 31 December 2019
Tradeandotherpayables 1,246.0 1,246.0 – – – 1,246.0
Borrowings 2,178.7 381.9 397.7 644.2 1,155.2 2,579.0
Otherfinancialliabilities 90.3 90.3 – – – 90.3
Leaseliabilities1 529.8 86.4 78.1 161.5 303.3 629.3
Derivativeliabilities 84.3 2.3 1.9 – 9.2 13.4
Total financial liabilities 4,129.1 1,806.9 477.7 805.7 1,467.7 4,558.0
Expected timing of contractual cash outflows
Financial liabilities (exposures)
Carryingamount
$M
Less than1 year
$M1 to 2 years
$M2 to 5 years
$MOver 5 years
$MTotal
$M
As at 31 December 2018
Tradeandotherpayables 1,246.8 1,246.8 – – – 1,246.8
Borrowings 2,402.2 231.8 618.3 874.0 1,121.5 2,845.6
Otherfinancialliabilities 67.9 67.9 – – – 67.9
Derivativeliabilities 99.3 22.6 2.6 2.6 48.6 76.4
Total financial liabilities 3,816.2 1,569.1 620.9 876.6 1,170.1 4,236.7
1 Refertotheoverviewsectiononpages105to107fordetailsoftheaccountingstandardchange.
TheGrouphadthefollowingfinancingfacilitiesavailableatthereportingdate:
2019 $M
2018 $M
Bank loan facilities
Totalarrangements 500.0 500.0
Carryingamount–usedasattheendoftheyear (20.0) (240.0)
Available facilities as at the end of the year 480.0 260.0
Bank overdraft facilities
Totalarrangements 19.5 19.5
Carryingamount–usedasattheendoftheyear (1.6) (2.0)
Available facilities as at the end of the year 17.9 17.5
Theavailableundrawncommittedbankloanfacilitiesaresufficienttofundtherepaymentofallcurrentborrowingsof$306.6millionasat31December2019.
ii) Credit riskCreditriskistheriskthatacontractingentitywillnotfulfilitsobligationsunderthetermsofafinancialinstrumentandwillcausetheGrouptomakeafinancialloss.TheGrouphasexposuretocreditriskonallfinancialassetsincludedintheGroup’sbalancesheet.To helpmanagethisrisk,theGroup:
— hasapolicyforestablishingcreditlimitsfortheentitiesitdealswith
— mayrequirecollateral.
Forcreditpurposes,thereisonlyacreditriskwherethecontractingentityisliabletopaytheGrouponsettlement.TheTreasuryPolicysetslimitsontheamountofcreditexposuretoeachfinancialinstitution.Newderivatives,cashandtermdeposittransactionsarelimitedtofinancialinstitutionsthatmeetminimumcreditratingcriteriainaccordancewiththePolicyorasapprovedunderthePolicy.Theselimitsaresettominimisetheconcentrationofriskandthereforemitigatetheriskoffinanciallossasaresultofacounterparty’sfailuretomakeapayment.
Customercreditriskismanagedbyeachbusinesssubjecttoestablishedpolicies,proceduresandcontrolsrelatingtocustomerriskmanagement.Creditlimitsaresetforeachcustomerandtheseareregularlymonitored.ForinformationconcerningpercentageofsalestotheGroup’stopthreecustomersandtradereceivablespastduebutnotimpaired,refertoNotes2and6arespectively.
TheGroup’smaximumexposuretocreditriskisthesumofthecarryingamountofallcashassets,heldtomaturityinvestments,loansreceivable,tradeandotherreceivablesandderivativeassetbalances.
NOTESTOTHEFINANCIALSTATEMENTS(CONTINUED) Coca-Cola Amatil Limited and its subsidiaries
IV OURRISKMANAGEMENT(CONTINUED)15 FINANCIALRISKMANAGEMENT(CONTINUED)a) MARKET RISKS (CONTINUED)iii) Commodity price risk (continued)
COCA-COLA AMATIL ANNUAL REPORT 2019138 139
BEING
A SU
STAIN
ABLE
BUSIN
ESSTH
E VALU
E W
E CREATEPERFO
RMA
NCE
& O
UTLO
OK
GO
VERNA
NCE
& RISK
SFIN
AN
CIAL &
STATUTO
RY REPO
RTS
OTH
ER IN
FORM
ATION
OU
R BU
SINESS
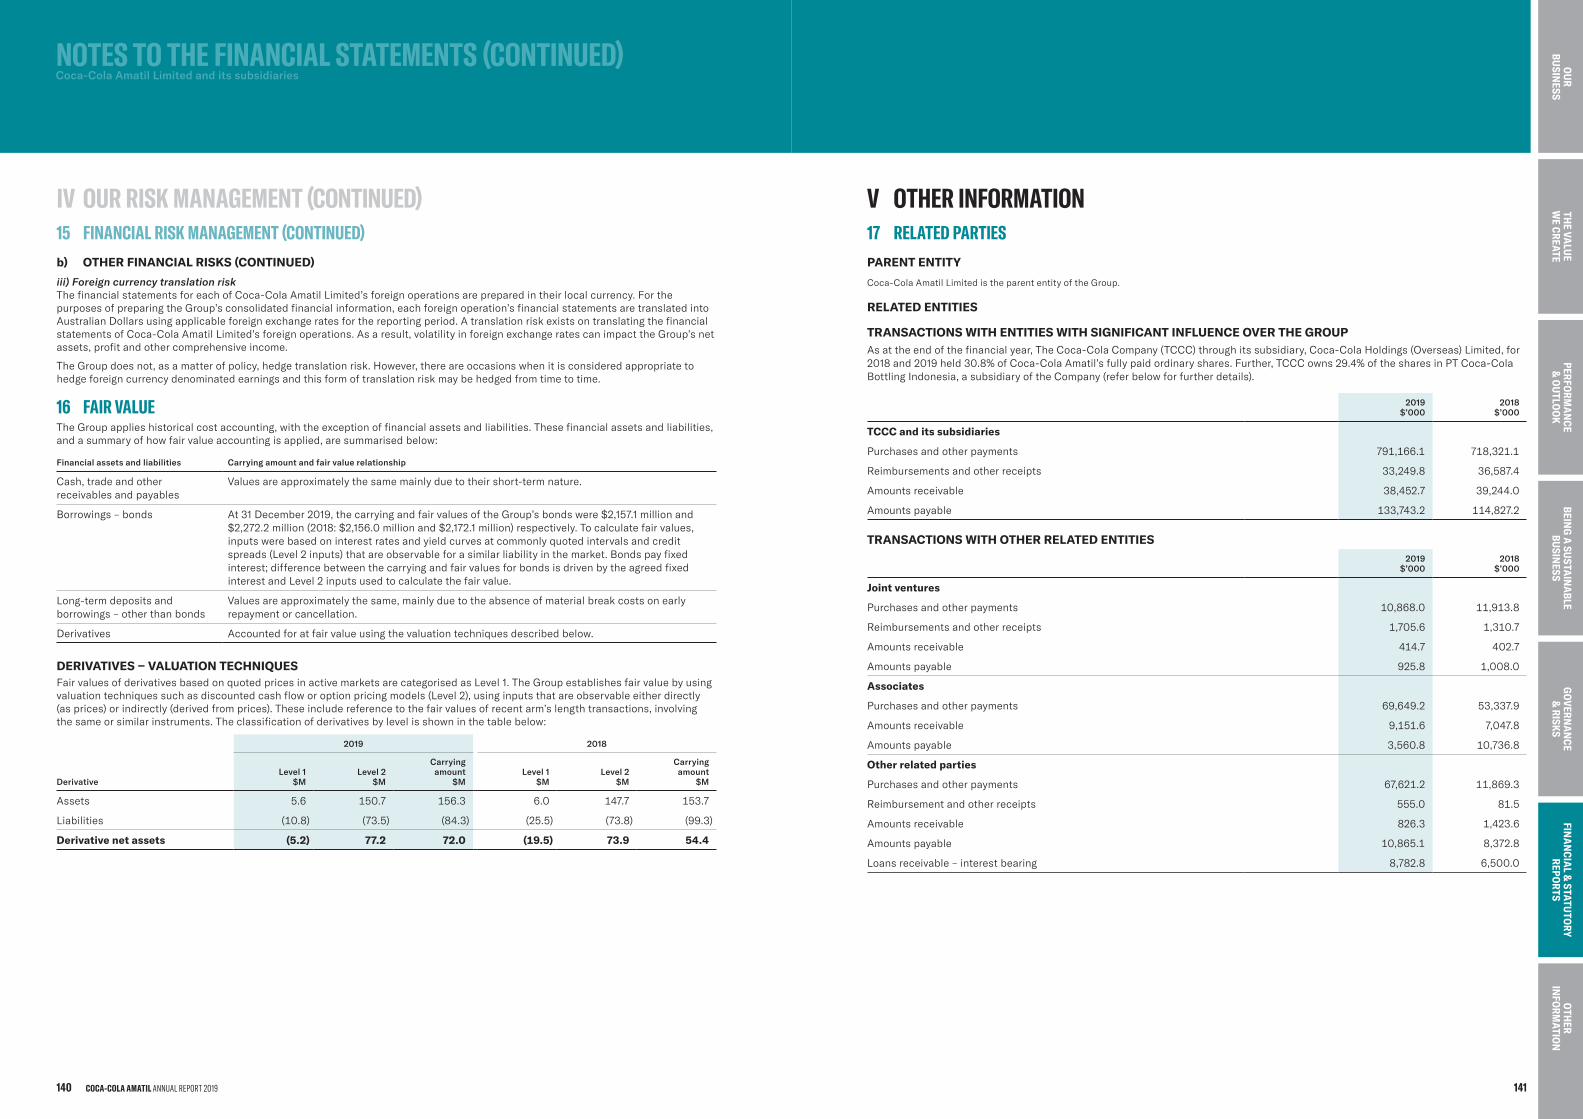
iii) Foreign currency translation riskThefinancialstatementsforeachofCoca-ColaAmatilLimited’sforeignoperationsarepreparedintheirlocalcurrency.ForthepurposesofpreparingtheGroup’sconsolidatedfinancialinformation,eachforeignoperation’sfinancialstatementsaretranslatedintoAustralianDollarsusingapplicableforeignexchangeratesforthereportingperiod.AtranslationriskexistsontranslatingthefinancialstatementsofCoca-ColaAmatilLimited’sforeignoperations.Asaresult,volatilityinforeignexchangeratescanimpacttheGroup’snetassets,profitandothercomprehensiveincome.
TheGroupdoesnot,asamatterofpolicy,hedgetranslationrisk.However,thereareoccasionswhenitisconsideredappropriatetohedgeforeigncurrencydenominatedearningsandthisformoftranslationriskmaybehedgedfromtimetotime.
16 FAIRVALUETheGroupapplieshistoricalcostaccounting,withtheexceptionoffinancialassetsandliabilities.Thesefinancialassetsandliabilities,andasummaryofhowfairvalueaccountingisapplied,aresummarisedbelow:
Financial assets and liabilities Carrying amount and fair value relationship
Cash,tradeandotherreceivablesandpayables
Valuesareapproximatelythesamemainlyduetotheirshort-termnature.
Borrowings–bonds At31December2019,thecarryingandfairvaluesoftheGroup’sbondswere$2,157.1millionand$2,272.2million(2018:$2,156.0millionand$2,172.1million)respectively.Tocalculatefairvalues,inputswerebasedoninterestratesandyieldcurvesatcommonlyquotedintervalsandcreditspreads(Level2inputs)thatareobservableforasimilarliabilityinthemarket.Bondspayfixedinterest;differencebetweenthecarryingandfairvaluesforbondsisdrivenbytheagreedfixedinterestandLevel2inputsusedtocalculatethefairvalue.
Long-termdepositsandborrowings–otherthanbonds
Valuesareapproximatelythesame,mainlyduetotheabsenceofmaterialbreakcostsonearlyrepaymentorcancellation.
Derivatives Accountedforatfairvalueusingthevaluationtechniquesdescribedbelow.
DERIVATIVES – VALUATION TECHNIQUESFairvaluesofderivativesbasedonquotedpricesinactivemarketsarecategorisedasLevel1.TheGroupestablishesfairvaluebyusingvaluationtechniquessuchasdiscountedcashfloworoptionpricingmodels(Level2),usinginputsthatareobservableeitherdirectly(as prices)orindirectly(derivedfromprices).Theseincludereferencetothefairvaluesofrecentarm’slengthtransactions,involvingthe sameorsimilarinstruments.Theclassificationofderivativesbylevelisshowninthetablebelow:
2019 2018
DerivativeLevel 1
$MLevel 2
$M
Carryingamount
$MLevel 1
$MLevel 2
$M
Carryingamount
$M
Assets 5.6 150.7 156.3 6.0 147.7 153.7
Liabilities (10.8) (73.5) (84.3) (25.5) (73.8) (99.3)
Derivative net assets (5.2) 77.2 72.0 (19.5) 73.9 54.4
V OTHER INFORMATION17 RELATEDPARTIESPARENT ENTITY
Coca-ColaAmatilLimitedistheparententityoftheGroup.
RELATED ENTITIES
TRANSACTIONS WITH ENTITIES WITH SIGNIFICANT INFLUENCE OVER THE GROUPAsattheendofthefinancialyear,TheCoca-ColaCompany(TCCC)throughitssubsidiary,Coca-ColaHoldings(Overseas)Limited,for2018and2019held30.8%ofCoca-ColaAmatil’sfullypaidordinaryshares.Further,TCCCowns29.4%ofthesharesinPTCoca-ColaBottlingIndonesia,asubsidiaryoftheCompany(referbelowforfurtherdetails).
2019 $’000
2018 $’000
TCCC and its subsidiaries
Purchasesandotherpayments 791,166.1 718,321.1
Reimbursementsandotherreceipts 33,249.8 36,587.4
Amountsreceivable 38,452.7 39,244.0
Amountspayable 133,743.2 114,827.2
TRANSACTIONS WITH OTHER RELATED ENTITIES 2019
$’0002018
$’000
Joint ventures
Purchasesandotherpayments 10,868.0 11,913.8
Reimbursementsandotherreceipts 1,705.6 1,310.7
Amountsreceivable 414.7 402.7
Amountspayable 925.8 1,008.0
Associates
Purchasesandotherpayments 69,649.2 53,337.9
Amountsreceivable 9,151.6 7,047.8
Amountspayable 3,560.8 10,736.8
Other related parties
Purchasesandotherpayments 67,621.2 11,869.3
Reimbursementandotherreceipts 555.0 81.5
Amountsreceivable 826.3 1,423.6
Amountspayable 10,865.1 8,372.8
Loansreceivable–interestbearing 8,782.8 6,500.0
NOTESTOTHEFINANCIALSTATEMENTS(CONTINUED) Coca-Cola Amatil Limited and its subsidiaries
IV OURRISKMANAGEMENT(CONTINUED)15 FINANCIALRISKMANAGEMENT(CONTINUED)b) OTHER FINANCIAL RISKS (CONTINUED)
COCA-COLA AMATIL ANNUAL REPORT 2019140 141
BEING
A SU
STAIN
ABLE
BUSIN
ESSTH
E VALU
E W
E CREATEPERFO
RMA
NCE
& O
UTLO
OK
GO
VERNA
NCE
& RISK
SFIN
AN
CIAL &
STATUTO
RY REPO
RTS
OTH
ER IN
FORM
ATION
OU
R BU
SINESS
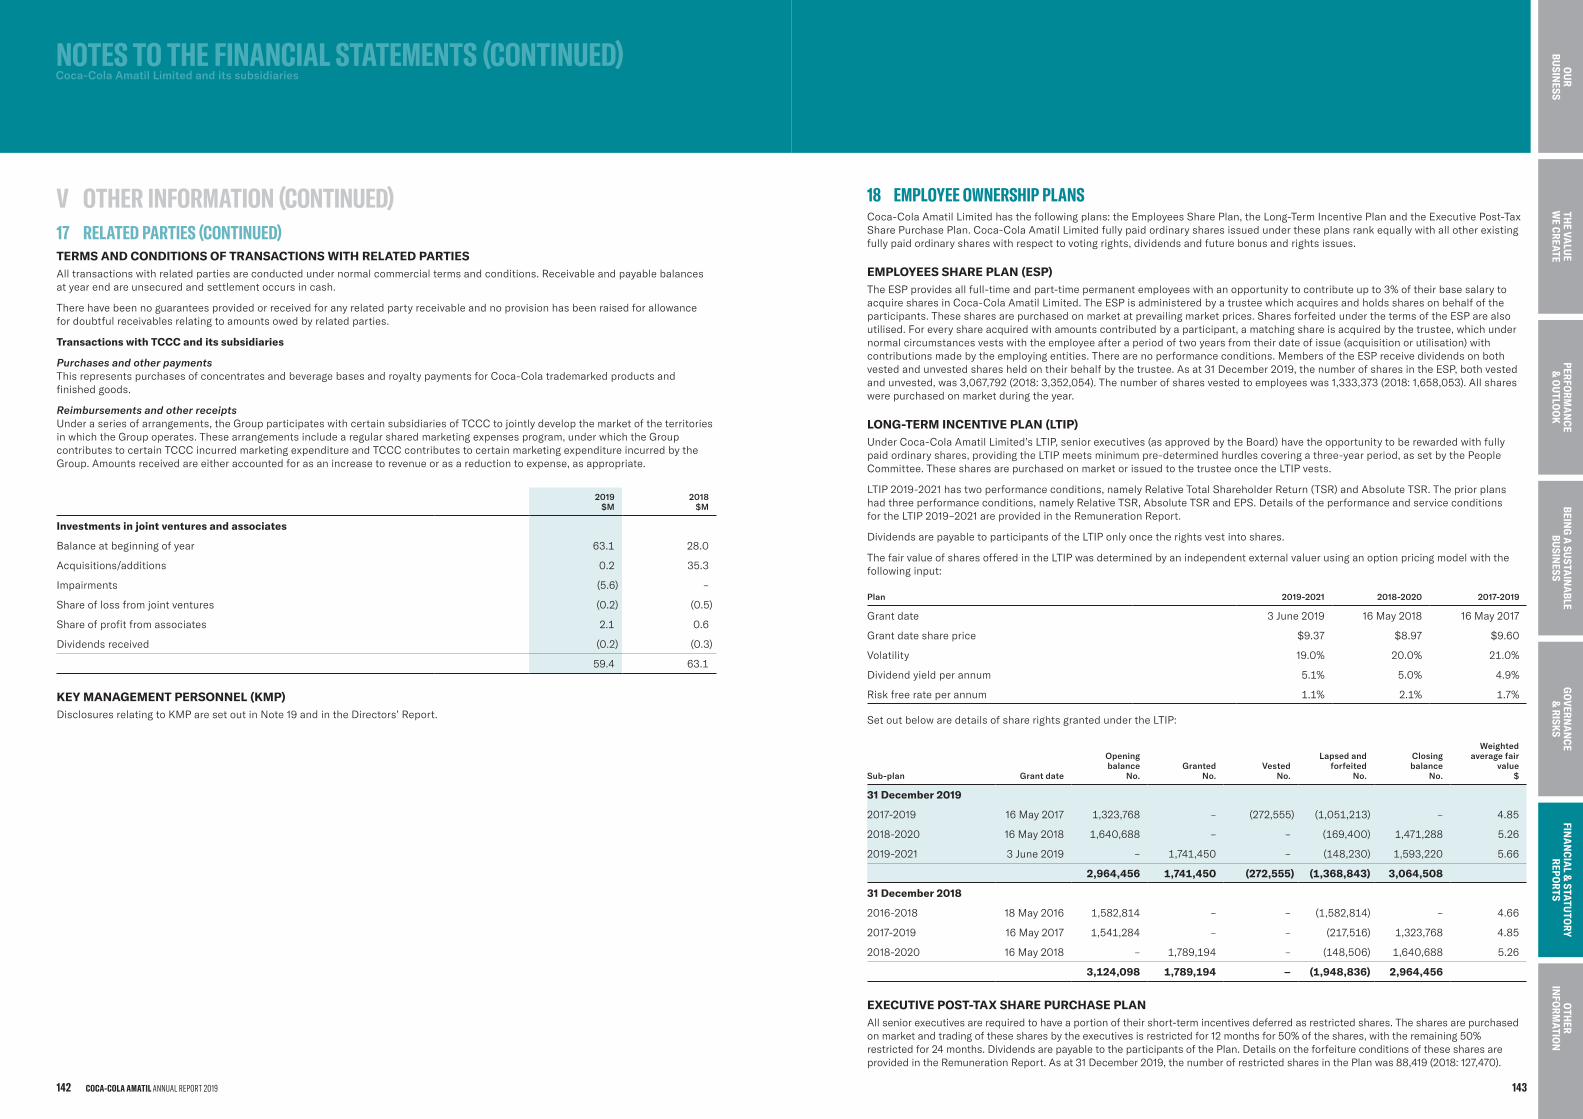
TERMS AND CONDITIONS OF TRANSACTIONS WITH RELATED PARTIESAlltransactionswithrelatedpartiesareconductedundernormalcommercialtermsandconditions.Receivableandpayablebalancesat yearendareunsecuredandsettlementoccursincash.
Therehavebeennoguaranteesprovidedorreceivedforanyrelatedpartyreceivableandnoprovisionhasbeenraisedforallowancefor doubtfulreceivablesrelatingtoamountsowedbyrelatedparties.
Transactions with TCCC and its subsidiaries
Purchases and other paymentsThisrepresentspurchasesofconcentratesandbeveragebasesandroyaltypaymentsforCoca-Colatrademarkedproductsandfinishedgoods.
Reimbursements and other receiptsUnderaseriesofarrangements,theGroupparticipateswithcertainsubsidiariesofTCCCtojointlydevelopthemarketoftheterritoriesinwhichtheGroupoperates.Thesearrangementsincludearegularsharedmarketingexpensesprogram,underwhichtheGroupcontributestocertainTCCCincurredmarketingexpenditureandTCCCcontributestocertainmarketingexpenditureincurredbytheGroup.Amountsreceivedareeitheraccountedforasanincreasetorevenueorasareductiontoexpense,asappropriate.
2019 $M
2018 $M
Investments in joint ventures and associates
Balanceatbeginningofyear 63.1 28.0
Acquisitions/additions 0.2 35.3
Impairments (5.6) –
Shareoflossfromjointventures (0.2) (0.5)
Shareofprofitfromassociates 2.1 0.6
Dividendsreceived (0.2) (0.3)
59.4 63.1
KEY MANAGEMENT PERSONNEL (KMP)DisclosuresrelatingtoKMParesetoutinNote19andintheDirectors’Report.
18 EMPLOYEEOWNERSHIPPLANSCoca-ColaAmatilLimitedhasthefollowingplans:theEmployeesSharePlan,theLong-TermIncentivePlanandtheExecutivePost-TaxSharePurchasePlan.Coca-ColaAmatilLimitedfullypaidordinarysharesissuedundertheseplansrankequallywithallotherexistingfullypaidordinaryshareswithrespecttovotingrights,dividendsandfuturebonusandrightsissues.
EMPLOYEES SHARE PLAN (ESP)TheESPprovidesallfull-timeandpart-timepermanentemployeeswithanopportunitytocontributeupto3%oftheirbasesalarytoacquiresharesinCoca-ColaAmatilLimited.TheESPisadministeredbyatrusteewhichacquiresandholdssharesonbehalfoftheparticipants.Thesesharesarepurchasedonmarketatprevailingmarketprices.SharesforfeitedunderthetermsoftheESParealsoutilised.Foreveryshareacquiredwithamountscontributedbyaparticipant,amatchingshareisacquiredbythetrustee,whichundernormalcircumstancesvestswiththeemployeeafteraperiodoftwoyearsfromtheirdateofissue(acquisitionorutilisation)withcontributionsmadebytheemployingentities.Therearenoperformanceconditions.MembersoftheESPreceivedividendsonbothvestedandunvestedsharesheldontheirbehalfbythetrustee.Asat31December2019,thenumberofsharesintheESP,bothvestedandunvested,was3,067,792(2018:3,352,054).Thenumberofsharesvestedtoemployeeswas1,333,373(2018:1,658,053).Allshareswerepurchasedonmarketduringtheyear.
LONG-TERM INCENTIVE PLAN (LTIP)UnderCoca-ColaAmatilLimited’sLTIP,seniorexecutives(asapprovedbytheBoard)havetheopportunitytoberewardedwithfullypaidordinaryshares,providingtheLTIPmeetsminimumpre-determinedhurdlescoveringathree-yearperiod,assetbythePeopleCommittee.ThesesharesarepurchasedonmarketorissuedtothetrusteeoncetheLTIPvests.
LTIP2019-2021hastwoperformanceconditions,namelyRelativeTotalShareholderReturn(TSR)andAbsoluteTSR.Thepriorplanshadthreeperformanceconditions,namelyRelativeTSR,AbsoluteTSRandEPS.Detailsoftheperformanceandserviceconditionsfor theLTIP2019–2021areprovidedintheRemunerationReport.
DividendsarepayabletoparticipantsoftheLTIPonlyoncetherightsvestintoshares.
ThefairvalueofsharesofferedintheLTIPwasdeterminedbyanindependentexternalvaluerusinganoptionpricingmodelwiththefollowinginput:
Plan 2019-2021 2018-2020 2017-2019
Grantdate 3June2019 16May2018 16May2017
Grantdateshareprice $9.37 $8.97 $9.60
Volatility 19.0% 20.0% 21.0%
Dividendyieldperannum 5.1% 5.0% 4.9%
Riskfreerateperannum 1.1% 2.1% 1.7%
SetoutbelowaredetailsofsharerightsgrantedundertheLTIP:
Sub-plan Grant date
Openingbalance
No.Granted
No.Vested
No.
Lapsed andforfeited
No.
Closingbalance
No.
Weightedaverage fair
value$
31 December 2019
2017-2019 16May2017 1,323,768 – (272,555) (1,051,213) – 4.85
2018-2020 16May2018 1,640,688 – – (169,400) 1,471,288 5.26
2019-2021 3June2019 – 1,741,450 – (148,230) 1,593,220 5.66
2,964,456 1,741,450 (272,555) (1,368,843) 3,064,508
31 December 2018
2016-2018 18May2016 1,582,814 – – (1,582,814) – 4.66
2017-2019 16May2017 1,541,284 – – (217,516) 1,323,768 4.85
2018-2020 16May2018 – 1,789,194 – (148,506) 1,640,688 5.26
3,124,098 1,789,194 – (1,948,836) 2,964,456
EXECUTIVE POST-TAX SHARE PURCHASE PLANAllseniorexecutivesarerequiredtohaveaportionoftheirshort-termincentivesdeferredasrestrictedshares.Thesharesarepurchasedonmarketandtradingofthesesharesbytheexecutivesisrestrictedfor12monthsfor50%oftheshares,withtheremaining50%restrictedfor24months.DividendsarepayabletotheparticipantsofthePlan.DetailsontheforfeitureconditionsofthesesharesareprovidedintheRemunerationReport.Asat31December2019,thenumberofrestrictedsharesinthePlanwas88,419(2018:127,470).
NOTESTOTHEFINANCIALSTATEMENTS(CONTINUED) Coca-Cola Amatil Limited and its subsidiaries
V OTHERINFORMATION(CONTINUED)17 RELATEDPARTIES(CONTINUED)
COCA-COLA AMATIL ANNUAL REPORT 2019142 143
BEING
A SU
STAIN
ABLE
BUSIN
ESSTH
E VALU
E W
E CREATEPERFO
RMA
NCE
& O
UTLO
OK
GO
VERNA
NCE
& RISK
SFIN
AN
CIAL &
STATUTO
RY REPO
RTS
OTH
ER IN
FORM
ATION
OU
R BU
SINESS
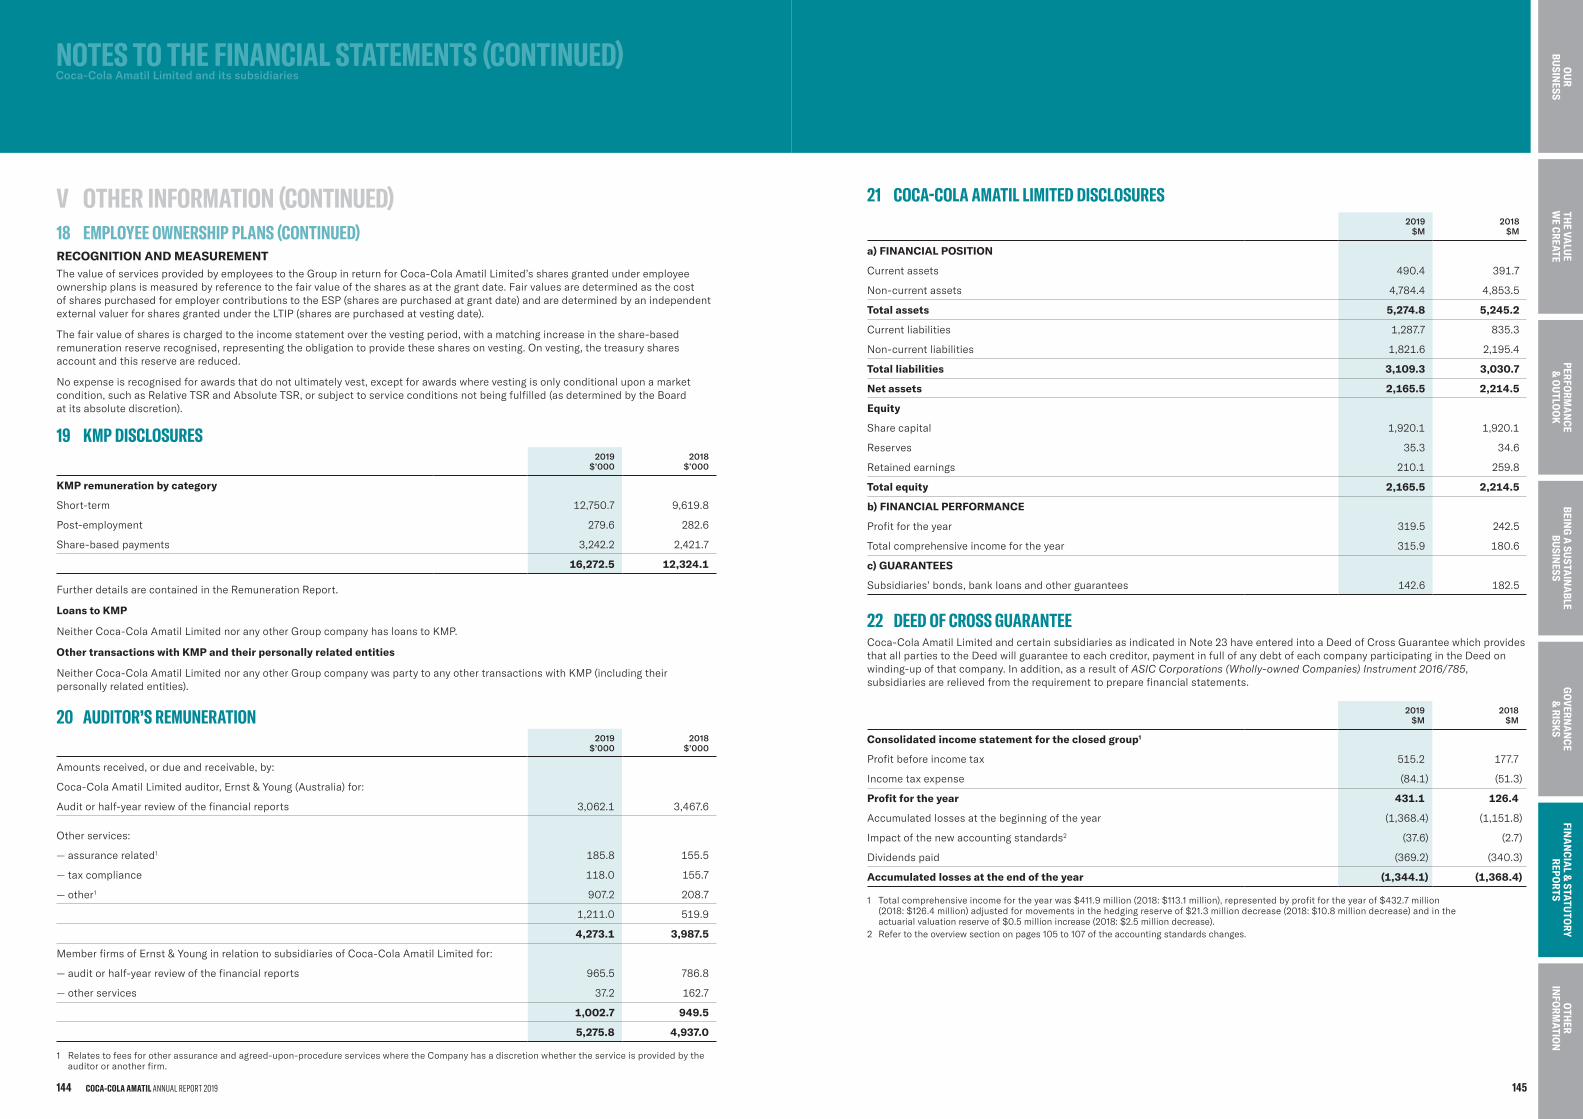
RECOGNITION AND MEASUREMENTThevalueofservicesprovidedbyemployeestotheGroupinreturnforCoca-ColaAmatilLimited’ssharesgrantedunderemployeeownershipplansismeasuredbyreferencetothefairvalueofthesharesasatthegrantdate.Fairvaluesaredeterminedasthecostof sharespurchasedforemployercontributionstotheESP(sharesarepurchasedatgrantdate)andaredeterminedbyanindependentexternalvaluerforsharesgrantedundertheLTIP(sharesarepurchasedatvestingdate).
Thefairvalueofsharesischargedtotheincomestatementoverthevestingperiod,withamatchingincreaseintheshare-basedremunerationreserverecognised,representingtheobligationtoprovidethesesharesonvesting.Onvesting,thetreasurysharesaccountandthisreservearereduced.
Noexpenseisrecognisedforawardsthatdonotultimatelyvest,exceptforawardswherevestingisonlyconditionaluponamarketcondition,suchasRelativeTSRandAbsoluteTSR,orsubjecttoserviceconditionsnotbeingfulfilled(asdeterminedbytheBoardat its absolutediscretion).
19 KMPDISCLOSURES2019
$’0002018
$’000
KMP remuneration by category
Short-term 12,750.7 9,619.8
Post-employment 279.6 282.6
Share-basedpayments 3,242.2 2,421.7
16,272.5 12,324.1
FurtherdetailsarecontainedintheRemunerationReport.
Loans to KMP
NeitherCoca-ColaAmatilLimitednoranyotherGroupcompanyhasloanstoKMP.
Other transactions with KMP and their personally related entities
NeitherCoca-ColaAmatilLimitednoranyotherGroupcompanywaspartytoanyothertransactionswithKMP(includingtheirpersonallyrelatedentities).
20 AUDITOR’SREMUNERATION2019
$’0002018
$’000
Amountsreceived,ordueandreceivable,by:
Coca-ColaAmatilLimitedauditor,Ernst&Young(Australia)for:
Auditorhalf-yearreviewofthefinancialreports 3,062.1 3,467.6
Otherservices:
— assurancerelated1 185.8 155.5
— taxcompliance 118.0 155.7
— other1 907.2 208.7
1,211.0 519.9
4,273.1 3,987.5
MemberfirmsofErnst&YounginrelationtosubsidiariesofCoca-ColaAmatilLimitedfor:
— auditorhalf-yearreviewofthefinancialreports 965.5 786.8
— otherservices 37.2 162.7
1,002.7 949.5
5,275.8 4,937.0
1 Relatestofeesforotherassuranceandagreed-upon-procedureserviceswheretheCompanyhasadiscretionwhethertheserviceisprovidedbytheauditororanotherfirm.
21 COCA-COLAAMATILLIMITEDDISCLOSURES2019
$M2018
$M
a) FINANCIAL POSITION
Currentassets 490.4 391.7
Non-currentassets 4,784.4 4,853.5
Total assets 5,274.8 5,245.2
Currentliabilities 1,287.7 835.3
Non-currentliabilities 1,821.6 2,195.4
Total liabilities 3,109.3 3,030.7
Net assets 2,165.5 2,214.5
Equity
Sharecapital 1,920.1 1,920.1
Reserves 35.3 34.6
Retainedearnings 210.1 259.8
Total equity 2,165.5 2,214.5
b) FINANCIAL PERFORMANCE
Profitfortheyear 319.5 242.5
Totalcomprehensiveincomefortheyear 315.9 180.6
c) GUARANTEES
Subsidiaries’bonds,bankloansandotherguarantees 142.6 182.5
22 DEEDOFCROSSGUARANTEECoca-ColaAmatilLimitedandcertainsubsidiariesasindicatedinNote23haveenteredintoaDeedofCrossGuaranteewhichprovidesthatallpartiestotheDeedwillguaranteetoeachcreditor,paymentinfullofanydebtofeachcompanyparticipatingintheDeedonwinding-upofthatcompany.Inaddition,asaresultofASIC Corporations (Wholly-owned Companies) Instrument 2016/785,subsidiariesarerelievedfromtherequirementtopreparefinancialstatements.
2019 $M
2018 $M
Consolidated income statement for the closed group1
Profitbeforeincometax 515.2 177.7
Incometaxexpense (84.1) (51.3)
Profit for the year 431.1 126.4
Accumulatedlossesatthebeginningoftheyear (1,368.4) (1,151.8)
Impactofthenewaccountingstandards2 (37.6) (2.7)
Dividendspaid (369.2) (340.3)
Accumulated losses at the end of the year (1,344.1) (1,368.4)
1 Totalcomprehensiveincomefortheyearwas$411.9million(2018:$113.1million),representedbyprofitfortheyearof$432.7million(2018: $126.4 million)adjustedformovementsinthehedgingreserveof$21.3milliondecrease(2018:$10.8milliondecrease)andintheactuarial valuationreserveof$0.5millionincrease(2018:$2.5milliondecrease).
2 Refertotheoverviewsectiononpages105to107oftheaccountingstandardschanges.
NOTESTOTHEFINANCIALSTATEMENTS(CONTINUED) Coca-Cola Amatil Limited and its subsidiaries
V OTHERINFORMATION(CONTINUED)18 EMPLOYEEOWNERSHIPPLANS(CONTINUED)
COCA-COLA AMATIL ANNUAL REPORT 2019144 145
BEING
A SU
STAIN
ABLE
BUSIN
ESSTH
E VALU
E W
E CREATEPERFO
RMA
NCE
& O
UTLO
OK
GO
VERNA
NCE
& RISK
SFIN
AN
CIAL &
STATUTO
RY REPO
RTS
OTH
ER IN
FORM
ATION
OU
R BU
SINESS
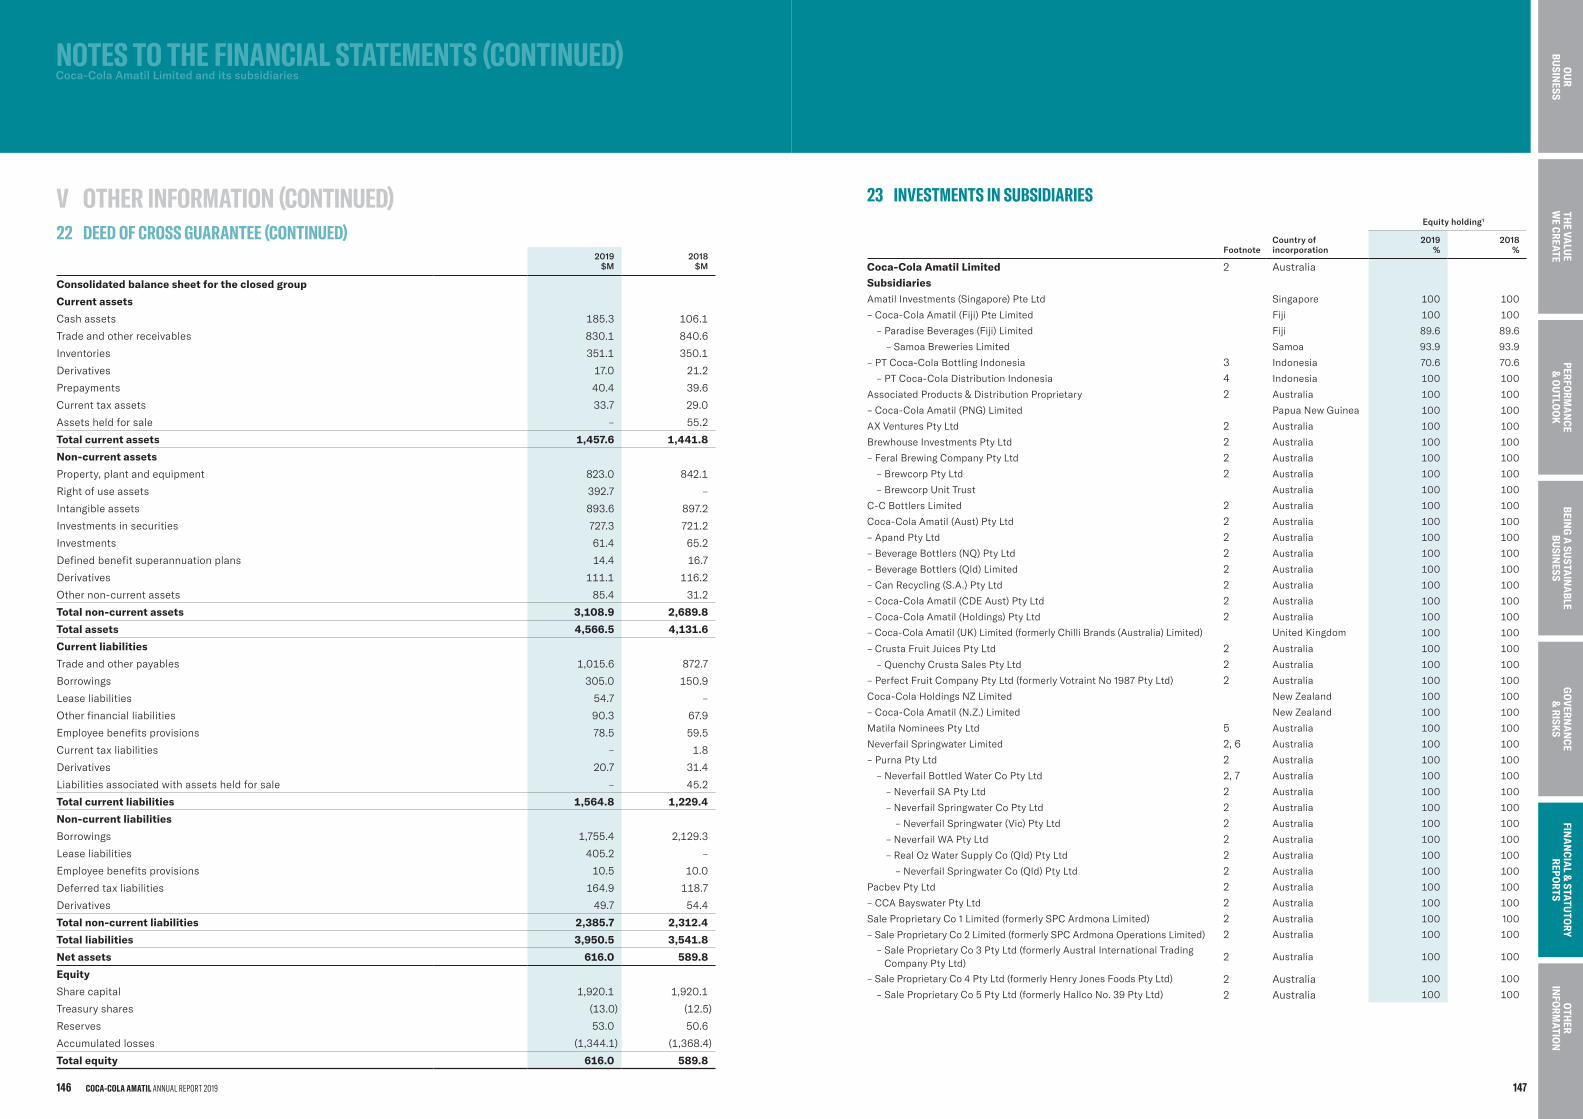
2019 $M
2018 $M
Consolidated balance sheet for the closed group
Current assets
Cashassets 185.3 106.1
Tradeandotherreceivables 830.1 840.6
Inventories 351.1 350.1
Derivatives 17.0 21.2
Prepayments 40.4 39.6
Currenttaxassets 33.7 29.0
Assetsheldforsale – 55.2
Total current assets 1,457.6 1,441.8
Non-current assets
Property,plantandequipment 823.0 842.1
Rightofuseassets 392.7 –
Intangibleassets 893.6 897.2
Investmentsinsecurities 727.3 721.2
Investments 61.4 65.2
Definedbenefitsuperannuationplans 14.4 16.7
Derivatives 111.1 116.2
Othernon-currentassets 85.4 31.2
Total non-current assets 3,108.9 2,689.8
Total assets 4,566.5 4,131.6
Current liabilities
Tradeandotherpayables 1,015.6 872.7
Borrowings 305.0 150.9
Leaseliabilities 54.7 –
Otherfinancialliabilities 90.3 67.9
Employeebenefitsprovisions 78.5 59.5
Currenttaxliabilities – 1.8
Derivatives 20.7 31.4
Liabilitiesassociatedwithassetsheldforsale – 45.2
Total current liabilities 1,564.8 1,229.4
Non-current liabilities
Borrowings 1,755.4 2,129.3
Leaseliabilities 405.2 –
Employeebenefitsprovisions 10.5 10.0
Deferredtaxliabilities 164.9 118.7
Derivatives 49.7 54.4
Total non-current liabilities 2,385.7 2,312.4
Total liabilities 3,950.5 3,541.8
Net assets 616.0 589.8
Equity
Sharecapital 1,920.1 1,920.1
Treasuryshares (13.0) (12.5)
Reserves 53.0 50.6
Accumulatedlosses (1,344.1) (1,368.4)
Total equity 616.0 589.8
23 INVESTMENTSINSUBSIDIARIESEquity holding1
FootnoteCountry of incorporation
2019%
2018%
Coca-Cola Amatil Limited 2 Australia
SubsidiariesAmatilInvestments(Singapore)PteLtd Singapore 100 100
–Coca-ColaAmatil(Fiji)PteLimited Fiji 100 100
– ParadiseBeverages(Fiji)Limited Fiji 89.6 89.6
–SamoaBreweriesLimited Samoa 93.9 93.9
–PTCoca-ColaBottlingIndonesia 3 Indonesia 70.6 70.6
– PTCoca-ColaDistributionIndonesia 4 Indonesia 100 100
AssociatedProducts&DistributionProprietary 2 Australia 100 100
–Coca-ColaAmatil(PNG)Limited PapuaNewGuinea 100 100
AXVenturesPtyLtd 2 Australia 100 100
BrewhouseInvestmentsPtyLtd 2 Australia 100 100
–FeralBrewingCompanyPtyLtd 2 Australia 100 100
– BrewcorpPtyLtd 2 Australia 100 100
– BrewcorpUnitTrust Australia 100 100
C-CBottlersLimited 2 Australia 100 100
Coca-ColaAmatil(Aust)PtyLtd 2 Australia 100 100
–ApandPtyLtd 2 Australia 100 100
–BeverageBottlers(NQ)PtyLtd 2 Australia 100 100
–BeverageBottlers(Qld)Limited 2 Australia 100 100
–CanRecycling(S.A.)PtyLtd 2 Australia 100 100
–Coca-ColaAmatil(CDEAust)PtyLtd 2 Australia 100 100
–Coca-ColaAmatil(Holdings)PtyLtd 2 Australia 100 100
–Coca-ColaAmatil(UK)Limited(formerlyChilliBrands(Australia)Limited) UnitedKingdom 100 100
–CrustaFruitJuicesPtyLtd 2 Australia 100 100
– QuenchyCrustaSalesPtyLtd 2 Australia 100 100
–PerfectFruitCompanyPtyLtd(formerlyVotraintNo1987PtyLtd) 2 Australia 100 100
Coca-ColaHoldingsNZLimited NewZealand 100 100
–Coca-ColaAmatil(N.Z.)Limited NewZealand 100 100
MatilaNomineesPtyLtd 5 Australia 100 100
NeverfailSpringwaterLimited 2,6 Australia 100 100
–PurnaPtyLtd 2 Australia 100 100
– NeverfailBottledWaterCoPtyLtd 2,7 Australia 100 100
–NeverfailSAPtyLtd 2 Australia 100 100
–NeverfailSpringwaterCoPtyLtd 2 Australia 100 100
– NeverfailSpringwater(Vic)PtyLtd 2 Australia 100 100
–NeverfailWAPtyLtd 2 Australia 100 100
–RealOzWaterSupplyCo(Qld)PtyLtd 2 Australia 100 100
– NeverfailSpringwaterCo(Qld)PtyLtd 2 Australia 100 100
PacbevPtyLtd 2 Australia 100 100
–CCABayswaterPtyLtd 2 Australia 100 100
SaleProprietaryCo1Limited(formerlySPCArdmonaLimited) 2 Australia 100 100
–SaleProprietaryCo2Limited(formerlySPCArdmonaOperationsLimited) 2 Australia 100 100
–SaleProprietaryCo3PtyLtd(formerlyAustralInternationalTradingCompanyPtyLtd)
2 Australia 100 100
–SaleProprietaryCo4PtyLtd(formerlyHenryJonesFoodsPtyLtd) 2 Australia 100 100
–SaleProprietaryCo5PtyLtd(formerlyHallcoNo.39PtyLtd) 2 Australia 100 100
NOTESTOTHEFINANCIALSTATEMENTS(CONTINUED) Coca-Cola Amatil Limited and its subsidiaries
V OTHERINFORMATION(CONTINUED)22 DEEDOFCROSSGUARANTEE(CONTINUED)
COCA-COLA AMATIL ANNUAL REPORT 2019146 147
BEING
A SU
STAIN
ABLE
BUSIN
ESSTH
E VALU
E W
E CREATEPERFO
RMA
NCE
& O
UTLO
OK
GO
VERNA
NCE
& RISK
SFIN
AN
CIAL &
STATUTO
RY REPO
RTS
OTH
ER IN
FORM
ATION
OU
R BU
SINESS
InaccordancewitharesolutionoftheDirectorsofCoca-ColaAmatilLimiteddated20February2020,westatethat:
IntheopinionoftheDirectors:
ThisdeclarationhasbeenmadeafterreceivingthedeclarationsrequiredtobemadetoDirectorsbytheGroupManagingDirectorand GroupChiefFinancialOfficer,inaccordancewithsection295AoftheCorporations Act 2001forthefinancialyearended31December2019.
OnbehalfoftheDirectors
Ilana R. Atlas, AO ChairmanSydney20February2020
Alison M. Watkins GroupManagingDirectorSydney20February2020
DIRECTORS’ DECLARATIONCoca-Cola Amatil Limited and its subsidiaries
Equity holding1
FootnoteCountry of incorporation
2019%
2018%
–SaleProprietaryCo6Limited(formerlyArdmonaFoodsLimited) 2 Australia 100 100
– SaleProprietaryCo7PtyLtd(formerlyGoulburnValleyCannersPty Ltd)
2 Australia 100 100
– SaleProprietaryCo8B.V.(formerlySPCArdmona(Netherlands)BV) 8 Netherlands 100 100
Namesinsetindicatethatsharesorunitsareheldbythecompanyimmediatelyabovetheinset.Theabovesubsidiariescarryonbusinessintheirrespectivecountriesofincorporation.
1 Theproportionofownershipinterestisequaltotheproportionofvotingpowerheld.2 ThesecompaniesarepartiestoaDeedofCrossGuaranteeasdetailedinNote22andareeligibleforthebenefitofASIC Corporations (Wholly-owned
Companies) Instrument 2016/785.3 Coca-ColaAmatilLimitedholds3.4%ofthesharesinthiscompanyandTCCCholds29.4%interestinthiscompany.4 Coca-ColaAmatilLimitedholds0.01%ofthesharesandPTCoca-ColaBottlingIndonesiaholds99.99%ofthesharesinthiscompany.5 MatilaNomineesPtyLtdisthetrusteecompanyfortheGroup’semployeeownershipplansandalsotheTrusteetotheDeedofCrossGuarantee.6 NeverfailSpringwaterLimitedholds40.7%ofthesharesinNeverfailBottledWaterCoPtyLtd.7 NeverfailBottledWaterCoPtyLtdholds1.5%ofthesharesinNeverfailSpringwater(Vic)PtyLtd.8 SaleProprietaryCo8B.V.isinprocessofliquidation.
24 NEWSTANDARDSANDINTERPRETATIONSCoca-ColaAmatilhasnotearlyadoptedanynewstandards,amendmentstostandardsandinterpretationsthathavebeenissuedor amendedbutarenotyeteffective.
25 EVENTSAFTERTHEBALANCEDATESubsequenttothebalancesheetdate,nomattersorcircumstanceshavearisensincetheendofthefinancialyearthathavesignificantlyaffected,ormaysignificantlyaffect,theoperations,theresultsofthoseoperationsorthestateofaffairsoftheGroupin subsequentfinancialperiods.
NOTESTOTHEFINANCIALSTATEMENTS(CONTINUED) Coca-Cola Amatil Limited and its subsidiaries
V OTHERINFORMATION(CONTINUED)23 INVESTMENTSINSUBSIDIARIES(CONTINUED)
COCA-COLA AMATIL ANNUAL REPORT 2019148 149
BEING
A SU
STAIN
ABLE
BUSIN
ESSTH
E VALU
E W
E CREATEPERFO
RMA
NCE
& O
UTLO
OK
GO
VERNA
NCE
& RISK
SFIN
AN
CIAL &
STATUTO
RY REPO
RTS
OTH
ER IN
FORM
ATION
OU
R BU
SINESS
a) thefinancialstatements,notesandtheadditionaldisclosuresincludedintheDirectors’ReportoftheGroupareaudited,andareinaccordancewiththeCorporations Act 2001,including:
i) givingatrueandfairviewoftheGroup’sfinancialpositionasat31December2019,andofitsperformancefortheyearendedonthatdate;and
ii) complyingwithAustralianAccountingStandardsandtheCorporations Regulations 2001;
b) thefinancialstatementsandnotesalsocomplywithInternational Financial Reporting Standardsasdisclosedonpage105oftheFinancialReport;
c) atthedateofthisdeclaration,therearereasonablegroundstobelievethattheCompanywillbeabletopayitsdebtsasandwhentheybecomedueandpayable;and
d) atthedateofthisdeclaration,therearereasonablegroundstobelievethattheCompanyandthewhollyownedsubsidiariesidentifiedonpages147and148oftheFinancialReportasbeingpartiestoaDeedofCrossGuaranteewithMatilaNomineesPtyLtdas trustee,willbeabletomeetanyobligationsorliabilitiestowhichtheyare,ormaybecome,subjectbyvirtueoftheDeed.
INDEPENDENT AUDITOR’S REPORT TO THE MEMBERS OF COCA-COLA AMATIL LIMITED (CONTINUED)Key Audit Matters (Continued)
Why significant How our audit addressed the key audit matter
1. Carrying Value of Indonesian Cash Generating Unit
Due to the limited amount by which the recoverable amount of the Indonesian Cash Generating Unit (CGU) exceeds it’s carrying value, this CGU is susceptible to impairment.
As disclosed in Note 10 to the financial statements, the assessment of impairment for the Indonesian CGU, involves critical accounting estimates and significant judgements. Note 10 also demonstrates the amount of change to the revenue, discount rate and terminal growth rate assumptions which would lead to an impairment charge being required.
This was considered a key audit matter given the limited headroom and significant judgment required in performing this assessment.
Our audit procedures included the following:
• Assessed whether the methodology used by the Group met therequirements of Australian Accounting Standards
• Tested the mathematical accuracy of the cash flow model • Assessed whether the carrying value of the CGU used in the
impairment test was appropriately determined in accordance with the Australian Accounting Standards
• Assessed the cash flow forecasts by considering the historical reliability of the Group’s cash flow forecasts, recent results, and our knowledge of the business and industry, corroborating this data with external information where possible
• Evaluated the Group’s analysis of the sensitivity of changes in keyassumptions used in their impairment testing model, byconsidering a range of reasonably possible changes in keyassumptions
• Involving our business valuation and modelling specialists in theconsideration of key assumptions such as, the discount rate, andterminal growth rates
• Assessed the adequacy of the financial statement disclosuresrelating to impairment testing
2. Accounting for Rebates and Promotional Allowances
As disclosed in Note 2 to the financial statements, revenue is recognised when control of the product has transferred, being when the product is delivered to the customer and there is no unfulfilled obligation that could affect the customer’s acceptance of the product.
Revenue is recognised net of rebates and promotional allowances owed to customers based on their individual contractual arrangements. The recognition and measurement of rebates and promotional allowances, including establishing an appropriate accrual at year end, involves significant judgment and estimate, particularly related to the expected level of rebate claims by the customers.
This was considered a key audit matter given the value of the rebate and promotional allowances provided to customers, together with the level of judgment involved in estimating the accrual for promotional allowances at year end.
Our audit procedures included the following: • Considered the application of Australian Accounting Standards to
the Group’s accounting policies regarding rebates andpromotional allowances
• Evaluated the effectiveness of the Group’s processes to calculateand record rebates and promotional allowances
• For a sample of contracts and promotional activities, assessedwhether the rebates and promotional allowances were calculatedin accordance with the terms of each contract
• Considered the impact of customer claims and payments madesubsequent to year end
• Analysed movements, trends and the ageing profile of therebates and promotional allowances accrual
• Performed analysis of write backs to the rebate and promotionalallowances throughout the year
• Enquired of the Group as to the existence of any sidearrangements or contracts with unusual terms and conditions
• Considered the presentation and disclosure in respect of rebatesand promotional allowances in the financial statements
A member firm of Ernst & Young Global Limited Liability limited by a scheme approved under Professional Standards Legislation
INDEPENDENT AUDITOR’S REPORT TO THE MEMBERS OF COCA-COLA AMATIL LIMITED REPORT ON THE AUDIT OF THE FINANCIAL REPORT
OPINION We have audited the financial report of Coca-Cola Amatil Limited (the Company) and its subsidiaries (collectively “the Group”), which comprises the consolidated balance sheet as at 31 December 2019, the consolidated income statement, the consolidated statement of comprehensive income, consolidated statement of changes in equity and consolidated statement of cash flows for the year then ended, notes to the financial statements, including a summary of significant accounting policies, and the directors' declaration.
In our opinion, the accompanying financial report of the Group is in accordance with the Corporations Act 2001, including:
a) giving a true and fair view of the consolidated financial position of the Group as at 31 December 2019 and of its consolidated financialperformance for the year ended on that date; and
b) complying with Australian Accounting Standards and the Corporations Regulations 2001.
BASIS FOR OPINION We conducted our audit in accordance with Australian Auditing Standards. Our responsibilities under those standards are further described in the Auditor’s Responsibilities for the Audit of the Financial Report section of our report. We are independent of the Group in accordance with the auditor independence requirements of the Corporations Act 2001 and the ethical requirements of the Accounting Professional and Ethical Standards Board’s APES 110 Code of Ethics for Professional Accountants (the Code) that are relevant to our audit of the financial report in Australia. We have also fulfilled our other ethical responsibilities in accordance with the Code.
We believe that the audit evidence we have obtained is sufficient and appropriate to provide a basis for our opinion.
Key Audit Matters
Key audit matters are those matters that, in our professional judgement, were of most significance in our audit of the financial report of the current year. These matters were addressed in the context of our audit of the financial report as a whole, and in forming our opinion thereon, but we do not provide a separate opinion on these matters. For each matter below, our description of how our audit addressed the matter is provided in that context.
We have fulfilled the responsibilities described in the Auditor’s Responsibilities for the Audit of the Financial Report section of our report, including in relation to these matters. Accordingly, our audit included the performance of procedures designed to respond to our assessment of the risks of material misstatement of the financial report. The results of our audit procedures, including the procedures performed to address the matters below, provide the basis for our audit opinion on the accompanying financial report.
A member firm of Ernst & Young Global Limited Liability limited by a scheme approved under Professional Standards Legislation
INDEPENDENT AUDITOR’S REPORTCoca-Cola Amatil Limited and its subsidiaries
COCA-COLA AMATIL ANNUAL REPORT 2019150 151
BEING
A SU
STAIN
ABLE
BUSIN
ESSTH
E VALU
E W
E CREATEPERFO
RMA
NCE
& O
UTLO
OK
GO
VERNA
NCE
& RISK
SFIN
AN
CIAL &
STATUTO
RY REPO
RTS
OTH
ER IN
FORM
ATION
OU
R BU
SINESS
INDEPENDENT AUDITOR’S REPORT TO THE MEMBERS OF COCA-COLA AMATIL LIMITED (CONTINUED)
AUDITOR’S RESPONSIBILITIES FOR THE AUDIT OF THE FINANCIAL REPORT (CONTINUED)
We communicate with the directors regarding, among other matters, the planned scope and timing of the audit and significant audit findings, including any significant deficiencies in internal control that we identify during our audit. We also provide the directors with a statement that we have complied with relevant ethical requirements regarding independence, and to communicate with them all relationships and other matters that may reasonably be thought to bear on our independence, and where applicable, related safeguards. From the matters communicated to the directors, we determine those matters that were of most significance in the audit of the financial report of the current year and are therefore the key audit matters. We describe these matters in our auditor’s report unless law or regulation precludes public disclosure about the matter or when, in extremely rare circumstances, we determine that a matter should not be communicated in our report because the adverse consequences of doing so would reasonably be expected to outweigh the public interest benefits of such communication.
REPORT ON THE AUDIT OF THE REMUNERATION REPORT
Opinion on the Remuneration Report
We have audited the Remuneration Report included in pages 74 to 98 of the directors' report for the year ended 31 December 2019. In our opinion, the Remuneration Report of Coca-Cola Amatil Limited for the year ended 31 December 2019, complies with section 300A of the Corporations Act 2001. Responsibilities
The directors of the Company are responsible for the preparation and presentation of the Remuneration Report in accordance with section 300A of the Corporations Act 2001. Our responsibility is to express an opinion on the Remuneration Report, based on our audit conducted in accordance with Australian Auditing Standards.
Ernst & Young Katrina Zdrilic Partner Sydney 20 February 2020
A member firm of Ernst & Young Global Limited Liability limited by a scheme approved under Professional Standards Legislation
INDEPENDENT AUDITOR’S REPORTCoca-Cola Amatil Limited and its subsidiaries
INDEPENDENT AUDITOR’S REPORT TO THE MEMBERS OF COCA-COLA AMATIL LIMITED (CONTINUED)
INFORMATION OTHER THAN THE FINANCIAL REPORT AND AUDITOR’S REPORT THEREON
The directors are responsible for the other information. The other information comprises the information included in the Company’s 2019 Annual Report other than the financial report and our audits report thereon. We obtained the Directors’ Report that is to be included in the Annual Report, prior to the date of this auditor’s report, and we expect to obtain the remaining sections of the Annual Report after the date of this auditor’s report. Our opinion on the financial report does not cover the other information and accordingly we do not express any form of assurance conclusion thereon, with the exception of the Remuneration Report and our related assurance opinion. In connection with our audit of the financial report, our responsibility is to read the other information and, in doing so, consider whether the other information is materially inconsistent with the financial report or our knowledge obtained in the audit or otherwise appears to be materially misstated. If, based on the work we have performed, we conclude that there is a material misstatement of this other information, we are required to report that fact. We have nothing to report in this regard.
RESPONSIBILITIES OF THE DIRECTORS FOR THE FINANCIAL REPORT
The directors of the Company are responsible for the preparation of the financial report that gives a true and fair view in accordance with Australian Accounting Standards and the Corporations Act 2001 and for such internal control as the directors determine is necessary to enable the preparation of the financial report that gives a true and fair view and is free from material misstatement, whether due to fraud or error. In preparing the financial report, the directors are responsible for assessing the Company’s and Group’s ability to continue as a going concern, disclosing, as applicable, matters relating to going concern and using the going concern basis of accounting unless the directors either intend to liquidate the Company or Group or to cease operations, or have no realistic alternative but to do so.
AUDITOR’S RESPONSIBILITIES FOR THE AUDIT OF THE FINANCIAL REPORT
Our objectives are to obtain reasonable assurance about whether the financial report as a whole is free from material misstatement, whether due to fraud or error, and to issue an auditor’s report that includes our opinion. Reasonable assurance is a high level of assurance but is not a guarantee that an audit conducted in accordance with the Australian Auditing Standards will always detect a material misstatement when it exists. Misstatements can arise from fraud or error and are considered material if, individually or in the aggregate, they could reasonably be expected to influence the economic decisions of users taken on the basis of this financial report. As part of an audit in accordance with the Australian Auditing Standards, we exercise professional judgment and maintain professional scepticism throughout the audit. We also: • Identify and assess the risks of material misstatement of the financial report, whether due to fraud or error, design and perform audit
procedures responsive to those risks, and obtain audit evidence that is sufficient and appropriate to provide a basis for our opinion. The riskof not detecting a material misstatement resulting from fraud is higher than for one resulting from error, as fraud may involve collusion,forgery, intentional omissions, misrepresentations, or the override of internal control
• Obtain an understanding of internal control relevant to the audit in order to design audit procedures that are appropriate in thecircumstances, but not for the purpose of expressing an opinion on the effectiveness of the Company’s or the Group’s internal control
• Evaluate the appropriateness of accounting policies used and the reasonableness of accounting estimates and related disclosures made bythe directors
• Conclude on the appropriateness of the directors’ use of the going concern basis of accounting and, based on the audit evidence obtained,whether a material uncertainty exists related to events or conditions that may cast significant doubt on the Company’s or Group’s ability tocontinue as a going concern. If we conclude that a material uncertainty exists, we are required to draw attention in our auditor’s report to therelated disclosures in the financial report or, if such disclosures are inadequate, to modify our opinion. Our conclusions are based on the auditevidence obtained up to the date of our auditor’s report. However, future events or conditions may cause the Company or the Group to ceaseto continue as a going concern
• Evaluate the overall presentation, structure and content of the financial report, including the disclosures, and whether the financial reportrepresents the underlying transactions and events in a manner that achieves fair presentation
• Obtain sufficient appropriate audit evidence regarding the financial information of the entities or business activities within the Group toexpress an opinion on the financial report. We are responsible for the direction, supervision and performance of the Group audit. We remainsolely responsible for our audit opinion.
A member firm of Ernst & Young Global Limited Liability limited by a scheme approved under Professional Standards Legislation
COCA-COLA AMATIL ANNUAL REPORT 2019152 153
BEING
A SU
STAIN
ABLE
BUSIN
ESSTH
E VALU
E W
E CREATEPERFO
RMA
NCE
& O
UTLO
OK
GO
VERNA
NCE
& RISK
SFIN
AN
CIAL &
STATUTO
RY REPO
RTS
OTH
ER IN
FORM
ATION
OU
R BU
SINESS
INDEPENDENT LIMITED ASSURANCE REPORTCoca-Cola Amatil Limited and its subsidiaries
INDEPENDENT AUDITOR’S REPORTCoca-Cola Amatil Limited and its subsidiaries
Coca-Cola Amatil Limited 5
AUDITOR’S INDEPENDENCE DECLARATION TO THE DIRECTORS OF COCA-COLA AMATIL LIMITED As lead auditor for the audit of Coca-Cola Amatil Limited for the financial year ended 31 December 2019, I declare to the best of my knowledge and belief, there have been:
a) no contraventions of the auditor independence requirements of the Corporations Act 2001 in relation to the audit; and
b) no contraventions of any applicable code of professional conduct in relation to the audit.
This declaration is in respect of Coca-Cola Amatil Limited and the entities it controlled during the financial year.
Ernst & Young Katrina Zdrilic Partner Sydney 20 February 2020
A member firm of Ernst & Young Global Limited Liability limited by a scheme approved under Professional Standards Legislation
COCA-COLA AMATIL ANNUAL REPORT 2019154 155
BEING
A SU
STAIN
ABLE
BUSIN
ESSTH
E VALU
E W
E CREATEPERFO
RMA
NCE
& O
UTLO
OK
GO
VERNA
NCE
& RISK
SO
UR
BUSIN
ESSO
THER
INFO
RMATIO
NFIN
AN
CIAL &
STATUTO
RY REPO
RTS
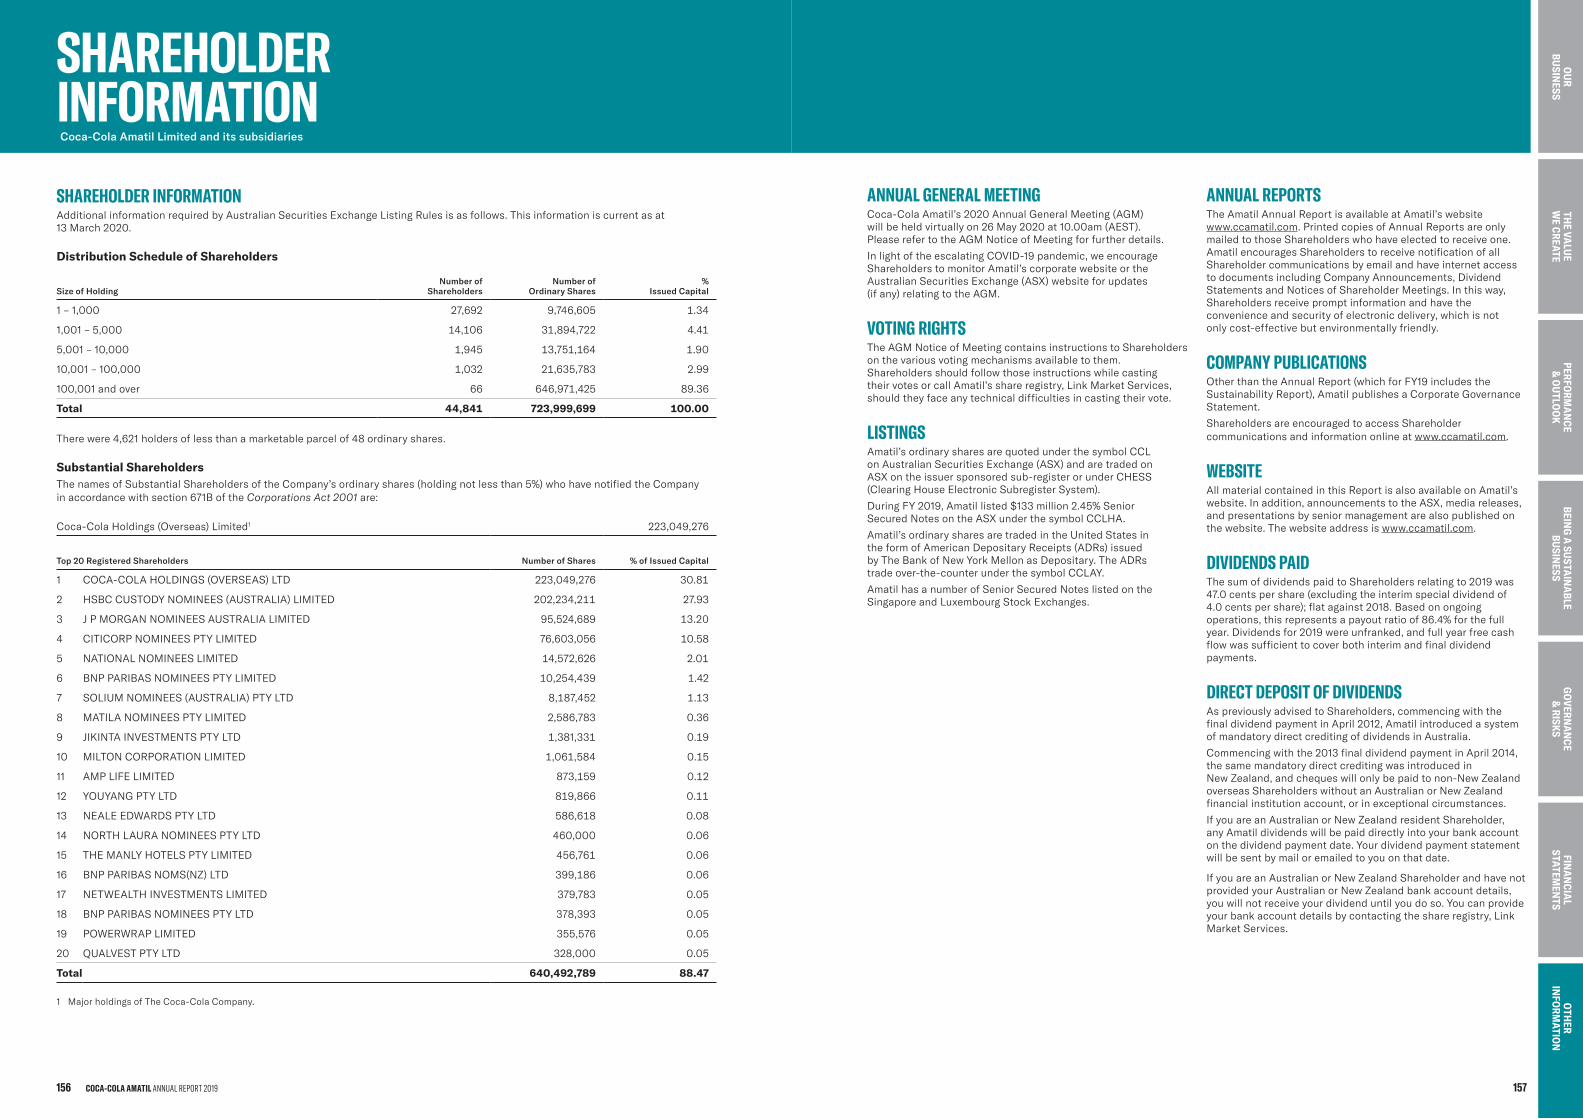
SHAREHOLDER INFORMATIONAdditionalinformationrequiredbyAustralianSecuritiesExchangeListingRulesisasfollows.Thisinformationiscurrentasat13 March 2020.
Distribution Schedule of Shareholders
Size of HoldingNumber of
ShareholdersNumber of
Ordinary Shares %
Issued Capital
1–1,000 27,692 9,746,605 1.34
1,001–5,000 14,106 31,894,722 4.41
5,001–10,000 1,945 13,751,164 1.90
10,001–100,000 1,032 21,635,783 2.99
100,001andover 66 646,971,425 89.36
Total 44,841 723,999,699 100.00
Therewere4,621holdersoflessthanamarketableparcelof48ordinaryshares.
Substantial ShareholdersThenamesofSubstantialShareholdersoftheCompany’sordinaryshares(holdingnotlessthan5%)whohavenotifiedtheCompanyin accordancewithsection671BoftheCorporations Act 2001are:
Coca-ColaHoldings(Overseas)Limited1 223,049,276
Top 20 Registered Shareholders Number of Shares % of Issued Capital
1 COCA-COLAHOLDINGS(OVERSEAS)LTD 223,049,276 30.81
2 HSBCCUSTODYNOMINEES(AUSTRALIA)LIMITED 202,234,211 27.93
3 JPMORGANNOMINEESAUSTRALIALIMITED 95,524,689 13.20
4 CITICORPNOMINEESPTYLIMITED 76,603,056 10.58
5 NATIONALNOMINEESLIMITED 14,572,626 2.01
6 BNPPARIBASNOMINEESPTYLIMITED 10,254,439 1.42
7 SOLIUMNOMINEES(AUSTRALIA)PTYLTD 8,187,452 1.13
8 MATILANOMINEESPTYLIMITED 2,586,783 0.36
9 JIKINTAINVESTMENTSPTYLTD 1,381,331 0.19
10 MILTONCORPORATIONLIMITED 1,061,584 0.15
11 AMPLIFELIMITED 873,159 0.12
12 YOUYANGPTYLTD 819,866 0.11
13 NEALEEDWARDSPTYLTD 586,618 0.08
14 NORTHLAURANOMINEESPTYLTD 460,000 0.06
15 THEMANLYHOTELSPTYLIMITED 456,761 0.06
16 BNPPARIBASNOMS(NZ)LTD 399,186 0.06
17 NETWEALTHINVESTMENTSLIMITED 379,783 0.05
18 BNPPARIBASNOMINEESPTYLTD 378,393 0.05
19 POWERWRAPLIMITED 355,576 0.05
20 QUALVESTPTYLTD 328,000 0.05
Total 640,492,789 88.47
1 MajorholdingsofTheCoca-ColaCompany.
SHAREHOLDER INFORMATIONCoca-Cola Amatil Limited and its subsidiaries
ANNUAL GENERAL MEETINGCoca-ColaAmatil’s2020AnnualGeneralMeeting(AGM)willbeheldvirtuallyon26May2020at10.00am(AEST).PleaserefertotheAGMNoticeofMeetingforfurtherdetails.
InlightoftheescalatingCOVID-19pandemic,weencourageShareholderstomonitorAmatil’scorporatewebsiteortheAustralianSecuritiesExchange(ASX)websiteforupdates(if any) relatingtotheAGM.
VOTING RIGHTSTheAGMNoticeofMeetingcontainsinstructionstoShareholdersonthevariousvotingmechanismsavailabletothem.Shareholdersshouldfollowthoseinstructionswhilecastingtheir votesorcallAmatil’sshareregistry,LinkMarketServices,shouldtheyfaceanytechnicaldifficultiesincastingtheirvote.
LISTINGSAmatil’sordinarysharesarequotedunderthesymbolCCLonAustralianSecuritiesExchange(ASX)andaretradedonASXon theissuersponsoredsub-registerorunderCHESS(ClearingHouseElectronicSubregisterSystem).
DuringFY2019,Amatillisted$133million2.45%SeniorSecuredNotesontheASXunderthesymbolCCLHA.
Amatil’sordinarysharesaretradedintheUnitedStatesintheformofAmericanDepositaryReceipts(ADRs)issuedbyTheBank ofNewYorkMellonasDepositary.TheADRstradeover-the-counterunderthesymbolCCLAY.
AmatilhasanumberofSeniorSecuredNoteslistedontheSingaporeandLuxembourgStockExchanges.
ANNUAL REPORTSTheAmatilAnnualReportisavailableatAmatil’swebsitewww.ccamatil.com.PrintedcopiesofAnnualReportsareonlymailedtothoseShareholderswhohaveelectedtoreceiveone.AmatilencouragesShareholderstoreceivenotificationofallShareholdercommunicationsbyemailandhaveinternetaccesstodocumentsincludingCompanyAnnouncements,DividendStatementsandNoticesofShareholderMeetings.Inthisway,Shareholdersreceivepromptinformationandhavetheconvenienceandsecurityofelectronicdelivery,whichisnotonly cost-effectivebutenvironmentallyfriendly.
COMPANY PUBLICATIONSOtherthantheAnnualReport(whichforFY19includestheSustainabilityReport),AmatilpublishesaCorporateGovernanceStatement.
ShareholdersareencouragedtoaccessShareholdercommunicationsandinformationonlineatwww.ccamatil.com.
WEBSITEAllmaterialcontainedinthisReportisalsoavailableonAmatil’swebsite.Inaddition,announcementstotheASX,mediareleases,andpresentationsbyseniormanagementarealsopublishedonthewebsite.Thewebsiteaddressiswww.ccamatil.com.
DIVIDENDS PAIDThesumofdividendspaidtoShareholdersrelatingto2019was47.0centspershare(excludingtheinterimspecialdividendof4.0 centspershare);flatagainst2018.Basedonongoingoperations,thisrepresentsapayoutratioof86.4%forthefullyear.Dividendsfor2019wereunfranked,andfullyearfreecashflowwassufficienttocoverbothinterimandfinaldividendpayments.
DIRECT DEPOSIT OF DIVIDENDSAspreviouslyadvisedtoShareholders,commencingwiththefinaldividendpaymentinApril2012,AmatilintroducedasystemofmandatorydirectcreditingofdividendsinAustralia.
Commencingwiththe2013finaldividendpaymentinApril2014,thesamemandatorydirectcreditingwasintroducedinNew Zealand,andchequeswillonlybepaidtonon-NewZealandoverseasShareholderswithoutanAustralianorNewZealandfinancialinstitutionaccount,orinexceptionalcircumstances.
IfyouareanAustralianorNewZealandresidentShareholder,any Amatildividendswillbepaiddirectlyintoyourbankaccountonthedividendpaymentdate.Yourdividendpaymentstatementwillbesentbymailoremailedtoyouonthatdate.
IfyouareanAustralianorNewZealandShareholderandhavenotprovidedyourAustralianorNewZealandbankaccountdetails,youwillnotreceiveyourdividenduntilyoudoso.Youcanprovideyourbankaccountdetailsbycontactingtheshareregistry,LinkMarketServices.
COCA-COLA AMATIL ANNUAL REPORT 2019156 157
BEING
A SU
STAIN
ABLE
BUSIN
ESSTH
E VALU
E W
E CREATEPERFO
RMA
NCE
& O
UTLO
OK
GO
VERNA
NCE
& RISK
SO
UR
BUSIN
ESSFIN
AN
CIAL
STATEMEN
TSO
THER
INFO
RMATIO
N
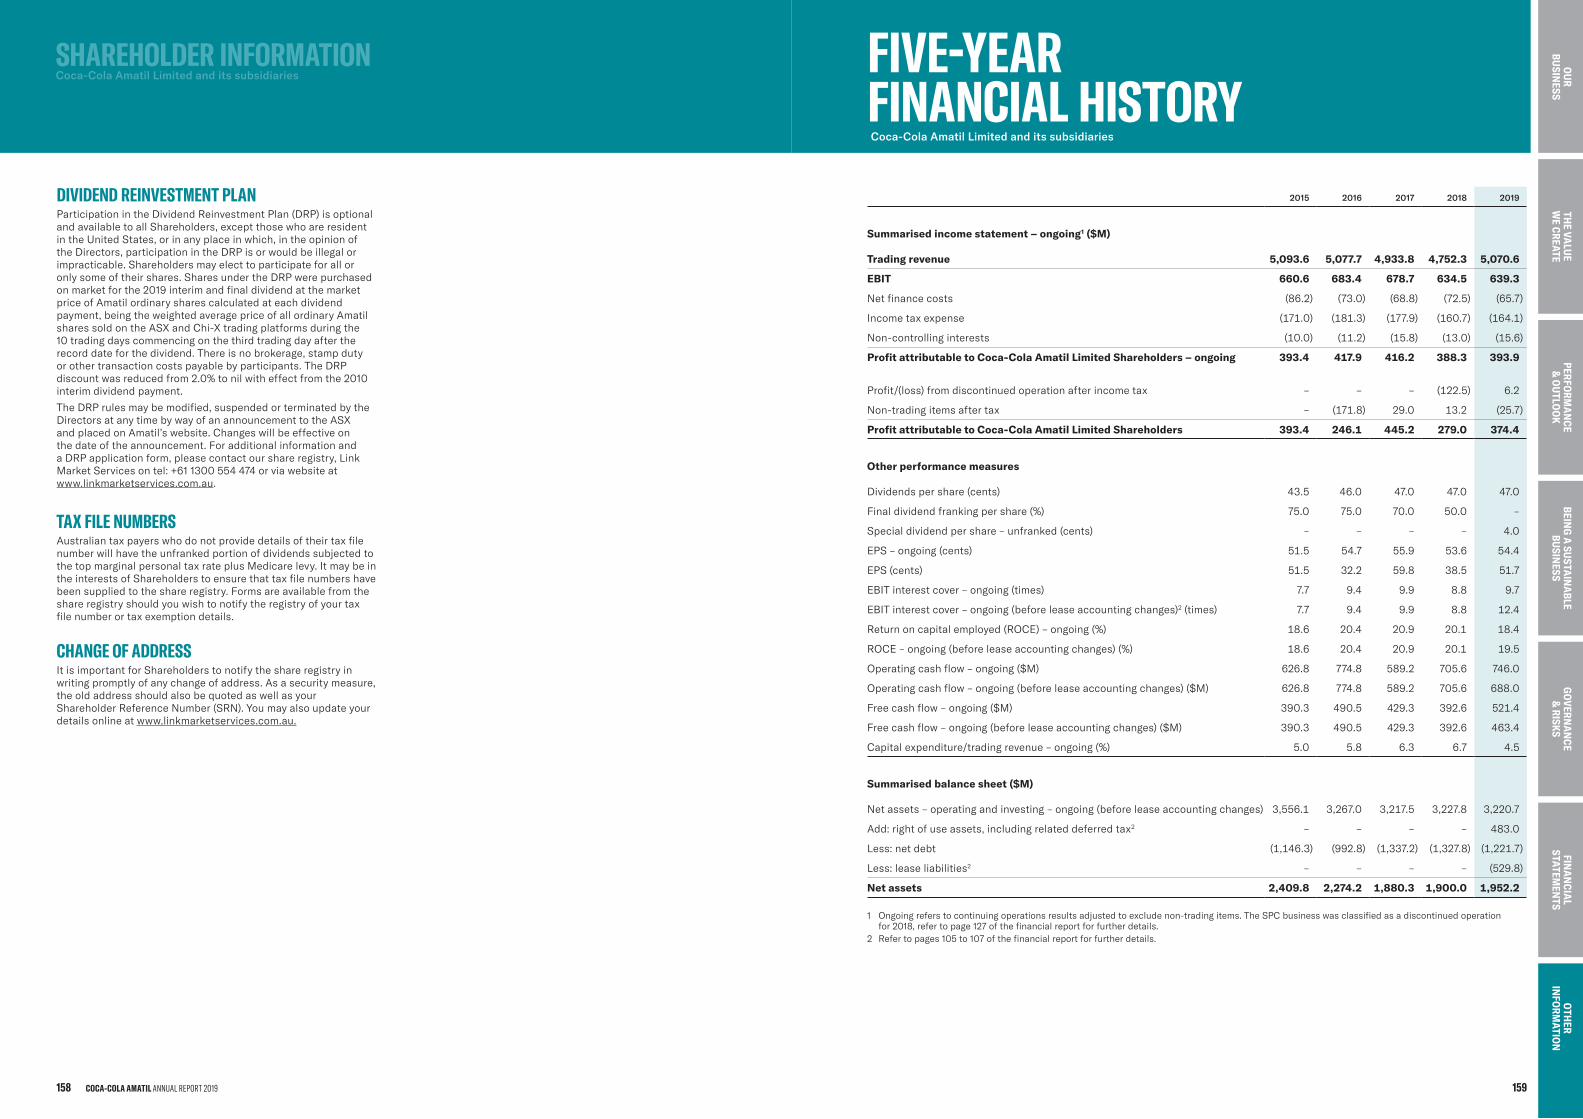
SHAREHOLDER INFORMATIONCoca-Cola Amatil Limited and its subsidiaries
2015 2016 2017 2018 2019
Summarised income statement – ongoing1 ($M)
Trading revenue 5,093.6 5,077.7 4,933.8 4,752.3 5,070.6
EBIT 660.6 683.4 678.7 634.5 639.3
Netfinancecosts (86.2) (73.0) (68.8) (72.5) (65.7)
Incometaxexpense (171.0) (181.3) (177.9) (160.7) (164.1)
Non-controllinginterests (10.0) (11.2) (15.8) (13.0) (15.6)
Profit attributable to Coca-Cola Amatil Limited Shareholders – ongoing 393.4 417.9 416.2 388.3 393.9
Profit/(loss)fromdiscontinuedoperationafterincometax – – – (122.5) 6.2
Non-tradingitemsaftertax – (171.8) 29.0 13.2 (25.7)
Profit attributable to Coca-Cola Amatil Limited Shareholders 393.4 246.1 445.2 279.0 374.4
Other performance measures
Dividendspershare(cents) 43.5 46.0 47.0 47.0 47.0
Finaldividendfrankingpershare(%) 75.0 75.0 70.0 50.0 –
Specialdividendpershare–unfranked(cents) – – – – 4.0
EPS–ongoing(cents) 51.5 54.7 55.9 53.6 54.4
EPS(cents) 51.5 32.2 59.8 38.5 51.7
EBITinterestcover–ongoing(times) 7.7 9.4 9.9 8.8 9.7
EBITinterestcover–ongoing(beforeleaseaccountingchanges)2(times) 7.7 9.4 9.9 8.8 12.4
Returnoncapitalemployed(ROCE)–ongoing(%) 18.6 20.4 20.9 20.1 18.4
ROCE–ongoing(beforeleaseaccountingchanges)(%) 18.6 20.4 20.9 20.1 19.5
Operatingcashflow–ongoing($M) 626.8 774.8 589.2 705.6 746.0
Operatingcashflow–ongoing(beforeleaseaccountingchanges)($M) 626.8 774.8 589.2 705.6 688.0
Freecashflow–ongoing($M) 390.3 490.5 429.3 392.6 521.4
Freecashflow–ongoing(beforeleaseaccountingchanges)($M) 390.3 490.5 429.3 392.6 463.4
Capitalexpenditure/tradingrevenue–ongoing(%) 5.0 5.8 6.3 6.7 4.5
Summarised balance sheet ($M)
Netassets–operatingandinvesting–ongoing(beforeleaseaccountingchanges) 3,556.1 3,267.0 3,217.5 3,227.8 3,220.7
Add:rightofuseassets,includingrelateddeferredtax2 – – – – 483.0
Less:netdebt (1,146.3) (992.8) (1,337.2) (1,327.8) (1,221.7)
Less:leaseliabilities2 – – – – (529.8)
Net assets 2,409.8 2,274.2 1,880.3 1,900.0 1,952.2
1 Ongoingreferstocontinuingoperationsresultsadjustedtoexcludenon-tradingitems.TheSPCbusinesswasclassifiedasadiscontinuedoperationfor2018,refertopage127ofthefinancialreportforfurtherdetails.
2 Refertopages105to107ofthefinancialreportforfurtherdetails.
FIVE-YEAR FINANCIAL HISTORYCoca-Cola Amatil Limited and its subsidiaries
DIVIDEND REINVESTMENT PLANParticipationintheDividendReinvestmentPlan(DRP)isoptionalandavailabletoallShareholders,exceptthosewhoareresidentin theUnitedStates,orinanyplaceinwhich,intheopinionofthe Directors,participationintheDRPisorwouldbeillegalorimpracticable.Shareholdersmayelecttoparticipateforalloronlysomeoftheirshares.SharesundertheDRPwerepurchasedonmarketforthe2019interimandfinaldividendatthemarketpriceofAmatilordinarysharescalculatedateachdividendpayment,beingtheweightedaveragepriceofallordinaryAmatilsharessoldontheASXandChi-Xtradingplatformsduringthe10 tradingdayscommencingonthethirdtradingdayaftertherecorddateforthedividend.Thereisnobrokerage,stampdutyor othertransactioncostspayablebyparticipants.TheDRPdiscountwas reducedfrom2.0%tonilwitheffectfromthe2010interimdividendpayment.
TheDRPrulesmaybemodified,suspendedorterminatedbytheDirectorsatanytimebywayofanannouncementtotheASXand placedonAmatil’swebsite.Changeswillbeeffectiveonthe dateoftheannouncement.Foradditionalinformationanda DRP applicationform,pleasecontactourshareregistry,LinkMarketServicesontel:+611300554474orviawebsiteatwww.linkmarketservices.com.au.
TAXFILENUMBERSAustraliantaxpayerswhodonotprovidedetailsoftheirtaxfilenumberwillhavetheunfrankedportionofdividendssubjectedtothetopmarginalpersonaltaxrateplusMedicarelevy.ItmaybeintheinterestsofShareholderstoensurethattaxfilenumbershavebeensuppliedtotheshareregistry.Formsareavailablefromtheshareregistryshouldyouwishtonotifytheregistryofyourtaxfilenumberortaxexemptiondetails.
CHANGE OF ADDRESSItisimportantforShareholderstonotifytheshareregistryinwritingpromptlyofanychangeofaddress.Asasecuritymeasure,theoldaddressshouldalsobequotedaswellasyourShareholderReferenceNumber(SRN).Youmayalsoupdateyourdetailsonlineatwww.linkmarketservices.com.au.
COCA-COLA AMATIL ANNUAL REPORT 2019158 159
BEING
A SU
STAIN
ABLE
BUSIN
ESSTH
E VALU
E W
E CREATEPERFO
RMA
NCE
& O
UTLO
OK
GO
VERNA
NCE
& RISK
SO
UR
BUSIN
ESSFIN
AN
CIAL
STATEMEN
TSO
THER
INFO
RMATIO
N
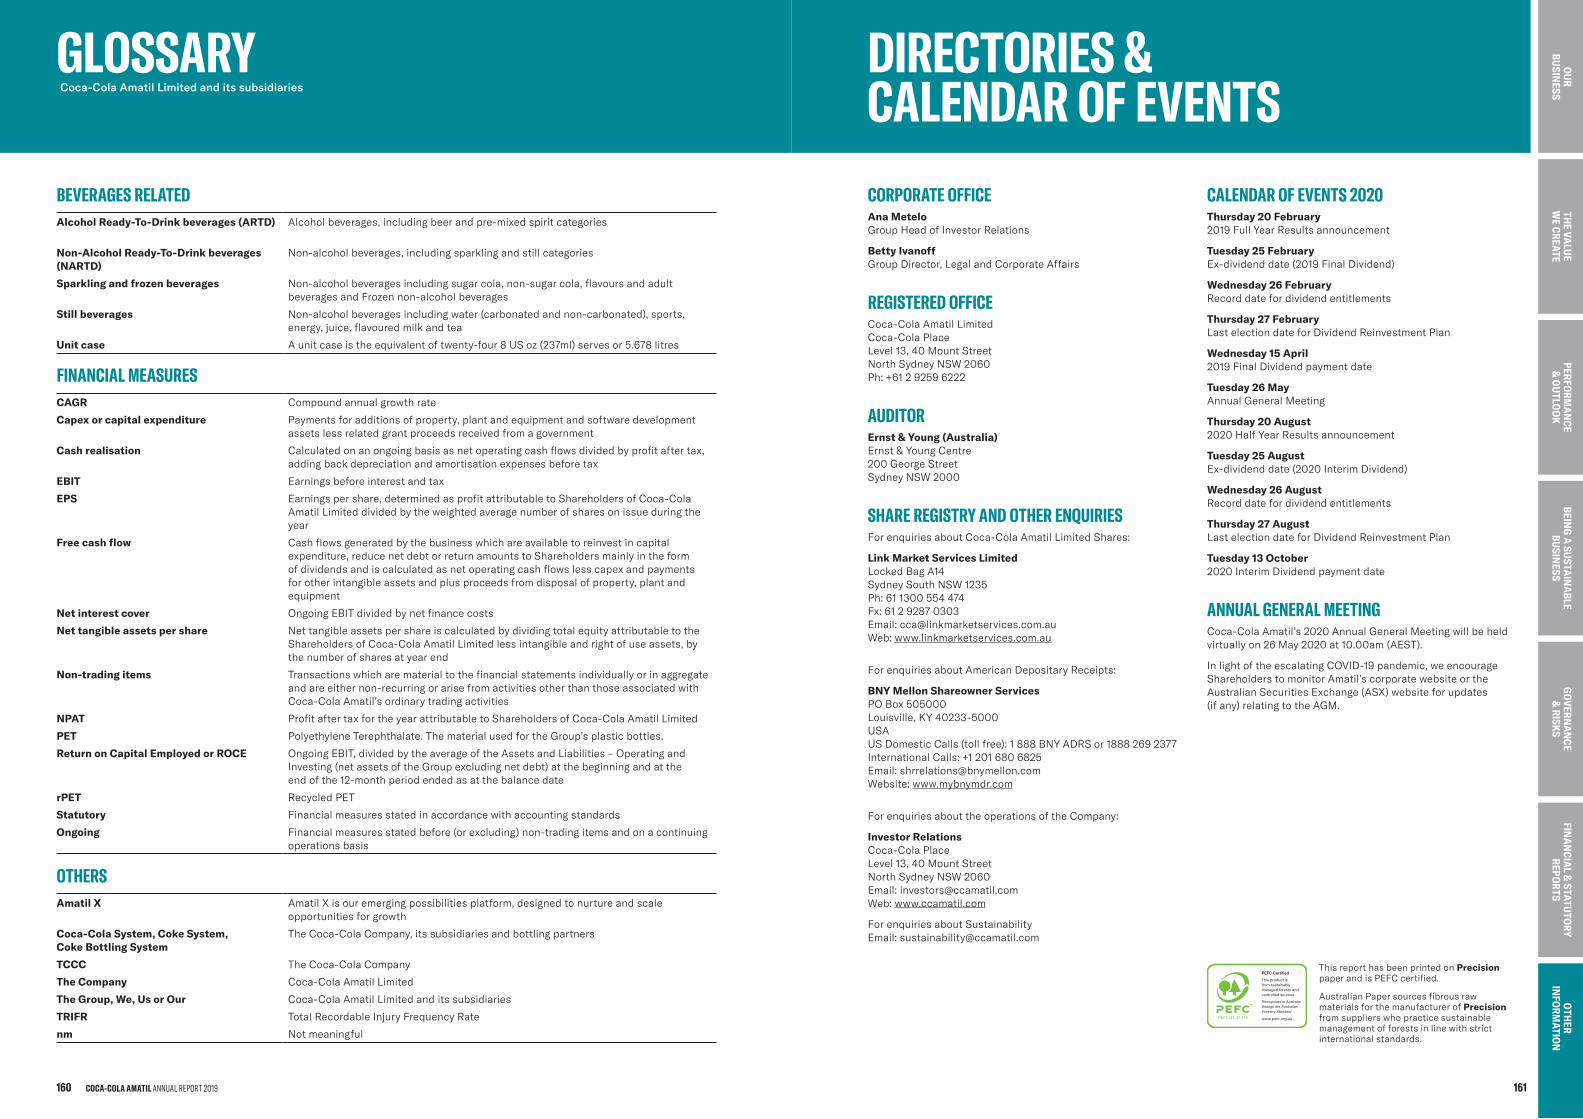
BEVERAGES RELATEDAlcohol Ready-To-Drink beverages (ARTD) Alcoholbeverages,includingbeerandpre-mixedspiritcategories
Non-Alcohol Ready-To-Drink beverages (NARTD)
Non-alcoholbeverages,includingsparklingandstillcategories
Sparkling and frozen beverages Non-alcoholbeveragesincludingsugarcola,non-sugarcola,flavoursandadultbeveragesandFrozennon-alcoholbeverages
Still beverages Non-alcoholbeveragesincludingwater(carbonatedandnon-carbonated),sports,energy,juice,flavouredmilkandtea
Unit case Aunitcaseistheequivalentoftwenty-four8USoz(237ml)servesor5.678litres
FINANCIAL MEASURESCAGR Compoundannualgrowthrate
Capex or capital expenditure Paymentsforadditionsofproperty,plantandequipmentandsoftwaredevelopmentassetslessrelatedgrantproceedsreceivedfromagovernment
Cash realisation Calculatedonanongoingbasisasnetoperatingcashflowsdividedbyprofitaftertax,addingbackdepreciationandamortisationexpensesbeforetax
EBIT Earningsbeforeinterestandtax
EPS Earningspershare,determinedasprofitattributabletoShareholdersofCoca-ColaAmatilLimiteddividedbytheweightedaveragenumberofsharesonissueduringtheyear
Free cash flow Cashflowsgeneratedbythebusinesswhichareavailabletoreinvestincapitalexpenditure,reducenetdebtorreturnamountstoShareholdersmainlyintheformof dividendsandiscalculatedasnetoperatingcashflowslesscapexandpaymentsfor otherintangibleassetsandplusproceedsfromdisposalofproperty,plantandequipment
Net interest cover OngoingEBITdividedbynetfinancecosts
Net tangible assets per share NettangibleassetspershareiscalculatedbydividingtotalequityattributabletotheShareholdersofCoca-ColaAmatilLimitedlessintangibleandrightofuseassets,bythenumberofsharesatyearend
Non-trading items Transactionswhicharematerialtothefinancialstatementsindividuallyorinaggregateandareeithernon-recurringorarisefromactivitiesotherthanthoseassociatedwithCoca-ColaAmatil’sordinarytradingactivities
NPAT ProfitaftertaxfortheyearattributabletoShareholdersofCoca-ColaAmatilLimited
PET PolyethyleneTerephthalate.ThematerialusedfortheGroup’splasticbottles.
Return on Capital Employed or ROCE OngoingEBIT,dividedbytheaverageoftheAssetsandLiabilities–OperatingandInvesting(netassetsoftheGroupexcludingnetdebt)atthebeginningandattheend ofthe12-monthperiodendedasatthebalancedate
rPET RecycledPET
Statutory Financialmeasuresstatedinaccordancewithaccountingstandards
Ongoing Financialmeasuresstatedbefore(orexcluding)non-tradingitemsandonacontinuingoperationsbasis
OTHERSAmatil X AmatilXisouremergingpossibilitiesplatform,designedtonurtureandscale
opportunitiesforgrowth
Coca-Cola System, Coke System, Coke Bottling System
TheCoca-ColaCompany,itssubsidiariesandbottlingpartners
TCCC TheCoca-ColaCompany
The Company Coca-ColaAmatilLimited
The Group, We, Us or Our Coca-ColaAmatilLimitedanditssubsidiaries
TRIFR TotalRecordableInjuryFrequencyRate
nm Notmeaningful
GLOSSARYCoca-Cola Amatil Limited and its subsidiaries
COCA-COLA AMATIL ANNUAL REPORT 2019160 161
BEING
A SU
STAIN
ABLE
BUSIN
ESSTH
E VALU
E W
E CREATEPERFO
RMA
NCE
& O
UTLO
OK
GO
VERNA
NCE
& RISK
SO
UR
BUSIN
ESSO
THER
INFO
RMATIO
NFIN
AN
CIAL &
STATUTO
RY REPO
RTS
DIRECTORIES & CALENDAR OF EVENTSCORPORATE OFFICE Ana MeteloGroupHeadofInvestorRelations
Betty IvanoffGroupDirector,LegalandCorporateAffairs
REGISTERED OFFICECoca-ColaAmatilLimitedCoca-ColaPlaceLevel13,40MountStreetNorthSydneyNSW2060Ph:+61292596222
AUDITOR Ernst & Young (Australia) Ernst&YoungCentre200GeorgeStreetSydneyNSW2000
SHARE REGISTRY AND OTHER ENQUIRIES ForenquiriesaboutCoca-ColaAmatilLimitedShares:
Link Market Services Limited LockedBagA14SydneySouthNSW1235Ph:611300554474Fx:61292870303Email:[email protected]:www.linkmarketservices.com.au
ForenquiriesaboutAmericanDepositaryReceipts:
BNY Mellon Shareowner Services POBox505000Louisville,KY40233-5000USAUSDomesticCalls(tollfree):1888BNYADRSor18882692377InternationalCalls:+12016806825Email:[email protected]:www.mybnymdr.com
ForenquiriesabouttheoperationsoftheCompany:
Investor RelationsCoca-ColaPlaceLevel13,40MountStreetNorthSydneyNSW2060Email:[email protected]:www.ccamatil.com
ForenquiriesaboutSustainabilityEmail:[email protected]
CALENDAROFEVENTS2020Thursday 20 February2019FullYearResultsannouncement
Tuesday 25 FebruaryEx-dividenddate(2019FinalDividend)
Wednesday 26 FebruaryRecorddatefordividendentitlements
Thursday 27 FebruaryLastelectiondateforDividendReinvestmentPlan
Wednesday 15 April2019FinalDividendpaymentdate
Tuesday 26 MayAnnualGeneralMeeting
Thursday 20 August2020HalfYearResultsannouncement
Tuesday 25 AugustEx-dividenddate(2020InterimDividend)
Wednesday 26 AugustRecorddatefordividendentitlements
Thursday 27 AugustLastelectiondateforDividendReinvestmentPlan
Tuesday 13 October2020InterimDividendpaymentdate
ANNUAL GENERAL MEETINGCoca-ColaAmatil’s2020AnnualGeneralMeetingwillbeheldvirtuallyon26 May 2020at10.00am(AEST).
InlightoftheescalatingCOVID-19pandemic,weencourageShareholderstomonitorAmatil’scorporatewebsiteortheAustralianSecuritiesExchange(ASX)websiteforupdates(if any) relatingtotheAGM.
ThisreporthasbeenprintedonPrecisionpaperandisPEFCcertified.
AustralianPapersourcesfibrousrawmaterialsforthemanufacturerofPrecisionfromsupplierswhopracticesustainablemanagementofforestsinlinewithstrictinternationalstandards.
Related Documents