Experience matters Annual Report 2019

Welcome message from author
This document is posted to help you gain knowledge. Please leave a comment to let me know what you think about it! Share it to your friends and learn new things together.
Transcript

Annual R
eport 2019
Experience matters
Annual Report 2019

Welcome to Landsec.
We apply our expertise to create positive experiences for those we rely on, from our customers and communities to our partners and employees. By getting that right, we create long-term, sustainable value for our shareholders and physical and social value for our communities.
2019 in numbers
45.55pDividend up 3.1%
£(123)mLoss before tax (2018: £(43)m)¹
59.7p Adjusted diluted earnings per share up 12.4% (2018: 53.1p)
0.4% Ungeared total property return (2018: 4.3%)
1,339p EPRA net assets per share down 4.6% (2018: 1,403p)¹
£3.2mSocial value created during the year
-1.2% Total business return (2018: 1.8%)
£442mRevenue profit up 8.9% (2018: £406m)
£11.8bnTotal contribution to the UK economy each year from people based at our assets
39.8%Carbon intensity (kgCO2e/m2) reduction compared to 2013/14 baseline
1. Restated as a result of changes in accounting policies.
Our diverse asset mix Chart 1
1. City of London 11% 1
Combined Portfolio
9
1011
8
7
6
5 4
3
2
2. Mid-town 10%
3. West End 24%
4. Inner London 3%
5. Central London retail 10%
6. London shopping centres 4%
7. Regional shopping centres 17%
8. Retail parks 5%
9. Outlets 7%
10. Leisure 6%
11. Hotels 3%
Our purpose is to provide the right space for our customers and communities so that businesses and people can thrive. We do this to create long-term financial, physical and social value. Together, these create sustainable value for our shareholders.
Our vision is to be the best property company in the UK in the eyes of our stakeholders – our customers, communities, partners, employees and investors.
Our focus is to provide a diverse mix of high-quality work, shopping, dining, leisure, social and residential space at destinations in London and across the UK.
Our core activities are buying, developing, managing and selling real estate.
Our values are customer service, innovation, excellence, accountability, respect and integrity. To read more, go to page 49.
Our performance is shaped by big impacts and trends that generate opportunities and challenges for us. These drive our actions. Our clear strategy has put the business in a strong position at a time of uncertainty in our markets – see our performance measures left and pages 20-21 for more.
Our reporting covers the short- and long-term effects of our actions. In this report, we’ve further integrated content on our broader social and physical impacts, but only included what’s material to our business.
01Landsec Annual Report 2019
Strateg
ic Rep
ort
Strategic report08 Chief Executive’s statement10 Our market12 Our business model16 Our strategy20 Key performance indicators22 Our stakeholders24 Portfolio review32 Financial review40 Physical review45 Social review54 Managing risk56 Our principal risks and uncertainties60 Going concern60 Viability statement
Governance62 Letter from the Chairman64 Board of Directors67 Executive Committee68 Leadership72 Our stakeholders and our Board74 Letter from the Chairman of the
Nomination Committee76 Effectiveness81 Letter from the Chairman of the
Audit Committee84 Accountability89 Investor relations91 Directors’ Remuneration Report –
Chairman’s Annual Statement94 Remuneration at a glance96 Annual Report on Remuneration108 Summary of Directors’ Remuneration
Policy111 Remuneration Policy118 Directors’ Report
Financial statements122 Statement of Directors’ Responsibilities123 Independent Auditor’s Report129 Income statement129 Statement of comprehensive income130 Balance sheets131 Statements of changes in equity132 Statement of cash flows133 Notes to the financial statements
Additional information182 Business analysis – Group188 Business analysis – London189 Business analysis – Retail190 Sustainability performance196 Combined Portfolio analysis198 Lease lengths199 Development pipeline199 Alternative performance measures200 Ten year summary202 Acquisitions, disposals and capital
expenditure203 Analysis of capital expenditure204 Subsidiaries, joint ventures and associates207 Shareholder information210 Key contacts and advisers211 GlossaryIBC Cautionary statement
This year, drawing on our capabilities we have: [ Delivered robust operational results [ Grown our development pipeline [ Deployed innovative ideas to reduce construction time, cost and waste [ Created social value and reduced our environmental impact
Over the following pages we show how we’re turning our skills and knowledge into results for our many stakeholders.
Our performance, together with our ability to address exciting new opportunities, demonstrates that experience matters.
Highlights
Chief Executive’s statement
Pages 8–9
Our strategy
Pages 16–19
Our portfolio
Pages 24–31
On the coverOur transformation of Victoria has created vibrant spaces like Nova. Now we’re developing the asset further to meet demand, using our experience to create the contemporary space customers need to thrive.
Visit our website: landsec.com

Decades of experience developing in the capital have shown us the value of securing opportunities early while timing construction carefully, in line with the conditions we see ahead. That’s the approach we’re taking now, adding substantial development options to our portfolio.
This year we progressed: our landmark scheme at 21 Moorfields, creating a new HQ for Deutsche Bank; our proposed scheme at Nova East; One Sherwood Street, a mixed use scheme behind Piccadilly Lights; and innovative proposals and tactical acquisitions around Southbank. We’re also considering options for Portland House. Add in our residential plans – blended with retail and leisure – at well-connected London suburban sites, and we have a potential £3bn pipeline in London.
Spotting possibilities that can become opportunities02 Landsec Annual Report 2019
2,400 Tonnes of CO2 to be saved using recycled aggregates and cement replacement at 21 Moorfields
£140mPotential annual rental value of our London office pipeline

Secondary retail locations and retail parks outside London are under pressure and the sector as a whole faces challenges. But people continue to spend time and money in destinations that provide a great experience. Great brands compete to be in those locations.
This is why we’ve decisively repositioned our consumer portfolio over recent years, creating a diverse mix of high-quality, experience-led assets. Our collection of vibrant brands – including a growing proportion of leisure, food and hotel operators – gives us a diverse income base.
Strateg
ic Rep
ort
03Landsec Annual Report 2019
Broadening from
retail to experience
23% Percentage of our
regional retail portfolio let to
leisure tenants*
*By rental value
+29%Growth in UK leisure spend
2013-2018(GlobalData; March 2019)

04 Landsec Annual Report 2019
Creating an ecosystem for fast-growth businesses
45%Percentage of occupiers who will make use of flexible space in next three years.(Source: CBRE EMEA Occupier Survey 2019)
38,290 Number of businesses with 10-99 employees in London (Source: gov.co.uk)
We’re seeing strong demand from high-growth businesses for a new type of flexible workspace offering – hassle-free, superbly managed, brilliantly designed space that can be customised and expanded to meet changing needs.
Building on our office experience, this year we expanded our flexible offer with the launch of Myo. Targeting businesses of 10–100 people, we started at 123 Victoria Street and will expand Myo into our workspace destinations. Myo means we can offer a new generation of customers an entry point to our portfolio, then support them with an ecosystem of space and services as they grow.
05Landsec Annual Report 2019
Strateg
ic Rep
ort
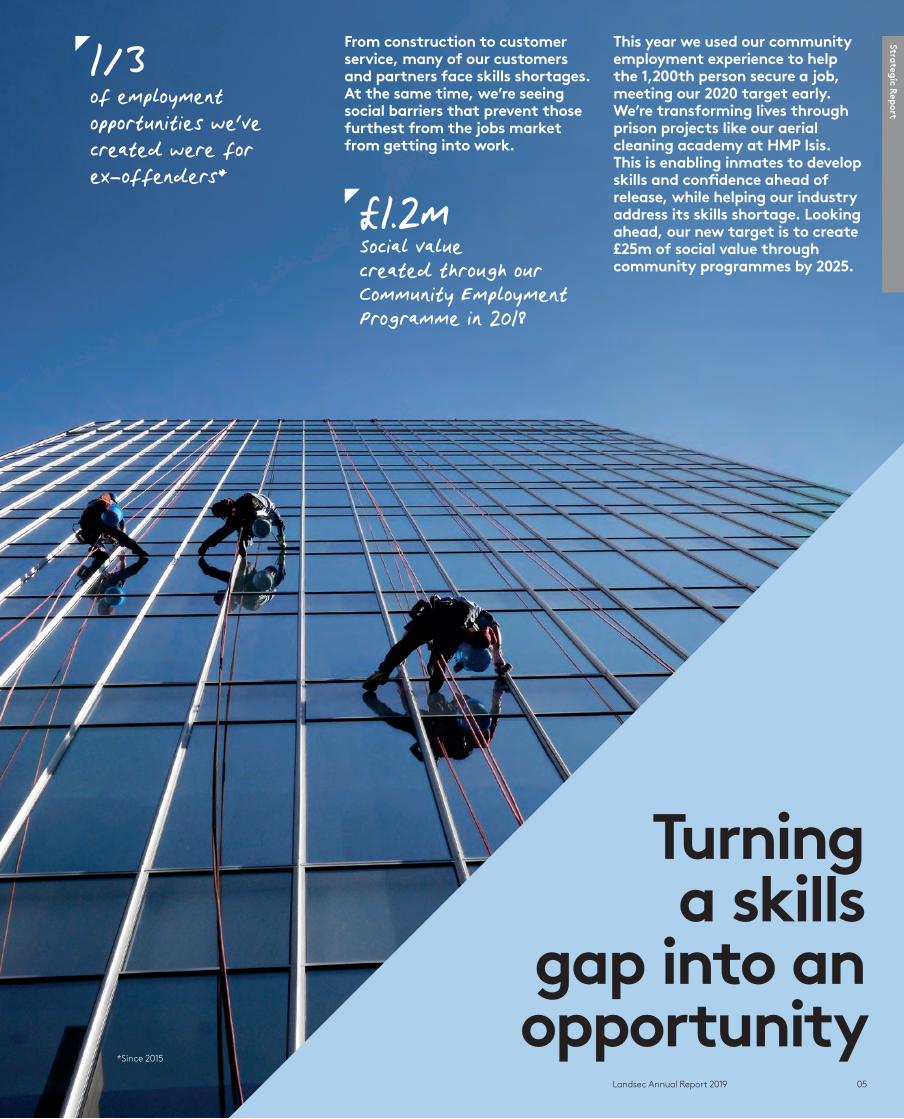
From construction to customer service, many of our customers and partners face skills shortages. At the same time, we’re seeing social barriers that prevent those furthest from the jobs market from getting into work.
This year we used our community employment experience to help the 1,200th person secure a job, meeting our 2020 target early. We’re transforming lives through prison projects like our aerial cleaning academy at HMP Isis. This is enabling inmates to develop skills and confidence ahead of release, while helping our industry address its skills shortage. Looking ahead, our new target is to create £25m of social value through community programmes by 2025.
Turning a skills
gap into an opportunity
1/3 of employment opportunities we've created were for ex-offenders*
£1.2mSocial value created through our Community Employment Programme in 2018
*Since 2015

06 Landsec Annual Report 2019
Curating brands to keep our offer fresh
975 Number of different consumer brands in our portfolio
* Barclaycard, OMD Survey, 2000 adults, July 2018
Visitors to retail destinations want a blend of established brands and new players. Emerging consumer brands can be cautious about long leases – and space providers like us want optionality – so there’s an opportunity to develop simpler space options that work for both sides and keep the retail mix fresh.
In response, we’ve teamed up with the British Fashion Council and designers Black Box Revolution at Trinity Leeds, introducing units for emerging brands new to physical space. We’re supporting those brands with innovative consumer tech to help drive sales. This also enables us to see which brands perform well and quickly remix the offer as required.
23%Percentage of UK consumers who visited a pop-up shop last year*

Strateg
ic Rep
ort
07Landsec Annual Report 2019
From Finchley Road to Shepherd’s Bush and Lewisham, we own sites in vibrant suburban locations in London with great potential to grow. These well-connected places are already popular, but – given the right market conditions – we could create more value from each site, for us and the local community.
We’re working on our resident-centred plans now. In total, they could create 4,000 new homes, all supported by shops, community services and public realm. Approval for the three schemes would give us scale without having to purchase any land. This a great opportunity to apply our experience, resources and reputation to a sector with huge potential.
Transforming locations into
destinations
*Estimate by The Council of Mortgage Lenders
25% By 2020 only a quarter of 30-year-olds will own their own home*
4.5mNumber of households in the private rented sector has doubled
since 2000
08 Landsec Annual Report 2019
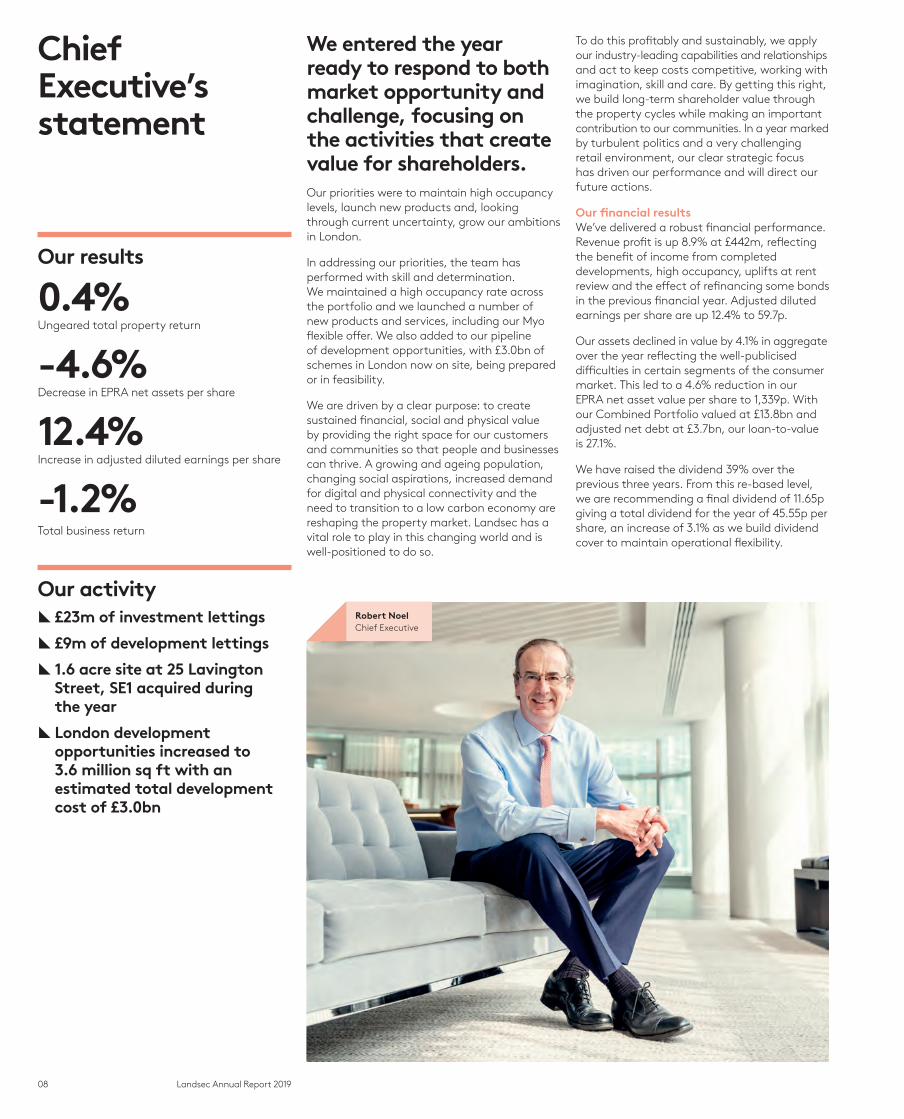
To do this profitably and sustainably, we apply our industry-leading capabilities and relationships and act to keep costs competitive, working with imagination, skill and care. By getting this right, we build long-term shareholder value through the property cycles while making an important contribution to our communities. In a year marked by turbulent politics and a very challenging retail environment, our clear strategic focus has driven our performance and will direct our future actions.
Our financial resultsWe’ve delivered a robust financial performance. Revenue profit is up 8.9% at £442m, reflecting the benefit of income from completed developments, high occupancy, uplifts at rent review and the effect of refinancing some bonds in the previous financial year. Adjusted diluted earnings per share are up 12.4% to 59.7p.
Our assets declined in value by 4.1% in aggregate over the year reflecting the well-publicised difficulties in certain segments of the consumer market. This led to a 4.6% reduction in our EPRA net asset value per share to 1,339p. With our Combined Portfolio valued at £13.8bn and adjusted net debt at £3.7bn, our loan-to-value is 27.1%.
We have raised the dividend 39% over the previous three years. From this re-based level, we are recommending a final dividend of 11.65p giving a total dividend for the year of 45.55p per share, an increase of 3.1% as we build dividend cover to maintain operational flexibility.
We entered the year ready to respond to both market opportunity and challenge, focusing on the activities that create value for shareholders. Our priorities were to maintain high occupancy levels, launch new products and, looking through current uncertainty, grow our ambitions in London.
In addressing our priorities, the team has performed with skill and determination. We maintained a high occupancy rate across the portfolio and we launched a number of new products and services, including our Myo flexible offer. We also added to our pipeline of development opportunities, with £3.0bn of schemes in London now on site, being prepared or in feasibility.
We are driven by a clear purpose: to create sustained financial, social and physical value by providing the right space for our customers and communities so that people and businesses can thrive. A growing and ageing population, changing social aspirations, increased demand for digital and physical connectivity and the need to transition to a low carbon economy are reshaping the property market. Landsec has a vital role to play in this changing world and is well-positioned to do so.
Our results
0.4% Ungeared total property return
-4.6% Decrease in EPRA net assets per share
12.4% Increase in adjusted diluted earnings per share
-1.2% Total business return
Our activity [ £23m of investment lettings
[ £9m of development lettings
[ 1.6 acre site at 25 Lavington Street, SE1 acquired during the year
[ London development opportunities increased to 3.6 million sq ft with an estimated total development cost of £3.0bn
Chief Executive’s statement
Robert NoelChief Executive

09Landsec Annual Report 2019
Strateg
ic Rep
ort
We see no near-term improvement in retail market conditions, with CVA activity set to continue. Rental values are likely to decline further in shopping centres and retail parks, though we expect continued rental growth in outlets and select leisure destinations. Consumers will continue to be attracted to destinations that provide a broad range of brands and experiences.
Our activities in London as a percentage of our portfolio will increase in the coming years. Much of our portfolio by value and our entire development pipeline is already in the capital and we are alert to further opportunities. Over time, capital allocated to assets outside London will reduce, but we will maintain our focus on experience-led destinations.
We are clear on what we have to do in the year ahead and beyond. Our targets focus on developments in London – both on-site and in the pipeline – together with further innovation in construction and active evolution of the products and services we offer; improving our retail destinations; and continued leadership on social and environmental sustainability.
This is an exciting time for real estate companies with the insight, capabilities and financial capacity needed to create the spaces for tomorrow’s businesses and communities. Ultimately, it is the deep expertise of our employees and partners that will deliver our strategy and create sustainable value for shareholders. This is why experience matters.
Robert NoelChief Executive
Our stakeholdersWe aim to be a force for good in society because we know it makes us stronger and more sustainable as a business. This year we hit our long-term target of getting 1,200 disadvantaged people into employment by 2020. Our award-winning approach to community employment is helping to address significant skills gaps in the construction and building maintenance sectors, and enabling ex-offenders to gain training and employment in scaffolding and window cleaning at heights. This year we’ve set a stretching new target to generate £25m of social value by 2025.
Given the increasingly stark warnings emanating from the Intergovernmental Panel on Climate Change, it’s essential we continue to help lead by example in critical areas such as energy, carbon, waste and biodiversity. This is why we’ve set rigorous science-based carbon reduction targets for the business. Effective collaboration is vital if we are to make progress as a company and an industry. Across the portfolio, we’re working with customers and partners to drive energy efficiency, reaching an 18.2% reduction this year against our 2014 baseline.
We were recognised for our actions on sustainability in this year’s edie awards, which named Landsec the leader in the built environment sector. We also retained our CDP A-list ranking and were sector leaders in the Global Real Estate Sustainability Benchmark and Dow Jones Sustainability Index.
Our outlookWe expect London to remain a successful global city with enduring appeal for businesses, talent, visitors and investors. Occupational and investment demand in London have remained stable over the last two years despite uncertainties created by the UK’s decision to leave the EU.
We have seen a noticeable shift to quality space by occupiers in the capital and the vacancy rate has fallen. Development starts have increased during the year but a good proportion of all new supply is already pre-let. We see positive market conditions for our quality product and have a growing pipeline of development opportunities. The demonstrable quality of our placemaking, spaces and services and our heightened approach to customer experience is central to our ambition and future success.
Our portfolioBy value, 65% of our assets are in London, one of the most celebrated and best connected cities in the world, energised by long-term positive economic and social trends and a comprehensive public transport system. Most market segments in the capital held up well over a year in which the UK faced, and continues to face, uncertainty, and this speaks volumes for London’s attractiveness and resilience as a place to live, work, visit and invest. We’ve continued to see a flight to quality and flexibility amongst customers and our buildings and developments match these expectations and aspirations.
Workspaces and living spaces are evolving quickly, driven by growing demand for more flexibility, collaboration and connectivity. Retail, leisure and amenity spaces must now be included in the mix. To ensure we meet our customers’ changing requirements, we’re providing new services to enhance their experience and convenience. This year we progressed plans to roll out our popular Landsec Lounge concept across the portfolio. We also created new entry points to our portfolio through our Myo flexible offer, and we introduced a turnkey solution for customers too. Our aim is to offer great space to a business across its entire life-cycle, from a start-up environment to landmark corporate headquarters.
Led by 21 Moorfields, we are moving forward with new schemes and have 3.6 million sq ft of space in development, planning or feasibility. With low levels of Grade A vacancy in London and occupiers increasingly looking to pre-let, we will be starting 0.5 million sq ft of speculative development this year. In partnership with our suppliers, we’ve introduced innovations across design and construction to enhance the speed, efficiency, quality and environmental performance at 21 Moorfields and are applying what we learn to other schemes.
The remaining 35% of our portfolio by value is predominantly focused on consumer markets outside London. These are challenging times for retailers. The rise of online retail and cost challenges for the industry have brought store closures and lease restructures, often under company voluntary arrangements (CVAs). We are not immune from market challenges but the impact has been softened by having repositioned our portfolio in recent years towards destinations which provide a great experience and away from the high street, secondary shopping centres and retail parks. Our destinations play a core role in retailers’ multi-channel strategies, drawing visitors with a mix of brand experience, product, food, drink and cinema.
Our outlets and leisure parks held up well in this difficult environment while shopping centres and retail parks were affected by downward pressure on rental values and poor investor sentiment. Operationally, I am pleased with our performance as we continue to attract new brands and upsize existing customers.
Areas of focus for 2019/20
[ Developments in London – both on-site and in our pipeline
[ Further innovation in construction and active evolution of the products and services we offer
[ Improving our retail destinations
[ Continued leadership on social and environmental sustainability
In a year marked by turbulent politics and a very challenging retail environment, our clear strategic focus has driven our performance and will direct our future actions.”
10 Landsec Annual Report 2019
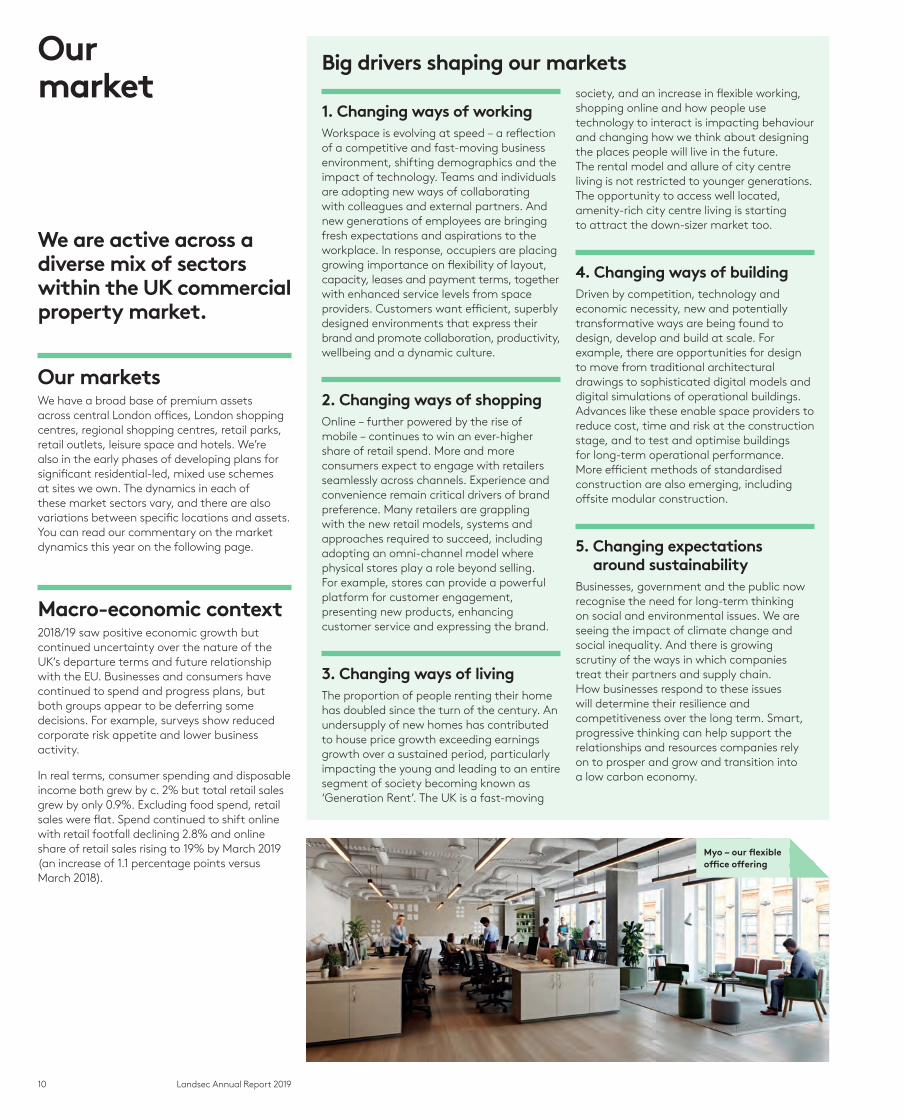
1. Changing ways of workingWorkspace is evolving at speed – a reflection of a competitive and fast-moving business environment, shifting demographics and the impact of technology. Teams and individuals are adopting new ways of collaborating with colleagues and external partners. And new generations of employees are bringing fresh expectations and aspirations to the workplace. In response, occupiers are placing growing importance on flexibility of layout, capacity, leases and payment terms, together with enhanced service levels from space providers. Customers want efficient, superbly designed environments that express their brand and promote collaboration, productivity, wellbeing and a dynamic culture.
2. Changing ways of shoppingOnline – further powered by the rise of mobile – continues to win an ever-higher share of retail spend. More and more consumers expect to engage with retailers seamlessly across channels. Experience and convenience remain critical drivers of brand preference. Many retailers are grappling with the new retail models, systems and approaches required to succeed, including adopting an omni-channel model where physical stores play a role beyond selling. For example, stores can provide a powerful platform for customer engagement, presenting new products, enhancing customer service and expressing the brand.
3. Changing ways of livingThe proportion of people renting their home has doubled since the turn of the century. An undersupply of new homes has contributed to house price growth exceeding earnings growth over a sustained period, particularly impacting the young and leading to an entire segment of society becoming known as ‘Generation Rent’. The UK is a fast-moving
society, and an increase in flexible working, shopping online and how people use technology to interact is impacting behaviour and changing how we think about designing the places people will live in the future. The rental model and allure of city centre living is not restricted to younger generations. The opportunity to access well located, amenity-rich city centre living is starting to attract the down-sizer market too.
4. Changing ways of buildingDriven by competition, technology and economic necessity, new and potentially transformative ways are being found to design, develop and build at scale. For example, there are opportunities for design to move from traditional architectural drawings to sophisticated digital models and digital simulations of operational buildings. Advances like these enable space providers to reduce cost, time and risk at the construction stage, and to test and optimise buildings for long-term operational performance. More efficient methods of standardised construction are also emerging, including offsite modular construction.
5. Changing expectations around sustainability
Businesses, government and the public now recognise the need for long-term thinking on social and environmental issues. We are seeing the impact of climate change and social inequality. And there is growing scrutiny of the ways in which companies treat their partners and supply chain. How businesses respond to these issues will determine their resilience and competitiveness over the long term. Smart, progressive thinking can help support the relationships and resources companies rely on to prosper and grow and transition into a low carbon economy.
We are active across a diverse mix of sectors within the UK commercial property market.
Our marketsWe have a broad base of premium assets across central London offices, London shopping centres, regional shopping centres, retail parks, retail outlets, leisure space and hotels. We’re also in the early phases of developing plans for significant residential-led, mixed use schemes at sites we own. The dynamics in each of these market sectors vary, and there are also variations between specific locations and assets. You can read our commentary on the market dynamics this year on the following page.
Macro-economic context 2018/19 saw positive economic growth but continued uncertainty over the nature of the UK’s departure terms and future relationship with the EU. Businesses and consumers have continued to spend and progress plans, but both groups appear to be deferring some decisions. For example, surveys show reduced corporate risk appetite and lower business activity.
In real terms, consumer spending and disposable income both grew by c. 2% but total retail sales grew by only 0.9%. Excluding food spend, retail sales were flat. Spend continued to shift online with retail footfall declining 2.8% and online share of retail sales rising to 19% by March 2019 (an increase of 1.1 percentage points versus March 2018).
Our market
Big drivers shaping our markets
Myo – our flexible office offering
11Landsec Annual Report 2019
Strateg
ic Rep
ort
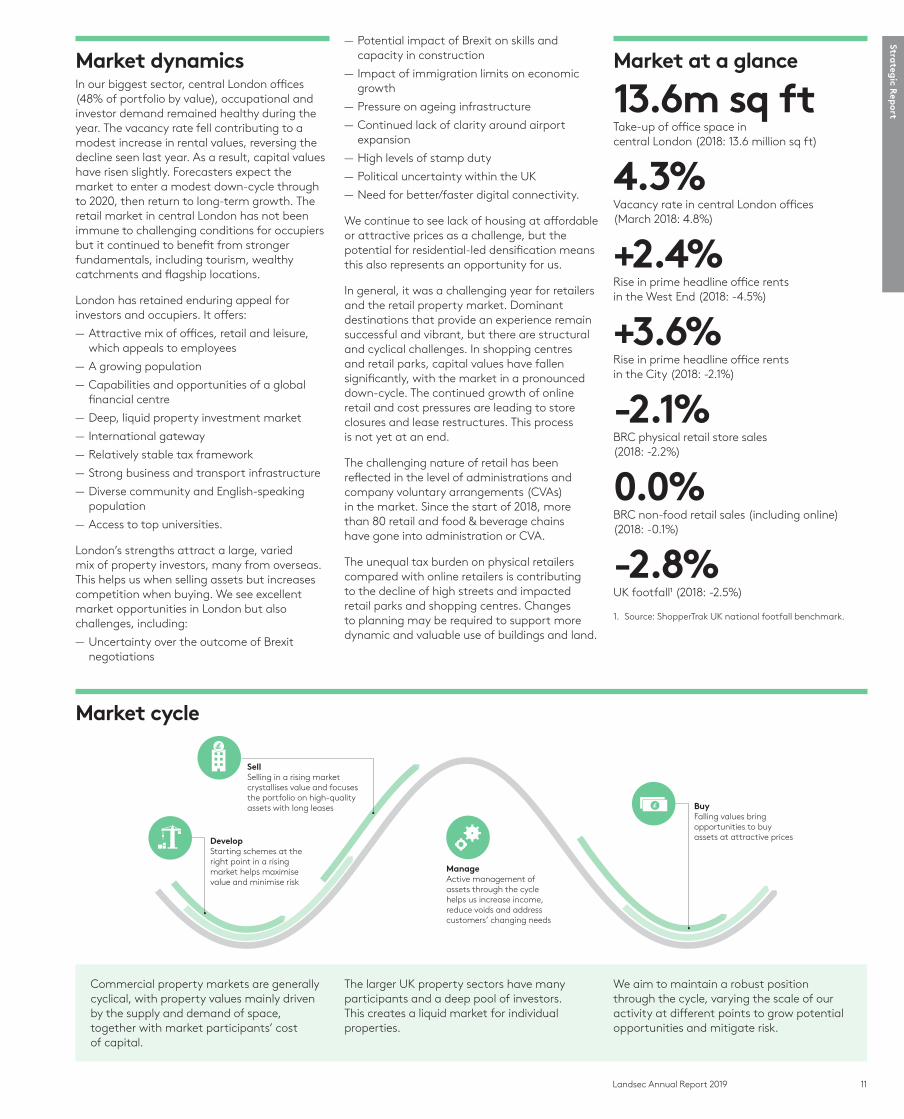
Market at a glance
13.6m sq ftTake-up of office space in central London (2018: 13.6 million sq ft)
4.3%Vacancy rate in central London offices (March 2018: 4.8%)
+2.4%Rise in prime headline office rents in the West End (2018: -4.5%)
+3.6%Rise in prime headline office rents in the City (2018: -2.1%)
-2.1%BRC physical retail store sales (2018: -2.2%)
0.0%BRC non-food retail sales (including online) (2018: -0.1%)
-2.8%UK footfall1 (2018: -2.5%)
1. Source: ShopperTrak UK national footfall benchmark.
— Potential impact of Brexit on skills and capacity in construction
— Impact of immigration limits on economic growth
— Pressure on ageing infrastructure
— Continued lack of clarity around airport expansion
— High levels of stamp duty
— Political uncertainty within the UK
— Need for better/faster digital connectivity.
We continue to see lack of housing at affordable or attractive prices as a challenge, but the potential for residential-led densification means this also represents an opportunity for us.
In general, it was a challenging year for retailers and the retail property market. Dominant destinations that provide an experience remain successful and vibrant, but there are structural and cyclical challenges. In shopping centres and retail parks, capital values have fallen significantly, with the market in a pronounced down-cycle. The continued growth of online retail and cost pressures are leading to store closures and lease restructures. This process is not yet at an end.
The challenging nature of retail has been reflected in the level of administrations and company voluntary arrangements (CVAs) in the market. Since the start of 2018, more than 80 retail and food & beverage chains have gone into administration or CVA.
The unequal tax burden on physical retailers compared with online retailers is contributing to the decline of high streets and impacted retail parks and shopping centres. Changes to planning may be required to support more dynamic and valuable use of buildings and land.
Market dynamicsIn our biggest sector, central London offices (48% of portfolio by value), occupational and investor demand remained healthy during the year. The vacancy rate fell contributing to a modest increase in rental values, reversing the decline seen last year. As a result, capital values have risen slightly. Forecasters expect the market to enter a modest down-cycle through to 2020, then return to long-term growth. The retail market in central London has not been immune to challenging conditions for occupiers but it continued to benefit from stronger fundamentals, including tourism, wealthy catchments and flagship locations.
London has retained enduring appeal for investors and occupiers. It offers:
— Attractive mix of offices, retail and leisure, which appeals to employees
— A growing population
— Capabilities and opportunities of a global financial centre
— Deep, liquid property investment market
— International gateway
— Relatively stable tax framework
— Strong business and transport infrastructure
— Diverse community and English-speaking population
— Access to top universities.
London’s strengths attract a large, varied mix of property investors, many from overseas. This helps us when selling assets but increases competition when buying. We see excellent market opportunities in London but also challenges, including:
— Uncertainty over the outcome of Brexit negotiations
Market cycle
DevelopStarting schemes at the right point in a rising market helps maximise value and minimise risk
BuyFalling values bring opportunities to buy assets at attractive prices
SellSelling in a rising market crystallises value and focuses the portfolio on high-quality assets with long leases
ManageActive management of assets through the cycle helps us increase income, reduce voids and address customers’ changing needs
Commercial property markets are generally cyclical, with property values mainly driven by the supply and demand of space, together with market participants’ cost of capital.
The larger UK property sectors have many participants and a deep pool of investors. This creates a liquid market for individual properties.
We aim to maintain a robust position through the cycle, varying the scale of our activity at different points to grow potential opportunities and mitigate risk.
12 Landsec Annual Report 201912 Landsec Annual Report 2019
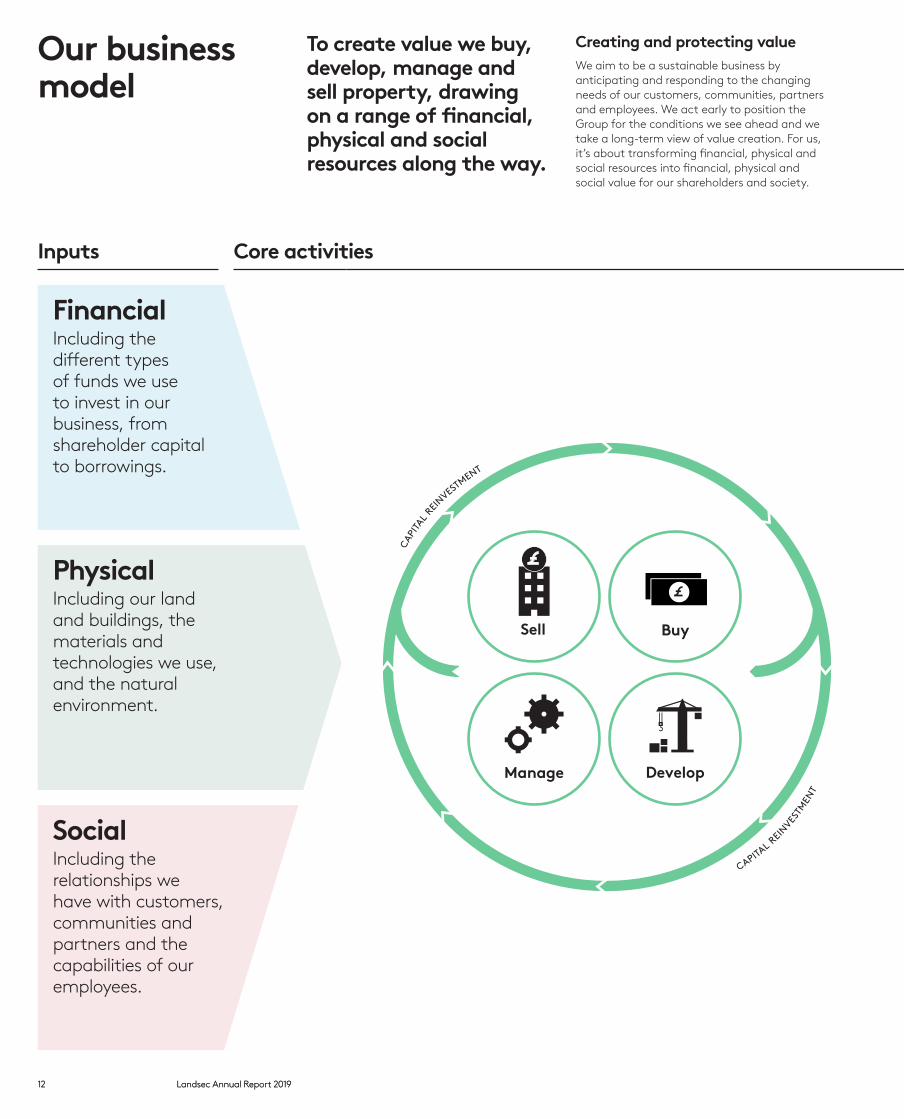
Creating and protecting valueWe aim to be a sustainable business by anticipating and responding to the changing needs of our customers, communities, partners and employees. We act early to position the Group for the conditions we see ahead and we take a long-term view of value creation. For us, it’s about transforming financial, physical and social resources into financial, physical and social value for our shareholders and society.
To create value we buy, develop, manage and sell property, drawing on a range of financial, physical and social resources along the way.
Our business model
Inputs Core activities Outputs
FinancialIncluding the different types of funds we use to invest in our business, from shareholder capital to borrowings.
Sell Buy
Manage Develop
CAP
ITAL
REI
NVESTMENT
CAPITAL R
EINVES
TMEN
T
FinancialLong-term growth in income and asset values, creating capacity for us to increase dividends for our shareholders.
To read our Financial review go to pages 32-39
PhysicalIncluding our land and buildings, the materials and technologies we use, and the natural environment.
PhysicalSpace that creates value for us by meeting the changing requirements of our customers and communities and a healthy environment for all.
To read our Physical review go to pages 40-44
SocialIncluding the relationships we have with customers, communities and partners and the capabilities of our employees.
SocialOur ability to help businesses and people to thrive – including our own employees.
To read our Social review go to pages 45-53

13Landsec Annual Report 2019
Strateg
ic Rep
ort
Inputs Core activities Outputs
FinancialIncluding the different types of funds we use to invest in our business, from shareholder capital to borrowings.
Sell Buy
Manage Develop
CAP
ITAL
REI
NVESTMENT
CAPITAL R
EINVES
TMEN
T
FinancialLong-term growth in income and asset values, creating capacity for us to increase dividends for our shareholders.
To read our Financial review go to pages 32-39
PhysicalIncluding our land and buildings, the materials and technologies we use, and the natural environment.
PhysicalSpace that creates value for us by meeting the changing requirements of our customers and communities and a healthy environment for all.
To read our Physical review go to pages 40-44
SocialIncluding the relationships we have with customers, communities and partners and the capabilities of our employees.
SocialOur ability to help businesses and people to thrive – including our own employees.
To read our Social review go to pages 45-53
14 Landsec Annual Report 2019
The way we manage the business – through the life-cycle of our assets – reflects our financial, physical and social approach and priorities.
Our business model – creating sustainable long-term value
Financial approach and track record
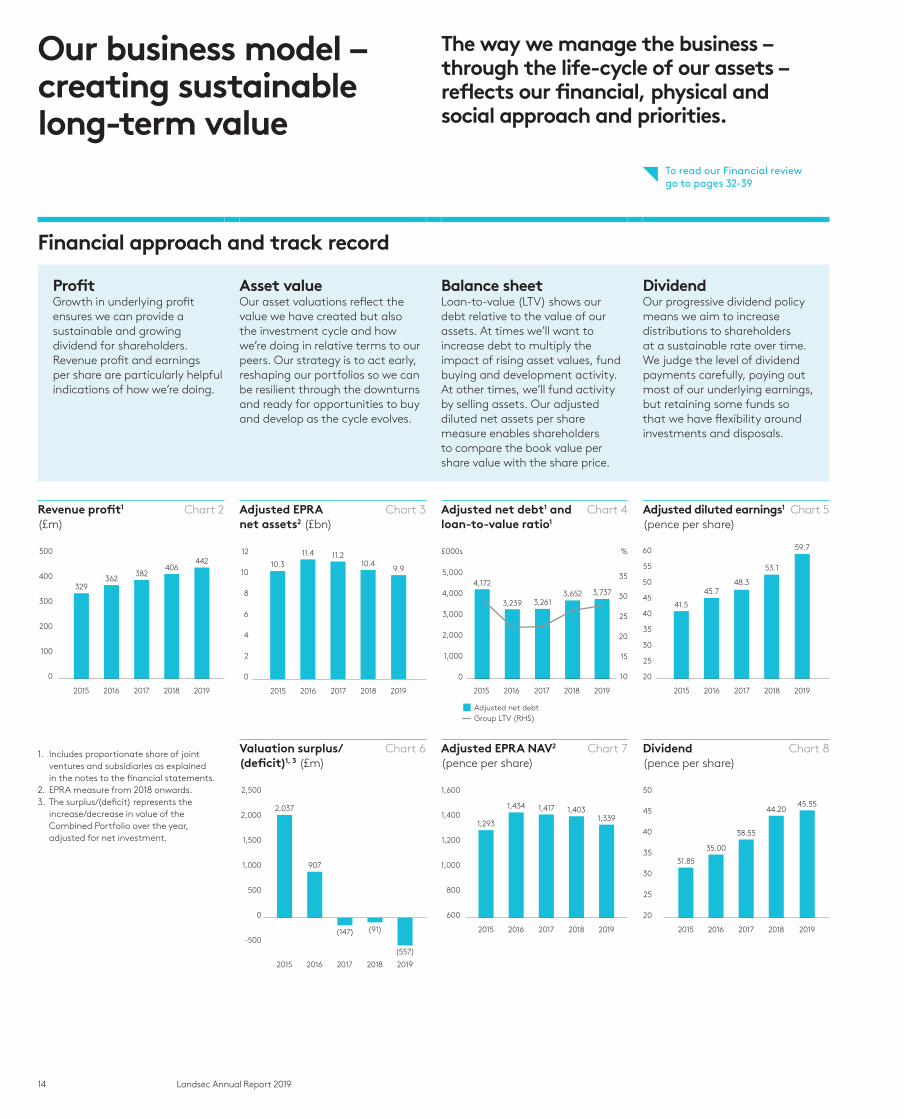
Profit Growth in underlying profit ensures we can provide a sustainable and growing dividend for shareholders. Revenue profit and earnings per share are particularly helpful indications of how we’re doing.
Asset value Our asset valuations reflect the value we have created but also the investment cycle and how we’re doing in relative terms to our peers. Our strategy is to act early, reshaping our portfolios so we can be resilient through the downturns and ready for opportunities to buy and develop as the cycle evolves.
Balance sheet Loan-to-value (LTV) shows our debt relative to the value of our assets. At times we’ll want to increase debt to multiply the impact of rising asset values, fund buying and development activity. At other times, we’ll fund activity by selling assets. Our adjusted diluted net assets per share measure enables shareholders to compare the book value per share value with the share price.
Dividend Our progressive dividend policy means we aim to increase distributions to shareholders at a sustainable rate over time. We judge the level of dividend payments carefully, paying out most of our underlying earnings, but retaining some funds so that we have flexibility around investments and disposals.
Revenue profit1 Chart 2 (£m)
Adjusted EPRA Chart 3 net assets2 (£bn)
Adjusted net debt1 and Chart 4 loan-to-value ratio1
Adjusted diluted earnings1 Chart 5 (pence per share)
2019
500
400
300
200
100
0
329362
382406
442
2016 2017 20182015 2016 2017 2018 20192015
12
10
8
6
4
2
0
10.311.4 11.2
10.49.9
2016 2017 2018 20192015
£000s
5,000
4,000
3,000
2,000
1,000
0
%
35
30
25
20
15
10
4,172
3,239 3,2613,652 3,737
■ Adjusted net debt Group LTV (RHS)
2016 2017 2018 20192015
41.5
45.748.3
53.1
59.7
20
25
30
35
40
45
50
55
60
1. Includes proportionate share of joint ventures and subsidiaries as explained in the notes to the financial statements.
2. EPRA measure from 2018 onwards.3. The surplus/(deficit) represents the
increase/decrease in value of the Combined Portfolio over the year, adjusted for net investment.
Valuation surplus/ Chart 6 (deficit)1, 3 (£m)
Adjusted EPRA NAV2 Chart 7 (pence per share)
Dividend Chart 8 (pence per share)
2016 2017 2018 20192015
2,500
2,000
1,500
1,000
500
0
-500
2,037
907
(147) (91)
(557)
2016 2017 2018 20192015
1,600
1,400
1,200
1,000
800
600
1,293
1,434 1,417 1,4031,339
2016 2017 2018 20192015
50
45
40
35
30
25
20
31.85
35.00
38.55
44.2045.55
To read our Financial review go to pages 32-39

15Landsec Annual Report 2019
Strateg
ic Rep
ort
Physical approach Social approach
Portfolio quality We constantly look to strengthen our portfolio to ensure it meets the changing needs of our customers and communities. We always bring social, economic and environmental benefits to the areas where we operate.
Natural resourcesWhen we buy, use and re-use resources efficiently we reduce costs for our customers, our partners and us, helping to minimise our impact on the environment and enhance our resilience to our warming planet.
Climate change We’re committed to leading the transition to a low-carbon economy. This helps mitigate our current and future risk and presents significant opportunities for our customers and us.
Sustainable design and innovation Great design increases efficiency, encourages people to spend time in our spaces and enables buildings to adapt to changing customer needs. We design with long-term value in mind.
Customers We design our buildings to support wellbeing and productivity. From office occupiers to brands and shoppers, we aim to provide our customers with a fabulous experience – creating value for our shareholders.
Employees We invest to attract and develop great people who add value to our business. We take engagement, wellbeing, diversity and reward seriously and conduct regular surveys.
Communities and partners We help those furthest from the jobs market access opportunities in our industry. We believe that everyone who works on our behalf must be treated and paid fairly and our business should reflect and support our diverse communities. We work to maintain an exceptional standard of health, safety and security in all the working environments we control and partner to help raise standards in our industry.
Investing through the life-cycle
Refurbish or retro�t to re-letInvest capital Reinvest capital
Buy We acquire an asset if it has the potential to meet the evolving needs of our customers and communities, can be acquired at the right price, and is likely to create financial value for us.
Our Responsible Property Investment Policy defines the standards we set for acquisitions and guides us when making buying decisions. We may acquire a poorly performing asset if we see an opportunity to improve performance through investment and better management.
Develop We develop to create space that will appeal to customers, enhance the area and create financial value for us. This activity creates job opportunities during construction and operation.
We design for safety, wellbeing, efficiency and productivity. We look to improve public realm, connectivity and wider infrastructure. And we embed our sustainability principles in the design and delivery process.
Manage We work with customers, communities and partners to ensure our buildings operate efficiently and to help increase local prosperity.
We redesign and refurbish space to make it more attractive, useful and valued. And we work with occupiers to manage energy, waste and water. Thinking about sustainability helps protect buildings from external risks such as price volatility, changing regulation, supply issues and premature obsolescence.
Sell We sell an asset when we see an opportunity to deploy capital more effectively elsewhere.
Through our investment and activity, the building we sell should perform at a higher level than the building we bought – financially, physically and socially. This should make it more valuable. We always aim to build a positive legacy, leaving a place in a better state than when we arrived.
To see our Stakeholder Engagement Policy, Responsible Property Investment Policy and Sustainability Brief go to landsec.com
To read our Physical review go to pages 40-44
To read our Social review go to pages 45-53
16 Landsec Annual Report 2019
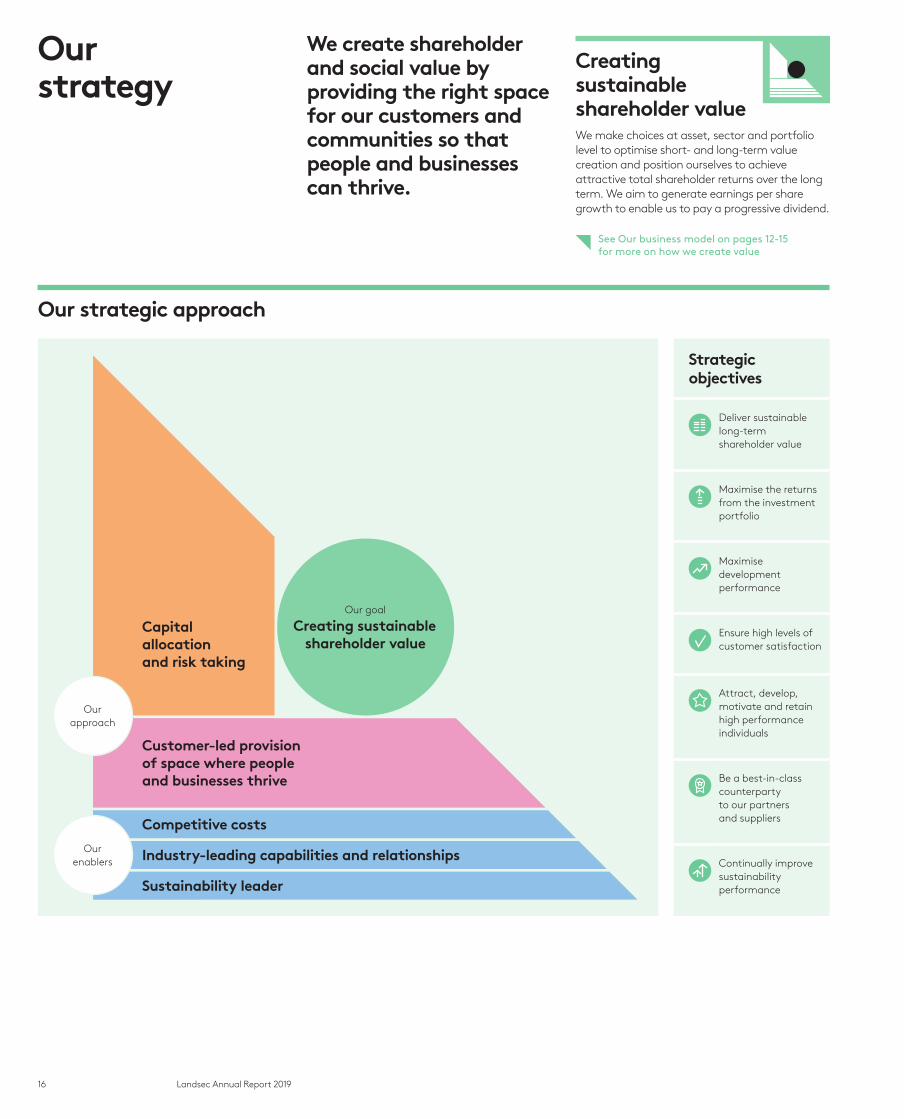
Our strategy
We create shareholder and social value by providing the right space for our customers and communities so that people and businesses can thrive.
Our strategic approach
Strategic objectives
Deliver sustainable long-term shareholder value
Maximise the returns from the investment portfolio
Maximise development performance
Ensure high levels of customer satisfaction
Attract, develop, motivate and retain high performance individuals
Be a best-in-class counterparty to our partners and suppliers
Continually improve sustainability performance
Capital allocation and risk taking
Competitive costs
Industry-leading capabilities and relationships
Sustainability leader
Customer-led provision of space where people and businesses thrive
Our approach
Our goal
Creating sustainable shareholder value
Our enablers
Creating sustainable shareholder valueWe make choices at asset, sector and portfolio level to optimise short- and long-term value creation and position ourselves to achieve attractive total shareholder returns over the long term. We aim to generate earnings per share growth to enable us to pay a progressive dividend.
See Our business model on pages 12-15 for more on how we create value
17Landsec Annual Report 2019
Strateg
ic Rep
ort
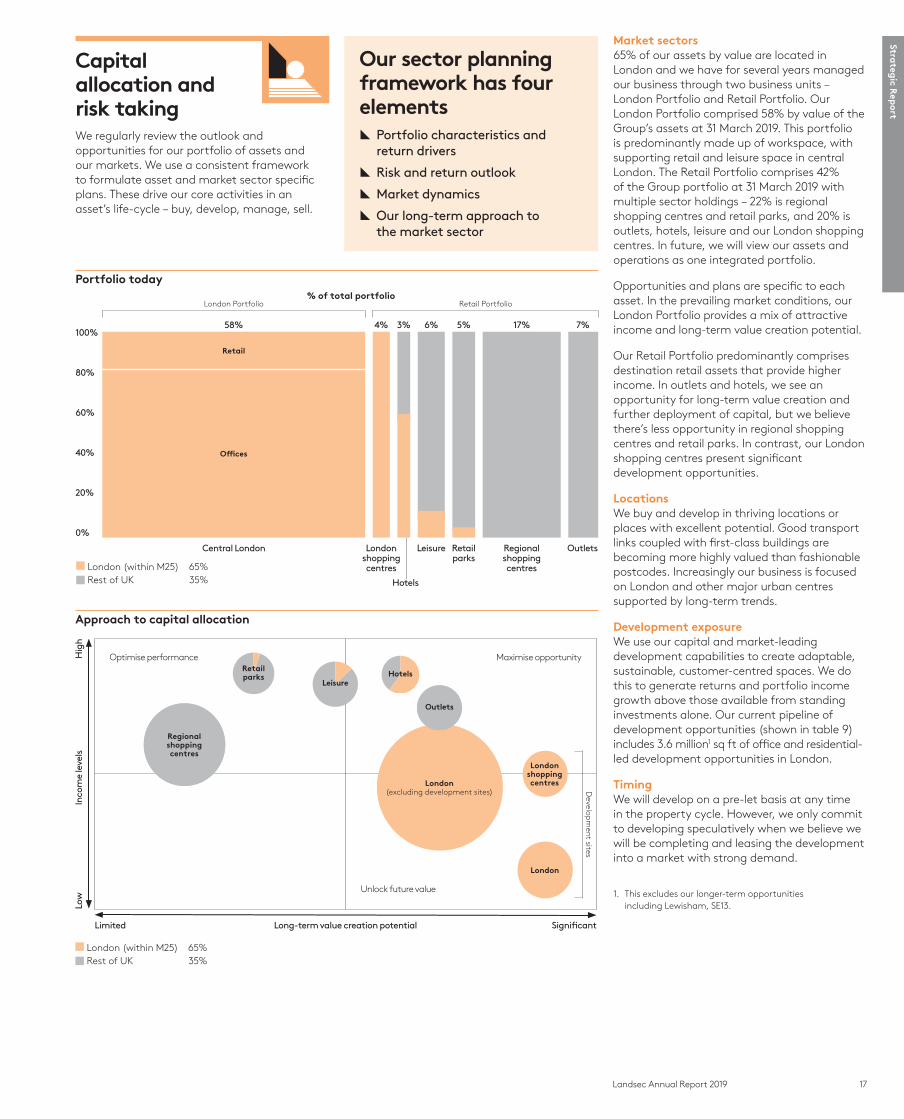
Capital allocation and risk taking We regularly review the outlook and opportunities for our portfolio of assets and our markets. We use a consistent framework to formulate asset and market sector specific plans. These drive our core activities in an asset’s life-cycle – buy, develop, manage, sell.
Our sector planning framework has four elements
[ Portfolio characteristics and return drivers
[ Risk and return outlook
[ Market dynamics
[ Our long-term approach to the market sector
Market sectors65% of our assets by value are located in London and we have for several years managed our business through two business units – London Portfolio and Retail Portfolio. Our London Portfolio comprised 58% by value of the Group’s assets at 31 March 2019. This portfolio is predominantly made up of workspace, with supporting retail and leisure space in central London. The Retail Portfolio comprises 42% of the Group portfolio at 31 March 2019 with multiple sector holdings – 22% is regional shopping centres and retail parks, and 20% is outlets, hotels, leisure and our London shopping centres. In future, we will view our assets and operations as one integrated portfolio.
Opportunities and plans are specific to each asset. In the prevailing market conditions, our London Portfolio provides a mix of attractive income and long-term value creation potential.
Our Retail Portfolio predominantly comprises destination retail assets that provide higher income. In outlets and hotels, we see an opportunity for long-term value creation and further deployment of capital, but we believe there’s less opportunity in regional shopping centres and retail parks. In contrast, our London shopping centres present significant development opportunities.
LocationsWe buy and develop in thriving locations or places with excellent potential. Good transport links coupled with first-class buildings are becoming more highly valued than fashionable postcodes. Increasingly our business is focused on London and other major urban centres supported by long-term trends.
Development exposureWe use our capital and market-leading development capabilities to create adaptable, sustainable, customer-centred spaces. We do this to generate returns and portfolio income growth above those available from standing investments alone. Our current pipeline of development opportunities (shown in table 9) includes 3.6 million1 sq ft of office and residential-led development opportunities in London.
TimingWe will develop on a pre-let basis at any time in the property cycle. However, we only commit to developing speculatively when we believe we will be completing and leasing the development into a market with strong demand.
Portfolio today
London (within M25) 65%Rest of UK 35%
100%58% 4% 3% 6% 5% 17% 7%
0%
20%
40%
60%
80%
Central London Regional shopping centres
Retail parks
Hotels
Leisure OutletsLondon shopping centres
Offices
Retail
London Portfolio% of total portfolio
Retail Portfolio
Approach to capital allocation
Hig
hIn
com
e le
vels
Long-term value creation potential
Low
Limited
Optimise performance Maximise opportunity
Unlock future value
Significant
London
Develop
ment sites
London(excluding development sites)
Regional shopping centres
Retailparks
LeisureHotels
London shoppingcentres
Outlets
London (within M25) 65%Rest of UK 35%
1. This excludes our longer-term opportunities including Lewisham, SE13.
18 Landsec Annual Report 2019
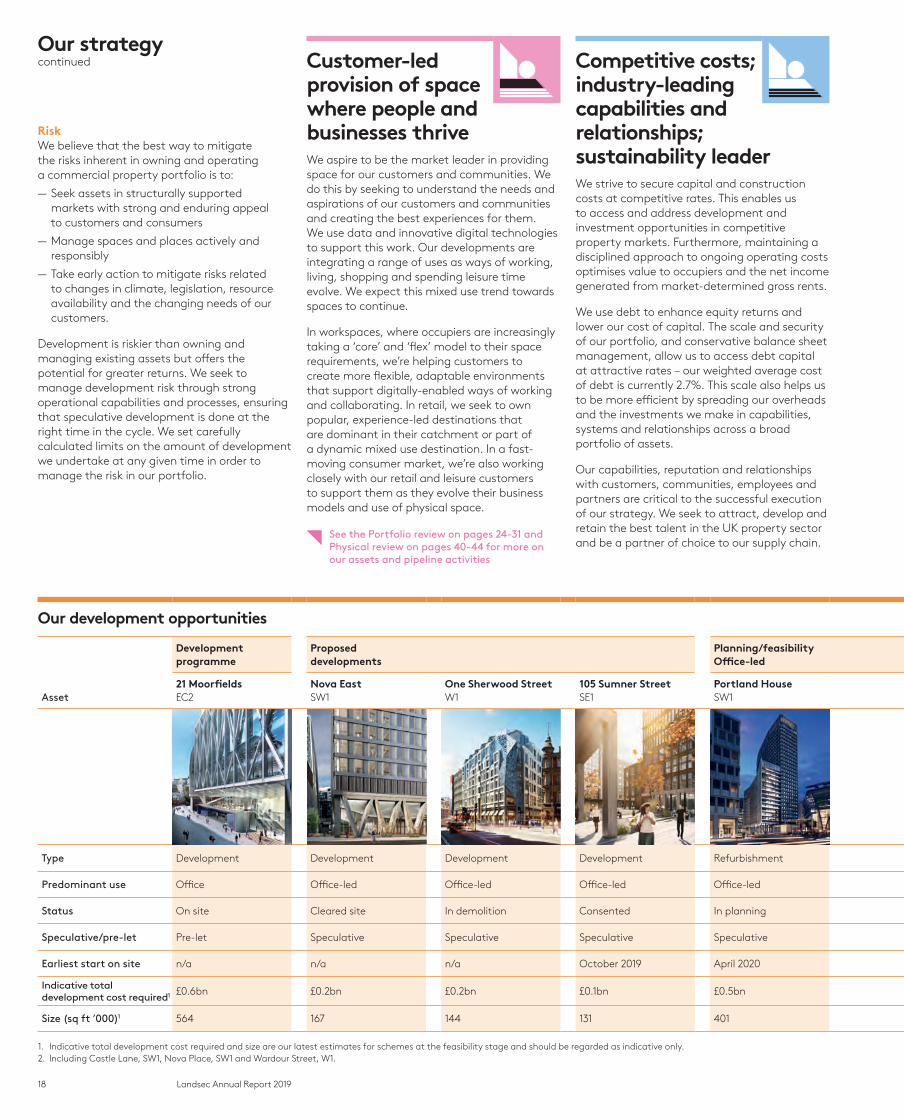
Competitive costs; industry-leading capabilities and relationships; sustainability leaderWe strive to secure capital and construction costs at competitive rates. This enables us to access and address development and investment opportunities in competitive property markets. Furthermore, maintaining a disciplined approach to ongoing operating costs optimises value to occupiers and the net income generated from market-determined gross rents.
We use debt to enhance equity returns and lower our cost of capital. The scale and security of our portfolio, and conservative balance sheet management, allow us to access debt capital at attractive rates – our weighted average cost of debt is currently 2.7%. This scale also helps us to be more efficient by spreading our overheads and the investments we make in capabilities, systems and relationships across a broad portfolio of assets.
Our capabilities, reputation and relationships with customers, communities, employees and partners are critical to the successful execution of our strategy. We seek to attract, develop and retain the best talent in the UK property sector and be a partner of choice to our supply chain.
Customer-led provision of space where people and businesses thriveWe aspire to be the market leader in providing space for our customers and communities. We do this by seeking to understand the needs and aspirations of our customers and communities and creating the best experiences for them. We use data and innovative digital technologies to support this work. Our developments are integrating a range of uses as ways of working, living, shopping and spending leisure time evolve. We expect this mixed use trend towards spaces to continue.
In workspaces, where occupiers are increasingly taking a ‘core’ and ‘flex’ model to their space requirements, we’re helping customers to create more flexible, adaptable environments that support digitally-enabled ways of working and collaborating. In retail, we seek to own popular, experience-led destinations that are dominant in their catchment or part of a dynamic mixed use destination. In a fast-moving consumer market, we’re also working closely with our retail and leisure customers to support them as they evolve their business models and use of physical space.
See the Portfolio review on pages 24-31 and Physical review on pages 40-44 for more on our assets and pipeline activities
Risk We believe that the best way to mitigate the risks inherent in owning and operating a commercial property portfolio is to:
— Seek assets in structurally supported markets with strong and enduring appeal to customers and consumers
— Manage spaces and places actively and responsibly
— Take early action to mitigate risks related to changes in climate, legislation, resource availability and the changing needs of our customers.
Development is riskier than owning and managing existing assets but offers the potential for greater returns. We seek to manage development risk through strong operational capabilities and processes, ensuring that speculative development is done at the right time in the cycle. We set carefully calculated limits on the amount of development we undertake at any given time in order to manage the risk in our portfolio.
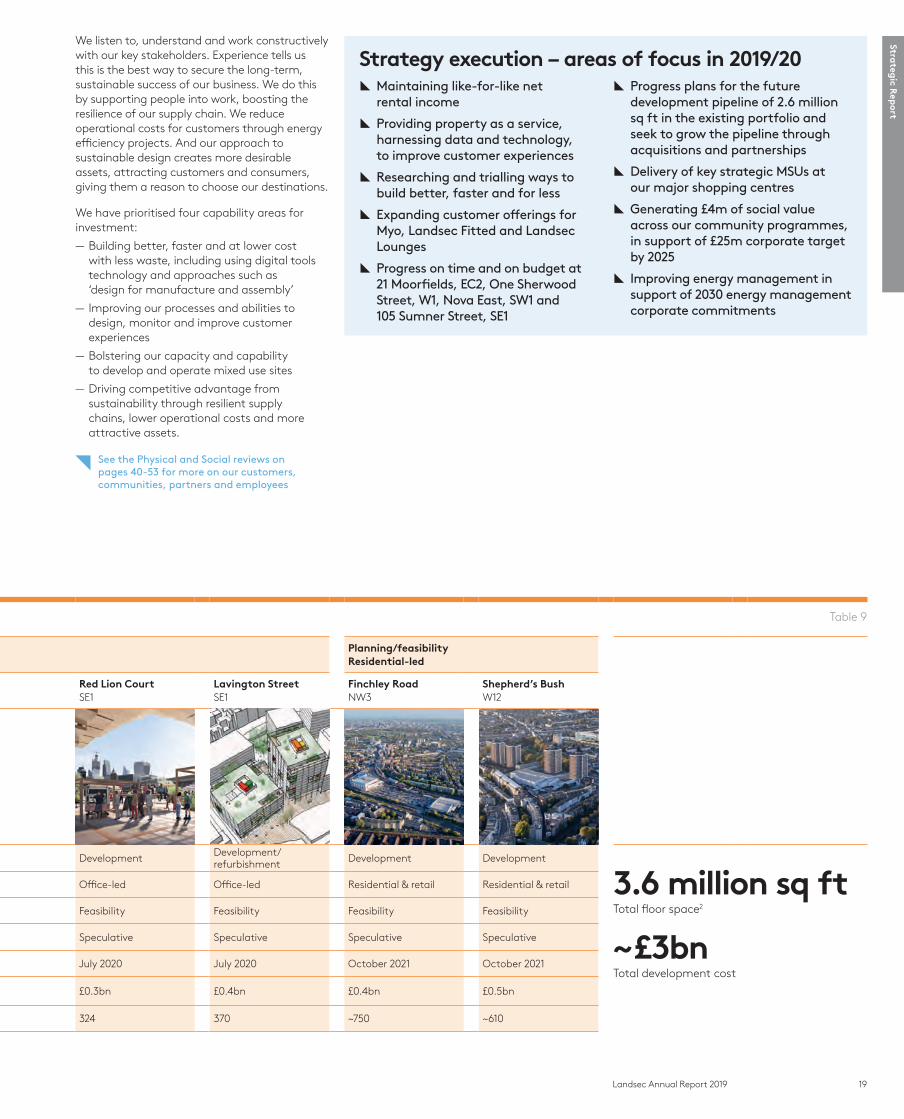
Our development opportunities Table 9
Development programme
Proposed developments
Planning/feasibility Office-led
Planning/feasibility Residential-led
Asset21 MoorfieldsEC2
Nova EastSW1
One Sherwood StreetW1
105 Sumner Street SE1
Portland HouseSW1
Red Lion CourtSE1
Lavington StreetSE1
Finchley RoadNW3
Shepherd’s BushW12
Type Development Development Development Development Refurbishment Development Development/refurbishment Development Development
3.6 million sq ft Total floor space2
~£3bn Total development cost
Predominant use Office Office-led Office-led Office-led Office-led Office-led Office-led Residential & retail Residential & retail
Status On site Cleared site In demolition Consented In planning Feasibility Feasibility Feasibility Feasibility
Speculative/pre-let Pre-let Speculative Speculative Speculative Speculative Speculative Speculative Speculative Speculative
Earliest start on site n/a n/a n/a October 2019 April 2020 July 2020 July 2020 October 2021 October 2021
Indicative total development cost required1 £0.6bn £0.2bn £0.2bn £0.1bn £0.5bn £0.3bn £0.4bn £0.4bn £0.5bn
Size (sq ft ’000)1 564 167 144 131 401 324 370 ~750 ~610
1. Indicative total development cost required and size are our latest estimates for schemes at the feasibility stage and should be regarded as indicative only.2. Including Castle Lane, SW1, Nova Place, SW1 and Wardour Street, W1.
Our strategycontinued
19Landsec Annual Report 2019
Strateg
ic Rep
ort
We listen to, understand and work constructively with our key stakeholders. Experience tells us this is the best way to secure the long-term, sustainable success of our business. We do this by supporting people into work, boosting the resilience of our supply chain. We reduce operational costs for customers through energy efficiency projects. And our approach to sustainable design creates more desirable assets, attracting customers and consumers, giving them a reason to choose our destinations.
We have prioritised four capability areas for investment:
— Building better, faster and at lower cost with less waste, including using digital tools technology and approaches such as ‘design for manufacture and assembly’
— Improving our processes and abilities to design, monitor and improve customer experiences
— Bolstering our capacity and capability to develop and operate mixed use sites
— Driving competitive advantage from sustainability through resilient supply chains, lower operational costs and more attractive assets.
See the Physical and Social reviews on pages 40-53 for more on our customers, communities, partners and employees
Strategy execution – areas of focus in 2019/20 [ Maintaining like-for-like net rental income
[ Providing property as a service, harnessing data and technology, to improve customer experiences
[ Researching and trialling ways to build better, faster and for less
[ Expanding customer offerings for Myo, Landsec Fitted and Landsec Lounges
[ Progress on time and on budget at 21 Moorfields, EC2, One Sherwood Street, W1, Nova East, SW1 and 105 Sumner Street, SE1
[ Progress plans for the future development pipeline of 2.6 million sq ft in the existing portfolio and seek to grow the pipeline through acquisitions and partnerships
[ Delivery of key strategic MSUs at our major shopping centres
[ Generating £4m of social value across our community programmes, in support of £25m corporate target by 2025
[ Improving energy management in support of 2030 energy management corporate commitments
Our development opportunities Table 9
Development programme
Proposed developments
Planning/feasibility Office-led
Planning/feasibility Residential-led
Asset21 MoorfieldsEC2
Nova EastSW1
One Sherwood StreetW1
105 Sumner Street SE1
Portland HouseSW1
Red Lion CourtSE1
Lavington StreetSE1
Finchley RoadNW3
Shepherd’s BushW12
Type Development Development Development Development Refurbishment Development Development/refurbishment Development Development
3.6 million sq ft Total floor space2
~£3bn Total development cost
Predominant use Office Office-led Office-led Office-led Office-led Office-led Office-led Residential & retail Residential & retail
Status On site Cleared site In demolition Consented In planning Feasibility Feasibility Feasibility Feasibility
Speculative/pre-let Pre-let Speculative Speculative Speculative Speculative Speculative Speculative Speculative Speculative
Earliest start on site n/a n/a n/a October 2019 April 2020 July 2020 July 2020 October 2021 October 2021
Indicative total development cost required1 £0.6bn £0.2bn £0.2bn £0.1bn £0.5bn £0.3bn £0.4bn £0.4bn £0.5bn
Size (sq ft ’000)1 564 167 144 131 401 324 370 ~750 ~610
1. Indicative total development cost required and size are our latest estimates for schemes at the feasibility stage and should be regarded as indicative only.2. Including Castle Lane, SW1, Nova Place, SW1 and Wardour Street, W1.
20 Landsec Annual Report 2019
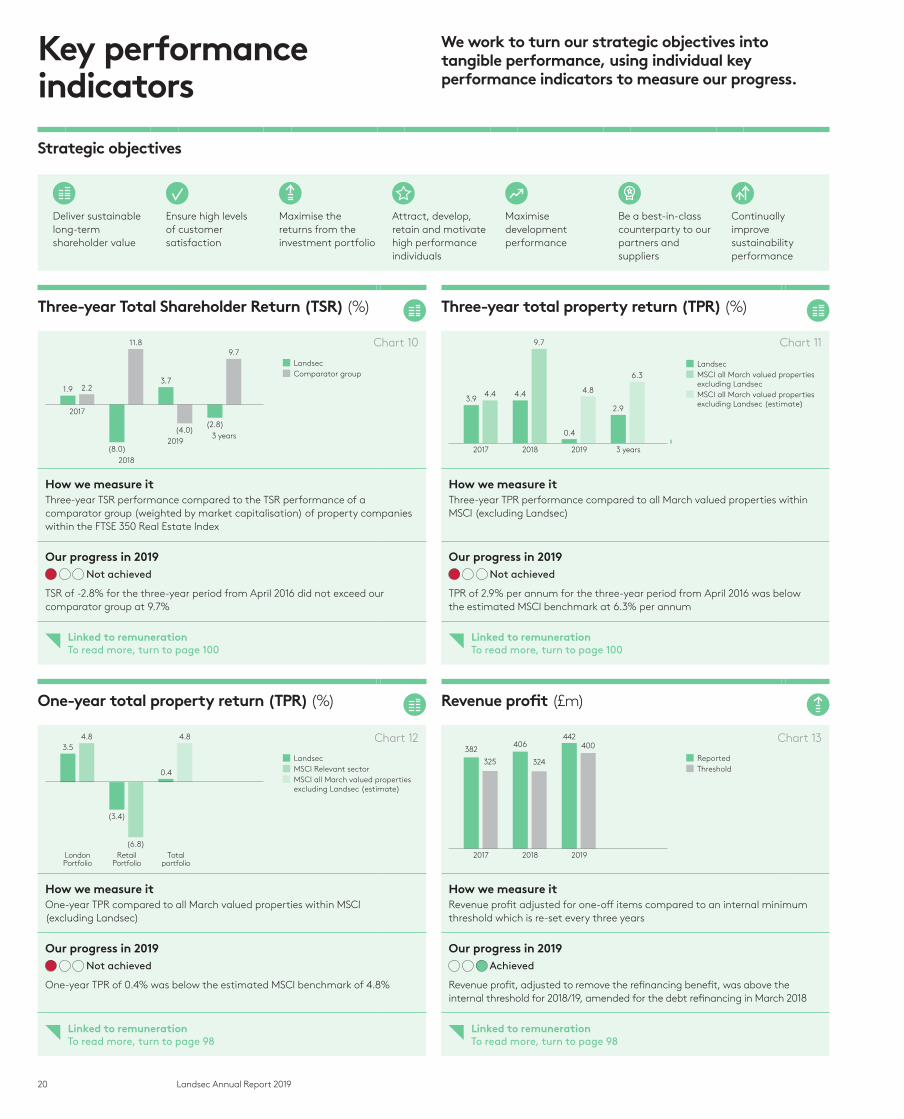
Three-year Total Shareholder Return (TSR) (%)
Three-year total property return (TPR) (%)
2017
2018
20193 years
(8.0)
11.8
1.9 2.23.7
(4.0)(2.8)
9.7■ Landsec ■ Comparator group
2017 2018 2019 3 years
4.4
9.7
0.4
4.8
2.9
6.3
3.94.4
■ Landsec ■ MSCI all March valued properties excluding Landsec■ MSCI all March valued properties excluding Landsec (estimate)
How we measure it How we measure itThree-year TSR performance compared to the TSR performance of a comparator group (weighted by market capitalisation) of property companies within the FTSE 350 Real Estate Index
Three-year TPR performance compared to all March valued properties within MSCI (excluding Landsec)
Our progress in 2019 Our progress in 2019
Not achieved
TSR of -2.8% for the three-year period from April 2016 did not exceed our comparator group at 9.7%
Not achieved
TPR of 2.9% per annum for the three-year period from April 2016 was below the estimated MSCI benchmark at 6.3% per annum
Linked to remuneration To read more, turn to page 100
Linked to remuneration To read more, turn to page 100
One-year total property return (TPR) (%)
Revenue profit (£m)
LondonPortfolio
RetailPortfolio
Totalportfolio
3.5
(3.4)
4.8
(6.8)
0.4
4.8
■ Landsec ■ MSCI Relevant sector■ MSCI all March valued properties excluding Landsec (estimate)
2017 2018 2019
382
325
442400406
324 ■ Reported■ Threshold
How we measure it How we measure itOne-year TPR compared to all March valued properties within MSCI (excluding Landsec)
Revenue profit adjusted for one-off items compared to an internal minimum threshold which is re-set every three years
Our progress in 2019 Our progress in 2019
Not achieved
One-year TPR of 0.4% was below the estimated MSCI benchmark of 4.8%
Achieved
Revenue profit, adjusted to remove the refinancing benefit, was above the internal threshold for 2018/19, amended for the debt refinancing in March 2018
Linked to remuneration To read more, turn to page 98
Linked to remuneration To read more, turn to page 98
Key performance indicators
We work to turn our strategic objectives into tangible performance, using individual key performance indicators to measure our progress.
Strategic objectives
Deliver sustainable long-term shareholder value
Ensure high levels of customer satisfaction
Maximise the returns from the investment portfolio
Attract, develop, retain and motivate high performance individuals
Maximise development performance
Be a best-in-class counterparty to our partners and suppliers
Continually improve sustainability performance
Chart 10
Chart 12
Chart 11
Chart 13

21Landsec Annual Report 2019
Strateg
ic Rep
ort
Investment portfolio
Development activity
Customers
How we measure it How we measure it How we measure it How we measure itExecution of improvement programmes for the three outlets acquired in 2017
Development of 21 Moorfields, EC2 to be on programme and on budget
Feasibility work progressed on two suburban London shopping centres – O2 Finchley Road and W12
Embedding of a truly customer-centric culture and the Landsec brand
Our progress in 2019 Our progress in 2019 Our progress in 2019 Our progress in 2019
Achieved
Planning submitted and approved at all three outlets
Partially achieved
21 Moorfields is progressing on time and to budget but the building contract was signed behind schedule
Partially achieved
The feasibility on Finchley Road, NW3 and Shepherd’s Bush, W12 has been completed. Planning applications have not yet been submitted for either scheme
Achieved
A brand research audit was undertaken and completed during the year. Results showed a significant improvement over the results of the last audit in 2015
Linked to remuneration To read more, turn to page 98
Linked to remuneration To read more, turn to page 98
Linked to remuneration To read more, turn to page 98
Linked to remuneration To read more, turn to page 98
Innovation Employees
Jobs and opportunities
Natural resources
187 People furthest from the jobs market supported into work
18.2% reduction in energy intensity versus 2013/14 baseline, for property under our management for at least two years
How we measure it How we measure it How we measure it How we measure itProgress of innovation workstreams Diversity – making measurable
progress on our stated 2020 targetsMake further progress on our 2020 target to support 1,200 people furthest from the jobs market into employment through our Community Employment Programme
Drive energy reduction across the London and Retail portfolios in support of our 2030 corporate commitments
Our progress in 2019 Our progress in 2019 Our progress in 2019 Our progress in 2019
Partially achieved
Myo flexible office product launched. Progress made in applying building information modelling (BIM) and modern methods of construction to development activity. Some progress in introducing innovation to retail such as Black Box in Trinity Leeds
Partially achieved
Have not reached our target of 30% females at Leader level. Employee reporting on diversity has improved
Achieved
Supported 187 people furthest from the jobs market in to work through our Community Employment Programme and achieved our 2020 target a year early
Achieved
Approved 19 energy efficiency projects, across 15 sites, to deliver 5.3m kWh of energy savings of which ten projects have already been completed
Linked to remuneration To read more, turn to page 98
Linked to remuneration To read more, turn to page 98
Linked to remuneration To read more, turn to page 99
Linked to remuneration To read more, turn to page 99
22 Landsec Annual Report 2019
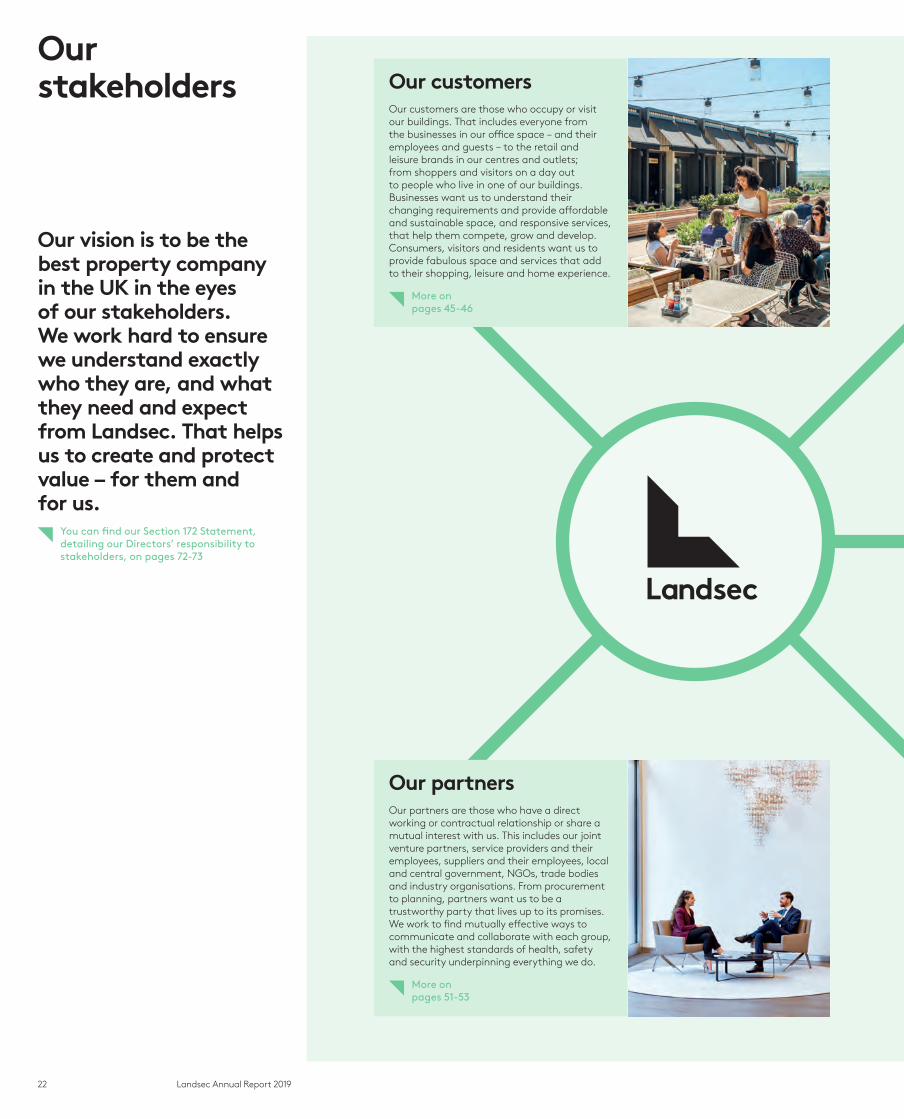
Our vision is to be the best property company in the UK in the eyes of our stakeholders. We work hard to ensure we understand exactly who they are, and what they need and expect from Landsec. That helps us to create and protect value – for them and for us.
You can find our Section 172 Statement, detailing our Directors’ responsibility to stakeholders, on pages 72-73
Our stakeholders Our customers
Our customers are those who occupy or visit our buildings. That includes everyone from the businesses in our office space – and their employees and guests – to the retail and leisure brands in our centres and outlets; from shoppers and visitors on a day out to people who live in one of our buildings. Businesses want us to understand their changing requirements and provide affordable and sustainable space, and responsive services, that help them compete, grow and develop. Consumers, visitors and residents want us to provide fabulous space and services that add to their shopping, leisure and home experience.
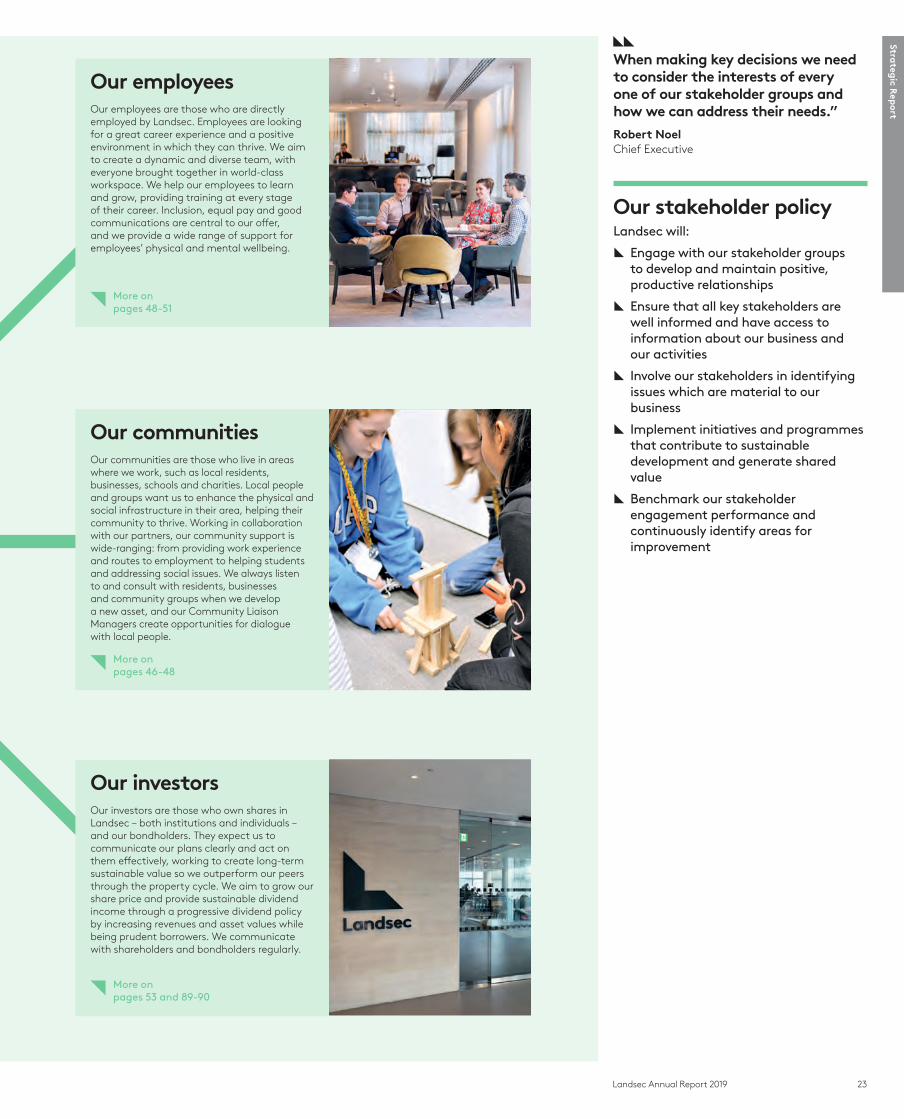
Our employeesOur employees are those who are directly employed by Landsec. Employees are looking for a great career experience and a positive environment in which they can thrive. We aim to create a dynamic and diverse team, with everyone brought together in world-class workspace. We help our employees to learn and grow, providing training at every stage of their career. Inclusion, equal pay and good communications are central to our offer, and we provide a wide range of support for employees’ physical and mental wellbeing.
More on pages 45-46
More on pages 48-51
Our partnersOur partners are those who have a direct working or contractual relationship or share a mutual interest with us. This includes our joint venture partners, service providers and their employees, suppliers and their employees, local and central government, NGOs, trade bodies and industry organisations. From procurement to planning, partners want us to be a trustworthy party that lives up to its promises. We work to find mutually effective ways to communicate and collaborate with each group, with the highest standards of health, safety and security underpinning everything we do.
Our investorsOur investors are those who own shares in Landsec – both institutions and individuals – and our bondholders. They expect us to communicate our plans clearly and act on them effectively, working to create long-term sustainable value so we outperform our peers through the property cycle. We aim to grow our share price and provide sustainable dividend income through a progressive dividend policy by increasing revenues and asset values while being prudent borrowers. We communicate with shareholders and bondholders regularly.
More on pages 51-53
More on pages 53 and 89-90
23Landsec Annual Report 2019
Strateg
ic Rep
ort
When making key decisions we need to consider the interests of every one of our stakeholder groups and how we can address their needs.”
Robert NoelChief Executive
Our stakeholder policyLandsec will:
[ Engage with our stakeholder groups to develop and maintain positive, productive relationships
[ Ensure that all key stakeholders are well informed and have access to information about our business and our activities
[ Involve our stakeholders in identifying issues which are material to our business
[ Implement initiatives and programmes that contribute to sustainable development and generate shared value
[ Benchmark our stakeholder engagement performance and continuously identify areas for improvement
Our customersOur customers are those who occupy or visit our buildings. That includes everyone from the businesses in our office space – and their employees and guests – to the retail and leisure brands in our centres and outlets; from shoppers and visitors on a day out to people who live in one of our buildings. Businesses want us to understand their changing requirements and provide affordable and sustainable space, and responsive services, that help them compete, grow and develop. Consumers, visitors and residents want us to provide fabulous space and services that add to their shopping, leisure and home experience.
Our employeesOur employees are those who are directly employed by Landsec. Employees are looking for a great career experience and a positive environment in which they can thrive. We aim to create a dynamic and diverse team, with everyone brought together in world-class workspace. We help our employees to learn and grow, providing training at every stage of their career. Inclusion, equal pay and good communications are central to our offer, and we provide a wide range of support for employees’ physical and mental wellbeing.
More on pages 45-46
More on pages 48-51
Our communitiesOur communities are those who live in areas where we work, such as local residents, businesses, schools and charities. Local people and groups want us to enhance the physical and social infrastructure in their area, helping their community to thrive. Working in collaboration with our partners, our community support is wide-ranging: from providing work experience and routes to employment to helping students and addressing social issues. We always listen to and consult with residents, businesses and community groups when we develop a new asset, and our Community Liaison Managers create opportunities for dialogue with local people.
More on pages 46-48
Our partnersOur partners are those who have a direct working or contractual relationship or share a mutual interest with us. This includes our joint venture partners, service providers and their employees, suppliers and their employees, local and central government, NGOs, trade bodies and industry organisations. From procurement to planning, partners want us to be a trustworthy party that lives up to its promises. We work to find mutually effective ways to communicate and collaborate with each group, with the highest standards of health, safety and security underpinning everything we do.
Our investorsOur investors are those who own shares in Landsec – both institutions and individuals – and our bondholders. They expect us to communicate our plans clearly and act on them effectively, working to create long-term sustainable value so we outperform our peers through the property cycle. We aim to grow our share price and provide sustainable dividend income through a progressive dividend policy by increasing revenues and asset values while being prudent borrowers. We communicate with shareholders and bondholders regularly.
More on pages 51-53
More on pages 53 and 89-90
24 Landsec Annual Report 2019
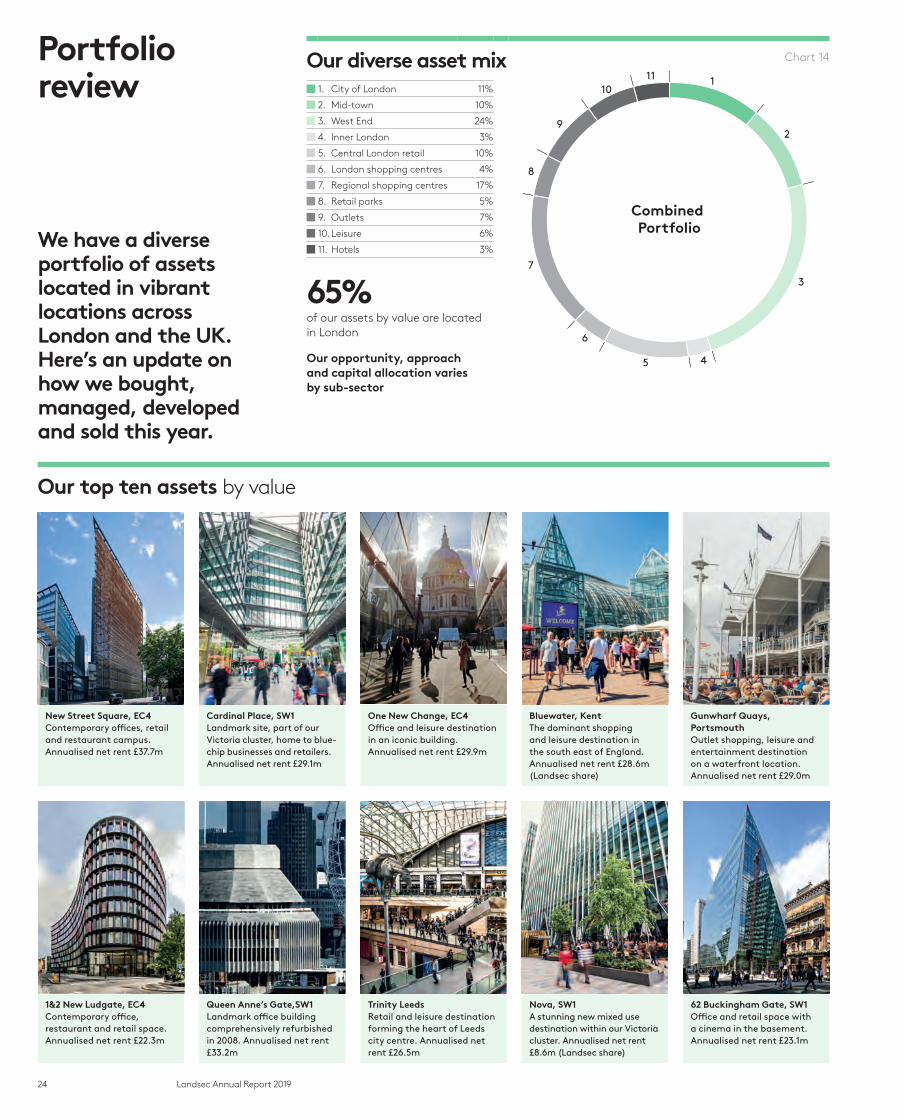
Our diverse asset mix Chart 14
1
2
3
Combined Portfolio
1110
9
8
7
6
5 4
1. City of London 11%
2. Mid-town 10%
3. West End 24%
4. Inner London 3%
5. Central London retail 10%
6. London shopping centres 4%
7. Regional shopping centres 17%
8. Retail parks 5%
9. Outlets 7%
10. Leisure 6%
11. Hotels 3%
65% of our assets by value are located in London
Our opportunity, approach and capital allocation varies by sub-sector
We have a diverse portfolio of assets located in vibrant locations across London and the UK. Here’s an update on how we bought, managed, developed and sold this year.
Portfolio review
Our top ten assets by value
New Street Square, EC4 Contemporary offices, retail and restaurant campus. Annualised net rent £37.7m
Cardinal Place, SW1 Landmark site, part of our Victoria cluster, home to blue- chip businesses and retailers. Annualised net rent £29.1m
One New Change, EC4 Office and leisure destination in an iconic building. Annualised net rent £29.9m
Bluewater, Kent The dominant shopping and leisure destination in the south east of England. Annualised net rent £28.6m (Landsec share)
Gunwharf Quays, Portsmouth Outlet shopping, leisure and entertainment destination on a waterfront location. Annualised net rent £29.0m
1&2 New Ludgate, EC4 Contemporary office, restaurant and retail space. Annualised net rent £22.3m
Queen Anne’s Gate,SW1 Landmark office building comprehensively refurbished in 2008. Annualised net rent £33.2m
Trinity Leeds Retail and leisure destination forming the heart of Leeds city centre. Annualised net rent £26.5m
Nova, SW1 A stunning new mixed use destination within our Victoria cluster. Annualised net rent £8.6m (Landsec share)
62 Buckingham Gate, SW1 Office and retail space with a cinema in the basement. Annualised net rent £23.1m
25Landsec Annual Report 2019
Strateg
ic Rep
ort
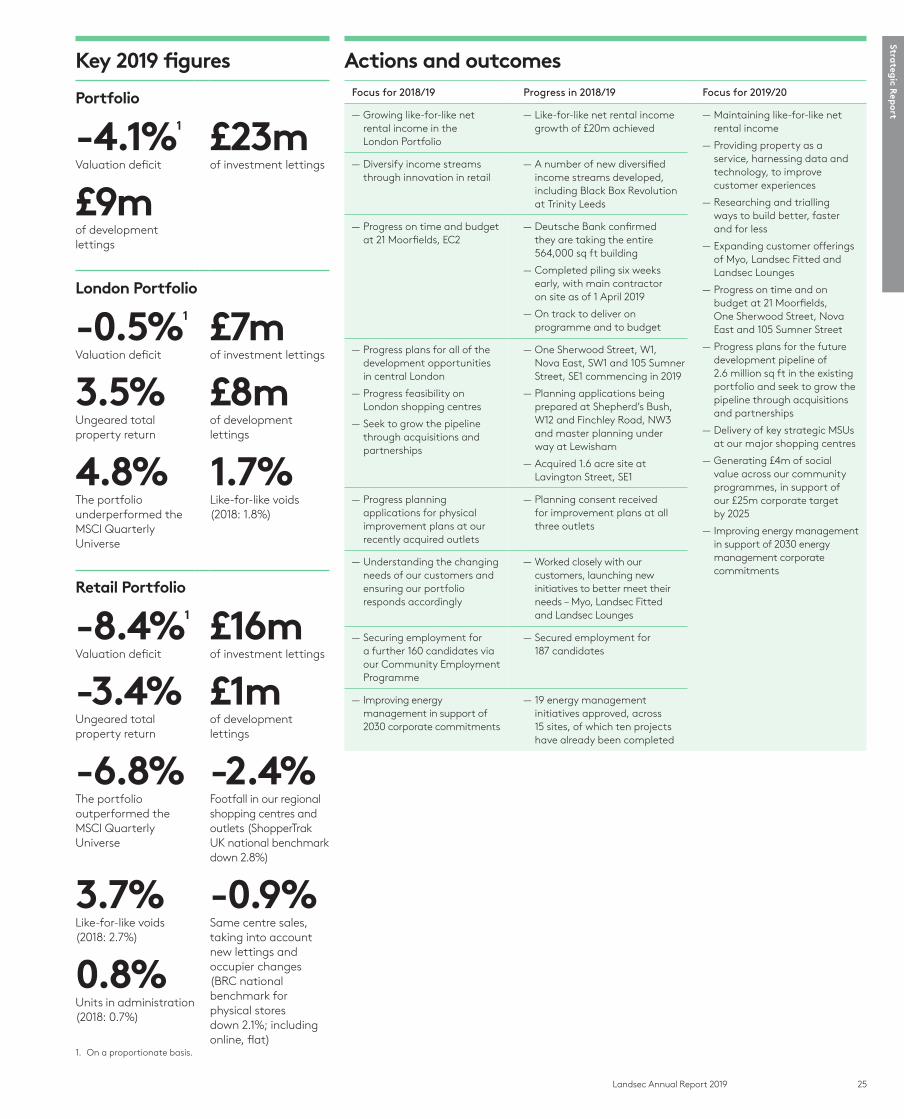
Key 2019 figures
Portfolio
-4.1%1
Valuation deficit
£23mof investment lettings
£9mof development lettings
London Portfolio
-0.5%1
Valuation deficit
£7m of investment lettings
3.5%Ungeared total property return
£8m of development lettings
4.8%The portfolio underperformed the MSCI Quarterly Universe
1.7% Like-for-like voids (2018: 1.8%)
Retail Portfolio
-8.4%1
Valuation deficit
£16mof investment lettings
-3.4% Ungeared total property return
£1mof development lettings
-6.8%The portfolio outperformed the MSCI Quarterly Universe
-2.4%Footfall in our regional shopping centres and outlets (ShopperTrak UK national benchmark down 2.8%)
3.7% Like-for-like voids (2018: 2.7%)
-0.9%Same centre sales, taking into account new lettings and occupier changes (BRC national benchmark for physical stores down 2.1%; including online, flat)
0.8% Units in administration (2018: 0.7%)
1. On a proportionate basis.
Actions and outcomesFocus for 2018/19 Progress in 2018/19 Focus for 2019/20
— Growing like-for-like net rental income in the London Portfolio
— Like-for-like net rental income growth of £20m achieved
— Maintaining like-for-like net rental income
— Providing property as a service, harnessing data and technology, to improve customer experiences
— Researching and trialling ways to build better, faster and for less
— Expanding customer offerings of Myo, Landsec Fitted and Landsec Lounges
— Progress on time and on budget at 21 Moorfields, One Sherwood Street, Nova East and 105 Sumner Street
— Progress plans for the future development pipeline of 2.6 million sq ft in the existing portfolio and seek to grow the pipeline through acquisitions and partnerships
— Delivery of key strategic MSUs at our major shopping centres
— Generating £4m of social value across our community programmes, in support of our £25m corporate target by 2025
— Improving energy management in support of 2030 energy management corporate commitments
— Diversify income streams through innovation in retail
— A number of new diversified income streams developed, including Black Box Revolution at Trinity Leeds
— Progress on time and budget at 21 Moorfields, EC2
— Deutsche Bank confirmed they are taking the entire 564,000 sq ft building
— Completed piling six weeks early, with main contractor on site as of 1 April 2019
— On track to deliver on programme and to budget
— Progress plans for all of the development opportunities in central London
— Progress feasibility on London shopping centres
— Seek to grow the pipeline through acquisitions and partnerships
— One Sherwood Street, W1, Nova East, SW1 and 105 Sumner Street, SE1 commencing in 2019
— Planning applications being prepared at Shepherd’s Bush, W12 and Finchley Road, NW3 and master planning under way at Lewisham
— Acquired 1.6 acre site at Lavington Street, SE1
— Progress planning applications for physical improvement plans at our recently acquired outlets
— Planning consent received for improvement plans at all three outlets
— Understanding the changing needs of our customers and ensuring our portfolio responds accordingly
— Worked closely with our customers, launching new initiatives to better meet their needs – Myo, Landsec Fitted and Landsec Lounges
— Securing employment for a further 160 candidates via our Community Employment Programme
— Secured employment for 187 candidates
— Improving energy management in support of 2030 corporate commitments
— 19 energy management initiatives approved, across 15 sites, of which ten projects have already been completed
26 Landsec Annual Report 2019
Our assets and operations continue to be focused on maximising financial, physical and social value by providing the right space for businesses and people to thrive. As the population grows and ages, and the boundaries between work, living and leisure time become more blurred, it is increasingly important to provide a broader mix of products and services to meet future demand.
In London, we have a portfolio of first-class office-led assets with supporting retail, leisure and amenity space, shopping centres with excellent development potential and hotels with longer term redevelopment opportunity. Strategically, London will become a larger proportion of our business and this year we’ve grown and progressed our development pipeline. We’ve also broadened our customer offer, including launching a flexible office product.
Outside London, we’re focused on shopping and leisure destinations where people can shop, eat and socialise. In what remains a very challenging time for retailers, we’re constantly enhancing the brand mix and reshaping space to provide the best experience. We also have a number of retail parks, a sector where we’ve significantly reduced our exposure over recent years.
BuyWe are actively tracking a high volume of both development and investment opportunities across London and are looking to buy in both well-established and emerging locations. We regard London as our core market. It is a huge, increasingly polycentric city with a world class public transport system. This year, in a market which has remained very competitive, we were pleased to grow our presence in SE1, with the acquisition of a 1.6 acre site in Lavington Street. We also acquired a small mixed use site on Wardour Street, W1, in order to satisfy part of the affordable housing requirements associated with our development at One Sherwood Street, W1. We didn’t see equivalent buying opportunities in the retail and leisure sectors.
In Southwark, at 105 Sumner Street we have consent for two buildings totalling 131,000 sq ft and will start on site in October with completion in early 2022. We will be implementing offsite manufacturing and automated on site assembly techniques here to reduce time, cost and environmental impact. Meanwhile, we are working up our plans for 324,000 sq ft of offices and new public riverside space at Red Lion Court. In addition, our recent acquisition on Lavington Street provides us with redevelopment and refurbishment opportunities for a range of workspaces. This will grow our presence in this increasingly popular part of London.
Outside central London, we’ve concluded a feasibility exercise on the opportunity to create residential-focused, mixed use developments in two well-connected vibrant locations in Shepherd’s Bush, W12 and Finchley Road, NW3 comprising around 1,700 new homes in total, much of which we intend to retain as homes for rent. We aim to submit planning applications during the course of this financial year. In Lewisham, we’ve started master planning our town centre asset which extends to around eight acres and provides the potential for a new residential-led, mixed use destination.
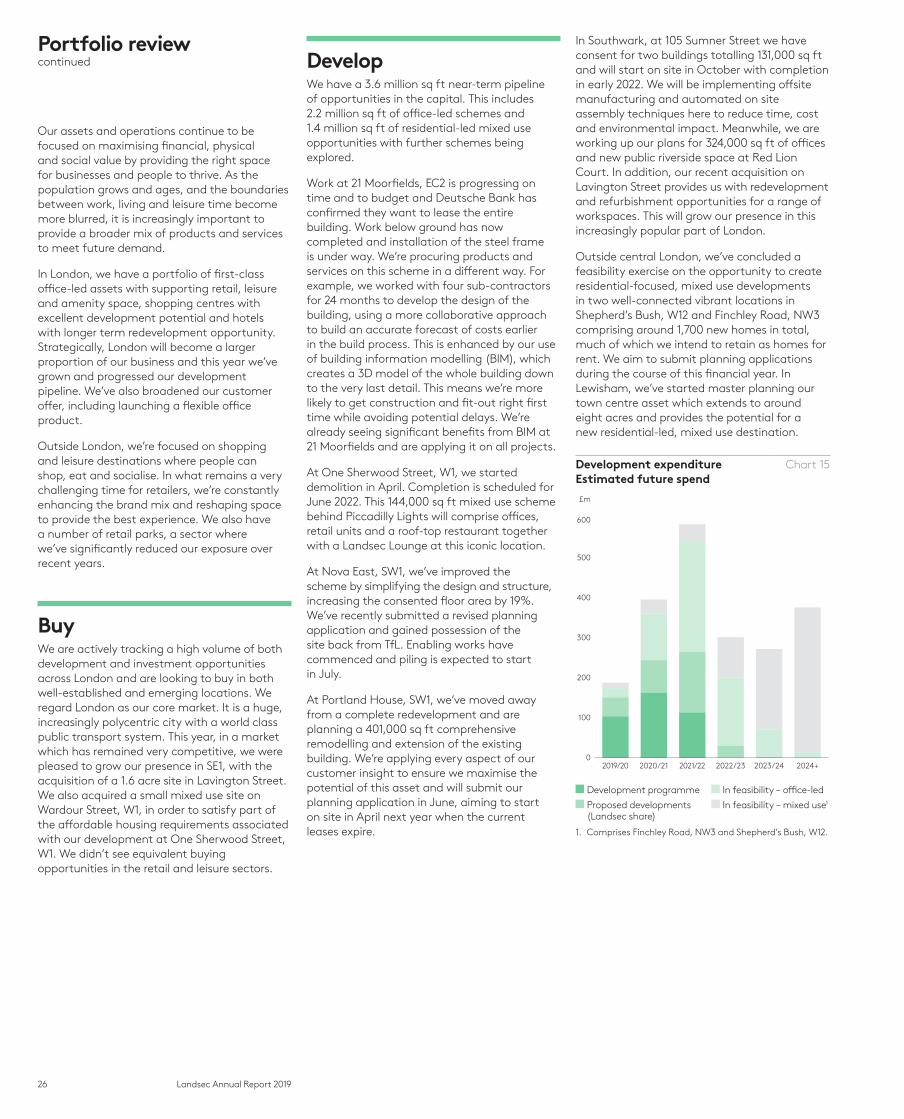
Development expenditure Estimated future spend
Chart 15
0
100
200
300
400
500
600
£m
2019/20 2020/21 2021/22 2024+2023/242022/23
Development programme In feasibility – office-led
Proposed developments In feasibility – mixed use1 (Landsec share)
1. Comprises Finchley Road, NW3 and Shepherd’s Bush, W12.
DevelopWe have a 3.6 million sq ft near-term pipeline of opportunities in the capital. This includes 2.2 million sq ft of office-led schemes and 1.4 million sq ft of residential-led mixed use opportunities with further schemes being explored.
Work at 21 Moorfields, EC2 is progressing on time and to budget and Deutsche Bank has confirmed they want to lease the entire building. Work below ground has now completed and installation of the steel frame is under way. We’re procuring products and services on this scheme in a different way. For example, we worked with four sub-contractors for 24 months to develop the design of the building, using a more collaborative approach to build an accurate forecast of costs earlier in the build process. This is enhanced by our use of building information modelling (BIM), which creates a 3D model of the whole building down to the very last detail. This means we’re more likely to get construction and fit-out right first time while avoiding potential delays. We’re already seeing significant benefits from BIM at 21 Moorfields and are applying it on all projects.
At One Sherwood Street, W1, we started demolition in April. Completion is scheduled for June 2022. This 144,000 sq ft mixed use scheme behind Piccadilly Lights will comprise offices, retail units and a roof-top restaurant together with a Landsec Lounge at this iconic location.
At Nova East, SW1, we’ve improved the scheme by simplifying the design and structure, increasing the consented floor area by 19%. We’ve recently submitted a revised planning application and gained possession of the site back from TfL. Enabling works have commenced and piling is expected to start in July.
At Portland House, SW1, we’ve moved away from a complete redevelopment and are planning a 401,000 sq ft comprehensive remodelling and extension of the existing building. We’re applying every aspect of our customer insight to ensure we maximise the potential of this asset and will submit our planning application in June, aiming to start on site in April next year when the current leases expire.
Portfolio reviewcontinued
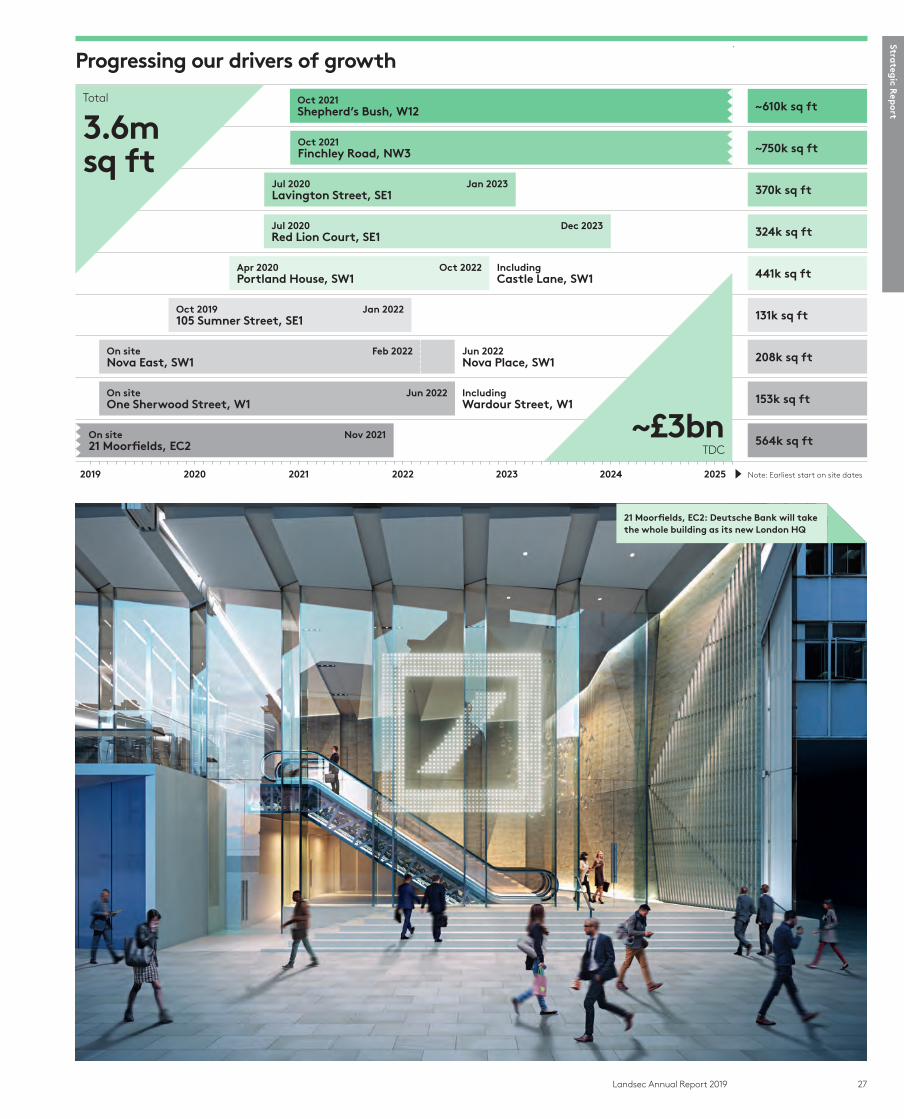
27Landsec Annual Report 2019
Strateg
ic Rep
ort
Progressing our drivers of growth
~610k sq ft
~750k sq ft
370k sq ft
324k sq ft
441k sq ft
131k sq ft
208k sq ft
153k sq ft
564k sq ft
2019 2020 2021 2022 2023 2024 2025 Note: Earliest start on site dates
Jul 2020 Jan 2023Lavington Street, SE1
Jul 2020 Dec 2023Red Lion Court, SE1
Apr 2020 Oct 2022Portland House, SW1
IncludingCastle Lane, SW1
Oct 2019 Jan 2022105 Sumner Street, SE1
Oct 2021Shepherd’s Bush, W12
On site Feb 2022Nova East, SW1
Jun 2022Nova Place, SW1
On site Jun 2022One Sherwood Street, W1
IncludingWardour Street, W1
Oct 2021Finchley Road, NW3
On site Nov 202121 Moorfields, EC2
Total
3.6m sq ft
~£3bnTDC
21 Moorfields, EC2: Deutsche Bank will take the whole building as its new London HQ

28 Landsec Annual Report 2019
20 Eastbourne Terrace, W2. We are now implementing our Lounge concept at Dashwood House, EC2, and 62 Buckingham Gate, SW1, with 6 New Street Square, EC4, and One New Change, EC4 to follow.
Myo, our new flexible office brand, has opened its doors to a new generation of growing customers, as well as meeting larger customers’ core and flex requirements. Myo offers flexible terms, customisable design options, seamless IT and front-of-house support, which means our customers can focus on their business. It adds to the flexible space already provided at our assets through third party operators.
We currently operate 36,000 sq ft as Myo flexible space and plan to grow this significantly through opportunities within our existing portfolio and our development pipeline, providing new and existing customers a broad ecosystem of space from a few desks to head offices.
We have also trialled Landsec Fitted this year, a fully fitted out workspace, providing customers with a faster and more convenient way into occupation. This has proved very successful, reducing leasing times and incentives and attracting rents at a premium to unfitted space.
Retail Portfolio18% of our Retail Portfolio by value is also located in London. These assets comprise our London shopping centres, which provide good development opportunities in densely populated catchments, and the majority of our hotels by value. Many of the hotels are valued at less than replacement cost and provide good development opportunities in the longer term, with resilient income streams in the meantime.
Outside London, our assets predominantly comprise six shopping, five outlet and 17 leisure destinations, increasingly focused on providing a great day out. The retail market is particularly challenging at the moment and our destinations are not immune from this. However, the work we did in recent years to shift investments away from secondary shopping centres and retail parks has limited our exposure to the retail sector most impacted by retailer difficulties. Our portfolio outperformed the national benchmarks for both footfall and retailer sales during the year.
The challenging nature of retail has been reflected in the level of company voluntary arrangements (CVAs) and administrations in the market. Since the start of 2018, more than 80 retail and food & beverage chains have gone into CVA or administration across the UK impacting more than 6,000 stores.
ManageLondon PortfolioThe quality and popularity of our central London office space is reflected in its 98% occupancy rate and healthy average lease term of nine years. During the year, we completed £15m of lettings. We also completed £23m of rent reviews at 17% above passing rent. Lettings included completing the line up at Nova where the blend of retail, restaurants and leisure has created a destination for local residents, occupiers and visitors.
With new ways of working and people’s expectations of their work environment evolving at speed, we’re continuing to enhance and extend the services we provide to office customers, their employees and visitors. For example, our Landsec Lounge concept – which provides communal touch-down meeting spaces in a café-style environment – has proved very popular at 80 Victoria Street, SW1 and
Myo, our new flexible office brand, was launched during the year
Portfolio reviewcontinued
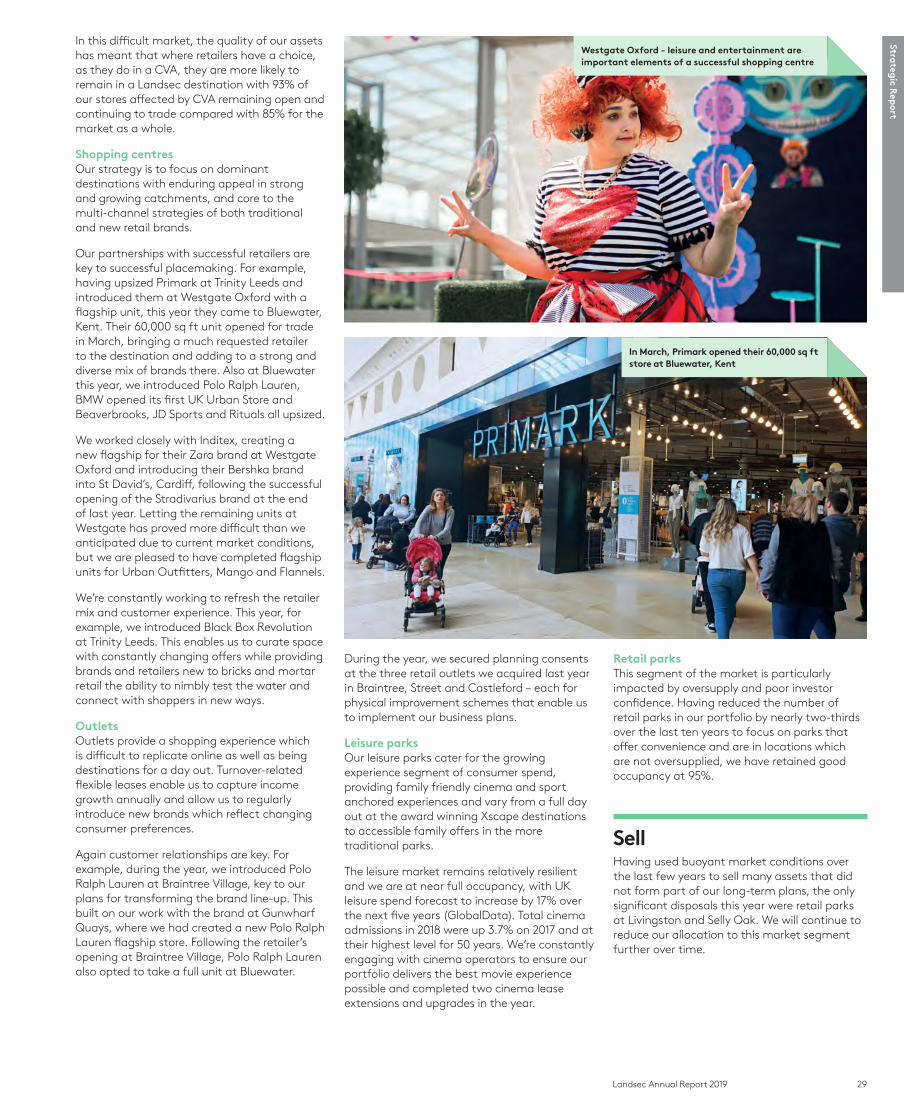
29Landsec Annual Report 2019
Strateg
ic Rep
ort
In this difficult market, the quality of our assets has meant that where retailers have a choice, as they do in a CVA, they are more likely to remain in a Landsec destination with 93% of our stores affected by CVA remaining open and continuing to trade compared with 85% for the market as a whole.
Shopping centresOur strategy is to focus on dominant destinations with enduring appeal in strong and growing catchments, and core to the multi-channel strategies of both traditional and new retail brands.
Our partnerships with successful retailers are key to successful placemaking. For example, having upsized Primark at Trinity Leeds and introduced them at Westgate Oxford with a flagship unit, this year they came to Bluewater, Kent. Their 60,000 sq ft unit opened for trade in March, bringing a much requested retailer to the destination and adding to a strong and diverse mix of brands there. Also at Bluewater this year, we introduced Polo Ralph Lauren, BMW opened its first UK Urban Store and Beaverbrooks, JD Sports and Rituals all upsized.
We worked closely with Inditex, creating a new flagship for their Zara brand at Westgate Oxford and introducing their Bershka brand into St David’s, Cardiff, following the successful opening of the Stradivarius brand at the end of last year. Letting the remaining units at Westgate has proved more difficult than we anticipated due to current market conditions, but we are pleased to have completed flagship units for Urban Outfitters, Mango and Flannels.
We’re constantly working to refresh the retailer mix and customer experience. This year, for example, we introduced Black Box Revolution at Trinity Leeds. This enables us to curate space with constantly changing offers while providing brands and retailers new to bricks and mortar retail the ability to nimbly test the water and connect with shoppers in new ways.
OutletsOutlets provide a shopping experience which is difficult to replicate online as well as being destinations for a day out. Turnover-related flexible leases enable us to capture income growth annually and allow us to regularly introduce new brands which reflect changing consumer preferences.
Again customer relationships are key. For example, during the year, we introduced Polo Ralph Lauren at Braintree Village, key to our plans for transforming the brand line-up. This built on our work with the brand at Gunwharf Quays, where we had created a new Polo Ralph Lauren flagship store. Following the retailer’s opening at Braintree Village, Polo Ralph Lauren also opted to take a full unit at Bluewater.
During the year, we secured planning consents at the three retail outlets we acquired last year in Braintree, Street and Castleford – each for physical improvement schemes that enable us to implement our business plans.
Leisure parksOur leisure parks cater for the growing experience segment of consumer spend, providing family friendly cinema and sport anchored experiences and vary from a full day out at the award winning Xscape destinations to accessible family offers in the more traditional parks.
The leisure market remains relatively resilient and we are at near full occupancy, with UK leisure spend forecast to increase by 17% over the next five years (GlobalData). Total cinema admissions in 2018 were up 3.7% on 2017 and at their highest level for 50 years. We’re constantly engaging with cinema operators to ensure our portfolio delivers the best movie experience possible and completed two cinema lease extensions and upgrades in the year.
Retail parksThis segment of the market is particularly impacted by oversupply and poor investor confidence. Having reduced the number of retail parks in our portfolio by nearly two-thirds over the last ten years to focus on parks that offer convenience and are in locations which are not oversupplied, we have retained good occupancy at 95%.
SellHaving used buoyant market conditions over the last few years to sell many assets that did not form part of our long-term plans, the only significant disposals this year were retail parks at Livingston and Selly Oak. We will continue to reduce our allocation to this market segment further over time.
Westgate Oxford - leisure and entertainment are important elements of a successful shopping centre
In March, Primark opened their 60,000 sq ft store at Bluewater, Kent
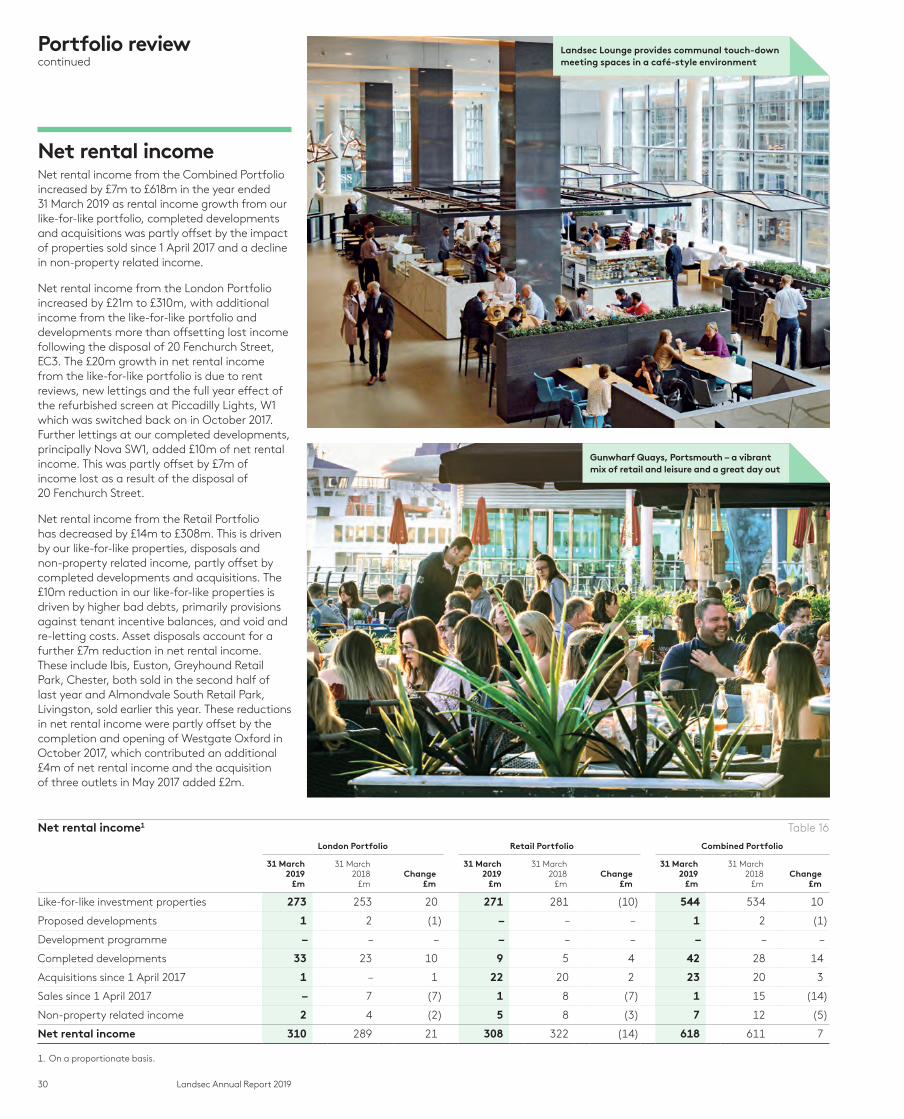
30 Landsec Annual Report 2019
Net rental incomeNet rental income from the Combined Portfolio increased by £7m to £618m in the year ended 31 March 2019 as rental income growth from our like-for-like portfolio, completed developments and acquisitions was partly offset by the impact of properties sold since 1 April 2017 and a decline in non-property related income.
Net rental income from the London Portfolio increased by £21m to £310m, with additional income from the like-for-like portfolio and developments more than offsetting lost income following the disposal of 20 Fenchurch Street, EC3. The £20m growth in net rental income from the like-for-like portfolio is due to rent reviews, new lettings and the full year effect of the refurbished screen at Piccadilly Lights, W1 which was switched back on in October 2017. Further lettings at our completed developments, principally Nova SW1, added £10m of net rental income. This was partly offset by £7m of income lost as a result of the disposal of 20 Fenchurch Street.
Net rental income from the Retail Portfolio has decreased by £14m to £308m. This is driven by our like-for-like properties, disposals and non-property related income, partly offset by completed developments and acquisitions. The £10m reduction in our like-for-like properties is driven by higher bad debts, primarily provisions against tenant incentive balances, and void and re-letting costs. Asset disposals account for a further £7m reduction in net rental income. These include Ibis, Euston, Greyhound Retail Park, Chester, both sold in the second half of last year and Almondvale South Retail Park, Livingston, sold earlier this year. These reductions in net rental income were partly offset by the completion and opening of Westgate Oxford in October 2017, which contributed an additional £4m of net rental income and the acquisition of three outlets in May 2017 added £2m.
Landsec Lounge provides communal touch-down meeting spaces in a café-style environment
Gunwharf Quays, Portsmouth – a vibrant mix of retail and leisure and a great day out
Portfolio reviewcontinued
Net rental income1 Table 16
London Portfolio Retail Portfolio Combined Portfolio
31 March 2019
£m
31 March 2018
£mChange
£m
31 March 2019
£m
31 March 2018
£mChange
£m
31 March 2019
£m
31 March 2018
£mChange
£m
Like-for-like investment properties 273 253 20 271 281 (10) 544 534 10
Proposed developments 1 2 (1) – – – 1 2 (1)
Development programme – – – – – – – – –
Completed developments 33 23 10 9 5 4 42 28 14
Acquisitions since 1 April 2017 1 – 1 22 20 2 23 20 3
Sales since 1 April 2017 – 7 (7) 1 8 (7) 1 15 (14)
Non-property related income 2 4 (2) 5 8 (3) 7 12 (5)
Net rental income 310 289 21 308 322 (14) 618 611 7
1. On a proportionate basis.
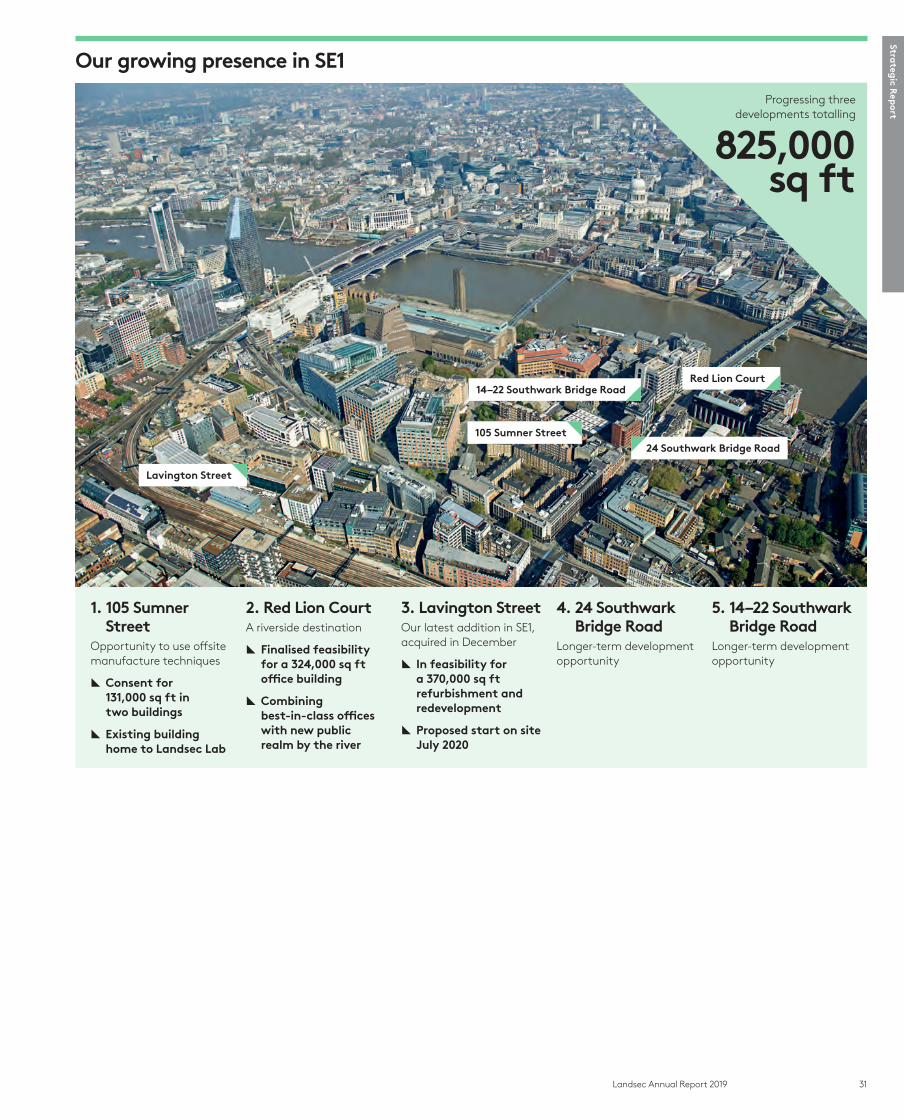
31Landsec Annual Report 2019
Strateg
ic Rep
ort
Our growing presence in SE1
1. 105 Sumner Street
Opportunity to use offsite manufacture techniques
[ Consent for 131,000 sq ft in two buildings
[ Existing building home to Landsec Lab
2. Red Lion CourtA riverside destination
[ Finalised feasibility for a 324,000 sq ft office building
[ Combining best-in-class offices with new public realm by the river
3. Lavington StreetOur latest addition in SE1, acquired in December
[ In feasibility for a 370,000 sq ft refurbishment and redevelopment
[ Proposed start on site July 2020
4. 24 Southwark Bridge Road
Longer-term development opportunity
5. 14–22 Southwark Bridge Road
Longer-term development opportunity
Progressing three developments totalling
825,000 sq ft
24 Southwark Bridge Road105 Sumner Street
Lavington Street
14–22 Southwark Bridge RoadRed Lion Court

32 Landsec Annual Report 2019
Martin Greenslade reports on our financial performance in detail and explains the movement in our key financial measures.
Overview Against a backdrop of political uncertainty and retailer difficulties, this has been a challenging year for Landsec. In general, the values of our London offices have held up well while retail assets have had a difficult year. Retailers have faced margin pressure from a variety of rising costs, weakening demand and a continuing shift to online. This has led to administrations and company voluntary arrangements (CVAs), the impact of which can be seen in our results. On page 34 , we explain how CVAs work, how many of our units are affected and the rental implications. The difficult retail environment has led to a fall in the values of our shopping centres, retail parks and, to a lesser extent, our central London shops. Our outlets, leisure and hotel assets have been more resilient, demonstrating the benefit of a diverse revenue stream in our Retail Portfolio.
Revenue profit for the year to 31 March 2019 was £442m, up 8.9% from £406m. The increase in revenue profit was driven by higher net rental income and reduced costs, in particular interest expense. Adjusted diluted earnings per share were up 12.4% at 59.7p due to the increased revenue profit and fewer shares in issue compared with last year following the £475m return of capital and share consolidation in September 2017. Over the year, our assets declined in value by 4.1% or £557m (including our proportionate share of subsidiaries and joint ventures) compared with a £91m decline last year. This decline in the value of our assets is behind the reduction in our EPRA net assets per share in the year, down 4.6% to 1,339p.
Highlights
£442mRevenue profit1 (2018: £406m)
59.7pAdjusted diluted earnings per share1 (2018: 53.1p)
45.55pDividend per share (2018: 44.2p)
£13.8bnCombined Portfolio1 (2018: £14.1bn)
1,341pNet assets per share (2018: 1,404p)2
1. Including our proportionate share of subsidiaries and joint ventures, as explained in the Presentation of financial information opposite.
2. Restated as a result of changes in accounting policies. See note 41 to the financial statements for details.
Financial review
Martin Greenslade, Chief Financial Officer
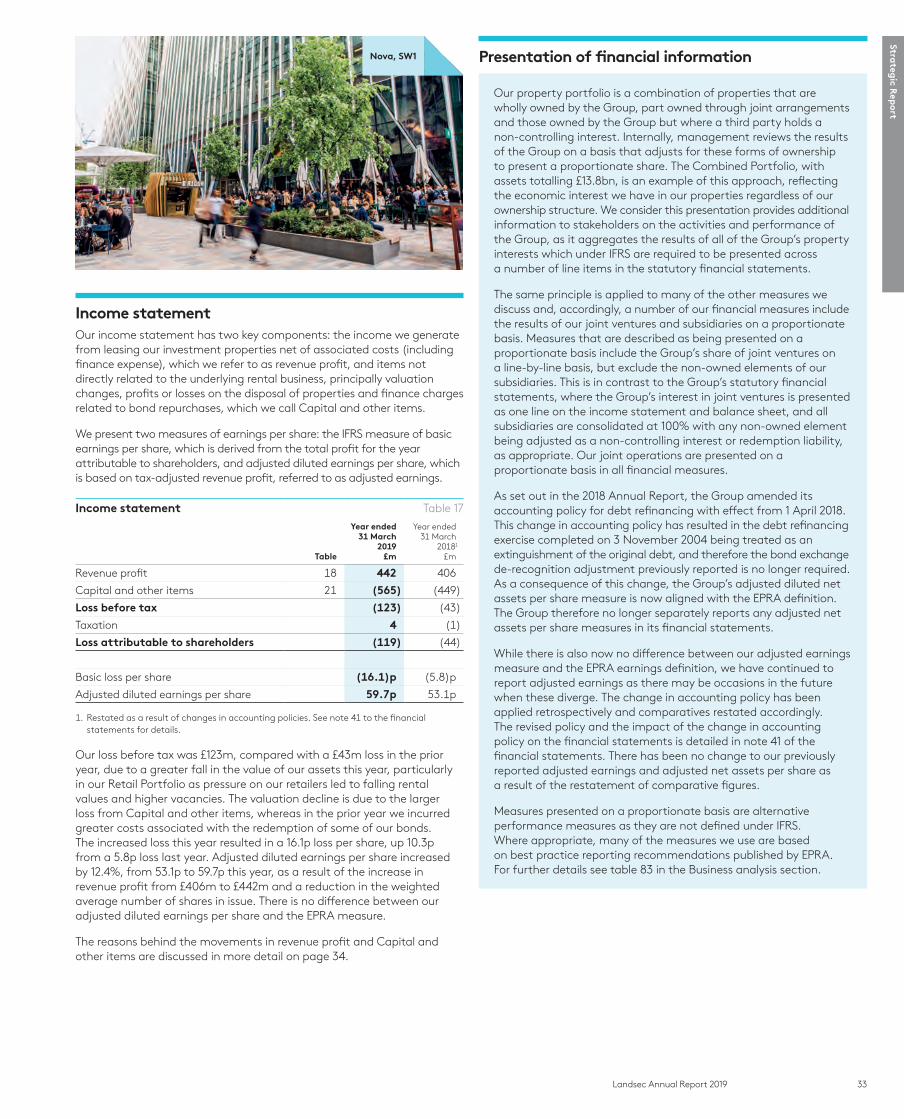
33Landsec Annual Report 2019
Strateg
ic Rep
ort
Presentation of financial information
Our property portfolio is a combination of properties that are wholly owned by the Group, part owned through joint arrangements and those owned by the Group but where a third party holds a non-controlling interest. Internally, management reviews the results of the Group on a basis that adjusts for these forms of ownership to present a proportionate share. The Combined Portfolio, with assets totalling £13.8bn, is an example of this approach, reflecting the economic interest we have in our properties regardless of our ownership structure. We consider this presentation provides additional information to stakeholders on the activities and performance of the Group, as it aggregates the results of all of the Group’s property interests which under IFRS are required to be presented across a number of line items in the statutory financial statements.
The same principle is applied to many of the other measures we discuss and, accordingly, a number of our financial measures include the results of our joint ventures and subsidiaries on a proportionate basis. Measures that are described as being presented on a proportionate basis include the Group’s share of joint ventures on a line-by-line basis, but exclude the non-owned elements of our subsidiaries. This is in contrast to the Group’s statutory financial statements, where the Group’s interest in joint ventures is presented as one line on the income statement and balance sheet, and all subsidiaries are consolidated at 100% with any non-owned element being adjusted as a non-controlling interest or redemption liability, as appropriate. Our joint operations are presented on a proportionate basis in all financial measures.
As set out in the 2018 Annual Report, the Group amended its accounting policy for debt refinancing with effect from 1 April 2018. This change in accounting policy has resulted in the debt refinancing exercise completed on 3 November 2004 being treated as an extinguishment of the original debt, and therefore the bond exchange de-recognition adjustment previously reported is no longer required. As a consequence of this change, the Group’s adjusted diluted net assets per share measure is now aligned with the EPRA definition. The Group therefore no longer separately reports any adjusted net assets per share measures in its financial statements.
While there is also now no difference between our adjusted earnings measure and the EPRA earnings definition, we have continued to report adjusted earnings as there may be occasions in the future when these diverge. The change in accounting policy has been applied retrospectively and comparatives restated accordingly. The revised policy and the impact of the change in accounting policy on the financial statements is detailed in note 41 of the financial statements. There has been no change to our previously reported adjusted earnings and adjusted net assets per share as a result of the restatement of comparative figures.
Measures presented on a proportionate basis are alternative performance measures as they are not defined under IFRS. Where appropriate, many of the measures we use are based on best practice reporting recommendations published by EPRA. For further details see table 83 in the Business analysis section.
Income statementOur income statement has two key components: the income we generate from leasing our investment properties net of associated costs (including finance expense), which we refer to as revenue profit, and items not directly related to the underlying rental business, principally valuation changes, profits or losses on the disposal of properties and finance charges related to bond repurchases, which we call Capital and other items.
We present two measures of earnings per share: the IFRS measure of basic earnings per share, which is derived from the total profit for the year attributable to shareholders, and adjusted diluted earnings per share, which is based on tax-adjusted revenue profit, referred to as adjusted earnings.
Income statement Table 17
Table
Year ended 31 March
2019£m
Year ended 31 March
20181
£m
Revenue profit 18 442 406
Capital and other items 21 (565) (449)
Loss before tax (123) (43)
Taxation 4 (1)
Loss attributable to shareholders (119) (44)
Basic loss per share (16.1)p (5.8)p
Adjusted diluted earnings per share 59.7p 53.1p
1. Restated as a result of changes in accounting policies. See note 41 to the financial statements for details.
Our loss before tax was £123m, compared with a £43m loss in the prior year, due to a greater fall in the value of our assets this year, particularly in our Retail Portfolio as pressure on our retailers led to falling rental values and higher vacancies. The valuation decline is due to the larger loss from Capital and other items, whereas in the prior year we incurred greater costs associated with the redemption of some of our bonds. The increased loss this year resulted in a 16.1p loss per share, up 10.3p from a 5.8p loss last year. Adjusted diluted earnings per share increased by 12.4%, from 53.1p to 59.7p this year, as a result of the increase in revenue profit from £406m to £442m and a reduction in the weighted average number of shares in issue. There is no difference between our adjusted diluted earnings per share and the EPRA measure.
The reasons behind the movements in revenue profit and Capital and other items are discussed in more detail on page 34.
Nova, SW1
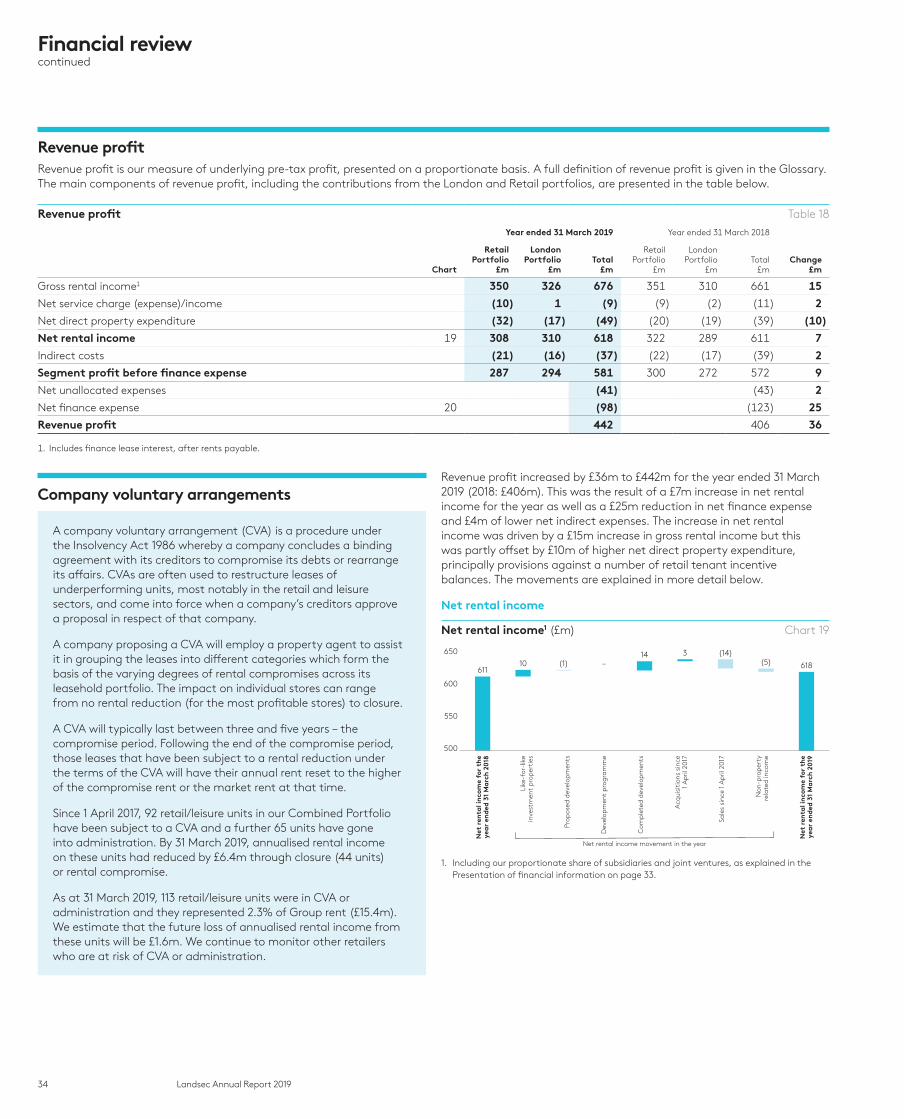
34 Landsec Annual Report 2019
Revenue profitRevenue profit is our measure of underlying pre-tax profit, presented on a proportionate basis. A full definition of revenue profit is given in the Glossary. The main components of revenue profit, including the contributions from the London and Retail portfolios, are presented in the table below.
Revenue profit Table 18
Year ended 31 March 2019 Year ended 31 March 2018
Chart
Retail Portfolio
£m
London Portfolio
£mTotal
£m
Retail Portfolio
£m
London Portfolio
£mTotal
£mChange
£m
Gross rental income1 350 326 676 351 310 661 15
Net service charge (expense)/income (10) 1 (9) (9) (2) (11) 2
Net direct property expenditure (32) (17) (49) (20) (19) (39) (10)
Net rental income 19 308 310 618 322 289 611 7
Indirect costs (21) (16) (37) (22) (17) (39) 2
Segment profit before finance expense 287 294 581 300 272 572 9
Net unallocated expenses (41) (43) 2
Net finance expense 20 (98) (123) 25
Revenue profit 442 406 36
1. Includes finance lease interest, after rents payable.
Company voluntary arrangements
A company voluntary arrangement (CVA) is a procedure under the Insolvency Act 1986 whereby a company concludes a binding agreement with its creditors to compromise its debts or rearrange its affairs. CVAs are often used to restructure leases of underperforming units, most notably in the retail and leisure sectors, and come into force when a company’s creditors approve a proposal in respect of that company.
A company proposing a CVA will employ a property agent to assist it in grouping the leases into different categories which form the basis of the varying degrees of rental compromises across its leasehold portfolio. The impact on individual stores can range from no rental reduction (for the most profitable stores) to closure.
A CVA will typically last between three and five years – the compromise period. Following the end of the compromise period, those leases that have been subject to a rental reduction under the terms of the CVA will have their annual rent reset to the higher of the compromise rent or the market rent at that time.
Since 1 April 2017, 92 retail/leisure units in our Combined Portfolio have been subject to a CVA and a further 65 units have gone into administration. By 31 March 2019, annualised rental income on these units had reduced by £6.4m through closure (44 units) or rental compromise.
As at 31 March 2019, 113 retail/leisure units were in CVA or administration and they represented 2.3% of Group rent (£15.4m). We estimate that the future loss of annualised rental income from these units will be £1.6m. We continue to monitor other retailers who are at risk of CVA or administration.
Revenue profit increased by £36m to £442m for the year ended 31 March 2019 (2018: £406m). This was the result of a £7m increase in net rental income for the year as well as a £25m reduction in net finance expense and £4m of lower net indirect expenses. The increase in net rental income was driven by a £15m increase in gross rental income but this was partly offset by £10m of higher net direct property expenditure, principally provisions against a number of retail tenant incentive balances. The movements are explained in more detail below.
Net rental income
Net rental income1 (£m) Chart 19
61110 (1) –
14 3 (14)(5) 618
Net
ren
tal i
nco
me
for
the
yea
r en
ded
31
Ma
rch
201
9
Net
ren
tal i
nco
me
for
the
yea
r en
ded
31
Ma
rch
201
8
Like
-for
-lik
ein
vest
men
t p
rop
erti
es
Non
-pro
per
tyre
late
d in
com
e
Acq
uisi
tion
s si
nce
1 A
pril
20
17
Prop
osed
dev
elop
men
ts
Dev
elop
men
t p
rog
ram
me
Com
ple
ted
dev
elop
men
ts
Sale
s si
nce
1 A
pril
20
17
650
600
550
500
Net rental income movement in the year
1. Including our proportionate share of subsidiaries and joint ventures, as explained in the Presentation of financial information on page 33.
Financial reviewcontinued
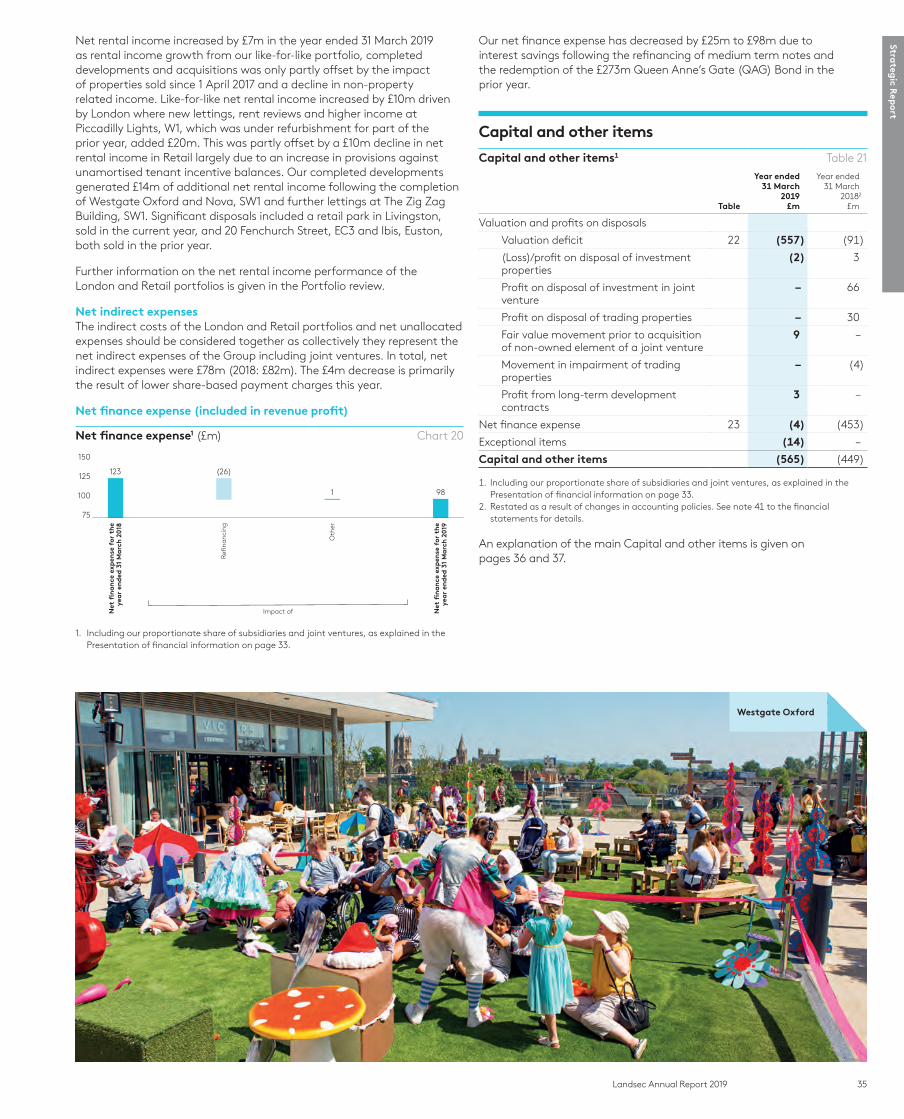
35Landsec Annual Report 2019
Strateg
ic Rep
ort
Net rental income increased by £7m in the year ended 31 March 2019 as rental income growth from our like-for-like portfolio, completed developments and acquisitions was only partly offset by the impact of properties sold since 1 April 2017 and a decline in non-property related income. Like-for-like net rental income increased by £10m driven by London where new lettings, rent reviews and higher income at Piccadilly Lights, W1, which was under refurbishment for part of the prior year, added £20m. This was partly offset by a £10m decline in net rental income in Retail largely due to an increase in provisions against unamortised tenant incentive balances. Our completed developments generated £14m of additional net rental income following the completion of Westgate Oxford and Nova, SW1 and further lettings at The Zig Zag Building, SW1. Significant disposals included a retail park in Livingston, sold in the current year, and 20 Fenchurch Street, EC3 and Ibis, Euston, both sold in the prior year.
Further information on the net rental income performance of the London and Retail portfolios is given in the Portfolio review.
Net indirect expensesThe indirect costs of the London and Retail portfolios and net unallocated expenses should be considered together as collectively they represent the net indirect expenses of the Group including joint ventures. In total, net indirect expenses were £78m (2018: £82m). The £4m decrease is primarily the result of lower share-based payment charges this year.
Net finance expense (included in revenue profit)
Net finance expense1 (£m) Chart 20
123 (26)
1 98
Net
�n
an
ce e
xpen
se f
or t
he
yea
r en
ded
31
Ma
rch
201
9
Net
�n
an
ce e
xpen
se f
or t
he
yea
r en
ded
31
Ma
rch
201
8
Re�
nanc
ing
Oth
er
150
125
100
75
Impact of
1. Including our proportionate share of subsidiaries and joint ventures, as explained in the Presentation of financial information on page 33.
Our net finance expense has decreased by £25m to £98m due to interest savings following the refinancing of medium term notes and the redemption of the £273m Queen Anne’s Gate (QAG) Bond in the prior year.
Capital and other items
Capital and other items1 Table 21
Table
Year ended 31 March
2019£m
Year ended 31 March
20182
£m
Valuation and profits on disposals
Valuation deficit 22 (557) (91)
(Loss)/profit on disposal of investment properties
(2) 3
Profit on disposal of investment in joint venture
– 66
Profit on disposal of trading properties – 30
Fair value movement prior to acquisition of non-owned element of a joint venture
9 –
Movement in impairment of trading properties
– (4)
Profit from long-term development contracts
3 –
Net finance expense 23 (4) (453)
Exceptional items (14) –
Capital and other items (565) (449)
1. Including our proportionate share of subsidiaries and joint ventures, as explained in the Presentation of financial information on page 33.
2. Restated as a result of changes in accounting policies. See note 41 to the financial statements for details.
An explanation of the main Capital and other items is given on pages 36 and 37.
Westgate Oxford
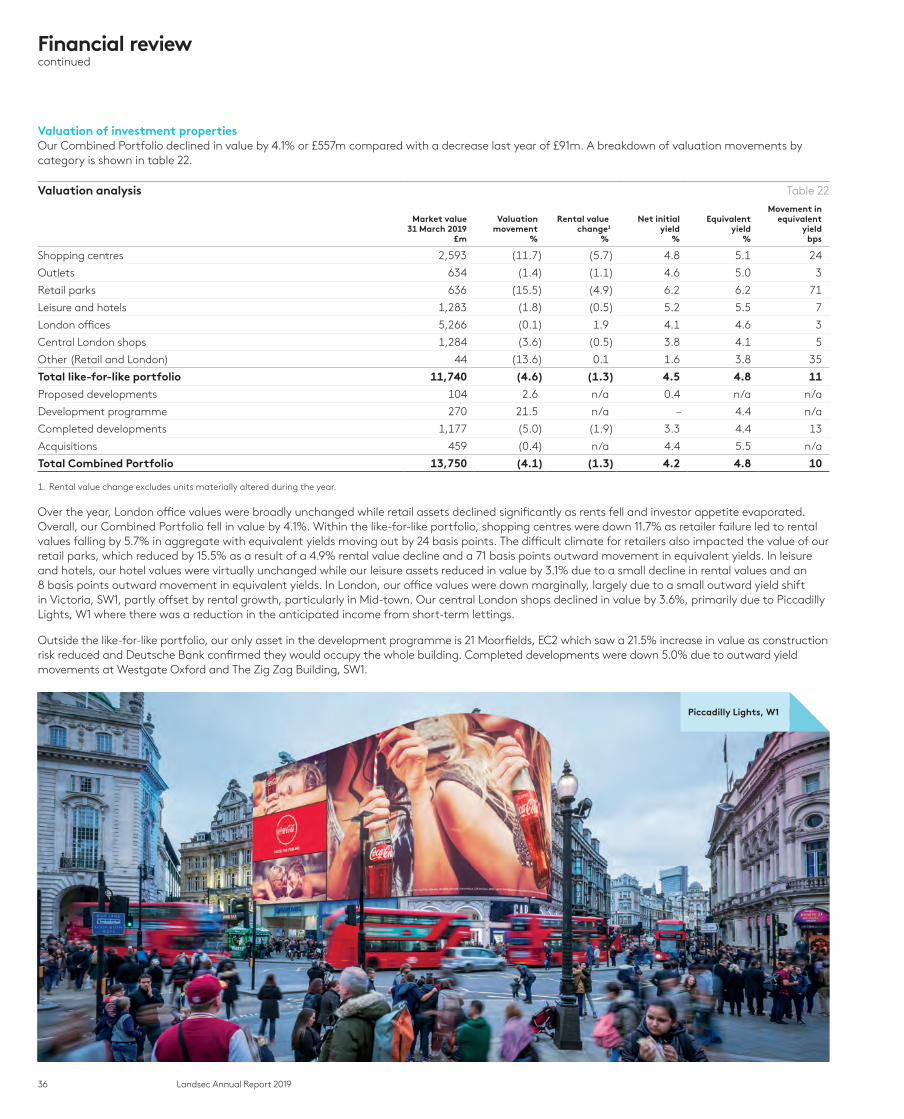
36 Landsec Annual Report 2019
Valuation of investment propertiesOur Combined Portfolio declined in value by 4.1% or £557m compared with a decrease last year of £91m. A breakdown of valuation movements by category is shown in table 22.
Valuation analysis Table 22
Market value 31 March 2019
£m
Valuation movement
%
Rental value change1
%
Net initial yield
%
Equivalent yield
%
Movement in equivalent
yieldbps
Shopping centres 2,593 (11.7) (5.7) 4.8 5.1 24
Outlets 634 (1.4) (1.1) 4.6 5.0 3
Retail parks 636 (15.5) (4.9) 6.2 6.2 71
Leisure and hotels 1,283 (1.8) (0.5) 5.2 5.5 7
London offices 5,266 (0.1) 1.9 4.1 4.6 3
Central London shops 1,284 (3.6) (0.5) 3.8 4.1 5
Other (Retail and London) 44 (13.6) 0.1 1.6 3.8 35
Total like-for-like portfolio 11,740 (4.6) (1.3) 4.5 4.8 11
Proposed developments 104 2.6 n/a 0.4 n/a n/a
Development programme 270 21.5 n/a – 4.4 n/a
Completed developments 1,177 (5.0) (1.9) 3.3 4.4 13
Acquisitions 459 (0.4) n/a 4.4 5.5 n/a
Total Combined Portfolio 13,750 (4.1) (1.3) 4.2 4.8 10
1. Rental value change excludes units materially altered during the year.
Over the year, London office values were broadly unchanged while retail assets declined significantly as rents fell and investor appetite evaporated. Overall, our Combined Portfolio fell in value by 4.1%. Within the like-for-like portfolio, shopping centres were down 11.7% as retailer failure led to rental values falling by 5.7% in aggregate with equivalent yields moving out by 24 basis points. The difficult climate for retailers also impacted the value of our retail parks, which reduced by 15.5% as a result of a 4.9% rental value decline and a 71 basis points outward movement in equivalent yields. In leisure and hotels, our hotel values were virtually unchanged while our leisure assets reduced in value by 3.1% due to a small decline in rental values and an 8 basis points outward movement in equivalent yields. In London, our office values were down marginally, largely due to a small outward yield shift in Victoria, SW1, partly offset by rental growth, particularly in Mid-town. Our central London shops declined in value by 3.6%, primarily due to Piccadilly Lights, W1 where there was a reduction in the anticipated income from short-term lettings.
Outside the like-for-like portfolio, our only asset in the development programme is 21 Moorfields, EC2 which saw a 21.5% increase in value as construction risk reduced and Deutsche Bank confirmed they would occupy the whole building. Completed developments were down 5.0% due to outward yield movements at Westgate Oxford and The Zig Zag Building, SW1.
Financial reviewcontinued
Piccadilly Lights, W1

37Landsec Annual Report 2019
Strateg
ic Rep
ort
Loss on disposals Loss on disposals in the year relates to the sale of investment properties. We made a total net loss on disposals of £2m (2018: net profit of £99m), largely due to the sale of Almondvale South Retail Park in Livingston.
Fair value movement prior to acquisition of non-owned element of a joint ventureThe £9m fair value movement relates to a previously unrealised profit being recognised upon our acquisition of the remaining 50% interest in The Oriana Limited Partnership.
Net finance expense (included in Capital and other items)In the year ended 31 March 2019, we incurred £4m of net finance expense which is excluded from revenue profit.
Net finance expense1 Table 23
Year ended 31 March
2019£m
Year ended 31 March
20182
£m
Premium and fees on redemption of medium term notes (MTNs)
2 390
Premium and fees on QAG Bond redemption – 62
Fair value movement on interest-rate swaps 6 (8)
Other (4) 9
Total 4 453
1. Including our proportionate share of subsidiaries and joint ventures, as explained in the Presentation of financial information on page 33.
2. Restated as a result of changes in accounting policies. See note 41 to the financial statements for details.
The decrease over the prior year in this element of our net finance expense is due to the much lower level of debt management activity.
Exceptional itemsThis year, we have incurred £14m of impairment charges which have been classified as exceptional.
As a result of a decline in the value of Bluewater, Kent, we carried out an impairment test of the intangible asset related to the management rights for the centre. This has resulted in impairment charges this year of £12m against the intangible asset we hold in the balance sheet and £2m against the related goodwill. These charges have arisen primarily from a change in the level of internal costs allocated to Bluewater reducing our net income from the management contract.
TaxationAs a REIT, our income and capital gains from qualifying activities are exempt from corporation tax. 90% of this income must be distributed as a Property Income Distribution, and is taxed at the shareholder level to give a similar tax position to direct property ownership. Non-qualifying activities, such as sales of trading properties, are subject to corporation tax.
This year, there was a tax credit of £4m (2018: charge of £1m) being current tax of £nil (2018: credit of £1m) and a deferred tax credit of £4m (2018: charge of £2m). The deferred tax credit in the year relates to movements in deferred tax on the Group’s intangible assets and property, plant and equipment.
Our tax strategy is published on our corporate website. The Group has a low tax risk rating from HMRC. In the year, the total taxes we incurred and collected were £158m (2018: £193m), of which £36m (2018: £46m) was directly borne by the Group including environmental taxes, business rates and stamp duty land tax.
Balance sheet
Balance sheet Table 24
31 March 2019
£m
31 March20181
£m
Combined Portfolio 13,750 14,103
Adjusted net debt (3,737) (3,652)
Other net assets (93) (71)
EPRA net assets 9,920 10,380
Fair value of interest-rate swaps – 6
Net assets 9,920 10,386
Net assets per share 1,341p 1,404p
EPRA net assets per share2 1,339p 1,403p
1. Restated as a result of changes in accounting policies. See note 41 to the financial statements for details.
2. EPRA net assets per share is a diluted measure.
Our net assets principally comprise the Combined Portfolio less net debt. Following the change in accounting policy outlined in note 41 to the financial statements, the EPRA measure of net assets now aligns with our calculation of an appropriate adjusted measure of net assets. It is also much more closely aligned with the IFRS measure, which now no longer includes the bond exchange de-recognition adjustment. The only difference between the two is the fair value of interest-rate swaps which is excluded from the calculation of EPRA net assets. Both IFRS net assets and EPRA net assets declined over the year ended 31 March 2019 due to the reduction in the value of our investment properties.
At 31 March 2019, our net assets per share were 1,341p, a decrease of 63p or 4.5% from 31 March 2018. EPRA net assets per share were 1,339p, a decrease of 64p or 4.6%.
Chart 25 summarises the key components of the £460m decrease in our EPRA net assets over the year.
Movement in EPRA net assets1 (£m) Chart 25
10,380
1,403
442
59
(557)
(349)
(14) 18 9,920
(76) (47) (2) 2 1,339
Year ended 31 March 2019
Diluted per share (pence)
EPR
A n
et a
sset
sa
t 31
Ma
rch
201
9
EPR
A n
et a
sset
sa
t 31
Ma
rch
201
82
Valu
ati
on d
e�ci
t
Rev
enue
pro
�t
Div
iden
ds
Oth
er
11,000
10,000
9,000
Imp
airm
ent
of
inta
ngib
le a
sset
a
nd g
ood
will
1. Including our proportionate share of subsidiaries and joint ventures, as explained in the Presentation of financial information on page 33.
2. Restated as a result of changes in accounting policies. See note 41 to the financial statements for details.

Net debt and gearing
Net debt and gearing Table 26
31 March 2019
31 March20181
Net debt £3,747m £3,654m
Adjusted net debt2 £3,737m £3,652m
Group LTV2 27.1% 25.8%
Security Group LTV 28.6% 27.2%
Weighted average cost of debt2 2.7% 2.6%
1. Restated as a result of changes in accounting policies. See note 41 to the financial statements for details.
2. Including our proportionate share of subsidiaries and joint ventures, as explained in the Presentation of financial information on page 33.
Over the year, our net debt increased by £93m to £3,747m. The main elements behind this increase are set out in our statement of cash flows and note 21 to the financial statements.
Adjusted net debt was up £85m to £3,737m. For a reconciliation of net debt to adjusted net debt, see note 20 to the financial statements. Chart 27 sets out the main movements behind the increase in our adjusted net debt.
Movement in adjusted net debt1 (£m) Chart 27
3,652 (412) 338127
140 (118)10 3,737
Year ended 31 March 2019
Ad
just
ed n
et d
ebt
at
31 M
arc
h 2
019
Ad
just
ed n
et d
ebt
at
31 M
arc
h 2
018
Net
op
era
ting
cash
in�o
w
Div
iden
ds
pa
id
Acq
uisi
tion
s
Dev
elop
men
t/ot
her
cap
ita
lex
pen
dit
ure
Dis
pos
als
Oth
er
4,000
3,000
2,000
1. Including our proportionate share of subsidiaries and joint ventures, as explained in the Presentation of financial information on page 33.
Net operating cash inflow was £412m, offset by dividend payments of £338m. Capital expenditure was £127m (£122m on investment properties and £5m on trading properties), largely spent on our development programme, and cash outflow for acquisitions was £140m. We spent £93m, including acquisition costs, on a development site in Lavington Street, SE1 and £40m on two assets related to the provision of residential accommodation in respect of our development at One Sherwood Street, W1. Net cash flows from disposals totalled £118m; £64m from the disposal of investment properties, principally two retail parks, and £54m from the disposal of trading properties.
The most widely used gearing measure in our industry is loan-to-value (LTV). We focus most on Group LTV, presented on a proportionate basis, which increased from 25.8% at 31 March 2018 to 27.1% at 31 March 2019, largely due to the decline in the value of our assets. Our Security Group LTV increased from 27.2% to 28.6% for the same reason.
FinancingAt 31 March 2019, our committed revolving facilities totalled £2,715m (31 March 2018: £2,090m). During the year, we took advantage of our strong credit rating and supportive market conditions to make improvements to our committed revolving facilities. We have entered into two new facilities and upsized an existing facility. We have also extended the maturity profile of all existing facilities. The pricing of our facilities which fall due in more than one year range from LIBOR +65 basis points to LIBOR +75 basis points. Borrowings under our commercial paper programme typically have a maturity of less than three months, currently carry a weighted average interest rate of LIBOR +22 basis points and are unsecured. The total amount drawn under the syndicated bank debt and commercial paper programme was £1,159m (31 March 2018: £1,100m).
In contrast to previous years, this year we did not conduct any significant tender exercises for our bonds. We bought back £8m (nominal value) of medium term notes (MTNs) for a premium of £2m following a reverse enquiry by an investor. However, we benefited from the full year effect of last year’s larger debt refinancing exercises, which resulted in a reduction in interest costs of £26m in the year ended 31 March 2019.
The Group’s debt (on a proportionate basis) has a weighted average maturity of 12.3 years (down from 13.1 years at 31 March 2018), a weighted average cost of 2.7% (2.6% at 31 March 2018) and 81% is at fixed interest rates (excluding finance leases). At 31 March 2019, we had £1.6bn of cash and available facilities. This gives the business considerable flexibility to deploy capital quickly when investment opportunities arise, as was the case with our purchase of 25 Lavington Street, SE1.
Changes in accounting policy
The Group adopted IFRS 9 Financial Instruments on 1 April 2018. While some accounting policies have been amended on adoption of the standard, none have required the Group’s income statement or balance sheet to be adjusted. The new accounting policies are set out in the notes to the financial statements.
The Group has adopted IFRS 15 Revenue from Contracts with Customers on 1 April 2018. As a result of adopting the standard, service charge income and expense have been presented on a net basis for those properties where the property management activities are performed by a third party (see note 41 of the financial statements for further details). The Group has elected to apply the standard on a full retrospective basis as permitted by IFRS 15. The service charge income and expense for the year ended 31 March 2018 have both reduced by £22m from that previously presented as a result of adopting this standard. There has been no change in net service charge, revenue profit, profit attributable to shareholders or the Group’s balance sheet.
As detailed in the Presentation of financial information on page 33, the Group amended its accounting policy for debt refinancing from 1 April 2018. The revised policy is set out in note 21 of the financial statements and the impact of the change in accounting policy is detailed in note 41 of the financial statements.
38 Landsec Annual Report 2019
Financial reviewcontinued
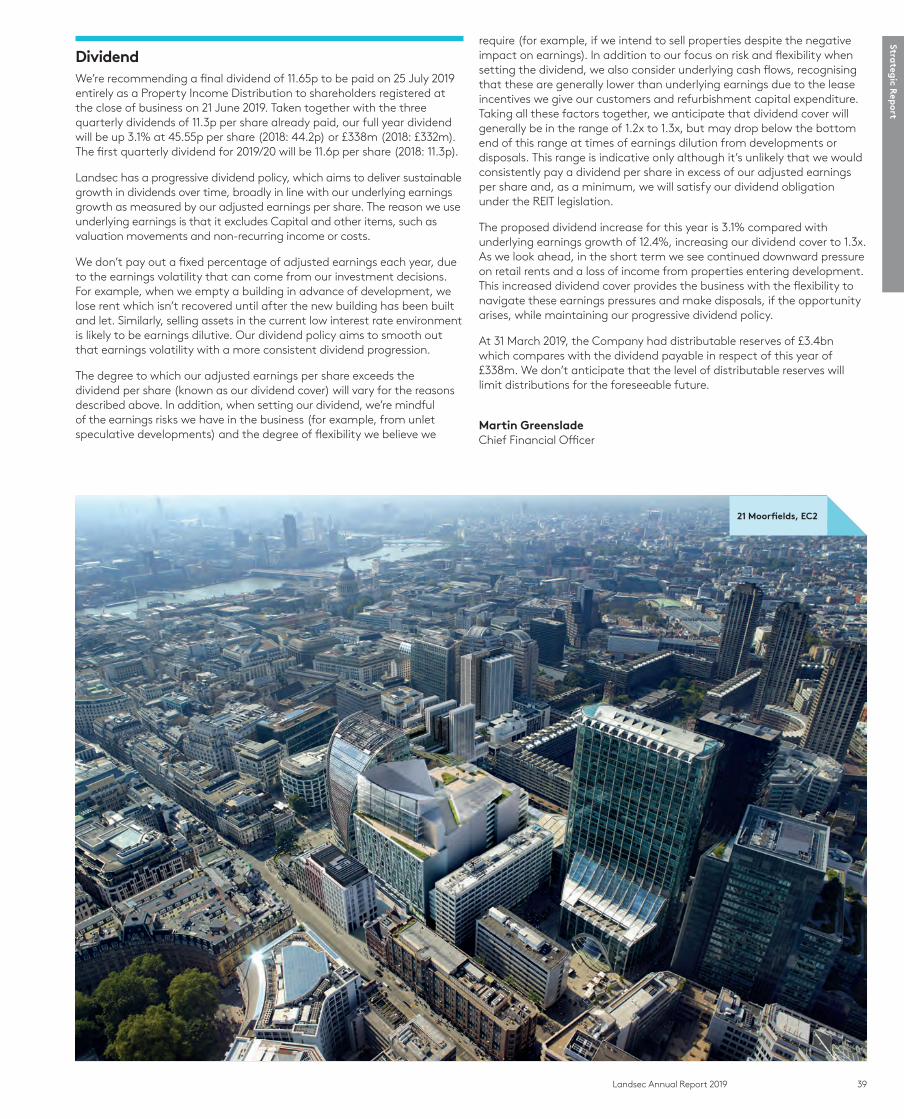
39Landsec Annual Report 2019
Strateg
ic Rep
ort
DividendWe’re recommending a final dividend of 11.65p to be paid on 25 July 2019 entirely as a Property Income Distribution to shareholders registered at the close of business on 21 June 2019. Taken together with the three quarterly dividends of 11.3p per share already paid, our full year dividend will be up 3.1% at 45.55p per share (2018: 44.2p) or £338m (2018: £332m). The first quarterly dividend for 2019/20 will be 11.6p per share (2018: 11.3p).
Landsec has a progressive dividend policy, which aims to deliver sustainable growth in dividends over time, broadly in line with our underlying earnings growth as measured by our adjusted earnings per share. The reason we use underlying earnings is that it excludes Capital and other items, such as valuation movements and non-recurring income or costs.
We don’t pay out a fixed percentage of adjusted earnings each year, due to the earnings volatility that can come from our investment decisions. For example, when we empty a building in advance of development, we lose rent which isn’t recovered until after the new building has been built and let. Similarly, selling assets in the current low interest rate environment is likely to be earnings dilutive. Our dividend policy aims to smooth out that earnings volatility with a more consistent dividend progression.
The degree to which our adjusted earnings per share exceeds the dividend per share (known as our dividend cover) will vary for the reasons described above. In addition, when setting our dividend, we’re mindful of the earnings risks we have in the business (for example, from unlet speculative developments) and the degree of flexibility we believe we
require (for example, if we intend to sell properties despite the negative impact on earnings). In addition to our focus on risk and flexibility when setting the dividend, we also consider underlying cash flows, recognising that these are generally lower than underlying earnings due to the lease incentives we give our customers and refurbishment capital expenditure. Taking all these factors together, we anticipate that dividend cover will generally be in the range of 1.2x to 1.3x, but may drop below the bottom end of this range at times of earnings dilution from developments or disposals. This range is indicative only although it’s unlikely that we would consistently pay a dividend per share in excess of our adjusted earnings per share and, as a minimum, we will satisfy our dividend obligation under the REIT legislation.
The proposed dividend increase for this year is 3.1% compared with underlying earnings growth of 12.4%, increasing our dividend cover to 1.3x. As we look ahead, in the short term we see continued downward pressure on retail rents and a loss of income from properties entering development. This increased dividend cover provides the business with the flexibility to navigate these earnings pressures and make disposals, if the opportunity arises, while maintaining our progressive dividend policy.
At 31 March 2019, the Company had distributable reserves of £3.4bn which compares with the dividend payable in respect of this year of £338m. We don’t anticipate that the level of distributable reserves will limit distributions for the foreseeable future.
Martin GreensladeChief Financial Officer
21 Moorfields, EC2

40 Landsec Annual Report 2019
responsibility of business, and every tonne of carbon and kWh of energy saved provides a financial benefit. For the benefit of customers and our investors, addressing carbon emissions and increasing energy efficiency is the sensible thing to do. Strong progress from business can also give government confidence to set more aspirational policies and regulations, which drive improvement across every sector and business. So, through our commitments and targets, we’re supporting the transition to a low-carbon world, creating benefits for our bottom line, reducing our customers’ costs and bringing our partners along with us.
StrategyThe Task Force for Climate-related Financial Disclosures (TCFD), launched in 2017, encourages businesses to build resilience to the possible outcomes of climate change. We’re committed to acting on the recommendations of TCFD. This means analysing how our portfolio can become more efficient, so we’re ready for a low-carbon economy. It also means knowing how our assets and customers could be affected by the impact of shifting climatic conditions. By assessing various scenarios and the possible impacts on our portfolio and our stakeholders, we can ensure our strategy is relevant and effective.
TransitionWe continue to focus on portfolio quality. Our assets should support the changing needs of customers, which means investing in low-carbon and energy efficient buildings and technology. New assets must move from dependence on gas towards all-electric solutions like air source heat pumps. We’ve begun this transition within our developments, scaling back fossil fuel-dependent boilers in favour of electric heating and cooling. This means our assets will be powered by cleaner energy as the volume of renewable energy resources on the grid increases.
ResiliencePart of becoming more resilient is being aware of the physical risks of climate change, like flooding, sea level rise and overheating. As the climate becomes hotter and wetter, we need to be sure our assets still deliver the same quality of experience to our customers. At present the percentage of our portfolio at high risk of extreme weather in the lead up to 2030 is 1.4% when measured by value. As climate change will gradually increase the level of risk over time, it’s important we continually reassess the risks.
Climate changeContextDuring the year, two important reports were released showing how climate change is affecting the UK and what the projected impacts are likely to be.
The UN Intergovernmental Panel on Climate Change report of October 2018 showed how the limiting of global warming to 1.5°C above pre-industrial levels is unlikely to happen. The current trajectory is towards 3°C of warming by 2100, which will cause unprecedented changes to the world’s natural systems and to society. Globally, average temperatures have already risen by 1°C and the likelihood and severity of extreme weather events is increasing every year.
Launched by the Environment Secretary, Michael Gove, in November, UK Climate Projections 2018 showed us what our climate and weather might be like in future. By mid-century, the likelihood of a summer as hot as 2018 will go from 10-20% to 50%, with extreme summer temperatures rising as much as 5°C. Rainfall will decrease by up to 47% in summer and increase by 35% in winter. Hotter, drier summers and warmer, wetter winters would have physical impacts on property, logistics and agriculture. Disruption from extreme weather and heatwaves could have unforeseen effects across society.
Although the UK has achieved significant emissions reductions over the past decade, it’s crucial that businesses continue to lead the way. While the UK has world-leading legislation and regulation on designing for low-carbon and energy efficiency, it isn’t sufficient to drive emissions down year on year. This is the
Physical review
A review of the actions we’ve taken this year to enhance the quality, efficiency and long-term sustainable performance of our physical infrastructure.
£4mCosts avoided for our customers through our energy efficiency projects
18.2% Reduction in energy intensity compared to a 2013/14 baseline
Energy transition We’re making big progress on carbon and energy. This year we’re almost half way to our 2030 energy reduction target with over £4m of avoided costs for our customers.

41Landsec Annual Report 2019
Strateg
ic Rep
ort
This year we joined with a group of pioneers in an industry-wide initiative called Design for Performance. This aims to ensure buildings perform as well in operation as by design – a challenge we face as an industry. The initiative is led by the Better Buildings Partnership, a collaboration between leading commercial property owners who are working together to improve the sustainability of commercial building stock.
Design for Performance should help give customers visibility of their potential energy costs. This is a significant change from current practice. This year we worked closely with our building designers and contractors to better model and test the energy performance of our 21 Moorfields development. This will benefit both our customer, Deutsche Bank, and us by ensuring the base building and customer spaces work together efficiently.
We’re working in close partnership with our customers to deliver energy, carbon and cost savings. At 7 Soho Square, for example, we’ve partnered with the building’s largest customer to install LED lighting on its floors. We’ve forward funded over £234,000 for the project and will recover this investment via the savings delivered to the customer. The new lighting reduces the building’s electricity usage by 13% and saves 47 tonnes of CO2 per year, while improving the look and feel of the offices. At Bluewater shopping centre we replaced all car park lamp posts with LEDs, delivering a saving of 832.5 kWh and £101,000 in the first six months. We’re looking for similar opportunities across the portfolio.
We mitigate climate risks through physical measures, insurance and business continuity planning. At present, the level of residual risk to our assets is low up to 2030. In our development pipeline, we’re designing and constructing high-quality buildings and spaces capable of delivering operational resilience over their lifetime, taking into account how the UK’s climate will change in the coming decades. We’re confident our focus on energy transition and mitigating physical risks means our business will continue to be resilient to the impact of climate change.
AdvocacyWe need swift and deep decarbonisation of the world’s economies. We are advocates for climate action and this year we worked closely with the World Business Council for Sustainable Development to promote the adoption of long-term, ambitious targets within the buildings and construction sector. We’ve also contributed to the UK Green Building Council’s Advancing Net Zero programme, joining the Steering Group to create a nationally agreed definition of ‘zero carbon buildings’ – a definition that may shape the industry for years to come.
See our full response to TCFD, and our Resilience commitment, in our Sustainability Performance and Data Report at landsec.com/ sustainability/reports-benchmarking
Efficient use of natural resourcesCarbonIn 2016 we became the first commercial real estate company in the world to have its carbon emission target approved by the Science Based Targets Initiative, linking our carbon reduction targets with the science of climate change. This year we achieved significant progress against those targets. We’ve reduced carbon intensity in the portfolio by 39.8% since 2014 and have almost surpassed our goal of reducing emissions by 40% by 2030. We’re now in pursuit of our longer-term ambition of reducing carbon intensity by 80% by 2050.
Energy Using less energy is fundamental if we’re to meet our long-term emission targets and keep making our spaces affordable for customers. Since 2013/14 we’ve reduced our energy intensity by 18.2%. This equates to a total of £4m per year of avoided costs for customers. To do this we’ve continued to work with facilities management partners to harness the vast amounts of data our building systems produce. Doing this helps us drive energy efficiency and proactive maintenance, and optimise the customer experience within our spaces.
Refill me In 2018 we launched the ‘Refill Me’ campaign to help tackle the issue of single-use plastics. This enables visitors at our retail destinations to request a free refill of water – in their own bottles – from our customers, without an obligation to make a purchase. Not only does this encourage people to refill reusable bottles, it also provides an opportunity for brands to engage with people on sustainability. 100 customers are now signed up across 12 of our assets.
7.7bn Plastic bottles of water are purchased each year in the UK
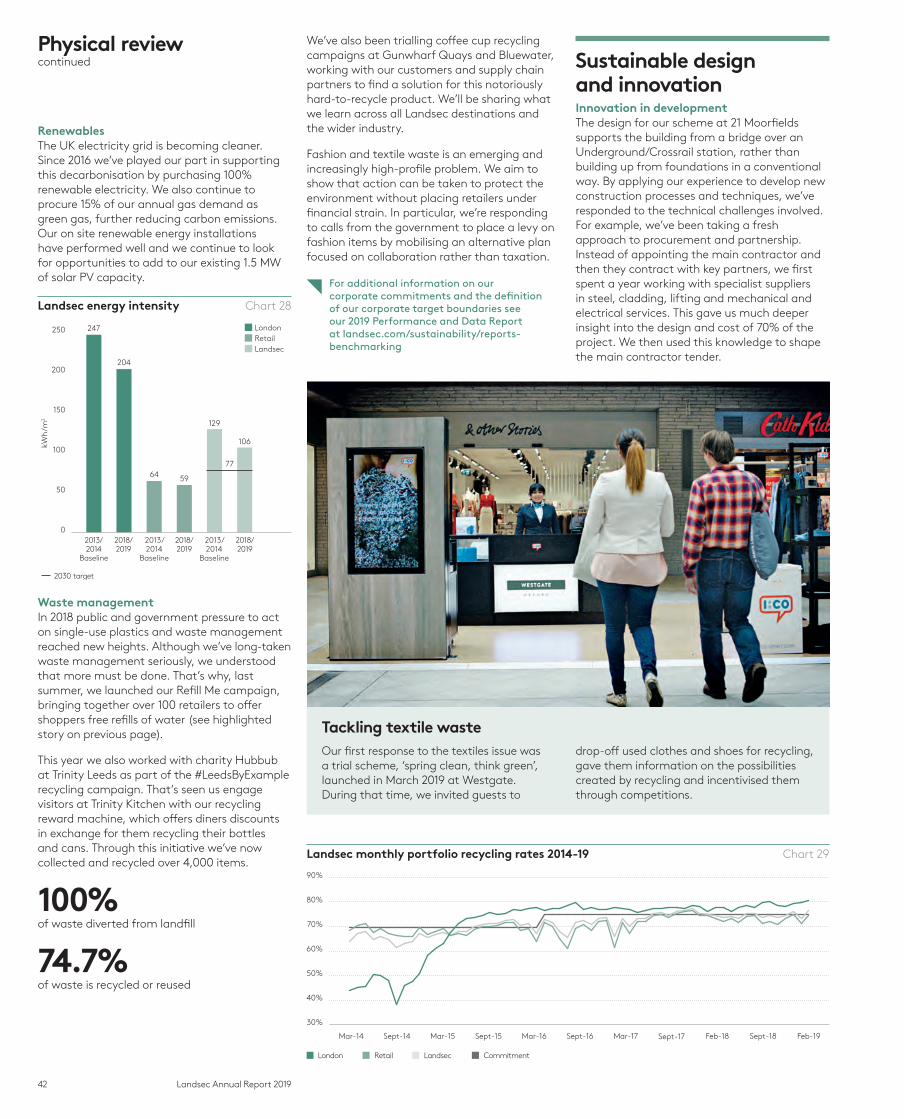
42 Landsec Annual Report 2019
Sustainable design and innovationInnovation in development The design for our scheme at 21 Moorfields supports the building from a bridge over an Underground/Crossrail station, rather than building up from foundations in a conventional way. By applying our experience to develop new construction processes and techniques, we’ve responded to the technical challenges involved. For example, we’ve been taking a fresh approach to procurement and partnership. Instead of appointing the main contractor and then they contract with key partners, we first spent a year working with specialist suppliers in steel, cladding, lifting and mechanical and electrical services. This gave us much deeper insight into the design and cost of 70% of the project. We then used this knowledge to shape the main contractor tender.
We’ve also been trialling coffee cup recycling campaigns at Gunwharf Quays and Bluewater, working with our customers and supply chain partners to find a solution for this notoriously hard-to-recycle product. We’ll be sharing what we learn across all Landsec destinations and the wider industry.
Fashion and textile waste is an emerging and increasingly high-profile problem. We aim to show that action can be taken to protect the environment without placing retailers under financial strain. In particular, we’re responding to calls from the government to place a levy on fashion items by mobilising an alternative plan focused on collaboration rather than taxation.
For additional information on our corporate commitments and the definition of our corporate target boundaries see our 2019 Performance and Data Report at landsec.com/sustainability/reports-benchmarking
RenewablesThe UK electricity grid is becoming cleaner. Since 2016 we’ve played our part in supporting this decarbonisation by purchasing 100% renewable electricity. We also continue to procure 15% of our annual gas demand as green gas, further reducing carbon emissions. Our on site renewable energy installations have performed well and we continue to look for opportunities to add to our existing 1.5 MW of solar PV capacity.
Landsec energy intensity Chart 28
247
204
64 59
129
106
77
0
50
100
150
200
250
kWh
/m2
2013/2014
Baseline
2018/2019
2013/2014
Baseline
2018/2019
2013/2014
Baseline
2018/2019
2030 target
■ London■ Retail■ Landsec
Waste managementIn 2018 public and government pressure to act on single-use plastics and waste management reached new heights. Although we’ve long-taken waste management seriously, we understood that more must be done. That’s why, last summer, we launched our Refill Me campaign, bringing together over 100 retailers to offer shoppers free refills of water (see highlighted story on previous page).
This year we also worked with charity Hubbub at Trinity Leeds as part of the #LeedsByExample recycling campaign. That’s seen us engage visitors at Trinity Kitchen with our recycling reward machine, which offers diners discounts in exchange for them recycling their bottles and cans. Through this initiative we’ve now collected and recycled over 4,000 items.
100%of waste diverted from landfill
74.7%of waste is recycled or reused
Landsec monthly portfolio recycling rates 2014-19 Chart 29
30%
40%
50%
60%
70%
80%
90%
Mar-14 Sept-14 Sept-15 Sept-16Mar-16Mar-15 Sept-17 Sept-18Feb-18 Feb-19Mar-17
Retail Landsec CommitmentLondon
Tackling textile wasteOur first response to the textiles issue was a trial scheme, ‘spring clean, think green’, launched in March 2019 at Westgate. During that time, we invited guests to
drop-off used clothes and shoes for recycling, gave them information on the possibilities created by recycling and incentivised them through competitions.
Physical reviewcontinued
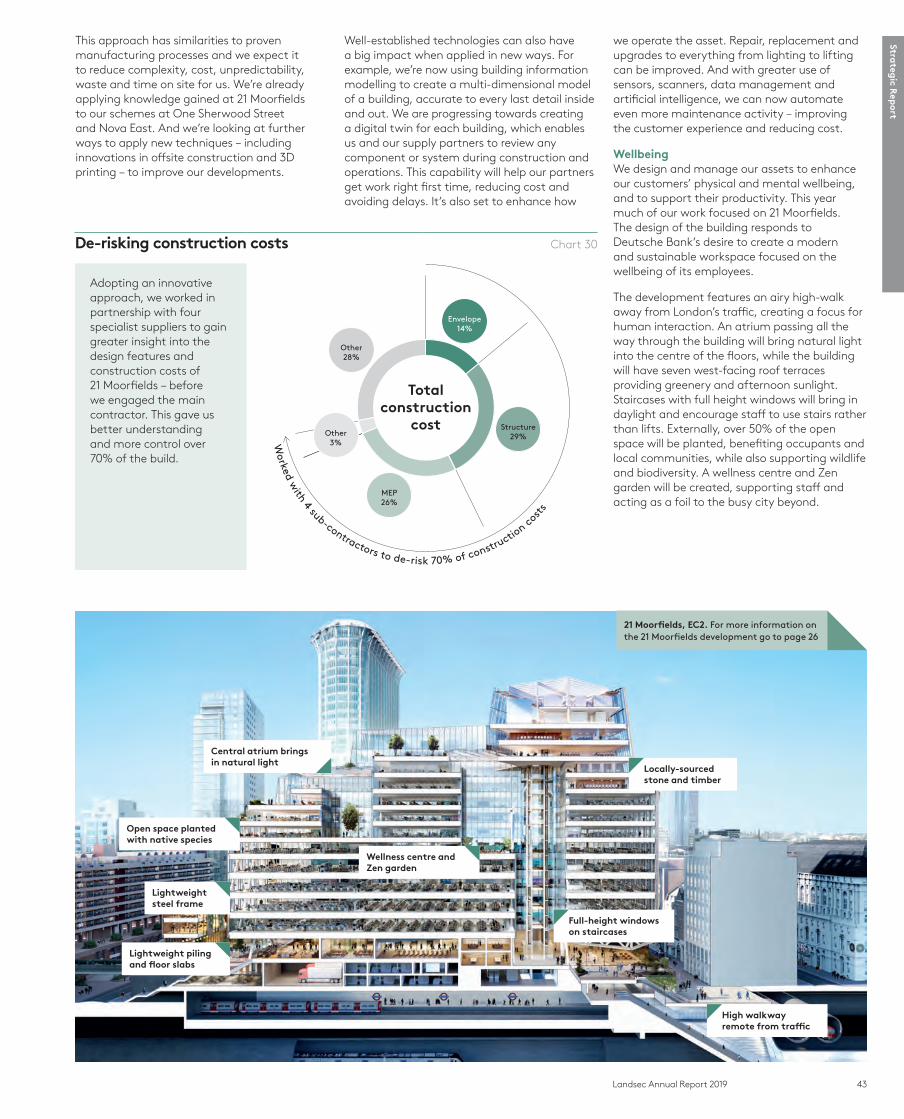
43Landsec Annual Report 2019
Strateg
ic Rep
ort
we operate the asset. Repair, replacement and upgrades to everything from lighting to lifting can be improved. And with greater use of sensors, scanners, data management and artificial intelligence, we can now automate even more maintenance activity – improving the customer experience and reducing cost.
WellbeingWe design and manage our assets to enhance our customers’ physical and mental wellbeing, and to support their productivity. This year much of our work focused on 21 Moorfields. The design of the building responds to Deutsche Bank’s desire to create a modern and sustainable workspace focused on the wellbeing of its employees.
The development features an airy high-walk away from London’s traffic, creating a focus for human interaction. An atrium passing all the way through the building will bring natural light into the centre of the floors, while the building will have seven west-facing roof terraces providing greenery and afternoon sunlight. Staircases with full height windows will bring in daylight and encourage staff to use stairs rather than lifts. Externally, over 50% of the open space will be planted, benefiting occupants and local communities, while also supporting wildlife and biodiversity. A wellness centre and Zen garden will be created, supporting staff and acting as a foil to the busy city beyond.
Well-established technologies can also have a big impact when applied in new ways. For example, we’re now using building information modelling to create a multi-dimensional model of a building, accurate to every last detail inside and out. We are progressing towards creating a digital twin for each building, which enables us and our supply partners to review any component or system during construction and operations. This capability will help our partners get work right first time, reducing cost and avoiding delays. It’s also set to enhance how
This approach has similarities to proven manufacturing processes and we expect it to reduce complexity, cost, unpredictability, waste and time on site for us. We’re already applying knowledge gained at 21 Moorfields to our schemes at One Sherwood Street and Nova East. And we’re looking at further ways to apply new techniques – including innovations in offsite construction and 3D printing – to improve our developments.
De-risking construction costs Chart 30
Adopting an innovative approach, we worked in partnership with four specialist suppliers to gain greater insight into the design features and construction costs of 21 Moorfields – before we engaged the main contractor. This gave us better understanding and more control over 70% of the build.
Worked w
ith 4 sub-contractors to de-risk 70% of constructio
n cost
s
Envelope14%
Structure29%
MEP26%
Other28%
Other3%
Totalconstruction
cost
21 Moorfields, EC2. For more information on the 21 Moorfields development go to page 26
Open space planted with native species
Central atrium brings in natural light
Wellness centre and Zen garden
Locally-sourced stone and timber
High walkway remote from traffic
Lightweight piling and floor slabs
Full-height windows on staircases
Lightweight steel frame
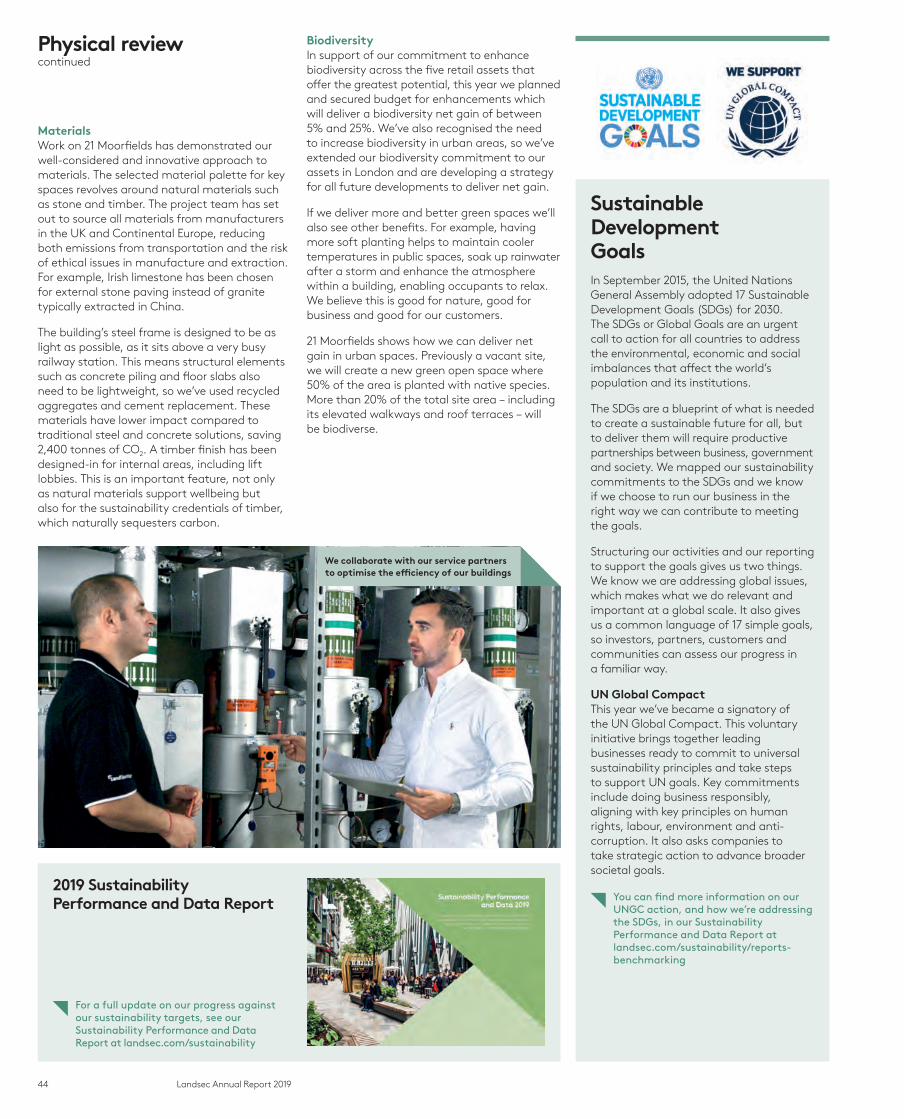
Sustainable Development Goals In September 2015, the United Nations General Assembly adopted 17 Sustainable Development Goals (SDGs) for 2030. The SDGs or Global Goals are an urgent call to action for all countries to address the environmental, economic and social imbalances that affect the world’s population and its institutions.
The SDGs are a blueprint of what is needed to create a sustainable future for all, but to deliver them will require productive partnerships between business, government and society. We mapped our sustainability commitments to the SDGs and we know if we choose to run our business in the right way we can contribute to meeting the goals.
Structuring our activities and our reporting to support the goals gives us two things. We know we are addressing global issues, which makes what we do relevant and important at a global scale. It also gives us a common language of 17 simple goals, so investors, partners, customers and communities can assess our progress in a familiar way.
UN Global CompactThis year we’ve became a signatory of the UN Global Compact. This voluntary initiative brings together leading businesses ready to commit to universal sustainability principles and take steps to support UN goals. Key commitments include doing business responsibly, aligning with key principles on human rights, labour, environment and anti-corruption. It also asks companies to take strategic action to advance broader societal goals.
You can find more information on our UNGC action, and how we’re addressing the SDGs, in our Sustainability Performance and Data Report at landsec.com/sustainability/reports-benchmarking
44 Landsec Annual Report 2019
BiodiversityIn support of our commitment to enhance biodiversity across the five retail assets that offer the greatest potential, this year we planned and secured budget for enhancements which will deliver a biodiversity net gain of between 5% and 25%. We’ve also recognised the need to increase biodiversity in urban areas, so we’ve extended our biodiversity commitment to our assets in London and are developing a strategy for all future developments to deliver net gain.
If we deliver more and better green spaces we’ll also see other benefits. For example, having more soft planting helps to maintain cooler temperatures in public spaces, soak up rainwater after a storm and enhance the atmosphere within a building, enabling occupants to relax. We believe this is good for nature, good for business and good for our customers.
21 Moorfields shows how we can deliver net gain in urban spaces. Previously a vacant site, we will create a new green open space where 50% of the area is planted with native species. More than 20% of the total site area – including its elevated walkways and roof terraces – will be biodiverse.
MaterialsWork on 21 Moorfields has demonstrated our well-considered and innovative approach to materials. The selected material palette for key spaces revolves around natural materials such as stone and timber. The project team has set out to source all materials from manufacturers in the UK and Continental Europe, reducing both emissions from transportation and the risk of ethical issues in manufacture and extraction. For example, Irish limestone has been chosen for external stone paving instead of granite typically extracted in China.
The building’s steel frame is designed to be as light as possible, as it sits above a very busy railway station. This means structural elements such as concrete piling and floor slabs also need to be lightweight, so we’ve used recycled aggregates and cement replacement. These materials have lower impact compared to traditional steel and concrete solutions, saving 2,400 tonnes of CO2. A timber finish has been designed-in for internal areas, including lift lobbies. This is an important feature, not only as natural materials support wellbeing but also for the sustainability credentials of timber, which naturally sequesters carbon.
2019 Sustainability Performance and Data Report
For a full update on our progress against our sustainability targets, see our Sustainability Performance and Data Report at landsec.com/sustainability
We collaborate with our service partners to optimise the efficiency of our buildings
Physical reviewcontinued
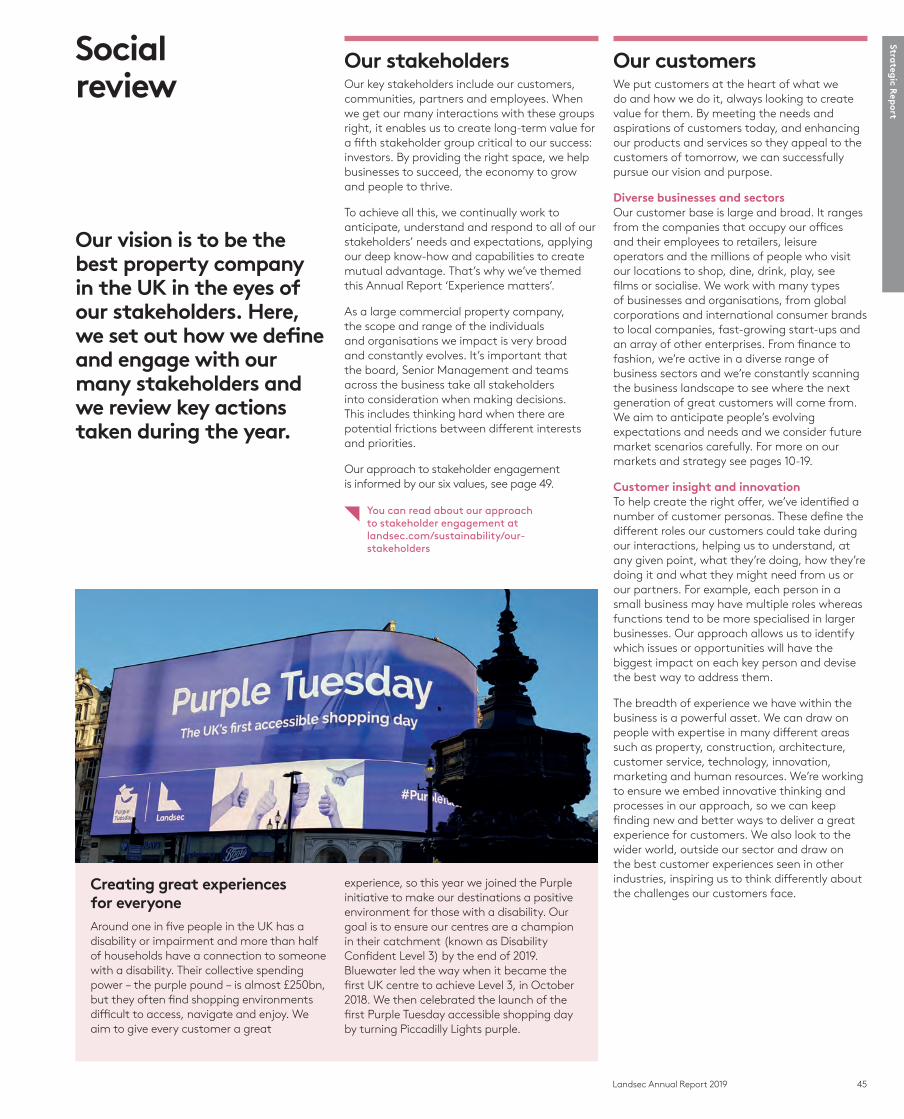
45Landsec Annual Report 2019
Strateg
ic Rep
ort
Our customers We put customers at the heart of what we do and how we do it, always looking to create value for them. By meeting the needs and aspirations of customers today, and enhancing our products and services so they appeal to the customers of tomorrow, we can successfully pursue our vision and purpose.
Diverse businesses and sectorsOur customer base is large and broad. It ranges from the companies that occupy our offices and their employees to retailers, leisure operators and the millions of people who visit our locations to shop, dine, drink, play, see films or socialise. We work with many types of businesses and organisations, from global corporations and international consumer brands to local companies, fast-growing start-ups and an array of other enterprises. From finance to fashion, we’re active in a diverse range of business sectors and we’re constantly scanning the business landscape to see where the next generation of great customers will come from. We aim to anticipate people’s evolving expectations and needs and we consider future market scenarios carefully. For more on our markets and strategy see pages 10-19.
Customer insight and innovationTo help create the right offer, we’ve identified a number of customer personas. These define the different roles our customers could take during our interactions, helping us to understand, at any given point, what they’re doing, how they’re doing it and what they might need from us or our partners. For example, each person in a small business may have multiple roles whereas functions tend to be more specialised in larger businesses. Our approach allows us to identify which issues or opportunities will have the biggest impact on each key person and devise the best way to address them.
The breadth of experience we have within the business is a powerful asset. We can draw on people with expertise in many different areas such as property, construction, architecture, customer service, technology, innovation, marketing and human resources. We’re working to ensure we embed innovative thinking and processes in our approach, so we can keep finding new and better ways to deliver a great experience for customers. We also look to the wider world, outside our sector and draw on the best customer experiences seen in other industries, inspiring us to think differently about the challenges our customers face.
Our stakeholdersOur key stakeholders include our customers, communities, partners and employees. When we get our many interactions with these groups right, it enables us to create long-term value for a fifth stakeholder group critical to our success: investors. By providing the right space, we help businesses to succeed, the economy to grow and people to thrive.
To achieve all this, we continually work to anticipate, understand and respond to all of our stakeholders’ needs and expectations, applying our deep know-how and capabilities to create mutual advantage. That’s why we’ve themed this Annual Report ‘Experience matters’.
As a large commercial property company, the scope and range of the individuals and organisations we impact is very broad and constantly evolves. It’s important that the board, Senior Management and teams across the business take all stakeholders into consideration when making decisions. This includes thinking hard when there are potential frictions between different interests and priorities.
Our approach to stakeholder engagement is informed by our six values, see page 49.
You can read about our approach to stakeholder engagement at landsec.com/sustainability/our-stakeholders
Our vision is to be the best property company in the UK in the eyes of our stakeholders. Here, we set out how we define and engage with our many stakeholders and we review key actions taken during the year.
Social review
Creating great experiences for everyoneAround one in five people in the UK has a disability or impairment and more than half of households have a connection to someone with a disability. Their collective spending power – the purple pound – is almost £250bn, but they often find shopping environments difficult to access, navigate and enjoy. We aim to give every customer a great
experience, so this year we joined the Purple initiative to make our destinations a positive environment for those with a disability. Our goal is to ensure our centres are a champion in their catchment (known as Disability Confident Level 3) by the end of 2019. Bluewater led the way when it became the first UK centre to achieve Level 3, in October 2018. We then celebrated the launch of the first Purple Tuesday accessible shopping day by turning Piccadilly Lights purple.

46 Landsec Annual Report 2019
Recent research shows that employment in the wholesale and retail sector is forecast to grow by 12% over the next 10 years. In the accommodation and food services sector that figure will be 13%. In October 2018, we launched Ambition:Leeds, a new training academy for retail and hospitality talent, created in partnership with Leeds City Council and Leeds Business Improvement District. We created the academy in response to demand from retailers for more skilled recruits ready to join their workforce. The academy provides bespoke training by some of the region’s most respected education partners including Leeds City College, Leeds Beckett University and The Source Skills Academy. In its first year alone, the centre will help to prepare 500 students to join the retail and hospitality sector.
Our communities Our destinations play an important role in their communities as space to work, shop or live. We listen to local organisations, residents and businesses when we’re planning and constructing a development, investing time and resources to support community projects and foster close relationships.
Measuring our social valueThis year we launched our first Social Contribution report, measuring the social value of our community programmes. Doing this enables us to bring our impact to life and quantify the difference we are making to people, communities and society in financial terms. It also helps us to find the areas of our programme which add the most value to society, meaning we can shape our activities to deliver even more. Since 2015 we have generated social value of £9.4m through our community programmes and partnerships.
Using the baseline from this report, we set a new social sustainability commitment this year: to create £25m of social value through our community programmes by 2025. It’s a stretching target so we’ll need to work closely with customers, communities and partners to achieve it. See ‘Our social value contribution in 2018’ right for more key facts and figures on our social contribution this year.
Community employmentIn 2011, we set a target to help a total of 1,200 people further from the jobs market into work by 2020 through our Community Employment Programme. We’ve already exceeded that target having now supported over 1,300 people from our local communities into employment since 2011. This year our Community Employment Programme has created £1.2m of social value, supporting 187 people into jobs.
We know working with ex-offenders creates significant social value. Getting people into productive and positive work significantly reduces the chances of re-offending. For this reason, in September 2018 we launched the UK’s first aerial window cleaning training academy at Her Majesty’s Prison & Young Offender Institution Isis, in partnership with our charity partner Bounce Back and our service partner Not Just Cleaning Ltd.
Aerial cleaning is a skilled job that keeps our buildings clean and operating efficiently. This involves highly technical access skills like abseiling. There’s currently a shortage of people trained in the necessary skills and this is a problem for us and our industry. So the new academy will play an important role in tackling the ongoing skills shortage while helping to reduce reoffending. Since 2015, our work with criminal justice charities has generated £1.3m of social value.
We experiment and collaborate with our partners to best meet the needs of our customers. As an example, we involve them in workshopping our joint futures through makeathon sessions. These six-hour immersive creative workshops focus on a real business problem, with the aim of finding an effective and feasible solution. A number of specific projects are underway to determine the customer value derived from Smart Buildings; the impact of new ways of working and living; and analysis of the longer-term impact of globalisation to our products and services, and how we can adapt them.
Knowing our customer means we can support them with important issues. For many customers in our buildings, energy costs can be significant. So we’re helping to drive down costs through creating insight from energy data, seeking opportunities for improvement and helping customers to carry out energy efficiency projects. Other customers in our buildings can experience skills shortages, and our community employment programmes can help to find candidates in retail, leisure and hospitality. Working with customers in this way benefits them, but also creates a bottom line benefit and value to society.
In this Annual Report, you can read about a range of ways in which we’re evolving our offer to customers, including our Myo flexible office brand (see page 4), our Landsec Lounge concept (see page 28) and the immersive brand experiences and next-generation retail environments we’re creating in our destinations (see page 6).
It’s an incredible thing to give people a second chance to turn around their lives and above all to help people into employment – with all that means for personal and family lives, our communities and society.”
Rory Stewart MPPrisons Minister, speaking at the launch of our aerial window cleaning academy in HMP Isis.
Our social value contribution in 2018
£3.2msocial value created through our community programmes and partnerships
1,500+number of people directly supported through our community programmes
£746,000rental value of space we donated to community partners
1,000+people who benefited from our volunteering programme
92%of students reported an increase in confidence through our education initiatives
£25mnew cumulative target set for 2025
Social reviewcontinued

47Landsec Annual Report 2019
Strateg
ic Rep
ort
EducationToo many young people face barriers that may prevent them from accessing jobs in our industry. Our education programmes aim to inspire the next generation of property professionals, allowing equal access to opportunities and bridging the skills gap. By encouraging students from all backgrounds into our industry we can become more diverse and successful as a business, and better reflect our local communities.
This year:
— We’ve run enterprise challenges focused on property and sustainability for students in London, Portsmouth, Oxford and Leeds
— 295 young people, 63% of whom are female, took part in our programmes
— 97% of these students felt more prepared for the labour market.
We’re encouraging more young women to consider careers in property, engineering and construction through our Build Your Future programme. Since 2017, 111 students from London have taken part to create their idea for a new development, supported by female role models from a diverse range of roles in our industry.
Our programmes raise young people’s aspirations and develop their employability skills, with the expertise of mentors from Landsec and our partners. This means we can identify future talent for our industry, including encouraging students from our local communities to apply to our Trainee Academy.
Charity partnershipsOur partnerships with local and national charities mean we can support causes that are important to our employees, customers and communities. This enables us to address issues such as rising homelessness, enhance social mobility and create opportunities for people living in the communities where we’re based.
Working with Bounce Back since 2012, we have met a shared objective of empowering people to fulfil their potential, regardless of background or any other barrier. Together, we’ve launched training academies in several London prisons, engaging closely with our supply partners to create job opportunities. This year we were thrilled to welcome Bounce Back’s offices and community training teams to our Castle Lane site for 18 months, providing in-kind donations of space and resources. Our community partners occupied spaces worth the equivalent of £746,000 in rental value this year, allowing them to maximise their resources whilst bringing our spaces to life between becoming vacant and redeveloped.
Cumulative total number of jobs secured Chart 31
0
200
400
600
800
1,000
1,400
1,200
2013 2015 2016 2017 20192018
Jobs Target
2014
1,336
1,149
962
779
583
206
426
This year we launched the first aerial window cleaning academy in a UK prison at HMP Isis
Students participating in our Made in Portsmouth challenge, supported by our employees
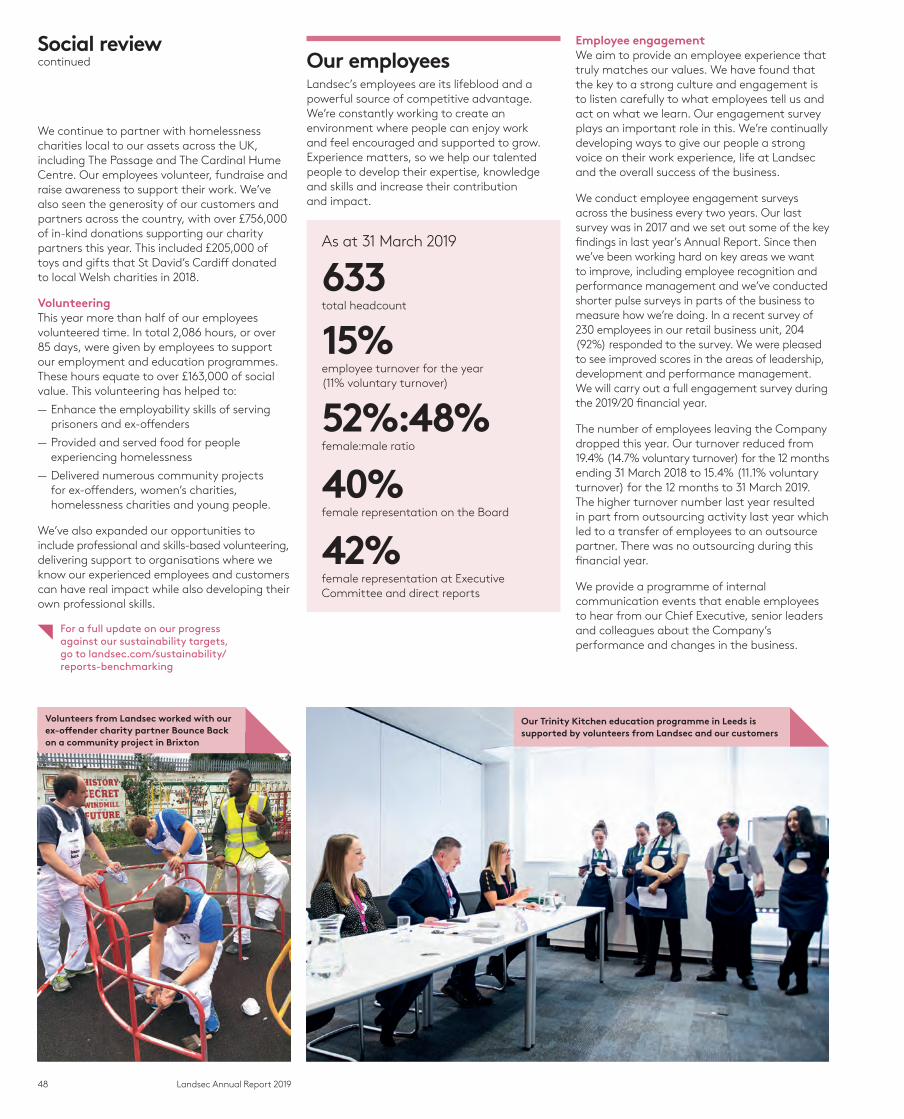
48 Landsec Annual Report 2019
Employee engagement We aim to provide an employee experience that truly matches our values. We have found that the key to a strong culture and engagement is to listen carefully to what employees tell us and act on what we learn. Our engagement survey plays an important role in this. We’re continually developing ways to give our people a strong voice on their work experience, life at Landsec and the overall success of the business.
We conduct employee engagement surveys across the business every two years. Our last survey was in 2017 and we set out some of the key findings in last year’s Annual Report. Since then we’ve been working hard on key areas we want to improve, including employee recognition and performance management and we’ve conducted shorter pulse surveys in parts of the business to measure how we’re doing. In a recent survey of 230 employees in our retail business unit, 204 (92%) responded to the survey. We were pleased to see improved scores in the areas of leadership, development and performance management. We will carry out a full engagement survey during the 2019/20 financial year.
The number of employees leaving the Company dropped this year. Our turnover reduced from 19.4% (14.7% voluntary turnover) for the 12 months ending 31 March 2018 to 15.4% (11.1% voluntary turnover) for the 12 months to 31 March 2019. The higher turnover number last year resulted in part from outsourcing activity last year which led to a transfer of employees to an outsource partner. There was no outsourcing during this financial year.
We provide a programme of internal communication events that enable employees to hear from our Chief Executive, senior leaders and colleagues about the Company’s performance and changes in the business.
Our employees Landsec’s employees are its lifeblood and a powerful source of competitive advantage. We’re constantly working to create an environment where people can enjoy work and feel encouraged and supported to grow. Experience matters, so we help our talented people to develop their expertise, knowledge and skills and increase their contribution and impact.
As at 31 March 2019
633total headcount
15%employee turnover for the year (11% voluntary turnover)
52%:48%female:male ratio
40%female representation on the Board
42%female representation at Executive Committee and direct reports
We continue to partner with homelessness charities local to our assets across the UK, including The Passage and The Cardinal Hume Centre. Our employees volunteer, fundraise and raise awareness to support their work. We’ve also seen the generosity of our customers and partners across the country, with over £756,000 of in-kind donations supporting our charity partners this year. This included £205,000 of toys and gifts that St David’s Cardiff donated to local Welsh charities in 2018.
VolunteeringThis year more than half of our employees volunteered time. In total 2,086 hours, or over 85 days, were given by employees to support our employment and education programmes. These hours equate to over £163,000 of social value. This volunteering has helped to:
— Enhance the employability skills of serving prisoners and ex-offenders
— Provided and served food for people experiencing homelessness
— Delivered numerous community projects for ex-offenders, women’s charities, homelessness charities and young people.
We’ve also expanded our opportunities to include professional and skills-based volunteering, delivering support to organisations where we know our experienced employees and customers can have real impact while also developing their own professional skills.
For a full update on our progress against our sustainability targets, go to landsec.com/sustainability/reports-benchmarking
Social reviewcontinued
Our Trinity Kitchen education programme in Leeds is supported by volunteers from Landsec and our customers
Volunteers from Landsec worked with our ex-offender charity partner Bounce Back on a community project in Brixton

49Landsec Annual Report 2019
Strateg
ic Rep
ort
We have launched a mental health app, ‘Thrive’, for all employees and this was supported by a powerful campaign video. We also introduced monthly mental health first aid lunches called ‘Time for You’, where our first aiders openly share their experiences and expertise. See pages 46-47 for information on how we’re also working to support mental health within our communities.
Employee health and wellbeingIn addition to our support for employees’ physical wellbeing, we’ve been giving close attention to the impact of mental health. One in ten of our employees are mental health first aiders. This means that, with the support of training, they are able to:
— Spot the triggers and signs of mental health issues in fellow colleagues
— Have the confidence to step in, reassure and support a person in distress
— Use non-judgemental listening skills and knowledge to ensure our employees are guided to the support they need.
Topics have ranged from our financial results to our social contribution, from innovation to the launch of our Myo flexible offer. These events are streamed to sites outside London and there is always a chance for questions and lively discussion. They’re supported by a constant stream of news and information on our internal Landsec News website, which we relaunched this year.
Our Chief Executive and Human Resources Director also attend quarterly meetings of our Employee Forum. The forum is made up of 13 employees who have volunteered to represent six functional groups of employees covering our whole business. It acts as a channel for employees to ask Senior Management questions and make suggestions.
In October 2018 the Employee Forum had its first meeting with our Chairman. This is an opportunity for our people to ask questions and for the Chairman to hear directly from employees about their experiences within Landsec. Meetings between the Chairman and the Employee Forum enable the Board to assess the culture of the organisation and engage directly with employees. We will be holding a session for the Employee Forum and other members of staff to get to know the Board in July 2019.
Creating experiencesThis year, senior leaders hosted 33 localised events with their teams to explore what it means to be customer-focused. Employees attending those events scored themselves on average at 81/100 in terms of how confident they are personally to deliver great customer experiences. We also held sessions for new starters in our business to help them understand our customer-experience led culture.
Following feedback from employees, and to better align with our culture and values, we’ve developed a new performance and development framework that focuses on each employee’s impact on customers and other stakeholders. We involved a number of employees, including members of the Employee Forum, in developing the framework and pilot training. The new framework will be rolled out during 2019/20, with training support for all employees.
This year we relaunched our Code of Conduct. The code is not just about providing access to a set of policies but a statement of how we will behave and how we will treat our customers and the communities where we work. It makes it easy for our people to make the right decisions and to know what it means to live our values. As our values articulate how we should behave every day, we refer to them throughout our recruitment process. Our aim is to attract talent who will help us to build an ‘experience’ culture at every level within the organisation. This year we also updated our Management and Leadership development programmes to align the content more to our values and leadership competencies, better equipping delegates to deliver exceptional experiences.
Our values
Our Chairman met with the Employee Forum in October
Customer service
Integrity
Innovation
ExcellenceRespect
Accountability
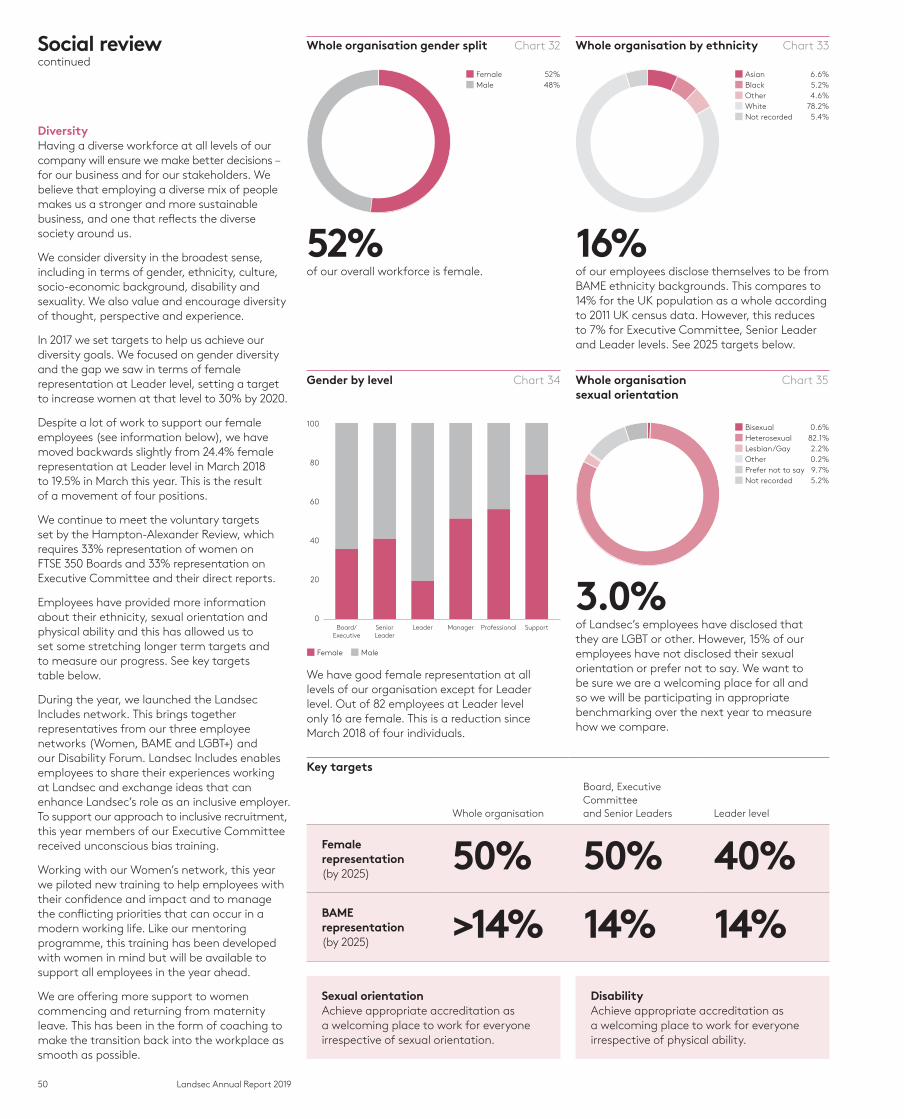
50 Landsec Annual Report 2019
DiversityHaving a diverse workforce at all levels of our company will ensure we make better decisions – for our business and for our stakeholders. We believe that employing a diverse mix of people makes us a stronger and more sustainable business, and one that reflects the diverse society around us.
We consider diversity in the broadest sense, including in terms of gender, ethnicity, culture, socio-economic background, disability and sexuality. We also value and encourage diversity of thought, perspective and experience.
In 2017 we set targets to help us achieve our diversity goals. We focused on gender diversity and the gap we saw in terms of female representation at Leader level, setting a target to increase women at that level to 30% by 2020.
Despite a lot of work to support our female employees (see information below), we have moved backwards slightly from 24.4% female representation at Leader level in March 2018 to 19.5% in March this year. This is the result of a movement of four positions.
We continue to meet the voluntary targets set by the Hampton-Alexander Review, which requires 33% representation of women on FTSE 350 Boards and 33% representation on Executive Committee and their direct reports.
Employees have provided more information about their ethnicity, sexual orientation and physical ability and this has allowed us to set some stretching longer term targets and to measure our progress. See key targets table below.
During the year, we launched the Landsec Includes network. This brings together representatives from our three employee networks (Women, BAME and LGBT+) and our Disability Forum. Landsec Includes enables employees to share their experiences working at Landsec and exchange ideas that can enhance Landsec’s role as an inclusive employer. To support our approach to inclusive recruitment, this year members of our Executive Committee received unconscious bias training.
Working with our Women’s network, this year we piloted new training to help employees with their confidence and impact and to manage the conflicting priorities that can occur in a modern working life. Like our mentoring programme, this training has been developed with women in mind but will be available to support all employees in the year ahead.
We are offering more support to women commencing and returning from maternity leave. This has been in the form of coaching to make the transition back into the workplace as smooth as possible.
Whole organisation gender split Chart 32 Whole organisation by ethnicity Chart 33
■ Female 52%■ Male 48%
■ Asian 6.6%■ Black 5.2%■ Other 4.6%■ White 78.2%■ Not recorded 5.4%
52%of our overall workforce is female.
16%of our employees disclose themselves to be from BAME ethnicity backgrounds. This compares to 14% for the UK population as a whole according to 2011 UK census data. However, this reduces to 7% for Executive Committee, Senior Leader and Leader levels. See 2025 targets below.
Gender by level Chart 34 Whole organisation Chart 35 sexual orientation
■ Female ■ Male
0
20
40
60
80
100
Board/Executive
SeniorLeader
Leader Manager Professional Support
We have good female representation at all levels of our organisation except for Leader level. Out of 82 employees at Leader level only 16 are female. This is a reduction since March 2018 of four individuals.
■ Bisexual 0.6%■ Heterosexual 82.1%■ Lesbian/Gay 2.2%■ Other 0.2%■ Prefer not to say 9.7%■ Not recorded 5.2%
3.0%of Landsec’s employees have disclosed that they are LGBT or other. However, 15% of our employees have not disclosed their sexual orientation or prefer not to say. We want to be sure we are a welcoming place for all and so we will be participating in appropriate benchmarking over the next year to measure how we compare.
Key targets
Whole organisation
Board, Executive Committee and Senior Leaders Leader level
Female representation (by 2025)
50% 50% 40%BAME representation (by 2025)
>14% 14% 14%
Sexual orientationAchieve appropriate accreditation as a welcoming place to work for everyone irrespective of sexual orientation.
DisabilityAchieve appropriate accreditation as a welcoming place to work for everyone irrespective of physical ability.
Social reviewcontinued
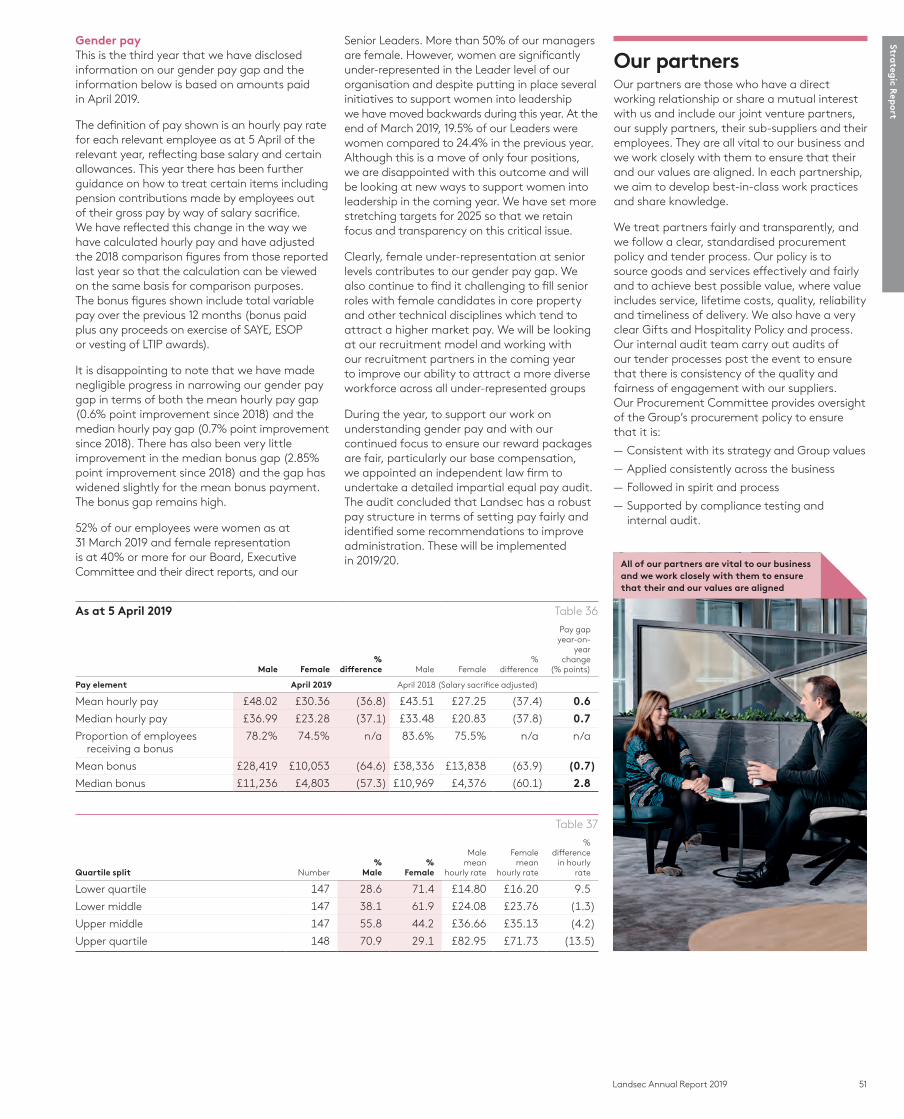
51Landsec Annual Report 2019
Strateg
ic Rep
ort
Gender payThis is the third year that we have disclosed information on our gender pay gap and the information below is based on amounts paid in April 2019.
The definition of pay shown is an hourly pay rate for each relevant employee as at 5 April of the relevant year, reflecting base salary and certain allowances. This year there has been further guidance on how to treat certain items including pension contributions made by employees out of their gross pay by way of salary sacrifice. We have reflected this change in the way we have calculated hourly pay and have adjusted the 2018 comparison figures from those reported last year so that the calculation can be viewed on the same basis for comparison purposes. The bonus figures shown include total variable pay over the previous 12 months (bonus paid plus any proceeds on exercise of SAYE, ESOP or vesting of LTIP awards).
It is disappointing to note that we have made negligible progress in narrowing our gender pay gap in terms of both the mean hourly pay gap (0.6% point improvement since 2018) and the median hourly pay gap (0.7% point improvement since 2018). There has also been very little improvement in the median bonus gap (2.85% point improvement since 2018) and the gap has widened slightly for the mean bonus payment. The bonus gap remains high.
52% of our employees were women as at 31 March 2019 and female representation is at 40% or more for our Board, Executive Committee and their direct reports, and our
Senior Leaders. More than 50% of our managers are female. However, women are significantly under-represented in the Leader level of our organisation and despite putting in place several initiatives to support women into leadership we have moved backwards during this year. At the end of March 2019, 19.5% of our Leaders were women compared to 24.4% in the previous year. Although this is a move of only four positions, we are disappointed with this outcome and will be looking at new ways to support women into leadership in the coming year. We have set more stretching targets for 2025 so that we retain focus and transparency on this critical issue.
Clearly, female under-representation at senior levels contributes to our gender pay gap. We also continue to find it challenging to fill senior roles with female candidates in core property and other technical disciplines which tend to attract a higher market pay. We will be looking at our recruitment model and working with our recruitment partners in the coming year to improve our ability to attract a more diverse workforce across all under-represented groups
During the year, to support our work on understanding gender pay and with our continued focus to ensure our reward packages are fair, particularly our base compensation, we appointed an independent law firm to undertake a detailed impartial equal pay audit. The audit concluded that Landsec has a robust pay structure in terms of setting pay fairly and identified some recommendations to improve administration. These will be implemented in 2019/20.
Our partners Our partners are those who have a direct working relationship or share a mutual interest with us and include our joint venture partners, our supply partners, their sub-suppliers and their employees. They are all vital to our business and we work closely with them to ensure that their and our values are aligned. In each partnership, we aim to develop best-in-class work practices and share knowledge.
We treat partners fairly and transparently, and we follow a clear, standardised procurement policy and tender process. Our policy is to source goods and services effectively and fairly and to achieve best possible value, where value includes service, lifetime costs, quality, reliability and timeliness of delivery. We also have a very clear Gifts and Hospitality Policy and process. Our internal audit team carry out audits of our tender processes post the event to ensure that there is consistency of the quality and fairness of engagement with our suppliers. Our Procurement Committee provides oversight of the Group’s procurement policy to ensure that it is:
— Consistent with its strategy and Group values
— Applied consistently across the business
— Followed in spirit and process
— Supported by compliance testing and internal audit.
As at 5 April 2019 Table 36
Male Female%
difference Male Female%
difference
Pay gap year-on-
year change
(% points)
Pay element April 2019 April 2018 (Salary sacrifice adjusted)
Mean hourly pay £48.02 £30.36 (36.8) £43.51 £27.25 (37.4) 0.6
Median hourly pay £36.99 £23.28 (37.1) £33.48 £20.83 (37.8) 0.7
Proportion of employees receiving a bonus
78.2% 74.5% n/a 83.6% 75.5% n/a n/a
Mean bonus £28,419 £10,053 (64.6) £38,336 £13,838 (63.9) (0.7)
Median bonus £11,236 £4,803 (57.3) £10,969 £4,376 (60.1) 2.8
Table 37
Quartile split Number%
Male%
Female
Malemean
hourly rate
Female mean
hourly rate
% difference
in hourly rate
Lower quartile 147 28.6 71.4 £14.80 £16.20 9.5
Lower middle 147 38.1 61.9 £24.08 £23.76 (1.3)
Upper middle 147 55.8 44.2 £36.66 £35.13 (4.2)
Upper quartile 148 70.9 29.1 £82.95 £71.73 (13.5)
All of our partners are vital to our business and we work closely with them to ensure that their and our values are aligned
52 Landsec Annual Report 2019
Health, safety and securityOur commitment is to provide a safe, healthy and secure environment for our people to work and for our customers to work, live, shop and relax. Clearly, the areas covered in this section are relevant to our customers, communities and employees – and by extension our investors – but we’ve included them in this communities section to underline that high standards are best achieved through great partnerships across the supply chain and beyond.
This year, we fell behind on training and action is being taken to ensure we keep ahead in a fast-moving world. Once again we maintained our OHSAS 18001 certification, the benchmark for health and safety management systems, across 100% of our sites.
Following the Grenfell fire, we worked closely with customers and partners to consider the potential ramifications of cladding in our portfolio. These consultations included our insurers, surveyors, local authorities and the London Fire Brigade. We assessed every asset in the portfolio during the year; remedial works to cladding and fire stopping are in progress.
Our ongoing work with the Health in Construction Leadership Group as well as our Customer Improvement Groups helps ensure we give health the same billing as safety, with mental health as important as physical health. A highlight of the year was the progress made on mental health, within the business and across the industry. This was underlined when Landsec won the best Health and Wellbeing Strategy Award at the International Institute of Risk & Safety Management (IIRSM) 2018 Awards. We will continue to push ahead in this area.
This year, in partnership with Revo (formerly the British Council of Shopping Centres), we held a suicide awareness and prevention roundtable. Increasing awareness around suicide and enhancing mitigation strategies are now clear priorities for Landsec and other Revo members. Through working with the wider industry, we strive to help support the wider government suicide prevention strategy, and are engaging with our local stakeholders to help prevent suicide incidents.
During the year, we enhanced security training and advice for employees and partners. We also reviewed measures to address hostile use of vehicles and acted where required. We have introduced a group-wide response plan that enables us to respond to an increase in national threat in a proportionate and cost-effective way. Through our Security Customer Improvement Group, we’ve engaged with our security partners to establish a consistent approach to physical security across our portfolio.
Engaging our supply chainWe’re committed to disclosure on supply chain issues and this year took part in the Workforce Disclosure Initiative for the second time, scoring 73% against an average of 53%. This means we’re transparent about how we support our employees and staff in our supply chain. But being transparent is just the start. We’re also working with partners to deliver on our Sustainability Charter, launched last year. The charter includes our supplier code of conduct and sets out our sustainability expectations for our partners.
Fairness is a critical part of our commitments in this area and it is partly about paying people a fair wage. It’s also about upholding their human rights, celebrating their individuality and making sure they feel safe and respected in the workplace. To tackle this, we engaged our supply chain partners this year, asking people employed across our activities whether our policies were effective on the ground.
To do this we carried out ten engagement surveys, encompassing over 250 supply chain staff carrying out construction and maintenance activities. This involved visiting offices, retail destinations and development sites and speaking in confidence with supply chain employees. Based on guidance from the Gangmasters and Labour Abuse Authority, we spoke with staff who were most likely to be the lowest paid, and in roles which typically experience high levels of turnover. This included construction labour, cleaning and security staff. Due to the long and complex nature of supply chains, especially in construction, this meant the staff we spoke with were often not employed either by Landsec or by our partners.
The surveys confirmed we still have progress to make in ensuring our partners pay the Foundation Living Wage throughout every part of the supply chain. This is particularly problematic in construction, where operatives employed by labour agencies are often at risk from wages falling below our expectations. We also found a small number of cases of discrimination, from co-workers and members of the public. To make sure we address these issues, we’re working with partners to make sure they have the right procedures, support and training in place.
This year, we extended the coverage of our whistleblowing hotline to our supply partners and their staff. This means future cases of discrimination or failure to receive a Living Wage can be reported directly to us. We promoted the hotline through communication with our partners and posters in our offices and staff welfare facilities.
You can find out more about our approach to fairness and how we’re addressing the risks of modern slavery in our annual disclosure at landsec.com/about/slavery-human-trafficking-statement
FairnessOur commitment is to ensure everyone working on our behalf, in an environment we control, is given equal opportunities, protected from discrimination and paid at least the Foundation Living Wage. We’re committed to paying Living Wages throughout our activities by 2020 and are working closely with our supply chain partners to achieve this.
We’re an official Living Wage Employer, accredited by the Living Wage Foundation. This recognises that everyone in our business is paid at least the Foundation Living Wage (£10.55 an hour in London; £9.00 outside London), except interns and apprentices who are exempt from the Foundation rates. We ask supply chain partners to pay the Foundation Living Wage in their own supply chain and check this is happening on our behalf. In the London Portfolio, our strategic partners have confirmed 100% of those working on our behalf – within an environment we control – are paid at least the Foundation Living Wage. In Retail there’s more to do but we’re confident we’ll meet our commitment by 2020.
We’re actively promoting our Whistleblowing Policy to our supply partners and their employees
Social reviewcontinued

53Landsec Annual Report 2019
Strateg
ic Rep
ort
Our economic contributionEach year we measure our contribution to the UK economy, helping to show the number of livelihoods we support and the financial value we add through our activities. Some key findings from this year’s study:
£11.8bnTotal contribution to the UK economy each year from people based at our assets
£5.1bnOur ten-year contribution to the economy through property development
139,000Number of people working across our workplace, retail and leisure destinations
54,000jobs created in construction through our development activities over the last decade
Our investors Our investors are those who own shares in Landsec and our bondholders.
Shareholders are important to us as they are the owners of the business. They are a vital source of capital and provide valuable feedback and challenge to management.
We want to ensure that shareholders know what we are doing, how we are performing and what our strategy is for the future. We have a comprehensive investor relations programme and are committed to maintaining open dialogue.
In addition to formal events such as the Annual General Meeting, results presentations and capital market days, we also host property tours and sustainability roadshows to enable shareholders to increase their knowledge of the business.
The availability, and effective management, of debt is essential for us to succeed as a property company. We approach our debt investor relations on a partnership basis and aim to provide best practice in our relationships with bondholders and other providers of debt.
You can find more information on pages 89-90
Our physical and cyber security is supported by robust processes, policies and governance, together with mandatory training for employees in relevant roles. We continually prepare the business to anticipate and respond to incidents and we take part in a number of cross-industry forums. And we integrate security architecture into the way we design buildings. Our security teams are introducing new and innovative ways to reduce the opportunity for crime at our properties, protecting value for our customers.
Public affairsThe company communicates with and responds to central and local government in many different ways on issues critical to the success of society, local communities, our industry and our business. Our engagement is led by our public affairs group, which brings together representatives from across the business to define key issues and oversee our response. The group provides a report to the Board twice a year. This year we identified our key policy issues as:
— Brexit
— Housing
— Government infrastructure strategy
— Energy and environment.
We engage across government, from No. 10 to constituency MPs in communities where our key assets are located. This year we sponsored and took part in events at two party conferences. At the Conservative conference the event looked at the private sector’s role in the rehabilitation of offenders. At the Labour conference the focus was on construction sector skills shortages. We are politically neutral.
Our development teams establish productive relationships with local authorities and communities wherever we intend to develop at scale. We work to understand local issues and find ways to support the local community in partnership with local government and organisations.
Senior Management are active in the government’s Inclusive Economy Partnership. Focus areas include mental health in the workplace and getting young people into work.

54 Landsec Annual Report 2019
Where there is a relatively high inherent risk and relatively low residual risk, we know we have a high dependency on internal controls, which helps to focus the work of the Internal Audit function.
Management of risks Ownership and management of the risks is assigned to members of the Executive Committee. They are responsible for ensuring the operating effectiveness of the internal control systems and for implementing risk mitigation plans.
The Board undertakes an annual assessment of the principal risks, taking account of those that would threaten our business model, future performance, solvency or liquidity as well as the Group’s strategic objectives.
Helping the business to navigate the challenges and opportunities it faces through proactive risk management.”
Risk appetite The Board is responsible for defining the level and type of risk that the Group is willing to take and ensuring it remains in line with our strategy. The Board regularly reviews the risk appetite of the business, re-assesses the information available and the risk factors that are relevant. This ensures our risk exposure remains appropriate at any point in the cycle and that risk is considered dynamic. Our risk appetite is cascaded throughout the organisation by being embedded within our policies, procedures and delegated authorities.
One of our successes this year has been to improve Group risk reporting by establishing a principal risk dashboard. This consolidates existing risk appetite statements and tolerance ranges into a single risk monitoring dashboard for the Board and Executive Committee. This explicitly aligns our risk appetite and the corresponding key risk indicators (KRIs) to our strategy and key performance indicators (KPIs).
The risk dashboard uses risk indicators to track whether our risk level is within our risk appetite. The risk indicators are a mixture of leading and lagging indicators, and internal and external indicators. The primary aim of the dashboard is to act as a catalyst for discussion about how the principal risks are moving, whether the risk tolerance ranges remain appropriate for the business circumstances, and whether further mitigating actions need to be taken in order to bring a risk back within the desired risk tolerance range. The KRIs are rated red, amber or green based on where the indicators sit in relation to our tolerance level.
Each of the principal risks has a number of KRIs and we provide some examples of the KRIs against our principal risks in the table below. All red rated KRIs will be discussed by the Executive Committee and the relevant business units, with required actions agreed by the Executive
We set out an overview of our risk management process explaining the key elements of our approach to risk, how we have continued to develop our process over the course of the current year, the key successes in risk management and our priorities for 2019/20.Governance The Board has overall responsibility for oversight of risk and for maintaining a robust risk management and internal control system. The Board recognises the importance of identifying and actively monitoring our strategic, reputational, financial and operational risks, and other longer-term threats, trends and challenges facing the business. The Audit Committee supports the Board in the management of risk and is responsible for reviewing the effectiveness of the risk management and internal control processes during the year.
Identification of risks Identifying risk is a continual process. We have established a network of risk champions across the business and we utilise this network, in conjunction with ongoing discussions with management, external agencies and stakeholders, to identify the risks facing our business. The London and Retail executive committees also complete a detailed review of their risks, controls and mitigation strategies four times a year as we continue to further embed the risk culture across our business. This forms the basis for the principal and emerging risks, which are challenged and validated by the Executive Committee and the Audit Committee, before being presented to the Board. In addition, an in-depth risk session is held with the Board every two years, with the next one due to take place in December 2019.
Evaluation of risks The business considers both external and internal risks from the business units through to Group level. We use a risk scoring matrix to ensure risks are evaluated consistently. Our matrix considers likelihood, financial impact to income and capital values and reputational impact. When we evaluate risk, we consider the inherent or gross risk (the level of the risk before any mitigating action) and the residual or net risk (the risk that remains after we consider the effect of mitigating actions and controls). From this, we identify principal risks (current risks with relatively high impact and certainty) and emerging risks (risks where the extent and implications are not yet fully understood).
Our key successes in 2018/19
[ Improved Group risk reporting by establishing a principal risk dashboard
[ Promoted a positive risk culture across the business using the risk champion network
[Operationalised risk appetite at a business unit level by establishing the London and Retail risk forums
[ Enhanced business key controls to improve the mitigation of our principal risks
Our key priorities in 2019/20
[ Improve the alignment of strategy and risk management processes
[ Enhance the process to identify, assess and monitor emerging risks
[ Improve the asset level risk reporting processes
[Analyse risk event root cause and response plan effectiveness
Managing risk

55Landsec Annual Report 2019
Strateg
ic Rep
ort
Internal Audit provides assurance to the Audit Committee and Executive Committee in evaluating the design and operating effectiveness of the risk management and internal control processes, through independent review. On a quarterly basis, management self-certify that the key controls within their area of responsibility have been operating effectively. These results are independently validated by Internal Audit through sample testing. We continue to enhance and refine the key controls to ensure we have the most effective set of key controls to mitigate our principal risks and this remains an area of focus for 2019/20.
We focus on being risk aware, clearly defining our risk appetite, responding to changes to our risk profile quickly and having a strong risk culture among employees.
The Executive Committee is responsible for the day-to-day management of risk. Senior managers also attend the Executive Committee and the Audit Committee to discuss specific risk areas, and will be accompanied by external advisers where relevant. Some of our specific risk focus areas from this year included cyber security and data privacy.
The Risk Management function, headed by the Director of Risk Management and Internal Audit, assists management with facilitating the risk discussions and provides challenge and insight where appropriate. The Risk Management function also oversees and provides support to a network of risk champions across the business.
Sponsor. These actions may be to refresh the risk tolerance range to reflect a change in the business landscape and/or further mitigating actions. The agreed action will be noted in the Audit Committee and Board reports for final approval by the Board. On an ongoing basis, we will continue to refine the tolerance ranges and to review regularly whether the KRIs continue to be the best indicators.
Risk management framework As shown in the diagram below, we have an established risk management and control framework that enables us to effectively identify, evaluate and manage our principal and emerging risks. Our approach is not to eliminate risk entirely, but to ensure we have the right structure to effectively navigate the challenges and opportunities we face.
Risk management framework
Top-down
Oversight, identification,
assessment and mitigation of risk at a Group level
Bottom-up
Identification, assessment and mitigation of risk at business unit and functional
level
Risk governance
Board — Set the risk culture
— Approve risk appetite
— Agree the risk programme
— Discuss the Group ‘principal’ risks with executive management
1st line of defence 2nd line of defence 3rd line of defence
Risk management
Executive Committee — Define the risk appetite
— Evaluate proposed strategies against risk appetite and risk tolerances
— Identify the principal risks
— Design, implementation and evaluation of the system of internal control, and for ensuring its operational effectiveness
— Identify and monitor emerging risks
Risk Management — Aggregate risk information
— Assist management with the identification and assessment of principal and emerging risks
— Monitor risks and risk response plans against risk appetite and tolerance levels
— Create a common risk framework and language
— Provide direction on applying framework
— Provide guidance and training
— Facilitate risk escalations
Audit Committee — Supports the Board in monitoring risk exposure against risk appetite
— Review the effectiveness of our risk management and internal control processes
Internal Audit — Provide assurance on effectiveness of the risk programme, testing of key controls and risk response plans for significant risks
Risk ownership
Business units and risk champions
— Identify and assess risks
— Respond to risks
— Monitor risks and risk response
— Ensure operating effectiveness of key controls
Support functions — Provide guidance/ support to the risk team and business units
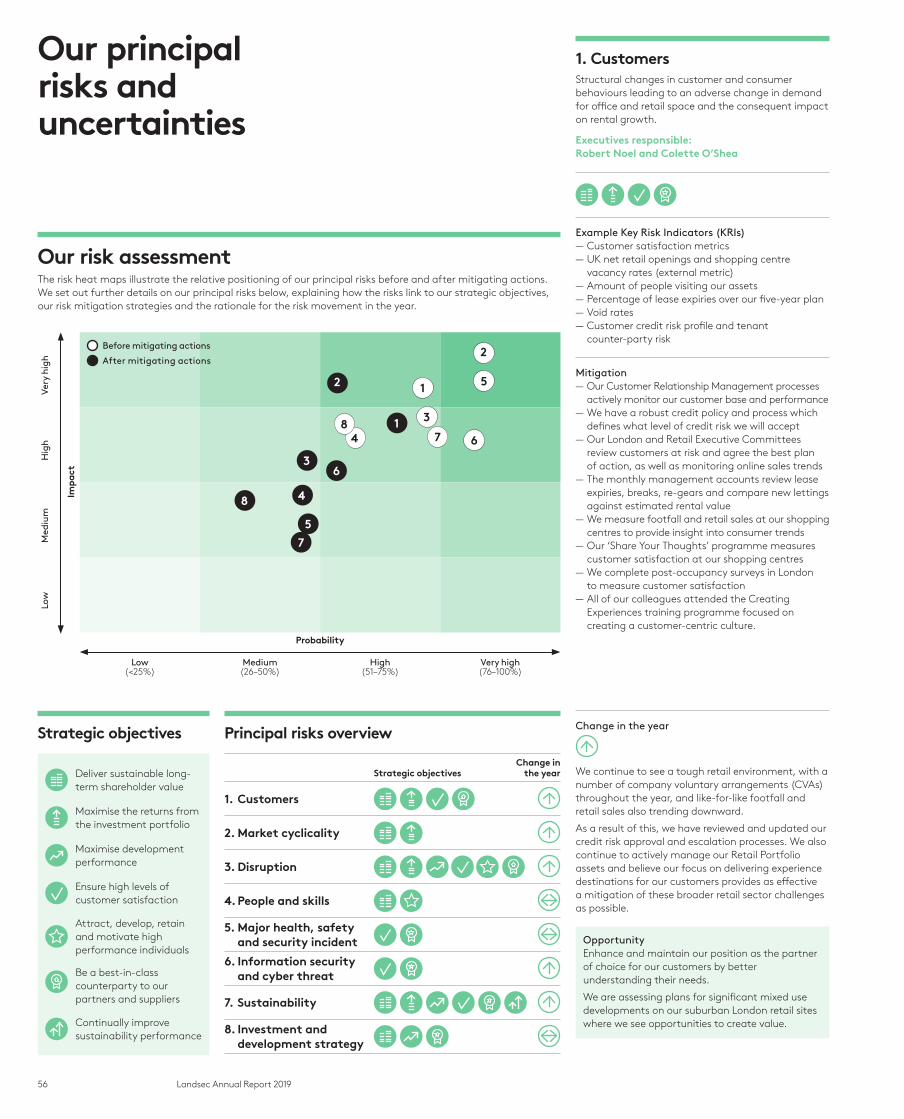
56 Landsec Annual Report 2019
1. CustomersStructural changes in customer and consumer behaviours leading to an adverse change in demand for office and retail space and the consequent impact on rental growth.
Executives responsible: Robert Noel and Colette O’Shea
2. Market cyclicalityMarket and political uncertainty leading to a reduction in demand or deferral of decisions by occupiers, impacting real estate values and the ability to buy, develop, manage and sell assets at the appropriate time in the property cycle.
Executive responsible: Robert Noel
3. DisruptionFailure to react effectively to a disruptive change in the competitive landscape.
Executive responsible: Robert Noel
4. People and skillsInability to attract, retain and develop the right people and skills required to deliver the business objectives in a culture and environment where employees can thrive.
Executive responsible: Group HR Director
Example Key Risk Indicators (KRIs) — Customer satisfaction metrics — UK net retail openings and shopping centre vacancy rates (external metric)
— Amount of people visiting our assets — Percentage of lease expiries over our five-year plan — Void rates — Customer credit risk profile and tenant counter-party risk
Example KRIs — UK Gross Domestic Product (external metric) — UK household spending levels (external metric) — Employment intentions – Business Services (external metric)
— Interest rates (external metric) — Business confidence (external metric) — Our loan-to-value ratio
Example KRIs — Serviced office take-up (external metric) — Proportion of total retail sales that are online (external metric)
— Engagement survey results – innovation mindset
Example KRIs — Internal promotion rate — Employee turnover levels — High potential employee turnover — Employee engagement score — Succession planning
Mitigation — Our Customer Relationship Management processes actively monitor our customer base and performance
— We have a robust credit policy and process which defines what level of credit risk we will accept
— Our London and Retail Executive Committees review customers at risk and agree the best plan of action, as well as monitoring online sales trends
— The monthly management accounts review lease expiries, breaks, re-gears and compare new lettings against estimated rental value
— We measure footfall and retail sales at our shopping centres to provide insight into consumer trends
— Our ‘Share Your Thoughts’ programme measures customer satisfaction at our shopping centres
— We complete post-occupancy surveys in London to measure customer satisfaction
— All of our colleagues attended the Creating Experiences training programme focused on creating a customer-centric culture.
Mitigation — Our Research team prepare a quarterly report for the Retail and London Executive Committees, which measures both macroeconomic and internal risk metrics, against tolerance ranges, e.g. occupancy vacancy levels
— Our Research team also produces a bi-annual Cycle Watch document, which analyses macroeconomic, political and market risk factors. This drives the assumptions used in our budget and forecasting process
— We complete scenario analyses as part of our annual budgeting and five year forecasting process. Specific scenarios we have modelled include the impact of different Brexit outcomes and changes in legislation
— Our business portfolios prepare a quarterly report reviewing the market risk for each of our sectors
— We are active members of local business and community groups, as well as industry and professional bodies. This ensures we are actively engaged in decisions affecting our business, customers, partners and communities.
Mitigation — We commissioned independent research into customer trends and disruptors so that we have a better understanding of the potential impact on our business
— Our Insight team holds a monthly Future of Work forum examining disruption themes, megatrends and changes in the way people shop, work and live
— We are actively investing in training our people to help create an innovation mindset and have established innovation roles in the business
— We are reviewing each element of our customer journeys to identify opportunities to improve
— We have defined an innovation process to capture ideas and workshop with our customers on their needs in a test office environment. For example, we hosted a Make-a-thon which was a seven hour competition where teams made up of both Landsec colleagues and customers had to solve customer problems
— Our Innovation team is debating and investigating ways to build more efficiently and effectively with our strategic partners
— We are actively speaking to and involving our customers in creating new experiences.
Mitigation — Our remuneration plans are benchmarked annually to ensure they remain competitive and support us in attracting and retaining the best talent
— The talent management programme identifies high potential individuals within the organisation
— We have robust succession plans in place for senior and critical roles to mitigate key people risks
— Clear employee objectives and development plans to ensure alignment to business goals
— We recognise the value of employee health and wellbeing through our Health and Wellbeing Statement of Practice
— We have set specific diversity metrics to be achieved by 2020 and 2025
— Our flexible working policy promotes work-life balance, reduces employee stress and improves performance
— We complete an annual employee engagement survey to understand areas of strength and opportunities for improvement
— We have high profile, market-leading developments and assets to manage, in places people want to work.
Change in the year
We continue to see a tough retail environment, with a number of company voluntary arrangements (CVAs) throughout the year, and like-for-like footfall and retail sales also trending downward.
As a result of this, we have reviewed and updated our credit risk approval and escalation processes. We also continue to actively manage our Retail Portfolio assets and believe our focus on delivering experience destinations for our customers provides as effective a mitigation of these broader retail sector challenges as possible.
Change in the year
This risk has increased which reflects a number of key drivers, including the high level of uncertainty surrounding the Brexit outcome and the challenging retail environment.
Change in the year
We have improved our internal capability in this area over the last year, with the recruitment of both the Head of Innovation and Head of Strategy roles.
We are introducing new skillsets such as user experience researchers to better understand our customers and their needs.
We have been developing partnerships with forward thinking companies, including sponsoring four UCL students from the Centre for Applied Spatial Analytics.
Change in the year
There has been no material change in the risk level for people and skills, with turnover levels within desired ranges and a number of key roles were hired throughout the year (such as the Heads of Innovation and Strategy).
OpportunityEnhance and maintain our position as the partner of choice for our customers by better understanding their needs.
We are assessing plans for significant mixed use developments on our suburban London retail sites where we see opportunities to create value.
OpportunityThe strength of our balance sheet, combined with our AA rating, enables us to invest in our growing development pipeline and other opportunities as they arise.
OpportunityManaging change effectively will enable us to deliver further value and growth while maintaining our competitive advantage.
We will create new things of value to Landsec and our customers.
OpportunityBuild further expertise, knowledge and capability in the business.
Our risk assessmentThe risk heat maps illustrate the relative positioning of our principal risks before and after mitigating actions. We set out further details on our principal risks below, explaining how the risks link to our strategic objectives, our risk mitigation strategies and the rationale for the risk movement in the year.
Low(<25%)
Medium(26–50%)
High(51–75%)
Very high(76–100%)
Imp
act
Probability
Before mitigating actions
After mitigating actions2
5
67
3
1
48 1
2
36
8 4
5
7
Our principal risks and uncertainties
Principal risks overview
Strategic objectivesChange in
the year
1. Customers
2. Market cyclicality
3. Disruption
4. People and skills 5. Major health, safety
and security incident 6. Information security
and cyber threat
7. Sustainability 8. Investment and
development strategy
Strategic objectives
Deliver sustainable long- term shareholder value
Maximise the returns from the investment portfolio
Maximise development performance
Ensure high levels of customer satisfaction
Attract, develop, retain and motivate high performance individuals
Be a best-in-class counterparty to our partners and suppliers
Continually improve sustainability performance
Low
Med
ium
H
igh
Very
hig
h
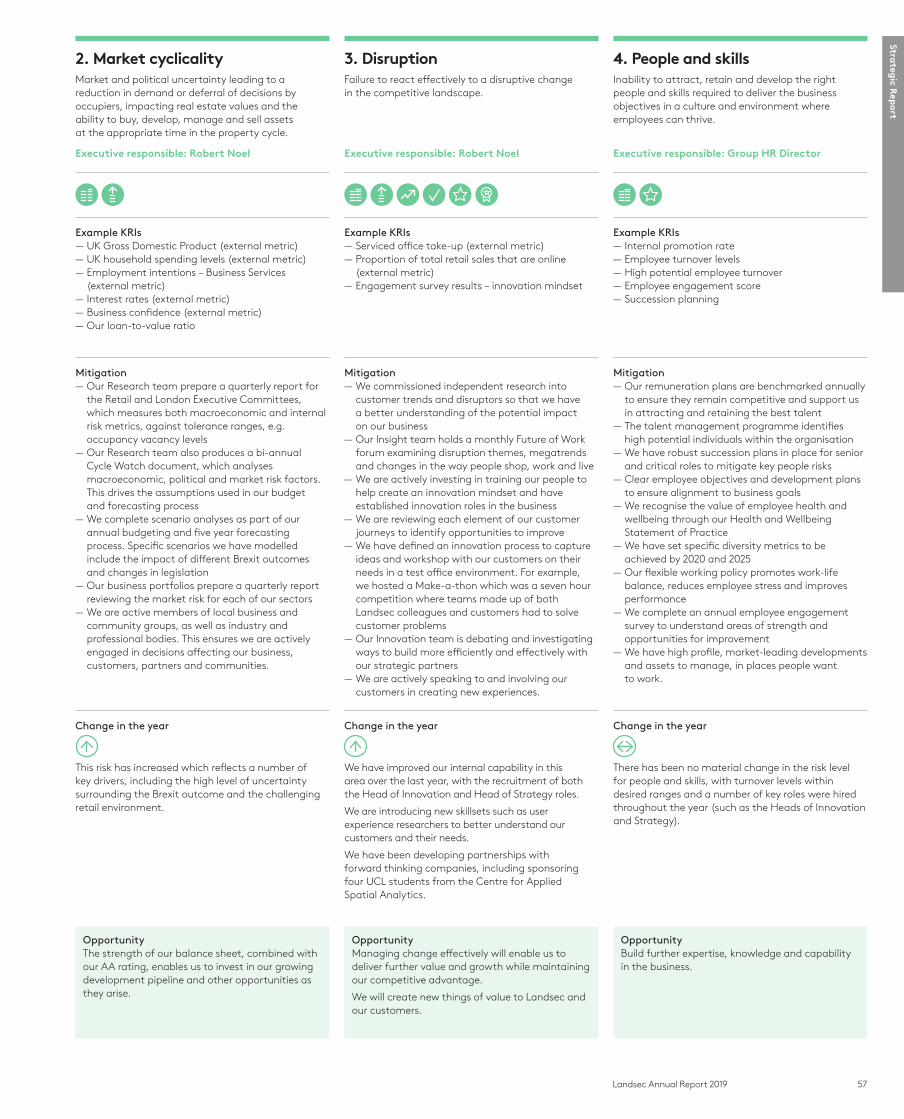
57Landsec Annual Report 2019
Strateg
ic Rep
ort
1. CustomersStructural changes in customer and consumer behaviours leading to an adverse change in demand for office and retail space and the consequent impact on rental growth.
Executives responsible: Robert Noel and Colette O’Shea
2. Market cyclicalityMarket and political uncertainty leading to a reduction in demand or deferral of decisions by occupiers, impacting real estate values and the ability to buy, develop, manage and sell assets at the appropriate time in the property cycle.
Executive responsible: Robert Noel
3. DisruptionFailure to react effectively to a disruptive change in the competitive landscape.
Executive responsible: Robert Noel
4. People and skillsInability to attract, retain and develop the right people and skills required to deliver the business objectives in a culture and environment where employees can thrive.
Executive responsible: Group HR Director
Example Key Risk Indicators (KRIs) — Customer satisfaction metrics — UK net retail openings and shopping centre vacancy rates (external metric)
— Amount of people visiting our assets — Percentage of lease expiries over our five-year plan — Void rates — Customer credit risk profile and tenant counter-party risk
Example KRIs — UK Gross Domestic Product (external metric) — UK household spending levels (external metric) — Employment intentions – Business Services (external metric)
— Interest rates (external metric) — Business confidence (external metric) — Our loan-to-value ratio
Example KRIs — Serviced office take-up (external metric) — Proportion of total retail sales that are online (external metric)
— Engagement survey results – innovation mindset
Example KRIs — Internal promotion rate — Employee turnover levels — High potential employee turnover — Employee engagement score — Succession planning
Mitigation — Our Customer Relationship Management processes actively monitor our customer base and performance
— We have a robust credit policy and process which defines what level of credit risk we will accept
— Our London and Retail Executive Committees review customers at risk and agree the best plan of action, as well as monitoring online sales trends
— The monthly management accounts review lease expiries, breaks, re-gears and compare new lettings against estimated rental value
— We measure footfall and retail sales at our shopping centres to provide insight into consumer trends
— Our ‘Share Your Thoughts’ programme measures customer satisfaction at our shopping centres
— We complete post-occupancy surveys in London to measure customer satisfaction
— All of our colleagues attended the Creating Experiences training programme focused on creating a customer-centric culture.
Mitigation — Our Research team prepare a quarterly report for the Retail and London Executive Committees, which measures both macroeconomic and internal risk metrics, against tolerance ranges, e.g. occupancy vacancy levels
— Our Research team also produces a bi-annual Cycle Watch document, which analyses macroeconomic, political and market risk factors. This drives the assumptions used in our budget and forecasting process
— We complete scenario analyses as part of our annual budgeting and five year forecasting process. Specific scenarios we have modelled include the impact of different Brexit outcomes and changes in legislation
— Our business portfolios prepare a quarterly report reviewing the market risk for each of our sectors
— We are active members of local business and community groups, as well as industry and professional bodies. This ensures we are actively engaged in decisions affecting our business, customers, partners and communities.
Mitigation — We commissioned independent research into customer trends and disruptors so that we have a better understanding of the potential impact on our business
— Our Insight team holds a monthly Future of Work forum examining disruption themes, megatrends and changes in the way people shop, work and live
— We are actively investing in training our people to help create an innovation mindset and have established innovation roles in the business
— We are reviewing each element of our customer journeys to identify opportunities to improve
— We have defined an innovation process to capture ideas and workshop with our customers on their needs in a test office environment. For example, we hosted a Make-a-thon which was a seven hour competition where teams made up of both Landsec colleagues and customers had to solve customer problems
— Our Innovation team is debating and investigating ways to build more efficiently and effectively with our strategic partners
— We are actively speaking to and involving our customers in creating new experiences.
Mitigation — Our remuneration plans are benchmarked annually to ensure they remain competitive and support us in attracting and retaining the best talent
— The talent management programme identifies high potential individuals within the organisation
— We have robust succession plans in place for senior and critical roles to mitigate key people risks
— Clear employee objectives and development plans to ensure alignment to business goals
— We recognise the value of employee health and wellbeing through our Health and Wellbeing Statement of Practice
— We have set specific diversity metrics to be achieved by 2020 and 2025
— Our flexible working policy promotes work-life balance, reduces employee stress and improves performance
— We complete an annual employee engagement survey to understand areas of strength and opportunities for improvement
— We have high profile, market-leading developments and assets to manage, in places people want to work.
Change in the year
We continue to see a tough retail environment, with a number of company voluntary arrangements (CVAs) throughout the year, and like-for-like footfall and retail sales also trending downward.
As a result of this, we have reviewed and updated our credit risk approval and escalation processes. We also continue to actively manage our Retail Portfolio assets and believe our focus on delivering experience destinations for our customers provides as effective a mitigation of these broader retail sector challenges as possible.
Change in the year
This risk has increased which reflects a number of key drivers, including the high level of uncertainty surrounding the Brexit outcome and the challenging retail environment.
Change in the year
We have improved our internal capability in this area over the last year, with the recruitment of both the Head of Innovation and Head of Strategy roles.
We are introducing new skillsets such as user experience researchers to better understand our customers and their needs.
We have been developing partnerships with forward thinking companies, including sponsoring four UCL students from the Centre for Applied Spatial Analytics.
Change in the year
There has been no material change in the risk level for people and skills, with turnover levels within desired ranges and a number of key roles were hired throughout the year (such as the Heads of Innovation and Strategy).
OpportunityEnhance and maintain our position as the partner of choice for our customers by better understanding their needs.
We are assessing plans for significant mixed use developments on our suburban London retail sites where we see opportunities to create value.
OpportunityThe strength of our balance sheet, combined with our AA rating, enables us to invest in our growing development pipeline and other opportunities as they arise.
OpportunityManaging change effectively will enable us to deliver further value and growth while maintaining our competitive advantage.
We will create new things of value to Landsec and our customers.
OpportunityBuild further expertise, knowledge and capability in the business.
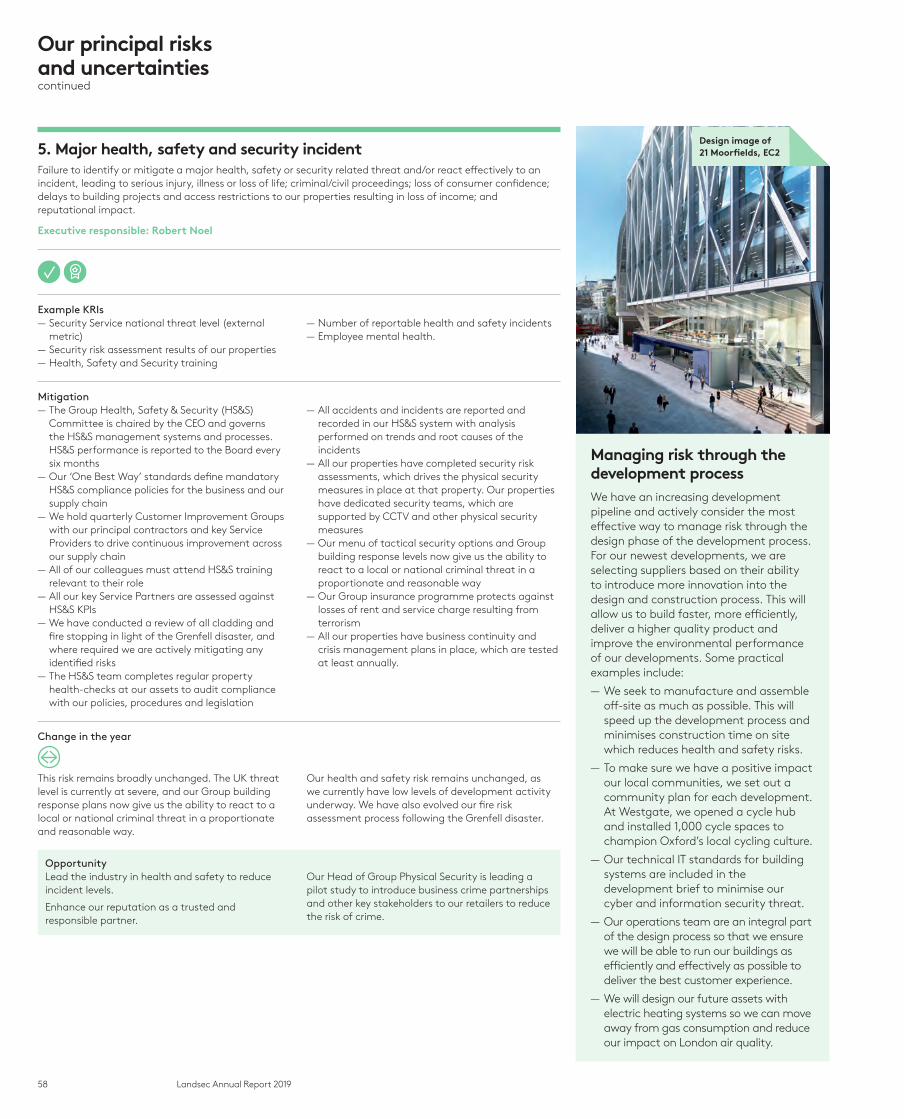
58 Landsec Annual Report 2019
Managing risk through the development processWe have an increasing development pipeline and actively consider the most effective way to manage risk through the design phase of the development process. For our newest developments, we are selecting suppliers based on their ability to introduce more innovation into the design and construction process. This will allow us to build faster, more efficiently, deliver a higher quality product and improve the environmental performance of our developments. Some practical examples include:
— We seek to manufacture and assemble off-site as much as possible. This will speed up the development process and minimises construction time on site which reduces health and safety risks.
— To make sure we have a positive impact our local communities, we set out a community plan for each development. At Westgate, we opened a cycle hub and installed 1,000 cycle spaces to champion Oxford’s local cycling culture.
— Our technical IT standards for building systems are included in the development brief to minimise our cyber and information security threat.
— Our operations team are an integral part of the design process so that we ensure we will be able to run our buildings as efficiently and effectively as possible to deliver the best customer experience.
— We will design our future assets with electric heating systems so we can move away from gas consumption and reduce our impact on London air quality.
5. Major health, safety and security incidentFailure to identify or mitigate a major health, safety or security related threat and/or react effectively to an incident, leading to serious injury, illness or loss of life; criminal/civil proceedings; loss of consumer confidence; delays to building projects and access restrictions to our properties resulting in loss of income; and reputational impact.
Executive responsible: Robert Noel
Example KRIs — Security Service national threat level (external metric)
— Security risk assessment results of our properties — Health, Safety and Security training
— Number of reportable health and safety incidents — Employee mental health.
Mitigation — The Group Health, Safety & Security (HS&S) Committee is chaired by the CEO and governs the HS&S management systems and processes. HS&S performance is reported to the Board every six months
— Our ‘One Best Way’ standards define mandatory HS&S compliance policies for the business and our supply chain
— We hold quarterly Customer Improvement Groups with our principal contractors and key Service Providers to drive continuous improvement across our supply chain
— All of our colleagues must attend HS&S training relevant to their role
— All our key Service Partners are assessed against HS&S KPIs
— We have conducted a review of all cladding and fire stopping in light of the Grenfell disaster, and where required we are actively mitigating any identified risks
— The HS&S team completes regular property health-checks at our assets to audit compliance with our policies, procedures and legislation
— All accidents and incidents are reported and recorded in our HS&S system with analysis performed on trends and root causes of the incidents
— All our properties have completed security risk assessments, which drives the physical security measures in place at that property. Our properties have dedicated security teams, which are supported by CCTV and other physical security measures
— Our menu of tactical security options and Group building response levels now give us the ability to react to a local or national criminal threat in a proportionate and reasonable way
— Our Group insurance programme protects against losses of rent and service charge resulting from terrorism
— All our properties have business continuity and crisis management plans in place, which are tested at least annually.
Change in the year
This risk remains broadly unchanged. The UK threat level is currently at severe, and our Group building response plans now give us the ability to react to a local or national criminal threat in a proportionate and reasonable way.
Our health and safety risk remains unchanged, as we currently have low levels of development activity underway. We have also evolved our fire risk assessment process following the Grenfell disaster.
OpportunityLead the industry in health and safety to reduce incident levels.
Enhance our reputation as a trusted and responsible partner.
Our Head of Group Physical Security is leading a pilot study to introduce business crime partnerships and other key stakeholders to our retailers to reduce the risk of crime.
Our principal risks and uncertaintiescontinued
Design image of 21 Moorfields, EC2

59Landsec Annual Report 2019
Strateg
ic Rep
ort
6. Information security and cyber threat
Data loss or disruption to the corporate systems and building management systems resulting in a negative reputational, operational, regulatory (including GDPR) or financial impact.
Executive responsible: Martin Greenslade
7. Sustainability
Failure to properly consider and act upon the environmental and social impact of our activities, leading to negative impact on our reputation, delays in our development activities, poor relationships with our customers or erosion of shareholder value.
Executive responsible: Miles Webber
8. Investment and development strategy
Unable to effectively execute our strategy of buying, developing and selling assets at the appropriate time in the property cycle, including inappropriate sector selection and weighting; inability to deliver capital expenditure programme to agreed returns; and/or occupiers reluctant to take new space.
Executive responsible: Robert Noel
Example KRIs — Speed of threat and vulnerability detection — Speed of vulnerability resolution — Number of data loss events — Disaster recovery – system availability — Building Management cyber security risk — Cyber security and GDPR training
Example KRIs — Sustainability training — Energy intensity reduction — Recycling waste — Ethical sourcing and living wage in supply chain — Community Employment Programme — Portfolio natural disaster risk
Example KRIs — Development pipeline — Portfolio liquidity — Headroom versus development capital expenditure — Speculative development, pre-development and trading property risk exposure
— Counter-party credit risk — Group hedging
Mitigation — We have a dedicated Information Security team and Data Privacy Officer who monitor information security and privacy risk and cyber threat
— All of our colleagues complete mandatory cyber security and GDPR training
— Our IT security management policy sets out our standards for security and penetration testing, vulnerability and patch management, data disposal and access control
— We complete a quarterly assessment that key IT controls are operating effectively
— All third party IT providers must complete an information security vendor assessment which is reviewed and approved by the cyber security officer
— We work closely with our IT service partners to manage risk and improve technical standards
— Our development brief clearly defines the required technical IT standards for all building systems
— Our move to the ‘Cloud’ has improved the resilience of our disaster recovery and business continuity plans
— We have an effective vulnerability management system, including an annual rolling penetration testing programme across our IT estate.
Mitigation — Through our Responsible Property Investment Policy and sustainability due-diligence process, we assess risks and opportunities in potential acquisitions
— We are making continuous progress against our science-based carbon target, reducing carbon emissions and increasing energy efficiency
— We ensure strong community involvement in the design process for our developments and create employment and education opportunities through our construction and operations activities
— We speak directly to individual workers at our offices, retail destinations and construction sites to assess whether our Human Rights and Health and Safety Policies and Foundation Living Wage commitments are being adhered to
— Our developments are designed to be resilient to climate change and are ready for the low-carbon economy, using our Sustainability Brief for developments and associated processes
— We undergo assurance for data and disclosures across our sustainability programme, enhancing the integrity, quality and usefulness of the information we provide.
Mitigation — Our Investment Appraisal Guidelines define the key investment criteria (including hurdle rates and alignment to strategic objectives), the risk assessment process, key stakeholders and the delegations of authority to approve investment decisions
— We have appointed a Head of Strategy to support the effective formulation and execution of our strategy
— We are actively considering other sector opportunities and running trials as appropriate to test our propositions and market demand and requirements
— Our highly experienced development team and partners have a track-record of delivery
— We have robust succession plans in place for senior and critical development and project management roles.
Change in the year
The level of this risk has increased, reflecting data that shows companies are subject to an increasing number of attempted cyber attacks.
During the year, we successfully migrated our corporate network to the ‘Cloud’. This has reduced our physical risk and improved our resilience.
Change in the year
The inherent risk has increased in response to new public data demonstrating how global emissions continue to grow, increasing climate-related risks. Residual risk remains the same as we have intensified our mitigation activities.
Change in the year
We have increased certainty over the London development pipeline and are progressing our plans for significant mixed use developments on our suburban London retail sites.
OpportunityWork with our service partners and strategic suppliers to challenge our industry norms; enhance our reputation as a trusted and responsible partner; and consider new technologies to leverage the latest innovations and opportunities.
OpportunityLead our business and the property sector toward a low-carbon economy, creating long-term value for our shareholders and wider stakeholder groups.
OpportunityAs mentioned above, the strength of our balance sheet, combined with our AA rating, enables us to invest in our growing development pipeline and other opportunities as they arise.

60 Landsec Annual Report 2019
The viability scenario represents a significant contraction in the size of the business over the five-year period considered, with the LTV at 33.0% at its highest point in the assessment period.
The Group would be required to renew or exercise extension options for a minimum of £1.8bn of its debt facilities at the end of the period considered. The Directors expect this to be possible considering the Group’s expected loan-to-value ratio and the flexibility of the financing structure in place.
Confirmation of viabilityBased on this assessment, the Directors have a reasonable expectation that the Group will continue in operation and meet its liabilities as they fall due over the period to March 2024.
flexed further to assess the impact of considerably worse macro-economic conditions than are currently expected, which forms the basis of the Group’s ‘viability scenario’.
Principal risksThe illustration above sets out those of the Group’s principal risks (see pages 56-59 for full details of the Group’s principal risks) that could most impact its ability to remain in operation and meet its liabilities as they fall due and how we have taken these into consideration when making our assessment of the Group’s viability.
Impact on key metricsWe have assessed the impact of these assumptions on the Group’s key financial metrics over the period, including profitability, loan-to-value ratios, net debt and available financial headroom.
Key metrics Table 38
31 March 2019
Viability scenario
31 March 2024
Loan-to-value ratio 27.1% 32.3%
Adjusted net debt £3,737m £3,887m
EPRA net assets £9,920m £8,038m
Available financial headroom
£1,570m £(1,760)m
Going concernThe Directors confirm they have a reasonable expectation that the Company has adequate resources to continue in operational existence for at least 12 months from the date of signing these financial statements. This confirmation is made after having reviewed assumptions about future trading performance, valuation projections, capital expenditure, asset sales and debt requirements contained within the Group’s current five-year plan. The Directors also considered potential risks and uncertainties in the business, credit, market and liquidity risks, including the availability and repayment profile of bank facilities, as well as forecast covenant compliance. Based on the above, together with available market information and the Directors’ knowledge and experience of the Group’s property portfolio and markets, the Directors continue to adopt the going concern basis in preparing the accounts for the year ended 31 March 2019.
Viability statementThe viability assessment periodThe Directors have assessed the viability of the Group over a five-year period to March 2024, taking account of the Group’s current financial position and the potential impact of our principal risks.
The Directors have determined five years to be the most appropriate period for the viability assessment as it fits well with the Group’s development and leasing cycles, and is broadly aligned to the maturity of the Group’s floating rate debt facilities.
ProcessOur financial planning process comprises a budget for the next financial year, together with a forecast for the following four financial years. Achievement of the one-year budget has a greater level of certainty and is used to set near- term targets across the Group. Achievement of the five-year plan is less certain than the budget, but provides a longer-term outlook against which strategic decisions can be made.
The financial planning process considers the Group’s profitability, capital values, gearing, cash flows and other key financial metrics over the plan period. These metrics are subject to sensitivity analysis, in which a number of the main underlying assumptions are flexed and tested to consider alternative macro-economic environments. Additionally, the Group also considers the impact of potential structural changes to the business in light of varying economic conditions, such as significant additional sales and acquisitions or refinancing. On the basis of this analysis, the Board agrees a five-year plan with an upside and downside sensitivity. The downside sensitivity is then
This Strategic Report was approved by the Board of Directors on 13 May 2019 and signed on its behalf by:
Robert NoelChief Executive
CustomersContinued cost pressures on retailers coupled with declining consumer confidence.
Structural changes in customer and consumer behaviours lead to a change in demand for office space.
Market cyclicalityImpact of Brexit negotiations.
Investment and development strategyInability to deliver the development pipeline and re-stock the Group’s portfolio.
Link to strategic objectives
Link to strategic objectives
Link to strategic objectives
Viability scenario assumptionLondon Portfolio
— Prime rents deteriorate to March 2021 then slowly recover to March 2024.
Retail Portfolio — Downward pressure on rental values from the ongoing disruption caused by online retail and economic slowdown
— Rents decline throughout the entire five-year period.
Viability scenario assumptionLondon Portfolio
— Economic slowdown and weakening occupier demand
— Decline in capital values and outward yield movements through to March 2021 before partial recovery to March 2024 and beyond.
Retail Portfolio — Severe capital value declines to March 2020; continued decline to March 2024, albeit at a slower rate
— Yield expansion across all sectors to March 2021 and rental value decline; minimal yield contraction in the outer years of the five-year assessment period.
Viability scenario assumption
— No uncommitted debt refinancing takes place, and no new debt or bank facilities are raised or extended
— Any uncommitted forecast acquisitions, disposals and developments do not take place.

61Landsec Annual Report 2019
Govern
an
ce
Highlights
Letter from the Chairmanpage 62
Letter from the Chairman of the Nomination Committeepage 74
Letter from the Chairman of the Audit Committeepage 81
Directors’ Remuneration Report – Chairman’s Annual Statementpage 91
Contents62 Letter from the Chairman64 Board of Directors67 Executive Committee68 Leadership72 Our stakeholders and our Board74 Letter from the Chairman of the
Nomination Committee76 Effectiveness81 Letter from the Chairman of the
Audit Committee84 Accountability89 Investor relations91 Directors’ Remuneration Report –
Chairman’s Annual Statement94 Remuneration at a glance96 Annual Report on Remuneration108 Summary of Directors’ Remuneration
Policy111 Remuneration Policy118 Directors’ Report
Governance
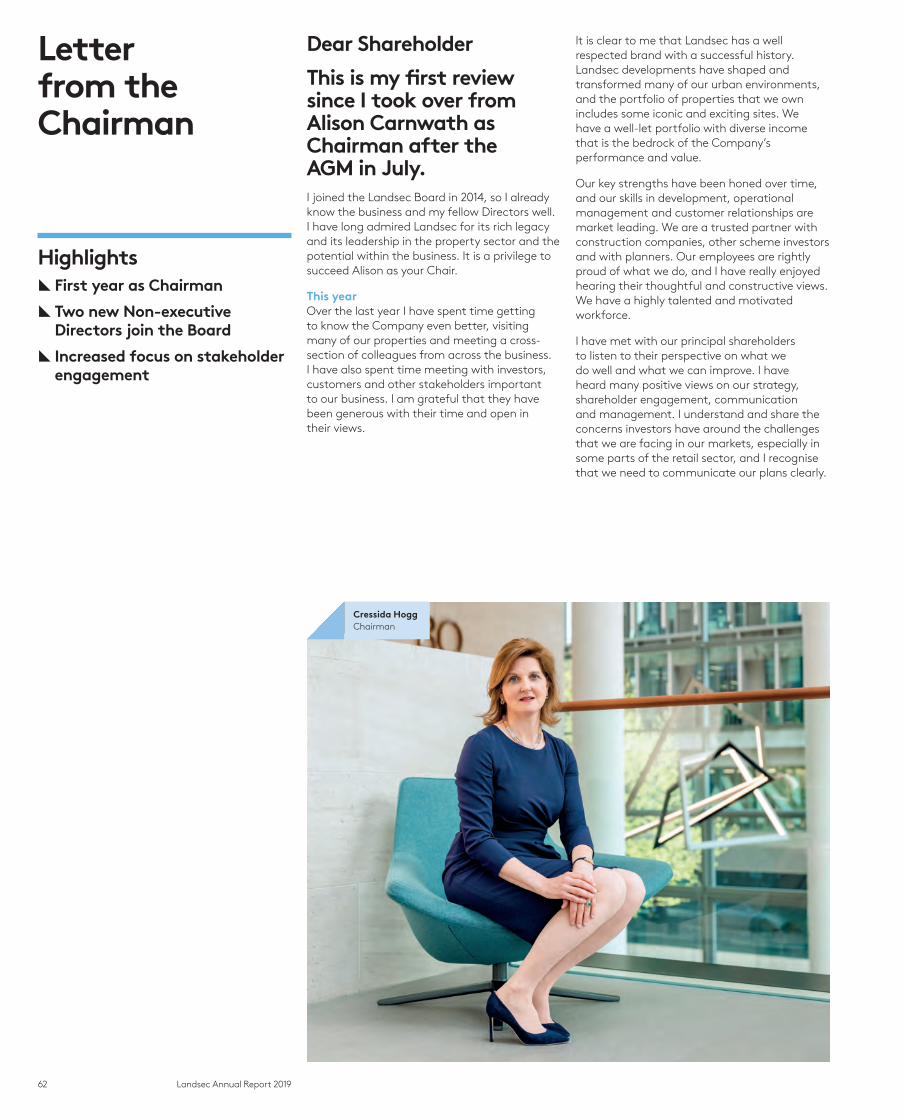
62 Landsec Annual Report 2019
Highlights [ First year as Chairman
[ Two new Non-executive Directors join the Board
[ Increased focus on stakeholder engagement
Dear Shareholder
This is my first review since I took over from Alison Carnwath as Chairman after the AGM in July.I joined the Landsec Board in 2014, so I already know the business and my fellow Directors well. I have long admired Landsec for its rich legacy and its leadership in the property sector and the potential within the business. It is a privilege to succeed Alison as your Chair.
This yearOver the last year I have spent time getting to know the Company even better, visiting many of our properties and meeting a cross-section of colleagues from across the business. I have also spent time meeting with investors, customers and other stakeholders important to our business. I am grateful that they have been generous with their time and open in their views.
It is clear to me that Landsec has a well respected brand with a successful history. Landsec developments have shaped and transformed many of our urban environments, and the portfolio of properties that we own includes some iconic and exciting sites. We have a well-let portfolio with diverse income that is the bedrock of the Company’s performance and value.
Our key strengths have been honed over time, and our skills in development, operational management and customer relationships are market leading. We are a trusted partner with construction companies, other scheme investors and with planners. Our employees are rightly proud of what we do, and I have really enjoyed hearing their thoughtful and constructive views. We have a highly talented and motivated workforce.
I have met with our principal shareholders to listen to their perspective on what we do well and what we can improve. I have heard many positive views on our strategy, shareholder engagement, communication and management. I understand and share the concerns investors have around the challenges that we are facing in our markets, especially in some parts of the retail sector, and I recognise that we need to communicate our plans clearly.
Letter from the Chairman
Cressida Hogg Chairman

63Landsec Annual Report 2019
Govern
an
ce
This year has clearly been a challenging one for the property sector, and this has been reflected in disappointing returns for investors. The political uncertainty in the UK has led through to patchy consumer confidence, which has exacerbated the structural challenges already in the retail market as consumer purchasing patterns and behaviours change. Our business customers have found it harder to plan for the longer term, although demand for our office space continues to be strong.
Despite market challenges, Landsec is in a financially robust position. We have a resilient balance sheet, which gives us strategic flexibility to manage the business to best deliver value for our shareholders over the longer term. The breadth of our portfolio of properties generates robust and sustainable income which we use to underpin our dividends to shareholders. We will continue to work with our customers aiming to provide the right product for their needs in this economic environment. Meanwhile, we are pleased to recommend a 3.1% increase in the full year dividend.
Board prioritiesThe Board is very clear that to drive long-term shareholder value Landsec needs to be skilled at anticipating and adapting to market changes. This year, the evolution of our strategy has been a priority for the Board. We have been particularly focused both on how current market conditions affect our performance, and what changes will impact the business in the future. In a changing world, our strategy needs to be fit for purpose.
The scale and diversity of Landsec’s portfolio is one of its great strengths. Supporting management in refreshing and upgrading the portfolio is always a key focus for the Board. Our performance is a sum of the parts, and we need to manage our assets as well as we can both for short-term income and also for longer-term value.
Rob is clear elsewhere in this report that over time we will continue to shift the balance of the business, reducing the number of assets in retail and consumer-facing areas. Reducing complexity in the portfolio should also make our operations more focused and streamlined.
The Board is excited about the development pipeline we have and also supports acquiring new development sites such as the one we recently bought in Southwark. We have rightly increased our focus on residential and mixed use development opportunities especially within our existing portfolio. These opportunities will underpin our future growth.
Management has made innovation a key priority for the business, particularly focusing on ways in which Landsec can deliver better products and services for our customers in a more sustainable way. The Board supports the investment that we are making in this area, especially in data analytics and smarter design and construction methods.
Our peopleI have already said how impressed I am with the talent we have in the business. It is a fundamental role for the Board to oversee the systems in place for effective talent management, and plan for succession in key roles.
Landsec is rightly committed to improving the diversity of talent at all levels in the business. To continue to be a leading UK business, Landsec’s employee mix should better reflect society more widely.
As I have met with colleagues over the last months it has been clear to me that we should improve the links between employees and the Board. To this end, this year we will be hosting a ‘meet the Board’ event immediately after the Annual General Meeting as the first of many new ideas for greater Board engagement with employees. I have very much enjoyed the time I have spent with members of our Employee Forum and we will also look at ways other Directors can become more involved.
GovernanceGood governance and control are at the heart of a well-run business. Under the previous Chairman, we gained a strong reputation for our environmental, social and governance work which I would like to build on. The recent changes made in the UK Corporate Governance Code emphasise the important role played by companies in modern society, and I recognise the key roles of the Chairman and the Board in setting tone and direction, and encouraging broad stakeholder engagement.
Our sustainability programme is wide-reaching and delivers social value. I am committed to developing our leadership in this area. In talking to our employees it has been very clear that they are passionate and proud of what we do. One of the things I have most enjoyed this year is gaining insight into the many different projects and initiatives that we have which we will continue to build on.
Board changesThere have been several changes to the Board during the year.
After nearly nine years as a Director, including seven as Chairman of the Remuneration Committee, Simon Palley stepped down on 31 March 2019. I would like to thank Simon for his wonderful contribution to the Board. His insight and support as a colleague will be much missed.
I would also like to thank Scott Parsons, who resigned from the Board in February. He provided leadership to our retail business through challenging times and we wish him well for the future.
We have appointed two new Directors to the Board.
Madeleine Cosgrave joined the Board at the beginning of January. She brings to the Board rich experience in the global real estate market. We were fortunate to find someone with such depth of experience in investment and portfolio management, and she is already making a valued contribution to Board discussions.
Christophe Evain joined the Board at the start of the new financial year on 1 April 2019. He brings to the Board an international heritage and deep experience both as an investor across a number of sectors, and as a CEO of a listed UK company.
I am aware of the attention that investors give to the balance of skills and capabilities on a listed board, and this is a key focus for the Nomination Committee when new appointments are made. We are also aware that it is important to maintain continuity and ‘board memory’ through Board evolution. With this in mind, I have asked Chris Bartram to stay on the Board until the end of the next financial year, even though he has been on the Board for nine years. His understanding of the business and his property expertise is highly valued, and I wanted to retain his insight through the Board transition and, in the current macro-economic conditions, at this phase of the property cycle.
In conclusion, I would like to thank you and the Board for electing me as your new Chairman, and thank Alison Carnwath for her thoughtful and successful leadership of the Company during her time in the Chair. I am confident that the business is well set to continue to deliver value for our shareholders, and I look forward to meeting many of you at the Annual General Meeting.
Cressida HoggChairman
We want to place greater emphasis on the quality of our service and our products, and this can only be achieved in a company that believes in the importance of delivering for its customers, both for the present and the future.”

64 Landsec Annual Report 2019
Chairman of the Board
Cressida HoggN R
Appointed to Board: January 2014Appointed as Chairman: 12 July 2018
Skills and experienceCressida has spent over 20 years in the investment industry and has experience of building and developing businesses both in the UK and globally. From 2014 to April 2018, she was Global Head of Infrastructure at the $350bn Canada Pension Fund Investment Board, managing a portfolio of investments worth c.£16bn. From 2009 to 2014, as Managing Partner, she was responsible for managing 3i Infrastructure plc, a FTSE 250 investment company, having co-founded the infrastructure business at 3i in 2005. Cressida started her career at JP Morgan. She has extensive Board experience, including most recently on the Boards of Anglian Water Group and Associated British Ports. She was previously a member of the advisory board for Infrastructure UK, the HM Treasury unit working on the UK’s long-term infrastructure priorities.
Other current appointmentsNon-executive Director, London Stock Exchange Group plc. Non-executive Director, Troy Asset Management.
Senior Independent Director
Edward Bonham CarterNon-executive Director*N R
Appointed to Board: January 2014Appointed as Senior Independent Director: July 2016
Skills and experienceEdward has significant experience of general management as a former CEO of a private equity backed and a large listed company. Having been a fund manager for many years, he has a comprehensive understanding of stock markets and investor expectations which is beneficial to the Company when it considers its engagement with investors. Edward became Vice Chairman of Jupiter Fund Management plc in March 2014, having been Chief Executive Officer of the company since June 2007 where he oversaw the firm’s listing on the London Stock Exchange in 2010. He started his career at Schroders as an investment analyst before moving to Electra Investment Trust where he was a fund manager.
Other current appointmentsVice Chairman, Jupiter Fund Management plc. Senior Independent Director, ITV plc. Board member, The Investor Forum CIC. Trustee, Esmée Fairbairn Foundation. Director, Netwealth Investments Ltd. Member, Strategic Advisory Board Livingbridge LLP.
Non-executive Directors
Chris BartramNon-executive Director* A N
Appointed to Board: August 2009
Skills and experience Chris is a scion of the property industry, with decades of property investment, fund management and capital allocation experience gained across a range of businesses and disciplines within the real estate sector. He has significant experience of general management as a former Chief Executive and Chairman of significant businesses. Chris was Chairman and Founding Partner of Orchard Street Investment Management LLP, a leading commercial property investment manager focused on the UK market, and continued to act as an adviser to that firm until 31 March 2017. He has also been a Board Member of The Crown Estate and was CEO at Haslemere NV and Chairman of Jones Lang Wootton Fund Management. He was previously President of the British Property Federation and Chairman of the Bank of England Property Forum. Chris is a chartered surveyor. Chris’s property expertise is of particular relevance to the current market cycle which is why he has been asked to remain a Director for a period longer than the nine-year term.
Other current appointmentsWilkins Fellow of Downing College, University of Cambridge. Governor, Oundle School. Advisory board member to certain overseas entities within the Brack Capital Real Estate Group.
Madeleine Cosgrave Non-executive Director* A
Appointed to Board: 1 January 2019
Skills and experience Madeleine has deep knowledge and perspective in relation to investment decisions, property management and market dynamics from her extensive experience in the property industry. She is a fellow of the Royal Institution of Chartered Surveyors and former chair of the INREV Investor Platform and has sat on a number of GIC Real Estate boards across Europe.
Madeleine qualified as a chartered surveyor and started her career in 1989 with JLL where she went on to hold roles in valuation, fund management, leasing and development in both London and Sydney, before moving to GIC in 1999. Madeleine is currently Managing Director and Regional Head of Europe at GIC Real Estate, a position she has held since 2016. She is responsible for the real estate investment strategy and portfolio, leads the real estate business in Europe and is a member of the GIC Real Estate global investment committee. Madeleine’s global real estate experience, combined with her knowledge and perspective of investment decisions, property management and market dynamics, is an asset to Board discussions on all property matters.
Other current appointmentsCorporate representative, Euro Lily Private Limited (a corporate director of Cegereal SA).
Christophe Evain Non-executive Director*R
Appointed to Board: 1 April 2019
Skills and experience Christophe has extensive investment experience in private equity, debt and other alternative asset classes. As the former CEO of a UK listed company, he also has management and leadership strengths, having successfully led the transformation of Intermediate Capital Group PLC (ICG) from a principal investment business into a diversified alternative asset management group with €34bn assets under management. Christophe’s broad experience, both as a business leader and an investor, will be a valuable asset to the Board.
Having started his career in banking, holding various positions at NatWest and Banque de Gestion Privée, he joined ICG in 1994 as an Investment professional, became CEO in 2010 and stepped down from that position in 2017. During this time he held various investment and management roles, founded the Group’s businesses in Paris, the Asia-Pacific region and North America, and was instrumental in adding various additional businesses, including a UK property lending business.
Other current appointmentsNone.
Nicholas CadburyNon-executive Director* A
Appointed to Board: January 2017
Skills and experience Nicholas brings wide-ranging and international financial and general management experience to the Group gained from working in consumer-facing businesses, particularly in the retail, leisure and hospitality sectors. He also has extensive commercial and operational knowledge and skills in relation to strategy and IT development. This broader commercial perspective adds breadth of discussion in Board discussions and enables Nicholas to provide effective challenge as Chairman of the Audit Committee. Nicholas is Group Finance Director of Whitbread PLC, a position he has held since November 2012. Before that, he was Chief Financial Officer of Premier Farnell PLC, and prior to that he worked at Dixons Retail PLC in a variety of management roles, including Chief Financial Officer. Nicholas originally qualified as an accountant with Price Waterhouse. Nicholas became Chairman of the Audit Committee in September 2017.
Other current appointmentsGroup Finance Director, Whitbread PLC.
Stacey RauchNon-executive Director*A N R
Appointed to Board: January 2012
Skills and experience Stacey brings deep analytical thought to the Board, with considerable expertise of retail trends and insights gained at a leading international management consultancy. Stacey is a Director (Senior Partner) Emeritus of McKinsey & Company where she served clients in the US and internationally for 24 years. Whilst there, she co-founded the New Jersey office and was the first woman to be appointed as an industry practice leader. She was a leader in the firm’s Retail and Consumer Goods Practices, served as the head of the North American Retail and Apparel Practice and acted as the Global Retail Practice Convener. She retired from McKinsey & Company in September 2010 and has since then pursued a portfolio career. She has significant board level experience gained through non-executive positions held in retail and other industries which is of particular relevance and benefit to the Company at a time of challenge in the UK retail sector. In 2019, Stacey was named to the NACD Directorship 100, the annual list of the most influential leaders in boardrooms and in corporate governance in the US.
Other current appointmentsChairman, Board Fiesta Restaurant Group Inc. Non-executive Director, Ascena Retail Group Inc. Non-executive Director, Heidrick & Struggles International, Inc.
Key to symbols
A Audit Committee
N Nomination Committee
R Remuneration Committee
* Independent (as per the UK Corporate Governance Code). Cressida Hogg was considered as independent upon appointment as Chairman.
Board of Directors
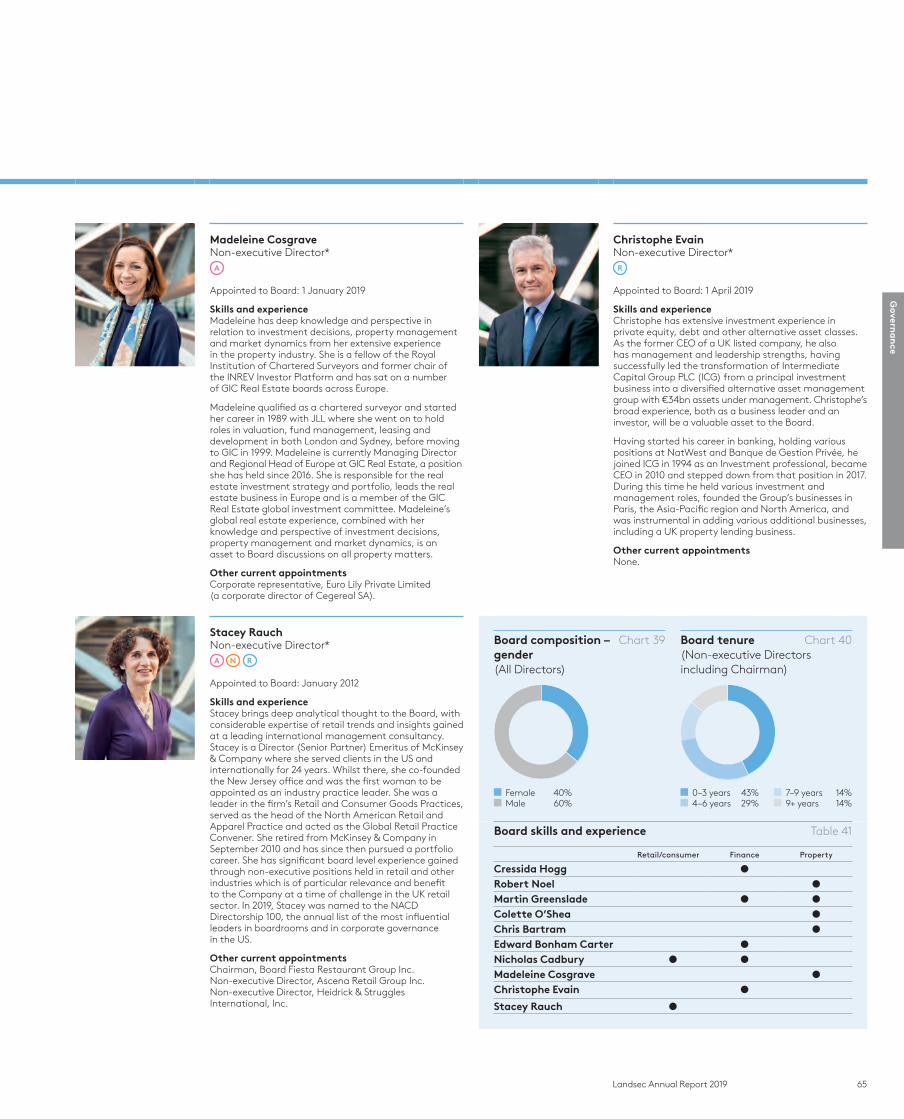
65Landsec Annual Report 2019
Govern
an
ce
Non-executive Directors
Chris BartramNon-executive Director* A N
Appointed to Board: August 2009
Skills and experience Chris is a scion of the property industry, with decades of property investment, fund management and capital allocation experience gained across a range of businesses and disciplines within the real estate sector. He has significant experience of general management as a former Chief Executive and Chairman of significant businesses. Chris was Chairman and Founding Partner of Orchard Street Investment Management LLP, a leading commercial property investment manager focused on the UK market, and continued to act as an adviser to that firm until 31 March 2017. He has also been a Board Member of The Crown Estate and was CEO at Haslemere NV and Chairman of Jones Lang Wootton Fund Management. He was previously President of the British Property Federation and Chairman of the Bank of England Property Forum. Chris is a chartered surveyor. Chris’s property expertise is of particular relevance to the current market cycle which is why he has been asked to remain a Director for a period longer than the nine-year term.
Other current appointmentsWilkins Fellow of Downing College, University of Cambridge. Governor, Oundle School. Advisory board member to certain overseas entities within the Brack Capital Real Estate Group.
Madeleine Cosgrave Non-executive Director* A
Appointed to Board: 1 January 2019
Skills and experience Madeleine has deep knowledge and perspective in relation to investment decisions, property management and market dynamics from her extensive experience in the property industry. She is a fellow of the Royal Institution of Chartered Surveyors and former chair of the INREV Investor Platform and has sat on a number of GIC Real Estate boards across Europe.
Madeleine qualified as a chartered surveyor and started her career in 1989 with JLL where she went on to hold roles in valuation, fund management, leasing and development in both London and Sydney, before moving to GIC in 1999. Madeleine is currently Managing Director and Regional Head of Europe at GIC Real Estate, a position she has held since 2016. She is responsible for the real estate investment strategy and portfolio, leads the real estate business in Europe and is a member of the GIC Real Estate global investment committee. Madeleine’s global real estate experience, combined with her knowledge and perspective of investment decisions, property management and market dynamics, is an asset to Board discussions on all property matters.
Other current appointmentsCorporate representative, Euro Lily Private Limited (a corporate director of Cegereal SA).
Christophe Evain Non-executive Director*R
Appointed to Board: 1 April 2019
Skills and experience Christophe has extensive investment experience in private equity, debt and other alternative asset classes. As the former CEO of a UK listed company, he also has management and leadership strengths, having successfully led the transformation of Intermediate Capital Group PLC (ICG) from a principal investment business into a diversified alternative asset management group with €34bn assets under management. Christophe’s broad experience, both as a business leader and an investor, will be a valuable asset to the Board.
Having started his career in banking, holding various positions at NatWest and Banque de Gestion Privée, he joined ICG in 1994 as an Investment professional, became CEO in 2010 and stepped down from that position in 2017. During this time he held various investment and management roles, founded the Group’s businesses in Paris, the Asia-Pacific region and North America, and was instrumental in adding various additional businesses, including a UK property lending business.
Other current appointmentsNone.
Nicholas CadburyNon-executive Director* A
Appointed to Board: January 2017
Skills and experience Nicholas brings wide-ranging and international financial and general management experience to the Group gained from working in consumer-facing businesses, particularly in the retail, leisure and hospitality sectors. He also has extensive commercial and operational knowledge and skills in relation to strategy and IT development. This broader commercial perspective adds breadth of discussion in Board discussions and enables Nicholas to provide effective challenge as Chairman of the Audit Committee. Nicholas is Group Finance Director of Whitbread PLC, a position he has held since November 2012. Before that, he was Chief Financial Officer of Premier Farnell PLC, and prior to that he worked at Dixons Retail PLC in a variety of management roles, including Chief Financial Officer. Nicholas originally qualified as an accountant with Price Waterhouse. Nicholas became Chairman of the Audit Committee in September 2017.
Other current appointmentsGroup Finance Director, Whitbread PLC.
Stacey RauchNon-executive Director*A N R
Appointed to Board: January 2012
Skills and experience Stacey brings deep analytical thought to the Board, with considerable expertise of retail trends and insights gained at a leading international management consultancy. Stacey is a Director (Senior Partner) Emeritus of McKinsey & Company where she served clients in the US and internationally for 24 years. Whilst there, she co-founded the New Jersey office and was the first woman to be appointed as an industry practice leader. She was a leader in the firm’s Retail and Consumer Goods Practices, served as the head of the North American Retail and Apparel Practice and acted as the Global Retail Practice Convener. She retired from McKinsey & Company in September 2010 and has since then pursued a portfolio career. She has significant board level experience gained through non-executive positions held in retail and other industries which is of particular relevance and benefit to the Company at a time of challenge in the UK retail sector. In 2019, Stacey was named to the NACD Directorship 100, the annual list of the most influential leaders in boardrooms and in corporate governance in the US.
Other current appointmentsChairman, Board Fiesta Restaurant Group Inc. Non-executive Director, Ascena Retail Group Inc. Non-executive Director, Heidrick & Struggles International, Inc.
Board composition – Chart 39gender (All Directors)
Board tenure Chart 40(Non-executive Directors including Chairman)
Female 40% Male 60%
0–3 years 43% 7–9 years 14% 4–6 years 29% 9+ years 14%
Board skills and experience Table 41
Retail/consumer Finance Property
Cressida HoggRobert NoelMartin GreensladeColette O’SheaChris BartramEdward Bonham CarterNicholas Cadbury Madeleine CosgraveChristophe Evain
Stacey Rauch

66 Landsec Annual Report 2019
Executive Directors
Robert NoelChief Executive
Appointed to Board: January 2010Appointed as Chief Executive: April 2012
Skills and experience Robert is a chartered surveyor and has over 30 years’ experience in a number of sectors within the property market and extensive knowledge of the London commercial property market in particular. He has substantial executive leadership and listed company experience. Before joining Landsec in 2010 as Managing Director of the London Portfolio, Robert was Property Director at Great Portland Estates plc and prior to that he was a director of the property services group Nelson Bakewell.
Other current appointmentsDirector European Public Real Estate Association (EPRA). Director of the British Property Federation and President July 2018-19. Trustee of the Natural History Museum.
Management committeesChairman of the Group’s Executive, Health, Safety & Security, Investment and Sustainability Committees. He attends the Audit, Remuneration and Nomination Committees at the invitation of the chairs of the relevant Committees.
Colette O’SheaManaging Director, London Portfolio
Appointed to Board: January 2018
Skills and experience Colette has over 20 years’ property experience in London, operating in investment, asset management and development. She joined Landsec in 2003 and was Head of Development, London Portfolio, before being appointed its Managing Director in April 2014. Colette led the London business through its 2010 three million sq ft speculative London development programme, including the transformation of Victoria. Prior to joining Landsec, Colette was Head of Estates at the Mercers’ Company where she led the property team whilst also gaining extensive office, retail and residential experience.
Other current appointmentsBusiness Board Member of the Mayor of London’s Local Enterprise Partnership for London (LEAP) in 2016. Joint Chair of the Royal Docks Enterprise Zone Programme Board.
Management committeesA member of the Group’s Executive and Investment Committees. From April 2019, Chairman of the Property Committee.
Tim AshbyGroup General Counsel and Company Secretary
Joined Landsec in September 2015
Skills and experienceTim is a solicitor and has significant legal, compliance and commercial experience gained across a number of different sectors and businesses both in the UK and overseas. Tim leads the Legal, Company Secretariat, Real Estate Information Management and GDPR teams and is responsible for legal, compliance and governance activity across the Group. He provides advice and support to the Board and its Committees and leads the Group’s relationships with its external law firms, and investor and shareholder bodies. Prior to joining Landsec, he was Group General Counsel and Company Secretary of Mothercare plc and previously Tim held senior roles at Yum Brands Inc. and PepsiCo Inc.
Other current appointmentsMember of Executive Committee GC100.
Management committeesMember of the Group’s Executive Committee. Secretary of Group PLC Board, Secretary of Audit, Nomination and Remuneration Committee. Attends Investment Committee.
Robert NoelChief Executive
Full biography on page 66
Martin GreensladeChief Financial Officer
Full biography on page 66
Colette O’SheaManaging Director, London Portfolio
Full biography on page 66
Martin GreensladeChief Financial Officer
Appointed to Board: September 2005
Skills and experienceMartin brings extensive and wide-ranging financial experience to the Group from the property, engineering and financial sectors in the UK and overseas. He also has extensive financial expertise, particularly in relation to corporate finance and investment arrangements, and significant listed company experience at board level. Prior to joining Landsec in 2005, Martin was Group Finance Director of Alvis plc and prior to that he worked in corporate finance serving as a member of the executive committee of Nordea’s investment banking division and Managing Director of its UK business.
Other current appointmentsTrustee of International Justice Mission UK.
Management committeesA member of the Group’s Executive and Investment Committees. He attends Audit Committee meetings at the invitation of the Committee Chairman.
Other Directors serving on the Board during the year
Dame Alison Carnwath stepped down as Chairman of the Board on 12 July 2018 after serving almost 14 years on the Board, of which the last nine years were as Chair.
Simon Palley, Non-executive Director and Chairman of the Remuneration Committee, retired from the Board on 31 March 2019. Simon had been a member of the Board since 2010.
Scott Parsons resigned as an Executive Director on 25 February 2019 having been appointed on 1 January 2018.
Jill BradyGroup Human Resources Director
Joined Landsec 15 January 2019
Skills and experienceJill is a solicitor by background and has held a number of executive roles in HR, legal and business affairs.
At Landsec, Jill has end-to-end responsibility for the articulation and delivery of a clear people strategy for Landsec, including talent, reward, organisational design and engagement. Jill was most recently Executive Vice President, Customer at Virgin Atlantic where she was responsible for leading the business’s 5,000 customer-facing people through a period of transformational change and new technology. She was at Virgin Atlantic for 14 years in a variety of roles, including General Counsel and Director of People and External Affairs. Jill has also worked as Head of Legal for lastminute.com and Opodo.
Other current appointmentsJill is Vice-chair of Trustees for Virgin Unite, the Branson family foundation, and a Major in the Engineer and Logistics Staff Corps which forms part of 77 Brigade in the British Army.
Management committeesMember of the Group’s Executive and Sustainability Committees. Attends Remuneration and Nomination Committee meetings at the invitation of the Chairs of the relevant Committees.
Miles WebberDirector of Corporate Affairs and Sustainability
Joined Landsec in May 2015
Skills and experienceMiles has more than 25 years’ experience in communications and public affairs. Miles’ broad responsibilities cover sustainability, public relations (both financial and business-to-business), internal communications, public affairs, investor relations and corporate marketing (including brand and reputational management). Before joining Landsec, Miles was Head of External Affairs, UK & Ireland, for General Electric, having previously held other senior external affairs and relations positions with them since he joined in 2005. Prior to that, he spent six years with Merrill Lynch where roles included Vice President, Corporate Communications, followed by Director of Public Affairs, EMEA.
Other current appointmentsDirector of Inspirasia Foundation. Director of Westminster Forum.
Management committeesMember of the Group’s Executive and Sustainability Committees. Attends Investment Committee.
Board of Directorscontinued
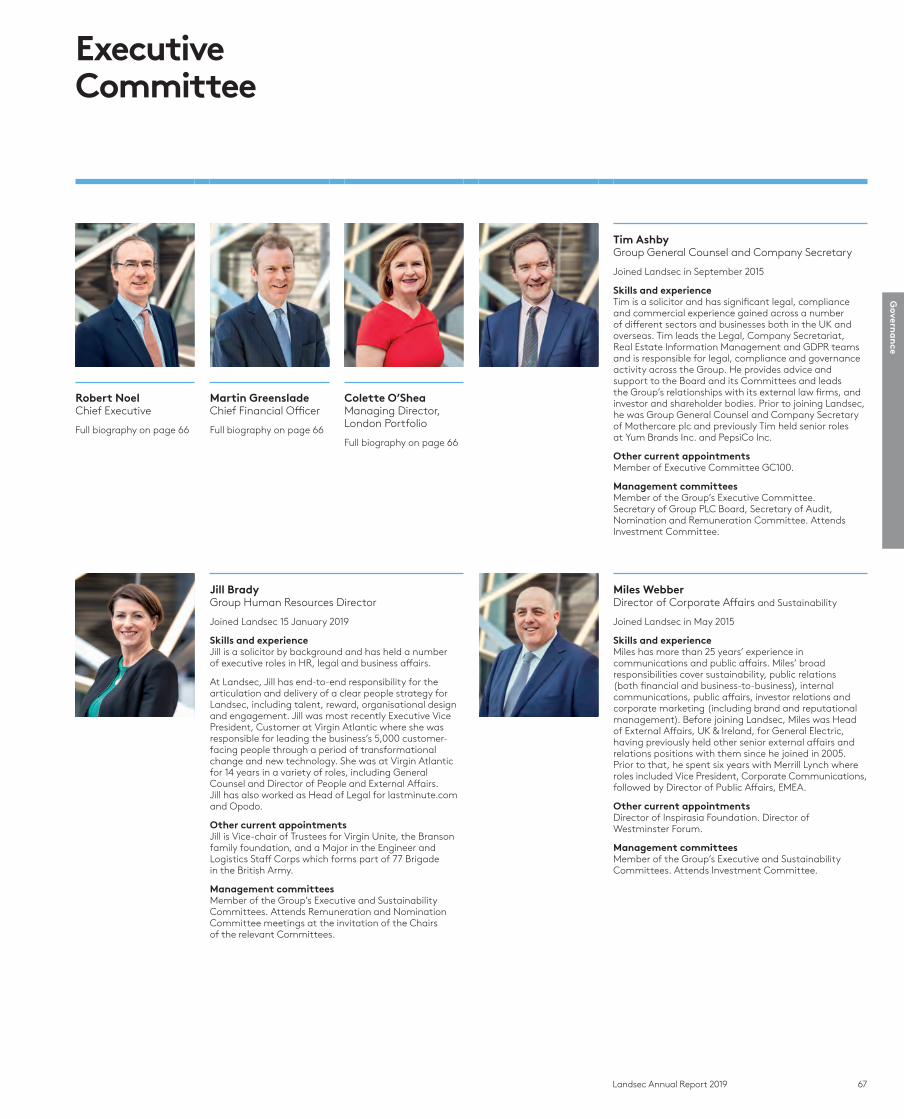
67Landsec Annual Report 2019
Govern
an
ce
Executive Directors
Robert NoelChief Executive
Appointed to Board: January 2010Appointed as Chief Executive: April 2012
Skills and experience Robert is a chartered surveyor and has over 30 years’ experience in a number of sectors within the property market and extensive knowledge of the London commercial property market in particular. He has substantial executive leadership and listed company experience. Before joining Landsec in 2010 as Managing Director of the London Portfolio, Robert was Property Director at Great Portland Estates plc and prior to that he was a director of the property services group Nelson Bakewell.
Other current appointmentsDirector European Public Real Estate Association (EPRA). Director of the British Property Federation and President July 2018-19. Trustee of the Natural History Museum.
Management committeesChairman of the Group’s Executive, Health, Safety & Security, Investment and Sustainability Committees. He attends the Audit, Remuneration and Nomination Committees at the invitation of the chairs of the relevant Committees.
Colette O’SheaManaging Director, London Portfolio
Appointed to Board: January 2018
Skills and experience Colette has over 20 years’ property experience in London, operating in investment, asset management and development. She joined Landsec in 2003 and was Head of Development, London Portfolio, before being appointed its Managing Director in April 2014. Colette led the London business through its 2010 three million sq ft speculative London development programme, including the transformation of Victoria. Prior to joining Landsec, Colette was Head of Estates at the Mercers’ Company where she led the property team whilst also gaining extensive office, retail and residential experience.
Other current appointmentsBusiness Board Member of the Mayor of London’s Local Enterprise Partnership for London (LEAP) in 2016. Joint Chair of the Royal Docks Enterprise Zone Programme Board.
Management committeesA member of the Group’s Executive and Investment Committees. From April 2019, Chairman of the Property Committee.
Tim AshbyGroup General Counsel and Company Secretary
Joined Landsec in September 2015
Skills and experienceTim is a solicitor and has significant legal, compliance and commercial experience gained across a number of different sectors and businesses both in the UK and overseas. Tim leads the Legal, Company Secretariat, Real Estate Information Management and GDPR teams and is responsible for legal, compliance and governance activity across the Group. He provides advice and support to the Board and its Committees and leads the Group’s relationships with its external law firms, and investor and shareholder bodies. Prior to joining Landsec, he was Group General Counsel and Company Secretary of Mothercare plc and previously Tim held senior roles at Yum Brands Inc. and PepsiCo Inc.
Other current appointmentsMember of Executive Committee GC100.
Management committeesMember of the Group’s Executive Committee. Secretary of Group PLC Board, Secretary of Audit, Nomination and Remuneration Committee. Attends Investment Committee.
Robert NoelChief Executive
Full biography on page 66
Martin GreensladeChief Financial Officer
Full biography on page 66
Colette O’SheaManaging Director, London Portfolio
Full biography on page 66
Martin GreensladeChief Financial Officer
Appointed to Board: September 2005
Skills and experienceMartin brings extensive and wide-ranging financial experience to the Group from the property, engineering and financial sectors in the UK and overseas. He also has extensive financial expertise, particularly in relation to corporate finance and investment arrangements, and significant listed company experience at board level. Prior to joining Landsec in 2005, Martin was Group Finance Director of Alvis plc and prior to that he worked in corporate finance serving as a member of the executive committee of Nordea’s investment banking division and Managing Director of its UK business.
Other current appointmentsTrustee of International Justice Mission UK.
Management committeesA member of the Group’s Executive and Investment Committees. He attends Audit Committee meetings at the invitation of the Committee Chairman.
Other Directors serving on the Board during the year
Dame Alison Carnwath stepped down as Chairman of the Board on 12 July 2018 after serving almost 14 years on the Board, of which the last nine years were as Chair.
Simon Palley, Non-executive Director and Chairman of the Remuneration Committee, retired from the Board on 31 March 2019. Simon had been a member of the Board since 2010.
Scott Parsons resigned as an Executive Director on 25 February 2019 having been appointed on 1 January 2018.
Jill BradyGroup Human Resources Director
Joined Landsec 15 January 2019
Skills and experienceJill is a solicitor by background and has held a number of executive roles in HR, legal and business affairs.
At Landsec, Jill has end-to-end responsibility for the articulation and delivery of a clear people strategy for Landsec, including talent, reward, organisational design and engagement. Jill was most recently Executive Vice President, Customer at Virgin Atlantic where she was responsible for leading the business’s 5,000 customer-facing people through a period of transformational change and new technology. She was at Virgin Atlantic for 14 years in a variety of roles, including General Counsel and Director of People and External Affairs. Jill has also worked as Head of Legal for lastminute.com and Opodo.
Other current appointmentsJill is Vice-chair of Trustees for Virgin Unite, the Branson family foundation, and a Major in the Engineer and Logistics Staff Corps which forms part of 77 Brigade in the British Army.
Management committeesMember of the Group’s Executive and Sustainability Committees. Attends Remuneration and Nomination Committee meetings at the invitation of the Chairs of the relevant Committees.
Miles WebberDirector of Corporate Affairs and Sustainability
Joined Landsec in May 2015
Skills and experienceMiles has more than 25 years’ experience in communications and public affairs. Miles’ broad responsibilities cover sustainability, public relations (both financial and business-to-business), internal communications, public affairs, investor relations and corporate marketing (including brand and reputational management). Before joining Landsec, Miles was Head of External Affairs, UK & Ireland, for General Electric, having previously held other senior external affairs and relations positions with them since he joined in 2005. Prior to that, he spent six years with Merrill Lynch where roles included Vice President, Corporate Communications, followed by Director of Public Affairs, EMEA.
Other current appointmentsDirector of Inspirasia Foundation. Director of Westminster Forum.
Management committeesMember of the Group’s Executive and Sustainability Committees. Attends Investment Committee.
Executive Committee
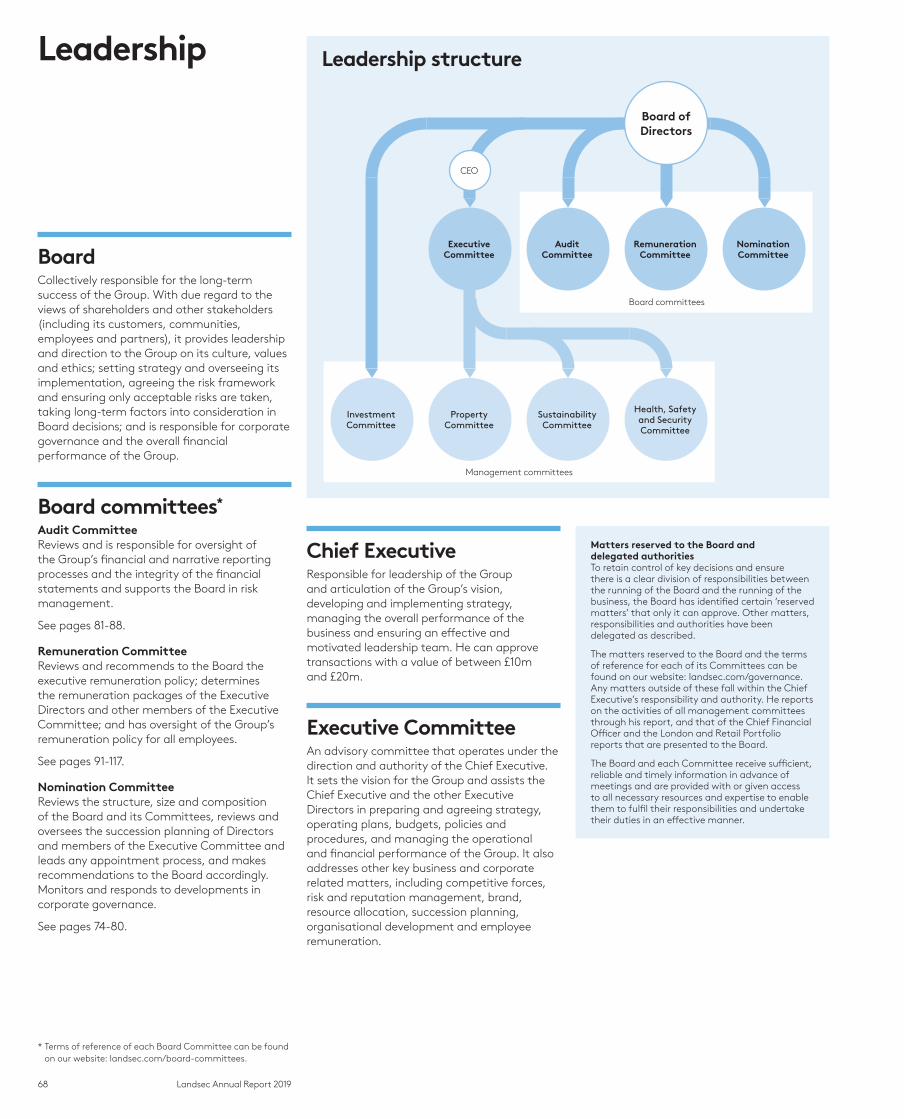
68 Landsec Annual Report 2019
BoardCollectively responsible for the long-term success of the Group. With due regard to the views of shareholders and other stakeholders (including its customers, communities, employees and partners), it provides leadership and direction to the Group on its culture, values and ethics; setting strategy and overseeing its implementation, agreeing the risk framework and ensuring only acceptable risks are taken, taking long-term factors into consideration in Board decisions; and is responsible for corporate governance and the overall financial performance of the Group.
Board committees*
Audit CommitteeReviews and is responsible for oversight of the Group’s financial and narrative reporting processes and the integrity of the financial statements and supports the Board in risk management.
See pages 81-88.
Remuneration CommitteeReviews and recommends to the Board the executive remuneration policy; determines the remuneration packages of the Executive Directors and other members of the Executive Committee; and has oversight of the Group’s remuneration policy for all employees.
See pages 91-117.
Nomination CommitteeReviews the structure, size and composition of the Board and its Committees, reviews and oversees the succession planning of Directors and members of the Executive Committee and leads any appointment process, and makes recommendations to the Board accordingly. Monitors and responds to developments in corporate governance.
See pages 74-80.
Chief ExecutiveResponsible for leadership of the Group and articulation of the Group’s vision, developing and implementing strategy, managing the overall performance of the business and ensuring an effective and motivated leadership team. He can approve transactions with a value of between £10m and £20m.
Executive CommitteeAn advisory committee that operates under the direction and authority of the Chief Executive.It sets the vision for the Group and assists the Chief Executive and the other Executive Directors in preparing and agreeing strategy, operating plans, budgets, policies and procedures, and managing the operational and financial performance of the Group. It also addresses other key business and corporate related matters, including competitive forces, risk and reputation management, brand, resource allocation, succession planning, organisational development and employee remuneration.
Matters reserved to the Board and delegated authoritiesTo retain control of key decisions and ensure there is a clear division of responsibilities between the running of the Board and the running of the business, the Board has identified certain ‘reserved matters’ that only it can approve. Other matters, responsibilities and authorities have been delegated as described.
The matters reserved to the Board and the terms of reference for each of its Committees can be found on our website: landsec.com/governance. Any matters outside of these fall within the Chief Executive’s responsibility and authority. He reports on the activities of all management committees through his report, and that of the Chief Financial Officer and the London and Retail Portfolio reports that are presented to the Board.
The Board and each Committee receive sufficient, reliable and timely information in advance of meetings and are provided with or given access to all necessary resources and expertise to enable them to fulfil their responsibilities and undertake their duties in an effective manner.
* Terms of reference of each Board Committee can be found on our website: landsec.com/board-committees.
Leadership structure
Remuneration Committee
Nomination Committee
Audit Committee
Board of Directors
Executive Committee
CEO
Investment Committee
Property Committee
Sustainability Committee
Health, Safety and Security Committee
Board committees
Management committees
Leadership
69Landsec Annual Report 2019
Govern
an
ce
Management committeesInvestment CommitteeConsiders and approves significant investment transactions and commercial agreements, including the acquisition, disposal and development of assets with a value between £20m and £150m. It also reviews and recommends higher value transactions to the Board and implements the annual funding strategy approved by the Board.
Assesses the impact of proposed sales, purchases, developments and debt funding arrangements on the Group’s balance sheet and internal control metrics over the short and medium term. Also addresses the likely impact of macro-economic developments on the business.
Property CommitteeResponsible for the financial, operational and governance performance of the London and Retail business portfolios. It can approve transactions up to a value of £10m. In April 2019, the Property Committee was created by the merger of the London and Retail Executive Committees.
Sustainability CommitteeDevelops and implements the Group’s sustainability strategy as integrated with the Group’s overall corporate strategy. In doing so, it also considers environmental, social, economic and energy issues affecting the business and the impact of these issues on our customers.
Health, Safety and Security CommitteeOversees the Group’s health and safety policy and operations, security governance, policy and procedures at all Group properties, performance against targets and progress towards goals. The Committee has continued to oversee the implementation of the agreed actions to address those properties identified as having insufficient mitigation measures in place following the tragedy at Grenfell Tower.
Board composition and roles ChairmanCressida Hogg Leads the Board, responsible for governance, major shareholder and other stakeholder engagement.
Chief ExecutiveRobert NoelResponsible for the leadership of the Group, implementation of strategy, managing overall business performance and leading the executive team.
Chief Financial Officer Martin Greenslade Supports the Chief Executive in developing and implementing strategy and Group financial performance.
Managing Director, London Portfolio Colette O’SheaResponsible for our London Portfolio comprising offices, leisure, retail and residential space. From April 2019, responsible for the management of the Retail and London portfolios.
Senior Independent DirectorEdward Bonham CarterActs as a sounding board for the Chairman and a trusted intermediary for other Directors. Available to discuss with shareholders any concerns that cannot be resolved through the normal channels of communication with the Chairman or the Executive Directors.
Independent Non-executive Directors Chris Bartram, Nicholas Cadbury, Madeleine Cosgrave, Christophe Evain and Stacey Rauch Responsible for bringing an external perspective, sound judgement and objectivity to the Board’s deliberations and decision-making. Support and constructively challenge the Executive Directors using their broad range of experience and expertise. Monitor the delivery of the agreed strategy within the risk management framework set by the Board.
Group General Counsel and Company SecretaryTim AshbyProvides advice and assistance to the Board, the Chairman and other Directors, particularly in relation to formulating the agenda for Board meetings, corporate governance, induction training and development.
Ensures that Board procedures are complied with, applicable rules are followed and good information flow exists to the Board and its Committees. The appointment and removal of the Company Secretary is a matter for the Board as a whole.
Board attendance schedule Table 42
BoardAudit Committee
Nomination Committee
Remuneration Committee
Robert Noel 8/8
Martin Greenslade 8/8
Colette O'Shea 8/8
Scott Parsons1 7/7
Dame Alison Carnwath2 2/2 2/2 2/2
Cressida Hogg 8/8 6/6 4/53
Edward Bonham Carter 8/8 8/8 5/5
Chris Bartram 8/8 4/4 8/8
Nicholas Cadbury 8/8 4/4
Madeleine Cosgrave4 8/8
Christophe Evain5
Simon Palley 8/8 8/8 5/5
Stacey Rauch6 8/8 4/4 8/8 3/3
1. Resigned on 25 February 2019.2. Stepped down on 12 July 2018.3. Cressida Hogg did not attend the May meeting because her appointment as Chairman was discussed.4. Appointed on 1 January 2019.5. Appointed on 1 April 2019.6. Joined the Remuneration Committee on 12 July 2018.
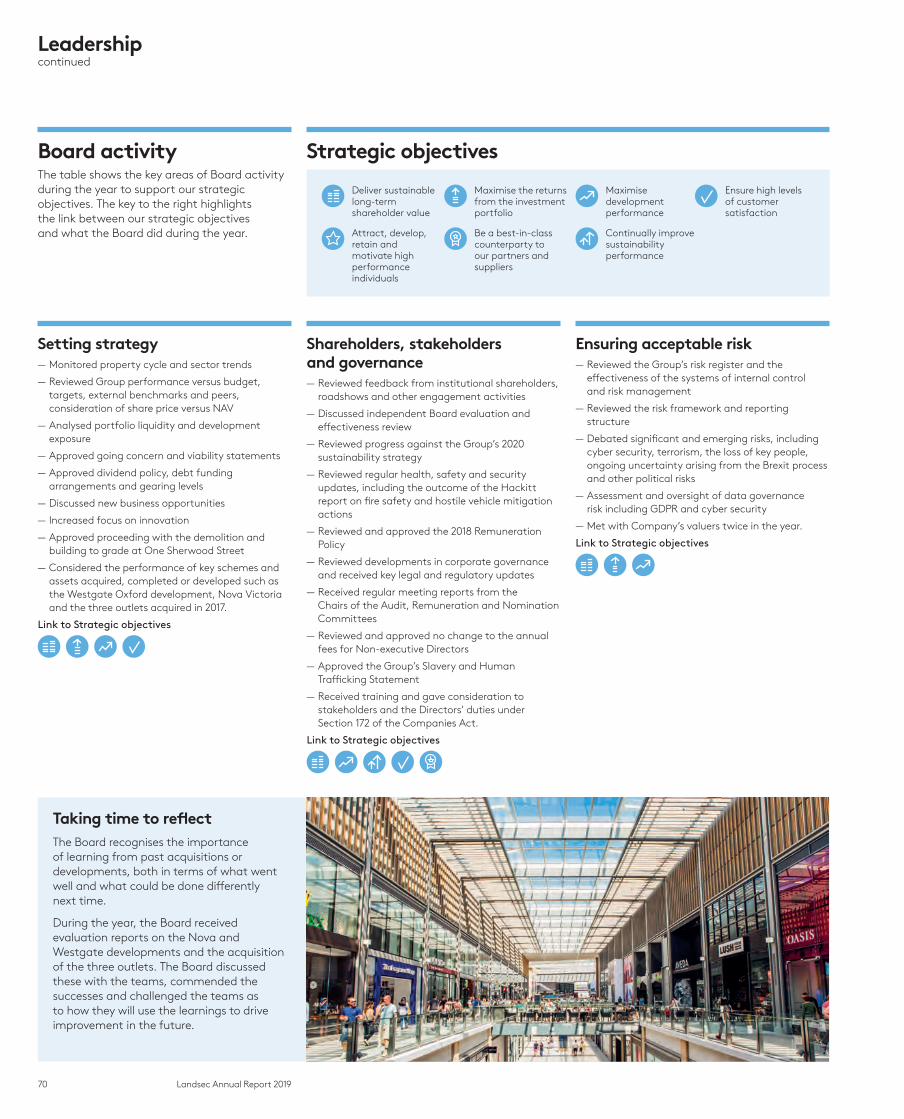
70 Landsec Annual Report 2019
Taking time to reflectThe Board recognises the importance of learning from past acquisitions or developments, both in terms of what went well and what could be done differently next time.
During the year, the Board received evaluation reports on the Nova and Westgate developments and the acquisition of the three outlets. The Board discussed these with the teams, commended the successes and challenged the teams as to how they will use the learnings to drive improvement in the future.
Board activityThe table shows the key areas of Board activity during the year to support our strategic objectives. The key to the right highlights the link between our strategic objectives and what the Board did during the year.
Strategic objectives
Deliver sustainable long-term shareholder value
Maximise the returns from the investment portfolio
Maximise development performance
Ensure high levels of customer satisfaction
Attract, develop, retain and motivate high performance individuals
Be a best-in-class counterparty to our partners and suppliers
Continually improve sustainability performance
Setting strategy — Monitored property cycle and sector trends
— Reviewed Group performance versus budget, targets, external benchmarks and peers, consideration of share price versus NAV
— Analysed portfolio liquidity and development exposure
— Approved going concern and viability statements
— Approved dividend policy, debt funding arrangements and gearing levels
— Discussed new business opportunities
— Increased focus on innovation
— Approved proceeding with the demolition and building to grade at One Sherwood Street
— Considered the performance of key schemes and assets acquired, completed or developed such as the Westgate Oxford development, Nova Victoria and the three outlets acquired in 2017.
Link to Strategic objectives
Shareholders, stakeholders and governance
— Reviewed feedback from institutional shareholders, roadshows and other engagement activities
— Discussed independent Board evaluation and effectiveness review
— Reviewed progress against the Group’s 2020 sustainability strategy
— Reviewed regular health, safety and security updates, including the outcome of the Hackitt report on fire safety and hostile vehicle mitigation actions
— Reviewed and approved the 2018 Remuneration Policy
— Reviewed developments in corporate governance and received key legal and regulatory updates
— Received regular meeting reports from the Chairs of the Audit, Remuneration and Nomination Committees
— Reviewed and approved no change to the annual fees for Non-executive Directors
— Approved the Group’s Slavery and Human Trafficking Statement
— Received training and gave consideration to stakeholders and the Directors’ duties under Section 172 of the Companies Act.
Link to Strategic objectives
Ensuring acceptable risk — Reviewed the Group’s risk register and the effectiveness of the systems of internal control and risk management
— Reviewed the risk framework and reporting structure
— Debated significant and emerging risks, including cyber security, terrorism, the loss of key people, ongoing uncertainty arising from the Brexit process and other political risks
— Assessment and oversight of data governance risk including GDPR and cyber security
— Met with Company’s valuers twice in the year.
Link to Strategic objectives
Leadershipcontinued
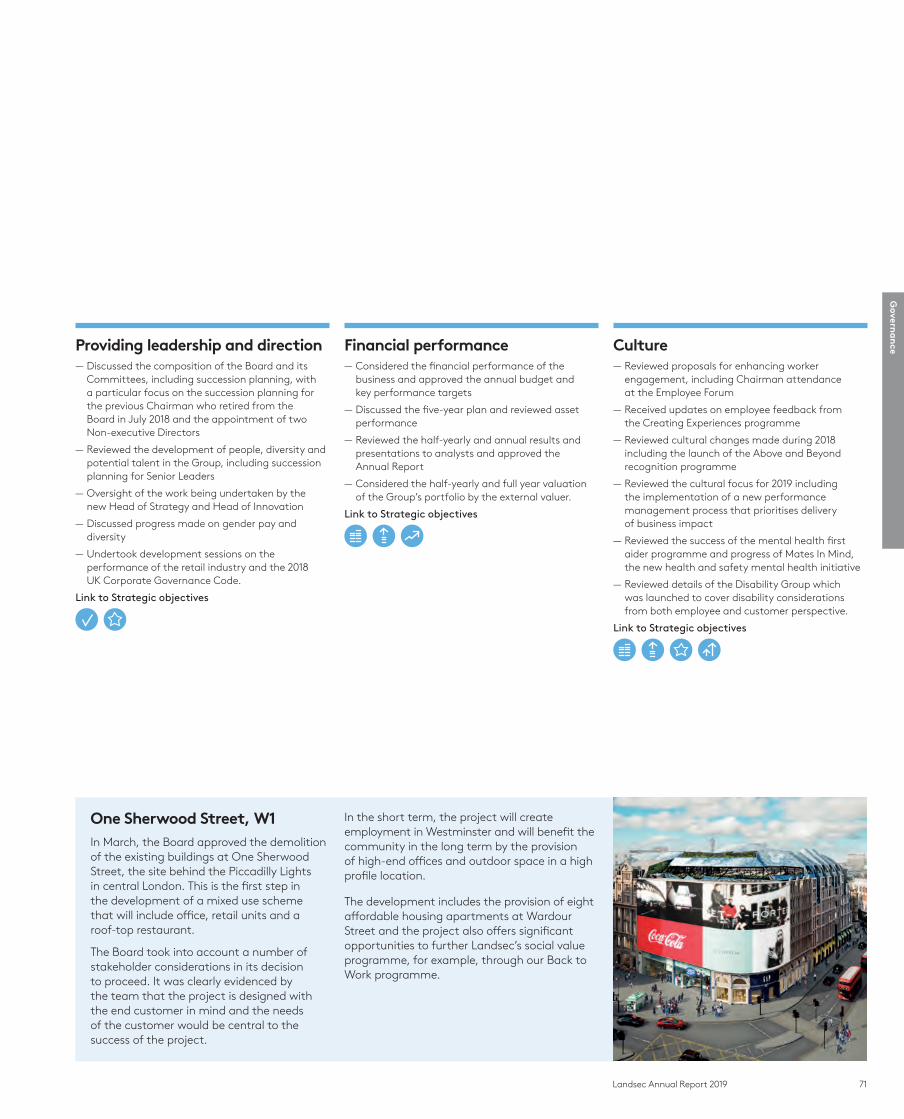
71Landsec Annual Report 2019
Govern
an
ceProviding leadership and direction — Discussed the composition of the Board and its Committees, including succession planning, with a particular focus on the succession planning for the previous Chairman who retired from the Board in July 2018 and the appointment of two Non-executive Directors
— Reviewed the development of people, diversity and potential talent in the Group, including succession planning for Senior Leaders
— Oversight of the work being undertaken by the new Head of Strategy and Head of Innovation
— Discussed progress made on gender pay and diversity
— Undertook development sessions on the performance of the retail industry and the 2018 UK Corporate Governance Code.
Link to Strategic objectives
Financial performance — Considered the financial performance of the business and approved the annual budget and key performance targets
— Discussed the five-year plan and reviewed asset performance
— Reviewed the half-yearly and annual results and presentations to analysts and approved the Annual Report
— Considered the half-yearly and full year valuation of the Group’s portfolio by the external valuer.
Link to Strategic objectives
Culture — Reviewed proposals for enhancing worker engagement, including Chairman attendance at the Employee Forum
— Received updates on employee feedback from the Creating Experiences programme
— Reviewed cultural changes made during 2018 including the launch of the Above and Beyond recognition programme
— Reviewed the cultural focus for 2019 including the implementation of a new performance management process that prioritises delivery of business impact
— Reviewed the success of the mental health first aider programme and progress of Mates In Mind, the new health and safety mental health initiative
— Reviewed details of the Disability Group which was launched to cover disability considerations from both employee and customer perspective.
Link to Strategic objectives
One Sherwood Street, W1In March, the Board approved the demolition of the existing buildings at One Sherwood Street, the site behind the Piccadilly Lights in central London. This is the first step in the development of a mixed use scheme that will include office, retail units and a roof-top restaurant.
The Board took into account a number of stakeholder considerations in its decision to proceed. It was clearly evidenced by the team that the project is designed with the end customer in mind and the needs of the customer would be central to the success of the project.
In the short term, the project will create employment in Westminster and will benefit the community in the long term by the provision of high-end offices and outdoor space in a high profile location.
The development includes the provision of eight affordable housing apartments at Wardour Street and the project also offers significant opportunities to further Landsec’s social value programme, for example, through our Back to Work programme.
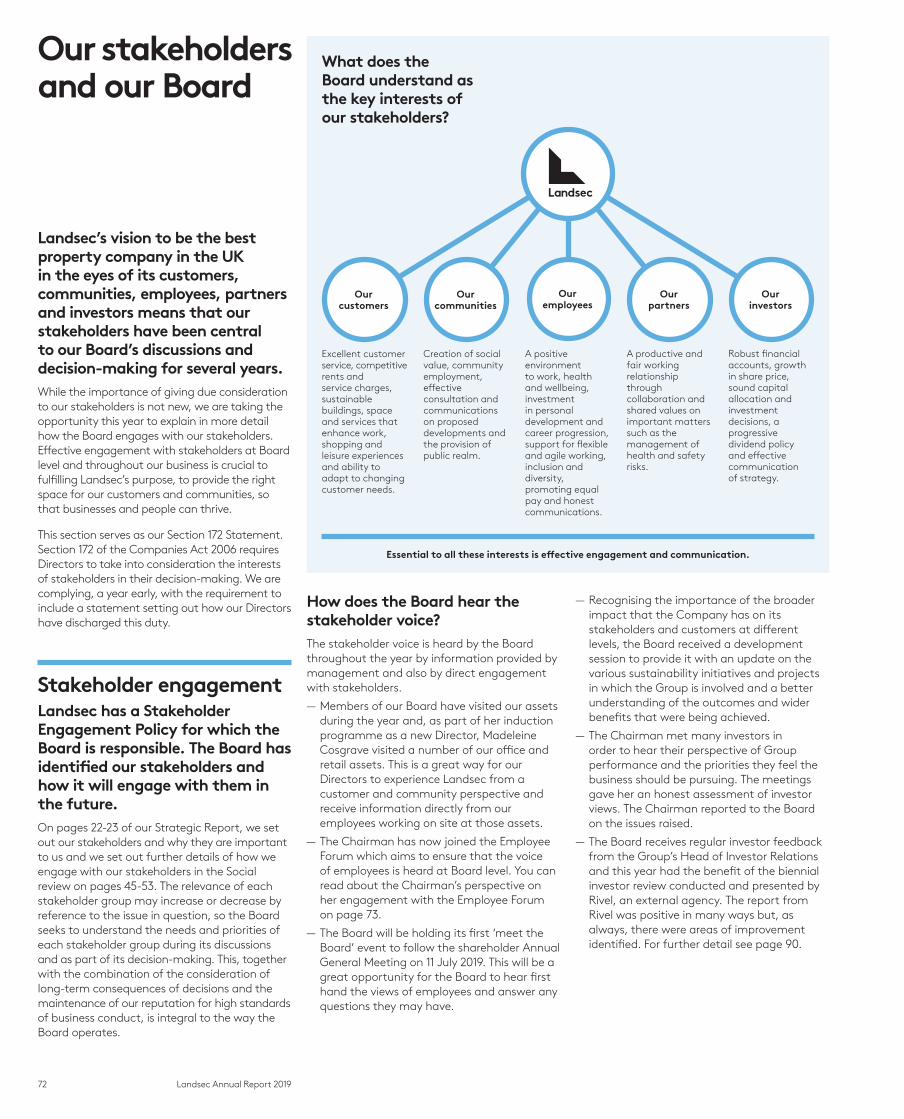
72 Landsec Annual Report 2019
Landsec’s vision to be the best property company in the UK in the eyes of its customers, communities, employees, partners and investors means that our stakeholders have been central to our Board’s discussions and decision-making for several years. While the importance of giving due consideration to our stakeholders is not new, we are taking the opportunity this year to explain in more detail how the Board engages with our stakeholders. Effective engagement with stakeholders at Board level and throughout our business is crucial to fulfilling Landsec’s purpose, to provide the right space for our customers and communities, so that businesses and people can thrive.
This section serves as our Section 172 Statement. Section 172 of the Companies Act 2006 requires Directors to take into consideration the interests of stakeholders in their decision-making. We are complying, a year early, with the requirement to include a statement setting out how our Directors have discharged this duty.
Stakeholder engagementLandsec has a Stakeholder Engagement Policy for which the Board is responsible. The Board has identified our stakeholders and how it will engage with them in the future. On pages 22-23 of our Strategic Report, we set out our stakeholders and why they are important to us and we set out further details of how we engage with our stakeholders in the Social review on pages 45-53. The relevance of each stakeholder group may increase or decrease by reference to the issue in question, so the Board seeks to understand the needs and priorities of each stakeholder group during its discussions and as part of its decision-making. This, together with the combination of the consideration of long-term consequences of decisions and the maintenance of our reputation for high standards of business conduct, is integral to the way the Board operates.
How does the Board hear the stakeholder voice?The stakeholder voice is heard by the Board throughout the year by information provided by management and also by direct engagement with stakeholders.
— Members of our Board have visited our assets during the year and, as part of her induction programme as a new Director, Madeleine Cosgrave visited a number of our office and retail assets. This is a great way for our Directors to experience Landsec from a customer and community perspective and receive information directly from our employees working on site at those assets.
— The Chairman has now joined the Employee Forum which aims to ensure that the voice of employees is heard at Board level. You can read about the Chairman’s perspective on her engagement with the Employee Forum on page 73.
— The Board will be holding its first ‘meet the Board’ event to follow the shareholder Annual General Meeting on 11 July 2019. This will be a great opportunity for the Board to hear first hand the views of employees and answer any questions they may have.
— Recognising the importance of the broader impact that the Company has on its stakeholders and customers at different levels, the Board received a development session to provide it with an update on the various sustainability initiatives and projects in which the Group is involved and a better understanding of the outcomes and wider benefits that were being achieved.
— The Chairman met many investors in order to hear their perspective of Group performance and the priorities they feel the business should be pursuing. The meetings gave her an honest assessment of investor views. The Chairman reported to the Board on the issues raised.
— The Board receives regular investor feedback from the Group’s Head of Investor Relations and this year had the benefit of the biennial investor review conducted and presented by Rivel, an external agency. The report from Rivel was positive in many ways but, as always, there were areas of improvement identified. For further detail see page 90.
Our stakeholders and our Board
What does the Board understand as the key interests of our stakeholders?
Excellent customer service, competitive rents and service charges, sustainable buildings, space and services that enhance work, shopping and leisure experiences and ability to adapt to changing customer needs.
Creation of social value, community employment, effective consultation and communications on proposed developments and the provision of public realm.
A positive environment to work, health and wellbeing, investment in personal development and career progression, support for flexible and agile working, inclusion and diversity, promoting equal pay and honest communications.
A productive and fair working relationship through collaboration and shared values on important matters such as the management of health and safety risks.
Robust financial accounts, growth in share price, sound capital allocation and investment decisions, a progressive dividend policy and effective communication of strategy.
Our investors
Our partners
Our employees
Our communities
Our customers
Essential to all these interests is effective engagement and communication.

73Landsec Annual Report 2019
Govern
an
ce
What training has the Board received on the importance of stakeholder considerations in its decision-making?The relevance of stakeholder considerations in the context of its decision-making has been brought to the Board’s attention by the Company Secretary for a while, as the principles are aligned with the Group’s existing vision. Nevertheless, we recognise the importance of keeping the interests of our stakeholders at the forefront of decision-making and continue to provide refresher training to Directors. This year, Slaughter and May conducted a training session with the Board that focused on corporate purpose, stakeholders and decision-making. The Board reflected on the nature of and opportunities for future engagement with stakeholders and the need for each Director to allocate time to this.
The Board recognises the need to review regularly the identity of our stakeholders as it makes decisions on behalf of the Group.
How have we embedded the consideration of stakeholder interests within the culture of the business?We have taken action to embed consideration of stakeholder interests within the culture and operating model of the business by providing training to those management committees that make investment decisions. Papers presented to these committees now always include a section on stakeholders.
How does the Board ensure that stakeholder considerations have been taken into account?We achieve this by ensuring that all papers coming from the business include a section on stakeholder considerations and including this as part of the debate when making decisions. The Company Secretary is on hand to provide support to the Board in ensuring that sufficient consideration is given to stakeholder issues.
The Board and stakeholders in action: the Chairman’s experiences of the Employee Forum.
Who attends the Employee Forum?Employees from across the business attend, from a variety of roles, and I have been pleased with the openness of the discussion and the questions raised.
What are the key things you have learnt from attending the Employee Forum?The Employee Forum has presented me with a great opportunity to hear from employees first hand how they feel about life at Landsec, how the culture is evolving and any concerns that they might have. We have discussed a range of topics including the performance review process for employees and shared parental leave/family policy.
How do you flow the information you have gained from attending the Forum back to the Board?I report back to the Board on the outcome of my attendance at the Forum, summarising my findings and setting out the actions arising. I seek the Board’s view on the matters raised.
What does the Board do with this information?This information helps the Board to understand, monitor and assess the culture at Landsec. Our employees are our most important assets and we need to ensure that their voice is heard at Board level.
Returning to Westgate a year after it opened enabled me to experience the vibrant destination we have created for our visitors and retailers.”
Edward Bonham CarterSenior Independent Director

74 Landsec Annual Report 2019
Committee membersCressida Hogg (Chairman and member from 12 July 2018)
Chris Bartram
Edward Bonham Carter
Stacey Rauch
Highlights [Appointment of two new Non-executive Directors
[ External Board evaluation
[ Early compliance with 2018 UK Corporate Governance Code
Key responsibilities [ Structure, size and composition of the Board and its Committees
[ Succession planning of the Board and Senior Management
[Monitoring corporate governance
Dear Shareholder
The Nomination Committee has been active this year both in overseeing several changes to the Board and monitoring corporate governance developments as they affect Landsec.The Nomination Committee oversees the process for appointing new directors, assessing the composition and skillset of the Board and its Committees and the Group’s diversity policy. Also, it oversees the governance agenda on behalf of the Board and considers the papers and proposals issued by Government and regulatory bodies, and their application to Landsec. It then ensures that the decisions taken by the Board and its delegated Committees are made in the best interests of the Company and that they address any wider implications that may affect stakeholders.
GovernanceWe applied the main principles and complied with the provisions of the 2016 UK Corporate Governance Code throughout the year and now comply with the new 2018 Code.
Landsec is recognised for its positive approach to corporate governance and this is something that I have inherited from our previous Chairman. This will continue. This Committee advises the Board on best practice and our ambition is to remain recognised for our approach. We inform the Board on governance matters and invite external advisers to Board meetings to support this.
You will find more detail regarding our compliance, governance and effectiveness elsewhere in this report, including our approach to Section 172 of the Companies Act 2006 and how we address the broader stakeholder base, as well as the interests of our investors. We are engaging more actively with stakeholders, including our employees through our Employee Forum and, for the first time this year, a ‘meet the Board’ session to follow our shareholder Annual General Meeting in July. We want to improve engagement with our other stakeholders and the Committee is following this work closely and will deepen its own engagement over the next 12 months, complementing the active relationships we have with leading investors.
Letter from the Chairman of the Nomination Committee
Cressida HoggChairman of the Nomination Committee

75Landsec Annual Report 2019
Govern
an
ce
Board and Committee changesIt has been a busy year for changes to the Board. I was delighted to accept the invitation to become Chairman last year, taking up the position in July 2018 to replace Alison Carnwath. Since then, we were pleased to appoint two Non-executive Directors, Madeleine Cosgrave with effect from 1 January 2019 and Christophe Evain who joined the Board on 1 April 2019. However, after nearly nine years as a Director, we were sorry to see the retirement of Simon Palley who stepped down on 31 March 2019.
Before appointing Madeleine and Christophe, the Committee thought carefully about the skills and experience we wanted from both appointments. A clear and detailed brief was developed for each position that focused on the particular knowledge and capabilities that we wanted from the new directors, both of whom were being appointed to provide succession to directors.
We used different external executive search companies for each appointment and demanded diversity in the range of candidates they proposed. We were pleased with the level of interest in both roles and the quality of the shortlists produced for us to review.
Madeleine has worked with GIC for 20 years and is currently Managing Director and Regional Head of Europe at GIC Real Estate. Her background and experience on all property matters will be invaluable to us in the coming years and will provide us with continuity in property expertise when Chris Bartram retires from the Board. Christophe has extensive investment experience in private equity, similar to Simon Palley, and this financially focused, analytical skill is an important requirement as we consider investment decisions. Additionally, both bring a different and fresh perspective to the Board discussion because of their different careers. The biographies of each director are set out in more detail elsewhere in this report.
We also announced Scott Parsons’ resignation as an Executive Director in February 2019. Scott had been on the Board in his capacity as Managing Director, Retail but is leaving Landsec to pursue other career options and we wish him well.
I am aware of the attention paid by investors to the skills and capabilities of a PLC board, and those available to it. This is an ongoing discussion for us and we will appoint new directors, or draw upon external expertise, when we believe it can help the Board in its short- and longer-term decision-making.
Board composition and successionWe have reviewed the Board and Committee composition and, with the changes made during the year, we believe that the current composition of the Board and its Committees remains appropriate for now. However, we keep this under regular review and the topic of succession planning is discussed at each
Committee meeting. We meet the Hampton-Alexander target for gender diversity at Board level but recognise that we have more to do in other areas.
The Committee supports the ongoing development of Directors and the Executive team to ensure that we retain and recruit the best talent for our needs. In my Chairman’s letter to shareholders on pages 62 and 63, I explain that I have asked Chris Bartram to remain on the Board for an extra year beyond the nine-year term after which he is no longer considered independent under the Code. However, the Board continues to consider him independent in character and judgement, as evidenced by the way he discharges his duties as a Board and Committee member. From a governance perspective, the Board as a whole is independent.
The Committee supports the Board in its work to secure the long-term health of the Company and its strategy for success in a fast-changing world. This can be achieved through the use of external experts advising the Board on particular issues and risks and, within Landsec, by having people with a diverse spectrum of background, personality and experience. The Committee has assessed the likely business needs of the Company by reference to shorter term trends as well as the longer-term five-year plan and risks affecting the business. This has been reflected in the discussions of management capability and succession plans at executive and senior manager level.
Independence and re-election to the Board The independence, effectiveness and commitment of each of the Non-executive Directors have been reviewed by the Committee. We were satisfied with the contributions and time commitment of all the Non-executive Directors during the year. The Committee also debated and took into consideration the additional commitments of Directors (and me as Chairman) before approving any changes to external appointments and recommending their approval. It considered potential conflict issues as part of that assessment. The Committee is confident that each of the Non-executive Directors remains independent (but noting Chris Bartram’s tenure of more than nine years) and will be in a position to discharge their duties and responsibilities in the coming year.
The appointment of Madeleine and Christophe will be ratified at the Annual General Meeting in July. The other Directors will stand for re-election with the support of the Board.
Committee effectivenessI am pleased to report that the recent externally facilitated Board performance evaluation concluded that the Board and its Committees operated well. This includes this Committee and the way that it has handled changes during the year, approved appointments and led the approach to corporate governance and sustainability.
You will find more information on these topics, the other work of the Committee, and more details of the Board evaluation process, and its outcomes, on the following pages.
Cressida HoggChairman, Nomination Committee
Landsec is recognised for its positive approach to corporate governance and this is something that I have inherited from our previous Chairman. This will continue. This Committee advises the Board on best practice and our ambition is to remain recognised for our approach.”
Stacey RauchNon-executive Director
I led the process to recruit the new Chairman to replace Dame Alison Carnwath who stepped down following last year’s AGM. We used Egon Zehnder as our independent consultants to provide the Committee with a long list of candidates, and to help us narrow this down to a shortlist by reference to the skills and experience that we wanted. After consideration of highly qualified internal and external candidates, we were delighted to appoint Cressida who has a background in infrastructure and big projects, working for many years at 3i and CPPIB, and was also a member of the advisory board of Infrastructure UK, the HM Treasury unit that works on long term UK infrastructure projects. This infrastructure experience, together with her knowledge of the Board, was compelling when recommending her for the role.”

76 Landsec Annual Report 2019
With the appointment of Cressida as the new Chairman, having an external Board evaluation this year was well-timed in providing an objective assessment of the Board, its Committees and its overall effectiveness.
Board evaluation cycle
Internal review focused on Year 1 issues raised and any new issues arising
Year 2 progress reviewed internally, and areas of focus identified
Independent, externally facilitated review
An external evaluation carried out by No4
Performance review against targets set for 2018/19
Areas of focus identified for 2019/20
Year 1
Year 3
Year 2
Progress against objectives set for 2018/19 Table 43
Strategy and innovation People and succession planning
Risk
Our objective 2018/19 Our objective 2018/19 Our objective 2018/19
Board to keep accessing diverse expertise and, where appropriate, to test and experiment as a part of the process to understand customer requirements.
The Board to continue to assess its own requirements, together with those of the Executive team and Senior Leaders within the organisation.
Be willing to re-assess risk on a regular basis by reference to the changing situation. This may involve new areas of business or re-considering past decisions.
Our performance 2018/19 Our performance 2018/19 Our performance 2018/19
The Board has drawn on external perspective in the course of its development sessions and consideration of strategy, particularly in the context of the evolving needs of our customer. It has supported the launch of Myo (our flexible offer), modern methods of construction and the preliminary test work on the O2 Centre, Finchley and the West 12 Centre, Shepherd’s Bush that is looking at a build-to-rent opportunity.
The Board has worked on its own succession planning with the appointment of two new Non-executive Directors. The Board has also continued to monitor succession plans at Executive level and below to ensure that there is a diverse talent pipeline under development.
The Board has monitored the risks affecting the commercial environment in which we operate. These include the wider macro-economic and political risks affecting business as well as the risks assessed when considering entering into new business areas, for example the risks around establishing Myo were reported to the Board before proceeding.
Next year’s internal review (Year 2 of the cycle) will assess the extent to which the areas of focus for 2019/20 have progressed.
Effectiveness
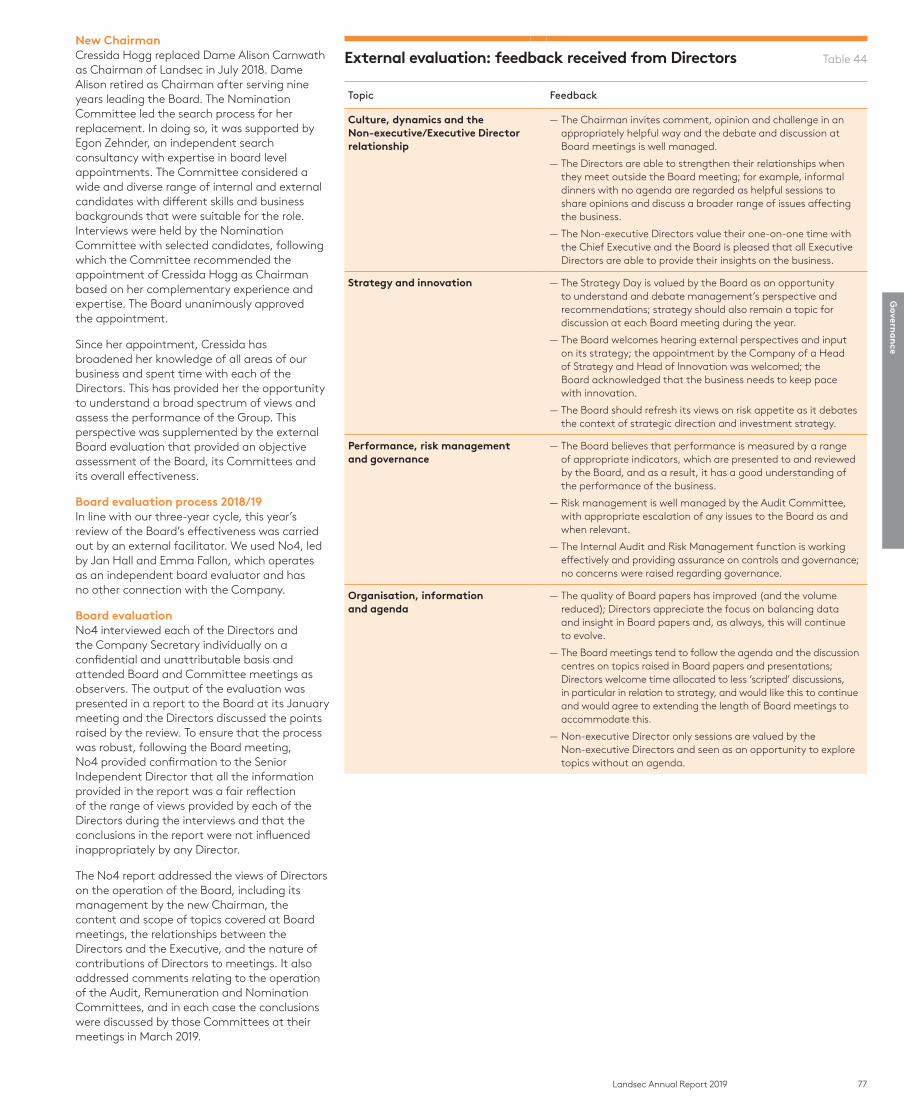
77Landsec Annual Report 2019
Govern
an
ce
New ChairmanCressida Hogg replaced Dame Alison Carnwath as Chairman of Landsec in July 2018. Dame Alison retired as Chairman after serving nine years leading the Board. The Nomination Committee led the search process for her replacement. In doing so, it was supported by Egon Zehnder, an independent search consultancy with expertise in board level appointments. The Committee considered a wide and diverse range of internal and external candidates with different skills and business backgrounds that were suitable for the role. Interviews were held by the Nomination Committee with selected candidates, following which the Committee recommended the appointment of Cressida Hogg as Chairman based on her complementary experience and expertise. The Board unanimously approved the appointment.
Since her appointment, Cressida has broadened her knowledge of all areas of our business and spent time with each of the Directors. This has provided her the opportunity to understand a broad spectrum of views and assess the performance of the Group. This perspective was supplemented by the external Board evaluation that provided an objective assessment of the Board, its Committees and its overall effectiveness.
Board evaluation process 2018/19In line with our three-year cycle, this year’s review of the Board’s effectiveness was carried out by an external facilitator. We used No4, led by Jan Hall and Emma Fallon, which operates as an independent board evaluator and has no other connection with the Company.
Board evaluationNo4 interviewed each of the Directors and the Company Secretary individually on a confidential and unattributable basis and attended Board and Committee meetings as observers. The output of the evaluation was presented in a report to the Board at its January meeting and the Directors discussed the points raised by the review. To ensure that the process was robust, following the Board meeting, No4 provided confirmation to the Senior Independent Director that all the information provided in the report was a fair reflection of the range of views provided by each of the Directors during the interviews and that the conclusions in the report were not influenced inappropriately by any Director.
The No4 report addressed the views of Directors on the operation of the Board, including its management by the new Chairman, the content and scope of topics covered at Board meetings, the relationships between the Directors and the Executive, and the nature of contributions of Directors to meetings. It also addressed comments relating to the operation of the Audit, Remuneration and Nomination Committees, and in each case the conclusions were discussed by those Committees at their meetings in March 2019.
External evaluation: feedback received from Directors Table 44
Topic Feedback
Culture, dynamics and the Non-executive/Executive Director relationship
— The Chairman invites comment, opinion and challenge in an appropriately helpful way and the debate and discussion at Board meetings is well managed.
— The Directors are able to strengthen their relationships when they meet outside the Board meeting; for example, informal dinners with no agenda are regarded as helpful sessions to share opinions and discuss a broader range of issues affecting the business.
— The Non-executive Directors value their one-on-one time with the Chief Executive and the Board is pleased that all Executive Directors are able to provide their insights on the business.
Strategy and innovation — The Strategy Day is valued by the Board as an opportunity to understand and debate management’s perspective and recommendations; strategy should also remain a topic for discussion at each Board meeting during the year.
— The Board welcomes hearing external perspectives and input on its strategy; the appointment by the Company of a Head of Strategy and Head of Innovation was welcomed; the Board acknowledged that the business needs to keep pace with innovation.
— The Board should refresh its views on risk appetite as it debates the context of strategic direction and investment strategy.
Performance, risk management and governance
— The Board believes that performance is measured by a range of appropriate indicators, which are presented to and reviewed by the Board, and as a result, it has a good understanding of the performance of the business.
— Risk management is well managed by the Audit Committee, with appropriate escalation of any issues to the Board as and when relevant.
— The Internal Audit and Risk Management function is working effectively and providing assurance on controls and governance; no concerns were raised regarding governance.
Organisation, information and agenda
— The quality of Board papers has improved (and the volume reduced); Directors appreciate the focus on balancing data and insight in Board papers and, as always, this will continue to evolve.
— The Board meetings tend to follow the agenda and the discussion centres on topics raised in Board papers and presentations; Directors welcome time allocated to less ‘scripted’ discussions, in particular in relation to strategy, and would like this to continue and would agree to extending the length of Board meetings to accommodate this.
— Non-executive Director only sessions are valued by the Non-executive Directors and seen as an opportunity to explore topics without an agenda.

78 Landsec Annual Report 2019
Conclusions from this year’s Board evaluationThe conclusion from this year’s Board evaluation was that the Board and its Committees continue to operate to a high standard and work well and effectively. There were no material issues to report. All Directors noted that the Board was in a period of transition, following the appointment of a new Chairman during the year and with a Non-executive Director rotating off the Board and two new Non-executive Directors being appointed. All Board members were keen to use this evaluation process as a timely opportunity to identify ways to improve performance.
Board environment and access to appropriate informationThe Board environment and its culture of transparency and openness were again rated favourably in this year’s effectiveness review. In addition to the Board meetings, and the private sessions scheduled at each Board meeting held by the Chairman and the Non-executive Directors, there are other opportunities arranged during the year when Directors can spend time together, for example, when Directors travel together to visit Group assets.
The Board and its Committees receive papers in a timely fashion and Directors have access to information, support and advice from the Company Secretary and members of his team throughout the year. The Board has been complimentary of the quality of papers which have been made more concise and the presentation of information enhanced.
Recruitment of new Non-executive DirectorsTwo new Non-executive Directors were appointed to the Board during the year: Madeleine Cosgrave who joined on 1 January 2019 and Christophe Evain whose appointment was announced on 20 March 2019 and who joined the Board on 1 April 2019. The process for the recruitment of Madeleine Cosgrave was handled by Spencer Stuart and of Christophe Evain by Russell Reynolds, both independent executive search agencies who proposed a list of candidates to the Nomination Committee for its consideration. Members of the Nomination Committee interviewed those candidates on the shortlist and proposed Madeleine and Christophe for appointment to the Board based on their skills and experience that would contribute to the overall performance of the Board. Both appointments were approved by the Board.
InductionA detailed induction programme has been put in place for Madeleine and Christophe which includes asset visits, time spent with Senior Leaders throughout the business and meeting with key advisers. The purpose of our induction plan is to facilitate contribution to Board discussions as soon as possible by providing sufficient knowledge to enable constructive challenge and contribution to strategy. Our induction plan is delivered over the first year of tenure, after which Directors participate in Board development sessions and ongoing training as required.
The priorities of our inductionProviding an understanding of:
[ the Group’s business and financial position
[ the way the Group operates, its culture and history
[ the Group’s strategy, and the opportunities, risks and threats it faces
[ the Board’s culture, style, governance and dynamics
[ the legal and regulatory obligations of a PLC director
[ the legal and regulatory environment in which the Group operates
Getting to know the Chairman and the Executive Directors:
[ access to the Executive Team and Chairman
[ access to key external advisers (for knowledge, insight and independence)
Professional development, support and training for DirectorsThe Board held an increased number of specific knowledge development sessions during the year, including a deep dive into the retail sector, sustainability and the importance of stakeholder engagement in the context of Section 172 of the Companies Act. Directors received regular reports in their Board papers, facilitating greater awareness and understanding of the Group’s business and the legal, regulatory and industry-specific environment in which it operates. This was complemented throughout the year by visits to properties owned, managed or being developed by the Group, which enables a deeper insight into the operations of the business and provides Directors with the opportunity to meet with senior and local management teams and gain customer and community insight.
Board strengths identified:
[ a collaborative and collegiate culture
[ open and respectful nature of discussion and debate
[ wide-ranging input from all Directors
[ underpinned by good relationships
Our areas of focus for 2019/20Strategy and innovation
[ Continue with the Board’s attention to strategy and to encourage less ‘scripted’ discussions on a broader range of topics by extending the duration of Board meetings; the Board will continue with its development sessions to capture external perspectives and its engagement with senior managers within the business
People and succession planning
[ The Board will increase its focus on the diverse talent pipeline and succession management for the business
Stakeholder engagement
[ The Board will reflect on the relevant stakeholder groups and how to engage with them appropriately
Effectivenesscontinued
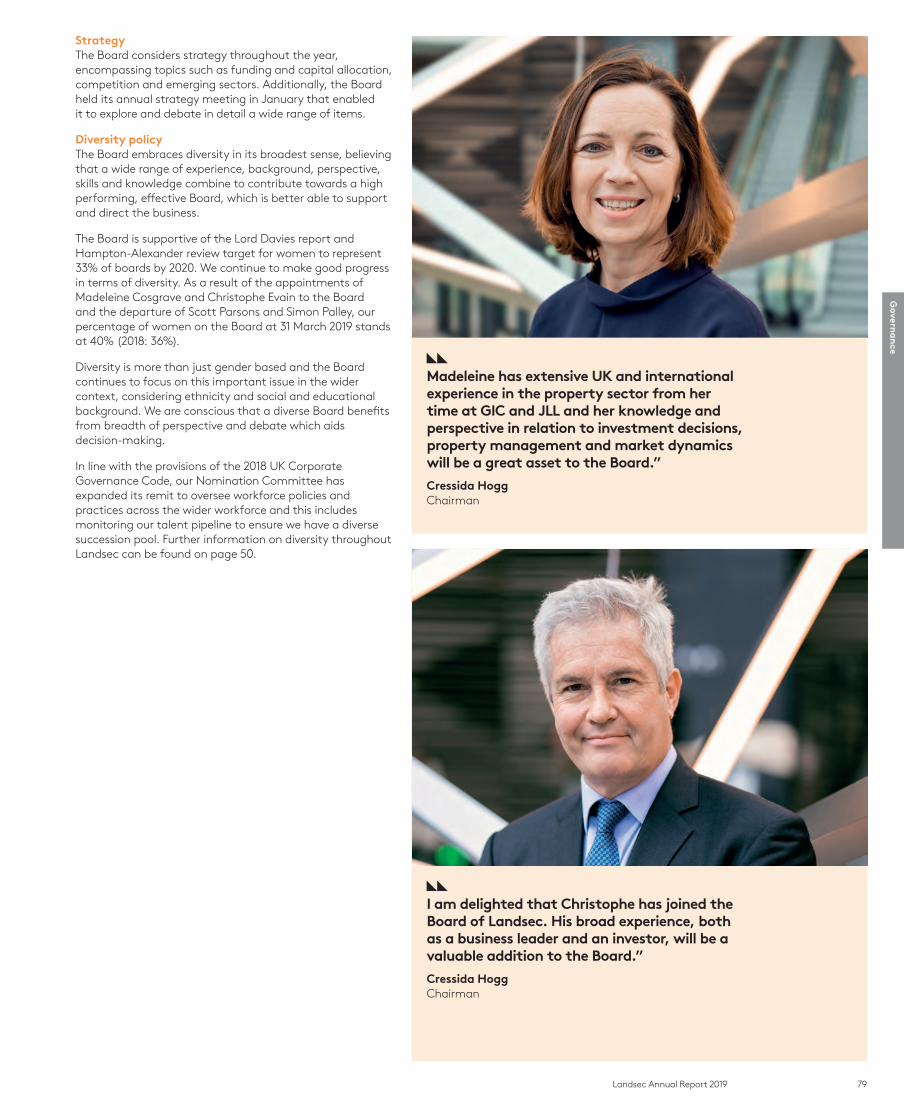
79Landsec Annual Report 2019
Govern
an
ce
Madeleine has extensive UK and international experience in the property sector from her time at GIC and JLL and her knowledge and perspective in relation to investment decisions, property management and market dynamics will be a great asset to the Board.”
Cressida HoggChairman
I am delighted that Christophe has joined the Board of Landsec. His broad experience, both as a business leader and an investor, will be a valuable addition to the Board.”
Cressida HoggChairman
StrategyThe Board considers strategy throughout the year, encompassing topics such as funding and capital allocation, competition and emerging sectors. Additionally, the Board held its annual strategy meeting in January that enabled it to explore and debate in detail a wide range of items.
Diversity policy The Board embraces diversity in its broadest sense, believing that a wide range of experience, background, perspective, skills and knowledge combine to contribute towards a high performing, effective Board, which is better able to support and direct the business.
The Board is supportive of the Lord Davies report and Hampton-Alexander review target for women to represent 33% of boards by 2020. We continue to make good progress in terms of diversity. As a result of the appointments of Madeleine Cosgrave and Christophe Evain to the Board and the departure of Scott Parsons and Simon Palley, our percentage of women on the Board at 31 March 2019 stands at 40% (2018: 36%).
Diversity is more than just gender based and the Board continues to focus on this important issue in the wider context, considering ethnicity and social and educational background. We are conscious that a diverse Board benefits from breadth of perspective and debate which aids decision-making.
In line with the provisions of the 2018 UK Corporate Governance Code, our Nomination Committee has expanded its remit to oversee workforce policies and practices across the wider workforce and this includes monitoring our talent pipeline to ensure we have a diverse succession pool. Further information on diversity throughout Landsec can be found on page 50.
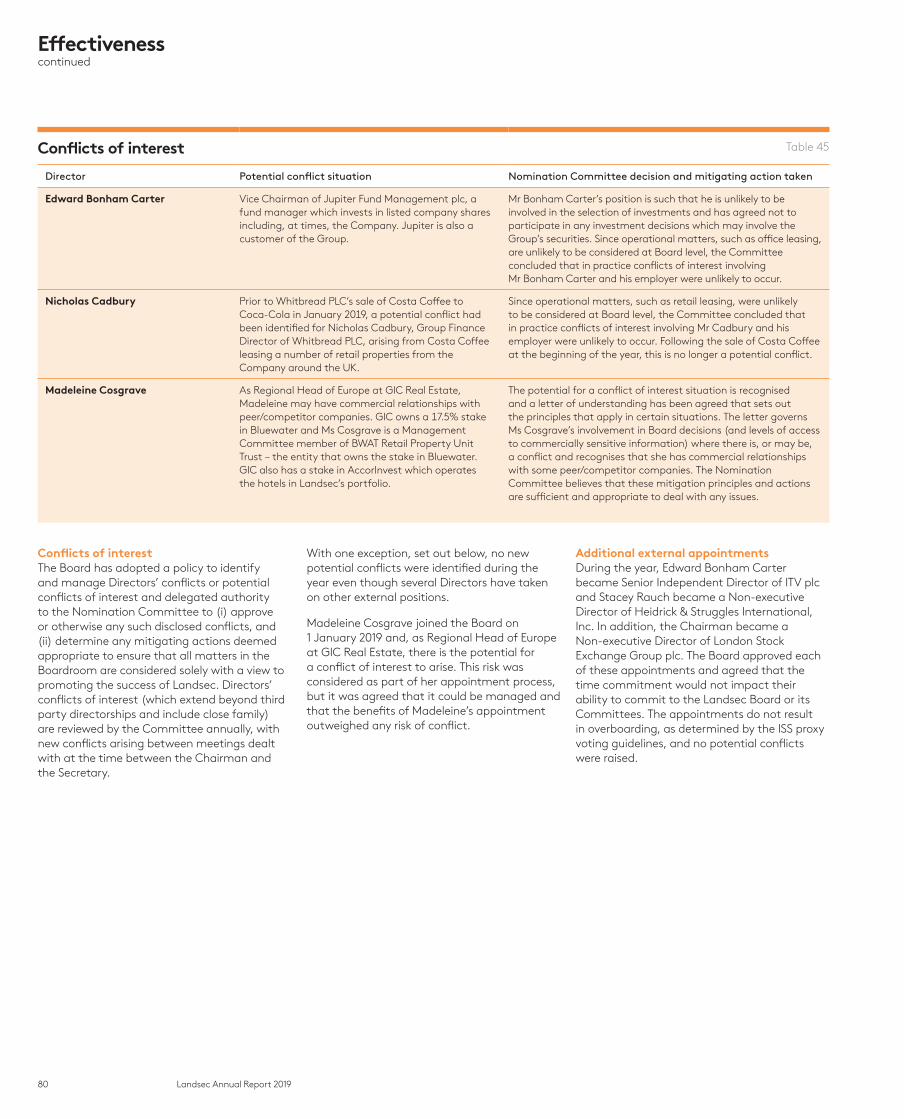
80 Landsec Annual Report 2019
Conflicts of interest Table 45
Director Potential conflict situation Nomination Committee decision and mitigating action taken
Edward Bonham Carter Vice Chairman of Jupiter Fund Management plc, a fund manager which invests in listed company shares including, at times, the Company. Jupiter is also a customer of the Group.
Mr Bonham Carter’s position is such that he is unlikely to be involved in the selection of investments and has agreed not to participate in any investment decisions which may involve the Group’s securities. Since operational matters, such as office leasing, are unlikely to be considered at Board level, the Committee concluded that in practice conflicts of interest involving Mr Bonham Carter and his employer were unlikely to occur.
Nicholas Cadbury Prior to Whitbread PLC’s sale of Costa Coffee to Coca-Cola in January 2019, a potential conflict had been identified for Nicholas Cadbury, Group Finance Director of Whitbread PLC, arising from Costa Coffee leasing a number of retail properties from the Company around the UK.
Since operational matters, such as retail leasing, were unlikely to be considered at Board level, the Committee concluded that in practice conflicts of interest involving Mr Cadbury and his employer were unlikely to occur. Following the sale of Costa Coffee at the beginning of the year, this is no longer a potential conflict.
Madeleine Cosgrave As Regional Head of Europe at GIC Real Estate, Madeleine may have commercial relationships with peer/competitor companies. GIC owns a 17.5% stake in Bluewater and Ms Cosgrave is a Management Committee member of BWAT Retail Property Unit Trust – the entity that owns the stake in Bluewater. GIC also has a stake in AccorInvest which operates the hotels in Landsec’s portfolio.
The potential for a conflict of interest situation is recognised and a letter of understanding has been agreed that sets out the principles that apply in certain situations. The letter governs Ms Cosgrave’s involvement in Board decisions (and levels of access to commercially sensitive information) where there is, or may be, a conflict and recognises that she has commercial relationships with some peer/competitor companies. The Nomination Committee believes that these mitigation principles and actions are sufficient and appropriate to deal with any issues.
Conflicts of interestThe Board has adopted a policy to identify and manage Directors’ conflicts or potential conflicts of interest and delegated authority to the Nomination Committee to (i) approve or otherwise any such disclosed conflicts, and (ii) determine any mitigating actions deemed appropriate to ensure that all matters in the Boardroom are considered solely with a view to promoting the success of Landsec. Directors’ conflicts of interest (which extend beyond third party directorships and include close family) are reviewed by the Committee annually, with new conflicts arising between meetings dealt with at the time between the Chairman and the Secretary.
With one exception, set out below, no new potential conflicts were identified during the year even though several Directors have taken on other external positions.
Madeleine Cosgrave joined the Board on 1 January 2019 and, as Regional Head of Europe at GIC Real Estate, there is the potential for a conflict of interest to arise. This risk was considered as part of her appointment process, but it was agreed that it could be managed and that the benefits of Madeleine’s appointment outweighed any risk of conflict.
Additional external appointments During the year, Edward Bonham Carter became Senior Independent Director of ITV plc and Stacey Rauch became a Non-executive Director of Heidrick & Struggles International, Inc. In addition, the Chairman became a Non-executive Director of London Stock Exchange Group plc. The Board approved each of these appointments and agreed that the time commitment would not impact their ability to commit to the Landsec Board or its Committees. The appointments do not result in overboarding, as determined by the ISS proxy voting guidelines, and no potential conflicts were raised.
Effectivenesscontinued
81Landsec Annual Report 2019
Govern
an
ce
Committee membersNicholas Cadbury (Chairman)
Chris Bartram
Madeleine Cosgrave (from 1 January 2019)
Stacey Rauch
Highlights [New Committee member
[Continued focus on integrity of reporting process
[Rigorous assessment of risk management and internal controls
Key responsibilities [ The reliability of the financial statements
[ The reliability of the internal controls
[ Effective risk identification and management
[Overall transparency and governance
Dear Shareholder
I am pleased to report on the key activities and focus of the Audit Committee during the year. The activity of the Audit Committee has been consistent with prior years, with its focus on financial statements, the integrity of the reporting process and oversight of the risk management process and internal controls. An important part of this is the thorough review of the asset valuations provided by the external valuer and examination of the financial statements and accounting judgements included in the full and half-yearly financial results. This helps us to ensure that financial and other information is verified, reported fairly in an understandable way and aligns with Landsec’s goals and corporate purpose.
The composition of the Committee changed during the year with Madeleine’s appointment with effect from 1 January 2019. Her extensive knowledge of the property industry and perspective on valuation is a real benefit to the Committee.
Financial statementsThe Committee monitors the integrity of the Group’s reporting process and financial management. It scrutinises the full and half-yearly financial statements before proposing them to the Board for approval, and reviews in detail the work of the external auditor and external valuer and any significant financial judgement and estimates made by management.
Asset valuationOur asset valuation process is robust. We use CBRE, an industry-leading agency, to provide us with an external valuation of our assets twice a year. CBRE has extensive expertise and knowledge and uses the best systems to provide us with a valuation prepared in accordance with the relevant industry standards. The valuation process relies on transactional evidence in the market in the period to the valuation date and, consequently, asset values are largely determined by empirical data. This can present some challenges in a fast-changing market where market trends are more volatile and, therefore, the Committee challenges and debates each valuation prepared by CBRE. The external valuation process and the values ascribed to specific assets are also reviewed independently by our auditor, Ernst & Young LLP (EY), as part of its audit scope.
Letter from the Chairman of the Audit Committee
Nicholas CadburyChairman of the Audit Committee

82 Landsec Annual Report 2019
Acquisitions and disposalsThere were no material property acquisitions or disposals during the year, in contrast to the greater level of activity during the previous year, meaning that no related judgements or estimates required scrutiny.
Company voluntary arrangements (CVAs)Regrettably, there has been an increase in the numbers of CVAs and administrations among our occupiers, particularly among our retail customers.
CVAs and administrations affect our income, as does bad debt, and the Committee reviewed the application of the accounting treatment and the Group’s policy to ensure that it was appropriate. To date, we have been fortunate that the level of CVAs and administrations has not affected us materially as a business. However, from a Committee perspective, it is important that the accounting is correct because it has implications on revenue profit, for example, which is one of the performance measures by which the annual bonus is calculated. Consequently, the Committee has monitored the impact of CVAs and reviewed trade debtor and tenant incentive balances.
Group financingThe Company’s treasury team has continued to look at the financing of the Group as a whole. During the year, the team’s focus shifted from liability management exercises which had reset our cost of debt to current market levels to enhancing our access to flexible revolving credit facilities. New facilities totalling £625m were established, taking our total committed bank lines to £2.7bn at 31 March 2019.
Risk The risks are set out on pages 56-59 of this Annual Report and include market cyclicality, structural changes in our markets, changing customer behaviours and information security.
Although at one level the categories of principal risk have remained much the same compared with last year, this does not mean that things have remained static. Matters such as data security have broadened in scope, the health and safety considerations for our employees have expanded to include mental health and the Committee acknowledges the longer-term nature of some of the sustainability risks. This is all in addition to the market and economic uncertainty that has affected Landsec and other commercial property companies.
The Committee reviews the process by which risks are identified, prioritised and managed, in addition to considering the range of identified risk. The risk register used by the Committee as the basis of its risk assessment is proposed by the Group’s Executive Committee. The risk register is compiled both from the top down, with identified macro-economic and political risks, as well as bottom-up, the result of greater consultation with all the functions within the organisation. This bottom-up review involved seeking views from across the business on existing, new or emerging risks and the issue of a questionnaire to its Directors, Executive Committee and Senior Leaders to act as a catalyst to a discussion on risk and risk appetite. This is important because it provides a broader range of data and perspective from which we can make decisions and has the added benefit of involving a wider set of contributions from across the business. Collectively, this improves the quality and thoroughness of the review and the identification of emerging risks from a broader pool of data.
There are particular risks that I would like to note. First, no-one has been immune from the implications of the protracted negotiations to leave the EU throughout the year. This has affected business and consumer confidence, and impacted longer-term business planning, with a knock on effect on the performance and valuation of assets and revenue income. During the year, the Company appointed a project group to assess and monitor the effect of Brexit risks, both direct and indirect, and we believe the Group is well-positioned to mitigate these risks should they materialise.
Second, the issue of data protection and information security continues to expand as a risk. We had a strong programme of training and awareness at the time of the GDPR legislation taking effect and the Committee has been pleased with the way this was managed, a view endorsed by an external audit of our programme which was complimentary in its conclusion. Since May 2018, we have (fortunately) avoided any reportable data breach but recognise that our business is likely to hold less personal data than many other companies. However, GDPR is one aspect: during the year, the Company migrated its data to a cloud-based server that provides extra security, replacing the use of our own servers to store information and the risks associated with that. There has been internal training on the new system, with additional safeguards now in place to reduce the risk of breach. The Committee has been pleased with progress on improving data protection, but there is no complacency and we continue to look at ways to improve training, awareness and best practice on data governance throughout the business.
Internal auditThe Company maintains its own risk management and internal audit function and the Committee is confident that this works well based on the quality of the data and reporting from the Director of Risk Management and Internal Audit. However, in order to test this conclusion, the Committee reviews the scope, skills and competencies of this function each year and considers any recommendations for change. We believe that the knowledge, skills and resources of our internal audit team remain appropriate, and there is a clear understanding that this may require and benefit from specialist external expertise from time to time. We believe that the combination of internal and external advisers continues to provide us with the best insight into areas of risk and appropriate controls, to ensure that the Committee receives clear advice and enables us to report to the Board that the system of internal processes is robust. External support was provided during the year by a number of consultants (but not our auditor, EY) on topics including GDPR and personal data, data governance, cyber and physical security and data analytics.
The Committee approves the annual internal audit plan which is assessed against the risk register and developing market practice. Internal audit reports are received by the Committee and any follow up recommendations or actions are tracked until completion. We ensure that we allocate sufficient time on the agenda to consider risk matters as part of our 12-month rolling agenda.
In addition to the items for which external audit support was used, internal audits carried out by the Group and reviewed by the Committee included contract risk management, delegations of authority, accounts payable and credit risk management. The internal audit team also provided assurance to the Committee on key controls and programme assurance, and developed further its data analytics capability to improve the identification of any issues.
External auditorEY was appointed as the Company’s auditor in 2013 and continues to perform to a high standard. Following the completion of our full year results in 2018, Eamonn McGrath stepped down as our audit partner after five years in post. He has been replaced as audit partner by Kathryn Barrow and we are pleased with the way that the transition was managed. Kathryn is supported by other members of the EY audit team who have been involved in the audit for a number of years and now attend Committee meetings.
Letter from the Chairman of the Audit Committeecontinued
83Landsec Annual Report 2019
Govern
an
ce
I have separate meetings during the year with Kathryn, as do other members of the Committee. This provides us the opportunity to obtain an independent perspective from EY as auditor on the Company’s performance from an accounting perspective, and also to ask questions of the audit work undertaken by EY. These meetings are not attended by management. No material concerns have been raised.
The fee basis for EY’s services is contained on page 86 in the Accountability section. Based on the Committee’s recommendation, the Board is proposing that EY be reappointed to office at this year’s AGM.
EY was appointed in 2013 following a thorough tender process and the nominated audit partner has been rotated after five years in position. The Committee is aware of the need to put the audit work to tender every ten years and of the current review by the Competition and Markets Authority into audit firms. However, we took the view that an audit tender was not required in 2018 because of EY’s performance to date as auditor, and the choice of, and smooth transition to, the new audit partner. We have no contractual obligation to remain with EY and the choice of audit firm will remain a topic of consideration for the Committee.
External valuerCBRE was appointed as the Group’s valuer for an initial term of three years expiring in March 2019 and we have been pleased with their work. We have no reason to change our valuer and they are still relatively new in role. We learnt from the change when CBRE was appointed that the amount of additional management time and resource involved with any tender process or a change of valuer is considerable and not something to be underestimated; this must be considered against the perceived benefit to the Company and its shareholders of changing the valuer on a regular basis. Accordingly, in March 2019, the Committee approved the re-appointment of CBRE to act as valuer for a further three-year period to 2022, although, as before, we have no contractual obligation to remain with CBRE and can terminate their contract on three months’ notice.
Fair, balanced and understandableThe Committee assessed and recommended to the Board that, taken as a whole, the Company’s 2019 Annual Report is fair, balanced and understandable. In order to come to this conclusion, the Committee relied on the Annual Report assurance document produced by the Company that detailed the individual responsible for each section, the assurance provided by the CFO following his review of the Annual Report and financial statements with the Executive Committee and the confirmation received from EY as external auditor on the process for preparing the full year results and the information contained in the Annual Report. Additionally, the Company used its own internal process to check the consistency of data throughout the Report.
Viability statement and going concernThe viability statement, together with the rationale behind the chosen five-year time horizon, is set out on page 60. The Committee again considered whether there should be any change to the period chosen for the statement, as it will do every year, but remained of the opinion that five years remained appropriate taking into account the balance sheet and financial strength of the Company and its current exposure to development risk.
The going concern statement is set out on page 60.
UK Corporate Governance Code/ FRC Guidance on Audit CommitteesThe Committee considered its compliance with the 2016 and 2018 UK Corporate Governance Code and the FRC Guidance on Audit Committees. We believe that we have addressed both the spirit and the requirements of each. We note that, under the 2018 UK Corporate Governance Code, responsibility for whistleblowing shifts from the Audit Committee to the Board as a whole. As a result, the Audit Committee will report regularly to the Board on our whistleblowing process and any reports arising from its operation.
We were contacted by the Competition and Markets Authority in connection with its investigation into UK audit firms and the dominance of the ‘Big Four’. We recognise some of the problems that were identified but are concerned about the cost/benefit of ever-increasing regulatory oversight and the potential loss of talent at audit firms. We continue to monitor the situation, as well as the recommendations of the Kingman review, and how they may affect us.
Committee effectivenessThe Committee’s performance was considered as part of the external Board evaluation conducted this year and the Committee assessed its own performance having taken input from its external advisers such as EY and CBRE. The conclusion is that we operate to a high standard, with clear priorities, well-defined responsibilities and clarity around our work plan. We will continue this next year and remain open to innovation or other, better ways of working.
The year aheadThe Committee recognises the increased attention on financial oversight of companies and will continue to work with management and the external advisers during the year in a way that keeps them, and us, at a high standard. This will apply to the asset valuations, financial oversight, risk management and internal audit process, and improvements in how we can communicate to our shareholders and stakeholders.
I would like to thank the other members of the Committee, together with management, CBRE and EY, for their support during the year and I hope that you find this review, and the report that follows, a helpful explanation of the work of the Committee.
Nicholas CadburyChairman, Audit Committee
During the year, the Company appointed a project group to assess and monitor the effect of Brexit risks, both direct and indirect, and we believe the Group is well-positioned to mitigate these risks should they materialise.”
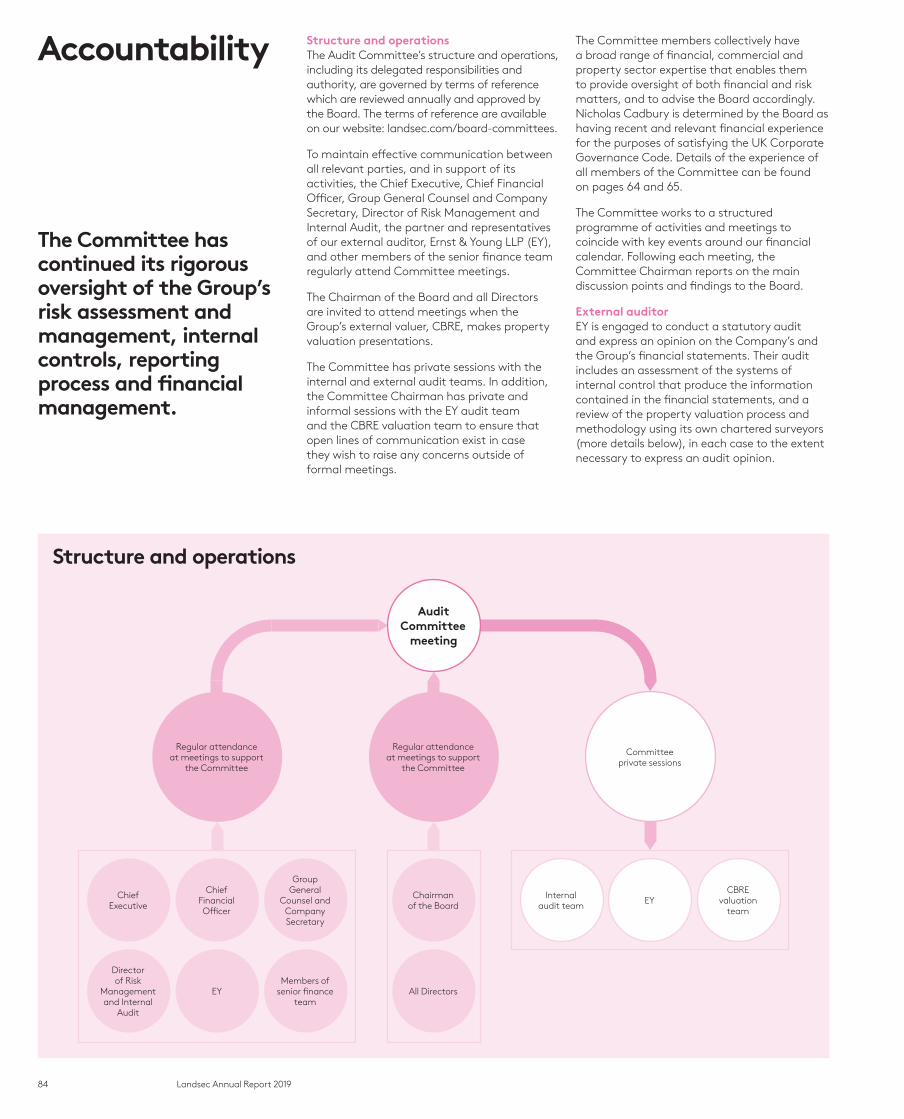
84 Landsec Annual Report 2019
The Committee has continued its rigorous oversight of the Group’s risk assessment and management, internal controls, reporting process and financial management.
Structure and operationsThe Audit Committee’s structure and operations, including its delegated responsibilities and authority, are governed by terms of reference which are reviewed annually and approved by the Board. The terms of reference are available on our website: landsec.com/board-committees.
To maintain effective communication between all relevant parties, and in support of its activities, the Chief Executive, Chief Financial Officer, Group General Counsel and Company Secretary, Director of Risk Management and Internal Audit, the partner and representatives of our external auditor, Ernst & Young LLP (EY), and other members of the senior finance team regularly attend Committee meetings.
The Chairman of the Board and all Directors are invited to attend meetings when the Group’s external valuer, CBRE, makes property valuation presentations.
The Committee has private sessions with the internal and external audit teams. In addition, the Committee Chairman has private and informal sessions with the EY audit team and the CBRE valuation team to ensure that open lines of communication exist in case they wish to raise any concerns outside of formal meetings.
The Committee members collectively have a broad range of financial, commercial and property sector expertise that enables them to provide oversight of both financial and risk matters, and to advise the Board accordingly. Nicholas Cadbury is determined by the Board as having recent and relevant financial experience for the purposes of satisfying the UK Corporate Governance Code. Details of the experience of all members of the Committee can be found on pages 64 and 65.
The Committee works to a structured programme of activities and meetings to coincide with key events around our financial calendar. Following each meeting, the Committee Chairman reports on the main discussion points and findings to the Board.
External auditorEY is engaged to conduct a statutory audit and express an opinion on the Company’s and the Group’s financial statements. Their audit includes an assessment of the systems of internal control that produce the information contained in the financial statements, and a review of the property valuation process and methodology using its own chartered surveyors (more details below), in each case to the extent necessary to express an audit opinion.
Structure and operations
Group General
Counsel and Company Secretary
Chairman of the Board
Members of senior finance
teamAll Directors
Chief Financial Officer
EY
Chief Executive
Director of Risk
Management and Internal
Audit
Regular attendance at meetings to support
the Committee
Committee private sessions
AuditCommittee
meeting
Regular attendance at meetings to support
the Committee
CBRE valuation
teamEYInternal
audit team
Accountability

85Landsec Annual Report 2019
Govern
an
ce
Audit Committee activity Table 46
The table shows the key areas of Audit Committee activity during the year.
Financial reporting — The quality, appropriateness and integrity of the half-yearly and full year financial statements
— The information, underlying assumptions and stress test analysis presented in support of going concern and the viability statement
— The consistency and appropriateness of the financial control and reporting environment
— The dividend policy with due regard to the Company’s REIT status
— The fair, balanced and understandable assessment of the Annual Report (and any other financial statements such as the half-yearly statement).
External audit — The external audit plan
— The independence and objectivity of EY
— The quality and effectiveness of EY’s audit services
— The level of fees paid to EY in accordance with the policy for the provision of non-audit services
— EY’s reappointment to office as external auditor.
Risk management and internal control
— The scope of the internal control and risk management programme
— The results of internal audit reviews and the progress made against agreed management action
— Quarterly reports on investigated internal control issues significant to the Group
— Quarterly reports on the Group’s risk register, including significant and emerging risks
— The implications and management of the General Data Protection Regulation (GDPR), data governance and information security
— Compliance by management concerning the operation of the business for which they are responsible
— The adequacy and effectiveness of the Group’s internal control and risk management processes.
Internal audit — The scope of the internal audit plan and resourcing requirements
— The independence, appropriateness and effectiveness of internal audit.
External property valuation — The quality and appropriateness of the half-yearly and full year external valuation of the Group’s property portfolio, together with an assessment of the methodology applied
— The independence and effectiveness of the external valuer.
Other — The Committee’s terms of reference and performance effectiveness
— Compliance with the Code and the Group’s regulatory and legislative environment.
Significant financial matters — The appropriateness of significant financial matters made in connection with the financial statements as set out on page 88.
Audit plan EY presented their proposed audit plan (reviewed by Senior Management and the Director of Risk Management and Internal Audit) to the Committee for discussion. The objective was to ensure that the focus of their work remained aligned to the Group’s structure and strategy. The audit plan was again risk and materiality focused, challenge-based and designed to provide valuable insights beyond the audit.
Objectivity and independenceThe Committee is responsible for monitoring and reviewing the objectivity and independence of the external auditor. In undertaking its annual assessment, the Committee has reviewed:
— the confirmation from EY that they maintain appropriate internal safeguards in line with applicable professional standards
— the mitigation actions we take in seeking to safeguard EY’s independent status, including the operation of policies designed to regulate the amount of non-audit services provided by EY and the employment of former EY employees
— the tenure of the audit partner (not being greater than five years); Kathryn Barrow was appointed as EY audit partner in April 2018, replacing her predecessor who had been in post for five years
— the internal performance and effectiveness review of EY referred to above.
Taking the above review into account, the Committee concluded that EY remained objective and independent in their role as external auditor.
Effectiveness of the external auditFollowing the issue of our Annual Report, the Director of Risk Management and Internal Audit conducts a performance evaluation and effectiveness review of the external audit. This is conducted against structured guidelines in consultation with the Executive Directors and members of the senior finance team. This year’s review will continue to use an audit quality assessment based on the Practice Aid Guidelines issued by the Financial Reporting Council (FRC). The Committee Chairman meets privately with the audit engagement partner before the Committee considers the results of the review.
The Committee’s preliminary view is that, in line with the conclusions from last year’s performance review, EY have again performed their audit services effectively and to a high standard. Areas identified for development will be shared with them for inclusion in their audit and service delivery plans going forward.
Audit tenderingEY were first appointed to the office of auditor, following a competitive tender process, in respect of the 2013/14 financial year.
Under current regulations, we will be required to retender the audit by no later than the 2023/24 financial year. Kathryn Barrow took over as audit

86 Landsec Annual Report 2019
partner on 1 April 2018. There are no contractual restrictions in relation to the Company’s choice of external auditor. The Board believes that, having regard to the quality, stability and continuity of the relationship with EY as the current auditor, it is in the best interests of the Company and shareholders to tender the audit contract by a date no later than that stipulated by the current regulations. On the recommendation of the Audit Committee, the Board is proposing a resolution at this year’s Annual General Meeting that EY be reappointed to office for a further year.
The Company has complied with the Statutory Audit Services Order 2014 for the year under review.
Audit feeThe fees payable to EY for the audit and half-yearly review for 2018/19 are £0.8m (2017/18: £0.8m).
Non-audit servicesTo help safeguard EY’s objectivity and independence, we operate a non-audit services policy that sets out the circumstances and financial limits within which EY may be permitted to provide certain non-audit services.
The Committee monitors compliance with the policy, including the prior approvals required for non-audit services, which are as follows:
Table 47Per assignment (£)
Aggregateduring the year (£)
Chief Financial Officer
0–25,000 <100,000
Audit Committee Chairman
25,000–100,000 100,000–321,000
Committee >100,000 >321,000
Details of the fees charged by EY during the year can be found in note 8 to the financial statements. Total fees for non-audit services, including the half-yearly review and other assurance-related services, amounted to £178,000. This sum represented 28% of the total audit fees payable by the Group to EY during the year (including the audit of its joint ventures). No non-audit fees were approved or paid on a contingent basis.
External valuations and valuers The valuation of the Group’s property portfolio, including properties held within the development programme and in joint arrangements, is undertaken by external valuers. The Group provides input, such as source data, and support to the valuation process. CBRE has been the Company’s principal valuer since 2015 and has recently been re-appointed for a further
three-year period. The valuation helps to determine a significant part of the Group’s total property return and net asset value, which have consequential implications for the Group’s reported performance and the level of variable remuneration received by Senior Management through bonus and long-term incentive schemes. Accordingly, the scrutiny of each valuation and the valuer’s objectivity and effectiveness represent an important part of the Committee’s work.
Valuations for the full and half-year were presented to the Committee by CBRE. These were reviewed and challenged by management and the Committee, with reference to CBRE’s approach, methodology, valuation basis and underlying property and market assumptions. Other Non-executive Directors attended the full and half-year presentations. The Committee Chairman and other members of the Committee also met separately with CBRE.
Additionally, CBRE met with EY and exchanged information independently of management. EY has experienced chartered surveyors on its team who consider the valuer’s qualifications and assess and challenge the valuation approach, assumptions and judgements made by them. Their audit procedures are targeted at addressing the risks in respect of the valuations and the potential for any undue management influence in arriving at them. This year, EY identified 35 properties (comprising 73% of the portfolio by valuation) for substantive review by its valuation experts primarily on the basis of their value, type, risk profile and location. EY performed site visits for a sample of assets and completed analytical reviews over the input data for the valuations, comparing this to market data. The Committee reviewed their findings.
An internal evaluation of CBRE’s performance and effectiveness will be conducted after the year-end results are finalised with the results reported to the Committee.
A fixed-fee arrangement (subject to adjustment for acquisitions and disposals) is in place with CBRE for the valuation of the Group’s properties and, given the importance of their work, we have disclosed the fees paid to them in note 9 to the financial statements. The total valuation fees paid by the Company to CBRE during the year represented less than 5% of their total fee income for the year.
Significant financial matters The Committee reviewed two significant financial matters in connection with the financial statements, namely the valuation of the Group’s property portfolio and revenue recognition. Further details are set out in the table on page 88.
These items were considered to be significant taking into account the level of materiality and the degree of judgement exercised by management and, in respect of the valuation, the external valuer. The Committee discussed
these with both parties, as well as EY. In addition, the Committee considered, took action and made onward recommendations to the Board, as appropriate, in respect of other key matters including the viability statement, the going concern basis on which the financial statements are prepared, accounting for property acquisitions and disposals, maintenance of the Group’s REIT status and other specific areas of individual property and audit focus.
The Committee was satisfied that all issues had been fully and adequately addressed and that the judgements made were reasonable and appropriate and had been reviewed and debated with the external auditor who concurred with the approach taken by management.
Risk management framework The Board is responsible for determining both the nature and extent of the Group’s risk management framework and the risk appetite that is acceptable in seeking to achieve its strategic objectives. The Committee supports the Board in the management of risk and is responsible for reviewing the effectiveness of risk management and internal control processes during the year.
An overview of the risk management process explaining the key elements of the approach to risk, any changes to the process over the course of the current year and the key risk management priorities for 2019/20 are described on pages 54 and 55.
Primary responsibility for operation of the Company’s internal control and risk management systems, which extend to include financial, operational and compliance controls (and accord with the FRC’s 2014 ‘Guidance on Risk Management, Internal Control and Related Financial and Business Reporting’), has been delegated to management. These systems have been designed to manage, rather than eliminate, the risk of failure to achieve the Group’s business goals and can provide only reasonable, not absolute, assurance against material misstatement or loss.
Risk management Under the overall supervision of the Committee, there are several sub-committees and work groups that oversee and manage day-to-day risk within the business. The Group has a Director of Risk Management and Internal Audit (with a direct reporting line to the Audit Committee Chairman) who provides regular oversight of risk matters, evaluates emerging risks that may affect the business and monitors compliance to ensure that any mitigating actions are properly managed and completed. The Committee, in consultation with management, agrees the annual work plan (including any assistance that may be required from external specialists) of the risk management and internal audit function to ensure alignment with the needs of the business and compliance with its governance charter.
Accountabilitycontinued
87Landsec Annual Report 2019
Govern
an
ce
Internal control
The key elements of the Group’s internal control are as follows:
— an established organisation structure with clear lines of responsibility, approval levels and delegated authorities
— a disciplined management and committee structure which facilitates regular performance review and decision-making
— a comprehensive strategic review and annual planning process
— a robust budgeting, forecasting and financial reporting process
— various policies, procedures and guidelines underpinning the development, asset management, financing and main operations of the business, together with professional services support including legal, human resources, information services, tax, company secretarial and health, safety and security
— a compliance certification process from management conducted in relation to the half-yearly and full year results, and business activities generally
— a quarterly self-certification by management confirming that key internal controls within their area of responsibility have been operating effectively
— a risk management and internal audit function whose work spans the whole Group
— a focused post-acquisition review and integration programme to ensure the Group’s governance, procedures, standards and control environment are implemented effectively and on time
— a financial and property information management system.
Additionally, the Committee receives and discusses on a quarterly basis:
— the Group’s risk register, including significant and emerging risks, and how exposures have changed during the period
— summary reports of findings and recommendations from completion of the internal audit plan
— progress against completion of agreed actions from internal audit on their review of the effectiveness of various elements of the internal control system maintained by the Group.
General Data Protection Regulation (GDPR) With GDPR taking effect in May 2018, the Committee provided oversight of the Company’s approach to data protection matters. The Company established a GDPR project team, led by the Group General Counsel and Company Secretary, and supported by our Privacy and Compliance Officer who has specific GDPR experience. As part of its risk assessment process, the Committee required the Company to explain the extent to which
personal data was held by the Group, the business reasons for holding such data, the protections in place to safeguard the data and the process for reporting any breach should that occur. The Committee also ensured that there was sufficient communication and training across all parts of the business to emphasise the importance of data protection compliance, and to explain how GDPR would or may impact the way we do business. In addition to the training, the Company revised its data protection policies and processes. The Committee received regular updates at its meetings on the GDPR programme. This was supported by an external audit of all aspects of its implementation and the outcome was positive and complimentary. The Company’s focus has now moved more broadly to data protection and information security but the Committee will continue to keep GDPR compliance under review in the year ahead.
Effectiveness The Board has undertaken a robust assessment of the principal risks faced by the Group, including those that could threaten the business model, future performance, solvency or liquidity. Assisted by the Committee, the Board also reviewed the effectiveness of the systems of internal control and risk management in place throughout the year and up to the date of this report. This took into account the valuable assurance work undertaken by the risk management and internal audit function (which is supplemented by external specialist resource as necessary) and the relevant process, controls and testing work undertaken by EY as part of their half-yearly review and full year audit. No weaknesses or control failures significant to the Group were identified. Where areas for improvement were identified, new procedures have been introduced to strengthen the controls and will themselves be subject to regular review as part of the ongoing assurance process.
Fair, balanced and understandableThe Committee applied the same due diligence approach adopted in previous years in order to assess whether the Annual Report is fair, balanced and understandable, one of the key UK Corporate Governance Code requirements. The Committee received assurance from the verification process carried out on the content of the Annual Report by the Executive Directors to ensure consistent reporting and the existence of appropriate links between key messages and relevant sections of the Annual Report and this was supported by an annual report assurance document produced by the Company.
Taking the above into account, together with the views expressed by EY, the Committee recommended, and in turn the Board confirmed, that the 2019 Annual Report, taken as a whole, is fair, balanced and understandable and provides the necessary information for shareholders to assess the Company’s position, performance, business model and strategy.
Whistleblowing policyThe Committee reviews the Group’s whistleblowing policy which allows employees to report concerns about suspected impropriety or wrongdoing (whether financial or otherwise) on a confidential basis, and anonymously if preferred. This includes an independent third party reporting facility comprising a telephone hotline and an alternative online process. Any matters reported are investigated by the Company Secretary and escalated to the Committee, as appropriate. During the year, no whistleblowing incidents were reported through the hotline but some HR grievances were received through other channels.
Each year we run a whistleblowing awareness campaign, reminding employees that a dedicated hotline exists should they ever need to ‘blow the whistle’. The arrangements also form part of the induction programme for new employees. The whistleblowing hotline has been included in our recently introduced Sustainability Charter and is included within our procurement tender documentation. This year we have sought to actively increase awareness of our whistleblowing hotline amongst our suppliers. This included the launch of a campaign that featured new posters which were displayed at all our retail sites, our 21 Moorfields development and the management areas of all our other London assets, including our head office, which illustrated the types of situation in which a supplier may need to use the hotline.
Bribery and corruption policyThe Board has a zero tolerance policy for bribery and corruption of any sort. We give regular training to staff on the procedures, highlighting areas of vulnerability, and the policy has been reinforced this year through the launch of our new Code of Conduct. Our principal suppliers are required to have similar policies and practices in place within their own businesses.
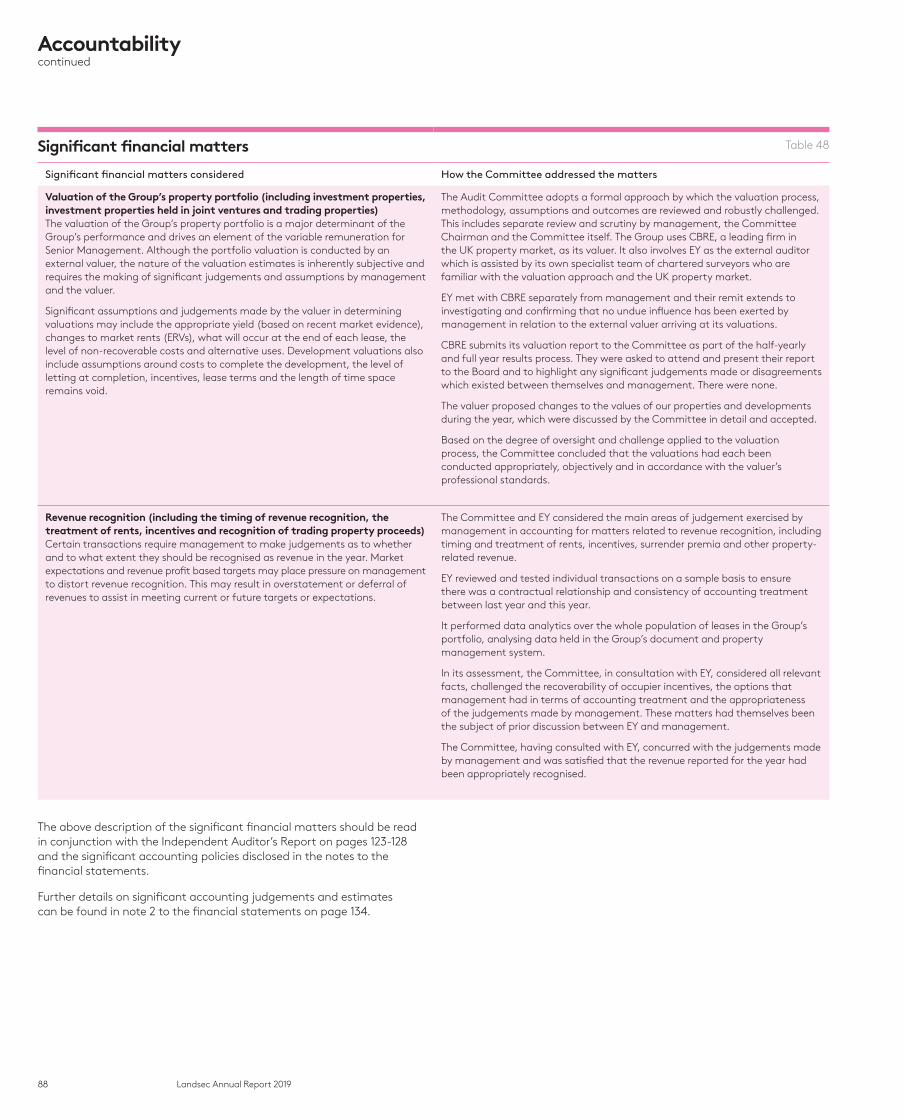
88 Landsec Annual Report 2019
Significant financial matters Table 48
Significant financial matters considered How the Committee addressed the matters
Valuation of the Group’s property portfolio (including investment properties, investment properties held in joint ventures and trading properties)The valuation of the Group’s property portfolio is a major determinant of the Group’s performance and drives an element of the variable remuneration for Senior Management. Although the portfolio valuation is conducted by an external valuer, the nature of the valuation estimates is inherently subjective and requires the making of significant judgements and assumptions by management and the valuer.
Significant assumptions and judgements made by the valuer in determining valuations may include the appropriate yield (based on recent market evidence), changes to market rents (ERVs), what will occur at the end of each lease, the level of non-recoverable costs and alternative uses. Development valuations also include assumptions around costs to complete the development, the level of letting at completion, incentives, lease terms and the length of time space remains void.
The Audit Committee adopts a formal approach by which the valuation process, methodology, assumptions and outcomes are reviewed and robustly challenged. This includes separate review and scrutiny by management, the Committee Chairman and the Committee itself. The Group uses CBRE, a leading firm in the UK property market, as its valuer. It also involves EY as the external auditor which is assisted by its own specialist team of chartered surveyors who are familiar with the valuation approach and the UK property market.
EY met with CBRE separately from management and their remit extends to investigating and confirming that no undue influence has been exerted by management in relation to the external valuer arriving at its valuations.
CBRE submits its valuation report to the Committee as part of the half-yearly and full year results process. They were asked to attend and present their report to the Board and to highlight any significant judgements made or disagreements which existed between themselves and management. There were none.
The valuer proposed changes to the values of our properties and developments during the year, which were discussed by the Committee in detail and accepted.
Based on the degree of oversight and challenge applied to the valuation process, the Committee concluded that the valuations had each been conducted appropriately, objectively and in accordance with the valuer’s professional standards.
Revenue recognition (including the timing of revenue recognition, the treatment of rents, incentives and recognition of trading property proceeds)Certain transactions require management to make judgements as to whether and to what extent they should be recognised as revenue in the year. Market expectations and revenue profit based targets may place pressure on management to distort revenue recognition. This may result in overstatement or deferral of revenues to assist in meeting current or future targets or expectations.
The Committee and EY considered the main areas of judgement exercised by management in accounting for matters related to revenue recognition, including timing and treatment of rents, incentives, surrender premia and other property-related revenue.
EY reviewed and tested individual transactions on a sample basis to ensure there was a contractual relationship and consistency of accounting treatment between last year and this year.
It performed data analytics over the whole population of leases in the Group’s portfolio, analysing data held in the Group’s document and property management system.
In its assessment, the Committee, in consultation with EY, considered all relevant facts, challenged the recoverability of occupier incentives, the options that management had in terms of accounting treatment and the appropriateness of the judgements made by management. These matters had themselves been the subject of prior discussion between EY and management.
The Committee, having consulted with EY, concurred with the judgements made by management and was satisfied that the revenue reported for the year had been appropriately recognised.
The above description of the significant financial matters should be read in conjunction with the Independent Auditor’s Report on pages 123-128 and the significant accounting policies disclosed in the notes to the financial statements.
Further details on significant accounting judgements and estimates can be found in note 2 to the financial statements on page 134.
Accountabilitycontinued
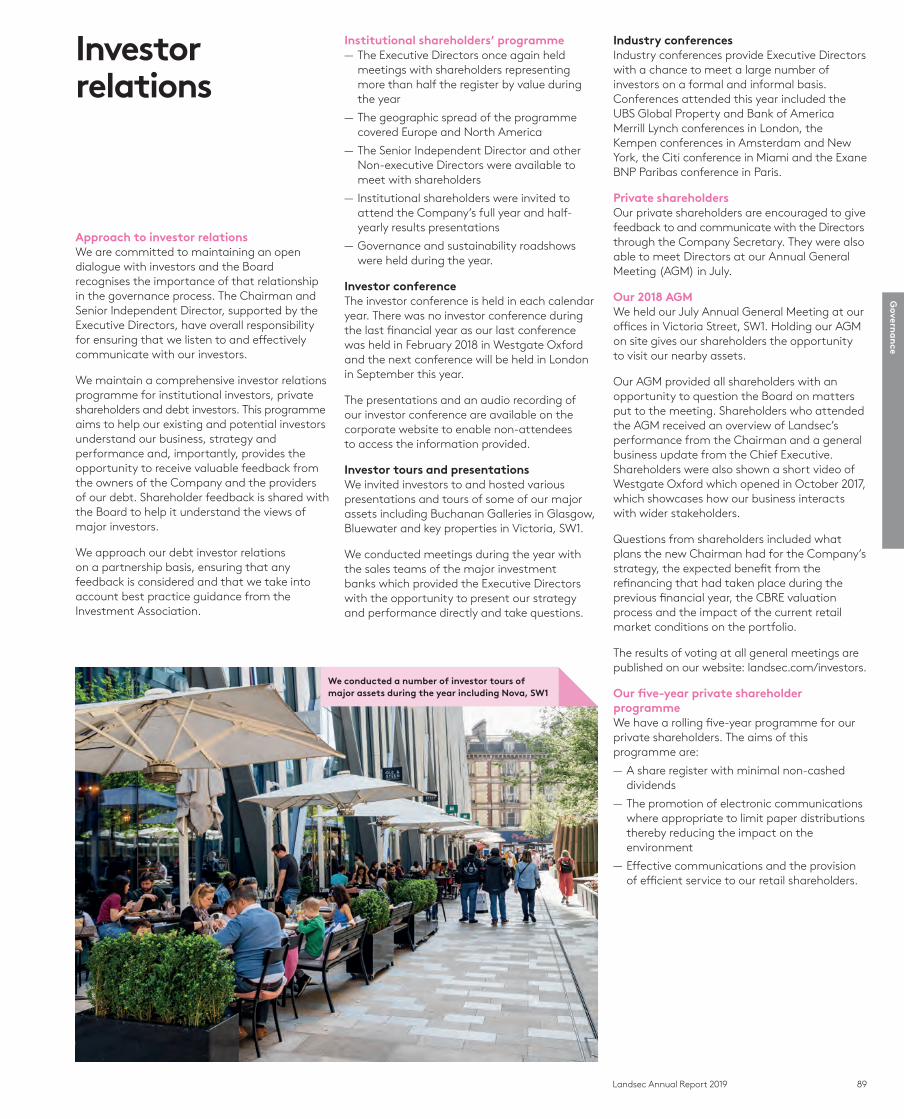
89Landsec Annual Report 2019
Govern
an
ce
Approach to investor relationsWe are committed to maintaining an open dialogue with investors and the Board recognises the importance of that relationship in the governance process. The Chairman and Senior Independent Director, supported by the Executive Directors, have overall responsibility for ensuring that we listen to and effectively communicate with our investors.
We maintain a comprehensive investor relations programme for institutional investors, private shareholders and debt investors. This programme aims to help our existing and potential investors understand our business, strategy and performance and, importantly, provides the opportunity to receive valuable feedback from the owners of the Company and the providers of our debt. Shareholder feedback is shared with the Board to help it understand the views of major investors.
We approach our debt investor relations on a partnership basis, ensuring that any feedback is considered and that we take into account best practice guidance from the Investment Association.
Institutional shareholders’ programme — The Executive Directors once again held meetings with shareholders representing more than half the register by value during the year
— The geographic spread of the programme covered Europe and North America
— The Senior Independent Director and other Non-executive Directors were available to meet with shareholders
— Institutional shareholders were invited to attend the Company’s full year and half-yearly results presentations
— Governance and sustainability roadshows were held during the year.
Investor conferenceThe investor conference is held in each calendar year. There was no investor conference during the last financial year as our last conference was held in February 2018 in Westgate Oxford and the next conference will be held in London in September this year.
The presentations and an audio recording of our investor conference are available on the corporate website to enable non-attendees to access the information provided.
Investor tours and presentationsWe invited investors to and hosted various presentations and tours of some of our major assets including Buchanan Galleries in Glasgow, Bluewater and key properties in Victoria, SW1.
We conducted meetings during the year with the sales teams of the major investment banks which provided the Executive Directors with the opportunity to present our strategy and performance directly and take questions.
Industry conferencesIndustry conferences provide Executive Directors with a chance to meet a large number of investors on a formal and informal basis. Conferences attended this year included the UBS Global Property and Bank of America Merrill Lynch conferences in London, the Kempen conferences in Amsterdam and New York, the Citi conference in Miami and the Exane BNP Paribas conference in Paris.
Private shareholdersOur private shareholders are encouraged to give feedback to and communicate with the Directors through the Company Secretary. They were also able to meet Directors at our Annual General Meeting (AGM) in July.
Our 2018 AGMWe held our July Annual General Meeting at our offices in Victoria Street, SW1. Holding our AGM on site gives our shareholders the opportunity to visit our nearby assets.
Our AGM provided all shareholders with an opportunity to question the Board on matters put to the meeting. Shareholders who attended the AGM received an overview of Landsec’s performance from the Chairman and a general business update from the Chief Executive. Shareholders were also shown a short video of Westgate Oxford which opened in October 2017, which showcases how our business interacts with wider stakeholders.
Questions from shareholders included what plans the new Chairman had for the Company’s strategy, the expected benefit from the refinancing that had taken place during the previous financial year, the CBRE valuation process and the impact of the current retail market conditions on the portfolio.
The results of voting at all general meetings are published on our website: landsec.com/investors.
Our five-year private shareholder programme We have a rolling five-year programme for our private shareholders. The aims of this programme are:
— A share register with minimal non-cashed dividends
— The promotion of electronic communications where appropriate to limit paper distributions thereby reducing the impact on the environment
— Effective communications and the provision of efficient service to our retail shareholders.
Investor relations
We conducted a number of investor tours of major assets during the year including Nova, SW1
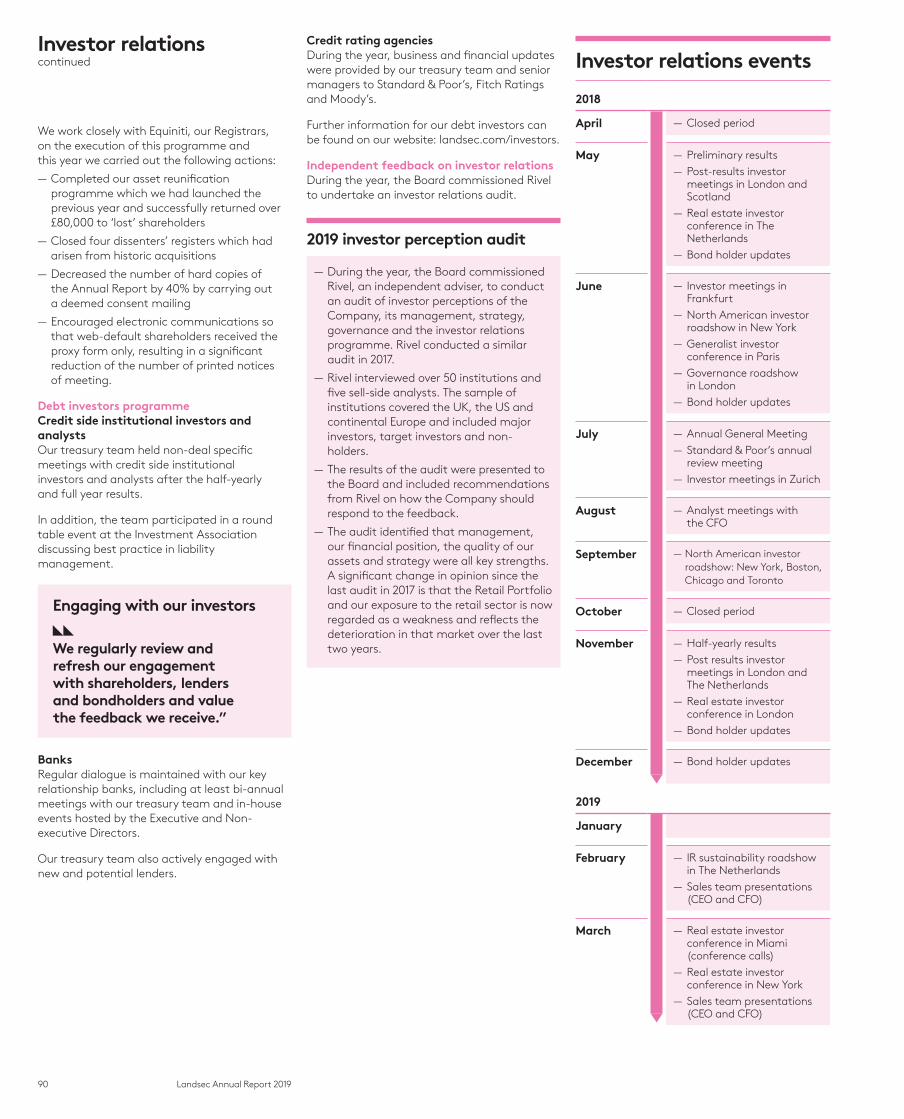
90 Landsec Annual Report 2019
We work closely with Equiniti, our Registrars, on the execution of this programme and this year we carried out the following actions:
— Completed our asset reunification programme which we had launched the previous year and successfully returned over £80,000 to ‘lost’ shareholders
— Closed four dissenters’ registers which had arisen from historic acquisitions
— Decreased the number of hard copies of the Annual Report by 40% by carrying out a deemed consent mailing
— Encouraged electronic communications so that web-default shareholders received the proxy form only, resulting in a significant reduction of the number of printed notices of meeting.
Debt investors programmeCredit side institutional investors and analystsOur treasury team held non-deal specific meetings with credit side institutional investors and analysts after the half-yearly and full year results.
In addition, the team participated in a round table event at the Investment Association discussing best practice in liability management.
Engaging with our investors
We regularly review and refresh our engagement with shareholders, lenders and bondholders and value the feedback we receive.”
BanksRegular dialogue is maintained with our key relationship banks, including at least bi-annual meetings with our treasury team and in-house events hosted by the Executive and Non-executive Directors.
Our treasury team also actively engaged with new and potential lenders.
Credit rating agenciesDuring the year, business and financial updates were provided by our treasury team and senior managers to Standard & Poor’s, Fitch Ratings and Moody’s.
Further information for our debt investors can be found on our website: landsec.com/investors.
Independent feedback on investor relations During the year, the Board commissioned Rivel to undertake an investor relations audit.
2019 investor perception audit
— During the year, the Board commissioned Rivel, an independent adviser, to conduct an audit of investor perceptions of the Company, its management, strategy, governance and the investor relations programme. Rivel conducted a similar audit in 2017.
— Rivel interviewed over 50 institutions and five sell-side analysts. The sample of institutions covered the UK, the US and continental Europe and included major investors, target investors and non-holders.
— The results of the audit were presented to the Board and included recommendations from Rivel on how the Company should respond to the feedback.
— The audit identified that management, our financial position, the quality of our assets and strategy were all key strengths. A significant change in opinion since the last audit in 2017 is that the Retail Portfolio and our exposure to the retail sector is now regarded as a weakness and reflects the deterioration in that market over the last two years.
Investor relations events
2018
April — Closed period
May — Preliminary results
— Post-results investor meetings in London and Scotland
— Real estate investor conference in The Netherlands
— Bond holder updates
June — Investor meetings in Frankfurt
— North American investor roadshow in New York
— Generalist investor conference in Paris
— Governance roadshow in London
— Bond holder updates
July — Annual General Meeting
— Standard & Poor’s annual review meeting
— Investor meetings in Zurich
August — Analyst meetings with the CFO
September — North American investor roadshow: New York, Boston, Chicago and Toronto
October — Closed period
November — Half-yearly results
— Post results investor meetings in London and The Netherlands
— Real estate investor conference in London
— Bond holder updates
December — Bond holder updates
2019
January
February — IR sustainability roadshow in The Netherlands
— Sales team presentations (CEO and CFO)
March — Real estate investor conference in Miami (conference calls)
— Real estate investor conference in New York
— Sales team presentations (CEO and CFO)
Investor relationscontinued
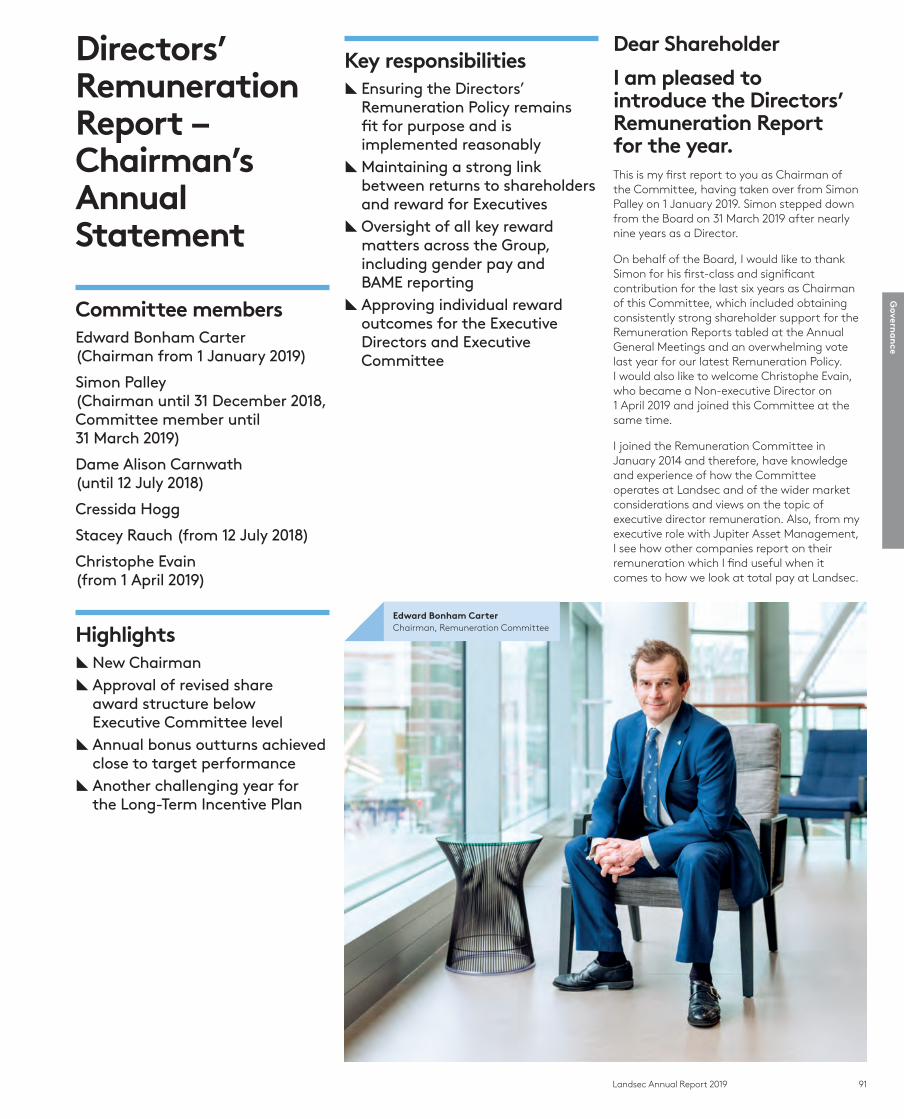
91Landsec Annual Report 2019
Govern
an
ce
Committee membersEdward Bonham Carter (Chairman from 1 January 2019)
Simon Palley (Chairman until 31 December 2018, Committee member until 31 March 2019)
Dame Alison Carnwath (until 12 July 2018)
Cressida Hogg
Stacey Rauch (from 12 July 2018)
Christophe Evain (from 1 April 2019)
Highlights [New Chairman [Approval of revised share award structure below Executive Committee level [Annual bonus outturns achieved close to target performance [Another challenging year for the Long-Term Incentive Plan
Key responsibilities [ Ensuring the Directors’ Remuneration Policy remains fit for purpose and is implemented reasonably [Maintaining a strong link between returns to shareholders and reward for Executives [Oversight of all key reward matters across the Group, including gender pay and BAME reporting [Approving individual reward outcomes for the Executive Directors and Executive Committee
Dear Shareholder
I am pleased to introduce the Directors’ Remuneration Report for the year.This is my first report to you as Chairman of the Committee, having taken over from Simon Palley on 1 January 2019. Simon stepped down from the Board on 31 March 2019 after nearly nine years as a Director.
On behalf of the Board, I would like to thank Simon for his first-class and significant contribution for the last six years as Chairman of this Committee, which included obtaining consistently strong shareholder support for the Remuneration Reports tabled at the Annual General Meetings and an overwhelming vote last year for our latest Remuneration Policy. I would also like to welcome Christophe Evain, who became a Non-executive Director on 1 April 2019 and joined this Committee at the same time.
I joined the Remuneration Committee in January 2014 and therefore, have knowledge and experience of how the Committee operates at Landsec and of the wider market considerations and views on the topic of executive director remuneration. Also, from my executive role with Jupiter Asset Management, I see how other companies report on their remuneration which I find useful when it comes to how we look at total pay at Landsec.
Directors’ Remuneration Report – Chairman’s Annual Statement
Edward Bonham CarterChairman, Remuneration Committee
92 Landsec Annual Report 2019
I am aware that remuneration reports have become detailed and can be confusing to those shareholders not accustomed to the way pay is reported. My objective here is to set out clearly and transparently how we reward our Directors. To assist with this goal, the report includes a ‘remuneration at a glance’ summary of Landsec performance and the corresponding compensation for our Executive Directors which I hope you find helpful.
Context for Executive Director pay at LandsecIt is important that the pay for our Executive Directors should be seen against the background of business performance, both during the financial year in question and over the performance period of the Long-Term Incentive Plan (LTIP).
In 2018/19, Landsec increased its revenue profit to £442m, increased the level of dividend paid to shareholders and maintained the resilient financial position of the Group. More broadly, Landsec delivered on some of its broader commitments, in particular relating to its impact on sustainability and the community. These non-financial metrics are important to Landsec which is why they are included in the Group’s business objectives that contribute towards the outcome of the Company performance bonus. This resulted in a close to target performance for the annual bonus at 49%.
Vesting of the LTIP is determined by performance against measures of total property return (TPR) and Total Shareholder Return (TSR). Over the past three years, our performance has fallen below that of our peer companies on a comparative basis. This is partly driven by the comparison with other property companies that are in different and better performing sectors (such as distribution warehouses). For this reason, the 2016 LTIP for the three years to 31 March 2019 did not vest (2018:0%).
Notwithstanding the comparative performance, the Directors have continued to focus on the Group’s core strategy, ensuring that the business is in the best position financially to withstand the current period of uncertainty and is able to take advantage of opportunities as and when they arise. We hear from shareholders that they do not want Landsec to be weak financially if there is a major market correction in property values and that they want us to maintain our progressive dividend policy. At a time when property values do not favour significant investment on a risk-adjusted basis, we have addressed some of the trends impacting us, such as providing a new flexible offer (Myo), the greater use of technology and
the focus on our customers and other stakeholders. We have also looked more broadly at the ‘build to rent’ residential market as a new sector. This broad approach will continue next year and elements will be reflected in the specific Group business metrics for 2019/20.
Directors’ Remuneration PolicyWe tabled our Directors’ Remuneration Policy (DRP) at last year’s Annual General Meeting on 12 July 2018 which was overwhelmingly supported with a 99.4% shareholder vote in favour.
There were no major changes introduced in last year’s DRP (a copy of which can be found on pages 111-117) but the Committee is aware that there have been governance and regulatory changes since then. These include the 2018 UK Corporate Governance Code and the publication of the revised Investment Association’s Principles of Remuneration, which impact certain aspects of our DRP, including the alignment of Directors’ pension contribution rates with the rest of the workforce, post-employment shareholding obligations, additional malus and clawback rights and certain aspects of pay reporting.
We have debated these points as a Committee and our decision is not to amend the DRP again in time for a shareholder vote at our AGM in July 2019. However, we will review these points over the next 12 months and consult with our shareholders and, depending on their view, may bring forward our next DRP approval from 2021 to 2020. In the meantime, the Committee has the authority to tighten the application of the approved policy if required. The Committee will take account of the 2018 Code and other guidance when the Company appoints the next Executive Director.
Remuneration outcomes for the yearExecutive pay is designed to reward successful performance and long-term sustainability that supports the Company strategy in a way that is fully aligned with our purpose and values.
Annual bonusThe annual bonus for the year forms two parts, Company performance and personal performance. Company performance is determined by three key measures – TPR, revenue profit and performance against specific business objectives. All employees are eligible for a personal performance bonus. Circa 330 employees (or approximately half the workforce) benefit from the Company performance element which is calculated using the same methodology for everyone.
For 2018/19, the Company performance has been assessed at being close to target at 49% (2018: 55.6%). The calculation of the individual elements of the bonus achievement is set out in more detail later in the report. The Committee assessed performance against the relevant objectives and this was thoroughly debated and tested by the members of the Committee before we determined the resulting figure.
If the Company performance element exceeds 50%, it unlocks an ‘outperformance element’ that can be used to provide additional reward to eligible employees (not Executive Directors or Executive Committee members) that have contributed most to achieving the Group’s annual KPIs. This year, the outperformance element was not triggered.
LTIP The LTIP has two elements, each contributing a maximum of 50% to the total. For the three years to 31 March 2019, both TSR and TPR (calculated by reference to the MSCI benchmark) have failed to achieve the threshold and, as a consequence, there is no vesting of the 2016 LTIP award.
Judgement and discretionAs mentioned above, the Committee used its judgement when assessing performance under certain Group business objectives that form part of the Company’s annual bonus. No judgement or discretion was required when assessing performance of the LTIP as it did not vest.
When considering the grant of LTIP awards for 2019, the Committee took into account the Company’s share price performance over the 12-month period to 31 March 2019.
The Committee considered the position of Scott Parsons following his resignation from the Company. Mr Parsons was on a 12-month notice period that started on 25 February 2019 and he will remain an employee for that period (unless both parties agree otherwise). His remuneration terms were in line with his service agreement and he will continue to receive his contractual salary and benefits, including pension, by way of phased monthly payments for up to 12 months from 25 February 2019. The Committee determined that Mr Parsons would be eligible for a bonus for the financial year ended 31 March 2019, but this was limited to the Company performance element only. No personal performance element of the annual bonus will be paid for last year.
Mr Parsons’ annual bonus will be paid at the same time as bonus payments to other eligible employees. With a Company performance outturn of 49%, this means that Mr Parsons will receive a bonus of £239k for last year, which the Committee believes is a fair reflection of his contribution to the Group’s performance during the year. He will not receive any bonus for 2019/20, and all his outstanding unvested LTIP and Matching Share Plan (MSP) awards lapsed.
There was no other exercise of discretion during the year by the Committee.
Changes to employee share awardsThis does not affect the Executive Directors or members of the Executive Committee, but the Committee has approved the move away from LTIPs and Employee Share Option Plans (ESOPs) to Restricted Shares Awards (RSAs) for its
Directors’ Remuneration Report – Chairman’s Annual Statementcontinued
93Landsec Annual Report 2019
Govern
an
ce
Senior Leaders and Leaders. RSAs are awards with no performance conditions and only subject to time vesting conditions over a three-year period. The awards vest as nil cost options with a seven-year exerciseable period. This change is the result of a review of workforce remuneration carried out by the Executive Committee under the supervision of the Remuneration Committee. Senior Leaders will be eligible to receive RSAs, budgeted to the equivalent of an average award of 20% of salary. There is room under the scheme rules for some flexibility in awards but only up to a maximum of 30% of salary. This compares to an award under the existing LTIP scheme of up to 50% of salary. For Leaders, the corresponding figures are 10% (budget) and 15% (maximum).
Pay reporting There is a continued need to be more transparent across remuneration, with greater scrutiny from all stakeholders on reward matters and how this is reflected across all job levels and employee groups. It is therefore right that the Committee has oversight on how our remuneration reflects pay in the wider context.
Therefore in 2018 we reviewed the following:
— New regulation requirements In August 2017, the Government announced that the Directors’ Reporting Regulations were amended to require a disclosure of the CEO pay as a ratio to the pay of their UK workforce (for listed companies with over 250 UK employees) and this has been followed by guidance from the Investment Association.
The regulations require the following:
— The ratio of the CEO’s pay (the single total figure of remuneration) to the median (50th), 25th and 75th percentile full-time equivalent remuneration of their UK employees.
Alongside this, there is a requirement for a more detailed narrative, explaining any changes over time and how this relates to pay and benefits across the wider workforce. Although this is effective for financial years beginning on or after 1 January 2019, we have made the decision to disclose the pay ratio in advance of the regulations coming into force (see page 107).
— There is also a requirement to include the impact of the future share price on executive pay and this will be included in next year’s report.
— Equal pay audit With our continued focus to ensure our reward packages are fair, particularly our base compensation, we appointed an independent law firm to undertake a detailed impartial equal pay audit. The audit concluded that Landsec had a robust pay structure in terms of setting pay fairly and identified some recommendations to improve administration. These will be implemented in 2019/20.
— Gender pay The Remuneration Committee continues to monitor gender pay closely, to ensure we are committed to reducing the pay gap and delivering against the objectives set for increasing gender representation across Landsec (see page 51).
Employee engagement As noted by the Chairman in her report, Cressida is attending the Company’s Employee Forum as the Board representative so that she can listen to employee views on matters such as remuneration and report to the Board and this Committee. Other Directors are invited to attend this forum and I intend to do so this year.
Looking forwardI do not anticipate any major changes in the focus for the Remuneration Committee over the coming year other than the points already covered in this letter. However, I am conscious of the increase in scrutiny of FTSE companies when it comes to remuneration, across all elements and all levels of the organisation.
As a Remuneration Committee, we will continue to have oversight of all reward matters and, in conjunction with the Executive team, increase our focus on the key measures to ensure greater fairness and transparency in our pay structure and ensure that our reward packages continue to attract and retain the best talent, regardless of background. To that end:
— Gender pay: we will continue to monitor gender pay closely, to ensure we are reducing the pay gap by delivering against the objectives set for increasing gender representation across Landsec (see page 51);
— Black, Asian and Minority Ethnicity (BAME) pay: we will undertake an independent detailed review of our BAME pay. This is in anticipation of a requirement for greater transparency for organisations and for Landsec to show leadership across the real estate industry on all diversity and inclusion matters.
I hope that you have found my letter useful, informative and clear. I am grateful for the engagement and support provided by you, our shareholders, and welcome your feedback on this report.
Edward Bonham CarterChairman, Remuneration Committee
In this section
Remuneration at a glance 94-95 Remuneration principles
and structure
Outcomes for the year.
Annual Report on Remuneration 96-107 Detail on outcomes for each
element of remuneration and for each individual Director
Performance targets for the year ahead.
Remuneration Policy 111-117 Remuneration Policy
Application of the Policy in the year ahead.
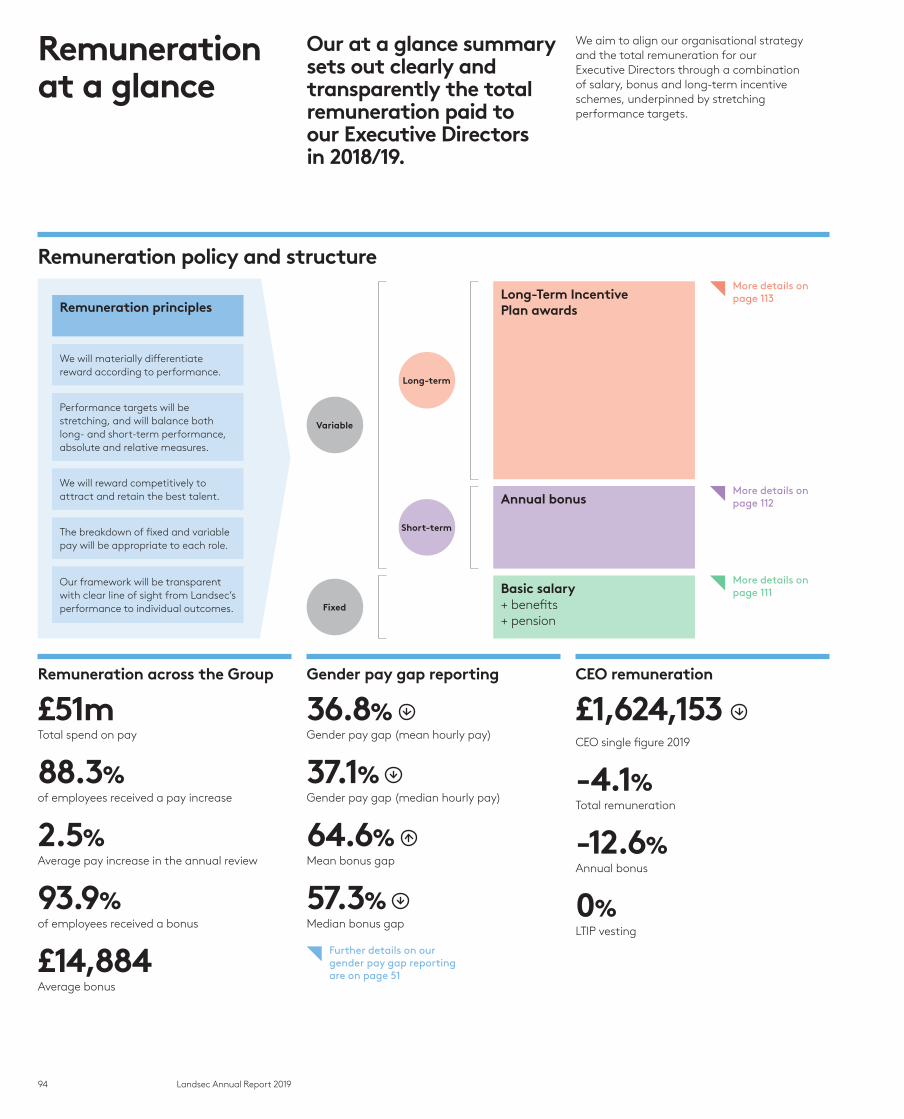
94 Landsec Annual Report 2019
Remuneration policy and structure
Remuneration principles
We will reward competitively to attract and retain the best talent.
We will materially differentiate reward according to performance.
The breakdown of fixed and variable pay will be appropriate to each role.
Performance targets will be stretching, and will balance both long- and short-term performance, absolute and relative measures.
Our framework will be transparent with clear line of sight from Landsec’s performance to individual outcomes.
Remuneration across the Group
£51mTotal spend on pay
88.3%of employees received a pay increase
2.5%Average pay increase in the annual review
93.9%of employees received a bonus
£14,884Average bonus
Gender pay gap reporting
36.8% Gender pay gap (mean hourly pay)
37.1% Gender pay gap (median hourly pay)
64.6% Mean bonus gap
57.3% Median bonus gap
Further details on our gender pay gap reporting are on page 51
CEO remuneration
£1,624,153 CEO single figure 2019
-4.1%Total remuneration
-12.6%Annual bonus
0%LTIP vesting
Our at a glance summary sets out clearly and transparently the total remuneration paid to our Executive Directors in 2018/19.
We aim to align our organisational strategy and the total remuneration for our Executive Directors through a combination of salary, bonus and long-term incentive schemes, underpinned by stretching performance targets.
Variable
Fixed
Short-term
Long-term
Long-Term Incentive Plan awards
Annual bonus
Basic salary+ benefits+ pension
More details on page 113
More details on page 112
More details on page 111
Remuneration at a glance

95Landsec Annual Report 2019
Govern
an
ce
Summary of Executive Directors’ remuneration for the year Table 49
Robert Noel, Chief Executive(£000)
Martin Greenslade, Chief Financial Officer(£000)
Colette O’Shea, Managing Director, London Portfolio(£000)
Scott Parsons, Managing Director, Retail Portfolio (£000)
£500
£1,000
£1,500
£2,000
0
1,6931,624
1,1081,063
197
827670
186
2018/19 2017/18 2018/19 2017/18 2018/19 2017/18 2018/192 2017/18
Basic salary 797 784 519 510 422 104 375 104
Benefits 22 21 20 20 17 4 17 5
Pension allowance 199 196 130 128 55 13 39 11
Annual bonus paid in cash
400 392 260 255 212 76 239 66
Annual bonus deferred into shares
206 300 134 195 121 – – –
Total emoluments 1,624 1,693 1,063 1,108 827 197¹ 670 186¹
Long-term incentives vested
– – – – – – – –
1. Figures for Colette O’Shea and Scott Parsons for 2017/18 reflect their appointment to the Board on 1 January 2018. 2. The 2018/19 figures for Scott Parsons reflect the period from 1 April 2018 to the date of his resignation on 25 February 2019.
Linking remuneration to achievement of key business priorities
Opportunity as a % of salaryOutturn
(% of salary)
Annual bonus
One-year TPR 39.0% 0.0%
Revenue profit 39.0% 25.6%
21 Moorfields 6.5% 5.2%
London shopping centres 6.5% 3.0%
Executing the outlet strategy 6.5% 6.5%
Business unit innovation 12.9% 6.5%
Customers 6.3% 6.3%
Diversity 5.3% 2.6%
Communities 4.0% 4.0%
Environment 4.0% 4.0%
Total Company bonus opportunity 130%1 63.7%
Individual targets 20% 13.0%2
Total bonus opportunity 150% 76.7%
Weighting Outturn
LTIP
Three-year TSR 50% 0.0%
Three-year TPR 50% 0.0%
Total LTIP opportunity 100% 0.0%
1. The elements that make up the Company bonus opportunity are aligned to the bonus opportunity for all eligible employees of the award.2. Average awarded to Robert Noel, Martin Greenslade and Colette O’Shea.

96 Landsec Annual Report 2019
The Annual Report on Remuneration describes how the Directors’ Remuneration Policy (‘The Policy’), approved by shareholders at the Annual General Meeting in July 2018, has been applied in the financial year ending 31 March 2019.
During the course of 2018/19, the Remuneration Committee was engaged in a number of key matters, including:
— Overseeing the calculation and publishing of the Group’s gender pay report
— Determining salary increases for the Executive Directors and Executive Committee members, together with the overall level of salary increases for employees across the Group
— Setting and subsequently reviewing the outcomes for corporate, business unit and personal targets under the annual bonus scheme for Executive Directors and Executive Committee members
— Reviewing and determining the outturns against the performance conditions, and subsequent vesting outcome, of awards granted under the Long-Term Incentive Plan (LTIP) and Matching Share Plan (MSP) in 2016
— Reviewing the long-term incentive arrangements below Executive level
— Determining the annual level of LTIP grants to Executive Directors and Executive Committee members
— Monitoring Directors’ compliance with the Company’s share ownership guidelines
— Monitoring developments in stakeholder sentiment on executive pay and corporate governance more generally, including participating in consultation exercises where appropriate
— Determining the remuneration terms for Scott Parsons following his resignation.
Unless otherwise stated, narrative and tables are unaudited.
1. Remuneration outcomes for Directors during the year
In this section, we explain the pay outcomes for Directors in relation to the financial year ended 31 March 2019. Tables 51 and 52 show the payments we expect to make and then tables 53 to 57 give more detail on how we have measured the performance outcomes with respect to the annual bonus and LTIP in the context of value created for shareholders.
1.1 Directors’ emoluments (Audited)The basis of disclosure in the table on page 97 is on an ‘accruals’ basis. This means that the annual bonus column includes the amount that will be paid in June 2019 in connection with performance achieved in the financial year ended 31 March 2019. It should be noted that the annual bonus figure has been estimated for the purposes of the table, as final data on the Company’s total property return versus the peer group using the benchmark (i.e. all March-valued properties) will not be available until after the date of this report’s publication. The estimate has been derived from the most up-to-date performance information available, and any payment made will be based on the final performance data when received and verified.
The values shown for the 2016 LTIP awards for the three-year performance period ended 31 March 2019 are based on estimated achievements against the performance measures. We estimate the vesting level on the 2016 LTIP to be zero.
Dates of appointment for Directors (Unaudited) Table 50
Name Date of appointment Date of contract
Executive Directors
Robert Noel 1 January 2010 23 January 2012
Martin Greenslade 1 September 2005 9 May 2013
Colette O’Shea 1 January 2018 1 January 2018
Scott Parsons (until 25 February 2019) 1 January 2018 1 January 2018
Non-executive Directors
Cressida Hogg¹ 12 July 2018 14 May 2018
Dame Alison Carnwath (until 12 July 2018) 1 September 2004 13 May 2015
Chris Bartram 1 August 2009 13 May 2015
Simon Palley 1 August 2010 13 May 2015
Stacey Rauch 1 January 2012 13 May 2015
Edward Bonham Carter 1 January 2014 13 May 2015
Nicholas Cadbury 1 January 2017 1 January 2017
Madeleine Cosgrave 1 January 2019 22 November 2018
1. Cressida Hogg was appointed to the Board 1 January 2014 as a Non-executive Director and the dates above reflect her appointment to Chairman in 2018.
2. Christophe Evain joined the Board with effect from 1 April 2019.
Annual Report on Remuneration
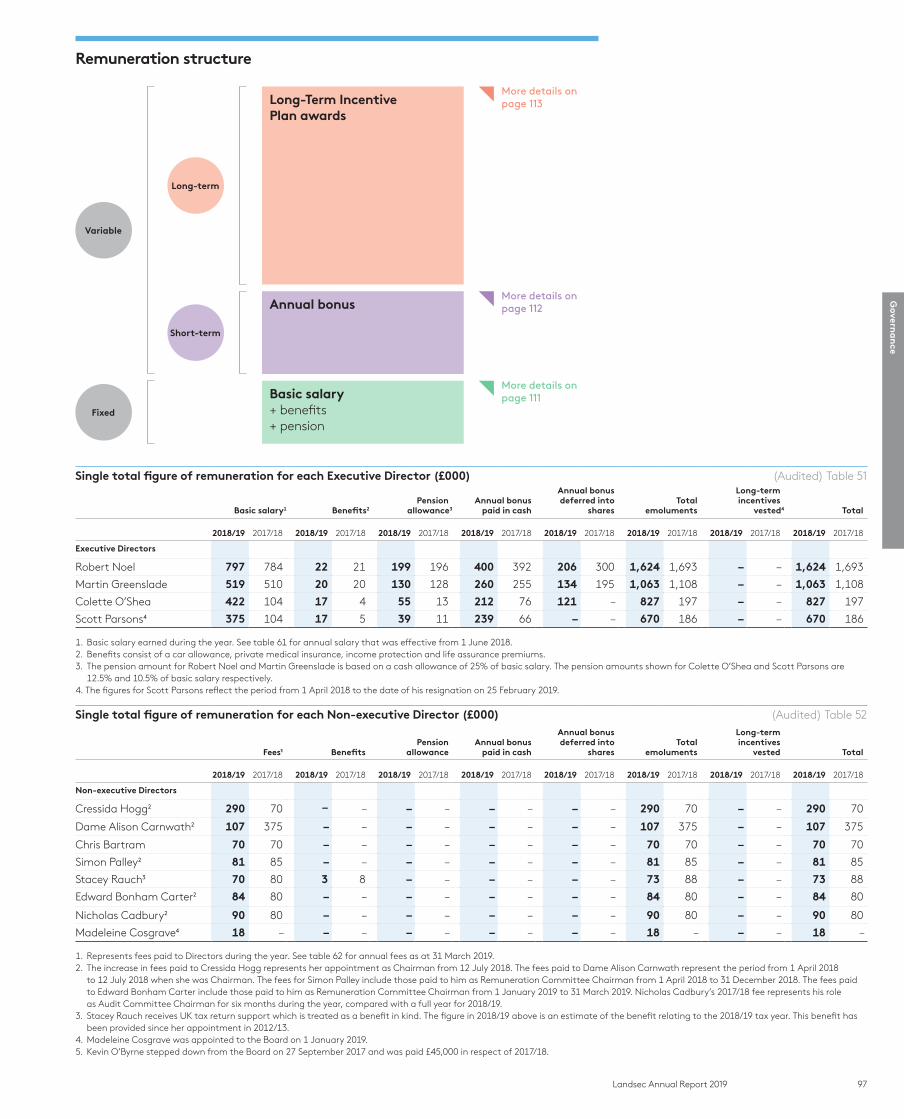
97Landsec Annual Report 2019
Govern
an
ce
Remuneration structure
Variable
Fixed
Short-term
Long-term
Long-Term Incentive Plan awards
Annual bonus
Basic salary+ benefits+ pension
More details on page 113
More details on page 112
More details on page 111
Single total figure of remuneration for each Executive Director (£000) (Audited) Table 51
Basic salary1 Benefits2Pension
allowance3Annual bonus
paid in cash
Annual bonus deferred into
sharesTotal
emoluments
Long-term incentives
vested4 Total
2018/19 2017/18 2018/19 2017/18 2018/19 2017/18 2018/19 2017/18 2018/19 2017/18 2018/19 2017/18 2018/19 2017/18 2018/19 2017/18
Executive Directors
Robert Noel 797 784 22 21 199 196 400 392 206 300 1,624 1,693 – – 1,624 1,693
Martin Greenslade 519 510 20 20 130 128 260 255 134 195 1,063 1,108 – – 1,063 1,108
Colette O’Shea 422 104 17 4 55 13 212 76 121 – 827 197 – – 827 197
Scott Parsons⁴ 375 104 17 5 39 11 239 66 – – 670 186 – – 670 186
1. Basic salary earned during the year. See table 61 for annual salary that was effective from 1 June 2018.2. Benefits consist of a car allowance, private medical insurance, income protection and life assurance premiums.3. The pension amount for Robert Noel and Martin Greenslade is based on a cash allowance of 25% of basic salary. The pension amounts shown for Colette O’Shea and Scott Parsons are
12.5% and 10.5% of basic salary respectively.4. The figures for Scott Parsons reflect the period from 1 April 2018 to the date of his resignation on 25 February 2019. Single total figure of remuneration for each Non-executive Director (£000) (Audited) Table 52
Fees¹ BenefitsPension
allowanceAnnual bonus
paid in cash
Annual bonus deferred into
sharesTotal
emoluments
Long-term incentives
vested Total
2018/19 2017/18 2018/19 2017/18 2018/19 2017/18 2018/19 2017/18 2018/19 2017/18 2018/19 2017/18 2018/19 2017/18 2018/19 2017/18
Non-executive Directors
Cressida Hogg² 290 70 – – – – – – – – 290 70 – – 290 70
Dame Alison Carnwath² 107 375 – – – – – – – – 107 375 – – 107 375
Chris Bartram 70 70 – – – – – – – – 70 70 – – 70 70
Simon Palley² 81 85 – – – – – – – – 81 85 – – 81 85
Stacey Rauch³ 70 80 3 8 – – – – – – 73 88 – – 73 88
Edward Bonham Carter² 84 80 – – – – – – – – 84 80 – – 84 80
Nicholas Cadbury² 90 80 – – – – – – – – 90 80 – – 90 80
Madeleine Cosgrave4 18 – – – – – – – – – 18 – – – 18 –
1. Represents fees paid to Directors during the year. See table 62 for annual fees as at 31 March 2019.2. The increase in fees paid to Cressida Hogg represents her appointment as Chairman from 12 July 2018. The fees paid to Dame Alison Carnwath represent the period from 1 April 2018
to 12 July 2018 when she was Chairman. The fees for Simon Palley include those paid to him as Remuneration Committee Chairman from 1 April 2018 to 31 December 2018. The fees paid to Edward Bonham Carter include those paid to him as Remuneration Committee Chairman from 1 January 2019 to 31 March 2019. Nicholas Cadbury’s 2017/18 fee represents his role as Audit Committee Chairman for six months during the year, compared with a full year for 2018/19.
3. Stacey Rauch receives UK tax return support which is treated as a benefit in kind. The figure in 2018/19 above is an estimate of the benefit relating to the 2018/19 tax year. This benefit has been provided since her appointment in 2012/13.
4. Made leine Cosgrave was appointed to the Board on 1 January 2019.5. Kevin O’Byrne stepped down from the Board on 27 September 2017 and was paid £45,000 in respect of 2017/18.
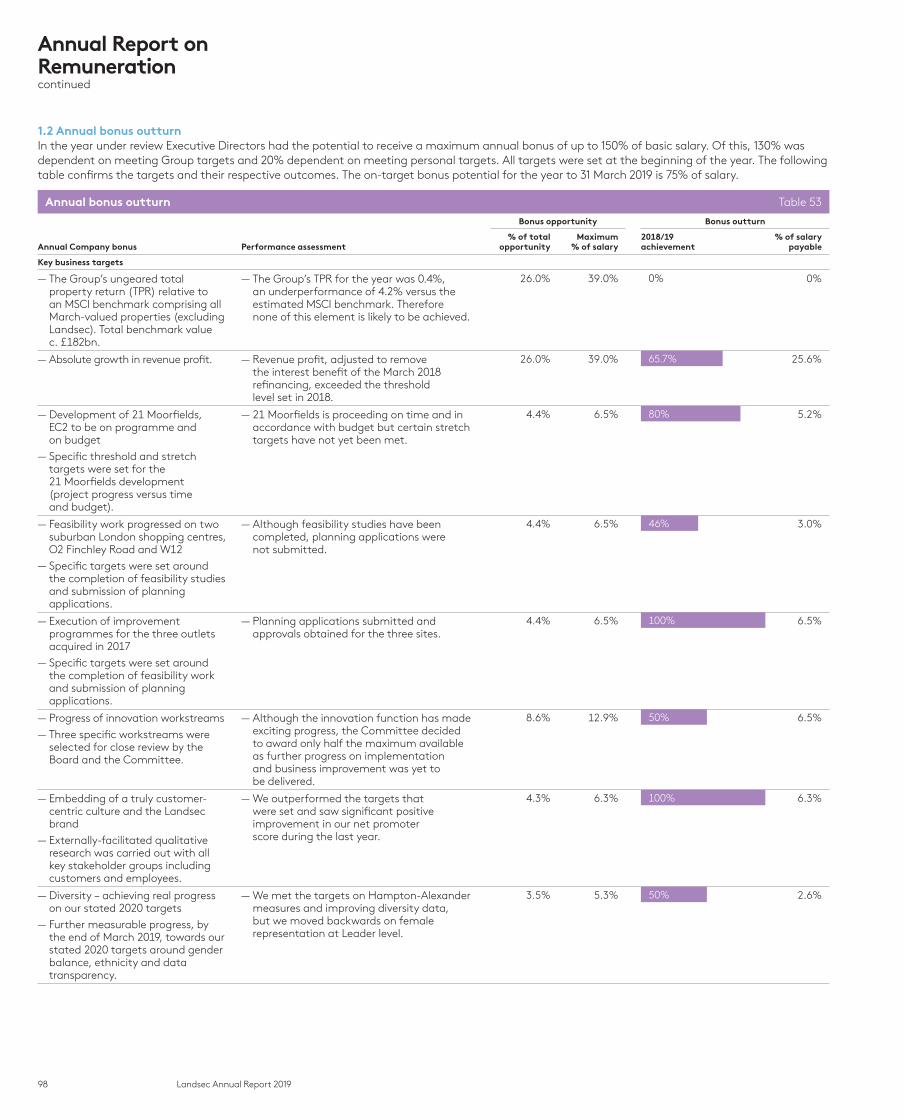
98 Landsec Annual Report 2019
1.2 Annual bonus outturnIn the year under review Executive Directors had the potential to receive a maximum annual bonus of up to 150% of basic salary. Of this, 130% was dependent on meeting Group targets and 20% dependent on meeting personal targets. All targets were set at the beginning of the year. The following table confirms the targets and their respective outcomes. The on-target bonus potential for the year to 31 March 2019 is 75% of salary.
Annual bonus outturn Table 53
Bonus opportunity Bonus outturn
Annual Company bonus Performance assessment% of total
opportunityMaximum
% of salary2018/19 achievement
% of salary payable
Key business targets
— The Group’s ungeared total property return (TPR) relative to an MSCI benchmark comprising all March-valued properties (excluding Landsec). Total benchmark value c. £182bn.
— The Group’s TPR for the year was 0.4%, an underperformance of 4.2% versus the estimated MSCI benchmark. Therefore none of this element is likely to be achieved.
26.0% 39.0% 0% 0%
— Absolute growth in revenue profit. — Revenue profit, adjusted to remove the interest benefit of the March 2018 refinancing, exceeded the threshold level set in 2018.
26.0% 39.0% 65.7% 25.6%
— Development of 21 Moorfields, EC2 to be on programme and on budget
— Specific threshold and stretch targets were set for the 21 Moorfields development (project progress versus time and budget).
— 21 Moorfields is proceeding on time and in accordance with budget but certain stretch targets have not yet been met.
4.4% 6.5% 80% 5.2%
— Feasibility work progressed on two suburban London shopping centres, O2 Finchley Road and W12
— Specific targets were set around the completion of feasibility studies and submission of planning applications.
— Although feasibility studies have been completed, planning applications were not submitted.
4.4% 6.5% 46% 3.0%
— Execution of improvement programmes for the three outlets acquired in 2017
— Specific targets were set around the completion of feasibility work and submission of planning applications.
— Planning applications submitted and approvals obtained for the three sites.
4.4% 6.5% 100% 6.5%
— Progress of innovation workstreams
— Three specific workstreams were selected for close review by the Board and the Committee.
— Although the innovation function has made exciting progress, the Committee decided to award only half the maximum available as further progress on implementation and business improvement was yet to be delivered.
8.6% 12.9% 50% 6.5%
— Embedding of a truly customer-centric culture and the Landsec brand
— Externally-facilitated qualitative research was carried out with all key stakeholder groups including customers and employees.
— We outperformed the targets that were set and saw significant positive improvement in our net promoter score during the last year.
4.3% 6.3% 100% 6.3%
— Diversity – achieving real progress on our stated 2020 targets
— Further measurable progress, by the end of March 2019, towards our stated 2020 targets around gender balance, ethnicity and data transparency.
— We met the targets on Hampton-Alexander measures and improving diversity data, but we moved backwards on female representation at Leader level.
3.5% 5.3% 50% 2.6%
Annual Report on Remunerationcontinued

99Landsec Annual Report 2019
Govern
an
ce
— Community Employment Programme – target was set around securing permanent employment for further candidates by extending the programme beyond its current focus.
— We have outperformed the targets set by helping 187 people furthest from the jobs market back into work.
2.7% 4.0% 100% 4.0%
— Environment – delivering quantifiable energy reduction targets across the portfolio.
— We have outperformed the targets set, having agreed implementation of energy reduction measures which will lead to over 3% reduction versus 2013/14 corporate baseline.
2.7% 4.0% 100% 4.0%
— Total Company bonus 87.0% 130.0% 49% 63.7%
— Individual targets for Executive Directors
13.0% 20.0% 65%¹
— Total bonus opportunity 100.0% 150.0%
1. Average achieved for Robert Noel, Martin Greenslade and Colette O’Shea.
Bonus paid as a % of basic salary Table 54
Company bonus Individual bonus Total bonus
DirectorMaximum
opportunity AwardedMaximum
opportunity AwardedMaximum
opportunity Awarded
Robert Noel 130.0 63.7 20.0 12.0 150.0 75.7
Martin Greenslade 130.0 63.7 20.0 12.0 150.0 75.7
Colette O’Shea 130.0 63.7 20.0 15.0 150.0 78.7
Scott Parsons¹ 130.0 63.7 20.0 – 150.0 63.7
Executive Directors’ personal targets Assessment
The Chief Executive, Chief Financial Officer and Managing Directors received a number of personal targets, which included:
— Personal development of succession candidates for all senior roles and broader identification and support for talent in the organisation
— All members of the Executive Committee and ‘high potential’ employees have active development plans. New tools to help identify potential have been introduced alongside those that measure performance
— Focus on internal process in order to improve employee experience and drive efficiency
— Improved capability around process improvement has been delivered and a structured programme of identification and implementation of process improvement has been introduced
— Continuing to build on the Creating Experience programme to enhance the customer experience-led culture
— Sessions were held in all teams across the organisation to further understand team impact on the customer experience and a new performance tool was developed which focuses on individual impact
— For the Managing Directors who were new to the Board in 2018, to develop in their role as Board Members so that they could be increasingly effective in Board discussion and decision making
— Both Managing Directors had active development support in place for this new role and were active participants in the Board throughout the year
— Continue to support the Board to evolve the strategy of the Company and maintain focus on the longer-term horizon
— Detailed work done to support Board conversations throughout the year and to build plans for the next period
1. Scott Parsons received no award for the individual element of the annual bonus for 2018/19 in accordance with the terms agreed by the Committee following his resignation.
Bonus opportunity Bonus outturn
Metric Performance assessment% of total
opportunityMaximum
% of salary2018/19 achievement
% of salary payable
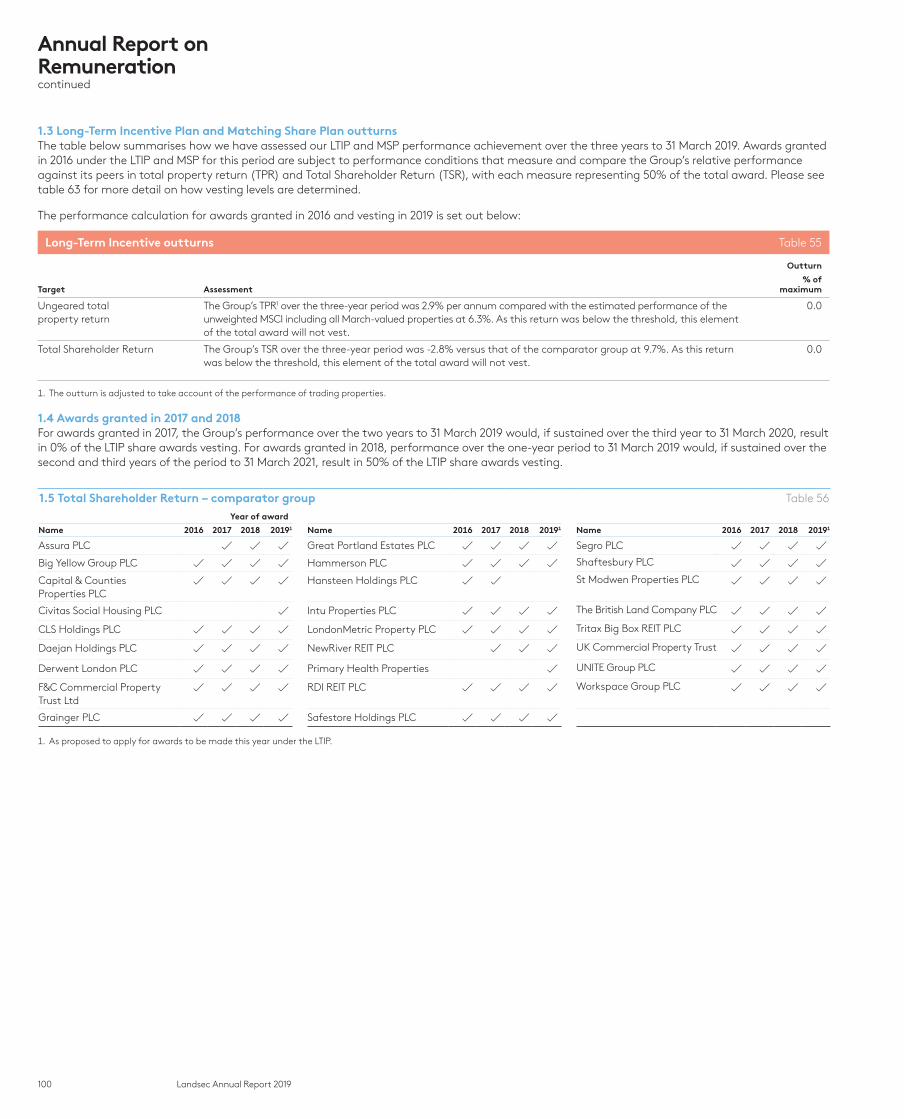
100 Landsec Annual Report 2019
1.3 Long-Term Incentive Plan and Matching Share Plan outturns The table below summarises how we have assessed our LTIP and MSP performance achievement over the three years to 31 March 2019. Awards granted in 2016 under the LTIP and MSP for this period are subject to performance conditions that measure and compare the Group’s relative performance against its peers in total property return (TPR) and Total Shareholder Return (TSR), with each measure representing 50% of the total award. Please see table 63 for more detail on how vesting levels are determined.
The performance calculation for awards granted in 2016 and vesting in 2019 is set out below:
Long-Term Incentive outturns Table 55
Target Assessment
Outturn
% of maximum
Ungeared total property return
The Group’s TPR1 over the three-year period was 2.9% per annum compared with the estimated performance of the unweighted MSCI including all March-valued properties at 6.3%. As this return was below the threshold, this element of the total award will not vest.
0.0
Total Shareholder Return The Group’s TSR over the three-year period was -2.8% versus that of the comparator group at 9.7%. As this return was below the threshold, this element of the total award will not vest.
0.0
1. The outturn is adjusted to take account of the performance of trading properties.
1.4 Awards granted in 2017 and 2018For awards granted in 2017, the Group’s performance over the two years to 31 March 2019 would, if sustained over the third year to 31 March 2020, result in 0% of the LTIP share awards vesting. For awards granted in 2018, performance over the one-year period to 31 March 2019 would, if sustained over the second and third years of the period to 31 March 2021, result in 50% of the LTIP share awards vesting.
1.5 Total Shareholder Return – comparator group Table 56
Year of award
Name 2016 2017 2018 20191 Name 2016 2017 2018 20191 Name 2016 2017 2018 20191
Assura PLC Great Portland Estates PLC Segro PLC
Big Yellow Group PLC Hammerson PLC Shaftesbury PLC
Capital & Counties Properties PLC
Hansteen Holdings PLC St Modwen Properties PLC
Civitas Social Housing PLC Intu Properties PLC The British Land Company PLC
CLS Holdings PLC LondonMetric Property PLC Tritax Big Box REIT PLC
Daejan Holdings PLC NewRiver REIT PLC UK Commercial Property Trust
Derwent London PLC Primary Health Properties UNITE Group PLC
F&C Commercial Property Trust Ltd
RDI REIT PLC Workspace Group PLC
Grainger PLC Safestore Holdings PLC
1. As proposed to apply for awards to be made this year under the LTIP.
Annual Report on Remunerationcontinued

101Landsec Annual Report 2019
Govern
an
ce
1.6 Individual outcomes by Executive Director versus target and maximum Table 57
Robert Noel, Chief Executive(£000)
Martin Greenslade, Chief Financial Officer(£000)
Colette O’Shea, Managing Director, London Portfolio(£000)
Scott Parsons, Managing Director, Retail Portfolio1 (£000)
Fixe
d p
ay
On-
targ
et
Ma
xim
um
Act
ual
Fixe
d p
ay
On-
targ
et
Ma
xim
um
Act
ual
Fixe
d p
ay
On-
targ
et
Ma
xim
um
Act
ual
Fixe
d p
ay
On-
targ
et
Ma
xim
um
Act
ual
■ Basic salary ■ Pension ■ Bene�ts ■ Annual bonus ■ Long-term incentives
■ Basic salary ■ Pension ■ Bene�ts ■ Annual bonus ■ Long-term incentives
■ Basic salary ■ Pension ■ Bene�ts ■ Annual bonus ■ Long-term incentives
■ Basic salary ■ Pension ■ Bene�ts ■ Annual bonus ■ Long-term incentives
£1,000
£2,000
£3,000
£5,000
£4,000
0
Maximum potential
(£000)Achieved
(%)Outturn(£000)
Maximum potential
(£000)Achieved
(%)Outturn(£000)
Maximum potential
(£000)Achieved
(%)Outturn(£000)
Maximum potential
(£000)Achieved
(%)Outturn(£000)Element of pay
Basic salary 797 n/a 797 519 n/a 519 422 n/a 422 375 n/a 375
Pension 199 n/a 199 130 n/a 130 55 n/a 55 39 n/a 39
Benefits 22 n/a 22 20 n/a 20 17 n/a 17 17 n/a 17
Annual bonus2
— Company bonus 1,040 49 510 677 49 332 550 49 269 487 49 239
— Individual bonus 160 60 96 104 60 62 85 75 64 75 n/a –
Long-term incentives³ 2,010 – – 1,308 – – 708 – – 667 – –
Total 4,228 38 1,624 2,758 39 1,063 1,837 45 827 1,660 40 670
1. The figures and chart shown for Scott Parsons have been pro-rated to reflect the period up to 25 February 2019.2. Robert Noel – £205,529 of the annual bonus will be deferred into shares for one year. Martin Greenslade – £133,788 of the annual bonus will be deferred into shares for one year.
Colette O’Shea – £121,401 of the annual bonus will be deferred into shares for one year. 3. To calculate the maximum potential, the value of shares due for vesting in 2019 has been calculated on the basis of an 876p average share price for the three-month period to 31 March 2019.
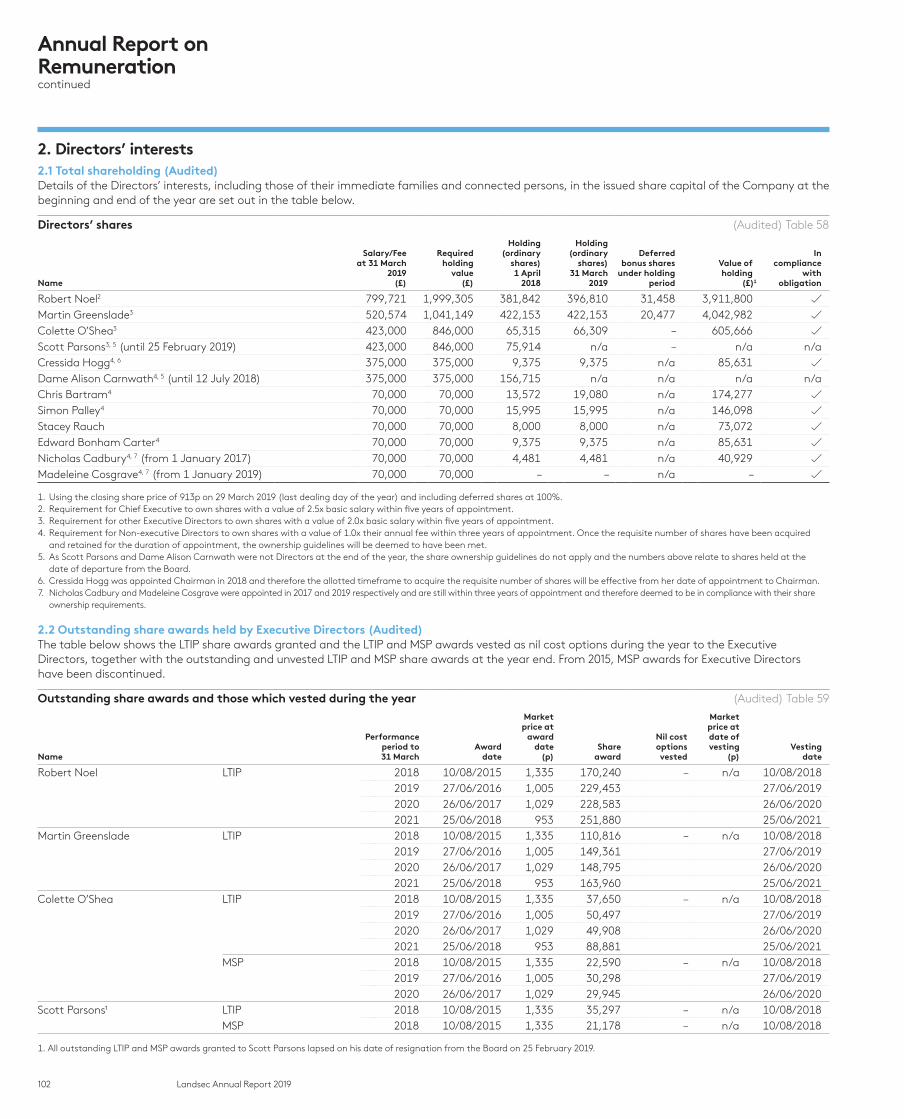
102 Landsec Annual Report 2019
2. Directors’ interests 2.1 Total shareholding (Audited)Details of the Directors’ interests, including those of their immediate families and connected persons, in the issued share capital of the Company at the beginning and end of the year are set out in the table below.
Directors’ shares (Audited) Table 58
Name
Salary/Fee at 31 March
2019(£)
Requiredholding
value(£)
Holding(ordinary
shares)1 April
2018
Holding(ordinary
shares)31 March
2019
Deferredbonus shares
under holding period
Value of holding
(£)1
In compliance
with obligation
Robert Noel2 799,721 1,999,305 381,842 396,810 31,458 3,911,800Martin Greenslade3 520,574 1,041,149 422,153 422,153 20,477 4,042,982Colette O’Shea3 423,000 846,000 65,315 66,309 – 605,666Scott Parsons3, 5 (until 25 February 2019) 423,000 846,000 75,914 n/a – n/a n/aCressida Hogg4, 6 375,000 375,000 9,375 9,375 n/a 85,631Dame Alison Carnwath4, 5 (until 12 July 2018) 375,000 375,000 156,715 n/a n/a n/a n/aChris Bartram4 70,000 70,000 13,572 19,080 n/a 174,277Simon Palley4 70,000 70,000 15,995 15,995 n/a 146,098Stacey Rauch 70,000 70,000 8,000 8,000 n/a 73,072Edward Bonham Carter4 70,000 70,000 9,375 9,375 n/a 85,631Nicholas Cadbury4, 7 (from 1 January 2017) 70,000 70,000 4,481 4,481 n/a 40,929Madeleine Cosgrave4, 7 (from 1 January 2019) 70,000 70,000 – – n/a –
1. Using the closing share price of 913p on 29 March 2019 (last dealing day of the year) and including deferred shares at 100%. 2. Requirement for Chief Executive to own shares with a value of 2.5x basic salary within five years of appointment.3. Requirement for other Executive Directors to own shares with a value of 2.0x basic salary within five years of appointment.4. Requirement for Non-executive Directors to own shares with a value of 1.0x their annual fee within three years of appointment. Once the requisite number of shares have been acquired
and retained for the duration of appointment, the ownership guidelines will be deemed to have been met. 5. As Scott Parsons and Dame Alison Carnwath were not Directors at the end of the year, the share ownership guidelines do not apply and the numbers above relate to shares held at the
date of departure from the Board.6. Cressida Hogg was appointed Chairman in 2018 and therefore the allotted timeframe to acquire the requisite number of shares will be effective from her date of appointment to Chairman.7. Nicholas Cadbury and Madeleine Cosgrave were appointed in 2017 and 2019 respectively and are still within three years of appointment and therefore deemed to be in compliance with their share
ownership requirements.
2.2 Outstanding share awards held by Executive Directors (Audited)The table below shows the LTIP share awards granted and the LTIP and MSP awards vested as nil cost options during the year to the Executive Directors, together with the outstanding and unvested LTIP and MSP share awards at the year end. From 2015, MSP awards for Executive Directors have been discontinued.
Outstanding share awards and those which vested during the year (Audited) Table 59
Name
Performance period to 31 March
Award date
Market price at
award date
(p) Share
award
Nil cost options vested
Market price at date of vesting
(p)Vesting
date
Robert Noel LTIP 2018 10/08/2015 1,335 170,240 – n/a 10/08/20182019 27/06/2016 1,005 229,453 27/06/20192020 26/06/2017 1,029 228,583 26/06/20202021 25/06/2018 953 251,880 25/06/2021
Martin Greenslade LTIP 2018 10/08/2015 1,335 110,816 – n/a 10/08/20182019 27/06/2016 1,005 149,361 27/06/20192020 26/06/2017 1,029 148,795 26/06/20202021 25/06/2018 953 163,960 25/06/2021
Colette O’Shea LTIP 2018 10/08/2015 1,335 37,650 – n/a 10/08/20182019 27/06/2016 1,005 50,497 27/06/20192020 26/06/2017 1,029 49,908 26/06/20202021 25/06/2018 953 88,881 25/06/2021
MSP 2018 10/08/2015 1,335 22,590 – n/a 10/08/20182019 27/06/2016 1,005 30,298 27/06/20192020 26/06/2017 1,029 29,945 26/06/2020
Scott Parsons¹ LTIP 2018 10/08/2015 1,335 35,297 – n/a 10/08/2018MSP 2018 10/08/2015 1,335 21,178 – n/a 10/08/2018
1. All outstanding LTIP and MSP awards granted to Scott Parsons lapsed on his date of resignation from the Board on 25 February 2019.
Annual Report on Remunerationcontinued

103Landsec Annual Report 2019
Govern
an
ce
2.3 Directors’ options over ordinary shares (Audited)The options over shares set out below relate to the Company’s Savings Related Share Option Scheme. The Scheme is open to all qualifying employees (including Executive Directors) and under HMRC rules does not include performance conditions.
Outstanding Savings Related Share Options grants and those which were exercised during the year (Audited) Table 60
Name
Number of options at 1 April
2018
Exercise price per
share (p)
Number of options granted in
year to 31 March
2019
Number of options lapsed
Market price at
exercise (p)
Number of options at
31 March 2019 Exercisable dates
Martin Greenslade 878 1,024 – 878 – – 08/2018 – 02/2019
1,047 859 – – – 1,047 08/2020 – 02/2021
– 758.5 2,373 – – 2,373 08/2021 – 02/2022
1,925 2,373 878 – 3,420
Colette O’Shea 1,047 859 – – – 1,047 08/2020 – 02/2021
– 758.5 1,186 – – 1,186 08/2021 – 02/2022
1,047 1,186 – 2,233
Scott Parsons¹ 1,767 848.5 – – – 1,767 08/2019 – 02/2020
– 758.5 1,977 – – 1,977 08/2021 – 02/2022
1,767 1,977 – – 3,744
1. Share options as at date of resignation, 25 February 2019.
3. Application of Policy for 2019/203.1 Executive Directors’ base salariesA formal salary benchmarking exercise was conducted last year and the conclusion of the benchmarking exercise was that the current remuneration arrangements are competitive and the Committee will undertake a benchmarking exercise next year. The Committee has therefore awarded a basic salary increase of 1.8% to Robert Noel and Martin Greenslade, effective from June 2019. A basic salary increase of 3.9% has been awarded to Colette O’Shea effective from April 2019, to reflect a change in responsibilities. The average increase for all the Executive Directors is in line with the average increase received by employees across the Group.
Executive Directors Table 61
Name
Current salary(£000)
New salary(£000)
Percentage increase
Average annual percentage increase
over five years (including 2019/20)
Robert Noel 800 814 1.8% 2.8%
Martin Greenslade 521 530 1.8% 2.0%
Colette O’Shea 423 440 3.9% 3.9%1
1. The average percentage increase over one year, to reflect Colette O’Shea’s appointment to the Board in January 2018.
3.2 Non-executive Directors’ feesThe fees for Non-executive Directors were last increased in 2016. We annually review fees for the Non-executive Directors and this year we concluded that the fees remained broadly competitive and no change was required.
Non-executive Directors’ fees Table 62
(£000)
Chairman 375
Non-executive Director 70
Audit Committee Chairman 20
Remuneration Committee Chairman 15
Senior Independent Director 10
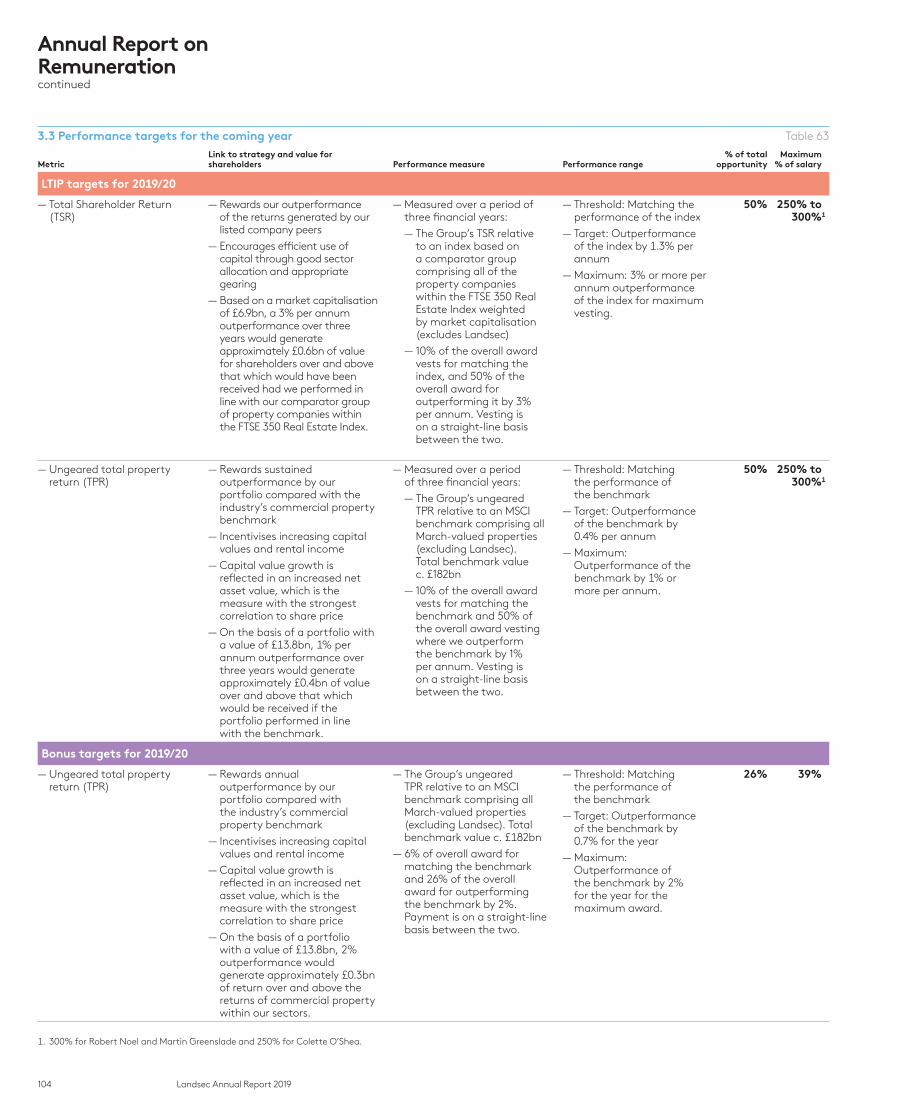
104 Landsec Annual Report 2019
3.3 Performance targets for the coming year Table 63
MetricLink to strategy and value for shareholders Performance measure Performance range
% of total opportunity
Maximum % of salary
LTIP targets for 2019/20
— Total Shareholder Return (TSR)
— Rewards our outperformance of the returns generated by our listed company peers
— Encourages efficient use of capital through good sector allocation and appropriate gearing
— Based on a market capitalisation of £6.9bn, a 3% per annum outperformance over three years would generate approximately £0.6bn of value for shareholders over and above that which would have been received had we performed in line with our comparator group of property companies within the FTSE 350 Real Estate Index.
— Measured over a period of three financial years:
— The Group’s TSR relative to an index based on a comparator group comprising all of the property companies within the FTSE 350 Real Estate Index weighted by market capitalisation (excludes Landsec) — 10% of the overall award vests for matching the index, and 50% of the overall award for outperforming it by 3% per annum. Vesting is on a straight-line basis between the two.
— Threshold: Matching the performance of the index
— Target: Outperformance of the index by 1.3% per annum
— Maximum: 3% or more per annum outperformance of the index for maximum vesting.
50% 250% to 300%1
— Ungeared total property return (TPR)
— Rewards sustained outperformance by our portfolio compared with the industry’s commercial property benchmark — Incentivises increasing capital values and rental income
— Capital value growth is reflected in an increased net asset value, which is the measure with the strongest correlation to share price — On the basis of a portfolio with a value of £13.8bn, 1% per annum outperformance over three years would generate approximately £0.4bn of value over and above that which would be received if the portfolio performed in line with the benchmark.
— Measured over a period of three financial years:
— The Group’s ungeared TPR relative to an MSCI benchmark comprising all March-valued properties (excluding Landsec). Total benchmark value c. £182bn — 10% of the overall award vests for matching the benchmark and 50% of the overall award vesting where we outperform the benchmark by 1% per annum. Vesting is on a straight-line basis between the two.
— Threshold: Matching the performance of the benchmark
— Target: Outperformance of the benchmark by 0.4% per annum
— Maximum: Outperformance of the benchmark by 1% or more per annum.
50% 250% to 300%1
Bonus targets for 2019/20
— Ungeared total property return (TPR)
— Rewards annual outperformance by our portfolio compared with the industry’s commercial property benchmark — Incentivises increasing capital values and rental income
— Capital value growth is reflected in an increased net asset value, which is the measure with the strongest correlation to share price — On the basis of a portfolio with a value of £13.8bn, 2% outperformance would generate approximately £0.3bn of return over and above the returns of commercial property within our sectors.
— The Group’s ungeared TPR relative to an MSCI benchmark comprising all March-valued properties (excluding Landsec). Total benchmark value c. £182bn — 6% of overall award for matching the benchmark and 26% of the overall award for outperforming the benchmark by 2%. Payment is on a straight-line basis between the two.
— Threshold: Matching the performance of the benchmark
— Target: Outperformance of the benchmark by 0.7% for the year
— Maximum: Outperformance of the benchmark by 2% for the year for the maximum award.
26% 39%
1. 300% for Robert Noel and Martin Greenslade and 250% for Colette O’Shea.
Annual Report on Remunerationcontinued
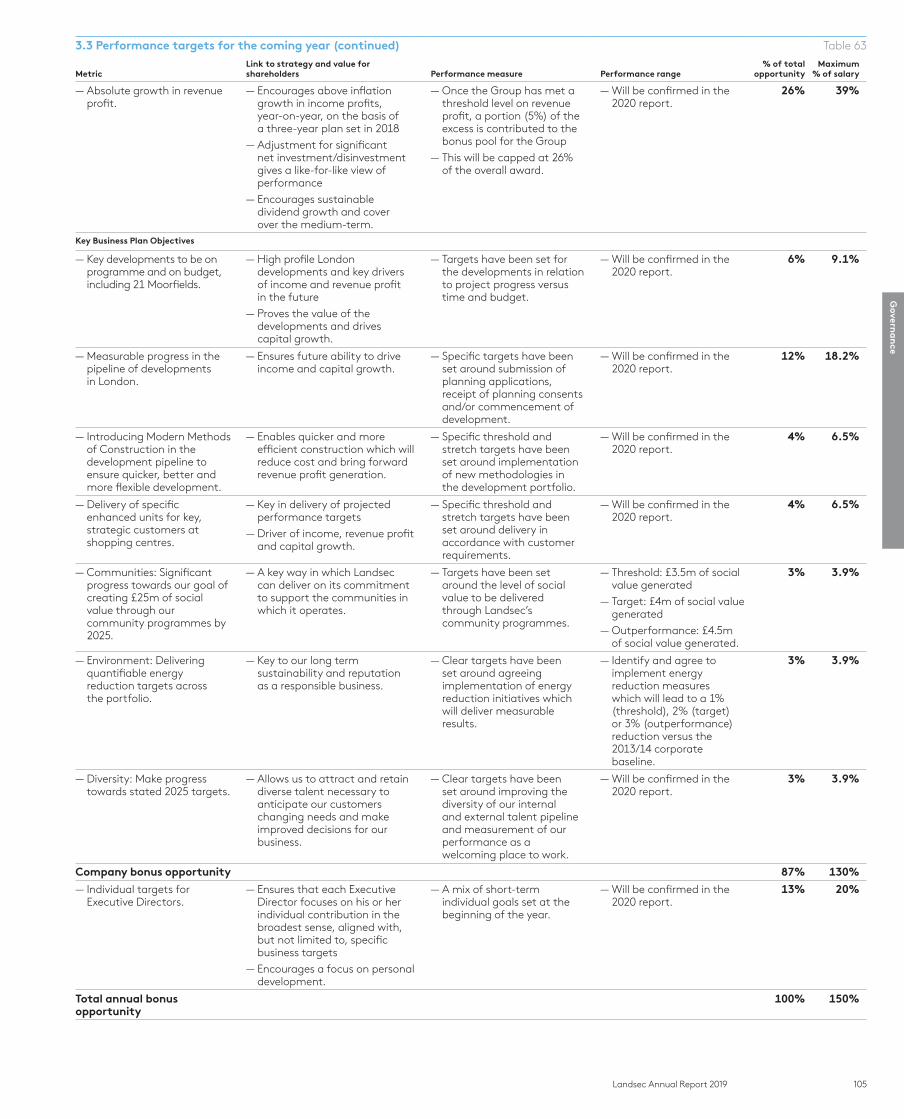
105Landsec Annual Report 2019
Govern
an
ce
— Absolute growth in revenue profit.
— Encourages above inflation growth in income profits, year-on-year, on the basis of a three-year plan set in 2018
— Adjustment for significant net investment/disinvestment gives a like-for-like view of performance
— Encourages sustainable dividend growth and cover over the medium-term.
— Once the Group has met a threshold level on revenue profit, a portion (5%) of the excess is contributed to the bonus pool for the Group — This will be capped at 26% of the overall award.
— Will be confirmed in the 2020 report.
26% 39%
Key Business Plan Objectives
— Key developments to be on programme and on budget, including 21 Moorfields.
— High profile London developments and key drivers of income and revenue profit in the future
— Proves the value of the developments and drives capital growth.
— Targets have been set for the developments in relation to project progress versus time and budget.
— Will be confirmed in the 2020 report.
6% 9.1%
— Measurable progress in the pipeline of developments in London.
— Ensures future ability to drive income and capital growth.
— Specific targets have been set around submission of planning applications, receipt of planning consents and/or commencement of development.
— Will be confirmed in the 2020 report.
12% 18.2%
— Introducing Modern Methods of Construction in the development pipeline to ensure quicker, better and more flexible development.
— Enables quicker and more efficient construction which will reduce cost and bring forward revenue profit generation.
— Specific threshold and stretch targets have been set around implementation of new methodologies in the development portfolio.
— Will be confirmed in the 2020 report.
4% 6.5%
— Delivery of specific enhanced units for key, strategic customers at shopping centres.
— Key in delivery of projected performance targets
— Driver of income, revenue profit and capital growth.
— Specific threshold and stretch targets have been set around delivery in accordance with customer requirements.
— Will be confirmed in the 2020 report.
4% 6.5%
— Communities: Significant progress towards our goal of creating £25m of social value through our community programmes by 2025.
— A key way in which Landsec can deliver on its commitment to support the communities in which it operates.
— Targets have been set around the level of social value to be delivered through Landsec’s community programmes.
— Threshold: £3.5m of social value generated
— Target: £4m of social value generated
— Outperformance: £4.5m of social value generated.
3% 3.9%
— Environment: Delivering quantifiable energy reduction targets across the portfolio.
— Key to our long term sustainability and reputation as a responsible business.
— Clear targets have been set around agreeing implementation of energy reduction initiatives which will deliver measurable results.
— Identify and agree to implement energy reduction measures which will lead to a 1% (threshold), 2% (target) or 3% (outperformance) reduction versus the 2013/14 corporate baseline.
3% 3.9%
— Diversity: Make progress towards stated 2025 targets.
— Allows us to attract and retain diverse talent necessary to anticipate our customers changing needs and make improved decisions for our business.
— Clear targets have been set around improving the diversity of our internal and external talent pipeline and measurement of our performance as a welcoming place to work.
— Will be confirmed in the 2020 report.
3% 3.9%
Company bonus opportunity 87% 130%
— Individual targets for Executive Directors.
— Ensures that each Executive Director focuses on his or her individual contribution in the broadest sense, aligned with, but not limited to, specific business targets — Encourages a focus on personal development.
— A mix of short-term individual goals set at the beginning of the year.
— Will be confirmed in the 2020 report.
13% 20%
Total annual bonus opportunity
100% 150%
3.3 Performance targets for the coming year (continued) Table 63
MetricLink to strategy and value for shareholders Performance measure Performance range
% of total opportunity
Maximum % of salary
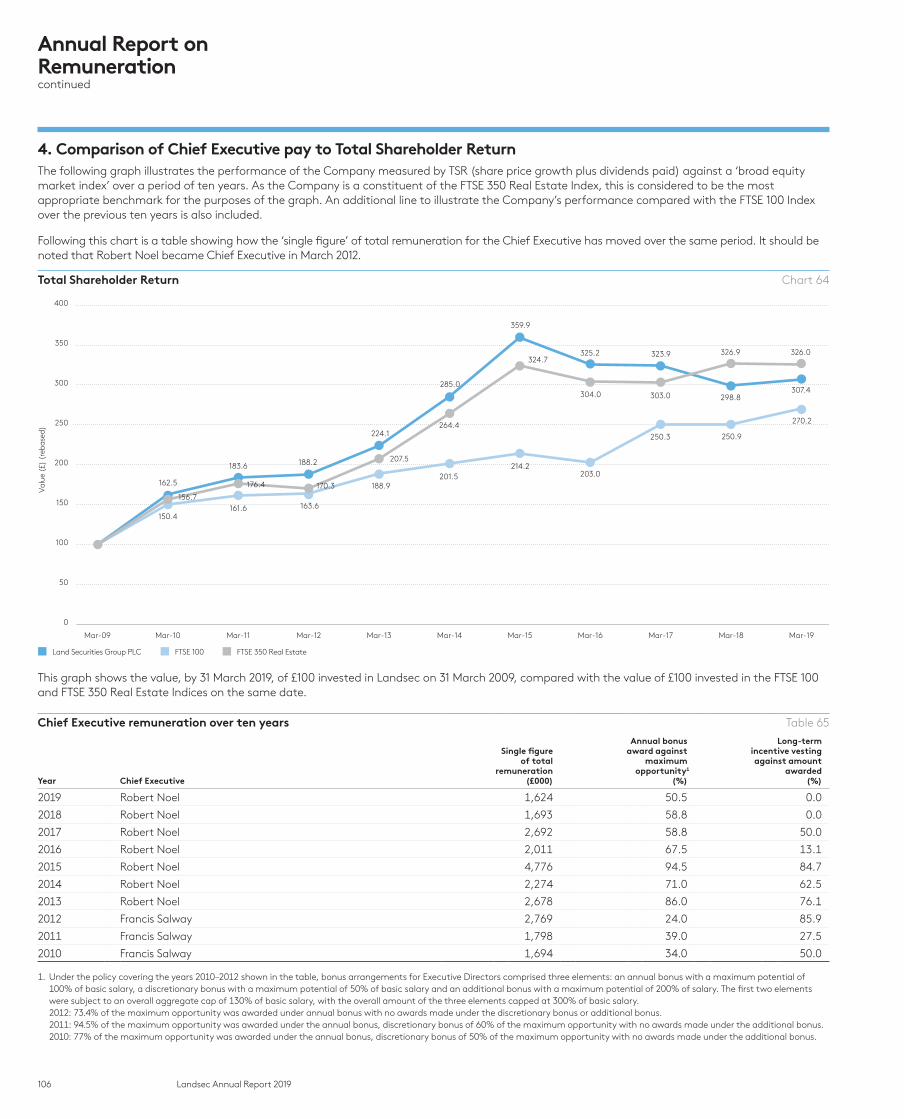
106 Landsec Annual Report 2019
4. Comparison of Chief Executive pay to Total Shareholder Return The following graph illustrates the performance of the Company measured by TSR (share price growth plus dividends paid) against a ‘broad equity market index’ over a period of ten years. As the Company is a constituent of the FTSE 350 Real Estate Index, this is considered to be the most appropriate benchmark for the purposes of the graph. An additional line to illustrate the Company’s performance compared with the FTSE 100 Index over the previous ten years is also included.
Following this chart is a table showing how the ‘single figure’ of total remuneration for the Chief Executive has moved over the same period. It should be noted that Robert Noel became Chief Executive in March 2012.
Total Shareholder Return Chart 64
0
50
100
150
200
250
300
350
400
Mar-09 Mar-10 Mar-11 Mar-12 Mar-13 Mar-14 Mar-15 Mar-16 Mar-17 Mar-19Mar-18
Land Securities Group PLC FTSE 100 FTSE 350 Real Estate
Val
ue (
£) (
reba
sed)
150.4161.6 163.6
188.9201.5
214.2
250.3
203.0
250.9
270.2
162.5
183.6 188.2
224.1
285.0
359.9
325.2 326.9 326.0323.9
207.5
264.4
324.7
304.0 303.0 298.8307.4
156.7
176.4 170.3
This graph shows the value, by 31 March 2019, of £100 invested in Landsec on 31 March 2009, compared with the value of £100 invested in the FTSE 100 and FTSE 350 Real Estate Indices on the same date.
Chief Executive remuneration over ten years Table 65
Year Chief Executive
Single figureof total
remuneration(£000)
Annual bonus award against
maximumopportunity1
(%)
Long-term incentive vesting against amount
awarded(%)
2019 Robert Noel 1,624 50.5 0.0
2018 Robert Noel 1,693 58.8 0.0
2017 Robert Noel 2,692 58.8 50.0
2016 Robert Noel 2,011 67.5 13.1
2015 Robert Noel 4,776 94.5 84.7
2014 Robert Noel 2,274 71.0 62.5
2013 Robert Noel 2,678 86.0 76.1
2012 Francis Salway 2,769 24.0 85.9
2011 Francis Salway 1,798 39.0 27.5
2010 Francis Salway 1,694 34.0 50.0
1. Under the policy covering the years 2010–2012 shown in the table, bonus arrangements for Executive Directors comprised three elements: an annual bonus with a maximum potential of 100% of basic salary, a discretionary bonus with a maximum potential of 50% of basic salary and an additional bonus with a maximum potential of 200% of salary. The first two elements were subject to an overall aggregate cap of 130% of basic salary, with the overall amount of the three elements capped at 300% of basic salary.
2012: 73.4% of the maximum opportunity was awarded under annual bonus with no awards made under the discretionary bonus or additional bonus. 2011: 94.5% of the maximum opportunity was awarded under the annual bonus, discretionary bonus of 60% of the maximum opportunity with no awards made under the additional bonus. 2010: 77% of the maximum opportunity was awarded under the annual bonus, discretionary bonus of 50% of the maximum opportunity with no awards made under the additional bonus.
Annual Report on Remunerationcontinued

107Landsec Annual Report 2019
Govern
an
ce
5. The context of pay in Landsec 5.1 Pay across the Group
a. Senior ManagementDuring the year under review, bonuses (including discretionary bonuses) for our 14 most senior employees (excluding the Executive Directors) ranged from 30% to 63% of salary (2018: 36% to 64%). The average bonus was 43% of salary (2018: 52%). The LTIP and MSP awards made to Senior Management vested on the same basis as the awards made to Executive Directors.
b. All other employees The average pay increase for all employees across the Group was 2.5%. The ratio of the base salary of the Chief Executive to the average base salary across the Group (excluding Executive Directors) was 13:1 (£799,722: £61,089).
Table 66
% changeSalary
(%) BenefitsBonus
(%)
Chief Executive +1.8 No change -12.6
Average employee +2.5 No change -1.9
c. CEO pay ratio
Table 67
Year Method25th percentile
pay ratioMedian
pay ratio75th percentile
pay ratio
2019 Option A¹ 38:1 25:1 16:1
1. Calculated as total pay and benefits for all employees, using the same methodology that is used to calculate the Chief Executive’s ‘single figure’.
5.2 The relative importance of spend on payThe chart below shows the total spend on pay for all Landsec employees, compared with our returns to shareholders in the form of dividends:
Table 68March 2019
(£m)March 2018
(£m)%
change
Spend on pay1 51 52 -1.9
Dividend paid2 338 332 1.8
1. Including base salaries for all employees, bonus and share-based payments.2. Dividend paid represents dividends declared for the year. See note 11 to the financial
statements.
6. DilutionAwards granted under the Company’s long-term incentive arrangements, which cover those made under the LTIP, MSP, Deferred Share Bonus Plan and the ESOP, are satisfied through the funding of an Employee Benefit Trust (administered by an external trustee) which acquires existing Land Securities Group PLC shares in the market. The Employee Benefit Trust held 1,080,624 shares at 31 March 2019.
The exercise of share options under the Savings Related Share Option Scheme, which is open to all employees who have completed more than one month’s service with the Group, can be satisfied by the allotment of newly issued shares. At 31 March 2019, the total number of shares which could be allotted under this Scheme was 355,095 shares, which represents less than 0.1% of the issued share capital of the Company.
7. Remuneration Committee meetingsThe Committee met five times over the course of the year, and all of the members attended all meetings. Simon Palley chaired the Committee up to 31 December 2018, thereafter Edward Bonham Carter was appointed Chairman of the Committee. The other members during the year were Dame Alison Carnwath (up to 12 July 2018), Cressida Hogg and Stacey Rauch (from 12 July 2018). The Committee meetings were also attended by the Chief Executive, the Group Human Resources Director, and the Group General Counsel and Company Secretary who acted as the Committee’s Secretary.
Over the course of the year, the Committee received advice on remuneration and ancillary legal matters from Aon plc’s Executive Compensation advisory practice. It has also made use of various published surveys to help determine appropriate remuneration levels and relied on information and advice provided by the Group General Counsel and Company Secretary and the Group Human Resources Director. Aon is a member of the Remuneration Consultants Group and is a signatory to its Code of Conduct. The Committee is satisfied that the advice it receives is independent and objective. Aside from some support in benchmarking remuneration for roles below the Board, Aon has no other connection with the Group. For the financial year under review, it received fees of £52,202 in connection with its work for the Committee.
8. Results of the voting on the Directors’ Remuneration Report at the AGM in 2018The votes cast on the resolutions seeking approval in respect of the Directors’ Remuneration Report at the Company’s 2018 AGM were as follows:
Table 69
Resolution% of votes
For% of votes
AgainstNumber of votes
withheld1
To approve the Annual Report on Remuneration for the year ended 31 March 2018 98.1 1.9 652,454
1. A vote withheld is not a vote at law.
The Directors’ Remuneration Report was approved by the Board on 13 May 2019 and signed on its behalf by:
Edward Bonham CarterChairman, Remuneration Committee

108 Landsec Annual Report 2019
Approach to policyOur Directors Remuneration Policy (DRP) was approved at the 2018 AGM receiving a 99.4% vote in favour.
The DRP includes the following key features:
— It is based on a pay-for-performance model (fixed pay, plus annual bonus and Long-Term Incentive Plan (LTIP))
— Annual performance is assessed against a scorecard of financial and strategic key performance indicators (KPIs), with an emphasis on financial outcomes
— Part of the annual bonus is deferred into shares
— Long-term performance is assessed by the delivery of long-term sustainable returns to shareholders (Total Shareholder Return (TSR)) and superior relative investment returns on the Company’s property portfolio
— A two-year LTIP post-vesting holding period operates
— There is shareholding requirement of 250% of salary for the Chief Executive and 200% of salary for other Executive Directors.
There have been no material changes in the nature or scope of the business over the past three years, which remains focused on the UK commercial real estate sector. We believe the current DRP provides a competitive and targeted remuneration package that will only reward the Executive Directors for delivering our collective key long-term objectives of long-term sustainable returns to shareholders and maximising investment returns on the Company’s property portfolio.
The Committee will always operate within the policy. It will also operate the various incentive plans and schemes according to their respective rules and consistent with normal market practice, the UK Corporate Governance Code and, as applicable, the Listing Rules. Within the DRP, the Committee will retain the discretion to look at performance ‘in the round’, including withholding or deferring payments in certain circumstances where the outcomes for Directors are clearly misaligned with the outcomes for shareholders. Any specific circumstances which necessitate the use of discretion will always be explained clearly in the following year’s Annual Report on Remuneration.
The diagram below shows the structure of our remuneration arrangements. More detail on the discretion reserved to the Committee for each element of the remuneration package can be found on pages 111-117.
Remuneration structure
Variable
Fixed
Short-term
Long-term
Long-Term Incentive Plan awards
Annual bonus
Basic salary+ benefits+ pension
More details on page 113
More details on page 112
More details on page 111
Summary of Directors’ Remuneration Policy
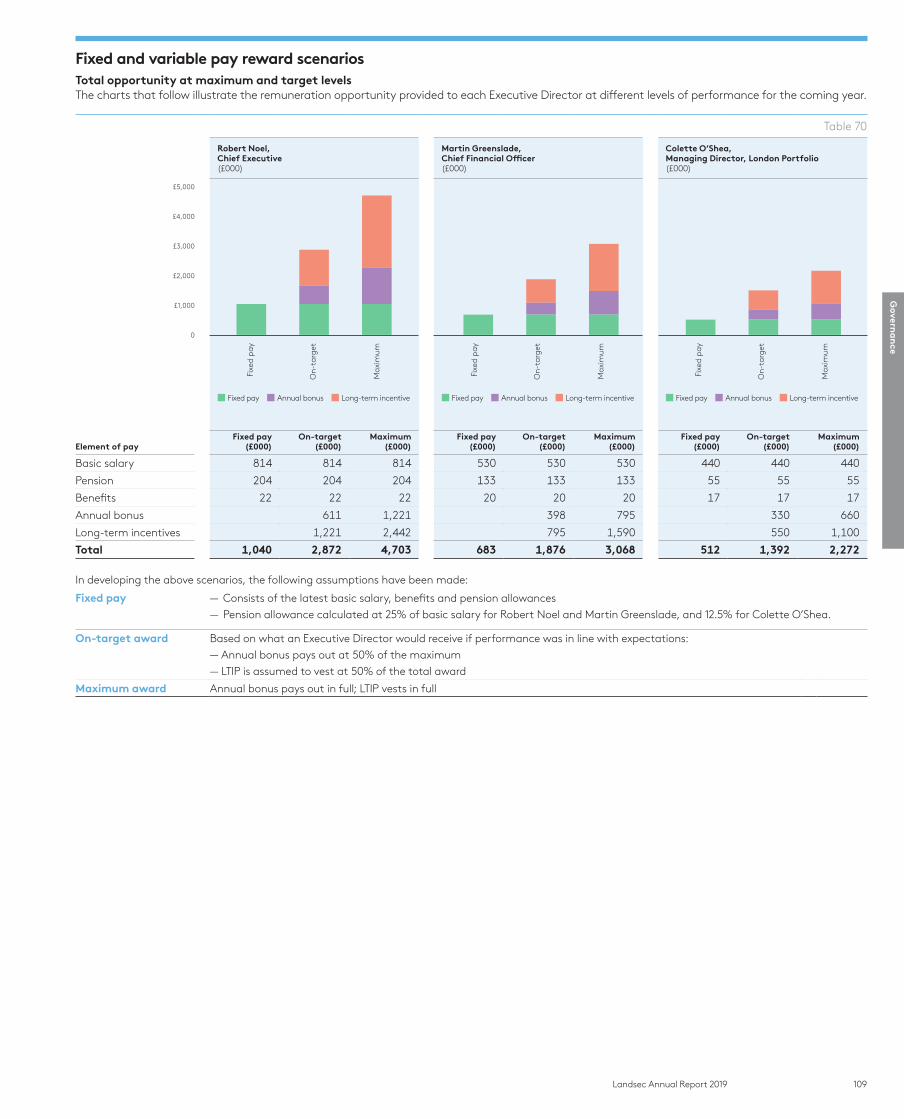
109Landsec Annual Report 2019
Govern
an
ce
Fixed and variable pay reward scenariosTotal opportunity at maximum and target levelsThe charts that follow illustrate the remuneration opportunity provided to each Executive Director at different levels of performance for the coming year.
Table 70
Robert Noel, Chief Executive(£000)
Martin Greenslade, Chief Financial Officer(£000)
Colette O’Shea, Managing Director, London Portfolio(£000)
Fixe
d p
ay
On-
targ
et
Ma
xim
um
Fixe
d p
ay
On-
targ
et
Ma
xim
um
Fixe
d p
ay
On-
targ
et
Ma
xim
um
£1,000
£2,000
£3,000
£5,000
£4,000
0
■ Fixed pay ■ Annual bonus ■ Long-term incentive ■ Fixed pay ■ Annual bonus ■ Long-term incentive ■ Fixed pay ■ Annual bonus ■ Long-term incentive
Element of payFixed pay
(£000)On-target
(£000)Maximum
(£000)Fixed pay
(£000)On-target
(£000)Maximum
(£000)Fixed pay
(£000)On-target
(£000)Maximum
(£000)
Basic salary 814 814 814 530 530 530 440 440 440
Pension 204 204 204 133 133 133 55 55 55
Benefits 22 22 22 20 20 20 17 17 17
Annual bonus 611 1,221 398 795 330 660
Long-term incentives 1,221 2,442 795 1,590 550 1,100
Total 1,040 2,872 4,703 683 1,876 3,068 512 1,392 2,272
In developing the above scenarios, the following assumptions have been made:
Fixed pay — Consists of the latest basic salary, benefits and pension allowances
— Pension allowance calculated at 25% of basic salary for Robert Noel and Martin Greenslade, and 12.5% for Colette O’Shea.
On-target award Based on what an Executive Director would receive if performance was in line with expectations:
— Annual bonus pays out at 50% of the maximum
— LTIP is assumed to vest at 50% of the total award
Maximum award Annual bonus pays out in full; LTIP vests in full
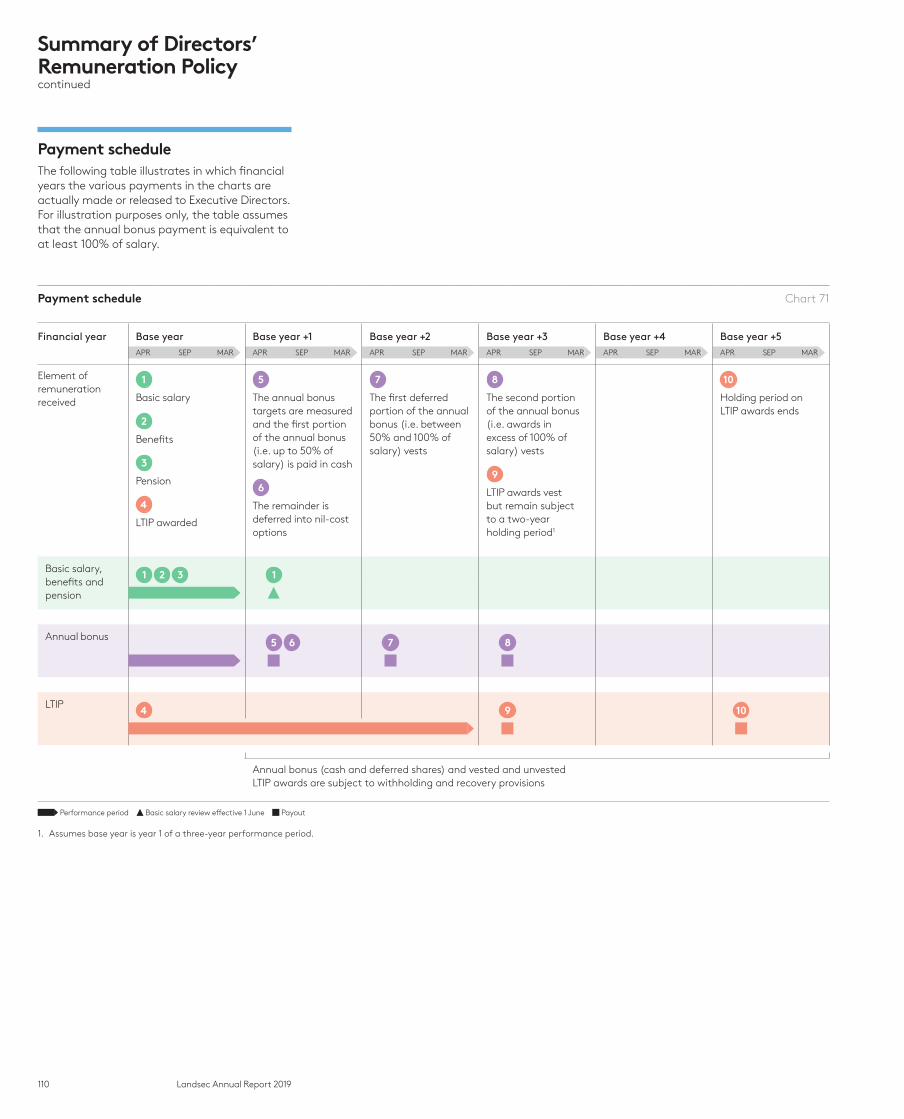
110 Landsec Annual Report 2019
Payment scheduleThe following table illustrates in which financial years the various payments in the charts are actually made or released to Executive Directors. For illustration purposes only, the table assumes that the annual bonus payment is equivalent to at least 100% of salary.
Payment schedule Chart 71
Financial year Base year Base year +1 Base year +2 Base year +3 Base year +4 Base year +5APR SEP MAR APR SEP MAR APR SEP MAR APR SEP MAR APR SEP MAR APR SEP MAR
Element of remuneration received
1
Basic salary
2
Benefits
3
Pension
4
LTIP awarded
5
The annual bonus targets are measured and the first portion of the annual bonus (i.e. up to 50% of salary) is paid in cash
6
The remainder is deferred into nil-cost options
7
The first deferred portion of the annual bonus (i.e. between 50% and 100% of salary) vests
8
The second portion of the annual bonus (i.e. awards in excess of 100% of salary) vests
9
LTIP awards vest but remain subject to a two-year holding period1
10
Holding period on LTIP awards ends
Basic salary, benefits and pension
1 2 3 1
Annual bonus 5 6 7 8
LTIP 4 9 10
Annual bonus (cash and deferred shares) and vested and unvested LTIP awards are subject to withholding and recovery provisions
Performance period Basic salary review effective 1 June Payout
1. Assumes base year is year 1 of a three-year performance period.
Summary of Directors’ Remuneration Policycontinued
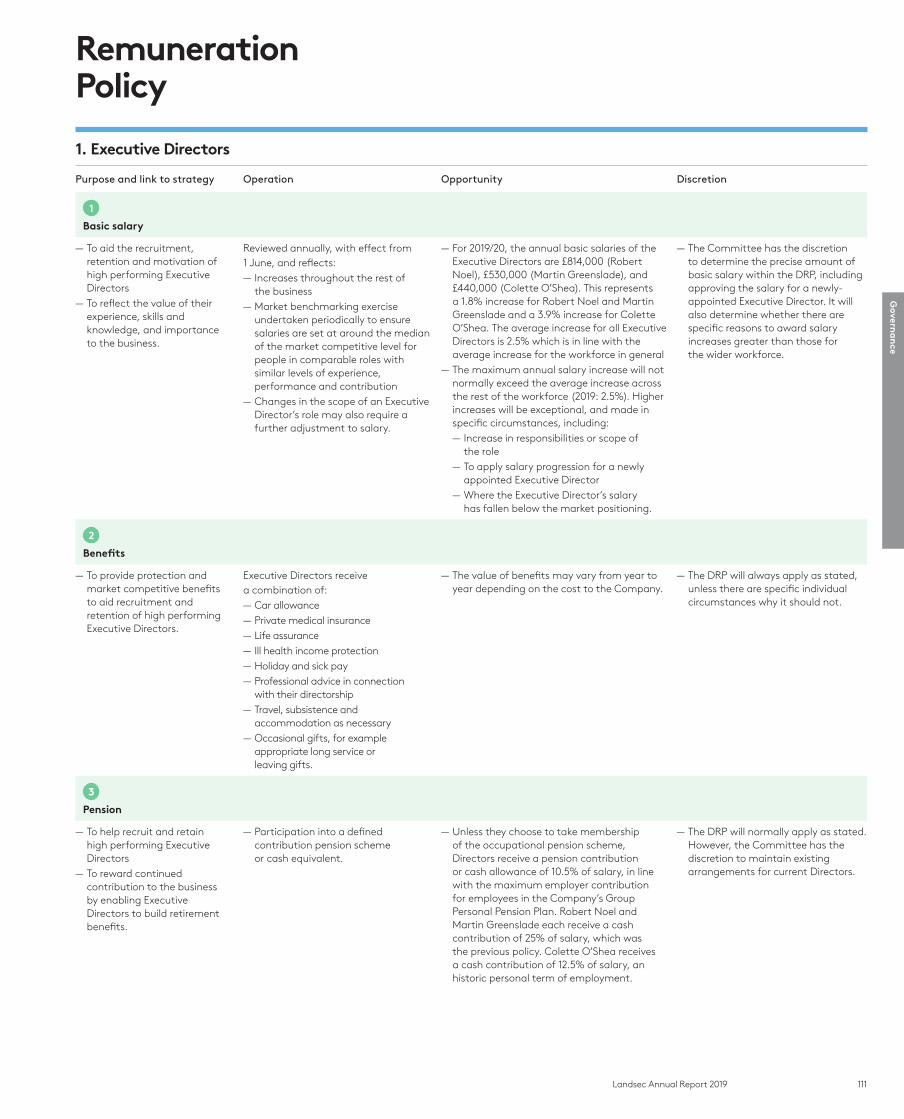
111Landsec Annual Report 2019
Govern
an
ce
1. Executive Directors
Purpose and link to strategy Operation Opportunity Discretion
1
Basic salary
— To aid the recruitment, retention and motivation of high performing Executive Directors
— To reflect the value of their experience, skills and knowledge, and importance to the business.
Reviewed annually, with effect from 1 June, and reflects:
— Increases throughout the rest of the business
— Market benchmarking exercise undertaken periodically to ensure salaries are set at around the median of the market competitive level for people in comparable roles with similar levels of experience, performance and contribution
— Changes in the scope of an Executive Director’s role may also require a further adjustment to salary.
— For 2019/20, the annual basic salaries of the Executive Directors are £814,000 (Robert Noel), £530,000 (Martin Greenslade), and £440,000 (Colette O’Shea). This represents a 1.8% increase for Robert Noel and Martin Greenslade and a 3.9% increase for Colette O’Shea. The average increase for all Executive Directors is 2.5% which is in line with the average increase for the workforce in general
— The maximum annual salary increase will not normally exceed the average increase across the rest of the workforce (2019: 2.5%). Higher increases will be exceptional, and made in specific circumstances, including:
— Increase in responsibilities or scope of the role
— To apply salary progression for a newly appointed Executive Director
— Where the Executive Director’s salary has fallen below the market positioning.
— The Committee has the discretion to determine the precise amount of basic salary within the DRP, including approving the salary for a newly-appointed Executive Director. It will also determine whether there are specific reasons to award salary increases greater than those for the wider workforce.
2 Benefits
— To provide protection and market competitive benefits to aid recruitment and retention of high performing Executive Directors.
Executive Directors receive a combination of:
— Car allowance — Private medical insurance — Life assurance — Ill health income protection — Holiday and sick pay — Professional advice in connection with their directorship
— Travel, subsistence and accommodation as necessary
— Occasional gifts, for example appropriate long service or leaving gifts.
— The value of benefits may vary from year to year depending on the cost to the Company.
— The DRP will always apply as stated, unless there are specific individual circumstances why it should not.
3 Pension
— To help recruit and retain high performing Executive Directors
— To reward continued contribution to the business by enabling Executive Directors to build retirement benefits.
— Participation into a defined contribution pension scheme or cash equivalent.
— Unless they choose to take membership of the occupational pension scheme, Directors receive a pension contribution or cash allowance of 10.5% of salary, in line with the maximum employer contribution for employees in the Company’s Group Personal Pension Plan. Robert Noel and Martin Greenslade each receive a cash contribution of 25% of salary, which was the previous policy. Colette O’Shea receives a cash contribution of 12.5% of salary, an historic personal term of employment.
— The DRP will normally apply as stated. However, the Committee has the discretion to maintain existing arrangements for current Directors.
Remuneration Policy
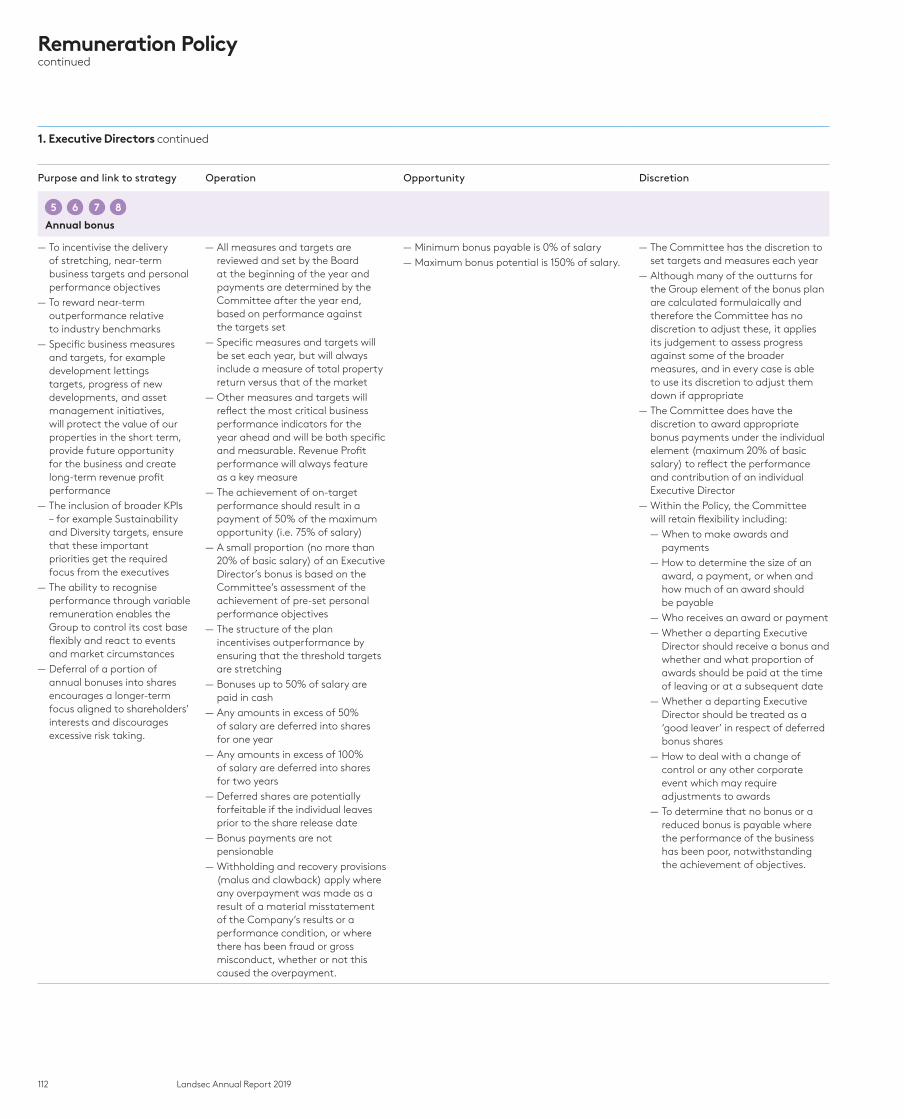
112 Landsec Annual Report 2019
5 6 7 8
Annual bonus
— To incentivise the delivery of stretching, near-term business targets and personal performance objectives
— To reward near-term outperformance relative to industry benchmarks
— Specific business measures and targets, for example development lettings targets, progress of new developments, and asset management initiatives, will protect the value of our properties in the short term, provide future opportunity for the business and create long-term revenue profit performance
— The inclusion of broader KPIs – for example Sustainability and Diversity targets, ensure that these important priorities get the required focus from the executives
— The ability to recognise performance through variable remuneration enables the Group to control its cost base flexibly and react to events and market circumstances
— Deferral of a portion of annual bonuses into shares encourages a longer-term focus aligned to shareholders’ interests and discourages excessive risk taking.
— All measures and targets are reviewed and set by the Board at the beginning of the year and payments are determined by the Committee after the year end, based on performance against the targets set
— Specific measures and targets will be set each year, but will always include a measure of total property return versus that of the market
— Other measures and targets will reflect the most critical business performance indicators for the year ahead and will be both specific and measurable. Revenue Profit performance will always feature as a key measure
— The achievement of on-target performance should result in a payment of 50% of the maximum opportunity (i.e. 75% of salary)
— A small proportion (no more than 20% of basic salary) of an Executive Director’s bonus is based on the Committee’s assessment of the achievement of pre-set personal performance objectives
— The structure of the plan incentivises outperformance by ensuring that the threshold targets are stretching
— Bonuses up to 50% of salary are paid in cash
— Any amounts in excess of 50% of salary are deferred into shares for one year
— Any amounts in excess of 100% of salary are deferred into shares for two years
— Deferred shares are potentially forfeitable if the individual leaves prior to the share release date
— Bonus payments are not pensionable
— Withholding and recovery provisions (malus and clawback) apply where any overpayment was made as a result of a material misstatement of the Company’s results or a performance condition, or where there has been fraud or gross misconduct, whether or not this caused the overpayment.
— Minimum bonus payable is 0% of salary — Maximum bonus potential is 150% of salary.
— The Committee has the discretion to set targets and measures each year
— Although many of the outturns for the Group element of the bonus plan are calculated formulaically and therefore the Committee has no discretion to adjust these, it applies its judgement to assess progress against some of the broader measures, and in every case is able to use its discretion to adjust them down if appropriate
— The Committee does have the discretion to award appropriate bonus payments under the individual element (maximum 20% of basic salary) to reflect the performance and contribution of an individual Executive Director
— Within the Policy, the Committee will retain flexibility including:
— When to make awards and payments
— How to determine the size of an award, a payment, or when and how much of an award should be payable
— Who receives an award or payment — Whether a departing Executive Director should receive a bonus and whether and what proportion of awards should be paid at the time of leaving or at a subsequent date
— Whether a departing Executive Director should be treated as a ‘good leaver’ in respect of deferred bonus shares
— How to deal with a change of control or any other corporate event which may require adjustments to awards
— To determine that no bonus or a reduced bonus is payable where the performance of the business has been poor, notwithstanding the achievement of objectives.
Remuneration Policycontinued
1. Executive Directors continued
Purpose and link to strategy Operation Opportunity Discretion
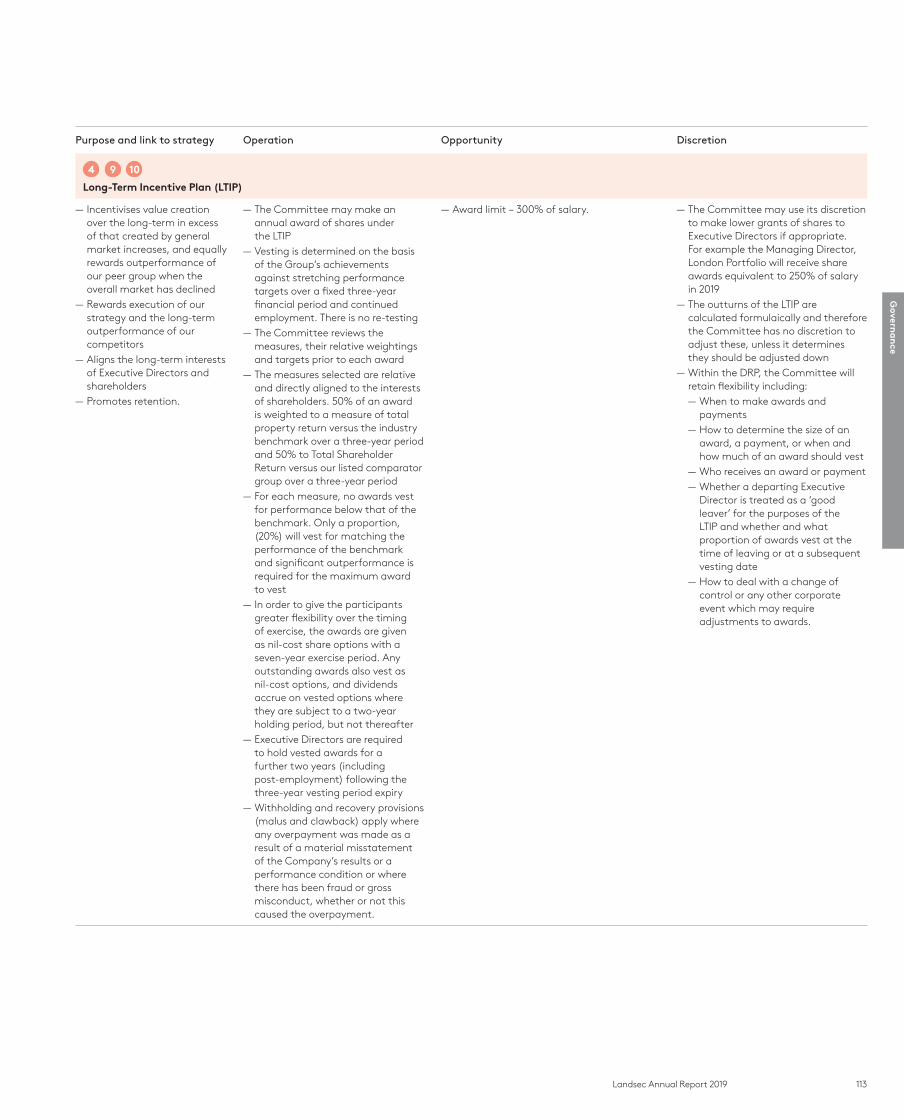
113Landsec Annual Report 2019
Govern
an
ce
4 9 10 Long-Term Incentive Plan (LTIP)
— Incentivises value creation over the long-term in excess of that created by general market increases, and equally rewards outperformance of our peer group when the overall market has declined
— Rewards execution of our strategy and the long-term outperformance of our competitors
— Aligns the long-term interests of Executive Directors and shareholders
— Promotes retention.
— The Committee may make an annual award of shares under the LTIP
— Vesting is determined on the basis of the Group’s achievements against stretching performance targets over a fixed three-year financial period and continued employment. There is no re-testing
— The Committee reviews the measures, their relative weightings and targets prior to each award
— The measures selected are relative and directly aligned to the interests of shareholders. 50% of an award is weighted to a measure of total property return versus the industry benchmark over a three-year period and 50% to Total Shareholder Return versus our listed comparator group over a three-year period
— For each measure, no awards vest for performance below that of the benchmark. Only a proportion, (20%) will vest for matching the performance of the benchmark and significant outperformance is required for the maximum award to vest
— In order to give the participants greater flexibility over the timing of exercise, the awards are given as nil-cost share options with a seven-year exercise period. Any outstanding awards also vest as nil-cost options, and dividends accrue on vested options where they are subject to a two-year holding period, but not thereafter
— Executive Directors are required to hold vested awards for a further two years (including post-employment) following the three-year vesting period expiry
— Withholding and recovery provisions (malus and clawback) apply where any overpayment was made as a result of a material misstatement of the Company’s results or a performance condition or where there has been fraud or gross misconduct, whether or not this caused the overpayment.
— Award limit – 300% of salary. — The Committee may use its discretion to make lower grants of shares to Executive Directors if appropriate. For example the Managing Director, London Portfolio will receive share awards equivalent to 250% of salary in 2019
— The outturns of the LTIP are calculated formulaically and therefore the Committee has no discretion to adjust these, unless it determines they should be adjusted down
— Within the DRP, the Committee will retain flexibility including:
— When to make awards and payments
— How to determine the size of an award, a payment, or when and how much of an award should vest
— Who receives an award or payment — Whether a departing Executive Director is treated as a ‘good leaver’ for the purposes of the LTIP and whether and what proportion of awards vest at the time of leaving or at a subsequent vesting date
— How to deal with a change of control or any other corporate event which may require adjustments to awards.
Purpose and link to strategy Operation Opportunity Discretion
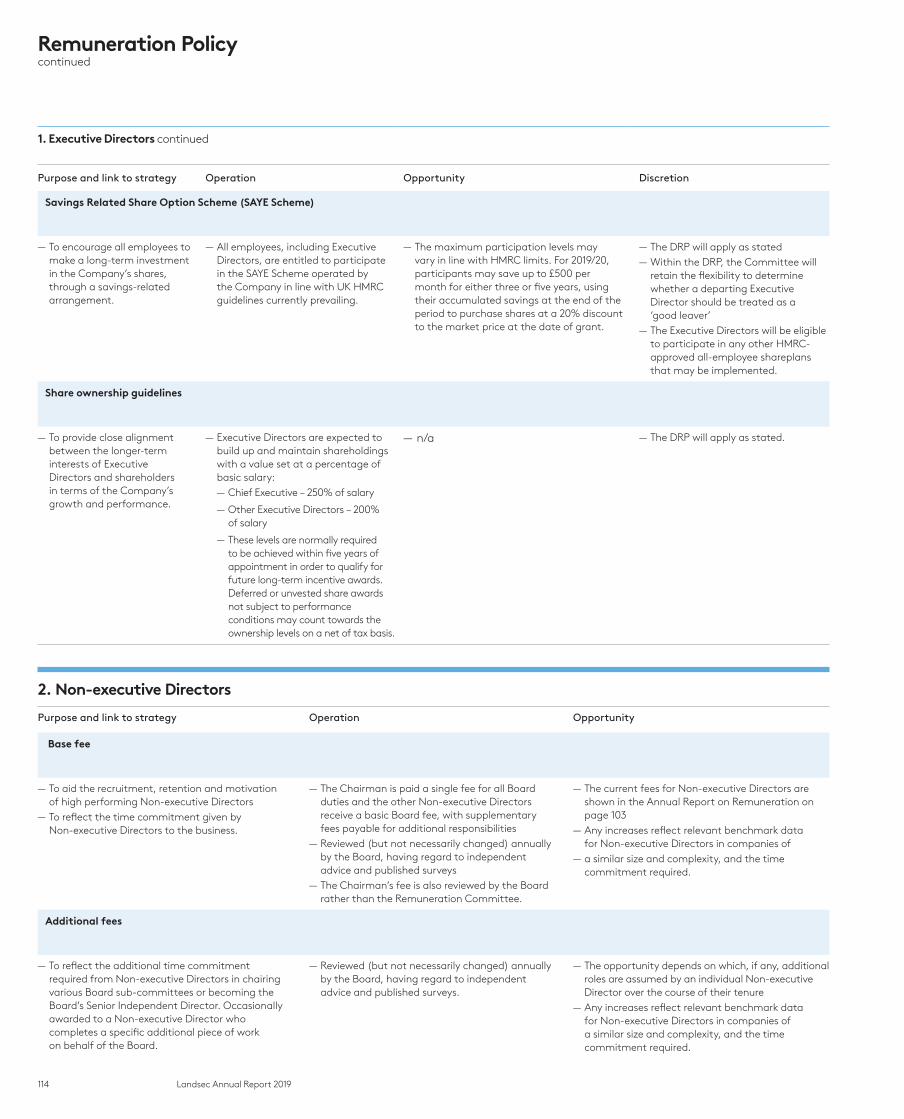
114 Landsec Annual Report 2019
Savings Related Share Option Scheme (SAYE Scheme)
— To encourage all employees to make a long-term investment in the Company’s shares, through a savings-related arrangement.
— All employees, including Executive Directors, are entitled to participate in the SAYE Scheme operated by the Company in line with UK HMRC guidelines currently prevailing.
— The maximum participation levels may vary in line with HMRC limits. For 2019/20, participants may save up to £500 per month for either three or five years, using their accumulated savings at the end of the period to purchase shares at a 20% discount to the market price at the date of grant.
— The DRP will apply as stated — Within the DRP, the Committee will retain the flexibility to determine whether a departing Executive Director should be treated as a ‘good leaver’
— The Executive Directors will be eligible to participate in any other HMRC-approved all-employee shareplans that may be implemented.
Share ownership guidelines
— To provide close alignment between the longer-term interests of Executive Directors and shareholders in terms of the Company’s growth and performance.
— Executive Directors are expected to build up and maintain shareholdings with a value set at a percentage of basic salary:
— Chief Executive – 250% of salary
— Other Executive Directors – 200% of salary
— These levels are normally required to be achieved within five years of appointment in order to qualify for future long-term incentive awards. Deferred or unvested share awards not subject to performance conditions may count towards the ownership levels on a net of tax basis.
— n/a — The DRP will apply as stated.
2. Non-executive Directors
Purpose and link to strategy Operation Opportunity
Base fee
— To aid the recruitment, retention and motivation of high performing Non-executive Directors
— To reflect the time commitment given by Non-executive Directors to the business.
— The Chairman is paid a single fee for all Board duties and the other Non-executive Directors receive a basic Board fee, with supplementary fees payable for additional responsibilities
— Reviewed (but not necessarily changed) annually by the Board, having regard to independent advice and published surveys
— The Chairman’s fee is also reviewed by the Board rather than the Remuneration Committee.
— The current fees for Non-executive Directors are shown in the Annual Report on Remuneration on page 103
— Any increases reflect relevant benchmark data for Non-executive Directors in companies of
— a similar size and complexity, and the time commitment required.
Additional fees
— To reflect the additional time commitment required from Non-executive Directors in chairing various Board sub-committees or becoming the Board’s Senior Independent Director. Occasionally awarded to a Non-executive Director who completes a specific additional piece of work on behalf of the Board.
— Reviewed (but not necessarily changed) annually by the Board, having regard to independent advice and published surveys.
— The opportunity depends on which, if any, additional roles are assumed by an individual Non-executive Director over the course of their tenure
— Any increases reflect relevant benchmark data for Non-executive Directors in companies of a similar size and complexity, and the time commitment required.
Remuneration Policycontinued
1. Executive Directors continued
Purpose and link to strategy Operation Opportunity Discretion
115Landsec Annual Report 2019
Govern
an
ce
Other incentives and benefits
— Non-executive Directors do not receive any other remuneration or benefits beyond the fees noted above. Expenses in relation to Company business will be reimbursed (including any tax thereon, where applicable)
— If deemed necessary, and in the performance of their duties, Non-executive Directors may take independent professional advice at the Company’s expense.
— n/a
Share ownership
— To provide close alignment between the longer- term interests of Non-executive Directors and shareholders in terms of the Company’s growth and performance.
— The current share ownership guidelines require Non-executive Directors to achieve an ownership level of 100% of annual fees within three years of appointment.
— n/a
3. Directors’ Service Agreements and Letters of Appointment3.1 Service Agreements – Executive Directors The Executive Directors have Service Agreements with the Company which normally continue until the Director’s agreed retirement date or such other date as the parties agree. In line with Group policy, the Executive Directors’ employment can be terminated at any time by either party on giving 12 months’ prior written notice.
The Company allows Executive Directors to hold external non-executive directorships, subject to the prior approval of the Board, and to retain fees from these roles.
3.2 Termination Provisions – Executive DirectorsAn Executive Director’s Service Agreement may be terminated without notice and without further payment or compensation, except for sums earned up to the date of termination, on the occurrence of certain events such as gross misconduct. The circumstances of the termination (taking into account the individual’s performance) and an individual’s opportunity to mitigate losses are taken into account by the Committee when determining amounts payable on termination, including pay in lieu of notice. The Group’s normal approach is to stop or reduce compensatory payments to former Executive Directors when they receive remuneration from other employment during the compensation period. The Company does not make any arrangements that guarantee pensions with limited or no abatement on severance or early retirement. There are no special provisions for Executive Directors with regard to compensation in the event of loss of office.
Any share-based entitlements granted under the Company’s share plans will be determined on the basis of the relevant plan rules. The default position is that any outstanding unvested awards automatically lapse on cessation of employment. However, under the rules of the LTIP, in certain prescribed circumstances, such as redundancy, disability, retirement or other circumstances at the discretion of the Committee (taking into account the individual’s performance and the reasons for their departure), ‘good leaver’ status can be applied. For example, if an Executive Director’s role has effectively been made redundant, and there are no significant performance issues, the Committee is likely to look favourably on the granting of some ‘good leaver’ provisions. However, if an Executive Director has resigned for a similar role in a competitor organisation then such provisions are extremely unlikely to apply. Where ‘good leaver’ provisions in respect of share awards are deemed to be appropriate, a participant’s awards will vest on a pro-rated basis and subject to the satisfaction of the relevant performance criteria with the balance of the awards lapsing. The Committee retains discretion to decide not to pro-rate if it is inappropriate to do so in particular circumstances. For the avoidance of doubt, if the termination of employment is not for one of the specified reasons, and the Committee does not exercise its discretion to allow an award to vest, all outstanding awards automatically lapse.
3.3 Remuneration of newly appointed Executive DirectorsThe remuneration package for a new externally appointed Executive Director will be set in accordance with the terms of the Company’s approved DRP in force at the time of appointment. The Committee has the flexibility to set the basic salary of a new hire at a discount to the market level initially, with a series of planned increases implemented over the following few years (subject to performance in the role) to bring the salary to the desired positioning. Only in very exceptional circumstances will the salary of a newly appointed Executive Director exceed the market median benchmark for the role.
The annual bonus will operate in accordance with the terms of the approved DRP, albeit with the opportunity pro-rated for the period of employment in the first year. Depending on the timing and responsibilities of the appointment, it may be necessary to set different performance measures and targets initially. The LTIP will also operate in accordance with the DRP. The maximum level of variable pay that may be offered to a new Executive Director is therefore at an aggregate maximum of 450% of salary, but it may be lower. This limit does not include the value of any buy-out arrangements deemed appropriate (see over the page).
Purpose and link to strategy Operation Opportunity

116 Landsec Annual Report 2019
In addition to the elements of the remuneration package covered by the policy, the Committee may ‘buy out’ certain existing remuneration arrangements of an incoming Executive Director through the offer of either additional cash and/or share-based elements (on a one- time basis or ongoing) when it considers these to be in the best interests of the Company. Any such payments will be based solely on remuneration lost when leaving the former employer and will take into account the existing delivery mechanism (i.e. cash, shares, options), time horizons and performance conditions.
In the case of an internally appointed Executive Director, any variable pay element awarded in respect of the prior role would be paid out according to its terms, adjusted as relevant to take into account the appointment. In addition, any other ongoing remuneration obligations existing prior to appointment will continue, provided that they are put to shareholders for approval at the earliest opportunity.
For external and internal appointments, the Committee may agree that the Company will meet certain relocation expenses, for a limited period only, as appropriate. Where a Director is recruited from overseas, flexibility is retained to provide benefits that take account of market practice in their country of residence. The Company may offer a cash amount on recruitment, payment of which may be staggered over a period of up to two years, to reflect the value of benefits a new recruit may have received from a former employer.
Shareholders will be informed of the remuneration package and all additional payments to newly-appointed Executive Directors at the time of their appointment.
3.4 Chairman and Non-executive Directors’ Letters of AppointmentThe Chairman and the Non-executive Directors do not have Service Agreements with the Company. Instead, each of them has a Letter of Appointment which sets out the terms of their appointment, including the three months’ prior written notice on which their appointment can be terminated by either party at any time. The dates of the current Letters of Appointment are shown in the Annual Report on Remuneration and these, together with the Executive Directors’ Service Agreements, are available for inspection at the Company’s registered office.
On appointment, the fee arrangements for a new Non-executive Director are set in accordance with the approved remuneration policy in force at that time.
4. Application of the Policy
Basic salary+ benefits+ pension
Annual bonus Long-Term Incentive Plan awards
Policy Element Application in 2019/20 Policy Element Application in 2019/20 Policy Element Application in 2019/20 Policy Element Application in 2019/20 Policy Element Application in 2019/20
1
Basic salary
5 6 7 8 Annual bonus
4 9 10 Long-Term Incentive Plan awards (and Matching Share Plan awards for 2019 vesting)
Savings Related Share Option Scheme Non-executive Director fees
More details on page 111
— The average increase in current salaries for the Executive Directors will be 2.5%, which is in line with the average increase to employees’ pay across the Group in 2019. The new annual gross salaries will be £814,000 for Robert Noel, £530,000 for Martin Greenslade and £440,000 for Colette O’Shea.
More details on page 112
— The maximum bonus potential for the Executive Directors will remain at 150% of salary. No changes are proposed to the weighting of the elements of the plan which remain at:
— 26% based on the Company’s total property return performance versus that of the market
— 26% based on the Company’s Revenue Profit performance
— 35% based on delivery of specific business objectives for the year
— 13% based on the delivery of individual targets
More details on page 104
— The value of this year’s Long-Term Incentive Plan (LTIP) award to the Executive Directors will not exceed the current individual limit of 300% of salary. Robert Noel and Martin Greenslade will each receive an award of 300% of salary. Colette O’Shea will receive an award equivalent to 250% of salary for 2019. Awards vest subject to performance conditions in the form of nil-cost options with a seven-year exercise period.
— Outstanding LTIP and Matching Share Plan awards granted in 2016 will vest later in 2019 subject to the performance conditions set at the time and the plan rules under which they were granted.
More details on page 114
— The Executive Directors, and all other eligible employees, will be entitled to participate in the Company’s Savings Related Share Option Scheme (which is operated in line with current UK HMRC guidelines).
Share Ownership Guidelines
More details on page 114
— The existing share ownership levels (i.e. 250% of salary for the Chief Executive and 200% of salary for other Executive Directors) will continue to apply, recognising that newly-appointed Directors will be given time to build up their shareholding.
Executive Director Recruitment and Termination Provisions
More details on page 115
— External recruitment and termination activity during the year is currently not envisaged; however should this occur, the Policy will apply as stated.
Service Agreements and Letters of Appointment
More details on page 115
— If new Service Agreements, or variations to existing ones, are required over the course of the year, the Policy will apply as stated.
— Any new Non-executive Director joining the Board will be contracted under a Letter of Appointment as per the Policy.
More details on page 103
— As the fees for Non-executive Directors are reviewed annually and no further revisions will take place over the course of the year. The annual fee for the Chairman remains at £375,000
— The annual base fee for all other Non-executive Directors remains at £70,000. These have been in effect since 1 April 2016. Additional fees also apply for Committee chairs, and these remain unchanged.
2
Benefits
More details on page 111
— No changes to the current benefit arrangements (which mainly covers annual holiday entitlement, car allowance, life assurance, private medical cover and income protection insurance) are proposed during the year
3
Pension
More details on page 111
— A policy of 10.5% pension provision applies to any new Executive Director appointments. As the existing Executive Directors had different pension arrangements prior to April 2018, the Committee has approved maintaining the existing pension arrangements. A supplement of 25% of basic salary (gross) is paid to Robert Noel and Martin Greenslade and 12.5% to Colette O’Shea
Remuneration Policycontinued

117Landsec Annual Report 2019
Govern
an
ce
4. Application of the Policy
Basic salary+ benefits+ pension
Annual bonus Long-Term Incentive Plan awards
Policy Element Application in 2019/20 Policy Element Application in 2019/20 Policy Element Application in 2019/20 Policy Element Application in 2019/20 Policy Element Application in 2019/20
1
Basic salary
5 6 7 8 Annual bonus
4 9 10 Long-Term Incentive Plan awards (and Matching Share Plan awards for 2019 vesting)
Savings Related Share Option Scheme Non-executive Director fees
More details on page 111
— The average increase in current salaries for the Executive Directors will be 2.5%, which is in line with the average increase to employees’ pay across the Group in 2019. The new annual gross salaries will be £814,000 for Robert Noel, £530,000 for Martin Greenslade and £440,000 for Colette O’Shea.
More details on page 112
— The maximum bonus potential for the Executive Directors will remain at 150% of salary. No changes are proposed to the weighting of the elements of the plan which remain at:
— 26% based on the Company’s total property return performance versus that of the market
— 26% based on the Company’s Revenue Profit performance
— 35% based on delivery of specific business objectives for the year
— 13% based on the delivery of individual targets
More details on page 104
— The value of this year’s Long-Term Incentive Plan (LTIP) award to the Executive Directors will not exceed the current individual limit of 300% of salary. Robert Noel and Martin Greenslade will each receive an award of 300% of salary. Colette O’Shea will receive an award equivalent to 250% of salary for 2019. Awards vest subject to performance conditions in the form of nil-cost options with a seven-year exercise period.
— Outstanding LTIP and Matching Share Plan awards granted in 2016 will vest later in 2019 subject to the performance conditions set at the time and the plan rules under which they were granted.
More details on page 114
— The Executive Directors, and all other eligible employees, will be entitled to participate in the Company’s Savings Related Share Option Scheme (which is operated in line with current UK HMRC guidelines).
Share Ownership Guidelines
More details on page 114
— The existing share ownership levels (i.e. 250% of salary for the Chief Executive and 200% of salary for other Executive Directors) will continue to apply, recognising that newly-appointed Directors will be given time to build up their shareholding.
Executive Director Recruitment and Termination Provisions
More details on page 115
— External recruitment and termination activity during the year is currently not envisaged; however should this occur, the Policy will apply as stated.
Service Agreements and Letters of Appointment
More details on page 115
— If new Service Agreements, or variations to existing ones, are required over the course of the year, the Policy will apply as stated.
— Any new Non-executive Director joining the Board will be contracted under a Letter of Appointment as per the Policy.
More details on page 103
— As the fees for Non-executive Directors are reviewed annually and no further revisions will take place over the course of the year. The annual fee for the Chairman remains at £375,000
— The annual base fee for all other Non-executive Directors remains at £70,000. These have been in effect since 1 April 2016. Additional fees also apply for Committee chairs, and these remain unchanged.
2
Benefits
More details on page 111
— No changes to the current benefit arrangements (which mainly covers annual holiday entitlement, car allowance, life assurance, private medical cover and income protection insurance) are proposed during the year
3
Pension
More details on page 111
— A policy of 10.5% pension provision applies to any new Executive Director appointments. As the existing Executive Directors had different pension arrangements prior to April 2018, the Committee has approved maintaining the existing pension arrangements. A supplement of 25% of basic salary (gross) is paid to Robert Noel and Martin Greenslade and 12.5% to Colette O’Shea
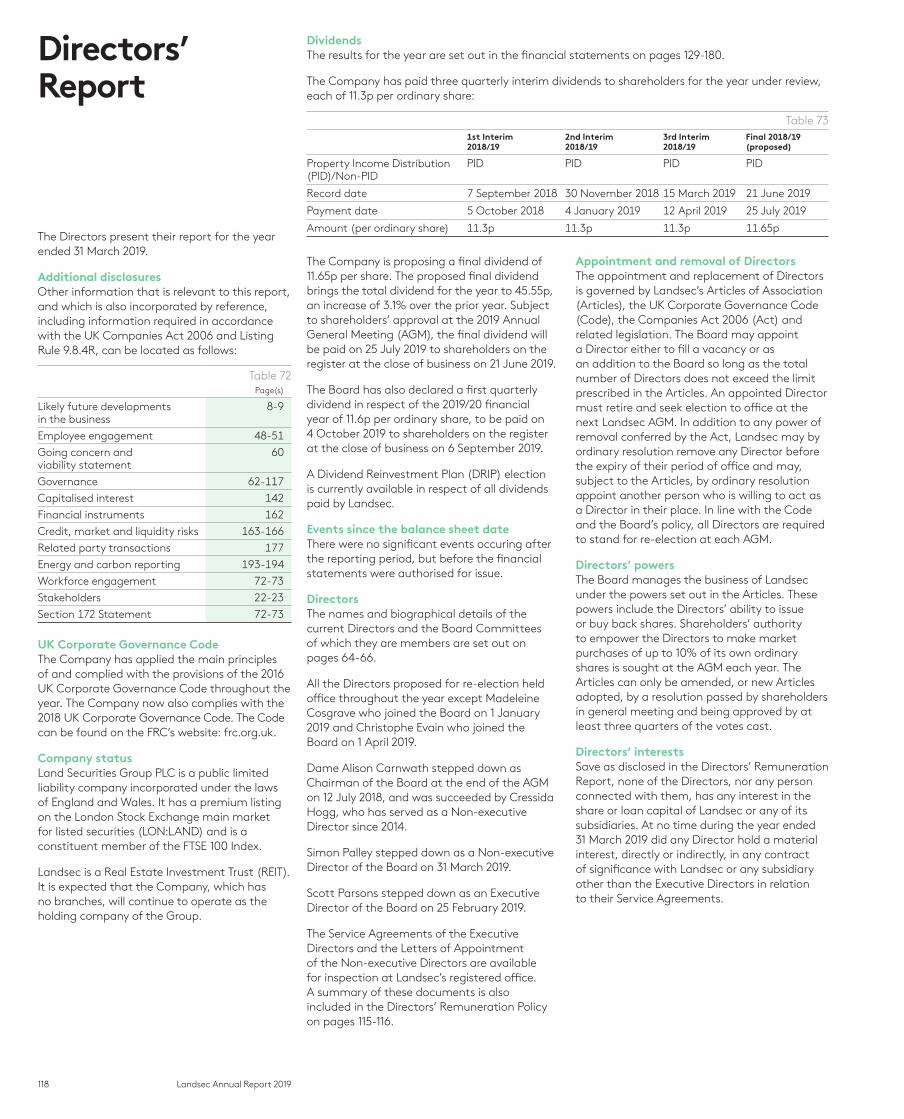
118 Landsec Annual Report 2019
The Directors present their report for the year ended 31 March 2019.
Additional disclosuresOther information that is relevant to this report, and which is also incorporated by reference, including information required in accordance with the UK Companies Act 2006 and Listing Rule 9.8.4R, can be located as follows:
Table 72Page(s)
Likely future developments in the business
8-9
Employee engagement 48-51
Going concern and viability statement
60
Governance 62-117
Capitalised interest 142
Financial instruments 162
Credit, market and liquidity risks 163-166
Related party transactions 177
Energy and carbon reporting 193-194
Workforce engagement 72-73
Stakeholders 22-23
Section 172 Statement 72-73
UK Corporate Governance CodeThe Company has applied the main principles of and complied with the provisions of the 2016 UK Corporate Governance Code throughout the year. The Company now also complies with the 2018 UK Corporate Governance Code. The Code can be found on the FRC’s website: frc.org.uk.
Company statusLand Securities Group PLC is a public limited liability company incorporated under the laws of England and Wales. It has a premium listing on the London Stock Exchange main market for listed securities (LON:LAND) and is a constituent member of the FTSE 100 Index.
Landsec is a Real Estate Investment Trust (REIT). It is expected that the Company, which has no branches, will continue to operate as the holding company of the Group.
The Company is proposing a final dividend of 11.65p per share. The proposed final dividend brings the total dividend for the year to 45.55p, an increase of 3.1% over the prior year. Subject to shareholders’ approval at the 2019 Annual General Meeting (AGM), the final dividend will be paid on 25 July 2019 to shareholders on the register at the close of business on 21 June 2019.
The Board has also declared a first quarterly dividend in respect of the 2019/20 financial year of 11.6p per ordinary share, to be paid on 4 October 2019 to shareholders on the register at the close of business on 6 September 2019.
A Dividend Reinvestment Plan (DRIP) election is currently available in respect of all dividends paid by Landsec.
Events since the balance sheet dateThere were no significant events occuring after the reporting period, but before the financial statements were authorised for issue.
DirectorsThe names and biographical details of the current Directors and the Board Committees of which they are members are set out on pages 64-66.
All the Directors proposed for re-election held office throughout the year except Madeleine Cosgrave who joined the Board on 1 January 2019 and Christophe Evain who joined the Board on 1 April 2019.
Dame Alison Carnwath stepped down as Chairman of the Board at the end of the AGM on 12 July 2018, and was succeeded by Cressida Hogg, who has served as a Non-executive Director since 2014.
Simon Palley stepped down as a Non-executive Director of the Board on 31 March 2019.
Scott Parsons stepped down as an Executive Director of the Board on 25 February 2019.
The Service Agreements of the Executive Directors and the Letters of Appointment of the Non-executive Directors are available for inspection at Landsec’s registered office. A summary of these documents is also included in the Directors’ Remuneration Policy on pages 115-116.
Appointment and removal of DirectorsThe appointment and replacement of Directors is governed by Landsec’s Articles of Association (Articles), the UK Corporate Governance Code (Code), the Companies Act 2006 (Act) and related legislation. The Board may appoint a Director either to fill a vacancy or as an addition to the Board so long as the total number of Directors does not exceed the limit prescribed in the Articles. An appointed Director must retire and seek election to office at the next Landsec AGM. In addition to any power of removal conferred by the Act, Landsec may by ordinary resolution remove any Director before the expiry of their period of office and may, subject to the Articles, by ordinary resolution appoint another person who is willing to act as a Director in their place. In line with the Code and the Board’s policy, all Directors are required to stand for re-election at each AGM.
Directors’ powersThe Board manages the business of Landsec under the powers set out in the Articles. These powers include the Directors’ ability to issue or buy back shares. Shareholders’ authority to empower the Directors to make market purchases of up to 10% of its own ordinary shares is sought at the AGM each year. The Articles can only be amended, or new Articles adopted, by a resolution passed by shareholders in general meeting and being approved by at least three quarters of the votes cast.
Directors’ interests Save as disclosed in the Directors’ Remuneration Report, none of the Directors, nor any person connected with them, has any interest in the share or loan capital of Landsec or any of its subsidiaries. At no time during the year ended 31 March 2019 did any Director hold a material interest, directly or indirectly, in any contract of significance with Landsec or any subsidiary other than the Executive Directors in relation to their Service Agreements.
DividendsThe results for the year are set out in the financial statements on pages 129-180.
The Company has paid three quarterly interim dividends to shareholders for the year under review, each of 11.3p per ordinary share:
Table 731st Interim 2018/19
2nd Interim 2018/19
3rd Interim 2018/19
Final 2018/19 (proposed)
Property Income Distribution (PID)/Non-PID
PID PID PID PID
Record date 7 September 2018 30 November 2018 15 March 2019 21 June 2019
Payment date 5 October 2018 4 January 2019 12 April 2019 25 July 2019
Amount (per ordinary share) 11.3p 11.3p 11.3p 11.65p
Directors’ Report
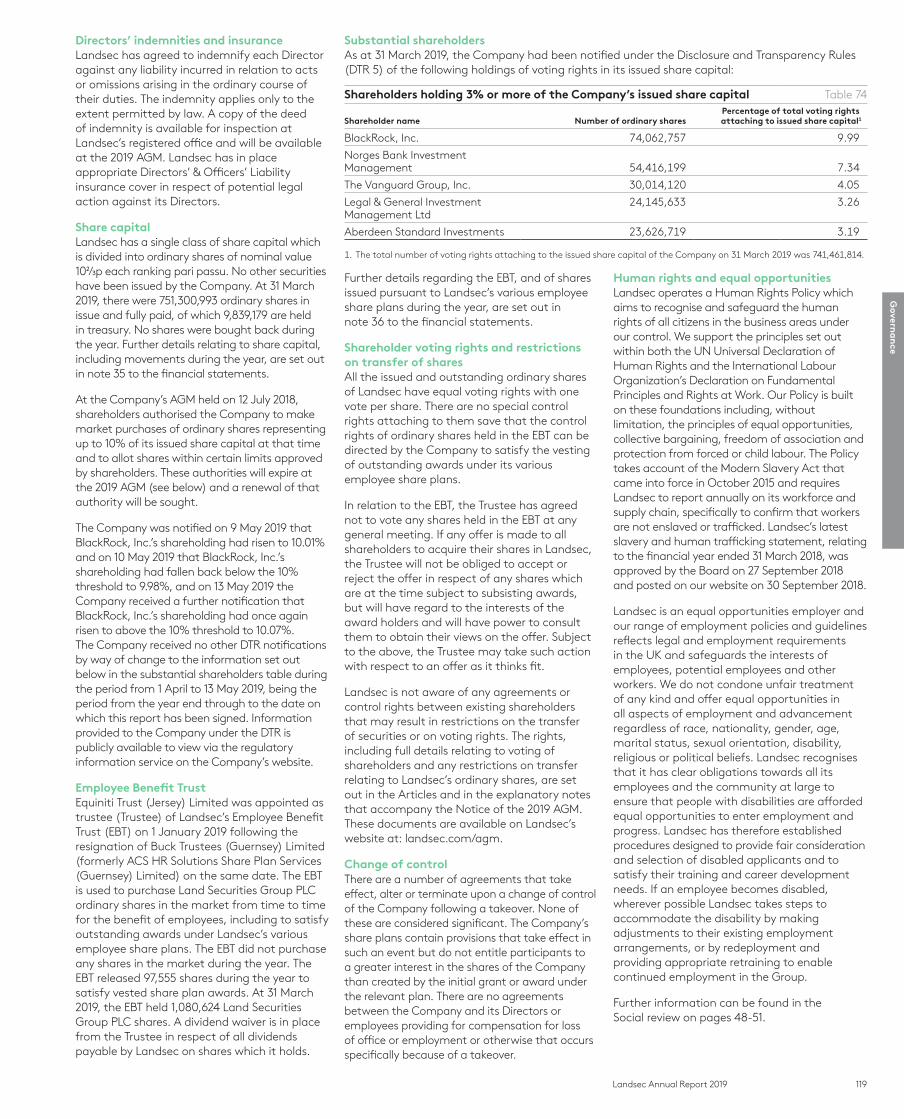
119Landsec Annual Report 2019
Govern
an
ce
Directors’ indemnities and insuranceLandsec has agreed to indemnify each Director against any liability incurred in relation to acts or omissions arising in the ordinary course of their duties. The indemnity applies only to the extent permitted by law. A copy of the deed of indemnity is available for inspection at Landsec’s registered office and will be available at the 2019 AGM. Landsec has in place appropriate Directors’ & Officers’ Liability insurance cover in respect of potential legal action against its Directors.
Share capitalLandsec has a single class of share capital which is divided into ordinary shares of nominal value 102/₃p each ranking pari passu. No other securities have been issued by the Company. At 31 March 2019, there were 751,300,993 ordinary shares in issue and fully paid, of which 9,839,179 are held in treasury. No shares were bought back during the year. Further details relating to share capital, including movements during the year, are set out in note 35 to the financial statements.
At the Company’s AGM held on 12 July 2018, shareholders authorised the Company to make market purchases of ordinary shares representing up to 10% of its issued share capital at that time and to allot shares within certain limits approved by shareholders. These authorities will expire at the 2019 AGM (see below) and a renewal of that authority will be sought.
The Company was notified on 9 May 2019 that BlackRock, Inc.’s shareholding had risen to 10.01% and on 10 May 2019 that BlackRock, Inc.’s shareholding had fallen back below the 10% threshold to 9.98%, and on 13 May 2019 the Company received a further notification that BlackRock, Inc.’s shareholding had once again risen to above the 10% threshold to 10.07%. The Company received no other DTR notifications by way of change to the information set out below in the substantial shareholders table during the period from 1 April to 13 May 2019, being the period from the year end through to the date on which this report has been signed. Information provided to the Company under the DTR is publicly available to view via the regulatory information service on the Company’s website.
Employee Benefit Trust Equiniti Trust (Jersey) Limited was appointed as trustee (Trustee) of Landsec’s Employee Benefit Trust (EBT) on 1 January 2019 following the resignation of Buck Trustees (Guernsey) Limited (formerly ACS HR Solutions Share Plan Services (Guernsey) Limited) on the same date. The EBT is used to purchase Land Securities Group PLC ordinary shares in the market from time to time for the benefit of employees, including to satisfy outstanding awards under Landsec’s various employee share plans. The EBT did not purchase any shares in the market during the year. The EBT released 97,555 shares during the year to satisfy vested share plan awards. At 31 March 2019, the EBT held 1,080,624 Land Securities Group PLC shares. A dividend waiver is in place from the Trustee in respect of all dividends payable by Landsec on shares which it holds.
Further details regarding the EBT, and of shares issued pursuant to Landsec’s various employee share plans during the year, are set out in note 36 to the financial statements.
Shareholder voting rights and restrictions on transfer of sharesAll the issued and outstanding ordinary shares of Landsec have equal voting rights with one vote per share. There are no special control rights attaching to them save that the control rights of ordinary shares held in the EBT can be directed by the Company to satisfy the vesting of outstanding awards under its various employee share plans.
In relation to the EBT, the Trustee has agreed not to vote any shares held in the EBT at any general meeting. If any offer is made to all shareholders to acquire their shares in Landsec, the Trustee will not be obliged to accept or reject the offer in respect of any shares which are at the time subject to subsisting awards, but will have regard to the interests of the award holders and will have power to consult them to obtain their views on the offer. Subject to the above, the Trustee may take such action with respect to an offer as it thinks fit.
Landsec is not aware of any agreements or control rights between existing shareholders that may result in restrictions on the transfer of securities or on voting rights. The rights, including full details relating to voting of shareholders and any restrictions on transfer relating to Landsec’s ordinary shares, are set out in the Articles and in the explanatory notes that accompany the Notice of the 2019 AGM. These documents are available on Landsec’s website at: landsec.com/agm.
Change of controlThere are a number of agreements that take effect, alter or terminate upon a change of control of the Company following a takeover. None of these are considered significant. The Company’s share plans contain provisions that take effect in such an event but do not entitle participants to a greater interest in the shares of the Company than created by the initial grant or award under the relevant plan. There are no agreements between the Company and its Directors or employees providing for compensation for loss of office or employment or otherwise that occurs specifically because of a takeover.
Human rights and equal opportunities Landsec operates a Human Rights Policy which aims to recognise and safeguard the human rights of all citizens in the business areas under our control. We support the principles set out within both the UN Universal Declaration of Human Rights and the International Labour Organization’s Declaration on Fundamental Principles and Rights at Work. Our Policy is built on these foundations including, without limitation, the principles of equal opportunities, collective bargaining, freedom of association and protection from forced or child labour. The Policy takes account of the Modern Slavery Act that came into force in October 2015 and requires Landsec to report annually on its workforce and supply chain, specifically to confirm that workers are not enslaved or trafficked. Landsec’s latest slavery and human trafficking statement, relating to the financial year ended 31 March 2018, was approved by the Board on 27 September 2018 and posted on our website on 30 September 2018.
Landsec is an equal opportunities employer and our range of employment policies and guidelines reflects legal and employment requirements in the UK and safeguards the interests of employees, potential employees and other workers. We do not condone unfair treatment of any kind and offer equal opportunities in all aspects of employment and advancement regardless of race, nationality, gender, age, marital status, sexual orientation, disability, religious or political beliefs. Landsec recognises that it has clear obligations towards all its employees and the community at large to ensure that people with disabilities are afforded equal opportunities to enter employment and progress. Landsec has therefore established procedures designed to provide fair consideration and selection of disabled applicants and to satisfy their training and career development needs. If an employee becomes disabled, wherever possible Landsec takes steps to accommodate the disability by making adjustments to their existing employment arrangements, or by redeployment and providing appropriate retraining to enable continued employment in the Group.
Further information can be found in the Social review on pages 48-51.
Substantial shareholdersAs at 31 March 2019, the Company had been notified under the Disclosure and Transparency Rules (DTR 5) of the following holdings of voting rights in its issued share capital:
Shareholders holding 3% or more of the Company’s issued share capital Table 74
Shareholder name Number of ordinary sharesPercentage of total voting rightsattaching to issued share capital1
BlackRock, Inc. 74,062,757 9.99
Norges Bank Investment Management 54,416,199 7.34
The Vanguard Group, Inc. 30,014,120 4.05
Legal & General Investment Management Ltd
24,145,633 3.26
Aberdeen Standard Investments 23,626,719 3.19
1. The total number of voting rights attaching to the issued share capital of the Company on 31 March 2019 was 741,461,814.
120 Landsec Annual Report 2019
Political donationsThe Company did not make any political donations or expenditure in the year that require disclosure (2018: nil).
Auditor and disclosure of information to the auditorSo far as the Directors are aware, there is no relevant audit information that has not been brought to the attention of the Company’s auditor. Each Director has taken all reasonable steps to make himself or herself aware of any relevant audit information and to establish that such information was provided to the auditor.
A resolution to confirm the reappointment of Ernst & Young LLP as auditor of the Company will be proposed at the 2019 AGM. The reappointment has been recommended to the Board by the Audit Committee and EY has indicated its willingness to remain in office.
2019 Annual General MeetingThis year’s AGM will be held at 10.00 am on Thursday, 11 July 2019, at 80 Victoria Street, London SW1E 5JL. A separate circular, comprising a letter from the Chairman, Notice of Meeting and explanatory notes in respect of the resolutions proposed, can be found on our website: landsec.com/agm.
DisclaimerThe purpose of this Annual Report is to provide information to the members of the Company and it has been prepared for, and only for, the members of the Company as a body, and no other persons. The Company, its Directors and employees, agents and advisers do not accept or assume responsibility to any other person to whom this document is shown or into whose hands it may come and any such responsibility or liability is expressly disclaimed.
A cautionary statement in respect of forward looking statements contained in this Annual Report appears on the inside back cover of this document.
The Directors’ Report was approved by the Board on 13 May 2019.
By Order of the Board
Tim AshbyGroup General Counsel and Company Secretary
Land Securities Group PLC Company number 4369054
Directors’ Reportcontinued

121Landsec Annual Report 2019
Financial statements
Contents
122 Statement of Directors’ Responsibilities123 Independent Auditor’s Report129 Income statement129 Statement of comprehensive income130 Balance sheets131 Statements of changes in equity132 Statement of cash flows133 Notes to the financial statements
Fina
ncia
l statem
ents
122 Landsec Annual Report 2019
The Directors are responsible for preparing the Annual Report and the financial statements in accordance with applicable law and regulations.
Company law requires the Directors to prepare financial statements for each financial year. Under that law the Directors have prepared the Group and parent company financial statements in accordance with International Financial Reporting Standards (IFRS) as adopted by the European Union (EU). Directors must not approve the financial statements unless they are satisfied that they give a true and fair view of the state of affairs of the Group and the Company and of the profit and loss of the Group and the Company for that period.
In preparing these financial statements the Directors are required to:
— select suitable accounting policies in accordance with IAS 8 ‘Accounting Policies, Changes in Accounting Estimates and Errors’ and then apply them consistently;
— make judgements and accounting estimates that are reasonable and prudent;
— present information, including accounting policies, in a manner that provides relevant, reliable, comparable and understandable information;
— state that the Group and Company has complied with IFRS as adopted by the EU, subject to any material departures disclosed and explained in the financial statements;
— provide additional disclosures when compliance with the specific requirements of IFRS is insufficient to enable users to understand the impact of particular transactions, other events and conditions on the Group’s and Company’s financial position and performance; and
— prepare the Group’s and Company’s financial statements on a going concern basis, unless it is inappropriate to do so.
The Directors are responsible for keeping adequate accounting records that are sufficient to show and explain the Group’s and Company’s transactions and disclose with reasonable accuracy at any time the financial position of the Group and the Company, and to enable them to ensure that the Annual Report complies with the Companies Act 2006 and, as regards the Group financial statements, Article 4 of the IAS regulation. They are also responsible for safeguarding the assets of the Group and the Company and hence for taking reasonable steps for the prevention and detection of fraud and other irregularities.
Directors’ responsibility statement under the Disclosure and Transparency RulesEach of the Directors, whose names and functions appear below, confirm to the best of their knowledge:
— the Group financial statements, which have been prepared in accordance with IFRS as adopted by the EU, give a true and fair view of the assets, liabilities, financial position and profit of the Group;
— the Company financial statements, prepared in accordance with IFRS as adopted by the EU, give a true and fair view of the assets, liabilities, financial position, performance and cash flows of the Company; and
— the Strategic Report contained in the Annual Report includes a fair review of the development and performance of the business and the position of the Group and the Company, together with a description of the principal risks and uncertainties faced by the Group and Company.
Directors’ statement under the UK Corporate Governance CodeEach of the Directors confirm that to the best of their knowledge the Annual Report taken as a whole is fair, balanced and understandable and provides the information necessary for shareholders to assess the Group’s and Company’s position, performance, business model and strategy.
A copy of the financial statements of the Group is placed on the Company’s website. The Directors are responsible for the maintenance and integrity of statutory and audited information on the Company’s website at landsec.com. Information published on the internet is accessible in many countries with different legal requirements. Legislation in the United Kingdom governing the preparation and dissemination of financial statements may differ from legislation in other jurisdictions.
The Directors of Land Securities Group PLC as at the date of this Annual Report are as set out below:
— Cressida Hogg, Chairman*
— Robert Noel, Chief Executive
— Martin Greenslade, Chief Financial Officer
— Colette O’Shea, Managing Director, London Portfolio
— Edward Bonham Carter, Senior Independent Director*
— Chris Bartram*
— Nicholas Cadbury*
— Madeleine Cosgrave*
— Christophe Evain*
— Stacey Rauch*
*Non-executive Directors
The Statement of Directors’ Responsibilities was approved by the Board of Directors on 13 May 2019 and is signed on its behalf by:
Robert Noel Martin GreensladeChief Executive Chief Financial Officer
Statement of Directors’ Responsibilities
123Landsec Annual Report 2019
Our opinion on the financial statementsIn our opinion:
— Land Securities Group PLC’s Group financial statements and Parent company financial statements (the ’financial statements’) give a true and fair view of the state of the Group’s and of the Parent company’s affairs as at 31 March 2019 and of the Group’s loss for the year then ended; — The Group financial statements have been properly prepared in accordance with IFRS as adopted by the European Union; — The Parent company financial statements have been properly prepared in accordance with IFRS as adopted by the European Union as applied in accordance with the provisions of the Companies Act 2006; and — The financial statements have been prepared in accordance with the requirements of the Companies Act 2006, and, as regards the Group financial statements, Article 4 of the IAS Regulation.
What we have audited Land Securities Group PLC’s financial statements comprise:
Group Parent company
Consolidated balance sheet as at 31 March 2019 Balance sheet as at 31 March 2019
Consolidated income statement for the year then ended
Consolidated statement of comprehensive income for the year then ended
Consolidated statement of changes in equity for the year then ended Statement of changes in equity for the year then ended
Consolidated statement of cash flows for the year then ended Statement of cash flows for the year then ended
Related notes 1 to 42 to the financial statements Related notes 1 to 42 to the financial statements
The financial reporting framework that has been applied in their preparation is applicable law and International Financial Reporting Standards (IFRS) as adopted by the European Union and as regards the Parent company financial statements as applied in accordance with the provisions of the Companies Act 2006.
Basis for opinion We conducted our audit in accordance with International Standards on Auditing (UK) (ISAs (UK)) and applicable law. Our responsibilities under those standards are further described in the Auditor’s responsibilities for the audit of the financial statements section of our report below. We are independent of the Group and Parent company in accordance with the ethical requirements that are relevant to our audit of the financial statements in the UK, including the FRC’s Ethical Standard as applied to listed public interest entities, and we have fulfilled our other ethical responsibilities in accordance with these requirements.
We believe that the audit evidence we have obtained is sufficient and appropriate to provide a basis for our opinion.
Conclusions relating to principal risks, going concern and viability statementWe have nothing to report in respect of the following information in the Annual Report, in relation to which the ISAs (UK) require us to report to you whether we have anything material to add or draw attention to:
— the disclosures in the Annual Report set out on pages 56-59 that describe the principal risks and explain how they are being managed or mitigated; — the Directors’ confirmation set out on pages 54-55 in the Annual Report that they have carried out a robust assessment of the principal risks facing the entity, including those that would threaten its business model, future performance, solvency or liquidity; — the Directors’ statement set out on page 60 in the financial statements about whether they considered it appropriate to adopt the going concern basis of accounting in preparing them, and their identification of any material uncertainties to the entity’s ability to continue to do so over a period of at least 12 months from the date of approval of the financial statements; — whether the Directors’ statement in relation to going concern required under the Listing Rules in accordance with Listing Rule 9.8.6R(3) is materially inconsistent with our knowledge obtained in the audit; or — the Directors’ explanation set out on page 60 in the Annual Report as to how they have assessed the prospects of the Group, over what period they have done so and why they consider that period to be appropriate, and their statement as to whether they have a reasonable expectation that the Group will be able to continue in operation and meet its liabilities as they fall due over the period of their assessment, including any related disclosures drawing attention to any necessary qualifications or assumptions.
Overview of our audit approach
Key audit matters
— The valuation of the property portfolio, including investment properties, investment properties held in joint ventures and trading properties
— Revenue recognition, including the timing of revenue recognition, the treatment of rents, incentives and recognition of trading property proceeds
Audit scope — The Group solely operates in the United Kingdom and operates through two segments, London and Retail, both of which were subject to the same audit scope. This included the Group audit team performing direct audit procedures on joint venture balances included within the Group financial statements.
Materiality — Overall Group materiality of £121m which represents 1% of the carrying value of investment properties line item in the Group balance sheet at 31 March 2019.
— Specific materiality of £22m which represents 5% of revenue profit before tax at 31 March 2019 is applied to account balances not related to investment properties (either wholly owned or held within joint ventures).
Independent Auditor’s ReportTo the members of Land Securities Group PLC
Fina
ncia
l statem
ents

124 Landsec Annual Report 2019
Independent Auditor’s Reportcontinued
Key audit mattersKey audit matters are those matters that, in our professional judgement, were of most significance in our audit of the financial statements of the current period and include the most significant assessed risks of material misstatement (whether or not due to fraud) that we identified. These matters included those which had the greatest effect on: the overall audit strategy, the allocation of resources in the audit; and directing the efforts of the engagement team. These matters were addressed in the context of our audit of the financial statements as a whole, and in our opinion thereon, and we do not provide a separate opinion on these matters.
Risk Our response to the riskKey observations communicated to the Audit Committee
The valuation of the property portfolio, including investment properties, investment properties held in joint ventures and trading properties
2019: £12,094m in investment properties, £1,117m (the Group’s share) in investment properties held in joint ventures and £23m in trading properties (2018: £12,336m in investment properties, £1,235m in investment properties held in joint ventures and £24m in trading properties).
Refer to the Accountability section of the Annual Report (pages 84-88); Accounting policies (pages 145-146); notes 14, 15 and 16 of the financial statements (pages 147-155).
The valuation of property including investment properties, investment properties held in joint ventures and trading properties requires significant judgement and estimates by management and the external valuer. Any input inaccuracies or unreasonable bases used in these judgements (such as in respect of estimated rental value and yield profile applied) could result in a material misstatement of the income statement and balance sheet.
There is also a risk that management may influence the significant judgements and estimates in respect of property valuations in order to achieve property valuation and other performance targets to meet market expectations or bonus targets.
Our audit procedures around the valuation of property included:
We evaluated the Group’s controls over data used in the valuation of the property portfolio and management’s review of the valuations.
We evaluated the competence of the external valuer which included consideration of their qualifications and expertise.
We met with the Group’s external valuer to discuss their valuation approach and the judgements they made in assessing the property valuation such as estimated rental value, yield profile and other assumptions that impact the value.
For a sample of properties we performed testing over source documentation provided by the Group to the external valuer. This included agreeing a sample of this documentation back to underlying lease data and vouching costs incurred to date in respect of development properties. We also assessed the reasonableness of the costs to complete information in respect of properties in the course of development by comparing the total forecast costs to contractual arrangements and approved budgets.
We included Chartered Surveyors on our audit team who reviewed and challenged the valuation approach and assumptions for a sample of properties which comprised 73% of the market value of investment properties (including investment properties held in joint ventures) and 99% of the carrying value of trading properties. Our Chartered Surveyors compared the equivalent yields applied to each property to an expected range of yields taking into account market data and asset specific considerations. They also considered whether the other assumptions applied by the external valuer, such as the estimated rental values, voids, tenant incentives and development costs to complete were supported by available data such as recent lettings and occupancy levels.
Together with our Chartered Surveyors, we met with the external valuer to discuss the findings from our audit work described above and to seek further explanations as required. We also discussed the impact of current market conditions, including Brexit, on the property valuations.
We conducted analytical procedures on the properties not included in the sample reviewed in detail by our Chartered Surveyors by comparing assumptions and the value of each property in the portfolio by reference to our understanding of the UK real estate market, external market data and asset specific considerations to evaluate the appropriateness of the valuations adopted by the Group. We investigated further the valuations of some properties which included further discussions with management and, where appropriate, obtaining evidence to support the movement in values and involvement of our Chartered Surveyors.
We attended meetings between management and the external valuer to assess for evidence of undue management influence and we obtained a confirmation from the external valuer that they had not been subject to undue influence from management.
We utilised our analytical procedures and work of the Chartered Surveyors described above in order to assess for evidence of undue management influence.
We performed site visits accompanied by our Chartered Surveyors for a sample of properties in the development programme, which enabled us to assess the stage of completion of, and gain specific insights into, these developments. We also performed site visits to some investment properties which are not under development, in order to gain a better understanding of the assets.
We met with development directors and project managers for major properties in the development programme and assessed project costs, progress of development and leasing status and considered the reasonableness of the forecast costs to complete included in the valuations as well as identified contingencies, exposures and remaining risks. We corroborated the information provided by the development directors and the project managers through valuation review, site visits and cost analysis. We also reviewed development feasibilities and monthly development reporting against budget.
On trading properties, we compared cost to net realisable value (actual sales prices achieved or market evidence) to identify any potential indicator of impairment.
Scope of our proceduresWe performed full scope audit procedures over valuation of all properties, including investment properties, investment properties held in joint ventures and trading properties.
We have tested the inputs, assumptions and methodology used by the external valuers. We have concluded that the methodology applied is reasonable and that the external valuations are an appropriate assessment of the market value of investment properties and net realisable value of trading properties at 31 March 2019.
We concluded that the value of the sample of properties reviewed by our Chartered Surveyors was within a reasonable range of values.
We consider that management provided an appropriate level of review and challenge over the valuations, but we did not identify evidence of undue management influence.
.
125Landsec Annual Report 2019
Risk Our response to the riskKey observations communicated to the Audit Committee
Revenue recognition, including the timing of revenue recognition, the treatment of rents, incentives and recognition of trading property proceeds
2019: £625m rental income and £7m trading property sales proceeds (2018: £612m rental income and £96m trading property sales proceeds).
Refer to the Accountability section of the Annual Report (pages 84-88); Accounting policy (page 138); and note 6 of the financial statements (pages 138-139).
Market expectations and revenue profit based targets may place pressure on management to distort revenue recognition. This may result in overstatement or deferral of revenues to assist in meeting current or future targets or expectations.
Our audit procedures over revenue recognition included:
We carried out testing relating to controls over revenue recognition and the treatment of rents which have been designed by the Group to prevent and detect fraud and errors in revenue recognition. This included testing the controls governing approvals and changes to lease terms and the upload of this information to the Group’s property information management system. We also performed controls testing on the billings process.
We selected a sample of new or amended lease agreements in the year and agreed the data input into PIMS, the property information management system, including lease incentive clauses.
Detailed analytical procedures and cut off procedures were performed using data analytics tools on the recognition of revenue, including rents, incentives and other property related revenue to assess whether revenue had been recognised in the appropriate accounting period.
We agreed a sample of lease agreements to the schedules used to calculate straight-lining of revenue in accordance with SIC 15 Operating Leases – Incentives and corroborated the arithmetical accuracy of these schedules and the resulting amounts in revenue for straight-lining of tenant lease incentives.
We assessed the recoverability of tenant lease incentives’ receivable balance by evaluating the financial viability of the major tenants with related lease incentive debtors.
We assessed whether the revenue recognition policies adopted complied with IFRS as adopted by the European Union.
We performed audit procedures specifically designed to address the risk of management override of controls including journal entry testing, which included a particular focus on journal entries which impact revenue.
We tested a sample of trading property proceeds recognised during the year through agreement to contracts and cash to bank in order to verify that revenue is recognised when the significant risks and rewards of ownership have been transferred to the buyer.
Scope of our proceduresThe whole Group was subject to full scope audit procedures over revenue.
We audited the timing of revenue recognition, treatment of rents and incentives and recognition of trading property proceeds and assessed the risk of management override.
Based upon the audit procedures performed, we concluded that revenue has been recognised on an appropriate basis in the year.
Compared to the prior year, there have been no changes to our assessment of the risks of material misstatement.
An overview of the scope of our audit Our assessment of audit risk, our evaluation of materiality and our allocation of performance materiality determine our audit scope for each entity within the Group. Taken together, this enables us to form an opinion on the consolidated financial statements.
The Group solely operates in the United Kingdom and operates through two segments, London and Retail, both of which were subject to the same audit scope. The Group audit team performed all the work necessary to issue the Group and Parent company audit opinion, including undertaking all of the audit work on the risks of material misstatement identified above.
Our application of materiality We apply the concept of materiality in planning and performing the audit, in evaluating the effect of identified misstatements on the audit and in forming our audit opinion.
MaterialityThe magnitude of an omission or misstatement that, individually or in the aggregate, could reasonably be expected to influence the economic decisions of the users of the financial statements. Materiality provides a basis for determining the nature and extent of our audit procedures.
The table below sets out the materiality, performance materiality and threshold for reporting audit differences applied on our audit:
Basis Materiality Performance materiality Audit differences
Overall 1% (2018: 1%) of the carrying value of investment properties
£121m (2018: £124m)
£91m (2018: £93m)
£6m (2018: £6m)
Account balances not related to investment properties (either wholly owned or held within joint ventures)
Revenue profit before tax (2018: Revenue profit before tax)
£22m (2018: £20m)
£17m (2018: £15m)
£1m (2018: £1m)
When establishing our overall audit strategy, we determined a magnitude of uncorrected misstatements that we judged would be material for the financial statements as a whole. We determined that the carrying value of investment property would be the most appropriate basis for determining overall materiality given that the Group’s investment property balance accounts for around 86% of the Group’s total assets (2018: 85%) and the fact that key users of the Group’s financial statements are primarily focused on the valuation of the investment property portfolio. This provided a basis for determining the nature, timing and extent of risk assessment procedures, identifying and assessing the risk of material misstatement and determining the nature, timing and extent of further audit procedures.
Fina
ncia
l statem
ents
126 Landsec Annual Report 2019
Independent Auditor’s Reportcontinued
We have determined that for other account balances not related to investment properties (either wholly owned or held within joint ventures) a misstatement of less than materiality for the financial statements as a whole could influence the economic decisions of users. We have determined that materiality for these areas should be based upon revenue profit before tax of £442m (2018: £406m). We believe that it is appropriate to use a profit based measure as profit is also a focus of users of the financial statements.
During the course of our audit, we reassessed initial materiality and, as the actual carrying value of investment properties was in line with that which we had used as the initial basis for determining overall materiality, our final materiality was consistent with the materiality we calculated initially.
Performance materialityThe application of materiality at the individual account or balance level. It is set at an amount to reduce to an appropriately low level the probability that the aggregate of uncorrected and undetected misstatements exceeds materiality.
On the basis of our risk assessments, together with our assessment of the Group’s overall control environment, our judgement is that overall performance materiality and specific performance materiality (i.e., our tolerance for misstatement in an individual account or balance) for the Group should be 75% (2018: 75%) of the respective materiality. We have set performance materiality at this percentage due to our past experience of the audit that indicates a lower risk of misstatements, both corrected and uncorrected. Our objective in adopting this approach is to confirm that total detected and undetected audit differences do not exceed our materiality for the financial statements as a whole.
Reporting thresholdAn amount below which identified misstatements are considered as being clearly trivial.
We agreed with the Audit Committee that we would report to the Committee all uncorrected audit differences in excess of £6m (2018: £6m), as well as audit differences in excess of £1m (2018: £1m) that relate to our specific testing of the other account balances not related to investment properties which are set at 5% of their respective planning materiality. We also agreed to report differences below that threshold that, in our view, warranted reporting on qualitative grounds.
We evaluate any uncorrected misstatements against both the quantitative measures of materiality discussed above and in light of other relevant qualitative considerations in forming our opinion.
Other information The other information comprises the information included in the Annual Report, including Strategic Report and Governance other than the financial statements and our auditor’s report thereon. The Directors are responsible for the other information.
Our opinion on the financial statements does not cover the other information and, except to the extent otherwise explicitly stated in this report, we do not express any form of assurance conclusion thereon.
In connection with our audit of the financial statements, our responsibility is to read the other information and, in doing so, consider whether the other information is materially inconsistent with the financial statements or our knowledge obtained in the audit or otherwise appears to be materially misstated. If we identify such material inconsistencies or apparent material misstatements, we are required to determine whether there is a material misstatement in the financial statements or a material misstatement of the other information. If, based on the work we have performed, we conclude that there is a material misstatement of the other information, we are required to report that fact.
We have nothing to report in this regard.
In this context, we also have nothing to report in regard to our responsibility to specifically address the following items in the other information and to report as uncorrected material misstatements of the other information where we conclude that those items meet the following conditions:
— Fair, balanced and understandable set out on page 122 – the statement given by the Directors that they consider the annual report and financial statements taken as a whole is fair, balanced and understandable and provides the information necessary for shareholders to assess the Group’s performance, business model and strategy, is materially inconsistent with our knowledge obtained in the audit; or
— Audit Committee reporting set out on pages 81-88 – the section describing the work of the Audit Committee does not appropriately address matters communicated by us to the Audit Committee is materially inconsistent with our knowledge obtained in the audit; or
— Directors’ statement of compliance with the UK Corporate Governance Code set out on page 122 – the parts of the Directors’ statement required under the Listing Rules relating to the Company’s compliance with the UK Corporate Governance Code containing provisions specified for review by the auditor in accordance with Listing Rule 9.8.10R(2) do not properly disclose a departure from a relevant provision of the UK Corporate Governance Code.

127Landsec Annual Report 2019
Opinion on other matters prescribed by the Companies Act 2006In our opinion, the part of the Directors’ Remuneration Report to be audited has been properly prepared in accordance with the Companies Act 2006.
In our opinion, based on the work undertaken in the course of the audit:
— the information given in the Strategic Report and the Directors’ Report for the financial year for which the financial statements are prepared is consistent with the financial statements; and
— the Strategic Report and the Directors’ Report have been prepared in accordance with applicable legal requirements.
Matters on which we are required to report by exceptionIn the light of the knowledge and understanding of the Group and the Parent Company and its environment obtained in the course of the audit, we have not identified material misstatements in the Strategic Report or the Directors’ Report.
We have nothing to report in respect of the following matters in relation to which the Companies Act 2006 requires us to report to you if, in our opinion:
— adequate accounting records have not been kept by the Parent company, or returns adequate for our audit have not been received from branches not visited by us; or
— the Parent company financial statements and the part of the Directors’ Remuneration Report to be audited are not in agreement with the accounting records and returns; or
— certain disclosures of Directors’ remuneration specified by law are not made; or
— we have not received all the information and explanations we require for our audit.
Responsibilities of DirectorsAs explained more fully in the Directors’ Responsibilities Statement set out on page 122, the Directors are responsible for the preparation of the financial statements and for being satisfied that they give a true and fair view, and for such internal control as the Directors determine is necessary to enable the preparation of financial statements that are free from material misstatement, whether due to fraud or error.
In preparing the financial statements, the Directors are responsible for assessing the Group and Parent company’s ability to continue as a going concern, disclosing, as applicable, matters related to going concern and using the going concern basis of accounting unless the Directors either intend to liquidate the Group or the Parent company or to cease operations, or have no realistic alternative but to do so.
Auditor’s responsibilities for the audit of the financial statements Our objectives are to obtain reasonable assurance about whether the financial statements as a whole are free from material misstatement, whether due to fraud or error, and to issue an auditor’s report that includes our opinion. Reasonable assurance is a high level of assurance, but is not a guarantee that an audit conducted in accordance with ISAs (UK) will always detect a material misstatement when it exists. Misstatements can arise from fraud or error and are considered material if, individually or in the aggregate, they could reasonably be expected to influence the economic decisions of users taken on the basis of these financial statements.
Explanation as to what extent the audit was considered capable of detecting irregularities, including fraudThe objectives of our audit, in respect to fraud, are; to identify and assess the risks of material misstatement of the financial statements due to fraud; to obtain sufficient appropriate audit evidence regarding the assessed risks of material misstatement due to fraud, through designing and implementing appropriate responses; and to respond appropriately to fraud or suspected fraud identified during the audit. However, the primary responsibility for the prevention and detection of fraud rests with both those charged with governance of the entity and management.
Our approach was as follows:
— We obtained an understanding of the legal and regulatory frameworks that are applicable to the Group and determined that the most significant frameworks which are directly relevant to specific assertions in the financial statements are those that relate to the reporting framework (IFRS, the Companies Act 2006 and UK Corporate Governance Code) and the relevant tax regulations in the United Kingdom, including the UK REIT regulations.
— We understood how the Parent company is complying with those frameworks through enquiry with management, and by identifying the Parent company’s policies and procedures regarding compliance with laws and regulations. We also identified those members of management who have the primary responsibility for ensuring compliance with laws and regulations, and for reporting any known instances of non-compliance to those charged with governance.
— We assessed the susceptibility of the Group’s financial statements to material misstatement, including how fraud might occur by reviewing the Companies risk register, enquiry with management and the Audit Committee during the planning and execution phases of our audit.
— Based on this understanding we designed our audit procedures to identify non-compliance with such laws and regulations. Our procedures involved the following:
— Inquire of members of Senior Management, and when appropriate, those charged with governance regarding their knowledge of any non-compliance or potential non-compliance with laws and regulations that could affect the financial statements.
— Reading minutes of meetings of those charged with governance.
— Obtaining and reading correspondence from legal and regulatory bodies including HMRC.
A further description of our responsibilities for the audit of the financial statements is located on the Financial Reporting Council’s website at https://www.frc.org.uk/auditorsresponsibilities. This description forms part of our auditor’s report.
Fina
ncia
l statem
ents
128 Landsec Annual Report 2019
Independent Auditor’s Reportcontinued
Other matters we are required to address — We were appointed by the Parent company at the AGM on 18 July 2013 to audit the financial statements for the year ending 31 March 2014 and subsequent financial periods. The period of total uninterrupted engagement including previous renewals and reappointments is six years, covering all year ends between 31 March 2014 and 31 March 2019. Our audit engagement letter was refreshed on 23 January 2018.
— The non-audit services prohibited by the FRC’s Ethical Standard were not provided to the Group or the Parent company and we remain independent of the Group and the Parent company in conducting the audit.
— The audit opinion is consistent with the additional report to the Audit Committee.
Use of our reportThis report is made solely to the Parent company’s members, as a body, in accordance with Chapter 3 of Part 16 of the Companies Act 2006. Our audit work has been undertaken so that we might state to the Parent company’s members those matters we are required to state to them in an auditor’s report and for no other purpose. To the fullest extent permitted by law, we do not accept or assume responsibility to anyone other than the Parent company and the Parent company’s members as a body, for our audit work, for this report, or for the opinions we have formed.
Kathryn Barrow (Senior statutory auditor)for and on behalf of Ernst & Young LLP, Statutory Auditor London 13 May 2019
Notes:1. The maintenance and integrity of the Land Securities Group PLC website is the responsibility of the Directors; the work carried out by the auditor does not involve consideration of these
matters and, accordingly, the auditor accepts no responsibility for any changes that may have occurred to the financial statements since they were initially presented on the website.2. Legislation in the United Kingdom governing the preparation and dissemination of financial statements may differ from legislation in other jurisdictions.
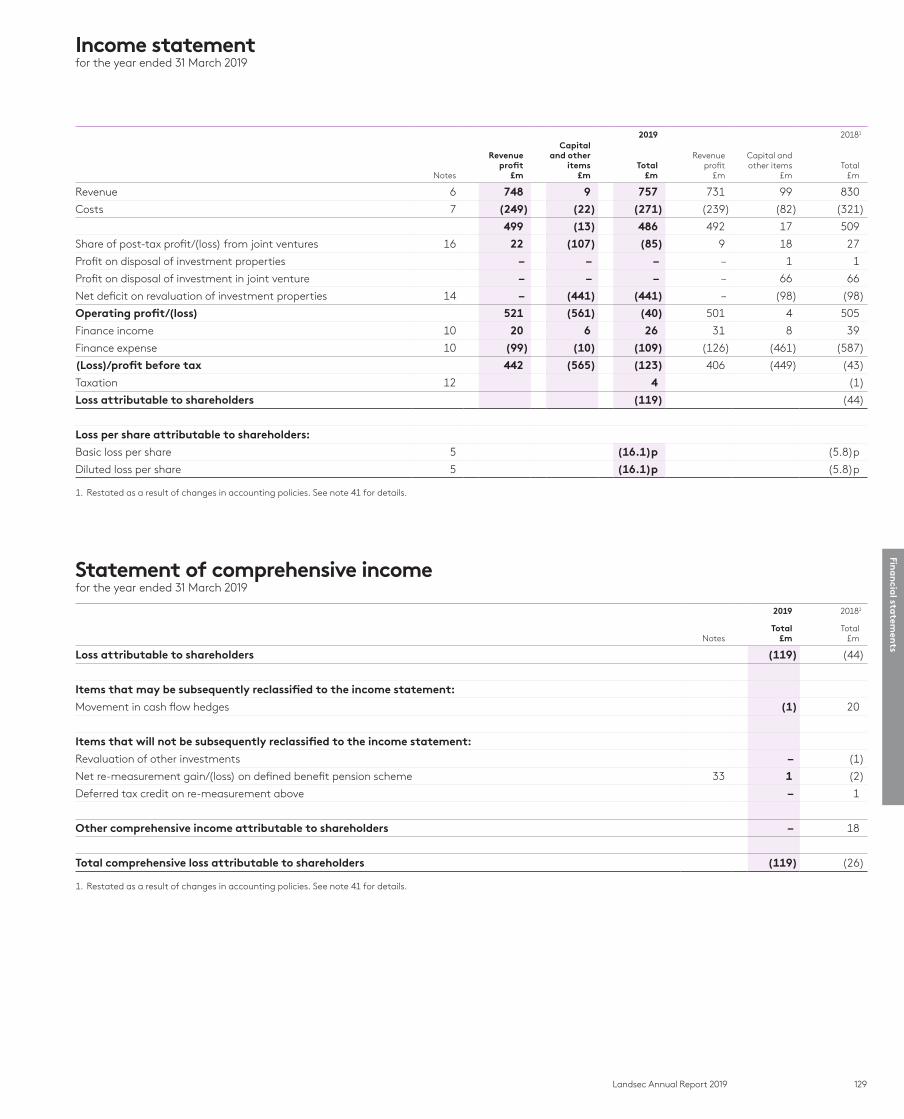
129Landsec Annual Report 2019
2019 20181
Notes
Revenue profit
£m
Capital and other
items£m
Total£m
Revenue profit
£m
Capital and other items
£mTotal
£m
Revenue 6 748 9 757 731 99 830
Costs 7 (249) (22) (271) (239) (82) (321)
499 (13) 486 492 17 509
Share of post-tax profit/(loss) from joint ventures 16 22 (107) (85) 9 18 27
Profit on disposal of investment properties – – – – 1 1
Profit on disposal of investment in joint venture – – – – 66 66
Net deficit on revaluation of investment properties 14 – (441) (441) – (98) (98)
Operating profit/(loss) 521 (561) (40) 501 4 505
Finance income 10 20 6 26 31 8 39
Finance expense 10 (99) (10) (109) (126) (461) (587)
(Loss)/profit before tax 442 (565) (123) 406 (449) (43)
Taxation 12 4 (1)
Loss attributable to shareholders (119) (44)
Loss per share attributable to shareholders:
Basic loss per share 5 (16.1)p (5.8)p
Diluted loss per share 5 (16.1)p (5.8)p
1. Restated as a result of changes in accounting policies. See note 41 for details.
Statement of comprehensive incomefor the year ended 31 March 2019
2019 20181
NotesTotal
£mTotal
£m
Loss attributable to shareholders (119) (44)
Items that may be subsequently reclassified to the income statement:
Movement in cash flow hedges (1) 20
Items that will not be subsequently reclassified to the income statement:
Revaluation of other investments – (1)
Net re-measurement gain/(loss) on defined benefit pension scheme 33 1 (2)
Deferred tax credit on re-measurement above – 1
Other comprehensive income attributable to shareholders – 18
Total comprehensive loss attributable to shareholders (119) (26)
1. Restated as a result of changes in accounting policies. See note 41 for details.
Income statementfor the year ended 31 March 2019
Fina
ncia
l statem
ents
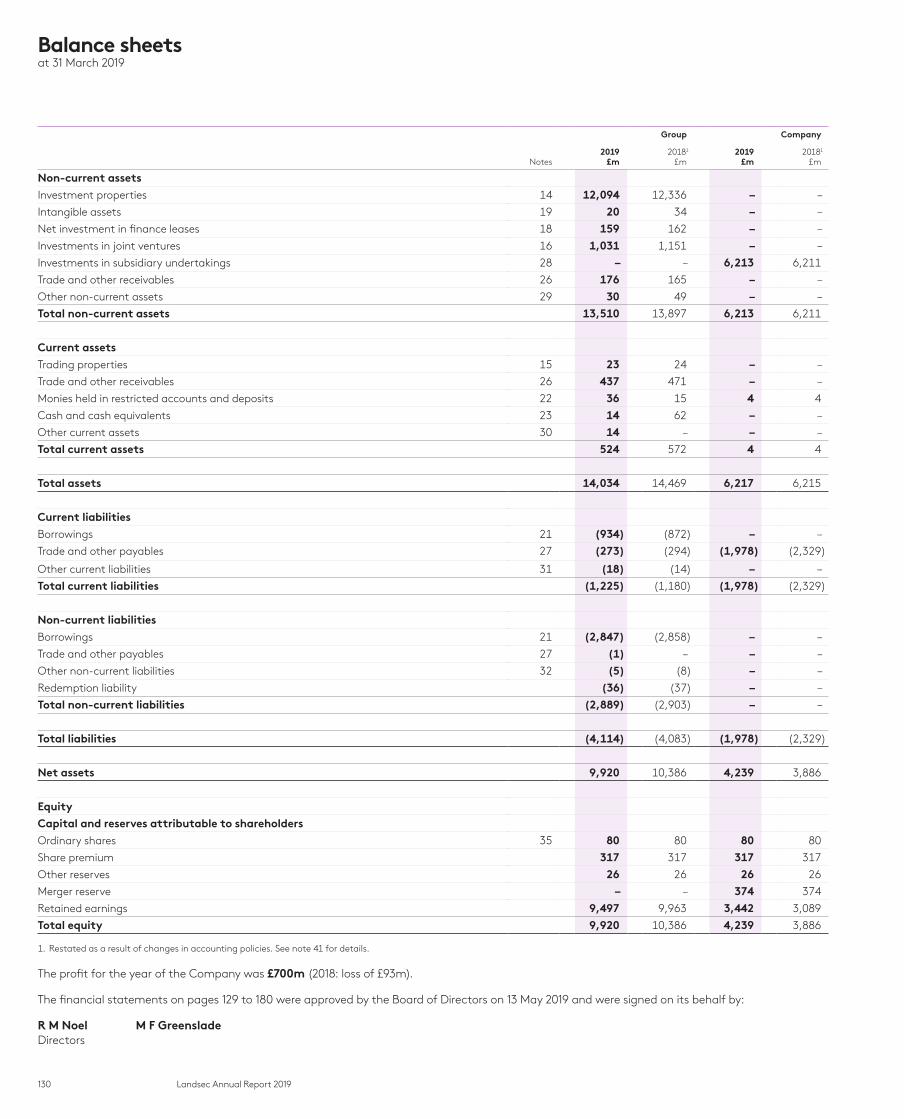
130 Landsec Annual Report 2019
Group Company
Notes2019
£m20181
£m2019
£m20181
£m
Non-current assetsInvestment properties 14 12,094 12,336 – –
Intangible assets 19 20 34 – –
Net investment in finance leases 18 159 162 – –
Investments in joint ventures 16 1,031 1,151 – –
Investments in subsidiary undertakings 28 – – 6,213 6,211
Trade and other receivables 26 176 165 – –
Other non-current assets 29 30 49 – –
Total non-current assets 13,510 13,897 6,213 6,211
Current assetsTrading properties 15 23 24 – –
Trade and other receivables 26 437 471 – –
Monies held in restricted accounts and deposits 22 36 15 4 4
Cash and cash equivalents 23 14 62 – –
Other current assets 30 14 – – –
Total current assets 524 572 4 4
Total assets 14,034 14,469 6,217 6,215
Current liabilitiesBorrowings 21 (934) (872) – –
Trade and other payables 27 (273) (294) (1,978) (2,329)
Other current liabilities 31 (18) (14) – –
Total current liabilities (1,225) (1,180) (1,978) (2,329)
Non-current liabilitiesBorrowings 21 (2,847) (2,858) – –
Trade and other payables 27 (1) – – –
Other non-current liabilities 32 (5) (8) – –
Redemption liability (36) (37) – –
Total non-current liabilities (2,889) (2,903) – –
Total liabilities (4,114) (4,083) (1,978) (2,329)
Net assets 9,920 10,386 4,239 3,886
EquityCapital and reserves attributable to shareholders Ordinary shares 35 80 80 80 80
Share premium 317 317 317 317
Other reserves 26 26 26 26
Merger reserve – – 374 374
Retained earnings 9,497 9,963 3,442 3,089
Total equity 9,920 10,386 4,239 3,886
1. Restated as a result of changes in accounting policies. See note 41 for details.
The profit for the year of the Company was £700m (2018: loss of £93m).
The financial statements on pages 129 to 180 were approved by the Board of Directors on 13 May 2019 and were signed on its behalf by:
R M Noel M F GreensladeDirectors
Balance sheetsat 31 March 2019

131Landsec Annual Report 2019
Attributable to shareholders Group
Ordinary shares
£m
Share premium
£m
Other reserves
£m
Retained earnings
£m
Total equity
£m
At 1 April 20171 80 791 30 10,301 11,202
Total comprehensive loss for the financial year1 – – – (26) (26)
Transactions with shareholders:
Share-based payments – 1 6 2 9
Capital distribution – (475) – – (475)
Dividends paid to shareholders – – – (314) (314)
Acquisition of own shares – – (10) – (10)
Total transactions with shareholders – (474) (4) (312) (790)
At 31 March 20181 80 317 26 9,963 10,386
Total comprehensive loss for the financial year – – – (119) (119)
Transactions with shareholders:
Share-based payments – – – 2 2
Dividends paid to shareholders – – – (349) (349)
Total transactions with shareholders – – – (347) (347)
At 31 March 2019 80 317 26 9,497 9,920
Company
Ordinary shares
£m
Share premium
£m
Other reserves
£m
Merger reserve
£m
Retained earnings2
£m
Total equity
£m
At 1 April 20171 80 791 30 374 3,494 4,769
Total comprehensive loss for the financial year – – – – (93) (93)
Transactions with shareholders:
Share-based payments1 – 1 6 – 2 9
Capital distribution – (475) – – – (475)
Dividends paid to shareholders – – – – (314) (314)
Acquisition of own shares – – (10) – – (10)
Total transactions with shareholders1 – (474) (4) – (312) (790)
At 31 March 20181 80 317 26 374 3,089 3,886
Total comprehensive income for the financial year – – – – 700 700
Transactions with shareholders:
Share-based payments – – – – 2 2
Dividends paid to shareholders – – – – (349) (349)
Total transactions with shareholders – – – – (347) (347)
At 31 March 2019 80 317 26 374 3,442 4,239
1. Restated as a result of changes in accounting policies. See note 41 for details.2. Available for distribution.
Statements of changes in equityfor the year ended 31 March 2019
Fina
ncia
l statem
ents
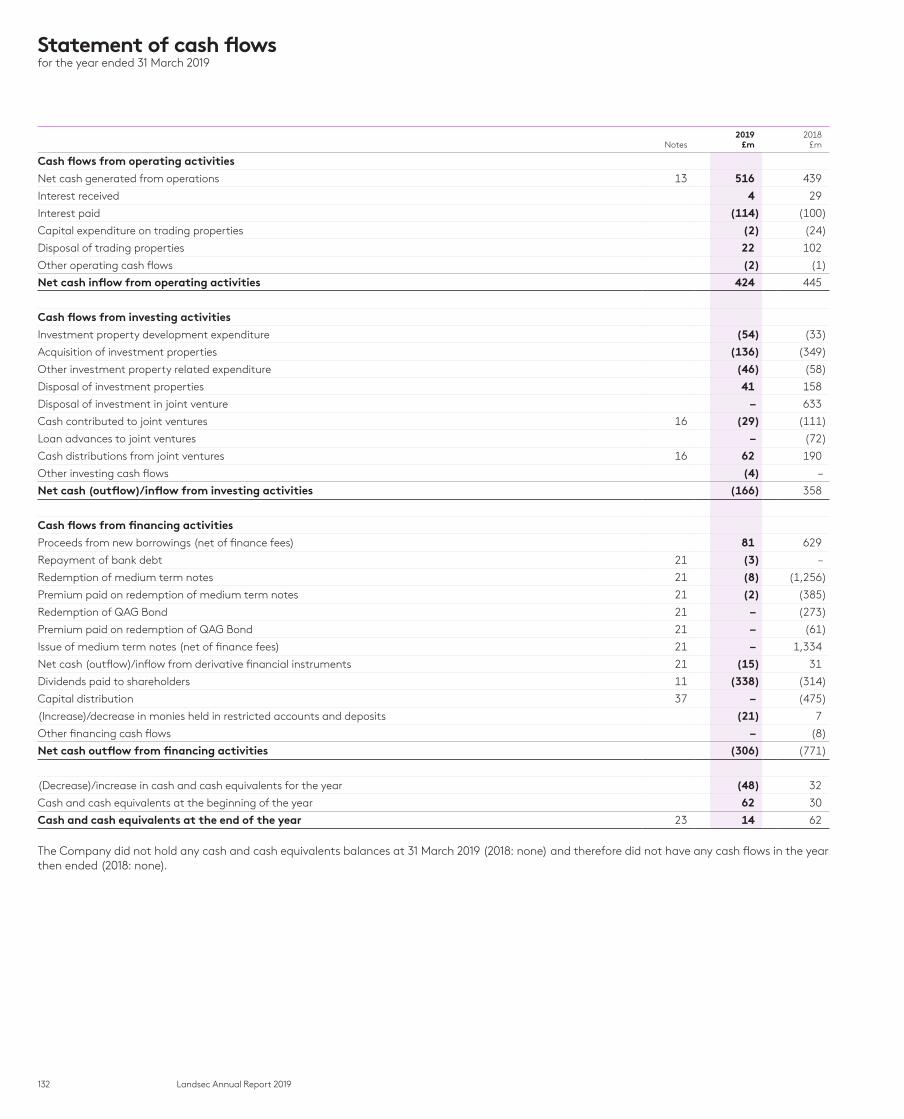
132 Landsec Annual Report 2019
Notes2019
£m2018
£m
Cash flows from operating activities
Net cash generated from operations 13 516 439
Interest received 4 29
Interest paid (114) (100)
Capital expenditure on trading properties (2) (24)
Disposal of trading properties 22 102
Other operating cash flows (2) (1)
Net cash inflow from operating activities 424 445
Cash flows from investing activities
Investment property development expenditure (54) (33)
Acquisition of investment properties (136) (349)
Other investment property related expenditure (46) (58)
Disposal of investment properties 41 158
Disposal of investment in joint venture – 633
Cash contributed to joint ventures 16 (29) (111)
Loan advances to joint ventures – (72)
Cash distributions from joint ventures 16 62 190
Other investing cash flows (4) –
Net cash (outflow)/inflow from investing activities (166) 358
Cash flows from financing activities
Proceeds from new borrowings (net of finance fees) 81 629
Repayment of bank debt 21 (3) –
Redemption of medium term notes 21 (8) (1,256)
Premium paid on redemption of medium term notes 21 (2) (385)
Redemption of QAG Bond 21 – (273)
Premium paid on redemption of QAG Bond 21 – (61)
Issue of medium term notes (net of finance fees) 21 – 1,334
Net cash (outflow)/inflow from derivative financial instruments 21 (15) 31
Dividends paid to shareholders 11 (338) (314)
Capital distribution 37 – (475)
(Increase)/decrease in monies held in restricted accounts and deposits (21) 7
Other financing cash flows – (8)
Net cash outflow from financing activities (306) (771)
(Decrease)/increase in cash and cash equivalents for the year (48) 32
Cash and cash equivalents at the beginning of the year 62 30
Cash and cash equivalents at the end of the year 23 14 62
The Company did not hold any cash and cash equivalents balances at 31 March 2019 (2018: none) and therefore did not have any cash flows in the year then ended (2018: none).
Statement of cash flowsfor the year ended 31 March 2019
133Landsec Annual Report 2019
Section 1 - General
This section contains a description of the Group’s significant accounting policies that relate to the financial statements as a whole. A description of accounting policies specific to individual areas (e.g. investment properties) is included within the relevant note to the financial statements.
This section also includes a summary of new accounting standards, amendments and interpretations that have been applied in the year and those not yet adopted, and their actual or expected impact on the reported results of the Group.
1. Basis of preparation and consolidation
Basis of preparationThese financial statements have been prepared on a going concern basis and in accordance with International Financial Reporting Standards as adopted by the EU (IFRS), IFRIC Interpretations and the Companies Act 2006 applicable to companies reporting under IFRS. The financial statements have been prepared in Pounds Sterling (rounded to the nearest one million), which is the presentation currency of the Group (Land Securities Group PLC and all its subsidiary undertakings), and under the historical cost convention as modified by the revaluation of investment property, financial assets at fair value through other comprehensive income (without recycling), derivative financial instruments and pension assets.
The preparation of financial statements in conformity with generally accepted accounting principles (GAAP) requires the use of estimates and assumptions that affect the reported amounts of assets and liabilities at the date of the financial statements and the reported amounts of revenues and expenses during the reporting period. Although these estimates are based on management’s best knowledge of the amount, event or actions, actual results ultimately may differ from those estimates. Further details on the Group’s significant accounting judgements and estimates are included in note 2. The Group’s share of post-tax profit from joint ventures has been included in Operating profit on the face of the income statement, to better reflect the way in which the Group’s Senior Management view the results of joint ventures. The presentation of the comparative income statement has also been amended to reflect this change.
Land Securities Group PLC (the Company) has not presented its own statement of comprehensive income (and separate income statement), as permitted by Section 408 of Companies Act 2006. The merger reserve arose on 6 September 2002 when the Company acquired 100% of the issued share capital of Land Securities PLC. The merger reserve represents the excess of the cost of acquisition over the nominal value of the shares issued by the Company to acquire Land Securities PLC. The merger reserve does not represent a realised or distributable profit. Other reserves includes the Capital redemption reserve, which represents the nominal value of cancelled shares, the Share-based payment reserve and Own shares held by the Group.
Basis of consolidationThe consolidated financial statements for the year ended 31 March 2019 incorporate the financial statements of the Company and all its subsidiary undertakings. Subsidiary undertakings are those entities controlled by the Company. Control exists where an entity is exposed to variable returns and has the ability to affect those returns through its power over the investee.
The results of subsidiaries and joint ventures acquired or disposed of during the year are included from the effective date of acquisition or to the effective date of disposal. Accounting policies of subsidiaries and joint ventures which differ from Group accounting policies are adjusted on consolidation.
Where instruments in a subsidiary held by third parties are redeemable at the option of the holder, these interests are classified as a financial liability, called the redemption liability. The liability is carried at fair value; the value is reassessed at the balance sheet date and movements are recognised in the income statement.
Joint arrangements are those entities over whose activities the Group has joint control, established by contractual agreement. Interests in joint arrangements are accounted for as either a joint venture or a joint operation. A joint arrangement is accounted for as a joint venture when the Group, along with the other parties that have joint control of the arrangement, have rights to the net assets of the arrangement. Interests in joint ventures are equity accounted. The equity method requires the Group’s share of the joint venture’s post-tax profit or loss for the year to be presented separately in the income statement and the Group’s share of the joint venture’s net assets to be presented separately in the balance sheet. A joint arrangement is accounted for as a joint operation when the Group, along with the parties that have joint control of the arrangement, have rights to the assets and obligations for the liabilities relating to the arrangement. Joint operations are accounted for by including the Group’s share of the assets, liabilities, income and expenses on a line-by-line basis.
Intra-group balances and any unrealised gains and losses arising from intra-group transactions are eliminated in preparing the consolidated financial statements. Unrealised gains arising from transactions with joint ventures are eliminated to the extent of the Group’s interest in the joint venture concerned. Unrealised losses are eliminated in the same way, but only to the extent that there is no evidence of impairment.
Notes to the financial statementsfor the year ended 31 March 2019
Fina
ncia
l statem
ents
134 Landsec Annual Report 2019
Notes to the financial statementsfor the year ended 31 March 2019 continued
2. Significant accounting judgements and estimates
The preparation of financial statements in conformity with IFRS requires management to exercise judgement in applying the Group‘s accounting policies. The areas where the Group considers the judgements to be most significant involve assumptions or estimates in respect of future events, where actual results may differ from these estimates.
Judgements — Recognising revenue where property management activities are performed by a third party (note 6)
— Compliance with the Real Estate Investment Trust (REIT) taxation regime and the recognition of deferred tax assets and liabilities (note 12)
— Accounting for property acquisitions and disposals (note 14)
Estimates — Valuation of investment and trading properties (note 14)
3. Changes in accounting policies and standards
The accounting policies used in these financial statements are consistent with those applied in the last annual financial statements, as amended where relevant to reflect the adoption of new standards, amendments and interpretations which became effective in the year, the impact of which is outlined below and in note 41.
Changes in accounting policyThe Group has adopted IFRS 9 Financial Instruments on 1 April 2018. While some accounting policies have been amended on adoption of the standard, there have been no adjustments to the Group’s income statement or balance sheet. The new accounting policies are set out in notes 21 to 26 and 41.
The Group has adopted IFRS 15 Revenue from Contracts with Customers on 1 April 2018. The Group has elected to apply the standard on a full retrospective basis as permitted by IFRS 15. Certain elements of service charge income and expense are now presented on a net basis as a result of adopting this standard. See notes 6 and 41 for further details.
The Group has amended its accounting policy for debt refinancing from 1 April 2018 such that it no longer carries a bond exchange de-recognition adjustment on its balance sheet. The revised policy and the impact of the change in accounting policy on the financial statements is detailed in notes 21 and 41.
The Company has amended its policy for accounting for the Employee Benefit Trust (EBT) from 1 April 2018 such that it no longer treats the EBT as a separate subsidiary of the Group, but rather as an extension of the Company. The revised policy and the impact of the change in accounting policy on the financial statements is detailed in notes 35 and 41.
Amendments to IFRSA number of new standards, amendments to standards and interpretations have been issued but are not yet effective for the Group. The most significant of these is IFRS 16 Leases (effective for the Group from 1 April 2019). Based on the impact assessment carried out, the Group expects to report separately service charge income for leases where a single payment is received to cover both rent and service charge. The total payment received is currently reported as rental income, but upon adoption of the standard, the service charge component will be separated and reported as service charge income in the notes to the financial statements. In the year ended 31 March 2019, the amount reported in rental income which would be separated and reported as service charge income was £7m. There will be no net impact on profit attributable to shareholders or the Group’s balance sheet.

135Landsec Annual Report 2019
Section 2 - Performance
This section focuses on the performance of the Group for the year, including segmental information, earnings per share and net assets per share, together with further details on specific components of the income statement and dividends paid.
Our property portfolio is a combination of properties that are wholly owned by the Group, part owned through joint arrangements and properties owned by the Group but where a third party holds a non-controlling interest. Internally, management review the results of the Group on a basis that adjusts for these different forms of ownership to present a proportionate share. The Combined Portfolio, with assets totalling £13.8bn, is an example of this approach, reflecting the economic interest we have in our properties regardless of our ownership structure. We consider this presentation provides further understanding to stakeholders of the activities and performance of the Group, as it aggregates the results of all of the Group’s property interests which under IFRS are required to be presented across a number of line items in the statutory financial statements.
The same principle is applied to many of the other measures we discuss and, accordingly, a number of our financial measures include the results of our joint ventures and subsidiaries on a proportionate basis. Measures that are described as being presented on a proportionate basis include the Group’s share of joint ventures on a line-by-line basis, and are adjusted to exclude the non-owned elements of our subsidiaries. This is in contrast to the Group’s statutory financial statements, where the Group’s interest in joint ventures is presented as one line on the income statement and balance sheet, and all subsidiaries are consolidated at 100% with any non-owned element being adjusted as a non-controlling interest or redemption liability, as appropriate. Our joint operations are presented on a proportionate basis in all financial measures.
Our income statement has two key components: the income we generate from leasing our investment properties net of associated costs (including interest expense), which we refer to as revenue profit, and items not directly related to the underlying rental business, principally valuation changes, profits or losses on the disposal of properties, refinancing activity and exceptional items, which we refer to as Capital and other items. Our income statement is presented in a columnar format, split into those items that relate to revenue profit and Capital and other items. The total column represents the Group’s results presented in accordance with IFRS; the other columns provide additional information. We believe revenue profit provides further understanding of the results of the Group’s operational performance to stakeholders as it focuses on the rental income performance of the business and excludes Capital and other items which can vary significantly from year to year. A full definition of revenue profit is given in the glossary. The components of revenue profit are presented on a proportionate basis in note 4.
4. Segmental information
The Group’s operations are organised into two operating segments, being the London Portfolio and the Retail Portfolio. The London Portfolio includes all our London offices and central London shops and the Retail Portfolio includes all our shopping centres and shops (excluding central London shops), hotel and leisure assets and retail parks. All of the Group’s operations are in the UK.
Management has determined the Group’s operating segments based on the information reviewed by Senior Management to make strategic decisions. During the year, the chief operating decision maker was the Executive Committee (ExecCom), which comprised the Executive Directors, the Group General Counsel and Company Secretary, the Group HR Director and the Corporate Affairs and Sustainability Director. The information presented to ExecCom includes reports from all functions of the business as well as strategy, financial planning, succession planning, organisational development and Group-wide policies.
The Group’s primary measure of underlying profit before tax is revenue profit. However, segment profit is the lowest level to which the profit arising from the ongoing operations of the Group is analysed between the two segments. The Group manages its financing structure, with the exception of joint ventures, on a pooled basis and, as such, debt facilities and finance expenses (other than those relating to joint ventures) are not specific to a particular segment. Unallocated income and expenses (Group Services) are items incurred centrally which are neither directly attributable nor can be reasonably allocated to individual segments.
All items in the segmental information note are presented on a proportionate basis. A reconciliation from the Group income statement to the information presented in the segmental information note is included in table 80.
Fina
ncia
l statem
ents
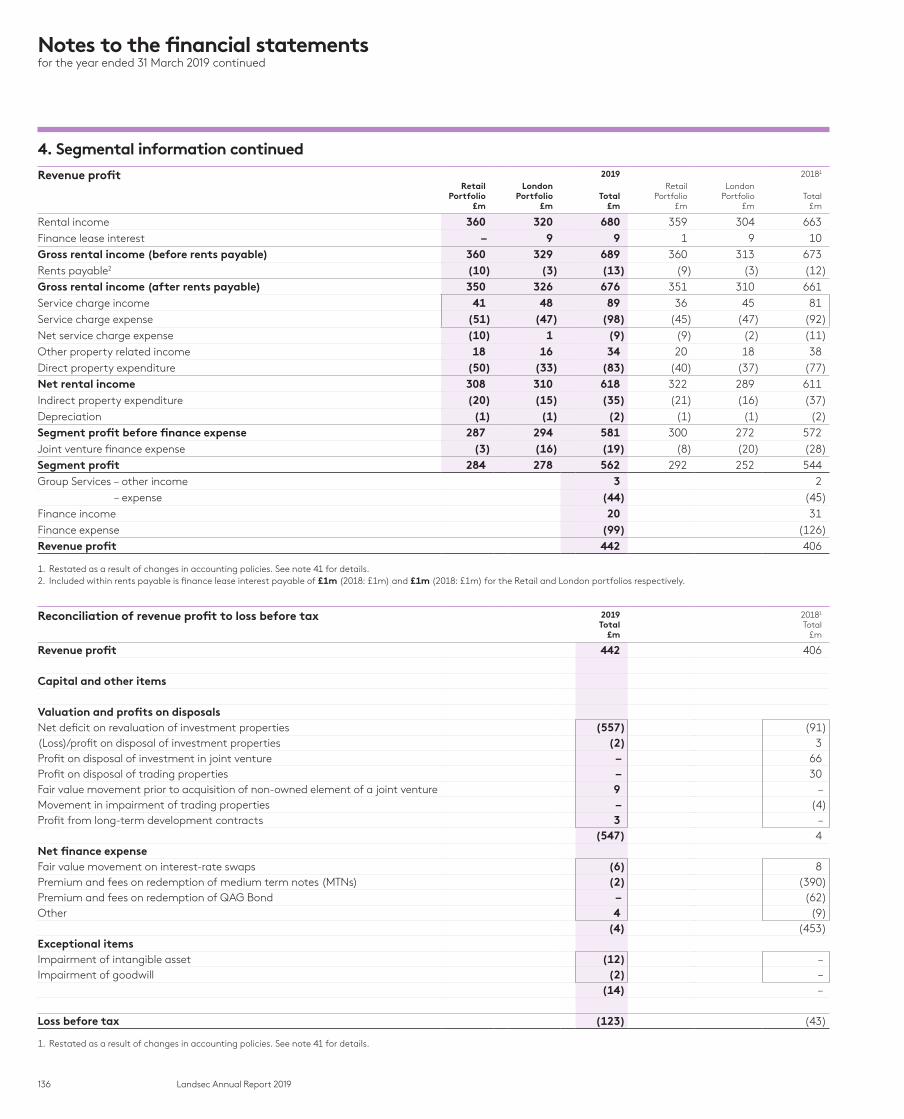
136 Landsec Annual Report 2019
Notes to the financial statementsfor the year ended 31 March 2019 continued
4. Segmental information continued
Revenue profit 2019 20181
Retail Portfolio
£m
London Portfolio
£mTotal
£m
RetailPortfolio
£m
LondonPortfolio
£mTotal
£m
Rental income 360 320 680 359 304 663Finance lease interest – 9 9 1 9 10Gross rental income (before rents payable) 360 329 689 360 313 673Rents payable2 (10) (3) (13) (9) (3) (12)Gross rental income (after rents payable) 350 326 676 351 310 661Service charge income 41 48 89 36 45 81Service charge expense (51) (47) (98) (45) (47) (92)Net service charge expense (10) 1 (9) (9) (2) (11)Other property related income 18 16 34 20 18 38Direct property expenditure (50) (33) (83) (40) (37) (77)Net rental income 308 310 618 322 289 611Indirect property expenditure (20) (15) (35) (21) (16) (37)Depreciation (1) (1) (2) (1) (1) (2)Segment profit before finance expense 287 294 581 300 272 572Joint venture finance expense (3) (16) (19) (8) (20) (28)Segment profit 284 278 562 292 252 544Group Services – other income 3 2
– expense (44) (45)Finance income 20 31Finance expense (99) (126)Revenue profit 442 406
1. Restated as a result of changes in accounting policies. See note 41 for details.2. Included within rents payable is finance lease interest payable of £1m (2018: £1m) and £1m (2018: £1m) for the Retail and London portfolios respectively.
Reconciliation of revenue profit to loss before tax 2019 Total
£m
20181
Total£m
Revenue profit 442 406
Capital and other items
Valuation and profits on disposalsNet deficit on revaluation of investment properties (557) (91)(Loss)/profit on disposal of investment properties (2) 3Profit on disposal of investment in joint venture – 66Profit on disposal of trading properties – 30Fair value movement prior to acquisition of non-owned element of a joint venture 9 –Movement in impairment of trading properties – (4)Profit from long-term development contracts 3 –
(547) 4Net finance expenseFair value movement on interest-rate swaps (6) 8Premium and fees on redemption of medium term notes (MTNs) (2) (390)Premium and fees on redemption of QAG Bond – (62)Other 4 (9)
(4) (453)Exceptional itemsImpairment of intangible asset (12) –Impairment of goodwill (2) –
(14) –
Loss before tax (123) (43)
1. Restated as a result of changes in accounting policies. See note 41 for details.
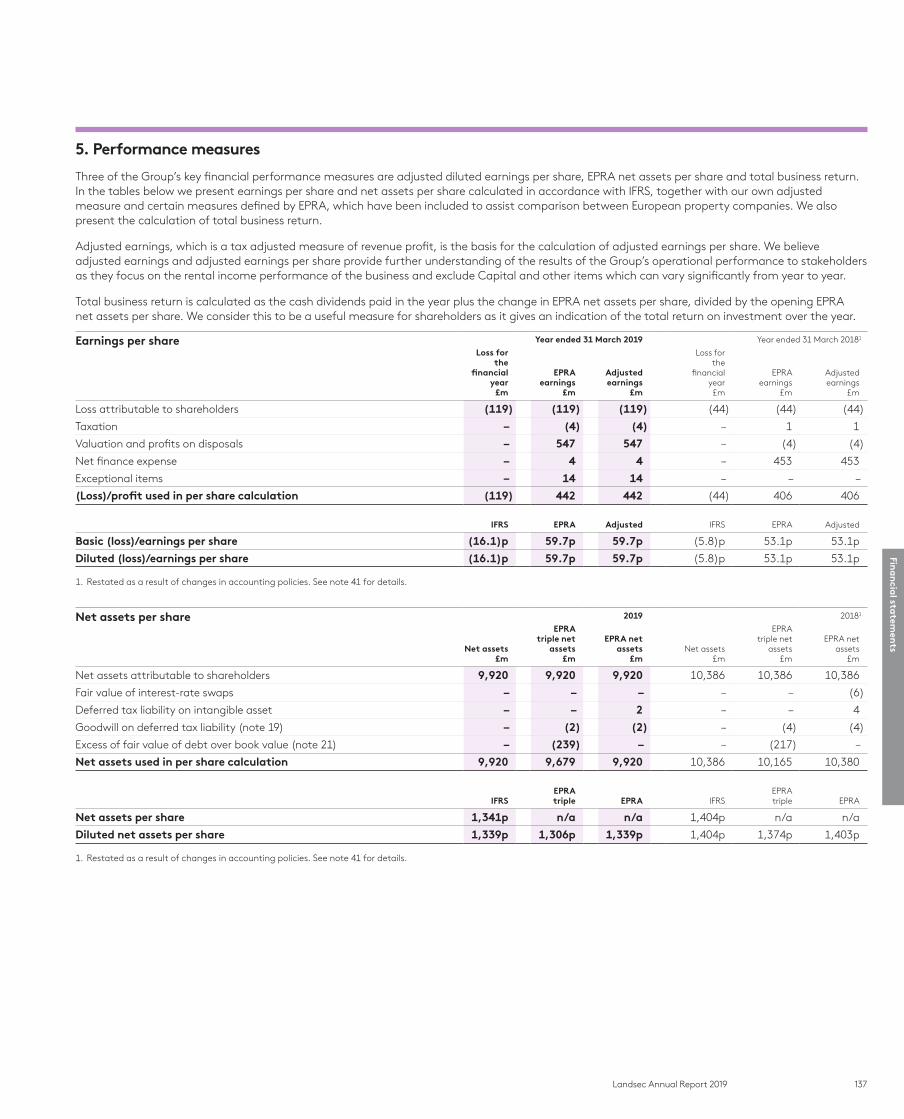
137Landsec Annual Report 2019
5. Performance measures
Three of the Group’s key financial performance measures are adjusted diluted earnings per share, EPRA net assets per share and total business return. In the tables below we present earnings per share and net assets per share calculated in accordance with IFRS, together with our own adjusted measure and certain measures defined by EPRA, which have been included to assist comparison between European property companies. We also present the calculation of total business return.
Adjusted earnings, which is a tax adjusted measure of revenue profit, is the basis for the calculation of adjusted earnings per share. We believe adjusted earnings and adjusted earnings per share provide further understanding of the results of the Group’s operational performance to stakeholders as they focus on the rental income performance of the business and exclude Capital and other items which can vary significantly from year to year.
Total business return is calculated as the cash dividends paid in the year plus the change in EPRA net assets per share, divided by the opening EPRA net assets per share. We consider this to be a useful measure for shareholders as it gives an indication of the total return on investment over the year.
Earnings per share Year ended 31 March 2019 Year ended 31 March 20181
Loss for the
financial year
£m
EPRA earnings
£m
Adjusted earnings
£m
Loss for the
financial year £m
EPRA earnings
£m
Adjusted earnings
£m
Loss attributable to shareholders (119) (119) (119) (44) (44) (44)
Taxation – (4) (4) – 1 1
Valuation and profits on disposals – 547 547 – (4) (4)
Net finance expense – 4 4 – 453 453
Exceptional items – 14 14 – – –
(Loss)/profit used in per share calculation (119) 442 442 (44) 406 406
IFRS EPRA Adjusted IFRS EPRA Adjusted
Basic (loss)/earnings per share (16.1)p 59.7p 59.7p (5.8)p 53.1p 53.1p
Diluted (loss)/earnings per share (16.1)p 59.7p 59.7p (5.8)p 53.1p 53.1p
1. Restated as a result of changes in accounting policies. See note 41 for details.
Net assets per share 2019 20181
Net assets £m
EPRA triple net
assets £m
EPRA net assets
£mNet assets
£m
EPRA triple net
assets £m
EPRA net assets
£m
Net assets attributable to shareholders 9,920 9,920 9,920 10,386 10,386 10,386
Fair value of interest-rate swaps – – – – – (6)
Deferred tax liability on intangible asset – – 2 – – 4
Goodwill on deferred tax liability (note 19) – (2) (2) – (4) (4)
Excess of fair value of debt over book value (note 21) – (239) – – (217) –
Net assets used in per share calculation 9,920 9,679 9,920 10,386 10,165 10,380
IFRSEPRA triple EPRA IFRS
EPRA triple EPRA
Net assets per share 1,341p n/a n/a 1,404p n/a n/a
Diluted net assets per share 1,339p 1,306p 1,339p 1,404p 1,374p 1,403p
1. Restated as a result of changes in accounting policies. See note 41 for details.
Fina
ncia
l statem
ents
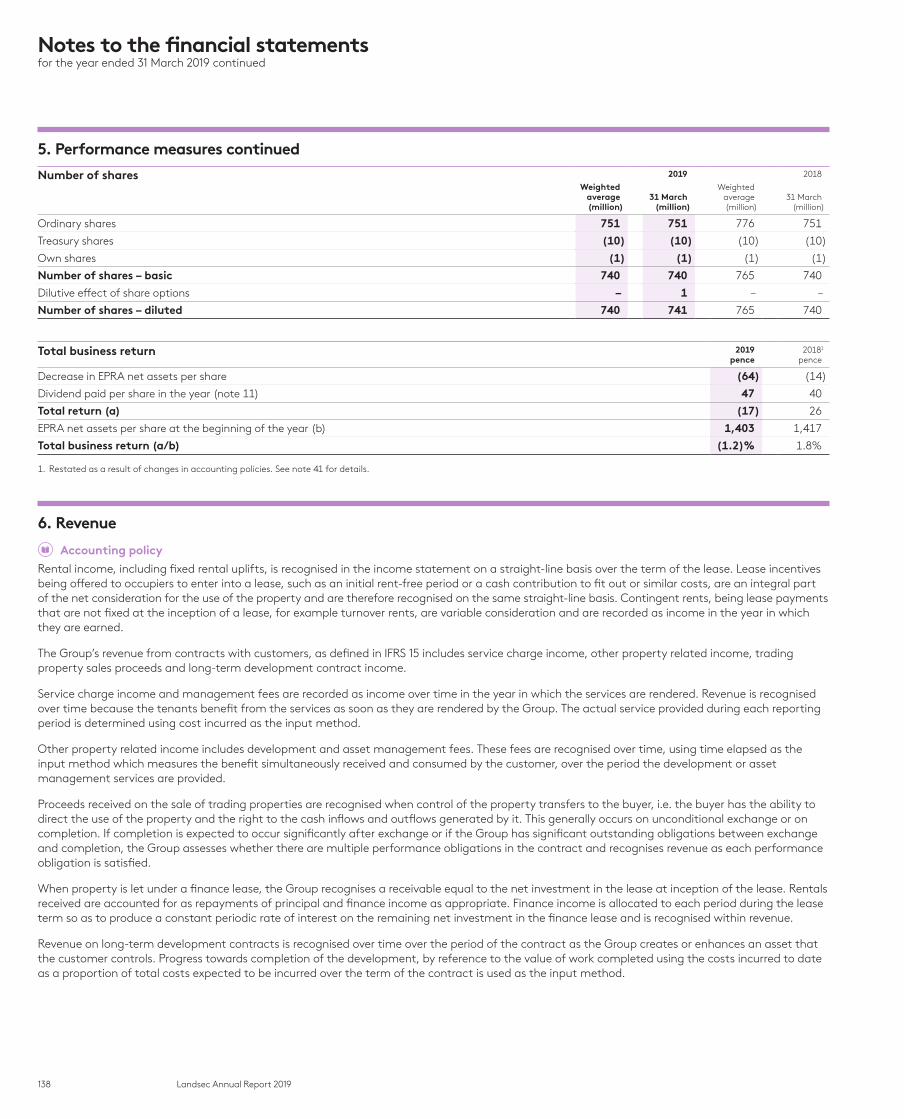
138 Landsec Annual Report 2019
Notes to the financial statementsfor the year ended 31 March 2019 continued
5. Performance measures continued
Number of shares 2019 2018
Weighted average(million)
31 March(million)
Weighted average(million)
31 March(million)
Ordinary shares 751 751 776 751
Treasury shares (10) (10) (10) (10)
Own shares (1) (1) (1) (1)
Number of shares – basic 740 740 765 740
Dilutive effect of share options – 1 – –
Number of shares – diluted 740 741 765 740
Total business return 2019pence
20181
pence
Decrease in EPRA net assets per share (64) (14)
Dividend paid per share in the year (note 11) 47 40
Total return (a) (17) 26
EPRA net assets per share at the beginning of the year (b) 1,403 1,417
Total business return (a/b) (1.2)% 1.8%
1. Restated as a result of changes in accounting policies. See note 41 for details.
6. Revenue
Accounting policy
Rental income, including fixed rental uplifts, is recognised in the income statement on a straight-line basis over the term of the lease. Lease incentives being offered to occupiers to enter into a lease, such as an initial rent-free period or a cash contribution to fit out or similar costs, are an integral part of the net consideration for the use of the property and are therefore recognised on the same straight-line basis. Contingent rents, being lease payments that are not fixed at the inception of a lease, for example turnover rents, are variable consideration and are recorded as income in the year in which they are earned.
The Group’s revenue from contracts with customers, as defined in IFRS 15 includes service charge income, other property related income, trading property sales proceeds and long-term development contract income.
Service charge income and management fees are recorded as income over time in the year in which the services are rendered. Revenue is recognised over time because the tenants benefit from the services as soon as they are rendered by the Group. The actual service provided during each reporting period is determined using cost incurred as the input method.
Other property related income includes development and asset management fees. These fees are recognised over time, using time elapsed as the input method which measures the benefit simultaneously received and consumed by the customer, over the period the development or asset management services are provided.
Proceeds received on the sale of trading properties are recognised when control of the property transfers to the buyer, i.e. the buyer has the ability to direct the use of the property and the right to the cash inflows and outflows generated by it. This generally occurs on unconditional exchange or on completion. If completion is expected to occur significantly after exchange or if the Group has significant outstanding obligations between exchange and completion, the Group assesses whether there are multiple performance obligations in the contract and recognises revenue as each performance obligation is satisfied.
When property is let under a finance lease, the Group recognises a receivable equal to the net investment in the lease at inception of the lease. Rentals received are accounted for as repayments of principal and finance income as appropriate. Finance income is allocated to each period during the lease term so as to produce a constant periodic rate of interest on the remaining net investment in the finance lease and is recognised within revenue.
Revenue on long-term development contracts is recognised over time over the period of the contract as the Group creates or enhances an asset that the customer controls. Progress towards completion of the development, by reference to the value of work completed using the costs incurred to date as a proportion of total costs expected to be incurred over the term of the contract is used as the input method.
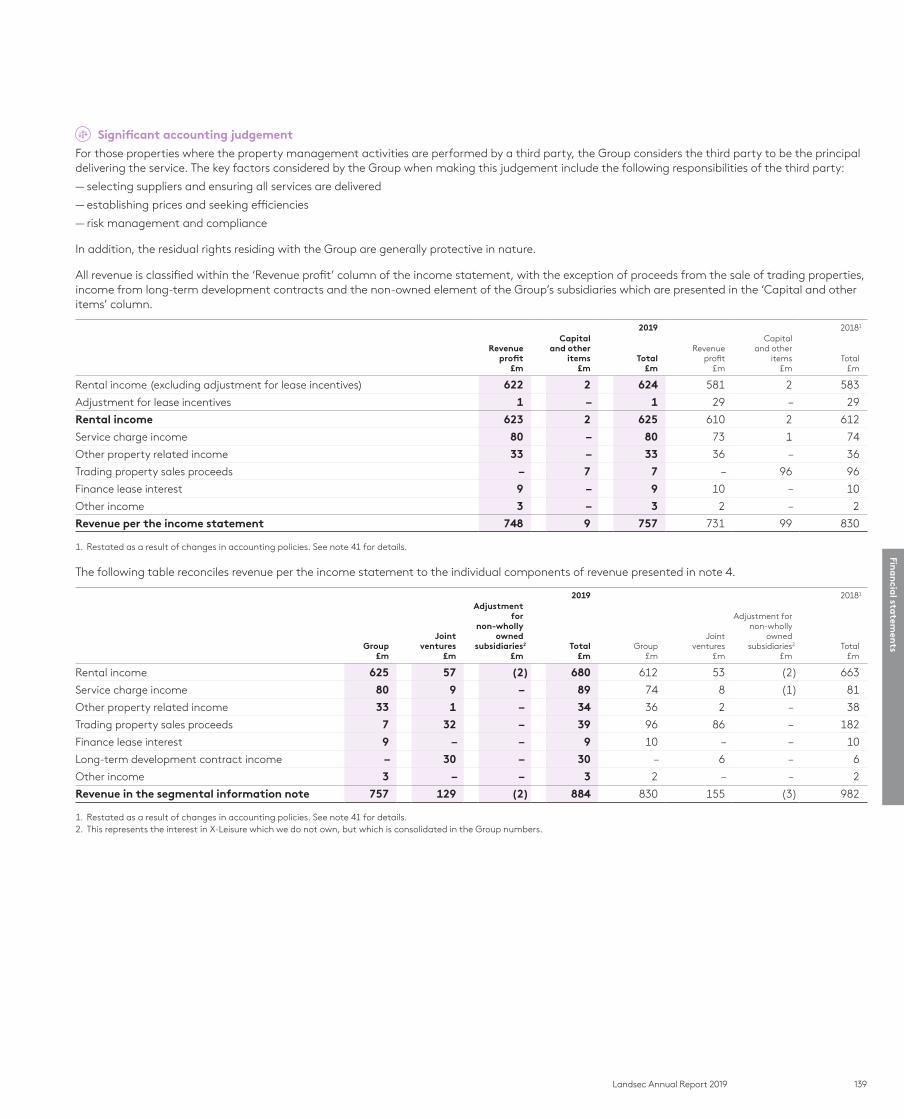
139Landsec Annual Report 2019
Significant accounting judgement
For those properties where the property management activities are performed by a third party, the Group considers the third party to be the principal delivering the service. The key factors considered by the Group when making this judgement include the following responsibilities of the third party:
— selecting suppliers and ensuring all services are delivered
— establishing prices and seeking efficiencies
— risk management and compliance
In addition, the residual rights residing with the Group are generally protective in nature.
All revenue is classified within the ‘Revenue profit’ column of the income statement, with the exception of proceeds from the sale of trading properties, income from long-term development contracts and the non-owned element of the Group’s subsidiaries which are presented in the ‘Capital and other items’ column.
2019 20181
Revenue profit
£m
Capital and other
items£m
Total£m
Revenue profit
£m
Capital and other
items£m
Total£m
Rental income (excluding adjustment for lease incentives) 622 2 624 581 2 583
Adjustment for lease incentives 1 – 1 29 – 29
Rental income 623 2 625 610 2 612
Service charge income 80 – 80 73 1 74
Other property related income 33 – 33 36 – 36
Trading property sales proceeds – 7 7 – 96 96
Finance lease interest 9 – 9 10 – 10
Other income 3 – 3 2 – 2
Revenue per the income statement 748 9 757 731 99 830
1. Restated as a result of changes in accounting policies. See note 41 for details.
The following table reconciles revenue per the income statement to the individual components of revenue presented in note 4.
2019 20181
Group£m
Joint ventures
£m
Adjustment for
non-wholly owned
subsidiaries2
£mTotal
£mGroup
£m
Joint ventures
£m
Adjustment for non-wholly
ownedsubsidiaries2
£mTotal
£m
Rental income 625 57 (2) 680 612 53 (2) 663
Service charge income 80 9 – 89 74 8 (1) 81
Other property related income 33 1 – 34 36 2 – 38
Trading property sales proceeds 7 32 – 39 96 86 – 182
Finance lease interest 9 – – 9 10 – – 10
Long-term development contract income – 30 – 30 – 6 – 6
Other income 3 – – 3 2 – – 2
Revenue in the segmental information note 757 129 (2) 884 830 155 (3) 982
1. Restated as a result of changes in accounting policies. See note 41 for details.2. This represents the interest in X-Leisure which we do not own, but which is consolidated in the Group numbers.
Fina
ncia
l statem
ents
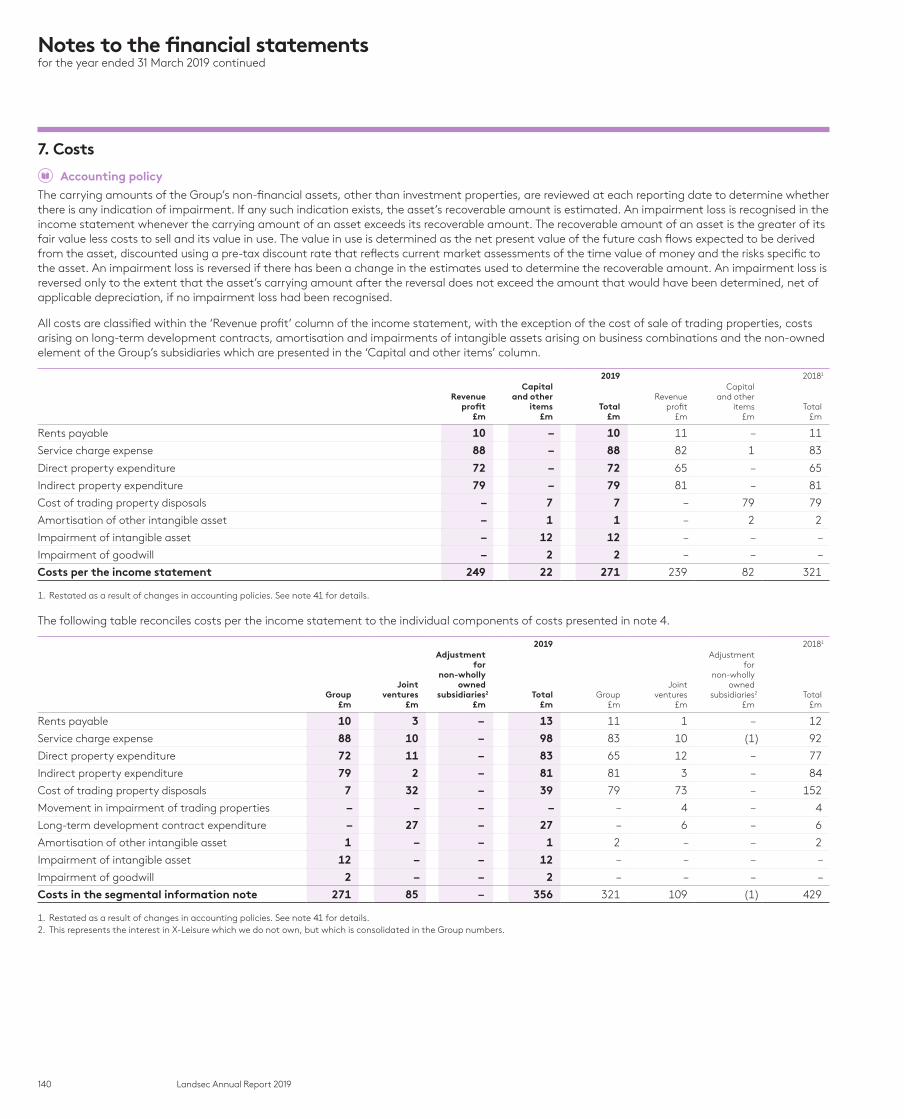
140 Landsec Annual Report 2019
Notes to the financial statementsfor the year ended 31 March 2019 continued
7. Costs
Accounting policy
The carrying amounts of the Group’s non-financial assets, other than investment properties, are reviewed at each reporting date to determine whether there is any indication of impairment. If any such indication exists, the asset’s recoverable amount is estimated. An impairment loss is recognised in the income statement whenever the carrying amount of an asset exceeds its recoverable amount. The recoverable amount of an asset is the greater of its fair value less costs to sell and its value in use. The value in use is determined as the net present value of the future cash flows expected to be derived from the asset, discounted using a pre-tax discount rate that reflects current market assessments of the time value of money and the risks specific to the asset. An impairment loss is reversed if there has been a change in the estimates used to determine the recoverable amount. An impairment loss is reversed only to the extent that the asset’s carrying amount after the reversal does not exceed the amount that would have been determined, net of applicable depreciation, if no impairment loss had been recognised.
All costs are classified within the ‘Revenue profit’ column of the income statement, with the exception of the cost of sale of trading properties, costs arising on long-term development contracts, amortisation and impairments of intangible assets arising on business combinations and the non-owned element of the Group’s subsidiaries which are presented in the ‘Capital and other items’ column.
2019 20181
Revenue profit
£m
Capital and other
items£m
Total£m
Revenue profit
£m
Capital and other
items£m
Total£m
Rents payable 10 – 10 11 – 11
Service charge expense 88 – 88 82 1 83
Direct property expenditure 72 – 72 65 – 65
Indirect property expenditure 79 – 79 81 – 81
Cost of trading property disposals – 7 7 – 79 79
Amortisation of other intangible asset – 1 1 – 2 2
Impairment of intangible asset – 12 12 – – –
Impairment of goodwill – 2 2 – – –
Costs per the income statement 249 22 271 239 82 321
1. Restated as a result of changes in accounting policies. See note 41 for details.
The following table reconciles costs per the income statement to the individual components of costs presented in note 4.
2019 20181
Group£m
Joint ventures
£m
Adjustment for
non-wholly owned
subsidiaries2
£mTotal
£mGroup
£m
Joint ventures
£m
Adjustment for
non-whollyowned
subsidiaries2
£mTotal
£m
Rents payable 10 3 – 13 11 1 – 12
Service charge expense 88 10 – 98 83 10 (1) 92
Direct property expenditure 72 11 – 83 65 12 – 77
Indirect property expenditure 79 2 – 81 81 3 – 84
Cost of trading property disposals 7 32 – 39 79 73 – 152
Movement in impairment of trading properties – – – – – 4 – 4
Long-term development contract expenditure – 27 – 27 – 6 – 6
Amortisation of other intangible asset 1 – – 1 2 – – 2
Impairment of intangible asset 12 – – 12 – – – –
Impairment of goodwill 2 – – 2 – – – –
Costs in the segmental information note 271 85 – 356 321 109 (1) 429
1. Restated as a result of changes in accounting policies. See note 41 for details.2. This represents the interest in X-Leisure which we do not own, but which is consolidated in the Group numbers.
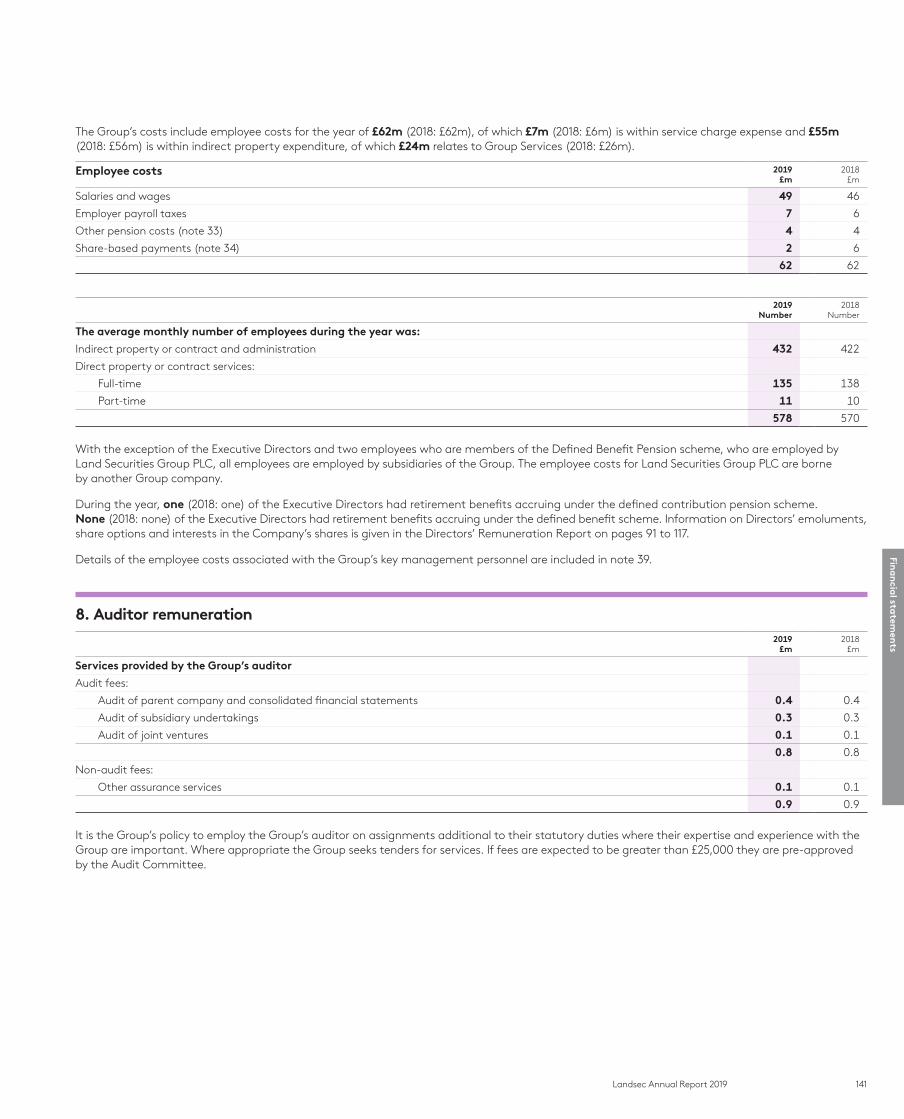
141Landsec Annual Report 2019
The Group’s costs include employee costs for the year of £62m (2018: £62m), of which £7m (2018: £6m) is within service charge expense and £55m (2018: £56m) is within indirect property expenditure, of which £24m relates to Group Services (2018: £26m).
Employee costs 2019£m
2018£m
Salaries and wages 49 46
Employer payroll taxes 7 6
Other pension costs (note 33) 4 4
Share-based payments (note 34) 2 6
62 62
2019Number
2018Number
The average monthly number of employees during the year was:
Indirect property or contract and administration 432 422
Direct property or contract services:
Full-time 135 138
Part-time 11 10
578 570
With the exception of the Executive Directors and two employees who are members of the Defined Benefit Pension scheme, who are employed by Land Securities Group PLC, all employees are employed by subsidiaries of the Group. The employee costs for Land Securities Group PLC are borne by another Group company.
During the year, one (2018: one) of the Executive Directors had retirement benefits accruing under the defined contribution pension scheme. None (2018: none) of the Executive Directors had retirement benefits accruing under the defined benefit scheme. Information on Directors’ emoluments, share options and interests in the Company’s shares is given in the Directors’ Remuneration Report on pages 91 to 117.
Details of the employee costs associated with the Group’s key management personnel are included in note 39.
8. Auditor remuneration2019
£m2018
£m
Services provided by the Group’s auditor
Audit fees:
Audit of parent company and consolidated financial statements 0.4 0.4
Audit of subsidiary undertakings 0.3 0.3
Audit of joint ventures 0.1 0.1
0.8 0.8
Non-audit fees:
Other assurance services 0.1 0.1
0.9 0.9
It is the Group’s policy to employ the Group’s auditor on assignments additional to their statutory duties where their expertise and experience with the Group are important. Where appropriate the Group seeks tenders for services. If fees are expected to be greater than £25,000 they are pre-approved by the Audit Committee.
Fina
ncia
l statem
ents
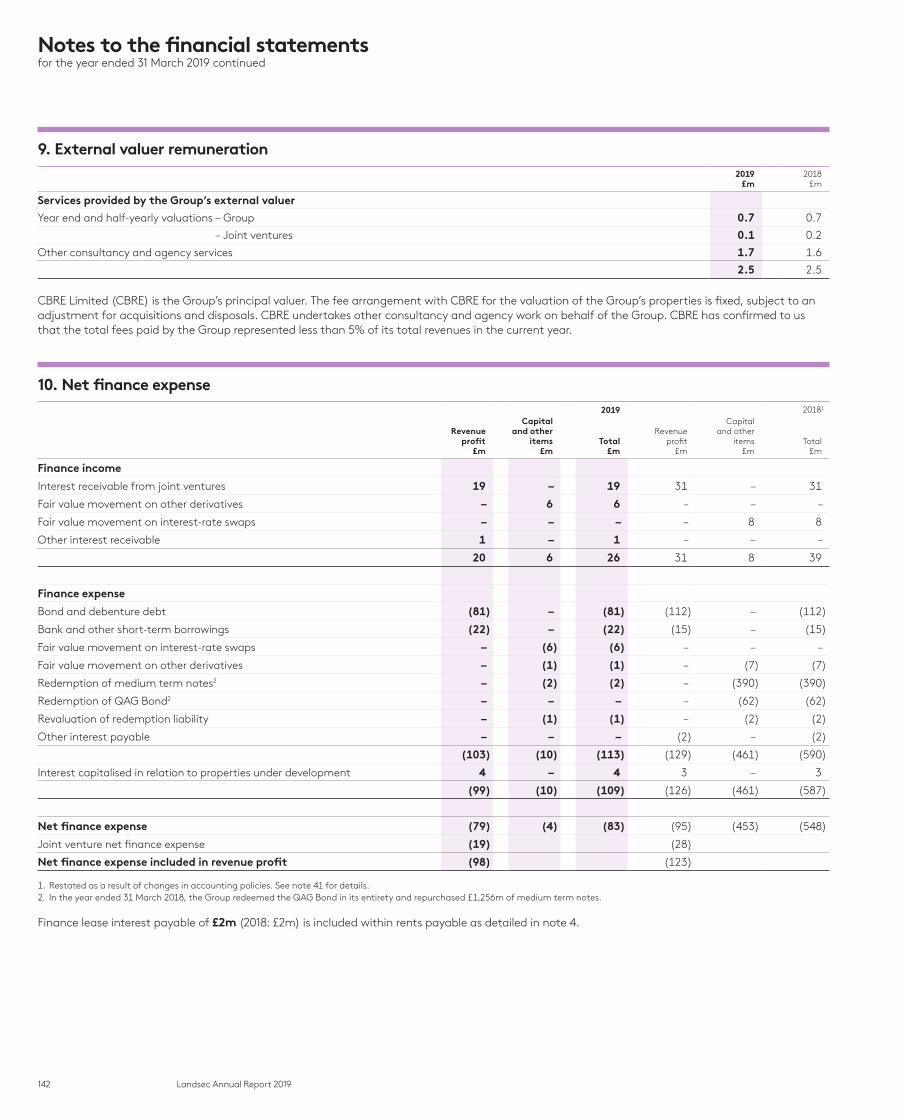
142 Landsec Annual Report 2019
Notes to the financial statementsfor the year ended 31 March 2019 continued
9. External valuer remuneration2019
£m2018
£m
Services provided by the Group’s external valuer
Year end and half-yearly valuations – Group 0.7 0.7
– Joint ventures 0.1 0.2
Other consultancy and agency services 1.7 1.6
2.5 2.5
CBRE Limited (CBRE) is the Group’s principal valuer. The fee arrangement with CBRE for the valuation of the Group’s properties is fixed, subject to an adjustment for acquisitions and disposals. CBRE undertakes other consultancy and agency work on behalf of the Group. CBRE has confirmed to us that the total fees paid by the Group represented less than 5% of its total revenues in the current year.
10. Net finance expense2019 20181
Revenue profit
£m
Capital and other
items£m
Total£m
Revenue profit
£m
Capital and other
items£m
Total£m
Finance income
Interest receivable from joint ventures 19 – 19 31 – 31
Fair value movement on other derivatives – 6 6 – – –
Fair value movement on interest-rate swaps – – – – 8 8
Other interest receivable 1 – 1 – – –
20 6 26 31 8 39
Finance expense
Bond and debenture debt (81) – (81) (112) – (112)
Bank and other short-term borrowings (22) – (22) (15) – (15)
Fair value movement on interest-rate swaps – (6) (6) – – –
Fair value movement on other derivatives – (1) (1) – (7) (7)
Redemption of medium term notes2 – (2) (2) – (390) (390)
Redemption of QAG Bond2 – – – – (62) (62)
Revaluation of redemption liability – (1) (1) – (2) (2)
Other interest payable – – – (2) – (2)
(103) (10) (113) (129) (461) (590)
Interest capitalised in relation to properties under development 4 – 4 3 – 3
(99) (10) (109) (126) (461) (587)
Net finance expense (79) (4) (83) (95) (453) (548)
Joint venture net finance expense (19) (28)
Net finance expense included in revenue profit (98) (123)
1. Restated as a result of changes in accounting policies. See note 41 for details.2. In the year ended 31 March 2018, the Group redeemed the QAG Bond in its entirety and repurchased £1,256m of medium term notes.
Finance lease interest payable of £2m (2018: £2m) is included within rents payable as detailed in note 4.
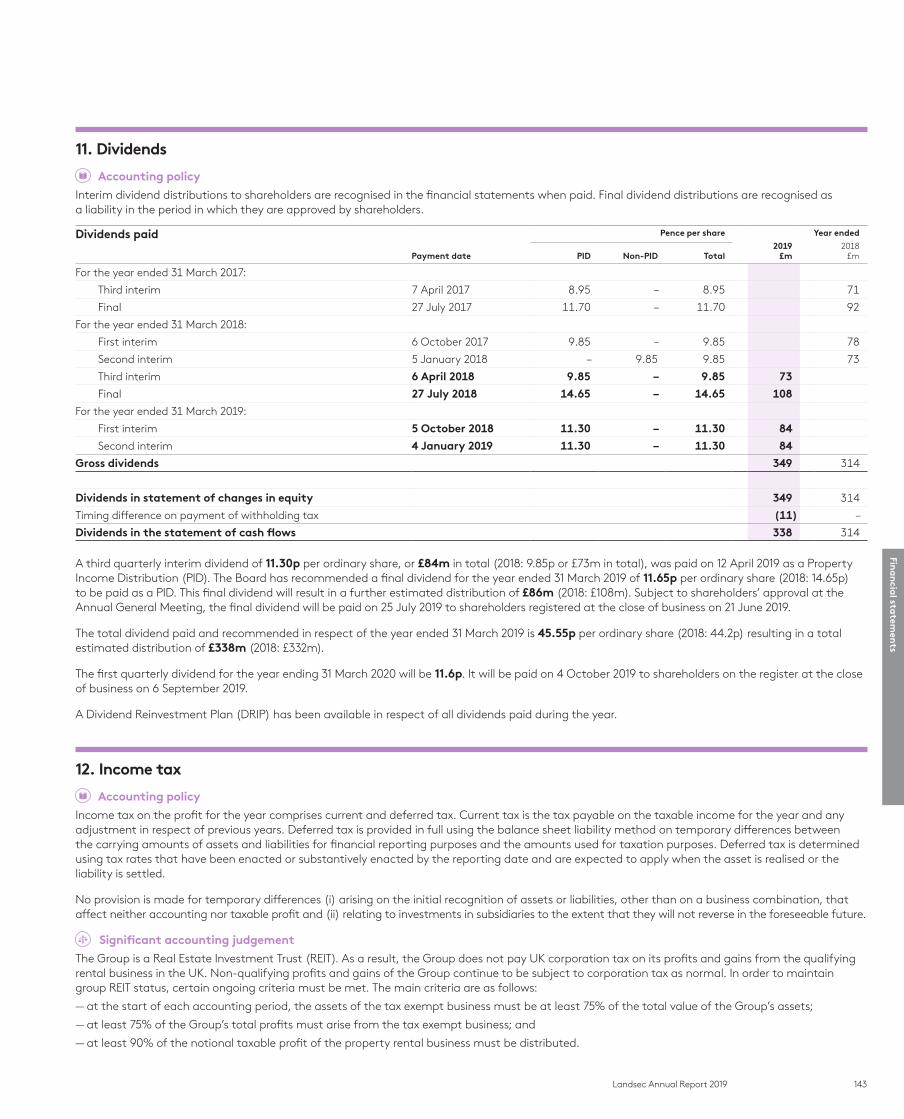
143Landsec Annual Report 2019
11. Dividends
Accounting policy
Interim dividend distributions to shareholders are recognised in the financial statements when paid. Final dividend distributions are recognised as a liability in the period in which they are approved by shareholders.
Dividends paid Pence per share Year ended
Payment date PID Non-PID Total2019
£m2018
£m
For the year ended 31 March 2017:
Third interim 7 April 2017 8.95 – 8.95 71
Final 27 July 2017 11.70 – 11.70 92
For the year ended 31 March 2018:
First interim 6 October 2017 9.85 – 9.85 78
Second interim 5 January 2018 – 9.85 9.85 73
Third interim 6 April 2018 9.85 – 9.85 73
Final 27 July 2018 14.65 – 14.65 108
For the year ended 31 March 2019:
First interim 5 October 2018 11.30 – 11.30 84
Second interim 4 January 2019 11.30 – 11.30 84
Gross dividends 349 314
Dividends in statement of changes in equity 349 314
Timing difference on payment of withholding tax (11) –
Dividends in the statement of cash flows 338 314
A third quarterly interim dividend of 11.30p per ordinary share, or £84m in total (2018: 9.85p or £73m in total), was paid on 12 April 2019 as a Property Income Distribution (PID). The Board has recommended a final dividend for the year ended 31 March 2019 of 11.65p per ordinary share (2018: 14.65p) to be paid as a PID. This final dividend will result in a further estimated distribution of £86m (2018: £108m). Subject to shareholders’ approval at the Annual General Meeting, the final dividend will be paid on 25 July 2019 to shareholders registered at the close of business on 21 June 2019.
The total dividend paid and recommended in respect of the year ended 31 March 2019 is 45.55p per ordinary share (2018: 44.2p) resulting in a total estimated distribution of £338m (2018: £332m).
The first quarterly dividend for the year ending 31 March 2020 will be 11.6p. It will be paid on 4 October 2019 to shareholders on the register at the close of business on 6 September 2019.
A Dividend Reinvestment Plan (DRIP) has been available in respect of all dividends paid during the year.
12. Income tax
Accounting policy
Income tax on the profit for the year comprises current and deferred tax. Current tax is the tax payable on the taxable income for the year and any adjustment in respect of previous years. Deferred tax is provided in full using the balance sheet liability method on temporary differences between the carrying amounts of assets and liabilities for financial reporting purposes and the amounts used for taxation purposes. Deferred tax is determined using tax rates that have been enacted or substantively enacted by the reporting date and are expected to apply when the asset is realised or the liability is settled.
No provision is made for temporary differences (i) arising on the initial recognition of assets or liabilities, other than on a business combination, that affect neither accounting nor taxable profit and (ii) relating to investments in subsidiaries to the extent that they will not reverse in the foreseeable future.
Significant accounting judgement
The Group is a Real Estate Investment Trust (REIT). As a result, the Group does not pay UK corporation tax on its profits and gains from the qualifying rental business in the UK. Non-qualifying profits and gains of the Group continue to be subject to corporation tax as normal. In order to maintain group REIT status, certain ongoing criteria must be met. The main criteria are as follows:
— at the start of each accounting period, the assets of the tax exempt business must be at least 75% of the total value of the Group’s assets;
— at least 75% of the Group’s total profits must arise from the tax exempt business; and
— at least 90% of the notional taxable profit of the property rental business must be distributed.
Fina
ncia
l statem
ents
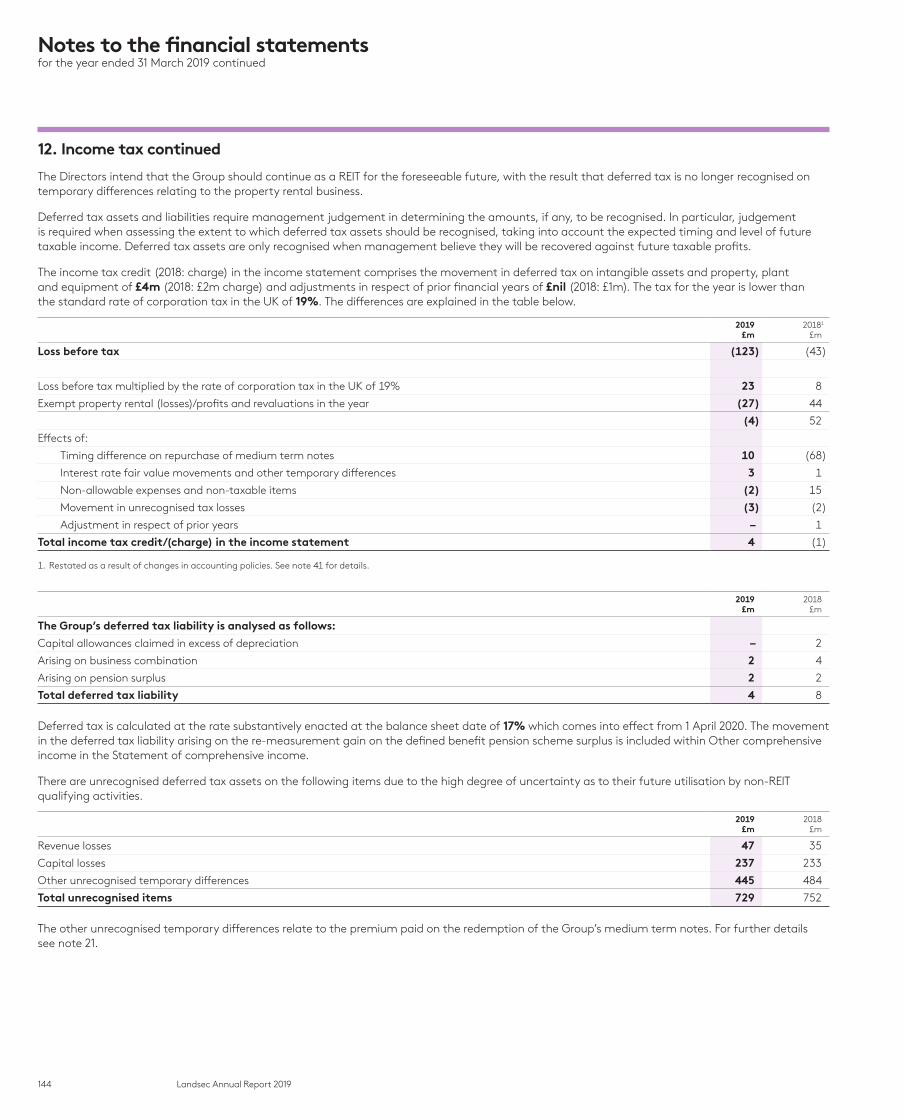
144 Landsec Annual Report 2019
Notes to the financial statementsfor the year ended 31 March 2019 continued
12. Income tax continued
The Directors intend that the Group should continue as a REIT for the foreseeable future, with the result that deferred tax is no longer recognised on temporary differences relating to the property rental business.
Deferred tax assets and liabilities require management judgement in determining the amounts, if any, to be recognised. In particular, judgement is required when assessing the extent to which deferred tax assets should be recognised, taking into account the expected timing and level of future taxable income. Deferred tax assets are only recognised when management believe they will be recovered against future taxable profits.
The income tax credit (2018: charge) in the income statement comprises the movement in deferred tax on intangible assets and property, plant and equipment of £4m (2018: £2m charge) and adjustments in respect of prior financial years of £nil (2018: £1m). The tax for the year is lower than the standard rate of corporation tax in the UK of 19%. The differences are explained in the table below.
2019£m
20181
£m
Loss before tax (123) (43)
Loss before tax multiplied by the rate of corporation tax in the UK of 19% 23 8
Exempt property rental (losses)/profits and revaluations in the year (27) 44
(4) 52
Effects of:
Timing difference on repurchase of medium term notes 10 (68)
Interest rate fair value movements and other temporary differences 3 1
Non-allowable expenses and non-taxable items (2) 15
Movement in unrecognised tax losses (3) (2)
Adjustment in respect of prior years – 1
Total income tax credit/(charge) in the income statement 4 (1)
1. Restated as a result of changes in accounting policies. See note 41 for details.
2019£m
2018£m
The Group’s deferred tax liability is analysed as follows:
Capital allowances claimed in excess of depreciation – 2
Arising on business combination 2 4
Arising on pension surplus 2 2
Total deferred tax liability 4 8
Deferred tax is calculated at the rate substantively enacted at the balance sheet date of 17% which comes into effect from 1 April 2020. The movement in the deferred tax liability arising on the re-measurement gain on the defined benefit pension scheme surplus is included within Other comprehensive income in the Statement of comprehensive income.
There are unrecognised deferred tax assets on the following items due to the high degree of uncertainty as to their future utilisation by non-REIT qualifying activities.
2019£m
2018£m
Revenue losses 47 35
Capital losses 237 233
Other unrecognised temporary differences 445 484
Total unrecognised items 729 752
The other unrecognised temporary differences relate to the premium paid on the redemption of the Group’s medium term notes. For further details see note 21.
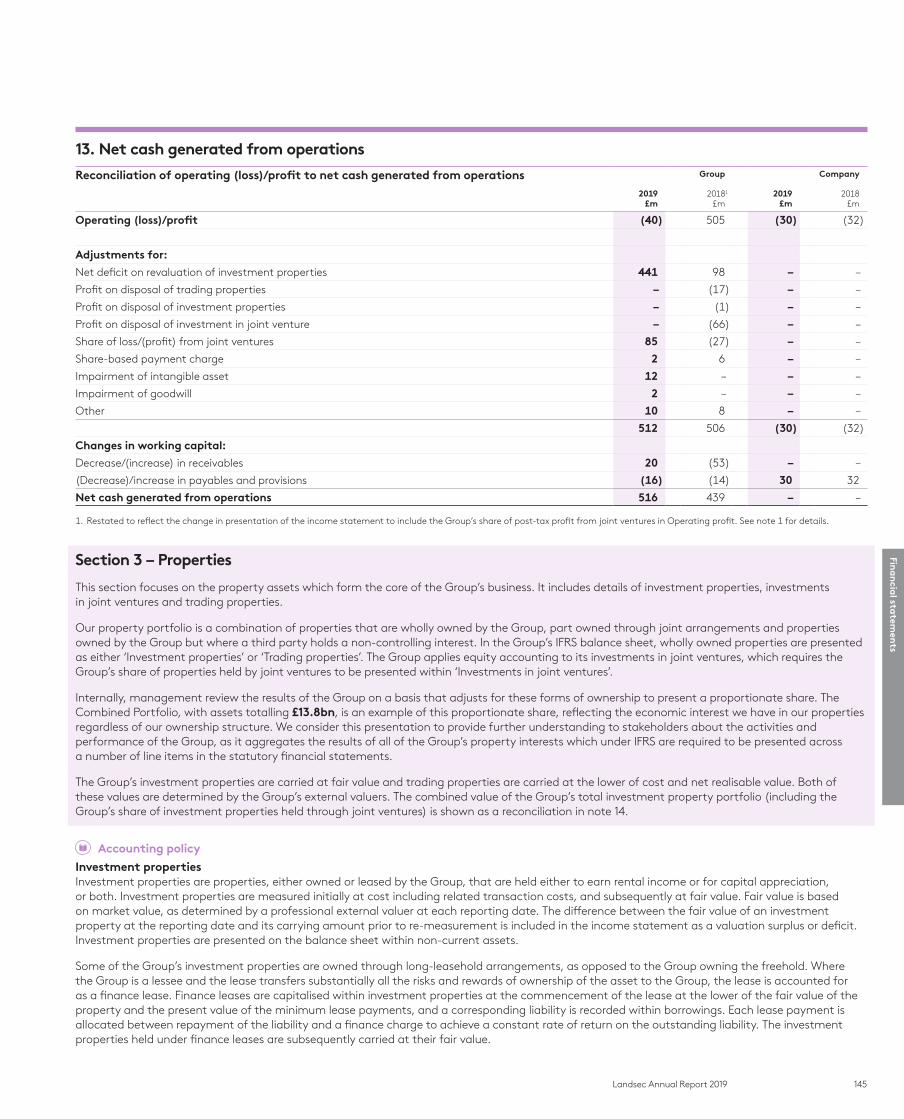
145Landsec Annual Report 2019
13. Net cash generated from operations
Reconciliation of operating (loss)/profit to net cash generated from operations Group Company
2019£m
20181
£m2019
£m2018
£m
Operating (loss)/profit (40) 505 (30) (32)
Adjustments for:
Net deficit on revaluation of investment properties 441 98 – –
Profit on disposal of trading properties – (17) – –
Profit on disposal of investment properties – (1) – –
Profit on disposal of investment in joint venture – (66) – –
Share of loss/(profit) from joint ventures 85 (27) – –
Share-based payment charge 2 6 – –
Impairment of intangible asset 12 – – –
Impairment of goodwill 2 – – –
Other 10 8 – –
512 506 (30) (32)
Changes in working capital:
Decrease/(increase) in receivables 20 (53) – –
(Decrease)/increase in payables and provisions (16) (14) 30 32
Net cash generated from operations 516 439 – –
1. Restated to reflect the change in presentation of the income statement to include the Group’s share of post-tax profit from joint ventures in Operating profit. See note 1 for details.
Section 3 – Properties
This section focuses on the property assets which form the core of the Group’s business. It includes details of investment properties, investments in joint ventures and trading properties.
Our property portfolio is a combination of properties that are wholly owned by the Group, part owned through joint arrangements and properties owned by the Group but where a third party holds a non-controlling interest. In the Group’s IFRS balance sheet, wholly owned properties are presented as either ‘Investment properties’ or ‘Trading properties’. The Group applies equity accounting to its investments in joint ventures, which requires the Group’s share of properties held by joint ventures to be presented within ‘Investments in joint ventures’.
Internally, management review the results of the Group on a basis that adjusts for these forms of ownership to present a proportionate share. The Combined Portfolio, with assets totalling £13.8bn, is an example of this proportionate share, reflecting the economic interest we have in our properties regardless of our ownership structure. We consider this presentation to provide further understanding to stakeholders about the activities and performance of the Group, as it aggregates the results of all of the Group’s property interests which under IFRS are required to be presented across a number of line items in the statutory financial statements.
The Group’s investment properties are carried at fair value and trading properties are carried at the lower of cost and net realisable value. Both of these values are determined by the Group’s external valuers. The combined value of the Group’s total investment property portfolio (including the Group’s share of investment properties held through joint ventures) is shown as a reconciliation in note 14.
Accounting policy
Investment propertiesInvestment properties are properties, either owned or leased by the Group, that are held either to earn rental income or for capital appreciation, or both. Investment properties are measured initially at cost including related transaction costs, and subsequently at fair value. Fair value is based on market value, as determined by a professional external valuer at each reporting date. The difference between the fair value of an investment property at the reporting date and its carrying amount prior to re-measurement is included in the income statement as a valuation surplus or deficit. Investment properties are presented on the balance sheet within non-current assets.
Some of the Group’s investment properties are owned through long-leasehold arrangements, as opposed to the Group owning the freehold. Where the Group is a lessee and the lease transfers substantially all the risks and rewards of ownership of the asset to the Group, the lease is accounted for as a finance lease. Finance leases are capitalised within investment properties at the commencement of the lease at the lower of the fair value of the property and the present value of the minimum lease payments, and a corresponding liability is recorded within borrowings. Each lease payment is allocated between repayment of the liability and a finance charge to achieve a constant rate of return on the outstanding liability. The investment properties held under finance leases are subsequently carried at their fair value.
Fina
ncia
l statem
ents
146 Landsec Annual Report 2019
Notes to the financial statementsfor the year ended 31 March 2019 continued
Trading propertiesTrading properties are those properties held for sale, or those being developed with a view to sell. Trading properties are recorded at the lower of cost and net realisable value. The net realisable value of a trading property is determined by a professional external valuer at each reporting date. If the net realisable value of a trading property is lower than its carrying value, an impairment loss is recorded in the income statement. If, in subsequent periods, the net realisable value of a trading property that was previously impaired increases above its carrying value, the impairment is reversed to align the carrying value of the property with the net realisable value. Trading properties are presented on the balance sheet within current assets.
Acquisition of propertiesProperties are treated as acquired when the Group assumes control of the property.
Capital expenditure and capitalisation of borrowing costsCapital expenditure on properties consists of costs of a capital nature, including costs associated with developments and refurbishments. Where a property is being developed or undergoing major refurbishment, interest costs associated with direct expenditure on the property are capitalised. The interest capitalised is calculated using the Group’s weighted average cost of borrowings. Interest is capitalised from the commencement of the development work until the date of practical completion. Certain internal staff and associated costs directly attributable to the management of major schemes are also capitalised.
Transfers between investment properties and trading propertiesWhen the Group begins to redevelop an existing investment property for continued future use as an investment property, the property continues to be held as an investment property. When the Group begins to redevelop an existing investment property with a view to sell, the property is transferred to trading properties and held as a current asset. The property is re-measured to fair value as at the date of the transfer with any gain or loss being taken to the income statement. The re-measured amount becomes the deemed cost at which the property is then carried in trading properties.
Disposal of propertiesProperties are treated as disposed when control of the property is transferred to the buyer. Typically, this will either occur on unconditional exchange or on completion. Where completion is expected to occur significantly after exchange, or where the Group continues to have significant outstanding obligations after exchange, the control will not usually transfer to the buyer until completion.
The profit on disposal is determined as the difference between the sales proceeds and the carrying amount of the asset at the beginning of the accounting period plus capital expenditure to the date of disposal. The profit on disposal of investment properties is presented separately on the face of the income statement. Proceeds received on the sale of trading properties are recognised within Revenue, and the carrying value at the date of disposal is recognised within Costs.
Significant accounting judgement
Acquisition and disposal of propertiesProperty transactions can be complex in nature and material to the financial statements. To determine when an acquisition or disposal should be recognised, management consider whether the Group assumes or relinquishes control of the property, and the point at which this is obtained or relinquished. Consideration is given to the terms of the acquisition or disposal contracts and any conditions that must be satisfied before the contract is fulfilled. In the case of an acquisition, management must also consider whether the transaction represents an asset acquisition or business combination.
Significant accounting estimate
Valuation of the Group’s propertiesThe valuation of the Group’s property portfolio is inherently subjective due to, among other factors, the individual nature of each property, its location and the expected future rental revenues from that particular property. As a result, the valuations the Group places on its property portfolio are subject to a degree of uncertainty and are made on the basis of assumptions which may not prove to be accurate, particularly in periods of volatility or low transaction flow in the property market.
The investment property valuation contains a number of assumptions upon which the Group’s valuer has based its valuation of the Group’s properties. The assumptions on which the property valuation reports have been based include, but are not limited to, matters such as the tenure and tenancy details for the properties, ground conditions at the properties, the structural condition of the properties, prevailing market yields and comparable market transactions. These assumptions are market standard and accord with the Royal Institution of Chartered Surveyors (RICS) Valuation – Professional Standards UK 2014 (revised April 2015).
The estimation of the net realisable value of the Group’s trading properties, in particular the development land and infrastructure programmes, is inherently subjective due to a number of factors, including their complexity, unusually large size, the substantial expenditure required and long timescales to completion. In addition, as a result of these timescales to completion, the plans associated with these programmes could be subject to significant variation. As a result, and similar to the valuation of investment properties, the net realisable values of the Group’s trading properties are subject to a degree of uncertainty and are determined on the basis of assumptions which may not prove to be accurate.
If the assumptions upon which the external valuer has based its valuations prove to be inaccurate, this may have an impact on the value of the Group’s investment and trading properties, which could in turn have an effect on the Group’s financial position and results.
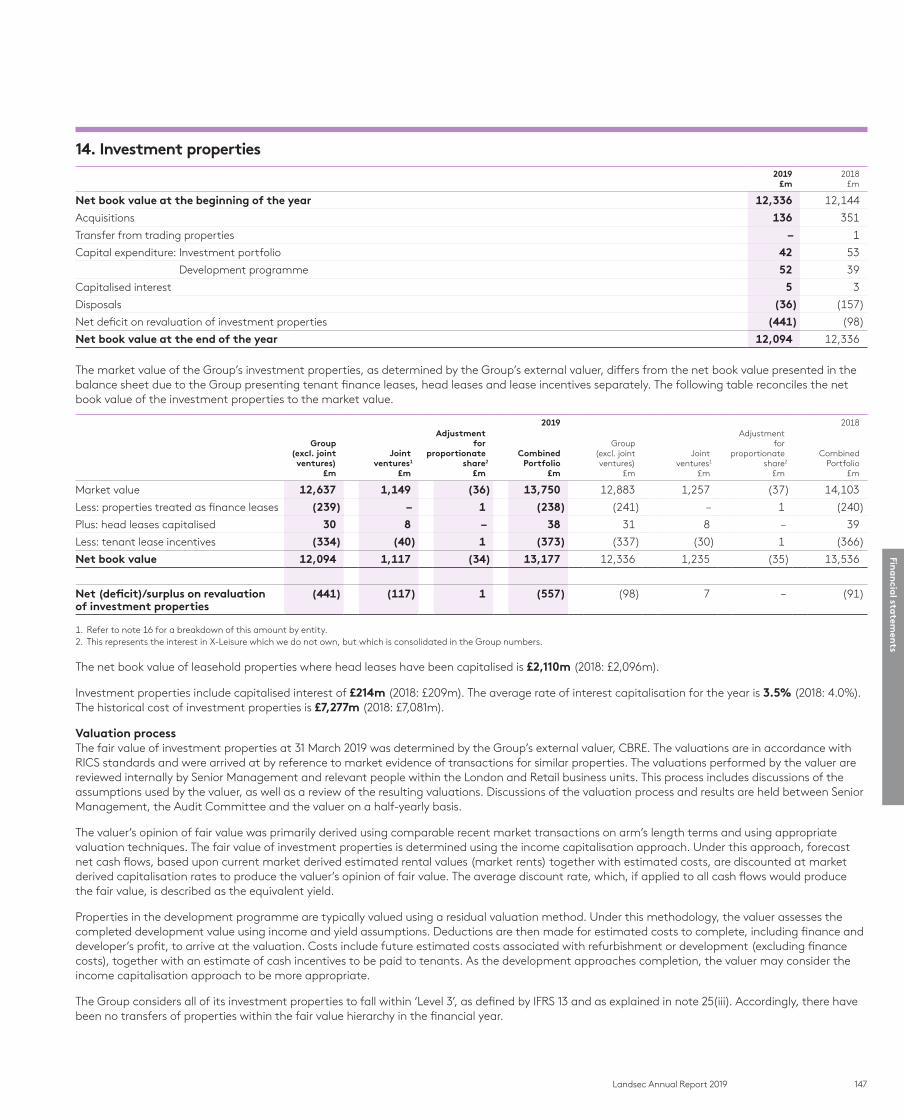
147Landsec Annual Report 2019
14. Investment properties2019
£m2018
£m
Net book value at the beginning of the year 12,336 12,144
Acquisitions 136 351
Transfer from trading properties – 1
Capital expenditure: Investment portfolio 42 53
Development programme 52 39
Capitalised interest 5 3
Disposals (36) (157)
Net deficit on revaluation of investment properties (441) (98)
Net book value at the end of the year 12,094 12,336
The market value of the Group’s investment properties, as determined by the Group’s external valuer, differs from the net book value presented in the balance sheet due to the Group presenting tenant finance leases, head leases and lease incentives separately. The following table reconciles the net book value of the investment properties to the market value.
2019 2018
Group (excl. joint
ventures)£m
Joint ventures1
£m
Adjustment for
proportionate share2
£m
Combined Portfolio
£m
Group (excl. joint
ventures)£m
Joint ventures1
£m
Adjustment for
proportionateshare2
£m
Combined Portfolio
£m
Market value 12,637 1,149 (36) 13,750 12,883 1,257 (37) 14,103
Less: properties treated as finance leases (239) – 1 (238) (241) – 1 (240)
Plus: head leases capitalised 30 8 – 38 31 8 – 39
Less: tenant lease incentives (334) (40) 1 (373) (337) (30) 1 (366)
Net book value 12,094 1,117 (34) 13,177 12,336 1,235 (35) 13,536
Net (deficit)/surplus on revaluation of investment properties
(441) (117) 1 (557) (98) 7 – (91)
1. Refer to note 16 for a breakdown of this amount by entity.2. This represents the interest in X-Leisure which we do not own, but which is consolidated in the Group numbers.
The net book value of leasehold properties where head leases have been capitalised is £2,110m (2018: £2,096m).
Investment properties include capitalised interest of £214m (2018: £209m). The average rate of interest capitalisation for the year is 3.5% (2018: 4.0%). The historical cost of investment properties is £7,277m (2018: £7,081m).
Valuation processThe fair value of investment properties at 31 March 2019 was determined by the Group’s external valuer, CBRE. The valuations are in accordance with RICS standards and were arrived at by reference to market evidence of transactions for similar properties. The valuations performed by the valuer are reviewed internally by Senior Management and relevant people within the London and Retail business units. This process includes discussions of the assumptions used by the valuer, as well as a review of the resulting valuations. Discussions of the valuation process and results are held between Senior Management, the Audit Committee and the valuer on a half-yearly basis.
The valuer’s opinion of fair value was primarily derived using comparable recent market transactions on arm’s length terms and using appropriate valuation techniques. The fair value of investment properties is determined using the income capitalisation approach. Under this approach, forecast net cash flows, based upon current market derived estimated rental values (market rents) together with estimated costs, are discounted at market derived capitalisation rates to produce the valuer’s opinion of fair value. The average discount rate, which, if applied to all cash flows would produce the fair value, is described as the equivalent yield.
Properties in the development programme are typically valued using a residual valuation method. Under this methodology, the valuer assesses the completed development value using income and yield assumptions. Deductions are then made for estimated costs to complete, including finance and developer’s profit, to arrive at the valuation. Costs include future estimated costs associated with refurbishment or development (excluding finance costs), together with an estimate of cash incentives to be paid to tenants. As the development approaches completion, the valuer may consider the income capitalisation approach to be more appropriate.
The Group considers all of its investment properties to fall within ‘Level 3’, as defined by IFRS 13 and as explained in note 25(iii). Accordingly, there have been no transfers of properties within the fair value hierarchy in the financial year.
Fina
ncia
l statem
ents

148 Landsec Annual Report 2019
Notes to the financial statementsfor the year ended 31 March 2019 continued
14. Investment properties continued
The table below summarises the key unobservable inputs used in the valuation of the Group’s wholly owned investment properties at 31 March 2019:
2019
Market value
£m
Estimated rental value£ per sq ft
Equivalent yield%
Costs£ per sq ft
Low Average High Low Average High Low Average1 High
Retail Portfolio
Shopping centres and shops 2,184 18 30 48 4.1% 5.0% 7.3% – 7 23
Outlets 971 23 47 55 4.7% 5.4% 7.1% – 3 18
Retail parks 636 11 20 26 4.8% 6.2% 9.0% – 1 10
Leisure and hotels 1,267 6 15 33 3.8% 5.5% 8.9% – 1 9
Other2 16 n/a n/a n/a n/a n/a n/a n/a n/a n/a
Total Retail Portfolio (excluding developments)
5,074 6 28 55 3.8% 5.4% 9.0% – 4 23
London Portfolio
West End 2,838 20 64 91 4.0% 4.5% 4.9% – 8 937
City 1,221 55 61 65 4.2% 4.5% 5.8% – 1 55
Mid-town 1,400 31 60 64 4.3% 4.5% 4.6% – 7 11
Inner London 430 27 42 63 1.8% 4.8% 5.5% – 1 610
Total London offices 5,889 20 61 91 1.8% 4.5% 5.8% – 6 937
Central London shops 1,372 19 85 179 3.1% 4.0% 6.5% – – 937
Other2 32 n/a n/a n/a n/a n/a n/a n/a n/a n/a
Total London Portfolio (excluding developments)
7,293 19 65 179 1.8% 4.4% 6.5% – 5 937
Developments: residual method 270 71 71 71 4.4% 4.4% 4.4% – – –
Development programme 270 71 71 71 4.4% 4.4% 4.4% – – –
Market value at 31 March 2019 – Group 12,637
1. The calculation for average costs excludes those properties which are assumed by the Group’s external valuer to be substantially refurbished or redeveloped, but which do not yet form part of the development programme.
2. The ‘Other’ category contains a range of low value properties of a diverse nature. As a result it is not meaningful to present assumptions used in valuing these properties.
The sensitivities illustrate the impact of changes in key unobservable inputs (in isolation) on the fair value of the Group’s properties:
Sensitivities 2019
Market value
£m
Impact on valuations of 5% change in
estimated rental value
Impact on valuations of 25 bps change in
equivalent yieldImpact on valuations of 5% change in costs
Increase£m
Decrease£m
Decrease£m
Increase£m
Decrease£m
Increase£m
Total Retail Portfolio (excluding developments) 5,074 215 (207) 261 (235) 2 (2)
Total London Portfolio (excluding developments) 7,293 268 (263) 443 (391) 24 (22)
Developments: residual method 270 11 (11) 38 (34) 12 (12)
Market value at 31 March 2019 – Group 12,637
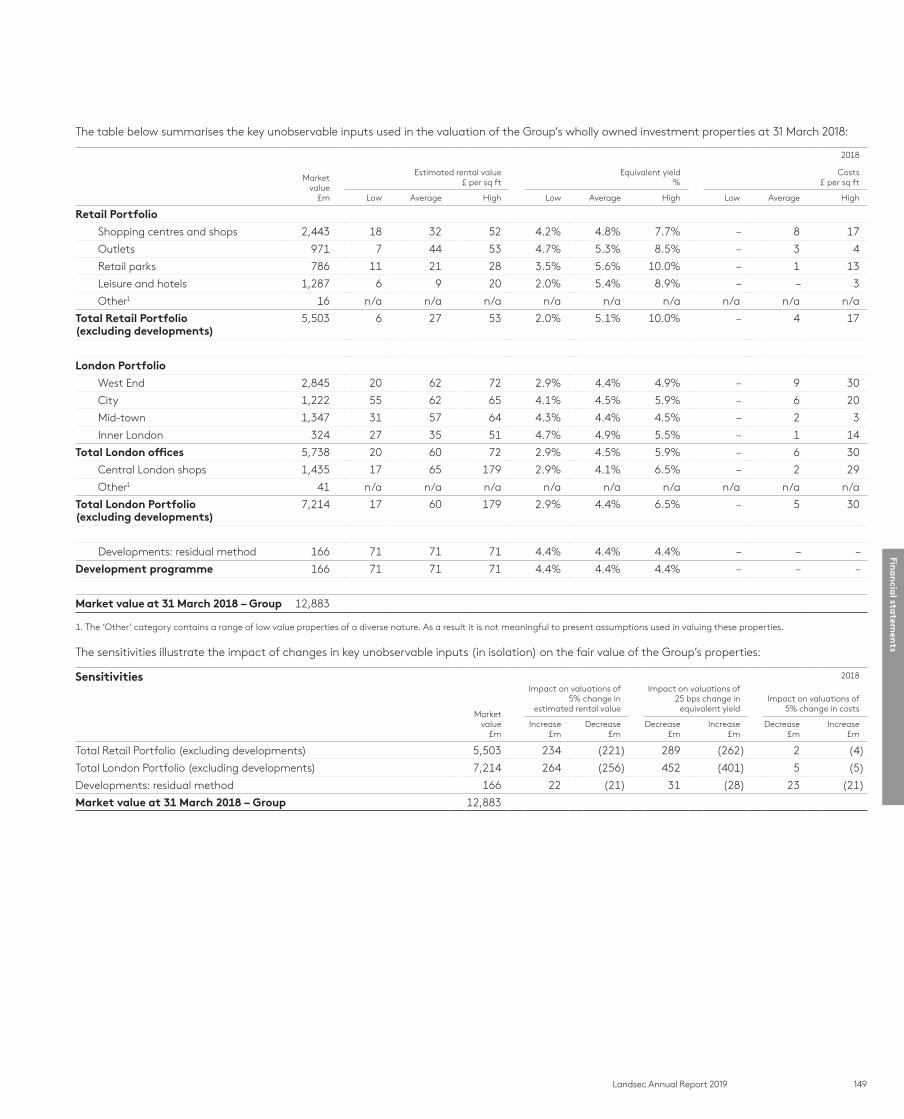
149Landsec Annual Report 2019
The table below summarises the key unobservable inputs used in the valuation of the Group’s wholly owned investment properties at 31 March 2018:
2018
Market value
£m
Estimated rental value£ per sq ft
Equivalent yield%
Costs£ per sq ft
Low Average High Low Average High Low Average High
Retail Portfolio
Shopping centres and shops 2,443 18 32 52 4.2% 4.8% 7.7% – 8 17
Outlets 971 7 44 53 4.7% 5.3% 8.5% – 3 4
Retail parks 786 11 21 28 3.5% 5.6% 10.0% – 1 13
Leisure and hotels 1,287 6 9 20 2.0% 5.4% 8.9% – – 3
Other1 16 n/a n/a n/a n/a n/a n/a n/a n/a n/a
Total Retail Portfolio (excluding developments)
5,503 6 27 53 2.0% 5.1% 10.0% – 4 17
London Portfolio
West End 2,845 20 62 72 2.9% 4.4% 4.9% – 9 30
City 1,222 55 62 65 4.1% 4.5% 5.9% – 6 20
Mid-town 1,347 31 57 64 4.3% 4.4% 4.5% – 2 3
Inner London 324 27 35 51 4.7% 4.9% 5.5% – 1 14
Total London offices 5,738 20 60 72 2.9% 4.5% 5.9% – 6 30
Central London shops 1,435 17 65 179 2.9% 4.1% 6.5% – 2 29
Other1 41 n/a n/a n/a n/a n/a n/a n/a n/a n/a
Total London Portfolio (excluding developments)
7,214 17 60 179 2.9% 4.4% 6.5% – 5 30
Developments: residual method 166 71 71 71 4.4% 4.4% 4.4% – – –
Development programme 166 71 71 71 4.4% 4.4% 4.4% – – –
Market value at 31 March 2018 – Group 12,883
1. The ‘Other’ category contains a range of low value properties of a diverse nature. As a result it is not meaningful to present assumptions used in valuing these properties.
The sensitivities illustrate the impact of changes in key unobservable inputs (in isolation) on the fair value of the Group’s properties:
Sensitivities 2018
Market value
£m
Impact on valuations of 5% change in
estimated rental value
Impact on valuations of 25 bps change in
equivalent yieldImpact on valuations of
5% change in costs
Increase£m
Decrease£m
Decrease£m
Increase£m
Decrease£m
Increase£m
Total Retail Portfolio (excluding developments) 5,503 234 (221) 289 (262) 2 (4)
Total London Portfolio (excluding developments) 7,214 264 (256) 452 (401) 5 (5)
Developments: residual method 166 22 (21) 31 (28) 23 (21)
Market value at 31 March 2018 – Group 12,883
Fina
ncia
l statem
ents

150 Landsec Annual Report 2019
Notes to the financial statementsfor the year ended 31 March 2019 continued
15. Trading propertiesDevelopment
land and infrastructure
£mResidential
£mTotal
£m
At 1 April 2017 108 14 122
Capital expenditure 17 (2) 15
Disposals (104) (8) (112)
Transfer to investment properties – (1) (1)
31 March 2018 21 3 24
Acquisitions – 4 4
Capital expenditure 2 – 2
Disposals – (7) (7)
At 31 March 2019 23 – 23
The cumulative impairment provision at 31 March 2019 in respect of Development land and infrastructure was £nil (31 March 2018: £nil); and in respect of Residential was £nil (31 March 2018: £1m).
16. Joint arrangements
Accounting policy
Joint arrangements are those entities over whose activities the Group has joint control, established by contractual agreement. Interests in joint arrangements are accounted for as either a joint venture or a joint operation. The treatment as either a joint venture or a joint operation will depend on whether the Group has rights to the net assets, or a direct interest in the assets and liabilities of the arrangement.
A joint arrangement is accounted for as a joint venture when the Group, along with the other parties that have joint control of the arrangement, has rights to the net assets of the arrangement. Interests in joint ventures are accounted for using the equity method of accounting. The equity method requires the Group’s share of the joint venture’s post-tax profit or loss for the year to be presented separately in the income statement and the Group’s share of the joint venture’s net assets to be presented separately in the balance sheet.
A joint arrangement is accounted for as a joint operation when the Group, along with the parties that have joint control of the arrangement, have rights to the assets and obligations for the liabilities relating to the arrangement. The Group’s share of jointly controlled assets, related liabilities, income and expenses are combined with the equivalent items in the financial statements on a line-by-line basis.

151Landsec Annual Report 2019
The Group’s principal joint arrangements are described below:
Joint ventures Percentage owned & voting rights
Business segment Year end date1 Joint venture partner
Held at 31 March 2019
Nova, Victoria2 50% London 31 March Canada Pension Plan Investment Board
Southside Limited Partnership 50% Retail 31 March Invesco Real Estate European Fund
St. David’s Limited Partnership 50% Retail 31 December Intu Properties plc
Westgate Oxford Alliance Limited Partnership 50% Retail 31 March The Crown Estate Commissioners
Harvest3, 4 50% Retail 31 March J Sainsbury plc
The Ebbsfleet Limited Partnership3 50% London 31 March Ebbsfleet Property Limited
West India Quay Unit Trust3, 5 50% Retail 31 March Schroder Exempt Property Unit Trust
Joint operation Ownership interest
Business segment Year end date1 Joint operation partners
Bluewater, Kent 30% Retail 31 March M&G Real Estate and GICLendlease Retail LPRoyal London Asset ManagementAberdeen Asset Management
The Group acquired the remaining 50% interest in the following joint arrangement in the year ended 31 March 2019:
Joint venture Ownership interest
Business segment Year end date1 Joint venture partner
The Oriana Limited Partnership3, 6 50% London 31 March Frogmore Real Estate Partners Limited Partnership
1. The year end date shown is the accounting reference date of the joint arrangement. In all cases, the Group’s accounting is performed using financial information for the Group’s own reporting period and reporting date.
2. Nova, Victoria includes the Victoria Circle Limited Partnership, Nova Residential Limited Partnership and Victoria Circle Developer Limited.3. Included within Other in subsequent tables.4. Harvest includes Harvest 2 Limited Partnership, Harvest Development Management Limited, Harvest 2 Selly Oak Limited, Harvest 2 GP Limited and Harvest GP Limited.5. West India Quay Unit Trust is held in the X-Leisure Unit Trust (X-Leisure) in which the Group holds a 95% share.6. On 12 April 2018, the Group purchased the remaining 50% interest in The Oriana Limited Partnership which it did not already own for consideration of £4m. The Group therefore owns 100%
of the share capital at 31 March 2019.
All of the Group’s joint arrangements have their principal place of business in the United Kingdom. All of the Group’s joint arrangements own and operate investment property, with the exception of The Ebbsfleet Limited Partnership which holds development land as a trading property. The Westgate Oxford Alliance Limited Partnership and Nova, Victoria are also engaged in the development of investment and trading properties. The activities of all the Group’s joint arrangements are therefore strategically important to the business activities of the Group.
All joint ventures are registered in England and Wales with the exception of Southside Limited Partnership and West India Quay Unit Trust which are registered in Jersey.
Fina
ncia
l statem
ents

152 Landsec Annual Report 2019
Notes to the financial statementsfor the year ended 31 March 2019 continued
16. Joint arrangements continued
Joint ventures Year ended 31 March 2019
Comprehensive income statement
Nova, Victoria
100%£m
Southside Limited
Partnership100%
£m
St. David’s Limited
Partnership100%
£m
Westgate Oxford
Alliance Partnership
100%£m
Other100%
£m
Total100%
£m
TotalGroup share
£m
Revenue1 97 13 44 38 66 258 129
Gross rental income (after rents payable) 32 13 35 26 3 109 54
Net rental income 28 10 26 20 3 87 43
Segment profit before finance expense 25 10 26 19 3 83 41
Finance expense (33) (6) – – – (39) (19)
Net finance expense (33) (6) – – – (39) (19)
Revenue (loss)/profit (8) 4 26 19 3 44 22
Capital and other items
Net deficit on revaluation of investment properties (25) (32) (101) (74) (1) (233) (117)
Movement in impairment of trading properties (1) – – – – (1) –
Loss on disposal of investment properties – – – – (4) (4) (2)
Fair value movement prior to acquisition of non-owned element of a joint venture
– – – – 17 17 9
(Loss)/profit on disposal of trading properties (3) – – 1 3 1 –
Profit on long-term development contracts – – – – 7 7 3
(Loss)/profit before tax (37) (28) (75) (54) 25 (169) (85)
Post-tax (loss)/profit (37) (28) (75) (54) 25 (169) (85)
Total comprehensive (loss)/income (37) (28) (75) (54) 25 (169) (85)
50% 50% 50% 50% 50% 50%
Group share of (loss)/profit before tax (19) (14) (38) (27) 13 (85) (85)
Group share of post-tax (loss)/profit (19) (14) (38) (27) 13 (85) (85)
Group share of total comprehensive (loss)/income (19) (14) (38) (27) 13 (85) (85)
1. Revenue includes gross rental income (before rents payable), service charge income, other property related income, trading properties disposal proceeds and income from long-term development contracts.
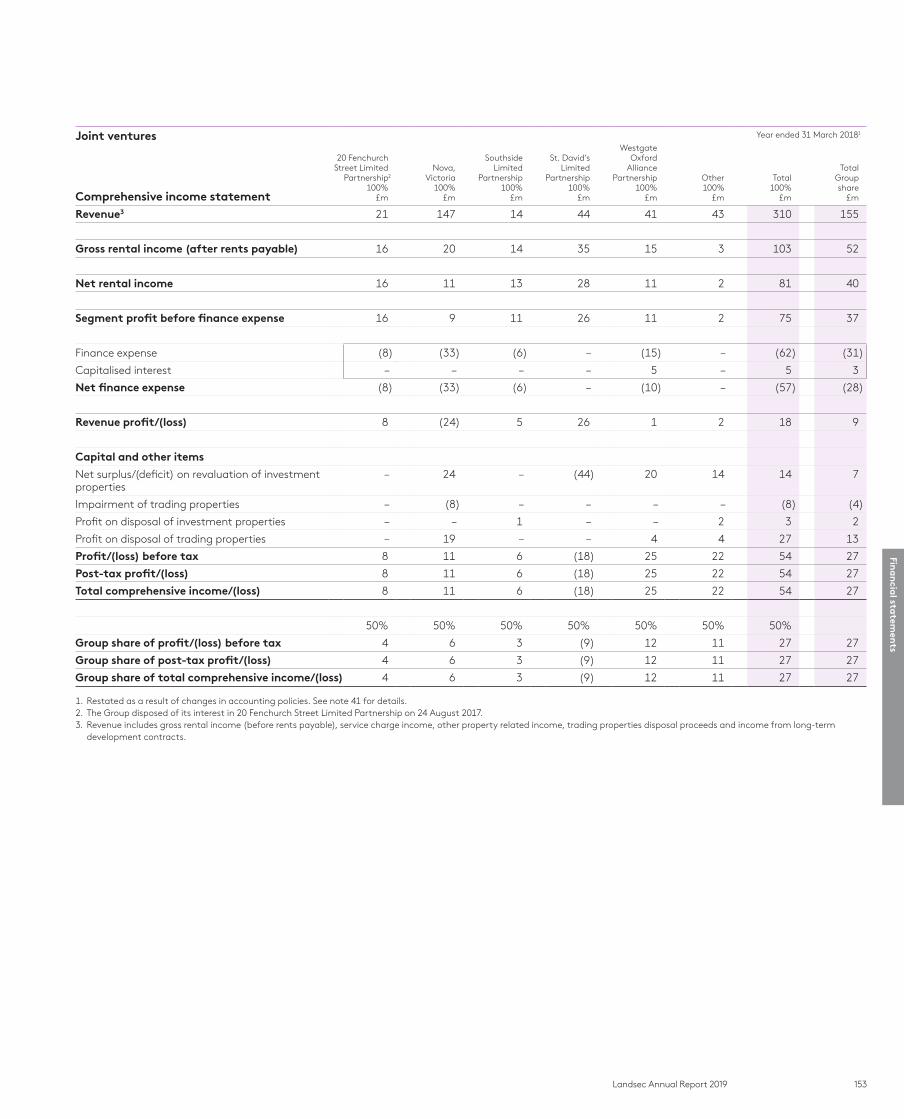
153Landsec Annual Report 2019
Joint ventures Year ended 31 March 20181
Comprehensive income statement
20 Fenchurch Street Limited
Partnership2
100%£m
Nova, Victoria
100%£m
Southside Limited
Partnership100%
£m
St. David’s Limited
Partnership100%
£m
Westgate Oxford
Alliance Partnership
100%£m
Other100%
£m
Total100%
£m
TotalGroup share
£m
Revenue3 21 147 14 44 41 43 310 155
Gross rental income (after rents payable) 16 20 14 35 15 3 103 52
Net rental income 16 11 13 28 11 2 81 40
Segment profit before finance expense 16 9 11 26 11 2 75 37
Finance expense (8) (33) (6) – (15) – (62) (31)
Capitalised interest – – – – 5 – 5 3
Net finance expense (8) (33) (6) – (10) – (57) (28)
Revenue profit/(loss) 8 (24) 5 26 1 2 18 9
Capital and other items
Net surplus/(deficit) on revaluation of investment properties
– 24 – (44) 20 14 14 7
Impairment of trading properties – (8) – – – – (8) (4)
Profit on disposal of investment properties – – 1 – – 2 3 2
Profit on disposal of trading properties – 19 – – 4 4 27 13
Profit/(loss) before tax 8 11 6 (18) 25 22 54 27
Post-tax profit/(loss) 8 11 6 (18) 25 22 54 27
Total comprehensive income/(loss) 8 11 6 (18) 25 22 54 27
50% 50% 50% 50% 50% 50% 50%
Group share of profit/(loss) before tax 4 6 3 (9) 12 11 27 27
Group share of post-tax profit/(loss) 4 6 3 (9) 12 11 27 27
Group share of total comprehensive income/(loss) 4 6 3 (9) 12 11 27 27
1. Restated as a result of changes in accounting policies. See note 41 for details.2. The Group disposed of its interest in 20 Fenchurch Street Limited Partnership on 24 August 2017.3. Revenue includes gross rental income (before rents payable), service charge income, other property related income, trading properties disposal proceeds and income from long-term
development contracts.
Fina
ncia
l statem
ents

154 Landsec Annual Report 2019
Notes to the financial statementsfor the year ended 31 March 2019 continued
16. Joint arrangements continued
Joint ventures 2019
Balance sheet
Nova, Victoria
100%£m
Southside Limited
Partnership100%
£m
St. David’s Limited
Partnership100%
£m
Westgate Oxford
Alliance Partnership
100%£m
Other100%
£m
Total100%
£m
TotalGroup share
£m
Investment properties1 843 263 562 495 71 2,234 1,117
Non-current assets 843 263 562 495 71 2,234 1,117
Cash and cash equivalents 10 4 1 13 4 32 16
Other current assets 68 4 17 22 161 272 136
Current assets 78 8 18 35 165 304 152
Total assets 921 271 580 530 236 2,538 1,269
Trade and other payables and provisions (26) (6) (11) (13) (85) (141) (70)
Current liabilities (26) (6) (11) (13) (85) (141) (70)
Non-current liabilities (178) (142) (16) – – (336) (168)
Non-current liabilities (178) (142) (16) – – (336) (168)
Total liabilities (204) (148) (27) (13) (85) (477) (238)
Net assets 717 123 553 517 151 2,061 1,031
Market value of investment properties1 893 265 557 511 72 2,298 1,149
Net cash/(debt) 11 4 (13) 14 4 20 10
2018
Balance sheet Investment properties1 845 295 664 549 117 2,470 1,235
Non-current assets 845 295 664 549 117 2,470 1,235
Cash and cash equivalents 7 2 2 10 12 33 16
Other current assets 101 8 18 21 39 187 94
Current assets 108 10 20 31 51 220 110
Total assets 953 305 684 580 168 2,690 1,345
Trade and other payables and provisions (24) (5) (12) (15) (10) (66) (33)
Current liabilities (24) (5) (12) (15) (10) (66) (33)
Non-current financial liabilities (144) (143) (16) – (18) (321) (161)
Non-current liabilities (144) (143) (16) – (18) (321) (161)
Total liabilities (168) (148) (28) (15) (28) (387) (194)
Net assets 785 157 656 565 140 2,303 1,151
Market value of investment properties1 874 298 661 562 118 2,513 1,257
Net cash/(debt) 7 1 (15) 10 12 15 8
1. The difference between the book value and the market value of investment properties is the amount recognised in respect of lease incentives, head leases capitalised and properties treated as finance leases, where applicable.
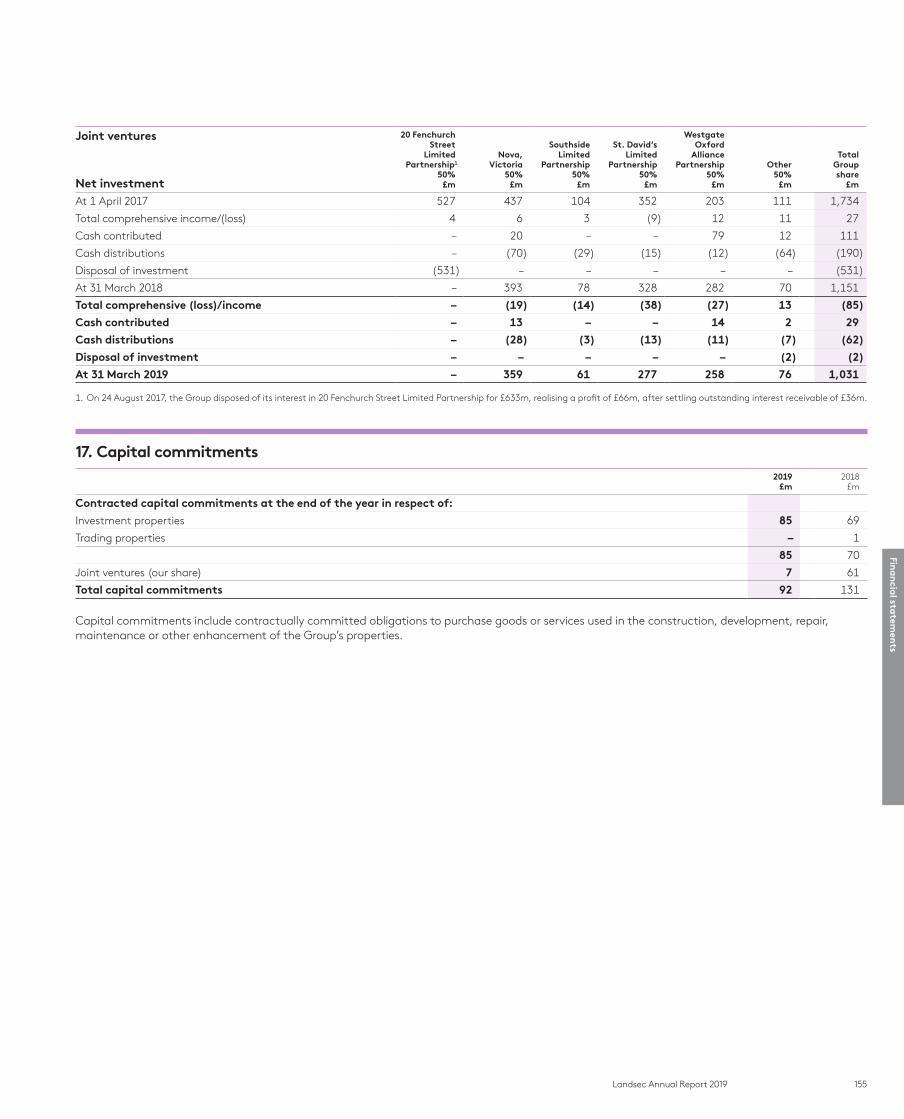
155Landsec Annual Report 2019
Joint ventures
Net investment
20 Fenchurch Street
Limited Partnership1
50%£m
Nova, Victoria
50%£m
Southside Limited
Partnership50%
£m
St. David’s Limited
Partnership50%
£m
Westgate Oxford
Alliance Partnership
50%£m
Other50%
£m
TotalGroup share
£m
At 1 April 2017 527 437 104 352 203 111 1,734
Total comprehensive income/(loss) 4 6 3 (9) 12 11 27
Cash contributed – 20 – – 79 12 111
Cash distributions – (70) (29) (15) (12) (64) (190)
Disposal of investment (531) – – – – – (531)
At 31 March 2018 – 393 78 328 282 70 1,151
Total comprehensive (loss)/income – (19) (14) (38) (27) 13 (85)
Cash contributed – 13 – – 14 2 29
Cash distributions – (28) (3) (13) (11) (7) (62)
Disposal of investment – – – – – (2) (2)
At 31 March 2019 – 359 61 277 258 76 1,031
1. On 24 August 2017, the Group disposed of its interest in 20 Fenchurch Street Limited Partnership for £633m, realising a profit of £66m, after settling outstanding interest receivable of £36m.
17. Capital commitments2019
£m2018
£m
Contracted capital commitments at the end of the year in respect of:
Investment properties 85 69
Trading properties – 1
85 70
Joint ventures (our share) 7 61
Total capital commitments 92 131
Capital commitments include contractually committed obligations to purchase goods or services used in the construction, development, repair, maintenance or other enhancement of the Group’s properties.
Fina
ncia
l statem
ents
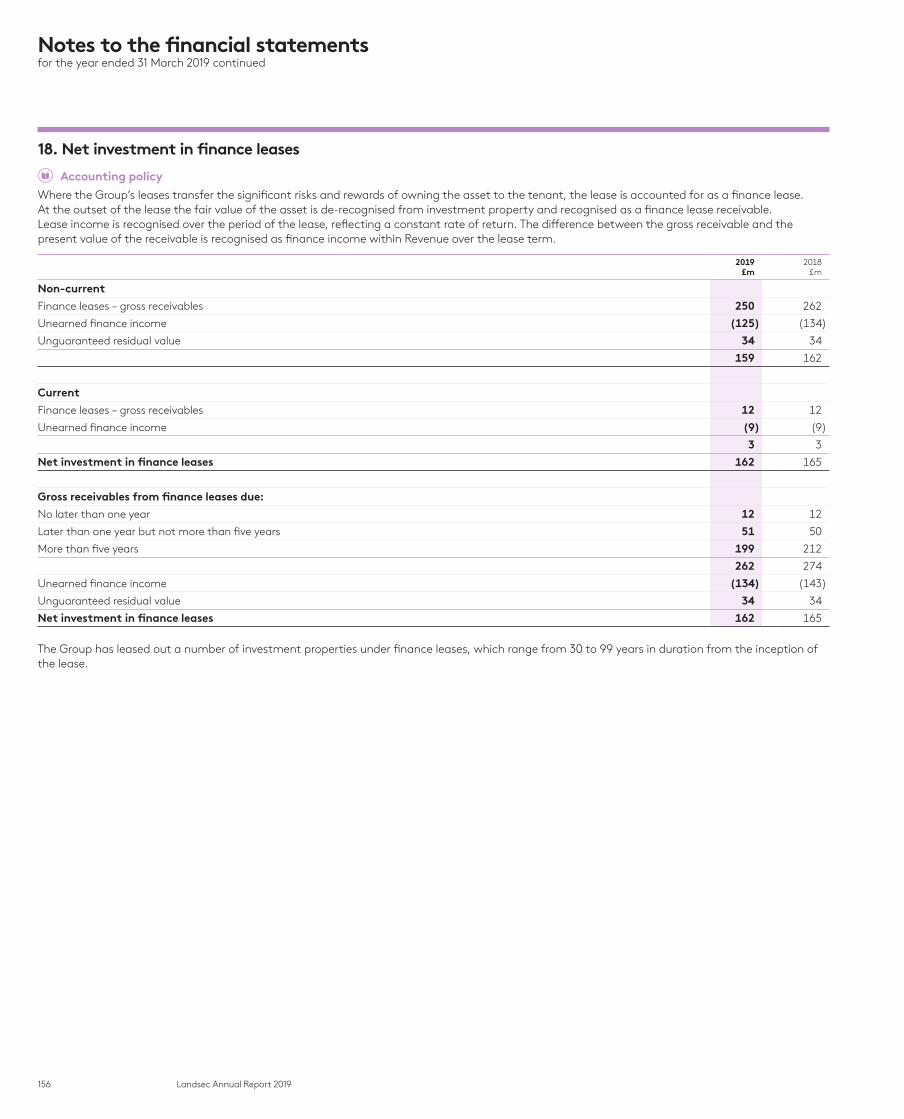
156 Landsec Annual Report 2019
Notes to the financial statementsfor the year ended 31 March 2019 continued
18. Net investment in finance leases
Accounting policy
Where the Group’s leases transfer the significant risks and rewards of owning the asset to the tenant, the lease is accounted for as a finance lease. At the outset of the lease the fair value of the asset is de-recognised from investment property and recognised as a finance lease receivable. Lease income is recognised over the period of the lease, reflecting a constant rate of return. The difference between the gross receivable and the present value of the receivable is recognised as finance income within Revenue over the lease term.
2019 £m
2018£m
Non-current
Finance leases – gross receivables 250 262
Unearned finance income (125) (134)
Unguaranteed residual value 34 34
159 162
Current
Finance leases – gross receivables 12 12
Unearned finance income (9) (9)
3 3
Net investment in finance leases 162 165
Gross receivables from finance leases due:
No later than one year 12 12
Later than one year but not more than five years 51 50
More than five years 199 212
262 274
Unearned finance income (134) (143)
Unguaranteed residual value 34 34
Net investment in finance leases 162 165
The Group has leased out a number of investment properties under finance leases, which range from 30 to 99 years in duration from the inception of the lease.
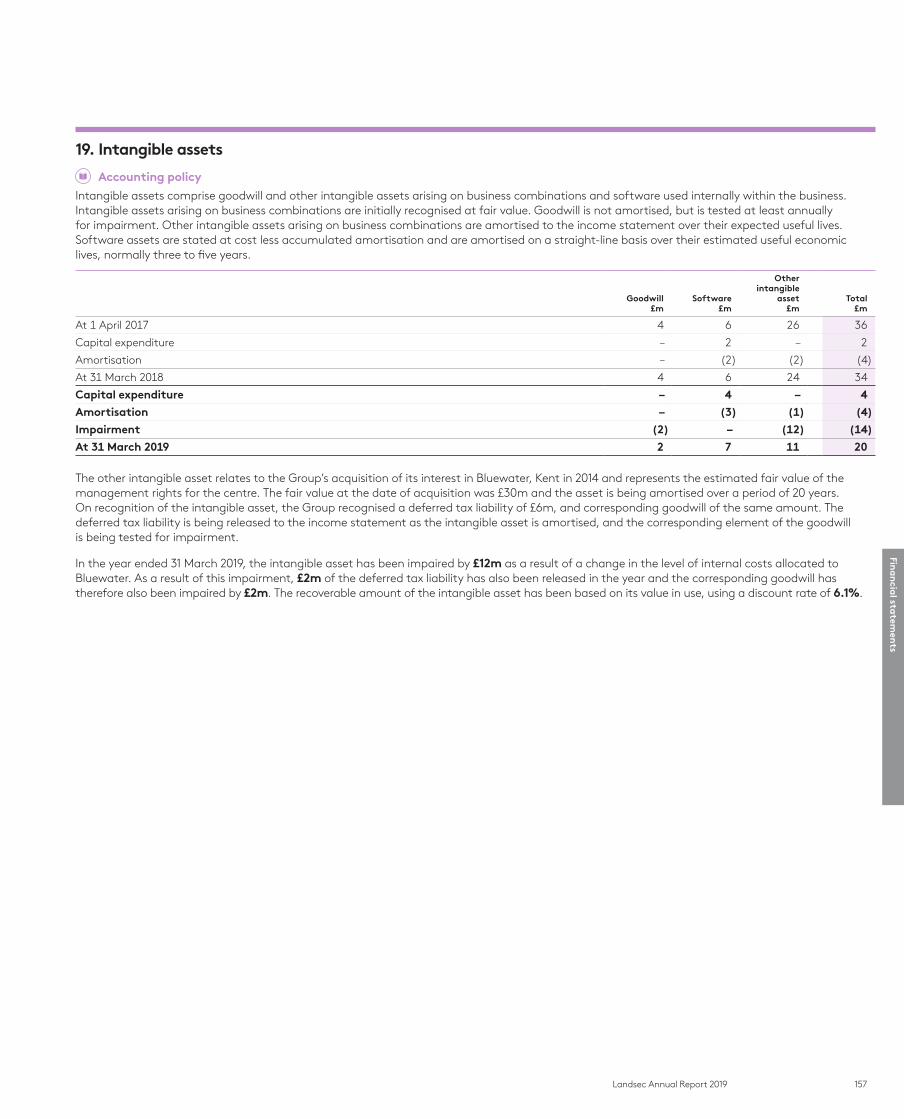
157Landsec Annual Report 2019
19. Intangible assets
Accounting policy
Intangible assets comprise goodwill and other intangible assets arising on business combinations and software used internally within the business. Intangible assets arising on business combinations are initially recognised at fair value. Goodwill is not amortised, but is tested at least annually for impairment. Other intangible assets arising on business combinations are amortised to the income statement over their expected useful lives. Software assets are stated at cost less accumulated amortisation and are amortised on a straight-line basis over their estimated useful economic lives, normally three to five years.
Goodwill£m
Software£m
Other intangible
asset£m
Total£m
At 1 April 2017 4 6 26 36
Capital expenditure – 2 – 2
Amortisation – (2) (2) (4)
At 31 March 2018 4 6 24 34
Capital expenditure – 4 – 4
Amortisation – (3) (1) (4)
Impairment (2) – (12) (14)
At 31 March 2019 2 7 11 20
The other intangible asset relates to the Group’s acquisition of its interest in Bluewater, Kent in 2014 and represents the estimated fair value of the management rights for the centre. The fair value at the date of acquisition was £30m and the asset is being amortised over a period of 20 years. On recognition of the intangible asset, the Group recognised a deferred tax liability of £6m, and corresponding goodwill of the same amount. The deferred tax liability is being released to the income statement as the intangible asset is amortised, and the corresponding element of the goodwill is being tested for impairment.
In the year ended 31 March 2019, the intangible asset has been impaired by £12m as a result of a change in the level of internal costs allocated to Bluewater. As a result of this impairment, £2m of the deferred tax liability has also been released in the year and the corresponding goodwill has therefore also been impaired by £2m. The recoverable amount of the intangible asset has been based on its value in use, using a discount rate of 6.1%.
Fina
ncia
l statem
ents
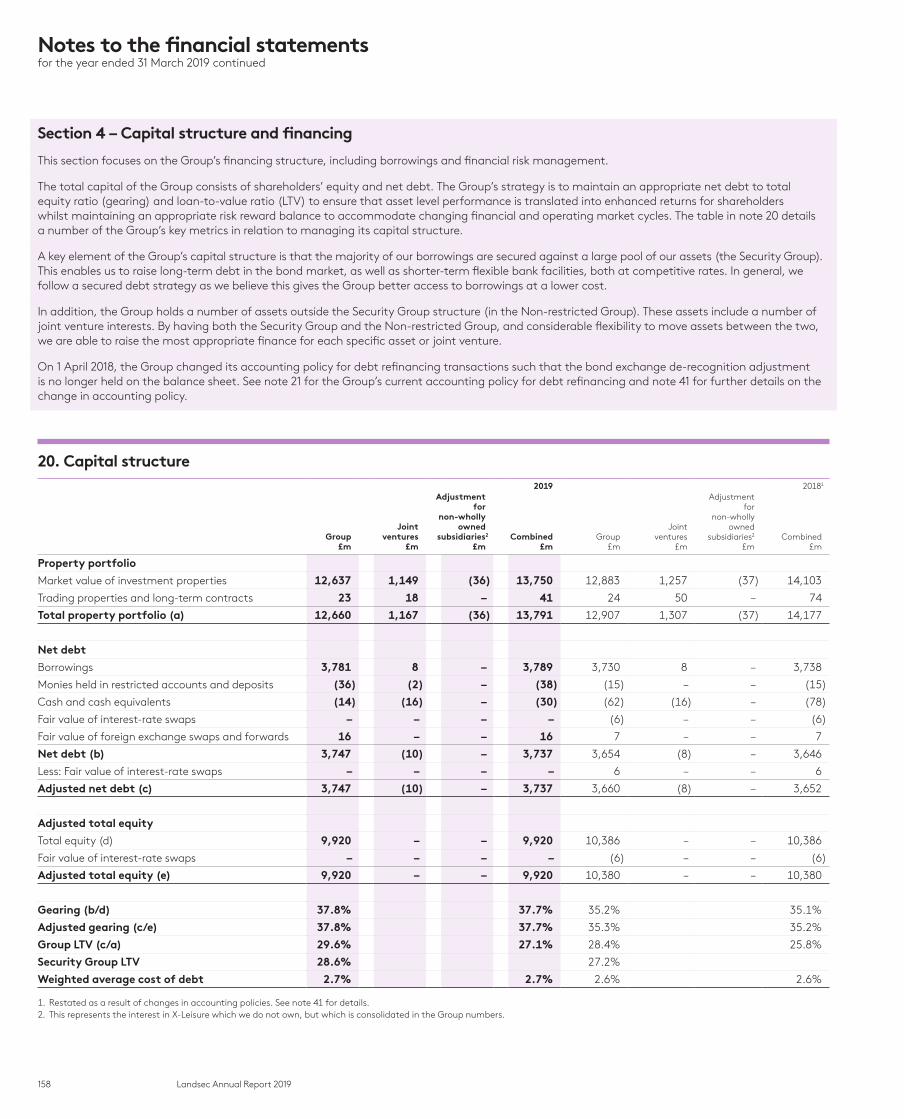
158 Landsec Annual Report 2019
Notes to the financial statementsfor the year ended 31 March 2019 continued
Section 4 – Capital structure and financing
This section focuses on the Group’s financing structure, including borrowings and financial risk management.
The total capital of the Group consists of shareholders’ equity and net debt. The Group’s strategy is to maintain an appropriate net debt to total equity ratio (gearing) and loan-to-value ratio (LTV) to ensure that asset level performance is translated into enhanced returns for shareholders whilst maintaining an appropriate risk reward balance to accommodate changing financial and operating market cycles. The table in note 20 details a number of the Group’s key metrics in relation to managing its capital structure.
A key element of the Group’s capital structure is that the majority of our borrowings are secured against a large pool of our assets (the Security Group). This enables us to raise long-term debt in the bond market, as well as shorter-term flexible bank facilities, both at competitive rates. In general, we follow a secured debt strategy as we believe this gives the Group better access to borrowings at a lower cost.
In addition, the Group holds a number of assets outside the Security Group structure (in the Non-restricted Group). These assets include a number of joint venture interests. By having both the Security Group and the Non-restricted Group, and considerable flexibility to move assets between the two, we are able to raise the most appropriate finance for each specific asset or joint venture.
On 1 April 2018, the Group changed its accounting policy for debt refinancing transactions such that the bond exchange de-recognition adjustment is no longer held on the balance sheet. See note 21 for the Group’s current accounting policy for debt refinancing and note 41 for further details on the change in accounting policy.
20. Capital structure2019 20181
Group£m
Joint ventures
£m
Adjustment for
non-wholly owned
subsidiaries2
£mCombined
£mGroup
£m
Joint ventures
£m
Adjustment for
non-wholly owned
subsidiaries2
£mCombined
£m
Property portfolio
Market value of investment properties 12,637 1,149 (36) 13,750 12,883 1,257 (37) 14,103
Trading properties and long-term contracts 23 18 – 41 24 50 – 74
Total property portfolio (a) 12,660 1,167 (36) 13,791 12,907 1,307 (37) 14,177
Net debt
Borrowings 3,781 8 – 3,789 3,730 8 – 3,738
Monies held in restricted accounts and deposits (36) (2) – (38) (15) – – (15)
Cash and cash equivalents (14) (16) – (30) (62) (16) – (78)
Fair value of interest-rate swaps – – – – (6) – – (6)
Fair value of foreign exchange swaps and forwards 16 – – 16 7 – – 7
Net debt (b) 3,747 (10) – 3,737 3,654 (8) – 3,646
Less: Fair value of interest-rate swaps – – – – 6 – – 6
Adjusted net debt (c) 3,747 (10) – 3,737 3,660 (8) – 3,652
Adjusted total equity
Total equity (d) 9,920 – – 9,920 10,386 – – 10,386
Fair value of interest-rate swaps – – – – (6) – – (6)
Adjusted total equity (e) 9,920 – – 9,920 10,380 – – 10,380
Gearing (b/d) 37.8% 37.7% 35.2% 35.1%
Adjusted gearing (c/e) 37.8% 37.7% 35.3% 35.2%
Group LTV (c/a) 29.6% 27.1% 28.4% 25.8%
Security Group LTV 28.6% 27.2%
Weighted average cost of debt 2.7% 2.7% 2.6% 2.6%
1. Restated as a result of changes in accounting policies. See note 41 for details.2. This represents the interest in X-Leisure which we do not own, but which is consolidated in the Group numbers.
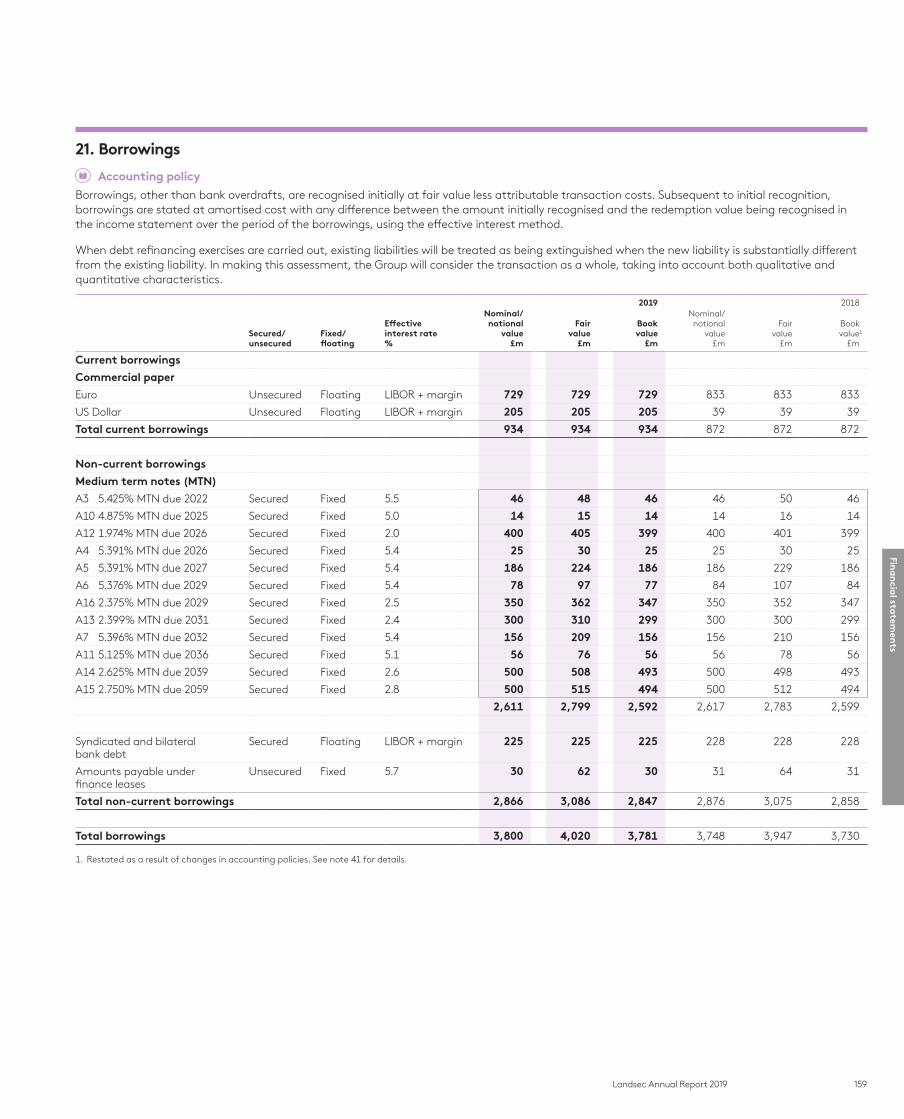
159Landsec Annual Report 2019
21. Borrowings
Accounting policy
Borrowings, other than bank overdrafts, are recognised initially at fair value less attributable transaction costs. Subsequent to initial recognition, borrowings are stated at amortised cost with any difference between the amount initially recognised and the redemption value being recognised in the income statement over the period of the borrowings, using the effective interest method.
When debt refinancing exercises are carried out, existing liabilities will be treated as being extinguished when the new liability is substantially different from the existing liability. In making this assessment, the Group will consider the transaction as a whole, taking into account both qualitative and quantitative characteristics.
2019 2018
Secured/ unsecured
Fixed/ floating
Effective interest rate%
Nominal/ notional
value £m
Fair value
£m
Book value
£m
Nominal/ notional
value £m
Fair value
£m
Bookvalue1
£m
Current borrowings
Commercial paper
Euro Unsecured Floating LIBOR + margin 729 729 729 833 833 833
US Dollar Unsecured Floating LIBOR + margin 205 205 205 39 39 39
Total current borrowings 934 934 934 872 872 872
Non-current borrowings
Medium term notes (MTN)
A3 5.425% MTN due 2022 Secured Fixed 5.5 46 48 46 46 50 46
A10 4.875% MTN due 2025 Secured Fixed 5.0 14 15 14 14 16 14
A12 1.974% MTN due 2026 Secured Fixed 2.0 400 405 399 400 401 399
A4 5.391% MTN due 2026 Secured Fixed 5.4 25 30 25 25 30 25
A5 5.391% MTN due 2027 Secured Fixed 5.4 186 224 186 186 229 186
A6 5.376% MTN due 2029 Secured Fixed 5.4 78 97 77 84 107 84
A16 2.375% MTN due 2029 Secured Fixed 2.5 350 362 347 350 352 347
A13 2.399% MTN due 2031 Secured Fixed 2.4 300 310 299 300 300 299
A7 5.396% MTN due 2032 Secured Fixed 5.4 156 209 156 156 210 156
A11 5.125% MTN due 2036 Secured Fixed 5.1 56 76 56 56 78 56
A14 2.625% MTN due 2039 Secured Fixed 2.6 500 508 493 500 498 493
A15 2.750% MTN due 2059 Secured Fixed 2.8 500 515 494 500 512 494
2,611 2,799 2,592 2,617 2,783 2,599
Syndicated and bilateral bank debt
Secured Floating LIBOR + margin 225 225 225 228 228 228
Amounts payable under finance leases
Unsecured Fixed 5.7 30 62 30 31 64 31
Total non-current borrowings 2,866 3,086 2,847 2,876 3,075 2,858
Total borrowings 3,800 4,020 3,781 3,748 3,947 3,730
1. Restated as a result of changes in accounting policies. See note 41 for details.
Fina
ncia
l statem
ents
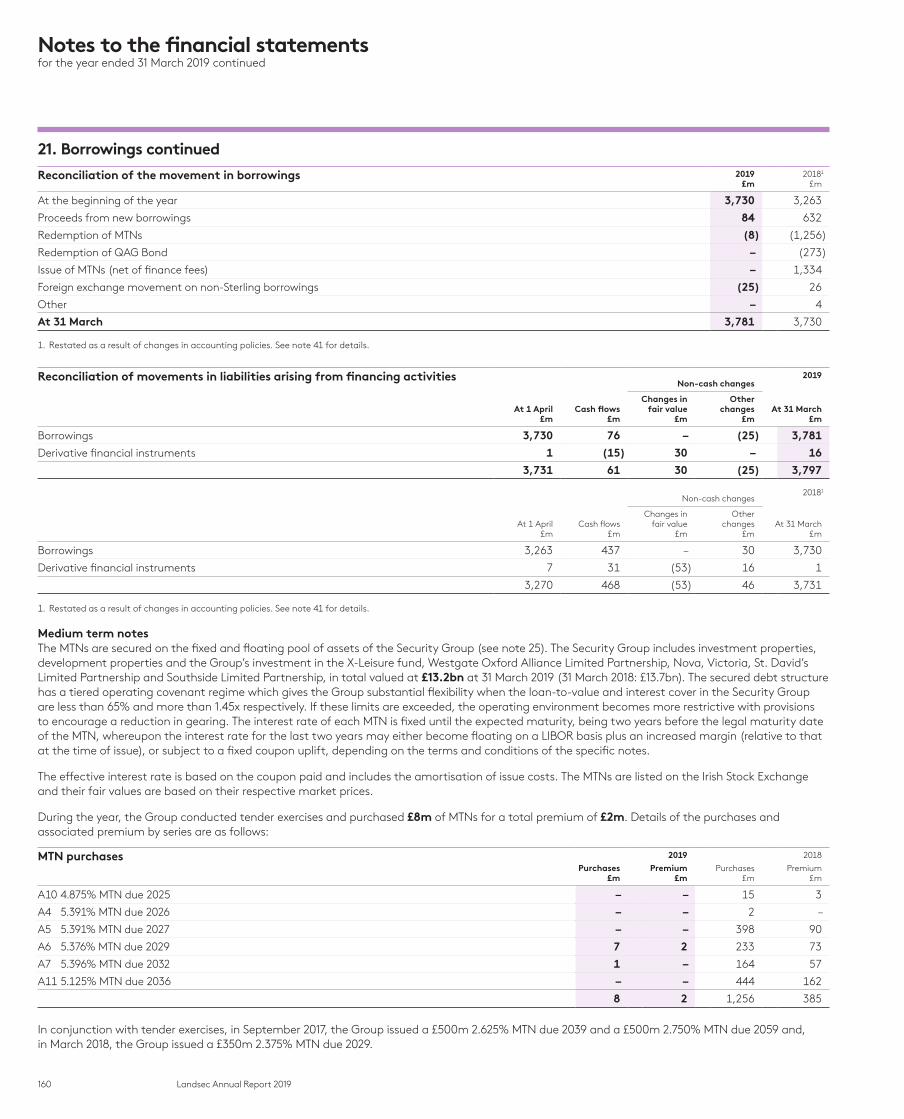
160 Landsec Annual Report 2019
Notes to the financial statementsfor the year ended 31 March 2019 continued
21. Borrowings continued
Reconciliation of the movement in borrowings 2019£m
20181
£m
At the beginning of the year 3,730 3,263
Proceeds from new borrowings 84 632
Redemption of MTNs (8) (1,256)
Redemption of QAG Bond – (273)
Issue of MTNs (net of finance fees) – 1,334
Foreign exchange movement on non-Sterling borrowings (25) 26
Other – 4
At 31 March 3,781 3,730
1. Restated as a result of changes in accounting policies. See note 41 for details.
Reconciliation of movements in liabilities arising from financing activities 2019Non-cash changes
At 1 April£m
Cash flows£m
Changes in fair value
£m
Other changes
£mAt 31 March
£m
Borrowings 3,730 76 – (25) 3,781
Derivative financial instruments 1 (15) 30 – 16
3,731 61 30 (25) 3,797
20181
Non-cash changes
At 1 April£m
Cash flows£m
Changes in fair value
£m
Other changes
£mAt 31 March
£m
Borrowings 3,263 437 – 30 3,730
Derivative financial instruments 7 31 (53) 16 1
3,270 468 (53) 46 3,731
1. Restated as a result of changes in accounting policies. See note 41 for details.
Medium term notes The MTNs are secured on the fixed and floating pool of assets of the Security Group (see note 25). The Security Group includes investment properties, development properties and the Group’s investment in the X-Leisure fund, Westgate Oxford Alliance Limited Partnership, Nova, Victoria, St. David’s Limited Partnership and Southside Limited Partnership, in total valued at £13.2bn at 31 March 2019 (31 March 2018: £13.7bn). The secured debt structure has a tiered operating covenant regime which gives the Group substantial flexibility when the loan-to-value and interest cover in the Security Group are less than 65% and more than 1.45x respectively. If these limits are exceeded, the operating environment becomes more restrictive with provisions to encourage a reduction in gearing. The interest rate of each MTN is fixed until the expected maturity, being two years before the legal maturity date of the MTN, whereupon the interest rate for the last two years may either become floating on a LIBOR basis plus an increased margin (relative to that at the time of issue), or subject to a fixed coupon uplift, depending on the terms and conditions of the specific notes.
The effective interest rate is based on the coupon paid and includes the amortisation of issue costs. The MTNs are listed on the Irish Stock Exchange and their fair values are based on their respective market prices.
During the year, the Group conducted tender exercises and purchased £8m of MTNs for a total premium of £2m. Details of the purchases and associated premium by series are as follows:
MTN purchases 2019 2018
Purchases£m
Premium£m
Purchases£m
Premium£m
A10 4.875% MTN due 2025 – – 15 3
A4 5.391% MTN due 2026 – – 2 –
A5 5.391% MTN due 2027 – – 398 90
A6 5.376% MTN due 2029 7 2 233 73
A7 5.396% MTN due 2032 1 – 164 57
A11 5.125% MTN due 2036 – – 444 162
8 2 1,256 385
In conjunction with tender exercises, in September 2017, the Group issued a £500m 2.625% MTN due 2039 and a £500m 2.750% MTN due 2059 and, in March 2018, the Group issued a £350m 2.375% MTN due 2029.

161Landsec Annual Report 2019
Syndicated and bilateral bank debt Maturity as at
31 March 2019
Authorised Drawn Undrawn
2019£m
2018£m
2019£m
2018£m
2019£m
2018£m
Syndicated debt 2023–24 2,490 1,965 100 103 2,390 1,862
Bilateral debt 2023–24 225 125 125 125 100 –
2,715 2,090 225 228 2,490 1,862
At 31 March 2019, the Group’s committed revolving facilities totalled £2,715m (31 March 2018: £2,090m). The £625m increase in committed facilities is the result of several increases in the syndicated debt facilities arranged throughout the year.
All syndicated and bilateral facilities are committed and secured on the assets of the Security Group. During the year ended 31 March 2019, the amounts drawn under the Group’s facilities decreased by £3m.
The terms of the Security Group funding arrangements require undrawn facilities to be reserved where syndicated and bilateral facilities mature within one year, or where commercial paper has been issued. Accordingly, the Group’s available undrawn facilities at 31 March 2019 were £1,556m (31 March 2018: £990m), compared with undrawn facilities of £2,490m (31 March 2018: £1,862m).
Queen Anne’s Gate BondIn two tranches, on 25 April 2017 and 9 May 2017, the Group repurchased and redeemed the £273m QAG Bond in its entirety for a total premium to nominal value of £61m, with associated costs of £1m.
22. Monies held in restricted accounts and deposits
Accounting policy
Monies held in restricted accounts and deposits represent cash held by the Group in accounts with conditions that restrict the use of these monies by the Group and, as such, does not meet the definition of cash and cash equivalents. Restrictions include funds which are held on behalf of tenants for meeting service charge costs, and funds held by the Group’s captive insurer. Holding cash in restricted accounts does not prevent the Group from optimising returns by putting these monies on short-term deposit.
Group Company
2019£m
2018£m
2019£m
2018£m
Cash at bank and in hand 29 7 4 4
Short-term deposits 7 8 – –
36 15 4 4
The credit quality of monies held in restricted accounts and deposits can be assessed by reference to external credit ratings of the counterparty where the account or deposit is placed.
Group
2019 £m
2018£m
Counterparties with external credit ratings
A+ 32 –
A 4 15
36 15
Fina
ncia
l statem
ents
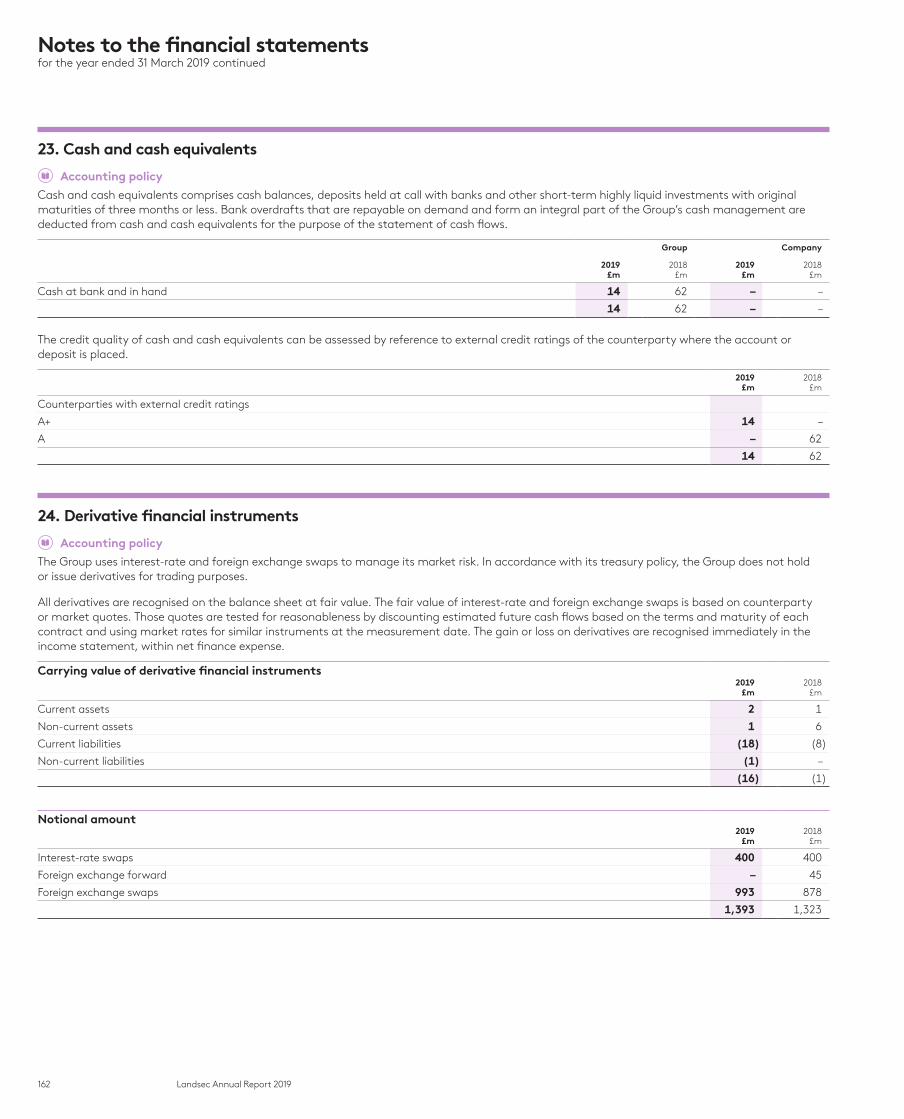
162 Landsec Annual Report 2019
Notes to the financial statementsfor the year ended 31 March 2019 continued
23. Cash and cash equivalents
Accounting policy
Cash and cash equivalents comprises cash balances, deposits held at call with banks and other short-term highly liquid investments with original maturities of three months or less. Bank overdrafts that are repayable on demand and form an integral part of the Group’s cash management are deducted from cash and cash equivalents for the purpose of the statement of cash flows.
Group Company
2019£m
2018£m
2019£m
2018£m
Cash at bank and in hand 14 62 – –
14 62 – –
The credit quality of cash and cash equivalents can be assessed by reference to external credit ratings of the counterparty where the account or deposit is placed.
2019 £m
2018£m
Counterparties with external credit ratings
A+ 14 –
A – 62
14 62
24. Derivative financial instruments
Accounting policy
The Group uses interest-rate and foreign exchange swaps to manage its market risk. In accordance with its treasury policy, the Group does not hold or issue derivatives for trading purposes.
All derivatives are recognised on the balance sheet at fair value. The fair value of interest-rate and foreign exchange swaps is based on counterparty or market quotes. Those quotes are tested for reasonableness by discounting estimated future cash flows based on the terms and maturity of each contract and using market rates for similar instruments at the measurement date. The gain or loss on derivatives are recognised immediately in the income statement, within net finance expense.
Carrying value of derivative financial instruments2019
£m2018
£m
Current assets 2 1
Non-current assets 1 6
Current liabilities (18) (8)
Non-current liabilities (1) –
(16) (1)
Notional amount2019
£m2018
£m
Interest-rate swaps 400 400
Foreign exchange forward – 45
Foreign exchange swaps 993 878
1,393 1,323
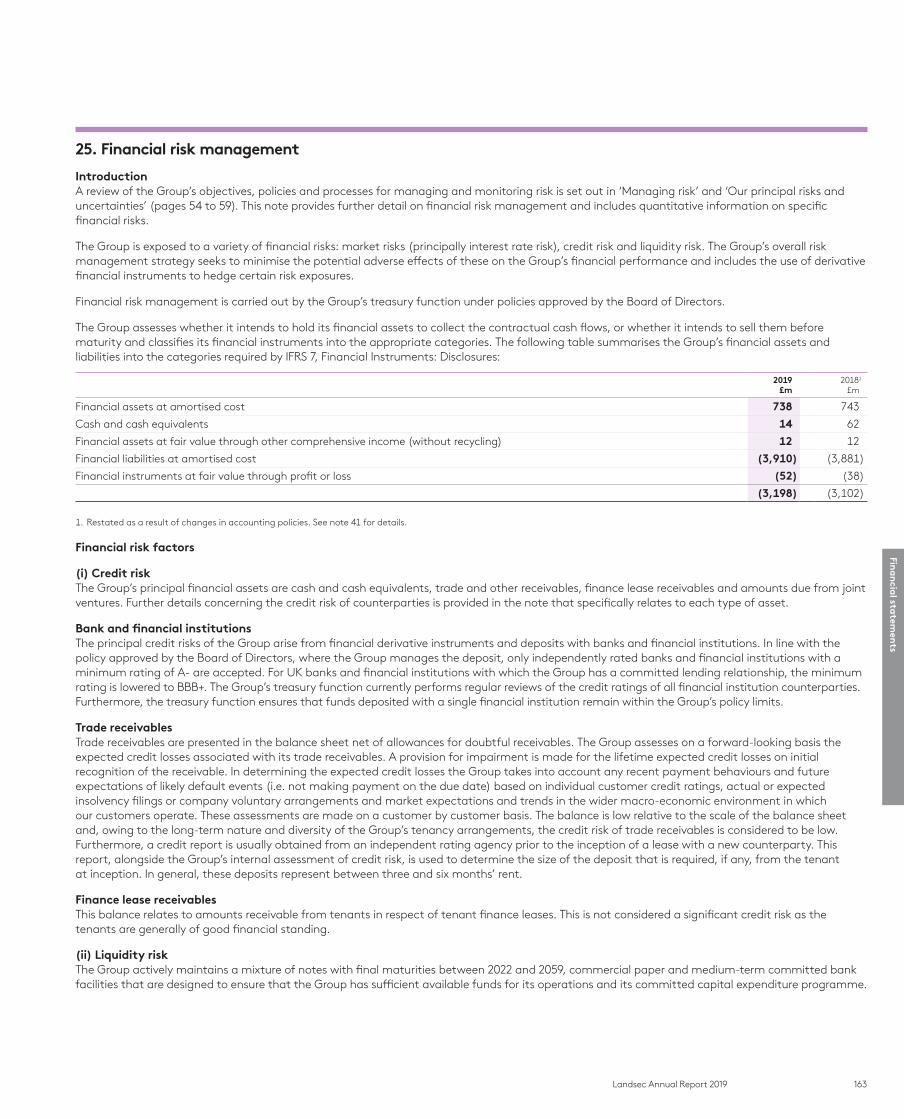
163Landsec Annual Report 2019
25. Financial risk management
IntroductionA review of the Group’s objectives, policies and processes for managing and monitoring risk is set out in ‘Managing risk’ and ‘Our principal risks and uncertainties’ (pages 54 to 59). This note provides further detail on financial risk management and includes quantitative information on specific financial risks.
The Group is exposed to a variety of financial risks: market risks (principally interest rate risk), credit risk and liquidity risk. The Group’s overall risk management strategy seeks to minimise the potential adverse effects of these on the Group’s financial performance and includes the use of derivative financial instruments to hedge certain risk exposures.
Financial risk management is carried out by the Group’s treasury function under policies approved by the Board of Directors.
The Group assesses whether it intends to hold its financial assets to collect the contractual cash flows, or whether it intends to sell them before maturity and classifies its financial instruments into the appropriate categories. The following table summarises the Group’s financial assets and liabilities into the categories required by IFRS 7, Financial Instruments: Disclosures:
2019 £m
20181
£m
Financial assets at amortised cost 738 743
Cash and cash equivalents 14 62
Financial assets at fair value through other comprehensive income (without recycling) 12 12
Financial liabilities at amortised cost (3,910) (3,881)
Financial instruments at fair value through profit or loss (52) (38)
(3,198) (3,102)
1. Restated as a result of changes in accounting policies. See note 41 for details.
Financial risk factors
(i) Credit riskThe Group’s principal financial assets are cash and cash equivalents, trade and other receivables, finance lease receivables and amounts due from joint ventures. Further details concerning the credit risk of counterparties is provided in the note that specifically relates to each type of asset.
Bank and financial institutionsThe principal credit risks of the Group arise from financial derivative instruments and deposits with banks and financial institutions. In line with the policy approved by the Board of Directors, where the Group manages the deposit, only independently rated banks and financial institutions with a minimum rating of A- are accepted. For UK banks and financial institutions with which the Group has a committed lending relationship, the minimum rating is lowered to BBB+. The Group’s treasury function currently performs regular reviews of the credit ratings of all financial institution counterparties. Furthermore, the treasury function ensures that funds deposited with a single financial institution remain within the Group’s policy limits.
Trade receivablesTrade receivables are presented in the balance sheet net of allowances for doubtful receivables. The Group assesses on a forward-looking basis the expected credit losses associated with its trade receivables. A provision for impairment is made for the lifetime expected credit losses on initial recognition of the receivable. In determining the expected credit losses the Group takes into account any recent payment behaviours and future expectations of likely default events (i.e. not making payment on the due date) based on individual customer credit ratings, actual or expected insolvency filings or company voluntary arrangements and market expectations and trends in the wider macro-economic environment in which our customers operate. These assessments are made on a customer by customer basis. The balance is low relative to the scale of the balance sheet and, owing to the long-term nature and diversity of the Group’s tenancy arrangements, the credit risk of trade receivables is considered to be low. Furthermore, a credit report is usually obtained from an independent rating agency prior to the inception of a lease with a new counterparty. This report, alongside the Group’s internal assessment of credit risk, is used to determine the size of the deposit that is required, if any, from the tenant at inception. In general, these deposits represent between three and six months’ rent.
Finance lease receivables This balance relates to amounts receivable from tenants in respect of tenant finance leases. This is not considered a significant credit risk as the tenants are generally of good financial standing.
(ii) Liquidity riskThe Group actively maintains a mixture of notes with final maturities between 2022 and 2059, commercial paper and medium-term committed bank facilities that are designed to ensure that the Group has sufficient available funds for its operations and its committed capital expenditure programme.
Fina
ncia
l statem
ents
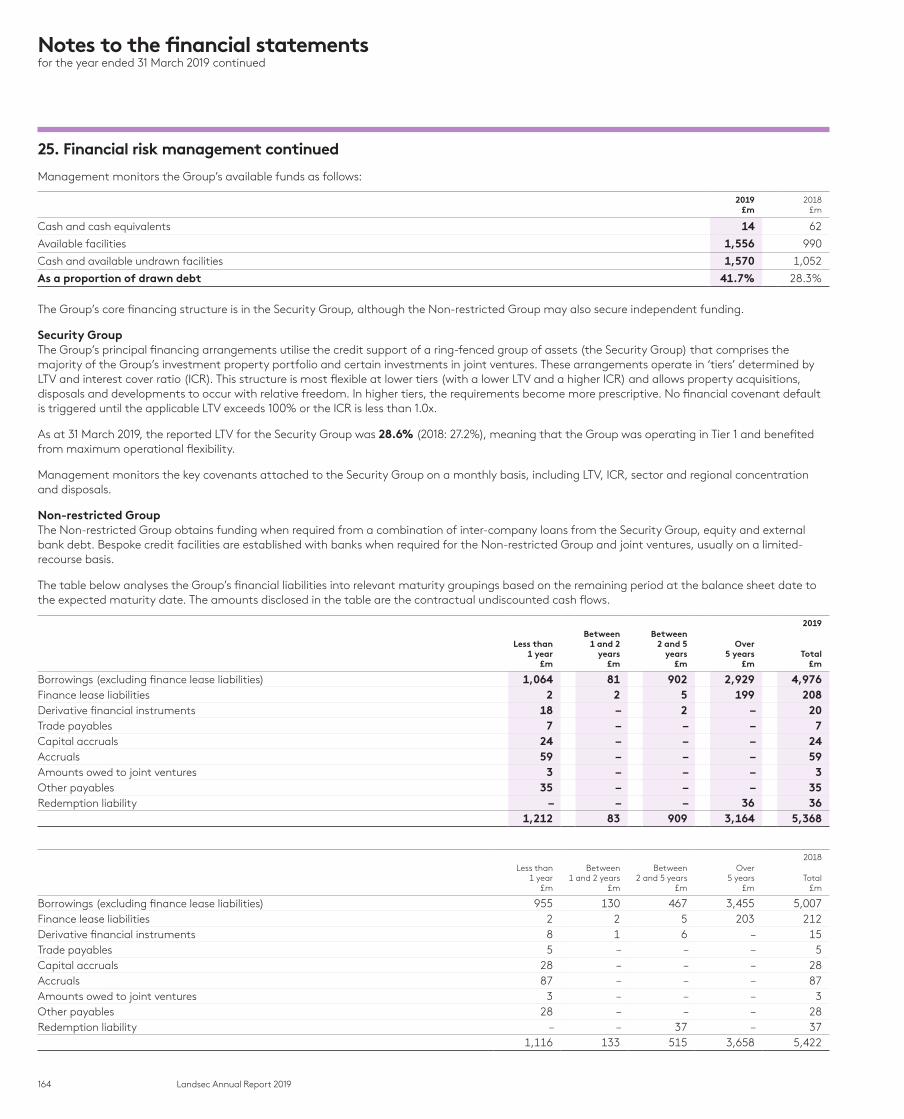
164 Landsec Annual Report 2019
Notes to the financial statementsfor the year ended 31 March 2019 continued
25. Financial risk management continued
Management monitors the Group’s available funds as follows:
2019 £m
2018£m
Cash and cash equivalents 14 62
Available facilities 1,556 990
Cash and available undrawn facilities 1,570 1,052
As a proportion of drawn debt 41.7% 28.3%
The Group’s core financing structure is in the Security Group, although the Non-restricted Group may also secure independent funding.
Security Group The Group’s principal financing arrangements utilise the credit support of a ring-fenced group of assets (the Security Group) that comprises the majority of the Group’s investment property portfolio and certain investments in joint ventures. These arrangements operate in ‘tiers’ determined by LTV and interest cover ratio (ICR). This structure is most flexible at lower tiers (with a lower LTV and a higher ICR) and allows property acquisitions, disposals and developments to occur with relative freedom. In higher tiers, the requirements become more prescriptive. No financial covenant default is triggered until the applicable LTV exceeds 100% or the ICR is less than 1.0x.
As at 31 March 2019, the reported LTV for the Security Group was 28.6% (2018: 27.2%), meaning that the Group was operating in Tier 1 and benefited from maximum operational flexibility.
Management monitors the key covenants attached to the Security Group on a monthly basis, including LTV, ICR, sector and regional concentration and disposals.
Non-restricted GroupThe Non-restricted Group obtains funding when required from a combination of inter-company loans from the Security Group, equity and external bank debt. Bespoke credit facilities are established with banks when required for the Non-restricted Group and joint ventures, usually on a limited-recourse basis.
The table below analyses the Group’s financial liabilities into relevant maturity groupings based on the remaining period at the balance sheet date to the expected maturity date. The amounts disclosed in the table are the contractual undiscounted cash flows.
2019
Less than 1 year
£m
Between 1 and 2
years£m
Between 2 and 5
years£m
Over 5 years
£mTotal
£m
Borrowings (excluding finance lease liabilities) 1,064 81 902 2,929 4,976 Finance lease liabilities 2 2 5 199 208Derivative financial instruments 18 – 2 – 20Trade payables 7 – – – 7Capital accruals 24 – – – 24Accruals 59 – – – 59Amounts owed to joint ventures 3 – – – 3Other payables 35 – – – 35Redemption liability – – – 36 36
1,212 83 909 3,164 5,368
2018Less than
1 year£m
Between 1 and 2 years
£m
Between 2 and 5 years
£m
Over 5 years
£mTotal
£m
Borrowings (excluding finance lease liabilities) 955 130 467 3,455 5,007Finance lease liabilities 2 2 5 203 212Derivative financial instruments 8 1 6 – 15Trade payables 5 – – – 5Capital accruals 28 – – – 28Accruals 87 – – – 87Amounts owed to joint ventures 3 – – – 3Other payables 28 – – – 28Redemption liability – – 37 – 37
1,116 133 515 3,658 5,422
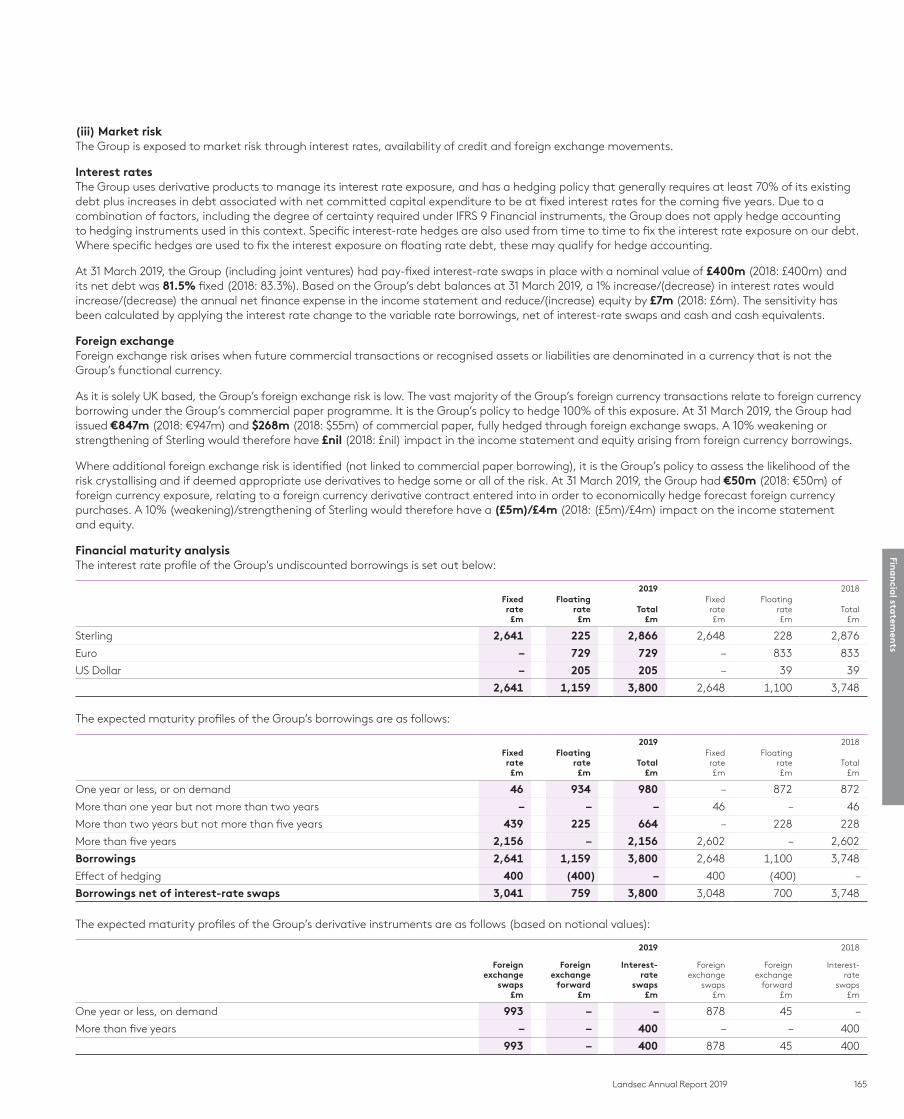
165Landsec Annual Report 2019
(iii) Market riskThe Group is exposed to market risk through interest rates, availability of credit and foreign exchange movements.
Interest ratesThe Group uses derivative products to manage its interest rate exposure, and has a hedging policy that generally requires at least 70% of its existing debt plus increases in debt associated with net committed capital expenditure to be at fixed interest rates for the coming five years. Due to a combination of factors, including the degree of certainty required under IFRS 9 Financial instruments, the Group does not apply hedge accounting to hedging instruments used in this context. Specific interest-rate hedges are also used from time to time to fix the interest rate exposure on our debt. Where specific hedges are used to fix the interest exposure on floating rate debt, these may qualify for hedge accounting.
At 31 March 2019, the Group (including joint ventures) had pay-fixed interest-rate swaps in place with a nominal value of £400m (2018: £400m) and its net debt was 81.5% fixed (2018: 83.3%). Based on the Group’s debt balances at 31 March 2019, a 1% increase/(decrease) in interest rates would increase/(decrease) the annual net finance expense in the income statement and reduce/(increase) equity by £7m (2018: £6m). The sensitivity has been calculated by applying the interest rate change to the variable rate borrowings, net of interest-rate swaps and cash and cash equivalents.
Foreign exchangeForeign exchange risk arises when future commercial transactions or recognised assets or liabilities are denominated in a currency that is not the Group’s functional currency.
As it is solely UK based, the Group’s foreign exchange risk is low. The vast majority of the Group’s foreign currency transactions relate to foreign currency borrowing under the Group’s commercial paper programme. It is the Group’s policy to hedge 100% of this exposure. At 31 March 2019, the Group had issued €847m (2018: €947m) and $268m (2018: $55m) of commercial paper, fully hedged through foreign exchange swaps. A 10% weakening or strengthening of Sterling would therefore have £nil (2018: £nil) impact in the income statement and equity arising from foreign currency borrowings.
Where additional foreign exchange risk is identified (not linked to commercial paper borrowing), it is the Group’s policy to assess the likelihood of the risk crystallising and if deemed appropriate use derivatives to hedge some or all of the risk. At 31 March 2019, the Group had €50m (2018: €50m) of foreign currency exposure, relating to a foreign currency derivative contract entered into in order to economically hedge forecast foreign currency purchases. A 10% (weakening)/strengthening of Sterling would therefore have a (£5m)/£4m (2018: (£5m)/£4m) impact on the income statement and equity.
Financial maturity analysisThe interest rate profile of the Group’s undiscounted borrowings is set out below:
2019 2018Fixed rate
£m
Floating rate
£mTotal
£m
Fixed rate
£m
Floating rate
£mTotal
£m
Sterling 2,641 225 2,866 2,648 228 2,876
Euro – 729 729 – 833 833
US Dollar – 205 205 – 39 39
2,641 1,159 3,800 2,648 1,100 3,748
The expected maturity profiles of the Group’s borrowings are as follows:
2019 2018Fixed rate
£m
Floating rate
£mTotal
£m
Fixed rate
£m
Floating rate
£mTotal
£m
One year or less, or on demand 46 934 980 – 872 872
More than one year but not more than two years – – – 46 – 46
More than two years but not more than five years 439 225 664 – 228 228
More than five years 2,156 – 2,156 2,602 – 2,602
Borrowings 2,641 1,159 3,800 2,648 1,100 3,748
Effect of hedging 400 (400) – 400 (400) –
Borrowings net of interest-rate swaps 3,041 759 3,800 3,048 700 3,748
The expected maturity profiles of the Group’s derivative instruments are as follows (based on notional values):
2019 2018
Foreign exchange
swaps£m
Foreign exchange
forward£m
Interest-rate
swaps£m
Foreign exchange
swaps£m
Foreign exchange
forward£m
Interest- rate
swaps£m
One year or less, on demand 993 – – 878 45 –
More than five years – – 400 – – 400
993 – 400 878 45 400
Fina
ncia
l statem
ents
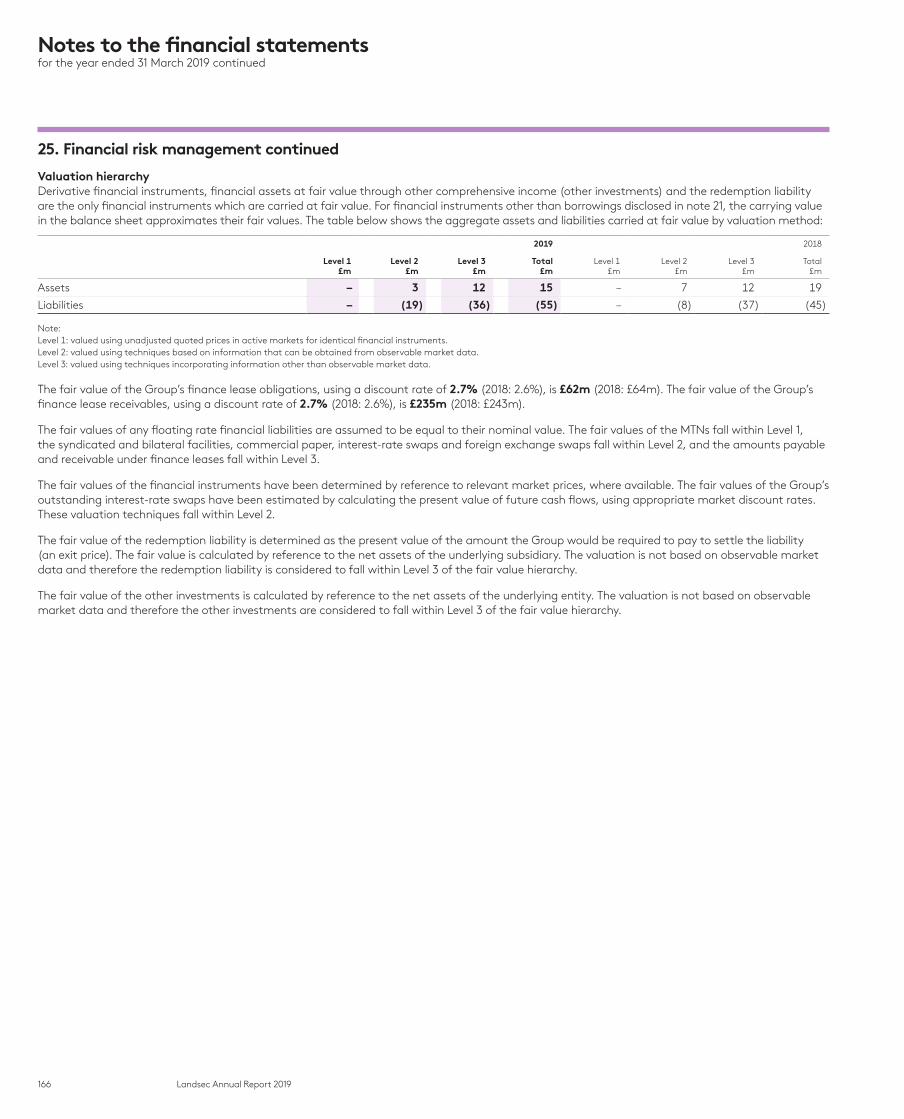
166 Landsec Annual Report 2019
Notes to the financial statementsfor the year ended 31 March 2019 continued
25. Financial risk management continued
Valuation hierarchyDerivative financial instruments, financial assets at fair value through other comprehensive income (other investments) and the redemption liability are the only financial instruments which are carried at fair value. For financial instruments other than borrowings disclosed in note 21, the carrying value in the balance sheet approximates their fair values. The table below shows the aggregate assets and liabilities carried at fair value by valuation method:
2019 2018
Level 1£m
Level 2£m
Level 3£m
Total£m
Level 1£m
Level 2£m
Level 3£m
Total£m
Assets – 3 12 15 – 7 12 19
Liabilities – (19) (36) (55) – (8) (37) (45)
Note:Level 1: valued using unadjusted quoted prices in active markets for identical financial instruments.Level 2: valued using techniques based on information that can be obtained from observable market data.Level 3: valued using techniques incorporating information other than observable market data.
The fair value of the Group’s finance lease obligations, using a discount rate of 2.7% (2018: 2.6%), is £62m (2018: £64m). The fair value of the Group’s finance lease receivables, using a discount rate of 2.7% (2018: 2.6%), is £235m (2018: £243m).
The fair values of any floating rate financial liabilities are assumed to be equal to their nominal value. The fair values of the MTNs fall within Level 1, the syndicated and bilateral facilities, commercial paper, interest-rate swaps and foreign exchange swaps fall within Level 2, and the amounts payable and receivable under finance leases fall within Level 3.
The fair values of the financial instruments have been determined by reference to relevant market prices, where available. The fair values of the Group’s outstanding interest-rate swaps have been estimated by calculating the present value of future cash flows, using appropriate market discount rates. These valuation techniques fall within Level 2.
The fair value of the redemption liability is determined as the present value of the amount the Group would be required to pay to settle the liability (an exit price). The fair value is calculated by reference to the net assets of the underlying subsidiary. The valuation is not based on observable market data and therefore the redemption liability is considered to fall within Level 3 of the fair value hierarchy.
The fair value of the other investments is calculated by reference to the net assets of the underlying entity. The valuation is not based on observable market data and therefore the other investments are considered to fall within Level 3 of the fair value hierarchy.
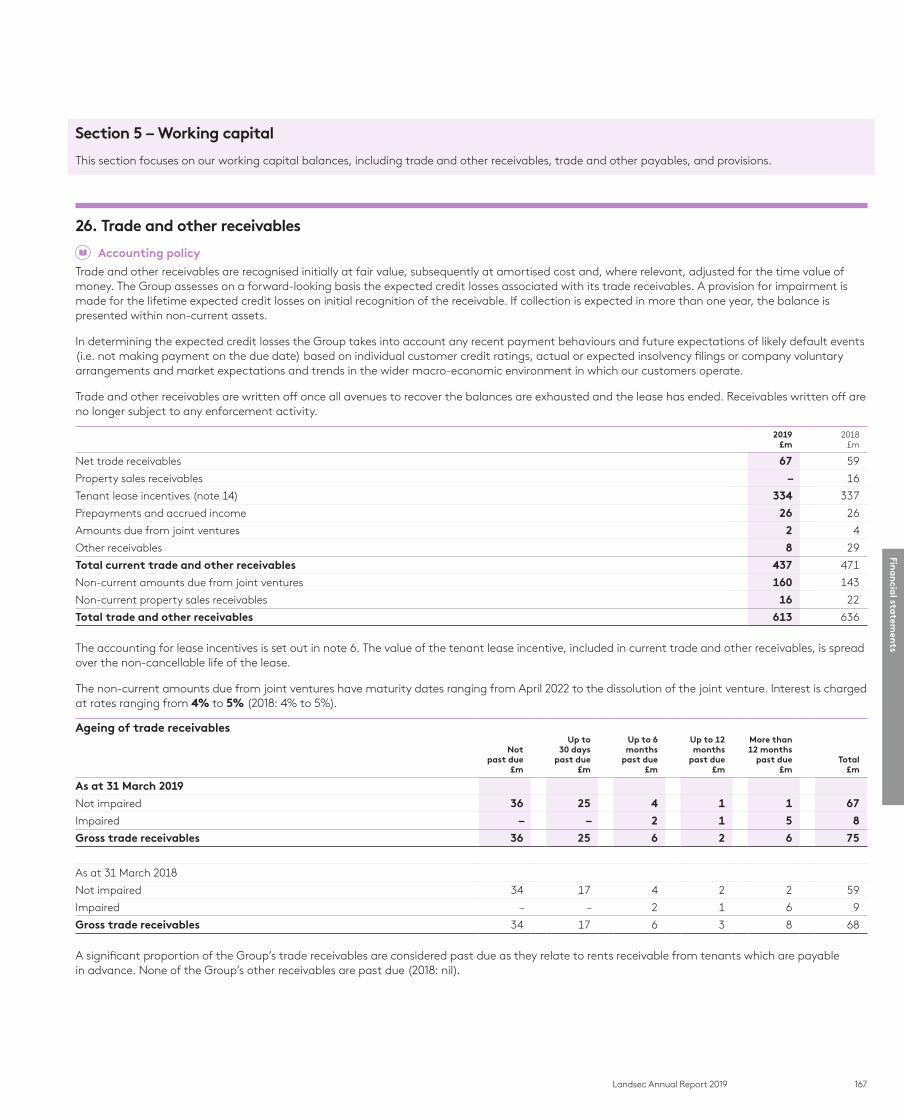
167Landsec Annual Report 2019
Section 5 – Working capital
This section focuses on our working capital balances, including trade and other receivables, trade and other payables, and provisions.
26. Trade and other receivables
Accounting policy
Trade and other receivables are recognised initially at fair value, subsequently at amortised cost and, where relevant, adjusted for the time value of money. The Group assesses on a forward-looking basis the expected credit losses associated with its trade receivables. A provision for impairment is made for the lifetime expected credit losses on initial recognition of the receivable. If collection is expected in more than one year, the balance is presented within non-current assets.
In determining the expected credit losses the Group takes into account any recent payment behaviours and future expectations of likely default events (i.e. not making payment on the due date) based on individual customer credit ratings, actual or expected insolvency filings or company voluntary arrangements and market expectations and trends in the wider macro-economic environment in which our customers operate.
Trade and other receivables are written off once all avenues to recover the balances are exhausted and the lease has ended. Receivables written off are no longer subject to any enforcement activity.
2019£m
2018£m
Net trade receivables 67 59
Property sales receivables – 16
Tenant lease incentives (note 14) 334 337
Prepayments and accrued income 26 26
Amounts due from joint ventures 2 4
Other receivables 8 29
Total current trade and other receivables 437 471
Non-current amounts due from joint ventures 160 143
Non-current property sales receivables 16 22
Total trade and other receivables 613 636
The accounting for lease incentives is set out in note 6. The value of the tenant lease incentive, included in current trade and other receivables, is spread over the non-cancellable life of the lease.
The non-current amounts due from joint ventures have maturity dates ranging from April 2022 to the dissolution of the joint venture. Interest is charged at rates ranging from 4% to 5% (2018: 4% to 5%).
Ageing of trade receivables
Not past due
£m
Up to 30 days
past due£m
Up to 6 months
past due£m
Up to 12 months
past due£m
More than 12 months
past due£m
Total£m
As at 31 March 2019
Not impaired 36 25 4 1 1 67
Impaired – – 2 1 5 8
Gross trade receivables 36 25 6 2 6 75
As at 31 March 2018
Not impaired 34 17 4 2 2 59
Impaired – – 2 1 6 9
Gross trade receivables 34 17 6 3 8 68
A significant proportion of the Group’s trade receivables are considered past due as they relate to rents receivable from tenants which are payable in advance. None of the Group’s other receivables are past due (2018: nil).
Fina
ncia
l statem
ents

168 Landsec Annual Report 2019
Notes to the financial statementsfor the year ended 31 March 2019 continued
26. Trade and other receivables continued
Movement in allowances for doubtful debts 2019 £m
2018£m
At the beginning of the year 9 11
Increase to provision 5 4
Decrease to provision (4) (2)
Utilised in the year (2) (4)
At 31 March 8 9
Movement in tenant lease incentives 2019 £m
2018£m
At the beginning of the year 337 311
Net revenue recognised 1 29
Capital incentives granted – 1
Provision for doubtful receivables (4) (1)
Disposal of properties – (3)
At 31 March 334 337
27. Trade and other payablesGroup Company
2019£m
2018£m
2019£m
20181
£m
Trade payables 7 5 – –
Capital accruals 24 28 – –
Other payables 35 28 11 –
Accruals 59 87 14 13
Deferred income 145 143 – –
Amounts owed to joint ventures 3 3 – –
Loans from Group undertakings – – 1,953 2,316
Total current trade and other payables 273 294 1,978 2,329
Non-current other payables 1 – – –
Total trade and other payables 274 294 1,978 2,329
1. Restated as a result of changes in accounting policies. See note 41 for details.
Capital accruals represent amounts due under contracts to purchase properties, which were unconditionally exchanged at the year end, and for work completed on investment properties but not paid for at the year end. Deferred income principally relates to rents received in advance.
The Loans from Group undertakings are repayable on demand with no fixed repayment date. Interest is charged at 4.1% per annum (2018: 4.3%).
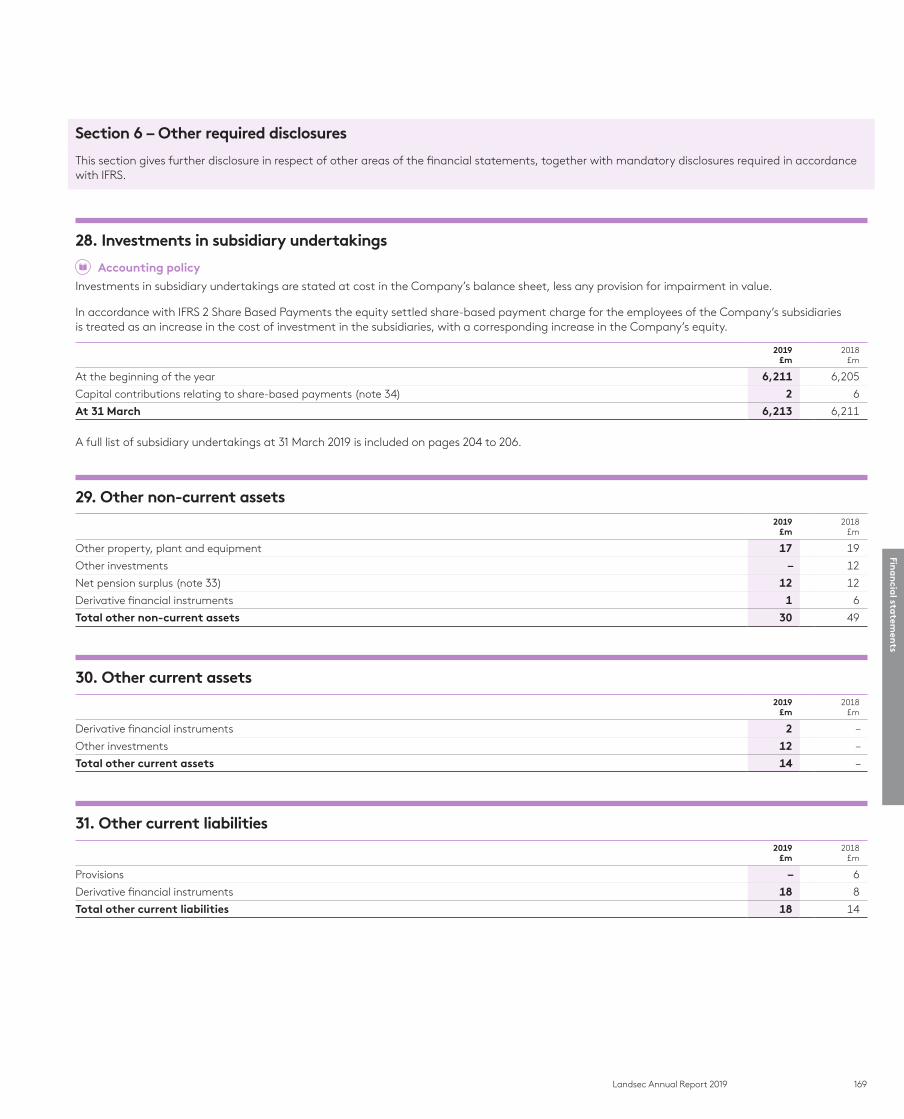
169Landsec Annual Report 2019
Section 6 – Other required disclosures
This section gives further disclosure in respect of other areas of the financial statements, together with mandatory disclosures required in accordance with IFRS.
28. Investments in subsidiary undertakings
Accounting policy
Investments in subsidiary undertakings are stated at cost in the Company’s balance sheet, less any provision for impairment in value.
In accordance with IFRS 2 Share Based Payments the equity settled share-based payment charge for the employees of the Company’s subsidiaries is treated as an increase in the cost of investment in the subsidiaries, with a corresponding increase in the Company’s equity.
2019 £m
2018£m
At the beginning of the year 6,211 6,205
Capital contributions relating to share-based payments (note 34) 2 6
At 31 March 6,213 6,211
A full list of subsidiary undertakings at 31 March 2019 is included on pages 204 to 206.
29. Other non-current assets2019
£m2018
£m
Other property, plant and equipment 17 19
Other investments – 12
Net pension surplus (note 33) 12 12
Derivative financial instruments 1 6
Total other non-current assets 30 49
30. Other current assets2019
£m2018
£m
Derivative financial instruments 2 –
Other investments 12 –
Total other current assets 14 –
31. Other current liabilities2019
£m2018
£m
Provisions – 6
Derivative financial instruments 18 8
Total other current liabilities 18 14
Fina
ncia
l statem
ents
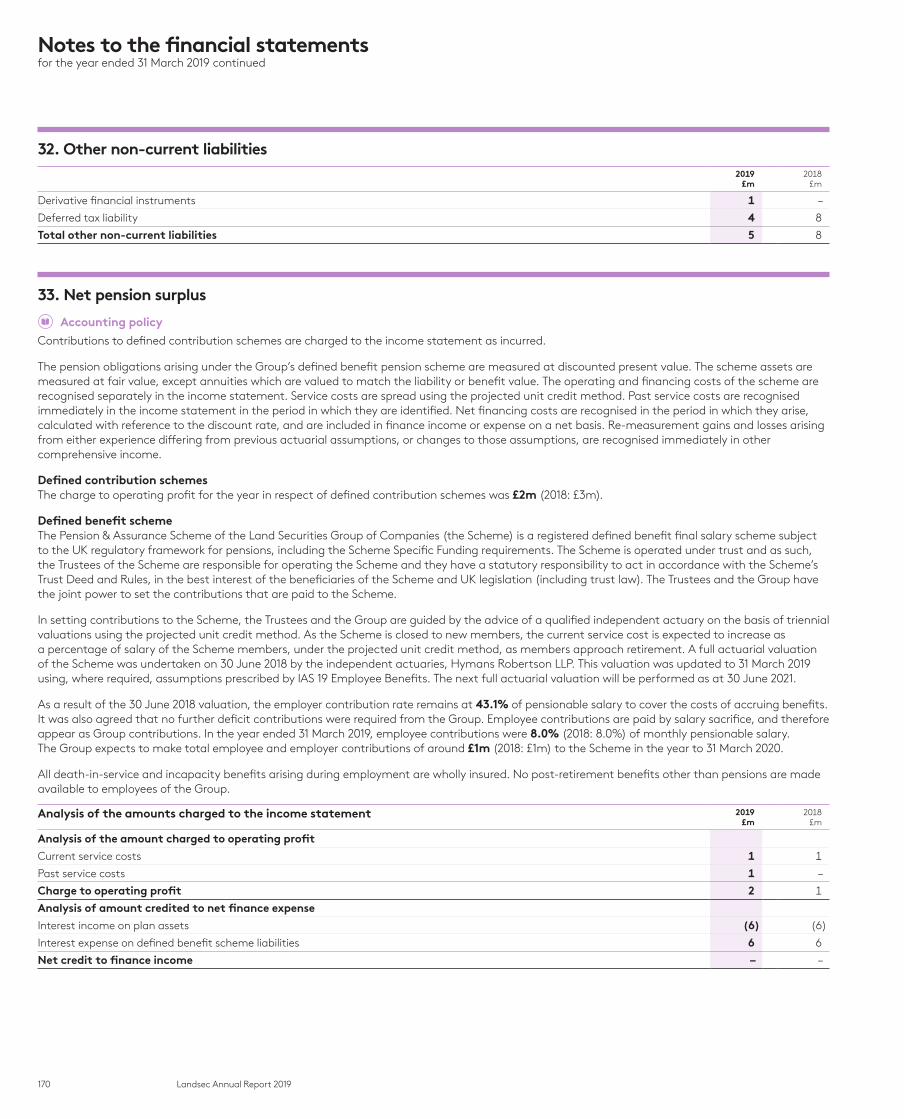
170 Landsec Annual Report 2019
Notes to the financial statementsfor the year ended 31 March 2019 continued
32. Other non-current liabilities2019
£m2018
£m
Derivative financial instruments 1 –
Deferred tax liability 4 8
Total other non-current liabilities 5 8
33. Net pension surplus
Accounting policy
Contributions to defined contribution schemes are charged to the income statement as incurred.
The pension obligations arising under the Group’s defined benefit pension scheme are measured at discounted present value. The scheme assets are measured at fair value, except annuities which are valued to match the liability or benefit value. The operating and financing costs of the scheme are recognised separately in the income statement. Service costs are spread using the projected unit credit method. Past service costs are recognised immediately in the income statement in the period in which they are identified. Net financing costs are recognised in the period in which they arise, calculated with reference to the discount rate, and are included in finance income or expense on a net basis. Re-measurement gains and losses arising from either experience differing from previous actuarial assumptions, or changes to those assumptions, are recognised immediately in other comprehensive income.
Defined contribution schemesThe charge to operating profit for the year in respect of defined contribution schemes was £2m (2018: £3m).
Defined benefit schemeThe Pension & Assurance Scheme of the Land Securities Group of Companies (the Scheme) is a registered defined benefit final salary scheme subject to the UK regulatory framework for pensions, including the Scheme Specific Funding requirements. The Scheme is operated under trust and as such, the Trustees of the Scheme are responsible for operating the Scheme and they have a statutory responsibility to act in accordance with the Scheme’s Trust Deed and Rules, in the best interest of the beneficiaries of the Scheme and UK legislation (including trust law). The Trustees and the Group have the joint power to set the contributions that are paid to the Scheme.
In setting contributions to the Scheme, the Trustees and the Group are guided by the advice of a qualified independent actuary on the basis of triennial valuations using the projected unit credit method. As the Scheme is closed to new members, the current service cost is expected to increase as a percentage of salary of the Scheme members, under the projected unit credit method, as members approach retirement. A full actuarial valuation of the Scheme was undertaken on 30 June 2018 by the independent actuaries, Hymans Robertson LLP. This valuation was updated to 31 March 2019 using, where required, assumptions prescribed by IAS 19 Employee Benefits. The next full actuarial valuation will be performed as at 30 June 2021.
As a result of the 30 June 2018 valuation, the employer contribution rate remains at 43.1% of pensionable salary to cover the costs of accruing benefits. It was also agreed that no further deficit contributions were required from the Group. Employee contributions are paid by salary sacrifice, and therefore appear as Group contributions. In the year ended 31 March 2019, employee contributions were 8.0% (2018: 8.0%) of monthly pensionable salary. The Group expects to make total employee and employer contributions of around £1m (2018: £1m) to the Scheme in the year to 31 March 2020.
All death-in-service and incapacity benefits arising during employment are wholly insured. No post-retirement benefits other than pensions are made available to employees of the Group.
Analysis of the amounts charged to the income statement 2019 £m
2018£m
Analysis of the amount charged to operating profit
Current service costs 1 1
Past service costs 1 –
Charge to operating profit 2 1
Analysis of amount credited to net finance expense
Interest income on plan assets (6) (6)
Interest expense on defined benefit scheme liabilities 6 6
Net credit to finance income – –
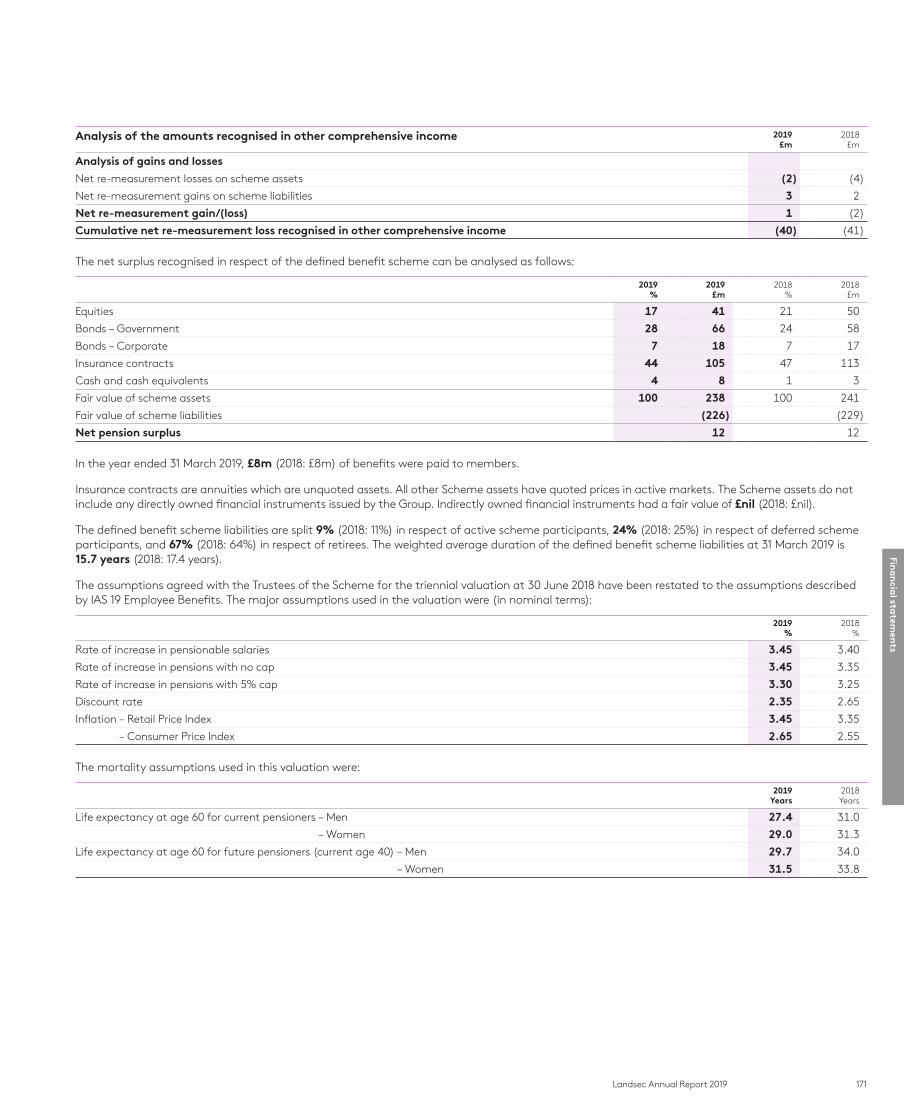
171Landsec Annual Report 2019
Analysis of the amounts recognised in other comprehensive income 2019 £m
2018£m
Analysis of gains and losses
Net re-measurement losses on scheme assets (2) (4)
Net re-measurement gains on scheme liabilities 3 2
Net re-measurement gain/(loss) 1 (2)
Cumulative net re-measurement loss recognised in other comprehensive income (40) (41)
The net surplus recognised in respect of the defined benefit scheme can be analysed as follows:
2019%
2019£m
2018 %
2018£m
Equities 17 41 21 50
Bonds – Government 28 66 24 58
Bonds – Corporate 7 18 7 17
Insurance contracts 44 105 47 113
Cash and cash equivalents 4 8 1 3
Fair value of scheme assets 100 238 100 241
Fair value of scheme liabilities (226) (229)
Net pension surplus 12 12
In the year ended 31 March 2019, £8m (2018: £8m) of benefits were paid to members.
Insurance contracts are annuities which are unquoted assets. All other Scheme assets have quoted prices in active markets. The Scheme assets do not include any directly owned financial instruments issued by the Group. Indirectly owned financial instruments had a fair value of £nil (2018: £nil).
The defined benefit scheme liabilities are split 9% (2018: 11%) in respect of active scheme participants, 24% (2018: 25%) in respect of deferred scheme participants, and 67% (2018: 64%) in respect of retirees. The weighted average duration of the defined benefit scheme liabilities at 31 March 2019 is 15.7 years (2018: 17.4 years).
The assumptions agreed with the Trustees of the Scheme for the triennial valuation at 30 June 2018 have been restated to the assumptions described by IAS 19 Employee Benefits. The major assumptions used in the valuation were (in nominal terms):
2019 %
2018%
Rate of increase in pensionable salaries 3.45 3.40
Rate of increase in pensions with no cap 3.45 3.35
Rate of increase in pensions with 5% cap 3.30 3.25
Discount rate 2.35 2.65
Inflation – Retail Price Index 3.45 3.35
– Consumer Price Index 2.65 2.55
The mortality assumptions used in this valuation were:
2019 Years
2018Years
Life expectancy at age 60 for current pensioners – Men 27.4 31.0
– Women 29.0 31.3
Life expectancy at age 60 for future pensioners (current age 40) – Men 29.7 34.0
– Women 31.5 33.8
Fina
ncia
l statem
ents
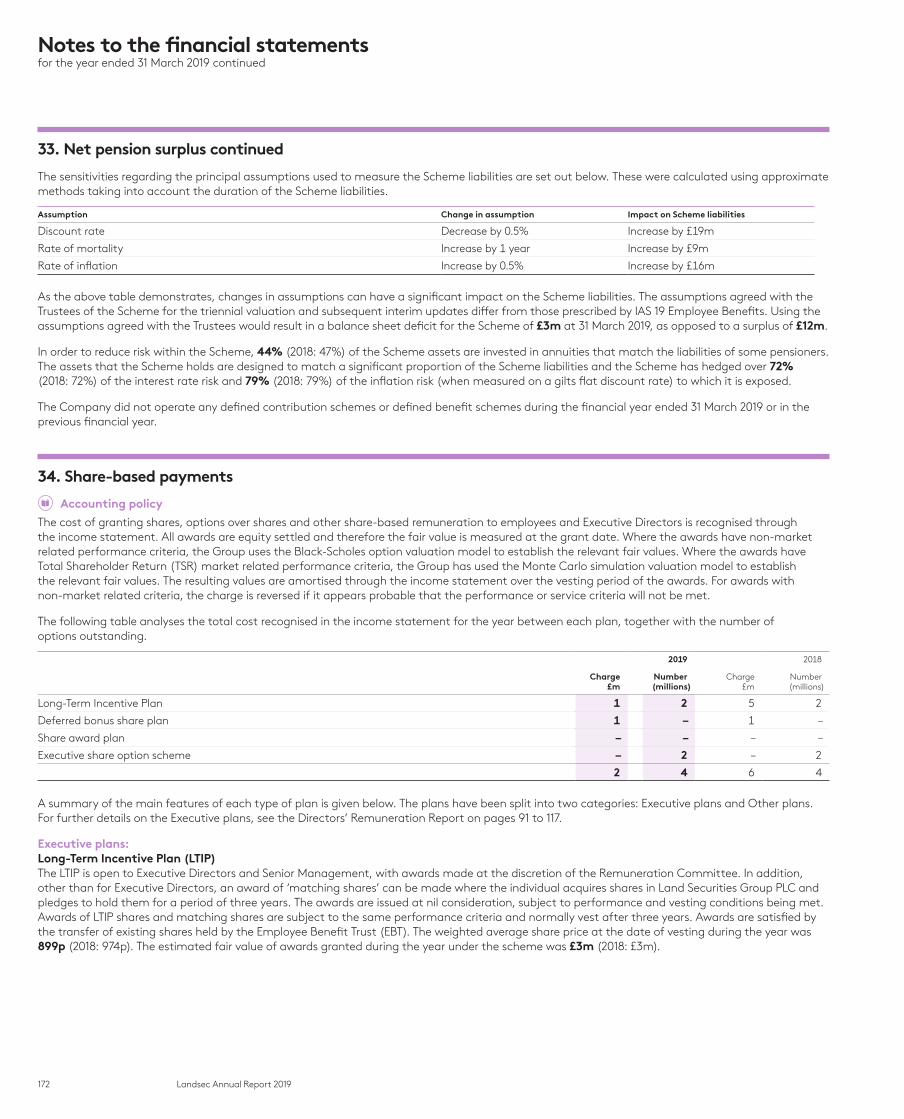
172 Landsec Annual Report 2019
Notes to the financial statementsfor the year ended 31 March 2019 continued
33. Net pension surplus continued
The sensitivities regarding the principal assumptions used to measure the Scheme liabilities are set out below. These were calculated using approximate methods taking into account the duration of the Scheme liabilities.
Assumption Change in assumption Impact on Scheme liabilities
Discount rate Decrease by 0.5% Increase by £19m
Rate of mortality Increase by 1 year Increase by £9m
Rate of inflation Increase by 0.5% Increase by £16m
As the above table demonstrates, changes in assumptions can have a significant impact on the Scheme liabilities. The assumptions agreed with the Trustees of the Scheme for the triennial valuation and subsequent interim updates differ from those prescribed by IAS 19 Employee Benefits. Using the assumptions agreed with the Trustees would result in a balance sheet deficit for the Scheme of £3m at 31 March 2019, as opposed to a surplus of £12m.
In order to reduce risk within the Scheme, 44% (2018: 47%) of the Scheme assets are invested in annuities that match the liabilities of some pensioners. The assets that the Scheme holds are designed to match a significant proportion of the Scheme liabilities and the Scheme has hedged over 72% (2018: 72%) of the interest rate risk and 79% (2018: 79%) of the inflation risk (when measured on a gilts flat discount rate) to which it is exposed.
The Company did not operate any defined contribution schemes or defined benefit schemes during the financial year ended 31 March 2019 or in the previous financial year.
34. Share-based payments
Accounting policy
The cost of granting shares, options over shares and other share-based remuneration to employees and Executive Directors is recognised through the income statement. All awards are equity settled and therefore the fair value is measured at the grant date. Where the awards have non-market related performance criteria, the Group uses the Black-Scholes option valuation model to establish the relevant fair values. Where the awards have Total Shareholder Return (TSR) market related performance criteria, the Group has used the Monte Carlo simulation valuation model to establish the relevant fair values. The resulting values are amortised through the income statement over the vesting period of the awards. For awards with non-market related criteria, the charge is reversed if it appears probable that the performance or service criteria will not be met.
The following table analyses the total cost recognised in the income statement for the year between each plan, together with the number of options outstanding.
2019 2018
Charge £m
Number(millions)
Charge £m
Number(millions)
Long-Term Incentive Plan 1 2 5 2
Deferred bonus share plan 1 – 1 –
Share award plan – – – –
Executive share option scheme – 2 – 2
2 4 6 4
A summary of the main features of each type of plan is given below. The plans have been split into two categories: Executive plans and Other plans. For further details on the Executive plans, see the Directors’ Remuneration Report on pages 91 to 117.
Executive plans:Long-Term Incentive Plan (LTIP)The LTIP is open to Executive Directors and Senior Management, with awards made at the discretion of the Remuneration Committee. In addition, other than for Executive Directors, an award of ‘matching shares’ can be made where the individual acquires shares in Land Securities Group PLC and pledges to hold them for a period of three years. The awards are issued at nil consideration, subject to performance and vesting conditions being met. Awards of LTIP shares and matching shares are subject to the same performance criteria and normally vest after three years. Awards are satisfied by the transfer of existing shares held by the Employee Benefit Trust (EBT). The weighted average share price at the date of vesting during the year was 899p (2018: 974p). The estimated fair value of awards granted during the year under the scheme was £3m (2018: £3m).
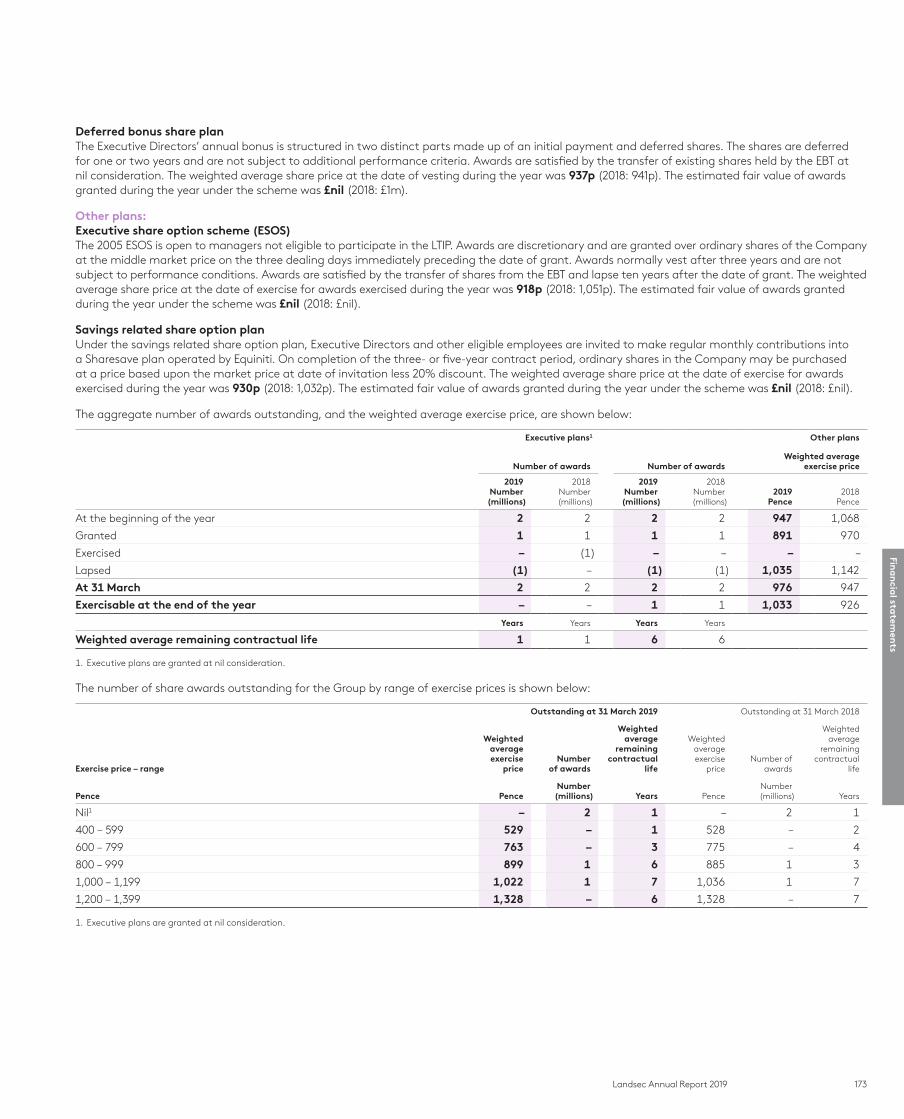
173Landsec Annual Report 2019
Deferred bonus share planThe Executive Directors’ annual bonus is structured in two distinct parts made up of an initial payment and deferred shares. The shares are deferred for one or two years and are not subject to additional performance criteria. Awards are satisfied by the transfer of existing shares held by the EBT at nil consideration. The weighted average share price at the date of vesting during the year was 937p (2018: 941p). The estimated fair value of awards granted during the year under the scheme was £nil (2018: £1m).
Other plans:Executive share option scheme (ESOS)The 2005 ESOS is open to managers not eligible to participate in the LTIP. Awards are discretionary and are granted over ordinary shares of the Company at the middle market price on the three dealing days immediately preceding the date of grant. Awards normally vest after three years and are not subject to performance conditions. Awards are satisfied by the transfer of shares from the EBT and lapse ten years after the date of grant. The weighted average share price at the date of exercise for awards exercised during the year was 918p (2018: 1,051p). The estimated fair value of awards granted during the year under the scheme was £nil (2018: £nil).
Savings related share option planUnder the savings related share option plan, Executive Directors and other eligible employees are invited to make regular monthly contributions into a Sharesave plan operated by Equiniti. On completion of the three- or five-year contract period, ordinary shares in the Company may be purchased at a price based upon the market price at date of invitation less 20% discount. The weighted average share price at the date of exercise for awards exercised during the year was 930p (2018: 1,032p). The estimated fair value of awards granted during the year under the scheme was £nil (2018: £nil).
The aggregate number of awards outstanding, and the weighted average exercise price, are shown below:
Executive plans1 Other plans
Number of awards Number of awardsWeighted average
exercise price
2019Number
(millions)
2018Number(millions)
2019Number
(millions)
2018Number(millions)
2019Pence
2018Pence
At the beginning of the year 2 2 2 2 947 1,068
Granted 1 1 1 1 891 970
Exercised – (1) – – – –
Lapsed (1) – (1) (1) 1,035 1,142
At 31 March 2 2 2 2 976 947
Exercisable at the end of the year – – 1 1 1,033 926
Years Years Years Years
Weighted average remaining contractual life 1 1 6 6
1. Executive plans are granted at nil consideration.
The number of share awards outstanding for the Group by range of exercise prices is shown below:
Outstanding at 31 March 2019 Outstanding at 31 March 2018
Exercise price – range
Weighted average exercise
priceNumber
of awards
Weighted average
remaining contractual
life
Weighted average exercise
priceNumber of
awards
Weighted average
remaining contractual
life
Pence PenceNumber
(millions) Years PenceNumber
(millions) Years
Nil1 – 2 1 – 2 1
400 – 599 529 – 1 528 – 2
600 – 799 763 – 3 775 – 4
800 – 999 899 1 6 885 1 3
1,000 – 1,199 1,022 1 7 1,036 1 7
1,200 – 1,399 1,328 – 6 1,328 – 7
1. Executive plans are granted at nil consideration.
Fina
ncia
l statem
ents
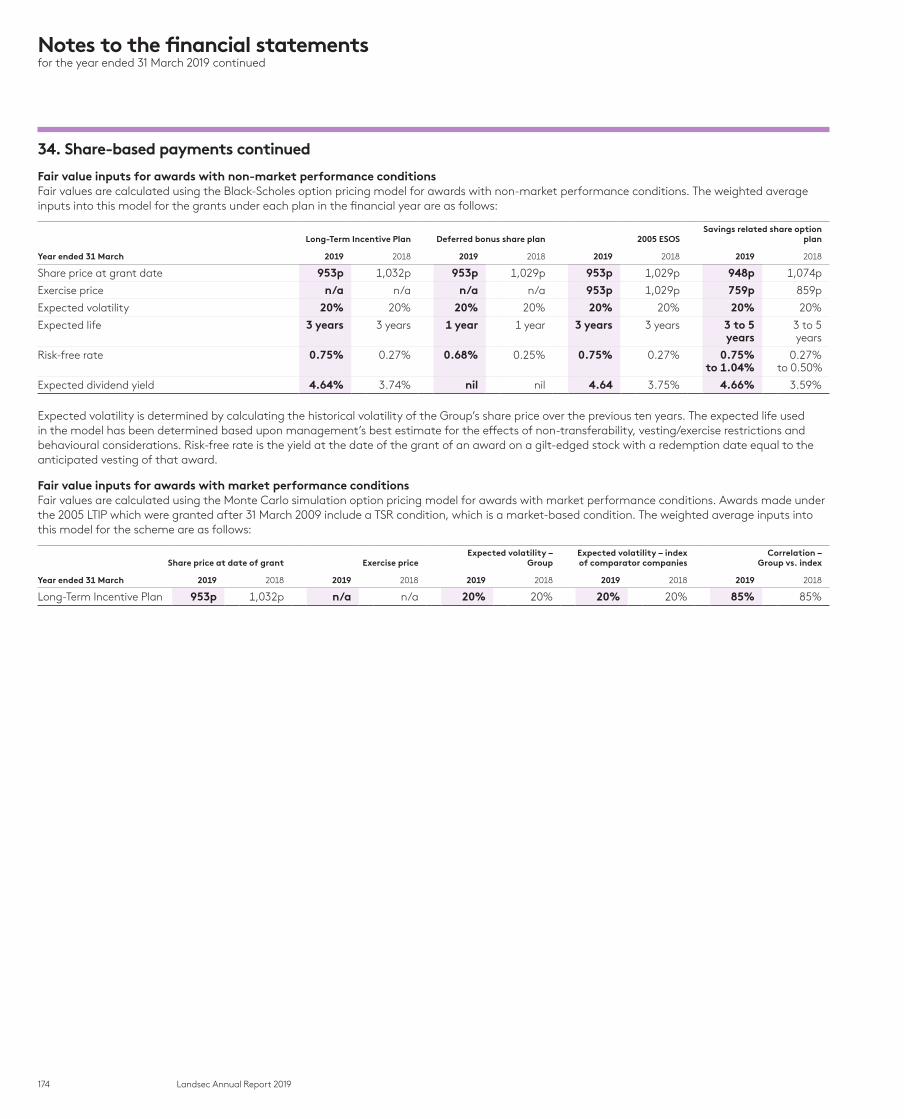
174 Landsec Annual Report 2019
Notes to the financial statementsfor the year ended 31 March 2019 continued
34. Share-based payments continued
Fair value inputs for awards with non-market performance conditionsFair values are calculated using the Black-Scholes option pricing model for awards with non-market performance conditions. The weighted average inputs into this model for the grants under each plan in the financial year are as follows:
Long-Term Incentive Plan Deferred bonus share plan 2005 ESOSSavings related share option
plan
Year ended 31 March 2019 2018 2019 2018 2019 2018 2019 2018
Share price at grant date 953p 1,032p 953p 1,029p 953p 1,029p 948p 1,074p
Exercise price n/a n/a n/a n/a 953p 1,029p 759p 859p
Expected volatility 20% 20% 20% 20% 20% 20% 20% 20%
Expected life 3 years 3 years 1 year 1 year 3 years 3 years 3 to 5 years
3 to 5 years
Risk-free rate 0.75% 0.27% 0.68% 0.25% 0.75% 0.27% 0.75% to 1.04%
0.27% to 0.50%
Expected dividend yield 4.64% 3.74% nil nil 4.64 3.75% 4.66% 3.59%
Expected volatility is determined by calculating the historical volatility of the Group’s share price over the previous ten years. The expected life used in the model has been determined based upon management’s best estimate for the effects of non-transferability, vesting/exercise restrictions and behavioural considerations. Risk-free rate is the yield at the date of the grant of an award on a gilt-edged stock with a redemption date equal to the anticipated vesting of that award.
Fair value inputs for awards with market performance conditionsFair values are calculated using the Monte Carlo simulation option pricing model for awards with market performance conditions. Awards made under the 2005 LTIP which were granted after 31 March 2009 include a TSR condition, which is a market-based condition. The weighted average inputs into this model for the scheme are as follows:
Share price at date of grant Exercise priceExpected volatility –
GroupExpected volatility – index of comparator companies
Correlation – Group vs. index
Year ended 31 March 2019 2018 2019 2018 2019 2018 2019 2018 2019 2018
Long-Term Incentive Plan 953p 1,032p n/a n/a 20% 20% 20% 20% 85% 85%

175Landsec Annual Report 2019
35. Ordinary share capital
Accounting policy
Ordinary shares are classified as equity. External costs directly attributable to the issue of new shares are shown in equity as a deduction from the proceeds.
The consideration paid by any Group entity to acquire the Company’s equity share capital, including any directly attributable incremental costs, is deducted from equity until the shares are cancelled, reissued or sold. Where own shares are sold or reissued, the net consideration received is included in equity. Shares acquired by the Employee Benefit Trust (EBT) are presented on the Group and Company balance sheets within ‘Other reserves’. Purchases of treasury shares are deducted from retained earnings.
Group and CompanyAllotted and fully paid
2019 £m
2018£m
Ordinary shares of 102/3p each 80 80
Number of shares
2019 2018
At the beginning of the year 751,298,964 801,244,628
Issued on the exercise of options 2,029 139,446
Share consolidation (see note 37) – (50,085,104)
Cancellation of treasury shares – (6)
At 31 March 751,300,993 751,298,964
The number of options over ordinary shares from Executive plans that were outstanding at 31 March 2019 was 2,267,391 (2018: 2,105,086). If all the options were exercised at that date then 2,267,391 (2018: 2,105,086) shares would be required to be transferred from the EBT. The number of options over ordinary shares from Other plans that were outstanding at 31 March 2019 was 2,150,274 (2018: 1,868,186). If all the options were exercised at that date then 355,095 new ordinary shares (2018: 304,582) would be issued and 1,795,179 shares would be required to be transferred from the EBT (2018: 1,563,604).
Shareholders at the Annual General Meeting have previously authorised the acquisition of shares by the Company representing up to 10% of its share capital, to be held as treasury shares. During the years ended 31 March 2019 and 2018, there were no ordinary shares acquired to be held as treasury shares. At 31 March 2019 the Group held 9,839,179 ordinary shares (2018: 9,839,179) with a market value of £90m (2018: £92m) in treasury. The reduction in the number of shares held in treasury as a result of the share consolidation in the year ended 31 March 2018 is explained in note 37.
Fina
ncia
l statem
ents

176 Landsec Annual Report 2019
Notes to the financial statementsfor the year ended 31 March 2019 continued
36. Own sharesGroup and Company
2019 £m
2018£m
At the beginning of the year 13 9
Acquisition of ordinary shares – 10
Transfer of shares to employees on exercise of share options (2) (6)
At 31 March 11 13
Own shares consist of shares in Land Securities Group PLC held by the EBT in respect of the Group’s commitment to a number of its employee share option schemes (note 34).
The number of shares held by the EBT at 31 March 2019 was 1,080,624 (2018: 1,178,179). The market value of these shares at 31 March 2019 was £10m (2018: £11m).
37. Capital distribution
On 27 September 2017, the Group’s shareholders approved a return of capital to shareholders of £475m through the issue of new B shares, which the Group then redeemed in order to return 60p per ordinary share to shareholders, reducing the Group’s share premium account. The capital distribution was paid on 13 October 2017.
Following the redemption of the B shares, there was a share consolidation in the ratio of 15 ordinary shares for every 16 existing shares. The share consolidation did not result in a change in the carrying value of the Group’s share capital, but reduced the number of ordinary shares in issue by 50,085,104 of which 655,946 were held in Treasury.
38. Contingencies
The Group has contingent liabilities in respect of legal claims, guarantees, and warranties arising in the ordinary course of business. It is not anticipated that any material liabilities will arise from the contingent liabilities.
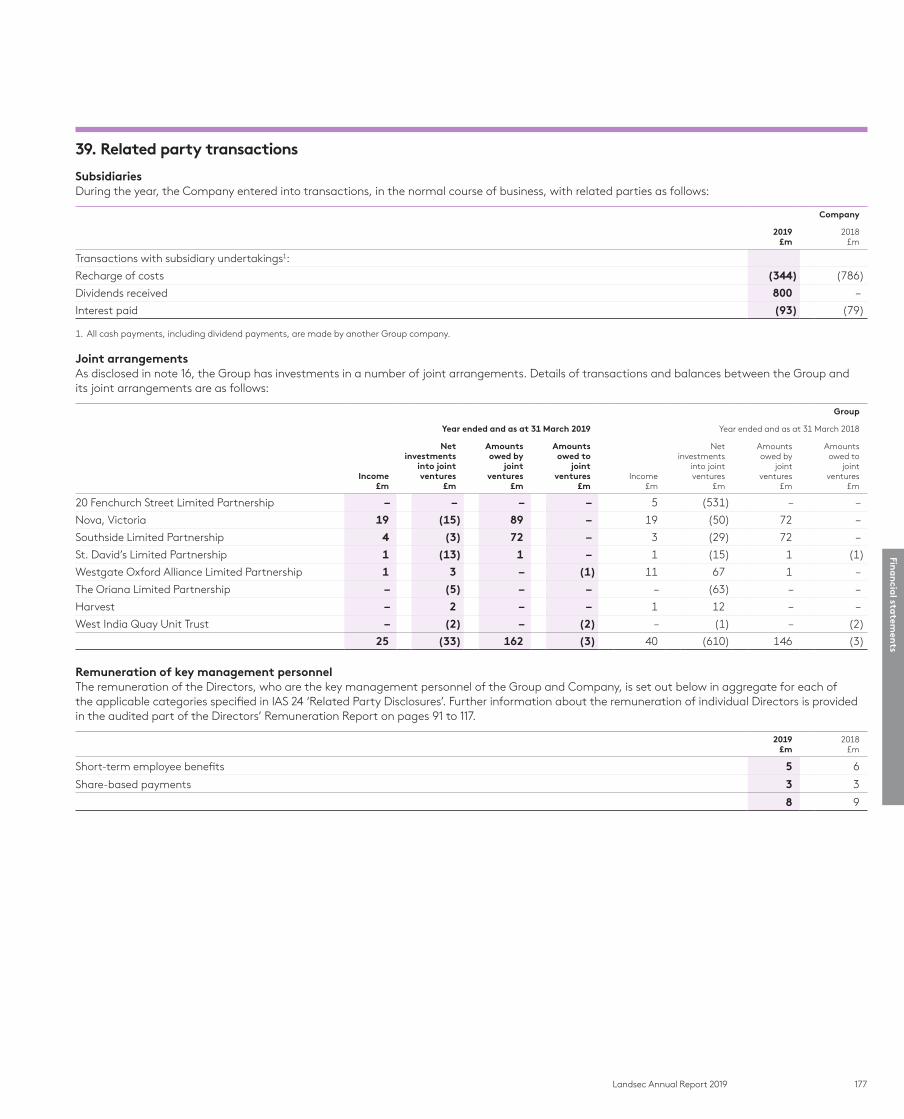
177Landsec Annual Report 2019
39. Related party transactions
SubsidiariesDuring the year, the Company entered into transactions, in the normal course of business, with related parties as follows:
Company
2019 £m
2018£m
Transactions with subsidiary undertakings1:
Recharge of costs (344) (786)
Dividends received 800 –
Interest paid (93) (79)
1. All cash payments, including dividend payments, are made by another Group company.
Joint arrangementsAs disclosed in note 16, the Group has investments in a number of joint arrangements. Details of transactions and balances between the Group and its joint arrangements are as follows:
Group
Year ended and as at 31 March 2019 Year ended and as at 31 March 2018
Income£m
Net investments
into joint ventures
£m
Amounts owed by
joint ventures
£m
Amounts owed to
joint ventures
£mIncome
£m
Net investments
into joint ventures
£m
Amounts owed by
joint ventures
£m
Amounts owed to
joint ventures
£m
20 Fenchurch Street Limited Partnership – – – – 5 (531) – –
Nova, Victoria 19 (15) 89 – 19 (50) 72 –
Southside Limited Partnership 4 (3) 72 – 3 (29) 72 –
St. David’s Limited Partnership 1 (13) 1 – 1 (15) 1 (1)
Westgate Oxford Alliance Limited Partnership 1 3 – (1) 11 67 1 –
The Oriana Limited Partnership – (5) – – – (63) – –
Harvest – 2 – – 1 12 – –
West India Quay Unit Trust – (2) – (2) – (1) – (2)
25 (33) 162 (3) 40 (610) 146 (3)
Remuneration of key management personnelThe remuneration of the Directors, who are the key management personnel of the Group and Company, is set out below in aggregate for each of the applicable categories specified in IAS 24 ‘Related Party Disclosures’. Further information about the remuneration of individual Directors is provided in the audited part of the Directors’ Remuneration Report on pages 91 to 117.
2019 £m
2018£m
Short-term employee benefits 5 6
Share-based payments 3 3
8 9
Fina
ncia
l statem
ents

178 Landsec Annual Report 2019
Notes to the financial statementsfor the year ended 31 March 2019 continued
40. Operating lease arrangements
Accounting policy
The Group earns rental income by leasing its properties to tenants under non-cancellable operating leases. Leases in which substantially all risks and rewards of ownership are retained by another party, the lessor, are classified as operating leases. Payments, including prepayments, made under operating leases (net of any incentives received from the lessor) are charged to the income statement on a straight-line basis over the period of the lease.
At the balance sheet date, the Group had contracted with tenants to receive the following future minimum lease payments:
2019 £m
2018£m
Not later than one year 559 533
Later than one year but not more than five years 1,883 1,945
More than five years 3,852 3,878
6,294 6,356
The total of contingent rents recognised as income during the year was £38m (2018: £40m).
41. Changes in accounting policies
IFRS 9 Financial instrumentsThe Group has adopted IFRS 9 with effect from 1 April 2018. IFRS 9 replaces the provisions of IAS 39 that relate to the recognition, classification and measurement of financial assets and financial liabilities, de-recognition of financial instruments, impairment of financial assets and hedge accounting. While some accounting policies have been amended on adoption of the standard, there have been no adjustments required to the Group’s income statement or balance sheet. The new accounting policies are set out in notes 21 to 26.
On 1 April 2018 (the date of initial application of IFRS 9), the Group has assessed whether it intends to hold its financial assets to collect the contractual cash flows, or whether it intends to sell them before maturity and has classified its financial instruments into the appropriate IFRS 9 categories. There is no net impact on the income statement or balance sheet as a result of these changes.
Financial asset Classification – IAS 39 Classification – IFRS 9 Measurement
Trade and other receivables
Trade receivables Loans and receivables Financial assets at amortised cost Amortised cost
Property sales debtors Loans and receivables Financial assets at amortised cost Amortised cost
Amounts due from joint ventures Loans and receivables Financial assets at amortised cost Amortised cost
Net investment in finance lease Loans and receivables Financial assets at amortised cost Amortised cost
Cash and cash equivalents Amortised cost Financial assets at amortised cost Amortised cost
Other investments
Equity investments Available for sale Financial assets at fair value through Other comprehensive income (without recycling)
Fair value, with changes recognised in Other comprehensive income
The Group’s financial assets are subject to the standard’s new expected credit loss model for assessing impairment. The Group applies the simplified approach to measuring expected credit losses by calculating a lifetime expected loss allowance for all trade receivables, the net investment in finance leases and contract assets. There has been no adjustment to the loss allowance on 1 April 2018 as the impact of adopting the revised accounting policy is not material.
IFRS 15 Revenue from contracts with customersThe Group has also adopted IFRS 15 with effect from 1 April 2018, which is applicable to service charge income, other property related income, trading property sales proceeds and proceeds from the sale of investment properties, but not rental income. As a result of adopting this standard, the service charge income and expenses for those properties where the property management activities are performed by a third party are now presented on a net basis. For these properties, the Group considers the third party performing the activities to be the principal delivering the service. The impact of this change on the Group’s income statement is shown in the table on page 179. There is no impact on the Group’s balance sheet. The new accounting policy for revenue from contracts with customers is set out in note 6.
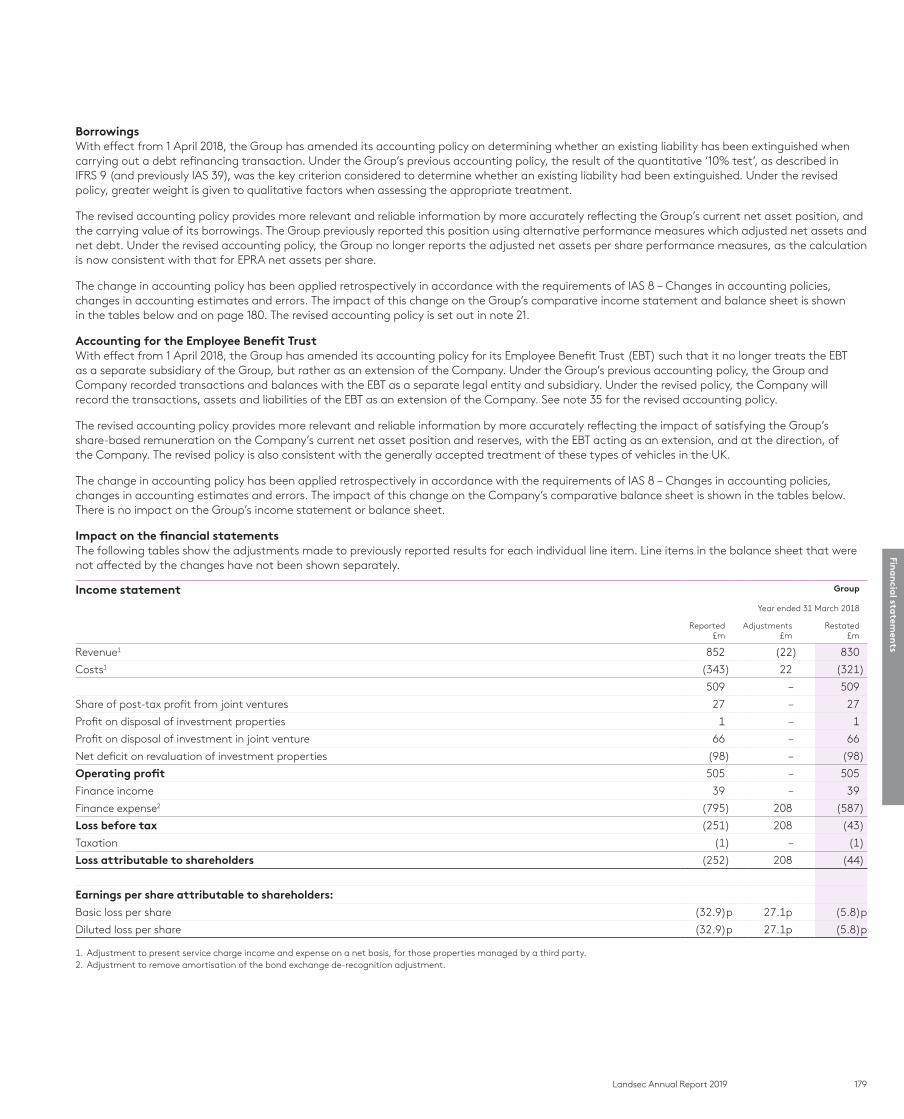
179Landsec Annual Report 2019
BorrowingsWith effect from 1 April 2018, the Group has amended its accounting policy on determining whether an existing liability has been extinguished when carrying out a debt refinancing transaction. Under the Group’s previous accounting policy, the result of the quantitative ‘10% test’, as described in IFRS 9 (and previously IAS 39), was the key criterion considered to determine whether an existing liability had been extinguished. Under the revised policy, greater weight is given to qualitative factors when assessing the appropriate treatment.
The revised accounting policy provides more relevant and reliable information by more accurately reflecting the Group’s current net asset position, and the carrying value of its borrowings. The Group previously reported this position using alternative performance measures which adjusted net assets and net debt. Under the revised accounting policy, the Group no longer reports the adjusted net assets per share performance measures, as the calculation is now consistent with that for EPRA net assets per share.
The change in accounting policy has been applied retrospectively in accordance with the requirements of IAS 8 – Changes in accounting policies, changes in accounting estimates and errors. The impact of this change on the Group’s comparative income statement and balance sheet is shown in the tables below and on page 180. The revised accounting policy is set out in note 21.
Accounting for the Employee Benefit TrustWith effect from 1 April 2018, the Group has amended its accounting policy for its Employee Benefit Trust (EBT) such that it no longer treats the EBT as a separate subsidiary of the Group, but rather as an extension of the Company. Under the Group’s previous accounting policy, the Group and Company recorded transactions and balances with the EBT as a separate legal entity and subsidiary. Under the revised policy, the Company will record the transactions, assets and liabilities of the EBT as an extension of the Company. See note 35 for the revised accounting policy.
The revised accounting policy provides more relevant and reliable information by more accurately reflecting the impact of satisfying the Group’s share-based remuneration on the Company’s current net asset position and reserves, with the EBT acting as an extension, and at the direction, of the Company. The revised policy is also consistent with the generally accepted treatment of these types of vehicles in the UK.
The change in accounting policy has been applied retrospectively in accordance with the requirements of IAS 8 – Changes in accounting policies, changes in accounting estimates and errors. The impact of this change on the Company’s comparative balance sheet is shown in the tables below. There is no impact on the Group’s income statement or balance sheet.
Impact on the financial statementsThe following tables show the adjustments made to previously reported results for each individual line item. Line items in the balance sheet that were not affected by the changes have not been shown separately.
Income statement Group
Year ended 31 March 2018
Reported£m
Adjustments£m
Restated£m
Revenue1 852 (22) 830
Costs1 (343) 22 (321)
509 – 509
Share of post-tax profit from joint ventures 27 – 27
Profit on disposal of investment properties 1 – 1
Profit on disposal of investment in joint venture 66 – 66
Net deficit on revaluation of investment properties (98) – (98)
Operating profit 505 – 505
Finance income 39 – 39
Finance expense2 (795) 208 (587)
Loss before tax (251) 208 (43)
Taxation (1) – (1)
Loss attributable to shareholders (252) 208 (44)
Earnings per share attributable to shareholders:
Basic loss per share (32.9)p 27.1p (5.8)p
Diluted loss per share (32.9)p 27.1p (5.8)p
1. Adjustment to present service charge income and expense on a net basis, for those properties managed by a third party.2. Adjustment to remove amortisation of the bond exchange de-recognition adjustment.
Fina
ncia
l statem
ents

180 Landsec Annual Report 2019
Notes to the financial statementsfor the year ended 31 March 2019 continued
41. Changes in accounting policies continued
Balance sheet Group
31 March 2018 31 March 2018 1 April 2017 1 April 2017
Reported£m
Adjustments£m
Restated£m
Reported£m
Adjustments£m
Restated£m
Total assets 14,469 – 14,469 14,844 – 14,844
Total current liabilities (1,180) – (1,180) (713) – (713)
Non-current liabilities
Borrowings1 (2,752) (106) (2,858) (2,545) (314) (2,859)
Other non-current liabilities (45) – (45) (70) – (70)
Total non-current liabilities (2,797) (106) (2,903) (2,615) (314) (2,929)
Total liabilities (3,977) (106) (4,083) (3,328) (314) (3,642)
Net assets 10,492 (106) 10,386 11,516 (314) 11,202
Equity
Capital and reserves attributable to shareholders
Retained earnings1 10,069 (106) 9,963 10,615 (314) 10,301
Other components of equity 423 – 423 901 – 901
Total equity 10,492 (106) 10,386 11,516 (314) 11,202
1. Adjustment to remove the bond exchange de-recognition adjustment.
Balance sheet Company
31 March 2018 31 March 2018 1 April 2017 1 April 2017
Reported£m
Adjustments£m
Restated£m
Reported£m
Adjustments£m
Restated£m
Total assets 6,215 – 6,215 6,226 – 6,226
Trade and other payables1 (2,258) (71) (2,329) (1,394) (63) (1,457)
Total current liabilities (2,258) (71) (2,329) (1,394) (63) (1,457)
Total liabilities (2,258) (71) (2,329) (1,394) (63) (1,457)
Net assets 3,957 (71) 3,886 4,832 (63) 4,769
Equity
Capital and reserves attributable to shareholders
Other reserves1 38 (12) 26 39 (9) 30
Retained earnings1 3,148 (59) 3,089 3,548 (54) 3,494
Other components of equity 771 – 771 1,245 – 1,245
Total equity 3,957 (71) 3,886 4,832 (63) 4,769
1. Adjustment to present the EBT as an extension of the Company.
42. Events after the reporting period
There were no significant events occurring after the reporting period, but before the financial statements were authorised for issue.

181Landsec Annual Report 2019
Ad
dition
al in
forma
tion
Additional information
Contents
182 Business analysis – Group188 Business analysis – London189 Business analysis – Retail190 Sustainability performance196 Combined Portfolio analysis198 Lease lengths199 Development pipeline199 Alternative performance measures200 Ten year summary202 Acquisitions, disposals and capital
expenditure203 Analysis of capital expenditure204 Subsidiaries, joint ventures and associates207 Shareholder information210 Key contacts and advisers211 GlossaryIBC Cautionary statement
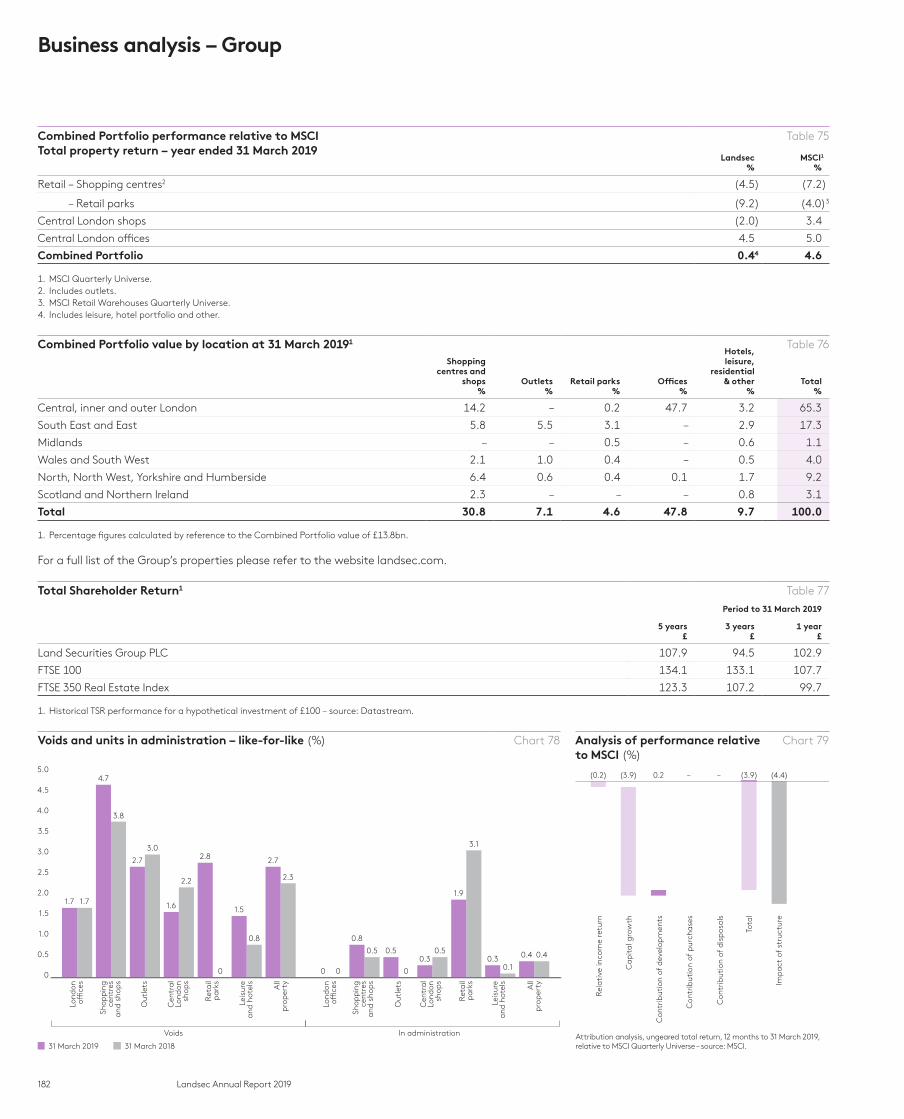
182 Landsec Annual Report 2019
Business analysis – Group
Combined Portfolio performance relative to MSCITotal property return – year ended 31 March 2019
Table 75
Landsec%
MSCI1
%
Retail – Shopping centres2 (4.5) (7.2)
– Retail parks (9.2) (4.0)3
Central London shops (2.0) 3.4
Central London offices 4.5 5.0
Combined Portfolio 0.44 4.6
1. MSCI Quarterly Universe.2. Includes outlets.3. MSCI Retail Warehouses Quarterly Universe.4. Includes leisure, hotel portfolio and other.
Combined Portfolio value by location at 31 March 20191 Table 76Shopping
centres and shops
%Outlets
%Retail parks
%Offices
%
Hotels, leisure,
residential & other
%Total
%
Central, inner and outer London 14.2 – 0.2 47.7 3.2 65.3
South East and East 5.8 5.5 3.1 – 2.9 17.3
Midlands – – 0.5 – 0.6 1.1
Wales and South West 2.1 1.0 0.4 – 0.5 4.0
North, North West, Yorkshire and Humberside 6.4 0.6 0.4 0.1 1.7 9.2
Scotland and Northern Ireland 2.3 – – – 0.8 3.1
Total 30.8 7.1 4.6 47.8 9.7 100.0
1. Percentage figures calculated by reference to the Combined Portfolio value of £13.8bn.
For a full list of the Group’s properties please refer to the website landsec.com.
Total Shareholder Return1 Table 77
Period to 31 March 2019
5 years£
3 years£
1 year£
Land Securities Group PLC 107.9 94.5 102.9
FTSE 100 134.1 133.1 107.7
FTSE 350 Real Estate Index 123.3 107.2 99.7
1. Historical TSR performance for a hypothetical investment of £100 – source: Datastream.
Voids and units in administration – like-for-like (%) Chart 78 Analysis of performance relative to MSCI (%)
Chart 79
Lond
ono�
ces
Ret
ail
pa
rks
Out
lets
Out
lets
Shop
pin
gce
ntre
sa
nd s
hop
s
Cen
tra
lLo
ndon
shop
s
Voids
31 March 2019
In administration
Leis
ure
and
hot
els
All
pro
per
ty
Lond
ono�
ces
Ret
ail
pa
rks
Shop
pin
gce
ntre
sa
nd s
hop
s
Cen
tra
lLo
ndon
shop
s
Leis
ure
and
hot
els
All
pro
per
ty
31 March 2018
0
0.5
1.0
1.5
2.0
2.5
3.0
3.5
5.0
4.5
4.0
1.7 1.7
4.7
3.8
2.7
3.0
1.6
2.2
2.8
0
1.5
0.8
2.7
2.3
1.9
3.1
0.30.50.5
0
0.8
0.5
0 0
0.30.1
0.4 0.4
Rel
ati
ve in
com
e re
turn
Ca
pit
al g
row
th
Con
trib
utio
n of
dev
elop
men
ts
Con
trib
utio
n of
pur
cha
ses
Con
trib
utio
n of
dis
pos
als
Imp
act
of
stru
ctur
e
Tota
l
(0.2) (3.9) 0.2 – (3.9) (4.4)–
Attribution analysis, ungeared total return, 12 months to 31 March 2019, relative to MSCI Quarterly Universe – source: MSCI.
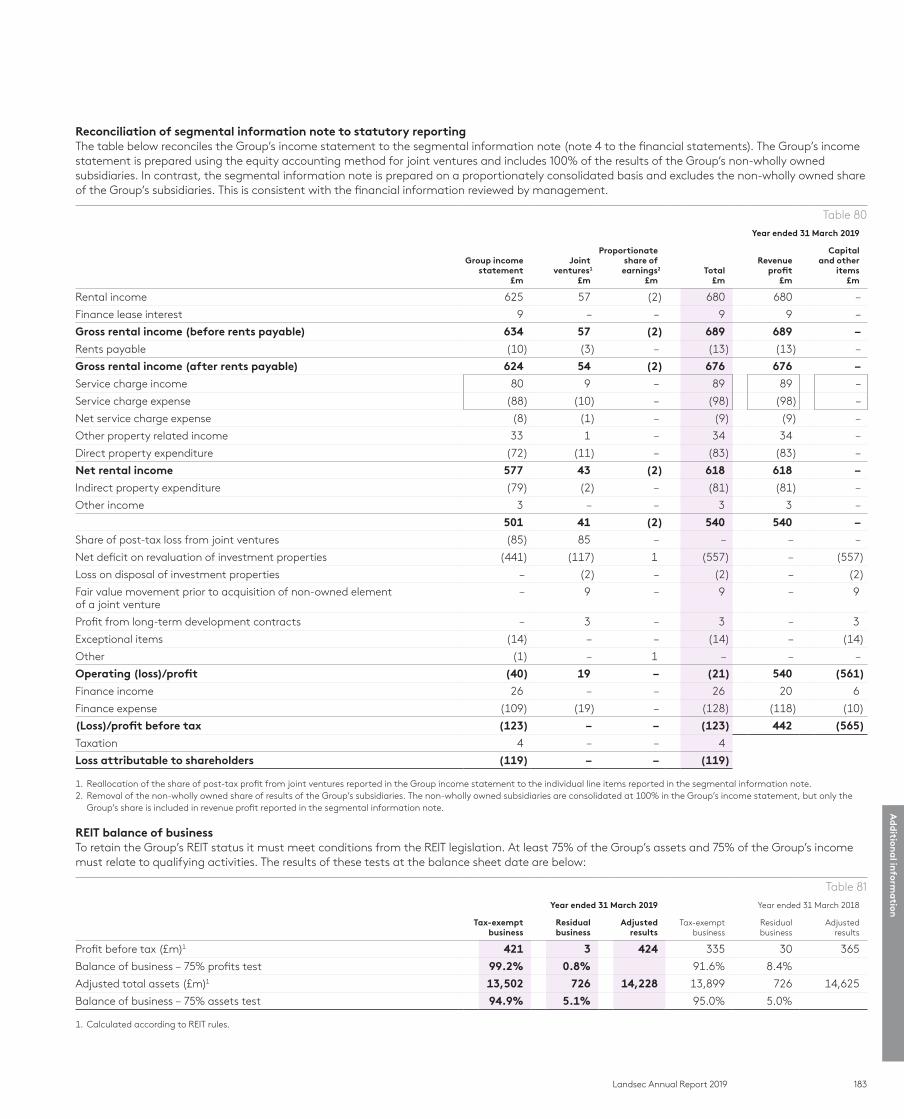
183Landsec Annual Report 2019
Ad
dition
al in
forma
tion
Reconciliation of segmental information note to statutory reporting The table below reconciles the Group’s income statement to the segmental information note (note 4 to the financial statements). The Group’s income statement is prepared using the equity accounting method for joint ventures and includes 100% of the results of the Group’s non-wholly owned subsidiaries. In contrast, the segmental information note is prepared on a proportionately consolidated basis and excludes the non-wholly owned share of the Group’s subsidiaries. This is consistent with the financial information reviewed by management.
Table 80
Year ended 31 March 2019
Group income statement
£m
Joint ventures1
£m
Proportionate share ofearnings2
£mTotal
£m
Revenue profit
£m
Capital and other
items£m
Rental income 625 57 (2) 680 680 –
Finance lease interest 9 – – 9 9 –
Gross rental income (before rents payable) 634 57 (2) 689 689 –
Rents payable (10) (3) – (13) (13) –
Gross rental income (after rents payable) 624 54 (2) 676 676 –
Service charge income 80 9 – 89 89 –
Service charge expense (88) (10) – (98) (98) –
Net service charge expense (8) (1) – (9) (9) –
Other property related income 33 1 – 34 34 –
Direct property expenditure (72) (11) – (83) (83) –
Net rental income 577 43 (2) 618 618 –
Indirect property expenditure (79) (2) – (81) (81) –
Other income 3 – – 3 3 –
501 41 (2) 540 540 –
Share of post-tax loss from joint ventures (85) 85 – – – –
Net deficit on revaluation of investment properties (441) (117) 1 (557) – (557)
Loss on disposal of investment properties – (2) – (2) – (2)
Fair value movement prior to acquisition of non-owned element of a joint venture
– 9 – 9 – 9
Profit from long-term development contracts – 3 – 3 – 3
Exceptional items (14) – – (14) – (14)
Other (1) – 1 – – –
Operating (loss)/profit (40) 19 – (21) 540 (561)
Finance income 26 – – 26 20 6
Finance expense (109) (19) – (128) (118) (10)
(Loss)/profit before tax (123) – – (123) 442 (565)
Taxation 4 – – 4
Loss attributable to shareholders (119) – – (119)
1. Reallocation of the share of post-tax profit from joint ventures reported in the Group income statement to the individual line items reported in the segmental information note.2. Removal of the non-wholly owned share of results of the Group’s subsidiaries. The non-wholly owned subsidiaries are consolidated at 100% in the Group’s income statement, but only the
Group’s share is included in revenue profit reported in the segmental information note.
REIT balance of businessTo retain the Group’s REIT status it must meet conditions from the REIT legislation. At least 75% of the Group’s assets and 75% of the Group’s income must relate to qualifying activities. The results of these tests at the balance sheet date are below:
Table 81
Year ended 31 March 2019 Year ended 31 March 2018
Tax-exempt business
Residual business
Adjusted results
Tax-exempt business
Residual business
Adjusted results
Profit before tax (£m)1 421 3 424 335 30 365
Balance of business – 75% profits test 99.2% 0.8% 91.6% 8.4%
Adjusted total assets (£m)1 13,502 726 14,228 13,899 726 14,625
Balance of business – 75% assets test 94.9% 5.1% 95.0% 5.0%
1. Calculated according to REIT rules.
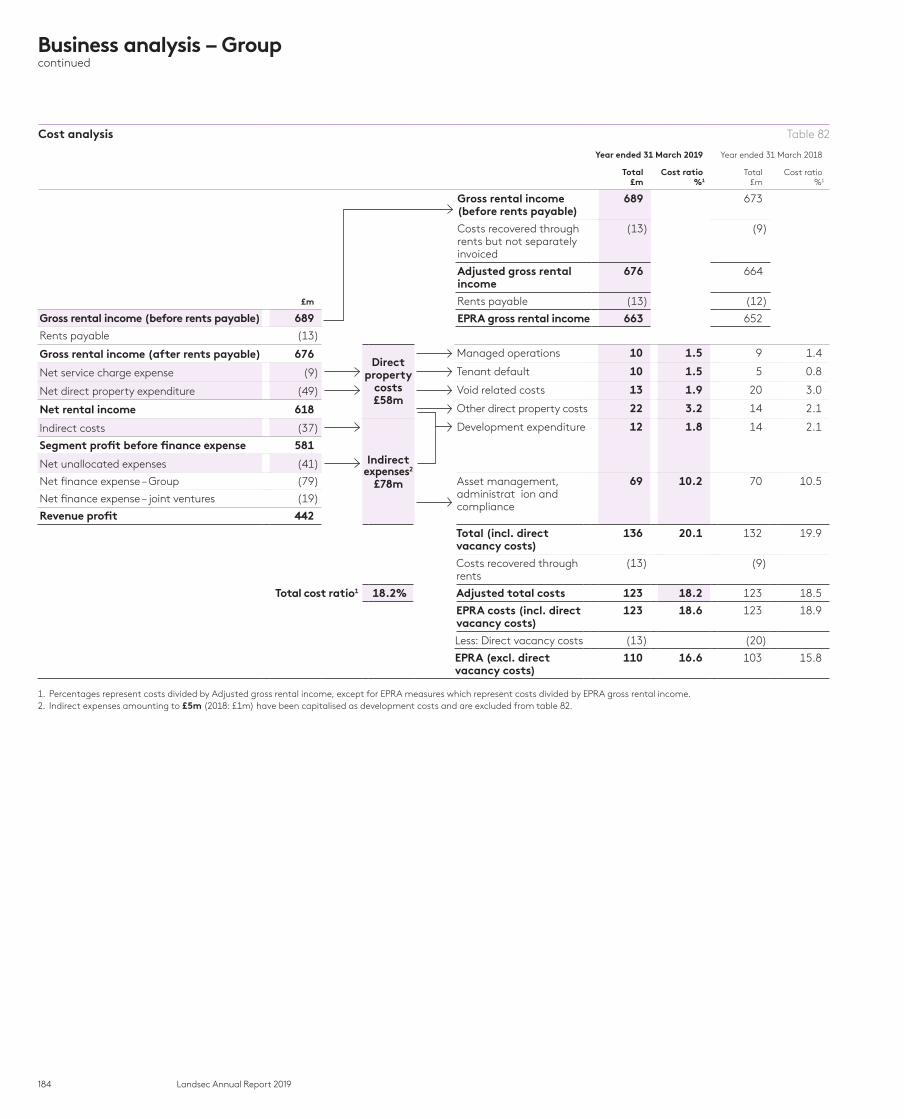
184 Landsec Annual Report 2019
Business analysis – Groupcontinued
Cost analysis Table 82
Year ended 31 March 2019 Year ended 31 March 2018
Total £m
Cost ratio%1
Total £m
Cost ratio%1
Gross rental income (before rents payable)
689 673
Costs recovered through rents but not separately invoiced
(13) (9)
Adjusted gross rental income
676 664
Rents payable (13) (12)
EPRA gross rental income 663 652
£m
Gross rental income (before rents payable) 689
Rents payable (13)
Gross rental income (after rents payable) 676Direct
propertycosts£58m
Managed operations 10 1.5 9 1.4
Net service charge expense (9) Tenant default 10 1.5 5 0.8
Net direct property expenditure (49) Void related costs 13 1.9 20 3.0
Net rental income 618 Other direct property costs 22 3.2 14 2.1
Indirect costs (37)
Indirectexpenses2
£78m
Development expenditure 12 1.8 14 2.1
Segment profit before finance expense 581
Net unallocated expenses (41)
Net finance expense – Group (79) Asset management,administrat ion andcompliance
69 10.2 70 10.5
Net finance expense – joint ventures (19)
Revenue profit 442
Total (incl. direct vacancy costs)
136 20.1 132 19.9
Total cost ratio1
Costs recovered through rents
(13) (9)
18.2% Adjusted total costs 123 18.2 123 18.5
EPRA costs (incl. direct vacancy costs)
123 18.6 123 18.9
Less: Direct vacancy costs (13) (20)
EPRA (excl. direct vacancy costs)
110 16.6 103 15.8
1. Percentages represent costs divided by Adjusted gross rental income, except for EPRA measures which represent costs divided by EPRA gross rental income.2. Indirect expenses amounting to £5m (2018: £1m) have been capitalised as development costs and are excluded from table 82.
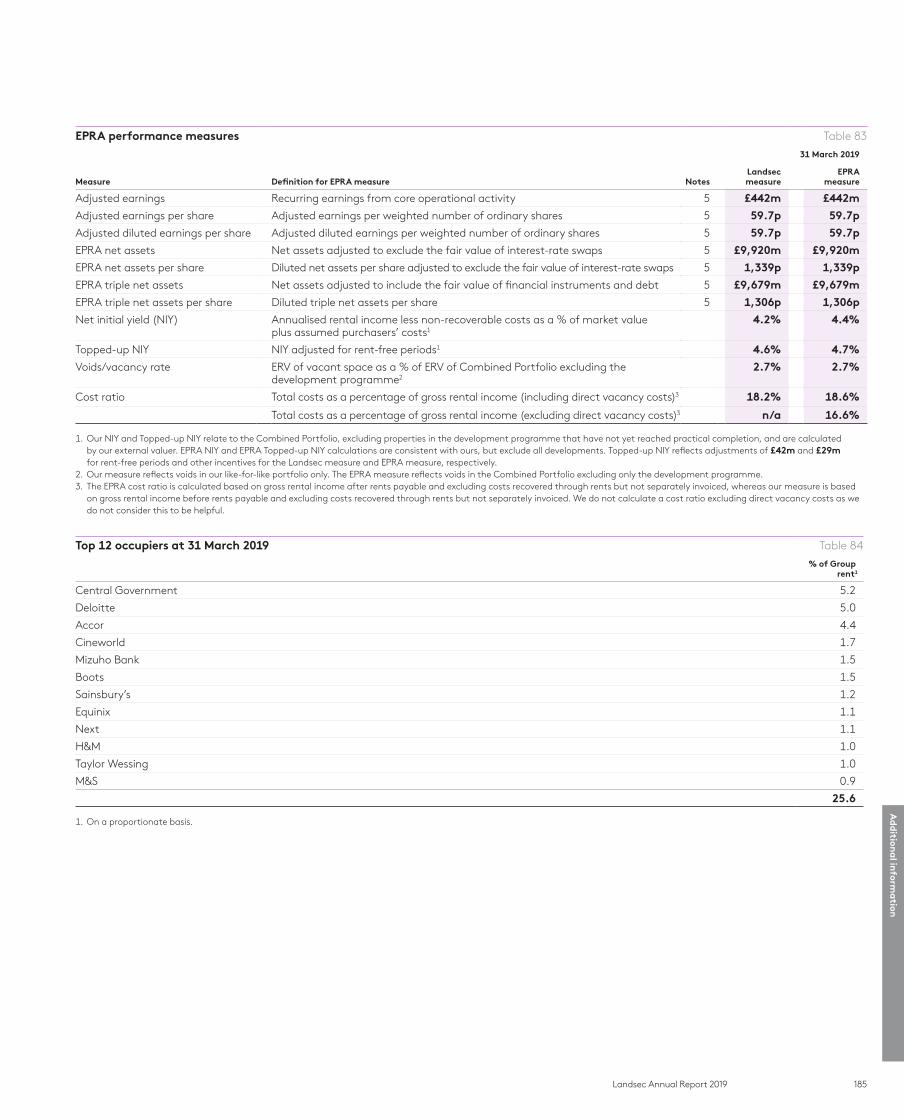
185Landsec Annual Report 2019
Ad
dition
al in
forma
tion
EPRA performance measures Table 83
31 March 2019
Measure Definition for EPRA measure NotesLandsecmeasure
EPRAmeasure
Adjusted earnings Recurring earnings from core operational activity 5 £442m £442m
Adjusted earnings per share Adjusted earnings per weighted number of ordinary shares 5 59.7p 59.7p
Adjusted diluted earnings per share Adjusted diluted earnings per weighted number of ordinary shares 5 59.7p 59.7p
EPRA net assets Net assets adjusted to exclude the fair value of interest-rate swaps 5 £9,920m £9,920m
EPRA net assets per share Diluted net assets per share adjusted to exclude the fair value of interest-rate swaps 5 1,339p 1,339p
EPRA triple net assets Net assets adjusted to include the fair value of financial instruments and debt 5 £9,679m £9,679m
EPRA triple net assets per share Diluted triple net assets per share 5 1,306p 1,306p
Net initial yield (NIY) Annualised rental income less non-recoverable costs as a % of market value plus assumed purchasers’ costs1
4.2% 4.4%
Topped-up NIY NIY adjusted for rent-free periods1 4.6% 4.7%
Voids/vacancy rate ERV of vacant space as a % of ERV of Combined Portfolio excluding the development programme2
2.7% 2.7%
Cost ratio Total costs as a percentage of gross rental income (including direct vacancy costs)3 18.2% 18.6%
Total costs as a percentage of gross rental income (excluding direct vacancy costs)3 n/a 16.6%
1. Our NIY and Topped-up NIY relate to the Combined Portfolio, excluding properties in the development programme that have not yet reached practical completion, and are calculated by our external valuer. EPRA NIY and EPRA Topped-up NIY calculations are consistent with ours, but exclude all developments. Topped-up NIY reflects adjustments of £42m and £29m for rent-free periods and other incentives for the Landsec measure and EPRA measure, respectively.
2. Our measure reflects voids in our like-for-like portfolio only. The EPRA measure reflects voids in the Combined Portfolio excluding only the development programme. 3. The EPRA cost ratio is calculated based on gross rental income after rents payable and excluding costs recovered through rents but not separately invoiced, whereas our measure is based
on gross rental income before rents payable and excluding costs recovered through rents but not separately invoiced. We do not calculate a cost ratio excluding direct vacancy costs as we do not consider this to be helpful.
Top 12 occupiers at 31 March 2019 Table 84
% of Grouprent1
Central Government 5.2
Deloitte 5.0
Accor 4.4
Cineworld 1.7
Mizuho Bank 1.5
Boots 1.5
Sainsbury’s 1.2
Equinix 1.1
Next 1.1
H&M 1.0
Taylor Wessing 1.0
M&S 0.9
25.6
1. On a proportionate basis.
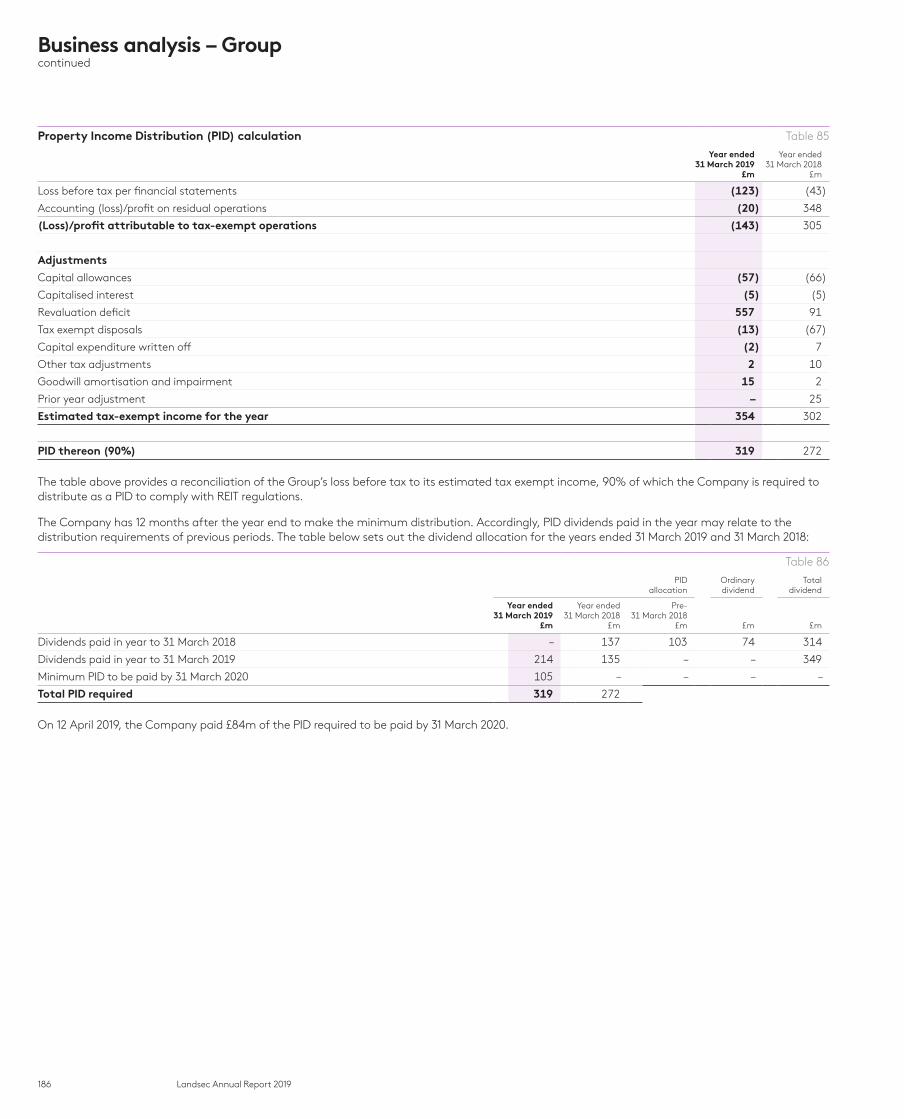
186 Landsec Annual Report 2019
Business analysis – Groupcontinued
Property Income Distribution (PID) calculation Table 85
Year ended 31 March 2019
£m
Year ended 31 March 2018
£m
Loss before tax per financial statements (123) (43)
Accounting (loss)/profit on residual operations (20) 348
(Loss)/profit attributable to tax-exempt operations (143) 305
Adjustments
Capital allowances (57) (66)
Capitalised interest (5) (5)
Revaluation deficit 557 91
Tax exempt disposals (13) (67)
Capital expenditure written off (2) 7
Other tax adjustments 2 10
Goodwill amortisation and impairment 15 2
Prior year adjustment – 25
Estimated tax-exempt income for the year 354 302
PID thereon (90%) 319 272
The table above provides a reconciliation of the Group’s loss before tax to its estimated tax exempt income, 90% of which the Company is required to distribute as a PID to comply with REIT regulations.
The Company has 12 months after the year end to make the minimum distribution. Accordingly, PID dividends paid in the year may relate to the distribution requirements of previous periods. The table below sets out the dividend allocation for the years ended 31 March 2019 and 31 March 2018:
Table 86
PID allocation
Ordinary dividend
Total dividend
Year ended 31 March 2019
£m
Year ended 31 March 2018
£m
Pre- 31 March 2018
£m £m £m
Dividends paid in year to 31 March 2018 – 137 103 74 314
Dividends paid in year to 31 March 2019 214 135 – – 349
Minimum PID to be paid by 31 March 2020 105 – – – –
Total PID required 319 272
On 12 April 2019, the Company paid £84m of the PID required to be paid by 31 March 2020.

187Landsec Annual Report 2019
Ad
dition
al in
forma
tion
Annual net rent breakdown by occupier business sector (%) Chart 87
■ Services 33.0%■ Retail trade 31.9%■ Financial services 16.0%■ Public administration 5.7%■ Wholesale trade 3.1%■ Manufacturing 2.8%■ Transport, communications 2.7%■ Other 4.8%
Floor space (million sq ft)1 Chart 88
■ London Portfolio 6.5■ Retail Portfolio 17.5
Total 24.0
1. Joint ventures are reflected at 100% values, not Landsec share.
% portfolio by value and number of property holdings at 31 March 2019
Table 89
£mValue
%Number of properties
0 – 10 0.7 26
10 – 25 3.0 25
25 – 50 4.4 17
50 – 100 11.8 22
100 – 150 7.9 9
150 – 200 7.7 6
200+ 64.5 20
Total 100.0 125
Committed development – estimated future spend (£m) Chart 90
2022 2023+2020 2021
0
30
60
90
120
180
150
105
165
115
0
Estimated future spend includes interest costs.
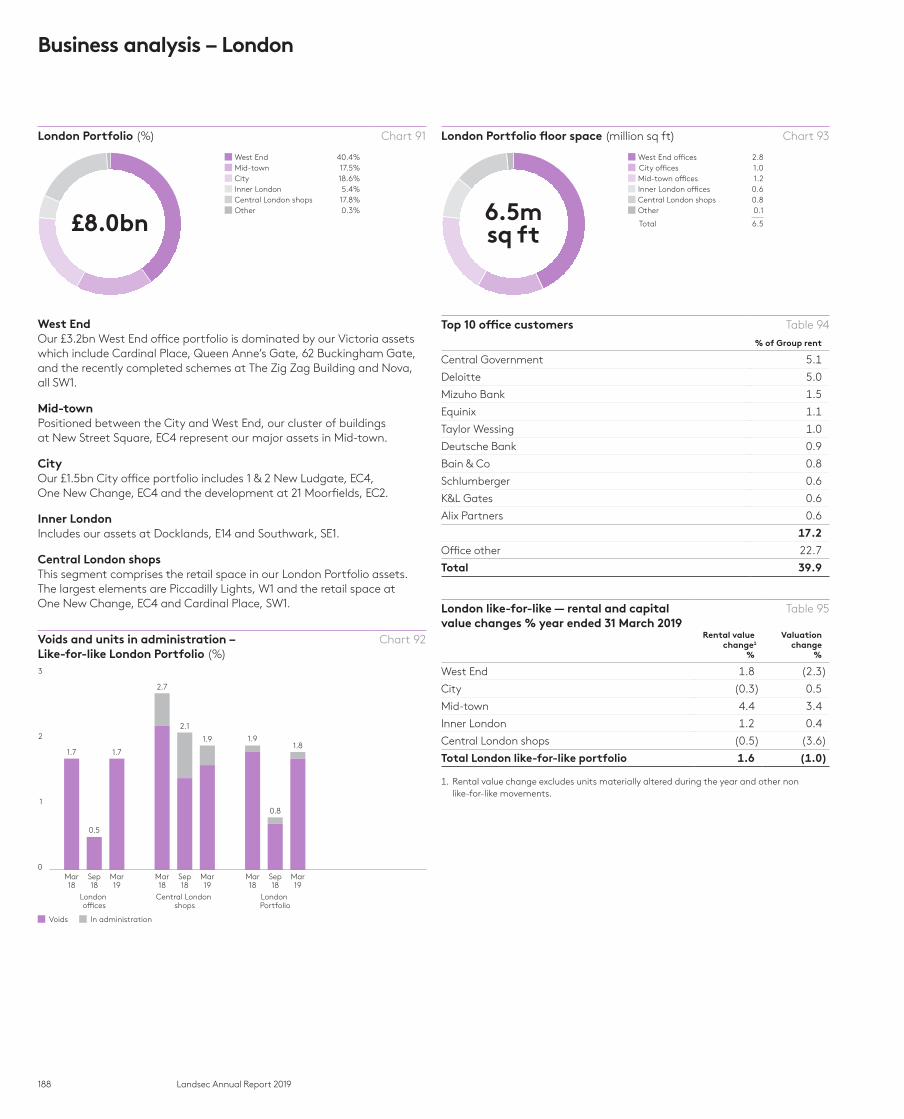
188 Landsec Annual Report 2019
Business analysis – London
London Portfolio (%) Chart 91
■ West End 40.4%■ Mid-town 17.5%■ City 18.6%■ Inner London 5.4%■ Central London shops 17.8%■ Other 0.3%
£8.0bn
West EndOur £3.2bn West End office portfolio is dominated by our Victoria assets which include Cardinal Place, Queen Anne’s Gate, 62 Buckingham Gate, and the recently completed schemes at The Zig Zag Building and Nova, all SW1.
Mid-townPositioned between the City and West End, our cluster of buildings at New Street Square, EC4 represent our major assets in Mid-town.
CityOur £1.5bn City office portfolio includes 1 & 2 New Ludgate, EC4, One New Change, EC4 and the development at 21 Moorfields, EC2.
Inner LondonIncludes our assets at Docklands, E14 and Southwark, SE1.
Central London shopsThis segment comprises the retail space in our London Portfolio assets. The largest elements are Piccadilly Lights, W1 and the retail space at One New Change, EC4 and Cardinal Place, SW1.
Voids and units in administration – Like-for-like London Portfolio (%)
Chart 92
London o�ces
Mar18
Mar19
Sep18
Mar18
Mar19
Sep18
Mar18
Mar19
Sep18
Central London shops
London Portfolio
In administrationVoids
0
1
2
3
1.7
0.5
1.7
2.7
2.1
1.9 1.9
0.8
1.8
London Portfolio floor space (million sq ft) Chart 93
■ West End o�ces 2.8■ City o�ces 1.0■ Mid-town o�ces 1.2■ Inner London o�ces 0.6■ Central London shops 0.8■ Other 0.1
Total 6.56.5msq ft
Top 10 office customers Table 94
% of Group rent
Central Government 5.1
Deloitte 5.0
Mizuho Bank 1.5
Equinix 1.1
Taylor Wessing 1.0
Deutsche Bank 0.9
Bain & Co 0.8
Schlumberger 0.6
K&L Gates 0.6
Alix Partners 0.6
17.2
Office other 22.7
Total 39.9
London like-for-like — rental and capital value changes % year ended 31 March 2019
Table 95
Rental value change1
%
Valuation change
%
West End 1.8 (2.3)
City (0.3) 0.5
Mid-town 4.4 3.4
Inner London 1.2 0.4
Central London shops (0.5) (3.6)
Total London like-for-like portfolio 1.6 (1.0)
1. Rental value change excludes units materially altered during the year and other non like-for-like movements.
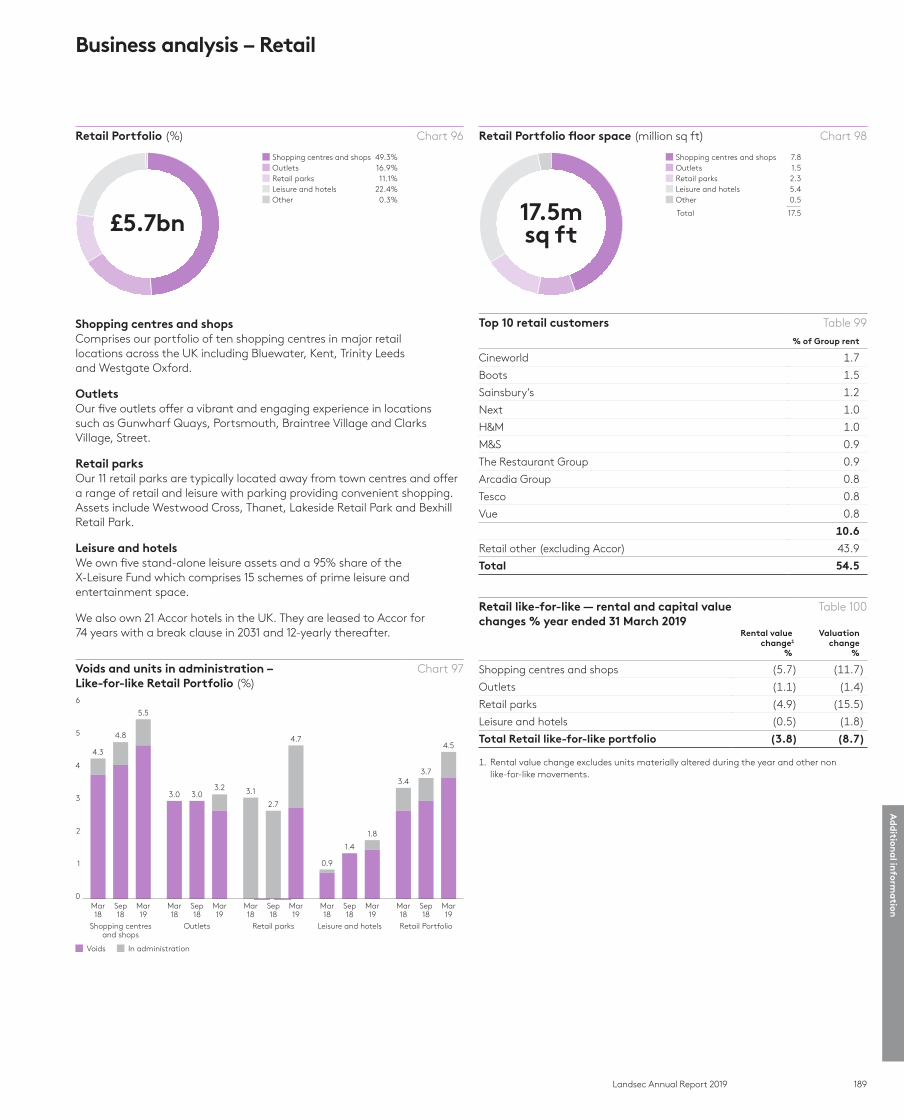
189Landsec Annual Report 2019
Ad
dition
al in
forma
tion
Business analysis – Retail
Retail Portfolio (%) Chart 96
■ Shopping centres and shops 49.3%■ Outlets 16.9%■ Retail parks 11.1%■ Leisure and hotels 22.4%■ Other 0.3%
£5.7bn
Shopping centres and shopsComprises our portfolio of ten shopping centres in major retail locations across the UK including Bluewater, Kent, Trinity Leeds and Westgate Oxford.
OutletsOur five outlets offer a vibrant and engaging experience in locations such as Gunwharf Quays, Portsmouth, Braintree Village and Clarks Village, Street.
Retail parksOur 11 retail parks are typically located away from town centres and offer a range of retail and leisure with parking providing convenient shopping. Assets include Westwood Cross, Thanet, Lakeside Retail Park and Bexhill Retail Park.
Leisure and hotelsWe own five stand-alone leisure assets and a 95% share of the X-Leisure Fund which comprises 15 schemes of prime leisure and entertainment space.
We also own 21 Accor hotels in the UK. They are leased to Accor for 74 years with a break clause in 2031 and 12-yearly thereafter.
Voids and units in administration – Like-for-like Retail Portfolio (%)
Chart 97
Shopping centresand shops
Mar18
Mar19
Sep18
Mar18
Mar19
Sep18
Mar18
Mar19
Sep18
Mar18
Mar19
Sep18
Mar18
Mar19
Sep18
Retail parksOutlets Leisure and hotels
In administration
Retail Portfolio
Voids
0
1
2
3
4
6
5
4.3
4.8
5.5
3.0 3.03.2 3.1
2.7
4.7
0.9
1.4
1.8
3.43.7
4.5
Retail Portfolio floor space (million sq ft) Chart 98
■ Shopping centres and shops 7.8■ Outlets 1.5■ Retail parks 2.3■ Leisure and hotels 5.4■ Other 0.5
Total 17.517.5msq ft
Top 10 retail customers Table 99
% of Group rent
Cineworld 1.7
Boots 1.5
Sainsbury’s 1.2
Next 1.0
H&M 1.0
M&S 0.9
The Restaurant Group 0.9
Arcadia Group 0.8
Tesco 0.8
Vue 0.8
10.6
Retail other (excluding Accor) 43.9
Total 54.5
Retail like-for-like — rental and capital value changes % year ended 31 March 2019
Table 100
Rental value change1
%
Valuation change
%
Shopping centres and shops (5.7) (11.7)
Outlets (1.1) (1.4)
Retail parks (4.9) (15.5)
Leisure and hotels (0.5) (1.8)
Total Retail like-for-like portfolio (3.8) (8.7)
1. Rental value change excludes units materially altered during the year and other non like-for-like movements.
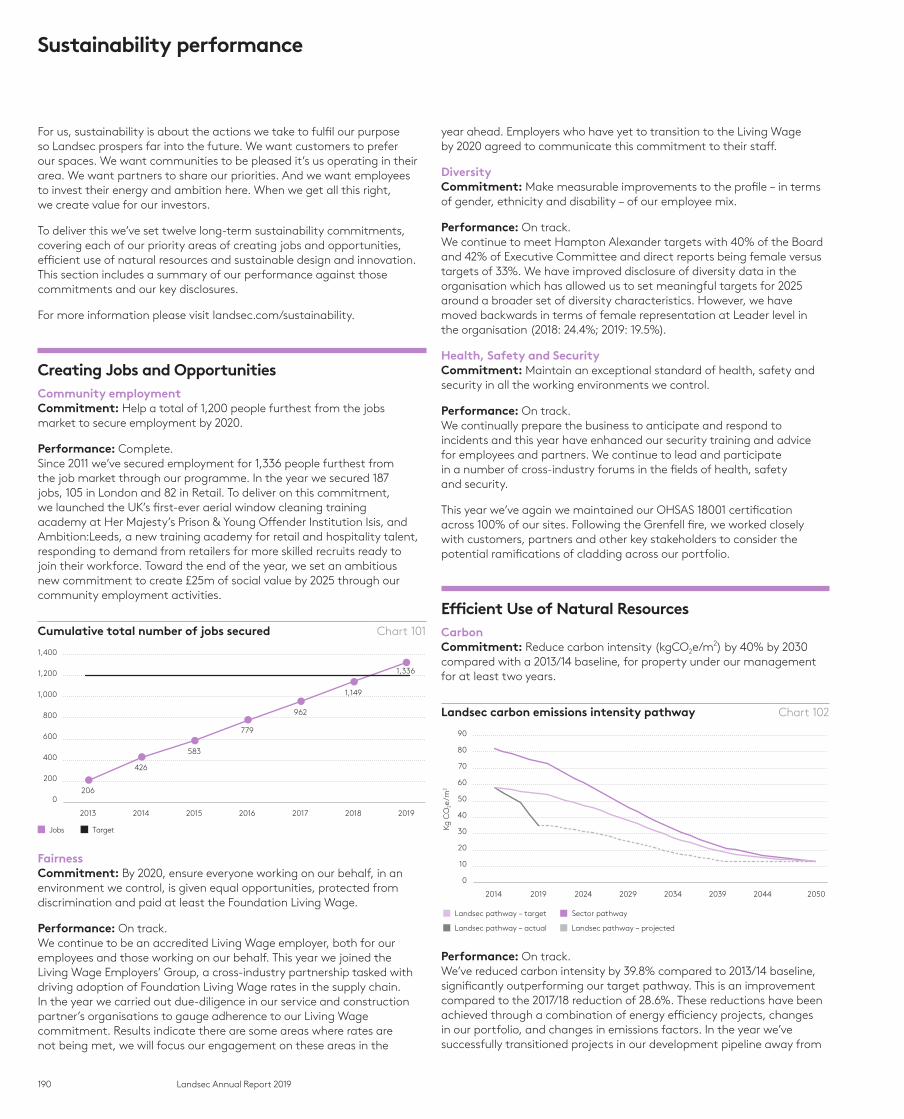
190 Landsec Annual Report 2019
For us, sustainability is about the actions we take to fulfil our purpose so Landsec prospers far into the future. We want customers to prefer our spaces. We want communities to be pleased it’s us operating in their area. We want partners to share our priorities. And we want employees to invest their energy and ambition here. When we get all this right, we create value for our investors.
To deliver this we’ve set twelve long-term sustainability commitments, covering each of our priority areas of creating jobs and opportunities, efficient use of natural resources and sustainable design and innovation. This section includes a summary of our performance against those commitments and our key disclosures.
For more information please visit landsec.com/sustainability.
Creating Jobs and OpportunitiesCommunity employmentCommitment: Help a total of 1,200 people furthest from the jobs market to secure employment by 2020.
Performance: Complete. Since 2011 we’ve secured employment for 1,336 people furthest from the job market through our programme. In the year we secured 187 jobs, 105 in London and 82 in Retail. To deliver on this commitment, we launched the UK’s first-ever aerial window cleaning training academy at Her Majesty’s Prison & Young Offender Institution Isis, and Ambition:Leeds, a new training academy for retail and hospitality talent, responding to demand from retailers for more skilled recruits ready to join their workforce. Toward the end of the year, we set an ambitious new commitment to create £25m of social value by 2025 through our community employment activities.
Cumulative total number of jobs secured Chart 101
0
200
400
600
800
1,000
1,400
1,200
2013 2015 2016 2017 2018 2019
Jobs Target
2014
1,149
1,336
962
779
583
206
426
FairnessCommitment: By 2020, ensure everyone working on our behalf, in an environment we control, is given equal opportunities, protected from discrimination and paid at least the Foundation Living Wage.
Performance: On track. We continue to be an accredited Living Wage employer, both for our employees and those working on our behalf. This year we joined the Living Wage Employers’ Group, a cross-industry partnership tasked with driving adoption of Foundation Living Wage rates in the supply chain. In the year we carried out due-diligence in our service and construction partner’s organisations to gauge adherence to our Living Wage commitment. Results indicate there are some areas where rates are not being met, we will focus our engagement on these areas in the
year ahead. Employers who have yet to transition to the Living Wage by 2020 agreed to communicate this commitment to their staff.
Diversity Commitment: Make measurable improvements to the profile – in terms of gender, ethnicity and disability – of our employee mix.
Performance: On track. We continue to meet Hampton Alexander targets with 40% of the Board and 42% of Executive Committee and direct reports being female versus targets of 33%. We have improved disclosure of diversity data in the organisation which has allowed us to set meaningful targets for 2025 around a broader set of diversity characteristics. However, we have moved backwards in terms of female representation at Leader level in the organisation (2018: 24.4%; 2019: 19.5%).
Health, Safety and SecurityCommitment: Maintain an exceptional standard of health, safety and security in all the working environments we control.
Performance: On track. We continually prepare the business to anticipate and respond to incidents and this year have enhanced our security training and advice for employees and partners. We continue to lead and participate in a number of cross-industry forums in the fields of health, safety and security.
This year we’ve again we maintained our OHSAS 18001 certification across 100% of our sites. Following the Grenfell fire, we worked closely with customers, partners and other key stakeholders to consider the potential ramifications of cladding across our portfolio.
Efficient Use of Natural Resources CarbonCommitment: Reduce carbon intensity (kgCO2e/m2) by 40% by 2030 compared with a 2013/14 baseline, for property under our management for at least two years.
Landsec carbon emissions intensity pathway Chart 102
0
30
40
20
10
50
60
70
80
90
2014 20242019 2034 2039 2044 20502029
Kg C
O2e
/m2
Sector pathwayLandsec pathway – target
Landsec pathway – actual Landsec pathway – projected
Performance: On track. We’ve reduced carbon intensity by 39.8% compared to 2013/14 baseline, significantly outperforming our target pathway. This is an improvement compared to the 2017/18 reduction of 28.6%. These reductions have been achieved through a combination of energy efficiency projects, changes in our portfolio, and changes in emissions factors. In the year we’ve successfully transitioned projects in our development pipeline away from
Sustainability performance
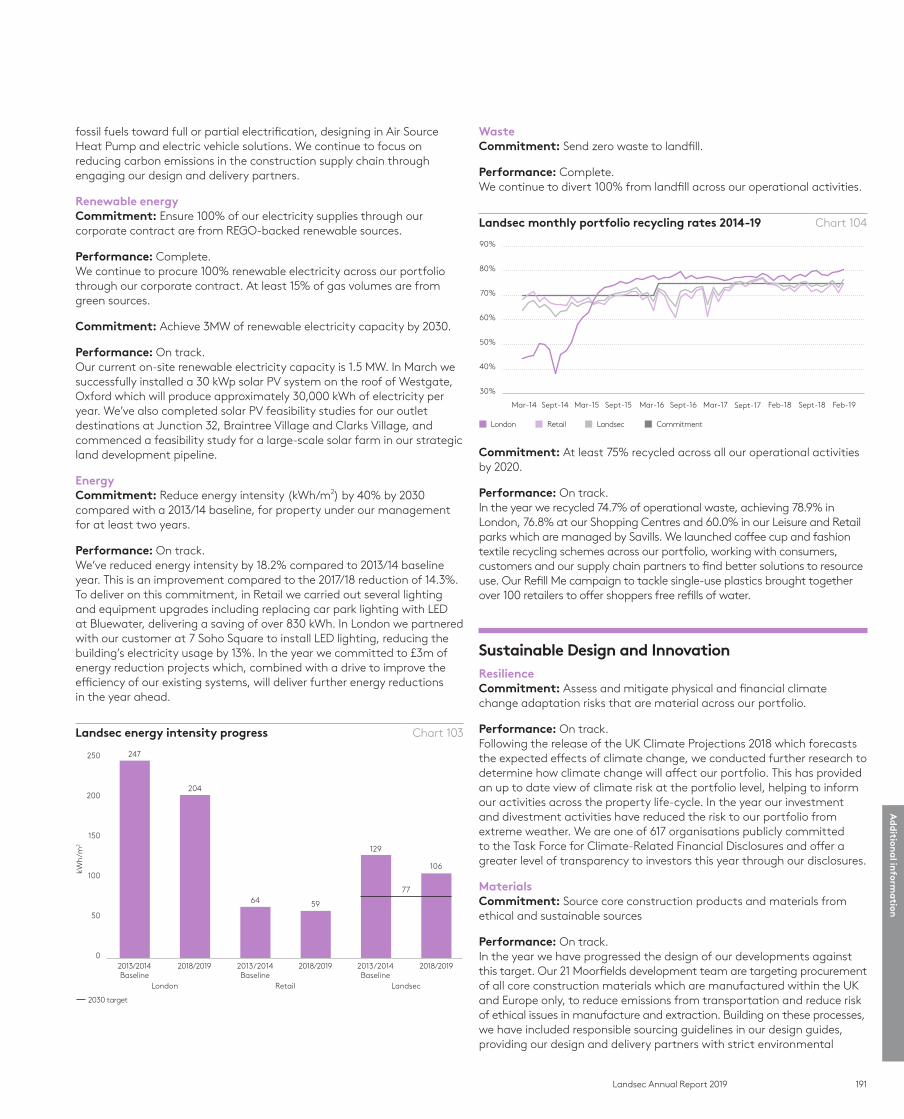
191Landsec Annual Report 2019
Ad
dition
al in
forma
tion
fossil fuels toward full or partial electrification, designing in Air Source Heat Pump and electric vehicle solutions. We continue to focus on reducing carbon emissions in the construction supply chain through engaging our design and delivery partners.
Renewable energyCommitment: Ensure 100% of our electricity supplies through our corporate contract are from REGO-backed renewable sources.
Performance: Complete. We continue to procure 100% renewable electricity across our portfolio through our corporate contract. At least 15% of gas volumes are from green sources.
Commitment: Achieve 3MW of renewable electricity capacity by 2030.
Performance: On track. Our current on-site renewable electricity capacity is 1.5 MW. In March we successfully installed a 30 kWp solar PV system on the roof of Westgate, Oxford which will produce approximately 30,000 kWh of electricity per year. We’ve also completed solar PV feasibility studies for our outlet destinations at Junction 32, Braintree Village and Clarks Village, and commenced a feasibility study for a large-scale solar farm in our strategic land development pipeline.
EnergyCommitment: Reduce energy intensity (kWh/m2) by 40% by 2030 compared with a 2013/14 baseline, for property under our management for at least two years.
Performance: On track. We‘ve reduced energy intensity by 18.2% compared to 2013/14 baseline year. This is an improvement compared to the 2017/18 reduction of 14.3%. To deliver on this commitment, in Retail we carried out several lighting and equipment upgrades including replacing car park lighting with LED at Bluewater, delivering a saving of over 830 kWh. In London we partnered with our customer at 7 Soho Square to install LED lighting, reducing the building’s electricity usage by 13%. In the year we committed to £3m of energy reduction projects which, combined with a drive to improve the efficiency of our existing systems, will deliver further energy reductions in the year ahead.
Landsec energy intensity progress Chart 103
247
204
64 59
129
106
77
0
50
100
150
200
250
kWh
/m2
2013/2014Baseline
London Retail Landsec
2018/2019 2013/2014Baseline
2018/2019 2013/2014Baseline
2018/2019
2030 target
WasteCommitment: Send zero waste to landfill.
Performance: Complete. We continue to divert 100% from landfill across our operational activities.
Landsec monthly portfolio recycling rates 2014-19 Chart 104
30%
40%
50%
60%
70%
80%
90%
Mar-14 Sept-14 Sept-15 Sept-16Mar-16Mar-15 Sept-17 Sept-18Feb-18 Feb-19Mar-17
Retail Landsec CommitmentLondon
Commitment: At least 75% recycled across all our operational activities by 2020.
Performance: On track. In the year we recycled 74.7% of operational waste, achieving 78.9% in London, 76.8% at our Shopping Centres and 60.0% in our Leisure and Retail parks which are managed by Savills. We launched coffee cup and fashion textile recycling schemes across our portfolio, working with consumers, customers and our supply chain partners to find better solutions to resource use. Our Refill Me campaign to tackle single-use plastics brought together over 100 retailers to offer shoppers free refills of water.
Sustainable Design and InnovationResilience Commitment: Assess and mitigate physical and financial climate change adaptation risks that are material across our portfolio.
Performance: On track.Following the release of the UK Climate Projections 2018 which forecasts the expected effects of climate change, we conducted further research to determine how climate change will affect our portfolio. This has provided an up to date view of climate risk at the portfolio level, helping to inform our activities across the property life-cycle. In the year our investment and divestment activities have reduced the risk to our portfolio from extreme weather. We are one of 617 organisations publicly committed to the Task Force for Climate-Related Financial Disclosures and offer a greater level of transparency to investors this year through our disclosures.
MaterialsCommitment: Source core construction products and materials from ethical and sustainable sources
Performance: On track.In the year we have progressed the design of our developments against this target. Our 21 Moorfields development team are targeting procurement of all core construction materials which are manufactured within the UK and Europe only, to reduce emissions from transportation and reduce risk of ethical issues in manufacture and extraction. Building on these processes, we have included responsible sourcing guidelines in our design guides, providing our design and delivery partners with strict environmental
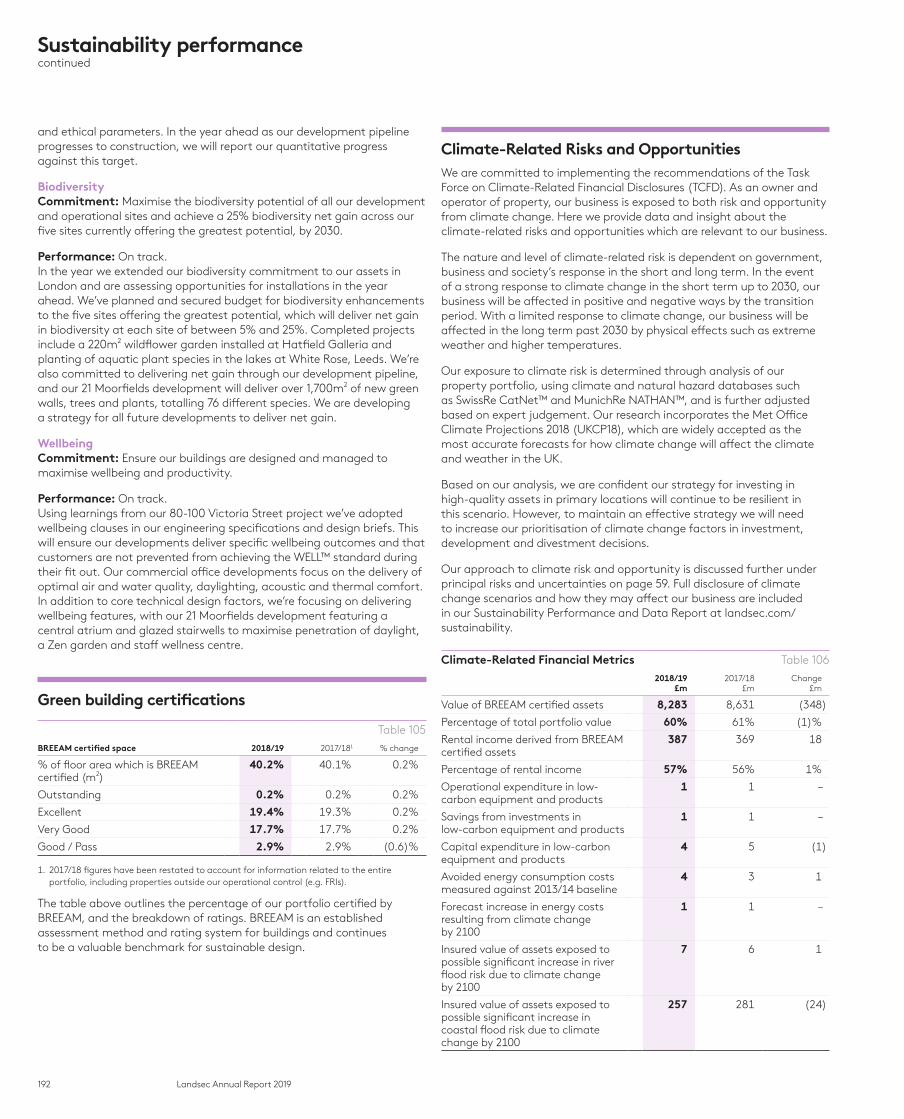
192 Landsec Annual Report 2019
Sustainability performancecontinued
and ethical parameters. In the year ahead as our development pipeline progresses to construction, we will report our quantitative progress against this target.
BiodiversityCommitment: Maximise the biodiversity potential of all our development and operational sites and achieve a 25% biodiversity net gain across our five sites currently offering the greatest potential, by 2030.
Performance: On track.In the year we extended our biodiversity commitment to our assets in London and are assessing opportunities for installations in the year ahead. We’ve planned and secured budget for biodiversity enhancements to the five sites offering the greatest potential, which will deliver net gain in biodiversity at each site of between 5% and 25%. Completed projects include a 220m2 wildflower garden installed at Hatfield Galleria and planting of aquatic plant species in the lakes at White Rose, Leeds. We’re also committed to delivering net gain through our development pipeline, and our 21 Moorfields development will deliver over 1,700m2 of new green walls, trees and plants, totalling 76 different species. We are developing a strategy for all future developments to deliver net gain.
WellbeingCommitment: Ensure our buildings are designed and managed to maximise wellbeing and productivity.
Performance: On track.Using learnings from our 80-100 Victoria Street project we’ve adopted wellbeing clauses in our engineering specifications and design briefs. This will ensure our developments deliver specific wellbeing outcomes and that customers are not prevented from achieving the WELL™ standard during their fit out. Our commercial office developments focus on the delivery of optimal air and water quality, daylighting, acoustic and thermal comfort. In addition to core technical design factors, we’re focusing on delivering wellbeing features, with our 21 Moorfields development featuring a central atrium and glazed stairwells to maximise penetration of daylight, a Zen garden and staff wellness centre.
Green building certifications
Table 105
BREEAM certified space 2018/19 2017/181 % change
% of floor area which is BREEAM certified (m2)
40.2% 40.1% 0.2%
Outstanding 0.2% 0.2% 0.2%
Excellent 19.4% 19.3% 0.2%
Very Good 17.7% 17.7% 0.2%
Good / Pass 2.9% 2.9% (0.6)%
1. 2017/18 figures have been restated to account for information related to the entire portfolio, including properties outside our operational control (e.g. FRIs).
The table above outlines the percentage of our portfolio certified by BREEAM, and the breakdown of ratings. BREEAM is an established assessment method and rating system for buildings and continues to be a valuable benchmark for sustainable design.
Climate-Related Risks and OpportunitiesWe are committed to implementing the recommendations of the Task Force on Climate-Related Financial Disclosures (TCFD). As an owner and operator of property, our business is exposed to both risk and opportunity from climate change. Here we provide data and insight about the climate-related risks and opportunities which are relevant to our business.
The nature and level of climate-related risk is dependent on government, business and society’s response in the short and long term. In the event of a strong response to climate change in the short term up to 2030, our business will be affected in positive and negative ways by the transition period. With a limited response to climate change, our business will be affected in the long term past 2030 by physical effects such as extreme weather and higher temperatures.
Our exposure to climate risk is determined through analysis of our property portfolio, using climate and natural hazard databases such as SwissRe CatNet™ and MunichRe NATHAN™, and is further adjusted based on expert judgement. Our research incorporates the Met Office Climate Projections 2018 (UKCP18), which are widely accepted as the most accurate forecasts for how climate change will affect the climate and weather in the UK.
Based on our analysis, we are confident our strategy for investing in high-quality assets in primary locations will continue to be resilient in this scenario. However, to maintain an effective strategy we will need to increase our prioritisation of climate change factors in investment, development and divestment decisions.
Our approach to climate risk and opportunity is discussed further under principal risks and uncertainties on page 59. Full disclosure of climate change scenarios and how they may affect our business are included in our Sustainability Performance and Data Report at landsec.com/sustainability.
Climate-Related Financial Metrics Table 106
2018/19£m
2017/18£m
Change£m
Value of BREEAM certified assets 8,283 8,631 (348)
Percentage of total portfolio value 60% 61% (1)%
Rental income derived from BREEAM certified assets
387 369 18
Percentage of rental income 57% 56% 1%
Operational expenditure in low-carbon equipment and products
1 1 –
Savings from investments in low-carbon equipment and products
1 1 –
Capital expenditure in low-carbon equipment and products
4 5 (1)
Avoided energy consumption costs measured against 2013/14 baseline
4 3 1
Forecast increase in energy costs resulting from climate change by 2100
1 1 –
Insured value of assets exposed to possible significant increase in river flood risk due to climate change by 2100
7 6 1
Insured value of assets exposed to possible significant increase in coastal flood risk due to climate change by 2100
257 281 (24)
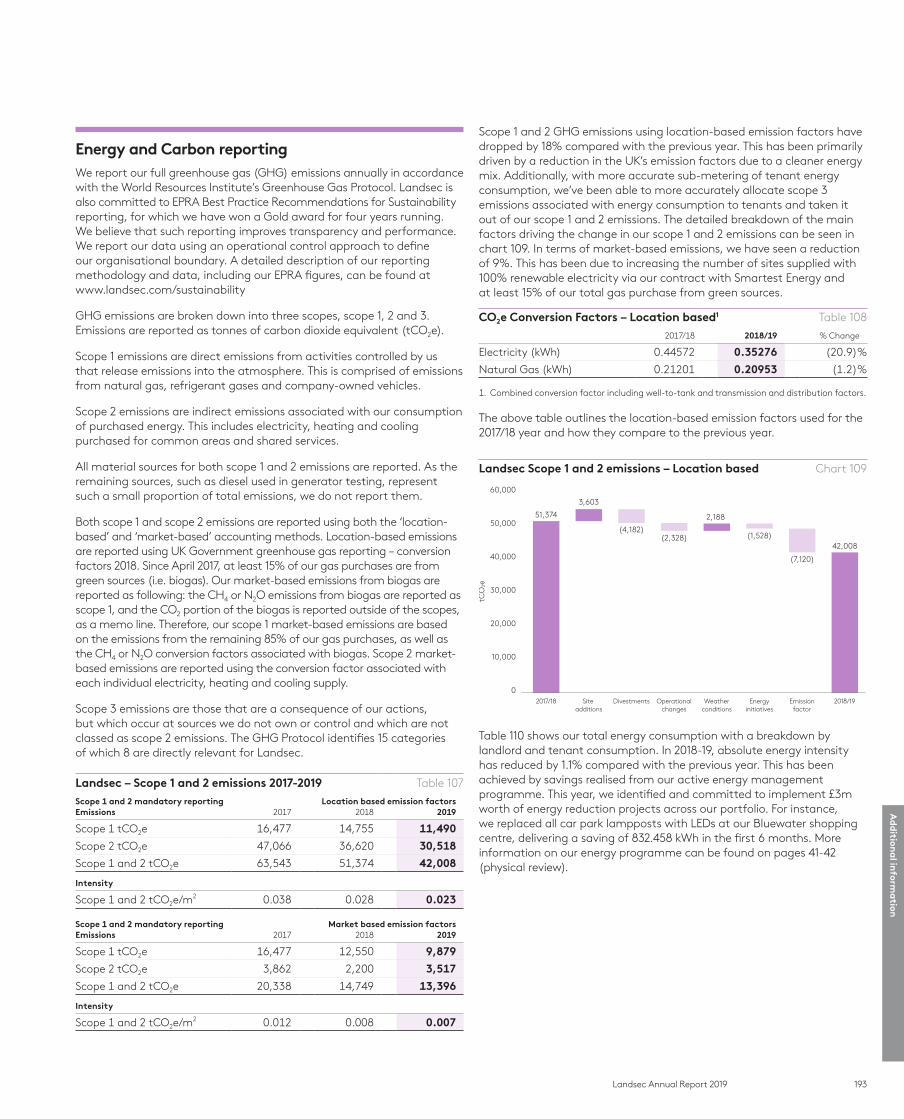
193Landsec Annual Report 2019
Ad
dition
al in
forma
tion
Energy and Carbon reportingWe report our full greenhouse gas (GHG) emissions annually in accordance with the World Resources Institute’s Greenhouse Gas Protocol. Landsec is also committed to EPRA Best Practice Recommendations for Sustainability reporting, for which we have won a Gold award for four years running. We believe that such reporting improves transparency and performance. We report our data using an operational control approach to define our organisational boundary. A detailed description of our reporting methodology and data, including our EPRA figures, can be found at www.landsec.com/sustainability
GHG emissions are broken down into three scopes, scope 1, 2 and 3. Emissions are reported as tonnes of carbon dioxide equivalent (tCO2e).
Scope 1 emissions are direct emissions from activities controlled by us that release emissions into the atmosphere. This is comprised of emissions from natural gas, refrigerant gases and company-owned vehicles.
Scope 2 emissions are indirect emissions associated with our consumption of purchased energy. This includes electricity, heating and cooling purchased for common areas and shared services.
All material sources for both scope 1 and 2 emissions are reported. As the remaining sources, such as diesel used in generator testing, represent such a small proportion of total emissions, we do not report them.
Both scope 1 and scope 2 emissions are reported using both the ‘location-based’ and ‘market-based’ accounting methods. Location-based emissions are reported using UK Government greenhouse gas reporting – conversion factors 2018. Since April 2017, at least 15% of our gas purchases are from green sources (i.e. biogas). Our market-based emissions from biogas are reported as following: the CH4 or N2O emissions from biogas are reported as scope 1, and the CO2 portion of the biogas is reported outside of the scopes, as a memo line. Therefore, our scope 1 market-based emissions are based on the emissions from the remaining 85% of our gas purchases, as well as the CH4 or N2O conversion factors associated with biogas. Scope 2 market-based emissions are reported using the conversion factor associated with each individual electricity, heating and cooling supply.
Scope 3 emissions are those that are a consequence of our actions, but which occur at sources we do not own or control and which are not classed as scope 2 emissions. The GHG Protocol identifies 15 categories of which 8 are directly relevant for Landsec.
Landsec – Scope 1 and 2 emissions 2017-2019 Table 107
Scope 1 and 2 mandatory reporting Location based emission factorsEmissions 2017 2018 2019
Scope 1 tCO2e 16,477 14,755 11,490
Scope 2 tCO2e 47,066 36,620 30,518
Scope 1 and 2 tCO2e 63,543 51,374 42,008
Intensity
Scope 1 and 2 tCO2e/m2 0.038 0.028 0.023
Scope 1 and 2 mandatory reporting Market based emission factorsEmissions 2017 2018 2019
Scope 1 tCO2e 16,477 12,550 9,879
Scope 2 tCO2e 3,862 2,200 3,517
Scope 1 and 2 tCO2e 20,338 14,749 13,396
Intensity
Scope 1 and 2 tCO2e/m2 0.012 0.008 0.007
Scope 1 and 2 GHG emissions using location-based emission factors have dropped by 18% compared with the previous year. This has been primarily driven by a reduction in the UK’s emission factors due to a cleaner energy mix. Additionally, with more accurate sub-metering of tenant energy consumption, we’ve been able to more accurately allocate scope 3 emissions associated with energy consumption to tenants and taken it out of our scope 1 and 2 emissions. The detailed breakdown of the main factors driving the change in our scope 1 and 2 emissions can be seen in chart 109. In terms of market-based emissions, we have seen a reduction of 9%. This has been due to increasing the number of sites supplied with 100% renewable electricity via our contract with Smartest Energy and at least 15% of our total gas purchase from green sources.
CO2e Conversion Factors – Location based1 Table 108
2017/18 2018/19 % Change
Electricity (kWh) 0.44572 0.35276 (20.9)%
Natural Gas (kWh) 0.21201 0.20953 (1.2)%
1. Combined conversion factor including well-to-tank and transmission and distribution factors.
The above table outlines the location-based emission factors used for the 2017/18 year and how they compare to the previous year.
Landsec Scope 1 and 2 emissions – Location based Chart 109
51,374
3,603
(4,182)(2,328)
2,188
(1,528)
(7,120)
42,008
0
10,000
20,000
30,000
40,000
60,000
50,000
tCO
2e
2017/18 Site additions
Divestments Operationalchanges
Weatherconditions
Energyinitiatives
Emissionfactor
2018/19
Table 110 shows our total energy consumption with a breakdown by landlord and tenant consumption. In 2018-19, absolute energy intensity has reduced by 1.1% compared with the previous year. This has been achieved by savings realised from our active energy management programme. This year, we identified and committed to implement £3m worth of energy reduction projects across our portfolio. For instance, we replaced all car park lampposts with LEDs at our Bluewater shopping centre, delivering a saving of 832.458 kWh in the first 6 months. More information on our energy programme can be found on pages 41-42 (physical review).
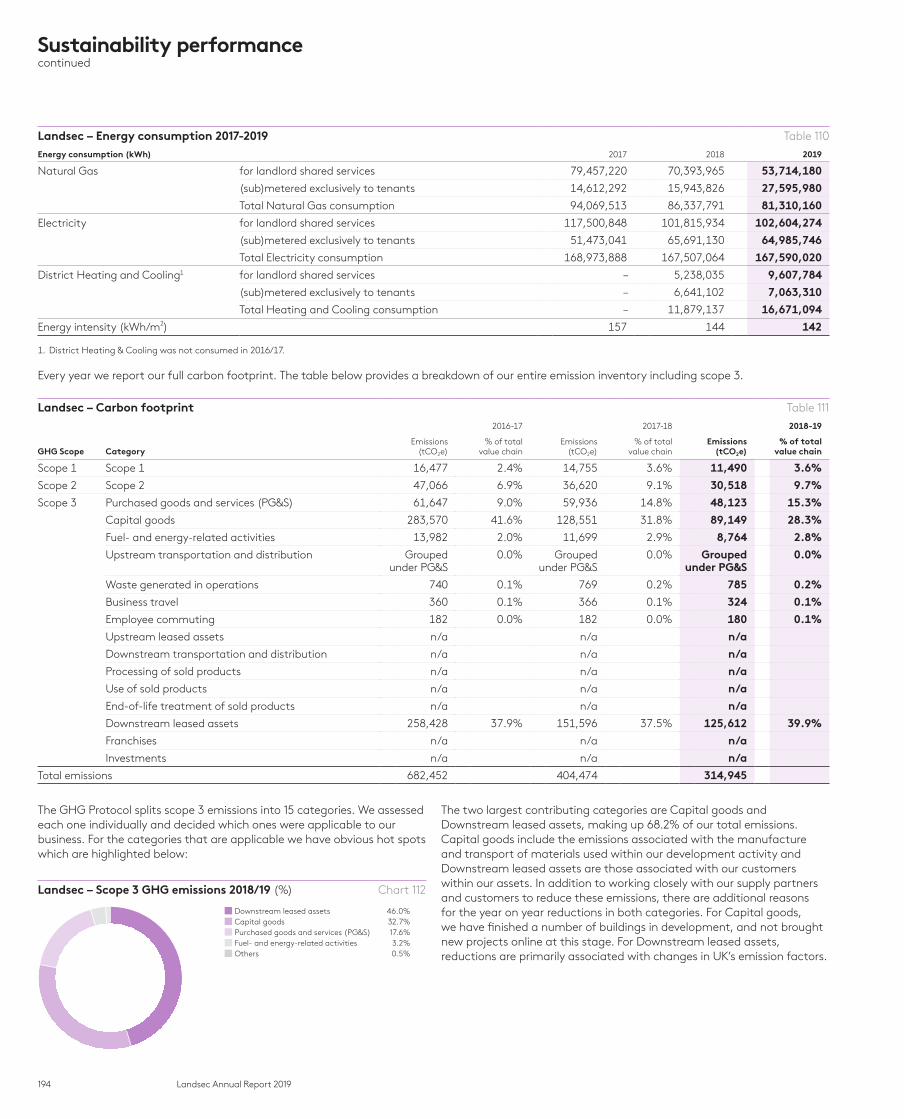
194 Landsec Annual Report 2019
Sustainability performancecontinued
Landsec – Energy consumption 2017-2019 Table 110
Energy consumption (kWh) 2017 2018 2019
Natural Gas for landlord shared services 79,457,220 70,393,965 53,714,180
(sub)metered exclusively to tenants 14,612,292 15,943,826 27,595,980
Total Natural Gas consumption 94,069,513 86,337,791 81,310,160
Electricity for landlord shared services 117,500,848 101,815,934 102,604,274
(sub)metered exclusively to tenants 51,473,041 65,691,130 64,985,746
Total Electricity consumption 168,973,888 167,507,064 167,590,020
District Heating and Cooling1 for landlord shared services – 5,238,035 9,607,784
(sub)metered exclusively to tenants – 6,641,102 7,063,310
Total Heating and Cooling consumption – 11,879,137 16,671,094
Energy intensity (kWh/m2) 157 144 142
1. District Heating & Cooling was not consumed in 2016/17.
Every year we report our full carbon footprint. The table below provides a breakdown of our entire emission inventory including scope 3.
Landsec – Carbon footprint Table 111
2016-17 2017-18 2018-19
GHG Scope CategoryEmissions
(tCO2e)% of total
value chainEmissions
(tCO2e)% of total
value chainEmissions
(tCO2e)% of total
value chain
Scope 1 Scope 1 16,477 2.4% 14,755 3.6% 11,490 3.6%
Scope 2 Scope 2 47,066 6.9% 36,620 9.1% 30,518 9.7%
Scope 3 Purchased goods and services (PG&S) 61,647 9.0% 59,936 14.8% 48,123 15.3%
Capital goods 283,570 41.6% 128,551 31.8% 89,149 28.3%
Fuel- and energy-related activities 13,982 2.0% 11,699 2.9% 8,764 2.8%
Upstream transportation and distribution Grouped under PG&S
0.0% Grouped under PG&S
0.0% Grouped under PG&S
0.0%
Waste generated in operations 740 0.1% 769 0.2% 785 0.2%
Business travel 360 0.1% 366 0.1% 324 0.1%
Employee commuting 182 0.0% 182 0.0% 180 0.1%
Upstream leased assets n/a n/a n/a
Downstream transportation and distribution n/a n/a n/a
Processing of sold products n/a n/a n/a
Use of sold products n/a n/a n/a
End-of-life treatment of sold products n/a n/a n/a
Downstream leased assets 258,428 37.9% 151,596 37.5% 125,612 39.9%
Franchises n/a n/a n/a
Investments n/a n/a n/a
Total emissions 682,452 404,474 314,945
The GHG Protocol splits scope 3 emissions into 15 categories. We assessed each one individually and decided which ones were applicable to our business. For the categories that are applicable we have obvious hot spots which are highlighted below:
Landsec – Scope 3 GHG emissions 2018/19 (%) Chart 112
■ Downstream leased assets 46.0%■ Capital goods 32.7%■ Purchased goods and services (PG&S) 17.6%■ Fuel- and energy-related activities 3.2%■ Others 0.5%
The two largest contributing categories are Capital goods and Downstream leased assets, making up 68.2% of our total emissions. Capital goods include the emissions associated with the manufacture and transport of materials used within our development activity and Downstream leased assets are those associated with our customers within our assets. In addition to working closely with our supply partners and customers to reduce these emissions, there are additional reasons for the year on year reductions in both categories. For Capital goods, we have finished a number of buildings in development, and not brought new projects online at this stage. For Downstream leased assets, reductions are primarily associated with changes in UK’s emission factors.

195Landsec Annual Report 2019
Ad
dition
al in
forma
tion
Benchmarking and AwardsTaking part in rigorous external benchmarking of our performance helps us to track and assess our progress. It also provides stakeholders with confidence that we’re turning our commitments and targets into action. And it underlines our ambition to be a sustainability leader in our industry. This year we received high scores from our key benchmarking schemes, including reaching the CDP A-list for the first time and being the highest scoring UK real estate company in the Dow Jones Sustainability Index.
Benchmarking scores Table 113
Activity Performance
CDP 2018: A (Leadership)2017: A (Leadership)2016: A- (Leadership)
Global Real Estate Sustainability Benchmark (GRESB) 2018: score 90%2017: score 78%2016: score 77%
Dow Jones Sustainability Index (DJSI) 2018: score 73/percentile ranking 932017: score 75/percentile ranking 922016: score 76/percentile ranking 92
FTSE4Good Percentile ranking 91We continue to retain our established position in the FTSE4Good Index
EPRA Received our fifth Gold Award from EPRA for best practice sustainability reporting
Workforce Disclosure Initiative (WDI) 2018: score 73%
MSCI ESG rating AA
Sustainalytics Score 82/Relative position 11th out of 300
EcoAct (Previously Carbon Clear) We’ve again been named a climate leader, ranking 10th for all FTSE 100 companies and first for our sector
Recent recognition Table 114
Award name Category Date
Clean City Awards Platinum Award Winner: New Street Square January 2019
Edie Sustainability Leaders Awards Winner: Mission Possible: The Built Environment Award February 2019
BusinessGreen Leaders Awards Shortlisted: Company of the Year March 2019
Community investment data 2018/19 Table 115
Total social value created through our community programmes and partnerships
£3.2m
Number of people engaged through our volunteering programme 1,018
Rental value of space that has been donated to charities and local groups including meeting rooms, mall space and retail units
£746,000
Social value created through volunteering in schools and communities
£163,000
Time volunteered by employees 2,086 hours
Funds donated to charities £624,600 including £97,500 to our national charity partner Barnardo’s
Assurance Landsec’s auditor, EY, has once again conducted sustainability assurance. This is part of our journey to embed sustainability across the business and enhance the integrity, quality and usefulness of the information we provide. EY performed a limited assurance engagement on selected performance data and qualitative statements in the Physical and Social sections of the Strategic Report (pages 40-53); the sustainability content in the ‘Additional Information’ section of the Landsec 2019 Annual Report (pages 190-195); and the online Landsec Performance Data Report 2019, which can be found at landsec.com/sustainability/reports-benchmarking. The full assurance statement is available at landsec.com/sustainability/governance-policies.
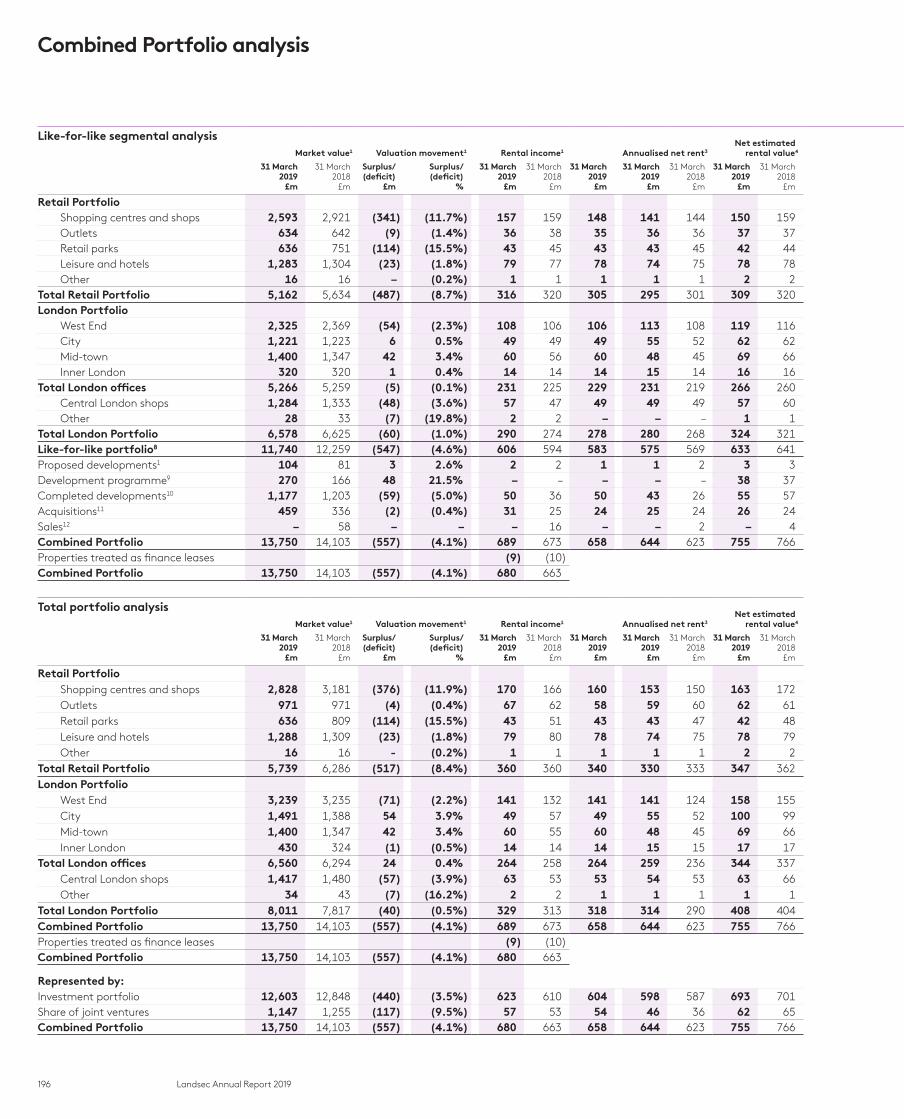
196 Landsec Annual Report 2019
Combined Portfolio analysis
Like-for-like segmental analysis Like-for-like segmental analysis continued Table 116Market value1 Valuation movement1 Rental income1 Annualised net rent3
Net estimated rental value4
Gross estimated rental value5 Net initial yield6 Equivalent yield7 Voids (by ERV)1
31 March 2019
£m
31 March 2018
£m
Surplus/ (deficit)
£m
Surplus/ (deficit)
%
31 March 2019
£m
31 March 2018
£m
31 March 2019
£m
31 March 2019
£m
31 March 2018
£m
31 March 2019
£m
31 March 2018
£m
31 March 2019
£m
31 March 2018
£m
31 March 2019
%
31 March 2018
%
31 March 2019
%
31 March 2018
%
31 March 2019
%
31 March 2018
%
Retail Portfolio Retail PortfolioShopping centres and shops 2,593 2,921 (341) (11.7%) 157 159 148 141 144 150 159 Shopping centres and shops 157 166 4.8% 4.4% 5.1% 4.8% 4.7% 3.8%Outlets 634 642 (9) (1.4%) 36 38 35 36 36 37 37 Outlets 37 37 4.6% 4.6% 5.0% 5.0% 2.7% 3.0%Retail parks 636 751 (114) (15.5%) 43 45 43 43 45 42 44 Retail parks 43 45 6.2% 5.3% 6.2% 5.5% 2.8% –Leisure and hotels 1,283 1,304 (23) (1.8%) 79 77 78 74 75 78 78 Leisure and hotels 78 79 5.2% 5.1% 5.5% 5.4% 1.5% 0.8%Other 16 16 – (0.2%) 1 1 1 1 1 2 2 Other 2 2 2.1% 0.9% 8.2% 8.5% 40.9% 40.9%
Total Retail Portfolio 5,162 5,634 (487) (8.7%) 316 320 305 295 301 309 320 Total Retail Portfolio 317 329 5.1% 4.7% 5.3% 5.1% 3.7% 2.7%London Portfolio London Portfolio
West End 2,325 2,369 (54) (2.3%) 108 106 106 113 108 119 116 West End 118 116 4.4% 4.3% 4.6% 4.5% 3.9% 3.4%City 1,221 1,223 6 0.5% 49 49 49 55 52 62 62 City 63 63 4.2% 4.1% 4.5% 4.5% – 0.2%Mid-town 1,400 1,347 42 3.4% 60 56 60 48 45 69 66 Mid-town 71 68 3.2% 3.3% 4.5% 4.4% – 0.4%Inner London 320 320 1 0.4% 14 14 14 15 14 16 16 Inner London 16 16 4.2% 4.2% 5.0% 4.9% – 0.6%
Total London offices 5,266 5,259 (5) (0.1%) 231 225 229 231 219 266 260 Total London offices 268 263 4.1% 4.0% 4.6% 4.5% 1.7% 1.7%Central London shops 1,284 1,333 (48) (3.6%) 57 47 49 49 49 57 60 Central London shops 58 60 3.8% 3.2% 4.1% 4.1% 1.6% 2.2%Other 28 33 (7) (19.8%) 2 2 – – – 1 1 Other 1 1 1.4% 1.3% 1.3% 1.1% 20.0% 20.0%
Total London Portfolio 6,578 6,625 (60) (1.0%) 290 274 278 280 268 324 321 Total London Portfolio 327 324 4.0% 3.8% 4.5% 4.4% 1.7% 1.8%Like-for-like portfolio8 11,740 12,259 (547) (4.6%) 606 594 583 575 569 633 641 Like-for-like portfolio8 644 653 4.5% 4.2% 4.8% 4.7% 2.7% 2.3%Proposed developments1 104 81 3 2.6% 2 2 1 1 2 3 3 Proposed developments1 3 3 0.4% 2.3% n/a n/a n/a n/aDevelopment programme9 270 166 48 21.5% – – – – – 38 37 Development programme9 40 38 – – 4.4% 4.4% n/a n/aCompleted developments10 1,177 1,203 (59) (5.0%) 50 36 50 43 26 55 57 Completed developments10 57 58 3.3% 1.8% 4.4% 4.3% n/a n/aAcquisitions11 459 336 (2) (0.4%) 31 25 24 25 24 26 24 Acquisitions11 26 24 4.4% 5.7% 5.5% n/a n/a n/aSales12 – 58 – – – 16 – – 2 – 4 Sales12 – 4 – 3.6% n/a n/a n/a n/aCombined Portfolio 13,750 14,103 (557) (4.1%) 689 673 658 644 623 755 766 Combined Portfolio 770 780 4.2% 4.0% 4.8% n/a n/a n/aProperties treated as finance leases (9) (10)Combined Portfolio 13,750 14,103 (557) (4.1%) 680 663
Total portfolio analysis Total portfolio analysis continued Notes1. Refer to Glossary for definition.2. Annualised rental income is annual ‘rental income’
(as defined in the Glossary) at the balance sheet date, except that car park and commercialisation income are included on a net basis (after deduction for operational outgoings). Annualised rental income includes temporary lettings.
3. Annualised net rent is annual cash rent, after the deduction of rent payable, as at the balance sheet date. It is calculated with the same methodology as annualised rental income but is stated net of rent payable and before SIC 15 adjustments.
4. Net estimated rental value is gross estimated rental value, as defined in the Glossary, after deducting expected rent payable.
5. Gross estimated rental value (ERV) – refer to Glossary for definition. The figure for proposed developments relates to the existing buildings and not the schemes proposed.
6. Net initial yield – refer to Glossary for definition. This calculation includes all properties including those sites with no income.
7. Equivalent yield – refer to Glossary for definition. Proposed developments are excluded from the calculation of equivalent yield on the Combined Portfolio.
8. The like-for-like portfolio – refer to Glossary for definition. Capital expenditure on refurbishments, acquisitions of head leases and similar capital expenditure has been allocated to the like-for-like portfolio in preparing this table.
9. The development programme – refer to Glossary for definition. Net initial yield figures are only calculated for properties in the development programme that have reached practical completion.
10. Completed developments – refer to Glossary for definition. Comprises The Zig Zag Building, SW1, Nova, SW1, 20 Eastbourne Terrace, W2 and Westgate Oxford.
11. Includes all properties acquired since 1 April 2017.12. Includes all properties sold since 1 April 2017.
Market value1 Valuation movement1 Rental income1 Annualised net rent3Net estimated
rental value4Gross estimated
rental value5 Net initial yield6
31 March 2019
£m
31 March 2018
£m
Surplus/ (deficit)
£m
Surplus/ (deficit)
%
31 March 2019
£m
31 March 2018
£m
31 March 2019
£m
31 March 2019
£m
31 March 2018
£m
31 March 2019
£m
31 March 2018
£m
31 March 2019
£m
31 March 2018
£m
31 March 2019
%
31 March 2018
%
Retail Portfolio Retail PortfolioShopping centres and shops 2,828 3,181 (376) (11.9%) 170 166 160 153 150 163 172 Shopping centres and shops 171 182 4.7% 4.1%Outlets 971 971 (4) (0.4%) 67 62 58 59 60 62 61 Outlets 62 61 5.0% 5.0%Retail parks 636 809 (114) (15.5%) 43 51 43 43 47 42 48 Retail parks 43 49 6.2% 5.1%Leisure and hotels 1,288 1,309 (23) (1.8%) 79 80 78 74 75 78 79 Leisure and hotels 78 79 5.2% 5.1%Other 16 16 - (0.2%) 1 1 1 1 1 2 2 Other 2 2 2.1% 0.9%
Total Retail Portfolio 5,739 6,286 (517) (8.4%) 360 360 340 330 333 347 362 Total Retail Portfolio 356 373 5.0% 4.6%London Portfolio London Portfolio
West End 3,239 3,235 (71) (2.2%) 141 132 141 141 124 158 155 West End 158 154 4.0% 3.6%City 1,491 1,388 54 3.9% 49 57 49 55 52 100 99 City 103 101 3.5% 3.6%Mid-town 1,400 1,347 42 3.4% 60 55 60 48 45 69 66 Mid-town 71 68 3.2% 3.3%Inner London 430 324 (1) (0.5%) 14 14 14 15 15 17 17 Inner London 17 17 3.2% 4.2%
Total London offices 6,560 6,294 24 0.4% 264 258 264 259 236 344 337 Total London offices 349 340 3.7% 3.6%Central London shops 1,417 1,480 (57) (3.9%) 63 53 53 54 53 63 66 Central London shops 64 66 3.7% 3.1%Other 34 43 (7) (16.2%) 2 2 1 1 1 1 1 Other 1 1 1.5% 1.3%
Total London Portfolio 8,011 7,817 (40) (0.5%) 329 313 318 314 290 408 404 Total London Portfolio 414 407 3.7% 3.5%Combined Portfolio 13,750 14,103 (557) (4.1%) 689 673 658 644 623 755 766 Combined Portfolio 770 780 4.2% 4.0%Properties treated as finance leases (9) (10) Combined Portfolio 13,750 14,103 (557) (4.1%) 680 663
Represented by: Represented by:Investment portfolio 12,603 12,848 (440) (3.5%) 623 610 604 598 587 693 701 Investment portfolio 707 714 4.3% 4.1%Share of joint ventures 1,147 1,255 (117) (9.5%) 57 53 54 46 36 62 65 Share of joint ventures 63 66 3.5% 2.3%Combined Portfolio 13,750 14,103 (557) (4.1%) 680 663 658 644 623 755 766 Combined Portfolio 770 780 4.2% 4.0%

197Landsec Annual Report 2019
Ad
dition
al in
forma
tion
Like-for-like segmental analysis Like-for-like segmental analysis continued Table 116Market value1 Valuation movement1 Rental income1 Annualised net rent3
Net estimated rental value4
Gross estimated rental value5 Net initial yield6 Equivalent yield7 Voids (by ERV)1
31 March 2019
£m
31 March 2018
£m
Surplus/ (deficit)
£m
Surplus/ (deficit)
%
31 March 2019
£m
31 March 2018
£m
31 March 2019
£m
31 March 2019
£m
31 March 2018
£m
31 March 2019
£m
31 March 2018
£m
31 March 2019
£m
31 March 2018
£m
31 March 2019
%
31 March 2018
%
31 March 2019
%
31 March 2018
%
31 March 2019
%
31 March 2018
%
Retail Portfolio Retail PortfolioShopping centres and shops 2,593 2,921 (341) (11.7%) 157 159 148 141 144 150 159 Shopping centres and shops 157 166 4.8% 4.4% 5.1% 4.8% 4.7% 3.8%Outlets 634 642 (9) (1.4%) 36 38 35 36 36 37 37 Outlets 37 37 4.6% 4.6% 5.0% 5.0% 2.7% 3.0%Retail parks 636 751 (114) (15.5%) 43 45 43 43 45 42 44 Retail parks 43 45 6.2% 5.3% 6.2% 5.5% 2.8% –Leisure and hotels 1,283 1,304 (23) (1.8%) 79 77 78 74 75 78 78 Leisure and hotels 78 79 5.2% 5.1% 5.5% 5.4% 1.5% 0.8%Other 16 16 – (0.2%) 1 1 1 1 1 2 2 Other 2 2 2.1% 0.9% 8.2% 8.5% 40.9% 40.9%
Total Retail Portfolio 5,162 5,634 (487) (8.7%) 316 320 305 295 301 309 320 Total Retail Portfolio 317 329 5.1% 4.7% 5.3% 5.1% 3.7% 2.7%London Portfolio London Portfolio
West End 2,325 2,369 (54) (2.3%) 108 106 106 113 108 119 116 West End 118 116 4.4% 4.3% 4.6% 4.5% 3.9% 3.4%City 1,221 1,223 6 0.5% 49 49 49 55 52 62 62 City 63 63 4.2% 4.1% 4.5% 4.5% – 0.2%Mid-town 1,400 1,347 42 3.4% 60 56 60 48 45 69 66 Mid-town 71 68 3.2% 3.3% 4.5% 4.4% – 0.4%Inner London 320 320 1 0.4% 14 14 14 15 14 16 16 Inner London 16 16 4.2% 4.2% 5.0% 4.9% – 0.6%
Total London offices 5,266 5,259 (5) (0.1%) 231 225 229 231 219 266 260 Total London offices 268 263 4.1% 4.0% 4.6% 4.5% 1.7% 1.7%Central London shops 1,284 1,333 (48) (3.6%) 57 47 49 49 49 57 60 Central London shops 58 60 3.8% 3.2% 4.1% 4.1% 1.6% 2.2%Other 28 33 (7) (19.8%) 2 2 – – – 1 1 Other 1 1 1.4% 1.3% 1.3% 1.1% 20.0% 20.0%
Total London Portfolio 6,578 6,625 (60) (1.0%) 290 274 278 280 268 324 321 Total London Portfolio 327 324 4.0% 3.8% 4.5% 4.4% 1.7% 1.8%Like-for-like portfolio8 11,740 12,259 (547) (4.6%) 606 594 583 575 569 633 641 Like-for-like portfolio8 644 653 4.5% 4.2% 4.8% 4.7% 2.7% 2.3%Proposed developments1 104 81 3 2.6% 2 2 1 1 2 3 3 Proposed developments1 3 3 0.4% 2.3% n/a n/a n/a n/aDevelopment programme9 270 166 48 21.5% – – – – – 38 37 Development programme9 40 38 – – 4.4% 4.4% n/a n/aCompleted developments10 1,177 1,203 (59) (5.0%) 50 36 50 43 26 55 57 Completed developments10 57 58 3.3% 1.8% 4.4% 4.3% n/a n/aAcquisitions11 459 336 (2) (0.4%) 31 25 24 25 24 26 24 Acquisitions11 26 24 4.4% 5.7% 5.5% n/a n/a n/aSales12 – 58 – – – 16 – – 2 – 4 Sales12 – 4 – 3.6% n/a n/a n/a n/aCombined Portfolio 13,750 14,103 (557) (4.1%) 689 673 658 644 623 755 766 Combined Portfolio 770 780 4.2% 4.0% 4.8% n/a n/a n/aProperties treated as finance leases (9) (10)Combined Portfolio 13,750 14,103 (557) (4.1%) 680 663
Total portfolio analysis Total portfolio analysis continued Notes1. Refer to Glossary for definition.2. Annualised rental income is annual ‘rental income’
(as defined in the Glossary) at the balance sheet date, except that car park and commercialisation income are included on a net basis (after deduction for operational outgoings). Annualised rental income includes temporary lettings.
3. Annualised net rent is annual cash rent, after the deduction of rent payable, as at the balance sheet date. It is calculated with the same methodology as annualised rental income but is stated net of rent payable and before SIC 15 adjustments.
4. Net estimated rental value is gross estimated rental value, as defined in the Glossary, after deducting expected rent payable.
5. Gross estimated rental value (ERV) – refer to Glossary for definition. The figure for proposed developments relates to the existing buildings and not the schemes proposed.
6. Net initial yield – refer to Glossary for definition. This calculation includes all properties including those sites with no income.
7. Equivalent yield – refer to Glossary for definition. Proposed developments are excluded from the calculation of equivalent yield on the Combined Portfolio.
8. The like-for-like portfolio – refer to Glossary for definition. Capital expenditure on refurbishments, acquisitions of head leases and similar capital expenditure has been allocated to the like-for-like portfolio in preparing this table.
9. The development programme – refer to Glossary for definition. Net initial yield figures are only calculated for properties in the development programme that have reached practical completion.
10. Completed developments – refer to Glossary for definition. Comprises The Zig Zag Building, SW1, Nova, SW1, 20 Eastbourne Terrace, W2 and Westgate Oxford.
11. Includes all properties acquired since 1 April 2017.12. Includes all properties sold since 1 April 2017.
Market value1 Valuation movement1 Rental income1 Annualised net rent3Net estimated
rental value4Gross estimated
rental value5 Net initial yield6
31 March 2019
£m
31 March 2018
£m
Surplus/ (deficit)
£m
Surplus/ (deficit)
%
31 March 2019
£m
31 March 2018
£m
31 March 2019
£m
31 March 2019
£m
31 March 2018
£m
31 March 2019
£m
31 March 2018
£m
31 March 2019
£m
31 March 2018
£m
31 March 2019
%
31 March 2018
%
Retail Portfolio Retail PortfolioShopping centres and shops 2,828 3,181 (376) (11.9%) 170 166 160 153 150 163 172 Shopping centres and shops 171 182 4.7% 4.1%Outlets 971 971 (4) (0.4%) 67 62 58 59 60 62 61 Outlets 62 61 5.0% 5.0%Retail parks 636 809 (114) (15.5%) 43 51 43 43 47 42 48 Retail parks 43 49 6.2% 5.1%Leisure and hotels 1,288 1,309 (23) (1.8%) 79 80 78 74 75 78 79 Leisure and hotels 78 79 5.2% 5.1%Other 16 16 - (0.2%) 1 1 1 1 1 2 2 Other 2 2 2.1% 0.9%
Total Retail Portfolio 5,739 6,286 (517) (8.4%) 360 360 340 330 333 347 362 Total Retail Portfolio 356 373 5.0% 4.6%London Portfolio London Portfolio
West End 3,239 3,235 (71) (2.2%) 141 132 141 141 124 158 155 West End 158 154 4.0% 3.6%City 1,491 1,388 54 3.9% 49 57 49 55 52 100 99 City 103 101 3.5% 3.6%Mid-town 1,400 1,347 42 3.4% 60 55 60 48 45 69 66 Mid-town 71 68 3.2% 3.3%Inner London 430 324 (1) (0.5%) 14 14 14 15 15 17 17 Inner London 17 17 3.2% 4.2%
Total London offices 6,560 6,294 24 0.4% 264 258 264 259 236 344 337 Total London offices 349 340 3.7% 3.6%Central London shops 1,417 1,480 (57) (3.9%) 63 53 53 54 53 63 66 Central London shops 64 66 3.7% 3.1%Other 34 43 (7) (16.2%) 2 2 1 1 1 1 1 Other 1 1 1.5% 1.3%
Total London Portfolio 8,011 7,817 (40) (0.5%) 329 313 318 314 290 408 404 Total London Portfolio 414 407 3.7% 3.5%Combined Portfolio 13,750 14,103 (557) (4.1%) 689 673 658 644 623 755 766 Combined Portfolio 770 780 4.2% 4.0%Properties treated as finance leases (9) (10) Combined Portfolio 13,750 14,103 (557) (4.1%) 680 663
Represented by: Represented by:Investment portfolio 12,603 12,848 (440) (3.5%) 623 610 604 598 587 693 701 Investment portfolio 707 714 4.3% 4.1%Share of joint ventures 1,147 1,255 (117) (9.5%) 57 53 54 46 36 62 65 Share of joint ventures 63 66 3.5% 2.3%Combined Portfolio 13,750 14,103 (557) (4.1%) 680 663 658 644 623 755 766 Combined Portfolio 770 780 4.2% 4.0%

198 Landsec Annual Report 2019
Lease lengths
Lease lengths Table 117Weighted average unexpired lease term at 31 March 2019
Like-for-like portfolioMean1
Years
Like-for-like portfolio, completed developments
and acquisitionsMean1
Years
Retail Portfolio
Shopping centres and shops 5.8 6.0
Outlets 4.6 3.7
Retail parks 6.1 6.1
Leisure and hotels 12.0 12.0
Other 1.7 1.7
Total Retail Portfolio 7.3 7.0
London Portfolio
West End 6.8 7.9
City 8.2 8.2
Mid-town 10.2 10.2
Inner London 13.9 13.9
Total London offices 8.4 8.8
Central London shops 6.0 6.5
Other 4.7 4.7
Total London Portfolio 8.1 8.5
Combined Portfolio 7.7 7.8
1. Mean is the rent weighted average of the unexpired lease term across all leases (excluding short-term leases). Term is defined as the earlier of tenant break or expiry.
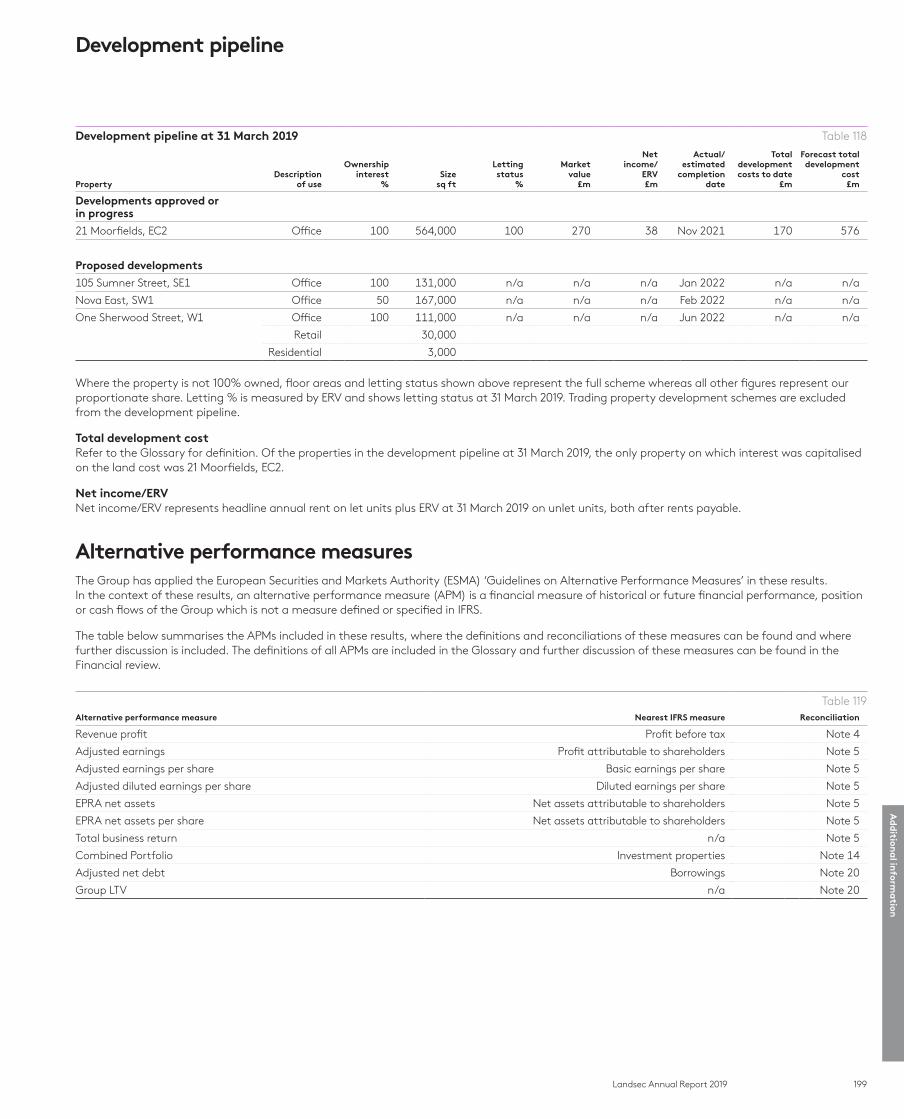
199Landsec Annual Report 2019
Ad
dition
al in
forma
tion
Development pipeline
Development pipeline at 31 March 2019 Table 118
PropertyDescription
of use
Ownership interest
%Size
sq ft
Letting status
%
Market value
£m
Net income/
ERV£m
Actual/ estimated
completion date
Total development costs to date
£m
Forecast total development
cost £m
Developments approved or in progress
21 Moorfields, EC2 Office 100 564,000 100 270 38 Nov 2021 170 576
Proposed developments
105 Sumner Street, SE1 Office 100 131,000 n/a n/a n/a Jan 2022 n/a n/a
Nova East, SW1 Office 50 167,000 n/a n/a n/a Feb 2022 n/a n/a
One Sherwood Street, W1 Office 100 111,000 n/a n/a n/a Jun 2022 n/a n/a
Retail 30,000
Residential 3,000
Where the property is not 100% owned, floor areas and letting status shown above represent the full scheme whereas all other figures represent our proportionate share. Letting % is measured by ERV and shows letting status at 31 March 2019. Trading property development schemes are excluded from the development pipeline.
Total development costRefer to the Glossary for definition. Of the properties in the development pipeline at 31 March 2019, the only property on which interest was capitalised on the land cost was 21 Moorfields, EC2.
Net income/ERVNet income/ERV represents headline annual rent on let units plus ERV at 31 March 2019 on unlet units, both after rents payable.
Alternative performance measuresThe Group has applied the European Securities and Markets Authority (ESMA) ‘Guidelines on Alternative Performance Measures’ in these results. In the context of these results, an alternative performance measure (APM) is a financial measure of historical or future financial performance, position or cash flows of the Group which is not a measure defined or specified in IFRS.
The table below summarises the APMs included in these results, where the definitions and reconciliations of these measures can be found and where further discussion is included. The definitions of all APMs are included in the Glossary and further discussion of these measures can be found in the Financial review.
Table 119Alternative performance measure Nearest IFRS measure Reconciliation
Revenue profit Profit before tax Note 4
Adjusted earnings Profit attributable to shareholders Note 5
Adjusted earnings per share Basic earnings per share Note 5
Adjusted diluted earnings per share Diluted earnings per share Note 5
EPRA net assets Net assets attributable to shareholders Note 5
EPRA net assets per share Net assets attributable to shareholders Note 5
Total business return n/a Note 5
Combined Portfolio Investment properties Note 14
Adjusted net debt Borrowings Note 20
Group LTV n/a Note 20
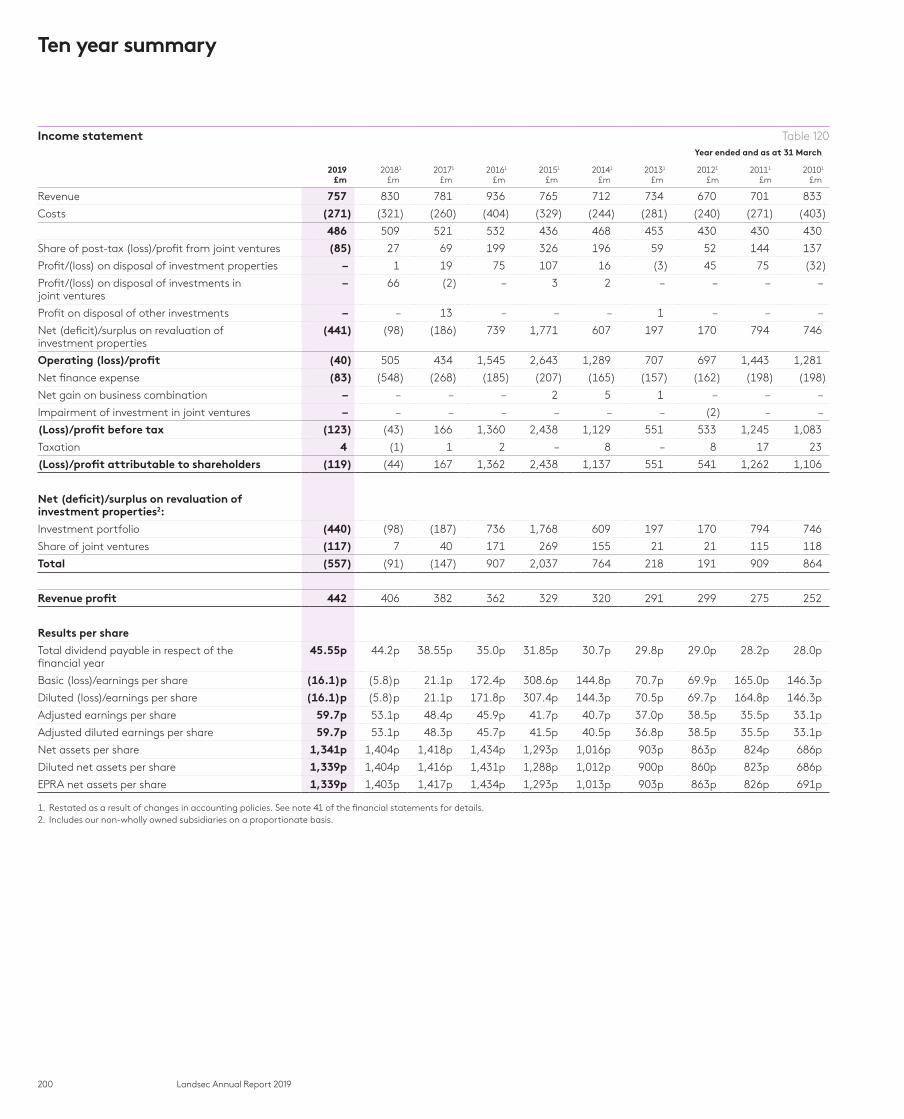
200 Landsec Annual Report 2019
Income statement Table 120Year ended and as at 31 March
2019£m
20181
£m20171
£m20161
£m20151
£m20141
£m20131
£m20121
£m20111
£m20101
£m
Revenue 757 830 781 936 765 712 734 670 701 833
Costs (271) (321) (260) (404) (329) (244) (281) (240) (271) (403)
486 509 521 532 436 468 453 430 430 430
Share of post-tax (loss)/profit from joint ventures (85) 27 69 199 326 196 59 52 144 137
Profit/(loss) on disposal of investment properties – 1 19 75 107 16 (3) 45 75 (32)
Profit/(loss) on disposal of investments in joint ventures
– 66 (2) – 3 2 – – – –
Profit on disposal of other investments – – 13 – – – 1 – – –
Net (deficit)/surplus on revaluation of investment properties
(441) (98) (186) 739 1,771 607 197 170 794 746
Operating (loss)/profit (40) 505 434 1,545 2,643 1,289 707 697 1,443 1,281
Net finance expense (83) (548) (268) (185) (207) (165) (157) (162) (198) (198)
Net gain on business combination – – – – 2 5 1 – – –
Impairment of investment in joint ventures – – – – – – – (2) – –
(Loss)/profit before tax (123) (43) 166 1,360 2,438 1,129 551 533 1,245 1,083
Taxation 4 (1) 1 2 – 8 – 8 17 23
(Loss)/profit attributable to shareholders (119) (44) 167 1,362 2,438 1,137 551 541 1,262 1,106
Net (deficit)/surplus on revaluation of investment properties2:
Investment portfolio (440) (98) (187) 736 1,768 609 197 170 794 746
Share of joint ventures (117) 7 40 171 269 155 21 21 115 118
Total (557) (91) (147) 907 2,037 764 218 191 909 864
Revenue profit 442 406 382 362 329 320 291 299 275 252
Results per share
Total dividend payable in respect of the financial year
45.55p 44.2p 38.55p 35.0p 31.85p 30.7p 29.8p 29.0p 28.2p 28.0p
Basic (loss)/earnings per share (16.1)p (5.8)p 21.1p 172.4p 308.6p 144.8p 70.7p 69.9p 165.0p 146.3p
Diluted (loss)/earnings per share (16.1)p (5.8)p 21.1p 171.8p 307.4p 144.3p 70.5p 69.7p 164.8p 146.3p
Adjusted earnings per share 59.7p 53.1p 48.4p 45.9p 41.7p 40.7p 37.0p 38.5p 35.5p 33.1p
Adjusted diluted earnings per share 59.7p 53.1p 48.3p 45.7p 41.5p 40.5p 36.8p 38.5p 35.5p 33.1p
Net assets per share 1,341p 1,404p 1,418p 1,434p 1,293p 1,016p 903p 863p 824p 686p
Diluted net assets per share 1,339p 1,404p 1,416p 1,431p 1,288p 1,012p 900p 860p 823p 686p
EPRA net assets per share 1,339p 1,403p 1,417p 1,434p 1,293p 1,013p 903p 863p 826p 691p
1. Restated as a result of changes in accounting policies. See note 41 of the financial statements for details.2. Includes our non-wholly owned subsidiaries on a proportionate basis.
Ten year summary
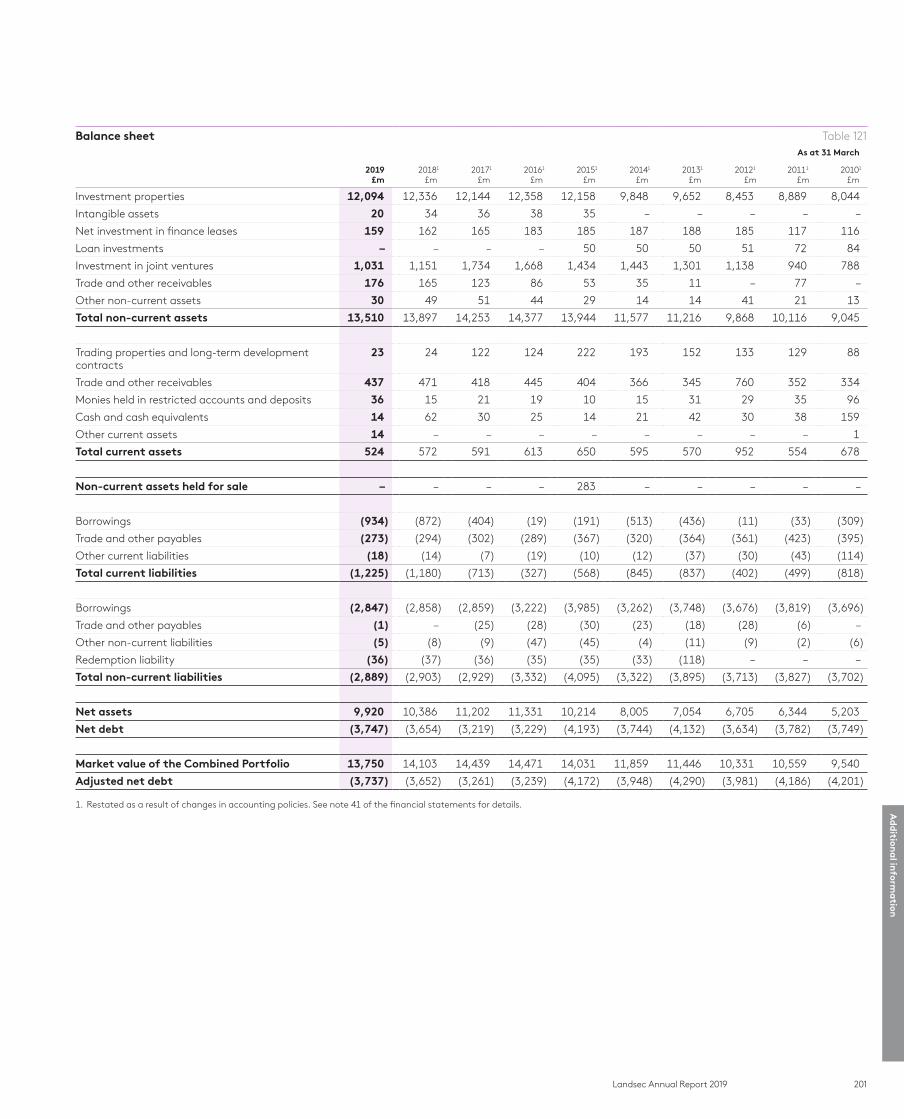
201Landsec Annual Report 2019
Ad
dition
al in
forma
tion
Balance sheet Table 121As at 31 March
2019£m
20181
£m20171
£m20161
£m20151
£m20141
£m20131
£m20121
£m20111
£m20101
£m
Investment properties 12,094 12,336 12,144 12,358 12,158 9,848 9,652 8,453 8,889 8,044
Intangible assets 20 34 36 38 35 – – – – –
Net investment in finance leases 159 162 165 183 185 187 188 185 117 116
Loan investments – – – – 50 50 50 51 72 84
Investment in joint ventures 1,031 1,151 1,734 1,668 1,434 1,443 1,301 1,138 940 788
Trade and other receivables 176 165 123 86 53 35 11 – 77 –
Other non-current assets 30 49 51 44 29 14 14 41 21 13
Total non-current assets 13,510 13,897 14,253 14,377 13,944 11,577 11,216 9,868 10,116 9,045
Trading properties and long-term development contracts
23 24 122 124 222 193 152 133 129 88
Trade and other receivables 437 471 418 445 404 366 345 760 352 334
Monies held in restricted accounts and deposits 36 15 21 19 10 15 31 29 35 96
Cash and cash equivalents 14 62 30 25 14 21 42 30 38 159
Other current assets 14 – – – – – – – – 1
Total current assets 524 572 591 613 650 595 570 952 554 678
Non-current assets held for sale – – – – 283 – – – – –
Borrowings (934) (872) (404) (19) (191) (513) (436) (11) (33) (309)
Trade and other payables (273) (294) (302) (289) (367) (320) (364) (361) (423) (395)
Other current liabilities (18) (14) (7) (19) (10) (12) (37) (30) (43) (114)
Total current liabilities (1,225) (1,180) (713) (327) (568) (845) (837) (402) (499) (818)
Borrowings (2,847) (2,858) (2,859) (3,222) (3,985) (3,262) (3,748) (3,676) (3,819) (3,696)
Trade and other payables (1) – (25) (28) (30) (23) (18) (28) (6) –
Other non-current liabilities (5) (8) (9) (47) (45) (4) (11) (9) (2) (6)
Redemption liability (36) (37) (36) (35) (35) (33) (118) – – –
Total non-current liabilities (2,889) (2,903) (2,929) (3,332) (4,095) (3,322) (3,895) (3,713) (3,827) (3,702)
Net assets 9,920 10,386 11,202 11,331 10,214 8,005 7,054 6,705 6,344 5,203
Net debt (3,747) (3,654) (3,219) (3,229) (4,193) (3,744) (4,132) (3,634) (3,782) (3,749)
Market value of the Combined Portfolio 13,750 14,103 14,439 14,471 14,031 11,859 11,446 10,331 10,559 9,540
Adjusted net debt (3,737) (3,652) (3,261) (3,239) (4,172) (3,948) (4,290) (3,981) (4,186) (4,201)
1. Restated as a result of changes in accounting policies. See note 41 of the financial statements for details.
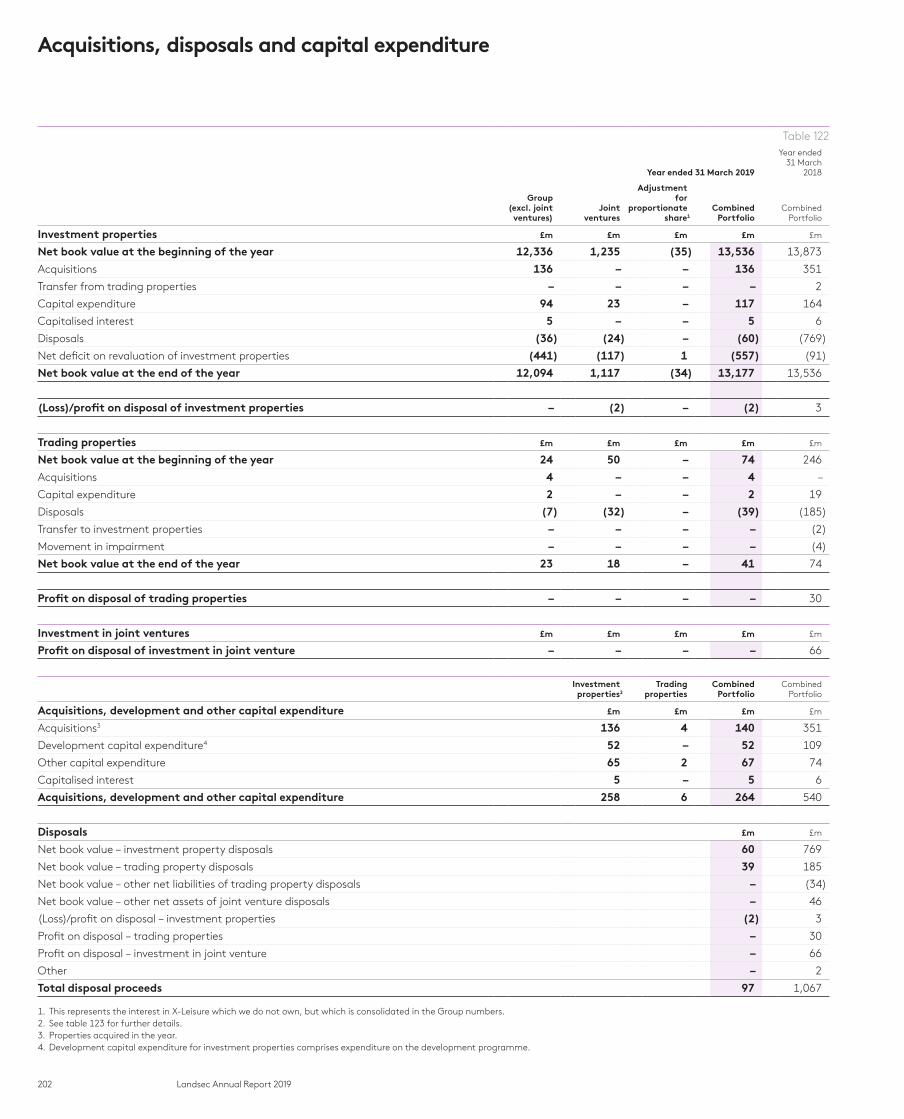
202 Landsec Annual Report 2019
Table 122
Year ended 31 March 2019
Year ended 31 March
2018
Group (excl. joint
ventures)Joint
ventures
Adjustment for
proportionateshare1
Combined Portfolio
Combined Portfolio
Investment properties £m £m £m £m £m
Net book value at the beginning of the year 12,336 1,235 (35) 13,536 13,873
Acquisitions 136 – – 136 351
Transfer from trading properties – – – – 2
Capital expenditure 94 23 – 117 164
Capitalised interest 5 – – 5 6
Disposals (36) (24) – (60) (769)
Net deficit on revaluation of investment properties (441) (117) 1 (557) (91)
Net book value at the end of the year 12,094 1,117 (34) 13,177 13,536
(Loss)/profit on disposal of investment properties – (2) – (2) 3
Trading properties £m £m £m £m £m
Net book value at the beginning of the year 24 50 – 74 246
Acquisitions 4 – – 4 –
Capital expenditure 2 – – 2 19
Disposals (7) (32) – (39) (185)
Transfer to investment properties – – – – (2)
Movement in impairment – – – – (4)
Net book value at the end of the year 23 18 – 41 74
Profit on disposal of trading properties – – – – 30
Investment in joint ventures £m £m £m £m £m
Profit on disposal of investment in joint venture – – – – 66
Investment properties2
Trading properties
Combined Portfolio
Combined Portfolio
Acquisitions, development and other capital expenditure £m £m £m £m
Acquisitions3 136 4 140 351
Development capital expenditure4 52 – 52 109
Other capital expenditure 65 2 67 74
Capitalised interest 5 – 5 6
Acquisitions, development and other capital expenditure 258 6 264 540
Disposals £m £m
Net book value – investment property disposals 60 769
Net book value – trading property disposals 39 185
Net book value – other net liabilities of trading property disposals – (34)
Net book value – other net assets of joint venture disposals – 46
(Loss)/profit on disposal – investment properties (2) 3
Profit on disposal – trading properties – 30
Profit on disposal – investment in joint venture – 66
Other – 2
Total disposal proceeds 97 1,067
1. This represents the interest in X-Leisure which we do not own, but which is consolidated in the Group numbers.2. See table 123 for further details.3. Properties acquired in the year.4. Development capital expenditure for investment properties comprises expenditure on the development programme.
Acquisitions, disposals and capital expenditure

203Landsec Annual Report 2019
Ad
dition
al in
forma
tion
Analysis of capital expenditure
Table 123Year ended 31 March 2019
Acquisitions1
£m
Development capital
expenditure2 £m
Other capital expenditure
Capitalised interest
£m
Totalcapital
expenditure – Combined
Portfolio£m
Total capital
expenditure – joint
ventures (Groupshare)
£m
Total capital
expenditure– Group
£m
Incremental lettable
space£m
Noincremental
lettablespace
£m
Agent fees£m
Tenantimprove-
ments£m
Total£m
Retail Portfolio
Shopping centres and shops 3 – 2 19 – – 21 – 24 10 14
Outlets – – – 3 – 1 4 – 4 – 4
Retail parks – – 3 1 – 1 5 – 5 2 3
Leisure and hotels – – – 3 – – 3 – 3 – 3
Other – – – – – – – – – – –
Total Retail Portfolio 3 – 5 26 – 2 33 – 36 12 24
London Portfolio
West End 9 – – 27 1 – 28 – 37 10 27
City – 52 – – – – – 5 57 – 57
Mid-town – – – – – – – – – – –
Inner London 93 – – 2 – – 2 – 95 – 95
Central London shops 31 – – 2 – – 2 – 33 1 32
Total London Portfolio 133 52 – 31 1 – 32 5 222 11 211
Total capital expenditure 136 52 5 57 1 2 65 5 258 23 235
Conversion from accrual to cash basis 1 – 1
Total capital expenditure on a cash basis
259 23 236
1. Investment properties acquired in the year.2. Expenditure on the development programme.

204 Landsec Annual Report 2019
Subsidiaries, joint ventures and associates
As at 31 March 2019, the Company had a 100% interest, direct or indirect, in the ordinary share capital of the following subsidiaries, all of which are registered in the UK at 100 Victoria Street, London, SW1E 5JL.
Alan House (Nottingham) (No.1) Limited
Alan House (Nottingham) (No.2) Limited
Arundel Great Court Development Management Limited
Blueco Limited
Bluewater Ground Lease Limited
Bluewater Outer Area Limited
Cedric (New Fetter Lane) (No.1) Limited
Cedric (New Fetter Lane) (No.2) Limited
Clock Tower (Canterbury) (No.1) Limited
Clock Tower (Canterbury) (No.2) Limited
Crossways 2000 Limited
Crossways 3065 Limited
Crossways 7055 Limited
Dashwood House Limited
Freeport (Nominee 1) Limited
Freeport (Nominee 2) Limited
Gunwharf Quays Limited
L & P Estates Limited
Land Securities (BH) Limited
Land Securities (Finance) Limited
Land Securities (Hotels) Limited
Land Securities (Insurance Services) Limited
Land Securities (Media Services) BH Limited
Land Securities (Media Services) PQ Limited
Land Securities Buchanan Street Developments Limited
Land Securities Business Services Limited
Land Securities Capital Markets PLC
Land Securities Consulting Limited
Land Securities Development Limited
Land Securities Ebbsfleet (No.2) Limited
Land Securities Ebbsfleet (No.3) Limited
Land Securities Ebbsfleet Limited
Land Securities Intermediate Limited
Land Securities Investment Trust Limited
Land Securities Lakeside Limited
Land Securities Management Limited
Land Securities Management Services Limited
Land Securities Partnerships Limited
Land Securities PLC
Land Securities Portfolio Management Limited
Land Securities Properties Limited
Land Securities Property Holdings Limited
Land Securities Reserve B Limited
Land Securities SPV’S Limited
Land Securities Trading Limited
Land Securities Trinity Limited
Landsec Limited
LC25 Limited
LS (Bracknell) Limited
LS (Finchley Road) Limited
LS (Jaguar) GP Investments Limited
LS (Victoria) Nominee No.1 Limited
LS (Victoria) Nominee No.2 Limited
LS 1 New Street Square Developer Limited
LS 1 New Street Square Limited
LS 1 Sherwood Street Developer Limited
LS 1 Sherwood Street Limited
LS 105 Sumner Street Developer Limited
LS 130 Wood ST Limited
LS 21 Moorfields Development Management Limited
LS 21 Moorfields Limited
LS 25 Lavington Street Developer Limited
LS 60-78 Victoria Street Limited
LS 62 Buckingham Gate Limited
LS Aldersgate Limited
LS Ashdown Limited
LS Banbridge Phase Two Limited
LS Bankside Development Limited
LS Bexhill Limited
LS Birmingham Limited
LS Braintree and Castleford GP Limited
LS Braintree Limited
LS Buchanan Limited
LS Canterbury Limited
LS Cardiff (GP) Investments Limited
LS Cardiff (Holdings) Limited
LS Cardiff Limited
LS Cardinal Limited
LS Castleford Limited
LS Chattenden Marketing Limited
LS Chesterfield Limited
Name Name
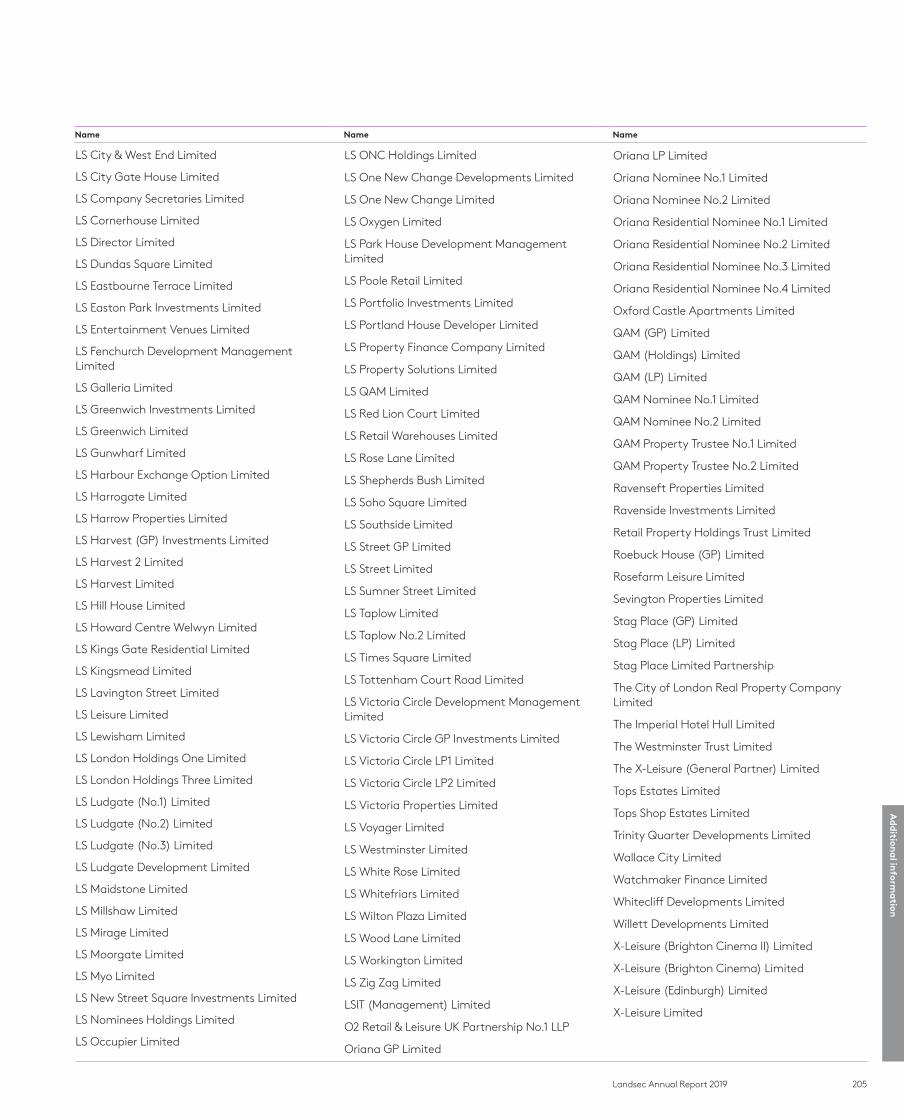
205Landsec Annual Report 2019
Ad
dition
al in
forma
tion
LS City & West End Limited
LS City Gate House Limited
LS Company Secretaries Limited
LS Cornerhouse Limited
LS Director Limited
LS Dundas Square Limited
LS Eastbourne Terrace Limited
LS Easton Park Investments Limited
LS Entertainment Venues Limited
LS Fenchurch Development Management Limited
LS Galleria Limited
LS Greenwich Investments Limited
LS Greenwich Limited
LS Gunwharf Limited
LS Harbour Exchange Option Limited
LS Harrogate Limited
LS Harrow Properties Limited
LS Harvest (GP) Investments Limited
LS Harvest 2 Limited
LS Harvest Limited
LS Hill House Limited
LS Howard Centre Welwyn Limited
LS Kings Gate Residential Limited
LS Kingsmead Limited
LS Lavington Street Limited
LS Leisure Limited
LS Lewisham Limited
LS London Holdings One Limited
LS London Holdings Three Limited
LS Ludgate (No.1) Limited
LS Ludgate (No.2) Limited
LS Ludgate (No.3) Limited
LS Ludgate Development Limited
LS Maidstone Limited
LS Millshaw Limited
LS Mirage Limited
LS Moorgate Limited
LS Myo Limited
LS New Street Square Investments Limited
LS Nominees Holdings Limited
LS Occupier Limited
LS ONC Holdings Limited
LS One New Change Developments Limited
LS One New Change Limited
LS Oxygen Limited
LS Park House Development Management Limited
LS Poole Retail Limited
LS Portfolio Investments Limited
LS Portland House Developer Limited
LS Property Finance Company Limited
LS Property Solutions Limited
LS QAM Limited
LS Red Lion Court Limited
LS Retail Warehouses Limited
LS Rose Lane Limited
LS Shepherds Bush Limited
LS Soho Square Limited
LS Southside Limited
LS Street GP Limited
LS Street Limited
LS Sumner Street Limited
LS Taplow Limited
LS Taplow No.2 Limited
LS Times Square Limited
LS Tottenham Court Road Limited
LS Victoria Circle Development Management Limited
LS Victoria Circle GP Investments Limited
LS Victoria Circle LP1 Limited
LS Victoria Circle LP2 Limited
LS Victoria Properties Limited
LS Voyager Limited
LS Westminster Limited
LS White Rose Limited
LS Whitefriars Limited
LS Wilton Plaza Limited
LS Wood Lane Limited
LS Workington Limited
LS Zig Zag Limited
LSIT (Management) Limited
O2 Retail & Leisure UK Partnership No.1 LLP
Oriana GP Limited
Oriana LP Limited
Oriana Nominee No.1 Limited
Oriana Nominee No.2 Limited
Oriana Residential Nominee No.1 Limited
Oriana Residential Nominee No.2 Limited
Oriana Residential Nominee No.3 Limited
Oriana Residential Nominee No.4 Limited
Oxford Castle Apartments Limited
QAM (GP) Limited
QAM (Holdings) Limited
QAM (LP) Limited
QAM Nominee No.1 Limited
QAM Nominee No.2 Limited
QAM Property Trustee No.1 Limited
QAM Property Trustee No.2 Limited
Ravenseft Properties Limited
Ravenside Investments Limited
Retail Property Holdings Trust Limited
Roebuck House (GP) Limited
Rosefarm Leisure Limited
Sevington Properties Limited
Stag Place (GP) Limited
Stag Place (LP) Limited
Stag Place Limited Partnership
The City of London Real Property Company Limited
The Imperial Hotel Hull Limited
The Westminster Trust Limited
The X-Leisure (General Partner) Limited
Tops Estates Limited
Tops Shop Estates Limited
Trinity Quarter Developments Limited
Wallace City Limited
Watchmaker Finance Limited
Whitecliff Developments Limited
Willett Developments Limited
X-Leisure (Brighton Cinema II) Limited
X-Leisure (Brighton Cinema) Limited
X-Leisure (Edinburgh) Limited
X-Leisure Limited
Name Name Name
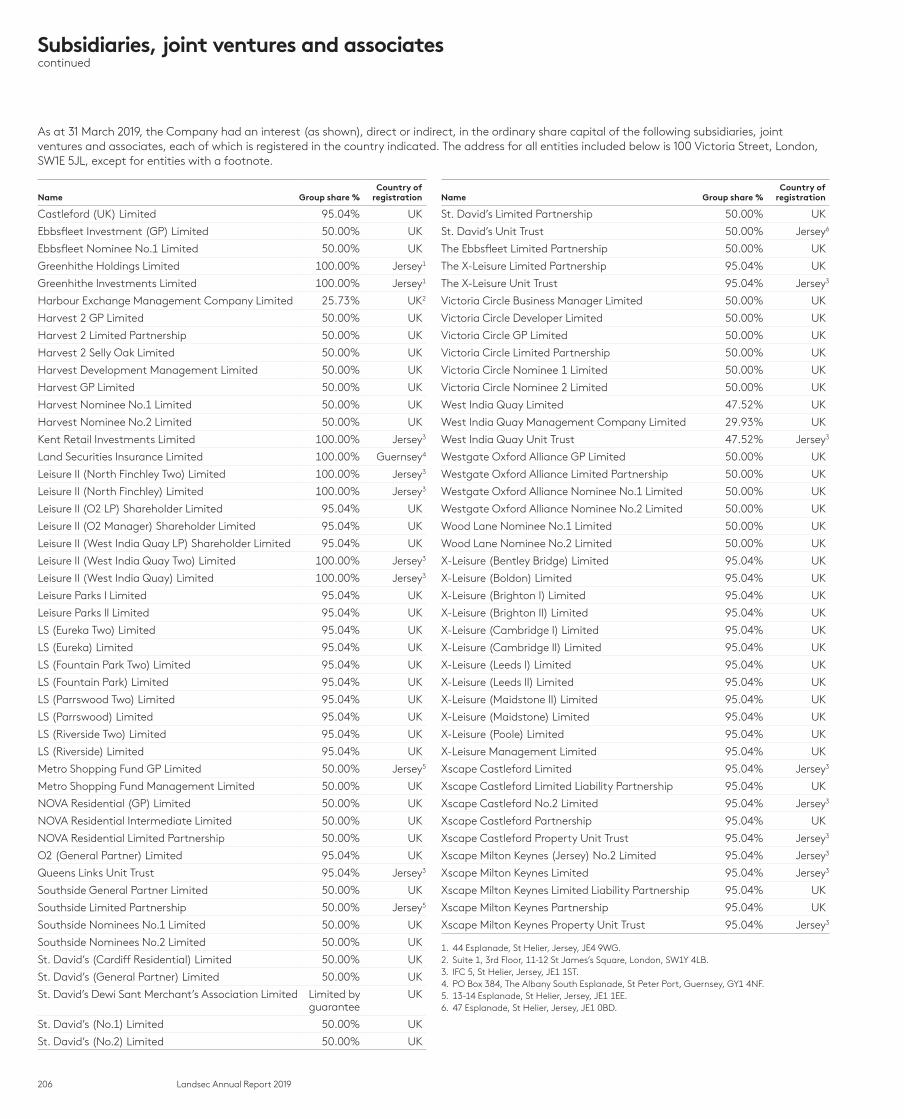
206 Landsec Annual Report 2019
Subsidiaries, joint ventures and associatescontinued
As at 31 March 2019, the Company had an interest (as shown), direct or indirect, in the ordinary share capital of the following subsidiaries, joint ventures and associates, each of which is registered in the country indicated. The address for all entities included below is 100 Victoria Street, London, SW1E 5JL, except for entities with a footnote.
Name Group share % Country of
registration
Castleford (UK) Limited 95.04% UK
Ebbsfleet Investment (GP) Limited 50.00% UK
Ebbsfleet Nominee No.1 Limited 50.00% UK
Greenhithe Holdings Limited 100.00% Jersey1
Greenhithe Investments Limited 100.00% Jersey1
Harbour Exchange Management Company Limited 25.73% UK2
Harvest 2 GP Limited 50.00% UK
Harvest 2 Limited Partnership 50.00% UK
Harvest 2 Selly Oak Limited 50.00% UK
Harvest Development Management Limited 50.00% UK
Harvest GP Limited 50.00% UK
Harvest Nominee No.1 Limited 50.00% UK
Harvest Nominee No.2 Limited 50.00% UK
Kent Retail Investments Limited 100.00% Jersey3
Land Securities Insurance Limited 100.00% Guernsey4
Leisure II (North Finchley Two) Limited 100.00% Jersey3
Leisure II (North Finchley) Limited 100.00% Jersey3
Leisure II (O2 LP) Shareholder Limited 95.04% UK
Leisure II (O2 Manager) Shareholder Limited 95.04% UK
Leisure II (West India Quay LP) Shareholder Limited 95.04% UK
Leisure II (West India Quay Two) Limited 100.00% Jersey3
Leisure II (West India Quay) Limited 100.00% Jersey3
Leisure Parks I Limited 95.04% UK
Leisure Parks II Limited 95.04% UK
LS (Eureka Two) Limited 95.04% UK
LS (Eureka) Limited 95.04% UK
LS (Fountain Park Two) Limited 95.04% UK
LS (Fountain Park) Limited 95.04% UK
LS (Parrswood Two) Limited 95.04% UK
LS (Parrswood) Limited 95.04% UK
LS (Riverside Two) Limited 95.04% UK
LS (Riverside) Limited 95.04% UK
Metro Shopping Fund GP Limited 50.00% Jersey5
Metro Shopping Fund Management Limited 50.00% UK
NOVA Residential (GP) Limited 50.00% UK
NOVA Residential Intermediate Limited 50.00% UK
NOVA Residential Limited Partnership 50.00% UK
O2 (General Partner) Limited 95.04% UK
Queens Links Unit Trust 95.04% Jersey3
Southside General Partner Limited 50.00% UK
Southside Limited Partnership 50.00% Jersey5
Southside Nominees No.1 Limited 50.00% UK
Southside Nominees No.2 Limited 50.00% UK
St. David’s (Cardiff Residential) Limited 50.00% UK
St. David’s (General Partner) Limited 50.00% UK
St. David’s Dewi Sant Merchant’s Association Limited Limited by guarantee
UK
St. David’s (No.1) Limited 50.00% UK
St. David’s (No.2) Limited 50.00% UK
Name Group share % Country of
registration
St. David’s Limited Partnership 50.00% UK
St. David’s Unit Trust 50.00% Jersey6
The Ebbsfleet Limited Partnership 50.00% UK
The X-Leisure Limited Partnership 95.04% UK
The X-Leisure Unit Trust 95.04% Jersey3
Victoria Circle Business Manager Limited 50.00% UK
Victoria Circle Developer Limited 50.00% UK
Victoria Circle GP Limited 50.00% UK
Victoria Circle Limited Partnership 50.00% UK
Victoria Circle Nominee 1 Limited 50.00% UK
Victoria Circle Nominee 2 Limited 50.00% UK
West India Quay Limited 47.52% UK
West India Quay Management Company Limited 29.93% UK
West India Quay Unit Trust 47.52% Jersey3
Westgate Oxford Alliance GP Limited 50.00% UK
Westgate Oxford Alliance Limited Partnership 50.00% UK
Westgate Oxford Alliance Nominee No.1 Limited 50.00% UK
Westgate Oxford Alliance Nominee No.2 Limited 50.00% UK
Wood Lane Nominee No.1 Limited 50.00% UK
Wood Lane Nominee No.2 Limited 50.00% UK
X-Leisure (Bentley Bridge) Limited 95.04% UK
X-Leisure (Boldon) Limited 95.04% UK
X-Leisure (Brighton I) Limited 95.04% UK
X-Leisure (Brighton II) Limited 95.04% UK
X-Leisure (Cambridge I) Limited 95.04% UK
X-Leisure (Cambridge II) Limited 95.04% UK
X-Leisure (Leeds I) Limited 95.04% UK
X-Leisure (Leeds II) Limited 95.04% UK
X-Leisure (Maidstone II) Limited 95.04% UK
X-Leisure (Maidstone) Limited 95.04% UK
X-Leisure (Poole) Limited 95.04% UK
X-Leisure Management Limited 95.04% UK
Xscape Castleford Limited 95.04% Jersey3
Xscape Castleford Limited Liability Partnership 95.04% UK
Xscape Castleford No.2 Limited 95.04% Jersey3
Xscape Castleford Partnership 95.04% UK
Xscape Castleford Property Unit Trust 95.04% Jersey3
Xscape Milton Keynes (Jersey) No.2 Limited 95.04% Jersey3
Xscape Milton Keynes Limited 95.04% Jersey3
Xscape Milton Keynes Limited Liability Partnership 95.04% UK
Xscape Milton Keynes Partnership 95.04% UK
Xscape Milton Keynes Property Unit Trust 95.04% Jersey3
1. 44 Esplanade, St Helier, Jersey, JE4 9WG. 2. Suite 1, 3rd Floor, 11-12 St James’s Square, London, SW1Y 4LB.3. IFC 5, St Helier, Jersey, JE1 1ST. 4. PO Box 384, The Albany South Esplanade, St Peter Port, Guernsey, GY1 4NF. 5. 13-14 Esplanade, St Helier, Jersey, JE1 1EE. 6. 47 Esplanade, St Helier, Jersey, JE1 0BD.
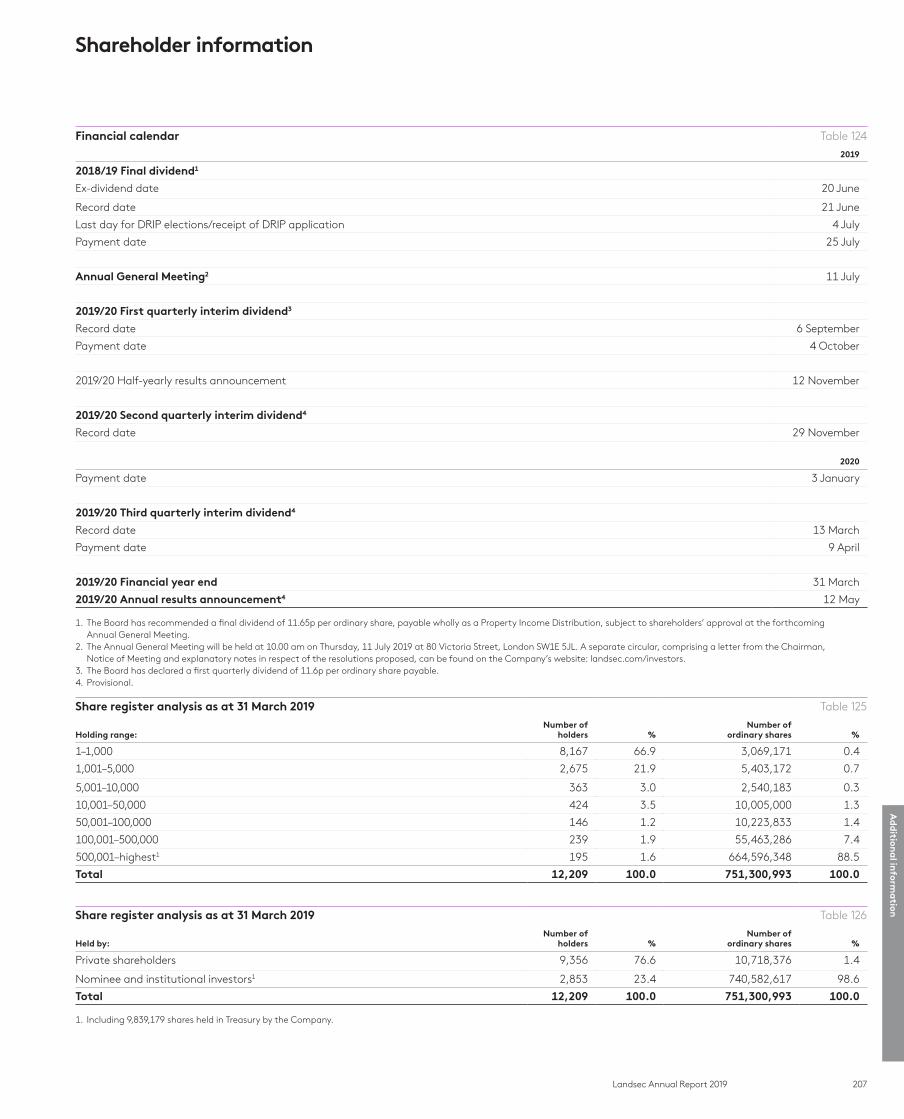
207Landsec Annual Report 2019
Ad
dition
al in
forma
tion
Shareholder information
Financial calendar Table 124
2019
2018/19 Final dividend1
Ex-dividend date 20 June
Record date 21 June
Last day for DRIP elections/receipt of DRIP application 4 July
Payment date 25 July
Annual General Meeting2 11 July
2019/20 First quarterly interim dividend3
Record date 6 September
Payment date 4 October
2019/20 Half-yearly results announcement 12 November
2019/20 Second quarterly interim dividend4
Record date 29 November
2020
Payment date 3 January
2019/20 Third quarterly interim dividend4
Record date 13 March
Payment date 9 April
2019/20 Financial year end 31 March
2019/20 Annual results announcement4 12 May
1. The Board has recommended a final dividend of 11.65p per ordinary share, payable wholly as a Property Income Distribution, subject to shareholders’ approval at the forthcoming Annual General Meeting.
2. The Annual General Meeting will be held at 10.00 am on Thursday, 11 July 2019 at 80 Victoria Street, London SW1E 5JL. A separate circular, comprising a letter from the Chairman, Notice of Meeting and explanatory notes in respect of the resolutions proposed, can be found on the Company’s website: landsec.com/investors.
3. The Board has declared a first quarterly dividend of 11.6p per ordinary share payable.4. Provisional.
Share register analysis as at 31 March 2019 Table 125
Holding range:Number of
holders %Number of
ordinary shares %
1–1,000 8,167 66.9 3,069,171 0.4
1,001–5,000 2,675 21.9 5,403,172 0.7
5,001–10,000 363 3.0 2,540,183 0.3
10,001–50,000 424 3.5 10,005,000 1.3
50,001–100,000 146 1.2 10,223,833 1.4
100,001–500,000 239 1.9 55,463,286 7.4
500,001–highest1 195 1.6 664,596,348 88.5
Total 12,209 100.0 751,300,993 100.0
Share register analysis as at 31 March 2019 Table 126
Held by:Number of
holders %Number of
ordinary shares %
Private shareholders 9,356 76.6 10,718,376 1.4
Nominee and institutional investors1 2,853 23.4 740,582,617 98.6
Total 12,209 100.0 751,300,993 100.0
1. Including 9,839,179 shares held in Treasury by the Company.
208 Landsec Annual Report 2019
Shareholder informationcontinued
Ordinary sharesThe Company’s ordinary shares of nominal value 102/3p each are traded on the main market for listed securities on the London Stock Exchange (LON:LAND).
Company website: landsec.comThe Company’s Annual Report, results announcements and presentations are available to view and download from its website.
The website also includes information about the latest Landsec share price and dividend information, news about the Company, its properties and operations, and how to obtain further information.
Registrar: EquinitiFor assistance with queries about administration of shareholdings, such as lost share certificates, change of address or personal details, amalgamation of accounts and dividend payments, please contact the Company’s Registrar:
EquinitiAspect HouseSpencer RoadLancingWest Sussex BN99 6DATelephone: 0371 384 21281
International dialling: +44 121 415 70491
www.shareview.co.uk
An online share management service is available which enables shareholders to access details of their Land Securities Group PLC shareholdings electronically. This is available on our website: landsec.com/investors or www.shareview.co.uk.
Electronic communicationsWe encourage shareholders to consider receiving their communications from the Company electronically as this will enable you to receive them more quickly and securely. It also allows Landsec to communicate in a more environmentally friendly and cost-effective manner. To register for this service, you should go to our website: landsec.com/investors or www.shareview.co.uk.
UK Real Estate Investment Trust (REIT) taxation and status on payment of dividendsAs a UK REIT, Landsec does not pay corporation tax on Qualifying Activities, which are rental profits and chargeable gains relating to its property rental business.
At least 90% of income derived from Qualifying Activities must be distributed as Property Income Distributions (PIDs). For most shareholders, PIDs will be paid after deducting withholding tax at 20%. However, certain categories of shareholder may be able to receive PIDs gross (i.e. without deduction of withholding tax). These categories are principally UK companies, charities, local authorities, UK pension schemes and managers of ISAs, PEPs and Child Trust Funds.
Further information on UK REITs and the forms required to be completed to apply for PIDs to be paid gross are available on the Landsec website or from the Registrar.
UK individual shareholders will be taxed on PIDs received at their full marginal tax rates. The gross amount, before the 20% withholding, should be included in their tax return in ‘other taxable income’, with the withholding tax recorded separately (see HMRC’s Tax Return Guide, page TRG8).
A REIT may additionally pay ordinary dividends which will be treated in the same way as dividends from non-REIT companies (see www.gov.uk/tax-on-dividends).
Payment of dividends to UK resident shareholdersShareholders whose dividends are currently sent to their registered address should consider having their dividends paid directly into their personal bank or building society account. This has a number of advantages, including the crediting of cleared funds on the actual dividend payment date. If you would prefer to have future dividends paid in this way, please contact the Registrar or complete a mandate instruction available on our website: landsec.com/investors and return it to the Registrar. Under this arrangement, dividend confirmations are still sent to your registered address.
Payment of dividends to non-UK resident shareholdersInstead of waiting for a Sterling cheque to arrive by post, shareholders can request that their dividends be paid directly to a personal bank account overseas. It’s a service we can arrange in over 90 countries worldwide and it normally costs less than paying in a Sterling cheque. The dividend will be credited to your account automatically – normally just a few days after the Company’s dividend payment date. For more information, you should contact the Registrar on +44 (0)121 415 70491 or download an application form online at www.shareview.co.uk. Alternatively, you can contact the Registrar at the address given above.
Dividend Reinvestment Plan (DRIP)The DRIP gives shareholders the opportunity to use cash dividends to increase their shareholding in Land Securities Group PLC. It is a convenient and cost-effective facility provided by Equiniti Financial Services Limited. Under the DRIP, cash dividends are used to buy shares in the market as soon as possible after the dividend payment, with any residual cash being carried forward to the next dividend payment.
Details of the DRIP, including terms and conditions and participation election forms, are available on our website: landsec.com/investors.
They are also available from:
Dividend Reinvestment Plans EquinitiAspect House Spencer Road LancingWest Sussex BN99 6DATelephone: 0371 384 22681
International dialling: +44 121 415 71731
Share dealing facilitiesEquiniti provides both existing and prospective UK shareholders with an easy to access and simple-to-use share dealing facility for buying and selling shares in Land Securities Group PLC by telephone, online or post. The telephone and online dealing service allows shareholders to trade ‘real-time’ at a known price that will be given to them at the time they give their instruction.
For telephone dealing, call 0345 603 7037 between 8.00am and 4.30pm, Monday to Friday (excluding public holidays in England and Wales). Calls are charged at the standard geographic rate and will vary by provider. Calls outside the UK will be charged at the applicable international rate. For online dealing, log on to www.shareview.co.uk/dealing. For postal dealing, call 0371 384 22481 for full details and a dealing instruction form. Existing shareholders will need to provide the account/shareholder reference number shown on their share certificate. Other brokers, banks and building societies also offer similar share dealing facilities.
209Landsec Annual Report 2019
Ad
dition
al in
forma
tion
ShareGiftShareholders with only a small number of shares, the value of which makes it uneconomic to sell them, may wish to consider donating them to the charity through ShareGift, a registered charity (No. 1052686) which specialises in using such holdings for charitable benefit. A ShareGift donation form can be obtained from the Registrar and further information about ShareGift is available at www.sharegift.org.uk or by writing to:
ShareGiftThe Orr Mackintosh Foundation Limited4th Floor Rear, 67/68 Jermyn Street, London SW1Y 6NYTelephone: +44 (0)20 7930 3737
Corporate Individual Savings Account (ISA)The Company has in place a Corporate ISA which is managed by:
Equiniti Financial Services LimitedAspect HouseSpencer RoadLancingWest Sussex BN99 6DATelephone: 0371 384 22441
Capital Gains TaxIn September 2017, Landsec returned 60p per share to shareholders via the issue and redemption of B shares and undertook a share consolidation issuing 15 shares for every 16 held. A worked example of the impact to the tax base cost of shares is on our website: landsec.com/investors/shareholders-equity-investors/return-capital.
For the purpose of Capital Gains Tax, the price of a Land Securities share at 31 March 1982, adjusted for the capitalisation issue in November 1983 and the Scheme of Arrangement in September 2002, was 203p. On the assumption that the 5 for 8 Rights Issue in March 2009 was taken up in full and there were no fractional shares in the 2017 share consolidation, the adjusted price, post consolidation, for Capital Gains Tax purposes would be 229p per share.
General Data Protection Regulation (GDPR)On 25 May 2018, the General Data Protection Regulation came into force which gives individuals improved clarity and rights over personal data. We have updated our Shareholder Privacy Notice to make it easier to understand how Landsec uses and protects shareholder information. A copy of the Shareholder Privacy Notice can be found on our website: landsec.com/ policies/privacy-policy/shareholders.
Unclaimed Assets RegisterThe Company participates in the Unclaimed Assets Register, which provides a search facility for financial assets which may have been forgotten. For further information, contact:
The Unclaimed Assets RegisterTelephone: +44 (0)333 000 0182email: [email protected]
Unsolicited mailThe Company is obliged by law to make its share register available on request to other organisations and this may result in shareholders receiving unsolicited mail. To limit the receipt of unsolicited mail, shareholders may register with the Mailing Preference Service, an independent organisation whose services are free, by visiting www.mpsonline.org.uk.
Shareholder securityIn the past, some of our shareholders have received unsolicited telephone calls or correspondence concerning investment matters from organisations or persons claiming or implying that they have some connection with the Company. These are typically from purported ‘brokers’ who offer to buy shares at a price often far in excess of their market value. These operations are commonly known as ‘boiler rooms’.
Shareholders are advised to be very wary of any offers of unsolicited advice, discounted shares, premium prices for shares they own or free reports into the Company. If you receive any such unsolicited calls, correspondence or investment advice:
— ensure you get the correct name of the person and firm;
— check that the firm is on the Financial Conduct Authority (FCA) Register to ensure they are authorised at www.register.fca.org.uk;
— use the details on the FCA Register to contact the firm;
— call the FCA Consumer Helpline (0800 111 6768) if there are no contact details in the Register or you are told they are out of date; and
— if you feel uncomfortable with the call or the calls persist, simply hang up.
Additionally, feel free to report and/or discuss any shareholder security matters with the Company. To do this, please call: +44 (0)20 7413 9000 and ask to be put through to a member of the Company Secretariat department.
1. Lines are open 8.30am to 5.30pm (UK time), Monday to Friday, excluding public holidays. Calls are charged at the standard geographic rate and will vary by provider. Calls from outside the UK will be charged at the applicable international rate.

210 Landsec Annual Report 2019
Key contacts and advisers
Registered office and principal UK addressLand Securities Group PLC 100 Victoria Street London SW1E 5JL Registered in England and Wales No. 4369054
Company SecretaryTim Ashby Group General Counsel and Company Secretary
Investor RelationsEdward Thacker Head of Investor Relations
Telephone: +44 (0)20 7413 9000 Email: [email protected] www.landsec.com
RegistrarEquiniti Group plc Aspect House Spencer Road Lancing West Sussex BN99 6DA
Telephone: 0371 384 2128 Textel: 0371 384 2255 International dialling: +44 121 415 7049 www.shareview.co.uk
AuditorErnst & Young LLP 1 More London Place London SE1 2AF
Telephone: +44 (0)20 7951 2000 www.ey.com
External advisersValuer: CBRE Financial adviser: Citigroup Solicitors: Slaughter and May Joint brokers: JP Morgan Cazenove and UBS
211Landsec Annual Report 2019
Ad
dition
al in
forma
tion
Adjusted earnings per share (Adjusted EPS)Earnings per share based on revenue profit after related tax.
Adjusted net debtNet debt excluding cumulative fair value movements on interest-rate swaps and amounts payable under finance leases. It generally includes the net debt of subsidiaries and joint ventures on a proportionate basis.
Book valueThe amount at which assets and liabilities are reported in the financial statements.
BREEAMBuilding Research Establishment’s Environmental Assessment Method.
Combined PortfolioThe Combined Portfolio comprises the investment properties of the Group’s subsidiaries, on a proportionately consolidated basis when not wholly owned, together with our share of investment properties held in our joint ventures.
Completed developmentsCompleted developments consist of those properties previously included in the development programme, which have been transferred from the development programme since 1 April 2017.
Development pipelineThe development programme together with proposed developments.
Development programmeThe development programme consists of committed developments (Board approved projects with the building contract let), authorised developments (Board approved), projects under construction and developments which have reached practical completion within the last two years but are not yet 95% let.
Diluted figuresReported results adjusted to include the effects of potentially dilutive shares issuable under employee share schemes.
Dividend Reinvestment Plan (DRIP)The DRIP provides shareholders with the opportunity to use cash dividends received to purchase additional ordinary shares in the Company immediately after the relevant dividend payment date. Full details appear on the Company’s website.
Earnings per share Profit after taxation attributable to owners divided by the weighted average number of ordinary shares in issue during the year.
EPRAEuropean Public Real Estate Association.
EPRA net assets per shareDiluted net assets per share adjusted to remove the effect of cumulative fair value movements on interest-rate swaps and similar instruments.
EPRA net initial yieldEPRA net initial yield is defined within EPRA’s Best Practice Recommendations as the annualised rental income based on the cash rents passing at the balance sheet date, less non-recoverable property operating expenses, divided by the gross market value of the property. It is consistent with the net initial yield calculated by the Group’s external valuer.
Equivalent yieldCalculated by the Group’s external valuer, equivalent yield is the internal rate of return from an investment property, based on the gross outlays for the purchase of a property (including purchase costs), reflecting reversions to current market rent and such items as voids and non-recoverable expenditure but ignoring future changes in capital value. The calculation assumes rent is received annually in arrears.
ERV – Gross estimated rental value The estimated market rental value of lettable space as determined bi-annually by the Group’s external valuer. For investment properties in the development programme, which have not yet reached practical completion, the ERV represents management’s view of market rents.
Fair value movementAn accounting adjustment to change the book value of an asset or liability to its market value (see also mark-to-market adjustment).
Finance leaseA lease that transfers substantially all the risks and rewards of ownership from the lessor to the lessee.
GearingTotal borrowings, including bank overdrafts, less short-term deposits, corporate bonds and cash, at book value, plus cumulative fair value movements on financial derivatives as a percentage of total equity. For adjusted gearing, see note 20.
Gross market valueMarket value plus assumed usual purchaser’s costs at the reporting date.
Head leaseA lease under which the Group holds an investment property.
Interest Cover Ratio (ICR)A calculation of a company’s ability to meet its interest payments on outstanding debt. It is calculated using revenue profit before interest, divided by net interest (excluding the mark-to-market movement on interest-rate swaps, foreign exchange swaps, capitalised interest and interest on the pension scheme assets and liabilities). The calculation excludes joint ventures.
Interest-rate swapA financial instrument where two parties agree to exchange an interest rate obligation for a predetermined amount of time. These are generally used by the Group to convert floating-rate debt or investments to fixed rates.
Investment portfolioThe investment portfolio comprises the investment properties of the Group’s subsidiaries, on a proportionately consolidated basis where not wholly owned.
Joint ventureAn arrangement in which the Group holds an interest and which is jointly controlled by the Group and one or more partners under a contractual arrangement. Decisions on the activities of the joint venture that significantly affect the joint venture’s returns, including decisions on financial and operating policies and the performance and financial position of the operation, require the unanimous consent of the partners sharing control.
Lease incentivesAny incentive offered to occupiers to enter into a lease. Typically, the incentive will be an initial rent-free period, or a cash contribution to fit-out or similar costs. For accounting purposes the value of the incentive is spread over the non-cancellable life of the lease.
LIBORThe London Interbank Offered Rate, the interest rate charged by one bank to another for lending money, often used as a reference rate in bank facilities.
Like-for-like portfolioThe like-for-like portfolio includes all properties which have been in the portfolio since 1 April 2017, but excluding those which are acquired or sold since that date. Properties in the development pipeline and completed developments are also excluded.
Loan-to-value (LTV) Group LTV is the ratio of adjusted net debt, including subsidiaries and joint ventures, to the sum of the market value of investment properties and the book value of trading properties of the Group, its subsidiaries and joint ventures, all on a proportionate basis, expressed as a percentage. For the Security Group, LTV is the ratio of net debt lent to the Security Group divided by the value of secured assets.
Market valueMarket value is determined by the Group’s external valuer, in accordance with the RICS Valuation Standards, as an opinion of the estimated amount for which a property should exchange on the date of valuation between a willing buyer and a willing seller in an arm’s-length transaction after proper marketing.
Mark-to-market adjustmentAn accounting adjustment to change the book value of an asset or liability to its market value (see also fair value movement).
MSCIRefers to the MSCI Direct Property indexes (previously IPD Direct Property indexes) which measure the property level investment returns in the UK.
Net assets per shareEquity attributable to owners divided by the number of ordinary shares in issue at the year end. Net assets per share is also commonly known as net asset value per share (NAV per share).
Net initial yieldNet initial yield is a calculation by the Group’s external valuer of the yield that would be received by a purchaser, based on the Estimated Net Rental Income expressed as a percentage of the acquisition cost, being the market value plus assumed usual purchasers’ costs at the reporting date. The calculation is in line with EPRA guidance. Estimated Net Rental Income is determined by the valuer and is based on the passing cash rent less rent payable at the balance sheet date, estimated non-recoverable outgoings and void costs including service charges, insurance costs and void rates.
Net rental incomeNet rental income is the net operational income arising from properties, on an accruals basis, including rental income, finance lease interest, rents payable, service charge income and expense, other property related income, direct property expenditure and bad debts. Net rental income is presented on a proportionate basis.
Over-rentedSpace where the passing rent is above the ERV.
Passing rentThe estimated annual rent receivable as at the reporting date which includes estimates of turnover rent and estimates of rent to be agreed in respect of outstanding rent review or lease renewal negotiations. Passing rent may be more or less than the ERV (see over-rented, reversionary and ERV). Passing rent excludes annual rent receivable from units in administration save to the extent that rents are expected to be received. Void units and units that are in a rent-free period at the reporting date are deemed to have no passing rent. Although temporary lets of less than 12 months are treated as void, income from temporary lets is included in passing rents.
Passing cash rentPassing cash rent is passing rent excluding units that are in a rent-free period at the reporting date.
Planning permissionThere are two common types of planning permission: full planning permission and outline planning permission. A full planning permission results in a decision on the detailed proposals on how the site can be developed. The grant of a full planning permission will, subject to satisfaction of any conditions, mean no further engagement with the local planning authority will be required to build the consented development. An outline planning permission approves general principles of how a site can be developed. Outline planning permission is granted subject to conditions known as ‘reserved matters’. Consent must be sought and achieved for discharge of all reserved matters within a specified time-limit, normally three years from the date outline planning permission was granted, before building can begin. In both the case of full and outline planning permission, the local planning authority will ‘resolve to grant permission’. At this stage, the planning permission is granted subject to agreement of legal documents, in particular the s106 agreement. On execution of the s106 agreement, the planning permission will be issued. Work can begin on satisfaction of any ‘pre-commencement’ planning conditions.
Pre-letA lease signed with an occupier prior to completion of a development.
Pre-development propertiesPre-development properties are those properties within the like-for-like portfolio which are being managed to align vacant possession within a three-year horizon with a view to redevelopment.
Property Income Distribution (PID)A PID is a distribution by a REIT to its shareholders paid out of qualifying profits. A REIT is required to distribute at least 90% of its qualifying profits as a PID to its shareholders.
Proposed developmentsProposed developments are properties which have not yet received final Board approval or are still subject to main planning conditions being satisfied, but which are more likely to proceed than not.
Glossary
212 Landsec Annual Report 2019
Qualifying activities/Qualifying assetsThe ownership (activity) of property (assets) which is held to earn rental income and qualifies for tax-exempt treatment (income and capital gains) under UK REIT legislation.
Real Estate Investment Trust (REIT)A REIT must be a publicly quoted company with at least three-quarters of its profits and assets derived from a qualifying property rental business. Income and capital gains from the property rental business are exempt from tax but the REIT is required to distribute at least 90% of those profits to shareholders. Corporation tax is payable on non-qualifying activities in the normal way.
Rental value changeIncrease or decrease in the current rental value, as determined by the Group’s external valuer, over the reporting period on a like-for-like basis.
Rental incomeRental income is as reported in the income statement, on an accruals basis, and adjusted for the spreading of lease incentives over the term certain of the lease in accordance with SIC 15. It is stated gross, prior to the deduction of ground rents and without deduction for operational outgoings on car park and commercialisation activities.
Return on average capital employedGroup profit before net finance expense, plus joint venture profit before net finance expense, divided by the average capital employed (defined as shareholders’ funds plus adjusted net debt).
Return on average equityGroup profit before tax plus joint venture tax divided by the average equity shareholders’ funds.
Revenue profitProfit before tax, excluding profits on the sale of non-current assets and trading properties, profits on long-term development contracts, valuation movements, fair value movements on interest-rate swaps and similar instruments used for hedging purposes, debt restructuring charges, and any other items of an exceptional nature.
Reversionary or under-rentedSpace where the passing rent is below the ERV.
Reversionary yieldThe anticipated yield to which the initial yield will rise (or fall) once the rent reaches the ERV.
Security GroupSecurity Group is the principal funding vehicle for the Group and properties held in the Security Group are mortgaged for the benefit of lenders. It has the flexibility to raise a variety of different forms of finance.
Temporary lettingsLettings for a period of one year or less. These are included within voids.
Topped-up net initial yieldTopped-up net initial yield is a calculation by the Group’s external valuer. It is calculated by making an adjustment to net initial yield in respect of the annualised cash rent foregone through unexpired rent-free periods and other lease incentives. The calculation is consistent with EPRA guidance.
Total business returnDividend paid per share in the year plus the change in EPRA net assets per share, divided by EPRA net assets per share at the beginning of the year.
Total cost ratioTotal cost ratio represents all costs included within revenue profit, other than rents payable and financing costs, expressed as a percentage of gross rental income before rents payable adjusted for costs recovered through rents but not separately invoiced.
Total development cost (TDC)Total development cost refers to the book value of the site at the commencement of the project, the estimated capital expenditure required to develop the scheme from the start of the financial year in which the property is added to our development programme, together with capitalised interest, being the Group’s borrowing costs associated with direct expenditure on the property under development. Interest is also capitalised on the purchase cost of land or property where it is acquired specifically for redevelopment. The TDC for trading property development schemes excludes any estimated tax on disposal.
Total property return (TPR)The change in market value, adjusted for net investment, plus the net rental income of our investment properties expressed as a percentage of opening market value plus the time weighted capital expenditure incurred during the year.
Total Shareholder Return (TSR)The growth in value of a shareholding over a specified period, assuming that dividends are reinvested to purchase additional units of the stock.
Trading propertiesProperties held for trading purposes and shown as current assets in the balance sheet.
Turnover rentRental income which is related to an occupier’s turnover.
Valuation surplus/deficitThe valuation surplus/deficit represents the increase or decrease in the market value of the Combined Portfolio, adjusted for net investment and the effect of SIC 15 under IFRS. The market value of the Combined Portfolio is determined by the Group’s external valuer.
VoidsVoids are expressed as a percentage of ERV and represent all unlet space, including voids where refurbishment work is being carried out and voids in respect of pre-development properties. Temporary lettings for a period of one year or less are also treated as voids. The screen at Piccadilly Lights, W1 is excluded from the void calculation as it will always carry advertising although the number and duration of our agreements with advertisers will vary. Commercialisation lettings are also excluded from the void calculation.
Weighted average cost of capital (WACC)Weighted average cost of debt and notional cost of equity, used as a benchmark to assess investment returns.
Weighted average unexpired lease termThe weighted average of the unexpired term of all leases other than short-term lettings such as car parks and advertising hoardings, temporary lettings of less than one year, residential leases and long ground leases.
Yield shiftA movement (negative or positive) in the equivalent yield of a property asset.
Zone AA means of analysing and comparing the rental value of retail space by dividing it into zones parallel with the main frontage. The most valuable zone, Zone A, is at the front of the unit. Each successive zone is valued at half the rate of the zone in front of it.
Glossarycontinued
Cautionary statement
This Annual Report and Landsec’s website may contain certain ‘forward-looking statements’ with respect to Land Securities Group PLC (the Company) and the Group’s financial condition, results of its operations and business, and certain plans, strategy, objectives, goals and expectations with respect to these items and the economies and markets in which the Group operates.
Forward-looking statements are sometimes, but not always, identified by their use of a date in the future or such words as ‘anticipates’, ‘aims’, ‘due’, ‘could’, ‘may’, ‘should’, ‘expects’, ‘believes’, ‘intends’, ‘plans’, ‘targets’, ‘goal’ or ‘estimates’ or, in each case, their negative or other variations or comparable terminology. Forward-looking statements are not guarantees of future performance. By their very nature forward-looking statements are inherently unpredictable, speculative and involve risk and uncertainty because they relate to events and depend on circumstances that will occur in the future. Many of these assumptions, risks and uncertainties relate to factors that are beyond the Group’s ability to control or estimate precisely. There are a number of such factors that could cause actual results and developments to differ materially from those expressed or implied by these forward-looking statements. These factors include, but are not limited to, changes in the political conditions, economies and markets in which the Group operates; changes in the legal, regulatory and competition frameworks in which the Group operates; changes in the markets from which the Group raises finance; the impact of legal or other proceedings against or which affect the Group; changes in accounting practices and interpretation of accounting standards under IFRS, and changes in interest and exchange rates.
Any forward-looking statements made in this Annual Report or Landsec’s website, or made subsequently, which are attributable to the Company or any other member of the Group, or persons acting on their behalf, are expressly qualified in their entirety by the factors referred to above. Each forward-looking statement speaks only as of the date it is made. Except as required by its legal or statutory obligations, the Company does not intend to update any forward-looking statements.
Nothing contained in this Annual Report or Landsec’s website should be construed as a profit forecast or an invitation to deal in the securities of the Company.
Land Securities Group PLC
Copyright and trade mark notices.
All rights reserved.
© Copyright 2019 Land Securities Group PLC
Landsec, Land Securities, the Cornerstone logo, the ‘L’ logo and ‘Everything is experience’ are trade marks of the Land Securities Group of companies.
Landsec is the trading name of Land Securities Group PLC.
All other trade marks and registered trade marks are the property of their respective owners.
This report has been printed on Heaven 42 – an FSC® certified paper containing 100% ECF pulp and manufactured at a mill accredited with the ISO 14001 and EMAS environmental standards.
Printed by CPI Colour. CPI Colour are ISO14001 certified, CarbonNeutral®, Alcohol Free and are FSC® Chain of Custody certified. The inks used are vegetable oil based.
Design: mslgroup.co.uk
Words: Landsec and Tim Rich
Photography: Landsec Andrew Urwin Luke Hayes Philippa LangleyJames Gowdy
Land Securities Group PLC 100 Victoria Street London SW1E 5JL +44 (0)20 7413 9000 www.landsec.com

Annual R
eport 2019
www.landsec.com
Related Documents