Welcome message from author
This document is posted to help you gain knowledge. Please leave a comment to let me know what you think about it! Share it to your friends and learn new things together.
Transcript


TO OUR STOCKHOLDERS:
Fiscal year 2006 signaled the beginning of profound change in our industry Ì change in the way
consumers purchase and play EA games, the platforms they play on, and the approach we take to develop
and publish our products. It was a year that challenged us to think diÅerently about navigating technology
transitions and to invest in new opportunities with potentially richer margins. It was a year that marked the
introduction of new titles and new services that improve the game experience and generate incremental
revenue. Most of all, it was a year that convinced us that the artistic and economic opportunities in our
business are much greater than we could have imagined just Ñve years ago.
Transition is never easy and the combination of new technology, new platforms and new markets makes
this one particularly complex. Today, EA is investing ahead of revenue in what we believe will be another
Chairm
an’s Letter
period of strong and sustained growth for the interactive entertainment industry. No other company is
investing in as many strategic areas; no other company has as much opportunity. Our commitment of
Ñnancial and creative resources is signiÑcant, but so is the potential for long-term growth.
Our net revenue for Ñscal 2006 was $2.951 billion, down six percent. Operating income was $325 million
or 11 percent of revenue. Operating cash Öow was $596 million and we ended the year with $2.272 billion
in cash and short term investments. Our return on invested capital was 21 percent and diluted earnings per
share were $0.75.
Better Games on More Powerful Consoles
We are navigating through the console transition that upgrades consumers from current generation
platforms to more powerful and innovative systems like the Xbox 360TM console, the PlayStation»3 console
and the WiiTM from Nintendo. Our most important strategic initiative is to maintain and grow our
leadership position on these next generation consoles.
Although it is much too early to celebrate, the initial results are promising:
‚ Xbox 360TM Ì In Ñscal 2006, EA had three of the top ten games in both North America and
Europe. Although hardware launch quantities were limited, revenue from our 360 titles more than
oÅset the decline in sales of games for the original Xbox. In addition, the ratio of software to
hardware hit an all-time high in North America for a console launch Ì exceeding 4:1. In the year
ahead, EA plans to publish 15 to 20 games for this system.
‚ PlayStation 3 Ì EA plans to release 8 to 12 titles in Ñscal 2007 for the next generation console
from Sony that is scheduled to launch in November. At a recent trade show we demonstrated a
new motion capture technology that brings authentic athletic performance to our sports franchises
like Tiger Woods PGA TOUR».
‚ WiiTM Ì The new system from Nintendo is also scheduled to debut this fall with an extremely
innovative controller and an appealing retail price point. EA has several games in development for
this console including Madden NFL, Need for SpeedTM, Harry PotterTM and The SimsTM.
New Platforms: Mobile and Handheld
Perhaps the biggest event of the past year was our acquisition of JAMDAT MobileTM. We now have
relationships with over 90 wireless carriers in more than 40 countries with a dedicated team delivering
some of the world's most popular mobile games. With this acquisition, EA Mobile has the leading
segment share in North America and is well-positioned internationally.
It is diÇcult to overstate the potential of games played on wireless phones. Today there are roughly
1.5 billion handsets in the world, less than 40 percent of which are game-enabled. While not everyone may
be able to aÅord a new hardware console, many own a cell phone which can be used to play games. EA
Mobile has an aggressive plan to bring our most popular franchises to the mobile platform, grow the
business in North America and expand our presence in Europe and Asia.
Our success in mobile gaming extends beyond phones. We achieved our goal of making EA number one
on the PSP» (PlayStation»Portable) handheld system in both North America and Europe, and have
brought some of our most popular franchises to the Nintendo DSTM system. In the years ahead we plan to
extend our leadership in this rapidly growing segment.
Everything Online
The biggest change in our business today is the way mainstream consumers are using the Internet to
purchase and play videogames. Whether the games are played on consoles, PCs or handhelds, a rapidly
growing percentage are connected.
Consumers are showing an aÇnity for downloading content to both PCs and consoles, paying for premium
content and accepting dynamic in-game advertising. In addition to bringing added value to the consumer,
these elements deliver more revenue and proÑt to our business.
Digital Downloads Ì Retail stores where consumers buy packaged games will always be fundamental to
our industry; however, the wide-spread acceptance of digital downloads foreshadows an exciting future for
buying games online. With the launch of our Xbox 360 titles, EA oÅered seven free demos Ì EASPORTSTM Fight Night Round 3 was downloaded more than 400,000 times and became the most popular
demo on Xbox LiveTM. For the PC we oÅered additional content for BattleÑeld 2 and The Sims 2 retailingat price points between $9.99-$29.99 and quickly sold more than 200,000 downloads. This year, most of
our PC games will be oÅered for sale digitally in addition to being available at retail. While the initial
numbers are small, these early experiments are encouraging. Exploiting this opportunity should help us
generate incremental revenue and improve operating margins.
Micro-transactions Ì EA is also investing in the means to deliver premium items that consumers can use
to enhance their games. We started with some of our PC oÅerings Ì Ultima OnlineTM and Club PogoTM Ì
and plan to expand this to our multi-million-selling console franchises. Players will be able to download
new uniforms for their athletes, customized parts for their cars and strategy guides to improve their skills.
Providing downloadable content at an easily aÅordable price will improve the game experience and create
new revenue streams for many of our most popular games.
Dynamic In-Game Advertising Ì In recent years, EA games have included a small number of static
ads Ì quick product messages that would not intrude on the player's entertainment experience. We intend
to continue that discipline as the industry experiments with new technology that will allow advertisers to
stream ads into online games. A roadside billboard in Need For Speed could display soft drinks on one day
and a fast food restaurant the next. While this technology is at an early stage, dynamic in-game advertising
is an exciting proposition.
Subscriptions Ì Quick and easy to play, EA's casual game site Club Pogo is building an impressive
audience. More than 1.2 million players pay a fee to play games and participate in the PogoTM community.
Interestingly, more than half of those subscribers are women over the age of 35. In the year ahead we plan
to launch Pogo in China and Europe.
New Markets Ì While EA is known primarily for its portfolio of great games, we are unrivaled in our
ability to market, sell and distribute our titles to consumers all over the world. Creating new online games
and cultivating new customers is an important part of our growth strategy. By the end of Ñscal 2007, EA
will have more than 300 people dedicated to production, marketing and sales in emerging markets like
China, India and Eastern Europe.
In late May, an online version of FIFA Soccer was launched in Korea in partnership with a local
publisher, Neowiz. EA SPORTSTM FIFA Online reached 100,000 peak concurrent users (PCUs) in the
Ñrst month of open beta Ì setting a new record for PCUs during an introductory period in the world's
largest online game market. While still early, we are extremely happy with the initial results of our online
games business in Korea. We plan to commercialize this service in July 2006 with the introduction of
micro-transactions.
PC Resurgence Ì Tied closely to the boom in online gaming is a recent creative and commercial
renaissance for PC games. By an order of magnitude, we are the world's number one publisher of games
for the PC. In Ñscal 2006, we had four of the top ten titles in North America and we estimate Ñve of the
top ten in Europe. Flagship franchises like The Sims, BattleÑeld and Command & ConquerTM have millions
of loyal players and new versions are being prepared to extend that success. We're also developing new PC
titles like SPORETM from The Sims mastermind Will Wright and CrysisTM from the Crytek Studio in
Germany. Just recently, we announced plans to acquire Mythic Entertainment, a critically-acclaimed
developer of massively multiplayer online (MMO) games Ì this acquisition will enhance our position in
the rapidly growing MMO category.
A Focus on Craftsmanship and ProÑtability
Chairm
an’s Letter
EA has four overarching priorities that are central to the way we make and sell games. We're training new
and existing talent; we're adopting more eÇcient processes for making games; we're focused on quality;
and we're seeking to improve proÑtability by reducing our reliance on licensed properties.
People Ì We have established robust programs for keeping our existing talent trained and for preparing
new talent. EA is now working directly with more than 75 colleges and universities Ì providing funding
and expertise Ì to develop curriculum that will train the next generation of video game developers.
Process Ì The backbone of our studio system is a library of shared tools and technologies. There is no
single solution Ì no game engine that Ñts every franchise Ì but our commitment to sharing learning
across our multiple development locations improves eÇciency and allows us to manage a much larger
portfolio of products than our competitors.
Quality Ì When you publish more than 30 titles per year, it's important to remember that our consumers
are intelligent, they judge you on every title, and they have very long memories when a popular franchise
disappoints them.
In some instances Ì such as when The GodfatherTM slipped out of the holiday quarter Ì we paid a heavy
price to ensure that we delivered a great game. Although it hurt our Ñnancial results in the short term, it
was the right decision for the long-term health of this important franchise. Shipping a high quality product
pays dividends in many ways and over many years Ì consumer loyalty, critical acclaim and most
importantly, enhanced morale among our employees who take an extraordinary amount of pride in their
work.
Wholly Owned Properties Ì A major shift in our portfolio strategy is to decrease our reliance on licensed
properties and increase the number of games that are based on ideas from people in our own studios.
Sports relationships such as our agreements with the NFL, NBA and FIFA, as well as movie titles like
Harry Potter and The Godfather will always be a part of EA's portfolio. However the cost of licenses
continues to escalate, which puts pressure on operating margins.
In an eÅort to improve both game quality and margins, we are striving to increase the percentage of our
revenue contributed by wholly owned properties from roughly forty percent today to at least Ñfty percent in
the next cycle.
To this goal, we've seen an explosion of creativity from our studios. Already in development is SPOREfrom Will Wright's team and an incredibly innovative project from our new Montreal studio, Army ofTwoTM. In addition, we'll see new iterations on powerful EA franchises such as The Sims, Need for Speed,Medal of HonorTM, BurnoutTM, SSXTM and Command & Conquer.
These and other new games to be announced in the months ahead will make an important statement about
EA's commitment to quality and innovation with a goal of improving our creative control and proÑt
margins.

In Position to Capture the Opportunity
In the past year we learned a great deal that will help us grow and manage our business in the future. We
learned that this transition is about much more than a console upgrade. We learned that consumer
behavior Ì the way they purchase and play games Ì is changing rapidly. We learned to challenge
traditional thinking while planning to exploit new revenue streams that will improve our margins.
Never in EA's 24-year history have we experienced a period of such dynamic change and opportunity. The
months ahead will be deÑned by complex challenges and enormous opportunities for growing our business
and creating entertainment for new platforms, new markets and new consumers.
The team at EA is focused on the future and conÑdent in our ability to drive long term revenue growth
and proÑtability.
Thank you for your ongoing conÑdence in our people, our products and our company.
Sincerely,
Lawrence F. Probst III
Chairman and Chief Executive OÇcer
This Letter to Stockholders, as well as the discussion under the headings ""Business'' and ""Management's Discussion and Analysis''
included in our Annual Report on Form 10-K for the year ended March 31, 2006, contain forward-looking statements about
circumstances that have not yet occurred and are subject to change. All statements, trend analysis and other information related to
industry prospects, our products, and trends in our Ñnancial performance, as well as other statements including such words as
""anticipate'', ""believe'', ""estimate'', ""expect'', ""intend'' (and the negative of any of these terms), ""future'' and statements in the
future tense are forward-looking statements. These forward-looking statements are subject to business and economic risks and
uncertainties that could cause actual events or actual future results to diÅer materially from the expectations set forth in the forward-
looking statements. Some of the factors which could cause our results to diÅer materially from our expectations include, but are not
limited to, those listed under the heading ""Risk Factors'' in our Annual Report on Form 10-K for the year ended March 31, 2006.
We undertake no obligation to update these forward-looking statements.
Proxy Statem
ent
ELECTRONIC ARTS INC.
Notice of 2006 Annual Meetingand Proxy Statement

(Intentionally Left Blank)

June 30, 2006
DEAR FELLOW STOCKHOLDERS:
You are cordially invited to join us at our 2006 Annual Meeting of Stockholders on July 27, 2006 at
2:00 p.m. The meeting will be held at the headquarters campus of Electronic Arts in Building 250 (please
note that the street address for Building 250 is 250 Shoreline Drive, Redwood City, California). At this
meeting, we are asking the stockholders to:
‚ Elect nine directors;
‚ Approve a program to permit eligible employees to voluntarily exchange signiÑcantly ""underwater''
stock options for a lesser number of shares of restricted stock or restricted stock units to be granted
under the 2000 Equity Incentive Plan;
‚ Approve amendments to the 2000 Equity Incentive Plan and the 2000 Employee Stock Purchase
Plan; and
‚ Ratify the appointment of KPMG LLP as our independent registered public accounting Ñrm for
Ñscal 2007.
Proxy Statem
ent
After the meeting, we will report on our performance in the last year and answer your questions.
Enclosed with this proxy statement are your proxy card and voting instructions and our 2006 annual report.
We encourage you to conserve natural resources, expedite the delivery of future communications, and
help us reduce our printing and mailing costs, by signing up for electronic delivery of our stockholder
communications. For more information, see Electronic Delivery of Our Stockholder Communications inthe attached proxy statement.
We know that it is not practical for most stockholders to attend the Annual Meeting in person. If you
would like to listen to the Annual Meeting via webcast, please visit our website at investor.ea.com.Whether or not you are able to attend in person, your vote is important. In addition to using the enclosed
proxy card to vote your shares, you may also vote your shares via the Internet or a toll-free telephone
number. Instructions for using these services are provided on your proxy card.
I look forward to seeing you at the meeting.
Sincerely,
LAWRENCE F. PROBST III
Chairman and Chief Executive OÇcer
WHETHER OR NOT YOU PLAN TO ATTEND THE ANNUAL MEETING, WE STRONGLY
ENCOURAGE YOU TO DESIGNATE THE PROXIES SHOWN ON THE ENCLOSED CARD SO
THAT YOUR SHARES WILL BE REPRESENTED AT THE ANNUAL MEETING.

(Intentionally Left Blank)
Notice of 2006 Annual Meeting of Stockholders
DATE: July 27, 2006
TIME: 2:00 p.m.
PLACE: ELECTRONIC ARTS HEADQUARTERS
Building 250*
209 Redwood Shores Parkway
Redwood City, CA 94065
* Please note: Building 250 is located on the headquarters campus at 250 Shoreline Drive
MATTERS TO BE VOTED UPON:
1. The election of nine directors to hold oÇce for a one-year term;
2. An exchange program in which eligible employees will be oÅered the opportunity to surrender
signiÑcantly ""underwater'' stock options in exchange for a lesser number of shares of restricted
stock or restricted stock units to be granted under the 2000 Equity Incentive Plan, provided that
Proposal 3 is also approved by the stockholders;
3. Amendments to the 2000 Equity Incentive Plan to (i) increase to 15 million shares the limit on
the total number of shares underlying awards of restricted stock and restricted stock units that may
be granted under the Equity Plan, and (ii) limit the number of shares subject to options
surrendered and cancelled in the Exchange Program that will be available for issuance under the
Equity Plan;
Proxy Statem
ent
4. An amendment to the 2000 Employee Stock Purchase Plan to increase by 1.5 million the number
of shares of common stock reserved for issuance under the Purchase Plan;
5. RatiÑcation of the appointment of KPMG LLP as our independent registered public accounting
Ñrm for Ñscal 2007; and
6. Any other matters that may properly come before the meeting.
OUR BOARD OF DIRECTORS RECOMMENDS YOU VOTE FOR EACH OF THE NOMINEES
AND FOR EACH PROPOSAL.
Stockholders of record at the close of business on June 6, 2006 are entitled to notice of the meeting and to
attend and vote at the meeting. A complete list of these stockholders will be available at Electronic Arts'
headquarters prior to the meeting.
By Order of the Board of Directors,
STEPHEN G. BEN πE
Senior Vice President, General Counseland Secretary

TABLE OF CONTENTS
Page
PROXY STATEMENT ÏÏÏÏÏÏÏÏÏÏÏÏÏÏÏÏÏÏÏÏÏÏÏÏÏÏÏÏÏÏÏÏÏÏÏÏÏÏÏÏÏÏÏÏÏÏÏÏÏÏÏÏÏÏÏÏÏÏÏÏÏÏÏÏ 1
HOW TO VOTE YOUR SHARES ÏÏÏÏÏÏÏÏÏÏÏÏÏÏÏÏÏÏÏÏÏÏÏÏÏÏÏÏÏÏÏÏÏÏÏÏÏÏÏÏÏÏÏÏÏÏÏÏÏÏÏÏÏÏ 1
ELECTRONIC DELIVERY OF OUR STOCKHOLDER COMMUNICATIONS ÏÏÏÏÏÏÏÏÏÏÏÏÏ 1
COMMONLY ASKED QUESTIONS AND ANSWERS ÏÏÏÏÏÏÏÏÏÏÏÏÏÏÏÏÏÏÏÏÏÏÏÏÏÏÏÏÏÏÏÏÏÏÏ 2
PROPOSAL 1 Ì ELECTION OF DIRECTORS ÏÏÏÏÏÏÏÏÏÏÏÏÏÏÏÏÏÏÏÏÏÏÏÏÏÏÏÏÏÏÏÏÏÏÏÏÏÏÏÏÏÏ 6
Required Vote and Board of Directors' Recommendation ÏÏÏÏÏÏÏÏÏÏÏÏÏÏÏÏÏÏÏÏÏÏÏÏÏÏÏÏÏÏÏÏÏÏÏ 6
Director Biographies ÏÏÏÏÏÏÏÏÏÏÏÏÏÏÏÏÏÏÏÏÏÏÏÏÏÏÏÏÏÏÏÏÏÏÏÏÏÏÏÏÏÏÏÏÏÏÏÏÏÏÏÏÏÏÏÏÏÏÏÏÏÏÏÏÏÏ 6
Board, Board Meetings, and CommitteesÏÏÏÏÏÏÏÏÏÏÏÏÏÏÏÏÏÏÏÏÏÏÏÏÏÏÏÏÏÏÏÏÏÏÏÏÏÏÏÏÏÏÏÏÏÏÏÏÏ 8
Audit Committee ÏÏÏÏÏÏÏÏÏÏÏÏÏÏÏÏÏÏÏÏÏÏÏÏÏÏÏÏÏÏÏÏÏÏÏÏÏÏÏÏÏÏÏÏÏÏÏÏÏÏÏÏÏÏÏÏÏÏÏÏÏÏÏÏÏÏÏÏ 9
Compensation Committee ÏÏÏÏÏÏÏÏÏÏÏÏÏÏÏÏÏÏÏÏÏÏÏÏÏÏÏÏÏÏÏÏÏÏÏÏÏÏÏÏÏÏÏÏÏÏÏÏÏÏÏÏÏÏÏÏÏÏÏÏÏ 9
Nominating and Governance Committee ÏÏÏÏÏÏÏÏÏÏÏÏÏÏÏÏÏÏÏÏÏÏÏÏÏÏÏÏÏÏÏÏÏÏÏÏÏÏÏÏÏÏÏÏÏÏÏÏÏ 9
Corporate Governance GuidelinesÏÏÏÏÏÏÏÏÏÏÏÏÏÏÏÏÏÏÏÏÏÏÏÏÏÏÏÏÏÏÏÏÏÏÏÏÏÏÏÏÏÏÏÏÏÏÏÏÏÏÏÏÏÏÏ 11
Global Code of Conduct ÏÏÏÏÏÏÏÏÏÏÏÏÏÏÏÏÏÏÏÏÏÏÏÏÏÏÏÏÏÏÏÏÏÏÏÏÏÏÏÏÏÏÏÏÏÏÏÏÏÏÏÏÏÏÏÏÏÏÏÏÏÏ 11
Director Attendance at Annual MeetingsÏÏÏÏÏÏÏÏÏÏÏÏÏÏÏÏÏÏÏÏÏÏÏÏÏÏÏÏÏÏÏÏÏÏÏÏÏÏÏÏÏÏÏÏÏÏÏÏÏ 11
Stockholder Communications with the Board of Directors ÏÏÏÏÏÏÏÏÏÏÏÏÏÏÏÏÏÏÏÏÏÏÏÏÏÏÏÏÏÏÏÏÏÏ 11
Director Compensation and Stock Ownership Guidelines ÏÏÏÏÏÏÏÏÏÏÏÏÏÏÏÏÏÏÏÏÏÏÏÏÏÏÏÏÏÏÏÏÏÏÏ 12
PROPOSAL 2 Ì APPROVAL OF THE EXCHANGE PROGRAMÏÏÏÏÏÏÏÏÏÏÏÏÏÏÏÏÏÏÏÏÏÏÏÏÏÏ 13
PROPOSAL 3 Ì AMENDMENTS TO THE 2000 EQUITY INCENTIVE PLAN ÏÏÏÏÏÏÏÏÏÏÏÏÏ 21
PROPOSAL 4 Ì AMENDMENT TO THE 2000 EMPLOYEE STOCK PURCHASE PLAN ÏÏÏ 23
PROPOSAL 5 Ì RATIFICATION OF THE APPOINTMENT OF KPMG LLP,INDEPENDENT REGISTERED PUBLIC ACCOUNTING FIRMÏÏÏÏÏÏÏÏÏÏÏÏÏÏÏÏÏÏÏÏÏÏÏÏ 24
OTHER BUSINESS ÏÏÏÏÏÏÏÏÏÏÏÏÏÏÏÏÏÏÏÏÏÏÏÏÏÏÏÏÏÏÏÏÏÏÏÏÏÏÏÏÏÏÏÏÏÏÏÏÏÏÏÏÏÏÏÏÏÏÏÏÏÏÏÏÏÏÏ 25
PRINCIPAL STOCKHOLDERS ÏÏÏÏÏÏÏÏÏÏÏÏÏÏÏÏÏÏÏÏÏÏÏÏÏÏÏÏÏÏÏÏÏÏÏÏÏÏÏÏÏÏÏÏÏÏÏÏÏÏÏÏÏÏÏÏ 26
STOCK PERFORMANCE GRAPH ÏÏÏÏÏÏÏÏÏÏÏÏÏÏÏÏÏÏÏÏÏÏÏÏÏÏÏÏÏÏÏÏÏÏÏÏÏÏÏÏÏÏÏÏÏÏÏÏÏÏÏÏÏ 27
SUMMARY COMPENSATION TABLEÏÏÏÏÏÏÏÏÏÏÏÏÏÏÏÏÏÏÏÏÏÏÏÏÏÏÏÏÏÏÏÏÏÏÏÏÏÏÏÏÏÏÏÏÏÏÏÏÏ 28
OPTIONS GRANTED IN FISCAL 2006ÏÏÏÏÏÏÏÏÏÏÏÏÏÏÏÏÏÏÏÏÏÏÏÏÏÏÏÏÏÏÏÏÏÏÏÏÏÏÏÏÏÏÏÏÏÏÏÏÏ 30
OPTIONS EXERCISED ÏÏÏÏÏÏÏÏÏÏÏÏÏÏÏÏÏÏÏÏÏÏÏÏÏÏÏÏÏÏÏÏÏÏÏÏÏÏÏÏÏÏÏÏÏÏÏÏÏÏÏÏÏÏÏÏÏÏÏÏÏÏÏ 31
EQUITY COMPENSATION PLAN INFORMATIONÏÏÏÏÏÏÏÏÏÏÏÏÏÏÏÏÏÏÏÏÏÏÏÏÏÏÏÏÏÏÏÏÏÏÏÏÏ 31
EMPLOYMENT AND CHANGE OF CONTROL AGREEMENTSÏÏÏÏÏÏÏÏÏÏÏÏÏÏÏÏÏÏÏÏÏÏÏÏÏ 33
COMPENSATION COMMITTEE REPORT ON EXECUTIVE COMPENSATION ÏÏÏÏÏÏÏÏÏÏ 34
REPORT OF THE AUDIT COMMITTEE OF THE BOARD OF DIRECTORS ÏÏÏÏÏÏÏÏÏÏÏÏÏÏ 39
CERTAIN TRANSACTIONS ÏÏÏÏÏÏÏÏÏÏÏÏÏÏÏÏÏÏÏÏÏÏÏÏÏÏÏÏÏÏÏÏÏÏÏÏÏÏÏÏÏÏÏÏÏÏÏÏÏÏÏÏÏÏÏÏÏÏ 41
COMPENSATION COMMITTEE INTERLOCKS AND INSIDER PARTICIPATION ÏÏÏÏÏÏÏ 41
SECTION 16(A) BENEFICIAL OWNERSHIP REPORTING COMPLIANCE ÏÏÏÏÏÏÏÏÏÏÏÏÏÏ 41
STOCKHOLDER PROPOSALS FOR 2007 ANNUAL MEETING ÏÏÏÏÏÏÏÏÏÏÏÏÏÏÏÏÏÏÏÏÏÏÏÏÏÏ 41
HOUSEHOLDING OF PROXY MATERIALS ÏÏÏÏÏÏÏÏÏÏÏÏÏÏÏÏÏÏÏÏÏÏÏÏÏÏÏÏÏÏÏÏÏÏÏÏÏÏÏÏÏÏÏ 42
OTHER BUSINESS ÏÏÏÏÏÏÏÏÏÏÏÏÏÏÏÏÏÏÏÏÏÏÏÏÏÏÏÏÏÏÏÏÏÏÏÏÏÏÏÏÏÏÏÏÏÏÏÏÏÏÏÏÏÏÏÏÏÏÏÏÏÏÏÏÏÏÏ 42
REQUESTS TO THE COMPANY ÏÏÏÏÏÏÏÏÏÏÏÏÏÏÏÏÏÏÏÏÏÏÏÏÏÏÏÏÏÏÏÏÏÏÏÏÏÏÏÏÏÏÏÏÏÏÏÏÏÏÏÏÏÏ 42
APPENDIX A Ì GENERAL DESCRIPTION OF THE 2000 EQUITY INCENTIVE PLANÏÏÏ A-1
APPENDIX B Ì GENERAL DESCRIPTION OF THE 2000 EMPLOYEE STOCKPURCHASE PLAN ÏÏÏÏÏÏÏÏÏÏÏÏÏÏÏÏÏÏÏÏÏÏÏÏÏÏÏÏÏÏÏÏÏÏÏÏÏÏÏÏÏÏÏÏÏÏÏÏÏÏÏÏÏÏÏÏÏÏÏÏÏÏÏÏÏ B-1
APPENDIX C Ì AUDIT COMMITTEE CHARTER ÏÏÏÏÏÏÏÏÏÏÏÏÏÏÏÏÏÏÏÏÏÏÏÏÏÏÏÏÏÏÏÏÏÏÏÏÏÏ C-1

PROXY STATEMENT
Our Board of Directors is soliciting proxies for the 2006 Annual Meeting of Stockholders. This proxy
statement contains important information for you to consider when deciding how to vote on the matters
brought before the meeting. Please read it carefully.
The Board has set June 6, 2006, as the record date for the meeting. Stockholders who owned common
stock on that date are entitled to notice of the meeting, and to attend and vote at the meeting, with each
share entitled to one vote. There were 306,158,333 shares of common stock outstanding on the record date.
Voting materials, which include the proxy statement, proxy card and our 2006 annual report, were Ñrst
mailed to stockholders on or about June 30, 2006.
In this proxy statement:
‚ ""EA'', ""we'' and ""the Company'' mean Electronic Arts Inc.
‚ ""2000 Equity Plan'' and ""Equity Plan'' mean EA's 2000 Equity Incentive Plan.
‚ ""2000 Purchase Plan'' and ""Purchase Plan'' mean EA's 2000 Employee Stock Purchase Plan.
‚ Holding shares in ""street name'' means your EA shares are held in an account at a bank, brokerage
Ñrm or other nominee.
‚ ""Common Stock'' means EA's common stock, as described in EA's current Amended and Restated
CertiÑcate of Incorporation.
‚ We use ""overhang'' to refer to the total number of shares subject to outstanding equity awards
(such as stock options and restricted stock units) as a percentage of our total shares of Common
Stock outstanding.
Proxy Statem
ent
‚ ""Fiscal 2007'', ""Ñscal 2006'', ""Ñscal 2005'', ""Ñscal 2004'' and ""Ñscal 2003'' refer to EA's Ñscal years
ending or ended (as the case may be) on March 31, 2007, 2006, 2005, 2004 and 2003, respectively.
‚ We use ""independent auditors'' to refer to an independent registered public accounting Ñrm.
‚ Unless otherwise noted, all share and per-share information has been adjusted to reÖect the
November 2003 two-for-one split of our common stock.
HOW TO VOTE YOUR SHARES
We are pleased to oÅer you three options for designating the proxies and indicating your voting
preferences:
(1) You may complete, sign, date and return by mail the enclosed proxy card;
(2) You may follow the instructions found on the proxy card and vote by telephone; or
(3) You may follow the instructions found on the proxy card and vote via the Internet.
If you choose to vote via telephone or the Internet, you will have a PIN number assigned to you on the
proxy card that you will use to safeguard your vote.
ELECTRONIC DELIVERY OF OUR STOCKHOLDER COMMUNICATIONS
If you are a beneÑcial holder or your shares are held in ""street name'' (your shares are held by a bank,
brokerage Ñrm, or other nominee) and you received your annual meeting materials by mail, we encourage
you to conserve natural resources, expedite the delivery of future communications, and help reduce our
printing and mailing costs, by signing up to receive future stockholder communications via e-mail. With
electronic delivery, you will be notiÑed via e-mail as soon as EA's next annual report and proxy statement
are available on the Internet, and you can easily submit your stockholder votes online. Electronic delivery
can also help reduce the number of bulky documents in your personal Ñles and eliminate duplicate
mailings. To sign up for electronic delivery, please visit www.icsdelivery.com/erts to enroll.
Your electronic delivery enrollment will be eÅective until you cancel it. If you have questions about
electronic delivery, please contact our Investor Relations department at 650-628-7352.

COMMONLY ASKED QUESTIONS AND ANSWERS
Why am I receiving this proxy statement and proxy card?
This proxy statement describes proposals on which you, as a stockholder, are being asked to vote. It also
gives you information on these proposals, as well as other information so that you can make an informed
decision. You are invited to attend the Annual Meeting to vote on the proposals, but you do not need to
attend in person in order to vote. You may, instead, follow the instructions below to vote by mail using the
enclosed proxy card, or to vote by telephone or over the Internet. By doing so, you are giving a proxy
appointing Lawrence F. Probst III (the Company's Chief Executive OÇcer) and Warren C. Jenson (the
Company's Chief Financial and Administrative OÇcer) to vote your shares at the meeting as you have
instructed. If a proposal comes up for vote at the meeting that is not on the proxy card, or if you do not
indicate an instruction, Mr. Probst and Mr. Jenson will vote your shares according to their best judgment.
Even if you currently plan to attend the meeting, it is a good idea to complete and return your proxy card,
or vote by telephone or on the Internet, before the meeting date just in case your plans change.
Who can vote at the Annual Meeting?
Stockholders who owned common stock on June 6, 2006 may attend and vote at the Annual Meeting.
Each share of common stock is entitled to one vote. There were 306,158,333 shares of common stock
outstanding on June 6, 2006.
What am I voting on?
We are asking you to:
‚ Elect nine directors;
‚ Approve a program to permit eligible employees to voluntarily exchange signiÑcantly ""underwater''
stock options for a lesser number of shares of restricted stock or restricted stock units to be granted
under the 2000 Equity Incentive Plan (the ""Exchange Program'');
‚ Approve amendments to the 2000 Equity Incentive Plan to (a) increase by 11 million shares the
limit on the total number of shares underlying awards of restricted stock and restricted stock units
that may be granted under the Equity Plan Ì from 4 million to 15 million shares, and (b) if the
Exchange Program is approved by stockholders, to limit the number of shares subject to options
surrendered and cancelled in the Exchange Program that will be available for issuance under the
Equity Plan to a total of 7 million plus the number of shares necessary for the issuance of the
restricted stock rights to be granted in connection with the Exchange Program;
‚ Approve an amendment to the 2000 Employee Stock Purchase Plan to increase by 1.5 million the
number of shares of common stock reserved for issuance under the Purchase Plan; and
‚ Ratify the appointment of KPMG LLP as our independent auditors for Ñscal 2007.
How do I vote?
You may vote by mail.
Complete, date, sign and mail the enclosed proxy card in the postage pre-paid envelope provided. If
you mark your voting instructions on the proxy card, your shares will be voted as you instruct.
If you do not mark your voting instructions on the proxy card, your shares will be voted:
‚ for the election of the nine nominees for director;
‚ for approval of the Exchange Program;
‚ for the proposed amendments to the 2000 Equity Incentive Plan;
‚ for the proposed amendment to the 2000 Employee Stock Purchase Plan; and
‚ for ratiÑcation of the appointment of KPMG LLP as our independent auditors for Ñscal 2007.
2

You may vote by telephone.
You may do this by following the ""Vote by Telephone'' instructions on your proxy card. If you vote
by telephone, you do not have to mail in your proxy card.
You may vote on the Internet.
You may do this by following the ""Vote by Internet'' instructions on your proxy card. If you vote by
Internet, you do not have to mail in your proxy card. The law of Delaware, where we are
incorporated, allows a proxy to be sent electronically, so long as it includes or is accompanied by
information that lets the inspector of elections determine it has been authorized by the stockholder.
You may vote in person at the meeting.
You may complete the ballot we will pass out to any stockholder who wants to vote at the meeting.
However, if you hold your shares in street name, you must obtain a proxy from the institution that
holds your shares in order to vote at the meeting.
What does it mean if I receive more than one proxy card?
It means that you have multiple accounts at the transfer agent or with stockbrokers. Please complete and
return all proxy cards, or follow the instructions on each to vote by telephone or over the Internet, to
ensure that all your shares are voted.
What if I change my mind after I give my proxy?
You may revoke your proxy and change your vote at any time before the polls close at the meeting. You
may do this by:
Proxy Statem
ent
‚ Sending a signed statement to the Company that the proxy is revoked (you may send such a
statement to the Company's Secretary at our corporate headquarters address listed on the Notice of
Meeting);
‚ Signing another proxy with a later date;
‚ Voting by telephone or on the Internet at a later date (your latest vote is counted); or
‚ Voting in person at the meeting.
Your proxy will not be revoked if you attend the meeting but do not vote.
Who will count the votes?
An employee of Wells Fargo Shareowner Services will tabulate the votes and act as the inspector of
election.
How many shares must be present to hold the meeting?
To hold the meeting and conduct business, a majority of EA's outstanding voting shares as of June 6, 2006
must be present or represented by proxies at the meeting. On this date a total of 306,158,333 shares of
common stock were outstanding and entitled to vote. Shares representing a majority, or 153,079,167 of
these votes must be present. This is called a quorum.
Shares are counted as present at the meeting if:
‚ They are voted in person at the meeting, or
‚ The stockholder has properly submitted a proxy card or voted via telephone or the Internet.
Will my shares be voted if I do not sign and return my proxy card?
If your shares are registered in your name, they will not be voted unless you submit your proxy card, vote
by telephone or on the Internet or vote in person at the meeting.
3

How will my shares be voted if they are held in ""street name''?
If your shares are held in ""street name'', you should have received voting instructions with these materials
from your broker or other nominee. We urge you to instruct your broker or other nominee how to vote
your shares by following those instructions. If you do not give your broker or nominee instructions as to
how to vote your shares, they may be voted only on matters for which the broker or nominee has
discretionary authority under applicable rules. These ""broker non-votes'' will be counted for purposes of
determining whether a quorum is present but will not be counted for any purpose with respect to
Proposals 2, 3 and 4.
How are votes counted?
In the election of directors, you may vote either ""for'' each nominee or withhold your vote. You may vote
""for'', ""against'' or ""abstain'' on each of the other proposals. Abstentions, although counted for purposes of
determining whether a quorum is present, will not be counted for any other purpose with respect to
Proposals 2, 3, 4 and 5.
If you sign and return your proxy without voting instructions, your shares will be counted as a ""for'' vote
in favor of each nominee and in favor of each of the other proposals.
How many votes must the nominees have to be elected as Directors?
The nine nominees receiving the highest number of ""for'' votes will be elected as directors. This number is
called a plurality.
What happens if one or more of the nominees is unable to stand for election?
The Board may reduce the number of directors or select a substitute nominee. In the latter case, if you
have completed and returned your proxy card, Lawrence F. Probst III and Warren C. Jenson shall have
the discretion to vote your shares for a substitute nominee. They cannot vote for more than nine nominees.
How many votes are required to pass the Exchange Program, the amendments to the 2000 Equity Plan and2000 Purchase Plan, and to ratify the Company's selection of independent auditors?
The Exchange Program, Equity Plan and Purchase Plan amendments and the ratiÑcation of independent
auditors must receive a ""for'' vote of a majority of the voting shares present at the meeting in person or by
proxy and voting on these proposals.
Where do I Ñnd the voting results of the meeting?
We will announce preliminary voting results at the meeting. We will also publish the Ñnal results in a
quarterly report on Form 10-Q, which we will Ñle with the Securities and Exchange Commission. Once
Ñled, you can request a copy of the Form 10-Q by contacting our Investor Relations department at
(650) 628-7352 or the SEC at (800) SEC-0330 for the location of its nearest public reference room. You
can also get a copy on the Internet at http://investor.ea.com or through the SEC's electronic data system
called EDGAR at www.sec.gov.
Why are you proposing the Exchange Program?
We are proposing the Exchange Program to:
‚ oÅer a meaningful retention incentive for employees who currently hold stock options with exercise
prices signiÑcantly higher than the current market prices of our Common Stock to remain with the
Company;
‚ to reduce our ""overhang'' of outstanding equity awards; and
‚ to further align our outstanding equity compensation with our philosophy of using a mix of stock
options and other equity-based incentives.
For more information regarding the Exchange Program, please see Proposal 2. Approval of the ExchangeProgram below.
4

Why are you amending the Equity Plan?
We are amending the Equity Plan to increase by 11 million shares the limit on the total number of shares
underlying awards of restricted stock and restricted stock units Ì from 4 million to 15 million shares. If
the proposed increase is not approved, we will have an insuÇcient number of shares available to issue
restricted stock rights in connection with, and therefore will be unable to implement, the Exchange
Program.
We are also proposing to amend the Equity Plan to limit the number of shares subject to options
surrendered and cancelled in the Exchange Program that will be available for issuance under the Equity
Plan to a total of 7 million plus the number of shares necessary for the issuance of the restricted stock
rights to be granted in connection with the Exchange Program.
For more information regarding the proposed amendments to the Equity Plan, please see Proposal 3.Amendments to the 2000 Equity Incentive Plan below.
Why are you amending the Purchase Plan?
We are amending the Purchase Plan to increase the number of shares available for issuance by an
additional 1.5 million shares. The Purchase Plan enables our employees to purchase our common stock
through payroll deductions and provides continuing opportunities for our employees to become
stockholders. It also provides an incentive for continued employment. Since the adoption of the Purchase
Plan, we have experienced both signiÑcant growth in the number of employees, as well as an increase in
the percentage of employees, who elect to participate in the Purchase Plan. We estimate that the proposed
increase of shares available for issuance under the Purchase Plan will permit all current and potential
Proxy Statem
ent
future employees to fully participate in the Purchase Plan through at least the end of Ñscal 2007, our
current Ñscal year.
For more information regarding the proposed amendment to the Purchase Plan, please see Proposal 4.Amendment to the 2000 Employee Stock Purchase Plan below.
Who will pay for this proxy solicitation?
We have retained Georgeson & Company Inc. to solicit proxies from stockholders at an estimated fee of
$7,500 plus expenses and we will pay these costs. This fee does not include costs of preparing, assembling,
printing, mailing and distributing the proxy statements and annual reports, all of which we will pay. If you
choose to access the proxy materials and/or vote over the Internet, you are responsible for Internet access
charges you may incur. If you choose to vote by telephone, you are responsible for telephone charges you
may incur. In addition, some of our oÇcers, directors, employees and other agents may also solicit proxies
personally, by telephone and by electronic and regular mail, and we will pay these costs as well. EA will
also reimburse brokerage houses and other custodians for their reasonable out-of-pocket expenses for
forwarding proxy and solicitation materials to the beneÑcial owners of common stock.
Whom can I call with any questions about my shares?
You may contact your broker. If you don't own your shares through a broker but are a shareholder of
record, you may also call our transfer agent, Wells Fargo Shareowner Services, at 1-800-468-9716 or visit
their web site at www.wellsfargo.com/shareownerservices.
5

PROPOSALS TO BE VOTED ON
PROPOSAL 1. ELECTION OF DIRECTORS
At the Annual Meeting, stockholders will elect nine directors to hold oÇce for a one-year term until the
next Annual Meeting (or until their respective successors are elected and qualiÑed). All nominees have
consented to serve a one-year term, if elected.
The Board has nominated the following directors to stand for re-election this year:
‚ M. Richard Asher
‚ Leonard S. Coleman
‚ Gary M. Kusin
‚ Gregory B. MaÅei
‚ Timothy Mott
‚ Vivek Paul
‚ Lawrence F. Probst III
‚ Linda J. Srere
In addition, the Board has nominated the following candidate to stand for election:
‚ Richard A. Simonson
Mr. Simonson was referred to our Nominating and Governance Committee as a potential candidate for
director by an external, independent recruiting Ñrm. If elected, Mr. Simonson will Ñll the seat being
vacated by Robert W. Pittman, a current director who will not be standing for re-election at the Annual
Meeting.
Required Vote and Board of Directors' Recommendation
The nine nominees receiving the highest number of ""for'' votes will be elected as directors. Shares
represented by your proxy will be voted for the election of the nine nominees recommended by EA's
management unless you mark your proxy to ""withhold authority'' to so vote.
The Board recommends a vote FOR each of the nominees.
Director Biographies
Each of the following directors and Mr. Simonson have been nominated for election or re-election at the
2006 Annual Meeting.
M. Richard Asher
Director since 1984Mr. Asher, age 74, is presently an attorney, a consultant, and an aÇliate professor with Florida Atlantic
University. He was a senior executive oÇcer and CEO in the music and record business with CBS,
Warner Brothers and PolyGram Records for over 25 years. Mr. Asher is a director of several private
companies and previously served as a director for a number of public companies.
6

Leonard S. Coleman
Director since 2001Mr. Coleman, age 57, served as Senior Advisor to Major League Baseball from 1999 until 2005 and, from
2001 to 2002, was the Chairman of ARENACO, a subsidiary of Yankees/Nets. Mr. Coleman was
President of The National League of Professional Baseball Clubs from 1994 to 1999, having previously
served since 1992 as Executive Director, Market Development of Major League Baseball. Mr. Coleman
serves on the Board of Directors of the following public companies: Cendant Corporation; Omnicom
Group Inc.; H.J. Heinz Company; Churchill Downs Inc.; and Aramark Corporation.
Gary M. Kusin
Director since 1995Mr. Kusin, age 55, has been a Special Advisor to the Texas PaciÑc Group since June 2006. He served as
the President and Chief Executive OÇcer of Fedex Kinko's OÇce and Print Services, an operating
division of Fedex, Inc. from August 2001 until February 2006. Fedex Kinko's is a leading provider of
document solutions and business services. From September 1998 to July 2001, he was the Chief Executive
OÇcer of HQ Global Workplaces, Inc., a global leader in oÇce outsourcing. In April 2002, HQ Global
Ñled a petition for reorganization under Chapter 11 of the U.S. Bankruptcy Code and subsequently
emerged from bankruptcy in October 2003. Prior to September 1998, Mr. Kusin was co-founder and
Chairman of Kusin Gurwitch Cosmetics, LLC and co-founder and President of Babbages, Inc.
Gregory B. MaÅei
Director since 2003Mr. MaÅei, age 46, has served as President and Chief Executive OÇcer of Liberty Media Corporation,
which owns electronic retailing, media, communications and entertainment businesses and investments,
Proxy Statem
ent
since February 2006. He joined Liberty Media in November 2005 as CEO-Elect. From June 2005 until
November 2005, Mr. MaÅei served as President and Chief Financial OÇcer of Oracle Corporation. From
2000 until June 2005, Mr. MaÅei served as Chief Executive OÇcer of 360networks Corporation, a
broadband telecom service provider, and also became Chairman of the Board of 360networks in 2002.
Previously, Mr. MaÅei was with Microsoft Corporation from 1993 to 2000, in several positions, including
Senior Vice President, Finance and Administration and Chief Financial OÇcer. Mr. MaÅei also served as
Chairman of Expedia, Inc. from 1999 to 2002. Mr. MaÅei serves on the Board of Directors of Liberty
Media.
Timothy Mott
Director since 1990Mr. Mott, age 57, has been Chairman of All Covered, a nationwide information technology outsourcing
company focused on small and mid-size businesses, since June 2000 and was Chief Executive OÇcer from
November 2001 to February 2004. At various times prior to 1999, Mr. Mott co-founded and was
Chairman of Audible Inc., co-founded and was Chief Executive OÇcer and Chairman of Macromedia
Inc., co-founded and was Senior Vice President of Electronic Arts, and was a member of the research staÅ
at Xerox PARC. Other than in his role as a director of EA, Mr. Mott has had no operating involvement
with EA since he ceased serving as an executive oÇcer in 1990.
Vivek Paul
Director since 2005Mr. Paul, age 47, has been a partner with the Texas PaciÑc Group since October 2005. From July 1999 to
September 2005, Mr. Paul served as Vice Chairman of the Board of Directors of Wipro, Ltd., a provider
of integrated business, technology and process solutions, and Chief Executive OÇcer of Wipro
Technologies, Wipro's global information technology, product engineering, and business process services
segments. From January 1996 to July 1999, Mr. Paul was General Manager of Global CT Business at
General Electric, Medical Systems Division. From March 1993 to December 1995, he served as President
and Chief Executive OÇcer of Wipro GE Medical Systems Limited. Mr. Paul holds a Bachelor of
Engineering from the Birla Institute of Technology and Science, and an M.B.A. from the University of
Massachusetts, Amherst.
7
Lawrence F. Probst III
Director since 1991Mr. Probst, age 56, has been employed by EA since 1984. He has served as Chairman of the Board since
July 1994, and Chief Executive OÇcer since May 1991. Previously Mr. Probst served as President from
1991 until 1998 and Senior Vice President of EA Distribution from 1987 to 1991. Mr. Probst holds a
B.S. degree from the University of Delaware.
Richard A. Simonson
Candidate for DirectorMr. Simonson, age 47, has served as Executive Vice President and Chief Financial OÇcer of Nokia
Corporation, a manufacturer of mobile devices and a leader in mobile network equipment, solutions and
services since 2004. From 2001 until 2003, Mr. Simonson served as Vice President & Head of Customer
Finance of Nokia. In 2001, Mr. Simonson was Managing Director of the Telecom & Media Investment
Banking Group of Barclays Capital. Prior to joining Barclays Capital, Mr. Simonson spent 16 years at
Bank of America Securities where he held various positions, including Managing Director & Head of
Global Project Finance, Global Corporate & Investment Bank, San Francisco and Chicago. Mr. Simonson
holds a B.S. degree from the Colorado School of Mines and an M.B.A. from Wharton School of Business
at the University of Pennsylvania.
Linda J. Srere
Director since 2001Ms. Srere, age 50, is currently a marketing and advertising consultant. Previously, Ms. Srere was President
of Young & Rubicam Advertising. Since 1994, Ms. Srere held many positions with Young & Rubicam
Inc. (""Y&R''), including Vice Chairman and Chief Client OÇcer, Executive Vice President and Director
of Business Development, Group Managing Director, and in 1997, was named Chief Executive OÇcer of
Y&R's New York oÇce, becoming the Ñrst female CEO in the company's 75-year history. Ms. Srere also
serves on the Board of Directors of aQuantive, Inc., a digital marketing services and technology company,
and Universal Technical Institute, Inc., a technical education provider.
BOARD, BOARD MEETINGS, AND COMMITTEES
Our Board of Directors consists of nine directors. The Board has determined that Mr. Simonson and all of
our current directors, other than Mr. Probst, are ""independent'' as that term is used in the NASDAQ
Marketplace Rules.
The Board meets on a Ñxed schedule four times each year and also occasionally holds special meetings
and acts by written consent. At each regularly scheduled meeting, the independent members of the Board
meet in executive session separately without management present. A Lead Director, elected by the
independent directors and serving a two-year term, is responsible for chairing executive sessions of the
Board and other meetings of the Board in the absence of the Chairman of the Board, serving as a liaison
between the Chairman of the Board and the other independent directors, and overseeing the Board's
stockholder communication policies and procedures (including, under appropriate circumstances, meeting
with stockholders). Our Lead Director may also call meetings of the independent directors. The term of
our current Lead Director, Linda Srere, is set to expire at the 2006 Annual Meeting of Stockholders. The
independent directors of the Board have elected Gary Kusin to replace Ms. Srere as Lead Director for a
two-year term beginning with our 2006 Annual Meeting of Stockholders.
The Board currently has three committees, each of which operates under a charter approved by the Board:
the Audit Committee; the Compensation Committee; and the Nominating and Governance Committee.
The Board of Directors amended and restated the Audit Committee's charter in May 2006, amended the
Compensation Committee's charter in July 2005, and adopted the Nominating and Governance
Committee's charter in May 2003. A copy of the Audit Committee Charter may be found in Appendix C
to this proxy statement. In addition, copies of the charters of each Committee may be found in the
Investor Relations portion of our website at http://investor.ea.com. In accordance with the charters for
each, and with current regulatory requirements, all members of these Committees are independent
8

directors. During Ñscal 2006, each director participated in at least 75% of all Board meetings and
Committee meetings held during the period for which he or she was a member.
As of June 1, 2006, the Committee members were as follows:
Audit Gregory B. MaÅei (Chair), Gary M. Kusin and M. Richard Asher
Compensation M. Richard Asher (Chair), Robert W. Pittman, and Linda J. Srere
Nominating and Governance Linda J. Srere (Chair), Timothy Mott and Leonard S. Coleman
The Board is expected to review and, where appropriate, change Committee assignments at its regularly-
scheduled meeting in July 2006.
Audit Committee
The Audit Committee assists the Board in its oversight of the Company's Ñnancial reporting and other
matters, and is directly responsible for the appointment, compensation and oversight of our independent
auditors. The Audit Committee is comprised of three directors, each of whom in the opinion of the Board
of Directors meets the independence requirements and the Ñnancial literacy standards of the NASDAQ
Marketplace Rules, as well as the independence requirements of the SEC. In the opinion of the Board of
Directors, Mr. MaÅei meets the criteria for an ""audit committee Ñnancial expert'' as set forth in applicable
SEC rules. The Audit Committee met ten times in Ñscal 2006. For further information about the Audit
Committee, please see the Report of the Audit Committee below.
Compensation Committee
Proxy Statem
ent
The Compensation Committee is responsible for setting the overall compensation strategy for the
Company, for determining the compensation of the CEO and other executive oÇcers and for overseeing
the Company's equity incentive plans and other beneÑt plans. In addition, the Compensation Committee is
responsible for reviewing and recommending to the Board compensation for non-employee directors. The
Compensation Committee is comprised of three directors, each of whom in the opinion of the Board of
Directors meets the independence requirements of the NASDAQ Marketplace Rules and qualiÑes as an
""outside director'' within the meaning of Section 162(m) of the Internal Revenue Code, as amended. The
Compensation Committee met six times in Ñscal 2006 and also acted frequently by written consent. For
further information about the Compensation Committee, please see the Report of the CompensationCommittee below.
Nominating and Governance Committee
The Nominating and Governance Committee is responsible for recommending to the Board nominees for
election to the Board of Directors, for appointing directors to Board Committees, and for reviewing
developments in corporate governance, reviewing and ensuring the quality of the Company's succession
plans, recommending formal governance standards to the Board, and establishing the Board's criteria for
selecting nominees for director and for reviewing from time to time the appropriate skills, characteristics
and experience required of the Board as a whole, as well as its individual members. The Nominating and
Governance Committee is comprised of three directors, each of whom in the opinion of the Board of
Directors meets the independence requirements of the NASDAQ Marketplace Rules. The Nominating
and Governance Committee met four times in Ñscal 2006.
In evaluating nominees for director to recommend to the Board, the Nominating and Governance
Committee will take into account many factors within the context of the characteristics and needs of the
Board as a whole. While the speciÑc needs of the Board may change from time to time, all nominees for
director are considered on the basis of the following minimum qualiÑcations:
‚ the highest level of personal and professional ethics and integrity, including a commitment to EA's
ACTION values (as set forth in EA's Global Code of Conduct);
9
‚ practical wisdom and mature judgment;
‚ broad training and signiÑcant leadership experience in business, entertainment, technology, Ñnance,
corporate governance, public interest or other disciplines relevant to the long-term success of EA;
‚ the ability to gain an in-depth understanding of EA's business; and
‚ a willingness to represent the best interests of all EA stockholders and objectively appraise
management's performance.
In determining whether to recommend a director for re-election, the Nominating and Governance
Committee will also consider the director's tenure on the Board, past attendance at meetings, participation
in and contributions to the activities of the Board, the Director's continued independence (including any
actual, potential or perceived conÖicts of interest), as well as the director's age and changes in his or her
principal occupation or professional status.
The Nominating and Governance Committee believes that the continuing service of qualiÑed incumbent
directors promotes stability and continuity on the Board of Directors, contributing to the Board's ability to
work eÅectively as a collective body, while providing EA with the beneÑts of familiarity and insight into
EA's aÅairs that its directors have developed over the course of their service. Accordingly, consistent with
past EA practice, the Nominating and Governance Committee will Ñrst consider recommending incumbent
directors who wish to continue to serve on the Board for re-election at EA's annual meeting of
stockholders.
In situations where the Nominating and Governance Committee determines not to recommend an
incumbent director for re-election, an incumbent director declines to stand for re-election, or a vacancy
arises on the Board for any reason (including the resignation, retirement, removal, death or disability of an
incumbent director or a decision of the directors to expand the size of the Board), the Committee will
commence a search for new director nominees. The Nominating and Governance Committee may, in its
discretion, use a variety of means to identify and evaluate potential nominees for director. The Nominating
and Governance Committee has used, and may continue to use, qualiÑed search Ñrms and may also work
with members of EA's Human Resources department to identify potential nominees meeting the Board's
general membership criteria discussed above. The Nominating and Governance Committee may also
consider potential nominees identiÑed by other sources, including current directors, senior management and
stockholders. In determining whether to recommend a candidate to the Board of Directors, the
Nominating and Governance Committee will consider the current composition and capabilities of current
directors, as well as any additional qualities or capabilities considered necessary or desirable in light of the
existing or anticipated needs of the Board.
The Nominating and Governance Committee will evaluate candidates proposed by stockholders under
criteria similar to the evaluation of other candidates, except that it may also consider as one of the factors
in its evaluation, the amount of EA voting stock held by the stockholder and the length of time the
stockholder has held such stock. Stockholders wishing to submit candidates for consideration by the
Nominating and Governance Committee may do so by writing to EA's Corporate Secretary at
209 Redwood Shores Parkway, Redwood City, CA 94065, Attn: Director Nominations. To be considered
by the Nominating and Governance Committee in connection with EA's annual meeting of stockholders,
recommendations must be submitted in writing to EA not less than 120 calendar days prior to the
anniversary of the date on which EA's proxy statement was released to stockholders in connection with the
previous year's annual meeting (on or about March 2, 2007 for our 2007 Annual Meeting of
Stockholders). Recommendations should include: (1) the stockholder's name, address and telephone
number; (2) the amount and nature of record and/or beneÑcial ownership of EA securities held by the
stockholder; (3) the name, age, business address, educational background, current principal occupation or
employment, and principal occupation or employment for the preceding Ñve full Ñscal years of the
proposed candidate; (4) a description of the qualiÑcations and background of the proposed candidate that
addresses the minimum qualiÑcations and other criteria for Board membership approved by the Board
from time to time and set forth in EA's Corporate Governance Guidelines; (5) the amount and nature of
10
record and/or beneÑcial ownership of EA securities held by the proposed candidate, if any; (6) a
description of all arrangements or understandings between the stockholder and the proposed candidate
relating to the proposed candidate's candidacy; (7) a statement as to whether the proposed candidate
would be considered an independent director under applicable NASDAQ Marketplace Rules; (8) the
consent of the proposed candidate (a) to be named in the proxy statement relating to EA's annual
meeting of stockholders, and (b) to serve as a director if elected at such annual meeting; and (9) any
other information regarding the proposed candidate that may be required to be included in a proxy
statement by applicable SEC rules. The Nominating and Governance Committee may request any
additional information reasonably necessary to assist it in assessing a proposed candidate.
Corporate Governance Guidelines
Our Board of Directors has adopted, upon the recommendation of the Nominating and Governance
Committee, a formal set of Corporate Governance Guidelines. A complete copy of the Corporate
Governance Guidelines are available in the Investor Relations portion of our website at
http://investor.ea.com. Our Corporate Governance Guidelines contain policies relating to:
‚ Board membership and independence criteria;
‚ Director resignations;
‚ Executive sessions of independent directors led by a Lead Director;
‚ Authority to hire outside advisors;
‚ Director orientation and education;
Proxy Statem
ent
‚ Board and Committee self-evaluations;
‚ Attendance at annual meetings of stockholders;
‚ Stock ownership guidelines for our directors and executive oÇcers;
‚ Stockholder communications with the Board; and
‚ Access to management, CEO evaluation and management succession planning.
Global Code of Conduct
Our Global Code of Conduct (which includes code of ethics provisions applicable to our directors,
principal executive oÇcer, principal Ñnancial oÇcer, principal accounting oÇcer, and other senior Ñnancial
oÇcers) is available in the Investor Relations section of our website at http://investor.ea.com. We will
post amendments to our Global Code of Conduct in the Investor Relations section of our website. Copies
of our charters and Global Code of Conduct are available without charge by contacting our Investor
Relations department at (650) 628-7352.
Director Attendance at Annual Meetings
Our directors are expected to make every eÅort to attend our annual meeting of stockholders. Eight of our
nine current directors attended our 2005 Annual Meeting of Stockholders.
Stockholder Communications with the Board of Directors
EA stockholders may communicate with the Board as a whole, with a committee of the Board, or with an
individual director by sending a letter to EA's Corporate Secretary at Electronic Arts Inc., 209 Redwood
Shores Parkway, Redwood City, CA 94065, or by sending an email to StockholderCommunica-
[email protected]. All stockholder communications received will be handled in accordance with procedures
approved by the independent directors serving on the Board. For further information regarding the
submission of stockholder communications, please visit the Investor Relations portion of our website at
http://investor.ea.com.
11

DIRECTOR COMPENSATION AND STOCK OWNERSHIP GUIDELINES
Mr. Probst, the Company's Chief Executive OÇcer, is not paid additional compensation for his services as
a director. During Ñscal 2006, our non-employee directors received the following compensation:
Cash Compensation
‚ $35,000 annual retainer for service on the Board of Directors;
‚ $7,500 annual retainer for service on the Compensation or Nominating and Governance
Committees;
‚ $2,500 additional annual retainer for service as Chair of the Compensation or Nominating and
Governance Committees;
‚ $10,000 annual retainer for service on the Audit Committee; and
‚ $5,000 additional annual retainer for service as Chair of the Audit Committee.
In addition, individual directors were eligible to earn up to $1,000 per day, with the approval of the Board
of Directors, for special assignments, which may include providing advisory services to management in
such areas as sales, marketing, public relations and Ñnance (provided, however, no independent director is
eligible for a special assignment if the assignment or payment for the assignment would prevent the
director from being considered independent under applicable NASDAQ Marketplace or SEC rules). No
directors earned any compensation for special assignments during Ñscal 2006.
Stock Compensation
Upon their initial appointment or election to the Board, new directors receive an option grant to
purchase 25,000 shares issued under the 2000 Equity Incentive Plan. Each continuing director receives an
annual option grant to purchase 10,000 shares upon his or her re-election to the Board. In Ñscal 2006,
annual option grants to purchase 10,000 shares of common stock were made under the Equity Plan to each
of the non-employee directors who was re-elected at the 2005 Annual Meeting of Stockholders, other than
Mr. Paul. Because Mr. Paul had been appointed to the Board on June 15, 2005, the number of shares
subject to his annual grant option was pro-rated to 833 shares. All annual grant options were granted on
July 28, 2005, the date of the directors' re-election to the Board, at an exercise price of $58.45 per share.
Under the Equity Plan, non-employee directors may elect to receive all or part of their cash compensation
in the form of common stock. As an incentive for our non-employee directors to increase their stock
ownership in EA, non-employee directors making such an election receive shares of common stock valued
at 110% of the cash compensation they would have otherwise received.
The material terms regarding the exercise price of options, vesting, changes in capital structure,
assumption of options and acceleration of vesting and prohibitions on ""repricing'' under the Equity Plan
are contained in Appendix A to this proxy statement.
Stock Ownership Guidelines
Each non-employee director is required, within three years of becoming a director, to own shares of EA
common stock having a value of at least 3 years' annual retainer for service on the Board. As of June 1,
2006, each of our directors had either fulÑlled their ownership requirements or had not yet reached three
years of service.
12

PROPOSAL 2. APPROVAL OF THE EXCHANGE PROGRAM
On June 19, 2006, our Board of Directors authorized, subject to stockholder approval, a voluntary program
(the ""Exchange Program'') that, if implemented, will permit our eligible employees to exchange certain
outstanding stock options that are signiÑcantly ""underwater'' for a lesser number of shares of restricted
stock or restricted stock units to be granted under our 2000 Equity Incentive Plan, provided that the
proposed amendments to the Equity Plan are approved by the stockholders (see Proposal 3. Amendmentsto the 2000 Equity Incentive Plan). The Exchange Program will be open to all employees of the Company
and any of our subsidiaries designated for participation by the Compensation Committee of the Board of
Directors. However, members of the Board of Directors and our Named Executive OÇcers will not be
eligible to participate. Options eligible for the Exchange Program (""Eligible Options'') will be those
having exercise prices that are at least 115% of the average closing price of our Common Stock as
reported on the NASDAQ National Market for the Ñve business days preceding the date on which we
commence the program. As a prerequisite to the implementation of the Exchange Program, stockholders
must not only approve this proposal, but also approve the proposed amendment to the Equity Plan
described in Proposal 3 below.
Eligible employees who elect to participate in the Exchange Program may surrender one or more
outstanding grants of Eligible Options and receive in exchange awards for a lesser number of shares of
Common Stock. These awards may consist either of shares of restricted stock or restricted stock units,
subject to determination within the discretion of the Compensation Committee. In making this
determination, the Compensation Committee will take into account factors including tax and other laws
applicable to an exchange of options for such awards in each of the tax jurisdictions of our participating
employees. Restricted stock is an award of shares of Common Stock that remain subject to forfeiture upon
termination of employment until they have vested following a speciÑed period of employment. Restricted
Proxy Statem
ent
stock units are rights to receive shares of Common Stock on speciÑed future dates when those rights have
vested following a required period of employment. In this proposal, we refer to both shares of restricted
stock and restricted stock units as ""restricted stock rights.'' The weighted average ratio of shares subject to
Eligible Options cancelled to restricted stock rights issued will be approximately 3.3-to-1 and is expected
to range from 3-to-1 to 4-to-1, subject to adjustment as further described below. These exchange ratios
have been selected to result in the issuance of restricted stock rights that have a value, as of the closing
date of the Exchange Program (""Exchange Date''), that is equal to or less than the value, determined
using the Black-Scholes option valuation model, of the options to be cancelled in exchange for the
restricted stock rights. The restricted stock rights will be subject to vesting schedules ranging from a
minimum of two years to a maximum of four years measured from August 1, 2006, depending on the
extent to which the Eligible Options exchanged were vested (or, in the case of Eligible Options that cliÅ
vest in their entirety after a minimum of three years, if at least 50% or more of the time required to vest
has elapsed) prior to their cancellation.
Reasons for the Exchange Program
The Company has granted stock options periodically to a substantial portion of its employees and those of
its subsidiaries. The Company has also assumed stock options in connection with certain acquisitions,
including stock options granted by JAMDAT Mobile Inc., which was acquired by the Company in
February 2006. Each stock option award speciÑes the exercise price that the employee must pay to
purchase shares of Common Stock when the option is exercised. The exercise price per share is set at the
closing market price of a share of our Common Stock on the date the option is granted. Employees
receive value from their options only by exercising their rights under the options to purchase shares of
Common Stock and subsequently selling the purchased shares at a price that exceeds their purchase price.
Restore Retention Incentives. Like many companies, our stock price has experienced signiÑcant volatility
during the last several years. As a result, many of our employees hold options with exercise prices
signiÑcantly higher than the current market price of our Common Stock. On June 19, 2006, options to
purchase 18,463,724 shares held by our employees (other than our Named Executive OÇcers and non-
employee directors), representing approximately 60% of outstanding options, had exercise prices greater
13

than $41.21, the closing price of our Common Stock on that date, as reported on the NASDAQ National
Market. These underwater options had a weighted average exercise price of $55.89 and a weighted average
expected term of 6 years. On June 19, 2006, approximately 92% of our employees held at least some
options that were underwater, and for approximately 63% of our employees all of their options were
underwater. The exercise prices of options that were underwater on June 19, 2006, ranged from $41.49 to
$65.93 per share. These underwater options may not be suÇciently eÅective as performance and retention
incentives. We believe that to enhance long-term stockholder value we need to maintain competitive
employee compensation and incentive programs that will assist us to motivate and retain our employees.
By oÅering restricted stock rights, which are designed to deliver value without regard to an exercise price,
we believe the Exchange Program will oÅer a meaningful retention incentive for eligible employees to
remain with the Company.
Reduce Outstanding Overhang. Since many of the Eligible Options have been out of the money for an
extended period of time, employees have had little or no incentive to exercise them. As a result, the value
of our overhang (i.e., the total number of shares subject to outstanding equity awards as a percentage of
our total shares of Common Stock outstanding) has decreased as a potential retention incentive for our
employees. The Exchange Program will also serve to reduce our overhang, particularly that portion
consisting of stock options having the highest exercise prices with the least employee retention value.
Under the program, participating employees will receive signiÑcantly fewer restricted stock rights than the
number of shares subject to the options they surrender. Because participating employees will exchange a
greater number of options for a lesser number of restricted stock rights, there will be an immediate
reduction in our overhang. For example, assuming that the average closing market price of our Common
Stock for the Ñve business days preceding the commencement of the Exchange Program is $41.21, options
for a total of 15,989,086 shares having exercise prices greater than $47.39 (115% of $41.21) would be
eligible for participation. If all of these Eligible Options are surrendered for cancellation, we would issue
restricted stock rights for 4,829,496 shares, based on the exchange ratios described in the table set forth
under ""Exchange Ratios'' below, resulting in a net reduction in overhang from the Exchange Program of
11,159,590 shares or approximately 3.6% of the number of shares of our Common Stock issued and
outstanding as of June 19, 2006. In this example, assuming all Eligible Options were surrendered for
cancellation in the Exchange Program and not taking into account additional stock option grant and
exercise activity prior to completion of the Exchange Program, immediately following the conclusion of the
Exchange Program, we would have (i) options outstanding to purchase 23,664,173 shares, with a weighted
average exercise price of $26.88 and a weighted average remaining contractual term of 5.21 years, and
(ii) 5,453,430 restricted stock rights outstanding (as compared to 623,934 restricted stock rights
outstanding on June 19, 2006).
The actual reduction in our overhang that could result from the Exchange Program could diÅer materially
from the example in the preceding paragraph and is dependent on a number of factors, including the
exercise price at which outstanding options become eligible to participate in the Exchange Program and
the actual level of employee participation in the program. The reduction in overhang would also be
partially oÅset by the grant of additional awards under our Equity Plan, including the retention awards
described in ""Additional Retention Awards'' below. As of June 19, 2006, there were 17,258,478 shares
available for future issuance under the Equity Plan. In addition, consistent with the terms of the Equity
Plan, we intend to (i) use shares subject to the options cancelled for the issuance of the restricted stock
rights granted under the Exchange Program, and (ii) return up to a total of 7 million shares subject to the
options cancelled in the Exchange Program to the Equity Plan to be available for issuance pursuant to
future awards. While returning these shares to the Equity Plan will not have any immediate impact on our
outstanding overhang, their use for future equity awards would increase our outstanding overhang.
Align Equity Incentives with Current Compensation Philosophy. In designing the terms of the Exchange
Program and recommending its approval by the Board of Directors, the Compensation Committee took
into account its philosophy of shifting from the exclusive use of stock options to using a mix of stock
options and other equity-based incentives, such as restricted stock units, to provide long-term equity
incentives to our employees (see ""Compensation Committee Report on Executive Compensation Ì
14

Executive Compensation Ì Stock-Based Compensation''). By granting replacement awards consisting of
restricted stock rights rather than new, at-the-money stock options, the Compensation Committee seeks to
strengthen the Company's equity-based retention incentives, while further aligning our existing equity
compensation programs with our compensation philosophy.
Additional Retention Awards
The Compensation Committee believes that the Exchange Program alone will not necessarily provide a
suÇciently strong retention incentive for certain key employees. Therefore, in addition to proposing
adoption of the Exchange Program, the Compensation Committee has adopted a program of granting a
mix of new stock option and restricted stock unit awards (the ""Retention Awards''), consistent with our
current equity compensation programs, to a targeted group of key employees, which may include our
Named Executive OÇcers. The Retention Awards do not require stockholder approval and are therefore
not part of Proposal 2. When implemented, the Compensation Committee anticipates granting a mix of
stock options to purchase approximately 2.2 million shares and 600,000 restricted stock units to a select
group of key employees. Retention awards granted to key employees at more senior positions will consist of
a combination of stock options and restricted stock units, while others will receive Retention Awards solely
in the form of restricted stock units. These Retention Awards will partially oÅset the reduction in overhang
achieved by the Exchange Program. In the example used to illustrate the overhang discussion above, the
net reduction in overhang achieved by the combination of the Exchange Program and the Retention
Awards would be 8,359,590 shares, representing approximately 2.7% of the number of shares of our
Common Stock issued and outstanding as of June 19, 2006. The Compensation Committee believes that
this combination of the Exchange Program and the grant of new Retention Awards is necessary to achieve
the Company's primary objective of improving its ability to retain and motivate current employees, while
Proxy Statem
ent
still achieving a favorable impact on overhang.
Implementing the Exchange Program
We have not commenced the Exchange Program, and we will not do so unless our stockholders approve
both this proposal and the amendments to the Equity Plan described in Proposal 3 contained in this proxy
statement and the Compensation Committee determines that the Exchange Program complies with
applicable regulatory requirements (as described in more detail below). The Exchange Program will
commence at a time determined by the Compensation Committee. However, even if the Exchange
Program and the Equity Plan amendments are approved by our stockholders, the Compensation
Committee will retain the authority, in its discretion, to terminate, amend or postpone the Exchange
Program at any time prior to expiration of the election period under the Exchange Program (provided,
however, in no event will the Exchange Program permit the issuance of restricted stock rights having a
value greater than the value of the stock options surrendered, as estimated using the Black-Scholes option
valuation model).
Upon the commencement of the Exchange Program, eligible employees holding Eligible Options will
receive written materials in the form of an ""OÅer to Exchange'' explaining the precise terms and timing of
the Exchange Program. Employees will be given at least 20 business days to elect to surrender their
Eligible Options in exchange for restricted stock rights. At or before the commencement of the Exchange
Program, we will Ñle the OÅer to Exchange with the Securities and Exchange Commission (the ""SEC'')
as part of a tender oÅer statement on Schedule TO. Eligible employees, as well as stockholders and
members of the public, will be able to obtain the OÅer to Exchange and other documents Ñled by the
Company with the SEC free of charge from the SEC's website at www.sec.gov.
Description of the Exchange Program
Eligible Options. As of June 19, 2006, options to purchase 39,653,259 shares of our Common Stock were
outstanding under all of our equity compensation plans, including options assumed by the Company in
connection with acquisitions. Of these, options to purchase 15,989,086 shares of Common Stock, having
exercise prices ranging from $47.42 to $65.93, are held by eligible employees and would be eligible for
15

exchange under the Exchange Program if the Ñve-business-day average closing price of our Common
Stock immediately preceding the commencement of the Exchange Program were equal to $41.21. The
Compensation Committee will retain the discretion to adjust the threshold exercise price of options eligible
to participate in the Exchange Program (using the Ñve-business-day average closing price of our Common
Stock immediately preceding the commencement of the Exchange Program) if there is a signiÑcant
change in the market price of our Common Stock preceding the commencement of the Exchange Program
in comparison to the average market price used in determining the exchange ratios described under
""Exchange Ratios'' below.
Eligible Employees. The Exchange Program will be open to all of our employees and employees of any of
our subsidiaries designated for participation by the Compensation Committee who hold Eligible Options.
However, members of our Board of Directors and our Named Executive OÇcers will not be eligible to
participate. In addition, we may exclude employees in certain non-U.S. jurisdictions from the Exchange
Program if local tax or other laws would make their participation infeasible or impractical. To be eligible,
an employee must be employed by us or one of our participating subsidiaries both at the time the
Exchange Program commences and on the date the surrendered options are cancelled and restricted stock
rights are granted to replace them. Any employee holding Eligible Options who elects to participate but
whose employment terminates for any reason prior to the grant of the restricted stock rights, including
voluntary resignation, retirement, involuntary termination, layoÅ, death or disability, will not be eligible to
participate in the Exchange Program and will instead retain his or her Eligible Options subject to their
existing terms. As of June 19, 2006, Eligible Options were held by approximately 5,600 eligible employees.
Exchange Ratios. Our objective in determining the exchange ratios applicable under the Exchange
Program is to provide for the grant of replacement restricted stock rights that will have a value no greater
than the value of the stock options surrendered. We estimated the fair value of the Eligible Options using
the Black-Scholes option valuation model. The Black-Scholes model is a common method used for
estimating the fair value of a stock option, and we have been using this model for required footnote
disclosures in our Ñnancial statements through our Ñscal 2006. For purposes of estimating the fair value of
an Eligible Option under the Black-Scholes model, the following factors were used:
(a) the option's exercise price;
(b) an assumed value of $41.21 per share of our Common Stock, which was the closing price
reported on the NASDAQ National Market on June 19, 2006;
(c) an expected volatility of our Common Stock price (the weighted average volatility of all Eligible
Options was 54%);
(d) the expected term of the stock option (the weighted average expected term of all Eligible
Options is 6 years);
(e) a risk-free interest rate (the weighted average risk-free interest rate of all Eligible Options was
5%); and
(f) no expected dividends.
16

We then discounted the resulting estimated fair value of the Eligible Options and grouped them into three
exercise price ranges that also represent a range of associated Black-Scholes values. Finally, we determined
an exchange ratio for each grouping of Eligible Options based on the relationship of the discounted Black-
Scholes value estimate for the most valuable option within the group to an assumed fair market value of
one share of our Common Stock to be made subject to a restricted stock right issued in the Exchange
Program. For this purpose, we assumed a fair market value per share equal to the closing price per share
of our Common Stock reported on the NASDAQ National Market on June 19, 2006. The following table
provides for each of the three option exercise price ranges the number of shares subject to Eligible Options
an employee must surrender in order to receive one restricted stock right in the Exchange Program,
assuming an average closing market price of $41.21 per share for the Ñve business days preceding the
commencement of the Exchange Program:
Table of Example Exchange Ratios
Exchange Ratio: Total RestrictedTotal Shares Stock Option Shares Stock RightsSubject to per Restricted Granted (assuming
Exercise Price Range Eligible Options Stock Right* 100% participation)
$47.39 to $53.99 ÏÏÏÏÏÏÏÏÏÏÏÏÏÏÏÏÏÏÏÏÏÏÏÏÏÏÏÏÏ 8,211,321 3.0 to 1 2,738,609
$54.00 to $60.99 ÏÏÏÏÏÏÏÏÏÏÏÏÏÏÏÏÏÏÏÏÏÏÏÏÏÏÏÏÏ 4,055,795 3.5 to 1 1,160,150
$61.00 and greater ÏÏÏÏÏÏÏÏÏÏÏÏÏÏÏÏÏÏÏÏÏÏÏÏÏÏÏÏ 3,721,970 4.0 to 1 930,737
* Actual exchange ratios will be subject to change at the discretion of the Compensation Committee if there is a change in themarket price of our Common Stock preceding the commencement of the Exchange Program from the market price used indetermining the exchange ratios set forth in this table or a change to any of the other factors used in the Black-Scholes calculationused to determine the exchange ratios; provided, however, in no event will the Exchange Program permit the issuance of restrictedstock rights having a value greater than the value of the stock options surrendered, as estimated using the Black-Scholes option
Proxy Statem
ent
valuation model.
The total number of restricted stock rights a participating employee will receive with respect to a
surrendered Eligible Option will be determined by dividing the number of shares subject to the
surrendered option by the applicable exchange ratio and rounding up to the nearest whole share.
The valuation of the Eligible Options and estimate of the number of restricted stock rights that may be
issued in the Exchange Program were made, and the exchange ratios were calculated, on the basis of the
closing price per share of our Common Stock as reported on the NASDAQ National Market on June 19,
2006. The Compensation Committee will retain the discretion to adjust the threshold exercise price of
options eligible to participate in the Exchange Program and the applicable exchange ratios if there is a
change in the market price of our Common Stock preceding the commencement of the Exchange Program
in comparison to the market price used in determining the exchange ratios set forth in the table above or a
change to any of the other factors used in the Black-Scholes calculation used to determine the exchange
ratios. However, in no event will the Exchange Program permit the issuance of restricted stock rights
having a value greater than the value of the stock options surrendered, as estimated using the Black-
Scholes option valuation model as of the Exchange Date.
Election to Participate. Participation in the Exchange Program will be entirely voluntary. Eligible
employees will have an election period of at least 20 business days from the commencement of the
Exchange Program in which to determine whether they wish to participate.
Vesting of Restricted Stock Rights. Restricted stock rights issued in the Exchange Program will be
completely unvested at the time they are granted and will become vested on the basis of the participant's
continued employment with the Company or any of its subsidiaries. The restricted stock rights will have a
minimum vesting period of two years measured from August 1, 2006, regardless of the extent to which the
corresponding Eligible Options were vested upon surrender (even if the corresponding Eligible Options
were already fully vested upon surrender). Eligible Options that are 50% or more vested (or, in the case of
Eligible Options that cliÅ vest in their entirety after a minimum of three years, if at least 50% or more of
the time required to vest has elapsed) on the date on which they are cancelled in the Exchange Program
will be replaced by restricted stock rights vesting over a period of two years measured from August 1,
17
2006. Eligible Options that are less than 50% vested on the date on which they are cancelled in the
Exchange Program will be replaced by restricted stock rights vesting over a period of three years measured
from August 1, 2006. However, Eligible Options granted in 2006 will be replaced by restricted stock rights
vesting over a period of four years measured from August 1, 2006. Restricted stock rights vesting over
periods of two or four years will vest in substantially equal annual installments over the applicable period,
while restricted stock rights vesting over a period of three years will vest at the rate of 25% in each of the
Ñrst two years and 50% in the third year. A participant in the Exchange Program will generally forfeit any
restricted stock rights received that remain unvested at the time his or her employment with us terminates
for any reason.
Other Material Terms and Conditions of Restricted Stock Rights. Restricted stock rights issued in the
Exchange Program will be granted pursuant to the Equity Plan and will be subject to its terms. Each share
of restricted stock issued to a participant in the Exchange Program is a share of our Common Stock that
remains subject to forfeiture upon the participant's termination of employment until it has vested following
a speciÑed period of employment. Each restricted stock unit issued to a participant in the Exchange
Program represents a right to receive one share of our Common Stock on a Ñxed settlement date, which is
the date on which the restricted stock unit vests based on continued employment. A participant is not
required to pay any monetary consideration to receive shares of our Common Stock upon receipt of a
restricted stock award or settlement of restricted stock units. However, subject to the limitations described
below, employees participating in the Exchange Program will recognize taxable income in connection with
their restricted stock rights awards no later than the vesting of the award, although the applicable tax laws
may vary from country to country. For our U.S. employees and many of our non-U.S. employees, this
income is subject to income and employment tax withholding. The Company intends to satisfy its tax
withholding obligations by deducting from the shares of Common Stock that would otherwise be released
to employees upon the vesting of restricted stock or issued in settlement of restricted stock units a number
of whole shares having a fair market value that does not exceed by more than the value of a fractional
share the applicable minimum statutory withholding requirements. All other terms and conditions of the
restricted stock rights issued in the Exchange Program will be substantially the same as those that apply
generally to such awards granted under the Equity Plan, as described in Appendix A to this proxy
statement.
Potential ModiÑcation to Exchange Program Terms to Comply with Governmental Requirements. The
terms of the Exchange Program will be described in an OÅer to Exchange that will be Ñled with the SEC.
Although we do not anticipate that the SEC would require us to materially modify the program's terms, it
is possible that we will need to alter the terms of the Exchange Program to comply with comments from
the SEC. Changes in the terms of the Exchange Program may also be required for tax purposes for
participants in the United States as the tax treatment of the Exchange Program is not entirely certain. In
addition, we intend to make the Exchange Program available to our employees who are located outside of
the United States, where permitted by local law and where we determine it is feasible and practical to do
so. It is possible that we may need to make modiÑcations to the terms oÅered to employees in countries
outside the U.S. to comply with local requirements, or for tax or accounting reasons. The Compensation
Committee of the Board of Directors will retain the discretion to make any such necessary or desirable
changes to the terms of the Exchange Program.
Summary of United States Federal Income Tax Consequences
The following is a summary of the anticipated material United States federal income tax consequences of
participating in the Exchange Program and of holding restricted stock rights. A more detailed summary of
the applicable tax considerations to participants will be provided in the OÅer to Exchange. The tax
consequences of the Exchange Program are not entirely certain, however, and the Internal Revenue
Service is not precluded from adopting a contrary position and the law and regulations themselves are
subject to change. All holders of Eligible Options are urged to consult their own tax advisors regarding the
tax treatment of participating in the Exchange Program under all applicable laws prior to participating in
the Exchange Program. We believe the exchange of Eligible Options for restricted stock rights pursuant to
18
the Exchange Program should be treated as a non-taxable exchange and the Company, our stockholders
and employees should recognize no income for United States federal income tax purposes upon the
surrender of Eligible Options and the grant of restricted stock rights (other than in the case of participants
who receive restricted stock and make certain elections). For a summary of the current United States
federal income tax consequences of restricted stock and restricted stock units we currently issue under the
Equity Plan, see the discussion of the treatment of such awards contained in Appendix A to this proxy
statement. The tax consequences of the receipt of restricted stock and stock units under the Equity Plan
for participating non-United States employees may diÅer signiÑcantly from the United States federal
income tax consequences described above and in Appendix A.
Accounting Treatment
EÅective with our Ñscal year commencing on April 2, 2006, we have adopted the provisions of Financial
Accounting Standards Board's Statement of Financial Accounting Standard No. 123 (revised 2004),
""Share-Based Payment'' (""SFAS No. 123R''), on accounting for share-based payments. Under
SFAS No. 123R, to the extent the fair value of each award of restricted stock rights granted to employees
exceeds the fair value of the stock options surrendered, such excess is considered additional compensation.
This excess, in addition to any remaining unrecognized expense for the stock options surrendered in
exchange for the restricted stock rights, will be recognized by the Company as an expense for
compensation. This expense will be recognized ratably over the vesting period of the restricted stock rights
in accordance with the requirements of SFAS No. 123R. In the event that any of the restricted stock
rights are forfeited prior to their vesting due to termination of employment, the expense for the forfeited
restricted stock rights will be reversed and will not be recognized. Because we do not anticipate issuing any
restricted stock rights having a fair value in excess of the fair value of the stock options surrendered, we do
Proxy Statem
ent
not expect to recognize any incremental compensation cost as a result of the Exchange Program.
New Plan BeneÑts
Because the decision of eligible employees to participate in the Exchange Program is completely voluntary,
we are not able to predict who or how many employees will elect to participate, how many options of any
class described in the table above under ""Exchange Ratios'' will be surrendered for exchange or the
number of restricted stock rights that may be issued. As noted above, members of our Board of Directors
and our Named Executive OÇcers are not eligible to participate in the Exchange Program.
EÅect on Stockholders
We are not able to predict the impact the Exchange Program will have on our stockholders because we
are unable to predict how many or which employees will exchange their Eligible Options. The Exchange
Program was designed to avoid any additional compensation charge and to reduce the overhang from
outstanding stock options. As of June 19, 2006, assuming a Ñve-business-day average closing price of our
Common Stock of $41.21 immediately prior to the commencement of the Exchange Program, the
maximum number of shares subject to Eligible Options which could be exchanged is 15,989,086 and the
maximum number of shares of Common Stock underlying the restricted stock rights which could be issued
using the exchange ratios set forth above is 4,829,496. As explained above, the net reduction in shares
subject to outstanding equity awards resulting from the Exchange Program could be signiÑcantly lower
depending on factors such as the level of participation by our employees in the Exchange Program. The
reduction in overhang will also be partially oÅset by the grant of additional Retention Awards. In addition,
we intend to return up to 7 million shares subject to options cancelled in the Exchange Program to the
Equity Plan where they will be available for the grant of future awards.
Required Vote and Board of Directors Recommendation
Approval of this proposal requires the aÇrmative vote of a majority of the voting shares present at the
meeting in person or by proxy and voting on this proposal.
19

Our Board of Directors believes that the proposed Exchange Program is favorable to the interests of our
stockholders and, at the same time, will strengthen incentives for employees currently holding underwater
stock options to remain with the Company and to contribute to our growth and success.
The Board recommends a vote FOR approval of the Exchange Program.
20

PROPOSAL 3. AMENDMENTS TO THE 2000 EQUITY INCENTIVE PLAN
The 2000 Equity Incentive Plan, which initially was approved by the stockholders on March 22, 2000,
continues EA's program of providing equity incentives to eligible employees, oÇcers and directors. We
oÅer these incentives in order to assist in recruiting, retaining and motivating qualiÑed employees, oÇcers
and directors. Since the Equity Plan's adoption, 67,400,000 shares of common stock have been reserved for
issuance. The following summary of the proposed amendments to the Equity Plan is subject to the speciÑc
provisions contained in the full text of the Equity Plan, as proposed to be amended, which we have Ñled
with the Securities and Exchange Commission along with this proxy statement. For more information
regarding the Equity Plan, we urge you to read the full text of the Equity Plan, as proposed to be
amended, or the summary of its material terms, as proposed to be amended, included as Appendix A of
this proxy statement.
We continue to believe that alignment of the interests of our stockholders and our employees, oÇcers and
directors is best advanced through the issuance of equity incentives as a portion of their total
compensation. In this way, we reinforce the link between our stockholders and our employees', oÇcers'
and directors' focus on personal responsibility, creativity and stockholder returns. We also believe that
delivering a portion of their total compensation in the form of long-term equity compensation helps
encourage a long-term view in an industry that is subject to lengthy business cycles. Equity incentives such
as stock options and restricted stock units also play an important role in our recruitment and retention
strategies, as the competition for creative and technical talent and leadership in our industry is intense.
Having said this, we also recognize our responsibility to keep the dilutive impact of the equity incentives
we oÅer within a reasonable range. For example, we decreased the size of option grants we made to our
executive oÇcers in Ñscal 2004 and, following the two-for-one split of our common stock in November
Proxy Statem
ent
2003, we did not increase our broad-based stock option award guidelines to reÖect the split. During Ñscal
2006, a year in which our employee base grew by approximately 1,050 people, we carefully managed stock
option and restricted stock unit issuances, granting stock options to purchase a total of 7,576,630 shares
(excluding 1,877,964 shares underlying options we assumed in connection with our acquisition of
JAMDAT Mobile Inc.) and restricted stock units to acquire a total of 654,230 shares (excluding
10,096 shares underlying restricted stock units we assumed in connection with our acquisition of JAMDAT
Mobile Inc.), together representing approximately 2.7% of our total shares outstanding. During Ñscal 2005,
Ñscal 2004 and Ñscal 2003, we granted stock options at an average annual rate of approximately 3.6% of
total shares outstanding. Going forward, we intend to continue to responsibly manage issuances of equity
incentive awards under the Equity Plan.
The Equity Plan also contains several features designed to protect stockholders' interests. For example, the
exercise price of outstanding options issued under the Plan may not be reduced without stockholder
approval, and the Plan does not allow any options to be granted at less than 100% of fair market value.
The Equity Plan also does not contain an ""evergreen'' provision whereby the number of authorized shares
is automatically increased on a regular basis. In addition, the Equity Plan prohibits us from loaning, or
guaranteeing the loan of, funds to participants under the Equity Plan.
We are proposing an amendment to the 2000 Equity Incentive Plan to increase by 11 million shares thelimit on the total number of shares underlying awards of restricted stock and restricted stock units thatmay be granted under the Equity Plan Ì from 4 million to 15 million shares.
In May 2005, we began granting restricted stock units to certain of our U.S.-based employees, and in
March 2006, we began oÅering restricted stock units to our employees throughout the world. As described
in Proposal 2, with stockholder approval of that proposal and this Proposal 3, we expect to implement an
Exchange Program under which eligible employees will be oÅered the opportunity to surrender signiÑcantly
""underwater'' stock options in exchange for a lesser number of shares of restricted stock or restricted stock
units to be granted under the Equity Plan. While reducing the number of shares subject to outstanding
stock options and equity awards in general, we anticipate that the Exchange Program will require the
issuance of an estimated 4.8 million shares (based on a set of assumptions discussed in Proposal 2 above)
21
under the restricted stock and restricted stock unit awards to be granted in exchange for surrendered stock
options. In addition, we expect restricted stock and/or restricted stock units to remain an important form
of equity incentive compensation that we oÅer our employees worldwide, including, for example, as a
component of the Retention Awards program described in Proposal 2 above under which we intend to
grant restricted stock units to a select group of key employees. We therefore believe it is important that
the Equity Plan be amended to allow us to issue an adequate amount of restricted stock and restricted
stock units to attract, retain and motivate eligible employees and to provide the shares necessary for
awards to be granted in exchange for stock options surrendered in the Exchange Program.
We are also proposing to amend the Equity Plan to limit the number of shares subject to optionssurrendered and cancelled in the Exchange Program that will again become available for issuance underthe Equity Plan to 7 million plus the number of shares necessary for the issuance of the restricted stockrights to be granted in connection with the Exchange Program.
Under the existing terms of the Equity Plan, shares subject to awards that terminate without shares being
issued automatically become available for issuance under other awards granted pursuant to the Equity
Plan. In order to limit the number of shares that will be available for future issuance as a result of the
Exchange Program, however, we do not intend to return every share subject to an award cancelled in the
Exchange Program back to the Equity Plan. Instead, we only intend to (i) use shares subject to the
options cancelled for the issuance of the restricted stock rights granted under the Exchange Program, and
(ii) return up to a total of an additional seven million shares subject to the options cancelled in the
Exchange Program to the Equity Plan to be available for issuance pursuant to future awards. While
returning these shares back to the Equity Plan will not have any immediate impact on our overhang, their
use for future equity awards would increase our overhang.
Required Vote and Board of Directors' Recommendation
Approval of this proposal requires the aÇrmative vote of a majority of the voting shares present at the
meeting in person or by proxy and voting on this proposal.
The Board recommends a vote FOR the amendments to the 2000 Equity Incentive Plan.
22

PROPOSAL 4. AMENDMENT TO THE 2000 EMPLOYEE STOCK PURCHASE PLAN
The 2000 Employee Stock Purchase Plan, which initially was approved by the stockholders on July 27,
2000, provides our employees with a convenient means of purchasing equity in the Company through
payroll deductions. It also provides an incentive for continued employment. Since its adoption,
5,300,000 shares of common stock have been reserved for issuance under the Purchase Plan.
Since the adoption of the Purchase Plan, we have experienced signiÑcant growth in the number of
employees, as well as an increase in the percentage of employees, who elect to participate in the Purchase
Plan. In addition, in February 2003, we terminated our International Employee Stock Purchase Plan, and
have since allowed our international employees to participate in the Purchase Plan. The following table
presents information since the beginning of Ñscal 2003 relating to the aggregate number of shares
purchased under the Purchase Plan and the International Purchase Plan, as well as the number of
employees who have participated in such plans:
No. ofEmployees
Shares Purchased ParticipatingShares Purchased Pursuant to as of the LastPursuant to 2000 International Total Shares Purchase DatePurchase Plan Purchase Plan(1) Purchased in Fiscal Year
Fiscal 2003ÏÏÏÏÏÏÏÏÏÏÏÏÏÏÏÏÏÏÏÏÏÏÏÏÏÏÏ 440,528 257,368 697,896 2,418Fiscal 2004ÏÏÏÏÏÏÏÏÏÏÏÏÏÏÏÏÏÏÏÏÏÏÏÏÏÏÏ 866,541 Ì 866,541 2,933Fiscal 2005ÏÏÏÏÏÏÏÏÏÏÏÏÏÏÏÏÏÏÏÏÏÏÏÏÏÏÏ 623,693 Ì 623,693 3,615Fiscal 2006ÏÏÏÏÏÏÏÏÏÏÏÏÏÏÏÏÏÏÏÏÏÏÏÏÏÏÏ 624,629 Ì 624,629 4,281Fiscal 2007ÏÏÏÏÏÏÏÏÏÏÏÏÏÏÏÏÏÏÏÏÏÏÏÏÏÏÏ (2) Ì (2) 4,500(3)
Proxy Statem
ent
(1) The International Employee Stock Purchase Plan was terminated in February 2003.(2) Fiscal 2007 purchases under the 2000 Purchase Plan will be made in August 2006 and February 2007.(3) Represents estimated number of participants in the 2000 Purchase Plan as of May 31, 2006.
Participants have the right to withdraw from the 2000 Purchase Plan at any time prior to a purchase
date. The number of participants may increase or decrease prior to February 2007, the last purchase
date in Ñscal 2007.
The proposed amendment would increase the number of shares authorized under the Purchase Plan by
1,500,000 to a total of 6,800,000, an amount that we expect will permit all current and potential future
employees to fully participate in the Purchase Plan at least through Ñscal 2007.
For more information about the Purchase Plan, we urge you to read the summary of its material terms
included as Appendix B to this proxy statement.
Required Vote and Board of Directors' Recommendation
Approval of this proposal requires the aÇrmative vote of a majority of the voting shares present at the
meeting in person or by proxy and voting on this proposal.
The Board recommends a vote FOR the amendment to the 2000 Employee Stock Purchase Plan.
23
PROPOSAL 5. RATIFICATION OF THE APPOINTMENT OF KPMG LLP, INDEPENDENTREGISTERED PUBLIC ACCOUNTING FIRM
KPMG LLP has audited the Ñnancial statements of EA and its consolidated subsidiaries since Ñscal 1987.
The Board, through the Audit Committee, has appointed KPMG LLP as EA's independent registered
public accounting Ñrm (""independent auditors'') for Ñscal 2007. The Audit Committee and the Board
believe that KPMG LLP's long-term knowledge of EA and its subsidiaries is valuable to the Company.
Representatives of KPMG LLP have direct access to members of the Audit Committee and the Board.
Representatives of KPMG LLP will attend the meeting in order to respond to appropriate questions from
stockholders, and may make a statement if they desire to do so.
RatiÑcation of the appointment of KPMG LLP as our independent auditors is not required by our bylaws
or otherwise. The Board of Directors has determined to submit this proposal to the stockholders as a
matter of good corporate practice. If the stockholders do not ratify the appointment, the Audit Committee
will review their future selection of auditors. Even if the appointment is ratiÑed, the Audit Committee
may, in its discretion, direct the appointment of diÅerent independent auditors at any time during the year
if they determine that such a change would be in the best interests of the Company and the stockholders.
Fees of Independent Auditors
The aggregate fees billed for the last two Ñscal years for each of the following categories of services are set
forth below:
Year Ended Year EndedDescription of Fees March 31, 2006 March 31, 2005
Audit(1)
Ó Worldwide audit fee ÏÏÏÏÏÏÏÏÏÏÏÏÏÏÏÏÏÏÏÏÏÏÏÏÏÏÏÏÏÏÏÏÏÏÏÏÏÏÏÏÏÏÏ $4,428,000 $3,600,000Ó Accounting concurrence and regulatory matters ÏÏÏÏÏÏÏÏÏÏÏÏÏÏÏÏÏÏÏÏ 67,000 169,000
Total audit feesÏÏÏÏÏÏÏÏÏÏÏÏÏÏÏÏÏÏÏÏÏÏÏÏÏÏÏÏÏÏÏÏÏÏÏÏÏÏÏÏÏÏÏÏÏÏÏÏÏ 4,495,000 3,769,000Audit-Related Fees(2)
Ó BeneÑt plan audit ÏÏÏÏÏÏÏÏÏÏÏÏÏÏÏÏÏÏÏÏÏÏÏÏÏÏÏÏÏÏÏÏÏÏÏÏÏÏÏÏÏÏÏÏÏ 27,000 18,000
Total audit-related fees ÏÏÏÏÏÏÏÏÏÏÏÏÏÏÏÏÏÏÏÏÏÏÏÏÏÏÏÏÏÏÏÏÏÏÏÏÏÏÏÏÏÏ 27,000 18,000Tax(3)
Ó Compliance ÏÏÏÏÏÏÏÏÏÏÏÏÏÏÏÏÏÏÏÏÏÏÏÏÏÏÏÏÏÏÏÏÏÏÏÏÏÏÏÏÏÏÏÏÏÏÏÏÏÏ 618,000 690,000Ó Planning ÏÏÏÏÏÏÏÏÏÏÏÏÏÏÏÏÏÏÏÏÏÏÏÏÏÏÏÏÏÏÏÏÏÏÏÏÏÏÏÏÏÏÏÏÏÏÏÏÏÏÏÏÏ 55,000 13,000
Total tax fees ÏÏÏÏÏÏÏÏÏÏÏÏÏÏÏÏÏÏÏÏÏÏÏÏÏÏÏÏÏÏÏÏÏÏÏÏÏÏÏÏÏÏÏÏÏÏÏÏÏÏ 673,000 703,000All Other Fees(4)
Total all other fees ÏÏÏÏÏÏÏÏÏÏÏÏÏÏÏÏÏÏÏÏÏÏÏÏÏÏÏÏÏÏÏÏÏÏÏÏÏÏÏÏÏÏÏÏÏÏ Ì Ì
Total All FeesÏÏÏÏÏÏÏÏÏÏÏÏÏÏÏÏÏÏÏÏÏÏÏÏÏÏÏÏÏÏÏÏÏÏÏÏÏÏÏÏÏÏÏÏÏÏÏÏÏÏÏÏ $5,195,000 $4,490,000
(1) Audit Fees: This category includes the annual audit of the Company's Ñnancial statements and management'sassessment of internal control over Ñnancial reporting, (including required quarterly reviews of Ñnancial statementsincluded in the Company's quarterly reports on Form 10-Q) and services normally provided by the independentauditors in connection with regulatory Ñlings. This category also includes consultation on matters that arose during,or as a result of the audit or review of Ñnancial statements, statutory audits required for our non-US subsidiaries,and services associated with our periodic reports and other documents Ñled with the SEC and foreign Ñlings, aswell as Sarbanes-Oxley Section 404 (""Section 404'') compliance consultation. The increase in audit fees for Ñscal2006 was primarily due to costs incurred in connection with the annual audit of the Company's Ñnancialstatements, the audit of internal control over Ñnancial reporting, as required by Section 404 and internationalregulatory audits.
(2) Audit-Related Fees: This category consists primarily of fees related to the annual audit of our 401(k) beneÑt plan.
(3) Tax Services: This category includes compliance services rendered for US and foreign tax compliance and returns,and transfer pricing consultation, as well as planning and advice which consists primarily of technical taxconsulting.
(4) Other: In Ñscal years 2005 and 2006, no products or services were provided under this category.
24

Services Provided by the Independent Auditors
The Audit Committee is required to pre-approve the engagement of, and has engaged, KPMG LLP to
perform audit and other services for the Company and its subsidiaries. The Company's procedures for the
pre-approval by the Audit Committee of all services provided by KPMG LLP comply with SEC
regulations regarding pre-approval of services. Services subject to these SEC requirements include audit
services, audit-related services, tax services and other services. The audit engagement is speciÑcally
approved and the auditors are retained by the Audit Committee. In some cases, pre-approval for a
particular category or group of services is provided by the Audit Committee for up to a year, subject to a
speciÑc budget and to regular management reporting. In other cases, the Chairman of the Audit
Committee has the delegated authority from the Audit Committee to pre-approve additional services up to
a speciÑed dollar limit, and such pre-approvals are then communicated to the full Audit Committee.
The Audit Committee considered and determined that fees for services other than audit and audit-related
services are compatible with maintaining KPMG LLP's independence.
Required Vote and Board of Directors' Recommendation
Approval of this proposal requires the aÇrmative vote of a majority of the voting shares present at the
meeting in person or by proxy and voting for or against the proposal.
The Board recommends a vote FOR the ratiÑcation of KPMG LLP as our independent auditors for Ñscal2007.
OTHER BUSINESS
Proxy Statem
ent
The Board knows of no other business for consideration at the Annual Meeting. If other matters are
properly presented at the Annual Meeting, or at any adjournment or postponement of the Annual Meeting,
Lawrence F. Probst III (the Company's Chief Executive OÇcer) and Warren C. Jenson (the Company's
Chief Financial and Administrative OÇcer) will vote, or otherwise act, in accordance with their judgment
on such matters.
25

PRINCIPAL STOCKHOLDERS
Common Stock
The following table shows, as of June 1, 2006, the number of shares of our common stock owned by our
directors, executive oÇcers named in the Summary Compensation Table below, our current directors and
executive oÇcers as a group, and beneÑcial owners known to us holding more than 5% of our common
stock. As of June 1, 2006, there were 306,143,008 shares of our common stock outstanding. Except as
otherwise indicated, the address for each of our directors and executive oÇcers is c/o Electronic Arts Inc.,
209 Redwood Shores Parkway, Redwood City, CA 94065.
Percent ofShares Right to Outstanding
Stockholder Name Owned(1) Acquire(2) Shares(3)
Legg Mason Capital Management, Inc.(4) ÏÏÏÏÏÏÏÏÏÏÏÏÏÏÏÏÏÏÏÏÏÏ 32,626,609 Ì 10.7
Janus Capital Management LLC(5) ÏÏÏÏÏÏÏÏÏÏÏÏÏÏÏÏÏÏÏÏÏÏÏÏÏÏÏ 18,744,209 Ì 6.1
Wellington Management Company, LLP(6)ÏÏÏÏÏÏÏÏÏÏÏÏÏÏÏÏÏÏÏÏÏ 17,682,489 Ì 5.8
Lawrence F. Probst III(7)ÏÏÏÏÏÏÏÏÏÏÏÏÏÏÏÏÏÏÏÏÏÏÏÏÏÏÏÏÏÏÏÏÏÏÏÏ 730,973 3,718,300 1.5
M. Richard Asher ÏÏÏÏÏÏÏÏÏÏÏÏÏÏÏÏÏÏÏÏÏÏÏÏÏÏÏÏÏÏÏÏÏÏÏÏÏÏÏÏÏÏ 167,858 183,200 *
Timothy Mott(8) ÏÏÏÏÏÏÏÏÏÏÏÏÏÏÏÏÏÏÏÏÏÏÏÏÏÏÏÏÏÏÏÏÏÏÏÏÏÏÏÏÏÏÏ 118,624 88,160 *
Nancy Smith ÏÏÏÏÏÏÏÏÏÏÏÏÏÏÏÏÏÏÏÏÏÏÏÏÏÏÏÏÏÏÏÏÏÏÏÏÏÏÏÏÏÏÏÏÏÏ 14,932 221,361 *
V. Paul Lee(9) ÏÏÏÏÏÏÏÏÏÏÏÏÏÏÏÏÏÏÏÏÏÏÏÏÏÏÏÏÏÏÏÏÏÏÏÏÏÏÏÏÏÏÏÏÏ 13,256 1,341,000 *
Warren C. Jenson ÏÏÏÏÏÏÏÏÏÏÏÏÏÏÏÏÏÏÏÏÏÏÏÏÏÏÏÏÏÏÏÏÏÏÏÏÏÏÏÏÏÏ 13,558 904,600 *
Gregory B. MaÅei ÏÏÏÏÏÏÏÏÏÏÏÏÏÏÏÏÏÏÏÏÏÏÏÏÏÏÏÏÏÏÏÏÏÏÏÏÏÏÏÏÏÏ 10,000 59,973 *
Robert W. Pittman ÏÏÏÏÏÏÏÏÏÏÏÏÏÏÏÏÏÏÏÏÏÏÏÏÏÏÏÏÏÏÏÏÏÏÏÏÏÏÏÏÏ 7,002 50,500 *
Gerhard FlorinÏÏÏÏÏÏÏÏÏÏÏÏÏÏÏÏÏÏÏÏÏÏÏÏÏÏÏÏÏÏÏÏÏÏÏÏÏÏÏÏÏÏÏÏÏ 6,808 235,872 *
Gary M. Kusin ÏÏÏÏÏÏÏÏÏÏÏÏÏÏÏÏÏÏÏÏÏÏÏÏÏÏÏÏÏÏÏÏÏÏÏÏÏÏÏÏÏÏÏÏ 4,574 60,640 *
Leonard S. Coleman, Jr. ÏÏÏÏÏÏÏÏÏÏÏÏÏÏÏÏÏÏÏÏÏÏÏÏÏÏÏÏÏÏÏÏÏÏÏÏ 4,095 99,872 *
Linda J. Srere ÏÏÏÏÏÏÏÏÏÏÏÏÏÏÏÏÏÏÏÏÏÏÏÏÏÏÏÏÏÏÏÏÏÏÏÏÏÏÏÏÏÏÏÏÏ 3,459 99,872 *
Vivek Paul ÏÏÏÏÏÏÏÏÏÏÏÏÏÏÏÏÏÏÏÏÏÏÏÏÏÏÏÏÏÏÏÏÏÏÏÏÏÏÏÏÏÏÏÏÏÏÏÏ 687 7,333 *
Former executive oÇcers:
Don A. Mattrick(10) ÏÏÏÏÏÏÏÏÏÏÏÏÏÏÏÏÏÏÏÏÏÏÏÏÏÏÏÏÏÏÏÏÏÏÏÏÏÏÏÏ 9,500 0 *
Bruce McMillan(10)ÏÏÏÏÏÏÏÏÏÏÏÏÏÏÏÏÏÏÏÏÏÏÏÏÏÏÏÏÏÏÏÏÏÏÏÏÏÏÏÏÏ 173,303 0 *
All executive oÇcers and directors as a group (20 persons)(11) ÏÏÏÏ 1,102,672 7,461,970 2.8
* Less than 1%(1) Unless otherwise indicated in the footnotes, includes shares for which the named person has sole voting and investment power, or
has shared voting and investment power with his or her spouse. Excludes shares that may be acquired through stock optionexercises.
(2) Represents shares of common stock that may be acquired through stock option exercises within 60 days of June 1, 2006. Noneof EA's directors or current executive oÇcers hold restricted stock units that vest within 60 days of June 1, 2006.
(3) Calculated based on the total number of shares owned plus the number of shares that may be acquired through stock optionexercises and the vesting of restricted stock units within 60 days of June 1, 2006.
(4) Based on information contained in a report on Schedule 13F Ñled with the SEC on March 31, 2006. The address for LeggMason, Inc. is 100 Light Street, Baltimore, MD 21202.
(5) Based on information contained in a report on Schedule 13F Ñled with the SEC on March 31, 2006. The address for JanusCapital Management LLC is 100 Fillmore Street, Suite 300, Denver, CO 80206.
(6) Based on information contained in a report on Schedule 13F Ñled with the SEC on March 31, 2006. The address for WellingtonManagement Company, LLP is 75 State Street, Boston, MA 02109.
(7) Includes 87,886 shares of common stock held by Mr. Probst's grantor's retained annuity trust, 10,805 shares held by Mr. Probst'sspouse, and 481,441 shares held by the Probst Family LP, of which Mr. Probst is a partner.
(8) Includes 36,656 shares of common stock held in trust for the beneÑt of Mr. Mott's son for which Mr. Mott is the trustee.(9) Includes 15 shares of common stock held by VPL Investments, of which Mr. Lee is the sole shareholder, and 12,803 shares held
by Briel Investments, of which Mr. Lee is the sole shareholder.(10) Mr. Mattrick and Mr. McMillan ceased serving as executive oÇcers of EA on September 2, 2005.(11) Includes all executive oÇcers and directors of EA as of June 1, 2006.
26
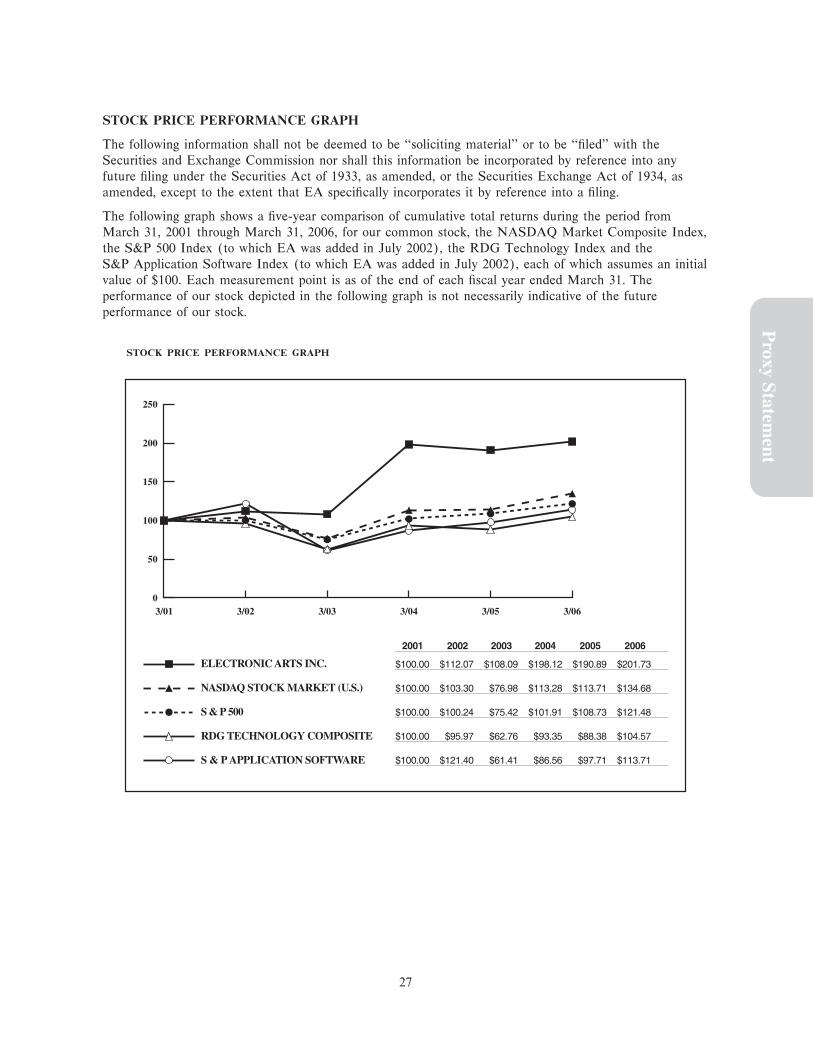
STOCK PRICE PERFORMANCE GRAPH
The following information shall not be deemed to be ""soliciting material'' or to be ""Ñled'' with the
Securities and Exchange Commission nor shall this information be incorporated by reference into any
future Ñling under the Securities Act of 1933, as amended, or the Securities Exchange Act of 1934, as
amended, except to the extent that EA speciÑcally incorporates it by reference into a Ñling.
The following graph shows a Ñve-year comparison of cumulative total returns during the period from
March 31, 2001 through March 31, 2006, for our common stock, the NASDAQ Market Composite Index,
the S&P 500 Index (to which EA was added in July 2002), the RDG Technology Index and the
S&P Application Software Index (to which EA was added in July 2002), each of which assumes an initial
value of $100. Each measurement point is as of the end of each Ñscal year ended March 31. The
performance of our stock depicted in the following graph is not necessarily indicative of the future
performance of our stock.
STOCK PRICE PERFORMANCE GRAPH
Proxy Statem
ent
S & P APPLICATION SOFTWARE
RDG TECHNOLOGY COMPOSITE
S & P 500
NASDAQ STOCK MARKET (U.S.)
ELECTRONIC ARTS INC.
2001 2002 2003 2004 2005 2006
$100.00 $112.07 $108.09 $198.12 $190.89 $201.73
$100.00 $103.30 $76.98 $113.28 $113.71 $134.68
$100.00 $100.24 $75.42 $101.91 $108.73 $121.48
$100.00 $95.97 $62.76 $93.35 $88.38 $104.57
$100.00 $121.40 $61.41 $86.56 $97.71 $113.71
3/063/053/043/033/023/010
50
100
150
200
250
27
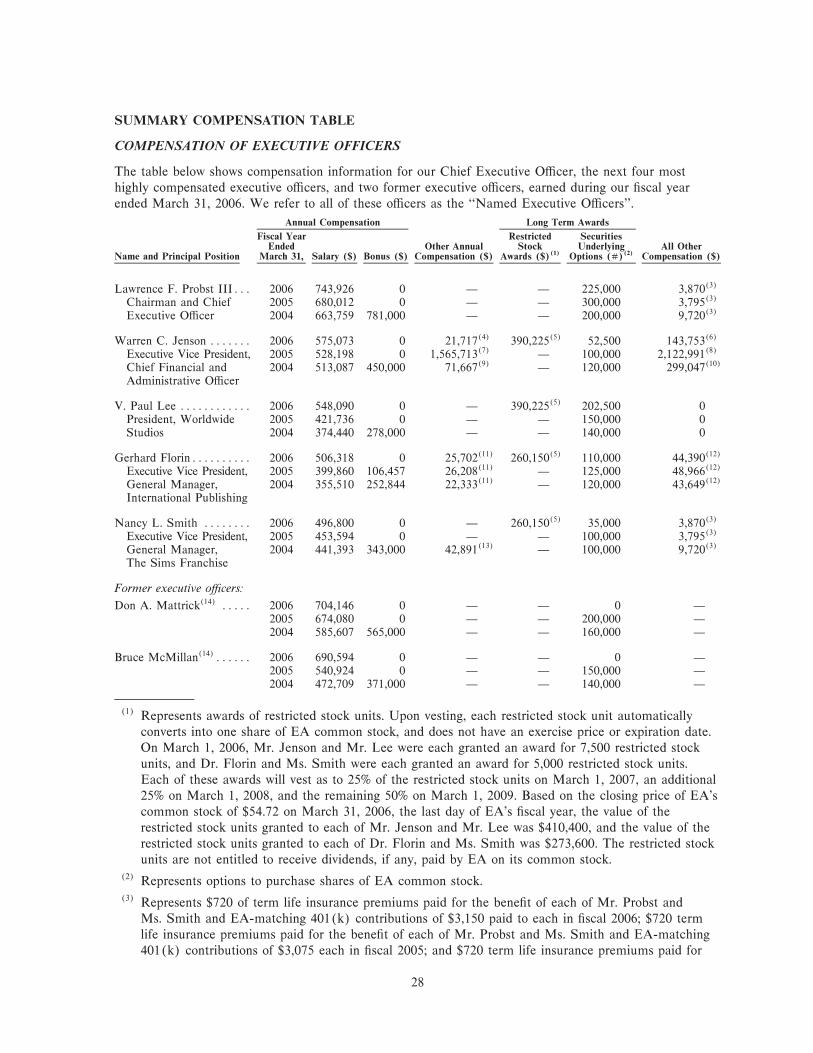
SUMMARY COMPENSATION TABLE
COMPENSATION OF EXECUTIVE OFFICERS
The table below shows compensation information for our Chief Executive OÇcer, the next four most
highly compensated executive oÇcers, and two former executive oÇcers, earned during our Ñscal year
ended March 31, 2006. We refer to all of these oÇcers as the ""Named Executive OÇcers''.
Annual Compensation Long Term Awards
Fiscal Year Restricted SecuritiesEnded Other Annual Stock Underlying All Other
Name and Principal Position March 31, Salary ($) Bonus ($) Compensation ($) Awards ($)(1) Options (#)(2) Compensation ($)
Lawrence F. Probst IIIÏÏÏ 2006 743,926 0 Ì Ì 225,000 3,870(3)
Chairman and Chief 2005 680,012 0 Ì Ì 300,000 3,795(3)
Executive OÇcer 2004 663,759 781,000 Ì Ì 200,000 9,720(3)
Warren C. Jenson ÏÏÏÏÏÏÏ 2006 575,073 0 21,717(4) 390,225(5) 52,500 143,753(6)
Executive Vice President, 2005 528,198 0 1,565,713(7) Ì 100,000 2,122,991(8)
Chief Financial and 2004 513,087 450,000 71,667(9) Ì 120,000 299,047(10)
Administrative OÇcer
V. Paul Lee ÏÏÏÏÏÏÏÏÏÏÏÏ 2006 548,090 0 Ì 390,225(5) 202,500 0President, Worldwide 2005 421,736 0 Ì Ì 150,000 0Studios 2004 374,440 278,000 Ì Ì 140,000 0
Gerhard FlorinÏÏÏÏÏÏÏÏÏÏ 2006 506,318 0 25,702(11) 260,150(5) 110,000 44,390(12)
Executive Vice President, 2005 399,860 106,457 26,208(11) Ì 125,000 48,966(12)
General Manager, 2004 355,510 252,844 22,333(11) Ì 120,000 43,649(12)
International Publishing
Nancy L. Smith ÏÏÏÏÏÏÏÏ 2006 496,800 0 Ì 260,150(5) 35,000 3,870(3)
Executive Vice President, 2005 453,594 0 Ì Ì 100,000 3,795(3)
General Manager, 2004 441,393 343,000 42,891(13) Ì 100,000 9,720(3)
The Sims Franchise
Former executive oÇcers:
Don A. Mattrick(14) ÏÏÏÏÏ 2006 704,146 0 Ì Ì 0 Ì2005 674,080 0 Ì Ì 200,000 Ì2004 585,607 565,000 Ì Ì 160,000 Ì
Bruce McMillan(14)ÏÏÏÏÏÏ 2006 690,594 0 Ì Ì 0 Ì2005 540,924 0 Ì Ì 150,000 Ì2004 472,709 371,000 Ì Ì 140,000 Ì
(1) Represents awards of restricted stock units. Upon vesting, each restricted stock unit automatically
converts into one share of EA common stock, and does not have an exercise price or expiration date.
On March 1, 2006, Mr. Jenson and Mr. Lee were each granted an award for 7,500 restricted stock
units, and Dr. Florin and Ms. Smith were each granted an award for 5,000 restricted stock units.
Each of these awards will vest as to 25% of the restricted stock units on March 1, 2007, an additional
25% on March 1, 2008, and the remaining 50% on March 1, 2009. Based on the closing price of EA's
common stock of $54.72 on March 31, 2006, the last day of EA's Ñscal year, the value of the
restricted stock units granted to each of Mr. Jenson and Mr. Lee was $410,400, and the value of the
restricted stock units granted to each of Dr. Florin and Ms. Smith was $273,600. The restricted stock
units are not entitled to receive dividends, if any, paid by EA on its common stock.(2) Represents options to purchase shares of EA common stock.(3) Represents $720 of term life insurance premiums paid for the beneÑt of each of Mr. Probst and
Ms. Smith and EA-matching 401(k) contributions of $3,150 paid to each in Ñscal 2006; $720 term
life insurance premiums paid for the beneÑt of each of Mr. Probst and Ms. Smith and EA-matching
401(k) contributions of $3,075 each in Ñscal 2005; and $720 term life insurance premiums paid for
28

the beneÑt of each of Mr. Probst and Ms. Smith and EA-matching 401(k) contributions of $9,000
each in Ñscal 2004.(4) Represents a tax ""gross-up'' paid to Mr. Jenson in connection with taxable relocation-related
expenses.(5) Represents the value of unvested restricted stock units granted on March 1, 2006 calculated by
multiplying the closing price of EA common stock on the date of grant, which was $52.03, by the
number of restricted stock units granted to the Named Executive OÇcer.(6) Represents $93,354 in imputed interest income on the remaining portion of Mr. Jenson's interest-free
loan (for more information regarding the loan to Mr. Jenson, see ""Certain Transactions'' below),
$46,529 in relocation expenses, $720 of term life insurance premium paid for the beneÑt of
Mr. Jenson, and EA-matching 401(k) contribution of $3,150.(7) Represents $1,565,552 of a tax ""gross-up'' paid to Mr. Jenson in connection with the forgiveness of an
interest-free loan made by EA to Mr. Jenson in June 2002 (for more information regarding the loan
to Mr. Jenson, see ""Certain Transactions'' below), and $161 of tax ""gross-up'' paid to Mr. Jenson in
connection with taxable relocation-related expenses.(8) Represents $2,000,000 in partial forgiveness of Mr. Jenson's interest-free loan, $119,196 in imputed
interest income on the remaining portion of the interest-free loan (for more information regarding the
loan to Mr. Jenson, see ""Certain Transactions'' below), $720 of term life insurance premium paid for
the beneÑt of Mr. Jenson, and EA-matching 401(k) contribution of $3,075.(9) Represents tax ""gross-up'' paid to Mr. Jenson in connection with taxable relocation-related expenses.
(10) Includes $148,800 imputed interest income on Mr. Jenson's interest-free loan (for more information
regarding the loan to Mr. Jenson, see ""Certain Transactions'' below), $36,000 temporary housing,
Proxy Statem
ent
$104,527 relocation expenses, $720 paid term life insurance premium, and EA-matching 401(k)
contribution of $9,000.(11) Represents automobile and fuel allowance received by Dr. Florin and for which all senior employees
and members of management resident in the UK are generally eligible.(12) Represents EA contribution to UK pension plan of $42,633 and life insurance premiums of $1,757 for
Ñscal 2006; EA contribution to UK pension plan of $45,871 and life insurance premiums of $3,095 for
Ñscal 2005; and EA contribution to UK pension plan of $42,399 and life insurance premiums of
$1,250 for Ñscal 2004.(13) Represents taxes and related tax ""gross up'' paid by EA on behalf of Ms. Smith.(14) Mr. Mattrick and Mr. McMillan ceased serving as executive oÇcers of EA on September 2, 2005.
Had they been serving as executive oÇcers as of the end of EA's Ñscal year, each would have been
one of the top four most highly compensated executive oÇcers (other than the CEO). Under
applicable SEC rules, EA is required to include their compensation information in this proxy
statement.
29

STOCK OPTION GRANTS
The following table shows stock options granted to the Named Executive OÇcers during the last Ñscal
year. In accordance with the rules of the Securities and Exchange Commission, the table sets forth the
hypothetical gains that would exist for the options at the end of their respective 10-year terms. This
hypothetical gain is based on assumed annualized rates of compound stock price appreciation of 5% and
10% from the dates the options were granted to the end of their respective ten-year option terms. Actual
gains, if any, on option exercises are dependent on the future performance of EA's common stock. The
hypothetical gains shown in this table are not intended to forecast possible future appreciation, if any, of
EA's common stock.
Options Granted in Fiscal 2006
Potential Realized Value atPercent ofAssumed Annual Rates ofNumber of Total Options
Stock Price Appreciation forSecurities Granted to ExerciseOption TermUnderlying Employees in Price Per Expiration
Options Granted FY2006(1) Share(2) Date 5% 10%
Lawrence F. Probst IIIÏÏÏÏÏ 225,000(3) 2.41 $52.03 03/01/16 $7,362,312 $18,657,545Warren C. Jenson ÏÏÏÏÏÏÏÏÏ 52,500(3) 0.56 $52.03 03/01/16 $1,717,873 $ 4,353,427V. Paul Lee ÏÏÏÏÏÏÏÏÏÏÏÏÏÏ 52,500(3) 0.56 $52.03 03/01/16 $1,717,873 $ 4,353,427
150,000(4) 1.61 $57.42 09/02/15 $5,416,669 $13,726,904Gerhard FlorinÏÏÏÏÏÏÏÏÏÏÏÏ 35,000(3) 0.37 $52.03 03/01/16 $1,145,249 $ 2,902,285
75,000(4) 0.80 $57.42 09/02/15 $2,708,335 $ 6,863,452Nancy L. Smith ÏÏÏÏÏÏÏÏÏÏ 35,000(3) 0.37 $52.03 03/01/16 $1,145,249 $ 2,902,285Former executive oÇcers:Don A. Mattrick ÏÏÏÏÏÏÏÏÏÏ Ì Ì Ì Ì Ì ÌBruce McMillan ÏÏÏÏÏÏÏÏÏÏ Ì Ì Ì Ì Ì Ì
(1) EA granted and/or assumed options to purchase 9,337,605 shares of common stock to employees
(excluding non-employee directors) in Ñscal 2006.(2) The exercise price of each stock option is equal to the closing price of EA common stock on the date
of grant.(3) These options were granted on March 1, 2006, will Ñrst vest and become exercisable as to 24% of the
underlying shares 12 months from date of grant, and will then vest in 2% increments on the Ñrst
calendar day of each month thereafter for 38 months.(4) These options were granted on September 2, 2005, and will vest and become exercisable as to 100% of
the underlying shares on September 2, 2009.
All option grants listed above were made pursuant to EA's 2000 Equity Incentive Plan. The material terms
of the options, including their exercise price, vesting terms, change of control provisions, and prohibitions
on ""repricing'' are summarized in Appendix A to this proxy statement.
30
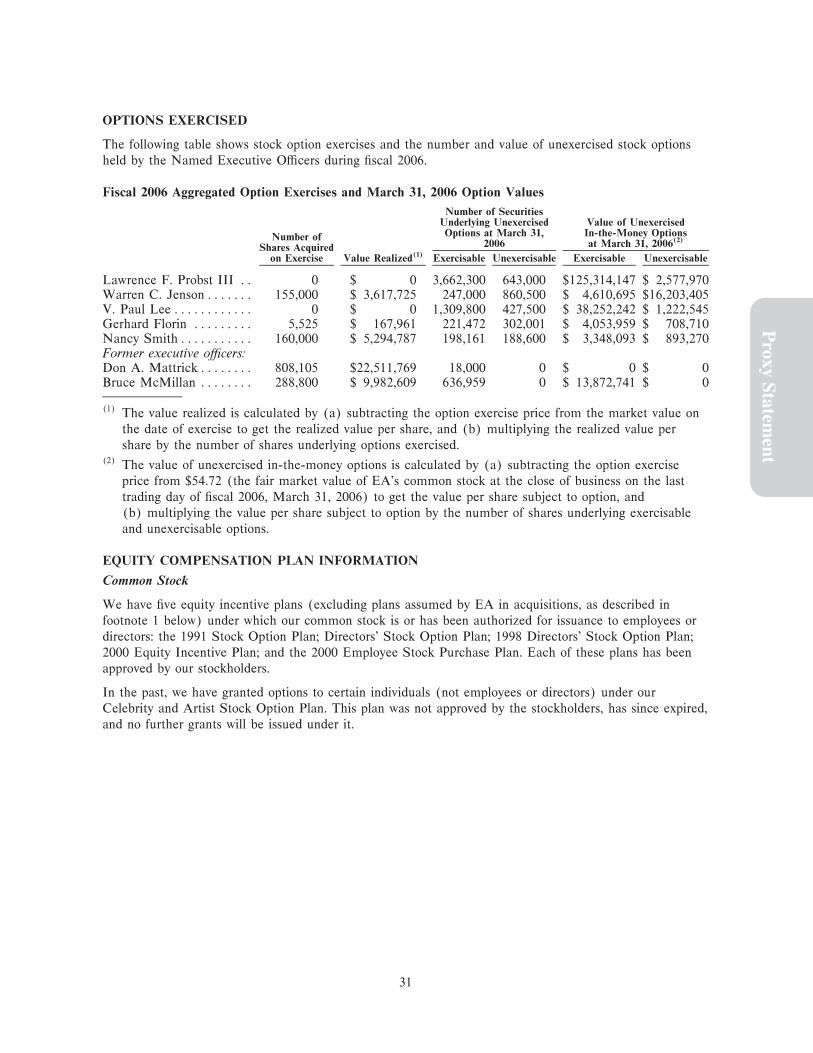
OPTIONS EXERCISED
The following table shows stock option exercises and the number and value of unexercised stock options
held by the Named Executive OÇcers during Ñscal 2006.
Fiscal 2006 Aggregated Option Exercises and March 31, 2006 Option Values
Number of SecuritiesUnderlying Unexercised Value of UnexercisedOptions at March 31, In-the-Money OptionsNumber of
2006 at March 31, 2006(2)
Shares Acquiredon Exercise Value Realized(1) Exercisable Unexercisable Exercisable Unexercisable
Lawrence F. Probst III ÏÏ 0 $ 0 3,662,300 643,000 $125,314,147 $ 2,577,970Warren C. JensonÏÏÏÏÏÏÏ 155,000 $ 3,617,725 247,000 860,500 $ 4,610,695 $16,203,405V. Paul Lee ÏÏÏÏÏÏÏÏÏÏÏÏ 0 $ 0 1,309,800 427,500 $ 38,252,242 $ 1,222,545Gerhard Florin ÏÏÏÏÏÏÏÏÏ 5,525 $ 167,961 221,472 302,001 $ 4,053,959 $ 708,710Nancy SmithÏÏÏÏÏÏÏÏÏÏÏ 160,000 $ 5,294,787 198,161 188,600 $ 3,348,093 $ 893,270Former executive oÇcers:Don A. MattrickÏÏÏÏÏÏÏÏ 808,105 $22,511,769 18,000 0 $ 0 $ 0Bruce McMillan ÏÏÏÏÏÏÏÏ 288,800 $ 9,982,609 636,959 0 $ 13,872,741 $ 0
(1) The value realized is calculated by (a) subtracting the option exercise price from the market value on
the date of exercise to get the realized value per share, and (b) multiplying the realized value per
share by the number of shares underlying options exercised.(2) The value of unexercised in-the-money options is calculated by (a) subtracting the option exercise
price from $54.72 (the fair market value of EA's common stock at the close of business on the last
Proxy Statem
ent
trading day of Ñscal 2006, March 31, 2006) to get the value per share subject to option, and
(b) multiplying the value per share subject to option by the number of shares underlying exercisable
and unexercisable options.
EQUITY COMPENSATION PLAN INFORMATION
Common Stock
We have Ñve equity incentive plans (excluding plans assumed by EA in acquisitions, as described in
footnote 1 below) under which our common stock is or has been authorized for issuance to employees or
directors: the 1991 Stock Option Plan; Directors' Stock Option Plan; 1998 Directors' Stock Option Plan;
2000 Equity Incentive Plan; and the 2000 Employee Stock Purchase Plan. Each of these plans has been
approved by our stockholders.
In the past, we have granted options to certain individuals (not employees or directors) under our
Celebrity and Artist Stock Option Plan. This plan was not approved by the stockholders, has since expired,
and no further grants will be issued under it.
31

The following table gives aggregate information regarding grants under all of our equity incentive plans as
of the end of Ñscal 2006, including the 2000 Equity Incentive and 2000 Employee Stock Purchase Plans,
which are proposed to be amended at the 2006 Annual Meeting as described in ""Proposals To Be Voted
On'' and Appendices A and B.
Number of SecuritiesRemaining Available for
Number of Securities to Weighted-Average Future Issuance Underbe Issued upon Exercise Exercise Price Equity Compensation Plansof Outstanding Options, of Outstanding Options, (Excluding Securities
Plan Category(1) Warrants and Rights Warrants and Rights ReÖected in Column A)
Equity compensation plansapproved by security holders(2) ÏÏ 39,243,560 $40.02 19,772,654
Equity compensation plans notapproved by security holders(3) ÏÏ 174,030 $10.23 0
Total ÏÏÏÏÏÏÏÏÏÏÏÏÏÏÏÏÏÏÏÏÏÏÏÏ 39,417,590 19,772,654
(1) The table does not include information for equity incentive plans we assumed in connection with our
acquisitions of Maxis in 1997, Criterion Software in 2004 and JAMDAT Mobile Inc. in February 2006.
As of March 31, 2006, a total of: (a) 387,728 shares of common stock were issuable upon exercise of
outstanding options issued under the 1995 Maxis stock option plan, with a weighted average exercise
price of $26.47; (b) a total of 9,558 shares were issuable upon exercise of outstanding options issued
under the Criterion stock option plan, with a weighted average exercise price of $1.61; (c) a total of
57,015 shares were issuable upon exercise of outstanding options issued under the JAMDAT Amended
and Restated 2000 Stock Incentive Plan, with a weighted average exercise price of $2.88; and (d) a
total of 1,654,640 shares were issuable upon exercise of outstanding options with a weighted average
exercise price of $47.66, and 9,453 unvested restricted stock units were outstanding under the
JAMDAT 2004 Equity Incentive Plan. No shares remain available for issuance under the Maxis,
Criterion or JAMDAT plans.(2) As of March 31, 2006, a total of: (a) 5,333,870 shares of common stock were issuable upon exercise of
outstanding options under the 1991 Stock Option Plan, with a weighted average exercise price of
$15.16; (b) a total of 49,400 shares of common stock were issuable upon exercise of outstanding
options under the Directors' Stock Option Plan, with a weighted average exercise price of $8.13;
(c) 534,410 shares of common stock were issuable upon exercise of outstanding options under the
1998 Directors' Stock Option Plan, with a weighted average exercise price of $31.00; and
(d) 32,680,470 shares of common stock were issuable upon exercise of outstanding options with a
weighted average exercise price of $44.28, and 645,410 unvested restricted stock units were outstanding
under the 2000 Equity Incentive Plan. The 1991 and Directors' Stock Option Plans have expired and
no further grants may be made under them. As of March 31, 2006, 24,379 shares remained available
for issuance under the 1998 Directors' Plan, however, we do not expect to make any future grants
under this plan. As of March 31, 2006, 17,425,228 shares remained available for issuance under the
2000 Equity Incentive Plan, and 2,323,047 shares remained available for purchase by our employees
under the 2000 Employee Stock Purchase Plan.(3) The Celebrity and Artist Stock Option Plan (""Artist Plan'') was adopted by our Board of Directors in July
1994 and expired in July 2004. The Artist Plan was established as a plan to attract, retain and provide
equity incentives to selected artists and celebrities associated with EA and certain employees of companies
providing services to EA and in which we hold a minority equity interest. The terms regarding the exercise
price of options, vesting, changes in capital structure, assumption of options and acceleration of vesting, and
prohibitions on ""repricing'' under the Artist Plan are substantially similar to the terms of the 2000 Equity
Incentive Plan, contained in Appendix A. As of March 31, 2006, a total of 174,030 shares of common
stock were issuable upon exercise of outstanding options under the Artist Plan, with a weighted average
exercise price of $10.23. No further grants will be made under the Artist Plan.
See also Note 12 to the Financial Statements included in EA's Annual Report on Form 10-K for the
period ended March 31, 2006 for additional information about these plans.
32
EMPLOYMENT AND CHANGE OF CONTROL AGREEMENTS
EA currently has no employment contracts with any Named Executive OÇcer, other than Dr. Florin, or
severance arrangements with respect to their resignation or termination of employment, except that
outstanding awards under the 2000 Equity Incentive Plan, including those held by executive oÇcers, may
immediately vest in connection with certain changes in control or ownership of the Company, unless the
successor company assumes or replaces those awards.
In February 2001, prior to becoming an executive oÇcer of EA, Dr. Florin entered into an agreement with
us setting forth the terms and conditions of his employment (""Florin Employment Agreement''). The
Florin Employment Agreement contains standard terms and conditions generally applicable at that time to
all full-time employees in the UK. In addition, the Florin Employment Agreement provided for:
(i) Dr. Florin's salary at the time (which has been superseded by subsequent salary increases not reÖected
in the agreement); (ii) use of a company car and a fuel allowance (in accordance with company policy,
this beneÑt is generally available to all senior employees and members of management resident in the
UK); (iii) a notice of termination of employment period of six months plus one week for each year of
employment with EA, up to a maximum of twelve additional weeks; and (iv) a six-month non-solicitation
period following the termination of Dr. Florin's employment during which he is prohibited from enticing
away from us any member of our senior management or our sales and development staÅ.
On September 2, 2005, Dr. Florin was promoted to Executive Vice President and General Manager,
International Publishing and accepted a letter setting forth the new terms and conditions of his
employment in connection with this promotion (""Florin Promotion Letter''). Pursuant to the terms of the
Florin Promotion Letter, Dr. Florin's annual gross salary was increased to 314,650 British pounds. His
discretionary bonus target was increased to 60% of his annual gross salary. In addition, Dr. Florin received
Proxy Statem
ent
a stock option grant to purchase 75,000 shares of EA common stock, which option will vest in its entirety
on the fourth anniversary of the date of grant and has an exercise price equal to the closing market price
of EA common stock on the NASDAQ market on the date of grant.
In addition, on September 6, 2005, Dr. Florin accepted an international relocation oÅer letter (""Florin
Relocation Letter'') setting forth the terms and conditions of his relocation to Geneva, Switzerland, where
EA is establishing a headquarters oÇce for its international publishing business. The headquarters
commenced limited operations in early 2006 and is expected to become fully operational later in the year.
At the time Dr. Florin relocates to Geneva, EA intends to enter into an employment agreement with him
that will supersede the Florin Employment Agreement. Pursuant to the terms of the Florin Relocation
Letter, Dr. Florin's salary will be increased to 718,817 Swiss francs (""CHF'') upon his relocation to
Geneva, while his discretionary bonus target will remain at 60% of his annual gross salary. In addition,
Dr. Florin will be eligible to receive an annual housing allowance for a period of up to 5 years of:
(i) CHF 300,000 during year one; (ii) CHF 192,177 during years two and three; (iii) CHF 102,177 in
year four; and (iv) CHF 42,177 in year Ñve. EA will bear the cost of any Swiss social security and income
taxes incurred by Dr. Florin arising from the annual housing allowance. The foregoing amounts reÖect the
deduction of an annual housing contribution of 15% of Dr. Florin's gross annual salary at the beginning of
year one, or CHF 107,823, that Dr. Florin is required to make to EA beginning in year two and continuing
each year during which he receives an annual housing allowance. In the event that Dr. Florin elects to
purchase a primary residence in Switzerland at the beginning of year one, he will receive 70% of the net
housing allowances he would have received during years one through Ñve. In the event Dr. Florin elects to
purchase a home by the end of year one, he will receive 70% of the net housing allowances he would have
received during years two through Ñve. EA will bear the cost of any Swiss social security and income taxes
incurred by Dr. Florin arising from funds provided to him for the purpose of purchasing a primary
residence in Switzerland. Dr. Florin will also be eligible to receive other transfer-related assistance, as well
an annual car allowance of CHF 25,000 and other beneÑts generally available to EA employees relocating
to Switzerland. In the event Dr. Florin voluntarily terminates his employment with EA in Switzerland for
any reason during the Ñrst 12 months following his relocation, Dr. Florin will be required to either repay or
have deducted from his Ñnal salary payment amounts previously paid by EA for transferring Dr. Florin and
his belongings to Switzerland. In the event that EA terminates Dr. Florin's employment for any reason,
33

except for gross misconduct, at any time up to 24 months following his transfer to Switzerland, EA will
pay the costs of relocating him and his family back to the United Kingdom.
COMPENSATION COMMITTEE REPORT ON EXECUTIVE COMPENSATION
The following is the Report of the Compensation Committee describing the compensation policies
applicable to EA's executive oÇcers (including all Section 16 executive oÇcers as well as all other
employees at the level of vice president or above). This information shall not be deemed to be ""soliciting
material'' or to be ""Ñled'' with the Securities and Exchange Commission nor shall this information be
incorporated by reference into any future Ñling under the Securities Act of 1933, as amended, or the
Securities Exchange Act of 1934, as amended, except to the extent that EA speciÑcally incorporates it by
reference into a Ñling.
Responsibilities and Composition of the Compensation Committee
The Compensation Committee's charter, which was most recently amended in July 2005, reÖects the
Committee's responsibilities and provides that all members must be ""independent'', as deÑned in
applicable regulations and listing standards. M. Richard Asher and Robert W. Pittman served on the
Committee throughout Ñscal 2006; William J. Byron served on the Committee until his retirement in July
2005, at which time he was replaced on the Committee by Linda J. Srere. None of these members is a
current or past employee of EA or any of its subsidiaries, nor are any of them eligible to participate in any
of the executive compensation programs of the Company except through automatic formulaic and other
grants pursuant to either the 2000 Equity Incentive Plan or Directors' Plan. In addition, each meets (and,
in the case of Mr. Byron during his tenure on the Committee, met) the deÑnition of ""Outside Director''
for the purposes of administering the compensation programs to meet the tax deductibility criteria under
Section 162(m) of the Internal Revenue Code, and the deÑnition of ""independent director'' under
applicable NASDAQ Marketplace Rules.
The Compensation Committee reviews and approves the compensation philosophy and programs for EA's
executives. In Ñscal 2006, the Compensation Committee reviewed and approved the salaries, bonuses and
equity compensation of each of EA's executive oÇcers, other than the Chief Executive OÇcer whose
salary, bonus and equity compensation were reviewed by the Compensation Committee and approved by
the independent members of the Board of Directors after discussing the Compensation Committee's
recommendation. The Compensation Committee also administers the Company's equity compensation
plans and the bonus plan for executive oÇcers and all signiÑcant or non-standard equity grants for other
employees. During Ñscal 2006, the Compensation Committee engaged in extensive reviews of long-term
incentive compensation strategies in light of stock option expensing, responsible dilution management, and
a desire to continue to eÅectively attract, motivate and retain key talent. During the course of these
reviews, the Compensation Committee evaluated the merits of several alternatives for delivering long-term
incentives.
The Compensation Committee meets at scheduled times throughout the year and also takes action by
written consent, often after informal telephone discussions amongst the members of the Committee. The
Compensation Committee met six times in Ñscal 2006. The Company's Human Resources and Legal
departments support the Committee in its work. In addition, the Compensation Committee has the
authority to engage the services of outside advisors. During Ñscal 2006, the Compensation Committee
engaged an independent compensation consulting Ñrm as an advisor and resource to assist the Committee
in its review of the compensation for executive oÇcers and other elements of the Company's total
compensation strategy.
Compensation Philosophy and Challenges
EA's compensation philosophy to attract, motivate and retain the best executive talent relies on two basic
principles. First, a signiÑcant portion of each executive's compensation should be in the form of equity to
align the executive's interests with those of EA's stockholders. Second, a signiÑcant portion of each
34

executive's cash compensation should be performance-based and ""at risk'' Ì varying from year to year
depending on EA's Ñnancial and operational performance and on the individual meeting Ñnancial and other
performance measures. Consistent with this philosophy, and in light of the Company's Ñnancial
performance during Ñscal 2006, several of EA's most senior executive oÇcers, including the Chief
Executive OÇcer, all Executive Vice Presidents, and the CEO's other executive direct reports, did not
receive an incentive bonus for the second consecutive year. The Compensation Committee and the
Company remain committed to this ""pay-for-performance'' philosophy which ensures that executive
compensation will reÖect the Company's and the executive's performance.
As the employment market has improved over the last Ñscal year, EA has experienced competitive
recruiting eÅorts aimed at its executives. EA's leading position within the entertainment industry makes it
a prime target for recruiting of executives and key creative talent.
The Company also continues to recruit for key talent and executives. Competition in attracting and
retaining talent comes primarily from three broad industry segments: entertainment, high technology and
consumer packaged goods. EA has continued to build its senior management team and has been successful
in attracting talent from the entertainment software industry and other market segments to add
management depth and experience to the organization. The Company continues to look at creative new
methods using its compensation programs to successfully recruit new talent into the organization while
maintaining parity with compensation of current key executives. Just as important as recruiting new talent
and executives into the organization, is the internal development and retention of key talent and
executives. As EA grows, it will, like all organizations, have normal turnover within its executive ranks.
Data Considered and Process Used
Proxy Statem
ent
In Ñscal 2006, at the direction of the Compensation Committee, EA's Human Resources department
gathered executive compensation data from nationally recognized surveys and provided a comprehensive
analysis of this data to the Compensation Committee and its independent compensation consulting Ñrm.
The factors used to determine the participants in the survey included industry type, annual revenues,
industry growth rate and geography. Companies included in this data were from high technology (primarily
software developers), entertainment and selected packaged goods companies as reference points. The
companies in the compensation survey overlap considerably with the companies contained in the RDG
Technology Composite index. Additional companies included in the survey group were judged to be
relevant because they compete for executive talent with EA.
EA's executive level positions, including the CEO, were matched to comparable survey positions and
competitive market compensation levels to determine base salary ranges, target incentives and target total
cash compensation. EA's Human Resources department participated in comprehensive surveys such as the
Buck Global Long-Term Incentive Practices Survey and the Radford High Tech Executive Compensation
Survey to assist in determining appropriate equity compensation levels. This competitive market data was
reviewed by the Human Resources department with the CEO for each benchmark executive-level position,
and with the Compensation Committee for the CEO and other key executives. The Compensation
Committee also considers each executive's responsibility level and EA's Ñscal year performance compared
to objectives and potential performance targets for the subsequent year.
Executive Compensation
The Compensation Committee awards executive compensation in three components: base salary, cash
incentive bonus and equity incentives. The Compensation Committee reviews and, if appropriate, adjusts
executive base salary and equity compensation each February, and reviews executive bonus recommenda-
tions and approves bonus payments each May.
Base Salary. In reviewing executive base salaries, the Compensation Committee considered each
executive's performance over the last year as reported by the CEO and the Head of Human Resources,
each executive's responsibility level, and the third quartile (50th to 75th percentile) of base salaries
reported in the competitive market compensation surveys noted above. In Ñscal 2006, those eligible
35

executives, including the Named Executive OÇcers (other than Mr. Mattrick and Mr. McMillan who
were no longer serving as executive oÇcers, and the CEO), received an annual merit increase to their base
salary during the Committee's February 2006 compensation review. Although the CEO did not receive a
merit increase to his base salary in Ñscal 2006, he did receive a market-based salary adjustment. Merit-
based salary increases for EA's executives were, at 3.5% in aggregate, approximately the same on a
percentage basis as merit-based salary increases received by the overall non-executive employee population.
Incentive Bonus. In Ñscal 2006, the Company's annual incentive bonus plan remained the same as it was
in Ñscal 2005. The Compensation Committee assigned a target bonus to each executive (expressed as a
percentage of that executive's base salary) designed to deliver total target cash compensation (base salary
plus target bonus) in the third quartile (50th to 75th percentile) of the competitive market compensation
surveys noted above. The Compensation Committee also determined which portions of each executive's
target bonus are dependent on EA's Ñnancial performance and individual achievements, and approved the
overall mechanics and structure of the bonus plan. As a result of EA's Ñnancial performance in Ñscal
2006, and in keeping with the Company's strong pay-for-performance philosophy, the Compensation
Committee approved the recommendation of EA's CEO and members of his executive staÅ that the CEO,
all Executive Vice Presidents and the CEO's other executive direct reports should not be awarded
incentive bonuses. Other executives and employees received bonuses that were substantially below their
target levels.
Stock-Based Compensation. The Company and the Compensation Committee continue to believe in the
use of stock-based compensation as a core component of the rewards strategy to achieve the Company's
goals of attracting the best talent to EA, retaining its high-performing teams and providing an incentive for
its executives to perform at their highest levels. The Company and the Compensation Committee also
continue to believe that stock options reward executives in a manner consistent with the value that is
created for the Company's stockholders when the Company achieves its goals, and that performance is
reÖected in the growth of the Company's share price. The Company and the Compensation Committee
have engaged in extensive reviews of long-term incentive compensation strategies in light of newly-
applicable stock-based compensation expensing requirements, responsible dilution management, and a
desire to continue to eÅectively attract, motivate and retain key talent. After extensive reviews of various
equity incentive alternatives, the Company and the Compensation Committee determined that a mix of
equity-based compensation, including both stock options and restricted stock unit awards
(""RSU awards''), would be an appropriate and eÅective means of providing equity compensation which is
aligned with competitive trends, consistent with the Company's ownership philosophy, helpful in the
retention of executives, and a responsible use of the Company's equity in light of the expense recognition
requirements of SFAS 123R.
Historically, the Compensation Committee has granted stock options, but not RSU awards, to executive
oÇcers when they Ñrst join EA, in connection with a signiÑcant change in responsibilities, annually to
provide incentives for continued performance and retention of employment and, occasionally, to achieve
internal equity between diÅerent positions within EA. The target value granted to each executive is based
upon a combination of comparable external market benchmarks and internal parity among similarly
situated executives. In addition, to determine competitive grant levels, the Committee reviews the ongoing
stock option grant value at the market 75th percentile for each benchmark position. Individual grants are
structured to achieve a future value in unvested awards equal to a multiple of each executive's annual base
salary assuming both growth and stock appreciation. All stock options granted to the Named Executive
OÇcers in Ñscal 2006 were made at fair market value on the date of grant and vest as described in
""Options Granted in Fiscal 2006'' above. All RSU awards granted in Ñscal 2006 to the Named Executive
OÇcers vest as described in the footnotes to the Summary Compensation Table above.
In Ñscal 2006, the Compensation Committee granted a mix of stock options and RSU awards to certain
executive oÇcers (other than the CEO) designed to deliver 70% of the target value in stock options and
30% of the value in RSU awards. This mix of stock options and RSU awards reÖects the Compensation
Committee's belief that stock options should remain the primary vehicle for encouraging equity ownership
by executive oÇcers and aligning their interests with EA's stockholders', while RSU awards allow the
36

Company keep abreast of competitive trends in equity compensation and aid in the retention of key
employees. The Compensation Committee determined that, unlike other executives, the CEO's equity
compensation should be structured to achieve maximum alignment with the interests of EA's stockholders.
As a result, the Compensation Committee granted a stock option to the CEO in Ñscal 2006 but did not
grant him an RSU award.
Excluding stock options and RSU awards assumed by EA in connection with its acquisition of JAMDAT
Mobile Inc., stock options and RSU awards granted to all executives represented 13.8% of total stock-
based compensation awarded during Ñscal 2006 and 0.37% of total shares outstanding as of the end of
Ñscal 2006. Overall, excluding stock options and RSU awards assumed by EA in connection with its
acquisition of JAMDAT, total stock option and RSU award grants made by EA to all employees during
Ñscal 2006 represented approximately 2.67% of total shares outstanding as of the end of Ñscal 2006.
Executive Ownership Requirements. In Ñscal 2004, the Board of Directors implemented EA stock
ownership requirements for all Section 16 executive oÇcers. These ownership requirements are established
as multiples of the executive's base pay, ranging from one to six times the executive's annual salary
depending on the executive's level within the organization. In some cases, the ownership requirements are
phased in on the basis of the executive's tenure. The Compensation Committee believes these ownership
guidelines further align the interests of EA's stockholders and executives. As of March 31, 2006, each of
EA's executives had either met their then-applicable stock ownership requirements or had not yet reached
the date on which they are required to meet their ownership requirements.
Exchange Program and Additional Retention Awards
In June 2006, the Compensation Committee considered the ongoing impact of the recent trading prices of
Proxy Statem
ent
EA's Common Stock on the Company's ability to retain employees. The Compensation Committee
recognized that many of the Company's employees hold options with exercise prices signiÑcantly higher
than the current market price of EA's Common Stock. The Compensation Committee concluded that to
enhance long-term stockholder value, the Company needed to maintain competitive employee compensa-
tion and incentive programs that will assist in motivating and retaining employees. The Compensation
Committee believes that a meaningful equity stake in the success of the Company is a critical component
of these programs. In considering the terms of the Exchange Program described under Proposal 2 above,
the Compensation Committee consulted with its independent compensation consulting Ñrm, outside legal
counsel, outside Ñnancial consultants (through management), and senior management of the Company.
The Compensation Committee considered the likely positive impact of the Exchange Program on
employee motivation and retention, and reviewed the terms and accounting consequences of the Exchange
Program, as described under Proposal 2 above. The Compensation Committee concluded that the
Exchange Program will provide the Company with an opportunity to enhance incentives for eligible
employees to remain with the Company, while reducing the Company's outstanding overhang. The
Compensation Committee also believes that the Exchange Program, pursuant to which employees will be
aÅorded the opportunity to exchange outstanding stock options for restricted stock or restricted stock units,
will further align the Company's current equity compensation with the Company's and Compensation
Committee's philosophy of shifting from the exclusive use of stock options to using a mix of stock options
and other equity-based incentives, such as RSU awards, to provide long-term equity incentives to
employees.
The Compensation Committee also concluded that while the Exchange Program would aÅord signiÑcant
retention beneÑts, these beneÑts would not necessarily be suÇcient to provide adequate retention for
certain key employees due to the signiÑcant competition for talented employees in EA's industry.
Accordingly, and again in consultation with various outside advisors and senior management, the
Compensation Committee also approved a program of additional retention awards consisting of a
combination of stock options and RSU awards to acquire up to 2.8 million total shares to be granted in
August 2006, as further described in Proposal 2 above. The Compensation Committee believes that the
combination of the Exchange Program and these new retention awards is necessary to achieve the primary
37
objective of improving the Company's ability to retain and motivate employees, while still having a
favorable impact on overhang.
Fiscal 2006 CEO Compensation
Compensation for the CEO is determined through a process similar to that discussed above for other
executives in general. In Ñscal 2006, EA's Human Resources department gathered CEO compensation
data from several nationally recognized surveys and conducted a proxy analysis comparing Mr. Probst's
compensation to that of other CEOs. The analysis, which was reviewed by the Compensation Committee's
independent compensation consulting Ñrm, demonstrated that Mr. Probst's total cash compensation
(consisting of base salary plus bonus target) was below the 50th percentile of the market while his 2005
equity grant value was within the highest quartile of the market. In February 2006, this analysis was
provided to the Compensation Committee for consideration.
The Compensation Committee then conferred with the full Board (other than Mr. Probst) in a closed
session to further review and discuss the results of the market analysis, to review Mr. Probst's performance
evaluation, and to recommend compensation adjustments. The Compensation Committee recommended,
and the independent members of the Board approved, a market-based salary increase for Mr. Probst of
3.5%, establishing a new base salary of $734,850 per annum. As a result of EA's Ñnancial performance in
Ñscal 2006, Mr. Probst did not receive a cash performance incentive bonus for Ñscal 2006.
Also in February 2006, the Compensation Committee approved a new stock option grant to Mr. Probst for
225,000 shares of common stock based upon the retention and incentive factors discussed above and taking
into account market comparisons, prior option grant history, the level of vested versus unvested shares and
the number of shares Mr. Probst already owned at the time of the grant. The shares will Ñrst vest and
become exercisable as to 24% of the shares 12 months after the date of grant, and will then vest as to an
additional 2% of the shares on the Ñrst calendar day of each month thereafter for 38 months. This grant
reÖects the Compensation Committee's continuing policy to subject a substantial portion of Mr. Probst's
overall compensation each year to the market performance of the Company's common stock, to maintain
his option holdings at a level consistent with that for other chief executive oÇcers of the survey
companies, and to maximize the retention value of those option holdings.
Other
Company-provided air travel for EA's executives is for business purposes only. EA's use of non-
commercial aircraft is limited to appropriate business travel.
In June 2002, EA hired Warren Jenson as Chief Financial and Administrative OÇcer. As part of its
eÅorts to recruit Mr. Jenson, EA agreed to loan him $4 million, to be forgiven over four years based on
his continuing employment. The loan does not bear interest. The loan was made prior to enactment of the
Sarbanes-Oxley Act of 2002 and the prohibition on loans to executive oÇcers. However, the Compensation
Committee did review this proposed arrangement in light of the then-current environment and sensitivity
to transactions with management and determined the environment for recruiting highly regarded and
talented chief Ñnancial oÇcers was, and has been, intensely competitive, and the Compensation
Committee believed that a competitive compensation oÅer tied to continuing service was in EA's best
interests and signiÑcantly more beneÑcial to the Company than unrestricted cash payments. In June 2004,
pursuant to the terms of the loan agreement, EA forgave $2 million of the loan and provided Mr. Jenson
approximately $1.6 million to oÅset the tax implications of the forgiveness. The remaining outstanding loan
balance of $2 million was forgiven on June 24, 2006. No additional funds were provided to Mr. Jenson to
oÅset the tax implications of the forgiveness of the remaining $2 million.
Tax Law Limits on Executive Compensation
Section 162(m) of the Internal Revenue Code limits deductions for executive compensation in excess of
$1 million except for certain compensation which qualiÑes for a performance-based exception. Certain
types of compensation in excess of $1 million are deductible by the Company if performance criteria are
38
speciÑed in detail and are contingent on stockholder approval of the compensation arrangement. The
Company and the Compensation Committee have endeavored to structure executive compensation plans to
achieve maximum deductibility under Section 162(m) with minimal sacriÑces of Öexibility and impact on
corporate objectives.
The Compensation Committee has structured the current use of stock option arrangements in a manner
intended to achieve tax deductibility of such amounts. Although the Compensation Committee has the
ability to grant restricted stock units subject to performance factors in order to achieve maximum
deductibility under Section 162(m), it elected not to do so in Ñscal 2006. With respect to non-equity
compensation arrangements, the Compensation Committee has reviewed the terms of those arrangements
most likely to be subject to the deduction limitation of Section 162(m). Cash compensation paid to EA's
Named Executive OÇcers did not exceed the Section 162(m) thresholds in Ñscal 2006.
While the Compensation Committee will continue to consider deductibility under Section 162(m) with
respect to future compensation arrangements with executives, deductibility will not be the only factor used
in ascertaining appropriate levels or modes of compensation. Since corporate objectives may not always be
consistent with the requirements for full deductibility, it is possible that the Committee may, if consistent
with EA's ""pay-for-performance'' philosophy described above, enter into compensation arrangements in the
future under which payments are not fully deductible under Section 162(m).
COMPENSATION COMMITTEE
M. Richard Asher (Chairman)
Robert Pittman
Proxy Statem
ent
Linda J. Srere
The following Report of the Audit Committee shall not be deemed to be ""soliciting material'' or to be
""filed'' with the Securities and Exchange Commission nor shall this information be incorporated by reference
into any future filing under the Securities Act of 1933, as amended, or the Securities Exchange Act of 1934,
as amended, except to the extent that EA specifically incorporates it by reference into a filing.
REPORT OF THE AUDIT COMMITTEE OF THE BOARD OF DIRECTORS
The Audit Committee of the Board of Directors operates under a written charter, which is reviewed on an
annual basis and was most recently amended in May 2006. The Audit Committee is comprised of three
non-employee directors, each of whom in the opinion of the Board of Directors meets the current
independence requirements and Ñnancial literacy standards of the NASDAQ Marketplace Rules, as well
as the independence requirements of the Securities and Exchange Commission (""SEC''). During Ñscal
2006, the Audit Committee consisted of M. Richard Asher, Gary M. Kusin and Gregory B. MaÅei. In the
opinion of the Board of Directors, Mr. MaÅei meets the criteria for a ""Ñnancial expert'' as set forth in
applicable SEC rules as well as the above-mentioned independence requirements.
EA's management is primarily responsible for the preparation, presentation and integrity of the Company's
Ñnancial statements. EA's independent registered public accounting Ñrm, KPMG LLP (""independent
auditors''), is responsible for performing an independent audit of the Company's (i) Ñnancial statements
and expressing an opinion as to the conformity of the Ñnancial statements with generally accepted
accounting principles, and (ii) internal control over Ñnancial reporting in accordance with the auditing
standards of the Public Company Accounting Oversight Board (United States) and issuing a report
thereon.
The function of the Audit Committee is to assist the Board of Directors in its oversight responsibilities
relating to the integrity of EA's accounting policies, internal controls and Ñnancial reporting. The Audit
Committee reviews EA's quarterly and annual Ñnancial statements prior to public earnings releases and
submission to the SEC; reviews and evaluates the performance of EA's internal audit function; reviews and
39

evaluates the performance of EA's independent auditors; consults with the independent auditors and EA's
internal audit function regarding internal controls and the integrity of the Company's Ñnancial statements;
assesses the independence of the independent auditors; and is responsible for the selection of the
independent auditors.
In this context, the Audit Committee has met and held discussions with members of management, EA's
internal audit function and the independent auditors. Management has represented to the Audit
Committee that the Company's consolidated Ñnancial statements were prepared in accordance with
accounting principles generally accepted in the United States, and the Audit Committee has reviewed and
discussed the consolidated Ñnancial statements with management and the independent auditors.
Management has also represented to the Audit Committee that the Company's internal control over
Ñnancial reporting was eÅective as of the end of the Company's most recently-completed Ñscal year, and
the Audit Committee has reviewed and discussed the Company's internal control over Ñnancial reporting
with management and the independent auditors. The Audit Committee also discussed with the
independent auditors matters required to be discussed by Statement on Auditing Standards No. 61
(Communications with Audit Committees), as amended, including the quality and acceptability of the
Company's Ñnancial reporting process and internal controls. The Audit Committee has also discussed with
the Company's independent auditors the overall scope and plans for their annual audit and reviewed the
results of that audit with management and the independent auditors.
In addition, the Audit Committee has discussed with the independent auditors the auditors' independence
from the Company and its management, including the matters in the written disclosures required by
Independence Standards Board Standard No. 1 (Independence Discussions with Audit Committees). The
Audit Committee has also considered whether the provision of any non-audit services (as described above
under ""Proposal 5. RatiÑcation of the Appointment of KPMG LLP, Independent Auditors Ì Fees of
Independent Auditors'') and the employment of former KPMG LLP employees by the Company is
compatible with maintaining the independence of KPMG LLP.
The members of the Audit Committee are not engaged in the practice of auditing or accounting. In
performing its functions, the Audit Committee necessarily relies on the work and assurances of the
Company's management and independent auditors.
In reliance on the reviews and discussions referred to in this report and in light of its role and
responsibilities, the Audit Committee recommended to the Board of Directors that the audited Ñnancial
statements of the Company for the three years ended March 31, 2006 be included for Ñling with the SEC
in the Company's Annual Report on Form 10-K for the year ended March 31, 2006. The Audit
Committee has also approved the selection of KPMG LLP as the Company's independent auditors for
Ñscal 2007.
AUDIT COMMITTEE
M. Richard Asher
Gary M. Kusin
Gregory B. MaÅei (Chairman)
40
OTHER INFORMATION
CERTAIN TRANSACTIONS
Indebtedness of Management
On June 24, 2002, we hired Warren Jenson as our Chief Financial and Administrative OÇcer and agreed
to loan him $4 million, to be forgiven over four years based on his continuing employment. The loan does
not bear interest. On June 24, 2004, pursuant to the terms of the loan agreement, we forgave $2 million of
the loan and provided Mr. Jenson approximately $1.6 million to oÅset the tax implications of the
forgiveness. The remaining outstanding loan balance of $2 million was forgiven on June 24, 2006. No
additional funds were provided to oÅset the tax implications of the forgiveness of the remaining $2 million.
COMPENSATION COMMITTEE INTERLOCKS AND INSIDER PARTICIPATION
M. Richard Asher and Robert W. Pittman served on the Compensation Committee throughout Ñscal
2006; William J. Byron served on the Compensation Committee until his retirement in July 2005, at which
time he was replaced on the Compensation Committee by Linda J. Srere. None of these individuals is an
employee or current or former oÇcer of EA. No EA oÇcer serves or has served since the beginning of
Ñscal 2006 as a member of the board of directors or the compensation committee of a company at which a
member of EA's Compensation Committee is an employee or oÇcer.
SECTION 16(a) BENEFICIAL OWNERSHIP REPORTING COMPLIANCE
Proxy Statem
ent
Section 16(a) of the Securities Exchange Act of 1934 requires EA's directors and executive oÇcers, and
persons who own more than ten percent of a registered class of EA's equity securities, to Ñle reports of
ownership and changes in ownership of common stock and other equity securities of EA. We have adopted
procedures to assist EA's directors and oÇcers in complying with these requirements, which include
assisting oÇcers and directors in preparing forms for Ñling.
To EA's knowledge, based solely upon review of such reports furnished to us and written representations
that no other reports were required, we believe that during the Ñscal year ended March 31, 2006, all
Section 16(a) Ñling requirements applicable to our oÇcers, directors and greater-than-ten-percent
stockholders were complied with on a timely basis.
STOCKHOLDER PROPOSALS FOR 2007 ANNUAL MEETING
If you would like us to consider a proposal to be included in our 2007 proxy statement and proxy card, you
must deliver it to the Company's Corporate Secretary at our principal executive oÇce no later than
March 2, 2007.
Stockholders who otherwise wish to present a proposal at the 2007 Annual Meeting of Stockholders must
deliver written notice of the proposal to our Corporate Secretary c/o Electronic Arts Inc., 209 Redwood
Shores Parkway, Redwood City, CA 94065, no earlier than March 24, 2007 and no later than April 23,
2007 (provided, however, that if the 2007 Annual Meeting is held earlier than June 27, 2007 or later than
August 26, 2007, proposals must be received no earlier than the close of business on the later of the
90th day prior to the 2007 Annual Meeting or the 10th day following the day on which public
announcement of the 2007 Annual Meeting is Ñrst made). The submission must include certain
information concerning the stockholder and the proposal, as speciÑed in the Company's amended and
restated bylaws. We have Ñled our amended and restated bylaws as an exhibit to our Quarterly Report on
Form 10-Q for the quarter ended June 30, 2004, which you may access through the SEC's electronic data
system called EDGAR at www.sec.gov. You may also request a copy of our amended and restated bylaws
by contacting our Corporate Secretary at the address above.
41
HOUSEHOLDING OF PROXY MATERIALS
The SEC has adopted rules that permit companies and intermediaries (e.g., brokers) to satisfy the delivery
requirements for proxy statements and annual reports with respect to two or more stockholders sharing the
same address by delivering a single proxy statement and annual report addressed to those stockholders.
This process, which is commonly referred to as ""householding'', potentially means extra convenience for
stockholders and cost savings for companies.
This year, a number of brokers with account holders who are EA stockholders will be ""householding'' our
proxy materials. A single proxy statement will be delivered to multiple stockholders sharing an address
unless contrary instructions have been received from the aÅected stockholders. Once you have received
notice from your broker that they will be ""householding'' communications to your address, ""householding''
will continue until you are notiÑed otherwise or until you revoke your consent. If, at any time, you no
longer wish to participate in ""householding'' and would prefer to receive a separate proxy statement and
annual report, please notify your broker, direct your written request to our Corporate Secretary at our
principal executive oÇce, or contact our Corporate Secretary at (650) 628-1500. Stockholders who
currently receive multiple copies of the proxy statement and annual report at their address and would like
to request ""householding'' of their communications should contact their broker.
OTHER BUSINESS
The Board does not know of any other matter that will be presented for consideration at the meeting
except as speciÑed in the notice of the meeting. If any other matter does properly come before the Annual
Meeting, it is intended that the proxies will be voted in respect thereof in accordance with the judgment of
the persons voting the proxies.
By Order of the Board of Directors,
STEPHEN G. BEN πE
Senior Vice President, General Counseland Secretary
REQUESTS TO THE COMPANY
The Company will provide without charge, to each person to whom a proxy statement is delivered, upon
request of such person and by Ñrst class mail within one business day of receipt of such request, a copy of
the 2000 Equity Incentive Plan and 2000 Employee Stock Purchase Plan. Any such request should be
directed as follows: Stock Administration Department, Electronic Arts Inc., 209 Redwood Shores Parkway,
Redwood City, CA 94065 Ì telephone number (650) 628-1500.
42
Appendix A
GENERAL DESCRIPTION OF THE 2000 EQUITY INCENTIVE PLAN
History
The Company's 2000 Equity Incentive Plan (the ""Equity Plan'') was adopted by our Board of Directors
on January 27, 2000 and approved by our stockholders on March 22, 2000. The Equity Plan has been
amended several times since it was initially adopted. The following general description of the Equity Plan
includes all prior amendments as well as amendments proposed to be adopted by the Company's
stockholders at the 2006 Annual Meeting.
Shares Subject to the Equity Plan
The stock subject to issuance under the Equity Plan consists of shares of the Company's authorized but
unissued common stock. The Equity Plan, as amended to date, authorizes the issuance of up to
67,400,000 shares of common stock pursuant to awards of stock options, stock appreciation rights,
restricted stock and restricted stock units. In addition, shares are again available for grant and issuance
under the Equity Plan that (a) were subject to an option granted under the Equity Plan that terminated,
to the extent then unexercised, (b) were subject to a restricted stock or restricted stock unit award under
the Equity Plan that is subsequently forfeited or repurchased by us at the original issue price, if any, or
(c) are subject to an award of restricted stock or restricted stock units under the Equity Plan that
otherwise terminates without shares being issued. The following types of shares are not be available for
future grant or issuance as awards under the Equity Plan: (x) shares that are not issued or delivered as a
result of the net settlement of a stock option or stock appreciation right; (y) shares that are used to pay
the exercise price or withholding taxes related to an award granted under the Equity Plan; and (z) shares
Proxy Statem
ent
that are repurchased by us with the proceeds of a stock option exercise. Provided that the stockholders
approve Proposal 2 (""Approval of The Exchange Program'') set forth in the proxy statement prepared in
connection with our 2006 Annual Meeting of Stockholders, we will amend the Equity Plan to limit the
number of shares subject to options surrendered and cancelled in the Exchange Program that will again
become available for issuance under the Equity Plan to 7 million plus the number of shares necessary for
the issuance of the restricted stock rights to be granted in connection with the Exchange Program.
The number of shares issuable under the Equity Plan, and under outstanding options and other awards, is
subject to proportional adjustment to reÖect stock splits, stock dividends and other similar events.
Limitation on Number of Shares Subject to Restricted Stock Awards and Restricted Stock Unit Awards.
The number of shares of common stock that may be issued pursuant to awards of restricted stock and
restricted stock units may not exceed 4,000,000 in the aggregate. As proposed to be amended, the number
of shares that would be issuable pursuant to awards of restricted stock and restricted stock units would be
increased to 15,000,000 in the aggregate.
Eligibility
The Equity Plan provides for the issuance of incentive stock options, nonqualiÑed stock options, stock
appreciation rights, restricted stock and restricted stock units. The Equity Plan provides that employees
(including oÇcers and directors who are also employees) of EA or any parent or subsidiary of EA may
receive incentive stock options under the Equity Plan. NonqualiÑed stock options, stock appreciation rights,
restricted stock, and restricted stock units may be granted to employees and directors of EA or any parent
or subsidiary of EA. As of May 31, 2006, approximately 7,100 persons were in the class of persons eligible
to participate in the Equity Plan. No person is eligible to receive more than 1,400,000 shares of common
stock (of which no more than 400,000 shares may be covered by awards of restricted stock) in any
calendar year, other than new employees who will be eligible to receive up to 2,800,000 shares of common
stock (of which no more than 800,000 shares may be covered by awards of restricted stock) in the
calendar year in which they commence employment. No awards of restricted stock or stock appreciation
A-1

rights have been made to date under the Equity Plan. A participant may hold more than one award
granted under the Equity Plan.
Administration
The Equity Plan is administered by our Compensation Committee. All of the members of the
Compensation Committee are ""non-employee'' and ""independent directors'' under applicable federal
securities laws and the NASDAQ National Market listing requirements and ""outside directors'' as deÑned
under applicable federal tax laws. The Compensation Committee has the authority to construe and
interpret the Equity Plan, grant awards and make all other determinations necessary or advisable for the
administration of the Equity Plan. The members of the Compensation Committee receive no compensation
for administering the Equity Plan other than their compensation for being Board and Committee members.
The Company bears all expenses in connection with administration of the Equity Plan and has agreed to
indemnify members of the Compensation Committee in connection with their administration of the Equity
Plan. The Compensation Committee may delegate to one or more oÇcers of the Company the authority to
grant Awards under the Equity Plan to participants who are not executives of the Company.
Stock Options
Stock options granted under the Equity Plan may be either incentive stock options or nonqualiÑed stock
options. The exercise period of stock options is determined by the Compensation Committee but, in no
event, may stock options be exercisable more than ten years from the date they are granted. The Equity
Plan provides the Compensation Committee with the ability, at its discretion, to grant performance-based
options subject to the achievement of one or more of the performance factors described under the heading
""Performance Factors'' below.
Exercise Price; No Repricings
The Compensation Committee determines the exercise price of each option granted under the Equity Plan.
The option exercise price for each incentive and nonqualiÑed stock option share must be no less than 100%
of the ""fair market value'' (as deÑned in the Equity Plan) of a share of common stock at the time the
stock option is granted. In the case of an incentive stock option granted to a stockholder that owns more
than 10% of the total combined voting power of all classes of stock of EA or any parent or subsidiary of
EA (a ""Ten Percent Stockholder''), the exercise price for each such incentive stock option must be no
less than 110% of the fair market value of a share of common stock at the time the incentive stock option
is granted. Pursuant to an amendment to the Equity Plan approved by the Board of Directors in February
2002, the exercise price of outstanding options issued under the Equity Plan may not be reduced without
stockholder approval.
The exercise price of options and purchase price of shares granted under the Equity Plan may be paid as
approved by the Compensation Committee at the time of grant: (a) in cash (by check); (b) by
cancellation of indebtedness of the Company to the award holder; (c) by surrender of shares that either:
(1) have been owned by the award holder for more than six (6) months and have been paid for within the
meaning of SEC Rule 144; or (2) were obtained by the award holder in the public market; (d) by waiver
of compensation due or accrued for services rendered; (e) with respect only to purchases upon exercise of
an option, and provided that a public market for the Company's stock exists: (1) subject to applicable
laws, by a ""same-day sale'' commitment from the optionee and a National Association of Securities
Dealers, Inc. (""NASD'') broker; or (2) by a ""margin'' commitment from the optionee and an NASD
broker; (f) by withholding from the shares to be issued upon exercise of an award that number of shares
having a fair market value equal to the minimum amount required to satisfy the exercise price or purchase
price; (g) by any combination of the foregoing; or (h) such other consideration and method of payment
for issuance of shares to the extent permitted by applicable laws.
A-2

Outside Directors
Our non-employee directors are entitled to receive automatic annual grants of options to purchase shares
of our common stock under the Equity Plan. Each non-employee director who Ñrst becomes a member of
the Board of Directors is granted an option to purchase 25,000 shares of common stock. Upon re-election
to our Board of Directors following each annual meeting of our stockholders, each non-employee director
is automatically granted an additional option to purchase 10,000 shares of common stock. If a non-
employee director has not served on our Board of Directors for a full year at the time of the annual
meeting of our stockholders, such director will receive a pro-rated annual grant.
Options issued to outside directors upon their initial election to the Board are exercisable as to 2% of the
shares on the date of grant and as to an additional 2% of the shares on the Ñrst day of each calendar
month after the date of grant so long as the outside director continues as a member of the Board. The
vesting schedule for annual grants made to directors upon their re-election to the Board is subject to the
discretion of the Compensation Committee.
In the event of our dissolution or liquidation or a ""change in control'' transaction, options granted to our
non-employee directors under the Equity Plan will become 100% vested and exercisable in full.
In addition, our non-employee directors may elect to receive all or a portion of their cash compensation in
shares of common stock. Directors making this election are entitled to receive shares having a value equal
to 110% of the amount of the cash compensation foregone.
Stock Appreciation Rights
The Compensation Committee may grant stock appreciation rights (a ""SAR'' or ""SARs'') as stand-alone
Proxy Statem
ent
awards or in addition to, or in tandem with, other awards under the Equity Plan under such terms,
conditions and restrictions as the Compensation Committee may determine. A SAR is an award which
provides the holder with the right to receive the appreciation in value of a set number of shares of
company stock over a set period of time. A SAR is similar to an option in that the holder beneÑts from
any increases in stock price above the exercise price set forth in the award agreement. However, unlike an
option, the holder is not required to pay an exercise price to exercise a SAR, but simply receives the net
amount of the increase in stock price in the form of cash or stock. The exercise price for a SAR must be
no less than 100% of the ""fair market value'' (as deÑned in the Equity Plan) of a share of common stock
at the time the SAR is granted. In addition, the Compensation Committee may, at its discretion, subject
SARs to the achievement of one or more of the performance factors described under the heading
""Performance Factors'' below.
Restricted Stock Awards
The Compensation Committee may grant restricted stock awards either in addition to, or in tandem with,
other awards under the Equity Plan under such terms, conditions and restrictions as the Compensation
Committee may determine. A restricted stock award is an oÅer by Electronic Arts to award shares of
common stock that are subject to restrictions established by the Compensation Committee. These
restrictions may be based upon completion by the award holder of a speciÑed number of years of service or
by the attainment of one or more of the performance factors described under the heading ""Performance
Factors'' below. The purchase price, if any, for each such award is determined by the Compensation
Committee at the time of grant. In the case of an award to a Ten Percent Stockholder, the purchase price
must be 100% of fair market value. The purchase price, if any, may be paid for in any of the forms of
consideration listed in items under ""Exercise Price'' above, as are approved by the Compensation
Committee at the time of grant.
Restricted Stock Units
The Compensation Committee may grant restricted stock unit awards either in addition to, or in tandem
with, other awards under the Equity Plan under such terms, conditions and restrictions as the
A-3

Compensation Committee may determine. A restricted stock unit award is similar to a restricted stock
award (and may be awarded subject to any or all of the performance goals established by the Committee
described under the heading ""Performance Factors'' below) except the stock is not delivered to the
participant unless and until all restrictions have terminated.
Performance Factors
The Compensation Committee may grant, in its sole discretion, performance-based stock options, stock
appreciation rights, restricted stock and restricted stock unit awards with vesting and/or exercisability
conditioned on one or more of the following permissible performance factors, to be measured over a
speciÑed performance period that may be as short as a quarter or as long as Ñve years (unless tied to a
speciÑc and objective milestone or event), to the extent applicable on an absolute basis or relative to a
pre-established target: (a) net revenue; (b) earnings before interest, income taxes, depreciation and
amortization; (c) operating income; (d) operating margin; (e) net income; (f) earnings per share;
(g) total stockholder return; (h) the Company's stock price; (i) growth in stockholder value relative to a
pre-determined index; (j) return on equity; (k) return on invested capital; (l) operating cash Öow;
(m) free cash Öow; (n) economic value added; and (o) individual conÑdential business objectives. In
addition, the Committee may, in its sole discretion and in recognition of unusual or non-recurring items
such as acquisition-related activities or changes in applicable accounting rules, provide for one or more
equitable adjustments (based on objective standards) to the performance factors to preserve the
Committee's original intent regarding the performance factors at the time of the initial award grant.
Mergers, Consolidations, Change of Control
Except for automatic grants to non-employee directors, in the event of a merger, consolidation, dissolution
or liquidation of EA, the sale of substantially all of its assets or any other similar corporate transaction, the
successor corporation may assume, replace or substitute equivalent awards in exchange for those granted
under the Equity Plan or provide substantially similar consideration, shares or other property as was
provided to our stockholders (after taking into account the provisions of the awards). In the event that the
successor corporation does not assume, replace or substitute awards, such awards will accelerate and all
options will become exercisable in full prior to the consummation of the transaction at the time and upon
the conditions as the Compensation Committee determines. Any awards not exercised prior to the
consummation of the transaction will terminate.
Transferability
Incentive stock options granted under the Equity Plan are not transferable other than by means of a
distribution upon the optionee's death. NonqualiÑed stock options, stock appreciation rights, restricted
stock, and restricted stock unit awards are subject to similar restrictions on transfer unless otherwise
determined by the Compensation Committee and except that nonqualiÑed stock options may be transferred
to family members and trusts or foundations controlled by, or primarily beneÑting, family members of the
optionee.
Term of the Equity Plan
Unless terminated earlier as provided in the Equity Plan, the Equity Plan expires in 2010, ten (10) years
from the date it was adopted by the Board of Directors.
United States Federal Income Tax Information
THE FOLLOWING IS A GENERAL SUMMARY AS OF THE DATE OF THIS PROXY
STATEMENT OF THE UNITED STATES FEDERAL INCOME TAX CONSEQUENCES TO THE
COMPANY AND PARTICIPANTS UNDER THE EQUITY PLAN. THE FEDERAL TAX LAWS
MAY CHANGE AND THE FEDERAL, STATE AND LOCAL TAX CONSEQUENCES FOR ANY
PARTICIPANT WILL DEPEND UPON HIS OR HER INDIVIDUAL CIRCUMSTANCES. IN
A-4
ADDITION, THE INTERNAL REVENUE SERVICE COULD, AT ANY TIME, TAKE A
POSITION CONTRARY TO THE INFORMATION DESCRIBED IN THE FOLLOWING SUM-
MARY. ANY TAX EFFECTS THAT ACCRUE TO FOREIGN PARTICIPANTS AS A RESULT
OF PARTICIPATING IN THE EQUITY PLAN ARE GOVERNED BY THE TAX LAWS OF THE
COUNTRIES IN WHICH SUCH PARTICIPANT RESIDES OR IS OTHERWISE SUBJECT.
EACH PARTICIPANT WILL BE ENCOURAGED TO SEEK THE ADVICE OF A QUALIFIED
TAX ADVISOR REGARDING THE TAX CONSEQUENCES OF PARTICIPATION IN THE
EQUITY PLAN.
Incentive Stock Options
A participant will recognize no income upon grant of an incentive stock option and incur no tax on its
exercise, unless the participant is subject to the alternative minimum tax (""AMT''). If the participant
holds shares acquired upon exercise of an incentive stock option (the ""ISO Shares'') for more than one
year after the date the option was exercised and for more than two years after the date the option was
granted, the participant generally will realize capital gain or loss (rather than ordinary income) upon
disposition of the ISO Shares. This gain or loss will be equal to the diÅerence between the amount
realized upon such disposition and the amount paid for the ISO Shares. The rate of taxation that applies
to capital gain depends upon the amount of time the ISO Shares are held by the participant.
If the participant disposes of ISO Shares prior to the expiration of either required holding period (a
""disqualifying disposition''), the gain realized upon such disposition, up to the diÅerence between the fair
market value of the ISO Shares on the date of exercise (or, if less, the amount realized on a sale of such
shares) and the option exercise price, will be treated as ordinary income. Any additional gain will be
capital gain, taxed at a rate that depends upon the amount of time the ISO Shares were held by the
Proxy Statem
ent
participant.
Alternative Minimum Tax
The diÅerence between the option exercise price and the fair market value of the ISO Shares on the date
of exercise of a vested ISO is an adjustment to income for purposes of the AMT. If a participant exercises
an ISO before it has fully vested, the participant may incur an AMT liability as the ISO Shares vest and
the Company's right to repurchase the ISO Shares at the original issue price lapses, unless the participant
makes a timely election under Section 83(b) of the U.S. Internal Revenue Code (an ""83(b) election'').
The AMT (imposed to the extent it exceeds the taxpayer's regular income tax) is 26% of an individual
taxpayer's alternative minimum taxable income (28% in the case of alternative minimum taxable income
in excess of $175,000 in the case of married individuals Ñling a joint return). Alternative minimum taxable
income is determined by adjusting regular taxable income for certain items, increasing that income by
certain tax preference items (including the diÅerence between the fair market value of the ISO Shares on
the date of exercise and the exercise price) and reducing this amount by the applicable exemption amount.
Under the Tax Increase Prevention and Reconciliation Act of 2005, the exemption amount for 2006 is
$62,550 in case of a joint return, subject to reduction under certain circumstances. If a disqualifying
disposition of the ISO Shares occurs in the same calendar year as exercise of the ISO, there is no AMT
adjustment with respect to those ISO Shares. Also, upon a sale of ISO Shares that is not a disqualifying
disposition, alternative minimum taxable income is reduced in the year of sale by the excess of the fair
market value of the ISO Shares at exercise over the amount paid for the ISO Shares.
NonqualiÑed Stock Options
A participant will not recognize any taxable income at the time a nonqualiÑed stock option (""NQSO'') is
granted or vests provided the exercise price is no less than the fair market value of the underlying shares
on the grant date. However, upon exercise of a vested NQSO, the participant must include in income as
compensation an amount equal to the diÅerence between the fair market value of the shares on the date of
exercise and the participant's exercise price. The included amount must be treated as ordinary income by
the participant and may be subject to withholding by the Company or its subsidiary (either by payment in
A-5

cash or withholding out of the participant's salary). If a participant exercises an NQSO before it has fully
vested, the participant may incur a regular income liability as the shares vest and the Company's right to
repurchase the shares at the original issue price lapses, unless the participant makes a timely 83(b)
election. Upon resale of the shares by the participant, any subsequent appreciation or depreciation in the
value of the shares will be treated as capital gain or loss, taxable at a rate that depends upon the length of
time the shares were held by the participant.
Restricted Stock Awards
A participant who receives a restricted stock award will include the amount of the award in income as
compensation at the time that any forfeiture restrictions on the shares of stock lapse, unless the participant
makes a timely 83(b) election. If the participant does not timely make an 83(b) election, the participant
will include in income the fair market value of the shares of stock on the date that the restrictions lapse as
to those shares, less any purchase price paid for such shares. The included amount may be treated as
ordinary income by the participant and will be subject to withholding by the Company or its subsidiary
(either by payment in cash or withholding out of the participant's award).
If the participant makes a timely 83(b) election, the participant who receives a restricted stock award will
include in income as ordinary income, the fair market value of the shares of stock on the date of receipt of
the award (determined without regard to lapse restrictions), less any purchase price paid for such shares.
The income may be subject to withholding by the Company or its subsidiary (either by payment in cash
or withholding out of the participant's award). If the award is subsequently forfeited, the participant will
not receive any deduction for the amount treated as ordinary income.
Restricted Stock Units
A participant will recognize income with respect to restricted stock units at the time that the restrictions
lapse, provided the shares are issued on the date the restrictions lapse. The participant will include in
income the fair market value of the shares of stock on the date that the restrictions lapse as to those
shares, less any purchase price paid for such shares. The included amount may be treated as ordinary
income by the participant and will be subject to withholding by the Company or its subsidiary (either by
payment in cash or withholding out of the participant's award).
Stock Appreciation Rights
Assuming that a stock-settled stock appreciation right (""SAR'') is granted at an exercise price that is not
less than the fair market value of the underlying shares on the grant date, a participant will not recognize
any taxable income at the time a stock-settled SAR is granted. However, upon exercise of a vested SAR,
the participant must include in income as compensation an amount equal to the diÅerence between the
fair market value of the shares on the date of exercise and the participant's exercise price. The included
amount must be treated as ordinary income by the participant and may be subject to withholding by the
Company or its subsidiary (either by payment in cash, shares or withholding out of the participant's
salary). Upon resale of the shares issued to the participant at the time of exercise, any subsequent
appreciation or depreciation in the value of the shares will be treated as capital gain or loss, taxable at a
rate that depends upon the length of time the shares were held by the participant.
Internal Revenue Code Section 409A
At the present time, the Company intends to grant equity awards to participants which are either outside
the scope of Section 409A of the U.S. Internal Revenue Code or are exempted from the application of
Section 409A. If the equity award is subject to Section 409A and the requirements of Section 409A are
not met, participants may suÅer adverse tax consequences with respect to the equity award. Such
consequences may include taxation at the time of the vesting of the award and interest and penalties on
any deferred income.
A-6
Tax Treatment of the Company
The Company generally will be entitled to a deduction in connection with the exercise of a NQSO or a
SAR by a participant, or the receipt by the participant of restricted stock or restricted stock unit award, to
the extent that the participant recognizes ordinary income and the Company properly reports such income
to the Internal Revenue Service (the ""IRS''). The Company will be entitled to a deduction in connection
with the disposition of ISO Shares only to the extent that the participant recognizes ordinary income on a
disqualifying disposition of the ISO Shares, provided that the Company properly reports such income to
the IRS.
ERISA
The Equity Plan is not subject to any of the provisions of the Employee Retirement Income Security Act
of 1974 and is not qualiÑed under Section 401(a) of the Code.
Outstanding Options Under the Equity Plan
As of March 31, 2006, 16,648,892 shares had been issued pursuant to exercises of stock options under the
Equity Plan by award recipients, 6,824 persons held NQSOs under the Equity Plan to purchase an
aggregate of 32,680,850 shares of common stock, with a weighted average exercise price of $44.28 per
share, 2,284 persons held restricted stock units to acquire 645,910 shares, and there were 17,424,348 shares
of common stock available for future awards under the Equity Plan. An aggregate of 67,400,000 shares of
the Company's authorized common stock have been reserved for issuance under the Equity Plan.
Proposed Amendments to the Equity Plan
Proxy Statem
ent
At the 2006 Annual Meeting, stockholders will be asked to approve amendments to the Equity Plan as
follows:
‚ Increase by 11 million shares the limit on the total number of shares underlying awards of
restricted stock and restricted stock units that may be granted under the Equity Plan Ì from
4 million to 15 million; and
‚ Provided that the stockholders approve Proposal 2 (""Approval of The Exchange Program'') set
forth in the proxy statement prepared in connection with our 2006 Annual Meeting of Stockholders,
we will amend the Equity Plan to limit the number of shares subject to options surrendered and
cancelled in the Exchange Program that will be available for issuance under the Equity Plan to
7 million plus the number of shares necessary for the issuance of the restricted stock rights to be
granted in connection with the Exchange Program.
A-7

(Intentionally Left Blank)
Appendix B
GENERAL DESCRIPTION OF THE 2000 EMPLOYEE STOCK PURCHASE PLAN
2000 Employee Stock Purchase Plan, as Amended
History. The 2000 Purchase Plan was adopted by the Board on May 25, 2000, approved by the
Stockholders on July 27, 2000, and has been subsequently amended. The following discussion describes the
material terms of the Purchase Plan, as amended to date.
Purpose. The purpose of the Purchase Plan is to provide employees of the Company with a convenient
means of acquiring common stock of the Company through payroll deductions, to enhance the employees'
sense of participation in the aÅairs of the Company and subsidiaries, and to provide an incentive for
continued employment.
Administration. The Purchase Plan is administered on behalf of the Board by the Compensation
Committee of the Board. The interpretation by the Compensation Committee of any provision of the
Purchase Plan is Ñnal and binding on all participating employees.
Eligibility. All employees of the Company (including directors who are employees), or any parent or
subsidiary, are eligible to participate in the Purchase Plan except the following: (i) employees who are not
employed by the Company on the 15th day of the month before the beginning of an OÅering Period (as
deÑned below); (ii) employees who are customarily employed for less than 20 hours per week;
(iii) employees who are customarily employed for less than 5 months in a calendar year; and
(iv) employees who, pursuant to Section 424(d) of the Code, own or hold options to purchase or who, as
a result of participation in the Purchase Plan, would own stock or hold options to purchase stock
Proxy Statem
ent
representing 5% or more of the total combined voting power or value of all classes of stock of the
Company or any parent or subsidiary. As of May 31, 2006, the Company estimates that approximately
7,100 persons were eligible to participate in the Purchase Plan.
Participation. Each oÅering of the Company's common stock under the Purchase Plan is for a period of
one year (the ""OÅering Period''). OÅering Periods commence on the Ñrst business day of March and
September of each year. The Ñrst day of each OÅering Period is the ""OÅering Date'' for such OÅering
Period. An employee cannot participate simultaneously in more than one OÅering Period. Each OÅering
Period consists of two six-month purchase periods (each a ""Purchase Period'') commencing on the Ñrst
business day of March and September. The last day of each Purchase Period is a ""Purchase Date.''
Employees may participate in the Purchase Plan during each pay period through payroll deductions. An
employee sets the rate of such payroll deductions, which may not be less than 2% nor more than 10% of
the employee's base salary, wages, commissions, overtime, shift premiums and bonuses plus draws against
commissions, unreduced by the amount by which the employee's salary is reduced pursuant to
Sections 125 or 401(k) of the Code. Eligible employees may elect to participate in any OÅering Period by
enrolling as provided under the terms of the Purchase Plan. Once enrolled, a participating employee will
automatically participate in each succeeding OÅering Period unless such employee withdraws from the
OÅering Period. After the rate of payroll deductions for an OÅering Period has been set by an employee,
that rate continues to be eÅective for the remainder of the OÅering Period (and for all subsequent
OÅering Periods in which the employee is automatically enrolled) unless otherwise changed by the
employee. The employee may increase or lower the rate of payroll deductions for any subsequent OÅering
Period but may only lower the rate of payroll deductions during the current Purchase Period. Not more
than one change may be made eÅective during any one Purchase Period.
In any given Purchase Period, no employee may purchase more than (a) twice the number of shares that
could have been purchased with the payroll deductions if the purchase price were determined by using
85% of the fair market value of a share of the Company's common stock on the OÅering Date or (b) the
maximum number of shares set by the Board. In addition, no employee may purchase shares at a rate
that, when aggregated with all other rights to purchase stock under all other employee stock purchase
B-1

plans of the Company, or any parent or subsidiary of the Company, exceeds $25,000 in fair market value
(determined on the OÅering Date) for each year.
Purchase Price. The purchase price of shares that may be acquired in any Purchase Period under the
Purchase Plan is 85% of the lesser of (a) the fair market value of the shares on the OÅering Date of the
OÅering Period in which the participant is enrolled or (b) the fair market value of the shares on the
Purchase Date. The fair market value of the common stock on a given date is the closing price of the
common stock on the immediately preceding business day as quoted on the NASDAQ National Market.
On May 31, 2006, the closing price of the Company's common stock was $42.07.
Purchase of Stock. The number of whole shares an employee may purchase in any Purchase Period is
determined by dividing the total amount of payroll deductions withheld from the employee during the
Purchase Period pursuant to the Purchase Plan by the price per share determined as described above,
subject to the limitations described above. The purchase takes place automatically on the last day of the
Purchase Period.
Withdrawal. An employee may withdraw from any OÅering Period at any time at least 15 days prior to
the end of an OÅering Period. No further payroll deductions for the purchase of shares will be made for
the succeeding OÅering Period unless the employee enrolls in the new OÅering Period in the same manner
as for initial participation in the Purchase Plan.
Termination of Employment. Termination of an employee's employment for any reason, including
retirement or death, immediately cancels the employee's participation in the Purchase Plan. In such event,
the payroll deductions credited to the employee's account will be returned to such employee or, in case of
death, to the employee's legal representative.
Adjustment Upon Changes in Capitalization. The number of shares subject to any purchase, and the
number of shares issuable under the Purchase Plan, is subject to adjustment in the event of a
recapitalization of the Company's common stock. In the event of a proposed dissolution or liquidation of
the Company, the OÅering Period will terminate and the Board may, in its sole discretion, give
participants the right to purchase shares that would not otherwise be purchasable until the last day of the
applicable Purchase Period.
Tax Treatment of U.S.-based Participants. Participating employees in the U.S. will not recognize income
for federal income tax purposes either upon enrollment in the Purchase Plan or upon the purchase of
shares. All tax consequences are deferred until a participating U.S. employee sells the shares, disposes of
the shares by gift, or dies.
If shares are held for more than one year after the date of purchase and more than two years from the
beginning of the applicable OÅering Period, or if the employee dies while owning the shares, the employee
realizes ordinary income on a sale (or a disposition by way of gift or upon death) to the extent of the
lesser of: (i) 15% of the fair market value of the shares at the beginning of the OÅering Period; or (ii) the
actual gain (the amount by which the market value of the shares on the date of sale, gift or death,
exceeds the purchase price). All additional gain upon the sale of shares is treated as long-term capital
gain. If the shares are sold and the sale price is less than the purchase price, there is no ordinary income,
and the employee has a long-term capital loss for the diÅerence between the sale price and the purchase
price.
If the shares are sold or are otherwise disposed of, including by way of gift (but not death, bequest or
inheritance), within either the one-year or the two-year holding periods described above (in any case a
""disqualifying disposition''), the employee will realize ordinary income at the time of sale or other
disposition taxable to the extent that the fair market value of the shares at the date of purchase was
greater than the purchase price. This excess will constitute ordinary income in the year of the sale or other
disposition even if no gain is realized on the sale or if a gratuitous transfer is made. The diÅerence, if any,
between the proceeds of sale and the fair market value of the shares at the date of purchase is a capital
gain or loss. Capital gains may be oÅset by capital losses, and up to $3,000 of capital losses in excess of
capital gains may be oÅset annually against ordinary income. Ordinary income recognized by an employee
B-2

upon a disqualifying disposition constitutes taxable compensation that will be reported on a W-2 form. The
Company takes the position that any ordinary income recognized upon a sale or other disposition is not
subject to withholding.
Tax Treatment of non-U.S.-based Participants. For participants residing outside the U.S., the Company
will assess its requirements regarding tax, social insurance and other applicable taxes in connection with
participation in the Purchase Plan. These requirements may change from time to time as laws or
interpretations change.
Tax Treatment of the Company. The Company is entitled to a deduction in connection with the
disposition of shares acquired under the Purchase Plan only to the extent that the employee recognized
ordinary income on a disqualifying disposition of the shares. The Company treats any transfer of record
ownership of shares, including transfer to a broker or nominee or into ""street name,'' as a disposition,
unless it is notiÑed to the contrary. In order to enable the Company to learn of disqualifying dispositions
and ascertain the amount of the deductions to which it is entitled, employees are required to notify the
Company in writing of the date and terms of any disposition of shares purchased under the Purchase Plan.
Proposed amendment of the 2000 Employee Stock Purchase Plan. At the Annual Meeting, stockholders
will be asked to approve an amendment to the Purchase Plan to increase by 1,500,000 the number of
shares of the Company's common stock reserved for issuance under the Purchase Plan. None of these
proposed shares have been granted or issued on the basis of such proposed approval.
Proxy Statem
ent
B-3

(Intentionally Left Blank)

Appendix C
ELECTRONIC ARTS INC.
BOARD OF DIRECTORS
AUDIT COMMITTEE CHARTER
As Amended May 24, 2006
1. PURPOSE
The Audit Committee of the Board of Directors (the ""Committee'') is charged with providing assistance
to the Board of Directors (the ""Board'') in fulÑlling its responsibility to Electronic Arts Inc. (""EA'') andits stockholders in overseeing (a) management and its auditors in respect of corporate accounting, Ñnancial
reporting practices, and the quality and integrity of the Ñnancial reports of EA, including EA's compliance
with legal and regulatory requirements, (b) the independent auditor's qualiÑcations and independence,
(c) the performance of EA's internal audit function and independent auditor, and (d) the preparation of
the report required by the rules of the Securities and Exchange Commission (""SEC'') to be included in
EA's annual proxy statement.
It is not the role of the Committee to plan or conduct audits, to guarantee the accuracy or quality of EA's
Ñnancial statements or to determine that the Ñnancial statements are in accordance with generally
accepted accounting principles and applicable laws and regulations. These are the responsibilities of
management, the independent auditor and internal auditors. It is the responsibility of the Committee to
maintain regular and open communication among the directors, the independent auditor, the internal
Proxy Statem
ent
auditors, and the Ñnancial management of EA.
2. COMPOSITION OF THE COMMITTEE
The Committee will consist of not less than three independent directors. To be considered ""independent,''
the member, and the compensation received by such member, must satisfy the requirements of all
applicable laws and regulations relative to audit committee independence, including without limitation
those of the NASDAQ Marketplace Rules and the SEC, as determined by the Board. The members of
the Committee shall possess such degree of Ñnancial or accounting expertise as may be required by law or
by the regulations of the SEC or the NASDAQ Marketplace Rules, as the Board of Directors interprets
such qualiÑcation in its business judgment. In addition, at least one member of the Committee shall
possess the requisite Ñnancial sophistication to qualify as a ""Ñnancial expert'' under applicable SEC
regulations. Each appointed Committee member will be subject to annual reconÑrmation and may be
removed by the Board at any time.
3. RESPONSIBILITIES AND DUTIES
In carrying out its purpose, the Committee will have the following responsibilities and duties:
Appointment of the Independent Auditor. To the extent required by applicable law or regulation: (i) the
Committee will be directly responsible for the appointment, retention, compensation and oversight of EA's
registered public accounting Ñrm (the ""independent auditor''), including the resolution of any
disagreements between management and the independent auditor regarding Ñnancial reporting, (ii) the
independent auditor shall report directly to the Committee, (iii) the Committee shall approve in advance
all auditing services (including comfort letters and statutory audits) performed by the independent auditor,
(iv) the Committee shall approve in advance all permitted non-audit services performed by the
independent auditor and (v) all non-audit services to be performed by the independent auditor shall be
disclosed. The Committee may delegate to one or more members of the Committee the authority to grant
pre-approvals required by this subsection, and the decisions of the member to whom this authority is
delegated shall be presented to the Committee at the next scheduled meeting of the Committee.
C-1

Annual Statement from the Independent Auditor. The Committee is responsible for obtaining from the
independent auditor at least annually, a formal written statement delineating all relationships between the
auditor and EA, consistent with Independence Standards Board Standard 1 (as such may be modiÑed or
superseded from time to time). The Committee shall be responsible for actively engaging in a dialogue
with the independent auditor with respect to any disclosed relationships or services that may impact the
objectivity and independence of the independent auditor and for taking, or recommending that the Board
of Directors take, such appropriate action as may be necessary to satisfy itself as to the qualiÑcations,
performance and independence of the independent auditor. To the extent required by law or regulation, the
annual statement also shall describe: (a) the Ñrm's internal quality control procedures, (b) any material
issues raised by the most recent internal quality-control review, or peer review, of the Ñrm, or by an
inquiry or investigation by governmental or professional authorities, within the preceding Ñve years,
respecting one or more independent audits carried out by the Ñrm, and (c) any steps taken to deal with
any such issues.
Risk Assessment and Accounting Controls. The Committee will review with the independent auditor,
EA's internal auditors, and appropriate Ñnancial and accounting personnel the adequacy and eÅectiveness
of the accounting and Ñnancial controls of EA, and guidelines and policies to govern the process by which
risk assessment and risk management is undertaken, and will elicit any recommendations for the
improvement of such internal control procedures or particular areas where new or more detailed controls or
procedures are desirable.
The Annual Audit. The Committee will meet with the independent auditor and Ñnancial management of
EA to review the scope of the proposed audit plan for the current year and the audit procedures to be
utilized, and approve the budget for such audit. At the conclusion of the annual audit, the Committee will
also review such audit, including any comments or recommendations of the independent auditor.
Review of Issues. The Committee will regularly review with the independent auditor any audit problems
or diÇculties the auditor encountered in the course of the audit work, including any restrictions on the
scope of the independent auditor's activities or on access to requested information, and any signiÑcant
disagreements with management, and management's response. In that regard, no oÇcer or director of EA,
or any other person acting under the direction thereof, shall violate any law or regulation that prohibits
fraudulently inÖuencing, coercing, manipulating, or misleading any independent auditor engaged in the
performance of an audit of the Ñnancial statements of EA for the purpose of rendering such Ñnancial
statements materially misleading.
Hiring Policies. The Committee will set clear hiring policies for employees or former employees of the
independent auditor consistent with statutory and regulatory requirements.
Related Party Transactions. The Committee will review and approve any ""related party transactions'', as
such term is deÑned by SEC rules and regulations and NASDAQ Marketplace Rules.
Complaint Procedures. The Committee will establish and maintain procedures for the (i) receipt,
retention, treatment, process and disposition of complaints received by EA regarding accounting, internal
accounting controls or audit matters, and (ii) the conÑdential, anonymous submission by employees of EA
of concerns regarding accounting or auditing matters.
Internal Audit Function. The Committee will oversee the internal audit function of EA, including the
independence and authority of its reporting obligations, its annual budget, the proposed audit plans for the
coming year, and the coordination of such plans with the independent auditor. The head of the Company's
internal audit function will report directly to the Committee. The Committee will receive, as necessary,
notiÑcation of material adverse Ñndings from internal audits and a progress report on the proposed internal
audit plan, as appropriate, with explanations for changes from the original plan.
Earnings Releases. The Committee will discuss earnings press releases and Ñnancial information and
earnings guidance provided to analysts and rating agencies, though this may be done generally (i.e.,
discussion of the types of information to be disclosed and the type of presentation to be made) and the
C-2

Committee need not discuss in advance each earnings release or each instance in which EA may provide
earnings guidance.
Review of Financial Statements. The Committee will discuss with management and the independent
auditor the annual audited Ñnancial statements and the quarterly unaudited Ñnancial statements, including
a discussion of all matters relevant thereto that are required to be discussed under any applicable law or
regulation or that the Committee otherwise considers it desirable to discuss.
Review of Additional Matters. The Committee will also review from time to time such additional
matters as may be required by law or regulation, or that it deems advisable to review, including without
limitation EA's critical accounting policies, the status of any signiÑcant income tax matters, the
Company's investment and foreign exchange policies and practices, and certiÑcations by management of
EA's Ñlings with the Securities and Exchange Commission.
Separate Meetings. Periodically, the Committee shall meet separately with management, with the
internal auditors, and with the independent auditor.
Investigations. The Committee will investigate any matter brought to its attention within the scope of its
duties to the extent and in such manner as it considers appropriate (including conÑdential, anonymous
submissions by employees of concerns regarding questionable accounting or auditing matters). The
Committee will discuss with management and the independent auditor any correspondence with regulators
or governmental agencies and any employee complaints or published reports that raise material issues
regarding EA's Ñnancial statements or accounting policies. EA will follow all provisions of law or
regulation that prohibit discipline of or discrimination against employees who report what they reasonably
believe to be violations of any law, rule or regulation applicable to EA.
Proxy Statem
ent
Ethics Policy Compliance. The Committee will review compliance with EA's Code of Conduct annually.
To the extent required by applicable laws or regulations: (a) the Code of Conduct will continue to be
applicable to senior Ñnancial oÇcers of EA, including its Chief Financial OÇcer, and its controller or
principal accounting oÇcer, and to persons performing similar functions; and (b) EA's Code of Conduct
shall continue to include such standards as are reasonably designed to deter wrongdoing and to promote:
(1) honest and ethical conduct, including the ethical handling of actual or apparent conÖicts of interest
between personal and professional relationships; (2) full, fair, accurate, timely, and understandable
disclosure in the reports EA Ñles with or furnishes to the SEC and in other public communications made
by EA; (3) compliance with applicable governmental laws, rules and regulations; (4) the prompt internal
reporting of violations of the Code of Conduct to an appropriate person or persons identiÑed in the Code
of Conduct; and (5) accountability for adherence to the Code of Conduct.
Legal Compliance. The Committee will review compliance with EA's legal compliance policies annually.
The Committee will discuss with EA's General Counsel legal matters that may have a material impact on
EA's Ñnancial statements or compliance policies.
Outside Advisors. The Committee may obtain advice and assistance from outside legal, accounting or
other advisors as it deems appropriate. It may retain these advisors without seeking approval of the Board
of Directors. EA will provide appropriate funding, as determined by the Audit Committee, for payment of
the compensation of the independent auditor and of any advisors engaged by the Committee, and for
ordinary administrative expenses necessary or appropriate in carrying out its duties.
Access to Management. The Committee shall have full access to EA's executives and personnel as
necessary to carry out its responsibilities.
Review of Charter. The Committee will review the Committee Charter from time to time and at least
annually and recommend any changes to the Board.
Reporting to the Board. The Committee will report to the Board on the major items covered at each
Committee meeting. The Committee will review with the full Board of Directors any issues that arise with
respect to the quality or integrity of EA's Ñnancial statements, EA's compliance with legal or regulatory
C-3

requirements, the performance and independence of EA's independent auditor, or the performance of the
internal audit function.
Notwithstanding the foregoing, any action of the Committee may be subject to Board review and may be
revised, modiÑed or rescinded by the Board.
4. COMMITTEE MEETINGS
The Committee will meet as often as necessary to carry out its responsibilities and in any event at least
quarterly. Meetings may be called by any Committee member and/or by the management of EA. A
majority of the total number of members of the Committee will constitute a quorum at all Committee
meetings and a quorum will be empowered to act on behalf of the Committee. Minutes of each meeting
will be duly Ñled in EA's records.
C-4

ELECTRONIC ARTS INC.
2006 Annual Report on Form 10-K
Annual R
eport

(Intentionally Left Blank)

UNITED STATES SECURITIES AND EXCHANGE COMMISSIONWashington, D.C. 20549
Form 10-K¥ ANNUAL REPORT PURSUANT TO SECTION 13 OR 15(d)
OF THE SECURITIES EXCHANGE ACT OF 1934
For the Ñscal year ended March 31, 2006
OR
n TRANSITION REPORT PURSUANT TO SECTION 13 OR 15(d)OF THE SECURITIES EXCHANGE ACT OF 1934
For the transition period from to
Commission File No. 0-17948
ELECTRONIC ARTS INC.(Exact name of registrant as speciÑed in its charter)
Delaware 94-2838567(State or other jurisdiction of (I.R.S. Employerincorporation or organization) IdentiÑcation No.)
209 Redwood Shores Parkway 94065(Zip Code)Redwood City, California
(Address of principal executive oÇces)
Registrant's telephone number, including area code:(650) 628-1500
Securities registered pursuant to Section 12(b) of the Act:None
Securities registered pursuant to Section 12(g) of the Act:Common Stock, $0.01 par value
(Title of class)
Indicate by check mark if the registrant is a well-known seasoned issuer, as deÑned in Rule 405 of the SecuritiesAct. Yes ¥ No n
Indicate by check mark if the registrant is not required to Ñle reports pursuant to Section 13 or Section 15(d) of the
Annual R
eport
Act. Yes n No ¥
Indicate by check mark whether the registrant (1) has Ñled all reports required to be Ñled by Section 13 or 15(d) ofthe Securities Exchange Act of 1934 during the preceding 12 months (or for such shorter period that the registrantwas required to Ñle such reports), and (2) has been subject to such Ñling requirements for the past90 days. Yes ¥ No n
Indicate by check mark if disclosure of delinquent Ñlers pursuant to Item 405 of Regulation S-K is not containedherein, and will not be contained, to the best of registrant's knowledge, in deÑnitive proxy or information statementsincorporated by reference in Part III of this Form 10-K or any amendment to this Form 10-K. ¥
Indicate by check mark whether the registrant is a large accelerated Ñler, an accelerated Ñler, or a non-acceleratedÑler. See deÑnition of ""accelerated Ñler and large accelerated Ñler'' in Rule 12b-2 of the Exchange Act. (Check one):
Large accelerated Ñler ¥ Accelerated Ñler n Non-accelerated Ñler n
Indicate by check mark whether the registrant is a shell company (as deÑned in Rule 12b-2 of the ExchangeAct). Yes n No ¥
The aggregate market value of the registrant's common stock, $0.01 par value, held by non-aÇliates of the registrantas of September 30, 2005, the last business day of the second Ñscal quarter, was $11,606,848,957.
As of June 5, 2006 there were 306,156,891 shares of the registrant's common stock, $0.01 par value, outstanding.
Documents Incorporated by Reference
Portions of the registrant's deÑnitive proxy statement for its 2006 Annual Meeting of Stockholders are incorporated byreference into Part III hereof.

ELECTRONIC ARTS INC.
2006 FORM 10-K ANNUAL REPORT
Table of Contents
Page
PART I
Item 1. Business ÏÏÏÏÏÏÏÏÏÏÏÏÏÏÏÏÏÏÏÏÏÏÏÏÏÏÏÏÏÏÏÏÏÏÏÏÏÏÏÏÏÏÏÏÏÏÏÏÏÏÏÏÏÏÏÏÏÏÏÏÏÏÏÏÏÏÏÏ 3
Item 1A. Risk Factors ÏÏÏÏÏÏÏÏÏÏÏÏÏÏÏÏÏÏÏÏÏÏÏÏÏÏÏÏÏÏÏÏÏÏÏÏÏÏÏÏÏÏÏÏÏÏÏÏÏÏÏÏÏÏÏÏÏÏÏÏÏÏÏÏÏ 18
Item 1B. Unresolved StaÅ CommentsÏÏÏÏÏÏÏÏÏÏÏÏÏÏÏÏÏÏÏÏÏÏÏÏÏÏÏÏÏÏÏÏÏÏÏÏÏÏÏÏÏÏÏÏÏÏÏÏÏÏÏÏ 27
Item 2. Properties ÏÏÏÏÏÏÏÏÏÏÏÏÏÏÏÏÏÏÏÏÏÏÏÏÏÏÏÏÏÏÏÏÏÏÏÏÏÏÏÏÏÏÏÏÏÏÏÏÏÏÏÏÏÏÏÏÏÏÏÏÏÏÏÏÏÏÏ 27
Item 3. Legal Proceedings ÏÏÏÏÏÏÏÏÏÏÏÏÏÏÏÏÏÏÏÏÏÏÏÏÏÏÏÏÏÏÏÏÏÏÏÏÏÏÏÏÏÏÏÏÏÏÏÏÏÏÏÏÏÏÏÏÏÏÏÏ 29
Item 4. Submission of Matters to a Vote of Security HoldersÏÏÏÏÏÏÏÏÏÏÏÏÏÏÏÏÏÏÏÏÏÏÏÏÏÏÏÏÏÏÏ 29
PART II
Item 5. Market for Registrant's Common Equity, Related Stockholder Matters and IssuerPurchases of Equity SecuritiesÏÏÏÏÏÏÏÏÏÏÏÏÏÏÏÏÏÏÏÏÏÏÏÏÏÏÏÏÏÏÏÏÏÏÏÏÏÏÏÏÏÏÏÏÏÏÏÏÏÏ 30
Item 6. Selected Financial Data ÏÏÏÏÏÏÏÏÏÏÏÏÏÏÏÏÏÏÏÏÏÏÏÏÏÏÏÏÏÏÏÏÏÏÏÏÏÏÏÏÏÏÏÏÏÏÏÏÏÏÏÏÏÏÏ 31
Item 7. Management's Discussion and Analysis of Financial Condition and Results of Operation 33
Item 7A. Quantitative and Qualitative Disclosures About Market Risk ÏÏÏÏÏÏÏÏÏÏÏÏÏÏÏÏÏÏÏÏÏÏÏÏ 62
Item 8. Financial Statements and Supplementary Data ÏÏÏÏÏÏÏÏÏÏÏÏÏÏÏÏÏÏÏÏÏÏÏÏÏÏÏÏÏÏÏÏÏÏÏÏ 66
Item 9. Changes in and Disagreements with Accountants on Accounting on Financial Disclosure 110
Item 9A. Controls and Procedures ÏÏÏÏÏÏÏÏÏÏÏÏÏÏÏÏÏÏÏÏÏÏÏÏÏÏÏÏÏÏÏÏÏÏÏÏÏÏÏÏÏÏÏÏÏÏÏÏÏÏÏÏÏÏÏ 110
Item 9B. Other Information ÏÏÏÏÏÏÏÏÏÏÏÏÏÏÏÏÏÏÏÏÏÏÏÏÏÏÏÏÏÏÏÏÏÏÏÏÏÏÏÏÏÏÏÏÏÏÏÏÏÏÏÏÏÏÏÏÏÏÏÏ 111
PART III
Item 10. Directors and Executive OÇcers of the Registrant ÏÏÏÏÏÏÏÏÏÏÏÏÏÏÏÏÏÏÏÏÏÏÏÏÏÏÏÏÏÏÏÏÏ 112
Item 11. Executive CompensationÏÏÏÏÏÏÏÏÏÏÏÏÏÏÏÏÏÏÏÏÏÏÏÏÏÏÏÏÏÏÏÏÏÏÏÏÏÏÏÏÏÏÏÏÏÏÏÏÏÏÏÏÏÏÏ 112
Item 12. Security Ownership of Certain BeneÑcial Owners and Management and RelatedStockholder Matters ÏÏÏÏÏÏÏÏÏÏÏÏÏÏÏÏÏÏÏÏÏÏÏÏÏÏÏÏÏÏÏÏÏÏÏÏÏÏÏÏÏÏÏÏÏÏÏÏÏÏÏÏÏÏÏÏÏÏ 112
Item 13. Certain Relationships and Related Transactions ÏÏÏÏÏÏÏÏÏÏÏÏÏÏÏÏÏÏÏÏÏÏÏÏÏÏÏÏÏÏÏÏÏÏÏ 112
Item 14. Principal Accounting Fees and Services ÏÏÏÏÏÏÏÏÏÏÏÏÏÏÏÏÏÏÏÏÏÏÏÏÏÏÏÏÏÏÏÏÏÏÏÏÏÏÏÏÏÏ 112
PART IV
Item 15. Exhibits, Financial Statement Schedule ÏÏÏÏÏÏÏÏÏÏÏÏÏÏÏÏÏÏÏÏÏÏÏÏÏÏÏÏÏÏÏÏÏÏÏÏÏÏÏÏÏÏ 112
SignaturesÏÏÏÏÏÏÏÏÏÏÏÏÏÏÏÏÏÏÏÏÏÏÏÏÏÏÏÏÏÏÏÏÏÏÏÏÏÏÏÏÏÏÏÏÏÏÏÏÏÏÏÏÏÏÏÏÏÏÏÏÏÏÏÏÏÏÏÏÏÏÏÏÏÏÏÏÏ 117
Exhibit IndexÏÏÏÏÏÏÏÏÏÏÏÏÏÏÏÏÏÏÏÏÏÏÏÏÏÏÏÏÏÏÏÏÏÏÏÏÏÏÏÏÏÏÏÏÏÏÏÏÏÏÏÏÏÏÏÏÏÏÏÏÏÏÏÏÏÏÏÏÏÏÏÏÏÏ 119
2
PART I
This Report contains forward-looking statements within the meaning of the Private Securities Litigation
Reform Act of 1995. All statements, other than statements of historical fact, including statements
regarding industry prospects and future results of operations or Ñnancial position, made in this Report
are forward looking. We use words such as ""anticipate'', ""believe'', ""expect'', ""intend'', ""estimate'' (and
the negative of any of these terms), ""future'' and similar expressions to help identify forward-looking
statements. These forward-looking statements are subject to business and economic risk and reÖect
management's current expectations, and involve subjects that are inherently uncertain and diÇcult to
predict. Our actual results could diÅer materially. We will not necessarily update information if any
forward-looking statement later turns out to be inaccurate. Risks and uncertainties that may aÅect our
future results include, but are not limited to, those discussed under the heading ""Risk Factors'',
beginning on page 18.
Item 1: Business
Overview
Electronic Arts develops, markets, publishes and distributes interactive software games (we sometimes
refer to them as ""titles'') that are playable by consumers on the following devices:
‚ In-home video game players (such as the Sony PlayStation» 2, Microsoft Xbox» and Xbox 360TM
and Nintendo GameCubeTM) Ì we call these players ""consoles'',
‚ Personal computers (PCs),
‚ Mobile platforms including handheld video game players (such as the PlayStation» Portable
(""PSPTM''), Nintendo DSTM and Game Boy» Advance) and cellular handsets, and
‚ Online, over the Internet and other proprietary online networks.
We refer to consoles, PCs, mobile platforms and online collectively as ""platforms''.
We were initially incorporated in California in 1982. In September 1991, we reincorporated under the laws
of Delaware. Our principal executive oÇces are located near San Francisco, California at 209 Redwood
Shores Parkway, Redwood City, California 94065 and our telephone number is (650) 628-1500.
We publish interactive software games for multiple platforms. Our products that are designed to play on
consoles and certain mobile platforms are published under license from the manufacturers of these
platforms (for example, Sony for the PlayStation 2 and PSP, Microsoft for the Xbox and Xbox 360, and
Annual R
eport
Nintendo for the Nintendo GameCube, Game Boy Advance and Nintendo DS). We invest in the creation
of software tools to more eÇciently develop games for multiple platforms. We also make investments in
facilities and equipment that allow us to create and edit video and audio recordings that are used in our
games. Since our inception, we have published games for over 47 diÅerent platforms.
Our product development methods and organization are modeled on those used in other sectors of the
entertainment industry. Employees whom we call ""executive producers'' are responsible for overseeing the
development of one or more products. The interactive software games that we develop and publish are
broken down into two major categories: (1) products developed by our EA studios for play on consoles,
PCs, mobile platforms and online, and (2) co-publishing and distribution products.
EA Studios Products
We develop games internally at our development and production studios located near San Francisco, Los
Angeles, Orlando, Chicago, Vancouver, Montreal, London, Sweden, Tokyo and Shanghai. We also engage
third parties to develop games on our behalf at their own development and production studios.
On February 15, 2006, we acquired JAMDAT Mobile Inc. (""JAMDAT'') based in Los Angeles,
California. JAMDAT is a global publisher of wireless games and other wireless entertainment applications
3
for cellular handsets. Subsequent to this acquisition, we merged our existing mobile business with
JAMDAT to establish our EA Mobile business which is responsible for the creation, marketing and
distribution of interactive entertainment software playable on cellular handsets.
Brands
We market our products under four brand names:
‚ EA SPORTSTM Ì We publish realistic sports simulation games under our EA SPORTS brand.
Some of our products published under the EA SPORTS brand include Madden NFL 06(professional football), FIFA 06 (professional soccer) and NBA Live 06 (professional basketball),
‚ EATM Ì We publish a variety of games under our EA brand. Some of our products published under
the EA brand include Need for Speed TM Most Wanted, The SimsTM 2, Harry Potter and the Gobletof FireTM and BurnoutTM Revenge,
‚ EA SPORTS BIGTM Ì We publish arcade-style extreme sports and modiÑed traditional sports
games under our EA SPORTS BIG brand. Some of our products published under the EA
SPORTS BIG brand include SSX TM On Tour (skiing and snowboarding) and FIFA Street 2(soccer), and
‚ PogoTM Ì Online casual games and downloadable casual games are marketed under the Pogo brand
and are marketed under three sub-brands: (1) Pogo (our free online games service), (2) Club
PogoTM (our premium subscription-based online games service) and (3) Pogo-To-GoTM (download-
able games).
Franchises
We develop product families, which we call ""franchises'' around many of our products. For example, every
year we release new versions of most of our EA SPORTS titles. Likewise, we have been successful in
developing, marketing, publishing and distributing sequels to several of our EA and EA SPORTS BIG
products. We also release products called ""expansion packs'' for PC titles that provide additional content
(characters, storylines, settings, missions) for games that we have previously published. For example, TheSimsTM 2 Open for Business expands the characters, settings and gameplay of the original The Sims 2game. We consider titles that iterate, sequel or spawn expansion packs to be franchise titles.
Co-publishing and Distribution Products
Through our EA Partners business unit, we team with other game development companies to assist them
to develop their own interactive software games, which we then publish, market and distribute. We refer to
these types of arrangements as ""co-publishing''. An example of a co-publishing product is TimeSplittersFuture Perfect TM, which was developed by Free Radical Design, a game development company located
near London.
We also distribute interactive software games that are developed and published by other companies. An
example of one of our recent distribution products is Half-Life» 2, developed and published by Valve,
which we distribute worldwide.
Method of Delivery
Packaged Goods
The console, PC and handheld games that we publish are made available to consumers on a disk (usually
CD, DVD or Universal Media Disc (""UMD'') format) that is packaged and typically sold in retail stores
and through online stores (including our own online store). We refer to these as ""packaged goods''
products. In North America and Europe, our largest markets, these packaged goods products are sold
primarily to retailers that may be mass market retailers (such as Wal-Mart), electronics specialty stores
(such as Best Buy) or game software specialty stores (such as GameStop).
4

Cellular Handsets
Following our acquisition of JAMDAT in February 2006, we merged our existing cellular handset software
game development and publishing business with JAMDAT to establish our EA Mobile business. Through
EA Mobile, we publish games for our customers to download onto their cellular handsets. Our customers
typically purchase and download our games through a wireless carrier's branded e-commerce service
accessed directly from their cellular handsets, which must be enabled by technologies such as BREW or
Java. These wireless carrier services include, among others, Verizon Wireless' Get It Now, Sprint PCS
Vision, Cingular MEdia and Vodafone live!. Our customers are charged a one-time or monthly
subscription fee on their cellular handset invoice for the game. The wireless carriers generally retain a
percentage of the fee and pay the rest to us. The wireless distribution of our games eliminates traditional
publishing complexities, including physical production, packaging, shipping, inventory management and
return processing.
Online
There are three ways in which we publish games that are playable online by consumers:
‚ Online-only casual games that we make available on the World Wide Web Ì such as card games,
puzzle games and word games Ì marketed under our Pogo brand. These are made available to
consumers on our web site, www.pogo.com, and on certain online services provided by America
Online, Inc.
‚ Another type of online-only games is called ""massively multiplayer online games'' (sometimes
called ""persistent state world games''). Players experience these games as interactive virtual worlds
where thousands of other players can interact with one another. We currently have two massively
multiplayer online game products, Ultima OnlineTM and The Sims OnlineTM. These games are sold
to consumers in the form of a CD, DVD or download containing the software necessary to play the
game.
‚ We include online capability features in certain of our PC, PlayStation 2, Xbox, Xbox 360 and PSP
products, which enable consumers to participate in online communities and play against one
another via the Internet.
In addition, online downloads are available for (1) certain PC games either from our EA.com site or third
party sites such as Gametap, and (2) Microsoft's Xbox Live service. We are also developing digital
content, which we intend to sell online via microtransactions, for next-generation console-based games.
Annual R
eport
Licensed Products
We also maintain a smaller business where we license to manufacturers of products in related industries
(for example, makers of personal computers or computer accessories) rights to include certain of our
products with the manufacturer's product or oÅer our products to consumers who have purchased the
manufacturer's product. We call these combined products ""OEM bundles''.
Intellectual Property
Like other entertainment companies, our business is based on the creation, acquisition, exploitation and
protection of intellectual property. Some of this intellectual property is in the form of software code,
patented technology, and other technology and trade secrets that we use to develop our games and to
make them run properly on the platforms. Other intellectual property is in the form of audio-visual
elements that consumers can see, hear and interact with when they are playing our games Ì we call this
form of intellectual property ""content''.
Each of our products embodies a number of separate forms of intellectual property protection: the software
and the content of our products are copyrighted; our products may use patented inventions or trade secrets;
our product brands and names may be trademarks of ours or others; our products may contain voices and
5

likenesses of actors, athletes and/or commentators (protected by personal publicity rights) and often
contain musical compositions and performances that are also copyrighted. Our products also may contain
content licensed from others, such as trademarks, Ñctional characters, storylines and software code.
We acquire the rights to include these kinds of intellectual property in our products through our own
development, acquisitions, and license agreements such as those with sports leagues and player
associations, movie studios and performing talent, music labels, music publishers and musicians. These
licenses are typically limited to use of the licensed rights in products for speciÑc time periods. In addition,
our products that play on consoles such as the Sony PlayStation 2 and some mobile platforms include
technology that is owned by the console manufacturer (for example, Sony) and licensed non-exclusively to
us for use. While we may have renewal rights for some licenses, our business and the justiÑcation for the
development of many of our products is dependent on our ability to continue to obtain the intellectual
property rights from the owners of these rights at reasonable rates.
Our products are susceptible to unauthorized copying. We typically distribute our PC products using copy
protection technology that we license from other companies. In addition, console manufacturers, such as
Sony, typically incorporate security devices in their consoles in an eÅort to prevent the use of unlicensed
products. Our primary protection against unauthorized use, duplication and distribution of our products is
enforcement of our copyright and trademark interests. We typically own the copyright to the software code
as well as the brand or title name trademark under which our products are marketed. We register our
copyrights in the United States and other countries.
Market Segment
Historically, there have been multiple consoles and mobile video game players available to consumers that
play interactive software games like ours, and there has been vigorous competition between manufacturers.
While Sony's PlayStation» and PlayStation 2 consoles have signiÑcantly outsold their competitors in the
past, Microsoft and Nintendo are large and viable competitors, and PCs continue to be a strong interactive
game platform. Similarly, while Nintendo's Game Boy, Game Boy Color and Game Boy Advance have
been the historic leaders in the mobile video game player market, Sony's PlayStation Portable is a recent
successful competitor in this segment. We develop and publish products for multiple platforms, and this
diversiÑcation continues to be a cornerstone of our product strategy.
We currently develop or publish products for 12 diÅerent hardware platforms. In Ñscal 2006, we released
games designed to play on the PlayStation 2, Xbox, Xbox 360, Nintendo GameCube, PC, Game Boy
Advance, Sony PSP, Nintendo DS, online and cellular handsets. In Ñscal 2007, we plan to release games
designed for play on these platforms as well as games designed for play on the PlayStation 3 and Nintendo
WiiTM.
6

Video Game Consoles
The latest generation of video game consoles was initiated by the launch of Microsoft's Xbox 360 in Ñscal
2006 and will continue with the launches of the upcoming Sony and Nintendo consoles. The following
table details select information on some of the console platforms for which we have published titles:
Year IntroducedManufacturer Video Game Console/Platform Name in North America Medium/Product Base
Sega ÏÏÏÏÏÏÏÏÏÏÏÏÏÏÏ Genesis 1989 Cartridge
Nintendo ÏÏÏÏÏÏÏÏÏÏÏ Super NESTM 1991 Cartridge
MatsushitaÏÏÏÏÏÏÏÏÏÏ 3DOTM Interactive MultiplayerTM 1993 Compact Disk
Sega ÏÏÏÏÏÏÏÏÏÏÏÏÏÏÏ Saturn 1995 Compact Disk
SonyÏÏÏÏÏÏÏÏÏÏÏÏÏÏÏ PlayStation 1995 Compact Disk
Nintendo ÏÏÏÏÏÏÏÏÏÏÏ Nintendo 64 1996 Cartridge
SonyÏÏÏÏÏÏÏÏÏÏÏÏÏÏÏ PlayStation 2 2000 Digital Versatile Disk
Nintendo ÏÏÏÏÏÏÏÏÏÏÏ Nintendo GameCube 2001 Proprietary Optical Format
MicrosoftÏÏÏÏÏÏÏÏÏÏÏ Xbox 2001 Digital Versatile Disk
MicrosoftÏÏÏÏÏÏÏÏÏÏÏ Xbox 360 2005 Digital Versatile Disk
PlayStation 2. Sony released the PlayStation 2 console in Japan in March 2000, in North America in
October 2000, and in Europe in November 2000. The PlayStation 2 console is a DVD-based system that,
with a network adaptor, is Internet ready, as well as backward compatible with games published for its
predecessor, the PlayStation. We have published and are currently developing numerous products for the
Sony PlayStation 2.
Nintendo GameCube. Nintendo launched the Nintendo GameCube console in Japan in September 2001,
in North America in November 2001, and in Europe in May 2002. The Nintendo GameCube plays games
that are manufactured on a proprietary optical disk. We have published and are currently developing
several products for the Nintendo GameCube.
Xbox. Microsoft launched the Xbox console in North America in November 2001, in Japan in February
2002, and in Europe in March 2002. The Microsoft Xbox is DVD-based system that is Internet ready. In
May 2004, we began to support the Xbox Live service with features including Quickmatch, Optimatch,
gamertags, Xbox Live friends list, voice communication and EA messenger service. We have published
and are currently developing numerous products for the Microsoft Xbox.
Annual R
eport
Xbox 360. Microsoft launched the Xbox 360 console in North America in November 2005, and in
Europe and Japan in December 2005. The Xbox 360 is a DVD-based system that is Internet and high
deÑnition ready. We have published several titles and are currently developing numerous products for the
Xbox 360, all of which also support the Xbox Live service. In addition, we are developing digital content
for sale via microtransactions on the Xbox Live service.
Next-Generation Consoles
Our industry is cyclical and is in the transition stage to the next cycle. Microsoft launched the Xbox 360
at the end of calendar year 2005. In the coming months, we expect Sony and Nintendo to introduce new
video game consoles as well. These next-generation consoles have and are expected to introduce new
complexities. Both the Xbox 360 and the PlayStation 3 have a complex multi-processor architecture and
High-DeÑnition video outputs. The Nintendo Wii will introduce a unique controller.
7

Mobile Platforms
The following table details select information on some of the handheld video game players for which we
have published titles:
Mobile Game Machine/ Year IntroducedManufacturer Platform Name in North America
NintendoÏÏÏÏÏÏÏÏÏÏÏÏÏÏÏÏÏÏÏÏÏÏÏÏÏÏÏÏÏÏÏÏÏÏÏÏÏÏÏÏÏÏÏÏÏÏÏÏÏ Game Boy 1989
NintendoÏÏÏÏÏÏÏÏÏÏÏÏÏÏÏÏÏÏÏÏÏÏÏÏÏÏÏÏÏÏÏÏÏÏÏÏÏÏÏÏÏÏÏÏÏÏÏÏÏ Game Boy Color 1998
NintendoÏÏÏÏÏÏÏÏÏÏÏÏÏÏÏÏÏÏÏÏÏÏÏÏÏÏÏÏÏÏÏÏÏÏÏÏÏÏÏÏÏÏÏÏÏÏÏÏÏ Game Boy Advance 2001
Nokia ÏÏÏÏÏÏÏÏÏÏÏÏÏÏÏÏÏÏÏÏÏÏÏÏÏÏÏÏÏÏÏÏÏÏÏÏÏÏÏÏÏÏÏÏÏÏÏÏÏÏÏ N-Gage 2003
NintendoÏÏÏÏÏÏÏÏÏÏÏÏÏÏÏÏÏÏÏÏÏÏÏÏÏÏÏÏÏÏÏÏÏÏÏÏÏÏÏÏÏÏÏÏÏÏÏÏÏ Nintendo DS 2004
Sony ÏÏÏÏÏÏÏÏÏÏÏÏÏÏÏÏÏÏÏÏÏÏÏÏÏÏÏÏÏÏÏÏÏÏÏÏÏÏÏÏÏÏÏÏÏÏÏÏÏÏÏÏ PSP 2005
Nintendo DS. Nintendo launched the Nintendo DS in North America in November 2004, in Japan in
December 2004, and in Europe in March 2005. We have published several products and are currently
developing several more products for the Nintendo DS.
Sony PSP. Sony launched the PSP in Japan in December 2004, in North America in March 2005, and
in Europe in September 2005. The Sony PSP is a UMD-based system. We have published, are currently
developing, and expect to develop numerous products for the Sony PSP.
Cellular handsets. Following our acquisition of JAMDAT in February 2006, we merged our existing
cellular handset software game development and publishing business with JAMDAT to establish our EA
Mobile business. Through EA Mobile, we are a leading global publisher of interactive entertainment
software playable on cellular handsets, which include games, ringtones, images and other content. In North
America, we are the leading publisher of interactive entertainment software playable on cellular handsets.
Many of our games are designed to take advantage of multimedia enhancements in the latest generation of
cellular handsets, including high-resolution color displays, increased processing power, improved audio
capabilities and increased memory capabilities. We publish games in multiple categories designed to appeal
to a broad range of wireless subscribers. Our portfolio is primarily based on intellectual properties that we
create and own, and well-established brands and content that we license from third parties.
Online Games
There are three types of EA-published games that are played online by consumers: (1) online casual
games marketed under the Pogo brand available to consumers on our web site, www.pogo.com, and on
certain online services provided by America Online, Inc., (2) massively multiplayer online games sold to
consumers in the form of a CD, DVD or download containing the software necessary to play the game,
and (3) online-enabled packaged goods in which certain of our PC, PlayStation 2, PSP and Xbox
products, allow consumers to participate in online communities and play against one another via the
Internet.
We believe that online gaming is integral to our existing and future products. However, the continued
growth of the online sector in our industry will depend on the following key factors:
‚ Growing interest in multiplayer games,
‚ Willingness by consumers to pay for online game content,
‚ Rapid innovation of new online entertainment experiences,
‚ Mass market adoption of broadband technologies,
‚ Convergence of online capabilities in next-generation consoles, and
‚ Ability to create online products that are applicable in diverse global markets.
8
Competition
We compete in the entertainment industry. At the most fundamental level, our products compete with
other forms of entertainment, such as motion pictures, television and music, for the leisure time and
discretionary spending of consumers. We believe that the software games segment is best viewed as a
segment of the overall entertainment market. We believe that large software companies and media
companies are increasing their focus on the software games segment of the entertainment market and, as a
result, may compete directly with us. Several large software companies and media companies (e.g.,
Microsoft and Sony) have been publishing products that compete with ours for a long time, and other
diversiÑed media/entertainment companies (e.g., Time Warner, Viacom, Fox and Disney) are expanding
their software game publishing eÅorts.
The software games business is highly competitive. It is characterized by the continuous introduction of
new titles and the development of new technologies. Our competitors vary in size and cost structure from
very small companies with limited resources to very large, diversiÑed corporations with greater Ñnancial
and marketing resources than ours. Our business is driven by hit titles, which require ever-increasing
budgets for development and marketing. As a result, the availability of signiÑcant Ñnancial resources has
become a major competitive factor in developing and marketing software games. Competition is also based
on product quality and features, timing of product releases, brand-name recognition, quality of in-game
content, access to distribution channels, eÅectiveness of marketing and price.
Games for Consoles, PCs and Handheld Video Game Players
We currently compete with Sony, Microsoft and Nintendo, each of which develop and publish software for
their respective console platforms. We also compete with numerous companies which are, like us, licensed
by the console manufacturers to develop and publish software games that operate on their consoles. These
competitors include Activision, Atari, Capcom, Koei, Konami, LucasArts, Midway, Namco, Sega, Take-
Two Interactive, THQ, Ubisoft and Vivendi Universal Games, among others. As discussed above,
diversiÑed media companies such as Time Warner, Viacom, Fox and Disney are also expanding their
software game publishing eÅorts.
In addition to competing for product sales, we face heavy competition from other software game
companies to obtain license agreements granting us the right to use intellectual property included in our
products. Some of these content licenses are controlled by the diversiÑed media companies, which, in some
cases, have decided to publish their own games based on popular movie properties that they control, rather
than licensing the content to a software game company such as us.
Annual R
eport
The market for our products is also characterized by signiÑcant price competition and we regularly face
pricing pressures from our competitors. These pressures have, from time to time, required us to reduce our
prices on certain products. Our experience has been that software game prices tend to decline once a
generation of consoles has been in the market for a signiÑcant period of time due to the increasing number
of software titles competing for acceptance by consumers and the anticipation of the next-generation of
consoles. We have experienced this kind of price erosion during the past twelve months, as the software
game segment has been going through a transition from the current generation of consoles (PlayStation 2,
Xbox and Nintendo GameCube) to the next generation of consoles (Xbox 360, PlayStation 3 and
Nintendo Wii).
Applications for Cellular Handsets
The wireless entertainment applications market segment, for which we develop and publish games,
ringtones and wallpapers for cellular handsets, is highly competitive and characterized by frequent product
introductions, evolving wireless platforms and new technologies. As demand for applications continues to
increase, we expect new competitors to enter the market and existing competitors to allocate more
resources to develop and market applications. As a result, we expect competition in the wireless
entertainment market segment to intensify.
9

The current and potential competition in the wireless entertainment applications market segment includes
major media companies, traditional video game publishing companies, wireless carriers, wireless software
providers and other companies that specialize in wireless entertainment applications. We also compete with
wireless content aggregators, who pool applications from multiple developers (and sometimes publishers)
and oÅer them to carriers or through other sales channels.
Currently, we consider our primary competitors in the wireless entertainment applications market segment
to be Disney, Gameloft, Infospace, Mforma, Namco, Sony Pictures, Sorrent, THQ Wireless, VeriSign and
Yahoo!.
Online Games
The online games market segment is also highly competitive and characterized by frequent product
introductions, new business models and new platforms. As the proportion of households with broadband
connections increases, we expect new competitors to enter the market and existing competitors to allocate
more resources to develop online games. As a result, we expect competition in the online games market
segment to intensify.
Our current and potential competitors in the online game market segment include major media companies,
traditional video game publishing companies, and companies that specialize in online games. Our
competitors in the casual games market segment include Yahoo! Popcap, Real and MSN. In the massively
multiplayer online game market segment our competitors include Vivendi Games, NC Soft, Sony and
Atari.
SigniÑcant Relationships
Hardware Platform Companies
Sony. Under the terms of license agreements we entered into with Sony Computer Entertainment of
America, Sony Computer Entertainment of Europe and Sony Computer Entertainment Inc. (Japan), we
are authorized to develop and distribute DVD-based software products and online content compatible with
the PlayStation 2. Pursuant to these agreements, we engage Sony to supply PlayStation 2 DVDs for our
products. Many of our PlayStation 2 products are capable of being played online by customers who have
an online adaptor, which is manufactured and sold by Sony. In addition, through another set of agreements
with Sony, we are authorized to develop and distribute games compatible with the Sony PSP.
In Ñscal 2006, approximately 38 percent of our net revenue was derived from sales of EA Studio games
designed for play on the PlayStation 2, compared to 43 percent in Ñscal 2005. We released 28 titles
worldwide in Ñscal 2006 for the PlayStation 2, compared to 27 titles in Ñscal 2005. Our top Ñve
PlayStation 2 releases for Ñscal 2006 were Need for Speed Most Wanted, Madden NFL 06, FIFA 06,NCAA» Football 06 and NBA LIVE 06.
In Ñscal 2006, approximately 9 percent of our net revenue was derived from sales of EA Studio games
designed for play on the Sony PSP, compared to 1 percent in Ñscal 2005. We released 16 titles worldwide
in Ñscal 2006 for the Sony PSP, compared to three titles in Ñscal 2005. Our top Ñve Sony PSP releases for
Ñscal 2006 were Need for Speed Most Wanted, Burnout Revenge, Madden NFL 06, Need for Speed TM
Underground 2 and FIFA 06.
We are currently in discussions with Sony Computer Entertainment of America, Sony Computer
Entertainment of Europe and Sony Computer Entertainment Inc. (Japan) to secure a license to develop
and distribute Blu-Ray based software products compatible with the forthcoming PlayStation 3 console.
Microsoft. Under the terms of license agreements we have entered into with Microsoft, we are authorized
to develop and distribute DVD-based software products and online content compatible with the Xbox and
Xbox 360.
In Ñscal 2006, approximately 13 percent of our net revenue was derived from sales of EA Studio games
designed for play on the Xbox, compared to 16 percent in Ñscal 2005. We released 28 titles worldwide in
10

fiscal 2006 for the Xbox, compared to 26 titles in fiscal 2005. Our top five Xbox releases for fiscal 2006
were Madden NFL 06, Need for Speed Most Wanted, NCAA Football 06, Burnout Revenge and FIFA 06.
In Ñscal 2006, approximately 5 percent of our net revenue was derived from sales of EA Studio games
designed for play on the Xbox 360. We released seven titles worldwide in Ñscal 2006 for the Xbox 360.
Our top Ñve Xbox 360 releases for Ñscal 2006 were Need for Speed Most Wanted, Madden NFL 06,EA SPORTS TM Fight Night Round 3, FIFA 06 and NBA LIVE 06.
Nintendo. Under the terms of license agreements we entered into with Nintendo of America and
Nintendo Company Ltd. (Japan), we are authorized to develop and distribute proprietary optical format
disk products compatible with the Nintendo GameCube, the Nintendo DS and Game Boy Advance.
Pursuant to these agreements, we engage Nintendo to supply Nintendo GameCube proprietary optical
format disk products for our products.
In Ñscal 2006, approximately 5 percent of our net revenue was derived from sales of EA Studio games
designed for play on the Nintendo GameCube, compared to 7 percent in Ñscal 2005. We released 14 titles
worldwide in Ñscal 2006 for the Nintendo GameCube, compared to 20 titles in Ñscal 2005. Our top Ñve
Nintendo GameCube releases for the year were Need for Speed Most Wanted, Harry Potter and theGoblet of Fire, Madden NFL 06, FIFA 06 and The Sims 2.
We are currently in discussions with Nintendo of America and Nintendo Company Ltd. (Japan) to secure
a license to develop and distribute DVD-based software products compatible with the forthcoming
Nintendo Wii console.
Wireless Carrier Channel
We have agreements to distribute our wireless applications through more than 90 carriers in over 40
countries. Our customers download our applications to their cellular handsets and their wireless carrier
invoices them a one-time fee or monthly subscription fee. Our carrier distribution agreements establish the
fees to be retained by the carrier for distributing our applications. Our carrier agreements are not exclusive
and generally have a limited term of one or two years, with evergreen, or automatic renewal, provisions
upon expiration of the initial term. The agreements generally do not obligate the carriers to market or
distribute any of our applications. In addition, the carriers can often terminate these agreements early and,
in some instances, without cause.
Annual R
eport
Content Licensors
Many of our products are based on or incorporate content and trademarks owned by others. For example,
our EA SPORTS and EA SPORTS BIG products include rights licensed from the major sports leagues
and players associations. Similarly, many of our hit EA franchises, such as The Godfather, Harry Potter
and Lord of the Rings, are based on key Ñlm and literary licenses. Celebrities and organizations with
whom we have contracts include: FIFA, FIFPRO Foundation and UEFA (professional soccer); NASCAR
and ISC (stock car racing); National Basketball Association (professional basketball); PGA TOUR, Tiger
Woods and Pebble Beach (professional golf); National Hockey League and NHLPA (professional
hockey); Warner Bros. (Harry Potter, Batman and Superman); New Line Productions and Saul Zaentz
Company (The Lord of the Rings); Marvel Enterprises (Ñghting); National Football League Properties,
Arena Football League and PLAYERS Inc. (professional football); Collegiate Licensing Company
(collegiate football, basketball and baseball); Simcoh (Def Jam); Viacom Consumer Products (The
Godfather); Valve Corporation (Half-Life and Counter-Strike); ESPN (content in EA SPORTS games);
Twentieth Century Fox Licensing and Merchandising (The Simpsons); Lamborghini, McLaren and
Porsche (car licenses for Need for Speed); and mobile game rights with PopCap Games and The Tetris
Company. In the future, we will likely enter into other relationships with other signiÑcant content
providers.
11
Products and Product Development
In Ñscal 2006, we generated approximately 73 percent of our net revenue from EA Studio-produced
products, released during the year as compared to approximately 71 percent in Ñscal 2005. During Ñscal
2006, we released 31 EA Studio titles, excluding titles developed for cellular handsets, compared to 35 EA
Studio titles in Ñscal 2005. We released 131 stock keeping units, or SKUs (a version of a title designed for
play on a particular platform) in Ñscal 2006, compared to 109 SKUs in Ñscal 2005. In Ñscal 2006, we had
27 titles that sold over one million units (aggregated across all platforms). In Ñscal 2005, we had 31 titles
and in Ñscal 2004 we had 27 titles that sold over one million units (aggregated across all platforms). In
Ñscal 2006, we had one title, Need for Speed Most Wanted, published on eight diÅerent platforms, which
represented approximately 10 percent of our total net revenue. In Ñscal 2005, we had one title, Need forSpeed Underground 2, published on Ñve diÅerent platforms, which represented approximately 11 percent of
our total net revenue. No title represented more than 10 percent of our total net revenue in Ñscal 2004.
The products produced by EA's studios are designed and created by our employee designers and artists
and by non-employee software developers (we call them ""independent artists'' or ""third-party
developers''). We typically advance development funds to the independent artists and third-party
developers during development of our games. These payments are considered advances against subsequent
royalties based on the sales of the products. These terms are typically set forth in written agreements
entered into with the independent artists and third-party developers.
During Ñscal 2006, the retail selling prices of our newly released products in North America ranged from
$29.99 to $59.99. Other titles, including re-releases of older titles marketed as ""Classics'', had retail selling
prices that ranged from $9.99 to $29.99. These ranges may not be indicative of our future retail selling
prices in North America, which are based on prevailing market conditions. The retail selling prices of our
titles outside of North America vary widely depending on factors such as local market conditions.
Our goal is to maintain our position as a leading publisher of games sold for play on video game consoles,
PCs and mobile platforms. We will continue to invest in tools and technologies designed to facilitate
development of our products for current and next-generation consoles, mobile platforms and online. We
have incurred and expect to incur higher costs during this transition to next-generation consoles. During
this transition, we intend to continue to develop titles for current-generation video game consoles while we
also continue to make signiÑcant investments in the development of products that operate on next-
generation consoles such as the Xbox 360, PlayStation 3 and Nintendo Wii. These investments are
recorded in research and development in our Consolidated Statement of Operations. We had research and
development expenditures of $758 million in Ñscal 2006, $633 million in Ñscal 2005 and $511 million in
Ñscal 2004.
Online Games
We publish three types of games that are played online by consumers: online casual games, massively
multiplayer online games, and online-enabled packaged goods games.
Online Casual Games. Our online casual games are marketed under three brands: Pogo (our free online
games service), Club Pogo (our subscription-based online games service) and Pogo-To-Go (downloadable
games).
‚ Pogo Ì Pogo provides approximately 80 free online games geared towards family entertainment.
The oÅerings include sports, arcade, card, board, casino, word, trivia and puzzle games. This games
service incorporates prizes, tournaments, community-building activities and the popularity of free,
familiar games to appeal to a broad consumer market.
‚ Club Pogo Ì In Ñscal 2004, we launched Club Pogo, a subscription-based service oÅering exclusive
games and premium features. We oÅer approximately 30 additional games for Club Pogo
subscribers. To join Club Pogo, players must register and subscribe online. Players have the option
of selecting a monthly or annual subscription fee plan. When a player joins Club Pogo, they have
access to all of the games and content they had on the free Pogo service, plus premium features
12

and beneÑts, such as additional member-exclusive games, ad-free gameplay, and an enhanced prize
system. Club Pogo players also have the option of purchasing digital content such as premium
badge albums. Club Pogo also provides a deeper community experience through upgraded player
proÑles, weekly game challenges and member badges. We had over 1.2 million paying subscribers
as of March 31, 2006, up from 800,000 paying subscribers as of March 31, 2005.
‚ Pogo-To-Go Ì Pogo-to-Go is our downloadable games oÅering. A one-time fee allows users to
download a Pogo game to play oÉine. We currently oÅer approximately 240 downloadable games
under the Pogo-To-Go service, including third party games. The Pogo-To-Go games include extra
features like exclusive game modes, bonus levels, high scores and enhanced graphics and sounds.
We also oÅer packaged goods versions of some of these games that consumers can purchase at
retail outlets.
Massively Multiplayer Online Games. Massively multiplayer online games are played exclusively online
and are experienced as interactive virtual worlds where thousands of other players can interact with one
another. Massively multiplayer online games are sold to consumers in the form of a CD, DVD or
download containing the software necessary to play the game. After installing the software on their PCs,
players are able to log-on to servers in order to interact with other players.
To date, we have launched Ñve massively multiplayer online games with mixed results. While we have
achieved success with Ultima Online, our other massively multiplayer online games have not met
expectations. We continue to explore opportunities to build success in this segment of online games.
Online-Enabled Packaged Goods. We include online capability features in certain of our PC,
PlayStation 2, Xbox, Xbox 360 and PSP products, which enable consumers to participate in online
communities and play against one another via the Internet. In Ñscal 2006, 16 Xbox, 14 PlayStation 2,
eight PC, seven Xbox 360 and four PSP titles had online gameplay capability. We expect to include online
gameplay capability in almost all of our titles going forward.
Marketing and Distribution
We market the products produced by our studios under the EA SPORTS, EA SPORTS BIG, EA and
Pogo brands. Products marketed under the EA SPORTS brand typically simulate professional and
collegiate sports and include franchises such as Madden NFL, FIFA Soccer and NBA Live. Products
marketed under the EA SPORTS BIG brand typically feature extreme sports or modiÑed traditional sports
in arcade-style games and include such titles as FIFA Street 2 and NBA Street V3. We market non-sports
games under the EA brand including franchises such as Need for Speed, The Sims and The Lord of the
Rings, as well as The Godfather TM The Game.
Annual R
eport
Our EA Partners business unit operates under a variety of deal types and structures with the intent of
generating, leveraging and/or owning intellectual properties conceived by other developers, publishers or
licensors worldwide. Through EA Partners we provide direct development expertise to our partners via an
internal production staÅ, while also making available our publishing resources to provide sales, marketing
and distribution services on a global basis. EA Partners also provides distribution and manufacturing
services to other publishers. These titles are typically delivered to us from other publishers in gold master
form or as completed products.
The interactive software game business is ""hit'' driven, requiring signiÑcant expenditures for marketing and
advertising of our products. There can be no assurance that we will continue to produce ""hit'' titles, or that
advertising for any product will increase sales suÇciently to recoup those advertising expenses.
We generated approximately 94 percent of our North American net revenue from direct sales to retailers.
The remaining 6 percent of our North American sales were made through a limited number of specialized
and regional distributors and rack jobbers in markets where we believe direct sales would not be
economical. Outside of North America, we derive revenue primarily from direct sales to retailers. In a few
of our smaller markets, we sell our products through distributors with whom we have written agreements
or informal arrangements, depending on the business customs of the territories. We had direct sales to one
13
customer, Wal-Mart Stores, Inc., which represented approximately 13 percent of total net revenue in both
Ñscal 2006 and 2004 and approximately 14 percent of total net revenue in Ñscal 2005.
In North America, we have stock-balancing programs for our PC products, which allow for the exchange
of PC products by resellers under certain circumstances. We may also decide to provide price protection
for our PC products under certain circumstances in North America. In most of our major geographical
markets, we accept product returns on our PC products and we may decide to accept product returns or
provide price protection under certain circumstances for our console products after we analyze inventory
remaining in the channel, the rate of inventory sell-through in the channel, and our remaining inventory on
hand. It is our policy to exchange products or give credits, rather than give cash refunds. We actively
monitor the volume of our sales to our channel partners and their inventories, as substantial overstocking
in the distribution channel could result in high returns or higher price protection costs in subsequent
periods.
The distribution channels through which our games are sold have been characterized by change, including
consolidations and Ñnancial diÇculties of certain distributors and retailers. The bankruptcy or other
business diÇculties of a distributor or retailer could render our accounts receivable from such entity
uncollectible, which could have an adverse eÅect on our operating results and Ñnancial condition. In
addition, an increasing number of companies are competing for access to our distribution channels. Our
arrangements with our distributors and retailers may be terminated by either party at any time without
cause. Distributors and retailers often carry products that compete with ours. Retailers of our products
typically have a limited amount of shelf space and promotional resources that they are willing to devote to
the software games category, and there is intense competition for these resources. There can be no
assurance that distributors and retailers will continue to purchase our products or provide our products with
adequate levels of shelf space and promotional support.
Inventory and Working Capital
We manage inventories by communicating with our customers prior to the release of our products, and
then using our industry experience to forecast demand on a product-by-product and territory-by-territory
basis. Historically, we have experienced high turnover of our products, and the lead times on re-orders of
our products are generally short, approximately two to three weeks. Further, as discussed in ""Marketing
and Distribution'' and in ""Management's Discussion and Analysis of Financial Condition and Results of
Operations'', we have practices in place with our customers (such as stock balancing and price protection)
that reduce product returns.
International Operations
We conduct business and have wholly-owned subsidiaries throughout the world, including oÇces in
Australia, Austria, Barbados, Belgium, Bermuda, Brazil, Canada, China, the Czech Republic, Denmark,
England, Finland, France, Germany, Greece, Hong Kong, Hungary, India, Italy, Japan, Mexico, the
Netherlands, New Zealand, Norway, Poland, Portugal, Romania, Singapore, South Africa, South Korea,
Spain, Sweden, Switzerland, Taiwan, and Thailand. International net revenue decreased by 7 percent to
$1.367 billion, or 46 percent of total net revenue in Ñscal 2006, compared to $1.464 billion, or 47 percent
of total net revenue in Ñscal 2005. Our decrease in international net revenue was primarily driven by lower
sales in Europe and the negative impact of foreign exchange rates.
We believe that in order to increase our online sales in Asia, we will need to devote signiÑcant resources to
hire local development talent and expand our infrastructure, most notably, the expansion and creation of
studio facilities to develop content locally. In addition, we are establishing online game marketing,
publishing and distribution functions in China. As part of this strategy, we may seek to partner with
established local companies through acquisitions, joint ventures or other similar arrangements.
The amounts of net revenue and long-lived assets attributable to each of our geographic regions for each of
the last three Ñscal years are set forth in Note 17 of the Notes to Consolidated Financial Statements,
included in Item 8 of this report.
14

Manufacturing and Suppliers
The suppliers we use to manufacture our packaged goods games can be characterized in three types:
‚ Manufacturing entities that press our game disks,
‚ Entities that print our game instruction booklets, and
‚ Entities that package the disks and printed game instruction booklets into the jewel cases and boxes
for shipping to customers.
Our online games and cellular handset applications are delivered digitally, and therefore, are not
manufactured.
In many instances, we are able to acquire materials on a volume-discount basis. We have multiple
potential sources of supply for most materials, except for the disk component of our PlayStation 2, PSP
and Nintendo GameCube disk products, as well as Nintendo DS cartridges, as discussed in ""SigniÑcant
Relationships''. We also have alternate sources for the manufacture and assembly of most of our products.
To date, we have not experienced any material diÇculties or delays in production of our software and
related documentation and packaging. However, a shortage of components, manufacturing delays by Sony,
Nintendo or other vendors, or other factors beyond our control could impair our ability to manufacture, or
have manufactured, our products.
Backlog
We typically ship orders immediately upon receipt. To the extent that any backlog may or may not exist at
the end of a reporting period, it would be both coincidental and an unreliable indicator of future results of
any period.
Seasonality
Our business is highly seasonal. We typically experience our highest revenue and proÑt in the holiday
season quarter ending in December and a seasonal low in revenue and proÑt in the quarter ending in June.
Our results however can vary based on title release dates, consumer demand for our products and shipment
schedules, among other factors.
Annual R
eport
Employees
As of March 31, 2006, we employed approximately 7,200 people, of whom over 4,000 were outside the
United States. We believe that our ability to attract and retain qualiÑed employees is a critical factor in
the successful development of our products and that our future success will depend, in large measure, on
our ability to continue to attract and retain qualiÑed employees. To date, we have been successful in
recruiting and retaining suÇcient numbers of qualiÑed personnel to conduct our business successfully. We
believe that our relationships with our employees are strong. Less than three percent of our employees, all
of whom work for our Swedish development subsidiary, are represented by a union, guild or other
collective bargaining organization.
15
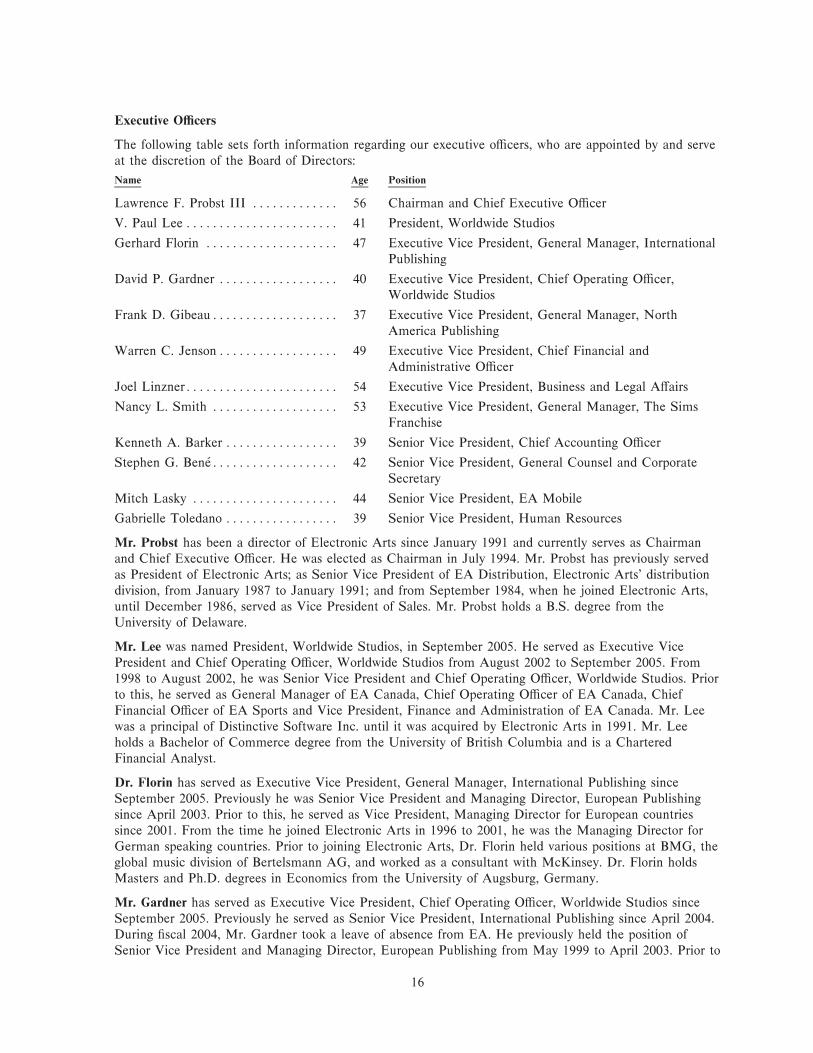
Executive OÇcers
The following table sets forth information regarding our executive oÇcers, who are appointed by and serve
at the discretion of the Board of Directors:
Name Age Position
Lawrence F. Probst III ÏÏÏÏÏÏÏÏÏÏÏÏÏ 56 Chairman and Chief Executive OÇcer
V. Paul Lee ÏÏÏÏÏÏÏÏÏÏÏÏÏÏÏÏÏÏÏÏÏÏÏ 41 President, Worldwide Studios
Gerhard Florin ÏÏÏÏÏÏÏÏÏÏÏÏÏÏÏÏÏÏÏÏ 47 Executive Vice President, General Manager, International
Publishing
David P. Gardner ÏÏÏÏÏÏÏÏÏÏÏÏÏÏÏÏÏÏ 40 Executive Vice President, Chief Operating OÇcer,
Worldwide Studios
Frank D. GibeauÏÏÏÏÏÏÏÏÏÏÏÏÏÏÏÏÏÏÏ 37 Executive Vice President, General Manager, North
America Publishing
Warren C. JensonÏÏÏÏÏÏÏÏÏÏÏÏÏÏÏÏÏÏ 49 Executive Vice President, Chief Financial and
Administrative OÇcer
Joel LinznerÏÏÏÏÏÏÏÏÏÏÏÏÏÏÏÏÏÏÏÏÏÏÏ 54 Executive Vice President, Business and Legal AÅairs
Nancy L. Smith ÏÏÏÏÏÏÏÏÏÏÏÏÏÏÏÏÏÏÏ 53 Executive Vice President, General Manager, The Sims
Franchise
Kenneth A. Barker ÏÏÏÏÏÏÏÏÏÏÏÏÏÏÏÏÏ 39 Senior Vice President, Chief Accounting OÇcer
Stephen G. Ben πeÏÏÏÏÏÏÏÏÏÏÏÏÏÏÏÏÏÏÏ 42 Senior Vice President, General Counsel and Corporate
Secretary
Mitch Lasky ÏÏÏÏÏÏÏÏÏÏÏÏÏÏÏÏÏÏÏÏÏÏ 44 Senior Vice President, EA Mobile
Gabrielle Toledano ÏÏÏÏÏÏÏÏÏÏÏÏÏÏÏÏÏ 39 Senior Vice President, Human Resources
Mr. Probst has been a director of Electronic Arts since January 1991 and currently serves as Chairman
and Chief Executive OÇcer. He was elected as Chairman in July 1994. Mr. Probst has previously served
as President of Electronic Arts; as Senior Vice President of EA Distribution, Electronic Arts' distribution
division, from January 1987 to January 1991; and from September 1984, when he joined Electronic Arts,
until December 1986, served as Vice President of Sales. Mr. Probst holds a B.S. degree from the
University of Delaware.
Mr. Lee was named President, Worldwide Studios, in September 2005. He served as Executive Vice
President and Chief Operating OÇcer, Worldwide Studios from August 2002 to September 2005. From
1998 to August 2002, he was Senior Vice President and Chief Operating OÇcer, Worldwide Studios. Prior
to this, he served as General Manager of EA Canada, Chief Operating OÇcer of EA Canada, Chief
Financial OÇcer of EA Sports and Vice President, Finance and Administration of EA Canada. Mr. Lee
was a principal of Distinctive Software Inc. until it was acquired by Electronic Arts in 1991. Mr. Lee
holds a Bachelor of Commerce degree from the University of British Columbia and is a Chartered
Financial Analyst.
Dr. Florin has served as Executive Vice President, General Manager, International Publishing since
September 2005. Previously he was Senior Vice President and Managing Director, European Publishing
since April 2003. Prior to this, he served as Vice President, Managing Director for European countries
since 2001. From the time he joined Electronic Arts in 1996 to 2001, he was the Managing Director for
German speaking countries. Prior to joining Electronic Arts, Dr. Florin held various positions at BMG, the
global music division of Bertelsmann AG, and worked as a consultant with McKinsey. Dr. Florin holds
Masters and Ph.D. degrees in Economics from the University of Augsburg, Germany.
Mr. Gardner has served as Executive Vice President, Chief Operating OÇcer, Worldwide Studios since
September 2005. Previously he served as Senior Vice President, International Publishing since April 2004.
During Ñscal 2004, Mr. Gardner took a leave of absence from EA. He previously held the position of
Senior Vice President and Managing Director, European Publishing from May 1999 to April 2003. Prior to
16

this, he held several positions in EA Europe, which he helped establish in 1987, including Director of
European Sales and Marketing and Managing Director of EA Europe. Mr. Gardner has also held various
positions at Electronic Arts in the sales, marketing and customer support departments since joining the
company in 1983.
Mr. Gibeau has served as Executive Vice President, General Manager, North America Publishing since
September 2005. Previously he was Senior Vice President of North American Marketing, a position he
held since 2002. Mr. Gibeau has held various publishing positions since joining the company in 1991.
Mr. Gibeau holds a B.S. degree from the University of Southern California and an M.B.A. from
Santa Clara University.
Mr. Jenson joined Electronic Arts in June 2002 as Executive Vice President, Chief Financial and
Administrative OÇcer. Before joining Electronic Arts, he was the Senior Vice President and Chief
Financial OÇcer for Amazon.com from 1999 to 2002. From 1998 to 1999, he was the Chief Financial
OÇcer and Executive Vice President for Delta Air Lines. Prior to that, he worked in several positions as
part of the General Electric Company. Most notably, he served as Chief Financial OÇcer and Senior Vice
President for the National Broadcasting Company, a subsidiary of General Electric. Mr. Jenson earned his
Masters of Accountancy-Business Taxation, and B.S. in Accounting from Brigham Young University.
Mr. Linzner has served as Executive Vice President, Business and Legal AÅairs since March 2005. From
April 2004 to March 2005, he served as Senior Vice President, Business and Legal AÅairs. From October
2002 to April 2004, Mr. Linzner held the position of Senior Vice President of Worldwide Business AÅairs
and from July 1999 to October 2002, he held the position of Vice President of Worldwide Business
AÅairs. Prior to joining Electronic Arts in July 1999, Mr. Linzner served as outside litigation counsel to
Electronic Arts and several other companies in the video game industry. Mr. Linzner earned his J.D. from
Boalt Hall at the University of California, Berkeley, after graduating from Brandeis University. He is a
member of the Bar of the State of California and is admitted to practice in the United States Supreme
Court, the Ninth Circuit Court of Appeals and several United States District Courts.
Ms. Smith was named Executive Vice President, General Manager, The Sims Franchise in September
2005. Prior to this position, she served as Executive Vice President and General Manager, North
American Publishing since March 1998. From October 1996 to March 1998, Ms. Smith served as
Executive Vice President, North American Sales. She previously held the position of Senior Vice
President of North American Sales and Distribution from July 1993 to October 1996 and as Vice
President of Sales from 1988 to 1993. Ms. Smith has also served as Western Regional Sales Manager and
National Sales Manager since she joined Electronic Arts in 1984. Ms. Smith holds a B.S. degree in
management and organizational behavior from the University of San Francisco.
Annual R
eport
Mr. Barker has served as Senior Vice President, Chief Accounting OÇcer since April 2006. From June
2003 to April 2006, Mr. Barker held the position of Vice President, Chief Accounting OÇcer. Prior to
joining Electronic Arts, Mr. Barker was employed at Sun Microsystems, Inc., as Vice President and
Corporate Controller from October 2002 to June 2003 and Assistant Corporate Controller from April 2000
to September 2002. Prior to that, he was an audit partner at Deloitte. Mr. Barker graduated from the
University of Notre Dame with a B.A. degree in Accounting.
Mr. Ben πe has served as Senior Vice President, General Counsel and Corporate Secretary since October
2004. From April 2004 to October 2004, Mr. Ben πe held the position of Vice President, Acting General
Counsel and Corporate Secretary, and from June 2003 to April 2004, he held the position of Vice
President and Associate General Counsel. Prior to June 2003, Mr. Ben πe had served as internal legal
counsel since joining the Company in March 1995. Mr. Ben πe earned his J.D. from Stanford Law School,
and received his B.S. in Mechanical Engineering from Rice University. Mr. Ben πe is a member of the Bar
of the State of California.
Mr. Lasky joined Electronic Arts in February 2006 as Senior Vice President of EA Mobile. From
November 2000 until February 2006, Mr. Lasky served as Chief Executive OÇcer of JAMDAT Mobile
Inc., and from February 2001 until February 2006, served as Chairman of the Board of JAMDAT. From
17

March 1995 to June 2000, Mr. Lasky held various positions at Activision, Inc., including Executive Vice
President of Worldwide Studios. Mr. Lasky graduated from Harvard College with a B.A. in History and
Literature, and earned a J.D. from the University of Virginia School of Law.
Ms. Toledano joined Electronic Arts in February 2006 as Senior Vice President, Human Resources. Prior
to joining Electronic Arts, Ms. Toledano served as Siebel Systems, Inc.'s Senior Vice President of Human
Resources from July 2002 to February 2006. From September 2000 to June 2002, she served as Senior
Director of Human Resources for Microsoft Corporation, and from September 1998 until September 2000,
she served as Director of Human Resources and Recruiting for Microsoft. Ms. Toledano earned both her
undergraduate degree in Humanities and her graduate degree in Education from Stanford University.
Investor Information
We Ñle various reports with, or furnish them to, the Securities and Exchange Commission (the ""SEC''),
including our annual report on Form 10-K, quarterly reports on Form 10-Q, current reports on Form 8-K,
and amendments to such reports. These reports are available free of charge on the Investor Relations
section of our web site, http://investor.ea.com, as soon as reasonably practicable after we electronically Ñle
the reports with, or furnish them to, the SEC.
The charters of our Audit, Compensation, and Nominating and Governance committees of our Board of
Directors, as well as our Global Code of Conduct (which includes code of ethics provisions applicable to
our directors, principal executive oÇcer, principal Ñnancial oÇcer, principal accounting oÇcer, and other
senior Ñnancial oÇcers), are available in the Investor Relations section of our web site at
http://investor.ea.com. We will post amendments to our Global Code of Conduct in the Investor Relations
section of our web site. Copies of our charters and Global Code of Conduct are available without charge
by contacting our Investor Relations department at (650) 628-1500.
Shareholders of record may hold their shares of our common stock in book-entry form. This eliminates
costs related to safekeeping or replacing paper stock certiÑcates. In addition, shareholders of record may
request electronic movement of book-entry shares between their account with our stock transfer agent and
their broker. Stock certiÑcates may be converted to book-entry shares at any time. Questions regarding
this service may be directed to our stock transfer agent, Wells Fargo Bank, N.A., at 1-800-468-9716.
Item 1A: Risk Factors
Our business is subject to many risks and uncertainties, which may aÅect our future Ñnancial performance.
If any of the events or circumstances described below occurs, our business and Ñnancial performance could
be harmed, our actual results could diÅer materially from our expectations and the market value of our
stock could decline. The risks and uncertainties discussed below are not the only ones we face. There may
be additional risks and uncertainties not currently known to us or that we currently do not believe are
material that may harm our business and Ñnancial performance.
Our business is highly dependent on the success, timely release and availability of new video game
platforms, on the continued availability of existing video game platforms, as well as our ability to develop
commercially successful products for these platforms.
We derive most of our revenue from the sale of products for play on video game platforms manufactured
by third parties, such as Sony's PlayStation 2 and Microsoft's Xbox. The success of our business is driven
in large part by the availability of an adequate supply of current-generation video game platforms, the
timely release, adequate supply, and success of new video game hardware systems, our ability to accurately
predict which platforms will be most successful in the marketplace, and our ability to develop
commercially successful products for these platforms. We must make product development decisions and
commit signiÑcant resources well in advance of the anticipated introduction of a new platform. A new
platform for which we are developing products may be delayed, may not succeed or may have a shorter
life cycle than anticipated. If the platforms for which we are developing products are not released when
anticipated, are not available in adequate amounts to meet consumer demand, or do not attain wide
18
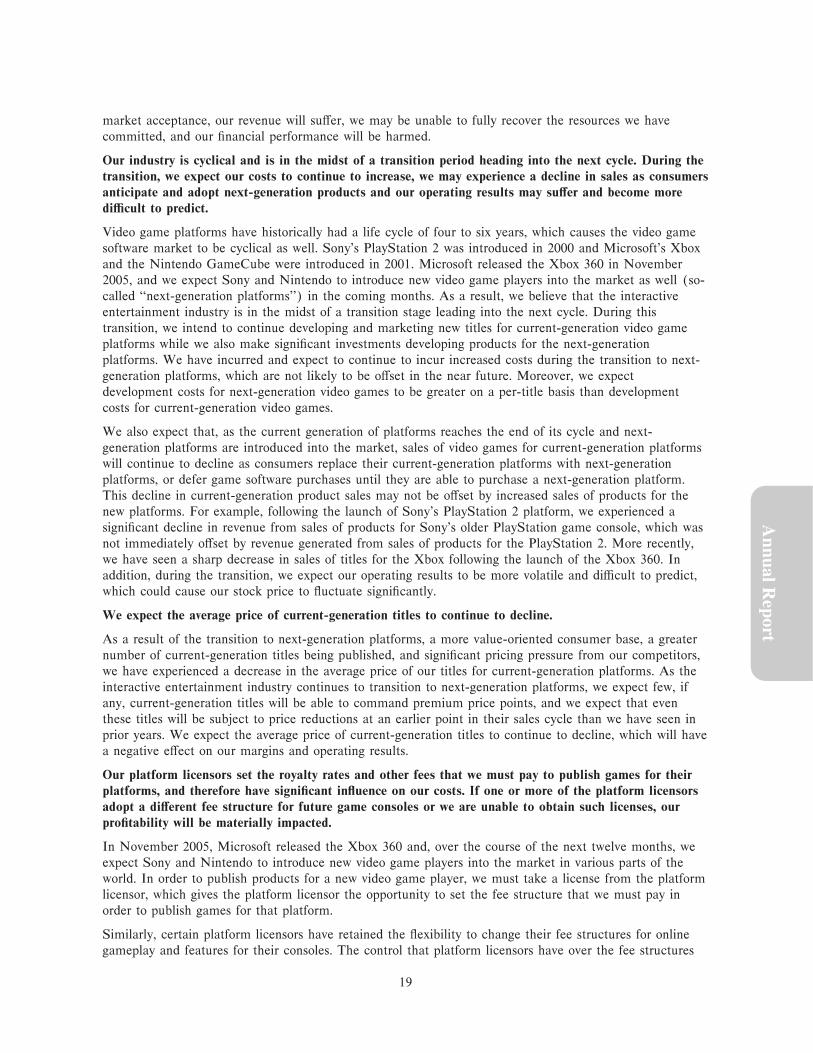
market acceptance, our revenue will suÅer, we may be unable to fully recover the resources we have
committed, and our Ñnancial performance will be harmed.
Our industry is cyclical and is in the midst of a transition period heading into the next cycle. During the
transition, we expect our costs to continue to increase, we may experience a decline in sales as consumers
anticipate and adopt next-generation products and our operating results may suÅer and become more
diÇcult to predict.
Video game platforms have historically had a life cycle of four to six years, which causes the video game
software market to be cyclical as well. Sony's PlayStation 2 was introduced in 2000 and Microsoft's Xbox
and the Nintendo GameCube were introduced in 2001. Microsoft released the Xbox 360 in November
2005, and we expect Sony and Nintendo to introduce new video game players into the market as well (so-
called ""next-generation platforms'') in the coming months. As a result, we believe that the interactive
entertainment industry is in the midst of a transition stage leading into the next cycle. During this
transition, we intend to continue developing and marketing new titles for current-generation video game
platforms while we also make signiÑcant investments developing products for the next-generation
platforms. We have incurred and expect to continue to incur increased costs during the transition to next-
generation platforms, which are not likely to be oÅset in the near future. Moreover, we expect
development costs for next-generation video games to be greater on a per-title basis than development
costs for current-generation video games.
We also expect that, as the current generation of platforms reaches the end of its cycle and next-
generation platforms are introduced into the market, sales of video games for current-generation platforms
will continue to decline as consumers replace their current-generation platforms with next-generation
platforms, or defer game software purchases until they are able to purchase a next-generation platform.
This decline in current-generation product sales may not be oÅset by increased sales of products for the
new platforms. For example, following the launch of Sony's PlayStation 2 platform, we experienced a
signiÑcant decline in revenue from sales of products for Sony's older PlayStation game console, which was
not immediately oÅset by revenue generated from sales of products for the PlayStation 2. More recently,
we have seen a sharp decrease in sales of titles for the Xbox following the launch of the Xbox 360. In
addition, during the transition, we expect our operating results to be more volatile and diÇcult to predict,
which could cause our stock price to Öuctuate signiÑcantly.
We expect the average price of current-generation titles to continue to decline.
As a result of the transition to next-generation platforms, a more value-oriented consumer base, a greater
number of current-generation titles being published, and signiÑcant pricing pressure from our competitors,
we have experienced a decrease in the average price of our titles for current-generation platforms. As the
Annual R
eport
interactive entertainment industry continues to transition to next-generation platforms, we expect few, if
any, current-generation titles will be able to command premium price points, and we expect that even
these titles will be subject to price reductions at an earlier point in their sales cycle than we have seen in
prior years. We expect the average price of current-generation titles to continue to decline, which will have
a negative eÅect on our margins and operating results.
Our platform licensors set the royalty rates and other fees that we must pay to publish games for their
platforms, and therefore have signiÑcant inÖuence on our costs. If one or more of the platform licensors
adopt a diÅerent fee structure for future game consoles or we are unable to obtain such licenses, our
proÑtability will be materially impacted.
In November 2005, Microsoft released the Xbox 360 and, over the course of the next twelve months, we
expect Sony and Nintendo to introduce new video game players into the market in various parts of the
world. In order to publish products for a new video game player, we must take a license from the platform
licensor, which gives the platform licensor the opportunity to set the fee structure that we must pay in
order to publish games for that platform.
Similarly, certain platform licensors have retained the Öexibility to change their fee structures for online
gameplay and features for their consoles. The control that platform licensors have over the fee structures
19

for their future platforms and online access makes it diÇcult for us to predict our costs and proÑtability in
the medium to long term. It is also possible that platform licensors may choose not to renew our licenses.
Because publishing products for video game consoles is the largest portion of our business, any increase in
fee structures or failure to secure a license relationship would signiÑcantly harm our ability to generate
revenues and/or proÑts.
If we do not consistently meet our product development schedules, our operating results will be adversely
aÅected.
Our business is highly seasonal, with the highest levels of consumer demand and a signiÑcant percentage
of our revenue occurring in the December quarter. In addition, we seek to release many of our products in
conjunction with speciÑc events, such as the release of a related movie or the beginning of a sports season
or major sporting event. If we miss these key selling periods for any reason, including product delays or
delayed introduction of a new platform for which we have developed products, our sales will suÅer
disproportionately. Likewise, if a key event to which our product release schedule is tied were to be
delayed or cancelled, our sales would also suÅer disproportionately. Our ability to meet product
development schedules is aÅected by a number of factors, including the creative processes involved, the
coordination of large and sometimes geographically dispersed development teams required by the
increasing complexity of our products, and the need to Ñne-tune our products prior to their release. We
have experienced development delays for our products in the past, which caused us to push back release
dates. In the future, any failure to meet anticipated production or release schedules would likely result in a
delay of revenue or possibly a signiÑcant shortfall in our revenue, harm our proÑtability, and cause our
operating results to be materially diÅerent than anticipated.
Our business is subject to risks generally associated with the entertainment industry, any of which could
signiÑcantly harm our operating results.
Our business is subject to risks that are generally associated with the entertainment industry, many of
which are beyond our control. These risks could negatively impact our operating results and include: the
popularity, price and timing of our games and the platforms on which they are played; economic conditions
that adversely aÅect discretionary consumer spending; changes in consumer demographics; the availability
and popularity of other forms of entertainment; and critical reviews and public tastes and preferences,
which may change rapidly and cannot necessarily be predicted.
Technology changes rapidly in our business and if we fail to anticipate or successfully implement new
technologies or the manner in which people play our games, the quality, timeliness and competitiveness
of our products and services will suÅer.
Rapid technology changes in our industry require us to anticipate, sometimes years in advance, which
technologies we must implement and take advantage of in order to make our products and services
competitive in the market. Therefore, we usually start our product development with a range of technical
development goals that we hope to be able to achieve. We may not be able to achieve these goals, or our
competition may be able to achieve them more quickly and eÅectively than we can. In either case, our
products and services may be technologically inferior to our competitors', less appealing to consumers, or
both. If we cannot achieve our technology goals within the original development schedule of our products
and services, then we may delay their release until these technology goals can be achieved, which may
delay or reduce revenue and increase our development expenses. Alternatively, we may increase the
resources employed in research and development in an attempt to accelerate our development of new
technologies, either to preserve our product or service launch schedule or to keep up with our competition,
which would increase our development expenses.
Our business is intensely competitive and ""hit'' driven. If we do not continue to deliver ""hit'' products
and services or if consumers prefer our competitors' products or services over our own, our operating
results could suÅer.
Competition in our industry is intense and we expect new competitors to continue to emerge in the United
States and abroad. While many new products and services are regularly introduced, only a relatively small
20
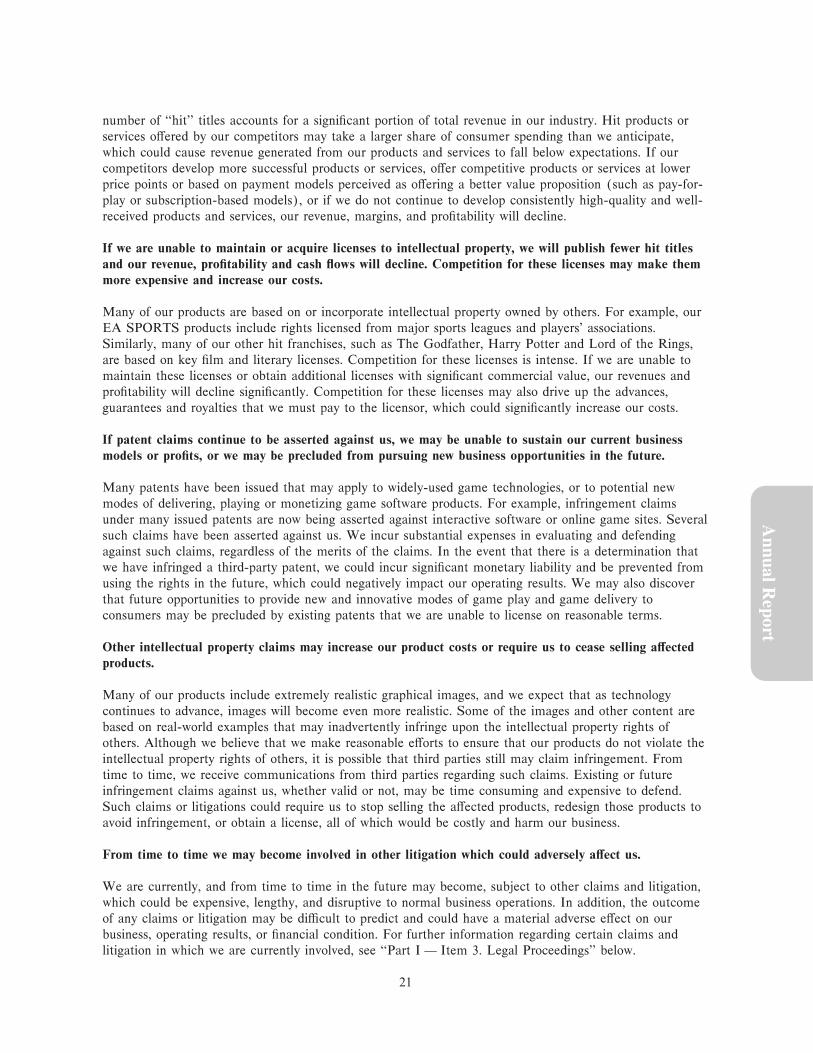
number of ""hit'' titles accounts for a signiÑcant portion of total revenue in our industry. Hit products or
services oÅered by our competitors may take a larger share of consumer spending than we anticipate,
which could cause revenue generated from our products and services to fall below expectations. If our
competitors develop more successful products or services, oÅer competitive products or services at lower
price points or based on payment models perceived as oÅering a better value proposition (such as pay-for-
play or subscription-based models), or if we do not continue to develop consistently high-quality and well-
received products and services, our revenue, margins, and proÑtability will decline.
If we are unable to maintain or acquire licenses to intellectual property, we will publish fewer hit titles
and our revenue, proÑtability and cash Öows will decline. Competition for these licenses may make them
more expensive and increase our costs.
Many of our products are based on or incorporate intellectual property owned by others. For example, our
EA SPORTS products include rights licensed from major sports leagues and players' associations.
Similarly, many of our other hit franchises, such as The Godfather, Harry Potter and Lord of the Rings,
are based on key Ñlm and literary licenses. Competition for these licenses is intense. If we are unable to
maintain these licenses or obtain additional licenses with signiÑcant commercial value, our revenues and
proÑtability will decline signiÑcantly. Competition for these licenses may also drive up the advances,
guarantees and royalties that we must pay to the licensor, which could signiÑcantly increase our costs.
If patent claims continue to be asserted against us, we may be unable to sustain our current business
models or proÑts, or we may be precluded from pursuing new business opportunities in the future.
Many patents have been issued that may apply to widely-used game technologies, or to potential new
modes of delivering, playing or monetizing game software products. For example, infringement claims
under many issued patents are now being asserted against interactive software or online game sites. Several
such claims have been asserted against us. We incur substantial expenses in evaluating and defending
against such claims, regardless of the merits of the claims. In the event that there is a determination that
we have infringed a third-party patent, we could incur signiÑcant monetary liability and be prevented from
using the rights in the future, which could negatively impact our operating results. We may also discover
that future opportunities to provide new and innovative modes of game play and game delivery to
consumers may be precluded by existing patents that we are unable to license on reasonable terms.
Other intellectual property claims may increase our product costs or require us to cease selling aÅected
products.
Annual R
eport
Many of our products include extremely realistic graphical images, and we expect that as technology
continues to advance, images will become even more realistic. Some of the images and other content are
based on real-world examples that may inadvertently infringe upon the intellectual property rights of
others. Although we believe that we make reasonable eÅorts to ensure that our products do not violate the
intellectual property rights of others, it is possible that third parties still may claim infringement. From
time to time, we receive communications from third parties regarding such claims. Existing or future
infringement claims against us, whether valid or not, may be time consuming and expensive to defend.
Such claims or litigations could require us to stop selling the aÅected products, redesign those products to
avoid infringement, or obtain a license, all of which would be costly and harm our business.
From time to time we may become involved in other litigation which could adversely aÅect us.
We are currently, and from time to time in the future may become, subject to other claims and litigation,
which could be expensive, lengthy, and disruptive to normal business operations. In addition, the outcome
of any claims or litigation may be diÇcult to predict and could have a material adverse eÅect on our
business, operating results, or Ñnancial condition. For further information regarding certain claims and
litigation in which we are currently involved, see ""Part I Ì Item 3. Legal Proceedings'' below.
21

Our business, our products and our distribution are subject to increasing regulation of content, consumer
privacy, distribution and online hosting and delivery in the key territories in which we conduct business.
If we do not successfully respond to these regulations, our business may suÅer.
Legislation is continually being introduced that may aÅect both the content of our products and their
distribution. For example, data protection laws in the United States and Europe impose various restrictions
on our web sites. Those rules vary by territory although the Internet recognizes no geographical
boundaries. Other countries, such as Germany, have adopted laws regulating content both in packaged
games and those transmitted over the Internet that are stricter than current United States laws. In the
United States, the federal and several state governments are continually considering content restrictions on
products such as ours, as well as restrictions on distribution of such products. For example, recent
legislation has been adopted in several states, and could be proposed at the federal level, that prohibits the
sale of certain games (e.g., violent games or those with ""M (Mature)'' or ""AO (Adults Only)'' ratings) to
minors. Any one or more of these factors could harm our business by limiting the products we are able to
oÅer to our customers, by limiting the size of the potential market for our products, and by requiring
additional diÅerentiation between products for diÅerent territories to address varying regulations. This
additional product diÅerentiation could be costly.
If one or more of our titles were found to contain hidden, objectionable content, our business could
suÅer.
Throughout the history of our industry, many video games have been designed to include certain hidden
content and gameplay features that are accessible through the use of in-game cheat codes or other
technological means that are intended to enhance the gameplay experience. However, in several cases, the
hidden content or feature was included in the game by an employee who was not authorized to do so or by
an outside developer without the knowledge of the publisher. From time to time, some hidden content and
features have contained profanity, graphic violence and sexually explicit or otherwise objectionable
material. In a few cases, the Entertainment Software Ratings Board (""ESRB'') has reacted to discoveries
of hidden content and features by reviewing the rating that was originally assigned to the product,
requiring the publisher to change the game packaging and/or Ñning the publisher. Retailers have on
occasion reacted to the discovery of such hidden content by removing these games from their shelves,
refusing to sell them, and demanding that their publishers accept them as product returns. Likewise,
consumers have reacted to the revelation of hidden content by refusing to purchase such games,
demanding refunds for games they've already purchased, and refraining from buying other games published
by the company whose game contained the objectionable material.
We have implemented preventative measures designed to reduce the possibility of hidden, objectionable
content from appearing in the video games we publish. Nonetheless, these preventative measures are
subject to human error, circumvention, overriding, and reasonable resource constraints. If a video game we
published were found to contain hidden, objectionable content, the ESRB could demand that we recall a
game and change its packaging to reÖect a revised rating, retailers could refuse to sell it and demand we
accept the return of any unsold copies or returns from customers, and consumers could refuse to buy it or
demand that we refund their money. This could have a material negative impact on our operating results
and Ñnancial condition. In addition, our reputation could be harmed, which could impact sales of other
video games we sell. If any of these consequences were to occur, our business and Ñnancial performance
could be signiÑcantly harmed.
If we ship defective products, our operating results could suÅer.
Products such as ours are extremely complex software programs, and are diÇcult to develop, manufacture
and distribute. We have quality controls in place to detect defects in the software, media and packaging of
our products before they are released. Nonetheless, these quality controls are subject to human error,
overriding, and reasonable resource constraints. Therefore, these quality controls and preventative measures
may not be eÅective in detecting defects in our products before they have been reproduced and released
into the marketplace. In such an event, we could be required to recall a product, or we may Ñnd it
22

necessary to voluntarily recall a product, and/or scrap defective inventory, which could signiÑcantly harm
our business and operating results.
If we do not continue to attract and retain key personnel, we will be unable to eÅectively conduct our
business. In addition, compensation-related changes in accounting requirements, as well as evolving legal
and operational factors, could have a signiÑcant impact on our expenses and operating results.
The market for technical, creative, marketing and other personnel essential to the development and
marketing of our products and management of our businesses is extremely competitive. Our leading
position within the interactive entertainment industry makes us a prime target for recruiting of executives
and key creative talent. If we cannot successfully recruit and retain the employees we need, or replace key
employees following their departure, our ability to develop and manage our businesses will be impaired.
We annually review and evaluate with the Compensation Committee of our Board of Directors the
compensation and beneÑts that we oÅer our employees to ensure that we are able to attract and retain our
talent. Within our regular review, we have considered recent changes in the accounting treatment of stock
options, the competitive market for technical, creative, marketing and other personnel, and the evolving
nature of job functions within our studios, marketing organizations and other areas of the business. Any
changes we make to our compensation programs could result in increased expenses and have a signiÑcant
impact on our operating results.
Our platform licensors are our chief competitors and frequently control the manufacturing of and/or
access to our video game products. If they do not approve our products, we will be unable to ship to our
customers.
Our agreements with hardware licensors (such as Sony for the PlayStation 2, Microsoft for the Xbox and
Nintendo for the Nintendo GameCube) typically give signiÑcant control to the licensor over the approval
and manufacturing of our products, which could, in certain circumstances, leave us unable to get our
products approved, manufactured and shipped to customers. These hardware licensors are also our chief
competitors. In most events, control of the approval and manufacturing process by the platform licensors
increases both our manufacturing lead times and costs as compared to those we can achieve independently.
While we believe that our relationships with our hardware licensors are currently good, the potential for
these licensors to delay or refuse to approve or manufacture our products exists. Such occurrences would
harm our business and our Ñnancial performance.
We also require compatibility code and the consent of Microsoft and Sony in order to include online
capabilities in our products for their respective platforms. As online capabilities for video game platforms
Annual R
eport
become more signiÑcant, Microsoft and Sony could restrict our ability to provide online capabilities for our
console platform products. If Microsoft or Sony refused to approve our products with online capabilities or
signiÑcantly impacted the Ñnancial terms on which these services are oÅered to our customers, our
business could be harmed.
Our international net revenue is subject to currency Öuctuations.
For the Ñscal year ended March 31, 2006, international net revenue comprised 46 percent of our total net
revenue. We expect foreign sales to continue to account for a signiÑcant portion of our total net revenue.
Such sales may be subject to unexpected regulatory requirements, tariÅs and other barriers. Additionally,
foreign sales are primarily made in local currencies, which may Öuctuate against the U.S. dollar. While we
utilize foreign exchange forward contracts to mitigate some foreign currency risk associated with foreign
currency denominated assets and liabilities (primarily certain intercompany receivables and payables) and,
from time to time, foreign currency option contracts to hedge foreign currency forecasted transactions
(primarily related to a portion of the revenue and expenses denominated in foreign currency generated by
our operational subsidiaries), our results of operations, including our reported net revenue and net income,
and Ñnancial condition would be adversely aÅected by unfavorable foreign currency Öuctuations,
particularly the Euro, British pound sterling and Canadian dollar.
23
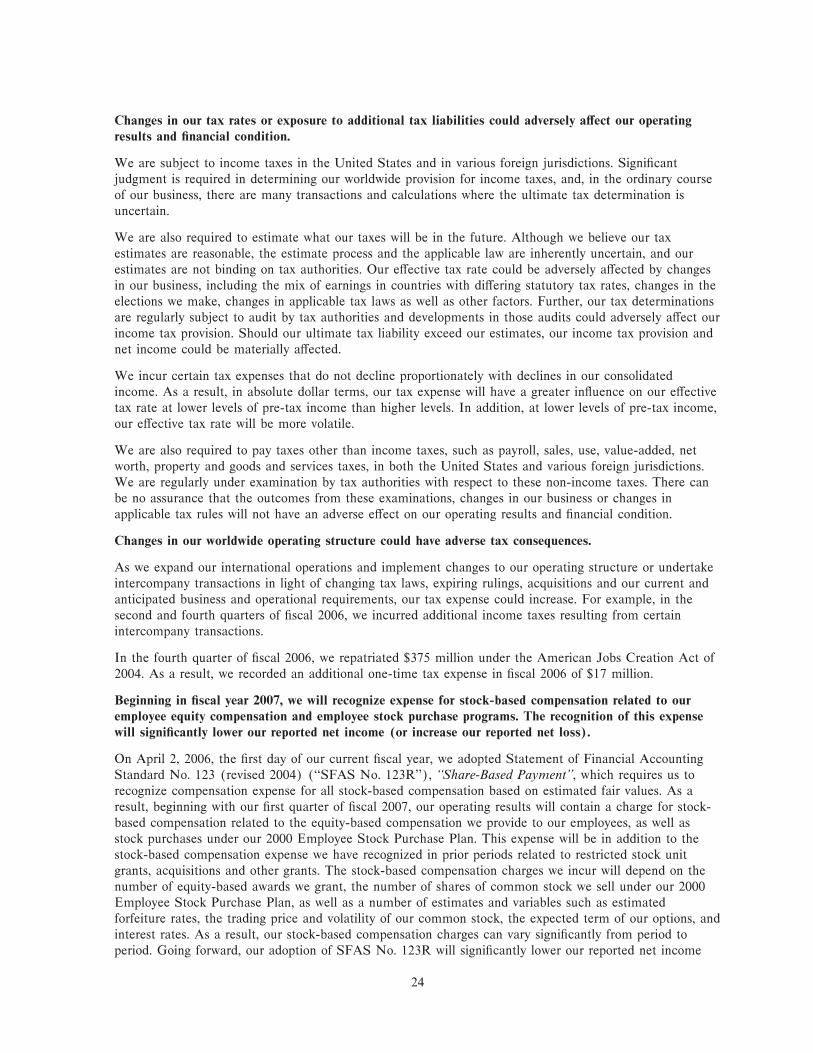
Changes in our tax rates or exposure to additional tax liabilities could adversely aÅect our operating
results and Ñnancial condition.
We are subject to income taxes in the United States and in various foreign jurisdictions. SigniÑcant
judgment is required in determining our worldwide provision for income taxes, and, in the ordinary course
of our business, there are many transactions and calculations where the ultimate tax determination is
uncertain.
We are also required to estimate what our taxes will be in the future. Although we believe our tax
estimates are reasonable, the estimate process and the applicable law are inherently uncertain, and our
estimates are not binding on tax authorities. Our eÅective tax rate could be adversely aÅected by changes
in our business, including the mix of earnings in countries with diÅering statutory tax rates, changes in the
elections we make, changes in applicable tax laws as well as other factors. Further, our tax determinations
are regularly subject to audit by tax authorities and developments in those audits could adversely aÅect our
income tax provision. Should our ultimate tax liability exceed our estimates, our income tax provision and
net income could be materially aÅected.
We incur certain tax expenses that do not decline proportionately with declines in our consolidated
income. As a result, in absolute dollar terms, our tax expense will have a greater inÖuence on our eÅective
tax rate at lower levels of pre-tax income than higher levels. In addition, at lower levels of pre-tax income,
our eÅective tax rate will be more volatile.
We are also required to pay taxes other than income taxes, such as payroll, sales, use, value-added, net
worth, property and goods and services taxes, in both the United States and various foreign jurisdictions.
We are regularly under examination by tax authorities with respect to these non-income taxes. There can
be no assurance that the outcomes from these examinations, changes in our business or changes in
applicable tax rules will not have an adverse eÅect on our operating results and Ñnancial condition.
Changes in our worldwide operating structure could have adverse tax consequences.
As we expand our international operations and implement changes to our operating structure or undertake
intercompany transactions in light of changing tax laws, expiring rulings, acquisitions and our current and
anticipated business and operational requirements, our tax expense could increase. For example, in the
second and fourth quarters of Ñscal 2006, we incurred additional income taxes resulting from certain
intercompany transactions.
In the fourth quarter of Ñscal 2006, we repatriated $375 million under the American Jobs Creation Act of
2004. As a result, we recorded an additional one-time tax expense in Ñscal 2006 of $17 million.
Beginning in Ñscal year 2007, we will recognize expense for stock-based compensation related to our
employee equity compensation and employee stock purchase programs. The recognition of this expense
will signiÑcantly lower our reported net income (or increase our reported net loss).
On April 2, 2006, the Ñrst day of our current Ñscal year, we adopted Statement of Financial Accounting
Standard No. 123 (revised 2004) (""SFAS No. 123R''), ""Share-Based Payment'', which requires us to
recognize compensation expense for all stock-based compensation based on estimated fair values. As a
result, beginning with our Ñrst quarter of Ñscal 2007, our operating results will contain a charge for stock-
based compensation related to the equity-based compensation we provide to our employees, as well as
stock purchases under our 2000 Employee Stock Purchase Plan. This expense will be in addition to the
stock-based compensation expense we have recognized in prior periods related to restricted stock unit
grants, acquisitions and other grants. The stock-based compensation charges we incur will depend on the
number of equity-based awards we grant, the number of shares of common stock we sell under our 2000
Employee Stock Purchase Plan, as well as a number of estimates and variables such as estimated
forfeiture rates, the trading price and volatility of our common stock, the expected term of our options, and
interest rates. As a result, our stock-based compensation charges can vary signiÑcantly from period to
period. Going forward, our adoption of SFAS No. 123R will signiÑcantly lower our reported net income
24
(or increase our reported net loss), which could have an adverse impact on the trading price of our
common stock.
Our reported Ñnancial results could be adversely aÅected by changes in Ñnancial accounting standards or
by the application of existing or future accounting standards to our business as it evolves.
As a result of the enactment of the Sarbanes-Oxley Act and the review of accounting policies by the SEC
and national and international accounting standards bodies, the frequency of accounting policy changes
may accelerate. For example, accounting policies aÅecting software revenue recognition have been the
subject of frequent interpretations, which could signiÑcantly aÅect the way we account for revenue related
to our products. In addition, the rules for tax accounting are in the process of being changed. As we
enhance, expand and diversify our business and product oÅerings, the application of existing or future
Ñnancial accounting standards, particularly those relating to the way we account for revenue and taxes,
could have a signiÑcant adverse eÅect on our reported results although not necessarily on our cash Öows. It
is likely that, as the industry transitions to the next generation of consoles, a more signiÑcant portion of
our business could be generated through online services and, as a result, we would recognize the related
revenue over an extended period of time rather than up front and all at once.
The majority of our sales are made to a relatively small number of key customers. If these customers
reduce their purchases of our products or become unable to pay for them, our business could be harmed.
Over 70 percent of our U.S. sales were made to Ñve key customers during the Ñscal year ended March 31,
2006. In Europe, our top ten customers accounted for approximately 32 percent of our sales in that
territory during the Ñscal year ended March 31, 2006. Worldwide, we had direct sales to one customer,
Wal-Mart Stores, Inc., which represented approximately 13 percent of total net revenue in the Ñscal year
ended March 31, 2006. In addition, we believe it likely that, had GameStop Corp.'s acquisition of
Electronics Boutique Holdings Corp. occurred on April 1, 2005, the combined company would have
represented greater than 10 percent of total net revenue for the Ñscal year ended March 31, 2006. Though
our products are available to consumers through a variety of retailers, the concentration of our sales in one,
or a few, large customers could lead to a short-term disruption in our sales if one or more of these
customers signiÑcantly reduced their purchases or ceased to carry our products, and could make us more
vulnerable to collection risk if one or more of these large customers became unable to pay for our
products. Additionally, our receivables from these large customers increase signiÑcantly in the December
quarter as they stock up for the holiday selling season. Also, having such a large portion of our total net
revenue concentrated in a few customers reduces our negotiating leverage with these customers.
Acquisitions, investments and other strategic transactions could result in operating diÇculties, dilution to
our investors and other negative consequences.
Annual R
eport
We have engaged in, evaluated, and expect to continue to engage in and evaluate, a wide array of potential
strategic transactions, including (i) acquisitions of companies, businesses, intellectual properties, and other
assets, and (ii) investments in new interactive entertainment businesses (for example, online and mobile
games). Any of these strategic transactions could be material to our Ñnancial condition and results of
operations. Although we regularly search for opportunities to engage in strategic transactions, we may not
be successful in identifying suitable opportunities. We may not be able to consummate potential
acquisitions or investments or an acquisition or investment may not enhance our business or may decrease
rather than increase our earnings. In addition, the process of integrating an acquired company or business,
or successfully exploiting acquired intellectual property or other assets, could divert a signiÑcant amount of
our management's time and focus and may create unforeseen operating diÇculties and expenditures.
Additional risks we face include:
‚ The need to implement or remediate controls, procedures and policies appropriate for a public
company in an acquired company that, prior to the acquisition, lacked these controls, procedures
and policies,
‚ Cultural challenges associated with integrating employees from an acquired company or business
into our organization,
25
‚ Retaining key employees from the businesses we acquire,
‚ The need to integrate an acquired company's accounting, management information, human resource
and other administrative systems to permit eÅective management, and
‚ To the extent that we engage in strategic transactions outside of the United States, we face
additional risks, including risks related to integration of operations across diÅerent cultures and
languages, currency risks and the particular economic, political and regulatory risks associated with
speciÑc countries.
Future acquisitions and investments could involve the issuance of our equity securities, potentially diluting
our existing stockholders, the incurrence of debt, contingent liabilities or amortization expenses, write-oÅs
of goodwill, intangibles, or acquired in-process technology, or other increased expenses, any of which could
harm our Ñnancial condition. Our stockholders may not have the opportunity to review, vote on or evaluate
future acquisitions or investments.
Our products are subject to the threat of piracy by a variety of organizations and individuals. If we are
not successful in combating and preventing piracy, our sales and proÑtability could be harmed
signiÑcantly.
In many countries around the world, more pirated copies of our products are sold than legitimate copies.
Though we believe piracy has not had a material impact on our operating results to date, highly organized
pirate operations have been expanding globally. In addition, the proliferation of technology designed to
circumvent the protection measures we use in our products, the availability of broadband access to the
Internet, the ability to download pirated copies of our games from various Internet sites, and the
widespread proliferation of Internet cafes using pirated copies of our products, all have contributed to
ongoing and expanding piracy. Though we take steps to make the unauthorized copying and distribution of
our products more diÇcult, as do the manufacturers of consoles on which our games are played, neither
our eÅorts nor those of the console manufacturers may be successful in controlling the piracy of our
products. This could have a negative eÅect on our growth and proÑtability in the future.
Our stock price has been volatile and may continue to Öuctuate signiÑcantly.
The market price of our common stock historically has been, and we expect will continue to be, subject to
signiÑcant Öuctuations. These Öuctuations may be due to factors speciÑc to us (including those discussed
in the risk factors above as well as others not currently known to us or that we currently do not believe are
material), to changes in securities analysts' earnings estimates or ratings, to our results or future Ñnancial
guidance falling below the expectations of analysts and investors, to factors aÅecting the computer,
software, Internet, entertainment, media or electronics industries, or to national or international economic
conditions.
26

Item 1B: Unresolved StaÅ Comments
None.
Item 2: Properties
The following diagram depicts the locations of the majority of our facilities throughout the world:
BurnabyVancouver
St. Louis ParkChicago
MontrealToronto
New YorkLouisville
Bentonville
OrlandoHamilton
Mexico City
Dallas
Bridgetown
Redwood CityEmeryville
Los Angeles
Hawaii
Sao PauloJohannesburg
PerthAdelaide
Melbourne
Sydney
Singapore
BangkokHyderabad
TaipeiHong Kong
Athens
Budapest
Bucharest
WarsawPrague
VantaaOslo
Virum
Milan
Geneva Vienna
LyonParis
Brussels
MadridLisbon
Buchs
Upplands Vasby
Tokyo
The Gold Coast
Auckland
OsakaShanghai
Seoul
GuildfordChertsey
Cologne
LondonWarrington
AmsterdamHoensbrock
Corporate Headquarters
Distribution Center
Sales and Administration
Development Studio
Development Studio and Administration
Legend
We currently own a 418,000 square feet product development studio facility in Burnaby, British Columbia,
Canada and a 122,000 square feet administrative, sales and development facility in Chertsey, England. In
addition to the properties we own, we lease approximately 2.6 million square feet of facilities, including the
following signiÑcant leases for our headquarters in Redwood City, California, our studios in Los Angeles,
California and Orlando, Florida, and our distribution center in Louisville, Kentucky. Our leased space is
summarized as follows (in square feet):North
Purpose America Europe Asia Total
DistributionÏÏÏÏÏÏÏÏÏÏÏÏÏÏÏÏÏÏÏÏÏÏÏÏÏÏÏÏÏÏÏÏÏÏÏÏÏÏÏÏÏ 250,000 86,735 Ì 336,735
Sales & Administrative ÏÏÏÏÏÏÏÏÏÏÏÏÏÏÏÏÏÏÏÏÏÏÏÏÏÏÏÏÏÏÏ 732,077 167,978 65,519 965,574
Studio Development ÏÏÏÏÏÏÏÏÏÏÏÏÏÏÏÏÏÏÏÏÏÏÏÏÏÏÏÏÏÏÏÏÏ 1,138,080 122,078 65,805 1,325,963
Annual R
eport
Total Leased Square Footage ÏÏÏÏÏÏÏÏÏÏÏÏÏÏÏÏÏÏÏÏÏÏÏÏ 2,120,157 376,791 131,324 2,628,272
Redwood City Headquarters
In February 1995, we entered into a build-to-suit lease (""Phase One Lease'') with a third party for our
headquarters facilities in Redwood City, California (""Phase One Facilities''). The Phase One Facilities
comprise a total of approximately 350,000 square feet and provide space for sales, marketing,
administration and research and development functions. In July 2001, we reÑnanced the Phase One Lease
with Keybank National Association through July 2006. We account for the Phase One Lease arrangement
as an operating lease in accordance with SFAS No. 13, ""Accounting for Leases'', as amended.
On May 26, 2006, we extended the financing under the Phase One Lease through July 2007. Upon expiration
of the financing in July 2007, we may purchase the Phase One Facilities, request up to two one-year extensions
of the financing (subject to bank approval), self-fund approximately 90 percent of the financing and extend the
remainder through July 2009, or arrange for the sale of the Phase One Facilities to a third party.
The Phase One Lease terminates upon expiration of the Ñnancing in July 2007 unless we have extended
the Ñnancing or elected to self-fund the Ñnancing as described above, in which case the term of the lease
27
could be extended until as late as July 2009. Subject to certain terms and conditions, upon termination of
the lease, we may purchase the Phase One Facilities, request an extension of the lease or arrange for the
sale of the Phase One Facilities to a third party.
Pursuant to the terms of the Phase One Lease, as amended to date, we have an option to purchase the
Phase One Facilities at any time for a maximum purchase price of $132 million. In the event of a sale to
a third party, if the sale price is less than $132 million, we will be obligated to reimburse the diÅerence
between the actual sale price and $132 million, up to maximum of $117 million, subject to certain
provisions of the Phase One Lease, as amended.
In December 2000, we entered into a second build-to-suit lease (""Phase Two Lease'') with Keybank
National Association for a Ñve and one-half year term beginning in December 2000 to expand our
Redwood City, California headquarters facilities and develop adjacent property (""Phase Two Facilities'').
Construction of the Phase Two Facilities was completed in June 2002. The Phase Two Facilities comprise
a total of approximately 310,000 square feet and provide space for sales, marketing, administration and
research and development functions. We account for the Phase Two Lease arrangement as an operating
lease in accordance with SFAS No. 13, as amended.
On May 26, 2006, we extended the financing under the Phase Two Lease through July 2007. Upon the
expiration of the financing in July 2007, we may purchase the Phase Two Facilities, request up to two one-year
extensions of the financing (subject to bank approval), self-fund approximately 90 percent of the financing and
extend the remainder through July 2009, or arrange for the sale of the Phase Two Facilities to a third party.
The Phase Two Lease terminates upon expiration of the Ñnancing in July 2007 unless we have extended
the Ñnancing or elected to self-fund the Ñnancing as described above, in which case the term of the lease
could be extended until as late as July 2009. Subject to certain terms and conditions, upon termination of
the lease, we may purchase the Phase Two Facilities, request an extension of the lease or arrange for the
sale of the Phase Two Facilities to a third party.
Pursuant to the terms of the Phase Two Lease, as amended to date, we have an option to purchase the
Phase Two Facilities at any time for a maximum purchase price of $115 million. In the event of a sale to
a third party, if the sale price is less than $115 million, we will be obligated to reimburse the diÅerence
between the actual sale price and $115 million, up to a maximum of $105 million, subject to certain
provisions of the Phase Two Lease, as amended.
The lease rates of the Phase One and Phase Two Leases Öuctuate and are based upon LIBOR plus a
margin that varies from 0.50% to 1.25% based on our ratio of total consolidated debt to consolidated
tangible net worth. Based on the 3-month LIBOR rate of 5.2% as of May 26, 2006, the annual rent
obligation of the two leases would total approximately $14 million. Our rent obligation under the leases
could increase or decrease signiÑcantly depending on changes in LIBOR.
Guildford, Orlando, Los Angeles and Vancouver Studios; Louisville Distribution Center
In February 2006, we entered into an agreement with an independent third party to lease a studio facility
in Guildford, Surrey, United Kingdom, which will commence in June 2006 and will expire in May 2016.
The facility comprises a total of approximately 95,000 square feet, which we intend to use for research and
development functions. Our rental obligation under this agreement is approximately $33 million over the
initial ten-year term of the lease.
In June 2004, we entered into a lease agreement, amended in December 2005, with an independent third
party for a studio facility in Orlando, Florida, which commenced in January 2005 and expires in June
2010, with one Ñve-year option to extend the lease term. The campus facilities comprise a total of
140,000 square feet and provide space for research and development functions. Our rental obligation over
the initial Ñve-and-a-half year term of the lease is $15 million. As of March 31, 2006, our remaining rental
obligation under this lease was $14 million.
28
In July 2003, we entered into a lease agreement with an independent third party (the ""Landlord'') for a studio
facility in Los Angeles, California, which commenced in October 2003 and expires in September 2013 with
two five-year options to extend the lease term. Additionally, we have options to purchase the property after five
and ten years based on the fair market value of the property at the date of sale, a right of first offer to
purchase the property upon terms offered by the Landlord, and a right to share in the profits from a sale of the
property. Existing campus facilities comprise a total of 243,000 square feet and provide space for research and
development functions. Our rental obligation under this agreement is $50 million over the initial ten-year term
of the lease. This commitment is offset by expected sublease income of $6 million for a sublease to an affiliate
of the Landlord of 18,000 square feet of the Los Angeles facility, which commenced in October 2003 and
expires in September 2013, with options of early termination by the affiliate after five years and by us after
four and five years. As of March 31, 2006, our remaining rental obligation under this lease was $43 million,
offset by expected sublease income of $5 million.
In October 2002, we entered into a lease agreement, with an independent third party for a studio facility in
Vancouver, British Columbia, Canada, which commenced in May 2003 and expires in April 2013. We
amended the lease in October 2003. The facility comprises a total of approximately 65,000 square feet and
provides space for research and development functions. Our rental obligation under this agreement is
approximately $16 million over the initial ten-year term of the lease. As of March 31, 2006, our remaining
rental obligation under this lease was $12 million.
Our North American distribution is supported by a centralized warehouse facility that we lease in
Louisville, Kentucky occupying 250,000 square feet.
In addition to the properties discussed above, we have other properties under lease which have been included
in our restructuring costs as discussed in Note 6 of the Notes to Consolidated Financial Statements included
in Item 8 of this report. While we continually evaluate our facility requirements, we believe that suitable
additional or substitute space will be available as needed to accommodate our future needs.
Item 3: Legal Proceedings
On February 14, 2005, an employment-related class action lawsuit, Hasty v. Electronic Arts Inc., was Ñled
against the company in Superior Court in San Mateo, California. The complaint alleges that we
improperly classiÑed ""Engineers'' in California as exempt employees and seeks injunctive relief, unspeciÑed
monetary damages, interest and attorneys' fees. On May 16, 2006, the court granted its preliminary
approval of a settlement pursuant to which we agreed to make a lump sum payment of $14.9 million, to
be paid to a third-party administrator, to cover (a) all claims allegedly suÅered by the class members,
(b) plaintiÅs' attorneys' fees, not to exceed 25% of the total settlement amount, (c) plaintiÅs' costs and
Annual R
eport
expenses, (d) any incentive payments to the named plaintiÅs that may be authorized by the court, and
(e) all costs of administration of the settlement. The hearing for the court to consider its Ñnal approval of
the settlement is set for September 22, 2006.
Each of the shareholder actions we have previously disclosed have been voluntarily dismissed by all plaintiffs.
The federal securities class action complaint has been dismissed with prejudice, by an order dated
January 26, 2006; the federal derivative action has been dismissed, by an order dated March 10, 2006; and
the two state derivative actions have been dismissed, by orders dated May 4, 2006 and May 8, 2006.
In addition, we are subject to other claims and litigation arising in the ordinary course of business. We
believe that any liability from any reasonably foreseeable disposition of such other claims and litigation,
individually or in the aggregate, would not have a material adverse eÅect on our consolidated Ñnancial
position or results of operations.
Item 4: Submission of Matters to a Vote of Security Holders
There were no matters submitted to a vote of our security holders during the quarter ended March 31,
2006.
29

PART II
Item 5: Market for Registrant's Common Equity, Related Stockholder Matters and Issuer Purchases ofEquity Securities
Market Information
Our common stock is traded on the NASDAQ National Market under the symbol ""ERTS''. The following
table sets forth the quarterly high and low price per share of our common stock from April 1, 2004
through March 31, 2006. Such prices represent prices between dealers and do not include retail mark-ups,
mark-downs or commissions and may not represent actual transactions.
Prices
High Low
Fiscal Year Ended March 31, 2005:
First QuarterÏÏÏÏÏÏÏÏÏÏÏÏÏÏÏÏÏÏÏÏÏÏÏÏÏÏÏÏÏÏÏÏÏÏÏÏÏÏÏÏÏÏÏÏÏÏÏÏÏÏÏÏÏÏÏÏÏÏÏÏÏÏ $55.91 $47.42
Second Quarter ÏÏÏÏÏÏÏÏÏÏÏÏÏÏÏÏÏÏÏÏÏÏÏÏÏÏÏÏÏÏÏÏÏÏÏÏÏÏÏÏÏÏÏÏÏÏÏÏÏÏÏÏÏÏÏÏÏÏÏ 55.01 45.52
Third Quarter ÏÏÏÏÏÏÏÏÏÏÏÏÏÏÏÏÏÏÏÏÏÏÏÏÏÏÏÏÏÏÏÏÏÏÏÏÏÏÏÏÏÏÏÏÏÏÏÏÏÏÏÏÏÏÏÏÏÏÏÏÏ 62.86 43.38
Fourth Quarter ÏÏÏÏÏÏÏÏÏÏÏÏÏÏÏÏÏÏÏÏÏÏÏÏÏÏÏÏÏÏÏÏÏÏÏÏÏÏÏÏÏÏÏÏÏÏÏÏÏÏÏÏÏÏÏÏÏÏÏÏ 71.16 54.52
Fiscal Year Ended March 31, 2006:
First QuarterÏÏÏÏÏÏÏÏÏÏÏÏÏÏÏÏÏÏÏÏÏÏÏÏÏÏÏÏÏÏÏÏÏÏÏÏÏÏÏÏÏÏÏÏÏÏÏÏÏÏÏÏÏÏÏÏÏÏÏÏÏÏ $59.83 $47.45
Second Quarter ÏÏÏÏÏÏÏÏÏÏÏÏÏÏÏÏÏÏÏÏÏÏÏÏÏÏÏÏÏÏÏÏÏÏÏÏÏÏÏÏÏÏÏÏÏÏÏÏÏÏÏÏÏÏÏÏÏÏÏ 63.12 55.22
Third Quarter ÏÏÏÏÏÏÏÏÏÏÏÏÏÏÏÏÏÏÏÏÏÏÏÏÏÏÏÏÏÏÏÏÏÏÏÏÏÏÏÏÏÏÏÏÏÏÏÏÏÏÏÏÏÏÏÏÏÏÏÏÏ 61.97 51.04
Fourth Quarter ÏÏÏÏÏÏÏÏÏÏÏÏÏÏÏÏÏÏÏÏÏÏÏÏÏÏÏÏÏÏÏÏÏÏÏÏÏÏÏÏÏÏÏÏÏÏÏÏÏÏÏÏÏÏÏÏÏÏÏÏ 58.59 50.14
Holders
There were approximately 1,738 holders of record of our common stock as of June 5, 2006. In addition,
we believe that a signiÑcant number of beneÑcial owners of our common stock hold their shares in street
name.
Dividends
We have not paid any cash dividends and do not anticipate paying cash dividends in the foreseeable future.
30

Item 6: Selected Financial Data
ELECTRONIC ARTS INC. AND SUBSIDIARIES
SELECTED FIVE-YEAR CONSOLIDATED FINANCIAL DATA
(In millions, except per share data)
Year Ended March 31,
STATEMENTS OF OPERATIONS DATA 2006 2005 2004 2003 2002
Net revenueÏÏÏÏÏÏÏÏÏÏÏÏÏÏÏÏÏÏÏÏÏÏÏÏÏÏÏÏÏÏÏÏÏÏÏÏÏÏÏ $2,951 $3,129 $2,957 $2,482 $1,725
Cost of goods soldÏÏÏÏÏÏÏÏÏÏÏÏÏÏÏÏÏÏÏÏÏÏÏÏÏÏÏÏÏÏÏÏÏÏ 1,181 1,197 1,103 1,073 815
Gross proÑt ÏÏÏÏÏÏÏÏÏÏÏÏÏÏÏÏÏÏÏÏÏÏÏÏÏÏÏÏÏÏÏÏÏÏÏÏÏ 1,770 1,932 1,854 1,409 910
Operating expenses:
Marketing and sales ÏÏÏÏÏÏÏÏÏÏÏÏÏÏÏÏÏÏÏÏÏÏÏÏÏÏÏÏÏÏ 431 391 370 332 241
General and administrative ÏÏÏÏÏÏÏÏÏÏÏÏÏÏÏÏÏÏÏÏÏÏÏÏ 215 221 185 131 108
Research and development ÏÏÏÏÏÏÏÏÏÏÏÏÏÏÏÏÏÏÏÏÏÏÏÏ 758 633 511 401 381
Amortization of intangibles(1) ÏÏÏÏÏÏÏÏÏÏÏÏÏÏÏÏÏÏÏÏÏÏ 7 3 3 8 25
Acquired in-process technologyÏÏÏÏÏÏÏÏÏÏÏÏÏÏÏÏÏÏÏÏÏ 8 13 Ì Ì Ì
Restructuring charges ÏÏÏÏÏÏÏÏÏÏÏÏÏÏÏÏÏÏÏÏÏÏÏÏÏÏÏÏÏ 26 2 9 15 7
Asset impairment charges ÏÏÏÏÏÏÏÏÏÏÏÏÏÏÏÏÏÏÏÏÏÏÏÏÏ Ì Ì Ì 66 13
Total operating expenses ÏÏÏÏÏÏÏÏÏÏÏÏÏÏÏÏÏÏÏÏÏÏÏÏ 1,445 1,263 1,078 953 775
Operating income ÏÏÏÏÏÏÏÏÏÏÏÏÏÏÏÏÏÏÏÏÏÏÏÏÏÏÏÏÏÏÏÏ 325 669 776 456 135
Interest and other income, net ÏÏÏÏÏÏÏÏÏÏÏÏÏÏÏÏÏÏÏÏÏÏÏ 64 56 21 5 13
Income before provision for income taxes and minorityinterest ÏÏÏÏÏÏÏÏÏÏÏÏÏÏÏÏÏÏÏÏÏÏÏÏÏÏÏÏÏÏÏÏÏÏÏÏÏÏÏ 389 725 797 461 148
Provision for income taxes ÏÏÏÏÏÏÏÏÏÏÏÏÏÏÏÏÏÏÏÏÏÏÏÏÏÏÏ 147 221 220 143 46
Income before minority interest ÏÏÏÏÏÏÏÏÏÏÏÏÏÏÏÏÏÏÏÏ 242 504 577 318 102
Minority interest ÏÏÏÏÏÏÏÏÏÏÏÏÏÏÏÏÏÏÏÏÏÏÏÏÏÏÏÏÏÏÏÏÏÏÏ (6) Ì Ì (1) Ì
Net income ÏÏÏÏÏÏÏÏÏÏÏÏÏÏÏÏÏÏÏÏÏÏÏÏÏÏÏÏÏÏÏÏÏÏÏÏÏ $ 236 $ 504 $ 577 $ 317 $ 102
Net income (loss) per share:
Common stock:
Net income:
BasicÏÏÏÏÏÏÏÏÏÏÏÏÏÏÏÏÏÏÏÏÏÏÏÏÏÏÏÏÏÏÏÏÏÏÏÏÏÏÏÏÏ $ 236 $ 504 $ 577 $ 329 $ 124
Annual R
eport
Diluted ÏÏÏÏÏÏÏÏÏÏÏÏÏÏÏÏÏÏÏÏÏÏÏÏÏÏÏÏÏÏÏÏÏÏÏÏÏÏÏ $ 236 $ 504 $ 577 $ 317 $ 102
Net income per share:
BasicÏÏÏÏÏÏÏÏÏÏÏÏÏÏÏÏÏÏÏÏÏÏÏÏÏÏÏÏÏÏÏÏÏÏÏÏÏÏÏÏÏ $ 0.78 $ 1.65 $ 1.95 $ 1.17 $ 0.45
Diluted ÏÏÏÏÏÏÏÏÏÏÏÏÏÏÏÏÏÏÏÏÏÏÏÏÏÏÏÏÏÏÏÏÏÏÏÏÏÏÏ $ 0.75 $ 1.59 $ 1.87 $ 1.08 $ 0.35
Number of shares used in computation:
BasicÏÏÏÏÏÏÏÏÏÏÏÏÏÏÏÏÏÏÏÏÏÏÏÏÏÏÏÏÏÏÏÏÏÏÏÏÏÏÏÏÏ 304 305 295 282 274
Diluted ÏÏÏÏÏÏÏÏÏÏÏÏÏÏÏÏÏÏÏÏÏÏÏÏÏÏÏÏÏÏÏÏÏÏÏÏÏÏÏ 314 318 308 293 286
Class B common stock:
Net loss, net of retained interest in EA.com ÏÏÏÏÏÏÏÏÏÏ N/A N/A N/A $ (12) $ (22)
Net loss per share:
BasicÏÏÏÏÏÏÏÏÏÏÏÏÏÏÏÏÏÏÏÏÏÏÏÏÏÏÏÏÏÏÏÏÏÏÏÏÏÏÏÏÏ N/A N/A N/A $(2.77) $(3.77)
Diluted ÏÏÏÏÏÏÏÏÏÏÏÏÏÏÏÏÏÏÏÏÏÏÏÏÏÏÏÏÏÏÏÏÏÏÏÏÏÏÏ N/A N/A N/A $(2.77) $(3.77)
Number of shares used in computation:
BasicÏÏÏÏÏÏÏÏÏÏÏÏÏÏÏÏÏÏÏÏÏÏÏÏÏÏÏÏÏÏÏÏÏÏÏÏÏÏÏÏÏ N/A N/A N/A 4 6
Diluted ÏÏÏÏÏÏÏÏÏÏÏÏÏÏÏÏÏÏÏÏÏÏÏÏÏÏÏÏÏÏÏÏÏÏÏÏÏÏÏ N/A N/A N/A 4 6
31
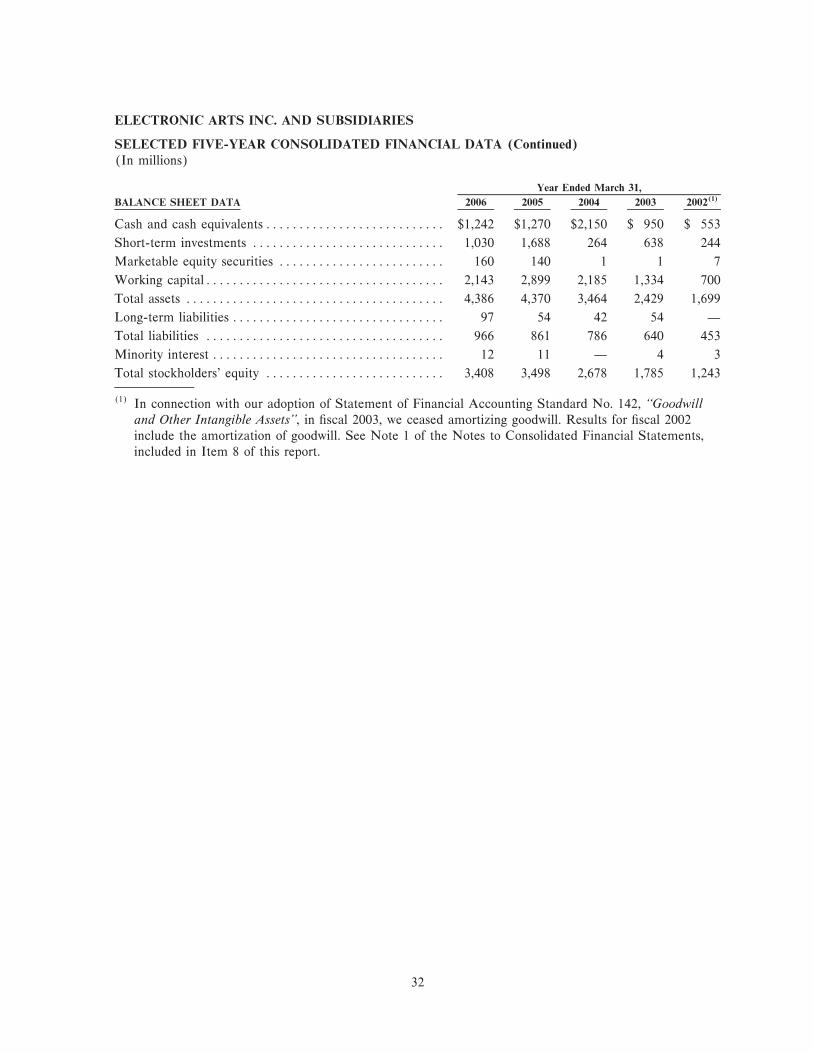
ELECTRONIC ARTS INC. AND SUBSIDIARIES
SELECTED FIVE-YEAR CONSOLIDATED FINANCIAL DATA (Continued)
(In millions)
Year Ended March 31,
BALANCE SHEET DATA 2006 2005 2004 2003 2002(1)
Cash and cash equivalentsÏÏÏÏÏÏÏÏÏÏÏÏÏÏÏÏÏÏÏÏÏÏÏÏÏÏÏ $1,242 $1,270 $2,150 $ 950 $ 553
Short-term investments ÏÏÏÏÏÏÏÏÏÏÏÏÏÏÏÏÏÏÏÏÏÏÏÏÏÏÏÏÏ 1,030 1,688 264 638 244
Marketable equity securities ÏÏÏÏÏÏÏÏÏÏÏÏÏÏÏÏÏÏÏÏÏÏÏÏÏ 160 140 1 1 7
Working capitalÏÏÏÏÏÏÏÏÏÏÏÏÏÏÏÏÏÏÏÏÏÏÏÏÏÏÏÏÏÏÏÏÏÏÏÏ 2,143 2,899 2,185 1,334 700
Total assets ÏÏÏÏÏÏÏÏÏÏÏÏÏÏÏÏÏÏÏÏÏÏÏÏÏÏÏÏÏÏÏÏÏÏÏÏÏÏÏ 4,386 4,370 3,464 2,429 1,699
Long-term liabilities ÏÏÏÏÏÏÏÏÏÏÏÏÏÏÏÏÏÏÏÏÏÏÏÏÏÏÏÏÏÏÏÏ 97 54 42 54 Ì
Total liabilities ÏÏÏÏÏÏÏÏÏÏÏÏÏÏÏÏÏÏÏÏÏÏÏÏÏÏÏÏÏÏÏÏÏÏÏÏ 966 861 786 640 453
Minority interest ÏÏÏÏÏÏÏÏÏÏÏÏÏÏÏÏÏÏÏÏÏÏÏÏÏÏÏÏÏÏÏÏÏÏÏ 12 11 Ì 4 3
Total stockholders' equity ÏÏÏÏÏÏÏÏÏÏÏÏÏÏÏÏÏÏÏÏÏÏÏÏÏÏÏ 3,408 3,498 2,678 1,785 1,243
(1) In connection with our adoption of Statement of Financial Accounting Standard No. 142, ""Goodwilland Other Intangible Assets'', in Ñscal 2003, we ceased amortizing goodwill. Results for Ñscal 2002
include the amortization of goodwill. See Note 1 of the Notes to Consolidated Financial Statements,
included in Item 8 of this report.
32
Item 7: Management's Discussion and Analysis of Financial Condition and Results of Operations
OVERVIEW
The following overview is a top-level discussion of our operating results as well as some of the trends and
drivers that aÅect our business. Management believes that an understanding of these trends and drivers is
important in order to understand our results for the Ñscal year ended March 31, 2006, as well as our future
prospects. This summary is not intended to be exhaustive, nor is it intended to be a substitute for the
detailed discussion and analysis provided elsewhere in this Form 10-K, including in the ""Business'' section
and the ""Risk Factors'' above, the remainder of ""Management's Discussion and Analysis of Financial
Condition and Results of Operations'', or the Consolidated Financial Statements and related notes.
About Electronic Arts
We develop, market, publish and distribute interactive software games that are playable by consumers on
home video game consoles (such as the Sony PlayStation» 2, Microsoft Xbox» and Xbox 360TM, and
Nintendo GameCubeTM), personal computers, mobile platforms (including cellular handsets and hand-held
game players such as the Nintendo DSTM and the PlayStation» Portable ""PSPTM'') and online, over the
Internet and other proprietary online networks. Some of our games are based on content that we license
from others (e.g., Madden NFL Football, The Godfather and FIFA Soccer), and some of our games are
based on our own wholly-owned intellectual property (e.g., The SimsTM, Need for SpeedTM and
BLACKTM). Our goal is to publish titles with mass-market appeal, which often means translating and
localizing them for sale in non-English speaking countries. In addition, we also attempt to create software
game ""franchises'' that allow us to publish new titles on a recurring basis that are based on the same
property. Examples of this franchise approach are the annual iterations of our sports-based products (e.g.,
Madden NFL Football, NCAA» Football and FIFA Soccer), wholly-owned properties that can be
successfully sequeled (e.g., The Sims, Need for Speed and BattleÑeld) and titles based on long-lived
literary movie properties (e.g. Lord of the Rings and Harry Potter).
Overview of Financial Results
Total net revenue for the Ñscal year ended March 31, 2006 was $2.951 billion, down 6 percent as
compared to the Ñscal year ended March 31, 2005. Total net revenue for the Ñscal year ended March 31,
2006 was driven by sales of Need for SpeedTM Most Wanted, Madden NFL 06, FIFA 06, The SimsTM 2, andHarry Potter and the Goblet of FireTM. Four titles sold more than Ñve million units in the Ñscal year ended
March 31, 2006: Need for Speed Most Wanted, Madden NFL 06, FIFA 06, and The Sims 2.
Net income for the Ñscal year ended March 31, 2006 was $236 million as compared to $504 million for
Annual R
eport
the Ñscal year ended March 31, 2005. Diluted net income per share for the Ñscal year ended March 31,
2006 was $0.75 as compared to $1.59 for the Ñscal year ended March 31, 2005.
We generated $596 million in cash from operating activities during the year ended March 31, 2006 as
compared to generating $634 million for year ended March 31, 2005. The decrease in cash generated from
operating activities was primarily due to a decrease in our net revenue and an increase in our operating
expenses primarily to support the development of next-generation console games. This decrease was
partially oÅset by a lower accounts receivable balance as of March 31, 2006 compared to March 31, 2005,
resulting from a higher percentage of revenue recognized in the Ñrst two months of our fourth quarter of
Ñscal 2006 as compared to the fourth quarter of Ñscal 2005, which allowed us to collect a higher
percentage of our revenue during the quarter.
Management's Overview of Historical and Prospective Business Trends
Transition to Next-Generation Consoles. Our industry is cyclical and in the midst of a transition stage
heading into the next cycle. During the three months ended December 31, 2005, Microsoft launched the
Xbox 360, and Sony and Nintendo have both announced their intention to introduce new video game
consoles in the coming months. We expect that, as the current generation of consoles continue to progress
33

and eventually reach the end of their commercial life cycle and next-generation consoles are introduced
into the market, sales of video games for current-generation consoles will continue to decline as consumers
replace their current-generation consoles with next-generation consoles, or defer game software purchases
until they are able to purchase a next-generation console. This pattern is referred to in our industry as a
transition to next-generation consoles. During this transition, we intend to continue to develop new titles
for current-generation video game consoles while we also continue to make signiÑcant investments in the
development of products for next-generation consoles. We expect the average selling prices and the
number of units of our titles for current-generation consoles to continue to decline as more value-oriented
consumers purchase current-generation consoles, a greater number of competitive titles are published at
reduced price points, and consumers defer purchases in anticipation of next-generation consoles. We expect
our gross margins to be negatively impacted by (1) a decrease in average selling prices of titles for
current-generation platforms, (2) higher license royalty rates, and (3) amortization of our newly-acquired
intangible assets.
We have incurred, and expect to continue to incur, higher costs during this transition to next-generation
consoles. Moreover, we expect development costs for next-generation video games to be greater on a per-
title basis than development costs for current-generation video games. We also expect our operating
expenses to increase for the Ñscal year ending March 31, 2007 as compared to prior Ñscal years, primarily
as a result of (1) the recognition of stock-based compensation due to our adoption of Statement of
Financial Accounting Standard No. 123 (revised 2004) (""SFAS No. 123R''), and (2) higher expenditures
for research and development due to our investment in next-generation consoles, online and mobile
platforms. As we move through the life cycle of current-generation consoles, we will continue to devote
signiÑcant resources to the development of current-generation titles while at the same time continuing to
invest heavily in tools, technologies and titles for the next generation of platforms and technology. We
expect our operating results to continue to be volatile and diÇcult to predict, which could cause our stock
price to Öuctuate signiÑcantly.
Expansion of Mobile Platforms. Advances in mobile technology have resulted in a variety of new and
evolving platforms for on-the-go interactive entertainment that appeal to a broader demographic of
consumers. Our eÅorts to capitalize on the growth in mobile interactive entertainment are focused in two
broad areas Ì packaged goods games for handheld game systems and downloadable games for cellular
handsets.
We have developed and published games for a variety of handheld platforms, including the Nintendo
Gameboy and Gameboy Advance, for several years. The introductions of the Sony PSP and the Nintendo
DS, with their richer graphics, deeper gameplay, and online functionality, provide a richer mobile gaming
experience to consumers. As a result, we have seen, and expect to continue to see, an increase in demand
for our games for handheld platforms. In Ñscal 2006, our net revenue from handheld platforms increased
217 percent over Ñscal 2005 to $374 million.
As cellular handsets become more-and-more commonplace and wireless technology advances to include
high-resolution color displays, increased processing power and improved audio capabilities, we expect sales
of games for cellular handsets to become an increasingly important part of our business worldwide. To
accelerate our position in this growing segment, in February 2006, we acquired JAMDAT Mobile Inc.
(""JAMDAT''), a global publisher of wireless games and other wireless entertainment applications. As a
result of this acquisition, in Ñscal 2007, we expect our net revenue from games for cellular handsets to
increase signiÑcantly from $19 million in Ñscal 2006. Likewise, the acquisition, along with the additional
investment required to grow this portion of our business globally, will result in increased development and
operating expenses.
As mobile technology continues to evolve and the installed base of both handheld game systems and
cellular phones expands, we expect that sales of our titles for mobile platforms Ì for both handhelds and
cellular handsets Ì will become an increasingly important part of our business.
Investment in Online. Today, we generate net revenue from a variety of online products and services,
including casual games and downloadable content marketed under our Pogo brand, persistent state world
34

games such as Ultima OnlineTM, PC-based downloadable content and online-enabled packaged goods. As
the nature of online game oÅerings expands and evolves, we anticipate long-term opportunities for growth
in this business. For example, we expect that consumers will take advantage of the online connectivity of
next-generation consoles at a much higher rate than they have so far on current-generation consoles,
allowing more consumers to enhance their gameplay experience through multiplayer activity, community-
building and downloading content. We also plan to increase the amount of content available for download
on the PC and consoles, and to enable entire PC-based games to be downloaded electronically. In
addition, we plan to expand our casual game oÅerings internationally and to invest in growing genres such
as advanced casual games. Although we intend to make signiÑcant investments in online products,
infrastructure and services and believe that online gameplay will become an increasingly important part of
our business in the long term, we do not expect revenue from persistent state world games or online
gameplay and distribution to be signiÑcant in Ñscal 2007.
International Expansion. Net revenue from international sales accounted for approximately 46 percent of
our total net revenue during Ñscal 2006. We expect international sales to remain a fundamental part of our
business. We believe that in order to succeed in Asia, it is important to locally develop content that is
speciÑcally directed toward Asian cultures and consumers. As such, we expect to continue to devote
resources to hiring local development talent and expanding our infrastructure outside of North America,
most notably, through the expansion and creation of local studio facilities in Asia. In addition, we are in
the process of establishing online game marketing, publishing and distribution functions in China. Further,
we are planning to expand our development and publishing activities in the cellular handset games
business in Europe and Asia. As part of our international expansion strategy, we may seek to partner with
established local companies through acquisitions, joint ventures or other similar arrangements.
Sales of ""Hit'' Titles. Sales of ""hit'' titles, several of which were top sellers in a number of countries,
contributed signiÑcantly to our net revenue. Our top-selling titles across all platforms worldwide during the
year ended March 31, 2006 were Need for Speed Most Wanted, Madden NFL 06, FIFA 06, The Sims 2,and Harry Potter and the Goblet of Fire. Hit titles are important to our Ñnancial performance because they
beneÑt from overall economies of scale. We have developed, and it is our objective to continue to develop,
many of our hit titles to become franchise titles that can be regularly iterated.
Increasing Licensing Costs. We generate a signiÑcant portion of our net revenue and operating income
from games based on licensed content such as Madden NFL Football, FIFA Soccer, Harry Potter and
ESPN. We have recently entered into new licenses and renewed older licenses, some of which contain
higher royalty rates than similar license agreements we have entered into in the past. We believe these
licenses, and the product franchises they support, will continue to be important to our future operations,
Annual R
eport
but the higher costs of these licenses will negatively impact our gross margins.
International Foreign Exchange Impact. Net revenue from international sales accounted for approxi-
mately 46 percent of our total net revenue during Ñscal 2006 and approximately 47 percent of our total net
revenue during Ñscal 2005. Our international net revenue was primarily driven by sales in Europe and, to a
lesser extent, in Asia. Foreign exchange rates had an unfavorable impact on our net revenue of
$36 million, or 1 percent, for the year ended March 31, 2006 as compared to the year ended March 31,
2005.
Acquisitions, Investments and Strategic Transactions. We have engaged in, evaluated, and expect to
continue to engage in and evaluate, a wide array of potential strategic transactions, including
(1) acquisitions of companies, businesses, intellectual properties, and other assets, and (2) investments in
new interactive entertainment businesses (for example, online and mobile games). In Ñscal 2006, we
acquired JAMDAT as part of our eÅorts to accelerate our growth in mobile gaming, and in Ñscal 2005 we
acquired Criterion Software Group, Ltd. (""Criterion''), and took a controlling interest in Digital Illusions
C.E. (""DICE''). We signed an agreement to fully merge DICE into EA, which will allow DICE to
become an integrated studio. The merger is expected to be completed during our Ñscal quarter ending
September 30, 2006.
35

Stock-Based Compensation. On April 2, 2006, the Ñrst day of our current Ñscal year, we adopted
SFAS No. 123R, ""Share-Based Payment'', which requires us to recognize compensation expense for all
stock-based compensation based on estimated fair values. As a result, beginning with our Ñrst quarter of
Ñscal 2007, our operating results will contain a charge for stock-based compensation related to the equity-
based compensation we provide to our employees, as well as stock purchases under our 2000 Employee
Stock Purchase Plan. This expense will be in addition to the stock-based compensation expense we have
recognized in prior periods related to restricted stock unit grants, acquisitions and other grants. The stock-
based compensation charges we incur will depend on the number of equity-based awards we grant, the
number of shares of common stock we sell under our 2000 Employee Stock Purchase Plan, as well as a
number of estimates and variables such as estimated forfeiture rates, the trading price and volatility of our
common stock, the expected term of our options, and interest rates. As a result, our stock-based
compensation charges can vary signiÑcantly from period to period. The expensing of stock-based
compensation will have a material adverse impact on our Consolidated Statements of Operations and may
not be similar to our pro forma disclosure under SFAS No. 123, as amended.
CRITICAL ACCOUNTING POLICIES AND ESTIMATES
Our Consolidated Financial Statements have been prepared in accordance with accounting principles
generally accepted in the United States. The preparation of these Consolidated Financial Statements
requires management to make estimates and assumptions that aÅect the reported amounts of assets and
liabilities, contingent assets and liabilities, and revenue and expenses during the reporting periods. The
policies discussed below are considered by management to be critical because they are not only important
to the portrayal of our Ñnancial condition and results of operations but also because application and
interpretation of these policies requires both judgment and estimates of matters that are inherently
uncertain and unknown. As a result, actual results may diÅer materially from our estimates.
Revenue Recognition, Sales Returns, Allowances and Bad Debt Reserves
We principally derive revenue from sales of packaged interactive software games designed for play on
video game consoles (such as the PlayStation 2, Xbox, Xbox 360 and Nintendo GameCube), PCs and
mobile platforms including handheld game players (such as the Sony PSP, Nintendo DS and Nintendo
Game Boy Advance) and cellular handsets. We evaluate the recognition of revenue based on the criteria
set forth in Statement of Position (""SOP'') 97-2, ""Software Revenue Recognition'', as amended by
SOP 98-9, ""ModiÑcation of SOP 97-2, Software Revenue Recognition, With Respect to CertainTransactions'' and StaÅ Accounting Bulletin (""SAB'') No. 101, ""Revenue Recognition in FinancialStatements'', as revised by SAB No. 104, ""Revenue Recognition''. We evaluate revenue recognition using
the following basic criteria and recognize revenue when all four of the following criteria are met:
‚ Evidence of an arrangement: Evidence of an agreement with the customer that reÖects the terms
and conditions to deliver products must be present in order to recognize revenue.
‚ Delivery: Delivery is considered to occur when the products are shipped and risk of loss and reward
have been transferred to the customer. For online games and services, revenue is recognized as the
service is provided.
‚ Fixed or determinable fee: If a portion of the arrangement fee is not Ñxed or determinable, we
recognize that amount as revenue when the amount becomes Ñxed or determinable.
‚ Collection is deemed probable: At the time of the transaction, we conduct a credit review of each
customer involved in a signiÑcant transaction to determine the creditworthiness of the customer.
Collection is deemed probable if we expect the customer to be able to pay amounts under the
arrangement as those amounts become due. If we determine that collection is not probable, we
recognize revenue when collection becomes probable (generally upon cash collection).
Determining whether and when some of these criteria have been satisÑed often involves assumptions and
judgments that can have a signiÑcant impact on the timing and amount of revenue we report. For
36
example, for multiple element arrangements, we must make assumptions and judgments in order to:
(1) determine whether and when each element has been delivered; (2) determine whether undelivered
products or services are essential to the functionality of the delivered products and services; (3) determine
whether vendor-speciÑc objective evidence of fair value (""VSOE'') exists for each undelivered element;
and (4) allocate the total price among the various elements we must deliver.
Changes to any of these assumptions or judgments, or changes to the elements in a software arrangement,
could cause a material increase or decrease in the amount of revenue that we report in a particular period.
Product revenue, including sales to resellers and distributors (""channel partners''), is recognized when the
above criteria are met. We reduce product revenue for estimated future returns, price protection, and other
oÅerings, which may occur with our customers and channel partners. In certain countries, we have stock-
balancing programs for our PC and video game system products, which allow for the exchange of these
products by resellers under certain circumstances. It is our general practice to exchange products or give
credits, rather than give cash refunds.
In certain countries, from time to time, we decide to provide price protection for both our PC and video
game system products. When evaluating the adequacy of sales returns and price protection allowances, we
analyze historical returns, current sell-through of distributor and retailer inventory of our products, current
trends in the video game market and the overall economy, changes in customer demand and acceptance of
our products and other related factors. In addition, we monitor the volume of sales to our channel partners
and their inventories, as substantial overstocking in the distribution channel could result in high returns or
higher price protection costs in subsequent periods.
In the future, actual returns and price protections may materially exceed our estimates as unsold products
in the distribution channels are exposed to rapid changes in consumer preferences, market conditions or
technological obsolescence due to new platforms, product updates or competing products. For example, the
risk of product returns and/or price protection for our products may continue to increase as the
PlayStation 2, Xbox and Nintendo GameCube consoles move through their lifecycles and an increasing
number and aggregate amount of competitive products heighten pricing and competitive pressures. While
we believe we can make reliable estimates regarding these matters, these estimates are inherently
subjective. Accordingly, if our estimates changed, our returns and price protection reserves would change,
which would impact the total net revenue we report. For example, if actual returns and/or price protection
were signiÑcantly greater than the reserves we have established, our actual results would decrease our
reported total net revenue. Conversely, if actual returns and/or price protection were signiÑcantly less than
our reserves, this would increase our reported total net revenue.
SigniÑcant judgment is required to estimate our allowance for doubtful accounts in any accounting period.
Annual R
eport
We determine our allowance for doubtful accounts by evaluating customer creditworthiness in the context
of current economic trends and historical experience. Depending upon the overall economic climate and
the Ñnancial condition of our customers, the amount and timing of our bad debt expense and cash
collection could change signiÑcantly.
Royalties and Licenses
Our royalty expenses consist of payments to (1) content licensors, (2) independent software developers
and (3) co-publishing and/or distribution aÇliates. License royalties consist of payments made to
celebrities, professional sports organizations, movie studios and other organizations for our use of their
trademarks, copyrights, personal publicity rights, content and/or other intellectual property. Royalty
payments to independent software developers are payments for the development of intellectual property
related to our games. Co-publishing and distribution royalties are payments made to third parties for
delivery of product.
Royalty-based obligations with content licensors and distribution aÇliates are either paid in advance and
capitalized as prepaid royalties or are accrued as incurred and subsequently paid. These royalty-based
obligations are generally expensed to cost of goods sold generally at the greater of the contractual rate or
37

an eÅective royalty rate based on expected net product sales. SigniÑcant judgment is required to estimate
the eÅective royalty rate for a particular contract. Because the computation of eÅective royalty rates
requires us to project future revenue, it is inherently subjective as our future revenue projections must
anticipate (1) the total number of titles subject to the contract, (2) the timing of the release of these
titles, (3) the number of software units we expect to sell, and (4) future pricing. Determining the eÅective
royalty rate for hit-based titles is particularly diÇcult due to the inherent risk of such titles. Accordingly, if
our future revenue projections change, our eÅective royalty rates would change, which could impact the
royalty expense we recognize. Prepayments made to thinly capitalized independent software developers and
co-publishing aÇliates are generally in connection with the development of a particular product and,
therefore, we are generally subject to development risk prior to the release of the product. Accordingly,
payments that are due prior to completion of a product are generally expensed as research and
development as the services are incurred. Payments due after completion of the product (primarily royalty-
based in nature) are generally expensed as cost of goods sold generally at the greater of the contractual
rate or an eÅective royalty rate based on expected net product sales.
Our contracts with some licensors include minimum guaranteed royalty payments which are initially
recorded as an asset and as a liability at the contractual amount when no signiÑcant performance remains
with the licensor. When signiÑcant performance remains with the licensor, we record royalty payments as
an asset when actually paid and as a liability when incurred, rather than upon execution of the contract.
Minimum royalty payment obligations are classiÑed as current liabilities to the extent such royalty
payments are contractually due within the next twelve months. As of March 31, 2006 and 2005,
approximately $9 million and $51 million, respectively, of minimum guaranteed royalty obligations had
been recognized.
Each quarter, we also evaluate the future realization of our royalty-based assets as well as any
unrecognized minimum commitments not yet paid to determine amounts we deem unlikely to be realized
through product sales. Any impairments determined before the launch of a product are charged to research
and development expense. Impairments determined post-launch are charged to cost of goods sold. In either
case, we rely on estimated revenue to evaluate the future realization of prepaid royalties and commitments.
If actual sales or revised revenue estimates fall below the initial revenue estimate, then the actual charge
taken may be greater in any given quarter than anticipated. During Ñscal 2006, 2005 and 2004, we
recorded impairment charges of $16 million, $8 million and $2 million, respectively.
Valuation of Long-Lived Assets
We evaluate both purchased intangible assets and other long-lived assets in order to determine if events or
changes in circumstances indicate a potential impairment in value exists. This evaluation requires us to
estimate, among other things, the remaining useful lives of the assets and future cash Öows of the business.
These evaluations and estimates require the use of judgment. Our actual results could diÅer materially
from our current estimates.
Under current accounting standards, we make judgments about the recoverability of purchased intangible
assets and other long-lived assets whenever events or changes in circumstances indicate a potential
impairment in the remaining value of the assets recorded on our Consolidated Balance Sheet. In order to
determine if a potential impairment has occurred, management makes various assumptions about the
future value of the asset by evaluating future business prospects and estimated cash Öows. Our future net
cash Öows are primarily dependent on the sale of products for play on proprietary video game consoles,
handheld game players, PCs and cellular handsets (""platforms''). The success of our products is aÅected
by our ability to accurately predict which platforms and which products we develop will be successful.
Also, our revenue and earnings are dependent on our ability to meet our product release schedules. Due to
product sales shortfalls, we may not realize the future net cash Öows necessary to recover our long-lived
assets, which may result in an impairment charge being recorded in the future. We did not record any
asset impairment charges in Ñscal 2006 and Ñscal 2005. During Ñscal 2004, we recognized less than
$1 million of asset impairment charges.
38

Income Taxes
In the ordinary course of our business, there are many transactions and calculations where the tax law and
ultimate tax determination is uncertain. As part of the process of preparing our Consolidated Financial
Statements, we are required to estimate our income taxes in each of the jurisdictions in which we operate
prior to the completion and Ñling of tax returns for such periods. This process requires estimating both our
geographic mix of income and our current tax exposures in each jurisdiction where we operate. These
estimates involve complex issues, require extended periods of time to resolve, and require us to make
judgments, such as anticipating the positions that we will take on tax returns prior to our actually
preparing the returns and the outcomes of disputes with tax authorities. We are also required to make
determinations of the need to record deferred tax liabilities and the recoverability of deferred tax assets. A
valuation allowance is established to the extent recovery of deferred tax assets is not likely based on our
estimation of future taxable income in each jurisdiction.
In addition, changes in our business, including acquisitions, changes in our international structure, changes
in the geographic location of business functions, changes in the geographic mix and amount of income, as
well as changes in our agreements with tax authorities, valuation allowances, applicable accounting rules,
applicable tax laws and regulations, rulings and interpretations thereof, developments in tax audit and other
matters, and variations in the estimated and actual level of annual pre-tax income can aÅect the overall
eÅective income tax rate and result in a variance between the projected eÅective tax rate for any quarter
and the Ñnal eÅective tax rate for the Ñscal year.
With respect to our projected annual eÅective income tax rate at the end of each quarter prior to the end
of a Ñscal year, we are required to make a projection of several items, including our projected mix of full-
year income in each jurisdiction in which we operate and the related income tax expense in each
jurisdiction. This projection is inherently uncertain and can Öuctuate throughout the Ñscal year. The
projected annual eÅective income tax rate may also be adjusted for taxes related to certain anticipated
changes in how we do business. SigniÑcant non-recurring charges are taken in the quarter incurred. The
actual results could and often does vary from those projections, and as such, the overall eÅective income
tax rate for a Ñscal year could be diÅerent from that previously projected for the full year.
RESULTS OF OPERATIONS
Our Ñscal year is reported on a 52 or 53-week period that, historically, has ended on the Ñnal Saturday of
March in each year. Beginning with the Ñscal year ended March 31, 2006, we end our Ñscal year on the
Saturday nearest March 31. As a result, Ñscal 2006 contains 53 weeks with the Ñrst quarter containing
14 weeks. Our results of operations for the Ñscal years March 31, 2007, 2006, 2005 and 2004 contain the
Annual R
eport
following number of weeks:
Fiscal Years Ended Number of Weeks Fiscal Period End Date
March 31, 2007 ÏÏÏÏÏÏÏÏÏÏÏÏÏÏÏÏÏÏÏÏÏÏÏÏÏÏÏÏÏÏÏÏÏÏÏÏÏÏÏÏÏÏÏ 52 weeks March 31, 2007
March 31, 2006 ÏÏÏÏÏÏÏÏÏÏÏÏÏÏÏÏÏÏÏÏÏÏÏÏÏÏÏÏÏÏÏÏÏÏÏÏÏÏÏÏÏÏÏ 53 weeks April 1, 2006
March 31, 2005 ÏÏÏÏÏÏÏÏÏÏÏÏÏÏÏÏÏÏÏÏÏÏÏÏÏÏÏÏÏÏÏÏÏÏÏÏÏÏÏÏÏÏÏ 52 weeks March 26, 2005
March 31, 2004 ÏÏÏÏÏÏÏÏÏÏÏÏÏÏÏÏÏÏÏÏÏÏÏÏÏÏÏÏÏÏÏÏÏÏÏÏÏÏÏÏÏÏÏ 52 weeks March 27, 2004
For simplicity of presentation, all Ñscal periods are treated as ending on a calendar month end.
Comparison of Fiscal 2006 to Fiscal 2005
Net Revenue
We principally derive net revenue from sales of packaged interactive software games designed for play on
video game consoles (such as the PlayStation 2, Xbox, Xbox 360 and Nintendo GameCube), PCs and
mobile platforms which include handheld game players (such as the Sony PSP, Nintendo DS and
Nintendo Game Boy Advance) and cellular handsets. We also derive net revenue from selling services to
some of our online games, programming third-party web sites with our game content, allowing other
39

companies to manufacture and sell our products in conjunction with other products, and selling
advertisements on our online web pages.
From a geographical perspective, our total net revenue for the Ñscal years ended March 31, 2006 and 2005
was as follows (in millions):
Year Ended March 31, Increase/ %2006 2005 (Decrease) Change
North America ÏÏÏÏÏÏÏÏÏÏÏÏÏÏÏÏÏÏÏÏÏÏÏÏÏÏÏÏÏÏÏ $1,584 54% $1,665 53% $ (81) (5%)
Europe ÏÏÏÏÏÏÏÏÏÏÏÏÏÏÏÏÏÏÏÏÏÏÏÏÏÏÏÏÏÏÏÏÏÏÏÏÏÏ 1,174 40% 1,284 41% (110) (9%)
Asia ÏÏÏÏÏÏÏÏÏÏÏÏÏÏÏÏÏÏÏÏÏÏÏÏÏÏÏÏÏÏÏÏÏÏÏÏÏÏÏÏ 193 6% 180 6% 13 7%
International ÏÏÏÏÏÏÏÏÏÏÏÏÏÏÏÏÏÏÏÏÏÏÏÏÏÏÏÏÏÏÏÏÏ 1,367 46% 1,464 47% (97) (7%)
Total Net RevenueÏÏÏÏÏÏÏÏÏÏÏÏÏÏÏÏÏÏÏÏÏÏÏÏÏÏÏÏ $2,951 100% $3,129 100% $(178) (6%)
North America
For Ñscal 2006, net revenue in North America was $1,584 million, driven primarily by sales of
(1) Madden NFL 06, Need for Speed Most Wanted, NBA LIVE 06, NCAA» Football 06 and The Sims 2,(2) titles for the PSP, which was launched in North America in March 2005, and (3) titles for the Xbox
360, which launched in November 2005. Overall, net revenue decreased $81 million, or 5 percent, as
compared to Ñscal 2005. As noted in the Overview section above, our industry is in the midst of a
transition from current-generation to next-generation consoles. Our net revenue was adversely impacted by
this transition in Ñscal 2006 as overall net revenue from sales of our titles for the PlayStation2, Xbox and
Nintendo GameCube decreased. While sales of titles for the PSP and the Xbox 360 helped to mitigate the
impact of the transition in Ñscal 2006, they were not enough to oÅset the overall decrease in net revenue
in North America. As the transition to next-generation consoles continues in Ñscal 2007, we expect net
revenue from sales of titles for current-generation consoles to further decline.
From a title and franchise perspective, the decrease in net revenue was primarily due to (1) lower sales
from our NFL Street, NBA Street, Def Jam and The UrbzTM franchises as there were no corresponding
titles released during Ñscal 2006, and (2) lower sales from our Lord of the Rings franchise which was
released on multiple platforms during Ñscal 2005 as compared to two platforms, the PSP and PC, during
Ñscal 2006. The overall decrease in net revenue was mitigated by (1) sales of BattleÑeld 2TM on the PC
which was released during the Ñrst quarter of Ñscal 2006 and BattleÑeld 2: Modern CombatTM on the
PlayStation 2 and Xbox released during the third quarter of Ñscal 2006, (2) increased net revenue from
our Madden franchise primarily resulting from the release of Madden NFL 06 on the Xbox 360 and PSP
in Ñscal 2006, and (3) increased net revenue from our Burnout franchise primarily resulting from the
release of BurnoutTM Revenge on the Xbox 360 and BurnoutTM Legends on the PSP in Ñscal 2006.
Europe
For Ñscal 2006, net revenue in Europe was $1,174 million, driven primarily by sales of Need for SpeedMost Wanted, FIFA 06, The Sims 2, Harry Potter and the Goblet of Fire, as well as sales of titles for the
PSP and Xbox 360 which were both introduced in Europe during Ñscal 2006. Overall, net revenue
declined $110 million, or 9 percent, as compared to Ñscal 2005. We estimate that foreign exchange rates
(primarily the Euro and the British pound sterling) decreased reported European net revenue by
approximately $36 million, or 3 percent, net of realized gains from hedging activities, for the Ñscal 2006 as
compared to Ñscal 2005. Excluding the eÅect of foreign exchange rates, we estimate that European net
revenue decreased by approximately $74 million, or 6 percent, for Ñscal 2006. Our net revenue in Europe
was adversely impacted by the transition to next-generation consoles in Ñscal 2006 as overall net revenue
from sales of our titles for the PlayStation 2, Xbox and Nintendo GameCube decreased. Sales of titles for
the PSP, Nintendo DS, and the Xbox 360, however, were enough to oÅset the overall decrease in net
revenue from sales of titles for current-generation consoles.
40
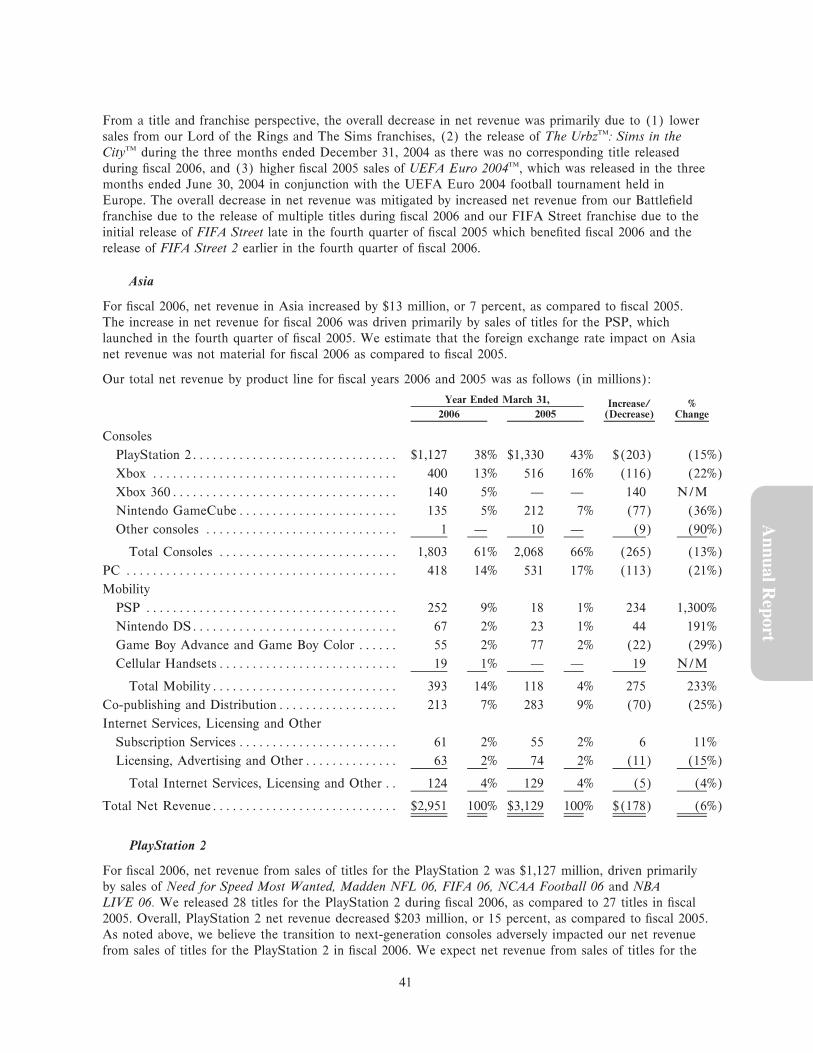
From a title and franchise perspective, the overall decrease in net revenue was primarily due to (1) lower
sales from our Lord of the Rings and The Sims franchises, (2) the release of The UrbzTM: Sims in theCityTM during the three months ended December 31, 2004 as there was no corresponding title released
during Ñscal 2006, and (3) higher Ñscal 2005 sales of UEFA Euro 2004TM, which was released in the three
months ended June 30, 2004 in conjunction with the UEFA Euro 2004 football tournament held in
Europe. The overall decrease in net revenue was mitigated by increased net revenue from our BattleÑeld
franchise due to the release of multiple titles during Ñscal 2006 and our FIFA Street franchise due to the
initial release of FIFA Street late in the fourth quarter of Ñscal 2005 which beneÑted Ñscal 2006 and the
release of FIFA Street 2 earlier in the fourth quarter of Ñscal 2006.
Asia
For Ñscal 2006, net revenue in Asia increased by $13 million, or 7 percent, as compared to Ñscal 2005.
The increase in net revenue for Ñscal 2006 was driven primarily by sales of titles for the PSP, which
launched in the fourth quarter of Ñscal 2005. We estimate that the foreign exchange rate impact on Asia
net revenue was not material for Ñscal 2006 as compared to Ñscal 2005.
Our total net revenue by product line for Ñscal years 2006 and 2005 was as follows (in millions):
Year Ended March 31, Increase/ %2006 2005 (Decrease) Change
Consoles
PlayStation 2ÏÏÏÏÏÏÏÏÏÏÏÏÏÏÏÏÏÏÏÏÏÏÏÏÏÏÏÏÏÏÏ $1,127 38% $1,330 43% $(203) (15%)
Xbox ÏÏÏÏÏÏÏÏÏÏÏÏÏÏÏÏÏÏÏÏÏÏÏÏÏÏÏÏÏÏÏÏÏÏÏÏÏ 400 13% 516 16% (116) (22%)
Xbox 360ÏÏÏÏÏÏÏÏÏÏÏÏÏÏÏÏÏÏÏÏÏÏÏÏÏÏÏÏÏÏÏÏÏÏ 140 5% Ì Ì 140 N/M
Nintendo GameCubeÏÏÏÏÏÏÏÏÏÏÏÏÏÏÏÏÏÏÏÏÏÏÏÏ 135 5% 212 7% (77) (36%)
Other consoles ÏÏÏÏÏÏÏÏÏÏÏÏÏÏÏÏÏÏÏÏÏÏÏÏÏÏÏÏÏ 1 Ì 10 Ì (9) (90%)
Total Consoles ÏÏÏÏÏÏÏÏÏÏÏÏÏÏÏÏÏÏÏÏÏÏÏÏÏÏÏ 1,803 61% 2,068 66% (265) (13%)
PC ÏÏÏÏÏÏÏÏÏÏÏÏÏÏÏÏÏÏÏÏÏÏÏÏÏÏÏÏÏÏÏÏÏÏÏÏÏÏÏÏÏ 418 14% 531 17% (113) (21%)
Mobility
PSP ÏÏÏÏÏÏÏÏÏÏÏÏÏÏÏÏÏÏÏÏÏÏÏÏÏÏÏÏÏÏÏÏÏÏÏÏÏÏ 252 9% 18 1% 234 1,300%
Nintendo DSÏÏÏÏÏÏÏÏÏÏÏÏÏÏÏÏÏÏÏÏÏÏÏÏÏÏÏÏÏÏÏ 67 2% 23 1% 44 191%
Game Boy Advance and Game Boy Color ÏÏÏÏÏÏ 55 2% 77 2% (22) (29%)
Cellular HandsetsÏÏÏÏÏÏÏÏÏÏÏÏÏÏÏÏÏÏÏÏÏÏÏÏÏÏÏ 19 1% Ì Ì 19 N/M
Annual R
eport
Total MobilityÏÏÏÏÏÏÏÏÏÏÏÏÏÏÏÏÏÏÏÏÏÏÏÏÏÏÏÏ 393 14% 118 4% 275 233%
Co-publishing and DistributionÏÏÏÏÏÏÏÏÏÏÏÏÏÏÏÏÏÏ 213 7% 283 9% (70) (25%)
Internet Services, Licensing and Other
Subscription Services ÏÏÏÏÏÏÏÏÏÏÏÏÏÏÏÏÏÏÏÏÏÏÏÏ 61 2% 55 2% 6 11%
Licensing, Advertising and OtherÏÏÏÏÏÏÏÏÏÏÏÏÏÏ 63 2% 74 2% (11) (15%)
Total Internet Services, Licensing and Other ÏÏ 124 4% 129 4% (5) (4%)
Total Net RevenueÏÏÏÏÏÏÏÏÏÏÏÏÏÏÏÏÏÏÏÏÏÏÏÏÏÏÏÏ $2,951 100% $3,129 100% $(178) (6%)
PlayStation 2
For Ñscal 2006, net revenue from sales of titles for the PlayStation 2 was $1,127 million, driven primarily
by sales of Need for Speed Most Wanted, Madden NFL 06, FIFA 06, NCAA Football 06 and NBALIVE 06. We released 28 titles for the PlayStation 2 during Ñscal 2006, as compared to 27 titles in Ñscal
2005. Overall, PlayStation 2 net revenue decreased $203 million, or 15 percent, as compared to Ñscal 2005.
As noted above, we believe the transition to next-generation consoles adversely impacted our net revenue
from sales of titles for the PlayStation 2 in Ñscal 2006. We expect net revenue from sales of titles for the
41
PlayStation 2 to continue to decrease in Ñscal 2007 as we move through the transition to next-generation
consoles. From a title and franchise perspective, the decrease in net revenue was primarily due to
(1) lower sales from our Lord of the Rings, The Urbz, Def Jam, NFL Street and NBA Street franchises,
none of which had Ñscal 2006 releases, and (2) lower sales of Ñscal 2006 releases from our Need for
Speed and Bond franchises as well as lower sales of our Fight Night franchise from which two titles were
released in Ñscal 2005 as compared to one title in Ñscal 2006. The overall decrease in net revenue was
mitigated by the releases of The GodfatherTM The Game, BLACKTM, Medal of Honor European AssaultTM,
and BattleÑeld 2: Modern Combat none of which had a corresponding release in Ñscal 2005.
Xbox
For Ñscal 2006, net revenue from sales of titles for the Xbox was $400 million, driven primarily by sales of
Madden NFL 06, Need for Speed Most Wanted, NCAA Football 06 and Burnout Revenge. We released
28 titles for the Xbox during Ñscal 2006, as compared to 26 titles in Ñscal 2005. Overall, Xbox net revenue
decreased $116 million, or 22 percent, as compared to Ñscal 2005. We believe the transition to next-
generation consoles, particularly the launch of the Xbox 360 during the last half of Ñscal 2006, adversely
impacted our net revenue from sales of titles for the Xbox in Ñscal 2006. We expect net revenue from
sales of titles for the Xbox to continue to decrease in Ñscal 2007 as we move through the transition and
the Xbox 360 installed base grows. From a title and franchise perspective, the decrease in net revenue was
primarily due to (1) lower sales from our Lord of the Rings, NFL Street, Def Jam, NBA Street and The
Urbz franchises, none of which had Ñscal 2006 releases, and (2) lower sales of Ñscal 2006 releases from
our Need for Speed and Bond franchises as well as lower sales of our Fight Night franchise from which
two titles were released in Ñscal 2005 as compared to one title in Ñscal 2006. The overall decrease in net
revenue was mitigated by the release of BattleÑeld 2: Modern Combat, BLACK and The Godfather TheGame, none of which had a corresponding release in Ñscal 2005.
Xbox 360
The Xbox 360 was launched in North America, Europe and Japan during the three months ended
December 31, 2005, and in the rest of Asia during the three months ended March 31, 2006. As of
March 31 2006, the installed base of the Xbox 360 continued to be small compared to the installed base
of the Xbox. Net revenue from sales of titles for the Xbox 360 was $140 million for Ñscal 2006, driven by
sales of Need for Speed Most Wanted, Madden NFL 06 and EA SPORTSTM Fight Night Round 3. We
released seven titles for the Xbox 360 in Ñscal 2006. We expect net revenue from sales of titles for the
Xbox 360 to increase in Ñscal 2007 as the installed base grows and we release more titles.
Nintendo GameCube
For Ñscal 2006, net revenue from sales of titles for the Nintendo GameCube was $135 million, driven
primarily by sales of Need for Speed Most Wanted, Harry Potter and the Goblet of Fire and MaddenNFL 06. We released 14 titles for the Nintendo GameCube during Ñscal 2006, as compared to 20 titles in
Ñscal 2005. Overall, Nintendo GameCube net revenue decreased $77 million, or 36 percent, as compared
to Ñscal 2005, consistent with the percentage decline in the number of titles we released for this platform.
We believe the transition to next-generation consoles adversely impacted our net revenue from sales of
titles for the Nintendo GameCube in Ñscal 2006. We expect net revenue from sales of titles for the
GameCube to continue to decrease in Ñscal 2007 as we move through the transition to next-generation
consoles. From a title and franchise perspective, the decrease in net revenue in Ñscal 2006 was primarily
due to (1) lower sales from our Lord of the Rings, The Urbz, NBA Street, NFL Street and Def Jam
franchises, none of which had Ñscal 2006 releases, and (2) lower sales of Ñscal 2006 releases from our
Need for Speed and Bond franchises.
PC
For Ñscal 2006, net revenue from sales of titles for the PC was $418 million, driven primarily by sales of
titles from The Sims franchise and BattleÑeld 2. We released 22 titles for the PC during Ñscal 2006, as
42
compared to 21 titles in Ñscal 2005. Overall, PC net revenue decreased $113 million, or 21 percent, as
compared to Ñscal 2005. The decrease was primarily due to (1) signiÑcantly higher Ñscal 2005 sales of
The Sims 2, (2) lower sales from our Medal of HonorTM franchise as there were no corresponding titles
released during Ñscal 2006, and (3) lower sales from our Lord of the Rings franchise. The overall decrease
in net revenue was mitigated by current-year sales of products from our BattleÑeld franchise. On
January 27, 2005, we began consolidating the Ñnancial results of Digital Illusion C.E. (a game
development company based in Sweden of which we are the majority owner) into our Ñnancial statements,
and, therefore, have characterized BattleÑeld 2 PC-based revenue as part of our PC product line. Prior to
consolidating DICE's Ñnancial results, we classiÑed revenue from the BattleÑeld franchise as co-publishing
and distribution revenue.
Mobile Platforms
Net revenue from mobile products Ì consisting of packaged goods games for handheld systems and
downloadable games for cellular handsets Ì increased from $118 million in Ñscal 2005 to $393 million in
Ñscal 2006. The increase was primarily due to sales of titles released in Ñscal 2006 for the PSP, and the
Nintendo DS, both of which were launched in Ñscal 2005 in certain countries. We released 16 titles for
the PSP during Ñscal 2006, as compared to three titles in Ñscal 2005. Overall, PSP net revenue increased
$234 million, driven primarily by sales of titles from our Need for Speed, FIFA, Burnout and Madden
franchises. We released ten titles for the Nintendo DS during Ñscal 2006, as compared to three titles in
Ñscal 2005. Nintendo DS net revenue increased $44 million, driven primarily by sales of titles from our
Need for Speed, The Sims and Madden franchises. The increase in PSP and Nintendo DS net revenue
was partially oÅset by lower sales of titles for the Game Boy Advance.
We expect mobile platform revenue to continue to increase in Ñscal 2007, driven primarily by anticipated
growth in our cellular handset games business.
Co-Publishing and Distribution
Net revenue from co-publishing and distribution products decreased from $283 million in Ñscal 2005 to
$213 million in Ñscal 2006. The decrease was primarily due to (1) the change in our classiÑcation of sales
of products from our BattleÑeld franchise, which, as discussed above, we no longer classify as co-
publishing and distribution revenue, and (2) overall higher Ñscal 2005 sales of various co-publishing and
distribution titles. The overall decrease in net revenue was mitigated by sales of Half-Life» 2 in Ñscal
2006.
Subscription Services
Annual R
eport
Net revenue from subscription services increased from $55 million in Ñscal 2005 to $61 million in Ñscal
2006. The increase in net revenue was primarily due to an increase in the number of paying subscribers to
Club PogoTM, partially oÅset by a decrease in net revenue from Ultima Online.
Licensing, Advertising and Other
Net revenue from licensing, advertising and other decreased from $74 million in Ñscal 2005 to $63 million
in Ñscal 2006. The decrease in net revenue was primarily due to Nokia N-Gage license revenue in Ñscal
2005.
Cost of Goods Sold
Cost of goods sold for our packaged-goods business consists of (1) product costs, (2) certain royalty
expenses for celebrities, professional sports and other organizations and independent software developers,
(3) manufacturing royalties, net of volume discounts and other vendor reimbursements, (4) expenses for
defective products, (5) write-oÅs of post-launch prepaid royalty costs, (6) amortization of certain
intangible assets, and (7) operations expenses. Volume discounts are generally recognized upon
achievement of milestones and vendor reimbursements are generally recognized as the related revenue is
43

recognized. Cost of goods sold for our online products consists primarily of data center and bandwidth
costs associated with hosting our web sites, credit card fees and royalties for use of third-party properties.
Cost of goods sold for our web site advertising business primarily consists of ad-serving costs.
Cost of goods sold for Ñscal years 2006 and 2005 were as follows (in millions):
March 31, % of Net March 31, % of Net2006 Revenue 2005 Revenue % Change
$1,181 40.0% $1,197 38.2% (1.3%)
In Ñscal 2006, cost of goods sold as a percentage of total net revenue increased 1.8 percent from
38.2 percent to 40.0 percent. As a percentage of total net revenue, the increase was primarily due to an
increase in our license royalties associated with new license agreements for our football titles.
We expect cost of goods sold as a percentage of total net revenue to increase during Ñscal 2007 as
compared to Ñscal 2006. Although there can be no assurance, and our actual results could diÅer
materially, we expect gross margin pressure as a result of (1) a decrease in average selling prices of titles
for current-generation platforms, (2) higher license royalty rates, and (3) amortization of our newly-
acquired intangible assets.
Marketing and Sales
Marketing and sales expenses consist of personnel-related costs and advertising, marketing and promotional
expenses, net of advertising expense reimbursements from third parties.
Marketing and sales expenses for Ñscal years 2006 and 2005 were as follows (in millions):
March 31, % of Net March 31, % of Net2006 Revenue 2005 Revenue $ Change % Change
$431 15% $391 13% $40 10%
Marketing and sales expenses increased by $40 million, or 10 percent, in Ñscal 2006 as compared to Ñscal
2005. The increase was primarily due to (1) an increase of $30 million in our marketing and advertising,
promotional and related contracted service expenses as a result of increased advertising to support our
titles, and (2) an increase of $11 million in personnel-related costs resulting from an increase in facilities
and headcount-related expenses in support of our marketing and sales functions worldwide.
Marketing and sales expenses included vendor reimbursements for advertising expenses of $41 million and
$42 million in Ñscal 2006 and 2005, respectively.
We expect marketing and sales expenses to increase in absolute dollars in Ñscal 2007 primarily due to our
adoption of SFAS No. 123R, which will require us to expense stock-based compensation.
General and Administrative
General and administrative expenses consist of personnel and related expenses of executive and
administrative staÅ, fees for professional services such as legal and accounting, and allowances for doubtful
accounts.
General and administrative expenses for Ñscal years 2006 and 2005 were as follows (in millions):
March 31, % of Net March 31, % of Net2006 Revenue 2005 Revenue $ Change % Change
$215 7% $221 7% $(6) (3%)
General and administrative expenses decreased by $6 million, or 3 percent, in Ñscal 2006 as compared to
Ñscal 2005 primarily due to a decrease in employee-related costs resulting from charges taken in
connection with certain employee-related litigation matters in Ñscal 2005. This decrease was partially oÅset
by an increase in personnel-related expenses due to an increase in headcount costs as well as an increase
in professional and contracted services to support our business.
44

We expect general and administrative expenses to increase in absolute dollars in Ñscal 2007 primarily due
to our adoption of SFAS No. 123R, which will require us to expense stock-based compensation.
Research and Development
Research and development expenses consist of expenses incurred by our production studios for personnel-
related costs, consulting, equipment depreciation and any impairment of prepaid royalties for pre-launch
products. Research and development expenses for our online business include expenses incurred by our
studios consisting of direct development and related overhead costs in connection with the development
and production of our online games. Research and development expenses also include expenses associated
with the development of web site content, network infrastructure direct expenses, software licenses and
maintenance, and network and management overhead.
Research and development expenses for Ñscal years 2006 and 2005 were as follows (in millions):
March 31, % of Net March 31, % of Net2006 Revenue 2005 Revenue $ Change % Change
$758 26% $633 20% $125 20%
Research and development expenses increased by $125 million, or 20 percent, in Ñscal 2006 as compared
to Ñscal 2005. The increase is primarily due to an increase of $124 million in personnel-related costs
resulting from an increase in employee headcount in our Canadian and European studios as we increased
our internal development eÅorts and invested in next-generation tools, technologies and titles, as well as
consolidation of DICE. To a lesser extent, these increases were also due to higher facilities-related costs
oÅset by lower third-party development costs.
We expect research and development expenses to increase in absolute dollars in Ñscal 2007 primarily as a
result of (1) our recognition of stock-based compensation, and (2) our investment in next-generation
consoles, online and mobile platforms.
Amortization of Intangibles
Amortization of intangibles for Ñscal years 2006 and 2005 were as follows (in millions):
March 31, % of Net March 31, % of Net2006 Revenue 2005 Revenue $ Change % Change
$7 Ì $3 Ì $4 133%
For Ñscal 2006, amortization of intangibles resulted from our acquisitions of JAMDAT, Criterion and
Annual R
eport
others. For Ñscal 2005, amortization of intangibles resulted from our acquisition of Criterion and others.
See Note 4 of the Notes to Consolidated Financial Statements included in Item 8 of this report.
We expect amortization of intangible expenses to increase in Ñscal 2007 primarily due to the amortization
of intangibles related to JAMDAT.
Acquired In-process Technology
Acquired in-process technology charges for Ñscal years 2006 and 2005 were as follows (in millions):
March 31, % of Net March 31, % of Net2006 Revenue 2005 Revenue $ Change % Change
$8 Ì $13 1% $(5) (38%)
The acquired in-process technology charge we incurred in Ñscal 2006 was primarily the result of our
acquisition of JAMDAT. The acquired in-process technology charge we incurred in Ñscal 2005 was the
result of our acquisitions of Criterion, and a majority stake of the outstanding shares of DICE. Acquired
in-process technology includes the value of products in the development stage that are not considered to
have reached technological feasibility or have an alternative future use. Accordingly, upon consummation
of these acquisitions, we incurred a charge for the acquired in-process technology, as reÖected in our
45
Consolidated Statement of Operations. See Note 4 of the Notes to Consolidated Financial Statements
included in Item 8 of this report.
Restructuring Charges
Restructuring charges for Ñscal years 2006 and 2005 were as follows (in millions):
March 31, % of Net March 31, % of Net2006 Revenue 2005 Revenue $ Change % Change
$26 1% $2 Ì $24 1,200%
In November 2005, we announced plans to establish an international publishing headquarters in Geneva,
Switzerland. Since that time and through the six months ending September 30, 2006, we expect to
continue to relocate certain current employees to our new facility in Geneva, close certain facilities in the
U.K., and make other related changes in our international publishing business.
During Ñscal 2006, restructuring charges were approximately $14 million, of which $8 million was for the
closure of certain U.K. facilities, $3 million for employee-related expenses, and $3 million in other costs
relating to our international publishing reorganization. In Ñscal 2007, we expect to incur between
$15 million and $20 million of restructuring costs. Overall, including Ñscal 2006, we expect to incur
between $40 million and $50 million of restructuring costs, substantially all of which will result in cash
expenditures by 2017. These restructuring costs will consist primarily of employee-related relocation
assistance (approximately $28 million), facility exit costs (approximately $10 million), as well as other
reorganization costs (approximately $8 million). While we may incur severance costs paid to terminating
employees in connection with the reorganization, we do not expect these costs to be signiÑcant.
During the fourth quarter of Ñscal 2006, we aligned our resources with our product plan for Ñscal 2007 and
strategic opportunities with next-generation consoles, online and mobile platforms. As part of this
alignment we recorded a total pre-tax restructuring charge of $10 million consisting entirely of one-time
beneÑts related to headcount reductions which are included in restructuring charges in our Consolidated
Statement of Operations.
Interest and Other Income, Net
Interest and other income, net, for Ñscal years 2006 and 2005 was as follows (in millions):
March 31, % of Net March 31, % of Net2006 Revenue 2005 Revenue $ Change % Change
$64 2% $56 2% $8 14%
For Ñscal 2006, interest and other income, net, increased by $8 million, or 14 percent, as compared to
Ñscal 2005 primarily due to an increase of $31 million in interest income as a result of higher yields on our
cash, cash equivalent and short-term investment balances, partially oÅset by a net loss of $22 million in
investments and foreign currency activities.
Income Taxes
Income taxes for Ñscal years 2006 and 2005 were as follows (in millions):
March 31, EÅective March 31, EÅective2006 Tax Rate 2005 Tax Rate % Change
$147 37.6% $221 30.5% (33%)
Our eÅective income tax rates were 37.6 percent and 30.5 percent for Ñscal 2006 and Ñscal 2005,
respectively. For Ñscal 2006, our eÅective income tax rate is higher than the U.S. statutory rate of
35.0 percent for Ñscal 2006 due to a number of factors, including the repatriation of foreign earnings in
connection with the American Jobs Creation Act of 2004 (the ""Jobs Act''), as discussed below, and
additional charges resulting from certain intercompany transactions during the second and fourth quarters
of Ñscal 2006, which were partially oÅset by other items.
46
We historically have considered undistributed earnings of our foreign subsidiaries to be indeÑnitely
reinvested and, accordingly, no U.S. taxes have been provided thereon. With the exception of taking
advantage of the one-time opportunity aÅorded to us by the Jobs Act, we currently intend to continue to
indeÑnitely reinvest the undistributed earnings of our foreign subsidiaries.
In July 2005, the Financial Accounting Standards Board (""FASB'') issued an exposure draft of a
proposed interpretation of SFAS No. 109, ""Accounting for Income Taxes'' which addresses the accounting
for uncertain tax positions. Including subsequent updates issued by the FASB, the proposed interpretation
provides that the best estimate of the impact of a tax position would be recognized in an entity's Ñnancial
statements only if it is more likely than not that the position will be sustained on audit based solely on its
technical merits. This proposed interpretation also would provide guidance on recognition and
measurement, balance sheet presentation, disclosure, accrual of interest and penalties, accounting in
interim periods and transition. We cannot predict what actions the FASB will take or how any such
actions might ultimately aÅect our Ñnancial position or results of operations. In January 2006, the FASB
announced that companies would not have to apply the proposed interpretation until Ñscal years beginning
after December 31, 2006. An exposure draft of proposed amendments to SFAS No. 109 is expected in the
third quarter of calendar year 2006.
Our eÅective income tax rates for Ñscal 2007 and future periods will depend on a variety of factors. For
example, changes in our business, including acquisitions and intercompany transactions, changes in our
international structure, changes in the geographic location of business functions or assets, changes in the
geographic mix of income, as well as changes in, or termination of, our agreements with tax authorities,
valuation allowances, applicable accounting rules, applicable tax laws and regulations, rulings and
interpretations thereof, developments in tax audit and other matters, and variations in the estimated and
actual level of annual pre-tax income can aÅect the overall eÅective income tax rate for future Ñscal years.
We incur certain tax expenses that do not decline proportionately with declines in our consolidated
income. As a result, in absolute dollar terms, our tax expense will have a greater inÖuence on our eÅective
tax rate at lower levels of pre-tax income than higher levels. In addition, at lower levels of pre-tax income,
our eÅective tax rate will be more volatile.
Net Income
Net income for Ñscal years 2006 and 2005 was as follows (in millions):
March 31, % of Net March 31, % of Net2006 Revenue 2005 Revenue $ Change % Change
$236 8% $504 16% $(268) (53%)
Annual R
eport
Reported net income decreased by $268 million, or 53 percent, in Ñscal 2006 as compared to Ñscal 2005.
The decrease was primarily due to a decrease in our net revenue and growth in our operating expenses.
The growth in our operating expenses was primarily driven by an increase in research and development
expenses as we increased our internal development eÅorts and invested in next-generation tools,
technologies and titles, while at the same time we continued to support current-generation product
development.
We expect our net income to decline in Ñscal 2007 as a result of (1) the eÅect of stock-based
compensation charges required by our adoption of SFAS No. 123R, and (2) our continued support of
current-generation product development while at the same time making signiÑcant investments in next-
generation consoles, online and mobile platforms.
47

Comparison of Fiscal 2005 to Fiscal 2004
Net Revenue
From a geographical perspective, our total net revenue for the Ñscal years ended March 31, 2005 and 2004
was as follows (in millions):
Year Ended March 31, %2005 2004 Increase Change
North America ÏÏÏÏÏÏÏÏÏÏÏÏÏÏÏÏÏÏÏÏÏÏÏÏÏÏÏÏÏÏÏÏÏ $1,665 53% $1,610 54% $ 55 3%
Europe ÏÏÏÏÏÏÏÏÏÏÏÏÏÏÏÏÏÏÏÏÏÏÏÏÏÏÏÏÏÏÏÏÏÏÏÏÏÏÏÏ 1,284 41% 1,180 40% 104 9%
Asia ÏÏÏÏÏÏÏÏÏÏÏÏÏÏÏÏÏÏÏÏÏÏÏÏÏÏÏÏÏÏÏÏÏÏÏÏÏÏÏÏÏÏ 180 6% 167 6% 13 8%
International ÏÏÏÏÏÏÏÏÏÏÏÏÏÏÏÏÏÏÏÏÏÏÏÏÏÏÏÏÏÏÏÏÏÏÏ 1,464 47% 1,347 46% 117 9%
Total Net RevenueÏÏÏÏÏÏÏÏÏÏÏÏÏÏÏÏÏÏÏÏÏÏÏÏÏÏÏÏÏÏ $3,129 100% $2,957 100% $172 6%
North America
For Ñscal 2005, net revenue in North America increased by 3 percent as compared to Ñscal 2004. From a
franchise perspective, the net revenue increase was primarily due to higher sales of products in our Need
for Speed franchise. The net revenue increase was also driven by sales of titles in our Fight Night and
Burnout franchises, neither of which had corresponding titles released in Ñscal 2004. Together, these items
resulted in a net revenue increase of $180 million during the Ñscal year ended March 31, 2005 as
compared to the Ñscal year ended March 31, 2004. This increase was partially oÅset by lower sales of
products in our Medal of Honor, SSXTM and Lord of the Rings franchises, which reduced net revenue by
$135 million in the Ñscal year ended March 31, 2005 as compared to the Ñscal year ended March 31,
2004. As part of this overall increase in net revenue, we beneÑted from the launch of the Nintendo DS
and Sony PSP in November 2004 and March 2005, respectively.
Europe
For Ñscal 2005, net revenue in Europe increased by 9 percent as compared to Ñscal 2004. We estimate
foreign exchange rates (primarily the Euro and the British pound sterling) strengthened reported European
net revenue by approximately $86 million, or 7 percent, for the Ñscal year ended March 31, 2005.
Excluding the eÅect of foreign exchange rates, we estimate that European net revenue increased by
approximately $18 million, or 2 percent, for the year ended March 31, 2005. From a franchise perspective,
the net revenue increase was primarily due to (1) higher sales of products in our Need for Speed and The
Sims franchises, (2) sales of products in our Burnout franchise which did not have a corresponding title
release in Ñscal 2004 and (3) sales of UEFA Euro 2004, which was released during the three months
ended June 30, 2004 in conjunction with the UEFA Euro 2004 football tournament held in Europe.
Together, these items resulted in a net revenue increase of $241 million during the Ñscal year ended
March 31, 2005 as compared to the Ñscal year ended March 31, 2004. This increase was partially oÅset by
lower sales of products in our Medal of Honor, Final Fantasy, SSX and Lord of the Rings franchises,
which reduced net revenue by $143 million in the Ñscal year ended March 31, 2005 as compared to the
Ñscal year ended March 31, 2004.
Asia
For Ñscal 2005, net revenue from sales in Asia increased by 8 percent as compared to Ñscal 2004. The
increase in net revenue was driven primarily by higher sales of products in our Need for Speed franchise
and sales of products in our Burnout franchise, which did not have a corresponding title release in Ñscal
2004, partially oÅset by declines in our Medal of Honor franchise. We estimate foreign exchange rates
strengthened reported Asia net revenue by approximately $9 million, or 5 percent, for the Ñscal year ended
48
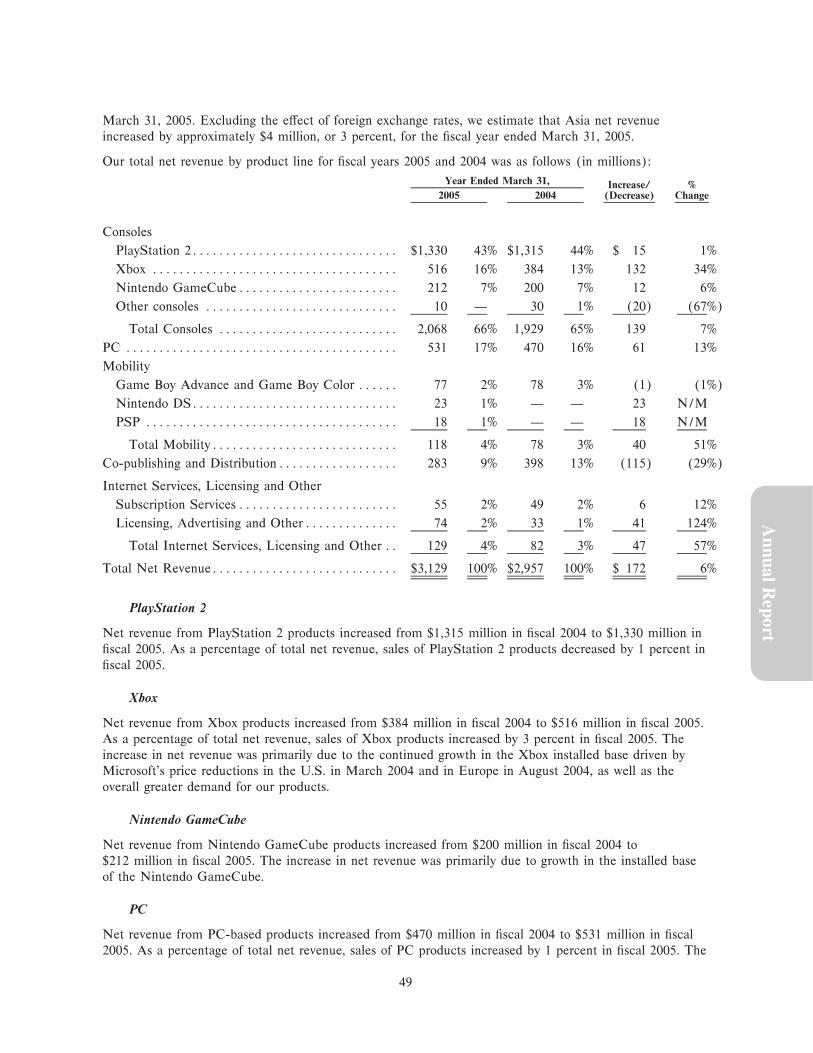
March 31, 2005. Excluding the eÅect of foreign exchange rates, we estimate that Asia net revenue
increased by approximately $4 million, or 3 percent, for the Ñscal year ended March 31, 2005.
Our total net revenue by product line for Ñscal years 2005 and 2004 was as follows (in millions):
Year Ended March 31, Increase/ %2005 2004 (Decrease) Change
Consoles
PlayStation 2ÏÏÏÏÏÏÏÏÏÏÏÏÏÏÏÏÏÏÏÏÏÏÏÏÏÏÏÏÏÏÏ $1,330 43% $1,315 44% $ 15 1%
Xbox ÏÏÏÏÏÏÏÏÏÏÏÏÏÏÏÏÏÏÏÏÏÏÏÏÏÏÏÏÏÏÏÏÏÏÏÏÏ 516 16% 384 13% 132 34%
Nintendo GameCubeÏÏÏÏÏÏÏÏÏÏÏÏÏÏÏÏÏÏÏÏÏÏÏÏ 212 7% 200 7% 12 6%
Other consoles ÏÏÏÏÏÏÏÏÏÏÏÏÏÏÏÏÏÏÏÏÏÏÏÏÏÏÏÏÏ 10 Ì 30 1% (20) (67%)
Total Consoles ÏÏÏÏÏÏÏÏÏÏÏÏÏÏÏÏÏÏÏÏÏÏÏÏÏÏÏ 2,068 66% 1,929 65% 139 7%
PC ÏÏÏÏÏÏÏÏÏÏÏÏÏÏÏÏÏÏÏÏÏÏÏÏÏÏÏÏÏÏÏÏÏÏÏÏÏÏÏÏÏ 531 17% 470 16% 61 13%
Mobility
Game Boy Advance and Game Boy Color ÏÏÏÏÏÏ 77 2% 78 3% (1) (1%)
Nintendo DSÏÏÏÏÏÏÏÏÏÏÏÏÏÏÏÏÏÏÏÏÏÏÏÏÏÏÏÏÏÏÏ 23 1% Ì Ì 23 N/M
PSP ÏÏÏÏÏÏÏÏÏÏÏÏÏÏÏÏÏÏÏÏÏÏÏÏÏÏÏÏÏÏÏÏÏÏÏÏÏÏ 18 1% Ì Ì 18 N/M
Total MobilityÏÏÏÏÏÏÏÏÏÏÏÏÏÏÏÏÏÏÏÏÏÏÏÏÏÏÏÏ 118 4% 78 3% 40 51%
Co-publishing and DistributionÏÏÏÏÏÏÏÏÏÏÏÏÏÏÏÏÏÏ 283 9% 398 13% (115) (29%)
Internet Services, Licensing and Other
Subscription Services ÏÏÏÏÏÏÏÏÏÏÏÏÏÏÏÏÏÏÏÏÏÏÏÏ 55 2% 49 2% 6 12%
Licensing, Advertising and OtherÏÏÏÏÏÏÏÏÏÏÏÏÏÏ 74 2% 33 1% 41 124%
Total Internet Services, Licensing and Other ÏÏ 129 4% 82 3% 47 57%
Total Net RevenueÏÏÏÏÏÏÏÏÏÏÏÏÏÏÏÏÏÏÏÏÏÏÏÏÏÏÏÏ $3,129 100% $2,957 100% $ 172 6%
PlayStation 2
Net revenue from PlayStation 2 products increased from $1,315 million in Ñscal 2004 to $1,330 million in
Ñscal 2005. As a percentage of total net revenue, sales of PlayStation 2 products decreased by 1 percent in
Ñscal 2005.
Annual R
eport
Xbox
Net revenue from Xbox products increased from $384 million in Ñscal 2004 to $516 million in Ñscal 2005.
As a percentage of total net revenue, sales of Xbox products increased by 3 percent in Ñscal 2005. The
increase in net revenue was primarily due to the continued growth in the Xbox installed base driven by
Microsoft's price reductions in the U.S. in March 2004 and in Europe in August 2004, as well as the
overall greater demand for our products.
Nintendo GameCube
Net revenue from Nintendo GameCube products increased from $200 million in Ñscal 2004 to
$212 million in Ñscal 2005. The increase in net revenue was primarily due to growth in the installed base
of the Nintendo GameCube.
PC
Net revenue from PC-based products increased from $470 million in Ñscal 2004 to $531 million in Ñscal
2005. As a percentage of total net revenue, sales of PC products increased by 1 percent in Ñscal 2005. The
49
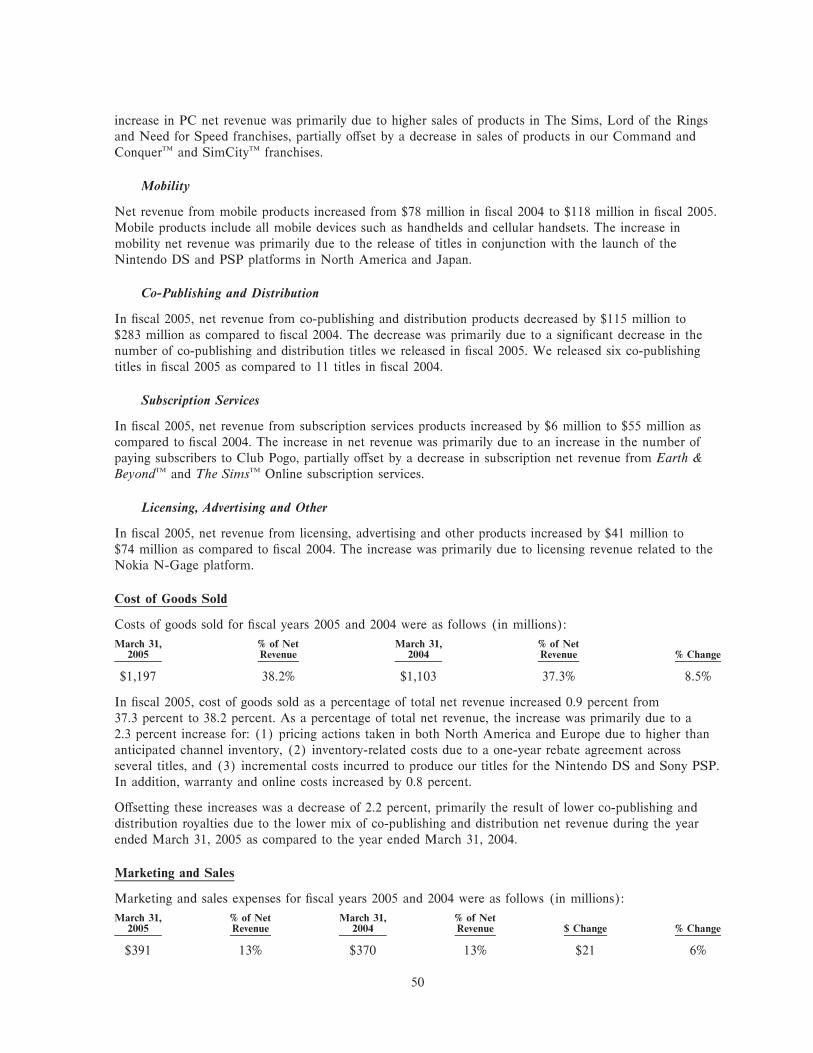
increase in PC net revenue was primarily due to higher sales of products in The Sims, Lord of the Rings
and Need for Speed franchises, partially oÅset by a decrease in sales of products in our Command and
ConquerTM and SimCityTM franchises.
Mobility
Net revenue from mobile products increased from $78 million in Ñscal 2004 to $118 million in Ñscal 2005.
Mobile products include all mobile devices such as handhelds and cellular handsets. The increase in
mobility net revenue was primarily due to the release of titles in conjunction with the launch of the
Nintendo DS and PSP platforms in North America and Japan.
Co-Publishing and Distribution
In Ñscal 2005, net revenue from co-publishing and distribution products decreased by $115 million to
$283 million as compared to Ñscal 2004. The decrease was primarily due to a signiÑcant decrease in the
number of co-publishing and distribution titles we released in Ñscal 2005. We released six co-publishing
titles in Ñscal 2005 as compared to 11 titles in Ñscal 2004.
Subscription Services
In Ñscal 2005, net revenue from subscription services products increased by $6 million to $55 million as
compared to Ñscal 2004. The increase in net revenue was primarily due to an increase in the number of
paying subscribers to Club Pogo, partially oÅset by a decrease in subscription net revenue from Earth &BeyondTM and The SimsTM Online subscription services.
Licensing, Advertising and Other
In Ñscal 2005, net revenue from licensing, advertising and other products increased by $41 million to
$74 million as compared to Ñscal 2004. The increase was primarily due to licensing revenue related to the
Nokia N-Gage platform.
Cost of Goods Sold
Costs of goods sold for Ñscal years 2005 and 2004 were as follows (in millions):
March 31, % of Net March 31, % of Net2005 Revenue 2004 Revenue % Change
$1,197 38.2% $1,103 37.3% 8.5%
In Ñscal 2005, cost of goods sold as a percentage of total net revenue increased 0.9 percent from
37.3 percent to 38.2 percent. As a percentage of total net revenue, the increase was primarily due to a
2.3 percent increase for: (1) pricing actions taken in both North America and Europe due to higher than
anticipated channel inventory, (2) inventory-related costs due to a one-year rebate agreement across
several titles, and (3) incremental costs incurred to produce our titles for the Nintendo DS and Sony PSP.
In addition, warranty and online costs increased by 0.8 percent.
OÅsetting these increases was a decrease of 2.2 percent, primarily the result of lower co-publishing and
distribution royalties due to the lower mix of co-publishing and distribution net revenue during the year
ended March 31, 2005 as compared to the year ended March 31, 2004.
Marketing and Sales
Marketing and sales expenses for Ñscal years 2005 and 2004 were as follows (in millions):
March 31, % of Net March 31, % of Net2005 Revenue 2004 Revenue $ Change % Change
$391 13% $370 13% $21 6%
50
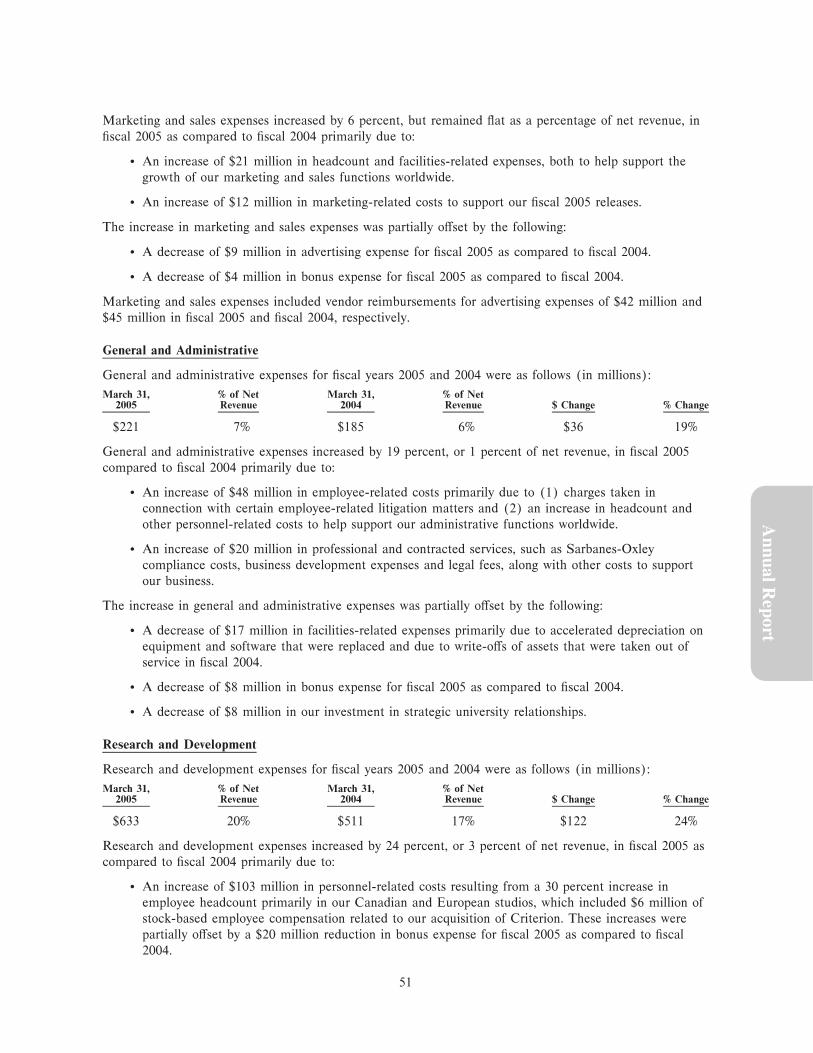
Marketing and sales expenses increased by 6 percent, but remained Öat as a percentage of net revenue, in
Ñscal 2005 as compared to Ñscal 2004 primarily due to:
‚ An increase of $21 million in headcount and facilities-related expenses, both to help support the
growth of our marketing and sales functions worldwide.
‚ An increase of $12 million in marketing-related costs to support our Ñscal 2005 releases.
The increase in marketing and sales expenses was partially oÅset by the following:
‚ A decrease of $9 million in advertising expense for Ñscal 2005 as compared to Ñscal 2004.
‚ A decrease of $4 million in bonus expense for Ñscal 2005 as compared to Ñscal 2004.
Marketing and sales expenses included vendor reimbursements for advertising expenses of $42 million and
$45 million in Ñscal 2005 and Ñscal 2004, respectively.
General and Administrative
General and administrative expenses for Ñscal years 2005 and 2004 were as follows (in millions):
March 31, % of Net March 31, % of Net2005 Revenue 2004 Revenue $ Change % Change
$221 7% $185 6% $36 19%
General and administrative expenses increased by 19 percent, or 1 percent of net revenue, in Ñscal 2005
compared to Ñscal 2004 primarily due to:
‚ An increase of $48 million in employee-related costs primarily due to (1) charges taken in
connection with certain employee-related litigation matters and (2) an increase in headcount and
other personnel-related costs to help support our administrative functions worldwide.
‚ An increase of $20 million in professional and contracted services, such as Sarbanes-Oxley
compliance costs, business development expenses and legal fees, along with other costs to support
our business.
The increase in general and administrative expenses was partially oÅset by the following:
‚ A decrease of $17 million in facilities-related expenses primarily due to accelerated depreciation on
equipment and software that were replaced and due to write-oÅs of assets that were taken out of
service in Ñscal 2004.
Annual R
eport
‚ A decrease of $8 million in bonus expense for Ñscal 2005 as compared to Ñscal 2004.
‚ A decrease of $8 million in our investment in strategic university relationships.
Research and Development
Research and development expenses for Ñscal years 2005 and 2004 were as follows (in millions):
March 31, % of Net March 31, % of Net2005 Revenue 2004 Revenue $ Change % Change
$633 20% $511 17% $122 24%
Research and development expenses increased by 24 percent, or 3 percent of net revenue, in Ñscal 2005 as
compared to Ñscal 2004 primarily due to:
‚ An increase of $103 million in personnel-related costs resulting from a 30 percent increase in
employee headcount primarily in our Canadian and European studios, which included $6 million of
stock-based employee compensation related to our acquisition of Criterion. These increases were
partially oÅset by a $20 million reduction in bonus expense for Ñscal 2005 as compared to Ñscal
2004.
51
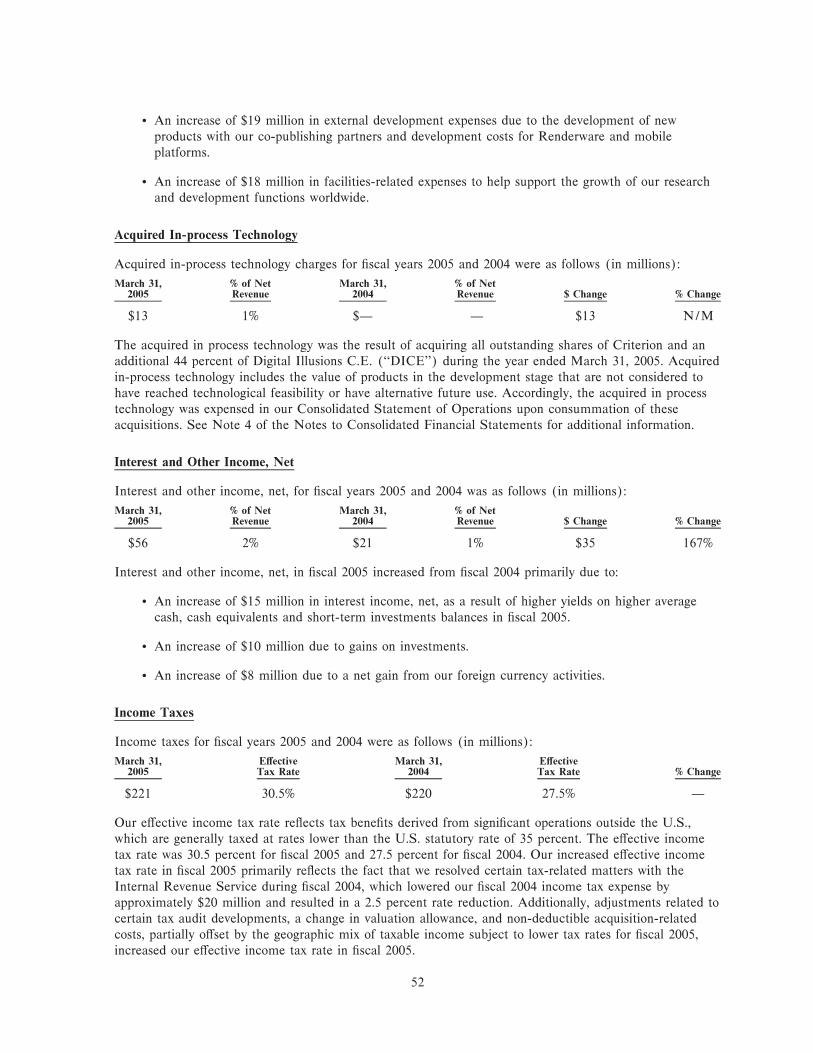
‚ An increase of $19 million in external development expenses due to the development of new
products with our co-publishing partners and development costs for Renderware and mobile
platforms.
‚ An increase of $18 million in facilities-related expenses to help support the growth of our research
and development functions worldwide.
Acquired In-process Technology
Acquired in-process technology charges for Ñscal years 2005 and 2004 were as follows (in millions):
March 31, % of Net March 31, % of Net2005 Revenue 2004 Revenue $ Change % Change
$13 1% $Ì Ì $13 N/M
The acquired in process technology was the result of acquiring all outstanding shares of Criterion and an
additional 44 percent of Digital Illusions C.E. (""DICE'') during the year ended March 31, 2005. Acquired
in-process technology includes the value of products in the development stage that are not considered to
have reached technological feasibility or have alternative future use. Accordingly, the acquired in process
technology was expensed in our Consolidated Statement of Operations upon consummation of these
acquisitions. See Note 4 of the Notes to Consolidated Financial Statements for additional information.
Interest and Other Income, Net
Interest and other income, net, for Ñscal years 2005 and 2004 was as follows (in millions):
March 31, % of Net March 31, % of Net2005 Revenue 2004 Revenue $ Change % Change
$56 2% $21 1% $35 167%
Interest and other income, net, in Ñscal 2005 increased from Ñscal 2004 primarily due to:
‚ An increase of $15 million in interest income, net, as a result of higher yields on higher average
cash, cash equivalents and short-term investments balances in Ñscal 2005.
‚ An increase of $10 million due to gains on investments.
‚ An increase of $8 million due to a net gain from our foreign currency activities.
Income Taxes
Income taxes for Ñscal years 2005 and 2004 were as follows (in millions):
March 31, EÅective March 31, EÅective2005 Tax Rate 2004 Tax Rate % Change
$221 30.5% $220 27.5% Ì
Our eÅective income tax rate reÖects tax beneÑts derived from signiÑcant operations outside the U.S.,
which are generally taxed at rates lower than the U.S. statutory rate of 35 percent. The eÅective income
tax rate was 30.5 percent for Ñscal 2005 and 27.5 percent for Ñscal 2004. Our increased eÅective income
tax rate in Ñscal 2005 primarily reÖects the fact that we resolved certain tax-related matters with the
Internal Revenue Service during Ñscal 2004, which lowered our Ñscal 2004 income tax expense by
approximately $20 million and resulted in a 2.5 percent rate reduction. Additionally, adjustments related to
certain tax audit developments, a change in valuation allowance, and non-deductible acquisition-related
costs, partially oÅset by the geographic mix of taxable income subject to lower tax rates for Ñscal 2005,
increased our eÅective income tax rate in Ñscal 2005.
52

Net Income
Net income for Ñscal years 2005 and 2004 was as follows (in millions):
March 31, % of Net March 31, % of Net2005 Revenue 2004 Revenue $ Change % Change
$504 16% $577 20% $(73) (13%)
Reported net income decreased in Ñscal 2005 as compared to Ñscal 2004 primarily due to growth in our
expenses, especially research and development, as we prepared for the adoption of next-generation
technology within our industry while at the same time we continued to devote resources to the
development of products for current-generation consoles.
Impact of Recently Issued Accounting Standards
In November 2004, the FASB issued SFAS No. 151, ""Inventory Costs Ì an amendment of ARB No. 43,Chapter 4''. SFAS No. 151 amends the guidance in Accounting Research Bulletin No. 43, Chapter 4,
""Inventory Pricing'', to clarify the accounting for abnormal amounts of idle facility expense, freight,
handling costs, and wasted material (spoilage) and requires that those items be recognized as current-
period charges. SFAS No. 151 also requires that allocation of Ñxed production overheads to the costs of
conversion be based on the normal capacity of the production facilities. SFAS No. 151 is eÅective for
inventory costs incurred during Ñscal years beginning after June 15, 2005. We do not expect the adoption
of SFAS No. 151 to have a material impact on our Consolidated Financial Statements.
In December 2004, the FASB issued SFAS No. 123R, ""Share-Based Payment''. SFAS No. 123R requires
that the cost resulting from all share-based payment transactions be recognized in the Ñnancial statements
using a fair-value-based method. The statement replaces SFAS No. 123, ""Accounting for Stock-BasedCompensation'', supersedes Accounting Principles Board No. 25, ""Accounting for Stock Issued toEmployees'', and amends SFAS No. 95, ""Statement of Cash Flows''. While the fair value method under
SFAS No. 123R is similar to the fair value method under SFAS No. 123 with regards to measurement
and recognition of stock-based compensation, there are several key diÅerences between the two standards.
For example, SFAS No. 123 permits us to recognize forfeitures as they occur while SFAS No. 123R will
require us to estimate future forfeitures and adjust our estimate on a quarterly basis. SFAS No. 123R will
also require a classiÑcation change in the statement of cash Öows, whereby a portion of the income tax
beneÑt from stock options will move from operating cash Öow activities to Ñnancing cash Öow activities
(total cash Öows will remain unchanged). In March 2005, the Securities and Exchange Commission
(""SEC'') released SAB No. 107, ""Share-Based Payment'', which provides the SEC's views regarding the
interaction between SFAS No. 123R and certain SEC rules and regulations for public companies. In April
Annual R
eport
2005, the SEC adopted a rule that amends the compliance dates of SFAS No. 123R. Under the revised
compliance dates, we are required to adopt the provisions of SFAS No. 123R no later than our Ñrst
quarter of Ñscal 2007. The expensing of stock-based compensation will have a material adverse impact on
our Consolidated Statements of Operations and may not be similar to our pro forma disclosure under
SFAS No. 123, as amended.
In October 2005, the FASB issued FASB StaÅ Position (""FSP'') Financial Accounting Standard
(""FAS'') No. 123(R) 2, ""Practical Accommodation to the Application of Grant Date As DeÑned in FASBStatement No. 123(R)''. The FASB provides companies with a ""practical accommodation'' when
determining the grant date of an award subject to SFAS No. 123R. If (1) the award is a unilateral grant,
that is, the recipient does not have the ability to negotiate the key terms and conditions of the award with
the employer, (2) the key terms and conditions of the award are expected to be communicated to an
individual recipient within a relatively short time period, and (3) as long as all other criteria in the grant
date deÑnition have been met, then a mutual understanding of the key terms and conditions of an award is
presumed to exist at the date the award is approved. In November 2005, the FASB issued FSP
FAS No. 123(R)-3, ""Transition Election Related to Accounting for the Tax EÅects of Share-BasedPayment Awards''. The FASB allows for a practical exception in calculating the additional paid Ì in
capital pool of excess tax beneÑts upon adoption that is available to absorb tax deÑciencies recognized
53

subsequent to adoption SFAS No. 123R. Accordingly, we may adopt either the method prescribed under
SFAS No. 123R or the one prescribed under FSP FAS No. 123(R)-3. We have not yet determined which
method to adopt. In February 2006, the FASB issued FSP FAS No. 123(R)-4, ""ClassiÑcation of Optionsand Similar Instruments Issued As Employee Compensation That Allow for Cash Settlement upon theOccurrence of a Contingent Event'', which amends certain paragraphs in SFAS No. 123R. FSP
FAS No. 123(R)-4 addresses situations when a company has option plans that require the company to
settle outstanding options in cash upon the occurrence of certain contingent events. Although we are
required to apply FSP FAS No. 123(R)-4 when we initially adopt SFAS No. 123R, we do not expect it
to impact our Consolidated Financial Statements.
In May 2005, the FASB issued SFAS No. 154, ""Accounting Changes and Error Corrections Ì AReplacement of APB Opinion No. 20 and FASB Statement No. 3''. SFAS No. 154 changes the
requirements for the accounting and reporting of a change in accounting principle. Under previous
guidance, changes in accounting principle were recognized as a cumulative eÅect in the net income of the
period of the change. The new statement requires retrospective application of changes in accounting
principle, limited to the direct eÅects of the change, to prior periods' Ñnancial statements, unless it is
impracticable to determine either the period-speciÑc eÅects or the cumulative eÅect of the change.
Additionally, this Statement requires that a change in depreciation, amortization or depletion method for
long-lived, nonÑnancial assets be accounted for as a change in accounting estimate aÅected by a change in
accounting principle and that correction of errors in previously issued Ñnancial statements should be
termed a ""restatement''. SFAS No. 154 is eÅective for accounting changes and correction of errors made
in Ñscal years beginning after December 15, 2005. We do not believe that, upon adoption, SFAS No. 154
will have a material impact on our Consolidated Financial Statements, however, after adoption, if a change
in accounting principle is made, SFAS No. 154 could have a material impact on our Consolidated
Financial Statements.
In February 2006, the FASB issued SFAS No. 155, ""Accounting for Certain Hybrid FinancialInstruments Ì An Amendment of FASB Statements No. 133 and 140''. SFAS No. 155 (1) permits fair
value measurement for any hybrid Ñnancial instrument that contains an embedded derivative that
otherwise would require bifurcation, (2) clariÑes that interest-only strips and principal-only strips are not
subject to the requirements of SFAS No. 133, ""Accounting for Derivative Instruments and HedgingActivities'', (3) establishes a requirement to evaluate interests in securitized Ñnancial assets to identify
interests that are freestanding derivatives or that are hybrid Ñnancial instruments that contain an embedded
derivative requiring bifurcation, (4) clariÑes that concentrations of credit risk in the form of subordination
are not embedded derivatives, and (5) amends SFAS No. 140, ""Accounting for Transfers and Servicing ofFinancial Assets and Extinguishments of Liabilities Ì A Replacement of FASB Statement 125'' toeliminate the prohibition on a qualifying special-purpose entity from holding a derivative Ñnancial
instrument that pertains to a beneÑcial interest other than another derivative Ñnancial instrument.
SFAS No. 155 is eÅective for all Ñnancial instruments acquired or issued for Ñscal years beginning after
September 15, 2006. We do not believe the adoption of SFAS No. 155 will have a material impact on our
Consolidated Financial Statements.
LIQUIDITY AND CAPITAL RESOURCES
Year Ended
March 31, March 31, Increase/2006 2005 (Decrease)(In millions)
Cash and cash equivalents ÏÏÏÏÏÏÏÏÏÏÏÏÏÏÏÏÏÏÏÏÏÏÏÏÏÏÏÏÏÏÏÏÏÏÏÏÏÏ $1,242 $ 1,270 $ (28)
Short-term investments ÏÏÏÏÏÏÏÏÏÏÏÏÏÏÏÏÏÏÏÏÏÏÏÏÏÏÏÏÏÏÏÏÏÏÏÏÏÏÏÏÏ $1,030 $ 1,688 $ (658)
Marketable equity securities ÏÏÏÏÏÏÏÏÏÏÏÏÏÏÏÏÏÏÏÏÏÏÏÏÏÏÏÏÏÏÏÏÏÏÏÏÏ 160 140 20
Total ÏÏÏÏÏÏÏÏÏÏÏÏÏÏÏÏÏÏÏÏÏÏÏÏÏÏÏÏÏÏÏÏÏÏÏÏÏÏÏÏÏÏÏÏÏÏÏÏÏÏÏÏÏÏ $2,432 $ 3,098 $ (666)
Percentage of total assets ÏÏÏÏÏÏÏÏÏÏÏÏÏÏÏÏÏÏÏÏÏÏÏÏÏÏÏÏÏÏÏÏÏÏÏÏÏ 55% 71%
54
Year Ended
March 31, March 31, Increase/2006 2005 (Decrease)(In millions)
Cash provided by operating activities ÏÏÏÏÏÏÏÏÏÏÏÏÏÏÏÏÏÏÏÏÏÏÏÏÏÏÏÏÏ $ 596 $ 634 $ (38)
Cash used in investing activitiesÏÏÏÏÏÏÏÏÏÏÏÏÏÏÏÏÏÏÏÏÏÏÏÏÏÏÏÏÏÏÏÏÏÏ (108) (1,726) 1,618
Cash provided by (used in) Ñnancing activities ÏÏÏÏÏÏÏÏÏÏÏÏÏÏÏÏÏÏÏÏÏ (503) 200 (703)
EÅect of foreign exchange on cash and cash equivalents ÏÏÏÏÏÏÏÏÏÏÏÏÏ (13) 12 (25)
Net decrease in cash and cash equivalents ÏÏÏÏÏÏÏÏÏÏÏÏÏÏÏÏÏÏÏÏÏÏÏÏÏ $ (28) $ (880) $ 852
Changes in Cash Flow
During Ñscal 2006, we generated $596 million of cash from operating activities as compared to
$634 million for Ñscal 2005. The decrease in cash generated from operating activities was primarily due to
our overall decline in net income resulting from a decrease in net revenue and an increase in operating
expenses primarily to support the development of titles for next-generation consoles. This decrease was
partially oÅset by a lower accounts receivable balance as of March 31, 2006 as compared to March 31,
2005, resulting from a higher percentage of net revenue recognized in the Ñrst two months of our fourth
quarter of Ñscal 2006 as compared to the fourth quarter of Ñscal 2005, which allowed us to collect a higher
percentage of our receivables prior to the end of the quarter. We expect cash from operating activities to
decline in Ñscal 2007.
For Ñscal 2006, our primary use of cash in non-operating activities consisted of $755 million used to
purchase short-term investments, $709 million used to repurchase and retire a portion of our common
stock, $661 million used primarily for our acquisition of JAMDAT, and $123 million in capital
expenditures primarily related to the expansion of our Vancouver studio and investments in our worldwide
development tools, technologies and equipment. These non-operating expenditures were partially oÅset by
$1,427 million in proceeds from the maturities and sales of short-term investments and $206 million in
proceeds from sales of common stock through our employee stock plans and other plans. During Ñscal
2007, we anticipate making continued capital investments in our studios as well as investments in next-
generation consoles, online infrastructure and mobile platforms.
Short-term investments and marketable equity securities
As of March 31, 2006, our portfolio of cash, cash equivalents and short-term investments was comprised of
Annual R
eport
55 percent cash and cash equivalents and 45 percent short-term investments. As of March 31, 2005,
43 percent of our portfolio consisted of cash and cash equivalents and 57 percent of our portfolio consisted
of short-term investments. In absolute dollars, our cash and cash equivalents decreased from
$1,270 million as of March 31, 2005 to $1,242 million as of March 31, 2006. This decrease was primarily
due to our purchase of short-term investments, our acquisition of JAMDAT, and our common stock
repurchase program during the Ñrst six months of Ñscal 2006. These decreases were partially oÅset by
proceeds received from the maturities and sales of short-term investments. Due to our mix of Ñxed and
variable rate securities, our short-term investment portfolio is susceptible to changes in short-term interest
rates. As of March 31, 2006, our short-term investments included gross unrealized losses of approximately
$7 million, or less than 1 percent of the total in short-term investments. From time to time, we may
liquidate some or all of our short-term investments to fund operational needs or other activities, such as
capital expenditures, business acquisitions or stock repurchase programs. Depending on which short-term
investments we liquidate to fund these activities, we could recognize a portion of the gross unrealized
losses.
Marketable equity securities increased to $160 million as of March 31, 2006, from $140 million as of
March 31, 2005, primarily due to an increase in the unrealized gain on our investment in Ubisoft
Entertainment.
55
Receivables, net
Our gross accounts receivable balances were $431 million and $458 million as of March 31, 2006 and
2005, respectively. The decrease in our accounts receivable balance was primarily due to a higher
percentage of revenue recognized in the Ñrst two months of our fourth quarter of Ñscal 2006 as compared
to the fourth quarter of Ñscal 2005, which allowed us to collect a higher percentage of our net revenue
during the quarter. Reserves for sales returns, pricing allowances and doubtful accounts increased in
absolute dollars from $162 million as of March 31, 2005 to $232 million as of March 31, 2006. As a
percentage of trailing six and nine month net revenue, reserves increased from 8 percent and 6 percent,
respectively, as of March 31, 2005, to 12 percent and 9 percent, respectively, as of March 31, 2006. The
increase in these reserves was primarily the result of lower anticipated demand for our products and the
continued decline in the average prices of our titles for current-generation consoles due to the competitive
retail environment. We believe these reserves are adequate based on historical experience and our current
estimate of potential returns, pricing allowances and doubtful accounts.
Inventories
Inventories decreased slightly to $61 million as of March 31, 2006 from $62 million as of March 31, 2005.
No single title represented more than $7 million of inventory as of March 31, 2006.
Other current assets
Other current assets increased to $234 million as of March 31, 2006, from $164 million as of March 31,
2005, primarily due to an increase in prepaid royalties as we continue to invest in our product development
and content, as well as an increase in advertising credits owed to us by our vendors due to the timing of
our claims.
Accounts payable
Accounts payable increased to $163 million as of March 31, 2006, from $134 million as of March 31,
2005, primarily due to higher sales volumes and higher expenditures to support our business in the fourth
quarter of Ñscal 2006 as compared to the fourth quarter of Ñscal 2005.
Accrued and other liabilities
Our accrued and other liabilities increased to $706 million as of March 31, 2006 from $673 million as of
March 31, 2005. The increase was primarily due to liabilities related to our JAMDAT acquisition and an
increase in deferred revenue.
Deferred income taxes, net
Our long-term position of deferred income taxes changed by $48 million, from an asset position as of
March 31, 2005 to a liability position as of March 31, 2006 primarily due to (1) a long-term deferred tax
liability we recorded in connection with our JAMDAT acquisition purchase accounting, and (2) the
utilization of tax credits during Ñscal 2006.
Financial Condition
We believe that existing cash, cash equivalents, short-term investments, marketable equity securities and
cash generated from operations will be suÇcient to meet our operating requirements for at least the next
twelve months, including working capital requirements, capital expenditures, potential future acquisitions or
strategic investments. We may choose at any time to raise additional capital to strengthen our Ñnancial
position, facilitate expansion, pursue strategic acquisitions and investments or to take advantage of business
opportunities as they arise. There can be no assurance, however, that such additional capital will be
available to us on favorable terms, if at all, or that it will not result in substantial dilution to our existing
stockholders.
56
The Ñnancing arrangements supporting our Redwood City headquarters leases with Keybank National
Association, described in the ""OÅ-Balance Sheet Commitments'' section below, are scheduled to expire in
July 2007. Upon expiration of the Ñnancing, we may purchase the facilities for $247 million, request an
extension of the Ñnancing (subject to bank approval), self-fund approximately 90 percent of the Ñnancing
and extend the remainder, or arrange for a sale of the facilities to a third party. In the event of a sale to a
third party, if the sale price is less than $247 million, we will be obligated to reimburse the diÅerence
between the actual sale price and $247 million, up to maximum of $222 million, subject to certain
provisions of the lease.
A portion of our cash, cash equivalents, short-term investments and marketable equity securities that was
generated from operations domiciled in foreign tax jurisdictions (approximately $692 million as of
March 31, 2006) is designated as indeÑnitely reinvested in the respective tax jurisdiction. During the
fourth quarter of Ñscal 2006, our CEO approved a domestic reinvestment plan, which was subsequently
approved by our Board of Directors, to repatriate $375 million of foreign earnings in Ñscal 2006 under the
Jobs Act. We completed the repatriation in Ñscal 2006 and resulted in a tax expense of $17 million related
to this $375 million repatriation.
On October 18, 2004, our Board of Directors authorized a program to repurchase up to an aggregate of
$750 million of our common stock. Pursuant to the authorization, we repurchased shares of our common
stock from time to time in the open market until we had completed our common stock repurchase
program in September 2005. We repurchased and retired the following (in millions):
Number of SharesRepurchased and Approximate
Retired Amount
From the inception of the program through March 31, 2005 ÏÏÏÏÏÏÏÏÏÏÏÏÏ 0.8 $ 41
Six months ended September 30, 2005 ÏÏÏÏÏÏÏÏÏÏÏÏÏÏÏÏÏÏÏÏÏÏÏÏÏÏÏÏÏÏÏ 12.6 709
From the inception of the program through September 30, 2005 ÏÏÏÏÏÏÏÏÏÏ 13.4 $750
We have a ""shelf'' registration statement on Form S-3 on Ñle with the SEC. This shelf registration
statement, which includes a base prospectus, allows us at any time to oÅer any combination of securities
described in the prospectus in one or more oÅerings up to a total amount of $2.0 billion. Unless otherwise
speciÑed in a prospectus supplement accompanying the base prospectus, we will use the net proceeds from
the sale of any securities oÅered pursuant to the shelf registration statement for general corporate purposes,
including for working capital, Ñnancing capital expenditures, research and development, marketing and
distribution eÅorts and, if opportunities arise, for acquisitions or strategic alliances. Pending such uses, we
Annual R
eport
may invest the net proceeds in interest-bearing securities. In addition, we may conduct concurrent or other
Ñnancings at any time.
Our ability to maintain suÇcient liquidity could be aÅected by various risks and uncertainties including,
but not limited to, those related to customer demand and acceptance of our products on new platforms and
new versions of our products on existing platforms, our ability to collect our accounts receivable as they
become due, successfully achieving our product release schedules and attaining our forecasted sales
objectives, the impact of competition, economic conditions in the United States and abroad, the seasonal
and cyclical nature of our business and operating results, risks of product returns and the other risks
described in the ""Risk Factors'' section, included in Item 1A of this report.
Contractual Obligations and Commercial Commitments
Letters of Credit
In July 2002, we provided an irrevocable standby letter of credit to Nintendo of Europe, which we have
amended on a number of occasions. The standby letter of credit, as amended, guarantees performance of
our obligations to pay Nintendo of Europe for trade payables. As of March 31, 2006, the standby letter of
credit, as amended, guaranteed our trade payable obligations to Nintendo of Europe for up to 47 million.
57

As of March 31, 2006, 42 million was payable to Nintendo of Europe under the standby letter of credit, as
amended.
In August 2003, we provided an irrevocable standby letter of credit to 300 California Associates II, LLC
in replacement of our security deposit for oÇce space. The standby letter of credit guarantees performance
of our obligations to pay our lease commitment up to approximately $1 million. The standby letter of
credit expires in December 2006. As of March 31, 2006, we did not have a payable balance on this
standby letter of credit.
Development, Celebrity, League and Content Licenses: Payments and Commitments
The products we produce in our studios are designed and created by our employee designers, artists,
software programmers and by non-employee software developers (""independent artists'' or ""third-party
developers''). We typically advance development funds to the independent artists and third-party
developers during development of our games, usually in installment payments made upon the completion
of speciÑed development milestones. Contractually, these payments are generally considered advances
against subsequent royalties on the sales of the products. These terms are set forth in written agreements
entered into with the independent artists and third-party developers.
In addition, we have certain celebrity, league and content license contracts that contain minimum
guarantee payments and marketing commitments that are not dependent on any deliverables. Celebrities
and organizations with whom we have contracts include: FIFA, FIFPRO Foundation and UEFA
(professional soccer); NASCAR and ISC (stock car racing); National Basketball Association (profes-
sional basketball); PGA TOUR, Tiger Woods and Pebble Beach (professional golf); National Hockey
League and NHL Players' Association (professional hockey); Warner Bros. (Harry Potter, Batman and
Superman); New Line Productions and Saul Zaentz Company (The Lord of the Rings); Marvel
Enterprises (Ñghting); National Football League Properties, Arena Football League and PLAYERS Inc.
(professional football); Collegiate Licensing Company (collegiate football, basketball and baseball);
Simcoh (Def Jam); Viacom Consumer Products (The Godfather); Valve Corporation (Half-Life); ESPN
(content in EA SPORTSTM games); Twentieth Century Fox Licensing and Merchandising (The
Simpsons); Lamborghini, McLaren and Porsche (car licenses for Need for Speed); and mobile game
rights with PopCap Games and The Tetris Company. These developer and content license commitments
represent the sum of (1) the cash payments due under non-royalty-bearing licenses and services
agreements and (2) the minimum guaranteed payments and advances against royalties due under royalty-
bearing licenses and services agreements, the majority of which are conditional upon performance by the
counterparty. These minimum guarantee payments and any related marketing commitments are included
in the table below.
58

The following table summarizes our minimum contractual obligations and commercial commitments as of
March 31, 2006, and the eÅect we expect them to have on our liquidity and cashÖow in future periods (in
millions):
CommercialContractual Obligations Commitments
Developer/ Letter of Credit,Licensor Other Purchase Bank and Other
Fiscal Year Ending March 31, Leases(1) Commitments(2) Marketing Obligations Guarantees Total
2007 ÏÏÏÏÏÏÏÏÏÏÏÏÏÏÏÏÏÏ $ 36 $ 155 $ 45 $ 7 $ 4 $ 247
2008 ÏÏÏÏÏÏÏÏÏÏÏÏÏÏÏÏÏÏ 28 144 30 Ì Ì 202
2009 ÏÏÏÏÏÏÏÏÏÏÏÏÏÏÏÏÏÏ 24 152 31 Ì Ì 207
2010 ÏÏÏÏÏÏÏÏÏÏÏÏÏÏÏÏÏÏ 18 140 31 Ì Ì 189
2011 ÏÏÏÏÏÏÏÏÏÏÏÏÏÏÏÏÏÏ 14 275 31 Ì Ì 320
Thereafter ÏÏÏÏÏÏÏÏÏÏÏÏÏ 30 700 186 Ì Ì 916
Total ÏÏÏÏÏÏÏÏÏÏÏÏÏÏÏÏÏÏ $150 $1,566 $354 $ 7 $ 4 $2,081
(1) See discussion on operating leases in the ""OÅ-Balance-Sheet Commitments'' section below for
additional information.(2) Developer/licensor commitments include $9 million of commitments to developers or licensors that
have been recorded in current and long-term liabilities and a corresponding amount in current and
long-term assets in our Consolidated Balance Sheet as of March 31, 2006 because payment is not
contingent upon performance by the developer or licensor.
The lease commitments disclosed above include contractual rental commitments of $25 million under real
estate leases for unutilized oÇce space resulting from our restructuring activities. These amounts, net of
estimated future sub-lease income, were expensed in the periods of the related restructuring and are
included in our accrued and other current liabilities reported on our Consolidated Balance Sheet as of
March 31, 2006. See Note 6 of the Notes to Consolidated Financial Statements.
Transactions with Related Parties
On June 24, 2002, we hired Warren Jenson as our Chief Financial and Administrative OÇcer and agreed
to loan him $4 million to be forgiven over four years based on his continuing employment. The loan does
not bear interest. On June 24, 2004, pursuant to the terms of the loan agreement, we forgave $2 million of
Annual R
eport
the loan and provided Mr. Jenson approximately $1.6 million to oÅset the tax implications of the
forgiveness. As of March 31, 2006, the remaining outstanding loan balance was $2 million, which will be
forgiven on June 24, 2006, provided that Mr. Jenson has not voluntarily resigned his employment with us
or been terminated for cause prior to that time. No additional funds will be provided to oÅset the tax
implications of the forgiveness of the remaining $2 million.
OFF-BALANCE SHEET COMMITMENTS
Lease Commitments and Residual Value Guarantees
We lease certain of our current facilities and equipment under non-cancelable operating lease agreements.
We are required to pay property taxes, insurance and normal maintenance costs for certain of these
facilities and will be required to pay any increases over the base year of these expenses on the remainder
of our facilities.
In February 1995, we entered into a build-to-suit lease (""Phase One Lease'') with a third party for our
headquarters facilities in Redwood City, California (""Phase One Facilities''). The Phase One Facilities
comprise a total of approximately 350,000 square feet and provide space for sales, marketing,
administration and research and development functions. In July 2001, we reÑnanced the Phase One Lease
59
with Keybank National Association through July 2006. We account for the Phase One Lease arrangement
as an operating lease in accordance with SFAS No. 13, ""Accounting for Leases'', as amended.
On May 26, 2006, we extended the Ñnancing under the Phase One Lease through July 2007. Upon
expiration of the Ñnancing in July 2007, we may purchase the Phase One Facilities, request up to two one-
year extensions of the Ñnancing (subject to bank approval), self-fund approximately 90 percent of the
Ñnancing and extend the remainder through July 2009, or arrange for the sale of the Phase One Facilities
to a third party.
The Phase One Lease terminates upon expiration of the Ñnancing in July 2007 unless we have extended
the Ñnancing or elected to self-fund the Ñnancing as described above, in which case the term of the lease
could be extended until as late as July 2009. Subject to certain terms and conditions, upon termination of
the lease, we may purchase the Phase One Facilities, request an extension of the lease or arrange for the
sale of the Phase One Facilities to a third party.
Pursuant to the terms of the Phase One Lease, as amended to date, we have an option to purchase the
Phase One Facilities at any time for a maximum purchase price of $132 million. In the event of a sale to
a third party, if the sale price is less than $132 million, we will be obligated to reimburse the diÅerence
between the actual sale price and $132 million, up to maximum of $117 million, subject to certain
provisions of the Phase One Lease, as amended.
In December 2000, we entered into a second build-to-suit lease (""Phase Two Lease'') with Keybank
National Association for a Ñve and one-half year term beginning in December 2000 to expand our
Redwood City, California headquarters facilities and develop adjacent property (""Phase Two Facilities'').
Construction of the Phase Two Facilities was completed in June 2002. The Phase Two Facilities comprise
a total of approximately 310,000 square feet and provide space for sales, marketing, administration and
research and development functions. We account for the Phase Two Lease arrangement as an operating
lease in accordance with SFAS No. 13, as amended.
On May 26, 2006, we extended the Ñnancing under the Phase Two Lease through July 2007. Upon the
expiration of the Ñnancing in July 2007, we may purchase the Phase Two Facilities, request up to two one-
year extensions of the Ñnancing (subject to bank approval), self-fund approximately 90 percent of the
Ñnancing and extend the remainder through July 2009, or arrange for the sale of the Phase Two Facilities
to a third party.
The Phase Two Lease terminates upon expiration of the Ñnancing in July 2007 unless we have extended
the Ñnancing or elected to self-fund the Ñnancing as described above, in which case the term of the lease
could be extended until as late as July 2009. Subject to certain terms and conditions, upon termination of
the lease, we may purchase the Phase Two Facilities, request an extension of the lease or arrange for the
sale of the Phase Two Facilities to a third party.
Pursuant to the terms of the Phase Two Lease, as amended to date, we have an option to purchase the
Phase Two Facilities at any time for a maximum purchase price of $115 million. In the event of a sale to
a third party, if the sale price is less than $115 million, we will be obligated to reimburse the diÅerence
between the actual sale price and $115 million, up to a maximum of $105 million, subject to certain
provisions of the Phase Two Lease, as amended.
The lease rates of the Phase One and Phase Two Leases Öuctuate and are based upon LIBOR plus a
margin that varies from 0.50% to 1.25% based on our ratio of total consolidated debt to consolidated
tangible net worth. Based on the 3-month LIBOR rate of 5.2% as of May 26, 2006, the annual rent
obligation of the two leases would total approximately $14 million. Our rent obligation under the leases
could increase or decrease signiÑcantly depending on changes in LIBOR.
The Phase One and Phase Two Leases require us to comply with certain Ñnancial covenants as shown
below, all of which we were in compliance with as of March 31, 2006. In the event we fail to comply with
the Ñnancial and other covenants contained in the leases, the lessor would have a number of remedies,
including the right to keep the leases in eÅect and suing for periodic rent, evicting us from the facilities, or
60

causing the facilities to be sold to a third party. In the event of a sale to a third party, we would be
required to reimburse the diÅerence between the actual sale price and $247 million, up to a total
maximum of $222 million. Alternatively, in order to avoid being evicted or having the two facilities sold to
a third party, we could elect to purchase the Phase One and Phase Two Facilities for a combined
maximum purchase price of $247 million.
We believe that, as of March 31, 2006, the estimated fair values of both properties under these operating
leases exceeded their respective guaranteed residual values of $117 million for the Phase One Facility and
$105 million for the Phase Two Facility as of March 31, 2006.
Actual as ofFinancial Covenants Requirement March 31, 2006
Consolidated Net Worth (in millions)ÏÏÏÏÏÏÏÏÏÏÏÏÏÏÏÏ equal to or greater than $2,293 $3,408
Fixed Charge Coverage Ratio ÏÏÏÏÏÏÏÏÏÏÏÏÏÏÏÏÏÏÏÏÏÏÏ equal to or greater than 3.00 8.89
Total Consolidated Debt to Capital ÏÏÏÏÏÏÏÏÏÏÏÏÏÏÏÏÏÏ equal to or less than 60% 6.8%
Quick Ratio Ì Q1 & Q2ÏÏÏÏÏÏÏÏÏÏÏÏÏÏÏÏÏÏÏÏÏÏÏÏÏÏÏ equal to or greater than 1.00 N/A
Q3 & Q4ÏÏÏÏÏÏÏÏÏÏÏÏÏÏÏÏÏÏÏÏÏÏÏÏÏÏÏ equal to or greater than 1.75 5.92
In February 2006, we entered into an agreement with an independent third party to lease a studio facility
in Guildford, Surrey, United Kingdom, which will commence in June 2006 and will expire in May 2016.
The facility comprises a total of approximately 95,000 square feet, which we intend to use for research and
development functions. Our rental obligation under this agreement is approximately $33 million over the
initial ten-year term of the lease.
In June 2004, we entered into a lease agreement, amended in December 2005, with an independent third
party for a studio facility in Orlando, Florida. The lease commenced in January 2005 and expires in June
2010, with one Ñve-year option to extend the lease term. The campus facilities comprise a total of
140,000 square feet and provide space for research and development functions. Our rental obligation over
the initial Ñve-and-a-half year term of the lease is $15 million. As of March 31, 2006, our remaining rental
obligation under this lease was $14 million.
In July 2003, we entered into a lease agreement with an independent third party (the ""Landlord'') for a
studio facility in Los Angeles, California, which commenced in October 2003 and expires in September
2013 with two Ñve-year options to extend the lease term. Additionally, we have options to purchase the
property after Ñve and ten years based on the fair market value of the property at the date of sale, a right
of Ñrst oÅer to purchase the property upon terms oÅered by the Landlord, and a right to share in the
proÑts from a sale of the property. We have accounted for this arrangement as an operating lease in
Annual R
eport
accordance with SFAS No. 13, as amended. Existing campus facilities comprise a total of 243,000 square
feet and provide space for research and development functions. Our rental obligation under this agreement
is $50 million over the initial ten-year term of the lease. This commitment is oÅset by expected sublease
income of $6 million for a sublease to an aÇliate of the Landlord of 18,000 square feet of the Los Angeles
facility, which commenced in October 2003 and expires in September 2013, with options of early
termination by the aÇliate after Ñve years and by us after four and Ñve years. As of March 31, 2006, our
remaining rental obligation under this lease was $43 million, of which $5 million was oÅset by expected
sublease income.
In October 2002, we entered into a lease agreement, with an independent third party for a studio facility in
Vancouver, British Columbia, Canada, which commenced in May 2003 and expires in April 2013. We
amended the lease in October 2003. The facility comprises a total of approximately 65,000 square feet and
provides space for research and development functions. Our rental obligation under this agreement is
approximately $16 million over the initial ten-year term of the lease. As of March 31, 2006, our remaining
rental obligation under this lease was $12 million.
61

Litigation
On February 14, 2005, an employment-related class action lawsuit, Hasty v. Electronic Arts Inc., was Ñled
against the company in Superior Court in San Mateo, California. The complaint alleges that we
improperly classiÑed ""Engineers'' in California as exempt employees and seeks injunctive relief, unspeciÑed
monetary damages, interest and attorneys' fees. On May 16, 2006, the court granted its preliminary
approval of a settlement pursuant to which we agreed to make a lump sum payment of $14.9 million, to
be paid to a third-party administrator, to cover (a) all claims allegedly suÅered by the class members,
(b) plaintiÅs' attorneys' fees, not to exceed 25% of the total settlement amount, (c) plaintiÅs' costs and
expenses, (d) any incentive payments to the named plaintiÅs that may be authorized by the court, and
(e) all costs of administration of the settlement. The hearing for the court to consider its Ñnal approval of
the settlement is set for September 22, 2006.
Each of the shareholder actions we have previously disclosed have been voluntarily dismissed by all
plaintiÅs. The federal securities class action complaint has been dismissed with prejudice, by an order
dated January 26, 2006; the federal derivative action has been dismissed, by an order dated March 10,
2006; and the two state derivative actions have been dismissed, by orders dated May 4, 2006 and May 8,
2006.
In addition, we are subject to other claims and litigation arising in the ordinary course of business. We
believe that any liability from any reasonably foreseeable disposition of such other claims and litigation,
individually or in the aggregate, would not have a material adverse eÅect on our consolidated Ñnancial
position or results of operations.
Director Indemnity Agreements
We have entered into indemniÑcation agreements with the members of our Board of Directors at the time
they joined the Board to indemnify them to the extent permitted by law against any and all liabilities,
costs, expenses, amounts paid in settlement and damages incurred by the directors as a result of any
lawsuit, or any judicial, administrative or investigative proceeding in which the directors are sued or
charged as a result of their service as members of our Board of Directors.
INFLATION
We believe the impact of inÖation on our results of operations has not been signiÑcant for each of the past
three Ñscal years.
Item 7A: Quantitative and Qualitative Disclosures About Market Risk
Market Risk
We are exposed to various market risks, including changes in foreign currency exchange rates, interest
rates, and market prices. Market risk is the potential loss arising from changes in market rates and market
prices. We employ established policies and practices to manage these risks. Foreign currency option and
foreign exchange forward contracts are used to either hedge anticipated exposures or mitigate some
existing exposures subject to market risk. We do not enter into derivatives or other Ñnancial instruments
for trading or speculative purposes (see Note 3 to the Consolidated Financial Statements included in
Item 8 of this report). Interest rate risk is the potential loss arising from changes in interest rates. We do
not consider our cash and cash equivalents to be exposed to signiÑcant interest rate risk because our
portfolio consists of highly liquid investments with original maturities of three months or less (see Note 2
to the Consolidated Financial Statements included in Item 8 of this report).
Foreign Currency Exchange Rate Risk
From time to time, we hedge some of our foreign currency risk related to forecasted foreign-currency-
denominated sales and expense transactions by purchasing option contracts that generally have maturities
of 15 months or less. These transactions are designated and qualify as cash Öow hedges. The derivative
62

assets associated with our hedging activities are recorded at fair value in other current assets in our
Consolidated Balance Sheet. The eÅective portion of gains or losses resulting from changes in fair value of
these hedges is initially reported, net of tax, as a component of accumulated other comprehensive income
in stockholders' equity and subsequently reclassiÑed into net revenue or operating expenses, as appropriate
in the period when the forecasted transaction is recorded. The ineÅective portion of gains or losses
resulting from changes in fair value, if any, is reported in each period in interest and other income, net in
our Consolidated Statement of Operations. Our hedging programs reduce, but do not entirely eliminate,
the impact of currency exchange rate movements in revenue and operating expenses. As of March 31,
2006, we had no foreign currency option contracts outstanding. As of March 31, 2005, we had foreign
currency option contracts outstanding with a total fair value of $1 million included in other current assets.
We utilize foreign exchange forward contracts to mitigate foreign currency risk associated with foreign-
currency-denominated assets and liabilities, primarily intercompany receivables and payables. The forward
contracts generally have a contractual term of approximately one month and are transacted near month-
end. Therefore, the fair value of the forward contracts generally is not signiÑcant at each month-end. Our
foreign exchange forward contracts are not designated as hedging instruments under SFAS No. 133 and
are accounted for as derivatives whereby the fair value of the contracts are reported as other current assets
or other current liabilities in our Consolidated Balance Sheet, and gains and losses from changes in fair
value are reported in interest and other income, net. The gains and losses on these forward contracts
generally oÅset the gains and losses on the underlying foreign-currency-denominated assets and liabilities,
which are also reported in interest and other income, net, in our Consolidated Statement of Operations.
As of March 31, 2006, we had forward foreign exchange contracts to purchase and sell approximately
$161 million in foreign currencies. Of this amount, $132 million represented contracts to sell foreign
currencies in exchange for U.S. dollars, $14 million to sell foreign currencies in exchange for British pound
sterling and $15 million to purchase foreign currency in exchange for U.S. dollars. As of March 31, 2005
we had forward foreign exchange contracts to purchase and sell approximately $425 million of foreign
currencies. Of this amount, $379 million represented contracts to sell foreign currencies in exchange for
U.S. dollars, $22 million to sell foreign currencies in exchange for British pound sterling and $24 million to
purchase foreign currency in exchange for U.S. dollars. The fair value of our forward contracts was
immaterial as of March 31, 2006 and March 31, 2005.
The counterparties to these forward and option contracts are creditworthy multinational commercial banks.
The risks of counterparty nonperformance associated with these contracts are not considered to be
material.
Notwithstanding our eÅorts to mitigate some foreign currency exchange rate risks, there can be no
Annual R
eport
assurances that our hedging activities will adequately protect us against the risks associated with foreign
currency Öuctuations. As of March 31, 2006, we had no foreign currency option contracts outstanding. As
of March 31, 2005, a hypothetical adverse foreign currency exchange rate movement of 10 percent or
15 percent would not have resulted in a material loss in fair value of our option contracts under either
scenario. However, a hypothetical adverse foreign currency exchange rate movement of 10 percent or
15 percent would result in potential losses on our forward contracts of $16 million and $23 million,
respectively, as of March 31, 2006, and $40 million and $61 million, respectively, as of March 31, 2005.
This sensitivity analysis assumes a parallel adverse shift in foreign currency exchange rates, which do not
always move in the same direction. Actual results may diÅer materially.
Interest Rate Risk
Our exposure to market risk for changes in interest rates relates primarily to our short-term investment
portfolio. We manage our interest rate risk by maintaining an investment portfolio generally consisting of
debt instruments of high credit quality and relatively short maturities. Additionally, the contractual terms
of the securities do not permit the issuer to call, prepay or otherwise settle the securities at prices less than
the stated par value of the securities. Our investments are held for purposes other than trading. Also, we
do not use derivative Ñnancial instruments or leverage in our short-term investment portfolio.
63

As of March 31, 2006 and 2005, our short-term investments were classiÑed as available-for-sale and,
consequently, recorded at fair market value with unrealized gains or losses resulting from changes in fair
value reported as a separate component of accumulated other comprehensive income, net of any tax
eÅects, in stockholders' equity. Our portfolio of short-term investments consisted of the following
investment categories, summarized by fair value as of March 31, 2006 and 2005 (in millions):
As of March 31,
2006 2005
U.S. agency securities ÏÏÏÏÏÏÏÏÏÏÏÏÏÏÏÏÏÏÏÏÏÏÏÏÏÏÏÏÏÏÏÏÏÏÏÏÏÏÏÏÏÏÏÏÏÏÏÏÏÏÏÏÏÏÏÏ $ 575 $1,168
U.S. Treasury securities ÏÏÏÏÏÏÏÏÏÏÏÏÏÏÏÏÏÏÏÏÏÏÏÏÏÏÏÏÏÏÏÏÏÏÏÏÏÏÏÏÏÏÏÏÏÏÏÏÏÏÏÏÏÏ 212 298
Corporate bonds ÏÏÏÏÏÏÏÏÏÏÏÏÏÏÏÏÏÏÏÏÏÏÏÏÏÏÏÏÏÏÏÏÏÏÏÏÏÏÏÏÏÏÏÏÏÏÏÏÏÏÏÏÏÏÏÏÏÏÏÏÏ 178 180
Asset-backed and other debt securities ÏÏÏÏÏÏÏÏÏÏÏÏÏÏÏÏÏÏÏÏÏÏÏÏÏÏÏÏÏÏÏÏÏÏÏÏÏÏÏÏÏÏ 65 42
Total short-term investments ÏÏÏÏÏÏÏÏÏÏÏÏÏÏÏÏÏÏÏÏÏÏÏÏÏÏÏÏÏÏÏÏÏÏÏÏÏÏÏÏÏÏÏÏÏÏÏÏ $1,030 $1,688
Notwithstanding our eÅorts to manage interest rate risks, there can be no assurance that we will be
adequately protected against risks associated with interest rate Öuctuations. At any time, a sharp change in
interest rates could have a signiÑcant impact on the fair value of our investment portfolio. The following
table presents the hypothetical changes in fair value in our short-term investment portfolio as of March 31,
2006, arising from potential changes in interest rates. The modeling technique estimates the change in fair
value from immediate hypothetical parallel shifts in the yield curve of plus or minus 50 basis points
(""BPS''), 100 BPS, and 150 BPS.
Fair ValueValuation of Securities Given an Interest Valuation of Securities Given an Interestas of
Rate Increase of X Basis Points Rate Increase of X Basis PointsMarch 31,(In millions)(150 BPS) (100 BPS) (50 BPS) 2006 50 BPS 100 BPS 150 BPS
U.S. agency securities ÏÏ $ 581 $ 579 $ 577 $ 575 $ 573 $ 571 $ 570
U.S. Treasury securities 218 216 214 212 210 208 205
Corporate bonds ÏÏÏÏÏÏ 182 181 179 178 176 175 173
Asset-backed and otherdebt securities ÏÏÏÏÏÏ 66 66 66 65 65 65 65
Total short-terminvestments ÏÏÏÏÏÏ $1,047 $1,042 $1,036 $1,030 $1,024 $1,019 $1,013
The following table presents the hypothetical changes in fair value in our short-term investment portfolio
as of March 31, 2005, arising from selected potential changes in interest rates.
Fair ValueValuation of Securities Given an Interest Valuation of Securities Given an Interestas of
Rate Decrease of X Basis Points Rate Increase of X Basis PointsMarch 31,(In millions)(150 BPS) (100 BPS) (50 BPS) 2005 50 BPS 100 BPS 150 BPS
U.S. agency securities ÏÏ $1,177 $1,175 $1,172 $1,168 $1,162 $1,156 $1,151
U.S. Treasury securities 306 303 300 298 295 293 290
Corporate bonds ÏÏÏÏÏÏ 185 184 182 180 178 177 175
Asset-backed securities 44 43 43 42 42 41 41
Total short-terminvestments ÏÏÏÏÏÏ $1,712 $1,705 $1,697 $1,688 $1,677 $1,667 $1,657
Market Price Risk
The value of our equity investments in publicly traded companies are subject to market price volatility. As
of March 31, 2006, our marketable equity securities were classiÑed as available-for-sale and, consequently,
were recorded in our Consolidated Balance Sheets at fair market value with unrealized gains or losses
64
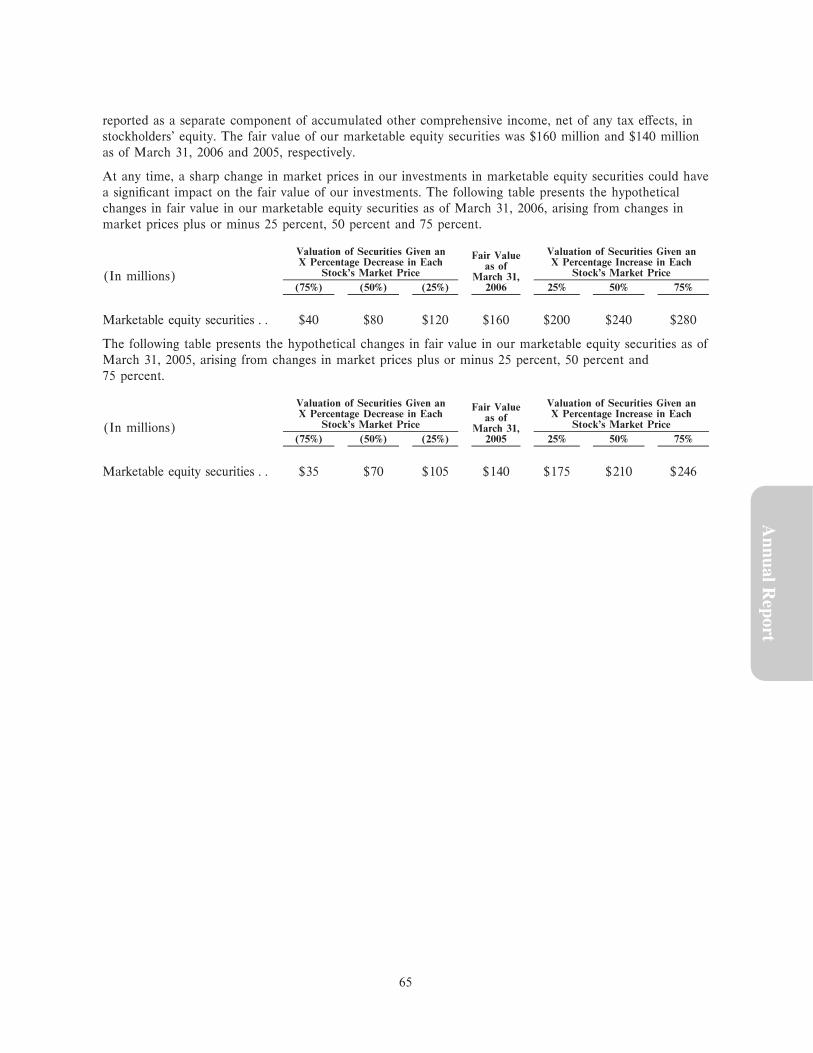
reported as a separate component of accumulated other comprehensive income, net of any tax eÅects, in
stockholders' equity. The fair value of our marketable equity securities was $160 million and $140 million
as of March 31, 2006 and 2005, respectively.
At any time, a sharp change in market prices in our investments in marketable equity securities could have
a signiÑcant impact on the fair value of our investments. The following table presents the hypothetical
changes in fair value in our marketable equity securities as of March 31, 2006, arising from changes in
market prices plus or minus 25 percent, 50 percent and 75 percent.
Valuation of Securities Given an Valuation of Securities Given anFair ValueX Percentage Decrease in Each X Percentage Increase in Eachas of
Stock's Market Price Stock's Market PriceMarch 31,(In millions)(75%) (50%) (25%) 2006 25% 50% 75%
Marketable equity securities ÏÏ $40 $80 $120 $160 $200 $240 $280
The following table presents the hypothetical changes in fair value in our marketable equity securities as of
March 31, 2005, arising from changes in market prices plus or minus 25 percent, 50 percent and
75 percent.
Valuation of Securities Given an Valuation of Securities Given anFair ValueX Percentage Decrease in Each X Percentage Increase in Eachas of
Stock's Market Price Stock's Market PriceMarch 31,(In millions)(75%) (50%) (25%) 2005 25% 50% 75%
Marketable equity securities ÏÏ $35 $70 $105 $140 $175 $210 $246
Annual R
eport
65
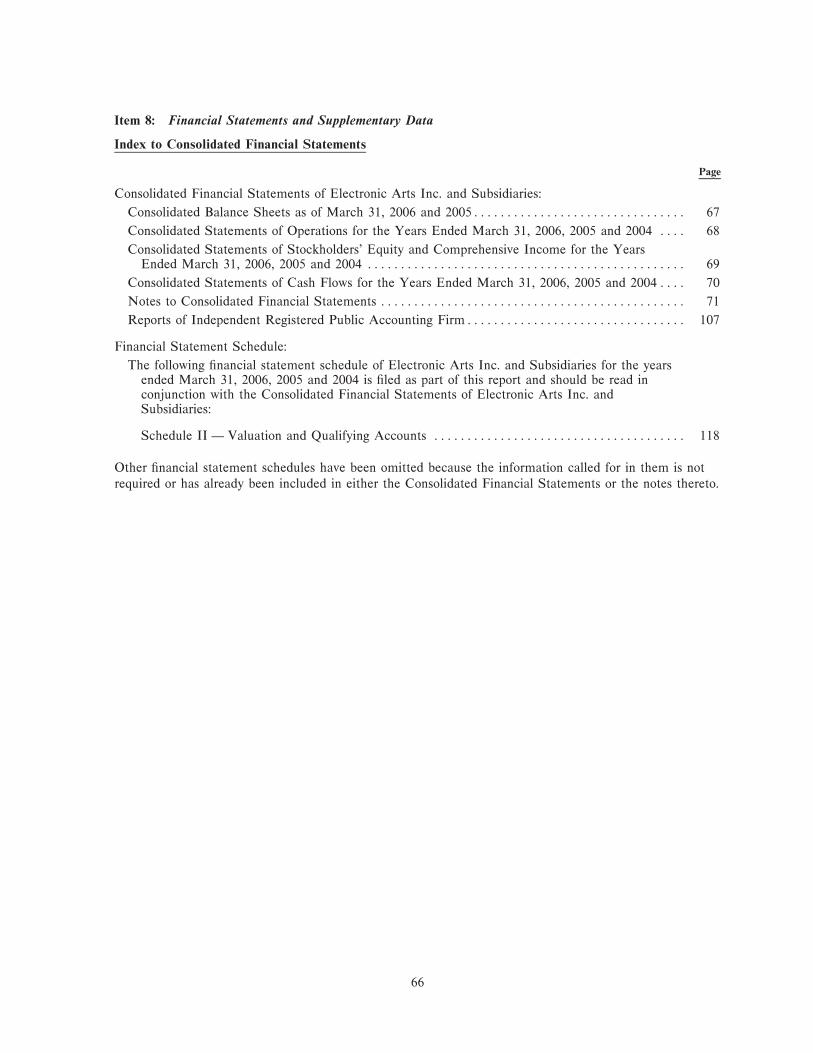
Item 8: Financial Statements and Supplementary Data
Index to Consolidated Financial Statements
Page
Consolidated Financial Statements of Electronic Arts Inc. and Subsidiaries:
Consolidated Balance Sheets as of March 31, 2006 and 2005ÏÏÏÏÏÏÏÏÏÏÏÏÏÏÏÏÏÏÏÏÏÏÏÏÏÏÏÏÏÏÏÏ 67
Consolidated Statements of Operations for the Years Ended March 31, 2006, 2005 and 2004 ÏÏÏÏ 68
Consolidated Statements of Stockholders' Equity and Comprehensive Income for the YearsEnded March 31, 2006, 2005 and 2004 ÏÏÏÏÏÏÏÏÏÏÏÏÏÏÏÏÏÏÏÏÏÏÏÏÏÏÏÏÏÏÏÏÏÏÏÏÏÏÏÏÏÏÏÏÏÏÏÏ 69
Consolidated Statements of Cash Flows for the Years Ended March 31, 2006, 2005 and 2004ÏÏÏÏ 70
Notes to Consolidated Financial Statements ÏÏÏÏÏÏÏÏÏÏÏÏÏÏÏÏÏÏÏÏÏÏÏÏÏÏÏÏÏÏÏÏÏÏÏÏÏÏÏÏÏÏÏÏÏÏ 71
Reports of Independent Registered Public Accounting FirmÏÏÏÏÏÏÏÏÏÏÏÏÏÏÏÏÏÏÏÏÏÏÏÏÏÏÏÏÏÏÏÏÏ 107
Financial Statement Schedule:
The following Ñnancial statement schedule of Electronic Arts Inc. and Subsidiaries for the yearsended March 31, 2006, 2005 and 2004 is Ñled as part of this report and should be read inconjunction with the Consolidated Financial Statements of Electronic Arts Inc. andSubsidiaries:
Schedule II Ì Valuation and Qualifying Accounts ÏÏÏÏÏÏÏÏÏÏÏÏÏÏÏÏÏÏÏÏÏÏÏÏÏÏÏÏÏÏÏÏÏÏÏÏÏÏ 118
Other Ñnancial statement schedules have been omitted because the information called for in them is not
required or has already been included in either the Consolidated Financial Statements or the notes thereto.
66

ELECTRONIC ARTS INC. AND SUBSIDIARIES
CONSOLIDATED BALANCE SHEETS
March 31, March 31,2006 2005(In millions, except par value data)
ASSETS
Current assets:
Cash and cash equivalents ÏÏÏÏÏÏÏÏÏÏÏÏÏÏÏÏÏÏÏÏÏÏÏÏÏÏÏÏÏÏÏÏÏÏÏÏÏÏÏÏÏÏÏÏÏÏÏÏÏÏÏ $1,242 $1,270
Short-term investmentsÏÏÏÏÏÏÏÏÏÏÏÏÏÏÏÏÏÏÏÏÏÏÏÏÏÏÏÏÏÏÏÏÏÏÏÏÏÏÏÏÏÏÏÏÏÏÏÏÏÏÏÏÏÏ 1,030 1,688
Marketable equity securitiesÏÏÏÏÏÏÏÏÏÏÏÏÏÏÏÏÏÏÏÏÏÏÏÏÏÏÏÏÏÏÏÏÏÏÏÏÏÏÏÏÏÏÏÏÏÏÏÏÏÏ 160 140
Receivables, net of allowances of $232 and $162, respectively ÏÏÏÏÏÏÏÏÏÏÏÏÏÏÏÏÏÏÏÏÏ 199 296
Inventories ÏÏÏÏÏÏÏÏÏÏÏÏÏÏÏÏÏÏÏÏÏÏÏÏÏÏÏÏÏÏÏÏÏÏÏÏÏÏÏÏÏÏÏÏÏÏÏÏÏÏÏÏÏÏÏÏÏÏÏÏÏÏÏÏ 61 62
Deferred income taxes, netÏÏÏÏÏÏÏÏÏÏÏÏÏÏÏÏÏÏÏÏÏÏÏÏÏÏÏÏÏÏÏÏÏÏÏÏÏÏÏÏÏÏÏÏÏÏÏÏÏÏÏ 86 86
Other current assets ÏÏÏÏÏÏÏÏÏÏÏÏÏÏÏÏÏÏÏÏÏÏÏÏÏÏÏÏÏÏÏÏÏÏÏÏÏÏÏÏÏÏÏÏÏÏÏÏÏÏÏÏÏÏÏÏ 234 164
Total current assets ÏÏÏÏÏÏÏÏÏÏÏÏÏÏÏÏÏÏÏÏÏÏÏÏÏÏÏÏÏÏÏÏÏÏÏÏÏÏÏÏÏÏÏÏÏÏÏÏÏÏÏÏÏÏÏ 3,012 3,706
Property and equipment, net ÏÏÏÏÏÏÏÏÏÏÏÏÏÏÏÏÏÏÏÏÏÏÏÏÏÏÏÏÏÏÏÏÏÏÏÏÏÏÏÏÏÏÏÏÏÏÏÏÏÏÏ 392 353
Investments in aÇliates ÏÏÏÏÏÏÏÏÏÏÏÏÏÏÏÏÏÏÏÏÏÏÏÏÏÏÏÏÏÏÏÏÏÏÏÏÏÏÏÏÏÏÏÏÏÏÏÏÏÏÏÏÏÏÏ 11 10
Goodwill ÏÏÏÏÏÏÏÏÏÏÏÏÏÏÏÏÏÏÏÏÏÏÏÏÏÏÏÏÏÏÏÏÏÏÏÏÏÏÏÏÏÏÏÏÏÏÏÏÏÏÏÏÏÏÏÏÏÏÏÏÏÏÏÏÏÏÏÏ 647 153
Other intangibles, net ÏÏÏÏÏÏÏÏÏÏÏÏÏÏÏÏÏÏÏÏÏÏÏÏÏÏÏÏÏÏÏÏÏÏÏÏÏÏÏÏÏÏÏÏÏÏÏÏÏÏÏÏÏÏÏÏÏ 232 36
Deferred income taxes, netÏÏÏÏÏÏÏÏÏÏÏÏÏÏÏÏÏÏÏÏÏÏÏÏÏÏÏÏÏÏÏÏÏÏÏÏÏÏÏÏÏÏÏÏÏÏÏÏÏÏÏÏÏ Ì 19
Other assets ÏÏÏÏÏÏÏÏÏÏÏÏÏÏÏÏÏÏÏÏÏÏÏÏÏÏÏÏÏÏÏÏÏÏÏÏÏÏÏÏÏÏÏÏÏÏÏÏÏÏÏÏÏÏÏÏÏÏÏÏÏÏÏÏÏ 92 93
TOTAL ASSETS ÏÏÏÏÏÏÏÏÏÏÏÏÏÏÏÏÏÏÏÏÏÏÏÏÏÏÏÏÏÏÏÏÏÏÏÏÏÏÏÏÏÏÏÏÏÏÏÏÏÏÏÏÏÏÏÏ $4,386 $4,370
LIABILITIES, MINORITY INTEREST AND STOCKHOLDERS' EQUITY
Current liabilities:
Accounts payableÏÏÏÏÏÏÏÏÏÏÏÏÏÏÏÏÏÏÏÏÏÏÏÏÏÏÏÏÏÏÏÏÏÏÏÏÏÏÏÏÏÏÏÏÏÏÏÏÏÏÏÏÏÏÏÏÏÏÏ $ 163 $ 134
Accrued and other current liabilities ÏÏÏÏÏÏÏÏÏÏÏÏÏÏÏÏÏÏÏÏÏÏÏÏÏÏÏÏÏÏÏÏÏÏÏÏÏÏÏÏÏÏÏ 706 673
Total current liabilities ÏÏÏÏÏÏÏÏÏÏÏÏÏÏÏÏÏÏÏÏÏÏÏÏÏÏÏÏÏÏÏÏÏÏÏÏÏÏÏÏÏÏÏÏÏÏÏÏÏÏÏÏ 869 807
Deferred income taxes ÏÏÏÏÏÏÏÏÏÏÏÏÏÏÏÏÏÏÏÏÏÏÏÏÏÏÏÏÏÏÏÏÏÏÏÏÏÏÏÏÏÏÏÏÏÏÏÏÏÏÏÏÏÏÏÏ 29 Ì
Other liabilities ÏÏÏÏÏÏÏÏÏÏÏÏÏÏÏÏÏÏÏÏÏÏÏÏÏÏÏÏÏÏÏÏÏÏÏÏÏÏÏÏÏÏÏÏÏÏÏÏÏÏÏÏÏÏÏÏÏÏÏÏÏÏ 68 54
Total liabilities ÏÏÏÏÏÏÏÏÏÏÏÏÏÏÏÏÏÏÏÏÏÏÏÏÏÏÏÏÏÏÏÏÏÏÏÏÏÏÏÏÏÏÏÏÏÏÏÏÏÏÏÏÏÏÏÏÏÏÏ 966 861
Annual R
eport
Commitments and contingencies (See Note 9)
Minority interest ÏÏÏÏÏÏÏÏÏÏÏÏÏÏÏÏÏÏÏÏÏÏÏÏÏÏÏÏÏÏÏÏÏÏÏÏÏÏÏÏÏÏÏÏÏÏÏÏÏÏÏÏÏÏÏÏÏÏÏÏÏ 12 11
Stockholders' equity:
Preferred stock, $0.01 par value. 10 shares authorized ÏÏÏÏÏÏÏÏÏÏÏÏÏÏÏÏÏÏÏÏÏÏÏÏÏÏÏÏ Ì Ì
Common stock, $0.01 par value. 1,000 shares authorized; 305 and 310 shares issuedand outstanding, respectively ÏÏÏÏÏÏÏÏÏÏÏÏÏÏÏÏÏÏÏÏÏÏÏÏÏÏÏÏÏÏÏÏÏÏÏÏÏÏÏÏÏÏÏÏÏÏÏ 3 3
Paid-in capital ÏÏÏÏÏÏÏÏÏÏÏÏÏÏÏÏÏÏÏÏÏÏÏÏÏÏÏÏÏÏÏÏÏÏÏÏÏÏÏÏÏÏÏÏÏÏÏÏÏÏÏÏÏÏÏÏÏÏÏÏÏ 1,081 1,434
Retained earnings ÏÏÏÏÏÏÏÏÏÏÏÏÏÏÏÏÏÏÏÏÏÏÏÏÏÏÏÏÏÏÏÏÏÏÏÏÏÏÏÏÏÏÏÏÏÏÏÏÏÏÏÏÏÏÏÏÏÏ 2,241 2,005
Accumulated other comprehensive income ÏÏÏÏÏÏÏÏÏÏÏÏÏÏÏÏÏÏÏÏÏÏÏÏÏÏÏÏÏÏÏÏÏÏÏÏÏ 83 56
Total stockholders' equity ÏÏÏÏÏÏÏÏÏÏÏÏÏÏÏÏÏÏÏÏÏÏÏÏÏÏÏÏÏÏÏÏÏÏÏÏÏÏÏÏÏÏÏÏÏÏÏÏÏÏ 3,408 3,498
TOTAL LIABILITIES, MINORITY INTEREST AND STOCKHOLDERS'EQUITYÏÏÏÏÏÏÏÏÏÏÏÏÏÏÏÏÏÏÏÏÏÏÏÏÏÏÏÏÏÏÏÏÏÏÏÏÏÏÏÏÏÏÏÏÏÏÏÏÏÏÏÏÏÏÏÏÏÏÏÏÏÏ $4,386 $4,370
See accompanying Notes to Consolidated Financial Statements.
67

ELECTRONIC ARTS INC. AND SUBSIDIARIES
CONSOLIDATED STATEMENTS OF OPERATIONS
Year Ended March 31,
2006 2005 2004(In millions, except per share data)
Net revenueÏÏÏÏÏÏÏÏÏÏÏÏÏÏÏÏÏÏÏÏÏÏÏÏÏÏÏÏÏÏÏÏÏÏÏÏÏÏÏÏÏÏÏÏÏÏÏÏÏÏÏÏÏÏÏÏ $2,951 $3,129 $2,957
Cost of goods soldÏÏÏÏÏÏÏÏÏÏÏÏÏÏÏÏÏÏÏÏÏÏÏÏÏÏÏÏÏÏÏÏÏÏÏÏÏÏÏÏÏÏÏÏÏÏÏÏÏÏÏ 1,181 1,197 1,103
Gross proÑt ÏÏÏÏÏÏÏÏÏÏÏÏÏÏÏÏÏÏÏÏÏÏÏÏÏÏÏÏÏÏÏÏÏÏÏÏÏÏÏÏÏÏÏÏÏÏÏÏÏÏÏÏÏÏ 1,770 1,932 1,854
Operating expenses:
Marketing and sales ÏÏÏÏÏÏÏÏÏÏÏÏÏÏÏÏÏÏÏÏÏÏÏÏÏÏÏÏÏÏÏÏÏÏÏÏÏÏÏÏÏÏÏÏÏÏÏ 431 391 370
General and administrative ÏÏÏÏÏÏÏÏÏÏÏÏÏÏÏÏÏÏÏÏÏÏÏÏÏÏÏÏÏÏÏÏÏÏÏÏÏÏÏÏÏ 215 221 185
Research and development ÏÏÏÏÏÏÏÏÏÏÏÏÏÏÏÏÏÏÏÏÏÏÏÏÏÏÏÏÏÏÏÏÏÏÏÏÏÏÏÏÏ 758 633 511
Amortization of intangibles ÏÏÏÏÏÏÏÏÏÏÏÏÏÏÏÏÏÏÏÏÏÏÏÏÏÏÏÏÏÏÏÏÏÏÏÏÏÏÏÏÏ 7 3 3
Acquired in-process technologyÏÏÏÏÏÏÏÏÏÏÏÏÏÏÏÏÏÏÏÏÏÏÏÏÏÏÏÏÏÏÏÏÏÏÏÏÏÏ 8 13 Ì
Restructuring charges ÏÏÏÏÏÏÏÏÏÏÏÏÏÏÏÏÏÏÏÏÏÏÏÏÏÏÏÏÏÏÏÏÏÏÏÏÏÏÏÏÏÏÏÏÏÏ 26 2 9
Total operating expenses ÏÏÏÏÏÏÏÏÏÏÏÏÏÏÏÏÏÏÏÏÏÏÏÏÏÏÏÏÏÏÏÏÏÏÏÏÏÏÏÏÏ 1,445 1,263 1,078
Operating income ÏÏÏÏÏÏÏÏÏÏÏÏÏÏÏÏÏÏÏÏÏÏÏÏÏÏÏÏÏÏÏÏÏÏÏÏÏÏÏÏÏÏÏÏÏÏÏ 325 669 776
Interest and other income, net ÏÏÏÏÏÏÏÏÏÏÏÏÏÏÏÏÏÏÏÏÏÏÏÏÏÏÏÏÏÏÏÏÏÏÏÏÏÏÏÏ 64 56 21
Income before provision for income taxes and minority interest ÏÏÏÏÏÏÏÏÏÏÏ 389 725 797
Provision for income taxes ÏÏÏÏÏÏÏÏÏÏÏÏÏÏÏÏÏÏÏÏÏÏÏÏÏÏÏÏÏÏÏÏÏÏÏÏÏÏÏÏÏÏÏÏ 147 221 220
Income before minority interest ÏÏÏÏÏÏÏÏÏÏÏÏÏÏÏÏÏÏÏÏÏÏÏÏÏÏÏÏÏÏÏÏÏÏÏÏÏ 242 504 577
Minority interest ÏÏÏÏÏÏÏÏÏÏÏÏÏÏÏÏÏÏÏÏÏÏÏÏÏÏÏÏÏÏÏÏÏÏÏÏÏÏÏÏÏÏÏÏÏÏÏÏÏÏÏÏ (6) Ì Ì
Net income ÏÏÏÏÏÏÏÏÏÏÏÏÏÏÏÏÏÏÏÏÏÏÏÏÏÏÏÏÏÏÏÏÏÏÏÏÏÏÏÏÏÏÏÏÏÏÏÏÏÏÏÏÏÏ $ 236 $ 504 $ 577
Net income per share:
BasicÏÏÏÏÏÏÏÏÏÏÏÏÏÏÏÏÏÏÏÏÏÏÏÏÏÏÏÏÏÏÏÏÏÏÏÏÏÏÏÏÏÏÏÏÏÏÏÏÏÏÏÏÏÏÏÏÏÏÏÏ $ 0.78 $ 1.65 $ 1.95
Diluted ÏÏÏÏÏÏÏÏÏÏÏÏÏÏÏÏÏÏÏÏÏÏÏÏÏÏÏÏÏÏÏÏÏÏÏÏÏÏÏÏÏÏÏÏÏÏÏÏÏÏÏÏÏÏÏÏÏÏ $ 0.75 $ 1.59 $ 1.87
Number of shares used in computation:
BasicÏÏÏÏÏÏÏÏÏÏÏÏÏÏÏÏÏÏÏÏÏÏÏÏÏÏÏÏÏÏÏÏÏÏÏÏÏÏÏÏÏÏÏÏÏÏÏÏÏÏÏÏÏÏÏÏÏÏÏÏ 304 305 295
Diluted ÏÏÏÏÏÏÏÏÏÏÏÏÏÏÏÏÏÏÏÏÏÏÏÏÏÏÏÏÏÏÏÏÏÏÏÏÏÏÏÏÏÏÏÏÏÏÏÏÏÏÏÏÏÏÏÏÏÏ 314 318 308
See accompanying Notes to Consolidated Financial Statements.
68
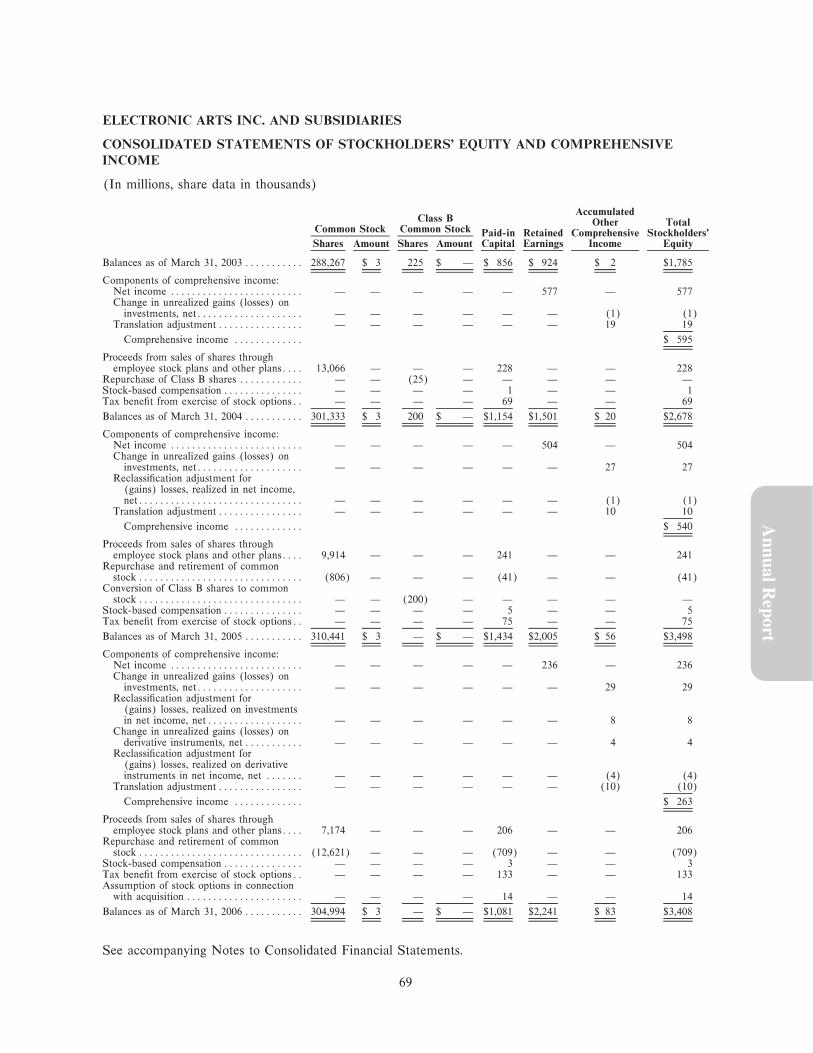
ELECTRONIC ARTS INC. AND SUBSIDIARIES
CONSOLIDATED STATEMENTS OF STOCKHOLDERS' EQUITY AND COMPREHENSIVE
INCOME
(In millions, share data in thousands)
AccumulatedClass B Other Total
Common Stock Common Stock Paid-in Retained Comprehensive Stockholders'Shares Amount Shares Amount Capital Earnings Income Equity
Balances as of March 31, 2003 ÏÏÏÏÏÏÏÏÏÏÏ 288,267 $ 3 225 $ Ì $ 856 $ 924 $ 2 $1,785
Components of comprehensive income:Net income ÏÏÏÏÏÏÏÏÏÏÏÏÏÏÏÏÏÏÏÏÏÏÏÏÏ Ì Ì Ì Ì Ì 577 Ì 577Change in unrealized gains (losses) on
investments, netÏÏÏÏÏÏÏÏÏÏÏÏÏÏÏÏÏÏÏÏ Ì Ì Ì Ì Ì Ì (1) (1)Translation adjustment ÏÏÏÏÏÏÏÏÏÏÏÏÏÏÏÏ Ì Ì Ì Ì Ì Ì 19 19
Comprehensive income ÏÏÏÏÏÏÏÏÏÏÏÏÏ $ 595
Proceeds from sales of shares throughemployee stock plans and other plansÏÏÏÏ 13,066 Ì Ì Ì 228 Ì Ì 228
Repurchase of Class B shares ÏÏÏÏÏÏÏÏÏÏÏÏ Ì Ì (25) Ì Ì Ì Ì ÌStock-based compensation ÏÏÏÏÏÏÏÏÏÏÏÏÏÏÏ Ì Ì Ì Ì 1 Ì Ì 1Tax beneÑt from exercise of stock optionsÏÏ Ì Ì Ì Ì 69 Ì Ì 69
Balances as of March 31, 2004 ÏÏÏÏÏÏÏÏÏÏÏ 301,333 $ 3 200 $ Ì $1,154 $1,501 $ 20 $2,678
Components of comprehensive income:Net income ÏÏÏÏÏÏÏÏÏÏÏÏÏÏÏÏÏÏÏÏÏÏÏÏÏ Ì Ì Ì Ì Ì 504 Ì 504Change in unrealized gains (losses) on
investments, netÏÏÏÏÏÏÏÏÏÏÏÏÏÏÏÏÏÏÏÏ Ì Ì Ì Ì Ì Ì 27 27ReclassiÑcation adjustment for
(gains) losses, realized in net income,netÏÏÏÏÏÏÏÏÏÏÏÏÏÏÏÏÏÏÏÏÏÏÏÏÏÏÏÏÏÏÏ Ì Ì Ì Ì Ì Ì (1) (1)
Translation adjustment ÏÏÏÏÏÏÏÏÏÏÏÏÏÏÏÏ Ì Ì Ì Ì Ì Ì 10 10
Comprehensive income ÏÏÏÏÏÏÏÏÏÏÏÏÏ $ 540
Proceeds from sales of shares throughemployee stock plans and other plansÏÏÏÏ 9,914 Ì Ì Ì 241 Ì Ì 241
Repurchase and retirement of commonstock ÏÏÏÏÏÏÏÏÏÏÏÏÏÏÏÏÏÏÏÏÏÏÏÏÏÏÏÏÏÏÏ (806) Ì Ì Ì (41) Ì Ì (41)
Conversion of Class B shares to commonstock ÏÏÏÏÏÏÏÏÏÏÏÏÏÏÏÏÏÏÏÏÏÏÏÏÏÏÏÏÏÏÏ Ì Ì (200) Ì Ì Ì Ì Ì
Stock-based compensation ÏÏÏÏÏÏÏÏÏÏÏÏÏÏÏ Ì Ì Ì Ì 5 Ì Ì 5Tax beneÑt from exercise of stock optionsÏÏ Ì Ì Ì Ì 75 Ì Ì 75
Balances as of March 31, 2005 ÏÏÏÏÏÏÏÏÏÏÏ 310,441 $ 3 Ì $ Ì $1,434 $2,005 $ 56 $3,498
Components of comprehensive income:Net income ÏÏÏÏÏÏÏÏÏÏÏÏÏÏÏÏÏÏÏÏÏÏÏÏÏ Ì Ì Ì Ì Ì 236 Ì 236Change in unrealized gains (losses) on
Annual R
eport
investments, netÏÏÏÏÏÏÏÏÏÏÏÏÏÏÏÏÏÏÏÏ Ì Ì Ì Ì Ì Ì 29 29ReclassiÑcation adjustment for
(gains) losses, realized on investmentsin net income, netÏÏÏÏÏÏÏÏÏÏÏÏÏÏÏÏÏÏ Ì Ì Ì Ì Ì Ì 8 8
Change in unrealized gains (losses) onderivative instruments, net ÏÏÏÏÏÏÏÏÏÏÏ Ì Ì Ì Ì Ì Ì 4 4
ReclassiÑcation adjustment for(gains) losses, realized on derivativeinstruments in net income, net ÏÏÏÏÏÏÏ Ì Ì Ì Ì Ì Ì (4) (4)
Translation adjustment ÏÏÏÏÏÏÏÏÏÏÏÏÏÏÏÏ Ì Ì Ì Ì Ì Ì (10) (10)
Comprehensive income ÏÏÏÏÏÏÏÏÏÏÏÏÏ $ 263
Proceeds from sales of shares throughemployee stock plans and other plansÏÏÏÏ 7,174 Ì Ì Ì 206 Ì Ì 206
Repurchase and retirement of commonstock ÏÏÏÏÏÏÏÏÏÏÏÏÏÏÏÏÏÏÏÏÏÏÏÏÏÏÏÏÏÏÏ (12,621) Ì Ì Ì (709) Ì Ì (709)
Stock-based compensation ÏÏÏÏÏÏÏÏÏÏÏÏÏÏÏ Ì Ì Ì Ì 3 Ì Ì 3Tax beneÑt from exercise of stock optionsÏÏ Ì Ì Ì Ì 133 Ì Ì 133Assumption of stock options in connection
with acquisition ÏÏÏÏÏÏÏÏÏÏÏÏÏÏÏÏÏÏÏÏÏÏ Ì Ì Ì Ì 14 Ì Ì 14
Balances as of March 31, 2006 ÏÏÏÏÏÏÏÏÏÏÏ 304,994 $ 3 Ì $ Ì $1,081 $2,241 $ 83 $3,408
See accompanying Notes to Consolidated Financial Statements.
69

ELECTRONIC ARTS INC. AND SUBSIDIARIES
CONSOLIDATED STATEMENTS OF CASH FLOWS
Year Ended March 31,
2006 2005 2004(In millions)
OPERATING ACTIVITIESNet income ÏÏÏÏÏÏÏÏÏÏÏÏÏÏÏÏÏÏÏÏÏÏÏÏÏÏÏÏÏÏÏÏÏÏÏÏÏÏÏÏÏÏÏÏÏÏÏÏÏÏÏÏÏÏÏÏÏ $ 236 $ 504 $ 577Adjustments to reconcile net income to net cash provided by operating
activities:Depreciation and amortization ÏÏÏÏÏÏÏÏÏÏÏÏÏÏÏÏÏÏÏÏÏÏÏÏÏÏÏÏÏÏÏÏÏÏÏÏÏÏÏ 95 75 78Minority interest ÏÏÏÏÏÏÏÏÏÏÏÏÏÏÏÏÏÏÏÏÏÏÏÏÏÏÏÏÏÏÏÏÏÏÏÏÏÏÏÏÏÏÏÏÏÏÏÏÏÏÏ 6 Ì ÌRealized (gains) losses on investments and sale of property and equipmentÏÏÏ 7 (8) 2Stock-based compensationÏÏÏÏÏÏÏÏÏÏÏÏÏÏÏÏÏÏÏÏÏÏÏÏÏÏÏÏÏÏÏÏÏÏÏÏÏÏÏÏÏÏÏ 3 6 1Tax beneÑt from exercise of stock options ÏÏÏÏÏÏÏÏÏÏÏÏÏÏÏÏÏÏÏÏÏÏÏÏÏÏÏÏÏ 133 75 69Acquired in-process technologyÏÏÏÏÏÏÏÏÏÏÏÏÏÏÏÏÏÏÏÏÏÏÏÏÏÏÏÏÏÏÏÏÏÏÏÏÏÏÏ 8 13 ÌChange in assets and liabilities:
Receivables, net ÏÏÏÏÏÏÏÏÏÏÏÏÏÏÏÏÏÏÏÏÏÏÏÏÏÏÏÏÏÏÏÏÏÏÏÏÏÏÏÏÏÏÏÏÏÏÏÏÏ 104 (80) (194)InventoriesÏÏÏÏÏÏÏÏÏÏÏÏÏÏÏÏÏÏÏÏÏÏÏÏÏÏÏÏÏÏÏÏÏÏÏÏÏÏÏÏÏÏÏÏÏÏÏÏÏÏÏÏÏÏ (3) (14) (23)Other assetsÏÏÏÏÏÏÏÏÏÏÏÏÏÏÏÏÏÏÏÏÏÏÏÏÏÏÏÏÏÏÏÏÏÏÏÏÏÏÏÏÏÏÏÏÏÏÏÏÏÏÏÏÏ (71) (35) (61)Accounts payable ÏÏÏÏÏÏÏÏÏÏÏÏÏÏÏÏÏÏÏÏÏÏÏÏÏÏÏÏÏÏÏÏÏÏÏÏÏÏÏÏÏÏÏÏÏÏÏÏ 31 28 23Accrued and other liabilities ÏÏÏÏÏÏÏÏÏÏÏÏÏÏÏÏÏÏÏÏÏÏÏÏÏÏÏÏÏÏÏÏÏÏÏÏÏÏÏ 39 46 191Deferred income taxes ÏÏÏÏÏÏÏÏÏÏÏÏÏÏÏÏÏÏÏÏÏÏÏÏÏÏÏÏÏÏÏÏÏÏÏÏÏÏÏÏÏÏÏÏ 8 24 6
Net cash provided by operating activities ÏÏÏÏÏÏÏÏÏÏÏÏÏÏÏÏÏÏÏÏÏÏÏÏÏÏ 596 634 669
INVESTING ACTIVITIESCapital expendituresÏÏÏÏÏÏÏÏÏÏÏÏÏÏÏÏÏÏÏÏÏÏÏÏÏÏÏÏÏÏÏÏÏÏÏÏÏÏÏÏÏÏÏÏÏÏÏÏÏÏ (123) (126) (90)Proceeds from sale of property and equipment ÏÏÏÏÏÏÏÏÏÏÏÏÏÏÏÏÏÏÏÏÏÏÏÏÏÏÏÏ 2 16 1Investments in aÇliates ÏÏÏÏÏÏÏÏÏÏÏÏÏÏÏÏÏÏÏÏÏÏÏÏÏÏÏÏÏÏÏÏÏÏÏÏÏÏÏÏÏÏÏÏÏÏÏ (2) (2) (1)Proceeds from sale of investments in aÇliates ÏÏÏÏÏÏÏÏÏÏÏÏÏÏÏÏÏÏÏÏÏÏÏÏÏÏÏÏ 2 Ì 8Purchase of short-term investments ÏÏÏÏÏÏÏÏÏÏÏÏÏÏÏÏÏÏÏÏÏÏÏÏÏÏÏÏÏÏÏÏÏÏÏÏÏ (755) (2,442) (2,511)Proceeds from maturities and sales of short-term investments ÏÏÏÏÏÏÏÏÏÏÏÏÏÏÏ 1,427 996 2,883Proceeds from sale of marketable equity securities ÏÏÏÏÏÏÏÏÏÏÏÏÏÏÏÏÏÏÏÏÏÏÏÏ 4 4 2Purchase of marketable equity securities ÏÏÏÏÏÏÏÏÏÏÏÏÏÏÏÏÏÏÏÏÏÏÏÏÏÏÏÏÏÏÏÏÏ Ì (90) ÌAcquisition of subsidiaries, net of cash acquiredÏÏÏÏÏÏÏÏÏÏÏÏÏÏÏÏÏÏÏÏÏÏÏÏÏÏÏ (661) (81) (3)Other investing activities ÏÏÏÏÏÏÏÏÏÏÏÏÏÏÏÏÏÏÏÏÏÏÏÏÏÏÏÏÏÏÏÏÏÏÏÏÏÏÏÏÏÏÏÏÏÏ (2) (1) (1)
Net cash provided by (used in) investing activities ÏÏÏÏÏÏÏÏÏÏÏÏÏÏÏÏÏÏ (108) (1,726) 288
FINANCING ACTIVITIESProceeds from sales of common stock through employee stock plans and other
plansÏÏÏÏÏÏÏÏÏÏÏÏÏÏÏÏÏÏÏÏÏÏÏÏÏÏÏÏÏÏÏÏÏÏÏÏÏÏÏÏÏÏÏÏÏÏÏÏÏÏÏÏÏÏÏÏÏÏÏÏÏ 206 241 228Repurchase and retirement of common stock ÏÏÏÏÏÏÏÏÏÏÏÏÏÏÏÏÏÏÏÏÏÏÏÏÏÏÏÏÏ (709) (41) ÌOther Ñnancing activities ÏÏÏÏÏÏÏÏÏÏÏÏÏÏÏÏÏÏÏÏÏÏÏÏÏÏÏÏÏÏÏÏÏÏÏÏÏÏÏÏÏÏÏÏÏÏ Ì Ì (3)
Net cash provided by (used in) Ñnancing activitiesÏÏÏÏÏÏÏÏÏÏÏÏÏÏÏÏÏÏ (503) 200 225
EÅect of foreign exchange on cash and cash equivalents ÏÏÏÏÏÏÏÏÏÏÏÏÏÏÏÏÏÏÏÏÏ (13) 12 18
Increase (decrease) in cash and cash equivalents ÏÏÏÏÏÏÏÏÏÏÏÏÏÏÏÏÏÏÏÏÏÏÏÏÏÏÏ (28) (880) 1,200Beginning cash and cash equivalents ÏÏÏÏÏÏÏÏÏÏÏÏÏÏÏÏÏÏÏÏÏÏÏÏÏÏÏÏÏÏÏÏÏÏÏÏÏÏ 1,270 2,150 950
Ending cash and cash equivalentsÏÏÏÏÏÏÏÏÏÏÏÏÏÏÏÏÏÏÏÏÏÏÏÏÏÏÏÏÏÏÏÏÏÏÏÏÏÏÏÏÏ 1,242 1,270 2,150Short-term investments ÏÏÏÏÏÏÏÏÏÏÏÏÏÏÏÏÏÏÏÏÏÏÏÏÏÏÏÏÏÏÏÏÏÏÏÏÏÏÏÏÏÏÏÏÏÏÏÏÏ 1,030 1,688 264
Ending cash, cash equivalents and short-term investments ÏÏÏÏÏÏÏÏÏÏÏÏÏÏÏÏÏÏÏÏ $2,272 $ 2,958 $ 2,414
Supplemental cash Öow information:Cash paid during the year for income taxes ÏÏÏÏÏÏÏÏÏÏÏÏÏÏÏÏÏÏÏÏÏÏÏÏÏÏÏÏÏÏ $ 24 $ 101 $ 65
Non-cash investing activities:Change in unrealized gains (losses) on investments, netÏÏÏÏÏÏÏÏÏÏÏÏÏÏÏÏÏÏÏÏ $ 37 $ 26 $ (1)Assumption of stock options in connection with acquisition ÏÏÏÏÏÏÏÏÏÏÏÏÏÏÏÏÏ $ 14 $ Ì $ Ì
See accompanying Notes to Consolidated Financial Statements.
70

ELECTRONIC ARTS INC. AND SUBSIDIARIES
NOTES TO CONSOLIDATED FINANCIAL STATEMENTS
(1) DESCRIPTION OF BUSINESS AND SUMMARY OF SIGNIFICANT ACCOUNTING
POLICIES
We develop, market, publish and distribute interactive software games that are playable by consumers on
home video game consoles (such as the Sony PlayStation» 2, Microsoft Xbox» and Xbox 360TM, and
Nintendo GameCubeTM), personal computers, mobile platforms (including cellular handsets and hand-held
game players such as the Nintendo DSTM and the PlayStation» Portable ""PSPTM'') and online, over the
Internet and other proprietary online networks. Some of our games are based on content that we license
from others (e.g., Madden NFL Football, The Godfather and FIFA Soccer), and some of our games are
based on our own wholly-owned intellectual property (e.g., The SimsTM, Need for SpeedTM and
BLACKTM). Our goal is to publish titles with mass-market appeal, which often means translating and
localizing them for sale in non-English speaking countries. In addition, we also attempt to create software
game ""franchises'' that allow us to publish new titles on a recurring basis that are based on the same
property. Examples of this franchise approach are the annual iterations of our sports-based products (e.g.,
Madden NFL Football, NCAA» Football and FIFA Soccer), wholly-owned properties that can be
successfully sequeled (e.g., The Sims, Need for Speed and BattleÑeld) and titles based on long-lived
literary movie properties (e.g. Lord of the Rings and Harry Potter).
A summary of our signiÑcant accounting policies applied in the preparation of our Consolidated Financial
Statements follows:
(a) Consolidation
The accompanying Consolidated Financial Statements include the accounts of Electronic Arts Inc. and its
domestic and foreign wholly-owned and majority-owned subsidiaries. All signiÑcant intercompany balances
and transactions have been eliminated in consolidation.
(b) Fiscal Year
Our Ñscal year is reported on a 52 or 53-week period that, historically, has ended on the Ñnal Saturday of
March in each year. Beginning with the Ñscal year ended March 31, 2006, our Ñscal year ends on the
Saturday nearest March 31. As a result, Ñscal 2006 contained 53 weeks with the Ñrst quarter containing
14 weeks. Our results of operations for the Ñscal years March 31, 2006, 2005 and 2004 contain the
following number of weeks:
Annual R
eport
Fiscal Years Ended Number of Weeks Fiscal Period End Date
March 31, 2006 ÏÏÏÏÏÏÏÏÏÏÏÏÏÏÏÏÏÏÏÏÏÏÏÏÏÏÏÏÏÏÏÏÏÏÏÏÏÏÏÏÏÏÏ 53 weeks April 1, 2006
March 31, 2005 ÏÏÏÏÏÏÏÏÏÏÏÏÏÏÏÏÏÏÏÏÏÏÏÏÏÏÏÏÏÏÏÏÏÏÏÏÏÏÏÏÏÏÏ 52 weeks March 26, 2005
March 31, 2004 ÏÏÏÏÏÏÏÏÏÏÏÏÏÏÏÏÏÏÏÏÏÏÏÏÏÏÏÏÏÏÏÏÏÏÏÏÏÏÏÏÏÏÏ 52 weeks March 27, 2004
For simplicity of presentation, all Ñscal periods are treated as ending on a calendar month end.
(c) ReclassiÑcations
Certain prior-year amounts have been reclassiÑed to conform to the Ñscal 2006 presentation.
(d) Use of Estimates
The preparation of Ñnancial statements in conformity with accounting principles generally accepted in the
United States requires us to make estimates and assumptions that aÅect the reported amounts of assets
and liabilities, contingent assets and liabilities, and revenue and expenses during the reporting period. Such
estimates include sales returns and allowances, provisions for doubtful accounts, accrued liabilities, income
taxes, estimates regarding the recoverability of prepaid royalties and royalty commitments, inventories,
71
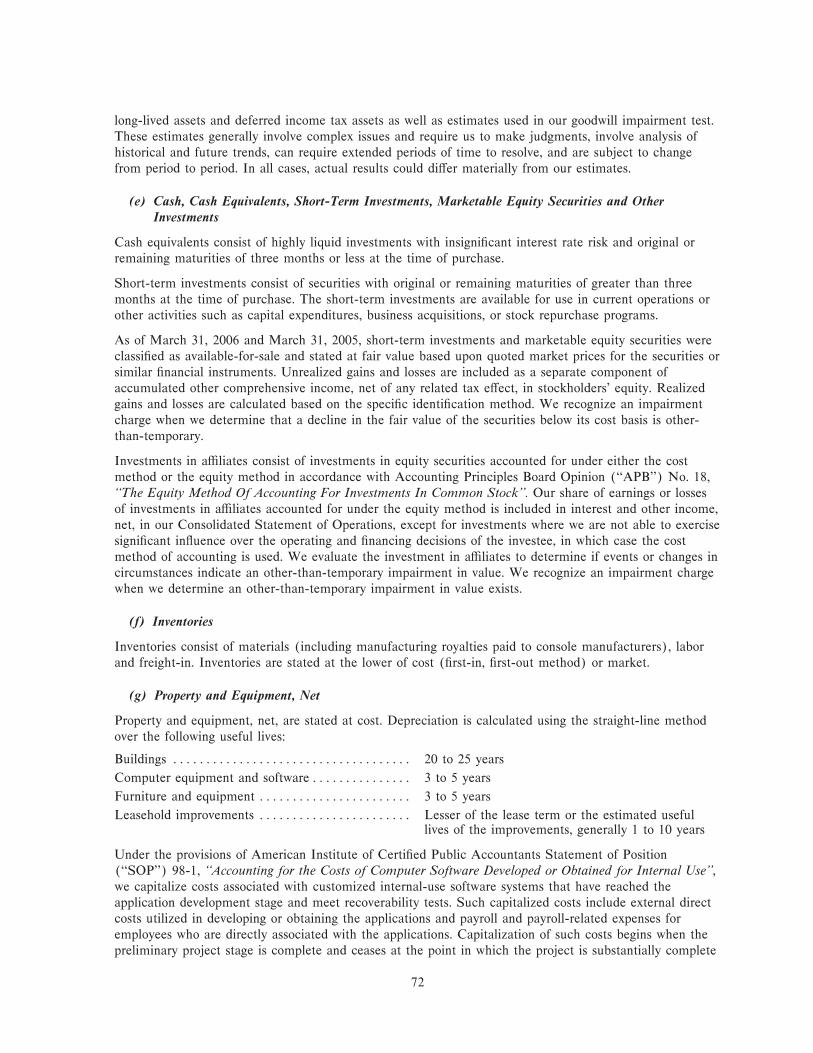
long-lived assets and deferred income tax assets as well as estimates used in our goodwill impairment test.
These estimates generally involve complex issues and require us to make judgments, involve analysis of
historical and future trends, can require extended periods of time to resolve, and are subject to change
from period to period. In all cases, actual results could diÅer materially from our estimates.
(e) Cash, Cash Equivalents, Short-Term Investments, Marketable Equity Securities and OtherInvestments
Cash equivalents consist of highly liquid investments with insigniÑcant interest rate risk and original or
remaining maturities of three months or less at the time of purchase.
Short-term investments consist of securities with original or remaining maturities of greater than three
months at the time of purchase. The short-term investments are available for use in current operations or
other activities such as capital expenditures, business acquisitions, or stock repurchase programs.
As of March 31, 2006 and March 31, 2005, short-term investments and marketable equity securities were
classiÑed as available-for-sale and stated at fair value based upon quoted market prices for the securities or
similar Ñnancial instruments. Unrealized gains and losses are included as a separate component of
accumulated other comprehensive income, net of any related tax eÅect, in stockholders' equity. Realized
gains and losses are calculated based on the speciÑc identiÑcation method. We recognize an impairment
charge when we determine that a decline in the fair value of the securities below its cost basis is other-
than-temporary.
Investments in aÇliates consist of investments in equity securities accounted for under either the cost
method or the equity method in accordance with Accounting Principles Board Opinion (""APB'') No. 18,
""The Equity Method Of Accounting For Investments In Common Stock''. Our share of earnings or losses
of investments in aÇliates accounted for under the equity method is included in interest and other income,
net, in our Consolidated Statement of Operations, except for investments where we are not able to exercise
signiÑcant inÖuence over the operating and Ñnancing decisions of the investee, in which case the cost
method of accounting is used. We evaluate the investment in aÇliates to determine if events or changes in
circumstances indicate an other-than-temporary impairment in value. We recognize an impairment charge
when we determine an other-than-temporary impairment in value exists.
(f) Inventories
Inventories consist of materials (including manufacturing royalties paid to console manufacturers), labor
and freight-in. Inventories are stated at the lower of cost (Ñrst-in, Ñrst-out method) or market.
(g) Property and Equipment, Net
Property and equipment, net, are stated at cost. Depreciation is calculated using the straight-line method
over the following useful lives:
Buildings ÏÏÏÏÏÏÏÏÏÏÏÏÏÏÏÏÏÏÏÏÏÏÏÏÏÏÏÏÏÏÏÏÏÏÏÏ 20 to 25 years
Computer equipment and software ÏÏÏÏÏÏÏÏÏÏÏÏÏÏÏ 3 to 5 years
Furniture and equipment ÏÏÏÏÏÏÏÏÏÏÏÏÏÏÏÏÏÏÏÏÏÏÏ 3 to 5 years
Leasehold improvements ÏÏÏÏÏÏÏÏÏÏÏÏÏÏÏÏÏÏÏÏÏÏÏ Lesser of the lease term or the estimated usefullives of the improvements, generally 1 to 10 years
Under the provisions of American Institute of CertiÑed Public Accountants Statement of Position
(""SOP'') 98-1, ""Accounting for the Costs of Computer Software Developed or Obtained for Internal Use'',we capitalize costs associated with customized internal-use software systems that have reached the
application development stage and meet recoverability tests. Such capitalized costs include external direct
costs utilized in developing or obtaining the applications and payroll and payroll-related expenses for
employees who are directly associated with the applications. Capitalization of such costs begins when the
preliminary project stage is complete and ceases at the point in which the project is substantially complete
72

and ready for its intended purpose. The net book value of capitalized costs associated with internal-use
software amounted to $23 million and $28 million as of March 31, 2006 and 2005, respectively, and are
being depreciated on a straight-line basis over each project's estimated useful life that ranges from three to
Ñve years.
(h) Long-Lived Assets
We evaluate long-lived assets and certain identiÑable intangibles for impairment, in accordance with
Statement of Financial Accounting Standard (""SFAS'') No. 144, ""Accounting for the Impairment orDisposal of Long-Lived Assets'', whenever events or changes in circumstances indicate that the carrying
amount of an asset may not be recoverable. Recoverability of assets is measured by a comparison of the
carrying amount of an asset to future undiscounted net cash Öows expected to be generated by the asset.
This may include assumptions about future prospects for the business that the asset relates to and typically
involves computations of the estimated future cash Öows to be generated by these businesses. Based on
these judgments and assumptions, we determine whether we need to take an impairment charge to reduce
the value of the asset stated on our Consolidated Balance Sheet to reÖect its actual fair value. Judgments
and assumptions about future values and remaining useful lives are complex and often subjective. They
can be aÅected by a variety of factors, including but not limited to, signiÑcant negative industry or
economic trends, signiÑcant changes in the manner of our use of the acquired assets or the strategy of our
overall business and signiÑcant under-performance relative to expected historical or projected future
operating results. If we were to consider such assets to be impaired, the amount of impairment we would
recognize would be measured by the amount by which the carrying amount of the asset exceeds its fair
value which is estimated by discounted cash Öows. We recognized no long-lived asset impairment charges
in Ñscal 2006 or 2005. During Ñscal 2004, we recognized less than $1 million of asset impairment charges.
See Note 6 of the Notes to Consolidated Financial Statements.
(i) Goodwill
SFAS No. 142, ""Goodwill and Other Intangible Assets'' requires that purchased goodwill and indeÑnite-
lived intangibles not be amortized. Rather, goodwill and indeÑnite-lived intangible assets are subject to at
least an annual assessment for impairment by applying a fair-value-based test.
SFAS No. 142 requires a two-step approach to testing goodwill for impairment for each reporting unit.
The Ñrst step tests for impairment by applying fair value-based tests at the reporting unit level. The second
step (if necessary) measures the amount of impairment by applying fair value-based tests to individual
Annual R
eport
assets and liabilities within each reporting unit. We completed the Ñrst step of the annual goodwill
impairment testing as of January 1, 2006 and found no indicators of impairment of our recorded goodwill.
We did not recognize an impairment loss on goodwill in Ñscal 2006, 2005 or 2004.
(j) Concentration of Credit Risk
We extend credit to various companies in the retail and mass merchandising industries. Collection of trade
receivables may be aÅected by changes in economic or other industry conditions and may, accordingly,
impact our overall credit risk. Although we generally do not require collateral, we perform ongoing credit
evaluations of our customers and maintain reserves for potential credit losses. As of March 31, 2006, we
had 11 percent of our gross accounts receivable outstanding with Wal-Mart Stores, Inc. As of March 31,
2005, we had 13 percent of our gross accounts receivable outstanding with both Wal-Mart Stores, Inc. and
Pinnacle, which is a European logistics and collections company.
Short-term investments are placed with high credit-quality Ñnancial institutions or in short-duration, high-
quality securities. We limit the amount of credit exposure in any one Ñnancial institution or type of
investment instrument.
73
(k) Revenue Recognition
We evaluate the recognition of revenue based on the criteria set forth in SOP 97-2, ""Software RevenueRecognition'', as amended by SOP 98-9, ""ModiÑcation of SOP 97-2, Software Revenue Recognition, WithRespect to Certain Transactions'' and StaÅ Accounting Bulletin (""SAB'') No. 101, ""Revenue Recognitionin Financial Statements'', as revised by SAB No. 104, ""Revenue Recognition''. We evaluate revenue
recognition using the following basic criteria and recognize revenue when all four of the following criteria
are met:
‚ Evidence of an arrangement: Evidence of an agreement with the customer that reÖects the terms
and conditions to deliver products must be present in order to recognize revenue.
‚ Delivery: Delivery is considered to occur when the products are shipped and risk of loss and reward
have been transferred to the customer. For online games and services, revenue is recognized as the
service is provided.
‚ Fixed or determinable fee: If a portion of the arrangement fee is not Ñxed or determinable, we
recognize that amount as revenue when the amount becomes Ñxed or determinable.
‚ Collection is deemed probable: At the time of the transaction, we conduct a credit review of each
customer involved in a signiÑcant transaction to determine the creditworthiness of the customer.
Collection is deemed probable if we expect the customer to be able to pay amounts under the
arrangement as those amounts become due. If we determine that collection is not probable, we
recognize revenue when collection becomes probable (generally upon cash collection).
Determining whether and when some of these criteria have been satisÑed often involves assumptions and
judgments that can have a signiÑcant impact on the timing and amount of revenue we report. For
example, for multiple element arrangements, we must make assumptions and judgments in order to:
(1) determine whether and when each element has been delivered; (2) determine whether undelivered
products or services are essential to the functionality of the delivered products and services; (3) determine
whether vendor-speciÑc objective evidence of fair value (""VSOE'') exists for each undelivered element;
and (4) allocate the total price among the various elements we must deliver. Changes to any of these
assumptions or judgments, or changes to the elements in a software arrangement, could cause a material
increase or decrease in the amount of revenue that we report in a particular period.
Product Revenue: Product revenue, including sales to resellers and distributors (""channel partners''), is
recognized when the above criteria are met. We reduce product revenue for estimated future returns, price
protection, and other oÅerings, which may occur with our customers and channel partners.
Shipping and Handling: In accordance with Emerging Issues Task Force (""EITF'') Issue No. 00-10,
""Accounting for Shipping and Handling Fees and Costs'', we recognize amounts billed to customers for
shipping and handling as revenue. Additionally, shipping and handling costs incurred by us are included in
cost of goods sold.
Online Subscription Revenue: Online subscription revenue is derived principally from subscription revenue
collected from customers for online play related to our massively multiplayer online games and Pogo-
branded online games services. These customers generally pay on an annual basis or a month-to-month
basis and prepaid subscription revenue, including revenue collected from credit card sales, are recognized
ratably over the period for which the services are provided.
Software Licenses: We license software rights to manufacturers of products in related industries (for
example, makers of personal computers or computer accessories) to include certain of our products with
the manufacturer's product, or oÅer our products to consumers who have purchased the manufacturer's
product. We call these combined products ""OEM bundles''. These OEM bundles generally require the
customer to pay us an upfront nonrefundable fee, which represents the guaranteed minimum royalty
amount. Revenue is generally recognized upon delivery of the product master or the Ñrst copy. Per-copy
royalties on sales that exceed the minimum guarantee are recognized as earned.
74
(l) Sales Returns and Allowances and Bad Debt Reserves
We estimate potential future product returns, price protection and stock-balancing programs related to
current-period product revenue. We analyze historical returns, current sell-through of distributor and
retailer inventory of our products, current trends in the video game market and the overall economy,
changes in customer demand and acceptance of our products and other related factors when evaluating the
adequacy of the sales returns and price protection allowances. In addition, we monitor the volume of sales
to our channel partners and their inventories as substantial overstocking in the distribution channel could
result in high returns or higher price protection costs in subsequent periods.
Similarly, signiÑcant judgment is required to estimate our allowance for doubtful accounts in any
accounting period. We analyze customer concentrations, customer credit-worthiness, current economic
trends, and historical experience when evaluating the adequacy of the allowance for doubtful accounts.
(m) Advertising Costs
We generally expense advertising costs as incurred, except for production costs associated with media
campaigns which are recognized as prepaid assets (to the extent paid in advance) and expensed at the Ñrst
run of the advertisement. Cooperative advertising with our channel partners is accrued when revenue is
recognized and such amounts are included in marketing and sales expense if there is a separate identiÑable
beneÑt for which we can reasonably estimate the fair value of the beneÑt identiÑed. Otherwise, they are
recognized as a reduction of net revenue. We then reimburse the channel partner when qualifying claims
are submitted. We sometimes receive reimbursements for advertising costs from our vendors, and such
amounts are recognized as a reduction of marketing and sales expense if the advertising (1) is speciÑc to
the vendor, (2) represents an identiÑable beneÑt to us and (3) represents an incremental cost to us.
Otherwise, vendor reimbursements are recognized as a reduction of cost of goods sold as the related
revenue is recognized. Vendor reimbursements of advertising expenses of $41 million, $42 million and
$45 million reduced marketing and sales expense for the Ñscal years ended March 31, 2006, 2005 and
2004, respectively. For the Ñscal years ended March 31, 2006, 2005 and 2004, advertising expenses, net of
vendor reimbursements, totaled approximately $180 million, $174 million and $183 million, respectively.
(n) Software Development Costs
Research and development costs, which consist primarily of software development costs, are expensed as
incurred. SFAS No. 86, ""Accounting for the Cost of Computer Software to be Sold, Leased, or Otherwise
Annual R
eport
Marketed'', provides for the capitalization of certain software development costs incurred after
technological feasibility of the software is established or for development costs that have alternative future
uses. Under our current practice of developing new products, the technological feasibility of the underlying
software is not established until substantially all product development is complete, which generally includes
the development of a working model. The software development costs that have been capitalized to date
have been insigniÑcant.
(o) Stock-based Compensation
We account for stock-based awards to employees using the intrinsic value method in accordance with APB
No. 25, ""Accounting for Stock Issued to Employees''. We have adopted the disclosure-only provisions of
SFAS No. 123, ""Accounting for Stock-Based Compensation'', as amended.
Had compensation cost for our stock-based compensation plans been measured based on the estimated fair
value at the grant dates in accordance with the provisions of SFAS No. 123, as amended, we estimate that
our reported net income and net income per share would have been the pro forma amounts indicated
below. The fair value of each option grant is estimated on the date of grant using the Black-Scholes
75
option-pricing model. The following weighted-average assumptions were used for grants made under our
stock-based compensation plans in Ñscal 2006, 2005 and 2004:
Year Ended March 31,
2006 2005 2004
Risk-free interest rate ÏÏÏÏÏÏÏÏÏÏÏÏÏÏÏÏÏÏÏÏÏÏÏÏÏÏÏÏÏÏÏÏÏÏÏÏÏÏÏÏÏÏÏÏÏÏ 4.3% 3.5% 2.3%
Expected volatility ÏÏÏÏÏÏÏÏÏÏÏÏÏÏÏÏÏÏÏÏÏÏÏÏÏÏÏÏÏÏÏÏÏÏÏÏÏÏÏÏÏÏÏÏÏÏÏÏÏ 33% 36% 50%
Expected life of stock options (in years) ÏÏÏÏÏÏÏÏÏÏÏÏÏÏÏÏÏÏÏÏÏÏÏÏÏÏÏÏÏÏ 3.20 3.30 3.09
Expected life of employee stock purchase plans (in months)ÏÏÏÏÏÏÏÏÏÏÏÏÏÏ 6 6 6
Assumed dividendsÏÏÏÏÏÏÏÏÏÏÏÏÏÏÏÏÏÏÏÏÏÏÏÏÏÏÏÏÏÏÏÏÏÏÏÏÏÏÏÏÏÏÏÏÏÏÏÏÏ None None None
Our stock-based compensation calculations are based on a multiple option valuation approach and
forfeitures are recognized when they occur.
Year Ended March 31,
2006 2005 2004(In millions, except per share data)
Net income:
As reported ÏÏÏÏÏÏÏÏÏÏÏÏÏÏÏÏÏÏÏÏÏÏÏÏÏÏÏÏÏÏÏÏÏÏÏÏÏÏÏÏÏÏÏÏÏÏÏÏÏÏÏÏÏÏÏÏÏ $ 236 $ 504 $ 577
Deduct: Total stock-based employee compensation expense determined underfair-value-based method for all awards, net of related tax eÅects ÏÏÏÏÏÏÏÏÏÏÏ (85) (83) (97)
Add: Stock-based employee compensation expense included in reported netincome, net of related tax eÅects ÏÏÏÏÏÏÏÏÏÏÏÏÏÏÏÏÏÏÏÏÏÏÏÏÏÏÏÏÏÏÏÏÏÏÏÏÏ 2 4 Ì
Pro formaÏÏÏÏÏÏÏÏÏÏÏÏÏÏÏÏÏÏÏÏÏÏÏÏÏÏÏÏÏÏÏÏÏÏÏÏÏÏÏÏÏÏÏÏÏÏÏÏÏÏÏÏÏÏÏÏÏÏÏ $ 153 $ 425 $ 480
Net income per share:
As reported Ì basic ÏÏÏÏÏÏÏÏÏÏÏÏÏÏÏÏÏÏÏÏÏÏÏÏÏÏÏÏÏÏÏÏÏÏÏÏÏÏÏÏÏÏÏÏÏÏÏÏÏÏ $0.78 $1.65 $1.95
Pro forma Ì basic ÏÏÏÏÏÏÏÏÏÏÏÏÏÏÏÏÏÏÏÏÏÏÏÏÏÏÏÏÏÏÏÏÏÏÏÏÏÏÏÏÏÏÏÏÏÏÏÏÏÏÏ $0.50 $1.39 $1.63
As reported Ì dilutedÏÏÏÏÏÏÏÏÏÏÏÏÏÏÏÏÏÏÏÏÏÏÏÏÏÏÏÏÏÏÏÏÏÏÏÏÏÏÏÏÏÏÏÏÏÏÏÏÏ $0.75 $1.59 $1.87
Pro forma Ì diluted ÏÏÏÏÏÏÏÏÏÏÏÏÏÏÏÏÏÏÏÏÏÏÏÏÏÏÏÏÏÏÏÏÏÏÏÏÏÏÏÏÏÏÏÏÏÏÏÏÏÏ $0.49 $1.35 $1.58
In December 2004, the Financial Accounting Standards Board (""FASB'') issued SFAS No. 123 (revised
2004) (""SFAS No. 123R''), ""Share-Based Payment''. SFAS No. 123R requires that the cost resulting
from all share-based payment transactions be recognized in the Ñnancial statements using a fair-value-
based method. The statement replaces SFAS No. 123, ""Accounting for Stock-Based Compensation'',supersedes APB No. 25, ""Accounting for Stock Issued to Employees'', and amends SFAS No. 95,
""Statement of Cash Flows''. While the fair value method under SFAS No. 123R is similar to the fair
value method under SFAS No. 123 with regards to measurement and recognition of stock-based
compensation, there are several key diÅerences between the two standards. For example, SFAS No. 123
permits us to recognize forfeitures as they occur while SFAS No. 123R will require us to estimate future
forfeitures and adjust our estimate on a quarterly basis. SFAS No. 123R will also require a classiÑcation
change in the statement of cash Öows, whereby a portion of the income tax beneÑt from stock options will
move from operating cash Öow activities to Ñnancing cash Öow activities (total cash Öows will remain
unchanged).
In March 2005, the Securities and Exchange Commission (""SEC'') released SAB No. 107, ""Share-BasedPayment'', which provides the SEC's views regarding the interaction between SFAS No. 123R and certain
SEC rules and regulations for public companies. In April 2005, the SEC adopted a rule that amends the
compliance dates of SFAS No. 123R. Under the revised compliance dates, we are required to adopt the
provisions of SFAS No. 123R no later than our Ñrst quarter of Ñscal 2007. The expensing of stock-based
compensation will have a material adverse impact on our Consolidated Statements of Operations which
may not be similar to our pro forma disclosure under SFAS No. 123, as amended.
In October 2005, the FASB issued FASB StaÅ Position (""FSP'') Financial Accounting Standard
(""FAS'') No. 123(R)-2, ""Practical Accommodation to the Application of Grant Date As DeÑned in FASB
76
Statement No. 123(R)''. The FASB provides companies with a ""practical accommodation'' when
determining the grant date of an award subject to SFAS No. 123R. If (1) the award is a unilateral grant,
that is, the recipient does not have the ability to negotiate the key terms and conditions of the award with
the employer, (2) the key terms and conditions of the award are expected to be communicated to an
individual recipient within a relatively short time period, and (3) as long as all other criteria in the grant
date deÑnition have been met, then a mutual understanding of the key terms and conditions of an award is
presumed to exist at the date the award is approved.
In November 2005, the FASB issued FSP FAS No. 123(R)-3, ""Transition Election Related toAccounting for the Tax EÅects of Share-Based Payment Awards''. The FASB allows for a practical
exception in calculating the additional paid-in capital pool of excess tax beneÑts upon adoption that is
available to absorb tax deÑciencies recognized subsequent to adoption SFAS No. 123R. Accordingly, we
may adopt either the method prescribed under SFAS No. 123R or the one prescribed under FSP
FAS No. 123(R)-3. We have not yet determined which method to adopt.
In February 2006, the FASB issued FSP FAS No. 123(R)-4, ""ClassiÑcation of Options and SimilarInstruments Issued As Employee Compensation That Allow for Cash Settlement upon the Occurrence of aContingent Event'', which amends certain paragraphs in SFAS No. 123R. FSP FAS No. 123(R)-4
addresses situations when a company has option plans that require the company to settle outstanding
options in cash upon the occurrence of certain contingent events. Although we are required to apply FSP
FAS No. 123(R)-4 when we initially adopt SFAS No. 123R, we do not expect it to impact our
Consolidated Financial Statements.
(p) Foreign Currency Translation
For each of our foreign operating subsidiaries the functional currency is generally its local currency. Assets
and liabilities of foreign operations are translated into U.S. dollars using month-end exchange rates, and
revenue and expenses are translated into U.S. dollars using average exchange rates. The eÅects of foreign
currency translation adjustments are included as a component of accumulated other comprehensive income
in stockholders' equity.
Foreign currency transaction gains and losses are a result of the eÅect of exchange rate changes on
transactions denominated in currencies other than the functional currency. Foreign currency transaction
gains (losses) of $(1) million, $25 million and $44 million for the Ñscal years ended March 31, 2006,
2005 and 2004, respectively, are included in interest and other income, net, in our Consolidated
Statements of Operations.
Annual R
eport
(q) Impact of Recently Issued Accounting Standards
In November 2004, the FASB issued SFAS No. 151, ""Inventory Costs Ì an amendment of ARB No. 43,Chapter 4''. SFAS No. 151 amends the guidance in Accounting Research Bulletin No. 43, Chapter 4,
""Inventory Pricing'', to clarify the accounting for abnormal amounts of idle facility expense, freight,
handling costs, and wasted material (spoilage) and requires that those items be recognized as current-
period charges. SFAS No. 151 also requires that allocation of Ñxed production overheads to the costs of
conversion be based on the normal capacity of the production facilities. SFAS No. 151 is eÅective for
inventory costs incurred during Ñscal years beginning after June 15, 2005. We do not expect the adoption
of SFAS No. 151 to have a material impact on our Consolidated Financial Statements.
In May 2005, the FASB issued SFAS No. 154, ""Accounting Changes and Error Corrections Ì AReplacement of APB Opinion No. 20 and FASB Statement No. 3''. SFAS No. 154 changes the
requirements for the accounting and reporting of a change in accounting principle. Under previous
guidance, changes in accounting principle were recognized as a cumulative eÅect in the net income of the
period of the change. The new statement requires retrospective application of changes in accounting
principle, limited to the direct eÅects of the change, to prior periods' Ñnancial statements, unless it is
impracticable to determine either the period-speciÑc eÅects or the cumulative eÅect of the change.
Additionally, this Statement requires that a change in depreciation, amortization or depletion method for
77

long-lived, nonÑnancial assets be accounted for as a change in accounting estimate aÅected by a change in
accounting principle and that correction of errors in previously issued Ñnancial statements should be
termed a ""restatement''. SFAS No. 154 is eÅective for accounting changes and correction of errors made
in Ñscal years beginning after December 15, 2005. We do not believe that, upon adoption, SFAS No. 154
will have a material impact on our Consolidated Financial Statements, however, after adoption, if a change
in accounting principle is made, SFAS No. 154 could have a material impact on our Consolidated
Financial Statements.
In February 2006, the FASB issued SFAS No. 155, ""Accounting for Certain Hybrid FinancialInstruments Ì An Amendment of FASB Statements No. 133 and 140''. SFAS No. 155 (1) permits fair
value measurement for any hybrid Ñnancial instrument that contains an embedded derivative that
otherwise would require bifurcation, (2) clariÑes that interest-only strips and principal-only strips are not
subject to the requirements of SFAS No. 133, ""Accounting for Derivative Instruments and HedgingActivities'', (3) establishes a requirement to evaluate interests in securitized Ñnancial assets to identify
interests that are freestanding derivatives or that are hybrid Ñnancial instruments that contain an embedded
derivative requiring bifurcation, (4) clariÑes that concentrations of credit risk in the form of subordination
are not embedded derivatives, and (5) amends SFAS No. 140, ""Accounting for Transfers and Servicing ofFinancial Assets and Extinguishments of Liabilities Ì A Replacement of FASB Statement 125'' toeliminate the prohibition on a qualifying special-purpose entity from holding a derivative Ñnancial
instrument that pertains to a beneÑcial interest other than another derivative Ñnancial instrument.
SFAS No. 155 is eÅective for all Ñnancial instruments acquired or issued for Ñscal years beginning after
September 15, 2006. We do not believe the adoption of SFAS No. 155 will have a material impact on our
Consolidated Financial Statements.
(2) FINANCIAL INSTRUMENTS
(a) Fair Value of Financial Instruments
Cash, cash equivalents, receivables, accounts payable and accrued and other liabilities are valued at their
carrying amounts as they approximate their fair value due to the short maturity of these Ñnancial
instruments.
78

(b) Cash, Cash Equivalents and Short-term Investments
Cash, cash equivalents and short-term investments consisted of the following as of March 31, 2006 (in
millions):
Unrealized LossesUnrealized Losses 12 Months or
Less Than 12 Months Greater Total
Gross Gross GrossFair Unrealized Fair Unrealized Fair Unrealized
Value Losses Value Losses Value Losses
Cash and cash equivalents:
Cash ÏÏÏÏÏÏÏÏÏÏÏÏÏÏÏÏÏÏÏÏÏÏÏÏÏÏÏÏÏÏ $ 260 $ Ì $ Ì $Ì $ 260 $ Ì
Money market funds ÏÏÏÏÏÏÏÏÏÏÏÏÏÏÏÏÏ 819 Ì Ì Ì 819 Ì
Commercial paper ÏÏÏÏÏÏÏÏÏÏÏÏÏÏÏÏÏÏÏ 145 Ì Ì Ì 145 Ì
U.S. agency securitiesÏÏÏÏÏÏÏÏÏÏÏÏÏÏÏÏ 14 Ì Ì Ì 14 Ì
Asset-backed securitiesÏÏÏÏÏÏÏÏÏÏÏÏÏÏÏ 4 Ì Ì Ì 4 Ì
Cash and cash equivalents ÏÏÏÏÏÏÏÏÏÏ 1,242 Ì Ì Ì 1,242 Ì
Short-term investments:
U.S. agency securitiesÏÏÏÏÏÏÏÏÏÏÏÏÏÏÏÏ 187 (1) 388 (3) 575 (4)
U.S. Treasury securities ÏÏÏÏÏÏÏÏÏÏÏÏÏÏ 202 (1) 10 Ì 212 (1)
Corporate bondsÏÏÏÏÏÏÏÏÏÏÏÏÏÏÏÏÏÏÏÏÏ 106 (1) 72 (1) 178 (2)
Asset-backed and other debt securitiesÏÏ 65 Ì Ì Ì 65 Ì
Short-term investmentsÏÏÏÏÏÏÏÏÏÏÏÏÏ 560 (3) 470 (4) 1,030 (7)
Cash, cash equivalents and short-terminvestmentsÏÏÏÏÏÏÏÏÏÏÏÏÏÏÏÏÏÏÏÏÏÏÏÏÏ $1,802 $ (3) $470 $(4) $2,272 $ (7)
Cash, cash equivalents and short-term investments consisted of the following as of March 31, 2005 (in
millions):
Unrealized LossesUnrealized Losses 12 Months or
Less Than 12 Months Greater Total
Gross Gross GrossFair Unrealized Fair Unrealized Fair Unrealized
Value Losses Value Losses Value Losses
Cash and cash equivalents:
Annual R
eport
Cash ÏÏÏÏÏÏÏÏÏÏÏÏÏÏÏÏÏÏÏÏÏÏÏÏÏÏÏÏÏÏ $ 342 $ Ì $ Ì $Ì $ 342 $ Ì
Money market funds ÏÏÏÏÏÏÏÏÏÏÏÏÏÏÏÏÏ 928 Ì Ì Ì 928 Ì
Cash and cash equivalents ÏÏÏÏÏÏÏÏÏÏ 1,270 Ì Ì Ì 1,270 Ì
Short-term investments:
U.S. agency securitiesÏÏÏÏÏÏÏÏÏÏÏÏÏÏÏÏ 692 (8) 476 (7) 1,168 (15)
U.S. Treasury securities ÏÏÏÏÏÏÏÏÏÏÏÏÏÏ 298 (4) Ì Ì 298 (4)
Corporate bondsÏÏÏÏÏÏÏÏÏÏÏÏÏÏÏÏÏÏÏÏÏ 180 (3) Ì Ì 180 (3)
Asset-backed securitiesÏÏÏÏÏÏÏÏÏÏÏÏÏÏÏ 42 Ì Ì Ì 42 Ì
Short-term investmentsÏÏÏÏÏÏÏÏÏÏÏÏÏ 1,212 (15) 476 (7) 1,688 (22)
Cash, cash equivalents and short-terminvestmentsÏÏÏÏÏÏÏÏÏÏÏÏÏÏÏÏÏÏÏÏÏÏÏÏÏ $2,482 $(15) $476 $(7) $2,958 $(22)
The gross unrealized losses in each of these investment categories were primarily caused by a decrease in
the fair value of the investments as a result of an increase in interest rates. The contractual terms of these
securities do not permit the issuer to call, prepay or otherwise settle the securities at prices less than the
79
stated par value of the security. Accordingly, we do not consider these investments to be other-than-
temporarily impaired as of March 31, 2006.
Gross unrealized gains in short-term investments were less than $1 million as of March 31, 2006 and 2005.
Realized losses of $9 million were recognized from the sale of short-term investments for the year ended
March 31, 2006. No material gains or losses were recognized from the sale of short-term investments for
the years ended March 31, 2005 and 2004.
The following table summarizes the amortized cost and fair value of our short-term investments, classiÑed
by stated maturity as of March 31, 2006 (in millions):
Amortized FairCost Value
Due in 1 year or less ÏÏÏÏÏÏÏÏÏÏÏÏÏÏÏÏÏÏÏÏÏÏÏÏÏÏÏÏÏÏÏÏÏÏÏÏÏÏÏÏÏÏÏÏÏÏÏÏÏÏÏÏÏÏÏ $ 510 $ 506
Due in 1-2 years ÏÏÏÏÏÏÏÏÏÏÏÏÏÏÏÏÏÏÏÏÏÏÏÏÏÏÏÏÏÏÏÏÏÏÏÏÏÏÏÏÏÏÏÏÏÏÏÏÏÏÏÏÏÏÏÏÏÏÏ 245 243
Due in 2-3 years ÏÏÏÏÏÏÏÏÏÏÏÏÏÏÏÏÏÏÏÏÏÏÏÏÏÏÏÏÏÏÏÏÏÏÏÏÏÏÏÏÏÏÏÏÏÏÏÏÏÏÏÏÏÏÏÏÏÏÏ 282 281
Short-term investments ÏÏÏÏÏÏÏÏÏÏÏÏÏÏÏÏÏÏÏÏÏÏÏÏÏÏÏÏÏÏÏÏÏÏÏÏÏÏÏÏÏÏÏÏÏÏÏÏÏÏÏ $1,037 $1,030
(c) Marketable Equity Securities
Marketable equity securities consisted of the following (in millions):
Gross GrossUnrealized Unrealized
Cost Gains Losses Fair Value
As of March 31, 2006ÏÏÏÏÏÏÏÏÏÏÏÏÏÏÏÏÏÏÏÏÏÏÏÏÏÏÏÏÏÏÏÏÏÏÏÏ $91 $69 $Ì $160
As of March 31, 2005ÏÏÏÏÏÏÏÏÏÏÏÏÏÏÏÏÏÏÏÏÏÏÏÏÏÏÏÏÏÏÏÏÏÏÏÏ $93 $47 $Ì $140
Our investments in marketable equity securities consist of investments in common stock of publicly traded
companies. On February 3, 2005, we purchased approximately 19.9 percent of the outstanding ordinary
shares (18.4 percent of the voting rights) of Ubisoft Entertainment for $91 million. As the fair value of
our marketable equity securities exceed the cost basis of those investments as of March 31, 2006, we do
not consider these investments to be other-than-temporarily impaired. During Ñscal 2005, no other-than-
temporary impairment charges were recognized. During Ñscal 2004, we recognized a $1 million other-than-
temporary impairment charge to write-down certain investments to their fair market value.
Realized gains from the sale of marketable equity securities were $1 million and $2 million for the years
ended March 31, 2006 and 2005, respectively. No material gains or losses were recognized from the sale of
marketable equity securities for the year ended March 31, 2004.
(d) Investments in AÇliates
As of March 31, 2006 and 2005, the total investment in aÇliates reÖected on our Consolidated Balance
Sheets was $11 million and $10 million, respectively.
Our investments in aÇliates included a warrant to acquire 2,327,602 additional shares of Digital Illusions,
C.E. (""DICE'') common stock. See Note 4 of the Notes to Consolidated Financial Statements. Prior to
April 2005, the warrant was accounted for as a derivative under SFAS No. 133. The warrant was amended
in April 2005, such that only subscriptions of 500,000 or more could be exercised. Due to the limited
trading volume of DICE's common stock, there is no market mechanism for settlement and the warrant is
no longer readily convertible to cash and is therefore currently accounted for under the cost method as
prescribed by APB No. 18. As of March 31, 2006, the cost basis of the warrant was $5 million.
For cost method investments we estimated that the fair value exceeded the cost basis of those investments.
Accordingly, we do not consider these investments to be other-than-temporarily impaired as of March 31,
2006. During Ñscal 2006, 2005 and 2004, no other-than-temporary impairments in investments in aÇliates
were recognized.
80

(3) DERIVATIVE FINANCIAL INSTRUMENTS
We account for our derivative and hedging activities under SFAS No. 133. The assets or liabilities
associated with our derivative instruments and hedging activities are recorded at fair value in other current
assets or other current liabilities, respectively, in our Consolidated Balance Sheet. As discussed below, the
accounting for gains and losses resulting from changes in fair value depends on the use of the derivative
and whether it is designated and qualiÑes for hedge accounting.
We transact business in various foreign currencies and have signiÑcant international sales and expenses
denominated in foreign currencies, subjecting us to foreign currency risk. Our policy is to purchase foreign
currency option contracts, generally with maturities of 15 months or less, to reduce the volatility of cash
Öows primarily related to forecasted revenue and expenses denominated in certain foreign currencies. In
addition, we utilize foreign exchange forward contracts to mitigate foreign currency exchange rate risk
associated with foreign-currency-denominated assets and liabilities, primarily intercompany receivables and
payables. The forward contracts generally have a contractual term of approximately one month and are
transacted near month-end; therefore, the fair value of the forward contracts generally is not signiÑcant at
each month-end. We do not use foreign currency option or foreign exchange forward contracts for
speculative or trading purposes.
Cash Flow Hedging Activities
Our foreign currency option contracts are designated and qualify as cash Öow hedges under
SFAS No. 133. The eÅectiveness of the cash Öow hedge contracts, including time value, is assessed
monthly using regression as well as other timing and probability criteria required by SFAS No. 133. To
receive hedge accounting treatment, all hedging relationships are formally documented at the inception of
the hedge and the hedges must be highly eÅective in oÅsetting changes to future cash Öows on hedged
transactions. The eÅective portion of gains or losses resulting from changes in fair value of these hedges is
initially reported, net of tax, as a component of accumulated other comprehensive income in stockholders'
equity. The gross amount of the eÅective portion of gains or losses resulting from changes in fair value of
these hedges is subsequently reclassiÑed into net revenue or operating expenses, as appropriate, in the
period when the forecasted transaction is recorded in the Consolidated Statements of Operations. The
ineÅective portion of gains or losses resulting from changes in fair value, if any, is reported in each period
in interest and other income, net in our Consolidated Statements of Operations. The eÅective portion of
hedges recognized in accumulated other comprehensive income at the end of each year will be reclassiÑed
to earnings within 12 months.
The following table summarizes the activity in accumulated other comprehensive income, net of related
Annual R
eport
taxes, with regard to the changes in fair value of derivative instruments, for Ñscal 2006 and 2005 (in
millions):
Year EndedMarch 31,
2006 2005
Beginning balance of unrealized gains (losses), net, on derivative instruments ÏÏÏÏÏÏÏÏÏÏÏÏÏ $ Ì $ Ì
Change in unrealized gains (losses), net, on derivative instruments ÏÏÏÏÏÏÏÏÏÏÏÏÏÏÏÏÏÏÏÏÏÏ 4 Ì
ReclassiÑcation adjustment for (gains) losses, realized on derivative instruments to netincome, net:
Net revenue ÏÏÏÏÏÏÏÏÏÏÏÏÏÏÏÏÏÏÏÏÏÏÏÏÏÏÏÏÏÏÏÏÏÏÏÏÏÏÏÏÏÏÏÏÏÏÏÏÏÏÏÏÏÏÏÏÏÏÏÏÏÏÏÏÏÏ (4) Ì
Operating expenses ÏÏÏÏÏÏÏÏÏÏÏÏÏÏÏÏÏÏÏÏÏÏÏÏÏÏÏÏÏÏÏÏÏÏÏÏÏÏÏÏÏÏÏÏÏÏÏÏÏÏÏÏÏÏÏÏÏÏÏÏ Ì Ì
Ending balance of unrealized gains (losses), net, on derivative instruments ÏÏÏÏÏÏÏÏÏÏÏÏÏÏÏ $ Ì $ Ì
Hedging ineÅectiveness for the year ended March 31, 2006 was not signiÑcant. The amount of hedging
ineÅectiveness recognized in interest and other income, net was a loss of $1 million and $2 million for the
years ended March 31, 2005 and 2004, respectively.
81
Balance Sheet Hedging Activities
Our foreign exchange forward contracts are not designated as hedging instruments under SFAS No. 133.
Accordingly, any gains or losses resulting from changes in the fair value of the forward contracts are
reported in interest and other income, net. The gains and losses on these forward contracts generally oÅset
the gains and losses associated with the underlying foreign-currency-denominated assets and liabilities,
which are also reported in interest and other income, net, in our Consolidated Statements of Operations.
(4) BUSINESS COMBINATIONS
JAMDAT Mobile Inc., Criterion Software Group Ltd. and Digital Illusions C.E.
The following table summarizes the estimated fair values of assets acquired and liabilities assumed in
connection with our acquisitions of JAMDAT Mobile Inc. (""JAMDAT'') and Criterion Software Group
Ltd. (""Criterion'') and the preliminary allocation of the Digital Illusions C.E. (""DICE'') assets acquired
and liabilities assumed for the Ñscal years ended March 31, 2006 and 2005 (in millions):
JAMDAT Criterion DICE Total
Current assetsÏÏÏÏÏÏÏÏÏÏÏÏÏÏÏÏÏÏÏÏÏÏÏÏÏÏÏÏÏÏÏÏÏÏÏÏÏÏÏÏÏÏÏÏÏÏ $ 50 $ 21 $35 $ 106
Property and equipment, net ÏÏÏÏÏÏÏÏÏÏÏÏÏÏÏÏÏÏÏÏÏÏÏÏÏÏÏÏÏÏÏÏÏ 2 1 2 5
Long-term deferred tax asset ÏÏÏÏÏÏÏÏÏÏÏÏÏÏÏÏÏÏÏÏÏÏÏÏÏÏÏÏÏÏÏÏÏ Ì 3 Ì 3
Acquired in-process technology ÏÏÏÏÏÏÏÏÏÏÏÏÏÏÏÏÏÏÏÏÏÏÏÏÏÏÏÏÏÏÏ 7 9 4 20
Stock-based employee compensationÏÏÏÏÏÏÏÏÏÏÏÏÏÏÏÏÏÏÏÏÏÏÏÏÏÏÏ Ì 6 Ì 6
Goodwill ÏÏÏÏÏÏÏÏÏÏÏÏÏÏÏÏÏÏÏÏÏÏÏÏÏÏÏÏÏÏÏÏÏÏÏÏÏÏÏÏÏÏÏÏÏÏÏÏÏÏ 495 23 36 554
Finite-lived intangibles ÏÏÏÏÏÏÏÏÏÏÏÏÏÏÏÏÏÏÏÏÏÏÏÏÏÏÏÏÏÏÏÏÏÏÏÏÏÏ 212 21 2 235
Liabilities ÏÏÏÏÏÏÏÏÏÏÏÏÏÏÏÏÏÏÏÏÏÏÏÏÏÏÏÏÏÏÏÏÏÏÏÏÏÏÏÏÏÏÏÏÏÏÏÏÏ (82) (16) (9) (107)
Minority interest ÏÏÏÏÏÏÏÏÏÏÏÏÏÏÏÏÏÏÏÏÏÏÏÏÏÏÏÏÏÏÏÏÏÏÏÏÏÏÏÏÏÏÏ Ì Ì (8) (8)
Total consideration ÏÏÏÏÏÏÏÏÏÏÏÏÏÏÏÏÏÏÏÏÏÏÏÏÏÏÏÏÏÏÏÏÏÏÏÏÏÏÏ $684 $ 68 $62 $ 814
JAMDAT
On February 15, 2006, we acquired all outstanding shares of JAMDAT. Based in Los Angeles, California,
JAMDAT is a global publisher of wireless games and other wireless entertainment applications. This
acquisition positions us for further growth in the mobile entertainment market. We paid $27 per share in
cash in exchange for each share of JAMDAT common stock and assumed outstanding stock options and
restricted stock units under certain JAMDAT equity plans for an aggregate purchase price of $684 million,
including transaction costs.
Prior to our acquisition of JAMDAT, on April 20, 2005, JAMDAT entered into a purchase agreement
with the shareholders of Blue Lava Wireless, LLC (""Blue Lava''). In connection with JAMDAT's
acquisition of Blue Lava, JAMDAT stock was placed in escrow to satisfy certain indemniÑcation
provisions under the Blue Lava purchase agreement. Upon completion of our acquisition of JAMDAT, we
assumed JAMDAT's contingent liability and replaced the JAMDAT stock in escrow with $27 million also
placed in escrow. The $27 million is included in our purchase price of JAMDAT as a pre-acquisition
contingency. We are required to pay $9 million on each of the three anniversaries beginning on April 20,
2006, less any claims we may have pursuant to the indemniÑcation provisions of the Blue Lava purchase
agreement. On April 20, 2006, we made the Ñrst payment of approximately $9 million. The preliminary
purchase price allocation, including the allocation of goodwill, will be updated in the Ñrst quarter of Ñscal
2007 as additional information becomes available related to certain accrued liabilities.
The results of operations of JAMDAT and the estimated fair market values of the acquired assets and
assumed liabilities have been included in our Consolidated Financial Statements since the date of
acquisition.
82

Except for acquired in-process technology, which is discussed below, the acquired Ñnite-lived intangible
assets are being amortized on a straight-line basis over estimated lives ranging from two to twelve years.
The intangible assets that make up that amount as of the date of the acquisition include:
Gross Carrying Weighted-AverageAmount Useful Life
(in millions) (Years)
Developed and Core Technology ÏÏÏÏÏÏÏÏÏÏÏÏÏÏÏÏÏÏÏÏÏÏÏÏÏÏÏÏÏÏÏÏÏÏÏ $122 10
Carrier Contracts and Related ÏÏÏÏÏÏÏÏÏÏÏÏÏÏÏÏÏÏÏÏÏÏÏÏÏÏÏÏÏÏÏÏÏÏÏÏÏ 85 5
Other Intangibles ÏÏÏÏÏÏÏÏÏÏÏÏÏÏÏÏÏÏÏÏÏÏÏÏÏÏÏÏÏÏÏÏÏÏÏÏÏÏÏÏÏÏÏÏÏÏÏÏ 5 3
Total Finite-Lived Intangibles ÏÏÏÏÏÏÏÏÏÏÏÏÏÏÏÏÏÏÏÏÏÏÏÏÏÏÏÏÏÏÏÏÏÏÏ $212 8
We recorded $495 million of goodwill, substantially none of which is tax deductible.
Acquired in-process technology includes the value of products in the development stage that are not
considered to have reached technological feasibility or have alternative future use. Accordingly, we
expensed acquired in-process technology in our Consolidated Statement of Operations upon consummation
of the acquisition.
Criterion
On October 19, 2004, we acquired all outstanding shares of Criterion for an aggregate purchase price of
approximately $68 million, including transaction costs and the assumption of outstanding stock options
under certain Criterion stock option plans. Based in England, Criterion is a developer of video games and a
provider of middleware solutions for the game development and publishing industry. The results of
operations of Criterion and the estimated fair market values of the acquired assets and assumed liabilities
have been included in our Consolidated Financial Statements since the date of acquisition. Except for
acquired in-process technology, which is discussed below, the acquired Ñnite-lived intangible assets are
being amortized on a straight-line basis over estimated lives ranging from two to four years.
Acquired in-process technology includes the value of products in the development stage that are not
considered to have reached technological feasibility or have alternative future use. Accordingly, the
acquired in-process technology was expensed in our Consolidated Statement of Operations upon
consummation of the acquisition. Stock-based employee compensation represents the intrinsic value of
certain unvested employee stock options that were assumed as part of the transaction. The stock options
were considered modiÑed for accounting purposes and were fully amortized over the remaining vesting
period in our Consolidated Statement of Operations for the year ended March 31, 2005.
Annual R
eport
DICE
In 2003 we acquired: (1) approximately 1,911,403 shares of Class B common stock representing a
19 percent equity interest in DICE and (2) a warrant to acquire an additional 2,327,602 shares of to-be-
issued Class A common stock at an exercise price of SEK 43.23. Based in Sweden, DICE develops games
for personal computers and video game consoles. DICE's products are primarily sold through co-publishing
agreements with us. The transactions between DICE and us have been recorded on an arm's length basis.
Prior to our tender oÅer in the fourth quarter of Ñscal 2005, we accounted for our Class B common stock
investment in DICE under the equity method of accounting, as prescribed by APB No. 18. Separately, the
warrant valued at $5 million as of March 31, 2006 was included in investments in aÇliates in our
Consolidated Balance Sheets. See Note 2 of the Notes to Consolidated Financial Statements.
On January 27, 2005 we completed a tender oÅer by acquiring 3,235,053 shares of Class A common stock
at a price of SEK 61 per share, representing 32 percent of the outstanding Class A common stock of
DICE. During the tender oÅer period and through the end of Ñscal 2005, we acquired, through open
market purchases at an average price of SEK 60.33, an additional 1,190,658 shares of Class A common
stock, representing approximately 12 percent of the outstanding Class A common stock of DICE. During
83
Ñscal 2006, we acquired, through open market purchases at an average price of SEK 63.07, an additional
1,071,152 shares of Class A common stock, representing approximately 10 percent of the outstanding
Class A common stock of DICE. Accordingly, on a cumulative basis as of March 31, 2006 and 2005 we
owned approximately 73 percent and 63 percent, respectively, of DICE on an undiluted basis (excluding
the warrant discussed above). As a result, we included the assets, liabilities and results of operations of
DICE in our Consolidated Financial Statements since January 27, 2005. The 27 percent and 37 percent of
DICE stock that we did not own was reÖected as minority interest on our Consolidated Balance Sheets as
of March 31, 2006 and 2005, respectively, and our Consolidated Statements of Operations for the years
ended March 31, 2006 and 2005, respectively.
In March 2006, we signed an agreement to fully merge DICE into EA, which will allow DICE to become
a fully integrated studio. We will pay SEK 67.50 per share in cash to DICE shareholders at the time of
the merger. The merger is subject to customary closing conditions, including regulatory approvals, and is
expected to close during the second quarter of Ñscal 2007. The preliminary purchase price allocation,
including the allocation of goodwill has been and will continue to be updated as additional information
becomes available.
Except for acquired-in-process technology, the acquired Ñnite-lived intangible assets are being amortized
on a straight-line basis over estimated lives ranging from one to four years. The acquired in-process
technology was expensed in our Consolidated Statement of Operations upon consummation of the
acquisition, and in each period, we increased our ownership percentage.
Square Co., Ltd.
In May 1998, we completed the formation of two joint ventures in North America and Japan with Square
Co., Ltd. (""Square''), a leading developer and publisher of entertainment software in Japan. In North
America, the companies formed Square Electronic Arts, LLC (""Square EA''), which had exclusive
publishing rights in North America for future interactive entertainment titles created by Square.
Additionally, we had the exclusive right to distribute in North America products published by this joint
venture. We contributed $3 million and owned a 30 percent minority interest in this joint venture while
Square owned 70 percent. This joint venture was accounted for under the equity method. The joint venture
agreements with Square expired as of March 31, 2003. Our distribution of Square products in North
America terminated on June 30, 2003. On May 30, 2003, Square acquired our 30 percent ownership
interest in the joint venture for $8 million and the investment was removed from our Consolidated Balance
Sheets.
In Japan, the companies established Electronic Arts Square K.K. (""EA Square KK'') in 1998, which
localized and published in Japan a selection of EA's properties originally created in North America and
Europe, as well as developed and published original video games in Japan. We contributed cash and had a
70 percent majority ownership interest, while Square contributed cash and owned 30 percent. Accordingly,
the assets, liabilities and results of operations for EA Square KK were included in our Consolidated
Balance Sheets and Consolidated Statements of Operations since June 1, 1998, the date of formation.
In May 2003, we acquired Square's 30 percent ownership interest in EA Square KK for approximately
$3 million in cash. As a result of the acquisition, EA Square KK became our wholly-owned subsidiary and
was renamed Electronic Arts K.K. The acquisition was accounted for as a step acquisition purchase and
the excess purchase price over fair value of the net tangible assets acquired, $1 million, was allocated to
goodwill.
84

(5) GOODWILL AND OTHER INTANGIBLE ASSETS
Goodwill information is as follows (in millions):
Year EndedMarch 31,
2006 2005
Goodwill Ì beginning of yearÏÏÏÏÏÏÏÏÏÏÏÏÏÏÏÏÏÏÏÏÏÏÏÏÏÏÏÏÏÏÏÏÏÏÏÏÏÏÏÏÏÏÏÏÏÏÏÏÏÏÏÏÏ $153 $ 92
Acquired ÏÏÏÏÏÏÏÏÏÏÏÏÏÏÏÏÏÏÏÏÏÏÏÏÏÏÏÏÏÏÏÏÏÏÏÏÏÏÏÏÏÏÏÏÏÏÏÏÏÏÏÏÏÏÏÏÏÏÏÏÏÏÏÏÏÏÏÏ 496 58
EÅects of Foreign Currency Translation ÏÏÏÏÏÏÏÏÏÏÏÏÏÏÏÏÏÏÏÏÏÏÏÏÏÏÏÏÏÏÏÏÏÏÏÏÏÏÏÏÏÏ (2) 3
Goodwill Ì end of yearÏÏÏÏÏÏÏÏÏÏÏÏÏÏÏÏÏÏÏÏÏÏÏÏÏÏÏÏÏÏÏÏÏÏÏÏÏÏÏÏÏÏÏÏÏÏÏÏÏÏÏÏÏÏÏÏÏÏ $647 $153
We completed our annual impairment test in the fourth quarter of Ñscal 2006, 2005 and 2004 with
measurement dates of January 1, 2006, January 1, 2005 and January 1, 2004, respectively, and found no
indicators of impairment of our recorded goodwill.
Finite-lived intangible assets, net of accumulated amortization, as of March 31, 2006 and 2005, were
$232 million and $36 million, respectively, and include costs for obtaining (1) developed technologies,
(2) carrier contracts and related, (3) trade names, and (4) subscribers and other intangibles. Amortization
of intangibles for Ñscal 2006, 2005 and 2004 was $16 million (of which $9 million was recognized in cost
of goods sold), $6 million (of which $3 million was recognized in cost of goods sold) and $3 million,
respectively. Finite-lived intangible assets are amortized using the straight-line method over the lesser of
their estimated useful lives or the agreement terms, typically from two to twelve years. As of March 31,
2006 and 2005, the weighted-average remaining useful life for Ñnite-lived intangible assets was
approximately 7.2 years and 4.3 years, respectively.
Finite-lived intangibles consist of the following (in millions):
As of March 31, 2006
Gross OtherCarrying Accumulated Intangibles,Amount Amortization Impairment Other Net
Developed and Core Technology ÏÏÏÏÏÏÏÏÏÏÏÏÏÏ $169 $(31) $ (9) $Ì $129
Carrier Contracts and Related ÏÏÏÏÏÏÏÏÏÏÏÏÏÏÏÏ 85 (2) Ì Ì 83
Trade NameÏÏÏÏÏÏÏÏÏÏÏÏÏÏÏÏÏÏÏÏÏÏÏÏÏÏÏÏÏÏÏ 37 (21) (1) Ì 15
Subscribers and Other IntangiblesÏÏÏÏÏÏÏÏÏÏÏÏÏ 17 (9) (2) (1) 5
Total ÏÏÏÏÏÏÏÏÏÏÏÏÏÏÏÏÏÏÏÏÏÏÏÏÏÏÏÏÏÏÏÏÏÏÏ $308 $(63) $(12) $(1) $232
Annual R
eport
As of March 31, 2005
Gross OtherCarrying Accumulated Intangibles,Amount Amortization Impairment Other Net
Developed and Core Technology ÏÏÏÏÏÏÏÏÏÏÏÏÏÏ $ 47 $(22) $ (9) $ 1 $ 17
Trade NameÏÏÏÏÏÏÏÏÏÏÏÏÏÏÏÏÏÏÏÏÏÏÏÏÏÏÏÏÏÏÏ 37 (18) (1) Ì 18
Subscribers and Other IntangiblesÏÏÏÏÏÏÏÏÏÏÏÏÏ 11 (7) (2) (1) 1
Total ÏÏÏÏÏÏÏÏÏÏÏÏÏÏÏÏÏÏÏÏÏÏÏÏÏÏÏÏÏÏÏÏÏÏÏ $ 95 $(47) $(12) $Ì $ 36
85

As of March 31, 2006, future amortization of Ñnite-lived intangibles that will be recorded in cost of goods
sold and operating expenses is estimated as follows (in millions):
Fiscal Year Ended March 31,
2007ÏÏÏÏÏÏÏÏÏÏÏÏÏÏÏÏÏÏÏÏÏÏÏÏÏÏÏÏÏÏÏÏÏÏÏÏÏÏÏÏÏÏÏÏÏÏÏÏÏÏÏÏÏÏÏÏÏÏÏÏÏÏÏÏÏÏÏÏÏÏÏÏÏÏÏÏÏÏÏ $ 47
2008ÏÏÏÏÏÏÏÏÏÏÏÏÏÏÏÏÏÏÏÏÏÏÏÏÏÏÏÏÏÏÏÏÏÏÏÏÏÏÏÏÏÏÏÏÏÏÏÏÏÏÏÏÏÏÏÏÏÏÏÏÏÏÏÏÏÏÏÏÏÏÏÏÏÏÏÏÏÏÏ 44
2009ÏÏÏÏÏÏÏÏÏÏÏÏÏÏÏÏÏÏÏÏÏÏÏÏÏÏÏÏÏÏÏÏÏÏÏÏÏÏÏÏÏÏÏÏÏÏÏÏÏÏÏÏÏÏÏÏÏÏÏÏÏÏÏÏÏÏÏÏÏÏÏÏÏÏÏÏÏÏÏ 32
2010ÏÏÏÏÏÏÏÏÏÏÏÏÏÏÏÏÏÏÏÏÏÏÏÏÏÏÏÏÏÏÏÏÏÏÏÏÏÏÏÏÏÏÏÏÏÏÏÏÏÏÏÏÏÏÏÏÏÏÏÏÏÏÏÏÏÏÏÏÏÏÏÏÏÏÏÏÏÏÏ 29
2011ÏÏÏÏÏÏÏÏÏÏÏÏÏÏÏÏÏÏÏÏÏÏÏÏÏÏÏÏÏÏÏÏÏÏÏÏÏÏÏÏÏÏÏÏÏÏÏÏÏÏÏÏÏÏÏÏÏÏÏÏÏÏÏÏÏÏÏÏÏÏÏÏÏÏÏÏÏÏÏ 26
Thereafter ÏÏÏÏÏÏÏÏÏÏÏÏÏÏÏÏÏÏÏÏÏÏÏÏÏÏÏÏÏÏÏÏÏÏÏÏÏÏÏÏÏÏÏÏÏÏÏÏÏÏÏÏÏÏÏÏÏÏÏÏÏÏÏÏÏÏÏÏÏÏÏÏÏÏ 54
Total ÏÏÏÏÏÏÏÏÏÏÏÏÏÏÏÏÏÏÏÏÏÏÏÏÏÏÏÏÏÏÏÏÏÏÏÏÏÏÏÏÏÏÏÏÏÏÏÏÏÏÏÏÏÏÏÏÏÏÏÏÏÏÏÏÏÏÏÏÏÏÏÏÏÏÏÏ $232
(6) RESTRUCTURING AND ASSET IMPAIRMENT CHARGES
Restructuring and asset impairment information as of March 31, 2006 was as follows (in millions):
Fiscal 2006 International Fiscal 2006 Fiscal 2004, 2003 andPublishing Reorganization Restructuring 2002 Restructurings
Facilities- Facilities-Workforce related Other Workforce Workforce related Total
Balances as of March 31, 2003 ÏÏÏÏÏÏÏÏÏÏ $ Ì $ Ì $ Ì $ Ì $ 2 $ 9 $ 11
Charges to operations ÏÏÏÏÏÏÏÏÏÏÏÏÏÏÏÏ Ì Ì Ì Ì 2 7 9
Charges utilized in cash ÏÏÏÏÏÏÏÏÏÏÏÏÏÏ Ì Ì Ì Ì (2) (4) (6)
Balances as of March 31, 2004 ÏÏÏÏÏÏÏÏÏÏ $ Ì $ Ì $ Ì $ Ì $ 2 $12 $ 14
Charges utilized in cash ÏÏÏÏÏÏÏÏÏÏÏÏÏÏ Ì Ì Ì Ì (2) (4) (6)
Adjustments to operations ÏÏÏÏÏÏÏÏÏÏÏÏ Ì Ì Ì Ì Ì 2 2
Balances as of March 31, 2005 ÏÏÏÏÏÏÏÏÏÏ $ Ì $ Ì $ Ì $ Ì $ Ì $10 $ 10
Charges to operations ÏÏÏÏÏÏÏÏÏÏÏÏÏÏÏÏ 3 8 3 10 Ì Ì 24
Charges utilized in cash ÏÏÏÏÏÏÏÏÏÏÏÏÏÏ (2) Ì (1) (7) Ì (5) (15)
Adjustments to operations ÏÏÏÏÏÏÏÏÏÏÏÏ Ì Ì Ì Ì Ì 2 2
Balances as of March 31, 2006 ÏÏÏÏÏÏÏÏÏÏ $ 1 $ 8 $ 2 $ 3 $ Ì $ 7 $ 21
All restructuring charges recorded subsequent to December 31, 2002, were recorded in accordance with
SFAS No. 146, ""Accounting for Costs Associated with Exit or Disposal Activities''. We generally expense
restructuring costs as they are incurred and accrue costs associated with certain facility closures at the
time we exit the facility. Adjustments to our restructuring reserves are made in future periods, if necessary,
based upon then-current events and circumstances.
Fiscal 2006 International Publishing Reorganization
In November 2005, we announced plans to establish an international publishing headquarters in Geneva,
Switzerland. Since that time and through the six months ending September 30, 2006, we expect to
continue to relocate certain current employees to our new facility in Geneva, close certain facilities in the
U.K., and make other related changes in our international publishing business.
During Ñscal 2006, restructuring charges were approximately $14 million of which $8 million was for the
closure of certain U.K. facilities, $3 million for employee-related expenses and $3 million in other costs in
connection with our international publishing reorganization. The restructuring accrual of $11 million as of
March 31, 2006 is expected to be utilized by March 2017. This accrual is included in other accrued
expenses presented in Note 8 of the Notes to Consolidated Financial Statements.
In Ñscal 2007, we expect to incur between $15 million and $20 million of restructuring costs. Overall,
including Ñscal 2006, we expect to incur between $40 million and $50 million of restructuring costs,
86

substantially all of which will result in cash expenditures by 2017. These restructuring costs will consist
primarily of employee-related relocation assistance (approximately $28 million), facility exit costs
(approximately $10 million), as well as other reorganization costs (approximately $8 million). While we
may incur severance costs paid to terminating employees in connection with the reorganization, we do not
expect these costs to be signiÑcant.
Fiscal 2006 Restructuring
During the fourth quarter of Ñscal 2006, we aligned our resources with our product plan for Ñscal 2007 and
strategic opportunities with next-generation consoles, online and mobile platforms. As part of this
alignment we recorded a total pre-tax restructuring charge of $10 million consisting entirely of one-time
beneÑts related to headcount reductions which are included in restructuring charges in our Consolidated
Statement of Operations. The restructuring accrual of $3 million is expected to be utilized during Ñscal
2007. This accrual is included in other accrued expenses presented in Note 8 of the Notes to Consolidated
Financial Statements.
Fiscal 2004 Studio Restructuring
During the fourth quarter of Ñscal 2004, we closed the majority of our leased studio facility in Walnut
Creek, California and our entire owned studio facility in Austin, Texas in order to consolidate local
development eÅorts in Redwood City, California. We recorded total pre-tax charges of $9 million,
consisting of $7 million for consolidation of facilities (net of expected future sublease income), $2 million
for workforce reductions of approximately 117 personnel and less than $1 million for the write-oÅ of non-
current assets, primarily leasehold improvements. As of March 31, 2006, an aggregate of $8 million in cash
had been paid out under the restructuring plans. In addition, we have made subsequent net adjustments of
approximately $3 million during Ñscal 2006 relating to projected future cash outlays under the Ñscal 2004
restructuring plan. The remaining projected net cash outlay of $5 million is expected to be utilized by
January 2009. The facilities-related accrued obligation shown above is net of $7 million of estimated future
sub-lease income. The restructuring accrual is included in other accrued expenses presented in Note 8 of
the Notes to Consolidated Financial Statements.
Fiscal 2003 and 2002 Restructurings
In Ñscal 2003 and 2002, we entered into various restructurings based on management decisions. As of
March 31, 2006, an aggregate of $19 million in cash had been paid out under the restructuring plans. In
addition, we have made subsequent net adjustments of approximately $1 million during Ñscal 2006 relating
to projected future cash outlays under the Ñscal 2003 restructuring plan. The remaining projected net cash
Annual R
eport
outlay of $2 million is expected to be utilized by December 2006. The facilities-related accrued obligation
shown above is net of $1 million of estimated future sub-lease income. The restructuring accrual is
included in other accrued expenses presented in Note 8 of the Notes to Consolidated Financial
Statements.
(7) ROYALTIES AND LICENSES
Our royalty expenses consist of payments to (1) content licensors, (2) independent software developers
and (3) co-publishing and/or distribution aÇliates. License royalties consist of payments made to
celebrities, professional sports organizations, movie studios and other organizations for our use of their
trademarks, copyrights, personal publicity rights, content and/or other intellectual property. Royalty
payments to independent software developers are payments for the development of intellectual property
related to our games. Co-publishing and distribution royalties are payments made to third parties for
delivery of product.
Royalty-based obligations with content licensors and distribution aÇliates are either paid in advance and
capitalized as prepaid royalties or are accrued as incurred and subsequently paid. These royalty-based
obligations are generally expensed to cost of goods sold generally at the greater of the contractual rate or
87
an eÅective royalty rate based on expected net product sales. Prepayments made to thinly capitalized
independent software developers and co-publishing aÇliates are generally in connection with the
development of a particular product and, therefore, we are generally subject to development risk prior to
the release of the product. Accordingly, payments that are due prior to completion of a product are
generally expensed as research and development as the services are incurred. Payments due after
completion of the product (primarily royalty-based in nature) are generally expensed as cost of goods sold
generally at the greater of the contractual rate or an eÅective royalty rate based on expected net product
sales.
Our contracts with some licensors include minimum guaranteed royalty payments which are initially
recorded as an asset and as a liability at the contractual amount when no signiÑcant performance remains
with the licensor. When signiÑcant performance remains with the licensor, we record royalty payments as
an asset when actually paid and as a liability when incurred, rather than upon execution of the contract.
Minimum royalty payment obligations are classiÑed as current liabilities to the extent such royalty
payments are contractually due within the next twelve months. As of March 31, 2006 and 2005,
approximately $9 million and $51 million, respectively, of minimum guaranteed royalty obligations had
been recognized and are included in the royalty-related assets and accrual tables below.
Each quarter, we also evaluate the future realization of our royalty-based assets as well as any
unrecognized minimum commitments not yet paid to determine amounts we deem unlikely to be realized
through product sales. Any impairments determined before the launch of a product are charged to research
and development expense. Impairments determined post-launch are charged to cost of goods sold. In either
case, we rely on estimated revenue to evaluate the future realization of prepaid royalties and commitments.
If actual sales or revised revenue estimates fall below the initial revenue estimate, then the actual charge
taken may be greater in any given quarter than anticipated. During Ñscal 2006, 2005 and 2004, we
recorded impairment charges of $16 million, $8 million and $2 million, respectively.
The current and long-term portions of prepaid royalties and minimum guaranteed royalty-related assets,
included in other current assets and other assets, consisted of (in millions):
As ofMarch 31,
2006 2005
Other current assetsÏÏÏÏÏÏÏÏÏÏÏÏÏÏÏÏÏÏÏÏÏÏÏÏÏÏÏÏÏÏÏÏÏÏÏÏÏÏÏÏÏÏÏÏÏÏÏÏÏÏÏÏÏÏÏÏÏÏÏÏÏ $ 76 $ 59
Other assets ÏÏÏÏÏÏÏÏÏÏÏÏÏÏÏÏÏÏÏÏÏÏÏÏÏÏÏÏÏÏÏÏÏÏÏÏÏÏÏÏÏÏÏÏÏÏÏÏÏÏÏÏÏÏÏÏÏÏÏÏÏÏÏÏÏÏÏ 55 76
Royalty-related assets ÏÏÏÏÏÏÏÏÏÏÏÏÏÏÏÏÏÏÏÏÏÏÏÏÏÏÏÏÏÏÏÏÏÏÏÏÏÏÏÏÏÏÏÏÏÏÏÏÏÏÏÏÏÏÏ $131 $135
At any given time, depending on the timing of our payments to our co-publishing and/or distribution
aÇliates, content licensors and/or independent software developers, we recognize unpaid royalty amounts
due to these parties as either accounts payable or accrued liabilities. The current and long-term portions of
accrued royalties, included in accrued and other current liabilities as well as other liabilities, consisted of
(in millions):
As ofMarch 31,
2006 2005
Accrued and other current liabilities ÏÏÏÏÏÏÏÏÏÏÏÏÏÏÏÏÏÏÏÏÏÏÏÏÏÏÏÏÏÏÏÏÏÏÏÏÏÏÏÏÏÏÏÏÏÏÏ $ 82 $ 88
Other liabilitiesÏÏÏÏÏÏÏÏÏÏÏÏÏÏÏÏÏÏÏÏÏÏÏÏÏÏÏÏÏÏÏÏÏÏÏÏÏÏÏÏÏÏÏÏÏÏÏÏÏÏÏÏÏÏÏÏÏÏÏÏÏÏÏÏÏ 7 33
Royalty-related liabilitiesÏÏÏÏÏÏÏÏÏÏÏÏÏÏÏÏÏÏÏÏÏÏÏÏÏÏÏÏÏÏÏÏÏÏÏÏÏÏÏÏÏÏÏÏÏÏÏÏÏÏÏÏÏ $ 89 $121
In addition, as of March 31, 2006, we were committed to pay approximately $1,557 million to co-
publishing and/or distribution aÇliates and content licensors, but signiÑcant performance remained with
the counterparty (i.e., delivery of the product or content or other factors) and such commitments were
therefore not recorded in our Consolidated Financial Statements. See Note 9 of the Notes to Consolidated
Financial Statements.
88
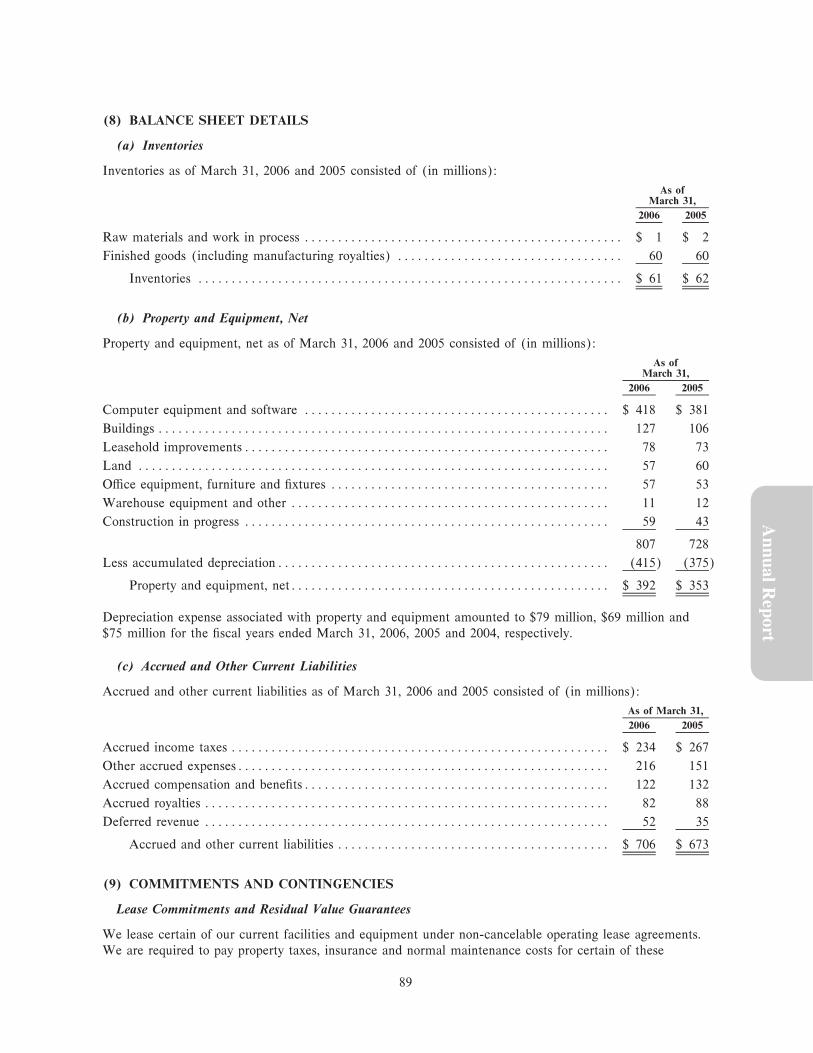
(8) BALANCE SHEET DETAILS
(a) Inventories
Inventories as of March 31, 2006 and 2005 consisted of (in millions):
As ofMarch 31,
2006 2005
Raw materials and work in process ÏÏÏÏÏÏÏÏÏÏÏÏÏÏÏÏÏÏÏÏÏÏÏÏÏÏÏÏÏÏÏÏÏÏÏÏÏÏÏÏÏÏÏÏÏÏÏÏ $ 1 $ 2
Finished goods (including manufacturing royalties) ÏÏÏÏÏÏÏÏÏÏÏÏÏÏÏÏÏÏÏÏÏÏÏÏÏÏÏÏÏÏÏÏÏÏ 60 60
Inventories ÏÏÏÏÏÏÏÏÏÏÏÏÏÏÏÏÏÏÏÏÏÏÏÏÏÏÏÏÏÏÏÏÏÏÏÏÏÏÏÏÏÏÏÏÏÏÏÏÏÏÏÏÏÏÏÏÏÏÏÏÏÏÏÏ $ 61 $ 62
(b) Property and Equipment, Net
Property and equipment, net as of March 31, 2006 and 2005 consisted of (in millions):
As ofMarch 31,
2006 2005
Computer equipment and software ÏÏÏÏÏÏÏÏÏÏÏÏÏÏÏÏÏÏÏÏÏÏÏÏÏÏÏÏÏÏÏÏÏÏÏÏÏÏÏÏÏÏÏÏÏÏ $ 418 $ 381
Buildings ÏÏÏÏÏÏÏÏÏÏÏÏÏÏÏÏÏÏÏÏÏÏÏÏÏÏÏÏÏÏÏÏÏÏÏÏÏÏÏÏÏÏÏÏÏÏÏÏÏÏÏÏÏÏÏÏÏÏÏÏÏÏÏÏÏÏÏÏ 127 106
Leasehold improvementsÏÏÏÏÏÏÏÏÏÏÏÏÏÏÏÏÏÏÏÏÏÏÏÏÏÏÏÏÏÏÏÏÏÏÏÏÏÏÏÏÏÏÏÏÏÏÏÏÏÏÏÏÏÏÏ 78 73
Land ÏÏÏÏÏÏÏÏÏÏÏÏÏÏÏÏÏÏÏÏÏÏÏÏÏÏÏÏÏÏÏÏÏÏÏÏÏÏÏÏÏÏÏÏÏÏÏÏÏÏÏÏÏÏÏÏÏÏÏÏÏÏÏÏÏÏÏÏÏÏÏ 57 60
OÇce equipment, furniture and Ñxtures ÏÏÏÏÏÏÏÏÏÏÏÏÏÏÏÏÏÏÏÏÏÏÏÏÏÏÏÏÏÏÏÏÏÏÏÏÏÏÏÏÏÏ 57 53
Warehouse equipment and other ÏÏÏÏÏÏÏÏÏÏÏÏÏÏÏÏÏÏÏÏÏÏÏÏÏÏÏÏÏÏÏÏÏÏÏÏÏÏÏÏÏÏÏÏÏÏÏÏ 11 12
Construction in progress ÏÏÏÏÏÏÏÏÏÏÏÏÏÏÏÏÏÏÏÏÏÏÏÏÏÏÏÏÏÏÏÏÏÏÏÏÏÏÏÏÏÏÏÏÏÏÏÏÏÏÏÏÏÏÏ 59 43
807 728
Less accumulated depreciationÏÏÏÏÏÏÏÏÏÏÏÏÏÏÏÏÏÏÏÏÏÏÏÏÏÏÏÏÏÏÏÏÏÏÏÏÏÏÏÏÏÏÏÏÏÏÏÏÏÏ (415) (375)
Property and equipment, netÏÏÏÏÏÏÏÏÏÏÏÏÏÏÏÏÏÏÏÏÏÏÏÏÏÏÏÏÏÏÏÏÏÏÏÏÏÏÏÏÏÏÏÏÏÏÏÏ $ 392 $ 353
Depreciation expense associated with property and equipment amounted to $79 million, $69 million and
$75 million for the Ñscal years ended March 31, 2006, 2005 and 2004, respectively.
(c) Accrued and Other Current Liabilities
Annual R
eport
Accrued and other current liabilities as of March 31, 2006 and 2005 consisted of (in millions):
As of March 31,
2006 2005
Accrued income taxes ÏÏÏÏÏÏÏÏÏÏÏÏÏÏÏÏÏÏÏÏÏÏÏÏÏÏÏÏÏÏÏÏÏÏÏÏÏÏÏÏÏÏÏÏÏÏÏÏÏÏÏÏÏÏÏÏÏ $ 234 $ 267
Other accrued expensesÏÏÏÏÏÏÏÏÏÏÏÏÏÏÏÏÏÏÏÏÏÏÏÏÏÏÏÏÏÏÏÏÏÏÏÏÏÏÏÏÏÏÏÏÏÏÏÏÏÏÏÏÏÏÏÏ 216 151
Accrued compensation and beneÑtsÏÏÏÏÏÏÏÏÏÏÏÏÏÏÏÏÏÏÏÏÏÏÏÏÏÏÏÏÏÏÏÏÏÏÏÏÏÏÏÏÏÏÏÏÏÏ 122 132
Accrued royalties ÏÏÏÏÏÏÏÏÏÏÏÏÏÏÏÏÏÏÏÏÏÏÏÏÏÏÏÏÏÏÏÏÏÏÏÏÏÏÏÏÏÏÏÏÏÏÏÏÏÏÏÏÏÏÏÏÏÏÏÏÏ 82 88
Deferred revenue ÏÏÏÏÏÏÏÏÏÏÏÏÏÏÏÏÏÏÏÏÏÏÏÏÏÏÏÏÏÏÏÏÏÏÏÏÏÏÏÏÏÏÏÏÏÏÏÏÏÏÏÏÏÏÏÏÏÏÏÏÏ 52 35
Accrued and other current liabilities ÏÏÏÏÏÏÏÏÏÏÏÏÏÏÏÏÏÏÏÏÏÏÏÏÏÏÏÏÏÏÏÏÏÏÏÏÏÏÏÏÏ $ 706 $ 673
(9) COMMITMENTS AND CONTINGENCIES
Lease Commitments and Residual Value Guarantees
We lease certain of our current facilities and equipment under non-cancelable operating lease agreements.
We are required to pay property taxes, insurance and normal maintenance costs for certain of these
89

facilities and will be required to pay any increases over the base year of these expenses on the remainder
of our facilities.
In February 1995, we entered into a build-to-suit lease (""Phase One Lease'') with a third party for our
headquarters facilities in Redwood City, California (""Phase One Facilities''). The Phase One Facilities
comprise a total of approximately 350,000 square feet and provide space for sales, marketing,
administration and research and development functions. In July 2001, we reÑnanced the Phase One Lease
with Keybank National Association through July 2006. We account for the Phase One Lease arrangement
as an operating lease in accordance with SFAS No. 13, ""Accounting for Leases'', as amended.
On May 26, 2006, we extended the Ñnancing under the Phase One Lease through July 2007. Upon
expiration of the Ñnancing in July 2007, we may purchase the Phase One Facilities, request up to two one-
year extensions of the Ñnancing (subject to bank approval), self-fund approximately 90 percent of the
Ñnancing and extend the remainder through July 2009, or arrange for the sale of the Phase One Facilities
to a third party.
The Phase One Lease terminates upon expiration of the Ñnancing in July 2007 unless we have extended
the Ñnancing or elected to self-fund the Ñnancing as described above, in which case the term of the lease
could be extended until as late as July 2009. Subject to certain terms and conditions, upon termination of
the lease, we may purchase the Phase One Facilities, request an extension of the lease or arrange for the
sale of the Phase One Facilities to a third party.
Pursuant to the terms of the Phase One Lease, as amended to date, we have an option to purchase the
Phase One Facilities at any time for a maximum purchase price of $132 million. In the event of a sale to
a third party, if the sale price is less than $132 million, we will be obligated to reimburse the diÅerence
between the actual sale price and $132 million, up to maximum of $117 million, subject to certain
provisions of the Phase One Lease, as amended.
In December 2000, we entered into a second build-to-suit lease (""Phase Two Lease'') with Keybank
National Association for a Ñve and one-half year term beginning in December 2000 to expand our
Redwood City, California headquarters facilities and develop adjacent property (""Phase Two Facilities'').
Construction of the Phase Two Facilities was completed in June 2002. The Phase Two Facilities comprise
a total of approximately 310,000 square feet and provide space for sales, marketing, administration and
research and development functions. We account for the Phase Two Lease arrangement as an operating
lease in accordance with SFAS No. 13, as amended.
On May 26, 2006, we extended the Ñnancing under the Phase Two Lease through July 2007. Upon the
expiration of the Ñnancing in July 2007, we may purchase the Phase Two Facilities, request up to two one-
year extensions of the Ñnancing (subject to bank approval), self-fund approximately 90 percent of the
Ñnancing and extend the remainder through July 2009, or arrange for the sale of the Phase Two Facilities
to a third party.
The Phase Two Lease terminates upon expiration of the Ñnancing in July 2007 unless we have extended
the Ñnancing or elected to self-fund the Ñnancing as described above, in which case the term of the lease
could be extended until as late as July 2009. Subject to certain terms and conditions, upon termination of
the lease, we may purchase the Phase Two Facilities, request an extension of the lease or arrange for the
sale of the Phase Two Facilities to a third party.
Pursuant to the terms of the Phase Two Lease, as amended to date, we have an option to purchase the
Phase Two Facilities at any time for a maximum purchase price of $115 million. In the event of a sale to
a third party, if the sale price is less than $115 million, we will be obligated to reimburse the diÅerence
between the actual sale price and $115 million, up to a maximum of $105 million, subject to certain
provisions of the Phase Two Lease, as amended.
The lease rates of the Phase One and Phase Two Leases Öuctuate and are based upon LIBOR plus a
margin that varies from 0.50% to 1.25% based on our ratio of total consolidated debt to consolidated
tangible net worth. Based on the 3-month LIBOR rate of 5.2% as of May 26, 2006, the annual rent
90

obligation of the two leases would total approximately $14 million. Our rent obligation under the leases
could increase or decrease signiÑcantly depending on changes in LIBOR.
The Phase One and Phase Two Leases require us to comply with certain Ñnancial covenants as shown
below, all of which we were in compliance with as of March 31, 2006. In the event we fail to comply with
the Ñnancial and other covenants contained in the leases, the lessor would have a number of remedies,
including the right to keep the leases in eÅect and suing for periodic rent, evicting us from the facilities, or
causing the facilities to be sold to a third party. In the event of a sale to a third party, we would be
required to reimburse the diÅerence between the actual sale price and $247 million, up to a total
maximum of $222 million. Alternatively, in order to avoid being evicted or having the two facilities sold to
a third party, we could elect to purchase the Phase One and Phase Two Facilities for a combined
maximum purchase price of $247 million.
We believe that, as of March 31, 2006, the estimated fair values of both properties under these operating
leases exceeded their respective guaranteed residual values of $117 million for the Phase One Facility and
$105 million for the Phase Two Facility as of March 31, 2006.
Actual as ofFinancial Covenants Requirement March 31, 2006
Consolidated Net Worth (in millions)ÏÏÏÏÏÏÏÏÏÏÏÏÏÏÏÏ equal to or greater than $2,293 $3,408
Fixed Charge Coverage Ratio ÏÏÏÏÏÏÏÏÏÏÏÏÏÏÏÏÏÏÏÏÏÏÏ equal to or greater than 3.00 8.89
Total Consolidated Debt to Capital ÏÏÏÏÏÏÏÏÏÏÏÏÏÏÏÏÏÏ equal to or less than 60% 6.8%
Quick Ratio Ì Q1 & Q2ÏÏÏÏÏÏÏÏÏÏÏÏÏÏÏÏÏÏÏÏÏÏÏÏÏÏÏ equal to or greater than 1.00 N/A
Q3 & Q4ÏÏÏÏÏÏÏÏÏÏÏÏÏÏÏÏÏÏÏÏÏÏÏÏÏÏÏ equal to or greater than 1.75 5.92
In February 2006, we entered into an agreement with an independent third party to lease a studio facility
in Guildford, Surrey, United Kingdom, which will commence in June 2006 and will expire in May 2016.
The facility comprises a total of approximately 95,000 square feet, which we intend to use for research and
development functions. Our rental obligation under this agreement is approximately $33 million over the
initial ten-year term of the lease.
In June 2004, we entered into a lease agreement, amended in December 2005, with an independent third
party for a studio facility in Orlando, Florida. The lease commenced in January 2005 and expires in June
2010, with one Ñve-year option to extend the lease term. The campus facilities comprise a total of
140,000 square feet and provide space for research and development functions. Our rental obligation over
the initial Ñve-and-a-half year term of the lease is $15 million. As of March 31, 2006, our remaining rental
obligation under this lease was $14 million.
Annual R
eport
In July 2003, we entered into a lease agreement with an independent third party (the ""Landlord'') for a
studio facility in Los Angeles, California, which commenced in October 2003 and expires in September
2013 with two Ñve-year options to extend the lease term. Additionally, we have options to purchase the
property after Ñve and ten years based on the fair market value of the property at the date of sale, a right
of Ñrst oÅer to purchase the property upon terms oÅered by the Landlord, and a right to share in the
proÑts from a sale of the property. We have accounted for this arrangement as an operating lease in
accordance with SFAS No. 13, as amended. Existing campus facilities comprise a total of 243,000 square
feet and provide space for research and development functions. Our rental obligation under this agreement
is $50 million over the initial ten-year term of the lease. This commitment is oÅset by expected sublease
income of $6 million for a sublease to an aÇliate of the Landlord of 18,000 square feet of the Los Angeles
facility, which commenced in October 2003 and expires in September 2013, with options of early
termination by the aÇliate after Ñve years and by us after four and Ñve years. As of March 31, 2006, our
remaining rental obligation under this lease was $43 million, of which $5 million was oÅset by expected
sublease income.
In October 2002, we entered into a lease agreement, with an independent third party for a studio facility in
Vancouver, British Columbia, Canada, which commenced in May 2003 and expires in April 2013. We
91

amended the lease in October 2003. The facility comprises a total of approximately 65,000 square feet and
provides space for research and development functions. Our rental obligation under this agreement is
approximately $16 million over the initial ten-year term of the lease. As of March 31, 2006, our remaining
rental obligation under this lease was $12 million.
Letters of Credit
In July 2002, we provided an irrevocable standby letter of credit to Nintendo of Europe, which we have
amended on a number of occasions. The standby letter of credit, as amended, guarantees performance of
our obligations to pay Nintendo of Europe for trade payables. As of March 31, 2006, the standby letter of
credit, as amended, guaranteed our trade payable obligations to Nintendo of Europe for up to 47 million.
As of March 31, 2006, 42 million was payable to Nintendo of Europe under the standby letter of credit, as
amended.
In August 2003, we provided an irrevocable standby letter of credit to 300 California Associates II, LLC
in replacement of our security deposit for oÇce space. The standby letter of credit guarantees performance
of our obligations to pay our lease commitment up to approximately $1 million. The standby letter of
credit expires in December 2006. As of March 31, 2006, we did not have a payable balance on this
standby letter of credit.
Development, Celebrity, League and Content Licenses: Payments and Commitments
The products we produce in our studios are designed and created by our employee designers, artists,
software programmers and by non-employee software developers (""independent artists'' or ""third-party
developers''). We typically advance development funds to the independent artists and third-party
developers during development of our games, usually in installment payments made upon the completion
of speciÑed development milestones. Contractually, these payments are generally considered advances
against subsequent royalties on the sales of the products. These terms are set forth in written agreements
entered into with the independent artists and third-party developers.
In addition, we have certain celebrity, league and content license contracts that contain minimum
guarantee payments and marketing commitments that are not dependent on any deliverables. Celebrities
and organizations with whom we have contracts include: FIFA, FIFPRO Foundation and UEFA
(professional soccer); NASCAR and ISC (stock car racing); National Basketball Association (profes-
sional basketball); PGA TOUR, Tiger Woods and Pebble Beach (professional golf); National Hockey
League and NHL Players' Association (professional hockey); Warner Bros. (Harry Potter, Batman and
Superman); New Line Productions and Saul Zaentz Company (The Lord of the Rings); Marvel
Enterprises (Ñghting); National Football League Properties, Arena Football League and PLAYERS Inc.
(professional football); Collegiate Licensing Company (collegiate football, basketball and baseball);
Simcoh (Def Jam); Viacom Consumer Products (The Godfather); Valve Corporation (Half-Life); ESPN
(content in EA SPORTSTM games); Twentieth Century Fox Licensing and Merchandising (The
Simpsons); Lamborghini, McLaren and Porsche (car licenses for Need for Speed); and mobile game
rights with PopCap Games and The Tetris Company. These developer and content license commitments
represent the sum of (1) the cash payments due under non-royalty-bearing licenses and services
agreements and (2) the minimum guaranteed payments and advances against royalties due under royalty-
bearing licenses and services agreements, the majority of which are conditional upon performance by the
counterparty. These minimum guarantee payments and any related marketing commitments are included
in the table below.
92
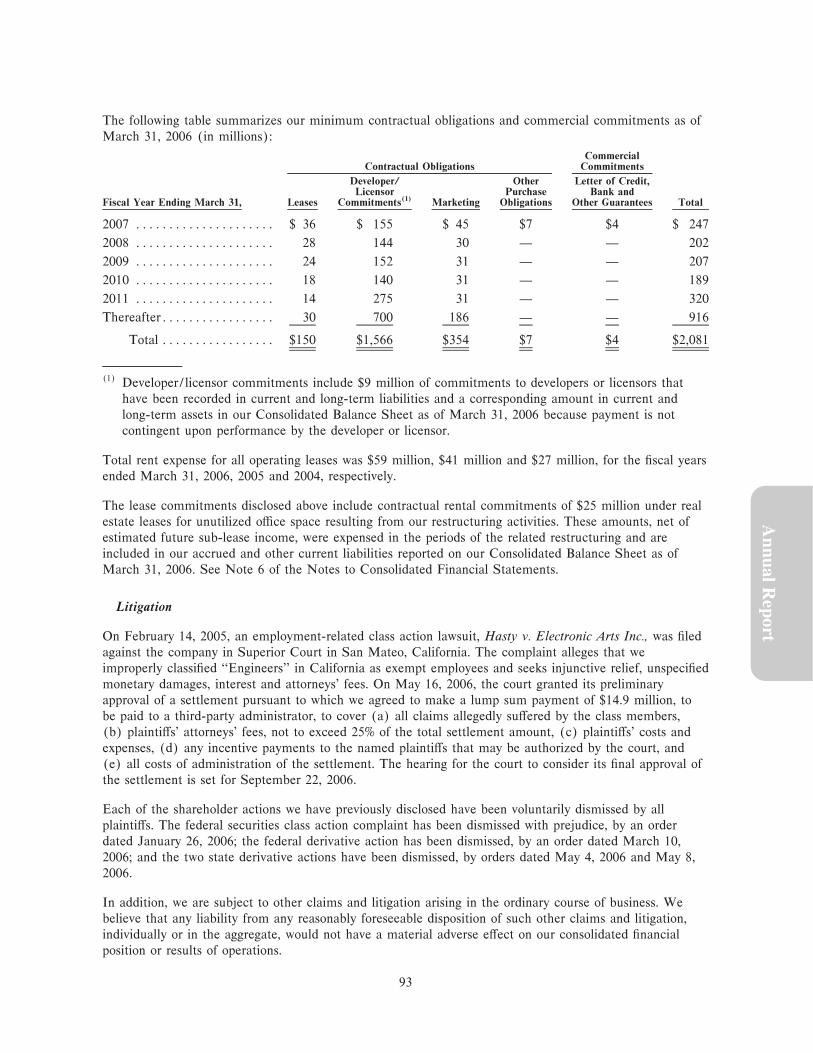
The following table summarizes our minimum contractual obligations and commercial commitments as of
March 31, 2006 (in millions):
CommercialContractual Obligations Commitments
Developer/ Other Letter of Credit,Licensor Purchase Bank and
Fiscal Year Ending March 31, Leases Commitments(1) Marketing Obligations Other Guarantees Total
2007 ÏÏÏÏÏÏÏÏÏÏÏÏÏÏÏÏÏÏÏÏÏ $ 36 $ 155 $ 45 $7 $4 $ 247
2008 ÏÏÏÏÏÏÏÏÏÏÏÏÏÏÏÏÏÏÏÏÏ 28 144 30 Ì Ì 202
2009 ÏÏÏÏÏÏÏÏÏÏÏÏÏÏÏÏÏÏÏÏÏ 24 152 31 Ì Ì 207
2010 ÏÏÏÏÏÏÏÏÏÏÏÏÏÏÏÏÏÏÏÏÏ 18 140 31 Ì Ì 189
2011 ÏÏÏÏÏÏÏÏÏÏÏÏÏÏÏÏÏÏÏÏÏ 14 275 31 Ì Ì 320
ThereafterÏÏÏÏÏÏÏÏÏÏÏÏÏÏÏÏÏ 30 700 186 Ì Ì 916
Total ÏÏÏÏÏÏÏÏÏÏÏÏÏÏÏÏÏ $150 $1,566 $354 $7 $4 $2,081
(1) Developer/licensor commitments include $9 million of commitments to developers or licensors that
have been recorded in current and long-term liabilities and a corresponding amount in current and
long-term assets in our Consolidated Balance Sheet as of March 31, 2006 because payment is not
contingent upon performance by the developer or licensor.
Total rent expense for all operating leases was $59 million, $41 million and $27 million, for the Ñscal years
ended March 31, 2006, 2005 and 2004, respectively.
The lease commitments disclosed above include contractual rental commitments of $25 million under real
estate leases for unutilized oÇce space resulting from our restructuring activities. These amounts, net of
estimated future sub-lease income, were expensed in the periods of the related restructuring and are
included in our accrued and other current liabilities reported on our Consolidated Balance Sheet as of
March 31, 2006. See Note 6 of the Notes to Consolidated Financial Statements.
Litigation
On February 14, 2005, an employment-related class action lawsuit, Hasty v. Electronic Arts Inc., was Ñled
against the company in Superior Court in San Mateo, California. The complaint alleges that we
improperly classiÑed ""Engineers'' in California as exempt employees and seeks injunctive relief, unspeciÑed
Annual R
eport
monetary damages, interest and attorneys' fees. On May 16, 2006, the court granted its preliminary
approval of a settlement pursuant to which we agreed to make a lump sum payment of $14.9 million, to
be paid to a third-party administrator, to cover (a) all claims allegedly suÅered by the class members,
(b) plaintiÅs' attorneys' fees, not to exceed 25% of the total settlement amount, (c) plaintiÅs' costs and
expenses, (d) any incentive payments to the named plaintiÅs that may be authorized by the court, and
(e) all costs of administration of the settlement. The hearing for the court to consider its Ñnal approval of
the settlement is set for September 22, 2006.
Each of the shareholder actions we have previously disclosed have been voluntarily dismissed by all
plaintiÅs. The federal securities class action complaint has been dismissed with prejudice, by an order
dated January 26, 2006; the federal derivative action has been dismissed, by an order dated March 10,
2006; and the two state derivative actions have been dismissed, by orders dated May 4, 2006 and May 8,
2006.
In addition, we are subject to other claims and litigation arising in the ordinary course of business. We
believe that any liability from any reasonably foreseeable disposition of such other claims and litigation,
individually or in the aggregate, would not have a material adverse eÅect on our consolidated Ñnancial
position or results of operations.
93
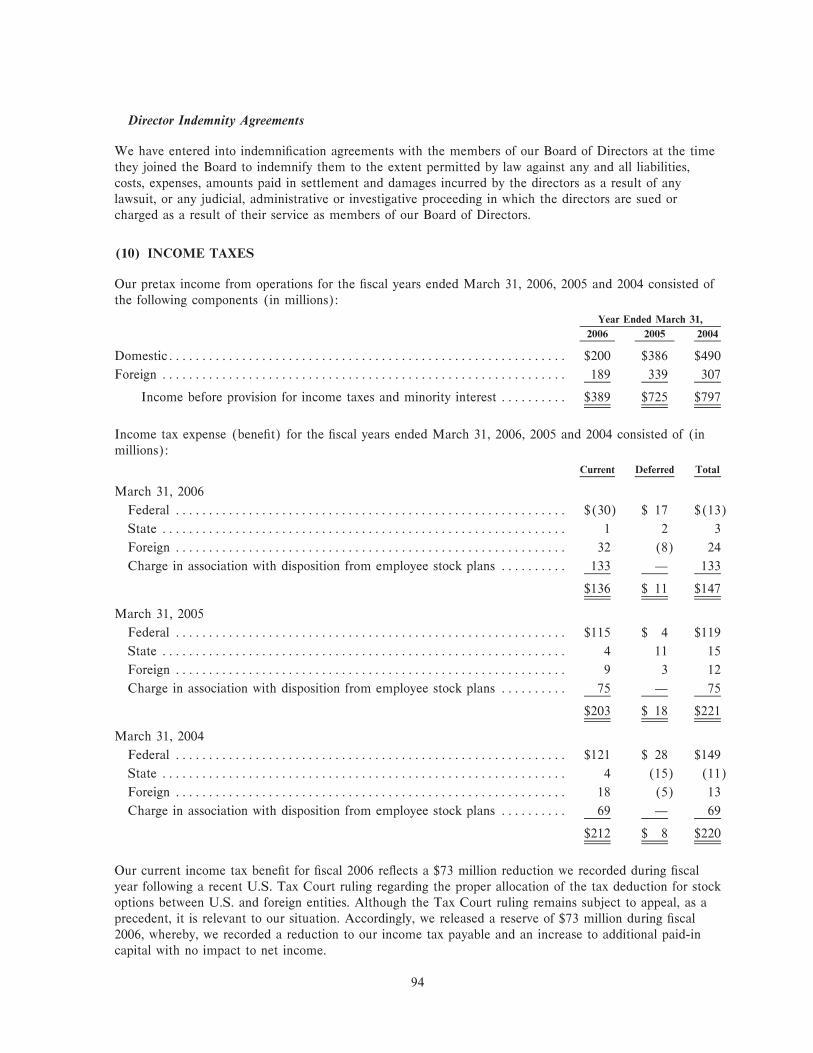
Director Indemnity Agreements
We have entered into indemniÑcation agreements with the members of our Board of Directors at the time
they joined the Board to indemnify them to the extent permitted by law against any and all liabilities,
costs, expenses, amounts paid in settlement and damages incurred by the directors as a result of any
lawsuit, or any judicial, administrative or investigative proceeding in which the directors are sued or
charged as a result of their service as members of our Board of Directors.
(10) INCOME TAXES
Our pretax income from operations for the Ñscal years ended March 31, 2006, 2005 and 2004 consisted of
the following components (in millions):
Year Ended March 31,
2006 2005 2004
DomesticÏÏÏÏÏÏÏÏÏÏÏÏÏÏÏÏÏÏÏÏÏÏÏÏÏÏÏÏÏÏÏÏÏÏÏÏÏÏÏÏÏÏÏÏÏÏÏÏÏÏÏÏÏÏÏÏÏÏÏÏ $200 $386 $490
Foreign ÏÏÏÏÏÏÏÏÏÏÏÏÏÏÏÏÏÏÏÏÏÏÏÏÏÏÏÏÏÏÏÏÏÏÏÏÏÏÏÏÏÏÏÏÏÏÏÏÏÏÏÏÏÏÏÏÏÏÏÏÏ 189 339 307
Income before provision for income taxes and minority interest ÏÏÏÏÏÏÏÏÏÏ $389 $725 $797
Income tax expense (beneÑt) for the Ñscal years ended March 31, 2006, 2005 and 2004 consisted of (in
millions):
Current Deferred Total
March 31, 2006
Federal ÏÏÏÏÏÏÏÏÏÏÏÏÏÏÏÏÏÏÏÏÏÏÏÏÏÏÏÏÏÏÏÏÏÏÏÏÏÏÏÏÏÏÏÏÏÏÏÏÏÏÏÏÏÏÏÏÏÏÏ $(30) $ 17 $(13)
State ÏÏÏÏÏÏÏÏÏÏÏÏÏÏÏÏÏÏÏÏÏÏÏÏÏÏÏÏÏÏÏÏÏÏÏÏÏÏÏÏÏÏÏÏÏÏÏÏÏÏÏÏÏÏÏÏÏÏÏÏÏ 1 2 3
Foreign ÏÏÏÏÏÏÏÏÏÏÏÏÏÏÏÏÏÏÏÏÏÏÏÏÏÏÏÏÏÏÏÏÏÏÏÏÏÏÏÏÏÏÏÏÏÏÏÏÏÏÏÏÏÏÏÏÏÏÏ 32 (8) 24
Charge in association with disposition from employee stock plans ÏÏÏÏÏÏÏÏÏÏ 133 Ì 133
$136 $ 11 $147
March 31, 2005
Federal ÏÏÏÏÏÏÏÏÏÏÏÏÏÏÏÏÏÏÏÏÏÏÏÏÏÏÏÏÏÏÏÏÏÏÏÏÏÏÏÏÏÏÏÏÏÏÏÏÏÏÏÏÏÏÏÏÏÏÏ $115 $ 4 $119
State ÏÏÏÏÏÏÏÏÏÏÏÏÏÏÏÏÏÏÏÏÏÏÏÏÏÏÏÏÏÏÏÏÏÏÏÏÏÏÏÏÏÏÏÏÏÏÏÏÏÏÏÏÏÏÏÏÏÏÏÏÏ 4 11 15
Foreign ÏÏÏÏÏÏÏÏÏÏÏÏÏÏÏÏÏÏÏÏÏÏÏÏÏÏÏÏÏÏÏÏÏÏÏÏÏÏÏÏÏÏÏÏÏÏÏÏÏÏÏÏÏÏÏÏÏÏÏ 9 3 12
Charge in association with disposition from employee stock plans ÏÏÏÏÏÏÏÏÏÏ 75 Ì 75
$203 $ 18 $221
March 31, 2004
Federal ÏÏÏÏÏÏÏÏÏÏÏÏÏÏÏÏÏÏÏÏÏÏÏÏÏÏÏÏÏÏÏÏÏÏÏÏÏÏÏÏÏÏÏÏÏÏÏÏÏÏÏÏÏÏÏÏÏÏÏ $121 $ 28 $149
State ÏÏÏÏÏÏÏÏÏÏÏÏÏÏÏÏÏÏÏÏÏÏÏÏÏÏÏÏÏÏÏÏÏÏÏÏÏÏÏÏÏÏÏÏÏÏÏÏÏÏÏÏÏÏÏÏÏÏÏÏÏ 4 (15) (11)
Foreign ÏÏÏÏÏÏÏÏÏÏÏÏÏÏÏÏÏÏÏÏÏÏÏÏÏÏÏÏÏÏÏÏÏÏÏÏÏÏÏÏÏÏÏÏÏÏÏÏÏÏÏÏÏÏÏÏÏÏÏ 18 (5) 13
Charge in association with disposition from employee stock plans ÏÏÏÏÏÏÏÏÏÏ 69 Ì 69
$212 $ 8 $220
Our current income tax beneÑt for Ñscal 2006 reÖects a $73 million reduction we recorded during Ñscal
year following a recent U.S. Tax Court ruling regarding the proper allocation of the tax deduction for stock
options between U.S. and foreign entities. Although the Tax Court ruling remains subject to appeal, as a
precedent, it is relevant to our situation. Accordingly, we released a reserve of $73 million during Ñscal
2006, whereby, we recorded a reduction to our income tax payable and an increase to additional paid-in
capital with no impact to net income.
94
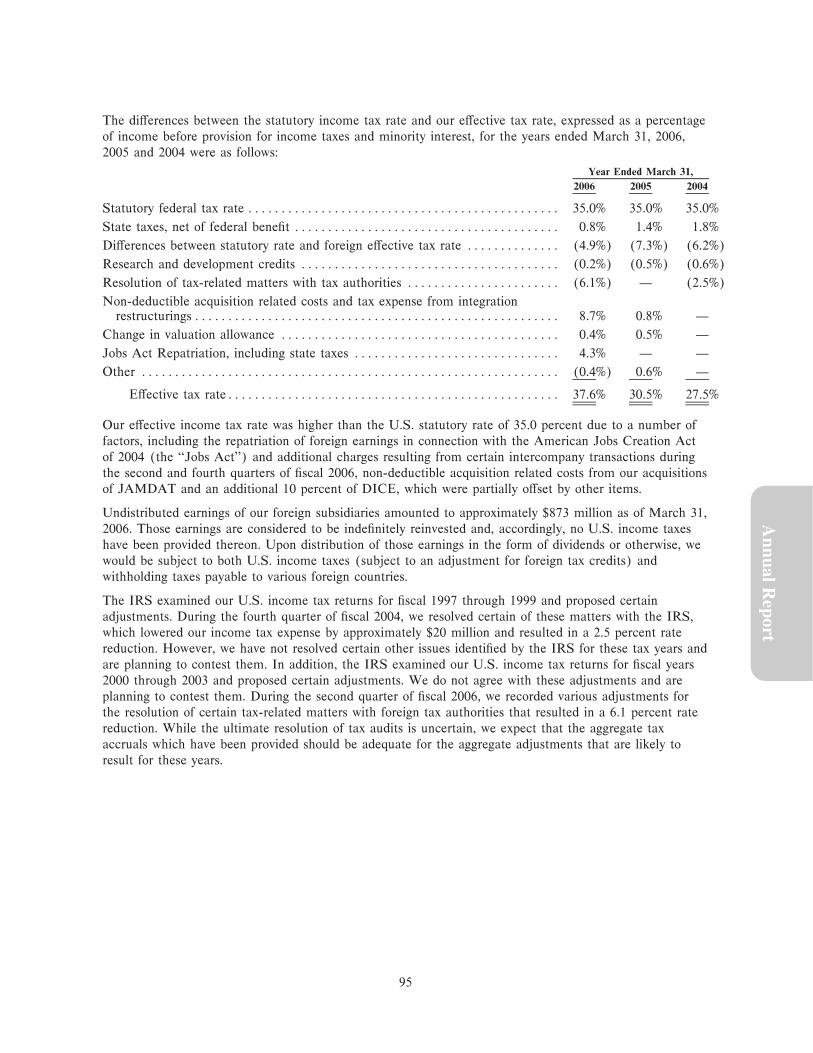
The diÅerences between the statutory income tax rate and our eÅective tax rate, expressed as a percentage
of income before provision for income taxes and minority interest, for the years ended March 31, 2006,
2005 and 2004 were as follows:
Year Ended March 31,
2006 2005 2004
Statutory federal tax rate ÏÏÏÏÏÏÏÏÏÏÏÏÏÏÏÏÏÏÏÏÏÏÏÏÏÏÏÏÏÏÏÏÏÏÏÏÏÏÏÏÏÏÏÏÏÏÏ 35.0% 35.0% 35.0%
State taxes, net of federal beneÑt ÏÏÏÏÏÏÏÏÏÏÏÏÏÏÏÏÏÏÏÏÏÏÏÏÏÏÏÏÏÏÏÏÏÏÏÏÏÏÏÏ 0.8% 1.4% 1.8%
DiÅerences between statutory rate and foreign eÅective tax rate ÏÏÏÏÏÏÏÏÏÏÏÏÏÏ (4.9%) (7.3%) (6.2%)
Research and development credits ÏÏÏÏÏÏÏÏÏÏÏÏÏÏÏÏÏÏÏÏÏÏÏÏÏÏÏÏÏÏÏÏÏÏÏÏÏÏÏ (0.2%) (0.5%) (0.6%)
Resolution of tax-related matters with tax authorities ÏÏÏÏÏÏÏÏÏÏÏÏÏÏÏÏÏÏÏÏÏÏÏ (6.1%) Ì (2.5%)
Non-deductible acquisition related costs and tax expense from integrationrestructurings ÏÏÏÏÏÏÏÏÏÏÏÏÏÏÏÏÏÏÏÏÏÏÏÏÏÏÏÏÏÏÏÏÏÏÏÏÏÏÏÏÏÏÏÏÏÏÏÏÏÏÏÏÏÏÏ 8.7% 0.8% Ì
Change in valuation allowance ÏÏÏÏÏÏÏÏÏÏÏÏÏÏÏÏÏÏÏÏÏÏÏÏÏÏÏÏÏÏÏÏÏÏÏÏÏÏÏÏÏÏ 0.4% 0.5% Ì
Jobs Act Repatriation, including state taxes ÏÏÏÏÏÏÏÏÏÏÏÏÏÏÏÏÏÏÏÏÏÏÏÏÏÏÏÏÏÏÏ 4.3% Ì Ì
Other ÏÏÏÏÏÏÏÏÏÏÏÏÏÏÏÏÏÏÏÏÏÏÏÏÏÏÏÏÏÏÏÏÏÏÏÏÏÏÏÏÏÏÏÏÏÏÏÏÏÏÏÏÏÏÏÏÏÏÏÏÏÏÏ (0.4%) 0.6% Ì
EÅective tax rateÏÏÏÏÏÏÏÏÏÏÏÏÏÏÏÏÏÏÏÏÏÏÏÏÏÏÏÏÏÏÏÏÏÏÏÏÏÏÏÏÏÏÏÏÏÏÏÏÏÏ 37.6% 30.5% 27.5%
Our eÅective income tax rate was higher than the U.S. statutory rate of 35.0 percent due to a number of
factors, including the repatriation of foreign earnings in connection with the American Jobs Creation Act
of 2004 (the ""Jobs Act'') and additional charges resulting from certain intercompany transactions during
the second and fourth quarters of Ñscal 2006, non-deductible acquisition related costs from our acquisitions
of JAMDAT and an additional 10 percent of DICE, which were partially oÅset by other items.
Undistributed earnings of our foreign subsidiaries amounted to approximately $873 million as of March 31,
2006. Those earnings are considered to be indeÑnitely reinvested and, accordingly, no U.S. income taxes
have been provided thereon. Upon distribution of those earnings in the form of dividends or otherwise, we
would be subject to both U.S. income taxes (subject to an adjustment for foreign tax credits) and
withholding taxes payable to various foreign countries.
The IRS examined our U.S. income tax returns for Ñscal 1997 through 1999 and proposed certain
adjustments. During the fourth quarter of Ñscal 2004, we resolved certain of these matters with the IRS,
which lowered our income tax expense by approximately $20 million and resulted in a 2.5 percent rate
reduction. However, we have not resolved certain other issues identiÑed by the IRS for these tax years and
are planning to contest them. In addition, the IRS examined our U.S. income tax returns for Ñscal years
Annual R
eport
2000 through 2003 and proposed certain adjustments. We do not agree with these adjustments and are
planning to contest them. During the second quarter of Ñscal 2006, we recorded various adjustments for
the resolution of certain tax-related matters with foreign tax authorities that resulted in a 6.1 percent rate
reduction. While the ultimate resolution of tax audits is uncertain, we expect that the aggregate tax
accruals which have been provided should be adequate for the aggregate adjustments that are likely to
result for these years.
95

The components of the net deferred tax assets as of March 31, 2006 and 2005 consisted of (in millions):
As ofMarch 31,
2006 2005
Deferred tax assets:
Accruals, reserves and other expenses ÏÏÏÏÏÏÏÏÏÏÏÏÏÏÏÏÏÏÏÏÏÏÏÏÏÏÏÏÏÏÏÏÏÏÏÏÏÏÏÏÏÏÏÏ $103 $ 78
Tax credit carryforwards ÏÏÏÏÏÏÏÏÏÏÏÏÏÏÏÏÏÏÏÏÏÏÏÏÏÏÏÏÏÏÏÏÏÏÏÏÏÏÏÏÏÏÏÏÏÏÏÏÏÏÏÏÏÏÏ 26 42
AmortizationÏÏÏÏÏÏÏÏÏÏÏÏÏÏÏÏÏÏÏÏÏÏÏÏÏÏÏÏÏÏÏÏÏÏÏÏÏÏÏÏÏÏÏÏÏÏÏÏÏÏÏÏÏÏÏÏÏÏÏÏÏÏÏÏÏ Ì 23
Unrealized loss on marketable equity securities ÏÏÏÏÏÏÏÏÏÏÏÏÏÏÏÏÏÏÏÏÏÏÏÏÏÏÏÏÏÏÏÏÏÏÏÏ 3 8
Net operating loss & capital loss carryforwards ÏÏÏÏÏÏÏÏÏÏÏÏÏÏÏÏÏÏÏÏÏÏÏÏÏÏÏÏÏÏÏÏÏÏÏÏ 4 1
Total ÏÏÏÏÏÏÏÏÏÏÏÏÏÏÏÏÏÏÏÏÏÏÏÏÏÏÏÏÏÏÏÏÏÏÏÏÏÏÏÏÏÏÏÏÏÏÏÏÏÏÏÏÏÏÏÏÏÏÏÏÏÏÏÏÏÏÏÏÏ 136 152
Valuation allowanceÏÏÏÏÏÏÏÏÏÏÏÏÏÏÏÏÏÏÏÏÏÏÏÏÏÏÏÏÏÏÏÏÏÏÏÏÏÏÏÏÏÏÏÏÏÏÏÏÏÏÏÏÏÏÏÏÏÏÏ (6) (11)
Deferred tax asset net of valuation allowanceÏÏÏÏÏÏÏÏÏÏÏÏÏÏÏÏÏÏÏÏÏÏÏÏÏÏÏÏÏÏÏÏÏÏÏÏ 130 141
Deferred tax liabilities:
Depreciation ÏÏÏÏÏÏÏÏÏÏÏÏÏÏÏÏÏÏÏÏÏÏÏÏÏÏÏÏÏÏÏÏÏÏÏÏÏÏÏÏÏÏÏÏÏÏÏÏÏÏÏÏÏÏÏÏÏÏÏÏÏÏÏÏÏ (40) (26)
AmortizationÏÏÏÏÏÏÏÏÏÏÏÏÏÏÏÏÏÏÏÏÏÏÏÏÏÏÏÏÏÏÏÏÏÏÏÏÏÏÏÏÏÏÏÏÏÏÏÏÏÏÏÏÏÏÏÏÏÏÏÏÏÏÏÏÏ (27) Ì
Other ÏÏÏÏÏÏÏÏÏÏÏÏÏÏÏÏÏÏÏÏÏÏÏÏÏÏÏÏÏÏÏÏÏÏÏÏÏÏÏÏÏÏÏÏÏÏÏÏÏÏÏÏÏÏÏÏÏÏÏÏÏÏÏÏÏÏÏÏÏÏÏ (6) (10)
Total ÏÏÏÏÏÏÏÏÏÏÏÏÏÏÏÏÏÏÏÏÏÏÏÏÏÏÏÏÏÏÏÏÏÏÏÏÏÏÏÏÏÏÏÏÏÏÏÏÏÏÏÏÏÏÏÏÏÏÏÏÏÏÏÏÏÏÏÏÏ (73) (36)
Net deferred tax asset ÏÏÏÏÏÏÏÏÏÏÏÏÏÏÏÏÏÏÏÏÏÏÏÏÏÏÏÏÏÏÏÏÏÏÏÏÏÏÏÏÏÏÏÏÏÏÏÏÏÏÏÏÏÏÏ $ 57 $105
As of March 31, 2006, net deferred tax assets of $86 million were classiÑed as current assets and deferred
tax liabilities of $29 million were classiÑed as long-term liabilities. As of March 31, 2005, net deferred tax
assets of $86 million and $19 million were classiÑed as current assets and long-term assets, respectively.
Of the tax credit carryforwards as of March 31, 2006, we have research and development tax credit
carryforwards of approximately $40 million for California purposes, which can be carried forward
indeÑnitely. The state tax credit carryforwards are valued at $26 million, net of federal beneÑts.
In the fourth quarter of Ñscal 2006, we repatriated $375 million of foreign earnings to take advantage of
the favorable provisions of the Jobs Act. Under the Jobs Act, the qualifying portion of this repatriation
was eligible for a temporary 85 percent dividends received deduction on certain foreign earnings.
Accordingly, we recorded tax expense in Ñscal 2006 of $17 million related to this repatriation.
In July 2005, the FASB issued an exposure draft of a proposed interpretation of SFAS No. 109,
""Accounting for Income Taxes'' which addresses the accounting for uncertain tax positions. Including
subsequent updates issued by the FASB, the proposed interpretation provides that the best estimate of the
impact of a tax position would be recognized in an entity's Ñnancial statements only if it is more likely
than not that the position will be sustained on audit based solely on its technical merits. This proposed
interpretation also would provide guidance on recognition and measurement, balance sheet presentation,
disclosure, accrual of interest and penalties, accounting in interim periods and transition. We cannot
predict what actions the FASB will take or how any such actions might ultimately aÅect our Ñnancial
position or results of operations. In January 2006, the FASB announced that companies would not have to
apply the proposed interpretation until Ñscal years beginning after December 31, 2006. An exposure draft
of proposed amendments to SFAS No. 109 is expected in the third quarter of calendar year 2006.
96

(11) STOCKHOLDERS' EQUITY
(a) Preferred Stock
As of March 31, 2006 and 2005, we had 10,000,000 shares of preferred stock authorized but unissued. The
rights, preferences, and restrictions of the preferred stock may be designated by the Board of Directors
without further action by our stockholders.
(b) Common Stock
On March 22, 2000, our stockholders authorized the issuance of a new series of common stock, designated
as Class B common stock (""Tracking Stock''). The Tracking Stock was intended to reÖect the
performance of the EA.com online games business segment. As a result of the approval of the Tracking
Stock proposal, our existing common stock was re-classiÑed as Class A common stock and was intended to
reÖect the performance of our core console and PC business segment. With the authorization of the
Class B common stock, we transferred a portion of our consolidated assets, liabilities, revenue, expenses
and cash Öows to EA.com Inc., a wholly-owned subsidiary of Electronic Arts.
In March 2003, we consolidated the operations of EA.com back into our core operations in order to
increase eÇciency, simplify our reporting structure and more directly integrate our online activities into our
core console and PC business. As a result, we eliminated dual class reporting starting in Ñscal 2004. The
majority of outstanding Class B options and warrants not directly held by us were acquired or converted to
common stock and warrants.
At our Annual Meeting of Stockholders, held on July 29, 2004, our stockholders approved an amendment
and restatement of our CertiÑcate of Incorporation to (1) consolidate our Class A and Class B common
stock into a single class of common stock by reclassifying each outstanding share of Class A common
stock as one share of common stock and converting each outstanding share of Class B common stock into
0.001 share of common stock, and (2) increase the authorized common stock from 500 million total
shares of Class A and Class B common stock combined to 1 billion shares of the newly consolidated single
class of common stock.
(c) Share Repurchase Program
On October 18, 2004, our Board of Directors authorized a program to repurchase up to an aggregate of
$750 million of our common stock. We completed the repurchase program in September 2005. We
repurchased and retired the following (in millions):
Annual R
eport
Number ofShares
Repurchased Approximateand Retired Amount
From the inception of the program through March 31, 2005 ÏÏÏÏÏÏÏÏÏÏÏÏÏÏÏÏÏ 0.8 $ 41
Six months ended September 30, 2005 ÏÏÏÏÏÏÏÏÏÏÏÏÏÏÏÏÏÏÏÏÏÏÏÏÏÏÏÏÏÏÏÏÏÏÏ 12.6 709
From the inception of the program through September 30, 2005 ÏÏÏÏÏÏÏÏÏÏÏÏÏÏ 13.4 $750
(12) EMPLOYEE BENEFIT AND STOCK-BASED COMPENSATION PLANS
(a) Employee Stock Purchase Plan
Since September 1991, we have oÅered our employees the ability to participate in an employee stock
purchase plan. Pursuant to our current plan, the 2000 Employee Stock Purchase Plan, eligible employees
may authorize payroll deductions of up to 10 percent of their compensation to purchase shares at
85 percent of the lower of the fair market value of the common stock on the date of commencement of
the oÅering or on the last day of the six-month purchase period.
97

At our Annual Meeting of Stockholders, held on July 28, 2005, our stockholders approved an amendment
to the 2000 Employee Stock Purchase Plan to increase by 1.5 million the number of shares of common
stock reserved for issuance under the plan.
Information related to stock issuances under this plan is as follows:
Year Ended March 31,
2006 2005 2004
Number of shares issued (in thousands) ÏÏÏÏÏÏÏÏÏÏÏÏÏÏÏÏÏÏÏÏÏÏÏÏÏ 625 624 867
Range of exercise prices for purchase rights ÏÏÏÏÏÏÏÏÏÏÏÏÏÏÏÏÏÏÏÏÏÏ $42.31 to $38.14 to $22.44 to$47.95 $51.35 $38.14
Estimated weighted-average fair value of purchase rights ÏÏÏÏÏÏÏÏÏÏÏ $15.42 $13.96 $9.53
The fair value above was estimated on the date of grant using the Black-Scholes option-pricing model
assumptions described in Note 1(o) of the Notes to Consolidated Financial Statements. As of March 31,
2006, we had approximately 2.3 million shares of common stock reserved for future issuance under the
2000 Employee Stock Purchase Plan.
(b) Stock Option Plans
Our 2000 Equity Incentive Plan (the ""Equity Plan'') allows us to grant options to purchase our common
stock, restricted stock and restricted stock units to our employees, oÇcers and directors. Pursuant to the
Equity Plan, incentive stock options may be granted to employees and oÇcers and non-qualiÑed options
may be granted to employees, oÇcers and directors, at not less than 100 percent of the fair market value
on the date of grant.
At our Annual Meeting of Stockholders, held on July 28, 2005, our stockholders approved an amendment
to our 2000 Equity Incentive Plan to (a) increase the number of shares authorized by 10 million,
(b) authorize the issuance of awards of stock appreciation rights, (c) increase by 1 million shares the limit
on the total number of shares underlying awards of restricted stock and restricted stock units that may be
granted under the Equity Plan Ì from 3 million to 4 million shares, (d) modify the payment alternatives
under the Equity Plan, (e) add Öexibility to grant performance-based stock options and stock appreciation
rights and modify the permissible performance factors currently contained in the Equity Plan, and
(f) revise the share-counting methodology used in the Equity Plan.
We also have options outstanding that were granted under (1) the Criterion Software Limited Approved
Share Option Scheme (the ""Criterion Plan''), which we assumed in connection with our acquisition of
Criterion, and (2) the JAMDAT Mobile Inc. Amended and Restated 2000 Stock Incentive Plan and the
JAMDAT Mobile Inc. 2004 Equity Incentive Plan (collectively, the ""JAMDAT Plans''), which we
assumed in connection with our acquisition of JAMDAT. See Note 4 of the Notes to Consolidated
Financial Statements.
Options granted under the Equity Plan generally expire ten years from the date of grant and are generally
exercisable as to 24 percent of the shares after 12 months, and then the remainder ratably over 38 months.
All options granted under the Criterion Plan were exercisable as of March 31, 2005, and expire in January
2012. Certain assumed options granted under the JAMDAT Plans have acceleration rights upon the
occurrence of various triggering events. Otherwise, the terms of the JAMDAT Plans are similar to our
Equity Plan.
In connection with the consolidation of our Class A and Class B common stock into a single class of
common stock described above, each outstanding option to purchase one share of Class B common stock
was converted into an option to purchase 0.001 shares of common stock.
98

The following summarizes the activity under our common stock option plans during the Ñscal years ended
March 31, 2006, 2005 and 2004:
(In thousands, except weighted-average exercise price)
Options Outstanding
Weighted- Average
Number of ExerciseShares Price
Balance as of March 31, 2003ÏÏÏÏÏÏÏÏÏÏÏÏÏÏÏÏÏÏÏÏÏÏÏÏÏÏÏÏÏÏÏÏÏÏÏÏÏÏÏÏÏÏÏÏÏÏ 47,959 $22.19
Granted ÏÏÏÏÏÏÏÏÏÏÏÏÏÏÏÏÏÏÏÏÏÏÏÏÏÏÏÏÏÏÏÏÏÏÏÏÏÏÏÏÏÏÏÏÏÏÏÏÏÏÏÏÏÏÏÏÏÏÏÏÏÏÏÏ 9,182 45.38
Canceled ÏÏÏÏÏÏÏÏÏÏÏÏÏÏÏÏÏÏÏÏÏÏÏÏÏÏÏÏÏÏÏÏÏÏÏÏÏÏÏÏÏÏÏÏÏÏÏÏÏÏÏÏÏÏÏÏÏÏÏÏÏÏÏ (1,363) 28.71
Exercised ÏÏÏÏÏÏÏÏÏÏÏÏÏÏÏÏÏÏÏÏÏÏÏÏÏÏÏÏÏÏÏÏÏÏÏÏÏÏÏÏÏÏÏÏÏÏÏÏÏÏÏÏÏÏÏÏÏÏÏÏÏÏÏ (12,224) 17.10
Balance as of March 31, 2004ÏÏÏÏÏÏÏÏÏÏÏÏÏÏÏÏÏÏÏÏÏÏÏÏÏÏÏÏÏÏÏÏÏÏÏÏÏÏÏÏÏÏÏÏÏÏ 43,554 28.31
(18,477 shares were exercisable at a weighted-average price of $20.26)
Granted and Assumed(1) ÏÏÏÏÏÏÏÏÏÏÏÏÏÏÏÏÏÏÏÏÏÏÏÏÏÏÏÏÏÏÏÏÏÏÏÏÏÏÏÏÏÏÏÏÏÏÏÏÏÏ 9,091 58.89
Canceled ÏÏÏÏÏÏÏÏÏÏÏÏÏÏÏÏÏÏÏÏÏÏÏÏÏÏÏÏÏÏÏÏÏÏÏÏÏÏÏÏÏÏÏÏÏÏÏÏÏÏÏÏÏÏÏÏÏÏÏÏÏÏÏ (2,422) 35.18
Exercised ÏÏÏÏÏÏÏÏÏÏÏÏÏÏÏÏÏÏÏÏÏÏÏÏÏÏÏÏÏÏÏÏÏÏÏÏÏÏÏÏÏÏÏÏÏÏÏÏÏÏÏÏÏÏÏÏÏÏÏÏÏÏÏ (9,271) 23.26
Balance as of March 31, 2005ÏÏÏÏÏÏÏÏÏÏÏÏÏÏÏÏÏÏÏÏÏÏÏÏÏÏÏÏÏÏÏÏÏÏÏÏÏÏÏÏÏÏÏÏÏÏ 40,952 35.82
(19,100 shares were exercisable at a weighted-average price of $24.58)
Granted and Assumed(2) ÏÏÏÏÏÏÏÏÏÏÏÏÏÏÏÏÏÏÏÏÏÏÏÏÏÏÏÏÏÏÏÏÏÏÏÏÏÏÏÏÏÏÏÏÏÏÏÏÏÏ 9,455 52.44
Canceled ÏÏÏÏÏÏÏÏÏÏÏÏÏÏÏÏÏÏÏÏÏÏÏÏÏÏÏÏÏÏÏÏÏÏÏÏÏÏÏÏÏÏÏÏÏÏÏÏÏÏÏÏÏÏÏÏÏÏÏÏÏÏÏ (2,976) 50.11
Exercised ÏÏÏÏÏÏÏÏÏÏÏÏÏÏÏÏÏÏÏÏÏÏÏÏÏÏÏÏÏÏÏÏÏÏÏÏÏÏÏÏÏÏÏÏÏÏÏÏÏÏÏÏÏÏÏÏÏÏÏÏÏÏÏ (6,549) 27.11
Balance as of March 31, 2006ÏÏÏÏÏÏÏÏÏÏÏÏÏÏÏÏÏÏÏÏÏÏÏÏÏÏÏÏÏÏÏÏÏÏÏÏÏÏÏÏÏÏÏÏÏÏ 40,882 $40.02
(22,478 shares were exercisable at a weighted-average price of $29.88)
Options available for grant as of March 31, 2006ÏÏÏÏÏÏÏÏÏÏÏÏÏÏÏÏÏÏÏÏÏÏÏÏÏÏÏÏÏÏ 17,449
(1) We assumed options to purchase approximately 128,000 shares of our common stock as part of our
acquisition of Criterion.
(2) We assumed options to purchase approximately 1,878,000 shares of our common stock as part of our
acquisition of JAMDAT.
Annual R
eport
The following summarizes the activity under our Class B stock option plan during the Ñscal years ended
March 31, 2005 and 2004:
(In thousands, except weighted-average exercise price)
Options Outstanding
Weighted- Average
Number Exerciseof Shares Price
Balance as of March 31, 2003ÏÏÏÏÏÏÏÏÏÏÏÏÏÏÏÏÏÏÏÏÏÏÏÏÏÏÏÏÏÏÏÏÏÏÏÏÏÏÏÏÏÏÏÏÏÏÏ 2,122 10.30
(1,470,855 shares were exercisable at a weighted-average price of $10.03)
Canceled ÏÏÏÏÏÏÏÏÏÏÏÏÏÏÏÏÏÏÏÏÏÏÏÏÏÏÏÏÏÏÏÏÏÏÏÏÏÏÏÏÏÏÏÏÏÏÏÏÏÏÏÏÏÏÏÏÏÏÏÏÏÏÏÏ (2,087) 10.38
Balance as of March 31, 2004ÏÏÏÏÏÏÏÏÏÏÏÏÏÏÏÏÏÏÏÏÏÏÏÏÏÏÏÏÏÏÏÏÏÏÏÏÏÏÏÏÏÏÏÏÏÏÏ 35 9.11
Canceled ÏÏÏÏÏÏÏÏÏÏÏÏÏÏÏÏÏÏÏÏÏÏÏÏÏÏÏÏÏÏÏÏÏÏÏÏÏÏÏÏÏÏÏÏÏÏÏÏÏÏÏÏÏÏÏÏÏÏÏÏÏÏÏÏ (35) 9.11
Balance as of March 31, 2005 and March 31, 2006ÏÏÏÏÏÏÏÏÏÏÏÏÏÏÏÏÏÏÏÏÏÏÏÏÏÏÏÏÏ Ì $ Ì
Options available for grant as of March 31, 2006ÏÏÏÏÏÏÏÏÏÏÏÏÏÏÏÏÏÏÏÏÏÏÏÏÏÏÏÏÏÏÏ Ì
99
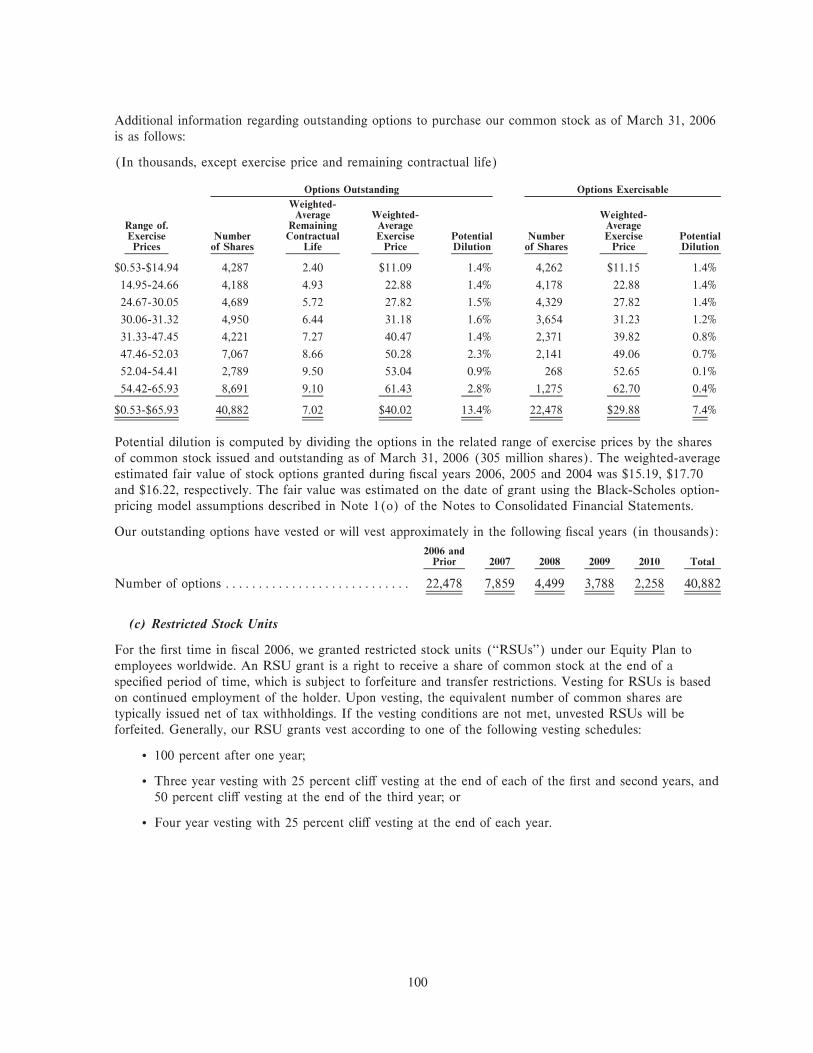
Additional information regarding outstanding options to purchase our common stock as of March 31, 2006
is as follows:
(In thousands, except exercise price and remaining contractual life)
Options Outstanding Options Exercisable
Weighted-Average Weighted- Weighted-
Range of. Remaining Average AverageExercise Number Contractual Exercise Potential Number Exercise PotentialPrices of Shares Life Price Dilution of Shares Price Dilution
$0.53-$14.94 4,287 2.40 $11.09 1.4% 4,262 $11.15 1.4%
14.95-24.66 4,188 4.93 22.88 1.4% 4,178 22.88 1.4%
24.67-30.05 4,689 5.72 27.82 1.5% 4,329 27.82 1.4%
30.06-31.32 4,950 6.44 31.18 1.6% 3,654 31.23 1.2%
31.33-47.45 4,221 7.27 40.47 1.4% 2,371 39.82 0.8%
47.46-52.03 7,067 8.66 50.28 2.3% 2,141 49.06 0.7%
52.04-54.41 2,789 9.50 53.04 0.9% 268 52.65 0.1%
54.42-65.93 8,691 9.10 61.43 2.8% 1,275 62.70 0.4%
$0.53-$65.93 40,882 7.02 $40.02 13.4% 22,478 $29.88 7.4%
Potential dilution is computed by dividing the options in the related range of exercise prices by the shares
of common stock issued and outstanding as of March 31, 2006 (305 million shares). The weighted-average
estimated fair value of stock options granted during Ñscal years 2006, 2005 and 2004 was $15.19, $17.70
and $16.22, respectively. The fair value was estimated on the date of grant using the Black-Scholes option-
pricing model assumptions described in Note 1(o) of the Notes to Consolidated Financial Statements.
Our outstanding options have vested or will vest approximately in the following Ñscal years (in thousands):
2006 andPrior 2007 2008 2009 2010 Total
Number of options ÏÏÏÏÏÏÏÏÏÏÏÏÏÏÏÏÏÏÏÏÏÏÏÏÏÏÏÏ 22,478 7,859 4,499 3,788 2,258 40,882
(c) Restricted Stock Units
For the Ñrst time in Ñscal 2006, we granted restricted stock units (""RSUs'') under our Equity Plan to
employees worldwide. An RSU grant is a right to receive a share of common stock at the end of a
speciÑed period of time, which is subject to forfeiture and transfer restrictions. Vesting for RSUs is based
on continued employment of the holder. Upon vesting, the equivalent number of common shares are
typically issued net of tax withholdings. If the vesting conditions are not met, unvested RSUs will be
forfeited. Generally, our RSU grants vest according to one of the following vesting schedules:
‚ 100 percent after one year;
‚ Three year vesting with 25 percent cliÅ vesting at the end of each of the Ñrst and second years, and
50 percent cliÅ vesting at the end of the third year; or
‚ Four year vesting with 25 percent cliÅ vesting at the end of each year.
100
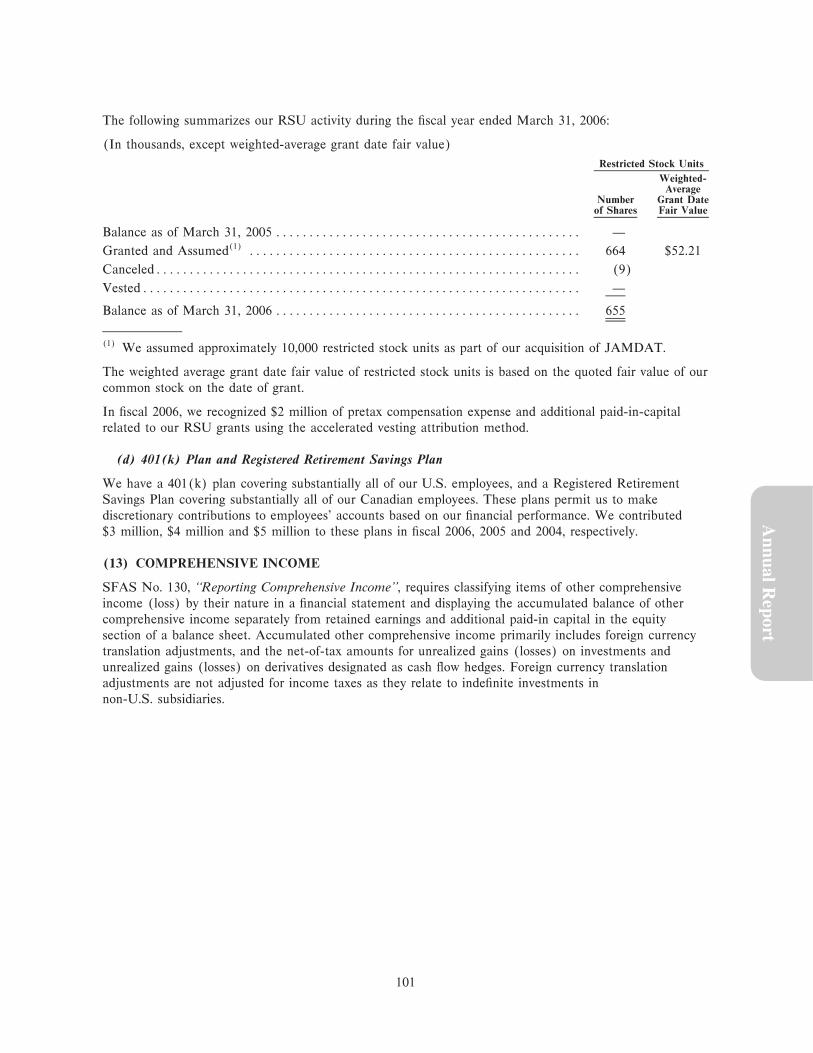
The following summarizes our RSU activity during the Ñscal year ended March 31, 2006:
(In thousands, except weighted-average grant date fair value)
Restricted Stock Units
Weighted-Average
Number Grant Dateof Shares Fair Value
Balance as of March 31, 2005 ÏÏÏÏÏÏÏÏÏÏÏÏÏÏÏÏÏÏÏÏÏÏÏÏÏÏÏÏÏÏÏÏÏÏÏÏÏÏÏÏÏÏÏÏÏÏ Ì
Granted and Assumed(1) ÏÏÏÏÏÏÏÏÏÏÏÏÏÏÏÏÏÏÏÏÏÏÏÏÏÏÏÏÏÏÏÏÏÏÏÏÏÏÏÏÏÏÏÏÏÏÏÏÏÏ 664 $52.21
CanceledÏÏÏÏÏÏÏÏÏÏÏÏÏÏÏÏÏÏÏÏÏÏÏÏÏÏÏÏÏÏÏÏÏÏÏÏÏÏÏÏÏÏÏÏÏÏÏÏÏÏÏÏÏÏÏÏÏÏÏÏÏÏÏÏ (9)
VestedÏÏÏÏÏÏÏÏÏÏÏÏÏÏÏÏÏÏÏÏÏÏÏÏÏÏÏÏÏÏÏÏÏÏÏÏÏÏÏÏÏÏÏÏÏÏÏÏÏÏÏÏÏÏÏÏÏÏÏÏÏÏÏÏÏÏ Ì
Balance as of March 31, 2006 ÏÏÏÏÏÏÏÏÏÏÏÏÏÏÏÏÏÏÏÏÏÏÏÏÏÏÏÏÏÏÏÏÏÏÏÏÏÏÏÏÏÏÏÏÏÏ 655
(1) We assumed approximately 10,000 restricted stock units as part of our acquisition of JAMDAT.
The weighted average grant date fair value of restricted stock units is based on the quoted fair value of our
common stock on the date of grant.
In Ñscal 2006, we recognized $2 million of pretax compensation expense and additional paid-in-capital
related to our RSU grants using the accelerated vesting attribution method.
(d) 401(k) Plan and Registered Retirement Savings Plan
We have a 401(k) plan covering substantially all of our U.S. employees, and a Registered Retirement
Savings Plan covering substantially all of our Canadian employees. These plans permit us to make
discretionary contributions to employees' accounts based on our Ñnancial performance. We contributed
$3 million, $4 million and $5 million to these plans in Ñscal 2006, 2005 and 2004, respectively.
(13) COMPREHENSIVE INCOME
SFAS No. 130, ""Reporting Comprehensive Income'', requires classifying items of other comprehensive
income (loss) by their nature in a Ñnancial statement and displaying the accumulated balance of other
comprehensive income separately from retained earnings and additional paid-in capital in the equity
section of a balance sheet. Accumulated other comprehensive income primarily includes foreign currency
translation adjustments, and the net-of-tax amounts for unrealized gains (losses) on investments and
unrealized gains (losses) on derivatives designated as cash Öow hedges. Foreign currency translation
Annual R
eport
adjustments are not adjusted for income taxes as they relate to indeÑnite investments in
non-U.S. subsidiaries.
101
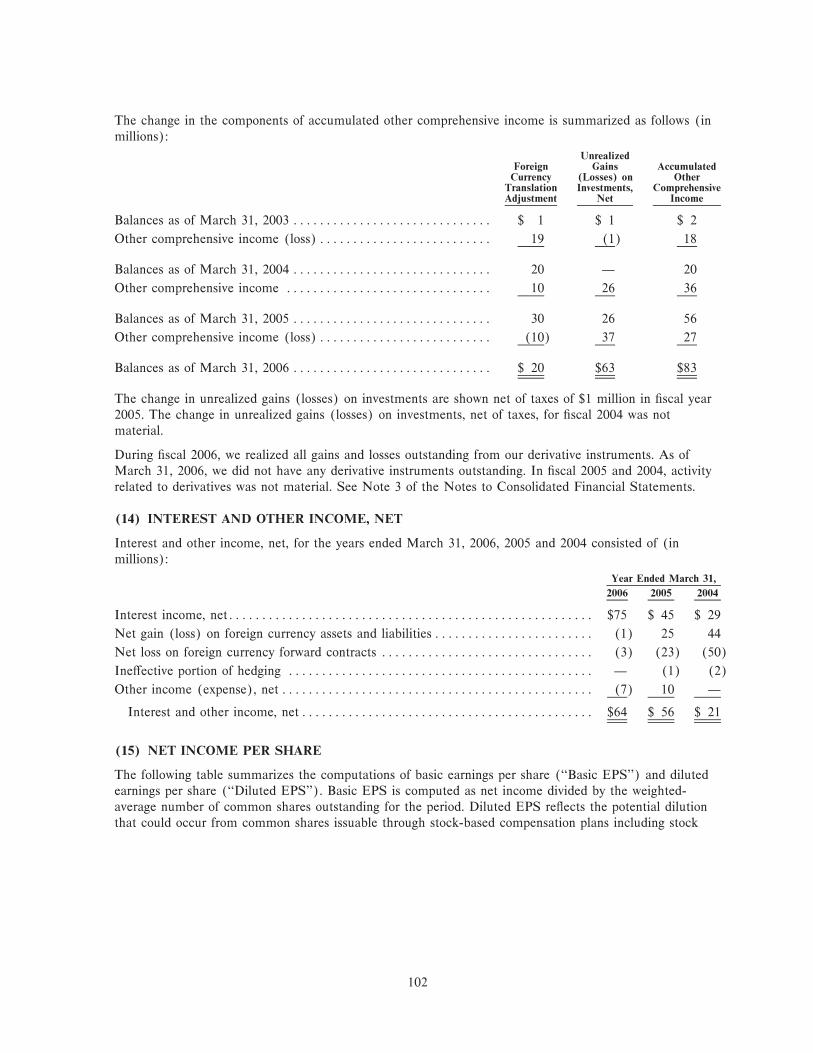
The change in the components of accumulated other comprehensive income is summarized as follows (in
millions):
UnrealizedForeign Gains AccumulatedCurrency (Losses) on Other
Translation Investments, ComprehensiveAdjustment Net Income
Balances as of March 31, 2003 ÏÏÏÏÏÏÏÏÏÏÏÏÏÏÏÏÏÏÏÏÏÏÏÏÏÏÏÏÏÏ $ 1 $ 1 $ 2
Other comprehensive income (loss)ÏÏÏÏÏÏÏÏÏÏÏÏÏÏÏÏÏÏÏÏÏÏÏÏÏÏ 19 (1) 18
Balances as of March 31, 2004 ÏÏÏÏÏÏÏÏÏÏÏÏÏÏÏÏÏÏÏÏÏÏÏÏÏÏÏÏÏÏ 20 Ì 20
Other comprehensive income ÏÏÏÏÏÏÏÏÏÏÏÏÏÏÏÏÏÏÏÏÏÏÏÏÏÏÏÏÏÏÏ 10 26 36
Balances as of March 31, 2005 ÏÏÏÏÏÏÏÏÏÏÏÏÏÏÏÏÏÏÏÏÏÏÏÏÏÏÏÏÏÏ 30 26 56
Other comprehensive income (loss)ÏÏÏÏÏÏÏÏÏÏÏÏÏÏÏÏÏÏÏÏÏÏÏÏÏÏ (10) 37 27
Balances as of March 31, 2006 ÏÏÏÏÏÏÏÏÏÏÏÏÏÏÏÏÏÏÏÏÏÏÏÏÏÏÏÏÏÏ $ 20 $63 $83
The change in unrealized gains (losses) on investments are shown net of taxes of $1 million in Ñscal year
2005. The change in unrealized gains (losses) on investments, net of taxes, for Ñscal 2004 was not
material.
During Ñscal 2006, we realized all gains and losses outstanding from our derivative instruments. As of
March 31, 2006, we did not have any derivative instruments outstanding. In Ñscal 2005 and 2004, activity
related to derivatives was not material. See Note 3 of the Notes to Consolidated Financial Statements.
(14) INTEREST AND OTHER INCOME, NET
Interest and other income, net, for the years ended March 31, 2006, 2005 and 2004 consisted of (in
millions):
Year Ended March 31,
2006 2005 2004
Interest income, netÏÏÏÏÏÏÏÏÏÏÏÏÏÏÏÏÏÏÏÏÏÏÏÏÏÏÏÏÏÏÏÏÏÏÏÏÏÏÏÏÏÏÏÏÏÏÏÏÏÏÏÏÏÏÏ $75 $ 45 $ 29
Net gain (loss) on foreign currency assets and liabilities ÏÏÏÏÏÏÏÏÏÏÏÏÏÏÏÏÏÏÏÏÏÏÏÏ (1) 25 44
Net loss on foreign currency forward contracts ÏÏÏÏÏÏÏÏÏÏÏÏÏÏÏÏÏÏÏÏÏÏÏÏÏÏÏÏÏÏÏÏ (3) (23) (50)
IneÅective portion of hedging ÏÏÏÏÏÏÏÏÏÏÏÏÏÏÏÏÏÏÏÏÏÏÏÏÏÏÏÏÏÏÏÏÏÏÏÏÏÏÏÏÏÏÏÏÏÏ Ì (1) (2)
Other income (expense), net ÏÏÏÏÏÏÏÏÏÏÏÏÏÏÏÏÏÏÏÏÏÏÏÏÏÏÏÏÏÏÏÏÏÏÏÏÏÏÏÏÏÏÏÏÏÏÏ (7) 10 Ì
Interest and other income, netÏÏÏÏÏÏÏÏÏÏÏÏÏÏÏÏÏÏÏÏÏÏÏÏÏÏÏÏÏÏÏÏÏÏÏÏÏÏÏÏÏÏÏÏ $64 $ 56 $ 21
(15) NET INCOME PER SHARE
The following table summarizes the computations of basic earnings per share (""Basic EPS'') and diluted
earnings per share (""Diluted EPS''). Basic EPS is computed as net income divided by the weighted-
average number of common shares outstanding for the period. Diluted EPS reÖects the potential dilution
that could occur from common shares issuable through stock-based compensation plans including stock
102
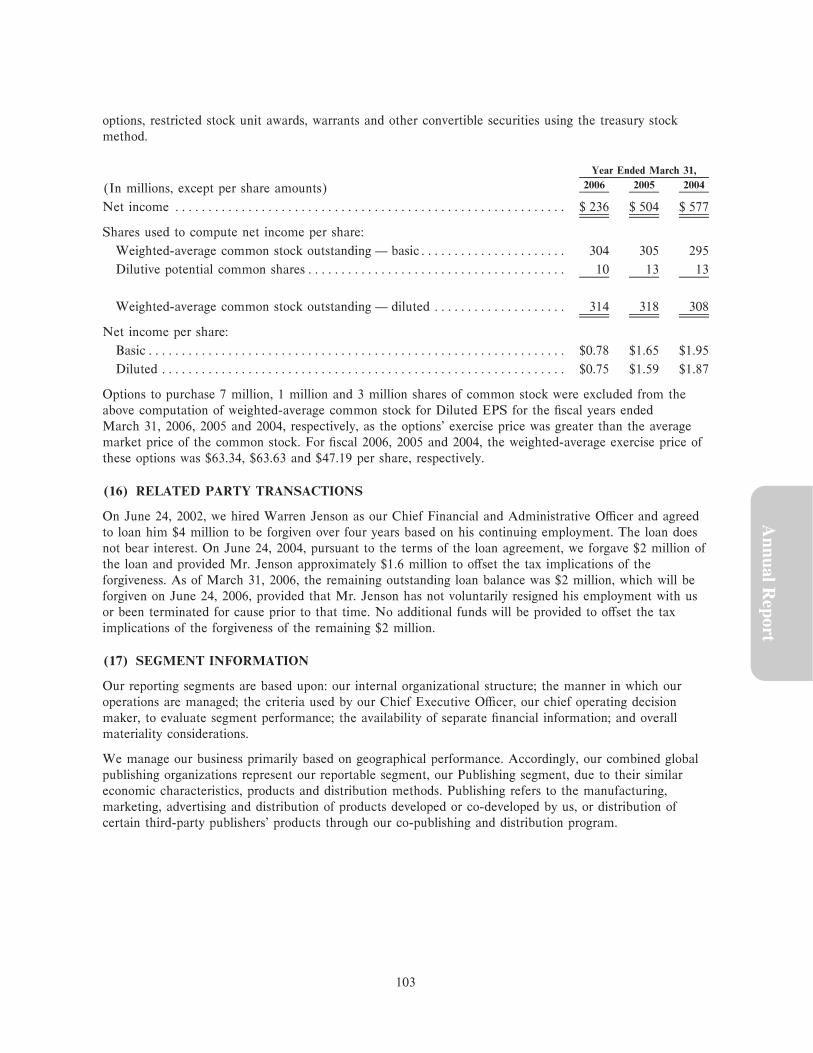
options, restricted stock unit awards, warrants and other convertible securities using the treasury stock
method.
Year Ended March 31,
2006 2005 2004(In millions, except per share amounts)
Net income ÏÏÏÏÏÏÏÏÏÏÏÏÏÏÏÏÏÏÏÏÏÏÏÏÏÏÏÏÏÏÏÏÏÏÏÏÏÏÏÏÏÏÏÏÏÏÏÏÏÏÏÏÏÏÏÏÏÏÏ $ 236 $ 504 $ 577
Shares used to compute net income per share:
Weighted-average common stock outstanding Ì basicÏÏÏÏÏÏÏÏÏÏÏÏÏÏÏÏÏÏÏÏÏÏ 304 305 295
Dilutive potential common sharesÏÏÏÏÏÏÏÏÏÏÏÏÏÏÏÏÏÏÏÏÏÏÏÏÏÏÏÏÏÏÏÏÏÏÏÏÏÏÏ 10 13 13
Weighted-average common stock outstanding Ì diluted ÏÏÏÏÏÏÏÏÏÏÏÏÏÏÏÏÏÏÏÏ 314 318 308
Net income per share:
BasicÏÏÏÏÏÏÏÏÏÏÏÏÏÏÏÏÏÏÏÏÏÏÏÏÏÏÏÏÏÏÏÏÏÏÏÏÏÏÏÏÏÏÏÏÏÏÏÏÏÏÏÏÏÏÏÏÏÏÏÏÏÏÏ $0.78 $1.65 $1.95
Diluted ÏÏÏÏÏÏÏÏÏÏÏÏÏÏÏÏÏÏÏÏÏÏÏÏÏÏÏÏÏÏÏÏÏÏÏÏÏÏÏÏÏÏÏÏÏÏÏÏÏÏÏÏÏÏÏÏÏÏÏÏÏ $0.75 $1.59 $1.87
Options to purchase 7 million, 1 million and 3 million shares of common stock were excluded from the
above computation of weighted-average common stock for Diluted EPS for the Ñscal years ended
March 31, 2006, 2005 and 2004, respectively, as the options' exercise price was greater than the average
market price of the common stock. For Ñscal 2006, 2005 and 2004, the weighted-average exercise price of
these options was $63.34, $63.63 and $47.19 per share, respectively.
(16) RELATED PARTY TRANSACTIONS
On June 24, 2002, we hired Warren Jenson as our Chief Financial and Administrative OÇcer and agreed
to loan him $4 million to be forgiven over four years based on his continuing employment. The loan does
not bear interest. On June 24, 2004, pursuant to the terms of the loan agreement, we forgave $2 million of
the loan and provided Mr. Jenson approximately $1.6 million to oÅset the tax implications of the
forgiveness. As of March 31, 2006, the remaining outstanding loan balance was $2 million, which will be
forgiven on June 24, 2006, provided that Mr. Jenson has not voluntarily resigned his employment with us
or been terminated for cause prior to that time. No additional funds will be provided to oÅset the tax
implications of the forgiveness of the remaining $2 million.
(17) SEGMENT INFORMATION
Annual R
eport
Our reporting segments are based upon: our internal organizational structure; the manner in which our
operations are managed; the criteria used by our Chief Executive OÇcer, our chief operating decision
maker, to evaluate segment performance; the availability of separate Ñnancial information; and overall
materiality considerations.
We manage our business primarily based on geographical performance. Accordingly, our combined global
publishing organizations represent our reportable segment, our Publishing segment, due to their similar
economic characteristics, products and distribution methods. Publishing refers to the manufacturing,
marketing, advertising and distribution of products developed or co-developed by us, or distribution of
certain third-party publishers' products through our co-publishing and distribution program.
103
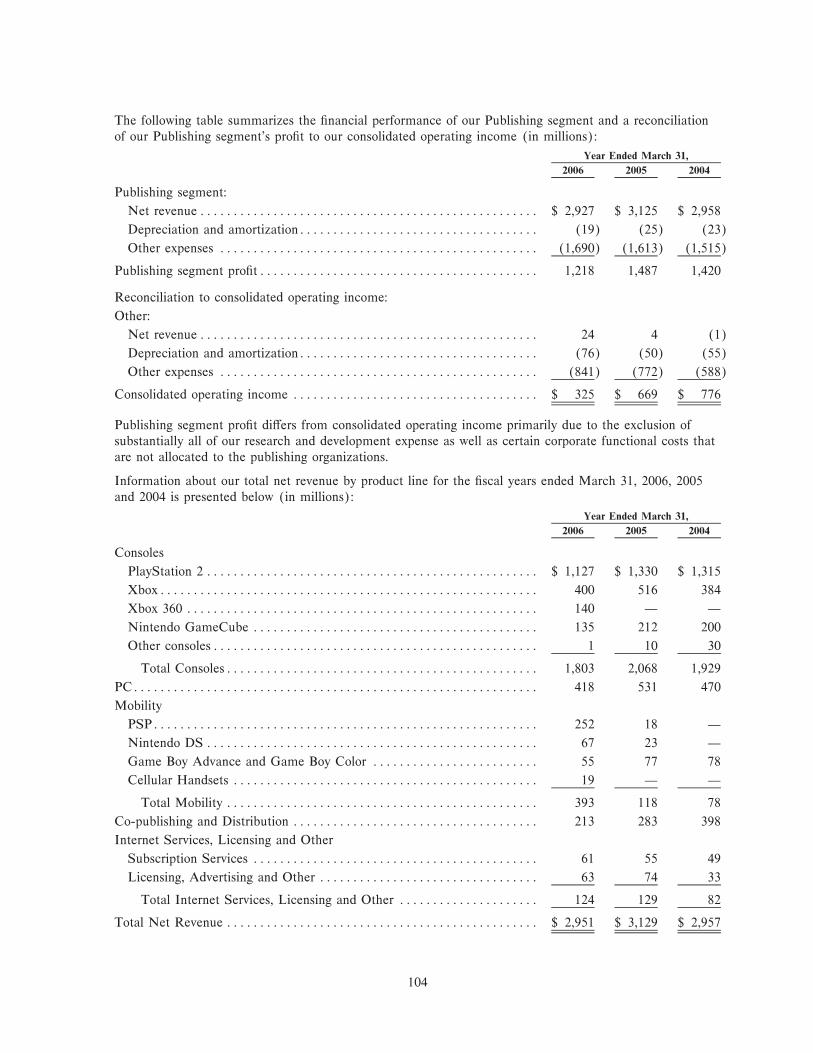
The following table summarizes the Ñnancial performance of our Publishing segment and a reconciliation
of our Publishing segment's proÑt to our consolidated operating income (in millions):
Year Ended March 31,
2006 2005 2004
Publishing segment:
Net revenueÏÏÏÏÏÏÏÏÏÏÏÏÏÏÏÏÏÏÏÏÏÏÏÏÏÏÏÏÏÏÏÏÏÏÏÏÏÏÏÏÏÏÏÏÏÏÏÏÏÏÏ $ 2,927 $ 3,125 $ 2,958
Depreciation and amortizationÏÏÏÏÏÏÏÏÏÏÏÏÏÏÏÏÏÏÏÏÏÏÏÏÏÏÏÏÏÏÏÏÏÏÏÏ (19) (25) (23)
Other expenses ÏÏÏÏÏÏÏÏÏÏÏÏÏÏÏÏÏÏÏÏÏÏÏÏÏÏÏÏÏÏÏÏÏÏÏÏÏÏÏÏÏÏÏÏÏÏÏÏ (1,690) (1,613) (1,515)
Publishing segment proÑtÏÏÏÏÏÏÏÏÏÏÏÏÏÏÏÏÏÏÏÏÏÏÏÏÏÏÏÏÏÏÏÏÏÏÏÏÏÏÏÏÏÏ 1,218 1,487 1,420
Reconciliation to consolidated operating income:
Other:
Net revenueÏÏÏÏÏÏÏÏÏÏÏÏÏÏÏÏÏÏÏÏÏÏÏÏÏÏÏÏÏÏÏÏÏÏÏÏÏÏÏÏÏÏÏÏÏÏÏÏÏÏÏ 24 4 (1)
Depreciation and amortizationÏÏÏÏÏÏÏÏÏÏÏÏÏÏÏÏÏÏÏÏÏÏÏÏÏÏÏÏÏÏÏÏÏÏÏÏ (76) (50) (55)
Other expenses ÏÏÏÏÏÏÏÏÏÏÏÏÏÏÏÏÏÏÏÏÏÏÏÏÏÏÏÏÏÏÏÏÏÏÏÏÏÏÏÏÏÏÏÏÏÏÏÏ (841) (772) (588)
Consolidated operating income ÏÏÏÏÏÏÏÏÏÏÏÏÏÏÏÏÏÏÏÏÏÏÏÏÏÏÏÏÏÏÏÏÏÏÏÏÏ $ 325 $ 669 $ 776
Publishing segment proÑt diÅers from consolidated operating income primarily due to the exclusion of
substantially all of our research and development expense as well as certain corporate functional costs that
are not allocated to the publishing organizations.
Information about our total net revenue by product line for the Ñscal years ended March 31, 2006, 2005
and 2004 is presented below (in millions):
Year Ended March 31,
2006 2005 2004
Consoles
PlayStation 2 ÏÏÏÏÏÏÏÏÏÏÏÏÏÏÏÏÏÏÏÏÏÏÏÏÏÏÏÏÏÏÏÏÏÏÏÏÏÏÏÏÏÏÏÏÏÏÏÏÏÏ $ 1,127 $ 1,330 $ 1,315
XboxÏÏÏÏÏÏÏÏÏÏÏÏÏÏÏÏÏÏÏÏÏÏÏÏÏÏÏÏÏÏÏÏÏÏÏÏÏÏÏÏÏÏÏÏÏÏÏÏÏÏÏÏÏÏÏÏÏ 400 516 384
Xbox 360 ÏÏÏÏÏÏÏÏÏÏÏÏÏÏÏÏÏÏÏÏÏÏÏÏÏÏÏÏÏÏÏÏÏÏÏÏÏÏÏÏÏÏÏÏÏÏÏÏÏÏÏÏÏ 140 Ì Ì
Nintendo GameCube ÏÏÏÏÏÏÏÏÏÏÏÏÏÏÏÏÏÏÏÏÏÏÏÏÏÏÏÏÏÏÏÏÏÏÏÏÏÏÏÏÏÏÏ 135 212 200
Other consolesÏÏÏÏÏÏÏÏÏÏÏÏÏÏÏÏÏÏÏÏÏÏÏÏÏÏÏÏÏÏÏÏÏÏÏÏÏÏÏÏÏÏÏÏÏÏÏÏÏ 1 10 30
Total ConsolesÏÏÏÏÏÏÏÏÏÏÏÏÏÏÏÏÏÏÏÏÏÏÏÏÏÏÏÏÏÏÏÏÏÏÏÏÏÏÏÏÏÏÏÏÏÏÏ 1,803 2,068 1,929
PCÏÏÏÏÏÏÏÏÏÏÏÏÏÏÏÏÏÏÏÏÏÏÏÏÏÏÏÏÏÏÏÏÏÏÏÏÏÏÏÏÏÏÏÏÏÏÏÏÏÏÏÏÏÏÏÏÏÏÏÏÏ 418 531 470
Mobility
PSPÏÏÏÏÏÏÏÏÏÏÏÏÏÏÏÏÏÏÏÏÏÏÏÏÏÏÏÏÏÏÏÏÏÏÏÏÏÏÏÏÏÏÏÏÏÏÏÏÏÏÏÏÏÏÏÏÏÏ 252 18 Ì
Nintendo DS ÏÏÏÏÏÏÏÏÏÏÏÏÏÏÏÏÏÏÏÏÏÏÏÏÏÏÏÏÏÏÏÏÏÏÏÏÏÏÏÏÏÏÏÏÏÏÏÏÏÏ 67 23 Ì
Game Boy Advance and Game Boy Color ÏÏÏÏÏÏÏÏÏÏÏÏÏÏÏÏÏÏÏÏÏÏÏÏÏ 55 77 78
Cellular Handsets ÏÏÏÏÏÏÏÏÏÏÏÏÏÏÏÏÏÏÏÏÏÏÏÏÏÏÏÏÏÏÏÏÏÏÏÏÏÏÏÏÏÏÏÏÏÏ 19 Ì Ì
Total Mobility ÏÏÏÏÏÏÏÏÏÏÏÏÏÏÏÏÏÏÏÏÏÏÏÏÏÏÏÏÏÏÏÏÏÏÏÏÏÏÏÏÏÏÏÏÏÏÏ 393 118 78
Co-publishing and Distribution ÏÏÏÏÏÏÏÏÏÏÏÏÏÏÏÏÏÏÏÏÏÏÏÏÏÏÏÏÏÏÏÏÏÏÏÏÏ 213 283 398
Internet Services, Licensing and Other
Subscription Services ÏÏÏÏÏÏÏÏÏÏÏÏÏÏÏÏÏÏÏÏÏÏÏÏÏÏÏÏÏÏÏÏÏÏÏÏÏÏÏÏÏÏÏ 61 55 49
Licensing, Advertising and Other ÏÏÏÏÏÏÏÏÏÏÏÏÏÏÏÏÏÏÏÏÏÏÏÏÏÏÏÏÏÏÏÏÏ 63 74 33
Total Internet Services, Licensing and Other ÏÏÏÏÏÏÏÏÏÏÏÏÏÏÏÏÏÏÏÏÏ 124 129 82
Total Net Revenue ÏÏÏÏÏÏÏÏÏÏÏÏÏÏÏÏÏÏÏÏÏÏÏÏÏÏÏÏÏÏÏÏÏÏÏÏÏÏÏÏÏÏÏÏÏÏÏ $ 2,951 $ 3,129 $ 2,957
104
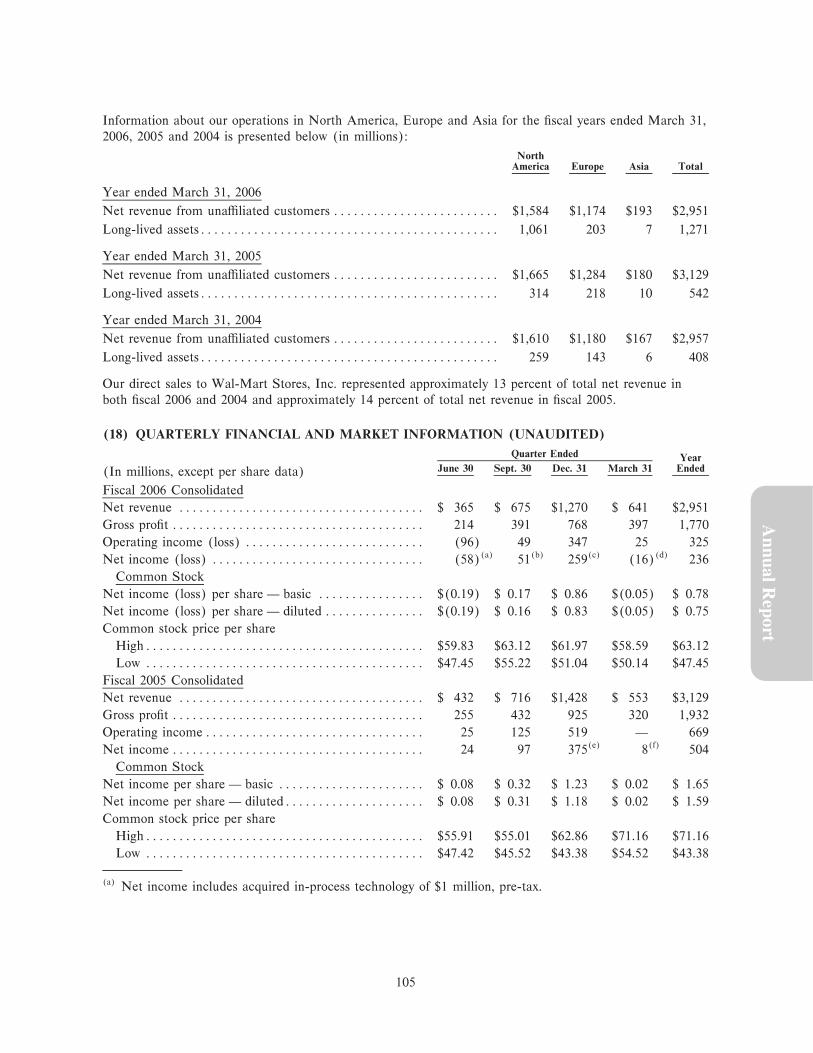
Information about our operations in North America, Europe and Asia for the Ñscal years ended March 31,
2006, 2005 and 2004 is presented below (in millions):
NorthAmerica Europe Asia Total
Year ended March 31, 2006
Net revenue from unaÇliated customers ÏÏÏÏÏÏÏÏÏÏÏÏÏÏÏÏÏÏÏÏÏÏÏÏÏ $1,584 $1,174 $193 $2,951
Long-lived assetsÏÏÏÏÏÏÏÏÏÏÏÏÏÏÏÏÏÏÏÏÏÏÏÏÏÏÏÏÏÏÏÏÏÏÏÏÏÏÏÏÏÏÏÏÏ 1,061 203 7 1,271
Year ended March 31, 2005
Net revenue from unaÇliated customers ÏÏÏÏÏÏÏÏÏÏÏÏÏÏÏÏÏÏÏÏÏÏÏÏÏ $1,665 $1,284 $180 $3,129
Long-lived assetsÏÏÏÏÏÏÏÏÏÏÏÏÏÏÏÏÏÏÏÏÏÏÏÏÏÏÏÏÏÏÏÏÏÏÏÏÏÏÏÏÏÏÏÏÏ 314 218 10 542
Year ended March 31, 2004
Net revenue from unaÇliated customers ÏÏÏÏÏÏÏÏÏÏÏÏÏÏÏÏÏÏÏÏÏÏÏÏÏ $1,610 $1,180 $167 $2,957
Long-lived assetsÏÏÏÏÏÏÏÏÏÏÏÏÏÏÏÏÏÏÏÏÏÏÏÏÏÏÏÏÏÏÏÏÏÏÏÏÏÏÏÏÏÏÏÏÏ 259 143 6 408
Our direct sales to Wal-Mart Stores, Inc. represented approximately 13 percent of total net revenue in
both Ñscal 2006 and 2004 and approximately 14 percent of total net revenue in Ñscal 2005.
(18) QUARTERLY FINANCIAL AND MARKET INFORMATION (UNAUDITED)
Quarter Ended YearJune 30 Sept. 30 Dec. 31 March 31 Ended(In millions, except per share data)
Fiscal 2006 Consolidated
Net revenue ÏÏÏÏÏÏÏÏÏÏÏÏÏÏÏÏÏÏÏÏÏÏÏÏÏÏÏÏÏÏÏÏÏÏÏÏÏ $ 365 $ 675 $1,270 $ 641 $2,951
Gross proÑt ÏÏÏÏÏÏÏÏÏÏÏÏÏÏÏÏÏÏÏÏÏÏÏÏÏÏÏÏÏÏÏÏÏÏÏÏÏÏ 214 391 768 397 1,770
Operating income (loss) ÏÏÏÏÏÏÏÏÏÏÏÏÏÏÏÏÏÏÏÏÏÏÏÏÏÏÏ (96) 49 347 25 325
Net income (loss) ÏÏÏÏÏÏÏÏÏÏÏÏÏÏÏÏÏÏÏÏÏÏÏÏÏÏÏÏÏÏÏÏ (58)(a) 51(b) 259(c) (16)(d) 236
Common Stock
Net income (loss) per share Ì basic ÏÏÏÏÏÏÏÏÏÏÏÏÏÏÏÏ $(0.19) $ 0.17 $ 0.86 $(0.05) $ 0.78
Net income (loss) per share Ì diluted ÏÏÏÏÏÏÏÏÏÏÏÏÏÏÏ $(0.19) $ 0.16 $ 0.83 $(0.05) $ 0.75
Common stock price per share
HighÏÏÏÏÏÏÏÏÏÏÏÏÏÏÏÏÏÏÏÏÏÏÏÏÏÏÏÏÏÏÏÏÏÏÏÏÏÏÏÏÏÏ $59.83 $63.12 $61.97 $58.59 $63.12
Low ÏÏÏÏÏÏÏÏÏÏÏÏÏÏÏÏÏÏÏÏÏÏÏÏÏÏÏÏÏÏÏÏÏÏÏÏÏÏÏÏÏÏ $47.45 $55.22 $51.04 $50.14 $47.45
Annual R
eport
Fiscal 2005 Consolidated
Net revenue ÏÏÏÏÏÏÏÏÏÏÏÏÏÏÏÏÏÏÏÏÏÏÏÏÏÏÏÏÏÏÏÏÏÏÏÏÏ $ 432 $ 716 $1,428 $ 553 $3,129
Gross proÑt ÏÏÏÏÏÏÏÏÏÏÏÏÏÏÏÏÏÏÏÏÏÏÏÏÏÏÏÏÏÏÏÏÏÏÏÏÏÏ 255 432 925 320 1,932
Operating incomeÏÏÏÏÏÏÏÏÏÏÏÏÏÏÏÏÏÏÏÏÏÏÏÏÏÏÏÏÏÏÏÏÏ 25 125 519 Ì 669
Net income ÏÏÏÏÏÏÏÏÏÏÏÏÏÏÏÏÏÏÏÏÏÏÏÏÏÏÏÏÏÏÏÏÏÏÏÏÏÏ 24 97 375(e) 8(f) 504
Common Stock
Net income per share Ì basic ÏÏÏÏÏÏÏÏÏÏÏÏÏÏÏÏÏÏÏÏÏÏ $ 0.08 $ 0.32 $ 1.23 $ 0.02 $ 1.65
Net income per share Ì dilutedÏÏÏÏÏÏÏÏÏÏÏÏÏÏÏÏÏÏÏÏÏ $ 0.08 $ 0.31 $ 1.18 $ 0.02 $ 1.59
Common stock price per share
HighÏÏÏÏÏÏÏÏÏÏÏÏÏÏÏÏÏÏÏÏÏÏÏÏÏÏÏÏÏÏÏÏÏÏÏÏÏÏÏÏÏÏ $55.91 $55.01 $62.86 $71.16 $71.16
Low ÏÏÏÏÏÏÏÏÏÏÏÏÏÏÏÏÏÏÏÏÏÏÏÏÏÏÏÏÏÏÏÏÏÏÏÏÏÏÏÏÏÏ $47.42 $45.52 $43.38 $54.52 $43.38
(a) Net income includes acquired in-process technology of $1 million, pre-tax.
105

(b) Net income includes certain litigation expense of $1 million, pre-tax, and net tax credits of $9 million.(c) Net income includes restructuring charges of $9 million, pre-tax.(d) Net income includes acquired in-process technology of $7 million, restructuring charges of $17 million,
a litigation expense credit of $1 million, all pre-tax, and net tax expense of $34 million.(e) Net income includes acquired in-process technology of $9 million, pre-tax, and non-deductible
acquisition related costs from our acquisition of Criterion of $3 million.(f) Net income includes acquired in-process technology of $4 million, restructuring charges of $1 million,
certain litigation expenses of $21 million and a bonus reversal of $26 million, all pre-tax.
Our common stock is traded on the NASDAQ National Market under the symbol ERTS. The prices for
the common stock in the table above represent the high and low sales prices as reported on the NASDAQ
National Market.
106
REPORT OF INDEPENDENT REGISTERED PUBLIC ACCOUNTING FIRM
The Board of Directors and Stockholders
Electronic Arts Inc.:
We have audited the accompanying consolidated balance sheets of Electronic Arts Inc. and subsidiaries as
of April 1, 2006 and March 26, 2005, and the related consolidated statements of operations, stockholders'
equity and comprehensive income, and cash Öows for each of the years in the three-year period ended
April 1, 2006. In connection with our audits of the consolidated Ñnancial statements, we also have audited
the accompanying Ñnancial statement schedule. These consolidated Ñnancial statements and Ñnancial
statement schedule are the responsibility of the Company's management. Our responsibility is to express
an opinion on these consolidated Ñnancial statements and Ñnancial statement schedule based on our audits.
We conducted our audits in accordance with the standards of the Public Company Accounting Oversight
Board (United States). Those standards require that we plan and perform the audit to obtain reasonable
assurance about whether the Ñnancial statements are free of material misstatement. An audit includes
examining, on a test basis, evidence supporting the amounts and disclosures in the Ñnancial statements. An
audit also includes assessing the accounting principles used and signiÑcant estimates made by
management, as well as evaluating the overall Ñnancial statement presentation. We believe that our audits
provide a reasonable basis for our opinion.
In our opinion, the consolidated Ñnancial statements referred to above present fairly, in all material
respects, the Ñnancial position of Electronic Arts Inc. and subsidiaries as of April 1, 2006 and March 26,
2005, and the results of their operations and their cash Öows for each of the years in the three-year period
ended April 1, 2006, in conformity with U.S. generally accepted accounting principles. Also in our opinion,
the related Ñnancial statement schedule, when considered in relation to the basic consolidated Ñnancial
statements taken as a whole, presents fairly, in all material respects, the information set forth therein.
We also have audited, in accordance with the standards of the Public Company Accounting Oversight
Board (United States), the eÅectiveness of Electronic Arts Inc.'s internal control over Ñnancial reporting
as of April 1, 2006, based on criteria established in Internal Control Ì Integrated Framework issued by
the Committee of Sponsoring Organizations of the Treadway Commission (COSO), and our report dated
June 9, 2006 expressed an unqualiÑed opinion on management's assessment of, and the eÅective operation
of, internal control over Ñnancial reporting.
KPMG LLP
Annual R
eport
Mountain View, California
June 9, 2006
107

REPORT OF INDEPENDENT REGISTERED PUBLIC ACCOUNTING FIRM
The Board of Directors and StockholdersElectronic Arts Inc.:
We have audited management's assessment, included in the accompanying Management's Report on
Internal Control over Financial Reporting, that Electronic Arts Inc. maintained eÅective internal control
over Ñnancial reporting as of April 1, 2006, based on criteria established in Internal Control Ì Integrated
Framework issued by the Committee of Sponsoring Organizations of the Treadway Commission (COSO).
Electronic Arts Inc.'s management is responsible for maintaining eÅective internal control over Ñnancial
reporting and for its assessment of the eÅectiveness of internal control over Ñnancial reporting. Our
responsibility is to express an opinion on management's assessment and an opinion on the eÅectiveness of
the Company's internal control over Ñnancial reporting based on our audit.
We conducted our audit in accordance with the standards of the Public Company Accounting Oversight
Board (United States). Those standards require that we plan and perform the audit to obtain reasonable
assurance about whether eÅective internal control over Ñnancial reporting was maintained in all material
respects. Our audit included obtaining an understanding of internal control over Ñnancial reporting,
evaluating management's assessment, testing and evaluating the design and operating eÅectiveness of
internal control, and performing such other procedures as we considered necessary in the circumstances.
We believe that our audit provides a reasonable basis for our opinion.
A company's internal control over Ñnancial reporting is a process designed to provide reasonable assurance
regarding the reliability of Ñnancial reporting and the preparation of Ñnancial statements for external
purposes in accordance with generally accepted accounting principles. A company's internal control over
Ñnancial reporting includes those policies and procedures that (1) pertain to the maintenance of records
that, in reasonable detail, accurately and fairly reÖect the transactions and dispositions of the assets of the
company; (2) provide reasonable assurance that transactions are recorded as necessary to permit
preparation of Ñnancial statements in accordance with generally accepted accounting principles, and that
receipts and expenditures of the company are being made only in accordance with authorizations of
management and directors of the company; and (3) provide reasonable assurance regarding prevention or
timely detection of unauthorized acquisition, use, or disposition of the company's assets that could have a
material eÅect on the Ñnancial statements.
Because of its inherent limitations, internal control over Ñnancial reporting may not prevent or detect
misstatements. Also, projections of any evaluation of eÅectiveness to future periods are subject to the risk
that controls may become inadequate because of changes in conditions, or that the degree of compliance
with the policies or procedures may deteriorate.
In our opinion, management's assessment that Electronic Arts Inc. maintained eÅective internal control
over Ñnancial reporting as of April 1, 2006, is fairly stated, in all material respects, based on criteria
established in Internal Control Ì Integrated Framework issued by the Committee of Sponsoring
Organizations of the Treadway Commission (COSO). Also, in our opinion, Electronic Arts Inc.
maintained, in all material respects, eÅective internal control over Ñnancial reporting as of April 1, 2006,
based on criteria established in Internal Control Ì Integrated Framework issued by the Committee of
Sponsoring Organizations of the Treadway Commission (COSO).
As indicated in the accompanying Management's Report on Internal Control over Financial Reporting,
management excluded from their evaluation of their internal control over Ñnancial reporting the internal
control over Ñnancial reporting of JAMDAT Mobile Inc. (""JAMDAT''), which the Company acquired on
February 15, 2006. As of April 1, 2006, total assets, excluding goodwill and acquired intangible assets,
subject to JAMDAT's internal control over Ñnancial reporting represented 1% of the Company's
consolidated total assets. For the period from February 15, 2006 through April 1, 2006, total net revenue
subject to JAMDAT's internal control over Ñnancial reporting represented less than 1% of the Company's
consolidated net revenue. Our audit of internal control over Ñnancial reporting of Electronic Arts Inc. also
excluded an evaluation of the internal control over Ñnancial reporting of JAMDAT.
108

We also have audited, in accordance with the standards of the Public Company Accounting Oversight
Board (United States), the consolidated balance sheets of Electronic Arts Inc. and subsidiaries as of
April 1, 2006 and March 26, 2005 and the related consolidated statements of operations, stockholders'
equity and comprehensive income, and cash Öows for each of the years in the three-year period ended
April 1, 2006, and our report dated June 9, 2006 expressed an unqualiÑed opinion on those consolidated
Ñnancial statements.
KPMG LLP
Mountain View, California
June 9, 2006
Annual R
eport
109
Item 9: Changes in and Disagreements with Accountants on Accounting and Financial Disclosure
None.
Item 9A: Controls and Procedures
DeÑnition and Limitations of Disclosure Controls
Our disclosure controls and procedures (as deÑned in Rules 13a-15(e) and 15d-15(e) under the Securities
Exchange Act of 1934, as amended (the ""Exchange Act'')) are controls and other procedures that are
designed to ensure that information required to be disclosed in our reports Ñled under the Exchange Act,
such as this report, is recorded, processed, summarized and reported within the time periods speciÑed in
the SEC's rules and forms. Disclosure controls and procedures are also designed to ensure that such
information is accumulated and communicated to our management, including the Chief Executive OÇcer
and Executive Vice President, Chief Financial and Administrative OÇcer, as appropriate to allow timely
decisions regarding required disclosure. Our management evaluates these controls and procedures on an
ongoing basis.
There are inherent limitations to the eÅectiveness of any system of disclosure controls and procedures.
These limitations include the possibility of human error, the circumvention or overriding of the controls
and procedures and reasonable resource constraints. In addition, because we have designed our system of
controls based on certain assumptions, which we believe are reasonable, about the likelihood of future
events, our system of controls may not achieve its desired purpose under all possible future conditions.
Accordingly, our disclosure controls and procedures provide reasonable assurance, but not absolute
assurance, of achieving their objectives.
Evaluation of Disclosure Controls and Procedures
Our Chief Executive OÇcer and our Chief Financial and Administrative OÇcer, after evaluating the
eÅectiveness of our disclosure controls and procedures, believe that as of the end of the period covered by
this report, our disclosure controls and procedures were eÅective in providing the requisite reasonable
assurance that material information required to be disclosed in the reports that we Ñle or submit under the
Exchange Act is recorded, processed, summarized and reported within the time periods speciÑed in the
SEC's rules and forms, and is accumulated and communicated to our management, including our Chief
Executive OÇcer and our Chief Financial and Administrative OÇcer, as appropriate to allow timely
decisions regarding the required disclosure.
Management's Report on Internal Control over Financial Reporting
Our management is responsible for establishing and maintaining adequate internal control over Ñnancial
reporting, as deÑned in Rules 13a-15(f) and 15d-15(f) under the Exchange Act.
Our internal control over Ñnancial reporting is designed to provide reasonable, but not absolute, assurance
regarding the reliability of Ñnancial reporting and the preparation of Ñnancial statements in accordance
with generally accepted accounting principles. There are inherent limitations to the eÅectiveness of any
system of internal control over Ñnancial reporting. These limitations include the possibility of human error,
the circumvention or overriding of the system and reasonable resource constraints. Because of its inherent
limitations, our internal control over Ñnancial reporting may not prevent or detect misstatements.
Projections of any evaluation of eÅectiveness to future periods are subject to the risks that controls may
become inadequate because of changes in conditions, or that the degree of compliance with our policies or
procedures may deteriorate.
Our management assessed the eÅectiveness of our internal control over Ñnancial reporting as of the end of
our most recently completed Ñscal year. We have excluded from our evaluation of our internal control over
Ñnancial reporting the internal control over Ñnancial reporting of JAMDAT Mobile Inc. (""JAMDAT''),
which we acquired on February 15, 2006. As of March 31, 2006, total assets, excluding goodwill and
acquired intangible assets, subject to JAMDAT's internal control over Ñnancial reporting represented
110
1 percent of our consolidated total assets. For the period from February 15, 2006 through March 31, 2006,
total net revenue subject to JAMDAT's internal control over Ñnancial reporting represented less than
1 percent of our consolidated net revenue. In making its assessment, management used the criteria set
forth in Internal Control-Integrated Framework, issued by the Committee of Sponsoring Organizations of
the Treadway Commission (COSO). Based on this assessment, our management believes that, as of the
end of our most recently completed Ñscal year, our internal control over Ñnancial reporting was eÅective.
KPMG LLP, our independent registered public accounting Ñrm, has issued an attestation report on
management's assessment of our internal control over Ñnancial reporting. That report appears on page 107.
Changes in Internal Controls
In preparation for management's report on internal control over Ñnancial reporting, we documented and
tested the design and operating eÅectiveness of our internal control over Ñnancial reporting. During Ñscal
2006, there were no signiÑcant changes in our internal controls or, to our knowledge, in other factors that
could signiÑcantly aÅect our disclosure controls and procedures.
Item 9B: Other Information
None.
Annual R
eport
111

PART III
Item 10: Directors and Executive OÇcers of the Registrant
The information regarding directors who are nominated for election required by Item 10 is incorporated
herein by reference to the information to be included in our deÑnitive Proxy Statement for our 2006
Annual Meeting of Stockholders (the ""Proxy Statement'') under the caption ""Proposal No. 1 Ì Election
of Directors''. The information regarding executive oÇcers required by Item 10 is included in Item 1 of
this report. The information regarding Section 16 compliance is incorporated herein by reference to the
information to be included in the Proxy Statement under the caption ""Section 16(a) BeneÑcial Ownership
Reporting Compliance''.
The information required by Item 10 regarding our Global Code of Conduct (which includes code of
ethics provisions applicable to our directors, principal executive oÇcer, principal Ñnancial oÇcer, principal
accounting oÇcer, and other senior Ñnancial oÇcers) appears in Item 1 of this Form 10-K under the
caption ""Investor Information''.
Item 11: Executive Compensation
The information required by Item 11 is incorporated herein by reference to the information to be included
in the Proxy Statement under the caption ""Compensation of Executive OÇcers'' speciÑcally excluding the
""Compensation Committee Report on Executive Compensation''.
Item 12: Security Ownership of Certain BeneÑcial Owners and Management and Related StockholderMatters
The information required by Item 12 is incorporated herein by reference to the information to be included
in the Proxy Statement under the captions ""Principal Stockholders'' and ""Equity Compensation Plan
Information''.
Item 13: Certain Relationships and Related Transactions
The information required by Item 13 is incorporated herein by reference to the information to be included
in the Proxy Statement under the caption ""Certain Transactions''.
Item 14: Principal Accounting Fees and Services
The information required by Item 14 is incorporated herein by reference to the information to be included
in the Proxy Statement under the caption ""Fees of Independent Auditors''.
PART IV
Item 15: Exhibits, Financial Statement Schedule
(a) Documents Ñled as part of this report
1. Financial Statements: See Index to Consolidated Financial Statements under Item 8 on Page 66 of this
report.
2. Financial Statement Schedule: See Schedule II on Page 118 of this report.
112

3. Exhibits: The following exhibits (other than exhibits 32.1 and 32.2, which are furnished with this
report) are Ñled as part of, or incorporated by reference into, this report:
Number Exhibit Title
2.01 Agreement and Plan of Merger by and among Electronic Arts Inc., EArts (Delaware), Inc. andJAMDAT Mobile Inc. dated December 8, 2005.(***)(1)
3.01 Amended and Restated CertiÑcate of Incorporation of Electronic Arts Inc.(2)
3.02 Amended and Restated Bylaws.(3)
4.01 Specimen CertiÑcate of Registrant's Common Stock.(4)
10.01 Registrant's Directors Stock Option Plan and related documents.(*)(5)
10.02 Registrant's 1991 Stock Option Plan and related documents as amended.(*)(6)
10.03 Registrant's 1998 Directors' Stock Option Plan and related documents, as amended.(*)(6)
10.04 Registrant's 2000 Equity Incentive Plan as amended, and related documents.(*)(7)
10.05 Registrant's 2000 Employee Stock Purchase Plan as amended, and related documents.(*)(7)
10.06 Form of Indemnity Agreement with Directors.(*)(8)
10.07 Electronic Arts Discretionary Bonus Program Plan Document (*)(9)
10.08 Electronic Arts Deferred Compensation Plan.(*)(3)
10.09 Electronic Arts Executive Long-Term Disability Plan.(*)(10)
10.10 Agreement for Lease between Flatirons Funding, LP and Electronic Arts Redwood, Inc. datedFebruary 14, 1995.(11)
10.11 Guarantee from Electronic Arts Inc. to Flatirons Funding, LP dated February 14, 1995.(11)
10.12 Amended and Restated Guaranty from Electronic Arts Inc. to Flatirons Funding, LP datedMarch 7, 1997.(12)
10.13 Amended and Restated Agreement for Lease between Flatirons Funding, LP and Electronic ArtsRedwood Inc. dated March 7,1997.(12)
10.14 Amendment No. 1 to Lease Agreement between Electronic Arts Redwood Inc. and FlatironsFunding, LP dated March 7, 1997.(12)
10.15 Lease Agreement by and between Registrant and Louisville Commerce Realty Corporation, datedApril 1, 1999.(13)
10.16 Option agreement, agreement of purchase and sale, and escrow instructions for Zones 2 and 4,Electronic Arts Business Park, Redwood Shores California, dated April 5, 1999.(13)
10.17 Licensed Publisher Agreement by and between EA and Sony Computer Entertainment AmericaInc. dated as of April 1, 2000.(**)(14)
Annual R
eport
10.18 Master Lease and Deed of Trust by and between Registrant and Selco Service Corporation, datedDecember 6, 2000.(15)
10.19 Guaranty, dated as of December 6, 2000, by Electronic Arts Inc. in favor of Selco ServiceCorporation, Victory Receivables Corporation, The Bank of Tokyo-Mitsubishi, Ltd., variousLiquidity Banks, and Keybank National Association.(16)
10.20 Participation Agreement among Electronic Arts Redwood, Inc., Electronic Arts, Inc., SelcoService Corporation, Victory Receivables Corporation, The Bank of Tokyo-Mitsubishi, Ltd.,various Liquidity Banks and Keybank National Association, dated December 6, 2000.(17)
10.21 Amendment No. 1 to Amended and Restated Credit Agreement by and among Flatirons FundingLP and The Dai-Ichi Kangyo Bank, Limited, New York Branch, dated February 21, 2001.(18)
10.22 Amendment No. 2 to Lease Agreement by and between Electronic Arts Redwood, Inc. andFlatirons Funding, LP dated July 16, 2001.(19)
10.23 Participation Agreement among Electronic Arts Redwood, Inc., Electronic Arts Inc., FlatironsFunding, LP, Selco Service Corporation and Selco Redwood, LLC, Victory ReceivablesCorporation, The Bank of Tokyo-Mitsubishi, Ltd., various Liquidity Banks and Tranche B Banksand Keybank National Association dated July 16, 2001.(19)
113

Number Exhibit Title
10.24 Guaranty, dated as of July 16, 2001, by Electronic Arts Inc. in favor of Flatirons Funding,Limited Partnership, Victory Receivables Corporation, The Bank of Tokyo-Mitsubishi, Ltd.,various Liquidity Banks and Tranche B Banks, and KeyBank National Association.(16)
10.25 First Amendment to Participation Agreement, dated as of May 13, 2002, by and amongElectronic Arts Redwood, Inc., Electronic Arts Inc., Flatirons Funding, Limited Partnership,Victory Receivables Corporation, The Bank of Tokyo-Mitsubishi, Ltd., various Liquidity Banks,KeyBank National Association, and The Bank of Nova Scotia.(16)
10.26 OÅer Letter for Employment at Electronic Arts Inc. to Warren Jenson, dated June 21,2002.(*)(20)
10.27 Full Recourse Promissory Note between Electronic Arts Inc. and Warren Jenson, dated July 19,2002.(20)
10.28 Full Recourse Promissory Note between Electronic Arts Inc. and Warren Jenson, dated July 19,2002.(20)
10.29 Lease Agreement by and between Registrant and Ontrea, Inc. dated October 7, 2002.(21)
10.30 Lease Agreement by and between Playa Vista-Waters Edge, LLC and Electronic Arts Inc., datedJuly 31, 2003.(22)
10.31 Agreement Re: Right of First OÅer to Purchase and Option to Purchase by and between PlayaVista-Waters Edge, LLC and Electronic Arts Inc., dated July 31, 2003.(22)
10.32 ProÑt Participation Agreement by and between Playa Vista-Waters Edge, LLC and ElectronicArts Inc., dated July 31, 2003.(22)
10.33 Sublease Agreement by and between Electronic Arts Inc. and Playa Capital Company, LLC,dated July 31, 2003.(22)
10.34 Amending Agreement among Ontrea Inc. (the ""Landlord''), Electronic Arts (Canada), Inc. (the""Tenant''), and Electronic Arts Inc. (the ""IndemniÑer''), dated October 30, 2003.(23)
10.35 First Amendment of Lease by and between Louisville Commerce Realty Corporation andElectronic Arts Inc., dated February 23, 2004.(8)
10.36 First Amendment to lease agreement by and between Playa Vista Ì Water's Edge, LLC andElectronic Arts Inc., entered into April 19, 2004.(3)
10.37 Lease agreement between ASP WT, L.L.C. ("Landlord'') and Tiburon Entertainment, Inc.(""Tenant'') for space at Summit Park I, dated June 15, 2004.(3)
10.38 Omnibus Amendment Agreement (2001 transaction), dated as of September 15, 2004, ElectronicArts Redwood, LLC, Electronic Arts, Inc., Selco Service Corporation, Victory ReceivablesCorporation, The Bank Of Tokyo-Mitsubishi, Ltd., various Liquidity Banks, and KeyBankNational Association.(16)
10.39 Omnibus Amendment Agreement (2000 transaction), dated as of September 15, 2004, by andamong Electronic Arts Redwood, LLC, Electronic Arts, Inc., Selco Service Corporation, VictoryReceivables Corporation, The Bank Of Tokyo-Mitsubishi, Ltd., various Liquidity Banks, andKeyBank National Association.(16)
10.40 Omnibus Amendment (2000 transaction), dated as of July 11, 2005, among Electronic ArtsRedwood, LLC, Electronic Arts, Inc., Selco Service Corporation, Victory Receivables Corpora-tion, The Bank of Tokyo-Mitsubishi, Ltd., New York Branch, various Liquidity Banks, DeutscheBank Trust Company Americas, and KeyBank National Association.(16)
10.41 Omnibus Amendment (2001 transaction), dated as of July 11, 2005, among Electronic ArtsRedwood, LLC, Electronic Arts, Inc., Selco Service Corporation, Victory Receivables Corpora-tion, The Bank of Tokyo-Mitsubishi, Ltd., New York Branch, various Liquidity Banks, DeutscheBank Trust Company Americas, The Bank of Nova Scotia, and KeyBank National Associa-tion.(16)
10.42 First amendment to lease, dated December 13, 2005, by and between Liberty Property LimitedPartnership, a Pennsylvania limited partnership and Electronic Arts Ì Tiburon, a Floridacorporation f/k/a Tiburon Entertainment, Inc.(24)
114

Number Exhibit Title
10.43 Agreement for Underlease relating to Onslow House, Guildford, Surrey, dated 7 February 2006,by and between The Standard Life Assurance Company and Electronic Arts Limited andElectronic Arts Inc.(24)
10.44 OÅer Letter for Employment at Electronic Arts Inc. to Gabrielle Toledano, dated February 6,2006.(*)
10.45 Second Omnibus Amendment (2001 Transaction), dated as of May 26, 2006, among ElectronicArts Redwood LLC, as Lessee, Electronic Arts Inc., as Guarantor, SELCO Service Corporation(doing business in California as ""Ohio SELCO Service Corporation''), as Lessor, the VariousLiquidity Banks party thereto, as Liquidity Banks, The Bank of Nova Scotia, as DocumentationAgent and Keybank National Association, as Agent.(25)
10.46 Second Omnibus Amendment (2000 Transaction), dated as of May 26, 2006, among ElectronicArts Redwood LLC, as Lessee, Electronic Arts Inc., as Guarantor, SELCO Service Corporation(doing business in California as ""Ohio SELCO Service Corporation''), as Lessor, the VariousLiquidity Banks party thereto, as Liquidity Banks, and KeyBank National Association, as Agent.(25)
21.01 Subsidiaries of the Registrant.
23.01 Consent of KPMG LLP, Independent Registered Public Accounting Firm.
31.1 CertiÑcation of Chairman and Chief Executive OÇcer pursuant to Rule 13a-14(a) of theExchange Act, as adopted pursuant to Section 302 of the Sarbanes-Oxley Act of 2002.
31.2 CertiÑcation of Executive Vice President, Chief Financial and Administrative OÇcer pursuant toRule 13a-14(a) of the Exchange Act, as adopted pursuant to Section 302 of the Sarbanes-OxleyAct of 2002.
Additional exhibits furnished with this report:
32.1 CertiÑcation of Chairman and Chief Executive OÇcer pursuant to Rule 13a-14(b) of theExchange Act and 18 U.S.C. Section 1350, as adopted pursuant to Section 906 of the Sarbanes-Oxley Act of 2002.
32.2 CertiÑcation of Executive Vice President, Chief Financial and Administrative OÇcer pursuant toRule 13a-14(b) of the Exchange Act and 18 U.S.C. Section 1350, as adopted pursuant toSection 906 of the Sarbanes-Oxley Act of 2002.
* Management contract or compensatory plan or arrangement.
** Portions of this exhibit have been redacted pursuant to a conÑdential treatment request Ñled with the
SEC.
*** Certain schedules have been omitted and the Company agrees to furnish to the Commission
Annual R
eport
supplementally a copy of any omitted schedules upon request.
(1) Incorporated by reference to exhibits Ñled with Registrant's Current Report on Form 8-K/A, Ñled
December 12, 2005.
(2) Incorporated by reference to exhibits Ñled with Registrant's Quarterly Report on Form 10-Q for the
quarter ended September 30, 2004.
(3) Incorporated by reference to exhibits Ñled with Registrant's Quarterly Report on Form 10-Q for the
quarter ended June 30, 2004.
(4) Incorporated by reference to exhibits Ñled with Registrant's Registration Statement on Form S-4,
Ñled March 3, 1994 (File No. 33-75892).
(5) Incorporated by reference to exhibits Ñled with Amendment No. 2 to Registrant's Registration
Statement on Form S-8, Ñled November 6, 1991 (File No. 33-32616).
(6) Incorporated by reference to exhibits Ñled with Registrant's Registration Statement on Form S-8,
Ñled July 30, 1999 (File No. 333-84215).
(7) Incorporated by reference to exhibits Ñled with Registrant's Registration Statement on Form S-8,
Ñled August 3, 2005 (File No. 333-127156).
115
(8) Incorporated by reference to exhibits Ñled with Registrant's Annual Report on Form 10-K for the
year ended March 31, 2004.
(9) Incorporated by reference to exhibits Ñled with Registrant's Quarterly Report on Form 10-Q for the
quarter ended September 30, 2005.
(10) Incorporated by reference to exhibits Ñled with Registrant's Annual Report on Form 10-K for the
year ended March 31, 2005.
(11) Incorporated by reference to exhibits Ñled with Registrant's Annual Report on Form 10-K for the
year ended March 31, 1995.
(12) Incorporated by reference to exhibits Ñled with Registrant's Annual Report on Form 10-K for the
year ended March 31, 1997.
(13) Incorporated by reference to exhibits Ñled with Registrant's Annual Report on Form 10-K for the
year ended March 31, 1999.
(14) Incorporated by reference to exhibits Ñled with Amendment No. 2 to Registrant's Registration
Statement on Form S-3, Ñled November 21, 2003 (File No. 333-102797).
(15) Incorporated by reference to exhibits Ñled with Registrant's Quarterly Report on Form 10-Q for the
quarter ended December 31, 2000.
(16) Incorporated by reference to exhibits Ñled with Registrant's Quarterly Report on Form 10-Q for the
quarter ended June 30, 2005.
(17) Incorporated by reference to exhibits Ñled with Registrant's Quarterly Report on Form 10-Q for the
quarter ended December 31, 2002.
(18) Incorporated by reference to exhibits Ñled with Registrant's Annual Report on Form 10-K for the
year ended March 31, 2001.
(19) Incorporated by reference to exhibits Ñled with Registrant's Annual Report on Form 10-K for the
year ended March 31, 2002.
(20) Incorporated by reference to exhibits Ñled with Registrant's Quarterly Report on Form 10-Q for the
quarter ended June 30, 2002.
(21) Incorporated by reference to exhibits Ñled with Registrant's Annual Report on Form 10-K for the
year ended March 31, 2003.
(22) Incorporated by reference to exhibits Ñled with Registrant's Quarterly Report on Form 10-Q for the
quarter ended September 30, 2003.
(23) Incorporated by reference to exhibits Ñled with Registrant's Quarterly Report on Form 10-Q for the
quarter ended December 31, 2003.
(24) Incorporated by reference to exhibits Ñled with Registrant's Quarterly Report on Form 10-Q for the
quarter ended December 31, 2005.
(25) Incorporated by reference to exhibits Ñled with Registrant's Current Report on Form 8-K, Ñled
June 1, 2006.
116

SIGNATURES
Pursuant to the requirements of the Section 13 or 15(d) of the Securities Exchange Act of 1934, the
Registrant has duly caused this report to be signed on its behalf by the undersigned, thereunto duly
authorized.
ELECTRONIC ARTS INC.
By: /s/ Lawrence F. Probst III
Lawrence F. Probst III,
Chairman of the Board and
Chief Executive OÇcer
Date: June 9, 2006
Pursuant to the requirements of the Securities Exchange Act of 1934, this report has been signed below by
the following persons, on behalf of the Registrant in the capacities indicated and on the 9th of June 2006.
Name Title
/s/ Lawrence F. Probst III Chairman of the Boardand Chief Executive OÇcerLawrence F. Probst III
/s/ Warren C. Jenson Executive Vice President, ChiefFinancial and Administrative OÇcerWarren C. Jenson
/s/ Kenneth A. Barker Senior Vice President,Chief Accounting OÇcerKenneth A. Barker
(Principal Accounting OÇcer)
Directors:
/s/ M. Richard Asher Director
M. Richard Asher
/s/ Leonard S. Coleman Director
Annual R
eport
Leonard S. Coleman
/s/ Gary M. Kusin Director
Gary M. Kusin
/s/ Gregory B. MaÅei Director
Gregory B. MaÅei
/s/ Timothy Mott Director
Timothy Mott
/s/ Vivek Paul Director
Vivek Paul
/s/ Robert W. Pittman Director
Robert W. Pittman
/s/ Linda J. Srere Director
Linda J. Srere
117

ELECTRONIC ARTS INC. AND SUBSIDIARIES
SCHEDULE II
VALUATION AND QUALIFYING ACCOUNTS
Years Ended March 31, 2006, 2005 and 2004
(In millions)
ChargedBalance at Charged to (credited) Balance at
Allowance for Doubtful Accounts, Beginning Costs and to Other End ofPrice Protection and Returns of Period Expenses Accounts(1) Deductions Period
Year Ended March 31, 2006ÏÏÏÏÏÏÏÏÏÏÏÏÏÏÏ $162 $483 $(6) $407 $232
Year Ended March 31, 2005ÏÏÏÏÏÏÏÏÏÏÏÏÏÏÏ $155 $471 $ 7 $471 $162
Year Ended March 31, 2004ÏÏÏÏÏÏÏÏÏÏÏÏÏÏÏ $165 $299 $14 $323 $155
(1) Primarily the translation eÅect of using the average exchange rate for expense items and the year-
ended exchange rate for the balance sheet item (allowance account) and other reclassiÑcation
adjustments.
118
ELECTRONIC ARTS INC.
2006 FORM 10-K ANNUAL REPORT
EXHIBIT INDEX
ExhibitNumber Exhibit Title
10.44 OÅer Letter for Employment at Electronic Arts Inc. to Gabrielle Toledano, dated February 6,2006.
21.01 Subsidiaries of the Registrant.
23.01 Consent of KPMG LLP, Independent Registered Public Accounting Firm.
31.1 CertiÑcation of Chairman and Chief Executive OÇcer pursuant to Rule 13a-14(a) of theExchange Act, as adopted pursuant to Section 302 of the Sarbanes-Oxley Act of 2002.
31.2 CertiÑcation of Executive Vice President, Chief Financial and Administrative OÇcer pursuant toRule 13a-14(a) of the Exchange Act, as adopted pursuant to Section 302 of the Sarbanes-OxleyAct of 2002.
ADDITIONAL EXHIBITS ACCOMPANYING THIS REPORT:
32.1 CertiÑcation of Chairman and Chief Executive OÇcer pursuant to Rule 13a-14(b) of theExchange Act and 18 U.S.C. Section 1350, as adopted pursuant to Section 906 of the Sarbanes-Oxley Act of 2002.
32.2 CertiÑcation of Executive Vice President, Chief Financial and Administrative OÇcer pursuant toRule 13a-14(b) of the Exchange Act and 18 U.S.C. Section 1350, as adopted pursuant toSection 906 of the Sarbanes-Oxley Act of 2002.
Annual R
eport
119

(Intentionally Left Blank)

(Intentionally Left Blank)

(Intentionally Left Blank)

B O A R D O F D I R E C T O R S
M. Richard AsherConsultantFormer Chief ExecutiveOffi cer & PresidentPolyGram Records, Inc.
Leonard S. ColemanFormer Senior AdvisorMajor League Baseball
Gary M. KusinSpecial AdvisorTexas Pacifi c Group
Gregory B. MaffeiPresident & ChiefExecutive Offi cerLiberty Media Corporation
Timothy MottChairmanAll Covered
Vivek PaulPartnerTexas Pacifi c Group
Robert W. PittmanMember ofPilot Group Manager, LLC
Lawrence F. Probst IIIChairman & ChiefExecutive Offi cerElectronic Arts Inc.
Linda J. SrereMarketing &Advertising ConsultantFormer PresidentYoung & Rubicam Advertising
C A N D I D A T E F O R D I R E C T O R
Richard A. SimonsonChief Financial Offi cerNokia Corporation
C O R P O R A T E O F F I C E R S
Lawrence F. Probst IIIChairman & Chief Executive Offi cer
V. Paul LeePresidentWorldwide Studios
Gerhard FlorinExecutive Vice PresidentGeneral ManagerInternational Publishing
David P. GardnerExecutive Vice PresidentChief Operating Offi cer Worldwide Studios
Frank D. GibeauExecutive Vice PresidentGeneral ManagerNorth America Publishing
William B. GordonExecutive Vice PresidentChief Creative Offi cer
Warren C. JensonExecutive Vice PresidentChief Financial &Administrative Offi cer
Joel LinznerExecutive Vice PresidentBusiness & Legal Affairs
Nancy L. SmithExecutive Vice PresidentGeneral ManagerThe Sims Franchise
Kenneth A. BarkerSenior Vice PresidentChief Accounting Offi cer
Stephen G. BenéSenior Vice PresidentGeneral Counsel& Corporate Secretary
Mitch LaskySenior Vice PresidentEA Mobile
Gabrielle ToledanoSenior Vice PresidentHuman Resources
C O R P O R A T E O F F I C E S
Corporate Headquarters209 Redwood Shores ParkwayRedwood City, CA 94065(650) 628-1500
North AmericaBentonville, ArkansasBurnaby, British ColumbiaVancouver, British ColumbiaEmeryville, CaliforniaLos Angeles, CaliforniaOrlando, FloridaHonolulu, HawaiiChicago, IllinoisLouisville, KentuckySt. Louis Park, MinnesotaNew York, New YorkToronto, OntarioMontreal, QuebecDallas, Texas
InternationalAdelaide, AustraliaThe Gold Coast, AustraliaMelbourne, AustraliaPerth, AustraliaSydney, AustraliaWayville, AustraliaVienna, AustriaBridgetown, BarbadosBrussels, BelgiumHamilton, BermudaSao Paulo, BrazilHong Kong, ChinaShanghai, ChinaPrague, Czech RepublicVirum, DenmarkChertsey, EnglandGuildford, EnglandLondon, EnglandWarrington, EnglandVantaa, FinlandLyon, FranceParis, FranceCologne, GermanyAthens, GreeceBudapest, HungaryHyderabad, IndiaMilan, ItalyOsaka, JapanTokyo, JapanMexico City, MexicoAmsterdam, The NetherlandsHoensbroeck, The NetherlandsAuckland, New ZealandOslo, NorwayWarsaw, PolandLisbon, PortugalBucharest, RomaniaSingaporeJohannesburg, South AfricaSeoul, South KoreaMadrid, SpainUpplands Vasby, SwedenBuchs, SwitzerlandGeneva, SwitzerlandTaipei, TaiwanBangkok, Thailand
A U D I T O R S
KPMG LLPIndependent Registered Public Accounting Firm Mountain View, California
T R A N S F E R A G E N T
Wells Fargo Shareowner ServicesSt. Paul, Minnesota
F O R M 1 0 - K
A copy of the Company’s Annual Report on Form 10-K, as fi led with the Securities and Exchange Commission, is available by contacting:
Investor RelationsElectronic Arts Inc.209 Redwood Shores ParkwayRedwood City, CA 94065(650) 628-7352
A N N U A L M E E T I N G
The Company’s Annual Meeting of Stockholders is scheduled to be held on July 27, 2006 at 2:00 P.M. at the Company’s headquarters:
Electronic Arts Inc.209 Redwood Shores ParkwayBuilding 250Redwood City, CA 94065
E L E C T R O N I C A R T S I N C .
Corporate Information
© 2006 Electronic Arts Inc. EA, the EA logo, EA SPORTS, EA SPORTS logo, EA SPORTS BIG, EA SPORTS BIG logo, Pogo, Club Pogo, JAMDAT Mobile, EA Mobile, The Sims, Need for Speed, Command & Conquer, Command & Conquer 3 Tiberium Wars, Spore, Medal of Honor Airborne, Medal of Honor, Ultima Online, Army of TWO, Burnout and SSX are trademarks or registered trademarks of Electronic Arts Inc. in the U.S. and/or other countries. All Rights Reserved. The mark “John Madden” and the name of John Madden reproduced on this product are trademarks or other intellectual property of Red Bear, Inc. or John Madden, are subject to license to Electronic Arts Inc., and may not be otherwise used in whole or in part without the prior written consent of Red Bear or John Madden. All NFL-related trademarks are trademarks of the National Football League. Offi cially licensed product of PLAYERS INC. NBA is a registered trademark of NBA Properties, Inc. The mark ‘TIGERWOODS’ is a trademark of ETW Corp. and may not be used, in whole or in part, without the prior written consent of ETW Corp. PGA TOUR is a trademark of PGA TOUR, INC. and used by permission. Battlefi eld 2, Battlefi eld 2: Modern Combat and Battlefi eld 2142 are trademarks of Digital Illusions CE AB. Crysis is a trademark of Crytek, Ltd. The Godfather ™ and © 2006 Paramount Pictures. All Rights Reserved. “PlayStation” and “PSP” are registered trademarks of Sony Computer Entertainment Inc. Xbox and Xbox 360 and Xbox Live are either registered trademarks or trademarks of Microsoft Corporation in the U.S. and/or other countries. Nintendo DS and Wii are trademarks of Nintendo. HARRY POTTER and all related characters and elements are trademarks of and © Warner Bros. Entertainment Inc. Harry Potter Publishing Rights © JKR.

™
Related Documents