COUNTER-ION EFFECTS ON THE KRAFFT TEMPERATURE AND MICELLE FORMATION OF IONIC SURFACTANTS IN AQUEOUS SOLUTION A DISSERTATION SUBMITTED TO THE DEPARTMENT OF CHEMISTRY IN THE PARTIAL FULFILLMENT OF THE REQUIREMENT FOR THE DEGREE OF MASTER OF PHILOSOPHY IN CHEMISTRY (PHYSICAL-INORGANIC) M.Phil Thesis SUBMITTED BY Komol Kanta Sharker St. ID-0413033209F Session-April, 2013 Department of Chemistry Bangladesh University of Engineering and Technology Dhaka-1000, Bangladesh September, 2016

Welcome message from author
This document is posted to help you gain knowledge. Please leave a comment to let me know what you think about it! Share it to your friends and learn new things together.
Transcript
COUNTER-ION EFFECTS ON THE KRAFFT TEMPERATURE AND MICELLE FORMATION OF IONIC SURFACTANTS IN
AQUEOUS SOLUTION
A DISSERTATION SUBMITTED TO THE DEPARTMENT OF CHEMISTRY IN THE PARTIAL FULFILLMENT OF THE REQUIREMENT FOR THE DEGREE OF MASTER
OF PHILOSOPHY IN CHEMISTRY (PHYSICAL-INORGANIC)
M.Phil Thesis
SUBMITTED BY
Komol Kanta Sharker
St. ID-0413033209F
Session-April, 2013
Department of Chemistry Bangladesh University of Engineering and Technology
Dhaka-1000, Bangladesh September, 2016

I
II
III
ABSTRACT
In this work the effect of some sodium and chloride salts on the Krafft temperature
(TK) and critical micelle concentration (CMC) of two classical ionic surfactants,
Octadecyltrimethylammonium bromide (OTAB) and Sodium dodecyl sulfate (SDS) have
been investigated by conductometric and tensiometric method. Sodium salts of different
monovalent and divalent anions belonging to the Hofmeister series found to decrease or
increase the TK of OTAB. In terms of decreasing the TK the propensity follows the order:
C7H5O3− > C7H5O2
− > C6H5SO3− > SO4
2− > Cl− > NO3− > F− > Br− > SCN− > I−. The results
show that hydrotropic and kosmotropic counter-ions decrease while chaotropic counter-ions
increase the TK of the surfactant. Chloride salts of monovalent cation such as Li+, Na+, Cs+,
K+ affect the solubility of SDS and hence TK of the surfactant. Some salts increase while
some decrease the TK of the system. In terms of deceasing the TK the ions follows the trend:
Li+ > Na+ > Cs+ > K+. Added counter-ions screen the charge of the micelle head group and
facilitate closer packing of the surfactant. Thus added salts always decrease the CMC of the
surfactant. Different salts interact differently with surfactant and thus decrease the CMC
differently. For SDS the effectiveness in lowering the CMC the ions follows the order: Cs+ >
K+ > Na+ > Li+. On the other hand, in terms of OTAB the ions follow the following trends in
decreasing the CMC: C6H5SO3− > C7H5O2
− > C7H5O3− > SO4
2− > NO3− > Br− > Cl− > F−.
Thermodynamic parameters (Gibbs free energy, enthalpy and entropy changes) of
micellization and adsorption were calculated from the specific conductance and surface
tension data. The negative value of free energy change indicates the process to be
spontaneous. The enthalpy and entropy terms are found to compensate each other for both
micellization and adsorption. For most of the cases surface excess concentration (Г) was
found to be higher in presence of salts than pure surfactant showing lower equilibrium
surface tension of the system. The solubilization behavior of a water insoluble dye, Sudan
Red B (SRB), in the micellar system was studied by the UV–visible spectrophotometric
technique. The solubilization of SRB in OTAB in the presence of Na2SO4 was found to be
about 1.33 times higher than that in pure water. In the case of SDS the value was found to be
1.07 times in the presence of NaCl. This indicates that the solubilization of SRB in the
surfactant micelles significantly increases in the presence of added salts.

IV
Dedicated
To My Ever
Loving Parents,
Sweet Brother
And Sisters

V
ACKNOWLEDGEMENTS
In extreme humbleness I bow my head before supreme personality of Godhead Vagaban Shree
Krishna who created mankind in a most splendid manner and bestowed upon him a distinguished
honor in the form of knowledge.
I venture to get inspiration from an adage that knowledge is an ornament amongst friends and
armor against enemy and adore the historical day when I joined the august institution to acquire
knowledge. I feel elated in having successfully to accomplish my studies with the keep support
and guidance of many personages to whom I owe a depth of gratitude.
I fumble for the appreciate words to offer thanks and pay gratitude to my respectable and worthy
supervisor Prof. Dr. Md. Nazrul Islam, Department of Chemistry who always exhibited
commendable alacrity in providing me proper guidance combined with educative discussions and
suggestions whereby I was encouraged to complete my research work confidently. I would like to
thank him for always keeping his door open for me.
My respectable faculty teachers deserve praise and thanks for their educative and constructive
corrective suggestions whenever I needed.
I also would like to extend my heartfelt thanks to the Board of Examiners: Dr. Md. Nazrul Islam
(Chairman), Dr. Md. Rafique Ullah (Member, Ex-Officio), Dr. Md. Shakhawat Hossain Firoz
(Member), Dr. Mahbub Kabir (Member, External) for their corrective suggestions.
I reciprocate the respect and regards shown to me by lab fellows, the technical staff and office
bearers of Department and the unforgettable cooperation exhibited by them during my research
work. I am grateful and thankful to my friends, roommates, nears and dears who extended all
possible moral support and encouragement during my strenuous study period and prayed for me.
Without you, I couldn’t have such a joyful life in BUET.
The biggest of all of my acknowledgements goes to my family for getting me here. Your
sacrifices and encouragement has allowed me to be who I am. Without your constant support this
arduous task would never have met the fateful and fruitful end. Therefore, I would like to thank
my parents Modhu Shudon Sharker and Srimotee Sharker and my brother Mithun Chandra
Sharker for their support, encouragement, unselfish love and faith. I love you and am glad to
forever have your support. K. K. Sharker
September, 2016

VI
CONTENTS
Title Page No. DECLARATION I
CERTIFICATION OF THESIS II
ABSTRACT III
DEDICATION IV
ACKNOWLEDGEMENTS V
TABLE OF CONTENTS VI
LAYOUT OF THIS PAPER XIII
CHAPTER ONE: INTRODUCTION
1.1 SURFACTANTS AND ITS BULK AND INTERFACIAL PHENOMENA 1
1.2 TYPES OF SURFACTANTS 4
1.2.1 Anionic Surfactants 4
1.2.2 Cationic Surfactants 5
1.2.3 Nonionic Surfactants 5
1.2.4 Zwitterionic Surfactants 5
1.3 PHYSICAL STATE 7
1.4 PROPERTIES OF SURFACTANTS 7
1.4.1 Adsorption of Surfactants 7
1.4.2 Micellization 9
1.4.2.1 Micelle 9
1.4.2.2 Micellization Process 10
1.4.2.3 Critical Micelle Concentration 11
1.4.2.4 Factors affecting CMC in aqueous solution 13
1.4.2.5 Cooperative association process in Surfactants 14
1.4.2.6 Thermodynamics of micellization 17
1.4.2.7 Micellar Solubilization 20
VII
1.4.2.8 Solubilization Theory 21
1.4.2.9 Factors affecting solubilization 22
1.4.2.10 Reasons for self-aggregation of surfactant molecules 24
1.5 SURFACTANT SOLUBILITY 27
1.5.1 The Krafft temperature 27
1.5.2 The Cloud point 28
1.6 APPLICATION OF SURFACTANTS 29
1.6.1 Consumer Products 29
1.6.1.1 Detergents and dishwashing 29
1.6.1.2 Cosmetics and Personal Care Products 29
1.6.2 Industrial Applications 30
1.6.2.1 Food products 30
1.6.2.2 Pharmaceutical industry 30
1.6.2.3 Insecticides and herbicides 30
1.6.2.4 Agriculture 30
1.6.2.5 Textiles and fibers 31
1.6.2.6 Chemical industry 31
1.6.2.7 Plastics industry 31
1.6.2.8 Paints and lacquers 31
1.6.2.9 Cellulose and paper 31
1.6.2.10 Leather and furs 32
1.6.2.11 Photographic industry 32
1.6.2.12 Metal processing 32
1.6.2.13 Electroplating 32
1.6.2.14 Adhesives 32
1.6.2.15 Road construction and building materials 32
1.6.2.16 Firefighting 33
1.6.2.17 Mining and flotation 33
1.6.2.18 Oilfield chemicals 33

VIII
1.6.2.19 Cleaning agents 33
1.6.2.20 Other: Surfactants in biological systems 33
1.7 THE SCOPE AND OBJECTIVES OF THE PRESENT THESIS 34
REFERENCES 37
CHAPTER TWO: THEORY AND EXPERIMENTS
2.1 MATERIALS 42
2.1.1 Surfactants 42
2.1.2 Salts 42
2.1.3 Dye 43
2.2 METHOD 44
2.2.1 Measurement of Krafft Temperature 44
2.2.2 Measurement of Critical Micelle Concentration 45
2.2.3 Solubilization 47
REFERENCES 50
CHAPTER THREE: RESULTS AND DISCUSSION
3.1 EFFECT OF ELECTROLYTES ON KRAFFT TEMPERATURE 51
3.2 EFFECT OF ADDED SALTS ON SURFACE ADSORPTION
AND MICELLIZATION 61
3.3 SURFACE EXCESS CONCENTRATION 74
3.4 THERMODYNAMICS OF MICELLIZATION 77
3.5 THERMODYNAMICS OF SURFACE ADSORPTION 81
3.6 SOLUBILIZATION STUDY OF SUDAN RED B (SRB) 87
REFERENCES 94
CONCLUSIONS 99
APPENDIX 101
LISTS OF PUBLISHED PAPER 124
IX
LIST OF FIGURES
No. Title Page No. Figure 1.1: Typical surfactant structure 1
Figure 1.2: Adsorption of amphiphiles at the air/water interface and
micelle as formed by self-assembly of the monomer units 3
Figure 1.3: Different phase structure of self association of
surfactant monomer 10
Figure 1.4: Changes in the concentration dependence of a wide
range of physico-chemical changes around the
critical micelle concentration (CMC) 12
Figure 1.5: Effect of "N" on fraction of added surfactant that goes
to micelle 17
Figure 1.6: Relation between the solubilized material and
concentration of surfactant 21
Figure 1.7: The chemical and physical solubilization (incorporation) of
drugs within micelle 22
Figure 1.8: The Krafft temperature (TK) is the point at which surfactant
solubility equals the critical micelle concentration. Above
TK, surfactant molecules form a dispersed phase; below
TK, hydrated crystals are formed 28
Figure 2.1: Hydrated crystal in the beaker (left side) and arrangement
for Krafft temperature measurement
(right side: EUTECH CON 510 conductivity meter and
Froilabo RE 5 refrigerated bath circulator) 44
Figure 2.2: Surface tension measurement: Surface tensiometer
(Kruss K9) and refrigerated bath circulator (JSRC-13C) 46
Figure 2.3: Shaking of the surfactant solution with dye (Top: Stuart
Orbital shakers, SSL1) and solution after shaking (Below) 48

X
Figure 2.4: Jenway UV-spectrophotometer, model 7315 (Top) and a
spectrophotogram of SRB (Below) 49
Figure 3.1: Specific conductance vs. temperature plots of SDS in pure
water and in the presence of different electrolytes
at 0.005 ionic strength. (i) Pure SDS, (ii) LiCl, (iii) KCl,
(iv) CsCl, (v) NaCl. The sharp break point in the plot indicates
the Krafft Temperature 52
Figure 3.2: Specific conductance vs. temperature plots of OTAB in pure
water and in the presence of different electrolytes
at 0.005 ionic strength. (i) Pure OTAB, (ii) Na2SO4, (iii) NaBr,
(iv) NaF, (v) C6H5SO3Na, (vi) C7H5O2Na, (vii) NaNO3,
(viii) C7H5O3Na, (ix) NaCl. The sharp break point in the plot
indicates the Krafft Temperature 53
Figure 3.3: Effect of ionic strength of electrolytes on the Krafft
Temperature of SDS. (i) LiCl, (ii) NaCl, (iii) CsCl, (iv) KCl 55
Figure 3.4: Effect of ionic strength of electrolytes on the Krafft
Temperature of OTAB. (i) C7H5O3Na, (ii) C7H5O2Na,
(iii) Na2SO4, (iv) C6H5SO3Na, (v) NaF, (vi) NaNO3, (vii) NaCl,
(viii) NaBr, (ix) NaSCN, (x) NaI 56
Figure 3.5: Conductometric determination of CMC of SDS in pure water
at 30°C 62
Figure 3.6: Conductometric determination of CMC of SDS in the
presence of 0.005M NaCl solution at 30°C 62
Figure 3.7: Conductance vs. surfactant concentration plot for OTAB
in aqueous solution at 40°C 63
Figure 3.8: Conductance vs. surfactant concentration plot for OTAB in
the presence of 0.005M NaCl solution at 40°C 63
Figure 3.9: Surface tensiometric determination of CMC of SDS
in pure water at 30°C 65
XI
Figure 3.10: Surface tensiometric determination of CMC of SDS in the
presence of 0.005M NaCl solution at 30°C 65
Figure 3.11: Surface tension vs. Log10C plot for OTAB in aqueous solution
at 40°C 66
Figure 3.12: Surface tension vs. Log10C plot for OTAB in the presence
of 0.005M NaCl solution at 40°C 66
Figure 3.13: surface excess concentration of SDS (i) in pure and
(ii) in 0.005M aqueous solution of NaCl 75
Figure 3.14: surface excess concentration of OTAB (i) in pure and
(ii) in 0.005M NaCl solution. 75
Figure 3.15: Enthalpy-Entropy compensation plot for (a) Micellization
(b) surface Adsorption of SDS in aqueous solution 84
Figure 3.16: Enthalpy-Entropy compensation plot for (a) Micellization
(b) surface Adsorption of OTAB in aqueous solution 85
Figure 3.17: Effect of surfactant concentration on the absorption spectra
of SRB: i 0.4, ii 0.6, iii 1.0, iv 1.5 and v 2.0 mM OTAB
solutions in pure water 88
Figure 3.18: Effect of surfactant concentration on the absorption spectra
of SRB: i 0.06, ii 0.1, iii 0.2, iv 0.4 and v 0.8 mM OTAB
solutions in 0.005 ionic strength Na2SO4 88
Figure 3.19: Effect of surfactant concentration on the absorption spectra
of SRB: i 8, ii 9, iii 10, iv 15, v 20 and vi 30 mM SDS solutions
in pure water 89
Figure 3.20: Effect of surfactant concentration on the absorption spectra
of SRB: i 6, ii 7, iii 8, iv 9, v 10 and vi 20 mM SDS solutions
in 0.005M NaCl 89
Figure 3.21: Solubilization of SRB in OTAB solution in (a) pure water and
(b) 0.005 ionic strength aqueous Na2SO4 solution. The break
point in the curve shows the CMC below which no significant
XII
absorbance was observed. This indicates the SRB solubilized
only when OTAB forms micelles 90
Figure 3.22: Solubilization of SRB in SDS solution in (a) pure water and
(b) 0.005M NaCl solution. The break point in the curve shows
the CMC below which no significant absorbance was
observed. This indicates the SRB solubilized only when SDS
forms micelles 91
LIST OF TABLES
No. Title Page No.
Table 1.1: Some representative examples of surfactant 6
Table 3.1: CMC values of OTAB at different temperatures in pure water
and in the presence of 0.005 ionic strength solutions of
several electrolytes 70
Table 3.2: CMC values of SDS at different temperatures in pure water
and in the presence of 0.005 ionic strength solutions of some
electrolytes 71
Table 3.3: Thermodynamic parameters of adsorption and micellization*
of the SDS surfactants solution. 78
Table 3.4: Thermodynamic parameters of adsorption and micellization*
of the SDS – 0.005M NaCl surfactants solution. 78
Table 3.5: Thermodynamic parameters of adsorption and micellization*
of the OTAB surfactants solution. 79
Table 3.6: Thermodynamic parameters of adsorption and micellization*
of the OTAB – 0.005M NaCl surfactants solution. 79
Table 3.7: Tc value for OTAB and SDS in water and 0.005M NaCl solution 86
Table 3.8: Molar Solubilization Ratio (MSR) values of SRB in SDS 93
Table 3.9: Molar Solubilization Ratio (MSR) values of SRB in OTAB 93
XIII
LAYOUT OF THIS DISSERTATION
This thesis paper has been divided into three chapters-
👉 Chapter one presents a general introduction. Here review of some earlier
research works is given for present investigation. Objectives of the present work
are also described in this chapter.
👉 Theory and experimental procedures are explained in chapter two.
👉 Experimental results and discussions are presented in chapter three. The
conclusions of this research work have also been discussed here.
👉 References are added at the end of the respective chapter.
👉 Appendix was also included at the end of this thesis paper.
👉 List of publications related to the present work have also been mentioned at the
very end of this thesis paper.

XIV
“Education is the most powerful weapon which you can use to
change the world”.
……. Nelson Mandela

Chapter One
Introduction
Introduction
1
1.1 SURFACTANTS AND ITS BULK AND INTERFACIAL
PHENOMENA
Surfactants are compounds that lower the surface tension of the liquid, the interfacial
tension between two liquids or interfacial tension between a liquid and solid. Surfactants
can act as wetting agents, emulsifiers, foaming agents and dispersants. For this reason
they are used in vast amounts in domestic and industrial applications such as in soaps,
detergents, paints, dyestuffs, paper coatings, inks, plastics and fibers, personal care and
cosmetics, agrochemicals, pharmaceuticals, food processing, oil industry, etc. [1-3].
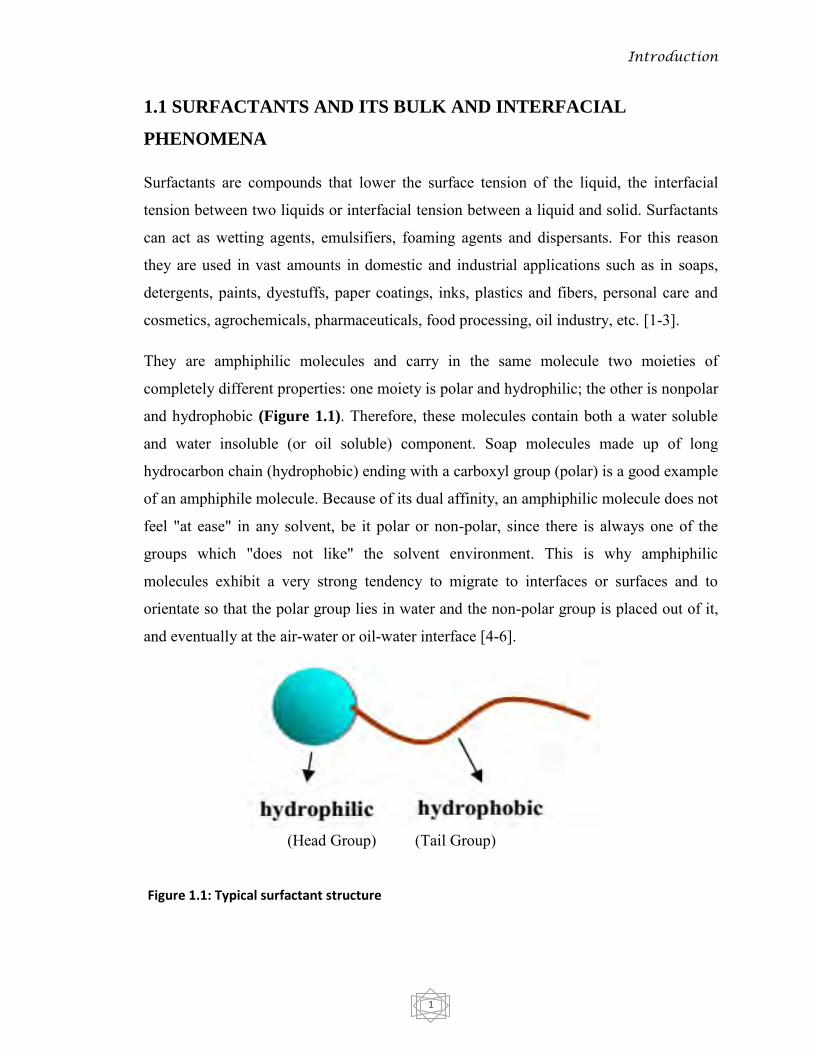
They are amphiphilic molecules and carry in the same molecule two moieties of
completely different properties: one moiety is polar and hydrophilic; the other is nonpolar
and hydrophobic (Figure 1.1). Therefore, these molecules contain both a water soluble
and water insoluble (or oil soluble) component. Soap molecules made up of long
hydrocarbon chain (hydrophobic) ending with a carboxyl group (polar) is a good example
of an amphiphile molecule. Because of its dual affinity, an amphiphilic molecule does not
feel "at ease" in any solvent, be it polar or non-polar, since there is always one of the
groups which "does not like" the solvent environment. This is why amphiphilic
molecules exhibit a very strong tendency to migrate to interfaces or surfaces and to
orientate so that the polar group lies in water and the non-polar group is placed out of it,
and eventually at the air-water or oil-water interface [4-6].
(Head Group) (Tail Group)
Figure 1.1: Typical surfactant structure
Introduction
2
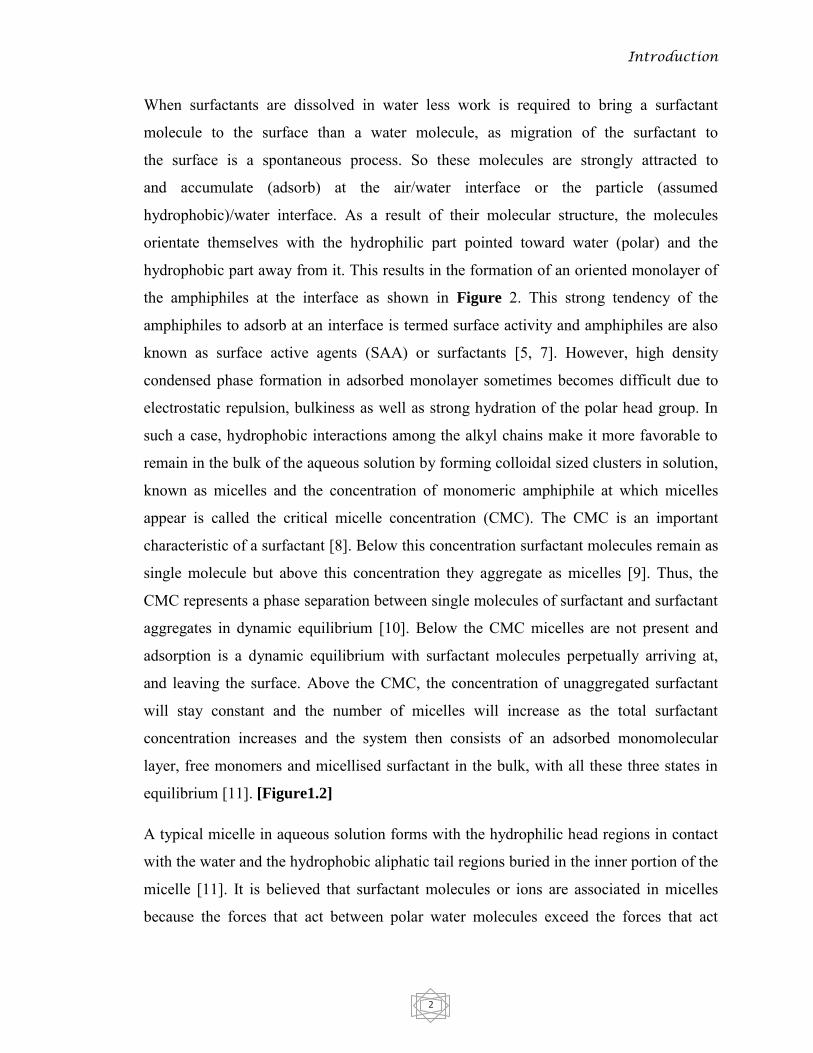
When surfactants are dissolved in water less work is required to bring a surfactant
molecule to the surface than a water molecule, as migration of the surfactant to
the surface is a spontaneous process. So these molecules are strongly attracted to
and accumulate (adsorb) at the air/water interface or the particle (assumed
hydrophobic)/water interface. As a result of their molecular structure, the molecules
orientate themselves with the hydrophilic part pointed toward water (polar) and the
hydrophobic part away from it. This results in the formation of an oriented monolayer of
the amphiphiles at the interface as shown in Figure 2. This strong tendency of the
amphiphiles to adsorb at an interface is termed surface activity and amphiphiles are also
known as surface active agents (SAA) or surfactants [5, 7]. However, high density
condensed phase formation in adsorbed monolayer sometimes becomes difficult due to
electrostatic repulsion, bulkiness as well as strong hydration of the polar head group. In
such a case, hydrophobic interactions among the alkyl chains make it more favorable to
remain in the bulk of the aqueous solution by forming colloidal sized clusters in solution,
known as micelles and the concentration of monomeric amphiphile at which micelles
appear is called the critical micelle concentration (CMC). The CMC is an important
characteristic of a surfactant [8]. Below this concentration surfactant molecules remain as
single molecule but above this concentration they aggregate as micelles [9]. Thus, the
CMC represents a phase separation between single molecules of surfactant and surfactant
aggregates in dynamic equilibrium [10]. Below the CMC micelles are not present and
adsorption is a dynamic equilibrium with surfactant molecules perpetually arriving at,
and leaving the surface. Above the CMC, the concentration of unaggregated surfactant
will stay constant and the number of micelles will increase as the total surfactant
concentration increases and the system then consists of an adsorbed monomolecular
layer, free monomers and micellised surfactant in the bulk, with all these three states in
equilibrium [11]. [Figure1.2]
A typical micelle in aqueous solution forms with the hydrophilic head regions in contact
with the water and the hydrophobic aliphatic tail regions buried in the inner portion of the
micelle [11]. It is believed that surfactant molecules or ions are associated in micelles
because the forces that act between polar water molecules exceed the forces that act
Introduction
3
between hydrocarbon chains and water. Therefore, the transfer of hydrocarbon chains
from water into a phase close to them in polarity is energetically favorable [12].
An immediate consequence of the adsorption of surfactant molecules at an interface is
that its interfacial energy is reduced. For a water surface covered with a monolayer of
surfactant molecules, its surface tension is very much lower than that of clean water
surface [13].
Surface tension occurs when water molecules on a surface bond very tightly to other
water molecules both next to and below them. When surfactants are dissolved in water
they form a monolayer upon spontaneous adsorption at the air-water interface [14] and do
not completely mix with water but are able to bond to water and prevent water molecules
from binding as tightly to one another, thus lowering the tension or strength of the
surface.
Figure 1.2: Adsorption of amphiphiles at the air/water interface and micelle as formed by self-assembly of the monomer units
Introduction
4
Below the CMC surfactants tend to accumulate at the interface, reducing surface tension.
At CMC, the surface tension of the solution does not change but remains constant,
as the gas-liquid interface is already fully packed with the surfactant molecules.
Above the CMC, most of the surfactant molecules are inside the bulk aggregating
into micelles. When this occurs, the addition of surfactants just increases the number of
micelles and the surface tension becomes independent of surfactant concentration [15].
1.2 TYPES OF SURFACTANTS
Surfactants may be classified according to their applications (emulsifiers, foaming agents,
wetting agents, dispersants etc.), some physical characteristics (water and oil solubility
and stability) and chemical structure of both the head and tail group of surfactants. The
head group can be charged or neutral, small and compact in size, or a polymeric chain.
The tail group is usually a single or double, straight or branched hydrocarbon chain, but
may also be a fluorocarbon, or a siloxane, or contain aromatic group(s).
Since the hydrophilic part normally achieves its solubility either by ionic interactions or
by hydrogen bonding, the simplest classification is based on surfactant head group type,
with further subgroups according to the nature of the lyophobic moiety. Four basic
classes therefore emerge as: Anionic, Cationic, Nonionic and Zwitterionic [16-19].
1.2.1 Anionic Surfactant
Anionic surfactants are dissociated in water into two oppositely charged species anion
(the surfactant ion) and cation (counter ion). Carboxylate, sulfate, sulfonate and
phosphate are the polar groups found in anionic surfactants. The counterions most
commonly used are sodium, potassium, ammonium, calcium and various protonated alkyl
amines. One main reason for their popularity is the ease and low cost of manufacture.
Anionics are used in most detergent formulations and the best detergency is obtained by
alkyl chains in the C12-C18 range. They are by far the largest surfactants class. They are
generally sensitive to hard water. Sensitivity decreases in the order carboxylate >
phosphate > sulfate ≅ sulfonate.
Introduction
5
1.2.2 Cationic Surfactant
Cationic surfactants are dissociated in water into an amphiphilic cation and an anion,
most often of the halogen type. A very large proportion of this class corresponds to
nitrogen compounds such as fatty amine salts and quaternary ammoniums, with one or
several long chain of the alkyl type, often coming from natural fatty acids. These
surfactants are in general more expensive than anionics and are only used in which there
is no cheaper substitute. They are the third largest surfactants class. They adsorb strongly
to most surfaces and their main uses are related to in situ surface modification.
1.2.3 Nonionic Surfactants
Nonionic surfactants do not ionize in aqueous solution, because their hydrophilic group is
of a non-dissociable type, such as alcohol, phenol, ether, ester, or amide. A large
proportion of these nonionic surfactants are made hydrophilic by the presence of a
polyethylene glycol chain, obtained by the polycondensation of ethylene oxide. They
are called polyethoxylated nonionics. The polycondensation of propylene oxide produce
a polyether which (in opposition to polyethylene oxide) is slightly hydrophobic. This
polyether chain is used as the lipophilic group in the so-called polyEOpolyPO block
copolymers, which are most often included in a different class, e.g. polymeric surfactants.
They are the second largest surfactant class. They are normally compatible with all other
types of surfactants. They are not sensitive to hard water. Their physicochemical
properties are not markedly affected by electrolytes. Contrary to ionic compounds they
become less water soluble-more hydrophobic.
1.2.4 Zwitterionic Surfactant
When the headgroup of a surfactant molecule contain both a negative and a positive
charge it is called amphoteric or zwitterionic. Whereas the positive charge is almost
invariably ammonium, the source of negative charge may vary, although carboxylate is
by far the most common. Some amphoteric surfactants are insensitive to pH, whereas
others are cationic at low pH and anionic at high pH, with an amphoteric behavior at
intermediate pH. Amphoteric surfactants are generally quite expensive, and consequently,
Introduction
6
their use is limited to very special applications such as cosmetics where their high
biological compatibility and low toxicity is of primary importance. They are the smallest
surfactant class. They are compatible with all other classes of surfactants. They are not
sensitive to hard water. Most types show very low eye and skin irritation. They are
therefore well suited for shampoos and other personal care products.
The past two decades have seen the introduction of a new class of surface active
substance, so-called polymeric surfactants or surface active polymers, which result from
the association of one or several macromolecular structures exhibiting hydrophilic and
lipophilic characters, either as separated blocks or as grafts. They are now very
commonly used in formulating products as different as cosmetics, paints, foodstuffs, and
petroleum production additives. Recently, there has been considerable research interest in
certain dimeric surfactants, containing two hydrphobic tails and two head groups known
as gemini surfactants, which have efficiency in lowering surface tension and very low
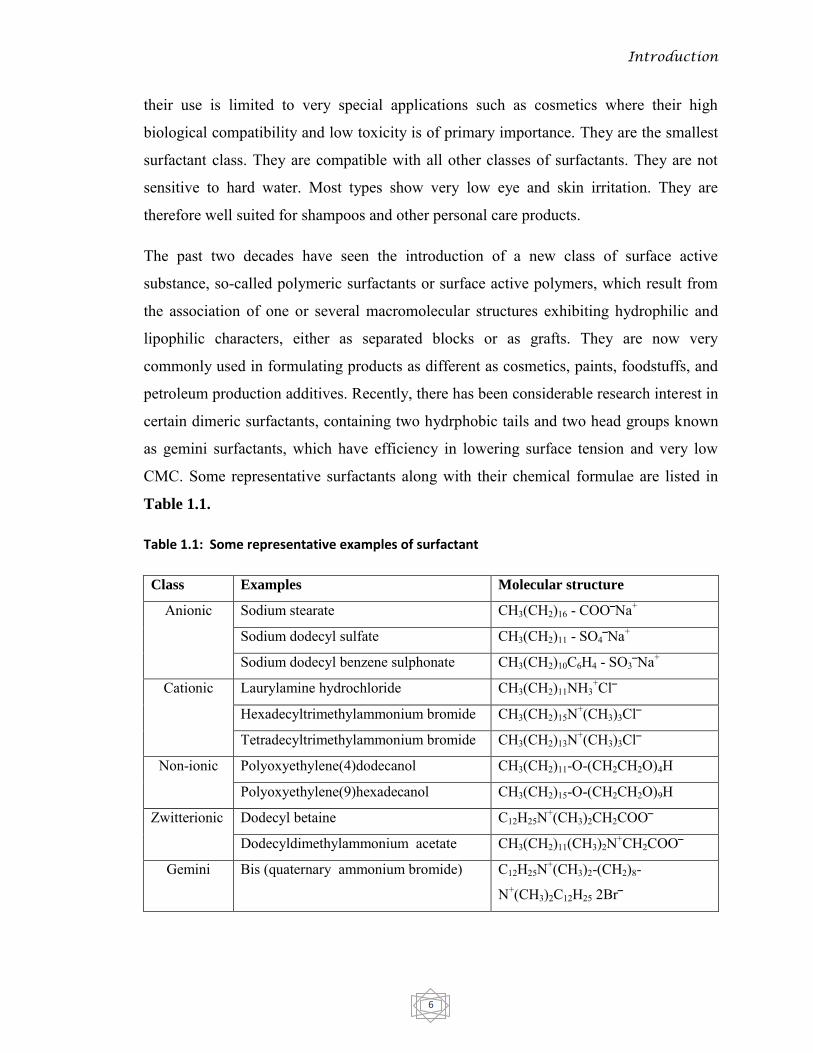
CMC. Some representative surfactants along with their chemical formulae are listed in
Table 1.1.
Table 1.1: Some representative examples of surfactant
Class Examples Molecular structure
Anionic
Sodium stearate CH3(CH2)16 - COO‾Na+
Sodium dodecyl sulfate CH3(CH2)11 - SO4‾Na+
Sodium dodecyl benzene sulphonate CH3(CH2)10C6H4 - SO3‾Na+
Cationic Laurylamine hydrochloride CH3(CH2)11NH3+Cl‾
Hexadecyltrimethylammonium bromide CH3(CH2)15N+(CH3)3Cl‾
Tetradecyltrimethylammonium bromide CH3(CH2)13N+(CH3)3Cl‾
Non-ionic Polyoxyethylene(4)dodecanol CH3(CH2)11-O-(CH2CH2O)4H
Polyoxyethylene(9)hexadecanol CH3(CH2)15-O-(CH2CH2O)9H
Zwitterionic Dodecyl betaine C12H25N+(CH3)2CH2COO‾
Dodecyldimethylammonium acetate CH3(CH2)11(CH3)2N+CH2COO‾
Gemini Bis (quaternary ammonium bromide) C12H25N+(CH3)2-(CH2)8-
N+(CH3)2C12H25 2Br‾
Introduction
7
1.3 PHYSICAL STATE
Ionic surfactants are generally amorphous or crystalline solids and nonionic surfactants
are liquid or solid. Crystalline surfactants can be prepared relatively purely. They can be
polymorphic, if their structures have different unit cell, or polytypic if their structures
have one dimensional polymorphism. Amorphous solids are surfactants that have one or
more chiral centres and exist in multiple optical isomers. Liquid crystalline surfactants
exhibit properties common to crystalline and to liquid physical state. Liquid surfactants
are fundamentally amorphous with no long range order and are typically isotropics.
1.4 PROPERTIES OF SURFACTANTS
Surfactants distort water structure and raise free energy of solution. The system, however,
has natural tendency to minimize its free energy. To satisfy this natural desire the system
may undergo- (A) Adsorption (B) Micellization
1.4.1 Adsorption of Surfactants
Adsorption is an entropically driven process by which molecules diffuse preferentially
from a bulk phase to an interface. Due to the affinity that a surfactant molecule
encounters towards both polar and non-polar phases, thermodynamic stability (i.e. a
minimum in free energy or maximum in entropy of the system) occurs when these
surfactants are adsorbed at a polar/non-polar (e.g. oil/water or air/water) interface. Due to
its amphiphilic structure, the surfactant can adsorb onto interfaces and lower the tension
(γ) of the interfaces. The adsorption dynamics, i.e. the time-dependent adsorption process
of surfactant molecules onto interfaces, is of significant importance in lots of applications
including foaming, emulsifying and coating processes, in which bubbles, drops or films
are rapidly formed [20-22]. The surfactant adsorption process from the bulk to the
air/water interface can be divided into two: the motion of the surfactant molecules from
the bulk to the sub-surface and the transfer of molecules from the sub-surface to the
air/water interface [23-25]
Due to the different environment of molecules located at an interface compared to those
from either bulk phase, an interface is associated with a surface free energy. At the air-
Introduction
8
water surface for example, water molecules are subjected to unequal short-range
attractive forces and thus, undergo a net inward pull to the bulk phase. Minimisation of
the contact area with the gas phase is therefore a spontaneous process, explaining why
drops and bubbles are round. The surface free energy per unit area, defined as the surface
tension (γo), is then the minimum amount of work (Wmin) required to create new unit area
of that interface (∆A), so Wmin= γo × ∆A. Another, but less intuitive, definition of surface
tension is given as the force acting normal to the liquid-gas interface per unit length of
the resulting thin film on the surface [15].
A surface-active agent is therefore a substance that at low concentrations adsorbs thereby
changing the amount of work required to expand that interface. In particular surfactants
can significantly reduce interfacial tension due to their dual chemical nature. Considering
the air-water boundary, the force driving adsorption is unfavourable hydrophobic
interactions within the bulk phase. There, water molecules interact with one another
through hydrogen bonding, so the presence of hydrocarbon groups in dissolved
amphiphilic molecules causes distortion of the solvent structure apparently increasing the
free energy of the system. This is known as the hydrophobic effect [26].
Less work is required to bring a surfactant molecule to the surface than a water molecule,
so that migration of the surfactant to the surface is a spontaneous process. At the gas-
liquid interface, the result is the formation of an oriented suractant monolayer with the
hydrophobic tails pointing out of, and the head group inside, the water phase. The
balance against the tendency of the surface to contract under normal surface tension
forces causes an increase in the surface (or expanding) pressure π, and therefore a
decrease in surface tension γ of the solution. The surface pressure is defined as π = γo − γ,
where γo is the surface tension of a clean air-water surface.
Depending on the surfactant molecular structure, adsorption takes place over various
concentration ranges and rates, but typically, above a well-defined concentration – the
critical micelle concentration (CMC) – micellisation or aggregation takes place. At the
CMC, the interface is at (near) maximum coverage and to minimise further free energy,
molecules begin to aggregate in the bulk phase. Above the CMC, the system then consists

Introduction
9
of an adsorbed mono-molecular layer, free monomers and micellised surfactant
molecules in the bulk, with all these three states in equilibrium.
1.4.2 Micellization
1.4.2.1 Micelle
The solubility pattern with respect to solvent properties of a non-polar compound like
alkane is in sharp contrast to that of a charged or otherwise strongly polar chemical
species. If these two features occur simultaneously in the same chemical entity, an
interesting phenomenon is observed. For aqueous solutions, one well known situation is
that the polar group is located in the solution while the nonpolar part seeks to avoid the
aqueous environment by stretching into the gas phase or into an adjacent non-polar liquid
phase. Except for this adsorption at gas –liquid, liquid-liquid or liquid-solid interfaces
there is an alternative possibility to avoid the unfavorable contact between non-polar
groups and water and between polar groups and non-polar solvent, i.e. by self-association
into various types of aggregates (Figure 1.3). The term micelle is introduced by the
pioneer in the field J.W. McBain in 1913 to describe the formation of colloidal properties
by detergents and soaps [27].
The word “micelle” has also been used in biology and in colloid chemistry for other
phenomena. Important features of the micelle are the high aggregation number and
effective separation of hydrophilic and hydrophobic part. It was established at an early
stage that micelle formation displays peculiar concentration dependence. Thus at low
concentration an aqueous ionic surfactant solution behaves essentially as a strong
electrolyte. On the other hand, an increased amphiphile concentration leads to a
corresponding increase in the amount of micelles while the monomer concentration stays
roughly independent of the total amphiphile concentration. Under these circumstances,
pronounced changes in the concentration dependence of a large number of properties
occur at the CMC.
The existence of micelles in a solution is an important parameter due to a number of
important interfacial phenomena, such as detergency and solubilization. Furthermore,
micelles have become a subject of great interest in the fields of organic chemistry and the
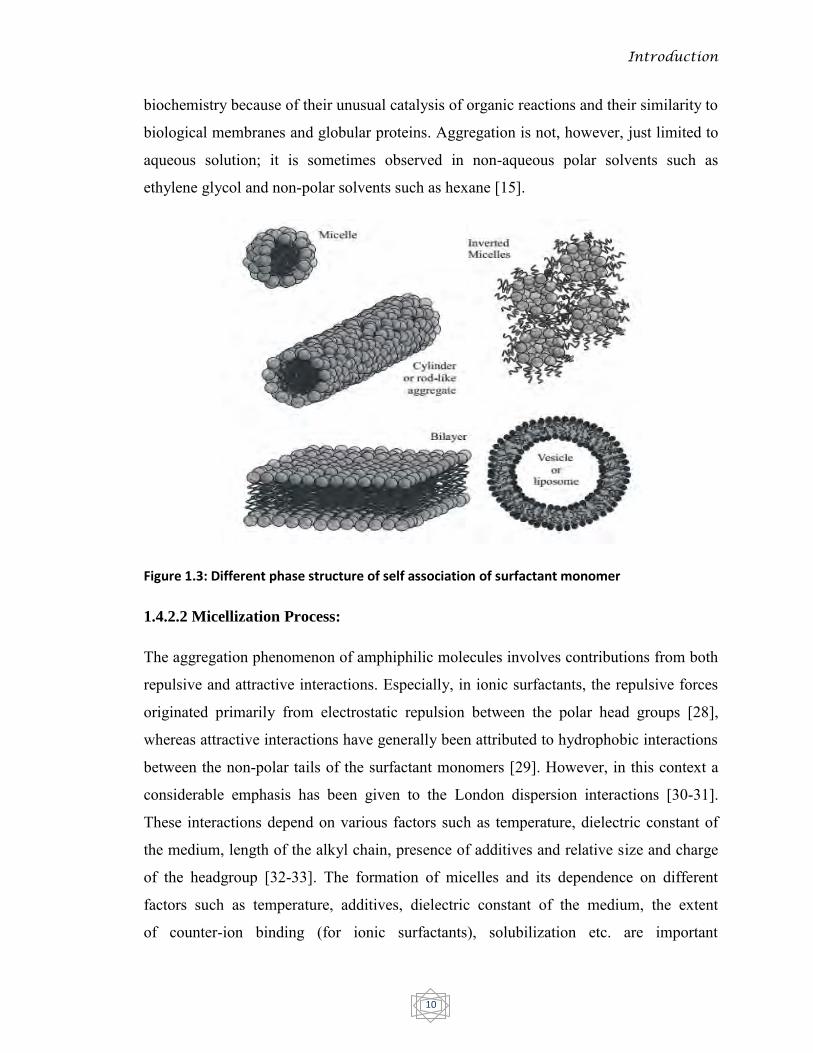
Introduction
10
biochemistry because of their unusual catalysis of organic reactions and their similarity to
biological membranes and globular proteins. Aggregation is not, however, just limited to
aqueous solution; it is sometimes observed in non-aqueous polar solvents such as
ethylene glycol and non-polar solvents such as hexane [15].
Figure 1.3: Different phase structure of self association of surfactant monomer
1.4.2.2 Micellization Process:
The aggregation phenomenon of amphiphilic molecules involves contributions from both
repulsive and attractive interactions. Especially, in ionic surfactants, the repulsive forces
originated primarily from electrostatic repulsion between the polar head groups [28],
whereas attractive interactions have generally been attributed to hydrophobic interactions
between the non-polar tails of the surfactant monomers [29]. However, in this context a
considerable emphasis has been given to the London dispersion interactions [30-31].
These interactions depend on various factors such as temperature, dielectric constant of
the medium, length of the alkyl chain, presence of additives and relative size and charge
of the headgroup [32-33]. The formation of micelles and its dependence on different
factors such as temperature, additives, dielectric constant of the medium, the extent
of counter-ion binding (for ionic surfactants), solubilization etc. are important
Introduction
11
physicochemical aspects that need detailed and intensive attention for both fundamental
understanding and industrial applications. The dominance of the favorable interaction
between alkyl chains of the surfactant favors micellization and lead CMC to lower
values by stabilizing micelles while the opposing repulsive interaction between the
polar/charged head groups disfavor micellization and leads CMC to higher values [32].
To differentiate among these different kinds of intractions, the surfactant solution
properties, such as critical micellar concentration (CMC), micelle shape and size,
solubility and Krafft temperature have been considerably important [34]. Micelles are
known to have an anisotropic water distribution within their structure. In other words, the
water concentration decreases from the bulk towards the interior of the micelle, with a
completely hydrophobic-like interior. Thus, micellar solution consists of special medium
in which hydrophobic organic compounds can be solubilized in aqueous surfactant
solution, which are otherwise insoluble in water [35-36]. At low concentration in water,
surfactants exist mostly as monomers [37]. At higher concentrations, the surfactants
molecules grouped together in a manner that their hydrophobic tails (usally an n-alkyl
hydrocarbon chain containing 8 to 18 methylene groups) tend to coaggregate to form
more or less spherical micelles with hydrocarbon chains forming a core and the polar
hydrophilic heads on the surface providing protection. A major source of stability of
micelle is the existence of an electric charge on their surface. On account of this charge,
ions of opposite charge tend to cluster nearby, and an ionic atmosphere is formed.
1.4.2.3 Critical Micelle Concentration
The change in surface properties as the concentration of an aqueous solution of a
surfactant rises is characteristic of most surface active molecules. During earlier studies
of the solution properties of surfactants, it was recognized that the bulk solution
properties of these materials were unusual and could change abruptly over a very small
concentration range, indicating the presence of colloidal particles in the solution [39].
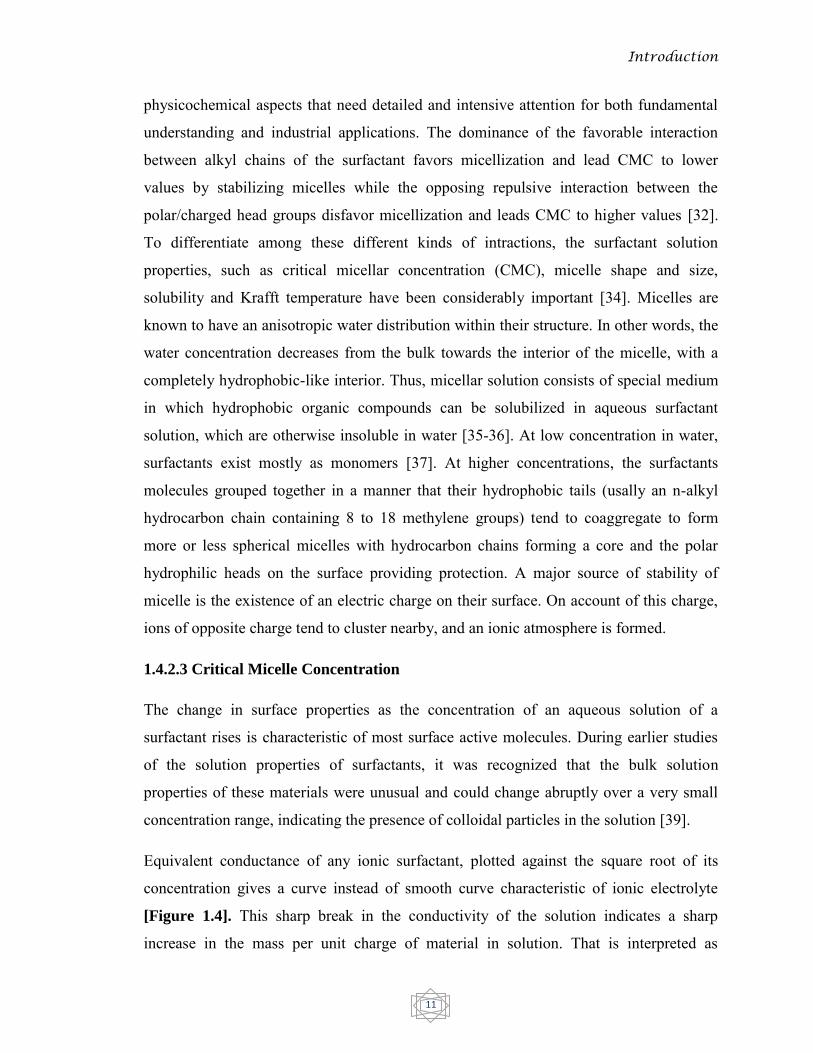
Equivalent conductance of any ionic surfactant, plotted against the square root of its
concentration gives a curve instead of smooth curve characteristic of ionic electrolyte
[Figure 1.4]. This sharp break in the conductivity of the solution indicates a sharp
increase in the mass per unit charge of material in solution. That is interpreted as
Introduction
12
evidence of the formation of micelles from the monomeric surfactant molecules with part
of the charge of the micelle neutralized by associated counter ions. The threshold
concentration at which micellization begins is known as the critical concentration.
Similar behavior in almost all measurable physical properties is observed by all types of
surface active materials (anionic, cationic, nonionic, zwitterionic) which depend on size
or number of particles in solution [Figure 1.4].
Phillips [38] had used that CMC is the concentration at which the properties of the
surfactant solution changes in the most abrupt manner, i.e
𝑑3𝜑
𝑑𝑐3 = 0
where φ is any additive property which varies linearly with the concentration of
micellized end of unassociated surfactant. The discovery of this discontinuity in physical
properties and reasons for it were first described by McBain [39] in 1920s and there has
been a considerable volume of work on the subject since then.
Figure 1.4: Changes in the concentration dependence of a wide range of physico-chemical changes around the critical micelle concentration (CMC)
Introduction
13
1.4.2.4 Factors affecting CMC in aqueous solution
(i) The Hydrophobic Group
The length of the hydrocarbon chain is a major factor determining the CMC. For a
homologous series of linear single-chain surfactants the CMC decreases logarithmically
with carbon number. Interestingly, for straight-chain dialkyl sulfosuccinates the value is
double than that for the single chain compounds. Alkyl chain branching and double
bonds, aromatic groups or some other polar character in the hydrophobic part produce
noticeable changes in the CMC. In hydrocarbon surfactants, chain branching gives a
higher CMC than a comparable straight chain surfactant [15], and introduction of a
benzene ring in the chain is equivalent to about 3.5 carbon atoms [5].
(ii) The Hydrophilic Group
For surfactants with the same hydrocarbon chain, varying the hydrophile nature (i.e.,
from ionic to non-ionic) has an important effect on the CMC values. Ionic surfactants
have much higher CMC than nonionic surfactants containing equivalent hydrophobic
groups. For instance, for a C12 hydrocarbon the CMC with an ionic headgroup lies in the
range of 1 ×10⁻³mol dm-3, while a C12 non-ionic material exhibits a CMC in the range of
1 ×10⁻⁴mol dm-3.
(iii) Temperature
The effect of temperature on the CMC of surfactants in aqueous medium is complex.
Rosen [15] pointed out that the value appearing first to decrease with the temperature to
some minimum and then to increase with further increase in temperature. The increase of
the temperature causes decrease of the hydration of the hydrophilic group, which favors
the micellization. However temperature increase also causes disruption of the structured
water surrounding of the hydrophobic group, an effect that disfavors micellization. The
relative magnitude of these two opposing effects, therefore, determines whether the CMC
increases or decreases over a particular temperature range. From the data available in the
literature, the minimum in the CMC temperature curve appears to be around 25oC for
ionic surfactants [40] and around 50oC for nonionic [41].
Introduction
14
(iv) Salts
Addition of neutral salts to an aqueous solution of surfactant usually decreases the CMC
of ionic surfactants. This effect is less pronounced when the surfactants is nonionic. Salts
tend to screen electrostatic repulsions between headgroups and make the surfactant
effectively more hydrophobic. This increases hydrophobic interactions among the
surfactants cause them to aggregate at a lower concentration, thereby the CMC decreases
[42].
1.4.2.5 Cooperative association process in Surfactants
When surfactants associate into micelles, they form a liquid like aggregate. As there is no
specific mechanism related to specific aggregation number, the association of monomers
into micelles is described as stepwise addition of a monomer, S to the aggregate, Sn-1 as
in
S + Sn-1 ⇋ Sn (1)
By neglecting additional interactions between aggregates and between monomers, the
equilibrium would be
Kn = [Sn ]
S [Sn−1] (2)
This equation gives description of any stepwise association process in dilute solution. In
the case of aggregation, n of order 100, there would be a number of intractable
equilibrium constants Kn. However, because it is almost impossible to specify all the Kn
equilibrium steps, approximate model of micellization are being used.
(i) Isodesmic model:
In this model it is assumed that Kn is independent of n where regardless of either the total
concentration or of K, [S] K < 1. The aggregation distribution function
Introduction
15
f(n) = [Sn ]
[Sn ]∞n =1
(3)
decays exponentially with [S1] > [S2] > [Sn].
In this model, aggregation is a continuous process that does not show the abrupt onset in
a narrow concentration range, which typifies micelle formation. Isodesmic model
describe the association of dyes in aqueous solution quite well but it is less successful as
a description of the formation of micelles because the model does not predict a CMC. Its
basic shortcoming lies in making Kn independent of n and thus depriving the process of
cooperativity.
(ii) Phase separation model
In this model aggregation is approximated as a phase separation process in which the
activity of the monomer remains constant above the CMC. Micelle formation having
several features in common with the formation of a separate liquid phase provides basis
for this model in which micelles formally constitute a separate phase. In terms of
association described in equation (1), the phase separation model assumes that aggregates
with large n, dominate all others except the monomer. This assumption implies strong
cooperativity because, once aggregation has started, and it becomes more and more
favorable to add another monomer until a large aggregation number is reached. In the
pseudo separate phase, the surfactant possesses a certain chemical potential µ° (micelle)
in the aggregates when monomers and aggregates coexist in equilibrium
µ°(micelle) = µθ(solvent) + RT ln[S] (4)
[S] is the CMC (neglecting dimers and oligomers). The standard free energy of micelle
formation ∆G°mic represents the standard free energy difference between a monomer in
the micelle and the standard chemical potential in dilute solutions and
∆G°mic= µ°(micelle) - µθ(solvent) = RT lnCMC (5)
This equation provides a useful approximation for obtaining ∆ G°mic. This phase
separation model captures several but not all essential features of micelle formation. It

Introduction
16
describes the start mechanism of the self-assembly process but does not describe the stop
mechanism [43].
(iii) Closed association model
This model describes both start and stop features of micellization. It is assumed that
aggregation number dominates with only monomers and N-aggregates
NS ⇋ SN (6)
KN = [SN ]
[S]N (7)
The total surfactant concentration in terms of model of monomers is
[S]T = N[SN] + [S] = NKN[S]N + [S] (8)
This KN can be related to other equilibrium constant in equation (2) as
KN = KnN2 (9)
Fraction of added surfactants enters into an aggregate is given by derivative
∂{N SN }
∂[S]T (10)
Figure 1.5 shows three curves with varying values of N, the larger the N value, the more
abruptly the derivative 𝜕 𝑁 𝑆𝑁 /𝜕[𝑆]𝑇 changes from a low concentration value of zero
to the high concentration value of unity. When N → ∞, discontinuity in the derivative at
CMC is regained. As the aggregation number, N increases, the fraction of added
surfactant that goes to the micelle varies more and more steeply with total concentration
[S]T. In the limiting case in which the aggregation number becomes infinite the transition
becomes a step function that unambiguously defines the CMC while small aggregation
numbers to less defined values of CMC. In the case of ionic surfactant an equilibrium
between surfactant monomers, S, counterions, C+ and micelles, SN is written as
(N−P)C+ + N𝑆− ⇋ 𝑆𝑁−𝑃 (11)

Introduction
17
for which
KN = [SN−P ]
[𝑆−]N [C+]N−P (12)
1.4.2.6 Thermodynamics of micellization
To evaluate the thermodynamic parameters of micellization two approaches are generally
used: the phase separation model [44] and mass action model or the equilibrium model
[45]. If, however the aggregation number of the micelle is small, the mass action model is
used, while if the aggregation number is large, the phase separation model is applied.
According to the mass action model, the micelles and monomeric species are considered
to be in a kind of chemical equilibrium, while in phase separation model, the micelles are
considered to constitute a new phase formed in the system at and above the critical
micelle concentration. In each case classical thermodynamic approaches are used to
describe the overall process of micellization. Analysis of both approaches produces the
same general results in terms of the energetic of micelle formation.
Figure 1.5: Effect of "N" on fraction of added surfactant that goes to micelle
2
30 3
Introduction
18
In the case of ionic surfactants the equilibrium model is preferable because it is possible
to take into consideration, in an explicit way, the effect of the counterion dissociation.
The equilibrium model considers that the micellization process can be described by
equilibrium between monomers, counterions, and monodisperse micelles. In the case of a
cationic surfactant this equilibrium can be represented by
nS+ + (n−p)C− ⇋ Mp+ (13)
The corresponding equilibrium constant can be written as
K = [M𝑝+]
[S+]𝑛 [C−]𝑛−𝑝
or, lnK = ln[M𝑝+] − 𝑛ln S+ − (𝑛 − 𝑝)ln[C−]
or, RT lnK = RT (ln[M𝑝+] − 𝑛ln S+ − (𝑛 − 𝑝)ln[C−])
where S+ represents the surfactant cations, C− the corresponding counterions, and Mp+ the
micelle formed by n monomers with an effective charge of p. The standard free energy
of micellization per mole of surfactant, ∆G°mic, is given by
or, ∆G°mic = RT − 1
𝑛ln 𝑎M𝑃+ + ln𝑎S+ + 1 −
𝑝
𝑛 ln𝑎C− [∆G° = −RT lnK] (14)
where a is the activity of the respective species. For large n values the first term of the
parenthesis is negligible and both aS+ and aC− can be replaced by the activity at the
CMC.
Moreover, since the micellar formation occurs in dilute solutions, the activity can be
replaced by the surfactant concentration (expressed in mole fraction) at the CMC.
Considering these approximations, Eq. (14) can be expressed as [46]
∆G°mic = (2 – 𝛽) RT ln XCMC (15)
Where 𝛽 = 𝑃
𝑛 is the degree of dissociation of the counterion binding. For a completely
ionized micelle, β = 1 and for neutral 𝛽 = 0.
Introduction
19
Counterions drawn into the regions of charged head groups reduce the repulsive
electrostatic interactions between them, and this is the heuristic physical basis for the
model of counterion binding. In the case of ionic surfactants the relative contribution of
enthalpy and entropy determines the temperature dependence of the CMC. Since the
thermodynamic parameters are related by the Gibbs-Helmholtz equation, ∆𝐺°mic can be
separated into its enthalpic and entropic components
∆𝐺°mic = ∆𝐻°mic – T∆𝑆°mic (16)
For the cases when the aggregation number and the degree of ionization are temperature
dependent. In classical thermodynamics, ∆𝐻°mic is also given by the relation
∆𝐻°mic = – RT2 2 − 𝛽 ∂ ln XCMC
∂T .p− ln XCMC
∂𝛽
∂T .p (17)
If the change in β with temperature is small, Eq. (17) yields
∆𝐻°mic = − 2 − 𝛽 RT2 ∂ ln XCMC
∂T .p (18)
In this way, the enthalpy of micellization can be evaluated from the slope of a tangent to
a plot of ln XCMC versus T at a particular temperature. Once ∆𝐺°mic and ∆𝐻°mic have been
obtained, the entropy of micellization can be estimated from Eq. (16).
T∆𝑆°mic = ∆𝐻°mic − ∆𝐺°mic
The micellization process is governed primarily by the entropy gain associated with it
and the driving force for the process is the tendency of the lyophobic group of the
surfactant to transfer from the solvent environment to the interior of the micelle [47].
The increased freedom of the hydrophobic chain in the nonpolar interior of the micelle
compared to the aqueous environment plays an important role in entropy of micellization.
Any structuranl or environmental factors that may affect solvent-lyophobic group
interactions or interactions between the lyophobic groups in the interior of the micelle,
therefore, affect ∆𝐺°mic and consequently the value of the CMC.
Introduction
20
1.4.2.7 Micellar Solubilization
An important property of micelles is their ability to increase the solubility of sparingly
soluble or insoluble substances in water. Solubilization, as defined by McBain and
Hutchinson [48, 49], is a particular mode of bringing into solution of substances that are
otherwise insoluble in a given medium, involving the previous presence of colloidal
solution whose particles take up and incorporate within or upon themselves the
otherwise insoluble material. Solubilization by micelles is of importance in many
industrial processes such as detergency, micellar catalysis and extraction, emulsion,
polymerization, oil recovery, etc. [50] and in a variety of fundamental research oriented
studies like micellar modeling of biological membrane [11].
Below the CMC surfactant molecules exist as monomers and have only little or no
influence on the solubility of water-insoluble compounds but above this concentration
solubility increases sharply with surfactant concentration. If the solubility of a normally
solvent-insoluble materials is plotted against the concentration of the surfactant solution,
the solubility is very limited at concentrations below the CMC of the surfactant but rise
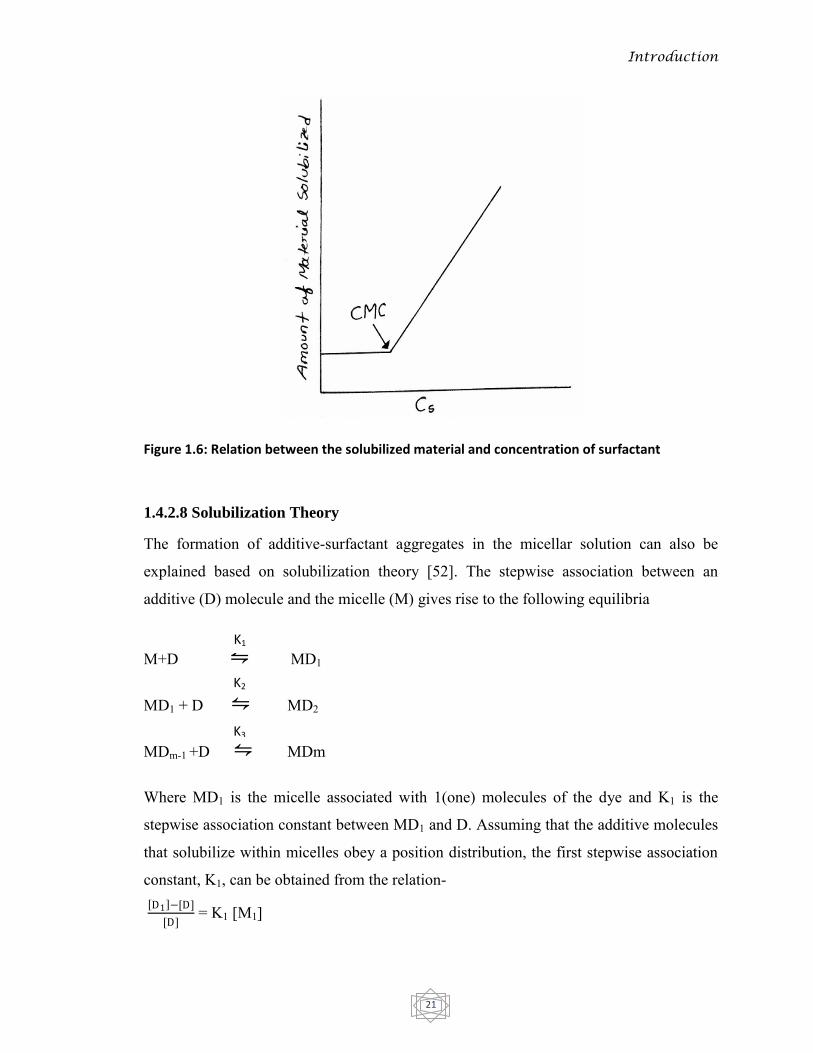
abruptly, once the CMC has been reached as shown in Figure 1.6. This indicates that
solubilization is a micellar phenomenon.
In solubilization, the solubilized material is in the same phase as the solubilizing solution,
and the system is consequently thermodynamically stable. The extent of solubilization
depends on many factors such as the structure of the surfactant, aggregation number,
micellar geometry, and temperature, ionic strength of the medium and the nature of the
solubilizate. The locus of solubilization of poorly water-soluble compounds in micellar
systems depends on the polarity of solubilizate. Non-polar molecules are solubilized in
the micelle core and substances with intermediate polarity are distributed along surfactant
molecules in certain intermediate position [50]. An increase in surfactant concentration in
solution increases the extent of solubilization of hydrophobic solutes because of an
increase in the number of micelles in the bulk. The solubilizing capacity of a surfactant is
usually expressed quantitatively by molar solubilization ratio (MSR). The MSR can be
expressed as the number of moles of the substance solubilized per mole of the surfactant
in solution [51].
Introduction
21
Figure 1.6: Relation between the solubilized material and concentration of surfactant
1.4.2.8 Solubilization Theory
The formation of additive-surfactant aggregates in the micellar solution can also be
explained based on solubilization theory [52]. The stepwise association between an
additive (D) molecule and the micelle (M) gives rise to the following equilibria
M+D ⇋ MD1
MD1 + D ⇋ MD2
MDm-1 +D ⇋ MDm
Where MD1 is the micelle associated with 1(one) molecules of the dye and K1 is the
stepwise association constant between MD1 and D. Assuming that the additive molecules
that solubilize within micelles obey a position distribution, the first stepwise association
constant, K1, can be obtained from the relation-
D1 −[D]
[D] = K1 [M1]
K1
K2
K3

Introduction
22
Here [M1] is total micelle concentration, [D1] is the total equivalent concentration of the
dye and [D] is the average number of additive incorporated into a single micelle
[D] = D1 −[D]
[M1]
Figure 1.7: The chemical and physical solubilization (incorporation) of drugs within micelle
1.4.2.9 Factors affecting solubilization
(i) Effect of structure of solubilizer
There are a number of factors regarding the structure of solubilizer such as chain length,
substitutions in the chain and position of hydrophilic group, which effect the
solubilization. The amount of material solubilized generally increases with increasing the
size of the micelles. The factors that cause an increase in either the diameter of the
micelle or its aggregation number can be expected to produce increased solubilization.
Introduction
23
An increase in the chain length of the hydrophobic portion of the surfactant generally
results in an increased solubilization capacity for hydrocarbons in the interior of the
micelle in aqueous media. Bivalent counterions show greater solubilizing power than the
corresponding univalent [53]. Nonionic surfactants, because of low CMC, are better
solubilizing agents than ionic surfactants in dilute solutions. In general, the solubilizing
power for hydrocarbons and polar compounds having same hydrophobic chain length
follows the order: [54] nonionics > cationics > anionics.
(ii) Effect of structure of the solubilizate
For polar solubilizates, the structure of the solubilizate shows variation in the depth of
penetration into the palisade layer of the micelle. In the case of more or less spherical
micelle, the polar compounds are solubilized close to the micelle-water interface, to a
greater extent than nonpolar solubilizates that are located in the inner core. Usually the
molecules having longer alkyl chain length and less polarity in nature show the smaller
degree of solubilization [55]. For condensed aromatic hydrocarbons the extent of
solubilization appears to decrease with an increase in the molecular size [56].
(iii) Effect of electrolytes
Neutral electrolytes in ionic surfactant solution decrease the repulsion between the
charged ionic surfactant headgroups, thereby decrease the CMC and increase the
aggregation number and volume of micelles. The increase in aggregation number of the
micelles presumably results in an increase in hydrocarbon solubilization in the inner core
of the micelle.
(iv) Effect of organic additives
The presence of solubilized hydrocarbons in the surfactant micelles generally increases
the solubility of polar compounds in these micelles. The solubilized hydrocarbon causes
the micelle to swell, and this may make it possible for the micelle to incorporate more
polar material in the palisade layer. The long chain polar compound which are less
capable of forming hydrogen bond, show the greater power to increase the solubilization
of hydrocarbons.
Introduction
24
(v) Effect of temperature
For ionic surfactants an increase in temperature generally results in an increase in the
extent of solubilization for both polar and nonpolar solubilizates, possibly because
increased thermal agitation increases the space available for solubilization in the micelle
[57]. For nonionic surfactants, the effect of temperature increase depends on the nature of
the solubilizate. Nonpolar materials, which are solubilized in the inner core of the
micelle, appear to show increased solubility as the temperature is raised. Increase in
temperature above 10°C, causes the increase in thermal agitation of the surfactant
molecules in the micelles which results in increased in solubilization. Further an increase
in temperature decreases the amount of material solubilized due to increased dehydration
and tighter coiling of the chains, decreasing the space available in the palisade layer.
1.4.2.10 Reasons for self-aggregation of surfactant molecules
(i) Hydrophobic Interaction
One of the important features that make water unique as a solvent is its response to a-
polar solutes. The tendency for a-polar molecules or molecular fragments to avoid
contact with water is said to be due to the hydrophobic interaction, which thus gives rise
to a thermodynamic force rather than a mechanical force. The hydrophobic interaction
and the mechanism of surfactant self-assembly has been studied extensively [58]. From a
thermodynamic point of view, surfactant self-assembly is entropy driven process [59].
When temperature is increased, entropy of water is increased due to the destruction of
structured water around the hydrophobic tail and entropy of surfactant is decreased a little
compared to the water. Even though it is an endothermic process, the free energy of the
whole process is negative which suggests micelle formation is a spontaneous process.
Generally, the water molecules are arranged in an ordered way around the monomeric
units of surfactants, which can be defined as „iceberg‟. During micellization, due to the
destruction of the iceberg a positive entropy change occurs. Despite this micellization-
favoring phenomenon, a negative entropy change can occur if the ordering of the
randomly oriented amphiphile molecules from the solvated form into a micelle structure

Introduction
25
is more pronounced than disordering effect due to the destruction of icebergs around the
alkyl chains. At the same time, the motion of the water molecules bound to the
hydrophilic heads become more restricted, contributing to the decrease in entropy [60].
(ii) Hydration
Due to its highly structured nature, water as a solvent displays a very complex behavior.
Thus in addition to direct ion-molecule interactions, the effect of a solute on the hydrogen
bonded network is of great importance. It is important to note that non-polar solutes have
particularly profound influences on water structure. Thus the alkyl groups markedly
reduce both the rotational and the translational mobility of the water molecules [61]. This
entropically unfavorable solution of nonpolar molecules or group in water is termed
“hydrophobic hydration”. X-ray diffraction studies have established their structure to be
of the clathrate type, with the solute surrounded by a layer of hydrogen-bonded water
molecules forming, for example, pentagonal dodecahedra. Thus even if the detailed
structure is not presently established, it is assumed that alkyl chain of an amphipile
monomer in water is surrounded by a hydrogen-bonded organized water layer. The polar
heads of the monomer interact with water in away similar to simple polar solutes and
electrolytes through hydrogen-bond, dipole-dipole and ion-dipole interactions. But when
the amphiphiles are in micelles these hydration features get affected. The nature and the
extent of this effect are interesting for both fundamental understanding and applied
aspects. Very few studies have been done on the hydration of non-ionic surfactants
because of the sensitive effects of temperature and concentration on their micellar size
and shape. There are also various spectroscopic methods for the study of amphiphile
hydration. Deuteron quadruple splitting studies may provide information on the number
of water molecules influenced in their orientation by the amphiphile aggregates in liquid
crystals [62]. For the lamellar phase of the systems alkali octanoate-decanol-water, for
example, at most about 5 water molecules per octanate are appreciably oriented [63].
Introduction
26
(iii) Counter-ion Binding
A counter ion is the ion that accompanies an ionic species in order to maintain electric
neutrality. In table salt (NaCl), the sodium cation is the counter ion for the chlorine anion
and vice versa. In a charged transition metal complex, a (i.e. non-coordnated) ion
accompanying the complex is termed the counterion. Counterions have a large influence
on the aggregation of the surfactant molecules in solution mainly through changes in the
ionic strength of the solution [64]. In addition, the valency of the counterion also
influences the CMC to a larger extent. The degree of the counterion binding is due to the
balance between the electrostatic forces which pull the counterion towards the oppositely
charged head group of micelles and the hydration forces which tends to inhibit the
binding [65]. The CMC value normally decreases as counterion binding increases.
Counterions or ions with opposite charge to that of the surface active moiety of the
surfactant are known to have an additional specific effect. For example, sodium bromide
was found to induce the growth of micelles of the cationic surfactant cetylpyridinium
bromide whereas sodium chloride did not [66]. Aromatic counterions like benzoate,
tosylate, salicylate, because of their strong binding at the micellar surface lower the CMC
while increasing the counterion binding [67]. Salicylate in particular is effective in
inducing micellar growth. The counterion binding also increases with increasing
counterion hydrophobicity enhancing the micelle formation [68]. Hydrophobic
counterions are interesting as charge carrier or quencher in biomembranes and membrane
photochemistry [69]. Addition of cationic surfactant to SDS is a special case of
hydrophobic counterion interaction. The CMC of a mixture of anionic and cationic
surfactant in aqueous solution is considerably lower than that of the individual
surfactants due to the synergistic interaction between the surfactant molecules and they
exhibit properties superior to their constituent single surfactant in many surfactant
applications [70].
Introduction
27
1.5 SURFACTANT SOLUBILITY
In aqueous solution, when all available interfaces are saturated, the overall energy
reduction may continue through other mechanisms. Depending on the system
composition, a surfactant molecule can play different roles in terms of aggregation
(formation of micelles, liquid crystal phases, bilayers or vesicles, etc). The physical
manifestation of one such mechanism is crystallisation or precipitation of surfactant from
solution – that is, bulkphase separation. While most common surfactants have a
substantial solubility in water, this can change significantly with variations in
hydrophobic tail length, head group nature, counterion valence, solution environment,
and most importantly, temperature.
1.5.1 The Krafft temperature
As for most solutes in water, increasing temperature produces an increase in solubility.
However, for ionic surfactants, which are initially insoluble, there is often a temperature
at which the solubility suddenly increases very dramatically. This is known as the Krafft
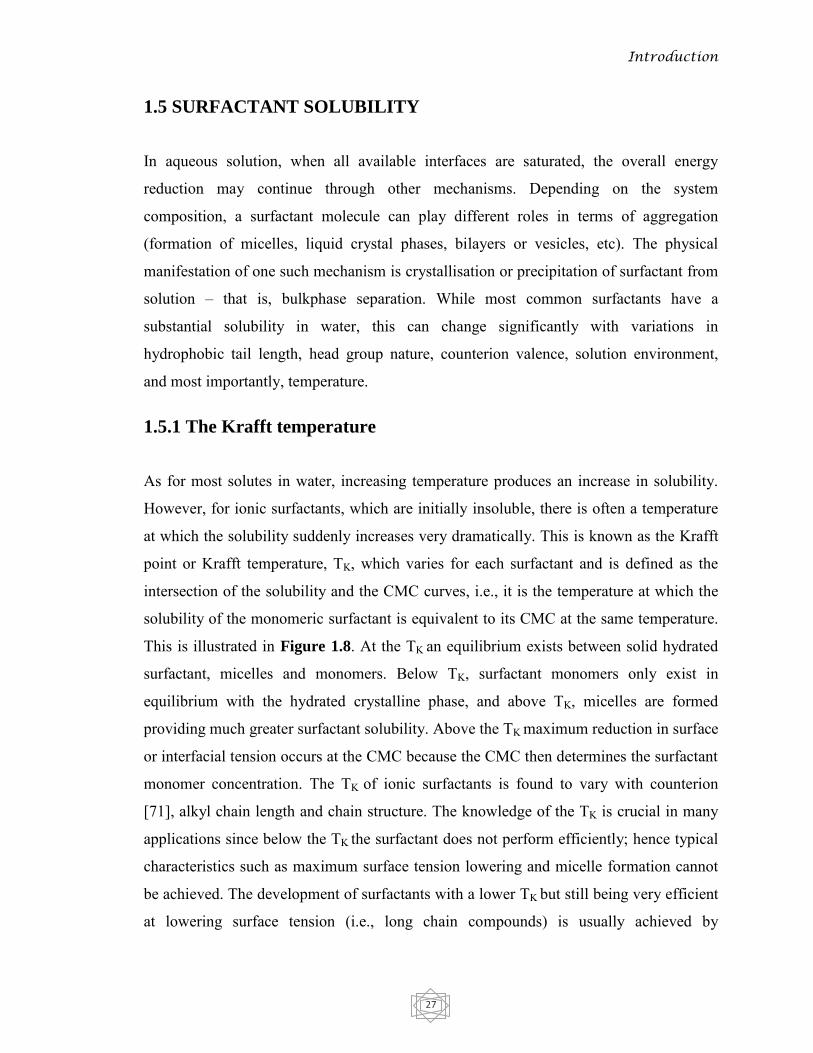
point or Krafft temperature, TK, which varies for each surfactant and is defined as the
intersection of the solubility and the CMC curves, i.e., it is the temperature at which the
solubility of the monomeric surfactant is equivalent to its CMC at the same temperature.
This is illustrated in Figure 1.8. At the TK an equilibrium exists between solid hydrated
surfactant, micelles and monomers. Below TK, surfactant monomers only exist in
equilibrium with the hydrated crystalline phase, and above TK, micelles are formed
providing much greater surfactant solubility. Above the TK maximum reduction in surface
or interfacial tension occurs at the CMC because the CMC then determines the surfactant
monomer concentration. The TK of ionic surfactants is found to vary with counterion
[71], alkyl chain length and chain structure. The knowledge of the TK is crucial in many
applications since below the TK the surfactant does not perform efficiently; hence typical
characteristics such as maximum surface tension lowering and micelle formation cannot
be achieved. The development of surfactants with a lower TK but still being very efficient
at lowering surface tension (i.e., long chain compounds) is usually achieved by
Introduction
28
introducing chain branching, multiple bonds in the alkyl chain or bulkier hydrophilic
groups thereby reducing intermolecular interactions that would tend to promote
crystallisation.
Figure 1.8: The Krafft temperature TK is the point at which surfactant solubility equals the
critical micelle concentration. Above TK, surfactant molecules form a dispersed phase; below
TK, hydrated crystals are formed.
1.5.2 The Cloud point
Nonionic surfactants do not exhibit krafft points. Instead, the solubility of nonionic
surfactants decreases with increasing temperature, and these surfactants may begin to lose
their surface active properties above a transition temperature referred to as the cloud
point. Above the cloud point, the system consists of an almost micelle-free dilute solution
at a concentration equal to its CMC at that temperature, and a surfactant-rich micellar
phase.
This separation is caused by a sharp increase in aggregation number and a decrease in
intermicellar repulsions [72] that produces a difference in density of the micelle-rich and
Introduction
29
micelle-poor phases. Since much larger particles are formed, the solution becomes visibly
turbid with large micelles efficiently scattering light. As with TK, the cloud point depends
on chemical structure. For polyoxyethylene (PEO) non-ionics, the cloud point increases
with increasing EO content for a given hydrophobic group, and at constant EO content it
may be lowered by decreasing the hydrophobe size, broadening the PEO chain-length
distribution, and branching in the hydrophobic group [73].
1.6 APPLICATIONS OF SURFACTANTS
In all processes that take place at interfaces, surfactants can become effective. By
application of surfactants, work processes may be simplified, accelerated, or economized.
Also, the quality, as well as the efficiency of much differing products, may be optimized.
An overview of the manifold application areas is given below:
1.6.1 Consumer Products
An important field of application for surfactants is consumer products. These products
are detergents, dishwashing agents, cleaning agents and personal products.
1.6.1.1 Detergents and dishwashing: The primary traditional application for surfactants
is their use as soaps and detergents for a wide variety of cleaning processes. Soap has
been used in personal hygiene for well over 2000 years with little change in the basic
chemistry of their production and use. New products with pleasant colors, odors, and
deodorant and antiperspirant activity have crept in to the market since the early twentieth
century. The soaps and detergents are used mainly in washing our clothes, dishes, houses,
and so on to remove unwanted dirt, oils, and other pollutants from the substrate.
1.6.1.2 Cosmetics and Personal Care Products: Cosmetics and personal care products
make up a vast multi-billion-dollar market worldwide, continues to grow as a result of
improved overall living standard. Such products are formulated mainly from surfactants
and other amphiphilic materials. It is probably safe to say that few, if any, cosmetic
Introduction
30
products known to women (or men, for that matter) are formulated without at least a
small amount of a surfactant or surface-active component. That includes not only the
more or less obvious creams and emulsions but also such decorative products as lipstick;
rouge; mascara; and hair dyes, tints, and rinses. An important aspect of such products is
that it may produce an adverse reaction in some cases. Unfortunately, our understanding
of the chemical reactions or interactions among surfactants, biological membranes, and
other components and structures is not sufficiently advanced to allow the formulator to
say with sufficient certainty what reaction an individual will have when in contact with a
surfactant. The possible adverse effects of surfactants in cosmetics and personal care
products, of course, be studied in depth for obvious safety reasons.
1.6.2 Industrial Applications
1.6.2.1 Food products: The food industry utilizes surfactants as cleaners and emulsifiers
[74]. Through application of natural or synthetic emulsifiers, O/W emulsions (milk
substitutes, ice cream, mayonnaise, sauces, etc.) and W/O emulsions (e.g., margarine) can
be improved in their consistency.
1.6.2.2 Pharmaceutical industry: The primary application of surfactants in the
pharmaceutical industry is as emulsifiers for creams and salves, but they are also used as
dispersing agents in tablets or as synergists for active ingredients. The most important
criterion for a specific application is the pharmacological or toxicological product safety.
1.6.2.3 Insecticides and herbicides: Active substances for the protection of growing
plants [75] are offered as powder or liquid concentrates, which are diluted to so-called
spray liquors for application. Surfactants are used here as aids for preparing satisfactorily
dispersed spray liquors for adequate wetting of the target, as well as for promoting
penetration of active substances into the plant.
1.6.2.4 Agriculture: In agriculture, surface active polymeric carboxylic acids or short
chain alkane sulfonates effect hydrophilizing of heavy soils. To prevent caking of
fertilizers in mixers and to achieve uniform distribution of fertilizers in the soil, dilute

Introduction
31
solutions of fatty alcohol polyglycol ethers, alkyl benzene sulfonates or cationic
surfactants are advantageous.
1.6.2.5 Textiles and fibers: In the manufacture and further processing of textiles,
surfactants have a role as auxiliaries in a number of process steps. In pretreating of textile
material, natural fibers are freed of accompanying substances (waxes, fats, pectines, seed
hulls and other impurities). The detergents and wetting agents needed for this are
primarily mixtures of different surfactant types. In the manufacture of textiles, surfactants
are applied to optimize individual processing steps (drawing, spinning, twisting,
texturizing, coning, weaving, knitting, etc.)
1.6.2.6 Chemical industry: The wetting and dispersing power of surfactants is being
utilized in chemical processes to aid processing. In systems containing immiscible
components, the reaction speed may be increased by the emulsification effect of
surfactants, e.g., in splitting of fats by the Twitchell process, in hydrolytic splitting of
wool wax and in hydrolysis of polyvinyl acetate. Also worth mentioning is phenol
manufacture by the cumene process, the preparation of ethylene carbamates, as well as
chlorination reactions. Surfactants may also be applied to increase the yield in extraction
processes.
1.6.2.7 Plastics industry: The application for surfactants in the plastics industry is in the
preparation of plastics dispersions (emulsion polymerization), pearl polymerizates,
polyurethane foams, mold release agents and in micro encapsulation processes etc.
1.6.2.8 Paints and laquers: Surfactants are also of great importance in the manufacture
of coating materials, paints, varnishes, lacquers, dyestuff pigments, binding materials,
and binders. Paints and lacquers are, for the most part, dispersed systems of dyestuff
pigments, binding materials and solvents. Therefore, surface active substances can speed
up the preparation of dispersions, and improve the dispersion degree and stability.
1.6.2.9 Cellulose and paper: Surfactants are employed in the pulp and paper industry for
the following purposes: rosin removal in pulp and paper manufacture, foam inhibition
and pigment dispersion in the manufacture of paper, emulsifying in paper sizing and
finishing processes, cleaning machinery, and regeneration of waste paper. In the

Introduction
32
regeneration of waste paper (deinking flotation process), wetting agents are used to
improve removal of substances adhering to the paper.
1.6.2.10 Leather and furs: The broad spectrum of the raw goods occurring in the leather
and fur industry [76] necessitates various wet treatment processes in which surfactants
and emulsifiers play a big role. In the finishing surface treatment (trimming) of the dry
leather, polymer films are applied to the leather surface, whereby the quality is improved.
The coatings can consist of polyacrylate-polyurethane-or polybutadiene dispersions.
1.6.2.11 Photographic industry: Surfactants are utilized in the photographic industry as
wetting agents in casting solutions and lubricants, as aids in the preparation of dye
emulsions and as additives in processing baths. In the application of antihalation layers,
filter layers, or other supercoats to photographic films various surfactants have proven
useful.
1.6.2.12 Metal processing: Surfactants do find broad application in the various processes
employed in the metal processing industry. In addition to the specific cleaning processes,
application in cooling lubricants, tempering oils, hydraulic emulsions, anticorrosion
agents, polishing pastes, mold separating agents, and metal drying agents is especially
noteworthy.
1.6.2.13 Electroplating: Surface active substances are applied in electrochemical
processes for removal of soil and grease from substrate surfaces prior to the actual
electrolytic process.
1.6.2.14 Adhesives: Surfactants are added to adhesives to effect a fast spreading on the
respective surfaces by lowering of interfacial tension between the substrate surfaces and
the adhesives. As a rule, surfactants find application only in aqueous adhesive
formulations, since organic solvents have inherently low interfacial tensions.
1.6.2.15 Road construction and building materials: Surfactants are applied in road
construction, in construction and building materials, in the preparation of bitumen
emulsions, as dispersants in the cement industry, in the utilization of polymer dispersions,
as additives to plasters and cement coatings and in wood impregnation.

Introduction
33
1.6.2.16 Firefighting: In fighting fires where water cannot penetrate toward the inside of
the fire source such as in fires of cotton, paper bales, wood flour, forest floors, etc., water
with wetting agent containing however may be fought more effectively. For fires of
storage tanks, in mines, on ships, in warehouses with combustible solid or liquid
materials, on airport runways, etc., heavy foams are better suited.
1.6.2.17 Mining and flotation: For prevention of coal dust explosions and as dust
binding agents for mineral dust in mining operations, calcium chloride pastes which are
brushed onto the rock surface, are being used with surfactants to improve the wettability
of the pastes. In the separation of raw material minerals, differences in surface properties
of individual mineral species are being utilized. Following suspension of finely milled
ore in water, air is sparged into the suspension. Minerals of value should float upwards by
attachment to the air bubbles and thus be separated from the accompanying burden. The
surface of the valuable mineral particles has to be hydrophobic to affect their attachment
to the air bubbles and surfactant works here actively.
1.6.2.18 Oilfield chemicals: Surfactants find manifold applications in crude oil
extraction activities [77]. In drilling operations, the properties of drilling fluids can be
improved. The application of drilling fluids, i.e. the continuous flushing of the bore hole,
has as its purpose to lubricate and cool the drilling tool, to flush the drilled out rock
particles upwards, to support the wall of the bore hole, and to prevent the sudden eruption
of oil or gas after penetration of the deposit. The basis of most drilling mud is bentonite.
Additionally used are heavy spar, protective colloids and thickeners.
1.6.2.19 Cleaning agents: The cleanliness of homes, work places, and public facilities, is
of great importance for reasons of hygiene, esthetics and value maintenance. Although
highly developed machines are available for the cleaning of both textiles and tableware,
the mechanical cleaning of fixed hard surfaces is only feasible on the large surface areas
found in the commercial sector. Hence, to a large extent hard surfaces have to be cleaned
by manual procedures. To simplify this work, cleaning agents are extensively utilized.
1.6.2.20 Other: Surfactants in biological systems: The understanding of the pulmonary
surfactant system, although discovered in 1929, has only been applied clinically since

Introduction
34
about 1990 for the treatment of respiratory distress syndrome. Surfactant replacement
therapy may also be used in treating other forms of lung disease, such as meconium
aspiration syndrome, neonatal pneumonia and congenital diaphragmatic hernia.
1.7 THE SCOPE AND OBJECTIVES OF THE PRESENT STUDY
Due to their immense application potential, surfactant-based systems are a topic of major
research interest in both academia and industry. They are one of the most important
groups of organic chemicals, and are used in vast amounts in domestic and industrial
applications. They are designed to remove dirt, sweat, sebum, and oils from the skin and
other surfaces. The main characteristic of these compounds is to decrease the surface
tension of solvent, and resulting many properties such as contact angle, foam properties
etc .and forming colloidal sized clusters known as micelle in solution [78]. These clusters
or aggregates of different morphologies endow the surfactant solutions with useful
properties. Such unique properties encouraged their applications in various field of study,
such as microbiology, pharmaceuticals industry, food industry, personal care, cosmetics,
catalytic reaction, oil recovery and polymerization, etc. [79]. However to initiate
aggregates or micelle the solution must attain a certain concentration level known as the
critical micelle concentration (CMC). Below the CMC surfactant molecule exist as
monomers and cannot show its activity. Many of its properties changes upon the
formation of micelles. Micellar solutions have the special characteristics of solubilizing
the hydrophobic organic compounds [80]. An increase in surfactant concentration in
solution increases the extent of solubilization of hydrophobic solutes because of an
increase in the number of micelles in the bulk. Studies of the solubilization of poorly
water-soluble compounds in non-aqueous and aqueous system have revealed a lot of
application in the practical fields such as drug formulations and drug carrier, drug
solubilization, separation, toxic waste removal etc. [81-82]. Therefore, it is a matter of
great research interest is to reduce the CMC to a lower value for wider application of
surfactants. In this study such an attempt has been taken to tune the CMC to a lower
value. A major area of concern nowadays is the micelle formation in the presence of
additives, among which surfactant- inorganic salts interactions are of great interest. Net
Introduction
35
charge, either on the molecules of one component or on both [81], determines the nature
of surfactant-salt interactions. When a salt is present in any aqueous surfactant system it
decreases the electrostatic repulsion between the charged head groups which causes a
decrease in the (CMC). For example, the CMC of cetyltrimethylammonium bromide
(CTAB) decreases from 0.92 to 0.56 mM when the NaCl concentration is 0.01 M [83].
Other major factors, which are playing an important role, are the length of the surfactant
hydrophobic tail, and temperature. The CMC values increase with temperature. The
temperature effect on the process of micellization of surfactants in water has usually been
analyzed in terms of two opposing factors. With an increase in temperature, the degree of
hydration of hydrophilic group decreases and this process is in favour of micellization.
On the other hand, it also breaks the water structure surrounding the hydrophobic groups
and is unfavourable for micellization [84] of the surfactant. The predominated one thus
determines CMC formation in aqueous surfactant solution. Increasing the number of
carbon atoms in the hydrophobic alkyl chain, decreased the (CMC). Longer chain length
of HTAB than that of TTAB increases the surface area of the micelle and, thus, reduces
the electrostatic repulsions [85]. The opposing repulsive interaction between the
polar/charged head groups disfavor micellization and leads CMC to higher values. So it is
a delicate balance between the interaction between hydrophobic alkyl chain and between
opposing repulsive head groups.
Another interesting characteristic feature shown by the ionic surfactant is their limited in
solubility below a certain critical temperature but above this temperature they are fully
soluble. This temperature is known as Krafft Temperature (TK). Below this temperature
the surfactant molecules remain as crystalline hydrated solids. At this state surfactant
solution loses many of its activities. The TK can also be termed as the melting
temperature of the hydrated solid surfactant [86]. The monomer solubility is essential for
the formation of micelle. At TK the surfactant monomers become soluble enough for the
formation of micellar aggregates and the solubility of an ionic surfactant becomes equal
to the CMC and there is an establishment of equilibrium state between crystalline
hydrated solid and micelle formation [15]. Above this temperature equilibrium state
shifted towards micelle formation and the solubility of the surfactant monomer increases
and micellar formation become thermodynamically favored [5]. For surfactants being
Introduction
36
used below TK, show lower effectiveness in reducing surface tension than similar
materials that are being used above their TK. The maximum reduction in surface tension
is determined by the concentration of surfactant at solution saturation [15]. The TK
increases with increase in the number of carbon atoms in the hydrophobic group and
decreases with branching or unsaturation in that group in a homologous series of ionic
surfactants [87]. Oxyethylenation of alkyl sulfates decreases their TK; oxypropylenation
decreases them even further. Alkane sulfonates have higher TK than their corresponding
alkyl sulfates. The substitution of triethyl for trimethyl in the head groups of cationic
alkyl trimethylammonium bromides leads to significant reduction in their TK values [88].
This probably explains why traditional surfactants bear a hydrocarbon chain usually
shorter than C18 [15]. On the other hand, increase in the number of head group in the
surfactant molecule increases the solubility of the surfactant in water and increases its
surface activity. When the surfactant contains two hydrophilic groups, however, its
solubility in water increases compared to conventional surfactants and shows much lower
Krafft points and at this stage the molecule can accommodate more carbon atoms in the
hydrophobic groups without becoming water-insoluble. The solubility of surfactant also
increases with the increasing the size of the head group. The concept of TK is very
important as below the TK surfactant cannot show their detergency, dispersing and
emulsifying properties as well as their characteristic properties of maximum lowering of
surface tension, formation of micelle thus solubilization of water insoluble organic
compounds. Therefore, it is essential to lower the TK of surfactants below room
temperature for their wider industrial applications. In many commercial formulations, the
solution contains a certain amount of dissolved salt, in addition to the surfactant ions and
their counterions [89, 90]. Usually added salts lower the critical micelle concentration
(CMC), increase the viscosity and surface activity of surfactants, which is favorable for
their industrial applications. Unfortunately, added salts elevate the TK of surfactants
which limits their industrial applications. The TK values of a number of ionic surfactants
have been measured in the presence of added electrolytes [91, 92]. These studies have
revealed that the TK increases with increasing the concentration of the added electrolyte.
At present, it has been the subject of many research to use surfactant with lower CMC
and depressed TK in comparison with pure surfactant.
Introduction
37
In the present work, we attempted to study the effect of some electrolytes on the TK and
micellar behavior of Octadecyltrimethylammonium Bromide (OTAB) and Sodium
Dodecyl Sulfate (SDS) in aqueous solution. Here we will show an important point that
was clothed for a long time of specific ion effect on TK of ionic surfactant. It is
engrossing to note here that the TK can increase or decrease depending on the nature of
electrolytes and the CMC can be depressed stunningly upon addition of electrolytes to the
surfactant solution. It is important to note here that except for Br− (common ion), SCN−
and I−, the rest of the anions used in this study are effective in lowering the TK and all the
anions are effectual to lower the CMC of the OTAB. Only Li+ is found to be effective in
lowering the TK while all cations used in this study are effective in lowering the CMC of
SDS. Moreover, a water insoluble dye, Sudan Red B (SRB) was solubilized in aqueous
micellar solution of OTAB and SDS in pure water and in aqueous salt solution. Since
many of the applications of surfactants lie in their capacity to form micelles, it can be
expected that the depression of the TK and lowering of the CMC in the presence of the
added electrolytes will favor wider industrial applications of OTAB and SDS.
REFERENCES
[1] Lomax, E. G.; Amphoteric surfactants. Marcel Dekker, New York, 1996
[2] Eichhorn, P.; Knepper, T. P.; J Mass Spectrom. 36, 6, 677, 2001
[3] Tharwat, F.; Tadros; Applied Surfactants, WILEY-VCH Verlag GmbH & Co.,
KGaA, Weinheim, United Kingdom, 2005
[4] Salager J. L.; J. Colloid and Interf. Sci.105, 21, 1985
[5] Mayers, D.; Surfactant Science and Technology, 3rd edn, John Wiley & Sons,
Interscience, New Jersey, 2006.
[6] Islam, M.N.; Kato, T.; Langmuir, 19, 7201, 2003
[7] Porter, M. R.; Handbook of surfactants. London, Blackie Academic and
Professional, 1994
[8] Shchukin, E. D.; Colloid Chemistry: Textbook for Universities and High School,
Vysshaya, Shkola, Moscow, 2004
Introduction
38
[9] Ruckenstein, E.; Nagarajan, R.; J. Phys. Chem.79, 24, 2622, 1975
[10] Domínguez, A.; Fernández, A.; González, N.; Iglesias, E.; Montenegro, L.;
Journal of Chemical Education, 74, 10, 1227, 1997
[11] Carlota, O.; Rangel, Y.; Adalberto, P. J.; Leoberto, C. T.; J Pharm Pharmaceut
Sci. 8, 2,147, 2005
[12] Frolov, Y. G.; Course in Colloid Chemistry: Surface Phenomena and Disperse
Systems, Khimiya, Moscow, 1988
[13] Tharwat, T.; Encyclopedia of Colloid and Interface Science: Micellization,
Springer. 2013
[14] Islam, M. N.; Kato, T. J. Phys. Chem. B, 107, 965. 2003
[15] Rosen, M. J.; Surfactants and Interfacial Phenomena, 3rd. ed., John Wiley &
Sons, Hoboken, 2004
[16] Schramm, L. L.; Stasiuk, E. N.; and Marangoni, D. G.; Annu. Rep. Prog. Chem.,
Sect. C, 99, 3, 2003
[17] Holmberg, K.; Jonsson, B.; Kronberg, B.; and Lindman, B.; Surfactants and
Polymers in Aqueous Solution. John Wiley & Sons, Ltd, 2002
[18] Robb, I. D.; Specialist Surfactants, Blackie Academic & Professional, London.
1997
[19] Holmberg, K. Ed.; Novel Surfactants, Marcel Dekker, New York, 1998
[20] Wilde, P. J.; Current Opinion in Colloid & Interface Science, 5, 176, 2000
[21] Klitzing R. V.; Müller H. J.; Current Opinion in Colloid &Interface Science,7, 42,
2002
[22] Babak, V. G.; Stébé, M. J.; Journal of Dispersion Science and Technology. 23, 1,
2002
[23] Eastoe, J.; Dalton, J. S.; Adv Colloid Interf Sci. 85, 103, 2000
[24] Prosser, A. J.; Franses, E.I.; Colloids and Surfaces A: Physicochemical and
Engineering Aspects. 178, 1, 2001
[25] Fainerman, V. B.; Miller, R.; J. Colloid and Interf Sci. 178, 1, 168, 1996
[26] Tanford, C.; The Hydrophobic Effect: formation of micelles and biological
membranes. John Wiley & Sons, USA, 1978
[27] Vincent, B.; Adv Colloid Interf Sci. 203, 51, 2014

Introduction
39
[28] Evan, D. F.; Mitchell, D. J.; Ninham, B. W.; J. Phys. Chem. 88, 6344 1984
[29] Kresheek, C.; Wate, a comprehensive treatise, Edt. By F. Franks, Plenum Press,
New York, 1975
[30] Evan, D. F.; Ninham, B. W.; J. Phys. Chem. 87, 5025, 1983
[31] Del Rio, J. M.; Prieto, G.; Sarmiento, F.; Mosquera, v.; Langmuir. 11, 1511, 1995
[32] Roy, J. C.; Islam, M. N.; Aktaruzzaman, G.; J Surfact Deterg. 17, 231, 2014
[33] Crook, E. H.; Trebbi, G. F.; Fordice, D. B.; J. Phys. Chem. 68, 3592, 1964,
[34] Bakshi, M. S.; Bull. Chem. Soc. Jpn, 69, 2723, 1996
[35] Liu, C.; Desai, K. G. H.; Liu, C.; J. Chem. Eng. Data.49, 1847, 2004
[36] Metha, S. K.; Bhasin, K. K.; Chauhan, R.; Dham, S.; Colloids and Surfaces A. 235,
153, 2005
[37] Drakenberg, T.; Lindman, B.; J. Colloid and Interf Sci .44, 184, 1973
[38] Phillips, J. N.; Trans Faraday Soc. 51, 561, 1958
[39] MacBain, J. W.; Third Colloidal Report of the British Association. 1920
[40] Flockhart, B. D.; J. Colloid and Interf Sci.16, 484, 1961
[41] Crook, E. H.; Fordyce, D. B.; Trebbi, G. F.; J. Phys. Chem.67, 10, 1987, 1963
[42] Lange, K. R.; Surfactant: A Practic al Handbook. Hanser Gardner Publications,
Inc., 6915 V alley Avenue, Cincinnati, Ohio, 1999
[43] Mayers, D.; Surfaces, Interfaces, and Colloids: Principles and Applications. VCH
Publishers, Inc., New York, 1999
[44] Shinoda, K.; Bull. Chem. Soc. Jpn. 26, 101, 1953
[45] Philips, J. N.; Trans. Faraday Soc. 51, 561, 1955
[46] Hiemenz, P. C.; and Rajagopalan, R.; Principles of Colloid and Surface
Chemistry. Dekker, New York, 1997
[47] Ballerat-Busserolles, K.; Roux-Desgranges, G.; Roux, A. H.; Langmuir. 13,
1946, 1997
[48] McBain, J. W.; Richards, P. H.; Ind. Eng. Chem. 38, 642, 1946
[49] Hutchinson, E.; Mosher, C. S.: J. Colloid and Interf Sci.11, 352, 1956
[50] Choucair, A.; Eisenberg, A.; J. Am. Chem. Soc. 125, 11993, 2003,
[51] Paria, S.; Yust, P.K.; Ind. Eng. Chem. Res. 45, 3558, 2006
[52] Moroi, Y.; Adv Colloid Interf Sci.73, 47, 1997
Introduction
40
[53] Stake, I.; Matsuura, R.; Bull. Chem. Soc. Japan. 36, 813, 1963
[54] Saito, S.; J. Colloid and Interf Sci. 24, 227, 1967
[55] Nakagawa, T.; Tori, K.; Kolloid-Z. 168, 132, 1960
[56] Schwuger, M. J.; Kolloid-Z. Z. Polym. 240, 872, 1970
[57] Elworthy, P. H.; Florence, A. T.; MacFarlane, C. B.; Solubilization by Surface-
Active Agents. Chapman & Hall, London, 68, 1968
[58] Franks, F.; water a comprehensive treatise, ed, F. Franks, Plenum Press, New
York, 2, 1, 1973
[59] Marilyn, F. E.; Holtzer, A.; J. Phys. Chem.71, 10, 3320, 1967
[60] Tanford, C.; The hydrophobic effect: Formation of micelles and biological
membranes. J. Wiley, New York, 1980
[61] Zeidler, M. D.; in: water: a comprehensive treatise, ed, F. Franks, Plenum Press,
New York, 2, 1973
[62] Johansson, A.; Drakenberg, T.; Mol. Cryst. Liquid Cryst. 14, 23, 1971
[63] Persson, N.O.; Lindman, B.; J. Phys. Chem. 79, 1410, 1975
[64] Lindman, B.; Wennerstrom, H.; Spinger, Verlag, New York, 1980
[65] Berr, S.; Jones, R. R. M.; Johnson, J. S. J.; J. Phys. Chem. 96, 5611, 1992
[66] Porte, G.; Appell, J.; Poggl, Y.; J. Phys. Chem. 84, 3105, 1980
[67] Bijma, K.; Engberts, J. B. F. N.; Langmuir. 13, 4843, 1997
[68] Manet, S.; Karpichev, Y.; Bassani, D.; Ahmad, R. K.; Odo, R.; Langmuir. 26,
10645, 2010
[69] Almgren, M.; Swarup, S.; J. Phys. Chem. 87, 876, 1983
[70] Puvvada, S.; Blankschtein, D.; J. Phys. Chem. 96, 5567, 1992
[71] Hato, M.; Tahara, M.; Suda, Y. J. Colloid and Interf Sci. 72, 458, 1979
[72] Staples, E. J.; Tiddy, G. J. T. J.; Chem. Soc., Faraday Trans. 1, 74, 2530, 1978
[73] Schott, H. J.; Pham. Sci. 58, 1443, 1969
[74] Kuchbuch, B.; Fette-Seifen-Anstrichmittel. 77, 407, 1975
[75] MUller, A.; in: Proceedings of the World Surfactants Congress, Miinchen, Vol.
IV, Gelnhausen, Kiirle, 1984
[76] Hollstein, M.; in: Proceedings of the World Surfactants Congress, Miinchen, Vol.
IV, Gelnhausen, Kiirle, 1984
Introduction
41
[77] Friedel, H.; in: Proceedings of the World Surfactants Congress, Miinchen, Vol. I,
Gelnhausen, Kiirle, 1984
[78] Staszak, K.; Wieczorek, D.; Michocka, K.; J Surfact Deterg.18, 321, 2015
[79] More, U.; Kumari, P.; Vaid, Z.; Behera, K.; Malek, N. I.; J Surfact Deterg 19, 75,
2016
[80] Paria, S.; Yust, P. K.; Ind. Eng. Chem. Res. 45, 3558, 2006
[81] Metha, S. K.; Bhasin, K. K.; Chauhan, R.; Dham, S.; Colloids and Surfaces A.
255, 153, 2005
[82] Kim, J.H.; Domach, M. M.; Tilton R. D.; Langmuir. 16, 10037, 2000
[83] Roy, J. C.; Islam, M. N.; Akhtaruzzaman, G.; J Surfact Deterg. 17, 231, 2013
[84] Varade, D.; Joshi, T.; Aswal, V. K.; Goyal, P. S.; Hassan, P. A.; Bahadur, P.;
Colloid Surf A. 259, 95, 2005
[85] Banipal, T. S.; Kaur, H.; Banipal, P. K.; Sood, A.K.; J Surfact Deterg17, 1181,
2014
[86] Tsuji, K.; Mino, J.; J. Phys. Chem. 82, 1610, 1978
[87] Gu, T.; Zhu, B-Y.; Rupprecht, H.; Prog. Colloid Polym. Sci. 88, 74,1992
[88] Davey, T. M.; Ducker, W. A.; Hayman, A. R.; Simpson, J.; Langmuir.14, 3210,
1998
[89] Diamant H.; Andelman, D.; J. Phys. Chem. 100, 13732, 1996
[90] Vijayan, S.; Ramachandran, C.; Shah, D. O.; J. Am. Oil Chem. Soc. 58, 566, 1981
[91] Carolina, V. G.; Bales, B. L.; J. Phys. Chem. B. 107, 5398, 2003
[92] Bakshi, MS.; Sood, R.; Colloids Surf A. 233, 203, 2004
Chapter Two
Experimental
section
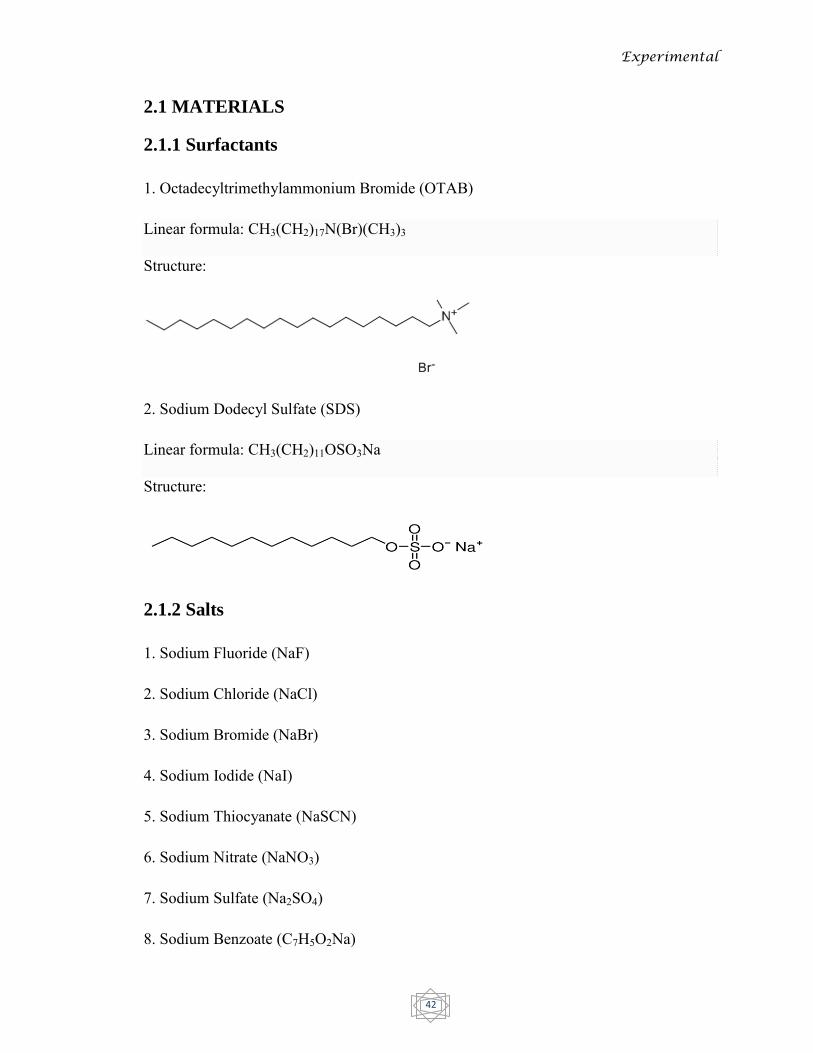
Experimental
42
2.1 MATERIALS
2.1.1 Surfactants
1. Octadecyltrimethylammonium Bromide (OTAB)
Linear formula: CH3(CH2)17N(Br)(CH3)3 Structure:
2. Sodium Dodecyl Sulfate (SDS)
Linear formula: CH3(CH2)11OSO3Na Structure:
2.1.2 Salts
1. Sodium Fluoride (NaF)
2. Sodium Chloride (NaCl)
3. Sodium Bromide (NaBr)
4. Sodium Iodide (NaI)
5. Sodium Thiocyanate (NaSCN)
6. Sodium Nitrate (NaNO3)
7. Sodium Sulfate (Na2SO4)
8. Sodium Benzoate (C7H5O2Na)
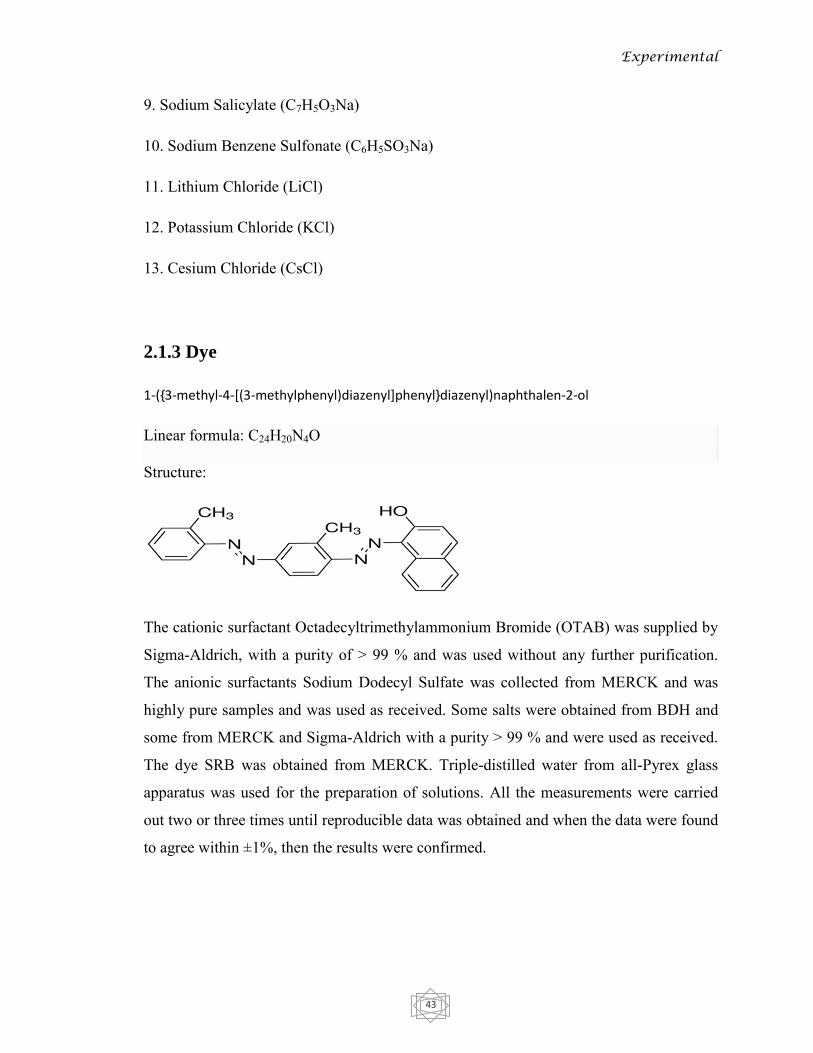
Experimental
43
9. Sodium Salicylate (C7H5O3Na)
10. Sodium Benzene Sulfonate (C6H5SO3Na)
11. Lithium Chloride (LiCl)
12. Potassium Chloride (KCl)
13. Cesium Chloride (CsCl)
2.1.3 Dye
1-({3-methyl-4-[(3-methylphenyl)diazenyl]phenyl}diazenyl)naphthalen-2-ol
Linear formula: C24H20N4O Structure:
The cationic surfactant Octadecyltrimethylammonium Bromide (OTAB) was supplied by
Sigma-Aldrich, with a purity of > 99 % and was used without any further purification.
The anionic surfactants Sodium Dodecyl Sulfate was collected from MERCK and was
highly pure samples and was used as received. Some salts were obtained from BDH and
some from MERCK and Sigma-Aldrich with a purity > 99 % and were used as received.
The dye SRB was obtained from MERCK. Triple-distilled water from all-Pyrex glass
apparatus was used for the preparation of solutions. All the measurements were carried
out two or three times until reproducible data was obtained and when the data were found
to agree within ±1%, then the results were confirmed.
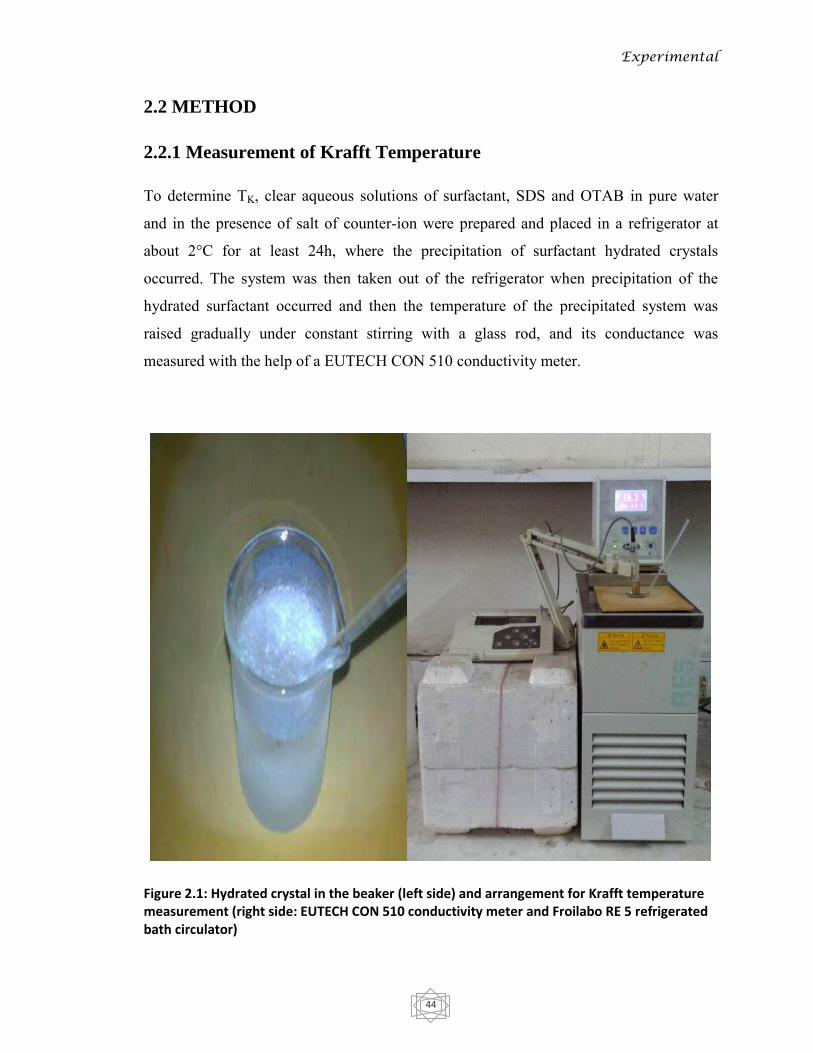
Experimental
44
2.2 METHOD
2.2.1 Measurement of Krafft Temperature
To determine TK, clear aqueous solutions of surfactant, SDS and OTAB in pure water
and in the presence of salt of counter-ion were prepared and placed in a refrigerator at
about 2°C for at least 24h, where the precipitation of surfactant hydrated crystals
occurred. The system was then taken out of the refrigerator when precipitation of the
hydrated surfactant occurred and then the temperature of the precipitated system was
raised gradually under constant stirring with a glass rod, and its conductance was
measured with the help of a EUTECH CON 510 conductivity meter.
Figure 2.1: Hydrated crystal in the beaker (left side) and arrangement for Krafft temperature measurement (right side: EUTECH CON 510 conductivity meter and Froilabo RE 5 refrigerated bath circulator)
Experimental
45
At each temperature, the conductance reading was checked every 2 min until it reach a
steady value. The temperature was measured using a sensor combined with conductivity
meter (precision of ±0.01) immersed in the investigated system. The Krafft temperature
was taken as the temperature where the conductance versus temperature plots showed an
abrupt change in slope. Operationally, TK values were determined from plots of the
second derivative of the data. This temperature was the same as that required to
completely dissolve the hydrated solid surfactant, judged visually to be the point of
complete clarification of the system. The reproducibility of TK measurements on a single
sample (typically ± 0.05°C) was superior to the reproducibility in samples presumably
prepared identically (averages about ±0.1°C). Details of the experimental procedure are
to be found elsewhere [1].
2.2.2 Measurement of Critical Micelle Concentration
Conductometric method: Conductivity measurements were carried out by using a
EUTECH CON 510 conductivity meter. Experiments were started with a dilute solution
and the subsequent concentrated solutions were obtained by adding a previously prepared
stock solution into a 100-mL beaker. The solution was stirred with glass rod after each
addition and the conductance of the solution was measured. The CMC was then taken
from the sharp break in the conductance vs concentration plot. The temperature of the
solution was kept constant by using a circulating water bath (Froilabo RE 5 refrigerated
bath circulator) with a precision of ±0.1°C. To observe the effect of electrolytes on the
CMC, surfactant solutions were prepared in various electrolytes solutions of desired
concentrations [2].
Surfacetensiometric method: To measure CMC, the surface tensions of the aqueous
surfactant solutions of different concentrations were measured by a surface tensiometer
(Kruss K9) furnished with a platinum plate. Before each measurement, the plate was
thoroughly washed by red heat. The solution was transferred into a vessel that was
thermostated by circulating water at the desired temperature. Before measurement, the
surface tension of the double distilled deionized water was confirmed to be in the range
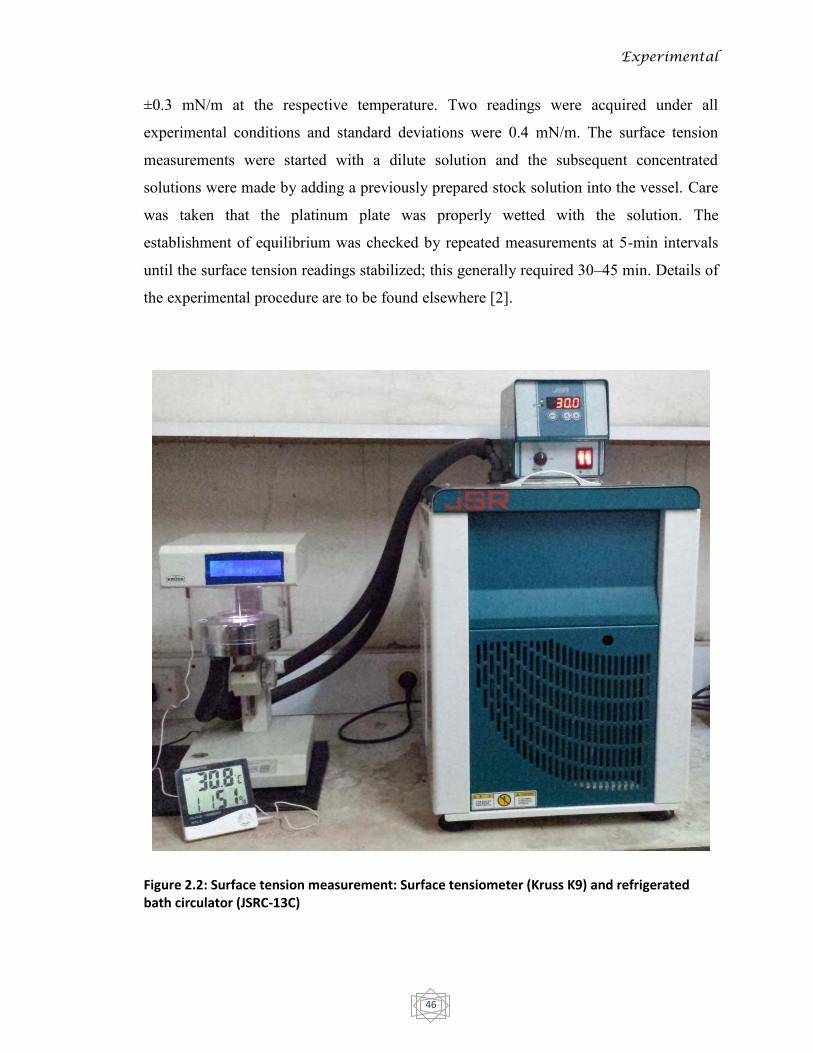
Experimental
46
±0.3 mN/m at the respective temperature. Two readings were acquired under all
experimental conditions and standard deviations were 0.4 mN/m. The surface tension
measurements were started with a dilute solution and the subsequent concentrated
solutions were made by adding a previously prepared stock solution into the vessel. Care
was taken that the platinum plate was properly wetted with the solution. The
establishment of equilibrium was checked by repeated measurements at 5-min intervals
until the surface tension readings stabilized; this generally required 30–45 min. Details of
the experimental procedure are to be found elsewhere [2].
Figure 2.2: Surface tension measurement: Surface tensiometer (Kruss K9) and refrigerated bath circulator (JSRC-13C)

Experimental
47
2.2.3 Solubilization
Solubilization studies of Sudan Red B (SRB) in OTAB and SDS solution in pure water
and in the presence of Na2SO4 and NaCl respectively were conducted under the condition
of maximum solubilization at a temperature of 30±1°C for SDS and associated salt,
NaCl and 38±1°C for OTAB and with Na2SO4. The temperature for each system was
chosen above the Krafft temperature to ensure the micelle formation of the surfactants in
aqueous solution. 50-mL reagent bottles were used for this study. Surfactant solutions of
different concentrations were poured separately into some reagent bottles, where the
surfactant concentrations in the first few were below the CMC and the last few were
above the CMC. A fixed amount of the solubilizate (SRB) was added to maintain excess
product at least three times its solubility limits for achieving solubilization equilibrium.
To equilibrate the solution the bottles were continuously agitated using a shaker (Stuart
Orbital shakers, SSL1) at 250 rpm for 24 hours held in a horizontal position. The
solutions were then filtered in order to separate the non- solubilized excess of dye from
the solution using Whatman 41 Ashless Quantitative Filter Paper 2.5µm and filtrate was
then analyzed by using the UV–visible spectrophotometer (Jenway Spectrophotometer-
7315). The absorbance of each solution was measured by using a quartz cell of path
length 1 cm. The concentration of SRB in surfactant micelles was calculated from a
calibration curve obtained from the absorption spectra of known concentrations of SRB
in OTAB and SDS against a blank. The strong absorbance at λmax = 517 nm for OTAB
and λmax = 524 for SDS gave a satisfactory Beer’s law plot.
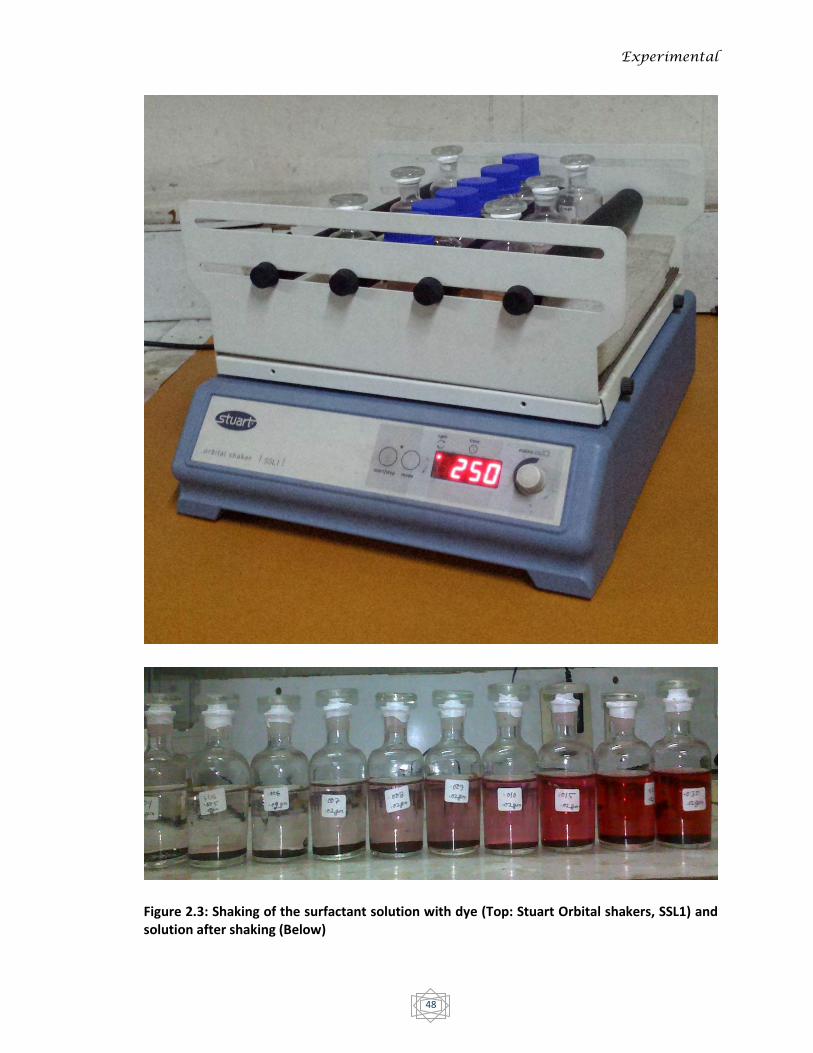
Experimental
48
Figure 2.3: Shaking of the surfactant solution with dye (Top: Stuart Orbital shakers, SSL1) and solution after shaking (Below)
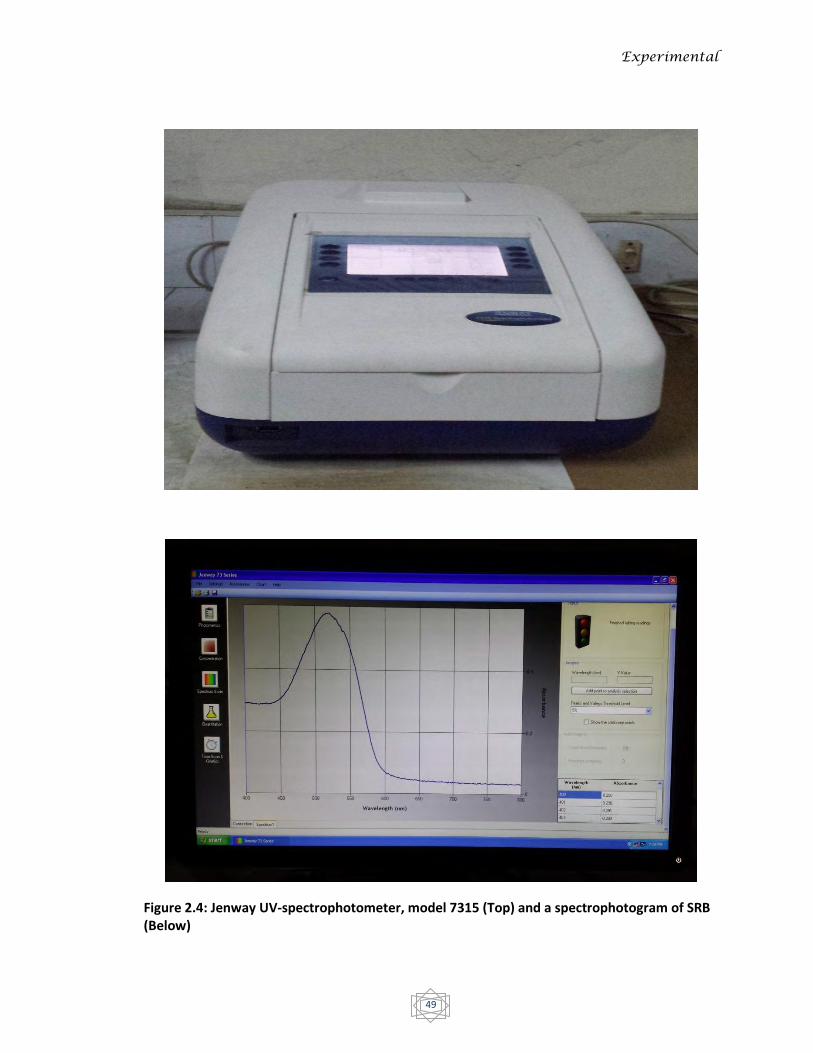
Experimental
49
Figure 2.4: Jenway UV-spectrophotometer, model 7315 (Top) and a spectrophotogram of SRB (Below)
Experimental
50
REFERENCES
[1] Islam, M. N.; Sharker, K. K.; Sarker, K. C.; J Surfact Deterg.18, 651, 2015
[2] Roy, J. C.; Islam, M. N.; Aktaruzzaman, G.; J Surfact Deterg. 17, 231, 2014

Chapter Three
Results and
discussion

Results and Discussion
51
3.1 EFFECT OF ELECTROLYTES ON KRAFFT TEMPERATURE
Specific conductance (κ) versus temperature curve of the solutions of aqueous Sodium
Dodecyl Sulfate (SDS), aqueous Octadecyltrimethylammonium Bromide (OTAB), and
their mixtures with several salts of 0.005 ionic strength are shown in Figures 3.1 and 3.2,
respectively. An important characteristic feature of ionic surfactants is their tendency to
precipitate from aqueous solutions as solid hydrates. At low temperature the solubility is
very limited until a certain temperature is reached commonly referred to as the Krafft
temperature (TK). But at this or higher this temperature surfactant is fully soluble in water
[1]. This temperature can be achieved by measuring the conductance of the surfactant
solution at different temperature. This is based on the fact that at low temperature
surfactants molecules remain hydrated. Therefore, at this temperature the conductivity of
the surfactant solution is somewhat lower due to low solubility of the surfactant in water.
While temperature is increased gradually, the surfactants molecules from hydrated state
start to ionize and thus increase the conductivity of the solution [2, 3]. The micelles are
spontaneously formed at the TK as the concentration of surfactant monomers becomes
equal to the CMC. Below the TK the surfactant solubility increases slowly with increasing
temperature because the surfactant exists as monomers. At the TK the surfactant
monomers form micelles showing a dramatic increase in solubility with increasing
temperature [1, 4, 5]. The SDS and OTAB solubility slowly increases below the TK. It is
only around the TK that a significant rise in conductivity can be seen, indicating a sharp
increase in the solubility of the surfactant. Beyond the TK the conductivity remains
almost steady. The TK was then taken when the sharp break in the κ vs. T plot occurred.
Further increase in temperature produces a small increase in conductivity, which can be
attributed to an increase in the thermal motion of the charged species [6]. Near the TK of
a surfactant, a network or worm-like micelles form. However, if the temperature is far
above the TK, worm-like micelles will transform to spherical micelles. Therefore, near the
TK the viscosity of a surfactant will be a maximum, which decreases if the temperature is
far above or below the TK [7]. Hence above the TK further increasing in conductivity is
governed by a delicate balance between the viscosity of the solution and the thermal
motion of the charged species. The effects of different electrolytes on the TK values of

Results and Discussion
52
SDS and OTAB are shown in Figure 3.1 and Figure 3.2, respectively. The TK values of
SDS and OTAB in pure water are found to be 14.45 and 36.74 οC respectively and are in
good agreement with the literature value [8, 9]. This variation in the TK is due to longer
carbon chain length of OTAB than that of SDS [10]. The TK varies differently for the two
surfactants [11]. Surfactants with dissimilar structures and counter-ions, a larger
depression in TK are detected [12]. Previously, it has been shown that the TK of ionic
surfactants can be changed by varying the counter-ion [13], or by increasing the degree of
unsaturation [14], or branching [12] in the hydrocarbon chain.
In the present work, we have investigated the influence of added electrolytes on the TK
and the CMC of two ionic surfactants in aqueous solution. It has been reported that the
Figure 3.1: Specific conductance vs. temperature plots of SDS in pure water and in the presence of different electrolytes at0.005 ionic strength. (i) Pure SDS, (ii) LiCl, (iii) KCl, (iv) CsCl, (v) NaCl. The sharp break point in the plot indicates the Krafft Temperature.
3 6 9 12 15 18 21 24 27 30 33 36
400
5001000
1100
1200
1300
1400
1500
v
iv
iii
ii
i
Sp
ecif
ic C
on
du
cta
nce (
µS
cm
-1)
Temperature (OC)

Results and Discussion
53
Figure 3.2: Specific conductance vs. temperature plots of OTAB in pure water and in the
presence of different electrolytes at 0.005 ionic strength. (i) Pure OTAB, (ii) Na2SO4, (iii) NaBr,
(iv) NaF, (v) C6H5SO3Na, (vi) C7H5O2Na, (vii) NaNO3, (viii) C7H5O3Na, (ix) NaCl. The sharp break
point in the plot indicates the Krafft Temperature.
inorganic additives do not always elevate the TK and that the added salts also lower TK
[15]. Islam, M. N. et al. showed that the krafft temperature can be tuned to lower value or
higher value by adding salts [16]. For example, the TK of Cetylpyridinium Chloride
(20.1°C in pure water) in presence of 0.005M NaCl is 21.4°C while in presence of
0.005M NaNO3 it is 14.3°C. TK depression of SDS in presence of LiCl was observed in
our study. At the time of preparing SDS solution with LiCl, NaCl and CsCl the solution
remained lucid at room temperature. But when KCl is introduced the system turned
cloudy and observed instant precipitation of the solution. This observation indicates that
10 15 20 25 30 35 40 450
50
100
500
600
700
800
900
ix
viii
vii
vi
v
iv
iii
ii
i
Sp
ecif
ic C
on
du
cta
nce (
µS
cm
-1)
Temperature (OC)
Results and Discussion
54
the mode of interaction of these ions with SDS in aqueous solution is governed by the
size and charge density of added counter-ions, affecting the solubility and thereby the TK
of the surfactant. Ions with a high charge to radius ratio (e.g., Li+) is called kosmotropes
or structure making ions, since it induce a more organized structure of the water around
the hydration sphere. On the other hand, ions with a low charge to radius ratio, such as
K+, Cs+ are termed as chaotropes or structure-breaking ions. Because of the more intense
electrostatic field, kosmotropes are more strongly hydrated than the chaotropes.
Consequently, the extent of distortion in the structure of free water surrounding the
hydrated kosmotropes is much less than that in the case of weakly hydrated chaotropes.
Thus Li+ being a kosmotrope remains in the bulk of the solution with a consequent
increase in solubility of SDS and thereby decrease the TK. Due to the common ion effect
Na+ increases the TK of the solution. This is due to the fact that when a solution contains a
salt in equilibrium with its ions, an increase in the concentration of one of the ions will
cause a corresponding decrease in the concentration of the other ion to maintain the
constancy of the solubility product of the ions present in solution [17]. Thus, to keep the
solubility product constant, the solubility of SDS in the presence of Na+ decreases,
showing an increase in the TK of the surfactant.
Vlachy et al. reported that alkyl sulphates in aqueous solution behave like a chaotrope
[18]. Being chaotrope Cs+ and K+ form contact ion pair with dodecyl sulfate ion and
decrease the solubility of the system and thus increase the TK of the system. The effect of
concentration of these salts on the TK of SDS is shown in Figure 3.3. Here, it is clear
from the graph that the TK of SDS decreases in the presence of Li+ and increases in the
presence of Na+, K+, and Cs+. An unusual behavior was observed for CsCl of 0.0025M.
The TK of CsCl for 0.0025M is lower than that of pure SDS. It has been reported that at
lower CsCl concentration ion-water interaction dominates over the ion-ion interaction
[19]. These ions disturb the highly structured liquid: the natural hydrogen bond network
is disrupted. Therefore, it can be anticipated that the free water molecules formed by the
presence of these ions should promote hydration of the surfactant. As a consequence, the
solubility of the surfactant increases resulting in a decrease in the TK. It is clear from
Figure 3.3 that Li+ has the greatest ability to lower the TK and the propensity follows the
order Li+ > Na+ > Cs+ > K+.
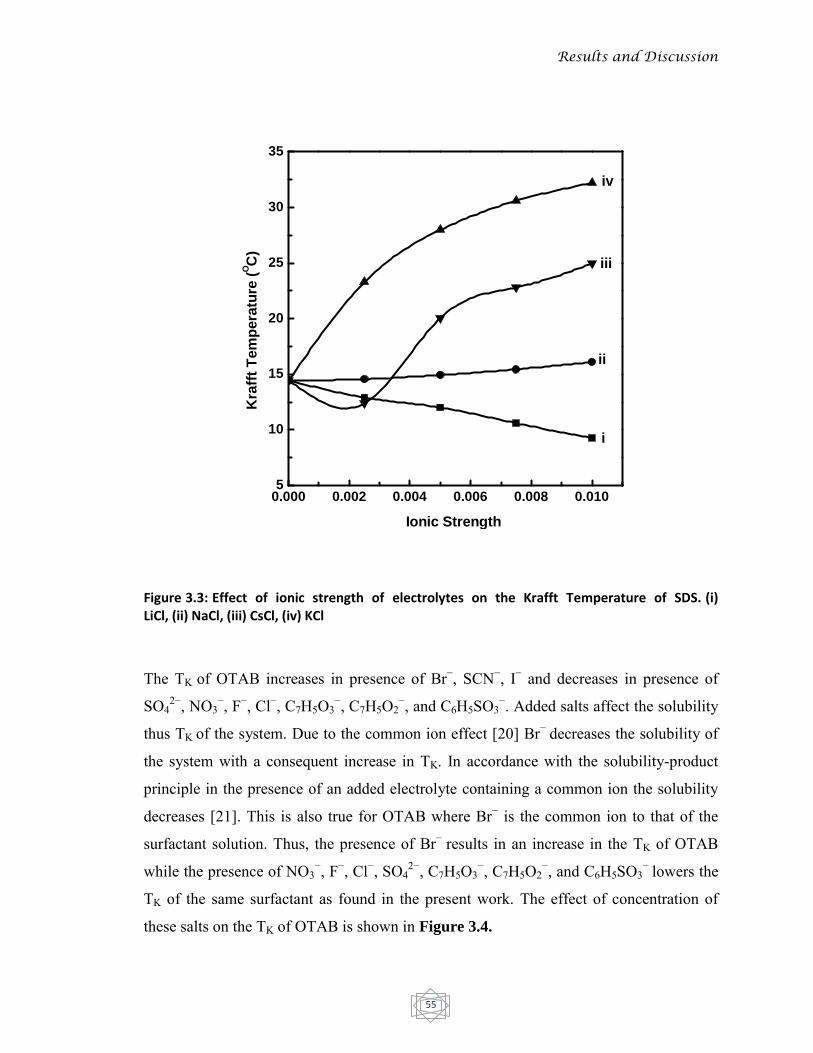
Results and Discussion
55
Figure 3.3: Effect of ionic strength of electrolytes on the Krafft Temperature of SDS. (i) LiCl, (ii) NaCl, (iii) CsCl, (iv) KCl
The TK of OTAB increases in presence of Br−, SCN−, I− and decreases in presence of
SO42−, NO3
−, F−, Cl−, C7H5O3−, C7H5O2
−, and C6H5SO3−. Added salts affect the solubility
thus TK of the system. Due to the common ion effect [20] Br− decreases the solubility of
the system with a consequent increase in TK. In accordance with the solubility-product
principle in the presence of an added electrolyte containing a common ion the solubility
decreases [21]. This is also true for OTAB where Br− is the common ion to that of the
surfactant solution. Thus, the presence of Br− results in an increase in the TK of OTAB
while the presence of NO3−, F−, Cl−, SO4
2−, C7H5O3−, C7H5O2
−, and C6H5SO3− lowers the
TK of the same surfactant as found in the present work. The effect of concentration of
these salts on the TK of OTAB is shown in Figure 3.4.
0.000 0.002 0.004 0.006 0.008 0.0105
10
15
20
25
30
35
iv
iii
ii
i
Kra
fft
Tem
pera
ture
(OC
)
Ionic Strength

Results and Discussion
56
Figure 3.4: Effect of ionic strength of electrolytes on the Krafft Temperature of OTAB. (i) C7H5O3Na, (ii) C7H5O2Na, (iii) Na2SO4, (iv) C6H5SO3Na, (v) NaF, (vi) NaNO3, (vii) NaCl, (viii) NaBr, (ix) NaSCN, (x) NaI.
Here, it is clear from Figure 3.4 that the TK of OTAB decreases in the presence of NO3−,
F−, Cl−, SO42− and increases in the presence of Br−, I−, and SCN−. Although both NO3
−
and Br− are chaotropes or structure breakers, one increases and another one decreases the
TK of OTAB. Hence the concept of structure breaking properties of ions cannot
satisfactorily explain the dependence of the TK of OTAB in the presence of added
electrolytes. To explain the influence of these salts on the TK, we have to consider the
concept of salting-in/out behavior of the ions along with the common ion effect on the
solubility of OTAB simultaneously. It is evident from Figure 3.4 that contrary to the
usual trend of the Hofmeister series, more chaotropic ions, SCN− and I− present in the
0.0000 0.0025 0.0050 0.0075 0.0100 0.0125
24
30
36
42
48
54
60
66
72
x
ix
viii
vii
viv
iviii ii i
Kra
fft
Tem
pera
ture
(oC
)
Ionic Strength
Results and Discussion
57
extreme right side in the series cause an increase in the TK (data were taken by visual
method) due to the salting out effect. On the other hand, less chaotropic Cl−, and NO3− as
well as kosmotropic SO42−, and to some extent F− lower the TK of the surfactant. In the
presence of NO3−, F−, Cl− and SO4
2− the TK decreases gradually with increasing the
concentration of the surfactant ions and then shows almost steady values with further
increases in concentration. This is in line with the observation of a previous study which
demonstrated that the TK varies with the concentration of the added electrolyte [22].
Islam, M. N. et al. [16] reported that SO42− has the highest ability to increase the surface
tension relative to pure water and this tendency decreases in the line with Hofmeister
series [23, 24]. It has been reported that large negatively charged anions with low charge
density tend to be pushed toward the water surface while those with high charge density
being extensively hydrated remain in the bulk [25, 26]. SO42− ion being kosmotropic in
nature with high charge density remain strongly hydrated in the bulk of the liquid. Thus,
it preferentially shows higher negative adsorption behavior in accordance with the Gibbs
adsorption equation [25]. Thus, for entropic reasons, the interface seeks to minimize its
volume, and this result in an increase in surface tension [27]. Water molecules at the air-
water interface possess a well-organized pattern with the negative oxygen atom pointed
towards the gaseous phase [28]. As a result, an electrical double layer is established
having a negative outermost surface while the positive innermost surface is directed to
the solvent side [28]. Therefore, it can be expected that chaotropes or structure breaking
ions such as NO3−, Cl−, Br−, I− and SCN− will preferentially accumulate near the
interface. Furthermore their extent of accumulation at the interface is also influenced by
their relative tendency of hydration in the bulk. Water molecules interact with individual
ions in charge density-dependent ways. These electrochemical processes dominate the
behavior of ions in the high dielectric regime of water and favor weakly hydrated anions
to adsorb preferentially at the air–water and low solvated hydrocarbon–water interface
[29]. The accumulation of these anions can interfere with hydrophobic hydration by
increasing the surface tension of the hydrocarbon–water interface and results in salting
out behavior of macromolecules [30]. Therefore, it is logical to expect that these ions will
be accumulated at the surface of the hydrophobic chain of the surfactant and directly
Results and Discussion
58
disturb the hydrophobic hydration, leading to salting out behavior with a consequent
increase in the TK.
The influence of the added electrolytes on the TK of the surfactants can also be explained
with the help of Collins “law of matching water affinities”. This theory explains the
interaction between oppositely charged ions based on their tendency for hydration [30,
31]. According to this concept the interaction between the ions in solution is associated
with the competition between the charge density dependent ion water interactions and the
hydrogen bond dominated water–water interactions. Large anions having low charge
density have the tendency to pair with large cations when their water affinities are similar
[30, 31]. These pairs with similar water affinities will be less hydrated and hence less
soluble than the separate ions. Applied to the present case, this means that SCN− and I−
ions will form contact ion pairs with the cationic part of the surfactant. Since Br−, SCN−
and I− are weakly hydrated chaotropes, their union with the octadecyltrimethylammonium
ion should lead to contact ion pairs with low solubility (compare: CsI is much less
soluble than LiI [32]). Differently stating, chaotropes form contact ion pairs with other
chaotropes and kosmotropes do other kosmotropes. Large difference in water affinities
keeps the chaotropes away from kosmotropes and weakly hydrated chaotropes cannot
break through the hydration shell of the strongly hydrated kosmotropes [31]. Nitrogen
based cations behave like chaotropes [33]. Therefore, it can be regarded that
octadecyltrimethylammoniumion ion should behave like a chaotrope and hence will be
weakly hydrated. Therefore, it can be expected that weakly hydrated chaotropes
I− and SCN− will readily form contact ion pairs with the weakly hydrated
octadecyltrimethylammonium ions. Such ion pairs will be much less hydrated than
separate ions and headgroups. Again the addition of electrolytes hampers polarizability of
water [34]. As a result, dielectric constant of water decreases in the presence of added
electrolytes [35]. Under such a condition, surfactant molecules feel stronger attraction for
added counter ions in solution and thus form contact ion pair with a consequent decrease
in the solubility of the surfactant. The electrostatic repulsion between surfactant
molecules is then decreased and promotes salting out behavior and this phenomenon
leads to an increase in TK. Such a salting out behavior of lysozyme in the presence of
strong chaotropes has been observed previously [36]. Ions with small radius have high
Results and Discussion
59
charge density and have the capability to bind the water molecules more tightly around
the hydration sphere. Therefore, less chaotropic Cl− and NO3− should exhibit higher
tendency for hydration than more chaotropic SCN− and I−. It has been reported that when
an ion is more strongly hydrated than its oppositely charged partner, their contact ion
pairing is not thermodynamically favorable because the dehydration of more strongly
hydrated ion costs more its energy than it can gain by forming a contact ion pair with the
more weakly hydrated ion [31]. Therefore, rather than forming contact ion pairs these
ions tend to stay away from one another being separated by the solvent molecules.
Furthermore, nuclear magnetic resonance experiments established that these ions increase
the activity of water molecules and that the water molecules adjacent to a chaotrope whirl
around more rapidly than in the bulk of the solution as expected for a water molecule
which is not held by its neighbors through hydrogen bonding [26]. Therefore it can be
expected that the presence of these ions should increase the concentration of free water
molecules and promote hydration of the surfactant. As a consequence, the solubility of
the surfactant increases in the presence of these ions, resulting in a decrease in the TK.
Similar behavior has also been observed for cetyltrimethylammonium bromide (CTAB)
and cetylpyridinium bromide (CPB) in the presence of NO3− and Cl− [2, 5]. Furthermore,
the salting-in effect phenomenon suggests that an added salt having no common ions
should increase the solubility of a sparingly soluble salt when the activity coefficient is
less than one [17]. The added salt increases the ionic strength of the medium and hence
the activity coefficient decreases. In order for the thermodynamic solubility product to
remain constant the solubility of the sparingly soluble salt increases. In the present study,
up to 0.01 M (0.01 ionic strength for Na2SO4 solution) salt solutions were used to
investigate the salt effect on the TK of OTAB where the activity coefficients of the salt
solutions remain below unity. Therefore, it is reasonable to expect that the solubility of
the surfactant should increase in the presence of the salts leading to a decrease in the TK.
Such a salting-in effect with a consequent decrease in the TK of CTAB in the
presence of added Cl− has been observed previously [5]. Both SO42− and F− are
strongly hydrated kosmotropes. They do not form a contact ion pair with the
octadecyltrimethylammoniumion ion due to large difference in water affinities. As
mentioned above, aqueous SO42− and F− solutions show much higher surface tensions
Results and Discussion
60
relative to pure water than chaotropic ions. In other words, the concentration of SO42− and
F− in the bulk is much higher than that at the air–water interface [3]. The increase in
surface tension of aqueous solution of inorganic ions can be explained by the Gibbs
adsorption equation in terms of negative adsorption [25]. Because of high charge density,
both SO42− and F− are extensively hydrated in the bulk. As a result, these strong
kosmotropes do not show any tendency to lose the hydration shell to form a contact ion
pair with the weakly hydrated octadecyltrimethylammonium ion. Hence, there exists a
significant electrostatic repulsion between the charged surfactant molecules, which favors
their dispersion in the aqueous solution leading to a decrease in the TK. From Figure 3.4
it appears that SO42− has higher ability and I− has the lowest ability to decrease the TK and
the propensity follows the order: SO42− > Cl− > NO3
− > F− > Br− > SCN− > I−. Thus it
appears that even though SO42− is a strong kosmotrope, its role in terms of lowering the
TK is more pronounced than chaotropic NO3−. Chen et al. [37] reported that SO4
2−appears
in its usual position in the direct Hofmeister series but migrates from its position and
behaves more like a chaotropic ion when the protein surface is positively charged. This
has been attributed to its lower tendency to lose the hydration shell and a stronger
charge–charge interaction than singly charged anions. Probably this argument holds in
the present case as the nitrogen present in OTAB is also positively charged. In previous
studies it has been shown that SO42− migrates from its usual position when it interacts
with a positively charged group as observed in the case of protein monolayers [36, 37].
Such a migration of SO42− has also been observed for micelle formation of n-dodecyl
-D-maltoside in aqueous solution [38].
In the present work, the effect of hydrotropes on the TK of OTAB has also been
investigated. Hodgdon et al. reported that hydrotropes with an amphiphilic molecular
structure possess the ability to increase the solubility (low value of TK) of sparingly
soluble organic molecules in water [39]. They increase the solubility due to weak
interaction with solute molecules [40]. Thus these hydrotropic molecules interact with
cationic part of surfactant via weak vander waals interactions such as π–π or attractive
dipole–dipole interaction and remain separated from this ion by hydrated layers of water
molecules. As a result, these hydrotropes do not show any tendency to lose their
Results and Discussion
61
hydration shell so that they can form contact ion pairs with the weakly hydrated
octadecyltrimethylammonium ion. Hence, there exists a significant electrostatic repulsion
between the charged surfactant molecules. This repulsion between the charged surfactant
molecules favors their dispersion in the aqueous solution leading to a decrease in the TK
[41]. The efficiency of a hydrotrope solubilization depends on the balance between
hydrophobic and hydrophilic part of hydrotrope [42]. The larger is the hydrophobic part
of an additive, the better is the hydrotropic efficiency; the presence of the charge on the
hydrophilic part is less significant [43]. This implies why sodium salicylate shows lower
TK value compared to the other two hydrotropes. Vlachy et al. reported that carboxylate
and sulfonate ions behave like a kosmotrope and the chaotrope, respectively [18]. As a
result, chaotropic C6H5SO3− ion cannot increase solubility of surfactant solution as much
as kosmotropic C7H5O2− can. So the tendency of decreasing the TK of three hydrotropes
follows the order: C7H5O3− > C7H5O2
− > C6H5SO3− and the overall propensity of
decreasing the TK of OTAB solution follows the order: C7H5O3− > C7H5O2
− > C6H5SO3−
> SO42− > Cl− > NO3
− > F− > Br− > SCN− > I−.
3.2 EFFECT OF ADDED SALTS ON SURFACE ADSORPTION AND
MICELLIZATION
At a certain surfactant concentration in a system when all interfaces and surfaces are
occupied by surfactant unimers, the surfactant unimers in the bulk start to aggregate into
micelles. This is due to the fact that surfactant molecules do not want their hydrophobic
tails to be in contact with water. To avoid the contact of water micelles are formed with
the hydrophobic tails pointing inwards and the hydrophilic head groups pointing
outwards, towards the water. The formation of micelles from the surfactant unimers is
mediated from the favorable interaction between the hydrophobic alkyl chains and
opposing repulsive interaction between the charged headgroups as well as the degree of
neutralization of micelle surface charge by the associated counter-ions [44]. The CMC of
SDS and OTAB in pure water and in the presence of added electrolytes at different
temperatures was measured by conductometric and tensiometric methods above the TK
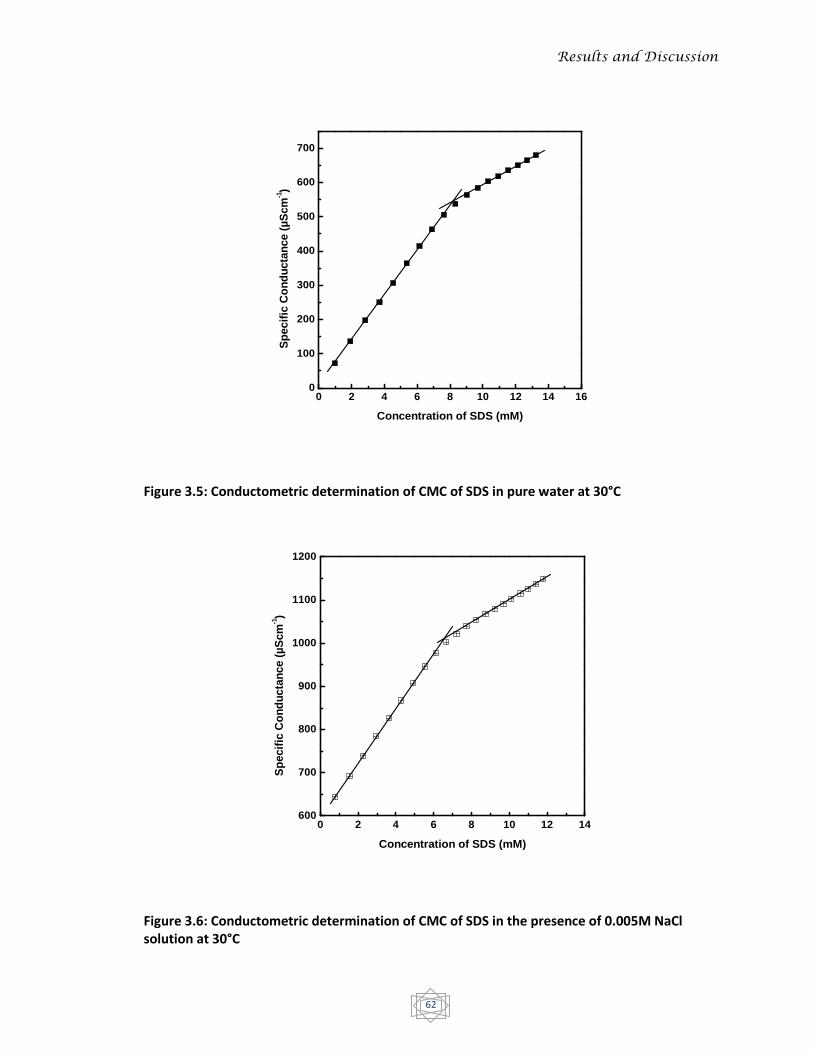
Results and Discussion
62
Figure 3.5: Conductometric determination of CMC of SDS in pure water at 30°C
Figure 3.6: Conductometric determination of CMC of SDS in the presence of 0.005M NaCl solution at 30°C
0 2 4 6 8 10 12 14 160
100
200
300
400
500
600
700
Sp
ecif
ic C
on
du
cta
nce (
µS
cm
-1)
Concentration of SDS (mM)
0 2 4 6 8 10 12 14600
700
800
900
1000
1100
1200
Sp
ecif
ic C
on
du
cta
nce (
µS
cm
-1)
Concentration of SDS (mM)
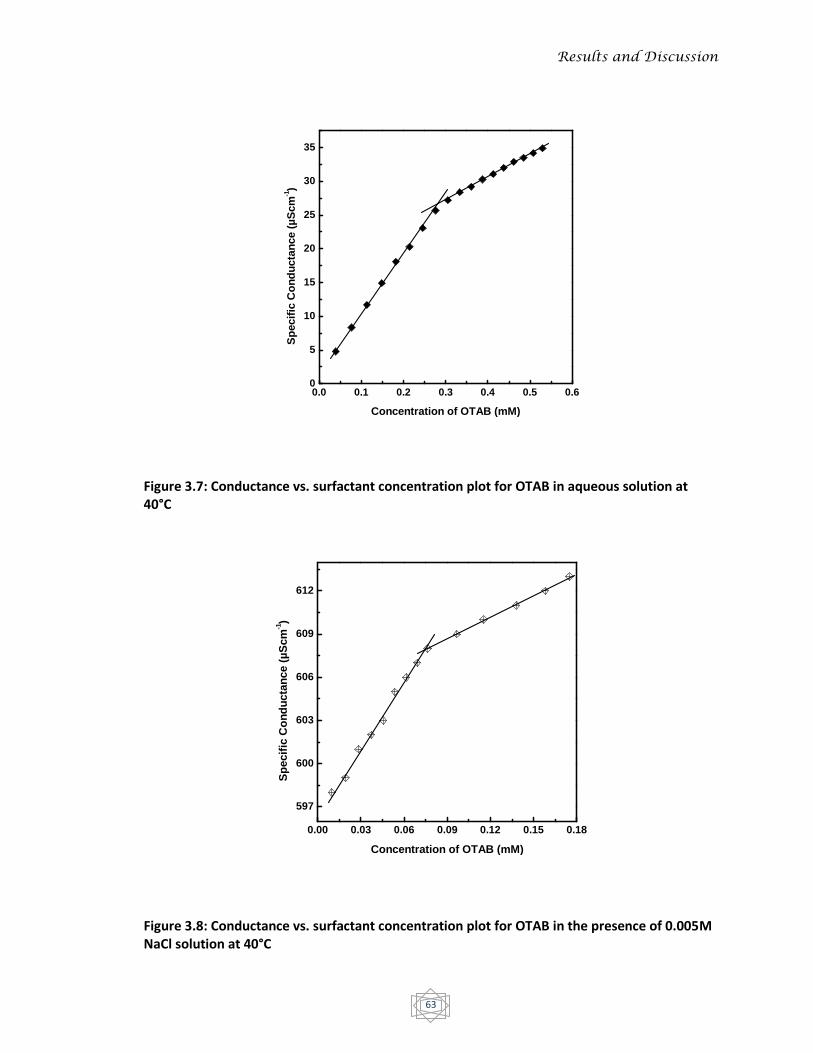
Results and Discussion
63
Figure 3.7: Conductance vs. surfactant concentration plot for OTAB in aqueous solution at 40°C
Figure 3.8: Conductance vs. surfactant concentration plot for OTAB in the presence of 0.005M NaCl solution at 40°C
0.0 0.1 0.2 0.3 0.4 0.5 0.60
5
10
15
20
25
30
35
Sp
ecif
ic C
on
du
cta
nce (
µS
cm
-1)
Concentration of OTAB (mM)
0.00 0.03 0.06 0.09 0.12 0.15 0.18
597
600
603
606
609
612
Sp
ecif
ic C
on
du
cta
nce (
µS
cm
-1)
Concentration of OTAB (mM)
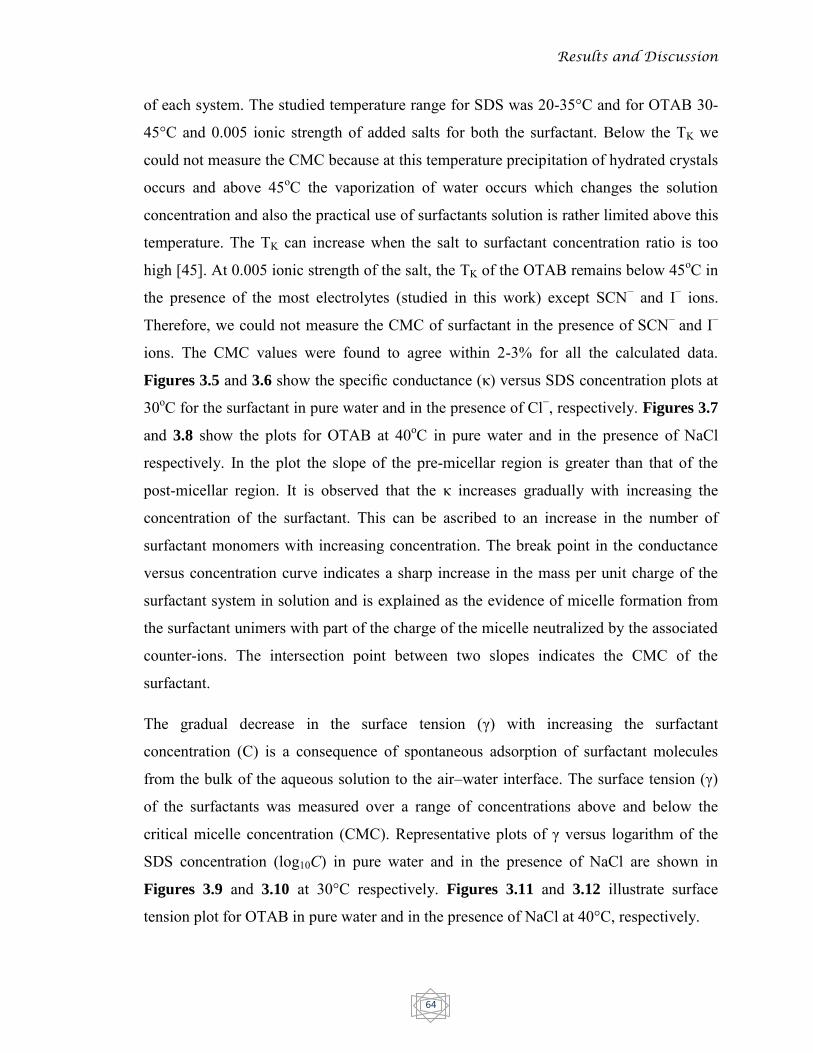
Results and Discussion
64
of each system. The studied temperature range for SDS was 20-35°C and for OTAB 30-
45°C and 0.005 ionic strength of added salts for both the surfactant. Below the TK we
could not measure the CMC because at this temperature precipitation of hydrated crystals
occurs and above 45οC the vaporization of water occurs which changes the solution
concentration and also the practical use of surfactants solution is rather limited above this
temperature. The TK can increase when the salt to surfactant concentration ratio is too
high [45]. At 0.005 ionic strength of the salt, the TK of the OTAB remains below 45οC in
the presence of the most electrolytes (studied in this work) except SCN− and I− ions.
Therefore, we could not measure the CMC of surfactant in the presence of SCN− and I−
ions. The CMC values were found to agree within 2-3% for all the calculated data.
Figures 3.5 and 3.6 show the specific conductance (κ) versus SDS concentration plots at
30οC for the surfactant in pure water and in the presence of Cl−, respectively. Figures 3.7
and 3.8 show the plots for OTAB at 40οC in pure water and in the presence of NaCl
respectively. In the plot the slope of the pre-micellar region is greater than that of the
post-micellar region. It is observed that the κ increases gradually with increasing the
concentration of the surfactant. This can be ascribed to an increase in the number of
surfactant monomers with increasing concentration. The break point in the conductance
versus concentration curve indicates a sharp increase in the mass per unit charge of the
surfactant system in solution and is explained as the evidence of micelle formation from
the surfactant unimers with part of the charge of the micelle neutralized by the associated
counter-ions. The intersection point between two slopes indicates the CMC of the
surfactant.
The gradual decrease in the surface tension (γ) with increasing the surfactant
concentration (C) is a consequence of spontaneous adsorption of surfactant molecules
from the bulk of the aqueous solution to the air–water interface. The surface tension (γ)
of the surfactants was measured over a range of concentrations above and below the
critical micelle concentration (CMC). Representative plots of γ versus logarithm of the
SDS concentration (log10C) in pure water and in the presence of NaCl are shown in
Figures 3.9 and 3.10 at 30°C respectively. Figures 3.11 and 3.12 illustrate surface
tension plot for OTAB in pure water and in the presence of NaCl at 40°C, respectively.
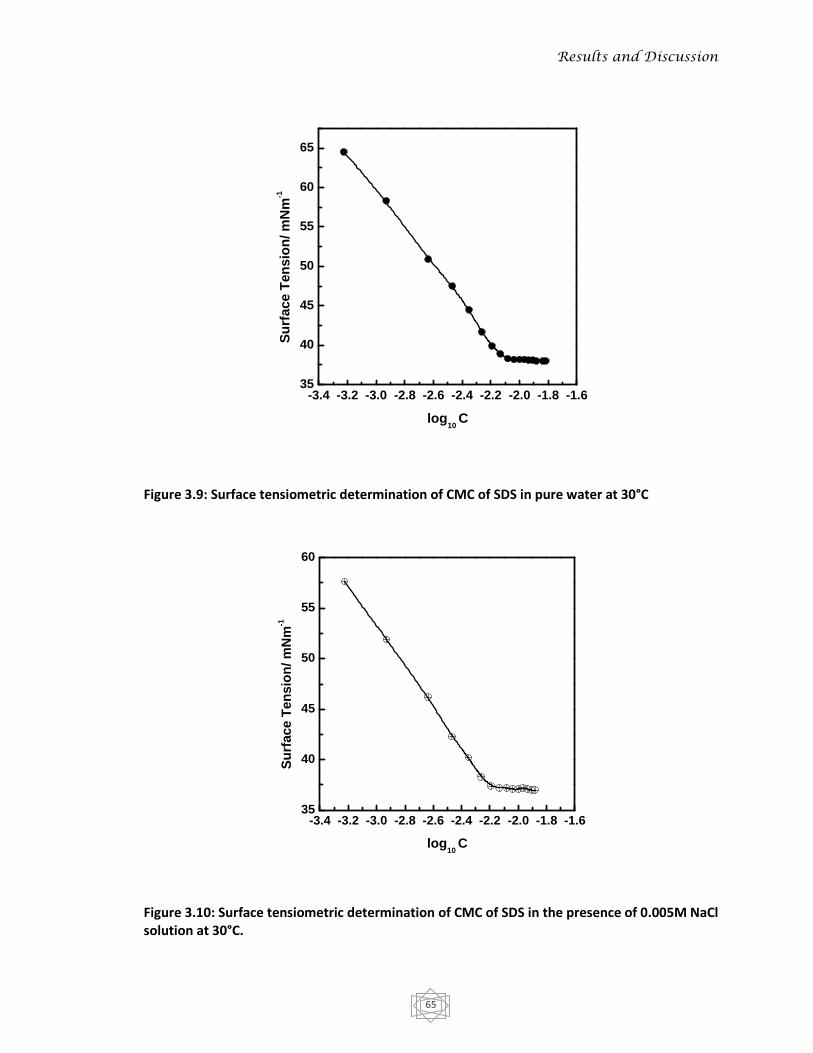
Results and Discussion
65
Figure 3.9: Surface tensiometric determination of CMC of SDS in pure water at 30°C
Figure 3.10: Surface tensiometric determination of CMC of SDS in the presence of 0.005M NaCl solution at 30°C.
-3.4 -3.2 -3.0 -2.8 -2.6 -2.4 -2.2 -2.0 -1.8 -1.635
40
45
50
55
60
65
Su
rface T
en
sio
n/ m
Nm
-1
log10
C
-3.4 -3.2 -3.0 -2.8 -2.6 -2.4 -2.2 -2.0 -1.8 -1.635
40
45
50
55
60
Su
rface T
en
sio
n/ m
Nm
-1
log10
C
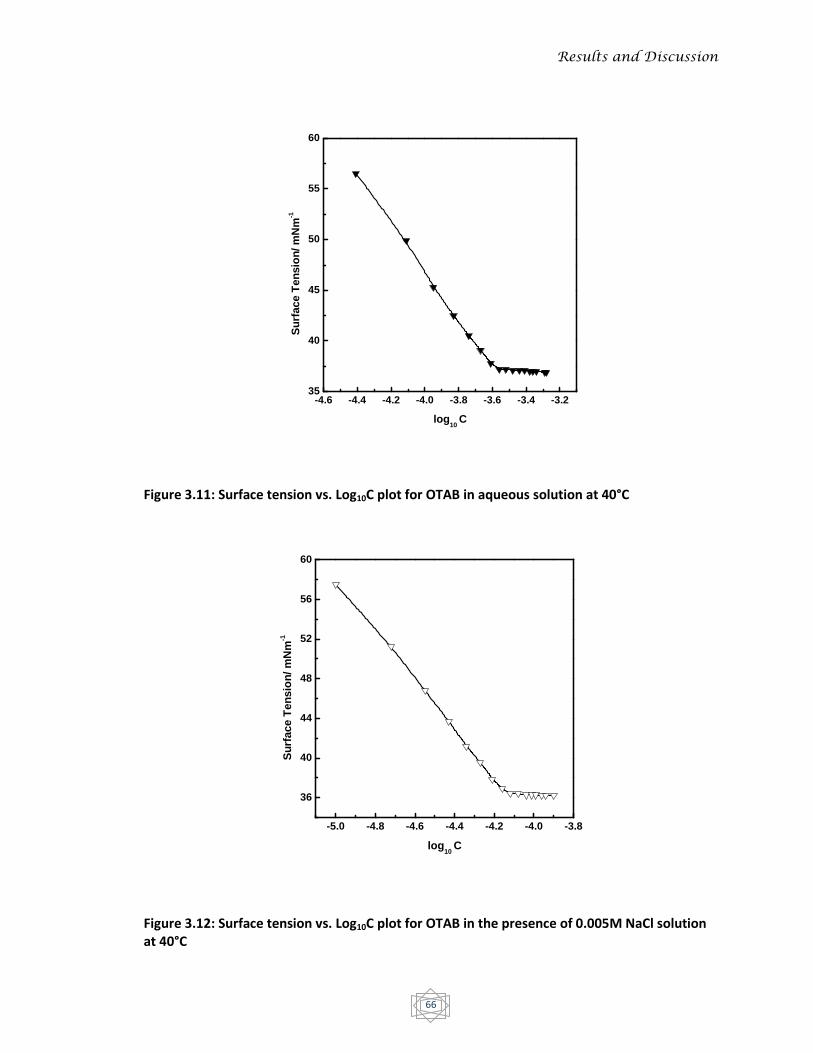
Results and Discussion
66
Figure 3.11: Surface tension vs. Log10C plot for OTAB in aqueous solution at 40°C
Figure 3.12: Surface tension vs. Log10C plot for OTAB in the presence of 0.005M NaCl solution at 40°C
-4.6 -4.4 -4.2 -4.0 -3.8 -3.6 -3.4 -3.235
40
45
50
55
60
Su
rface T
en
sio
n/ m
Nm
-1
log10
C
-5.0 -4.8 -4.6 -4.4 -4.2 -4.0 -3.8
36
40
44
48
52
56
60
Su
rface T
en
sio
n/ m
Nm
-1
log10
C
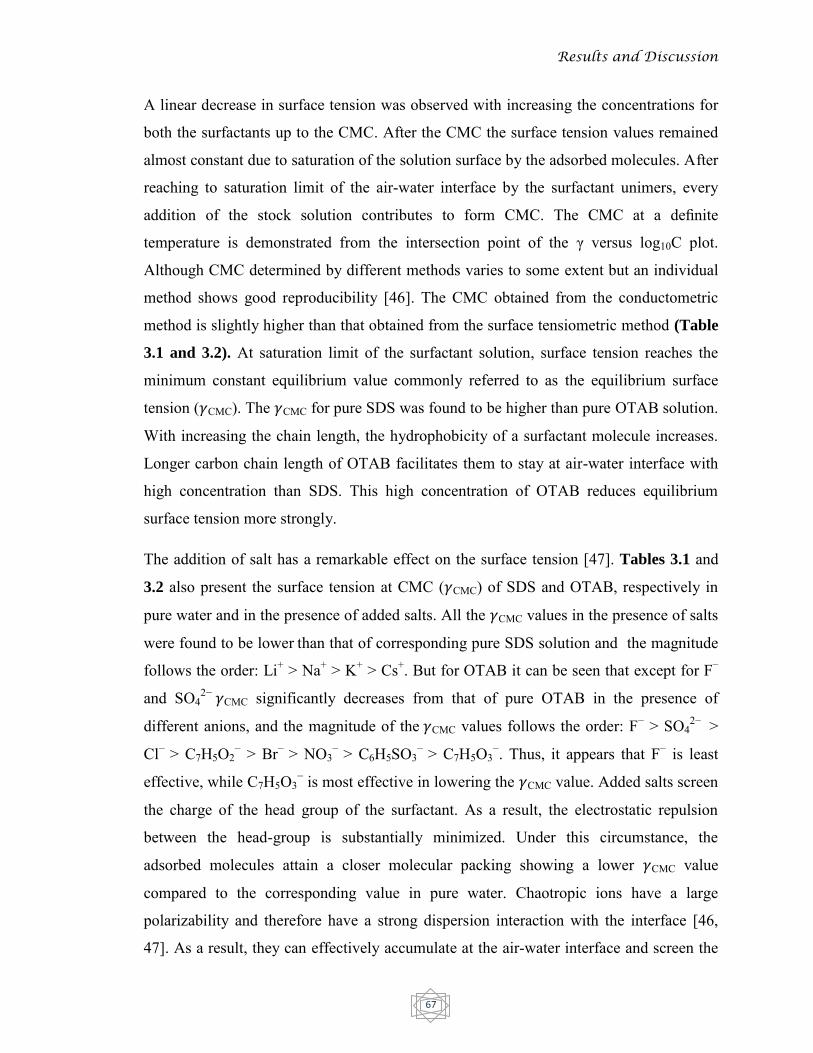
Results and Discussion
67
A linear decrease in surface tension was observed with increasing the concentrations for
both the surfactants up to the CMC. After the CMC the surface tension values remained
almost constant due to saturation of the solution surface by the adsorbed molecules. After
reaching to saturation limit of the air-water interface by the surfactant unimers, every
addition of the stock solution contributes to form CMC. The CMC at a definite
temperature is demonstrated from the intersection point of the γ versus log10C plot.
Although CMC determined by different methods varies to some extent but an individual
method shows good reproducibility [46]. The CMC obtained from the conductometric
method is slightly higher than that obtained from the surface tensiometric method (Table
3.1 and 3.2). At saturation limit of the surfactant solution, surface tension reaches the
minimum constant equilibrium value commonly referred to as the equilibrium surface
tension (𝛾CMC). The 𝛾CMC for pure SDS was found to be higher than pure OTAB solution.
With increasing the chain length, the hydrophobicity of a surfactant molecule increases.
Longer carbon chain length of OTAB facilitates them to stay at air-water interface with
high concentration than SDS. This high concentration of OTAB reduces equilibrium
surface tension more strongly.
The addition of salt has a remarkable effect on the surface tension [47]. Tables 3.1 and
3.2 also present the surface tension at CMC (𝛾CMC) of SDS and OTAB, respectively in
pure water and in the presence of added salts. All the 𝛾CMC values in the presence of salts
were found to be lower than that of corresponding pure SDS solution and the magnitude
follows the order: Li+ > Na+ > K+ > Cs+. But for OTAB it can be seen that except for F−
and SO42− 𝛾CMC significantly decreases from that of pure OTAB in the presence of
different anions, and the magnitude of the 𝛾CMC values follows the order: F− > SO42− >
Cl− > C7H5O2− > Br− > NO3
− > C6H5SO3− > C7H5O3
−. Thus, it appears that F− is least
effective, while C7H5O3− is most effective in lowering the 𝛾CMC value. Added salts screen
the charge of the head group of the surfactant. As a result, the electrostatic repulsion
between the head-group is substantially minimized. Under this circumstance, the
adsorbed molecules attain a closer molecular packing showing a lower 𝛾CMC value
compared to the corresponding value in pure water. Chaotropic ions have a large
polarizability and therefore have a strong dispersion interaction with the interface [46,
47]. As a result, they can effectively accumulate at the air-water interface and screen the

Results and Discussion
68
surface charge of the adsorbed molecules. Thus, electrostatic repulsion between the
charged headgroup substantially reduced favoring closer molecular packing in the
monolayer. Consequently, chaotropic ions are more effective in lowering the 𝛾CMC
compared to the kosmotropic ions. In our present study contrary to the usual trend
kosmotropic C7H5O3− is found most effective in lowering the 𝛾CMC. Due to hydrotropic in
nature this ion interact with surfactant ion via weak vander waals interactions in the bulk
of the solution [40]. Therefore, they show strong tendency to migrate to the air-water
interface. Their relative tendency depends on the size of the hydrophobic part on the
respective molecules. The larger the hydrotropic part greater will be the tendency to
migrate at the interface. As C7H5O3− has the larger hydrophobic part, it prevails in the
competition of substantial reduction of surface charge of the adsorbed surfactant
molecules. Thus it facilitates closer packing of OTAB molecules at the air-water interface
with a consequent decrease 𝛾CMC value. It is to be mentioned here that 𝛾CMC of F− and
SO42− is slightly higher than that of pure OTAB. Both the ions are kosmotropes.
Therefore, they preferentially remain in the bulk due to their extreme tendency for
hydration. Their hydrated shell is much thicker than those of Cl− and Br− [50]. This
hydrated layer, considering acting as steric hindrance and diffuse layer of F− are more
significant than the screening of the electric charge of the adsorbed monolayer [3]. The
origin of this steric hindrance probably arises from the fact that the water molecules in
the hydration shells are oriented differently toward the positively charged headgroup of
OTAB and negatively charged F− and SO42−. As a result, the monolayer attains a loose
molecular packing resulting in higher 𝛾CMC compared to that of pure OTAB.
Furthermore, at a given temperature molecular motion of F− is higher than SO42−. So
loose packing in monolayer for F− is higher than SO42− with a consequent higher 𝛾CMC for
F− than SO42−.
𝛾CMC values for SDS were found to increase with increasing temperature while for OTAB
values were found to decrease with increasing temperature. The lower the value of 𝛾CMC,
the higher will be the surface excess concentration (max) of the adsorbed molecules.
With increasing temperature, the molecular motion and chain flexibility increase and
result in a poorer packing of the molecules in adsorbed monolayers of SDS. In the case of
Results and Discussion
69
OTAB the dehydration effect prevails over molecular motion of monomeric ions and
facilitates them closer packing with a consequent decrease in 𝛾CMC.
The CMC value for OTAB is found to be lower than that of SDS. Longer carbon chain
length of OTAB facilitates them to entangle with minimum number of monomer and thus
lowering the CMC. It is well known that temperature is one of the major factors affecting
the CMC. The effect of temperature on the CMC of amphiphiles in aqueous solution is
usually a consequence of two opposing phenomena [48, 49]. First, with the increase in
temperature, dehydration of the ionic head group increases, leading to an increased
hydrophobicity of the amphiphile molecule. This favors the aggregation process and
lowers the CMC. On the other hand, an increase in temperature results in the breakdown
of the structured water surrounding the hydrophobic chain along with thermal motion of
the molecules. This is unfavorable for aggregation and the CMC increases [49, 50]. These
two factors determine whether the CMC will decrease or increase over a particular
temperature range. The first factor dominates usually in the low temperature range where
above a certain temperature, the second factor starts to dominate. However, the literature
also contains examples of a continuous increase in CMC with temperature [51, 52].
Rosen [53] reported that the CMC decreased with temperature initially and then increased
with increasing temperature. With increasing temperature dehydration of the hydrophilic
group occurred which favors micellization.
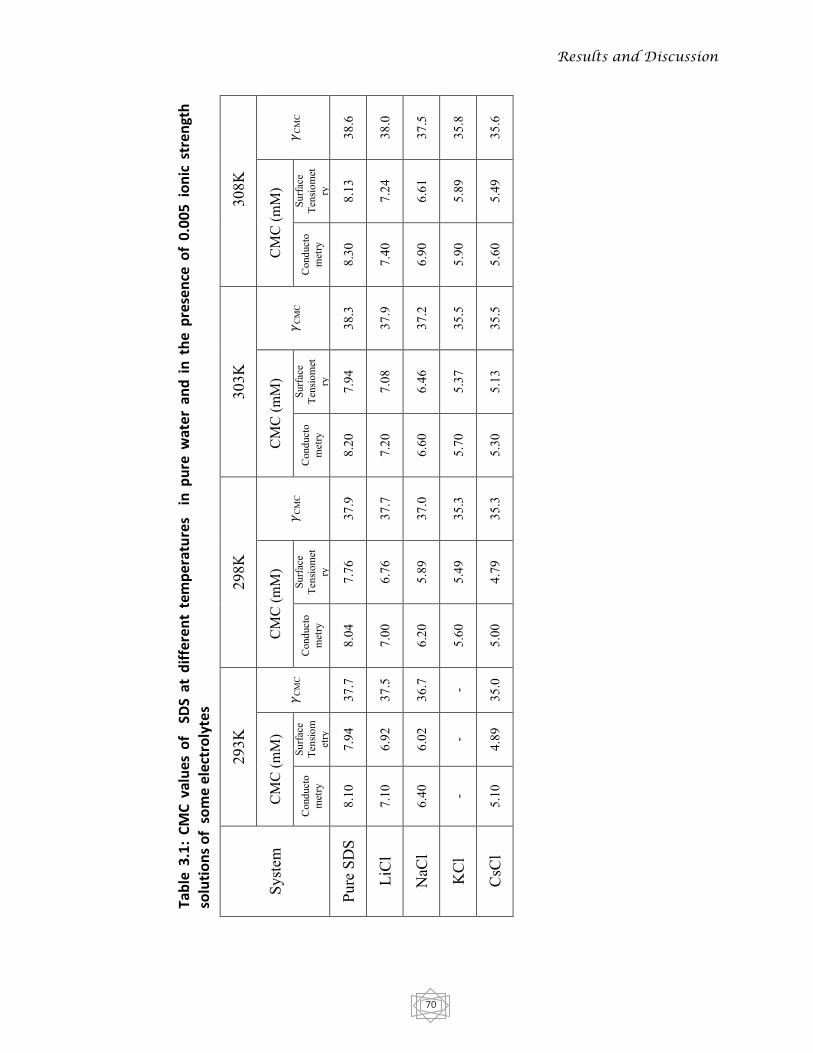
Results and Discussion
70
Tab
le 3
.1:
CM
C v
alu
es o
f S
DS
at d
iffe
ren
t te
mp
erat
ure
s i
n p
ure
wat
er
and
in
th
e p
rese
nce
of
0.0
05
io
nic
str
engt
h
solu
tio
ns
of
so
me
elec
tro
lyte
s
308
K
𝛾C
MC
38.6
38.0
37.5
35.8
35.6
CM
C (m
M)
Surfa
ce
Tens
iom
etry
8.13
7.24
6.61
5.89
5.49
Con
duct
om
etry
8.30
7.40
6.90
5.90
5.60
303K
𝛾C
MC
38.3
37.9
37.2
35.5
35.5
CM
C (m
M)
Surfa
ce
Tens
iom
etry
7.94
7.08
6.46
5.37
5.13
Con
duct
om
etry
8.20
7.20
6.60
5.70
5.30
298K
𝛾C
MC
37.9
37.7
37.0
35.3
35.3
CM
C (m
M)
Surfa
ce
Tens
iom
etry
7.76
6.76
5.89
5.49
4.79
Con
duct
om
etry
8.04
7.00
6.20
5.60
5.00
293K
𝛾C
MC
37.7
37.5
36.7
-
35.0
CM
C (m
M)
Surfa
ce
Tens
iom
etry
7.94
6.92
6.02
-
4.89
Con
duct
om
etry
8.10
7.10
6.40
-
5.10
Syst
em
Pure
SD
S
LiC
l
NaC
l
KC
l
CsC
l

Results and Discussion
71
Tab
le 3
.2:
CM
C v
alu
es o
f O
TAB
at
dif
fere
nt
tem
per
atu
res
in
pu
re w
ate
r an
d i
n t
he
pre
sen
ce o
f 0
.00
5 i
on
ic s
tren
gth
so
luti
on
s o
f s
eve
ral e
lect
roly
tes
318K
𝛾C
MC
36.3
0
32.3
33.4
30.2
36.5
33.1
33.1
35.6
38.3
CM
C (m
M)
Surfa
ce
Tens
iom
etry
0.30
0.02
6
0.03
8
0.03
5
0.06
8
0.06
9
0.07
9
0.07
9
0.09
5
Con
duct
om
etry
0.30
0.03
3
0.03
9
0.04
3
0.07
9
0.07
9
0.08
7
0.09
3
0.09
7
313K
𝛾C
MC
37.1
5
33.3
33.9
30.8
37.4
33.5
33.8
36.8
38.9
CM
C (m
M)
Surfa
ce
Tens
iom
etry
0.25
0.01
8
0.02
8
0.03
1
0.05
8
0.05
6
0.05
9
0.07
2
0.10
Con
duct
om
etry
0.28
0.02
3
0.02
9
0.03
6
0.06
1
0.06
6
0.06
7
0.07
5
0.11
308K
𝛾C
MC
37.8
33.9
34.8
31.3
38.0
34.3
-
37.3
39.4
CM
C (m
M)
Surfa
ce
Tens
iom
etry
0.
24
(310
)
0.01
6
0.02
2
0.02
1
0.05
0
0.05
0
-
0.05
8
0.11
Con
duct
om
etry
0.25
(3
10)
0.01
9
0.02
3
0.02
3
0.05
1
0.06
2
-
0.06
1
0.13
303K
𝛾C
MC
36.4
34.2
35.1
31.9
38.7
- -
36.0
-
CM
C (m
M)
Surfa
ce
Tens
iom
etry
0.
28
(316
)
0.01
3
0.01
5
0.01
6
0.04
5
- -
0.08
1 (3
16)
-
Con
duct
om
etry
0.30
(3
16)
0.01
4
0.02
1
0.01
8
0.04
7
- -
0.08
8
(316
)
-
Syst
em
Pure
OTA
B
C6H
5SO
3Na
C7H
5O2N
a
C7H
5O3N
a
Na 2
SO4
NaN
O3
NaB
r
NaC
l
NaF

Results and Discussion
72
However temperature increase also causes disruption of the structured water surrounding
of the hydrophobic group, an effect that disfavors micellization. The relative magnitude
of these two opposing effects, therefore, determines whether the CMC increases or
decreases over a particular temperature range. In the present work, we have found that
CMC of SDS decreases upto room temperature and then increases with increasing
temperature for all pure surfactant and in the presence of added salts over the studied
temperature range [Table 3.1]. Now it is obvious that dehydration of hydrophilic group
dominates over disruption of the water structure around hydrophobic group upto room
temperature and disruption of the water structure around hydrophobic group prevail over
the dehydration of hydrophilic group beyond the room temperature. For OTAB, CMC
values were found to increase with temperature [Table 3.2] in the presence of all added
salts except NaF over the studied temperature range. So it is assumed that disruption of
the water structure around hydrophobic group prevails over the first one. Because of high
charge density F− remains extensively hydrated. With increasing temperature dehydration
of hydrophilic group dominates over the disruption of the structured water surrounding of
the hydrophobic group. That is why increasing temperature favors micellization of NaF
with a consequent decrease of CMC. Addition of electrolytes in surfactant solution has
significant influence on lowering the CMC. Table 3.1 shows the CMC of SDS in the
presence of the added electrolytes. The uncertainty in the CMC values is found to be
within 1-2%. From the Table 3.1 and 3.2 it is clear that the CMC decreases significantly
in the presence of the added electrolytes favoring assembling of the surfactant molecules
in the bulk of the aqueous solution. A significant number of papers have dealt with the
effect of electrolytes (containing a common ion to that of the surfactant) on the CMC of
ionic surfactants [54-56]. These studies have shown that the CMC decreases in the
presence of added electrolytes, which has been attributed to partial neutralization of
surface charge by the excess counter-ions. When counter-ions adsorb at micelle surface,
they screen the charge of surfactant headgroups. Thus electrostatic repulsion between the
surfactant molecules is substantially reduced. The screening of the micelle surface charge
reduces electrostatic repulsion between the charged headgroups and promotes axial
growth of micelles [33]. The effectiveness of lowering the CMC appears to be dependent
on the nature of the added counter-ion.
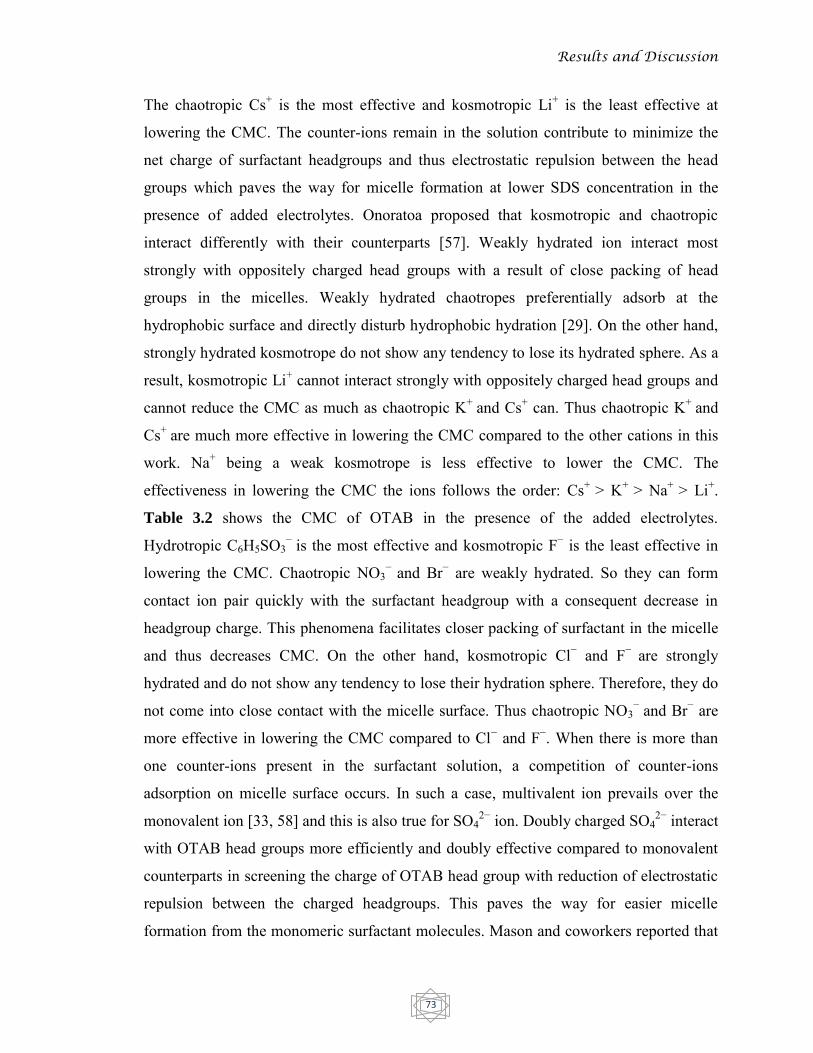
Results and Discussion
73
The chaotropic Cs+ is the most effective and kosmotropic Li+ is the least effective at
lowering the CMC. The counter-ions remain in the solution contribute to minimize the
net charge of surfactant headgroups and thus electrostatic repulsion between the head
groups which paves the way for micelle formation at lower SDS concentration in the
presence of added electrolytes. Onoratoa proposed that kosmotropic and chaotropic
interact differently with their counterparts [57]. Weakly hydrated ion interact most
strongly with oppositely charged head groups with a result of close packing of head
groups in the micelles. Weakly hydrated chaotropes preferentially adsorb at the
hydrophobic surface and directly disturb hydrophobic hydration [29]. On the other hand,
strongly hydrated kosmotrope do not show any tendency to lose its hydrated sphere. As a
result, kosmotropic Li+ cannot interact strongly with oppositely charged head groups and
cannot reduce the CMC as much as chaotropic K+ and Cs+ can. Thus chaotropic K+ and
Cs+ are much more effective in lowering the CMC compared to the other cations in this
work. Na+ being a weak kosmotrope is less effective to lower the CMC. The
effectiveness in lowering the CMC the ions follows the order: Cs+ > K+ > Na+ > Li+.
Table 3.2 shows the CMC of OTAB in the presence of the added electrolytes.
Hydrotropic C6H5SO3− is the most effective and kosmotropic F− is the least effective in
lowering the CMC. Chaotropic NO3− and Br− are weakly hydrated. So they can form
contact ion pair quickly with the surfactant headgroup with a consequent decrease in
headgroup charge. This phenomena facilitates closer packing of surfactant in the micelle
and thus decreases CMC. On the other hand, kosmotropic Cl− and F− are strongly
hydrated and do not show any tendency to lose their hydration sphere. Therefore, they do
not come into close contact with the micelle surface. Thus chaotropic NO3− and Br− are
more effective in lowering the CMC compared to Cl− and F−. When there is more than
one counter-ions present in the surfactant solution, a competition of counter-ions
adsorption on micelle surface occurs. In such a case, multivalent ion prevails over the
monovalent ion [33, 58] and this is also true for SO42− ion. Doubly charged SO4
2− interact
with OTAB head groups more efficiently and doubly effective compared to monovalent
counterparts in screening the charge of OTAB head group with reduction of electrostatic
repulsion between the charged headgroups. This paves the way for easier micelle
formation from the monomeric surfactant molecules. Mason and coworkers reported that

Results and Discussion
74
the SO42− behaves like a chaotrope and shifts from its usual position in the Hofmeister
series when it interacts with positively charged nitrogen [59]. In the present study SO42−
interacts with Octadecyltrimethylammonium ion and behave like a chaotrope shifting
from its usual position in the Hofmeister series and thus lowering the CMC.
Hydrotropes are most effective at lowering the CMC of the surfactant. They do not
aggregate in well-arranged structures such as micelles, but somewhat form dimers,
trimers, etc [60]. It suggests that the mixed micelles are formed due to attractive
interactions between the surfactant and hydrotropes. These hydrotropes are tied on the
ionic headgroup of the surfactant, reducing the headgroup repulsions and favoring
micellization. Among the three hydrotropes used in this study C6H5SO3− being more
chaotropre decrease the CMC more effectively than that of kosmotropic C7H5O2− and
C7H5O3−. The effectiveness in lowering the CMC the ions follows the order: C6H5SO3
− >
C7H5O2− > C7H5O3
− > SO42− > NO3
− > Br− > Cl− > F−
3.3 SURFACE EXCESS CONCENTRATION
The surface excess concentration () is an important physical property of adsorbed
molecules which is closely related to formation of an oriented surfactant monolayer. This
is defined as the concentration of surfactant molecules at the surface, relative to that in
the bulk. Monolayer formation by surfactant system is of theoretical interest and
industrial importance. One of the most important aspects of surfactant adsorption at the
air–water interface is its relationship to surface tension reduction. Monolayer formation
affects contact angle with a solid surface (affecting flotation), rate of wetting of a solid,
and foaming (with applications in enhanced oil recovery or fire extinguishers). So it is
important to understand monolayer composed of surfactant as well as surface excess
concentration () [61].
Figures 3.13 and 3.14 show the variation of the surface excess concentration of SDS and
OTAB at different temperatures in the presence of NaCl respectively.
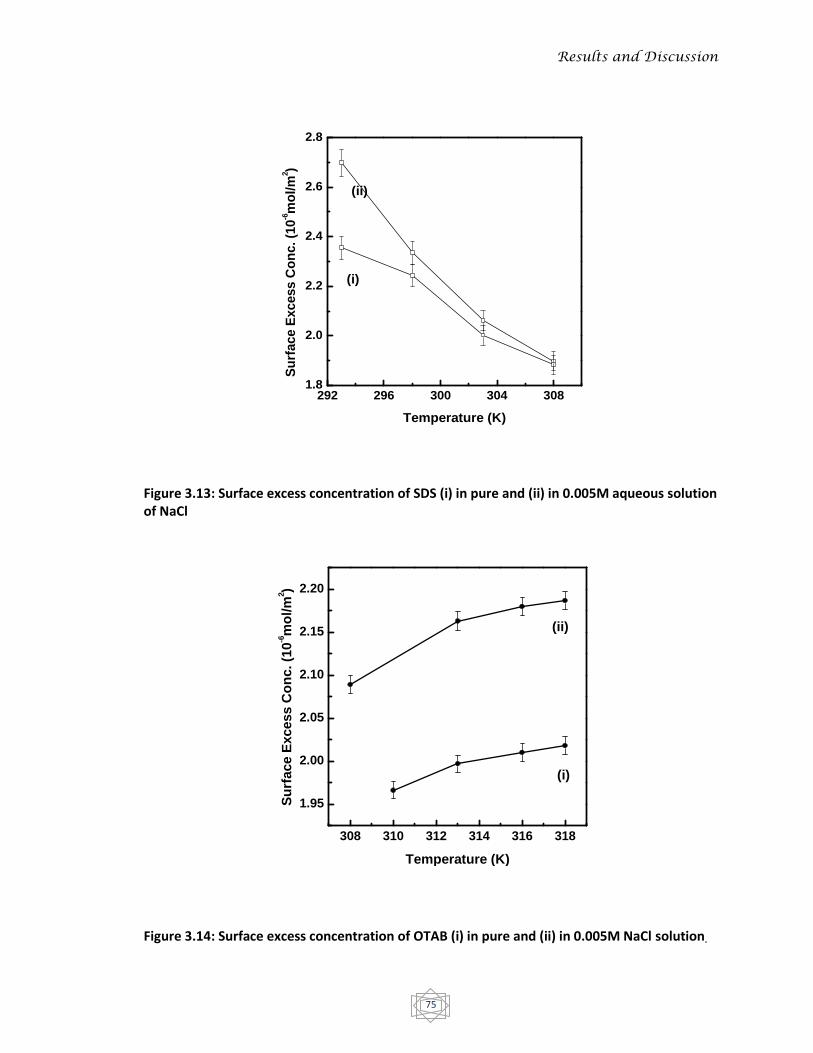
Results and Discussion
75
Figure 3.13: Surface excess concentration of SDS (i) in pure and (ii) in 0.005M aqueous solution of NaCl
Figure 3.14: Surface excess concentration of OTAB (i) in pure and (ii) in 0.005M NaCl solution.
292 296 300 304 3081.8
2.0
2.2
2.4
2.6
2.8
(ii)
(i)
Su
rface E
xcess C
on
c. (1
0-6m
ol/m
2)
Temperature (K)
308 310 312 314 316 318
1.95
2.00
2.05
2.10
2.15
2.20
(ii)
(i)
Su
rface E
xcess C
on
c. (1
0-6m
ol/m
2)
Temperature (K)
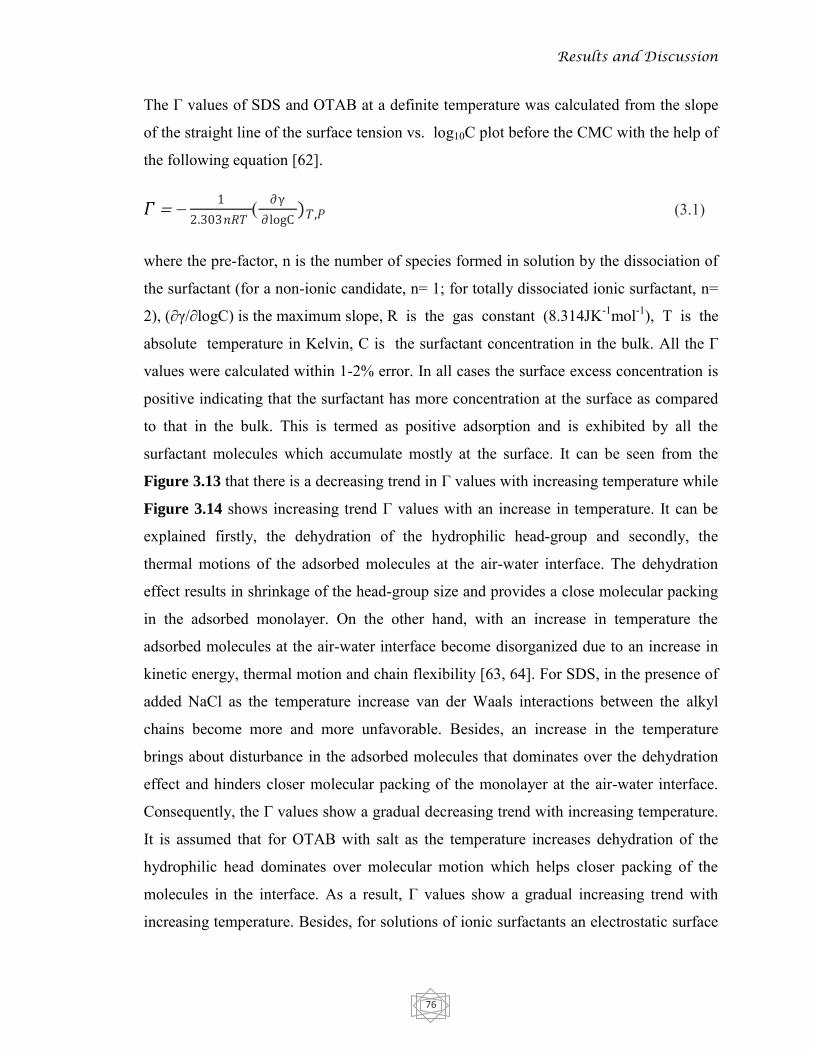
Results and Discussion
76
The Г values of SDS and OTAB at a definite temperature was calculated from the slope
of the straight line of the surface tension vs. log10C plot before the CMC with the help of
the following equation [62].
𝛤1
2.303𝑛𝑅𝑇
∂γ
∂logC)𝑇,𝑃 (3.1)
where the pre-factor, n is the number of species formed in solution by the dissociation of
the surfactant (for a non-ionic candidate, n= 1; for totally dissociated ionic surfactant, n=
2), (∂γ/∂logC) is the maximum slope, R is the gas constant (8.314JK-1mol-1), T is the
absolute temperature in Kelvin, C is the surfactant concentration in the bulk. All the Г
values were calculated within 1-2% error. In all cases the surface excess concentration is
positive indicating that the surfactant has more concentration at the surface as compared
to that in the bulk. This is termed as positive adsorption and is exhibited by all the
surfactant molecules which accumulate mostly at the surface. It can be seen from the
Figure 3.13 that there is a decreasing trend in Г values with increasing temperature while
Figure 3.14 shows increasing trend Г values with an increase in temperature. It can be
explained firstly, the dehydration of the hydrophilic head-group and secondly, the
thermal motions of the adsorbed molecules at the air-water interface. The dehydration
effect results in shrinkage of the head-group size and provides a close molecular packing
in the adsorbed monolayer. On the other hand, with an increase in temperature the
adsorbed molecules at the air-water interface become disorganized due to an increase in
kinetic energy, thermal motion and chain flexibility [63, 64]. For SDS, in the presence of
added NaCl as the temperature increase van der Waals interactions between the alkyl
chains become more and more unfavorable. Besides, an increase in the temperature
brings about disturbance in the adsorbed molecules that dominates over the dehydration
effect and hinders closer molecular packing of the monolayer at the air-water interface.
Consequently, the Г values show a gradual decreasing trend with increasing temperature.
It is assumed that for OTAB with salt as the temperature increases dehydration of the
hydrophilic head dominates over molecular motion which helps closer packing of the
molecules in the interface. As a result, Г values show a gradual increasing trend with
increasing temperature. Besides, for solutions of ionic surfactants an electrostatic surface

Results and Discussion
77
potential acts as a barrier for the adsorption of additional molecules as they migrate from
the bulk of the solution to the air-water interface. When an electrolyte is introduced to the
surfactant solution electrostatic screening of surface potential occurs at the air-water
interface [65, 66]. As a result, the obstruction for further adsorption of surfactant
molecules is substantially reduced, giving higher surface excess concentration of
the adsorbed molecules in the presence of NaCl for both SDS and OTAB. This higher
surface excess concentration can also be attributed to the lower equilibrium surface
tension of SDS and OTAB in the presence of NaCl.
3.4 THERMODYNAMICS OF MICELLIZATION
The thermodynamics of micellization processes of ionic surfactants with different
additives received much attention in recent years as the thermodynamic parameters are
powerful means for elucidating the mechanism of the micellization and effects of
additives on the micellization process [67]. The Thermodynamics of micelle formation of
the cationic surfactant OTAB and anionic surfactant SDS in water and aqueous NaCl
solutions were investigated. Conductometric method has been used to study the effect of
the added NaCl on the critical micelle concentration, CMC and enthalpy of micellization,
∆Hm° between 293 and 308 K for SDS and between 308 and 318 K for OTAB. Gibbs free
energy, ∆Gm° and entropy, ∆Sm° were deduced by taking into account the counterion
binding. Estimates of the thermodynamic parameters of micellization the free energy
(∆Gm°), the entropy (∆Sm°), the enthalpy (∆Hm°) have been determined for anionic
surfactant SDS and cationic surfactant OTAB from the following expression [68].
∆Gm° = (1 + 𝛽) RT ln Xcmc (for pure surfactant) (3.2)
∆Gm° = RT [lnXcmc + (1−𝛼) ln (Xcmc + Xs)] (in the presence of salt) (3.3)
∆Sm° = − 𝜕(∆𝐺𝑚
° )
𝜕𝑇 P (3.4)
∆Hm° = 𝑇∆Sm° + ∆Gm° (3.5)

Results and Discussion
78
Where β is the degree of counter-ion binding, Xcmc is mole fraction of the surfactants
and Xs is the mole fraction of salts at the CMC. Details of calculation will be found in the
calculation part at the end of this paper. All the thermodynamic parameters have been
calculated within 2-3% error. The data of thermodynamics parameters during aggregates
formation are listed in Tables 3.3, 3.4, 3.5 and 3.6 from which it can be seen that:
Table 3.3: Thermodynamic parameters of adsorption and micellization* of the SDS surfactants
solution.
Temp/K
ΔHm°/
kJmol-1 ΔHad°/ kJmol-1
ΔSm°/ Jmol-1K-1
ΔSad°/ Jmol-1K-1
ΔGm°/ kJmol-1
ΔGad°/ kJmol-1
293 -5.18 0.60 100.44 171.01 -34.61 -49.50
298 -15.33 2.75 66.34 178.51 -35.10 -50.44
303 -25.46 5.11 32.24 186.01 -35.23 -51.26
308 -35.96 7.33 -1.86 193.51 -35.38 -52.27
Table 3.4: Thermodynamic parameters of adsorption and micellization* of the SDS – 0.005M NaCl surfactants solution.
Temp/K ΔHm°/
kJmol-1 ΔHad°/ kJmol-1
ΔSm°/ Jmol-1K-1
ΔSad°/ Jmol-1K-1
ΔGm°/ kJmol-1
ΔGad°/ kJmol-1
293 -27.78 71.48 23.02 407.7 -34.53 -47.98
298 -27.48 49.26 23.62 331.7 -34.52 -49.59
303 -27.49 26.06 24.22 255.7 -34.83 -51.41
308 -27.18 3.09 24.82 179.7 -34.82 -52.26
*The CMC values were taken in mole fractions for the calculation of the thermodynamic parameters.

Results and Discussion
79
Table 3.5: Thermodynamic parameters of adsorption and micellization* of the OTAB surfactants solution.
Temp/K
ΔHm°/
kJmol-1 ΔHad°/ kJmol-1
ΔSm°/ Jmol-1K-1
ΔSad°/ Jmol-1K-1
ΔGm°/ kJmol-1
ΔGad°/ kJmol-1
310 -69.70 -131.64 -59.33 -205.96 -51.31 -67.79
313 -68.05 -112.40 -54.03 -144.21 -51.14 -67.26
316 -66.09 -85.31 -47.19 -60.41 -50.99 -66.98
318 -65.26 -79.93 -45.20 -41.29 -50.89 -66.80
Table 3.6: Thermodynamic parameters of adsorption and micellization* of the OTAB – 0.005M
NaCl surfactants solution.
Temp/K
ΔHm°/
kJmol-1 ΔHad°/ kJmol-1
ΔSm°/ Jmol-1K-1
ΔSad°/ Jmol-1K-1
ΔGm°/ kJmol-1
ΔGad°/ kJmol-1
308 -74.89 -152.97 -74.78 -276.52 -51.86 -67.80
313 -63.34 -100.87 -37.58 -108.72 -51.58 -66.84
316 -55.78 -69.1 -8.54 -65.34 -51.53 -66.74
318 -51.61 -47.92 -0.38 59.08 -51.49 -66.71
*The CMC values were taken in mole fractions for the calculation of the thermodynamic
parameters.
(i) The values of free energy change (∆Gm°) during micelle formation for pure SDS and
OTAB as well as in the presence of NaCl are found to be negative. This means that
micelle formation is a spontaneous process for the surfactants. Based on Equation (3.2
and 3.3), ∆Gm° values are affected by both critical micelle concentration (CMC,
expressed as molar fraction) and miceller degree of ionization (α). The values of ∆Gm°
for OTAB are found to be more negative than that of SDS in pure water and in the
presence of NaCl. This indicates OTAB form micelle more spontaneously than SDS.
Longer alkyl chain lengths result in considerably more negative values of ∆Gm° [68]. It is

Results and Discussion
80
found that the changes in ∆Gm° with increasing the temperature are very small. In the
case of SDS ∆Gm° is found to become slightly more negative while in case of OTAB the
negative values are found to decrease with increasing temperature. This suggests
that spontaneity of micellization increases for SDS while decreases for OTAB with
temperature.
(ii) All ∆Hm° values for both the surfactants over the studied temperature range are
negative, indicating that micelle formation is an exothermic process. ∆Hm° values are
found to be more negative for OTAB than SDS. The negative contribution to the ∆Hm° is
indicative of the transfer of the hydrocarbon chains into the micelles and restoring the
hydrogen bonding structure of the water around the micelles [69]. In addition, the
negative ∆Hm° values can be taken as the evidence of London dispersion force, a
major attractive force for micellization which becomes more and more dominant with
increasing the hydrocarbon chain length [38]. With increasing temperature, the three-
dimensional structure of the hydration water is partially broken down and, consequently,
the role of hydrophobic and other dehydration becomes weaker because less energy is
required to break up the three-dimensional water structure. Thus ∆Hm° became more
exothermic [70]. It is evident from the Tables 3.3, 3.4, 3.5 and 3.6 that all ∆Hm° values
are negative for SDS and OTAB. With increasing the chain length of a surfactant
molecule, the enthalpy of micellization becomes more negative. This suggests that the
enthalpy term for OTAB is more effective in contributing to the free energy term
than the SDS.
(iii) Entropy makes a major contribution to ∆Gm°. Over the investigated temperature
range, the entropy change of micellization (∆Sm°)for SDS and OTAB presents different
trends. The ∆Sm° values for SDS are found to be positive while for OTAB the values are
negative. The values are found to decrease with increasing temperature except SDS in the
presence of NaCl. The negative ∆Sm° values means that there is a reduction of disorder at
the molecular level, probably because the effect of the liberation of surfactant hydration
water molecules on micellization becomes less important than the loss of freedom when
monomers join each other to form micelles [71]. The positive ∆Sm° values indicate that
the micellization process is associated with the destruction of the iceberg around the

Results and Discussion
81
hydrophobic alkyl chain. On the other hand, lower values of ∆Sm° for OTAB compared
to those of SDS are probably a result of the organization of a greater number of OTAB
molecules from randomly oriented monomers to well organized micelle structure.
3.5 THERMODYNAMICS OF SURFACE ADSORPTION
Before the conductance and surface tension measurement, TK were measured to ensure
the absolute dissolution for the surfactants in water and in the presence of salts at the
experimental temperature. Based on the surface and aggregation properties, the
thermodynamics of adsorption during the aggregates formation in the aqueous solution of
surfactant was studied. Tables 3.3, 3.4, 3.5 and 3.6 also show the thermodynamic of
adsorption of OTAB and SDS at the air-water interface. The free energy of
adsorption (∆Gad°), enthalpy of adsorption (∆Had°) and entropy of adsorption (∆Sad°)
values were calculated from the following expression [46, 53, 72]
(∆𝐺ad°) = (∆𝐺m°)−( 𝜋cmc / 𝛤max) (3.6)
where, 𝜋cmc and𝛤max are the equilibrium surface pressure and the surface concentration of
the adsorbed molecules, respectively, at and above the CMC. The ∆𝑆ad° and ∆𝐻ad° were
calculated from the relationships corresponding to Equation 3.4 and 3.5 like that-
∆Sad° = − 𝜕(∆𝐺𝑎𝑑
° )
𝜕𝑇 p (3.7)
∆Had° = 𝑇∆Sad° + ∆Gad° (3.8)
The free energy of adsorption is the energy required to transfer 1 mol of surfactant in
solution to the surface at unit surface pressure. The adsorption of the surfactant molecule
at the solution–air interface causes a decrease in free energy, indicating that the head of
the adsorbed surfactant molecule is orientated towards the interface, so that the chains
move away from the aqueous phase [73].
The ∆𝐺ad° values for SDS and OTAB are negative which indicates that the adsorption of
monomeric surfactant from bulk of the solution to the surface is a spontaneous process.
For SDS with added NaCl, the values are found to become more negative, suggesting that
Results and Discussion
82
adsorption becomes more spontaneous with increasing temperature. This result is in line
with the increases in the hydrophobicity of the molecules caused by the dehydration of
the headgroup with increasing temperature [63]. On the other hand ∆𝐺ad° values for
OTAB solution and in the presence of NaCl become a bit less negative with increasing
temperature suggesting molecular motion of monomer at high temperature dominates
over dehydration. At a given temperature, the ∆𝐺ad° values of OTAB are found to be
more negative than the corresponding ∆𝐺ad° values of SDS (Tables 3.3, 3.4, 3.5 and 3.6).
This may due to longer hydrocarbon tail present in OTAB than that of SDS. Moreover, at
a definite temperature the ∆𝐺ad° values are found to be more negative than the
corresponding ∆Gm° values, suggesting that adsorption of monomeric surfactant
molecules at the air-water interface is more spontaneous than micelle formation in the
bulk.
The ∆𝐻ad° values for SDS are found to be positive while for OTAB the values are
negative. This result implies stronger van der Waals interaction between alkyl chains
during micellization due to the presence of longer hydrophobic chain in OTAB.
The ∆𝐻ad° values become more positive for pure SDS and less positive in the presence of
NaCl and for OTAB become less negative with increasing temperature. Moreover at
lower temperature surfactant remains hydrated and require more energy to adsorb at the
air-water interface while at high temperature less energy is required to adsorb at the
interface [63, 74, 75]. This is why over the studied temperature range the ∆𝐻ad° values
become positive for SDS and negative for OTAB. The more negative value of ∆𝐻ad° than
∆𝐻m° for OTAB suggests easier adsorption than micellization of the surfactant monomer.
The ∆𝐻ad° values are positive and ∆𝐻m° is negative for SDS. This indicates that fewer
bonds between surfactant molecules and water molecules are broken in the process of
adsorption at the air/aqueous solution interface than in micellization [76].
The ∆Sad° values for SDS are positive while for OTAB the values are negative. This may
due to longer hydrocarbon chain present in OTAB than that of SDS. The positive
∆Sad° value suggests that the adsorption at the air/liquid interface is favored by entropy
effect [77]. The ∆Sad° values are higher than ∆Sm° for SDS. This may reflect greater
freedom of motion of the hydrocarbon chains at the planar air/aqueous solution interface

Results and Discussion
83
compared to that in the relatively cramped interior beneath the convex surface of the
micelle [76]. The lower ∆Sad° values than ∆Sm° for both SDS and OTAB indicate
domination of the relative molecular motion in the bulk than surface. The ∆Sad° values
are found to increase except SDS in the presence of NaCl with increasing temperature.
The ∆Sad° value is governed by the following competitive factors: A positive ∆Sad° values
can arise from the destruction of the ordered ice-berg structure around the hydrophobic
alkyl chain and the subsequent dangling of the alkyl chains of the adsorbed surfactant
molecules at the air-water interface. On the contrary, a negative ∆Sad° value can arise
from the spontaneous adsorption of the surfactant molecules in the form of organized
monolayer and the concomitant loss of one degree of rational freedom of the adsorbed
molecules at the air-water interface.
Figures 3.15 and 3.16 show the linear relationships between enthalpy changes
(∆Hm°, ∆Had°) and the entropy changes (∆Sm°, ∆Sad°) of SDS and OTAB, respectively.
This linear relationship is called the enthalpy–entropy compensation phenomenon [78,
79]. The micellization/adsorption of SDS and OTAB in the presence of NaCl also exhibit
such a compensation phenomenon. Lumry and Rajender [80, 81], reported that the
micellization/adsorption involves a two-part process: (1) the „desolvation‟ part, i.e., the
dehydration of the hydrocarbon tail of surfactant molecules, and (2) the „chemical‟ part,
i.e., aggregation of the hydrocarbon tails of surfactant molecules in the formation of
micelle. The study of enthalpy–entropy compensation phenomena can provide a measure
of the desolvation part of the micellization/adsorption process through the temperature of
compensation Tc, having the dimension of the Kelvin temperature, which is the slope of
the plot [82]. This parameter is a characteristic of solute–solute and solute–solvent
interactions, as suggested by Chen et al [83].
In general the compensation between the enthalpy and entropy changes can be described
as, ∆H°m/ad = ∆H*m/ad + Tc∆S°m/ad, where ∆H*
m/ad is the intercept on the enthalpy axis that
represent the solute–solute interactions and can be considered as an index of the chemical
part of the process of micellization/adsorption, and it stands for the enthalpy effect under
the condition ∆S°m/ad = 0. ∆S°m/ad stands for the entropy effect under the condition
∆H*m/ad = 0.
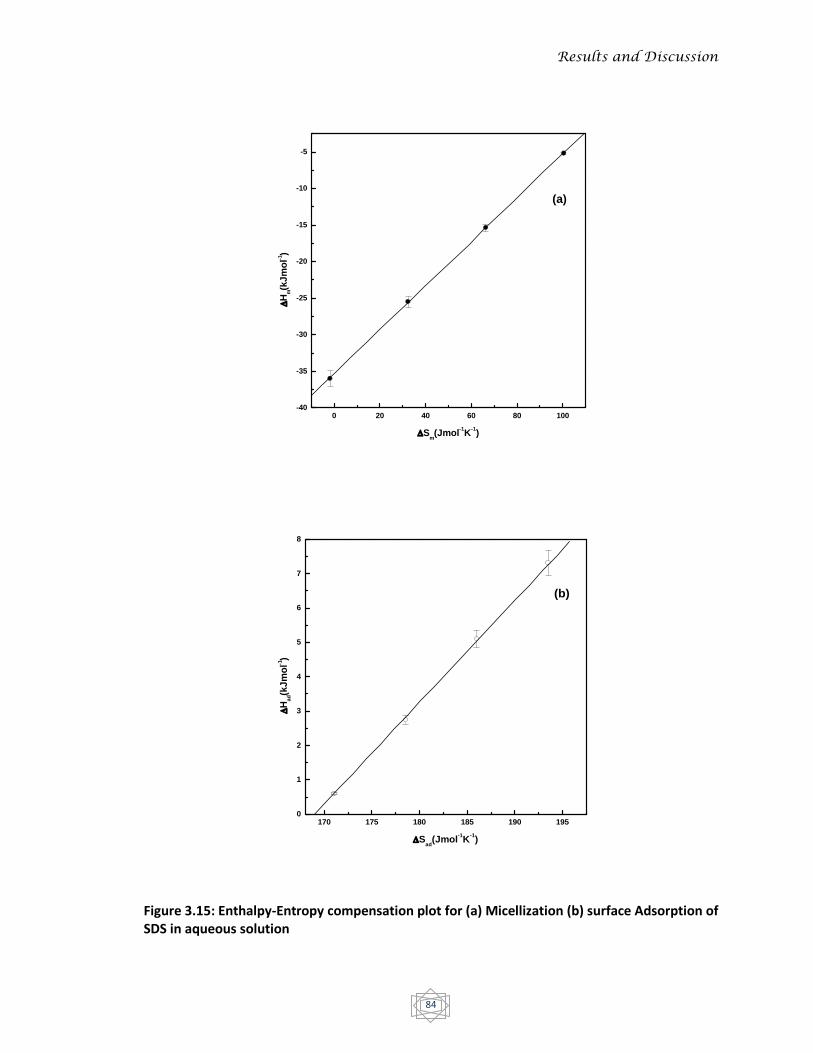
Results and Discussion
84
Figure 3.15: Enthalpy-Entropy compensation plot for (a) Micellization (b) surface Adsorption of SDS in aqueous solution
0 20 40 60 80 100-40
-35
-30
-25
-20
-15
-10
-5
(a)
H
m(k
Jm
ol-1
)
Sm(Jmol
-1K
-1)
170 175 180 185 190 1950
1
2
3
4
5
6
7
8
(b)
H
ad(k
Jm
ol-1
)
Sad
(Jmol-1K
-1)

Results and Discussion
85
Figure 3.16: Enthalpy-Entropy compensation plot for (a) Micellization (b) surface Adsorption of OTAB in aqueous solution
-60 -58 -56 -54 -52 -50 -48 -46 -44
-70
-69
-68
-67
-66
-65 (a)
H
m(k
Jm
ol-1
)
Sm(Jmol
-1K
-1)
-210 -180 -150 -120 -90 -60 -30-140
-130
-120
-110
-100
-90
-80(b)
H
ad(k
Jm
ol-1
)
Sad
(Jmol-1K
-1)
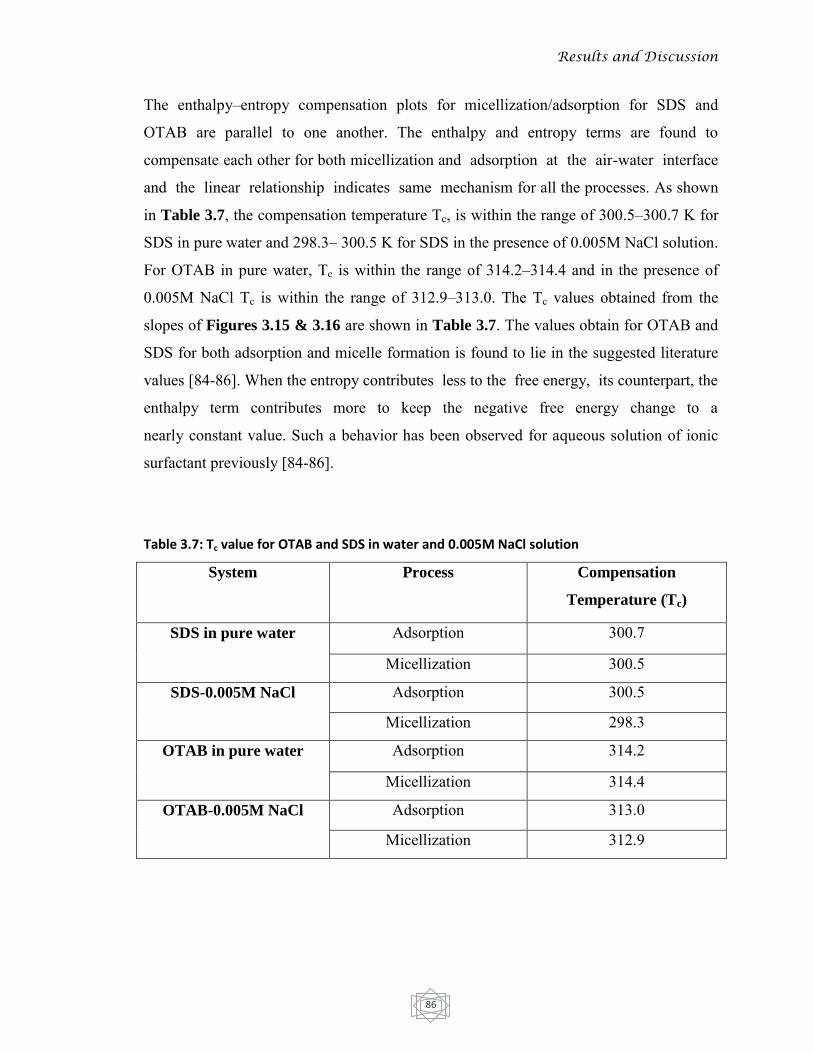
Results and Discussion
86
The enthalpy–entropy compensation plots for micellization/adsorption for SDS and
OTAB are parallel to one another. The enthalpy and entropy terms are found to
compensate each other for both micellization and adsorption at the air-water interface
and the linear relationship indicates same mechanism for all the processes. As shown
in Table 3.7, the compensation temperature Tc, is within the range of 300.5–300.7 K for
SDS in pure water and 298.3– 300.5 K for SDS in the presence of 0.005M NaCl solution.
For OTAB in pure water, Tc is within the range of 314.2–314.4 and in the presence of
0.005M NaCl Tc is within the range of 312.9–313.0. The Tc values obtained from the
slopes of Figures 3.15 & 3.16 are shown in Table 3.7. The values obtain for OTAB and
SDS for both adsorption and micelle formation is found to lie in the suggested literature
values [84-86]. When the entropy contributes less to the free energy, its counterpart, the
enthalpy term contributes more to keep the negative free energy change to a
nearly constant value. Such a behavior has been observed for aqueous solution of ionic
surfactant previously [84-86].
Table 3.7: Tc value for OTAB and SDS in water and 0.005M NaCl solution
System Process Compensation
Temperature (Tc)
SDS in pure water Adsorption 300.7
Micellization 300.5
SDS-0.005M NaCl Adsorption 300.5
Micellization 298.3
OTAB in pure water Adsorption 314.2
Micellization 314.4
OTAB-0.005M NaCl Adsorption 313.0
Micellization 312.9

Results and Discussion
87
3.6 SOLUBILIZATION STUDY OF SUDAN RED B (SRB)
It is well known that surfactants self-aggregate spontaneously to form micelles in
aqueous solution and this property is the basis of their use in many industrial processes.
Micelle-enhanced solubilization of nonpolar compounds is one of the more significant
applications of surfactants. Micelles of surfactants, containing an inner hydrophobic core
and an extended interfacial region called mantle, can incorporate other molecular species
into their structure, which is known as micellar solubilization [87, 88]. Below the
surfactant‟s critical micelle concentration (CMC), surfactants exist as monomers and
have only minimal effects on the aqueous solubility of organics. Micellar solubilization
occurs at the CMC and increases almost linearly with the surfactant concentration
[89]. When the surfactant concentration exceeds the CMC, the aqueous solubility of
organics is enhanced by the incorporation of hydrophobic molecules into surfactant
micelles [90, 91].
The solubilizations of SRB in both pure water and in the presence of added electrolytes
were studied. Figures 3.17 and 3.18 show the absorption spectra of solubilization of SRB
in pure OTAB solution and in the presence of Na2SO4 solution respectively. Several
surfactant concentrations ranging from 0.05 to 2 mM for pure OTAB solution and 0.01 to
0.8 mM for OTAB solution in 0.005 ionic strength Na2SO4 solution (some of which are
below the CMC and some are above the CMC) were used to carry out the solubilization
study. Figures 3.19 and 3.20 show the absorption spectra of solubilization of SRB in
pure SDS solution and in the presence of NaCl solution, respectively. In this case
surfactant concentrations ranging from 4 to 30 mM for pure SDS solution and 3 to 20
mM for SDS solution in 0.005M NaCl solution (some of which are below the CMC and
some are above the CMC) were used. Fixed amount but excess to that of the
solubilization equilibrium of the SRB dye with OTAB and SDS micelle was used for
solubilization study. It is important to note here that no significant absorbance was found
below the CMC. On the other hand above the CMC value the absorbance increases with
increasing the surfactant concentration (Figures 3.17- 3.20) which is in line with the
previous observation [92]. This means below the CMC there is no incorporation of
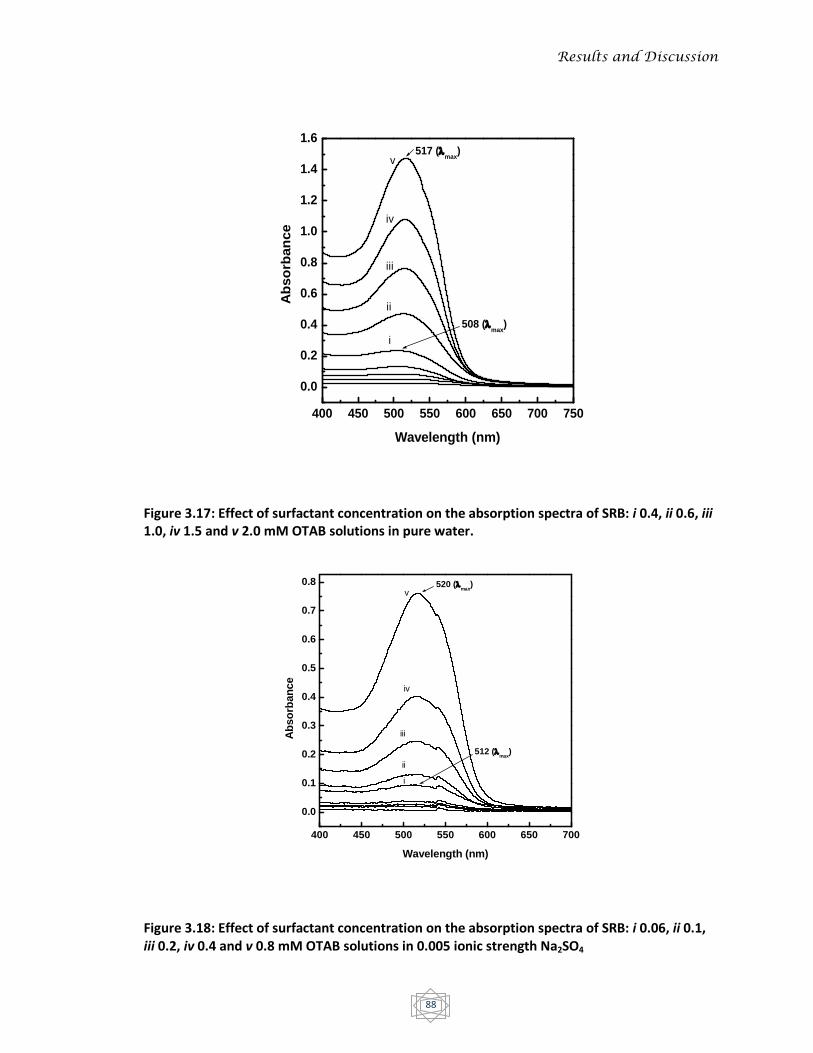
Results and Discussion
88
Figure 3.17: Effect of surfactant concentration on the absorption spectra of SRB: i 0.4, ii 0.6, iii 1.0, iv 1.5 and v 2.0 mM OTAB solutions in pure water.
Figure 3.18: Effect of surfactant concentration on the absorption spectra of SRB: i 0.06, ii 0.1, iii 0.2, iv 0.4 and v 0.8 mM OTAB solutions in 0.005 ionic strength Na2SO4
400 450 500 550 600 650 700 750
0.0
0.2
0.4
0.6
0.8
1.0
1.2
1.4
1.6
v
iv
iii
ii
i
508 (max
)
517 (max
)
Ab
so
rban
ce
Wavelength (nm)
400 450 500 550 600 650 700
0.0
0.1
0.2
0.3
0.4
0.5
0.6
0.7
0.8v
iv
iii
ii
i
512 (max
)
520 (max
)
Ab
so
rban
ce
Wavelength (nm)

Results and Discussion
89
Figure 3.19: Effect of surfactant concentration on the absorption spectra of SRB: i 8, ii 9, iii 10, iv 15, v 20 and vi 30 mM SDS solutions in pure water.
Figure 3.20: Effect of surfactant concentration on the absorption spectra of SRB: i 6, ii 7, iii 8, iv 9, v 10 and vi 20 mM SDS solutions in 0.005M NaCl
400 500 600 700 800
0.0
0.2
0.4
0.6
0.8
1.0
1.2
1.4
1.6
vi
v
iv
iii
iii
520 (max
)
524 (max
)
Ab
so
rban
ce
Wavelength (nm)
400 500 600 700
0.0
0.1
0.2
0.3
0.4
0.5
0.6
0.7
vi
v
iv
iii
ii
i
517 (max
)
524 (max
)
Ab
so
rban
ce
Wavelength (nm)

Results and Discussion
90
Figure 3.21: Solubilization of SRB in OTAB solution in (a) pure water and (b) 0.005 ionic strength aqueous Na2SO4 solution. The break point in the curve shows the CMC below which no significant absorbance was observed. This indicates the SRB solubilized only when OTAB forms micelles
-0.2 0.0 0.2 0.4 0.5 1.0 1.5 2.0
0.00
0.01
0.02
0.03
0.04 (a)
Co
nc. o
f S
ud
an
Red
B (mM
)
OTAB Conc. (mM)
-0.02 0.00 0.02 0.040.05 0.10 0.15 0.20
0.000
0.001
0.002
0.003
0.004
0.005(b)
Co
nc. o
f S
ud
an
Red
B (mM
)
OTAB Conc. (mM)

Results and Discussion
91
Figure 3.22: Solubilization of SRB in SDS solution in (a) pure water and (b) 0.005M NaCl solution. The break point in the curve shows the CMC below which no significant absorbance was observed. This indicates the SRB solubilized only when SDS forms micelles
4 5 6 7 8 9 100.000
0.001
0.002
0.003
0.004
0.005
(a)
Co
nc. o
f S
ud
an
Red
B (mM
)
SDS Conc. (mM)
2 3 4 5 6 7 8 9 10 110.000
0.001
0.002
0.003
0.004
0.005
0.006
0.007
(b)
Co
nc. o
f S
ud
an
Red
B (mM
)
SDS Conc. (mM)
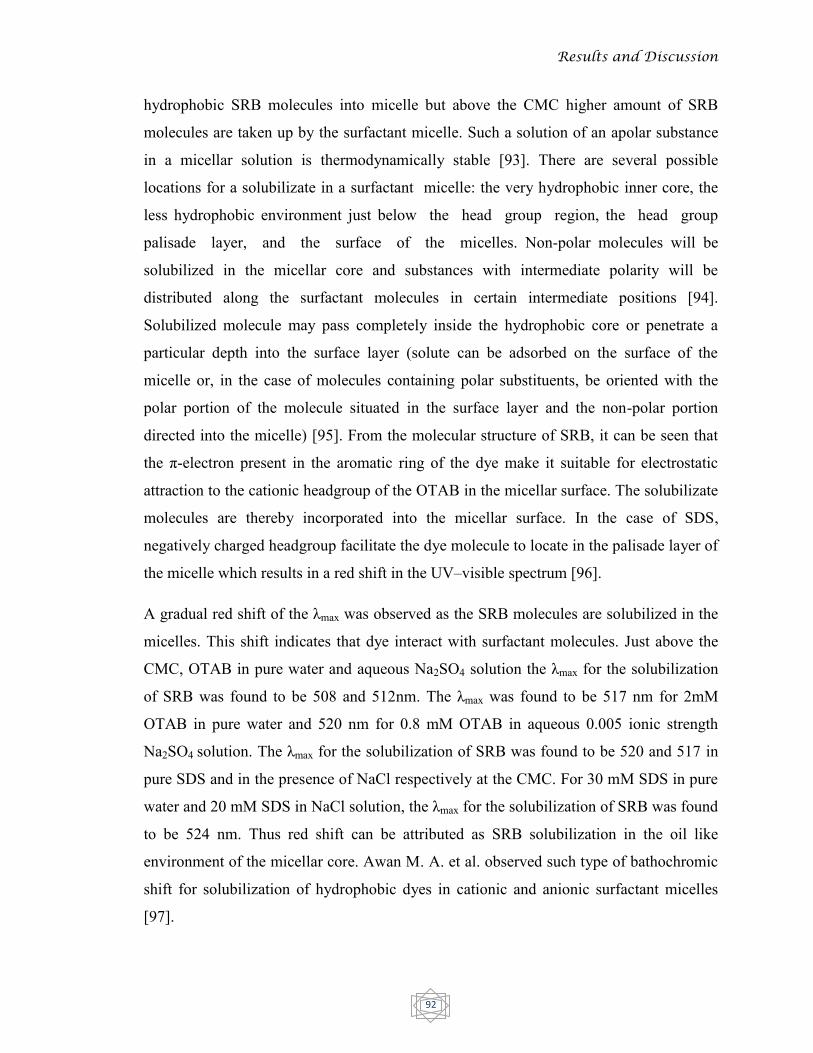
Results and Discussion
92
hydrophobic SRB molecules into micelle but above the CMC higher amount of SRB
molecules are taken up by the surfactant micelle. Such a solution of an apolar substance
in a micellar solution is thermodynamically stable [93]. There are several possible
locations for a solubilizate in a surfactant micelle: the very hydrophobic inner core, the
less hydrophobic environment just below the head group region, the head group
palisade layer, and the surface of the micelles. Non-polar molecules will be
solubilized in the micellar core and substances with intermediate polarity will be
distributed along the surfactant molecules in certain intermediate positions [94].
Solubilized molecule may pass completely inside the hydrophobic core or penetrate a
particular depth into the surface layer (solute can be adsorbed on the surface of the
micelle or, in the case of molecules containing polar substituents, be oriented with the
polar portion of the molecule situated in the surface layer and the non-polar portion
directed into the micelle) [95]. From the molecular structure of SRB, it can be seen that
the π-electron present in the aromatic ring of the dye make it suitable for electrostatic
attraction to the cationic headgroup of the OTAB in the micellar surface. The solubilizate
molecules are thereby incorporated into the micellar surface. In the case of SDS,
negatively charged headgroup facilitate the dye molecule to locate in the palisade layer of
the micelle which results in a red shift in the UV–visible spectrum [96].
A gradual red shift of the λmax was observed as the SRB molecules are solubilized in the
micelles. This shift indicates that dye interact with surfactant molecules. Just above the
CMC, OTAB in pure water and aqueous Na2SO4 solution the λmax for the solubilization
of SRB was found to be 508 and 512nm. The λmax was found to be 517 nm for 2mM
OTAB in pure water and 520 nm for 0.8 mM OTAB in aqueous 0.005 ionic strength
Na2SO4 solution. The λmax for the solubilization of SRB was found to be 520 and 517 in
pure SDS and in the presence of NaCl respectively at the CMC. For 30 mM SDS in pure
water and 20 mM SDS in NaCl solution, the λmax for the solubilization of SRB was found
to be 524 nm. Thus red shift can be attributed as SRB solubilization in the oil like
environment of the micellar core. Awan M. A. et al. observed such type of bathochromic
shift for solubilization of hydrophobic dyes in cationic and anionic surfactant micelles
[97].

Results and Discussion
93
To quantify the effectiveness of a surfactant in solubilizing a given solubilizate, the molar
solubilization ratio, MSR, is defined as the number of moles of organic compound
solubilized per mole of surfactant added to the solution [98]. When solute concentration
is plotted against surfactant concentration above the CMC, MSR can be determined from
the slope of the linearly fitted line. Figure 3.21 shows the effect of OTAB concentration
on SRB solubilization in pure water and in aqueous Na2SO4 solution, respectively and the
Figure 3.22 shows the effect of SDS concentration on SRB solubilization in pure water
and in aqueous NaCl solution respectively. The molar solubilization ratio of OTAB in
pure water and in 0.005 ionic strength of Na2SO4 solution are found to be 0.0194 and
0.0259, respectively (Table 3.8). On the other hand, the molar solubilization values of
SDS in pure water and in 0.005M NaCl solution are found to be 0.00113 and 0.00121,
respectively (Table 3.9). This indicates that the solubilizing power of OTAB and SDS
increases in aqueous salt solution. The solubilizing power of OTAB and SDS in the
presence of added salts is found to be 1.33 and 1.07 fold than that of respective pure
surfactant respectively. Counter-ion present in aqueous solution reduced electrostatic
repulsion between the charged head groups at the micelle surface and thus imparts an
increase in the micellar aggregation number resulting in an increase in the solubilization
capacity [99, 100]. This occurs due to the decrease in the CMC of the surfactant solution
in the presence of counter ion.
Table 3.8: Molar Solubilization Ratio (MSR) values of SRB in SDS
Surfactant NaCl Concentration (M)
Regression coefficient (R2)
MSR
SDS 0.00 0.968 0.00113
0.005 0.998 0.00121
Table 3.9: Molar Solubilization Ratio (MSR) values of SRB in OTAB
Surfactant Na2SO4 Concentration (M)
Regression coefficient (R2)
MSR
OTAB 0.00 0.996 0.0194
0.005 0.994 0.0259
Results and Discussion
94
REFERENCES
[1] Malik, N. A.; Ali, A.; Journal of Molecular Liquids. 213, 213, 2016
[2] Islam, M. N.; Sarker, K. C.; Sharker, K. K.; J Surfact Deterg. 18, 9, 2015
[3] Islam, M. N.; Sharker, K. K.; Sarker, K. C.; J Surfact Deterg. 18, 651, 2015
[4] Jalali-Heravi, M.; Konouz, E.; Internet Electron. J. Mol. Des. 1,410, 2002
[5] Roy, J. C.; Islam, M. N.; Aktaruzzaman, G.; J Surfact Deterg.17, 231, 2014
[6] Mehta, S. K.; Bhasin, K. K.; Chauhan, R.; Dham, S.; Colloids Surf. A. 255 153,
2005
[7] Chen, H.; Ye, Z.; Han, L.; Luo, P.; Zhang, L.; Surf Sci. 601, 10, 2147, 2007
[8] Bakshi, M. S.; Sood, R.; Colloids Surf A. 233, 203, 2004
[9] Islam, M. M.; Rahman, M. R.; Islam, M. N.; International Journal of Scientific &
Engineering Research. 6, 1, 1508, 2015
[10] Varade, D.; Joshi, T.; Aswal, V. K.; Goyal, P. S.; Hassan, P. A.; Bahadur, P.;
Colloids Surf. A. 259, 95, 2005
[11] Tsujii, K.; Okahashi, K.; Takeuchi, T.; J. Phys. Chem. 86,1437, 1982
[12] Tsujii, K.; Saito, N.; Takeuchi, T.; J. Phys. Chem. 84, 2287, 1980
[13] Shinoda, K.; Hato, M.; Hayashi, T.; J. Phys. Chem. 76,909, 1972
[14] Yang, P. W.; Mantsch, H. H.; J. Colloid and Interf. Sci.113, 218, 1986
[15] Tsujii, K.; Mino, J.; J. Phys. Chem. 82, 1610, 1978
[16] Islam, M. N.; Sarker, K. C.; Aktaruzzaman, G.; J Surfact Deterg. 17, 525, 2014
[17] Glasstone, S.; Thermodynamics for chemists, 3rd edn, Litton Educational
Publishing, New York, 1947
[18] Vlachy, N.; Cwiklik, B. J.; Vácha, R.; Touraud, D.; Jungwirth, P.; Kunz, W.; Adv
Colloid Interface Sci. 146, 42, 2009
[19] Dole, M.; Faraday Discuss 60, 904, 1939
[20] Margolis, E.; J. Chemical principles in calculations of ionic equilibria.
Macmilian, New York, 1966
[21] Nakayama, H.; Shinoda, K.; Bull Chem. Soc. Jpn. 40, 1797, 1967
[22] Carolina, V. G.; Bales, B. L.; J. Phys. Chem. B.107, 5398, 2003
Results and Discussion
95
[23] Hofmeister, F.; Naunyn-Schmiedebergs Arch. Exp. Pathol. Pharmakol. (Leipzig)
24, 247, 1888
[24] Zhang, Y.; Cremer, P. S.; Annu. Rev. Phys. Chem. 61, 63, 2010
[25] Pegram, L. M.; Record, M. T. J.; J. Phys. Chem. 111, 5411, 2007
[26] Lund, M.; Vacha, R.; Jungwirth, P.; Langmuir. 24, 3387, 2008
[27] Cari, S. D.; Anthony S. W.; Simon L. C.; J. Phys. Chem. 114, 12216, 2010
[28] Jarvis, N. L.; Schelman, M. A.; J. Phys. Chem. 72, 74, 1968
[29] Nishikido, N.; Matauura, R.; Bull Chem. Soc. Jpn. 50, 1690, 1977
[30] Collins, K. D.; BioPhys. Chem. 167, 43, 2012
[31] Collins, K. D.; Neilson, G. W.; Enderby, J. E.; Biophys. Chem.128, 95, 2007
[32] Lee, J. D.; Inorganic chemistry, 4th edn. ELBS, Singapore, 1991
[33] Abezgauz, L.; Kuperkar, K.; Hassan, P. A.; Ramon, O.; Bahadur, P.; Danino, D.;
J. Colloid and Interf. Sci. 342, 83, 2010
[34] Manciu, M.; Ruckenstein, E.; Adv Colloid Interface Sci. 105, 63, 2003
[35] Cheng, J.; Vecitis, C. D.; Hoffmann, M. R.; Colussi, A. J.; J. Phys. Chem.110,
25598, 2006
[36] Zhang, Y.; Cremer, P. S.; Proc Nat Acad Sci. 106, 15249, 2009
[37] Chen, X.; Sarah, C.; Flores, S. C.; Lim, S. M.; Zhang, Y.; Yang, T.; Kherb, J.;
Cremer, P. S.; Langmuir. 26, 16447, 2010
[38] Zhang, L.; Somasundaran, P.; Maltesh, C.; Langmuir.12, 2371, 1996
[39] Hodgdon, T.; Kaler, E.; Curr. Opin. Colloid. In. 12, 121, 2007
[40] Kumar, V.; Raja, C.; Jayakumar, C.; Int. J. Pharm. Pharm. Sci. 6, 1, 2014
[41] Neumann, M.; Schmitt, C.; Prieto, K.; J. Colloid and Interf. Sci.315, 810, 2007
[42] Kim, J.; Kim, S.; Papp, M.; Park, K.; Pinal, R.; J. Pharm. Sci. 99, 3953, 2010
[43] Bauduin, P.; Renoncourt, A.; Kopf, A.; Touraud, D.; Kunz, W.; Langmuir. 21,
6769, 2005
[44] Ropers, M. H.; Czichocki, G.; Brezesinski, G.; J. Phys. Chem. B. 107, 5281, 2003
[45] Carolina, V. G.; Bales, B. L.; J. Phys. Chem. B. 107, 5398, 2003
[46] Moulik, S. P.; Haque, M. E.; Jana, P. K.; Das, A. R.; J. Phys. Chem.100, 701,
1996
[47] Han, L.; Ye, Z.; Chen, H.; Luo, P.; J Surfact Deterg 12, 185, 2009

Results and Discussion
96
[48] Chen, L.; Shi-Yow, L.; Chiung-Chang, H.; En-Ming, C.; Colloids Surf. A.135,
175, 1998
[49] Hunter, R.J.; Foundations of Colloid Science, vol. 1. Oxford University Press,
New York, 1989
[50] Hiemenz, P. C.; Rajagopalan, R.; Principles of Colloid and Surface Chemistry.
Marcel Dekker Inc., New York, 1989
[51] Ruiz, C. C.; Dias–Lopez, L.; Aguiar, J.; J. Colloid and Interf. Sci. 305, 293, 2007
[52] Das, C.; Das, B.; J. Chem. Eng. Data. 54, 559–565, 2009
[53] Rosen, M. J.; Surfactants and Interfacial Phenomena, 3rd. ed., John Wiley &
Sons, Hoboken, 2004
[54] Michele, A. D.; Brinchi, L.; Profio, P.D.; Germani, R.; Sawelli, G.; Onori, G.; J.
Colloid and Interf. Sci.358, 160, 2011
[55] Mukerjee, P.; Mysels, K.; Kapauan, J.; J. Phys. Chem.71, 4166, 1967
[56] Bojan, S.; Marija, B. R.; J. Colloid and Interf. Sci. 338, 216, 2009
[57] Onoratoa, R. M.; Ottena, D. E.; Saykallya, R. J.; Proc Nat Aca Sci.106, 15176,
2009
[58] Srinivasan, V.; Blankschtein, D.; Langmuir.19, 9946, 2003
[59] Mason, P. E.; Neilson, G. W.; Dempsey, C. E.; Barnes, A. C.; Cruickshank, J. M.;
Proc Nat Acad Sci. 100, 4557, 2003
[60] Rub, M. A.; Asiri, M.A.; Khan, A.; Khan, A. A. P.; Naved Azum, N.; Khan, S.
B.; Kabir-ud-Din; J Solution Chem. 42, 390, 2013
[61] Gad, E. A. M.; Omar, A. M. A.; Zaki M.; J Surfact and Deterg. 2, 1, 39, 1999
[62] Mukherjee, I.; Moulik, S. P.; Animesh, K.; J. Colloid and Interf. Sci. 394, 329,
2013
[63] Islam, M. N.; Kato, T.; Langmuir. 19, 7201, 2003
[64] Crook, E. H.; Trebbi, G. F.; Fordice, D. B.; J Phys. Chem. 68, 3592, 1964
[65] Chotipong, A.; Scamehorn, J. F.; Rirksomboon, T.; Chavadej, S.; Supaphol,
P.; Colloids and Surfaces A: Physicochem. Eng. 297, 163, 2007
[66] Ritacco, H.; Langevin, D.; Diamant, H.; Andelman, D.; Langmuir. 27, 1009, 2011
[67] Malik, N. A.; Ali, A.; Journal of Molecular Liquids. 213, 213, 2016
[68] Perger, T. M.; Rogac, M. B.; J. Colloid and Interf. Sci.313, 69, 288, 2007
Results and Discussion
97
[69] Łuczak, J.; Jungnickel, C.; Joskowska, M.; Thöming, J.; Hupka, J.; J. Colloid and
Interf. Sci.336,111, 2009
[70] Kiral, Z.; Dekany, I.; J. Colloid and Interf. Sci. 242, 214, 2001
[71] Fontán, J. L. L.; Pérez, A. G.; Costa, J.; Ruso, J. M.; Prieto, G.; Schulz, P. C.;
Sarmiento, F.; J. Colloid and Interf. Sci. 297, 10, 2006
[72] Dahanayake, M.; Cohen, A. W.; Rosen, M. J.; J Phys Chem. 90, 2413, 1982
[73] Castro F. H. B.; J. Colloid and Interf. Sci.173, 8, 1995
[74] Lu, T.; Lan, Y.; Liu, C.; Huang, J.; Wang, Y.; J. Colloid and Interf. Sci.377, 222,
2012
[75] Łuczak, J.; Jungnickel, C.; Joskowska, M.; Thöming,J.; Hupka, J.; J. Colloid and
Interf. Sci.336, 111, 2009
[76] Ziyafaddin, H. A.; Ravan, A. R.; Shafiga, M. N.; Gulnara, A. A.; J Surfact
Deterg.13, 459, 2010
[77] Patel, R.; Khan, A. B.; Dohare, N.; Ali, M. M.; Rajor, H. K.; J Surfact Deterg.18,
719, 2015
[78] Chen, L. J.; Lin, S. Y.; Huang, C. C.; J. Phys Chem B. 22, 4350, 1998
[79] Krug, R. R.; Hunter, W. G.; Griegerla, R. A.; J. Phys Chem A. 21, 2335, 1976
[80] Yu, L.; Lu, T.; Luan, Y. X.; Colloids Surf A. 257, 375, 2005
[81] Lumry, R.; Rajender, S.; Biopolymers. 9, 1125, 1970
[82] Lo´pez-Fonta´n, J. L.; Gonza´lez-Pe ´rez, A.; Costa, J.; Ruso, J. M.; Prieto, G.;
Schulz, P. C.; Sarmiento, F.; J. Colloid and Interf. Sci. 297, 10, 2006
[83] Chen, L. J.; Lin, S. Y.; Huang, C. C.; J. Phys Chem. 102, 4350, 1998
[84] Lindman, B.; Brun, B.; J. Colloid and Interf. Sci. 42, 388, 1973
[85] Sugihara, G.; Hisatomi, M.; J. Colloid and Interf. Sci. 219, 31, 1999
[86] Kabir-ud-Din; Koya, A. P.; Khan, Z. A.; J. Colloid and Interf. Sci. 342, 340, 2010
[87] Kim, J. H.;Domach, M. M.; Tilton, R. D.; Langmuir.16, 10037, 2000
[88] Farías, T.; Ménorval, L.C. de; Zajac, J.; Rivera, A.; Colloids and Surfaces A:
Physicochem. Eng. Aspects. 345, 51, 2009
[89] Holmberg, K.; Jonsson, B.; Kronberg, B.; Lindman, B.; Surfactant and Polymers
in Aqueous Solution, 2nd ed., Wiley, Chichester, 2003
Results and Discussion
98
[90] Mukerjee, P.; In Solution chemistry of surfactants; Mittal, K. L., Ed.; Plenum
Press: New York, 1979
[91] Kile, D. E.; Chiou, C. T.; EnViron. Sci. Technol. 23, 832, 1989
[92] Holmberg, K.; Jonsson, B.; Kronberg, B.; Lindman, B.; Surfactant and Polymers
in Aqueous Solution, 2nd ed., Wiley, Chichester, 2003
[93] Tehrani-Bagha, A. R.; Singh, R. G.; Holmberga, K.; Colloids and Surfaces A:
Physicochem. Eng. Aspects. 417, 133, 2013
[94] Carlota, O. R. Y.; Rangel, Y.; Adalberto, P. J.; Leoberto, C. T.; J. Pharm.
Pharmaceut. Sci. 8, 147.2005
[95] Hosseinzadeh, R.; Maleki, R.; Matin, A. A.; Nikkhahi, Y.; Elsevier. 69, 1183,
2008
[96] Fujio, K.; Mitsui, T.; Kurumizawa, H.; Tanaka, Y.; Uzu, Y.; Colloid Polym Sci..
282, 223, 2004
[97] Awan, M. A.; Shah, S. S.; Colloids Surf A. 122, 97, 1997
[98] Santanu, P.; Pak, K. Y.; Ind. Eng. Chem. Res. 45, 3552, 2006
[99] Harendra, S.; Vipulanandan, C.; Ind. Eng. Chem. Res. 50, 5831, 2011
[100] Schott, H.; J. Phys. Chem. 71, 3611, 1967

conclusions
Conclusions
99
CONCLUSIONS
The Krafft temperature (TK) and critical micelle concentration (CMC) of SDS and OTAB
were found to be functions of added counter-ions in the aqueous phase. The study
brought out that the TK can be increased or decreased depending on the nature of added
electrolytes and the CMC can be tuned to lower value with added electrolytes and
associated interactions. TK was also found to vary with the concentration of the added
salts. Some system increases while some decreases TK with concentration of the ions. In
the case of OTAB the TK decreases in the presence of C6H5SO3−, C7H5O2
−, C7H5O3−,
SO42−, NO3
−, Cl−, F− while Br−, SCN−, I− are found to increase TK with increase in
concentration. Li+ ion decreases while K+, Cs+, Na+ ions increase the TK of SDS with
increase in concentration. The hydrotropic C7H5O3−, C7H5O2
−, C6H5SO3−, less chaotropic
NO3− and Cl− as well as kosmotropic SO42− and F− increase the solubility of the OTAB
due to salting in effect with a consequent decrease in the TK. Li+ ion being kosmotrope
decrease the TK of the SDS. On the other hand the common ion effect of Br− in OTAB
solution and Na+ in SDS solution negatively affects the solubility of surfactant, resulting
in an increase in the TK. More chaotropic SCN− and I− form contact ion pair with the
octadecyltrimethylammonium ion and K+, and Cs+ form contact ion pair with the dodecyl
sulfate ion due to their matching water affinities, and thereby reduce the electrostatic
repulsion between the surfactant ions. This leads to a decrease in the solubility with a
consequent increase in the TK of the surfactant. The same explanation can be attributed
for the decreasing of CMC of surfactant solution in the presence of these ions. These ions
screen the surface charge of micelle and thus contribute for the closer packing of
surfactant molecules with a consequent decrease in CMC. It appears that C6H5SO3− and
Cs+ is the most effective in lowering the CMC with F− and Li+ being least effective in
lowering the CMC of OTAB and SDS respectively. The thermodynamic parameters of
the studied compounds were estimated. The ∆Gm° is negative over the studied
temperature range measured for all the system. This indicates a spontaneous process of
micelle formation of the ionic liquid in aqueous solution. ∆Hm° and ∆Sm° have an
opposite effect on ∆Gm°, so thus the value of ∆Gm° is dependent on relative changes of
enthalpy and entropy in the system. The negative ∆𝐺ad° values for SDS and OTAB
Conclusions
100
indicate the adsorption of monomeric surfactant from bulk of the solution to the surface is
spontaneous process. The more negative ∆𝐺ad° value than ∆Gm° suggesting that the
adsorption of surfactant at the air-water interface is more spontaneous than the
micellization in the bulk. The ∆𝐻ad° values for SDS are found to be positive while for
OTAB the values are negative. The positive ∆𝐻ad° value for SDS implies non spontaneity
while negative ∆𝐻ad° value for OTAB indicates spontaneity of the system. The ∆Sad°
values for SDS are positive while for OTAB the values are negative. The positive ∆Sad°
value suggests that the adsorption at the air/liquid interface is favored by entropy effect.
Higher surface excess concentration (Г) for SDS than OTAB indicates lower equilibrium
surface tension of the system. However except some anomaly added salts contribute to
lower the equilibrium surface tension of the system than that of respective pure state.
Solubilization study showed that the molar solubilization ratio (MSR) increases in the
presence of added salts. From this result, it is evident that the presence of salts helps to
increase the hydrophobic interaction of the surfactant by reducing the surface potential of
the micelles and thereby increases the oil-like environment of the micelle core. This helps
to solubilize more SRB molecules compared to that in the case in aqueous OTAB and
SDS solution. Since many of the industrial applications of surfactants are governed by the
TK and the formation of CMC, it can be emphasized that the depression of the Krafft
temperature and lowering of the CMC in the presence of C7H5O3−, C7H5O2
−, C6H5SO3−,
NO3−, F−, Cl−, SO4
2− and Li+ will pave the way for wider industrial applications of OTAB
and SDS, respectively.
Appendix
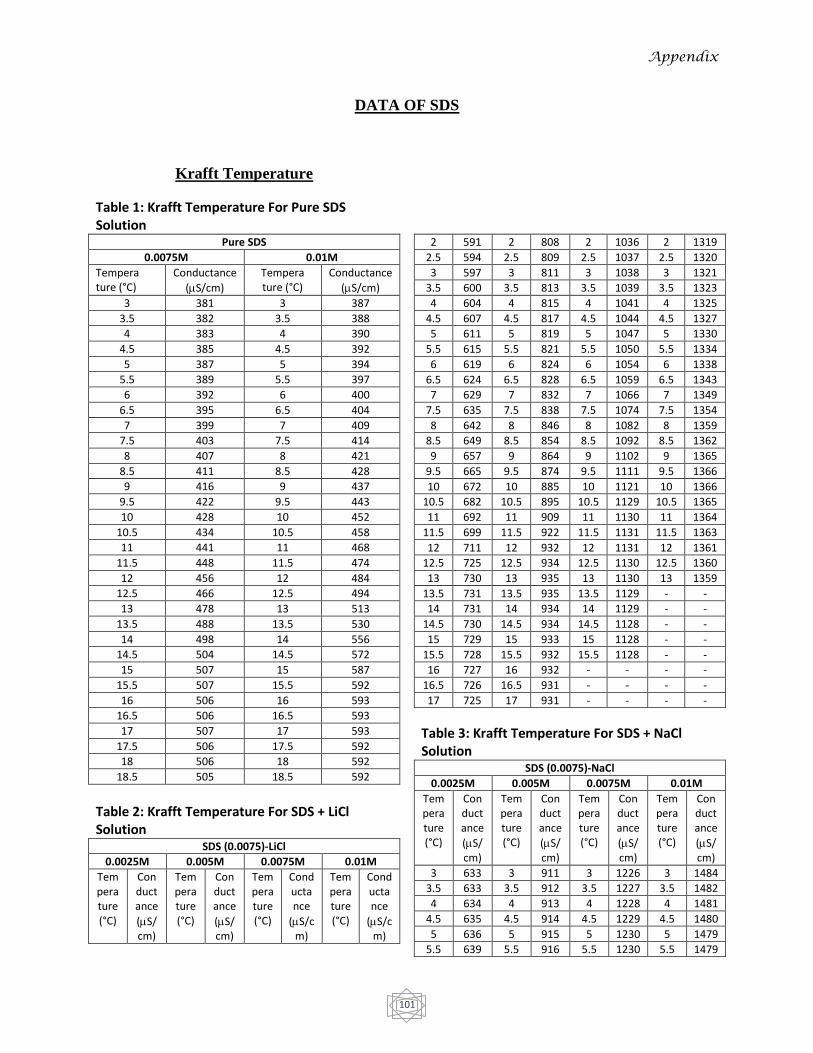
Appendix
101
DATA OF SDS
Krafft Temperature
Table 1: Krafft Temperature For Pure SDS Solution
Pure SDS
0.0075M 0.01M
Tempera ture (°C)
Conductance
(S/cm)
Tempera ture (°C)
Conductance
(S/cm)
3 381 3 387
3.5 382 3.5 388
4 383 4 390
4.5 385 4.5 392
5 387 5 394
5.5 389 5.5 397
6 392 6 400
6.5 395 6.5 404
7 399 7 409
7.5 403 7.5 414
8 407 8 421
8.5 411 8.5 428
9 416 9 437
9.5 422 9.5 443
10 428 10 452
10.5 434 10.5 458
11 441 11 468
11.5 448 11.5 474
12 456 12 484
12.5 466 12.5 494
13 478 13 513
13.5 488 13.5 530
14 498 14 556
14.5 504 14.5 572
15 507 15 587
15.5 507 15.5 592
16 506 16 593
16.5 506 16.5 593
17 507 17 593
17.5 506 17.5 592
18 506 18 592
18.5 505 18.5 592
Table 2: Krafft Temperature For SDS + LiCl Solution
SDS (0.0075)-LiCl
0.0025M 0.005M 0.0075M 0.01M
Temperature (°C)
Conductance
(S/cm)
Temperature (°C)
Conductance
(S/cm)
Temperature (°C)
Conductance
(S/cm)
Temperature (°C)
Conductance
(S/cm)
2 591 2 808 2 1036 2 1319
2.5 594 2.5 809 2.5 1037 2.5 1320
3 597 3 811 3 1038 3 1321
3.5 600 3.5 813 3.5 1039 3.5 1323
4 604 4 815 4 1041 4 1325
4.5 607 4.5 817 4.5 1044 4.5 1327
5 611 5 819 5 1047 5 1330
5.5 615 5.5 821 5.5 1050 5.5 1334
6 619 6 824 6 1054 6 1338
6.5 624 6.5 828 6.5 1059 6.5 1343
7 629 7 832 7 1066 7 1349
7.5 635 7.5 838 7.5 1074 7.5 1354
8 642 8 846 8 1082 8 1359
8.5 649 8.5 854 8.5 1092 8.5 1362
9 657 9 864 9 1102 9 1365
9.5 665 9.5 874 9.5 1111 9.5 1366
10 672 10 885 10 1121 10 1366
10.5 682 10.5 895 10.5 1129 10.5 1365
11 692 11 909 11 1130 11 1364
11.5 699 11.5 922 11.5 1131 11.5 1363
12 711 12 932 12 1131 12 1361
12.5 725 12.5 934 12.5 1130 12.5 1360
13 730 13 935 13 1130 13 1359
13.5 731 13.5 935 13.5 1129 - -
14 731 14 934 14 1129 - -
14.5 730 14.5 934 14.5 1128 - -
15 729 15 933 15 1128 - -
15.5 728 15.5 932 15.5 1128 - -
16 727 16 932 - - - -
16.5 726 16.5 931 - - - -
17 725 17 931 - - - -
Table 3: Krafft Temperature For SDS + NaCl Solution
SDS (0.0075)-NaCl
0.0025M 0.005M 0.0075M 0.01M
Temperature (°C)
Conductance
(S/cm)
Temperature (°C)
Conductance
(S/cm)
Temperature (°C)
Conductance
(S/cm)
Temperature (°C)
Conductance
(S/cm)
3 633 3 911 3 1226 3 1484
3.5 633 3.5 912 3.5 1227 3.5 1482
4 634 4 913 4 1228 4 1481
4.5 635 4.5 914 4.5 1229 4.5 1480
5 636 5 915 5 1230 5 1479
5.5 639 5.5 916 5.5 1230 5.5 1479
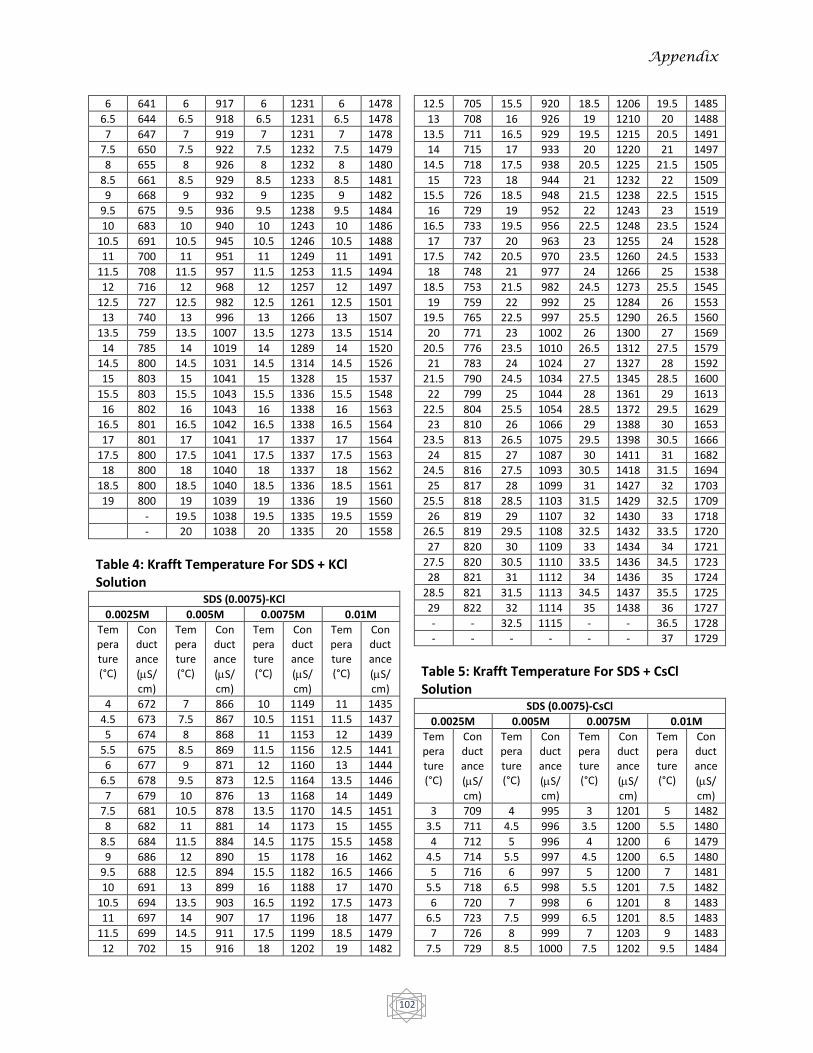
Appendix
102
6 641 6 917 6 1231 6 1478
6.5 644 6.5 918 6.5 1231 6.5 1478
7 647 7 919 7 1231 7 1478
7.5 650 7.5 922 7.5 1232 7.5 1479
8 655 8 926 8 1232 8 1480
8.5 661 8.5 929 8.5 1233 8.5 1481
9 668 9 932 9 1235 9 1482
9.5 675 9.5 936 9.5 1238 9.5 1484
10 683 10 940 10 1243 10 1486
10.5 691 10.5 945 10.5 1246 10.5 1488
11 700 11 951 11 1249 11 1491
11.5 708 11.5 957 11.5 1253 11.5 1494
12 716 12 968 12 1257 12 1497
12.5 727 12.5 982 12.5 1261 12.5 1501
13 740 13 996 13 1266 13 1507
13.5 759 13.5 1007 13.5 1273 13.5 1514
14 785 14 1019 14 1289 14 1520
14.5 800 14.5 1031 14.5 1314 14.5 1526
15 803 15 1041 15 1328 15 1537
15.5 803 15.5 1043 15.5 1336 15.5 1548
16 802 16 1043 16 1338 16 1563
16.5 801 16.5 1042 16.5 1338 16.5 1564
17 801 17 1041 17 1337 17 1564
17.5 800 17.5 1041 17.5 1337 17.5 1563
18 800 18 1040 18 1337 18 1562
18.5 800 18.5 1040 18.5 1336 18.5 1561
19 800 19 1039 19 1336 19 1560
- 19.5 1038 19.5 1335 19.5 1559
- 20 1038 20 1335 20 1558
Table 4: Krafft Temperature For SDS + KCl Solution
SDS (0.0075)-KCl
0.0025M 0.005M 0.0075M 0.01M
Temperature (°C)
Conductance
(S/cm)
Temperature (°C)
Conductance
(S/cm)
Temperature (°C)
Conductance
(S/cm)
Temperature (°C)
Conductance
(S/cm)
4 672 7 866 10 1149 11 1435
4.5 673 7.5 867 10.5 1151 11.5 1437
5 674 8 868 11 1153 12 1439
5.5 675 8.5 869 11.5 1156 12.5 1441
6 677 9 871 12 1160 13 1444
6.5 678 9.5 873 12.5 1164 13.5 1446
7 679 10 876 13 1168 14 1449
7.5 681 10.5 878 13.5 1170 14.5 1451
8 682 11 881 14 1173 15 1455
8.5 684 11.5 884 14.5 1175 15.5 1458
9 686 12 890 15 1178 16 1462
9.5 688 12.5 894 15.5 1182 16.5 1466
10 691 13 899 16 1188 17 1470
10.5 694 13.5 903 16.5 1192 17.5 1473
11 697 14 907 17 1196 18 1477
11.5 699 14.5 911 17.5 1199 18.5 1479
12 702 15 916 18 1202 19 1482
12.5 705 15.5 920 18.5 1206 19.5 1485
13 708 16 926 19 1210 20 1488
13.5 711 16.5 929 19.5 1215 20.5 1491
14 715 17 933 20 1220 21 1497
14.5 718 17.5 938 20.5 1225 21.5 1505
15 723 18 944 21 1232 22 1509
15.5 726 18.5 948 21.5 1238 22.5 1515
16 729 19 952 22 1243 23 1519
16.5 733 19.5 956 22.5 1248 23.5 1524
17 737 20 963 23 1255 24 1528
17.5 742 20.5 970 23.5 1260 24.5 1533
18 748 21 977 24 1266 25 1538
18.5 753 21.5 982 24.5 1273 25.5 1545
19 759 22 992 25 1284 26 1553
19.5 765 22.5 997 25.5 1290 26.5 1560
20 771 23 1002 26 1300 27 1569
20.5 776 23.5 1010 26.5 1312 27.5 1579
21 783 24 1024 27 1327 28 1592
21.5 790 24.5 1034 27.5 1345 28.5 1600
22 799 25 1044 28 1361 29 1613
22.5 804 25.5 1054 28.5 1372 29.5 1629
23 810 26 1066 29 1388 30 1653
23.5 813 26.5 1075 29.5 1398 30.5 1666
24 815 27 1087 30 1411 31 1682
24.5 816 27.5 1093 30.5 1418 31.5 1694
25 817 28 1099 31 1427 32 1703
25.5 818 28.5 1103 31.5 1429 32.5 1709
26 819 29 1107 32 1430 33 1718
26.5 819 29.5 1108 32.5 1432 33.5 1720
27 820 30 1109 33 1434 34 1721
27.5 820 30.5 1110 33.5 1436 34.5 1723
28 821 31 1112 34 1436 35 1724
28.5 821 31.5 1113 34.5 1437 35.5 1725
29 822 32 1114 35 1438 36 1727
- - 32.5 1115 - - 36.5 1728
- - - - - - 37 1729
Table 5: Krafft Temperature For SDS + CsCl Solution
SDS (0.0075)-CsCl
0.0025M 0.005M 0.0075M 0.01M
Temperature (°C)
Conductance
(S/cm)
Temperature (°C)
Conductance
(S/cm)
Temperature (°C)
Conductance
(S/cm)
Temperature (°C)
Conductance
(S/cm)
3 709 4 995 3 1201 5 1482
3.5 711 4.5 996 3.5 1200 5.5 1480
4 712 5 996 4 1200 6 1479
4.5 714 5.5 997 4.5 1200 6.5 1480
5 716 6 997 5 1200 7 1481
5.5 718 6.5 998 5.5 1201 7.5 1482
6 720 7 998 6 1201 8 1483
6.5 723 7.5 999 6.5 1201 8.5 1483
7 726 8 999 7 1203 9 1483
7.5 729 8.5 1000 7.5 1202 9.5 1484

Appendix
103
8 733 9 1000 8 1203 10 1484
8.5 738 9.5 1001 8.5 1204 10.5 1484
9 744 10 1003 9 1205 11 1484
9.5 752 10.5 1005 9.5 1206 11.5 1485
10 763 11 1007 10 1207 12 1486
10.5 770 11.5 1009 10.5 1208 12.5 1487
11 778 12 1012 11 1209 13 1488
11.5 783 12.5 1015 11.5 1211 13.5 1489
12 788 13 1018 12 1215 14 1492
12.5 792 13.5 1021 12.5 1220 14.5 1495
13 793 14 1026 13 1225 15 1499
13.5 793 14.5 1029 13.5 1230 15.5 1503
14 792 15 1036 14 1236 16 1509
14.5 792 15.5 1039 14.5 1240 16.5 1515
15 791 16 1043 15 1246 17 1521
15.5 791 16.5 1047 15.5 1252 17.5 1528
16 791 17 1052 16 1259 18 1538
16.5 790 17.5 1056 16.5 1270 18.5 1551
17 790 18 1064 17 1282 19 1563
- - 18.5 1070 17.5 1292 19.5 1573
- - 19 1078 18 1304 20 1585
- - 19.5 1082 18.5 1312 20.5 1595
- - 20 1087 19 1320 21 1606
- - 20.5 1089 19.5 1327 21.5 1618
- - 21 1091 20 1337 22 1631
- - 21.5 1091 20.5 1349 22.5 1641
- - 22 1092 21 1363 23 1654
- - 22.5 1092 21.5 1375 23.5 1665
- - 23 1092 22 1389 24 1677
- - 23.5 1091 22.5 1394 24.5 1685
- - 24 1091 23 1399 25 1693
- - 24.5 1091 23.5 1403 25.5 1697
- - 25 1091 24 1407 26 1697
- - - - 24.5 1407 26.5 1697
- - - - 25 1407 27 1697
- - - - 25.5 1407 27.5 1698
- - - - 26 1406 28 1698
- - - - 26.5 1406 28.5 1698
- - - - 27 1406 29 1698
Critical Micelle Concentration (CMC)
Conductometric Method
Table 6: Plot of conductance vs. concentration of aqueous SDS solution at different temperatures (293K, 298K, 303K, 308K)
Concentration (mM)
293K 298K 303K 308K
0.98 68.5 70.1 71.7 72.1
1.92 132.4 133.7 135.9 137.3
2.83 192.9 195 197.8 197
3.7 248 249 250 256
4.54 303 306 307 308
5.35 357 360 364 367
6.14 408 410 415 415
6.9 455 457 463 467
7.63 497 499 506 510
8.33 528 531 538 545
9.02 553 557 564 573
9.68 572 577 584 596
10.32 590 595 603 616
10.94 606 610 618 633
11.54 621 626 636 650
12.12 636 640 650 667
12.69 649 655 665 680
13.24 661 666 680 697
13.77 675 -- -- 710
Table 7: Plot of conductance vs. concentration of aqueous SDS-0.005M LiCl solution at different temperatures (293K, 298K, 303K, 308K)
Concentration (mM)
293K 298K 303K 308K
0.78 413 412 411 412
1.54 462 460 461 465
2.26 508 506 507 514
2.96 552 552 553 558
3.64 597 595 598 605
4.29 639 639 639 645
4.91 679 679 680 688
5.52 717 717 719 725
6.1 752 754 754 765
6.67 783 785 789 798
7.21 809 811 814 825
7.74 829 831 836 848
8.25 845 846 852 865
8.75 860 862 868 882
9.23 874 876 883 899
9.7 886 890 896 912
10.1 898 902 909 925
10.6 910 914 922 938
11 921 925 933 951
11.4 931 936 944 964
11.8 941 947 955 976
12.2 951 958 967 986

Appendix
104
Table 8: Plot of conductance vs. concentration of aqueous SDS-0.005M NaCl solution at different temperatures (293K, 298K, 303K, 308K)
Concentration (mM)
293K 298K 303K 308K
0.78 647 645 644 646
1.54 696 694 692 696
2.26 742 739 739 743
2.96 785 784 784 788
3.64 828 826 826 831
4.29 868 867 867 872
4.91 907 907 908 915
5.52 945 933 946 951
6.1 975 974 977 985
6.67 999 998 1003 1011
7.21 1018 1016 1022 1033
7.74 1032 1031 1039 1050
8.25 1044 1046 1054 1064
8.75 1057 1059 1068 1080
9.23 1070 1072 1080 1094
9.7 1082 1084 1092 1108
10.1 1092 1096 1103 1122
10.6 1103 1106 1115 1132
11 1113 1116 1126 1143
11.4 1123 1126 1137 1154
11.8 1132 1136 1148 1165
Table 9: Plot of conductance vs. concentration of aqueous SDS-0.005M KCl solution at different temperatures (298K, 303K, 308K)
Concentration (mM)
298K 303K 308K
0.78 758 754 755
1.54 805 804 804
2.26 852 850 851
2.96 896 896 896
3.64 938 938 940
4.29 979 979 982
4.91 1018 1015 1022
5.52 1047 1050 1057
6.1 1069 1071 1082
6.67 1082 1087 1102
7.21 1096 1102 1116
7.74 1107 1114 1130
8.25 1117 1124 1141
8.75 1126 1135 1152
9.23 1135 1146 1162
9.7 1145 1156 1173
10.1 1154 1166 1183
10.6 1164 1175 1192
11 1173 1184 1204
11.4 1181 1195 --
Table 10: Plot of conductance vs. concentration of aqueous SDS-0.005M CsCl solution at different temperatures (293K, 298K, 303K, 308K)
Concentration (mM)
293K 298K 303K 308K
0.78 757 763 765 759
1.54 804 811 814 810
2.26 849 856 862 857
2.96 893 899 905 903
3.64 934 941 947 946
4.29 970 979 987 988
4.91 1005 1015 1018 1024
5.52 1026 1033 1044 1052
6.1 1037 1047 1063 1071
6.67 1048 1059 1077 1088
7.21 1058 1072 1088 1101
7.74 1067 1083 1099 1113
8.25 1076 1093 1108 1126
8.75 1085 1102 1118 1139
9.23 1094 1111 1128 1149
9.7 1103 1120 1138 1158
10.1 1111 1129 1148 1169
10.6 1119 1138 1157 1179
11 -- -- 1166 1189
11.4 -- -- 1175 1198
Surfacetensiometric Method
Table 11: Surface tension vs. logarithm of
concentration of aqueous solutions of SDS at
different temperatures (293K, 298K, 303K, 308K)
SDS Concentration
(M)
Log (C) Surface Tension (mN/m)
293K 298K 303K 308K
0.000594 -3.226 65.9 66.1 64.1 63.2
0.001178 -2.929 59.1 59.3 57.5 57.2
0.002307 -2.637 51.5 51.9 50.9 50.6
0.003396 -2.469 46.9 47.3 47.3 46.5
0.004446 -2.352 44 44.5 44.5 44.1
0.005458 -2.263 41.2 41.4 41.7 42.1
0.006427 -2.192 39.9 39.7 39.9 40.4
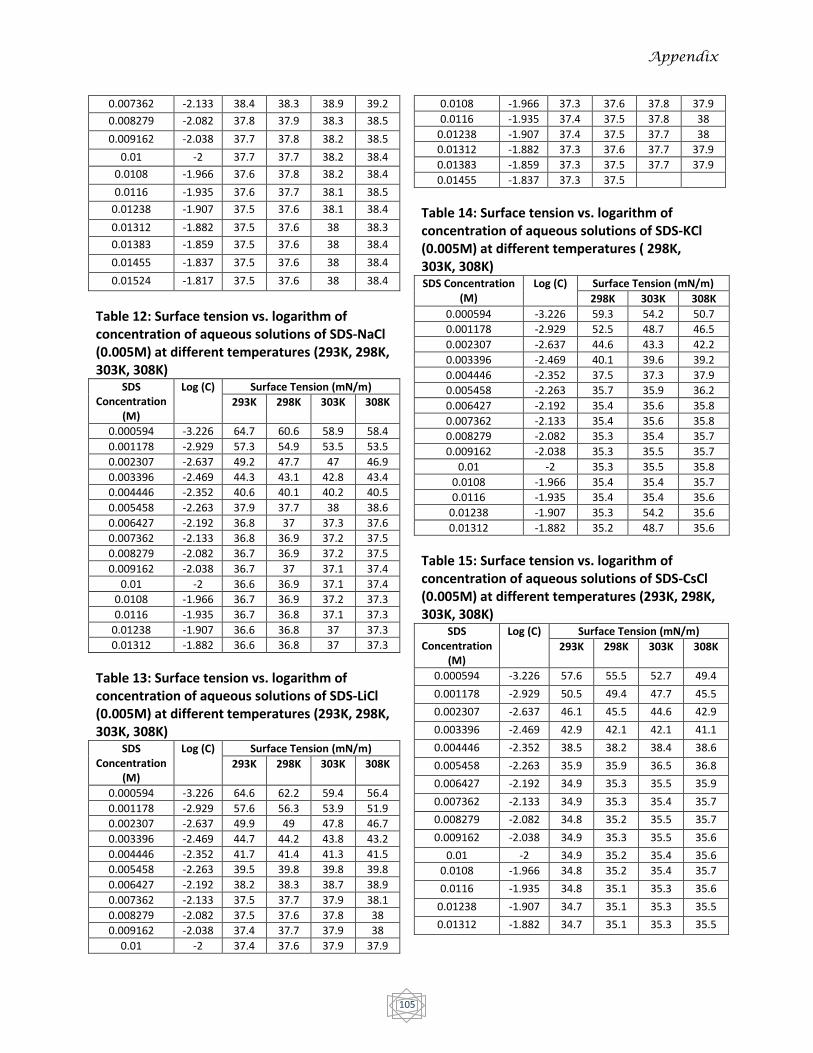
Appendix
105
0.007362 -2.133 38.4 38.3 38.9 39.2
0.008279 -2.082 37.8 37.9 38.3 38.5
0.009162 -2.038 37.7 37.8 38.2 38.5
0.01 -2 37.7 37.7 38.2 38.4
0.0108 -1.966 37.6 37.8 38.2 38.4
0.0116 -1.935 37.6 37.7 38.1 38.5
0.01238 -1.907 37.5 37.6 38.1 38.4
0.01312 -1.882 37.5 37.6 38 38.3
0.01383 -1.859 37.5 37.6 38 38.4
0.01455 -1.837 37.5 37.6 38 38.4
0.01524 -1.817 37.5 37.6 38 38.4
Table 12: Surface tension vs. logarithm of concentration of aqueous solutions of SDS-NaCl (0.005M) at different temperatures (293K, 298K, 303K, 308K)
SDS Concentration
(M)
Log (C) Surface Tension (mN/m)
293K 298K 303K 308K
0.000594 -3.226 64.7 60.6 58.9 58.4
0.001178 -2.929 57.3 54.9 53.5 53.5
0.002307 -2.637 49.2 47.7 47 46.9
0.003396 -2.469 44.3 43.1 42.8 43.4
0.004446 -2.352 40.6 40.1 40.2 40.5
0.005458 -2.263 37.9 37.7 38 38.6
0.006427 -2.192 36.8 37 37.3 37.6
0.007362 -2.133 36.8 36.9 37.2 37.5
0.008279 -2.082 36.7 36.9 37.2 37.5
0.009162 -2.038 36.7 37 37.1 37.4
0.01 -2 36.6 36.9 37.1 37.4
0.0108 -1.966 36.7 36.9 37.2 37.3
0.0116 -1.935 36.7 36.8 37.1 37.3
0.01238 -1.907 36.6 36.8 37 37.3
0.01312 -1.882 36.6 36.8 37 37.3
Table 13: Surface tension vs. logarithm of concentration of aqueous solutions of SDS-LiCl (0.005M) at different temperatures (293K, 298K, 303K, 308K)
SDS Concentration
(M)
Log (C) Surface Tension (mN/m)
293K 298K 303K 308K
0.000594 -3.226 64.6 62.2 59.4 56.4
0.001178 -2.929 57.6 56.3 53.9 51.9
0.002307 -2.637 49.9 49 47.8 46.7
0.003396 -2.469 44.7 44.2 43.8 43.2
0.004446 -2.352 41.7 41.4 41.3 41.5
0.005458 -2.263 39.5 39.8 39.8 39.8
0.006427 -2.192 38.2 38.3 38.7 38.9
0.007362 -2.133 37.5 37.7 37.9 38.1
0.008279 -2.082 37.5 37.6 37.8 38
0.009162 -2.038 37.4 37.7 37.9 38
0.01 -2 37.4 37.6 37.9 37.9
0.0108 -1.966 37.3 37.6 37.8 37.9
0.0116 -1.935 37.4 37.5 37.8 38
0.01238 -1.907 37.4 37.5 37.7 38
0.01312 -1.882 37.3 37.6 37.7 37.9
0.01383 -1.859 37.3 37.5 37.7 37.9
0.01455 -1.837 37.3 37.5
Table 14: Surface tension vs. logarithm of concentration of aqueous solutions of SDS-KCl (0.005M) at different temperatures ( 298K, 303K, 308K) SDS Concentration
(M) Log (C) Surface Tension (mN/m)
298K 303K 308K
0.000594 -3.226 59.3 54.2 50.7
0.001178 -2.929 52.5 48.7 46.5
0.002307 -2.637 44.6 43.3 42.2
0.003396 -2.469 40.1 39.6 39.2
0.004446 -2.352 37.5 37.3 37.9
0.005458 -2.263 35.7 35.9 36.2
0.006427 -2.192 35.4 35.6 35.8
0.007362 -2.133 35.4 35.6 35.8
0.008279 -2.082 35.3 35.4 35.7
0.009162 -2.038 35.3 35.5 35.7
0.01 -2 35.3 35.5 35.8
0.0108 -1.966 35.4 35.4 35.7
0.0116 -1.935 35.4 35.4 35.6
0.01238 -1.907 35.3 54.2 35.6
0.01312 -1.882 35.2 48.7 35.6
Table 15: Surface tension vs. logarithm of concentration of aqueous solutions of SDS-CsCl (0.005M) at different temperatures (293K, 298K, 303K, 308K)
SDS Concentration
(M)
Log (C) Surface Tension (mN/m)
293K 298K 303K 308K
0.000594 -3.226 57.6 55.5 52.7 49.4
0.001178 -2.929 50.5 49.4 47.7 45.5
0.002307 -2.637 46.1 45.5 44.6 42.9
0.003396 -2.469 42.9 42.1 42.1 41.1
0.004446 -2.352 38.5 38.2 38.4 38.6
0.005458 -2.263 35.9 35.9 36.5 36.8
0.006427 -2.192 34.9 35.3 35.5 35.9
0.007362 -2.133 34.9 35.3 35.4 35.7
0.008279 -2.082 34.8 35.2 35.5 35.7
0.009162 -2.038 34.9 35.3 35.5 35.6
0.01 -2 34.9 35.2 35.4 35.6
0.0108 -1.966 34.8 35.2 35.4 35.7
0.0116 -1.935 34.8 35.1 35.3 35.6
0.01238 -1.907 34.7 35.1 35.3 35.5
0.01312 -1.882 34.7 35.1 35.3 35.5
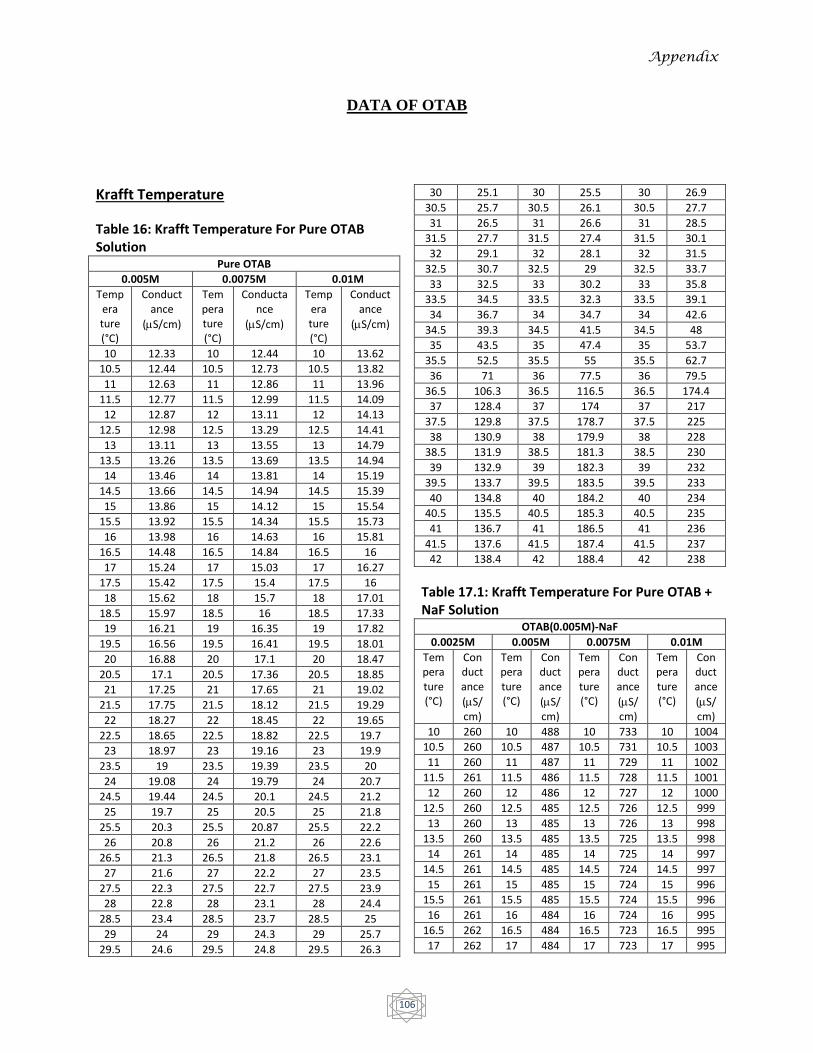
Appendix
106
DATA OF OTAB
Krafft Temperature
Table 16: Krafft Temperature For Pure OTAB Solution
Pure OTAB
0.005M 0.0075M 0.01M
Tempera ture (°C)
Conductance
(S/cm)
Tempera ture (°C)
Conductance
(S/cm)
Tempera ture (°C)
Conductance
(S/cm)
10 12.33 10 12.44 10 13.62
10.5 12.44 10.5 12.73 10.5 13.82
11 12.63 11 12.86 11 13.96
11.5 12.77 11.5 12.99 11.5 14.09
12 12.87 12 13.11 12 14.13
12.5 12.98 12.5 13.29 12.5 14.41
13 13.11 13 13.55 13 14.79
13.5 13.26 13.5 13.69 13.5 14.94
14 13.46 14 13.81 14 15.19
14.5 13.66 14.5 14.94 14.5 15.39
15 13.86 15 14.12 15 15.54
15.5 13.92 15.5 14.34 15.5 15.73
16 13.98 16 14.63 16 15.81
16.5 14.48 16.5 14.84 16.5 16
17 15.24 17 15.03 17 16.27
17.5 15.42 17.5 15.4 17.5 16
18 15.62 18 15.7 18 17.01
18.5 15.97 18.5 16 18.5 17.33
19 16.21 19 16.35 19 17.82
19.5 16.56 19.5 16.41 19.5 18.01
20 16.88 20 17.1 20 18.47
20.5 17.1 20.5 17.36 20.5 18.85
21 17.25 21 17.65 21 19.02
21.5 17.75 21.5 18.12 21.5 19.29
22 18.27 22 18.45 22 19.65
22.5 18.65 22.5 18.82 22.5 19.7
23 18.97 23 19.16 23 19.9
23.5 19 23.5 19.39 23.5 20
24 19.08 24 19.79 24 20.7
24.5 19.44 24.5 20.1 24.5 21.2
25 19.7 25 20.5 25 21.8
25.5 20.3 25.5 20.87 25.5 22.2
26 20.8 26 21.2 26 22.6
26.5 21.3 26.5 21.8 26.5 23.1
27 21.6 27 22.2 27 23.5
27.5 22.3 27.5 22.7 27.5 23.9
28 22.8 28 23.1 28 24.4
28.5 23.4 28.5 23.7 28.5 25
29 24 29 24.3 29 25.7
29.5 24.6 29.5 24.8 29.5 26.3
30 25.1 30 25.5 30 26.9
30.5 25.7 30.5 26.1 30.5 27.7
31 26.5 31 26.6 31 28.5
31.5 27.7 31.5 27.4 31.5 30.1
32 29.1 32 28.1 32 31.5
32.5 30.7 32.5 29 32.5 33.7
33 32.5 33 30.2 33 35.8
33.5 34.5 33.5 32.3 33.5 39.1
34 36.7 34 34.7 34 42.6
34.5 39.3 34.5 41.5 34.5 48
35 43.5 35 47.4 35 53.7
35.5 52.5 35.5 55 35.5 62.7
36 71 36 77.5 36 79.5
36.5 106.3 36.5 116.5 36.5 174.4
37 128.4 37 174 37 217
37.5 129.8 37.5 178.7 37.5 225
38 130.9 38 179.9 38 228
38.5 131.9 38.5 181.3 38.5 230
39 132.9 39 182.3 39 232
39.5 133.7 39.5 183.5 39.5 233
40 134.8 40 184.2 40 234
40.5 135.5 40.5 185.3 40.5 235
41 136.7 41 186.5 41 236
41.5 137.6 41.5 187.4 41.5 237
42 138.4 42 188.4 42 238
Table 17.1: Krafft Temperature For Pure OTAB + NaF Solution
OTAB(0.005M)-NaF
0.0025M 0.005M 0.0075M 0.01M
Temperature (°C)
Conductance
(S/cm)
Temperature (°C)
Conductance
(S/cm)
Temperature (°C)
Conductance
(S/cm)
Temperature (°C)
Conductance
(S/cm)
10 260 10 488 10 733 10 1004
10.5 260 10.5 487 10.5 731 10.5 1003
11 260 11 487 11 729 11 1002
11.5 261 11.5 486 11.5 728 11.5 1001
12 260 12 486 12 727 12 1000
12.5 260 12.5 485 12.5 726 12.5 999
13 260 13 485 13 726 13 998
13.5 260 13.5 485 13.5 725 13.5 998
14 261 14 485 14 725 14 997
14.5 261 14.5 485 14.5 724 14.5 997
15 261 15 485 15 724 15 996
15.5 261 15.5 485 15.5 724 15.5 996
16 261 16 484 16 724 16 995
16.5 262 16.5 484 16.5 723 16.5 995
17 262 17 484 17 723 17 995
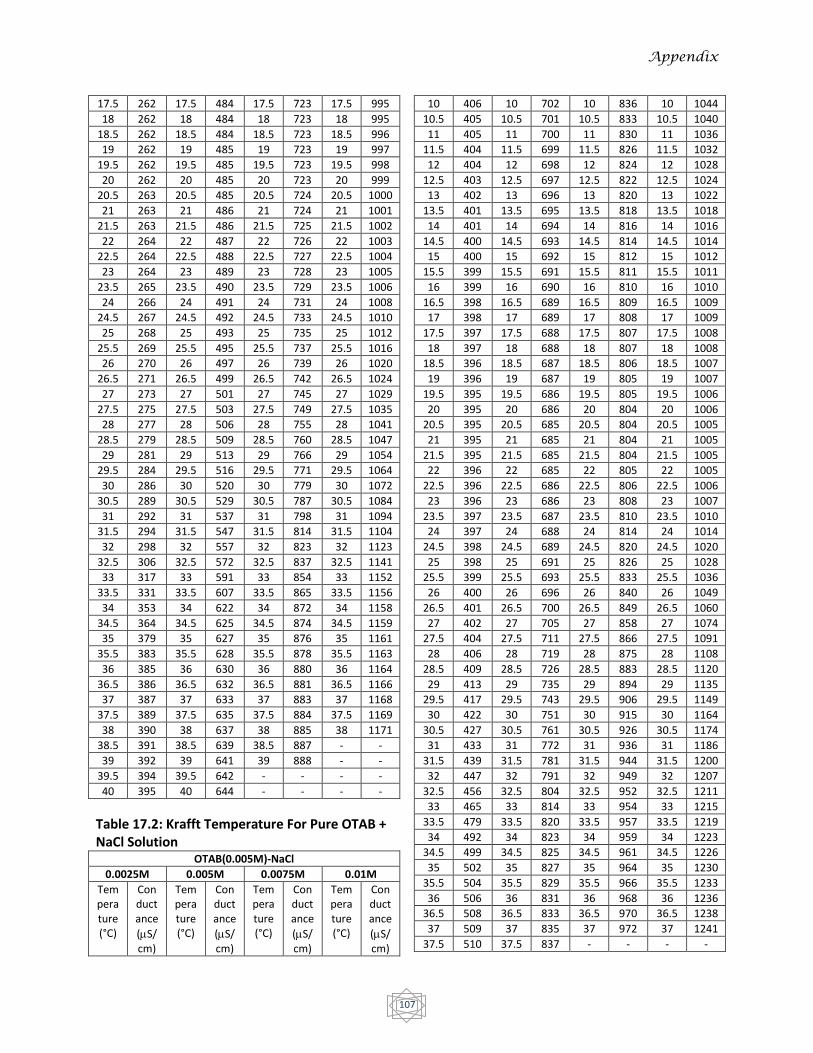
Appendix
107
17.5 262 17.5 484 17.5 723 17.5 995
18 262 18 484 18 723 18 995
18.5 262 18.5 484 18.5 723 18.5 996
19 262 19 485 19 723 19 997
19.5 262 19.5 485 19.5 723 19.5 998
20 262 20 485 20 723 20 999
20.5 263 20.5 485 20.5 724 20.5 1000
21 263 21 486 21 724 21 1001
21.5 263 21.5 486 21.5 725 21.5 1002
22 264 22 487 22 726 22 1003
22.5 264 22.5 488 22.5 727 22.5 1004
23 264 23 489 23 728 23 1005
23.5 265 23.5 490 23.5 729 23.5 1006
24 266 24 491 24 731 24 1008
24.5 267 24.5 492 24.5 733 24.5 1010
25 268 25 493 25 735 25 1012
25.5 269 25.5 495 25.5 737 25.5 1016
26 270 26 497 26 739 26 1020
26.5 271 26.5 499 26.5 742 26.5 1024
27 273 27 501 27 745 27 1029
27.5 275 27.5 503 27.5 749 27.5 1035
28 277 28 506 28 755 28 1041
28.5 279 28.5 509 28.5 760 28.5 1047
29 281 29 513 29 766 29 1054
29.5 284 29.5 516 29.5 771 29.5 1064
30 286 30 520 30 779 30 1072
30.5 289 30.5 529 30.5 787 30.5 1084
31 292 31 537 31 798 31 1094
31.5 294 31.5 547 31.5 814 31.5 1104
32 298 32 557 32 823 32 1123
32.5 306 32.5 572 32.5 837 32.5 1141
33 317 33 591 33 854 33 1152
33.5 331 33.5 607 33.5 865 33.5 1156
34 353 34 622 34 872 34 1158
34.5 364 34.5 625 34.5 874 34.5 1159
35 379 35 627 35 876 35 1161
35.5 383 35.5 628 35.5 878 35.5 1163
36 385 36 630 36 880 36 1164
36.5 386 36.5 632 36.5 881 36.5 1166
37 387 37 633 37 883 37 1168
37.5 389 37.5 635 37.5 884 37.5 1169
38 390 38 637 38 885 38 1171
38.5 391 38.5 639 38.5 887 - -
39 392 39 641 39 888 - -
39.5 394 39.5 642 - - - -
40 395 40 644 - - - -
Table 17.2: Krafft Temperature For Pure OTAB + NaCl Solution
OTAB(0.005M)-NaCl
0.0025M 0.005M 0.0075M 0.01M
Temperature (°C)
Conductance
(S/cm)
Temperature (°C)
Conductance
(S/cm)
Temperature (°C)
Conductance
(S/cm)
Temperature (°C)
Conductance
(S/cm)
10 406 10 702 10 836 10 1044
10.5 405 10.5 701 10.5 833 10.5 1040
11 405 11 700 11 830 11 1036
11.5 404 11.5 699 11.5 826 11.5 1032
12 404 12 698 12 824 12 1028
12.5 403 12.5 697 12.5 822 12.5 1024
13 402 13 696 13 820 13 1022
13.5 401 13.5 695 13.5 818 13.5 1018
14 401 14 694 14 816 14 1016
14.5 400 14.5 693 14.5 814 14.5 1014
15 400 15 692 15 812 15 1012
15.5 399 15.5 691 15.5 811 15.5 1011
16 399 16 690 16 810 16 1010
16.5 398 16.5 689 16.5 809 16.5 1009
17 398 17 689 17 808 17 1009
17.5 397 17.5 688 17.5 807 17.5 1008
18 397 18 688 18 807 18 1008
18.5 396 18.5 687 18.5 806 18.5 1007
19 396 19 687 19 805 19 1007
19.5 395 19.5 686 19.5 805 19.5 1006
20 395 20 686 20 804 20 1006
20.5 395 20.5 685 20.5 804 20.5 1005
21 395 21 685 21 804 21 1005
21.5 395 21.5 685 21.5 804 21.5 1005
22 396 22 685 22 805 22 1005
22.5 396 22.5 686 22.5 806 22.5 1006
23 396 23 686 23 808 23 1007
23.5 397 23.5 687 23.5 810 23.5 1010
24 397 24 688 24 814 24 1014
24.5 398 24.5 689 24.5 820 24.5 1020
25 398 25 691 25 826 25 1028
25.5 399 25.5 693 25.5 833 25.5 1036
26 400 26 696 26 840 26 1049
26.5 401 26.5 700 26.5 849 26.5 1060
27 402 27 705 27 858 27 1074
27.5 404 27.5 711 27.5 866 27.5 1091
28 406 28 719 28 875 28 1108
28.5 409 28.5 726 28.5 883 28.5 1120
29 413 29 735 29 894 29 1135
29.5 417 29.5 743 29.5 906 29.5 1149
30 422 30 751 30 915 30 1164
30.5 427 30.5 761 30.5 926 30.5 1174
31 433 31 772 31 936 31 1186
31.5 439 31.5 781 31.5 944 31.5 1200
32 447 32 791 32 949 32 1207
32.5 456 32.5 804 32.5 952 32.5 1211
33 465 33 814 33 954 33 1215
33.5 479 33.5 820 33.5 957 33.5 1219
34 492 34 823 34 959 34 1223
34.5 499 34.5 825 34.5 961 34.5 1226
35 502 35 827 35 964 35 1230
35.5 504 35.5 829 35.5 966 35.5 1233
36 506 36 831 36 968 36 1236
36.5 508 36.5 833 36.5 970 36.5 1238
37 509 37 835 37 972 37 1241
37.5 510 37.5 837 - - - -

Appendix
108
38 512 38 839 - - - -
38.5 513 38.5 841 - - - -
39 514 39 843 - - - -
Table 18: Krafft Temperature For Pure OTAB + NaBr Solution
OTAB(0.005M)-NaBr
0.0025M 0.005M 0.0075M 0.01M
Temperature (°C)
Conductance
(S/cm)
Temperature (°C)
Conductance
(S/cm)
Temperature (°C)
Conductance
(S/cm)
Temperature (°C)
Conductance
(S/cm)
10 226 10 477 10 676 10 908
10.5 225 10.5 476 10.5 675 10.5 906
11 225 11 476 11 673 11 904
11.5 224 11.5 474 11.5 671 11.5 902
12 224 12 472 12 670 12 900
12.5 223 12.5 471 12.5 669 12.5 898
13 223 13 470 13 668 13 897
13.5 223 13.5 469 13.5 667 13.5 895
14 223 14 469 14 666 14 894
14.5 222 14.5 468 14.5 665 14.5 892
15 222 15 468 15 664 15 890
15.5 222 15.5 467 15.5 663 15.5 888
16 222 16 467 16 662 16 887
16.5 222 16.5 467 16.5 660 16.5 885
17 221 17 467 17 659 17 884
17.5 221 17.5 466 17.5 658 17.5 883
18 221 18 465 18 658 18 882
18.5 220 18.5 464 18.5 657 18.5 881
19 220 19 464 19 656 19 880
19.5 220 19.5 464 19.5 655 19.5 879
20 220 20 464 20 654 20 878
20.5 219 20.5 463 20.5 654 20.5 877
21 219 21 463 21 653 21 877
21.5 219 21.5 463 21.5 653 21.5 876
22 219 22 463 22 652 22 876
22.5 219 22.5 462 22.5 652 22.5 875
23 219 23 462 23 652 23 875
23.5 219 23.5 462 23.5 652 23.5 874
24 220 24 462 24 652 24 874
24.5 220 24.5 463 24.5 652 24.5 874
25 220 25 463 25 651 25 874
25.5 220 25.5 463 25.5 651 25.5 873
26 221 26 463 26 651 26 873
26.5 221 26.5 463 26.5 651 26.5 873
27 221 27 463 27 651 27 873
27.5 221 27.5 464 27.5 651 27.5 873
28 221 28 464 28 651 28 873
28.5 221 28.5 464 28.5 651 28.5 873
29 222 29 464 29 651 29 873
29.5 222 29.5 464 29.5 651 29.5 874
30 222 30 464 30 652 30 874
30.5 222 30.5 465 30.5 652 30.5 874
31 223 31 465 31 652 31 874
31.5 223 31.5 466 31.5 652 31.5 875
32 224 32 466 32 653 32 875
32.5 224 32.5 467 32.5 653 32.5 875
33 225 33 467 33 653 33 875
33.5 225 33.5 468 33.5 653 33.5 876
34 226 34 468 34 654 34 876
34.5 227 34.5 469 34.5 655 34.5 876
35 230 35 469 35 657 35 876
35.5 235 35.5 472 35.5 662 35.5 877
36 249 36 476 36 670 36 878
36.5 277 36.5 487 36.5 682 36.5 892
37 310 37 521 37 691 37 904
37.5 314 37.5 563 37.5 724 37.5 951
38 316 38 567 38 736 38 964
38.5 317 38.5 571 38.5 742 38.5 970
39 319 39 573 39 744 39 972
39.5 320 39.5 574 39.5 746 39.5 973
40 321 40 575 40 747 40 974
40.5 323 40.5 576 40.5 748 40.5 975
41 324 41 577 41 749 41 976
41.5 325 41.5 578 41.5 750 41.5 977
42 326 42 579 42 751 42 978
- - 42.5 580 42.5 752 42.5 979
- - 43 581 43 753 43 980
- - 43.5 582 43.5 754 - -
- - - - 44 755 - -
Table 19: Krafft Temperature For Pure OTAB + Na2SO4 Solution
OTAB(0.005M)-Na2SO4
0.0025 Ionic Strength
0.005 Ionic Strength
0.0075 Ionic Strength
0.01 Ionic Strength
Temperature (°C)
Conductance
(S/cm)
Temperature (°C)
Conductance
(S/cm)
Temperature (°C)
Conductance
(S/cm)
Temperature (°C)
Conductance
(S/cm)
10 226 10 432 10 627 10 812
10.5 226 10.5 432 10.5 626 10.5 812
11 225 11 431 11 625 11 811
11.5 225 11.5 431 11.5 624 11.5 811
12 225 12 431 12 624 12 810
12.5 225 12.5 431 12.5 623 12.5 810
13 225 13 430 13 623 13 809
13.5 225 13.5 430 13.5 622 13.5 809
14 226 14 430 14 622 14 808
14.5 226 14.5 430 14.5 622 14.5 808
15 226 15 430 15 622 15 808
15.5 227 15.5 430 15.5 622 15.5 808
16 227 16 430 16 622 16 808
16.5 227 16.5 430 16.5 622 16.5 808
17 227 17 430 17 623 17 809
17.5 228 17.5 430 17.5 623 17.5 809
18 228 18 431 18 624 18 810
18.5 228 18.5 431 18.5 624 18.5 810
19 228 19 431 19 625 19 811
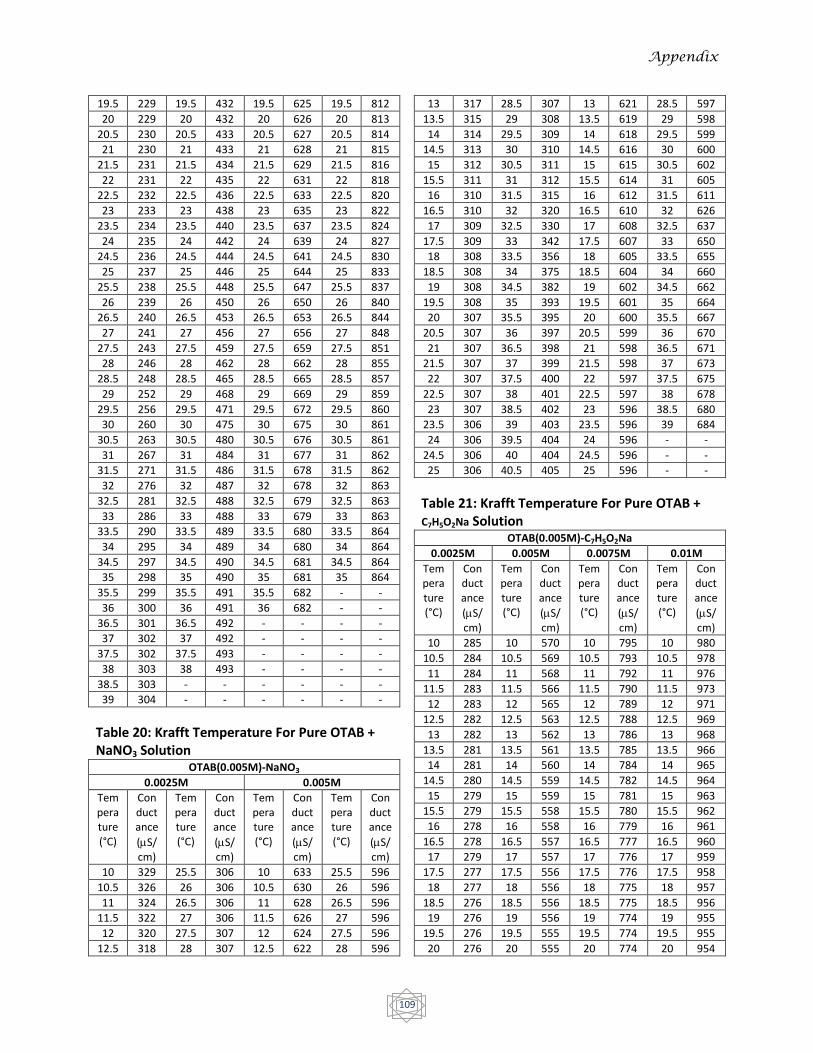
Appendix
109
19.5 229 19.5 432 19.5 625 19.5 812
20 229 20 432 20 626 20 813
20.5 230 20.5 433 20.5 627 20.5 814
21 230 21 433 21 628 21 815
21.5 231 21.5 434 21.5 629 21.5 816
22 231 22 435 22 631 22 818
22.5 232 22.5 436 22.5 633 22.5 820
23 233 23 438 23 635 23 822
23.5 234 23.5 440 23.5 637 23.5 824
24 235 24 442 24 639 24 827
24.5 236 24.5 444 24.5 641 24.5 830
25 237 25 446 25 644 25 833
25.5 238 25.5 448 25.5 647 25.5 837
26 239 26 450 26 650 26 840
26.5 240 26.5 453 26.5 653 26.5 844
27 241 27 456 27 656 27 848
27.5 243 27.5 459 27.5 659 27.5 851
28 246 28 462 28 662 28 855
28.5 248 28.5 465 28.5 665 28.5 857
29 252 29 468 29 669 29 859
29.5 256 29.5 471 29.5 672 29.5 860
30 260 30 475 30 675 30 861
30.5 263 30.5 480 30.5 676 30.5 861
31 267 31 484 31 677 31 862
31.5 271 31.5 486 31.5 678 31.5 862
32 276 32 487 32 678 32 863
32.5 281 32.5 488 32.5 679 32.5 863
33 286 33 488 33 679 33 863
33.5 290 33.5 489 33.5 680 33.5 864
34 295 34 489 34 680 34 864
34.5 297 34.5 490 34.5 681 34.5 864
35 298 35 490 35 681 35 864
35.5 299 35.5 491 35.5 682 - -
36 300 36 491 36 682 - -
36.5 301 36.5 492 - - - -
37 302 37 492 - - - -
37.5 302 37.5 493 - - - -
38 303 38 493 - - - -
38.5 303 - - - - - -
39 304 - - - - - -
Table 20: Krafft Temperature For Pure OTAB + NaNO3 Solution
OTAB(0.005M)-NaNO3
0.0025M 0.005M
Temperature (°C)
Conductance
(S/cm)
Temperature (°C)
Conductance
(S/cm)
Temperature (°C)
Conductance
(S/cm)
Temperature (°C)
Conductance
(S/cm)
10 329 25.5 306 10 633 25.5 596
10.5 326 26 306 10.5 630 26 596
11 324 26.5 306 11 628 26.5 596
11.5 322 27 306 11.5 626 27 596
12 320 27.5 307 12 624 27.5 596
12.5 318 28 307 12.5 622 28 596
13 317 28.5 307 13 621 28.5 597
13.5 315 29 308 13.5 619 29 598
14 314 29.5 309 14 618 29.5 599
14.5 313 30 310 14.5 616 30 600
15 312 30.5 311 15 615 30.5 602
15.5 311 31 312 15.5 614 31 605
16 310 31.5 315 16 612 31.5 611
16.5 310 32 320 16.5 610 32 626
17 309 32.5 330 17 608 32.5 637
17.5 309 33 342 17.5 607 33 650
18 308 33.5 356 18 605 33.5 655
18.5 308 34 375 18.5 604 34 660
19 308 34.5 382 19 602 34.5 662
19.5 308 35 393 19.5 601 35 664
20 307 35.5 395 20 600 35.5 667
20.5 307 36 397 20.5 599 36 670
21 307 36.5 398 21 598 36.5 671
21.5 307 37 399 21.5 598 37 673
22 307 37.5 400 22 597 37.5 675
22.5 307 38 401 22.5 597 38 678
23 307 38.5 402 23 596 38.5 680
23.5 306 39 403 23.5 596 39 684
24 306 39.5 404 24 596 - -
24.5 306 40 404 24.5 596 - -
25 306 40.5 405 25 596 - -
Table 21: Krafft Temperature For Pure OTAB + C7H5O2Na Solution
OTAB(0.005M)-C7H5O2Na
0.0025M 0.005M 0.0075M 0.01M
Temperature (°C)
Conductance
(S/cm)
Temperature (°C)
Conductance
(S/cm)
Temperature (°C)
Conductance
(S/cm)
Temperature (°C)
Conductance
(S/cm)
10 285 10 570 10 795 10 980
10.5 284 10.5 569 10.5 793 10.5 978
11 284 11 568 11 792 11 976
11.5 283 11.5 566 11.5 790 11.5 973
12 283 12 565 12 789 12 971
12.5 282 12.5 563 12.5 788 12.5 969
13 282 13 562 13 786 13 968
13.5 281 13.5 561 13.5 785 13.5 966
14 281 14 560 14 784 14 965
14.5 280 14.5 559 14.5 782 14.5 964
15 279 15 559 15 781 15 963
15.5 279 15.5 558 15.5 780 15.5 962
16 278 16 558 16 779 16 961
16.5 278 16.5 557 16.5 777 16.5 960
17 279 17 557 17 776 17 959
17.5 277 17.5 556 17.5 776 17.5 958
18 277 18 556 18 775 18 957
18.5 276 18.5 556 18.5 775 18.5 956
19 276 19 556 19 774 19 955
19.5 276 19.5 555 19.5 774 19.5 955
20 276 20 555 20 774 20 954
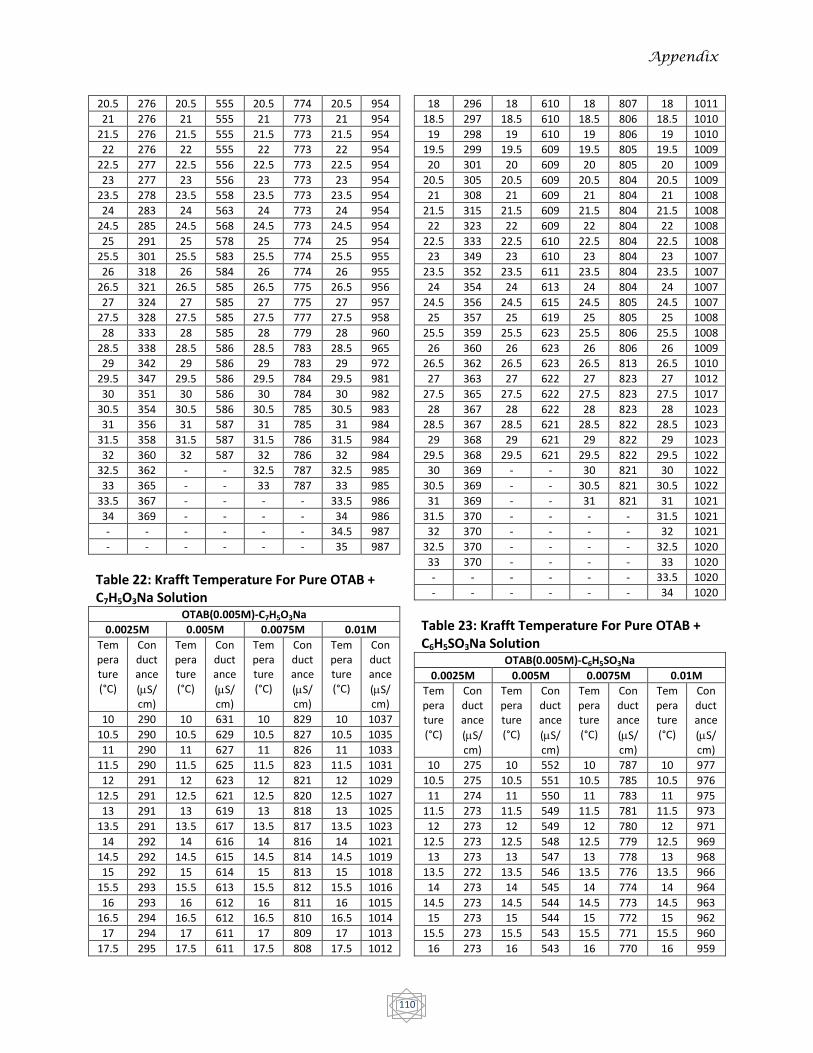
Appendix
110
20.5 276 20.5 555 20.5 774 20.5 954
21 276 21 555 21 773 21 954
21.5 276 21.5 555 21.5 773 21.5 954
22 276 22 555 22 773 22 954
22.5 277 22.5 556 22.5 773 22.5 954
23 277 23 556 23 773 23 954
23.5 278 23.5 558 23.5 773 23.5 954
24 283 24 563 24 773 24 954
24.5 285 24.5 568 24.5 773 24.5 954
25 291 25 578 25 774 25 954
25.5 301 25.5 583 25.5 774 25.5 955
26 318 26 584 26 774 26 955
26.5 321 26.5 585 26.5 775 26.5 956
27 324 27 585 27 775 27 957
27.5 328 27.5 585 27.5 777 27.5 958
28 333 28 585 28 779 28 960
28.5 338 28.5 586 28.5 783 28.5 965
29 342 29 586 29 783 29 972
29.5 347 29.5 586 29.5 784 29.5 981
30 351 30 586 30 784 30 982
30.5 354 30.5 586 30.5 785 30.5 983
31 356 31 587 31 785 31 984
31.5 358 31.5 587 31.5 786 31.5 984
32 360 32 587 32 786 32 984
32.5 362 - - 32.5 787 32.5 985
33 365 - - 33 787 33 985
33.5 367 - - - - 33.5 986
34 369 - - - - 34 986
- - - - - - 34.5 987
- - - - - - 35 987
Table 22: Krafft Temperature For Pure OTAB + C7H5O3Na Solution
OTAB(0.005M)-C7H5O3Na
0.0025M 0.005M 0.0075M 0.01M
Temperature (°C)
Conductance
(S/cm)
Temperature (°C)
Conductance
(S/cm)
Temperature (°C)
Conductance
(S/cm)
Temperature (°C)
Conductance
(S/cm)
10 290 10 631 10 829 10 1037
10.5 290 10.5 629 10.5 827 10.5 1035
11 290 11 627 11 826 11 1033
11.5 290 11.5 625 11.5 823 11.5 1031
12 291 12 623 12 821 12 1029
12.5 291 12.5 621 12.5 820 12.5 1027
13 291 13 619 13 818 13 1025
13.5 291 13.5 617 13.5 817 13.5 1023
14 292 14 616 14 816 14 1021
14.5 292 14.5 615 14.5 814 14.5 1019
15 292 15 614 15 813 15 1018
15.5 293 15.5 613 15.5 812 15.5 1016
16 293 16 612 16 811 16 1015
16.5 294 16.5 612 16.5 810 16.5 1014
17 294 17 611 17 809 17 1013
17.5 295 17.5 611 17.5 808 17.5 1012
18 296 18 610 18 807 18 1011
18.5 297 18.5 610 18.5 806 18.5 1010
19 298 19 610 19 806 19 1010
19.5 299 19.5 609 19.5 805 19.5 1009
20 301 20 609 20 805 20 1009
20.5 305 20.5 609 20.5 804 20.5 1009
21 308 21 609 21 804 21 1008
21.5 315 21.5 609 21.5 804 21.5 1008
22 323 22 609 22 804 22 1008
22.5 333 22.5 610 22.5 804 22.5 1008
23 349 23 610 23 804 23 1007
23.5 352 23.5 611 23.5 804 23.5 1007
24 354 24 613 24 804 24 1007
24.5 356 24.5 615 24.5 805 24.5 1007
25 357 25 619 25 805 25 1008
25.5 359 25.5 623 25.5 806 25.5 1008
26 360 26 623 26 806 26 1009
26.5 362 26.5 623 26.5 813 26.5 1010
27 363 27 622 27 823 27 1012
27.5 365 27.5 622 27.5 823 27.5 1017
28 367 28 622 28 823 28 1023
28.5 367 28.5 621 28.5 822 28.5 1023
29 368 29 621 29 822 29 1023
29.5 368 29.5 621 29.5 822 29.5 1022
30 369 - - 30 821 30 1022
30.5 369 - - 30.5 821 30.5 1022
31 369 - - 31 821 31 1021
31.5 370 - - - - 31.5 1021
32 370 - - - - 32 1021
32.5 370 - - - - 32.5 1020
33 370 - - - - 33 1020
- - - - - - 33.5 1020
- - - - - - 34 1020
Table 23: Krafft Temperature For Pure OTAB + C6H5SO3Na Solution
OTAB(0.005M)-C6H5SO3Na
0.0025M 0.005M 0.0075M 0.01M
Temperature (°C)
Conductance
(S/cm)
Temperature (°C)
Conductance
(S/cm)
Temperature (°C)
Conductance
(S/cm)
Temperature (°C)
Conductance
(S/cm)
10 275 10 552 10 787 10 977
10.5 275 10.5 551 10.5 785 10.5 976
11 274 11 550 11 783 11 975
11.5 273 11.5 549 11.5 781 11.5 973
12 273 12 549 12 780 12 971
12.5 273 12.5 548 12.5 779 12.5 969
13 273 13 547 13 778 13 968
13.5 272 13.5 546 13.5 776 13.5 966
14 273 14 545 14 774 14 964
14.5 273 14.5 544 14.5 773 14.5 963
15 273 15 544 15 772 15 962
15.5 273 15.5 543 15.5 771 15.5 960
16 273 16 543 16 770 16 959
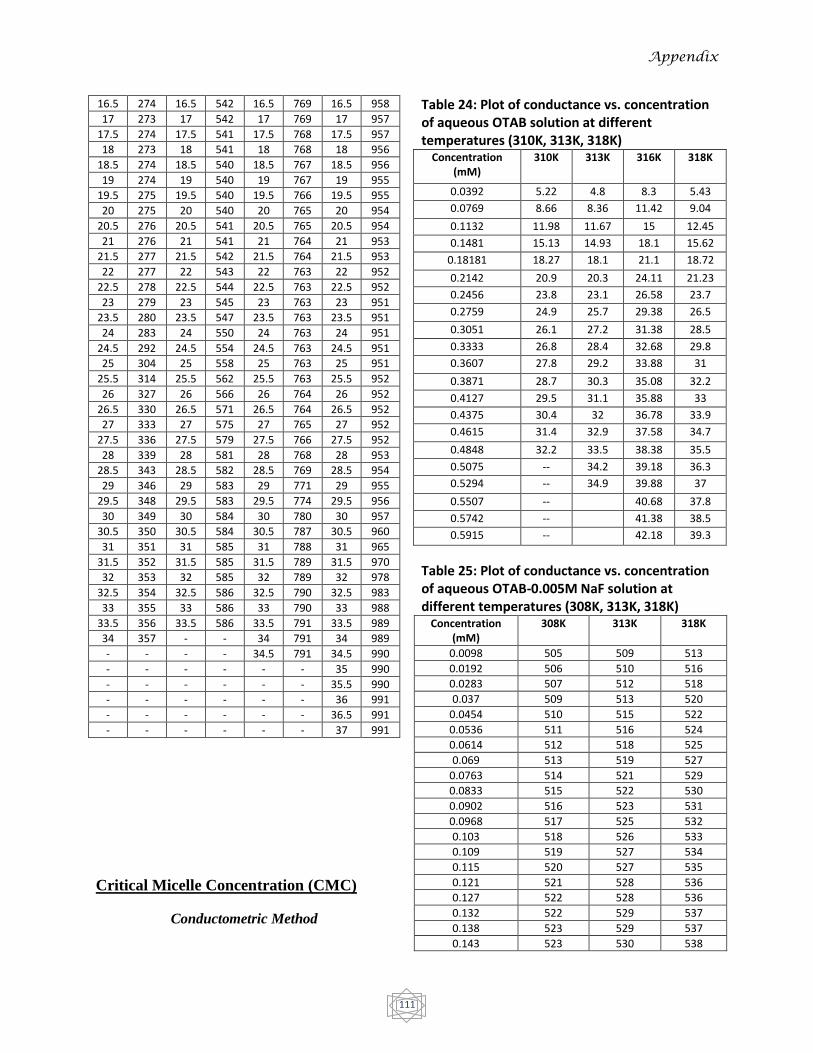
Appendix
111
16.5 274 16.5 542 16.5 769 16.5 958
17 273 17 542 17 769 17 957
17.5 274 17.5 541 17.5 768 17.5 957
18 273 18 541 18 768 18 956
18.5 274 18.5 540 18.5 767 18.5 956
19 274 19 540 19 767 19 955
19.5 275 19.5 540 19.5 766 19.5 955
20 275 20 540 20 765 20 954
20.5 276 20.5 541 20.5 765 20.5 954
21 276 21 541 21 764 21 953
21.5 277 21.5 542 21.5 764 21.5 953
22 277 22 543 22 763 22 952
22.5 278 22.5 544 22.5 763 22.5 952
23 279 23 545 23 763 23 951
23.5 280 23.5 547 23.5 763 23.5 951
24 283 24 550 24 763 24 951
24.5 292 24.5 554 24.5 763 24.5 951
25 304 25 558 25 763 25 951
25.5 314 25.5 562 25.5 763 25.5 952
26 327 26 566 26 764 26 952
26.5 330 26.5 571 26.5 764 26.5 952
27 333 27 575 27 765 27 952
27.5 336 27.5 579 27.5 766 27.5 952
28 339 28 581 28 768 28 953
28.5 343 28.5 582 28.5 769 28.5 954
29 346 29 583 29 771 29 955
29.5 348 29.5 583 29.5 774 29.5 956
30 349 30 584 30 780 30 957
30.5 350 30.5 584 30.5 787 30.5 960
31 351 31 585 31 788 31 965
31.5 352 31.5 585 31.5 789 31.5 970
32 353 32 585 32 789 32 978
32.5 354 32.5 586 32.5 790 32.5 983
33 355 33 586 33 790 33 988
33.5 356 33.5 586 33.5 791 33.5 989
34 357 - - 34 791 34 989
- - - - 34.5 791 34.5 990
- - - - - - 35 990
- - - - - - 35.5 990
- - - - - - 36 991
- - - - - - 36.5 991
- - - - - - 37 991
Critical Micelle Concentration (CMC)
Conductometric Method
Table 24: Plot of conductance vs. concentration of aqueous OTAB solution at different temperatures (310K, 313K, 318K)
Concentration (mM)
310K 313K 316K 318K
0.0392 5.22 4.8 8.3 5.43
0.0769 8.66 8.36 11.42 9.04
0.1132 11.98 11.67 15 12.45
0.1481 15.13 14.93 18.1 15.62
0.18181 18.27 18.1 21.1 18.72
0.2142 20.9 20.3 24.11 21.23
0.2456 23.8 23.1 26.58 23.7
0.2759 24.9 25.7 29.38 26.5
0.3051 26.1 27.2 31.38 28.5
0.3333 26.8 28.4 32.68 29.8
0.3607 27.8 29.2 33.88 31
0.3871 28.7 30.3 35.08 32.2
0.4127 29.5 31.1 35.88 33
0.4375 30.4 32 36.78 33.9
0.4615 31.4 32.9 37.58 34.7
0.4848 32.2 33.5 38.38 35.5
0.5075 -- 34.2 39.18 36.3
0.5294 -- 34.9 39.88 37
0.5507 -- 40.68 37.8
0.5742 -- 41.38 38.5
0.5915 -- 42.18 39.3
Table 25: Plot of conductance vs. concentration of aqueous OTAB-0.005M NaF solution at different temperatures (308K, 313K, 318K)
Concentration (mM)
308K 313K 318K
0.0098 505 509 513
0.0192 506 510 516
0.0283 507 512 518
0.037 509 513 520
0.0454 510 515 522
0.0536 511 516 524
0.0614 512 518 525
0.069 513 519 527
0.0763 514 521 529
0.0833 515 522 530
0.0902 516 523 531
0.0968 517 525 532
0.103 518 526 533
0.109 519 527 534
0.115 520 527 535
0.121 521 528 536
0.127 522 528 536
0.132 522 529 537
0.138 523 529 537
0.143 523 530 538
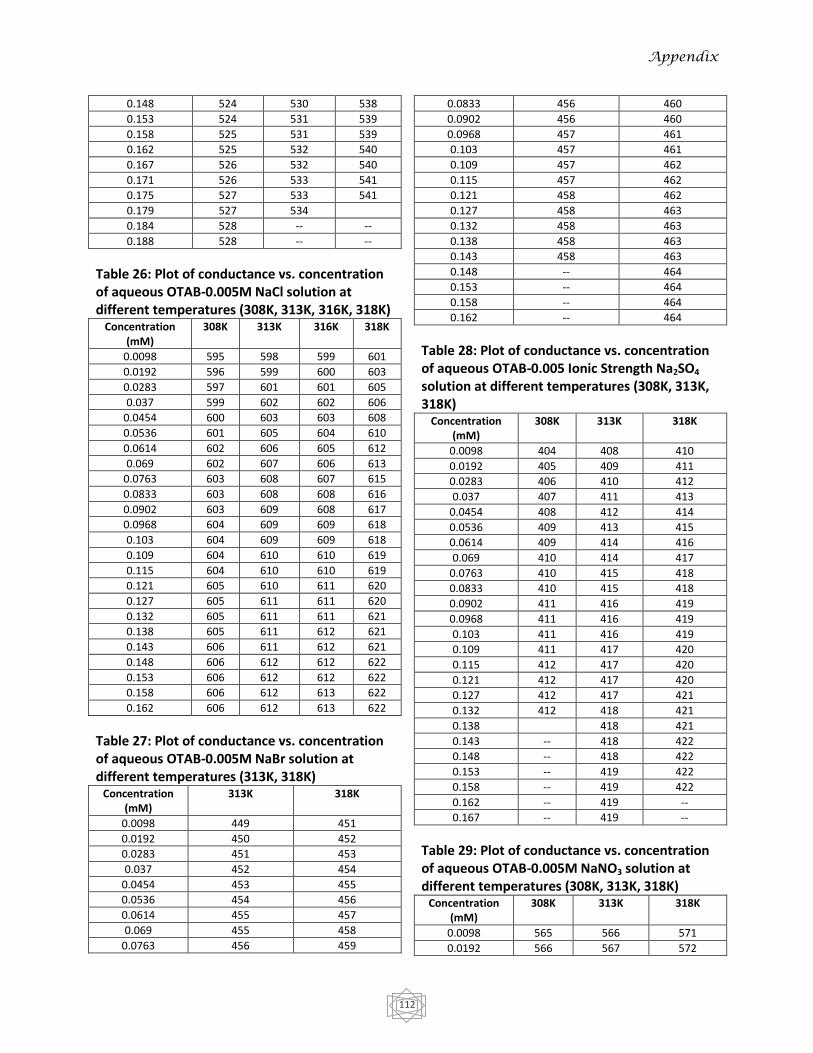
Appendix
112
0.148 524 530 538
0.153 524 531 539
0.158 525 531 539
0.162 525 532 540
0.167 526 532 540
0.171 526 533 541
0.175 527 533 541
0.179 527 534
0.184 528 -- --
0.188 528 -- --
Table 26: Plot of conductance vs. concentration of aqueous OTAB-0.005M NaCl solution at different temperatures (308K, 313K, 316K, 318K)
Concentration (mM)
308K 313K 316K 318K
0.0098 595 598 599 601
0.0192 596 599 600 603
0.0283 597 601 601 605
0.037 599 602 602 606
0.0454 600 603 603 608
0.0536 601 605 604 610
0.0614 602 606 605 612
0.069 602 607 606 613
0.0763 603 608 607 615
0.0833 603 608 608 616
0.0902 603 609 608 617
0.0968 604 609 609 618
0.103 604 609 609 618
0.109 604 610 610 619
0.115 604 610 610 619
0.121 605 610 611 620
0.127 605 611 611 620
0.132 605 611 611 621
0.138 605 611 612 621
0.143 606 611 612 621
0.148 606 612 612 622
0.153 606 612 612 622
0.158 606 612 613 622
0.162 606 612 613 622
Table 27: Plot of conductance vs. concentration of aqueous OTAB-0.005M NaBr solution at different temperatures (313K, 318K)
Concentration (mM)
313K 318K
0.0098 449 451
0.0192 450 452
0.0283 451 453
0.037 452 454
0.0454 453 455
0.0536 454 456
0.0614 455 457
0.069 455 458
0.0763 456 459
0.0833 456 460
0.0902 456 460
0.0968 457 461
0.103 457 461
0.109 457 462
0.115 457 462
0.121 458 462
0.127 458 463
0.132 458 463
0.138 458 463
0.143 458 463
0.148 -- 464
0.153 -- 464
0.158 -- 464
0.162 -- 464
Table 28: Plot of conductance vs. concentration of aqueous OTAB-0.005 Ionic Strength Na2SO4 solution at different temperatures (308K, 313K, 318K)
Concentration (mM)
308K 313K 318K
0.0098 404 408 410
0.0192 405 409 411
0.0283 406 410 412
0.037 407 411 413
0.0454 408 412 414
0.0536 409 413 415
0.0614 409 414 416
0.069 410 414 417
0.0763 410 415 418
0.0833 410 415 418
0.0902 411 416 419
0.0968 411 416 419
0.103 411 416 419
0.109 411 417 420
0.115 412 417 420
0.121 412 417 420
0.127 412 417 421
0.132 412 418 421
0.138 418 421
0.143 -- 418 422
0.148 -- 418 422
0.153 -- 419 422
0.158 -- 419 422
0.162 -- 419 --
0.167 -- 419 --
Table 29: Plot of conductance vs. concentration of aqueous OTAB-0.005M NaNO3 solution at different temperatures (308K, 313K, 318K)
Concentration (mM)
308K 313K 318K
0.0098 565 566 571
0.0192 566 567 572
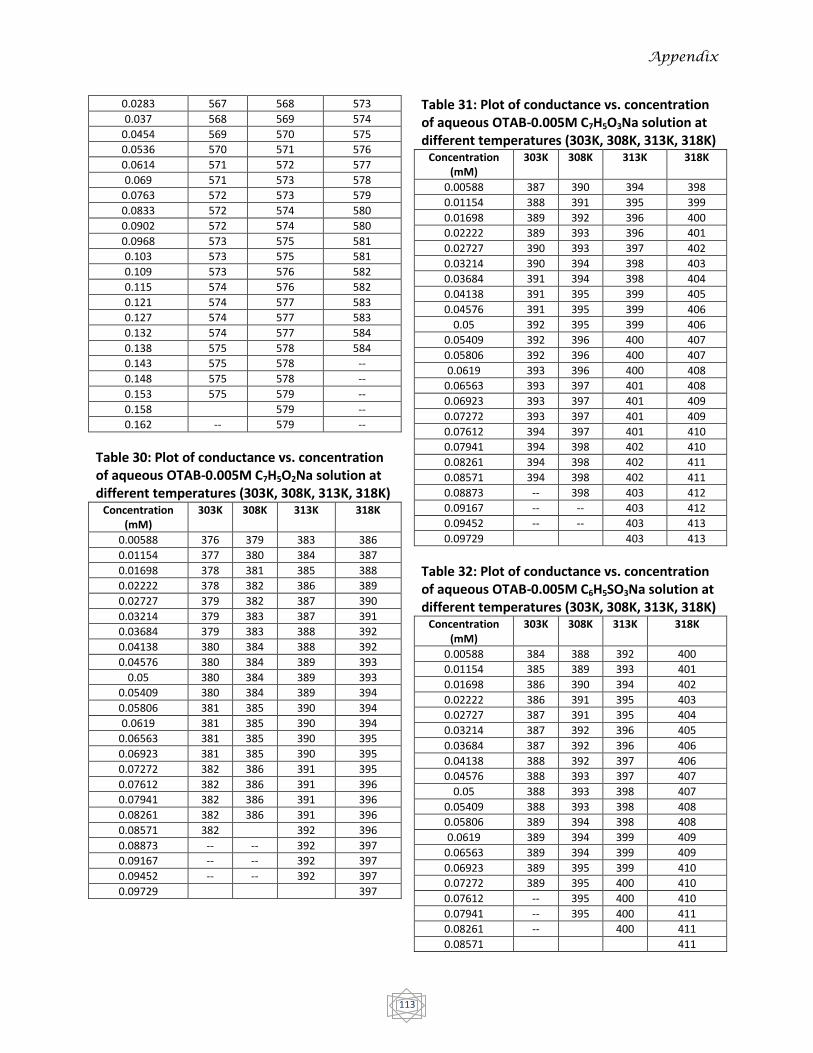
Appendix
113
0.0283 567 568 573
0.037 568 569 574
0.0454 569 570 575
0.0536 570 571 576
0.0614 571 572 577
0.069 571 573 578
0.0763 572 573 579
0.0833 572 574 580
0.0902 572 574 580
0.0968 573 575 581
0.103 573 575 581
0.109 573 576 582
0.115 574 576 582
0.121 574 577 583
0.127 574 577 583
0.132 574 577 584
0.138 575 578 584
0.143 575 578 --
0.148 575 578 --
0.153 575 579 --
0.158 579 --
0.162 -- 579 --
Table 30: Plot of conductance vs. concentration of aqueous OTAB-0.005M C7H5O2Na solution at different temperatures (303K, 308K, 313K, 318K)
Concentration (mM)
303K 308K 313K 318K
0.00588 376 379 383 386
0.01154 377 380 384 387
0.01698 378 381 385 388
0.02222 378 382 386 389
0.02727 379 382 387 390
0.03214 379 383 387 391
0.03684 379 383 388 392
0.04138 380 384 388 392
0.04576 380 384 389 393
0.05 380 384 389 393
0.05409 380 384 389 394
0.05806 381 385 390 394
0.0619 381 385 390 394
0.06563 381 385 390 395
0.06923 381 385 390 395
0.07272 382 386 391 395
0.07612 382 386 391 396
0.07941 382 386 391 396
0.08261 382 386 391 396
0.08571 382 392 396
0.08873 -- -- 392 397
0.09167 -- -- 392 397
0.09452 -- -- 392 397
0.09729 397
Table 31: Plot of conductance vs. concentration of aqueous OTAB-0.005M C7H5O3Na solution at different temperatures (303K, 308K, 313K, 318K)
Concentration (mM)
303K 308K 313K 318K
0.00588 387 390 394 398
0.01154 388 391 395 399
0.01698 389 392 396 400
0.02222 389 393 396 401
0.02727 390 393 397 402
0.03214 390 394 398 403
0.03684 391 394 398 404
0.04138 391 395 399 405
0.04576 391 395 399 406
0.05 392 395 399 406
0.05409 392 396 400 407
0.05806 392 396 400 407
0.0619 393 396 400 408
0.06563 393 397 401 408
0.06923 393 397 401 409
0.07272 393 397 401 409
0.07612 394 397 401 410
0.07941 394 398 402 410
0.08261 394 398 402 411
0.08571 394 398 402 411
0.08873 -- 398 403 412
0.09167 -- -- 403 412
0.09452 -- -- 403 413
0.09729 403 413
Table 32: Plot of conductance vs. concentration of aqueous OTAB-0.005M C6H5SO3Na solution at different temperatures (303K, 308K, 313K, 318K)
Concentration (mM)
303K 308K 313K 318K
0.00588 384 388 392 400
0.01154 385 389 393 401
0.01698 386 390 394 402
0.02222 386 391 395 403
0.02727 387 391 395 404
0.03214 387 392 396 405
0.03684 387 392 396 406
0.04138 388 392 397 406
0.04576 388 393 397 407
0.05 388 393 398 407
0.05409 388 393 398 408
0.05806 389 394 398 408
0.0619 389 394 399 409
0.06563 389 394 399 409
0.06923 389 395 399 410
0.07272 389 395 400 410
0.07612 -- 395 400 410
0.07941 -- 395 400 411
0.08261 -- 400 411
0.08571 411
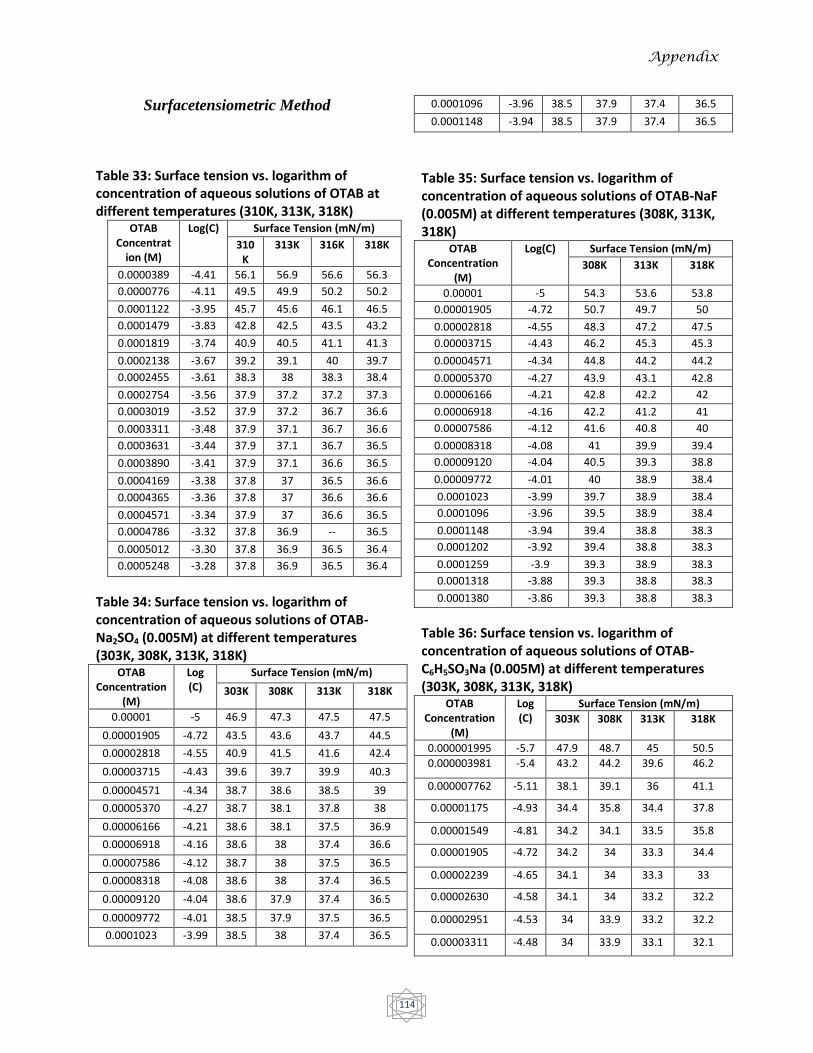
Appendix
114
Surfacetensiometric Method
Table 33: Surface tension vs. logarithm of concentration of aqueous solutions of OTAB at different temperatures (310K, 313K, 318K)
OTAB Concentrat
ion (M)
Log(C) Surface Tension (mN/m)
310K
313K 316K 318K
0.0000389 -4.41 56.1 56.9 56.6 56.3
0.0000776 -4.11 49.5 49.9 50.2 50.2
0.0001122 -3.95 45.7 45.6 46.1 46.5
0.0001479 -3.83 42.8 42.5 43.5 43.2
0.0001819 -3.74 40.9 40.5 41.1 41.3
0.0002138 -3.67 39.2 39.1 40 39.7
0.0002455 -3.61 38.3 38 38.3 38.4
0.0002754 -3.56 37.9 37.2 37.2 37.3
0.0003019 -3.52 37.9 37.2 36.7 36.6
0.0003311 -3.48 37.9 37.1 36.7 36.6
0.0003631 -3.44 37.9 37.1 36.7 36.5
0.0003890 -3.41 37.9 37.1 36.6 36.5
0.0004169 -3.38 37.8 37 36.5 36.6
0.0004365 -3.36 37.8 37 36.6 36.6
0.0004571 -3.34 37.9 37 36.6 36.5
0.0004786 -3.32 37.8 36.9 -- 36.5
0.0005012 -3.30 37.8 36.9 36.5 36.4
0.0005248 -3.28 37.8 36.9 36.5 36.4
Table 34: Surface tension vs. logarithm of concentration of aqueous solutions of OTAB-Na2SO4 (0.005M) at different temperatures (303K, 308K, 313K, 318K)
OTAB Concentration
(M)
Log (C)
Surface Tension (mN/m)
303K 308K 313K 318K
0.00001 -5 46.9 47.3 47.5 47.5
0.00001905 -4.72 43.5 43.6 43.7 44.5
0.00002818 -4.55 40.9 41.5 41.6 42.4
0.00003715 -4.43 39.6 39.7 39.9 40.3
0.00004571 -4.34 38.7 38.6 38.5 39
0.00005370 -4.27 38.7 38.1 37.8 38
0.00006166 -4.21 38.6 38.1 37.5 36.9
0.00006918 -4.16 38.6 38 37.4 36.6
0.00007586 -4.12 38.7 38 37.5 36.5
0.00008318 -4.08 38.6 38 37.4 36.5
0.00009120 -4.04 38.6 37.9 37.4 36.5
0.00009772 -4.01 38.5 37.9 37.5 36.5
0.0001023 -3.99 38.5 38 37.4 36.5
0.0001096 -3.96 38.5 37.9 37.4 36.5
0.0001148 -3.94 38.5 37.9 37.4 36.5
Table 35: Surface tension vs. logarithm of concentration of aqueous solutions of OTAB-NaF (0.005M) at different temperatures (308K, 313K, 318K)
OTAB Concentration
(M)
Log(C) Surface Tension (mN/m)
308K 313K 318K
0.00001 -5 54.3 53.6 53.8
0.00001905 -4.72 50.7 49.7 50
0.00002818 -4.55 48.3 47.2 47.5
0.00003715 -4.43 46.2 45.3 45.3
0.00004571 -4.34 44.8 44.2 44.2
0.00005370 -4.27 43.9 43.1 42.8
0.00006166 -4.21 42.8 42.2 42
0.00006918 -4.16 42.2 41.2 41
0.00007586 -4.12 41.6 40.8 40
0.00008318 -4.08 41 39.9 39.4
0.00009120 -4.04 40.5 39.3 38.8
0.00009772 -4.01 40 38.9 38.4
0.0001023 -3.99 39.7 38.9 38.4
0.0001096 -3.96 39.5 38.9 38.4
0.0001148 -3.94 39.4 38.8 38.3
0.0001202 -3.92 39.4 38.8 38.3
0.0001259 -3.9 39.3 38.9 38.3
0.0001318 -3.88 39.3 38.8 38.3
0.0001380 -3.86 39.3 38.8 38.3
Table 36: Surface tension vs. logarithm of concentration of aqueous solutions of OTAB-C6H5SO3Na (0.005M) at different temperatures (303K, 308K, 313K, 318K)
OTAB Concentration
(M)
Log (C)
Surface Tension (mN/m)
303K 308K 313K 318K
0.000001995 -5.7 47.9 48.7 45 50.5
0.000003981 -5.4 43.2 44.2 39.6 46.2
0.000007762 -5.11 38.1 39.1 36 41.1
0.00001175 -4.93 34.4 35.8 34.4 37.8
0.00001549 -4.81 34.2 34.1 33.5 35.8
0.00001905 -4.72 34.2 34 33.3 34.4
0.00002239 -4.65 34.1 34 33.3 33
0.00002630 -4.58 34.1 34 33.2 32.2
0.00002951 -4.53 34 33.9 33.2 32.2
0.00003311 -4.48 34 33.9 33.1 32.1

Appendix
115
0.00003631 -4.44 33.8 33.1 32.2
0.00003981 -4.4 -- 33.8 -- 32.1
Table 37: Surface tension vs. logarithm of concentration of aqueous solutions of OTAB-NaCl (0.005M) at different temperatures (308K, 313K, 318K)
OTAB Concentration
(M)
Log(C) Surface Tension (mN/m)
308K 313K 316K 318K
0.00001 -5 56.7 57.5 51.9 57.7
0.00001905 -4.72 50 51.3 47 51.9
0.00002818 -4.55 46 46.8 43.9 47.4
0.00003715 -4.43 42.8 43.7 41.8 44.2
0.00004571 -4.34 40.4 41.2 40.3 41.8
0.00005370 -4.27 38.8 39.6 39 39.9
0.00006166 -4.21 37.6 37.9 38.1 38.2
0.00006918 -4.16 37.4 36.9 37.3 36.9
0.00007586 -4.12 37.4 36.4 36.6 36.1
0.00008318 -4.08 37.4 36.4 36.2 35.8
0.00009120 -4.04 37.3 36.3 36.2 35.6
0.00009772 -4.01 37.3 36.3 36.2 35.6
0.0001023 -3.99 37.3 36.3 36.1 35.5
0.0001096 -3.96 36.2 36.1 35.5
0.0001148 -3.94 36.2 36.1 35.5
0.0001202 -3.92 36.2 36 35.5
0.0001259 -3.9 36.2 36 35.5
Table 38: Surface tension vs. logarithm of concentration of aqueous solutions of OTAB-C7H5O2Na (0.005M) at different temperatures (303K, 308K, 313K, 318K)
OTAB Concentration
(M)
Log (C)
Surface Tension (mN/m)
303K 308K 313K 318K
0.000001995 -5.7 45.7 47.9 49.7 51.4
0.000003981 -5.4 42.3 44.3 45.7 47.3
0.000007762 -5.11 38.8 40.4 41.7 43.5
0.00001175 -4.93 36.3 38.2 38.6 41.1
0.00001549 -4.81 35.1 36.3 37.1 38.9
0.00001905 -4.72 35.1 35.4 36 37.9
0.00002239 -4.65 35.1 34.8 35 37
0.00002630 -4.58 35 34.7 34.2 36
0.00002951 -4.53 35 34.7 34 35.1
0.00003311 -4.48 35 34.6 34 34.3
0.00003631 -4.44 34.9 34.6 33.9 33.7
0.00003981 -4.4 34.9 34.5 33.9 33.5
0.00004266 -4.37 34.8 34.5 33.8 33.5
0.00004571 -4.34 34.8 34.5 33.7 33.4
0.00004898 -4.31 34.8 34.5 33.7 33.4
0.00005248 -4.28 -- -- 33.8 33.4
0.00005495 -4.26 -- -- 33.7 33.3
Table 39: Surface tension vs. logarithm of concentration of aqueous solutions of OTAB-NaNO3 (0.005M) at different temperatures (308K, 313K, 318K)
OTAB Concentration
(M)
Log(C) Surface Tension (mN/m)
308K 313K 318K
0.00001 -5 51.7 50.9 50.1
0.00001905 -4.72 45.3 44.3 45
0.00002818 -4.55 41 40.4 41.2
0.00003715 -4.43 37.6 37.3 38.9
0.00004571 -4.34 35.2 35.4 36.9
0.00005370 -4.27 34.5 33.9 35.5
0.00006166 -4.21 34.2 33.5 34.6
0.00006918 -4.16 34.2 33.4 33.7
0.00007586 -4.12 34.1 33.4 33.1
0.00008318 -4.08 34.2 33.5 33.1
0.00009120 -4.04 34.1 33.4 33
0.00009772 -4.01 34.1 33.4 33
0.0001023 -3.99 34.1 33.4 33
Table 40: Surface tension vs. logarithm of concentration of aqueous solutions of OTAB-NaBr (0.005M) at different temperatures (313K, 318K)
OTAB Concentration
(M)
Log(C) Surface Tension (mN/m)
313K 318K
0.00001 -5 45.1 44.9
0.00001905 -4.72 41.4 41.5
0.00002818 -4.55 38.4 39.4
0.00003715 -4.43 36.5 37.6
0.00004571 -4.34 35.3 36.6
0.00005370 -4.27 34.3 35.5
0.00006166 -4.21 33.8 34.8
0.00006918 -4.16 33.8 34.1
0.00007586 -4.12 33.8 33.5
0.00008318 -4.08 33.7 33.2
0.00009120 -4.04 33.8 33.2
0.00009772 -4.01 33.7 33.1
0.0001023 -3.99 33.7 33.2
0.0001096 -3.96 33.6 33.1
0.0001148 -3.94 33.6 33.1
0.0001202 -3.92 33.6 33
0.0001259 -3.9 33.6 33
0.0001318 -3.88 33.6 33

Appendix
116
Table 41: Surface tension vs. logarithm of concentration of aqueous solutions of OTAB-C7H5O3Na (0.005M) at different temperatures (303K, 308K, 313K, 318K)
OTAB Concentration
(M)
Log (C)
Surface Tension (mN/m)
303K 308K
313K 318K
0.000001479 -5.83 48.5 47.5 48.3 48.1
0.000002951 -5.53 44.5 44 44.3 44.3
0.000005888 -5.23 38.7 40.1 40.3 40.7
0.000008709 -5.06 36.4 37.5 37.8 38.1
0.00001148 -4.94 34.3 35.8 36.2 36.7
0.00001413 -4.85 32.8 34.4 35.5 35.4
0.00001698 -4.77 32.1 33.2 34.1 34.1
0.00001949 -4.71 32 32.4 33.4 33.5
0.00002239 -4.65 31.9 31.6 32.3 32.9
0.00002455 -4.61 31.9 31.3 32.1 32.2
0.00002754 -4.56 31.9 31.3 31.4 31.5
0.00002951 -4.53 31.8 31.3 31 31.1
0.00003236 -4.49 31.8 31.3 30.8 30.8
0.00003467 -4.46 31.8 31.2 30.8 30.6
0.00003715 -4.43 31.7 31.2 30.8 30.4
0.00003890 -4.41 31.7 31.1 30.7 30.3
0.00004074 -4.39 31.7 31.1 30.7 30.3
0.00004365 -4.36 -- 31 30.7 30.2
0.00004571 -4.34 -- 31 30.7 30.2
0.00004786 -4.32 -- -- 30.7 30.2
Table 42: Temperature dependence on counter-ion binding parameter and Surface Excess Concentration of SDS. T/K Counter-ion binding () Surface Excess
Concentration()/ 10-6
Pure SDS
SDS-0.005M NaCl
Pure SDS
SDS-0.005M NaCl
293 0.607 0.599 2.36 2.70
298 0.602 0.569 2.22 2.34
303 0.585 0.564 2.05 2.06
308 0.568 0.544 1.88 1.90
Table 43: Temperature dependence on counter-ion binding parameter and Surface Excess Concentration of OTAB. T/K Counter-ion binding () Surface Excess
Concentration()/ 10-6
Pure OTAB
OTAB-0.005M NaCl
Pure OTAB
OTAB-0.005M
NaCl
308 0.702 2.09
310 0.617 1.96
313 0.611 0.678 1.99 2.16
318 0.587 0.664 2.02 2.19
Table 44: Absorption vs. Wavelength data of SRB for SDS surfactant Concentration
(mM) Pure SDS SDS-0.005M NaCl
𝝀max Absorbance
𝝀max Absorbance
3 -- -- 517 0.019
4 517 0.018 517 0.025
5 518 0.031 518 0.029
6 518 0.041 517 0.051
7 519 0.046 521 0.093
8 520 0.074 521 0.145
9 519 0.116 523 0.189
10 523 0.18 523 0.241
15 524 0.504 -- --
20 523 0.85 524 0.606
30 524 1.495
Table 45: Absorption vs. Wavelength data of SRB for OTAB surfactant Concentration
(mM) Pure OTAB OTAB-0.005 ionic
strength Na2SO4
𝝀max Absorbance
𝝀max Absorbance
0.01 -- -- 511 0.006
0.02 -- -- 511 0.018
0.03 -- -- 511 0.025
0.04 -- -- 512 0.036
0.06 -- -- 512 0.094
0.1 505 0.053 517 0.129
0.15 -- -- -- --
0.2 506 0.083 515 0.245
0.3 507 0.13 -- --
0.4 508 0.23 515 0.399
0.6 512 0.47 -- --
0.8 -- -- 520 0.761
1 515 0.763 -- --
1.5 515 1.079 -- --
2.0 517 1.474 -- --
Table 46: Data of calibration curve of SRB in surfactant media
Amount of Dye (g) Absorbance
2E-5 0.047
4E-5 0.092
8E-5 0.177
1.2E-4 0.257
1.6E-4 0.341
2.4E-4 0.512
4E-4 0.82
6E-4 1.23
1E-3 2.059
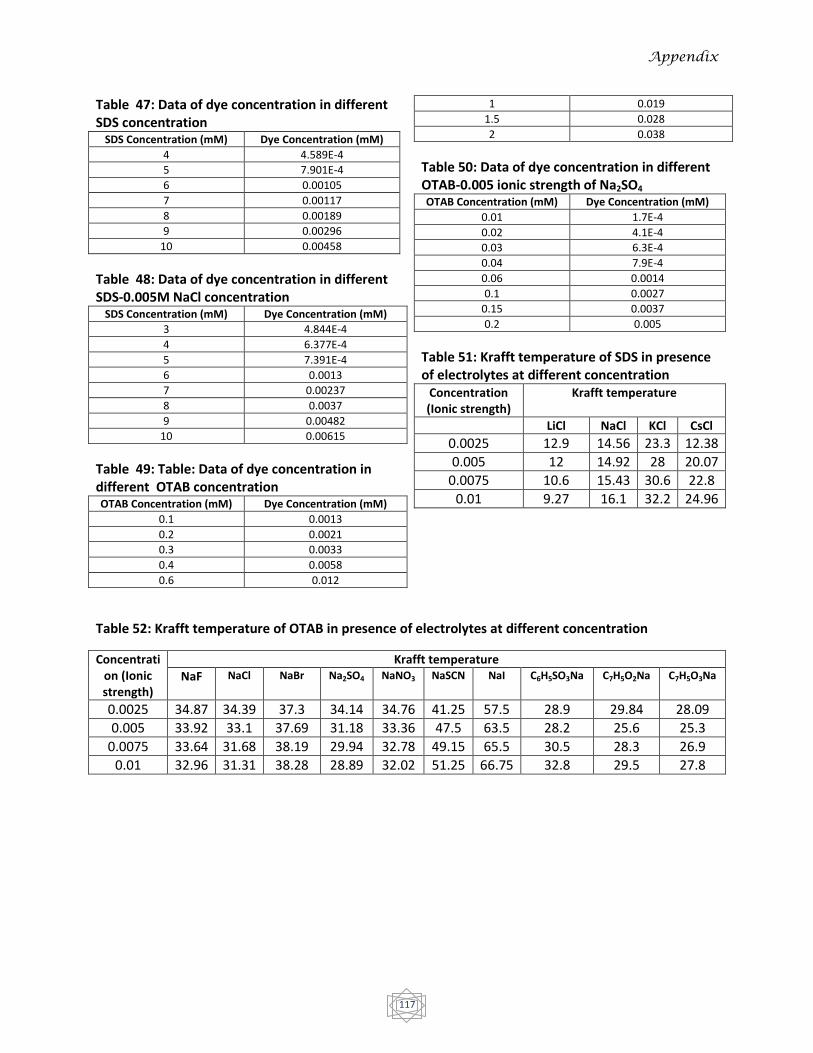
Appendix
117
Table 47: Data of dye concentration in different SDS concentration
SDS Concentration (mM) Dye Concentration (mM)
4 4.589E-4
5 7.901E-4
6 0.00105
7 0.00117
8 0.00189
9 0.00296
10 0.00458
Table 48: Data of dye concentration in different SDS-0.005M NaCl concentration
SDS Concentration (mM) Dye Concentration (mM)
3 4.844E-4
4 6.377E-4
5 7.391E-4
6 0.0013
7 0.00237
8 0.0037
9 0.00482
10 0.00615
Table 49: Table: Data of dye concentration in different OTAB concentration OTAB Concentration (mM) Dye Concentration (mM)
0.1 0.0013
0.2 0.0021
0.3 0.0033
0.4 0.0058
0.6 0.012
1 0.019
1.5 0.028
2 0.038
Table 50: Data of dye concentration in different OTAB-0.005 ionic strength of Na2SO4 OTAB Concentration (mM) Dye Concentration (mM)
0.01 1.7E-4
0.02 4.1E-4
0.03 6.3E-4
0.04 7.9E-4
0.06 0.0014
0.1 0.0027
0.15 0.0037
0.2 0.005
Table 51: Krafft temperature of SDS in presence of electrolytes at different concentration
Concentration (Ionic strength)
Krafft temperature
LiCl NaCl KCl CsCl
0.0025 12.9 14.56 23.3 12.38
0.005 12 14.92 28 20.07
0.0075 10.6 15.43 30.6 22.8
0.01 9.27 16.1 32.2 24.96
Table 52: Krafft temperature of OTAB in presence of electrolytes at different concentration
Concentration (Ionic strength)
Krafft temperature
NaF NaCl NaBr Na2SO4 NaNO3 NaSCN NaI C6H5SO3Na C7H5O2Na C7H5O3Na
0.0025 34.87 34.39 37.3 34.14 34.76 41.25 57.5 28.9 29.84 28.09
0.005 33.92 33.1 37.69 31.18 33.36 47.5 63.5 28.2 25.6 25.3
0.0075 33.64 31.68 38.19 29.94 32.78 49.15 65.5 30.5 28.3 26.9
0.01 32.96 31.31 38.28 28.89 32.02 51.25 66.75 32.8 29.5 27.8

Appendix
118
CALCULATION
Micellization
Counter ion binding calculation: (from data of conductometric method used for CMC
measurement)
In aqueous solution and in salt solution the way of calculation of counter ion binding (𝛽) is
same.
𝛽 = (1 − 𝛼)
𝛼 = 𝑆𝑙𝑜𝑝𝑒 𝑜𝑓 𝑝𝑜𝑠𝑡𝑚𝑖𝑐𝑒𝑙𝑙𝑎𝑟 𝑧𝑜𝑛𝑒
𝑆𝑙𝑜𝑝𝑒 𝑜𝑓 𝑝𝑟𝑒𝑚𝑖𝑐𝑒𝑙𝑙𝑎𝑟 𝑧𝑜𝑛𝑒
Example: At 293K in SDS solution
The value of post-micellar region = 25.39650 (by taking the Fit Linear)
The value of pre-micellar region = 64.70421 (by taking the Fit Linear)
Now, 𝛼 = 25.39650
64.70421= 0.392502
So, 𝛽 = 0.607
Note: At all temperatures and medium 𝛼 value was calculated in the same way.
Thermodynamic parameters calculation for aqueous SDS solution
Mole fraction calculation
At 293K, the CMC of aqueous SDS solution = 8.09 mM. During this CMC value the total volume of the solution is (50+9.86) = 59.86 ml.
1000 ml 1M SDS solution contains = 288.37g SDS
So, 59.86 ml 0.00809 M SDS solution contains = 288.37×59.86×0.00809
1000 = 0.1396g SDS
Mole of SDS = 0.1396
288.37 = 4.841×10⁻⁴
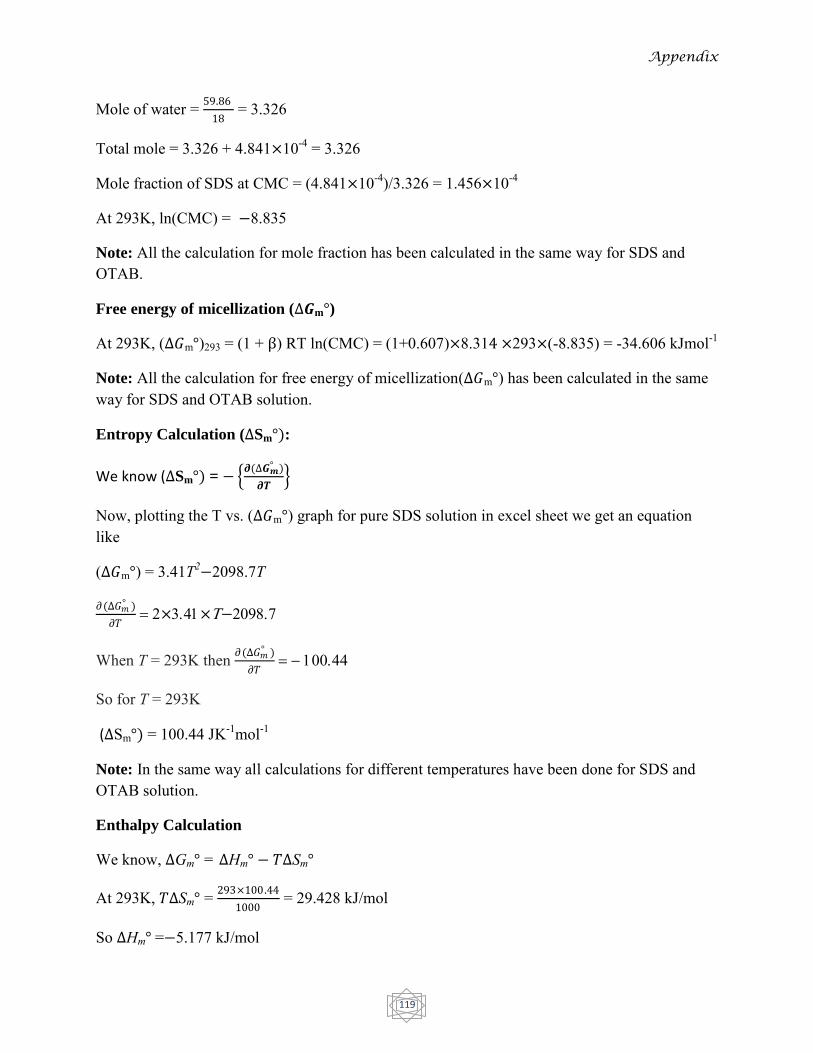
Appendix
119
Mole of water = 59.86
18 = 3.326
Total mole = 3.326 + 4.841×10-4 = 3.326
Mole fraction of SDS at CMC = (4.841×10⁻⁴)/3.326 = 1.456×10⁻⁴
At 293K, ln(CMC) = −8.835
Note: All the calculation for mole fraction has been calculated in the same way for SDS and OTAB.
Free energy of micellization (∆𝑮m°)
At 293K, (∆𝐺m°)293 = (1 + β) RT ln(CMC) = (1+0.607)×8.314 ×293×(-8.835) = -34.606 kJmol-1
Note: All the calculation for free energy of micellization(∆𝐺m°) has been calculated in the same way for SDS and OTAB solution.
Entropy Calculation (∆Sm°):
We know (∆Sm°) = − 𝝏(∆𝑮𝒎
° )
𝝏𝑻
Now, plotting the T vs. (∆𝐺m°) graph for pure SDS solution in excel sheet we get an equation like
(∆𝐺m°) = 3.41T2−2098.7T
𝜕(∆𝐺𝑚° )
𝜕𝑇××−
When T = 293K then 𝜕(∆𝐺𝑚° )
𝜕𝑇
So for T = 293K
(∆Sm°) = 100.44 JK-1mol-1
Note: In the same way all calculations for different temperatures have been done for SDS and OTAB solution.
Enthalpy Calculation
We know, ∆Gm° = ∆Hm° − 𝑇∆Sm°
At 293K, 𝑇∆Sm° = 293×100.44
1000 = 29.428 kJ/mol
So ∆Hm° =−5.177 kJ/mol
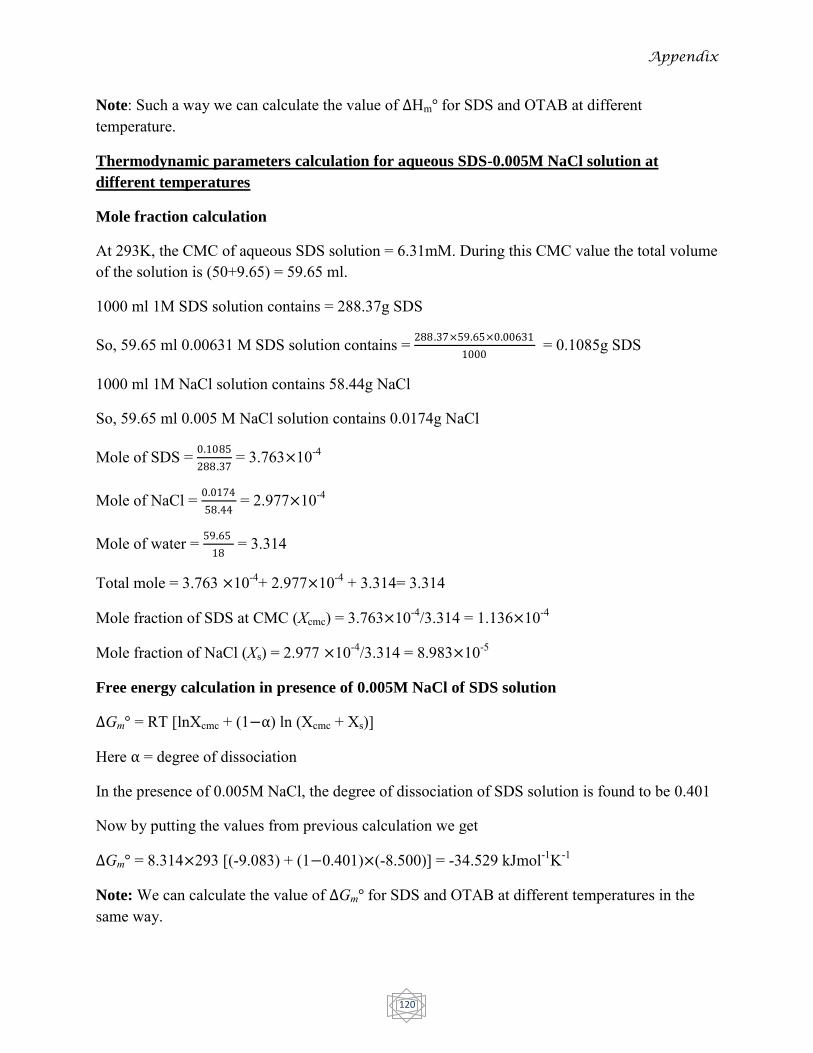
Appendix
120
Note: Such a way we can calculate the value of ∆Hm° for SDS and OTAB at different temperature.
Thermodynamic parameters calculation for aqueous SDS-0.005M NaCl solution at
different temperatures
Mole fraction calculation
At 293K, the CMC of aqueous SDS solution = 6.31mM. During this CMC value the total volume of the solution is (50+9.65) = 59.65 ml.
1000 ml 1M SDS solution contains = 288.37g SDS
So, 59.65 ml 0.00631 M SDS solution contains = 288.37×59.65×0.00631
1000 = 0.1085g SDS
1000 ml 1M NaCl solution contains 58.44g NaCl
So, 59.65 ml 0.005 M NaCl solution contains 0.0174g NaCl
Mole of SDS = 0.1085
288.37 = 3.763×10⁻⁴
Mole of NaCl = 0.0174
58.44 = 2.977×10⁻⁴
Mole of water = 59.65
18 = 3.314
Total mole = 3.763 ×10⁻⁴+ 2.977×10⁻⁴ + 3.314= 3.314
Mole fraction of SDS at CMC (Xcmc) = 3.763×10⁻⁴/3.314 = 1.136×10⁻⁴
Mole fraction of NaCl (Xs) = 2.977 ×10⁻⁴/3.314 = 8.983×10⁻⁵
Free energy calculation in presence of 0.005M NaCl of SDS solution
∆Gm° = RT [lnXcmc + (1−α) ln (Xcmc + Xs)]
Here α = degree of dissociation
In the presence of 0.005M NaCl, the degree of dissociation of SDS solution is found to be 0.401
Now by putting the values from previous calculation we get
∆Gm° = 8.314×293 [(-9.083) + (1−0.401)×(-8.500)] = -34.529 kJmol-1K-1
Note: We can calculate the value of ∆Gm° for SDS and OTAB at different temperatures in the same way.
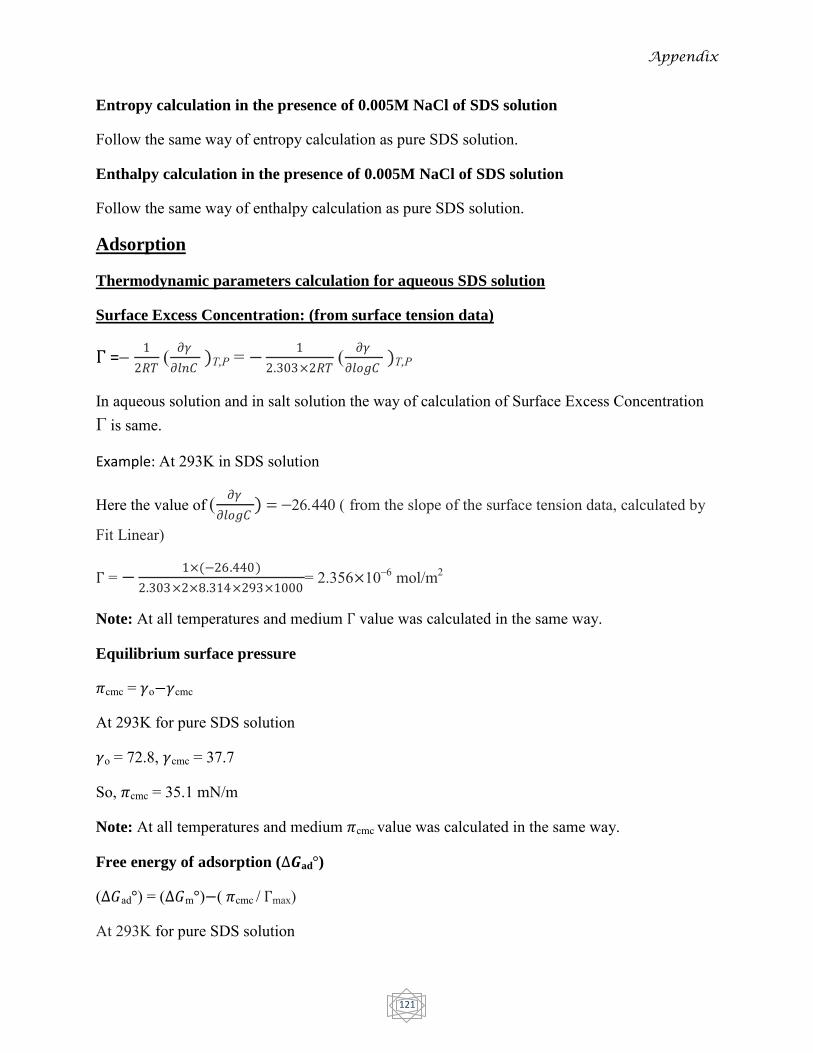
Appendix
121
Entropy calculation in the presence of 0.005M NaCl of SDS solution
Follow the same way of entropy calculation as pure SDS solution.
Enthalpy calculation in the presence of 0.005M NaCl of SDS solution
Follow the same way of enthalpy calculation as pure SDS solution.
Adsorption
Thermodynamic parameters calculation for aqueous SDS solution
Surface Excess Concentration: (from surface tension data)
Γ =1
2𝑅𝑇
𝜕𝛾
𝜕𝑙𝑛𝐶 )TP = − 1
2.303×2𝑅𝑇
𝜕𝛾
𝜕𝑙𝑜𝑔𝐶 )TP
In aqueous solution and in salt solution the way of calculation of Surface Excess Concentration Γ is same.
Example: At 293K in SDS solution
Here the value of 𝜕𝛾
𝜕𝑙𝑜𝑔𝐶)from the slope of the surface tension data, calculated by
Fit Linear)
Γ = −1×(−26.440)
2.303×2×8.314×293×1000= 2.356×10mol/m2
Note: At all temperatures and medium Γ value was calculated in the same way.
Equilibrium surface pressure
𝜋cmc = 𝛾o−𝛾cmc
At 293K for pure SDS solution
𝛾o = 72.8, 𝛾cmc = 37.7
So, 𝜋cmc = 35.1 mN/m
Note: At all temperatures and medium 𝜋cmc value was calculated in the same way.
Free energy of adsorption (∆𝑮ad°)
(∆𝐺ad°) = (∆𝐺m°)−( 𝜋cmc / Γmax)
At 293K for pure SDS solution
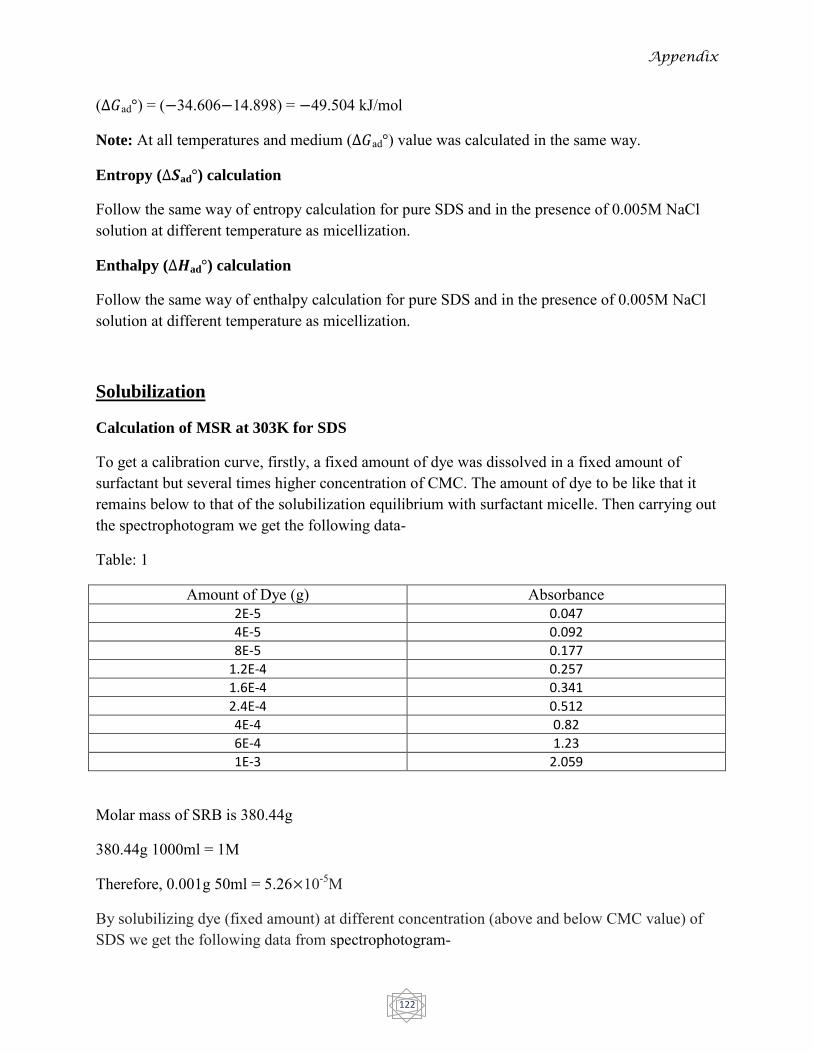
Appendix
122
(∆𝐺ad°) = (−34.606−14.898) = −49.504 kJ/mol
Note: At all temperatures and medium (∆𝐺ad°) value was calculated in the same way.
Entropy (∆𝑺ad°) calculation
Follow the same way of entropy calculation for pure SDS and in the presence of 0.005M NaCl solution at different temperature as micellization.
Enthalpy (∆𝑯ad°) calculation
Follow the same way of enthalpy calculation for pure SDS and in the presence of 0.005M NaCl solution at different temperature as micellization.
Solubilization
Calculation of MSR at 303K for SDS
To get a calibration curve, firstly, a fixed amount of dye was dissolved in a fixed amount of surfactant but several times higher concentration of CMC. The amount of dye to be like that it remains below to that of the solubilization equilibrium with surfactant micelle. Then carrying out the spectrophotogram we get the following data-
Table: 1
Amount of Dye (g) Absorbance 2E-5 0.047
4E-5 0.092
8E-5 0.177
1.2E-4 0.257
1.6E-4 0.341
2.4E-4 0.512
4E-4 0.82
6E-4 1.23
1E-3 2.059
Molar mass of SRB is 380.44g
380.44g 1000ml = 1M
Therefore, 0.001g 50ml = 5.26×10⁻⁵M
By solubilizing dye (fixed amount) at different concentration (above and below CMC value) of SDS we get the following data from spectrophotogram-

Appendix
123
Table: 2
Surfactant Concentration (M) Absorbance 0.004 0.018
0.005 0.031
0.006 0.041
0.007 0.046
0.008 0.074
0.009 0.116
0.01 0.18
Using absorbance value from Table-2 we can calculate corresponding amount of dye from Table-1 by plotting graph.
Table: 3
Surfactant Concentration (mM) Dye Concentration (mM) 4 4.589E-4
5 7.901E-4
6 0.00105
7 0.00117
8 0.00189
9 0.00296
10 0.00458

Published Articles
124
List of publications related to the present work
Journal Paper
1. Islam, M. N.; Sarker, K. C.; Sharker, K. K.; Influence of some Hofmeister anions on the Krafft
temperature and micelle formation of cetylpyridinium bromide in aqueous solution.
J Surfact Deterg. 18: 9-16, 2015
2. Islam, M. N.; Sharker, K. K.; Sarker, K. C.; Salt-Induced Modulation of the Krafft Temperature
and Critical Micelle Concentration of Benzyldimethylhexadecylammonium Chloride.
J Surfact Deterg. 18:651–659, 2015
3. Sharker, K. K.; Islam, M. N.; Das, S.; Influence of Some Counterions on the Krafft Temperature
and Related Physico-Chemical Properties of Aqueous Octadecyltrimethylammonium Bromide
Solution. J Surfact Deterg. (Submitted)
4. Sharker, K. K.; Islam, M. N.; Effect of some salts on the Krafft temperature and micellization of Sodium dodecyl sulfate and their thermodynamic studies (To be Submitted)
Conference Paper
1. Sharker, K. K.; Islam, M. N.; Counter-ion Effects on Krafft Temperature and Related Behavior of
Octadecyltrimethylammonium Bromide in Aqueous Solution (16th Asian Chemical Congress, 16-19
March, 2016, Dhaka, Bangladesh)
Related Documents