Cost-efficiency of biodiversity indicators for Mediterranean ecosystems and the effects of socio-economic factors Yael Mandelik 1 *, Uri Roll 2 and Aliza Fleischer 3 1 Department of Entomology, The Hebrew University of Jerusalem, PO Box 12, Rehovot 76100, Israel; 2 Biomathematics Unit, Department of Zoology, Tel-Aviv University, Tel-Aviv 69978, Israel; and 3 Department of Agricultural Economics and Management, The Hebrew University of Jerusalem, PO Box 12, Rehovot 76100, Israel Summary 1. Biodiversity assessments usually rely on indicators as surrogates for direct measures. Although the ecological validity of indicators has been extensively studied, their economic feasibility and cost- effectiveness have seldom been assessed. 2. Here we present a novel generic framework for analysing the cost-effectiveness of biodiversity indicators and the effect of budget allocations on the quality of biodiversity surveys. We sampled a suite of environmental and biological indicators in a Mediterranean ecosystem and calculated their cost-effectiveness using measures of species richness, rarity and composition. 3. Environmental indicators were the cheapest indicator for richness and rarity but not for compo- sition patterns, and they conveyed low accuracy (<70% of the variation in diversity patterns). For higher accuracy, plants and a combination of plants and insects provided the most cost-effective indication of species richness, rarity and composition. Representation of composition patterns conveyed higher representation accuracy per given budget than richness patterns. 4. Marginal costs of improving the survey’s ecological performance were high, making a taxonomi- cally extensive sampling strategy non-cost-effective. Taxonomic identification of species-rich inver- tebrate taxa is the major cost component in surveying these groups, and the availability of taxonomic expertise is a critical factor in determining their cost-effectiveness. 5. We further illustrated the effects of socio-economic context on the cost-effectiveness of indicators by comparing the expected costs of conducting this survey in California and Morocco, two Mediter- ranean-type regions at opposite socio-economic extremes. Labour costs and the need for taxonomic out-sourcing were the main sources of differences between regions, showing that cost-effectiveness of indicators is, to a great extent, context-dependent, and that the availability of in-house taxonomic expertise is a major determinant. 6. Synthesis and applications. The acquisition of reliable data on biodiversity distribution is often a major limiting factor in effective conservation planning and management. We show that biodiver- sity representation and site prioritization can be conducted efficiently with limited funds by explic- itly incorporating costs into the selection of indicators. The generic framework developed here for cost-efficiency analysis of indicators can improve the quality and scope of biodiversity surveys and subsequently improve conservation decision-making. Key-words: biodiversity indicator, biodiversity survey, biological indicator, conservation planning, cost-efficiency analysis, environmental indicator, Mediterranean ecosystem Introduction Acquiring reliable data on biodiversity distribution is often a prerequisite for effective priority setting and management of conservation areas (Margules & Pressey 2000). However, due to limited time, money and taxonomic expertise, surrogates commonly replace direct biodiversity assessments. These sur- rogates are broadly categorized as environmental indicators, i.e. physical characteristics of the environment, and biological indicators – subsets of taxa expected to reflect wider pat- terns of diversity (Oliver et al. 2004). Two fundamental *Correspondence author. E-mail: [email protected] Journal of Applied Ecology doi: 10.1111/j.1365-2664.2010.01864.x Ó 2010 The Authors. Journal compilation Ó 2010 British Ecological Society

Welcome message from author
This document is posted to help you gain knowledge. Please leave a comment to let me know what you think about it! Share it to your friends and learn new things together.
Transcript

Cost-efficiency of biodiversity indicators for
Mediterranean ecosystems and the effects
of socio-economic factors
Yael Mandelik1*, Uri Roll2 and Aliza Fleischer3
1Department of Entomology, The Hebrew University of Jerusalem, PO Box 12, Rehovot 76100, Israel;2Biomathematics Unit, Department of Zoology, Tel-Aviv University, Tel-Aviv 69978, Israel; and 3Department of
Agricultural Economics and Management, The Hebrew University of Jerusalem, PO Box 12, Rehovot 76100, Israel
Summary
1. Biodiversity assessments usually rely on indicators as surrogates for direct measures. Although
the ecological validity of indicators has been extensively studied, their economic feasibility and cost-
effectiveness have seldom been assessed.
2. Here we present a novel generic framework for analysing the cost-effectiveness of biodiversity
indicators and the effect of budget allocations on the quality of biodiversity surveys. We sampled a
suite of environmental and biological indicators in a Mediterranean ecosystem and calculated their
cost-effectiveness usingmeasures of species richness, rarity and composition.
3. Environmental indicators were the cheapest indicator for richness and rarity but not for compo-
sition patterns, and they conveyed low accuracy (<70% of the variation in diversity patterns). For
higher accuracy, plants and a combination of plants and insects provided the most cost-effective
indication of species richness, rarity and composition. Representation of composition patterns
conveyed higher representation accuracy per given budget than richness patterns.
4. Marginal costs of improving the survey’s ecological performance were high, making a taxonomi-
cally extensive sampling strategy non-cost-effective. Taxonomic identification of species-rich inver-
tebrate taxa is the major cost component in surveying these groups, and the availability of
taxonomic expertise is a critical factor in determining their cost-effectiveness.
5. We further illustrated the effects of socio-economic context on the cost-effectiveness of indicators
by comparing the expected costs of conducting this survey in California andMorocco, twoMediter-
ranean-type regions at opposite socio-economic extremes. Labour costs and the need for taxonomic
out-sourcing were the main sources of differences between regions, showing that cost-effectiveness
of indicators is, to a great extent, context-dependent, and that the availability of in-house taxonomic
expertise is a major determinant.
6. Synthesis and applications. The acquisition of reliable data on biodiversity distribution is often a
major limiting factor in effective conservation planning and management. We show that biodiver-
sity representation and site prioritization can be conducted efficiently with limited funds by explic-
itly incorporating costs into the selection of indicators. The generic framework developed here for
cost-efficiency analysis of indicators can improve the quality and scope of biodiversity surveys and
subsequently improve conservation decision-making.
Key-words: biodiversity indicator, biodiversity survey, biological indicator, conservation
planning, cost-efficiency analysis, environmental indicator, Mediterranean ecosystem
Introduction
Acquiring reliable data on biodiversity distribution is often a
prerequisite for effective priority setting and management of
conservation areas (Margules & Pressey 2000). However, due
to limited time, money and taxonomic expertise, surrogates
commonly replace direct biodiversity assessments. These sur-
rogates are broadly categorized as environmental indicators,
i.e. physical characteristics of the environment, and biological
indicators – subsets of taxa expected to reflect wider pat-
terns of diversity (Oliver et al. 2004). Two fundamental*Correspondence author. E-mail: [email protected]
Journal of Applied Ecology doi: 10.1111/j.1365-2664.2010.01864.x
� 2010 The Authors. Journal compilation � 2010 British Ecological Society
requirements of indicators are that they be ecologically reli-
able, i.e. adequately reflect biodiversity patterns, and economi-
cally favourable, i.e. less costly than a full biodiversity survey
(Lawton et al. 1998; Wilson 2000). To date, most of the
research on biodiversity indicators has focussed on evaluating
their ecological performance but has largely neglected their
cost-effectiveness, i.e. the ratio between their ecological perfor-
mance and the cost of surveying them (Gardner et al. 2008;
Grantham et al. 2008).
Biodiversity surveys are an important tool in conservation
decision-making (Margules & Sarkar 2007). Generally, higher
levels of protection will be given to regions that are physically
and biologically more diverse and ⁄or unique. Such decisions
require detailed knowledge of the different taxa inhabiting the
area, their relative abundance, and the temporal and spatial
variation in their distribution. However, a severe shortage of
funding and limited time lead to partial often biased surveys of
a narrow set of well-known and easily surveyed indicators that
do not necessarily reflect wider diversity patterns, e.g. various
vertebrate groups (Balmford & Whitten 2003). Choice of the
most appropriate biodiversity indicator is a hotly debated
topic, as using unreliable indicators can lead to erroneous deci-
sions (Grand et al. 2007). Many selection criteria have been
proposed and a large body of literature exists on the topic (e.g.
Pearson 1994;McGeoch 1998; Noss 1999; Hilty &Merenlender
2000).
However, establishing ecological validity is only the first
step in choosing an appropriate indicator: the cost of sam-
pling often dictates which indicator(s) will ultimately be used
because the limited conservation funds need to promote
biodiversity conservation through improved planning and
management, not just data compilation. Nevertheless, most
studies on biodiversity indicators largely ignore economic
constraints. The incorporation of economic factors in theo-
retical conservation planning is relatively new (Faith et al.
1996, 2003; Faith & Walker 2002; Cowling et al. 2004;
Moore et al. 2004; McBride et al. 2007), and costs are usu-
ally integrated only late in the planning process, for example,
when considering alternatives for land acquisition, manage-
ment actions, and lost-opportunity costs (Naidoo et al. 2006;
Wilson et al. 2007; Bode et al. 2008a). Economic concepts
such as efficiency and return-on-investment are gradually
being incorporated into conservation thinking (Brooks et al.
2006; Franco, Palmeirim & Sutherland 2007; Murdoch et al.
2007; Underwood et al. 2008), but their application to the
choice of biodiversity indicators has been very limited
(Hortal & Lobo 2005; Bode et al. 2008b; Grantham et al.
2008, 2009). A recent study in the Brazilian Amazon demon-
strated a strong relationship between survey costs and eco-
logical performance of indicators in discriminating habitat
types (Gardner et al. 2008). To the best of our knowledge,
cost-efficiency of biodiversity indicators has not been investi-
gated in other ecosystems.
The cost structure of a survey – the relative cost of its major
components, labour, field and laboratory equipment and sup-
plies, and travel and lodging – also plays an important role in
the choice of indicator(s), and thus on diversity mapping. Cost
structure may differ considerably between eco-regions and
between countries within eco-regions, depending on their: (i)
level of economic development, which affects labour and lod-
ging expenses, and can be expressed by per capita GDP (Gross
Domestic Product) (Diener & Suh 1997); (ii) availability of
local taxonomic expertise, i.e. whether taxonomic identifica-
tion can be done by local experts or needs to be out-sourced by
either sending specimens abroad or hosting foreign experts;
and (iii) availability of research infrastructure, e.g. laboratories
equipped for taxonomic work, reference collections, field gear,
etc. These socio-economic factors may affect the cost-effective-
ness of indicators, and lead to the application of different indi-
cators in different countries. Therefore, conservation decisions
ultimately depend on survey budgets and cost structure. The
potential effects of socio-economic factors on survey cost struc-
ture and consequently, on conservation decision-making have
received only limited attention to date (Lawton et al. 1998;
Balmford&Gaston 1999).
The Mediterranean biome, a global biodiversity hot spot of
highest conservation priority (Myers et al. 2000; Brooks et al.
2006), is under intense development pressure (Hoekstra et al.
2005). Conservation practitioners and planners are often faced
with local-scale decision-making, especially in densely popu-
lated areas where only limited land is still available, and habitat
loss and fragmentation are intense. Indicators are needed
mostly for local-scale biodiversity assessments, as many land-
use conflicts are confined to an area of a few square kilometres
(Vogiatzakis, Mannion & Griffiths 2006). Tools developed for
large spatial scales (hundreds to thousands of square kilome-
tres) may not be efficient for finer-scale diversity assessments
because the changes in patterns are more subtle and spatial
autocorrelation may be high. For example, the region of the
present study was given high conservation value in a country-
level evaluation (TAHAL 2004). However, detailed surveys
were subsequently conducted when various local-scale devel-
opment projects were proposed and could not be adequately
scrutinized using the coarser evaluation method (Kaplan,
Kimhi&Choshen 2000). TheMediterranean biome is an inter-
esting case study for exploring the effects of the biodiversity
survey’s cost structure on cost-efficiency of indicators, as coun-
tries within this climatic region differ significantly in per capita
GDP, availability of taxonomic expertise, and institutional
infrastructure for biodiversity research. At one end there are
countries ⁄ regions with developed economies (relatively high
per capita GDP) such as California, some Southern European
countries andAustralia, where standards of living are high and
well-established research institutions provide taxonomic sup-
port and research infrastructure. At the other extreme are the
countries ⁄ regions with a developing economy (relatively low
per capita GDP), such as some Middle Eastern and North
African countries, where standards of living are lower and
taxonomic expertise and research infrastructure are largely
lacking.
In this study, we investigate the cost-effectiveness of biodi-
versity indicators for local-scale diversity assessments in a
Mediterranean ecosystem and explore how our results
are affected by socio-economic factors, reflecting other
2 Y. Mandelik, U. Roll & A. Fleischer
� 2010 The Authors. Journal compilation � 2010 British Ecological Society, Journal of Applied Ecology

Mediterranean countries ⁄ regions. Specifically, we ask the fol-
lowing questions: (i) What is the shape of the cost-efficiency
curve for different indicators and sets of indicators in the stud-
ied Mediterranean ecosystem? (ii) What is the optimal choice
of indicator(s) under different budget constraints? (iii) How
does budget allocation for biodiversity surveys affect site prior-
itization? (iv) How may socio-economic context generally
affect the survey cost structure and ultimately the cost-
effectiveness, and optimal choice of indicators?
Materials and methods
ECOLOGICAL DATA
In 2003–2004, a comprehensive biodiversity survey was conducted in
the JerusalemMountains and Judean foothills, a Mediterranean eco-
system in central Israel. The survey encompassed forty 1000-m2 plots
representing the typical vegetation formations of the region (see
Mandelik 2005; Mandelik et al. 2007). Five taxa were selected, based
on the availability of standardized survey methodologies, local taxo-
nomic expertise, sensitivity to local-scale habitat changes, and proven
indicative abilities in other ecosystems on local and wider spatial
scales (see review by Hilty &Merenlender 2000; Rodrigues & Brooks
2007): annual and perennial vascular plants, ground-dwelling beetles,
moths, spiders, and small mammals. Moths were sampled in 25 plots
that were not adjacent to light-contamination sources to avoid biased
sampling. Additional species-poor taxa were sampled (scorpions, five
species; diplopods, six species; reptiles, six species) but they were
excluded from the analysis due to their low species numbers and
abundance which limited the power of the analysis. The sampling
effort needed to achieve a representative sample in this ecosystem was
previously investigated (Mandelik et al. 2002) and set accordingly. In
addition, a set of coarse- and fine-scale environmental variables (alti-
tude, slope, aspect, foliage cover and heterogeneity, ground cover and
heterogeneity; see Mandelik 2005) were recorded. All taxa were iden-
tified,mostly to the species level, by local expert taxonomists. The sur-
vey accounted for the major seasonal and spatial variation
components in the studied ecosystem. Detailed species lists and diver-
sity analyses are reported in Mandelik (2005) and Mandelik et al.
(2007).
COST DATA
We classified three main cost categories: labour, equipment ⁄ supplies,travel and lodging, and four main stages in biodiversity surveys: field
collection, laboratory processing (including taxonomic identifica-
tion), museum curation (including labelling and data entry, and pres-
ervation), and data analysis. We calculated the monetary cost of
surveying each of the indicators by summing the different cost com-
ponents at each stage (see Table S1, Supporting information for
detailed cost calculations).
Labour costs in Israel were calculated by multiplying the number
of hours spent working on each indicator, during the four described
stages, by the hourly cost to the employer. We classified three profes-
sional levels of personnel involved in the survey: unskilled field and
laboratory assistants (6 USD per hour), trained technicians (includ-
ing graduate students; 10 USD per hour), and expert biologists
(32 USD per hour). Hourly payment rates were obtained from the
standard salary tables of academic institutions in Israel. Perishable
materials and supplies included field and laboratory items used for
field sampling and processing of specimens, such as traps, chemicals,
insect pins, etc. Non-perishable equipment included items used for
specimen identification and long-term storage such as stereoscopes
and storage cabinets. Travel costs were calculated based on the dis-
tance of the field site from the academic institution (Tel-Aviv Univer-
sity), lodging costs were added when an overnight stay was required,
and food costs were calculated on a per diem basis. Labour costs for
each taxon were estimated for the survey as a whole, while perishable
materials and supplies and travel and lodging were calculated for a
single sampling and multiplied by the number of samplings con-
ducted.
When conducting field surveys, some of the costs, such as travel
and lodging, are shared among taxa. Similarly, when using non-selec-
tive traps, non-target taxa will be sampled. Thus the combined costs
of sampling sets of indicators are usually lower than implied by a sim-
ple additive calculation of single-taxon survey costs. To test the cost-
effectiveness of using single vs. suites of indicators, we calculated the
cost of sampling sets (combinations) of indicator taxa, taking into
account these ‘shared costs’. In total, we had 26 different indicators
and sets of indicators – five single taxon, environmental variables
(regarded as one type of indicator), 10 possible pairs and 10 possible
triplets of indicators.
DATA ANALYSIS
Ecological performance of indicators
Each indicator was tested for its ability to reflect species richness,
rarity (number of rare species) and composition (b diversity using
Sorensen’s qualitative similarity index) of all taxa combined, i.e.
the indicator taxon was a subset of whole biodiversity measured
(Rodrigues & Brooks 2007). Naturally, the ecological performance of
each taxon will be affected by the number of species it adds to the
overall species pool. However, representation of total diversity pat-
terns is generally the ultimate goal of biodiversity surveys and we
wanted our analysis to reflect this. In addition, there are no external
sources for diversity-pattern comparisons in this region. The indica-
tive ability in our analysis is comprised of the number of species the
indicator taxon contributes to the total species pool and its correlative
relation with the other taxa. Rare species were classified as those in
the first quartile of the abundance distribution of each taxon (Gaston
1994) corresponding to 50–76% of the species of each taxon. For all
analyses, we included only the 25 plots in which moths were sampled.
We use the term ‘diversity’ to refer collectively to the three compo-
nents analysed (species richness, rarity and composition).
Cross-taxon congruence in species richness and rarity was analysed
by regressing the richness and rarity of each indicator (using linear
regression) and set of indicators (using stepwise multiple regression)
against the richness and rarity of all taxa combined, respectively.
Cross-taxon congruence in species composition was analysed using
the average Sorensen’s similarity index of each plot with all other
plots, calculated for each indicator and set of indicators. These values
were regressed against the average Sorensen’s index for all taxa com-
bined. We further examined correlations between the regression coef-
ficients for the analyses of species richness, rarity and composition in
order to test for congruence between these parameters.
We used a principal component analysis (PCA) on the environmen-
tal variables to extract main axes of environmental variation while
accounting for correlative variables (see Mandelik 2005). Ground
and vertical cover variables were arcsine transformed; altitude,
aspect, and slope were square-root transformed. We conducted a for-
ward stepwise multiple regression to test the relationships between
the environmental variables (four main PCA axes, accounting for
Cost-efficiency of biodiversity indicators 3
� 2010 The Authors. Journal compilation � 2010 British Ecological Society, Journal of Applied Ecology

over 79% of the variation in the environmental variables) and species
richness, rarity, and composition. We obtained consistent results
when applying forward vs. backward selection procedures (Mandelik
2005) and further reduced potential inconsistencies by using non-
correlated PCA axes (Whittingham et al. 2006).
Cost-efficiency analysis of indicators
We used the adjustedR2 of the regression models of the richness, rar-
ity and composition analyses as measures of ecological efficiency. We
plotted these coefficients against the cost of sampling each indicator
and set of indicators to obtain a cost-efficiency curve. The indica-
tors ⁄ sets of indicators that have the highest ecological performance
under different budgets collectively form what we define as a ‘cost-
efficiency frontier’. All indicators not on the frontier have equal or
lower ecological performance relative to those on it, but cost more.
We applied the Bonferroni method to account for multiple testing.
Travel and lodging costs are highly case-specific, e.g. dependent on
the distance between study sites and the research institution and logis-
tics. However, since this component may comprise a substantial por-
tion of the survey costs, we tested the correlation between the costs of
conducting the survey with and without travel and lodging for each
indicator ⁄ set of indicators.We further explored the effect of budget allocation on the probabil-
ity of erroneous richness and composition mapping and consequent
erroneous site prioritization. Plots were ranked according to their
total species richness and composition similarity. The latter was based
on average values of the similarity index for the 24 possible pairs of
plots for each plot. These were referred to as the ‘correct rankings’.
For each indicator and set of indicators, we performed a 25-step pro-
cess starting with the plot with the highest number of species, or low-
est similarity values, i.e. the most unique species composition. This
would be the first plot to be set aside for conservation according to
this indicator ⁄ set of indicators. Next, we added the remaining 24
plots, one at a time, according to their number of species, or similarity
index values. We then compared the ‘correct ranking’ with the rank-
ing obtained for each indicator and set of indicators. The number of
plots from the ‘correct ranking’ that were not included in each step of
the indicator ranking were referred to as mistakes in site prioritiza-
tion. We compared these figures to: (i) average mistakes – average
number of erroneous plots chosen compared to the ‘correct ranking’,
for each indicator and set of indicators, at each step separately, and
for all 25 steps together, and (ii) null (baseline) probability of making
such mistakes – the number of erroneous plots from sets of randomly
chosen plots, regardless of their rank.
Finally, we explored the effect of socio-economic factors on the sur-
vey cost structure of indicators by analysing two opposing case stud-
ies – California, among the highest per capita GDP in this biome
(41 663 USD; US BEA 2008), with ample well-established research
institutions harbouring broad taxonomic expertise, and Morocco,
among the lowest per capita GDP in this biome (2145 USD; World
Bank 2008), where taxonomic expertise, as well as infrastructure for
field surveys are largely lacking.
Since the main purpose of this analysis is to provide a general illus-
tration of the impact of socio-economic context on cost-effectiveness
of indicators and since no data are readily available on the exact cost
structure in Morocco or California, we applied the aforementioned
gauges to evaluate the different costs in these countries. We evaluated
the costs of conducting our survey in California and Morocco based
on the per capita GDP ratios in comparison to Israel [used for calcu-
lating expected labour and lodging costs (see Diener & Suh 1997); per
capita GDP of Israel 19 927 USD (World Bank 2008)], travel
expenses compared to Israel (based on cheapest car rental and petrol
rates), and the need for taxonomic out-sourcing and non-perishable
equipment in Morocco but not California (see Table S2, Supporting
information for detailed cost estimations). We evaluated the accuracy
of using per capita GDP ratio as an indicator for the difference in
labour and lodging costs by comparing the ratio between wages of
biological scientists in California (Bureau of Labor Statistics 2008)
and Israel (no exact wage values were available for Morocco). The
ratio between wages and per capita GDP in California and Israel is
2Æ02 and 2Æ09 respectively, corresponding to the ratio between wages
of experts in the two regions ($48Æ57 in California, $24 in Israel). Simi-
lar results were obtained for technicians.We assumed that taxonomic
out-sourcing in Morocco would be needed for the species-rich taxa
for which no species-level field guides are available (i.e. beetles, moths
and spiders) and would include labour costs (calculated at a rate of
3 USD per specimen, based on previous studies conducted in our
region; Y. Mandelik, unpublished data) and costs of shipping speci-
mens to European countries where many of the relevant reference
collections and much of the expertise for the fauna of this region are
found.
Results
A total of 420 plant species (2800 specimens), 424 beetle species
(12 656 individuals), 111 moth species (10 397 individuals),
102 spider species (8119 individuals), and 8 mammalian
species (544 individuals) were sampled (see Mandelik 2005 for
detailed species lists). Surveying these cost 117 806 USD,
of which labour cost 83 884 USD, field and laboratory equip-
ment ⁄ supplies cost 23 262 USD, and travel and lodging cost
10 660 USD.
The correlation between species richness and rarity
accounted for 85% of the variation in regression coefficients
(r = 0Æ921, P � 0Æ001). Correlations between species compo-
sition and species richness and rarity were lower, accounting
for c. 46% and 54% of the variation in regression coefficients,
respectively (composition-richness: r = 0Æ68, P � 0Æ001;composition-rarity: r = 0Æ738,P � 0Æ001).We therefore pres-
ent the cost-efficiency analyses for richness and composition;
cost-effectiveness for rarity was highly similar to that of the
richness analysis.
Travel and lodging constituted on average 11Æ5 ± 5Æ5% of
total survey costs in Israel for the different indicators and sets
of indicators. Survey costs with and without travel and lodging
were highly correlated (R2 = 0Æ996, P � 0Æ001). We therefore
present the analysis in which travel and lodging costs were
excluded, to better focus on the other cost components
analysed.
Labour was the major cost component when sampling
fauna and flora (37Æ5–80% of total costs for the different indi-
cators), but not environmental variables. The expenses for field
vs. laboratory labour differed greatly among taxa and
depended on the ease of their taxonomic identification
(Fig. 1). When sampling beetles, moths and spiders – small-
bodied species-rich arthropod taxa – laboratory work
constituted c. 50–75% of total survey costs, mainly due to
time-consuming specimen identification requiring high exper-
tise. Due to the high cost of labour, total costs incurred in
4 Y. Mandelik, U. Roll & A. Fleischer
� 2010 The Authors. Journal compilation � 2010 British Ecological Society, Journal of Applied Ecology

sampling these indicators were highest (Fig. 1). When
sampling taxa which can be identified with relative ease by
non-experts – small mammals and plants in this study – most
of the costs were incurred in field collection, and total costs
were much lower (Fig. 1). Sampling environmental variables
was by far the cheapest option.
The richness and composition cost-effective frontiers were
similar in terms of included indicators, but throughout much
of the inspected range, the composition frontier was higher,
i.e. it conveyed higher representation accuracy per given bud-
get (Fig. 2; see Table S3, Supporting information for
detailed regression results). Environmental variables repre-
sented 63% of the variation in richness patterns and consti-
tuted the lower end of the curve, but did not correlate
significantly with composition patterns (Fig. 2). While an
exhaustive representation of richness and composition pat-
terns in this ecosystem cost more than 88 000 USD (using
the combination of beetles, plants and moths), only 3% of
this sum (3040 USD) was required for the minimal represen-
tation of richness patterns using environmental variables
(Fig. 2). Only 11% of the total sum (c. 9600 USD) was
required for the minimal representation of 77% of the varia-
tion in species composition by sampling plants. Plants were
included in all sets of indicators along the richness and com-
position frontiers (Fig. 2).
Most indicators and sets of indicators decreased the number
of erroneous plot rankings and improved site prioritization
compared to null (random) site selection (Fig. 3). For the anal-
yses of both species richness and species composition, plants
had the lowest averagemistakes per single indicator taxon, and
beetles and plants had the lowest average mistakes per pair of
indicator taxa (Fig. 3). The combination of beetles, plants and
moths performed best for both richness and composition rep-
resentation, having 0–2 erroneous plots per step (Fig. 3). How-
ever, the combination of beetles and plants, and even plants
alone, had generally lower errors compared to the null and
average number of mistakes using the 26 possible indicators
and sets of indicators.
Labour contributed themost to total costs and to differences
between countries ⁄ regions with different survey cost structures
0
10 000
20 000
30 000
40 000
50 000
60 000
Plants Beetles Moths Spiders Mammals Environmental variables
Cos
ts (U
SD)
Data analysisMuseum curationLaboratory processingField collection
Fig. 1. Survey costs of the different taxo-
nomic and environmental indicators investi-
gated during the four main stages of the
survey: field collection, laboratory process-
ing, museum curation, and data analysis.
Costs do not include travel and lodging.
0·0
0·1
0·2
0·3
0·4
0·5
0·6
0·7
0·8
0·9
1·0
0 10 000 20 000 30 000 40 000 50 000 60 000 70 000 80 000 90 000 100 000
Adju
sted
R2
Cost (USD)
Pl
Ma+Pl
Pl+Mo
Sp+Pl Sp+Ma+Pl
Ma+Pl+Mo Be+Pl
Sp+Pl+Mo
Be+Ma+PlBe+Sp+Pl
Be+Pl+Mo
Env
Ma
Mo
SpSp+Ma
Ma+Mo
Be
Sp+Mo
Be+Ma
Sp+Ma+Mo
Be+Sp
Be+Sp+Ma
Be+MoBe+Ma+Mo
Be+Sp+MoPl Ma+Pl
Pl+Mo
Sp+Pl Sp+Ma+Pl
Ma+Pl+Mo
Be+Pl
Sp+Pl+Mo
Be+Ma+Pl
Be+Sp+Pl
Be+Pl+Mo
Env
Mo
Sp Sp+Ma
Ma+Mo
Be
Sp+Mo
Be+Ma
Sp+Ma+Mo
Be+Sp
Be+Sp+Ma
Be+Mo
Be+Ma+Mo
Be+Sp+Mo
Fig. 2. Cost-efficiency correlation and effi-
ciency frontiers for the 26 indicators and sets
of indicators for cross-taxon congruence in
species richness (squares, dotted line) and
species composition (circles, solid line) using
the Sorensen’s similarity index. Filled
symbols represent significant results; empty
symbols represent non-significant results.
Be-beetles, Env-environmental variables,
Ma-mammals, Mo-moths, Pl-plants, Sp-
spiders. Costs do not include travel and
lodging.
Cost-efficiency of biodiversity indicators 5
� 2010 The Authors. Journal compilation � 2010 British Ecological Society, Journal of Applied Ecology

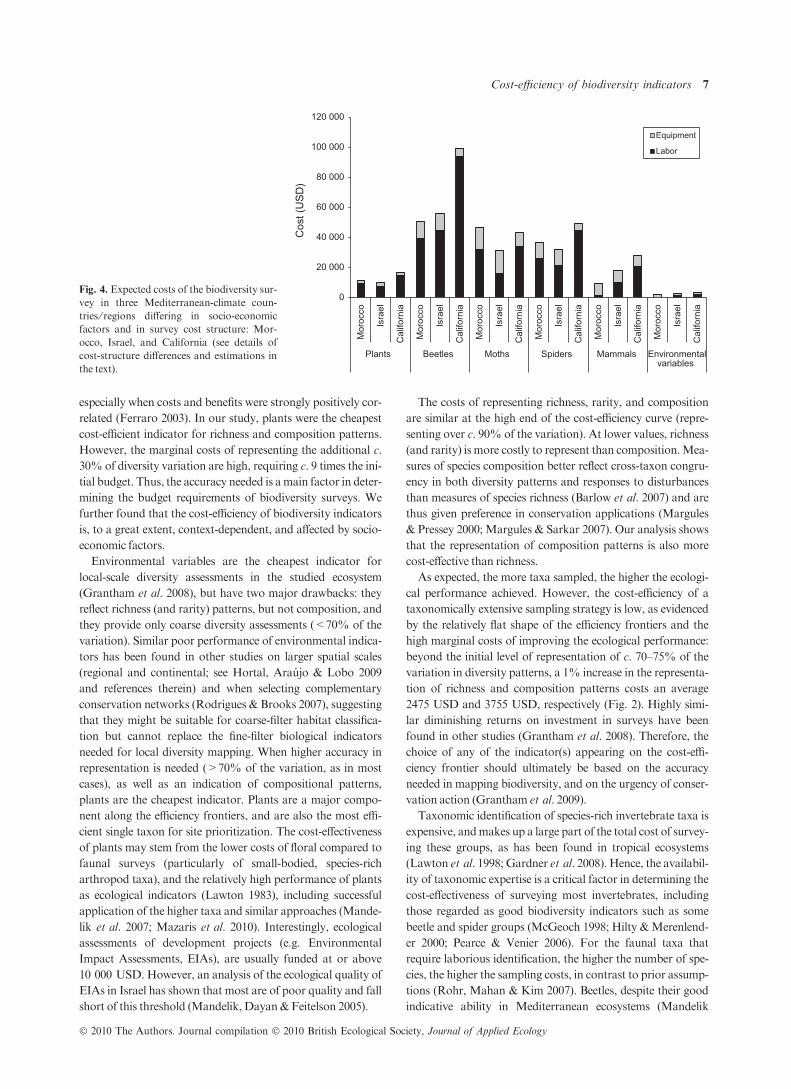
(Fig. 4). These differences were greatest for assistants and tech-
nicians. The estimated expenditure on expert taxonomists was
similar in California and Morocco (106 195 USD and
101 916 USD, respectively), compared to 50 720 USD in
Israel, but constituted 75% of the total estimated survey costs
in Morocco, compared to 51% in California, and 43% in
Israel. For all taxa except moths, sampling was predicted to be
most costly in California, because although taxonomic exper-
tise is available, labour costs are higher (Fig. 4). The estimated
differences between countries ⁄ regions were greatest when sam-
pling beetles, probably because of the expected high diversity
and subsequent extensive taxonomic work. Sampling environ-
mental variables exhibited similar low costs in all three coun-
tries (Fig. 4). Travel and lodging were estimated to constitute
on average 9Æ5 ± 6Æ8% and 9Æ8 ± 5Æ8% of total survey costs
in Morocco and California, respectively, for the different indi-
cators and sets of indicators. Correlation between survey costs
with and without travel and lodging were highly significant for
both California andMorocco (R2 = 0Æ998, 0Æ999 respectively,P > 0Æ001 for each).
Discussion
This study provides the first cost-efficiency analyses of environ-
mental and biological biodiversity indicators for a Mediterra-
nean ecosystem. By presenting the use of a cost-efficiency
frontier and analysing how it is affected by different socio-
economic factors, we provide a generic framework that can be
instructive for other Mediterranean ecosystems, as well as
other biomes. Though this study is prone to case-specific
issues, such as the sampling effort and sampling techniques
applied, our survey addressed main seasonal and spatial varia-
tion in the ecosystem, and we obtained comprehensive data
sets (Mandelik et al. 2002; Mandelik 2005). An important
findingwas that aminimal representation of c. 70%of the vari-
ation in diversity patterns is feasible, even with limited funds
(less than 10 000 USD), if a cost-efficient indicator is applied.
Favourable conservation outcomes in other problems related
to the economics of biodiversity conservation have been
obtained upon incorporation of cost-benefit information
(Naidoo & Adamowicz 2005; Naidoo & Ricketts 2006),
0
1
2
3
4
5
6
7
8
1 2 3 4 5 6 7 8 9 10 11 12 13 14 15 16 17 18 19 20 21 22 23 24 25
Num
ber o
f erro
neou
s pl
ots
choo
sen
Plot ranking
Be+Pl+Mo
Be+Pl
Plants
Null probability
Average mistakes
0
1
2
3
4
5
6
7
1 2 3 4 5 6 7 8 9 10 11 12 13 14 15 16 17 18 19 20 21 22 23 24 25
Num
ber o
f erro
neou
s pl
ots
choo
sen
Plot ranking
(a)
(b)
Fig. 3. The effect of indicators on the proba-
bility of erroneous site prioritization. Shown
are the best-performing single, pair and
triplet indicators (having the lowest average
mistakes among all single, pair and triplet
indicators, respectively). Be-beetles, Pl-
plants, Mo-moths, Null probability-baseline
probability of making such mistakes, Aver-
age mistakes-the average mistakes of all 26
indicators and sets of indicators. (a) Species
richness, (b) species composition.
6 Y. Mandelik, U. Roll & A. Fleischer
� 2010 The Authors. Journal compilation � 2010 British Ecological Society, Journal of Applied Ecology
especially when costs and benefits were strongly positively cor-
related (Ferraro 2003). In our study, plants were the cheapest
cost-efficient indicator for richness and composition patterns.
However, the marginal costs of representing the additional c.
30% of diversity variation are high, requiring c. 9 times the ini-
tial budget. Thus, the accuracy needed is amain factor in deter-
mining the budget requirements of biodiversity surveys. We
further found that the cost-efficiency of biodiversity indicators
is, to a great extent, context-dependent, and affected by socio-
economic factors.
Environmental variables are the cheapest indicator for
local-scale diversity assessments in the studied ecosystem
(Grantham et al. 2008), but have two major drawbacks: they
reflect richness (and rarity) patterns, but not composition, and
they provide only coarse diversity assessments (<70% of the
variation). Similar poor performance of environmental indica-
tors has been found in other studies on larger spatial scales
(regional and continental; see Hortal, Araujo & Lobo 2009
and references therein) and when selecting complementary
conservation networks (Rodrigues & Brooks 2007), suggesting
that they might be suitable for coarse-filter habitat classifica-
tion but cannot replace the fine-filter biological indicators
needed for local diversity mapping. When higher accuracy in
representation is needed (>70% of the variation, as in most
cases), as well as an indication of compositional patterns,
plants are the cheapest indicator. Plants are a major compo-
nent along the efficiency frontiers, and are also the most effi-
cient single taxon for site prioritization. The cost-effectiveness
of plants may stem from the lower costs of floral compared to
faunal surveys (particularly of small-bodied, species-rich
arthropod taxa), and the relatively high performance of plants
as ecological indicators (Lawton 1983), including successful
application of the higher taxa and similar approaches (Mande-
lik et al. 2007; Mazaris et al. 2010). Interestingly, ecological
assessments of development projects (e.g. Environmental
Impact Assessments, EIAs), are usually funded at or above
10 000 USD. However, an analysis of the ecological quality of
EIAs in Israel has shown that most are of poor quality and fall
short of this threshold (Mandelik, Dayan&Feitelson 2005).
The costs of representing richness, rarity, and composition
are similar at the high end of the cost-efficiency curve (repre-
senting over c. 90% of the variation). At lower values, richness
(and rarity) is more costly to represent than composition.Mea-
sures of species composition better reflect cross-taxon congru-
ency in both diversity patterns and responses to disturbances
than measures of species richness (Barlow et al. 2007) and are
thus given preference in conservation applications (Margules
& Pressey 2000; Margules & Sarkar 2007). Our analysis shows
that the representation of composition patterns is also more
cost-effective than richness.
As expected, the more taxa sampled, the higher the ecologi-
cal performance achieved. However, the cost-efficiency of a
taxonomically extensive sampling strategy is low, as evidenced
by the relatively flat shape of the efficiency frontiers and the
high marginal costs of improving the ecological performance:
beyond the initial level of representation of c. 70–75% of the
variation in diversity patterns, a 1% increase in the representa-
tion of richness and composition patterns costs an average
2475 USD and 3755 USD, respectively (Fig. 2). Highly simi-
lar diminishing returns on investment in surveys have been
found in other studies (Grantham et al. 2008). Therefore, the
choice of any of the indicator(s) appearing on the cost-effi-
ciency frontier should ultimately be based on the accuracy
needed in mapping biodiversity, and on the urgency of conser-
vation action (Grantham et al. 2009).
Taxonomic identification of species-rich invertebrate taxa is
expensive, andmakes up a large part of the total cost of survey-
ing these groups, as has been found in tropical ecosystems
(Lawton et al. 1998; Gardner et al. 2008). Hence, the availabil-
ity of taxonomic expertise is a critical factor in determining the
cost-effectiveness of surveying most invertebrates, including
those regarded as good biodiversity indicators such as some
beetle and spider groups (McGeoch 1998; Hilty &Merenlend-
er 2000; Pearce & Venier 2006). For the faunal taxa that
require laborious identification, the higher the number of spe-
cies, the higher the sampling costs, in contrast to prior assump-
tions (Rohr, Mahan & Kim 2007). Beetles, despite their good
indicative ability in Mediterranean ecosystems (Mandelik
0
20 000
40 000
60 000
80 000
100 000
120 000
Mor
occo
Isra
el
Cal
iforn
ia
Mor
occo
Isra
el
Cal
iforn
ia
Mor
occo
Isra
el
Cal
iforn
ia
Mor
occo
Isra
el
Cal
iforn
ia
Mor
occo
Isra
el
Cal
iforn
ia
Mor
occo
Isra
el
Cal
iforn
ia
Plants Beetles Moths Spiders Mammals Environmental variables
Cos
t (U
SD)
Equipment
Labor
Fig. 4. Expected costs of the biodiversity sur-
vey in three Mediterranean-climate coun-
tries ⁄ regions differing in socio-economic
factors and in survey cost structure: Mor-
occo, Israel, and California (see details of
cost-structure differences and estimations in
the text).
Cost-efficiency of biodiversity indicators 7
� 2010 The Authors. Journal compilation � 2010 British Ecological Society, Journal of Applied Ecology
et al. 2007; Zamora, Verdu & Galante 2007), appear only in
the second half of the efficiency frontiers. Furthermore, reduc-
ing field expenses by using sets of indicators sampled by the
same technique, such as beetles and spiders sampled with pit-
fall traps, does not improve cost-efficiency (but see Gardner
et al. 2008).
In countries where labour is costly, species-rich taxa that
require high expertise and time for their identification may not
appear on the cost-efficiency frontier, despite having good eco-
logical performance. In those countries, cost-effectiveness anal-
ysis might lead to the application of an indicator(s) with lower
indicative abilities if its sampling is less labour-intensive. The
‘taxonomic impediment’ – the severe shortage of taxonomic
expertise in most parts of the world (Giangrande 2003), might
further decrease the cost-efficiency of indicators needing expert
identification, and may enhance the application of gauges that
are ecologically less favourable. Furthermore, over-reliance on
cost-efficiency analyses may limit the search for, and develop-
ment of, new indicators that are currently less cost-efficient due
to poor taxonomic knowledge and lack of sampling methodol-
ogies (Pawar 2003).
A need for taxonomic out-sourcing due to lack of in-
house knowledge will affect mostly developing economies, as
this may consume a large part of their total survey budget,
as illustrated in our analysis for Morocco. Though travel
and lodging costs might be higher than the cheapest rate we
accounted for, they constituted c. 10% of all survey
expenses, and thus have a limited impact on the survey’s
cost structure. Naturally, some of our cost estimations might
not always be fully realized; nonetheless, our analysis illus-
trates two contrasting extremes along a gradient of intercon-
nected socio-economic factors characteristic of the
Mediterranean biome. Our analysis further showed that the
cost structure of biodiversity surveys greatly affects the total
costs of surveying different indicators, and consequently the
optimal selection of indicator(s). Hence, the accuracy of con-
servation decision-making is to a great extent context-depen-
dent and will ultimately be dictated not only by overall
funding allocation but also by socio-economic factors,
mainly per capita GDP and availability of in-house taxo-
nomic knowledge.
The development and application of DNA barcode technol-
ogy may affect our results and conclusions. These technologies
are likely to reduce the cost of identifying species-rich taxa
(Hebert et al. 2003; Kress et al. 2005; Hajibabaei et al. 2007)
and the need for taxonomic out-sourcing, placing additional
taxa on the cost-efficiency frontier. The application of the
higher taxa and similar approaches may similarly reduce cost
of taxonomic identification and affect the cost-efficiency fron-
tier (Mazaris et al. 2010).
Our generic framework may facilitate reallocation of survey
funds to expand and ⁄or better focus the spatial, temporal, and
taxonomic scope of biodiversity surveys and to include gauges
for functions and processes that are essential for long-term
management of ecosystems (Kremen 2005). The data pro-
duced using cost-efficient indicators would ultimately improve
the link between monitoring programmes and procedures of
risk analysis, site prioritization and adaptive management
(Cleary 2006). To achieve this goal, however, cost-efficiency
analyses of indicators in other ecosystems, on different spatial
scales and with different taxa are needed, so that general guide-
lines for the optimal choice of indicators can be formulated.
Data acquisition is only the first step in effective conserva-
tion. In light of ever-limited conservation budgets and intense
development pressures, data acquisition is competing with
subsequent conservation actions for time and money
(Grantham et al. 2008). The trade-offs between the cost and
time required to get more data vs. applying it in subsequent
conservation actions and the urgency of doing so (rate of hab-
itat conversion and fragmentation; Grantham et al. 2009)
should ultimately dictate the allocation of time and money
spent on the different stages of the conservation process. The
strong diminishing-return pattern in acquiring additional data
on biodiversity found here and in other studies (Bode et al.
2008b; Grantham et al. 2008) points to the need to move
away from the traditional approach of trying to get as much
data as possible to a more critical and holistic evaluation of
the marginal value of additional data to the conservation
process as a whole.
Acknowledgements
We thank J. Hortal, S. Meiri, M. Coll and three anonymous reviewers for their
most thoughtful and valuable comments and E. Ungar for statistical advice.
U.R. is supported by the Adams Fellowship Programme of the Israel Academy
of Sciences and Humanities. This study was funded by the Hebrew University
of JerusalemRingCenter for Interdisciplinary Environmental Research.
References
Balmford, A. & Gaston, K.J. (1999) Why biodiversity surveys are good value.
Nature, 398, 204–205.
Balmford, A. & Whitten, T. (2003) Who should pay for tropical conservation,
and how could the costs bemet?Oryx, 37, 238–250.
Barlow, J., Gardner, T.A., Araujo, I.S., Avila-Pires, T.C., Costa, J.E., Esposito,
M.C., Ferreira, L.V., Hawes, J., Hernandez, M.I.M., Hoogmoed, M.S.,
Leite, R.N., Lo-Man-Hung, N.F., Malcolm, J.R., Martins, M.B., Mestre,
L.A.M.,Miranda-Santos, R., Nunes-Gutjahr, A.L., Overal,W.L., Parry, L.,
Peters, S.L., Ribeiro-Junior, M.A., DA Silva, M.N.F., da Silva Motta, C. &
Peres, C.A. (2007) Quantifying the biodiversity value of tropical primary,
secondary, and plantation forests. Proceedings of the National Academy of
Sciences of the USA, 104, 18555–18560.
Bode, M., Watson, J., Iwamura, T. & Possingham, H.P. (2008a) The cost of
conservation.Science, 321, 340–341.
Bode, M., Wilson, K.A., Brooks, T.M., Turner, W.R., Mittermeier, R.A.,
McBride, M.F., Underwood, E.C. & Possingham, H.P. (2008b) Cost-
effective global conservation spending is robust to taxonomic group.
Proceedings of the National Academy of Sciences of the USA, 105, 11446–
11450.
Brooks, T.M., Mittermeier, R.A., da Fonseca, G.A.B., Gerlach, J., Hoffmann,
M., Lamoreux, J.F., Mittermeier, C.G., Pilgrim, J.D. & Rodrigues, A.S.L.
(2006)Global biodiversity conservation priorities. Science, 313, 58–61.
Bureau of Labor Statistics October (2008)Occupational Employment Statistics.
May 2008 State Occupational Employment and Wage Estimates California.
Available from http://www.bls.gov/oes/2008/may/oes_ca.htm#b19-0000
(accessed April 2009).
Cleary, D. (2006) The questionable effectiveness of science spending by interna-
tional conservation organizations in the tropics. Conservation biology, 20,
733–738.
Cowling, R.M., Knight, A.T., Faith, D.P., Ferrier, S., Lombard, A.T., Driver,
A., Rouget, M., Maze, K. & Desmet, P.G. (2004) Nature conservation
requires more than a passion for species. Conservation Biology, 18, 1674–
1676.
8 Y. Mandelik, U. Roll & A. Fleischer
� 2010 The Authors. Journal compilation � 2010 British Ecological Society, Journal of Applied Ecology
Diener, E. & Suh, E. (1997) Measuring quality of life: economic, social, and
subjective indicators.Social Indicators Research, 40, 189–216.
Faith, D.P. &Walker, P.A. (2002) The role of trade-offs in biodiversity conser-
vation planning: linking local management, regional planning and global
conservation efforts. Journal of Biosciences, 27, 393–407.
Faith, D.P., Walker, P.A., Ive, J.R. & Belbin, L. (1996) Integrating conserva-
tion and forestry production: exploring trade-offs between biodiversity and
production in regional land-use assessment. Forest Ecology and Manage-
ment, 85, 251–260.
Faith, D.P., Carter, G., Cassis, G., Ferrier, S. &Wilkie, L. (2003) Complemen-
tarity, biodiversity viability analysis, and policy-based algorithms for conser-
vation.Environmental Science and Policy, 6, 311–328.
Ferraro,P.J. (2003)Assigningpriority toenvironmentalpolicy interventions ina
heterogeneousworld.Journal ofPolicyAnalysis andManagement,22, 27–43.
Franco, A.M.A., Palmeirim, J.M. & Sutherland, W.J. (2007) A method for
comparing effectiveness of research techniques in conservation and applied
ecology.Biological Conservation, 134, 96–105.
Gardner, T.A., Barlow, J., Araujo, I.S., Avila-Pires, T.C., Bonaldo, A.B.,
Costa, J.E., Esposito, M.C., Ferreira, L.V., Hawes, J., Hernandez, M.I.M.,
Hoogmoed, M.S., Leite, R.N., Lo-Man-Hung, N.F., Malcolm, J.R., Mar-
tins, M.B., Mestre, L.A.M., Miranda-Santos, R., Overal, W.L., Parry, L.,
Peters, S.L., Ribeiro-Junior, M.A., da Silva, M.N.F., da Silva Motta, C. &
Peres, C.A. (2008) The cost-effectiveness of biodiversity surveys in tropical
surveys.Ecology Letters, 11, 139–150.
Gaston, K.J. (1994)Rarity. Chapman&May, London.
Giangrande, A. (2003) Biodiversity, conservation, and the ‘taxonomic impedi-
ment’. Aquatic Conservation-Marine and Freshwater Ecosystems, 13, 451–
459.
Grand, J., Cummings, M.P., Rebelo, T.G., Ricketts, T.H. & Maile, C.N.
(2007) Biased data reduce efficiency and effectiveness of conservation reserve
networks.Ecology Letters, 10, 364–374.
Grantham, H.S., Moilanen, A., Wilson, K.A., Pressey, R.L., Rebelo, T.G. &
Possingham, H.P. (2008) Diminishing return on investment for biodiversity
data in conservation planning.Conservation Letters, 1, 190–198.
Grantham, H.S., Wilson, K.A., Moilanen, A., Rebelo, T.G. & Possingham,
H.P. (2009) Delaying conservation actions for improved knowledge: how
long should wewait?Ecology Letters, 12, 293–301.
Hajibabaei, M., Singer, G.A.C., Hebert, P.D.N. & Hickey, D.A. (2007) DNA
barcoding: how it complements taxonomy, molecular phylogenetics and
population genetics.Trends in Genetics, 23, 167–172.
Hebert, P.D.N., Cywinska, A., Ball, S.L. & deWaard, J.R. (2003) Biological
identifications through DNA barcodes. Proceedings of the Royal Society of
London, Series B, Biological Sciences, 270, 313–321.
Hilty, J. &Merenlender, A. (2000) Faunal indicator taxa selection for monitor-
ing ecosystem health.Biological Conservation, 92, 185–197.
Hoekstra, J.M., Boucher, T.M., Ricketts, T.H. & Roberts, C. (2005) Confront-
ing a biome crisis: global disparities of habitat loss and protection. Ecology
Letters, 8, 23–29.
Hortal, J., Araujo, M.B. & Lobo, J.M. (2009) Testing the effectiveness of dis-
crete and continuous environmental diversity as a surrogate for species diver-
sity.Ecological Indicators, 9, 138–149.
Hortal, J. & Lobo, J.M. (2005) An ED-based protocol for optimal sampling of
biodiversity.Biodiversity and Conservation, 14, 2913–2947.
Kaplan, M., Kimhi, I. & Choshen, M. (2000) The Jerusalem Hills and the
Judean Coastal Plain: Policy for Land Conservation and Sustainable Develop-
ment (in Hebrew, English summary). The Jerusalem Institute for Israel Stud-
ies, Jerusalem.
Kremen, C. (2005) Managing ecosystem services: what do we need to know
about their ecology.Ecology Letters, 8, 468–479.
Kress, W.J., Wurdack, K.J., Zimmer, E.A., Weigt, L.A. & Janzen, D.H. (2005)
Use of DNA barcodes to identify flowering plants. Proceedings of the
National Academy of Sciences of the USA, 102, 8369–8374.
Lawton, J.H. (1983) Plant architecture and the diversity of phytophagous
insects.Annual Review of Entomology, 28, 23–39.
Lawton, J.H., Bignell, D.E., Bolton, B., Bloemers, G.F., Eggleton, P.,
Hammond, P.M., Hodda, M., Holt, R.D., Larsen, T.B., Mawdsley, N.A.,
Stork, N.E., Srivastava, D.S. & Watt, A.D. (1998) Biodiversity inventories,
indicator taxa and effects of habitat modification in tropical forest. Nature,
391, 72–75.
Mandelik, Y. 2005. Conservation planning at the local scale: ecological and
land use planning tools for species diversity assessments in Mediterranean
ecosystems. Ph.D. dissertation, Tel-AvivUniversity, Tel-Aviv.
Mandelik, Y., Dayan, T. & Feitelson, E. (2005) Planning for biodiversity:
the role of Ecological Impact Assessment. Conservation Biology, 19, 1254–
1261.
Mandelik, Y., Dayan, T., Chikatunov, V. & Kravchenko, V. (2002) Measuring
species diversity: sampling effort for beetles, moths and vegetation of the
SansanNature Reserve. Israel Journal of Zoology, 48, 174.
Mandelik, Y., Chiktunov, V., Kravchenko, V. & Dayan, T. (2007) Reliability
of the higher-taxa approach for diversity assessment at the local scale.
Conservation Biology, 21, 1506–1515.
Margules, C.R. & Pressey, R.L. (2000) Systematic conservation planning.
Nature, 405, 243–253.
Margules, C. & Sarkar, S. (2007) Systematic Conservation Planning. Cambridge
University Press, NewYork.
Mazaris, A.D., Kallimanis, A.S., Tzanopoulos, J., Sgardelis, S.P. & Pantis,
J.D. (2010) Can we predict the number of plant species from the richness of a
few common genera, families and orders? Journal of Applied Ecology, 47,
662–670.
McBride, M.F., Wilson, K.A., Bode, M. & Possingham, H.P. (2007) Incorpo-
rating the effects of socioeconomic uncertainty into priority setting for con-
servation investment.Conservation Biology, 21, 1463–1474.
McGeoch, M.A. (1998) The selection, testing and application of terrestrial
insects as bioindicators.Biological Review, 73, 181–201.
Moore, J., Balmford, A., Allnutt, T. & Burgess, N. (2004) Integrating costs into
conservation planning across Africa.Biological Conservation, 117, 343–350.
Murdoch, W., Polasky, S., Wilson, K.A., Possingham, H.P., Kareiva, P. &
Shaw, R. (2007) Maximizing return on investment in conservation. Biologi-
cal Conservation, 139, 375–388.
Myers, N., Mittermeier, R.A., Mittermeier, C.G., de Fonseca, G.A.B. & Kent,
J. (2000) Biodiversity hotspots for conservation priorities.Nature, 403, 853–
858.
Naidoo, R. & Adamowicz, W.L. (2005) Economic benefits of biodiversity
exceeds costs of conservation at an African rainforest reserve. Proceedings of
the National Academy of Sciences of theUSA, 102, 16712–16716.
Naidoo, R. & Ricketts, T.H. (2006) Mapping the economic costs and benefits
of conservation.PLOSBiology, 4, 2153–2164.
Naidoo, R., Balmford, A., Ferraro, P.J., Polasky, S., Ricketts, T.H. & Rouget,
M. (2006) Integrating economic costs into conservation planning. Trends in
Ecology and Evolution, 21, 681–687.
Noss, R.F. (1999) Assessing and monitoring forest biodiversity: a suggested
framework and indicators. Forest Ecology andManagement, 115, 135–146.
Oliver, I., Holmes, A., Dangerfield, J.M., Gillings, M., Pik, A.J., Britton, D.R.,
Holley, M., Montgomery, M.E., Raison, M., Logan, V., Pressey, R.L. &
Beattie, A.J. (2004) Land systems as surrogates for biodiversity in conserva-
tion planning.Ecological Application, 14, 485–503.
Pawar, S. (2003) Taxonomic chauvinism and the methodologically challenged.
BioScience, 53, 861–864.
Pearce, J.L. &Venier, L.A. (2006) The use of ground beetles (Coleoptera: Cara-
bidae) and spiders (Araneae) as bioindicators of sustainable forest manage-
ment: a review.Ecological Indicators, 6, 780–793.
Pearson, D.L. (1994) Selecting indicator taxa for the quantitative assessment of
biodiversity. Philosophical Transactions of the Royal Society of London B,
345, 75–79.
Rodrigues, A.S.L. & Brooks, T.M. (2007) Shortcuts for biodiversity conserva-
tion planning: the effectiveness of surrogates.Annual Review of Ecology Evo-
lution and Systematics, 38, 713–737.
Rohr, J.R., Mahan, C.G. & Kim, K.C. (2007) Developing a monitoring pro-
gram for invertebrates: guidelines and a case study. Conservation Biology,
21, 422–433.
TAHAL (2004) Survey of the Open Landscape of Israel. Israel Ministry of Envi-
ronmental Protection, Jerusalem.
Underwood, E.C., Shaw, M.R., Wilson, K.A., Kareiva, P., Klausmeyer, K.R.,
McBride, M.F., Bode, M., Morrison, S.A., Hoekstra, J.M. & Possingham,
H.P. (2008) Protecting biodiversity when money matters: maximizing return
on investment.PLoSOne, 3, e1515.
US BEA (Bureau of Economic Analysis) October (2008) Gross Domestic Prod-
uct by State. Available from http://BEA.gov/regional/gsp (accessed March
2009).
Vogiatzakis, I.N.,Mannion, A.M.&Griffiths, G.H. (2006)Mediterranean eco-
systems: problems and tools for conservation. Progress in Physical Geogra-
phy, 30, 175–200.
Whittingham, M.J., Stephens, P.A., Bradbury, R.B. & Freckleton, R.P. (2006)
Why do we still use stepwise modelling in ecology and behaviour? Journal of
Animal Ecology, 75, 1182–1189.
Wilson, E.O. (2000) A global biodiversity map. Science, 289, 2279.
Wilson, K.A., Underwood, E.C., Morrison, S.A., Klausmeyer, K.R.,
Murdoch, W.W., Reyers, B., Wardell-Johnson, G., Marquet, P.A., Rundel,
P.W., McBride, M.F., Pressey, R.L., Bode, M., Hoekstra, J.M., Andelman,
S., Looker,M., Rondinini, C., Kareiva, P., Shaw,M.R. & Possingham,H.P.
Cost-efficiency of biodiversity indicators 9
� 2010 The Authors. Journal compilation � 2010 British Ecological Society, Journal of Applied Ecology

(2007) Conserving biodiversity efficiently: what to do, where and when.
PLOSBiology, 5, 1850–1861.
World Bank October (2008) Data and Statistics- Key Development Data and
Statistics. Available from http://www.worldbank.com (accessed March
2009).
Zamora, J., Verdu, J.R. &Galante, E. (2007) Species richness inMediterranean
agroecosystems: spatial and temporal analysis for biodiversity conservation.
Biological Conservation, 134, 113–121.
Received 16March 2010; accepted 26 July 2010
Handling Editor:Marc Cadotte
Supporting Information
Additional Supporting Information may be found in the online ver-
sion of this article.
Table S1.Detailed costs of labour, equipment and supplies, and travel
and lodging for the different biological and environmental indicators
surveyed in Israel.
Table S2.Cost estimations in California andMorocco for conducting
the same survey that was conducted in Israel.
Table S3. Results of regression tests for the different indicators and
sets of indicators.
As a service to our authors and readers, this journal provides support-
ing information supplied by the authors. Such materials may be
re-organized for online delivery, but are not copy-edited or typeset.
Technical support issues arising from supporting information (other
thanmissing files) should be addressed to the authors.
10 Y. Mandelik, U. Roll & A. Fleischer
� 2010 The Authors. Journal compilation � 2010 British Ecological Society, Journal of Applied Ecology
Related Documents