Copyright by Gregory Michael Glass 2007

Welcome message from author
This document is posted to help you gain knowledge. Please leave a comment to let me know what you think about it! Share it to your friends and learn new things together.
Transcript

Copyright
by
Gregory Michael Glass
2007

Performance of Tension Lap Splices with MMFX High Strength
Reinforcing Bars
by
Gregory Michael Glass, B.S.E.
Thesis
Presented to the Faculty of the Graduate School of
The University of Texas at Austin
in Partial Fulfillment
of the Requirements
for the Degree of
Master of Science in Engineering
The University of Texas at Austin
May 2007

Performance of Tension Lap Splices with MMFX High Strength
Reinforcing Bars
Approved by Supervising Committee:
James O. Jirsa
John E. Breen

iv
Acknowledgements
I would like to thank everyone who has made this research process and this thesis
enjoyable, rewarding, and possible. Thank you to Dr. Jim Jirsa for his guidance and
patience during the past two years. Thank you also for your trust and confidence in my
work. I enjoyed working closely with you during the past two years.
Thank you to my family for the support you have always provided for me. Your
encouragement in everything that I have done has allowed me to achieve my goals.
Thank you for believing in me and supporting me in every decision that I have made, no
matter where it has taken me.
Thank you to my fellow students at Ferguson Lab. I would have never completed
this research program within two years without your help. Thank you especially to Katie
Hoyt, Brian Graves, and Kristin Donnelly for your efforts on this project.
Thank you to the researchers at the University of Kansas and North Carolina State
University. The data from your research greatly increased the database of results for my
analyses and provided confirmation of the results found at the University of Texas.
Finally, thank you to our sponsor, MMFX Steel Corporation of America, for
funding this project.
May 4, 2007

v
Abstract
Performance of Tension Lap Splices with MMFX High Strength
Reinforcing Bars
Gregory Michael Glass, M.S.E.
The University of Texas at Austin, 2007
Supervisor: James O. Jirsa
The specialized microstructure and chemical composition of MMFX
reinforcement results in a material that possesses both corrosion resistance and high
tensile strength. MMFX Steel Corporation of America guarantees for its reinforcement a
minimum ultimate tensile capacity of 150 ksi and a minimum yield strength of 100 ksi
when measured using the 0.2% elongation method. To safely utilize the high strength of
MMFX steel in design, proper anchorage of the reinforcement must be provided.
Development length equations included in the ACI 318-05 building design code
and the 4th edition of the AASHTO LRFD bridge design code are based on data obtained
from splice tests failing primarily at bar stresses less than their respective maximum
allowable design yield strengths for tensile reinforcement of 80 ksi and 75 ksi. Limited
data exists for splices failing at bar stresses greater than 75-80 ksi, and no data exists for

vi
splices failing at bar stresses greater than 120 ksi — a stress attainable by MMFX
reinforcement.
To determine the adequacy of the development length equations in the ACI 318
and AASHTO LRFD design codes and a development length equation proposed by ACI
Committee 408 at high bar stresses, the University of Texas, the University of Kansas,
and North Carolina State University are each testing 22 beam-splice specimens designed
to fail at bar stresses between 80 ksi and 140 ksi. Test variables include bar size,
concrete compressive strength, splice length, concrete cover, and amount of transverse
reinforcement (confinement). The results of 45 tests completed by the researchers are
reported in this thesis. Splice design recommendations are presented for bars spliced at
high stress, and general design considerations are outlined for flexural members
reinforced with high strength reinforcing bars.

vii
Table of Contents
List of Tables ...........................................................................................................x
List of Figures ........................................................................................................ xi
CHAPTER 1 1
Introduction..............................................................................................................1 1.1 MMFX Reinforcement...........................................................................1 1.2 Project Scope and Objectives.................................................................2
CHAPTER 2 5
Bond Failure Mechanism.........................................................................................5 2.1 Bond Force Transfer ..............................................................................5 2.2 Governing Parameters............................................................................9
2.2.1 Development/Splice Length..........................................................9 2.2.2 Concrete Compressive Strength..................................................10 2.2.3 Bar Size.......................................................................................11 2.2.4 Concrete Cover and Bar Spacing................................................11 2.2.5 Transverse Reinforcement ..........................................................13 2.2.6 Reinforcing Bar Relative Rib Area.............................................13 2.2.7 Bar Casting Position ...................................................................14
CHAPTER 3 15
Previous Research..................................................................................................15 3.1 Testing Methods...................................................................................15
3.1.1 Pullout Test .................................................................................15 3.1.2 Beam-End Test............................................................................16 3.1.3 Beam-Splice Test ........................................................................17
3.2 Descriptive Equations ..........................................................................18 3.2.1 Orangun, Jirsa, and Breen (1977) ...............................................18 3.2.2 Darwin, et al. (1996a) .................................................................20

viii
3.2.3 Zuo and Darwin (2000)...............................................................22 3.3 United States Design Code Equations .................................................23
3.3.1 ACI 318-05 .................................................................................23 3.3.2 ACI 408R-03 Recommendations................................................25 3.3.3 AASHTO LRFD 4th Edition .......................................................26 3.3.4 Comparison of Development Length Equations.........................28
3.4 MMFX Bond Research........................................................................34
CHAPTER 4 37
Experimental Program ...........................................................................................37 4.1 Beam-Splice Tests ...............................................................................37
4.1.1 Test Matrix..................................................................................37 4.1.2 Specimen Design ........................................................................40 4.1.3 Specimen Fabrication and Instrumentation ................................43 4.1.4 Laboratory Test Setup and Testing Procedure............................46
4.2 Reinforcement Tests ............................................................................49 4.2.1 Specimen Description .................................................................49 4.2.2 Laboratory Test Setup and Testing Procedure............................50
CHAPTER 5 52
Experimental Results .............................................................................................52 5.1 Reinforcement Tests ............................................................................52
5.1.1 #5 Bars ........................................................................................52 5.1.2 #8 Bars ........................................................................................55 5.1.3 #11 Bars ......................................................................................57
5.2 Beam-Splice Tests ...............................................................................60 5.2.1 Tests Conducted at the University of Texas ...............................60 5.2.2 Tests Conducted at Other Participating Research Universities ..84
CHAPTER 6 86
Evaluation of Test Results .....................................................................................86 6.1 Comparison of Duplicate Tests............................................................86

ix
6.2 Performance of Development Length Equations.................................87 6.2.1 All Specimens .............................................................................88 6.2.2 Splices not Confined by Transverse Reinforcement...................89 6.2.3 Splices Confined by Transverse Reinforcement.........................91
6.3 Effect of Splice Length ........................................................................92 6.4 Effect of Confinement........................................................................100 6.5 Crack Widths .....................................................................................108
CHAPTER 7 113
Implementation of Results ...................................................................................113 7.1 Introduction to Design Considerations ..............................................113 7.2 Splice Design Recommendations ......................................................113 7.3 Requirements for Transverse Reinforcement ....................................118 7.4 General Design Considerations..........................................................119
7.4.2 Ultimate Behavior.....................................................................121 7.4.3 Deflections ................................................................................124 7.4.4 Crack Widths ............................................................................125 7.4.5 General Design Overview and Future Research.......................127
CHAPTER 8 129
Conclusions..........................................................................................................129 8.1 Research Summary ............................................................................129 8.2 Conclusions........................................................................................131
APPENDIX 133
Beam-Splice Specimen Details............................................................................133
REFERENCES 138
VITA 141
x
List of Tables
Table 3-1: Distribution of test/calculated failure stress ratios for design code equations (data from ACI 408 database 10-2001)............................................................ 30
Table 3-2: Performance of ACI 318 and AASHTO LRFD design code equations within the range of allowable design stresses and concrete strengths ......................... 34
Table 3-3: Performance of ACI 318 and AASHTO LRFD design code equations outside the range of acceptable design stresses (fc’ ≤ 10,000 psi) ................................ 34
Table 4-1: Experimental test matrix (duplicate tests bolded, tests not included in original matrix italicized)............................................................................................... 39
Table 4-2: Beam-splice specimen design details .............................................................. 42 Table 4-3: Concrete mix proportions (per cubic yard) ..................................................... 46 Table 5-1: Summary of results for #5 MMFX tension tests ............................................. 53 Table 5-2: Summary of results for #8 MMFX tension tests ............................................. 56 Table 5-3: Summary of results for #11 MMFX tension tests ........................................... 59 Table 5-4: Summary of results for UT unconfined tests................................................... 71 Table 5-5: Summary of results for UT confined tests....................................................... 84 Table 5-6: Summary of results for non-UT unconfined tests ........................................... 85 Table 5-7: Summary of results for non-UT confined tests ............................................... 85 Table 6-1: Comparison of duplicate tests ......................................................................... 87 Table 6-2: Distribution of test/calculated failure stress ratios for all specimens.............. 89 Table 6-3: Distribution of test/calculated failure stress ratios for unconfined specimens 90 Table 6-4: Distribution of test/calculated failure stress ratios for confined specimens.... 92 Table 6-5: Expected increases in failure stresses over unconfined C0 specimens for C1
and C2 specimens based on ACI 408 calculated failure stress predictions – UT specimens ....................................................................................................... 105
Table 6-6: Actual increases in failure stresses over unconfined C0 specimens for C1 and C2 splices – UT specimens ............................................................................ 105
Table 6-7: Comparison of deflection increases over unconfined C0 specimens for pairs of C1 and C2 beams – UT specimens................................................................. 107
Table 7-1: Distribution of MMFX test/calculated failure stress ratios when using the ACI 408 development length equation with φ = 0.82 ............................................ 116
Table 7-2: Distribution of test/calculated failure stress ratios when using the ACI 408 development length equation with φ = 0.82 (Data includes all bond tests in the ACI 408 database 10-2001 and the MMFX research program failing at bar stresses > 75 ksi)............................................................................................. 117
Table A-1: Splice details for specimens tested at the University of Texas .................... 135 Table A-2: Splice details for specimens tested at North Carolina State University and the
University of Kansas ...................................................................................... 136 Table A-3: Cross-section, reinforcement, and failure load details for specimens tested at
the University of Texas .................................................................................. 137

xi
List of Figures
Figure 2-1: Bond force transfer (adapted from ACI 408)................................................... 6 Figure 2-2: Formation of Goto cracks (adapted from ACI 408)......................................... 7 Figure 2-3: Radial cracking due to hoop tensile stresses (adapted from ACI 408) ............ 7 Figure 2-4: Splitting failure (adapted from ACI 408)......................................................... 8 Figure 2-5: Pullout failure (adapted from ACI 408)........................................................... 8 Figure 2-6: Types of splitting failure (adapted from Orangun, Jirsa, Breen 1977) .......... 12 Figure 3-1: Schematic of pullout test (adapted from ACI 408) ........................................ 15 Figure 3-2: Schematic of beam-end test (adapted from ACI 408).................................... 17 Figure 3-3: Schematic of beam-splice test (adapted from ACI 408R-03) ........................ 18 Figure 3-4: Definition of Atr and n for different failure planes......................................... 20 Figure 3-5: Test vs. calculated stresses using ACI 408 equation with φ = 1.00 (data from
ACI 408 database 10-2001)........................................................................... 31 Figure 3-6: Test vs. calculated stresses using ACI 408 equation with φ = 0.82 (data from
ACI 408 database 10-2001)........................................................................... 32 Figure 3-7: Test vs. calculated stresses using ACI 318 equation (data from ACI 408
database 10-2001, fs and fc’ limits not applied) ............................................. 32 Figure 3-8: Test vs. calculated stresses using AASHTO LRFD equation (data from ACI
408 database 10-2001, fs and fc’ limits not applied) ...................................... 33 Figure 4-1: General cross-section for beam specimens (#8 and #11)............................... 42 Figure 4-2: General cross-section for slab specimens (#5)............................................... 43 Figure 4-3: Elevation of test specimens and loading schematic ....................................... 43 Figure 4-4: Varying levels of transverse reinforcement among a group of three specimens
containing #8 bars ......................................................................................... 44 Figure 4-5: Varying splice length among a pair of specimens containing #5 bars........... 45 Figure 4-6: Confined #8 splices with strain gauges at the ends of the splices.................. 45 Figure 4-7: Typical laboratory test setup for narrow splice specimens ............................ 48 Figure 4-8: Typical laboratory test setup for wide splice specimens................................ 48 Figure 4-9: Typical test setup for reinforcement tension tests.......................................... 50 Figure 5-1: Stress-strain relationship for #5 MMFX bars (End of plot indicates removal
of extensometer) ............................................................................................ 53 Figure 5-2: Comparison of MMFX and Grade 60 stress-strain behavior......................... 54 Figure 5-3: 0.2% offset yield - #5 MMFX bars ................................................................ 54 Figure 5-4: #5 MMFX reinforcement specimens after testing ......................................... 55 Figure 5-5: Stress-strain relationship for #8 MMFX bars (End of plot indicates removal
of extensometer) ............................................................................................ 56 Figure 5-6: 0.2% offset yield - #8 MMFX bars ................................................................ 57 Figure 5-7: #8 MMFX reinforcement specimens after testing ......................................... 57 Figure 5-8: Stress-strain relationship for #11 MMFX bars (End of plot indicates removal
of extensometer) ............................................................................................ 58 Figure 5-9: 0.2% offset yield - #11 MMFX bars .............................................................. 59 Figure 5-10: #11 MMFX reinforcement specimens after testing ..................................... 60 Figure 5-11: Typical bar stress-load plot for unconfined specimen (8-8-XC0-1.5) ......... 62

xii
Figure 5-12: Typical load-deflection plot for unconfined specimen (8-8-XC0-1.5) ........ 62 Figure 5-13: Cracking of typical unconfined specimen at early loading stages ............... 63 Figure 5-14: Cracking of typical unconfined splice at onset of longitudinal splitting ..... 64 Figure 5-15: Cracking of typical unconfined splice near failure ...................................... 65 Figure 5-16: Measured crack widths for typical unconfined splice (8-8-XC0-1.5) ......... 66 Figure 5-17: Unconfined splice at failure ......................................................................... 67 Figure 5-18: Unconfined splice after failure..................................................................... 67 Figure 5-19: Bar strain vs. load for 5-5-OC0-1.25 highlighting initiation of failure by
exterior splices (Gauges on bar 4 malfunctioned during this test) ................ 68 Figure 5-20: 5-5-OC0-2 after failure ................................................................................ 69 Figure 5-21: Measured end-of-splice crack widths for UT unconfined specimens.......... 72 Figure 5-22: Comparison of cracking of unconfined and confined specimens near the
failure load of the unconfined specimen ....................................................... 73 Figure 5-23: Effect of stirrups on arresting splitting cracks ............................................. 75 Figure 5-24: Cracking at the end of typical confined splice at 80% of failure load ......... 76 Figure 5-25: Formation of inclined side splitting cracks .................................................. 76 Figure 5-26: 0.08 in. crack at the end of a splice in specimen 11-5-XC2-3. Applied load
is 68% of failure load. ................................................................................... 77 Figure 5-27: Increased cracking and deflections at failure for varying levels of
confinement ................................................................................................... 78 Figure 5-28: Nonlinear load-deflection plot for a highly confined specimen (8-5-XC2-
1.5)................................................................................................................. 79 Figure 5-29: Comparison of measured crack widths for two confined specimens (8-8-
XC1-1.5 and 8-8-XC2-1.5) ........................................................................... 80 Figure 5-30: Load-deflection of confined specimens experiencing concrete crushing prior
to splice failure .............................................................................................. 81 Figure 5-31: Ruptured #8 bar in specimen 8-5-OC2-1.5.................................................. 82 Figure 5-32: Failure sequence for specimen 8-5-OC2-1.5 ............................................... 82 Figure 5-33: Failure sequence of specimen 8-5-OC2-1.5 demonstrated through load-
deflection behavior ........................................................................................ 83 Figure 5-34: Measured end-of-splice crack widths for UT confined specimens.............. 84 Figure 6-1: Distribution of test/calculated failure stress ratios for all specimens............. 89 Figure 6-2: Distribution of test/calculated failure stress ratios for unconfined specimens90 Figure 6-3: Distribution of test/calculated failure stress ratios for confined specimens... 92 Figure 6-4: Effect of ls/db on ACI 408 test/calculated failure stress ratios ....................... 94 Figure 6-5: Effect of ls/db on ACI 318 test/calculated failure stress ratios ....................... 94 Figure 6-6: Effect of ls/db on AASHTO LRFD test/calculated failure stress ratios ......... 95 Figure 6-7: Comparison of ACI 408 test/calculated failure stress ratios for pairs of
specimens containing shorter (OC) and longer (XC) splices ........................ 96 Figure 6-8: Comparison of ACI 318 test/calculated failure stress ratios for pairs of
specimens containing shorter (OC) and longer (XC) splices ........................ 96 Figure 6-9: Comparison of AASHTO LRFD test/calculated failure stress ratios for pairs
of specimens containing shorter (OC) and longer (XC) splices.................... 97 Figure 6-10: Effect of ls/db on ACI 408 test/calculated failure stress ratios (data from ACI
408 database 10-2001)................................................................................... 98

xiii
Figure 6-11: Effect of ls/db on ACI 318 test/calculated failure stress ratios (data from ACI 408 database 10-2001, bar stress and concrete strength limits not applied) . 99
Figure 6-12: Effect of ls/db on AASHTO test/calculated failure stress ratios (data from ACI 408 database 10-2001, bar stress and concrete strength limits not applied) .......................................................................................................... 99
Figure 6-13: Load-deflection for a group of three splices with varying levels of transverse reinforcement............................................................................................... 100
Figure 6-14: Increases in failure stresses and deflections relative to unconfined splice – UT tests........................................................................................................ 101
Figure 6-15: Test/calculated failure stress ratios versus cover/confinement term in ACI 318 equation (bar stress and concrete strength limits not applied) ............. 103
Figure 6-16: Test/calculated failure stress ratios versus cover/confinement term in ACI 408 equation ................................................................................................ 103
Figure 6-17: Test/calculated failure stress ratios versus cover/confinement term in ACI 318 equation (limit changed to 4.0, bar stress and concrete strength limits not applied) ........................................................................................................ 104
Figure 6-18: Increasing nonlinearity of MMFX stress-stress behavior between C1 and C2 failure stresses ............................................................................................. 106
Figure 6-19: Reduction in the efficiency of confinement with increasing failure stress 107 Figure 6-20: End-of-splice crack widths for UT #5 specimens (load at or below 60% of
failure load) ................................................................................................. 109 Figure 6-21: End-of-splice crack widths for UT #8 specimens (load at or below 60% of
failure load) ................................................................................................. 111 Figure 6-22: End-of-splice crack widths for UT #11 specimens (load at or below 60% of
failure load) ................................................................................................. 112 Figure 7-1: Distribution of MMFX test/calculated failure stress ratios when using the ACI
408 development length equation with φ = 0.82 ......................................... 116 Figure 7-2: Distribution of test/calculated failure stress ratios when using the ACI 408
development length equation with φ = 0.82 (Data includes all bond tests in the ACI 408 database 10-2001 and the MMFX research program failing at bar stresses > 75 ksi) ................................................................................... 118
Figure 7-3: Span and loading of example beam ............................................................. 120 Figure 7-4: Details of example beam.............................................................................. 120 Figure 7-5: Calculated load-deflection for example beam assuming varying design yield
strengths for the MMFX reinforcement ...................................................... 122 Figure 7-6: Calculated service load deflections for the example beam assuming varying
design yield strengths for the MMFX reinforcement .................................. 125 Figure 7-7: Calculated crack widths for the example beam assuming varying design yield
strengths for the MMFX reinforcement ...................................................... 127

1
CHAPTER 1
Introduction
1.1 MMFX REINFORCEMENT
MMFX microcomposite steel reinforcement is manufactured using a patented
proprietary process which results in a high strength material that is reported to have
corrosion resistance. A high chromium content of 9-10% — a percentage nearing that of
stainless steel — is partially responsible for the corrosion resistance of the material. A
specialized microstructure also provides a means of corrosion resistance.
Ordinary black steel is composed of a two phased microstructure of ferrite and
iron-carbide. Macrogalvanic electrochemical cells between the two phases of the steel
microstructure lead to a reaction in which electrons flow from the ferrite anode to the iron-carbide
cathode where corrosion byproducts are produced. In contrast to ordinary black steel, the
microstructure of MMFX reinforcement is composed of 100% packet martensite between
untransformed sheets of austenite. MMFX steel is nearly devoid of carbide so the development
of macrogalvanic cells is greatly reduced; consequently, the production of corrosion products is
also greatly reduced (Zia 2003, Dawood, et al. 2004).
The corrosion resistance of MMFX steel has been tested in laboratories in order to
evaluate the claims made by MMFX Steel Corportation of America — the manufacturers of
MMFX reinforcement. A report compiled by the Concrete Innovation Appraisal Service
examined the results of several independent research studies related to the corrosion resistance of
MMFX steel. The authors found that that there is sufficient evidence that MMFX steel
exhibits improved corrosion resistance over conventional ASTM A 615 reinforcing steel
2
and that this corrosion resistance can lead to longer service lives and lower life-cycle
costs (Zia 2003).
In addition to corrosion resistance, MMFX steel possesses a very high tensile
strength due to its low average carbon content of 0.08%. The producers of MMFX steel
guarantee a minimum ultimate tensile strength of 150 ksi and a minimum yield strength
of 100 ksi when measured using the 0.2% offset method (MMFX 2004). Previous
research has indicated that the actual ultimate tensile strength of MMFX reinforcement
can be as high as 177 ksi and the actual 0.2% offset yield strength may be closer to 120
ksi (El-Hacha and Rizkalla 2002). As with many high strength steels, MMFX
reinforcement does not display a clearly defined yield point or a yield plateau. However,
the steel still displays a reasonable amount of ductility with a minimum elongation of 7%
for #11 and smaller bars (MMFX 2004).
MMFX steel has been approved for use in structural concrete design subject to the
80 ksi limitation on tensile yield strength given in the ACI 318-05 building code. The
material conforms to the provisions of ASTM A1035-04, ASTM A 615 Grade 75, and
AASHTO M31 Grade 75 (MMFX 2004).
1.2 PROJECT SCOPE AND OBJECTIVES
MMFX reinforcement is most efficient when a design utilizes both its corrosion
resistant and high strength attributes. However, design yield strengths for reinforcing
steel in flexural concrete members are currently limited to 75 ksi in the AASTHO LRFD
bridge design code and 80 ksi in the ACI 318-05 building design code. These limits are
imposed since many design equations have been developed on empirical data. The
applicability of these equations beyond the limits of the variables included in the
empirical data cannot be guaranteed without additional laboratory tests on specimens that
expand the breadth of variables in the experimental database.

3
Development length equations are examples of equations produced from
empirical data. Due to such factors as the non-homogeneity of concrete and the large
variation in stresses between cracked and uncracked portions of a member, the bond
failure mechanism is difficult to accurately characterize through purely theoretical
expressions. For this reason, development length equations have been developed based
on the average behavior displayed by a large database of experimental bond tests.
The development length equation included in the ACI 318-05 building code is
based on the experimental results of bond tests failing primarily at bar stresses less than
the code limit of 80 ksi. The AASHTO LRFD development length equation is a semi-
theoretical equation that has limits imposed on it based on experimental data. A
development length equation recently proposed by ACI Committee 408 is based on a
larger database of tests than those used in the development of the ACI 318 and AASHTO
LRFD code equations, but the data are still limited in the very high stress range. The
expanded database includes only 12 tests failing at bar stresses greater than 100 ksi and
does not include any tests failing at bar stresses greater than 120 ksi.
The research program reported herein is a joint effort between the University of
Texas, the University of Kansas, and North Carolina State University. In this study, each
research group will test 22 beam-splice specimens to evaluate the bond capacity of
MMFX steel spliced at high stresses. Test variables include bar size, concrete
compressive strength, splice length, concrete cover, and amount of transverse
reinforcement (confinement). All splices will be designed to fail at stresses between 80
ksi and 140 ksi. To accurately relate bar strains to bar stresses, a series of tension tests
will also be performed on the MMFX bars.
The results of this research program will significantly increase the number of tests
in the ACI 408 database failing at high stress levels. Data from these tests will be
4
compared with the current ACI 408, ACI 38-05, and AASHTO LRFD development
length equations to determine their adequacy at high strengths. Based on these
evaluations, design recommendations will be proposed for the splicing and anchorage of
high strength bars.
Crack widths and deflections will also be monitored to evaluate the serviceability
performance of members reinforced with MMFX bars at very high stress levels. Based
on these observations, general design recommendations will be presented for members
reinforced with high strength bars.

5
CHAPTER 2
Bond Failure Mechanism
2.1 BOND FORCE TRANSFER
The basic principles of reinforced concrete design require proper anchorage of
reinforcing bars. Without sufficient anchorage, reinforcement cannot develop the stresses
required to reach the ultimate capacity of a member. Current design codes require that a
minimum embedment length of a reinforcing bar be provided beyond a point of high
tensile stress. Adequate lengths are also required at all locations where reinforcement is
spliced. The evolution of the current design code requirements for development length of
reinforcement will be discussed in Chapter 3. In this chapter, bond failure mechanisms
are discussed. Unless otherwise noted, information provided in the remainder of this
chapter has been derived from a 2003 report compiled by ACI Committee 408 entitled
Bond and Development of Straight Reinforcing Bars in Tension (ACI 408R-03). This
report summarizes the bond failure mechanism and the major research efforts that have
led to the current descriptive and design code equations.
Development length provisions are based on expressions for the bond forces
between reinforcing bars in tension and the surrounding concrete. At low stresses,
chemical adhesion between the bar and the concrete is sufficient to transfer forces
between the two materials. As stress increases, chemical adhesion can no longer
maintain force transfer; and the reinforcing bar begins to slip relative to the surrounding
concrete.
After the initial slip of the bar, force transfer is obtained primarily through bearing
between the bar deformations and the concrete. Friction provides a smaller, yet

significant, amount of force transfer. As slip continues, friction on the barrel of the bar
reduces; and force is transferred to the concrete entirely by the bar deformations.
Compressive bearing forces on the bar ribs increase along with friction forces along the
surface of the deformations. The bond force transfer mechanism is shown in Figure 2-1.
Adhesion and Friction on Bar Surface
Friction and Bearing on Deformations
Figure 2-1: Bond force transfer (adapted from ACI 408)
Compressive and shear stresses in the concrete surrounding the bar balance the
forces applied by the reinforcing bar. Local compressive stresses immediately ahead of
the bar deformations result in principle tensile stresses that may cause cracking
perpendicular to lug on the reinforcing bar. These cracks, first identified by Goto, rarely
play a major role in bond failure. Hoop tensile stresses in the concrete surrounding the
bar caused by the wedging action of the bar deformations produce more serious cracks
which extend radially from the reinforcing bar. Depictions of Goto and radial crack
formations are shown in Figure 2-2 and Figure 2-3, respectively.
6

Principle Tensile
Stresses
Principle Compressive
Stresses
Goto Crack
Friction and Bearing on
Deformations
Figure 2-2: Formation of Goto cracks (adapted from ACI 408)
Hoop Tensile Stresses Due to Wedging of Bar
Deformations
Reinforcing BarRadial Cracks Caused by Hoop Tensile Stresses
Figure 2-3: Radial cracking due to hoop tensile stresses (adapted from ACI 408)
Radial cracks initially form near the loaded end of an anchored or spliced bar
since this portion is the most highly stressed region of the bar. As load is increased,
radial cracks progress longitudinally down the length of the bar. Bond failure occurs
when these radial cracks progress fully through the concrete cover along the full
development or splice length. The surrounding concrete is no longer capable of
providing anchorage for the reinforcing bar, and the bar can no longer carry load. This
7

mode of failure is referred to as splitting failure. A splitting failure is demonstrated in
Figure 2-4.
Figure 2-4: Splitting failure (adapted from ACI 408)
If the surrounding concrete has sufficient strength such that it can prevent the
extension of splitting cracks, failure may occur due to the shearing of concrete
immediately surrounding the bar. This mode of failure is referred to as a pullout failure.
The increased strength necessary to obtain a pullout failure may be obtained by using
concrete with a higher compressive strength, increasing the concrete cover provided
around the reinforcing bar, and/or providing a high level of transverse reinforcement. A
schematic of a pullout failure is given in Figure 2-5 .
Figure 2-5: Pullout failure (adapted from ACI 408)
8

9
2.2 GOVERNING PARAMETERS
Research on laboratory specimens failing in bond has highlighted the most
influential parameters related to bond strength of uncoated reinforcing bars. These
parameters are development/splice length, concrete compressive strength, bar size,
concrete cover and bar spacing, transverse reinforcement, relative rib area of the
reinforcing bar, and bar casting position.
2.2.1 Development/Splice Length
An increase in development/splice length will result in a higher bond capacity.
Mathey and Watstein (1961) indicated that bond stress and the ratio of bar diameter to
bonded length are approximately linearly related. Research by Darwin, et al. (1996b)
confirms that the relationship between bond force and bonded length is nearly linear but
not proportional. Therefore, an increase in bond force by a given percentage will require
a higher percentage increase in development length.
The non-proportional relationship between bond force and bonded length is a
result of the non-uniform participation in force transfer by the tensioned and non-
tensioned ends of the bar. Bond failure is incremental, with slip first occurring at the
loaded end where bond stresses are highest. Splitting also initiates at the loaded end and
progresses down the length of the bar. Post failure examinations of concrete surrounding
spliced bars indicate that localized crushing in front of the bar ribs varies along the length
of the splice due to the incremental failure mode. More crushing is observed near the
non-tensioned end of the bar than at the loaded end where crushing is minimal or non-
existent. This suggests a failure sequence initiated by splitting at the loaded end followed
by a rapid slip of the bar at the non-loaded end. Therefore, the non-loaded end is less
effective in transferring bond forces than the loaded end.
Despite the non-proportional relationship, current design equations for
development length assume a linear and proportional relationship between bond force
and bonded length for simplicity. The design equations like those found in the ACI 318
building code are conservative for most bonded lengths with typical bar stresses but
become less conservative as the bonded length and bar stress increase. Eventually, these
equations can become unconservative if applied to relatively long bonded lengths with
high stresses in the reinforcing bars.
2.2.2 Concrete Compressive Strength
The contribution of concrete compressive strength to the bond strength of reinforcing bars in tension has traditionally been represented using the term 'cf . Below
fc’ = 8000 psi, this assumption is reasonably accurate; however, the implications of using
this relationship at higher strengths have been debated among researchers. Many
(Azizinamini et al. 1993, Azizinamini, Chisala, and Ghosh 1995, Zuo and Darwin 1998,
2000, Hamad and Itani, 1998) have found that the average bond strength normalized with respect to 'cf decreases with increased concrete strength because not all bar lugs
contribute equally in bond force transfer in higher strength concrete. However, Esfahani
and Rangan (1998) found the opposite relationship to be true.
The consensus of ACI Committee 408 is that bond strength is best represented
by 41'cf . Statistical analyses conducted by Darwin, et al. (1996a) and Zuo and Darwin
(2000) showed that 41'cf provided the best representation of the contribution of concrete
to bond strength when compared to a database of 367 bond tests. Zuo and Darwin also
found that concrete strength affects the contribution of transverse reinforcement to bond
strength. Their analyses showed that the optimal factor for relating these two parameters
falls between 43'cf and fc’.
10

11
2.2.3 Bar Size
Larger diameter bars require larger forces to be developed in order to cause
splitting failure for a given bonded length. This is due to the increased surface area
associated with larger bars. For a given force within a bar, the bond stresses developed
on the surface of the bar will be lower as the surface area increases. However, the area of
a bar increases at a higher rate than the surface area of a bar as the bar diameter increases.
Therefore, although larger bars can maintain higher forces than smaller bars for a given
bonded length, the stress developed in the bars at that bonded length will be higher in the
smaller bars. As a result, the required development length to develop a given stress
increases with bar diameter.
Bar size also affects the contribution of transverse reinforcement to bond strength.
Slip of larger bars mobilizes higher strains in the transverse reinforcement than slip of
smaller bars. The higher strains in the confining reinforcement provide an increase in the
confining force.
2.2.4 Concrete Cover and Bar Spacing
When bond failure is governed by the splitting mode, the relative values of
bottom cover, side cover, and ½ the clear spacing between bars play a significant role in
bond failure. The minimum of these values is a principle factor in the determination of
bond strength. An increase in the minimum value results in an increase in overall bond
strength. Research by Orangun, Jirsa, and Breen (1977) and Darwin, et al. (1996a) has
also suggested that the relative values of the maximum and minimum of the bar cover
and spacing terms play a secondary role in bond strength. For large variations in
maximum and minimum cover (i.e. – widely spaced bars with small bottom covers), the
increase in bond strength may be as large as 25% over that of a situation where all three
cover and spacing values were equal (Darwin, et al. 1996a).
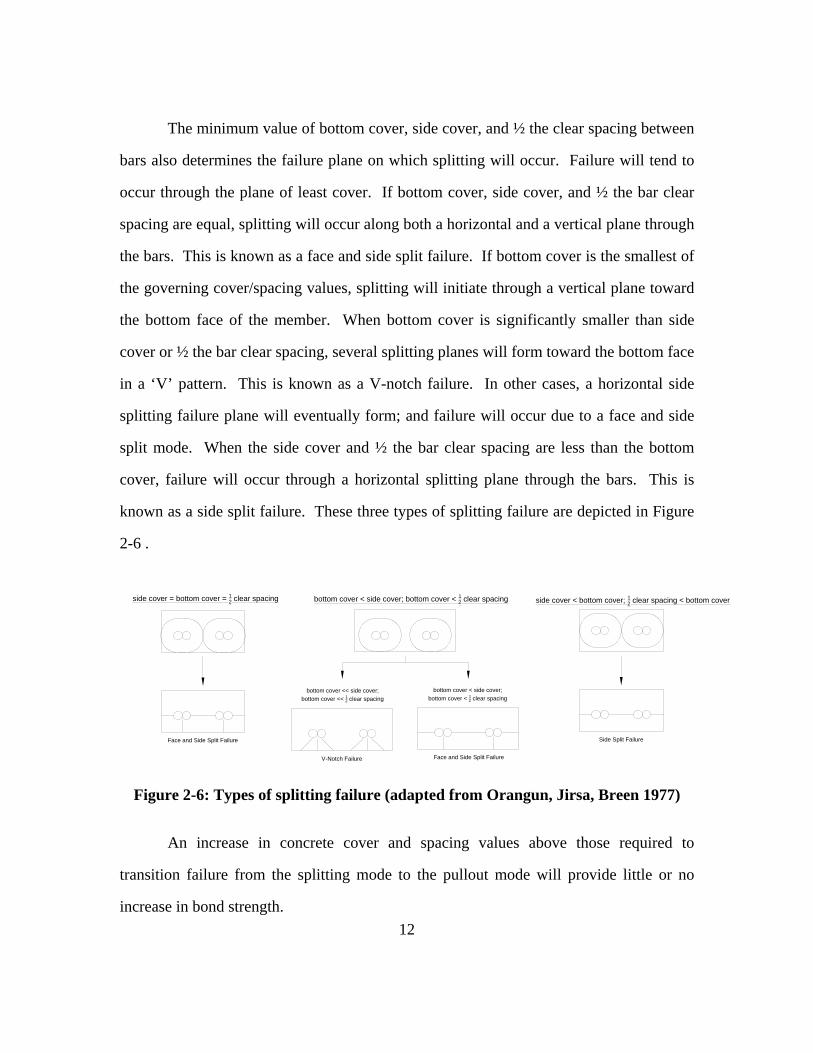
The minimum value of bottom cover, side cover, and ½ the clear spacing between
bars also determines the failure plane on which splitting will occur. Failure will tend to
occur through the plane of least cover. If bottom cover, side cover, and ½ the bar clear
spacing are equal, splitting will occur along both a horizontal and a vertical plane through
the bars. This is known as a face and side split failure. If bottom cover is the smallest of
the governing cover/spacing values, splitting will initiate through a vertical plane toward
the bottom face of the member. When bottom cover is significantly smaller than side
cover or ½ the bar clear spacing, several splitting planes will form toward the bottom face
in a ‘V’ pattern. This is known as a V-notch failure. In other cases, a horizontal side
splitting failure plane will eventually form; and failure will occur due to a face and side
split mode. When the side cover and ½ the bar clear spacing are less than the bottom
cover, failure will occur through a horizontal splitting plane through the bars. This is
known as a side split failure. These three types of splitting failure are depicted in Figure
2-6 .
Face and Side Split Failure
Face and Side Split FailureV-Notch Failure
Side Split Failure
side cover = bottom cover = 12 clear spacing bottom cover < side cover; bottom cover < 12 clear spacing side cover < bottom cover; 12 clear spacing < bottom cover
bottom cover << side cover; bottom cover << 12 clear spacing
bottom cover < side cover; bottom cover < 12 clear spacing
Figure 2-6: Types of splitting failure (adapted from Orangun, Jirsa, Breen 1977)
An increase in concrete cover and spacing values above those required to
transition failure from the splitting mode to the pullout mode will provide little or no
increase in bond strength. 12

2.2.5 Transverse Reinforcement
Transverse reinforcement increases overall bond strength by limiting the
progression of splitting cracks. Its effectiveness is governed not only by the amount of
transverse reinforcement provided but also by the properties of the bar being developed
and the strength of the concrete surrounding the bar.
When bond failure is governed by the splitting mode, an increase in the area of
transverse reinforcement crossing the potential crack planes will result in an increase in
bond strength. However, an increase in the tensile strength of the transverse
reinforcement will not provide additional bond capacity since the transverse
reinforcement rarely yields (Maeda, Otani and Aoyama 1991; Sakurada, Moohasi and
Tanaka 1993; Azizinamini, Chisala, and Ghosh 1995).
As discussed in Section 2.2.2, the contribution of transverse steel to total bond
strength is related to a factor between 43'cf and fc’. Therefore, an increase in concrete
strength will result in a non-proportional increase in bond strength. An increase in bar
size has also been shown to increase the effectiveness of transverse reinforcement as
discussed in Section 2.2.3. In a similar way, bar deformation geometry affects the
performance of transverse reinforcement. This will be discussed in Section 2.2.6.
An increase in transverse reinforcement above that necessary to transition from
splitting failure to pullout failure will result in little or no increase in bond strength.
2.2.6 Reinforcing Bar Relative Rib Area
The effect of bar deformation geometry on bond strength is not governed strictly
by deformation size or spacing alone. Rather, the ratio of bearing area to the shearing
area of the bar — known as the relative rib area Rr — determines the contribution of bar
geometry to bond strength. A detailed method for measuring Rr is provided in ACI 408.3
but the relationship may be expressed generally as 13

spacing ribcenter -to-center perimeter bar nominalaxisbar tonormal area rib projected
⋅=rR
Darwin, et al. (1996b) and Zuo and Darwin (2000) showed that an increase in Rr
will produce an increase in bond strength for bars confined by transverse reinforcement.
This effect is due to the increased wedging action provided by higher Rr rib patterns. The
increased wedging mobilizes larger strains in the transverse reinforcement which results
in higher confining forces. According to Darwin, et al. (1996b), the use of bars with Rr =
0.1275 (average Rr = 0.0727 for standard bars) could provide up to a 26% reduction in
required splice length. This effect is most pronounced for bars with small covers and a
large amount of transverse reinforcement.
Because the effect of Rr is related to increased strains in the transverse
reinforcement, an increase in Rr does not provide an increase in bond strength for
uncoated unconfined bars. However, Darwin, et al. concluded from laboratory tests that
increased Rr did provide additional bond strength for unconfined epoxy-coated bars.
2.2.7 Bar Casting Position
Bottom cast bars display higher bond strength than top cast bars. This is due to
the increased settlement and amount of bleed water at the location of a top cast bar in
relation to a bottom cast bar. These factors reduce the efficiency of the surrounding
concrete to prevent splitting cracks from developing. Although modern U.S. design
codes (ACI 318, AASHTO LRFD) only begin to recognize this “top bar effect” when the
amount of fresh concrete below a bar is greater than 12 in., any increase in depth of
concrete below a bar will reduce the bond strength of the bar.
14

CHAPTER 3
Previous Research
3.1 TESTING METHODS
Current descriptive equations and design codes for bond strength are based on
empirical knowledge gained from a multitude of laboratory experiments. Sections 3.1.1,
3.1.2, and 3.1.3 describe the three most common testing procedures used to determine
bond strength. Information regarding these testing procedures was obtained from the
ACI 408 report referred to in Chapter 2.
3.1.1 Pullout Test
Pullout tests are the easiest and least expensive bond tests to conduct; however,
they provide the least realistic results of bond strength. In these tests, tension is applied
directly to a bar which has been embedded in a block of concrete. A schematic of a
pullout test is shown in Figure 3-1 .
Figure 3-1: Schematic of pullout test (adapted from ACI 408)
15

16
Results of pullout tests are not a good indicator of actual bond strength because
they do not represent realistic loading conditions found in structural members. The
concrete block is placed in compression during the test while bars being anchored as
tension reinforcement are usually surrounded by concrete in tension. Compression struts
also form between the end reaction and the reinforcing bar which place the bar in lateral
compression. In actual structural members, compression between the bar and the
surrounding concrete is produced as the lugs of the bar bear on the concrete after
adhesion is overcome and initial slip of the bar occurs. To prevent crushing failure of the
concrete block, pullout specimens usually contain a high level of confining transverse
reinforcement. As described previously, transverse reinforcement adds significantly to
the bond strength by preventing the growth of splitting cracks. Due to these
shortcomings, ACI Committee 408 does not recommend pullout tests as a sole indicator
of bond strength.
3.1.2 Beam-End Test
Beam-end tests are the simplest tests that reflect realistic boundary conditions and
bond strength results. In these tests, tension is applied to a reinforcing bar that has been
eccentrically embedded in a block of concrete. A schematic of a beam-end test is shown
in Figure 3-2.

Figure 3-2: Schematic of beam-end test (adapted from ACI 408)
Unlike the pullout test, beam-end tests more accurately represent actual loading
conditions in structural members. Both the bar and the surrounding concrete are placed
in tension due to eccentric placement of the reinforcing bar in the concrete block. The
effect of the end reactions can be negated if the supports are located at a distance of at
least the embedment length of the bar from the end of the reinforcing bar. Shear
reinforcement can be detailed such that it does not provide confinement to the bar being
developed or it may enclose the reinforcing bar in order to study the effect of transverse
reinforcement.
3.1.3 Beam-Splice Test
Full scale beam tests provide the most accurate results for bond strength since
they best duplicate the actual stress state around the reinforcing bars being developed. A
popular full scale test used for bond research is the beam-splice test. In these tests, bars
are lap spliced within a constant moment region at the center of the beam span. A
schematic of a beam splice test is shown in Figure 3-3. Because of its simplicity of
design and fabrication and because of the accuracy of the test results, beam splice tests
17

have provided the majority of data for the development of descriptive and design code
equations for bond and anchorage of reinforcement.
Figure 3-3: Schematic of beam-splice test (adapted from ACI 408R-03)
3.2 DESCRIPTIVE EQUATIONS
3.2.1 Orangun, Jirsa, and Breen (1977)
Orangun, Jirsa, and Breen developed descriptive equations for the bond strength
of splices with and without confining transverse reinforcement that incorporated the most
influential variables related to bond behavior. The researchers assumed a linear
relationship between the average bond stress, u, and ld /db. Bond strength was assumed to be proportional to 'cf .
Nonlinear regression analysis of 62 beams — of which four contained side cast
bars, one contained top cast bars, and 57 contained bottom cast bars — produced a best
fit curve for the average bond stress, uc*, of bars without transverse reinforcement
d
b
bc
c
ld
dC
fu 5323.322.1
'
*
++= (1)
where:
C = smaller of concrete clear cover or half of the clear spacing between bars (in) 18

db = bar diameter (in)
ld = development or splice length (in)
fc’ = concrete compressive strength (psi)
uc* = average bond stress (psi)
Since the results were meant to be used as a basis for design, the coefficients of the best
fit equation were conservatively rounded to produce an approximate average bond stress,
uc,
d
b
bc
c
ld
dC
fu 5032.1
'++= (2)
An additional 27 splice tests and 27 development length tests containing
confining transverse reinforcement were included in further analyses to determine the
contribution of confining steel, us, to the total average bond stress, ub. The best fit
expression for total average bond stress was found to be
b
yttr
d
b
bc
sc
c
b
sndfA
ld
dC
fuu
fu
5005032.1
''+++=
+= (3)
where:
Atr* = area of transverse reinforcement crossing the plane of splitting (in2)
fyt = yield stress of transverse reinforcement (psi)
n *= number of bars being developed or spliced in the plane of splitting
s = spacing of transverse reinforcement (in)
*See Figure 3-4 for examples
19

Atr = 2 x Astirrupn = 2
Atr = Astirrupn = 1
Atr = 2 x Astirrupn = 3
Figure 3-4: Definition of Atr and n for different failure planes
This expression can be rewritten in terms of bar force by replacing the term ub with
Abfs/πdbld and substituting4
2b
bdA π
= .
( )snfAl
AdClffA
fTT
fT yttrd
bbdc
sb
c
sc
c
b
5002004.03
'''π
π +++==+
= (4)
The previous equations are only applicable to cases in which splitting governs.
To prevent cases of pullout failure, the following restriction applies.
5.21500
4.01≤⎟⎟
⎠
⎞⎜⎜⎝
⎛++
snfA
dCd
yttrb
b
(5)
3.2.2 Darwin, et al. (1996a)
Darwin, et al. used a larger database of 133 unconfined and 166 confined bottom
cast splice and development specimens to reevaluate the findings of Orangun, Jirsa, and
Breen. The researchers found that normalizing bond forces with respect to 41'cf resulted
in a better correlation of data than normalizing with respect to 'cf . The resulting
expressions also accounted for the ratio of maximum to minimum cover values and the
beneficial effects of increased relative rib area, Rr, on the contribution of transverse
reinforcement to total bond force.
Bond force provided by concrete alone was given as
20

25.19.01.0 where
9.01.0]2130)5.0(63[''
min
max
max
minmin4141
≤⎟⎟⎠
⎞⎜⎜⎝
⎛+
⎟⎟⎠
⎞⎜⎜⎝
⎛+++==
cc
ccAdcl
ffA
fT
bbdc
sb
c
c
(6)
where:
cmin =minimum of cs or cb (in)
cmax = maximum of cs or cb (in)
cs = minimum of csi + 0.25 in. or cso (in)
csi = one-half clear spacing between bars (in)
cso = side cover of reinforcing bars (in)
cb = bottom cover of reinforcing bars (in)
Total bond force was given as the sum of the contribution of concrete and the
contribution due to confining transverse reinforcement.
6622269.01.0]2130)5.0(63[
'''
min
maxmin
414141
++⎟⎟⎠
⎞⎜⎜⎝
⎛+++
==+
=
nNAtt
ccAdcl
ffA
fTT
fT
trdrbbd
c
sb
c
sc
c
b
(7)
The previous restriction on ⎟⎟⎠
⎞⎜⎜⎝
⎛+ 9.01.0
min
max
cc still applies and:
N = number of transverse stirrups, or ties, within the development length
Rr = relative rib area of reinforcement as defined in Section 6.6 of ACI 408R-03
td = 0.72db + 0.28
tr = 9.6Rr + 0.28
21

As with the expressions developed by Orangun, Jirsa, and Breen, the expressions
from Darwin, et al. only apply to cases where splitting failure governs. To prevent
pullout failures, the following restriction applies.
( ) 0.4359.01.05.01min
maxmin ≤⎟⎟
⎠
⎞⎜⎜⎝
⎛+⎟⎟
⎠
⎞⎜⎜⎝
⎛++
snAtt
ccdc
dtrdr
bb
(8)
3.2.3 Zuo and Darwin (2000)
Zuo and Darwin continued the research performed by Darwin, et al. using a
database of experimental results larger than that considered in the previous research. The
results of 171 unconfined and 196 confined bottom cast splice and development
specimens were used. This database included a significantly larger population of
specimens cast in high strength concrete ( > 8000 psi). Analysis of the new database
confirmed the finding of Darwin, et al. that
'cf41'cf is a better indicator of the concrete
contribution to bond strength than 'cf . Therefore, the expression for the concrete
contribution to bond force shown below includes only minor changes from that cited by
Darwin, et al.
25.19.01.0 where
9.01.0]2350)5.0(8.59[''
min
max
min
maxmin4141
≤⎟⎟⎠
⎞⎜⎜⎝
⎛+
⎟⎟⎠
⎞⎜⎜⎝
⎛+++==
cc
ccAdcl
ffA
fT
bbdc
sb
c
c
(9)
Zuo and Darwin found that the contribution of confining transverse reinforcement
to the total bond force is related to the concrete compressive strength and is best
represented by a value between 43'cf and . For simplicity, the researchers chose to
conservatively use
'cf43'cf in their descriptive equations. The expression for total bond
force then becomes
22

'414.319.01.0]2350)5.0(8.59[
'''
max
minmin
414141
ctr
drbbd
c
sb
c
sc
c
b
fn
NAttccAdcl
ffA
fTT
fT
⎟⎠⎞
⎜⎝⎛ ++⎟⎟
⎠
⎞⎜⎜⎝
⎛+++
==+
=
(10)
where all variables remain as defined in Equation (7) except td = 0.78db + 0.22.
To exclude cases in which pullout failure governs, the following restriction
applies.
( ) 0.4'52.09.01.05.01
min
maxmin ≤⎟⎟
⎠
⎞⎜⎜⎝
⎛⎟⎠⎞
⎜⎝⎛+⎟⎟
⎠
⎞⎜⎜⎝
⎛++ c
trdrb
b
fsn
Attccdc
d (11)
3.3 UNITED STATES DESIGN CODE EQUATIONS
The previous descriptive equations were developed as best fit curves based on
empirical data; therefore, they must be altered to provide conservatism before being used
in design. Furthermore, current design codes no longer consider anchorage requirements
in terms of average bond strength. Modern codes mandate a required development or
splice length necessary to reach the desired stress — usually the material yield stress —
in a given bar.
3.3.1 ACI 318-05
The development length requirements in the ACI 318-05 Building Code are based
on the expressions given by Orangun, Jirsa, and Breen in Section 3.2.1. Solving
Equation (3) for ld and replacing (C + 0.4db) with cb = (C + 0.5db) produces
23

b
b
trb
c
s
d d
dKc
ff
l
⎟⎟⎟⎟⎟
⎠
⎞
⎜⎜⎜⎜⎜
⎝
⎛
⎟⎟⎠
⎞⎜⎜⎝
⎛ +
−=
12
200'
(12)
where sn
fAK yttr
tr 1500= .
Setting the stress in the bar at splitting failure, fs, equal to the yield stress of the
bar, fy, removing the 200 from the numerator, and changing 1/12 to 3/40 results in the
final development length equation
b
b
trb
set
c
yd d
dKcf
fl
⎟⎟⎟⎟⎟
⎠
⎞
⎜⎜⎜⎜⎜
⎝
⎛
⎟⎟⎠
⎞⎜⎜⎝
⎛ +=
λψψψ'40
3 (13)
where:
fy ≤ 80,000 psi
fc’ ≤ 10,000 psi
ψt = 1.3 where horizontal reinforcement is placed such that more than 12 in. of
fresh concrete is cast below the developed length or splice
= 1.0 for all other cases.
ψe = 1.5 for epoxy-coated bars or wires with covers less than 3db or clear spacing
less than 6db.
= 1.2 for all other epoxy-coated bars
= 1.0 for all uncoated bars
ψtψe need not exceed 1.7
ψs = 0.8 for No. 6 and smaller bars and deformed wires
= 1.0 for No. 7 and larger bars
24
λ = 1.3 or 0.1'7.6 ≥ctc ff for lightweight concrete
= 1.0 for normalweight concrete
To prevent situations where pullout failure governs,
5.2≤+
b
trb
dKc
(14)
The limits placed on the concrete compressive strength, fc’, and the bar yield
stress, fy, represent the limits of applicability for the ACI 318 design equation. The
variables included in the empirical data used in the background research by Orangun,
Jirsa, and Breen were limited to concrete strengths and bar stresses within this range.
Given the empirical development of the equation, the ACI 318 expression should not be
applied beyond the limits of the variables included in the supporting research.
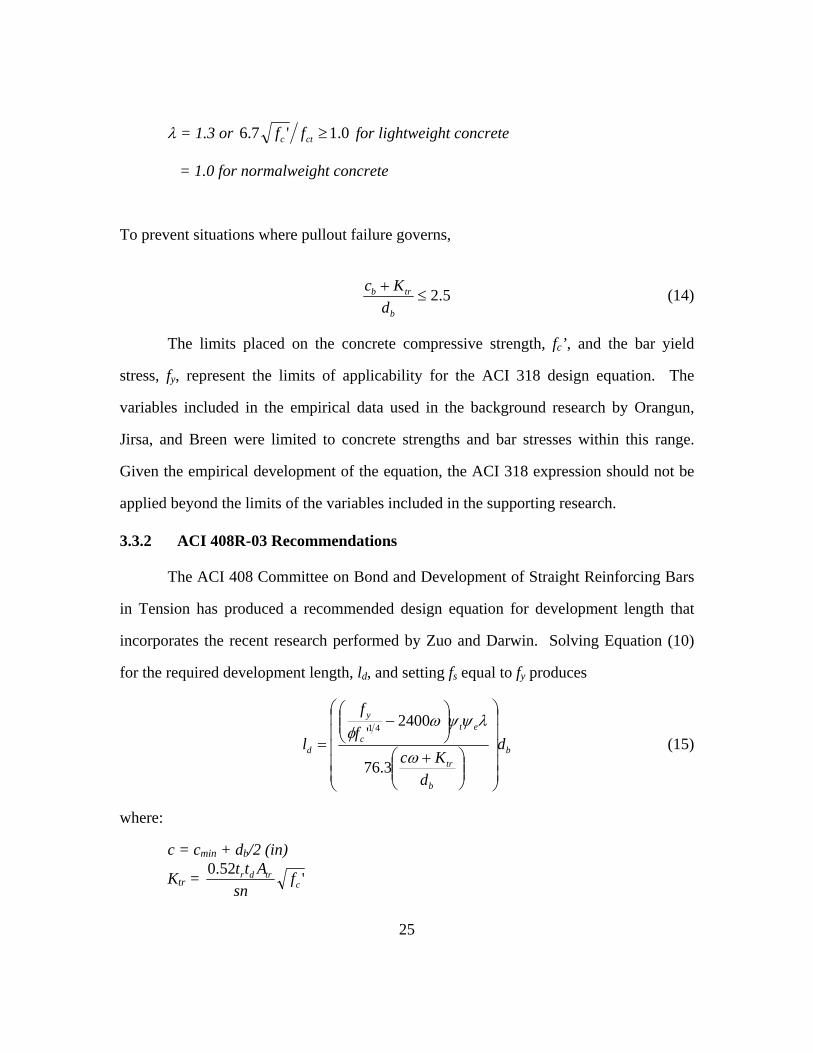
3.3.2 ACI 408R-03 Recommendations
The ACI 408 Committee on Bond and Development of Straight Reinforcing Bars
in Tension has produced a recommended design equation for development length that
incorporates the recent research performed by Zuo and Darwin. Solving Equation (10)
for the required development length, ld, and setting fs equal to fy produces
b
b
tr
etc
y
d d
dKc
ff
l
⎟⎟⎟⎟⎟
⎠
⎞
⎜⎜⎜⎜⎜
⎝
⎛
⎟⎟⎠
⎞⎜⎜⎝
⎛ +
⎟⎟⎠
⎞⎜⎜⎝
⎛−
=ω
λψψωφ
3.76
2400' 41
(15)
where:
c = cmin + db/2 (in)
Ktr = '52.0c
trdr fsn
Att
25
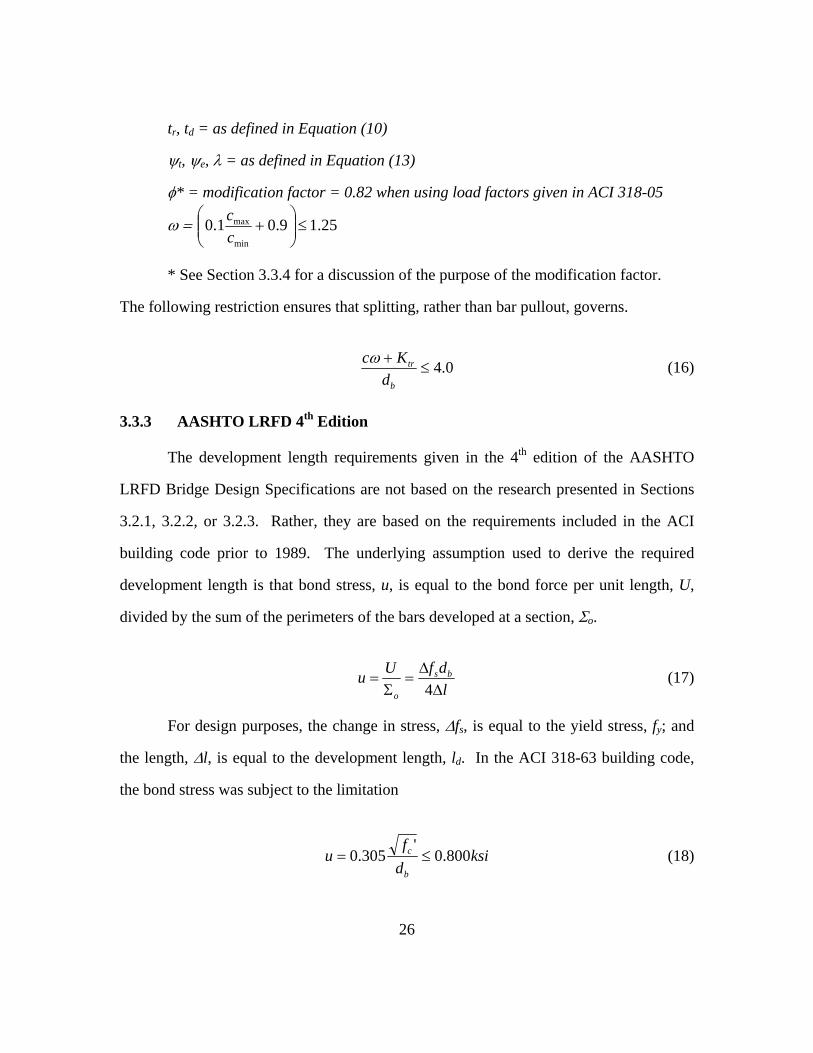
tr, td = as defined in Equation (10)
ψt, ψe, λ = as defined in Equation (13)
φ* = modification factor = 0.82 when using load factors given in ACI 318-05
ω = 25.19.01.0min
max ≤⎟⎟⎠
⎞⎜⎜⎝
⎛+
cc
* See Section 3.3.4 for a discussion of the purpose of the modification factor.
The following restriction ensures that splitting, rather than bar pullout, governs.
0.4≤+
b
tr
dKcω
(16)
3.3.3 AASHTO LRFD 4th Edition
The development length requirements given in the 4th edition of the AASHTO
LRFD Bridge Design Specifications are not based on the research presented in Sections
3.2.1, 3.2.2, or 3.2.3. Rather, they are based on the requirements included in the ACI
building code prior to 1989. The underlying assumption used to derive the required
development length is that bond stress, u, is equal to the bond force per unit length, U,
divided by the sum of the perimeters of the bars developed at a section, Σo.
ldfUu bs
o ΔΔ
=Σ
=4
(17)
For design purposes, the change in stress, Δfs, is equal to the yield stress, fy; and
the length, Δl, is equal to the development length, ld. In the ACI 318-63 building code,
the bond stress was subject to the limitation
ksidf
ub
c 800.0'
305.0 ≤= (18)
26

where ' is given in ksi. Setting Equation (17) equal to Equation (18), solving for lcf d,
and multiplying by 1.2 to account for the negative effects of closely spaced bars results in
the basic development length equation for #11 and smaller bars.
'
25.1
c
ybd f
fAl = (19)
In this equation, ' and fcf y are in ksi and are limited to 10 ksi and 75 ksi, respectively for
similar reasons that stress limits are applied to the ACI 318 development length equation
described in Section 3.3.1. The basic development length is subject to the restriction
ybd fdl 4.0≥
The basic development length is then increased or decreased by multiplying by
the following factors where applicable.
• 1.4 – for horizontal reinforcement where more than 12.0 in. of fresh concrete is
cast below the reinforcement
• 0.1'22.0
≥ct
c
ff
– for lightweight concrete where fct (ksi) is specified
• 1.3 – for all lightweight concrete where fct is not specified
• 1.2 – for sand lightweight concrete where fct is not specified
• 1.5 – for epoxy coated bars with cover less than 3db or with clear spacing between
bars less than 6db
• 1.2 – for all other epoxy coated bars
• 0.8 – for reinforcement spaced laterally not less than 6.0 in. center-to-center, with
not less than 3.0 in. clear cover measured in the direction of the spacing
27

28
)• ( )( provided
required s
s
AA – where anchorage or development for the full yield strength of
reinforcement is not required, or where reinforcement in flexural members is in
excess of that required by analysis
• 0.75 – where reinforcement is enclosed within a spiral composed of bars of not
less than 0.25 in. in diameter and spaced at not more than a 4.0 in. pitch
3.3.4 Comparison of Development Length Equations
ACI Committee 408 maintains a database of full scale development length beam
tests dating from 1955. The current database — database 10-2001 — contains the results
of 478 independent development length tests on bottom cast bars. This database is useful
for the development of new descriptive equations related to bond strength and for
evaluating the reliability of current and future design code equations for development
length.
When comparing the performance of development length equations, one must
consider the intended use of each equation. Predictive equations should provide
reasonably accurate estimates of failure stresses. Therefore, the mean test/calculated
failure stress ratio for a large sample of tests should ideally be near 1.0. Design equations
are meant to provide conservative estimates of failure stresses. Traditionally, equations
used in ultimate strength design have represented a reasonable lower bound on data often
defined by the 5% fractile. The 5% fractile represents a curve on which there is 90%
confidence that there is a 95% probability that the actual strength exceeds the nominal
strength (ACI 318). Therefore, very few tests (less than 5-10%) should fail at stresses
below those calculated by the design equation; and the mean tests/calculated failure stress
ratio for a design equation should be significantly higher than 1.0. In both predictive and

29
design equations, coefficients of variation should be low. This indicates that the
variables used in the equations correlate well with test data.
For the remainder of this thesis, the ACI 408 equation will be evaluated as a
predictive equation and the modification factor, φ, will be taken as 1.0 unless otherwise
noted. The ACI 318 and AASHTO equations will be evaluated as design equations.
When appropriate, the ACI 408 equation will also be examined as a design equation with
the modification factor, φ, set to 0.82 as recommended by ACI Committee 408. When
this modification factor is applied, the ACI 408 equation is converted to a lower bound
expression and an approximate 5% fractile. The modification factor should not be
confused with a strength reduction factor typically used in strength design and ordinarily
denoted by the symbol φ. The strength reduction factor accounts for material
understrengths, geometry tolerances, and desired ductility. It is not meant to convert best
fit expressions into lower bound equations.
The distributions of test/calculated failure stress ratios for the ACI 408, ACI 318,
and AASHTO LRFD equations are compared in Table 3-1. Two rows of data are shown
for the ACI 408 development length equation. The first includes data calculated with the
modification factor φ = 1.00 to demonstrate the capability of the equation to represent a
best fit of current experimental data. The second row includes data calculated with the
modification factor φ = 0.82 to demonstrate the reliability of the equation as a design
guideline. It is important to note that the code mandated limits on bar stresses and
concrete compressive strengths have not been applied when calculating the failure
stresses according to the ACI 318 and AASHTO equations. These limits have been
omitted in order to evaluate the performance of the equations through the full range of
variables. More specific analyses with the limits applied will follow.

N = 478Equation Mean Std. Dev. COV Max Min # < 1.0 % < 1.0
ACI 408 (φ = 1.00) 1.01 0.14 0.13 1.64 0.62 252 53ACI 408 (φ = 0.82) 1.23 0.17 0.13 2.00 0.76 28 6
ACI 318† 1.25 0.30 0.24 2.42 0.51 95 20AASHTO‡ 1.32 0.37 0.28 2.63 0.50 90 19
† limits f s ≤ 80 ksi and f c ' ≤ 10,000 psi not applied‡ limits f s ≤ 75 ksi and f c ' ≤ 10,000 psi not applied
Distribution of Test/Calculated Failure Stress Ratios
Table 3-1: Distribution of test/calculated failure stress ratios for design code equations (data from ACI 408 database 10-2001)
The data presented in Table 3-1 indicate that the proposed equation from ACI
Committee 408 performs well as both a best fit predictive equation and as a design
equation through the full range of bar stresses and concrete strengths included in the ACI
408 database. The predictive ACI 408 equation results in a mean test/calculated failure
stress ratio of 1.01. When the modification factor of 0.82 is applied to the ACI 408
equation, the mean test/calculated failure stress ratio is significantly above 1.0 and less
than 6% of tests fall below the minimum desired value of 1.0. The low coefficient of
variation of 0.13 for both versions of the ACI 408 equation suggests that the variables in
the equations are well correlated with the experimental data.
Data for the ACI 318 and AASHTO code equations shown in Table 3-1 suggest
that the equations are not suitable for use through the full range of bar stresses and
concrete strengths represented in the ACI 408 database of bond tests. While both
equations produce mean test/calculated failure stress ratios that are significantly higher
than 1.0, they both also result in nearly 20% of tests failing below the calculated failure
stress. The coefficients of variation for both equations are also much greater than the
coefficient of variation of 0.13 produced by the ACI 408 predictive and design equations.
30

The performance of the ACI 408 predictive and design equations, the ACI 318
design equation, and the AASHTO design equation through the full range of bar stresses
and concrete strengths included in the ACI 408 database are shown in Figure 3-5 through
Figure 3-8. For reference, data points are labeled as either within or outside the
allowable bar stress and concrete strength limits for the ACI 318 and AASHTO plots.
0
20
40
60
80
100
120
140
160
0 20 40 60 80 100 120 140 160
Calculated Failure Stress (ksi)
Test
Fai
lure
Str
ess
(ksi
)
Figure 3-5: Test vs. calculated stresses using ACI 408 equation with φ = 1.00 (data from ACI 408 database 10-2001)
31

0
20
40
60
80
100
120
140
160
0 20 40 60 80 100 120 140 160
Calculated Failure Stress (ksi)
Test
Fai
lure
Str
ess
(ksi
)
Figure 3-6: Test vs. calculated stresses using ACI 408 equation with φ = 0.82 (data from ACI 408 database 10-2001)
0
20
40
60
80
100
120
140
160
0 20 40 60 80 100 120 140 160
Calculated Failure Stress (ksi)
Test
Fai
lure
Str
ess
(ksi
)
Within LimitsOutside Limits
Figure 3-7: Test vs. calculated stresses using ACI 318 equation (data from ACI 408 database 10-2001, fs and fc’ limits not applied)
32

0
20
40
60
80
100
120
140
160
0 20 40 60 80 100 120 140 160
Calculated Failure Stress (ksi)
Test
Fai
lure
Str
ess
(ksi
)
Within LimitsOutside Limits
Figure 3-8: Test vs. calculated stresses using AASHTO LRFD equation (data from ACI 408 database 10-2001, fs and fc’ limits not applied)
As noted, the previous data are based on the entire range of bar stresses and
concrete strengths tested by researchers in bond. The ACI 318 building code limits
stresses in tensile reinforcement to 80 ksi. The AASHTO LRFD bridge design
specification limits bar stresses to 75 ksi. Both restrict concrete compressive strength to
10,000 psi. When these limits are applied to the results tabulated in the ACI 408 database
of bond tests, the ACI 318 and AASHTO development length equations provide more
acceptable results as shown in Table 3-2. The mean test/calculated failure stress ratios
increase slightly, and the number of tests failing below their calculated failure stresses
reduces drastically for both equations. However, 9% of tests still failed below their
calculated failure stresses according to the ACI 318 equation and 13% of tests failed
below their calculated failure stresses according to the AASHTO equation. These
percentages are greater than the 6% produced by the design version of the ACI 408
33

equation for all bar stresses and concrete strengths and are on the upper limit of
acceptable for design expressions. Nevertheless, the data indicate that the current ACI
318 and AASHTO equations provide sufficient conservatism when used within the limits
of the variables mandated by the two codes.
ACI 318 ≤ 80 348 1.31 0.28 0.21 2.42 0.72 32 9AASHTO ≤ 75 351 1.34 0.34 0.26 2.63 0.74 47 13
COV Max Min # < 1.0 % < 1.0
Distribution of Test/Calculated Failure Stress Ratios
Equation Calculated Stresses (ksi) N Mean Std. Dev.
Table 3-2: Performance of ACI 318 and AASHTO LRFD design code equations within the range of allowable design stresses and concrete strengths
Based on more limited data, when calculated failure stresses for the ACI 318 and
AASHTO LRFD equations exceed the permissible maximum bar stresses, the
conservatism of the design code equations diminishes drastically. This phenomenon is
highlighted in Table 3-3.
ACI 318 > 80 24 0.93 0.15 0.16 1.35 0.70 17 71AASHTO > 75 17 0.81 0.14 0.18 1.15 0.62 15 88
N Mean # < 1.0 % < 1.0Min
Distribution of Test/Calculated Failure Stress Ratios
Equation Calculated Stresses (ksi) Std. Dev. COV Max
Table 3-3: Performance of ACI 318 and AASHTO LRFD design code equations outside the range of acceptable design stresses (fc’ ≤ 10,000 psi)
3.4 MMFX BOND RESEARCH
MMFX high strength reinforcement provides a guaranteed ultimate tensile stress
of 150 ksi with a minimum yield stress of 100 ksi when measured using the 0.2% offset
method (MMFX 2004). In order to mobilize this high strength, proper anchorage must be
achieved; however, limited research has been conducted to extend current design code
provisions to higher stress levels. The current database includes only 12 tests which 34

35
displayed bond failure at stresses in excess of 100 ksi. No tests have been reported with
failure stresses in excess of 120 ksi which has been shown in previous research (El-Hacha
and Rizkalla 2002) and will be shown in this research to be the yield strength of MMFX
reinforcement when the 0.2% offset method is used.
Limited data exists on bond characteristics specifically for MMFX reinforcement.
Ahlborn and DenHartigh (2002) indicated that MMFX reinforcement can be substituted
as a one-to-one replacement for conventional A 615 Grade 60 reinforcement when
considering bond. The expressions by Orangun, Jirsa, and Breen as well as the design
provisions of ACI 318-99 and AASHTO Standard Specification provided conservative
predictions of bond behavior for the 130 beam-end specimens used in their tests.
However, the variables included in these tests were limited. Only No. 4 and No. 6 bars
were studied. All tests included identical cover dimensions (1.5 in.) and were embedded
in concrete of similar compressive strength (~5500 psi). Because the research was
intended to be used only as a comparative study of MMFX and A 615 bond behavior, the
bonded lengths chosen for the tests were not sufficient to develop the stresses in the
upper stress range of MMFX reinforcement. Therefore, the conclusions of the research
by Ahlborn and DenHartigh are limited to stresses at or below 60 ksi.
El-Hacha, El-Agroudy, and Rizkalla (2006) tested four beam-end specimens
containing #4 or #8 MMFX bars and eight beam-splice specimens containing #6 or #8
MMFX bars. Data from the beam-end specimens indicated that the relationship between
the splice length to bar diameter ratio and the stress in the MMFX bar transitions from
nearly linear at low stresses to highly nonlinear at stresses in excess of 110 ksi. The
results of the beam-splice specimens suggested that the nonlinear behavior of the MMFX
bars above the reported proportional limit of 80 ksi significantly reduced the bond
strength of the MMFX bars at high stresses. In agreement with the findings of Ahlborn

36
and DenHartigh; El-Hacha, El-Agroudy, and Rizkalla found that the ACI 318-05 design
equation provides conservative estimates for splice failure stresses up to 80 ksi. Beyond
80 ksi, the design code equation becomes unconservative and must be modified.

37
CHAPTER 4
Experimental Program
4.1 BEAM-SPLICE TESTS
4.1.1 Test Matrix
The experimental program described herein is part of a joint investigation
conducted by the University of Kansas, North Carolina State University, and the
University of Texas at Austin. According to the original project proposal, each school
would test 22 full scale beam splice specimens. Duplicate tests among pairs of schools
were included in the test matrix to ensure consistency of results among researchers.
Test variables included bar size, concrete compressive strength, splice length,
concrete cover, and amount of transverse reinforcement (confinement). The tests
included three bar sizes – #5, #8, and #11 – and two concrete compressive strengths –
5000 psi and 8000 psi. The range of bottom cover values varied according to bar size.
Cover values of 0.75 in., 1.25 in., and 2.0 in. were used for #5 specimens. Values of 1.5
in. and 2.5 in were used for #8 specimens; and values of 2.0 in. and 3.0 in. were used for
#11 specimens. Splice lengths were chosen based on two target failure stress levels — 80
ksi and 100 ksi — when calculated according to the ACI 408 development length
equation without consideration for transverse reinforcement or increased relative rib area
and with the modification factor, φ, equal to 1.0.
The effect of transverse reinforcement was only investigated on the #8 and #11
specimens. For these bar sizes, three specimens were tested for each splice length. One
specimen included an unconfined splice. The remaining two included varying levels of
transverse reinforcement in the form of closed hoop shear ties. The spacing of the ties

38
was chosen to provide a 20 ksi or 40 ksi increase in predicted failure stress per the ACI
408 equation when compared to the unconfined splice of the same length. Due to a
misinterpretation of confinement parameters during the design stage of the project,
specimens from North Carolina State University contained double the transverse
reinforcement necessary to provide the desired increases of 20 ksi and 40 ksi in failure
stress. Therefore, the predicted increases in failure stresses for the confined splices tested
at North Carolina State University were 40 ksi and 80 ksi over those of the unconfined
splices. The effect of transverse reinforcement was not studied in the #5 specimens since
they were intended to represent slabs where stirrups are rarely used.
At the University of Texas, an additional three beams not included in the original
test matrix were tested to study the effect of concrete strength specifically. All test
variables pertinent to bond except concrete strength were held constant between these
beams containing 5000 psi concrete and a corresponding set of beams with a concrete
strength of 8000 psi.
All of the test variables are represented in the standard specimen notation
developed for this research program. A sample designation and the range of values for
each parameter are shown below. The sample designation represents a specimen
containing #8 bars embedded in 5000 psi concrete with 1.5 in. cover. The splice length is
that which would result in a predicted failure stress of 80 ksi assuming the previous
parameters, and the level of transverse reinforcement was calculated to provide a 20 ksi
increase in failure stress over that of the unconfined splice, or 100 ksi.

39
8-5-OC1-1.5Bar Size (US)
• #5, #8, #11
Concrete Strength (ksi)• 5, 8
Splice Length• O: fs = 80ksi* for unconfined splice
• X: fs = 100ksi* for unconfined splice*per ACI 408 equation with φ = 1.0
Confinement• C0: unconfined
• C1: fs = unconfined + 20ksi
• C2: fs = unconfined + 40ksi
• C3: fs = unconfined + 80 ksi
• CX*: additional UT tests
Cover (in)• 0.75, 1.25, 2.0 for #5 bars
• 1.5, 2.5 for #8 bars
• 2.0, 3.0 for #11 bars
The experimental test matrix for the three participating schools is given in Table
4-1. In this table, the standard specimen naming convention is used.
f'c db
3/4 in 1.25 in 2 in 3/4 in 1.25 in 2 in 3/4 in 1.25 in 2 inOC0 OC0 OC0 OC0 OC0XC0 XC0 XC0 XC0 XC0
1.5 in 2.5 in 1.5 in 2.5 in 1.5 in 2.5 inOC0,1,2 OC0,2,3 OC0,2XC0,1,2 XC0,2,3 XC0,2
OC0*,1*,2*
2 in 3 in 2 in 3 in 2 in 3 inOC0,2,3 OC0,1,2XC0,2,3 XC0,1,2
1.5 in 2.5 in 1.5 in 2.5 in 1.5 in 2.5 inOC0,1,2 OC0,2 OC0,1,2XC0,1,2 XC0,2 XC0,1,2
2 in 3 in 2 in 3 in 2 in 3 inOC0,1,2 OC0,2,3XC0,1,2 XC0,2,3
UT
Cover
#8
#11
#5
Cover
KU NCSU
Cover
Cover Cover Cover
5 ksi
Cover Cover Cover
Cover Cover Cover
Cover
Total 22 22 25
8 ksi
#11
Cover Cover
#8
Table 4-1: Experimental test matrix (duplicate tests bolded, tests not included in original matrix italicized)
40
Further discussion in this chapter will relate solely to the specimens and
laboratory test setup for the research carried out by the University of Texas.
4.1.2 Specimen Design
Beams containing #8 and #11 bars included two splices of equal length located at
mid-span of the beam. Side cover values were set equal to bottom cover values, and clear
spacing between splices was set to twice the side cover values. These covers were
chosen to create equal probability of failure by side splitting or face splitting.
To better represent the behavior of slabs, specimens containing #5 bars were
wider, including four splices of equal length at mid-span of the beam. In these
specimens, side covers were greater than bottom cover values as is typical in slab design.
Clear spacing between splices remained equal to twice the side cover values.
Specimens were designed with sufficient strength to develop bar stresses in
excess of the highest expected failure stress of the splices. #8 and #11 bar specimens
were required to develop at least 150 ksi at the onset of concrete crushing. Since none of
the #5 specimens contained transverse reinforcement, the requirements for design were
relaxed. These specimens were designed to develop at least 120 ksi when the moment in
the beams produced concrete crushing on the compression face.
Beam lengths were governed by available tie down points in the concrete strong
floor at the University of Texas. The spacing of hydraulic rams ensured that the splices
were completely within the constant moment region and that the required loads for failure
were within the load carrying capabilities of the testing apparatus.
Beams were originally designed with the assumption that concrete at the extreme
compression fiber reached the maximum usable strain value of 0.003 in/in simultaneous
with the tension steel reaching the desired ultimate stress (150 ksi or 120 ksi).
Distribution of concrete stress throughout the sections was estimated using the Whitney

41
stress block. Beam depths were chosen to satisfy strain compatibility. For design
purposes, the stress-strain relationship for the MMFX reinforcement was taken as:
( )MMFXefMMFXε⋅−−⋅= 1851165
This stress-strain relationship was cited in a North Carolina State University research
paper and was based on tension tests performed on MMFX reinforcing bars by several
previous researchers (Dawood, et al. 2004).
After preliminary design, the depths of the #5 slab specimens were modified to a
uniform depth of 12 in. to reduce the required amount of formwork. The depths of 8-8-
XC0-1.5, 8-8-XC1-1.5, and 8-8-XC2-1.5 were also increased from 23 in. to 27 in. after
specimen 8-8-OC2-1.5 nearly failed in flexure during its test.
Details of the specimen designs are given in Table 4-2. The general cross-
sections for beam (#8 and #11) and slab (#5) specimens are shown in Figure 4-1 and
Figure 4-2, respectively. An elevation view of the test specimens and the loading
schematic is shown in Figure 4-3.

42
Splicetest area
5-5-OC0-3/4 33
5-5-XC0-3/4 44
5-5-OC0-1.25 185-5-XC0-1.25 25
5-5-OC0-2 155-5-XC0-2 20
8-5-OC0-1.5 N/A8-5-OC2-1.5 5.5
8-5-XC0-1.5 N/A8-5-XC2-1.5 7.0
8-5-OC0*-1.5 N/A8-5-OC1*-1.5 13.58-5-OC2*-1.5 7.0
8-8-OC0-1.5 N/A8-8-OC1-1.5 13.58-8-OC2-1.5 7.0
8-8-XC0-1.5 N/A8-8-XC1-1.5 18.58-8-XC2-1.5 9.0
11-5-OC0-3 N/A11-5-OC1-3 8.011-5-OC2-3 4.0
11-5-XC0-3 N/A11-5-XC1-3 11.011-5-XC2-3 5.5
h (in)
cb (in)
cso (in)
Comp. Reinf.
bar # ct (in)
Test SetupTransverse Reinforcement
Specimen
Materials Section Cover
Bar # f'c (ksi)
b (in) 2*csi (in) Span
(ft)
ram spacing
(ft)
non-test area
Bar # Spacing s1 (in)
12 5
Spacing s2 (in)
5 5
13 12 0.75 1 2
N/A35 12 1.25 3.75 7.5
35 12
5.0
2
3
7.5
5
1.5 3
3.75
1.5
1.5 1.5
31
5 10
10
27
23
10 27
8
8
203 3 611 5 18 8
4 8.5
16 6
8.0
1.5
4 5.011 1.5
1.5 4
1.5
3
8
40
54
50
67
ls (in)
47
62
40
Table 4-2: Beam-splice specimen design details
b
h
cso
cb
ct
cso2*csi
Figure 4-1: General cross-section for beam specimens (#8 and #11)

43
b
h
2*csi 2*csi csocso
cb
ct
2*csi
Figure 4-2: General cross-section for slab specimens (#5)
Ram Spacing
Span
s1 s1
s2
P P
ls
1'1'
Figure 4-3: Elevation of test specimens and loading schematic
4.1.3 Specimen Fabrication and Instrumentation
All beam-splice specimens were fabricated and tested at the Ferguson Structural
Engineering Laboratory at the University of Texas at Austin. Beams containing #8 and
#11 bars were cast in groups according to splice length. In each group, only the amount
of transverse reinforcement varied among the beams. A group of #8 specimens with the
same splice length but varying amounts of transverse reinforcement is shown in Figure
4-4. Specimens containing #5 bars were cast in groups according to cover values. In

44
each group, only the splice length varied among the beams. A pair of specimens
containing #5 bars with varying splice lengths is shown in Figure 4-5.
Figure 4-4: Varying levels of transverse reinforcement among a group of three specimens containing #8 bars

45
Figure 4-5: Varying splice length among a pair of specimens containing #5 bars
120 ohm electrical resistance foil strain gauges with a 5 mm gage length were
applied to the spliced MMFX bars at the end of each splice. This location was chosen so
that the maximum strains being developed in the spliced bars could be measured without
interfering with the bond of the bars along the splice. The location of these strain gauges
is shown on a confined #8 splice in Figure 4-6.
Figure 4-6: Confined #8 splices with strain gauges at the ends of the splices
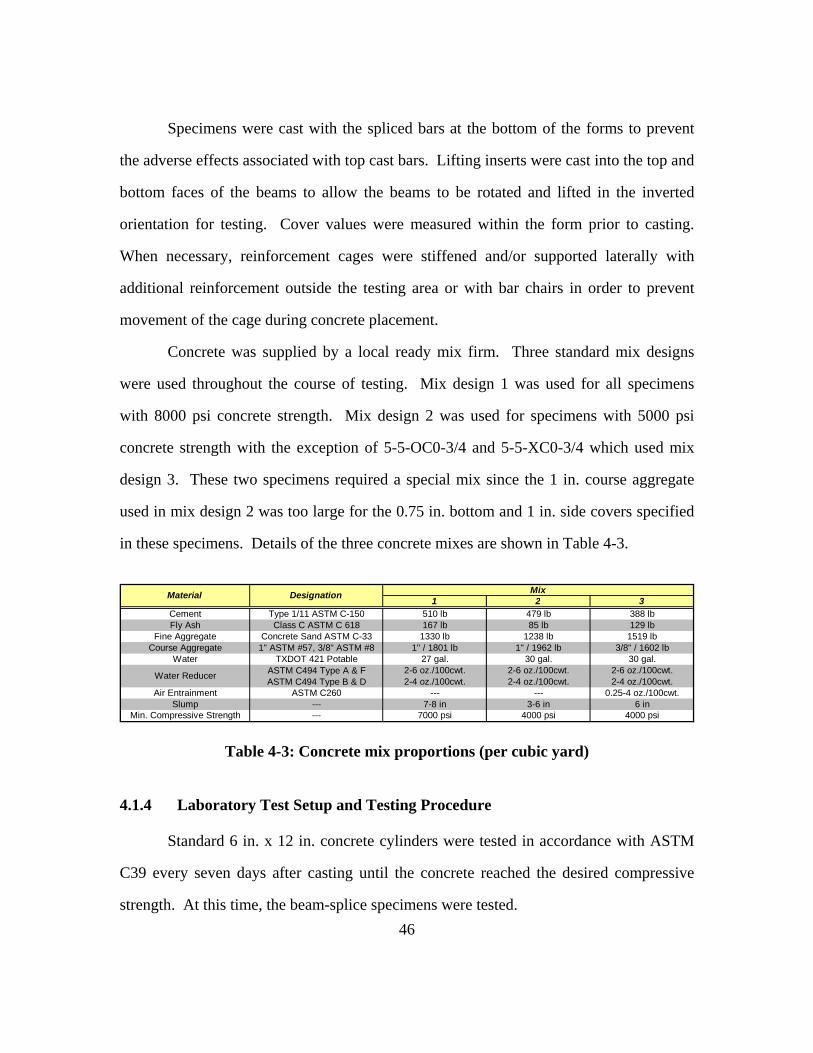
46
Specimens were cast with the spliced bars at the bottom of the forms to prevent
the adverse effects associated with top cast bars. Lifting inserts were cast into the top and
bottom faces of the beams to allow the beams to be rotated and lifted in the inverted
orientation for testing. Cover values were measured within the form prior to casting.
When necessary, reinforcement cages were stiffened and/or supported laterally with
additional reinforcement outside the testing area or with bar chairs in order to prevent
movement of the cage during concrete placement.
Concrete was supplied by a local ready mix firm. Three standard mix designs
were used throughout the course of testing. Mix design 1 was used for all specimens
with 8000 psi concrete strength. Mix design 2 was used for specimens with 5000 psi
concrete strength with the exception of 5-5-OC0-3/4 and 5-5-XC0-3/4 which used mix
design 3. These two specimens required a special mix since the 1 in. course aggregate
used in mix design 2 was too large for the 0.75 in. bottom and 1 in. side covers specified
in these specimens. Details of the three concrete mixes are shown in Table 4-3.
1 2 3
Cement Type 1/11 ASTM C-150 510 lb 479 lb 388 lbFly Ash Class C ASTM C 618 167 lb 85 lb 129 lb
Fine Aggregate Concrete Sand ASTM C-33 1330 lb 1238 lb 1519 lbCourse Aggregate 1" ASTM #57, 3/8" ASTM #8 1" / 1801 lb 1" / 1962 lb 3/8" / 1602 lb
Water TXDOT 421 Potable 27 gal. 30 gal. 30 gal.ASTM C494 Type A & F 2-6 oz./100cwt. 2-6 oz./100cwt. 2-6 oz./100cwt.ASTM C494 Type B & D 2-4 oz./100cwt. 2-4 oz./100cwt. 2-4 oz./100cwt.
Air Entrainment ASTM C260 --- --- 0.25-4 oz./100cwt.Slump --- 7-8 in 3-6 in 6 in
Min. Compressive Strength --- 7000 psi 4000 psi 4000 psi
Material Designation Mix
Water Reducer
Table 4-3: Concrete mix proportions (per cubic yard)
4.1.4 Laboratory Test Setup and Testing Procedure
Standard 6 in. x 12 in. concrete cylinders were tested in accordance with ASTM
C39 every seven days after casting until the concrete reached the desired compressive
strength. At this time, the beam-splice specimens were tested.

47
The beams were loaded in four point bending in the inverted position to facilitate
crack observation. For specimens containing #8 and #11 bars as well as for the two 13
in. wide specimens containing #5 bars, two hydraulic rams connected to the same
pressure line created a near constant moment region in the center of the span by
providing nearly identical load at two intermediate points along the beam. For the wider
#5 specimens, this setup was modified to provide a more uniform load across the width of
the slabs. Four hydraulic rams were used when testing these specimens, with two rams
located at each line of loading.
As load was applied, the beams transferred end reactions through roller supports
that reacted against built-up crossbeam sections comprised of back-to-back C10X30
channels. These crossbeams transferred load to the laboratory strong floor through high-
strength threaded rods.
Load cells measured the applied load at each hydraulic ram, and a pressure
transducer provided back-up data. A linear variable displacement transducer (LVDT)
measured midspan deflection throughout the test. Strains in the spliced MMFX bars were
monitored by strain gauges applied to the bars at the end of each splice as described
previously.
The typical laboratory test setup for #8 and #11 specimens and for the 13 in. wide
#5 specimens is pictured in Figure 4-7. The typical laboratory test setup for the wider #5
slab specimens is pictured in Figure 4-8.

48
Splice Length
LVDTHydraulic Ram Load Cell
Roller Back-to-Back C10X30s
Figure 4-7: Typical laboratory test setup for narrow splice specimens
Splice Length
Roller Back-to-Back C10X30s
Hydraulic Rams LVDT
Load Cell
Figure 4-8: Typical laboratory test setup for wide splice specimens
Beams were loaded up to the cracking load. At this point, the load was held
constant while cracks were traced and crack widths at the ends of the splice and in the
center of the splice were measured with a crack comparator. Additional load was added
in varying increments depending on the capacity of the beam being tested. These
increments were typically 2.5 kip, 5 kip, and 10 kip for specimens containing #5, #8, and
#11 bars, respectively. After each load increment, new cracks were traced and crack
widths were again measured in the same locations as at the cracking load.

49
Due to the brittle and explosive nature of splice failures, it was deemed unsafe to
approach the beams as they neared the anticipated failure load; therefore, cracks were no
longer marked or measured near the expected failure load. The point at which these
measurements were ceased varied from beam to beam. At this point, load was increased
until failure of the splices was achieved and the beams lost all load carrying capacity.
The peak load was recorded as the failure load.
After failure, the spalled concrete cover was examined to confirm that cover
values matched those recorded prior to casting.
4.2 REINFORCEMENT TESTS
MMFX Steel Corporation of America provided all tension reinforcement for this
project. All bars of a given size were rolled from the same heat to ensure consistent
behavior among bars. They were then distributed to the three participating research
universities as required.
In order to accurately relate steel strains observed in laboratory tests to
corresponding stress values, a series of tension tests were performed on a sample of #5,
#8, and #11 MMFX reinforcement. Although North Carolina State University reported a
stress-strain relationship based on earlier research, additional tension tests were required
for this project since the stress-strain relationship of steel reinforcement can vary from
heat to heat.
4.2.1 Specimen Description
Reinforcement samples measuring approximately 3 ft. in length were used for
tension testing. This length provided sufficient area for gripping at the ends of the
specimens and enough length to attach an 8 in. gage extensometer. Samples of each bar
size were obtained from a single bar due to the limited number of excess bars provided to

50
the University of Texas. This was not believed to affect the results since all bars of a
given size were rolled from the same heat and should display almost identical behavior.
4.2.2 Laboratory Test Setup and Testing Procedure
Small notches spaced approximately 8 in. apart were made in the reinforcement
samples in order to ensure that the knife edges of an 8 in. extensometer would not slip
and to determine the total elongation upon completion of the test. The exact spacing of
these notches was measured with calipers, and this length was used as the actual gage
length in calculations. The typical test setup is shown in Figure 4-9.
Figure 4-9: Typical test setup for reinforcement tension tests
A 600 kip capacity testing machine applied tension to each bar at a rate which
produced a relatively constant increase in bar stress (approximately 15 ksi/min) in the
initial linear stage of elongation. As each specimen entered its nonlinear range, the rate
of stress increase decreased accordingly. The test was allowed to continue without

51
interference until the specimen had experienced 3.5-4.0% elongation. At this point, the
application of load was temporarily stopped to remove the extensometer. The test then
resumed until the bar ruptured.
After each test, the two pieces of the ruptured bar were fit together along the
fracture surface; and the separation of the notches was again measured with calipers so
that total elongation could be calculated.

52
CHAPTER 5
Experimental Results
5.1 REINFORCEMENT TESTS
5.1.1 #5 Bars
Four #5 bars were tested in tension according to the procedure described in
Chapter 4. Four bars were chosen due to the amount of scatter in the data from test to
test. In Figure 5-1, the stress-strain curves are plotted for the four tension tests as well as
an exponential curve fit for the data obtained using the program Sigma Plot. Details of
each tension test are shown in Table 5-1. In these tests, failure never occurred within the
gage length notched into the bars prior to testing so measurements of total elongation do
not accurately represent the ductility and necking observed during the tests.
The #5 MMFX bars maintained a linear stress-strain relationship with a modulus
of approximately 28,400 ksi to their proportional limit of 80-90 ksi as indicated in Figure
5-1. At this point, the stress-strain curve became nonlinear. At a strain of about 0.02, the
bars reached a stress of 155 ksi. Additional strain beyond this point resulted in very little
additional bar stress.
The MMFX reinforcement did not display a well defined yield point like that
observed in traditional Grade 60 reinforcement. A comparison of the two stress-strain
relationships is shown in Figure 5-2. Using the 0.2% offset method, the approximate
yield stress of #5 MMFX reinforcement used in this research program was 122 ksi. This
is shown in Figure 5-3. Maximum stresses attained by the four bars were consistently
between 160-161 ksi as indicated in Table 5-1.

53
0
20
40
60
80
100
120
140
160
180
0 0.005 0.01 0.015 0.02 0.025 0.03 0.035 0.04 0.045
Strain (in/in)
Stre
ss (k
si)
#5 Bar 1
#5 Bar 2
#5 Bar 3
#5 Bar 4
Exponential Curve Fit
fs = 156*(1-EXP(-230 ε MMFX))
Figure 5-1: Stress-strain relationship for #5 MMFX bars (End of plot indicates removal of extensometer)
l o l f ε tot P max f max(in) (in) (in/in) (kip) (ksi)
Bar 1 8.292 8.679 0.0467* 49.6 160.0Bar 2 8.310 8.685 0.0451* 49.7 160.3Bar 3 8.278 8.650 0.0449* 49.9 161.0Bar 4 8.310 8.650 0.0409* 49.9 161.0
Average --- --- --- 49.8 160.6* Bar rupture occurred outside gage length
Test
Results of Tension Tests on #5 MMFX Bars
Table 5-1: Summary of results for #5 MMFX tension tests

54
0
20
40
60
80
100
120
140
160
180
0 0.005 0.01 0.015 0.02 0.025 0.03 0.035 0.04
Strain (in/in)
Stre
ss (k
si)
#5 Bar 1#5 Bar 2#5 Bar 3#5 Bar 4Exponential Curve FitGrade 60
Figure 5-2: Comparison of MMFX and Grade 60 stress-strain behavior
0
20
40
60
80
100
120
140
0 0.001 0.002 0.003 0.004 0.005 0.006 0.007 0.008 0.009 0.01
Strain (in/in)
Stre
ss (k
si)
Bar 1Bar 2Bar 3Bar 4E ≈ 28,400 ksi
Figure 5-3: 0.2% offset yield - #5 MMFX bars

55
The #5 MMFX bars displayed some ductility prior to rupture. Necking coupled
with a gradual reduction in load carrying capacity was observed before failure of all
specimens. A post-failure picture of the #5 bars is provided in Figure 5-4.
Figure 5-4: #5 MMFX reinforcement specimens after testing
5.1.2 #8 Bars
Two #8 MMFX bars were tested in tension. Additional tests were unnecessary
due to the consistency of the results between the first two tests. As shown in Figure 5-5,
the stress-strain behavior of the #8 MMFX bars was nearly identical to that displayed by
the #5 MMFX bars. A maximum stress between 161 ksi and 162 ksi for both #8 bars is
reported in Table 5-2. Measurements of total elongation again underestimate the ductility
exhibited by the bars during testing since both failures occurred outside the gage length
marked prior to testing.

56
0
20
40
60
80
100
120
140
160
180
0.000 0.005 0.010 0.015 0.020 0.025 0.030 0.035 0.040 0.045
Strain (in/in)
Stre
ss (k
si)
#8 Bar 1
#8 Bar 2
Exponential Curve Fit
fs = 156*(1-EXP(-220 ε MMFX))
Figure 5-5: Stress-strain relationship for #8 MMFX bars (End of plot indicates removal of extensometer)
l o l f ε tot P max f max(in) (in) (in/in) (kip) (ksi)
Bar 1 8.110 8.440 0.0407* 127.7 161.6Bar 2 8.150 8.570 0.0515* 127.8 161.8
Average --- --- --- 127.8 161.7* Bar rupture occurred outside gage length
Results of Tension Tests on #8 MMFX Bars
Test
Table 5-2: Summary of results for #8 MMFX tension tests
The yield stress of the #8 MMFX bars was approximately 121 ksi when using the
0.2% offset method as shown in Figure 5-6. The initial modulus of approximately 28,000
ksi is also shown in this figure. Post-failure pictures of the #8 MMFX bars are provided
in Figure 5-7. Again, necking and a gradual reduction in load capacity were witnessed
prior to failure of both specimens.

57
0
20
40
60
80
100
120
140
0 0.001 0.002 0.003 0.004 0.005 0.006 0.007 0.008 0.009 0.01
Strain (in/in)
Stre
ss (k
si)
Bar 1
Bar 2
E ≈ 28,000 ksi
Figure 5-6: 0.2% offset yield - #8 MMFX bars
Figure 5-7: #8 MMFX reinforcement specimens after testing
5.1.3 #11 Bars
Three #11 bars were tested in tension. The stress-strain behavior for the three
specimens is shown in Figure 5-6. While the general shape of the stress-strain curve for
the #11 bars was the same as that for the #5 and #8 bars, the #11 bars displayed a higher
initial modulus and strength than the bars of smaller size. The modulus of the #11 bars

58
was approximately 30,500 ksi as shown in Figure 5-9. Results shown in Table 5-3
indicate that the tensile capacity of the #11 bars was about 169 ksi which was 7-8 ksi
higher than the ultimate stresses attained by the #5 and #8 bars.
All of the #11 specimens failed within the gage length that was marked prior to
testing. As a result, the elongations listed in Table 5-3 are significantly higher than those
reported for the #5 and #8 bars. The values shown for the #11 specimens are more
representative of the actual ductility displayed by all sizes of MMFX bars since they
include the substantial deformations experienced in and around the region of necking.
0
20
40
60
80
100
120
140
160
180
0.000 0.005 0.010 0.015 0.020 0.025 0.030 0.035 0.040 0.045
Strain (in/in)
Stre
ss (k
si)
#11 Bar 1
#11 Bar 2
#11 Bar 3
Exponential Curve Fit
fs = 162*(1-EXP(-235 ε MMFX))
Figure 5-8: Stress-strain relationship for #11 MMFX bars (End of plot indicates removal of extensometer)

59
l o l f ε tot P max f max(in) (in) (in/in) (kip) (ksi)
Bar 1 8.345 9.243 0.1076 264.5 169.6Bar 2 8.249 9.265 0.1232 263.4 168.8Bar 4 8.255 9.294 0.1259 262.8 168.5
Average --- --- 0.1189 263.6 169.0* Bar rupture occurred outside gauge length
Results of Tension Tests on #11 MMFX Bars
Test
Table 5-3: Summary of results for #11 MMFX tension tests
The data for the #11 bars during initial loading varied from bar to bar, but the
yield stress of the #11 MMFX bars was about 122 ksi when using the 0.2% offset method
as shown in Figure 5-9. Post-failure pictures of the #11 MMFX bars are shown in Figure
5-10.
0
20
40
60
80
100
120
140
0 0.001 0.002 0.003 0.004 0.005 0.006 0.007 0.008 0.009 0.01
Strain (in/in)
Stre
ss (k
si)
Bar 1Bar 2Bar 3
E ≈ 30,500 ksi
Figure 5-9: 0.2% offset yield - #11 MMFX bars

60
Figure 5-10: #11 MMFX reinforcement specimens after testing
5.2 BEAM-SPLICE TESTS
Forty-five beam-splice tests have been completed at the time of this writing. This
number includes 25 tests conducted by the University of Texas, 17 tests conducted by
North Carolina State University, and 3 tests conducted by the University of Kansas. The
results of the tests conducted at the University of Texas are presented in Section 5.2.1.
The results of tests conducted at the other two participating universities are presented in
Section 5.2.2.
5.2.1 Tests Conducted at the University of Texas
The behavior and results of tests conducted on splices not confined by transverse
reinforcement are outlined in Section 5.2.1.1. The behavior and results of splices
confined by transverse reinforcement are covered in Section 5.2.1.2. The test results are
separated because of the significant differences in behavior and ultimate capacity
displayed by unconfined and confined splices.
5.2.1.1 Splices not Confined by Transverse Reinforcement
5.2.1.1.1 Behavior

61
Unconfined beam-splice specimens remained uncracked until stresses at the
extreme tension fiber reached the maximum tensile capacity of the concrete. Estimating cracking load based on a maximum tensile capacity '5.7 ccr ff = provided reasonably
accurate predictions. Within the pre-cracking stage of loading, all test specimens were
less stiff than predicted through analysis. This discrepancy was likely due to
microcracking present in the specimens prior to testing.
Flexural cracks directly above the loading points were the first cracks to form. In
many tests, one or more additional flexural cracks formed between the load points and
the ends of the splices. Flexural cracks rarely extended into the splice region at the initial
cracking load.
At the cracking load, stresses in the MMFX steel reinforcement immediately
increased to carry the tensile forces in the beam. The slope of the load-deflection plot
also reduced due to the lower effective moment of inertia of the beam. Unlike during the
pre-cracking stage of loading, the stiffness of the beams after cracking aligned well with
the calculated stiffness. These phenomena can be seen in the typical bar stress-load and
load-deflection plots shown in Figure 5-11 and Figure 5-12, respectively.

62
0
20
40
60
80
100
120
0.0 10.0 20.0 30.0 40.0 50.0 60.0 70.0
Load / Ram (kip)
Bar
Str
ess
(ksi
)
PredictedExperimental
Figure 5-11: Typical bar stress-load plot for unconfined specimen (8-8-XC0-1.5)
0.0
10.0
20.0
30.0
40.0
50.0
60.0
70.0
0.00 0.10 0.20 0.30 0.40 0.50 0.60 0.70 0.80 0.90 1.00
Deflection (in)
Load
/ R
am (k
ip)
PredictedExperimental
Figure 5-12: Typical load-deflection plot for unconfined specimen (8-8-XC0-1.5)

63
The application of additional load resulted in the formation of additional flexural
cracks along the shear span of the beam and within the splice region. Flexural cracks
also tended to form directly above the ends of each splice. Cracks in the shear span
appeared at regular intervals and were usually located above stirrups. Shear cracks began
to develop between the loading points and the supports as the applied shear exceeded the
shear capacity of the concrete alone. A typical unconfined splice specimen in the early
stages of loading is shown in Figure 5-13.
Figure 5-13: Cracking of typical unconfined specimen at early loading stages
As testing progressed, the cracks directly above the splice ends began to open at a
rate greater than that of the flexural cracks along the remainder of the beam. Eventually,
longitudinal face splitting cracks above the spliced bars began to form at the ends of the
splices. This marked the first indication of impending failure at the splice. Specimens
typically began to show longitudinal cracks in the splice region when the maximum stress
in the spliced MMFX bars reached 40-50 ksi; however, these cracks were initiated at
stresses as low as 35 ksi in specimen 11-5-OC0-3 and at stresses as high as 68 ksi in
specimen 5-5-XC0-1.25. Longitudinal cracks were not observed in specimens 5-5-OC0-
2 and 5-5-XC0-2, but this may be due to the fact that observations on these specimens

64
ceased well before failure. A typical cracking pattern along the splice in unconfined
specimens at the onset of longitudinal splitting is shown in Figure 5-14.
Figure 5-14: Cracking of typical unconfined splice at onset of longitudinal splitting
Near the failure load, the longitudinal face splitting cracks progressed from the
ends of the splices toward the middle of the splices. The extent that these cracks
propagated prior to failure varied from specimen to specimen. At this point, longitudinal
side splitting cracks also began to form. These cracks initiated at the end of the splices at
a depth equal to the depth of the spliced bars within the member. Similar to the face
splitting cracks, the side splitting cracks progressed from the ends of the splices toward
the center of the splices. The length of propagation varied from specimen to specimen.
The cracking of an unconfined splice near failure is shown in Figure 5-15. Immediately
prior to failure, the widths of the flexural cracks above the ends of the splices increased
sharply as shown in Figure 5-16. Throughout the tests, the flexural cracks within the
splice length remained small since this region contained double the amount of steel

65
present in other portions of the beam. The difference in crack widths at the ends of the
splices and in the middle of the splices is highlighted in Figure 5-16.
Figure 5-15: Cracking of typical unconfined splice near failure

66
0
0.01
0.02
0.03
0.04
0.05
0.06
0.07
0 10 20 30 40 50 60 70 80 90
Bar Stress (ksi)
Cra
ck W
idth
(in)
End 1End 2Middle
fs max = 86 k i
Figure 5-16: Measured crack widths for typical unconfined splice (8-8-XC0-1.5)
Failure of the splice was signaled by explosive spalling of the concrete cover
along at least half of the splice length and complete and immediate loss of load carrying
capacity of the beam. Since most unconfined splices failed with the MMFX bars
developing stresses of 75-90 ksi, the reinforcement in the unconfined specimens did not
reach strains high enough to provide visual warning of failure through the development
of large deflections. Typical unconfined specimens maintained a linear load-deflection
relationship from initial cracking to failure. A picture of an unconfined specimen at
failure is shown in Figure 5-17. A picture of an unconfined splice after failure is
provided in Figure 5-18.

67
Figure 5-17: Unconfined splice at failure
Figure 5-18: Unconfined splice after failure
The #5 beam-splice tests displayed noticeably different behavior than that of other
unconfined tests due to their four splice design and due to the large ratio of maximum
cover to minimum cover in the wider specimens. In all of the #5 specimens, the exterior
splices failed before the interior splices. This phenomenon was clearly visible during
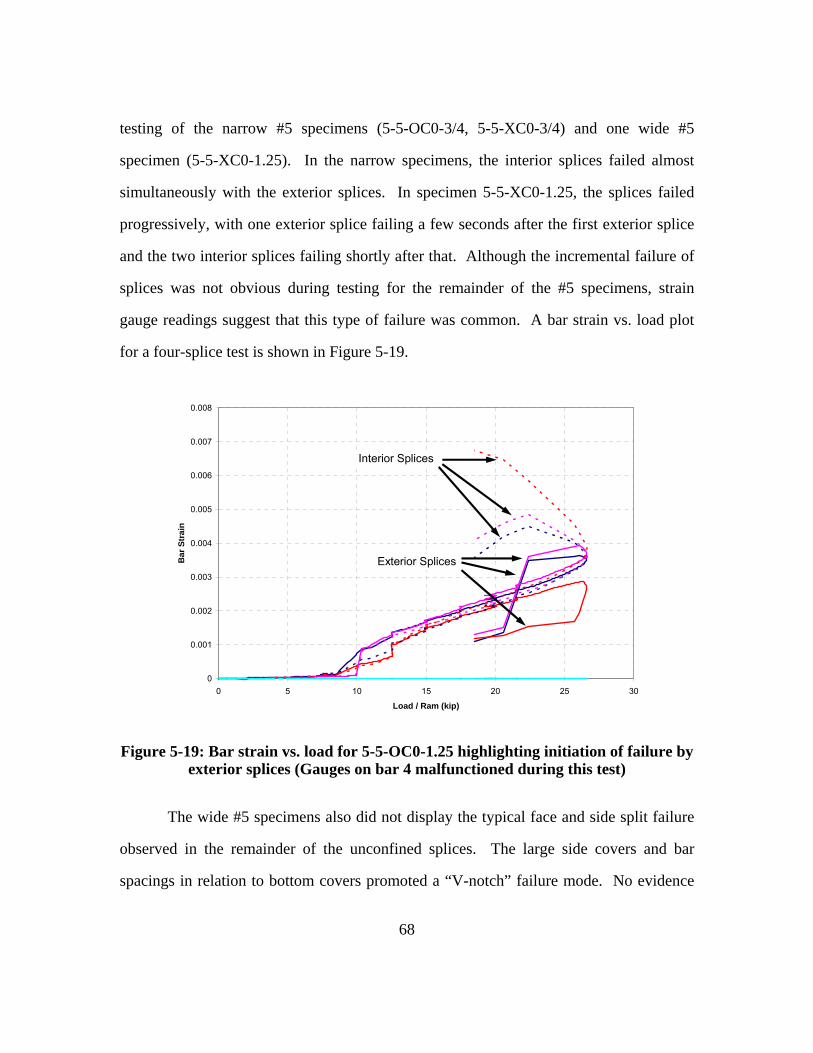
68
testing of the narrow #5 specimens (5-5-OC0-3/4, 5-5-XC0-3/4) and one wide #5
specimen (5-5-XC0-1.25). In the narrow specimens, the interior splices failed almost
simultaneously with the exterior splices. In specimen 5-5-XC0-1.25, the splices failed
progressively, with one exterior splice failing a few seconds after the first exterior splice
and the two interior splices failing shortly after that. Although the incremental failure of
splices was not obvious during testing for the remainder of the #5 specimens, strain
gauge readings suggest that this type of failure was common. A bar strain vs. load plot
for a four-splice test is shown in Figure 5-19.
0
0.001
0.002
0.003
0.004
0.005
0.006
0.007
0.008
0 5 10 15 20 25 30
Load / Ram (kip)
Bar
Str
ain
Interior Splices
Exterior Splices
Figure 5-19: Bar strain vs. load for 5-5-OC0-1.25 highlighting initiation of failure by exterior splices (Gauges on bar 4 malfunctioned during this test)
The wide #5 specimens also did not display the typical face and side split failure
observed in the remainder of the unconfined splices. The large side covers and bar
spacings in relation to bottom covers promoted a “V-notch” failure mode. No evidence
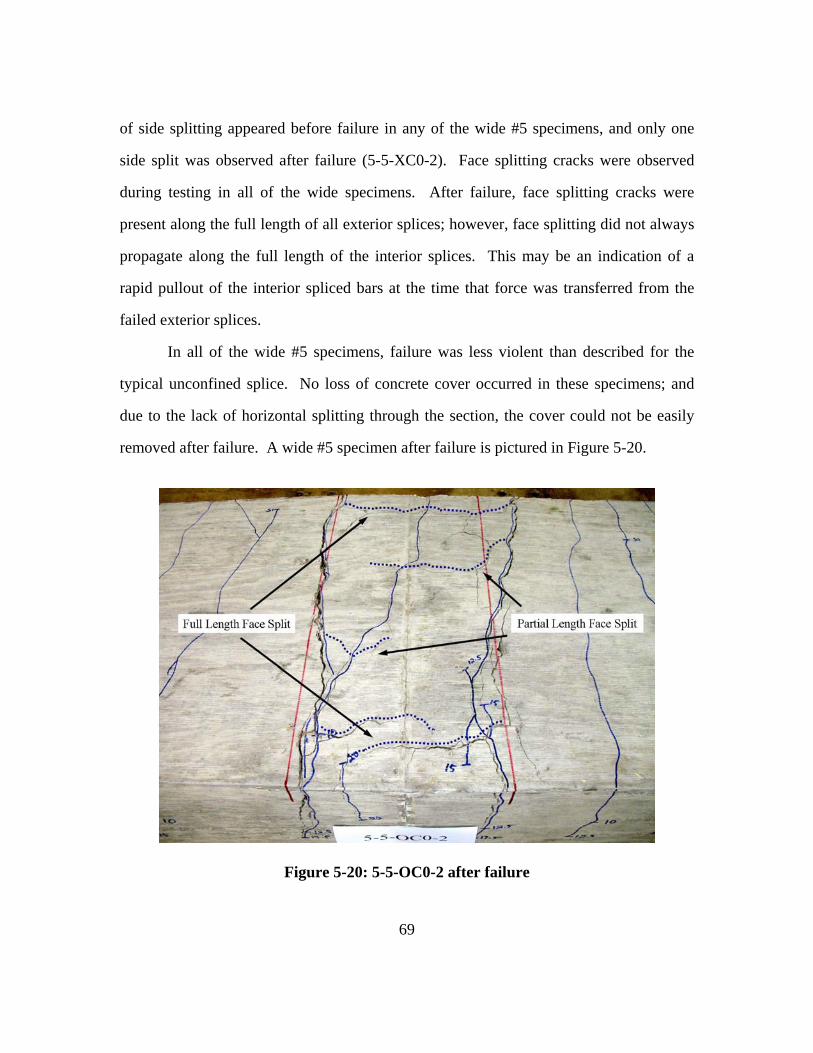
69
of side splitting appeared before failure in any of the wide #5 specimens, and only one
side split was observed after failure (5-5-XC0-2). Face splitting cracks were observed
during testing in all of the wide specimens. After failure, face splitting cracks were
present along the full length of all exterior splices; however, face splitting did not always
propagate along the full length of the interior splices. This may be an indication of a
rapid pullout of the interior spliced bars at the time that force was transferred from the
failed exterior splices.
In all of the wide #5 specimens, failure was less violent than described for the
typical unconfined splice. No loss of concrete cover occurred in these specimens; and
due to the lack of horizontal splitting through the section, the cover could not be easily
removed after failure. A wide #5 specimen after failure is pictured in Figure 5-20.
Figure 5-20: 5-5-OC0-2 after failure

70
5.2.1.1.2 Failure Stresses and Crack Widths
Failure stresses for all specimens were calculated based on the applied loads at the
time of splice failure. Stresses in the spliced MMFX bars were determined using the ACI
408 standard moment-curvature method in which internal stresses are calculated through
cracked section analysis. In the analyses, the distribution of concrete stresses was
approximated using Hognestad’s parabola which is defined by the relationship
⎥⎥⎦
⎤
⎢⎢⎣
⎡⎟⎟⎠
⎞⎜⎜⎝
⎛−⎟⎟
⎠
⎞⎜⎜⎝
⎛−=
2
''2'
c
cf
c
cfcc ff
εε
εε
where:
'57000
'2'
cc
ct
co
oc
fE
Ef
=
=
−=
ε
εε
fc’ = concrete compressive strength
εcf = concrete strain
fc’, εcf, εc’ are negative quantities
MMFX bar stresses were calculated using the stress-strain relationships derived
from the tension tests described previously. For simplicity, the stress-strain behavior of
the #5 bars was assumed to be identical to that of the #8 bars. The difference in stress-
strain behavior between the #11 bars and the #5 and #8 bars warranted the use of a
different stress-strain relationship. The following relationships were used in the
determination of bar stresses.
#5 and #8 Bars: ( )sefsε2201156 −−⋅=

71
#11 Bars: ( )sefsε2351162 −−⋅=
Calculated failure stresses based on the ACI 408, ACI 318, and AASHTO LRFD
development length equations (Chapter 3) were computed for comparison with the test
values. Each equation was solved for fy and then fy was replaced by the calculated failure
stress fs. The modification factor, φ, for the ACI 408 equation was taken as 1.0 since the
equation was evaluated as a best fit expression in this research program. The respective
bar stress limits of 80 ksi and 75 ksi for the ACI 318 and AASHTO equations were not
applied so that the applicability of these design equations could be investigated at high
bar stresses. As discussed in Chapter 3, the difference in purpose should be considered
when comparing calculated stresses produced by the ACI 408, ACI 318, and AASHTO
equations.
The results of the tests performed on unconfined splices at the University of
Texas are tabulated in Table 5-4. As-built cover dimensions and concrete strengths are
also shown.
f'c ls db cso csi cb s2 Test fs
(psi) (in) (in) (in) (in) (in) (in) (ksi) ACI 408 ACI 318 AASHTO8-8-OC0-1.5 UT 8300 40 1.00 1.60 1.40 1.50 N/A 80 82 92 1008-5-OC0*-1.5 UT 5200 40 1.00 1.55 1.45 1.50 N/A 72 72 75 938-8-XC0-1.5 UT 7800 54 1.00 1.50 1.50 1.50 N/A 86 100 127 1358-5-OC0-1.5 UT 5000 47 1.00 1.55 1.45 1.50 N/A 74 81 86 1078-5-XC0-1.5 UT 4700 62 1.00 1.50 1.50 1.50 N/A 82 98 113 13711-5-OC0-3 UT 5000 50 1.41 3.25 2.88 2.75 N/A 75 77 82 5711-5-XC0-3 UT 5400 67 1.41 3.13 3.00 2.75 N/A 84 98 114 805-5-OC0-3/4 UT 5200 33 0.625 1.00 1.00 0.75 N/A 80 81 108 1325-5-XC0-3/4 UT 5200 44 0.625 1.00 1.00 0.75 N/A 91 101 144 176
5-5-OC0-1.25 UT 5200 18 0.625 3.50 3.75 1.25 N/A 88 79 87 725-5-XC0-1.25 UT 5200 25 0.625 3.50 3.75 1.25 N/A 110 101 120 100
5-5-OC0-2 UT 5700 15 0.625 3.50 3.75 2.00 N/A 97 86 75 605-5-XC0-2 UT 5700 20 0.625 3.50 3.75 2.00 N/A 120 107 101 80
Specimen School Calculated fs (ksi)
Table 5-4: Summary of results for UT unconfined tests

72
Measured end-of-splice crack widths for all unconfined specimens tested at the
University of Texas are plotted in Figure 5-21. Mid-splice crack widths were not
included in this plot since these cracks remained significantly smaller than the end-of-
splice cracks for all tests.
0
0.01
0.02
0.03
0.04
0.05
0.06
0.07
0 20 40 60 80 100 120
Bar Stress (ksi)
Cra
ck W
idth
(in)
#5
#8
#11
Figure 5-21: Measured end-of-splice crack widths for UT unconfined specimens
5.2.1.2 Splices Confined by Transverse Reinforcement
5.2.1.2.1 Behavior
The behavior of confined splice specimens was similar to the behavior of
unconfined splice specimens until the stresses in the spliced MMFX bars exceeded the
failure stresses of the identically designed unconfined splices. Splitting cracks developed
in confined specimens within the same stress range reported for the unconfined splices
regardless of the level of confinement provided. A comparison of a confined and an
unconfined specimen near the failure load of the unconfined specimen is provided in

73
Figure 5-22. The similarity in cracking behavior between unconfined and confined
splices is evident in this figure.
Figure 5-22: Comparison of cracking of unconfined and confined specimens near the failure load of the unconfined specimen

74
However, the load on confined specimens continued to increase beyond the
failure load of the unconfined splice. Cracking near the splice ends became more severe,
both in number of cracks and width of cracks, as the stresses in the MMFX bars
increased. The number and severity of splitting cracks reduced significantly beyond the
location of the first stirrup within the splice length. This served as a visual indication of
the effectiveness of transverse reinforcement to arrest the propagation of splitting cracks.
The effect of stirrups in preventing splitting crack growth is highlighted in Figure 5-23.
Splitting cracks in the pictured specimen have progressed only slightly from the upper
picture to the lower picture despite a 22% increase in the stress in the spliced MMFX
bars. A few smaller cracks have developed between the end of the splice and the first
stirrup line; but the end-of-splice crack has been most affected by the increased bar stress.
It has begun to open significantly, growing from 0.02 in. to 0.03 in.
A closer view of the region near the end of the splice is shown in Figure 5-24.
The large number of cracks in this region and the wide end-of-splice crack are evident.
In this picture, the side splitting crack is inclined; but the angled crack is not due to shear
since it is located within the constant moment region. Side-splitting cracks often are
inclined because force transfer is primarily achieved by bearing of the bar lugs on the
surrounding concrete at this phase of loading. The angled faces of the bar lugs cause the
formation of angled compressive struts in the concrete. Principle tensile stresses are
situated perpendicular to these angled compressive struts; hence, the cracks are inclined.
This concept is well depicted in the failed specimen 11-5-XC1-3 pictured in Figure 5-25.
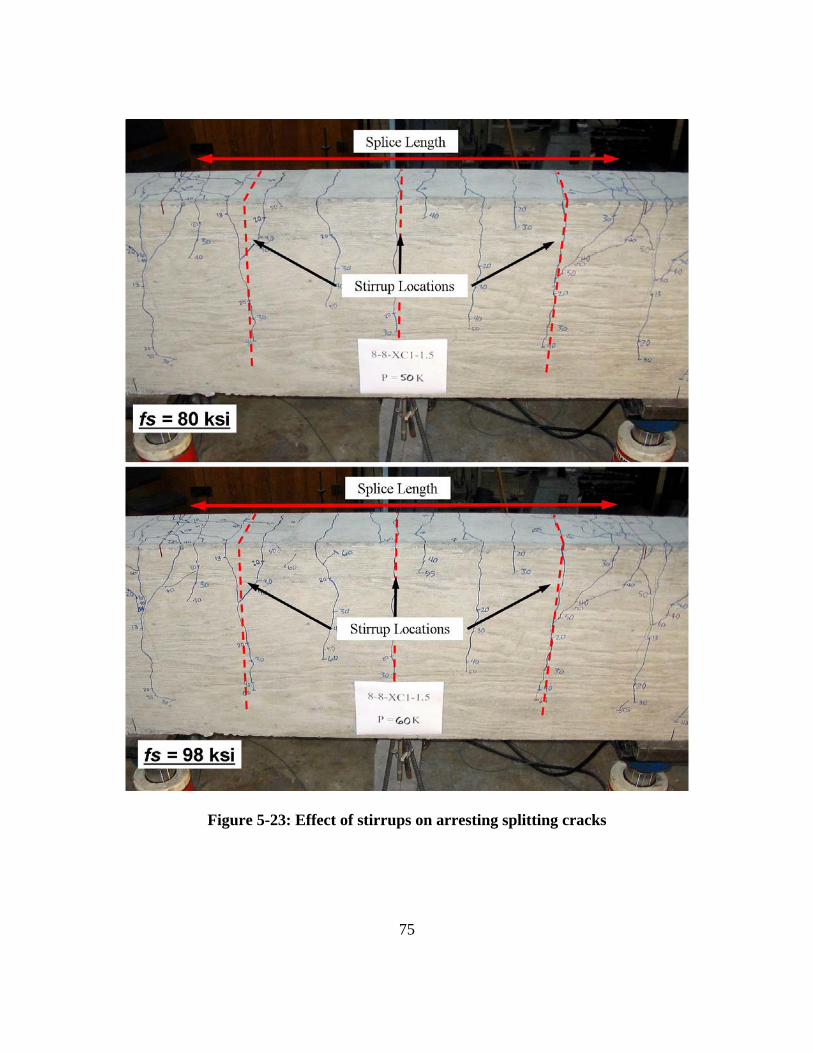
75
Figure 5-23: Effect of stirrups on arresting splitting cracks

76
Figure 5-24: Cracking at the end of typical confined splice at 80% of failure load
Figure 5-25: Formation of inclined side splitting cracks

77
As the confined specimens neared failure, cracks at the end of the splices
continued to widen. In most cases, the widths of these end-of-splice cracks were
substantially larger than those found in beams using Grade 60 reinforcement. This was
especially true for the specimens containing #11 bars due to their wider bar spacings and
larger cover values. In these specimens, crack widths were as large as 0.070 in. when the
applied load was less than 60% of the failure load and as large as 0.125 in. near the
failure load. Figure 5-26 shows the severity of these cracks.
Figure 5-26: 0.08 in. crack at the end of a splice in specimen 11-5-XC2-3. Applied load is 68% of failure load.
The increased capacity of the confined splices allowed the MMFX bars to surpass
the proportional limit of the MMFX stress-strain curve. As the bars entered the nonlinear
range of response, beam deflections began to increase nonlinearly. Although failure of
the confined splices displayed the same sudden brittle behavior described for the
unconfined splices, the increased deflections exhibited by the confined splices as well as
the increased number and width of cracks provided a visual indication of impending
failure. This is demonstrated in Figure 5-27 with a set of three specimens containing #8

78
bars. The nonlinear load-deflection response for a highly confined (C2) specimen is
shown in Figure 5-28.
Figure 5-27: Increased cracking and deflections at failure for varying levels of confinement
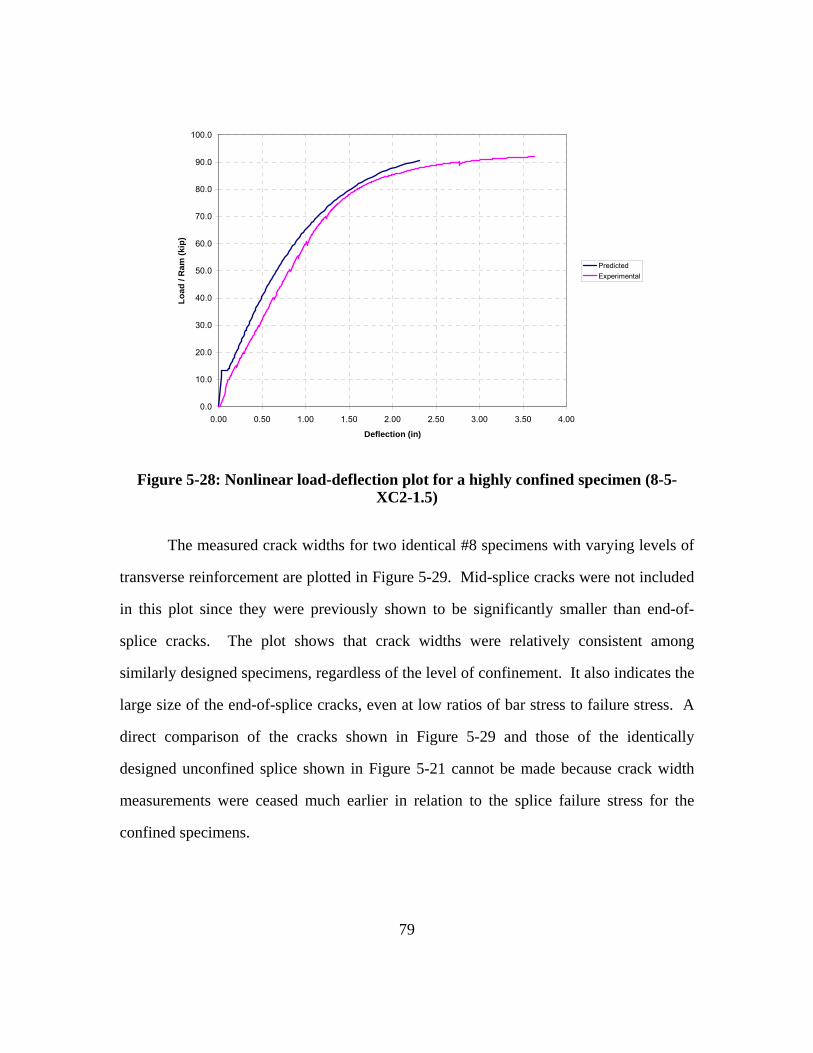
79
0.0
10.0
20.0
30.0
40.0
50.0
60.0
70.0
80.0
90.0
100.0
0.00 0.50 1.00 1.50 2.00 2.50 3.00 3.50 4.00
Deflection (in)
Load
/ R
am (k
ip)
PredictedExperimental
Figure 5-28: Nonlinear load-deflection plot for a highly confined specimen (8-5-XC2-1.5)
The measured crack widths for two identical #8 specimens with varying levels of
transverse reinforcement are plotted in Figure 5-29. Mid-splice cracks were not included
in this plot since they were previously shown to be significantly smaller than end-of-
splice cracks. The plot shows that crack widths were relatively consistent among
similarly designed specimens, regardless of the level of confinement. It also indicates the
large size of the end-of-splice cracks, even at low ratios of bar stress to failure stress. A
direct comparison of the cracks shown in Figure 5-29 and those of the identically
designed unconfined splice shown in Figure 5-21 cannot be made because crack width
measurements were ceased much earlier in relation to the splice failure stress for the
confined specimens.

80
0
0.01
0.02
0.03
0.04
0.05
0.06
0.07
0 20 40 60 80 100 120 140 160
Bar Stress (ksi)
Cra
ck W
idth
(in)
fs max (C1) = 122 ksi
fs max (C2) = 144 ksi
Highly Confined (C2)
Moderately Confined (C1)
Figure 5-29: Comparison of measured crack widths for two confined specimens (8-8-XC1-1.5 and 8-8-XC2-1.5)
A few of the highly confined splices displayed slightly different behavior than
that described for the typical confined specimen. In specimens 8-8-OC2-1.5, 8-5-XC2-
1.5, and 11-5-XC2-3, concrete on the compression face of the beam began to crush near
the failure load of the splice indicating an impending flexural failure. The amount of
concrete crushing and spalling prior to splice failure varied among the three specimens,
but the crushing was always confined to the region immediately adjacent to the load
points in the constant moment region. As shown in Figure 5-30, specimen 8-8-OC2-1.5
was the only one of these three specimens that experienced a loss of load carrying
capacity before splice failure. This suggests that the concrete crushing witnessed in the
other two beams did not affect the results of the splice tests. Despite the slight reduction
in load at the end of the 8-8-OC2-1.5 test, the results of this specimen were included in
this study because the splice was clearly on the verge of failure at the maximum load.

81
The loss of member depth due to concrete spalling caused the reduction in load in the
specimen. This also resulted in a small increase in the stress in the spliced bars and the
ultimate failure of the splice. Therefore, the recorded maximum load carried by the beam
serves as a conservative, yet reasonably accurate, estimation of the actual capacity of the
splice.
0
20
40
60
80
100
120
140
160
0 0.5 1 1.5 2 2.5 3 3.5 4 4.5
Deflection (in)
Load
(kip
)
11-5-XC2-3
8-5-XC2-1.5
8-8-OC2-1.5
Figure 5-30: Load-deflection of confined specimens experiencing concrete crushing prior to splice failure
Another specimen, 8-5-OC2-1.5, experienced a rupture of one of the spliced bars
during testing as shown in Figure 5-31. The failure sequence for this specimen is
summarized in Figure 5-32. It is believed that bar 1 slipped a small amount at the peak
load, and this caused a shift in tensile force from bar 1 to bar 2. Bar 2 maintained the
additional tensile force through large strains and then ruptured. At this point, all tension
needed to be carried by bar 1. Although it still possessed some tensile load capacity, the

82
bar 1 splice could not maintain the tension required; and a typical splitting failure soon
occurred over bar 1. The events leading to the failure of specimen 8-5-OC2-1.5 are
indicated on its load-deflection plot in Figure 5-33. Based on this failure sequence, the
splice failure occurred when the first bar began to slip; and the peak load provides an
accurate estimate of the splice strength for this specimen.
Figure 5-31: Ruptured #8 bar in specimen 8-5-OC2-1.5
Figure 5-32: Failure sequence for specimen 8-5-OC2-1.5

83
0
10
20
30
40
50
60
70
80
90
100
0 0.5 1 1.5 2 2.5 3 3.5 4
Deflection (in)
Load
/ R
am (k
ip)
Bar 1 Slip
Bar 2 Rupture Bar 1 Splitting
Figure 5-33: Failure sequence of specimen 8-5-OC2-1.5 demonstrated through load-deflection behavior
5.2.1.2.2 Failure Stresses and Crack Widths
Test failure stresses were determined for the confined splice specimens following
the procedure used for the unconfined splice specimens. Calculated failure stresses per
the ACI 408, ACI 318, and AASHTO LRFD equations were also determined for
comparison. Relative rib areas of the #5, #8, and #11 bars were measured by the
University of Kansas for use in the ACI 408 development length equation. The three bar
sizes contained relative rib area values within the range of ordinary reinforcement. Their
values were 0.0767 for the #5 bars, 0.0838 for the #8 bars, and 0.0797 for the #11 bars.
The results and as-built dimensions for the confined specimens tested at the
University of Texas are listed in Table 5-5. The measured end-of-splice crack widths for
UT confined splice tests are plotted in Figure 5-34.
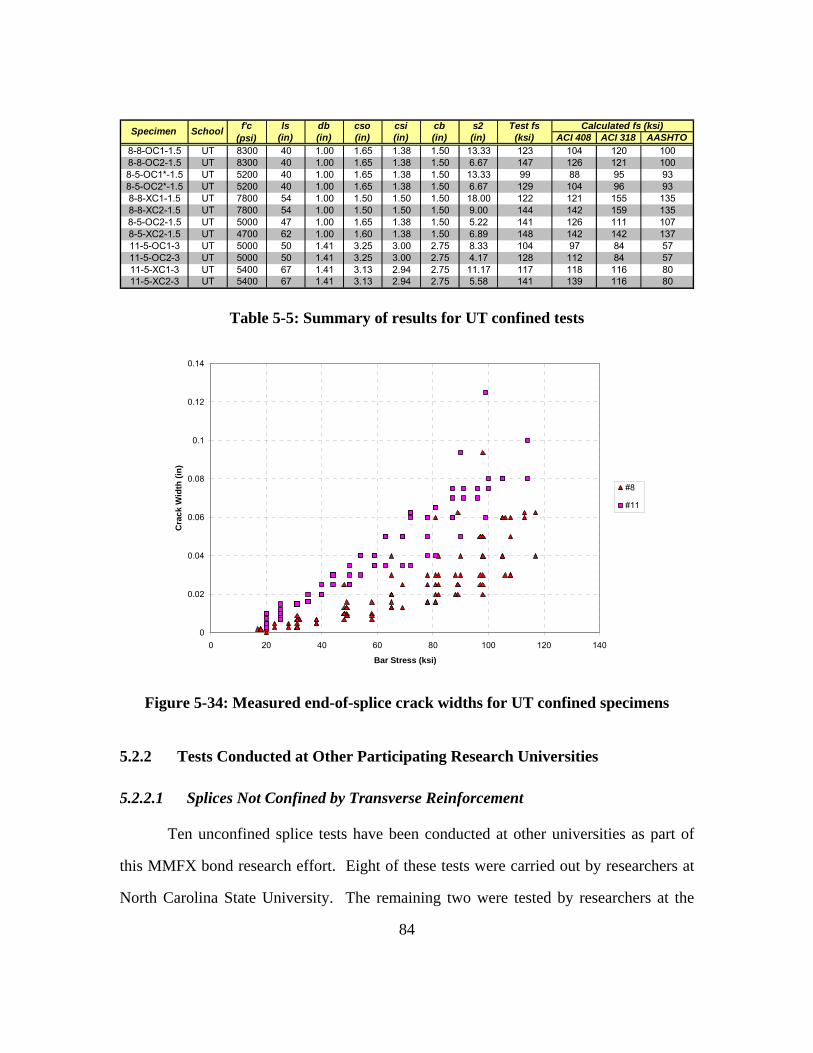
84
f'c ls db cso csi cb s2 Test fs(psi) (in) (in) (in) (in) (in) (in) (ksi) ACI 408 ACI 318 AASHTO
8-8-OC1-1.5 UT 8300 40 1.00 1.65 1.38 1.50 13.33 123 104 120 1008-8-OC2-1.5 UT 8300 40 1.00 1.65 1.38 1.50 6.67 147 126 121 1008-5-OC1*-1.5 UT 5200 40 1.00 1.65 1.38 1.50 13.33 99 88 95 938-5-OC2*-1.5 UT 5200 40 1.00 1.65 1.38 1.50 6.67 129 104 96 938-8-XC1-1.5 UT 7800 54 1.00 1.50 1.50 1.50 18.00 122 121 155 1358-8-XC2-1.5 UT 7800 54 1.00 1.50 1.50 1.50 9.00 144 142 159 1358-5-OC2-1.5 UT 5000 47 1.00 1.65 1.38 1.50 5.22 141 126 111 1078-5-XC2-1.5 UT 4700 62 1.00 1.60 1.38 1.50 6.89 148 142 142 13711-5-OC1-3 UT 5000 50 1.41 3.25 3.00 2.75 8.33 104 97 84 5711-5-OC2-3 UT 5000 50 1.41 3.25 3.00 2.75 4.17 128 112 84 5711-5-XC1-3 UT 5400 67 1.41 3.13 2.94 2.75 11.17 117 118 116 8011-5-XC2-3 UT 5400 67 1.41 3.13 2.94 2.75 5.58 141 139 116 80
Specimen School Calculated fs (ksi)
Table 5-5: Summary of results for UT confined tests
0
0.02
0.04
0.06
0.08
0.1
0.12
0.14
0 20 40 60 80 100 120 140
Bar Stress (ksi)
Cra
ck W
idth
(in)
#8
#11
Figure 5-34: Measured end-of-splice crack widths for UT confined specimens
5.2.2 Tests Conducted at Other Participating Research Universities
5.2.2.1 Splices Not Confined by Transverse Reinforcement
Ten unconfined splice tests have been conducted at other universities as part of
this MMFX bond research effort. Eight of these tests were carried out by researchers at
North Carolina State University. The remaining two were tested by researchers at the

85
University of Kansas. The results and as-built dimensions of these specimens are
summarized in Table 5-6. Detailed crack width data for these specimens were not
provided in their reports.
f'c ls db cso csi cb s2 Test fs
(psi) (in) (in) (in) (in) (in) (in) (ksi) ACI 408 ACI 318 AASHTO8-5-OC0-2.5 NCSU 6000 31 1.00 2.50 2.50 2.50 N/A 95 84 80 778-5-XC0-2.5 NCSU 5800 41 1.00 2.50 2.50 2.50 N/A 107 103 104 1018-8-OC0-1.5 NCSU 8400 40 1.00 1.50 1.50 1.50 N/A 90 81 98 1008-8-XC0-1.5 NCSU 10200 54 1.00 1.50 1.50 1.50 N/A 108 107 145 13511-8-OC0-3 NCSU 6070 43 1.41 3.00 3.00 3.00 N/A 78 75 79 6811-8-XC0-3 NCSU 8380 57 1.41 3.00 3.00 3.00 N/A 96 101 123 10611-5-OC0-2 NCSU 5340 69 1.41 2.00 2.00 2.00 N/A 74 82 92 8211-5-XC0-2 NCSU 4060 91 1.41 2.00 2.00 2.00 N/A 72 95 105 948-5-OC0-1.5 KU 5260 47 1.00 1.48 3.60 1.40 N/A 77 79 86 1108-5-XC0-1.5 KU 5940 63 1.00 1.41 3.69 1.41 N/A 89 102 124 156
Specimen School Calculated fs (ksi)
Table 5-6: Summary of results for non-UT unconfined tests
5.2.2.2 Splices Confined by Transverse Reinforcement
Ten confined splice tests have been conducted at other universities as part of this
MMFX bond research program. Nine of the tests were performed at North Carolina State
University, and one was performed at the University of Kansas. The results and as-built
dimensions for these tests are listed in Table 5-7. Again, detailed crack width data for
these tests were not provided.
f'c ls db cso csi cb s2 Test fs
(psi) (in) (in) (in) (in) (in) (in) (ksi) ACI 408 ACI 318 AASHTO8-5-OC2-2.5 NCSU 6000 31 1.00 2.50 2.50 2.50 3.88 142 104 80 778-8-OC2-1.5 NCSU 8400 40 1.00 1.50 1.50 1.50 8.00 151 118 122 1008-8-XC2-1.5 NCSU 10200 54 1.00 1.50 1.50 1.50 7.71 151 167 182 13511-8-OC2-3 NCSU 6070 43 1.41 3.00 3.00 3.00 5.38 116 103 79 6811-8-XC2-3 NCSU 8340 57 1.41 3.00 3.00 3.00 7.13 128 138 123 10611-5-OC2-2 NCSU 5340 69 1.41 2.00 2.00 2.00 6.27 132 119 119 8211-5-OC3-2 NCSU 5340 69 1.41 2.00 2.00 2.00 3.00 151 148 119 8211-5-XC2-2 NCSU 4060 91 1.41 2.00 2.00 2.00 8.27 127 125 137 9411-5-XC3-2 NCSU 4060 91 1.41 2.00 2.00 2.00 3.96 155 158 137 948-5-OC2-1.5 KU 6050 47 1.00 1.40 3.58 1.40 5.88 126 128 122 118
Specimen School Calculated fs (ksi)
Table 5-7: Summary of results for non-UT confined tests
86
CHAPTER 6
Evaluation of Test Results
6.1 COMPARISON OF DUPLICATE TESTS
Several sets of duplicate tests were included in the original test matrix to ensure
the consistency of results among the three participating universities. Seven pairs of
duplicates are included in the dataset of 45 beams being analyzed in this thesis. Ideally,
these beams would be perfect duplicates of each other with identical bar covers, spacings,
confinement, and concrete strengths; but since the duplicate beams were built and tested
in different laboratories, variations exist even between the duplicate beams. Therefore, a
direct comparison of failure stresses cannot be used as a measure of consistency; and
normalizing based on concrete strength alone will not capture the small differences in bar
cover, spacing, or confinement levels. The most appropriate comparisons of duplicate
beams appear to be the test/calculated failure stress ratios using the ACI 408 development
length equation.
The comparison of the ACI 408, ACI 318, and AASHTO development length
equations provided in Chapter 3 showed that the ACI 408 equation displayed the least
variability in test/calculated failure stress ratios with a coefficient of variation of 0.13.
Assuming that the data are normally distributed, this implies that approximately 68% of
test/calculated ratios for bond tests reported in the ACI database 10-2001 are within
±13% of the mean. A predictive development length equation can at best provide
consistency equal to that shown by two identical specimens; but due to the non-
homogeneity of concrete and other factors, a moderate variation in bond strength should
be expected even between two identical specimens. However, a reasonable expectation
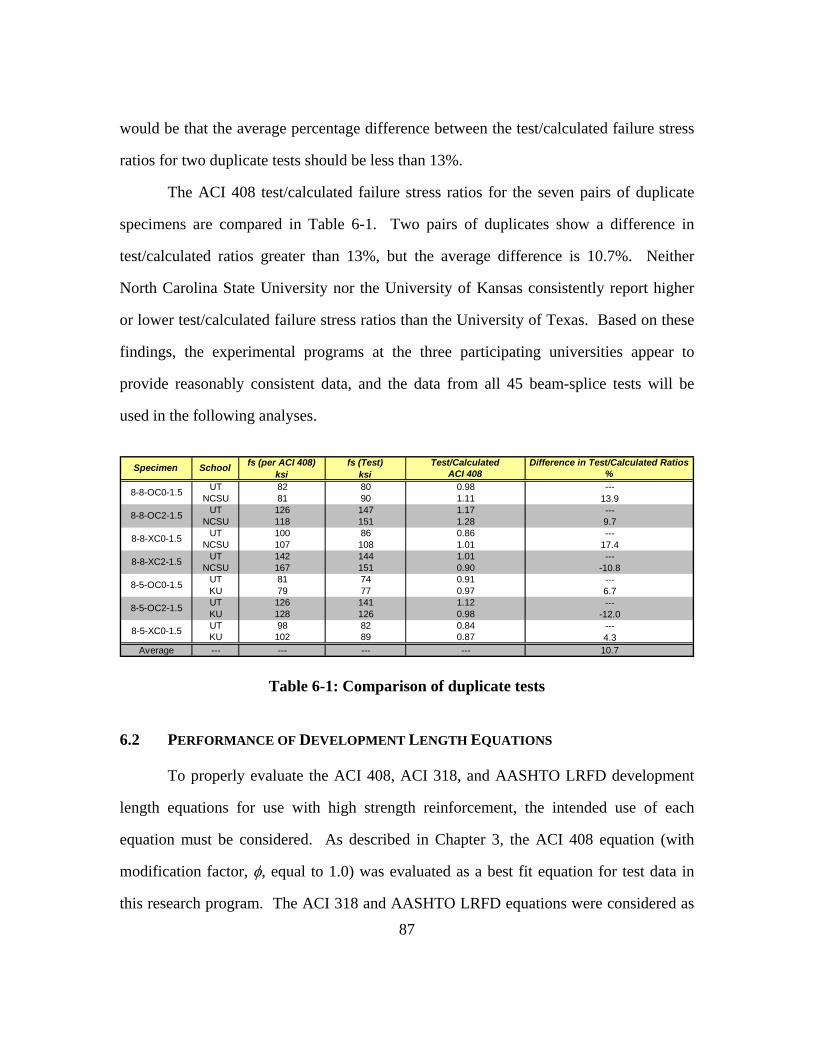
87
would be that the average percentage difference between the test/calculated failure stress
ratios for two duplicate tests should be less than 13%.
The ACI 408 test/calculated failure stress ratios for the seven pairs of duplicate
specimens are compared in Table 6-1. Two pairs of duplicates show a difference in
test/calculated ratios greater than 13%, but the average difference is 10.7%. Neither
North Carolina State University nor the University of Kansas consistently report higher
or lower test/calculated failure stress ratios than the University of Texas. Based on these
findings, the experimental programs at the three participating universities appear to
provide reasonably consistent data, and the data from all 45 beam-splice tests will be
used in the following analyses.
fs (per ACI 408) fs (Test) Test/Calculated Difference in Test/Calculated Ratios
ksi ksi ACI 408 %UT 82 80 0.98 ---
NCSU 81 90 1.11 13.9UT 126 147 1.17 ---
NCSU 118 151 1.28 9.7UT 100 86 0.86 ---
NCSU 107 108 1.01 17.4UT 142 144 1.01 ---
NCSU 167 151 0.90 -10.8UT 81 74 0.91 ---KU 79 77 0.97 6.7UT 126 141 1.12 ---KU 128 126 0.98 -12.0UT 98 82 0.84 ---KU 102 89 0.87 4.3
Average --- --- --- --- 10.7
Specimen School
8-5-OC0-1.5
8-5-OC2-1.5
8-5-XC0-1.5
8-8-OC0-1.5
8-8-OC2-1.5
8-8-XC0-1.5
8-8-XC2-1.5
Table 6-1: Comparison of duplicate tests
6.2 PERFORMANCE OF DEVELOPMENT LENGTH EQUATIONS
To properly evaluate the ACI 408, ACI 318, and AASHTO LRFD development
length equations for use with high strength reinforcement, the intended use of each
equation must be considered. As described in Chapter 3, the ACI 408 equation (with
modification factor, φ, equal to 1.0) was evaluated as a best fit equation for test data in
this research program. The ACI 318 and AASHTO LRFD equations were considered as

88
design code equations. As such, the ACI 408 equation should ideally produce a mean
test/calculated failure stress ratio near 1.0 with a low coefficient of variation and with
approximately 50% of tests producing ratios greater than 1.0 and 50% of tests with ratios
less than 1.0. The ACI 318 and AASHTO LRFD equations should ideally produce mean
test/calculated failure stress ratios above 1.0 with low coefficients of variation and a very
low percentage of tests (5-10%) producing ratios below 1.0.
6.2.1 All Specimens
The distribution of test/calculated failure stress ratios for all 45 beam-splice
specimens tested in this MMFX bond research program is shown in Table 6-2 and Figure
6-1. Based on the previous evaluation criteria, the ACI 408 equation performs well with
a mean of 1.03 and a relatively small coefficient of variation of 0.12. The two design
code equations performed unsatisfactorily. Both equations displayed high variability in
test/calculated failure stress ratios with coefficients of variation of 0.24 and 0.35 for the
ACI 318 and AASHTO equations, respectively. The average value of 1.02 for the ACI
318 equation is significantly lower than desired for a design code equation where
conservatism is required. The fact that 49% of tests failed at stresses lower than those
calculated by the ACI 318 equation highlights the lack of conservatism. While the
AASHTO equation shows a more appropriate design code mean value of 1.18, the large
coefficient of variation still produces dangerously low test/calculated ratios in some cases
and overly conservative test/calculated ratios in other cases. The AASHTO equation
produced both the largest and smallest ratios of any of the three equations with a
maximum value of 2.23 and a minimum value of 0.52

89
N = 45Equation Mean Std. Dev. COV Max Min # < 1.0 % < 1.0ACI 408 1.03 0.12 0.12 1.36 0.76 19 42ACI 318 1.02 0.25 0.24 1.77 0.63 22 49AASHTO 1.18 0.41 0.35 2.23 0.52 12 27
Distribution of MMFX Results - All Specimens
Table 6-2: Distribution of test/calculated failure stress ratios for all specimens
0
2
4
6
8
10
12
14
Below 0.
6
0.6 - 0
.7
0.7 - 0
.8
0.8 - 0
.9
0.9 - 1
.0
1.0 - 1
.1
1.1 - 1
.2
1.2 - 1
.3
1.3 - 1
.4
1.4 - 1
.5
1.5 - 1
.6
Above
1.6
Test/Calculated Failure Stress Ratio
# of
MM
FX T
ests
ACI 408ACI 318AASHTO LRFD
Figure 6-1: Distribution of test/calculated failure stress ratios for all specimens
6.2.2 Splices not Confined by Transverse Reinforcement
Separating the data into splices not confined by transverse reinforcement and
splices confined by transverse reinforcement highlights the difference in performance of
unconfined and confined splices. The distribution of test/calculated failure stress ratios
for the unconfined splices is shown in Table 6-3 and Figure 6-2. The ACI 408 equation
again performed satisfactorily with a mean test/calculated ratio near 1.0 (0.98) and with a
low coefficient of variation of 0.11. The ACI 318 and AASHTO equations both provided
extremely unconservative calculated failure stresses. The ACI 318 equation produced a

90
mean test/calculated failure stress ratio of only 0.88 with 78% of tests failing below the
calculated failure stress, and the AASHTO equation produced a mean ratio of 0.93 with
48% of tests failing below the calculated failure stress. Again, despite having a higher
mean value than the ACI 318 equation, the AASHTO equation showed the greatest
variability with a coefficient of variation of 0.33. It produced both the largest and
smallest ratios among the three equations with a maximum value of 1.62 and a minimum
value of 0.52.
N = 23
Equation Mean Std. Dev. COV Max Min # < 1.0 % < 1.0ACI 408 0.98 0.11 0.11 1.14 0.76 14 61ACI 318 0.88 0.18 0.20 1.28 0.63 18 78AASHTO 0.93 0.30 0.33 1.62 0.52 11 48
Distribution of MMFX Results - Unconfined Specimens
Table 6-3: Distribution of test/calculated failure stress ratios for unconfined specimens
0
1
2
3
4
5
6
7
8
9
Below 0.
6
0.6 - 0
.7
0.7 - 0
.8
0.8 - 0
.9
0.9 - 1
.0
1.0 - 1
.1
1.1 - 1
.2
1.2 - 1
.3
1.3 - 1
.4
1.4 - 1
.5
1.5 - 1
.6
Above
1.6
Test/Calculated Failure Stress Ratio
# of
MM
FX T
ests
ACI 408ACI 318AASHTO LRFD
Figure 6-2: Distribution of test/calculated failure stress ratios for unconfined specimens

91
6.2.3 Splices Confined by Transverse Reinforcement
The distribution of test/calculated failure stress ratios for the confined splices is
shown in Table 6-4 and Figure 6-3. In this table and figure, the increased conservatism
of the development length equations in confined splices is highlighted. The ACI 408
equation produced a higher than ideal mean test/calculated failure stress ratio of 1.08, but
it displayed low variability with a coefficient of variation of 0.11. Both the ACI 318 and
AASHTO equations displayed larger variability, with coefficients of variation of 0.20
and 0.24, respectively. In contrast to its performance with the unconfined splices, the
ACI 318 equation provided relatively conservative calculated failure stresses in the
confined splices. Its mean value of 1.16 is more appropriate for a design code equation;
but with a coefficient of variation of 0.20, the ACI 318 equation still provided
unconservative calculated failure stresses for 18% of the confined tests. The AASHTO
equation displayed the largest difference in performance between the unconfined and the
confined specimens since the type of confinement used in this bond study did not qualify
as confining reinforcement per the AASHTO equation. Ordinary closed hoop shear ties
at moderate spacings were used in this experimental program. AASHTO only recognizes
the beneficial effects of confinement if a splice is enclosed within spiral reinforcement
with a diameter of at least 0.25 in. and spaced at a pitch not more than 4.0 in. Therefore,
the calculated failure stress for a confined splice in this study was the same as the
calculated failure stress for the identical unconfined splice. As expected, this produced
overly conservative test/calculated failure stress ratios for the confined specimens with an
average value of 1.44 and a maximum ratio of 2.23. Nevertheless, one confined splice
did fail below its calculated failure stress.

92
N = 22Equation Mean Std. Dev. COV Max Min # < 1.0 % < 1.0ACI 408 1.08 0.11 0.11 1.36 0.90 5 23ACI 318 1.16 0.23 0.20 1.77 0.79 4 18AASHTO 1.44 0.34 0.24 2.23 0.90 1 5
Distribution of MMFX Results - Confined Specimens
Table 6-4: Distribution of test/calculated failure stress ratios for confined specimens
0
1
2
3
4
5
6
7
8
9
Below 0.
6
0.6 - 0
.7
0.7 - 0
.8
0.8 - 0
.9
0.9 - 1
.0
1.0 - 1
.1
1.1 - 1
.2
1.2 - 1
.3
1.3 - 1
.4
1.4 - 1
.5
1.5 - 1
.6
Above
1.6
Test/Calculated Failure Stress Ratio
# of
MM
FX T
ests
ACI 408ACI 318AASHTO LRFD
Figure 6-3: Distribution of test/calculated failure stress ratios for confined specimens
6.3 EFFECT OF SPLICE LENGTH
The effect of splice length will be investigated only on unconfined splices.
Confined splices have not been considered because the addition of confining
reinforcement creates difficulties in separating the effects of splice length and
confinement terms when comparing the performance of development length equations.
In order to investigate the relative performance of splices of various lengths, the
splice lengths must first be normalized to account for differences in bar diameter.

93
Required splice lengths increase with increasing bar diameter for a given bar stress. As
discussed in Chapter 2, this is due to the larger rate of increase in bar area in relation to
bar surface area with respect to bar diameter. The difference in the rate of change is
proportional to the bar diameter; therefore, splice lengths have been normalized with
respect to bar diameter for the following comparisons.
The reliability of the ACI 408, ACI 318, and AASHTO LRFD development
length equations reduced with increasing values of ls/db as evidenced by the negative
sloping trends in Figure 6-4, Figure 6-5, and Figure 6-6. The negative effects of long
splices were more pronounced in the ACI 318 and AASHTO equations. For all three
equations, test/calculated failure stress ratios transitioned from predominately greater
than 1.0 to predominately less than 1.0 at a value of ls/db of approximately 40. For
reference, this value corresponds to stresses of 115 ksi, 84 ksi, and 67 ksi for #5, #8, and
#11 bars embedded in 5000 psi concrete and with a 2 in. clear cover on all sides
according to the ACI 408 equation.

94
0.0
0.2
0.4
0.6
0.8
1.0
1.2
1.4
1.6
1.8
2.0
0 10 20 30 40 50 60 70 80
ls/db
Test
/Cal
cula
ted
failu
re s
tres
s (A
CI 4
08)
Figure 6-4: Effect of ls/db on ACI 408 test/calculated failure stress ratios
0.0
0.2
0.4
0.6
0.8
1.0
1.2
1.4
1.6
1.8
2.0
0 10 20 30 40 50 60 70 80
ls/db
Test
/Cal
cula
ted
failu
re s
tres
s (A
CI 3
18)
Figure 6-5: Effect of ls/db on ACI 318 test/calculated failure stress ratios

95
0.0
0.2
0.4
0.6
0.8
1.0
1.2
1.4
1.6
1.8
2.0
0 10 20 30 40 50 60 70 80
ls/db
Test
/Cal
cula
ted
failu
re s
tres
s (A
ASH
TO L
RFD
)
Figure 6-6: Effect of ls/db on AASHTO LRFD test/calculated failure stress ratios
The negative effect of increasing ls/db on the performance of the three
development length equations can also be seen in the comparison of pairs of OC and XC
splice specimens. According to the test matrix described in Chapter 4, unconfined OC
specimens were designed to achieve 80 ksi in the MMFX bars at splice failure. The XC
specimens were designed to achieve 100 ksi at splice failure. In a given pair of OC and
XC specimens, the splice length was the only variable that was changed; therefore, the
splice in an XC specimen was always longer than the splice in its corresponding OC
specimen. As shown in Figure 6-7, Figure 6-8, and Figure 6-9, the test/calculated failure
stress ratio for the XC specimen was also always lower than the ratio for the OC
specimen, regardless of the equation used to calculate the failure stress. Again, the data
indicate a reduction in conservatism of the development length equations with increasing
ls/db.

96
0.00
0.20
0.40
0.60
0.80
1.00
1.20
1.40
8-8-O/XC0-1.5 (UT)
8-5-O/XC0-1.5 (UT)
11-5-O/XC0-3 (UT)
5-5-O/XC0-3/4 (UT)
5-5-O/XC0-1.25 (UT)
5-5-O/XC0-2 (UT)
8-5-O/XC0-2.5 (NCSU)
8-8-O/XC0-1.5 (NCSU)
11-8-O/XC0-3 (NCSU)
11-5-O/XC0-2 (NCSU)
8-5-O/XC0-1.5 (KU)
Specimen Pair
Test
/Cal
cula
ted
failu
re s
tres
s (A
CI 4
08)
OCXC
Figure 6-7: Comparison of ACI 408 test/calculated failure stress ratios for pairs of specimens containing shorter (OC) and longer (XC) splices
0.00
0.20
0.40
0.60
0.80
1.00
1.20
1.40
8-8-O/XC0-1.5 (UT)
8-5-O/XC0-1.5 (UT)
11-5-O/XC0-3 (UT)
5-5-O/XC0-3/4 (UT)
5-5-O/XC0-1.25 (UT)
5-5-O/XC0-2 (UT)
8-5-O/XC0-2.5 (NCSU)
8-8-O/XC0-1.5 (NCSU)
11-8-O/XC0-3 (NCSU)
11-5-O/XC0-2 (NCSU)
8-5-O/XC0-1.5 (KU)
Specimen Pair
Test
/Cal
cula
ted
failu
re s
tres
s (A
CI 3
18)
OCXC
Figure 6-8: Comparison of ACI 318 test/calculated failure stress ratios for pairs of specimens containing shorter (OC) and longer (XC) splices

97
0.00
0.20
0.40
0.60
0.80
1.00
1.20
1.40
1.60
1.80
8-8-O/XC0-1.5 (UT)
8-5-O/XC0-1.5 (UT)
11-5-O/XC0-3 (UT)
5-5-O/XC0-3/4 (UT)
5-5-O/XC0-1.25 (UT)
5-5-O/XC0-2 (UT)
8-5-O/XC0-2.5 (NCSU)
8-8-O/XC0-1.5 (NCSU)
11-8-O/XC0-3 (NCSU)
11-5-O/XC0-2 (NCSU)
8-5-O/XC0-1.5 (KU)
Specimen Pair
Test
/Cal
cula
ted
failu
re s
tres
ses
(AA
SHTO
LR
FD) OC
XC
Figure 6-9: Comparison of AASHTO LRFD test/calculated failure stress ratios for pairs of specimens containing shorter (OC) and longer (XC) splices
To determine if the negative effect of ls/db was unique to the MMFX tests, the
data from this project were combined with the data of previous unconfined splice tests
provided in ACI database 10-2001. A negative trend was not conclusive for the ACI 408
equation. As seen in Figure 6-10, the data show a slight negative slope; however, the low
test/calculated failure stress ratios at high values of ls/db are no smaller than the low ratios
at low values of ls/db. Therefore, the negative trend could be a result of a lack of tests at
high ls/db values rather than a reduction in conservatism as ls/db increases.

98
0.0
0.2
0.4
0.6
0.8
1.0
1.2
1.4
1.6
1.8
2.0
0 10 20 30 40 50 60 70 80
ls/db
Test
/Cal
cula
ted
failu
re s
tres
s (A
CI 4
08)
ACI 408 DatabaseMMFX
Figure 6-10: Effect of ls/db on ACI 408 test/calculated failure stress ratios (data from ACI 408 database 10-2001)
The negative effect on the conservatism of the ACI 318 and AASHTO
development length equations is highlighted in Figure 6-11 and Figure 6-12, respectively.
Both plots show clear negative trends. From these plots, the average test/calculated
failure stress ratio for both equations again falls below 1.0 near an ls/db value of 35 to 40.
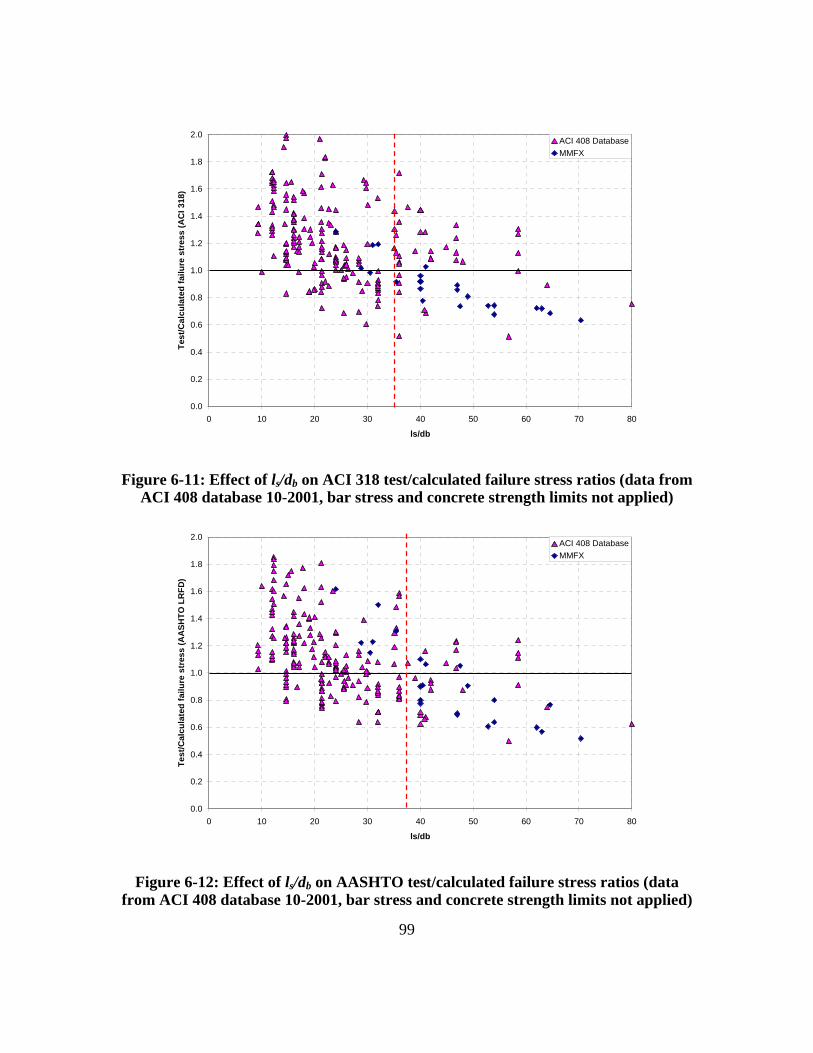
99
0.0
0.2
0.4
0.6
0.8
1.0
1.2
1.4
1.6
1.8
2.0
0 10 20 30 40 50 60 70 80
ls/db
Test
/Cal
cula
ted
failu
re s
tres
s (A
CI 3
18)
ACI 408 DatabaseMMFX
Figure 6-11: Effect of ls/db on ACI 318 test/calculated failure stress ratios (data from ACI 408 database 10-2001, bar stress and concrete strength limits not applied)
0.0
0.2
0.4
0.6
0.8
1.0
1.2
1.4
1.6
1.8
2.0
0 10 20 30 40 50 60 70 80
ls/db
Test
/Cal
cula
ted
failu
re s
tres
s (A
ASH
TO L
RFD
)
ACI 408 DatabaseMMFX
Figure 6-12: Effect of ls/db on AASHTO test/calculated failure stress ratios (data from ACI 408 database 10-2001, bar stress and concrete strength limits not applied)

100
6.4 EFFECT OF CONFINEMENT
Adding confining reinforcement around splices increased both the stress in the
spliced bars and the deflections of the specimens at failure. The load versus deflection
behavior for a group of three splices with varying levels of confinement (8-8-XC0-1.5, 8-
8-XC1-1.5, 8-8-XC2-1.5) is plotted in Figure 6-13. In this group of specimens, the
addition of stirrups spaced at 18.0 in. resulted in a 42% increase in the failure stress and a
64% increase in the deflection over the values of the unconfined specimen. Stirrups
spaced at 9.0 in. resulted in a 67% increase in the failure stress and a 207% increase in
the deflection over the values of the unconfined specimen.
0
10
20
30
40
50
60
70
80
90
100
0 0.5 1 1.5 2 2.5 3
Deflection (in)
Load
/ R
am (k
ip)
8-8-XC0-1.5
8-8-XC1-1.5
8-8-XC2-1.5
No Stirrups
Stirrups at 18.0 in
Stirrups at 9.0 in
Figure 6-13: Load-deflection for a group of three splices with varying levels of transverse reinforcement

101
0
50
100
150
200
250
300
350
8-8-OC1-1.5
8-5-OC1*-1.5
8-8-XC1-1.5
11-5-OC1-3
11-5-XC1-3
8-8-OC2-1.5
8-5-OC2*-1.5
8-8-XC2-1.5
8-5-OC2-1.5
8-5-XC2-1.5
11-5-OC2-3
11-5-XC2-3
Specimen
% In
reas
e in
Qua
ntity
Ove
r Ide
ntic
al U
ncon
fined
Spl
ice Failure Stress
DeflectionModerate
ConfinementC1
HighConfinement
C2
Figure 6-14: Increases in failure stresses and deflections relative to unconfined splice – UT tests
The behavior shown in Figure 6-13 was typical of the confined specimens in this
study. As shown in Figure 6-14, C1 specimens provided a 42% increase in failure stress
and a 68% increase in deflection, on average, over the values attained by the
corresponding unconfined (C0) splice. C2 specimens provided a 74% increase in failure
stress and a 171% increase in deflection, on average.
The respective increases of 42% and 74% in failure stresses in C1 and C2
specimens represent greater increases than predicted by the ACI 408 and the ACI 318
development length equations. Calculations using the ACI 408 equation predict an
average increase of 23% in failure stress for C1 specimens and an increase of 47% for C2
specimens. Using the ACI 318 equation, the average expected increase in failure stress
for C1 and C2 specimens was 16% and 20%, respectively.

102
The lower expected increases in failure stress provided by the ACI 318 equation
when compared to the ACI 408 equation result from the limit of 2.5 enforced on its cover
and confinement term, ⎟⎟⎠
⎞⎜⎜⎝
⎛ +
b
trb
dKc . The limit is placed on this term to prevent the
possibility of a pullout failure; however, results from the MMFX tests indicate that this
limit could be relaxed. Values of ⎟⎟⎠
⎞⎜⎜⎝
⎛ +
b
trb
dKc for confined specimens in this research
program ranged from 2.44 to 5.0, and splitting failure was observed in all specimens.
The ACI 408 equation recognizes the conservatism of the ACI 318 limit and limits its
cover and confinement term ⎟⎟⎠
⎞⎜⎜⎝
⎛ +
b
tr
dKcω to a value of 4.0. This increase resulted in the
ACI 408 equation reflecting increased confinement benefits between the C1 and C2
specimens while the benefits of confinement appear to level off between the C1 and C2
specimens when using the ACI 318 equation.
The effect of the different limits on the cover and confinement terms in the ACI
318 and ACI 408 equations is demonstrated in Figure 6-15 and Figure 6-16, respectively.
ACI 318 test/calculated failure stress ratios resulting from an increase in the cover and
confinement limit from 2.5 to 4.0 are shown in Figure 6-17. Although MMFX data
indicated that confinement remained effective at ⎟⎟⎠
⎞⎜⎜⎝
⎛ +
b
trb
dKc well in excess of 2.5, the
values plotted in Figure 6-17 indicate that modifying the limit on this term in the ACI 318
equation would result in unconservative predictions of failure stresses in many cases.
The 2.5 limit does not accurately predict the point at which the pullout mode begins to
govern failure, but the low limit provides the conservatism necessary for a design code
equation. Therefore, a modification to the cover/confinement limit in the ACI 318
equation is not recommended.

103
0
0.5
1
1.5
2
2.5
0 1 2 3 4 5 6 7 8
(cb+Ktr)/db
Test
/Cal
cula
ted
failu
re s
tres
s (A
CI 3
18)
ACI 408 DatabaseMMFX
ACI 318 Limit = 2.5
Figure 6-15: Test/calculated failure stress ratios versus cover/confinement term in ACI 318 equation (bar stress and concrete strength limits not applied)
0
0.5
1
1.5
2
2.5
0 1 2 3 4 5 6 7 8
(cω+Ktr)/db
Test
/Cal
cula
ted
failu
re s
tres
s (A
CI 4
08)
ACI 408 DatabaseMMFX
ACI 408 Limit = 4.0
Figure 6-16: Test/calculated failure stress ratios versus cover/confinement term in ACI 408 equation

104
0
0.5
1
1.5
2
2.5
0 1 2 3 4 5 6 7 8
(cb+Ktr)/db
Test
/Cal
cula
ted
failu
re s
tres
s (A
CI 3
18)
ACI 408 DatabaseMMFX
ACI 318 Limit = 4.0
Figure 6-17: Test/calculated failure stress ratios versus cover/confinement term in ACI 318 equation (limit changed to 4.0, bar stress and concrete strength limits not
applied)
While the ACI 408 equation predicted increased beneficial effects of confinement
between the C1 and C2, the assumption of a failure stress increase proportional to the
increase in the area of confining reinforcement was not substantiated by the test results.
As indicated in Table 6-5, doubling the amount of transverse reinforcement between C1
and C2 specimens should result in a proportional increase in the failure stress over the
unconfined C0 specimen according to the ACI 408 equation. However, the test results
indicate that the C2 specimens only provided an average increase of 1.77 times that of the
C1 specimens, and only one C2 specimen (8-5-OC2*-1.5) provided a failure stress
increase greater than two times that of its corresponding C1 specimen, as shown in Table
6-6.

105
C0 C1 C2 C1 C2 C2/C1 C1 C2 C2/C18-8-OCx-1.5 82 104 126 3 6 2 27 54 2.008-5-OCx*-1.5 72 88 104 3 6 2 22 44 2.008-8-XCx-1.5 100 121 142 3 6 2 21 42 2.0011-5-OCx-3† 77 97 112 6 12 2 26 45 1.7511-5-XCx-3 98 118 139 6 12 2 20 42 2.05
Average --- --- --- --- --- 2 23 45 1.96
†: Confinement term in C2 specimen exceeds ACI 408 limit of 4.0
# of stirrupsCalculated fs (ACI 408) % increase in fs over C0Specimen Group
Table 6-5: Expected increases in failure stresses over unconfined C0 specimens for C1 and C2 specimens based on ACI 408 calculated failure stress predictions – UT
specimens
C0 C1 C2 C1 C2 C2/C1 C1 C2 C2/C18-8-OCx-1.5 80 123 147 3 6 2 54 84 1.568-5-OCx*-1.5 72 99 129 3 6 2 38 79 2.118-8-XCx-1.5 86 122 144 3 6 2 42 67 1.6111-5-OCx-3 75 104 128 6 12 2 39 71 1.8311-5-XCx-3 84 117 141 6 12 2 39 68 1.73
Average --- --- --- --- --- 2 42 74 1.77
% increase in fs over C0Specimen Group
Test fs # of stirrups
Table 6-6: Actual increases in failure stresses over unconfined C0 specimens for C1 and C2 splices – UT specimens
The disproportionate increase in failure stress with respect to the area of confining
reinforcement may be a result of the increasing nonlinearity of the MMFX steel stress-
strain relationship between the typical C1 and C2 failure stresses. Failure stresses for C1
specimens tested at the University of Texas ranged between 99 and 123 ksi. Failure
stresses for the UT C2 specimens ranged from 129 to 147 ksi. As shown in Figure 6-18,
the stress-strain relationship of the MMFX steel becomes increasingly nonlinear between
these two stress ranges. Therefore, the effective stiffness of the bars reduces sharply
between the C1 and C2 failure stress ranges. Research by Pay (2005) indicated that bond
strength reduces with reduced bar stiffness so a reduction in the effect of confinement
could be a result of the reduced effective stiffness of the bars at high stresses.
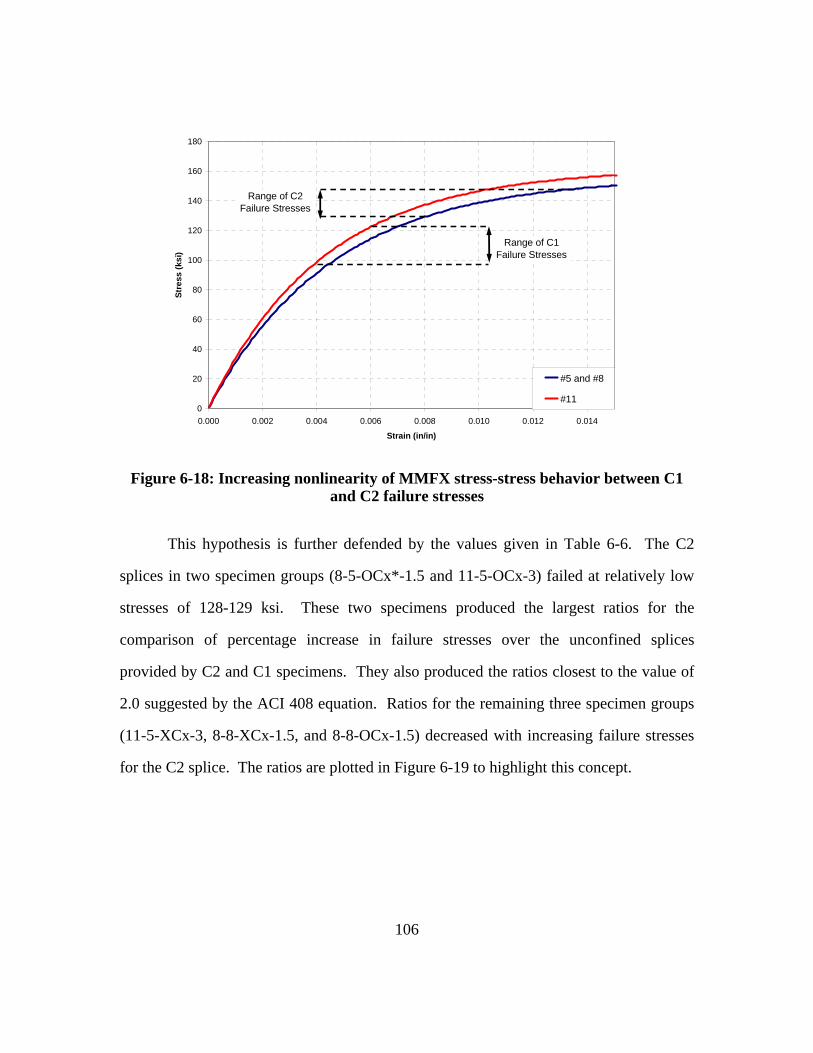
106
0
20
40
60
80
100
120
140
160
180
0.000 0.002 0.004 0.006 0.008 0.010 0.012 0.014
Strain (in/in)
Stre
ss (k
si)
#5 and #8
#11
Range of C2 Failure Stresses
Range of C1 Failure Stresses
Figure 6-18: Increasing nonlinearity of MMFX stress-stress behavior between C1 and C2 failure stresses
This hypothesis is further defended by the values given in Table 6-6. The C2
splices in two specimen groups (8-5-OCx*-1.5 and 11-5-OCx-3) failed at relatively low
stresses of 128-129 ksi. These two specimens produced the largest ratios for the
comparison of percentage increase in failure stresses over the unconfined splices
provided by C2 and C1 specimens. They also produced the ratios closest to the value of
2.0 suggested by the ACI 408 equation. Ratios for the remaining three specimen groups
(11-5-XCx-3, 8-8-XCx-1.5, and 8-8-OCx-1.5) decreased with increasing failure stresses
for the C2 splice. The ratios are plotted in Figure 6-19 to highlight this concept.

107
1.50
1.60
1.70
1.80
1.90
2.00
2.10
2.20
125 130 135 140 145 150
Failure Stress of C2 Specimen
% in
crea
se in
failu
re s
tres
s fo
r C2
/ % in
crea
se in
failu
re s
tres
sfo
r C1 11-5-OCx-3
8-5-OCx*-1.5
11-5-XCx-3
8-8-XCx-1.5
8-8-OCx-1.5
Expected per ACI 408
Figure 6-19: Reduction in the efficiency of confinement with increasing failure stress
Although the material nonlinearity resulted in a less than proportional increase in
failure stress with respect to area of confining reinforcement, it produced substantially
greater than proportional increases in deflections with respect to area of confining
reinforcement. This is demonstrated in Table 6-7 with pairs of C1 and C2 specimens
tested at the University of Texas. On average, the increase in deflections of C2
specimens was 2.6 times the deflection increase of the C1 specimens when compared to
the deflection of unconfined specimens at failure.
C0 C1 C2 C1 C2 C2/C1 C1 C2 C2/C18-8-OCx-1.5 0.87 1.73 2.53 3 6 2 99 191 1.938-5-OCx*-1.5 0.71 1.10 1.83 3 6 2 55 158 2.878-8-XCx-1.5 0.83 1.36 2.55 3 6 2 64 207 3.2511-5-OCx-3 1.05 1.64 2.46 6 12 2 56 134 2.3911-5-XCx-3 1.04 1.74 2.77 6 12 2 67 166 2.47
Average --- --- --- --- --- 2 68 171 2.58
Specimen Group
Deflection (in) # of stirrups % increase in deflection over C0
Table 6-7: Comparison of deflection increases over unconfined C0 specimens for pairs of C1 and C2 beams – UT specimens

108
6.5 CRACK WIDTHS
The crack width plots shown in Chapter 5 showed all crack widths measured at
the ends of the splices in specimens tested at the University of Texas. The plots indicate
the crack width trends for the #5, #8, and #11 specimens through the full range of stresses
experienced by the spliced bars. In design, crack widths are controlled for serviceability
concerns; therefore, crack width measurements during service level loadings are most
relevant for evaluating the impact of crack widths on design. Service loads are typically
defined as loads at or below approximately 60% of the ultimate design load. In order to
filter crack width measurements that are representative of service level cracks, all
measurements taken above 60% of the failure load for a given specimen have been
removed from the crack width database for the following analyses.
The service level end-of-splice crack widths for the #5 specimens tested at the
University of Texas are plotted in Figure 6-20. For reference, the crack width limitations
used to develop serviceability guidelines in pre-1999 versions of the ACI 318 code are
also shown on the plot. As expected, the data indicated a linear increase in crack widths
with an increase in service stress. Crack width theory would suggest that the wide #5
specimens with large covers and bar spacings (5-5-O/XC0-1.25, 5-5-O/XC0-2) would
produce larger cracks than the narrow #5 specimens with small covers and bar spacings
(5-5-O/XC0-3/4). However, the crack widths for the three different #5 specimen designs
were relatively consistent for a given bar stress.
Crack widths remained small in all specimens when the bar stresses were below
55 ksi. At bar stresses above 55 ksi, the crack widths of the #5 specimens exceeded
0.013 in. — a value that has been considered acceptable for concrete members with
exterior exposure. The limit of 0.016 in. for concrete members with interior exposure
was surpassed by the #5 specimens at bar stresses of approximately 60 ksi. Assuming

109
service loads represent 60% of the ultimate load, the 0.013 in. and 0.016 in. service crack
width limits allow for bar stresses of 92 ksi and 100 ksi at ultimate load, respectively.
0
0.005
0.01
0.015
0.02
0.025
0.03
0 10 20 30 40 50 60 70 80
Bar Stress (ksi)
Cra
ck W
idth
(in)
5-5-O/XC0-3/45-5-O/XC0-1.255-5-O/XC0-2S i 2
Interior Limit (0.016 in)
Exterior Limit (0.013 in)
Figure 6-20: End-of-splice crack widths for UT #5 specimens (load at or below 60% of failure load)
The service level end-of-splice crack widths for the #8 specimens tested at the
University of Texas are plotted in Figure 6-21. The ACI limits for interior and exterior
exposure are again included for reference. Since the theoretical crack widths for all of
the #8 specimens were the same, the predicted crack widths computed according to the
equation developed by Gergely and Lutz (1968) are also included.
The Gergely-Lutz equation predicts the maximum crack width in a flexural
member as
3076.0 Adfw csβ=

110
where:
w = expected maximum crack width in 0.001 in. units
β = ratio of distances to the neutral axis from the extreme tension fiber and from
the centroid of As. (1.1 for #8 specimens, 1.2 for #11 specimens)
fs = steel stress in ksi
dc = cover of outermost bar of As, measured to the center of the bar
A = tension area per bar measured as the area centered around the c.g. of the
tension bars divided by the number of tension bars.
Since crack width data are highly variable, Figure 6-21 indicates the range of Gergely-
Lutz ±50% rather than a single line for predicted crack widths.
The #8 crack width data showed a slight nonlinear increase with increasing bar
stress. The majority of the data were within the range of predicted crack widths, but a
few data points are well outside of the Gergely-Lutz ±50% limits. These points were
more common at high bar stresses.
Similar to the #5 specimens, crack widths remained relatively small at stresses
below 50-55 ksi. At this point, the average crack width exceeded the 0.013 in. exterior
exposure limit. The average crack width exceeded the 0.016 in. interior exposure limit
around 60 ksi. Again, these values suggest that the stresses at ultimate load in the #8 bars
would need to be limited in beams of similar design to 92 ksi and 100 ksi for exterior and
interior elements, respectively.
Above 60 ksi, the crack width data began to display more scatter. Most data
remained within the expected range of widths; however, a few very large values were
recorded at higher stresses. The most severe service level crack measured 0.0625 in. at a

111
bar stress of 89 ksi. This value was 2.5 times that predicted by the Gergely-Lutz
equation.
0
0.01
0.02
0.03
0.04
0.05
0.06
0.07
0 10 20 30 40 50 60 70 80 90 100
Bar Stress (ksi)
Cra
ck W
idth
(in)
Gergely-Lutz ±50%
Interior Limit (0.016 in)
Exterior Limit (0.013 in)
Figure 6-21: End-of-splice crack widths for UT #8 specimens (load at or below 60% of failure load)
The service level end-of-splice crack widths for the #11 specimens tested at the
University of Texas are plotted in Figure 6-22. Similar to the #5 specimens, the data
indicated an approximately linear relationship between bar stress and crack width. The
rate of increase of crack widths with increasing bar stress was greater than predicted by
the Gergely-Lutz equation. As a result, crack widths in the #11 specimens were smaller
than predicted by the Gergely-Lutz equation at low stresses and larger than predicted by
the Gergely-Lutz equation at high stresses. Nevertheless, the majority of the crack
widths were within the predicted range of widths bounded by the Gergely-Lutz equation
±50%.

112
Due to large spacing and cover values in the #11 specimens, crack widths in these
beams exceeded the 0.013 in. and 0.016 in. limits at substantially lower stresses than the
crack widths in the #5 and #8 specimens. The average crack width exceeded the exterior
limit of 0.013 in. at a bar stress of approximately 28 ksi. The interior limit of 0.016 in.
was surpassed at an approximate bar stress of 32 ksi. These values imply that ultimate
bar stresses in beams of similar design should be restricted to 47 ksi and 53 ksi for
exterior and interior exposures, respectively.
0
0.01
0.02
0.03
0.04
0.05
0.06
0.07
0.08
0 10 20 30 40 50 60 70 80 90 100
Bar Stress (ksi)
Cra
ck W
idth
(in)
Gergely-Lutz ±50%
Interior Limit (0.016 in)
Exterior Limit (0.013 in)
Figure 6-22: End-of-splice crack widths for UT #11 specimens (load at or below 60% of failure load)

113
CHAPTER 7
Implementation of Results
7.1 INTRODUCTION TO DESIGN CONSIDERATIONS
The results of this research program have provided insight for the design of
flexural concrete members reinforced with MMFX high strength reinforcement.
Although this study was focused primarily on the splice behavior of reinforcing bars at
high stresses, the general behavior of the test specimens offered an understanding of the
primary differences between design for ordinary Grade 60 reinforcement and high
strength MMFX reinforcement. Splice specific design recommendations are presented in
Section 7.2. General design considerations are discussed in Section 7.4.
7.2 SPLICE DESIGN RECOMMENDATIONS
The data analyses provided in Chapter 6 indicated that the current development
length equations included in the ACI 318 building design code and the AASHTO LRFD
bridge design code are inadequate for use at high bar stresses. This is largely due to the
lack of data for high strength reinforcing bars at the time of development of these
equations. The ACI 318 equation was developed based on a best fit expression for data
from splice tests failing primarily at or below the ACI limit of 80 ksi. The AASHTO
equation was not developed empirically, but its theoretical basis does not appear to apply
at high stress levels.
Since the best fit development length equation recommended by ACI Committee
408 was based on the results of splice tests in a wider range of bar stresses and concrete
strengths, it aligns more favorably with the test data obtained in this research program.
When using the ACI 408 equation, variability in the ratios of test to calculated failure

114
stresses were consistently and significantly less than when using the ACI 318 or
AASHTO equations. The mean value of 1.03 for test/calculated ratios for specimens in
the MMFX research program, provides further indication of suitability of the ACI 408
equation for determining splice strength over a wide range of bar stresses. For reference,
the ACI 408 development length equation is
b
b
tr
etc
y
d d
dKc
ff
l
⎟⎟⎟⎟⎟
⎠
⎞
⎜⎜⎜⎜⎜
⎝
⎛
⎟⎟⎠
⎞⎜⎜⎝
⎛ +
⎟⎟⎠
⎞⎜⎜⎝
⎛−
=ω
λψψωφ
3.76
2400' 41
where:
fy = yield stress of reinforcing bar (psi)
fc’ = concrete compressive strength (psi) < 16,000 psi
db = bar diameter (in)
csi = one-half clear spacing between bars (in)
cso = side cover of reinforcing bars (in)
cb = bottom cover of reinforcing bars (in)
cs = minimum of csi + 0.25 in. or cso (in)
cmin =minimum of cs or cb (in)
cmax = maximum of cs or cb (in)
c = cmin + db/2 (in)
ω = 25.19.01.0min
max ≤⎟⎟⎠
⎞⎜⎜⎝
⎛+
cc
Ktr = '52.0c
trdr fsn
Att
td = 0.78db+0.22

115
tr = 9.6Rr + 0.28 or 1.0 in the absence of specific values of bar relative rib area
during design
Atr = area of transverse reinforcement crossing the plane of splitting (in2)
n = number of bars being developed or spliced in the plane of splitting
s = spacing of transverse reinforcement (in)
φ = modification factor = 0.82 when using load factors given in ACI 318-05
ψt = 1.3 where horizontal reinforcement is placed such that more than 12 in. of
fresh concrete is cast below the developed length or splice
= 1.0 for all other cases.
ψe = 1.5 for epoxy-coated bars
= 1.0 for all uncoated bars
ψtψe need not exceed 1.7 λ = 1.3 or 0.1'7.6 ≥ctc ff for lightweight concrete
= 1.0 for normalweight concrete
and the term
b
tr
dKc +ω is limited to 4.0 to prevent pullout failure.
In order to safely apply the ACI 408 equation in design, an appropriate
modification factor must be included in the calculation. As stated in Chapter 3, ACI
Committee 408 recommends this factor, φ, be taken as 0.82 when the load factors
included in the ACI 318-05 building code are used. The distributions of test/calculated
ratios for the MMFX splice tests when this value of φ is used are shown in Table 7-1 and
Figure 7-1.

116
Mean Std. Dev. COV Max Min # < 1.0 % < 1.0All 45 1.26 0.15 0.12 1.66 0.93 1 2
Unconfined 23 1.20 0.13 0.11 1.39 0.93 1 4Confined 22 1.32 0.14 0.11 1.66 1.10 0 0
Splice Type N Distribution of MMFX Results Using ACI 408 Equation ( φ = 0.82)
Table 7-1: Distribution of MMFX test/calculated failure stress ratios when using the ACI 408 development length equation with φ = 0.82
0
2
4
6
8
10
12
14
Below 0.6
0.6 - 0.7
0.7 - 0.8
0.8 - 0.9
0.9 - 1.0
1.0 - 1.1
1.1 - 1.2
1.2 - 1.3
1.3 - 1.4
1.4 - 1.5
1.5 - 1.6
Above 1.6
Test/Calculated Failure Stress Ratio
# of
MM
FX T
ests
UnconfinedConfined
Figure 7-1: Distribution of MMFX test/calculated failure stress ratios when using the ACI 408 development length equation with φ = 0.82
The mean test/calculated failure stress ratios for unconfined and confined splices
are both well above 1.0 as expected for a design equation. Because of the increased
mean values and the low coefficients of variation for both the unconfined and confined
splices, only one splice failed at a bar stress less than calculated by the equation. Based
on these data, the ACI 408 equation with a modification factor of 0.82 provides a
conservative estimate of failure stresses for splices of bars over a range of high stresses
up to 150 ksi.

117
When the data from ACI 408 database 10-2001 are included in the analyses, the
combined distributions of test/calculated failure stress ratios for previous bond tests and
MMFX bond tests failing at bar stresses greater than 75 ksi exhibited the same consistent
conservatism as shown in Table 7-2 and Figure 7-2. Therefore, the use of the ACI 408
development length equation with a modification factor of 0.82 is recommended for
calculating required splice lengths of bars expected to develop stresses in excess of 75
ksi. Equivalently, the following equation with the modification factor of 0.82 pre-
multiplied to the ACI 408 equation may be used.
b
b
tr
etc
y
d d
dKc
ff
l
⎟⎟⎟⎟⎟
⎠
⎞
⎜⎜⎜⎜⎜
⎝
⎛
⎟⎟⎠
⎞⎜⎜⎝
⎛ +
⎟⎟⎠
⎞⎜⎜⎝
⎛−
=ω
λψψω
63
1970' 41
Mean Std. Dev. COV Max Min # < 1.0 % < 1.0All 134 1.31 0.19 0.15 2.00 0.94 2 1.5
Unconfined 27 1.20 0.13 0.11 1.42 0.94 1 4Confined 107 1.34 0.20 0.15 2.00 0.99 1 1
Splice Type N Distribution of All Results Using ACI 408 Equation ( φ = 0.82, fs > 75 ksi)
Table 7-2: Distribution of test/calculated failure stress ratios when using the ACI 408 development length equation with φ = 0.82 (Data includes all bond tests in the
ACI 408 database 10-2001 and the MMFX research program failing at bar stresses > 75 ksi)

118
0
5
10
15
20
25
30
35
Below 0.6
0.6 - 0.7
0.7 - 0.8
0.8 - 0.9
0.9 - 1.0
1.0 - 1.1
1.1 - 1.2
1.2 - 1.3
1.3 - 1.4
1.4 - 1.5
1.5 - 1.6
Above 1.6
Test/Calculated Failure Stress Ratio
# of
MM
FX T
ests
UnconfinedConfined
Figure 7-2: Distribution of test/calculated failure stress ratios when using the ACI 408 development length equation with φ = 0.82 (Data includes all bond tests in the
ACI 408 database 10-2001 and the MMFX research program failing at bar stresses > 75 ksi)
7.3 REQUIREMENTS FOR TRANSVERSE REINFORCEMENT
Splices of reinforcing bars at high stress should include at least a minimal amount
of confining transverse reinforcement. The results of this research program cannot
provide a definitive value for minimal transverse reinforcement, but the minimum
transverse reinforcement required for shear (§11.5.6.3 of ACI 318-05) may be used as a
guideline for bar splices until this issue is studied in more detail. As indicated by the
distribution of test/calculated ratios, the ACI 408 development length equation displays
more conservatism in confined splices than in unconfined splices. The addition of
confinement also provides a considerable increase in ductility. Given the brittle and
sudden nature of bond failure, allowing flexural members to extend into the nonlinear

119
range of their load-deflection behavior is crucial in providing adequate warning of
impending failure.
The requirement for minimal confining reinforcement does not apply to splices of
widely spaced #5 or smaller bars with large covers. Test results in this research program
indicate that stresses as high as 120 ksi can safely be developed in unconfined splices of
#5 bars. These splices performed better than other splices at high stresses since the
values of ls/db required to develop high stresses in spliced bars of this configuration are
usually less than 40 — the threshold at which the ratios of test to calculated failure
stresses are approximately 1.0 as described in Chapter 6. The requirement for minimal
confining reinforcement is also not extended to these splice configurations because the
effectiveness of confinement reduces as bar size reduces. This is demonstrated by the limit of 4.0 imposed on the cover and confinement term
b
tr
dKc +ω . For example, a #5
splice with 4.0 in. clear spacing between splices and 2.0 in. clear cover produces a value of
b
tr
dKc +ω equal to 3.7. Adding confinement will provide minimal, if any, additional
strength or ductility since the splice failure mode will likely convert to a pullout failure.
Research on short splices of #5 MMFX bars conducted by Donnelly (2007) confirms this
conclusion.
7.4 GENERAL DESIGN CONSIDERATIONS
The results of this study show that MMFX high strength reinforcement can be lap
spliced to develop bar stresses up to 150 ksi. However, designing a member for both
strength and serviceability while taking advantage of the high strength of MMFX
reinforcement presents many challenges.
A simple example beam is presented to demonstrate the important design issues
related to MMFX and other high strength reinforcing bars. The example beam is a 14 in.
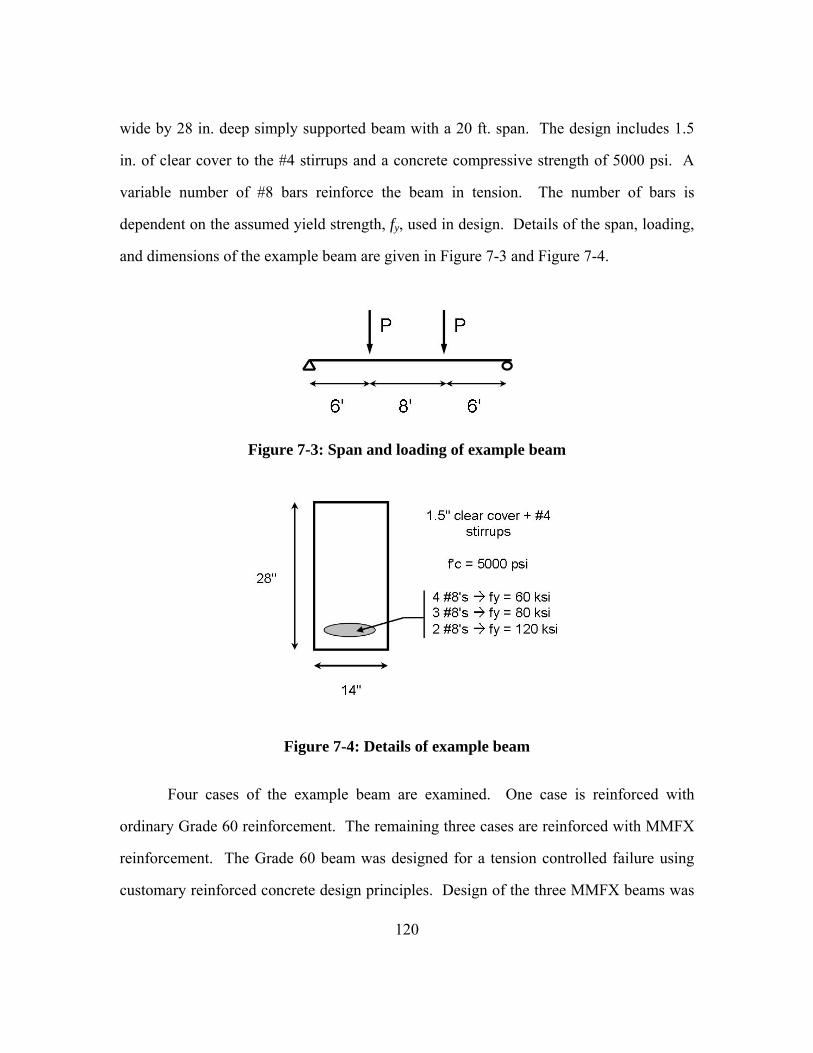
120
wide by 28 in. deep simply supported beam with a 20 ft. span. The design includes 1.5
in. of clear cover to the #4 stirrups and a concrete compressive strength of 5000 psi. A
variable number of #8 bars reinforce the beam in tension. The number of bars is
dependent on the assumed yield strength, fy, used in design. Details of the span, loading,
and dimensions of the example beam are given in Figure 7-3 and Figure 7-4.
Figure 7-3: Span and loading of example beam
Figure 7-4: Details of example beam
Four cases of the example beam are examined. One case is reinforced with
ordinary Grade 60 reinforcement. The remaining three cases are reinforced with MMFX
reinforcement. The Grade 60 beam was designed for a tension controlled failure using
customary reinforced concrete design principles. Design of the three MMFX beams was
121
carried out by assuming different yield strengths of the MMFX reinforcement ― 60 ksi,
80 ksi, and 120 ksi. After design of each MMFX beam, the strains in the steel were
checked to ensure that the beams could attain at least the strain necessary to develop the
assumed yield stress.
The following three sections describe issues related to the ultimate behavior,
deflections, and crack widths for the different beam designs. Although the example
beams were not constructed and tested in the laboratory, the good correlation between
calculated and actual flexural behavior, deflections, and crack widths displayed by
specimens in this research project substantiate the claims made in the following sections.
7.4.2 Ultimate Behavior
All four example beams posses equal strength assuming that failure of each
example beam occurs when the stress in the reinforcing steel reaches the design stress.
This assumption is valid for the example beam reinforced with Grade 60 reinforcement.
However, it does not hold for the example beams reinforced with MMFX steel since
MMFX does not display a yield plateau. As shown in Figure 7-5, the MMFX beams
continue to carry load above the design load of 60 kip.

122
0
20
40
60
80
100
120
140
0.0 0.5 1.0 1.5 2.0 2.5 3.0 3.5 4.0
Deflection (in)
Load
, P (k
ip)
Grade 60
MMFX(fy = 120 ksi)
MMFX(fy = 80 ksi)
MMFX(fy = 60 ksi)
Figure 7-5: Calculated load-deflection for example beam assuming varying design yield strengths for the MMFX reinforcement
This may appear to provide conservatism to the MMFX designs; but if ductile
failure is the primary goal of the designer, the ability of the MMFX designs to carry more
than the design load may lead to undesirable brittle failure modes. Reinforced concrete
members are typically designed to avoid brittle failures such as those caused by shear or
bond. Strength reduction factors vary for different modes of failure to promote certain
failure modes over others. This explains why the strength reduction factor for flexure in
tension controlled members is 0.90 and the strength reduction factor for shear is 0.75.
The ductile flexural failure of a tension controlled member is more desirable than brittle
failure by shear.
Since the example beams reinforced with MMFX reinforcement can exceed their
design strengths, the difference in strength reduction factors between flexure and shear
may not be sufficient to prevent the occurrence of a brittle failure. For example, the

123
design load effects for shear and flexure are proportional to the ratio of the strength
reduction factor for flexure to the strength reduction factor for shear. Therefore, the
design load for shear would be 0.90/0.75 = 1.20 times that of the design load for flexure.
This results in a design shear of 60 x 1.20 = 72 kip for the example beams. As seen in
Figure 7-5, the three example beams reinforced with MMFX steel are all capable of
reaching 72 kip so an overload to 72 kip could cause a shear failure in these beams
instead of a flexural failure. This may be of little concern in the beam designed for a
yield strength of 120 ksi since the beam would have experienced significant deflections
from the overload; but the deflections experienced by the beams designed based on a 60
ksi and 80 ksi assumed yield would provide little warning of failure.
The issue may be more severe for bond failure. A strength reduction factor is not
applied to development lengths. It is usually assumed that the required safety is provided
by the strength reduction factor used in flexural design calculations and by the inclusion
of more steel than necessary in design. Where ductility and/or structural integrity would
be severely compromised by a bond failure, development lengths are increased by 30-
70% (ACI 318 Class B, AASHTO Class B, C). However, since bar stresses in members
reinforced with MMFX reinforcement can continue to increase above the yield strength
assumed in design, these traditional methods of avoiding bond failure may not be
sufficient to prevent this brittle mode of failure from occurring.
The additional load carrying capacity above that calculated based on the assumed
yield strength also raises concerns for applications in seismic areas. In seismic design,
members are expected to yield for several reasons. Yielding allows for the dissipation of
large amounts of energy without an increase in applied load on the structure. This
reduces design loads and makes them more predictable. Yielding also allows for the
redistribution of moments in statically indeterminate structures. Without the ability to

124
yield, designs with MMFX steel will be subject to larger and less predictable seismic
loads. Desirable levels of ductility may not be achievable, and failure may occur by
brittle failure rather than through the desired ductile mode. For these reasons, the use of
MMFX steel in seismic design is not recommended at this time, especially in fuse
members expected to yield.
7.4.3 Deflections
Designers may wish to utilize the high strength of MMFX reinforcement for
several reasons. The reduction in necessary steel may offset the increased cost of MMFX
over conventional Grade 60 reinforcement. Fewer bars may increase constructability in
crowded beams and connections. As shown above, utilizing the high strength in design
also produces larger deflections at the design load, thereby providing a better indication
of distress and impending failure.
However, this final reason for utilizing the high strength of MMFX reinforcement
leads to an argument why the use of the high strength may be undesirable. Not only do
ultimate deflections increase with higher assumed MMFX yield strengths, but service
load deflections also increase. Large service deflections can lead to issues with
vibrations, aesthetics, and damage to non-structural elements. To avoid these problems,
service deflections are usually limited to certain acceptable values.
The effects of assumed yield strength on service load deflections are shown in
Figure 7-6. Service deflections are approximately proportional to the assumed yield
stress. Therefore, the service deflection for the example beam designed assuming a 120
ksi yield strength would be roughly twice the service deflection of the beam designed
assuming a 60 ksi yield strength. In this case, the increase in deflection due to the higher
assumed yield strength caused the computed deflections for the 120 ksi yield example
beam to exceed the ACI 318 limit of L/360 = 0.67 in. As the service deflection of a

125
baseline Grade 60 beam becomes closer to the ACI limit (i.e. – due to a longer span or
lower stiffness), service deflections will become a greater issue for alternate designs
reinforced with MMFX reinforcement, especially those designed with high assumed yield
strengths.
0
10
20
30
40
50
60
70
80
0.0 0.2 0.4 0.6 0.8 1.0 1.2 1.4
Deflection (in)
Load
, P (k
ip)
Grade 60
MMFX(fy = 120 ksi)
MMFX(fy = 80 ksi)
MMFX(fy = 60 ksi)
0.43 in.
0.84 in.
0.55 in.
60% Pu
L/360 = 0.67 in
Figure 7-6: Calculated service load deflections for the example beam assuming varying design yield strengths for the MMFX reinforcement
7.4.4 Crack Widths
Given the inherent corrosion resistance of MMFX steel, large cracks in beams
reinforced with MMFX bars may not be as much of a concern as with beams reinforced
with ordinary Grade 60 bars from a corrosion perspective; but crack widths must also be
limited for other reasons such as aesthetics and freeze/thaw effects. Therefore, crack
widths should still be limited in designs incorporating MMFX reinforcement.

126
Crack widths increase as stresses in the reinforcing bars increase. Since the use of
a higher assumed yield strength for MMFX reinforcement will result in a higher bar
stress for a given load, crack widths will also increase for a given load. The effects of the
different assumed yield strengths in the example beams on the computed crack widths are
highlighted in Figure 7-7. In this figure, the expected crack widths were computed using
the Gergely-Lutz equation. The limits of 0.013 in. and 0.016 in. for service crack widths
of exterior and interior members are included in the figure for reference.
As expected, the example beams designed with higher assumed yield strengths
produce larger computed crack widths. The increase in crack widths between the designs
is proportional to the increase in assumed yield strength. Again, the example beam
designed with an assumed yield strength of 120 ksi does not satisfy the serviceability
limits; and as the crack widths of a baseline Grade 60 beam design approach the
acceptable service crack limits, crack widths will become an even more serious issue in
alternate designs using the high strength of MMFX reinforcement.
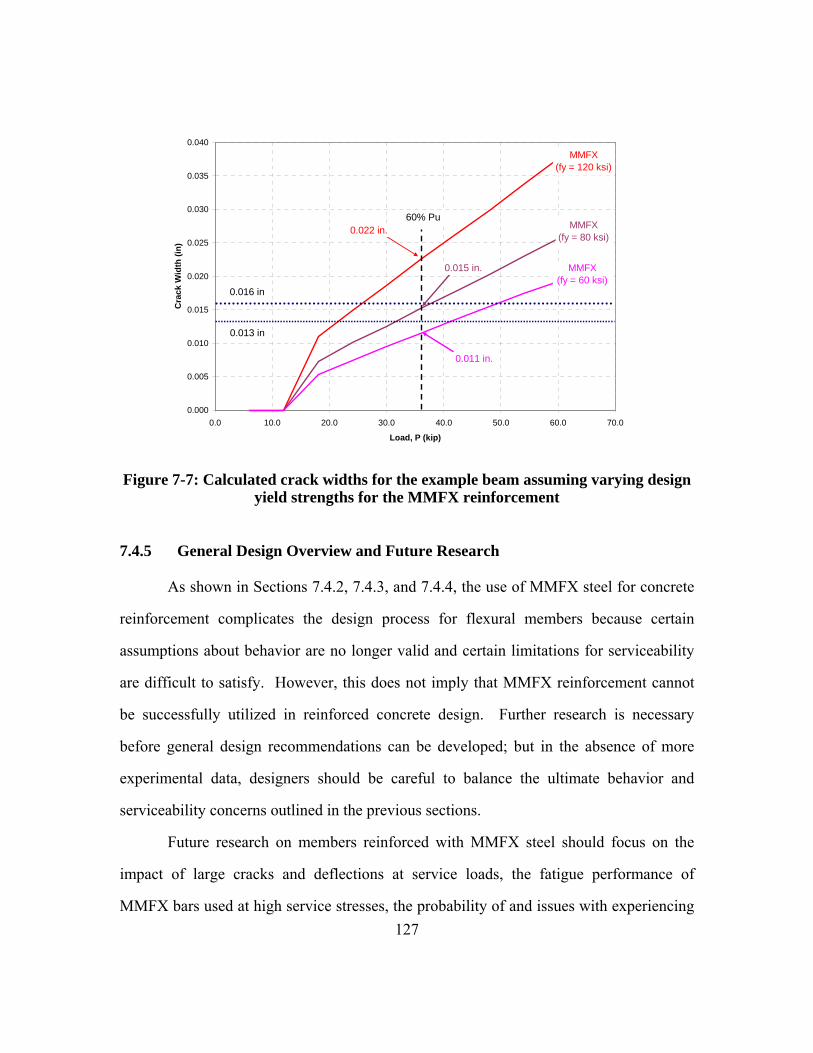
127
0.000
0.005
0.010
0.015
0.020
0.025
0.030
0.035
0.040
0.0 10.0 20.0 30.0 40.0 50.0 60.0 70.0
Load, P (kip)
Cra
ck W
idth
(in)
0.013 in
0.016 in
60% Pu
0.011 in.
0.022 in.
0.015 in. MMFX(fy = 60 ksi)
MMFX(fy = 80 ksi)
MMFX(fy = 120 ksi)
Figure 7-7: Calculated crack widths for the example beam assuming varying design yield strengths for the MMFX reinforcement
7.4.5 General Design Overview and Future Research
As shown in Sections 7.4.2, 7.4.3, and 7.4.4, the use of MMFX steel for concrete
reinforcement complicates the design process for flexural members because certain
assumptions about behavior are no longer valid and certain limitations for serviceability
are difficult to satisfy. However, this does not imply that MMFX reinforcement cannot
be successfully utilized in reinforced concrete design. Further research is necessary
before general design recommendations can be developed; but in the absence of more
experimental data, designers should be careful to balance the ultimate behavior and
serviceability concerns outlined in the previous sections.
Future research on members reinforced with MMFX steel should focus on the
impact of large cracks and deflections at service loads, the fatigue performance of
MMFX bars used at high service stresses, the probability of and issues with experiencing

128
non-flexural failures, moment redistribution in statically indeterminate members, and the
seismic performance and design implications associated with a reinforcing steel that does
not yield.

129
CHAPTER 8
Conclusions
8.1 RESEARCH SUMMARY
MMFX microcomposite steel reinforcement is manufactured through a patented
proprietary process that results in a high strength, corrosion resistant material. The high
chromium content (9-10%) and the unique microstructure of MMFX steel are believed to
contribute to the inherent corrosion resistance of the material. An appraisal report
compiled by the Concrete Innovation Appraisal Service (Zia 2003) evaluated the findings
of several independent research studies related to the corrosion resistance of MMFX
reinforcement. The authors of the report concluded that there is sufficient evidence that
MMFX steel exhibits improved corrosion resistance over conventional ASTM A 615
reinforcing steel and that this corrosion resistance can lead to longer service lives and
lower life-cycle costs.
The low carbon content (0.08%) of MMFX steel leads to its high strength.
MMFX steel guarantees a minimum ultimate tensile strength of 150 ksi and a minimum
yield strength of 100 ksi when measured using the 0.2% offset method (MMFX 2004).
Tension tests conducted on MMFX reinforcing bars as part of this project and in previous
research programs indicate that the tensile strength can be significantly higher (160-177
ksi), and the 0.2% offset yield strength is more commonly near 120 ksi (El-Hacha and
Rizkalla 2002).
To utilize MMFX steel reinforcement most efficiently, designers may wish to take
advantage of the material’s high strength in addition to its corrosion resistance; however
the current ACI 318-05 building code limits the allowable yield stress in tensile

130
reinforcement to 80 ksi. The AASHTO LRFD bridge code limits tensile yield strengths
to 75 ksi. Structural tests on laboratory specimens reinforced with steel that experiences
stresses well in excess of these limits must be conducted to substantiate a change in the
maximum design stresses. These tests are necessary because many of the design
equations included in the ACI 318 and AASHTO LRFD codes have been developed from
empirical data, and they were not intended to be used beyond the limits of the variables
included in the supporting research.
Development length equations are an example of such empirical equations. The
development length equation included in the ACI 318-05 building design code was based
on the results of splice tests failing primarily at or below 80 ksi. The AASHTO LRFD
development length equation is based on theoretical assumptions of bond behavior and
empirically developed limits of bond stresses. A recently proposed development length
equation provided by ACI Committee 408 is based on a larger database of tests than
those used for the development of the ACI 318 and AASHTO LRFD design equations,
but the bar stresses at failure were still limited to less than 120 ksi. Only 12 tests were
available between 100 and 120 ksi.
The goal of this research program was to increase the current database of splice
tests at high stresses. The data were used to evaluate the adequacy of the ACI 318,
AASHTO LRFD, and ACI 408 development length equations at high bar stresses and to
develop design recommendations for the splicing and development of MMFX steel at
stresses above the current code limits of 75-80 ksi.
According to the original test matrix, 22 beam-splice specimens are being tested
at each of the three participating research universities — the University of Texas, the
University of Kansas, and North Carolina State University. Test variables included bar
size, concrete compressive strength, splice length, concrete cover, and amount of

131
transverse reinforcement (confinement). All splices were designed to fail in the stress
range of 80-140 ksi. In addition to the bar stresses at splice failure, crack widths and
deflections were monitored to examine serviceability concerns related to high stresses in
tensile reinforcement. Tension tests were also performed on each size of MMFX
reinforcement in order to accurately relate bar strains with bar stresses.
8.2 CONCLUSIONS
Based on the results of 25 beam-splice tests conducted at the University of Texas,
22 beam-splice tests conducted at North Carolina State University, and 3 beam-splice
tests conducted at the University of Kansas, the following conclusions were developed
for the splice behavior of MMFX high strength reinforcement.
• Lap splices using MMFX high strength reinforcement developed bar stresses up
to 155 ksi.
• The ACI 408 development length equation provided relatively accurate estimates
of failure stresses for splices with and without confining transverse reinforcement.
• Both the ACI 318 and AASHTO LRFD development length equations provided
unconservative calculated failure stresses for unconfined splices. The two
equations provided reasonably conservative calculated failure stresses for
confined splices.
• The use of the ACI 408 development length equation resulted in less scatter of
test/calculated failure stress ratios for splices with and without confining
reinforcement than the use of either the ACI 318 or the AASHTO LRFD
development length equations.
• The conservatism of the ACI 408, ACI 318, and AASHTO LRFD development
length equations reduced in unconfined splices as the ratio of splice length to bar
diameter (ls/db) increased. Test/calculated failure stress ratios for all three

132
equations transitioned from predominately greater than 1.0 to predominately less
than 1.0 at values of ls/db between 35 and 40.
• The addition of confining transverse reinforcement provided an increase in failure
stress. This increase was greater than predicted by either the ACI 408 or ACI 318
equation. The increase in failure stress between two identical splices with varying
levels of confinement was less than proportional to the increase in confining
reinforcement between the two specimens.
• The addition of confining transverse reinforcement provided an increase in beam
deflections at failure. The increase in deflections between two identical splices
with varying levels of confinement was significantly greater than proportional to
the increase in confining reinforcement between the two specimens.
• Service level crack widths were consistently greater than the limits of 0.013 in.
and 0.016 in. used as a basis for serviceability provisions included in pre-1999
editions of the ACI 318 building code. Crack widths were very large in
specimens containing #11 bars that had wide bar spacings and large covers.
• Splices of bars expected to experience stresses greater than 75 ksi should be
designed using the ACI 408 development length equation with the modification
factor, φ, equal to 0.82.
• A minimum level of transverse reinforcement should be included for all splices
above 75 ksi except for those with #5 or smaller bars with large bar spacings and
covers.
• Designers should be aware of the ultimate and service level concerns related to
the use of MMFX bars.

133
APPENDIX
Beam-Splice Specimen Details
Splice details for specimens tested at the University of Texas are given in Table
A-1. Splice details for specimens tested at North Carolina State University and the
University of Kansas are given in Table A-2. The details are reported using the
terminology and layout consistent with the data reported in the ACI 408 database 10-
2001. The notation is as follows.
Ab Bar area
At Area of one leg of a stirrup
b Beam width
csi One-half clear spacing between bars
cso Side clear cover
cb Bottom clear cover
d Beam effective depth
db Bar diameter
dtr Nominal stirrup diameter
f'c Concrete compressive strength fsc Ultimate bar stress determined using moment-curvature method
fsu Ultimate bar stress determined using working stress method or ultimate strength method
fy Bar yield strength
fyt Stirrup yield strength

134
h Beam height
ls Splice length
Nb Number of spliced or developed bars
Nl Number of legs per stirrup Ns Number of stirrups along splice or development length; multiple legged stirrups at one location are treated as a single stirrup Rr Relative rib area of bar (ratio of projected rib area normal to bar axis to the product of the norminal bar perimeter and the center-to-center rib spacing) * Not Provided † Nominal Dimension

135
Table A-1: Splice details for specimens tested at the University of Texas
l sd
bb
hd
cso
csi
cb
dtr
Ab
At
f'c
f yf y
tf s
cf s
u
in.
in.
in.
in.
in.
in.
in.
in.
in.
in.2
in.2
psi
ksi
ksi
ksi
ksi
8-8-
OC
0-1.
5U
T40
1.00
0.08
3810
.25
22.3
820
.38
1.60
1.40
1.50
20
00
0.79
0.00
8300
**
80*
8-8-
OC
1-1.
5U
T40
1.00
0.08
3810
.13
23.2
521
.25
1.65
1.38
1.50
20.
53
20.
790.
2083
00*
*12
3*
8-8-
OC
2-1.
5U
T40
1.00
0.08
3810
.13
23.2
521
.25
1.65
1.38
1.50
20.
56
20.
790.
2083
00*
*14
7*
8-5-
OC
0*-1
.5U
T40
1.00
0.08
3810
.25
27.5
025
.50
1.55
1.45
1.50
20
00
0.79
0.00
5200
**
72*
8-5-
OC
1*-1
.5U
T40
1.00
0.08
3810
.25
27.5
025
.50
1.65
1.38
1.50
20.
53
20.
790.
2052
00*
*99
*8-
5-O
C2*
-1.5
UT
401.
000.
0838
10.2
527
.50
25.5
01.
651.
381.
502
0.5
62
0.79
0.20
5200
**
129
*8-
8-XC
0-1.
5U
T54
1.00
0.08
3810
.25
27.5
025
.50
1.50
1.50
1.50
20
00
0.79
0.00
7800
**
86*
8-8-
XC1-
1.5
UT
541.
000.
0838
10.2
527
.50
25.5
01.
501.
501.
502
0.5
32
0.79
0.20
7800
**
122
*8-
8-XC
2-1.
5U
T54
1.00
0.08
3810
.25
27.5
025
.50
1.50
1.50
1.50
20.
56
20.
790.
2078
00*
*14
4*
8-5-
OC
0-1.
5U
T47
1.00
0.08
3810
.25
27.5
025
.50
1.55
1.45
1.50
20
00
0.79
0.00
5000
**
74*
8-5-
OC
2-1.
5U
T47
1.00
0.08
3810
.25
27.5
025
.50
1.65
1.38
1.50
20.
59
20.
790.
2050
00*
*14
1*
8-5-
XC0-
1.5
UT
621.
000.
0838
10.2
527
.50
25.5
01.
501.
501.
502
00
00.
790.
0047
00*
*82
*8-
5-XC
2-1.
5U
T62
1.00
0.08
3810
.25
27.5
025
.50
1.60
1.38
1.50
20.
59
20.
790.
2047
00*
*14
8*
11-5
-OC
0-3
UT
501.
410.
0797
18.1
331
.50
28.0
53.
252.
882.
752
00
01.
560.
0050
00*
*75
*11
-5-O
C1-
3U
T50
1.41
0.07
9718
.13
31.2
527
.80
3.25
3.00
2.75
20.
56
21.
560.
2050
00*
*10
4*
11-5
-OC
2-3
UT
501.
410.
0797
18.1
331
.25
27.8
03.
253.
002.
752
0.5
122
1.56
0.20
5000
**
128
*11
-5-X
C0-
3U
T67
1.41
0.07
9718
.38
31.2
527
.80
3.13
3.00
2.75
20
00
1.56
0.00
5400
**
84*
11-5
-XC
1-3
UT
671.
410.
0797
18.2
531
.25
27.8
03.
132.
942.
752
0.5
62
1.56
0.20
5400
**
117
*11
-5-X
C2-
3U
T67
1.41
0.07
9718
.33
31.2
527
.80
3.13
2.94
2.75
20.
512
21.
560.
2054
00*
*14
1*
5-5-
OC
0-3/
4U
T33
0.62
50.
0767
13.0
012
.00
10.9
41.
001.
000.
754
00
00.
310.
0052
00*
*80
*5-
5-XC
0-3/
4U
T44
0.62
50.
0767
13.0
012
.00
10.9
41.
001.
000.
754
00
00.
310.
0052
00*
*91
*5-
5-O
C0-
1.25
UT
180.
625
0.07
6735
.00
12.5
010
.94
3.50
3.75
1.25
40
00
0.31
0.00
5200
**
88*
5-5-
XC0-
1.25
UT
250.
625
0.07
6735
.00
12.2
510
.69
3.50
3.75
1.25
40
00
0.31
0.00
5200
**
110
*5-
5-O
C0-
2U
T15
0.62
50.
0767
35.0
012
.25
9.94
3.50
3.75
2.00
40
00
0.31
0.00
5700
**
97*
5-5-
XC0-
2U
T20
0.62
50.
0767
35.0
012
.25
9.94
3.50
3.75
2.00
40
00
0.31
0.00
5700
**
120
*
TEST
#Sc
hool
Rr
Ns
Nl
Nb

136
Table A-2: Splice details for specimens tested at North Carolina State University and the University of Kansas
l sd
bb
†h
†d
†c
soc
sic
bd
trA
bA
tf'
cf y
f yt
f sc
f su
in.
in.
in.
in.
in.
in.
in.
in.
in.
in.2
in.2
psi
ksi
ksi
ksi
ksi
8-5-
OC
0-2.
5N
CS
U31
1.00
0.08
3814
2421
.02.
502.
502.
502
00
00.
790.
0060
00*
*95
*8-
5-O
C2-
2.5
NC
SU
311.
000.
0838
1424
21.0
2.50
2.50
2.50
20.
58
20.
790.
2060
00*
*14
2*
8-5-
XC0-
2.5
NC
SU
411.
000.
0838
1424
21.0
2.50
2.50
2.50
20
00
0.79
0.00
5800
**
107
*8-
8-O
C0-
1.5
NC
SU
401.
000.
0838
1024
22.0
1.50
1.50
1.50
20
00
0.79
0.00
8400
**
90*
8-8-
OC
2-1.
5N
CS
U40
1.00
0.08
3810
2422
.01.
501.
501.
502
0.5
52
0.79
0.20
8400
**
151
*8-
8-XC
0-1.
5N
CS
U54
1.00
0.08
3810
2422
.01.
501.
501.
502
00
00.
790.
0010
200
**
108
*8-
8-XC
2-1.
5N
CS
U54
1.00
0.08
3810
2422
.01.
501.
501.
502
0.5
72
0.79
0.20
1020
0*
*15
1*
11-8
-OC
0-3
NC
SU
431.
410.
0797
1824
20.3
3.00
3.00
3.00
20
00
1.56
0.00
6070
**
78*
11-8
-OC
2-3
NC
SU
431.
410.
0797
1824
20.3
3.00
3.00
3.00
20.
58
21.
560.
2060
70*
*11
6*
11-8
-XC
0-3
NC
SU
571.
410.
0797
1824
20.3
3.00
3.00
3.00
20
00
1.56
0.00
8383
**
96*
11-8
-XC
2-3
NC
SU
571.
410.
0797
1824
20.3
3.00
3.00
3.00
20.
58
21.
560.
2083
83*
*12
8*
11-5
-OC
0-2
NC
SU
691.
410.
0797
1436
33.3
2.00
2.00
2.00
20
00
1.56
0.00
5344
**
74*
11-5
-OC
2-2
NC
SU
691.
410.
0797
1436
33.3
2.00
2.00
2.00
20.
511
21.
560.
2053
44*
*13
2*
11-5
-OC
3-2
NC
SU
691.
410.
0797
1436
33.3
2.00
2.00
2.00
20.
523
21.
560.
2053
44*
*15
1*
11-5
-XC
0-2
NC
SU
911.
410.
0797
1436
33.3
2.00
2.00
2.00
20
00
1.56
0.00
4058
**
72*
11-5
-XC
2-2
NC
SU
911.
410.
0797
1436
33.3
2.00
2.00
2.00
20.
511
21.
560.
2040
58*
*12
7*
11-5
-XC
3-2
NC
SU
911.
410.
0797
1436
33.3
2.00
2.00
2.00
20.
523
21.
560.
2040
58*
*15
5*
8-5-
OC
0-1.
5KU
471.
000.
0838
1430
28.1
1.48
3.60
1.40
20
00
0.79
0.00
5260
**
77*
8-5-
XC0-
1.5
KU63
1.00
0.08
3814
3028
.11.
413.
691.
412
00
00.
790.
0059
40*
*89
*8-
5-O
C2-
1.5
KU47
1.00
0.08
3814
3028
.11.
403.
581.
402
0.5
82
0.79
0.20
6050
**
126
*
Rr
Nb
Ns
Nl
TEST
#Sc
hool

137
Cross-section, reinforcement, and failure load details for specimens tested at the
University of Texas are listed in Table A-3. In this table, ct represents the clear cover
above the compression reinforcement.
Table A-3: Cross-section, reinforcement, and failure load details for specimens tested at the University of Texas
f' c b h Failure Load Failure Stress(psi) (in) (in) Bar Size (U.S.) # of Bars cb (in) Bar Size (U.S.) # of Bars ct (in) (kip/ram) (ksi)
8-8-OC0-1.5 8300 10.25 22.38 8 2 1.50 8 2 3.00 39.1 808-8-OC1-1.5 8300 10.13 23.25 8 2 1.50 8 2 3.00 63.0 1238-8-OC2-1.5 8300 10.13 23.25 8 2 1.50 8 2 3.00 75.4 1478-5-OC0*-1.5 5200 10.25 27.50 8 2 1.50 8 2 3.00 44.1 728-5-OC1*-1.5 5200 10.25 27.50 8 2 1.50 8 2 3.00 60.6 998-5-OC2*-1.5 5200 10.25 27.50 8 2 1.50 8 2 3.00 78.8 1298-8-XC0-1.5 7800 10.25 27.50 8 2 1.50 8 2 3.00 53.0 868-8-XC1-1.5 7800 10.25 27.50 8 2 1.50 8 2 3.00 75.2 1228-8-XC2-1.5 7800 10.25 27.50 8 2 1.50 8 2 3.00 89.5 1448-5-OC0-1.5 5000 10.25 27.50 8 2 1.50 8 2 3.00 45.2 748-5-OC2-1.5 5000 10.25 27.50 8 2 1.50 8 2 3.00 85.9 1418-5-XC0-1.5 4700 10.25 27.50 8 2 1.50 8 2 2.25 50.2 828-5-XC2-1.5 4700 10.25 27.50 8 2 1.50 8 2 2.25 92.2 14811-5-OC0-3 5000 18.13 31.50 11 2 2.75 11 2 2.75 83.3 7511-5-OC1-3 5000 18.13 31.25 11 2 2.75 11 2 2.75 115.0 10411-5-OC2-3 5000 18.13 31.25 11 2 2.75 11 2 2.75 140.9 12811-5-XC0-3 5400 18.38 31.25 11 2 2.75 11 2 2.75 92.2 8411-5-XC1-3 5400 18.25 31.25 11 2 2.75 11 2 2.75 128.0 11711-5-XC2-3 5400 18.33 31.25 11 2 2.75 11 2 2.75 154.6 1415-5-OC0-3/4 5200 13.00 12.00 5 4 0.75 5 2 0.88 23.2 805-5-XC0-3/4 5200 13.00 12.00 5 4 0.75 5 2 1.50 26.0 91
5-5-OC0-1.25 5200 35.00 12.50 5 4 1.25 5 4 2.00 26.6 885-5-XC0-1.25 5200 35.00 12.25 5 4 1.25 5 4 2.00 32.5 110
5-5-OC0-2 5700 35.00 12.25 5 4 2.00 5 4 1.38 26.2 975-5-XC0-2 5700 35.00 12.25 5 4 2.00 5 4 1.50 32.8 120
Spliced Tension Reinforcement Compression ReinforcementSpecimen

138
REFERENCES
AASHTO, 2007, “AASHTO LRFD Bridge Design Specifications: Customary Units,” 4th Ed., American Association of State Highway and Transportation Officials, Washington, D.C., 1518 pp.
Ahlborn, T. and DenHartigh, T., 2002, “A Comparative Bond Study of MMFX Reinforcing Steel in Concrete,” Final Report, CSD-2002-03, Michigan Technological University, Center for Structural Durability, Houghton, M.I., July, 24 pp.
ACI Committee 318, 2005, “Building Code Requirements for Reinforced Concrete (ACI 318-05) and Commentary (ACI 318R-05),” American Concrete Institute, Farmington Hills, Mich., 430 pp.
ACI Committee 408, 2003, “Bond and Development of Straight Reinforcing Bars in Tension (ACI 408R-03),” American Concrete Institute, Farmington Hills, Mich., 49 pp.
ASTM C 39-04a, 2004, “Standard Method of Test for Compressive Strength of Cylindrical Concrete Specimens,” ASTM International, West Conshohocken, Pa., 14 pp.
Azizinamini, A.; Chisas, M.; and Ghosh, S. K., 1995, “Tension Development Length of Reinforcing Bars Embedded in High-Strength Concrete,” Engineering Structures, V. 17, No. 7, pp. 512-522.
Azizinamini, A.; Stark, M.; Roller, J. J.; and Ghosh, S. K., 1993, “Bond Performance of Reinforcing Bars Embedded in High-Strength Concrete,” ACI Structural Journal, V. 90, No. 5, Sept.-Oct., pp. 554-561.
Darwin, D.; Tholen, M. L; Idun, E. K.; and Zuo, J., 1996a, “Splice Strength of High Relative Rib Area Reinforcing Bars,” ACI Structural Journal, V. 93, No. 1, Jan.-Feb., pp. 95-107.
Darwin, D.; Zuo, J.; Tholen, M. L.; and Idun, E. K., 1996b, “Development Length Criteria for Conventional and High Relative Rib Area Reinforcing Bars,” ACI Structural Journal, V. 93, No. 3, May-June, pp. 347-359.
Dawood, M.; Seliem, H.; Hassan, T.; and Rizkalla, S., 2004, “Design Guidelines for Concrete Beams Reinforced with MMFX Microcomposite Reinforcing Bars,” Proceedings of the International Conference on Future Vision and Challenges for Urban Development, Cairo, Egypt, Dec. 20-22., 12 pp.

139
Donnelly, K., 2007, “Behavior of Minimum Length Splices of High-Strength Reinforcement,” Thesis, University of Texas, Dept. of Civil, Architectural, and Environmental Engineering, Austin, T.X.
El-Hacha, R.; El-Agroudy, H.; and Rizkalla, S. H., 2006, “Bond Characteristics of High-Strength Steel Reinforcement,” ACI Structural Journal, V. 103, No. 6, Nov.-Dec., pp. 771-782.
El-Hacha, R and Rizkalla, S. H., 2002, “Fundamental Material Properties of MMFX Steel Bars,” Research Report, RD-02/04, North Carolina State University, Constructed Facilities Laboratory, Raleigh, N.C., July, 62 pp.
Esfahani, M. R. and Rangan, B. J., 1998, “Local Bond Strength of Reinforcing Bars in Normal Strength and High-Strength Concrete (HSC),” ACI Structural Journal, V. 95, No. 2, Mar.-Apr., pp. 96-106.
Gergely, P. and Lutz, L. A., 1968, “Maximum Crack Width in Reinforced Concrete Members,” Causes, Mechanisms, and Control of Cracking in Concrete, SP-20, American Concrete Institute, Farmington Hills, M.I., pp. 87-117.
Hamad, B. S., and Itani, M. S., 1998, “Bond Strength of Reinforcement in High-Performance Concrete: The Role of Silica Fume, Casting Position, and Superplasticizer Dosage,” ACI Materials Journal, V. 95, No. 5, Sept.-Oct., pp. 499-511.
Maeda, M.; Otani, S.; and Aoyama, H., 1991, “Bond Splitting Strength in Reinforced Concrete Members,” Transactions of the Japan Concrete Institute, V. 13, pp. 581-588.
Mathey, R., and Watstein, D., 1961, “Investigation of Bond in Beam and Pull-Out Specimens with High-Yield-Strength Deformed Bars,” ACI JOURNAL, Proceedings V. 57, No. 9, Mar., pp 1071-1090.
MMFX Steel Corporation of America, 2004, MMFX 2 Rebar – Product Guide Specification, Charlotte, N.C. 10 pp.
Orangun, C. O.; Jirsa, J. O.; and Breen, J. E., 1977, “Reevaluation of Test Data on Development Length and Splices,” ACI JOURNAL, Proceedings V. 74, No. 3, Mar., pp. 114-122.
Pay, A. C., 2005, “Bond Behavior of Unconfined Steel and Fiber Reinforced Polymer (FRP) Bar Splices in Concrete Beams,” Dissertation, Purdue University, West Lafayette, I.N., Dec., 336 pp.

140
Sakurada, T.; Morohashi, N.; and Tanaka, R., 1993, “Effect of Transverse Reinforcement on Bond Splitting Strength of Lap Splices,” Transactions of the Japan Concrete Institute, V. 15, pp. 573-580.
Zuo, J., and Darwin, D., 2000, “Splice Strength of Conventional and High Relative Rib Area Bars in Normal and High-Strength Concrete,” ACI Structural Journal, V. 97, No. 4, July-Aug., pp 630-641.

141
VITA
Gregory Michael Glass, son of Larry Thomas Glass and Angela Battaglini Glass,
was born in Panama City, Florida on February 12, 1983. Greg completed his high school
education at Charlotte Catholic High School in Charlotte, North Carolina in June of 2001;
and he entered Princeton University in September of the same year. He received a
Bachelor of Science in Engineering in Civil and Environmental Engineering in May of
2005 from Princeton University. In August of 2005, Greg entered the Graduate School at
the University of Texas at Austin to pursue a Master of Science in Engineering in Civil
Engineering.
Permanent Address: 4901 Truscott Road
Charlotte, N.C. 28226
This thesis was typed by the author.
Related Documents