C O O K I S L A N D S G O V E R N M E N T M I N I S T R Y O F A G R I C U L T U R E

Welcome message from author
This document is posted to help you gain knowledge. Please leave a comment to let me know what you think about it! Share it to your friends and learn new things together.
Transcript
COOK ISLANDS GOVERNMENT MINISTRY OF AGRICULTURE
2011 CAF Report
Cook Islands Census of Agriculture and Fisheries
2000
This report documents the Cook Islands 2011 Census of Agriculture and Fisheries. It contains the analysis of the main findings and seven (7) sets of tables providing information collected during the Census. More detailed information can be obtained from either of the agencies listed below.
Ministry of Agriculture PO Box 96 Rarotonga
Cook Islands Ph: (682) 28711
www.agriculture.gov.ck
Statistics Office
PO Box 41 Rarotonga
Cook Islands Ph: (682) 29511
www.mfem.gov.ck
Published March 2014
2011 CAF Report I2011 CAF Report
Message from the Minister
As Minister for Agriculture, National Environment Service, and the Business Trade and Investment Board, I have great pleasure in presenting the information contained in this report on the Cook Islands Census of Agriculture 2011.
This census is showing huge changes in agricultural activity in the country. There is a major decline in horticulture subsistence and commercial production. This corresponds with population trends that are revealed in the 2011 Census of Population. Another factor affecting horticulture production on Rarotonga is less arable land as expansion in the tourism industry makes it a more attractive sector to capitalize on. Therefore, intensive economic and social changes in our country over the past 20 or so years has changed the way we sustain our food security needs, importing more and growing less.
The information contained in this document will serve to better assist our planners in designing policies necessary to address our food security and nutritional requirements, also guide us towards a healthier lifestyle. We can only address our current and future needs through team effort, not working as individual agencies as has too often been the case.
I extend to the people of the Cook Islands, the primary beneficiaries of the findings of the census, my sincere appreciation for their cooperation in providing the necessary information to our census staff, and hope we can utilise the information contained within to reverse this negative change.
Sincere thanks to FAO for the financial and technical support for this project. I wish to thank, in particular, the services and expertise of David Marshall who was also involved in the previous censuses, and has seen this changing trend in agriculture.
Finally, many thanks to all the hard-working staff whom in some way or another invested time and professionalism in the census. Special thanks also goes to all those who assisted with the collection of additional data, after the census proper, to improve the findings of this report.
Hon. Kiriau Turepu
Minister for Agriculture, National Environment Service and Business Trade Investment Board
I
2011 CAF Report II
2011 CAF Report
ACKNOWLEDGEMENT
COOK ISLANDS GOVERNMENT
1. Ministry of Agriculture - manpower, financial support, logistics 2. Statistics Office - manpower, financial support, logistics, data processing 3. Tim Nubono, Policy Officer, Ministry of Agriculture - formatting of report
FOOD AND AGRICULTURE ORGANIZATION (FAO)
1. Financial support 2. David Marshall - Census consultant 3. Kevin Hosking - Data processing 4. Jairo Castano - Project technical officer 5. Madeline Kare & Elizabeth Potoru - Preliminary data processing, post-enumeration
survey
CENSUS STAFF
1. William Wigmore - National Project Coordinator 2. Moe Tutira, Ngametua Kino, Moekopu Vogel, Sherro Tomokino, Mere Charlie, Noo
Tokari - Re-enumeration of selected census districts on Rarotonga 3. Moekopu Vogel, Ngametua Kino, Madeleine Kare, Twin Ruarangi, Maki Toko, - Re-
enumeration of Aitutaki 4. Maru Willie & Banabas Henry - assisting with the Census of Agriculture and
Fisheries enumeration in the northern group 5. All census Supervisors and their Enumerators, as listed in Annex 4.
II
2011 CAF Report III2011 CAF Report
FOREWORD This report presents the main findings of the Census of Agriculture 2011 (CoA 2011) which was the third such census of agriculture to be conducted in Cook Islands. The CoA 2011 was conducted at the same time as the Census of Population and Dwellings in November 2011 (CoPD 2011). This was the first time the two censuses had been conducted as an integrated exercise. The key issue such an approach sought to address, was the high cost of data collection in the Northern Group of Islands where transport costs were a major factor. It was also recognised that other cost savings and efficiencies could be gained by conducting the two censuses at the same time and the resultant database would be far richer since the datasets could be combined, for analytical purposes, through the household number.
The report is arranged in 3 sections. The first section outlines the methodology used and the integration of the census of agriculture with the census of population and dwellings. The second section presents the main findings of the census of agriculture presenting comparisons with previous censuses to illustrate how the sector has changed over time. The third section analyses additional data on the agricultural sector captured as part of the Census of Population and Dwellings 2011.
The census impacted on every household in the country and without the support from the public it could not have been realised. We would like to thank all those farmers and households that contributed so willingly to this Census as well as the team of enumerators that collected the information. Thanks also go to the staff of the Ministry of Agriculture who acted as supervisors and coordinators and the staff of the Statistics Office who provided technical guidance and the overall coordination of the joint census programme. The data processing was carried out by Mr. Kevin Hosking, Statistics Division and technical support was provided by the Food and Agriculture Organization of the United Nations (FAO), for which the Government is extremely grateful.
................................... ....................................
Dr. Mat Purea Ms. Taggy Tangimetua
Secretary, Government Statistician, Ministry of Agriculture Ministry of Finance and Economic Management
III

2011 CAF Report
2011 CAF Report V2011 CAF Report
CONTENTS
MESSAGE FROM THE MINISTER I
ACKNOWLEDGEMENT II
FOREWORD III
CONTENTS IV
INTRODUCTION and MAIN RESULTS 1
Section 1: Introduction, Background and Methodology 1
Section 2: Main Results of the Census of Agriculture 2011 8
Section 3: Data from the Census of Population and Dwellings 2011 19
CENSUS TABLES 27
Set 1: Household Details
Set 2: Holding Details
Set 3: Parcel Details
Set 4: Livestock Details
Set 5: Capture Fishing
Set 6: Pearl Farming
Set 7: Selected Tables from the Census of Population and Dwellings 2011
ANNEXES
Annex 1: The Census Questionnaires 28
Annex 2: Crop Planting Densities 33
Annex 3: Definition of Terms and Concepts 38
Annex 4: List of Census Staff 43
IV
I
II
III
V
1
8
19
27
28
38
60
92
110
122
134
144
150
155
160
2011 CAF Report 1
1 2011 CAF Report
SECTION 1: BACKGROUND AND METHODOLOGY
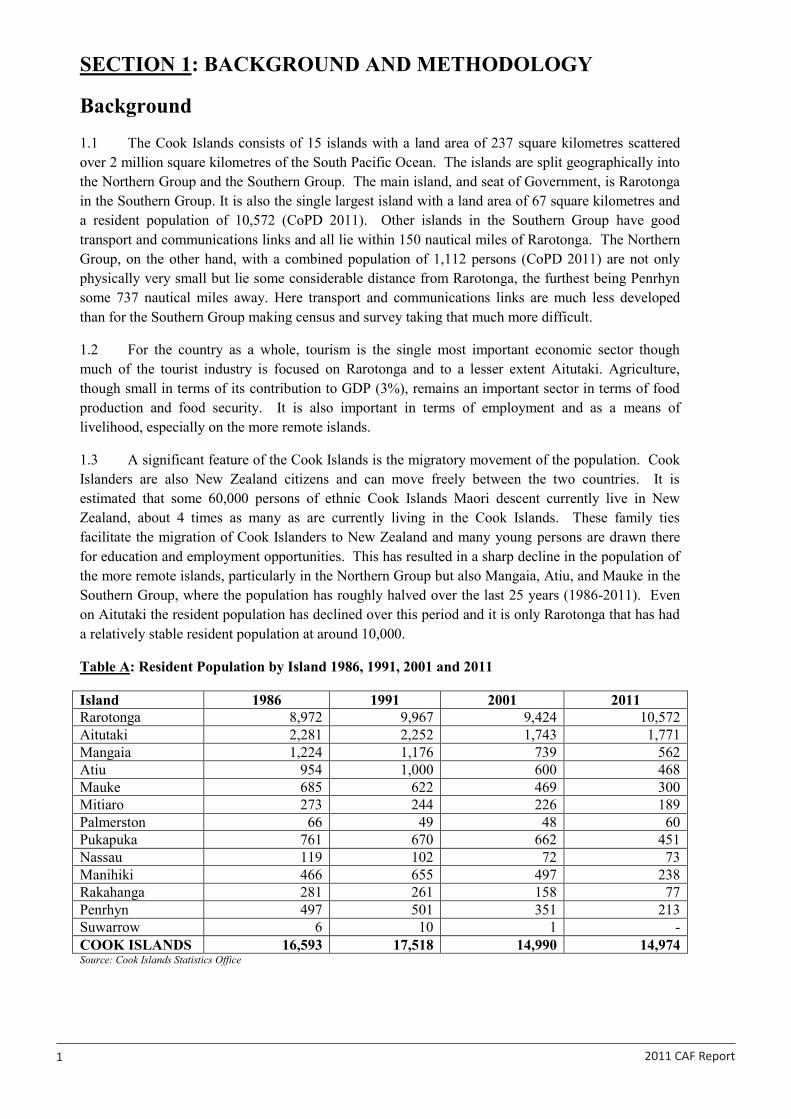
Background 1.1 The Cook Islands consists of 15 islands with a land area of 237 square kilometres scattered over 2 million square kilometres of the South Pacific Ocean. The islands are split geographically into the Northern Group and the Southern Group. The main island, and seat of Government, is Rarotonga in the Southern Group. It is also the single largest island with a land area of 67 square kilometres and a resident population of 10,572 (CoPD 2011). Other islands in the Southern Group have good transport and communications links and all lie within 150 nautical miles of Rarotonga. The Northern Group, on the other hand, with a combined population of 1,112 persons (CoPD 2011) are not only physically very small but lie some considerable distance from Rarotonga, the furthest being Penrhyn some 737 nautical miles away. Here transport and communications links are much less developed than for the Southern Group making census and survey taking that much more difficult.
1.2 For the country as a whole, tourism is the single most important economic sector though much of the tourist industry is focused on Rarotonga and to a lesser extent Aitutaki. Agriculture, though small in terms of its contribution to GDP (3%), remains an important sector in terms of food production and food security. It is also important in terms of employment and as a means of livelihood, especially on the more remote islands.
1.3 A significant feature of the Cook Islands is the migratory movement of the population. Cook Islanders are also New Zealand citizens and can move freely between the two countries. It is estimated that some 60,000 persons of ethnic Cook Islands Maori descent currently live in New Zealand, about 4 times as many as are currently living in the Cook Islands. These family ties facilitate the migration of Cook Islanders to New Zealand and many young persons are drawn there for education and employment opportunities. This has resulted in a sharp decline in the population of the more remote islands, particularly in the Northern Group but also Mangaia, Atiu, and Mauke in the Southern Group, where the population has roughly halved over the last 25 years (1986-2011). Even on Aitutaki the resident population has declined over this period and it is only Rarotonga that has had a relatively stable resident population at around 10,000.
Table A: Resident Population by Island 1986, 1991, 2001 and 2011
Island 1986 1991 2001 2011 Rarotonga 8,972 9,967 9,424 10,572 Aitutaki 2,281 2,252 1,743 1,771 Mangaia 1,224 1,176 739 562 Atiu 954 1,000 600 468 Mauke 685 622 469 300 Mitiaro 273 244 226 189 Palmerston 66 49 48 60 Pukapuka 761 670 662 451 Nassau 119 102 72 73 Manihiki 466 655 497 238 Rakahanga 281 261 158 77 Penrhyn 497 501 351 213 Suwarrow 6 10 1 - COOK ISLANDS 16,593 17,518 14,990 14,974 Source: Cook Islands Statistics Office
2011 CAF Report 2
2 2011 CAF Report
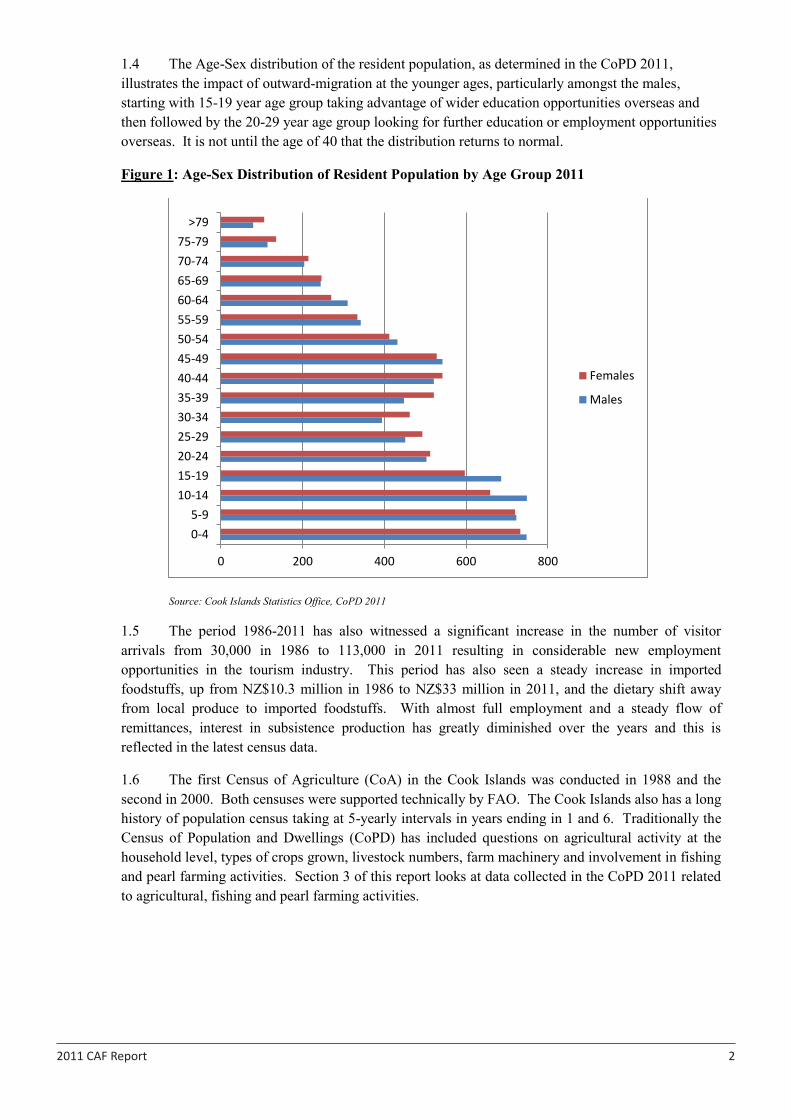
1.4 The Age-Sex distribution of the resident population, as determined in the CoPD 2011, illustrates the impact of outward-migration at the younger ages, particularly amongst the males, starting with 15-19 year age group taking advantage of wider education opportunities overseas and then followed by the 20-29 year age group looking for further education or employment opportunities overseas. It is not until the age of 40 that the distribution returns to normal.
Figure 1: Age-Sex Distribution of Resident Population by Age Group 2011
Source: Cook Islands Statistics Office, CoPD 2011
1.5 The period 1986-2011 has also witnessed a significant increase in the number of visitor arrivals from 30,000 in 1986 to 113,000 in 2011 resulting in considerable new employment opportunities in the tourism industry. This period has also seen a steady increase in imported foodstuffs, up from NZ$10.3 million in 1986 to NZ$33 million in 2011, and the dietary shift away from local produce to imported foodstuffs. With almost full employment and a steady flow of remittances, interest in subsistence production has greatly diminished over the years and this is reflected in the latest census data.
1.6 The first Census of Agriculture (CoA) in the Cook Islands was conducted in 1988 and the second in 2000. Both censuses were supported technically by FAO. The Cook Islands also has a long history of population census taking at 5-yearly intervals in years ending in 1 and 6. Traditionally the Census of Population and Dwellings (CoPD) has included questions on agricultural activity at the household level, types of crops grown, livestock numbers, farm machinery and involvement in fishing and pearl farming activities. Section 3 of this report looks at data collected in the CoPD 2011 related to agricultural, fishing and pearl farming activities.
0 200 400 600 800
0-45-9
10-1415-1920-2425-2930-3435-3940-4445-4950-5455-5960-6465-6970-7475-79
>79
Females
Males
2011 CAF Report 3
3 2011 CAF Report
Census Approach
1.7 In considering the approach to be adopted for the CoPD 2011, the need to also conduct a census of agriculture was recognised and a decision taken, in line with FAO recommendations, to integrate the two censuses. The questionnaires used for the CoA 2000 and the CoPD 2006, related to agriculture, were reviewed and efforts made to avoid duplication. In particular, the question on the numbers of livestock kept by the household was dropped from the CoPD as this data was being collected in the CoA. Likewise, information on machinery and equipment was dropped from the CoA as this was being collected in the CoPD. Questions on the extent of involvement in agricultural activity at the household level were maintained in both censuses as was the extent of involvement in fishing and pearl farming. This provided a useful coverage check for the CoA, in particular, although it was noted that there were definitional differences between the two censuses especially related to flower cultivation which was considered an agricultural activity in the CoPD but not in the CoA. At the individual level, data on labour inputs was recorded in the CoA by age and sex but other data at the individual level has then to be obtained through linkages to the CoPD through the person and household number.
1.8 The approach adopted to the data collection was to have two separate teams of supervisors and enumerators, one for the CoPD and another for the CoA. The MoA was responsible for the CoA team while the Cook Islands Statistics Office (CISO) was responsible for the CoPD team. Training for the CoA was carried out in a number of locations, prior to the fieldwork. This training was scheduled as a single session of a few hours and focused on the completion of the census forms. This was in contrast to the training for previous census where training of trainers and supervisors was first organised over 3 days. This was followed by the training of the enumerators, again over 3 days. The very short duration of the training of supervisors and enumerators for the CoA 2011 adversely impacted on the quality of the fieldwork which was sub-standard in many areas.
1.9 Both censuses used the statistical Enumeration Area (EA) for the allocation of households and work areas. In each Census District, the CoPD was first conducted. The list of households engaged in agriculture and fishing in each EA was then passed to the CoA team which then visited these households to complete the CoA.
1.10 For the Northern Group the two census teams travelled together on the police patrol boat. The two census teams also worked very closely together to help each other out and to complete the fieldwork within the time allocated for each island. For the Southern Islands, the fieldwork for the two censuses was less integrated although lists of households engaged in agricultural and fishing activities, identified in the CoPD, were made available to the CoA teams. In total, 19 supervisors and 83 enumerators were used.
1.11 Despite the best efforts of the organisers, the fieldwork for the CoA got delayed. The CoPD enumerated the population on 1 December 2011, however, much of the fieldwork for the CoA was carried out after that date and very quickly got caught up in the festive season. A review of the coverage in January 2012, EA by EA, identified significant under-enumeration in a number of EAs and especially those on Rarotonga. Using the lists of households engaged in agriculture and fishing activities from the CoPD, the worst affected EAs were identified and the enumerators went back to interview the households that had not been visited.
1.12 Prior to this ‘mopping-up’ exercise the enumerators were re-trained on how the census questionnaires should be completed as well as on the main concepts and definitions. Clarification was provided on the classification of households into the four categories: non-agricultural, minor
2011 CAF Report 4
4 2011 CAF Report
agricultural, subsistence and commercial as it had been noted that many households with just one or two fruit trees had been treated as non-agricultural rather than minor agricultural and in fact many had not even been visited as non-agricultural households did not need to be visited.
1.13 Following the data collection exercise, the forms were checked, edited and coded and prepared for ‘scanning’. Scanning technology for data capture was used in the CISO for the first time for the CoPD 2011 and the CoA 2011. The data processing exercise for the CoPD was completed first and then followed by the data processing exercise for the CoA. The length and complexity of the CoA forms made the later exercise much more time consuming and virtually all records had to be edited. The data capture and data cleaning exercise for the CoA took the best part of 12 months, including the adjustments following the re-enumeration of Aitutaki. Tabulation also proved to be challenging because of the need for considerable internal computation of areas and numbers of plants. The final database was then split up into a number of smaller databases designed for each set of tables. The tabulation was done using Microsoft excel and ACCESS.
Data Quality
1.14 In interpreting the results of the CoA, account needs to be taken of the fact that households classified as having no agricultural or fishing activities in the CoPD were excluded from the CoA, especially on Rarotonga. Other definitional differences between the two censuses should also be noted. The CoPD defined agricultural activity as crops, livestock and floriculture whereas the CoA definition was primarily crops. Livestock and poultry raising was treated separately in the CoA and flower growing was only included in the CoA if it was a commercial activity or was carried out in conjunction with food crop activities.
Table B: Resident Population and Number of Households by Level of Agricultural Activity
Location of Household
Total Resident
Population
Total Number of Households
Level of Agricultural Activity
No Agriculture
Subsistence Only
Subsistence and
Commercial Commercial Producers
Rarotonga 10,572 3,154 1,056 1,860 215 23 (percent) 100 33 59 7 1 Other Southern Islands
3,290 939 152 638 141 8
(percent) 100 16 68 15 1 Northern Islands 1,112 279 38 238 3 - (percent) 100 14 85 1 - COOK ISLANDS 14,974 4,372 1,246 2,736 359 31 (percent) 100 28 63 8 1 Source: Cook Islands Statistics Office CoPD 2011
1.15 The CoPD had 4 categories of agricultural activity, namely: Subsistence only, Commercial only, Subsistence and Commercial and No agriculture. For those engaged in agricultural activity a further breakdown was collected, namely: vegetables, fruit, flowers and other. The CoA also had 4 categories but for crop growing only, namely, non-agricultural, minor agricultural, subsistence and commercial. The differences in these classifications and the types of agriculture included make comparisons difficult, however, it is useful to evaluate the two sets of data and draw conclusions as to the extent of agricultural activity in the Cook Islands from these two sources.
2011 CAF Report 5
5 2011 CAF Report
1.16 Table B shows the level of agricultural activity of households as recorded in the CoPD 2011. 28 percent of households were recorded as having no-agriculture, 63 percent as subsistence only, 8 percent as subsistence and commercial and 1 percent as commercial. In terms of crops grown, the CoPD 2011 recorded 31 percent of households growing vegetables, spices and herbs, 43 percent as growing fruit and tree crops, 35 percent as growing flowers and 3 percent other (see Table C). Unlike in previous censuses, and because the CoA was being conducted at the same time as the CoPD, no information was collected in the CoPD to separately identify how many households were engaged in raising livestock and poultry. 1.17 In evaluating the CoPD 2011 data, it is also useful to make some comparisons with the data from the CoPD 2006. This showed 48 percent of households as non-agricultural, 49 percent as subsistence and 3 percent as commercial (Rarotonga 59 percent non-agricultural, 38 percent subsistence and 3 percent commercial). This would ‘prima facie’ imply that the proportion of households engaged in agriculture has risen quite markedly between 2006 and 2011. Some of this increase is explained by flower growing, a relatively new activity with some 1,524 households engaged in this activity in 2011. However, the general consensus was that agricultural activity (crops and livestock was on the decline, especially on Rarotonga.
Table C: Resident Population and Number of Households by Types of Crops Grown
Location of Household
Total Resident
Population
Total Number of Households
Households growing Crops
Vegetables, Spices, Herbs
Fruit and Tree
Crops
Flowers Other
Rarotonga 10,572 3,154 881 1,325 1,094 43 (percent) 28 42 35 1 Other Southern Islands
3,290 939 340 431 341 83
(percent) 36 46 36 9 Northern Islands 1,112 279 123 126 89 1 (percent) 44 45 32 0 COOK ISLANDS 14,974 4,372 1,344 1,882 1,524 127 (percent) 31 43 35 3 Source: Census of Population and Dwellings 2011
1.18 The CoA 2011 also had 4 categories of agricultural activity but these were different to those used in the CoPD 2011. The four categories were: Non-agricultural, minor agricultural, subsistence and commercial. Non-agricultural was determined in terms of crops only; minor agricultural was a category of households growing very small quantities of crops defined as less than 64 sq.m. of garden crops and/or less than 20 fruit trees; subsistence households were evaluated as growing more than the minimum quantities grown by minor agricultural households but not selling any produce; commercial households were growing more than the minimum quantities and also selling their agricultural produce. Commercial agricultural enterprises, outside the household sector, were also included in the CoA 2011. 1.19 Table D summarises the results of the CoA 2011 by level of agricultural activity. From this it can be seen that number of households enumerated was 2,334 compared to 4,372 in the CoPD 2011 a difference of 2,038 households of which 1,883 were on Rarotonga. This difference was, in theory, households with no agricultural activity but only 1,246 such households were recorded in total in the
2011 CAF Report 6
6 2011 CAF Report
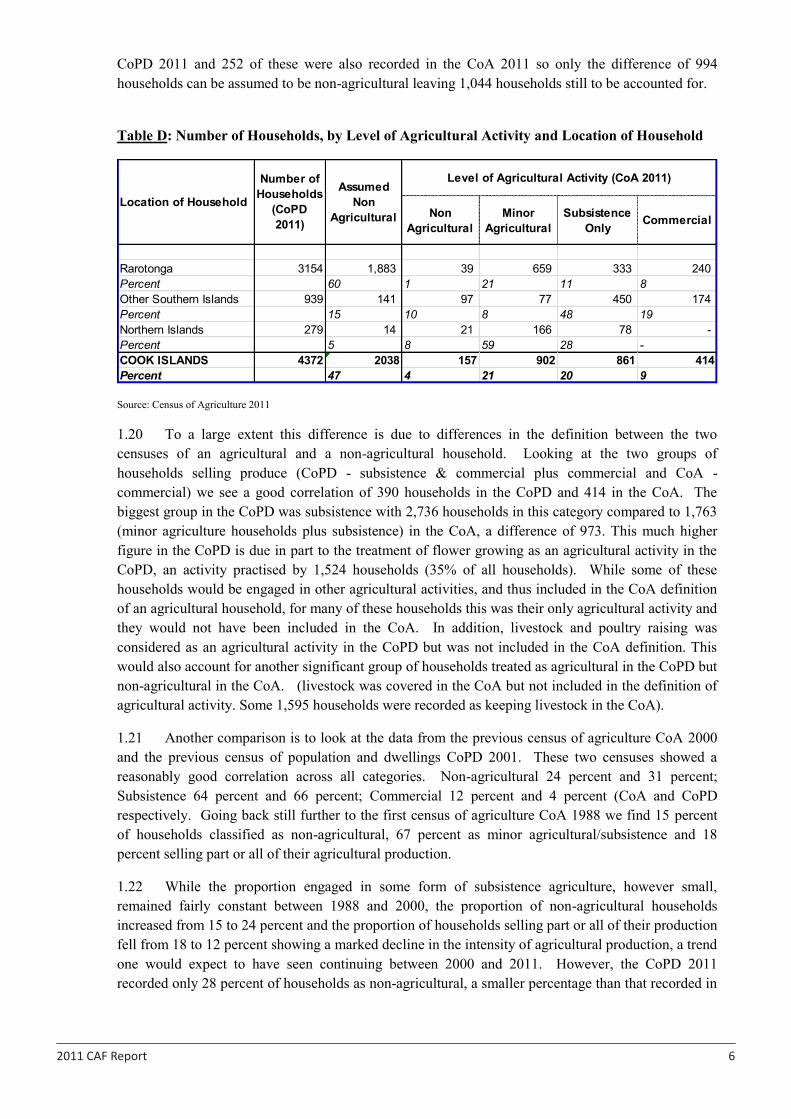
CoPD 2011 and 252 of these were also recorded in the CoA 2011 so only the difference of 994 households can be assumed to be non-agricultural leaving 1,044 households still to be accounted for.
Table D: Number of Households, by Level of Agricultural Activity and Location of Household
Source: Census of Agriculture 2011
1.20 To a large extent this difference is due to differences in the definition between the two censuses of an agricultural and a non-agricultural household. Looking at the two groups of households selling produce (CoPD - subsistence & commercial plus commercial and CoA - commercial) we see a good correlation of 390 households in the CoPD and 414 in the CoA. The biggest group in the CoPD was subsistence with 2,736 households in this category compared to 1,763 (minor agriculture households plus subsistence) in the CoA, a difference of 973. This much higher figure in the CoPD is due in part to the treatment of flower growing as an agricultural activity in the CoPD, an activity practised by 1,524 households (35% of all households). While some of these households would be engaged in other agricultural activities, and thus included in the CoA definition of an agricultural household, for many of these households this was their only agricultural activity and they would not have been included in the CoA. In addition, livestock and poultry raising was considered as an agricultural activity in the CoPD but was not included in the CoA definition. This would also account for another significant group of households treated as agricultural in the CoPD but non-agricultural in the CoA. (livestock was covered in the CoA but not included in the definition of agricultural activity. Some 1,595 households were recorded as keeping livestock in the CoA).
1.21 Another comparison is to look at the data from the previous census of agriculture CoA 2000 and the previous census of population and dwellings CoPD 2001. These two censuses showed a reasonably good correlation across all categories. Non-agricultural 24 percent and 31 percent; Subsistence 64 percent and 66 percent; Commercial 12 percent and 4 percent (CoA and CoPD respectively. Going back still further to the first census of agriculture CoA 1988 we find 15 percent of households classified as non-agricultural, 67 percent as minor agricultural/subsistence and 18 percent selling part or all of their agricultural production.
1.22 While the proportion engaged in some form of subsistence agriculture, however small, remained fairly constant between 1988 and 2000, the proportion of non-agricultural households increased from 15 to 24 percent and the proportion of households selling part or all of their production fell from 18 to 12 percent showing a marked decline in the intensity of agricultural production, a trend one would expect to have seen continuing between 2000 and 2011. However, the CoPD 2011 recorded only 28 percent of households as non-agricultural, a smaller percentage than that recorded in
Non Agricultural
Minor Agricultural
Subsistence Only Commercial
Rarotonga 3154 1,883 39 659 333 240 Percent 60 1 21 11 8Other Southern Islands 939 141 97 77 450 174 Percent 15 10 8 48 19Northern Islands 279 14 21 166 78 -Percent 5 8 59 28 -COOK ISLANDS 4372 2038 157 902 861 414Percent 47 4 21 20 9
Location of Household
Level of Agricultural Activity (CoA 2011)Number of Households
(CoPD 2011)
Assumed Non
Agricultural
2011 CAF Report 7
7 2011 CAF Report
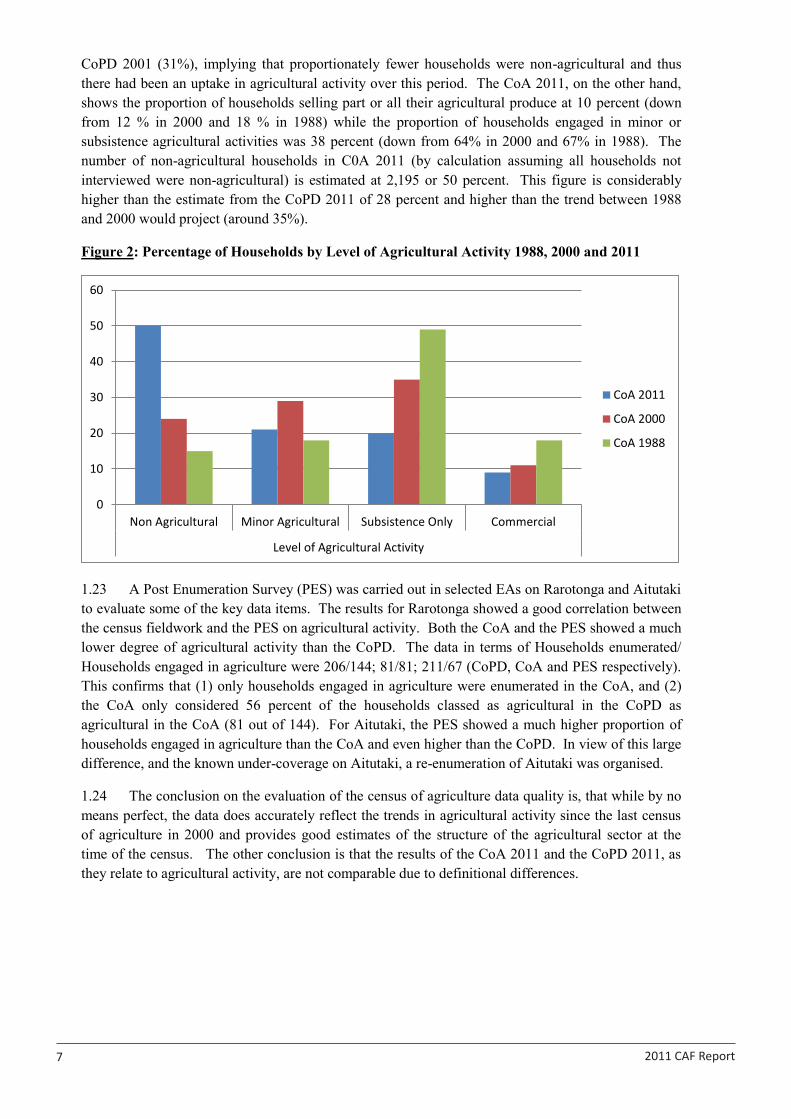
CoPD 2001 (31%), implying that proportionately fewer households were non-agricultural and thus there had been an uptake in agricultural activity over this period. The CoA 2011, on the other hand, shows the proportion of households selling part or all their agricultural produce at 10 percent (down from 12 % in 2000 and 18 % in 1988) while the proportion of households engaged in minor or subsistence agricultural activities was 38 percent (down from 64% in 2000 and 67% in 1988). The number of non-agricultural households in C0A 2011 (by calculation assuming all households not interviewed were non-agricultural) is estimated at 2,195 or 50 percent. This figure is considerably higher than the estimate from the CoPD 2011 of 28 percent and higher than the trend between 1988 and 2000 would project (around 35%).
Figure 2: Percentage of Households by Level of Agricultural Activity 1988, 2000 and 2011
1.23 A Post Enumeration Survey (PES) was carried out in selected EAs on Rarotonga and Aitutaki to evaluate some of the key data items. The results for Rarotonga showed a good correlation between the census fieldwork and the PES on agricultural activity. Both the CoA and the PES showed a much lower degree of agricultural activity than the CoPD. The data in terms of Households enumerated/ Households engaged in agriculture were 206/144; 81/81; 211/67 (CoPD, CoA and PES respectively). This confirms that (1) only households engaged in agriculture were enumerated in the CoA, and (2) the CoA only considered 56 percent of the households classed as agricultural in the CoPD as agricultural in the CoA (81 out of 144). For Aitutaki, the PES showed a much higher proportion of households engaged in agriculture than the CoA and even higher than the CoPD. In view of this large difference, and the known under-coverage on Aitutaki, a re-enumeration of Aitutaki was organised.
1.24 The conclusion on the evaluation of the census of agriculture data quality is, that while by no means perfect, the data does accurately reflect the trends in agricultural activity since the last census of agriculture in 2000 and provides good estimates of the structure of the agricultural sector at the time of the census. The other conclusion is that the results of the CoA 2011 and the CoPD 2011, as they relate to agricultural activity, are not comparable due to definitional differences.
0
10
20
30
40
50
60
Non Agricultural Minor Agricultural Subsistence Only Commercial
Level of Agricultural Activity
CoA 2011
CoA 2000
CoA 1988
2011 CAF Report 8
8 2011 CAF Report
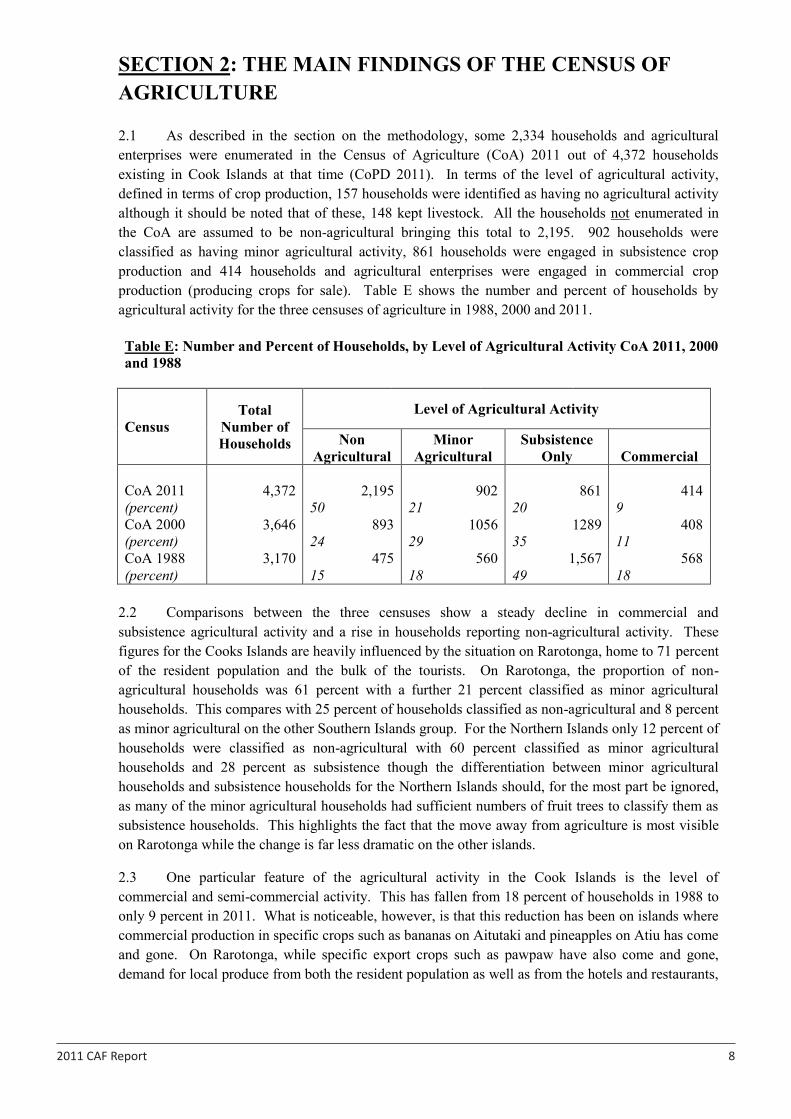
SECTION 2: THE MAIN FINDINGS OF THE CENSUS OF AGRICULTURE 2.1 As described in the section on the methodology, some 2,334 households and agricultural enterprises were enumerated in the Census of Agriculture (CoA) 2011 out of 4,372 households existing in Cook Islands at that time (CoPD 2011). In terms of the level of agricultural activity, defined in terms of crop production, 157 households were identified as having no agricultural activity although it should be noted that of these, 148 kept livestock. All the households not enumerated in the CoA are assumed to be non-agricultural bringing this total to 2,195. 902 households were classified as having minor agricultural activity, 861 households were engaged in subsistence crop production and 414 households and agricultural enterprises were engaged in commercial crop production (producing crops for sale). Table E shows the number and percent of households by agricultural activity for the three censuses of agriculture in 1988, 2000 and 2011. Table E: Number and Percent of Households, by Level of Agricultural Activity CoA 2011, 2000 and 1988
Census Total
Number of Households
Level of Agricultural Activity
Non Agricultural
Minor Agricultural
Subsistence Only Commercial
CoA 2011 4,372 2,195 902 861 414
(percent) 50 21 20 9 CoA 2000 3,646 893 1056 1289 408
(percent) 24 29 35 11 CoA 1988 3,170 475 560 1,567 568 (percent) 15 18 49 18
2.2 Comparisons between the three censuses show a steady decline in commercial and subsistence agricultural activity and a rise in households reporting non-agricultural activity. These figures for the Cooks Islands are heavily influenced by the situation on Rarotonga, home to 71 percent of the resident population and the bulk of the tourists. On Rarotonga, the proportion of non-agricultural households was 61 percent with a further 21 percent classified as minor agricultural households. This compares with 25 percent of households classified as non-agricultural and 8 percent as minor agricultural on the other Southern Islands group. For the Northern Islands only 12 percent of households were classified as non-agricultural with 60 percent classified as minor agricultural households and 28 percent as subsistence though the differentiation between minor agricultural households and subsistence households for the Northern Islands should, for the most part be ignored, as many of the minor agricultural households had sufficient numbers of fruit trees to classify them as subsistence households. This highlights the fact that the move away from agriculture is most visible on Rarotonga while the change is far less dramatic on the other islands.
2.3 One particular feature of the agricultural activity in the Cook Islands is the level of commercial and semi-commercial activity. This has fallen from 18 percent of households in 1988 to only 9 percent in 2011. What is noticeable, however, is that this reduction has been on islands where commercial production in specific crops such as bananas on Aitutaki and pineapples on Atiu has come and gone. On Rarotonga, while specific export crops such as pawpaw have also come and gone, demand for local produce from both the resident population as well as from the hotels and restaurants,

2011 CAF Report 9
9 2011 CAF Report
has maintained a small but important commercial sector. In 1988, of the 568 commercial/semi-commercial farmers, 238 were on Rarotonga. 25 years later the total number has dropped to 414 but there were still 238 commercial/semi-commercial farmers on Rarotonga. So while it is clear that agricultural activity at the household level has declined significantly over the 25 years (1986-2011) due to the changing life style, the aspirations of the youth and the increasingly cash economy, demand for local produce is still very visible and provides a livelihood for a small but relatively stable number of farmers on Rarotonga. Land Area, Land Tenure and Land Use 2.4 The location, area (acres or sq.m.), land tenure and land use of each parcel was recorded as was the number of months the parcel had been in continuous use or left fallow. This was the section of the forms most likely to capture the actual area of the parcel as opposed to a land area code used elsewhere on the forms. However, even here there was some confusion as to whether or not numbers entered in the ‘acres’ column was actually an area or a code. Because this area data was fundamental to the whole analysis of the crop data as well as to the other analysis related to land area, at the editing stage, an evaluation was made of the area code for the holding entered in Section II of the Household Form and the Total Area of the Holding entered in the header of the Holding Form. Through this information it was possible to come up with a meaningful physical area for each parcel of land.
2.5 The total area of holdings was estimated at 1,489 acres down from 2,543 acres in 2000 and 6,435 acres in 1988. The estimate of the area of holdings in 2011 is under-reported, particularly in the Northern Islands, where many households were classified as minor agricultural households but in fact qualified as a subsistence household through the number of trees owned. Despite this caveat, the decline in the area of holdings is consistent with the decline in the number of agriculturally active households.
Table F: Holding and Parcel Characteristics 2011, 2000, 1988
Census Year
Number of Holdings
Number of Parcels
Area of Holdings/ Parcels (acres)
Parcels per Holding
Average Holding
Size (acres)
Average Parcel Size
(acres) 2011 1269 2458 1489 1.9 1.2 0.6
2000 1721 3467 2543 2.0 1.5 0.7
1988 2188 6399 6435 2.9 2.9 1.0
2.6 The number of holdings has declined from 2,188 in 1988 to 1,721 in 2000 and 1,275 in 2011 while the average holding size has also declined from 2.9 acres in 1988 to 1.5 acres in 2000 and 1.2 acres in 2011.
2.7 In terms of land tenure, customary land was the most common type of land tenure, particularly outside Rarotonga. Borrowed land was common on Rarotonga as was ‘occupation rights’.
2011 CAF Report 10
10 2011 CAF Report
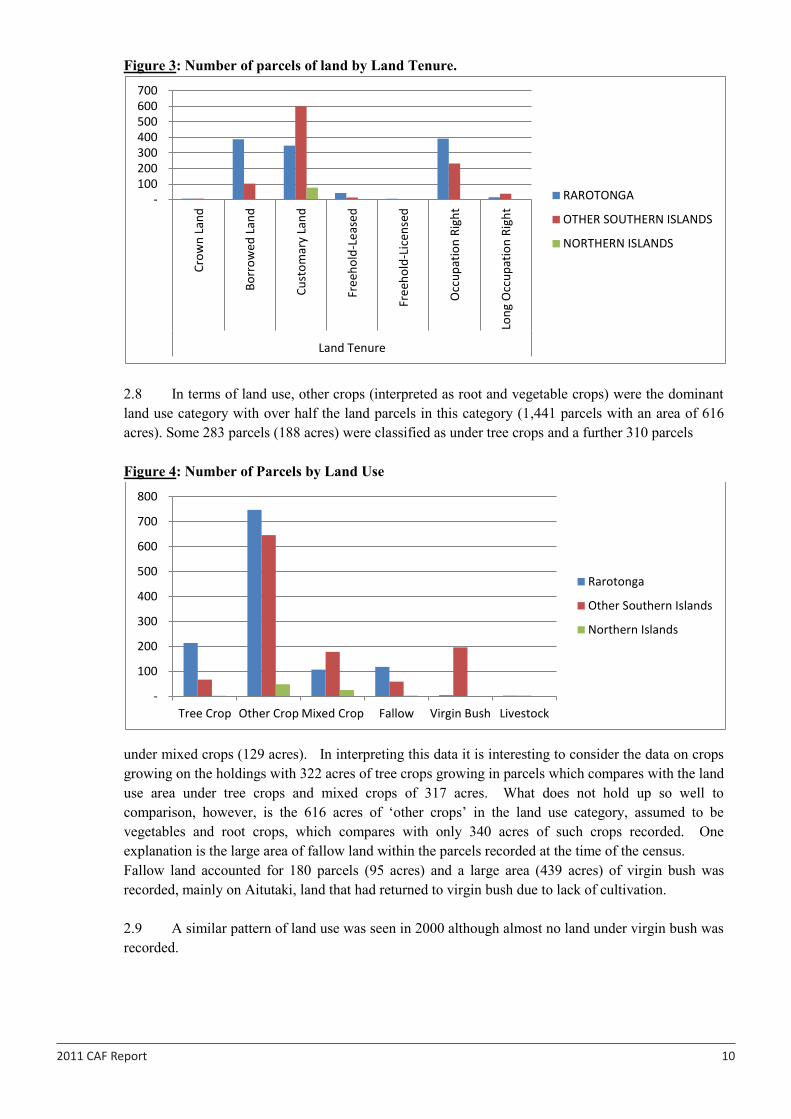
Figure 3: Number of parcels of land by Land Tenure.
2.8 In terms of land use, other crops (interpreted as root and vegetable crops) were the dominant land use category with over half the land parcels in this category (1,441 parcels with an area of 616 acres). Some 283 parcels (188 acres) were classified as under tree crops and a further 310 parcels Figure 4: Number of Parcels by Land Use
under mixed crops (129 acres). In interpreting this data it is interesting to consider the data on crops growing on the holdings with 322 acres of tree crops growing in parcels which compares with the land use area under tree crops and mixed crops of 317 acres. What does not hold up so well to comparison, however, is the 616 acres of ‘other crops’ in the land use category, assumed to be vegetables and root crops, which compares with only 340 acres of such crops recorded. One explanation is the large area of fallow land within the parcels recorded at the time of the census. Fallow land accounted for 180 parcels (95 acres) and a large area (439 acres) of virgin bush was recorded, mainly on Aitutaki, land that had returned to virgin bush due to lack of cultivation. 2.9 A similar pattern of land use was seen in 2000 although almost no land under virgin bush was recorded.
- 100 200 300 400 500 600 700
Crow
n La
nd
Borr
owed
Lan
d
Cust
omar
y La
nd
Free
hold
-Lea
sed
Free
hold
-Lic
ense
d
Occ
upat
ion
Righ
t
Long
Occ
upat
ion
Righ
t
Land Tenure
RAROTONGA
OTHER SOUTHERN ISLANDS
NORTHERN ISLANDS
-
100
200
300
400
500
600
700
800
Tree Crop Other Crop Mixed Crop Fallow Virgin Bush Livestock
Rarotonga
Other Southern Islands
Northern Islands
2011 CAF Report 11
11 2011 CAF Report
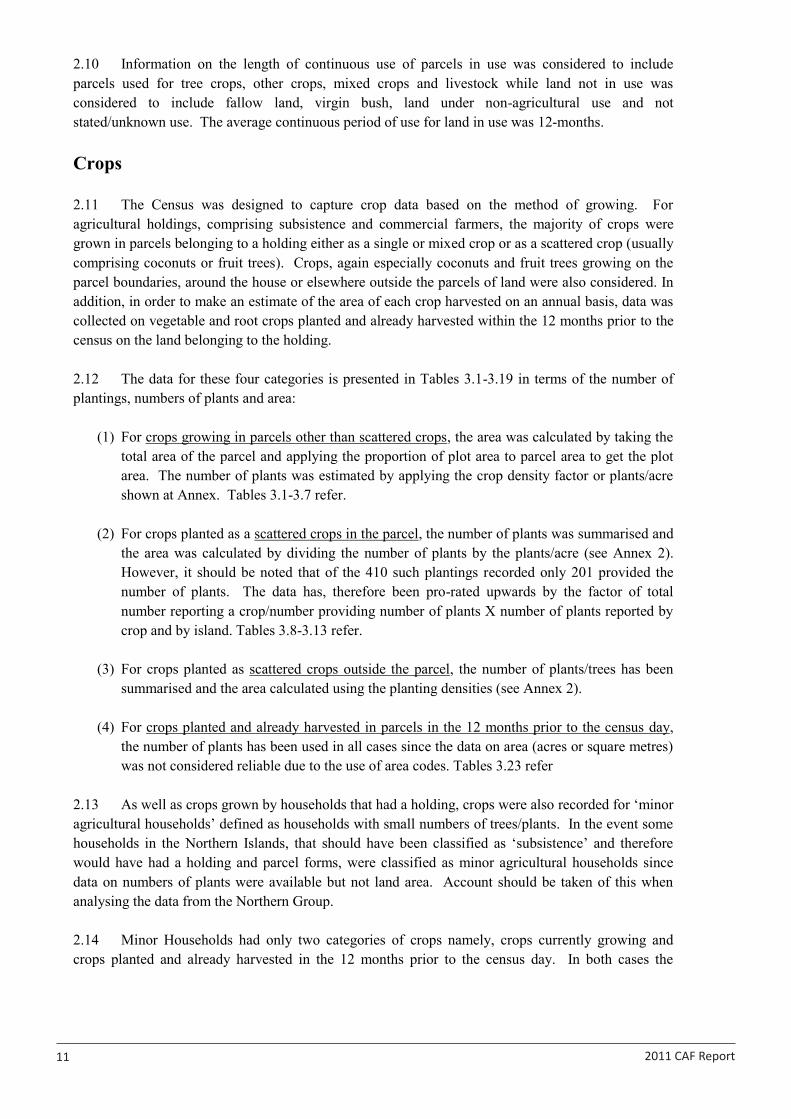
2.10 Information on the length of continuous use of parcels in use was considered to include parcels used for tree crops, other crops, mixed crops and livestock while land not in use was considered to include fallow land, virgin bush, land under non-agricultural use and not stated/unknown use. The average continuous period of use for land in use was 12-months. Crops 2.11 The Census was designed to capture crop data based on the method of growing. For agricultural holdings, comprising subsistence and commercial farmers, the majority of crops were grown in parcels belonging to a holding either as a single or mixed crop or as a scattered crop (usually comprising coconuts or fruit trees). Crops, again especially coconuts and fruit trees growing on the parcel boundaries, around the house or elsewhere outside the parcels of land were also considered. In addition, in order to make an estimate of the area of each crop harvested on an annual basis, data was collected on vegetable and root crops planted and already harvested within the 12 months prior to the census on the land belonging to the holding. 2.12 The data for these four categories is presented in Tables 3.1-3.19 in terms of the number of plantings, numbers of plants and area:
(1) For crops growing in parcels other than scattered crops, the area was calculated by taking the total area of the parcel and applying the proportion of plot area to parcel area to get the plot area. The number of plants was estimated by applying the crop density factor or plants/acre shown at Annex. Tables 3.1-3.7 refer.
(2) For crops planted as a scattered crops in the parcel, the number of plants was summarised and
the area was calculated by dividing the number of plants by the plants/acre (see Annex 2). However, it should be noted that of the 410 such plantings recorded only 201 provided the number of plants. The data has, therefore been pro-rated upwards by the factor of total number reporting a crop/number providing number of plants X number of plants reported by crop and by island. Tables 3.8-3.13 refer.
(3) For crops planted as scattered crops outside the parcel, the number of plants/trees has been summarised and the area calculated using the planting densities (see Annex 2).
(4) For crops planted and already harvested in parcels in the 12 months prior to the census day,
the number of plants has been used in all cases since the data on area (acres or square metres) was not considered reliable due to the use of area codes. Tables 3.23 refer
2.13 As well as crops grown by households that had a holding, crops were also recorded for ‘minor agricultural households’ defined as households with small numbers of trees/plants. In the event some households in the Northern Islands, that should have been classified as ‘subsistence’ and therefore would have had a holding and parcel forms, were classified as minor agricultural households since data on numbers of plants were available but not land area. Account should be taken of this when analysing the data from the Northern Group. 2.14 Minor Households had only two categories of crops namely, crops currently growing and crops planted and already harvested in the 12 months prior to the census day. In both cases the
2011 CAF Report 12
12 2011 CAF Report
number of plants was used and not the area which was recorded as a code. The area estimates were made using the plant density factors (see Annex 2). 2.15 Crops growing in parcels, other than scattered crops was by far the single most important method of planting for vegetables and root crops. While some tree crops are grown in plantations (pawpaw, banana, nono, citrus and coconut) many are grown around the house or as scattered trees around the property. The census found that for many tree crops, the scattered trees made up the majority of the fruit trees. Minor agricultural households also contributed a significant number of avocado, banana, breadfruit, citrus, coconut, mango and pawpaw trees. 2.16 As well as the crops growing at the time of the census, efforts were made to estimate the vegetable and root crops that had been planted during the 12 months prior to the census and already harvested. By including this category, estimates of the annual area planted could be made. This was done both for crops grown in parcels as well crops grown by minor agricultural households. A classic example of such a crop would be lettuce which has a growing cycle of less than 2 months. While some 34,350 plants were recorded as being in the ground at the time of the census, only 17,397 plants had already been harvested. This would appear to be a gross under-estimate of the area planted to lettuce in 2011. An alternative method of estimation would be to take the number of plants in the ground at the time of the census and then apply a factor for each crop based on the average number of crop cycles each year. For lettuce this might be 4 and so the total number of plants would be 4 X 34,450. The important concept is that the figures of plants/trees in the ground at the time of the census would equate to the annual area for most tree crops but would be anunder-estimation for vegetables and to a lesser extent for root crops.
2.17 Tables 3.26 and 3.27 summarise the area and number of plants for selected crops for the year 2011 by method of growing. The total area was estimated at 2,028 acres of which 1,406 acres was inside parcels. In this regard, it should be noted that the total area in parcels was estimated at 1,489 acres (table 2.4 refers). The lower figure calculated based on the summation of the plot data is due to some 200 plot records that could not be matched to the holding records. This accounts for the difference of 83 acres. Also of note is the fact that some 539 acres were recorded as fallow, virgin bush, livestock or non-agricultural parcels under the land use classification, yet the analysis by plot shows this as 795 acres. In reality many parcels classified as under crops have plots of land within them that are fallow whilst some area classified as fallow have small areas of crops or scattered trees on them. To illustrate this we note that 180 parcels were recorded as fallow parcels under the land use classification yet 1,642 plots of fallow land, within parcels, were recorded in the census. 2.18 While comparison with earlier censuses has limitations, mainly due to the different plant densities used in the calculations of single crop equivalent areas based on the numbers of plants and trees, it is still useful to look at the trends in table. The cropped area in parcels has declined quite dramatically over the 25 years. These crops are typically vegetables and root crops but also include significant areas of banana, nono, orange, and papaw. This downward trend follows the similar trend in the number of households engaged in subsistence/commercial activities. The area of coconuts and fruit trees grown as scattered crops has not declined so markedly reflecting the fact that many such trees growing 25 years ago are still bearing. Many households, previously classified as subsistence are now only classified as minor agricultural households as their level of activity declines. With the increase in size of this group compared to 1988, it is not surprising to see the area of crops grown also increasing though this is distorted to some extent by the inclusion of a number of such households in the Northern Islands that should have been classified as subsistence. The area of plants already harvested in the crop year has declined very considerable, much more than would have been expected
2011 CAF Report 13
13 2011 CAF Report
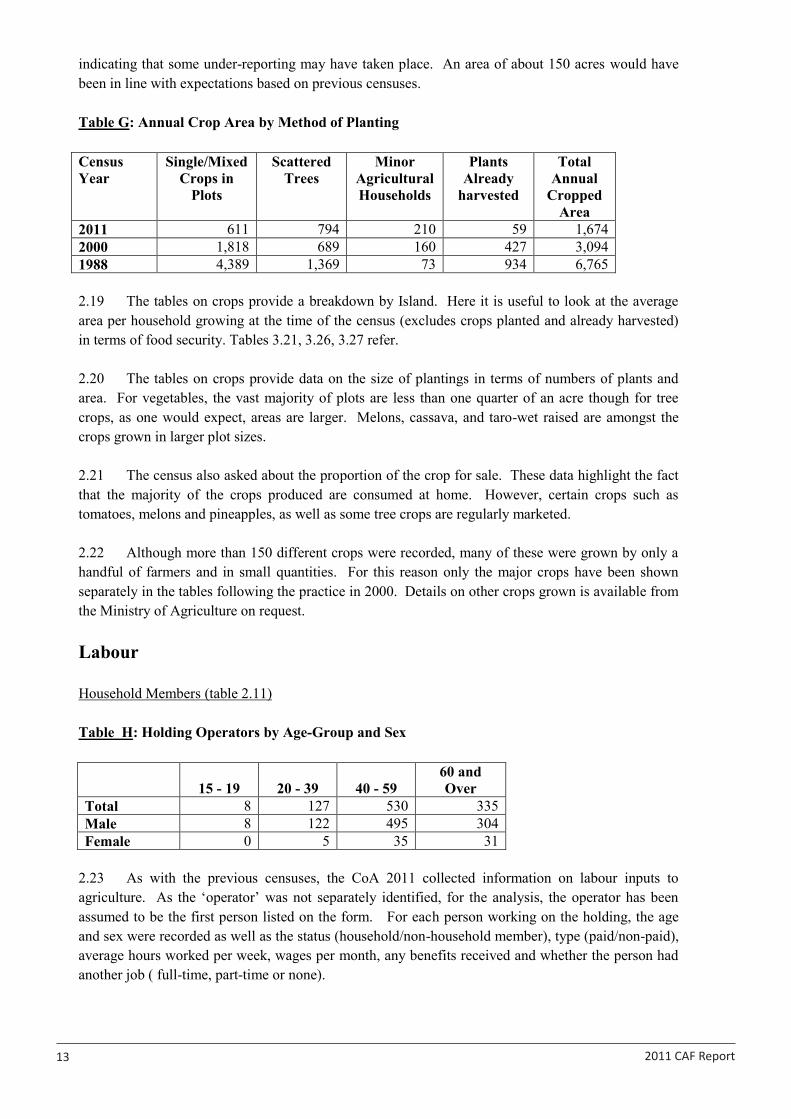
indicating that some under-reporting may have taken place. An area of about 150 acres would have been in line with expectations based on previous censuses. Table G: Annual Crop Area by Method of Planting Census Year
Single/Mixed Crops in
Plots
Scattered Trees
Minor Agricultural Households
Plants Already
harvested
Total Annual
Cropped Area
2011 611 794 210 59 1,674 2000 1,818 689 160 427 3,094 1988 4,389 1,369 73 934 6,765 2.19 The tables on crops provide a breakdown by Island. Here it is useful to look at the average area per household growing at the time of the census (excludes crops planted and already harvested) in terms of food security. Tables 3.21, 3.26, 3.27 refer. 2.20 The tables on crops provide data on the size of plantings in terms of numbers of plants and area. For vegetables, the vast majority of plots are less than one quarter of an acre though for tree crops, as one would expect, areas are larger. Melons, cassava, and taro-wet raised are amongst the crops grown in larger plot sizes. 2.21 The census also asked about the proportion of the crop for sale. These data highlight the fact that the majority of the crops produced are consumed at home. However, certain crops such as tomatoes, melons and pineapples, as well as some tree crops are regularly marketed. 2.22 Although more than 150 different crops were recorded, many of these were grown by only a handful of farmers and in small quantities. For this reason only the major crops have been shown separately in the tables following the practice in 2000. Details on other crops grown is available from the Ministry of Agriculture on request. Labour Household Members (table 2.11) Table H: Holding Operators by Age-Group and Sex
15 - 19 20 - 39 40 - 59 60 and Over
Total 8 127 530 335 Male 8 122 495 304 Female 0 5 35 31
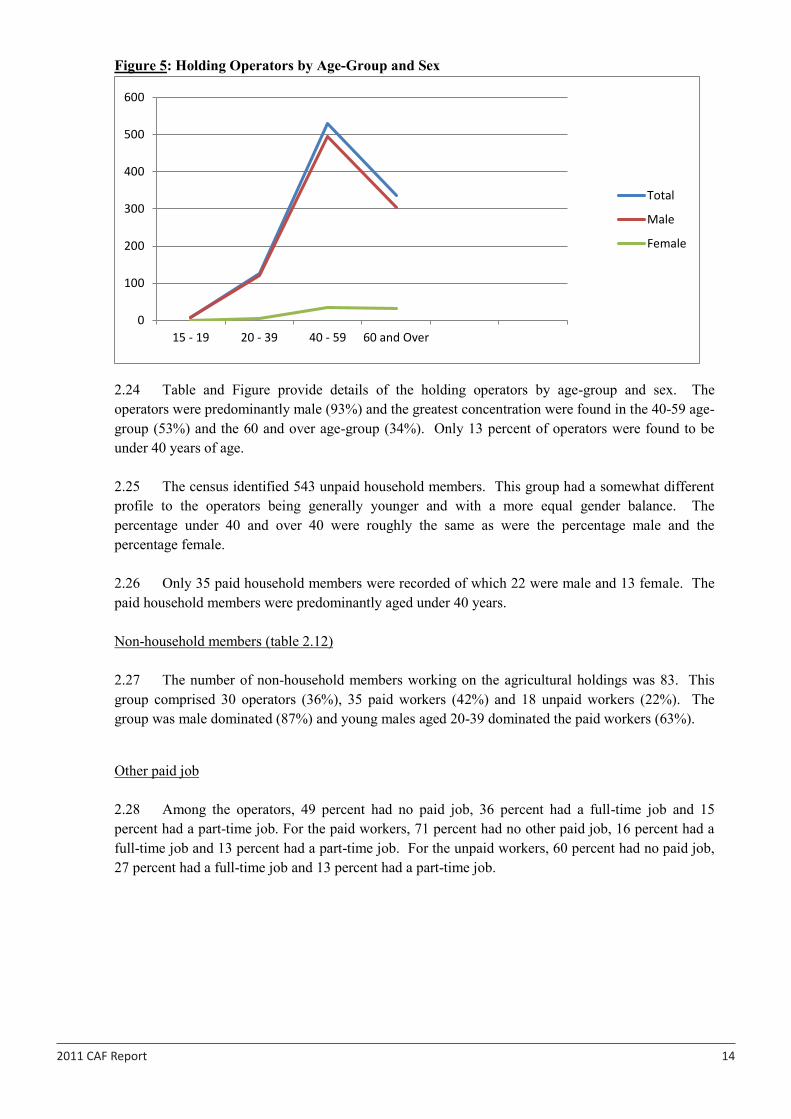
2.23 As with the previous censuses, the CoA 2011 collected information on labour inputs to agriculture. As the ‘operator’ was not separately identified, for the analysis, the operator has been assumed to be the first person listed on the form. For each person working on the holding, the age and sex were recorded as well as the status (household/non-household member), type (paid/non-paid), average hours worked per week, wages per month, any benefits received and whether the person had another job ( full-time, part-time or none).
2011 CAF Report 14
14 2011 CAF Report
Figure 5: Holding Operators by Age-Group and Sex
2.24 Table and Figure provide details of the holding operators by age-group and sex. The operators were predominantly male (93%) and the greatest concentration were found in the 40-59 age-group (53%) and the 60 and over age-group (34%). Only 13 percent of operators were found to be under 40 years of age. 2.25 The census identified 543 unpaid household members. This group had a somewhat different profile to the operators being generally younger and with a more equal gender balance. The percentage under 40 and over 40 were roughly the same as were the percentage male and the percentage female. 2.26 Only 35 paid household members were recorded of which 22 were male and 13 female. The paid household members were predominantly aged under 40 years. Non-household members (table 2.12) 2.27 The number of non-household members working on the agricultural holdings was 83. This group comprised 30 operators (36%), 35 paid workers (42%) and 18 unpaid workers (22%). The group was male dominated (87%) and young males aged 20-39 dominated the paid workers (63%).
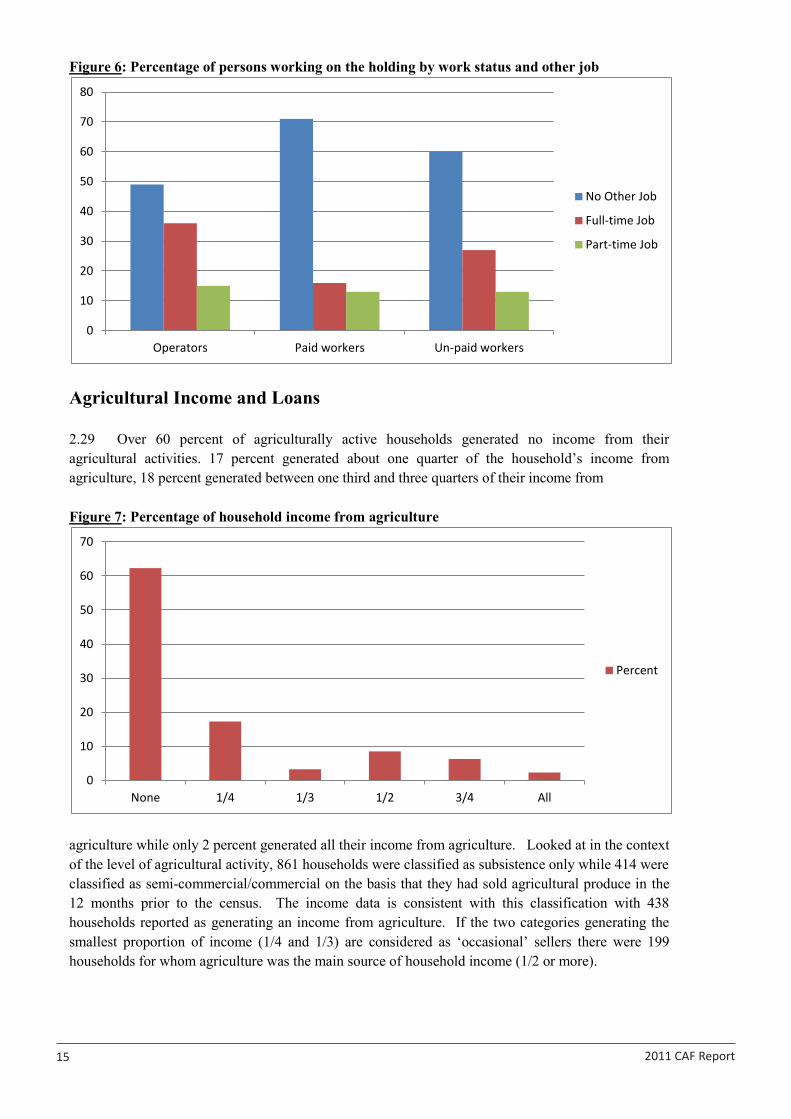
Other paid job 2.28 Among the operators, 49 percent had no paid job, 36 percent had a full-time job and 15 percent had a part-time job. For the paid workers, 71 percent had no other paid job, 16 percent had a full-time job and 13 percent had a part-time job. For the unpaid workers, 60 percent had no paid job, 27 percent had a full-time job and 13 percent had a part-time job.
0
100
200
300
400
500
600
15 - 19 20 - 39 40 - 59 60 and Over
Total
Male
Female
2011 CAF Report 15
15 2011 CAF Report
Figure 6: Percentage of persons working on the holding by work status and other job
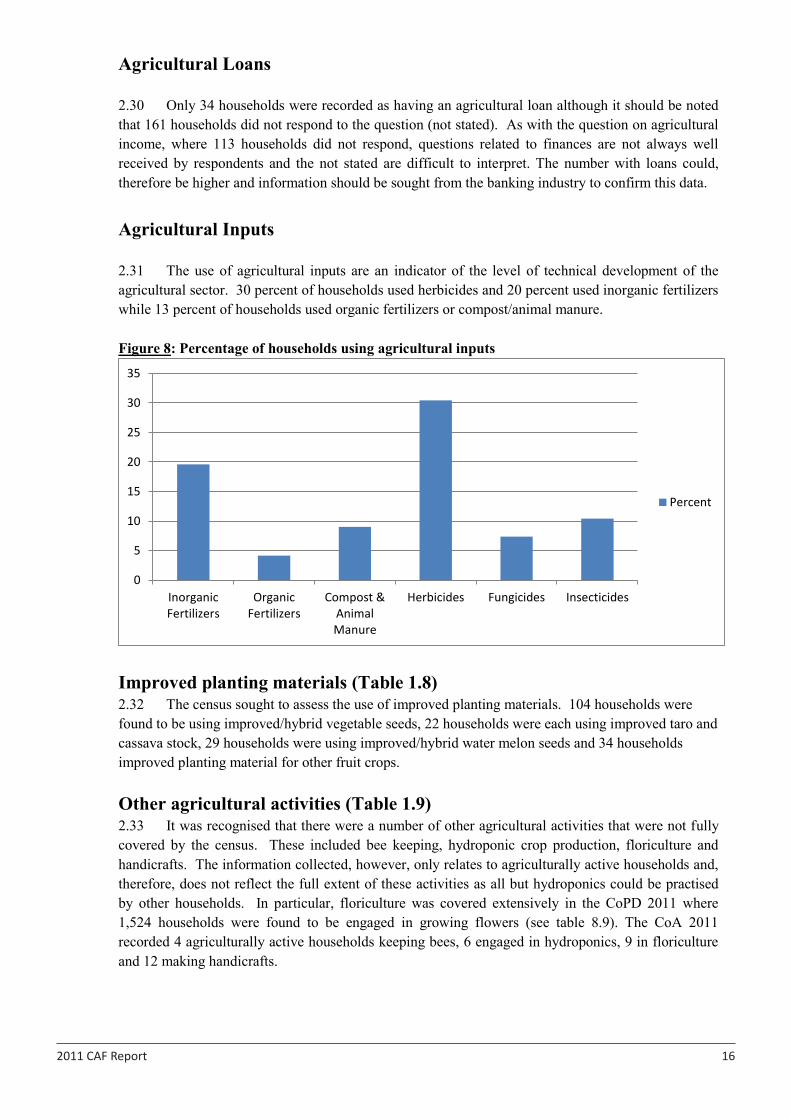
Agricultural Income and Loans 2.29 Over 60 percent of agriculturally active households generated no income from their agricultural activities. 17 percent generated about one quarter of the household’s income from agriculture, 18 percent generated between one third and three quarters of their income from Figure 7: Percentage of household income from agriculture
agriculture while only 2 percent generated all their income from agriculture. Looked at in the context of the level of agricultural activity, 861 households were classified as subsistence only while 414 were classified as semi-commercial/commercial on the basis that they had sold agricultural produce in the 12 months prior to the census. The income data is consistent with this classification with 438 households reported as generating an income from agriculture. If the two categories generating the smallest proportion of income (1/4 and 1/3) are considered as ‘occasional’ sellers there were 199 households for whom agriculture was the main source of household income (1/2 or more).
0
10
20
30
40
50
60
70
80
Operators Paid workers Un-paid workers
No Other Job
Full-time Job
Part-time Job
0
10
20
30
40
50
60
70
None 1/4 1/3 1/2 3/4 All
Percent
2011 CAF Report 16
16 2011 CAF Report
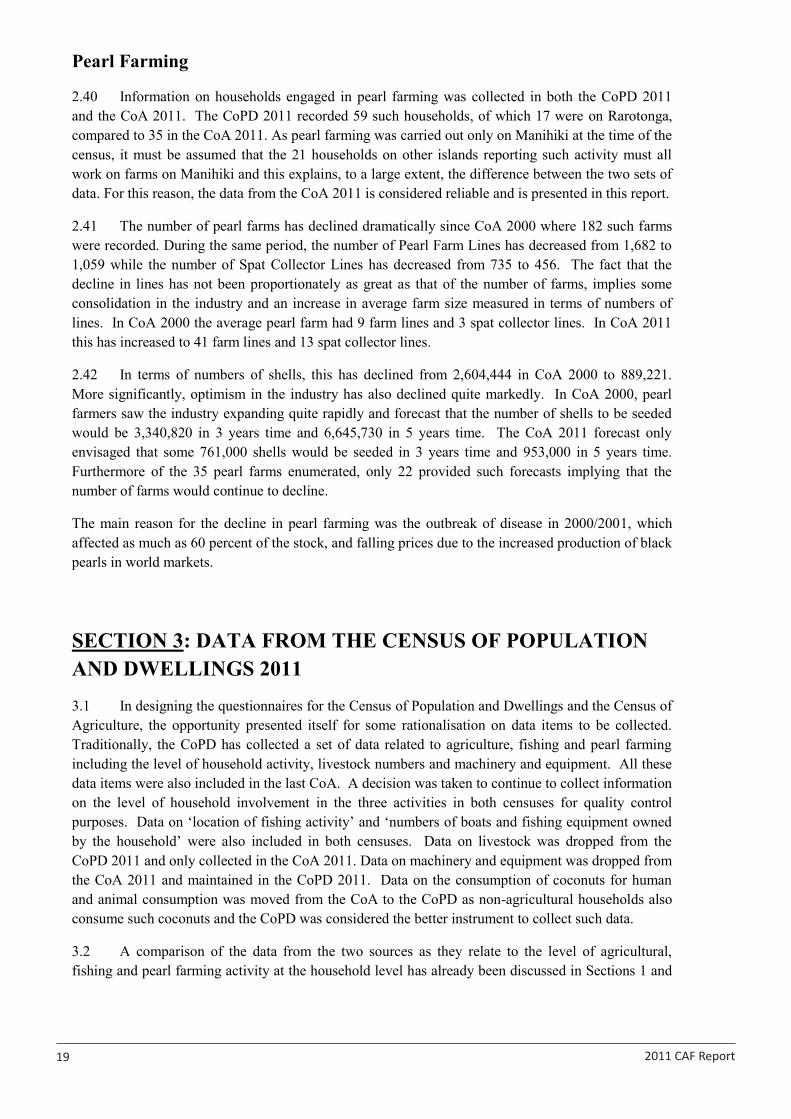
Agricultural Loans 2.30 Only 34 households were recorded as having an agricultural loan although it should be noted that 161 households did not respond to the question (not stated). As with the question on agricultural income, where 113 households did not respond, questions related to finances are not always well received by respondents and the not stated are difficult to interpret. The number with loans could, therefore be higher and information should be sought from the banking industry to confirm this data. Agricultural Inputs 2.31 The use of agricultural inputs are an indicator of the level of technical development of the agricultural sector. 30 percent of households used herbicides and 20 percent used inorganic fertilizers while 13 percent of households used organic fertilizers or compost/animal manure. Figure 8: Percentage of households using agricultural inputs
Improved planting materials (Table 1.8) 2.32 The census sought to assess the use of improved planting materials. 104 households were found to be using improved/hybrid vegetable seeds, 22 households were each using improved taro and cassava stock, 29 households were using improved/hybrid water melon seeds and 34 households improved planting material for other fruit crops. Other agricultural activities (Table 1.9) 2.33 It was recognised that there were a number of other agricultural activities that were not fully covered by the census. These included bee keeping, hydroponic crop production, floriculture and handicrafts. The information collected, however, only relates to agriculturally active households and, therefore, does not reflect the full extent of these activities as all but hydroponics could be practised by other households. In particular, floriculture was covered extensively in the CoPD 2011 where 1,524 households were found to be engaged in growing flowers (see table 8.9). The CoA 2011 recorded 4 agriculturally active households keeping bees, 6 engaged in hydroponics, 9 in floriculture and 12 making handicrafts.
0
5
10
15
20
25
30
35
InorganicFertilizers
OrganicFertilizers
Compost &AnimalManure
Herbicides Fungicides Insecticides
Percent

2011 CAF Report 17
17 2011 CAF Report
Livestock 2.34 As part of the census of agriculture, households were asked whether they kept any livestock or poultry. Of the 2,334 households interviewed, 1,595 households were recorded as keeping livestock or poultry. Table 2 shows the breakdown of households keeping livestock or poultry by the level of agricultural activity for Rarotonga, other Southern Islands and the Northern Islands group.
2.35 The data shows that livestock and poultry keeping is typically associated with crop growing. Of the 1,595 households recorded as keeping livestock or poultry, 1,447 or 91 percent were also engaged in crop growing. Only 148 households were recorded as keeping animals but not growing any crops (non-agricultural households). For CoA 2000 some 1,977 households were recorded as keeping livestock while for CoA 1988 the figure was 2,305 households. In terms of the percentages of households keeping livestock and poultry, this has declined from 73 percent in CoA1988 to 54 percent in CoA 2000 and 36 percent in CoA 2011. Again, this hides the considerable difference between Rarotonga and the other islands. On Rarotonga, only 22 percent of households were recorded as keeping livestock while on the other islands it was 74 percent.
2.36 The number s of livestock kept are shown in Table I. A comparison with the CoA 2000 and the CoPD 2006 shows that the number of pigs has declined from 15,876 to 14,145 and 13,951 (2000, 2006 and 2011 respectively). For goats a small but significant increase is seen over the three censuses from 3,595 to 4,066 and 4,388. For chickens the respective numbers were 24,277, 30,611 and 34,427. However, not too much should be read into changes in the poultry numbers since these are notoriously difficult to collect and a wide margin of error must be assumed. In particular, it is known that the CoA 2000 under-reported the number of chickens on Aitutaki. Table I: Number of Livestock, by Type of Livestock and Island Location of Household Type of Livestock Kept
Cattle Horses Goats Pigs Chickens Ducks RAROTONGA 185 4 1,211 5,219 12,549 193 OTHER SOUTHERN ISLANDS
55 9 3,177 6,739 18,421 98
Aitutaki - - 675 1,889 9,000 57 Mangaia 2 8 1,179 1,782 2,782 41 Atiu 11 1 790 1,512 2,611 - Mauke 42 - 434 1,013 2,711 - Mitiaro - - 99 543 1,317 -
NORTHERN ISLANDS - - - 1,993 3,457 -
Palmerston - - - 7 150 - Pukapuka - - - 586 2,077 - Nassau - - - 59 351 - Manihiki - - - 886 490 - Rakahanga - - - 182 354 - Penrhyn - - - 273 35 -
COOK ISLANDS 240 13 4,388 13,951 34,427 291
2011 CAF Report 18
18 2011 CAF Report
Fishing Activities and Pearl Farming
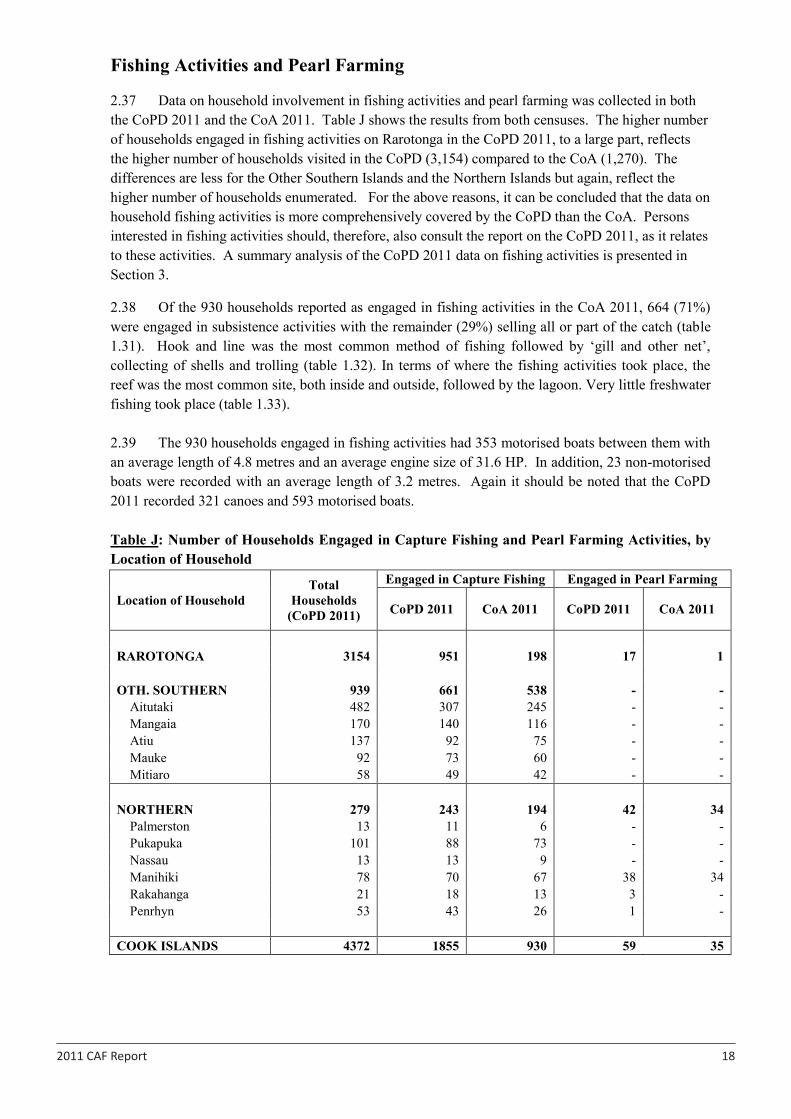
2.37 Data on household involvement in fishing activities and pearl farming was collected in both the CoPD 2011 and the CoA 2011. Table J shows the results from both censuses. The higher number of households engaged in fishing activities on Rarotonga in the CoPD 2011, to a large part, reflects the higher number of households visited in the CoPD (3,154) compared to the CoA (1,270). The differences are less for the Other Southern Islands and the Northern Islands but again, reflect the higher number of households enumerated. For the above reasons, it can be concluded that the data on household fishing activities is more comprehensively covered by the CoPD than the CoA. Persons interested in fishing activities should, therefore, also consult the report on the CoPD 2011, as it relates to these activities. A summary analysis of the CoPD 2011 data on fishing activities is presented in Section 3.
2.38 Of the 930 households reported as engaged in fishing activities in the CoA 2011, 664 (71%) were engaged in subsistence activities with the remainder (29%) selling all or part of the catch (table 1.31). Hook and line was the most common method of fishing followed by ‘gill and other net’, collecting of shells and trolling (table 1.32). In terms of where the fishing activities took place, the reef was the most common site, both inside and outside, followed by the lagoon. Very little freshwater fishing took place (table 1.33). 2.39 The 930 households engaged in fishing activities had 353 motorised boats between them with an average length of 4.8 metres and an average engine size of 31.6 HP. In addition, 23 non-motorised boats were recorded with an average length of 3.2 metres. Again it should be noted that the CoPD 2011 recorded 321 canoes and 593 motorised boats. Table J: Number of Households Engaged in Capture Fishing and Pearl Farming Activities, by Location of Household
Location of Household Total
Households (CoPD 2011)
Engaged in Capture Fishing Engaged in Pearl Farming
CoPD 2011 CoA 2011 CoPD 2011 CoA 2011
RAROTONGA 3154 951 198 17 1
OTH. SOUTHERN 939 661 538 - -
Aitutaki 482 307 245 - - Mangaia 170 140 116 - - Atiu 137 92 75 - - Mauke 92 73 60 - - Mitiaro 58 49 42 - -
NORTHERN 279 243 194 42 34
Palmerston 13 11 6 - - Pukapuka 101 88 73 - - Nassau 13 13 9 - - Manihiki 78 70 67 38 34 Rakahanga 21 18 13 3 - Penrhyn 53 43 26 1 -
COOK ISLANDS 4372 1855 930 59 35
2011 CAF Report 19
19 2011 CAF Report
Pearl Farming
2.40 Information on households engaged in pearl farming was collected in both the CoPD 2011 and the CoA 2011. The CoPD 2011 recorded 59 such households, of which 17 were on Rarotonga, compared to 35 in the CoA 2011. As pearl farming was carried out only on Manihiki at the time of the census, it must be assumed that the 21 households on other islands reporting such activity must all work on farms on Manihiki and this explains, to a large extent, the difference between the two sets of data. For this reason, the data from the CoA 2011 is considered reliable and is presented in this report.
2.41 The number of pearl farms has declined dramatically since CoA 2000 where 182 such farms were recorded. During the same period, the number of Pearl Farm Lines has decreased from 1,682 to 1,059 while the number of Spat Collector Lines has decreased from 735 to 456. The fact that the decline in lines has not been proportionately as great as that of the number of farms, implies some consolidation in the industry and an increase in average farm size measured in terms of numbers of lines. In CoA 2000 the average pearl farm had 9 farm lines and 3 spat collector lines. In CoA 2011 this has increased to 41 farm lines and 13 spat collector lines.
2.42 In terms of numbers of shells, this has declined from 2,604,444 in CoA 2000 to 889,221. More significantly, optimism in the industry has also declined quite markedly. In CoA 2000, pearl farmers saw the industry expanding quite rapidly and forecast that the number of shells to be seeded would be 3,340,820 in 3 years time and 6,645,730 in 5 years time. The CoA 2011 forecast only envisaged that some 761,000 shells would be seeded in 3 years time and 953,000 in 5 years time. Furthermore of the 35 pearl farms enumerated, only 22 provided such forecasts implying that the number of farms would continue to decline.
The main reason for the decline in pearl farming was the outbreak of disease in 2000/2001, which affected as much as 60 percent of the stock, and falling prices due to the increased production of black pearls in world markets.
SECTION 3: DATA FROM THE CENSUS OF POPULATION AND DWELLINGS 2011 3.1 In designing the questionnaires for the Census of Population and Dwellings and the Census of Agriculture, the opportunity presented itself for some rationalisation on data items to be collected. Traditionally, the CoPD has collected a set of data related to agriculture, fishing and pearl farming including the level of household activity, livestock numbers and machinery and equipment. All these data items were also included in the last CoA. A decision was taken to continue to collect information on the level of household involvement in the three activities in both censuses for quality control purposes. Data on ‘location of fishing activity’ and ‘numbers of boats and fishing equipment owned by the household’ were also included in both censuses. Data on livestock was dropped from the CoPD 2011 and only collected in the CoA 2011. Data on machinery and equipment was dropped from the CoA 2011 and maintained in the CoPD 2011. Data on the consumption of coconuts for human and animal consumption was moved from the CoA to the CoPD as non-agricultural households also consume such coconuts and the CoPD was considered the better instrument to collect such data.
3.2 A comparison of the data from the two sources as they relate to the level of agricultural, fishing and pearl farming activity at the household level has already been discussed in Sections 1 and
2011 CAF Report 20
20 2011 CAF Report
2. As far as fishing activity was concerned, the CoA under-reported the number of households involved in fishing activities, particularly on Rarotonga, as only agriculturally active households were visited. The data from the CoPD 2011 on fishing activity is, therefore considered the more comprehensive and reliable.
Fishing Activity
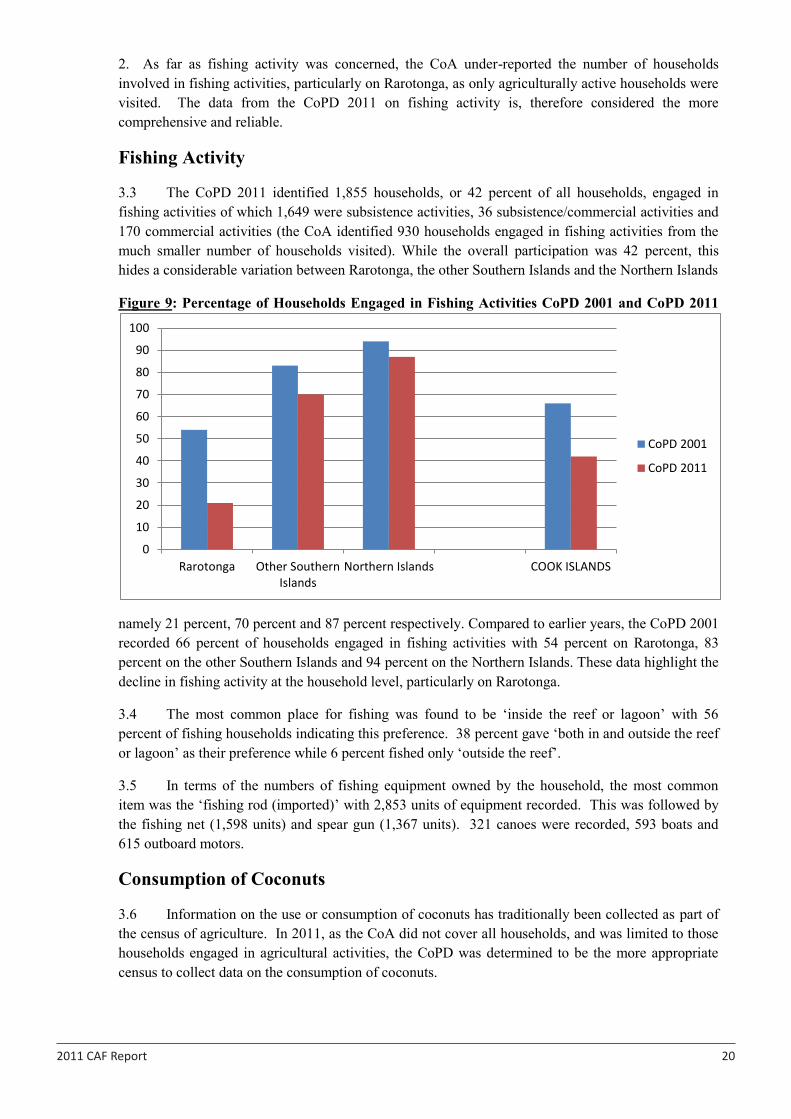
3.3 The CoPD 2011 identified 1,855 households, or 42 percent of all households, engaged in fishing activities of which 1,649 were subsistence activities, 36 subsistence/commercial activities and 170 commercial activities (the CoA identified 930 households engaged in fishing activities from the much smaller number of households visited). While the overall participation was 42 percent, this hides a considerable variation between Rarotonga, the other Southern Islands and the Northern Islands
Figure 9: Percentage of Households Engaged in Fishing Activities CoPD 2001 and CoPD 2011
namely 21 percent, 70 percent and 87 percent respectively. Compared to earlier years, the CoPD 2001 recorded 66 percent of households engaged in fishing activities with 54 percent on Rarotonga, 83 percent on the other Southern Islands and 94 percent on the Northern Islands. These data highlight the decline in fishing activity at the household level, particularly on Rarotonga.
3.4 The most common place for fishing was found to be ‘inside the reef or lagoon’ with 56 percent of fishing households indicating this preference. 38 percent gave ‘both in and outside the reef or lagoon’ as their preference while 6 percent fished only ‘outside the reef’.
3.5 In terms of the numbers of fishing equipment owned by the household, the most common item was the ‘fishing rod (imported)’ with 2,853 units of equipment recorded. This was followed by the fishing net (1,598 units) and spear gun (1,367 units). 321 canoes were recorded, 593 boats and 615 outboard motors.
Consumption of Coconuts
3.6 Information on the use or consumption of coconuts has traditionally been collected as part of the census of agriculture. In 2011, as the CoA did not cover all households, and was limited to those households engaged in agricultural activities, the CoPD was determined to be the more appropriate census to collect data on the consumption of coconuts.
0
10
20
30
40
50
60
70
80
90
100
Rarotonga Other SouthernIslands
Northern Islands COOK ISLANDS
CoPD 2001
CoPD 2011
2011 CAF Report 21
21 2011 CAF Report
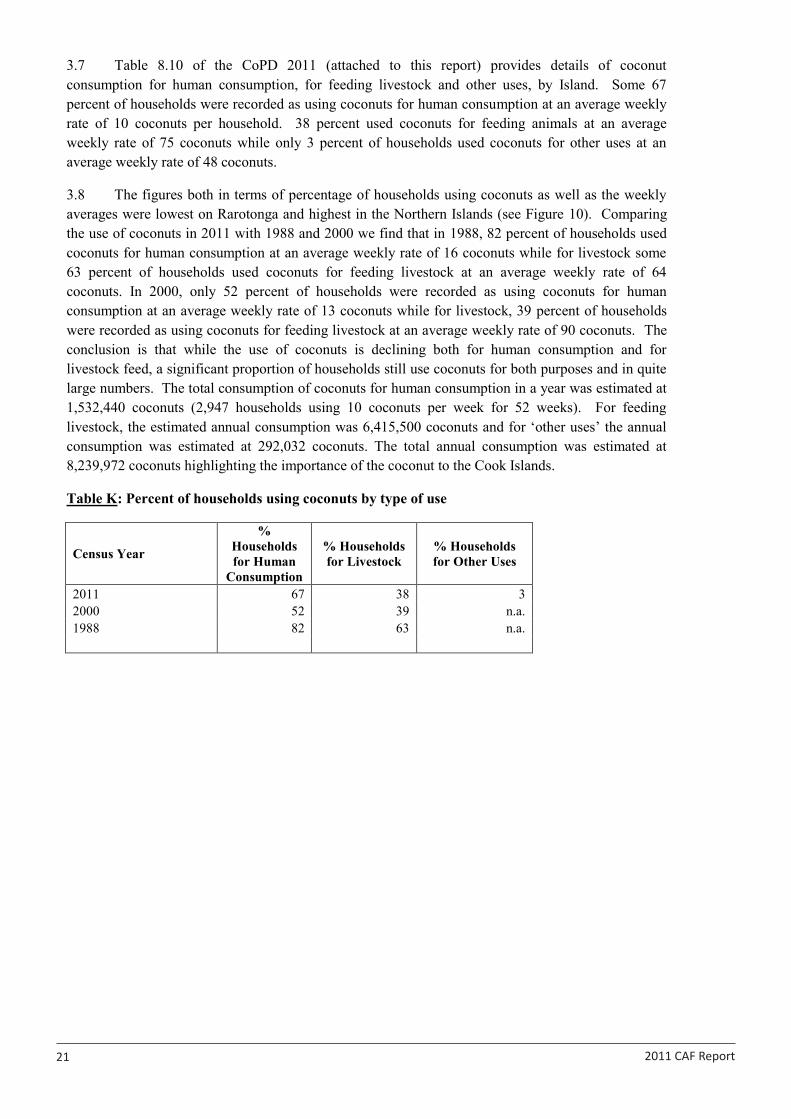
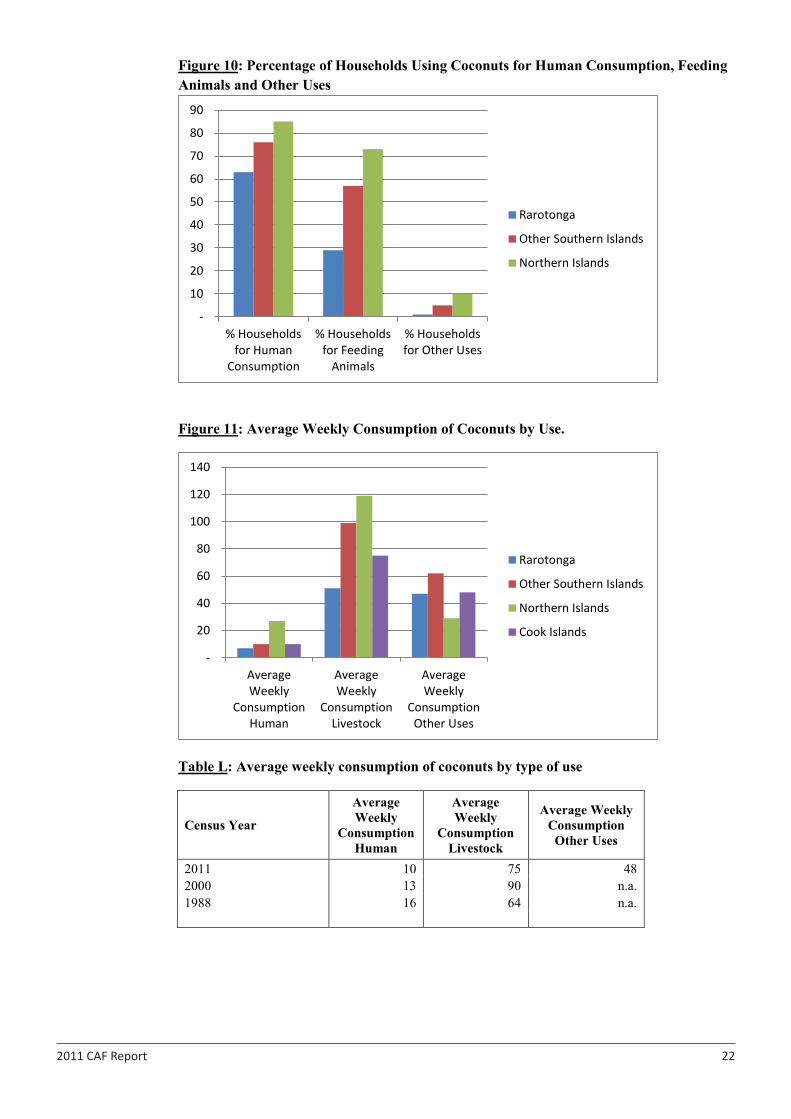
3.7 Table 8.10 of the CoPD 2011 (attached to this report) provides details of coconut consumption for human consumption, for feeding livestock and other uses, by Island. Some 67 percent of households were recorded as using coconuts for human consumption at an average weekly rate of 10 coconuts per household. 38 percent used coconuts for feeding animals at an average weekly rate of 75 coconuts while only 3 percent of households used coconuts for other uses at an average weekly rate of 48 coconuts.
3.8 The figures both in terms of percentage of households using coconuts as well as the weekly averages were lowest on Rarotonga and highest in the Northern Islands (see Figure 10). Comparing the use of coconuts in 2011 with 1988 and 2000 we find that in 1988, 82 percent of households used coconuts for human consumption at an average weekly rate of 16 coconuts while for livestock some 63 percent of households used coconuts for feeding livestock at an average weekly rate of 64 coconuts. In 2000, only 52 percent of households were recorded as using coconuts for human consumption at an average weekly rate of 13 coconuts while for livestock, 39 percent of households were recorded as using coconuts for feeding livestock at an average weekly rate of 90 coconuts. The conclusion is that while the use of coconuts is declining both for human consumption and for livestock feed, a significant proportion of households still use coconuts for both purposes and in quite large numbers. The total consumption of coconuts for human consumption in a year was estimated at 1,532,440 coconuts (2,947 households using 10 coconuts per week for 52 weeks). For feeding livestock, the estimated annual consumption was 6,415,500 coconuts and for ‘other uses’ the annual consumption was estimated at 292,032 coconuts. The total annual consumption was estimated at 8,239,972 coconuts highlighting the importance of the coconut to the Cook Islands.
Table K: Percent of households using coconuts by type of use
Census Year
% Households for Human
Consumption
% Households for Livestock
% Households for Other Uses
2011 67 38 3 2000 52 39 n.a. 1988 82 63 n.a.
2011 CAF Report 22
22 2011 CAF Report
Figure 10: Percentage of Households Using Coconuts for Human Consumption, Feeding Animals and Other Uses
Figure 11: Average Weekly Consumption of Coconuts by Use.
Table L: Average weekly consumption of coconuts by type of use
Census Year
Average Weekly
Consumption Human
Average Weekly
Consumption Livestock
Average Weekly Consumption
Other Uses
2011 10 75 48 2000 13 90 n.a. 1988 16 64 n.a.
-
10
20
30
40
50
60
70
80
90
% Householdsfor Human
Consumption
% Householdsfor Feeding
Animals
% Householdsfor Other Uses
Rarotonga
Other Southern Islands
Northern Islands
-
20
40
60
80
100
120
140
AverageWeekly
ConsumptionHuman
AverageWeekly
ConsumptionLivestock
AverageWeekly
ConsumptionOther Uses
Rarotonga
Other Southern Islands
Northern Islands
Cook Islands
2011 CAF Report 23
23 2011 CAF Report
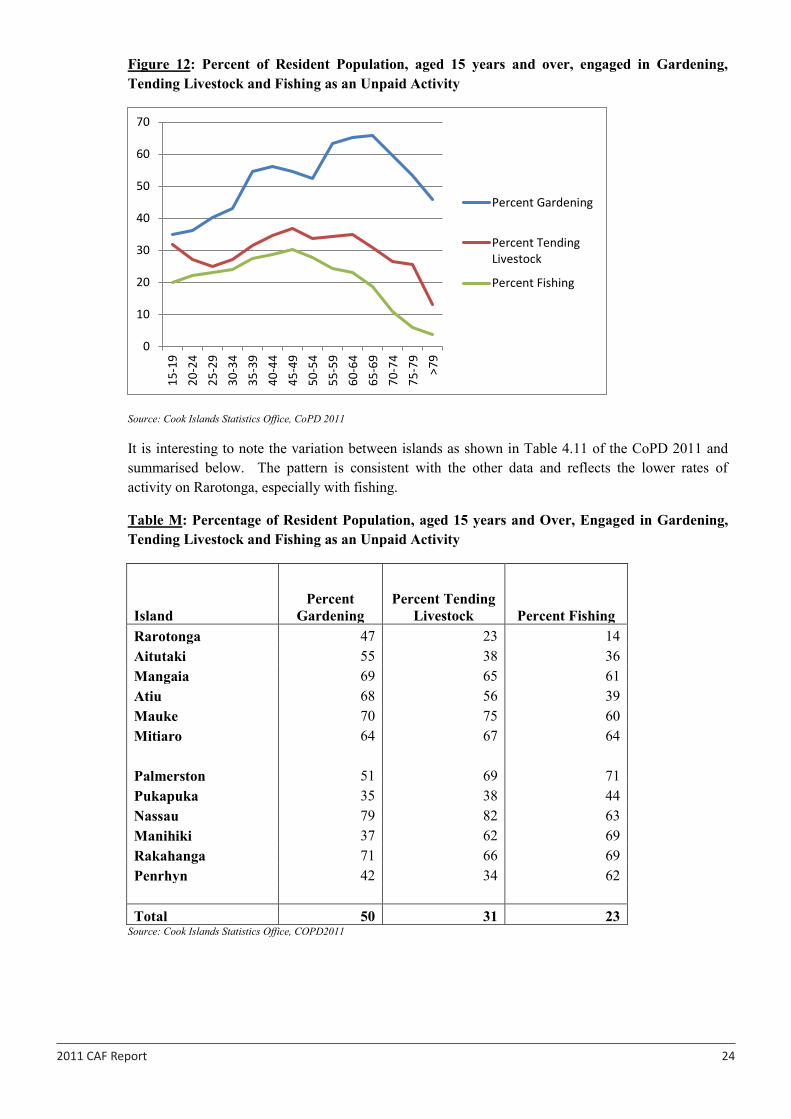
Farm Equipment Table 8.13 of the CoPD 2011 provides data, at the household level, of farm equipment owned. The most common item was the Grass Cutter followed by the Motor Mower, Chainsaw and Knapsack Sprayer. Some 224 Tractors were also recorded and 212 Rotary Hoes. Unpaid Work The CoPD 2011 collected information from all persons aged 15 years and over on unpaid work carried out in the four weeks prior to the census (the month of November 2011). Tables 4.11 and 4.12 of the CoPD 2011 provide the data and are attached as an annex to this report. Three categories are of particular interest namely gardening, tending livestock and fishing. Table 4.12 shows the number of residents engaged in the three categories in an unpaid capacity by age-group and sex. Figure presents a summary of this data. By the age of 35, more than 50 percent of the resident population are engaged in gardening and this remains an unpaid activity carried out by more than half the population until the age of 75 and peaking in the 65-69 years age group at 66 percent. Tending livestock and fishing are typically the activities of a younger age group both peaking in the 45-49 years age group at 37 percent and 30 percent respectively.
2011 CAF Report 24
24 2011 CAF Report
Figure 12: Percent of Resident Population, aged 15 years and over, engaged in Gardening, Tending Livestock and Fishing as an Unpaid Activity
Source: Cook Islands Statistics Office, CoPD 2011
It is interesting to note the variation between islands as shown in Table 4.11 of the CoPD 2011 and summarised below. The pattern is consistent with the other data and reflects the lower rates of activity on Rarotonga, especially with fishing.
Table M: Percentage of Resident Population, aged 15 years and Over, Engaged in Gardening, Tending Livestock and Fishing as an Unpaid Activity
Island Percent
Gardening Percent Tending
Livestock Percent Fishing Rarotonga 47 23 14 Aitutaki 55 38 36 Mangaia 69 65 61 Atiu 68 56 39 Mauke 70 75 60 Mitiaro 64 67 64
Palmerston 51 69 71 Pukapuka 35 38 44 Nassau 79 82 63 Manihiki 37 62 69 Rakahanga 71 66 69 Penrhyn 42 34 62 Total 50 31 23
Source: Cook Islands Statistics Office, COPD2011
0
10
20
30
40
50
60
70
15-1
920
-24
25-2
930
-34
35-3
940
-44
45-4
950
-54
55-5
960
-64
65-6
970
-74
75-7
9>7
9
Percent Gardening
Percent TendingLivestock
Percent Fishing

2011
CAF
Rep
ort
25
25
2011
CAF
Rep
ort
Tabl
e 1.
1: N
umbe
r of H
ouse
hold
s, b
y Le
vel o
f Agr
icul
tura
l Act
ivity
and
Loc
atio
n of
Hou
seho
ld
Loca
tion
of H
ouse
hold
To
tal N
umbe
r of
Hou
seho
lds
Leve
l of A
gric
ultu
ral a
ctiv
ity
Agr
icul
tura
lly
Act
ive
Non
Agr
icul
tura
l M
inor
A
gric
ultu
ral
Subs
iste
nce
Onl
y
Agr
icul
tura
l pr
oduc
tion
prim
arily
for
sale
RA
RO
TON
GA
1,27
1
39
659
333
240
573
Kiik
ii-O
oa-P
ue
11
4
7
7
1
15
21
3
6
Tupa
pa-M
arae
reng
a
38
-
18
12
8
2
0
Taku
vain
e
62
2
16
36
8
4
4
Tuta
kim
oa-T
eotu
e
17
-
8
4
5
9
Avat
iu-R
uato
nga-
Pana
ma
11
0
8
5
7
38
7
45
Nik
ao-P
anam
a
190
1
1
51
20
18
3
8
Ruaa
u-Ar
eren
ga-A
rora
ngi
19
7
10
8
1
91
15
10
6
Akao
a-Be
tela
-Aro
rang
i
46
-
30
9
7
16
Mur
ienu
a-Ar
oran
gi
11
1
-
5
9
15
37
5
2
Titik
avek
a
234
2
1
30
38
64
10
2
Nga
tang
iia
59
2
1
8
15
24
3
9
Mat
aver
a
93
7
20
40
26
66
-
O
THER
SO
UTH
ERN
IS
LAN
DS
79
8
97
7
7
45
0
17
4
62
4

2011
CAF
Rep
ort
26
26
2011
CAF
Rep
ort
Aitu
taki
420
2
7
62
260
71
331
Man
gaia
141
2
7
4
76
34
11
0
Atiu
111
1
7
9
46
39
8
5
Mau
ke
81
21
1
41
18
59
Miti
aro
45
5
1
27
12
39
-
NO
RTH
ERN
ISLA
ND
S
265
2
1
1
66
78
-
7
8
Palm
erst
on
14
-
1
4
-
-
-
Puka
puka
97
1
5
25
57
-
57
Nas
sau
13
-
3
10
-
10
Man
ihik
i
78
3
73
2
-
2
Raka
hang
a
13
1
4
8
-
8
Penr
hyn
50
2
4
7
1
-
1
-
CO
OK
ISLA
ND
S
2,33
4
157
902
861
414
1
,275
* *
Incl
udes
6 h
oldi
ngs f
or
whi
ch n
o ho
ldin
g or
par
cel
reco
rd w
as re
cord
ed
2011 CAF Report 27
27 2011 CAF Report
CENSUS TABLES
The census tables are presented in seven Table Sets relating to details for households, holdings, parcel, livestock, fishing, pearl farming, and census of population and dwellings 2011.
Users requiring more detailed information than is presented in this report should contact the Ministry of Agriculture, Rarotonga.
2011
CAF
Rep
ort
28
TA
BL
E S
ET
1:
HO
USE
HO
LD
DE
TA
ILS
EX
TE
NT
OF
AG
RIC
UL
TU
RA
L A
CT
IVIT
YTa
ble
1.1
-N
umbe
r of H
ouse
hold
s, by
Lev
el o
f Agr
icul
tura
l Act
ivity
and
Loc
atio
n of
Hou
seho
ldTa
ble
1.2
-N
umbe
r of H
oldi
ngs,
by L
evel
of A
gric
ultu
ral A
ctiv
ity a
nd L
ocat
ion
of H
ouse
hold
Tabl
e 1.
3-
Num
ber o
f Par
cels
, by
Leve
l of A
gric
ultu
ral A
ctiv
ity a
nd L
ocat
ion
of H
ouse
hold
Tabl
e 1.
4-
Num
ber o
f Hol
ding
s and
Num
ber o
f Par
cels
, In-
Use
and
Fal
low
, by
Loca
tion
of H
ouse
hold
AG
RIC
UL
TU
RA
L IN
CO
ME
& L
OA
NS
Tabl
e 1.
5-
Num
ber o
f Agr
icul
tura
lly A
ctiv
e H
ouse
hold
s, by
Pro
porti
on o
f Tot
al In
com
e U
sual
ly D
eriv
ed fr
om A
gric
ultu
ral A
ctiv
ities
, by
Loca
tion
of H
ouse
hold
Tabl
e 1.
6-
Num
ber o
f Agr
icul
tura
lly A
ctiv
e H
ouse
hold
s, by
Sou
rce
of L
oans
for A
gric
ultu
ral P
urpo
ses a
nd b
y Lo
catio
n of
Hou
seho
ld
ASS
OC
IAT
ED
AC
TIV
ITIE
STa
ble
1.7
-N
umbe
r of A
gric
ultu
rally
Act
ive
Hou
seho
lds U
sing
Fer
tiliz
ers a
nd A
gric
ultu
ral C
hem
ical
s, by
Loc
atio
n of
Hou
seho
ldTa
ble
1.8
-N
umbe
r of A
gric
ultu
rally
Act
ive
Hou
seho
lds U
sing
Impr
oved
Var
ietie
s in
Sele
cted
Cro
ps, b
y Lo
catio
n of
Hou
seho
ldTa
ble
1.9
-N
umbe
r of A
gric
ultu
rally
Act
ive
Hou
seho
lds E
ngag
ed in
Sel
ecte
d A
gric
ultu
ral A
ctiv
ities
, by
Loca
tion
of H
ouse
hold
Sour
ce: C
ook
Isla
nds
2011
Cen
sus
of A
gric
ultu
re a
nd F
ishe
ries
TAB
LE S
ET 1
: HO
USE
HO
LD D
ETAI
LS
2011
CAF
Rep
ort
29
Tabl
e 1.
1 N
umbe
r of H
ouse
hold
s, b
y Le
vel o
f Agr
icul
tura
l Act
ivity
and
Loc
atio
n of
Hou
seho
ld
Non
Ag
ricul
tura
lM
inor
Ag
ricul
tura
lSu
bsis
tenc
e O
nly
Agric
ultu
ral
prod
uctio
n pr
imar
ily fo
r sal
e
RAR
OTO
NG
A1,
271
39
659
333
240
573
Kiik
ii-O
oa-P
ue11
4
7
71
15
21
36
Tu
papa
-Mar
aere
nga
38
-
18
12
8
20
Taku
vain
e62
2
16
36
8
44
Tu
taki
moa
-Teo
tue
17
-
8
4
5
9
Avat
iu-R
uato
nga-
Pana
ma
110
8
57
38
7
45
Nik
ao-P
anam
a19
0
1
151
20
18
38
Ru
aau-
Arer
enga
-Aro
rang
i19
7
10
81
91
15
106
Akao
a-Be
tela
-Aro
rang
i46
-
30
9
7
16
M
urie
nua-
Aror
angi
11
1
-
59
15
37
52
Ti
tikav
eka
234
2
13
0
38
64
10
2
N
gata
ngiia
59
2
18
15
24
39
Mat
aver
a93
7
20
40
26
66
-
O
THER
SO
UTH
ERN
ISLA
ND
S79
8
97
77
450
174
624
Aitu
taki
420
27
62
26
0
71
33
1
M
anga
ia14
1
27
4
76
34
11
0
At
iu11
1
17
9
46
39
85
Mau
ke81
21
1
41
18
59
Miti
aro
45
5
1
27
12
39
-
N
OR
THER
N IS
LAN
DS
265
21
16
6
78
-
78
Pa
lmer
ston
14
-
14
-
-
-
Pu
kapu
ka97
15
25
57
-
57
Nas
sau
13
-
3
10
-
10
Man
ihik
i78
3
73
2
-
2
Ra
kaha
nga
13
1
4
8
-
8
Pe
nrhy
n50
2
47
1
-
1
-
CO
OK
ISLA
ND
S2,
334
15
7
902
861
414
1,27
5**
Incl
udes
6 h
oldi
ngs f
or w
hich
no
hold
ing
or p
arce
l rec
ord
was
reco
rded
Loca
tion
of H
ouse
hold
Tota
l Num
ber o
f H
ouse
hold
s
Leve
l of A
gric
ultu
ral a
ctiv
ityAg
ricul
tura
lly
Activ
e
Sour
ce: C
ook
Isla
nds
2011
Cen
sus
of A
gric
ultu
re a
nd F
ishe
ries
TAB
LE S
ET 1
: HO
USE
HO
LD D
ETAI
LS

2011
CAF
Rep
ort
30
Subs
iste
nce
Onl
y
Agric
ultu
ral
prod
uctio
n pr
imar
ily fo
r sal
e
RAR
OTO
NG
A57
2
33
3
239
K
iikii-
Ooa
-Pue
36
15
21
Tu
papa
-Mar
aere
nga
20
12
8
Taku
vain
e44
36
8
Tu
taki
moa
-Teo
tue
9
4
5
A
vatiu
-Rua
tong
a-P
anam
a44
38
6
N
ikao
-Pan
ama
38
20
18
R
uaau
-Are
reng
a-A
rora
ngi
106
91
15
Aka
oa-B
etel
a-A
rora
ngi
16
9
7
Mur
ienu
a-A
rora
ngi
52
15
37
Ti
tikav
eka
102
38
64
Nga
tang
iia39
15
24
Mat
aver
a66
40
26
OTH
ER S
OU
THER
N IS
LAN
DS
622
448
17
4
Aitu
taki
330
259
71
Man
gaia
109
75
34
Atiu
85
46
39
M
auke
59
41
18
M
itiar
o39
27
12
NO
RTH
ERN
ISLA
ND
S75
75
-
P
alm
erst
on-
-
-
Puk
apuk
a55
55
-
N
assa
u10
10
-
M
anih
iki
1
1
-
R
akah
anga
8
8
-
P
enrh
yn1
1
-
CO
OK
ISLA
ND
S1,
269
85
6
413
Not
e: H
oldi
ngs
for n
on-a
gric
ultu
ral a
nd m
inor
agr
icul
tura
l act
iviti
es d
o no
t exi
st.
Loca
tion
of H
ouse
hold
Tota
l Num
ber o
f H
oldi
ngs
Leve
l of A
gric
ultu
ral a
ctiv
ityTa
ble
1.2
Num
ber o
f Hol
ding
s, b
y Le
vel o
f Agr
icul
tura
l Act
ivity
and
Loc
atio
n of
Hou
seho
ld
Sour
ce: C
ook
Isla
nds
2011
Cen
sus
of A
gric
ultu
re a
nd F
ishe
ries
TAB
LE S
ET 1
: HO
USE
HO
LD D
ETAI
LS
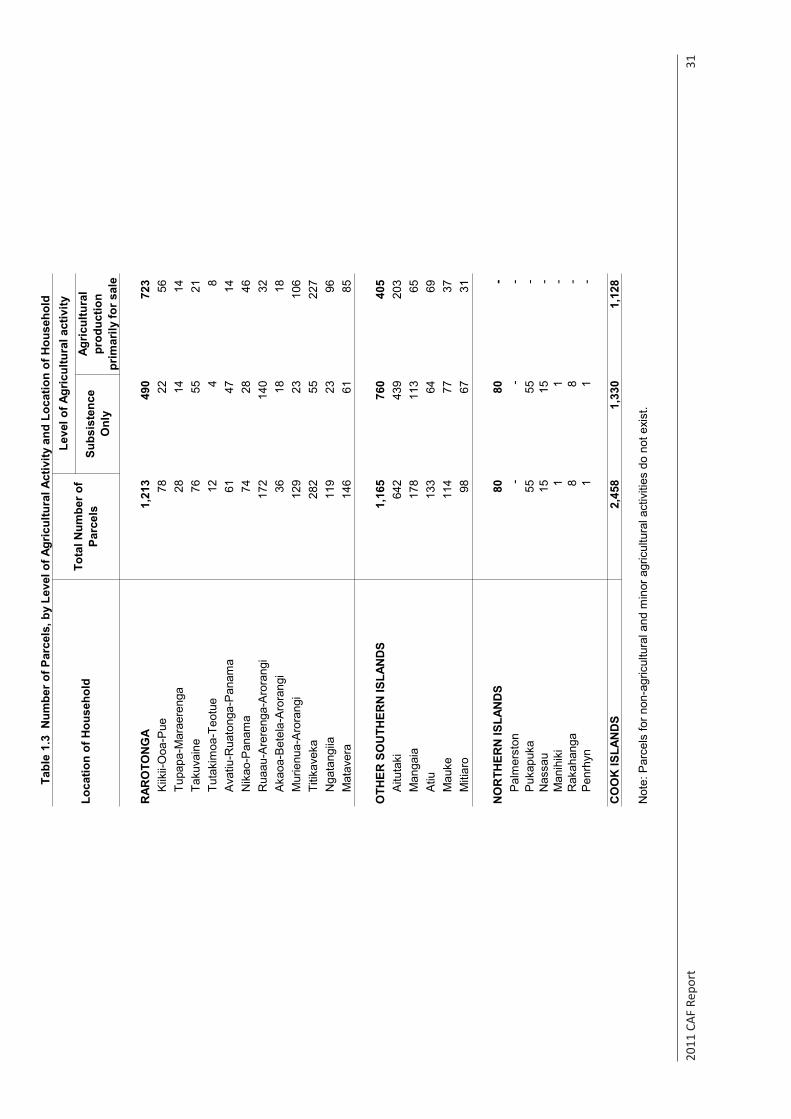
2011
CAF
Rep
ort
31
Subs
iste
nce
Onl
y
Agric
ultu
ral
prod
uctio
n pr
imar
ily fo
r sal
e
RAR
OTO
NG
A1,
213
49
0
723
Kiik
ii-O
oa-P
ue78
22
56
Tu
papa
-Mar
aere
nga
28
14
14
Taku
vain
e76
55
21
Tu
taki
moa
-Teo
tue
12
4
8
Ava
tiu-R
uato
nga-
Pan
ama
61
47
14
Nik
ao-P
anam
a74
28
46
R
uaau
-Are
reng
a-A
rora
ngi
172
140
32
Aka
oa-B
etel
a-A
rora
ngi
36
18
18
Mur
ienu
a-A
rora
ngi
129
23
10
6
Ti
tikav
eka
282
55
22
7
N
gata
ngiia
119
23
96
Mat
aver
a14
6
61
85
OTH
ER S
OU
THER
N IS
LAN
DS
1,16
5
760
40
5
A
ituta
ki64
2
43
9
203
Man
gaia
178
113
65
Atiu
133
64
69
Mau
ke11
4
77
37
M
itiar
o98
67
31
NO
RTH
ERN
ISLA
ND
S80
80
-
Pal
mer
ston
-
-
-
P
ukap
uka
55
55
-
N
assa
u15
15
-
Man
ihik
i1
1
-
R
akah
anga
8
8
-
Pen
rhyn
1
1
-
CO
OK
ISLA
ND
S2,
458
1,
330
1,12
8
Not
e: P
arce
ls fo
r non
-agr
icul
tura
l and
min
or a
gric
ultu
ral a
ctiv
ities
do
not e
xist
.
Loca
tion
of H
ouse
hold
Tota
l Num
ber o
f Pa
rcel
s
Leve
l of A
gric
ultu
ral a
ctiv
ityTa
ble
1.3
Num
ber o
f Par
cels
, by
Leve
l of A
gric
ultu
ral A
ctiv
ity a
nd L
ocat
ion
of H
ouse
hold
Sour
ce: C
ook
Isla
nds
2011
Cen
sus
of A
gric
ultu
re a
nd F
ishe
ries
TAB
LE S
ET 1
: HO
USE
HO
LD D
ETAI
LS

2011
CAF
Rep
ort
32
Tota
lIn
-Use
Fallo
w
RAR
OTO
NG
A57
2
1,21
3
1,
077
136
K
iikii-
Ooa
-Pue
36
78
68
10
Tupa
pa-M
arae
reng
a20
28
27
1
Taku
vain
e44
76
73
3
Tuta
kim
oa-T
eotu
e9
12
12
-
A
vatiu
-Rua
tong
a-P
anam
a44
61
59
2
Nik
ao-P
anam
a38
74
65
9
Rua
au-A
rere
nga-
Aro
rang
i10
6
172
16
3
9
Aka
oa-B
etel
a-A
rora
ngi
16
36
33
3
M
urie
nua-
Aro
rang
i 52
129
11
5
14
Ti
tikav
eka
102
28
2
241
41
Nga
tang
iia39
119
89
30
M
atav
era
66
14
6
132
14
OTH
ER S
OU
THER
N IS
LAN
DS
622
1,
165
899
26
6
Aitu
taki
330
64
2
405
23
7
Man
gaia
109
17
8
169
9
A
tiu85
133
12
8
5
Mau
ke59
114
10
7
7
Miti
aro
39
98
90
8
NO
RTH
ERN
ISLA
ND
S75
80
75
5
Pal
mer
ston
-
-
-
-
Puk
apuk
a55
55
55
-
Nas
sau
10
15
10
5
M
anih
iki
1
1
1
-
Rak
ahan
ga8
8
8
-
P
enrh
yn1
1
1
-
CO
OK
ISLA
ND
S1,
269
2,45
8
2,
051
407
Loca
tion
of H
ouse
hold
Tota
l Num
ber o
f H
oldi
ngs
Num
ber o
f Par
cels
Tabl
e 1.
4 N
umbe
r of H
oldi
ngs
and
Num
ber o
f Par
cels
, In-
Use
and
Fal
low
, by
Loca
tion
of H
ouse
hold
Sour
ce: C
ook
Isla
nds
2011
Cen
sus
of A
gric
ultu
re a
nd F
ishe
ries
TAB
LE S
ET 1
: HO
USE
HO
LD D
ETAI
LS
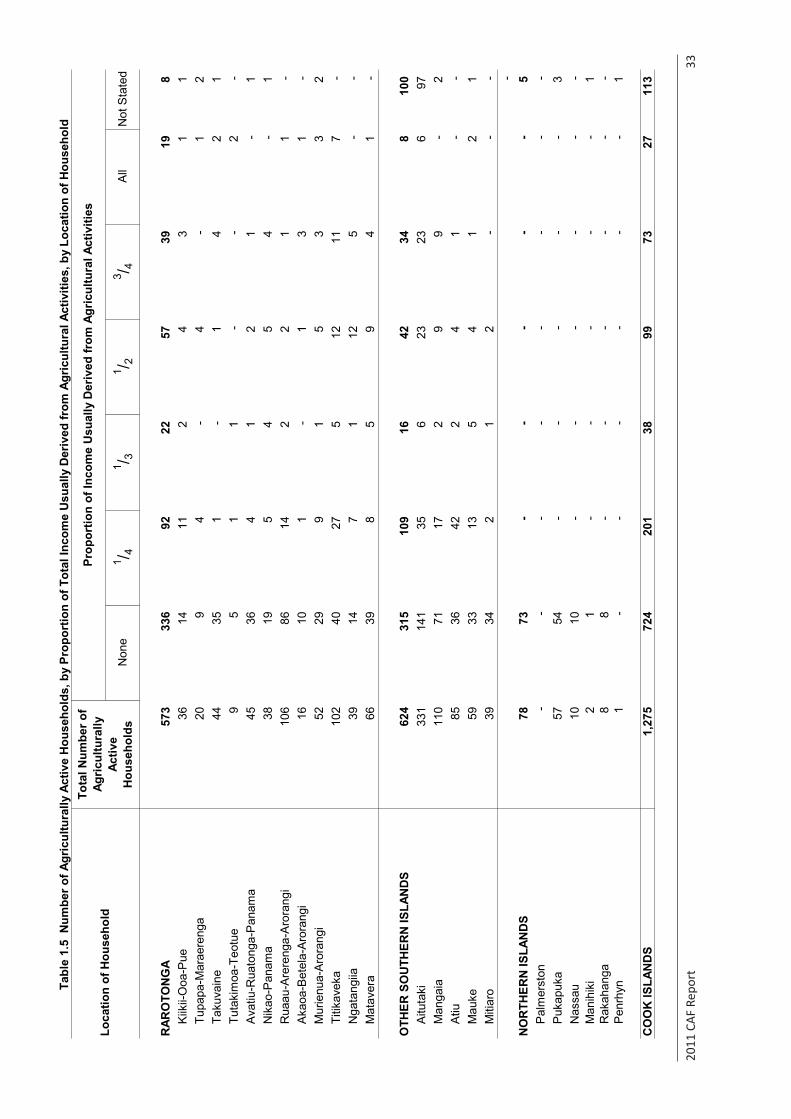
2011
CAF
Rep
ort
33
Non
e1 / 4
1 / 31 / 2
3 / 4A
llN
ot S
tate
d
RAR
OTO
NG
A57
3
33
6
92
22
57
39
19
8
Kiik
ii-O
oa-P
ue36
14
11
2
4
3
1
1
Tu
papa
-Mar
aere
nga
20
9
4
-
4
-
1
2
Taku
vain
e44
35
1
-
1
4
2
1
Tuta
kim
oa-T
eotu
e9
5
1
1
-
-
2
-
A
vatiu
-Rua
tong
a-P
anam
a45
36
4
1
2
1
-
1
Nik
ao-P
anam
a38
19
5
4
5
4
-
1
Rua
au-A
rere
nga-
Aro
rang
i10
6
86
14
2
2
1
1
-
A
kaoa
-Bet
ela-
Aro
rang
i16
10
1
-
1
3
1
-
Mur
ienu
a-A
rora
ngi
52
29
9
1
5
3
3
2
Ti
tikav
eka
102
40
27
5
12
11
7
-
Nga
tang
iia39
14
7
1
12
5
-
-
M
atav
era
66
39
8
5
9
4
1
-
OTH
ER S
OU
THER
N IS
LAN
DS
624
315
10
9
16
42
34
8
10
0
Aitu
taki
331
141
35
6
23
23
6
97
Man
gaia
110
71
17
2
9
9
-
2
Atiu
85
36
42
2
4
1
-
-
Mau
ke59
33
13
5
4
1
2
1
M
itiar
o39
34
2
1
2
-
-
-
-
N
OR
THER
N IS
LAN
DS
78
73
-
-
-
-
-
5
P
alm
erst
on-
-
-
-
-
-
-
-
Puk
apuk
a57
54
-
-
-
-
-
3
Nas
sau
10
10
-
-
-
-
-
-
M
anih
iki
2
1
-
-
-
-
-
1
Rak
ahan
ga8
8
-
-
-
-
-
-
P
enrh
yn1
-
-
-
-
-
-
1
CO
OK
ISLA
ND
S1,
275
72
4
201
38
99
73
27
11
3
Loca
tion
of H
ouse
hold
Tota
l Num
ber o
f Ag
ricul
tura
lly
Activ
e H
ouse
hold
s
Prop
ortio
n of
Inco
me
Usu
ally
Der
ived
from
Agr
icul
tura
l Act
iviti
es
Tabl
e 1.
5 N
umbe
r of A
gric
ultu
rally
Act
ive
Hou
seho
lds,
by
Prop
ortio
n of
Tot
al In
com
e U
sual
ly D
eriv
ed fr
om A
gric
ultu
ral A
ctiv
ities
, by
Loca
tion
of H
ouse
hold
Sour
ce: C
ook
Isla
nds
2011
Cen
sus
of A
gric
ultu
re a
nd F
ishe
ries
TAB
LE S
ET 1
: HO
USE
HO
LD D
ETAI
LS
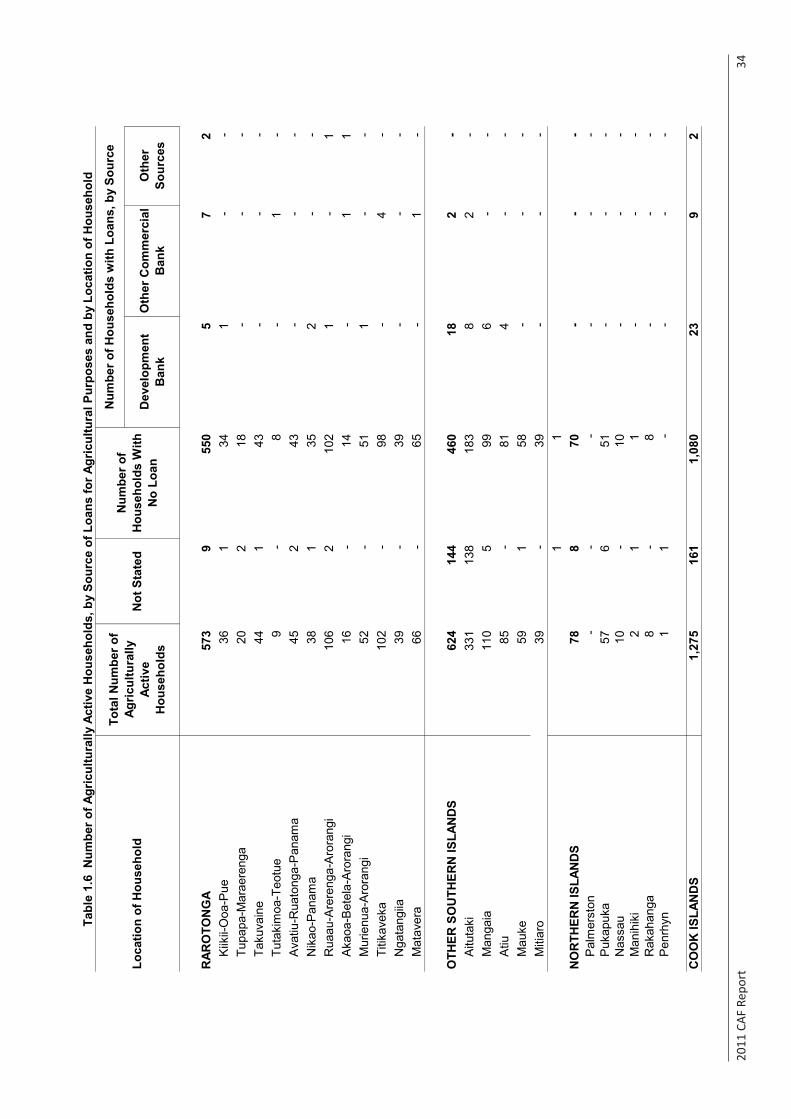
2011
CAF
Rep
ort
34
Dev
elop
men
t B
ank
Oth
er C
omm
erci
al
Ban
kO
ther
So
urce
s
RAR
OTO
NG
A57
3
9
55
0
5
7
2
Kiik
ii-O
oa-P
ue36
1
34
1
-
-
Tupa
pa-M
arae
reng
a20
2
18
-
-
-
Ta
kuva
ine
44
1
43
-
-
-
Tuta
kim
oa-T
eotu
e9
-
8
-
1
-
Ava
tiu-R
uato
nga-
Pan
ama
45
2
43
-
-
-
Nik
ao-P
anam
a38
1
35
2
-
-
Rua
au-A
rere
nga-
Aro
rang
i10
6
2
10
2
1
-
1
A
kaoa
-Bet
ela-
Aro
rang
i16
-
14
-
1
1
M
urie
nua-
Aro
rang
i 52
-
51
1
-
-
Titik
avek
a10
2
-
98
-
4
-
Nga
tang
iia39
-
39
-
-
-
M
atav
era
66
-
65
-
1
-
OTH
ER S
OU
THER
N IS
LAN
DS
624
144
460
18
2
-
Aitu
taki
331
138
183
8
2
-
Man
gaia
110
5
99
6
-
-
A
tiu85
-
81
4
-
-
Mau
ke59
1
58
-
-
-
M
itiar
o39
-
39
-
-
-
1
1
N
OR
THER
N IS
LAN
DS
78
8
70
-
-
-
Pal
mer
ston
-
-
-
-
-
-
Puk
apuk
a57
6
51
-
-
-
N
assa
u10
-
10
-
-
-
M
anih
iki
2
1
1
-
-
-
Rak
ahan
ga8
-
8
-
-
-
P
enrh
yn1
1
-
-
-
-
CO
OK
ISLA
ND
S1,
275
16
1
1,
080
23
9
2
Tabl
e 1.
6 N
umbe
r of A
gric
ultu
rally
Act
ive
Hou
seho
lds,
by
Sour
ce o
f Loa
ns fo
r Agr
icul
tura
l Pur
pose
s an
d by
Loc
atio
n of
Hou
seho
ld
Loca
tion
of H
ouse
hold
Tota
l Num
ber o
f Ag
ricul
tura
lly
Activ
e H
ouse
hold
s
Num
ber o
f H
ouse
hold
s W
ith
No
Loan
Num
ber o
f Hou
seho
lds
with
Loa
ns, b
y So
urce
Not
Sta
ted
Sour
ce: C
ook
Isla
nds
2011
Cen
sus
of A
gric
ultu
re a
nd F
ishe
ries
TAB
LE S
ET 1
: HO
USE
HO
LD D
ETAI
LS
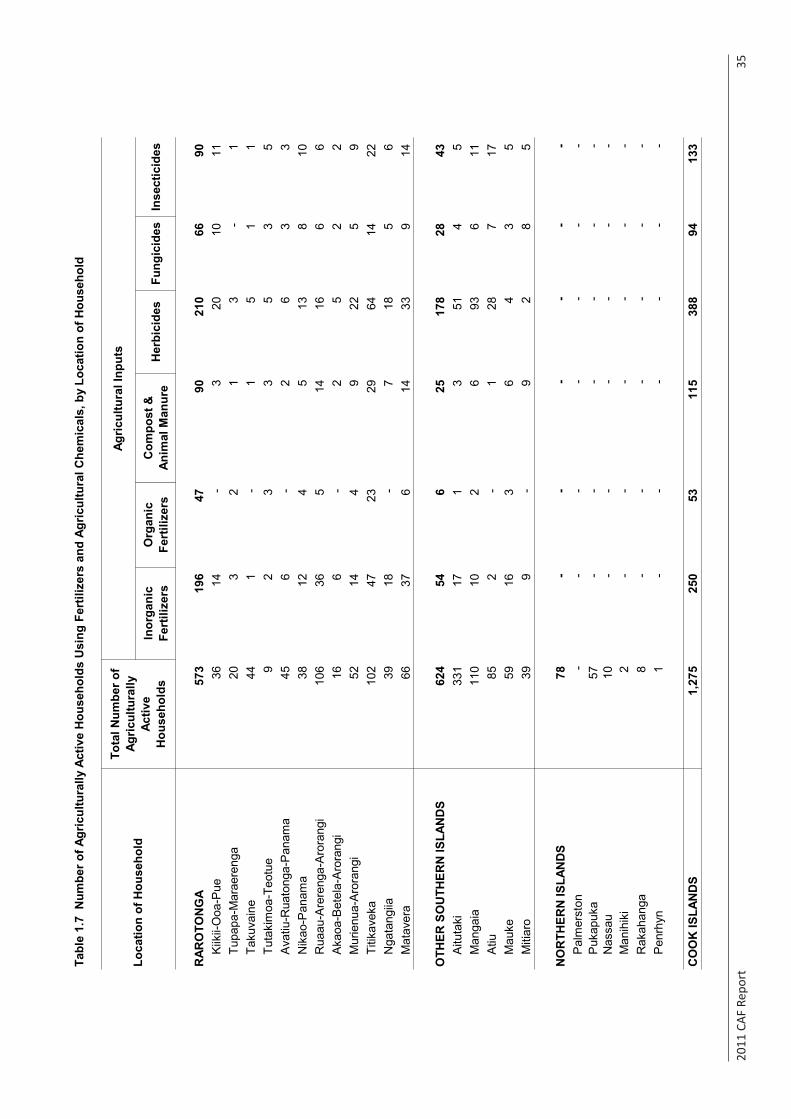
2011
CAF
Rep
ort
35
Tabl
e 1.
7 N
umbe
r of A
gric
ultu
rally
Act
ive
Hou
seho
lds
Usi
ng F
ertil
izer
s an
d Ag
ricul
tura
l Che
mic
als,
by
Loca
tion
of H
ouse
hold
Inor
gani
c Fe
rtili
zers
Org
anic
Fe
rtili
zers
Com
post
&
Anim
al M
anur
eH
erbi
cide
sFu
ngic
ides
Inse
ctic
ides
RAR
OTO
NG
A57
3
19
6
47
90
210
66
90
K
iikii-
Ooa
-Pue
36
14
-
3
20
10
11
Tupa
pa-M
arae
reng
a20
3
2
1
3
-
1
Taku
vain
e44
1
-
1
5
1
1
Tuta
kim
oa-T
eotu
e9
2
3
3
5
3
5
Ava
tiu-R
uato
nga-
Pan
ama
45
6
-
2
6
3
3
N
ikao
-Pan
ama
38
12
4
5
13
8
10
R
uaau
-Are
reng
a-A
rora
ngi
106
36
5
14
16
6
6
A
kaoa
-Bet
ela-
Aro
rang
i16
6
-
2
5
2
2
Mur
ienu
a-A
rora
ngi
52
14
4
9
22
5
9
Ti
tikav
eka
102
47
23
29
64
14
22
N
gata
ngiia
39
18
-
7
18
5
6
M
atav
era
66
37
6
14
33
9
14
OTH
ER S
OU
THER
N IS
LAN
DS
624
54
6
25
178
28
43
A
ituta
ki33
1
17
1
3
51
4
5
Man
gaia
110
10
2
6
93
6
11
A
tiu85
2
-
1
28
7
17
M
auke
59
16
3
6
4
3
5
Miti
aro
39
9
-
9
2
8
5
NO
RTH
ERN
ISLA
ND
S78
-
-
-
-
-
-
Pal
mer
ston
-
-
-
-
-
-
-
Puk
apuk
a57
-
-
-
-
-
-
Nas
sau
10
-
-
-
-
-
-
M
anih
iki
2
-
-
-
-
-
-
R
akah
anga
8
-
-
-
-
-
-
P
enrh
yn1
-
-
-
-
-
-
CO
OK
ISLA
ND
S1,
275
25
0
53
115
388
94
133
Loca
tion
of H
ouse
hold
Tota
l Num
ber o
f Ag
ricul
tura
lly
Activ
e H
ouse
hold
s
Agric
ultu
ral I
nput
s
Sour
ce: C
ook
Isla
nds
2011
Cen
sus
of A
gric
ultu
re a
nd F
ishe
ries
TAB
LE S
ET 1
: HO
USE
HO
LD D
ETAI
LS
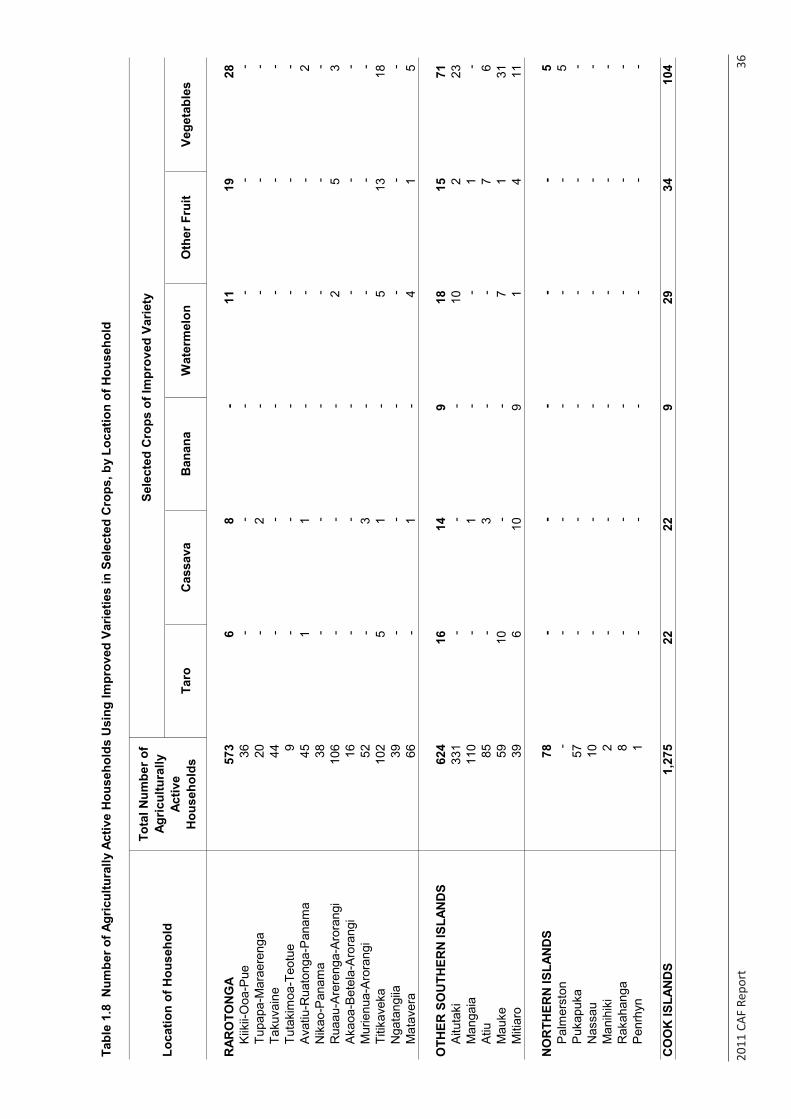
2011
CAF
Rep
ort
36
Tabl
e 1.
8 N
umbe
r of A
gric
ultu
rally
Act
ive
Hou
seho
lds
Usi
ng Im
prov
ed V
arie
ties
in S
elec
ted
Cro
ps, b
y Lo
catio
n of
Hou
seho
ld
Taro
Cas
sava
Ban
ana
Wat
erm
elon
Oth
er F
ruit
Vege
tabl
es
RAR
OTO
NG
A57
3
6
8
-
11
19
28
Kiik
ii-O
oa-P
ue36
-
-
-
-
-
-
Tu
papa
-Mar
aere
nga
20
-
2
-
-
-
-
Ta
kuva
ine
44
-
-
-
-
-
-
Tuta
kim
oa-T
eotu
e9
-
-
-
-
-
-
A
vatiu
-Rua
tong
a-P
anam
a45
1
1
-
-
-
2
Nik
ao-P
anam
a38
-
-
-
-
-
-
R
uaau
-Are
reng
a-A
rora
ngi
106
-
-
-
2
5
3
A
kaoa
-Bet
ela-
Aro
rang
i16
-
-
-
-
-
-
M
urie
nua-
Aro
rang
i 52
-
3
-
-
-
-
Titik
avek
a10
2
5
1
-
5
13
18
Nga
tang
iia39
-
-
-
-
-
-
M
atav
era
66
-
1
-
4
1
5
OTH
ER S
OU
THER
N IS
LAN
DS
624
16
14
9
18
15
71
Aitu
taki
331
-
-
-
10
2
23
M
anga
ia11
0
-
1
-
-
1
-
A
tiu85
-
3
-
-
7
6
Mau
ke59
10
-
-
7
1
31
M
itiar
o39
6
10
9
1
4
11
NO
RTH
ERN
ISLA
ND
S78
-
-
-
-
-
5
Pal
mer
ston
-
-
-
-
-
-
5
Puk
apuk
a57
-
-
-
-
-
-
N
assa
u10
-
-
-
-
-
-
M
anih
iki
2
-
-
-
-
-
-
Rak
ahan
ga8
-
-
-
-
-
-
P
enrh
yn1
-
-
-
-
-
-
CO
OK
ISLA
ND
S1,
275
22
22
9
29
34
10
4
Loca
tion
of H
ouse
hold
Tota
l Num
ber o
f Ag
ricul
tura
lly
Activ
e H
ouse
hold
s
Sele
cted
Cro
ps o
f Im
prov
ed V
arie
ty
Sour
ce: C
ook
Isla
nds
2011
Cen
sus
of A
gric
ultu
re a
nd F
ishe
ries
TAB
LE S
ET 1
: HO
USE
HO
LD D
ETAI
LS
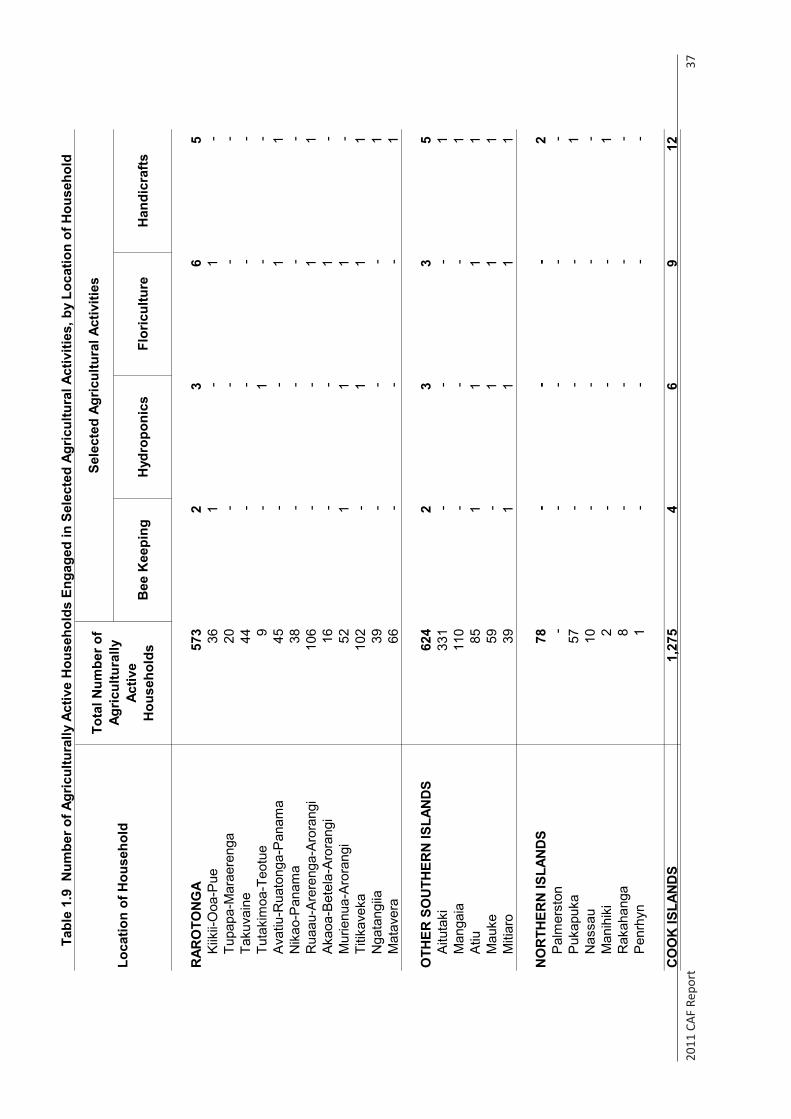
2011
CAF
Rep
ort
37
Bee
Kee
ping
Hyd
ropo
nics
Flor
icul
ture
Han
dicr
afts
RAR
OTO
NG
A57
3
2
3
6
5
K
iikii-
Ooa
-Pue
36
1
-
1
-
Tupa
pa-M
arae
reng
a20
-
-
-
-
Ta
kuva
ine
44
-
-
-
-
Tuta
kim
oa-T
eotu
e9
-
1
-
-
Ava
tiu-R
uato
nga-
Pan
ama
45
-
-
1
1
Nik
ao-P
anam
a38
-
-
-
-
R
uaau
-Are
reng
a-A
rora
ngi
106
-
-
1
1
Aka
oa-B
etel
a-A
rora
ngi
16
-
-
1
-
M
urie
nua-
Aro
rang
i 52
1
1
1
-
Titik
avek
a10
2
-
1
1
1
Nga
tang
iia39
-
-
-
1
Mat
aver
a66
-
-
-
1
OTH
ER S
OU
THER
N IS
LAN
DS
624
2
3
3
5
Aitu
taki
331
-
-
-
1
M
anga
ia11
0
-
-
-
1
Atiu
85
1
1
1
1
Mau
ke59
-
1
1
1
Miti
aro
39
1
1
1
1
NO
RTH
ERN
ISLA
ND
S78
-
-
-
2
Pal
mer
ston
-
-
-
-
-
P
ukap
uka
57
-
-
-
1
N
assa
u10
-
-
-
-
M
anih
iki
2
-
-
-
1
R
akah
anga
8
-
-
-
-
Pen
rhyn
1
-
-
-
-
CO
OK
ISLA
ND
S1,
275
4
6
9
12
Loca
tion
of H
ouse
hold
Tota
l Num
ber o
f Ag
ricul
tura
lly
Activ
e H
ouse
hold
s
Sele
cted
Agr
icul
tura
l Act
iviti
es
Tabl
e 1.
9 N
umbe
r of A
gric
ultu
rally
Act
ive
Hou
seho
lds
Enga
ged
in S
elec
ted
Agric
ultu
ral A
ctiv
ities
, by
Loca
tion
of H
ouse
hold
Sour
ce: C
ook
Isla
nds
2011
Cen
sus
of A
gric
ultu
re a
nd F
ishe
ries
TAB
LE S
ET 1
: HO
USE
HO
LD D
ETAI
LS
2011
CAF
Rep
ort
38
TA
BL
E S
ET
2: H
OL
DIN
GS
AN
D L
AB
OU
R IN
PUT
S
Tabl
e 2.
1-
Num
ber o
f Hol
ding
s, by
Siz
e an
d Lo
catio
n of
Hol
ding
Tabl
e 2.
2-
Are
a of
Hol
ding
s, by
Siz
e an
d Lo
catio
n of
Hol
ding
Tabl
e 2.
3-
Num
ber o
f Par
cels
, by
Size
and
Loc
atio
n of
Par
cel
Tabl
e 2.
4-
Are
a of
Par
cels
, by
Size
and
Loc
atio
n of
Par
cel
Tabl
e 2.
5-
Num
ber o
f Par
cels
, by
Land
Ten
ure
and
Loca
tion
of P
arce
lTa
ble
2.6
-A
rea
of P
arce
ls, b
y La
nd T
enur
e an
d Lo
catio
n of
Par
cel
Tabl
e 2.
7-
Num
ber o
f Par
cels
, by
Land
Use
and
Loc
atio
n of
Par
cel
Tabl
e 2.
8-
Are
a of
Par
cels
, by
Land
Use
and
Loc
atio
n of
Par
cel
Tabl
e 2.
9-
Are
a of
Par
cels
In U
se, b
y N
umbe
r of M
onth
s Use
d an
d Lo
catio
n of
Par
cel
Tabl
e 2.
10-
Are
a of
Fal
low
Par
cels
, by
Num
ber o
f Mon
ths U
nuse
d an
d Lo
catio
n of
Par
cel
Tabl
e 2.
11-
Num
ber o
f Hou
seho
ld M
embe
rs 1
5 an
d O
ver,
Wor
king
in H
oldi
ng D
urin
g M
onth
Prio
r to
Enum
erat
ion,
by
Sex,
Age
Gro
up, T
ype
of L
abou
r, by
Lo
catio
n of
Hou
seho
ldTa
ble
2.12
-N
umbe
r of N
on-H
ouse
hold
Mem
bers
15
and
Ove
r, W
orki
ng in
Hol
ding
Dur
ing
Mon
th P
rior t
o En
umer
atio
n, b
y Se
x, A
ge G
roup
, Typ
e of
Lab
our,
by
Loca
tion
of H
ouse
hold
Tabl
e 2.
13-
Ave
rage
Hou
rs W
orke
d Pe
r Wee
k, b
y Pe
rson
s 15
and
Ove
r, in
Hol
ding
Dur
ing
Mon
th P
rior t
o En
umer
atio
n, b
y Se
x, A
ge G
roup
, Typ
e of
Lab
our,
by
Loca
tion
of H
ouse
hold
Tabl
e 2.
14-
Ave
rage
Wag
es (N
Z$) P
er M
onth
by
Pers
ons 1
5 an
d O
ver,
Wor
king
in P
aid
Cap
acity
in H
oldi
ng D
urin
g M
onth
Prio
r to
Enum
erat
ion,
by
Sex,
Age
G
roup
, by
Loca
tion
of H
ouse
hold
Tabl
e 2.
15-
Num
ber o
f Per
sons
15
and
Ove
r, W
orki
ng in
Pai
d C
apac
ity in
the
Hol
ding
Dur
ing
the
Mon
th P
rior t
o En
umer
atio
n, b
y Se
x, O
ther
Ben
efits
Rec
eive
d an
d Is
land
Tabl
e 2.
16-
Num
ber o
f Per
sons
15
and
Ove
r, W
orki
ng in
Hol
ding
Dur
ing
Mon
th P
rior t
o En
umer
atio
n H
oldi
ng O
ther
Pai
d Jo
bs, b
y Se
x, S
tatu
s of O
ther
Pai
d Jo
b,
Type
of L
abou
r, by
Loc
atio
n of
Hou
seho
ld
HO
LD
ING
S A
ND
PA
RC
EL
S
LA
BO
UR
INPU
TS
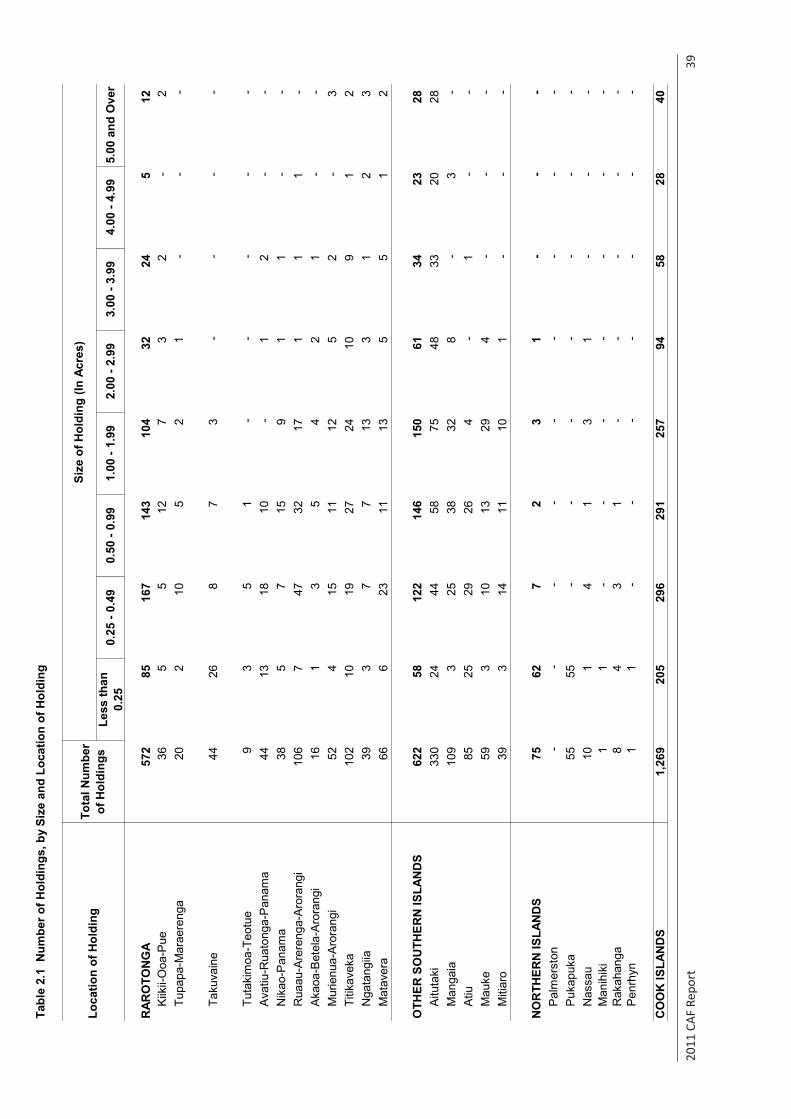
2011
CAF
Rep
ort
39
Tabl
e 2.
1 N
umbe
r of H
oldi
ngs,
by
Size
and
Loc
atio
n of
Hol
ding
Less
than
0.
250.
25 -
0.49
0.50
- 0.
991.
00 -
1.99
2.00
- 2.
993.
00 -
3.99
4.00
- 4.
995.
00 a
nd O
ver
RAR
OTO
NG
A57
2
85
167
143
104
32
24
5
12
K
iikii-
Ooa
-Pue
36
5
5
12
7
3
2
-
2
Tupa
pa-M
arae
reng
a20
2
10
5
2
1
-
-
-
Taku
vain
e44
26
8
7
3
-
-
-
-
Tuta
kim
oa-T
eotu
e9
3
5
1
-
-
-
-
-
A
vatiu
-Rua
tong
a-P
anam
a44
13
18
10
-
1
2
-
-
N
ikao
-Pan
ama
38
5
7
15
9
1
1
-
-
Rua
au-A
rere
nga-
Aro
rang
i10
6
7
47
32
17
1
1
1
-
Aka
oa-B
etel
a-A
rora
ngi
16
1
3
5
4
2
1
-
-
M
urie
nua-
Aro
rang
i 52
4
15
11
12
5
2
-
3
Ti
tikav
eka
102
10
19
27
24
10
9
1
2
N
gata
ngiia
39
3
7
7
13
3
1
2
3
Mat
aver
a66
6
23
11
13
5
5
1
2
OTH
ER S
OU
THER
N IS
LAN
DS
622
58
12
2
14
6
15
0
61
34
23
28
A
ituta
ki33
0
24
44
58
75
48
33
20
28
M
anga
ia10
9
3
25
38
32
8
-
3
-
Atiu
85
25
29
26
4
-
1
-
-
Mau
ke59
3
10
13
29
4
-
-
-
M
itiar
o39
3
14
11
10
1
-
-
-
NO
RTH
ERN
ISLA
ND
S75
62
7
2
3
1
-
-
-
P
alm
erst
on-
-
-
-
-
-
-
-
-
P
ukap
uka
55
55
-
-
-
-
-
-
-
Nas
sau
10
1
4
1
3
1
-
-
-
M
anih
iki
1
1
-
-
-
-
-
-
-
Rak
ahan
ga8
4
3
1
-
-
-
-
-
P
enrh
yn1
1
-
-
-
-
-
-
-
CO
OK
ISLA
ND
S1,
269
20
5
29
6
29
1
25
7
94
58
28
40
Loca
tion
of H
oldi
ngTo
tal N
umbe
r of
Hol
ding
s
Size
of H
oldi
ng (I
n Ac
res)
Sour
ce: C
ook
Isla
nds
2011
Cen
sus
of A
gric
ultu
re a
nd F
ishe
ries
TAB
LE S
ET 2
: HO
LDIN
G D
ETA
ILS
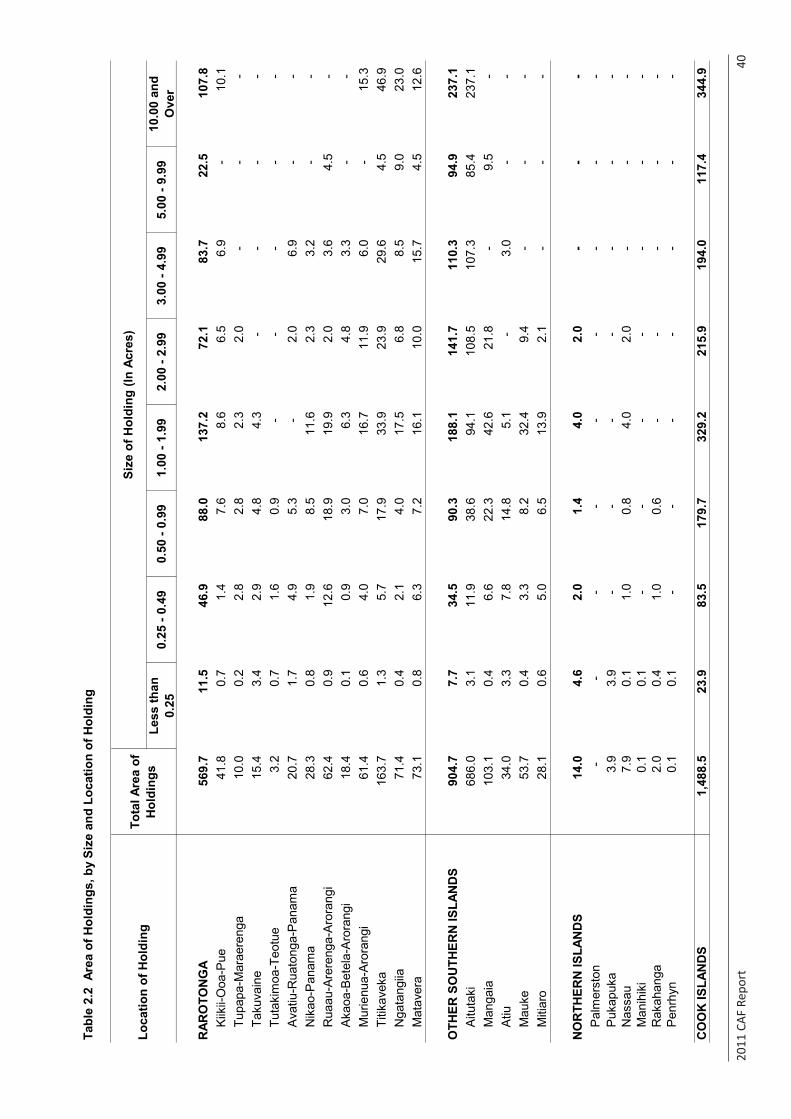
2011
CAF
Rep
ort
40
Tabl
e 2.
2 A
rea
of H
oldi
ngs,
by
Size
and
Loc
atio
n of
Hol
ding
Less
than
0.
250.
25 -
0.49
0.50
- 0.
991.
00 -
1.99
2.00
- 2.
993.
00 -
4.99
5.00
- 9.
9910
.00
and
Ove
r
RAR
OTO
NG
A56
9.7
11
.5
46.9
88
.0
137.
2
72.1
83
.7
22.5
10
7.8
K
iikii-
Ooa
-Pue
41.8
0.
7
1.
4
7.
6
8.
6
6.
5
6.
9
-
10.1
Tu
papa
-Mar
aere
nga
10.0
0.
2
2.
8
2.
8
2.
3
2.
0
-
-
-
Taku
vain
e15
.4
3.4
2.9
4.8
4.3
-
-
-
-
Tuta
kim
oa-T
eotu
e3.
2
0.
7
1.
6
0.
9
-
-
-
-
-
Ava
tiu-R
uato
nga-
Pan
ama
20.7
1.
7
4.
9
5.
3
-
2.0
6.9
-
-
Nik
ao-P
anam
a28
.3
0.8
1.9
8.5
11.6
2.
3
3.
2
-
-
R
uaau
-Are
reng
a-A
rora
ngi
62.4
0.
9
12
.6
18.9
19
.9
2.0
3.6
4.5
-
A
kaoa
-Bet
ela-
Aro
rang
i18
.4
0.1
0.9
3.0
6.3
4.8
3.3
-
-
Mur
ienu
a-A
rora
ngi
61.4
0.
6
4.
0
7.
0
16
.7
11.9
6.
0
-
15.3
Ti
tikav
eka
163.
7
1.3
5.7
17.9
33
.9
23.9
29
.6
4.5
46.9
N
gata
ngiia
71.4
0.
4
2.
1
4.
0
17
.5
6.8
8.5
9.0
23.0
M
atav
era
73.1
0.
8
6.
3
7.
2
16
.1
10.0
15
.7
4.5
12.6
OTH
ER S
OU
THER
N IS
LAN
DS
904.
7
7.7
34.5
90
.3
188.
1
141.
7
110.
3
94.9
23
7.1
A
ituta
ki68
6.0
3.
1
11
.9
38.6
94
.1
108.
5
107.
3
85.4
23
7.1
M
anga
ia10
3.1
0.
4
6.
6
22
.3
42.6
21
.8
-
9.
5
-
Atiu
34.0
3.
3
7.
8
14
.8
5.1
-
3.
0
-
-
M
auke
53.7
0.
4
3.
3
8.
2
32
.4
9.4
-
-
-
M
itiar
o28
.1
0.6
5.0
6.5
13.9
2.
1
-
-
-
NO
RTH
ERN
ISLA
ND
S14
.0
4.6
2.0
1.4
4.0
2.0
-
-
-
P
alm
erst
on-
-
-
-
-
-
-
-
-
Puk
apuk
a3.
9
3.
9
-
-
-
-
-
-
-
Nas
sau
7.9
0.1
1.0
0.8
4.0
2.0
-
-
-
M
anih
iki
0.1
0.1
-
-
-
-
-
-
-
R
akah
anga
2.0
0.4
1.0
0.6
-
-
-
-
-
P
enrh
yn0.
1
0.
1
-
-
-
-
-
-
-
CO
OK
ISLA
ND
S1,
488.
5
23
.9
83.5
17
9.7
32
9.2
21
5.9
19
4.0
11
7.4
34
4.9
Loca
tion
of H
oldi
ngTo
tal A
rea
of
Hol
ding
s
Size
of H
oldi
ng (I
n Ac
res)
Sour
ce: C
ook
Isla
nds
2011
Cen
sus
of A
gric
ultu
re a
nd F
ishe
ries
TAB
LE S
ET 2
: HO
LDIN
G D
ETA
ILS
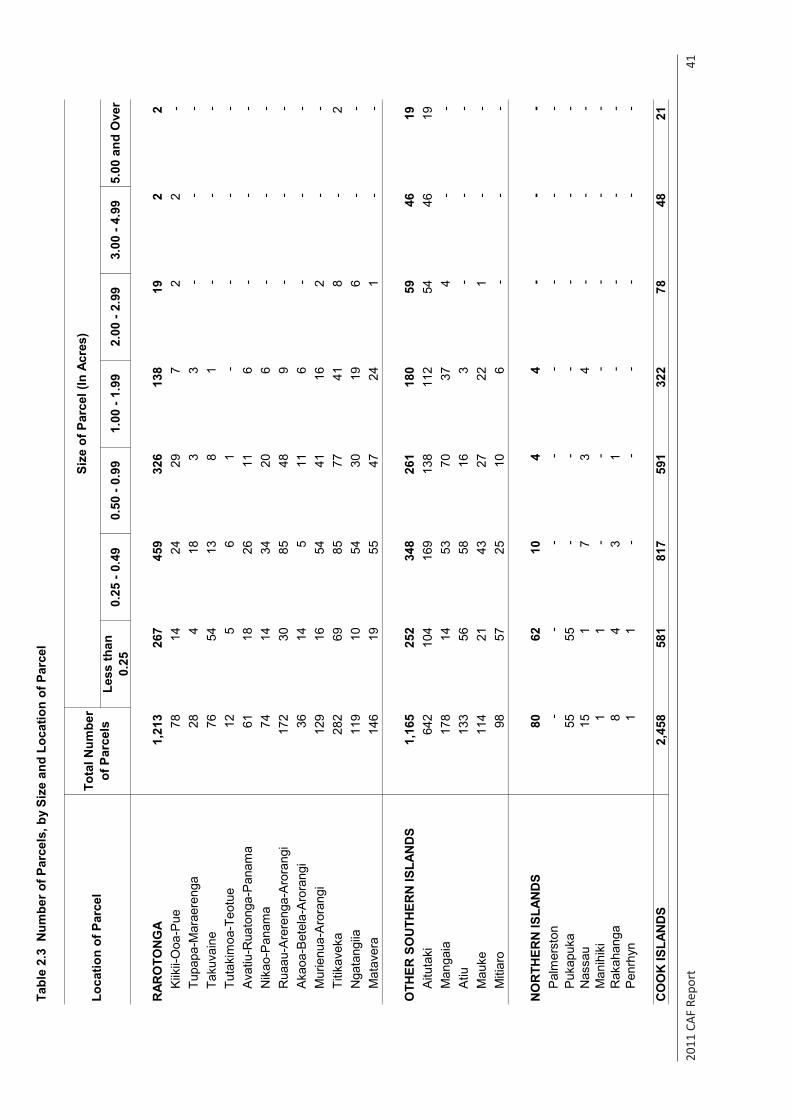
2011
CAF
Rep
ort
41
Tabl
e 2.
3 N
umbe
r of P
arce
ls, b
y Si
ze a
nd L
ocat
ion
of P
arce
l
Less
than
0.
250.
25 -
0.49
0.50
- 0.
991.
00 -
1.99
2.00
- 2.
993.
00 -
4.99
5.00
and
Ove
r
RAR
OTO
NG
A1,
213
26
7
45
9
32
6
13
8
19
2
2
Kiik
ii-O
oa-P
ue78
14
24
29
7
2
2
-
Tu
papa
-Mar
aere
nga
28
4
18
3
3
-
-
-
Taku
vain
e76
54
13
8
1
-
-
-
Tuta
kim
oa-T
eotu
e12
5
6
1
-
-
-
-
Ava
tiu-R
uato
nga-
Pan
ama
61
18
26
11
6
-
-
-
Nik
ao-P
anam
a74
14
34
20
6
-
-
-
R
uaau
-Are
reng
a-A
rora
ngi
172
30
85
48
9
-
-
-
A
kaoa
-Bet
ela-
Aro
rang
i36
14
5
11
6
-
-
-
Mur
ienu
a-A
rora
ngi
129
16
54
41
16
2
-
-
Titik
avek
a28
2
69
85
77
41
8
-
2
N
gata
ngiia
119
10
54
30
19
6
-
-
Mat
aver
a14
6
19
55
47
24
1
-
-
OTH
ER S
OU
THER
N IS
LAN
DS
1,16
5
252
348
261
180
59
46
19
A
ituta
ki64
2
10
4
16
9
13
8
11
2
54
46
19
Man
gaia
178
14
53
70
37
4
-
-
Atiu
133
56
58
16
3
-
-
-
M
auke
114
21
43
27
22
1
-
-
Miti
aro
98
57
25
10
6
-
-
-
NO
RTH
ERN
ISLA
ND
S80
62
10
4
4
-
-
-
Pal
mer
ston
-
-
-
-
-
-
-
-
Puk
apuk
a55
55
-
-
-
-
-
-
N
assa
u15
1
7
3
4
-
-
-
Man
ihik
i1
1
-
-
-
-
-
-
R
akah
anga
8
4
3
1
-
-
-
-
Pen
rhyn
1
1
-
-
-
-
-
-
CO
OK
ISLA
ND
S2,
458
58
1
81
7
59
1
32
2
78
48
21
Loca
tion
of P
arce
lTo
tal N
umbe
r of
Par
cels
Size
of P
arce
l (In
Acr
es)
Sour
ce: C
ook
Isla
nds
2011
Cen
sus
of A
gric
ultu
re a
nd F
ishe
ries
TAB
LE S
ET 2
: HO
LDIN
G D
ETA
ILS
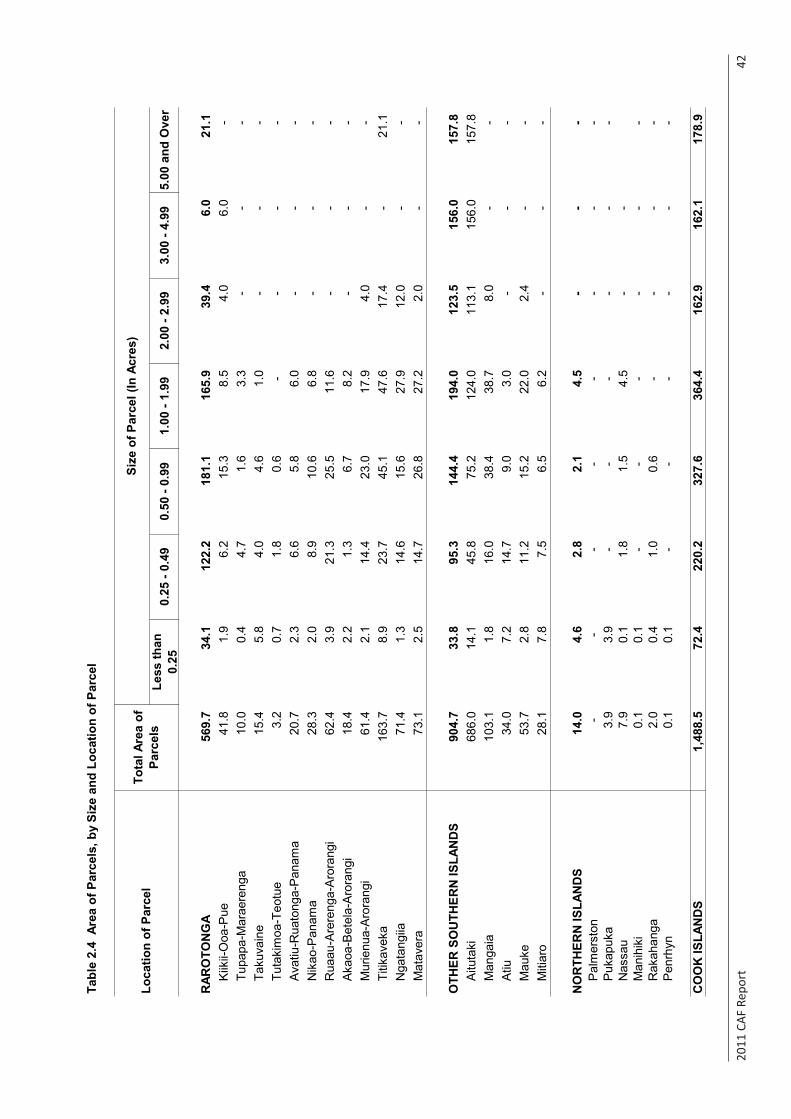
2011
CAF
Rep
ort
42
Tabl
e 2.
4 A
rea
of P
arce
ls, b
y Si
ze a
nd L
ocat
ion
of P
arce
l
Less
than
0.
250.
25 -
0.49
0.50
- 0.
991.
00 -
1.99
2.00
- 2.
993.
00 -
4.99
5.00
and
Ove
r
RAR
OTO
NG
A56
9.7
34
.1
122.
2
181.
1
165.
9
39.4
6.
0
21
.1
Kiik
ii-O
oa-P
ue41
.8
1.9
6.2
15.3
8.
5
4.
0
6.
0
-
Tupa
pa-M
arae
reng
a10
.0
0.4
4.7
1.6
3.3
-
-
-
Ta
kuva
ine
15.4
5.
8
4.
0
4.
6
1.
0
-
-
-
Tuta
kim
oa-T
eotu
e3.
2
0.
7
1.
8
0.
6
-
-
-
-
A
vatiu
-Rua
tong
a-P
anam
a20
.7
2.3
6.6
5.8
6.0
-
-
-
N
ikao
-Pan
ama
28.3
2.
0
8.
9
10
.6
6.8
-
-
-
R
uaau
-Are
reng
a-A
rora
ngi
62.4
3.
9
21
.3
25.5
11
.6
-
-
-
A
kaoa
-Bet
ela-
Aro
rang
i18
.4
2.2
1.3
6.7
8.2
-
-
-
M
urie
nua-
Aro
rang
i 61
.4
2.1
14.4
23
.0
17.9
4.
0
-
-
Ti
tikav
eka
163.
7
8.9
23.7
45
.1
47.6
17
.4
-
21
.1
Nga
tang
iia71
.4
1.3
14.6
15
.6
27.9
12
.0
-
-
Mat
aver
a73
.1
2.5
14.7
26
.8
27.2
2.
0
-
-
OTH
ER S
OU
THER
N IS
LAN
DS
904.
7
33.8
95
.3
144.
4
194.
0
123.
5
156.
0
157.
8
Aitu
taki
686.
0
14.1
45
.8
75.2
12
4.0
11
3.1
15
6.0
15
7.8
M
anga
ia10
3.1
1.
8
16
.0
38.4
38
.7
8.0
-
-
Atiu
34.0
7.
2
14
.7
9.0
3.0
-
-
-
M
auke
53.7
2.
8
11
.2
15.2
22
.0
2.4
-
-
Miti
aro
28.1
7.
8
7.
5
6.
5
6.
2
-
-
-
NO
RTH
ERN
ISLA
ND
S14
.0
4.6
2.8
2.1
4.5
-
-
-
P
alm
erst
on-
-
-
-
-
-
-
-
P
ukap
uka
3.9
3.9
-
-
-
-
-
-
Nas
sau
7.9
0.1
1.8
1.5
4.5
-
-
Man
ihik
i0.
1
0.
1
-
-
-
-
-
-
R
akah
anga
2.0
0.4
1.0
0.6
-
-
-
-
Pen
rhyn
0.1
0.1
-
-
-
-
-
-
CO
OK
ISLA
ND
S1,
488.
5
72
.4
220.
2
327.
6
364.
4
162.
9
162.
1
178.
9
Loca
tion
of P
arce
lTo
tal A
rea
of
Parc
els
Size
of P
arce
l (In
Acr
es)
Sour
ce: C
ook
Isla
nds
2011
Cen
sus
of A
gric
ultu
re a
nd F
ishe
ries
TAB
LE S
ET 2
: HO
LDIN
G D
ETA
ILS
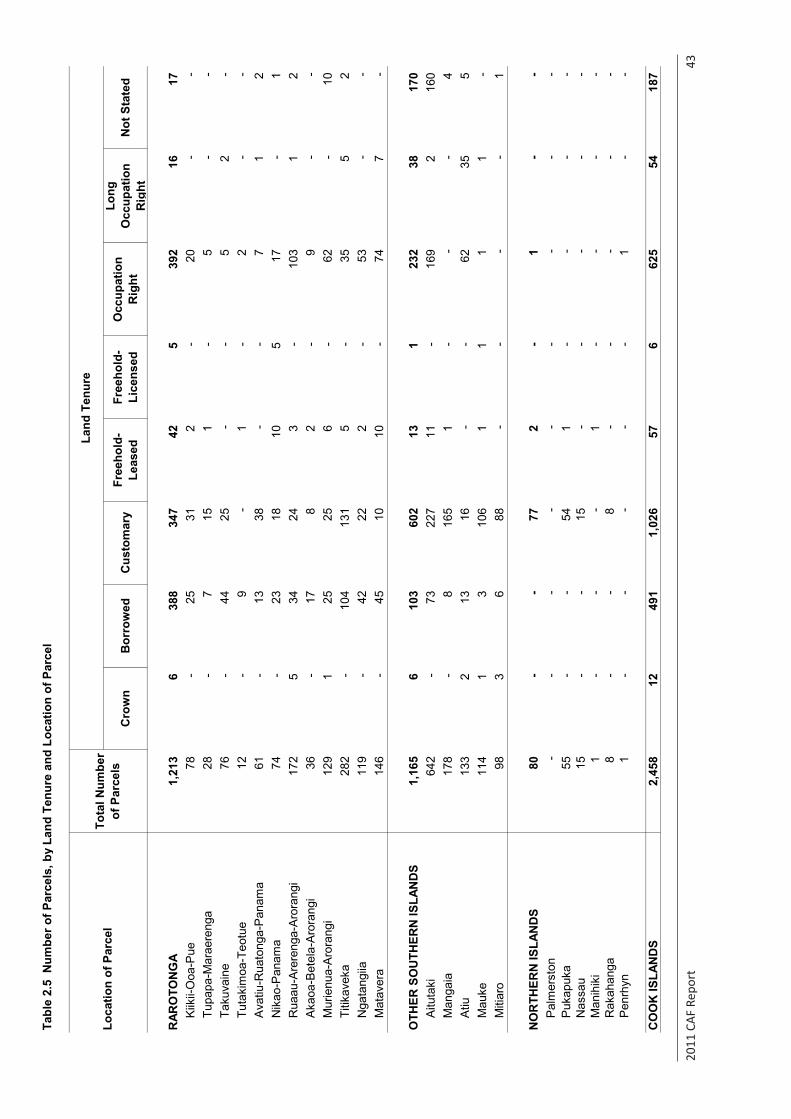
2011
CAF
Rep
ort
43
Tabl
e 2.
5 N
umbe
r of P
arce
ls, b
y La
nd T
enur
e an
d Lo
catio
n of
Par
cel
Cro
wn
Bor
row
edC
usto
mar
yFr
eeho
ld-
Leas
edFr
eeho
ld-
Lice
nsed
Occ
upat
ion
Rig
ht
Long
O
ccup
atio
n R
ight
Not
Sta
ted
RAR
OTO
NG
A1,
213
6
38
8
34
7
42
5
392
16
17
Kiik
ii-O
oa-P
ue78
-
25
31
2
-
20
-
-
Tu
papa
-Mar
aere
nga
28
-
7
15
1
-
5
-
-
Taku
vain
e76
-
44
25
-
-
5
2
-
Tuta
kim
oa-T
eotu
e12
-
9
-
1
-
2
-
-
Ava
tiu-R
uato
nga-
Pan
ama
61
-
13
38
-
-
7
1
2
N
ikao
-Pan
ama
74
-
23
18
10
5
17
-
1
R
uaau
-Are
reng
a-A
rora
ngi
172
5
34
24
3
-
103
1
2
Aka
oa-B
etel
a-A
rora
ngi
36
-
17
8
2
-
9
-
-
Mur
ienu
a-A
rora
ngi
129
1
25
25
6
-
62
-
10
Titik
avek
a28
2
-
10
4
13
1
5
-
35
5
2
Nga
tang
iia11
9
-
42
22
2
-
53
-
-
Mat
aver
a14
6
-
45
10
10
-
74
7
-
OTH
ER S
OU
THER
N IS
LAN
DS
1,16
5
6
103
602
13
1
23
2
38
170
Aitu
taki
642
-
73
22
7
11
-
169
2
160
Man
gaia
178
-
8
165
1
-
-
-
4
Atiu
133
2
13
16
-
-
62
35
5
Mau
ke11
4
1
3
10
6
1
1
1
1
-
M
itiar
o98
3
6
88
-
-
-
-
1
NO
RTH
ERN
ISLA
ND
S80
-
-
77
2
-
1
-
-
P
alm
erst
on-
-
-
-
-
-
-
-
-
P
ukap
uka
55
-
-
54
1
-
-
-
-
Nas
sau
15
-
-
15
-
-
-
-
-
Man
ihik
i1
-
-
-
1
-
-
-
-
R
akah
anga
8
-
-
8
-
-
-
-
-
Pen
rhyn
1
-
-
-
-
-
1
-
-
CO
OK
ISLA
ND
S2,
458
12
491
1,02
6
57
6
62
5
54
187
Loca
tion
of P
arce
lTo
tal N
umbe
r of
Par
cels
Land
Ten
ure
Sour
ce: C
ook
Isla
nds
2011
Cen
sus
of A
gric
ultu
re a
nd F
ishe
ries
TAB
LE S
ET 2
: HO
LDIN
G D
ETA
ILS
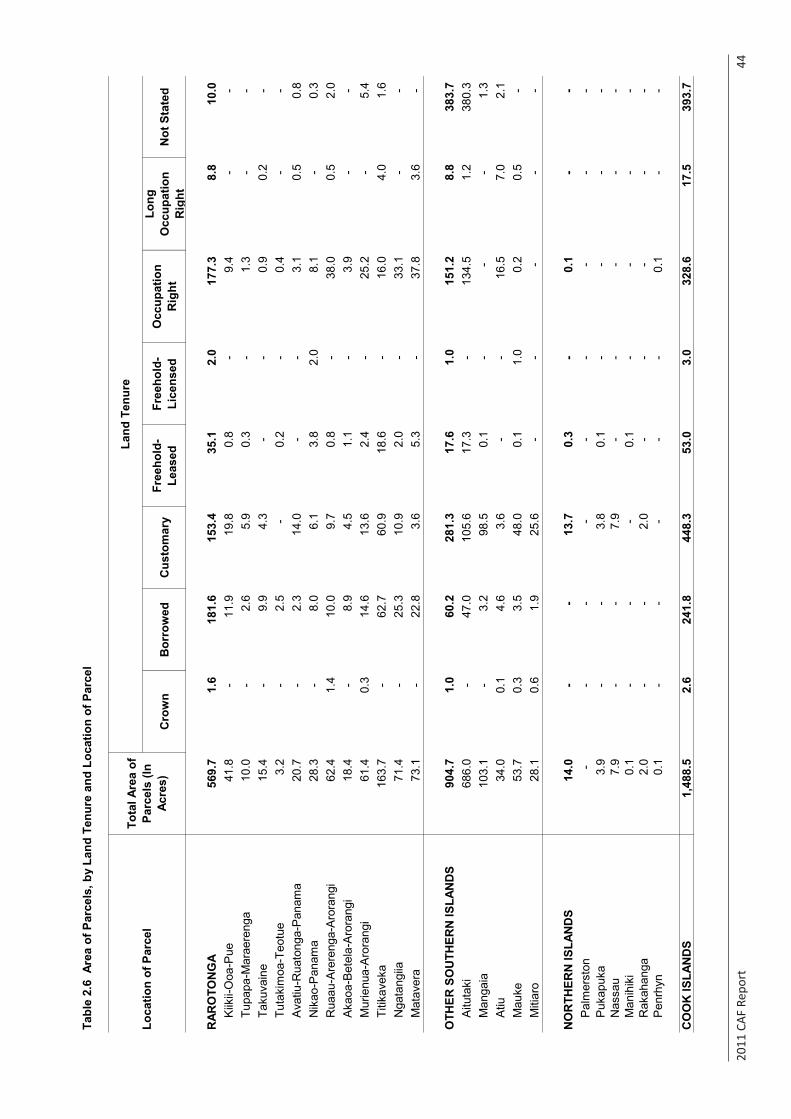
2011
CAF
Rep
ort
44
Tabl
e 2.
6 A
rea
of P
arce
ls, b
y La
nd T
enur
e an
d Lo
catio
n of
Par
cel
Cro
wn
Bor
row
edC
usto
mar
yFr
eeho
ld-
Leas
edFr
eeho
ld-
Lice
nsed
Occ
upat
ion
Rig
ht
Long
O
ccup
atio
n R
ight
Not
Sta
ted
RAR
OTO
NG
A56
9.7
1.
6
18
1.6
15
3.4
35
.1
2.0
177.
3
8.
8
10.0
K
iikii-
Ooa
-Pue
41.8
-
11.9
19
.8
0.8
-
9.
4
-
-
Tu
papa
-Mar
aere
nga
10.0
-
2.6
5.9
0.3
-
1.
3
-
-
Ta
kuva
ine
15.4
-
9.9
4.3
-
-
0.9
0.
2
-
Tu
taki
moa
-Teo
tue
3.2
-
2.
5
-
0.2
-
0.
4
-
-
A
vatiu
-Rua
tong
a-P
anam
a20
.7
-
2.
3
14
.0
-
-
3.1
0.
5
0.8
Nik
ao-P
anam
a28
.3
-
8.
0
6.
1
3.
8
2.
0
8.
1
-
0.3
Rua
au-A
rere
nga-
Aro
rang
i62
.4
1.4
10.0
9.
7
0.
8
-
38.0
0.5
2.
0
A
kaoa
-Bet
ela-
Aro
rang
i18
.4
-
8.
9
4.
5
1.
1
-
3.9
-
-
Mur
ienu
a-A
rora
ngi
61.4
0.
3
14
.6
13.6
2.
4
-
25.2
-
5.4
Titik
avek
a16
3.7
-
62.7
60
.9
18.6
-
16.0
4.0
1.
6
N
gata
ngiia
71.4
-
25.3
10
.9
2.0
-
33
.1
-
-
Mat
aver
a73
.1
-
22
.8
3.6
5.3
-
37
.8
3.
6
-
OTH
ER S
OU
THER
N IS
LAN
DS
904.
7
1.0
60.2
28
1.3
17
.6
1.0
151.
2
8.
8
383.
7
Aitu
taki
686.
0
-
47
.0
105.
6
17.3
-
134.
5
1.
2
380.
3
Man
gaia
103.
1
-
3.
2
98
.5
0.1
-
-
-
1.3
Atiu
34.0
0.
1
4.
6
3.
6
-
-
16
.5
7.
0
2.1
Mau
ke53
.7
0.3
3.5
48.0
0.
1
1.
0
0.
2
0.5
-
Miti
aro
28.1
0.
6
1.
9
25
.6
-
-
-
-
-
NO
RTH
ERN
ISLA
ND
S14
.0
-
-
13.7
0.
3
-
0.1
-
-
Pal
mer
ston
-
-
-
-
-
-
-
-
-
Puk
apuk
a3.
9
-
-
3.
8
0.
1
-
-
-
-
Nas
sau
7.9
-
-
7.9
-
-
-
-
-
Man
ihik
i0.
1
-
-
-
0.1
-
-
-
-
R
akah
anga
2.0
-
-
2.0
-
-
-
-
-
Pen
rhyn
0.1
-
-
-
-
-
0.
1
-
-
CO
OK
ISLA
ND
S1,
488.
5
2.
6
24
1.8
44
8.3
53
.0
3.0
328.
6
17
.5
39
3.7
Loca
tion
of P
arce
lTo
tal A
rea
of
Parc
els
(In
Acre
s)
Land
Ten
ure
Sour
ce: C
ook
Isla
nds
2011
Cen
sus
of A
gric
ultu
re a
nd F
ishe
ries
TAB
LE S
ET 2
: HO
LDIN
G D
ETA
ILS

2011
CAF
Rep
ort
45
Tabl
e 2.
7 N
umbe
r of P
arce
ls, b
y La
nd U
se a
nd L
ocat
ion
of P
arce
l
Tree
Cro
pO
ther
Cro
pM
ixed
Cro
pFa
llow
Virg
in B
ush
Live
stoc
kN
on-
Agric
ultu
re
Use
Not
Sta
ted/
U
nkno
wn
RAR
OTO
NG
A1,
213
21
4
74
7
10
7
11
8
5
3
2
17
Kiik
ii-O
oa-P
ue78
11
53
5
9
-
-
-
-
Tupa
pa-M
arae
reng
a28
2
22
2
1
-
-
-
1
Ta
kuva
ine
76
14
57
2
3
-
-
-
-
Tu
taki
moa
-Teo
tue
12
2
9
1
-
-
-
-
-
A
vatiu
-Rua
tong
a-P
anam
a61
8
50
2
-
-
-
-
1
N
ikao
-Pan
ama
74
17
38
10
9
-
-
-
-
Rua
au-A
rere
nga-
Aro
rang
i17
2
50
100
15
6
-
-
1
-
A
kaoa
-Bet
ela-
Aro
rang
i36
6
23
3
2
-
-
1
1
M
urie
nua-
Aro
rang
i 12
9
20
83
4
11
-
-
-
11
Ti
tikav
eka
282
39
16
9
30
38
-
3
-
3
N
gata
ngiia
119
26
50
14
26
3
-
-
-
Mat
aver
a14
6
19
93
19
13
2
-
-
-
OTH
ER S
OU
THER
N IS
LAN
DS
1,16
5
67
64
6
17
8
59
196
2
-
17
A
ituta
ki64
2
23
345
40
36
195
1
-
2
Man
gaia
178
4
119
41
8
-
-
-
6
A
tiu13
3
3
98
22
3
-
-
-
7
M
auke
114
29
48
29
6
1
1
-
-
M
itiar
o98
8
36
46
6
-
-
-
2
NO
RTH
ERN
ISLA
ND
S80
2
48
25
3
-
-
-
2
Pal
mer
ston
-
-
-
-
-
-
-
-
-
Puk
apuk
a55
-
38
17
-
-
-
-
-
Nas
sau
15
2
7
1
3
-
-
-
2
M
anih
iki
1
-
-
1
-
-
-
-
-
Rak
ahan
ga8
-
2
6
-
-
-
-
-
P
enrh
yn1
-
1
-
-
-
-
-
-
CO
OK
ISLA
ND
S2,
458
28
3
1,
441
31
0
18
0
20
1
5
2
36
Loca
tion
of P
arce
lTo
tal N
umbe
r of
Par
cels
Num
ber o
f Lan
d Pa
rcel
s U
nder
…
Sour
ce: C
ook
Isla
nds
2011
Cen
sus
of A
gric
ultu
re a
nd F
ishe
ries
TAB
LE S
ET 2
: HO
LDIN
G D
ETA
ILS
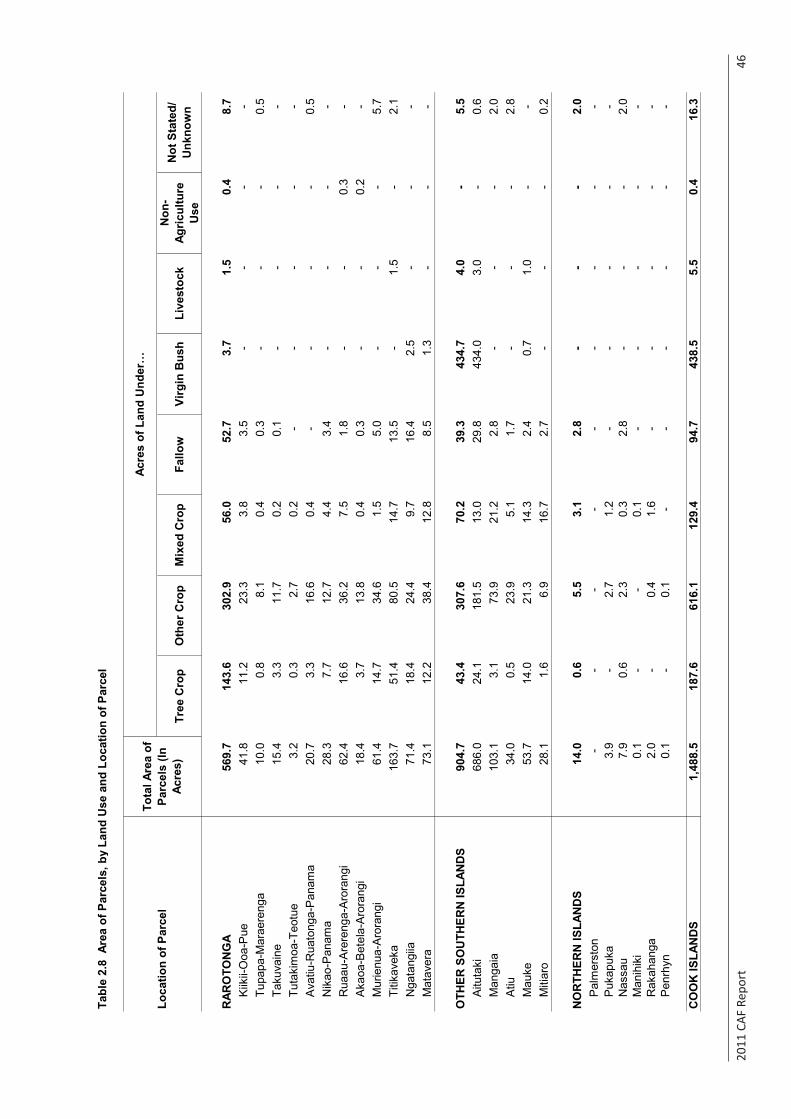
2011
CAF
Rep
ort
46
Tabl
e 2.
8 A
rea
of P
arce
ls, b
y La
nd U
se a
nd L
ocat
ion
of P
arce
l
Tree
Cro
pO
ther
Cro
pM
ixed
Cro
pFa
llow
Virg
in B
ush
Live
stoc
kN
on-
Agric
ultu
re
Use
Not
Sta
ted/
U
nkno
wn
RAR
OTO
NG
A56
9.7
14
3.6
30
2.9
56
.0
52.7
3.
7
1.
5
0.
4
8.
7
K
iikii-
Ooa
-Pue
41.8
11
.2
23.3
3.
8
3.
5
-
-
-
-
Tu
papa
-Mar
aere
nga
10.0
0.
8
8.
1
0.
4
0.
3
-
-
-
0.5
Taku
vain
e15
.4
3.3
11.7
0.
2
0.
1
-
-
-
-
Tu
taki
moa
-Teo
tue
3.2
0.3
2.7
0.2
-
-
-
-
-
A
vatiu
-Rua
tong
a-P
anam
a20
.7
3.3
16.6
0.
4
-
-
-
-
0.
5
N
ikao
-Pan
ama
28.3
7.
7
12
.7
4.4
3.4
-
-
-
-
Rua
au-A
rere
nga-
Aro
rang
i62
.4
16.6
36
.2
7.5
1.8
-
-
0.3
-
A
kaoa
-Bet
ela-
Aro
rang
i18
.4
3.7
13.8
0.
4
0.
3
-
-
0.
2
-
Mur
ienu
a-A
rora
ngi
61.4
14
.7
34.6
1.
5
5.
0
-
-
-
5.7
Titik
avek
a16
3.7
51
.4
80.5
14
.7
13.5
-
1.5
-
2.
1
N
gata
ngiia
71.4
18
.4
24.4
9.
7
16
.4
2.5
-
-
-
M
atav
era
73.1
12
.2
38.4
12
.8
8.5
1.3
-
-
-
OTH
ER S
OU
THER
N IS
LAN
DS
904.
7
43.4
30
7.6
70
.2
39.3
43
4.7
4.
0
-
5.5
Aitu
taki
686.
0
24.1
18
1.5
13
.0
29.8
43
4.0
3.
0
-
0.6
Man
gaia
103.
1
3.1
73.9
21
.2
2.8
-
-
-
2.
0
A
tiu34
.0
0.5
23.9
5.
1
1.
7
-
-
-
2.8
Mau
ke53
.7
14.0
21
.3
14.3
2.
4
0.
7
1.
0
-
-
M
itiar
o28
.1
1.6
6.9
16.7
2.
7
-
-
-
0.2
NO
RTH
ERN
ISLA
ND
S14
.0
0.6
5.5
3.1
2.8
-
-
-
2.
0
P
alm
erst
on-
-
-
-
-
-
-
-
-
Puk
apuk
a3.
9
-
2.7
1.2
-
-
-
-
-
N
assa
u7.
9
0.
6
2.
3
0.
3
2.
8
-
-
-
2.0
Man
ihik
i0.
1
-
-
0.
1
-
-
-
-
-
Rak
ahan
ga2.
0
-
0.4
1.6
-
-
-
-
-
P
enrh
yn0.
1
-
0.1
-
-
-
-
-
-
CO
OK
ISLA
ND
S1,
488.
5
18
7.6
61
6.1
12
9.4
94
.7
438.
5
5.5
0.4
16.3
Loca
tion
of P
arce
lTo
tal A
rea
of
Parc
els
(In
Acre
s)
Acre
s of
Lan
d U
nder
…
Sour
ce: C
ook
Isla
nds
2011
Cen
sus
of A
gric
ultu
re a
nd F
ishe
ries
TAB
LE S
ET 2
: HO
LDIN
G D
ETA
ILS
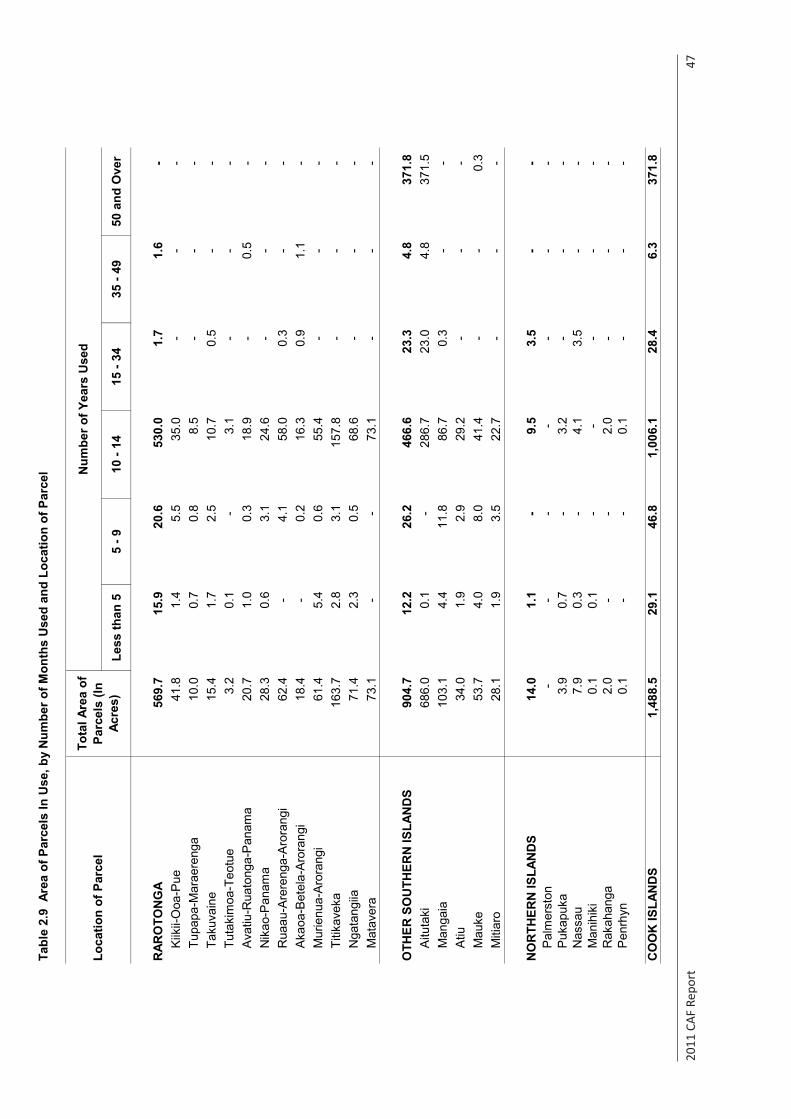
2011
CAF
Rep
ort
47
Tabl
e 2.
9 A
rea
of P
arce
ls In
Use
, by
Num
ber o
f Mon
ths
Use
d an
d Lo
catio
n of
Par
cel
Less
than
55
- 910
- 14
15 -
3435
- 49
50 a
nd O
ver
RAR
OTO
NG
A56
9.7
15
.9
20.6
53
0.0
1.
7
1.
6
-
K
iikii-
Ooa
-Pue
41.8
1.
4
5.
5
35
.0
-
-
-
Tupa
pa-M
arae
reng
a10
.0
0.7
0.8
8.5
-
-
-
Taku
vain
e15
.4
1.7
2.5
10.7
0.
5
-
-
Tu
taki
moa
-Teo
tue
3.2
0.1
-
3.1
-
-
-
Ava
tiu-R
uato
nga-
Pan
ama
20.7
1.
0
0.
3
18
.9
-
0.5
-
Nik
ao-P
anam
a28
.3
0.6
3.1
24.6
-
-
-
R
uaau
-Are
reng
a-A
rora
ngi
62.4
-
4.1
58.0
0.
3
-
-
A
kaoa
-Bet
ela-
Aro
rang
i18
.4
-
0.
2
16
.3
0.9
1.1
-
Mur
ienu
a-A
rora
ngi
61.4
5.
4
0.
6
55
.4
-
-
-
Titik
avek
a16
3.7
2.
8
3.
1
15
7.8
-
-
-
N
gata
ngiia
71.4
2.
3
0.
5
68
.6
-
-
-
Mat
aver
a73
.1
-
-
73
.1
-
-
-
OTH
ER S
OU
THER
N IS
LAN
DS
904.
7
12.2
26
.2
466.
6
23.3
4.
8
37
1.8
A
ituta
ki68
6.0
0.
1
-
28
6.7
23
.0
4.8
371.
5
Man
gaia
103.
1
4.4
11.8
86
.7
0.3
-
-
Atiu
34.0
1.
9
2.
9
29
.2
-
-
-
Mau
ke53
.7
4.0
8.0
41.4
-
-
0.
3
M
itiar
o28
.1
1.9
3.5
22.7
-
-
-
NO
RTH
ERN
ISLA
ND
S14
.0
1.1
-
9.5
3.5
-
-
Pal
mer
ston
-
-
-
-
-
-
-
Puk
apuk
a3.
9
0.
7
-
3.
2
-
-
-
N
assa
u7.
9
0.
3
-
4.
1
3.
5
-
-
M
anih
iki
0.1
0.1
-
-
-
-
-
Rak
ahan
ga2.
0
-
-
2.0
-
-
-
Pen
rhyn
0.1
-
-
0.
1
-
-
-
CO
OK
ISLA
ND
S1,
488.
5
29
.1
46.8
1,
006.
1
28
.4
6.3
371.
8
Loca
tion
of P
arce
lTo
tal A
rea
of
Parc
els
(In
Acre
s)
Num
ber o
f Yea
rs U
sed
Sour
ce: C
ook
Isla
nds
2011
Cen
sus
of A
gric
ultu
re a
nd F
ishe
ries
TAB
LE S
ET 2
: HO
LDIN
G D
ETA
ILS
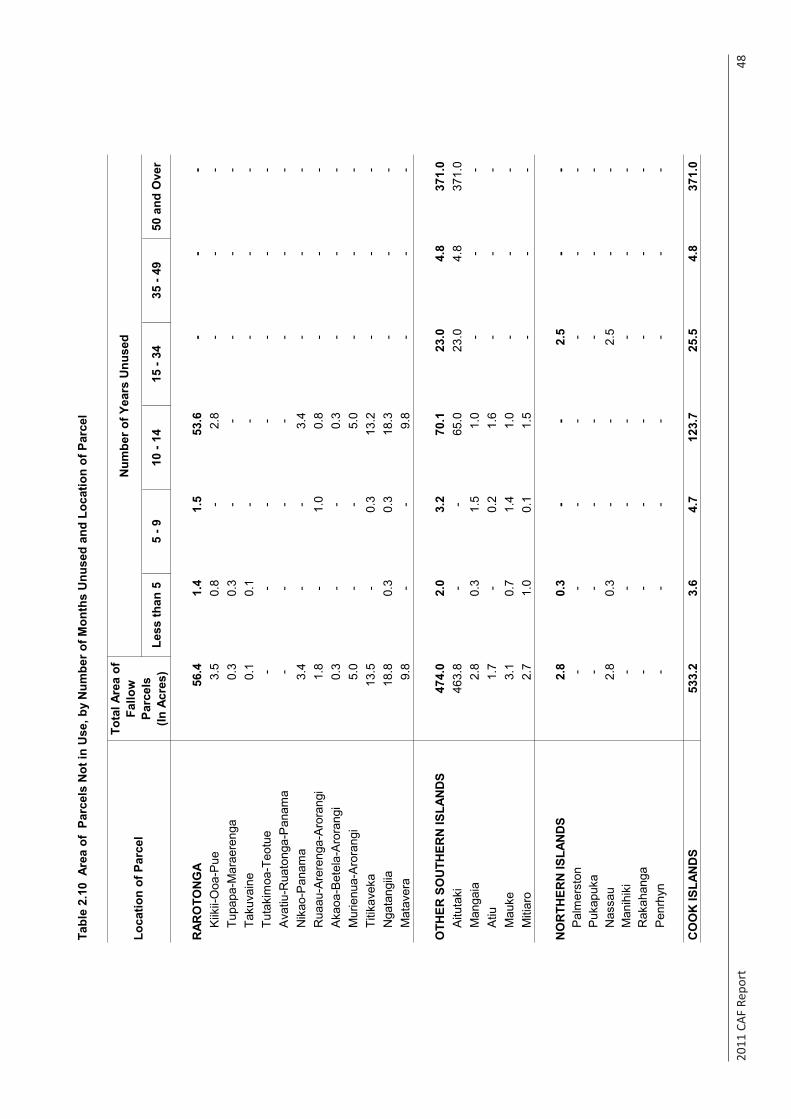
2011
CAF
Rep
ort
48
Tabl
e 2.
10 A
rea
of P
arce
ls N
ot in
Use
, by
Num
ber o
f Mon
ths
Unu
sed
and
Loca
tion
of P
arce
l
Less
than
55
- 910
- 14
15 -
3435
- 49
50 a
nd O
ver
RAR
OTO
NG
A56
.4
1.4
1.5
53.6
-
-
-
Kiik
ii-O
oa-P
ue3.
5
0.
8
-
2.8
-
-
-
Tu
papa
-Mar
aere
nga
0.3
0.3
-
-
-
-
-
Ta
kuva
ine
0.1
0.1
-
-
-
-
-
Tu
taki
moa
-Teo
tue
-
-
-
-
-
-
-
A
vatiu
-Rua
tong
a-P
anam
a-
-
-
-
-
-
-
Nik
ao-P
anam
a3.
4
-
-
3.
4
-
-
-
Rua
au-A
rere
nga-
Aro
rang
i1.
8
-
1.0
0.8
-
-
-
A
kaoa
-Bet
ela-
Aro
rang
i0.
3
-
-
0.
3
-
-
-
Mur
ienu
a-A
rora
ngi
5.0
-
-
5.0
-
-
-
Ti
tikav
eka
13.5
-
0.3
13.2
-
-
-
Nga
tang
iia18
.8
0.3
0.3
18.3
-
-
-
Mat
aver
a9.
8
-
-
9.
8
-
-
-
OTH
ER S
OU
THER
N IS
LAN
DS
474.
0
2.0
3.2
70.1
23
.0
4.8
371.
0
Aitu
taki
463.
8
-
-
65.0
23
.0
4.8
371.
0
Man
gaia
2.8
0.3
1.5
1.0
-
-
-
A
tiu1.
7
-
0.2
1.6
-
-
-
M
auke
3.1
0.7
1.4
1.0
-
-
-
M
itiar
o2.
7
1.
0
0.
1
1.
5
-
-
-
NO
RTH
ERN
ISLA
ND
S2.
8
0.
3
-
-
2.
5
-
-
P
alm
erst
on-
-
-
-
-
-
-
Puk
apuk
a-
-
-
-
-
-
-
Nas
sau
2.8
0.3
-
-
2.5
-
-
Man
ihik
i-
-
-
-
-
-
-
Rak
ahan
ga-
-
-
-
-
-
-
Pen
rhyn
-
-
-
-
-
-
-
CO
OK
ISLA
ND
S53
3.2
3.
6
4.
7
12
3.7
25
.5
4.8
371.
0
Loca
tion
of P
arce
l
Tota
l Are
a of
Fa
llow
Pa
rcel
s
(In A
cres
)
Num
ber o
f Yea
rs U
nuse
d
Sour
ce: C
ook
Isla
nds
2011
Cen
sus
of A
gric
ultu
re a
nd F
ishe
ries
TAB
LE S
ET 2
: HO
LDIN
G D
ETA
ILS
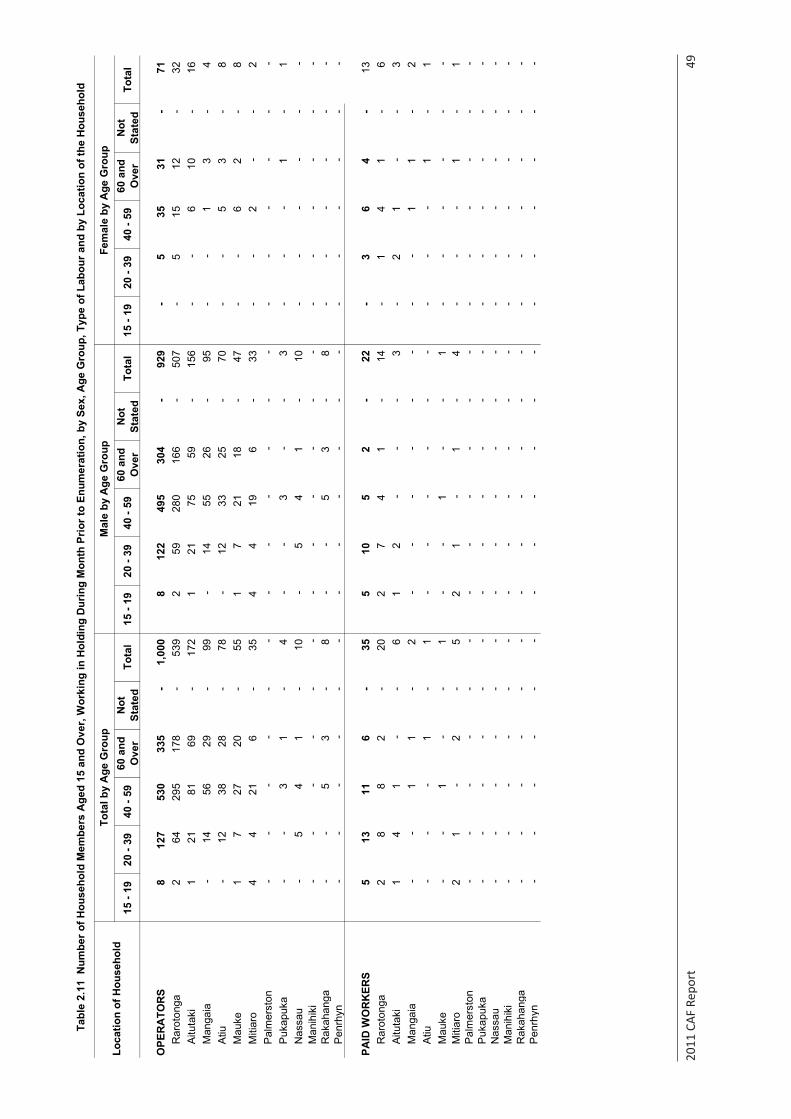
2011
CAF
Rep
ort
49
15 -
1920
- 39
40 -
5960
and
O
ver
Not
St
ated
Tota
l15
- 19
20 -
3940
- 59
60 a
nd
Ove
rN
ot
Stat
edTo
tal
15 -
1920
- 39
40 -
5960
and
O
ver
Not
St
ated
Tota
l
OPE
RA
TOR
S8
127
53
0
335
-
1,00
0
8
122
49
5
304
-
929
-
5
35
31
-
71
Rar
oton
ga2
64
295
17
8
-
53
9
2
59
28
0
166
-
507
-
5
15
12
-
32
Aitu
taki
1
21
81
69
-
172
1
21
75
59
-
15
6
-
-
6
10
-
16
Man
gaia
-
14
56
29
-
99
-
14
55
26
-
95
-
-
1
3
-
4
Atiu
-
12
38
28
-
78
-
12
33
25
-
70
-
-
5
3
-
8
Mau
ke1
7
27
20
-
55
1
7
21
18
-
47
-
-
6
2
-
8
M
itiar
o4
4
21
6
-
35
4
4
19
6
-
33
-
-
2
-
-
2
P
alm
erst
on-
-
-
-
-
-
-
-
-
-
-
-
-
-
-
-
-
-
P
ukap
uka
-
-
3
1
-
4
-
-
3
-
-
3
-
-
-
1
-
1
Nas
sau
-
5
4
1
-
10
-
5
4
1
-
10
-
-
-
-
-
-
Man
ihik
i-
-
-
-
-
-
-
-
-
-
-
-
-
-
-
-
-
-
R
akah
anga
-
-
5
3
-
8
-
-
5
3
-
8
-
-
-
-
-
-
Pen
rhyn
-
-
-
-
-
-
-
-
-
-
-
-
-
-
-
-
-
-
PAID
WO
RK
ERS
5
13
11
6
-
35
5
10
5
2
-
22
-
3
6
4
-
13
Rar
oton
ga2
8
8
2
-
20
2
7
4
1
-
14
-
1
4
1
-
6
A
ituta
ki1
4
1
-
-
6
1
2
-
-
-
3
-
2
1
-
-
3
M
anga
ia-
-
1
1
-
2
-
-
-
-
-
-
-
-
1
1
-
2
A
tiu-
-
-
1
-
1
-
-
-
-
-
-
-
-
-
1
-
1
M
auke
-
-
1
-
-
1
-
-
1
-
-
1
-
-
-
-
-
-
Miti
aro
2
1
-
2
-
5
2
1
-
1
-
4
-
-
-
1
-
1
Pal
mer
ston
-
-
-
-
-
-
-
-
-
-
-
-
-
-
-
-
-
-
Puk
apuk
a-
-
-
-
-
-
-
-
-
-
-
-
-
-
-
-
-
-
N
assa
u-
-
-
-
-
-
-
-
-
-
-
-
-
-
-
-
-
-
M
anih
iki
-
-
-
-
-
-
-
-
-
-
-
-
-
-
-
-
-
-
Rak
ahan
ga-
-
-
-
-
-
-
-
-
-
-
-
-
-
-
-
-
-
P
enrh
yn-
-
-
-
-
-
-
-
-
-
-
-
-
-
-
-
-
-
Loca
tion
of H
ouse
hold
Tota
l by
Age
Gro
upM
ale
by A
ge G
roup
Fem
ale
by A
ge G
roup
Tabl
e 2.
11 N
umbe
r of H
ouse
hold
Mem
bers
Age
d 15
and
Ove
r, W
orki
ng in
Hol
ding
Dur
ing
Mon
th P
rior t
o En
umer
atio
n, b
y Se
x, A
ge G
roup
, Typ
e of
Lab
our a
nd b
y Lo
catio
n of
the
Hou
seho
ld
Sour
ce: C
ook
Isla
nds
2011
Cen
sus
of A
gric
ultu
re a
nd F
ishe
ries
TAB
LE S
ET 2
: HO
LDIN
G D
ETA
ILS
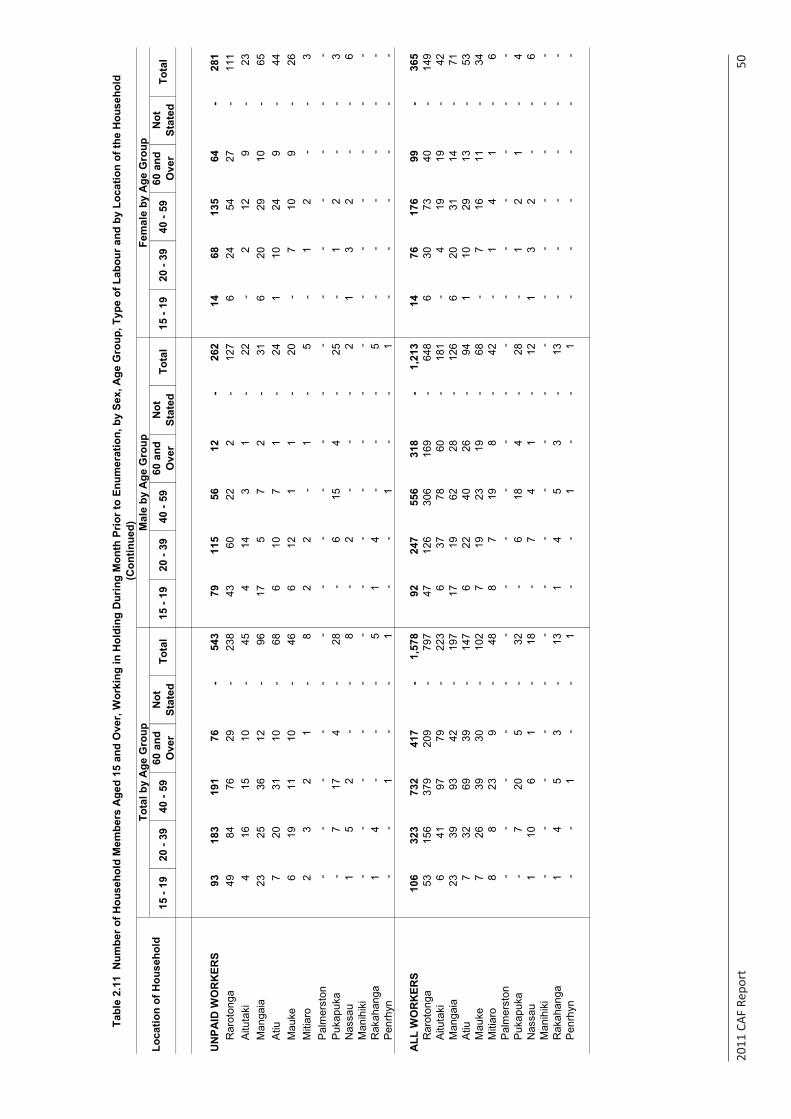
2011
CAF
Rep
ort
50
15 -
1920
- 39
40 -
5960
and
O
ver
Not
St
ated
Tota
l15
- 19
20 -
3940
- 59
60 a
nd
Ove
rN
ot
Stat
edTo
tal
15 -
1920
- 39
40 -
5960
and
O
ver
Not
St
ated
Tota
l
UN
PAID
WO
RK
ERS
93
183
19
1
76
-
54
3
79
115
56
12
-
262
14
68
13
5
64
-
28
1
Rar
oton
ga49
84
76
29
-
238
43
60
22
2
-
12
7
6
24
54
27
-
111
A
ituta
ki4
16
15
10
-
45
4
14
3
1
-
22
-
2
12
9
-
23
M
anga
ia23
25
36
12
-
96
17
5
7
2
-
31
6
20
29
10
-
65
Atiu
7
20
31
10
-
68
6
10
7
1
-
24
1
10
24
9
-
44
M
auke
6
19
11
10
-
46
6
12
1
1
-
20
-
7
10
9
-
26
Miti
aro
2
3
2
1
-
8
2
2
-
1
-
5
-
1
2
-
-
3
Pal
mer
ston
-
-
-
-
-
-
-
-
-
-
-
-
-
-
-
-
-
-
Puk
apuk
a-
7
17
4
-
28
-
6
15
4
-
25
-
1
2
-
-
3
N
assa
u1
5
2
-
-
8
-
2
-
-
-
2
1
3
2
-
-
6
M
anih
iki
-
-
-
-
-
-
-
-
-
-
-
-
-
-
-
-
-
-
Rak
ahan
ga1
4
-
-
-
5
1
4
-
-
-
5
-
-
-
-
-
-
P
enrh
yn-
-
1
-
-
1
-
-
1
-
-
1
-
-
-
-
-
-
ALL
WO
RK
ERS
106
32
3
732
41
7
-
1,
578
92
247
55
6
318
-
1,21
3
14
76
17
6
99
-
36
5
Rar
oton
ga53
15
6
379
20
9
-
79
7
47
126
30
6
169
-
648
6
30
73
40
-
14
9
Aitu
taki
6
41
97
79
-
223
6
37
78
60
-
18
1
-
4
19
19
-
42
M
anga
ia23
39
93
42
-
197
17
19
62
28
-
126
6
20
31
14
-
71
A
tiu7
32
69
39
-
14
7
6
22
40
26
-
94
1
10
29
13
-
53
Mau
ke7
26
39
30
-
10
2
7
19
23
19
-
68
-
7
16
11
-
34
M
itiar
o8
8
23
9
-
48
8
7
19
8
-
42
-
1
4
1
-
6
P
alm
erst
on-
-
-
-
-
-
-
-
-
-
-
-
-
-
-
-
-
-
P
ukap
uka
-
7
20
5
-
32
-
6
18
4
-
28
-
1
2
1
-
4
Nas
sau
1
10
6
1
-
18
-
7
4
1
-
12
1
3
2
-
-
6
M
anih
iki
-
-
-
-
-
-
-
-
-
-
-
-
-
-
-
-
-
-
Rak
ahan
ga1
4
5
3
-
13
1
4
5
3
-
13
-
-
-
-
-
-
P
enrh
yn-
-
1
-
-
1
-
-
1
-
-
1
-
-
-
-
-
-
Tabl
e 2.
11 N
umbe
r of H
ouse
hold
Mem
bers
Age
d 15
and
Ove
r, W
orki
ng in
Hol
ding
Dur
ing
Mon
th P
rior t
o En
umer
atio
n, b
y Se
x, A
ge G
roup
, Typ
e of
Lab
our a
nd b
y Lo
catio
n of
the
Hou
seho
ld
(Con
tinue
d)
Loca
tion
of H
ouse
hold
Tota
l by
Age
Gro
upM
ale
by A
ge G
roup
Fem
ale
by A
ge G
roup
Sour
ce: C
ook
Isla
nds
2011
Cen
sus
of A
gric
ultu
re a
nd F
ishe
ries
TAB
LE S
ET 2
: HO
LDIN
G D
ETA
ILS
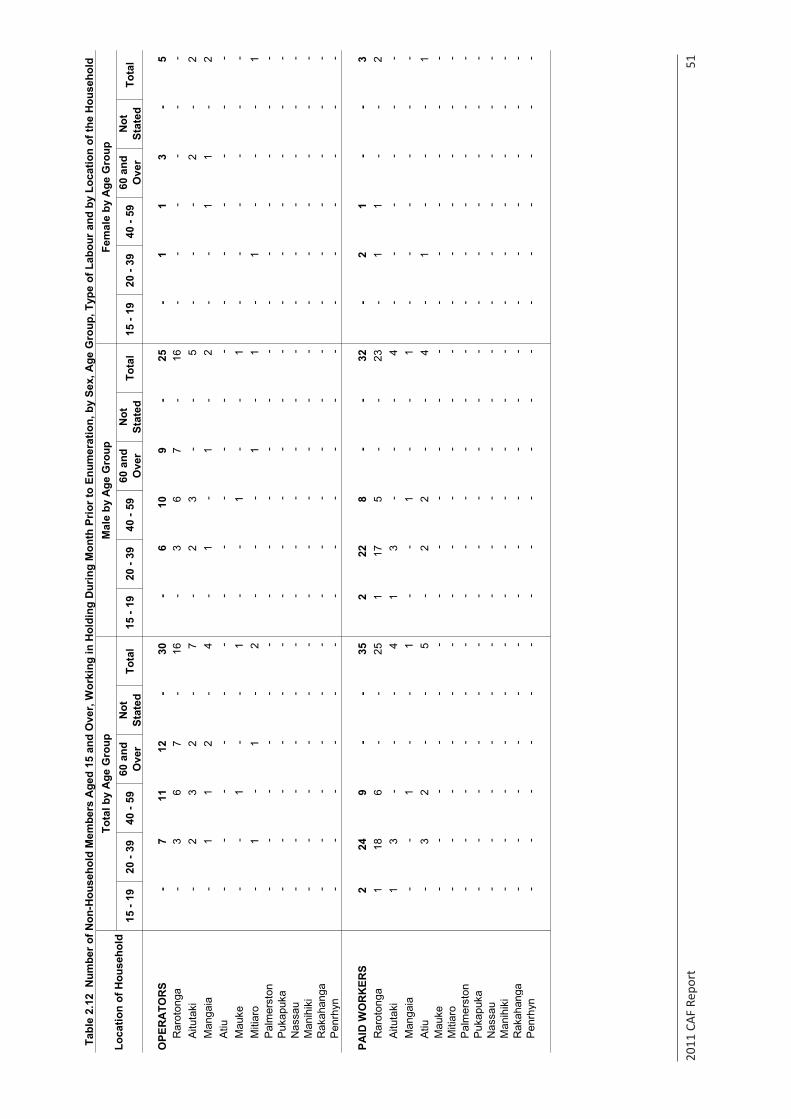
2011
CAF
Rep
ort
51
15 -
1920
- 39
40 -
5960
and
O
ver
Not
St
ated
Tota
l15
- 19
20 -
3940
- 59
60 a
nd
Ove
rN
ot
Stat
edTo
tal
15 -
1920
- 39
40 -
5960
and
O
ver
Not
St
ated
Tota
l
OPE
RA
TOR
S-
7
11
12
-
30
-
6
10
9
-
25
-
1
1
3
-
5
Rar
oton
ga-
3
6
7
-
16
-
3
6
7
-
16
-
-
-
-
-
-
A
ituta
ki-
2
3
2
-
7
-
2
3
-
-
5
-
-
-
2
-
2
M
anga
ia-
1
1
2
-
4
-
1
-
1
-
2
-
-
1
1
-
2
A
tiu-
-
-
-
-
-
-
-
-
-
-
-
-
-
-
-
-
-
M
auke
-
-
1
-
-
1
-
-
1
-
-
1
-
-
-
-
-
-
Miti
aro
-
1
-
1
-
2
-
-
-
1
-
1
-
1
-
-
-
1
Pal
mer
ston
-
-
-
-
-
-
-
-
-
-
-
-
-
-
-
-
-
-
Puk
apuk
a-
-
-
-
-
-
-
-
-
-
-
-
-
-
-
-
-
-
N
assa
u-
-
-
-
-
-
-
-
-
-
-
-
-
-
-
-
-
-
M
anih
iki
-
-
-
-
-
-
-
-
-
-
-
-
-
-
-
-
-
-
Rak
ahan
ga-
-
-
-
-
-
-
-
-
-
-
-
-
-
-
-
-
-
P
enrh
yn-
-
-
-
-
-
-
-
-
-
-
-
-
-
-
-
-
-
PAID
WO
RK
ERS
2
24
9
-
-
35
2
22
8
-
-
32
-
2
1
-
-
3
Rar
oton
ga1
18
6
-
-
25
1
17
5
-
-
23
-
1
1
-
-
2
A
ituta
ki1
3
-
-
-
4
1
3
-
-
-
4
-
-
-
-
-
-
M
anga
ia-
-
1
-
-
1
-
-
1
-
-
1
-
-
-
-
-
-
A
tiu-
3
2
-
-
5
-
2
2
-
-
4
-
1
-
-
-
1
M
auke
-
-
-
-
-
-
-
-
-
-
-
-
-
-
-
-
-
-
Miti
aro
-
-
-
-
-
-
-
-
-
-
-
-
-
-
-
-
-
-
Pal
mer
ston
-
-
-
-
-
-
-
-
-
-
-
-
-
-
-
-
-
-
Puk
apuk
a-
-
-
-
-
-
-
-
-
-
-
-
-
-
-
-
-
-
N
assa
u-
-
-
-
-
-
-
-
-
-
-
-
-
-
-
-
-
-
M
anih
iki
-
-
-
-
-
-
-
-
-
-
-
-
-
-
-
-
-
-
Rak
ahan
ga-
-
-
-
-
-
-
-
-
-
-
-
-
-
-
-
-
-
P
enrh
yn-
-
-
-
-
-
-
-
-
-
-
-
-
-
-
-
-
-
Loca
tion
of H
ouse
hold
Tota
l by
Age
Gro
upM
ale
by A
ge G
roup
Fem
ale
by A
ge G
roup
Tabl
e 2.
12 N
umbe
r of N
on-H
ouse
hold
Mem
bers
Age
d 15
and
Ove
r, W
orki
ng in
Hol
ding
Dur
ing
Mon
th P
rior t
o En
umer
atio
n, b
y Se
x, A
ge G
roup
, Typ
e of
Lab
our a
nd b
y Lo
catio
n of
the
Hou
seho
ld
Sour
ce: C
ook
Isla
nds
2011
Cen
sus
of A
gric
ultu
re a
nd F
ishe
ries
TAB
LE S
ET 2
: HO
LDIN
G D
ETA
ILS
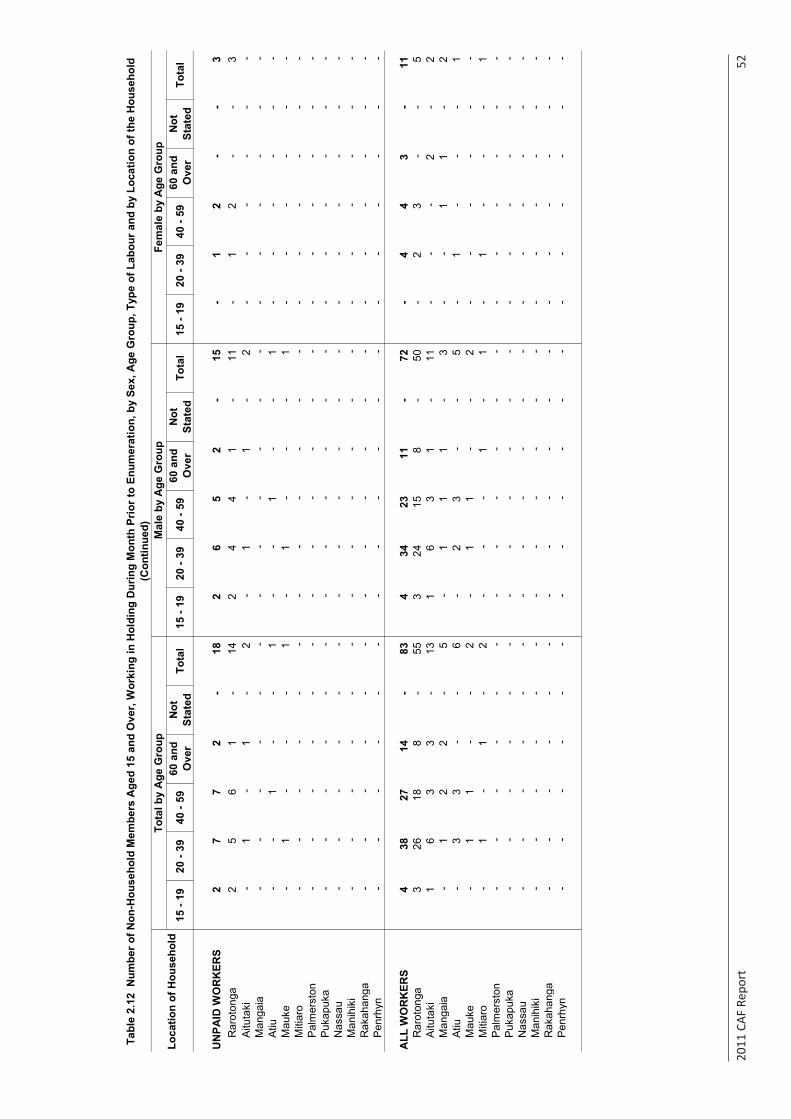
2011
CAF
Rep
ort
52
15 -
1920
- 39
40 -
5960
and
O
ver
Not
St
ated
Tota
l15
- 19
20 -
3940
- 59
60 a
nd
Ove
rN
ot
Stat
edTo
tal
15 -
1920
- 39
40 -
5960
and
O
ver
Not
St
ated
Tota
l
UN
PAID
WO
RK
ERS
2
7
7
2
-
18
2
6
5
2
-
15
-
1
2
-
-
3
Rar
oton
ga2
5
6
1
-
14
2
4
4
1
-
11
-
1
2
-
-
3
A
ituta
ki-
1
-
1
-
2
-
1
-
1
-
2
-
-
-
-
-
-
M
anga
ia-
-
-
-
-
-
-
-
-
-
-
-
-
-
-
-
-
-
A
tiu-
-
1
-
-
1
-
-
1
-
-
1
-
-
-
-
-
-
M
auke
-
1
-
-
-
1
-
1
-
-
-
1
-
-
-
-
-
-
Miti
aro
-
-
-
-
-
-
-
-
-
-
-
-
-
-
-
-
-
-
Pal
mer
ston
-
-
-
-
-
-
-
-
-
-
-
-
-
-
-
-
-
-
Puk
apuk
a-
-
-
-
-
-
-
-
-
-
-
-
-
-
-
-
-
-
N
assa
u-
-
-
-
-
-
-
-
-
-
-
-
-
-
-
-
-
-
M
anih
iki
-
-
-
-
-
-
-
-
-
-
-
-
-
-
-
-
-
-
Rak
ahan
ga-
-
-
-
-
-
-
-
-
-
-
-
-
-
-
-
-
-
P
enrh
yn-
-
-
-
-
-
-
-
-
-
-
-
-
-
-
-
-
-
ALL
WO
RK
ERS
4
38
27
14
-
83
4
34
23
11
-
72
-
4
4
3
-
11
R
arot
onga
3
26
18
8
-
55
3
24
15
8
-
50
-
2
3
-
-
5
Aitu
taki
1
6
3
3
-
13
1
6
3
1
-
11
-
-
-
2
-
2
Man
gaia
-
1
2
2
-
5
-
1
1
1
-
3
-
-
1
1
-
2
Atiu
-
3
3
-
-
6
-
2
3
-
-
5
-
1
-
-
-
1
Mau
ke-
1
1
-
-
2
-
1
1
-
-
2
-
-
-
-
-
-
M
itiar
o-
1
-
1
-
2
-
-
-
1
-
1
-
1
-
-
-
1
P
alm
erst
on-
-
-
-
-
-
-
-
-
-
-
-
-
-
-
-
-
-
P
ukap
uka
-
-
-
-
-
-
-
-
-
-
-
-
-
-
-
-
-
-
Nas
sau
-
-
-
-
-
-
-
-
-
-
-
-
-
-
-
-
-
-
Man
ihik
i-
-
-
-
-
-
-
-
-
-
-
-
-
-
-
-
-
-
R
akah
anga
-
-
-
-
-
-
-
-
-
-
-
-
-
-
-
-
-
-
Pen
rhyn
-
-
-
-
-
-
-
-
-
-
-
-
-
-
-
-
-
-
Tabl
e 2.
12 N
umbe
r of N
on-H
ouse
hold
Mem
bers
Age
d 15
and
Ove
r, W
orki
ng in
Hol
ding
Dur
ing
Mon
th P
rior t
o En
umer
atio
n, b
y Se
x, A
ge G
roup
, Typ
e of
Lab
our a
nd b
y Lo
catio
n of
the
Hou
seho
ld
(Con
tinue
d)
Loca
tion
of H
ouse
hold
Tota
l by
Age
Gro
upM
ale
by A
ge G
roup
Fem
ale
by A
ge G
roup
Sour
ce: C
ook
Isla
nds
2011
Cen
sus
of A
gric
ultu
re a
nd F
ishe
ries
TAB
LE S
ET 2
: HO
LDIN
G D
ETA
ILS

2011
CAF
Rep
ort
53
15 -
1920
- 39
40 -
5960
and
O
ver
Not
St
ated
Tota
l15
- 19
20 -
3940
- 59
60 a
nd
Ove
rN
ot
Stat
edTo
tal
15 -
1920
- 39
40 -
5960
and
O
ver
Not
St
ated
Tota
l
OPE
RA
TOR
S3.
3
3.9
5.
2
4.8
-
4.7
7.7
5.
7
5.5
5.
7
-
6.
1
-
6.
6
4.3
4.
7
-
5.
2
Rar
oton
ga7.
0
4.6
4.
0
3.4
-
4.8
7.0
4.
7
4.0
3.
5
-
4.
8
-
3.
6
3.5
3.
3
-
3.
4
Aitu
taki
12.0
8.4
9.
3
8.4
-
9.5
12.0
8.4
9.
6
8.9
-
9.7
-
-
4.
8
6.2
-
3.7
M
anga
ia-
5.8
3.
5
2.7
-
4.0
-
5.
8
3.5
2.
4
-
3.
9
-
-
5.5
4.
5
-
3.
3
Atiu
-
7.
3
8.8
9.
3
-
5.
1
-
7.3
9.
3
9.6
-
8.7
-
-
5.
4
6.3
-
3.9
M
auke
10.0
6.1
8.
8
14.1
-
7.
8
10
.0
6.
1
10.0
14.9
-
10
.3
-
-
4.
2
6.5
-
3.6
M
itiar
o10
.5
7.
0
9.0
8.
7
-
7.
0
10
.5
8.
8
9.1
8.
7
-
9.
3
-
-
8.0
-
-
8.
0
Pal
mer
ston
-
-
-
-
-
-
-
-
-
-
-
-
-
-
1.
0
2.0
-
1.0
P
ukap
uka
-
-
5.3
-
-
5.
3
-
-
5.
3
-
-
5.3
-
-
-
-
-
-
N
assa
u-
8.0
6.
5
6.0
-
6.8
-
8.
0
6.5
6.
0
-
6.
8
-
-
-
-
-
-
Man
ihik
i-
-
-
-
-
-
-
-
-
-
-
-
-
-
-
-
-
-
Rak
ahan
ga-
-
6.
8
4.7
-
5.7
-
-
6.8
4.
7
-
5.
7
-
-
-
-
-
-
Pen
rhyn
-
-
-
-
-
-
-
-
-
-
-
-
-
-
-
-
-
-
PAID
WO
RK
ERS
16.2
13.7
13.2
3.3
-
11.6
14
.4
10
.0
3.
8
4.5
-
8.2
-
11.0
10.1
2.5
-
7.9
R
arot
onga
3.7
5.
7
3.4
3.
0
-
3.
9
3.
7
6.2
2.
7
6.0
-
4.6
-
-
4.
6
-
-
4.6
A
ituta
ki40
.0
28
.0
40
.0
-
-
36
.0
40.0
29.0
-
-
-
34
.5
-
25.5
40.0
-
-
32.8
Man
gaia
-
-
6.5
4.
0
-
5.
3
-
-
5.
0
-
-
5.0
-
-
8.
0
4.0
-
6.0
A
tiu-
5.0
4.
0
3.0
-
4.0
-
5.
5
4.0
-
-
4.
8
-
4.
0
-
3.
0
-
2.
3
Mau
ke-
-
12
.0
-
-
12
.0
-
-
12.0
-
-
12.0
-
-
-
-
-
-
Miti
aro
5.0
16
.0
-
3.0
-
8.0
5.0
16
.0
-
3.0
-
6.0
-
-
-
3.0
-
3.0
P
alm
erst
on-
-
-
-
-
-
-
-
-
-
-
-
-
-
-
-
-
-
Puk
apuk
a-
-
-
-
-
-
-
-
-
-
-
-
-
-
-
-
-
-
Nas
sau
-
-
-
-
-
-
-
-
-
-
-
-
-
-
-
-
-
-
M
anih
iki
-
-
-
-
-
-
-
-
-
-
-
-
-
-
-
-
-
-
R
akah
anga
-
-
-
-
-
-
-
-
-
-
-
-
-
-
-
-
-
-
P
enrh
yn-
-
-
-
-
-
-
-
-
-
-
-
-
-
-
-
-
-
Tabl
e 2.
13 A
vera
ge H
ours
Wor
ked
Per W
eek,
by
Pers
ons
Age
d 15
and
Ove
r, in
Hol
ding
Dur
ing
Mon
th P
rior t
o En
umer
atio
n, b
y Se
x, A
ge G
roup
, Typ
e of
Lab
our a
nd b
y Lo
catio
n of
the
Hou
seho
ld
Loca
tion
of H
ouse
hold
Tota
l by
Age
Gro
upM
ale
by A
ge G
roup
Fem
ale
by A
ge G
roup
Sour
ce: C
ook
Isla
nds
2011
Cen
sus
of A
gric
ultu
re a
nd F
ishe
ries
TAB
LE S
ET 2
: HO
LDIN
G D
ETA
ILS
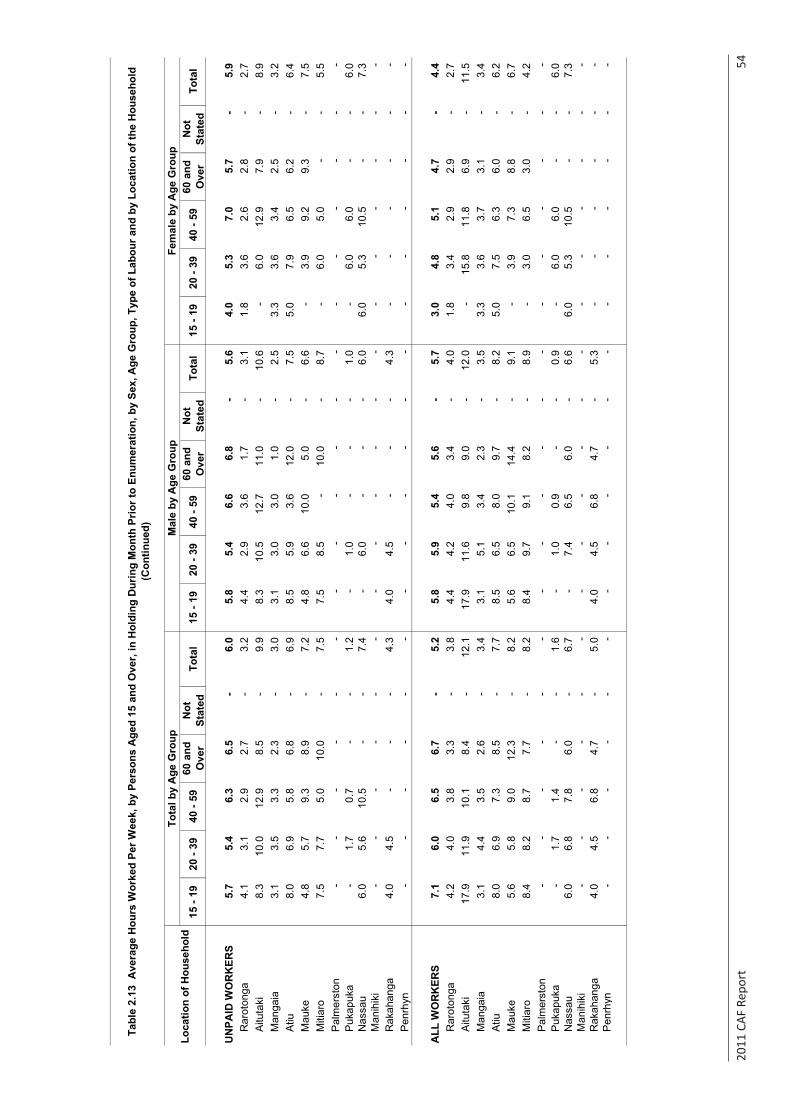
2011
CAF
Rep
ort
54
15 -
1920
- 39
40 -
5960
and
O
ver
Not
St
ated
Tota
l15
- 19
20 -
3940
- 59
60 a
nd
Ove
rN
ot
Stat
edTo
tal
15 -
1920
- 39
40 -
5960
and
O
ver
Not
St
ated
Tota
l
UN
PAID
WO
RK
ERS
5.7
5.
4
6.3
6.
5
-
6.
0
5.
8
5.4
6.
6
6.8
-
5.6
4.
0
5.3
7.
0
5.7
-
5.9
R
arot
onga
4.1
3.
1
2.9
2.
7
-
3.
2
4.
4
2.9
3.
6
1.7
-
3.1
1.
8
3.6
2.
6
2.8
-
2.7
A
ituta
ki8.
3
10.0
12.9
8.5
-
9.9
8.3
10
.5
12
.7
11
.0
-
10.6
-
6.
0
12.9
7.9
-
8.9
M
anga
ia3.
1
3.5
3.
3
2.3
-
3.0
3.1
3.
0
3.0
1.
0
-
2.
5
3.3
3.
6
3.4
2.
5
-
3.
2
Atiu
8.0
6.
9
5.8
6.
8
-
6.
9
8.
5
5.9
3.
6
12.0
-
7.
5
5.0
7.
9
6.5
6.
2
-
6.
4
Mau
ke4.
8
5.7
9.
3
8.9
-
7.2
4.8
6.
6
10.0
5.0
-
6.6
-
3.9
9.
2
9.3
-
7.5
M
itiar
o7.
5
7.7
5.
0
10.0
-
7.
5
7.
5
8.5
-
10.0
-
8.
7
-
6.
0
5.0
-
-
5.
5
Pal
mer
ston
-
-
-
-
-
-
-
-
-
-
-
-
-
-
-
-
-
-
P
ukap
uka
-
1.
7
0.7
-
-
1.
2
-
1.0
-
-
-
1.0
-
6.0
6.
0
-
-
6.0
N
assa
u6.
0
5.6
10
.5
-
-
7.
4
-
6.0
-
-
-
6.0
6.
0
5.3
10
.5
-
-
7.
3
Man
ihik
i-
-
-
-
-
-
-
-
-
-
-
-
-
-
-
-
-
-
Rak
ahan
ga4.
0
4.5
-
-
-
4.3
4.0
4.
5
-
-
-
4.
3
-
-
-
-
-
-
Pen
rhyn
-
-
-
-
-
-
-
-
-
-
-
-
-
-
-
-
-
-
ALL
WO
RK
ERS
7.1
6.
0
6.5
6.
7
-
5.
2
5.
8
5.9
5.
4
5.6
-
5.7
3.
0
4.8
5.
1
4.7
-
4.4
R
arot
onga
4.2
4.
0
3.8
3.
3
-
3.
8
4.
4
4.2
4.
0
3.4
-
4.0
1.
8
3.4
2.
9
2.9
-
2.7
A
ituta
ki17
.9
11
.9
10
.1
8.
4
-
12
.1
17.9
11.6
9.8
9.
0
-
12
.0
-
15.8
11.8
6.9
-
11.5
Man
gaia
3.1
4.
4
3.5
2.
6
-
3.
4
3.
1
5.1
3.
4
2.3
-
3.5
3.
3
3.6
3.
7
3.1
-
3.4
A
tiu8.
0
6.9
7.
3
8.5
-
7.7
8.5
6.
5
8.0
9.
7
-
8.
2
5.0
7.
5
6.3
6.
0
-
6.
2
Mau
ke5.
6
5.8
9.
0
12.3
-
8.
2
5.
6
6.5
10
.1
14
.4
-
9.1
-
3.9
7.
3
8.8
-
6.7
M
itiar
o8.
4
8.2
8.
7
7.7
-
8.2
8.4
9.
7
9.1
8.
2
-
8.
9
-
3.
0
6.5
3.
0
-
4.
2
Pal
mer
ston
-
-
-
-
-
-
-
-
-
-
-
-
-
-
-
-
-
-
P
ukap
uka
-
1.
7
1.4
-
-
1.
6
-
1.0
0.
9
-
-
0.9
-
6.0
6.
0
-
-
6.0
N
assa
u6.
0
6.8
7.
8
6.0
-
6.7
-
7.
4
6.5
6.
0
-
6.
6
6.0
5.
3
10.5
-
-
7.3
M
anih
iki
-
-
-
-
-
-
-
-
-
-
-
-
-
-
-
-
-
-
R
akah
anga
4.0
4.
5
6.8
4.
7
-
5.
0
4.
0
4.5
6.
8
4.7
-
5.3
-
-
-
-
-
-
P
enrh
yn-
-
-
-
-
-
-
-
-
-
-
-
-
-
-
-
-
-
Fem
ale
by A
ge G
roup
Mal
e by
Age
Gro
upTo
tal b
y A
ge G
roup
Loca
tion
of H
ouse
hold
Tabl
e 2.
13 A
vera
ge H
ours
Wor
ked
Per W
eek,
by
Pers
ons
Age
d 15
and
Ove
r, in
Hol
ding
Dur
ing
Mon
th P
rior t
o En
umer
atio
n, b
y Se
x, A
ge G
roup
, Typ
e of
Lab
our a
nd b
y Lo
catio
n of
the
Hou
seho
ld
(Con
tinue
d)
Sour
ce: C
ook
Isla
nds
2011
Cen
sus
of A
gric
ultu
re a
nd F
ishe
ries
TAB
LE S
ET 2
: HO
LDIN
G D
ETA
ILS
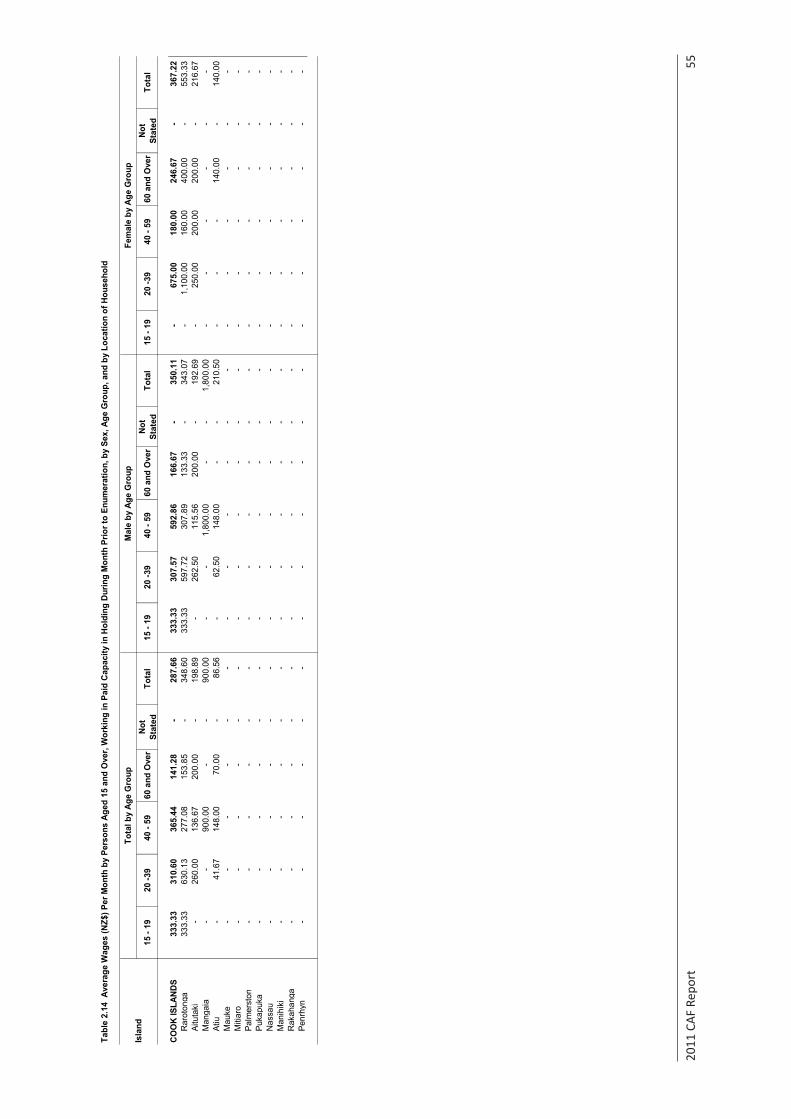
2011
CAF
Rep
ort
55
15 -
1920
-39
40 -
5960
and
Ove
rNo
t St
ated
Tota
l15
- 19
20 -3
940
- 59
60 a
nd O
ver
Not
Stat
edTo
tal
15 -
1920
-39
40 -
5960
and
Ove
rNo
t St
ated
Tota
l
COO
K IS
LAND
S33
3.33
31
0.60
36
5.44
14
1.28
-
287.
66
333.
33
307.
57
592.
86
166.
67
-
350.
11
-
67
5.00
18
0.00
24
6.67
-
367.
22
Rar
oton
ga33
3.33
63
0.13
27
7.08
15
3.85
-
348.
60
333.
33
597.
72
307.
89
133.
33
-
343.
07
-
1,
100.
00
16
0.00
40
0.00
-
553.
33
Aitu
taki
-
260.
00
136.
67
200.
00
-
19
8.89
-
26
2.50
11
5.56
20
0.00
-
19
2.69
-
250.
00
200.
00
200.
00
-
21
6.67
M
anga
ia-
-
90
0.00
-
-
900.
00
-
-
1,80
0.00
-
-
1,80
0.00
-
-
-
-
-
-
Atiu
-
41.6
7
14
8.00
70
.00
-
86
.56
-
62.5
0
14
8.00
-
-
21
0.50
-
-
-
140.
00
-
14
0.00
M
auke
-
-
-
-
-
-
-
-
-
-
-
-
-
-
-
-
-
-
M
itiar
o-
-
-
-
-
-
-
-
-
-
-
-
-
-
-
-
-
-
Palm
erst
on-
-
-
-
-
-
-
-
-
-
-
-
-
-
-
-
-
-
Puka
puka
-
-
-
-
-
-
-
-
-
-
-
-
-
-
-
-
-
-
N
assa
u-
-
-
-
-
-
-
-
-
-
-
-
-
-
-
-
-
-
Man
ihik
i-
-
-
-
-
-
-
-
-
-
-
-
-
-
-
-
-
-
Rak
ahan
ga-
-
-
-
-
-
-
-
-
-
-
-
-
-
-
-
-
-
Penr
hyn
-
-
-
-
-
-
-
-
-
-
-
-
-
-
-
-
-
-
Tabl
e 2.
14 A
vera
ge W
ages
(NZ$
) Per
Mon
th b
y Pe
rson
s Ag
ed 1
5 an
d O
ver,
Wor
king
in P
aid
Capa
city
in H
oldi
ng D
urin
g M
onth
Prio
r to
Enum
erat
ion,
by
Sex,
Age
Gro
up, a
nd b
y Lo
catio
n of
Hou
seho
ld
Isla
ndTo
tal b
y Ag
e G
roup
Mal
e by
Age
Gro
upFe
mal
e by
Age
Gro
up
Sour
ce: C
ook
Isla
nds
2011
Cen
sus
of A
gric
ultu
re a
nd F
ishe
ries
TABL
E SE
T 2:
HO
LDIN
G D
ETAI
LS
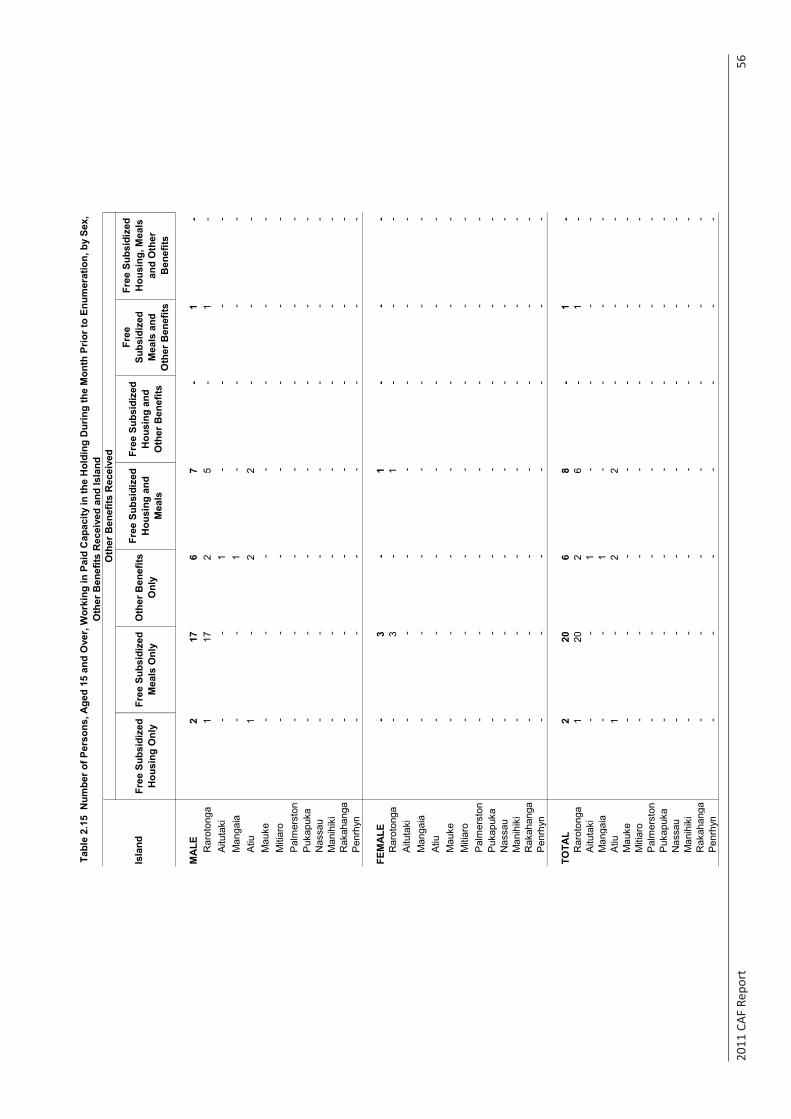
2011
CAF
Rep
ort
56
Free
Sub
sidi
zed
Hou
sing
Onl
yFr
ee S
ubsi
dize
d M
eals
Onl
yO
ther
Ben
efits
O
nly
Free
Sub
sidi
zed
Hou
sing
and
M
eals
Free
Sub
sidi
zed
Hou
sing
and
O
ther
Ben
efits
Free
Su
bsid
ized
M
eals
and
O
ther
Ben
efits
Free
Sub
sidi
zed
Hou
sing
, Mea
ls
and
Oth
er
Ben
efits
MA
LE2
17
6
7
-
1
-
R
arot
onga
1
17
2
5
-
1
-
Aitu
taki
-
-
1
-
-
-
-
Man
gaia
-
-
1
-
-
-
-
Atiu
1
-
2
2
-
-
-
Mau
ke-
-
-
-
-
-
-
M
itiar
o-
-
-
-
-
-
-
P
alm
erst
on-
-
-
-
-
-
-
P
ukap
uka
-
-
-
-
-
-
-
Nas
sau
-
-
-
-
-
-
-
Man
ihik
i-
-
-
-
-
-
-
R
akah
anga
-
-
-
-
-
-
-
Pen
rhyn
-
-
-
-
-
-
-
FEM
ALE
-
3
-
1
-
-
-
Rar
oton
ga-
3
-
1
-
-
-
A
ituta
ki-
-
-
-
-
-
-
M
anga
ia-
-
-
-
-
-
-
A
tiu-
-
-
-
-
-
-
M
auke
-
-
-
-
-
-
-
Miti
aro
-
-
-
-
-
-
-
Pal
mer
ston
-
-
-
-
-
-
-
Puk
apuk
a-
-
-
-
-
-
-
N
assa
u-
-
-
-
-
-
-
M
anih
iki
-
-
-
-
-
-
-
Rak
ahan
ga-
-
-
-
-
-
-
P
enrh
yn-
-
-
-
-
-
-
TOTA
L2
20
6
8
-
1
-
R
arot
onga
1
20
2
6
-
1
-
Aitu
taki
-
-
1
-
-
-
-
Man
gaia
-
-
1
-
-
-
-
Atiu
1
-
2
2
-
-
-
Mau
ke-
-
-
-
-
-
-
M
itiar
o-
-
-
-
-
-
-
P
alm
erst
on-
-
-
-
-
-
-
P
ukap
uka
-
-
-
-
-
-
-
Nas
sau
-
-
-
-
-
-
-
Man
ihik
i-
-
-
-
-
-
-
R
akah
anga
-
-
-
-
-
-
-
Pen
rhyn
-
-
-
-
-
-
-
Isla
nd
Oth
er B
enef
its R
ecei
ved
Tabl
e 2.
15 N
umbe
r of P
erso
ns, A
ged
15 a
nd O
ver,
Wor
king
in P
aid
Cap
acity
in th
e H
oldi
ng D
urin
g th
e M
onth
Prio
r to
Enum
erat
ion,
by
Sex,
O
ther
Ben
efits
Rec
eive
d an
d Is
land
Sour
ce: C
ook
Isla
nds
2011
Cen
sus
of A
gric
ultu
re a
nd F
ishe
ries
TAB
LE S
ET 2
: HO
LDIN
G D
ETA
ILS

2011
CAF
Rep
ort
57
No
Oth
er
Paid
Job
Full-
time
Part
-tim
eN
ot
Stat
edTo
tal
No
Oth
er
Paid
Job
Full-
time
Part
-tim
eN
ot
Stat
edTo
tal
No
Oth
er
Paid
Job
Full-
time
Part
-tim
eN
ot
Stat
edTo
tal
OPE
RA
TOR
S50
1
36
6
15
1
12
1,03
0
451
352
140
11
95
4
50
14
11
1
76
R
arot
onga
287
186
78
4
55
5
26
6
18
0
73
4
523
21
6
5
-
32
Aitu
taki
73
75
27
4
17
9
62
70
25
4
161
11
5
2
-
18
Man
gaia
54
35
14
-
10
3
48
35
14
-
97
6
-
-
-
6
A
tiu39
29
9
1
78
34
28
7
1
70
5
1
2
-
8
M
auke
26
14
15
1
56
21
13
14
-
48
5
1
1
1
8
Miti
aro
16
17
4
-
37
15
16
3
-
34
1
1
1
-
3
Pal
mer
ston
-
-
-
-
-
-
-
-
-
-
-
-
-
-
-
Puk
apuk
a2
1
-
1
4
1
1
-
1
3
1
-
-
-
1
N
assa
u2
3
4
1
10
2
3
4
1
10
-
-
-
-
-
M
anih
iki
-
-
-
-
-
-
-
-
-
-
-
-
-
-
-
Rak
ahan
ga2
6
-
-
8
2
6
-
-
8
-
-
-
-
-
P
enrh
yn-
-
-
-
-
-
-
-
-
-
-
-
-
-
-
PAID
WO
RK
ERS
49
11
9
1
70
37
9
8
-
54
12
2
1
1
16
R
arot
onga
30
7
7
1
45
25
6
6
-
37
5
1
1
1
8
Aitu
taki
8
2
-
-
10
5
2
-
-
7
3
-
-
-
3
M
anga
ia1
1
1
-
3
-
-
1
-
1
1
1
-
-
2
A
tiu5
-
1
-
6
3
-
1
-
4
2
-
-
-
2
M
auke
-
1
-
-
1
-
1
-
-
1
-
-
-
-
-
Miti
aro
5
-
-
-
5
4
-
-
-
4
1
-
-
-
1
Pal
mer
ston
-
-
-
-
-
-
-
-
-
-
-
-
-
-
-
Puk
apuk
a-
-
-
-
-
-
-
-
-
-
-
-
-
-
-
N
assa
u-
-
-
-
-
-
-
-
-
-
-
-
-
-
-
M
anih
iki
-
-
-
-
-
-
-
-
-
-
-
-
-
-
-
Rak
ahan
ga-
-
-
-
-
-
-
-
-
-
-
-
-
-
-
P
enrh
yn-
-
-
-
-
-
-
-
-
-
-
-
-
-
-
Loca
tion
of H
ouse
hold
Tota
l by
Age
Gro
upM
ale
by A
ge G
roup
Fem
ale
by A
ge G
roup
Tabl
e 2.
16 N
umbe
r of P
erso
ns A
ged
15 a
nd O
ver,
Wor
king
in H
oldi
ng D
urin
g M
onth
Prio
r to
Enum
erat
ion
Hol
ding
Oth
er P
aid
Jobs
, by
Sex,
Sta
tus
of O
ther
Pai
d Jo
b, T
ype
of L
abou
r and
by
Loca
tion
of H
ouse
hold
Sour
ce: C
ook
Isla
nds
2011
Cen
sus
of A
gric
ultu
re a
nd F
ishe
ries
TAB
LE S
ET 2
: HO
LDIN
G D
ETA
ILS
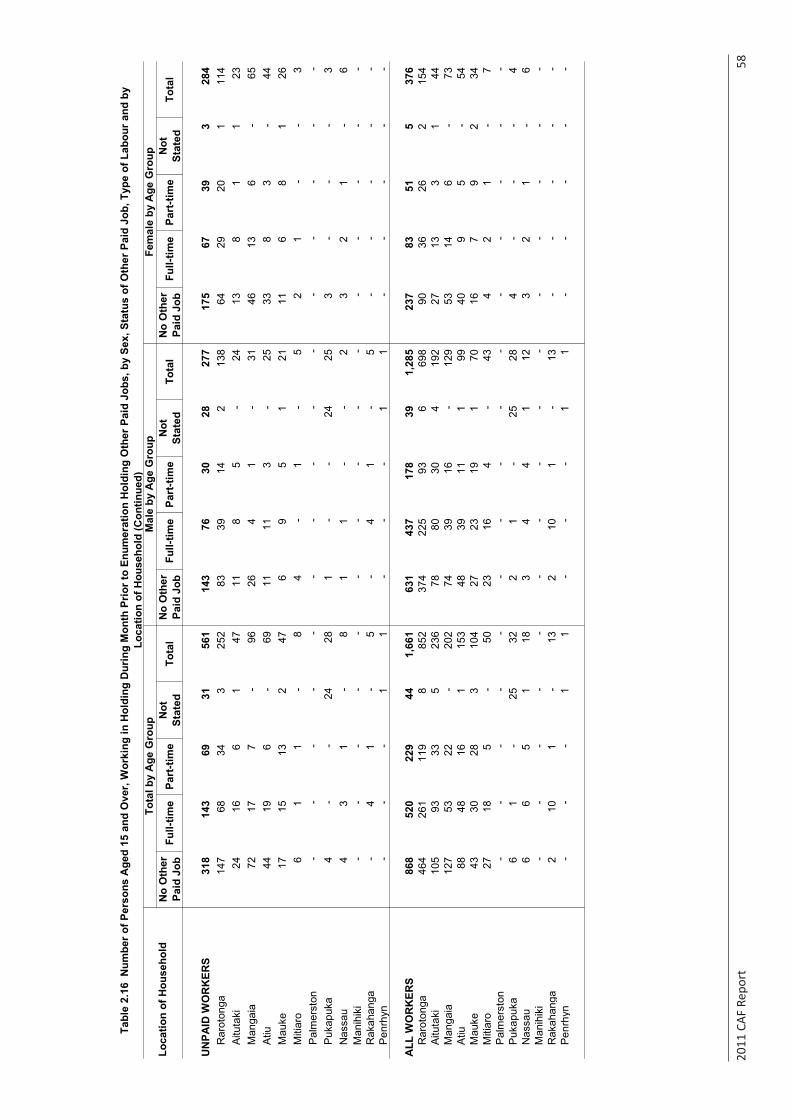
2011
CAF
Rep
ort
58
No
Oth
er
Paid
Job
Full-
time
Part
-tim
eN
ot
Stat
edTo
tal
No
Oth
er
Paid
Job
Full-
time
Part
-tim
eN
ot
Stat
edTo
tal
No
Oth
er
Paid
Job
Full-
time
Part
-tim
eN
ot
Stat
edTo
tal
UN
PAID
WO
RK
ERS
318
143
69
31
561
143
76
30
28
27
7
17
5
67
39
3
28
4
R
arot
onga
147
68
34
3
252
83
39
14
2
13
8
64
29
20
1
114
Aitu
taki
24
16
6
1
47
11
8
5
-
24
13
8
1
1
23
M
anga
ia72
17
7
-
96
26
4
1
-
31
46
13
6
-
65
A
tiu44
19
6
-
69
11
11
3
-
25
33
8
3
-
44
M
auke
17
15
13
2
47
6
9
5
1
21
11
6
8
1
26
M
itiar
o6
1
1
-
8
4
-
1
-
5
2
1
-
-
3
P
alm
erst
on-
-
-
-
-
-
-
-
-
-
-
-
-
-
-
P
ukap
uka
4
-
-
24
28
1
-
-
24
25
3
-
-
-
3
Nas
sau
4
3
1
-
8
1
1
-
-
2
3
2
1
-
6
Man
ihik
i-
-
-
-
-
-
-
-
-
-
-
-
-
-
-
R
akah
anga
-
4
1
-
5
-
4
1
-
5
-
-
-
-
-
Pen
rhyn
-
-
-
1
1
-
-
-
1
1
-
-
-
-
-
ALL
WO
RK
ERS
868
520
229
44
1,
661
63
1
43
7
17
8
39
1,28
5
237
83
51
5
376
Rar
oton
ga46
4
26
1
11
9
8
85
2
37
4
22
5
93
6
698
90
36
26
2
15
4
A
ituta
ki10
5
93
33
5
23
6
78
80
30
4
192
27
13
3
1
44
M
anga
ia12
7
53
22
-
20
2
74
39
16
-
129
53
14
6
-
73
A
tiu88
48
16
1
153
48
39
11
1
99
40
9
5
-
54
Mau
ke43
30
28
3
104
27
23
19
1
70
16
7
9
2
34
Miti
aro
27
18
5
-
50
23
16
4
-
43
4
2
1
-
7
Pal
mer
ston
-
-
-
-
-
-
-
-
-
-
-
-
-
-
-
Puk
apuk
a6
1
-
25
32
2
1
-
25
28
4
-
-
-
4
N
assa
u6
6
5
1
18
3
4
4
1
12
3
2
1
-
6
M
anih
iki
-
-
-
-
-
-
-
-
-
-
-
-
-
-
-
Rak
ahan
ga2
10
1
-
13
2
10
1
-
13
-
-
-
-
-
P
enrh
yn-
-
-
1
1
-
-
-
1
1
-
-
-
-
-
Tabl
e 2.
16 N
umbe
r of P
erso
ns A
ged
15 a
nd O
ver,
Wor
king
in H
oldi
ng D
urin
g M
onth
Prio
r to
Enum
erat
ion
Hol
ding
Oth
er P
aid
Jobs
, by
Sex,
Sta
tus
of O
ther
Pai
d Jo
b, T
ype
of L
abou
r and
by
Loca
tion
of H
ouse
hold
(Con
tinue
d)
Loca
tion
of H
ouse
hold
Tota
l by
Age
Gro
upM
ale
by A
ge G
roup
Fem
ale
by A
ge G
roup
Sour
ce: C
ook
Isla
nds
2011
Cen
sus
of A
gric
ultu
re a
nd F
ishe
ries
TAB
LE S
ET 2
: HO
LDIN
G D
ETA
ILS
2011
CAF
Rep
ort
59
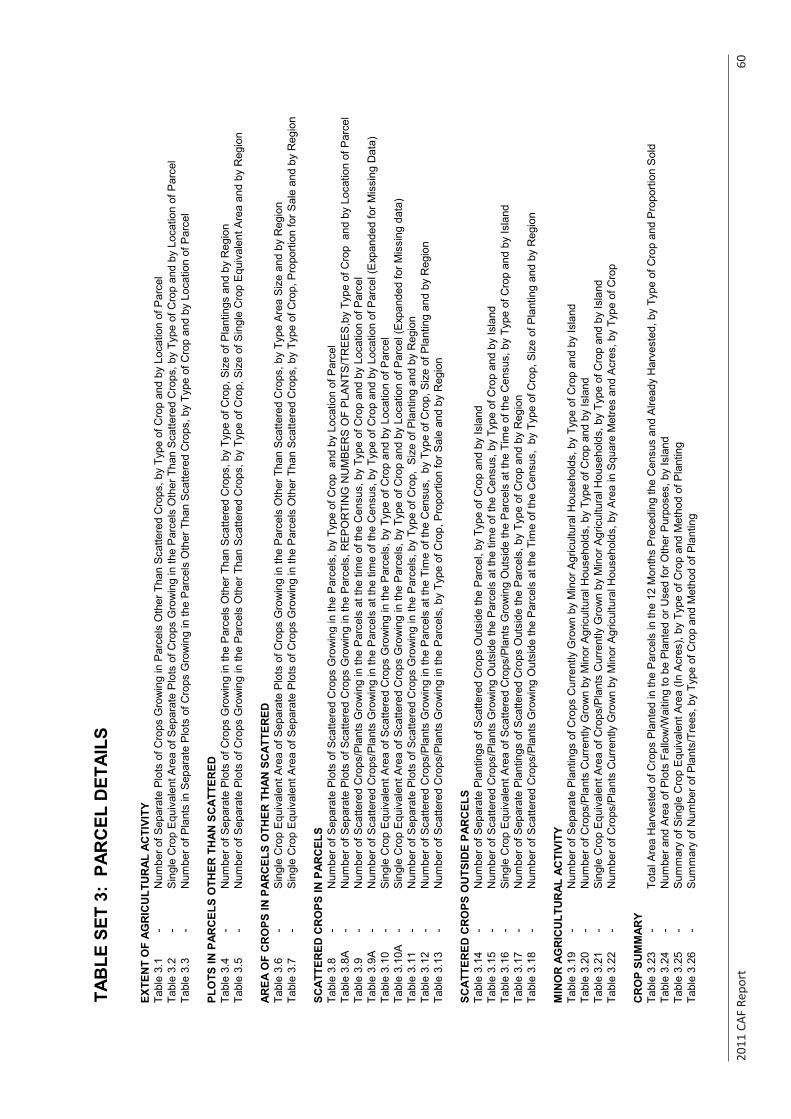
2011
CAF
Rep
ort
60
TAB
LE S
ET 3
: PA
RC
EL D
ETAI
LS
EXTE
NT
OF
AGR
ICU
LTU
RAL
AC
TIVI
TYTa
ble
3.1
-N
umbe
r of S
epar
ate
Plo
ts o
f Cro
ps G
row
ing
in P
arce
ls O
ther
Tha
n S
catte
red
Cro
ps, b
y Ty
pe o
f Cro
p an
d by
Loc
atio
n of
Par
cel
Tabl
e 3.
2-
Sin
gle
Cro
p E
quiv
alen
t Are
a of
Sep
arat
e P
lots
of C
rops
Gro
win
g in
the
Par
cels
Oth
er T
han
Sca
ttere
d C
rops
, by
Type
of C
rop
and
by L
ocat
ion
of P
arce
lTa
ble
3.3
-N
umbe
r of P
lant
s in
Sep
arat
e P
lots
of C
rops
Gro
win
g in
the
Par
cels
Oth
er T
han
Sca
ttere
d C
rops
, by
Type
of C
rop
and
by L
ocat
ion
of P
arce
l
PLO
TS IN
PAR
CEL
S O
THER
TH
AN S
CAT
TER
EDTa
ble
3.4
-N
umbe
r of S
epar
ate
Plo
ts o
f Cro
ps G
row
ing
in th
e P
arce
ls O
ther
Tha
n S
catte
red
Cro
ps, b
y Ty
pe o
f Cro
p, S
ize
of P
lant
ings
and
by
Reg
ion
Tabl
e 3.
5-
Num
ber o
f Sep
arat
e P
lots
of C
rops
Gro
win
g in
the
Par
cels
Oth
er T
han
Sca
ttere
d C
rops
, by
Type
of C
rop,
Siz
e of
Sin
gle
Cro
p E
quiv
alen
t Are
a an
d by
Reg
ion
AREA
OF
CR
OPS
IN P
ARC
ELS
OTH
ER T
HAN
SC
ATTE
RED
Tabl
e 3.
6-
Sin
gle
Cro
p E
quiv
alen
t Are
a of
Sep
arat
e P
lots
of C
rops
Gro
win
g in
the
Par
cels
Oth
er T
han
Sca
ttere
d C
rops
, by
Type
Are
a S
ize
and
by R
egio
nTa
ble
3.7
-S
ingl
e C
rop
Equ
ival
ent A
rea
of S
epar
ate
Plo
ts o
f Cro
ps G
row
ing
in th
e P
arce
ls O
ther
Tha
n S
catte
red
Cro
ps, b
y Ty
pe o
f Cro
p, P
ropo
rtion
for S
ale
and
by R
egio
n
SCAT
TER
ED C
RO
PS IN
PAR
CEL
STa
ble
3.8
-N
umbe
r of S
epar
ate
Plo
ts o
f Sca
ttere
d C
rops
Gro
win
g in
the
Par
cels
, by
Type
of C
rop
and
by
Loca
tion
of P
arce
lTa
ble
3.8A
-N
umbe
r of S
epar
ate
Plo
ts o
f Sca
ttere
d C
rops
Gro
win
g in
the
Par
cels
, RE
PO
RTI
NG
NU
MB
ER
S O
F P
LAN
TS/T
RE
ES
,by
Type
of C
rop
and
by
Loca
tion
of P
arce
lTa
ble
3.9
-N
umbe
r of S
catte
red
Cro
ps/P
lant
s G
row
ing
in th
e P
arce
ls a
t the
tim
e of
the
Cen
sus,
by
Type
of C
rop
and
by L
ocat
ion
of P
arce
lTa
ble
3.9A
-N
umbe
r of S
catte
red
Cro
ps/P
lant
s G
row
ing
in th
e P
arce
ls a
t the
tim
e of
the
Cen
sus,
by
Type
of C
rop
and
by L
ocat
ion
of P
arce
l (E
xpan
ded
for M
issi
ng D
ata)
Tabl
e 3.
10-
Sin
gle
Cro
p E
quiv
alen
t Are
a of
Sca
ttere
d C
rops
Gro
win
g in
the
Par
cels
, by
Type
of C
rop
and
by L
ocat
ion
of P
arce
lTa
ble
3.10
A-
Sin
gle
Cro
p E
quiv
alen
t Are
a of
Sca
ttere
d C
rops
Gro
win
g in
the
Par
cels
, by
Type
of C
rop
and
by L
ocat
ion
of P
arce
l (E
xpan
ded
for M
issi
ng d
ata)
Tabl
e 3.
11-
Num
ber o
f Sep
arat
e P
lots
of S
catte
red
Cro
ps G
row
ing
in th
e P
arce
ls, b
y Ty
pe o
f Cro
p, S
ize
of P
lant
ing
and
by R
egio
nTa
ble
3.12
-N
umbe
r of S
catte
red
Cro
ps/P
lant
s G
row
ing
in th
e P
arce
ls a
t the
Tim
e of
the
Cen
sus,
by
Type
of C
rop,
Siz
e of
Pla
ntin
g an
d by
Reg
ion
Tabl
e 3.
13-
Num
ber o
f Sca
ttere
d C
rops
/Pla
nts
Gro
win
g in
the
Par
cels
, by
Type
of C
rop,
Pro
porti
on fo
r Sal
e an
d by
Reg
ion
SCAT
TER
ED C
RO
PS O
UTS
IDE
PAR
CEL
STa
ble
3.14
-N
umbe
r of S
epar
ate
Pla
ntin
gs o
f Sca
ttere
d C
rops
Out
side
the
Par
cel,
by T
ype
of C
rop
and
by Is
land
Tabl
e 3.
15-
Num
ber o
f Sca
ttere
d C
rops
/Pla
nts
Gro
win
g O
utsi
de th
e P
arce
ls a
t the
tim
e of
the
Cen
sus,
by
Type
of C
rop
and
by Is
land
Tabl
e 3.
16-
Sin
gle
Cro
p E
quiv
alen
t Are
a of
Sca
ttere
d C
rops
/Pla
nts
Gro
win
g O
utsi
de th
e P
arce
ls a
t the
Tim
e of
the
Cen
sus,
by
Type
of C
rop
and
by Is
land
Tabl
e 3.
17-
Num
ber o
f Sep
arat
e P
lant
ings
of S
catte
red
Cro
ps O
utsi
de th
e P
arce
ls, b
y Ty
pe o
f Cro
p an
d by
Reg
ion
Tabl
e 3.
18-
Num
ber o
f Sca
ttere
d C
rops
/Pla
nts
Gro
win
g O
utsi
de th
e P
arce
ls a
t the
Tim
e of
the
Cen
sus,
by
Type
of C
rop,
Siz
e of
Pla
ntin
g an
d by
Reg
ion
MIN
OR
AG
RIC
ULT
UR
AL A
CTI
VITY
Tabl
e 3.
19-
Num
ber o
f Sep
arat
e P
lant
ings
of C
rops
Cur
rent
ly G
row
n by
Min
or A
gric
ultu
ral H
ouse
hold
s, b
y Ty
pe o
f Cro
p an
d by
Isla
ndTa
ble
3.20
-N
umbe
r of C
rops
/Pla
nts
Cur
rent
ly G
row
n by
Min
or A
gric
ultu
ral H
ouse
hold
s, b
y Ty
pe o
f Cro
p an
d by
Isla
ndTa
ble
3.21
-S
ingl
e C
rop
Equ
ival
ent A
rea
of C
rops
/Pla
nts
Cur
rent
ly G
row
n by
Min
or A
gric
ultu
ral H
ouse
hold
s, b
y Ty
pe o
f Cro
p an
d by
Isla
ndTa
ble
3.22
-N
umbe
r of C
rops
/Pla
nts
Cur
rent
ly G
row
n by
Min
or A
gric
ultu
ral H
ouse
hold
s, b
y A
rea
in S
quar
e M
etre
s an
d A
cres
, by
Type
of C
rop
CR
OP
SUM
MAR
YTa
ble
3.23
-To
tal A
rea
Har
vest
ed o
f Cro
ps P
lant
ed in
the
Par
cels
in th
e 12
Mon
ths
Pre
cedi
ng th
e C
ensu
s an
d A
lread
y H
arve
sted
, by
Type
of C
rop
and
Pro
porti
on S
old
Tabl
e 3.
24-
Num
ber a
nd A
rea
of P
lots
Fal
low
/Wai
ting
to b
e P
lant
ed o
r Use
d fo
r Oth
er P
urpo
ses,
by
Isla
ndTa
ble
3.25
-S
umm
ary
of S
ingl
e C
rop
Equ
ival
ent A
rea
(In A
cres
), by
Typ
e of
Cro
p an
d M
etho
d of
Pla
ntin
gTa
ble
3.26
-S
umm
ary
of N
umbe
r of P
lant
s/Tr
ees,
by
Type
of C
rop
and
Met
hod
of P
lant
ing
Sour
ce:
Coo
k Is
land
s 20
11 C
ensu
s of
Agr
icul
ture
and
Fis
herie
sTA
BLE
SET
3: P
ARC
EL D
ETAI
LS
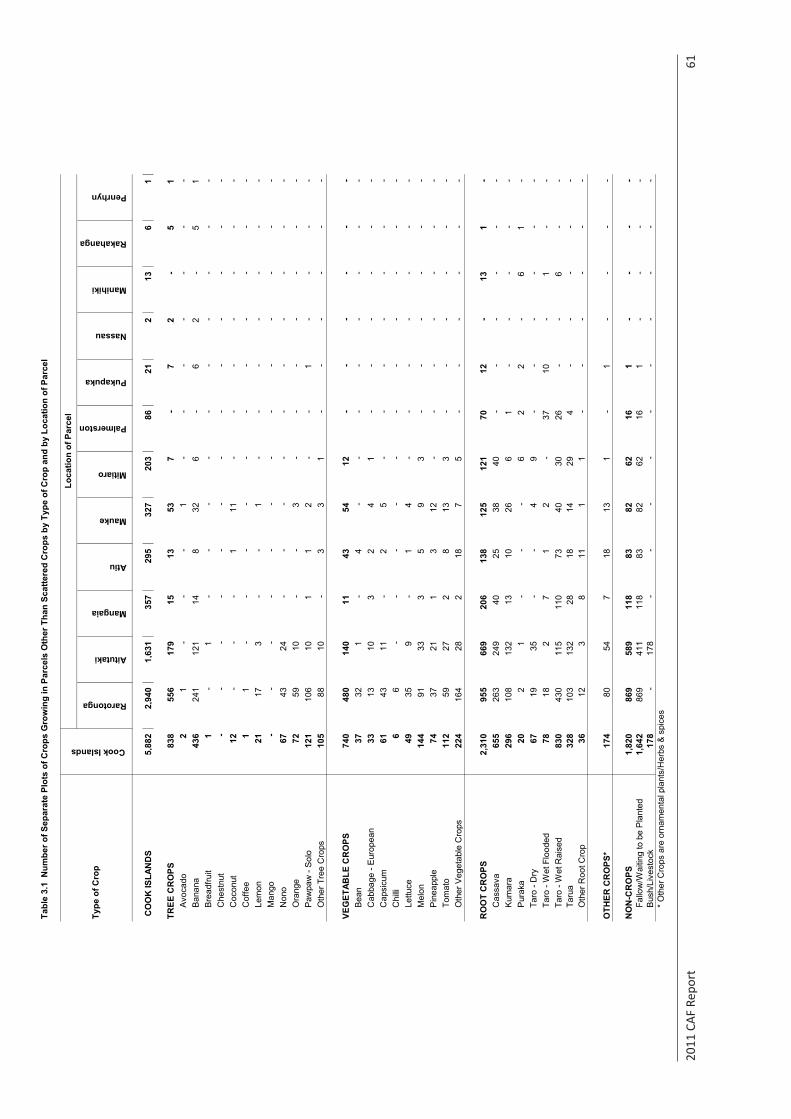
2011
CAF
Rep
ort
61
Tabl
e 3.
1 N
umbe
r of S
epar
ate
Plot
s of
Cro
ps G
row
ing
in P
arce
ls O
ther
Tha
n Sc
atte
red
Cro
ps b
y Ty
pe o
f Cro
p an
d by
Loc
atio
n of
Par
cel
Rarotonga
Aitutaki
Mangaia
Atiu
Mauke
Mitiaro
Palmerston
Pukapuka
Nassau
Manihiki
Rakahanga
Penrhyn
CO
OK
ISLA
ND
S5,
882
2,
940
1,
631
35
7
29
5
32
7
20
3
86
21
2
13
6
1
TREE
CR
OPS
838
556
179
15
13
53
7
-
7
2
-
5
1
A
voca
do2
1
-
-
-
1
-
-
-
-
-
-
-
B
anan
a43
6
24
1
12
1
14
8
32
6
-
6
2
-
5
1
B
read
fruit
1
-
1
-
-
-
-
-
-
-
-
-
-
Che
stnu
t-
-
-
-
-
-
-
-
-
-
-
-
-
C
ocon
ut12
-
-
-
1
11
-
-
-
-
-
-
-
C
offe
e1
1
-
-
-
-
-
-
-
-
-
-
-
Le
mon
21
17
3
-
-
1
-
-
-
-
-
-
-
Man
go-
-
-
-
-
-
-
-
-
-
-
-
-
N
ono
67
43
24
-
-
-
-
-
-
-
-
-
-
O
rang
e72
59
10
-
-
3
-
-
-
-
-
-
-
Paw
paw
- S
olo
121
106
10
1
1
2
-
-
1
-
-
-
-
O
ther
Tre
e C
rops
105
88
10
-
3
3
1
-
-
-
-
-
-
VEG
ETAB
LE C
RO
PS74
0
48
0
14
0
11
43
54
12
-
-
-
-
-
-
B
ean
37
32
1
-
4
-
-
-
-
-
-
-
-
Cab
bage
- E
urop
ean
33
13
10
3
2
4
1
-
-
-
-
-
-
C
apsi
cum
61
43
11
-
2
5
-
-
-
-
-
-
-
C
hilli
6
6
-
-
-
-
-
-
-
-
-
-
-
Lettu
ce49
35
9
-
1
4
-
-
-
-
-
-
-
M
elon
144
91
33
3
5
9
3
-
-
-
-
-
-
Pin
eapp
le74
37
21
1
3
12
-
-
-
-
-
-
-
To
mat
o11
2
59
27
2
8
13
3
-
-
-
-
-
-
Oth
er V
eget
able
Cro
ps22
4
16
4
28
2
18
7
5
-
-
-
-
-
-
RO
OT
CR
OPS
2,31
0
955
669
206
138
125
121
70
12
-
13
1
-
C
assa
va65
5
26
3
24
9
40
25
38
40
-
-
-
-
-
-
K
umar
a29
6
10
8
13
2
13
10
26
6
1
-
-
-
-
-
Pur
aka
20
2
1
-
-
-
6
2
2
-
6
1
-
Ta
ro -
Dry
67
19
35
-
-
4
9
-
-
-
-
-
-
Ta
ro -
Wet
Flo
oded
78
18
2
7
1
2
-
37
10
-
1
-
-
Taro
- W
et R
aise
d83
0
43
0
11
5
11
0
73
40
30
26
-
-
6
-
-
Ta
rua
328
103
132
28
18
14
29
4
-
-
-
-
-
Oth
er R
oot C
rop
36
12
3
8
11
1
1
-
-
-
-
-
-
OTH
ER C
RO
PS*
174
80
54
7
18
13
1
-
1
-
-
-
-
NO
N-C
RO
PS1,
820
86
9
58
9
11
8
83
82
62
16
1
-
-
-
-
Fa
llow
/Wai
ting
to b
e P
lant
ed1,
642
86
9
41
1
11
8
83
82
62
16
1
-
-
-
-
B
ush/
Live
stoc
k17
8
-
17
8
-
-
-
-
-
-
-
-
-
-
* O
ther
Cro
ps a
re o
rnam
enta
l pla
nts/
Her
bs &
spi
ces
Type
of C
rop
Cook Islands
Loca
tion
of P
arce
l
Sour
ce:
Coo
k Is
land
s 20
11 C
ensu
s of
Agr
icul
ture
and
Fis
herie
sTA
BLE
SET
3: P
AR
CEL
DET
AIL
S
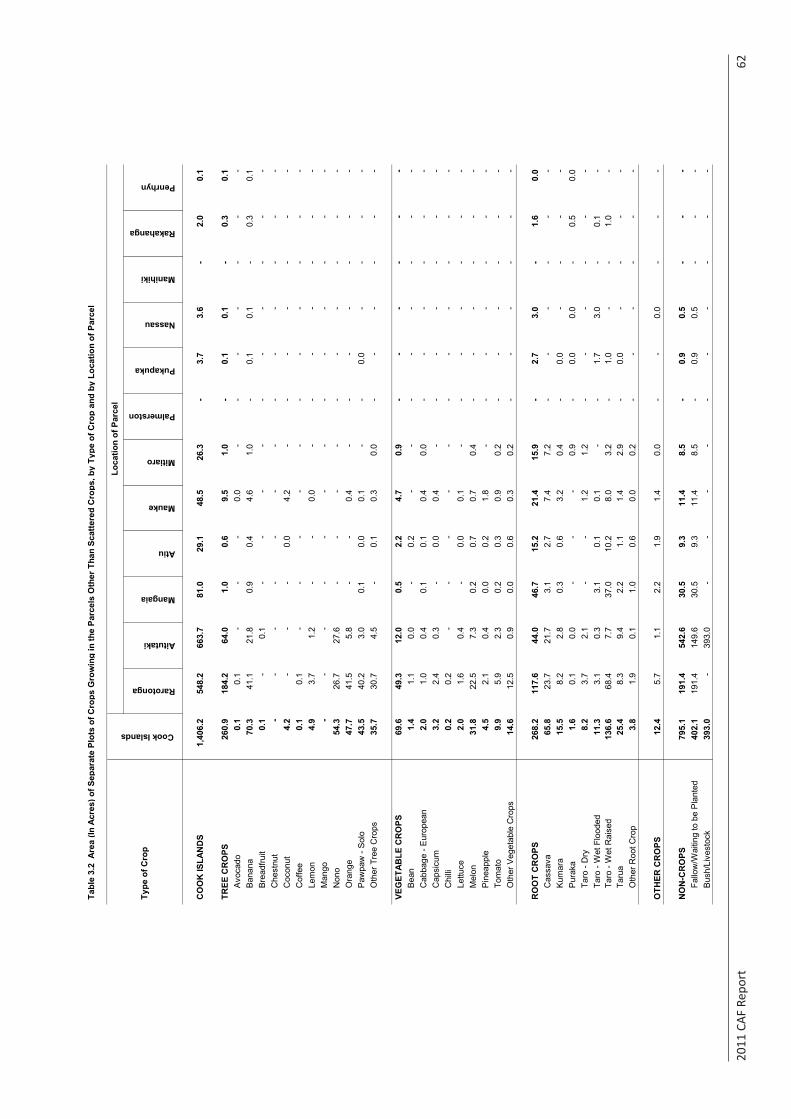
2011
CAF
Rep
ort
62
Tabl
e 3.
2 A
rea
(In A
cres
) of S
epar
ate
Plot
s of
Cro
ps G
row
ing
in th
e Pa
rcel
s O
ther
Tha
n Sc
atte
red
Cro
ps, b
y Ty
pe o
f Cro
p an
d by
Loc
atio
n of
Par
cel
Rarotonga
Aitutaki
Mangaia
Atiu
Mauke
Mitiaro
Palmerston
Pukapuka
Nassau
Manihiki
Rakahanga
Penrhyn
CO
OK
ISLA
ND
S1,
406.
2
54
8.2
66
3.7
81
.0
29.1
48
.5
26.3
-
3.
7
3.
6
-
2.
0
0.
1
TREE
CR
OPS
260.
9
184.
2
64.0
1.
0
0.
6
9.
5
1.
0
-
0.
1
0.
1
-
0.
3
0.
1
A
voca
do0.
1
0.
1
-
-
-
0.
0
-
-
-
-
-
-
-
B
anan
a70
.3
41.1
21
.8
0.9
0.4
4.6
1.0
-
0.1
0.1
-
0.3
0.1
Bre
adfru
it0.
1
-
0.
1
-
-
-
-
-
-
-
-
-
-
C
hest
nut
-
-
-
-
-
-
-
-
-
-
-
-
-
Coc
onut
4.2
-
-
-
0.0
4.2
-
-
-
-
-
-
-
Cof
fee
0.1
0.1
-
-
-
-
-
-
-
-
-
-
-
Lem
on4.
9
3.
7
1.
2
-
-
0.
0
-
-
-
-
-
-
-
M
ango
-
-
-
-
-
-
-
-
-
-
-
-
-
Non
o54
.3
26.7
27
.6
-
-
-
-
-
-
-
-
-
-
Ora
nge
47.7
41
.5
5.8
-
-
0.4
-
-
-
-
-
-
-
Paw
paw
- S
olo
43.5
40
.2
3.0
0.1
0.0
0.1
-
-
0.0
-
-
-
-
Oth
er T
ree
Cro
ps35
.7
30.7
4.
5
-
0.
1
0.
3
0.
0
-
-
-
-
-
-
VEG
ETAB
LE C
RO
PS69
.6
49.3
12
.0
0.5
2.2
4.7
0.9
-
-
-
-
-
-
Bea
n1.
4
1.
1
0.
0
-
0.
2
-
-
-
-
-
-
-
-
C
abba
ge -
Eur
opea
n2.
0
1.
0
0.
4
0.
1
0.
1
0.
4
0.
0
-
-
-
-
-
-
C
apsi
cum
3.2
2.4
0.3
-
0.0
0.4
-
-
-
-
-
-
-
Chi
lli0.
2
0.
2
-
-
-
-
-
-
-
-
-
-
-
Le
ttuce
2.0
1.6
0.4
-
0.0
0.1
-
-
-
-
-
-
-
Mel
on31
.8
22.5
7.
3
0.
2
0.
7
0.
7
0.
4
-
-
-
-
-
-
P
inea
pple
4.5
2.1
0.4
0.0
0.2
1.8
-
-
-
-
-
-
-
Tom
ato
9.9
5.9
2.3
0.2
0.3
0.9
0.2
-
-
-
-
-
-
Oth
er V
eget
able
Cro
ps14
.6
12.5
0.
9
0.
0
0.
6
0.
3
0.
2
-
-
-
-
-
-
RO
OT
CR
OPS
268.
2
117.
6
44.0
46
.7
15.2
21
.4
15.9
-
2.
7
3.
0
-
1.
6
0.
0
C
assa
va65
.8
23.7
21
.7
3.1
2.7
7.4
7.2
-
-
-
-
-
-
Kum
ara
15.5
8.
2
2.
8
0.
3
0.
6
3.
2
0.
4
-
0.
0
-
-
-
-
P
urak
a1.
6
0.
1
0.
0
-
-
-
0.
9
-
0.
0
0.
0
-
0.
5
0.
0
Ta
ro -
Dry
8.2
3.7
2.1
-
-
1.2
1.2
-
-
-
-
-
-
Taro
- W
et F
lood
ed11
.3
3.1
0.3
3.1
0.1
0.1
-
-
1.7
3.0
-
0.1
-
Taro
- W
et R
aise
d13
6.6
68
.4
7.7
37.0
10
.2
8.0
3.2
-
1.0
-
-
1.0
-
Taru
a25
.4
8.3
9.4
2.2
1.1
1.4
2.9
-
0.0
-
-
-
-
Oth
er R
oot C
rop
3.8
1.9
0.1
1.0
0.6
0.0
0.2
-
-
-
-
-
-
OTH
ER C
RO
PS12
.4
5.7
1.1
2.2
1.9
1.4
0.0
-
-
0.0
-
-
-
NO
N-C
RO
PS79
5.1
19
1.4
54
2.6
30
.5
9.3
11.4
8.
5
-
0.
9
0.
5
-
-
-
Fa
llow
/Wai
ting
to b
e P
lant
ed40
2.1
19
1.4
14
9.6
30
.5
9.3
11.4
8.
5
-
0.
9
0.
5
-
-
-
B
ush/
Live
stoc
k39
3.0
-
39
3.0
-
-
-
-
-
-
-
-
-
-
Type
of C
rop
Cook Islands
Loca
tion
of P
arce
l
Sour
ce:
Coo
k Is
land
s 20
11 C
ensu
s of
Agr
icul
ture
and
Fis
herie
sTA
BLE
SET
3: P
ARC
EL D
ETAI
LS
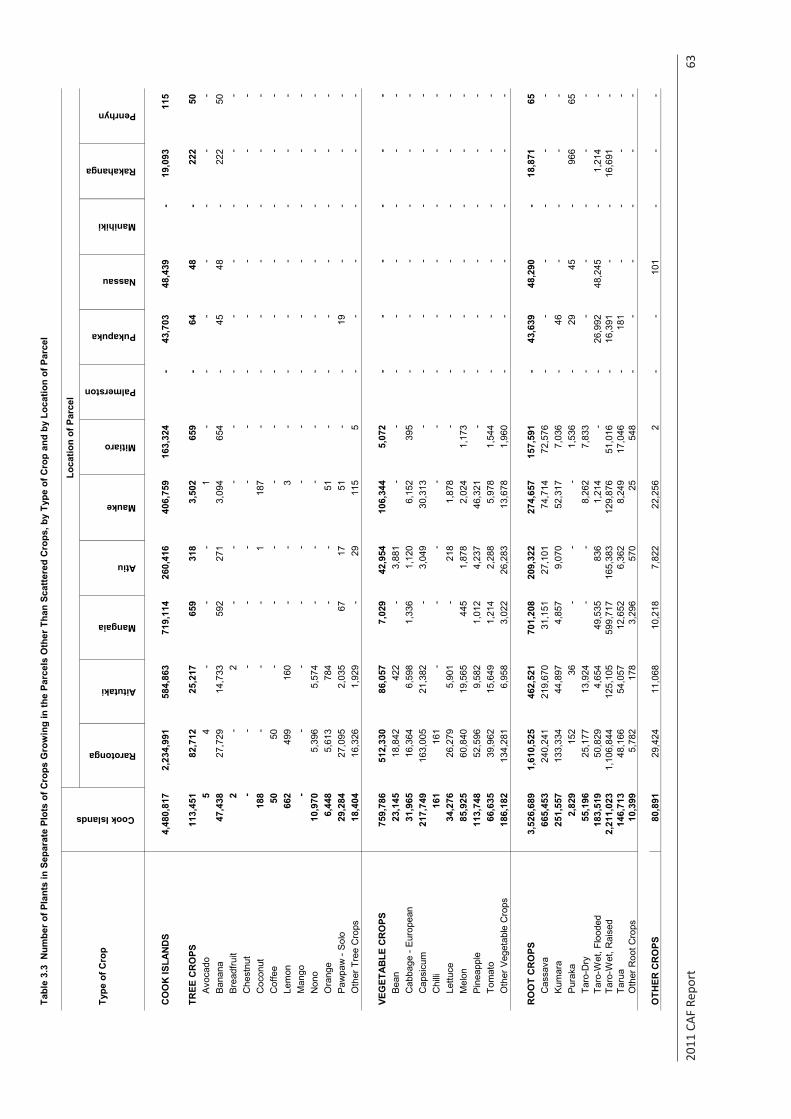
2011
CAF
Rep
ort
63
Tabl
e 3.
3 N
umbe
r of P
lant
s in
Sep
arat
e Pl
ots
of C
rops
Gro
win
g in
the
Parc
els
Oth
er T
han
Scat
tere
d C
rops
, by
Type
of C
rop
and
by L
ocat
ion
of P
arce
l
Rarotonga
Aitutaki
Mangaia
Atiu
Mauke
Mitiaro
Palmerston
Pukapuka
Nassau
Manihiki
Rakahanga
Penrhyn
CO
OK
ISLA
ND
S4,
480,
817
2,23
4,99
1
58
4,86
3
719,
114
26
0,41
6
40
6,75
9
163,
324
-
43
,703
48
,439
-
19,0
93
115
TREE
CR
OPS
113,
451
82
,712
25,2
17
65
9
318
3,50
2
659
-
64
48
-
222
50
Avoc
ado
5
4
-
-
-
1
-
-
-
-
-
-
-
Bana
na47
,438
27,7
29
14
,733
592
27
1
3,
094
65
4
-
45
48
-
22
2
50
Br
eadf
ruit
2
-
2
-
-
-
-
-
-
-
-
-
-
Che
stnu
t-
-
-
-
-
-
-
-
-
-
-
-
-
C
ocon
ut18
8
-
-
-
1
187
-
-
-
-
-
-
-
Cof
fee
50
50
-
-
-
-
-
-
-
-
-
-
-
Lem
on66
2
499
16
0
-
-
3
-
-
-
-
-
-
-
Man
go-
-
-
-
-
-
-
-
-
-
-
-
-
N
ono
10,9
70
5,
396
5,57
4
-
-
-
-
-
-
-
-
-
-
O
rang
e6,
448
5,61
3
78
4
-
-
51
-
-
-
-
-
-
-
Pa
wpa
w -
Solo
29,2
84
27
,095
2,03
5
67
17
51
-
-
19
-
-
-
-
O
ther
Tre
e C
rops
18,4
04
16
,326
1,92
9
-
29
11
5
5
-
-
-
-
-
-
VEG
ETAB
LE C
RO
PS75
9,78
6
512,
330
86
,057
7,02
9
42
,954
10
6,34
4
5,07
2
-
-
-
-
-
-
Bean
23,1
45
18
,842
422
-
3,
881
-
-
-
-
-
-
-
-
Cab
bage
- Eu
rope
an31
,965
16,3
64
6,
598
1,33
6
1,
120
6,
152
39
5
-
-
-
-
-
-
C
apsi
cum
217,
749
16
3,00
5
21,3
82
-
3,
049
30
,313
-
-
-
-
-
-
-
C
hilli
161
16
1
-
-
-
-
-
-
-
-
-
-
-
Lettu
ce34
,276
26,2
79
5,
901
-
218
1,87
8
-
-
-
-
-
-
-
M
elon
85
,925
60,8
40
19
,565
445
1,
878
2,
024
1,
173
-
-
-
-
-
-
Pi
neap
ple
113,
748
52
,596
9,58
2
1,
012
4,23
7
46,3
21
-
-
-
-
-
-
-
Tom
ato
66,6
35
39
,962
15,6
49
1,
214
2,28
8
5,97
8
1,54
4
-
-
-
-
-
-
Oth
er V
eget
able
Cro
ps18
6,18
2
134,
281
6,
958
3,02
2
26
,283
13
,678
1,96
0
-
-
-
-
-
-
RO
OT
CR
OPS
3,52
6,68
9
1,
610,
525
462,
521
70
1,20
8
209,
322
274,
657
15
7,59
1
-
43,6
39
48,2
90
-
18
,871
65
C
assa
va66
5,45
3
240,
241
21
9,67
0
31,1
51
27
,101
74
,714
72,5
76
-
-
-
-
-
-
Kum
ara
251,
557
13
3,33
4
44,8
97
4,
857
9,07
0
52,3
17
7,
036
-
46
-
-
-
-
Pura
ka2,
829
152
36
-
-
-
1,
536
-
29
45
-
96
6
65
Ta
ro-D
ry55
,196
25,1
77
13
,924
-
-
8,
262
7,
833
-
-
-
-
-
-
Ta
ro-W
et, F
lood
ed18
3,51
9
50,8
29
4,
654
49,5
35
83
6
1,
214
-
-
26
,992
48
,245
-
1,21
4
-
Ta
ro-W
et, R
aise
d2,
211,
023
1,10
6,84
4
12
5,10
5
599,
717
16
5,38
3
12
9,87
6
51,0
16
-
16
,391
-
-
16
,691
-
Taru
a14
6,71
3
48,1
66
54
,057
12,6
52
6,
362
8,
249
17
,046
-
181
-
-
-
-
Oth
er R
oot C
rops
10,3
99
5,
782
178
3,
296
570
25
54
8
-
-
-
-
-
-
OTH
ER C
RO
PS80
,891
29,4
24
11
,068
10,2
18
7,
822
22
,256
2
-
-
101
-
-
-
Type
of C
rop
Cook Islands
Loca
tion
of P
arce
l
Sour
ce:
Coo
k Is
land
s 20
11 C
ensu
s of
Agr
icul
ture
and
Fis
herie
sTA
BLE
SET
3: P
AR
CEL
DET
AIL
S
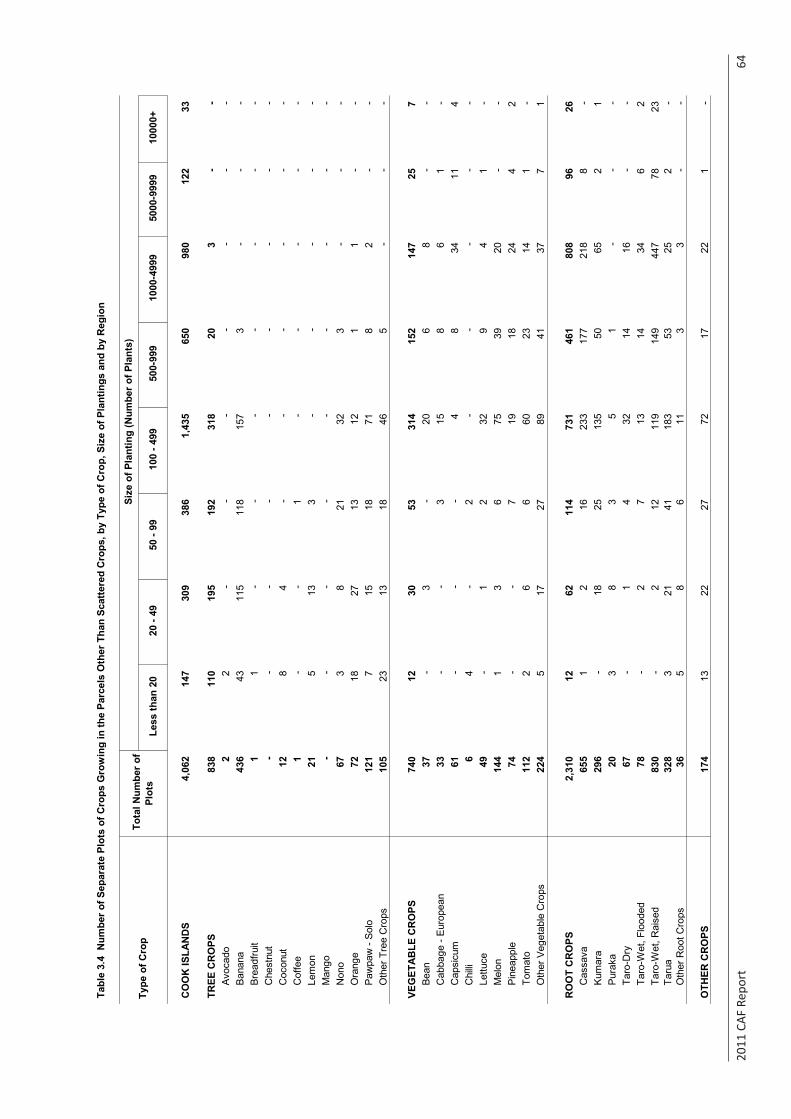
2011
CAF
Rep
ort
64
Tabl
e 3.
4 N
umbe
r of S
epar
ate
Plot
s of
Cro
ps G
row
ing
in th
e Pa
rcel
s O
ther
Tha
n Sc
atte
red
Cro
ps, b
y Ty
pe o
f Cro
p, S
ize
of P
lant
ings
and
by
Reg
ion
Les
s th
an 2
0 2
0 - 4
9 5
0 - 9
9 1
00 -
499
500
-999
1
000-
4999
5
000-
9999
1
0000
+
CO
OK
ISLA
ND
S4,
062
147
30
9
386
1,
435
650
98
0
122
33
TREE
CR
OPS
838
11
0
195
19
2
318
20
3
-
-
Av
ocad
o2
2
-
-
-
-
-
-
-
Bana
na43
6
43
11
5
118
15
7
3
-
-
-
Br
eadf
ruit
1
1
-
-
-
-
-
-
-
C
hest
nut
-
-
-
-
-
-
-
-
-
C
ocon
ut12
8
4
-
-
-
-
-
-
C
offe
e1
-
-
1
-
-
-
-
-
Lem
on21
5
13
3
-
-
-
-
-
Man
go-
-
-
-
-
-
-
-
-
Non
o67
3
8
21
32
3
-
-
-
O
rang
e72
18
27
13
12
1
1
-
-
Pa
wpa
w -
Solo
121
7
15
18
71
8
2
-
-
O
ther
Tre
e C
rops
105
23
13
18
46
5
-
-
-
VEG
ETA
BLE
CR
OPS
740
12
30
53
314
15
2
147
25
7
Bean
37
-
3
-
20
6
8
-
-
C
abba
ge -
Euro
pean
33
-
-
3
15
8
6
1
-
Cap
sicu
m61
-
-
-
4
8
34
11
4
Chi
lli6
4
-
2
-
-
-
-
-
Lettu
ce49
-
1
2
32
9
4
1
-
M
elon
14
4
1
3
6
75
39
20
-
-
Pine
appl
e74
-
-
7
19
18
24
4
2
Tom
ato
112
2
6
6
60
23
14
1
-
Oth
er V
eget
able
Cro
ps22
4
5
17
27
89
41
37
7
1
RO
OT
CR
OPS
2,31
0
12
62
11
4
731
46
1
808
96
26
Cas
sava
655
1
2
16
233
17
7
218
8
-
Ku
mar
a29
6
-
18
25
135
50
65
2
1
Pura
ka20
3
8
3
5
1
-
-
-
Ta
ro-D
ry67
-
1
4
32
14
16
-
-
Taro
-Wet
, Flo
oded
78
-
2
7
13
14
34
6
2
Ta
ro-W
et, R
aise
d83
0
-
2
12
11
9
149
44
7
78
23
Ta
rua
328
3
21
41
18
3
53
25
2
-
Oth
er R
oot C
rops
36
5
8
6
11
3
3
-
-
OTH
ER C
RO
PS17
4
13
22
27
72
17
22
1
-
Typ
e of
Cro
p T
otal
Num
ber o
f Pl
ots
Siz
e of
Pla
ntin
g (N
umbe
r of P
lant
s)
Sour
ce:
Coo
k Is
land
s 20
11 C
ensu
s of
Agr
icul
ture
and
Fis
herie
sTA
BLE
SET
3: P
AR
CEL
DET
AIL
S
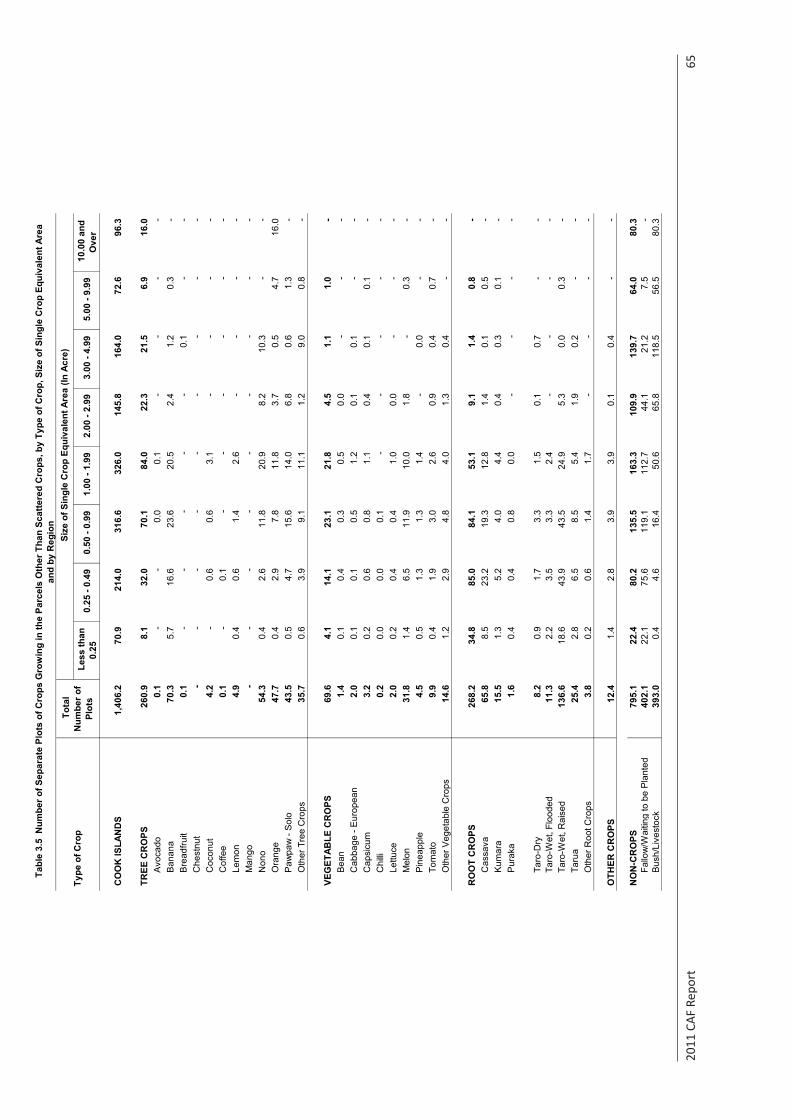
2011
CAF
Rep
ort
65
Les
s th
an
0.25
0
.25
- 0.4
9 0
.50
- 0.9
9 1
.00
- 1.9
9 2
.00
- 2.9
9 3
.00
- 4.9
9 5
.00
- 9.9
9 1
0.00
and
O
ver
CO
OK
ISLA
ND
S1,
406.
2
70.9
21
4.0
316.
6
32
6.0
145.
8
16
4.0
72.6
96
.3
TREE
CR
OPS
260.
9
8.
1
32.0
70
.1
84.0
22
.3
21.5
6.
9
16.0
A
voca
do0.
1
-
-
0.0
0.
1
-
-
-
-
Ban
ana
70.3
5.
7
16.6
23
.6
20.5
2.
4
1.2
0.
3
-
Bre
adfru
it0.
1
-
-
-
-
-
0.1
-
-
C
hest
nut
-
-
-
-
-
-
-
-
-
Coc
onut
4.2
-
0.
6
0.6
3.
1
-
-
-
-
Cof
fee
0.1
-
0.
1
-
-
-
-
-
-
Lem
on4.
9
0.4
0.
6
1.4
2.
6
-
-
-
-
Man
go-
-
-
-
-
-
-
-
-
N
ono
54.3
0.
4
2.6
11
.8
20.9
8.
2
10.3
-
-
O
rang
e47
.7
0.4
2.
9
7.8
11
.8
3.7
0.
5
4.7
16
.0
Paw
paw
- S
olo
43.5
0.
5
4.7
15
.6
14.0
6.
8
0.6
1.
3
-
Oth
er T
ree
Cro
ps35
.7
0.6
3.
9
9.1
11
.1
1.2
9.
0
0.8
-
VEG
ETAB
LE C
RO
PS69
.6
4.1
14
.1
23.1
21
.8
4.5
1.
1
1.0
-
B
ean
1.4
0.
1
0.4
0.
3
0.5
0.
0
-
-
-
Cab
bage
- E
urop
ean
2.0
0.
1
0.1
0.
5
1.2
0.
1
0.1
-
-
C
apsi
cum
3.2
0.
2
0.6
0.
8
1.1
0.
4
0.1
0.
1
-
Chi
lli0.
2
0.0
0.
0
0.1
-
-
-
-
-
Le
ttuce
2.0
0.
2
0.4
0.
4
1.0
0.
0
-
-
-
Mel
on31
.8
1.4
6.
5
11.9
10
.0
1.8
-
0.
3
-
Pin
eapp
le4.
5
0.5
1.
3
1.3
1.
4
-
0.0
-
-
To
mat
o9.
9
0.4
1.
9
3.0
2.
6
0.9
0.
4
0.7
-
O
ther
Veg
etab
le C
rops
14.6
1.
2
2.9
4.
8
4.0
1.
3
0.4
-
-
RO
OT
CR
OPS
268.
2
34
.8
85.0
84
.1
53.1
9.
1
1.4
0.
8
-
Cas
sava
65.8
8.
5
23.2
19
.3
12.8
1.
4
0.1
0.
5
-
Kum
ara
15.5
1.
3
5.2
4.
0
4.4
0.
4
0.3
0.
1
-
Pur
aka
1.6
0.
4
0.4
0.
8
0.0
-
-
-
-
Taro
-Dry
8.2
0.
9
1.7
3.
3
1.5
0.
1
0.7
-
-
Ta
ro-W
et, F
lood
ed11
.3
2.2
3.
5
3.3
2.
4
-
-
-
-
Taro
-Wet
, Rai
sed
136.
6
18
.6
43.9
43
.5
24.9
5.
3
0.0
0.
3
-
Taru
a25
.4
2.8
6.
5
8.5
5.
4
1.9
0.
2
-
-
Oth
er R
oot C
rops
3.8
0.
2
0.6
1.
4
1.7
-
-
-
-
OTH
ER C
RO
PS12
.4
1.4
2.
8
3.9
3.
9
0.1
0.
4
-
-
NO
N-C
RO
PS79
5.1
22.4
80
.2
135.
5
16
3.3
109.
9
13
9.7
64.0
80
.3
Fallo
w/W
aitin
g to
be
Pla
nted
402.
1
22
.1
75.6
11
9.1
112.
7
44
.1
21.2
7.
5
-
Bus
h/Li
vest
ock
393.
0
0.
4
4.6
16
.4
50.6
65
.8
118.
5
56
.5
80.3
Typ
e of
Cro
p T
otal
N
umbe
r of
Plot
s
Siz
e of
Sin
gle
Cro
p Eq
uiva
lent
Are
a (In
Acr
e)
Tab
le 3
.5 N
umbe
r of S
epar
ate
Plot
s of
Cro
ps G
row
ing
in th
e Pa
rcel
s O
ther
Tha
n Sc
atte
red
Cro
ps, b
y Ty
pe o
f Cro
p, S
ize
of S
ingl
e C
rop
Equi
vale
nt A
rea
and
by R
egio
n
Sour
ce:
Coo
k Is
land
s 20
11 C
ensu
s of
Agr
icul
ture
and
Fis
herie
sTA
BLE
SET
3: P
AR
CEL
DET
AIL
S
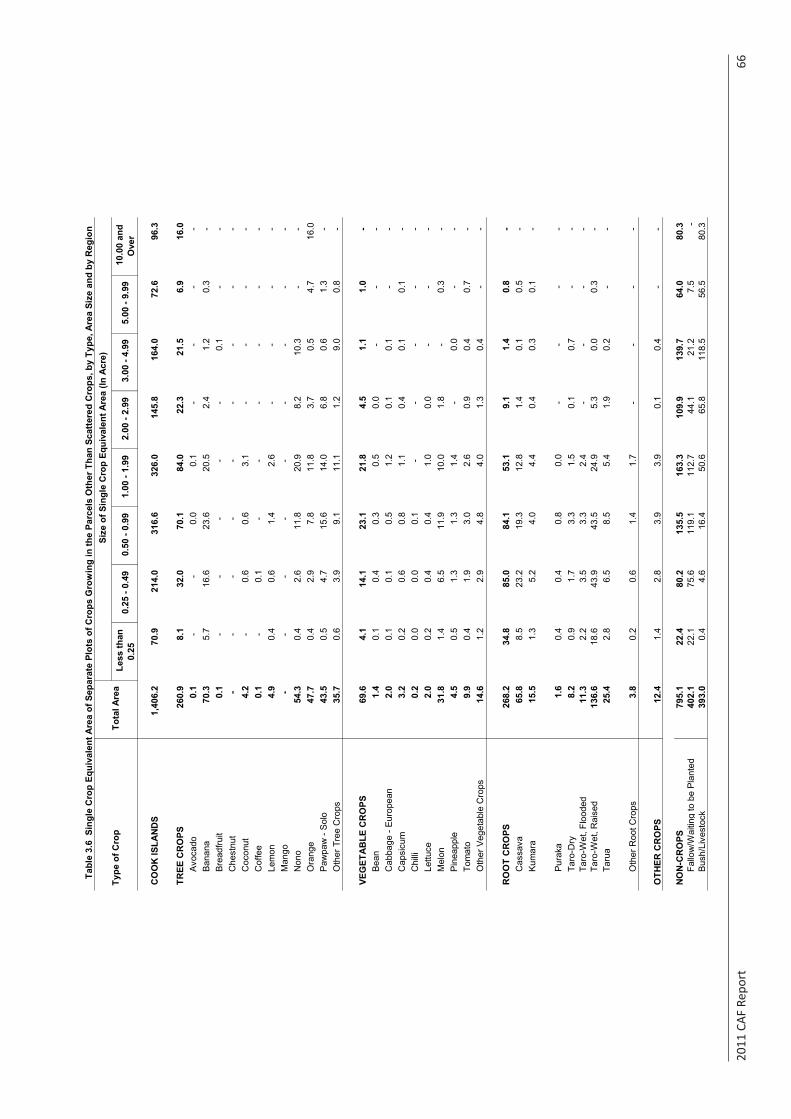
2011
CAF
Rep
ort
66
Les
s th
an
0.25
0
.25
- 0.4
9 0
.50
- 0.9
9 1
.00
- 1.9
9 2
.00
- 2.9
9 3
.00
- 4.9
9 5
.00
- 9.9
9 1
0.00
and
O
ver
CO
OK
ISLA
ND
S1,
406.
2
70.9
21
4.0
316.
6
32
6.0
145.
8
16
4.0
72.6
96
.3
TREE
CR
OPS
260.
9
8.
1
32.0
70
.1
84.0
22
.3
21.5
6.
9
16.0
Av
ocad
o0.
1
-
-
0.0
0.
1
-
-
-
-
Bana
na70
.3
5.7
16
.6
23.6
20
.5
2.4
1.
2
0.3
-
Brea
dfru
it0.
1
-
-
-
-
-
0.
1
-
-
Che
stnu
t-
-
-
-
-
-
-
-
-
Coc
onut
4.2
-
0.6
0.
6
3.1
-
-
-
-
C
offe
e0.
1
-
0.
1
-
-
-
-
-
-
Lem
on4.
9
0.4
0.
6
1.4
2.
6
-
-
-
-
Man
go-
-
-
-
-
-
-
-
-
Non
o54
.3
0.4
2.
6
11.8
20
.9
8.2
10
.3
-
-
Ora
nge
47.7
0.
4
2.9
7.
8
11.8
3.
7
0.5
4.
7
16.0
Pa
wpa
w -
Solo
43.5
0.
5
4.7
15
.6
14.0
6.
8
0.6
1.
3
-
O
ther
Tre
e C
rops
35.7
0.
6
3.9
9.
1
11.1
1.
2
9.0
0.
8
-
VEG
ETA
BLE
CR
OPS
69.6
4.
1
14.1
23
.1
21.8
4.
5
1.1
1.
0
-
Be
an1.
4
0.1
0.
4
0.3
0.
5
0.0
-
-
-
Cab
bage
- Eu
rope
an2.
0
0.1
0.
1
0.5
1.
2
0.1
0.
1
-
-
Cap
sicu
m3.
2
0.2
0.
6
0.8
1.
1
0.4
0.
1
0.1
-
Chi
lli0.
2
0.0
0.
0
0.1
-
-
-
-
-
Lettu
ce2.
0
0.2
0.
4
0.4
1.
0
0.0
-
-
-
Mel
on31
.8
1.4
6.
5
11.9
10
.0
1.8
-
0.3
-
Pine
appl
e4.
5
0.5
1.
3
1.3
1.
4
-
0.
0
-
-
Tom
ato
9.9
0.
4
1.9
3.
0
2.6
0.
9
0.4
0.
7
-
O
ther
Veg
etab
le C
rops
14.6
1.
2
2.9
4.
8
4.0
1.
3
0.4
-
-
RO
OT
CR
OPS
268.
2
34
.8
85.0
84
.1
53.1
9.
1
1.4
0.
8
-
C
assa
va65
.8
8.5
23
.2
19.3
12
.8
1.4
0.
1
0.5
-
Kum
ara
15.5
1.
3
5.2
4.
0
4.4
0.
4
0.3
0.
1
-
Pura
ka1.
6
0.4
0.
4
0.8
0.
0
-
-
-
-
Taro
-Dry
8.2
0.
9
1.7
3.
3
1.5
0.
1
0.7
-
-
Ta
ro-W
et, F
lood
ed11
.3
2.2
3.
5
3.3
2.
4
-
-
-
-
Taro
-Wet
, Rai
sed
136.
6
18
.6
43.9
43
.5
24.9
5.
3
0.0
0.
3
-
Ta
rua
25.4
2.
8
6.5
8.
5
5.4
1.
9
0.2
-
-
Oth
er R
oot C
rops
3.8
0.
2
0.6
1.
4
1.7
-
-
-
-
OTH
ER C
RO
PS12
.4
1.4
2.
8
3.9
3.
9
0.1
0.
4
-
-
NO
N-C
RO
PS79
5.1
22.4
80
.2
135.
5
16
3.3
109.
9
13
9.7
64.0
80
.3
Fallo
w/W
aitin
g to
be
Plan
ted
402.
1
22
.1
75.6
11
9.1
112.
7
44
.1
21.2
7.
5
-
Bush
/Liv
esto
ck39
3.0
0.4
4.
6
16.4
50
.6
65.8
11
8.5
56.5
80
.3
Typ
e of
Cro
p T
otal
Are
a S
ize
of S
ingl
e C
rop
Equi
vale
nt A
rea
(In A
cre)
T
able
3.6
Sin
gle
Cro
p Eq
uiva
lent
Are
a of
Sep
arat
e Pl
ots
of C
rops
Gro
win
g in
the
Parc
els
Oth
er T
han
Scat
tere
d C
rops
, by
Type
, Are
a Si
ze a
nd b
y R
egio
n
Sour
ce:
Coo
k Is
land
s 20
11 C
ensu
s of
Agr
icul
ture
and
Fis
herie
sTA
BLE
SET
3: P
ARC
EL D
ETAI
LS
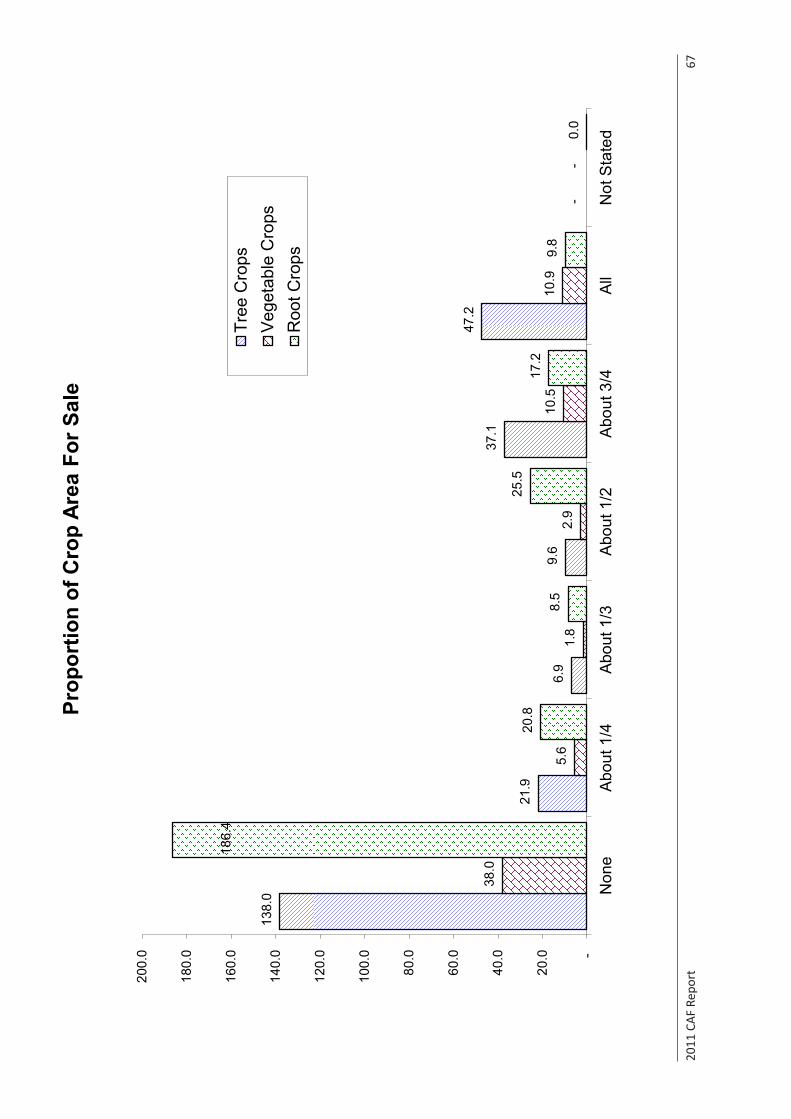
2011
CAF
Rep
ort
67
138.
0
21.9
6.9
9.6
37.1
47.2
-
38.0
5.6
1.8
2.9
10.5
10
.9
-
186.
4
20.8
8.5
25.5
17
.2
9.8
0.0
-
20.
0
40.
0
60.
0
80.
0
100
.0
120
.0
140
.0
160
.0
180
.0
200
.0
Non
eA
bout
1/4
Abo
ut 1
/3A
bout
1/2
Abo
ut 3
/4A
llN
ot S
tate
d
Prop
ortio
n of
Cro
p Ar
ea F
or S
ale
Tree
Cro
psVe
geta
ble
Cro
psR
oot C
rops
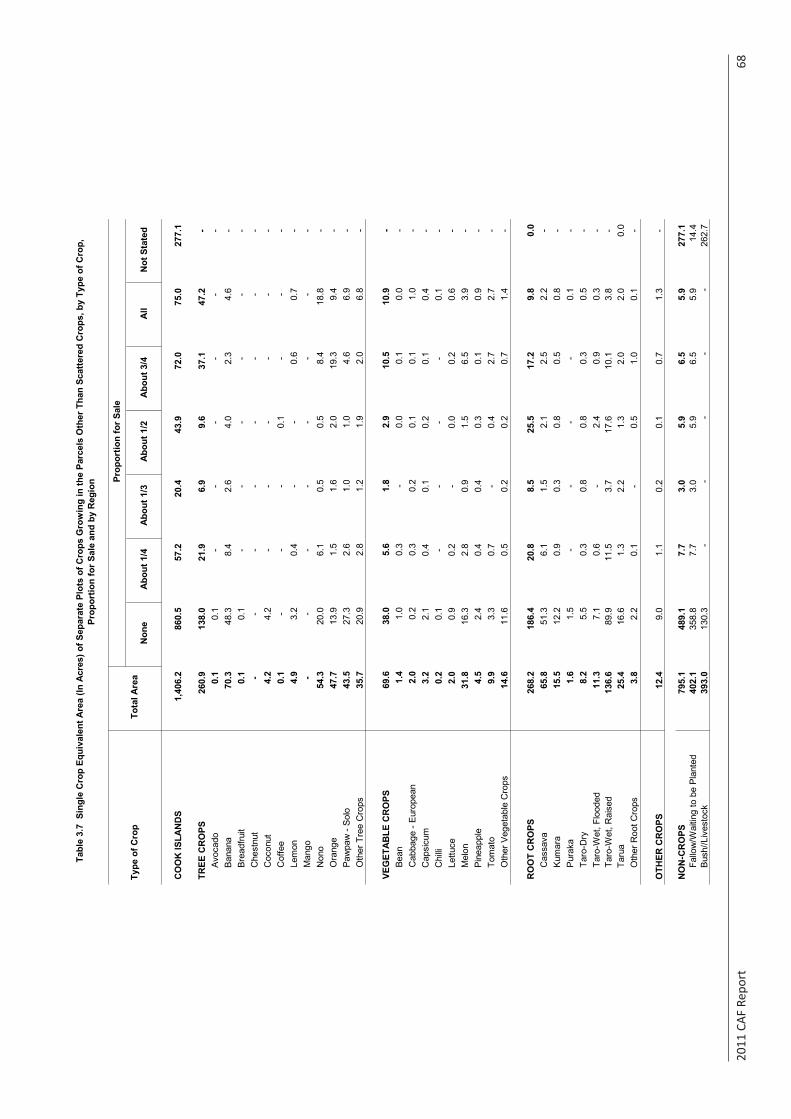
2011
CAF
Rep
ort
68
Non
e A
bout
1/4
A
bout
1/3
A
bout
1/2
A
bout
3/4
A
ll N
ot S
tate
d
CO
OK
ISLA
ND
S1,
406.
2
86
0.5
57
.2
20.4
43
.9
72.0
75
.0
277.
1
TREE
CR
OPS
260.
9
138.
0
21.9
6.
9
9.
6
37
.1
47.2
-
Avoc
ado
0.1
0.1
-
-
-
-
-
-
Bana
na70
.3
48.3
8.
4
2.
6
4.
0
2.
3
4.
6
-
Brea
dfru
it0.
1
0.
1
-
-
-
-
-
-
C
hest
nut
-
-
-
-
-
-
-
-
Coc
onut
4.2
4.2
-
-
-
-
-
-
Cof
fee
0.1
-
-
-
0.
1
-
-
-
Lem
on4.
9
3.
2
0.
4
-
-
0.
6
0.
7
-
Man
go-
-
-
-
-
-
-
-
N
ono
54.3
20
.0
6.1
0.5
0.5
8.4
18.8
-
Ora
nge
47.7
13
.9
1.5
1.6
2.0
19.3
9.
4
-
Paw
paw
- So
lo43
.5
27.3
2.
6
1.
0
1.
0
4.
6
6.
9
-
Oth
er T
ree
Cro
ps35
.7
20.9
2.
8
1.
2
1.
9
2.
0
6.
8
-
VEG
ETA
BLE
CR
OPS
69.6
38
.0
5.6
1.8
2.9
10.5
10
.9
-
Be
an1.
4
1.
0
0.
3
-
0.0
0.1
0.0
-
C
abba
ge -
Euro
pean
2.0
0.2
0.3
0.2
0.1
0.1
1.0
-
C
apsi
cum
3.2
2.1
0.4
0.1
0.2
0.1
0.4
-
C
hilli
0.2
0.1
-
-
-
-
0.1
-
Le
ttuce
2.0
0.9
0.2
-
0.
0
0.
2
0.
6
-
Mel
on31
.8
16.3
2.
8
0.
9
1.
5
6.
5
3.
9
-
Pine
appl
e4.
5
2.
4
0.
4
0.
4
0.
3
0.
1
0.
9
-
Tom
ato
9.9
3.3
0.7
-
0.
4
2.
7
2.
7
-
Oth
er V
eget
able
Cro
ps14
.6
11.6
0.
5
0.
2
0.
2
0.
7
1.
4
-
RO
OT
CR
OPS
268.
2
186.
4
20.8
8.
5
25
.5
17.2
9.
8
0.
0
C
assa
va65
.8
51.3
6.
1
1.
5
2.
1
2.
5
2.
2
-
Kum
ara
15.5
12
.2
0.9
0.3
0.8
0.5
0.8
-
Pu
raka
1.6
1.5
-
-
-
-
0.1
-
Ta
ro-D
ry8.
2
5.
5
0.
3
0.
8
0.
8
0.
3
0.
5
-
Taro
-Wet
, Flo
oded
11.3
7.
1
0.
6
-
2.4
0.9
0.3
-
Ta
ro-W
et, R
aise
d13
6.6
89
.9
11.5
3.
7
17
.6
10.1
3.
8
-
Taru
a25
.4
16.6
1.
3
2.
2
1.
3
2.
0
2.
0
0.
0
O
ther
Roo
t Cro
ps3.
8
2.
2
0.
1
-
0.5
1.0
0.1
-
OTH
ER C
RO
PS12
.4
9.0
1.1
0.2
0.1
0.7
1.3
-
NO
N-C
RO
PS79
5.1
48
9.1
7.
7
3.
0
5.
9
6.
5
5.
9
27
7.1
Fa
llow
/Wai
ting
to b
e Pl
ante
d40
2.1
35
8.8
7.
7
3.
0
5.
9
6.
5
5.
9
14
.4
Bush
//Liv
esto
ck39
3.0
13
0.3
-
-
-
-
-
26
2.7
Typ
e of
Cro
p T
otal
Are
a
Pro
port
ion
for S
ale
Tab
le 3
.7 S
ingl
e C
rop
Equi
vale
nt A
rea
(In A
cres
) of S
epar
ate
Plot
s of
Cro
ps G
row
ing
in th
e Pa
rcel
s O
ther
Tha
n Sc
atte
red
Cro
ps, b
y Ty
pe o
f Cro
p,
Prop
ortio
n fo
r Sal
e an
d by
Reg
ion
Sour
ce:
Coo
k Is
land
s 20
11 C
ensu
s of
Agr
icul
ture
and
Fis
herie
sTA
BLE
SET
3: P
ARC
EL D
ETAI
LS
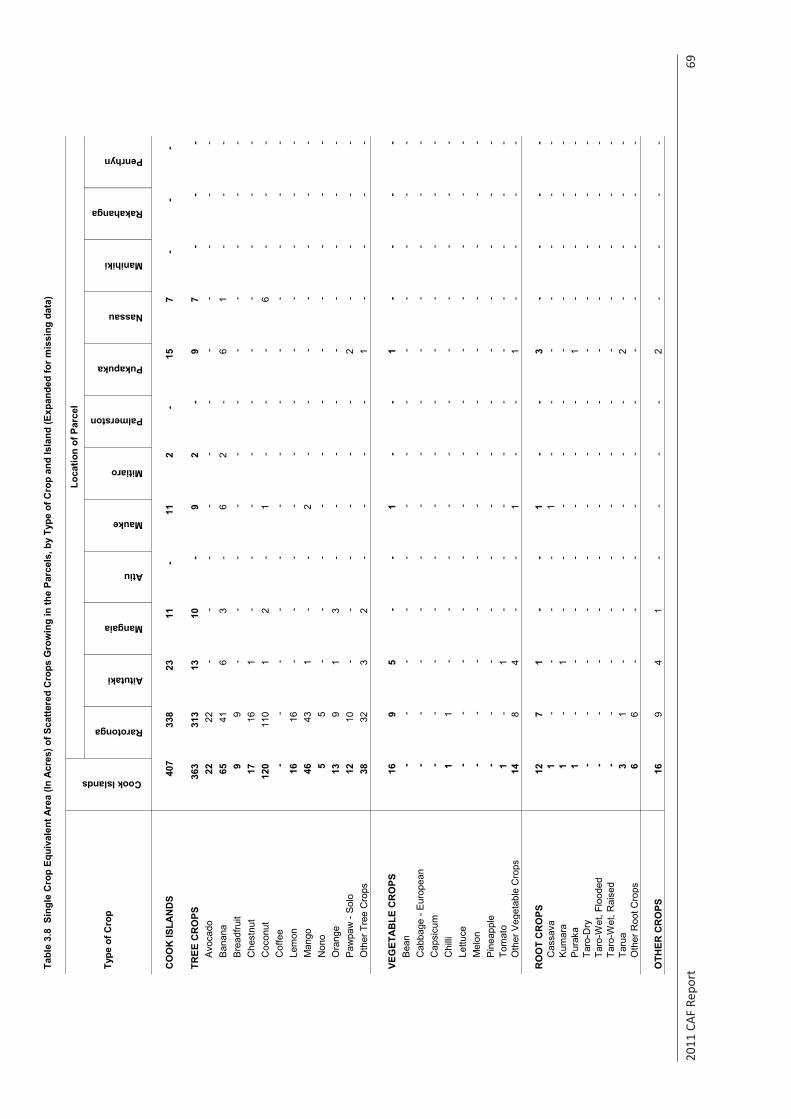
2011
CAF
Rep
ort
69
Tabl
e 3.
8 S
ingl
e C
rop
Equi
vale
nt A
rea
(In A
cres
) of S
catte
red
Cro
ps G
row
ing
in th
e Pa
rcel
s, b
y Ty
pe o
f Cro
p an
d Is
land
(Exp
ande
d fo
r mis
sing
dat
a)
Rarotonga
Aitutaki
Mangaia
Atiu
Mauke
Mitiaro
Palmerston
Pukapuka
Nassau
Manihiki
Rakahanga
Penrhyn
CO
OK
ISLA
ND
S40
733
8
23
11
-
11
2
-
15
7
-
-
-
TREE
CR
OPS
363
313
13
10
-
9
2
-
9
7
-
-
-
Avo
cado
22
22
-
-
-
-
-
-
-
-
-
-
-
Ban
ana
65
41
6
3
-
6
2
-
6
1
-
-
-
Bre
adfru
it9
9
-
-
-
-
-
-
-
-
-
-
-
C
hest
nut
17
16
1
-
-
-
-
-
-
-
-
-
-
Coc
onut
120
110
1
2
-
1
-
-
-
6
-
-
-
Cof
fee
-
-
-
-
-
-
-
-
-
-
-
-
-
Lem
on16
16
-
-
-
-
-
-
-
-
-
-
-
M
ango
46
43
1
-
-
2
-
-
-
-
-
-
-
Non
o5
5
-
-
-
-
-
-
-
-
-
-
-
O
rang
e13
9
1
3
-
-
-
-
-
-
-
-
-
Paw
paw
- S
olo
12
10
-
-
-
-
-
-
2
-
-
-
-
Oth
er T
ree
Cro
ps38
32
3
2
-
-
-
-
1
-
-
-
-
VEG
ETA
BLE
CR
OPS
16
9
5
-
-
1
-
-
1
-
-
-
-
B
ean
-
-
-
-
-
-
-
-
-
-
-
-
-
Cab
bage
- E
urop
ean
-
-
-
-
-
-
-
-
-
-
-
-
-
Cap
sicu
m-
-
-
-
-
-
-
-
-
-
-
-
-
C
hilli
1
1
-
-
-
-
-
-
-
-
-
-
-
Lettu
ce-
-
-
-
-
-
-
-
-
-
-
-
-
M
elon
-
-
-
-
-
-
-
-
-
-
-
-
-
Pin
eapp
le-
-
-
-
-
-
-
-
-
-
-
-
-
To
mat
o1
-
1
-
-
-
-
-
-
-
-
-
-
O
ther
Veg
etab
le C
rops
14
8
4
-
-
1
-
-
1
-
-
-
-
RO
OT
CR
OPS
12
7
1
-
-
1
-
-
3
-
-
-
-
C
assa
va1
-
-
-
-
1
-
-
-
-
-
-
-
K
umar
a1
-
1
-
-
-
-
-
-
-
-
-
-
P
urak
a1
-
-
-
-
-
-
-
1
-
-
-
-
Ta
ro-D
ry-
-
-
-
-
-
-
-
-
-
-
-
-
Ta
ro-W
et, F
lood
ed-
-
-
-
-
-
-
-
-
-
-
-
-
Ta
ro-W
et, R
aise
d-
-
-
-
-
-
-
-
-
-
-
-
-
Ta
rua
3
1
-
-
-
-
-
-
2
-
-
-
-
Oth
er R
oot C
rops
6
6
-
-
-
-
-
-
-
-
-
-
-
OTH
ER C
RO
PS16
9
4
1
-
-
-
-
2
-
-
-
-
Type
of C
rop
Cook Islands
Loca
tion
of P
arce
l
Sour
ce:
Coo
k Is
land
s 20
11 C
ensu
s of
Agr
icul
ture
and
Fis
herie
sTA
BLE
SET
3: P
AR
CEL
DET
AIL
S
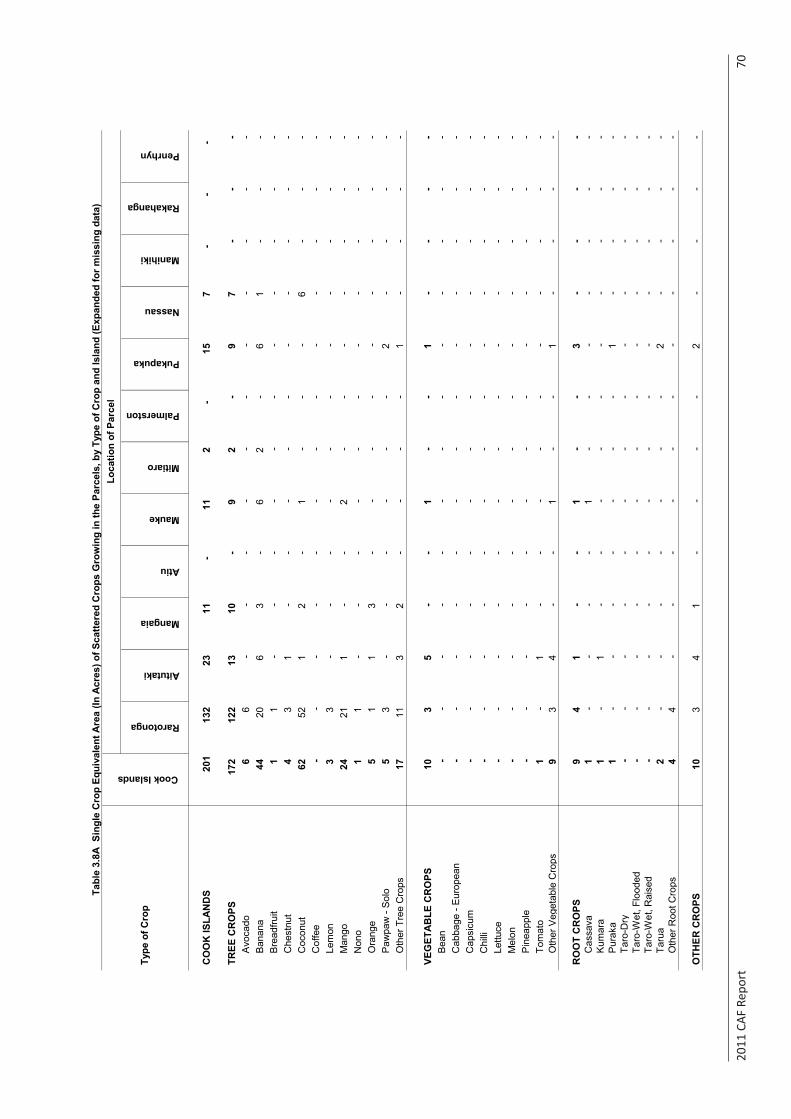
2011
CAF
Rep
ort
70
Rarotonga
Aitutaki
Mangaia
Atiu
Mauke
Mitiaro
Palmerston
Pukapuka
Nassau
Manihiki
Rakahanga
Penrhyn
CO
OK
ISLA
ND
S20
113
2
23
11
-
11
2
-
15
7
-
-
-
TREE
CR
OPS
172
122
13
10
-
9
2
-
9
7
-
-
-
Avo
cado
6
6
-
-
-
-
-
-
-
-
-
-
-
Ban
ana
44
20
6
3
-
6
2
-
6
1
-
-
-
Bre
adfru
it1
1
-
-
-
-
-
-
-
-
-
-
-
C
hest
nut
4
3
1
-
-
-
-
-
-
-
-
-
-
Coc
onut
62
52
1
2
-
1
-
-
-
6
-
-
-
Cof
fee
-
-
-
-
-
-
-
-
-
-
-
-
-
Lem
on3
3
-
-
-
-
-
-
-
-
-
-
-
M
ango
24
21
1
-
-
2
-
-
-
-
-
-
-
Non
o1
1
-
-
-
-
-
-
-
-
-
-
-
O
rang
e5
1
1
3
-
-
-
-
-
-
-
-
-
P
awpa
w -
Sol
o5
3
-
-
-
-
-
-
2
-
-
-
-
O
ther
Tre
e C
rops
17
11
3
2
-
-
-
-
1
-
-
-
-
VEG
ETA
BLE
CR
OPS
10
3
5
-
-
1
-
-
1
-
-
-
-
B
ean
-
-
-
-
-
-
-
-
-
-
-
-
-
Cab
bage
- E
urop
ean
-
-
-
-
-
-
-
-
-
-
-
-
-
Cap
sicu
m-
-
-
-
-
-
-
-
-
-
-
-
-
C
hilli
-
-
-
-
-
-
-
-
-
-
-
-
-
Lettu
ce-
-
-
-
-
-
-
-
-
-
-
-
-
M
elon
-
-
-
-
-
-
-
-
-
-
-
-
-
Pin
eapp
le-
-
-
-
-
-
-
-
-
-
-
-
-
To
mat
o1
-
1
-
-
-
-
-
-
-
-
-
-
O
ther
Veg
etab
le C
rops
9
3
4
-
-
1
-
-
1
-
-
-
-
RO
OT
CR
OPS
9
4
1
-
-
1
-
-
3
-
-
-
-
Cas
sava
1
-
-
-
-
1
-
-
-
-
-
-
-
Kum
ara
1
-
1
-
-
-
-
-
-
-
-
-
-
Pur
aka
1
-
-
-
-
-
-
-
1
-
-
-
-
Taro
-Dry
-
-
-
-
-
-
-
-
-
-
-
-
-
Taro
-Wet
, Flo
oded
-
-
-
-
-
-
-
-
-
-
-
-
-
Taro
-Wet
, Rai
sed
-
-
-
-
-
-
-
-
-
-
-
-
-
Taru
a2
-
-
-
-
-
-
-
2
-
-
-
-
O
ther
Roo
t Cro
ps4
4
-
-
-
-
-
-
-
-
-
-
-
OTH
ER C
RO
PS10
3
4
1
-
-
-
-
2
-
-
-
-
Type
of C
rop
Cook Islands
Loca
tion
of P
arce
lTa
ble
3.8A
Sin
gle
Cro
p Eq
uiva
lent
Are
a (In
Acr
es) o
f Sca
ttere
d C
rops
Gro
win
g in
the
Parc
els,
by
Type
of C
rop
and
Isla
nd (E
xpan
ded
for m
issi
ng d
ata)
Sour
ce:
Coo
k Is
land
s 20
11 C
ensu
s of
Agr
icul
ture
and
Fis
herie
sTA
BLE
SET
3: P
ARC
EL D
ETAI
LS
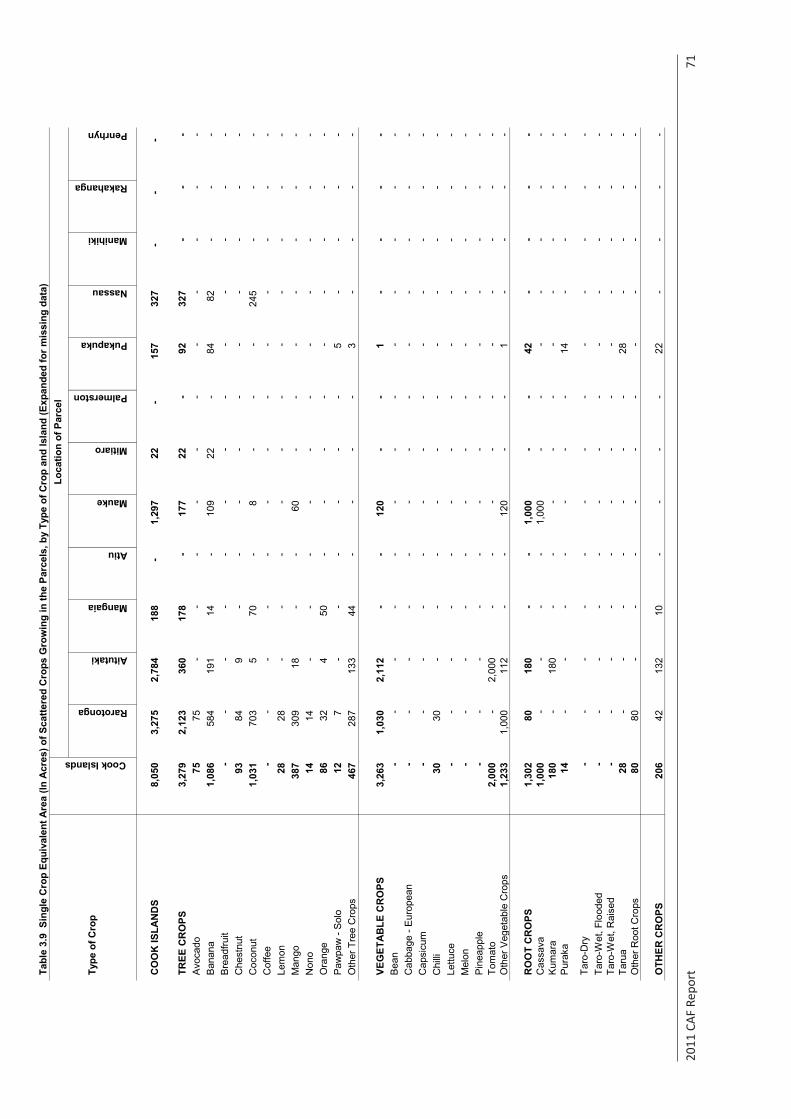
2011
CAF
Rep
ort
71
Rarotonga
Aitutaki
Mangaia
Atiu
Mauke
Mitiaro
Palmerston
Pukapuka
Nassau
Manihiki
Rakahanga
Penrhyn
CO
OK
ISLA
ND
S8,
050
3,
275
2,
784
18
8
-
1,
297
22
-
157
327
-
-
-
TREE
CR
OPS
3,27
9
2,12
3
360
178
-
177
22
-
92
327
-
-
-
Avo
cado
75
75
-
-
-
-
-
-
-
-
-
-
-
B
anan
a1,
086
58
4
19
1
14
-
109
22
-
84
82
-
-
-
B
read
fruit
-
-
-
-
-
-
-
-
-
-
-
-
-
C
hest
nut
93
84
9
-
-
-
-
-
-
-
-
-
-
C
ocon
ut1,
031
70
3
5
70
-
8
-
-
-
245
-
-
-
Cof
fee
-
-
-
-
-
-
-
-
-
-
-
-
-
Le
mon
28
28
-
-
-
-
-
-
-
-
-
-
-
M
ango
387
309
18
-
-
60
-
-
-
-
-
-
-
Non
o14
14
-
-
-
-
-
-
-
-
-
-
-
Ora
nge
86
32
4
50
-
-
-
-
-
-
-
-
-
Paw
paw
- S
olo
12
7
-
-
-
-
-
-
5
-
-
-
-
Oth
er T
ree
Cro
ps46
7
28
7
13
3
44
-
-
-
-
3
-
-
-
-
VEG
ETA
BLE
CR
OPS
3,26
3
1,03
0
2,11
2
-
-
120
-
-
1
-
-
-
-
Bea
n-
-
-
-
-
-
-
-
-
-
-
-
-
Cab
bage
- E
urop
ean
-
-
-
-
-
-
-
-
-
-
-
-
-
C
apsi
cum
-
-
-
-
-
-
-
-
-
-
-
-
-
C
hilli
30
30
-
-
-
-
-
-
-
-
-
-
-
Le
ttuce
-
-
-
-
-
-
-
-
-
-
-
-
-
M
elon
-
-
-
-
-
-
-
-
-
-
-
-
-
P
inea
pple
-
-
-
-
-
-
-
-
-
-
-
-
-
To
mat
o2,
000
-
2,
000
-
-
-
-
-
-
-
-
-
-
O
ther
Veg
etab
le C
rops
1,23
3
1,00
0
112
-
-
120
-
-
1
-
-
-
-
RO
OT
CR
OPS
1,30
2
80
18
0
-
-
1,
000
-
-
42
-
-
-
-
Cas
sava
1,00
0
-
-
-
-
1,00
0
-
-
-
-
-
-
-
Kum
ara
180
-
180
-
-
-
-
-
-
-
-
-
-
Pur
aka
14
-
-
-
-
-
-
-
14
-
-
-
-
Taro
-Dry
-
-
-
-
-
-
-
-
-
-
-
-
-
Ta
ro-W
et, F
lood
ed-
-
-
-
-
-
-
-
-
-
-
-
-
Taro
-Wet
, Rai
sed
-
-
-
-
-
-
-
-
-
-
-
-
-
Ta
rua
28
-
-
-
-
-
-
-
28
-
-
-
-
O
ther
Roo
t Cro
ps80
80
-
-
-
-
-
-
-
-
-
-
-
OTH
ER C
RO
PS20
6
42
132
10
-
-
-
-
22
-
-
-
-
Type
of C
rop
Cook Islands
Loca
tion
of P
arce
lTa
ble
3.9
Sin
gle
Cro
p Eq
uiva
lent
Are
a (In
Acr
es) o
f Sca
ttere
d C
rops
Gro
win
g in
the
Parc
els,
by
Type
of C
rop
and
Isla
nd (E
xpan
ded
for m
issi
ng d
ata)
Sour
ce:
Coo
k Is
land
s 20
11 C
ensu
s of
Agr
icul
ture
and
Fis
herie
sTA
BLE
SET
3: P
ARC
EL D
ETAI
LS

2011
CAF
Rep
ort
72
Rarotonga
Aitutaki
Mangaia
Atiu
Mauke
Mitiaro
Palmerston
Pukapuka
Nassau
Manihiki
Rakahanga
Penrhyn
CO
OK
ISLA
ND
S13
,093
8,31
8
2,78
4
188
-
1,
297
22
-
15
7
32
7
-
-
-
TREE
CR
OPS
6,56
2
5,40
6
360
178
-
177
22
-
92
327
-
-
-
Avoc
ado
275
275
-
-
-
-
-
-
-
-
-
-
-
Bana
na1,
699
1,
197
19
1
14
-
109
22
-
84
82
-
-
-
Br
eadf
ruit
-
-
-
-
-
-
-
-
-
-
-
-
-
C
hest
nut
457
448
9
-
-
-
-
-
-
-
-
-
-
Coc
onut
1,81
5
1,48
7
5
70
-
8
-
-
-
24
5
-
-
-
C
offe
e-
-
-
-
-
-
-
-
-
-
-
-
-
Lem
on14
9
14
9
-
-
-
-
-
-
-
-
-
-
-
M
ango
711
633
18
-
-
60
-
-
-
-
-
-
-
Non
o70
70
-
-
-
-
-
-
-
-
-
-
-
Ora
nge
342
288
4
50
-
-
-
-
-
-
-
-
-
Pa
wpa
w -
Solo
28
23
-
-
-
-
-
-
5
-
-
-
-
O
ther
Tre
e C
rops
1,01
5
835
133
44
-
-
-
-
3
-
-
-
-
VEG
ETAB
LE C
RO
PS4,
900
2,
667
2,
112
-
-
12
0
-
-
1
-
-
-
-
Be
an-
-
-
-
-
-
-
-
-
-
-
-
-
Cab
bage
- Eu
rope
an-
-
-
-
-
-
-
-
-
-
-
-
-
Cap
sicu
m-
-
-
-
-
-
-
-
-
-
-
-
-
Chi
lli-
-
-
-
-
-
-
-
-
-
-
-
-
Lettu
ce-
-
-
-
-
-
-
-
-
-
-
-
-
Mel
on-
-
-
-
-
-
-
-
-
-
-
-
-
Pine
appl
e-
-
-
-
-
-
-
-
-
-
-
-
-
Tom
ato
2,00
0
-
2,00
0
-
-
-
-
-
-
-
-
-
-
Oth
er V
eget
able
Cro
ps2,
900
2,
667
11
2
-
-
12
0
-
-
1
-
-
-
-
RO
OT
CR
OPS
1,34
2
120
180
-
-
1,00
0
-
-
42
-
-
-
-
C
assa
va1,
000
-
-
-
-
1,
000
-
-
-
-
-
-
-
Ku
mar
a18
0
-
18
0
-
-
-
-
-
-
-
-
-
-
Pu
raka
14
-
-
-
-
-
-
-
14
-
-
-
-
Taro
-Dry
-
-
-
-
-
-
-
-
-
-
-
-
-
Ta
ro-W
et, F
lood
ed-
-
-
-
-
-
-
-
-
-
-
-
-
Taro
-Wet
, Rai
sed
-
-
-
-
-
-
-
-
-
-
-
-
-
Ta
rua
28
-
-
-
-
-
-
-
28
-
-
-
-
O
ther
Roo
t Cro
ps12
0
12
0
-
-
-
-
-
-
-
-
-
-
-
OTH
ER C
RO
PS29
0
12
6
13
2
10
-
-
-
-
22
-
-
-
-
Type
of C
rop
Cook Islands
Loca
tion
of P
arce
l T
able
3.9
A S
ingl
e C
rop
Equi
vale
nt A
rea
(In A
cres
) of S
catte
red
Cro
ps G
row
ing
in th
e Pa
rcel
s, b
y Ty
pe o
f Cro
p an
d Is
land
(Exp
ande
d fo
r mis
sing
dat
a)
Sour
ce:
Coo
k Is
land
s 20
11 C
ensu
s of
Agr
icul
ture
and
Fis
herie
sTA
BLE
SET
3: P
AR
CEL
DET
AIL
S

2011
CAF
Rep
ort
73
Tabl
e 3.
10 S
ingl
e C
rop
Equi
vale
nt A
rea
(In A
cres
) of S
catte
red
Cro
ps G
row
ing
in th
e Pa
rcel
s, b
y Ty
pe o
f Cro
p an
d Is
land
(Exp
ande
d fo
r mis
sing
dat
a)
Rarotonga
Aitutaki
Mangaia
Atiu
Mauke
Mitiaro
Palmerston
Pukapuka
Nassau
Manihiki
Rakahanga
Penrhyn
CO
OK
ISLA
ND
S33
.1
21
.9
1.5
0.8
-
0.8
0.0
-
0.2
8.0
-
-
-
TREE
CR
OPS
32.2
21.5
1.
1
0.
8
-
0.
7
0.
0
-
0.
2
8.
0
-
-
-
A
voca
do0.
6
0.6
-
-
-
-
-
-
-
-
-
-
-
Ban
ana
1.3
0.
5
0.
3
0.
1
-
0.
2
0.
0
-
0.
1
0.
0
-
-
-
B
read
fruit
0.1
0.
1
-
-
-
-
-
-
-
-
-
-
-
C
hest
nut
0.4
0.
3
0.
1
-
-
-
-
-
-
-
-
-
-
C
ocon
ut23
.8
14
.8
0.4
0.4
-
0.2
-
-
-
7.9
-
-
-
Cof
fee
-
-
-
-
-
-
-
-
-
-
-
-
-
Le
mon
0.4
0.
4
-
-
-
-
-
-
-
-
-
-
-
M
ango
4.0
3.
7
0.
1
-
-
0.
2
-
-
-
-
-
-
-
N
ono
0.0
0.
0
-
-
-
-
-
-
-
-
-
-
-
O
rang
e0.
3
0.1
0.1
0.2
-
-
-
-
-
-
-
-
-
Paw
paw
- S
olo
0.5
0.
5
-
-
-
-
-
-
0.
0
-
-
-
-
O
ther
Tre
e C
rops
0.7
0.
6
0.
1
0.
0
-
-
-
-
0.
0
-
-
-
-
VEG
ETAB
LE C
RO
PS0.
6
0.2
0.3
-
-
0.0
-
-
0.0
-
-
-
-
Bea
n -
-
-
-
-
-
-
-
-
-
-
-
-
Cab
bage
- E
urop
ean
-
-
-
-
-
-
-
-
-
-
-
-
-
C
apsi
cum
-
-
-
-
-
-
-
-
-
-
-
-
-
C
hilli
-
-
-
-
-
-
-
-
-
-
-
-
-
Le
ttuce
-
-
-
-
-
-
-
-
-
-
-
-
-
M
elon
-
-
-
-
-
-
-
-
-
-
-
-
-
Pin
eapp
le-
-
-
-
-
-
-
-
-
-
-
-
-
Tom
ato
0.3
-
0.
3
-
-
-
-
-
-
-
-
-
-
O
ther
Veg
etab
le C
rops
0.3
0.
2
0.
0
-
-
0.
0
-
-
0.
0
-
-
-
-
RO
OT
CR
OPS
0.2
0.
0
0.
0
-
-
0.
1
-
-
0.
0
-
-
-
-
C
assa
va0.
1
-
-
-
-
0.1
-
-
-
-
-
-
-
Kum
ara
0.0
-
0.
0
-
-
-
-
-
-
-
-
-
-
P
urak
a0.
0
-
-
-
-
-
-
-
0.0
-
-
-
-
Taro
-Dry
-
-
-
-
-
-
-
-
-
-
-
-
-
Ta
ro-W
et, F
lood
ed-
-
-
-
-
-
-
-
-
-
-
-
-
Taro
-Wet
, Rai
sed
-
-
-
-
-
-
-
-
-
-
-
-
-
Ta
rua
0.0
-
-
-
-
-
-
-
0.
0
-
-
-
-
O
ther
Roo
t Cro
ps0.
0
0.0
-
-
-
-
-
-
-
-
-
-
-
OTH
ER C
RO
PS0.
2
0.2
0.0
0.0
-
-
-
-
0.0
-
-
-
-
Type
of C
rop
Cook Islands
Loca
tion
of P
arce
l
Sour
ce:
Coo
k Is
land
s 20
11 C
ensu
s of
Agr
icul
ture
and
Fis
herie
sTA
BLE
SET
3: P
AR
CEL
DET
AIL
S
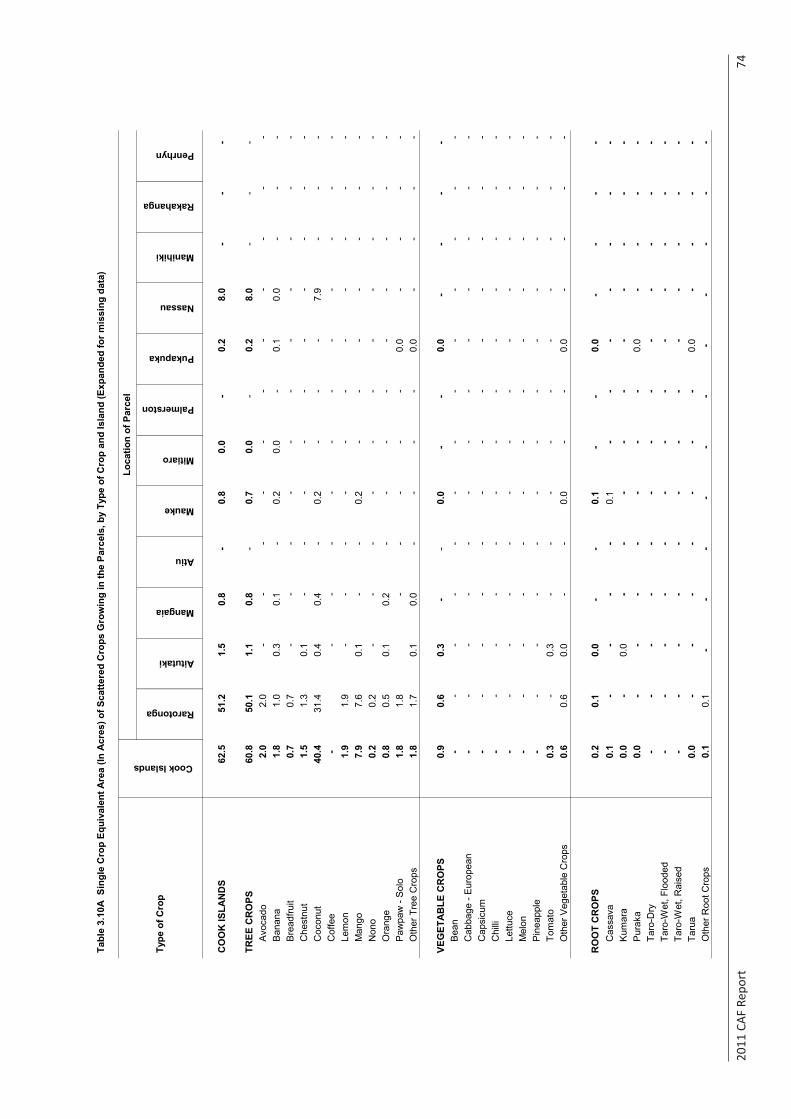
2011
CAF
Rep
ort
74
Rarotonga
Aitutaki
Mangaia
Atiu
Mauke
Mitiaro
Palmerston
Pukapuka
Nassau
Manihiki
Rakahanga
Penrhyn
CO
OK
ISLA
ND
S62
.5
51
.2
1.5
0.8
-
0.8
0.0
-
0.2
8.0
-
-
-
TREE
CR
OPS
60.8
50.1
1.
1
0.
8
-
0.
7
0.
0
-
0.
2
8.
0
-
-
-
A
voca
do2.
0
2.0
--
--
--
--
--
-B
anan
a 1.
8
1.0
0.3
0.1
-0.
2
0.
0
-
0.1
0.0
--
-B
read
fruit
0.7
0.
7
-
--
--
--
--
--
Che
stnu
t1.
5
1.3
0.1
--
--
--
--
--
Coc
onut
40.4
31.4
0.
4
0.
4
-
0.2
--
-7.
9
-
--
Cof
fee
-
--
--
--
--
--
-Le
mon
1.9
1.
9
-
--
--
--
--
--
Man
go7.
9
7.6
0.1
--
0.2
--
--
--
-N
ono
0.2
0.
2
-
--
--
--
--
--
Ora
nge
0.8
0.
5
0.
1
0.
2
-
--
--
--
--
Paw
paw
- S
olo
1.8
1.
8
-
--
--
0.0
--
--
Oth
er T
ree
Cro
ps1.
8
1.7
0.1
0.0
--
--
0.0
--
--
VEG
ETA
BLE
CR
OPS
0.9
0.
6
0.
3
-
-
0.
0
-
-
0.
0
-
-
-
-
B
ean
-
--
--
--
--
--
--
Cab
bage
- E
urop
ean
-
--
--
--
--
--
--
Cap
sicu
m-
-
--
--
--
--
--
-C
hilli
-
--
--
--
--
--
--
Lettu
ce-
-
--
--
--
--
--
-M
elon
-
-
--
--
--
--
--
-P
inea
pple
-
--
--
--
--
--
--
Tom
ato
0.3
-
0.3
--
--
--
--
--
Oth
er V
eget
able
Cro
ps0.
6
0.6
0.0
--
0.0
--
0.0
--
--
RO
OT
CR
OPS
0.2
0.
1
0.
0
-
-
0.
1
-
-
0.
0
-
-
-
-
C
assa
va0.
1
--
--
0.1
--
--
-
-
-
Kum
ara
0.0
-
0.0
--
--
--
--
-
-
P
urak
a0.
0
--
--
--
-0.
0
-
-
-
-
Taro
-Dry
-
--
--
--
--
--
-
-
Ta
ro-W
et, F
lood
ed-
-
--
--
--
--
-
-
-
Taro
-Wet
, Rai
sed
-
--
--
--
--
--
-
-
Ta
rua
0.0
-
--
--
--
0.0
--
-
-
O
ther
Roo
t Cro
ps0.
1
0.1
-
-
-
-
-
-
-
-
-
-
-
Type
of C
rop
Cook Islands
Loca
tion
of P
arce
l
Tabl
e 3.
10A
Sin
gle
Cro
p Eq
uiva
lent
Are
a (In
Acr
es) o
f Sca
ttere
d C
rops
Gro
win
g in
the
Parc
els,
by
Type
of C
rop
and
Isla
nd (E
xpan
ded
for m
issi
ng d
ata)
Sour
ce:
Coo
k Is
land
s 20
11 C
ensu
s of
Agr
icul
ture
and
Fis
herie
sTA
BLE
SET
3: P
ARC
EL D
ETAI
LS
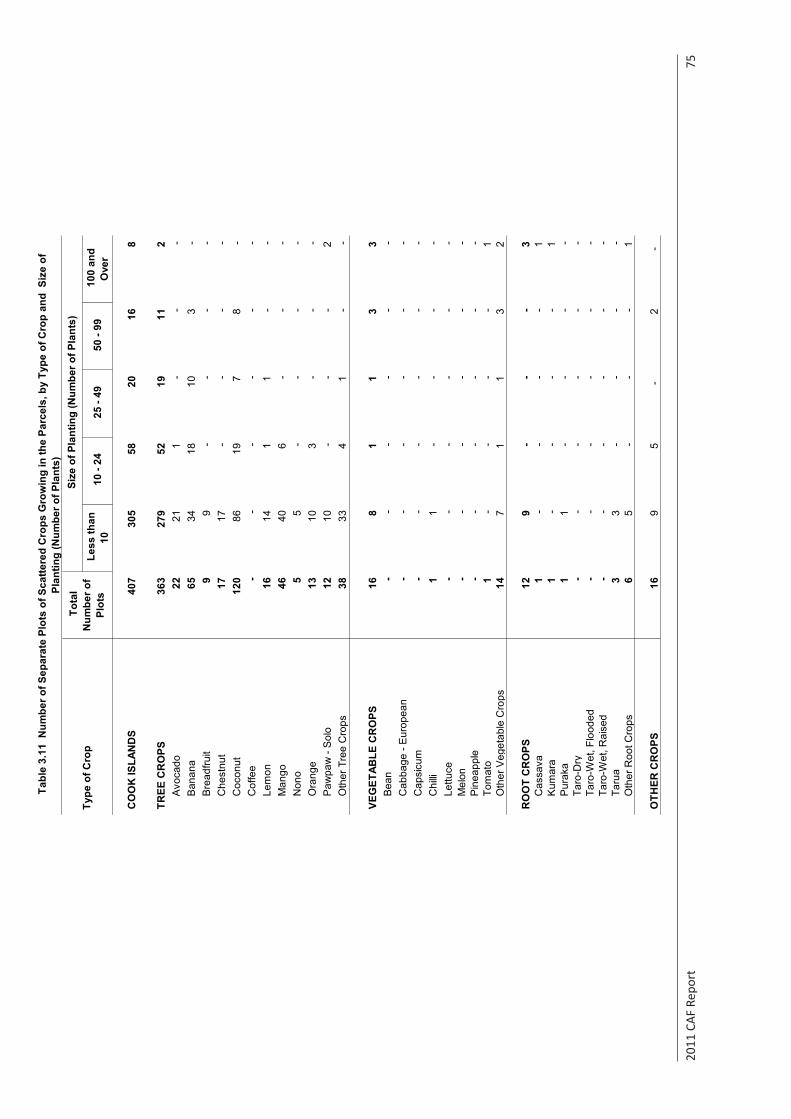
2011
CAF
Rep
ort
75
Les
s th
an
10
10
- 24
25
- 49
50
- 99
100
and
O
ver
CO
OK
ISLA
ND
S40
7
305
58
20
16
8
TREE
CR
OPS
363
27
9
52
19
11
2
Avo
cado
22
21
1
-
-
-
B
anan
a65
34
18
10
3
-
Bre
adfru
it9
9
-
-
-
-
C
hest
nut
17
17
-
-
-
-
Coc
onut
120
86
19
7
8
-
C
offe
e-
-
-
-
-
-
Le
mon
16
14
1
1
-
-
Man
go46
40
6
-
-
-
Non
o5
5
-
-
-
-
O
rang
e13
10
3
-
-
-
Paw
paw
- S
olo
12
10
-
-
-
2
O
ther
Tre
e C
rops
38
33
4
1
-
-
VEG
ETAB
LE C
RO
PS16
8
1
1
3
3
B
ean
-
-
-
-
-
-
Cab
bage
- E
urop
ean
-
-
-
-
-
-
Cap
sicu
m-
-
-
-
-
-
C
hilli
1
1
-
-
-
-
Lettu
ce-
-
-
-
-
-
M
elon
-
-
-
-
-
-
Pin
eapp
le-
-
-
-
-
-
To
mat
o1
-
-
-
-
1
O
ther
Veg
etab
le C
rops
14
7
1
1
3
2
RO
OT
CR
OPS
12
9
-
-
-
3
C
assa
va1
-
-
-
-
1
K
umar
a1
-
-
-
-
1
P
urak
a1
1
-
-
-
-
Ta
ro-D
ry-
-
-
-
-
-
Ta
ro-W
et, F
lood
ed-
-
-
-
-
-
Ta
ro-W
et, R
aise
d-
-
-
-
-
-
Ta
rua
3
3
-
-
-
-
Oth
er R
oot C
rops
6
5
-
-
-
1
OTH
ER C
RO
PS16
9
5
-
2
-
Typ
e of
Cro
p T
otal
N
umbe
r of
Plot
s
Siz
e of
Pla
ntin
g (N
umbe
r of P
lant
s)
Tab
le 3
.11
Num
ber o
f Sep
arat
e Pl
ots
of S
catte
red
Cro
ps G
row
ing
in th
e Pa
rcel
s, b
y Ty
pe o
f Cro
p an
d S
ize
of
Plan
ting
(Num
ber o
f Pla
nts)
Sour
ce:
Coo
k Is
land
s 20
11 C
ensu
s of
Agr
icul
ture
and
Fis
herie
sTA
BLE
SET
3: P
AR
CEL
DET
AIL
S
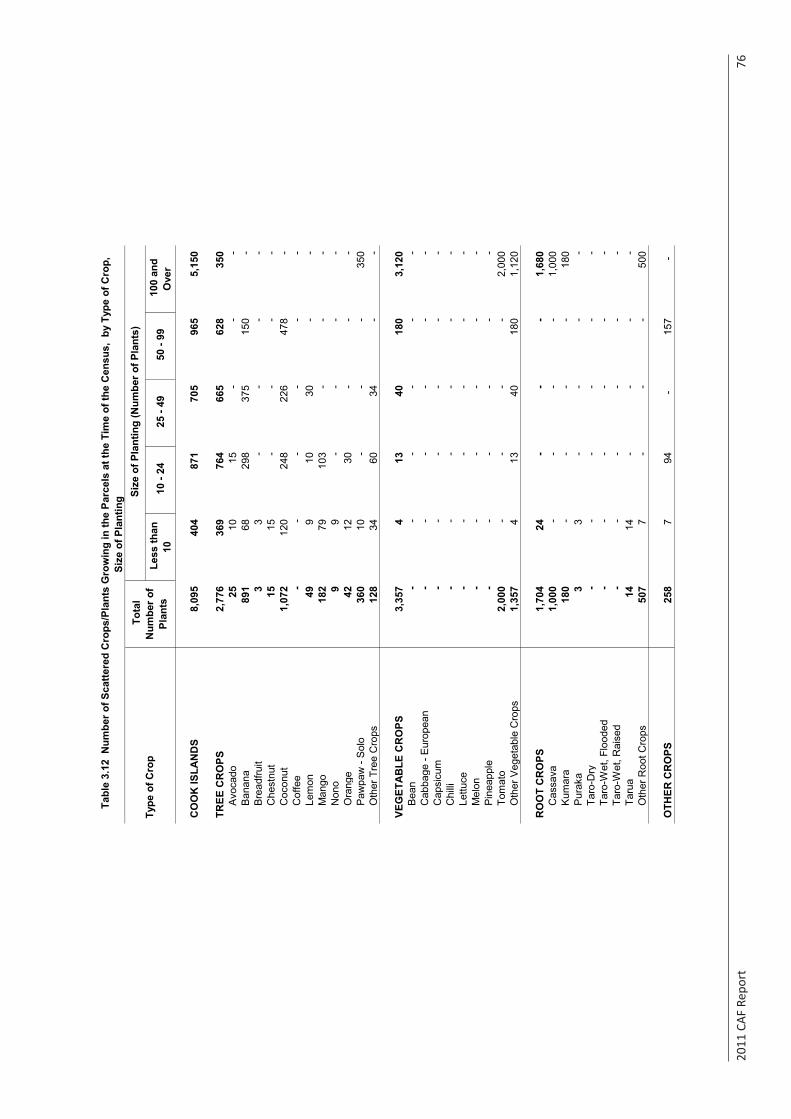
2011
CAF
Rep
ort
76
Les
s th
an
10
10
- 24
25
- 49
50
- 99
100
and
O
ver
CO
OK
ISLA
ND
S8,
095
404
87
1
705
96
5
5,15
0
TREE
CR
OPS
2,77
6
36
9
764
66
5
628
35
0
Avo
cado
25
10
15
-
-
-
B
anan
a89
1
68
29
8
375
15
0
-
Bre
adfru
it3
3
-
-
-
-
C
hest
nut
15
15
-
-
-
-
Coc
onut
1,07
2
12
0
248
22
6
478
-
C
offe
e-
-
-
-
-
-
Le
mon
49
9
10
30
-
-
Man
go18
2
79
10
3
-
-
-
Non
o9
9
-
-
-
-
O
rang
e42
12
30
-
-
-
Paw
paw
- S
olo
360
10
-
-
-
350
O
ther
Tre
e C
rops
128
34
60
34
-
-
VEG
ETA
BLE
CR
OPS
3,35
7
4
13
40
180
3,
120
Bea
n-
-
-
-
-
-
C
abba
ge -
Eur
opea
n-
-
-
-
-
-
C
apsi
cum
-
-
-
-
-
-
Chi
lli-
-
-
-
-
-
Le
ttuce
-
-
-
-
-
-
Mel
on-
-
-
-
-
-
P
inea
pple
-
-
-
-
-
-
Tom
ato
2,00
0
-
-
-
-
2,
000
Oth
er V
eget
able
Cro
ps1,
357
4
13
40
18
0
1,12
0
RO
OT
CR
OPS
1,70
4
24
-
-
-
1,68
0
C
assa
va1,
000
-
-
-
-
1,00
0
K
umar
a18
0
-
-
-
-
180
P
urak
a3
3
-
-
-
-
Ta
ro-D
ry-
-
-
-
-
-
Ta
ro-W
et, F
lood
ed-
-
-
-
-
-
Ta
ro-W
et, R
aise
d-
-
-
-
-
-
Ta
rua
14
14
-
-
-
-
Oth
er R
oot C
rops
507
7
-
-
-
500
OTH
ER C
RO
PS25
8
7
94
-
15
7
-
Typ
e of
Cro
p T
otal
N
umbe
r of
Plan
ts
Siz
e of
Pla
ntin
g (N
umbe
r of P
lant
s)
Tab
le 3
.12
Num
ber o
f Sca
ttere
d C
rops
/Pla
nts
Gro
win
g in
the
Parc
els
at th
e Ti
me
of th
e C
ensu
s, b
y Ty
pe o
f Cro
p,
Size
of P
lant
ing
Sour
ce:
Coo
k Is
land
s 20
11 C
ensu
s of
Agr
icul
ture
and
Fis
herie
sTA
BLE
SET
3: P
AR
CEL
DET
AIL
S
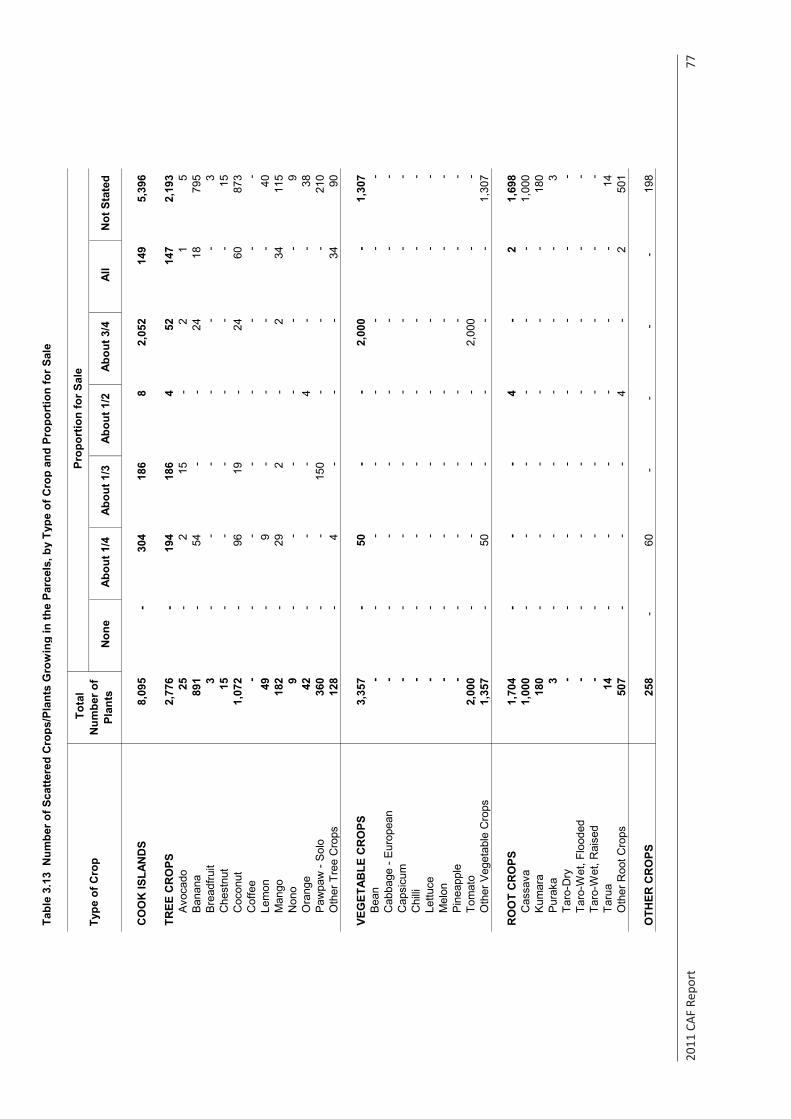
2011
CAF
Rep
ort
77
Tabl
e 3.
13 N
umbe
r of S
catte
red
Cro
ps/P
lant
s G
row
ing
in th
e Pa
rcel
s, b
y Ty
pe o
f Cro
p an
d Pr
opor
tion
for S
ale
Non
e A
bout
1/4
A
bout
1/3
A
bout
1/2
A
bout
3/4
A
ll N
ot S
tate
d
CO
OK
ISLA
ND
S8,
095
-
30
4
186
8
2,05
2
14
9
5,39
6
TREE
CR
OPS
2,77
6
-
194
18
6
4
52
147
2,
193
Avo
cado
25
-
2
15
-
2
1
5
Ban
ana
891
-
54
-
-
24
18
79
5
Bre
adfru
it3
-
-
-
-
-
-
3
C
hest
nut
15
-
-
-
-
-
-
15
Coc
onut
1,07
2
-
96
19
-
24
60
87
3
Cof
fee
-
-
-
-
-
-
-
-
Lem
on49
-
9
-
-
-
-
40
M
ango
182
-
29
2
-
2
34
11
5
Non
o9
-
-
-
-
-
-
9
O
rang
e42
-
-
-
4
-
-
38
P
awpa
w -
Sol
o36
0
-
-
150
-
-
-
210
O
ther
Tre
e C
rops
128
-
4
-
-
-
34
90
VEG
ETAB
LE C
RO
PS3,
357
-
50
-
-
2,00
0
-
1,30
7
B
ean
-
-
-
-
-
-
-
-
Cab
bage
- E
urop
ean
-
-
-
-
-
-
-
-
Cap
sicu
m-
-
-
-
-
-
-
-
C
hilli
-
-
-
-
-
-
-
-
Lettu
ce-
-
-
-
-
-
-
-
M
elon
-
-
-
-
-
-
-
-
Pin
eapp
le-
-
-
-
-
-
-
-
To
mat
o2,
000
-
-
-
-
2,00
0
-
-
O
ther
Veg
etab
le C
rops
1,35
7
-
50
-
-
-
-
1,
307
RO
OT
CR
OPS
1,70
4
-
-
-
4
-
2
1,
698
Cas
sava
1,00
0
-
-
-
-
-
-
1,
000
Kum
ara
180
-
-
-
-
-
-
18
0
Pur
aka
3
-
-
-
-
-
-
3
Taro
-Dry
-
-
-
-
-
-
-
-
Taro
-Wet
, Flo
oded
-
-
-
-
-
-
-
-
Taro
-Wet
, Rai
sed
-
-
-
-
-
-
-
-
Taru
a14
-
-
-
-
-
-
14
O
ther
Roo
t Cro
ps50
7
-
-
-
4
-
2
501
OTH
ER C
RO
PS25
8
-
60
-
-
-
-
198
Typ
e of
Cro
p T
otal
N
umbe
r of
Plan
ts
Pro
port
ion
for S
ale
Sour
ce:
Coo
k Is
land
s 20
11 C
ensu
s of
Agr
icul
ture
and
Fis
herie
sTA
BLE
SET
3: P
ARC
EL D
ETAI
LS
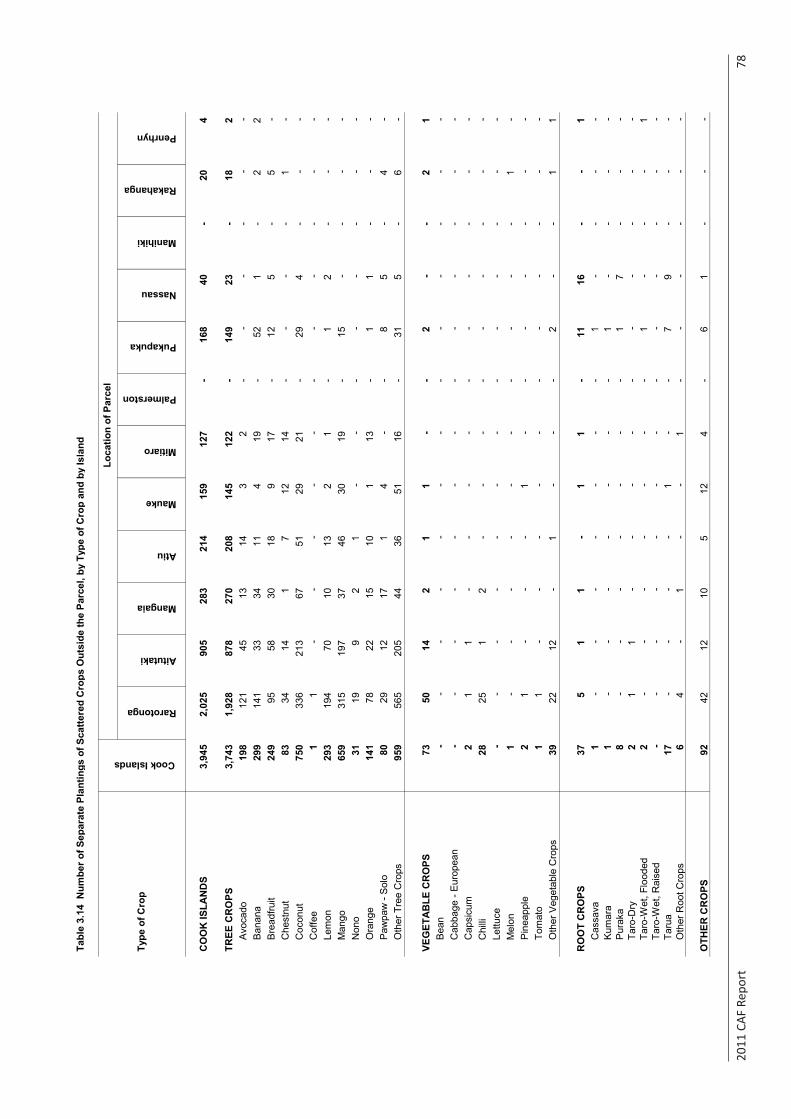
2011
CAF
Rep
ort
78
Tabl
e 3.
14 N
umbe
r of S
epar
ate
Plan
tings
of S
catte
red
Cro
ps O
utsi
de th
e Pa
rcel
, by
Type
of C
rop
and
by Is
land
Rarotonga
Aitutaki
Mangaia
Atiu
Mauke
Mitiaro
Palmerston
Pukapuka
Nassau
Manihiki
Rakahanga
Penrhyn
CO
OK
ISLA
ND
S3,
945
2,
025
90
5
28
3
21
4
15
9
12
7
-
16
8
40
-
20
4
TREE
CR
OPS
3,74
3
1,92
8
878
270
208
145
122
-
149
23
-
18
2
Avo
cado
198
121
45
13
14
3
2
-
-
-
-
-
-
B
anan
a29
9
14
1
33
34
11
4
19
-
52
1
-
2
2
Bre
adfru
it24
9
95
58
30
18
9
17
-
12
5
-
5
-
C
hest
nut
83
34
14
1
7
12
14
-
-
-
-
1
-
C
ocon
ut75
0
33
6
21
3
67
51
29
21
-
29
4
-
-
-
Cof
fee
1
1
-
-
-
-
-
-
-
-
-
-
-
Lem
on29
3
19
4
70
10
13
2
1
-
1
2
-
-
-
Man
go65
9
31
5
19
7
37
46
30
19
-
15
-
-
-
-
Non
o31
19
9
2
1
-
-
-
-
-
-
-
-
O
rang
e14
1
78
22
15
10
1
13
-
1
1
-
-
-
Paw
paw
- S
olo
80
29
12
17
1
4
-
-
8
5
-
4
-
Oth
er T
ree
Cro
ps95
9
56
5
20
5
44
36
51
16
-
31
5
-
6
-
VEG
ETA
BLE
CR
OPS
73
50
14
2
1
1
-
-
2
-
-
2
1
B
ean
-
-
-
-
-
-
-
-
-
-
-
-
-
Cab
bage
- E
urop
ean
-
-
-
-
-
-
-
-
-
-
-
-
-
Cap
sicu
m2
1
1
-
-
-
-
-
-
-
-
-
-
C
hilli
28
25
1
2
-
-
-
-
-
-
-
-
-
Lettu
ce-
-
-
-
-
-
-
-
-
-
-
-
-
M
elon
1
-
-
-
-
-
-
-
-
-
-
1
-
Pin
eapp
le2
1
-
-
-
1
-
-
-
-
-
-
-
To
mat
o1
1
-
-
-
-
-
-
-
-
-
-
-
O
ther
Veg
etab
le C
rops
39
22
12
-
1
-
-
-
2
-
-
1
1
RO
OT
CR
OPS
37
5
1
1
-
1
1
-
11
16
-
-
1
C
assa
va1
-
-
-
-
-
-
-
1
-
-
-
-
K
umar
a1
-
-
-
-
-
-
-
1
-
-
-
-
P
urak
a8
-
-
-
-
-
-
-
1
7
-
-
-
Ta
ro-D
ry2
1
1
-
-
-
-
-
-
-
-
-
-
Ta
ro-W
et, F
lood
ed2
-
-
-
-
-
-
-
1
-
-
-
1
Ta
ro-W
et, R
aise
d-
-
-
-
-
-
-
-
-
-
-
-
-
Ta
rua
17
-
-
-
-
1
-
-
7
9
-
-
-
O
ther
Roo
t Cro
ps6
4
-
1
-
-
1
-
-
-
-
-
-
OTH
ER C
RO
PS92
42
12
10
5
12
4
-
6
1
-
-
-
Type
of C
rop
Cook Islands
Loca
tion
of P
arce
l
Sour
ce:
Coo
k Is
land
s 20
00 C
ensu
s of
Agr
icul
ture
and
Fis
herie
sTA
BLE
SET
3: P
ARC
EL D
ETAI
LS
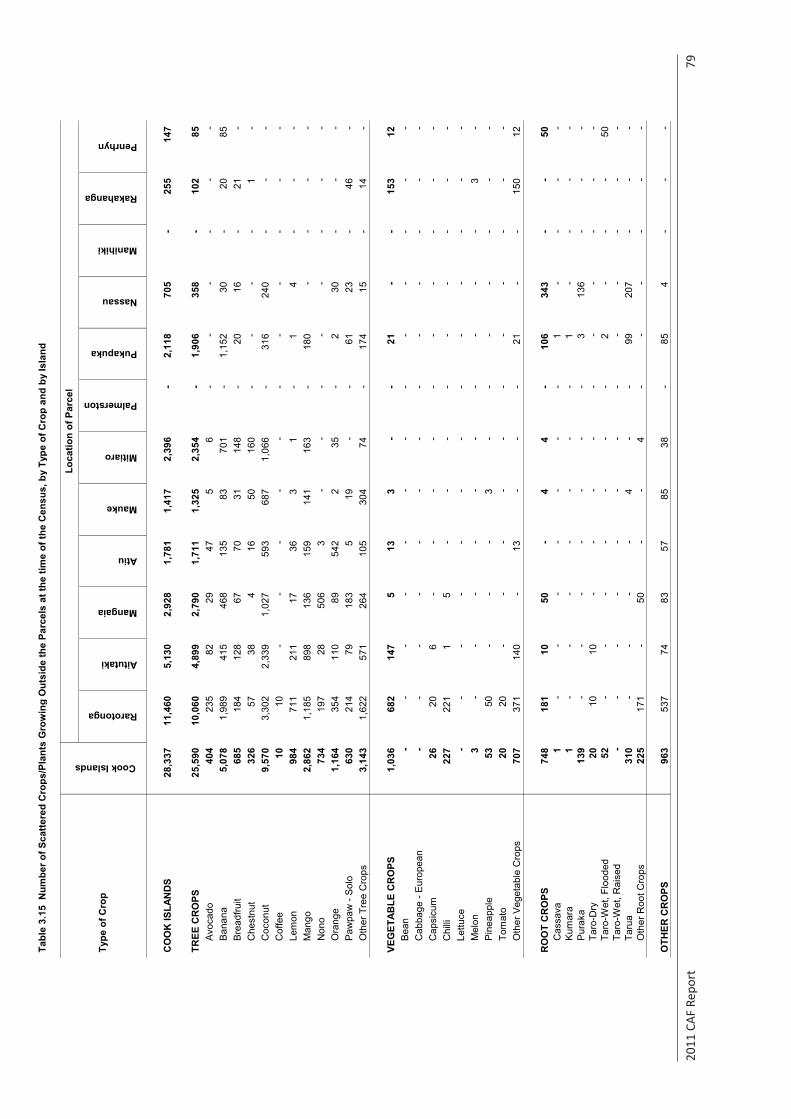
2011
CAF
Rep
ort
79
Tabl
e 3.
15 N
umbe
r of S
catte
red
Cro
ps/P
lant
s G
row
ing
Out
side
the
Parc
els
at th
e tim
e of
the
Cen
sus,
by
Type
of C
rop
and
by Is
land
Rarotonga
Aitutaki
Mangaia
Atiu
Mauke
Mitiaro
Palmerston
Pukapuka
Nassau
Manihiki
Rakahanga
Penrhyn
CO
OK
ISLA
ND
S28
,337
11,4
60
5,
130
2,
928
1,
781
1,
417
2,
396
-
2,
118
70
5
-
25
5
14
7
TREE
CR
OPS
25,5
90
10
,060
4,89
9
2,79
0
1,71
1
1,32
5
2,35
4
-
1,90
6
358
-
102
85
A
voca
do40
4
23
5
82
29
47
5
6
-
-
-
-
-
-
Ban
ana
5,07
8
1,98
9
415
468
135
83
70
1
-
1,
152
30
-
20
85
Bre
adfru
it68
5
18
4
12
8
67
70
31
148
-
20
16
-
21
-
C
hest
nut
326
57
38
4
16
50
160
-
-
-
-
1
-
Coc
onut
9,57
0
3,30
2
2,33
9
1,02
7
593
687
1,06
6
-
316
240
-
-
-
Cof
fee
10
10
-
-
-
-
-
-
-
-
-
-
-
Lem
on98
4
71
1
21
1
17
36
3
1
-
1
4
-
-
-
M
ango
2,86
2
1,18
5
898
136
159
141
163
-
180
-
-
-
-
Non
o73
4
19
7
28
506
3
-
-
-
-
-
-
-
-
Ora
nge
1,16
4
354
110
89
54
2
2
35
-
2
30
-
-
-
P
awpa
w -
Sol
o63
0
21
4
79
183
5
19
-
-
61
23
-
46
-
Oth
er T
ree
Cro
ps3,
143
1,
622
57
1
26
4
10
5
30
4
74
-
174
15
-
14
-
VEG
ETAB
LE C
RO
PS1,
036
68
2
14
7
5
13
3
-
-
21
-
-
15
3
12
Bea
n-
-
-
-
-
-
-
-
-
-
-
-
-
C
abba
ge -
Eur
opea
n-
-
-
-
-
-
-
-
-
-
-
-
-
C
apsi
cum
26
20
6
-
-
-
-
-
-
-
-
-
-
Chi
lli22
7
22
1
1
5
-
-
-
-
-
-
-
-
-
Le
ttuce
-
-
-
-
-
-
-
-
-
-
-
-
-
Mel
on3
-
-
-
-
-
-
-
-
-
-
3
-
P
inea
pple
53
50
-
-
-
3
-
-
-
-
-
-
-
Tom
ato
20
20
-
-
-
-
-
-
-
-
-
-
-
Oth
er V
eget
able
Cro
ps70
7
37
1
14
0
-
13
-
-
-
21
-
-
15
0
12
RO
OT
CR
OPS
748
181
10
50
-
4
4
-
106
343
-
-
50
C
assa
va1
-
-
-
-
-
-
-
1
-
-
-
-
K
umar
a1
-
-
-
-
-
-
-
1
-
-
-
-
P
urak
a13
9
-
-
-
-
-
-
-
3
13
6
-
-
-
Ta
ro-D
ry20
10
10
-
-
-
-
-
-
-
-
-
-
Taro
-Wet
, Flo
oded
52
-
-
-
-
-
-
-
2
-
-
-
50
Taro
-Wet
, Rai
sed
-
-
-
-
-
-
-
-
-
-
-
-
-
Taru
a31
0
-
-
-
-
4
-
-
99
207
-
-
-
Oth
er R
oot C
rops
225
171
-
50
-
-
4
-
-
-
-
-
-
OTH
ER C
RO
PS96
3
53
7
74
83
57
85
38
-
85
4
-
-
-
Type
of C
rop
Cook Islands
Loca
tion
of P
arce
l
Sour
ce:
Coo
k Is
land
s 20
00 C
ensu
s of
Agr
icul
ture
and
Fis
herie
sTA
BLE
SET
3: P
ARC
EL D
ETAI
LS
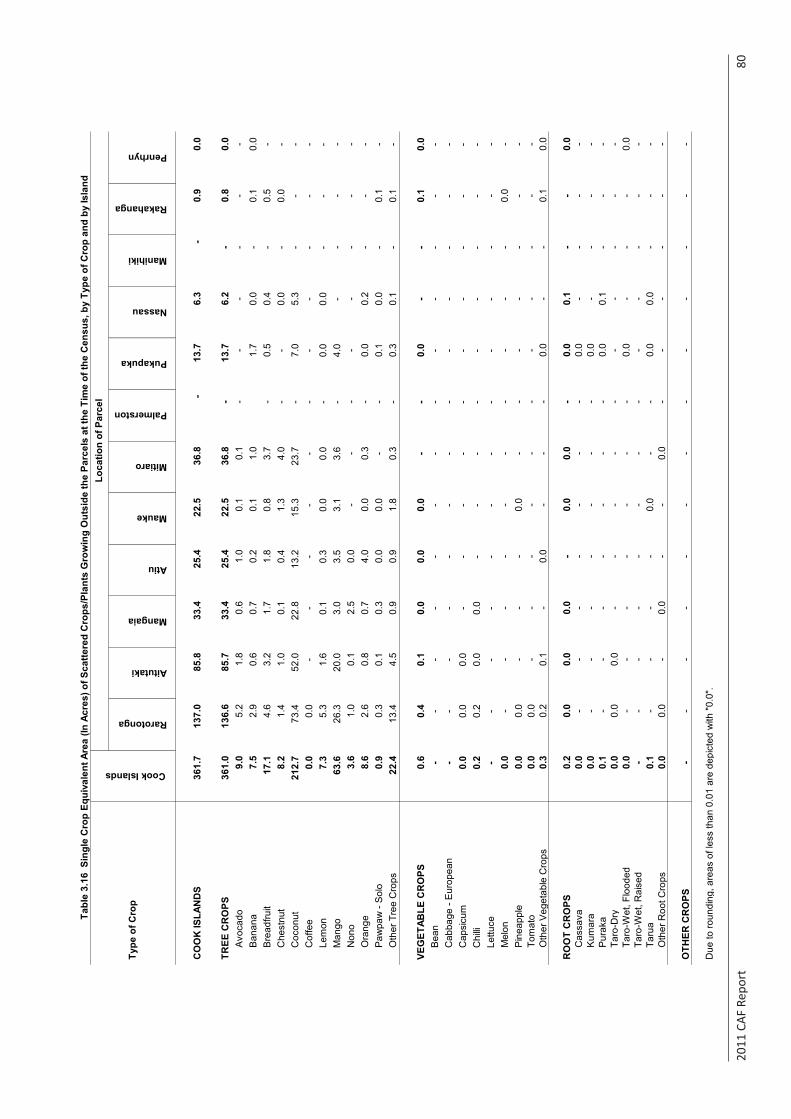
2011
CAF
Rep
ort
80
Rarotonga
Aitutaki
Mangaia
Atiu
Mauke
Mitiaro
Palmerston
Pukapuka
Nassau
Manihiki
Rakahanga
Penrhyn
CO
OK
ISLA
ND
S36
1.7
13
7.0
85
.8
33.4
25
.4
22.5
36
.8
-
13.7
6.
3
-
0.
9
0.
0
TREE
CR
OPS
361.
0
136.
6
85.7
33
.4
25.4
22
.5
36.8
-
13
.7
6.2
-
0.8
0.0
Avo
cado
9.0
5.2
1.8
0.6
1.0
0.1
0.1
-
-
-
-
-
-
Ban
ana
7.5
2.9
0.6
0.7
0.2
0.1
1.0
1.7
0.0
-
0.1
0.0
Bre
adfru
it17
.1
4.6
3.2
1.7
1.8
0.8
3.7
-
0.5
0.4
-
0.5
-
Che
stnu
t8.
2
1.
4
1.
0
0.
1
0.
4
1.
3
4.
0
-
-
0.
0
-
0.
0
-
C
ocon
ut21
2.7
73
.4
52.0
22
.8
13.2
15
.3
23.7
-
7.
0
5.
3
-
-
-
C
offe
e0.
0
0.
0
-
-
-
-
-
-
-
-
-
-
-
Le
mon
7.3
5.3
1.6
0.1
0.3
0.0
0.0
-
0.0
0.0
-
-
-
Man
go63
.6
26.3
20
.0
3.0
3.5
3.1
3.6
-
4.0
-
-
-
-
Non
o3.
6
1.
0
0.
1
2.
5
0.
0
-
-
-
-
-
-
-
-
O
rang
e8.
6
2.
6
0.
8
0.
7
4.
0
0.
0
0.
3
-
0.
0
0.
2
-
-
-
P
awpa
w -
Sol
o0.
9
0.
3
0.
1
0.
3
0.
0
0.
0
-
-
0.
1
0.
0
-
0.
1
-
O
ther
Tre
e C
rops
22.4
13
.4
4.5
0.9
0.9
1.8
0.3
-
0.3
0.1
-
0.1
-
VEG
ETAB
LE C
RO
PS0.
6
0.
4
0.
1
0.
0
0.
0
0.
0
-
-
0.
0
-
-
0.
1
0.
0
B
ean
-
-
-
-
-
-
-
-
-
-
-
-
-
Cab
bage
- E
urop
ean
-
-
-
-
-
-
-
-
-
-
-
-
-
Cap
sicu
m0.
0
0.
0
0.
0
-
-
-
-
-
-
-
-
-
-
C
hilli
0.2
0.2
0.0
0.0
-
-
-
-
-
-
-
-
-
Lettu
ce-
-
-
-
-
-
-
-
-
-
-
-
-
M
elon
0.0
-
-
-
-
-
-
-
-
-
-
0.0
-
Pin
eapp
le0.
0
0.
0
-
-
-
0.
0
-
-
-
-
-
-
-
To
mat
o0.
0
0.
0
-
-
-
-
-
-
-
-
-
-
-
O
ther
Veg
etab
le C
rops
0.3
0.2
0.1
-
0.0
-
-
-
0.0
-
-
0.1
0.0
RO
OT
CR
OPS
0.2
0.0
0.0
0.0
-
0.0
0.0
-
0.0
0.1
-
-
0.0
Cas
sava
0.0
-
-
-
-
-
-
-
0.0
-
-
-
-
Kum
ara
0.0
-
-
-
-
-
-
-
0.0
-
-
-
-
Pur
aka
0.1
-
-
-
-
-
-
-
0.0
0.1
-
-
-
Taro
-Dry
0.0
0.0
0.0
-
-
-
-
-
-
-
-
-
-
Taro
-Wet
, Flo
oded
0.0
-
-
-
-
-
-
-
0.0
-
-
-
0.0
Taro
-Wet
, Rai
sed
-
-
-
-
-
-
-
-
-
-
-
-
-
Taru
a0.
1
-
-
-
-
0.
0
-
-
0.
0
0.
0
-
-
-
O
ther
Roo
t Cro
ps0.
0
0.
0
-
0.
0
-
-
0.
0
-
-
-
-
-
-
OTH
ER C
RO
PS-
-
-
-
-
-
-
-
-
-
-
-
-
Due
to ro
undi
ng, a
reas
of l
ess
than
0.0
1 ar
e de
pict
ed w
ith "0
.0".
Tab
le 3
.16
Sin
gle
Cro
p Eq
uiva
lent
Are
a (In
Acr
es) o
f Sca
ttere
d C
rops
/Pla
nts
Gro
win
g O
utsi
de th
e Pa
rcel
s at
the
Tim
e of
the
Cen
sus,
by
Type
of C
rop
and
by Is
land
Type
of C
rop
Cook Islands
Loca
tion
of P
arce
l
Sour
ce:
Coo
k Is
land
s 20
00 C
ensu
s of
Agr
icul
ture
and
Fis
herie
sTA
BLE
SET
3: P
AR
CEL
DET
AIL
S
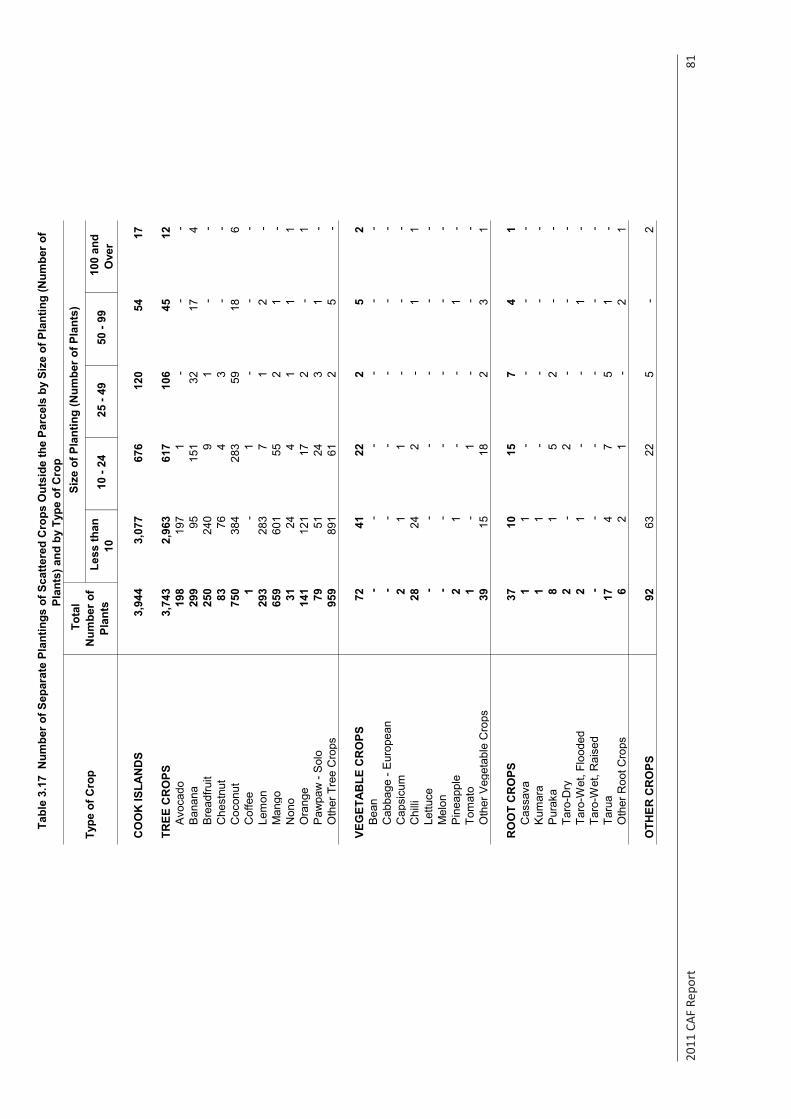
2011
CAF
Rep
ort
81
Les
s th
an
10
10
- 24
25
- 49
50
- 99
100
and
O
ver
CO
OK
ISLA
ND
S3,
944
3,07
7
67
6
120
54
17
TREE
CR
OPS
3,74
3
2,
963
617
10
6
45
12
Avo
cado
198
19
7
1
-
-
-
B
anan
a29
9
95
15
1
32
17
4
B
read
fruit
250
24
0
9
1
-
-
Che
stnu
t83
76
4
3
-
-
C
ocon
ut75
0
384
28
3
59
18
6
C
offe
e1
-
1
-
-
-
Le
mon
293
28
3
7
1
2
-
M
ango
659
60
1
55
2
1
-
N
ono
31
24
4
1
1
1
Ora
nge
141
12
1
17
2
-
1
P
awpa
w -
Sol
o79
51
24
3
1
-
Oth
er T
ree
Cro
ps95
9
891
61
2
5
-
VEG
ETA
BLE
CR
OPS
72
41
22
2
5
2
Bea
n-
-
-
-
-
-
C
abba
ge -
Eur
opea
n-
-
-
-
-
-
C
apsi
cum
2
1
1
-
-
-
C
hilli
28
24
2
-
1
1
Le
ttuce
-
-
-
-
-
-
Mel
on-
-
-
-
-
-
P
inea
pple
2
1
-
-
1
-
To
mat
o1
-
1
-
-
-
O
ther
Veg
etab
le C
rops
39
15
18
2
3
1
RO
OT
CR
OPS
37
10
15
7
4
1
Cas
sava
1
1
-
-
-
-
Kum
ara
1
1
-
-
-
-
Pur
aka
8
1
5
2
-
-
Taro
-Dry
2
-
2
-
-
-
Taro
-Wet
, Flo
oded
2
1
-
-
1
-
Ta
ro-W
et, R
aise
d-
-
-
-
-
-
Ta
rua
17
4
7
5
1
-
O
ther
Roo
t Cro
ps6
2
1
-
2
1
OTH
ER C
RO
PS92
63
22
5
-
2
Tab
le 3
.17
Num
ber o
f Sep
arat
e Pl
antin
gs o
f Sca
ttere
d C
rops
Out
side
the
Parc
els
by S
ize
of P
lant
ing
(Num
ber o
f Pl
ants
) and
by
Type
of C
rop
Typ
e of
Cro
p T
otal
N
umbe
r of
Plan
ts
Siz
e of
Pla
ntin
g (N
umbe
r of P
lant
s)
Sour
ce:
Coo
k Is
land
s 20
11 C
ensu
s of
Agr
icul
ture
and
Fis
herie
sTA
BLE
SET
3: P
ARC
EL D
ETAI
LS
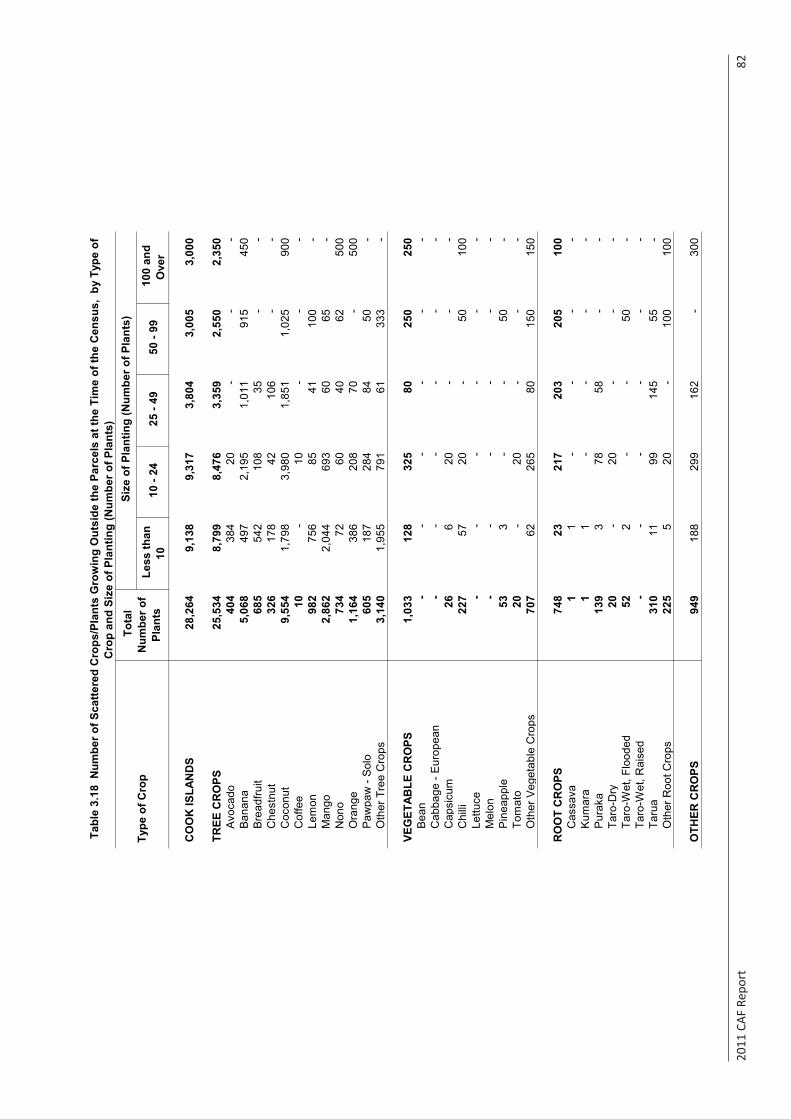
2011
CAF
Rep
ort
82
Les
s th
an
10
10
- 24
25
- 49
50
- 99
100
and
O
ver
CO
OK
ISLA
ND
S28
,264
9,
138
9,31
7
3,
804
3,00
5
3,
000
TREE
CR
OPS
25,5
34
8,79
9
8,
476
3,35
9
2,
550
2,35
0
A
voca
do40
4
384
20
-
-
-
Ban
ana
5,06
8
49
7
2,19
5
1,
011
915
45
0
Bre
adfru
it68
5
542
10
8
35
-
-
C
hest
nut
326
17
8
42
10
6
-
-
Coc
onut
9,55
4
1,
798
3,98
0
1,
851
1,02
5
90
0
Cof
fee
10
-
10
-
-
-
Lem
on98
2
756
85
41
10
0
-
Man
go2,
862
2,04
4
69
3
60
65
-
Non
o73
4
72
60
40
62
500
O
rang
e1,
164
386
20
8
70
-
50
0
Paw
paw
- S
olo
605
18
7
284
84
50
-
O
ther
Tre
e C
rops
3,14
0
1,
955
791
61
333
-
VEG
ETAB
LE C
RO
PS1,
033
128
32
5
80
25
0
250
B
ean
-
-
-
-
-
-
Cab
bage
- E
urop
ean
-
-
-
-
-
-
Cap
sicu
m26
6
20
-
-
-
Chi
lli22
7
57
20
-
50
10
0
Lettu
ce-
-
-
-
-
-
M
elon
-
-
-
-
-
-
Pin
eapp
le53
3
-
-
50
-
Tom
ato
20
-
20
-
-
-
Oth
er V
eget
able
Cro
ps70
7
62
26
5
80
15
0
150
RO
OT
CR
OPS
748
23
217
20
3
205
10
0
Cas
sava
1
1
-
-
-
-
Kum
ara
1
1
-
-
-
-
Pur
aka
139
3
78
58
-
-
Taro
-Dry
20
-
20
-
-
-
Taro
-Wet
, Flo
oded
52
2
-
-
50
-
Ta
ro-W
et, R
aise
d-
-
-
-
-
-
Ta
rua
310
11
99
14
5
55
-
O
ther
Roo
t Cro
ps22
5
5
20
-
100
10
0
OTH
ER C
RO
PS94
9
188
29
9
162
-
30
0
Typ
e of
Cro
p T
otal
N
umbe
r of
Plan
ts
Siz
e of
Pla
ntin
g (N
umbe
r of P
lant
s)
Tab
le 3
.18
Num
ber o
f Sca
ttere
d C
rops
/Pla
nts
Gro
win
g O
utsi
de th
e Pa
rcel
s at
the
Tim
e of
the
Cen
sus,
by
Type
of
Cro
p an
d Si
ze o
f Pla
ntin
g (N
umbe
r of P
lant
s)
Sour
ce:
Coo
k Is
land
s 20
11 C
ensu
s of
Agr
icul
ture
and
Fis
herie
sTA
BLE
SET
3: P
ARC
EL D
ETAI
LS

2011
CAF
Rep
ort
83
Tabl
e 3.
19 N
umbe
r of S
epar
ate
Plan
tings
of C
rops
Cur
rent
ly G
row
n by
Min
or A
gric
ultu
ral H
ouse
hold
s, b
y Ty
pe o
f Cro
p an
d by
Isla
nd
Rarotonga
Aitutaki
Mangaia
Atiu
Mauke
Mitiaro
Palmerston
Pukapuka
Nassau
Manihiki
Rakahanga
Penrhyn
CO
OK
ISLA
ND
S3,
098
2,
387
10
2
7
8
-
-
63
58
11
241
24
19
7
TREE
CR
OPS
2,83
3
2,25
8
79
1
-
-
-
46
31
9
21
4
20
175
Avo
cado
149
148
1
-
-
-
-
-
-
-
-
-
-
Ban
ana
409
294
12
1
-
-
-
8
9
3
37
10
35
Bre
adfru
it18
1
11
4
9
-
-
-
-
7
1
2
27
4
17
C
hest
nut
15
12
3
-
-
-
-
-
-
-
-
-
-
Coc
onut
669
505
22
-
-
-
-
11
9
3
73
-
46
Cof
fee
-
-
-
-
-
-
-
-
-
-
-
-
-
Lem
on21
5
20
0
6
-
-
-
-
1
1
-
4
-
3
M
ango
359
328
15
-
-
-
-
2
3
-
5
-
6
N
ono
29
11
-
-
-
-
-
-
-
-
12
-
6
O
rang
e68
65
1
-
-
-
-
-
-
-
-
-
2
P
awpa
w -
Sol
o81
67
2
-
-
-
-
1
6
-
-
2
3
O
ther
Tre
e C
rops
658
514
8
-
-
-
-
16
2
1
56
4
57
VEG
ETAB
LE C
RO
PS12
1
72
6
-
1
-
-
12
7
-
17
-
6
Bea
n2
2
-
-
-
-
-
-
-
-
-
-
-
C
abba
ge -
Eur
opea
n3
1
-
-
-
-
-
-
2
-
-
-
-
C
apsi
cum
7
7
-
-
-
-
-
-
-
-
-
-
-
Chi
lli10
1
1
-
-
-
-
4
2
-
1
-
1
Lettu
ce4
2
-
-
-
-
-
1
-
-
1
-
-
M
elon
3
1
-
-
-
-
-
-
-
-
2
-
-
Pin
eapp
le-
-
-
-
-
-
-
-
-
-
-
-
-
To
mat
o15
4
1
-
-
-
-
6
-
-
4
-
-
Oth
er V
eget
able
Cro
ps77
54
4
-
1
-
-
1
3
-
9
-
5
RO
OT
CR
OPS
114
34
13
6
5
-
-
5
19
2
10
4
16
C
assa
va29
15
5
3
1
-
-
-
-
-
5
-
-
K
umar
a14
5
4
-
2
-
-
1
-
-
1
-
1
Pur
aka
16
-
-
-
-
-
-
3
-
1
1
-
11
Taro
-Dry
6
2
1
-
1
-
-
-
1
1
-
-
-
Taro
-Wet
, Flo
oded
7
-
-
-
-
-
-
1
-
-
2
-
4
Taro
-Wet
, Rai
sed
30
2
2
3
-
-
-
-
18
-
1
4
-
Taru
a9
7
1
-
1
-
-
-
-
-
-
-
-
O
ther
Roo
t Cro
ps3
3
-
-
-
-
-
-
-
-
-
-
-
OTH
ER C
RO
PS30
23
4
-
2
-
-
-
1
-
-
-
-
Type
of C
rop
Cook Islands
Loca
tion
of P
arce
l
Sour
ce:
Coo
k Is
land
s 20
00 C
ensu
s of
Agr
icul
ture
and
Fis
herie
sTA
BLE
SET
3: P
ARC
EL D
ETAI
LS
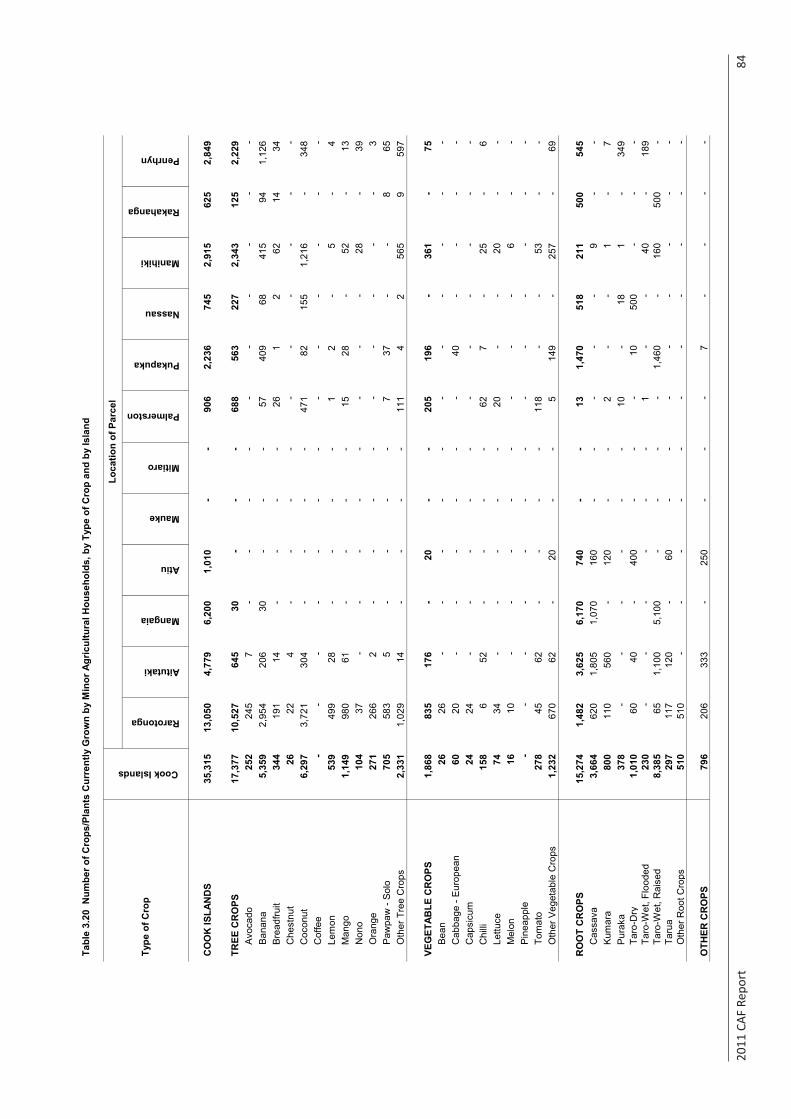
2011
CAF
Rep
ort
84
Tabl
e 3.
20 N
umbe
r of C
rops
/Pla
nts
Cur
rent
ly G
row
n by
Min
or A
gric
ultu
ral H
ouse
hold
s, b
y Ty
pe o
f Cro
p an
d by
Isla
nd
Rarotonga
Aitutaki
Mangaia
Atiu
Mauke
Mitiaro
Palmerston
Pukapuka
Nassau
Manihiki
Rakahanga
Penrhyn
CO
OK
ISLA
ND
S35
,315
13,0
50
4,
779
6,
200
1,
010
-
-
90
6
2,
236
74
5
2,
915
62
5
2,
849
TREE
CR
OPS
17,3
77
10
,527
645
30
-
-
-
68
8
56
3
22
7
2,
343
12
5
2,
229
A
voca
do25
2
24
5
7
-
-
-
-
-
-
-
-
-
-
B
anan
a5,
359
2,
954
20
6
30
-
-
-
57
40
9
68
415
94
1,
126
B
read
fruit
344
191
14
-
-
-
-
26
1
2
62
14
34
C
hest
nut
26
22
4
-
-
-
-
-
-
-
-
-
-
Coc
onut
6,29
7
3,72
1
304
-
-
-
-
471
82
15
5
1,
216
-
34
8
C
offe
e-
-
-
-
-
-
-
-
-
-
-
-
-
Le
mon
539
499
28
-
-
-
-
1
2
-
5
-
4
M
ango
1,14
9
980
61
-
-
-
-
15
28
-
52
-
13
N
ono
104
37
-
-
-
-
-
-
-
-
28
-
39
O
rang
e27
1
26
6
2
-
-
-
-
-
-
-
-
-
3
P
awpa
w -
Sol
o70
5
58
3
5
-
-
-
-
7
37
-
-
8
65
O
ther
Tre
e C
rops
2,33
1
1,02
9
14
-
-
-
-
11
1
4
2
56
5
9
59
7
VEG
ETAB
LE C
RO
PS1,
868
83
5
17
6
-
20
-
-
205
196
-
361
-
75
B
ean
26
26
-
-
-
-
-
-
-
-
-
-
-
Cab
bage
- E
urop
ean
60
20
-
-
-
-
-
-
40
-
-
-
-
C
apsi
cum
24
24
-
-
-
-
-
-
-
-
-
-
-
Chi
lli15
8
6
52
-
-
-
-
62
7
-
25
-
6
Lettu
ce74
34
-
-
-
-
-
20
-
-
20
-
-
M
elon
16
10
-
-
-
-
-
-
-
-
6
-
-
Pin
eapp
le-
-
-
-
-
-
-
-
-
-
-
-
-
To
mat
o27
8
45
62
-
-
-
-
11
8
-
-
53
-
-
Oth
er V
eget
able
Cro
ps1,
232
67
0
62
-
20
-
-
5
14
9
-
25
7
-
69
RO
OT
CR
OPS
15,2
74
1,
482
3,
625
6,
170
74
0
-
-
13
1,47
0
518
211
500
545
Cas
sava
3,66
4
620
1,80
5
1,07
0
160
-
-
-
-
-
9
-
-
Kum
ara
800
110
560
-
120
-
-
2
-
-
1
-
7
Pur
aka
378
-
-
-
-
-
-
10
-
18
1
-
349
Taro
-Dry
1,01
0
60
40
-
400
-
-
-
10
50
0
-
-
-
Ta
ro-W
et, F
lood
ed23
0
-
-
-
-
-
-
1
-
-
40
-
189
Taro
-Wet
, Rai
sed
8,38
5
65
1,
100
5,
100
-
-
-
-
1,
460
-
16
0
50
0
-
Ta
rua
297
117
120
-
60
-
-
-
-
-
-
-
-
O
ther
Roo
t Cro
ps51
0
51
0
-
-
-
-
-
-
-
-
-
-
-
OTH
ER C
RO
PS79
6
20
6
33
3
-
25
0
-
-
-
7
-
-
-
-
Type
of C
rop
Cook Islands
Loca
tion
of P
arce
l
Sour
ce:
Coo
k Is
land
s 20
00 C
ensu
s of
Agr
icul
ture
and
Fis
herie
sTA
BLE
SET
3: P
ARC
EL D
ETAI
LS
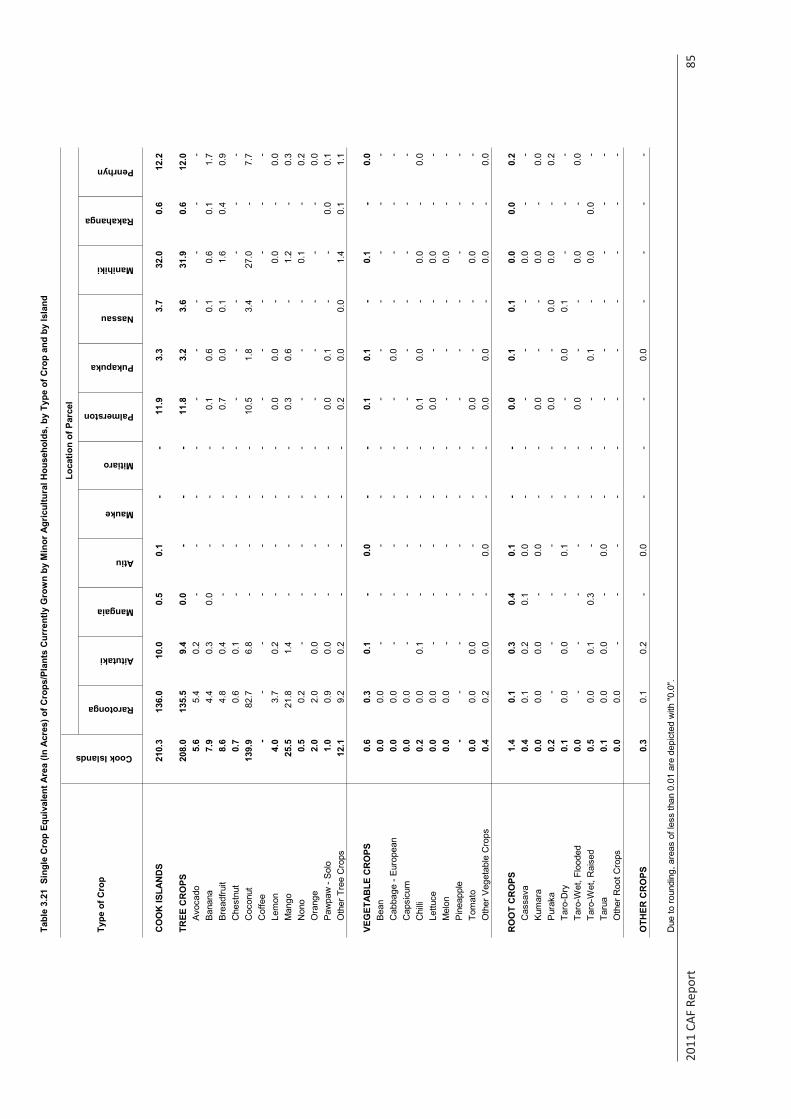
2011
CAF
Rep
ort
85
Tabl
e 3.
21 S
ingl
e C
rop
Equi
vale
nt A
rea
(In A
cres
) of C
rops
/Pla
nts
Cur
rent
ly G
row
n by
Min
or A
gric
ultu
ral H
ouse
hold
s, b
y Ty
pe o
f Cro
p an
d by
Isla
nd
Rarotonga
Aitutaki
Mangaia
Atiu
Mauke
Mitiaro
Palmerston
Pukapuka
Nassau
Manihiki
Rakahanga
Penrhyn
CO
OK
ISLA
ND
S21
0.3
13
6.0
10
.0
0.5
0.1
-
-
11.9
3.
3
3.
7
32
.0
0.6
12.2
TREE
CR
OPS
208.
0
135.
5
9.4
0.0
-
-
-
11.8
3.
2
3.
6
31
.9
0.6
12.0
Av
ocad
o5.
6
5.
4
0.
2
-
-
-
-
-
-
-
-
-
-
Ba
nana
7.9
4.4
0.3
0.0
-
-
-
0.1
0.6
0.1
0.6
0.1
1.7
Brea
dfru
it8.
6
4.
8
0.
4
-
-
-
-
0.
7
0.
0
0.
1
1.
6
0.
4
0.
9
C
hest
nut
0.7
0.6
0.1
-
-
-
-
-
-
-
-
-
-
Coc
onut
139.
9
82.7
6.
8
-
-
-
-
10
.5
1.8
3.4
27.0
-
7.
7
C
offe
e-
-
-
-
-
-
-
-
-
-
-
-
-
Le
mon
4.0
3.7
0.2
-
-
-
-
0.0
0.0
-
0.0
-
0.0
Man
go25
.5
21.8
1.
4
-
-
-
-
0.
3
0.
6
-
1.
2
-
0.
3
N
ono
0.5
0.2
-
-
-
-
-
-
-
-
0.1
-
0.2
Ora
nge
2.0
2.0
0.0
-
-
-
-
-
-
-
-
-
0.0
Paw
paw
- So
lo1.
0
0.
9
0.
0
-
-
-
-
0.
0
0.
1
-
-
0.
0
0.
1
O
ther
Tre
e C
rops
12.1
9.
2
0.
2
-
-
-
-
0.
2
0.
0
0.
0
1.
4
0.
1
1.
1
VEG
ETA
BLE
CR
OPS
0.6
0.3
0.1
-
0.0
-
-
0.1
0.1
-
0.1
-
0.0
Bean
0.0
0.0
-
-
-
-
-
-
-
-
-
-
-
Cab
bage
- Eu
rope
an0.
0
0.
0
-
-
-
-
-
-
0.
0
-
-
-
-
C
apsi
cum
0.0
0.0
-
-
-
-
-
-
-
-
-
-
-
Chi
lli0.
2
0.
0
0.
1
-
-
-
-
0.
1
0.
0
-
0.
0
-
0.
0
Le
ttuce
0.0
0.0
-
-
-
-
-
0.0
-
-
0.0
-
-
Mel
on0.
0
0.
0
-
-
-
-
-
-
-
-
0.
0
-
-
Pi
neap
ple
-
-
-
-
-
-
-
-
-
-
-
-
-
Tom
ato
0.0
0.0
0.0
-
-
-
-
0.0
-
-
0.0
-
-
Oth
er V
eget
able
Cro
ps0.
4
0.
2
0.
0
-
0.
0
-
-
0.
0
0.
0
-
0.
0
-
0.
0
RO
OT
CR
OPS
1.4
0.1
0.3
0.4
0.1
-
-
0.0
0.1
0.1
0.0
0.0
0.2
Cas
sava
0.4
0.1
0.2
0.1
0.0
-
-
-
-
-
0.0
-
-
Kum
ara
0.0
0.0
0.0
-
0.0
-
-
0.0
-
-
0.0
-
0.0
Pura
ka0.
2
-
-
-
-
-
-
0.
0
-
0.
0
0.
0
-
0.
2
Ta
ro-D
ry0.
1
0.
0
0.
0
-
0.
1
-
-
-
0.
0
0.
1
-
-
-
Ta
ro-W
et, F
lood
ed0.
0
-
-
-
-
-
-
0.
0
-
-
0.
0
-
0.
0
Ta
ro-W
et, R
aise
d0.
5
0.
0
0.
1
0.
3
-
-
-
-
0.
1
-
0.
0
0.
0
-
Ta
rua
0.1
0.0
0.0
-
0.0
-
-
-
-
-
-
-
-
Oth
er R
oot C
rops
0.0
0.0
-
-
-
-
-
-
-
-
-
-
-
OTH
ER C
RO
PS0.
3
0.
1
0.
2
-
0.
0
-
-
-
0.
0
-
-
-
-
Due
to ro
undi
ng, a
reas
of l
ess
than
0.0
1 ar
e de
pict
ed w
ith "0
.0".
Type
of C
rop
Cook Islands
Loca
tion
of P
arce
l
Sour
ce:
Coo
k Is
land
s 20
00 C
ensu
s of
Agr
icul
ture
and
Fis
herie
sTA
BLE
SET
3: P
ARC
EL D
ETAI
LS
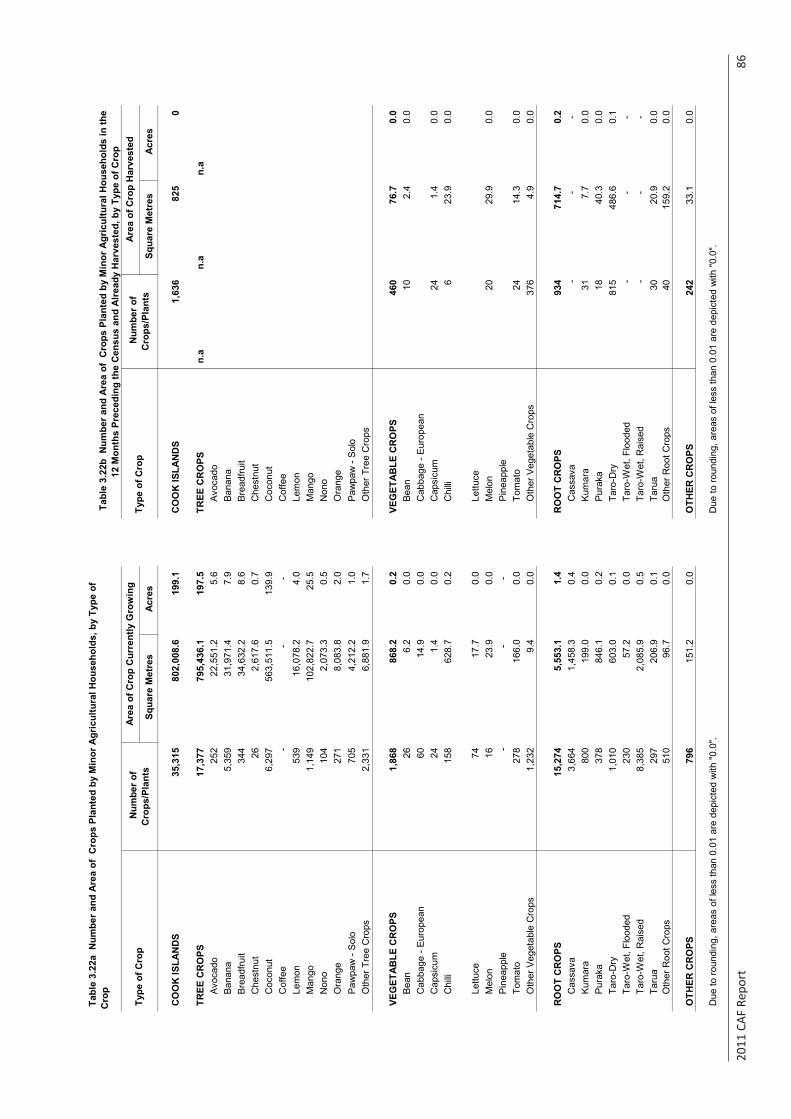
2011
CAF
Rep
ort
86
Squ
are
Met
res
Acr
es
Squ
are
Met
res
Acr
es
CO
OK
ISLA
ND
S35
,315
80
2,00
8.6
19
9.1
C
OO
K IS
LAN
DS
1,63
6
82
5
0
TREE
CR
OPS
17,3
77
795,
436.
1
197.
5
TREE
CR
OPS
n.a
n.a
n.a
Avoc
ado
252
22
,551
.2
5.
6
Av
ocad
oBa
nana
5,35
9
31
,971
.4
7.
9
Ba
nana
Brea
dfru
it34
4
34,6
32.2
8.6
Brea
dfru
itC
hest
nut
26
2,61
7.6
0.
7
C
hest
nut
Coc
onut
6,29
7
56
3,51
1.5
13
9.9
C
ocon
utC
offe
e-
-
-
C
offe
eLe
mon
539
16
,078
.2
4.
0
Le
mon
Man
go1,
149
102,
822.
7
25.5
M
ango
Non
o10
4
2,07
3.3
0.
5
N
ono
Ora
nge
271
8,
083.
8
2.0
Ora
nge
Paw
paw
- So
lo70
5
4,21
2.2
1.
0
Pa
wpa
w -
Solo
Oth
er T
ree
Cro
ps2,
331
6,88
1.9
1.
7
O
ther
Tre
e C
rops
VEG
ETAB
LE C
RO
PS1,
868
868.
2
0.
2
VE
GET
ABLE
CR
OPS
460
76
.7
0.0
Be
an26
6.
2
0.0
Bean
10
2.
4
0.0
C
abba
ge -
Euro
pean
60
14.9
0.0
Cab
bage
- Eu
rope
anC
apsi
cum
24
1.4
0.
0
C
apsi
cum
24
1.
4
0.0
C
hilli
158
62
8.7
0.2
Chi
lli6
23.9
0.
0
Lettu
ce74
17
.7
0.
0
Le
ttuce
Mel
on16
23
.9
0.
0
M
elon
20
29
.9
0.0
Pi
neap
ple
-
-
-
Pine
appl
eTo
mat
o27
8
166.
0
0.
0
To
mat
o24
14.3
0.
0
Oth
er V
eget
able
Cro
ps1,
232
9.4
0.
0
O
ther
Veg
etab
le C
rops
376
4.
9
0.0
RO
OT
CR
OPS
15,2
74
5,55
3.1
1.
4
R
OO
T C
RO
PS93
4
714.
7
0.
2
Cas
sava
3,66
4
1,
458.
3
0.4
Cas
sava
-
-
-
Kum
ara
800
19
9.0
0.0
Kum
ara
31
7.
7
0.0
Pu
raka
378
84
6.1
0.2
Pura
ka18
40.3
0.
0
Taro
-Dry
1,01
0
60
3.0
0.1
Taro
-Dry
815
48
6.6
0.1
Ta
ro-W
et, F
lood
ed23
0
57.2
0.0
Taro
-Wet
, Flo
oded
-
-
-
Taro
-Wet
, Rai
sed
8,38
5
2,
085.
9
0.5
Taro
-Wet
, Rai
sed
-
-
-
Taru
a29
7
206.
9
0.
1
Ta
rua
30
20
.9
0.0
O
ther
Roo
t Cro
ps51
0
96.7
0.0
Oth
er R
oot C
rops
40
15
9.2
0.0
OTH
ER C
RO
PS79
6
151.
2
0.
0
O
THER
CR
OPS
242
33
.1
0.0
Due
to ro
undi
ng, a
reas
of l
ess
than
0.0
1 ar
e de
pict
ed w
ith "0
.0".
Due
to ro
undi
ng, a
reas
of l
ess
than
0.0
1 ar
e de
pict
ed w
ith "0
.0".
Tab
le 3
.22a
Num
ber a
nd A
rea
of C
rops
Pla
nted
by
Min
or A
gric
ultu
ral H
ouse
hold
s, b
y Ty
pe o
f C
rop
T
able
3.2
2b N
umbe
r and
Are
a of
Cro
ps P
lant
ed b
y M
inor
Agr
icul
tura
l Hou
seho
lds
in th
e 12
Mon
ths
Prec
edin
g th
e C
ensu
s an
d Al
read
y H
arve
sted
, by
Type
of C
rop
Type
of C
rop
Num
ber o
f C
rops
/Pla
nts
Area
of C
rop
Cur
rent
ly G
row
ing
Type
of C
rop
Num
ber o
f C
rops
/Pla
nts
Area
of C
rop
Har
vest
ed
Sour
ce:
Coo
k Is
land
s 20
11 C
ensu
s of
Agr
icul
ture
and
Fis
herie
sTA
BLE
SET
3: P
AR
CEL
DET
AIL
S

2011
CAF
Rep
ort
87
Non
e A
bout
1/4
A
bout
1/3
A
bout
1/2
A
bout
3/4
A
ll N
ot S
tate
d
CO
OK
ISLA
ND
S61
.2
10.6
5.
7
3.
8
6.
5
9.
8
24
.3
0.5
TREE
CR
OPS
-
-
-
-
-
-
-
-
Avo
cado
-
-
-
-
-
-
-
-
Ban
ana
-
-
-
-
-
-
-
-
Bre
adfru
it-
-
-
-
-
-
-
-
C
hest
nut
-
-
-
-
-
-
-
-
Coc
onut
-
-
-
-
-
-
-
-
Cof
fee
-
-
-
-
-
-
-
-
Lem
on-
-
-
-
-
-
-
-
M
ango
-
-
-
-
-
-
-
-
Non
o-
-
-
-
-
-
-
-
O
rang
e-
-
-
-
-
-
-
-
P
awpa
w -
Sol
o-
-
-
-
-
-
-
-
O
ther
Tre
e C
rops
-
-
-
-
-
-
-
-
VEG
ETAB
LE C
RO
PS34
.5
2.2
2.3
0.8
2.0
7.6
19.6
-
B
ean
0.7
0.2
0.0
-
0.1
0.2
0.3
-
Cab
bage
- E
urop
ean
2.6
0.1
0.0
-
0.1
0.1
2.3
-
Cap
sicu
m0.
1
0.
0
0.
0
0.
0
0.
0
0.
0
0.
1
-
C
hilli
0.1
-
-
-
-
-
0.1
-
Lettu
ce1.
0
0.
1
0.
0
0.
1
0.
1
0.
2
0.
6
-
M
elon
15.3
0.
8
1.
0
0.
4
1.
0
5.
3
6.
7
-
P
inea
pple
0.8
0.0
0.0
0.0
0.0
0.2
0.5
-
Tom
ato
7.0
0.5
0.2
0.2
0.4
0.6
5.1
-
Oth
er V
eget
able
Cro
ps7.
0
0.
6
1.
1
0.
1
0.
2
1.
0
4.
0
-
RO
OT
CR
OPS
24.3
8.
4
3.
4
1.
7
4.
0
2.
2
4.
0
0.
5
C
assa
va5.
0
2.
1
0.
7
0.
2
0.
9
0.
2
1.
0
0.
1
K
umar
a2.
5
0.
7
0.
5
0.
1
0.
2
0.
5
0.
5
0.
0
P
urak
a0.
1
0.
1
-
-
-
-
-
-
Ta
ro-D
ry1.
2
0.
3
-
-
0.
3
0.
1
0.
4
-
Ta
ro-W
et, F
lood
ed4.
8
1.
7
0.
4
0.
3
1.
1
0.
9
-
0.
5
Ta
ro-W
et, R
aise
d7.
3
2.
0
1.
3
1.
1
1.
1
0.
5
1.
3
-
Ta
rua
2.1
0.9
0.5
0.1
0.1
0.0
0.4
-
Oth
er R
oot C
rops
1.4
0.6
-
0.0
0.4
-
0.3
-
OTH
ER C
RO
PS2
0.
0
-
1.
3
0.
5
0.
0
0.
7
-
Due
to ro
undi
ng, a
reas
of l
ess
than
0.0
1 ar
e de
pict
ed w
ith "0
.0".
Tab
le 3
.23
Tot
al A
rea
(In A
cres
) Har
vest
ed o
f Cro
ps P
lant
ed in
the
Parc
els
in th
e 12
Mon
ths
Prec
edin
g th
e C
ensu
s an
d Al
read
y H
arve
sted
, by
Type
of
Cro
p an
d Pr
opor
tion
Sold
Typ
e of
Cro
p T
otal
Are
a H
arve
sted
Pro
port
ion
Sold
Sour
ce:
Coo
k Is
land
s 20
00 C
ensu
s of
Agr
icul
ture
and
Fis
herie
sTA
BLE
SET
3: P
AR
CEL
DET
AIL
S
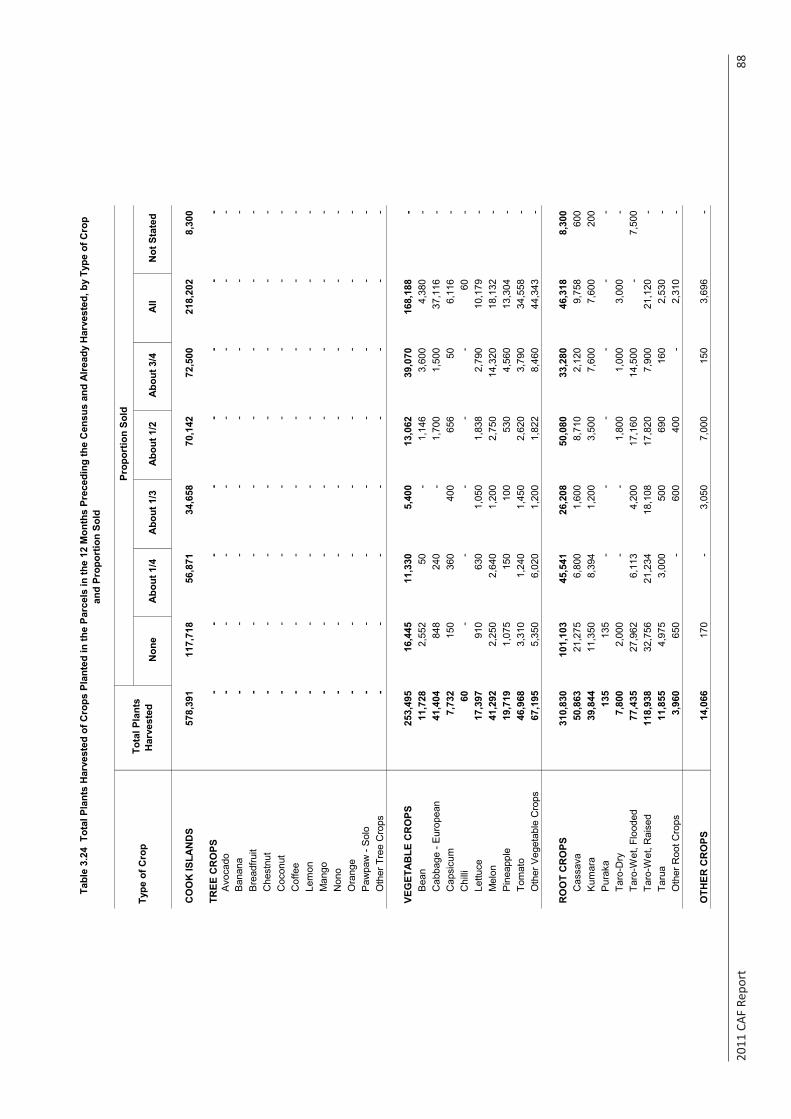
2011
CAF
Rep
ort
88
Non
e A
bout
1/4
A
bout
1/3
A
bout
1/2
A
bout
3/4
A
ll N
ot S
tate
d
CO
OK
ISLA
ND
S57
8,39
1
117,
718
56
,871
34,6
58
70
,142
72,5
00
21
8,20
2
8,30
0
TREE
CR
OPS
-
-
-
-
-
-
-
-
Avo
cado
-
-
-
-
-
-
-
-
Ban
ana
-
-
-
-
-
-
-
-
Bre
adfru
it-
-
-
-
-
-
-
-
C
hest
nut
-
-
-
-
-
-
-
-
Coc
onut
-
-
-
-
-
-
-
-
Cof
fee
-
-
-
-
-
-
-
-
Lem
on-
-
-
-
-
-
-
-
M
ango
-
-
-
-
-
-
-
-
Non
o-
-
-
-
-
-
-
-
O
rang
e-
-
-
-
-
-
-
-
P
awpa
w -
Sol
o-
-
-
-
-
-
-
-
O
ther
Tre
e C
rops
-
-
-
-
-
-
-
-
VEG
ETA
BLE
CR
OPS
253,
495
16
,445
11,3
30
5,
400
13
,062
39,0
70
16
8,18
8
-
Bea
n11
,728
2,55
2
50
-
1,
146
3,
600
4,
380
-
C
abba
ge -
Eur
opea
n41
,404
848
240
-
1,70
0
1,50
0
37,1
16
-
C
apsi
cum
7,73
2
150
360
400
656
50
6,
116
-
C
hilli
60
-
-
-
-
-
60
-
Lettu
ce17
,397
910
630
1,05
0
1,83
8
2,79
0
10,1
79
-
M
elon
41,2
92
2,
250
2,
640
1,
200
2,
750
14
,320
18,1
32
-
P
inea
pple
19,7
19
1,
075
15
0
10
0
53
0
4,
560
13
,304
-
Tom
ato
46,9
68
3,
310
1,
240
1,
450
2,
620
3,
790
34
,558
-
Oth
er V
eget
able
Cro
ps67
,195
5,35
0
6,02
0
1,20
0
1,82
2
8,46
0
44,3
43
-
RO
OT
CR
OPS
310,
830
10
1,10
3
45,5
41
26
,208
50,0
80
33
,280
46,3
18
8,
300
C
assa
va50
,863
21,2
75
6,
800
1,
600
8,
710
2,
120
9,
758
60
0
K
umar
a39
,844
11,3
50
8,
394
1,
200
3,
500
7,
600
7,
600
20
0
P
urak
a13
5
13
5
-
-
-
-
-
-
Ta
ro-D
ry7,
800
2,
000
-
-
1,
800
1,
000
3,
000
-
Ta
ro-W
et, F
lood
ed77
,435
27,9
62
6,
113
4,
200
17
,160
14,5
00
-
7,
500
Ta
ro-W
et, R
aise
d11
8,93
8
32,7
56
21
,234
18,1
08
17
,820
7,90
0
21,1
20
-
Ta
rua
11,8
55
4,
975
3,
000
50
0
69
0
16
0
2,
530
-
O
ther
Roo
t Cro
ps3,
960
65
0
-
60
0
40
0
-
2,
310
-
OTH
ER C
RO
PS14
,066
170
-
3,05
0
7,00
0
150
3,69
6
-
Tab
le 3
.24
Tot
al P
lant
s H
arve
sted
of C
rops
Pla
nted
in th
e Pa
rcel
s in
the
12 M
onth
s Pr
eced
ing
the
Cen
sus
and
Alre
ady
Har
vest
ed, b
y Ty
pe o
f Cro
p an
d Pr
opor
tion
Sold
Typ
e of
Cro
p T
otal
Pla
nts
Har
vest
ed
Pro
port
ion
Sold
Sour
ce:
Coo
k Is
land
s 20
00 C
ensu
s of
Agr
icul
ture
and
Fis
herie
sTA
BLE
SET
3: P
ARC
EL D
ETAI
LS

2011
CAF
Rep
ort
89
Tabl
e 3.
25 N
umbe
r and
Are
a of
Plo
ts F
allo
w/W
aitin
g to
be
Plan
ted
or U
sed
for O
ther
Pur
pose
s, b
y Is
land
Num
ber o
f Pl
ots
Are
a in
A
cres
N
umbe
r of
Plot
s A
rea
in
Acr
es
Num
ber o
f Pl
ots
Are
a in
A
cres
N
umbe
r of
Plot
s A
rea
in
Acr
es
CO
OK
ISLA
ND
S1,
820
79
5.0
1,
642
40
2.1
17
7
39
0.0
1
3.0
Rar
oton
ga86
9
19
1.4
86
9
19
1.4
-
-
-
-
A
titut
aki
589
542.
6
411
149.
6
177
390.
0
1
3.
0
Man
gaia
118
30.4
118
30.4
-
-
-
-
Atiu
83
9.3
83
9.
3
-
-
-
-
Mau
ke82
11
.4
82
11
.4
-
-
-
-
M
itiar
o62
8.
5
62
8.5
-
-
-
-
P
alm
erst
on16
-
-
-
-
-
-
P
ukap
uka
1
0.
9
16
0.9
-
-
-
-
N
assa
u-
0.5
1
0.5
-
-
-
-
M
anih
iki
-
-
-
-
-
-
-
-
Rak
ahan
ga-
-
-
-
-
-
-
-
P
enrh
yn-
-
-
-
-
-
-
-
Isla
nd
Tot
al
Fal
low
B
ush
Use
d fo
r Liv
esto
ck
Sour
ce:
Coo
k Is
land
s 20
11 C
ensu
s of
Agr
icul
ture
and
Fis
herie
sTA
BLE
SET
3: P
ARC
EL D
ETAI
LS

2011
CAF
Rep
ort
90
Tabl
e 3.
26 S
umm
ary
of S
ingl
e C
rop
Equi
vale
nt A
rea
(In A
cres
), by
Typ
e of
Cro
p an
d M
etho
d of
Pla
ntin
g
Tot
al
Sin
gle/
Mix
ed
Cro
ps in
the
Parc
el
Sca
ttere
d C
rops
in th
e Pa
rcel
Sca
ttere
d C
rops
Out
side
th
e Pa
rcel
Cro
ps
Gro
wn
by
Min
or
Agric
ultu
ral
Hou
seho
lds
Tot
al
In P
arce
ls
By
Min
or
Agric
ultu
ral
Hou
seho
lds
CO
OK
ISLA
ND
S2,
029.
21,
406.
262
.236
1.7
199.
159
.058
.80.
2
TREE
CR
OPS
880.
2
26
0.9
60
.8
361.
0
19
7.5
-
-
-
Avo
cado
16.7
0.
1
2.
0
9.
0
5.6
-
-
-
B
anan
a87
.5
70.3
1.
8
7.
5
7.9
-
-
-
B
read
fruit
26.5
0.
1
0.
7
17
.1
8.6
-
-
-
C
hest
nut
10.3
-
1.
5
8.
2
0.7
-
-
-
C
ocon
ut39
7.2
4.2
40.4
21
2.7
139.
9
-
-
-
C
offe
e0.
2
0.1
-
0.0
-
-
-
-
Lem
on18
.1
4.9
1.9
7.3
4.
0
-
-
-
Man
go97
.1
-
7.9
63.6
25
.5
-
-
-
N
ono
58.7
54
.3
0.2
3.6
0.
5
-
-
-
Ora
nge
59.1
47
.7
0.8
8.6
2.
0
-
-
-
Paw
paw
- S
olo
47.2
43
.5
1.8
0.9
1.
0
-
-
-
Oth
er T
ree
Cro
ps61
.6
35.7
1.
8
22
.4
1.7
-
-
-
-
VE
GET
ABLE
CR
OPS
71.3
69
.6
0.9
0.6
0.
2
34
.5
34.5
0.
0
Bea
n1.
4
1.4
-
-
0.
0
0.
7
0.
7
0.
0
Cab
bage
- E
urop
ean
2.0
2.
0
-
-
0.0
2.6
2.6
-
C
apsi
cum
3.2
3.
2
-
0.
0
0.0
0.1
0.1
0.0
C
hilli
0.5
0.
2
-
0.
2
0.2
0.1
0.1
0.0
Le
ttuce
2.0
2.
0
-
-
0.0
1.0
1.0
-
M
elon
31.9
31
.8
-
0.0
0.
0
15
.3
15.3
0.
0
Pin
eapp
le4.
5
4.5
-
0.0
-
0.
8
0.
8
-
Tom
ato
10.2
9.
9
0.
3
0.
0
0.0
7.0
7.0
0.0
O
ther
Veg
etab
le C
rops
15.5
14
.6
0.6
0.3
0.
0
7.
0
7.
0
0.
0
-
RO
OT
CR
OPS
269.
9
26
8.2
0.
2
0.
2
1.4
24.5
24
.3
0.2
C
assa
va66
.2
65.8
0.
1
0.
0
0.4
5.0
5.0
-
K
umar
a15
.6
15.5
0.
0
0.
0
0.0
2.5
2.5
0.0
P
urak
a1.
9
1.6
0.0
0.1
0.
2
0.
1
0.
1
0.
0
Taro
-Dry
8.3
8.
2
-
0.
0
0.1
1.3
1.2
0.1
Ta
ro-W
et, F
lood
ed11
.4
11.3
-
0.
0
0.0
4.8
4.8
-
Ta
ro-W
et, R
aise
d13
7.1
136.
6
-
-
0.
5
7.
3
7.
3
-
Taru
a25
.5
25.4
0.
0
0.
1
0.1
2.1
2.1
0.0
O
ther
Roo
t Cro
ps3.
9
3.8
0.1
0.0
0.
0
1.
4
1.
4
0.
0
-
O
THER
CR
OPS
12.7
12
.4
0.2
-
-
-
-
-
NO
N-C
RO
PS79
5.1
795.
1
-
-
-
-
-
-
Fallo
w/W
aitin
g to
be
Pla
nted
402.
1
40
2.1
-
-
-
-
-
-
B
ush/
Live
stoc
k39
3.0
393.
0
-
-
-
-
-
-
Due
to ro
undi
ng, a
reas
of l
ess
than
0.1
5 ar
e de
pict
ed w
ith "0
.0".
Typ
e of
Cro
p
Typ
e of
Cro
ps G
row
ing
at th
e Ti
me
of th
e C
ensu
s C
rops
Pla
nted
& H
arve
sted
in th
e 12
Mon
ths
Prec
edin
g th
e C
ensu
s
Sour
ce:
Coo
k Is
land
s 20
11 C
ensu
s of
Agr
icul
ture
and
Fis
herie
sTA
BLE
SET
3: P
ARC
EL D
ETAI
LS

2011
CAF
Rep
ort
91
Tabl
e 3.
27 S
umm
ary
of N
umbe
r of P
lant
s/Tr
ees,
by
Type
of C
rop
and
Met
hod
of P
lant
ing
Tot
al
Sin
gle/
Mix
ed
Cro
ps in
the
Parc
el
Sca
ttere
d C
rops
in th
e Pa
rcel
Sca
ttere
d C
rops
Out
side
th
e Pa
rcel
Cro
ps G
row
n by
Min
or
Agr
icul
tura
l H
ouse
hold
s
Tot
al
In P
arce
ls
By
Min
or
Agr
icul
tura
l H
ouse
hold
s
CO
OK
ISLA
ND
S
4,55
7,35
2
4
,480
,817
1
2,88
3
2
8,33
7
3
5,31
5
58
0,02
7
578
,391
1,6
36
TREE
CR
OPS
162,
980
113,
451
6,56
2
25,5
90
17,3
77
-
-
-
Avo
cado
936
5
27
5
40
4
25
2
-
-
-
B
anan
a59
,574
47
,438
1,69
9
5,07
8
5,35
9
-
-
-
Bre
adfru
it1,
031
2
-
68
5
34
4
-
-
-
C
hest
nut
809
-
457
326
26
-
-
-
Coc
onut
17,8
70
188
1,81
5
9,57
0
6,29
7
-
-
-
Cof
fee
60
50
-
10
-
-
-
-
Lem
on2,
334
662
149
984
539
-
-
-
Man
go4,
722
-
71
1
2,
862
1,
149
-
-
-
N
ono
11,8
78
10,9
70
70
73
4
10
4
-
-
-
O
rang
e8,
225
6,44
8
342
1,16
4
271
-
-
-
Paw
paw
- S
olo
30,6
47
29,2
84
28
63
0
70
5
-
-
-
O
ther
Tre
e C
rops
24,8
93
18,4
04
1,
015
3,
143
2,
331
-
-
-
VEG
ETA
BLE
CR
OPS
767,
590
759,
786
4,90
0
1,03
6
1,86
8
253,
955
253,
495
46
0
B
ean
23,1
71
23,1
45
-
-
26
11
,738
11
,728
10
Cab
bage
- E
urop
ean
32,0
25
31,9
65
-
-
60
41
,404
41
,404
-
C
apsi
cum
217,
799
217,
749
-
26
24
7,
756
7,
732
24
C
hilli
546
16
1
-
227
158
66
60
6
Lettu
ce34
,350
34
,276
-
-
74
17,3
97
17,3
97
-
Mel
on85
,944
85
,925
-
3
16
41,3
12
41,2
92
20
P
inea
pple
113,
801
113,
748
-
53
-
19,7
19
19,7
19
-
Tom
ato
68,9
33
66,6
35
2,
000
20
27
8
46
,992
46
,968
24
Oth
er V
eget
able
Cro
ps19
1,02
1
18
6,18
2
2,
900
70
7
1,
232
67
,571
67
,195
376
RO
OT
CR
OPS
3,54
4,05
3
3,52
6,68
9
1,34
2
748
15,2
74
311,
764
310,
830
93
4
C
assa
va67
0,11
8
66
5,45
3
1,
000
1
3,66
4
50,8
63
50,8
63
-
Kum
ara
252,
538
251,
557
180
1
80
0
39
,875
39
,844
31
Pur
aka
3,36
0
2,
829
14
13
9
37
8
15
3
13
5
18
Ta
ro-D
ry56
,226
55
,196
-
20
1,
010
8,
615
7,
800
81
5
Ta
ro-W
et, F
lood
ed18
3,80
1
18
3,51
9
-
52
230
77,4
35
77,4
35
-
Taro
-Wet
, Rai
sed
2,21
9,40
8
2,21
1,02
3
-
-
8,38
5
118,
938
118,
938
-
Taru
a14
7,34
8
14
6,71
3
28
31
0
29
7
11
,885
11
,855
30
Oth
er R
oot C
rops
11,2
54
10,3
99
12
0
22
5
51
0
4,
000
3,
960
40
Typ
e of
Cro
p
Typ
e of
Cro
ps G
row
ing
at th
e Ti
me
of th
e C
ensu
s C
rops
Pla
nted
& H
arve
sted
in th
e 12
Mon
ths
Prec
edin
g th
e C
ensu
s
Sour
ce:
Coo
k Is
land
s 20
11 C
ensu
s of
Agr
icul
ture
and
Fis
herie
sTA
BLE
SET
3: P
AR
CEL
DET
AIL
S
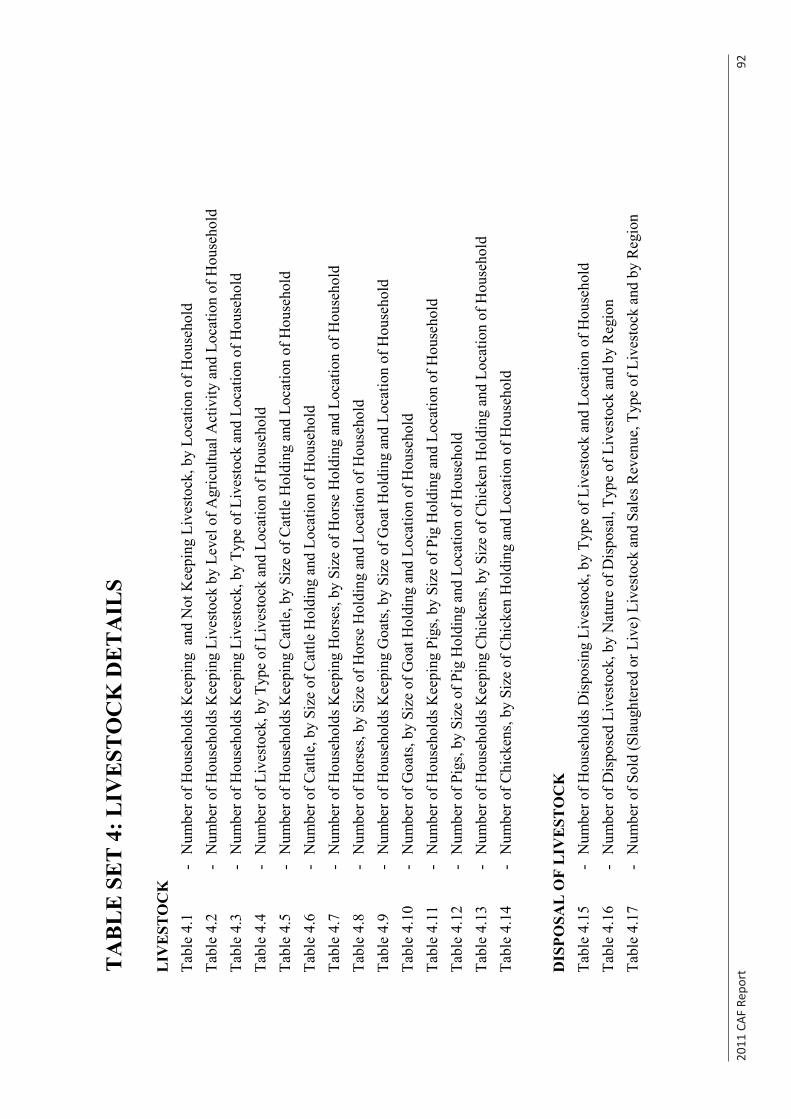
2011
CAF
Rep
ort
92
TA
BL
E S
ET
4: L
IVE
STO
CK
DE
TA
ILS
Tabl
e 4.
1-
Num
ber o
f Hou
seho
lds K
eepi
ng a
nd N
ot K
eepi
ng L
ives
tock
, by
Loca
tion
of H
ouse
hold
Ta
ble
4.2
-N
umbe
r of H
ouse
hold
s Kee
ping
Liv
esto
ck b
y Le
vel o
f Agr
icul
tual
Act
ivity
and
Loc
atio
n of
Hou
seho
ldTa
ble
4.3
-N
umbe
r of H
ouse
hold
s Kee
ping
Liv
esto
ck, b
y Ty
pe o
f Liv
esto
ck a
nd L
ocat
ion
of H
ouse
hold
Tabl
e 4.
4-
Num
ber o
f Liv
esto
ck, b
y Ty
pe o
f Liv
esto
ck a
nd L
ocat
ion
of H
ouse
hold
Tabl
e 4.
5-
Num
ber o
f Hou
seho
lds K
eepi
ng C
attle
, by
Size
of C
attle
Hol
ding
and
Loc
atio
n of
Hou
seho
ldTa
ble
4.6
-N
umbe
r of C
attle
, by
Size
of C
attle
Hol
ding
and
Loc
atio
n of
Hou
seho
ldTa
ble
4.7
-N
umbe
r of H
ouse
hold
s Kee
ping
Hor
ses,
by S
ize
of H
orse
Hol
ding
and
Loc
atio
n of
Hou
seho
ldTa
ble
4.8
-N
umbe
r of H
orse
s, by
Siz
e of
Hor
se H
oldi
ng a
nd L
ocat
ion
of H
ouse
hold
Tabl
e 4.
9-
Num
ber o
f Hou
seho
lds K
eepi
ng G
oats
, by
Size
of G
oat H
oldi
ng a
nd L
ocat
ion
of H
ouse
hold
Tabl
e 4.
10-
Num
ber o
f Goa
ts, b
y Si
ze o
f Goa
t Hol
ding
and
Loc
atio
n of
Hou
seho
ldTa
ble
4.11
-N
umbe
r of H
ouse
hold
s Kee
ping
Pig
s, by
Siz
e of
Pig
Hol
ding
and
Loc
atio
n of
Hou
seho
ldTa
ble
4.12
-N
umbe
r of P
igs,
by S
ize
of P
ig H
oldi
ng a
nd L
ocat
ion
of H
ouse
hold
Tabl
e 4.
13-
Num
ber o
f Hou
seho
lds K
eepi
ng C
hick
ens,
by S
ize
of C
hick
en H
oldi
ng a
nd L
ocat
ion
of H
ouse
hold
Tabl
e 4.
14-
Num
ber o
f Chi
cken
s, by
Siz
e of
Chi
cken
Hol
ding
and
Loc
atio
n of
Hou
seho
ld
DIS
POSA
L O
F L
IVES
TOC
KTa
ble
4.15
-N
umbe
r of H
ouse
hold
s Dis
posi
ng L
ives
tock
, by
Type
of L
ives
tock
and
Loc
atio
n of
Hou
seho
ldTa
ble
4.16
-N
umbe
r of D
ispo
sed
Live
stoc
k, b
y N
atur
e of
Dis
posa
l, Ty
pe o
f Liv
esto
ck a
nd b
y R
egio
nTa
ble
4.17
-N
umbe
r of S
old
(Sla
ught
ered
or L
ive)
Liv
esto
ck a
nd S
ales
Rev
enue
, Typ
e of
Liv
esto
ck a
nd b
y R
egio
n
LIV
ESTO
CK
Sour
ce: C
ook
Isla
nds
2011
Cen
sus
of A
gric
ultu
re a
nd F
ishe
ries
TAB
LE S
ET 4
: LIV
ESTO
CK
DET
AIL
S
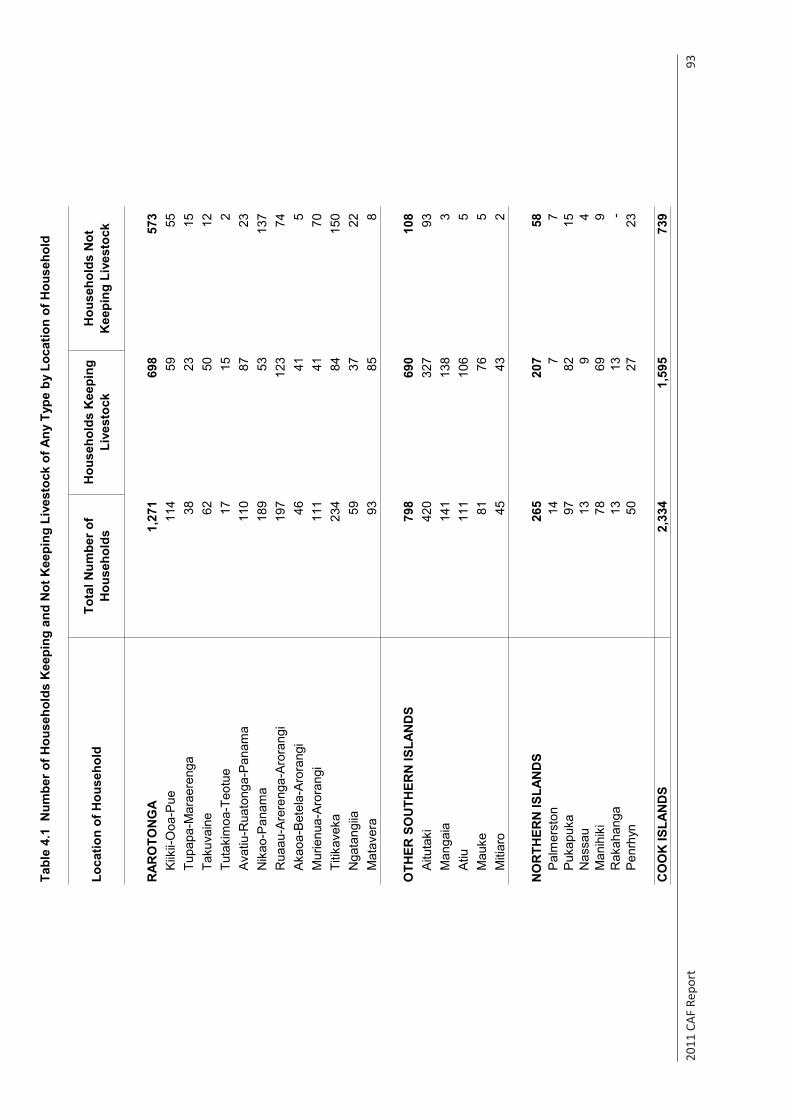
2011
CAF
Rep
ort
93
Tabl
e 4.
1 N
umbe
r of H
ouse
hold
s K
eepi
ng a
nd N
ot K
eepi
ng L
ives
tock
of A
ny T
ype
by L
ocat
ion
of H
ouse
hold
Loca
tion
of H
ouse
hold
Tota
l Num
ber o
f H
ouse
hold
sH
ouse
hold
s K
eepi
ng
Live
stoc
kH
ouse
hold
s N
ot
Kee
ping
Liv
esto
ck
RAR
OTO
NG
A1,
271
698
57
3
Kiik
ii-O
oa-P
ue11
4
59
55
Tupa
pa-M
arae
reng
a38
23
15
Ta
kuva
ine
62
50
12
Tuta
kim
oa-T
eotu
e17
15
2
Avat
iu-R
uato
nga-
Pana
ma
110
87
23
N
ikao
-Pan
ama
189
53
13
7
Rua
au-A
rere
nga-
Aror
angi
197
12
3
74
Akao
a-B
etel
a-A
rora
ngi
46
41
5
M
urie
nua-
Aro
rang
i 11
1
41
70
Titik
avek
a23
4
84
150
N
gata
ngiia
59
37
22
Mat
aver
a93
85
8
OTH
ER S
OU
THER
N IS
LAN
DS
798
69
0
108
Ai
tuta
ki42
0
327
93
M
anga
ia14
1
138
3
Atiu
111
10
6
5
M
auke
81
76
5
M
itiar
o45
43
2
NO
RTH
ERN
ISLA
ND
S26
5
207
58
Pa
lmer
ston
14
7
7
Puka
puka
97
82
15
Nas
sau
13
9
4
Man
ihik
i78
69
9
Rak
ahan
ga13
13
-
Penr
hyn
50
27
23
CO
OK
ISLA
ND
S2,
334
1,59
5
73
9
Sour
ce: C
ook
Isla
nds
2011
Cen
sus
of A
gric
ultu
re a
nd F
ishe
ries
TAB
LE S
ET 4
: LIV
ESTO
CK
DET
AILS
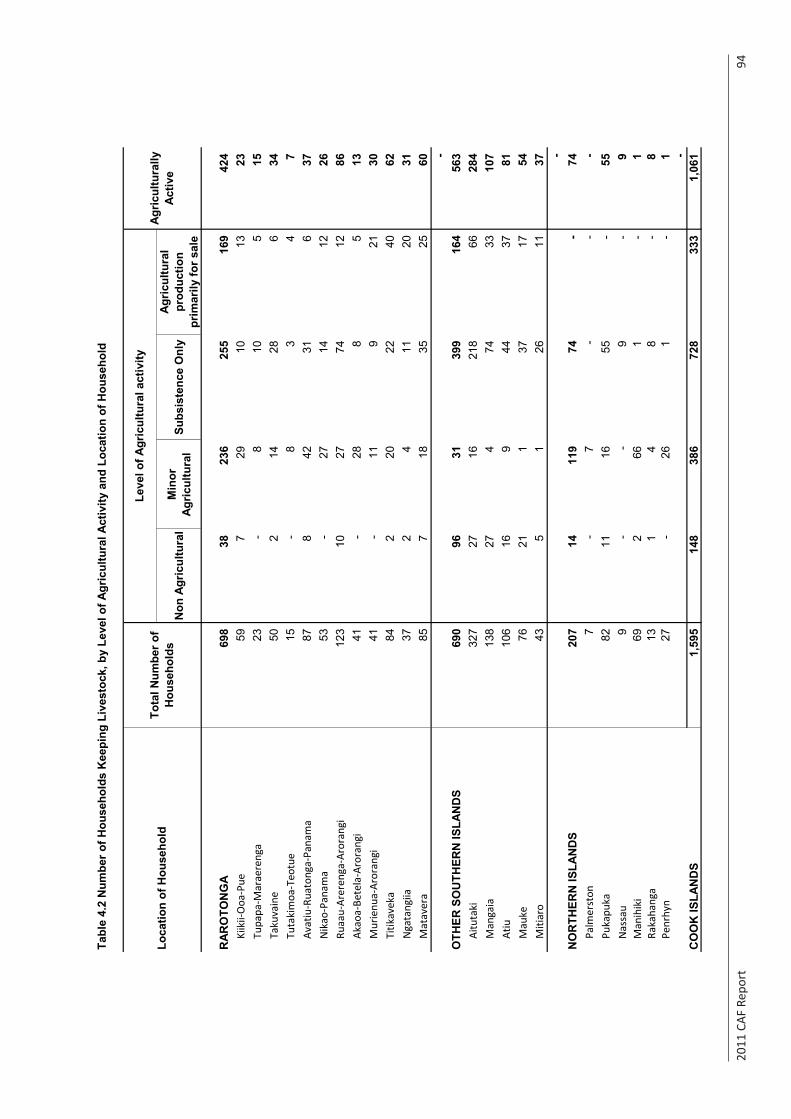
2011
CAF
Rep
ort
94
Tabl
e 4.
2 N
umbe
r of H
ouse
hold
s K
eepi
ng L
ives
tock
, by
Leve
l of A
gric
ultu
ral A
ctiv
ity a
nd L
ocat
ion
of H
ouse
hold
Non
Agr
icul
tura
lM
inor
Ag
ricul
tura
lSu
bsis
tenc
e O
nly
Agric
ultu
ral
prod
uctio
n pr
imar
ily fo
r sal
e
RAR
OTO
NG
A69
8
38
236
25
5
16
9
42
4
Ki
ikii-
Ooa
-Pue
59
7
29
10
13
23
Tupa
pa-M
arae
reng
a23
-
8
10
5
15
Taku
vain
e50
2
14
28
6
34
Tuta
kim
oa-T
eotu
e15
-
8
3
4
7
Avat
iu-R
uato
nga-
Pana
ma
87
8
42
31
6
37
N
ikao
-Pan
ama
53
-
27
14
12
26
Ru
aau-
Arer
enga
-Aro
rang
i12
3
10
27
74
12
86
Ak
aoa-
Bete
la-A
rora
ngi
41
-
28
8
5
13
M
urie
nua-
Aror
angi
41
-
11
9
21
30
Ti
tikav
eka
84
2
20
22
40
62
Nga
tang
iia37
2
4
11
20
31
Mat
aver
a85
7
18
35
25
60
-
O
THER
SO
UTH
ERN
ISLA
ND
S69
0
96
31
399
164
563
Aitu
taki
327
27
16
21
8
66
28
4
M
anga
ia13
8
27
4
74
33
10
7
At
iu10
6
16
9
44
37
81
Mau
ke76
21
1
37
17
54
Miti
aro
43
5
1
26
11
37
-
N
OR
THER
N IS
LAN
DS
207
14
11
9
74
-
74
Palm
erst
on7
-
7
-
-
-
Pu
kapu
ka82
11
16
55
-
55
Nas
sau
9
-
-
9
-
9
Man
ihik
i69
2
66
1
-
1
Raka
hang
a13
1
4
8
-
8
Pe
nrhy
n27
-
26
1
-
1
-
CO
OK
ISLA
ND
S1,
595
14
8
386
72
8
33
3
1,
061
Loca
tion
of H
ouse
hold
Tota
l Num
ber o
f H
ouse
hold
s
Leve
l of A
gric
ultu
ral a
ctiv
ityAg
ricul
tura
lly
Activ
e
Sour
ce: C
ook
Isla
nds
2011
Cen
sus
of A
gric
ultu
re a
nd F
ishe
ries
TAB
LE S
ET 4
: LIV
ESTO
CK
DET
AIL
S
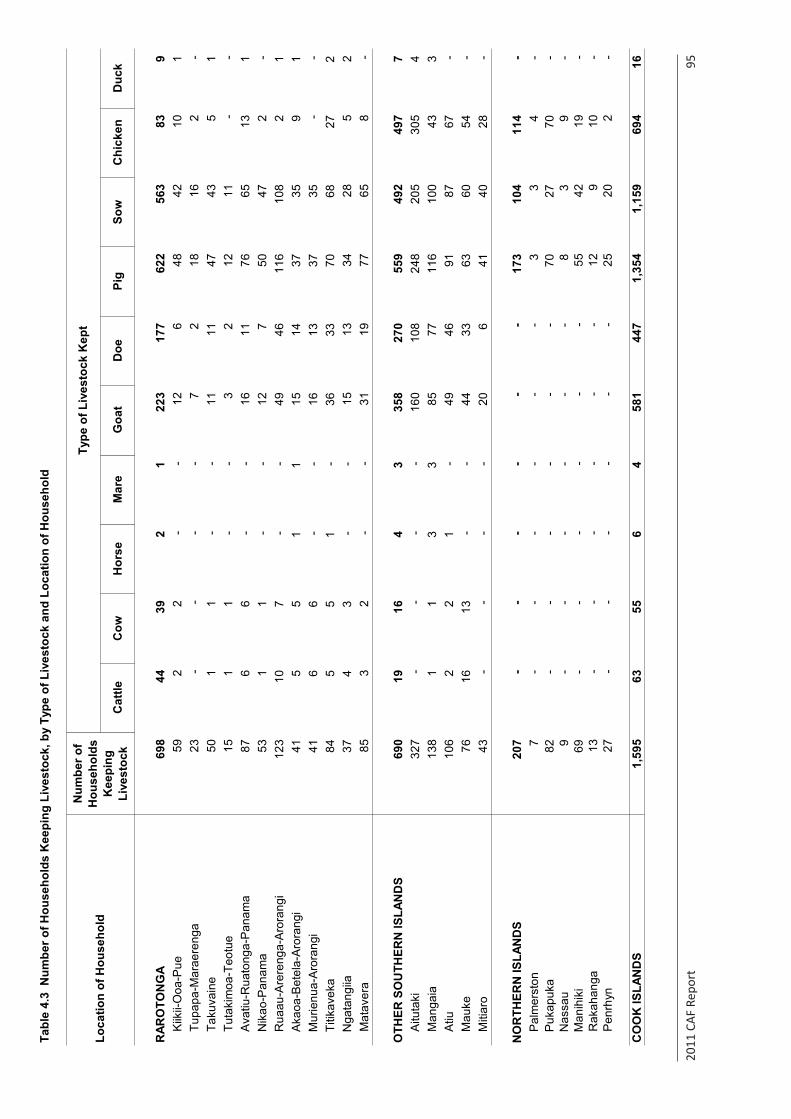
2011
CAF
Rep
ort
95
Tabl
e 4.
3 N
umbe
r of H
ouse
hold
s K
eepi
ng L
ives
tock
, by
Type
of L
ives
tock
and
Loc
atio
n of
Hou
seho
ld
Cat
tleC
owH
orse
Mar
eG
oat
Doe
Pig
Sow
Chi
cken
Duc
k
RAR
OTO
NG
A69
8
44
39
2
1
22
3
17
7
62
2
56
3
83
9
K
iikii-
Ooa
-Pue
59
2
2
-
-
12
6
48
42
10
1
Tupa
pa-M
arae
reng
a23
-
-
-
-
7
2
18
16
2
-
Ta
kuva
ine
50
1
1
-
-
11
11
47
43
5
1
Tuta
kim
oa-T
eotu
e15
1
1
-
-
3
2
12
11
-
-
A
vatiu
-Rua
tong
a-P
anam
a87
6
6
-
-
16
11
76
65
13
1
Nik
ao-P
anam
a53
1
1
-
-
12
7
50
47
2
-
Rua
au-A
rere
nga-
Aro
rang
i12
3
10
7
-
-
49
46
116
108
2
1
A
kaoa
-Bet
ela-
Aro
rang
i41
5
5
1
1
15
14
37
35
9
1
M
urie
nua-
Aro
rang
i 41
6
6
-
-
16
13
37
35
-
-
Ti
tikav
eka
84
5
5
1
-
36
33
70
68
27
2
N
gata
ngiia
37
4
3
-
-
15
13
34
28
5
2
Mat
aver
a85
3
2
-
-
31
19
77
65
8
-
OTH
ER S
OU
THER
N IS
LAN
DS
690
19
16
4
3
358
270
559
492
497
7
Aitu
taki
327
-
-
-
-
160
108
248
205
305
4
Man
gaia
138
1
1
3
3
85
77
116
100
43
3
Atiu
106
2
2
1
-
49
46
91
87
67
-
Mau
ke76
16
13
-
-
44
33
63
60
54
-
Miti
aro
43
-
-
-
-
20
6
41
40
28
-
NO
RTH
ERN
ISLA
ND
S20
7
-
-
-
-
-
-
17
3
10
4
11
4
-
P
alm
erst
on7
-
-
-
-
-
-
3
3
4
-
Puk
apuk
a82
-
-
-
-
-
-
70
27
70
-
Nas
sau
9
-
-
-
-
-
-
8
3
9
-
M
anih
iki
69
-
-
-
-
-
-
55
42
19
-
R
akah
anga
13
-
-
-
-
-
-
12
9
10
-
Pen
rhyn
27
-
-
-
-
-
-
25
20
2
-
CO
OK
ISLA
ND
S1,
595
63
55
6
4
58
1
44
7
1,
354
1,
159
69
4
16
Loca
tion
of H
ouse
hold
Num
ber o
f H
ouse
hold
s K
eepi
ng
Live
stoc
k
Type
of L
ives
tock
Kep
t
Sour
ce: C
ook
Isla
nds
2011
Cen
sus
of A
gric
ultu
re a
nd F
ishe
ries
TAB
LE S
ET 4
: LIV
ESTO
CK
DET
AILS
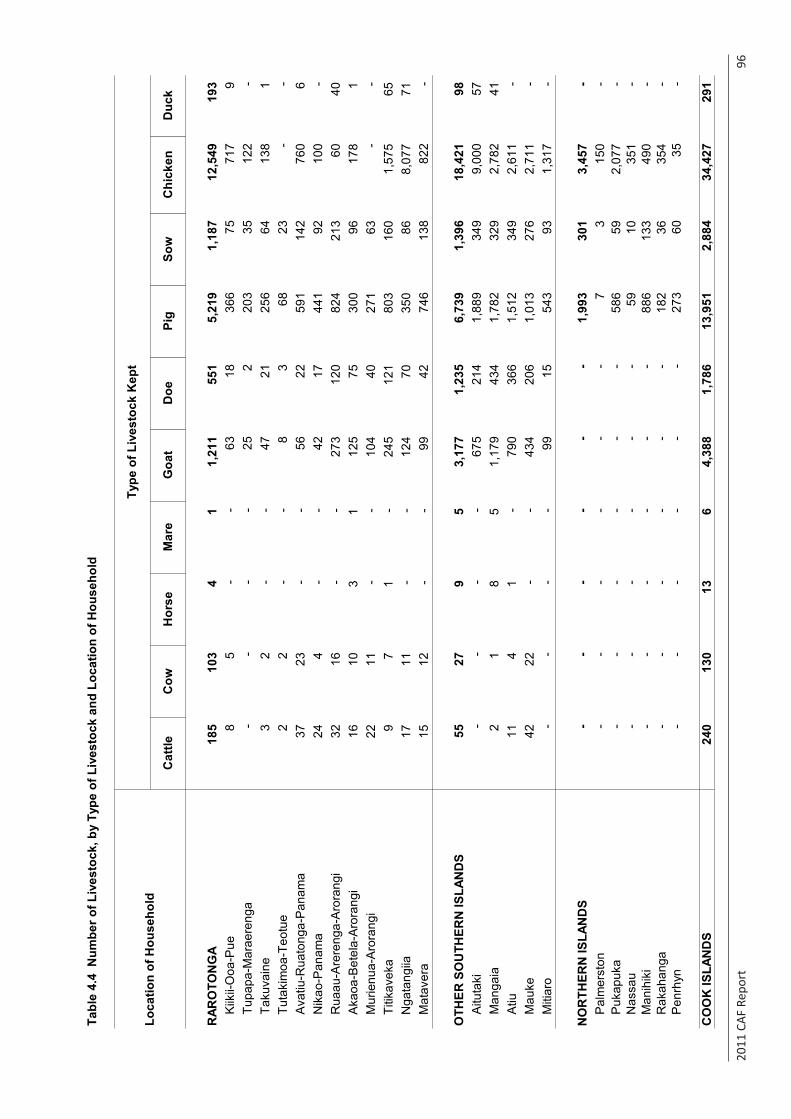
2011
CAF
Rep
ort
96
Tabl
e 4.
4 N
umbe
r of L
ives
tock
, by
Type
of L
ives
tock
and
Loc
atio
n of
Hou
seho
ld
Cat
tleC
owH
orse
Mar
eG
oat
Doe
Pig
Sow
Chi
cken
Duc
k
RAR
OTO
NG
A18
5
10
3
4
1
1,
211
55
1
5,
219
1,
187
12
,549
19
3
Kiik
ii-O
oa-P
ue8
5
-
-
63
18
36
6
75
71
7
9
Tupa
pa-M
arae
reng
a-
-
-
-
25
2
203
35
122
-
Ta
kuva
ine
3
2
-
-
47
21
256
64
138
1
Tu
taki
moa
-Teo
tue
2
2
-
-
8
3
68
23
-
-
A
vatiu
-Rua
tong
a-P
anam
a37
23
-
-
56
22
59
1
14
2
76
0
6
Nik
ao-P
anam
a24
4
-
-
42
17
441
92
100
-
R
uaau
-Are
reng
a-A
rora
ngi
32
16
-
-
273
120
824
213
60
40
Aka
oa-B
etel
a-A
rora
ngi
16
10
3
1
125
75
300
96
178
1
M
urie
nua-
Aro
rang
i 22
11
-
-
10
4
40
27
1
63
-
-
Titik
avek
a9
7
1
-
24
5
12
1
80
3
16
0
1,
575
65
N
gata
ngiia
17
11
-
-
124
70
350
86
8,07
7
71
Mat
aver
a15
12
-
-
99
42
74
6
13
8
82
2
-
OTH
ER S
OU
THER
N IS
LAN
DS
55
27
9
5
3,17
7
1,23
5
6,73
9
1,39
6
18,4
21
98
A
ituta
ki-
-
-
-
67
5
21
4
1,
889
34
9
9,
000
57
M
anga
ia2
1
8
5
1,
179
43
4
1,
782
32
9
2,
782
41
A
tiu11
4
1
-
790
366
1,51
2
349
2,61
1
-
M
auke
42
22
-
-
434
206
1,01
3
276
2,71
1
-
M
itiar
o-
-
-
-
99
15
54
3
93
1,
317
-
NO
RTH
ERN
ISLA
ND
S-
-
-
-
-
-
1,
993
30
1
3,
457
-
Pal
mer
ston
-
-
-
-
-
-
7
3
150
-
P
ukap
uka
-
-
-
-
-
-
586
59
2,07
7
-
N
assa
u-
-
-
-
-
-
59
10
35
1
-
Man
ihik
i-
-
-
-
-
-
88
6
13
3
49
0
-
Rak
ahan
ga-
-
-
-
-
-
18
2
36
35
4
-
Pen
rhyn
-
-
-
-
-
-
273
60
35
-
CO
OK
ISLA
ND
S24
0
13
0
13
6
4,38
8
1,78
6
13,9
51
2,88
4
34,4
27
291
Loca
tion
of H
ouse
hold
Type
of L
ives
tock
Kep
t
Sour
ce: C
ook
Isla
nds
2011
Cen
sus
of A
gric
ultu
re a
nd F
ishe
ries
TAB
LE S
ET 4
: LIV
ESTO
CK
DET
AILS
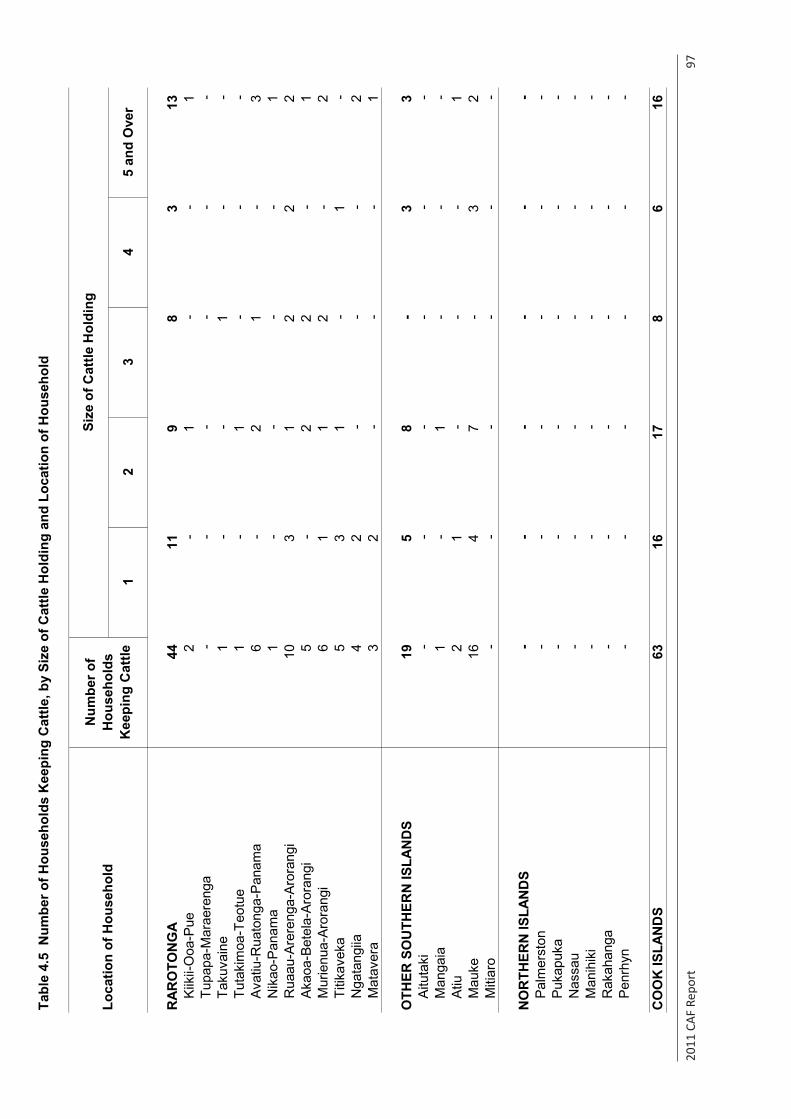
2011
CAF
Rep
ort
97
Tabl
e 4.
5 N
umbe
r of H
ouse
hold
s K
eepi
ng C
attle
, by
Size
of C
attle
Hol
ding
and
Loc
atio
n of
Hou
seho
ld
12
34
5 an
d O
ver
RAR
OTO
NG
A44
11
9
8
3
13
Ki
ikii-
Ooa
-Pue
2
-
1
-
-
1
Tu
papa
-Mar
aere
nga
-
-
-
-
-
-
Taku
vain
e1
-
-
1
-
-
Tu
taki
moa
-Teo
tue
1
-
1
-
-
-
Avat
iu-R
uato
nga-
Pana
ma
6
-
2
1
-
3
Nik
ao-P
anam
a1
-
-
-
-
1
R
uaau
-Are
reng
a-Ar
oran
gi10
3
1
2
2
2
Ak
aoa-
Bete
la-A
rora
ngi
5
-
2
2
-
1
Mur
ienu
a-Ar
oran
gi
6
1
1
2
-
2
Ti
tikav
eka
5
3
1
-
1
-
Nga
tang
iia4
2
-
-
-
2
Mat
aver
a3
2
-
-
-
1
OTH
ER S
OU
THER
N IS
LAN
DS
19
5
8
-
3
3
Ai
tuta
ki-
-
-
-
-
-
M
anga
ia1
-
1
-
-
-
At
iu2
1
-
-
-
1
Mau
ke16
4
7
-
3
2
Miti
aro
-
-
-
-
-
-
NO
RTH
ERN
ISLA
ND
S-
-
-
-
-
-
Pa
lmer
ston
-
-
-
-
-
-
Puka
puka
-
-
-
-
-
-
Nas
sau
-
-
-
-
-
-
Man
ihik
i-
-
-
-
-
-
R
akah
anga
-
-
-
-
-
-
Penr
hyn
-
-
-
-
-
-
CO
OK
ISLA
ND
S63
16
17
8
6
16
Loca
tion
of H
ouse
hold
Num
ber o
f H
ouse
hold
s K
eepi
ng C
attle
Size
of C
attle
Hol
ding
Sour
ce: C
ook
Isla
nds
2011
Cen
sus
of A
gric
ultu
re a
nd F
ishe
ries
TAB
LE S
ET 4
: LIV
ESTO
CK
DET
AILS
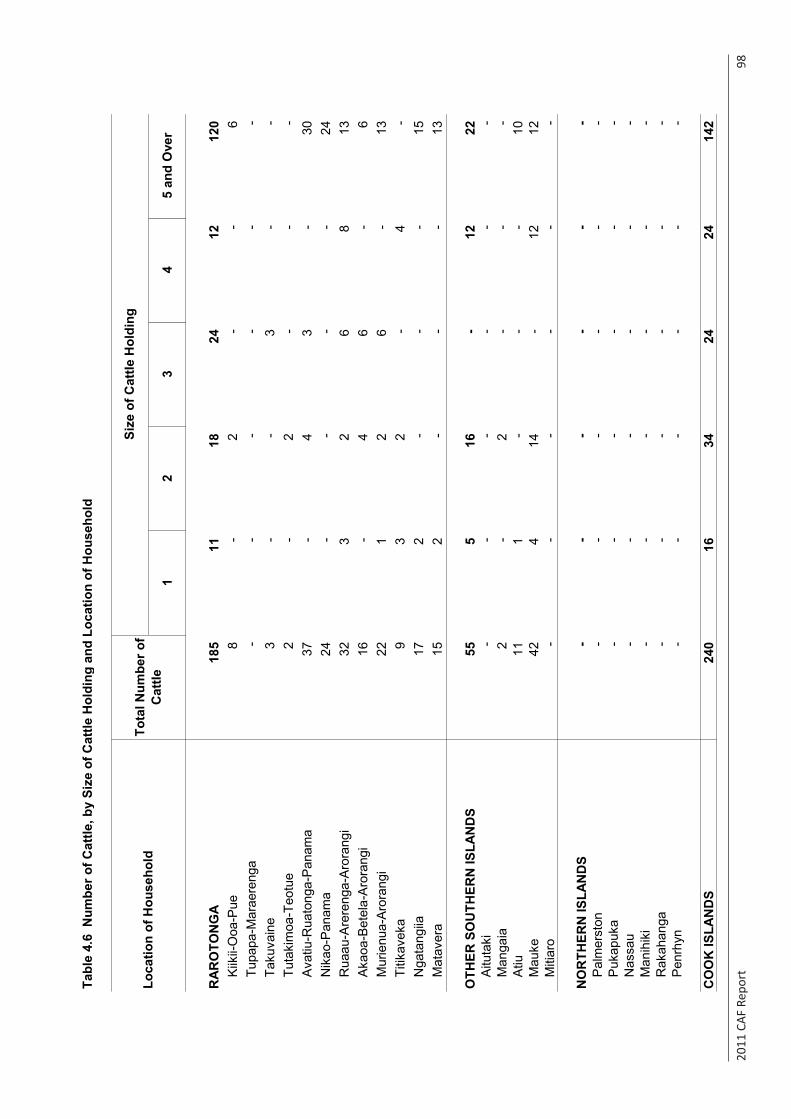
2011
CAF
Rep
ort
98
Tabl
e 4.
6 N
umbe
r of C
attle
, by
Size
of C
attle
Hol
ding
and
Loc
atio
n of
Hou
seho
ld
12
34
5 an
d O
ver
RA
RO
TON
GA
185
11
18
24
12
12
0
Kiik
ii-O
oa-P
ue8
-
2
-
-
6
Tupa
pa-M
arae
reng
a-
-
-
-
-
-
Ta
kuva
ine
3
-
-
3
-
-
Tuta
kim
oa-T
eotu
e2
-
2
-
-
-
A
vatiu
-Rua
tong
a-P
anam
a37
-
4
3
-
30
N
ikao
-Pan
ama
24
-
-
-
-
24
Rua
au-A
rere
nga-
Aro
rang
i32
3
2
6
8
13
A
kaoa
-Bet
ela-
Aro
rang
i16
-
4
6
-
6
M
urie
nua-
Aro
rang
i 22
1
2
6
-
13
Titik
avek
a9
3
2
-
4
-
N
gata
ngiia
17
2
-
-
-
15
M
atav
era
15
2
-
-
-
13
OTH
ER S
OU
THER
N IS
LAN
DS
55
5
16
-
12
22
A
ituta
ki-
-
-
-
-
-
M
anga
ia2
-
2
-
-
-
A
tiu11
1
-
-
-
10
Mau
ke42
4
14
-
12
12
Miti
aro
-
-
-
-
-
-
NO
RTH
ERN
ISLA
ND
S-
-
-
-
-
-
P
alm
erst
on-
-
-
-
-
-
P
ukap
uka
-
-
-
-
-
-
Nas
sau
-
-
-
-
-
-
Man
ihik
i-
-
-
-
-
-
R
akah
anga
-
-
-
-
-
-
Pen
rhyn
-
-
-
-
-
-
CO
OK
ISLA
ND
S24
0
16
34
24
24
142
Loca
tion
of H
ouse
hold
Tota
l Num
ber o
f C
attle
Size
of C
attle
Hol
ding
Sour
ce: C
ook
Isla
nds
2011
Cen
sus
of A
gric
ultu
re a
nd F
ishe
ries
TAB
LE S
ET 4
: LIV
ESTO
CK
DET
AILS
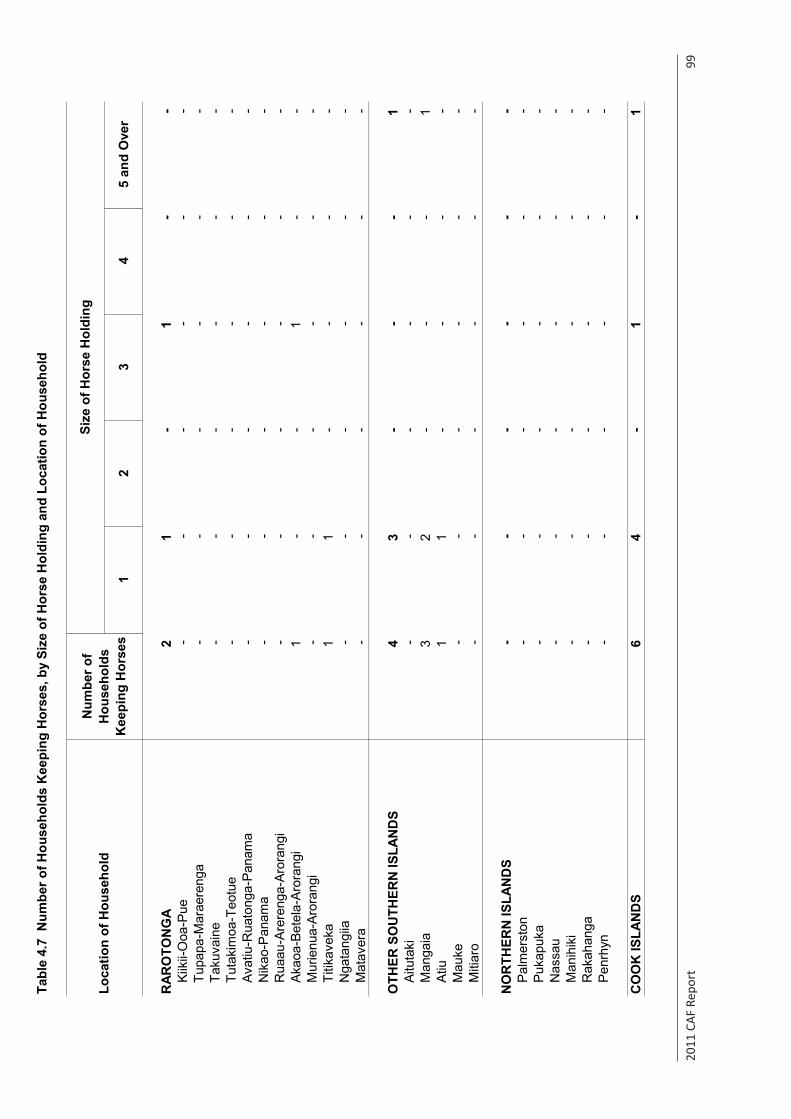
2011
CAF
Rep
ort
99
Tabl
e 4.
7 N
umbe
r of H
ouse
hold
s K
eepi
ng H
orse
s, b
y Si
ze o
f Hor
se H
oldi
ng a
nd L
ocat
ion
of H
ouse
hold
12
34
5 an
d O
ver
RAR
OTO
NG
A2
1
-
1
-
-
Kiik
ii-O
oa-P
ue-
-
-
-
-
-
Tu
papa
-Mar
aere
nga
-
-
-
-
-
-
Taku
vain
e-
-
-
-
-
-
Tu
taki
moa
-Teo
tue
-
-
-
-
-
-
Avat
iu-R
uato
nga-
Pana
ma
-
-
-
-
-
-
Nik
ao-P
anam
a-
-
-
-
-
-
R
uaau
-Are
reng
a-Ar
oran
gi-
-
-
-
-
-
Ak
aoa-
Bete
la-A
rora
ngi
1
-
-
1
-
-
Mur
ienu
a-Ar
oran
gi
-
-
-
-
-
-
Titik
avek
a1
1
-
-
-
-
N
gata
ngiia
-
-
-
-
-
-
Mat
aver
a-
-
-
-
-
-
OTH
ER S
OU
THER
N IS
LAN
DS
4
3
-
-
-
1
Ai
tuta
ki-
-
-
-
-
-
M
anga
ia3
2
-
-
-
1
Atiu
1
1
-
-
-
-
Mau
ke-
-
-
-
-
-
M
itiar
o-
-
-
-
-
-
NO
RTH
ERN
ISLA
ND
S-
-
-
-
-
-
Pa
lmer
ston
-
-
-
-
-
-
Puka
puka
-
-
-
-
-
-
Nas
sau
-
-
-
-
-
-
Man
ihik
i-
-
-
-
-
-
R
akah
anga
-
-
-
-
-
-
Penr
hyn
-
-
-
-
-
-
CO
OK
ISLA
ND
S6
4
-
1
-
1
Loca
tion
of H
ouse
hold
Num
ber o
f H
ouse
hold
s K
eepi
ng H
orse
s
Size
of H
orse
Hol
ding
Sour
ce: C
ook
Isla
nds
2011
Cen
sus
of A
gric
ultu
re a
nd F
ishe
ries
TAB
LE S
ET 4
: LIV
ESTO
CK
DET
AILS
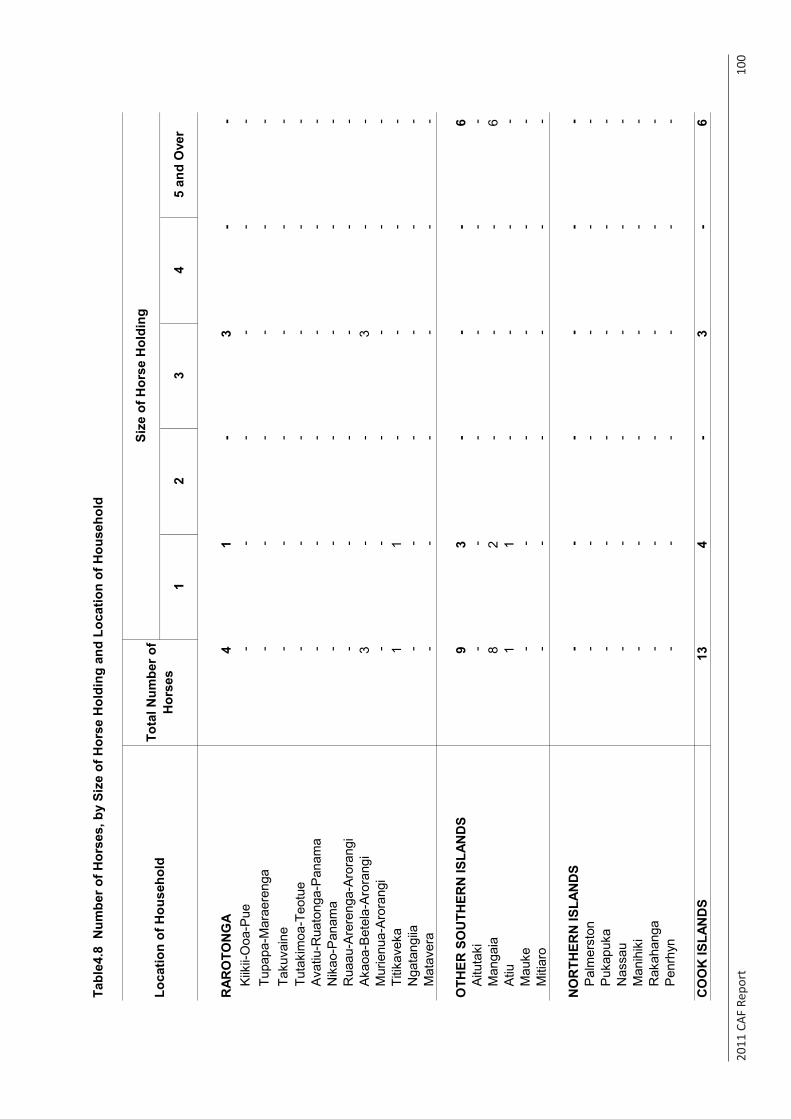
2011
CAF
Rep
ort
10
0
Tabl
e4.8
Num
ber o
f Hor
ses,
by
Size
of H
orse
Hol
ding
and
Loc
atio
n of
Hou
seho
ld
12
34
5 an
d O
ver
RAR
OTO
NG
A4
1
-
3
-
-
Kiik
ii-O
oa-P
ue-
-
-
-
-
-
Tu
papa
-Mar
aere
nga
-
-
-
-
-
-
Taku
vain
e-
-
-
-
-
-
Tu
taki
moa
-Teo
tue
-
-
-
-
-
-
Ava
tiu-R
uato
nga-
Pan
ama
-
-
-
-
-
-
Nik
ao-P
anam
a-
-
-
-
-
-
R
uaau
-Are
reng
a-A
rora
ngi
-
-
-
-
-
-
Aka
oa-B
etel
a-A
rora
ngi
3
-
-
3
-
-
Mur
ienu
a-A
rora
ngi
-
-
-
-
-
-
Titik
avek
a1
1
-
-
-
-
N
gata
ngiia
-
-
-
-
-
-
Mat
aver
a-
-
-
-
-
-
OTH
ER S
OU
THER
N IS
LAN
DS
9
3
-
-
-
6
A
ituta
ki-
-
-
-
-
-
M
anga
ia8
2
-
-
-
6
Atiu
1
1
-
-
-
-
Mau
ke-
-
-
-
-
-
M
itiar
o-
-
-
-
-
-
NO
RTH
ERN
ISLA
ND
S-
-
-
-
-
-
P
alm
erst
on-
-
-
-
-
-
P
ukap
uka
-
-
-
-
-
-
Nas
sau
-
-
-
-
-
-
Man
ihik
i-
-
-
-
-
-
R
akah
anga
-
-
-
-
-
-
Pen
rhyn
-
-
-
-
-
-
CO
OK
ISLA
ND
S13
4
-
3
-
6
Loca
tion
of H
ouse
hold
Tota
l Num
ber o
f H
orse
s
Size
of H
orse
Hol
ding
Sour
ce: C
ook
Isla
nds
2011
Cen
sus
of A
gric
ultu
re a
nd F
ishe
ries
TAB
LE S
ET 4
: LIV
ESTO
CK
DET
AIL
S
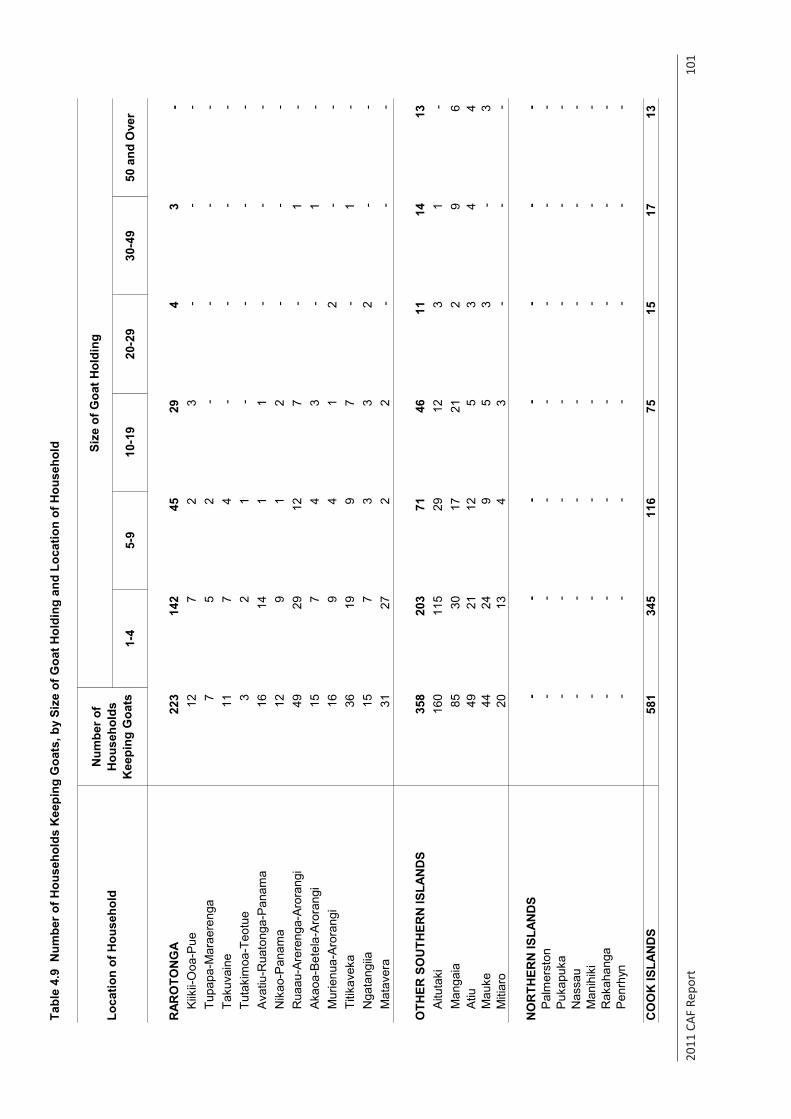
2011
CAF
Rep
ort
10
1
Tabl
e 4.
9 N
umbe
r of H
ouse
hold
s K
eepi
ng G
oats
, by
Size
of G
oat H
oldi
ng a
nd L
ocat
ion
of H
ouse
hold
1-4
5-9
10-1
920
-29
30-4
950
and
Ove
r
RAR
OTO
NG
A22
3
142
45
29
4
3
-
Kiik
ii-O
oa-P
ue12
7
2
3
-
-
-
Tupa
pa-M
arae
reng
a7
5
2
-
-
-
-
Taku
vain
e11
7
4
-
-
-
-
Tuta
kim
oa-T
eotu
e3
2
1
-
-
-
-
Avat
iu-R
uato
nga-
Pana
ma
16
14
1
1
-
-
-
N
ikao
-Pan
ama
12
9
1
2
-
-
-
R
uaau
-Are
reng
a-Ar
oran
gi49
29
12
7
-
1
-
Akao
a-B
etel
a-A
rora
ngi
15
7
4
3
-
1
-
M
urie
nua-
Aro
rang
i 16
9
4
1
2
-
-
Titik
avek
a36
19
9
7
-
1
-
Nga
tang
iia15
7
3
3
2
-
-
Mat
aver
a31
27
2
2
-
-
-
OTH
ER S
OU
THER
N IS
LAN
DS
358
20
3
71
46
11
14
13
Ai
tuta
ki16
0
115
29
12
3
1
-
Man
gaia
85
30
17
21
2
9
6
At
iu49
21
12
5
3
4
4
Mau
ke44
24
9
5
3
-
3
Miti
aro
20
13
4
3
-
-
-
NO
RTH
ERN
ISLA
ND
S-
-
-
-
-
-
-
Palm
erst
on-
-
-
-
-
-
-
Puka
puka
-
-
-
-
-
-
-
N
assa
u-
-
-
-
-
-
-
Man
ihik
i-
-
-
-
-
-
-
Rak
ahan
ga-
-
-
-
-
-
-
Penr
hyn
-
-
-
-
-
-
-
CO
OK
ISLA
ND
S58
1
345
11
6
75
15
17
13
Loca
tion
of H
ouse
hold
Num
ber o
f H
ouse
hold
s K
eepi
ng G
oats
Size
of G
oat H
oldi
ng
Sour
ce: C
ook
Isla
nds
2011
Cen
sus
of A
gric
ultu
re a
nd F
ishe
ries
TAB
LE S
ET 4
: LIV
ESTO
CK
DET
AILS
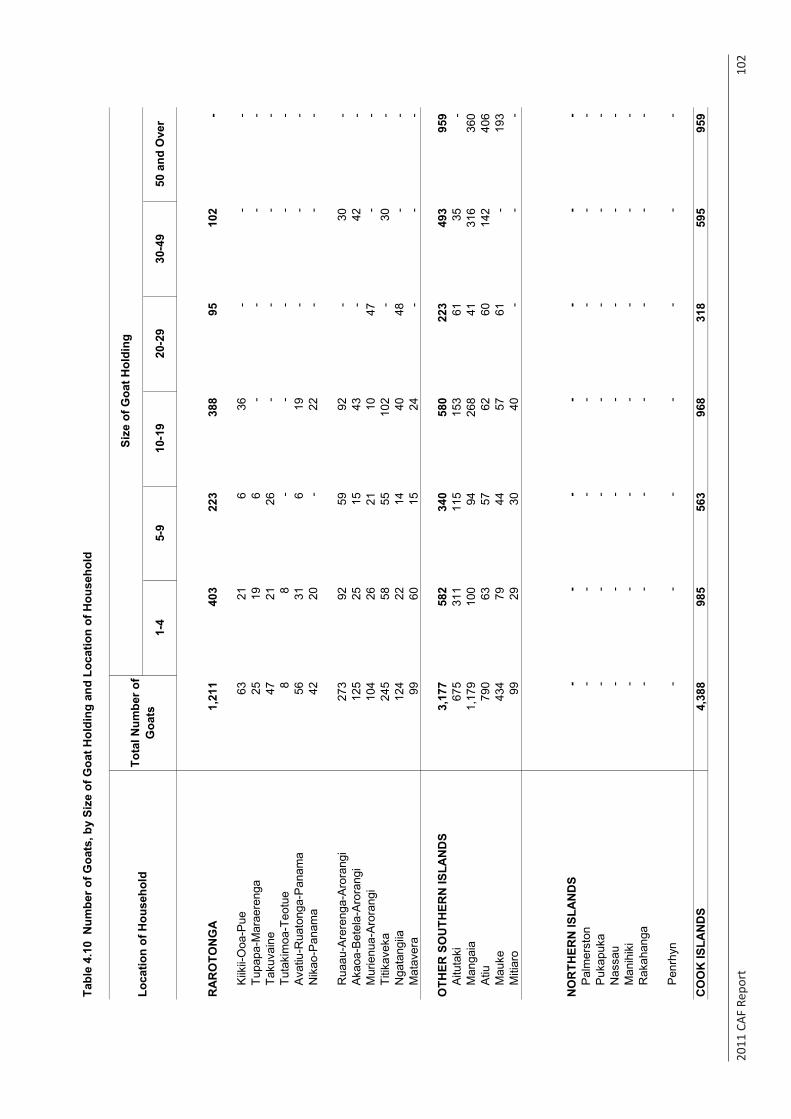
2011
CAF
Rep
ort
10
2
Tabl
e 4.
10 N
umbe
r of G
oats
, by
Size
of G
oat H
oldi
ng a
nd L
ocat
ion
of H
ouse
hold
1-4
5-9
10-1
920
-29
30-4
950
and
Ove
r
RA
RO
TON
GA
1,21
1
40
3
223
38
8
95
10
2
-
Kiik
ii-O
oa-P
ue63
21
6
36
-
-
-
Tu
papa
-Mar
aere
nga
25
19
6
-
-
-
-
Ta
kuva
ine
47
21
26
-
-
-
-
Tu
taki
moa
-Teo
tue
8
8
-
-
-
-
-
Ava
tiu-R
uato
nga-
Pan
ama
56
31
6
19
-
-
-
Nik
ao-P
anam
a42
20
-
22
-
-
-
Rua
au-A
rere
nga-
Aro
rang
i27
3
92
59
92
-
30
-
Aka
oa-B
etel
a-A
rora
ngi
125
25
15
43
-
42
-
M
urie
nua-
Aro
rang
i 10
4
26
21
10
47
-
-
Titik
avek
a24
5
58
55
102
-
30
-
Nga
tang
iia12
4
22
14
40
48
-
-
Mat
aver
a99
60
15
24
-
-
-
OTH
ER S
OU
THER
N IS
LAN
DS
3,17
7
58
2
340
58
0
223
49
3
959
A
ituta
ki67
5
311
11
5
153
61
35
-
M
anga
ia1,
179
100
94
268
41
316
36
0
Atiu
790
63
57
62
60
14
2
406
M
auke
434
79
44
57
61
-
19
3
Miti
aro
99
29
30
40
-
-
-
NO
RTH
ERN
ISLA
ND
S-
-
-
-
-
-
-
P
alm
erst
on-
-
-
-
-
-
-
P
ukap
uka
-
-
-
-
-
-
-
Nas
sau
-
-
-
-
-
-
-
Man
ihik
i-
-
-
-
-
-
-
R
akah
anga
-
-
-
-
-
-
-
Pen
rhyn
-
-
-
-
-
-
-
CO
OK
ISLA
ND
S4,
388
985
56
3
968
31
8
595
95
9
Loca
tion
of H
ouse
hold
Tota
l Num
ber o
f G
oats
Size
of G
oat H
oldi
ng
Sour
ce: C
ook
Isla
nds
2011
Cen
sus
of A
gric
ultu
re a
nd F
ishe
ries
TAB
LE S
ET 4
: LIV
ESTO
CK
DET
AILS
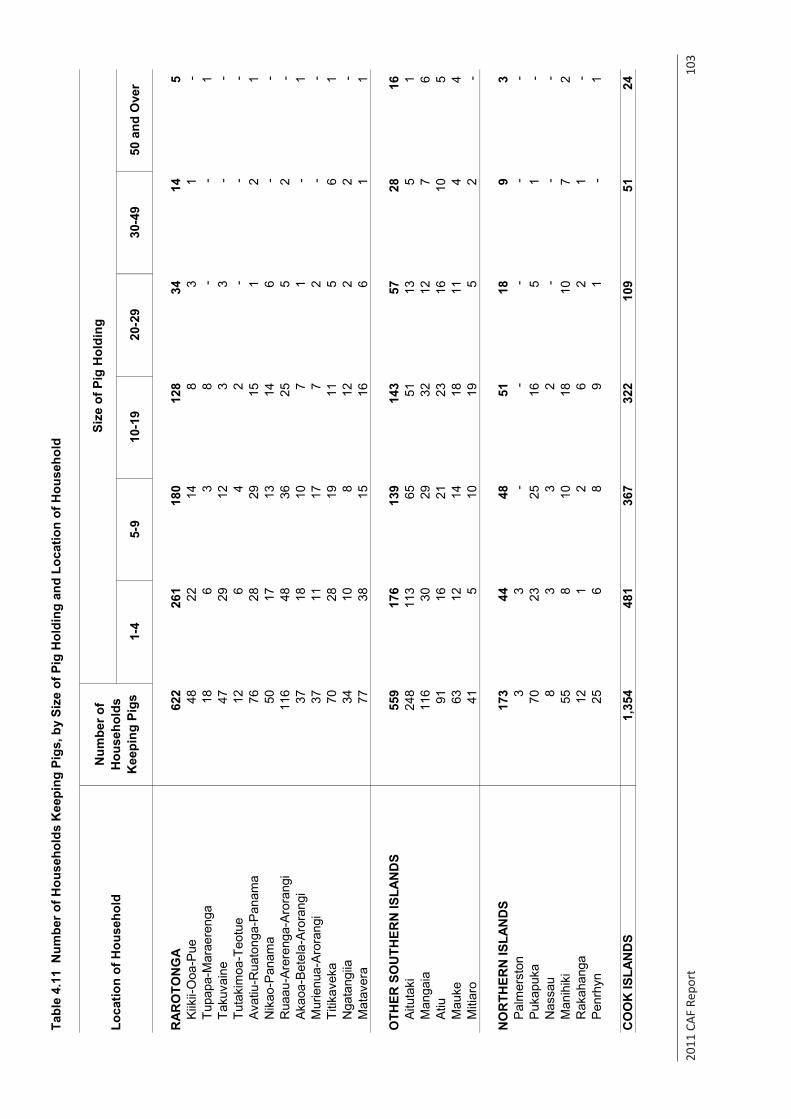
2011
CAF
Rep
ort
10
3
Tabl
e 4.
11 N
umbe
r of H
ouse
hold
s K
eepi
ng P
igs,
by
Size
of P
ig H
oldi
ng a
nd L
ocat
ion
of H
ouse
hold
1-4
5-9
10-1
920
-29
30-4
950
and
Ove
r
RAR
OTO
NG
A62
2
261
18
0
128
34
14
5
Kiik
ii-O
oa-P
ue48
22
14
8
3
1
-
Tu
papa
-Mar
aere
nga
18
6
3
8
-
-
1
Ta
kuva
ine
47
29
12
3
3
-
-
Tu
taki
moa
-Teo
tue
12
6
4
2
-
-
-
Avat
iu-R
uato
nga-
Pana
ma
76
28
29
15
1
2
1
N
ikao
-Pan
ama
50
17
13
14
6
-
-
R
uaau
-Are
reng
a-Ar
oran
gi11
6
48
36
25
5
2
-
Ak
aoa-
Bete
la-A
rora
ngi
37
18
10
7
1
-
1
Mur
ienu
a-Ar
oran
gi
37
11
17
7
2
-
-
Ti
tikav
eka
70
28
19
11
5
6
1
N
gata
ngiia
34
10
8
12
2
2
-
Mat
aver
a77
38
15
16
6
1
1
OTH
ER S
OU
THER
N IS
LAN
DS
559
17
6
139
14
3
57
28
16
Ai
tuta
ki24
8
113
65
51
13
5
1
Man
gaia
116
30
29
32
12
7
6
At
iu91
16
21
23
16
10
5
Mau
ke63
12
14
18
11
4
4
Miti
aro
41
5
10
19
5
2
-
NO
RTH
ERN
ISLA
ND
S17
3
44
48
51
18
9
3
Palm
erst
on3
3
-
-
-
-
-
Pu
kapu
ka70
23
25
16
5
1
-
N
assa
u8
3
3
2
-
-
-
M
anih
iki
55
8
10
18
10
7
2
R
akah
anga
12
1
2
6
2
1
-
Penr
hyn
25
6
8
9
1
-
1
CO
OK
ISLA
ND
S1,
354
481
36
7
322
10
9
51
24
Loca
tion
of H
ouse
hold
Num
ber o
f H
ouse
hold
s K
eepi
ng P
igs
Size
of P
ig H
oldi
ng
Sour
ce: C
ook
Isla
nds
2011
Cen
sus
of A
gric
ultu
re a
nd F
ishe
ries
TAB
LE S
ET 4
: LIV
ESTO
CK
DET
AILS
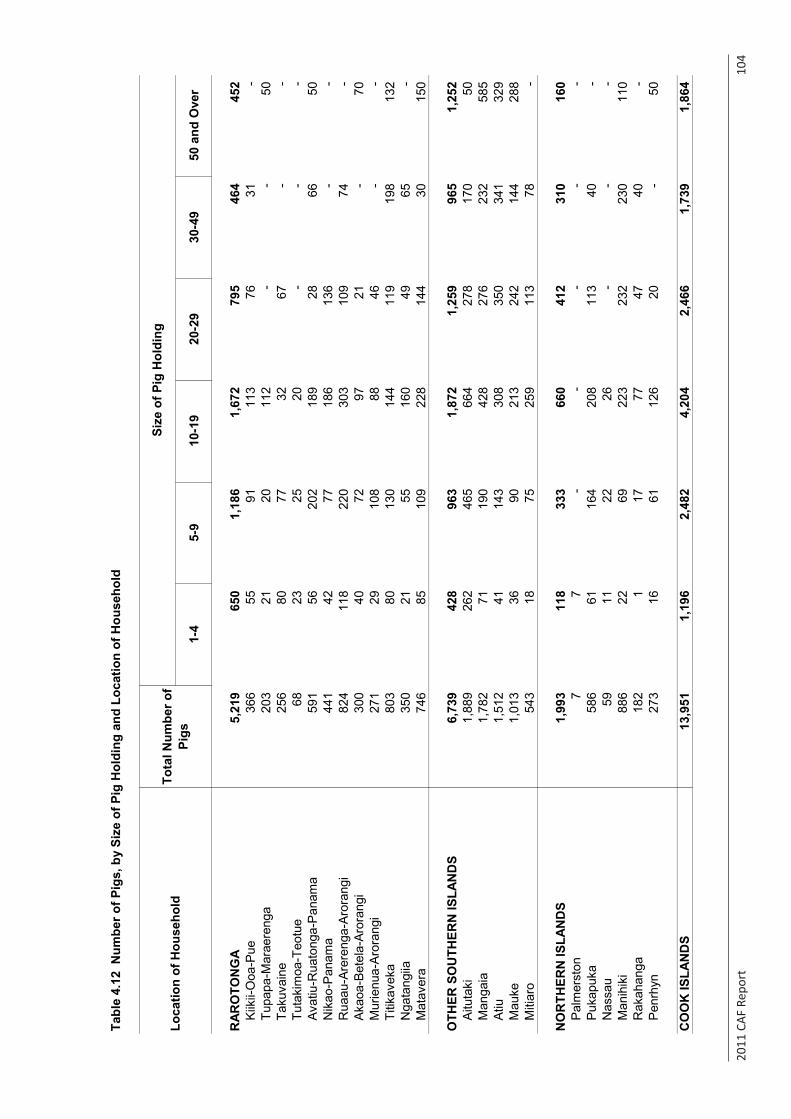
2011
CAF
Rep
ort
10
4
Tabl
e 4.
12 N
umbe
r of P
igs,
by
Size
of P
ig H
oldi
ng a
nd L
ocat
ion
of H
ouse
hold
1-4
5-9
10-1
920
-29
30-4
950
and
Ove
r
RAR
OTO
NG
A5,
219
650
1,
186
1,67
2
79
5
464
45
2
Kiik
ii-O
oa-P
ue36
6
55
91
113
76
31
-
Tu
papa
-Mar
aere
nga
203
21
20
11
2
-
-
50
Ta
kuva
ine
256
80
77
32
67
-
-
Tu
taki
moa
-Teo
tue
68
23
25
20
-
-
-
Avat
iu-R
uato
nga-
Pana
ma
591
56
202
18
9
28
66
50
N
ikao
-Pan
ama
441
42
77
18
6
136
-
-
R
uaau
-Are
reng
a-Ar
oran
gi82
4
118
22
0
303
10
9
74
-
Ak
aoa-
Bete
la-A
rora
ngi
300
40
72
97
21
-
70
Mur
ienu
a-Ar
oran
gi
271
29
108
88
46
-
-
Ti
tikav
eka
803
80
130
14
4
119
19
8
132
N
gata
ngiia
350
21
55
16
0
49
65
-
Mat
aver
a74
6
85
10
9
228
14
4
30
15
0
OTH
ER S
OU
THER
N IS
LAN
DS
6,73
9
42
8
963
1,
872
1,25
9
96
5
1,25
2
Ai
tuta
ki1,
889
262
46
5
664
27
8
170
50
Man
gaia
1,78
2
71
190
42
8
276
23
2
585
At
iu1,
512
41
14
3
308
35
0
341
32
9
Mau
ke1,
013
36
90
213
24
2
144
28
8
Miti
aro
543
18
75
25
9
113
78
-
NO
RTH
ERN
ISLA
ND
S1,
993
118
33
3
660
41
2
310
16
0
Palm
erst
on7
7
-
-
-
-
-
Pu
kapu
ka58
6
61
16
4
208
11
3
40
-
N
assa
u59
11
22
26
-
-
-
M
anih
iki
886
22
69
22
3
232
23
0
110
R
akah
anga
182
1
17
77
47
40
-
Penr
hyn
273
16
61
12
6
20
-
50
CO
OK
ISLA
ND
S13
,951
1,
196
2,48
2
4,
204
2,46
6
1,
739
1,86
4
Loca
tion
of H
ouse
hold
Tota
l Num
ber o
f Pi
gs
Size
of P
ig H
oldi
ng
Sour
ce: C
ook
Isla
nds
2011
Cen
sus
of A
gric
ultu
re a
nd F
ishe
ries
TAB
LE S
ET 4
: LIV
ESTO
CK
DET
AILS
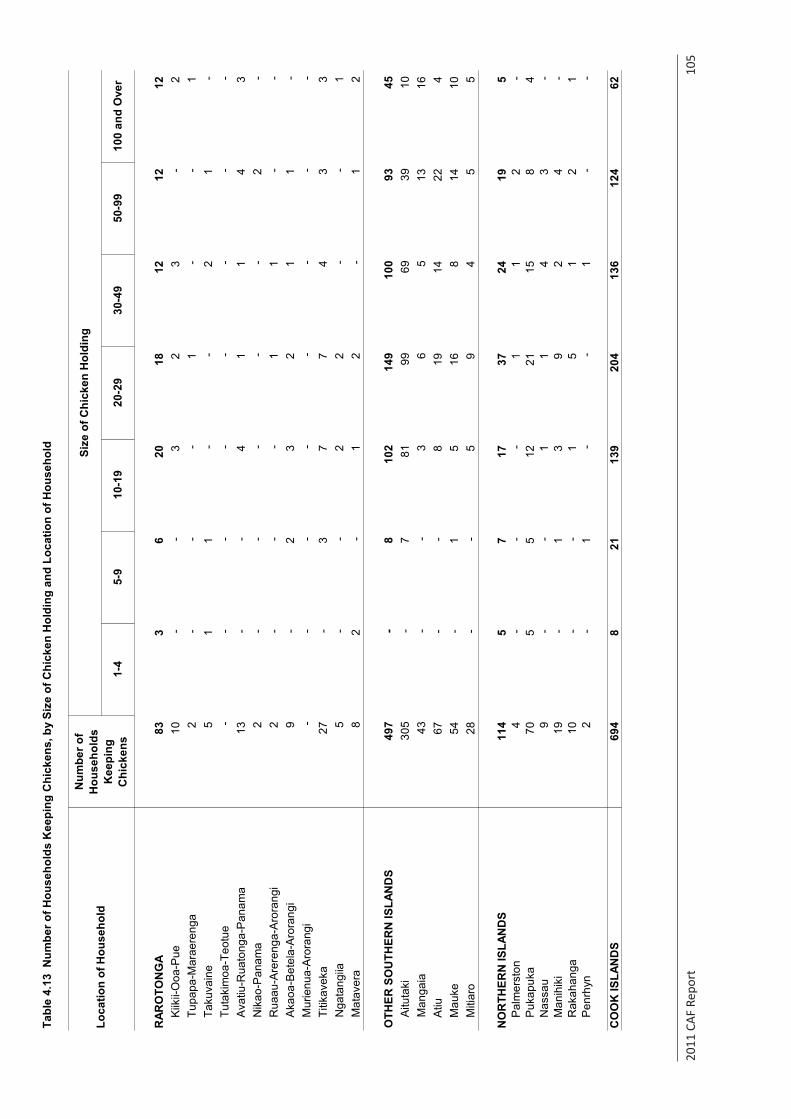
2011
CAF
Rep
ort
10
5
Tabl
e 4.
13 N
umbe
r of H
ouse
hold
s K
eepi
ng C
hick
ens,
by
Size
of C
hick
en H
oldi
ng a
nd L
ocat
ion
of H
ouse
hold
1-4
5-9
10-1
920
-29
30-4
950
-99
100
and
Ove
r
RAR
OTO
NG
A83
3
6
20
18
12
12
12
K
iikii-
Ooa
-Pue
10
-
-
3
2
3
-
2
Tu
papa
-Mar
aere
nga
2
-
-
-
1
-
-
1
Ta
kuva
ine
5
1
1
-
-
2
1
-
Tu
taki
moa
-Teo
tue
-
-
-
-
-
-
-
-
Ava
tiu-R
uato
nga-
Pan
ama
13
-
-
4
1
1
4
3
Nik
ao-P
anam
a2
-
-
-
-
-
2
-
R
uaau
-Are
reng
a-A
rora
ngi
2
-
-
-
1
1
-
-
A
kaoa
-Bet
ela-
Aro
rang
i9
-
2
3
2
1
1
-
M
urie
nua-
Aro
rang
i -
-
-
-
-
-
-
-
Ti
tikav
eka
27
-
3
7
7
4
3
3
N
gata
ngiia
5
-
-
2
2
-
-
1
Mat
aver
a8
2
-
1
2
-
1
2
OTH
ER S
OU
THER
N IS
LAN
DS
497
-
8
102
14
9
100
93
45
A
ituta
ki30
5
-
7
81
99
69
39
10
Man
gaia
43
-
-
3
6
5
13
16
Atiu
67
-
-
8
19
14
22
4
Mau
ke54
-
1
5
16
8
14
10
Miti
aro
28
-
-
5
9
4
5
5
NO
RTH
ERN
ISLA
ND
S11
4
5
7
17
37
24
19
5
P
alm
erst
on4
-
-
-
1
1
2
-
P
ukap
uka
70
5
5
12
21
15
8
4
Nas
sau
9
-
-
1
1
4
3
-
M
anih
iki
19
-
1
3
9
2
4
-
Rak
ahan
ga10
-
-
1
5
1
2
1
P
enrh
yn2
-
1
-
-
1
-
-
CO
OK
ISLA
ND
S69
4
8
21
139
20
4
136
12
4
62
Loca
tion
of H
ouse
hold
Num
ber o
f H
ouse
hold
s K
eepi
ng
Chi
cken
s
Size
of C
hick
en H
oldi
ng
Sour
ce: C
ook
Isla
nds
2011
Cen
sus
of A
gric
ultu
re a
nd F
ishe
ries
TAB
LE S
ET 4
: LIV
ESTO
CK
DET
AILS
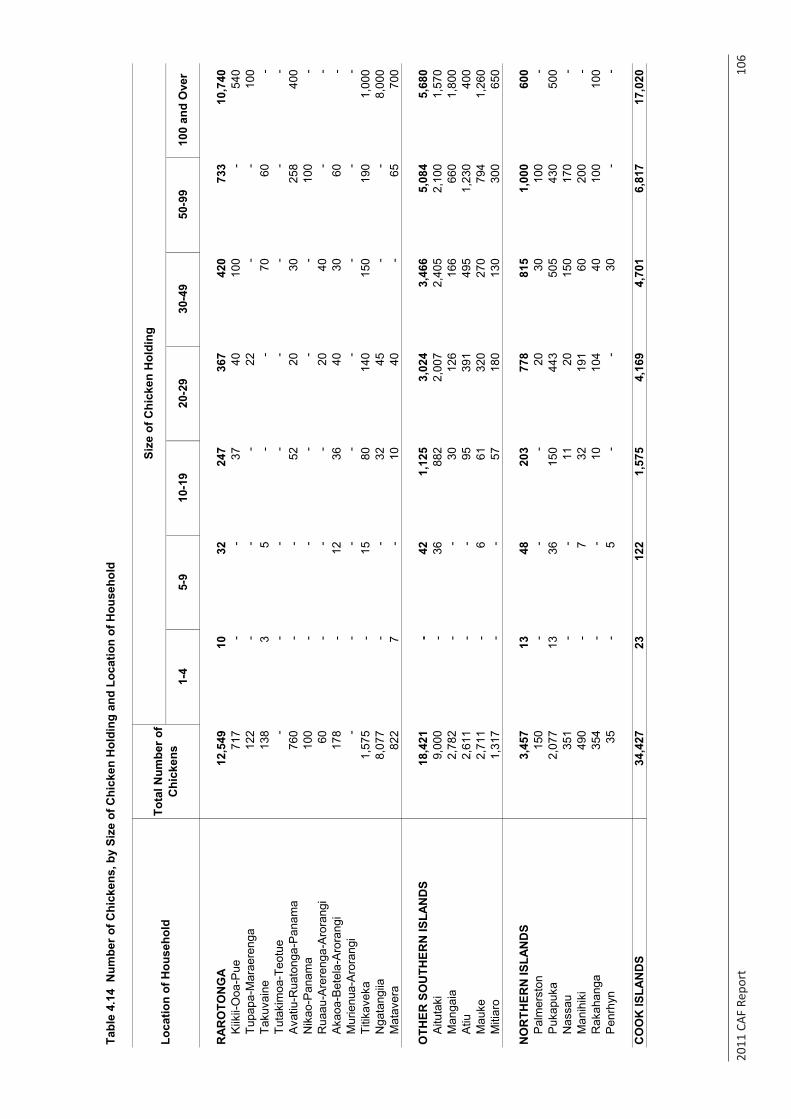
2011
CAF
Rep
ort
10
6
Tabl
e 4.
14 N
umbe
r of C
hick
ens,
by
Size
of C
hick
en H
oldi
ng a
nd L
ocat
ion
of H
ouse
hold
1-4
5-9
10-1
920
-29
30-4
950
-99
100
and
Ove
r
RA
RO
TON
GA
12,5
49
10
32
247
36
7
420
73
3
10,7
40
Kiik
ii-O
oa-P
ue71
7
-
-
37
40
100
-
54
0
Tupa
pa-M
arae
reng
a12
2
-
-
-
22
-
-
10
0
Taku
vain
e13
8
3
5
-
-
70
60
-
Tuta
kim
oa-T
eotu
e-
-
-
-
-
-
-
-
A
vatiu
-Rua
tong
a-P
anam
a76
0
-
-
52
20
30
25
8
400
N
ikao
-Pan
ama
100
-
-
-
-
-
10
0
-
Rua
au-A
rere
nga-
Aro
rang
i60
-
-
-
20
40
-
-
Aka
oa-B
etel
a-A
rora
ngi
178
-
12
36
40
30
60
-
Mur
ienu
a-A
rora
ngi
-
-
-
-
-
-
-
-
Titik
avek
a1,
575
-
15
80
140
15
0
190
1,
000
Nga
tang
iia8,
077
-
-
32
45
-
-
8,00
0
M
atav
era
822
7
-
10
40
-
65
70
0
OTH
ER S
OU
THER
N IS
LAN
DS
18,4
21
-
42
1,
125
3,02
4
3,
466
5,08
4
5,
680
Aitu
taki
9,00
0
-
36
882
2,
007
2,40
5
2,
100
1,57
0
M
anga
ia2,
782
-
-
30
12
6
166
66
0
1,80
0
A
tiu2,
611
-
-
95
39
1
495
1,
230
400
M
auke
2,71
1
-
6
61
32
0
270
79
4
1,26
0
M
itiar
o1,
317
-
-
57
18
0
130
30
0
650
NO
RTH
ERN
ISLA
ND
S3,
457
13
48
203
77
8
815
1,
000
600
P
alm
erst
on15
0
-
-
-
20
30
100
-
P
ukap
uka
2,07
7
13
36
15
0
443
50
5
430
50
0
Nas
sau
351
-
-
11
20
15
0
170
-
M
anih
iki
490
-
7
32
19
1
60
20
0
-
Rak
ahan
ga35
4
-
-
10
10
4
40
10
0
100
P
enrh
yn35
-
5
-
-
30
-
-
CO
OK
ISLA
ND
S34
,427
23
122
1,
575
4,16
9
4,
701
6,81
7
17
,020
Loca
tion
of H
ouse
hold
Tota
l Num
ber o
f C
hick
ens
Size
of C
hick
en H
oldi
ng
Sour
ce: C
ook
Isla
nds
2011
Cen
sus
of A
gric
ultu
re a
nd F
ishe
ries
TAB
LE S
ET 4
: LIV
ESTO
CK
DET
AILS
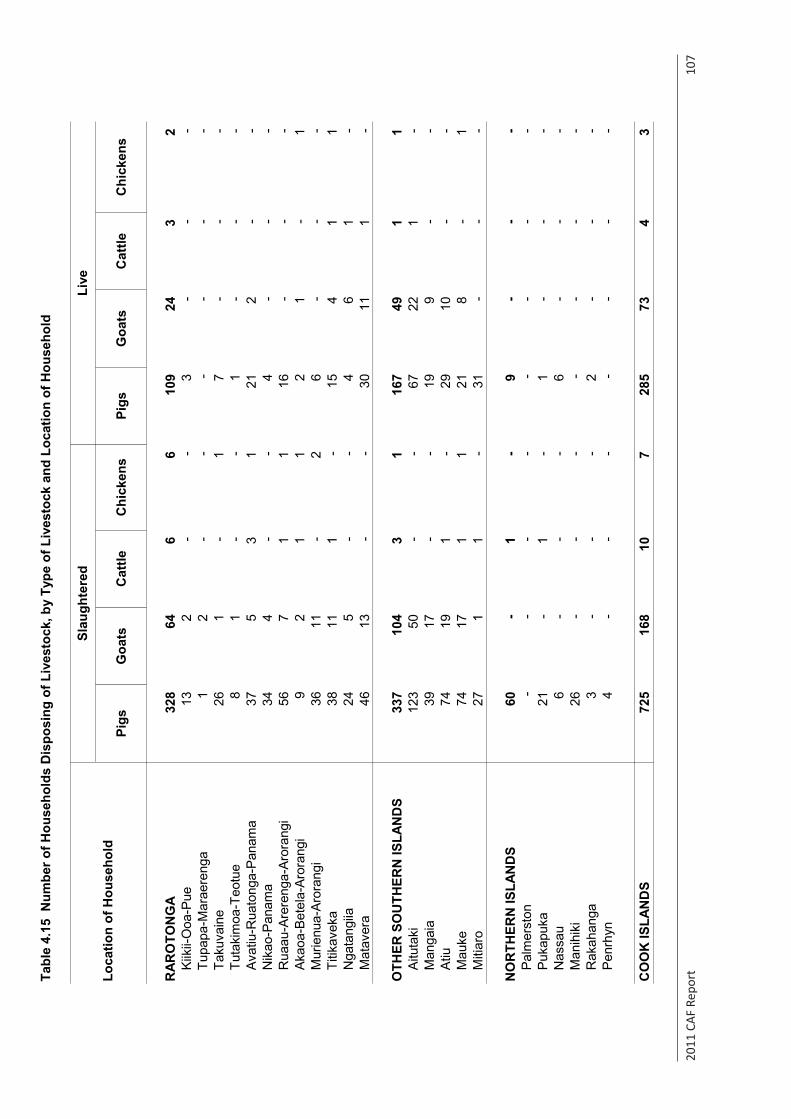
2011
CAF
Rep
ort
10
7
Tabl
e 4.
15 N
umbe
r of H
ouse
hold
s D
ispo
sing
of L
ives
tock
, by
Type
of L
ives
tock
and
Loc
atio
n of
Hou
seho
ld
Pigs
Goa
tsC
attle
Chi
cken
sPi
gsG
oats
Cat
tleC
hick
ens
RAR
OTO
NG
A32
8
64
6
6
109
24
3
2
Ki
ikii-
Ooa
-Pue
13
2
-
-
3
-
-
-
Tu
papa
-Mar
aere
nga
1
2
-
-
-
-
-
-
Taku
vain
e26
1
-
1
7
-
-
-
Tuta
kim
oa-T
eotu
e8
1
-
-
1
-
-
-
Av
atiu
-Rua
tong
a-Pa
nam
a37
5
3
1
21
2
-
-
N
ikao
-Pan
ama
34
4
-
-
4
-
-
-
R
uaau
-Are
reng
a-Ar
oran
gi56
7
1
1
16
-
-
-
Ak
aoa-
Bete
la-A
rora
ngi
9
2
1
1
2
1
-
1
Mur
ienu
a-Ar
oran
gi
36
11
-
2
6
-
-
-
Titik
avek
a38
11
1
-
15
4
1
1
Nga
tang
iia24
5
-
-
4
6
1
-
Mat
aver
a46
13
-
-
30
11
1
-
OTH
ER S
OU
THER
N IS
LAN
DS
337
104
3
1
16
7
49
1
1
Aitu
taki
123
50
-
-
67
22
1
-
Man
gaia
39
17
-
-
19
9
-
-
At
iu74
19
1
-
29
10
-
-
M
auke
74
17
1
1
21
8
-
1
M
itiar
o27
1
1
-
31
-
-
-
NO
RTH
ERN
ISLA
ND
S60
-
1
-
9
-
-
-
Palm
erst
on-
-
-
-
-
-
-
-
Pu
kapu
ka21
-
1
-
1
-
-
-
Nas
sau
6
-
-
-
6
-
-
-
Man
ihik
i26
-
-
-
-
-
-
-
Rak
ahan
ga3
-
-
-
2
-
-
-
Pe
nrhy
n4
-
-
-
-
-
-
-
CO
OK
ISLA
ND
S72
5
16
8
10
7
28
5
73
4
3
Loca
tion
of H
ouse
hold
Slau
ghte
red
Live
Sour
ce: C
ook
Isla
nds
2011
Cen
sus
of A
gric
ultu
re a
nd F
ishe
ries
TAB
LE S
ET 4
: LIV
ESTO
CK
DET
AILS

2011
CAF
Rep
ort
10
8
Tabl
e 4.
16 N
umbe
r of L
ives
tock
Sla
ught
ered
/Sol
d A
live
by T
ype
of L
ives
tock
, Met
hod
of D
ispo
sal a
nd R
egio
n
Hom
e U
seFe
ast/
Gift
sSo
ldTo
tal
Feas
t/ G
ifts
Sold
Tota
l
RA
RO
TON
GA
3,83
4
1,
578
541
46
2
2,58
1
43
0
823
1,
253
Wea
ners
(Pig
s)18
1
42
12
100
15
4
18
9
27
Fa
ttene
rs (P
igs)
2,01
2
93
4
397
28
7
1,61
8
28
4
110
39
4
Sow
s21
1
91
42
29
162
47
2
49
Boa
rs14
0
96
26
1
12
3
17
-
17
G
oats
138
77
19
5
101
22
15
37
D
oes
71
29
19
-
48
21
2
23
Cat
tle5
3
-
-
3
-
2
2
C
ows
6
5
-
-
5
-
1
1
Chi
cken
(Bro
ilers
)39
9
287
20
10
31
7
20
62
82
Chi
cken
(Lay
ers)
671
14
6
30
50
1
62
0
621
OTH
ER S
OU
THER
N IS
LAN
DS
5,42
3
2,
536
1,26
2
34
6
4,14
4
79
9
480
1,
279
Wea
ners
(Pig
s)40
17
8
-
25
15
-
15
Fatte
ners
(Pig
s)2,
765
1,09
8
72
8
254
2,
080
430
25
5
685
S
ows
399
14
1
108
20
26
9
105
25
13
0
Boa
rs26
0
108
58
12
17
8
45
37
82
Goa
ts52
7
160
14
2
29
331
10
0
96
196
D
oes
153
76
26
13
11
5
19
19
38
Cat
tle-
-
-
-
-
-
-
-
C
ows
5
1
-
-
1
4
-
4
Chi
cken
(Bro
ilers
)1,
214
920
18
7
18
1,12
5
81
8
89
Chi
cken
(Lay
ers)
60
15
5
-
20
-
40
40
NO
RTH
ERN
ISLA
ND
S1,
361
929
37
8
-
1,
307
52
2
54
W
eane
rs (P
igs)
65
18
47
-
65
-
-
-
Fatte
ners
(Pig
s)39
8
249
13
6
-
38
5
11
2
13
S
ows
16
13
3
-
16
-
-
-
B
oars
30
24
3
-
27
3
-
3
G
oats
-
-
-
-
-
-
-
-
Doe
s-
-
-
-
-
-
-
-
C
attle
-
-
-
-
-
-
-
-
Cow
s-
-
-
-
-
-
-
-
C
hick
en (B
roile
rs)
846
61
9
189
-
808
38
-
38
Chi
cken
(Lay
ers)
6
6
-
-
6
-
-
-
CO
OK
ISLA
ND
S10
,618
5,
043
2,18
1
80
8
8,03
2
1,
281
1,30
5
2,
586
Wea
ners
(Pig
s)28
6
77
67
100
24
4
33
9
42
Fa
ttene
rs (P
igs)
5,17
5
2,
281
1,26
1
54
1
4,08
3
72
5
367
1,
092
Sow
s62
6
245
15
3
49
447
15
2
27
179
B
oars
430
22
8
87
13
328
65
37
10
2
Goa
ts66
5
237
16
1
34
432
12
2
111
23
3
Doe
s22
4
105
45
13
16
3
40
21
61
Cat
tle5
3
-
-
3
-
2
2
C
ows
11
6
-
-
6
4
1
5
C
hick
en (B
roile
rs)
2,45
9
1,
826
396
28
2,
250
139
70
20
9
Chi
cken
(Lay
ers)
737
35
11
30
76
1
660
66
1
Slau
ghte
red
Live
Loca
tion
of H
ouse
hold
/ Typ
e of
Li
vest
ock
Tota
l Num
ber
of L
ives
tock
D
ispo
sals
Sour
ce: C
ook
Isla
nds
2011
Cen
sus
of A
gric
ultu
re a
nd F
ishe
ries
TAB
LE S
ET 4
: LIV
ESTO
CK
DET
AIL
S
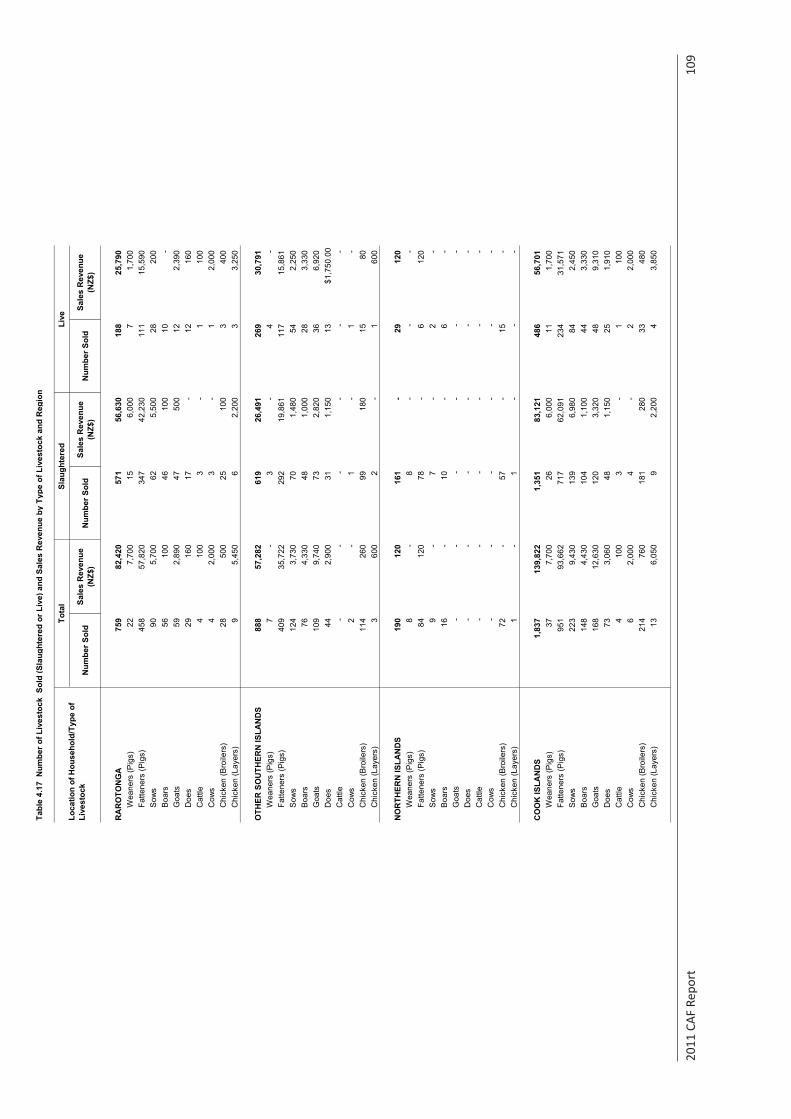
2011
CAF
Rep
ort
10
9
Tabl
e 4.
17 N
umbe
r of L
ives
tock
Sol
d (S
laug
hter
ed o
r Liv
e) a
nd S
ales
Rev
enue
by
Type
of L
ives
tock
and
Reg
ion
Num
ber S
old
Sale
s R
even
ue
(NZ$
)N
umbe
r Sol
dSa
les
Rev
enue
(N
Z$)
Num
ber S
old
Sale
s R
even
ue
(NZ$
)
RA
RO
TON
GA
759
82,4
20
57
1
56
,630
188
25,7
90
W
eane
rs (P
igs)
22
7,70
0
15
6,00
0
7
1,70
0
Fatte
ners
(Pig
s)45
8
57
,820
347
42,2
30
11
1
15
,590
Sow
s90
5,
700
62
5,
500
28
20
0
B
oars
56
100
46
100
10
-
G
oats
59
2,89
0
47
500
12
2,39
0
Doe
s29
16
0
17
-
12
160
Cat
tle4
10
0
3
-
1
100
Cow
s4
2,
000
3
-
1
2,00
0
Chi
cken
(Bro
ilers
)28
50
0
25
10
0
3
40
0
C
hick
en (L
ayer
s)9
5,
450
6
2,
200
3
3,
250
OTH
ER S
OU
THER
N IS
LAN
DS
888
57,2
82
61
9
26
,491
269
30,7
91
W
eane
rs (P
igs)
7
-
3
-
4
-
Fa
ttene
rs (P
igs)
409
35,7
22
29
2
19
,861
117
15,8
61
S
ows
124
3,73
0
70
1,48
0
54
2,25
0
Boa
rs76
4,
330
48
1,
000
28
3,
330
G
oats
109
9,74
0
73
2,82
0
36
6,92
0
Doe
s44
2,
900
31
1,
150
13
$1
,750
.00
Cat
tle-
-
-
-
-
-
C
ows
2
-
1
-
1
-
C
hick
en (B
roile
rs)
114
260
99
180
15
80
Chi
cken
(Lay
ers)
3
600
2
-
1
60
0
NO
RTH
ERN
ISLA
ND
S19
0
12
0
16
1
-
29
120
Wea
ners
(Pig
s)8
-
8
-
-
-
Fa
ttene
rs (P
igs)
84
120
78
-
6
12
0
S
ows
9
-
7
-
2
-
B
oars
16
-
10
-
6
-
G
oats
-
-
-
-
-
-
Doe
s-
-
-
-
-
-
C
attle
-
-
-
-
-
-
Cow
s-
-
-
-
-
-
C
hick
en (B
roile
rs)
72
-
57
-
15
-
C
hick
en (L
ayer
s)1
-
1
-
-
-
CO
OK
ISLA
ND
S1,
837
13
9,82
2
1,
351
83
,121
486
56,7
01
W
eane
rs (P
igs)
37
7,70
0
26
6,00
0
11
1,70
0
Fatte
ners
(Pig
s)95
1
93
,662
717
62,0
91
23
4
31
,571
Sow
s22
3
9,
430
13
9
6,
980
84
2,
450
B
oars
148
4,43
0
104
1,10
0
44
3,33
0
Goa
ts16
8
12
,630
120
3,32
0
48
9,31
0
Doe
s73
3,
060
48
1,
150
25
1,
910
C
attle
4
100
3
-
1
10
0
C
ows
6
2,00
0
4
-
2
2,
000
C
hick
en (B
roile
rs)
214
760
181
280
33
480
Chi
cken
(Lay
ers)
13
6,05
0
9
2,20
0
4
3,85
0
Tota
lLo
catio
n of
Hou
seho
ld/T
ype
of
Live
stoc
k
Slau
ghte
red
Live
Sour
ce: C
ook
Isla
nds
2011
Cen
sus
of A
gric
ultu
re a
nd F
ishe
ries
TAB
LE S
ET 4
: LIV
ESTO
CK
DET
AIL
S

2011
CAF
Rep
ort
11
0
SET
5: C
APT
UR
E F
ISH
ING
Tabl
e 5.
1-
Num
ber o
f Hou
seho
lds E
ngag
ed in
Cap
ture
Fis
hing
and
Pea
rl Fa
rmin
g A
ctiv
ities
by
Agr
icul
tura
l Aci
vity
and
Loc
atio
n of
H
ouse
hold
Tabl
e 5.
2-
Num
ber o
f Hou
seho
lds E
ngag
ed in
Cap
ture
Fis
hing
, by
Mai
n Pu
rpos
e of
Fis
hing
Act
iviti
es a
nd L
ocat
ion
of H
ouse
hold
Tabl
e 5.
3-
Num
ber o
f Hou
seho
lds E
ngag
ed in
Cap
ture
Fis
hing
Act
iviti
es, b
y Fo
rms o
f Fis
hing
and
Loc
atio
n of
Hou
seho
ld
Tabl
e 5.
4-
Num
ber o
f Hou
seho
lds E
ngag
ed in
Cap
ture
Fis
hing
, by
Loca
tion
of F
ishi
ng A
ctiv
ities
and
Loc
atio
n of
Hou
seho
ldTa
ble
5.5
-N
umbe
r of H
ouse
hold
s Eng
aged
in C
aptu
re F
ishi
ng A
ctiv
ities
, Ave
rage
Num
ber o
f Fis
hing
Trip
s Mad
e D
urin
g th
e La
st 1
2 M
onth
s Pr
eced
ing
the
Cen
sus a
nd A
vera
ge H
ours
Per
Fis
hing
Trip
, by
Loca
tion
of th
e H
ouse
hold
Tabl
e 5.
6-
Num
ber o
f Hou
seho
lds E
ngag
ed in
Cap
ture
Fis
hing
Act
iviti
es, b
y Fo
rms o
f Fis
hing
and
by
Loca
tion
of F
ishi
ng A
ctiv
ities
and
by
Reg
ion
Tabl
e 5.
7-
Num
ber o
f Hou
seho
lds E
ngag
ed in
Cap
ture
Fis
hing
Act
iviti
es, b
y Fo
rms o
f Fis
hing
, by
Ave
rage
Num
ber o
f Fis
hing
Trip
s per
Yea
r an
d R
egio
nTa
ble
5.8
-N
umbe
r of H
ouse
hold
s Eng
aged
in C
aptu
re F
ishi
ng A
ctiv
ities
, by
Type
of B
oat(s
) Use
d an
d Lo
catio
n of
Hou
seho
ld
Tabl
e 5.
9-
Num
ber o
f Hou
seho
lds E
ngag
ed in
Cap
ture
Fis
hing
, by
Prop
ortio
n of
Fis
h an
d O
ther
Sea
Pro
duct
s Sol
d an
d Lo
catio
n of
Hou
seho
ld
Tabl
e 5.
10-
Num
ber o
f Hou
seho
lds E
ngag
ed in
Cap
ture
Fis
hing
, by
Prop
ortio
n of
Fis
h an
d O
ther
Sea
Pro
duct
s Con
sum
ed a
nd L
ocat
ion
of
Hou
seho
ld
Sour
ce: C
ook
Isla
nds
2011
Cen
sus
of A
gric
ultu
re a
nd F
ishe
ries
TAB
LE S
ET 5
: FIS
HIN
G D
ETA
ILS
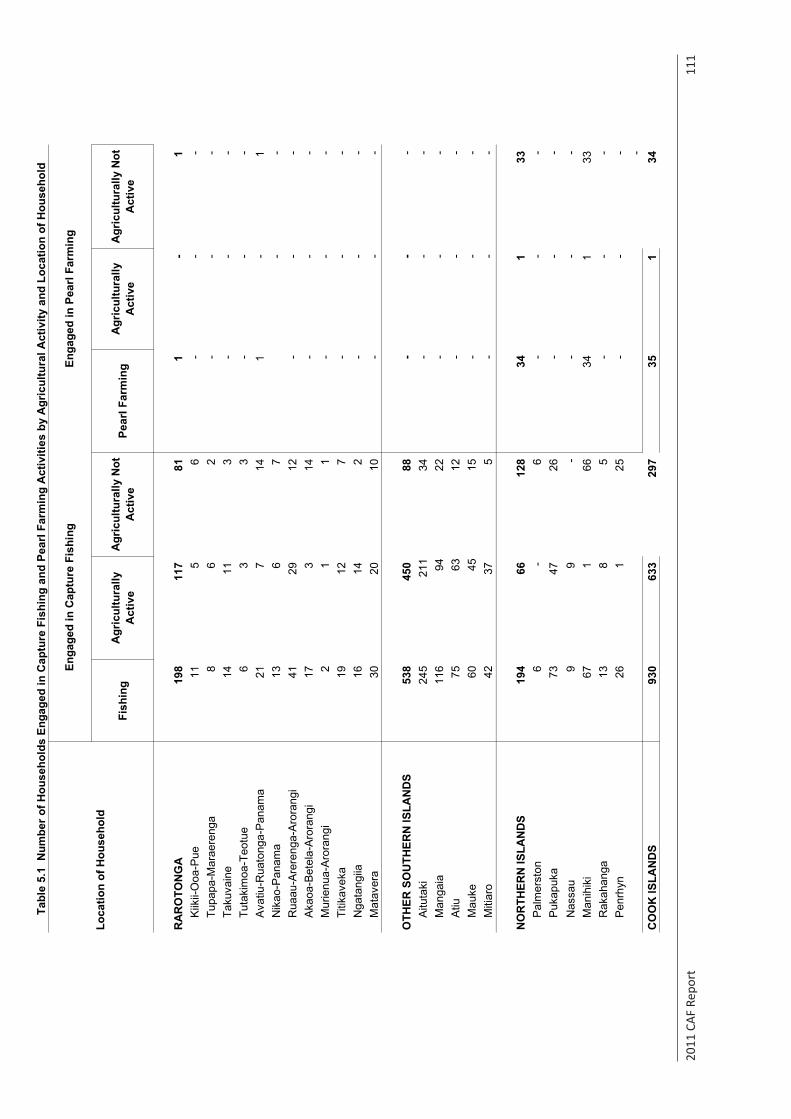
2011
CAF
Rep
ort
11
1
Fish
ing
Agr
icul
tura
lly
Act
ive
Agr
icul
tura
lly N
ot
Act
ive
Pear
l Far
min
gA
gric
ultu
rally
A
ctiv
eA
gric
ultu
rally
Not
A
ctiv
e
RA
RO
TON
GA
198
117
81
1
-
1
Kiik
ii-O
oa-P
ue11
5
6
-
-
-
Tu
papa
-Mar
aere
nga
8
6
2
-
-
-
Taku
vain
e14
11
3
-
-
-
Tu
taki
moa
-Teo
tue
6
3
3
-
-
-
Ava
tiu-R
uato
nga-
Pan
ama
21
7
14
1
-
1
Nik
ao-P
anam
a13
6
7
-
-
Rua
au-A
rere
nga-
Aro
rang
i41
29
12
-
-
-
A
kaoa
-Bet
ela-
Aro
rang
i17
3
14
-
-
-
M
urie
nua-
Aro
rang
i 2
1
1
-
-
-
Ti
tikav
eka
19
12
7
-
-
-
Nga
tang
iia16
14
2
-
-
-
M
atav
era
30
20
10
-
-
-
OTH
ER S
OU
THER
N IS
LAN
DS
538
450
88
-
-
-
Aitu
taki
245
211
34
-
-
-
Man
gaia
116
9422
-
-
-
A
tiu75
63
12
-
-
-
Mau
ke60
45
15
-
-
-
Miti
aro
42
37
5
-
-
-
NO
RTH
ERN
ISLA
ND
S19
4
66
12
8
34
1
33
P
alm
erst
on6
-
6
-
-
-
Puk
apuk
a73
47
26
-
-
-
N
assa
u9
9
-
-
-
-
Man
ihik
i67
1
66
34
1
33
R
akah
anga
13
8
5
-
-
-
Pen
rhyn
26
1
25
-
-
-
-
CO
OK
ISLA
ND
S93
0
63
3
29
7
35
1
34
Loca
tion
of H
ouse
hold
Enga
ged
in C
aptu
re F
ishi
ngEn
gage
d in
Pea
rl Fa
rmin
g
Tabl
e 5.
1 N
umbe
r of H
ouse
hold
s En
gage
d in
Cap
ture
Fis
hing
and
Pea
rl Fa
rmin
g A
ctiv
ities
by
Agr
icul
tura
l Act
ivity
and
Loc
atio
n of
Hou
seho
ld
Sour
ce: C
ook
Isla
nds
2011
Cen
sus
of A
gric
ultu
re a
nd F
ishe
ries
TAB
LE S
ET 5
: FIS
HIN
G D
ETAI
LS
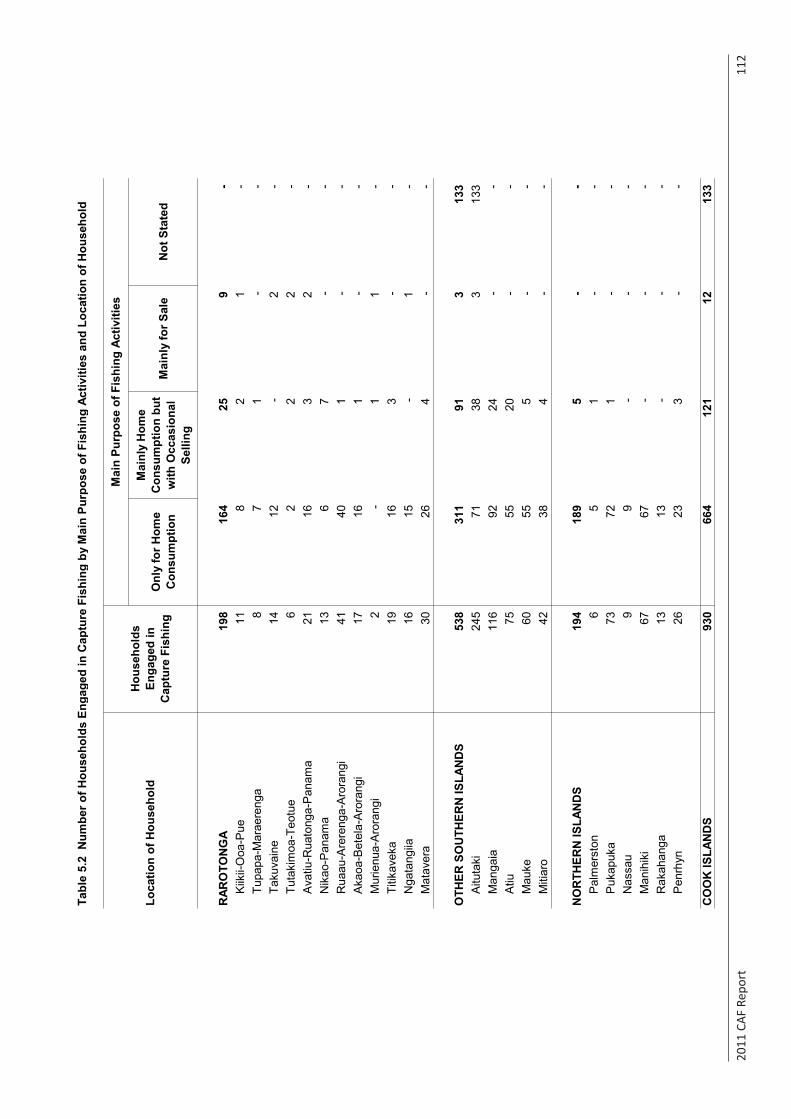
2011
CAF
Rep
ort
11
2
Tabl
e 5.
2 N
umbe
r of H
ouse
hold
s En
gage
d in
Cap
ture
Fis
hing
by
Mai
n Pu
rpos
e of
Fis
hing
Act
iviti
es a
nd L
ocat
ion
of H
ouse
hold
Onl
y fo
r Hom
e C
onsu
mpt
ion
Mai
nly
Hom
e C
onsu
mpt
ion
but
with
Occ
asio
nal
Selli
ng
Mai
nly
for S
ale
Not
Sta
ted
RAR
OTO
NG
A19
8
16
4
25
9
-
Kiik
ii-O
oa-P
ue11
8
2
1
-
Tupa
pa-M
arae
reng
a8
7
1
-
-
Ta
kuva
ine
14
12
-
2
-
Tuta
kim
oa-T
eotu
e6
2
2
2
-
Ava
tiu-R
uato
nga-
Pan
ama
21
16
3
2
-
N
ikao
-Pan
ama
13
6
7
-
-
Rua
au-A
rere
nga-
Aro
rang
i41
40
1
-
-
A
kaoa
-Bet
ela-
Aro
rang
i17
16
1
-
-
M
urie
nua-
Aro
rang
i 2
-
1
1
-
Ti
tikav
eka
19
16
3
-
-
Nga
tang
iia16
15
-
1
-
M
atav
era
30
26
4
-
-
OTH
ER S
OU
THER
N IS
LAN
DS
538
311
91
3
133
Aitu
taki
245
71
38
3
133
Man
gaia
116
92
24
-
-
Atiu
75
55
20
-
-
Mau
ke60
55
5
-
-
M
itiar
o42
38
4
-
-
NO
RTH
ERN
ISLA
ND
S19
4
18
9
5
-
-
P
alm
erst
on6
5
1
-
-
P
ukap
uka
73
72
1
-
-
Nas
sau
9
9
-
-
-
M
anih
iki
67
67
-
-
-
R
akah
anga
13
13
-
-
-
P
enrh
yn26
23
3
-
-
CO
OK
ISLA
ND
S93
0
66
4
12
1
12
13
3
Loca
tion
of H
ouse
hold
Hou
seho
lds
Enga
ged
in
Cap
ture
Fis
hing
Mai
n Pu
rpos
e of
Fis
hing
Act
iviti
es
Sour
ce: C
ook
Isla
nds
2011
Cen
sus
of A
gric
ultu
re a
nd F
ishe
ries
TAB
LE S
ET 5
: FIS
HIN
G D
ETAI
LS
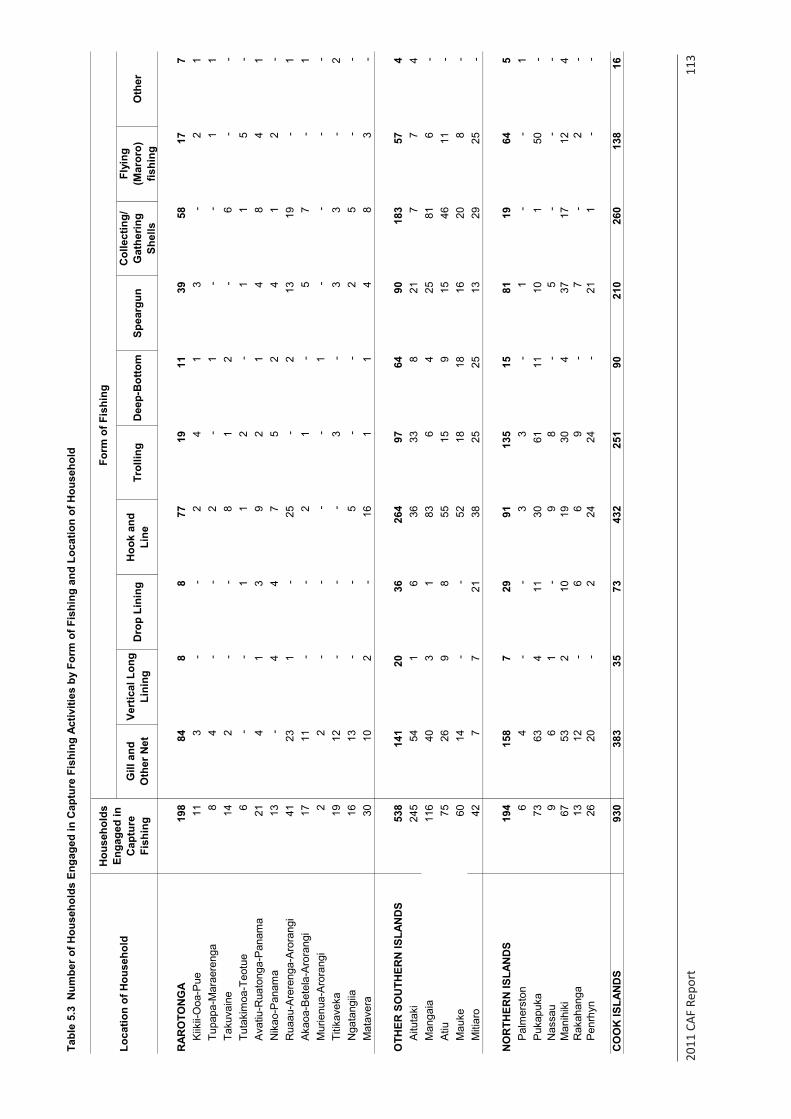
2011
CAF
Rep
ort
11
3
Tabl
e 5.
3 N
umbe
r of H
ouse
hold
s En
gage
d in
Cap
ture
Fis
hing
Act
iviti
es b
y Fo
rm o
f Fis
hing
and
Loc
atio
n of
Hou
seho
ld
Gill
and
O
ther
Net
Vert
ical
Lon
g Li
ning
Dro
p Li
ning
Hoo
k an
d Li
neTr
ollin
gD
eep-
Bot
tom
Spea
rgun
Col
lect
ing/
G
athe
ring
Shel
ls
Flyi
ng
(Mar
oro)
fis
hing
Oth
er
RAR
OTO
NG
A19
8
84
8
8
77
19
11
39
58
17
7
Kiik
ii-O
oa-P
ue11
3
-
-
2
4
1
3
-
2
1
Tupa
pa-M
arae
reng
a8
4
-
-
2
-
1
-
-
1
1
Ta
kuva
ine
14
2
-
-
8
1
2
-
6
-
-
Tu
taki
moa
-Teo
tue
6
-
-
1
1
2
-
1
1
5
-
Ava
tiu-R
uato
nga-
Pan
ama
21
4
1
3
9
2
1
4
8
4
1
N
ikao
-Pan
ama
13
-
4
4
7
5
2
4
1
2
-
R
uaau
-Are
reng
a-A
rora
ngi
41
23
1
-
25
-
2
13
19
-
1
A
kaoa
-Bet
ela-
Aro
rang
i17
11
-
-
2
1
-
5
7
-
1
M
urie
nua-
Aro
rang
i 2
2
-
-
-
-
1
-
-
-
-
Ti
tikav
eka
19
12
-
-
-
3
-
3
3
-
2
Nga
tang
iia16
13
-
-
5
-
-
2
5
-
-
M
atav
era
30
10
2
-
16
1
1
4
8
3
-
OTH
ER S
OU
THER
N IS
LAN
DS
538
141
20
36
264
97
64
90
18
3
57
4
Aitu
taki
245
54
1
6
36
33
8
21
7
7
4
Man
gaia
116
40
3
1
83
6
4
25
81
6
-
Atiu
75
26
9
8
55
15
9
15
46
11
-
M
auke
60
14
-
-
52
18
18
16
20
8
-
M
itiar
o42
7
7
21
38
25
25
13
29
25
-
NO
RTH
ERN
ISLA
ND
S19
4
15
8
7
29
91
13
5
15
81
19
64
5
P
alm
erst
on6
4
-
-
3
3
-
1
-
-
1
P
ukap
uka
73
63
4
11
30
61
11
10
1
50
-
Nas
sau
9
6
1
-
9
8
-
5
-
-
-
Man
ihik
i67
53
2
10
19
30
4
37
17
12
4
R
akah
anga
13
12
-
6
6
9
-
7
-
2
-
Pen
rhyn
26
20
-
2
24
24
-
21
1
-
-
CO
OK
ISLA
ND
S93
0
38
3
35
73
43
2
25
1
90
210
260
138
16
Loca
tion
of H
ouse
hold
Hou
seho
lds
Enga
ged
in
Cap
ture
Fi
shin
g
Form
of F
ishi
ng
Sour
ce: C
ook
Isla
nds
2011
Cen
sus
of A
gric
ultu
re a
nd F
ishe
ries
TAB
LE S
ET 5
: FIS
HIN
G D
ETAI
LS
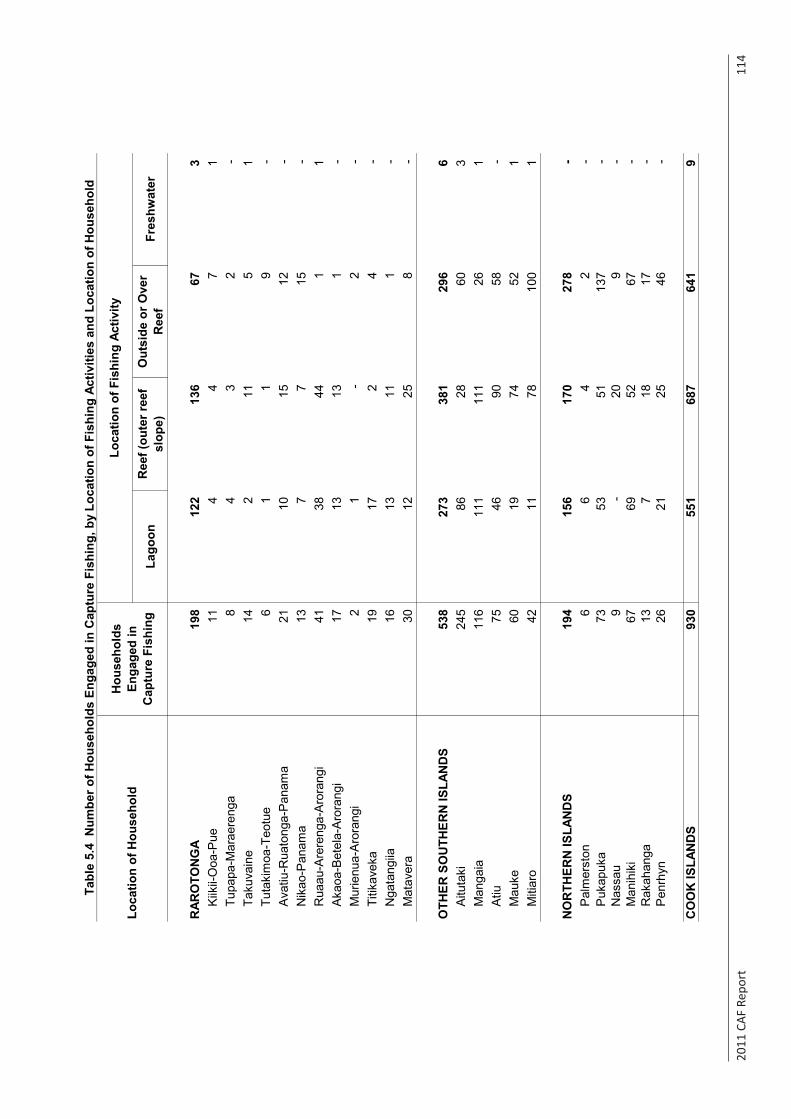
2011
CAF
Rep
ort
11
4
Lago
onR
eef (
oute
r ree
f sl
ope)
Out
side
or O
ver
Ree
fFr
eshw
ater
RAR
OTO
NG
A19
8
12
2
13
6
67
3
K
iikii-
Ooa
-Pue
11
4
4
7
1
Tupa
pa-M
arae
reng
a8
4
3
2
-
Taku
vain
e14
2
11
5
1
Tu
taki
moa
-Teo
tue
6
1
1
9
-
A
vatiu
-Rua
tong
a-P
anam
a21
10
15
12
-
Nik
ao-P
anam
a13
7
7
15
-
Rua
au-A
rere
nga-
Aro
rang
i41
38
44
1
1
A
kaoa
-Bet
ela-
Aro
rang
i17
13
13
1
-
Mur
ienu
a-A
rora
ngi
2
1
-
2
-
Titik
avek
a19
17
2
4
-
Nga
tang
iia16
13
11
1
-
Mat
aver
a30
12
25
8
-
OTH
ER S
OU
THER
N IS
LAN
DS
538
273
381
296
6
Aitu
taki
245
86
28
60
3
Man
gaia
116
111
111
26
1
Atiu
75
46
90
58
-
M
auke
60
19
74
52
1
Miti
aro
42
11
78
100
1
NO
RTH
ERN
ISLA
ND
S19
4
15
6
17
0
27
8
-
Pal
mer
ston
6
6
4
2
-
P
ukap
uka
73
53
51
137
-
N
assa
u9
-
20
9
-
M
anih
iki
67
69
52
67
-
R
akah
anga
13
7
18
17
-
P
enrh
yn26
21
25
46
-
CO
OK
ISLA
ND
S93
0
55
1
68
7
64
1
9
Loca
tion
of H
ouse
hold
Hou
seho
lds
Enga
ged
in
Cap
ture
Fis
hing
Loca
tion
of F
ishi
ng A
ctiv
ity
Tabl
e 5.
4 N
umbe
r of H
ouse
hold
s En
gage
d in
Cap
ture
Fis
hing
, by
Loca
tion
of F
ishi
ng A
ctiv
ities
and
Loc
atio
n of
Hou
seho
ld
Sour
ce: C
ook
Isla
nds
2011
Cen
sus
of A
gric
ultu
re a
nd F
ishe
ries
TAB
LE S
ET 5
: FIS
HIN
G D
ETAI
LS
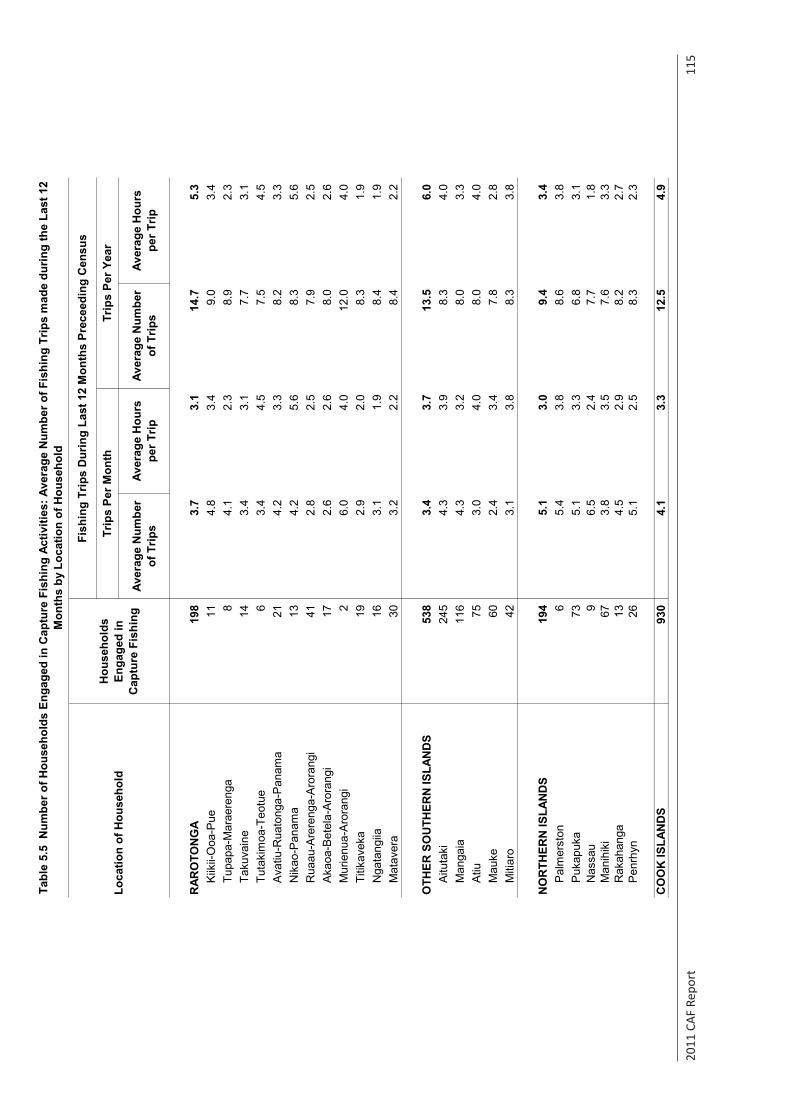
2011
CAF
Rep
ort
11
5
Aver
age
Num
ber
of T
rips
Aver
age
Hou
rs
per T
ripAv
erag
e N
umbe
r of
Trip
sAv
erag
e H
ours
pe
r Trip
RAR
OTO
NG
A19
8
3.
7
3.
1
14
.7
5.
3
K
iikii-
Ooa
-Pue
11
4.8
3.4
9.0
3.4
Tupa
pa-M
arae
reng
a8
4.
1
2.
3
8.
9
2.
3
Ta
kuva
ine
14
3.4
3.1
7.7
3.1
Tuta
kim
oa-T
eotu
e6
3.
4
4.
5
7.
5
4.
5
A
vatiu
-Rua
tong
a-P
anam
a21
4.
2
3.
3
8.
2
3.
3
N
ikao
-Pan
ama
13
4.2
5.6
8.3
5.6
Rua
au-A
rere
nga-
Aro
rang
i41
2.
8
2.
5
7.
9
2.
5
A
kaoa
-Bet
ela-
Aro
rang
i17
2.
6
2.
6
8.
0
2.
6
M
urie
nua-
Aro
rang
i 2
6.
0
4.
0
12
.0
4.
0
Ti
tikav
eka
19
2.9
2.0
8.3
1.9
Nga
tang
iia16
3.
1
1.
9
8.
4
1.
9
M
atav
era
30
3.2
2.2
8.4
2.2
OTH
ER S
OU
THER
N IS
LAN
DS
538
3.4
3.7
13.5
6.0
Aitu
taki
245
4.3
3.9
8.3
4.0
Man
gaia
116
4.3
3.2
8.0
3.3
Atiu
75
3.0
4.0
8.0
4.0
Mau
ke60
2.
4
3.
4
7.
8
2.
8
M
itiar
o42
3.
1
3.
8
8.
3
3.
8
NO
RTH
ERN
ISLA
ND
S19
4
5.
1
3.
0
9.
4
3.
4
P
alm
erst
on6
5.
4
3.
8
8.
6
3.
8
P
ukap
uka
73
5.1
3.3
6.8
3.1
Nas
sau
9
6.5
2.4
7.7
1.8
Man
ihik
i67
3.
8
3.
5
7.
6
3.
3
R
akah
anga
13
4.5
2.9
8.2
2.7
Pen
rhyn
26
5.1
2.5
8.3
2.3
CO
OK
ISLA
ND
S93
0
4.
1
3.
3
12
.5
4.
9
Tabl
e 5.
5 N
umbe
r of H
ouse
hold
s En
gage
d in
Cap
ture
Fis
hing
Act
iviti
es: A
vera
ge N
umbe
r of F
ishi
ng T
rips
mad
e du
ring
the
Last
12
Mon
ths
by L
ocat
ion
of H
ouse
hold
Loca
tion
of H
ouse
hold
Hou
seho
lds
Enga
ged
in
Cap
ture
Fis
hing
Fish
ing
Trip
s D
urin
g La
st 1
2 M
onth
s Pr
ecee
ding
Cen
sus
Trip
s Pe
r Mon
thTr
ips
Per Y
ear
Sour
ce: C
ook
Isla
nds
2011
Cen
sus
of A
gric
ultu
re a
nd F
ishe
ries
TAB
LE S
ET 5
: FIS
HIN
G D
ETAI
LS
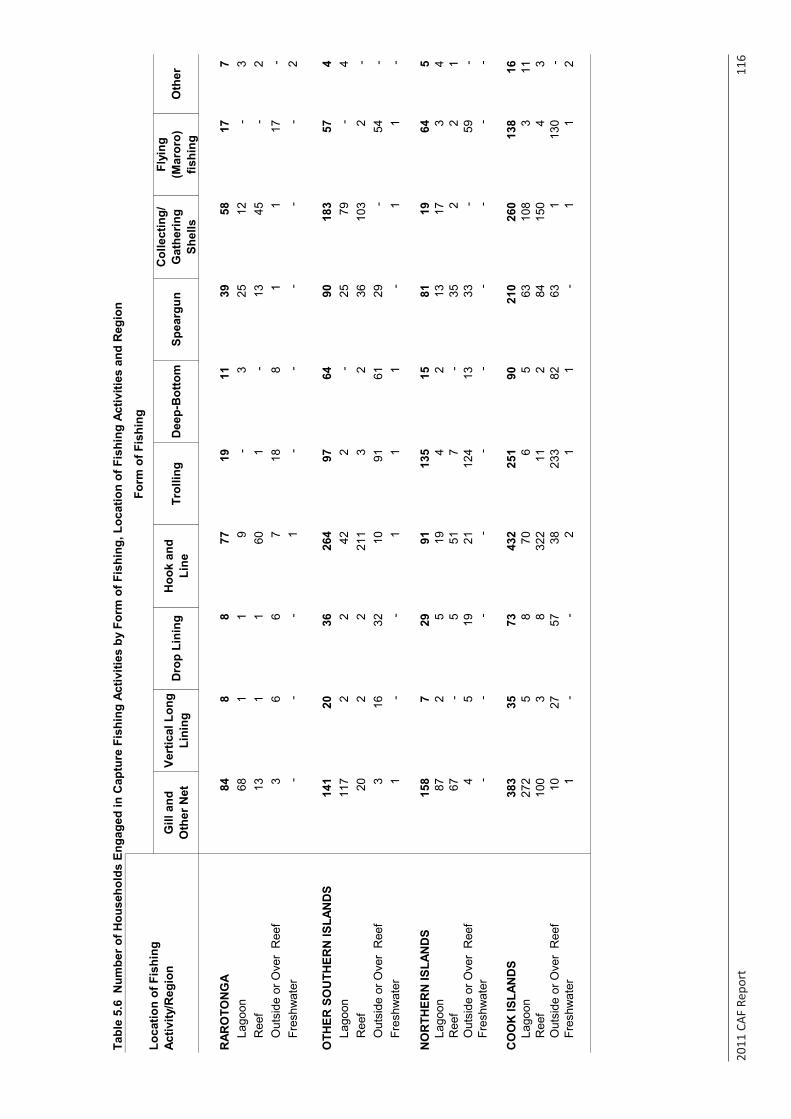
2011
CAF
Rep
ort
11
6
Gill
and
O
ther
Net
Vert
ical
Lon
g Li
ning
Dro
p Li
ning
Hoo
k an
d Li
neTr
ollin
gD
eep-
Bot
tom
Spea
rgun
Col
lect
ing/
G
athe
ring
Shel
ls
Flyi
ng
(Mar
oro)
fis
hing
Oth
er
RAR
OTO
NG
A84
8
8
77
19
11
39
58
17
7
Lago
on68
1
1
9
-
3
25
12
-
3
Ree
f13
1
1
60
1
-
13
45
-
2
O
utsi
de o
r Ove
r R
eef
3
6
6
7
18
8
1
1
17
-
Fres
hwat
er-
-
-
1
-
-
-
-
-
2
OTH
ER S
OU
THER
N IS
LAN
DS
141
20
36
264
97
64
90
18
3
57
4
Lago
on11
7
2
2
42
2
-
25
79
-
4
Ree
f20
2
2
211
3
2
36
10
3
2
-
O
utsi
de o
r Ove
r R
eef
3
16
32
10
91
61
29
-
54
-
Fr
eshw
ater
1
-
-
1
1
1
-
1
1
-
NO
RTH
ERN
ISLA
ND
S15
8
7
29
91
13
5
15
81
19
64
5
La
goon
87
2
5
19
4
2
13
17
3
4
Ree
f67
-
5
51
7
-
35
2
2
1
Out
side
or O
ver
Ree
f4
5
19
21
12
4
13
33
-
59
-
Fres
hwat
er-
-
-
-
-
-
-
-
-
-
CO
OK
ISLA
ND
S38
3
35
73
43
2
25
1
90
210
260
138
16
La
goon
272
5
8
70
6
5
63
108
3
11
R
eef
100
3
8
322
11
2
84
150
4
3
Out
side
or O
ver
Ree
f10
27
57
38
23
3
82
63
1
13
0
-
Fr
eshw
ater
1
-
-
2
1
1
-
1
1
2
Loca
tion
of F
ishi
ng
Activ
ity/R
egio
n
Form
of F
ishi
ng
Tabl
e 5.
6 N
umbe
r of H
ouse
hold
s En
gage
d in
Cap
ture
Fis
hing
Act
iviti
es b
y Fo
rm o
f Fis
hing
, Loc
atio
n of
Fis
hing
Act
iviti
es a
nd R
egio
n
Sour
ce: C
ook
Isla
nds
2011
Cen
sus
of A
gric
ultu
re a
nd F
ishe
ries
TAB
LE S
ET 5
: FIS
HIN
G D
ETAI
LS
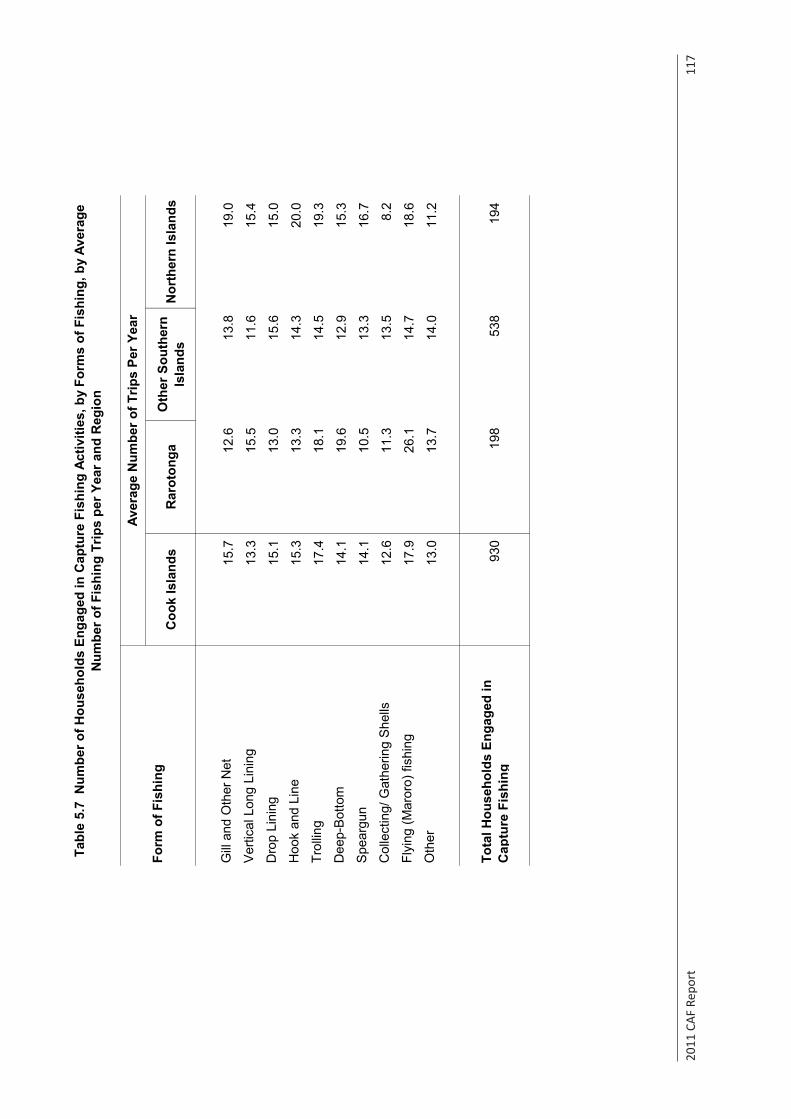
2011
CAF
Rep
ort
11
7
Coo
k Is
land
sR
arot
onga
Oth
er S
outh
ern
Isla
nds
Nor
ther
n Is
land
s
Gill
and
Oth
er N
et15
.7
12.6
13
.8
19.0
V
ertic
al L
ong
Lini
ng13
.3
15.5
11
.6
15.4
D
rop
Lini
ng15
.1
13.0
15
.6
15.0
H
ook
and
Line
15.3
13
.3
14.3
20
.0
Trol
ling
17.4
18
.1
14.5
19
.3
Dee
p-B
otto
m14
.1
19.6
12
.9
15.3
S
pear
gun
14.1
10
.5
13.3
16
.7
Col
lect
ing/
Gat
herin
g S
hells
12.6
11
.3
13.5
8.
2
Fl
ying
(Mar
oro)
fish
ing
17.9
26
.1
14.7
18
.6
Oth
er13
.0
13.7
14
.0
11.2
Tota
l Hou
seho
lds
Enga
ged
in
Cap
ture
Fis
hing
930
19
8
538
19
4
Form
of F
ishi
ng
Aver
age
Num
ber o
f Trip
s Pe
r Yea
r
Tabl
e 5.
7 N
umbe
r of H
ouse
hold
s En
gage
d in
Cap
ture
Fis
hing
Act
iviti
es, b
y Fo
rms
of F
ishi
ng, b
y Av
erag
e N
umbe
r of F
ishi
ng T
rips
per Y
ear a
nd R
egio
n
Sour
ce: C
ook
Isla
nds
2011
Cen
sus
of A
gric
ultu
re a
nd F
ishe
ries
TAB
LE S
ET 5
: FIS
HIN
G D
ETAI
LS
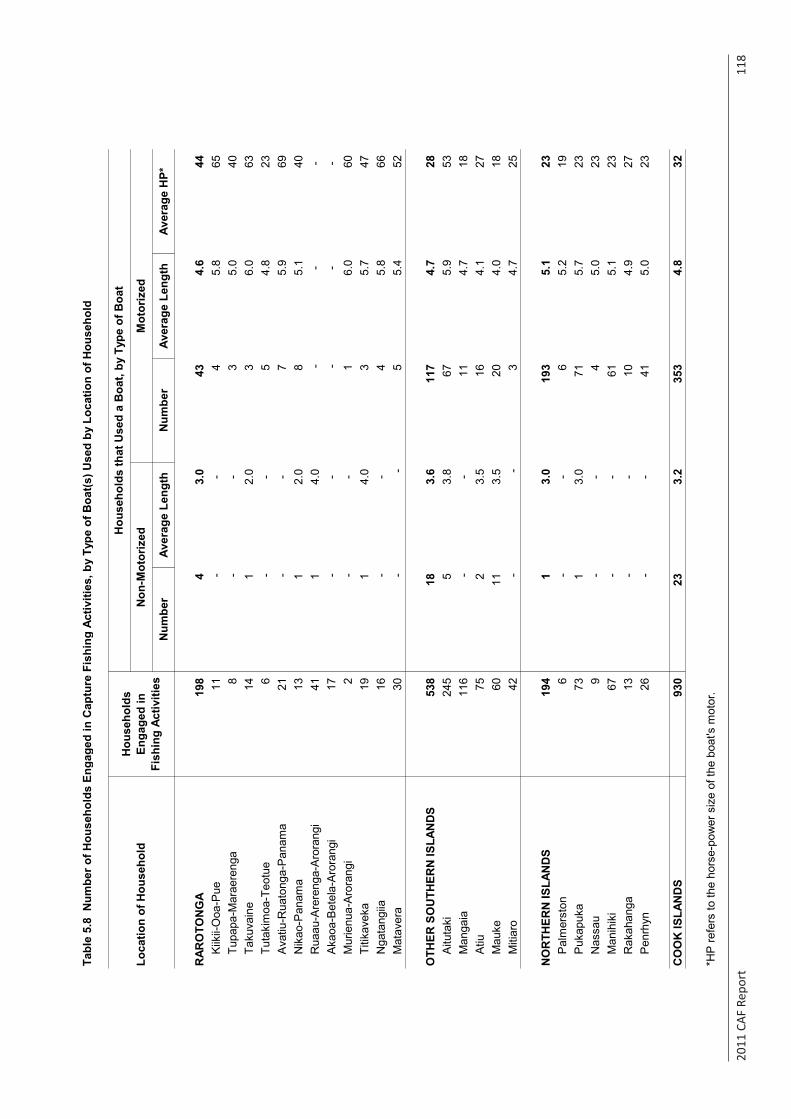
2011
CAF
Rep
ort
11
8
Tabl
e 5.
8 N
umbe
r of H
ouse
hold
s En
gage
d in
Cap
ture
Fis
hing
Act
iviti
es, b
y Ty
pe o
f Boa
t(s) U
sed
by L
ocat
ion
of H
ouse
hold
Num
ber
Aver
age
Leng
thN
umbe
rAv
erag
e Le
ngth
Aver
age
HP*
RAR
OTO
NG
A19
8
4
3.
0
43
4.
6
44
K
iikii-
Ooa
-Pue
11
-
-
4
5.
8
65
Tu
papa
-Mar
aere
nga
8
-
-
3
5.
0
40
Ta
kuva
ine
14
1
2.0
3
6.0
63
Tuta
kim
oa-T
eotu
e6
-
-
5
4.8
23
Ava
tiu-R
uato
nga-
Pan
ama
21
-
-
7
5.
9
69
N
ikao
-Pan
ama
13
1
2.0
8
5.1
40
Rua
au-A
rere
nga-
Aro
rang
i41
1
4.
0
-
-
-
Aka
oa-B
etel
a-A
rora
ngi
17
-
-
-
-
-
Mur
ienu
a-A
rora
ngi
2
-
-
1
6.
0
60
Ti
tikav
eka
19
1
4.0
3
5.7
47
Nga
tang
iia16
-
-
4
5.8
66
Mat
aver
a30
-
-
5
5.
4
52
OTH
ER S
OU
THER
N IS
LAN
DS
538
18
3.6
117
4.7
28
Aitu
taki
245
5
3.8
67
5.9
53
Man
gaia
116
-
-
11
4.
7
18
A
tiu75
2
3.
5
16
4.
1
27
M
auke
60
11
3.5
20
4.0
18
Miti
aro
42
-
-
3
4.7
25
NO
RTH
ERN
ISLA
ND
S19
4
1
3.
0
19
3
5.
1
23
P
alm
erst
on6
-
-
6
5.2
19
Puk
apuk
a73
1
3.
0
71
5.
7
23
N
assa
u9
-
-
4
5.0
23
Man
ihik
i67
-
-
61
5.1
23
Rak
ahan
ga13
-
-
10
4.9
27
Pen
rhyn
26
-
-
41
5.
0
23
CO
OK
ISLA
ND
S93
0
23
3.
2
35
3
4.
8
32
*HP
refe
rs to
the
hors
e-po
wer
siz
e of
the
boat
's m
otor
.
Loca
tion
of H
ouse
hold
Hou
seho
lds
Enga
ged
in
Fish
ing
Activ
ities
Hou
seho
lds
that
Use
d a
Boa
t, by
Typ
e of
Boa
t
Non
-Mot
oriz
edM
otor
ized
Sour
ce: C
ook
Isla
nds
2011
Cen
sus
of A
gric
ultu
re a
nd F
ishe
ries
TAB
LE S
ET 5
: FIS
HIN
G D
ETAI
LS

2011
CAF
Rep
ort
11
9
Non
eAb
out 1 / 4
Abou
t 1 / 3Ab
out 1 / 2
Abou
t 3 / 4Al
lN
ot S
tate
d
RAR
OTO
NG
A19
8
154
8
1
9
10
12
4
K
iikii-
Ooa
-Pue
11
8
1
-
-
2
-
-
Tu
papa
-Mar
aere
nga
8
7
1
-
-
-
-
-
Taku
vain
e14
13
1
-
-
-
-
-
Tu
taki
moa
-Teo
tue
6
2
-
-
1
2
1
-
Ava
tiu-R
uato
nga-
Pan
ama
21
15
1
-
2
-
2
1
Nik
ao-P
anam
a13
6
2
-
2
3
-
-
Rua
au-A
rere
nga-
Aro
rang
i41
31
-
-
-
1
8
1
A
kaoa
-Bet
ela-
Aro
rang
i17
15
-
-
1
-
-
1
M
urie
nua-
Aro
rang
i 2
1
-
-
-
-
1
-
Ti
tikav
eka
19
17
1
-
1
-
-
-
Nga
tang
iia16
13
-
-
2
-
-
1
M
atav
era
30
26
1
1
-
2
-
-
OTH
ER S
OU
THER
N IS
LAN
DS
538
28
9
38
4
25
26
2
15
4
A
ituta
ki24
5
56
9
-
13
18
2
147
Man
gaia
116
89
10
3
7
4
-
3
Atiu
75
54
14
-
2
4
-
1
M
auke
60
55
4
1
-
-
-
-
Miti
aro
42
35
1
-
3
-
-
3
NO
RTH
ERN
ISLA
ND
S19
4
186
5
-
-
-
-
3
P
alm
erst
on6
5
1
-
-
-
-
-
P
ukap
uka
73
71
1
-
-
-
-
1
Nas
sau
9
7
-
-
-
-
-
2
Man
ihik
i67
67
-
-
-
-
-
-
R
akah
anga
13
13
-
-
-
-
-
-
Pen
rhyn
26
23
3
-
-
-
-
-
CO
OK
ISLA
ND
S93
0
629
51
5
34
36
14
16
1
Loca
tion
of H
ouse
hold
Hou
seho
lds
Enga
ged
in
Fish
ing
Activ
ities
Prop
ortio
n of
Fis
h an
d O
ther
Sea
Pro
duct
s So
ld
Tabl
e 5.
9 N
umbe
r of H
ouse
hold
s En
gage
d in
Cap
ture
Fis
hing
by
Prop
ortio
n of
Fis
h an
d O
ther
Sea
Pro
duct
s So
ld a
nd L
ocat
ion
of H
ouse
hold
Sour
ce: C
ook
Isla
nds
2011
Cen
sus
of A
gric
ultu
re a
nd F
ishe
ries
TAB
LE S
ET 5
: FIS
HIN
G D
ETAI
LS
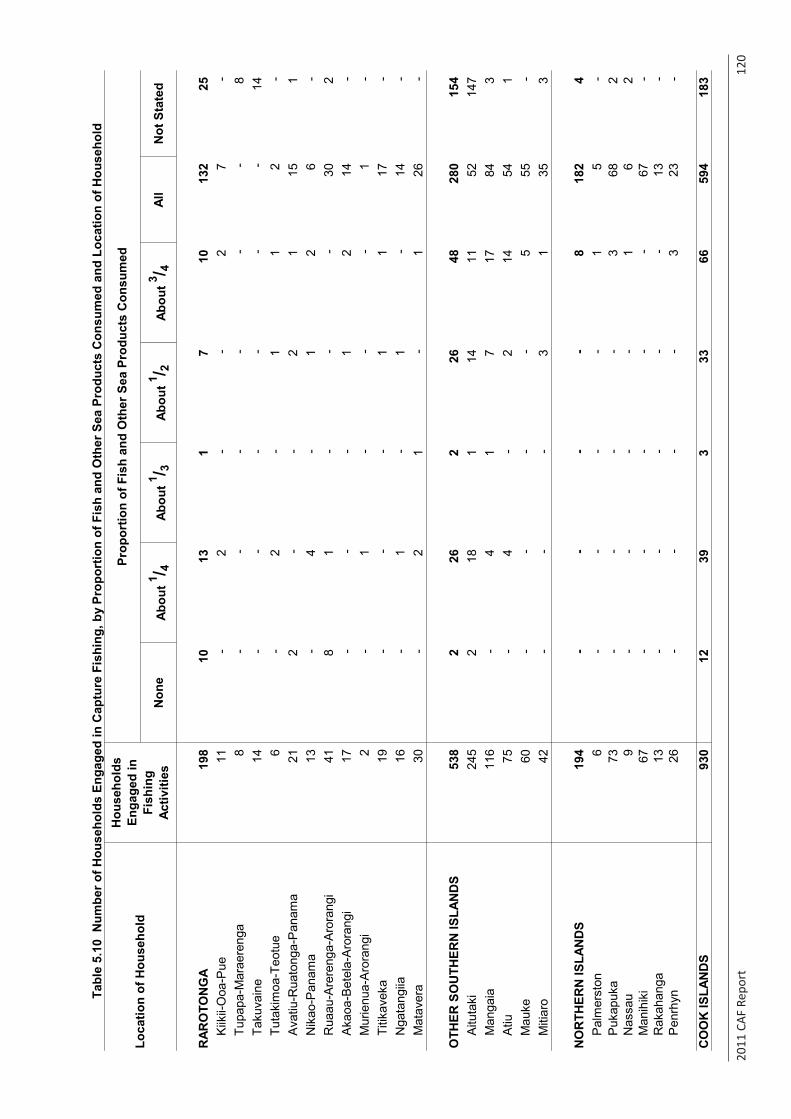
2011
CAF
Rep
ort
12
0
Non
eAb
out 1 / 4
Abou
t 1 / 3Ab
out 1 / 2
Abou
t 3 / 4Al
lN
ot S
tate
d
RAR
OTO
NG
A19
8
10
13
1
7
10
132
25
K
iikii-
Ooa
-Pue
11
-
2
-
-
2
7
-
Tu
papa
-Mar
aere
nga
8
-
-
-
-
-
-
8
Taku
vain
e14
-
-
-
-
-
-
14
Tu
taki
moa
-Teo
tue
6
-
2
-
1
1
2
-
Ava
tiu-R
uato
nga-
Pan
ama
21
2
-
-
2
1
15
1
Nik
ao-P
anam
a13
-
4
-
1
2
6
-
Rua
au-A
rere
nga-
Aro
rang
i41
8
1
-
-
-
30
2
A
kaoa
-Bet
ela-
Aro
rang
i17
-
-
-
1
2
14
-
M
urie
nua-
Aro
rang
i 2
-
1
-
-
-
1
-
Ti
tikav
eka
19
-
-
-
1
1
17
-
Nga
tang
iia16
-
1
-
1
-
14
-
M
atav
era
30
-
2
1
-
1
26
-
OTH
ER S
OU
THER
N IS
LAN
DS
538
2
26
2
26
48
28
0
15
4
A
ituta
ki24
5
2
18
1
14
11
52
14
7
M
anga
ia11
6
-
4
1
7
17
84
3
A
tiu75
-
4
-
2
14
54
1
Mau
ke60
-
-
-
-
5
55
-
M
itiar
o42
-
-
-
3
1
35
3
NO
RTH
ERN
ISLA
ND
S19
4
-
-
-
-
8
18
2
4
P
alm
erst
on6
-
-
-
-
1
5
-
P
ukap
uka
73
-
-
-
-
3
68
2
Nas
sau
9
-
-
-
-
1
6
2
Man
ihik
i67
-
-
-
-
-
67
-
R
akah
anga
13
-
-
-
-
-
13
-
Pen
rhyn
26
-
-
-
-
3
23
-
CO
OK
ISLA
ND
S93
0
12
39
3
33
66
59
4
18
3
Loca
tion
of H
ouse
hold
Hou
seho
lds
Enga
ged
in
Fish
ing
Activ
ities
Prop
ortio
n of
Fis
h an
d O
ther
Sea
Pro
duct
s C
onsu
med
Tabl
e 5.
10 N
umbe
r of H
ouse
hold
s En
gage
d in
Cap
ture
Fis
hing
, by
Prop
ortio
n of
Fis
h an
d O
ther
Sea
Pro
duct
s C
onsu
med
and
Loc
atio
n of
Hou
seho
ld
Sour
ce: C
ook
Isla
nds
2011
Cen
sus
of A
gric
ultu
re a
nd F
ishe
ries
TAB
LE S
ET 5
: FIS
HIN
G D
ETAI
LS

2011
CAF
Rep
ort
12
1
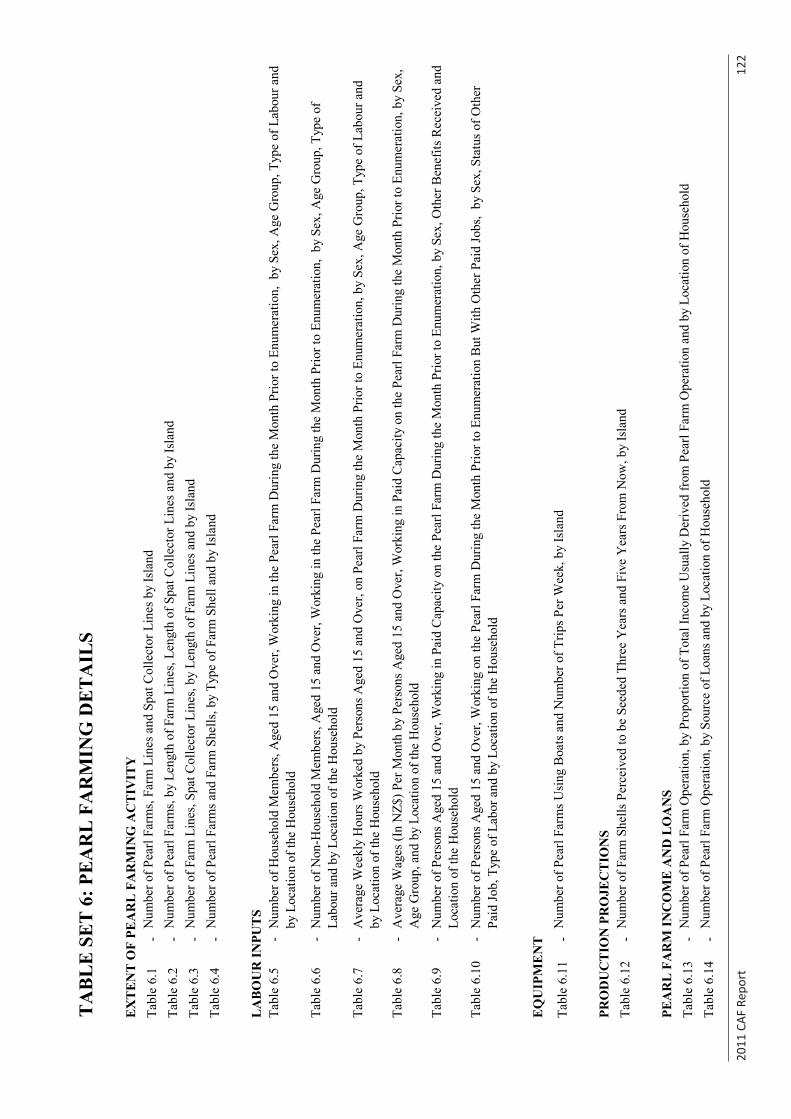
2011
CAF
Rep
ort
12
2
TA
BL
E S
ET
6: P
EAR
L F
AR
MIN
G D
ET
AIL
S
EX
TE
NT
OF
PEA
RL
FA
RM
ING
AC
TIV
ITY
Tabl
e 6.
1-
Num
ber o
f Pea
rl Fa
rms,
Farm
Lin
es a
nd S
pat C
olle
ctor
Lin
es b
y Is
land
Tabl
e 6.
2-
Num
ber o
f Pea
rl Fa
rms,
by L
engt
h of
Far
m L
ines
, Len
gth
of S
pat C
olle
ctor
Lin
es a
nd b
y Is
land
Tabl
e 6.
3-
Num
ber o
f Far
m L
ines
, Spa
t Col
lect
or L
ines
, by
Leng
th o
f Far
m L
ines
and
by
Isla
nd
Tabl
e 6.
4-
Num
ber o
f Pea
rl Fa
rms a
nd F
arm
She
lls, b
y Ty
pe o
f Far
m S
hell
and
by Is
land
LA
BO
UR
INPU
TS
Tabl
e 6.
5-
Num
ber o
f Hou
seho
ld M
embe
rs, A
ged
15 a
nd O
ver,
Wor
king
in th
e Pe
arl F
arm
Dur
ing
the
Mon
th P
rior t
o En
umer
atio
n, b
y Se
x, A
ge G
roup
, Typ
e of
Lab
our a
nd
by L
ocat
ion
of th
e H
ouse
hold
Tabl
e 6.
6-
Num
ber o
f Non
-Hou
seho
ld M
embe
rs, A
ged
15 a
nd O
ver,
Wor
king
in th
e Pe
arl F
arm
Dur
ing
the
Mon
th P
rior t
o En
umer
atio
n, b
y Se
x, A
ge G
roup
, Typ
e of
La
bour
and
by
Loca
tion
of th
e H
ouse
hold
Tabl
e 6.
7-
Ave
rage
Wee
kly
Hou
rs W
orke
d by
Per
sons
Age
d 15
and
Ove
r, on
Pea
rl Fa
rm D
urin
g th
e M
onth
Prio
r to
Enum
erat
ion,
by
Sex,
Age
Gro
up, T
ype
of L
abou
r and
by
Loc
atio
n of
the
Hou
seho
ld
Tabl
e 6.
8-
Ave
rage
Wag
es (I
n N
Z$) P
er M
onth
by
Pers
ons A
ged
15 a
nd O
ver,
Wor
king
in P
aid
Cap
acity
on
the
Pear
l Far
m D
urin
g th
e M
onth
Prio
r to
Enum
erat
ion,
by
Sex,
A
ge G
roup
, and
by
Loca
tion
of th
e H
ouse
hold
Tabl
e 6.
9-
Num
ber o
f Per
sons
Age
d 15
and
Ove
r, W
orki
ng in
Pai
d C
apac
ity o
n th
e Pe
arl F
arm
Dur
ing
the
Mon
th P
rior t
o En
umer
atio
n, b
y Se
x, O
ther
Ben
efits
Rec
eive
d an
d Lo
catio
n of
the
Hou
seho
ld
Tabl
e 6.
10-
Num
ber o
f Per
sons
Age
d 15
and
Ove
r, W
orki
ng o
n th
e Pe
arl F
arm
Dur
ing
the
Mon
th P
rior t
o En
umer
atio
n B
ut W
ith O
ther
Pai
d Jo
bs,
by S
ex, S
tatu
s of O
ther
Pa
id Jo
b, T
ype
of L
abor
and
by
Loca
tion
of th
e H
ouse
hold
EQ
UIP
ME
NT
Tabl
e 6.
11-
Num
ber o
f Pea
rl Fa
rms U
sing
Boa
ts a
nd N
umbe
r of T
rips P
er W
eek,
by
Isla
nd
PRO
DU
CT
ION
PR
OJE
CT
ION
STa
ble
6.12
-N
umbe
r of F
arm
She
lls P
erce
ived
to b
e Se
eded
Thr
ee Y
ears
and
Fiv
e Y
ears
Fro
m N
ow, b
y Is
land
PEA
RL
FA
RM
INC
OM
E A
ND
LO
AN
STa
ble
6.13
-N
umbe
r of P
earl
Farm
Ope
ratio
n, b
y Pr
opor
tion
of T
otal
Inco
me
Usu
ally
Der
ived
from
Pea
rl Fa
rm O
pera
tion
and
by L
ocat
ion
of H
ouse
hold
Tabl
e 6.
14-
Num
ber o
f Pea
rl Fa
rm O
pera
tion,
by
Sour
ce o
f Loa
ns a
nd b
y Lo
catio
n of
Hou
seho
ld
Sour
ce: C
ook
Isla
nds
2011
Cen
sus
of A
gric
ultu
re a
nd F
ishe
ries
TAB
LE S
ET 6
: PEA
RL
FAR
MIN
G D
ETA
ILS
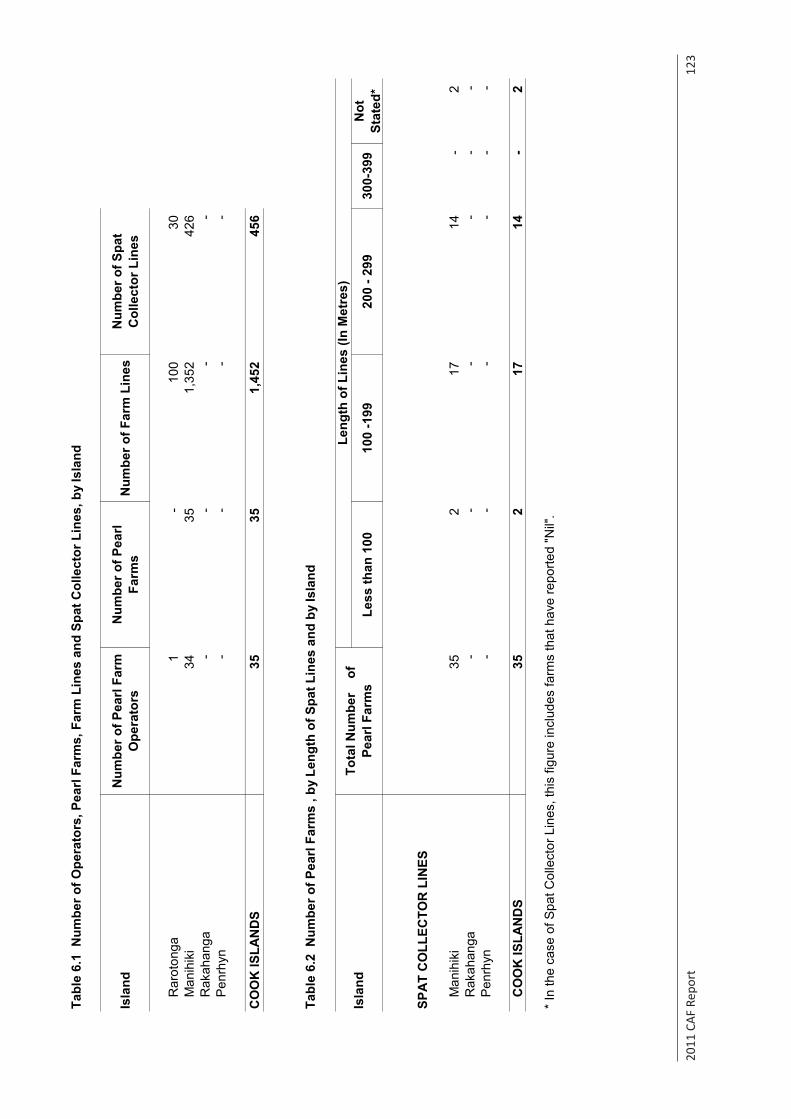
2011
CAF
Rep
ort
12
3
Tabl
e 6.
1 N
umbe
r of O
pera
tors
, Pea
rl Fa
rms,
Far
m L
ines
and
Spa
t Col
lect
or L
ines
, by
Isla
nd
Isla
ndN
umbe
r of P
earl
Farm
O
pera
tors
Num
ber o
f Pea
rl
Farm
sN
umbe
r of F
arm
Lin
esN
umbe
r of S
pat
Col
lect
or L
ines
Rar
oton
ga1
-
10
0
30
M
anih
iki
34
35
1,35
2
42
6
Rak
ahan
ga-
-
-
-
P
enrh
yn-
-
-
-
CO
OK
ISLA
ND
S35
35
1,
452
456
Tabl
e 6.
2 N
umbe
r of P
earl
Farm
s , b
y Le
ngth
of S
pat L
ines
and
by
Isla
nd
Less
than
100
100
-199
200
- 299
300-
399
Not
St
ated
*
SPA
T C
OLL
ECTO
R L
INES
Man
ihik
i35
2
17
14
-
2
R
akah
anga
-
-
-
-
-
-
Pen
rhyn
-
-
-
-
-
-
CO
OK
ISLA
ND
S35
2
17
14
-
2
* In
the
case
of S
pat C
olle
ctor
Lin
es, t
his
figur
e in
clud
es fa
rms
that
hav
e re
porte
d "N
il".
Leng
th o
f Lin
es (I
n M
etre
s)To
tal N
umbe
r o
f Pe
arl F
arm
sIs
land
Sour
ce: C
ook
Isla
nds
2011
Cen
sus
of A
gric
ultu
re a
nd F
ishe
ries
TAB
LE S
ET 6
: PEA
RL
FAR
MIN
G D
ETAI
LS
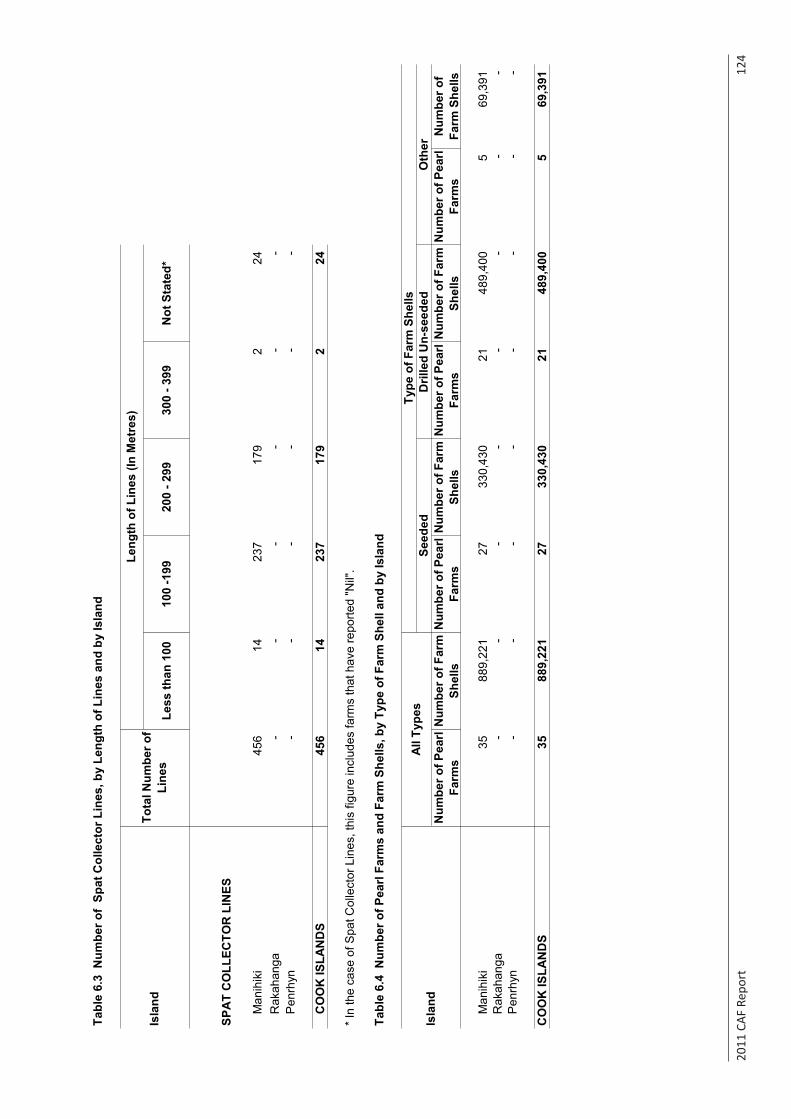
2011
CAF
Rep
ort
12
4
Tabl
e 6.
3 N
umbe
r of
Spat
Col
lect
or L
ines
, by
Leng
th o
f Lin
es a
nd b
y Is
land
Less
than
100
100
-199
200
- 299
300
- 399
Not
Sta
ted*
SPA
T C
OLL
ECTO
R L
INES
Man
ihik
i45
6
14
23
7
179
2
24
Rak
ahan
ga-
-
-
-
-
-
P
enrh
yn-
-
-
-
-
-
CO
OK
ISLA
ND
S45
6
14
23
7
179
2
24
* In
the
case
of S
pat C
olle
ctor
Lin
es, t
his
figur
e in
clud
es fa
rms
that
hav
e re
porte
d "N
il".
Tabl
e 6.
4 N
umbe
r of P
earl
Farm
s an
d Fa
rm S
hells
, by
Type
of F
arm
She
ll an
d by
Isla
nd
Num
ber o
f Pea
rl Fa
rms
Num
ber o
f Far
m
Shel
lsN
umbe
r of P
earl
Farm
sN
umbe
r of F
arm
Sh
ells
Num
ber o
f Pea
rl Fa
rms
Num
ber o
f Far
m
Shel
lsN
umbe
r of P
earl
Farm
sN
umbe
r of
Farm
She
lls
Man
ihik
i35
889,
221
27
330,
430
21
489,
400
5
69
,391
Rak
ahan
ga-
-
-
-
-
-
-
-
P
enrh
yn-
-
-
-
-
-
-
-
CO
OK
ISLA
ND
S35
889,
221
27
330,
430
21
489,
400
5
69
,391
Isla
ndTo
tal N
umbe
r of
Line
s
Leng
th o
f Lin
es (I
n M
etre
s)
Isla
ndA
ll Ty
pes
Type
of F
arm
She
llsSe
eded
Dril
led
Un-
seed
edO
ther
Sour
ce: C
ook
Isla
nds
2011
Cen
sus
of A
gric
ultu
re a
nd F
ishe
ries
TAB
LE S
ET 6
: PEA
RL
FAR
MIN
G D
ETA
ILS
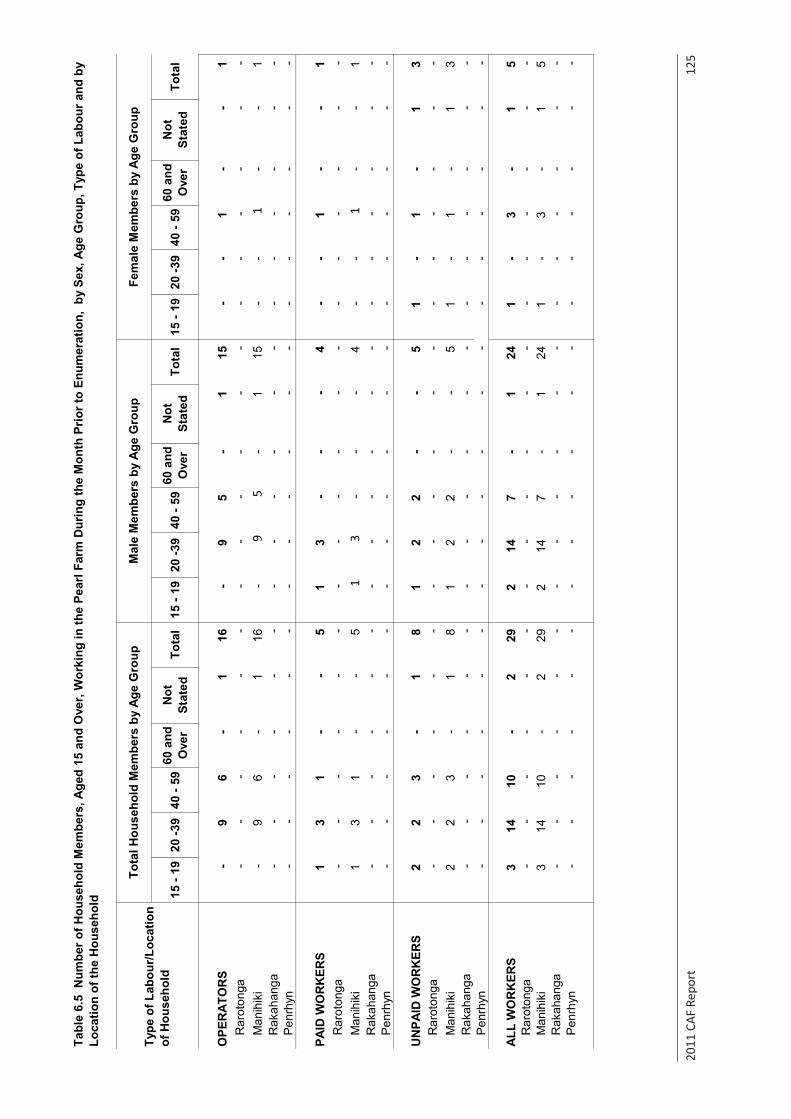
2011
CAF
Rep
ort
12
5
15 -
1920
-39
40 -
5960
and
O
ver
Not
St
ated
Tota
l15
- 19
20 -3
940
- 59
60 a
nd
Ove
rN
ot
Stat
edTo
tal
15 -
1920
-39
40 -
5960
and
O
ver
Not
St
ated
Tota
l
OPE
RAT
OR
S-
9
6
-
1
16
-
9
5
-
1
15
-
-
1
-
-
1
R
arot
onga
-
-
-
-
-
-
-
-
-
-
-
-
-
-
-
-
-
-
M
anih
iki
-
9
6
-
1
16
-
95
-
1
15
-
-
1-
-
1
R
akah
anga
-
-
-
-
-
-
-
-
-
-
-
-
-
-
-
-
-
-
Pe
nrhy
n-
-
-
-
-
-
-
-
-
-
-
-
-
-
-
-
-
-
PAID
WO
RK
ERS
1
3
1
-
-
5
1
3
-
-
-
4
-
-
1
-
-
1
R
arot
onga
-
-
-
-
-
-
-
-
-
-
-
-
-
-
-
-
-
-
M
anih
iki
1
3
1
-
-
5
1
3-
-
-
4
-
-
1
-
-
1
Rak
ahan
ga-
-
-
-
-
-
-
-
-
-
-
-
-
-
-
-
-
-
Penr
hyn
-
-
-
-
-
-
-
-
-
-
-
-
-
-
-
-
-
-
UN
PAID
WO
RK
ERS
2
2
3
-
1
8
1
2
2
-
-
5
1
-
1
-
1
3
R
arot
onga
-
-
-
-
-
-
-
-
-
-
-
-
-
-
-
-
-
-
M
anih
iki
2
2
3
-
1
8
1
2
2
-
-
5
1
-
1
-
1
3
R
akah
anga
-
-
-
-
-
-
-
-
-
-
-
-
-
-
-
-
-
-
Pe
nrhy
n-
-
-
-
-
-
-
-
-
-
-
-
-
-
-
-
-
-
ALL
WO
RK
ERS
3
14
10
-
2
29
2
14
7
-
1
24
1
-
3
-
1
5
R
arot
onga
-
-
-
-
-
-
-
-
-
-
-
-
-
-
-
-
-
-
M
anih
iki
3
14
10
-
2
29
2
14
7
-
1
24
1
-
3
-
1
5
R
akah
anga
-
-
-
-
-
-
-
-
-
-
-
-
-
-
-
-
-
-
Pe
nrhy
n-
-
-
-
-
-
-
-
-
-
-
-
-
-
-
-
-
-
Tabl
e 6.
5 N
umbe
r of H
ouse
hold
Mem
bers
, Age
d 15
and
Ove
r, W
orki
ng in
the
Pear
l Far
m D
urin
g th
e M
onth
Prio
r to
Enum
erat
ion,
by
Sex,
Age
Gro
up, T
ype
of L
abou
r and
by
Loca
tion
of th
e H
ouse
hold
Mal
e M
embe
rs b
y Ag
e G
roup
Fem
ale
Mem
bers
by
Age
Gro
upTo
tal H
ouse
hold
Mem
bers
by
Age
Gro
upTy
pe o
f Lab
our/L
ocat
ion
of H
ouse
hold
Sour
ce: C
ook
Isla
nds
2011
Cen
sus
of A
gric
ultu
re a
nd F
ishe
ries
TAB
LE S
ET 6
: PEA
RL
FAR
MIN
G D
ETAI
LS

2011
CAF
Rep
ort
12
6
15 -
1920
-39
40 -
5960
and
O
ver
Not
St
ated
Tota
l15
- 19
20 -3
940
- 59
60 a
nd
Ove
rN
ot
Stat
edTo
tal
15 -
1920
-39
40 -
5960
and
O
ver
Not
St
ated
Tota
l
OPE
RAT
OR
S-
13
6
-
1
20
-
13
5
-
1
19
-
-
1
-
-
1
R
arot
onga
-
-
-
-
-
-
-
-
-
-
-
-
-
-
-
-
-
-
M
anih
iki
-
13
6
-
1
20
-
13
5-
1
19
-
-
1-
-
1
Rak
ahan
ga-
-
-
-
-
-
-
-
-
-
-
-
-
-
-
-
-
-
Pen
rhyn
-
-
-
-
-
-
-
-
-
-
-
-
-
-
-
-
-
-
PAID
WO
RK
ERS
7
23
9
-
-
39
6
19
5
-
-
30
1
4
4
-
-
9
R
arot
onga
-
4
-
-
-
-
-
3
-
-
-
3
-
1-
-
-
1
Man
ihik
i7
19
9
-
-
35
6
16
5
-
-
27
1
34
-
-
8
R
akah
anga
-
-
-
-
-
-
-
-
-
-
-
-
-
-
-
-
-
-
P
enrh
yn-
-
-
-
-
-
-
-
-
-
-
-
-
-
-
-
-
-
UN
PAID
WO
RK
ERS
2
7
4
-
-
13
2
4
2
-
-
8
-
3
2
-
-
5
Rar
oton
ga-
-
-
-
-
-
-
-
-
-
-
-
-
-
-
-
-
-
Man
ihik
i2
7
4
-
-
13
2
4
2
-
-
8
-
3
2
-
-
5
R
akah
anga
-
-
-
-
-
-
-
-
-
-
-
-
-
-
-
-
-
-
P
enrh
yn-
-
-
-
-
-
-
-
-
-
-
-
-
-
-
-
-
-
ALL
WO
RK
ERS
9
43
19
-
1
72
8
36
12
-
1
57
1
7
7
-
-
15
R
arot
onga
-
4
-
-
-
-
-
3
-
-
-
3
-
1
-
-
-
1
M
anih
iki
9
39
19
-
1
68
8
33
12
-
1
54
1
6
7
-
-
14
R
akah
anga
-
-
-
-
-
-
-
-
-
-
-
-
-
-
-
-
-
-
P
enrh
yn-
-
-
-
-
-
-
-
-
-
-
-
-
-
-
-
-
-
Type
of L
abou
r/ Lo
catio
n of
H
ouse
hold
Tota
l Non
-Hou
seho
ld M
embe
rs b
y Ag
e G
roup
Mal
e M
embe
rs b
y Ag
e G
roup
Fem
ale
Mem
bers
by
Age
Gro
up
Tabl
e 6.
6 N
umbe
r of N
on-H
ouse
hold
Mem
bers
, Age
d 15
and
Ove
r, W
orki
ng in
the
Pear
l Far
m D
urin
g th
e M
onth
Prio
r to
Enum
erat
ion,
by
Sex,
Age
Gro
up, T
ype
of L
abou
r and
by
Loc
atio
n of
the
Hou
seho
ld
Sour
ce: 2
011
Cen
sus
of A
gric
ultu
re a
nd F
ishe
ries
TAB
LE S
ET 6
: PEA
RL
FAR
MIN
G
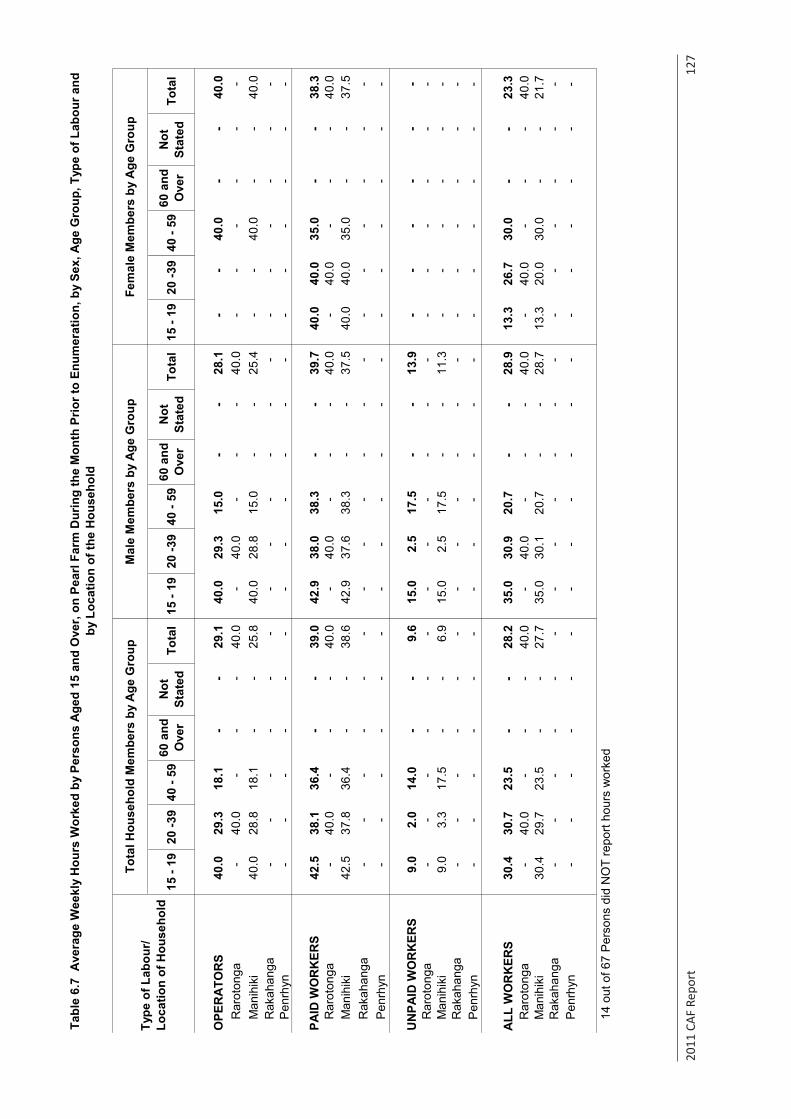
2011
CAF
Rep
ort
12
7
15 -
1920
-39
40 -
5960
and
O
ver
Not
St
ated
Tota
l15
- 19
20 -3
940
- 59
60 a
nd
Ove
rN
ot
Stat
edTo
tal
15 -
1920
-39
40 -
5960
and
O
ver
Not
St
ated
Tota
l
OPE
RA
TOR
S40
.0
29.3
18
.1
-
-
29.1
40
.0
29.3
15
.0
-
-
28.1
-
-
40
.0
-
-
40.0
R
arot
onga
-
40.0
-
-
-
40
.0
-
40.0
-
-
-
40
.0
-
-
-
-
-
-
Man
ihik
i40
.0
28.8
18
.1
-
-
25.8
40
.0
28.8
15
.0
-
-
25.4
-
-
40
.0
-
-
40.0
R
akah
anga
-
-
-
-
-
-
-
-
-
-
-
-
-
-
-
-
-
-
Pen
rhyn
-
-
-
-
-
-
-
-
-
-
-
-
-
-
-
-
-
-
PAID
WO
RK
ERS
42.5
38
.1
36.4
-
-
39
.0
42.9
38
.0
38.3
-
-
39
.7
40.0
40
.0
35.0
-
-
38
.3
Rar
oton
ga-
40
.0
-
-
-
40.0
-
40
.0
-
-
-
40.0
-
40
.0
-
-
-
40.0
M
anih
iki
42.5
37
.8
36.4
-
-
38
.6
42.9
37
.6
38.3
-
-
37
.5
40.0
40
.0
35.0
-
-
37
.5
Rak
ahan
ga-
-
-
-
-
-
-
-
-
-
-
-
-
-
-
-
-
-
P
enrh
yn-
-
-
-
-
-
-
-
-
-
-
-
-
-
-
-
-
-
UN
PAID
WO
RK
ERS
9.0
2.0
14.0
-
-
9.
6
15
.0
2.5
17.5
-
-
13
.9
-
-
-
-
-
-
Rar
oton
ga-
-
-
-
-
-
-
-
-
-
-
-
-
-
-
-
-
-
M
anih
iki
9.0
3.3
17.5
-
-
6.
9
15
.0
2.5
17.5
-
-
11
.3
-
-
-
-
-
-
Rak
ahan
ga-
-
-
-
-
-
-
-
-
-
-
-
-
-
-
-
-
-
P
enrh
yn-
-
-
-
-
-
-
-
-
-
-
-
-
-
-
-
-
-
ALL
WO
RK
ERS
30.4
30
.7
23.5
-
-
28
.2
35.0
30
.9
20.7
-
-
28
.9
13.3
26
.7
30.0
-
-
23
.3
Rar
oton
ga-
40
.0
-
-
-
40.0
-
40
.0
-
-
-
40.0
-
40
.0
-
-
-
40.0
M
anih
iki
30.4
29
.7
23.5
-
-
27
.7
35.0
30
.1
20.7
-
-
28
.7
13.3
20
.0
30.0
-
-
21
.7
Rak
ahan
ga-
-
-
-
-
-
-
-
-
-
-
-
-
-
-
-
-
-
P
enrh
yn-
-
-
-
-
-
-
-
-
-
-
-
-
-
-
-
-
-
14 o
ut o
f 67
Per
sons
did
NO
T re
port
hour
s w
orke
d
Type
of L
abou
r/ Lo
catio
n of
Hou
seho
ld
Tota
l Hou
seho
ld M
embe
rs b
y A
ge G
roup
Mal
e M
embe
rs b
y A
ge G
roup
Fem
ale
Mem
bers
by
Age
Gro
up
Tabl
e 6.
7 A
vera
ge W
eekl
y H
ours
Wor
ked
by P
erso
ns A
ged
15 a
nd O
ver,
on P
earl
Farm
Dur
ing
the
Mon
th P
rior t
o En
umer
atio
n, b
y Se
x, A
ge G
roup
, Typ
e of
Lab
our a
nd
by L
ocat
ion
of th
e H
ouse
hold
Sour
ce: C
ook
Isla
nds
2011
Cen
sus
of A
gric
ultu
re a
nd F
ishe
ries
TAB
LE S
ET 6
: PEA
RL
FAR
MIN
G D
ETAI
LS
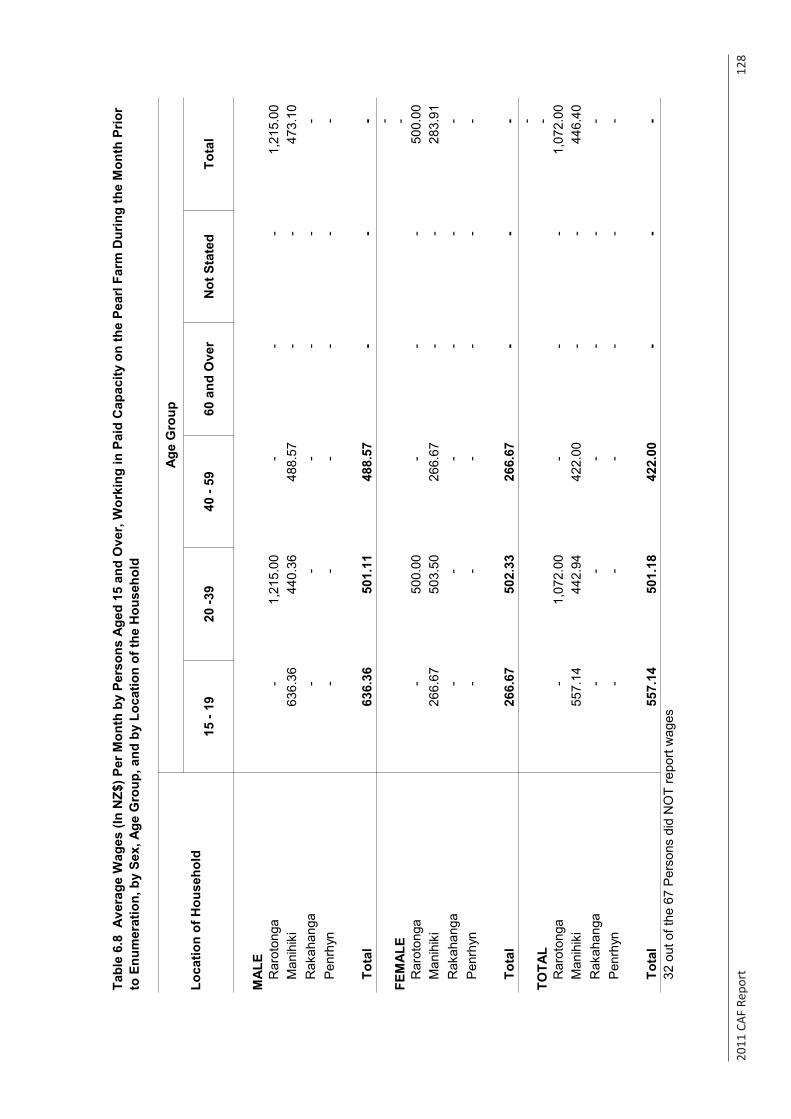
2011
CAF
Rep
ort
12
8
15 -
1920
-39
40 -
5960
and
Ove
rN
ot S
tate
dTo
tal
MAL
ER
arot
onga
-
1,
215.
00
-
-
-
1,
215.
00
Man
ihik
i63
6.36
440.
36
48
8.57
-
-
473.
10
R
akah
anga
-
-
-
-
-
-
Penr
hyn
-
-
-
-
-
-
Tota
l63
6.36
501.
11
48
8.57
-
-
-
-
FE
MAL
E-
Rar
oton
ga-
500.
00
-
-
-
500.
00
M
anih
iki
266.
67
50
3.50
266.
67
-
-
28
3.91
Rak
ahan
ga-
-
-
-
-
-
Pe
nrhy
n-
-
-
-
-
-
Tota
l26
6.67
502.
33
26
6.67
-
-
-
-
TO
TAL
-
R
arot
onga
-
1,
072.
00
-
-
-
1,
072.
00
Man
ihik
i55
7.14
442.
94
42
2.00
-
-
446.
40
R
akah
anga
-
-
-
-
-
-
Penr
hyn
-
-
-
-
-
-
Tota
l55
7.14
501.
18
42
2.00
-
-
-
32
out
of t
he 6
7 Pe
rson
s di
d N
OT
repo
rt w
ages
Age
Gro
up
Loca
tion
of H
ouse
hold
Tabl
e 6.
8 A
vera
ge W
ages
(In
NZ$
) Per
Mon
th b
y Pe
rson
s Ag
ed 1
5 an
d O
ver,
Wor
king
in P
aid
Cap
acity
on
the
Pear
l Far
m D
urin
g th
e M
onth
Prio
r to
Enu
mer
atio
n, b
y Se
x, A
ge G
roup
, and
by
Loca
tion
of th
e H
ouse
hold
Sour
ce: C
ook
Isla
nds
2011
Cen
sus
of A
gric
ultu
re a
nd F
ishe
ries
TAB
LE S
ET 6
: PEA
RL
FAR
MIN
G D
ETA
ILS
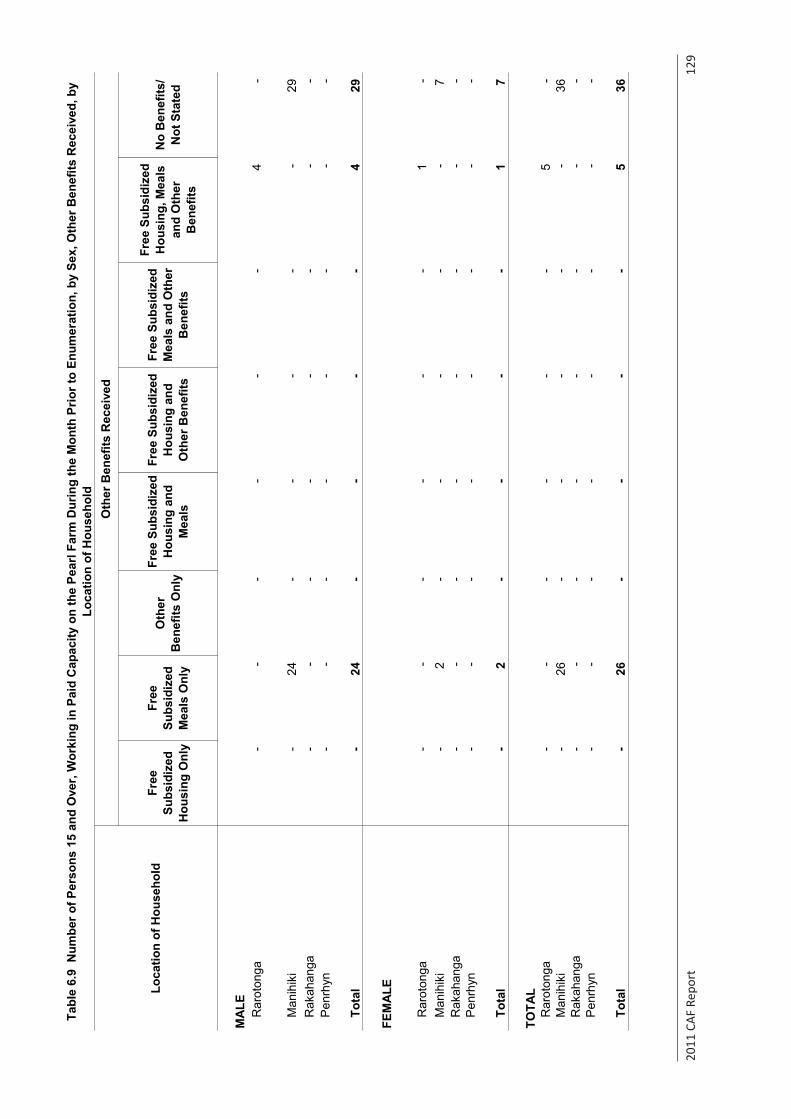
2011
CAF
Rep
ort
12
9
Free
Su
bsid
ized
H
ousi
ng O
nly
Free
Su
bsid
ized
M
eals
Onl
y
Oth
er
Ben
efits
Onl
y
Free
Sub
sidi
zed
Hou
sing
and
M
eals
Free
Sub
sidi
zed
Hou
sing
and
O
ther
Ben
efits
Free
Sub
sidi
zed
Mea
ls a
nd O
ther
B
enef
its
Free
Sub
sidi
zed
Hou
sing
, Mea
ls
and
Oth
er
Ben
efits
No
Ben
efits
/ N
ot S
tate
d
MAL
ER
arot
onga
-
-
-
-
-
-
4
-
Man
ihik
i-
24
-
-
-
-
-
29
R
akah
anga
-
-
-
-
-
-
-
-
Pen
rhyn
-
-
-
-
-
-
-
-
Tota
l-
24
-
-
-
-
4
29
FEM
ALE
Rar
oton
ga-
-
-
-
-
-
1
-
M
anih
iki
-
2
-
-
-
-
-
7
Rak
ahan
ga-
-
-
-
-
-
-
-
P
enrh
yn-
-
-
-
-
-
-
-
Tota
l-
2
-
-
-
-
1
7
TOTA
LR
arot
onga
-
-
-
-
-
-
5
-
Man
ihik
i-
26
-
-
-
-
-
36
R
akah
anga
-
-
-
-
-
-
-
-
Pen
rhyn
-
-
-
-
-
-
-
-
Tota
l-
26
-
-
-
-
5
36
Loca
tion
of H
ouse
hold
Tabl
e 6.
9 N
umbe
r of P
erso
ns 1
5 an
d O
ver,
Wor
king
in P
aid
Cap
acity
on
the
Pear
l Far
m D
urin
g th
e M
onth
Prio
r to
Enum
erat
ion,
by
Sex,
Oth
er B
enef
its R
ecei
ved,
by
Loca
tion
of H
ouse
hold
Oth
er B
enef
its R
ecei
ved
Sour
ce: C
ook
Isla
nds
2011
Cen
sus
of A
gric
ultu
re a
nd F
ishe
ries
TAB
LE S
ET 6
: PEA
RL
FAR
MIN
G D
ETAI
LS
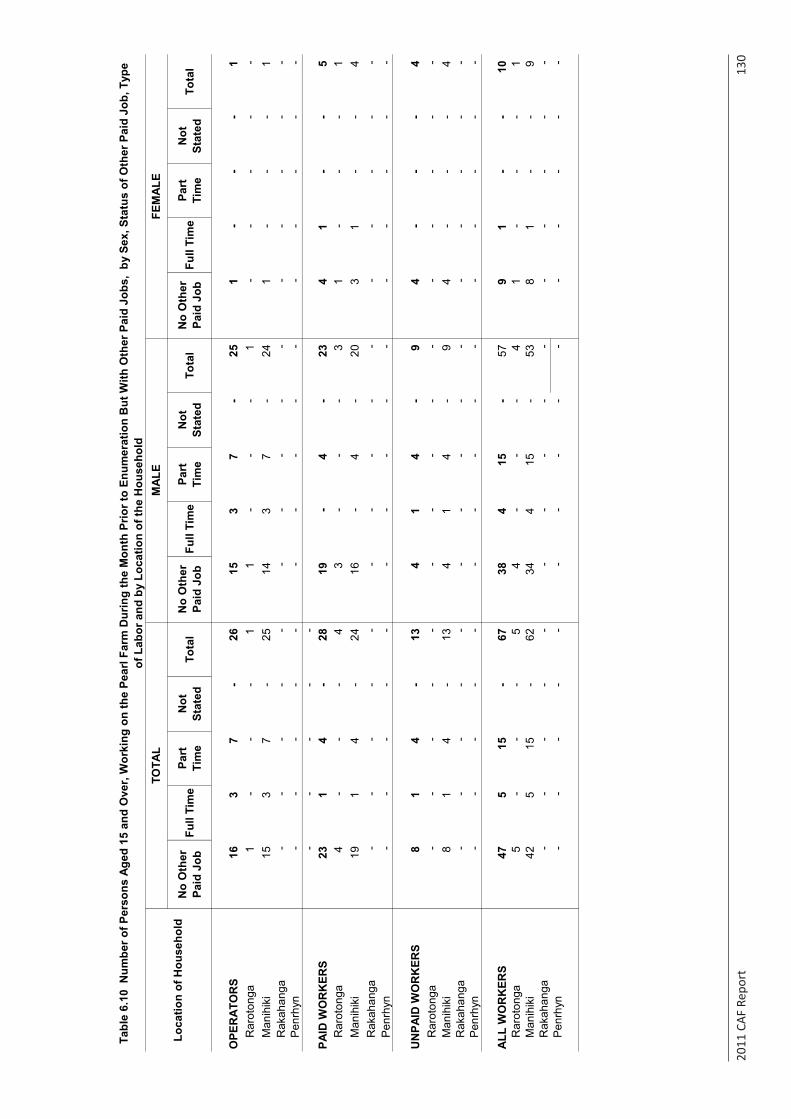
2011
CAF
Rep
ort
13
0
No
Oth
er
Paid
Job
Full
Tim
ePa
rt
Tim
eN
ot
Stat
edTo
tal
No
Oth
er
Paid
Job
Full
Tim
ePa
rt
Tim
eN
ot
Stat
edTo
tal
No
Oth
er
Paid
Job
Full
Tim
ePa
rt
Tim
eN
ot
Stat
edTo
tal
OPE
RAT
OR
S16
3
7
-
26
15
3
7
-
25
1
-
-
-
1
R
arot
onga
1
-
-
-
1
1
-
-
-
1
-
-
-
-
-
M
anih
iki
15
3
7
-
25
14
3
7
-
24
1
-
-
-
1
Rak
ahan
ga-
-
-
-
-
-
-
-
-
-
-
-
-
-
-
Penr
hyn
-
-
-
-
-
-
-
-
-
-
-
-
-
-
-
-
-
-
-
-
PAID
WO
RK
ERS
23
1
4
-
28
19
-
4
-
23
4
1
-
-
5
Rar
oton
ga4
-
-
-
4
3
-
-
-
3
1
-
-
-
1
M
anih
iki
19
1
4
-
24
16
-
4
-
20
3
1
-
-
4
Rak
ahan
ga-
-
-
-
-
-
-
-
-
-
-
-
-
-
-
Penr
hyn
-
-
-
-
-
-
-
-
-
-
-
-
-
-
-
UN
PAID
WO
RK
ERS
8
1
4
-
13
4
1
4
-
9
4
-
-
-
4
Rar
oton
ga-
-
-
-
-
-
-
-
-
-
-
-
-
-
-
Man
ihik
i8
1
4
-
13
4
1
4
-
9
4
-
-
-
4
R
akah
anga
-
-
-
-
-
-
-
-
-
-
-
-
-
-
-
Pe
nrhy
n-
-
-
-
-
-
-
-
-
-
-
-
-
-
-
ALL
WO
RK
ERS
47
5
15
-
67
38
4
15
-
57
9
1
-
-
10
R
arot
onga
5
-
-
-
5
4
-
-
-
4
1
-
-
-
1
Man
ihik
i42
5
15
-
62
34
4
15
-
53
8
1
-
-
9
Rak
ahan
ga-
-
-
-
-
-
-
-
-
-
-
-
-
-
-
Penr
hyn
-
-
-
-
-
-
-
-
-
-
-
-
-
-
-
TOTA
LM
ALE
FEM
ALE
Loca
tion
of H
ouse
hold
Tabl
e 6.
10 N
umbe
r of P
erso
ns A
ged
15 a
nd O
ver,
Wor
king
on
the
Pear
l Far
m D
urin
g th
e M
onth
Prio
r to
Enum
erat
ion
But
With
Oth
er P
aid
Jobs
, by
Sex
, Sta
tus
of O
ther
Pai
d Jo
b, T
ype
of L
abor
and
by
Loca
tion
of th
e H
ouse
hold
Sour
ce: C
ook
Isla
nds
2011
Cen
sus
of A
gric
ultu
re a
nd F
ishe
ries
TAB
LE S
ET 6
: PEA
RL
FAR
MIN
G D
ETAI
LS
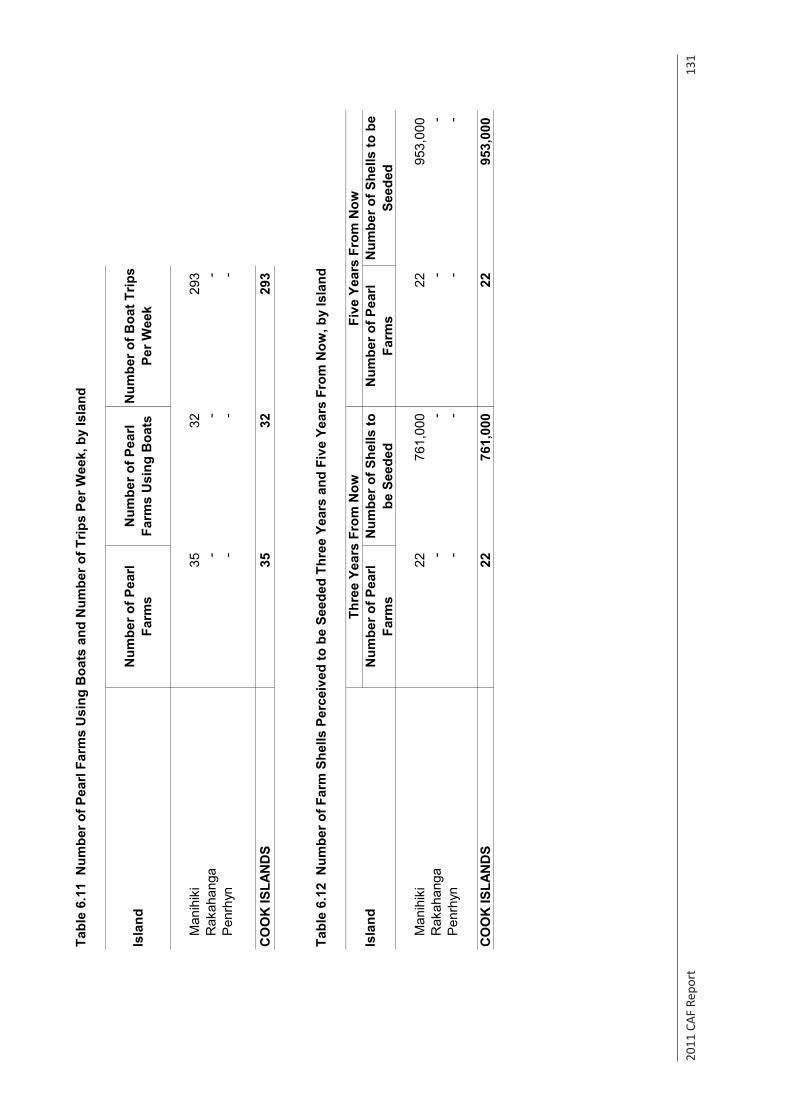
2011
CAF
Rep
ort
13
1
Tabl
e 6.
11 N
umbe
r of P
earl
Farm
s U
sing
Boa
ts a
nd N
umbe
r of T
rips
Per W
eek,
by
Isla
nd
Isla
ndN
umbe
r of P
earl
Fa
rms
Num
ber o
f Pea
rl
Farm
s U
sing
Boa
tsN
umbe
r of B
oat T
rips
Per W
eek
Man
ihik
i35
32
29
3
R
akah
anga
-
-
-
Pe
nrhy
n-
-
-
CO
OK
ISLA
ND
S35
32
29
3
Tabl
e 6.
12 N
umbe
r of F
arm
She
lls P
erce
ived
to b
e Se
eded
Thr
ee Y
ears
and
Fiv
e Ye
ars
From
Now
, by
Isla
nd
Num
ber o
f Pea
rl
Farm
sN
umbe
r of S
hells
to
be S
eede
dN
umbe
r of P
earl
Fa
rms
Num
ber o
f She
lls to
be
Seed
ed
Man
ihik
i22
76
1,00
0
22
95
3,00
0
Rak
ahan
ga-
-
-
-
Penr
hyn
-
-
-
-
CO
OK
ISLA
ND
S22
76
1,00
0
22
95
3,00
0
Isla
ndTh
ree
Year
s Fr
om N
owFi
ve Y
ears
Fro
m N
ow
Sour
ce: C
ook
Isla
nds
2011
Cen
sus
of A
gric
ultu
re a
nd F
ishe
ries
TAB
LE S
ET 6
: PEA
RL
FAR
MIN
G D
ETA
ILS
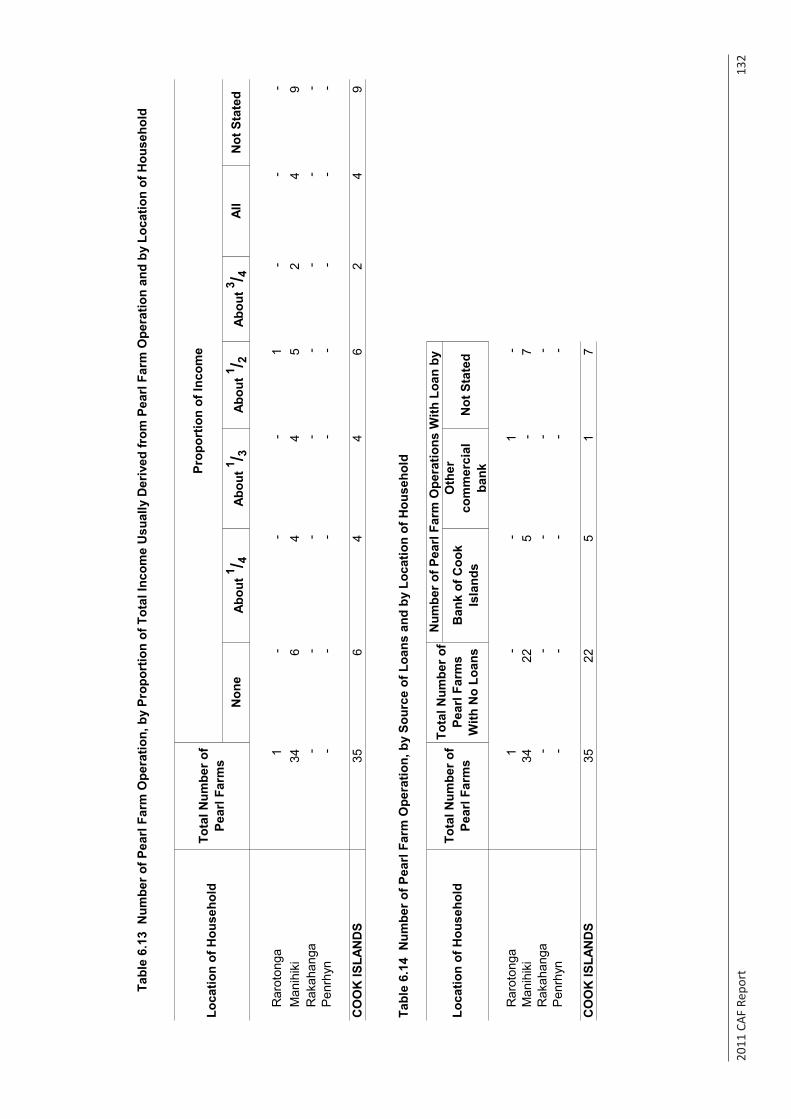
2011
CAF
Rep
ort
13
2
Non
eAb
out 1 / 4
Abou
t 1 / 3Ab
out 1 / 2
Abou
t 3 / 4Al
lN
ot S
tate
d
Rar
oton
ga1
-
-
-
1
-
-
-
Man
ihik
i34
6
4
4
5
2
4
9
Rak
ahan
ga-
-
-
-
-
-
-
-
Pen
rhyn
-
-
-
-
-
-
-
-
CO
OK
ISLA
ND
S35
6
4
4
6
2
4
9
Tabl
e 6.
14 N
umbe
r of P
earl
Farm
Ope
ratio
n, b
y So
urce
of L
oans
and
by
Loca
tion
of H
ouse
hold
Ban
k of
Coo
k Is
land
s
Oth
er
com
mer
cial
ba
nkN
ot S
tate
d
Rar
oton
ga1
-
-
1
-
Man
ihik
i34
22
5
-
7
R
akah
anga
-
-
-
-
-
P
enrh
yn-
-
-
-
-
CO
OK
ISLA
ND
S35
22
5
1
7
Tabl
e 6.
13 N
umbe
r of P
earl
Farm
Ope
ratio
n, b
y Pr
opor
tion
of T
otal
Inco
me
Usu
ally
Der
ived
from
Pea
rl Fa
rm O
pera
tion
and
by L
ocat
ion
of H
ouse
hold
Loca
tion
of H
ouse
hold
Tota
l Num
ber o
f Pe
arl F
arm
s
Tota
l Num
ber o
f Pe
arl F
arm
s W
ith N
o Lo
ans
Num
ber o
f Pea
rl Fa
rm O
pera
tions
With
Loa
n by
Loca
tion
of H
ouse
hold
Tota
l Num
ber o
f Pe
arl F
arm
sPr
opor
tion
of In
com
e
Sour
ce: 2
011
Cen
sus
of A
gric
ultu
re a
nd F
ishe
ries
TAB
LE S
ET 5
: PEA
RL
FAR
MIN
G
2011
CAF
Rep
ort
13
3
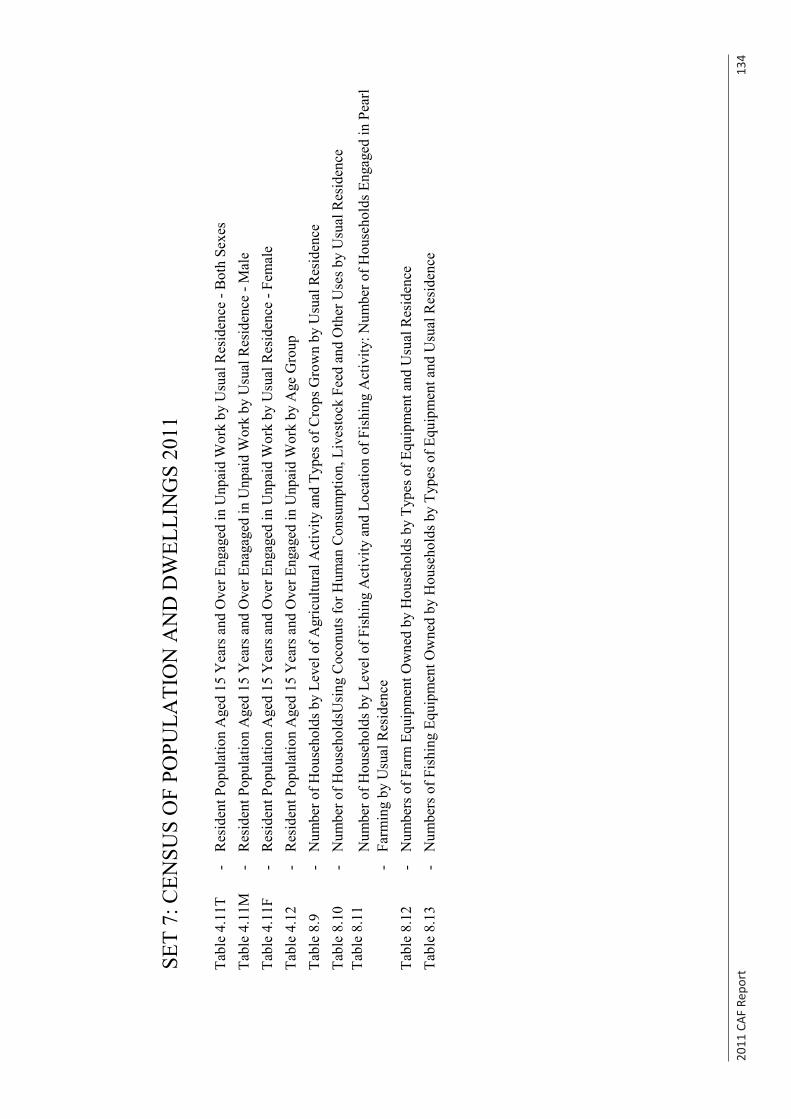
2011
CAF
Rep
ort
13
4
Tabl
e 4.
11T
-R
esid
ent P
opul
atio
n A
ged
15 Y
ears
and
Ove
r Eng
aged
in U
npai
d W
ork
by U
sual
Res
iden
ce -
Bot
h Se
xes
Tabl
e 4.
11M
-R
esid
ent P
opul
atio
n A
ged
15 Y
ears
and
Ove
r Ena
gage
d in
Unp
aid
Wor
k by
Usu
al R
esid
ence
- M
ale
Tabl
e 4.
11F
-R
esid
ent P
opul
atio
n A
ged
15 Y
ears
and
Ove
r Eng
aged
in U
npai
d W
ork
by U
sual
Res
iden
ce -
Fem
ale
Tabl
e 4.
12-
Tabl
e 8.
9-
Num
ber o
f Hou
seho
lds b
y Le
vel o
f Agr
icul
tura
l Act
ivity
and
Typ
es o
f Cro
ps G
row
n by
Usu
al R
esid
ence
Tabl
e 8.
10-
Num
ber o
f Hou
seho
ldsU
sing
Coc
onut
s for
Hum
an C
onsu
mpt
ion,
Liv
esto
ck F
eed
and
Oth
er U
ses b
y U
sual
Res
iden
ceTa
ble
8.11
-Ta
ble
8.12
-Ta
ble
8.13
-N
umbe
rs o
f Far
m E
quip
men
t Ow
ned
by H
ouse
hold
s by
Type
s of E
quip
men
t and
Usu
al R
esid
ence
Num
bers
of F
ishi
ng E
quip
men
t Ow
ned
by H
ouse
hold
s by
Type
s of E
quip
men
t and
Usu
al R
esid
ence
Res
iden
t Pop
ulat
ion
Age
d 15
Yea
rs a
nd O
ver E
ngag
ed in
Unp
aid
Wor
k by
Age
Gro
up
Num
ber o
f Hou
seho
lds b
y Le
vel o
f Fis
hing
Act
ivity
and
Loc
atio
n of
Fis
hing
Act
ivity
: Num
ber o
f Hou
seho
lds E
ngag
ed in
Pea
rl Fa
rmin
g by
Usu
al R
esid
ence
SET
7: C
ENSU
S O
F PO
PULA
TIO
N A
ND
DW
ELLI
NG
S 20
11
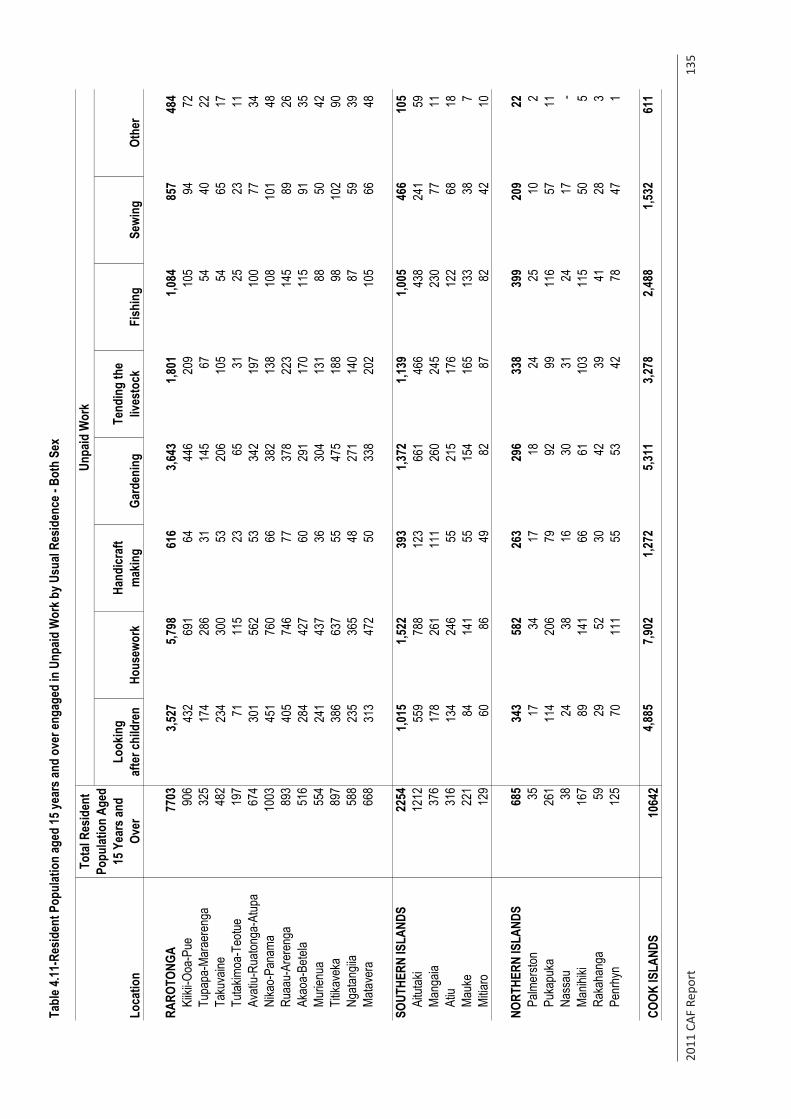
2011
CAF
Rep
ort
13
5
Tabl
e 4.11
-Res
iden
t Pop
ulat
ion
aged
15 ye
ars a
nd o
ver e
ngag
ed in
Unp
aid W
ork b
y Usu
al Re
siden
ce -
Both
Sex
Look
ing
afte
r chi
ldre
nHo
usew
ork
Hand
icraf
t m
akin
gGa
rden
ing
Tend
ing
the
lives
tock
Fish
ing
Sewi
ngOt
her
RARO
TONG
A77
033,5
27
5,7
98
61
6
3,643
1,801
1,084
857
48
4
Kiiki
i-Ooa
-Pue
906
432
69
1
64
44
6
209
10
5
94
72
Tupa
pa-M
arae
reng
a32
517
4
286
31
145
67
54
40
22
Ta
kuva
ine48
223
4
300
53
206
10
5
54
65
17
Tu
takim
oa-T
eotue
197
71
11
5
23
65
31
25
23
11
Avati
u-Ru
atong
a-At
upa
674
301
56
2
53
34
2
197
10
0
77
34
Nika
o-Pa
nama
1003
451
76
0
66
38
2
138
10
8
101
48
Ruaa
u-Ar
eren
ga89
340
5
746
77
378
22
3
145
89
26
Ak
aoa-
Betel
a51
628
4
427
60
291
17
0
115
91
35
Mu
rienu
a55
424
1
437
36
304
13
1
88
50
42
Tit
ikave
ka89
738
6
637
55
475
18
8
98
10
2
90
Ng
atang
iia58
823
5
365
48
271
14
0
87
59
39
Ma
taver
a66
831
3
472
50
338
20
2
105
66
48
SOUT
HERN
ISLA
NDS
2254
1,015
1,522
393
1,3
72
1,1
39
1,0
05
46
6
105
Ai
tutak
i12
1255
9
788
12
3
661
46
6
438
24
1
59
Ma
ngaia
376
178
26
1
111
26
0
245
23
0
77
11
Atiu
316
134
24
6
55
21
5
176
12
2
68
18
Mauk
e22
184
141
55
154
16
5
133
38
7
Mi
tiaro
129
60
86
49
82
87
82
42
10
NORT
HERN
ISLA
NDS
685
343
58
2
263
29
6
338
39
9
209
22
Palm
ersto
n35
17
34
17
18
24
25
10
2
Puka
puka
261
114
20
6
79
92
99
11
6
57
11
Nass
au38
24
38
16
30
31
24
17
-
Manih
iki16
789
141
66
61
10
3
115
50
5
Ra
kaha
nga
5929
52
30
42
39
41
28
3
Pe
nrhy
n12
570
111
55
53
42
78
47
1
COOK
ISLA
NDS
1064
24,8
85
7,9
02
1,2
72
5,3
11
3,2
78
2,4
88
1,5
32
61
1
Loca
tion
Unpa
id W
ork
Tota
l Res
iden
t Po
pulat
ion
Aged
15
Yea
rs an
d Ov
er
Cen
sus
of P
opul
atio
n an
d D
wel
lings
201
1C
ook
Isla
nds
Stat
istic
s O
ffice
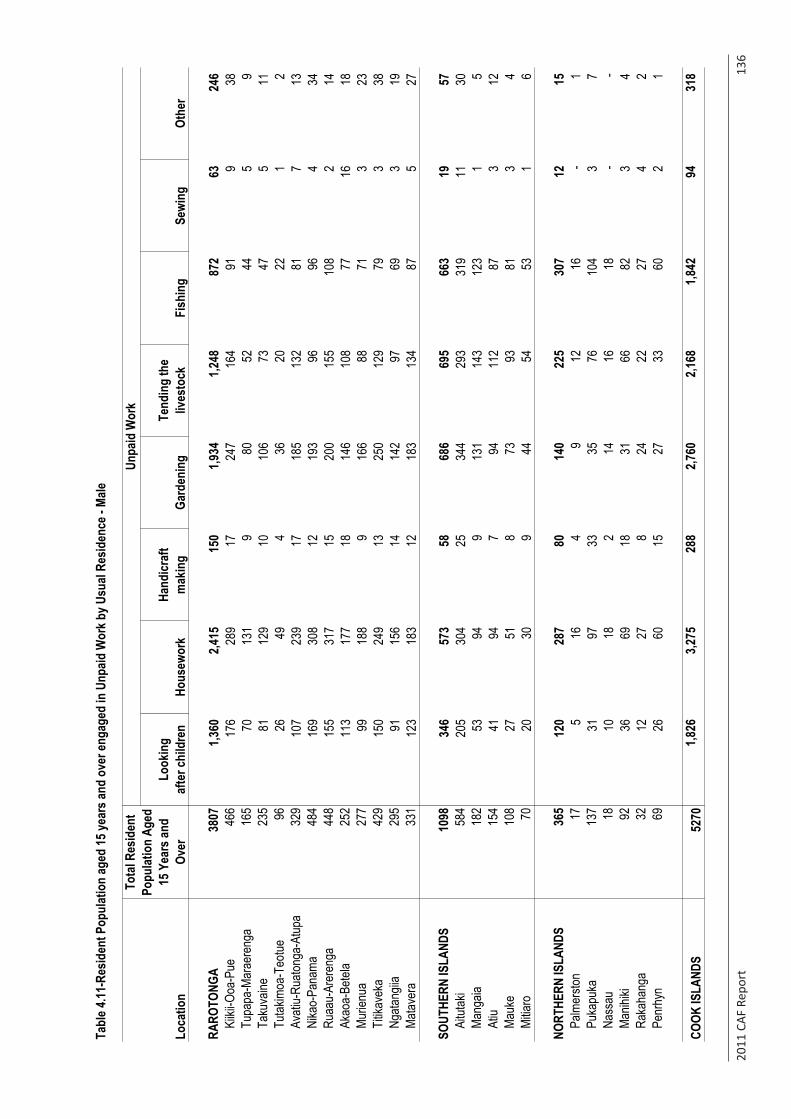
2011
CAF
Rep
ort
13
6
Tabl
e 4.11
-Res
iden
t Pop
ulat
ion
aged
15 ye
ars a
nd o
ver e
ngag
ed in
Unp
aid W
ork b
y Usu
al Re
siden
ce -
Male
Look
ing
afte
r chi
ldre
nHo
usew
ork
Hand
icraf
t m
akin
gGa
rden
ing
Tend
ing
the
lives
tock
Fish
ing
Sewi
ngOt
her
RARO
TONG
A38
071,3
60
2,415
15
0
1,9
34
1,248
87
2
63
246
Kiiki
i-Ooa
-Pue
466
176
289
17
24
7
16
4
91
9
38
Tu
papa
-Mar
aere
nga
165
70
13
1
9
80
52
44
5
9
Taku
vaine
235
81
12
9
10
106
73
47
5
11
Tu
takim
oa-T
eotue
9626
49
4
36
20
22
1
2
Avati
u-Ru
atong
a-At
upa
329
107
239
17
18
5
13
2
81
7
13
Ni
kao-
Pana
ma48
416
9
30
8
12
193
96
96
4
34
Ru
aau-
Arer
enga
448
155
317
15
20
0
15
5
10
8
2
14
Akao
a-Be
tela
252
113
177
18
14
6
10
8
77
16
18
Murie
nua
277
99
18
8
9
16
6
88
71
3
23
Titika
veka
429
150
249
13
25
0
12
9
79
3
38
Ng
atang
iia29
591
156
14
14
2
97
69
3
19
Matav
era
331
123
183
12
18
3
13
4
87
5
27
SOUT
HERN
ISLA
NDS
1098
346
573
58
68
6
69
5
66
3
19
57
Ai
tutak
i58
420
5
30
4
25
344
293
319
11
30
Mang
aia18
253
94
9
13
1
14
3
12
3
1
5
At
iu15
441
94
7
94
112
87
3
12
Mauk
e10
827
51
8
73
93
81
3
4
Mitia
ro70
20
30
9
44
54
53
1
6
NORT
HERN
ISLA
NDS
365
120
287
80
14
0
22
5
30
7
12
15
Pa
lmer
ston
175
16
4
9
12
16
-
1
Puka
puka
137
31
97
33
35
76
10
4
3
7
Na
ssau
1810
18
2
14
16
18
-
-
Manih
iki92
36
69
18
31
66
82
3
4
Raka
hang
a32
12
27
8
24
22
27
4
2
Pe
nrhy
n69
26
60
15
27
33
60
2
1
COOK
ISLA
NDS
5270
1,826
3,2
75
288
2,760
2,1
68
1,842
94
318
Loca
tion
Unpa
id W
ork
Tota
l Res
iden
t Po
pulat
ion
Aged
15
Yea
rs an
d Ov
er
Cen
sus
of P
opul
atio
n an
d D
wel
lings
201
1C
ook
Isla
nds
Stat
istic
s O
ffice
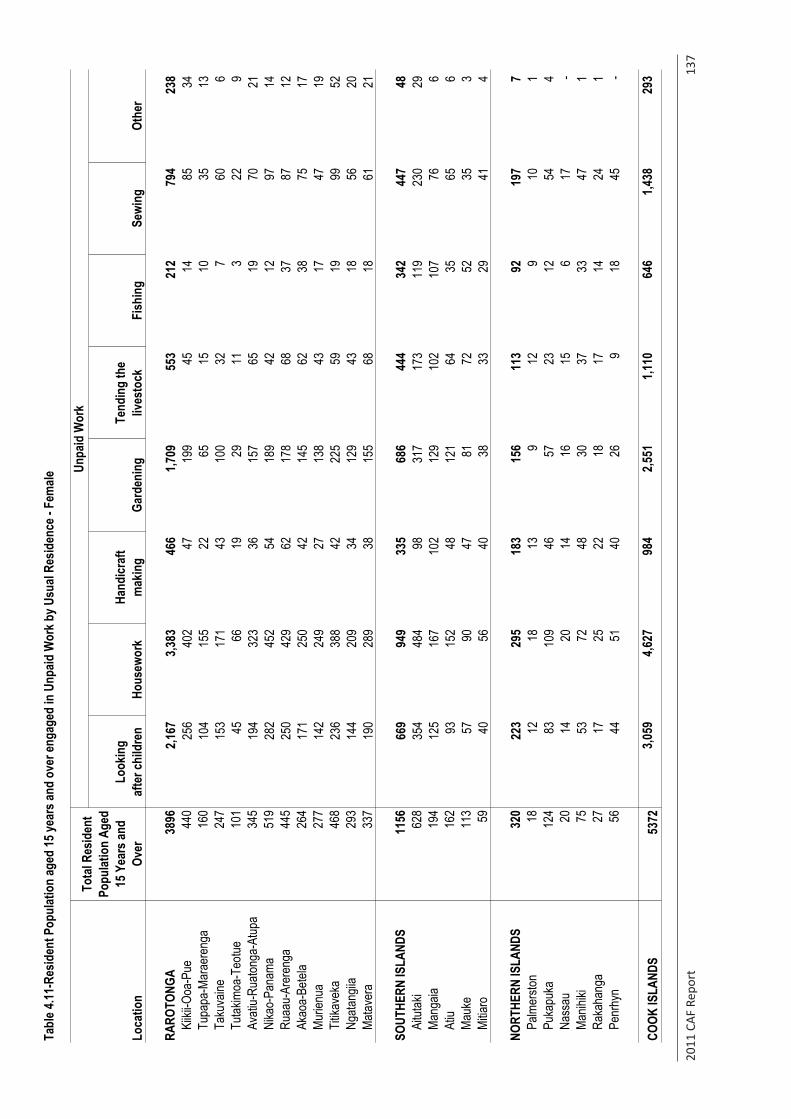
2011
CAF
Rep
ort
13
7
Tabl
e 4.11
-Res
iden
t Pop
ulat
ion
aged
15 ye
ars a
nd o
ver e
ngag
ed in
Unp
aid W
ork b
y Usu
al Re
siden
ce -
Fem
ale
Look
ing
afte
r chi
ldre
nHo
usew
ork
Hand
icraf
t m
akin
gGa
rden
ing
Tend
ing
the
lives
tock
Fish
ing
Sewi
ngOt
her
RARO
TONG
A38
962,1
67
3,383
46
6
1,7
09
553
212
794
238
Kiiki
i-Ooa
-Pue
440
256
402
47
19
9
45
14
85
34
Tu
papa
-Mar
aere
nga
160
104
155
22
65
15
10
35
13
Taku
vaine
247
153
171
43
10
0
32
7
60
6
Tu
takim
oa-T
eotue
101
45
66
19
29
11
3
22
9
Avati
u-Ru
atong
a-At
upa
345
194
323
36
15
7
65
19
70
21
Ni
kao-
Pana
ma51
928
2
45
2
54
189
42
12
97
14
Ruaa
u-Ar
eren
ga44
525
0
42
9
62
178
68
37
87
12
Akao
a-Be
tela
264
171
250
42
14
5
62
38
75
17
Mu
rienu
a27
714
2
24
9
27
138
43
17
47
19
Titika
veka
468
236
388
42
22
5
59
19
99
52
Ng
atang
iia29
314
4
20
9
34
129
43
18
56
20
Matav
era
337
190
289
38
15
5
68
18
61
21
SOUT
HERN
ISLA
NDS
1156
669
949
335
686
444
342
447
48
Ai
tutak
i62
835
4
48
4
98
317
173
119
230
29
Ma
ngaia
194
125
167
102
129
102
107
76
6
At
iu16
293
152
48
12
1
64
35
65
6
Mauk
e11
357
90
47
81
72
52
35
3
Mitia
ro59
40
56
40
38
33
29
41
4
NORT
HERN
ISLA
NDS
320
223
295
183
156
113
92
19
7
7
Pa
lmer
ston
1812
18
13
9
12
9
10
1
Puka
puka
124
83
10
9
46
57
23
12
54
4
Nass
au20
14
20
14
16
15
6
17
-
Manih
iki75
53
72
48
30
37
33
47
1
Ra
kaha
nga
2717
25
22
18
17
14
24
1
Penr
hyn
5644
51
40
26
9
18
45
-
COOK
ISLA
NDS
5372
3,059
4,6
27
984
2,551
1,1
10
646
1,438
29
3
Loca
tion
Unpa
id W
ork
Tota
l Res
iden
t Po
pulat
ion
Aged
15
Yea
rs an
d Ov
er
Cen
sus
of P
opul
atio
n an
d D
wel
lings
201
1C
ook
Isla
nds
Stat
istic
s O
ffice

2011 CAF Report 138
Table 4.12-Resident Population aged 15 years and over engaged in Unpaid Work by Age Group
Looking after
children HouseworkHandicraft
making GardeningTending the
livestock Fishing Sewing OtherBOTH SEXES
Total 10642 4,885 7,902 1,272 5,311 3,278 2,488 1,532 611 15-19 916 417 926 75 447 406 255 52 54 20-24 745 436 768 87 368 274 225 71 40 25-29 727 512 714 90 380 234 219 90 50 30-34 672 517 659 92 369 231 205 95 39 35-39 750 625 776 120 529 304 266 146 49 40-44 784 626 814 142 596 369 305 180 68 45-49 749 527 780 168 585 392 323 175 76 50-54 602 367 616 108 442 284 234 162 51 55-59 485 274 509 104 427 231 165 148 43 60-64 397 211 426 84 378 203 133 115 37 65-69 336 163 339 76 323 151 91 113 32 70-74 278 130 293 64 249 111 45 98 25 75-79 163 56 161 40 133 64 15 55 26 > 79 99 24 121 22 85 24 7 32 21
MALETotal 5270 1,826 3,275 288 2,760 2,168 1,842 94 318 15-19 484 127 426 19 285 295 202 6 27 20-24 365 165 327 32 216 198 181 10 24 25-29 345 186 290 24 209 149 162 8 26 30-34 309 186 262 32 178 142 149 9 21 35-39 351 238 310 25 256 174 180 9 19 40-44 387 255 328 41 292 238 229 17 32 45-49 366 217 335 36 316 259 238 12 36 50-54 311 146 257 20 228 184 170 7 34 55-59 246 102 219 18 211 158 119 7 21 60-64 213 82 186 18 198 143 102 4 19 65-69 172 56 129 10 148 98 63 2 18 70-74 139 42 108 6 121 73 33 1 16 75-79 77 19 56 5 62 40 10 1 14 > 79 42 5 42 2 40 17 4 1 11
FEMALETotal 5372 3,059 4,627 984 2,551 1,110 646 1,438 293 15-19 432 290 500 56 162 111 53 46 27 20-24 380 271 441 55 152 76 44 61 16 25-29 382 326 424 66 171 85 57 82 24 30-34 363 331 397 60 191 89 56 86 18 35-39 399 387 466 95 273 130 86 137 30 40-44 397 371 486 101 304 131 76 163 36 45-49 383 310 445 132 269 133 85 163 40 50-54 291 221 359 88 214 100 64 155 17 55-59 239 172 290 86 216 73 46 141 22 60-64 184 129 240 66 180 60 31 111 18 65-69 164 107 210 66 175 53 28 111 14 70-74 139 88 185 58 128 38 12 97 9 75-79 86 37 105 35 71 24 5 54 12 > 79 57 19 79 20 45 7 3 31 10
Age Group
Unpaid Work
Total Resident Populaion
Aged 15 Years and Over
Census of Population and Dwellings 2011 Cook Islands Statistics Office
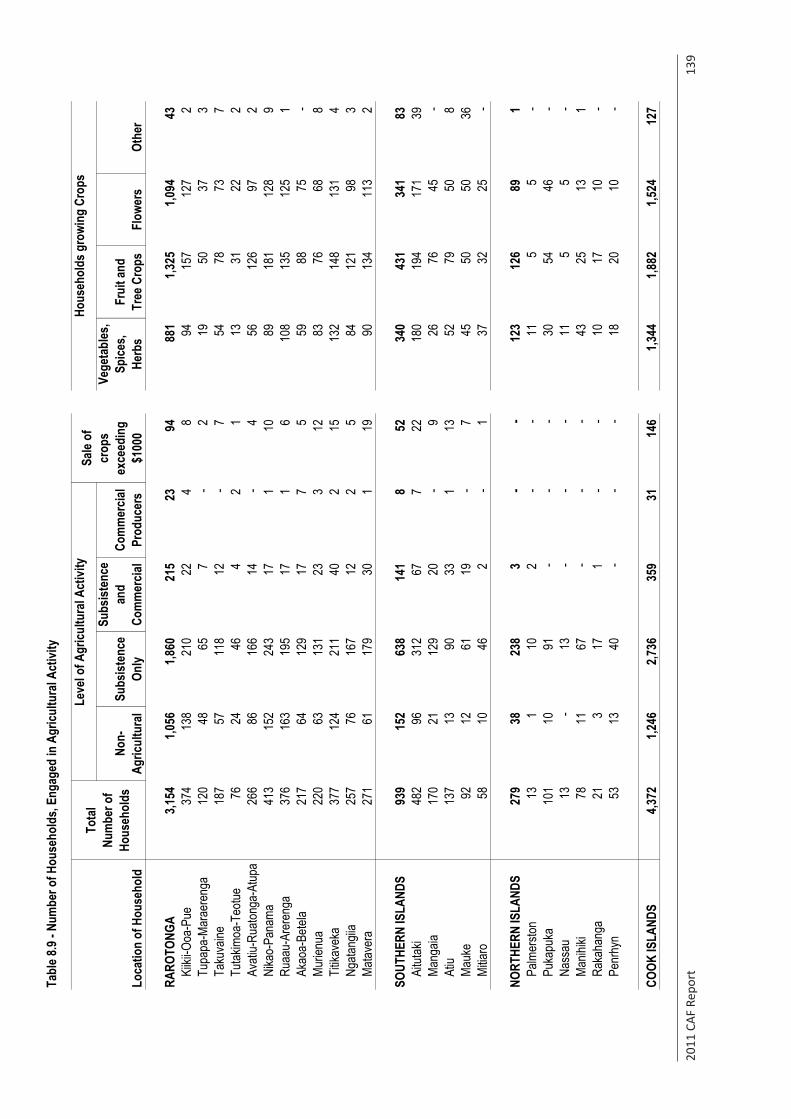
2011
CAF
Rep
ort
13
9
Tabl
e 8.9
- Num
ber o
f Hou
seho
lds,
Enga
ged
in A
gricu
ltura
l Act
ivity
Non-
Agric
ultu
ral
Subs
isten
ce
Only
Subs
isten
ce
and
Com
mer
cial
Com
mer
cial
Prod
ucer
s
Vege
tabl
es,
Spice
s, He
rbs
Frui
t and
Tr
ee C
rops
Flow
ers
Othe
r
RARO
TONG
A3,1
54
1,0
56
1,860
21
5
23
94
881
1,325
1,0
94
43
Kiiki
i-Ooa
-Pue
374
13
8
21
0
22
4
8
94
15
7
12
7
2
Tu
papa
-Mar
aere
nga
120
48
65
7
-
2
19
50
37
3
Ta
kuva
ine18
7
57
118
12
-
7
54
78
73
7
Tutak
imoa
-Teo
tue76
24
46
4
2
1
13
31
22
2
Av
atiu-
Ruato
nga-
Atup
a26
6
86
166
14
-
4
56
126
97
2
Nika
o-Pa
nama
413
15
2
24
3
17
1
10
89
181
128
9
Ruaa
u-Ar
eren
ga37
6
163
195
17
1
6
108
135
125
1
Akao
a-Be
tela
217
64
12
9
17
7
5
59
88
75
-
Mu
rienu
a22
0
63
131
23
3
12
83
76
68
8
Tit
ikave
ka37
7
124
211
40
2
15
13
2
14
8
13
1
4
Ng
atang
iia25
7
76
167
12
2
5
84
121
98
3
Matav
era
271
61
17
9
30
1
19
90
134
113
2
SOUT
HERN
ISLA
NDS
939
15
2
63
8
14
1
8
52
340
431
341
83
Aitut
aki
482
96
31
2
67
7
22
180
194
171
39
Mang
aia17
0
21
129
20
-
9
26
76
45
-
Atiu
137
13
90
33
1
13
52
79
50
8
Mauk
e92
12
61
19
-
7
45
50
50
36
Mi
tiaro
58
10
46
2
-
1
37
32
25
-
NORT
HERN
ISLA
NDS
279
38
23
8
3
-
-
12
3
12
6
89
1
Pa
lmer
ston
13
1
10
2
-
-
11
5
5
-
Puka
puka
101
10
91
-
-
-
30
54
46
-
Na
ssau
13
-
13
-
-
-
11
5
5
-
Manih
iki78
11
67
-
-
-
43
25
13
1
Ra
kaha
nga
21
3
17
1
-
-
10
17
10
-
Penr
hyn
53
13
40
-
-
-
18
20
10
-
COOK
ISLA
NDS
4,372
1,246
2,7
36
359
31
146
1,344
1,8
82
1,524
12
7
Loca
tion
of H
ouse
hold
Tota
l Nu
mbe
r of
Hous
ehol
ds
Leve
l of A
gricu
ltura
l Act
ivity
Sale
of
crop
s ex
ceed
ing
$100
0
Hous
ehol
ds g
rowi
ng C
rops
Cen
sus
of P
opul
atio
n an
d D
wel
lings
201
1C
ook
Isla
nds
Stat
istic
s O
ffice
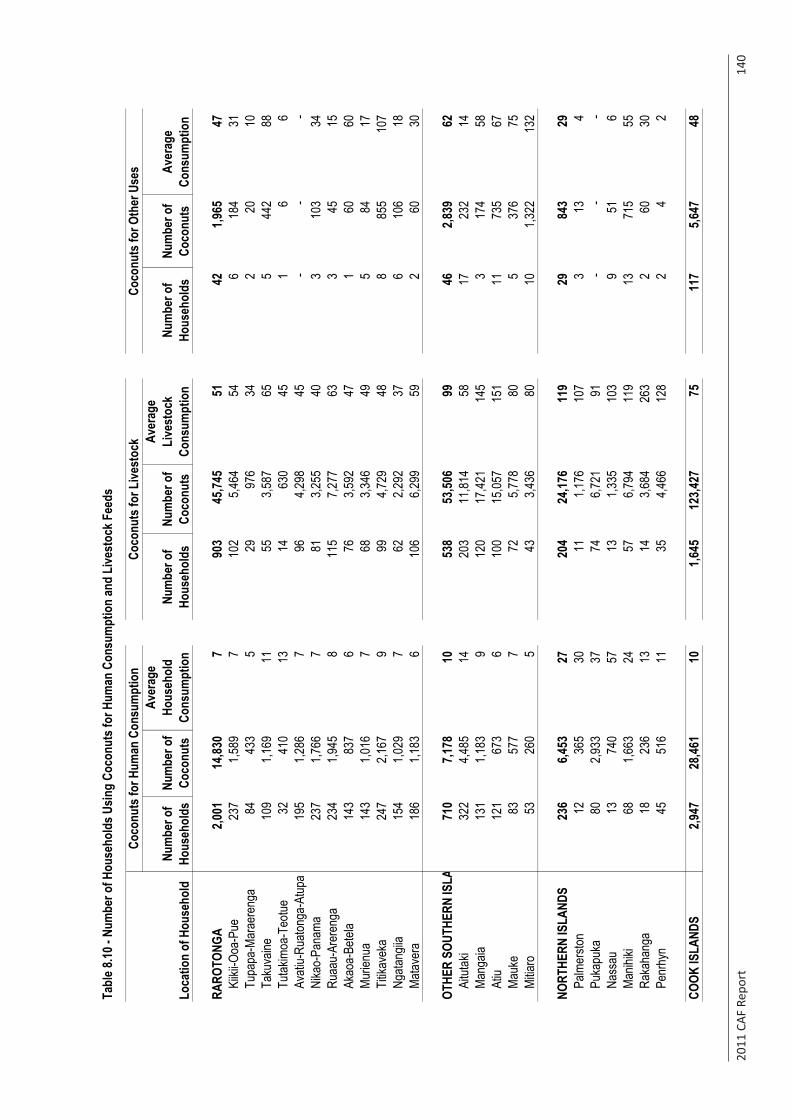
2011
CAF
Rep
ort
14
0
Tabl
e 8.10
- Nu
mbe
r of H
ouse
hold
s Usin
g Co
conu
ts fo
r Hum
an C
onsu
mpt
ion
and
Live
stoc
k Fee
ds
Num
ber o
f Ho
useh
olds
Num
ber o
f Co
conu
ts
Aver
age
Hous
ehol
d Co
nsum
ptio
nNu
mbe
r of
Hous
ehol
dsNu
mbe
r of
Coco
nuts
Aver
age
Live
stoc
k Co
nsum
ptio
nNu
mbe
r of
Hous
ehol
dsNu
mbe
r of
Coco
nuts
Aver
age
Cons
umpt
ion
RARO
TONG
A2,0
01
14
,830
7
90
3
45,74
5
51
42
1,965
47
Kiiki
i-Ooa
-Pue
237
1,589
7
102
5,4
64
54
6
184
31
Tu
papa
-Mar
aere
nga
84
433
5
29
976
34
2
20
10
Ta
kuva
ine10
9
1,1
69
11
55
3,587
65
5
44
2
88
Tutak
imoa
-Teo
tue32
41
0
13
14
63
0
45
1
6
6
Avati
u-Ru
atong
a-At
upa
195
1,286
7
96
4,2
98
45
-
-
-
Ni
kao-
Pana
ma23
7
1,7
66
7
81
3,255
40
3
10
3
34
Ruaa
u-Ar
eren
ga23
4
1,9
45
8
11
5
7,277
63
3
45
15
Akao
a-Be
tela
143
837
6
76
3,592
47
1
60
60
Murie
nua
143
1,016
7
68
3,3
46
49
5
84
17
Tit
ikave
ka24
7
2,1
67
9
99
4,729
48
8
85
5
10
7
Ngata
ngiia
154
1,029
7
62
2,2
92
37
6
106
18
Ma
taver
a18
6
1,1
83
6
10
6
6,299
59
2
60
30
OTHE
R SO
UTHE
RN IS
LAND
S71
0
7,1
78
10
53
8
53,50
6
99
46
2,839
62
Aitut
aki
322
4,485
14
203
11
,814
58
17
23
2
14
Mang
aia13
1
1,1
83
9
12
0
17,42
1
145
3
174
58
At
iu12
1
67
3
6
100
15
,057
15
1
11
73
5
67
Mauk
e83
57
7
7
72
5,7
78
80
5
376
75
Mi
tiaro
53
260
5
43
3,436
80
10
1,3
22
132
NORT
HERN
ISLA
NDS
236
6,453
27
204
24
,176
11
9
29
84
3
29
Palm
ersto
n12
36
5
30
11
1,1
76
107
3
13
4
Pu
kapu
ka80
2,9
33
37
74
6,721
91
-
-
-
Nass
au13
74
0
57
13
1,3
35
103
9
51
6
Ma
nihiki
68
1,663
24
57
6,7
94
119
13
715
55
Ra
kaha
nga
18
236
13
14
3,684
26
3
2
60
30
Penr
hyn
45
516
11
35
4,466
12
8
2
4
2
COOK
ISLA
NDS
2,947
28,46
1
10
1,645
123,4
27
75
117
5,6
47
48
Loca
tion
of H
ouse
hold
Coco
nuts
for H
uman
Con
sum
ptio
nCo
conu
ts fo
r Live
stoc
kCo
conu
ts fo
r Oth
er U
ses
Cen
sus
of P
opul
atio
n an
d D
wel
lings
201
1C
ook
Isla
nds
Stat
istic
s O
ffice
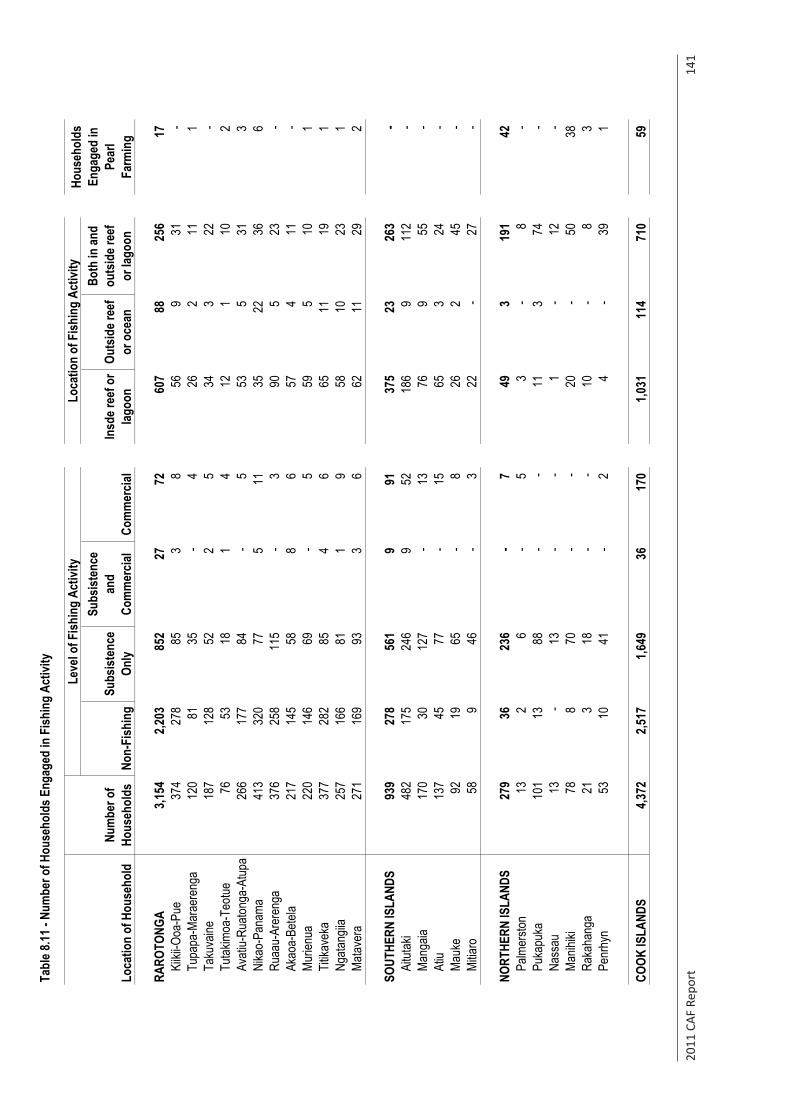
2011
CAF
Rep
ort
14
1
Tabl
e 8.11
- Nu
mbe
r of H
ouse
hold
s Eng
aged
in F
ishin
g Ac
tivity
Non-
Fish
ing
Subs
isten
ce
Only
Subs
isten
ce
and
Com
mer
cial
Com
mer
cial
Insd
e ree
f or
lagoo
nOu
tsid
e ree
f or
oce
an
Both
in an
d ou
tsid
e ree
f or
lago
on
RARO
TONG
A3,1
54
2,2
03
852
27
72
60
7
88
25
6
17
Ki
ikii-O
oa-P
ue37
4
278
85
3
8
56
9
31
-
Tu
papa
-Mar
aere
nga
120
81
35
-
4
26
2
11
1
Taku
vaine
187
12
8
52
2
5
34
3
22
-
Tutak
imoa
-Teo
tue76
53
18
1
4
12
1
10
2
Avati
u-Ru
atong
a-At
upa
266
17
7
84
-
5
53
5
31
3
Nika
o-Pa
nama
413
32
0
77
5
11
35
22
36
6
Ruaa
u-Ar
eren
ga37
6
258
115
-
3
90
5
23
-
Ak
aoa-
Betel
a21
7
145
58
8
6
57
4
11
-
Mu
rienu
a22
0
146
69
-
5
59
5
10
1
Tit
ikave
ka37
7
282
85
4
6
65
11
19
1
Ng
atang
iia25
7
166
81
1
9
58
10
23
1
Ma
taver
a27
1
169
93
3
6
62
11
29
2
SOUT
HERN
ISLA
NDS
939
27
8
56
1
9
91
375
23
263
-
Aitut
aki
482
17
5
24
6
9
52
186
9
112
-
Mang
aia17
0
30
127
-
13
76
9
55
-
At
iu13
7
45
77
-
15
65
3
24
-
Ma
uke
92
19
65
-
8
26
2
45
-
Mi
tiaro
58
9
46
-
3
22
-
27
-
NORT
HERN
ISLA
NDS
279
36
23
6
-
7
49
3
191
42
Palm
ersto
n13
2
6
-
5
3
-
8
-
Puka
puka
101
13
88
-
-
11
3
74
-
Nass
au13
-
13
-
-
1
-
12
-
Manih
iki78
8
70
-
-
20
-
50
38
Raka
hang
a21
3
18
-
-
10
-
8
3
Penr
hyn
53
10
41
-
2
4
-
39
1
COOK
ISLA
NDS
4,372
2,517
1,6
49
36
17
0
1,0
31
114
710
59
Loca
tion
of H
ouse
hold
Num
ber o
f Ho
useh
olds
Leve
l of F
ishin
g Ac
tivity
Loca
tion
of F
ishin
g Ac
tivity
Hous
ehol
ds
Enga
ged
in
Pear
l Fa
rmin
g
Cen
sus
of P
opul
atio
n an
d D
wel
lings
201
1C
ook
Isla
nds
Stat
istic
s O
ffice
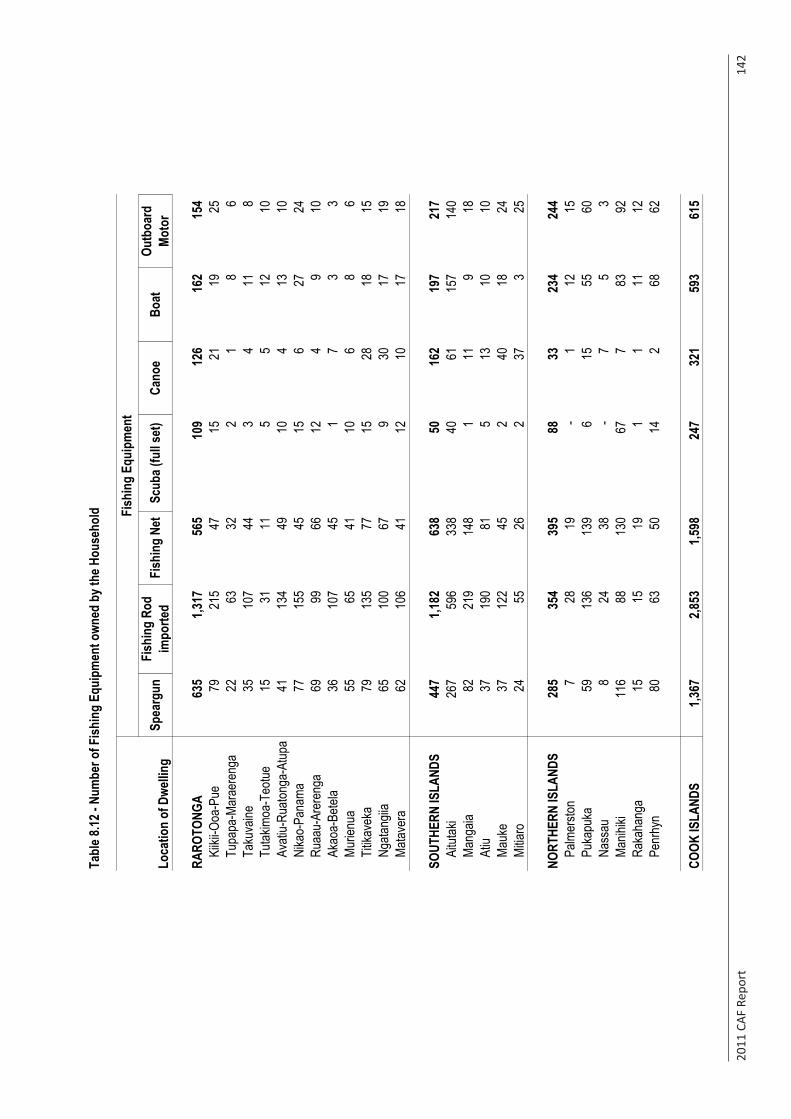
2011
CAF
Rep
ort
14
2
Tabl
e 8.12
- Nu
mbe
r of F
ishin
g Eq
uipm
ent o
wned
by t
he H
ouse
hold
Spea
rgun
Fish
ing
Rod
impo
rted
Fish
ing
Net
Scub
a (fu
ll set
)Ca
noe
Boat
Outb
oard
Mo
tor
RARO
TONG
A63
5
1,317
565
109
126
162
154
Kiiki
i-Ooa
-Pue
79
21
5
47
15
21
19
25
Tu
papa
-Mar
aere
nga
22
63
32
2
1
8
6
Ta
kuva
ine35
107
44
3
4
11
8
Tu
takim
oa-T
eotue
15
31
11
5
5
12
10
Av
atiu-
Ruato
nga-
Atup
a41
134
49
10
4
13
10
Ni
kao-
Pana
ma77
155
45
15
6
27
24
Ru
aau-
Arer
enga
69
99
66
12
4
9
10
Ak
aoa-
Betel
a36
107
45
1
7
3
3
Murie
nua
55
65
41
10
6
8
6
Titika
veka
79
13
5
77
15
28
18
15
Ng
atang
iia65
100
67
9
30
17
19
Ma
taver
a62
106
41
12
10
17
18
SOUT
HERN
ISLA
NDS
447
1,1
82
63
8
50
162
197
217
Aitut
aki
267
59
6
338
40
61
157
140
Mang
aia82
219
14
8
1
11
9
18
At
iu37
190
81
5
13
10
10
Ma
uke
37
12
2
45
2
40
18
24
Mitia
ro24
55
26
2
37
3
25
NORT
HERN
ISLA
NDS
285
35
4
395
88
33
234
244
Palm
ersto
n7
28
19
-
1
12
15
Puka
puka
59
13
6
139
6
15
55
60
Na
ssau
8
24
38
-
7
5
3
Ma
nihiki
116
88
130
67
7
83
92
Ra
kaha
nga
15
15
19
1
1
11
12
Pe
nrhy
n80
63
50
14
2
68
62
COOK
ISLA
NDS
1,367
2,853
1,598
24
7
32
1
59
3
61
5
Loca
tion
of D
wellin
g
Fish
ing
Equi
pmen
t
Cen
sus
of P
opul
atio
n an
d D
wel
lings
201
1C
ook
Isla
nds
Stat
istic
s O
ffice

2011
CAF
Rep
ort
14
3
Tabl
e 8.13
- Nu
mbe
r of F
arm
Equ
ipm
ents
own
ed b
y the
Hou
seho
ld
Trac
tor
Rota
ry
Hoe
Mist
Bl
ower
Gras
s Cu
tter
Moto
r Mo
wer
Disc
ha
rrow
Plou
ghRo
to
vato
rSl
ashe
rTy
neRi
pper
Chain
sa
wKn
ap
sack
Wat
er
pum
pOt
her
RARO
TONG
A17
1
17
9
14
5
2,1
50
1,7
42
67
10
0
29
12
0
27
58
98
3
92
6
52
5
33
Ki
ikii-O
oa-P
ue14
25
13
269
208
5
5
1
15
-
3
107
107
72
6
Tupa
pa-M
arae
reng
a1
2
3
81
45
1
1
-
2
-
1
28
28
4
1
Taku
vaine
3
6
5
131
82
-
-
-
-
-
-
49
41
20
-
Tutak
imoa
-Teo
tue-
3
3
45
24
-
-
-
4
-
-
23
11
7
-
Avati
u-Ru
atong
a-At
upa
3
8
15
197
126
-
1
-
3
-
2
80
65
60
1
Nika
o-Pa
nama
14
12
12
27
9
23
4
7
6
3
15
1
5
11
8
95
10
9
4
Ru
aau-
Arer
enga
22
24
15
24
9
19
3
7
14
1
13
2
3
98
83
11
2
6
Ak
aoa-
Betel
a15
20
9
175
134
9
10
3
10
5
6
95
76
44
3
Murie
nua
22
10
12
13
7
13
1
8
12
2
11
3
3
62
58
19
1
Tit
ikave
ka41
38
30
244
256
16
27
11
27
3
17
144
175
37
7
Ngata
ngiia
18
11
12
16
8
14
7
6
9
3
8
5
6
92
82
21
1
Ma
taver
a18
20
16
175
162
8
15
5
12
8
12
87
105
20
3
SOUT
HERN
ISLA
NDS
50
33
21
64
1
62
0
25
26
3
31
5
10
49
0
44
2
17
4
9
Ai
tutak
i41
18
8
305
396
20
18
2
23
4
7
219
216
96
4
Mang
aia3
6
6
12
5
54
2
3
-
2
1
2
92
134
16
2
Atiu
3
5
6
103
100
2
3
1
4
-
1
85
59
50
1
Mauk
e2
4
1
74
47
1
2
-
2
-
-
59
22
7
-
Mitia
ro1
-
-
34
23
-
-
-
-
-
-
35
11
5
2
NORT
HERN
ISLA
NDS
3
-
1
61
3
-
-
-
-
-
-
86
11
63
7
Pa
lmer
ston
-
-
-
-
-
-
-
-
-
-
-
6
-
2
7
Pu
kapu
ka-
-
-
4
-
-
-
-
-
-
-
36
2
27
-
Nass
au-
-
-
2
1
-
-
-
-
-
-
3
1
-
-
Manih
iki3
-
1
42
-
-
-
-
-
-
-
21
4
26
-
Ra
kaha
nga
-
-
-
2
-
-
-
-
-
-
-
2
-
-
-
Pe
nrhy
n-
-
-
11
2
-
-
-
-
-
-
18
4
8
-
COOK
ISLA
NDS
224
212
167
2,852
2,365
92
126
32
151
32
68
1,559
1,379
762
49
Loca
tion
of D
wellin
g
Farm
Equ
ipm
ent
Cen
sus
of P
opul
atio
n an
d D
wel
lings
201
1C
ook
Isla
nds
Stat
istic
s O
ffice
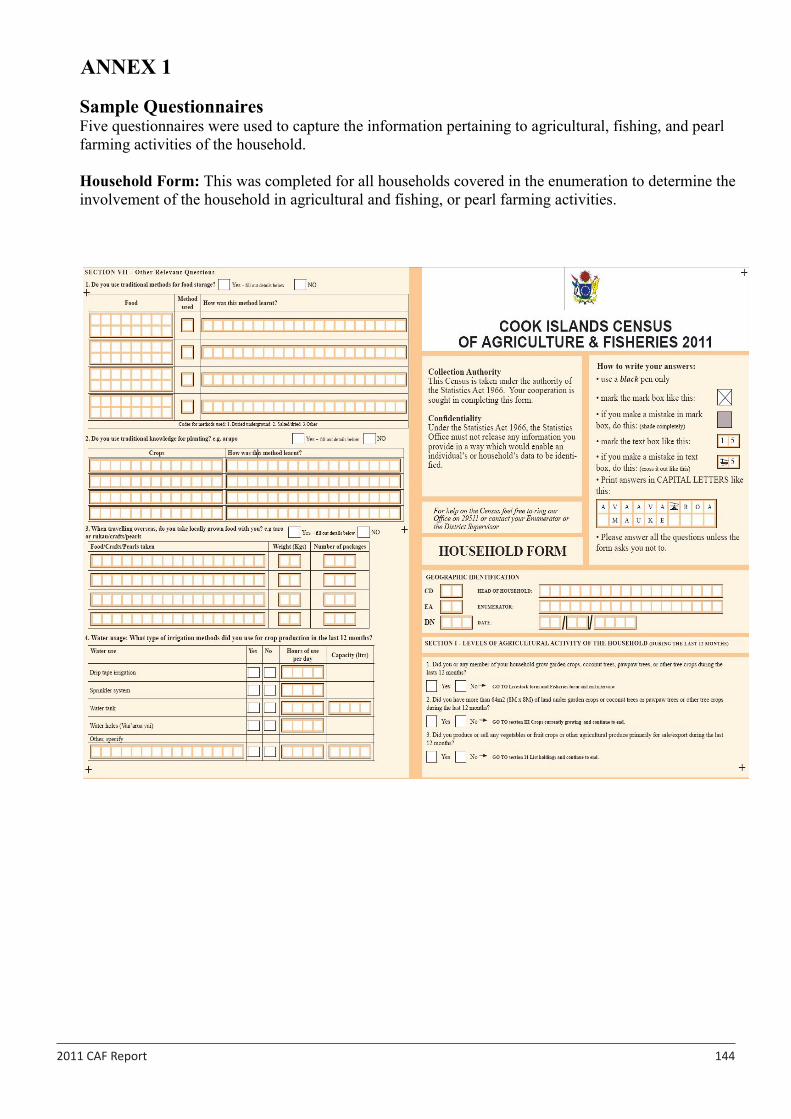
2011 CAF Report 144
28 2011 CAF Report
ANNEX 1
Sample Questionnaires Five questionnaires were used to capture the information pertaining to agricultural, fishing, and pearl farming activities of the household. Household Form: This was completed for all households covered in the enumeration to determine the involvement of the household in agricultural and fishing, or pearl farming activities.
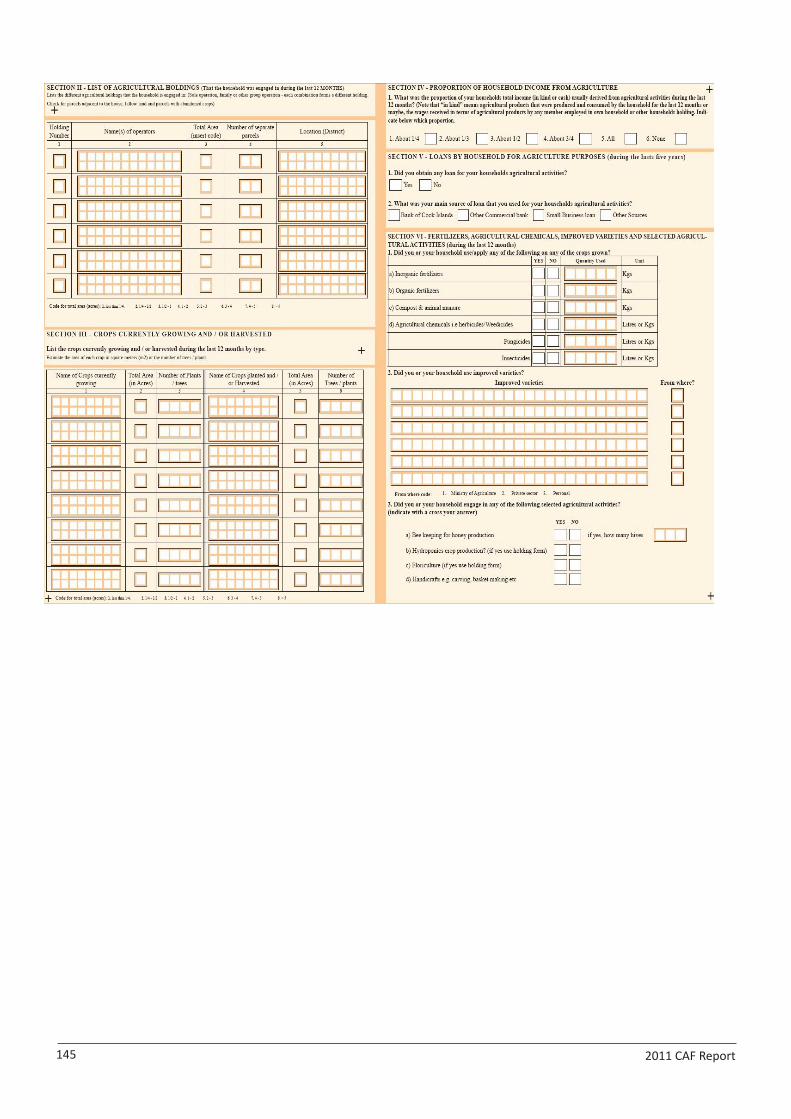
2011 CAF Report 145
29 2011 CAF Report

2011 CAF Report 146
30 2011 CAF Report
Parcel Form: This was reported only for those households which have a holding. The number of parcel forms completed corresponded to the number of parcels, either in use or fallow or virgin bush.
31 2011 CAF Report
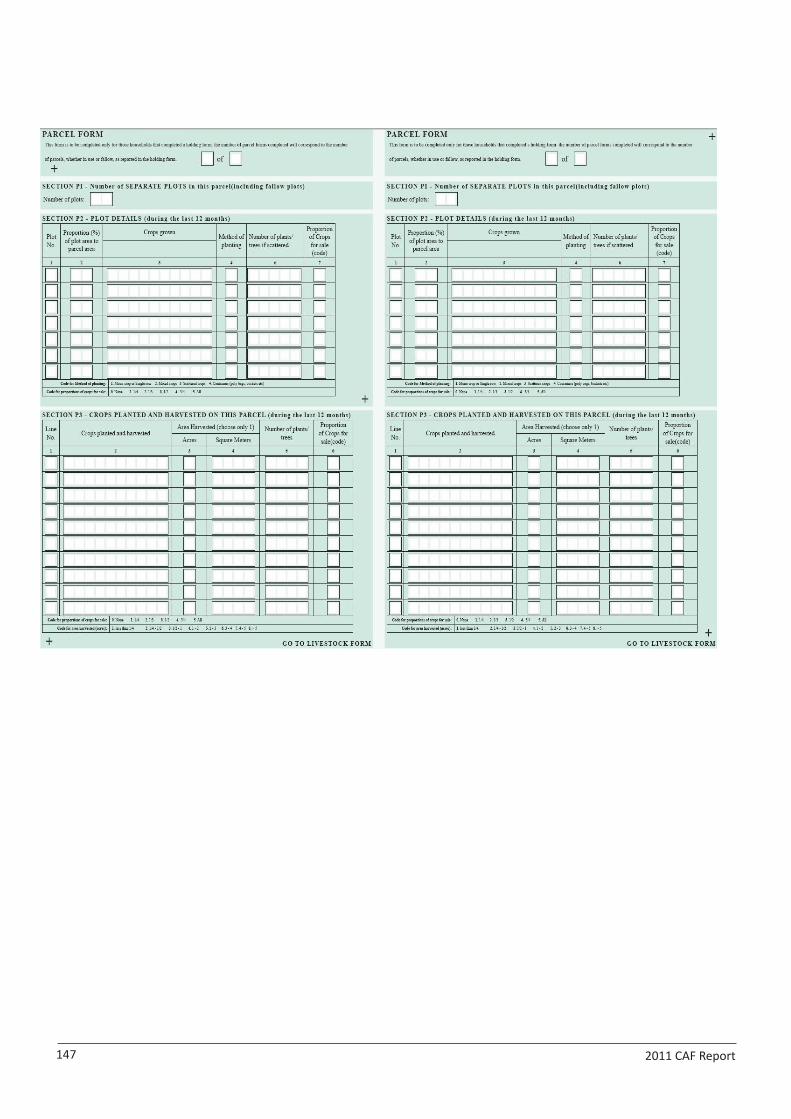
2011 CAF Report 147
31 2011 CAF Report
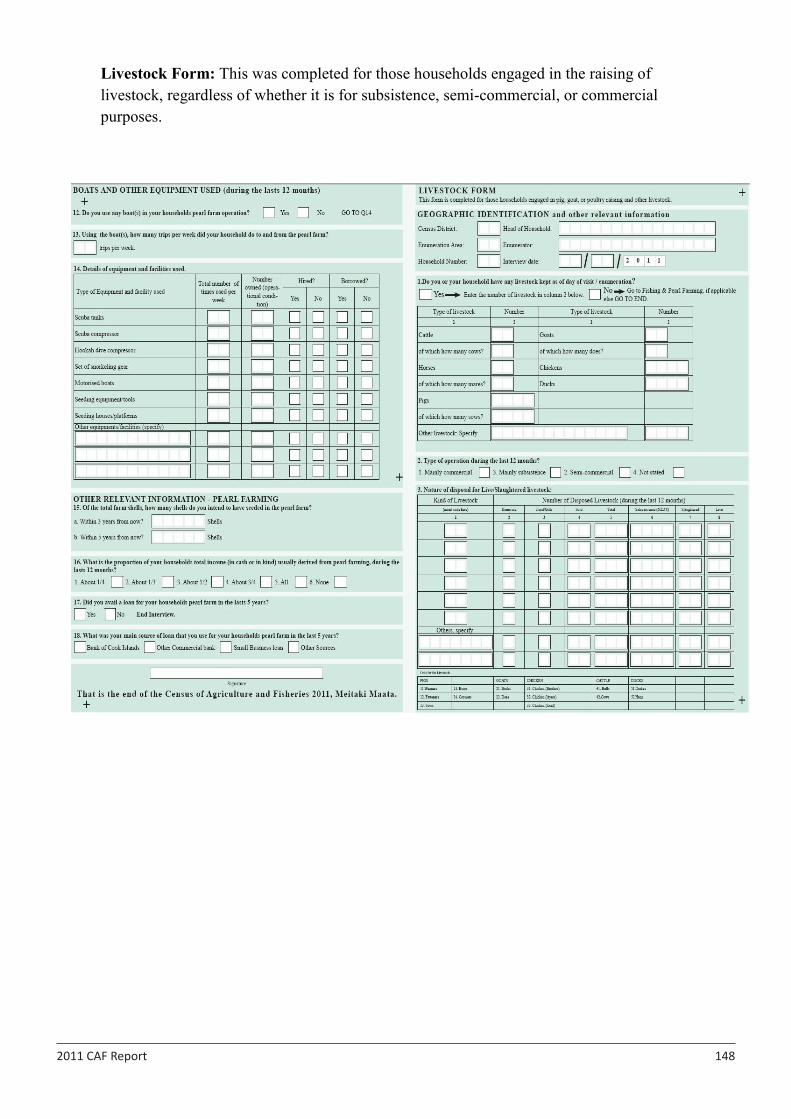
2011 CAF Report 148
32 2011 CAF Report
Livestock Form: This was completed for those households engaged in the raising of livestock, regardless of whether it is for subsistence, semi-commercial, or commercial purposes.
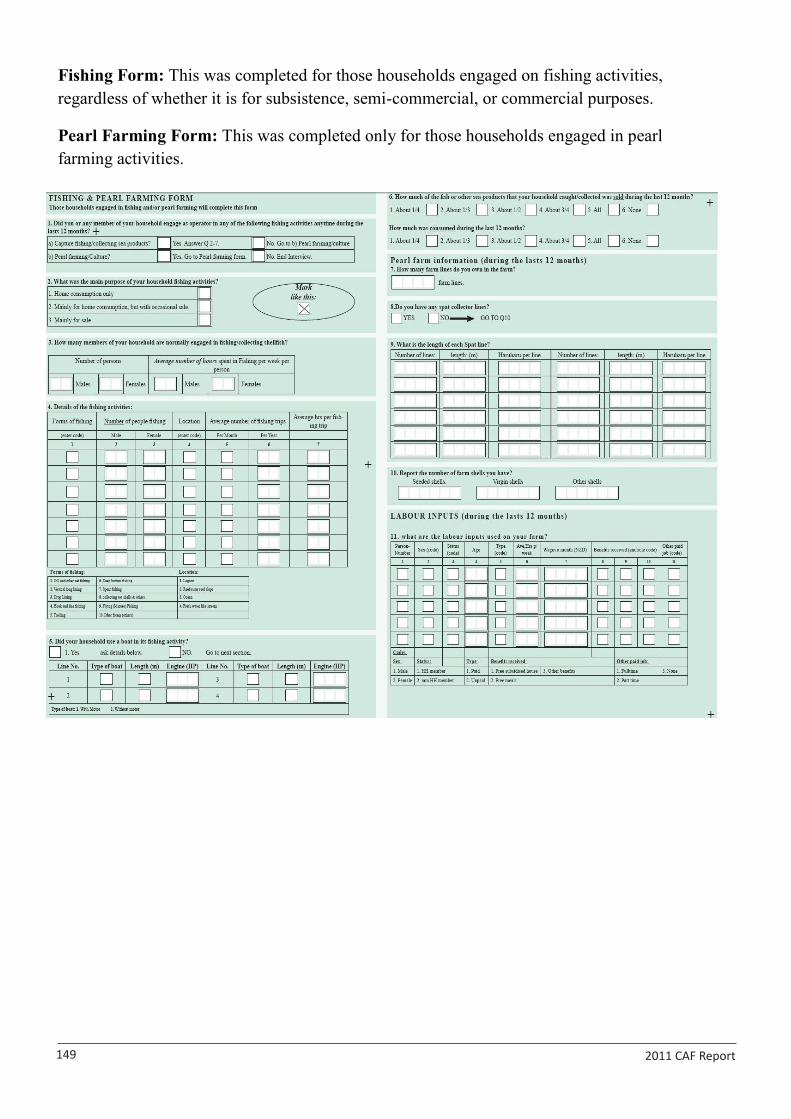
2011 CAF Report 149
33 2011 CAF Report
Fishing Form: This was completed for those households engaged on fishing activities, regardless of whether it is for subsistence, semi-commercial, or commercial purposes.
Pearl Farming Form: This was completed only for those households engaged in pearl farming activities.
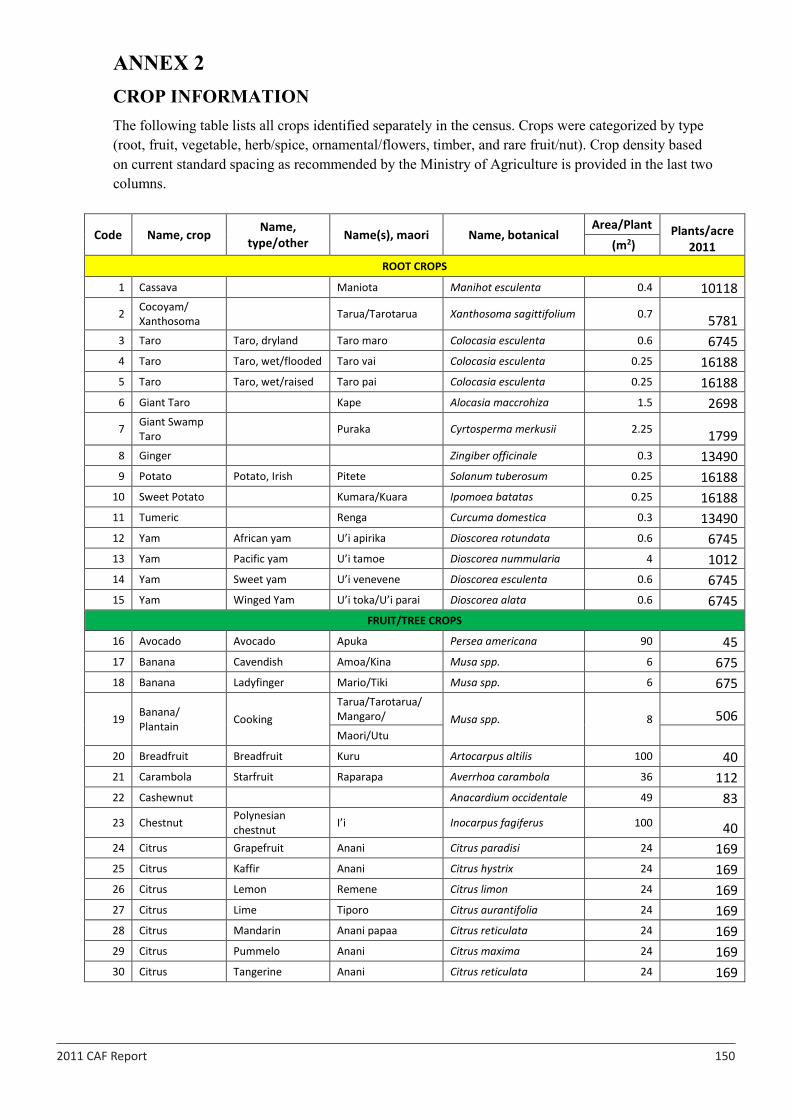
2011 CAF Report 150
34 2011 CAF Report
ANNEX 2
CROP INFORMATION
The following table lists all crops identified separately in the census. Crops were categorized by type (root, fruit, vegetable, herb/spice, ornamental/flowers, timber, and rare fruit/nut). Crop density based on current standard spacing as recommended by the Ministry of Agriculture is provided in the last two columns.
Code Name, crop Name, type/other Name(s), maori Name, botanical
Area/Plant Plants/acre 2011 (m2)
ROOT CROPS
1 Cassava Maniota Manihot esculenta 0.4 10118
2 Cocoyam/ Xanthosoma Tarua/Tarotarua Xanthosoma sagittifolium 0.7 5781
3 Taro Taro, dryland Taro maro Colocasia esculenta 0.6 6745 4 Taro Taro, wet/flooded Taro vai Colocasia esculenta 0.25 16188 5 Taro Taro, wet/raised Taro pai Colocasia esculenta 0.25 16188 6 Giant Taro Kape Alocasia maccrohiza 1.5 2698
7 Giant Swamp Taro Puraka Cyrtosperma merkusii 2.25 1799
8 Ginger Zingiber officinale 0.3 13490 9 Potato Potato, Irish Pitete Solanum tuberosum 0.25 16188
10 Sweet Potato Kumara/Kuara Ipomoea batatas 0.25 16188 11 Tumeric Renga Curcuma domestica 0.3 13490 12 Yam African yam U’i apirika Dioscorea rotundata 0.6 6745 13 Yam Pacific yam U’i tamoe Dioscorea nummularia 4 1012 14 Yam Sweet yam U’i venevene Dioscorea esculenta 0.6 6745 15 Yam Winged Yam U’i toka/U’i parai Dioscorea alata 0.6 6745
FRUIT/TREE CROPS
16 Avocado Avocado Apuka Persea americana 90 45 17 Banana Cavendish Amoa/Kina Musa spp. 6 675 18 Banana Ladyfinger Mario/Tiki Musa spp. 6 675
19 Banana/ Plantain Cooking
Tarua/Tarotarua/ Mangaro/ Musa spp. 8 506 Maori/Utu
20 Breadfruit Breadfruit Kuru Artocarpus altilis 100 40 21 Carambola Starfruit Raparapa Averrhoa carambola 36 112 22 Cashewnut Anacardium occidentale 49 83
23 Chestnut Polynesian chestnut I’i Inocarpus fagiferus 100 40
24 Citrus Grapefruit Anani Citrus paradisi 24 169 25 Citrus Kaffir Anani Citrus hystrix 24 169 26 Citrus Lemon Remene Citrus limon 24 169 27 Citrus Lime Tiporo Citrus aurantifolia 24 169 28 Citrus Mandarin Anani papaa Citrus reticulata 24 169 29 Citrus Pummelo Anani Citrus maxima 24 169 30 Citrus Tangerine Anani Citrus reticulata 24 169
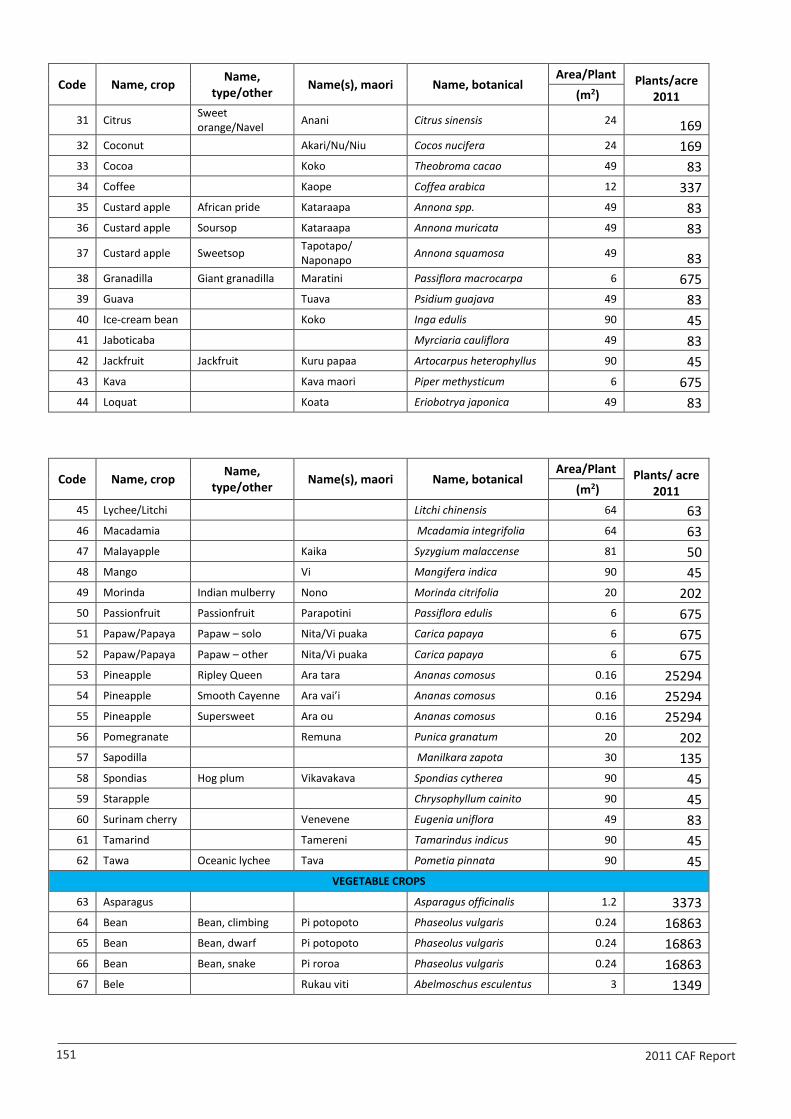
2011 CAF Report 151
35 2011 CAF Report
Code Name, crop Name, type/other Name(s), maori Name, botanical
Area/Plant Plants/acre 2011 (m2)
31 Citrus Sweet orange/Navel Anani Citrus sinensis 24 169
32 Coconut Akari/Nu/Niu Cocos nucifera 24 169 33 Cocoa Koko Theobroma cacao 49 83 34 Coffee Kaope Coffea arabica 12 337 35 Custard apple African pride Kataraapa Annona spp. 49 83 36 Custard apple Soursop Kataraapa Annona muricata 49 83
37 Custard apple Sweetsop Tapotapo/ Naponapo Annona squamosa 49 83
38 Granadilla Giant granadilla Maratini Passiflora macrocarpa 6 675 39 Guava Tuava Psidium guajava 49 83 40 Ice-cream bean Koko Inga edulis 90 45 41 Jaboticaba Myrciaria cauliflora 49 83 42 Jackfruit Jackfruit Kuru papaa Artocarpus heterophyllus 90 45 43 Kava Kava maori Piper methysticum 6 675 44 Loquat Koata Eriobotrya japonica 49 83
Code Name, crop Name,
type/other Name(s), maori Name, botanical Area/Plant Plants/ acre
2011 (m2) 45 Lychee/Litchi Litchi chinensis 64 63 46 Macadamia Mcadamia integrifolia 64 63 47 Malayapple Kaika Syzygium malaccense 81 50 48 Mango Vi Mangifera indica 90 45 49 Morinda Indian mulberry Nono Morinda citrifolia 20 202 50 Passionfruit Passionfruit Parapotini Passiflora edulis 6 675 51 Papaw/Papaya Papaw – solo Nita/Vi puaka Carica papaya 6 675 52 Papaw/Papaya Papaw – other Nita/Vi puaka Carica papaya 6 675 53 Pineapple Ripley Queen Ara tara Ananas comosus 0.16 25294 54 Pineapple Smooth Cayenne Ara vai’i Ananas comosus 0.16 25294 55 Pineapple Supersweet Ara ou Ananas comosus 0.16 25294 56 Pomegranate Remuna Punica granatum 20 202 57 Sapodilla Manilkara zapota 30 135 58 Spondias Hog plum Vikavakava Spondias cytherea 90 45 59 Starapple Chrysophyllum cainito 90 45 60 Surinam cherry Venevene Eugenia uniflora 49 83 61 Tamarind Tamereni Tamarindus indicus 90 45 62 Tawa Oceanic lychee Tava Pometia pinnata 90 45
VEGETABLE CROPS
63 Asparagus Asparagus officinalis 1.2 3373 64 Bean Bean, climbing Pi potopoto Phaseolus vulgaris 0.24 16863 65 Bean Bean, dwarf Pi potopoto Phaseolus vulgaris 0.24 16863 66 Bean Bean, snake Pi roroa Phaseolus vulgaris 0.24 16863 67 Bele Rukau viti Abelmoschus esculentus 3 1349

2011 CAF Report 152
36 2011 CAF Report
Code Name, crop Name, type/other Name(s), maori Name, botanical
Area/Plant Plants/acre 2011 (m2)
68 Broccoli Brassica oleracea var. italic 0.25 16188
69 Brussels sprouts Brassica oleracea var. gemmifera 0.25 16188
70 Cabbage Cabbage, Chinese Pinapi Brassica chinensis 0.25 16188
71 Cabbage Cabbage, head,/English Kapati Brassica oleracea var.
capitata 0.25 16188 72 Capsicum Pepper, hot Oporo Capsicum frutescens 4 1012 73 Capsicum Pepper, sweet Capsicum annuum 0.6 6745 74 Carrot Daucus carota 0.015 269800
75 Cauliflower Brassica oleracea var. botrytis 0.25 16188
76 Celery Apium graveolens 0.16 25294 77 Choko Sechium edule 0.6 6745
78 Courgette/Zucchini Marrow Cucumis pepo 0.6 6745
79 Eggplant Uarao puakanio Solanum melongena 0.9 4497 80 Kang Kong Ipomoea aquatica 0.6 6745 81 Lettuce Tarati Lactuca sativa 0.24 16863 82 Melon Honeydew/Musk Mereni Cucumis melo 1.5 2698 83 Melon Rock Mereni Cucumis melo 1.5 2698 84 Melon Water Mereni Citrullus lanatus 1.5 2698 85 Okra Hibiscus esculentus 0.72 5621 86 Onion Oniani Allium cepa 0.02 202350 87 Parsley Petroselinum crispum 0.19 21300 88 Peanut Groundnut Aratita Arachis hypogaea 0.6 6745 89 Pumpkin Crown Mautini Cucurbita pepo 2.4 1686
Code Name, crop Name,
type/other Name(s), maori Name, botanical Area/Plant Plants/ acre
2011 (m2) 90 Pumpkin Buttercup Mautini Cucurbita pepo 1.2 3373 91 Pumpkin Butternut Mautini Cucurbita pepo 1.2 3373 92 Pumpkin Mautini maori Cucurbita maxima 2.4 1686 93 Radish Raphanus sativus 0.015 269800 94 Rukau Taro Colocasia esculenta 0.72 5621 95 Silverbeet Swisschard Beta vulgaris 0.6 6745 96 Snowpeas Chinese peas Pi Pisum sativum 0.24 16863 97 Spinach Basella alba 0.5 8094 98 Spring onions Oniani rau Allium cepa var. cepa 0.015 269800 99 Sweet corn Kaoni Zea mays 0.72 5621
100 Tomato Cocktail/cherry Tomato Solanum lycopersicon 0.6 6745 101 Tomato Fresh Tomato Solanum lycopersicon 0.6 6745
HERB & SPICE CROPS
102 Basil Miri kai Ocimum basilicum 0.6 6745
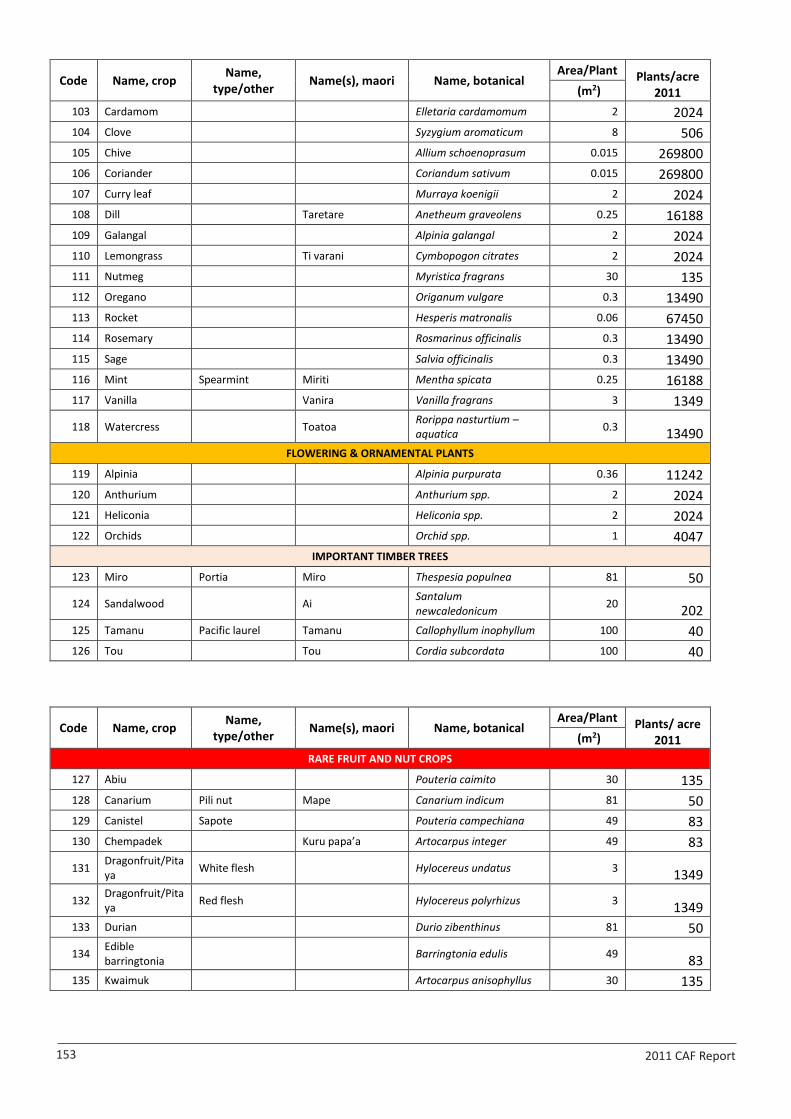
2011 CAF Report 153
37 2011 CAF Report
Code Name, crop Name, type/other Name(s), maori Name, botanical
Area/Plant Plants/acre 2011 (m2)
103 Cardamom Elletaria cardamomum 2 2024 104 Clove Syzygium aromaticum 8 506 105 Chive Allium schoenoprasum 0.015 269800 106 Coriander Coriandum sativum 0.015 269800 107 Curry leaf Murraya koenigii 2 2024 108 Dill Taretare Anetheum graveolens 0.25 16188 109 Galangal Alpinia galangal 2 2024 110 Lemongrass Ti varani Cymbopogon citrates 2 2024 111 Nutmeg Myristica fragrans 30 135 112 Oregano Origanum vulgare 0.3 13490 113 Rocket Hesperis matronalis 0.06 67450 114 Rosemary Rosmarinus officinalis 0.3 13490 115 Sage Salvia officinalis 0.3 13490 116 Mint Spearmint Miriti Mentha spicata 0.25 16188 117 Vanilla Vanira Vanilla fragrans 3 1349
118 Watercress Toatoa Rorippa nasturtium – aquatica 0.3 13490
FLOWERING & ORNAMENTAL PLANTS
119 Alpinia Alpinia purpurata 0.36 11242 120 Anthurium Anthurium spp. 2 2024 121 Heliconia Heliconia spp. 2 2024 122 Orchids Orchid spp. 1 4047
IMPORTANT TIMBER TREES
123 Miro Portia Miro Thespesia populnea 81 50
124 Sandalwood Ai Santalum newcaledonicum 20 202
125 Tamanu Pacific laurel Tamanu Callophyllum inophyllum 100 40 126 Tou Tou Cordia subcordata 100 40
Code Name, crop Name,
type/other Name(s), maori Name, botanical Area/Plant Plants/ acre
2011 (m2) RARE FRUIT AND NUT CROPS
127 Abiu Pouteria caimito 30 135 128 Canarium Pili nut Mape Canarium indicum 81 50 129 Canistel Sapote Pouteria campechiana 49 83 130 Chempadek Kuru papa’a Artocarpus integer 49 83
131 Dragonfruit/Pitaya White flesh Hylocereus undatus 3 1349
132 Dragonfruit/Pitaya Red flesh Hylocereus polyrhizus 3 1349
133 Durian Durio zibenthinus 81 50
134 Edible barringtonia Barringtonia edulis 49 83
135 Kwaimuk Artocarpus anisophyllus 30 135
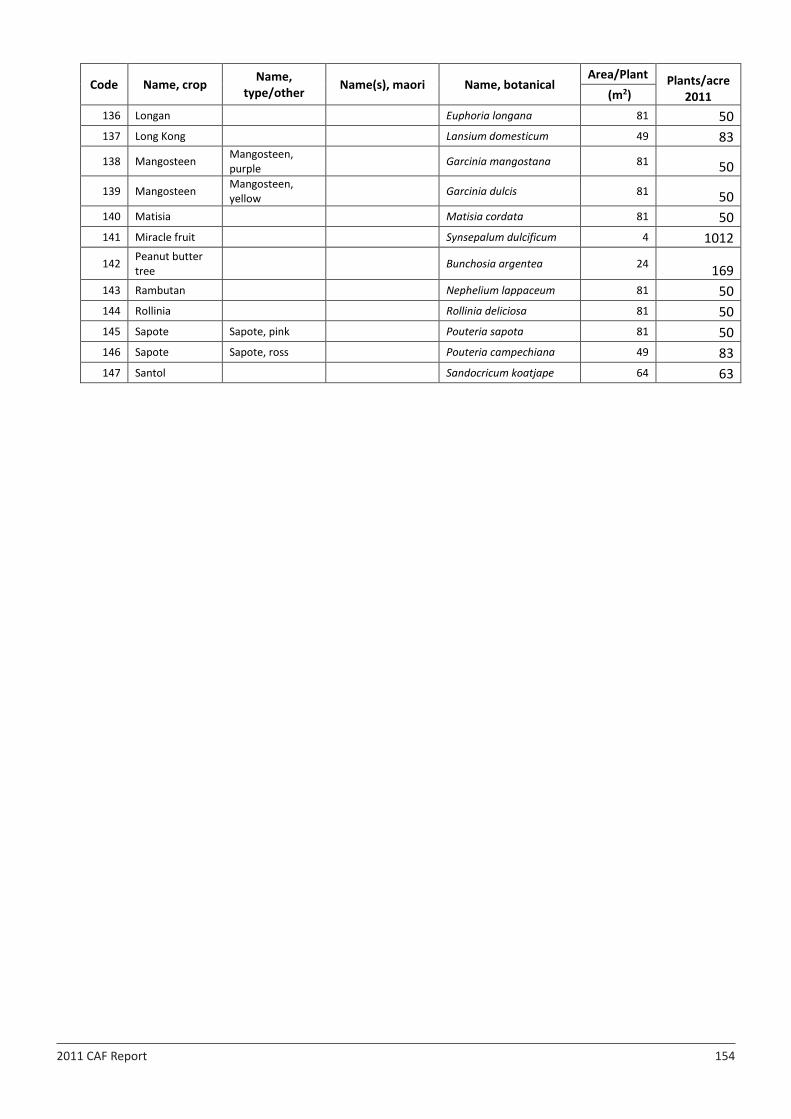
2011 CAF Report 154
38 2011 CAF Report
Code Name, crop Name, type/other Name(s), maori Name, botanical
Area/Plant Plants/acre 2011 (m2)
136 Longan Euphoria longana 81 50 137 Long Kong Lansium domesticum 49 83
138 Mangosteen Mangosteen, purple Garcinia mangostana 81 50
139 Mangosteen Mangosteen, yellow Garcinia dulcis 81 50
140 Matisia Matisia cordata 81 50 141 Miracle fruit Synsepalum dulcificum 4 1012
142 Peanut butter tree Bunchosia argentea 24 169
143 Rambutan Nephelium lappaceum 81 50 144 Rollinia Rollinia deliciosa 81 50 145 Sapote Sapote, pink Pouteria sapota 81 50 146 Sapote Sapote, ross Pouteria campechiana 49 83 147 Santol Sandocricum koatjape 64 63
2011 CAF Report 155
38 2011 CAF Report
Code Name, crop Name, type/other Name(s), maori Name, botanical
Area/Plant Plants/acre 2011 (m2)
136 Longan Euphoria longana 81 50 137 Long Kong Lansium domesticum 49 83
138 Mangosteen Mangosteen, purple Garcinia mangostana 81 50
139 Mangosteen Mangosteen, yellow Garcinia dulcis 81 50
140 Matisia Matisia cordata 81 50 141 Miracle fruit Synsepalum dulcificum 4 1012
142 Peanut butter tree Bunchosia argentea 24 169
143 Rambutan Nephelium lappaceum 81 50 144 Rollinia Rollinia deliciosa 81 50 145 Sapote Sapote, pink Pouteria sapota 81 50 146 Sapote Sapote, ross Pouteria campechiana 49 83 147 Santol Sandocricum koatjape 64 63
39 2011 CAF Report
ANNEX 3 DEFINITIONS OF TERMS & CONCEPTS
Household Related
Agriculturally Active Household: This refers to a household whose level of agricultural activity was neither subsistence only, subsistence with cash cropping or commercial producers.
Commercial: - The level of agricultural activity where a household’s main purpose for agricultural production is to have their produce sold locally or for export.
Household: Based on the arrangements made by persons, individually or in groups, for providing themselves with food or other essentials for living, a household may be either
A one person household, that is, a person who makes provision for his or her own food or other essentials for living without combining with any other person to form part of a multi-person household; or
A multi-person household, that is, a group or two or more persons living together who make common provision for food or other essentials for living. They may be related or unrelated persons or a combination of both. They may live in one house or in one or more than one house.
Minor Agricultural: The level of agricultural activity where a household has only very few crops defined as no more than 64m2 (8m x 8m) of land under garden crops or no more than 10 coconut trees or any other no more than 10 bearing other tree crops.
Operator: The person exercising the management control over the operation of the agricultural holding. Where the holding is being operated by a single household the head of the household is in most cases the operator. A holding can also have more than one operator.
Subsistence Only: The level of agricultural activity where a household produces crops for own use.
Subsistence with Cash Cropping/Semi-Subsistence: The level of agricultural activity where a household’s main purpose for agricultural production is to feed it-self but some crops or surplus crops are sold.
Farm Related Holding: An economic unit of agricultural production under single management comprising all livestock kept and all land used wholly or partly for agricultural production purposes, without regard to title, legal form, size, or location. Single management may be exercised by either an individual or household; jointly by two or more individuals or households; by a clan or by a tribe. The holding’s land may consist of one or more parcels, located in one or more separate areas or in one or more enumeration or census areas, providing the parcels share the same production means utilized by the holding, such as labour, farm buildings or machinery.
2011 CAF Report 156
40 2011 CAF Report
Inorganic Fertilizers: Manufactured mineral substances applied either directly to soil; through the leaves, or irrigation water, to supply plants/crops with the necessary nutrients. Examples include Nitrophoska Blue or Perfekt, N-P-K mixes, urea, ammonium sulphate, superphosphate, nitrosol. Organic Fertilizers: Materials of organic origin, either natural or processed, that can be used as sources of plant nutrients. Parcel: Any piece of land entirely surrounded by other land, water, road, forest etc. not forming part of this holding, A parcel may consist of one or more plots adjacent to each other. Plot: A part or whole of a parcel on which a specific crop or crop mixture is cultivated. A plot can also be fallow land or land waiting to be planted. Hydroponics: Refers to crop production in soil-less medium. Floriculture: Refers to cultivation of flowering and ornamental plants including Alpinia (flowering ginger), Anthuriums, Gingers, Heliconias, and Orchids. Compost: A mixture of decaying organic matter, as from leaves and manure (animal) used to improve soil structure and provide nutrients. Insecticides: A chemical substance used to kill insects. Fungicides: A chemical substance that inhibits or kills the growth of fungi. Herbicides or Weedicides: A chemical substance used to inhibit or kill the growth of weeds.
Land Related Crown Land: Any land which has not been alienated from the Crown for a subsisting estate in fee simple, other than Native land. Examples of such land types include the main road, schools, hospitals, government premises, beaches, and usually inaccessible lands such as the interior of Rarotonga. Borrowed Land: Land belonging to another household or person that the borrower has borrowed for use usually on a temporary basis. Terms of the agreement are between the two parties concerned, such agreements are usually verbal in nature and not legally-binding. Customary Land: Alias Native land, Native Freehold land, is a land which, being vested in the Crown, is held by Natives or the descendants of Natives under the Native customs and usage in the Cook Islands. Customary land is not investigated by the land court but is being looked after and handled by the Natives. Freehold Leased Land: Freehold land which is obtained through a land court contract by which one party (lessor), usually in consideration of rent, conveys land to another (lessee) for a specified time period.
2011 CAF Report 157
41 2011 CAF Report
Freehold Licensed Land: Freehold land belonging to another household or person that the borrower has borrowed for use usually on a temporary basis. Terms of the agreement are between the two parties concerned; i.e. It need not go through the land court. Occupation Right: The operator has an exclusive right to use a piece of land, such right being obtained through the land court system of the Cook Islands. Long-occupation Right Land: Alias vested order; that is, if any person or persons has lived on Crown or Customary land without any right for 20 years or more, such person(s) can apply to the land court for a right to occupy the same land indefinitely.
Crop Related Mixed Crop: Refers to “two or more crops” which are interplanted over a plot in a regular pattern such as rows. Sometimes there are a few scattered plantings of other crops but not considered to be part of the mixed crop. Single Row: Refers to “one crop” planted over a plot in a regular pattern of “single rows”. If there are a few scattered trees or plants of different crops within the plot, the plot is still considered to be single rows. Double Rows: Refers to “one crop” planted over a plot in a regular pattern of “double rows”. If there are a few scattered trees or plants of different crops within the plot, the plot is still considered to be double rows. Scattered Crop: Refers to trees or plants, which have not been planted with any uniform method of spacing over a plot. Important timber trees including; Miro, Tamanu, Tou shall also be recorded. Tree Crops: Trees bearing edible fruits or nuts. The economic lifespan of such trees vary significantly, at more than five years.
Livestock Related Pigs
Weaners – Piglets separated from the sow. Their live weight is less than 24Kg. Growers – Pigs from 3-months after weaning. Their live weight ranging from 20-
40Kg. Fatteners – Middle aged pigs. Their live weight ranging from 40Kg. Sows – Adult female pigs that has given birth at least once. Boars – Adult male pigs. Their live weight is over 40Kg.
Goat Buck – Adult male goat. Doe – Adult female goat.
Chicken
Chicken (broilers) – Refers to chicken raised for meat and not for eggs.
2011 CAF Report 158
42 2011 CAF Report
Chicken (layers) – Refers to chicken raised for laying eggs. Chicken (local) – Refers to chickens of local breed (moa kainga).
Cattle Bulls – Adult male cattle. Cows – Adult female cattle.
Horse Mare – Adult female horse. Stallion – Adult male horse.
Ducks Drakes – Refers to male ducks. Hens – Refers to female ducks.
Fishing Related Collecting/Gleaning Sea Products (Angota): Method of fishing using limited equipment and gear for gathering seafood like clams (paua), sea urchins (avake/atuke), sea cucumbers (rori), turban snails (ariri), octopus, crabs etc. It is usually done in the lagoon and on the reef during low tide. Gill and other Net Fishing (Kupenga): Gill nets are used to catch a number of different reef fish in a lagoon or along the reefs edge. Other netting includes scoop nets, cast nets etc. Vertical Long Lining (Tukutuku pouto): A fishing method that involves setting-out a large number of short-lines carrying hooks, which are attached to a longer main line at regular intervals. The short-lines are suspended horizontally at a predetermined depth with the help of surface floats. Drop Lining (I’i): Method of fishing usually done by dropping a baited hook to great depths to catch deep-sea fish such as grouper, snapper and pelagic fish like tuna, wahoo, barracuda, marlin etc. Hook and Line Fishing (I’i): One of the oldest methods for catching fish. It is considered an environmentally friendly method as it catches primarily target species, and causes minimal damage to the surrounding environment. Trolling (Tavere): Method of deep-sea fishing where baited or artificial hooks are trolled behind an outboard motor boat. Deep Bottom Fishing (I’i): Method of fishing used in catching tuna and other pelagic fishes in large quantities. Spear Fishing (Titia): Method of fishing using either a home-made spear or spear gun for catching fish among coral reefs, in the lagoon, or beyond the reef. Flying Fishing (Rama Maroro): A method of fishing using a scooping net to catch maroro. This type of fishing is normally done at night.
2011 CAF Report 159
43 2011 CAF Report
Pearl Related Farm Lines: The main lines used to hang cultured black pearl oysters. Spat Collector Lines: The lines used to hang spat collectors or devices used to for the collection of oyster larva. Seeded Shells: These are cultured black lip pearl oysters which have a nucleus inserted into their gonads to generate black pearls. Virgin Shells/Unseeded Shells: These are black lip pearl oysters which are not yet ready for nucleus insertion. Seeding Equipment: These are equipment used for the insertion of the nucleus into the gonads of the black lip oysters. Seeding Houses: Shelter used for black pearl seeding activities. It is also used for the cleaning of pearl shells.
Diving Related Scuba Tanks: These contain compressed-air and used with a breathing apparatus to assist deep-sea divers stay underwater for extended periods. Scuba Compressor: Equipment used to fill the scuba tanks with compressed air. Hookah Dive Compressor: The use of a small air compressor which is located at the surface, or on the boat. Air is delivered to the diver via a floating air hose. Motorised Boats: Small-type boats with an engine to assist with movement on the water. Also known as “outboard motor” boats.
2011 CAF Report 160
44 2011 CAF Report
ANNEX 4
CENSUS FIELD STAFF Twelve (12) census trainers, seventeen (17) supervisors, and ninety-one (91) enumerators were involved in the census undertaking. Trainers were selected from the Ministry of Agriculture and the Statistics Office of the Ministry of Finance and Economic Management. Most of the supervisors and enumerators on all islands were recruited from government ministries and were required to conduct the census after regular hours. William Wigmore and Moe Tutira of the Ministry of Agriculture travelled to the Northern Islands on the police patrol boat “Te Kukupa” to conduct the census in the islands of Palmerston, Nassau, Rakahanga, and Penrhyn with the assistance of recruited personnel from the respective islands. They trained the supervisors and enumerators on Pukapuka and Manihiki in the conduct of the census. TRAINERS: William WIGMORE, Amelia NGATOKORUA, Kathy
TEAMOKE, Enua PAKITOA, Kevin HOSKING, Annie TANGIMETUA, Tiria RERE, Noo TOKARI, Moe TUTIRA, Tina AKAMA, Edwin APERA, Moekopu VOGEL
SUPERVISORS AND ENUMERATORS RAROTONGA TUPAPA-PUE-MARAERENGA: Tiria RERE, Mata IROA, Tokoa HARMON, Linda
PEPE, Moetuma NICHOLAS, Michael KAMANA, Tama JOSEPH
TAKUVAINE-TUTAKIMOA-TEOTUE: Howard TANGIMETUA, Mii MATAMAKI,
Jonathan MATAORA, Rufina TUTAI, Tereapii NIMEROTA, Roger NEHEMIA
AVATIU-RUATONGA: Noo TOKARI, Tua MANEA, Ngariki Eliu THOMPSON,
Terry PIRI, Cedric TORU, Tereapii TORU, Vasie POILA NIKAO-PANAMA: Tearoa TINI, Casper MATEARIKI, Tekena TEAMOKE,
Makara MATAPO, Kake IOANE, Junior TANGATA RUAAU Tina AKAMA, Nane TEPAI, Apii HEATHER, Elena
MATAORA, Kapolani PURUA, Tangireka AKAMA, Pangi PURUA
AKAOA Edwin APERA, Moeroa TINIRAU, Joel POKURA,
Dorothy POKURA, Turori MATUTU, Tino NAPA
2011 CAF Report 161
45 2011 CAF Report
MURIENUA Eirangi MARSTERS, Louisa PETERS, Tisa BATES, Joseph WICHMAN
TITIKAVEKA Tutai MATENGA, Carmen TEMATA, Tamaiti TUTIRA,
Sharon IRO, Nooroa NUMANGA, Brian TAIREA, Tuaine TURUA, Makiroa BEN, Philomena WILLIAMS
NGATANGIIA Josephine MAOATE, Mataina MAOATE, Tereinga MAOATE, Emily TANGIMETUA MATAVERA Moekopu VOGEL, Madeline KARE, Mere CHARLIE,
Marianna MATAIO, Tukana MAKARA, Sherro TOMOKINO
SOUTHERN GROUP
AITUTAKI Fred CHARLIE, Tiraa ARERE, Pepe RAELA, Mataiti RAVE, Tuangaro BISHOP, Vavia PUAPII, Elizabeth RAELA, Tu Hewitt, Pokotai TEPAKI, Ana TEINANGARO, Temanu UNUKA, Tungane BAXTER, Tuao MESSINE, Manuela KITAI Snr, Manuela KITAI Jnr
MANGAIA Pa Epi MANA, Ngametua TANGATAKINO, Mary
DANIEL, Ake TANGATAKINO, Marion HARRY, Aerenga MATAPO, Arumetua ATETU, Poroa AROKAPITI
ATIU Maara TAIRI, Tangata EDWARDS, Mareta TANGA,
Tutai MAKAKEA, Teata BOB MAUKE Taukea RAUI, Vaine KEU, Basilio KAOKAO, Kurauru
TAIA, Andrew HOSKING MITIARO Tokai NGAIORAE, Tereapii AURUPA, Ngametua
TAMA NORTHERN GROUP PUKAPUKA Neiao NEIAO, Tai RAVARUA, Loloka WILLIAMS,
Terira TAUNGA MANIHIKI Moto FINIASI, Jean-Marie WILLIAM, Justine
WILLIAM, Tuakana Tariau AVE, Emily HEATHER, Helen McKENZIE
Related Documents