UTTC IJBE | 1 Content Page Determinantion of passenger load factor: The case of Thai airlines. Waralee Peetawan______________________________________________________ 3 Factors related to consumer behavior on luxury good purchasing in China. Jinfeng Wang, Piraphong Foosiri_________________________________________ 19 The influence of personal and environmental factors on business start ups: A case study in the district of Dili and Oecusse, Timor-Leste. Tarcisio Ximenes, Suthawan Chirapanda Sato_______________________________ 37 A psychological model of residential property purchasing decision in Thailand Chayada Nunarong, Prattana Punnakitikashem _____________________________ 53 A Senge’s model on the practical domain for developing team learning skills Ravee Phoewhawm____________________________________________________ 75 Exploring the relationship between the big five personality traits and exhibition shows attendance Xiameng Wu, Theeranuch Pusaksrikit _____________________________________ 95 Bank-specific and macroeconomic factors related to bank profitability and stock return in Thailand Junevio Antonio Silva Ximenes, Li Li______________________________________ 119 The impact of social media on hospitality brand and image Chanin Yoopetch _____________________________________________________ 139 The moderating role of residents’ involvement on perception of MICE impacts Patcharaporn Mahasuweerachai _________________________________________151 The effects of experiential value, technology acceptance and satisfaction on users’ intention to continue using - A case study of an English online dictionary in Guangxi, China Guangpei Wei, Thitikan Satchabut _______________________________________ 169 Guide for author______________________________________________________ 193

Welcome message from author
This document is posted to help you gain knowledge. Please leave a comment to let me know what you think about it! Share it to your friends and learn new things together.
Transcript
UTCC International Journal of Business and Economics
UTTC IJBE | 1
Content Page
Determinantion of passenger load factor: The case of Thai airlines.
Waralee Peetawan______________________________________________________ 3
Factors related to consumer behavior on luxury good purchasing in China.
Jinfeng Wang, Piraphong Foosiri_________________________________________ 19
The influence of personal and environmental factors on business start ups:
A case study in the district of Dili and Oecusse, Timor-Leste.
Tarcisio Ximenes, Suthawan Chirapanda Sato_______________________________ 37
A psychological model of residential property purchasing decision in Thailand
Chayada Nunarong, Prattana Punnakitikashem _____________________________ 53
A Senge’s model on the practical domain for developing team learning skills
Ravee Phoewhawm____________________________________________________ 75
Exploring the relationship between the big five personality traits and
exhibition shows attendance
Xiameng Wu, Theeranuch Pusaksrikit _____________________________________ 95
Bank-specific and macroeconomic factors related to bank profitability
and stock return in Thailand
Junevio Antonio Silva Ximenes, Li Li______________________________________ 119
The impact of social media on hospitality brand and image
Chanin Yoopetch _____________________________________________________ 139
The moderating role of residents’ involvement on perception of MICE impacts
Patcharaporn Mahasuweerachai _________________________________________151
The effects of experiential value, technology acceptance and satisfaction
on users’ intention to continue using - A case study of an English online
dictionary in Guangxi, China
Guangpei Wei, Thitikan Satchabut _______________________________________ 169
Guide for author______________________________________________________ 193

UTCC International Journal of Business and Economics
UTTC IJBE | 2
UTCC International Journal of Business and Economics
UTTC IJBE | 3
UTCC International Journal of Business and Economics (UTCC IJBE)
Volume 10 Number 1, April 2018
Determination of passenger load factor:
The case of Thai airlines
Waralee Peetawan International Academy of Aviation Industry
King Mongkut’s Institute of Technology Latkrabang
Abstract This research aims to investigate the relative factors affecting level of passenger loading
factor for Thai airlines. Through literature review, factors affecting passenger loading
factor were identified. Researcher included airline alliance status, number of global air
incidents, number of flight departures airlines’ selling and advertising expenses, revenue
passenger kilometers, and number of passenger seats in the multiple linear regression
model. Secondary data were collected from three major airlines of Thailand which are
listed in the Stock Exchange of Thailand. By using ordinary least squares estimation, at 95
percent confidence level, the airline alliance status, air incidents, revenue passenger
kilometers, and number of passenger seats are the significant variables that explain the
passenger load factor.
Keywords: Passenger Load Factor (PFL), Airlines, Air Incidents,
Airline Alliances, Thailand
UTCC International Journal of Business and Economics
UTTC IJBE | 4
Introduction
One of the key operating statistics of an
airline is load factor, which determines
the efficiency in carrying passengers and
freights. High passenger load factor
reflects well-managed available seats
sold to passengers. In March 2016,
International Air Transport Association
(IATA) announced the strong passenger
demand for air transport for international
passenger market. The average
international PFL was 79.7% in 2015 and
rose by 1.0% in January 2016 (IATA,
2016). Since passenger load factor (PFL) is a
very important key performance figure,
airlines target to produce high PFL while
minimizing operating costs. It is
interesting to explore relative factors
affecting level of PFL and utilize them to
determine PFL for Thai airlines to
visualize opportunities for operating cost
and performance efficiency’s
improvement. Benefits of this study is
clearly contributed to Thai airlines.
Realizing the factor influencing the load
factor would lead them to better planning
and forming necessary strategies in order
to maintain or reach the desire level of
future load factor.
This research aims to determine relativity
of airline operating performances,
expenses, and external factors to PFL of
Thai major airlines by using multiple
linear regression with ordinary least
squares estimation. The first section
dedicates to research’s introduction and
objective. The second section provides
literature review on PFL and
methodologies used to quantify PFL. The
third section proposes a multiple
regression model for PFL. The forth
section describes data characteristics and
data collection. The fifth section presents
regression results, model improvement
and discussion of results. The last section
summarizes the research findings as well
as offers recommendations.
Literature review
Commercial airlines service in Thailand
took place during 1910s, with Don
Muang airfield (nowadays Don Muang
International Airport) the major air hub.
Thai Airways International Public
Company Limited (THAI) was founded
in 1959 as Thai Airways Company. The
company was operated jointly between
Thai government and Scandinavian
Airlines System to provide international
passenger air transport service. As a flag
carrier of Thailand, THAI offers aviation
related business services range from full-
service passenger air transport, ground
service, inflight-catering, air cargo
service, and aircraft repairs and
maintenance (THAI, 2015). Nine years
after the foundation of THAI, Bangkok Airways Public Company Limited (BA)
was established as Sahakol Air to provide
contracted private air-taxi services. The
company started offering schedule flight
services in 1986 and changed airline’s
name to Bangkok Airways in 1989 (BA,
2015). The expansion of commercial
airlines services was not appeared until
the beginning of 2000s. As of 2016, there
are 11 commercial airlines that offer
domestic flight services and five
commercial airlines that offer
international flight services (Department
of Civil Aviation, 2016).
Airport of Thailand Public Company
Limited (AOT) has reported continuous
growth in air traffic in terms of aircraft
movement and number of passengers
UTCC International Journal of Business and Economics
UTTC IJBE | 5
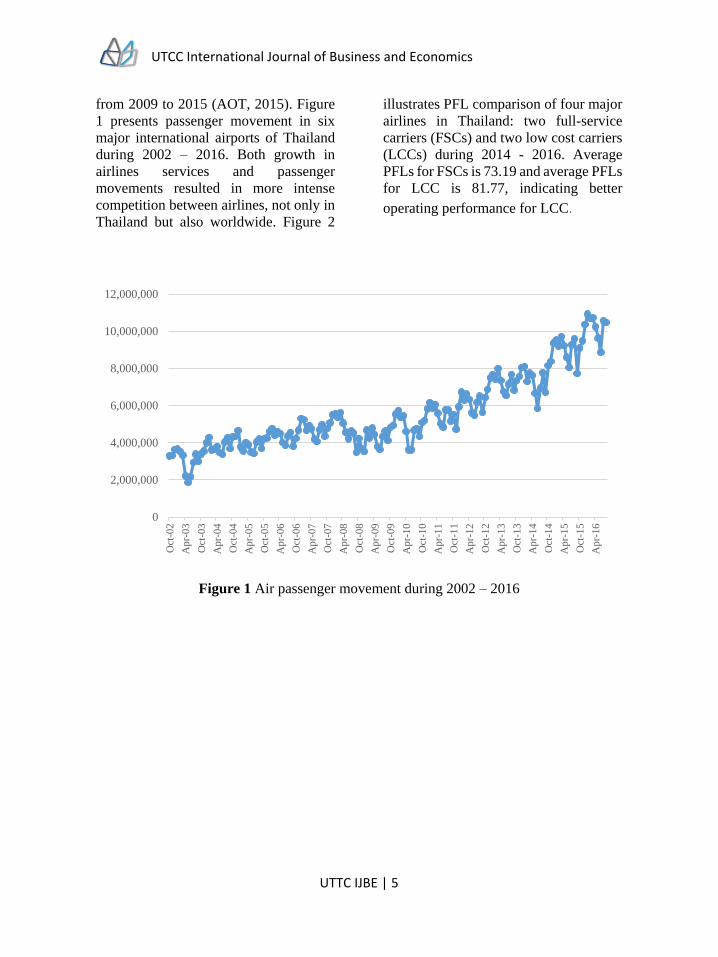
from 2009 to 2015 (AOT, 2015). Figure
1 presents passenger movement in six
major international airports of Thailand
during 2002 – 2016. Both growth in
airlines services and passenger
movements resulted in more intense
competition between airlines, not only in
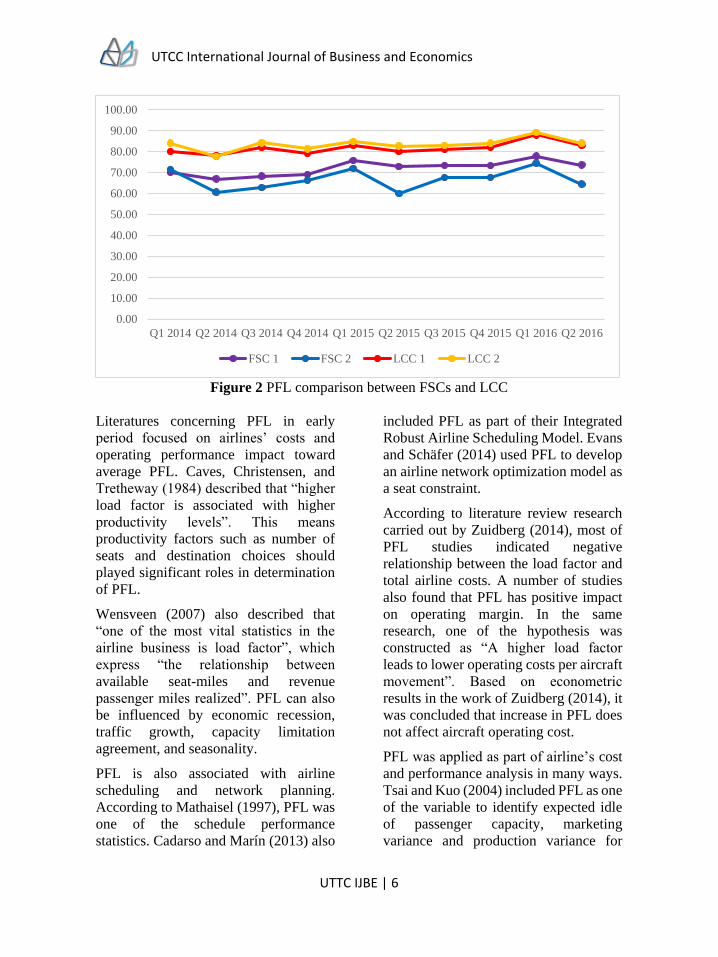
Thailand but also worldwide. Figure 2
illustrates PFL comparison of four major
airlines in Thailand: two full-service
carriers (FSCs) and two low cost carriers
(LCCs) during 2014 - 2016. Average
PFLs for FSCs is 73.19 and average PFLs
for LCC is 81.77, indicating better
operating performance for LCC.
Figure 1 Air passenger movement during 2002 – 2016
0
2,000,000
4,000,000
6,000,000
8,000,000
10,000,000
12,000,000
Oct
-02
Ap
r-03
Oct
-03
Ap
r-04
Oct
-04
Ap
r-05
Oct
-05
Ap
r-06
Oct
-06
Ap
r-07
Oct
-07
Ap
r-08
Oct
-08
Ap
r-09
Oct
-09
Ap
r-10
Oct
-10
Ap
r-11
Oct
-11
Ap
r-12
Oct
-12
Apr-
13
Oct
-13
Ap
r-14
Oct
-14
Ap
r-15
Oct
-15
Ap
r-16
UTCC International Journal of Business and Economics
UTTC IJBE | 6
Figure 2 PFL comparison between FSCs and LCC
Literatures concerning PFL in early
period focused on airlines’ costs and
operating performance impact toward
average PFL. Caves, Christensen, and
Tretheway (1984) described that “higher
load factor is associated with higher
productivity levels”. This means
productivity factors such as number of
seats and destination choices should
played significant roles in determination
of PFL.
Wensveen (2007) also described that
“one of the most vital statistics in the
airline business is load factor”, which
express “the relationship between
available seat-miles and revenue
passenger miles realized”. PFL can also
be influenced by economic recession,
traffic growth, capacity limitation
agreement, and seasonality.
PFL is also associated with airline
scheduling and network planning.
According to Mathaisel (1997), PFL was
one of the schedule performance
statistics. Cadarso and Marín (2013) also
included PFL as part of their Integrated
Robust Airline Scheduling Model. Evans
and Schäfer (2014) used PFL to develop
an airline network optimization model as
a seat constraint.
According to literature review research
carried out by Zuidberg (2014), most of
PFL studies indicated negative
relationship between the load factor and
total airline costs. A number of studies
also found that PFL has positive impact
on operating margin. In the same
research, one of the hypothesis was
constructed as “A higher load factor
leads to lower operating costs per aircraft
movement”. Based on econometric
results in the work of Zuidberg (2014), it
was concluded that increase in PFL does
not affect aircraft operating cost.
PFL was applied as part of airline’s cost
and performance analysis in many ways.
Tsai and Kuo (2004) included PFL as one
of the variable to identify expected idle
of passenger capacity, marketing
variance and production variance for
0.00
10.00
20.00
30.00
40.00
50.00
60.00
70.00
80.00
90.00
100.00
Q1 2014 Q2 2014 Q3 2014 Q4 2014 Q1 2015 Q2 2015 Q3 2015 Q4 2015 Q1 2016 Q2 2016
FSC 1 FSC 2 LCC 1 LCC 2
UTCC International Journal of Business and Economics
UTTC IJBE | 7
aircraft renewal and composition
decisions. Due to the nature of
operations, low cost carriers generally
has higher PFL when compare with full-
service carriers (Morrell, 2005). McLean
(2006) claimed that PFL has relatively
high effect toward operating efficiency,
along with aircraft utilization, fuel
efficiency, and yield management, which
leaded to a suggestion that an airline can
improve the poor PFL by withdrawing
aircraft from service.
In terms of alliance, PFL was viewed as
part of success factors. Chen and Chen
(2003) concluded that parallel code-
sharing of airlines resulted in higher PFL.
Iatrou and Alamdari (2005) also explored
the impact of alliances on airline
operations by using five-scale ratings.
PFL, which has been identified as one of
the impacts, was positively influenced by
the alliances on airline operations in
general.
Apart from cost and operating
performance, price also reflects PFL.
Research conducted by Clark and
Vincent (2012) revealed that in some
airlines, prices are responsive to PFL as
well as prices of competing airlines.
Mumbower, Garrow, and Newman
(2015) identified PFL as one of factors
affecting passenger purchasing behavior
for premium coach seats.
Safety is another issue that could have
affected the PFL. Barnett and Curtis
(1991) has investigated the association
between domestic jet accidents in the
United States and increasing PFL.
Statistical results from 10 randomly
chosen aircrafts showed that the higher
the load factor, the greater the death risk
per flight. Safety was also identified as
one of attributes for flight choice
(Hagmann, Semejin, and Vellenga,
2015). Out of 12 attributes, flight choice
preferences are heavily dominated by
non-stopover and safety, respectively.
The researchers concluded that people
prefer to travel with airlines that offer
direct flights and have good safety
records.
PFL was also applied to the Forecast of
Aircraft Movement (FoAM) model
proposed by Kölker, Bießlich, and
Lütjens (2016). By putting the certain
load factors into FoAM model, future
frequency of flight segments can be
calculated, under an assumption that the
maximum PFL has to be 90% with
decreasing growth of 0.01% per annum.
Different approaches were used to
quantify PFL. In 2007, two researchers
determined factors affecting load factor
in airline industry. According to
Jenatabadi and Ismail (2007), PFL is a
measure of an airline’s passenger
carrying capacity. Researchers used data
from seven Iranian commercial airlines
with time span between 1997 and 2006;
resulting in total of 70 observations, for
the regression model. They defined
mathematical definition of load factor as
follows.
𝐿𝑜𝑎𝑑 𝐹𝑎𝑐𝑡𝑜𝑟 = ∑ (𝑁𝑢𝑚𝑏𝑒𝑟 𝑜𝑓 𝑐𝑎𝑟𝑟𝑖𝑒𝑑 𝑝𝑎𝑠𝑠𝑒𝑛𝑔𝑒𝑟𝑠 × 𝑑𝑖𝑠𝑡𝑎𝑛𝑐𝑒
𝐴𝑣𝑎𝑖𝑙𝑎𝑏𝑙𝑒 𝑠𝑒𝑎𝑡 × 𝑑𝑖𝑠𝑡𝑎𝑛𝑐𝑒) × 100%
𝑟
𝑖=1
UTCC International Journal of Business and Economics
UTTC IJBE | 8
Where r = the number of routes.
Number of carried passenger = number of passengers carried in the route between
two cities or stations; either in one country or two different countries
Distance = distance between two stations and is measured by kilometer.
Available seat = number of available seats in the which depends on the kind of
aircraft
Jenatabadi et al. (2007) developed a
model for load factor including
independent variables as follows.
Computerized System is the number
of agencies using computerized
reservation system. It is labeled as
System Location by Duliba,
Kauffman and Lucas (2001) and it is
lagged one year to take into account
the learning curve of the travel
agency, expecting that the full
impact of automating a travel agency
should be felt during the year after
the automation occurs.
Average length is the average
distance in kilometer of the airline’s
flights between the city pairs.
Departures is the number of
departures in a year.
Organization is a binary variable
where 1 denotes private organization
and 0 denotes governmental
organization.
Advertising expenses is the sum of
expenses for each airline in a year.
Subsidy is the amount of subsidy in
US dollar given by Iran government
to the airline companies.
Inflation rate is the rate of increase
of the average price level
Number of Seat is the total number of
seats for every airline
Change in Vehicle Kilometers is the
first difference of air transportation
vehicle kilometers between year t
and t-1.
The researchers computed generalized
least squares solution for the model.
Result showed that Computerized
System, Average Length, Organization,
Subsidy and Change in Vehicle
Kilometer are significant while
Departures, Advertising Expenses,
Inflation Rate and Number of Seats are
not significant in explaining the variation
in the load factors. Researchers also
suggested that Iranian airlines should
increase their investment in
computerized reservation system and
have proper operation planning.
Devriendt, Burghouwt, Derudder, de
Wit, and Witlox (2009) use demand and
supply data to compute PFL for
transatlantic airlines. The data was
derived from the Official Airline Guide
(OAG) and Marketing Information Data
Transfer (MIDT) database. Data set from
OAG was treated as supply data while
data from MIDT was treated as demand
data. Variables associated with the load
factor are origins and destinations of the
direct flights; operating alliances that
was active in 2001; total number of
passengers that book flights; seat
capacity; and flight frequency. By using
the combined OAG-MIDT database, the
calculated load factors underestimate the
actual the load factor by approximately
10%.
UTCC International Journal of Business and Economics
UTTC IJBE | 9
The regression model
Researcher developed multiple
regression model by using factors
defined or discussed by Iatrou et al.
(2005), McLean (2006), Jenatabadi et al.
(2007), Devriendt et al. (2009), Zuidberg
(2014), and Hagmann et al. (2015).
Researcher introduced Air incident as
one of independent variables to verify the
pattern proposed by Barnett et al. (1991),
since this research was conducted by
using only 10 incidents occurred during
1975 – 1989. Researcher developed a
regression model based on the regression
model proposed by Jenatabadi et al.
(2007) by dropping some outdated and/or
invalid independent variables and adding
new independent variables, resulted in
total of six independent variables. The
multiple regression model for PFL can be
written as follows.
𝑃𝐹𝐿𝑡 = 𝛽0 + 𝛽1𝐴𝑖𝑟𝐼𝑛𝑐𝑖𝑑𝑒𝑛𝑡𝑡 + 𝛽2𝐴𝑙𝑙𝑖𝑎𝑛𝑐𝑒𝑠𝑡 + 𝛽3𝐷𝑒𝑝𝑎𝑟𝑡𝑢𝑟𝑒𝑠𝑡 + 𝛽4𝐸𝑥𝑝𝑒𝑛𝑠𝑒𝑠𝑡
+ 𝛽5𝑅𝑃𝐾𝑡 + 𝛽6𝑆𝑒𝑎𝑡𝑠𝑡 + 𝜀𝑡
Where
PFL is the passenger efficiency ratio. It
is calculated by dividing number of
carried passengers by total available seat.
Air Incidents represents the number of
worldwide air accidents and incidents.
The accidents and incidents, either
investigated or under investigation, are
concerned with the safety issue in air
transport. This variable is an
experimental external factor that could
have affect the load factor and was
discussed by Hagmann et al. (2015).
Departures represents the number of
departed flights. This variable is an
internal factor that presents airlines’
operations and was defined by Jenatabadi
et al. (2007).
Alliances is a binary variable where 1
denotes the airlines with alliance (Part of
Star Alliance, Oneworld, SkyTeam,
Vanilla Alliance, U-FLY Alliance, and
Value Alliance) and/or affiliations
(airlines with subsidiaries, being
subsidiary of an international airline or
part of international airline group) and 0
denotes airlines without alliance.
Airlines with code share agreement are
considered as non-alliance. This variable
was discussed by Iatrou et al. (2005).
Expenses represents total selling and
advertising expense of the company (unit
in millions). This variable is an internal
factor that indicates airlines’ operating
costs and was used by Jenatabadi et al.
(2007) and Zuidberg (2014).
RPK stands for revenue passenger
kilometers. The variable represents the
total revenue passenger kilometers (unit
in millions) which calculate by
multiplying number of passengers that
generate revenue to the airline by the
distance travelled in kilometers. This
variable directly reflects productivity of
the airline and was discussed by McLean
(2006).
Seats represents the total number of
passenger seats in each period. This
variable is an internal factor that exhibits
UTCC International Journal of Business and Economics
UTTC IJBE | 10
airlines’ operations and was mentioned
by Jenatabadi et al. (2007) and Devriendt
et al. (2009).
Data collection
This research used secondary data from
four leading airlines in Thailand that
yield highest number of passengers at
Suvarnabhumi International Airport and
Don Muang International Airport (AOT,
2015). All airlines are registered as Thai
organization and listed in the Stock
Exchange of Thailand. Characteristics of
airlines are described in Table 1. Airlines
were ranked by number of passenger
movement for international and domestic
flights at Suvarnabhumi International
Airport and Don Muang International
Airport (AOT, 2015), with exclusion of
non-Thai airlines.
Table 1 Characteristics of airlines
Airlines
Ranking*
Type Organization Listed
Year
Major
Shareholder
Alliances and
Affiliations
1 FSC Public Company 1991 Government Part of airline alliance
Owned two affiliated
airlines
2 LCC Public Company 2012 Family
shareholders
Part of airline group
Affiliated airline of
international LCC
3 LCC Public Company 2013 Public
Company
Affiliated airline of
Thai FSC
5 FSC Public Company 2013 Family
shareholders
None
*4th ranking airline is a privately held company. Due to data availability and reliability issues,
researcher excluded the airline from the analysis.
The data were collected in quarterly
manner. Because one of the airlines was
listed in the Stock Exchange of Thailand
in the last quarter of 2013, data set were
limited. Observations are data from the
first quarter of 2014 to the second quarter
of 2016. Financial and operating
statistics data are publicly available in
each airline’s investor relation websites.
Air Incidents data were obtained from
SKYbrary. All data, despite being time-
series data, were treated as cross-
sectional data.
Regression results and
discussions
Multiple linear regression
By using ordinary least squares
estimation with 95% confidence level,
the regression result is displayed in Table
2.
UTCC International Journal of Business and Economics
UTTC IJBE | 11
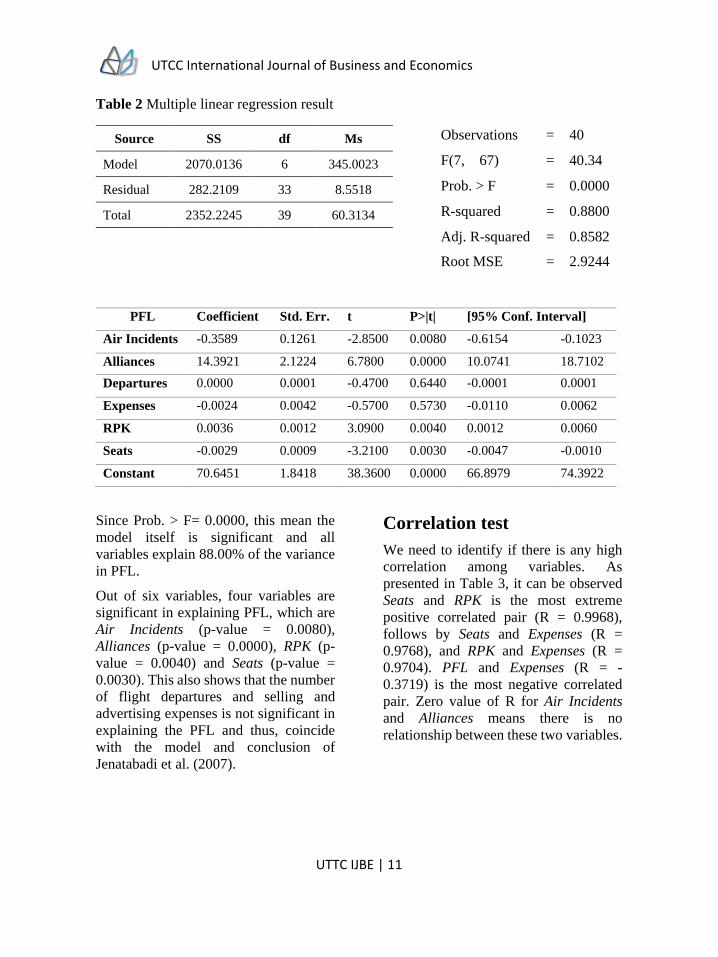
Table 2 Multiple linear regression result
Source SS df Ms Observations = 40
Model 2070.0136 6 345.0023 F(7, 67) = 40.34
Residual 282.2109 33 8.5518 Prob. > F = 0.0000
Total 2352.2245 39 60.3134 R-squared = 0.8800
Adj. R-squared = 0.8582
Root MSE = 2.9244
PFL Coefficient Std. Err. t P>|t| [95% Conf. Interval]
Air Incidents -0.3589 0.1261 -2.8500 0.0080 -0.6154 -0.1023
Alliances 14.3921 2.1224 6.7800 0.0000 10.0741 18.7102
Departures 0.0000 0.0001 -0.4700 0.6440 -0.0001 0.0001
Expenses -0.0024 0.0042 -0.5700 0.5730 -0.0110 0.0062
RPK 0.0036 0.0012 3.0900 0.0040 0.0012 0.0060
Seats -0.0029 0.0009 -3.2100 0.0030 -0.0047 -0.0010
Constant 70.6451 1.8418 38.3600 0.0000 66.8979 74.3922
Since Prob. > F= 0.0000, this mean the
model itself is significant and all
variables explain 88.00% of the variance
in PFL.
Out of six variables, four variables are
significant in explaining PFL, which are
Air Incidents (p-value = 0.0080),
Alliances (p-value = 0.0000), RPK (p-
value = 0.0040) and Seats (p-value =
0.0030). This also shows that the number
of flight departures and selling and
advertising expenses is not significant in
explaining the PFL and thus, coincide
with the model and conclusion of
Jenatabadi et al. (2007).
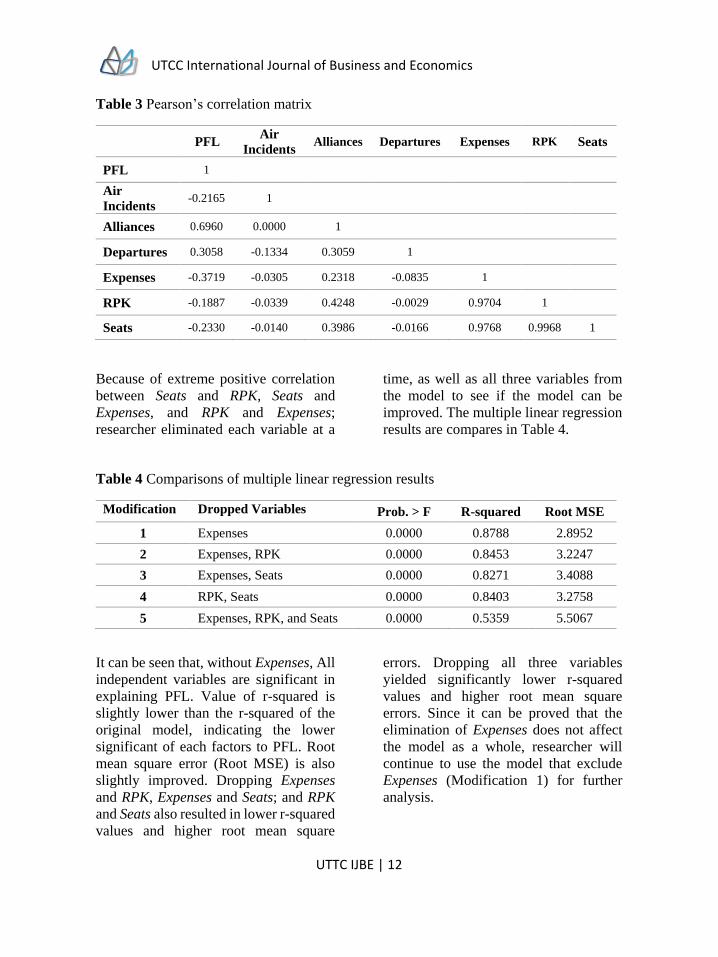
Correlation test
We need to identify if there is any high
correlation among variables. As
presented in Table 3, it can be observed
Seats and RPK is the most extreme
positive correlated pair (R = 0.9968),
follows by Seats and Expenses (R =
0.9768), and RPK and Expenses (R =
0.9704). PFL and Expenses (R = -
0.3719) is the most negative correlated
pair. Zero value of R for Air Incidents
and Alliances means there is no
relationship between these two variables.
UTCC International Journal of Business and Economics
UTTC IJBE | 12
Table 3 Pearson’s correlation matrix
PFL
Air
Incidents Alliances Departures Expenses RPK Seats
PFL 1
Air
Incidents -0.2165 1
Alliances 0.6960 0.0000 1
Departures 0.3058 -0.1334 0.3059 1
Expenses -0.3719 -0.0305 0.2318 -0.0835 1
RPK -0.1887 -0.0339 0.4248 -0.0029 0.9704 1
Seats -0.2330 -0.0140 0.3986 -0.0166 0.9768 0.9968 1
Because of extreme positive correlation
between Seats and RPK, Seats and
Expenses, and RPK and Expenses;
researcher eliminated each variable at a
time, as well as all three variables from
the model to see if the model can be
improved. The multiple linear regression
results are compares in Table 4.
Table 4 Comparisons of multiple linear regression results
Modification Dropped Variables Prob. > F R-squared Root MSE
1 Expenses 0.0000 0.8788 2.8952
2 Expenses, RPK 0.0000 0.8453 3.2247
3 Expenses, Seats 0.0000 0.8271 3.4088
4 RPK, Seats 0.0000 0.8403 3.2758
5 Expenses, RPK, and Seats 0.0000 0.5359 5.5067
It can be seen that, without Expenses, All
independent variables are significant in
explaining PFL. Value of r-squared is
slightly lower than the r-squared of the
original model, indicating the lower
significant of each factors to PFL. Root
mean square error (Root MSE) is also
slightly improved. Dropping Expenses
and RPK, Expenses and Seats; and RPK
and Seats also resulted in lower r-squared
values and higher root mean square
errors. Dropping all three variables
yielded significantly lower r-squared
values and higher root mean square
errors. Since it can be proved that the
elimination of Expenses does not affect
the model as a whole, researcher will
continue to use the model that exclude
Expenses (Modification 1) for further
analysis.
UTCC International Journal of Business and Economics
UTTC IJBE | 13
Tests for heteroscedasticity
Because the time-series data are treated
as cross-sectional data, tests for
heteroscedasticity are required. There are
several tests for heteroscedasticity but
this research applied the two most
popular tests: Breusch-Pagan test and
White test. Both tests were deployed with
the model without Expenses variable.
For Breusch-Pagan test for
heteroscedasticity, the null hypothesis is
defined as H0: Constant variance. The
variables are fitted values of the load
factor. The chi-square (1) or χ2 (1) is 3.90
and Prob. > χ2 is 0.0483. Therefore, the
null hypothesis have to be rejected.
Another test for heteroscedasticity is
Cameron & Trivedi’s decomposition of
IM-test or White test. By setting the null
hypothesis as H0: homoscedasticity,
against Ha: unrestricted
heteroscedasticity. The chi-square (19)
or χ2 (19) is 18.15 and Prob. > χ2 is
0.5125. Therefore, the null hypothesis
cannot be rejected.
Since in Breusch-Pagan test for
heteroscedasticity, the null hypothesis
have to be rejected, it can be concluded
that the variance of the error terms is not
constant. However, White test revealed
that heteroscedasticity does not exist.
Conflict in test results suggested that the
regression model should be further
revised.
Model improvement
Because there are heteroscedasticity in
data, researcher tried to improve the
model by dropping variables that cause
heteroscedasticity and inconstant
variance of the error terms. The test
results are displayed in Table 6.
Modification 1 are tests for
heteroscedasticity of the original model.
In both tests, the null hypothesis cannot
be rejected. Similarly, by dropping the
variable Expenses and Seats, the null
hypothesis in both tests cannot be
rejected. On the other hand, dropping out
the variable Expenses and the variables
Expenses and RPK resulted in rejecting
the null hypothesis in the Breusch-Pagan
Test. Interestingly, by dropping out RPK
and Seats (Modification 5), which are
significant variables in explaining PFL in
the original model, the model is not only
pass both tests for heteroscedasticity but
also resulted in having Expenses as one
of significant variable in explaining PFL
(p-value = 0.0000).
Table 6 Comparisons for test for heteroscedasticity
Modification Dropped
Variables
Test for Heteroscedasticity
Breusch-Pagan Test White Test
χ2 df Prob. > χ2 χ2 df Prob. > χ2
1 - 3.77 1 0.0521 25.39 26 0.4970
2 Expenses 3.90 1 0.0483 18.15 19 0.5125
3 Expenses, Seats 3.50 1 0.0614 12.78 13 0.4652
4 Expenses, RPK 3.85 1 0.0498 12.09 13 0.5207
5 RPK, Seats 3.52 1 0.0606 15.47 13 0.2792
UTCC International Journal of Business and Economics
UTTC IJBE | 14
Therefore, the researcher will continue
using the original model since the model
yields the highest r-squared value and the
lowest root mean square error. The tests
for heteroscedasticity confirmed that the
variance of the error terms is constant and
heteroscedasticity does not exist. It can
be concluded that Air Incidents,
Alliances, RPK, and Seats are significant
in explaining the PFL for Thai airlines.
Alliances is one of the variables with
positive coefficient, which means PFL
will decrease in absent of airline alliance
and coherent with the study of Chen et al.
(2003) and Iatrou et al. (2005). RPK also
has positive coefficient. The coefficient
number is quite small and the variable
has negative correlation with PFL.
Negative coefficient of Air Incidents can
be interpreted that the higher the number
of global air incident, the lower the PFL
for Thai airlines. Additionally, Seats has
negative coefficient. The coefficient
number is also small and the variable has
negative correlation with PFL. Negative
correlations between RPK and PFL; and
Seats and PFL is still rational because
both variables are the determinations of
PFL. Decreasing in both value can still
yield higher PFL. When passenger traffic
and number of available seats of airlines
negatively reacted with PFL but PFL
increases, this means revenue-generating
passengers (numerator) decrease in
smaller proportion in compare with
number of available seats of airlines
(denominator).
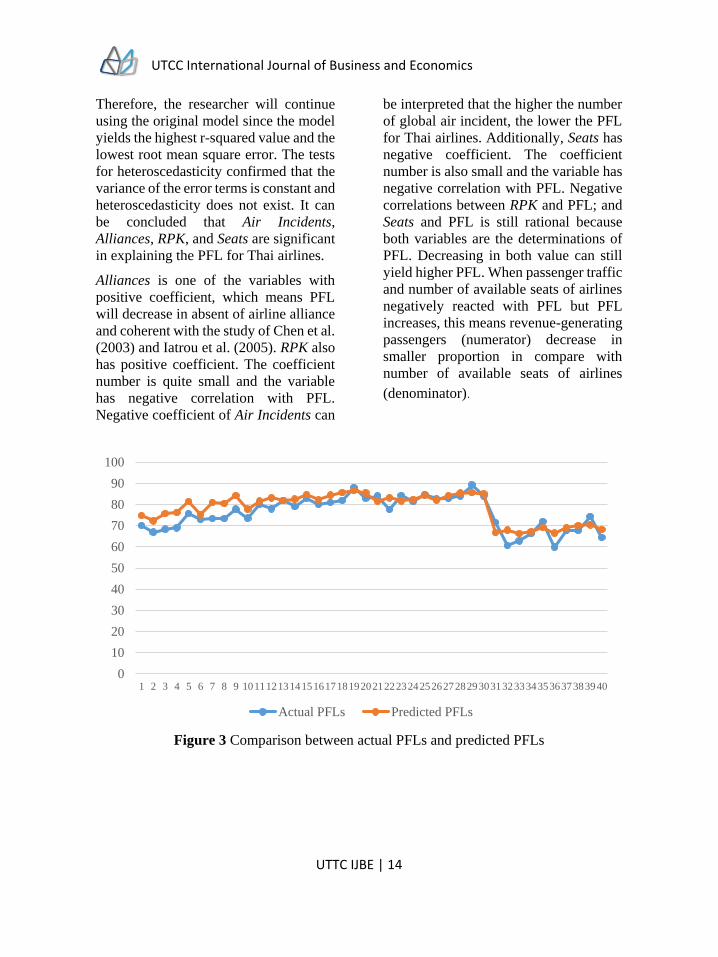
Figure 3 Comparison between actual PFLs and predicted PFLs
0
10
20
30
40
50
60
70
80
90
100
1 2 3 4 5 6 7 8 9 10111213141516171819202122232425262728293031323334353637383940
Actual PFLs Predicted PFLs
UTCC International Journal of Business and Economics
UTTC IJBE | 15
Figure 3 compares the actual PFLs with
the predicted PFLs, which can be
observed that the predicted PFLs
resemble the data pattern of the actual
PFLs. Although the four independent
variables can explain only 88% of
dependent variable, and root mean square
error is 2.9244, the average error in this
model is approximately -3.36%,
indicating slight underestimations for
PFLs in this model. On average, the
model perform better determinations for
LCCs than FSCs.
Conclusion and recommendations PFL for Thai airlines can be determined
by using four variables: air incidents;
airline alliance status; RPK; and number
of seats, which lead to a conclusion that
decreasing number of global air
incidents, existence of airline alliance,
and slight increase in RPK with small
drop in number of available seats of
airline will resulted in higher PFLs.
Despite the fact that low cost variable
was excluded from the regression model,
it is undeniable that low cost carriers will
generally yield higher PFL than full-
service carriers (Morrell, 2005).
By taking a closer look into the air
incidents data, it can be observed that out
of 591 air incidents over the past ten
years. There are only one major incidents
that cause severe casualties occurred in
Thailand during that period. The incident
of MD-82 aircraft crashed at Phuket
International Airport in 2007 was
operated by One Two Go Airlines, which
is not part of this research. Because the
air turbulence experience of a flight
bounded from Hong Kong to Bangkok,
and the runway excursion of a flight
bounded from Guangzhou to Bangkok
are not taken in to account (both of them
occurred in 2013), it is undeterminable
whether the non-severe air incidents
influence the PFL or not. Therefore, as
long as the air incident exists, it can be
presumed that the higher the number of
global air incidents, the more passengers
will be attracted to Thai airlines. Because
people prefer to travel with airlines that
have good safety (or air incident)
records, it is recommended that the
airlines should strictly follow safety rules
and regulation in accordance with safety
standard set by International Civil
Aviation Organization (ICAO) to
maintain the desirable level of PFL.
There are some remarks about the
analysis of PFL. First, researcher is
unable to obtain code share seat in
proportionate to seat sold by Thai
airlines. The data should support the
proposition that the airline alliances have
positive affect the passenger load factor
because the cooperation between airlines
should have increased number of
passengers and the load factor. In this
research, only the existence of airline
alliances is known and the variable was
set as binary, detailed data concerning
code share seats should provide more
insightful analysis.
Another factor that researcher did not
take into account is the pricing strategies
of airlines. It would be interesting to
quantify the effect of price in various
situations such as prices of the airlines
against their rivals; pricing and zero fare
promotion; and prices comparison
between incumbent airlines the new
comer airlines; to see whether this factor
have any significant effect to PFL.
UTCC International Journal of Business and Economics
UTTC IJBE | 16
The last remark concerned with data
issue. Due to availability of data of a
commercial airline that was listed in the
Stock Exchange of Thailand in the last
quarter of 2013, researcher can obtain
only 10 observations from the airline,
resulted in using the data from the same
period of the other three airlines. Future
research when there is more data
available is recommended to ensure
model’s reliability. Additionally,
researcher limited scope of research to
airlines that were listed the Stock
Exchange of Thailand, not only because
data concerning financial and operations
are thoroughly verified by the Securities
and Exchange Commission, but also the
accessibility of data. Research can also
be extended to cover global airlines,
particularly for FSCs and LCCs, which
the later focus heavily in maintain high
level of PFL.
References
Airport of Thailand Public Company Limited. (2015). 2015 Traffic Report. Bangkok: AOT
Arul, S. (2014). Methodologies to monetize the variations in load factor and GHG
emissions per passenger-mile of airlines. Transportation Research Part D, 32, 411
– 420.
Bangkok Airways Public Company Limited. (2015). Annual Report B.E. 2558. Bangkok:
BA.
Barnett, A., & Curtis, T. (1991). An Unfortunate Pattern Observed in U.S. Domestic Jet
Accidents. Flight Safety Foundation. Flight Safety Digest, October 1991, 1 – 8.
Cadarso, L. & Marín, Á. (2013). Robust passenger oriented timetable and fleet assignment
integration in airline planning. Journal of Air Transport Management, 26, 44 – 49.
Caves, D., Christensen, M., & Tretheway M. (1981). U.S trunk air carriers, 1972 – 1977:
A multilateral comparison of total factor productivity. T. Cowing, R. Stevenson,
eds. Productivity Measurement in Regulated Industries. New York: Academic
Press.
Chen, F. C.–Y., & Chen, C. (2003). The effects of strategic alliances and risk pooling on
the load factors of international airline operations. Transportation Research Part
E, 39, 19 – 34.
Clark, R., & Vincent, N. (2012). Capacity-contingent pricing and competition in the airline
industry. Journal of Air Transport Management, 24, 7 – 11.
Department of Civil Aviation (2016). Airlines: Domestic Airlines. Retrieved October 4,
2016, from www.aviation.go.th/en/content/19413/1202.html.
Devriendt, L., Burghouwt, G., Derudder, B., de Wit, J., & Witlox, F. (2009). Calculating
load factors for the transatlantic airline market using supply and demand data – A
note on the identification of gaps in the available airline statistics. Journal of Air
Transport Management, 15, 337 – 343.
UTCC International Journal of Business and Economics
UTTC IJBE | 17
Evans, A., & Schäfer, A. (2014). Simulating airline operational responses to airport
capacity constraints. Transport Policy, 34, 5 – 13.
Hagmann, C., Semejin, J., & Vellenga, D.B. (2015). Exploring the green image of airlines:
Passenger perceptions and airline choice. Journal of Air Transport Management,
43, 37 – 45.
International Air Transport Association (2016). Demand for Air Travel in 2015 Surges to
Strongest Result in Five Years. Retrieved June 14, 2016, from
http://www.iata.org/pressroom/pr/Pages/ 2016-02-04-01.aspx.
International Air Transport Association (2016). Fact Sheet – Industry Statistics. Retrieved
June 14, 2016, from http://www.iata.org/pressroom/facts_figures/fact_sheets/
Documents/fact-sheet-industry-facts.pdf
International Air Transport Association (2016). Strong Passenger Demand Continues into
2016. Retrieved June 14, 2016, from
http://www.iata.org/pressroom/pr/Pages/2016-03-08-01.aspx.
Iatrou, K., & Alamdari, F. (2005). The empirical analysis of the impact of alliances on
airline operations. Journal of Air Transport Management, 11, 127 – 134.
Jenatabadi, H. S., & Ismail, N. A. (2007). The Determination of Load Factors in the Airline
Industry. International Review of Business Research Papers, 3, 125 – 133.
Kölker, K., Bießlich, P., & Lütjens, K. (2016). From passenger growth to aircraft
movements. Journal of Air Transport Management, 56, 99 – 106.
Mathaisel, D.F.X. (1997). Decision Support for Airline Schedule Planning. Journal of
Combinatorial Optimization, 1, 251 – 275.
McLean, D. (2006). The operational efficiency of passenger aircraft. Aircraft Engineering
and Aerospace Technology, 78, 32 – 38.
Morrell, P. (2005). Airlines within airlines: An analysis of US network airline responses
to Low Cost Carriers. Journal of Air Transport Management, 11, 303 – 312.
Mumbower, S., Garrow, L.A., & Newman, J.P. (2015). Investigating airline customers’
premium coach seat purchases and implications for optimal pricing strategies.
Transportation Research Part A, 73, 53 – 69.
Thai Airway International Public Company Limited. (2015). Annual Report B.E. 2558.
Bangkok: THAI.
Tsai, W.–H., & Kuo, L. (2004). Operating costs and capacity in the airline industry.
Journal of Air Transport Management, 10, 271 – 277.
Wensveen, J. G. (2007). Air Transportation: A Management Perspective. 6th Edition.
Hamshire, UK: Ashgate.
Zuidberg, J. (2014). Identifying airline cost economies: An econometric analysis of the factors affecting aircraft operating costs. Journal of Air Transport Management, 40, 86 – 95.

UTCC International Journal of Business and Economics
UTTC IJBE | 18
UTCC International Journal of Business and Economics
UTTC IJBE | 19
UTCC International Journal of Business and Economics (UTCC IJBE)
Volume 10 Number 1, April 2018
Factors related to consumer behavior on
luxury goods purchasing in China
Jinfeng Wang1, Piraphong Foosiri2 1,2School of Business, University of the Thai Chamber of Commerce [email protected]
Abstract
The study on luxury consumers is always connected to their drives behind consumption.
Why Chinese people like purchasing luxury goods is an interesting question. A better
understanding of the Chinese consumption of luxury goods may assist the luxury industry
when targeting China as the soon-to-be largest consumer market. This research is designed
to study factors related to consumer behavior on luxury goods purchasing in China. And
four research hypotheses are proposed in this research. Based on 446 samples, this study
explores the factors such like demographic, motivation, cultural factor and brand equity
affect consumer behavior on luxury goods in China.
The purpose of this study is to analyze consumer behavior on luxury goods in China and
determine the factors that affect luxury consumption.
The study focuses on motivation, cultural factor and brand equity of Chinese luxury
consumer. Quantitative research method via survey was used for this research. Using a
survey among a large sample of people in four cities via questionnaire by hard copies,
chose an investigation website to make an formal questionnaire through online channel,
and use Wechat scanned the questionnaire QR code by mobile phone.
The results show that Chinese consumer is motivated to purchase luxury goods by
interpersonal effects that the way influence consumer is perceived by others, and purchase
luxury goods for personal effect that consumer individual preference oriented and free of
external interference. Face saving, gifting, and social status are the highlight in Chinese
culture. Also the reference group influence people when they make a decision and fit friend
circle. The results also show that brand equity may affect Chinese consumer behavior on
luxury goods.
UTCC International Journal of Business and Economics
UTTC IJBE | 20
Limitation is amount of time is a constraint in this research, also limited to four major first-
line cities in China by hard copy questionnaire. From a practical point of view, this study
has certain inspiration for business and consumer. It is benefit for marketer to develop
marketing strategy for luxury goods in China market.
Western scholars started do research on luxury goods earlier based on western culture; the
proposed model is not entirely applicable in China. This study based on the Chinese
traditional culture to analyze the factors related to consumer behavior on luxury goods
purchasing in China.
Keywords: Consumer Behavior, Luxury Goods, Motivation,
Cultural Factor, Brand Equity
Introduction
According to the rapid development of
national economy and the enhancement
of the purchasing power, the luxury
consumption Chinese people also get a
certain development. In 2006, there were
320,000 Chinese millionaires and
Chinese consumers' spending on luxury
products accounted for 10% of global
luxury brand sales. Six years later, these
numbers have doubled or even tripled. In
2012, the global luxury market valued
EUR212 billion, representing a year-on-
year increase of 10%. Chinese consumers
became the world's largest consumer
group of luxury goods and they spent
RMB306 billion in the world, most of
which was done in Hong Kong, Macao
and other countries , while only 39.28%
in Mainland China (Source: Bain Survey
of Luxury Goods Consumers in
Mainland China). Data from World
Luxury Association official report for
Chinese overseas luxury goods
consumption during the 2013 spring
festival show that Chinese overseas
luxury goods consumption totaled $8.5
billion, compared with last year’s total of
$7.2 billion, an increase of 18%.
For another way, Chinese online luxury
shopping increases 68.8% in 2011. From
iResearch, the market scale of China
luxury online shopping in 2010
(including C2C and B2C) is 6.36 billion
yuan; the number in 2011 is estimated to
be 10.73 billion yuan with an annual
growth of 68.8%. In the whole market
scale of China online shopping,
transaction size of online luxury
shopping keeps percentage of 1%-2%: it
account for 1.38% in 2010 and is
estimated to be 1.41% in 2011.From the
view of proportion of online luxury
shopping transaction size in luxury
shopping, the penetration tate in 2010 is
3.16% and is estimated to be 4.37% in
2011 and 8.03% in 2015. Only market
scale of online luxury shopping in
mainland China is calculated, excluding
online luxury consumption in Hong
Kong, Macao, Taiwan and overseas.
UTCC International Journal of Business and Economics
UTTC IJBE | 21
Problem statement
An interesting appearance is a lot of
Chinese travelling to overseas countries,
while Chinese tourist splash out a lot of
money for luxury good, they save on
food and hotels. They travel in groups,
prefer to stay in budget hotels and do not
want to spend too much on (Chinese)
food. In the mainland China, some
young office ladies, every day they eat
noodle, cram onto the bus and subway,
just after two or three months, they have
enough to buy a Louis Viutton handbag
or Chanel, it is completely can not
understand. As the matter of fact, the
price of luxury goods is much higher than
people’s salaries. Why Chinese people
are so crazy to purchase luxury goods?
Chinese consumers are also becoming
younger and more individualistic.
Released 2010- 2011 World Luxury
Association Annual Report, China’s
luxury consumers are younger than
world average. The report shows that
73% of Chinese luxury consumers are
under the age of 45 years old, and 45% of
Chinese luxury consumers are between
18 to 34 years old. This ratio in Japan and
Britain are 37% and 28 % respectively.
There must be great changes in their
behavior.
Thus, a further research of Chinese
luxury consumption motivation and
behavior is necessary.
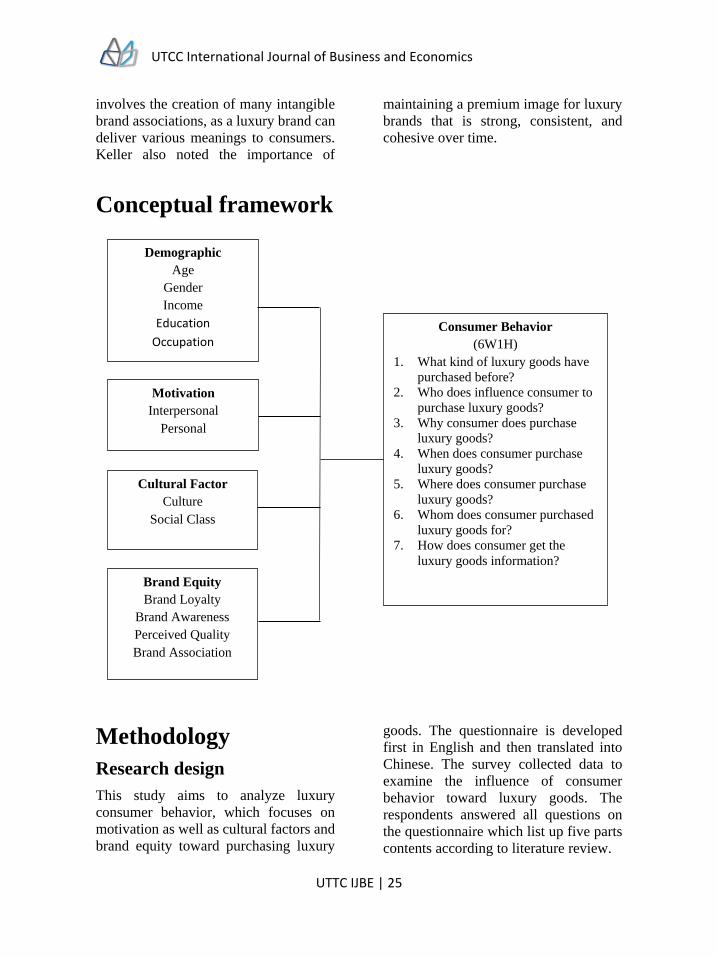
Objectives 1) To study demographic factor
affecting consumer behavior.
2) To study motivation affecting
consumer behavior.
3) To study cultural factor affecting
consumer behavior.
4) To study brand equity affecting
consumer behavior.
Literature
Definition of luxury
Luxury is derived from the Latin word
“luxus”, which implies indulgence of the
senses, regardless of cost (Mootee,
2004). Luxury goods are a wide concept,
but it has three basic elements: good,
expensive and not necessarily. “Luxuries
are the extras in life that make it more
fulfilling, more rewarding, more
comforable,more enjoyable” (Danziger
, 2005, p.56). Luxuries have high
quality is perceived as a fundamental
attribute associated with luxury goods
(Garfein, 1989; Roux, 1995).
Motivation
“Motivation refers to the process that
lead people to behave as they do
(Solomon, 1994).” Understanding
consumer’s motivation for buying luxury
goods and services is important to
marketers (Danziger, 2002). Vigneron
and Johnson (2004) proposed modify
luxury consumption motives that,
consumer motivation can be divided into
the interpersonal perception motivation,
including the conspicuous, uniqueness,
bandwagon and personal motivation,
including hedonic and quality.
Conspicuousness
Luxury goods are high-designed,
Chinese consumer wants to buy the
product to make them more attractive.
“China is at the show off stage (Chadha
UTCC International Journal of Business and Economics
UTTC IJBE | 22
and Husband, 2006)”, that people are
tripping over each other trying to acquire
the symbols of wealth and displaying
them in the most conspicuous manner
(Chadha and Huband, 2006). Hence the
measure of conspicuousness includes
items such as ‘extremely expensive’ or
‘for wealthy’ that tap into perceptions of
price and social status associated with the
brand.
Uniqueness
“Uniqueness is sought to enhance one’s
self-image and social image by adhering
to one’s personal taste, or breaking the
rules, or avoiding similar consumption
(Vigneron and Johnson, 2004).” “Items
that are in limited supply have high
value, while those readily available are
less desirable. Rare items command
respect and prestige” (Solomon, 1994).
Rare products have more affect on
consumer demand even perceive the
product unique, popular and expensive
(Verhallen and Robben, 1994).
Bandwagon
Bandwagon motivation refers as
represents consumers who purchase
luxury goods because they wish to fit in
with a particular group. Berry (1994)
states that people purchase fashionable
and stylish products to associate
themselves to similar people. More over,
the education of the affluent lifestyle is
applied and imitated in reality by
purchasing similar luxury goods that is
televised (Dittmar, 1994). Consumers
will choose the same buy luxury goods
group values to identity and make the
self-consistent with the group, showed
the group internal rules of obedience.
Hedonic
Hedonic usually refers to the luxuries
reflected by sensory gratification and
sensory pleasure expected from the
consumption (Vigneron and Johnson,
2004). Luxuries bring people subjective
intangible benefits. “Hedoniest
consumers are more interested in their
own thoughts and feelings, thus they will
place less emphasis on price as an
indicator of prestige (Vigneron and
Johnson, 1999).” Buy luxury goods make
consumer feel fun from products and
gain emotional pleasure. For example,
reward for good work or celebrate some
events.
Quality
Consumer influenced by the quality
dimension of luxury may perceive that
luxury brands have superior
characteristics compared with non luxury
brands (Vigneron and Johnson, 2004).
Pursuit of refined quality motivation,
consumer purchase expensive luxuries
because they enjoy this remarkable
product quality, including high quality,
unique design, artistic value, long
cultural connotation and ecquisite
workmanship.Chadha and Husband
(2006) conducted that Chinese consuemr
loving buy luxury goods because
luxuries show good taste. Consumers
who seek perfect willing to perceive
more value from a luxury brand, because
they may have a greater brand quality and
reassurance (Aaker, 1991).
Cultural factors “Face” is the Chinese traditional culture,
traditional values, and personality traits,
UTCC International Journal of Business and Economics
UTTC IJBE | 23
social and cultural syntheses of
combined action of the shame of
orientation. Chinese are concerned with
their images among in group members
and often seek the inclusion of a certain
social group through owning luxury
brands (Yang, 1981). Refers as “the
positive social value a person effectively
claims for himself by the line others
assume he has at akin during a particular
contact (Goffman, 1967, p.5).” “Face” in
China also implies a group value
orientation. For example, the face of
family refers to the family honors or
ensures that looks good, is an important
aspect of Chinese culture (Braxton,
1999). People attempt to get and keep
face rather than losing face (Hwang,
1987).
In China, gifting is necessary for
establishing relationships, the Chinese
call “guanxi” (Chadha and Husband,
2006). Asians often purchase luxury
goods for families and “package”
families with luxury brands to show off
family wealth and status (Ger and Belk,
1996). As a typical collectivist culture,
Chinese society emphasizes harmonious
interpersonal relationships. Exchanging
gifts in maintaining and expanding
relationship play an important role
(Bond, 1991, 1996; Bond and Lee, 1981;
Gu, Hung, and Tse, 2008). Nothing is
possible in China if without guanxi (Ju,
1995).
A major influence on one's purchasing
habits and consumer behavior is the
social class in which one finds him or
herself. Social class is considered an
external influence on consumer behavior
because it is not a function of feelings or
knowledge. Social class defined as social
groups, the people don't need to shown in
a formal process of similar lifestyle show
are groups formed by individuals
(Wayne and Deborah, 1997). The
behavior of members have similar social
class structure, education levels,
attitudes, values and communication
styles, and these characteristics are
different from other social class members
(Williams, 2002). Across social class
levels could be expected to lead to
variations in consumer information
processing and decision-making styles
within and across social strata (Fisher,
1987; Komarovsky, 1961). Social class
focus on buying and consumption
processes as opposed to consumption
objects, i.e. products and services (Holt,
1998).
Brand equity There are two aspects academic
perspectives of brand equity, financial
and customer based. This research
reviews the definitions and dimensions
of brand equity and focus on customer-
based context that includes the
dimensions of brand equity.
Brand loyalty
Brand loyalty defines as “the attachment
that a customer has to a brand” (Aaker,
1991). Commitment and repeated
purchase behavior are considered as
necessary conditions for brand loyalty
followed by perceived value,
satisfaction, and brand trust
(Punniyamoorthy and Raj, 2007). As the
study by Jung and Sung (2008) revealed
the positive correlation between brand
loyalty and purchase intention, this
dimension of brand equity is directly
linked to future profits. Because quality
UTCC International Journal of Business and Economics
UTTC IJBE | 24
of products and customer service are
emphasized for promoting luxury brands,
consumer brand loyalty toward luxury
brands would be greater than that toward
the general merchandise.
Brand awareness
Brand awareness defines as “the
customers’ ability to recall and recognize
the brand as reflected by their ability to
identify the brand under different
conditions and to link the brand name,
logo, symbol, and so forth to certain
associations in memory” (Keller, 2003).
Aaker (1996) defines brand awareness as
“a consumer’s ability to recognize or
recall a brand in a certain product
category”; in other words, the brand is
called to mind when a consumer thinks
about the category. Consumers may link
the related brand knowledge to the brand
name, which finally constitutes brand
equity (Aaker, 1991; Keller,
1993).Consumers' purchase and
subsequent usage experience may predict
brand awareness better, rather than the
vice versa (Olshavsky and Granbois,
1979). Brand awareness is an essential
part of brand development, helping the
brand stand out from competitors, it
plays a major role in a consumer’s
buying decision process.
Perceived quality
Perceived quality can be defined as the
customer's perception of the overall
quality or superiority of a product or
service with respect to its intended
purpose, relative to alternatives.
Perceived quality cannot necessarily be
objectively determined, because it is a
perception and judgments about what is
important to consumers are involved.
Perceived quality is an intangible, overall
feeling about a brand (Aaker, 1991).
Perceived quality of a particular branded
product cannot be based only on
consumers’ own experience from the
actual consumption but on others’
feedback, such as the reference group or
celebrity endorsement. It has been shown
that the price of a product may have a
positive relationship with the perception
of high quality or prestige (Groth and
McDaniel 1993). Indeed, Aaker
suggested that consumers may associate
luxury products with a superior quality,
which can lead to a greater perceived
value for a brand. However, as the
perception of price can be subjective, the
perceived quality and its importance
placed on quality of a product for
assessing a brand value is expected to
vary across different cultures.
Brand association
Brand association refers as all things
involve consumer's imagination,
product's features and the usages about
brand in the mind, the assaciations
related to the organization, personality
and symbols (Jung and Sung, 2008). A
brand association is the most accepted
aspect of brand equity (Aaker, 1992).
Associations represent the basis for
purchase decision and for brand loyalty
(Aaker,1991). Brand associations consist
of all brand-related thoughts, feelings,
perceptions, images, experiences,
beliefs, attitudes (Kotler and Keller,
2006) and is anything linked in memory
to a brand. Brand association derives
from a consumer's past experience of
using a particular brand. According to
Keller (2009), luxury branding typically
UTCC International Journal of Business and Economics
UTTC IJBE | 25
involves the creation of many intangible
brand associations, as a luxury brand can
deliver various meanings to consumers.
Keller also noted the importance of
maintaining a premium image for luxury
brands that is strong, consistent, and
cohesive over time.
Conceptual framework
Methodology
Research design
This study aims to analyze luxury
consumer behavior, which focuses on
motivation as well as cultural factors and
brand equity toward purchasing luxury
goods. The questionnaire is developed
first in English and then translated into
Chinese. The survey collected data to
examine the influence of consumer
behavior toward luxury goods. The
respondents answered all questions on
the questionnaire which list up five parts
contents according to literature review.
Cultural Factor
Culture
Social Class
Demographic
Age
Gender
Income
Education
Occupation
Motivation
Interpersonal
Personal
Brand Equity
Brand Loyalty
Brand Awareness
Perceived Quality
Brand Association
Consumer Behavior
(6W1H)
1. What kind of luxury goods have
purchased before?
2. Who does influence consumer to
purchase luxury goods?
3. Why consumer does purchase
luxury goods?
4. When does consumer purchase
luxury goods?
5. Where does consumer purchase
luxury goods?
6. Whom does consumer purchased
luxury goods for?
7. How does consumer get the
luxury goods information?
UTCC International Journal of Business and Economics
UTTC IJBE | 26
Experiments and data
collection
The data was collected primary data via
questionnaire by three ways. First, the
researcher chose an investigation website
to make a formal questionnaire, and
distributed via online channel, such as
BBS, blog and social network. Second,
the respondents used WeChat to scan the
questionnaire QR code to complete
questionnaire by mobile phone. Third,
the questionnaires were sent by hard
copy to respondents in different cities.
There are 385 respondents as the sample
size which according to Suzie Sangren
(1999) to calculate.
Data measurement and
analysis
There have three parts resectively are
consumer motivation, cultural factors
and brand equity to measure consumer
behavior and might ask them to specify
their feelings as either “Strongly Agree”
“Agree” “Neutral” “Disagree” “Strongly
Disagree”. The items in this scale are
ordered, ranging from most agree to
least. The test method depends on what
scale used. The first part is ordinal scale,
part two to part four are interval scale,
and the fifth part on questionnaire is
nominal scale. Data from questionnaire
processed by statistical program and used
Chi- Square methods to analyze data.
Results and analysis
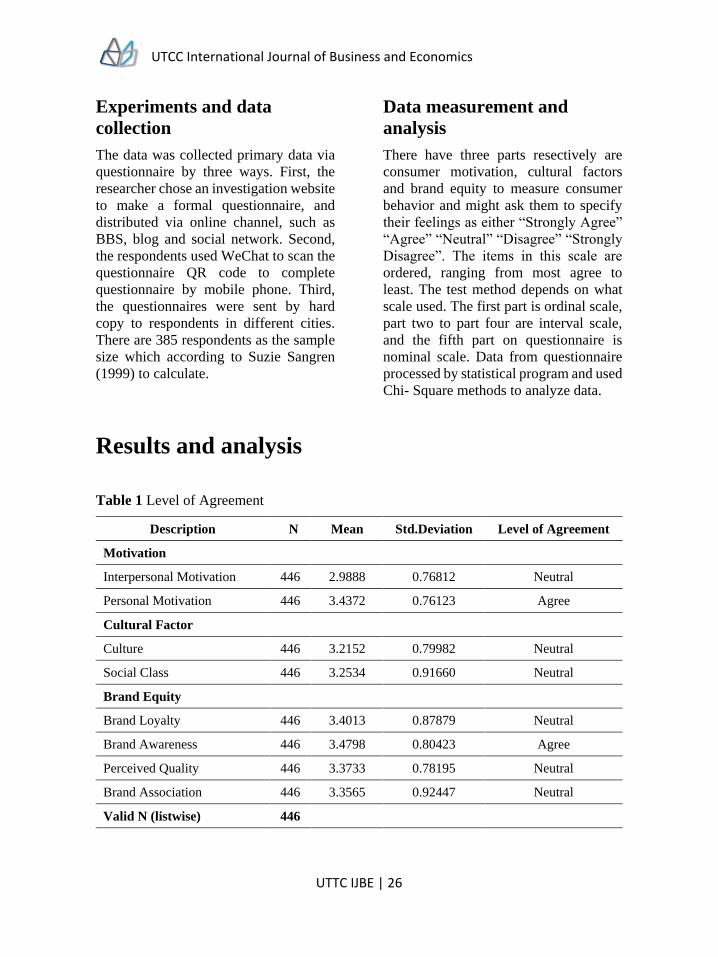
Table 1 Level of Agreement
Description N Mean Std.Deviation Level of Agreement
Motivation
Interpersonal Motivation 446 2.9888 0.76812 Neutral
Personal Motivation 446 3.4372 0.76123 Agree
Cultural Factor
Culture 446 3.2152 0.79982 Neutral
Social Class 446 3.2534 0.91660 Neutral
Brand Equity
Brand Loyalty 446 3.4013 0.87879 Neutral
Brand Awareness 446 3.4798 0.80423 Agree
Perceived Quality 446 3.3733 0.78195 Neutral
Brand Association 446 3.3565 0.92447 Neutral
Valid N (listwise) 446
UTCC International Journal of Business and Economics
UTTC IJBE | 27
Motivation was classified by
interpersonal motivation and personal
motivation. Interpersonal motivation has
the mean as 2.9888 and standard
deviation as 0.76812, which agreement
level is “Neutral”. Personal motivation
has the mean as 3.4372 and standard
deviation as 0.76123, which agreement
level is “Agree”. Cultural factor
concluded two dimensions, in which
were culture and social class. The level
of agreement both of them are “Neutral”.
The mean of culture is 3.2152 and the
standard deviation is 0.79982. The mean
of social class is 3.2534 and the standard
deviation is 0.91660. Brand loyalty has
the mean as 3.4013 and standard
deviation as 0.87879, which is consider
as “Neutral”. Brand awareness has the
mean as 3.4798 and standard deviation as
0.80423, which is consider as “Agree”.
Perceived quality has the mean as 3.3733
and standard deviation as 0.78195, which
is consider “Neutral”. Brand association
has the mean as 3.3565 and standard
deviation as 0.92447, which is consider
as Neutral.
Hypothesis testing
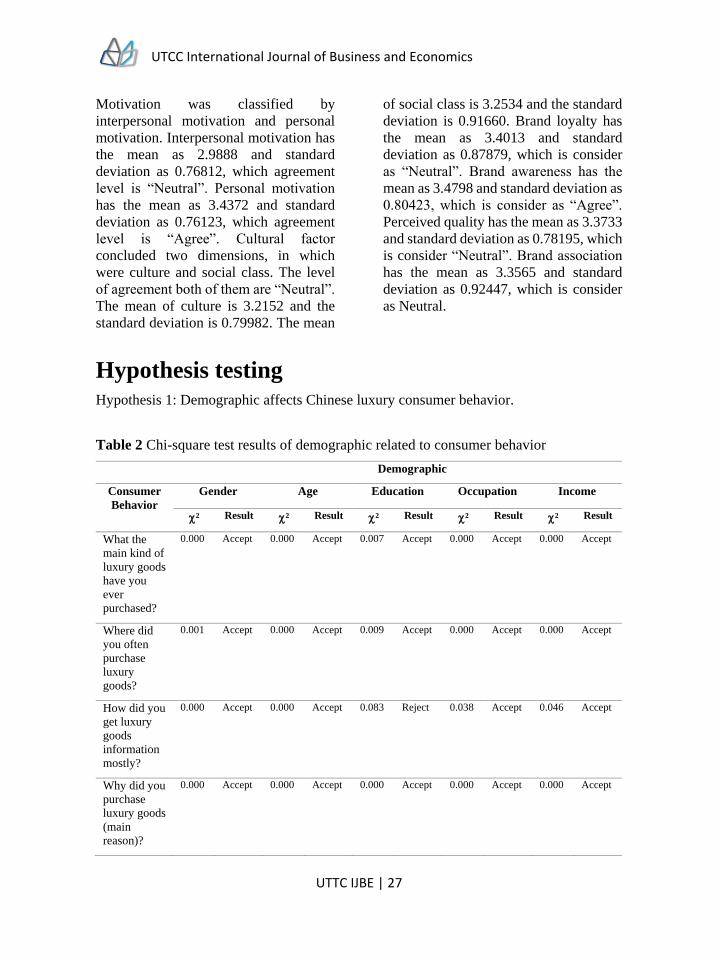
Hypothesis 1: Demographic affects Chinese luxury consumer behavior.
Table 2 Chi-square test results of demographic related to consumer behavior
Demographic
Consumer
Behavior
Gender Age Education Occupation Income
² Result ² Result ² Result ² Result ² Result
What the
main kind of
luxury goods
have you
ever
purchased?
0.000 Accept 0.000 Accept 0.007 Accept 0.000 Accept 0.000 Accept
Where did
you often
purchase
luxury
goods?
0.001 Accept 0.000 Accept 0.009 Accept 0.000 Accept 0.000 Accept
How did you
get luxury
goods
information
mostly?
0.000 Accept 0.000 Accept 0.083 Reject 0.038 Accept 0.046 Accept
Why did you
purchase
luxury goods
(main
reason)?
0.000 Accept 0.000 Accept 0.000 Accept 0.000 Accept 0.000 Accept
UTCC International Journal of Business and Economics
UTTC IJBE | 28
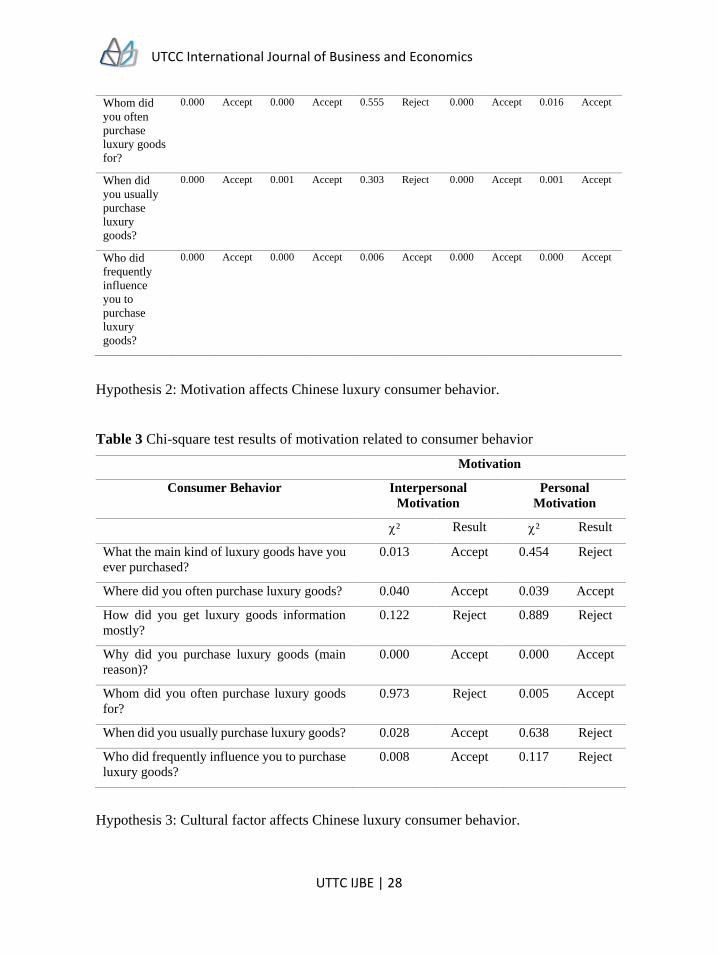
Whom did
you often
purchase
luxury goods
for?
0.000 Accept 0.000 Accept 0.555 Reject 0.000 Accept 0.016 Accept
When did
you usually
purchase
luxury
goods?
0.000 Accept 0.001 Accept 0.303 Reject 0.000 Accept 0.001 Accept
Who did
frequently
influence
you to
purchase
luxury
goods?
0.000 Accept 0.000 Accept 0.006 Accept 0.000 Accept 0.000 Accept
Hypothesis 2: Motivation affects Chinese luxury consumer behavior.
Table 3 Chi-square test results of motivation related to consumer behavior
Motivation
Consumer Behavior Interpersonal
Motivation
Personal
Motivation
² Result ² Result
What the main kind of luxury goods have you
ever purchased?
0.013 Accept 0.454 Reject
Where did you often purchase luxury goods? 0.040 Accept 0.039 Accept
How did you get luxury goods information
mostly?
0.122 Reject 0.889 Reject
Why did you purchase luxury goods (main
reason)?
0.000 Accept 0.000 Accept
Whom did you often purchase luxury goods
for?
0.973 Reject 0.005 Accept
When did you usually purchase luxury goods? 0.028 Accept 0.638 Reject
Who did frequently influence you to purchase
luxury goods?
0.008 Accept 0.117 Reject
Hypothesis 3: Cultural factor affects Chinese luxury consumer behavior.
UTCC International Journal of Business and Economics
UTTC IJBE | 29
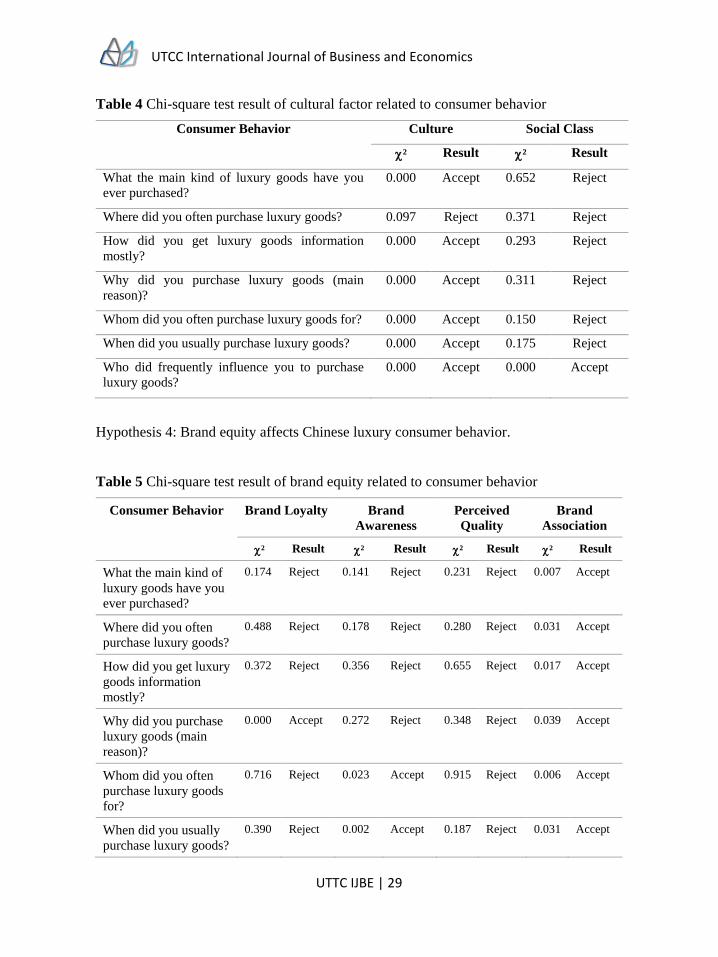
Table 4 Chi-square test result of cultural factor related to consumer behavior
Consumer Behavior Culture Social Class
² Result ² Result
What the main kind of luxury goods have you
ever purchased?
0.000 Accept 0.652 Reject
Where did you often purchase luxury goods? 0.097 Reject 0.371 Reject
How did you get luxury goods information
mostly?
0.000 Accept 0.293 Reject
Why did you purchase luxury goods (main
reason)?
0.000 Accept 0.311 Reject
Whom did you often purchase luxury goods for? 0.000 Accept 0.150 Reject
When did you usually purchase luxury goods? 0.000 Accept 0.175 Reject
Who did frequently influence you to purchase
luxury goods?
0.000 Accept 0.000 Accept
Hypothesis 4: Brand equity affects Chinese luxury consumer behavior.
Table 5 Chi-square test result of brand equity related to consumer behavior
Consumer Behavior Brand Loyalty Brand
Awareness
Perceived
Quality
Brand
Association
² Result ² Result ² Result ² Result
What the main kind of
luxury goods have you
ever purchased?
0.174 Reject 0.141 Reject 0.231 Reject 0.007 Accept
Where did you often
purchase luxury goods?
0.488 Reject 0.178 Reject 0.280 Reject 0.031 Accept
How did you get luxury
goods information
mostly?
0.372 Reject 0.356 Reject 0.655 Reject 0.017 Accept
Why did you purchase
luxury goods (main
reason)?
0.000 Accept 0.272 Reject 0.348 Reject 0.039 Accept
Whom did you often
purchase luxury goods
for?
0.716 Reject 0.023 Accept 0.915 Reject 0.006 Accept
When did you usually
purchase luxury goods?
0.390 Reject 0.002 Accept 0.187 Reject 0.031 Accept
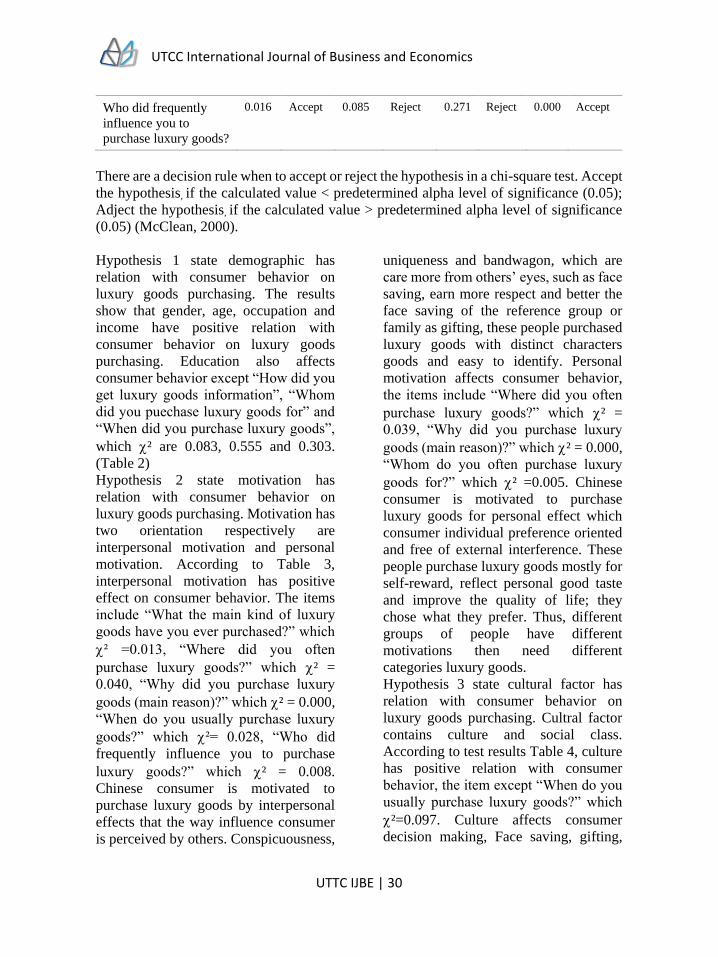
UTCC International Journal of Business and Economics
UTTC IJBE | 30
Who did frequently
influence you to
purchase luxury goods?
0.016 Accept 0.085 Reject 0.271 Reject 0.000 Accept
There are a decision rule when to accept or reject the hypothesis in a chi-square test. Accept
the hypothesis, if the calculated value < predetermined alpha level of significance (0.05);
Adject the hypothesis, if the calculated value > predetermined alpha level of significance
(0.05) (McClean, 2000).
Hypothesis 1 state demographic has
relation with consumer behavior on
luxury goods purchasing. The results
show that gender, age, occupation and
income have positive relation with
consumer behavior on luxury goods
purchasing. Education also affects
consumer behavior except “How did you
get luxury goods information”, “Whom
did you puechase luxury goods for” and
“When did you purchase luxury goods”,
which ² are 0.083, 0.555 and 0.303.
(Table 2)
Hypothesis 2 state motivation has
relation with consumer behavior on
luxury goods purchasing. Motivation has
two orientation respectively are
interpersonal motivation and personal
motivation. According to Table 3,
interpersonal motivation has positive
effect on consumer behavior. The items
include “What the main kind of luxury
goods have you ever purchased?” which
² =0.013, “Where did you often
purchase luxury goods?” which ² =
0.040, “Why did you purchase luxury
goods (main reason)?” which ² = 0.000,
“When do you usually purchase luxury
goods?” which ²= 0.028, “Who did
frequently influence you to purchase
luxury goods?” which ² = 0.008.
Chinese consumer is motivated to
purchase luxury goods by interpersonal
effects that the way influence consumer
is perceived by others. Conspicuousness,
uniqueness and bandwagon, which are
care more from others’ eyes, such as face
saving, earn more respect and better the
face saving of the reference group or
family as gifting, these people purchased
luxury goods with distinct characters
goods and easy to identify. Personal
motivation affects consumer behavior,
the items include “Where did you often
purchase luxury goods?” which ² =
0.039, “Why did you purchase luxury
goods (main reason)?” which ² = 0.000,
“Whom do you often purchase luxury
goods for?” which ² =0.005. Chinese
consumer is motivated to purchase
luxury goods for personal effect which
consumer individual preference oriented
and free of external interference. These
people purchase luxury goods mostly for
self-reward, reflect personal good taste
and improve the quality of life; they
chose what they prefer. Thus, different
groups of people have different
motivations then need different
categories luxury goods.
Hypothesis 3 state cultural factor has
relation with consumer behavior on
luxury goods purchasing. Cultral factor
contains culture and social class.
According to test results Table 4, culture
has positive relation with consumer
behavior, the item except “When do you
usually purchase luxury goods?” which
²=0.097. Culture affects consumer
decision making, Face saving, gifting,
UTCC International Journal of Business and Economics
UTTC IJBE | 31
and social status are the highlight in the
Chinese culture. Expensive luxury goods
are the symbol of wealth and success,
people are likely to purchase luxury
goods to make themselves and their
sociality counterparts have face. There
are 48.43% respondents purchased
luxury goods in normal, 26.91%
respondents purchase luxury goods
during the festival. Gifting links to build
relationship in the Chinese society, they
believe more expensive gain more
recognition and more face. Thus, usually
send luxury goods in the special events or
purchase luxury goods in special day to
others, such as festival, birthday, and
business events and among others. Social
class affects consumer behavior which
“who did frequently influence you to
purchased luxury goods?” (²=0.000).
There are 48.88% respondents purchased
luxury goods influence on friends.
Chinese people are group orientation,
thus influenced by the reference group
when they make decisions and fit friend
circle. (Table 4)
Hypothesis 4 state brand equity has
relation with consumer behavior on
luxury goods purchasing. There are four
dimension in brand equity respectively
are brand loyalty, brand awareness,
perceived quality and brand association.
Brand loyalty has relation with consumer
behavior, the items include “Why did
you purchase luxury goods (main
reason)?” which ² = 0.000, “Who did
frequently influence you to purchase
luxury goods?” which ² = 0.016. Brand
awareness has relation with consumer
behavior, the items include “Whom did
you often purchase luxury goods for?”
which ² = 0.023, “When did you usually
purchase luxury goods?” which ² =
0.002. The results indicate that perceived
quality has no relation with consumer
behavior which ² greater than 0.005.
Brand association has relation with
consumer behavior, the items include
“What the main kind of luxury goods
have you ever purchased?” which ² =
0.007, “Where did you often purchase
luxury goods?” which ² = 0.031, “How
did you get luxury goods information
mostly?” which ² = 0.017, “Why did
you purchase luxury goods (main
reason)?” which ² = 0.039, “Whom did
you often purchase luxury goods for?”
which ² = 0.006, “When did you usually
purchase luxury goods?” which ² =
0.031, “Who did frequently influence
you to purchase luxury goods?” which ²
= 0.000. Chinese consumer considered
goods value as a part of brand value
dimension. Perceived quality value
remains the main type of brand value
perceived by consumers. As the matter of
fact, in luxury, brand name, logo, symbol
or color, shapes distinct consumer
perceptions forming emotional links to
the brand, as well as secondary links to
product quality. There are 48.43%
respondents purchased luxury goods in
normal. Brand awareness affects people
perceptions and attitudes, which drive
consumer brand choice and brand
loyalty. With the vigorous development
of China's luxury market, Chinese luxury
consumers are gradually mature. They
have no longer blindly worship luxury
logo and more brand awareness. (Table
5)
Discussion
In previous studies, Chinese consumer
purchased luxury goods to make them
more attractive, pay more attention on
UTCC International Journal of Business and Economics
UTTC IJBE | 32
extrinsic self, that is the image of himself
in the eyes of others (Smith, 1983),
Chinese young people prefer to use
luxury brands to build their uniqueness
(Roberts, 2007), but in this survey, the
respondents’ choice agreement level is
neutral, and a quiet of disagree with
them. Those respondents prefer disagree
with bandwagon. And more and more
people interested in their own thoughts
and feelings, purchase luxury goods
show good personal taste and seek
delicate life. Now young people are the
main power of Chinese luxury consumer,
they focus on the independent
preference; their consumption concept is
changing that close to western country
concept and become mature in the future.
Expensive gift is necessary for build
important relationship. In this survey,
luxury goods bring consumer “face” and
used for gifting, the agreement level is
neutral. And the main reason of
consumer purchased luxury goods only
14.35% for face and 10.09% for gifting.
In the previous study, most Chinese
consumers do not know the behind story
of brand, usually they focus on the luxury
brand logo and blindly follow the trend
and fashion. In this survey, the main
reason of the respondents purchased
luxury goods, because of brand culture
is 5.16%, design is 11.88%, good quality
and service is 15.7%, personal taste
is14.8%,follow the trend only is 2.02%.
Chinese wealthy consumers have
exceptionally limited knowledge about
luxury brands compared to their
counterparts in other countries. A
McKinsey and Company report indicates
that over half of Chinese consumers who
own luxury fashion goods started
purchasing them in the past four years,
and most of them can only name one or
two luxury brands in a category. The
mean of brand awareness is 3.4798 and
agreement level is Agree. It means
Chinese consumer increased brand
awareness on luxury goods.
Implication for
business
From a practical point of view, this study
has certain inspiration for businesses and
consumers. Luxury companies need to
improve luxury the brand equity and
individuality characteristic of cognition,
which can change consumer attitude
when they buy luxury goods. It can be
achieved by raising consumer's
perception of luxury in conspicuity and
scarcity which is important to
consumers’ face and gifting. It can affect
consumer behavior. Luxury brand
marketing is no longer just to sell
product, but to guide consumers agree
with luxury brand craft and the concept
of brand value, and willing to pay for it.
Thus provide emotional satisfaction and
experience for consumers, it seems to be
luxury brand marketing comes in.
Luxury companies can from the
following several aspects to improve
consumer behavior.
First, enhance the brand value of luxury
goods, cultivate consumer brand loyalty.
Base on the result of this study, there are
only 5.16% respondents who purchased
luxury goods because of brand culture.
That means most Chinese consumers do
not know the behind story of luxury
goods, and just match luxuries to fortune.
Luxury brand sales staff can deliver
brand story even brand benifit to
consumers when they make purchasing
decision. Also luxury brand companies
UTCC International Journal of Business and Economics
UTTC IJBE | 33
should create a good corporate image, so
that consumers understand the brand
positioning is consistent with their social
status. Luxury brand companies should
develop a reasonable price. High price
will reduce consumer desire to purchase
luxury goods. According to the result of
this study, one-third of Chinese
consumers prefer to go abroad to
purchase luxury goods. One of the most
important factors is the price of a same
product in mainland China much higher
than overseas. This study found that
15.7% respondents purchased luxury
goods because of good quality and
service. Product quality is the basis of
consumer brand loyalty. The consumers
are loyal to brand because of the high
quality of the products. The basic way to
improve brand loyalty and win the
consumers’ favor and trust is to meet
consumers’ demand for service.
Second, this research found that social
symbol is the second large reason
prompted Chinese to purchase luxury
goods. With consumer spending that
conveys some meaning and expression
and information, including the status of
consumers, identity, personality, taste,
and identity. Consumption process is not
only to meet people's basic needs, but
also social performance and social
exchange process. The marketer should
manage brand as a key point, make the
brand concept is deeply rooted in the
people’s heart, set up the brand of distinct
character and the symbolism of the full
performance product, which match
consumers' characteristics towards their
behaviors. For example, Louis Vuitton
ever the past 150 years has been to
advocate refined, quality, and
comfortable "travel philosophy", as the
starting basis for the design, each product
have become irreplaceable classic. It will
not only apply the product to their ideas,
but his ideas into a culture, to meet the
aristocratic in the past, now the upper
class pursuit of ornaments. The first flat
trunk lid production is changing the way
people symbolizing the pain of travel,
perhaps people see a few simple pieces of
cloth or leather mixed bag, but because
of this simplicity, it is consistent with the
pursuit of simple people, simple symbols
of life.
Third, only one third Chinese consumer
purchase luxury goods in mainland
China because of limited styles, retailers
are supposed to keep step with Europe in
product style. The marketer should attach
great importance to Chines who has
become the largest group of luxury
consumers in the world, and accounted
for a quarter of the total amount of world
luxury consumption. Furthermore,
luxury goods design should be more
humanization, can be combined with
Chinese cultural elements, from the
perspective of target customers to
develop products, in order to meet the
different needs of different consumers,
yet subtle enough to suit the moderate
and balanced life style associated with
Chinese.
Forth, to consider different levels on the
pricing consumer psychological
motivation, in order to achieve
consumers, only one third consumers
purchased luxury goods in mainland
China, an important reason is the price
higher than abroad. For example, a part
of Chinese purchase luxury goods by
motivation of bandwagon or hedonic
even they couldn’t afford it. They are not
often proud to tell others if they have
bought a luxury item in a sale. Finding
also showed, a part of Chinese
consumers focus more good quality and
service while Chinese consumers place
UTCC International Journal of Business and Economics
UTTC IJBE | 34
higher importance on social symbol,
gifting and face reason in luxury
purchasing. The marketers should try and
create innovation promotional strategies
to successfully market their goods,
retailers could provide gift samples or
VIP treatment gift vouchers when
purchases have been made.
Limitations Time constraint is a limitation of this
study. The respondents did not spend
enough time on completing the
questionnaires, even did not pay attention
to each question. The researcher
conducted the survey only in first-line
cities which include Shanghai, Beijing,
Tianjing, Shenzhen and Guangzhou,
these sent the hard copy questionnaire.
The results cannot be generalized to
second-line cities, especially those in less
developed regions, because consumer
behaviors differ greatly in those places.
Further research For next study, they should focus on
customer satisfaction which is the
emotional response that consumer feel
after making a purchase. It will be a big
contribution for luxury goods industry.
Consumers’ individual differences such
as previous experiences in purchasing
luxury goods might have a different
effect on their attitude towards and
purchase intent of luxury. Try to find
deeper reason behind Chinese luxury
consumer behavior, otherwise, should do
comparing between Chinese consumers
with western country, examine forces
behind luxury consumption. From the
cultural perspective, different cultural
traditions and cultural characteristics of
Chinese and western, lead to different
consumer behavior. Finally, the future
researchers should further explore the
role of knowledge in understanding
individual differences in luxury
consumption.
References
Aaker, D. A. (1991). Managing brand equity: capitalizing on the value of a brand name.
New York: The Free Press.
Aaker David.A. and A. Biel eds. (1992). Building strong brands. Hillsdale, NJ: Lawrence
Erlbaum Associates.
Aaker, David. A. (1996) Measuring brand equity across products and markets. California
Management Revision. 38(Spring): 102-120.
Berry, C. J. (1994). The Idea of Luxury: A Conceptual and Historical Investigation, New
York: Cambridge University Press.
Bond, M. (1991). Beyond the Chinese face. Hong Kong: Oxford University Press.
Bond, M., and Lee, P. W. (1981). Face saving in Chinese culture. In: A. King & R. P. Lee
(Eds), Social life and development in Hong Kong (pp. 288–305). Hong Kong:
Chinese University Press.
UTCC International Journal of Business and Economics
UTTC IJBE | 35
Braxton, R. (1999). Culture, family and Chinese Korean American student achievement:
commercials. Journal of Advertising Research, 36, 27-45.
Chadha, R. and Husband, P. (2006). The Cult of the Luxury Brand: Inside Asia’s Love
Affair with Luxury, London, Nicholas Brealey.
Danziger, P. N. (2002). Why people buy things they do not need. Ithaca, NY: Paramount
Market Publishing.
Danziger, P. N. (2005). Let Them Eat Cake: Marketing Luxury to the Masses-As well as
the Classes, Chicago, Dearborn Trade Publishing.
Dittmar, H. (1994). Material Possessions as Stereotypes: Material Images of Different
Socio-Economic Group, Journal of Economic Psychology, 15(December):561-585.
Fisher, J. E. (1987). Social class and consumer behavior: the relevance of class and status,
Advances in Consumer Research, 14:492-6.
Garfein, R. T. (1989). Cross-cultural perspectives on the dynamics of prestige, Journal of
Services Marketing, 3(3), 17-24.
Ger, G., and Belk, R. W. (1996). Cross-cultural differences in materialism. Journal of
Economic Psychology, 17:55-77.
Goffman, E. (1967). Interaction ritual: Essays on face to face behavior. Garden City, NY:
Anchor.
Groth, J., and S. W. McDaniel. 1993. The exclusive value principle: The basis for prestige
pricing. Journal of Consumer Marketing, 10:10–16.
Gu, F. F., Hung, K., and Tse, D. (2008). When does Guanxi matter? Issues of capitalization
and its dark sides. Journal of Marketing, 72:12–28.
Holt, D. B. (1998). Does cultural capital structure American Consumption?, Journal of
Consumer Research, 25( June):1-25.
Hwang, K. K. (1987). Face and favor: The Chinese power game. American Journal of
Sociology, 92(4), 944-974.
Jung, J. and Sung, E. Y. (2008). Consumer-Based Brand Equity: Comparisons among
Americans and South Koreans in the USA and South Korea in Korea, Journal of
Fashion Marketing and Management, 12(1):24-35.
Keller, K. L. (2009). Managing the growth tradeoff: Challenges and opportunities in luxury
branding. Journal of Brand Management 16:290–301.
Keller, K. L. (1993). “Conceptualizing, Measuring and Managing Customer-Based Brand
Equity”, Journal of Marketing, 57(1), 1-22.
Keller, K. L. (2003). Strategic brand management: Building, measuring, and managing
brand equity. Upper Saddle River, NJ: Prentice-Hall.
Komarovsky, M. (1961). Class differences in family decision making, in Foote, N.N.
Consumer Behavior: Household Decision Making, New York University Press,
255-65.
UTCC International Journal of Business and Economics
UTTC IJBE | 36
Kotler, P. and Keller, K. L. (2006). Marketing Management (12th ed.). Upper Saddle River,
Prentice Hall International, New Jersey.
McClean, P. (2000). The Chi-Square Test. Retrieved from
http://www.ndsu.edu/pubweb/~mcclean/plsc431/mendel/mendel4.htm
Mootee, I. (2004). High Intensity Marketing, Canada, Strategy Architects Press.
Olshavsky, R. W., and Granbois, D. H. (1979). Consumer decision making — fact or
fiction? Journal of Consumer Research; 6(September):93-100.
Punniyamoorthy, M., and Prasanna, M. Raj., (2007). An empirical model for brand loyalty
measurement", Journal of Targeting, Measurement and Analysis for Marketing,
15(4), September :222-233(12).
Roux, E. (1995). Consumer evaluation of luxury brand extensions, EMAC Conference
proceedings, May, ESSEC, Paris.
Solomon, M. R. (1994). Cosumer Bevavior, (2nd ed.), Boston, MA: Allyn and Bacon.
Williams, T. G. (2002). Social Class Influence on Purchase Evaluation Criteria, Journal of
Consumer Marketing, 19(spring): 250.
Verhallen, T. M., and Henry, S. R. (1994). “Scarcity and Preference: An Experiment on
Unavailability and Product Evaluation,” Journal of Economic Psychology, 15
(June):315-331.
Vigneron, F., and Johnson, L. W. (1999). A Review and a Conceptual Framework of
Prestige-Seeking Consumer Behavior. Academy of Marketing Science Review,
Vancouver, 1999:1.
Vigneron, F., and Johnson, L. W. (2004). “Measuring Perception of Brand Luxury,”
Journal of Brand Management. 11(6): 484–506.
Wayne, D. H., and Deborah, J. M. (1997). Consumer Behavior, Houghton Mifflin
Company, Boston, spring: 325.
Yang, K. (1981). Social orientation and individual modernity among Chinese students in
Taiwan. Journal of Social Psychology, 113(2): 159–170.
UTCC International Journal of Business and Economics
UTTC IJBE | 37
UTCC International Journal of Business and Economics (UTCC IJBE)
Volume 10 Number 1, April 2018
The influence of personal and environmental
factors on business start-ups:
A case study in the district of Dili and
Oecusse, Timor-Leste
Tarcisio Ximenes1, Suthawan Chirapanda Sato2 2School of Business, University of the Thai Chamber of Commerce [email protected], [email protected]
Abstract Small enterprise has been playing important role in economic development of every
country. Small enterprises participation in economic development gave direct impact on
creating jobs, creating competitive advantage, and an important career option. This paper
aims to investigate the influence of personal (demographics and personal traits) and
environmental factors on business start-ups in Dili and Oecusse Districts, Timor-Leste.
Sample of this population came from small enterprises in both districts, 178 small
enterprises have been identified as target population, only 134 sample size used for this
study. Linear structural relationship statistics provide a systematic understand of the
effect of personal and environmental factor on business start-ups. Under significant
analysis, the result pointed that variables of demographics, personal traits, and
environmental factors have influenced business start-ups. The most important is
government and business and professional service providers should create appropriate
facilities and professional assistance for entrepreneurial development.
Keywords: Entrepreneurship, Small businesses, Entrepreneur,
business start-ups, Economics, start-up motivation, demographics,
personal traits, environmental determinants.
UTCC International Journal of Business and Economics
UTTC IJBE | 38
Introduction
The focus of this study is about the
influencing of personal and
environmental factors on business start-
ups. New business play important role in
creating new job. Based on national
report in many counties, include
Thailand national report, shown that in
some specific number of jobs came from
small enterprise and medium enterprise.
Second, new business also creates
competitive advantage. New firms often
come up with new ideas or new model of
quality of product and services. By new
firm’s presence, it is also challenging
existing enterprise to improve their
product and service quality. Third,
starting a business is an important career
option. In this term, starting a business is
one way how to maximize freedom of
economic opportunity
Previous researchers have found the
important variable such demographics
(gender, age, education level, and
working experience), personality traits
(desire for independence, need for
achievement, locus of control, risk taking
propensity, and recognition of
opportunity), and environmental factors
(financial support, government support,
education and training, business and
professional infrastructure, access to
physical infrastructure, and cultural and
social norms), all these variables have
been identified as factors influencing
entrepreneurial activity. However, this
study has been developed in different
testing procedures, sampling and country
specific factors. Furthermore, this is the
first research related business start-ups in
Timor-Leste, which enterprises
development target has been part of The
Strategic Development Plan after
restoration independence in 2000.
Review of the literature
Apart from economic development, the
entrepreneur has been approached under
of different perspectives. Since the
beginning of the century, the
entrepreneurs and entrepreneurship
became enthusiasm of many aspects.
This interest has related in the academic
activities, which are an impressive
increased in the number of study that
relate this subject. Researchers have
identified that new firm creation is an
important factor for economic growth,
creating many new jobs (Birley, 1987;
Reynolds, 1987; Dyck and Ovaska,
2011), and creating competitive
advantage.
Previous studies have identified the
entrepreneur's personal and
environmental play critical role in
entrepreneurial formation. Not
surprisingly, many researchers concept
of entrepreneurship based on the
definition of Low and McMillan (1988)
as the “creation of new enterprise” (p.
141). This concept came from a growing
awareness that entrepreneurship is a
“process of becoming rather than state of
being” (Bygrave, 1989, p. 21). Surely
that starting a business is a process that
takes many years to develop gradually
and come to successfully.
The process of starting a business is the
focus of this research. This process
related to two perspectives:
(1) The influence of the personal factors
on business start-ups;
UTCC International Journal of Business and Economics
UTTC IJBE | 39
(2) The influence of the environment
factors on business start-ups.
Some definitions of
entrepreneurship
Low and McMillan (1988) stated good
science has to begin with good
definitions. However, some empiricists
believe they can go forward (function)
without appropriate definitions, but
many researchers are questioning it. The
problem is how can empiricists know
what phenomenon they are studying if
they cannot define what they have
observed? Some researchers believed
only theorists function if define with
exact definitions. After all, both models
and theories can predict the result of
operations. As Bygrave and Hofer (1991)
stated it is impossible to operationalize a
concept if it cannot be defined.
Bridgman (1927) and Dewey (1929)
wrote: "the concept is synonymous with
the corresponding set of operations."
As Low and MacMillan (1988) that the
phenomenon of entrepreneurship is
interrelation with complex issues such as
management of change, innovation,
technological and environmental
turbulence, new product development,
small business management,
individualism and industry evolution.
Furthermore, the phenomenon can be
investigated from varied disciplines such
as economics, sociology, finance,
history, psychology, and anthropology,
each of this discipline uses its own
concepts and operates within its own
terms of reference.
The definition of entrepreneurship for
this study related with statement of Low
and MacMillan (1988) that
entrepreneurship as the “creation of new
enterprise”, it mean that entrepreneurship
seeks to explain and simplify the role of
new enterprise in bring forward
economic progress. "Explanation" it
pushes researchers not only staying in
descriptive studies, but also to follow
causal inference. Through "facilitation"
it pushes researchers to maintain
relevance factor for practice and to
consider both micro and macro
perspectives. Entrepreneurship is a
process that evolves with time, which is
changing over time, and only can
understands within observe what
happening in the field.
The model and studies related
demographic
Under personal factors, numerous factors
have identified relation with
demographic, such as gender, age,
education level, working experience.
According to studies in different
countries, it has found that there are
determining the links between
demographic and entrepreneurship.
Previous researchers have found the
gender differences are not significant
with business start-ups (Bergmann and
Sternberg, 2007; Rosti and Chelli, 2005;
Williams, 2004; Remeikiene and
Startiene, 2008).
Some specific age can be representative
of person maturity in making decision to
become an entrepreneur (Blanchflower
and Meyer, 1994; Bergmann and
Sternberg, 2007). As Ritsilä (2002)
stated that the age of 26 to 40 can be
considered a period of readiness the
choice of occupation. People at these
ages are possibilities to come success.
UTCC International Journal of Business and Economics
UTTC IJBE | 40
However, as Parker (2004) stated age can
positive correlation if its connected with
the professional experience, self-
reliance, availability of capital increase.
Enter business activities with sufficient
knowledge are needed. Researchers have
found that knowledge and information
are basic elements for initial self-
confidence of individuals in an
entrepreneur venture (Minniti and
Bygrave, 1999; Aldrich and Martinez,
2001). With sufficient knowledge,
transferring idea into an organization can
make entrepreneur obtain resources.
Attitudes are usually formed by previous
experience, it was logical that
entrepreneur who direct experienced
with entrepreneurial activities in the past
would have stronger entrepreneurial
attitudes (Harris and Gibson, 2008).
Moreover, Harris and Gibson found
students who have experience with
family business are possible to be an
entrepreneur. Students whose family
owned a business had a greater sense of
achievement, innovation, and personal
control as a result of interacting and
working within the business.
The model and studiesa
related personal traits
Trait theory argues that individual
always have the personality traits to
determine which action should be taking.
Under the content of entrepreneurship,
personal characteristics or traits became
focused of many researchers that make
distinguish entrepreneurs from the
general population (Low & MacMillan,
1988). Five factors were decided to be
part of this study:
(1) Desire for independence
(2) Need for achievement
(3) Locus of control
(4) Risk taking propensity; and
(5) Recognition of opportunity.
Some researchers found person decides
to become an entrepreneur is because
they want to be independence and not to
work for other (Kirkwood and Walton,
2010; Lee, 1997). These studies showed
the basic difference between the role of a
person become entrepreneur and a person
working for others.
McClelland (1967) pointed achievement
motivation is an important factor provide
some light to the entrepreneurship
mindset and challenges, especially for
the motivational disposition of the
entrepreneurs. A person have
characteristics of high need for
achievement that appreciates and willing
to take responsibility, prefers solving
problem without any assistance, taking
risk, and respect all outcomes of their
own decision (McClelland, 1967; Sesen,
2013).
Under the personal characteristic theory,
locus of control has been one of the focus
studies. Locus of control is a complex
individual phenomenon which has
concerned with determining the effects
of the perception of an individual to
control all events that implies to their
lives.
Risk-taking propensity is another
psychological characteristic often related
to entrepreneur intention of starting a
new business venture. Ability for risk-
taking also a significant dimension under
content of entrepreneurship. In
responding to the risks, entrepreneurs
always learn how to handle it from their
previous mistake attitude, environment,
UTCC International Journal of Business and Economics
UTTC IJBE | 41
and from other experience (Stokes and
Blackburn, 2002; Harrison and Leitch,
2005).
Shane and Venkataraman (2000) in their
study suggest two factors implies a
person to recognize particular
opportunities: 1) congruent information
from previous and current can affect a
person on recognizing a business
opportunity, 2) the cognitive
characteristics are needed to evaluate
these opportunities and later make a
decision to exploit them. Every person
has different abilities to recognize
specific opportunities, it’s depend on
availability of information. Availability
of information defines mental structure,
which provides process of recognizing
new information. To recognize an
opportunity, every entrepreneur should
congruent with previous information and
new information. Under cognitive
science, Researchers pointed people
always combine existing concept and
information into new ideas based on their
ability.
The model and studies related
envtironmental factors
Personal decision to become an
entrepreneur is not only personal factor
issues, but also environment factor issues
as well (Bird, 1988). As Stevenson and
Jarill (1990) stated that environmental
factors are also relevant because
environments conducive can direct
influence to new business success.
Studies about environmental factors
influencing business start-ups come from
difference macro economics, institution
and cultural characterizing the country or
from macro or regional in time period, or
specific issue of industries. Even though,
a topic related to environmental factors
are very abroad and diverse to integrate
effectively. As Gnyawali and Fogel
(1994) stated there is no integrated
scheme to identifying environmental
conditions conducive for business
activities. Based on literatures, there was
many research highlighted different
environmental factors on business start-
ups, but for needs of this study only six
factors considerable.
(1) Financial support
(2) Government (policy and
programs),
(3) Education and training,
(4) Business and professional
infrastructure,
(5) Access to physical
infrastructure; and
(6) Cultural and social norms.
Formation of new organization requires
resources include financial resources.
When an entrepreneur transforms their
idea into a firm, financial resources are
important factors to be considered such
as financial institution, investors and
others. This financial resource use for
financing operation such as security
deposits, transaction, and others, or for
investment such as loans (Evans and
Jovanovic, 1989). However, Kim et al.
(2006) stated that for many reasons, get
money from bank loan or investors can
be difficult because they just start and it
might faced high risk, lenders are usually
do not want to provide capital and some
compensate through cost of borrowing.
Under the social development theory,
government policy and programmes play
an important role to ensure quality
change in the structure and framework of
society that helps the society to realize
aim and objectives of life. As previous
UTCC International Journal of Business and Economics
UTTC IJBE | 42
studies pointed that government policy,
institutions, and programmes can
influence business start-up in many ways
(Reynolds et al, 1994; Yusuf, 1995).
Through cognitive test with student
samples (who have studied at a
university), Peterman and Kennedy
(2003) pointed education is an important
factor influencing students cognitive to
be an entrepreneur. Feasibility and
desirability perceptions also consider as
factor influence individual intention to
make the decision to be an entrepreneur,
especially when they finished their study
at university or any education level
(Krueger, 1993; Shapero and Sokol,
1982). As Greene and Brown (1997)
noted, a certain amount of knowledge
that a person obtains from formal
education, working experience or
additional training is measurement for a
new business venture.
Business and professional services
defined as technical and/ or unique
functions performed by independent
contractors/ consultants provide
professional assistance on business
success. Grimaldi and Grandi (2005)
stated that Business and Professional
infrastructure play important role in
providing support services and assistance
in business activities.
Infrastructure influencing economic
development has been well recorded in
the academic studies and in the policy
debate (Aschauer, 1989; Munnell, 1990;
World Economics Forum, 2013).
Moreover, the World Economics Forum
reported that good infrastructure plays an
important role in macro and micro level
enhance effective functioning of
economic growth. If at macro level
physical infrastructure is an important
factor, then at micro level also consider
as an important factor. Sahoo et al.
(2010) stated that good physical
infrastructure has been effected on (i)
production facilities; (ii) minimizing cost
of the transaction and cost of trade can
create and improve the competitive; and
(iii) provides employment opportunities.
There also appears in society that people
often respect for those who have hard
work and success started their own
business. Through environmental where
persons success, potential entrepreneurs
and entrepreneurs, where both can
discuss ideas, challenges and solutions,
new business will be produced
(Gomezelj and Kušce, 2013; Ajzen,
1991).
Previous subsections were identified that
personal and environmental factors
influencing business start-ups.
Researchers have proposed conceptual
framework of creating new venture
which both factors are considerable. Bird
(1988) stated that in business creation
both personal and environmental define
entrepreneurial intentions. Greenberger
and Sexton (1988) stated that personal
characteristics collaborate with
environmental factors determining new
venture creation. Thus this study
proposed a specific model of the personal
and environmental factors influencing
business start-ups.
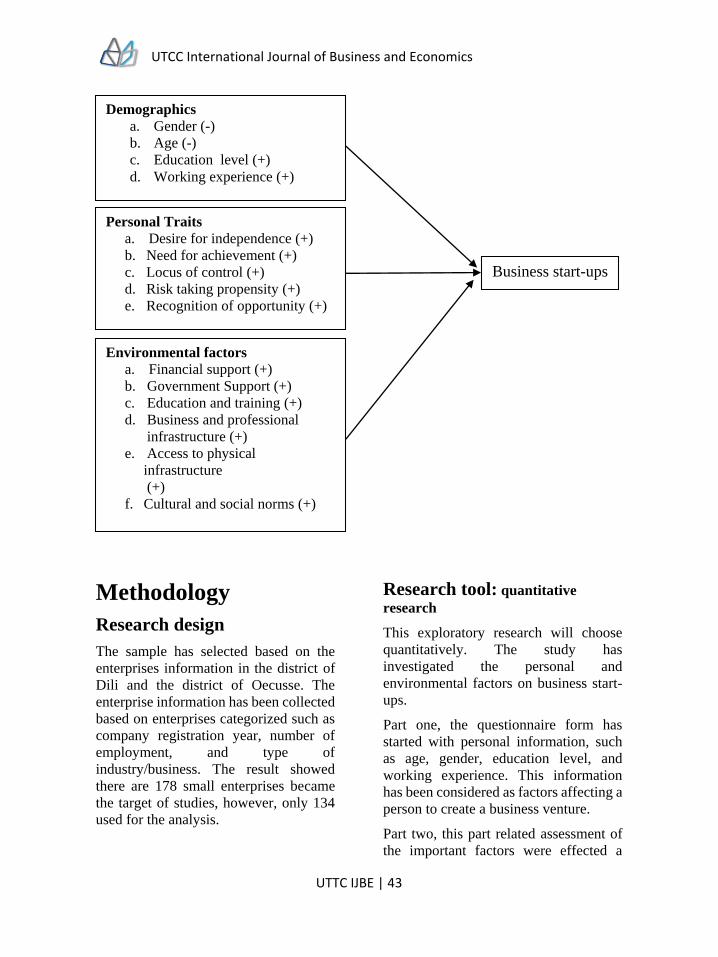
UTCC International Journal of Business and Economics
UTTC IJBE | 43
Methodology
Research design
The sample has selected based on the
enterprises information in the district of
Dili and the district of Oecusse. The
enterprise information has been collected
based on enterprises categorized such as
company registration year, number of
employment, and type of
industry/business. The result showed
there are 178 small enterprises became
the target of studies, however, only 134
used for the analysis.
Research tool: quantitative
research
This exploratory research will choose
quantitatively. The study has
investigated the personal and
environmental factors on business start-
ups.
Part one, the questionnaire form has
started with personal information, such
as age, gender, education level, and
working experience. This information
has been considered as factors affecting a
person to create a business venture.
Part two, this part related assessment of
the important factors were effected a
Demographics
a. Gender (-)
b. Age (-)
c. Education level (+)
d. Working experience (+)
Personal Traits
a. Desire for independence (+)
b. Need for achievement (+)
c. Locus of control (+)
d. Risk taking propensity (+)
e. Recognition of opportunity (+)
Environmental factors
a. Financial support (+)
b. Government Support (+)
c. Education and training (+)
d. Business and professional infrastructure (+)
e. Access to physical
infrastructure (+)
f. Cultural and social norms (+)
Business start-ups
UTCC International Journal of Business and Economics
UTTC IJBE | 44
person’s decision to start their own
business such as personal traits with
variable desire for independence; need
for achievement; locus of control; risk
taking propensity; and recognition of
opportunity. This questionnaire also
relation to characteristics of the business
environment such as financial support,
government support, education and
training, business and professional
infrastructure, access to physical
infrastructure; and cultural and social
norms.
Part three, this part related company
information, such as type of industry or
business, year of establishment, and
number of employees. This part has
related to small enterprises categorized.
Data measurement and
analysis
This study sets a different statement for
each of those dimensions using Likert
scale. Each question has a statement
followed by a five-point Likert scale
ranging from 'strongly disagree' to '
strongly agree'
This study also used two procedure
model to analyze the correlation between
personal information with factors and
also correlation independent factors and
dependent factors. For first model, A chi-
square analysis of the relationship
between demographics and business
start-ups. For the second model, the
ANOVA procedure will use to analyze
the significant level among independent
variable and dependent variable.
Analysis
Demography characteristics
The sample represented a diversity of
gender, age group, education level, and
working experience group. In the
category of gender participation, there
are male participated in the survey by
90.3% than female participated by 9.7%.
Under age category, there are 47.8% of
respondent from age 25 to 40 years old,
by 41 % of respondents in the range 41 to
50 years old, 6.7% of the respondents
from age 51 and above years old, and
4.5% in the range 15 to 24 years old.
In terms of education level, the most
responded sample came from
participants who finished their Senior
High School by 40.3%, following by
37.3% of Junior High School, by 19.4%
of Bachelors Degree, by 3.0% of Primary
School, Masters Degree and PH.D., was
not participating in this study. Most of
entrepreneurs who had started their own
business has working experience with
humanitarian organizations (local or
international NGOs) by 32.1%, by 31.3%
of profit organization (local or
international companies) and
unemployed, and by 5.2% with
government.
Respondent in the sample came from
different business activities, restaurant
companies were dominated with 27.6%,
by 19.4% of agriculture, by 10.4% of
electronic companies, by 9.7% of
construction and furniture companies, by
9.0% of health care companies, by 3.7%
of hotels, by 5.3 of music, by 3.0% night
clubs, by 1.5 of education, and 2.2% have
considered as missing date.
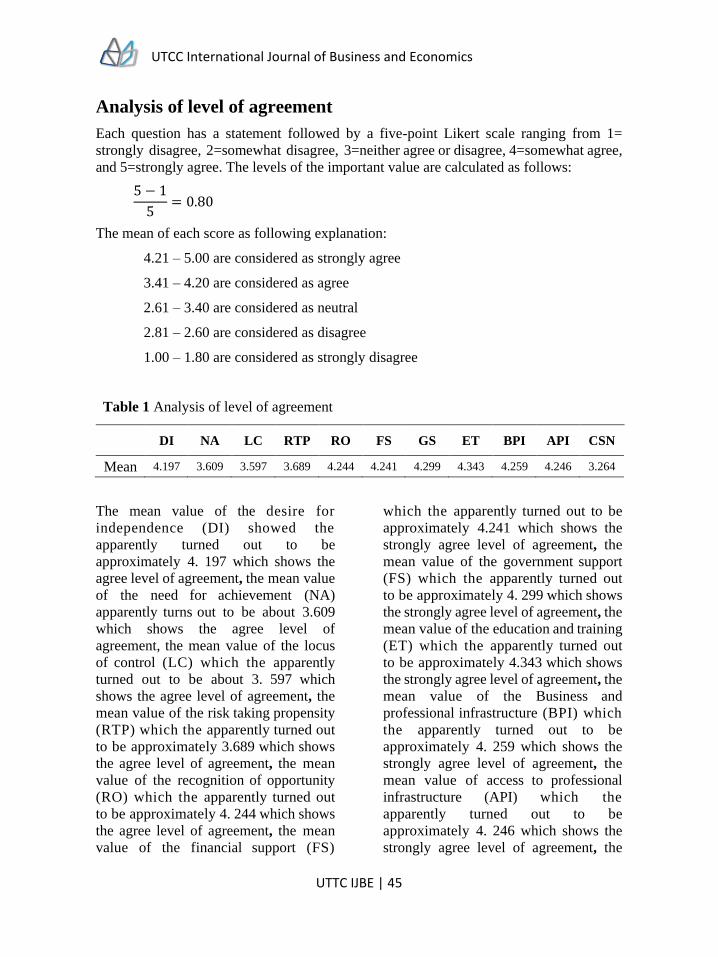
UTCC International Journal of Business and Economics
UTTC IJBE | 45
Analysis of level of agreement
Each question has a statement followed by a five-point Likert scale ranging from 1=
strongly disagree, 2=somewhat disagree, 3=neither agree or disagree, 4=somewhat agree,
and 5=strongly agree. The levels of the important value are calculated as follows:
5 − 1
5= 0.80
The mean of each score as following explanation:
4.21 – 5.00 are considered as strongly agree
3.41 – 4.20 are considered as agree
2.61 – 3.40 are considered as neutral
2.81 – 2.60 are considered as disagree
1.00 – 1.80 are considered as strongly disagree
Table 1 Analysis of level of agreement
DI NA LC RTP RO FS GS ET BPI API CSN
Mean 4.197 3.609 3.597 3.689 4.244 4.241 4.299 4.343 4.259 4.246 3.264
The mean value of the desire for
independence (DI) showed the
apparently turned out to be
approximately 4. 197 which shows the
agree level of agreement, the mean value
of the need for achievement (NA)
apparently turns out to be about 3.609
which shows the agree level of
agreement, the mean value of the locus
of control (LC) which the apparently
turned out to be about 3. 597 which
shows the agree level of agreement, the
mean value of the risk taking propensity
(RTP) which the apparently turned out
to be approximately 3.689 which shows
the agree level of agreement, the mean
value of the recognition of opportunity
(RO) which the apparently turned out
to be approximately 4. 244 which shows
the agree level of agreement, the mean
value of the financial support (FS)
which the apparently turned out to be
approximately 4.241 which shows the
strongly agree level of agreement, the
mean value of the government support
(FS) which the apparently turned out
to be approximately 4. 299 which shows
the strongly agree level of agreement, the
mean value of the education and training
(ET) which the apparently turned out
to be approximately 4.343 which shows
the strongly agree level of agreement, the
mean value of the Business and
professional infrastructure (BPI) which
the apparently turned out to be
approximately 4. 259 which shows the
strongly agree level of agreement, the
mean value of access to professional
infrastructure (API) which the
apparently turned out to be
approximately 4. 246 which shows the
strongly agree level of agreement, the
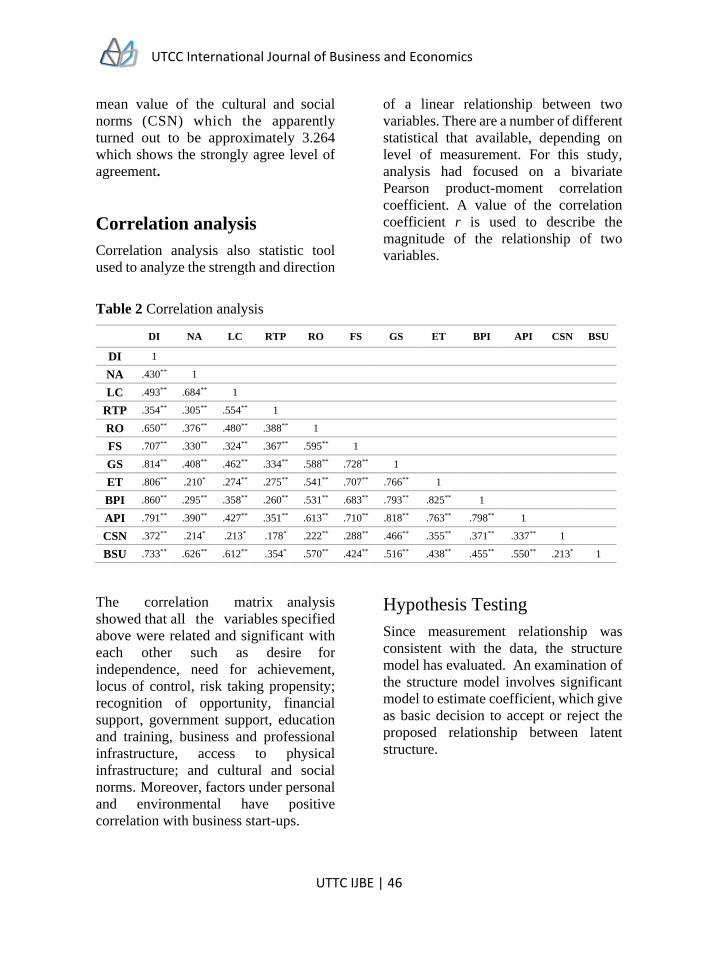
UTCC International Journal of Business and Economics
UTTC IJBE | 46
mean value of the cultural and social
norms (CSN) which the apparently
turned out to be approximately 3.264
which shows the strongly agree level of
agreement.
Correlation analysis
Correlation analysis also statistic tool
used to analyze the strength and direction
of a linear relationship between two
variables. There are a number of different
statistical that available, depending on
level of measurement. For this study,
analysis had focused on a bivariate
Pearson product-moment correlation
coefficient. A value of the correlation
coefficient r is used to describe the
magnitude of the relationship of two
variables.
Table 2 Correlation analysis
DI NA LC RTP RO FS GS ET BPI API CSN BSU
DI 1
NA .430** 1
LC .493** .684** 1
RTP .354** .305** .554** 1
RO .650** .376** .480** .388** 1
FS .707** .330** .324** .367** .595** 1
GS .814** .408** .462** .334** .588** .728** 1
ET .806** .210* .274** .275** .541** .707** .766** 1
BPI .860** .295** .358** .260** .531** .683** .793** .825** 1
API .791** .390** .427** .351** .613** .710** .818** .763** .798** 1
CSN .372** .214* .213* .178* .222** .288** .466** .355** .371** .337** 1
BSU .733** .626** .612** .354* .570** .424** .516** .438** .455** .550** .213* 1
The correlation matrix analysis
showed that all the variables specified
above were related and significant with
each other such as desire for
independence, need for achievement,
locus of control, risk taking propensity;
recognition of opportunity, financial
support, government support, education
and training, business and professional
infrastructure, access to physical
infrastructure; and cultural and social
norms. Moreover, factors under personal
and environmental have positive
correlation with business start-ups.
Hypothesis Testing
Since measurement relationship was
consistent with the data, the structure
model has evaluated. An examination of
the structure model involves significant
model to estimate coefficient, which give
as basic decision to accept or reject the
proposed relationship between latent
structure.
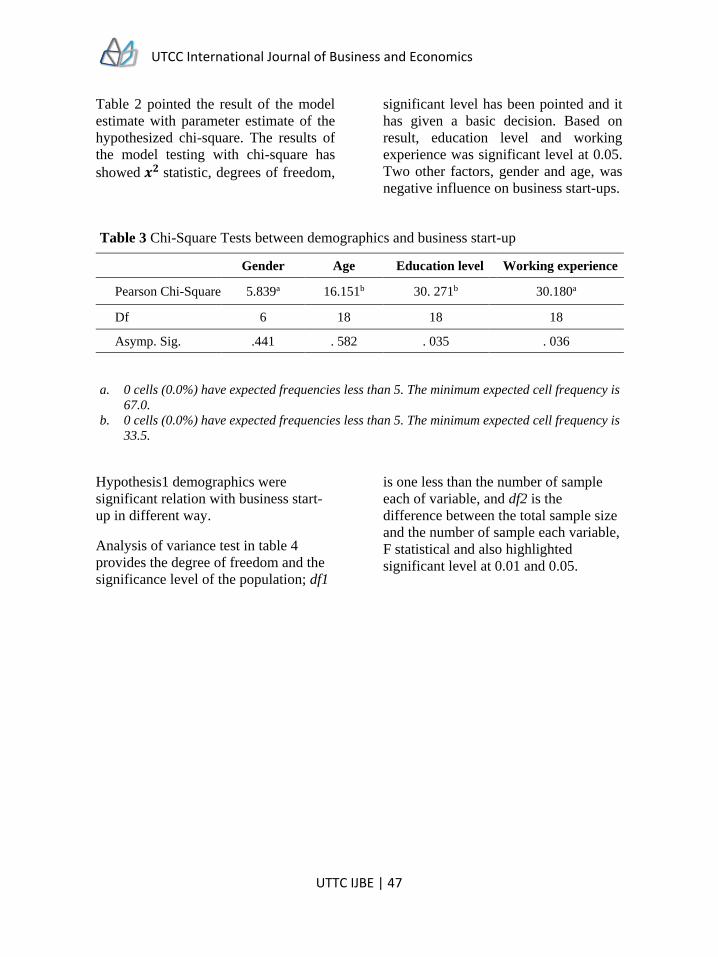
UTCC International Journal of Business and Economics
UTTC IJBE | 47
Table 2 pointed the result of the model
estimate with parameter estimate of the
hypothesized chi-square. The results of
the model testing with chi-square has
showed 𝒙𝟐 statistic, degrees of freedom,
significant level has been pointed and it
has given a basic decision. Based on
result, education level and working
experience was significant level at 0.05.
Two other factors, gender and age, was
negative influence on business start-ups.
Table 3 Chi-Square Tests between demographics and business start-up
Gender Age Education level Working experience
Pearson Chi-Square 5.839a 16.151b 30. 271b 30.180a
Df 6 18 18 18
Asymp. Sig. .441 . 582 . 035 . 036
a. 0 cells (0.0%) have expected frequencies less than 5. The minimum expected cell frequency is
67.0.
b. 0 cells (0.0%) have expected frequencies less than 5. The minimum expected cell frequency is
33.5.
Hypothesis1 demographics were
significant relation with business start-
up in different way.
Analysis of variance test in table 4
provides the degree of freedom and the
significance level of the population; df1
is one less than the number of sample
each of variable, and df2 is the
difference between the total sample size
and the number of sample each variable,
F statistical and also highlighted
significant level at 0.01 and 0.05.
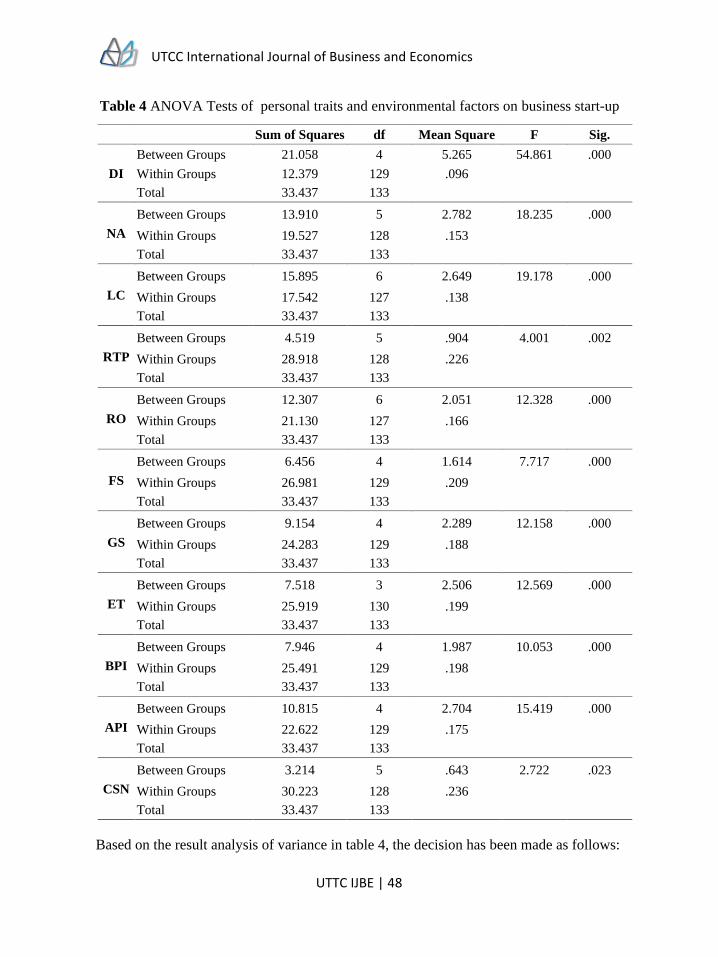
UTCC International Journal of Business and Economics
UTTC IJBE | 48
Table 4 ANOVA Tests of personal traits and environmental factors on business start-up
Sum of Squares df Mean Square F Sig.
DI
Between Groups 21.058 4 5.265 54.861 .000
Within Groups 12.379 129 .096
Total 33.437 133
NA
Between Groups 13.910 5 2.782 18.235 .000
Within Groups 19.527 128 .153
Total 33.437 133
LC
Between Groups 15.895 6 2.649 19.178 .000
Within Groups 17.542 127 .138
Total 33.437 133
RTP
Between Groups 4.519 5 .904 4.001 .002
Within Groups 28.918 128 .226
Total 33.437 133
RO
Between Groups 12.307 6 2.051 12.328 .000
Within Groups 21.130 127 .166
Total 33.437 133
FS
Between Groups 6.456 4 1.614 7.717 .000
Within Groups 26.981 129 .209
Total 33.437 133
GS
Between Groups 9.154 4 2.289 12.158 .000
Within Groups 24.283 129 .188
Total 33.437 133
ET
Between Groups 7.518 3 2.506 12.569 .000
Within Groups 25.919 130 .199
Total 33.437 133
BPI
Between Groups 7.946 4 1.987 10.053 .000
Within Groups 25.491 129 .198
Total 33.437 133
API
Between Groups 10.815 4 2.704 15.419 .000
Within Groups 22.622 129 .175
Total 33.437 133
CSN
Between Groups 3.214 5 .643 2.722 .023
Within Groups 30.223 128 .236
Total 33.437 133
Based on the result analysis of variance in table 4, the decision has been made as follows:
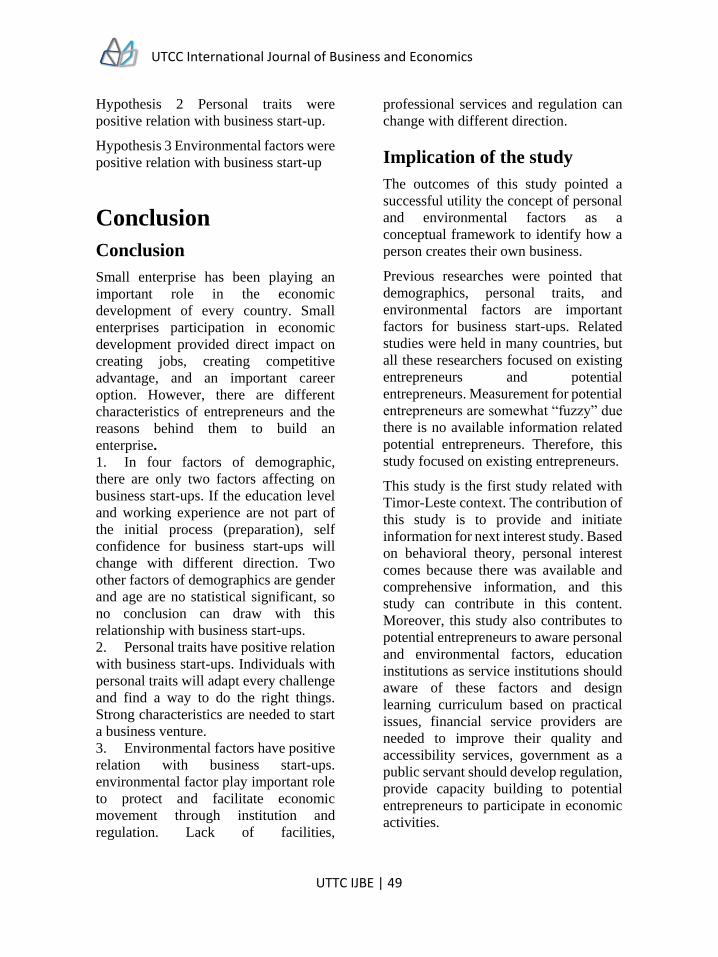
UTCC International Journal of Business and Economics
UTTC IJBE | 49
Hypothesis 2 Personal traits were
positive relation with business start-up.
Hypothesis 3 Environmental factors were
positive relation with business start-up
Conclusion
Conclusion
Small enterprise has been playing an
important role in the economic
development of every country. Small
enterprises participation in economic
development provided direct impact on
creating jobs, creating competitive
advantage, and an important career
option. However, there are different
characteristics of entrepreneurs and the
reasons behind them to build an
enterprise.
1. In four factors of demographic,
there are only two factors affecting on
business start-ups. If the education level
and working experience are not part of
the initial process (preparation), self
confidence for business start-ups will
change with different direction. Two
other factors of demographics are gender
and age are no statistical significant, so
no conclusion can draw with this
relationship with business start-ups.
2. Personal traits have positive relation
with business start-ups. Individuals with
personal traits will adapt every challenge
and find a way to do the right things.
Strong characteristics are needed to start
a business venture.
3. Environmental factors have positive
relation with business start-ups.
environmental factor play important role
to protect and facilitate economic
movement through institution and
regulation. Lack of facilities,
professional services and regulation can
change with different direction.
Implication of the study
The outcomes of this study pointed a
successful utility the concept of personal
and environmental factors as a
conceptual framework to identify how a
person creates their own business.
Previous researches were pointed that
demographics, personal traits, and
environmental factors are important
factors for business start-ups. Related
studies were held in many countries, but
all these researchers focused on existing
entrepreneurs and potential
entrepreneurs. Measurement for potential
entrepreneurs are somewhat “fuzzy” due
there is no available information related
potential entrepreneurs. Therefore, this
study focused on existing entrepreneurs.
This study is the first study related with
Timor-Leste context. The contribution of
this study is to provide and initiate
information for next interest study. Based
on behavioral theory, personal interest
comes because there was available and
comprehensive information, and this
study can contribute in this content.
Moreover, this study also contributes to
potential entrepreneurs to aware personal
and environmental factors, education
institutions as service institutions should
aware of these factors and design
learning curriculum based on practical
issues, financial service providers are
needed to improve their quality and
accessibility services, government as a
public servant should develop regulation,
provide capacity building to potential
entrepreneurs to participate in economic
activities.
UTCC International Journal of Business and Economics
UTTC IJBE | 50
References
Ajzen, I. (1991). The theory of planned behavior. Organizational behavior and human
decision processes, 50(2): 179-211.
Aldrich, H. E. and Martinez, M. A. (2001). Many are called, but few are chosen: An
evolutionary perspective for the study of entrepreneurship. Entrepreneurship
theory and practice 25(4): 41-56.
Aschauer, D. A. (1989). Is public expenditure productive?. Journal of monetary economics,
23(2): 177-200.
Bergmann, H., & Sternberg, R. (2007). The changing face of entrepreneurship in Germany.
Small Business Economics, 28(2-3), 205-221.
Bird, B. (1988). Implementing entrepreneurial ideas: The case for intention. Academy of
management Review, 13(3): 442-453.
Birley, S. (1987). New ventures and employment growth. Journal of Business Venturing,
2(2): 155-165.
Blanchflower, D. G., Meyer, B. D. (1994). A Longitudinal Analysis of Young Self-
Employed in Australia and the United States. Small Business Economics, 6, 1-19.
Bridgman, P. W., et al. (1927). The logic of modern physics. New York:Macmillan.
Bygrave, W. D. and Hofer, C. W. (1991). Theorizing about entrepreneurship.
Entrepreneurship theory and practice, 16(2): 13-22.
Bygrave, W.D. (1989). The entrepreneurship paradigm: a philosophical look at research
methodologies. Entrepreneurship Theory and Practice, Vol. 14 No. 1, (pp. 7-26).
Dewey, J. (1929). The quest for certainty. New York: J.J. Little and Ives Company
Dyck, A. and Ovaska, T. (2011). Business Environment and New Firm Creation: An
International Comparison. Journal of Small Business & Entrepreneurship, 24(3):
301-317.
Evans, D. S. and Jovanovic, B. (1989). An estimated model of entrepreneurial choice under
liquidity constraints. The Journal of Political Economy, 97(4): 808.
Evans, D. S. and Leighton, L. S. (2002). Some empirical aspects of entrepreneurship.
Entrepreneurship: Critical Perspectives on Business and Management, 1: 146.
Gnyawali, D. R. and Fogel, D. S. (1994). Environments for entrepreneurship development:
key dimensions and research implications. Entrepreneurship theory and practice,
18: 43-43.
Gomezelj, D. O. and Kušce, I. (2013). The influence of personal and environmental factors
on entrepreneurs' performance. Kybernetes, 42(6): 906.
Greenberger, D. B. and Sexton, D. L. (1988). An interactive model of new venture
initiation. Journal of Small Business Management, 26(3): 1-7.
UTCC International Journal of Business and Economics
UTTC IJBE | 51
Greene, P., and Brown, T. (1997). Resource needs and the dynamic capitalism typology.
Journal of Business Venturing, 12(3), 161–173.
Grimaldi, R., & Grandi, A. (2005). Business incubators and new venture creation: an
assessment of incubating models. Technovation, 25(2), 111-121.
Harris, M. L. and Gibson, S. G. (2008). Examining the entrepreneurial attitudes of US
business students. Education+ Training, 50(7): 568-581.
Harrison, R. T. and Leitch, C. M. (2005). Entrepreneurial learning: researching the
interface between learning and the entrepreneurial context. Entrepreneurship
theory and practice, 29(4): 351-371.
Hornaday, J. A. (1982). Research about living entrepreneurs. Encyclopedia of
entrepreneurship: 20-34.
Hung, D. K. M., et al. (2004). A Preliminary Study of Top SMEs in Malaysia: Key Success
Factors vs Government Support Programs. Journal of Global Business and
Econoics, 2(1): 49-58
Kim, P. H., et al. (2006). The impact of financial, human, and cultural capital on
entrepreneurial entryin the United States. Small Business Economics, 27(1): 5-22.
Kirkwood, J. and Walton, S. (2010). What motivates ecopreneurs to start businesses?
International Journal of Entrepreneurial Behaviour & Research, 16(3): 204-228.
Krueger Jr, N. F., et al. (2000). Competing models of entrepreneurial intentions. Journal
of Business Venturing, 15(5): 411-432.
Krueger, N. F. and Carsrud, A. L. (1993). Entrepreneurial intentions: applying the theory
of planned behaviour. Entrepreneurship & regional development, 5(4): 315-330.
Lee, J. (1997). The motivation of women entrepreneurs in Singapore. International Journal
of Entrepreneurial Behaviour & Research, 3(2): 93-110.
Low, M. B. and MacMillan, I. C. (1988). Entrepreneurship: Past research and future
challenges. Journal of management, 14(2): 139-161.
McClelland, D.C. (1967). The achieving society. New York: Free Press
Minniti, M. and Bygrave, W. (1999). The microfoundations of entrepreneurship.
Entrepreneurship theory and practice, 23: 41-52.
Munnell, A. H. (1990). Why has productivity growth declined? Productivity and public
investment. New England Economic Review(Jan): 3-22.
Parker, S. C. (2004). The economics of self-employment and entrepreneurship. Cambridge
University Press.
Peterman, N. E. and Kennedy, J. (2003). Enterprise education: Influencing students’
perceptions of entrepreneurship. Entrepreneurship theory and practice, 28(2):
129-144.
UTCC International Journal of Business and Economics
UTTC IJBE | 52
Reynolds, P. D. and White, S. B. (1997). The entrepreneurial process: Economic growth,
men, women, and minorities. Quorum Books Westport, CT.
Reynolds, P. D., (1987). New firms: societal contribution versus survival potential.
Journal of Business Venturing, 2(3): 231-246.
Reynolds, P.D. (2005). Understanding business creation: Serendipity and scope in two
decades of business creation studies. Small Business Economics, 24, 359–364.
Reynolds, P.D., et al. (1994). Cross-national comparisons of the variation in new firm
formation rates. Regional Studies, 28(4). 443–456.
Ritsilä, J., & Tervo, H. (2002). Effects of unemployment on new firm formation: Micro-
level panel data evidence from Finland. Small business economics, 19(1), 31-40.
Rosti, L., & Chelli, F. (2005). Gender discrimination, entrepreneurial talent and self-
employment. Small Business Economics, 24(2), 131-142.
Sahoo, P., et al. (2010). Infrastructure development and economic growth in China.
Working paper.
Sesen, H. (2013). Personality or environment? A comprehensive study on the
entrepreneurial intentions of university students. Education+ Training, 55(7): 1-1.
Shane, S. and Venkataraman, S. (2000). The promise of entrepreneurship as a field of
research. Academy of management Review 25(1): 217-226.
Shapero, A. (1982). Some social dimensions of entrepreneurship. In C. Kent, D. Sexton,
and K. Vesper (Eds.), The encyclopedia of entrepreneurship. Englewood Cliffs,
NJ: Prentice Hall.
Startienė, G., & Remeikienė, R. (2008). Gender gap in entrepreneurship. Engineering
economics, 5(60), 95-103.
Stevenson, H.H. and Jarillo, J.C. (1990). A paradigm of entrepreneurship research:
Entrepreneurial management. Strategic Management Journal, 11, 17–27.
Stokes, D. and R. Blackburn (2002). Learning the hard way: the lessons of owner-managers
who have closed their businesses. Journal of Small Business and Enterprise
Development, 9(1): 17-27.
Williams, D. R. (2004). Youth self employment: Its nature and consequences. Small
Business Economics, 23(4), 323-336.
Yusuf, A. (1995). Critical success factors for small business: perceptions of South Pacific
entrepreneurs. Journal of Small Business Management 33: 2-68.
La’o Hamutuk Repport. (2011). Timor-Leste’s Economy and State Budget. Retrieved
February 26, 2014, from http://www.laohamutuk.org/econ/training/PresentUNTL-
VUEn.pdf
UTCC International Journal of Business and Economics
UTTC IJBE | 53
UTCC International Journal of Business and Economics (UTCC IJBE)
Volume 10 Number 1, April 2018
A psychological model of residential property
purchasing decision in Thailand
Chayada Nunarong1, Prattana Punnakitikashem2 1,2College of Management, Mahidol University, Thailand [email protected]
Abstract
Research interest in residential property consumer purchase decision has widely conducted
over the past years. The majority of the research was conducted based on the external
influencing factors such as marketing mix and product attribute. It has overlooked the
importance of the internal or psychological factors that play an important role in a customer
mind before making a purchase decision.
The purpose of this paper is to study the factors that influencing a residential property
purchase decision in another perspective, which focuses on psychological factors including
attitude, motivation, personal value and belief in Thailand context. The quantitative
approach was used to conduct this research. The data were gathered from 178 respondents and
translated into a useful knowledge though the statistical techniques such as descriptive statistic,
independent t-test and chi-square.
The result reveals that two main psychological factors that impact purchase decision are
motivations and personal values. The consumers purchase a residential property with the
intention to satisfy their self-esteem and self-actualization needs. Furthermore, seven out
of nine personal values were involved in decision to purchase residential property. The
personal values include Sense of belonging, Self-fulfilment, Security, Self-respect, Sense
of accomplishment, and fun and enjoyment in life. The customer tends to emphasize on their
self-interest over the others. The value of warm relationship with others and being well-
respect were not important to their purchase intention. However, belief and attitude have
not influenced the purchase decision. Findings of this study will benefit the developers and
marketers who have an interest in the residential property business in Thailand as it
provides guidance for better understanding customer insights in order to formulate an effective
strategic decisions on product development and marketing strategies.
UTCC International Journal of Business and Economics
UTTC IJBE | 54
Psychological factor might interpret purchase decision and intention. However, the purchase
decision of a residential property is tied heavily with the financial ability of that person
which were not take into consideration in this research.
Keywords: Psychological Factors, Purchase Decision,
Residential Property, Housing, Real Estate
Introduction
The residential property refers to a place
or a zone for single-family homes, multi-
family apartments, townhouses, and/or
condominiums. The residential property
market in Bangkok was growing rapidly
since 2010 and the housing boom
continues. New supplies were likely added
50,000 units in 2015 and keep adding up in
the following years while predicted price
rise upwards of seven percent each year.
This was mainly the result of government
spending and expansion of mass-transit.
(Paha, 2016) and (Bangkok's condo index
up 14%, despite the politics, 2015).
Referring to SorPaha (2016) the demand
and supply of high-rise property
(condominium) were fast growing and
the gap is getting bigger. This can be
translated that high-rise market is nearly
oversupply. In additional, it has further
mentioned about the market growth of
the low-rise segment (townhouse, house,
townhome). The low-rise segment is not
growing as fast as condos due to less
liquidity. However, its demand is
increasing year by year. Therefore, the
competition is getting tougher both low-rise
and high-rise market. Furthermore, in the
current situation of residential market in
Bangkok, the unsold inventory has risen
sharply from 130,300 units in 2011 to
167,400 at the end of 2014 and it would
take about more than two years to absorb
these entire unsold units according to a
report by Agency for Real Estate Affairs
(AREA). Various developers reported
cancellation rates ranging between 15%
and 20% in previous years. (Paha, 2016:
Yu & Thongpan, 2015)
In the past, one customer might have just
a few alternative choices before making
a decision to purchase but not anymore.
The large number of unsold units allows
the customer to have more choices
together with the digital age that offers
availability of the abundant information
everywhere. The customers can easily
search for information, compare and
contrast before choose with lesser effort.
Property investor faces a great challenge
and proper strategic plan needs to apply.
Not only improving the product
attributes to answer customer’s needs but
various marketing tactic were used by the
property providers in order to position
themselves and also to influence purchaser.
By understanding customer
psychological (attitude, motivation,
belief or personal value), it helps the
business to be innovated. They can
understand the different ways in which
customers value products. Therefore,
provide product that satisfy the customer
not just functional but into the emotional
and psychological level. The marketing
become more efficient when they really
understand customer insight how they live
UTCC International Journal of Business and Economics
UTTC IJBE | 55
their life and how they make decision.
“Successful marketers are able to able to
drive sales by appealing to customer
psychology” (Patel & Puri, n.d.)
Problem statement
In this fierce competitive environment, it
is important for the investor to know
what really influence customer to buy a
residential property. As mentioned in
Hall (2012) knowing a customer in depth
is one of the key characteristics of highly
successful business entrepreneurs. It is
not only about their need but also what
drive their decision. The residential
property purchase decisions are different
from other business decisions due to “the
innate, durable and long-term
characteristic of real-estate” together
with its fixed in location and uniqueness
in each specific site. (Kinnard, 1968,
p.10-16)
The previous studies in this field try to
identify the key factors that influencing
customer buying decision in Bangkok.
Sanichwannakul (2009) reveals
trustworthiness of the company ranks
highest, follows by facilities, price,
location, marketing and promotion
respectively. Although other relevant
studies such as Chedsadawarangkul,
Waweewanich and Saransom (2010) and
Myra (2016) reports that location is the
biggest factor affecting consumers’
decision to purchase a residence.
However, what if there are still much more
choices at that same location provided by
few trustworthiness companies. There are
a dearth of study that evaluates the role of
psychological thinking and attitudes in the
decision to own a residential property.
The internal force of the person or the real
purpose of purchasing a particular
residential property has not analyzed.
Thus, every firm is still driving to the same
direction by providing just to satisfy
external factors. The problem of unable to
sell the house still remains. Additionally,
as a property provider, it is important to
understand the customers’ real intention
to purchase a particular product and tries
to satisfy them rather than just trying to
influence them to purchase a product that
might not add value or even match their
need. Consequently, in terms of residential
property purchase decision of customers,
the research questions of this paper are
raised as the following question:
What are the psychological factors that
influencing a residential property
purchase decision?
The objectives of this research are to study
the psychological factors that influencing a
residential property purchase decision and
to give recommendation on the possible
strategy or marketing tactic to property
providers or marketer in order to achieve
business goals.
Literature review
A model of buyer behavior
The analysis of customer behavior by
observing and researching on consumer
buying behavior and characteristics in
order to understand the needs, motives
and step to purchase is the basis for
marketing strategy formulation.
(Kotler,1997; Hawkins, Best & Coney,
2004).
Figure 1 shows the black box model of
consumer behavior, it is a well-developed
model that shows the interaction of stimuli,
customer characteristics, decision process
and customer responses. The final
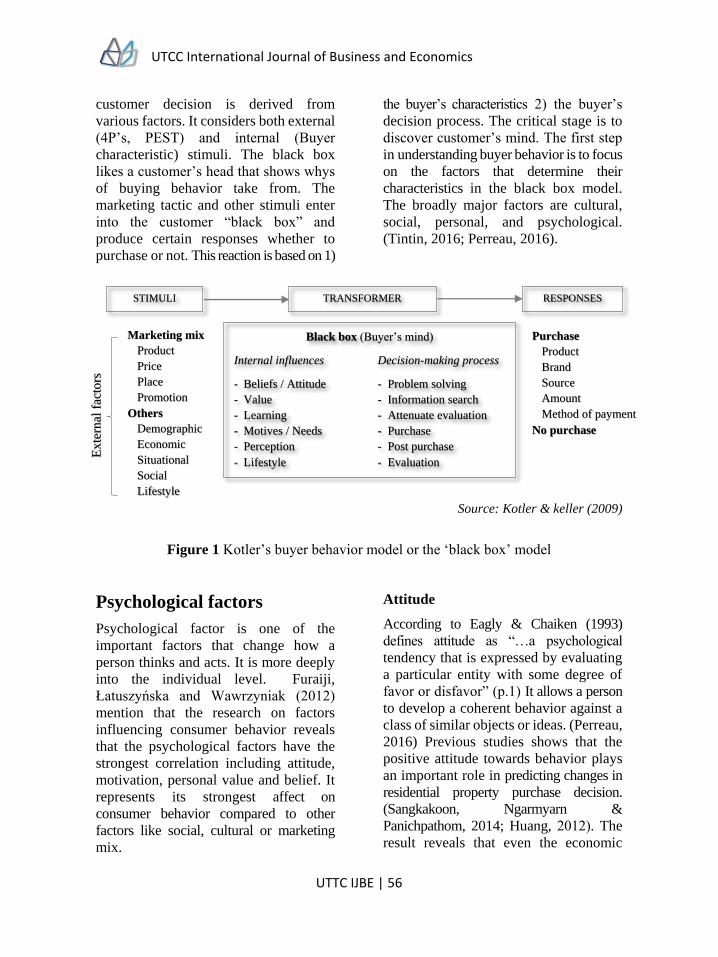
UTCC International Journal of Business and Economics
UTTC IJBE | 56
customer decision is derived from
various factors. It considers both external
(4P’s, PEST) and internal (Buyer
characteristic) stimuli. The black box
likes a customer’s head that shows whys
of buying behavior take from. The
marketing tactic and other stimuli enter
into the customer “black box” and
produce certain responses whether to
purchase or not. This reaction is based on 1)
the buyer’s characteristics 2) the buyer’s
decision process. The critical stage is to
discover customer’s mind. The first step
in understanding buyer behavior is to focus
on the factors that determine their
characteristics in the black box model.
The broadly major factors are cultural,
social, personal, and psychological.
(Tintin, 2016; Perreau, 2016).
Source: Kotler & keller (2009)
Figure 1 Kotler’s buyer behavior model or the ‘black box’ model
Psychological factors
Psychological factor is one of the
important factors that change how a
person thinks and acts. It is more deeply
into the individual level. Furaiji,
Łatuszyńska and Wawrzyniak (2012)
mention that the research on factors
influencing consumer behavior reveals
that the psychological factors have the
strongest correlation including attitude,
motivation, personal value and belief. It
represents its strongest affect on
consumer behavior compared to other
factors like social, cultural or marketing
mix.
Attitude
According to Eagly & Chaiken (1993)
defines attitude as “…a psychological
tendency that is expressed by evaluating
a particular entity with some degree of
favor or disfavor” (p.1) It allows a person
to develop a coherent behavior against a
class of similar objects or ideas. (Perreau,
2016) Previous studies shows that the
positive attitude towards behavior plays
an important role in predicting changes in
residential property purchase decision.
(Sangkakoon, Ngarmyarn &
Panichpathom, 2014; Huang, 2012). The
result reveals that even the economic
STIMULI TRANSFORMER RESPONSES
Marketing mix
Product
Price
Place
Promotion
Others
Demographic
Economic
Situational
Social
Lifestyle
Black box (Buyer’s mind)
Internal influences Decision-making process
- Beliefs / Attitude - Problem solving
- Value - Information search
- Learning - Attenuate evaluation
- Motives / Needs - Purchase
- Perception - Post purchase
- Lifestyle - Evaluation
Purchase
Product
Brand
Source
Amount
Method of payment
No purchase
Ex
tern
al f
acto
rs
UTCC International Journal of Business and Economics
UTTC IJBE | 57
resession, people develop negative
attitude toward owning a house only in
that short period of time. Their positive
attitude remains and still wishes to buy a
house in the future time. (Rohe &
Lindblad, 2013) In additional, Al-Nahdi,
Nyakwende, Banamah and Jappie (2015)
mention that the intention to purchase a
residential property is influenced by
attitude.
H1: There is difference in terms of
attitude between those who wanted to
purchase a residential property versus
those who did not.
Motivation
Motivation is “the driving force whithin
individuals that inpels them to action”.
(p.83) Motivation views as a
psychological force that stimulates
response. It is a reason for behavior.
(Hawkins, Best & Coney, 2001 p.362)
Maslow’s hierarchy of need is widely used
in the decision making based research to
study customer motivation to purchase a
property as it can provide the
environment which can encourgae a
person to express their ability and potential.
(Abdullah, Jumadi, Nor & Arshad, 2012)
The Maslow’s hierarchy of need, based
on the idea that human actions are
directed toward goal accomplishment. It
represented in a hierarchy pyramid with
five levels such as physiological, safety,
belongingness, esteem, and self-
actualization need. The lower one must
be satisfied before the higher-order need.
(Sheth & Mittal, 2004) Previous study
regarding motivation to own a house in
Hong Kong reveals that the respondents
are mostly purchase a house because they
wish to meet housing needs, improve
quality of life and security need
respectively. And only 4 percent purchase
a house just to raise their social status. (Tang
& Freda, 1996)
H2: There is difference in terms of
motivation between those who wanted to
purchase a residential property versus
those who did not.
Personal values
Values are a major motivating force for
people because it gives you a sense of
importance, standard and quality toward
something. Comparatively, Aron (2001)
also reports that consumer’s value
systems and involvement have been
recognized to be the potential influencing
which directly linked to an individual’s
lifestyle. It produces direct energy and
activities of an individual’s lifestyle and
consequently their consumption behavior.
Further discusses by Aron (2001) that the
values also affect consumption motives
that partially set the choice criteria.
Personal values tend to play more
important factor in decision making
especially for the product with high
involvement. Hawkins, Best & Coney
(2004) mentions homes are frequently
have high purchase involvement.
Therefore, values play a critical role on
home buying decision.
H3: There is difference in terms of
personal value between those who
wanted to purchase a residential property
versus those who did not.
Beliefs
A belief is a trust or confidence that a
person has on something. It may derived
from his/her experience, learning or even
from external influences such as family
and friends. The beliefs will be
developed and eventually influence
his/her buying behavior. (Perreau, 2016).
Previous study shows that a personal
UTCC International Journal of Business and Economics
UTTC IJBE | 58
with stong beliefs in the benefits of
ownership are more likely to expect to
buy own asset in the future compare to
those without such belief.
H4: There is a association between belief
and decision to purchase.
Demographic
Demographics describe a population in
terms of size, structure and distribution.
Size involves the number of people in the
society while structure describes the
society concerning age, income, education
and occupation. Distribution includes
physical location of that group of people
such as rural, suburban and urban
location. (Hawkins, Best & Coney, 2004).
The demographic data is considered
reasonable predictors of buyer behavior and
other marketing activities. (Pol, 1991) In
addition, demographic clearly influences
consumption behavior both indirectly and
as by individual influencing factors such
as personal value and decision style.
(Hawkins, Best & Coney, 2001).
According to previous studies, the study
on what drive consumer’s intention to
own or rent. The result shows that
demographic (income, age, marital
status, employment status) is the primary
driver towards intention to purchase a
house for current homeowner. Their
housing choice preference is driven more
by thier demographics, specifically
income and employment status.
Conversely, demographic factor is less
important for those who is looking for a
house. (Huang, 2012)
H5: There is an association between
demographic variables and decision to
purchase a residential property.
Psychographic and
demographic profiles
Psychographic factors and demographic
profiles are highly complimentary
approached that work best when they are
applied together. The knowledge from
both approaches is provided strong and
insightful information about target
market. For example, it helps the
advertiser/marketer to know who is their
audience, what should the advertisement
say and where should they say.
(Schiffman & Kanuk, 2007, p.62)
UTCC International Journal of Business and Economics
UTTC IJBE | 59
Conceptual framework of psychological model of residential
property purchase decision in Thailand
Independent variables Dependent variables
Research methodology The quantitative survey was used to
gather data and translated into a useful
information and knowledge. The total
sample size was 178 respondents from
convenience sampling method.
Considering 90% confidence level in
sampling from population of Yamane
(1967), sample size shall be more than 100
respondents. Thus, 178 respondents are
considered sufficient and good
representation of population. The analysis
will conduct mainly on two groups of
people for those who wanted to buy new
residential property versus those who did
not want to buy soon and further analyze its
statistical to identify significance
differences between these two groups in
terms of their psychological factors.
Several statistical techniques were
employed to test the hypothesis. The
descriptive statistics were used to describe
demographic profiles of the respondents.
Independent t-test was employed to
identify significance differences between
Demographic
- Gender - Age - Martial status - Career - Education
Psychological factors
- Attitude (H1) Positive Negative
- Motivation/ need (H2) Physiological Safety Social Self-esteem Self-actualization
- Value (H3) Self-respect Warm relationship with
others values Sense if accomplishment Self-fulfillment Fun and enjoyment in life Excitement Sense of belonging Being well respected Security
- Belief (H4) Homeownership Renting
Residential property
purchase decision
H5
H1-H4
UTCC International Journal of Business and Economics
UTTC IJBE | 60
those who wanted to purchase a
residential property versus those who did
not want to purchase soon in terms of
their attitudes, motivations, and personal
value. Additionally, chi-square test was
used to test relationship between beliefs,
demographic profiles and decision to
purchase a residential property. All of the
significance tests in this study were
performed at 90% and 95% confidence
level. Five hypotheses have been proposed
and tested.
Research findings
Descriptive analysis
The survey reports the demographic
profile of the respondents in this survey.
Total sample size was n=178. The
majority of the participants were female
(70%), aged between 20-30 years (63%),
single (76%), studied or finished bachelor
degree (53%), most of them worked as
employees (57%), had monthly personal
income 24,001-35,000 baht (30%) and
had monthly household income 85,001-
160,000 baht (29%).
The question whether the respondent
want or likely to purchase a residential
property soon was asked in order to
categorize the respondents into two
groups which are first who wanted to buy
new residential property versus second
those who did not want to buy soon
before comparing its significance
differences among them. The result
shows the minor group of 56 respondents
(33%) of the sample size was not want to
purchase a new residential property soon
while 122 respondents (67%) wanted to
purchase a new residential property.
A residential property
purchase decision
Reason to purchase a residential
property
Only the respondents who are willing to
purchase a residential property were
eligible to answer this question to observe
their reason to purchase. More than half of
the respondents (55%) were looking for a
new residential property because they
want to own it by themselves. 16% were
searching for a residential property to get
a bigger living space. 14% and 12% were
giving the reason of family expansion
and investment purpose accordingly.
However, only 3% were mentioning
about relocation.
Reason for postponing purchase
decision
The majority of the respondents that
accounted for 37% were postponing their
decision due to financial condition. 21 %
of the respondents were unable to find a
good choice. 20% of the respondents
were postponing their decision due to
economy condition. 13% of the
respondents were mentioned about
interest rate. Only 7% were mentioned
that influencers such as friends or
families were stopped them from making
a purchase decision. And only 2% were
derived from other reasons.
Reliability analysis
Cronbach’s alpha was used to measure
the internal consistency of the
questionnaires. The reliable of 0.830 and
all factors in the questionnaire are greater
than 7, which explain that this set of
questions is reliable to be used and tested
in the research.
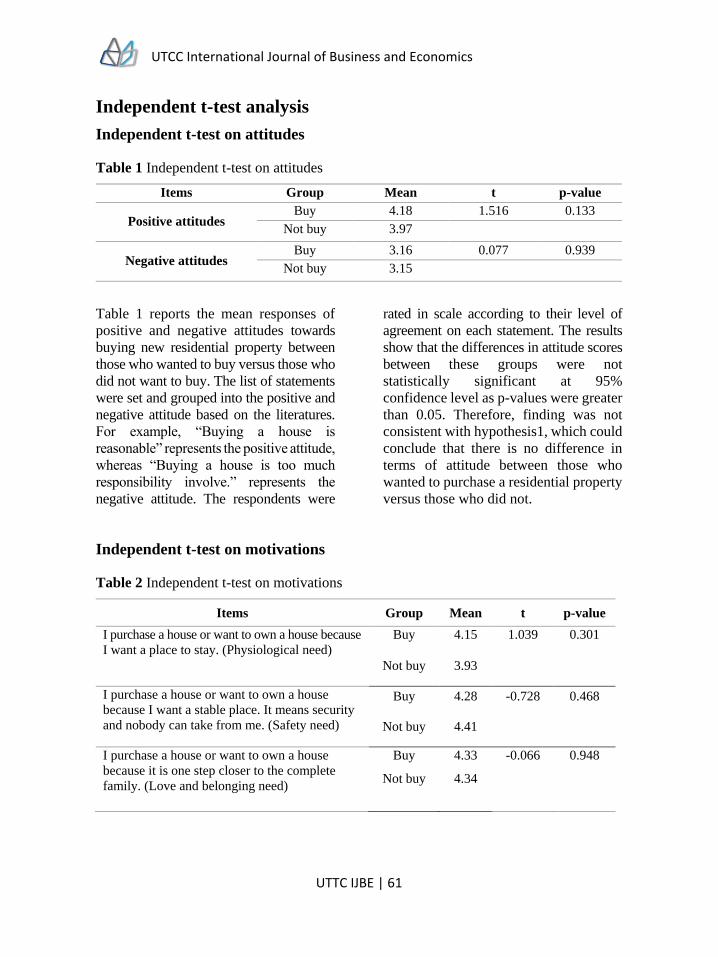
UTCC International Journal of Business and Economics
UTTC IJBE | 61
Independent t-test analysis
Independent t-test on attitudes
Table 1 Independent t-test on attitudes
Items Group Mean t p-value
Positive attitudes Buy 4.18 1.516 0.133
Not buy 3.97
Negative attitudes Buy 3.16 0.077 0.939
Not buy 3.15
Table 1 reports the mean responses of
positive and negative attitudes towards
buying new residential property between
those who wanted to buy versus those who
did not want to buy. The list of statements
were set and grouped into the positive and
negative attitude based on the literatures.
For example, “Buying a house is
reasonable” represents the positive attitude,
whereas “Buying a house is too much
responsibility involve.” represents the
negative attitude. The respondents were
rated in scale according to their level of
agreement on each statement. The results
show that the differences in attitude scores
between these groups were not
statistically significant at 95%
confidence level as p-values were greater
than 0.05. Therefore, finding was not
consistent with hypothesis1, which could
conclude that there is no difference in
terms of attitude between those who
wanted to purchase a residential property
versus those who did not.
Independent t-test on motivations
Table 2 Independent t-test on motivations
Items Group Mean t p-value
I purchase a house or want to own a house because
I want a place to stay. (Physiological need)
Buy 4.15 1.039 0.301
Not buy 3.93
I purchase a house or want to own a house
because I want a stable place. It means security
and nobody can take from me. (Safety need)
Buy 4.28 -0.728 0.468
Not buy 4.41
I purchase a house or want to own a house
because it is one step closer to the complete
family. (Love and belonging need)
Buy
Not buy
4.33
4.34
-0.066 0.948
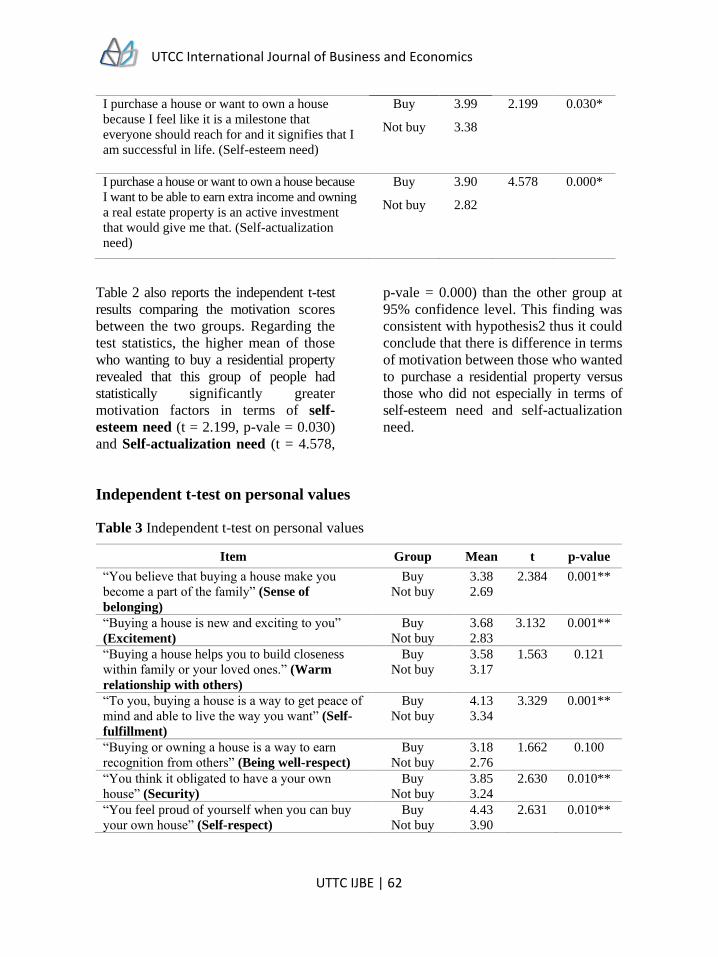
UTCC International Journal of Business and Economics
UTTC IJBE | 62
I purchase a house or want to own a house
because I feel like it is a milestone that
everyone should reach for and it signifies that I
am successful in life. (Self-esteem need)
Buy
Not buy
3.99
3.38
2.199 0.030*
I purchase a house or want to own a house because
I want to be able to earn extra income and owning
a real estate property is an active investment
that would give me that. (Self-actualization
need)
Buy
Not buy
3.90
2.82
4.578 0.000*
Table 2 also reports the independent t-test
results comparing the motivation scores
between the two groups. Regarding the
test statistics, the higher mean of those
who wanting to buy a residential property
revealed that this group of people had
statistically significantly greater
motivation factors in terms of self-
esteem need (t = 2.199, p-vale = 0.030)
and Self-actualization need (t = 4.578,
p-vale = 0.000) than the other group at
95% confidence level. This finding was
consistent with hypothesis2 thus it could
conclude that there is difference in terms
of motivation between those who wanted
to purchase a residential property versus
those who did not especially in terms of
self-esteem need and self-actualization
need.
Independent t-test on personal values
Table 3 Independent t-test on personal values
Item Group Mean t p-value
“You believe that buying a house make you
become a part of the family” (Sense of
belonging)
Buy
Not buy
3.38
2.69
2.384
0.001**
“Buying a house is new and exciting to you”
(Excitement) Buy
Not buy 3.68
2.83
3.132
0.001**
“Buying a house helps you to build closeness
within family or your loved ones.” (Warm
relationship with others)
Buy
Not buy 3.58
3.17
1.563 0.121
“To you, buying a house is a way to get peace of
mind and able to live the way you want” (Self-
fulfillment)
Buy
Not buy 4.13
3.34
3.329 0.001**
“Buying or owning a house is a way to earn
recognition from others” (Being well-respect) Buy
Not buy 3.18
2.76
1.662 0.100
“You think it obligated to have a your own
house” (Security) Buy
Not buy 3.85
3.24
2.630 0.010**
“You feel proud of yourself when you can buy
your own house” (Self-respect) Buy
Not buy 4.43
3.90
2.631 0.010**
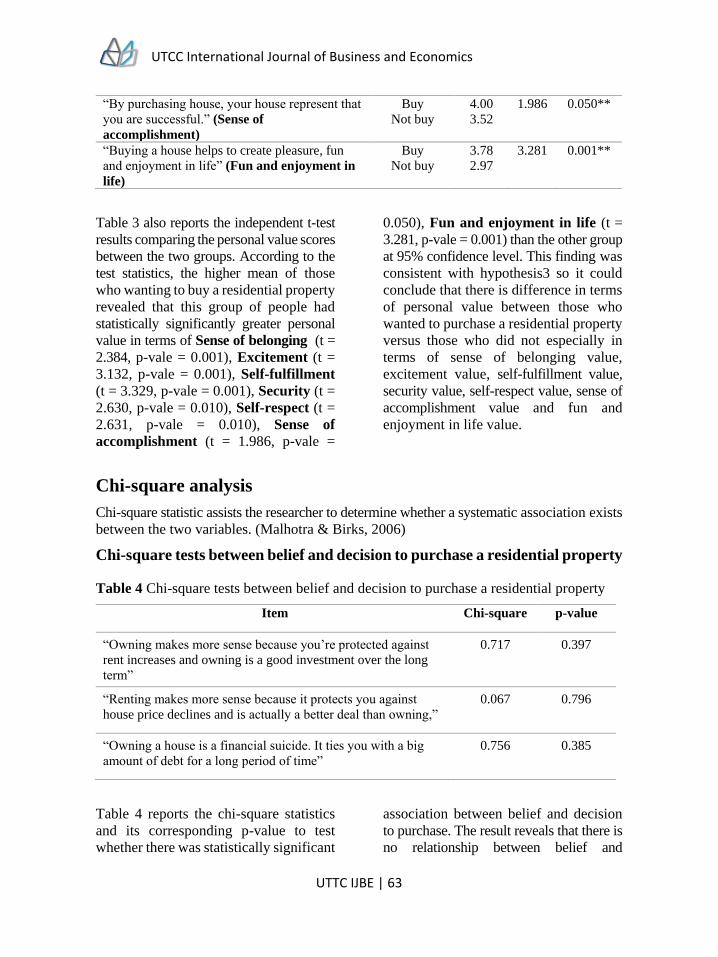
UTCC International Journal of Business and Economics
UTTC IJBE | 63
“By purchasing house, your house represent that
you are successful.” (Sense of
accomplishment)
Buy
Not buy 4.00
3.52 1.986 0.050**
“Buying a house helps to create pleasure, fun
and enjoyment in life” (Fun and enjoyment in
life)
Buy
Not buy 3.78
2.97
3.281 0.001**
Table 3 also reports the independent t-test
results comparing the personal value scores
between the two groups. According to the
test statistics, the higher mean of those
who wanting to buy a residential property
revealed that this group of people had
statistically significantly greater personal
value in terms of Sense of belonging (t =
2.384, p-vale = 0.001), Excitement (t =
3.132, p-vale = 0.001), Self-fulfillment
(t = 3.329, p-vale = 0.001), Security (t =
2.630, p-vale = 0.010), Self-respect (t =
2.631, p-vale = 0.010), Sense of
accomplishment (t = 1.986, p-vale =
0.050), Fun and enjoyment in life (t =
3.281, p-vale = 0.001) than the other group
at 95% confidence level. This finding was
consistent with hypothesis3 so it could
conclude that there is difference in terms
of personal value between those who
wanted to purchase a residential property
versus those who did not especially in
terms of sense of belonging value,
excitement value, self-fulfillment value,
security value, self-respect value, sense of
accomplishment value and fun and
enjoyment in life value.
Chi-square analysis
Chi-square statistic assists the researcher to determine whether a systematic association exists
between the two variables. (Malhotra & Birks, 2006)
Chi-square tests between belief and decision to purchase a residential property
Table 4 Chi-square tests between belief and decision to purchase a residential property
Item Chi-square p-value
“Owning makes more sense because you’re protected against
rent increases and owning is a good investment over the long
term”
0.717 0.397
“Renting makes more sense because it protects you against
house price declines and is actually a better deal than owning,”
0.067 0.796
“Owning a house is a financial suicide. It ties you with a big
amount of debt for a long period of time”
0.756 0.385
Table 4 reports the chi-square statistics
and its corresponding p-value to test
whether there was statistically significant
association between belief and decision
to purchase. The result reveals that there is
no relationship between belief and
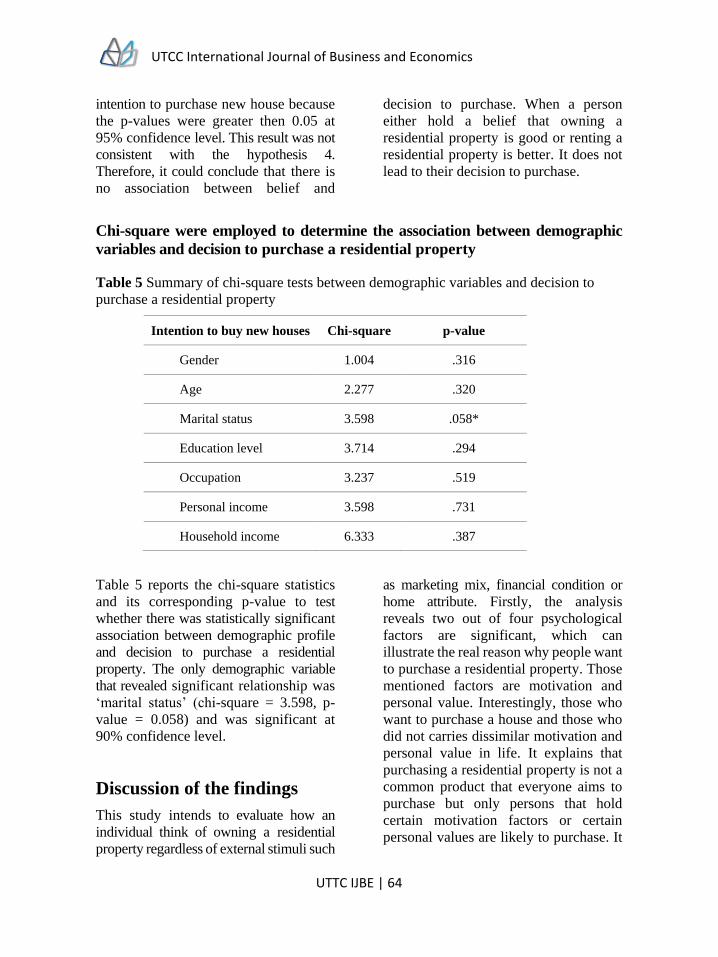
UTCC International Journal of Business and Economics
UTTC IJBE | 64
intention to purchase new house because
the p-values were greater then 0.05 at
95% confidence level. This result was not
consistent with the hypothesis 4.
Therefore, it could conclude that there is
no association between belief and
decision to purchase. When a person
either hold a belief that owning a
residential property is good or renting a
residential property is better. It does not
lead to their decision to purchase.
Chi-square were employed to determine the association between demographic
variables and decision to purchase a residential property
Table 5 Summary of chi-square tests between demographic variables and decision to
purchase a residential property
Intention to buy new houses Chi-square p-value
Gender 1.004 .316
Age 2.277 .320
Marital status 3.598 .058*
Education level 3.714 .294
Occupation 3.237 .519
Personal income 3.598 .731
Household income 6.333 .387
Table 5 reports the chi-square statistics
and its corresponding p-value to test
whether there was statistically significant
association between demographic profile
and decision to purchase a residential
property. The only demographic variable
that revealed significant relationship was
‘marital status’ (chi-square = 3.598, p-
value = 0.058) and was significant at
90% confidence level.
Discussion of the findings
This study intends to evaluate how an
individual think of owning a residential
property regardless of external stimuli such
as marketing mix, financial condition or
home attribute. Firstly, the analysis
reveals two out of four psychological
factors are significant, which can
illustrate the real reason why people want
to purchase a residential property. Those
mentioned factors are motivation and
personal value. Interestingly, those who
want to purchase a house and those who
did not carries dissimilar motivation and
personal value in life. It explains that
purchasing a residential property is not a
common product that everyone aims to
purchase but only persons that hold
certain motivation factors or certain
personal values are likely to purchase. It
UTCC International Journal of Business and Economics
UTTC IJBE | 65
is unlike the conventional thinking that
everyone wants to purchase a residential
property to satisfy his or her basic need.
At this stage, people are looking for more
than that.
Attitude factor, the result reveals that
there is no difference in terms of attitude
between those who wanted to purchase a
residential property versus those who did
not. The positive and negative attitudes
do not impact their purchase decision.
Positive or negative attitude cannot use to
predict a person’s intention to purchase a
residential property. The result is
consistent with the previous study that
individual’s negative attitude might
develop only a short period of time. It
depends on situation. For example,
during the financial crisis, people might
develop a negative attitude and develop a
positive one once the crisis in over.
(Rohe, Boshamer & Lindblad, 2013)
Motivation factor, the research reveals
that, those who wanted to purchase a
residential property contained different
motivation factors in terms of self-
esteem need and self-actualization need.
The result is not consistent with the
previous study in Hong Kong, which
states the majority respondents
purchased a residential property to
satisfy their basic need. (Tang & Freda,
1996) However, the research in Hong
Kong was conducted in 1996, which is
too old. In additional, Hong Kong faces
the problem of limited living spaces.
Thus, the major need was just to be able
to find a shelter to fit all family members.
Surprisingly, supported by the statistic
from this study, in Bangkok they think that
to purchase a residential property is a
milestone that they would like to achieve in
life and it represents their success.
Moreover, they aim to purchase for a long-
term investment to grow their wealth.
Similarly, the Thailand property trend in
2016 is expected to shift toward a super
luxury market. They are looking for a
residential property that fulfill their
successful life and to show others.
(Benjarong, 2016) This could be the
changing in value within Thai people at
the present. We need to admit that the
new generations value money over other
intrinsic factors. They care about self-
image and search for social acceptance.
The fact can be seen from the increasing
in luxury product consumption and
personal debt from credit card. The
absorption of the western culture also
plays an essential role in Thailand society
due to social network and globalization.
We are more independent and always
seeking to improve our life. The salary
earners start to invest in condominium or
purchase a second home for investment.
The use of social network also creates
blended society and skewed self-image.
We post pictures of us looking perfect.
All these factors build our value and
motivate us to purchase a particular
product that can help us to satisfy those
needs. This paper has shown that a
residential property has become one of
the products that help the customer to
satisfy their self-esteem and self-
actualization need as well.
Personal values, This paper shows that
those who wanted to purchase a
residential property contained different
personal value factors in terms of sense
of belonging value, excitement value,
self-fulfillment value, security value,
self-respect value, sense of
accomplishment value and fun and
enjoyment in life value. For example, they
think that buying a residential property
helps to represent their success (sense of
accomplishment) and it makes them proud
UTCC International Journal of Business and Economics
UTTC IJBE | 66
(self-respect). Personal value refers to a
person life goal. Seven personal values
out of nine were considered important for
the consumer to purchase a residential
property. Surprisingly, warm
relationship with others value and being
well-respect value were not important to
them. So, the result explains that in their
point of view owning or purchasing a
residential property does not help to
improve a family relationship. This result
is actually quite consistent with the
motivation factors that the customer are
more concerning about themselves over
the others. When it comes to purchase
decision, they do not consider about
building closeness within family. This
fact might somehow interpret the lesser
family closeness within the urbanize
society. The changing in culture and
lifestyle leads to changing in purchase
decision. The result was consistent with
the previous study in the US; the
respondents intended to purchase a
residential property to expand their sense
of personal accomplishment and social
status. The reason to improve
relationship with others was not
mentioned. (Rohe, Boshamer &
Lindblad, 2013)
Indeed, the result of motivation factor
and personal value factor are pretty much
the same direction. The customers are no
longer looking for just a quality
residential property to stay but they want
to have a place to represent their success
or status in the society. The family is
important but when it comes to the
purchase decision they tend to emphasis
more in the interest of themselves.
Belief factor, the result shows that there
is no association between belief and
decision to purchase. The research was
evaluated the belief in benefit of owning
or renting. When it comes to decision
making to purchase a residential
property, the belief itself was not strong
enough to influence a person to buy or
not to buy a property. Realizing the
benefit of either owning or renting does
not imply to purchase decision. This was
not consistent with the previous research
in the U.S. Huang (2012) observes that
renters’ belief in homeownership play a
major role in decision-making. It even
forms an ownership optimistic. However,
it can be explained that many Americans
hold a mindset of believing in the benefit
of owning a house so called an American
dream. Most Americans want to own
their own home. This belief seems
general for them. The belief becomes
norm and so results in that pervious
research that believes in homeownership
plays a major role in decision-making for
them. Unlike, in Bangkok, the belief is
not as strong as the American. Therefore,
it results in dissimilar outcome
eventually.
Demographic factor, the only
noticeable relationship between
demographic profiles and decision to
purchase a residential property were the
consumer change in marital status. The
marital status can be used to explain the
family life cycle of a person. Needs have
changed according to different
requirement in life. When the customers
are changing their life stage from single to
married, the need of new residential
property arise due to family expansion.
Interestingly, the result was not consistent
with previous studies in Malaysia and
Jorden. The marital status or family life
cycle shows the lowest importance in
decision making to purchase a residential
property in those countries. In Jordan, the
marital status and education were not
significant difference in the respondents
UTCC International Journal of Business and Economics
UTTC IJBE | 67
answer. Jordan knows as one of the world’s
lowest rates of female participation in the
workforce. (Gender Equality and Female
Empowerment, 2016). They tend to
concern less about purchase a residential
property for themselves or family.
Therefore, the marital status seems to have
less importance to identify intention to
purchase. Furthermore, in Malaysia the
marital status was not as important as the
financial factor due to higher cost of
residential property. Referring to Poo
(2015) states the remarkable problem of
severely unaffordable housing price in
Malaysia especially in the major city like
Kuala Lumpur and Penang. Unlike
Thailand, the survey were conducted
mainly in Bangkok and metropolitan area
where people have distinctive lifestyle
compared to those who living in poverty.
There are still affordable properties
available and the shifting in lifestyle of
people can explain why the result was not
consistent with other countries. In this
new era, the smaller family size and the
increased smaller condominium space
have proved that they tend to move out
and live by themselves more. Customers
choose a residential property that they can
afford in terms of financial and also
appropriate space for themselves. Then,
they might decide to buy the new one after
getting married or having baby to expend
the family size later. This is why marital
status matters to the intention to purchase
a residential property.
Psychological factors are interrelated and
largely dealing with culture that a person
learn and develop understanding and
perception from the surrounded
environment overtime. Whenever
changes in culture or environment
around them have occurred, it will
eventually impact people in the society.
Conclusion
Research conclusion
The property section once has been
contributing large proportion in the
world economic expansion and also in
Thailand. It is an essential sector that can
be both causing country wealth and
crises. Currently, the increasingly unsold
units have recorded in Thailand property
market. Most of the studies were
conducting on how external factor such
as marketing mix, influencers or home
attribute impact purchase decision. In
fact, there are more variable involved.
The internal or psychological factors are
overlooked.
This research aims to study the
influencing factor on purchase decision
in the other perspective, which is the
psychological factor i.e. attitude,
motivation, personal value and belief.
This perhaps derives to the different useful
strategy. As the decision to purchase a
residential property considers as a
lifetime investment. The individual
might tie themselves to the mortgage for
more than 30 years. It would be better if
the provider understand their real desire
or goal to purchase a particular product,
help them to make a better choice and
satisfy their essential need.
The survey was used to gather data and
translated into a useful information and
knowledge. The total sample size was 178
respondents. Several statistical techniques
were employed to test the hypothesis. The
descriptive statistics were used to describe
demographic profiles of the respondents,
their behaviors, and their attitudes,
motivations, and personal values to buy a
residential property. Independent t-test
was employed to identify significance
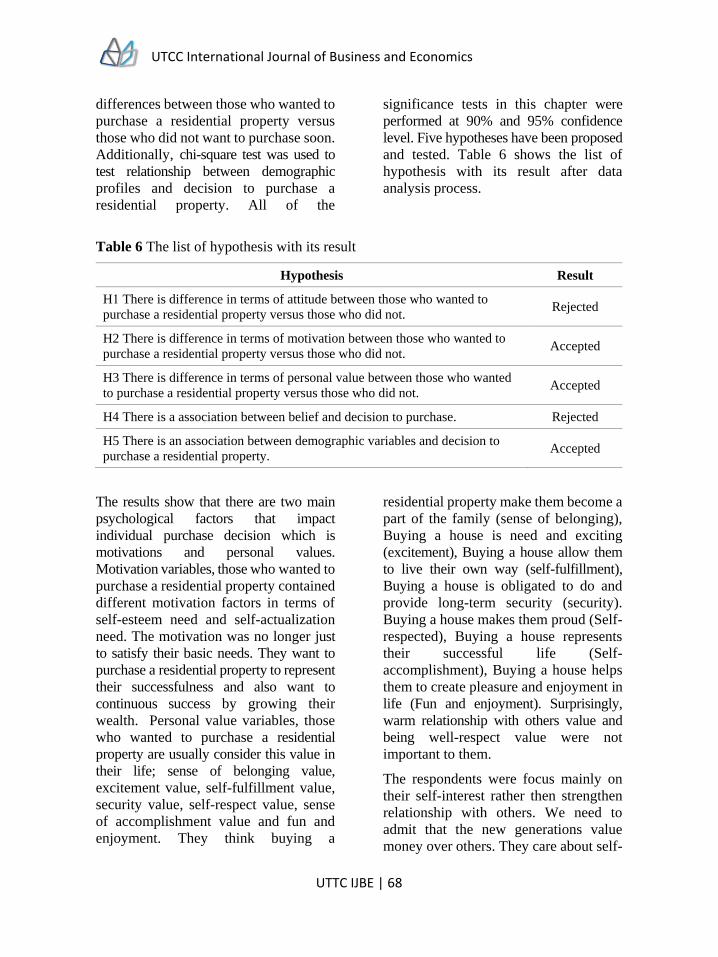
UTCC International Journal of Business and Economics
UTTC IJBE | 68
differences between those who wanted to
purchase a residential property versus
those who did not want to purchase soon.
Additionally, chi-square test was used to
test relationship between demographic
profiles and decision to purchase a
residential property. All of the
significance tests in this chapter were
performed at 90% and 95% confidence
level. Five hypotheses have been proposed
and tested. Table 6 shows the list of
hypothesis with its result after data
analysis process.
Table 6 The list of hypothesis with its result
Hypothesis Result
H1 There is difference in terms of attitude between those who wanted to
purchase a residential property versus those who did not. Rejected
H2 There is difference in terms of motivation between those who wanted to
purchase a residential property versus those who did not. Accepted
H3 There is difference in terms of personal value between those who wanted
to purchase a residential property versus those who did not. Accepted
H4 There is a association between belief and decision to purchase. Rejected
H5 There is an association between demographic variables and decision to
purchase a residential property. Accepted
The results show that there are two main
psychological factors that impact
individual purchase decision which is
motivations and personal values.
Motivation variables, those who wanted to
purchase a residential property contained
different motivation factors in terms of
self-esteem need and self-actualization
need. The motivation was no longer just
to satisfy their basic needs. They want to
purchase a residential property to represent
their successfulness and also want to
continuous success by growing their
wealth. Personal value variables, those
who wanted to purchase a residential
property are usually consider this value in
their life; sense of belonging value,
excitement value, self-fulfillment value,
security value, self-respect value, sense
of accomplishment value and fun and
enjoyment. They think buying a
residential property make them become a
part of the family (sense of belonging),
Buying a house is need and exciting
(excitement), Buying a house allow them
to live their own way (self-fulfillment),
Buying a house is obligated to do and
provide long-term security (security).
Buying a house makes them proud (Self-
respected), Buying a house represents
their successful life (Self-
accomplishment), Buying a house helps
them to create pleasure and enjoyment in
life (Fun and enjoyment). Surprisingly,
warm relationship with others value and
being well-respect value were not
important to them.
The respondents were focus mainly on
their self-interest rather then strengthen
relationship with others. We need to
admit that the new generations value
money over others. They care about self-
UTCC International Journal of Business and Economics
UTTC IJBE | 69
image and search for social acceptance.
This research was conducted in Bangkok
so it basically differs from the suburban
people. The absorption of the western
culture also plays an essential role in
society in Thailand due to social network
and globalization. We learn to become
more independent and always seeking to
improve our life. The use of social
network also creates blended society and
skewed self-image. All these factors
build our value and motivate us to
purchase a particular product that can
help us to satisfy those needs. This paper
has shown that a residential property has
become one of the products that help the
customer to satisfy their self-esteem and
self-actualization need as well. Lastly,
the attitude and belief variables were
found no significant relationship with the
residential property purchase decision.
In additional, the marital status is the
only demographic profile that has a
relationship with decision to purchase a
residential property, as evidenced by the
survey that the second highest reason for
purchasing a residential property was the
family expansion purpose. Therefore, the
changing in marital status reflected
demand. Although, Thailand has a
collectivism culture that we are living in a
big family with parent, in this new era the
smaller family size and the increased
smaller condominium space have proved
that they tend to move out and live by
themselves more. They buy a residential
property that fit their present lifestyle and
change to a bigger one when they expand
their family or reach a later stage of life.
Implications
The research provides an understanding
of customer insights and motive
influencing their purchasing decisions at
psychological factors. The paper can
serve as a guideline for property
developers develop both product and
marketing strategy to achieve business
goals with the provided customer
insights. To be competitive in the market,
they should try to satisfy the customer
into their intrinsic level. Yet the person’s
psychological factors are hard to change,
the marketer should understand them and
try to develop a product that satisfy them
and influence them with the right
message that matched their value. The
customers are no longer looking for just
only a quality residential property to stay
but they want to have a place that
represents their success within the
society. The family is important but
when comes to purchase decision they
tend to emphasis more in interest of
themselves.
For property development firms, concept
development plays a vital role that will
have significant impact to customers’
purchase intention. Clear concept
representing motivations and personal
values of targeted customers shall be
thoroughly developed. Then, marketing
communication by sales & marketing
team shall ensure this concept is well
conveyed to the potential customers. The
developer should invest in branding,
brand concept and clear positioning that
allow customer to picture themselves when
they are living in the house from that
particular brand. The image of the brand
or a product represents the image of the
buyer.
Product development and product value,
since the buyer is looking for a residential
property that represents their success and
creates sense of accomplishment, the
developer should not only focus on
UTCC International Journal of Business and Economics
UTTC IJBE | 70
function but also the product appearance
such as interior and exterior design.
Furthermore, the value that developer
can add into their product are investment
benefit in long-term to satisfy the
customer’s self-actualization need. These
values shall be emphasis by sales team
during customers’ contact with the
company.
Marketing communication, this is very
useful also for the property provider to
custom their advertising message to attack
the customer personal value. Most people
set their personal value as their life goal
to achieve. When the property provider
can tell them how your product or
residential property can help them to
achieve their goal. It is more likely to
influence their purchase decision.
However, the mixture of other marketing
mix components and activities should be
addressed before sum up with the right
strategy. Moreover, the developer can
approach the new market that is those
who are renting a house at the present.
The research shown that the belief in
benefit of renting or owning does not
impact their purchase decision. Those
who preferred to rent now do not mean
they will rent forever. In additional, those
who have negative attitude towards
owning a house or think owning a house
is a bad idea now, do not mean that they
do not want to buy one in the future.
Lastly, the changing in marital status
reflects the customer purchase decision.
When people are moving from single to
married, they tend to look for a new
residential property to expand their
family. The sales and marketing team of
developer can view this as an opportunity
to create new target segment. People at
different life stage might require
different product features. The provider
can target single people or retirement
people with specific facility or architect
design.
Limitations
Limitation of this research is that
psychological factor might interpret
purchase decision and intention. However,
the purchase decision of a residential
property is tied heavily with the financial
ability of that person which were not take
into consideration in this research.
(Rohe, Boshamer & Lindblad, 2013)
Future research
For future research, more variables should
involve in the research to compare and see
the relationship between the internal or
psychological factors and external factors
in order to gain more insightful information
that will enable them to improve their
strategies for attracting more consumers.
Lastly, the future research can also
conduct to test these related values or
needs on the advertising message
whether they are really capable of
influencing consumer intention. This
could be a useful guideline for the
marketer or any related parties to
efficiently spend their marketing or
media budget.
UTCC International Journal of Business and Economics
UTTC IJBE | 71
References
Abdullah, L., Jumadi, N., Nor, I. & Arshad, H. (2012). First-time Home Buyers: Factors
Influencing Decision Making. University Teknologi MARA, Malaysia.
Al-Nahdi, T., Nyakwende, E., Banamah, A. & Jappie, A. (2015). Factors Affecting Purchasing
Behavior in Real Estate in Saudi Arabia. Al-Faisal University, Saudi Arabia.
American Psychological Association. (2016). Socioeconomic Status. Retrieved from
http://www.apa.org/pi/ses/resources/publications/minorities.aspx.
Aron, O. (2001). “An Exploratory Study of the Influence of Personal Values on Purchase
Decision & Amp; Advertising Involvement”, in AP - Asia Pacific Advances in
Consumer Research. Volume 4, eds. Paula M. Tidwell and Thomas E. Muller,
Provo, UT: Association for Consumer Research, Pages: 67-72.
Chedsadawarangkul, S., Waweewanich, T. & Saransom, D. (2010). The Factors Which
Affected The Decision Process Making to Buy Townhouses of Wangthong Group
(Public) Company Limited. Rajabhat University Valailongkorn, Thailand.
Decision Making Confidence. (2016). Personal values and decision-making clearly explained.
Retrieved from http://www.decision-making-confidence.com/ personal-values-
and-decision-making.html.
Eagly, A. H., & Chaiken, S. (1993). The psychology of attitudes. Harcourt Brace Jovanovich
College Publishers. pp.1.
Furaiji, F., Łatuszyńska, M. & Wawrzyniak, A. (2012). An Empirical Study of the Factors
Influencing Consumer Behavior in the Electric Appliances Market. Basra
Universitiy, Iraq.
Gallo, M. (2012). Do Values Influence Strategic Decision Making? Retrieved from
http://blog.valerisys.com/tlt/do-values-influence-strategic-decision-making/
Global Property Guide. (2015). Bangkok's condo index up 14%, despite the politics. Retrieved
from http://www.globalpropertyguide.com/Asia/Thailand/Price-History.
Hall, A. (2012). To Succeed as an Entrepreneur, Know Your Customer. Retrieved from
http://www.forbes.com/sites/alanhall/2012/06/14/to-succeed-as-an-entrepreneur-
know-your-customer/#e9fd662755e6
Hawkins, D. I., Coney, K. A., & Best, R. J. (2004). Consumer behavior building marketing
strategy. Boston: McGraw-Hill/Irwin.
Hoyer, W. D., MacInnis, D. J., & Pieters, R. (2012). Consumer behavior. Mason, OH: South-
Western, Cengage Learning.
Huang, L. (2012). Own-Rent Analysis. What Drives Consumers’ Intentions to Own or Rent, 1-
6
Independent T-Test for Two Samples. (2013). Retrieved from https://statistics.laerd.com/
statistical-guides/independent-t-test-statistical-guide.php
UTCC International Journal of Business and Economics
UTTC IJBE | 72
Israel, G. (n.d.). Determining Sample Size. Retrieved from https://edis.ifas.ufl.edu/pdffiles/
PD/PD00600.pdf.
Kahle, L., Beatty, S. & Homer, P. (1986). Alternative Measurement Approachs to Consumer
Values: The List of Values (LOV) and Values and Life Style (VALS), The
Journal of Consumer Research, 13(3), 405-409.
Kinnard, W. N. (1968). Reducing uncertainty in real estate decisions. The Real Estate
Appraiser, 34(7), 10-16.
Kotler, P. (1997). Marketing management: Analysis, planning, implementation, and control.
Upper Saddle River, NJ: Prentice Hall.
Kotler, P., & Keller, K. L. (2009). Marketing management. Upper Saddle River, NJ: Pearson
Prentice Hall.
Leshetz, M. (2012). Hierarchy of a Home Self-Actualization for House & Owner | livebetter
Magazine. Retrieved from http://livebettermagazine.com/article/ hierarchy-of-a-
home-self-actualization-for-house-owner/.
Levi, DS., Murphy, LD. & Lee, C. (2008). Influences and Emotions: Exploring family
decision-making processes when buying a house. Journal of Housing Study, 1-
10. Retrieved from https://researchspace.auckland.ac.nz/handle/2292/13496.
Malhotra, N. & Birks, D. (2006). Marketing Research An Applied Approach (2nd ed.). England,
Pearson Education Limited.
Myra, S. (2016). The Three Real Reasons People Buy Property. Retrieved from http://www.
dailymail.co.uk/property/article-3420607/The-three-real-reasons-people-buy-
property.html.
Paha, K. (2016). Low-rise housing in Bangkok is in big demand. Retrieved from http://www.
ddproperty.com/en/property-news/2016/1/115524/low-rise-housing-in-bangkok -
is-in-big-demand.
Paha, K. (2016). Steady growth for Bangkok property market. Retrieved from http://www.
ddproperty.com/en/property-news/2016/3/118819/steady-growth-for-bangkok-
property-market.
Patel, N., & Puri, R. (n.d.). The Complete Guide to Understand Customer Psychology –
Chapter 1. Retrieved from https://www.quicksprout.com/the-complete-guide-to-
understand-customer-psychology-chapter-1/.
Perreau, F. (2016). The Consumer FactorConsumer Insights, Market Research, Consumer
Behavior & Neuromarketing. Retrieved from http://theconsumerfactor.com/
en/4-factors-influencing-consumer-behavior/.
Pol, L.G. (1991). Demographic contributions to marketing: An assessment. Journal of the
Academy of Marketing Science, 19 (1), 53-59.
Poo, C. (2015). Houses in KL too expensive. Retrieved from http://www.thestar.com.my/
business/business-news/2015/08/25/houses-in-kl-too-expensive/.
UTCC International Journal of Business and Economics
UTTC IJBE | 73
Sangkakoon, P., Ngarmyarn, A., & Panichpathom, S. (2014). The Influence of Group
References in Home Purchase Intention in Thailand. Thammasat University,
Thailand.
Sanichwannakul, S. (2009). Factors Affecting Consumers’ Decision Making on Buying
Condominium Among People of Different Genders, Marital Status and Incomes.
Thammasat University, Thailand.
Schieffer, R. (2005). Ten key customer insights: Unlocking the mind of the market. Mason, OH:
Thomson. pp. 51.
Shciffman. L & Kanuk. L (2007). Consumer Behavior (9th ed.). New Jersey: Pearson
Prentice Hall. pp.83.
Sheth, J. N., & Mittal, B. (2004). Customer behavior: A managerial perspective. Mason,
OH: Thomson/South-Western.
Tang & Freda, S. (1996). A high motivation to own: a case study of home ownership in
Hong Kong and its social implications in the nineties. The University of Hong
Kong, Hong Kong.
Thailand Market Research Society (2010). Standardize of Socio-Economic Status (SES)
Classification Thailand Year 2010. Retrieved from http://www.
slideshare.net/sundaesolutions/ses-thailand-2010.
Tintin, R. (2016). 4 major factors that influence consumer buyer bahaviour. Retrieved
from http://www.superprofesseur.com/19.html.
USAID. (2016). Gender Equality and Female Empowerment Jordan U.S. Agency for
International Development. Retrieved from https://www.usaid.gov/jordan/
gender-equality-womens-empowerment
Vilcekova, L. & Sabo, M. (2013). The influence of demographic factors on attitudes toward
brands and brand buying behavior of Slovak consumers. Comenius University,
Slovakia.
Wang, J., Piron, F. & Xuan, M. (2001). “Faring One Thousand Miles to Give Goose
Feathers: Gift Giving in the People=S Republic of China”, in NA – Advances in
Consumer Research Volume 28, eds. 58-63.
Yamane, T. (1967). Statistics: An Introductory Analysis, 2nd Edition, New York: Harper
and Row.
Yu, F & Thongpan, N (2015). Bubble trouble. Retrieved July 26, 2016, from http://
property.bangkokpost.com/news/599640/bubble-trouble

UTCC International Journal of Business and Economics
UTTC IJBE | 74
UTCC International Journal of Business and Economics
UTTC IJBE | 75
UTCC International Journal of Business and Economics (UTCC IJBE)
Volume 10 Number 1, April 2018
A Senge’s model on the practical domain for
developing team learning skills
Ravee Phoewhawm
Department of Innovative Business Management
International College, Chiang Mai Rajabhat University
Abstract
For human resource managers that want to foster a team learning environment that
promotes a way for members to rehearse, experiment, assess, and reflect the practice has
to see how the tools can be truly integrated. According to Senge, team learning is a team
skill that requires practice fields as a concept for team members to practice together so that
they can develop their collective learning skills. This study attempts to extend the work of
Senge’s theory of a practical field with in-depth information so that the model can be
utilized by human resource manager for supporting the discipline of team learning.
Literature works are done to revise the four practical precepts. The refined model is applied
as a case study methodology on an organization resembling the conceptual procedure. An
analysis is provided for developing the four team learning skills, along with a discussion
and conclusion at the end of the study.
Keywords: Assessment, Collaboration, Dialogue, Experimenting, Innovation,
Performance, Practice, Rehearsing, Reflecting, Team Learning,
UTCC International Journal of Business and Economics
UTTC IJBE | 76
Introduction
For human resource managers that want
to foster a team learning environment
that promotes a way for members to
rehearse, experiment, assess, and reflect
the practice has to see how the tools can
be truly integrated in order to gain a
positive impact, otherwise the learning
itself can become utterly redundant and
difficult to maintain on a consistent basis.
In Peter Senge’s “The Fifth Discipline:
The Art & Practice of the Learning
Organization”, he analyzed that team
learning is a team skill that requires
‘practice fields’ as a concept for team
members to practice together so that they
can develop their collective learning
skills (Senge, p. 258, 2006). According
to Senge, team skills are more
challenging to develop than individual
skills, therefore it’s imperative that
‘practice fields’ need to be established so
that colleagues are engaged in an activity
that is directed towards developing their
collective learning skills. He states that
the total absence of meaningful
“practice” is probably the predominant
factor that prevents associates from
evolving into an effective learning group.
Drawing upon the work from Donald
Schon, Senge highlights the idea of
practice as a tool for making a diagnosis
to see how the facts come to reveal
themselves and reconfiguring them to
serve the greatest benefit. In addition, he
sees practice as a form which allows the
freedom to experiment with a
phenomenon so that the team can study
the phases of action and grasp the
consequences of particular actions when
they’re taken. By manipulating with the
actions, Senge believes that the changes
in the environment can be eliminated and
complexity can be simplified by
uncoupling variables that are interlocked
in reality. Senge applies the analogy of a
basketball team and a symphony
orchestra to make the assertion of a
practice field by saying the following:
“They vary the pace of the action – by
slowing down the music, by running
plays in slow motion. They isolate
components and simplify the complexity
– by playing individual sections, by
running plays without a competitor.
They reverse what is, in the real
performance, irreversible – they replay
the same section over and over, they
rerun the play over and over.” Despite
advanced technology and having access
to intelligence, Senge believes that this
style of practice is lacking for a team to
truly become the ideal entity that
collectively and collaboratively learns
together in permanence within the
organization. Senge provided four ideas
for his model of a practice field. The first
is rehearsal. Under this notion team
members can get a better feel of
understanding with the abstract,
engaging in intellectual debate of ideas,
and learn each others’ rational thinking.
Second is experimentation. Sometimes
the team is forced to make a decision on
specific situations that is under great time
pressure. Experimentation can help
make the decision process become a lot
more professional. Third is assessment.
With an assessment team members are
given the opportunity to form their
reasons of different decisions. The
fourth is reflection. Reflection enables
associates to contemplate as a team and
ponder on how they might arrive together
at making better decisions.
Since the work on the practice field has
been written, there has been a scarce
source of literary studies that have
contributed to the theory; particularly for
UTCC International Journal of Business and Economics
UTTC IJBE | 77
the human resources managers to obtain
a full understanding on how it should it
be actually implemented. In this paper,
the author attempts to provide a
theoretical exposition of Peter Senge’s
model on the practical domain for
developing team learning skills so that
human resource managers can get a
better idea in designing a team learning
environment.
The purpose of this work is to present the
idea of ‘Senge’s discussion on having a
practice field’ with in-depth information
so that human resource manager applies
the model for supporting the discipline of
team learning. The initiative is to make
a contribution to a better understanding
of the practical field (which consists of
the four ideas) that is related to team
learning. The research poses the
following four questions to be focused
upon:
“How does a team learn when the course
is in the form of rehearsing?”
“How does a team learn when the course
is on having to do an experiment?”
“How does a team learn when the course
is in making an assessment?”
“How does a team learn when the course
is on reflecting?”
The conjecture of Senge’s practical
domain is examined in a case study
format on a documentary series about pit
crews who are seen as playing an
important role in helping their driver win
a racing competition. First, the study
begins with a literary illustration on the
four ideas that were mentioned in
Senge’s model of the practice field.
Second, the refined model is applied as a
case study methodology on an
organization that is engaged in an event
which resembles the concept of the
procedure. Third, an analysis of Senge’s
model for developing team learning
skills through the perception of the
practical domain is offered. Finally, the
author provides a discussion and
conclusion for human resource
manager’s application of Senge’s
practical domain.
The practical domain
of team learning
through Peter Senge’s
perspective This part of the section showcases the
literary details of the four elements that
make up the practical domain of team
learning. Each of the elements had been
theoretically reviewed from scholars who
have done an in-depth work with the
meaning and how it has been utilized in a
team setting. The work incorporates the
ideas and concepts in order to provide a
greater detail for the human resource
manager in designing the application of a
team learning environment.
Rehearsing
Rehearsing is about measuring the extent
of alignment to see how firm the team is
in executing for actual performance in
the next event (Kontogiannis and
Malakis, 2009). Team leaders or
members provide the rating for the ability
to execute as a team. Rehearsing
provides an opportunity to be engaged in
the presence of others by analyzing the
movements and coordinating with them
(Välikangas and Romme, 2012). In
UTCC International Journal of Business and Economics
UTTC IJBE | 78
addition, individuals observe the
capabilities of the team and see that if
these abilities coincide with the mission
or intended outcome (Lloyd, 2009).
While engaging in the rehearsal the
opportunity presents itself for team mates
to evaluate the chosen process and
principles that are intertwined for
performance as well as to make critical
comments (Foverskov and Binder,
2009). As a learning process for a team,
the extent of being innovative or creative
in performance has to be factored in with
the immediate environment, the social
environment, and the organizational
context in order to realize how much
there is to discover before being affirmed
to the details (Dobny, 2011). In an
example of rehearsing, members of the
legendary rock and roll group “KISS” set
their sights on being the hottest band in
the world by constantly working hard on
finding the right set of rhythm and vocals
for a song that their audience would
appreciate listening to. With the song
already a smash hit with their fans,
members of KISS would formulate in the
studios on ways they would perform the
song live on stage so that the concert
goers can truly say that this was one of
the most memorable events in their lives.
With the song as the main selling point,
the band would use their costume/make-
up, pyro-techniques and smokes, and
board lights as added props to spice up
the experience of listening to a live song.
From timing to ensure that their musical
performance is flawless, to getting ideas
erupted during the jam session, to having
cues that call for certain display of action
while making sure that they are directing
the raw energy towards the crowd, the
rehearsals made KISS developed the
mastery on managing stage performance.
Not only did the rehearsals provide the
band members a solid confidence in
playing the perfect song and making it
entertaining for their fans but it also
allowed them to seek for ways to doing it
a lot better when the next occasion comes
(Sharp, Stanley, and Simmons, 2013).
Experimenting
Doing an experiment as a team means
validating or rejecting the stated
hypothesis so that decisions can be made
whether to move forward with another
practical method or to rearrange the
working system (Persons, Beckner and
Tompkins, 2013). It is an action learning
event that assists team members to
challenge assumptions, thus enabling
them to refine their practical methods of
operation for delivering the necessary
requirements and assured quality to the
intended receiver (Kess, Tong-In,
Ayutthaya and Anusornnitisarn, 2014).
By experimenting, the facts or truths are
presented for further discussion and
setting a proper action plan that would
help the team state the right frame of
mind of getting closer to the desired
objectives (Yeganah and Kolb, 2009).
Also, flaws can be identified and
improvements can be proposed for
supporting the current operational
concept or make some slight alterations
in the idea. With the results from doing
a test the team can obtain a complete
answer on how and why the situation
happened for the aim of discussing about
the mistakes in the plan as well as on
learning the lessons for preventing any
misunderstandings that might occur
again in the future (Ramanujam and
Goodman, 2011). The information
provided from the examination
disseminates credibility for making
UTCC International Journal of Business and Economics
UTTC IJBE | 79
decisions on policy or strategy (Jain,
2011), thus leading to a better sense of
assurance on setting the aims and
objectives that would most highly be
attainable under a refined scheme.
According to a study done by Clements
(2010), the Segoku period of Japan was
the feudal system that depicted samurais
vying to be retainer for a Daimyo (feudal
lord). Samurais who represent their clans
and schools have to go through an intense
period of training to test their knowledge
of swordsmanship. Their masters and
fellow peers, who possess a high degree
of expertise in swordsmanship, demand a
strong sense of commitment in reaching
the pinnacle status of being a samurai.
When the samurais are not carrying out
the service functions for the Daimyo they
are expected to be at the dojo which is a
school for training one’s technique in
sword handling. First and foremost, they
take sparring lessons to see how much
they’ve mastered the basics. The training
becomes intense as their teachers create
some life and death scenarios that
examine their approaches in resolving
such these events. By being placed in
critical situations the teachers help their
young protégé to discover some
innovative or creative swordsmanship
techniques in attacking or defending.
The experiment of putting one’s life on
the line not only hones the sword fighting
skills but also develops the mental
fortitude where there’s no slight sense of
hesitation or fear when knowing that
death is imminent in a battle (Clements,
2010).
Assessment
The team makes an assessment for the
purpose of being aware or mindful of
hidden factors that may hinder or support
the effort for achieving the aims (Fahey,
2007), once the flaws have been
discovered than the team can raise the
issue to eliminate or reduce the threat.
The idea of an assessment is to make the
necessary configurations in designing for
a better strategy/ performance (Ullman
and Ast, 2011) so that when the actions
are executed there is a maximum usage
of resources being utilized. As the team
takes assessment into account individual
members can make an analysis and
utilize the viewpoints of fellow
colleagues to sustain the official practice
of administration (McCAnn, Selsky and
Lee, 2011). Making an assessment is like
looking in a mirror to get a reflection and
seeing how fully equipped the team is
before taking its course towards
achieving the goal; if not then questions
may be raised on the level of competency
in team interaction (Weick and Sutcliffe,
2008). Moreover, the team can offer
suggestions for refining or reforming the
program/process in use. In a National
Geographic presentation on killer whales
there was footage of the pod working
together to hone their collective hunting
skill on a lone seal. The killer whales
have come across a lone seal resting on a
large ice flow. Before attacking their
prey these whales form into a group
mode of spy-hopping, which is a
technique of raising the head to see
what’s going above the water. Spy-
hopping allows them to scan and see the
situation of their prey. The learning point
of this event is that the pod is carrying out
the mission or targeting an objective (that
is clear). As a team they assess the
situation at hand to see where the
opportunities are presented as well as
determining where the advantages are for
the team to capitalize on their strengths
UTCC International Journal of Business and Economics
UTTC IJBE | 80
(Orcas Attack Seal with Waves,
youtube.com).
Reflecting
When teams reflect on the occurrence of
the work performance they want to gain
a sense of relativity with the operating
procedures and to determine whether the
systems may need to be updated or
replaced with a new working paradigm
(Petraeus, 2006). Team members want to
gain an understanding of what had
worked and what prevented the desired
outcome (Donahue and Tuohy, 2007),
thus ensuring themselves that all matters
have been taken care of and that they can
fully concentrate on the current issue
without having to worry about what can
go wrong. As members of the team
review upon the situation they get a
chance to discover any hidden concerns
that may need to be addressed for the
next operation. Reflecting with the
recent episodes allows serendipity to
flourish thus leading to innovative or
creative thoughts for managing a familiar
event (Tjosvold, Yu and Hui, 2004). The
critical point for reflecting as a team is to
see if the group has to adapt with the
working environment and make some
necessary changes in performing and
executing (Antonacopoulou, 2006). On
the case of reflecting professional ice
hockey teams sometime have to make
some changes into the way they skate,
pass, defend, and shoot the puck as a
collective unit. Teams that often go into
a funk or a long losing streak have to
review their tactics so that they can install
a sense of competence and confidence
among each other. As members are
taking part in the practice drills on ice
they make inquiries, and seek for
feedback from each other and their
coaches to see where they can improve or
on determining where their skills can
assist in supporting the game plan
(Gilbert, 2008).
Research methodology:
Application of the model –
A case study on the Pit Crews
The design of this study is focused on the
four research questions as followed:
“How does a team learn when the course
is in the form of rehearsing? How does a
team learn when the course is on having
to do an experiment? How does a team
learn when the course is in making an
assessment? How does a team learn
when the course is on reflecting?” From
the Discovery Turbo channel, a
documentary series called “Pit Crews”
was selected as the field for this study.
Twelve episodes were chosen to be
studied to answer the research questions
and to gather the data in the form of key
contents for analysis. They were the
following: NASCAR (National
Association for Stock Car Auto Racing),
AMA (American Motorcycle
Association), OSS (Offshore Super
Series Powerboat Racing Association),
Supercross, Champ Cars, IHRA
(International Hot Rod Association),
Canadian Superbike National, Indy Car
Racing, Rolex Grand Am Series, NHRA
Funny Cars, NASCAR Craftsman Truck
Series, and Moto ST Endurance Series.
Each of the series was approximately 45
minutes long. The rationale for choosing
the documentary series of pit crews was
that the working conditions of racing
stressed the importance of not only
working as a team, but to also be resilient
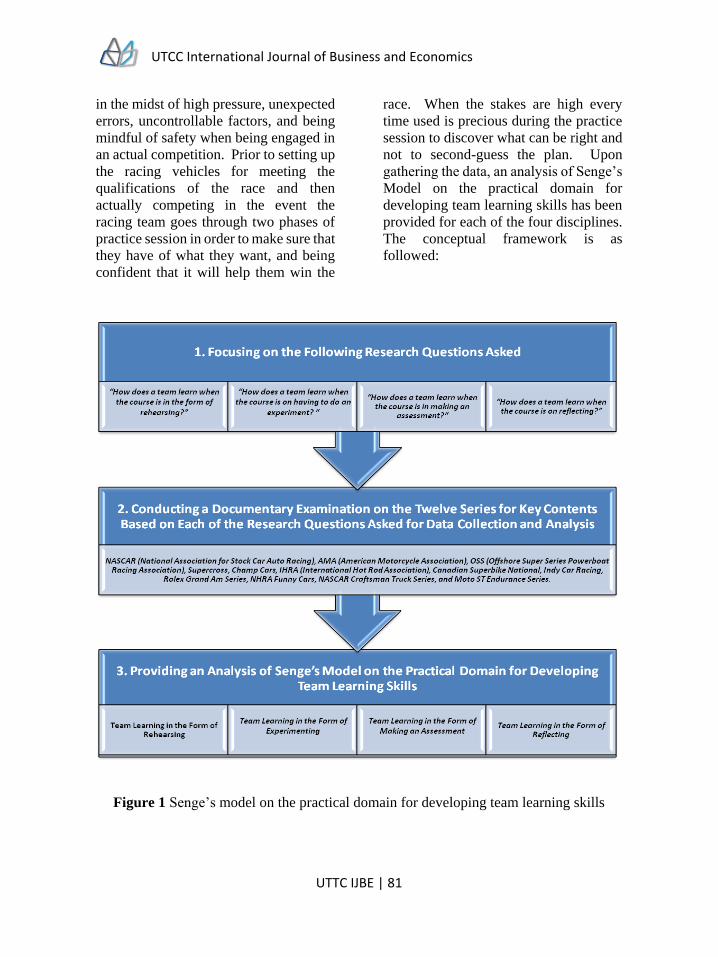
UTCC International Journal of Business and Economics
UTTC IJBE | 81
in the midst of high pressure, unexpected
errors, uncontrollable factors, and being
mindful of safety when being engaged in
an actual competition. Prior to setting up
the racing vehicles for meeting the
qualifications of the race and then
actually competing in the event the
racing team goes through two phases of
practice session in order to make sure that
they have of what they want, and being
confident that it will help them win the
race. When the stakes are high every
time used is precious during the practice
session to discover what can be right and
not to second-guess the plan. Upon
gathering the data, an analysis of Senge’s
Model on the practical domain for
developing team learning skills has been
provided for each of the four disciplines.
The conceptual framework is as
followed:
Figure 1 Senge’s model on the practical domain for developing team learning skills
UTCC International Journal of Business and Economics
UTTC IJBE | 82
This work was done in the approach of a
case study method. The construction of
“Senge’s Model on the Practical Domain
for Developing Team Learning Skills”
was examined through each episode of
the film in order to draw out the evidence
of how the pit crews demonstrated the
idea of the practical field. The narrator’s
illustration of the team and the
participants’ behavior in action from the
documentary series were examined to see
how the pit crews demonstrated learning
as a collective group in the form of
rehearsing, experimenting, assessing,
and reflecting. The car and motorcycle
shall be referred to as a ‘racing vehicle’
in the analysis section of the study.
Analysis of Senge’s
model on the practical
domain for developing
team learning skills
Analysis was conducted from the data
gathered in the documents that focused
on answering the four research questions.
The key contents were screened for and
examined to see the parallel connections
with the theory. The information from
the documentary series was addressed to
present the findings for each of the four
practical domain.
Team learning in the form of
rehearsing
The outcome of the racing event depends
on how much the team works together in
a manner that is disciplined in being
highly focused, minimizing the flaws,
and anticipating for any disruptions and
immediately fixing them. Rehearsing is
utilized as a process for equipping the pit
crew to take a proactive stance to ensure
that the operator of the motor vehicle
undergoes high performance and safety
during the competition. During the
practice sessions, team managers
conduct a rehearsal with the crew
members to let them obtain the know-
how of setting-up the form of the racing
vehicle, tuning its engine, discussing
with the drivers on their needs for
performance, and developing a good
communicating relationship with each
other. So for the human resource
manager, the drills and practices done are
meant to foster a sense of team chemistry
so that everyone is aligned in mind, body,
and soul to make a collective effort
(Jackson and Delehanty, 2014) in
winning the race. For current members
and newcomers to the team, rehearsing is
about doing things much more
efficiently, solving problems quickly,
and lessening the potential of risk and
damages. In an event where the stakes
are high, doing a team rehearsal sends the
message out to associates about the
desired behavior and attitude that are
required to carry out, thus creating a
shared value for group members when
performing to the best of their capacity
(Bartelme, 2005), whereas the human
resource manager needs to follow up to
develop an ongoing learning behavior
amongst team. As the pit crew goes
through the motion and emotions of
rehearsing they are also taking part in a
feedback methodology for management
to see the extent of the strategic plan’s
hypothetical objectives meeting with the
expectations and demands of progress.
Rehearsing, as a tool for team learning to
be further supported by the human
UTCC International Journal of Business and Economics
UTTC IJBE | 83
resource manager, is applied to ensure
that everything that had been proposed
before actually producing the intended
results (Bone and Lintern, 1999), but if
that is not the case then the team can
always go back to make some necessary
adjustments or changes so that the
opportunity for winning a race is in their
control. Overall, the idea is to expose
any critical flaws that may show up
during the competition. In this practical
mode it allows the team to develop a
checklist for making the proper
maintenance and requirements that are
crucial for the driver to gain a
competitive edge. The uniqueness of
doing a rehearsal for the pit crew is that
it solidifies the psychological
infrastructure to identify the mistakes
and errors during the practice session so
that the team can communicate on
correcting the matter right away without
ever have the feeling of doubt on whether
or not some colleagues are keeping silent
due to a fear of unwanted consequences,
such as being belittled for speaking up or
not wanting to be inconsiderate towards
someone’s ego (Shojaie, Matin, and
Barani, 2011) which would disrupt the
teamwork.
Team learning in the form of
experimenting
In the mindset of the pit crew there is
always room for improvement so that the
opportunity for winning the race can be
greater than the current action plan.
During the practice session qualifying
‘mock-runs’ are done to see how the
racing vehicle and driver can be operated
as a complete unit. In the form of a test
for the human resource manager to get a
better idea of, the mock-runs also provide
a chance to determine whether the
assertions of the set-up is leaning towards
the standard time in actual competition
and then make some efficient
adjustments for better anticipated results
in the next mock-run. Numbers and data
are relayed as information for
questioning the adjustments or for
proposing ideas to get the racing vehicle
to run with absolute speed and agility on
the track, this can help the human
resource manager to explain the situation
with clarity and better understanding of
the situation. By doing a test it
contributes to crafting a better strategy
and making better decisions for the team
(Moosa and Lee, 2013) to be much more
confident in. Asides from making a
discovery for some new or better
concepts for a competitive advantage and
examining the configurations to ensure
the comfort and safety for the driver’s
performance mock-runs set the condition
for the team to perform as a cohesive
group. It assists in developing the team
to be a tight and coordinated group that is
greatly focused on examining the task
parameters of promoting efficiency and
safety. This mode of testing not only
builds the skills of the team members to
evolve but it also enlarges their
competency to deal with pressure and
scrutiny (Ogawa and Piller, 2006) as they
are highly expected to get everything all
done right with the least mistakes and
errors as possible.
It’s crucial for the human resource
manager to understand that what the team
learns from the test run eliminates the
tendency to be absorbed in a conundrum
which saves time for discussing and
deciding to deal with the information at
hand rather than speculating on what is
not given (Tuulenmäki and Välikangas,
2011). Colleagues are able to be
UTCC International Journal of Business and Economics
UTTC IJBE | 84
straightforward with the situation and
avoid upholding any previous
assumptions. Another form of
experimentation is the ‘test-fire’ which is
aimed at making sure that every part of
the racing vehicle is working properly
and that the details should not be
overlooked. This test is conducted with
the engine of the racing vehicle turned on
in a stationary form. The format provides
the opportunity for experts to share
knowledge with their fellow team
members to understand what is
happening and then move into action to
resolve any early disturbances or
disruptions (Bos, Brown and Farrelly,
2013).
Team learning in the form of
making an assessment
Apart from rehearsing and experimenting
the team does an assessment to make sure
that their racing vehicle pass an
inspection test so that they qualify for the
actual competition. Prior to making the
qualifications the team has to put a lot of
effort in making sure that all the details
are covered otherwise it could reduce
their chances of winning the race. The
team takes a survey of the racing track
and then determines how they should
prepare their equipments for providing
the proper maintenance to the tires.
Since the tires are critical for enhancing
speed the team has to set their skills in
changing the tires in the fastest time as
possible. An investigation is also done to
see what has happened and then
illustrating the information for crew
members to learn on why it happened so
that the motor vehicle can be arranged for
another round of proper testing. Doing
this type of an assessment helps the team
to find the target points for victory while
at the same time identifying their
advantages and disadvantages and
finding other alternatives for decision-
making (Roth, Multer and Raslear,
2006), here is where the human resource
manager can design the process for teams
to learn in the workplace. An
investigation platform can be arranged
for team members to offer information
from the assessment to support the
effective ways for delivering maximum
results. With a limited amount of time in
the practice session and the focus being
on the tires, the operator of the racing
vehicle and the pit crew have to work in
tandem in order to get the final resolution
for the game plan. The driver does some
lapse on the track to determine whether
the tires are good enough or may need
some proper adjustments for the right
speed and balance in an actual race. He
serves as the feedback for the pit crew to
make some changes with the tires’
volume, weight, and precision for the
track. The team perceives the issues with
the same frame of mind so that solutions
can be discussed or ideas can be proposed
(Barton and Sutcliffe, 2010). By dealing
with the facts that are being presented
team members obtain a better
understanding and knowledge of the
structural environment which allow them
to find other ways of contriving around
the challenges (Sarcevic, 2009), thus
providing a better rationale on part of the
human resource manager for enhancing
the support for the team to keep on
learning. Assessment is also carried into
the competition itself to assure the
driver’s chance for winning. Whether
it’s standing in the highest section of the
bleachers with the crowd or on a raised
platform, the spotter provides real time
information into the driver’s headphones
UTCC International Journal of Business and Economics
UTTC IJBE | 85
to make a split-second decision and
determine which position he should start
to accelerate in order to outmaneuver the
rival competitors. The spotter also looks
out for any threat that may hinder the
driving progress and warns the driver of
any potential hazards up ahead, therefore
allowing the driver on deciding the next
course of action to take. In addition, the
spotter lets the driver know what’s going
in the moment so that the driver can
anticipate the movements of others to get
ahead of the race. This format is about
building trust in the strategic plan and
confident that fellow colleagues are
making a tremendous effort that the
outcome is attainable (Covey, 2006). As
a learning tool for the team and for
human resource managers to utilize it
with best intentions, assessment is a way
for developing a wealth of information so
that there’s a foresight for anticipating
with the unknown and uncertainties that
can disrupt the applied concept (Miller,
Riley and Davis, 2009).
Team learning in the form of
reflecting
Racing is a seasonal event. Everything
done in the practice session translates
into either a victory or a setback in the
competition. But when it’s the latter the
experience tests the team’s character and
will to become resilient in getting another
chance to compete for the championship.
As the pit crews reflect on their previous
shortcoming they get together for a de-
briefing on ideas and solutions for
powering up the racing vehicle to get
more acceleration for quickness. They
discuss about the concept of the set-ups
and learn where adjustments can be made
for greater performance. De-briefing
allows the crew members to target the
specific parts of the engine system with a
great deal of knowledge and for
proposing better ways in making the
motor vehicle go faster. As a form of a
lesson learned tool, de-briefing not only
assures a better sense of confidence for
the team to have more faith in their
capabilities (Joseph and Heading, 2010)
but sets the process of converting the
information to become the sources of
intelligence for coming up with an
effective proposed strategy (Hakkyong,
2013), human resource manager has to
examine the necessary factors to set the
system to make the initiative occur on a
continuous basis. In the face of defeat the
pit crews contemplate over the decisions
made and the execution methods that
failed to help them obtain success in the
racing event. Crews go through a
dialogue with fellow colleagues about
the level of progress from the changes
made, re-examining the techniques that
had been deployed, and re-configuring
the working dynamics for producing
efficient results. While a defeat is a bitter
pill to swallow it can also serve as a good
lesson for realizing the limits and
potential that each member of the group
has when applying the chemistry for
raising the team’s performance and
meeting the expectations. Although
mistakes and errors may occur during an
unexpected brief moment the team needs
to inspect the level of consistency for
making a quick recovery to stay ahead of
the competition (Johnstone, Gilmore and
Carson, 2008), as for the human resource
manager’s role he/she has to partake in
the role of assisting team members to not
be overwhelmed by what went wrong
and stay focused throughout the course.
At the end of the day the winners and
losers go into the record books of the
UTCC International Journal of Business and Economics
UTTC IJBE | 86
event. But for the pit crews they have to
research their strategic philosophy, the
dynamics of working and
communicating together, and the concept
of rehearsing, experimenting, and doing
an assessment in the practice session so
that it leads to a better chance for a
victory in the future. Dealing with the
facts at hand the pit crews encourage
everyone to communicate and make a
comparison of data for developing
information that would help team
members make better decisions. With the
support from the human resource
manager in contributing to the
organization strategy for teams to
perform at a high level, getting team
members to mull over and reframe the
organization’s mission raises the morale,
passion and spirit of individual members
to challenge themselves in strengthening
their capabilities as an effective faction
(Evans, 2009).
Discussion and
conclusion on human
resource manager’s
application of Senge’s
practical domain
From the impression on Senge’s theory
of the practical domain it may be
perceived as finding a particular process
for enhancing team learning. However,
based on the application the study asserts
that when teams are going through a
specific practical activity they should
also incorporate various learning
techniques to help team members go
beyond knowing with better insight and
a great deal of understanding as a
collective group (Webster et. al., 2008).
This information entails that the human
resource manager foster learning
methods such as knowledge sharing,
lessons learned, having dialogues, and
other effective techniques to assist
members of being equipped with many
ways to help their fellow colleagues learn
as a team. Rehearsing is an effective
format for teams that want to analyze
their level of chemistry in being
determined and consistent in achieving
high performance. The concept is on
getting team members to discuss about
the proposed strategy, envisioning
scenarios, and going into the details of
crafting a method to achieve the mission
objectives (O’ Brien and Meadows,
2013). Rehearsing draws out the
challenges that teams are able to see
beforehand so that changes or
adjustments in the skills and abilities can
be made to accommodate the plan as well
as determining the amount of resources
to be used (Olivier and Verity, 2008). As
a methodology, rehearsing calls for
experimentation to reveal the facts, doing
assessments to develop decision-making,
and reflecting to get a better sense of
direction to go to. The value should be
on informing colleagues to know where
they are applying their strengths and
where they need to make up for their
weaknesses (Edmondson and Mclain,
2006).
Conducting experimentations are about
anticipating for any discoveries of
unclear issues or obstacles that may
hinder the ability of reaching the goal;
with the information obtained from the
tests teams can go about revising or
refining the ways of rehearsing (Miller,
2003). Examining the factors ahead of
time is a good way for getting the
problems or unwanted/unexpected issues
UTCC International Journal of Business and Economics
UTTC IJBE | 87
exposed and solving them right away.
Also, it breaks the habit of conducting the
current routines for work and fosters the
behavior to innovate on other forms of
method for obtaining the objectives (Brix
and Lauridsen, 2012). Results from the
experimentation not only indicates
assessing the concept but can also be
used for helping and teaching fellow
colleagues to obtain the comprehension
on why things are happening in a
particular situation and to set forth the
necessary action for being a bit more
innovative or creative to manage the
outcome (Distanont, Haapasalo and
Vaananen, 2014). After reflecting
through a series of tests team members
can raise question about the strategy and
reframe the working system to support
the idea or make some recommendations
that would make the plan become more
effective (Van Vactor, 2012).
Assessments are learning on what has
been learned. Teams deal with what they
are given and they try to convert the data
into information by inquiring with fellow
colleagues to see where the opportunities
are for attaining the goal (Postma and
Liebl, 2005). What has been learned
becomes instant feedback for doing a
rehearsal and revising the
experimentation. With updated
information from the assessment teams
can develop intelligence by utilizing
rehearsal as a way of seeing how each
team member can perform at a certain
pace and with precision in producing the
required outcome under a limited amount
of time. This practice allows the team as
a whole to get a feel within the time
frame and to moderate their behavior and
attitude for effective performance.
Overall, an assessment could also be
done after the rehearsal to decide whether
the ideal working system is actually
promoting the growth of the teams’
capabilities or stunting their potential for
development (Seligman, 2005). For
carrying out experiments an assessment
provides a review of previous testing
activities by reviewing the procedures
that have been done. More questions are
added to the testing format so that issues
can be further analyzed from researching
the hypothesis or doing a trial run for
mastering the ways getting close to the
truth with the facts being presented at
hand (Nicholls-Nixon, Cooper and Woo,
2000). With the issue of reflecting, doing
an assessment can bring about a better
view of the situation when the phases are
studied together to let teams perceive the
concerning issues to be addressed upon
while also seeking for ways in supporting
morale and teamwork so that everyone
performs with consistency (Putkonen,
2009).
As for human resource managers that
may want to promote the four discipline
in Senge’s practical domain, no matter
what the line of work is there will always
be success and failure. Ironically, in the
midst of failure there are always lessons
to be learned on becoming successful.
Human resource managers will have to
set the ideas within the foundation that it
is always permissible to allow some
room for setbacks as long as team
members are held accountable for
learning what has gone wrong and being
responsible to themselves in helping
other people learn to keep the process
moving towards achieving the desired
objectives and goal. Reflecting is a tool
for teams to rewind back and see how all
the activities have been done in practice
and in the actual event led to the results.
With the key issue of being much more
equipped in the future teams have to
redefine the method of raising standards
UTCC International Journal of Business and Economics
UTTC IJBE | 88
and reconfigure the ways of working and
communicating with each other (Craig,
2007) in order to gain a competitive edge
in their vocational field. Reflecting is
done to see how teams can raise their
collective performance through the
process of rehearsing, experimenting,
and when making an assessment. While
being aware of the emotions displayed
under the conditions of a setback the
psychological factors have to be
addressed so that people don’t become
caught in a defensive behavior. From a
reflective viewpoint, to maintain a good
working relationship while members are
confident to perform without any level of
anxiety of being trapped in a ‘goalodicy’
when rehearsing this would require the
fostering of trust where there’s a sense of
awareness for meeting the needs of other
(Roberto, 2002). To uphold
communication and rising to challenges
teams should be exposed to experiments
so that the facts and information are
updated for making decisions in a timely
manner (Wooten and James, 2004).
Sustaining a behavior in teams that are
mindful of the changes that may need to
take place while letting people raise
issues without having an awkward
feeling of disrupting the harmony of
teamwork (Noonan, 2009) should be the
concept of doing an assessment. Overall,
reflecting gives a chance to ponder on the
things that have been done and to reframe
the methods for better improvement. It’s
about developing an organizational
culture that cultivates a sense of urgency
rather than one that is always reacting
with a scarce amount of time to take any
action at all (Godkin and Alcom, 2008).
To keep the idea of Senge’s practical
domain applied on a continuous basis for
team learning human resource managers
must also put the model into practice
themselves in order to make sure they
understand how the four tools can be
effective in achieving the desired results.
While team members go through the
process human resource managers should
also reflect, experiment, assess, and
rehearse with the team to identify how
the organizational structure can make the
necessary adjustments for the team to
seek for support and improvement as
they take part in upholding the
organization’s strategy and working
within the system towards reaching the
goal. This would truly help the intentions
of human resource managers being
recognized with credibility and trust as
they are making an effort towards
helping members to learn as a team.
In conclusion, upon conducting this work
the study proclaims that the discipline of
rehearsing, experimentation, assessment,
and reflecting are intertwined to make the
concept of team learning fruitful for
groups trying to make their plans work or
being challenged with the changes to
their performance. So for the human
resource managers, even if each domain
was to act on its own or separated from
the team learning model it would still call
for other fields to carry out the
disciplinary techniques to support its
agenda. The practical concepts actually
incorporate the ideas from other field to
make the learning methodology for
teams to be more sound and effective in
helping them to achieve their outcomes
or goal.
UTCC International Journal of Business and Economics
UTTC IJBE | 89
References
Antonacopoulou, E. (2006) “The Challenges and Prospects of Learning-in-Practise”,
OLKC 2006 Conference at the University of Warwick, Coventry on 20th - 22nd
March.
Bartelme, L. (2005) “The view from the Trenches: An Interview with Harvey Seifter and
Tim Stockil”, Journal of Business Strategy, Vol. 26, No. 5, pp. 7-13, © Emerald
Group Publishing Limited, ISSN 0275-6668, DOI 10.1108/02756660510620716
Barton, M. and Sutcliffe, K (2010) “Learning When to Stop Momentum”, MIT Sloan
Management Review, Vol. 51, No. 3, Spring
Bone, R. and Lintern, G. (1999) “Rehearsal versus Map Study as Preparation for a Flight
Navigation Exercise”, Human Factors and Ergonomics Society, Vol. 41, No. 3,
September, pp. 467–473.
Bos, J., Brown, R. and Farrelly, M. (2013) “A Design Framework for Creating Social
Learning Situations”, Global Environmental Change, Elsevier Ltd., Vol. 23, Issue
2, April, pp. 398-412
Brix, J. and Lauridsen, K. M. (2012) “Learning Styles and Organisational Development in
Practice: An Exploratory Study of How Learning Styles and Individual Learning
Strategies can Facilitate Organisational Development”, Int. J. of Innovation and
Learning, 2012 Vol.12, No.2, pp.181 - 196
Clements, J. (2010) “A Brief History of the Samurai: A New History of the Warrior Elite”,
Running Press Book Publishers, Philadelphia, PA, USA, ISBN-978-1-84529-947-7
Covey, S. (2006) “The Speed of Trust, The One Thing That Changes Everything”, Free
Press, Simon & Schuster Inc., New York, NY, U.S.A., ISBN-13: 978-1-4165-
3816-5
Distanont, A., Haapasalo, H. and Vaananen, M. (2014) “Organising Knowledge Transfer
in Requirements Engineering Over Organisational Interfaces”, Int. J. Innovation
and Learning, Vol. 15, No. 1, pp.41–64.
Dobny, B.C. (2011) “The Relationship Between Innovation Orientation and
Organisational Performance”, Int. J. Innovation and Learning, Vol. 10, No. 3,
pp.226-240.
Donahue, A. and Tuohy, R. (2007) “Lessons We Don’t Learn: A Study of the Lessons of
Disasters, Why We Repeat Them, and How We Can Learn Them”, Homeland
Security Affairs, Vol. II, No. 2, July
Evans, D. (2009) “Building Leadership Capital”, Deakin Prime, Reflective Practice White
Paper, Vol. 1
Fahey, L. (2007) “Connecting Strategy and Competitive Intelligence: Refocusing
Intelligence to Produce Critical Strategy Inputs”, Strategy & Leadership, Vol. 35,
UTCC International Journal of Business and Economics
UTTC IJBE | 90
No. 1, pp. 4-12, ©Emerald Group Publishing Limited, ISSN 1087-8572 DOI
10.1108/10878570710717236
Foverskov, M. and Binder, T. (2009) “Rehearsing the Future: In and Out of Scenarios in
a Reflective Practicum”, Proceedings of the Nordic Design Research Conference,
Oslo School of Architecture & Design
Gilbert, P. (2008) “Herb Brooks: The Inside Story of a Hockey Mastermind”, MBI
Publishing Company, Minneapolis, MN, USA, ISBN-978-0-7603-3241-2
Godkin, L., & Allcorn, S. (2008). “Overcoming Organizational Inertia: A Tripartite Model
for Achieving Strategic Organizational Change”. Journal of Applied Business and
Economics, Vol. 8, Issue 1, pp. 82–94.
Hakkyong, K. (2013) “Improving Simulation Exercises in Korea for Disaster
Preparedness”, Disaster Prevention and Management, Vol. 22, No. 1, pp. 38-47,
©Emerald Group Publishing Limited, 0965-3562, DOI 10.1108/09653561311
301961
Jackson, P. and Delehanty, H. (2014) “Eleven Rings: The Soul of Success”, Penguin
Books, New York, NY, USA, ISBN-978-0143125341
Jain, N. (2011) “Entry Deterrence and Experimentation Under Demand Uncertainty”,
International Journal of Industrial Organization, Elsevier Ltd., Vol. 29, Issue 4, July,
pp. 464–472
Johnstone, M., Gilmore, A. and Carson, D. (2008) “Dealing with Environmental
Uncertainty: The Value of Scenario Planning for Small to Medium Sized-Enterprises
(SMEs)”, European Journal of Marketing, Vol. 42, No. 11/12, pp. 1170-1178, ©
Emerald Group Publishing Limited, 0309-0566, DOI 10.1108/03090560810903628
Kess, P., Tong-In, D., Ayutthaya, P.S-n. and Anusornnitisarn, P. (2014) “Process
Innovation in Pre-stressed Concrete Wire Using Mechanical-based Process
Simulator”, Int. J. Innovation and Learning, Vol. 15, No. 1, pp.95–113.
Kontogiannis, T. and Malakis, S. (2009) “A Proactive Approach to Human Error
Detection and Identification in Aviation and Air Traffic Control”, Safety Science,
Elsevier Ltd., Vol. 47, Issue 5, pp. 693-706
Lloyd, A. (2009) “Informing Practice: Information Experiences of Ambulance Officers in
Training and On-road Practice”, Journal of Documentation, Vol. 65, No. 3, pp. 396-
419, ©Emerald Group Publishing Limited, 0022-0418, DOI 10.1108/002204
10910952401
McCann, J., Selsky, J. and Lee, J. (2009) “Building Agility, Resilience and Performance
in Turbulent Environments”, People & Strategy, Vol. 32, Issue 3, pp. 44-51
Miller, K., Riley, W. and Davis, S. (2009) “Identifying Key Nursing and Team Behaviours
to Achieve High Reliability”, Journal of Nursing Management, Vol. 17, pp. 247-255
UTCC International Journal of Business and Economics
UTTC IJBE | 91
Miller, P. (2003) “Workplace Learning by Action Learning: A Practical Example”,
Journal of Workplace Learning Volume 15 – Number 1- pp.14-23 ISSN 1366-5266
Moosa, N. and Lee, J. (2013) “Smart Experimentation: Moving in-market with Maximum
Velocity and Minimum Risk”, Business Strategy Series, Vol. 13, No. 3, pp. 118-123,
©Emerald Group Publishing Limited, ISSN 1751-5637 DOI10.1108/175156
31211225251
Nicholls-Nixon, C., Cooper, A. and Woo, C. (2000) “Strategic Experimentation:
Understanding Change and Performance in New Ventures”, Journal of Business
Venturing, Elsevier Ltd., Volume 15, Issues 5–6, September–November, pp. 493-
521
Noonan, W. (2009) “Discussing the Undiscussable”, 61st Annual Conference &
Exposition, Society for Human Resources Management, New Orleans, Louisiana,
June 28 – July 1. O’Brien, F. and Meadows, M. (2013) “Scenario Orientation and
Use to Support Strategy Development”, Technological Forecasting & Social
Change, Elsevier Ltd., Vol. 80, Issue 4, May, pp. 643–656
Ogawa, S. & Piller F.T. (2006), “Reducing the risks of new product development”, MIT
Sloan Management Review, Winter, pp 65-71.
Olivier, R. and Verity, J. (2008) “Rehearsing Tomorrow’s Leaders: The Potential of
Mythodrama”, Business Strategy Series, Vol. 9, No. 3, pp. 138-143, © Emerald
Group Publishing Limited, ISSN 1751-5637, DOI 10.1108/17515630810873375
Orcas Attack Seal with Waves – accessed 5 Oct 2011: http://www.youtube.com/watch?
v=oxDZW4k8tCY, “Untamed and Uncut: Orcas Attack Seal”
Persons, J., Beckner, V. and Tompkins, M. (2013) “Testing Case Formulation Hypotheses
in Psychotherapy: Two Case Examples, Cognitive and Behavioral Practice”,
Elsevier Ltd., Vol. 20, Issue 4, November, pp. 399–409
Petraeus, D. (2006) “Learning Counterinsurgency: Observations from Soldiering in Iraq”,
Military Review, Jan-Feb, pp. 45-55
Postma, T. and Liebl, F. (2005) “How to Improve Scenario Analysis as a Strategic
Management Tool?”, Technological Forecasting & Social Change, Elsevier Ltd.,
Vol. 72, Issue 2, February, pp. 161–173
Putkonen, A. (2009) “Teams Are Not Innovative When Under Constant Time Pressure”,
Int. J. Innovation and Learning, Volume 6, Number 5, pp. 477-492(16)
Ramanujam, R. and Goodman, P. S., (2011) “The Challenge of Collective Learning from
Event Analysis”, Safety Science, Elsevier Ltd., Vol. 49, Issue 1, January, pp. 83-89
Roberto, MA. (2002) “Lessons from Everest: the Interaction of Cognitive Bias,
Psychological Safety and System Complexity”, California Management Review,
Fall, Vol.45, Issue 1, pp. 136-160.
UTCC International Journal of Business and Economics
UTTC IJBE | 92
Roth, E., Multer, J. and Raslear, T. (2006) “Shared Situation Awareness as a Contributor
to High Reliability Performance in Railroad Operations”, Organization Studies,
Vol. 27, Issue 7, pp. 967-987
Sarcevic, A. (2009) “Understanding Teamwork in High-Risk Domains Through Analysis
of Errors”, CHI 2009 ~ Spotlight on Works in Progress ~ Session 2, April 4-9
Seligman, J. (2005) “Building a Systems Thinking Culture at Ford Motor Company”,
Reflections, The Society for Organizational Learning Journal, Vol. 6, No. 4/5, pp.
5-13, ISSN 1524-1734
Senge, P. (2006) “The Fifth Discipline: the Art & Practice of the Learning Organization.”,
Currency Doubleday, New York, NY, USA, ISBN- 978-0385517256
Sharp, K., Stanley, P. and Simmons, G. (2013) “Nothing to Lose: The Making of KISS
1972 – 1975”, HarperCollins Publisher, New York, NY, USA, ISBN-978-0-06-
213173-7
Shojaie, S. Matin, H. Z. and Barani, G. (2011) “Analyzing the Infrastructures of
Organizational Silence and Ways to Get Rid of it.”, Social and Behavioral Sciences,
Elsevier Ltd., Vol. 30, pp. 1731-1735
Tjosvold, D., Yu, Z. and Hui, C. (2004) “Team Learning from Mistakes: The Contribution
of Cooperative Goals and Problem-Solving.”, Journal of Management Studies, Vol.
41, Issue 7 November, 0022-2380
Tuulenmäki, A. and Välikangas, L. (2011) “The Art of Rapid, Hands-on Execution
Innovation.”, Strategy & Leadership, Vol. 39, No. 2, pp. 28-35, © Emerald Group
Publishing Limited, ISSN 1087-8572 DOI 10.1108/10878571111114446
Ullman, D. and Ast, R. (2011) “Analysis of Alternatives (AoA) Based on Decisions.”,
MORS, Phalanx, Vol. 44, No. 3, September, pp. 24-36
Välikangas, L. and Romme, A.G. (2012) “Building Resilience Capabilities at Big Brown
Box, Inc.”, Strategy & Leadership, Vol. 40, No. 4,
Van Vactor, J. (2012) “Strategic Health Care Logistics Planning in Emergency
Management”, Disaster Prevention and Management, Vol. 21, No. 3, pp. 299-309,
©Emerald Group Publishing Limited 0965-3562, DOI 10.1108/0965356
1211234480
Webster, J., King, H., Toomey, L., Salisbury, M., Powell, S., Craft, B., Baker, D. and Salas,
E. (2008) “Understanding Quality and Safety Problems in the Ambulatory
Environment: Seeking Improvement with Promising Teamwork Tools and
Strategies”, In Advances in Patient Safety: New Directions and Alternative
Approaches (Vol. 3: Performance and Tools). Edited by Henriksen K, Battles JB,
Keyes MA, Grady ML. Rockville (MD): Agency for Healthcare Research and
Quality (US); 2008:1–15.
Weick, K. and Sutcliffe, K. (2008) “Organizing for Higher Reliability: Lessons Learned
from Wildland Firefighters”, Fire Management Today, Vol. 68, No.2, Spring

UTCC International Journal of Business and Economics
UTTC IJBE | 93
Wooten, L. and James, E. (2004) “When Firms Fail to Learn: The Perpetuation of
Discrimination in the Workplace”, Journal of Management Inquiry, Vol. 13,
Issue 23
Yeganah, B. and Kolb, D. (2009) “Mindfulness & Experiential Learning”, OD Practitioner,
Vol. 41, No. 3

UTCC International Journal of Business and Economics
UTTC IJBE | 94
UTCC International Journal of Business and Economics
UTTC IJBE | 95
UTCC International Journal of Business and Economics (UTCC IJBE)
Volume 10 Number 1, April 2018
Exploring the relationship between the big
five personality traits and exhibition shows
attendance
Xiameng Wu1, Theeranuch Pusaksrikit2
1,2School of Business, University of the Thai Chamber of Commerce [email protected], [email protected]
Abstract The aim of the present study is to investigate how the Big five Personality traits have an
impact on exhibition attendees’ behaviors in the exhibition shows in the Bangkok
exhibitions. The participants in the study were 400 attendees who attended to exhibition
shows in the main exhibition centers in Bangkok area. Employing multiple regression
analysis on data, the results indicated that Extraversion and Neuroticism had a positive
relationship with the frequency of visit exhibition show; Conscientiousness had a positive
relationship with the preference of communication channel about exhibition show;
Agreeableness, Conscientiousness and Openness to experience had a positive relationship
with the reason to visit the exhibition show.
Keywords: Exhibition shows, Exhibition attendance, attendees’ behaviors,
Personality, Extraversion, Agreeableness, Conscientiousness,
Neuroticism, Openness to experience
UTCC International Journal of Business and Economics
UTTC IJBE | 96
Introduction Nowadays, the services industry plays an
increasingly important role in a country's
economic trade activities and becomes a
measure of the strength of a country's
international competitiveness. The
MICE (Meetings, Incentives,
Conferences and Exhibitions) industry is
a generic term for the conference and
exhibition industry sector. Belonging to
the service industry, it focuses on
organizing conferences and exhibitions
in various forms, including large
international fair exhibitions, fairs, sports
investment and economics seminars.
Each year, the MICE industry attracts a
large number of business travelers, and
promotes the development of the market,
not only with technology and
information exchange, but also foreign
trade and tourism. The industry
stimulates the development of the
transportation, accommodation,
business, dining, shopping, and many
other related industries.
Thailand is a very important country that
is located in the heart of Southeast Asia.
The rapid development of the exhibition
industry has achieved remarkable
success, and shows a brilliant prospect
for the future. In 2015, the ASEAN
Economic Community will combine the
10 member countries of ASEAN to
become a single market with about 600
million people. They will be one of the
biggest markets and host to some of the
world’s most important business events.
It is not only full of opportunities, but
also a very big challenge for MICE
industry in Thailand. At the same time,
Thailand also faces the competition from
the 5 new economic countries which
include China, India, Russia, Brazil and
Mexico. Their MICE industries are also
growing fast in broad areas. They
possess a variety of disciplines, strong
market potentials and good prospects for
development. These countries will then
become exhibitors’ new choices.
Therefore, Thailand must improve itself
and prepare for the new changes in the
future in order to meet the demand of the
market and cope with the competitive
conditions in the world.
For exhibition organizers and exhibitors,
convention and exhibition attendance is
one of the very important measures of
effectiveness which generally is used by
both exhibitors and organizers. How to
improve the attendance in the
Exhibitions is very important because it
can help to improve the region's
competitiveness and creating greater
economic benefits. Exhibition organizers
should improve their understanding of
their attendees. Thus, organizers should
try to encourage the exhibitors, retail
outlets and leisure facilities to meet the
needs of the attendees. Then in this way,
they can help to improve the quality of
the exhibitor-visitor experience. This can
generate a loyal visitor base, which is
important for winning a market share,
repeat visitation and making not only the
exhibition but also the complex revenues
(Whitfield, Dioko, Webber, and Zhang,
2012). There are many factors that will
affect exhibition attendance. Such as
organizers’ executive management
performance, the exhibition of brand
awareness, exhibitors’ exhibition
experience, the company's influence on
product promotion and marketing.
Moreover, consumers’ purpose,
motivation, satisfaction, and their
characteristics also have an impact on
their attending exhibition behavior.
UTCC International Journal of Business and Economics
UTTC IJBE | 97
In marketing, a lot of researchers work on
the relationship between personality
traits and consumer behavior (Aldemir
and Bayraktaroglu, 2004).They continue
to work in this direction to discover and
improve these theories in order to apply
them to actual practice. Therefore we
believe that different personality traits
are an influence on exhibition attendance
and they are also an influence on people’s
decisions and their motives. This study
aims to examine attendees’ personality
traits as it will help us to understand
attendees’ needs and behaviors, in order
to satisfy them. Thus, the research chose
to study the relationship between the Big
Five Personality traits (also called the
five-factor model) of attendees and
exhibition attendance. The five-factor
model of personality is a hierarchical
organization of personality traits in terms
of five basic dimensions: Extraversion,
Agreeableness, Conscientiousness,
Neuroticism, and Openness to
Experience (Costa and McCrae, 1995).
Literature review
The exhibition industry and
exhibition attendance:
Nowadays in a competitive exhibition
market environment, exhibition
organizers and exhibitors focus on
retaining current exhibition visitors or
attendees and attracting new attendees
(Lee, Yeung and Dewald, 2010).
Exhibition shows, also called public
shows, are an important function of the
promotional mix for industrial products
and services. The exhibition shows
connect to customers and companies
directly. Exhibiting firms exhibit the
products and perform their activities at
exhibitions, convey their messages to
target traders and potential customers in
an effective way. Moreover, they can
improve the company's outstanding
brand image. This is a very good
advertising channel, at same time they
can introduce their new products or
services to the public(Lee, Yeung and
Dewald, 2010).
Severt, Wang, Chen and Breiter (2007)
explained that there are five important
factors which can impact the attendees in
deciding to attend a conference: (1)
activities and opportunities, (2) build
networking, (3) convenience of the
conference, (4) education benefits, and
(5) products and deals. These factors are
supported by the previous studies about
the motives of the attendees to attend the
conferences. People regard the
conferences as a very good place to find
activities, look for new opportunities and
build networking for self-enhancement
(Severt , Wang, Chen and Breiter , 2007).
Nowadays exhibition planners and
exhibitors focus on how to attract more
people to attend the exhibitions, because
exhibition attendance becomes a very
important factor in evaluating the success
of exhibitions (Lee and Palakurthi,2011).
In the study which was to examine the
Japanese attendees’ behaviors and
objectives in the trade shows, Smith,
Hama, and Smith (2003) also found that
seeing new products and industry trends
at the domestic shows had a great effect
on attendees’ interest in future shows and
at the offshore U.S. shows. Attendees not
only focus on looking for new products
and trends, but are also interested in the
“buying process” information (Smith,
Hama and Smith, 2003).
Mondok (2012) explained that trade
shows or fairs become an important
UTCC International Journal of Business and Economics
UTTC IJBE | 98
bridge between the companies and
customers. For companies, it is their way
to exhibit their new products and
technology, at the same time to get a
good chance to get in touch with old and
potential customers, also to develop
business partners. A wide variety of
exhibitions, namely entertainment and
products promotion as a whole, attract
people's attention. Not only can people
be the first to see the new products on
display, but also allow people to
experience the interesting and fantasying
entertainment. They also can learn about
more extensive product knowledge.
Therefore, people who attend the
exhibition shows or special events can
get pleasure and leisure. They can escape
from their boring daily lives, seeing new
things, do shopping, learning interesting
things, getting social and cultural
experiences, which are different from
everyday experiences (Hede, Jago and
Deery, 2004).
Personality definition
There are many explanations of personality
by previous researchers, but it seems to have
little common agreement among personality
theorists (Enger,1999). Triandis and Suh
(2002) said personality is included as a
configuration of cognitions, emotions, and
habits are activated when situations
stimulate people’s expressions. Personality
is used to explain consistency and
coherency within the individuals, including
their characters, cognitions, motives and
behaviors. How the people’s feelings,
thinking, wants, and reactions can be
different in external situations. Personality
presents a pattern across situations and can
be used to study, recognize, describe and
understand a person (Revelle, 2007). Nunes,
Cerriand Blanc (2008) also explained that
there is no a common definition of
personality in the previous studies. Burger
(2000) defines personality as a long-term
behavioral pattern and the process of
internal self-consciousness. Personality not
only shows superficial and physical, but also
is stable and predictable. Personality traits
can differ psychologically, which are a
cluster of human traits (Nunes, Cerri and
Blanc, 2008).In general, personality can be
defined as the enduring, inner characteristics
of individuals that contribute to consistency
in people’s behaviors. Personalities are
within individuals, which can help us to
distinguish them from other individuals and
make them unique as to attributes of
functioning that are common to all humans,
such as extravert, shy, aggressive, lazy and
etc. (Robbins and Judge, 2007).Personality
can be used for measuring and predicting
individuals’ attitudes, behaviors in the life,
and there are numerous previous studies
showing strong evidence to support the use
of personality assessment in life’s event
decisions. This is true particularly in
personnel selection (Störmer and Fahr,
2010).The aim of this study is to study the
relationship between the Big Five
Personality traits of people and their
decision to attend the exhibition shows.
Big five personality traits
The Big Five Personality traits are some of
the most important concepts in the recent
studies of personality traits. Many
personality researchers have studied about
the five basic dimensions of personality.
Previous personality psychologists believed
that there are a various number of possible
traits. Raymond Cattell emphasized 16
personality factors (cf. Oliver and
Srivastava, 1999). Other psychologists,
UTCC International Journal of Business and Economics
UTTC IJBE | 99
Hans Eysenck just focused on a developed a
model of personality based on a three-factor
theory (Oliver and Srivastava, 1999).
Moreover, Costa and McCrae (1985)
distinguished between the five personality
traits of neuroticism changes (neuroticism),
extra version (extraversion), openness to
experience (openness experience),
agreeableness (agreeableness) and rigor
(conscientiousness). The structure of the
five personality traits to this development is
illustrated as followed:
Extraversion: (Outgoing, Talkative, Active)
Extraverts focus on the outside world. They
like social interactions and feel comfortable
with human relations. They always like to
spend time with people and tend to be
enthusiastic. Extraversion is characterized
by assertive, talkativeness, outgoing, and
gregarious (Costa and McCrae, 1992).Thus,
extraverts are more sociable, assertive, and
active. On the other hand, introverts are
more reserved. They prefer it to be quiet and
peaceful. They tend to be low key, and do
not want to be involved in the social world
(Rorhman and Coetzer, 2003).
Sharp (1987) said extraverts like to take
adventure, enjoy travelling, go to meet new
people, and go seeking new places. Zafar,
Shahila and Meenakshi’s (2012) studies
have shown that extravert’s have a greater
advantage in second foreign language
learning because they are cheerful, like to
join groups and communicate with other
people, which can make them have more
advantages in learning.
As we mentioned earlier, extraverts tend to
be outgoing, like social interactions and feel
comfortable with human relationships.
They always like to spend time with people
and desire a variety of leisure(Costa and
McCrae, 1995).In this case, for extraverts to
go to exhibition shows can be a very good
opportunity for them to relax and have fun
as they can go shopping, see new things and
make new friends (Störmer and Fahr, 2010).
Moreover, for this kind of person, they may
like to accompany friends or family
members to participate in different kinds of
exhibitions. Therefore, we expect that
people who have a high score in
extraversion will be more likely to attend
exhibition shows.
Hypothesis 1: Extraversion will have a
positive relationship with attending
exhibition shows (public shows).
Agreeableness: (Warming, Sympathetic, Friendly):
Agreeableness is defined as the tendency to
act in altruistic, sympathetic and helpful
way to others. However, a disagreeable
person is more skeptical and likes to be
competitive rather than co-operative
(Rorhman and Coetzer, 2003). Agreeable
people always have a kind heart. They are
generous, affectionate, cooperative and
trusting. In contrast, low agreeable persons
are more antagonistic, uncooperative, cold
and suspicious (Bornsteina, 2007). Recent
study found that those people who have a
high score on agreeableness would be less
likely to engage in workplace deviant
behavior. Due to such characteristics:
pleasant, helpful, when in the work they
would rather be cooperative with others than
argue with trusting and tolerance (Fatimah,
Nasir, and Shahrazad, (2012).Therefore, we
assume that this type of person is likely to
participate in the exhibition when invited by
colleagues and friends with their pleasant
mind.
A previous study showed, agreeableness
had a significant direct effect on
volunteering. Highly agreeable people
usually have a positive social value motive.
UTCC International Journal of Business and Economics
UTTC IJBE | 100
They are more willing to comply with
requests to volunteer (Gustavo, Morris,
Knight, and de Guzman, 2005). We can see
that agreeableness is a trait that we find in
very gentle and friendly people. They
generally do not refuse the invitation of
others and are good companions. Recent
studies supported that agreeableness is
cooperative and should be used more in
constructive conflict resolution strategies
such as pleasure induction and reason.
There is evidence that cooperators are
strongly affected by information about a
partner’s honesty (Jager, Berg, Vlek and
Hofstee, 2001).
Agreeable people are relatively
sympathetic, trust worthy, gregarious,
humble and honest (Oliver and Srivastava,
1999).Therefore, we expect that people who
havea high score in agreeableness will be
more likely to attend exhibition shows.
Hypothesis2: Agreeableness will have a
positive relationship with attending
exhibition shows (public shows).
Conscientiousness: (Organized, Responsible, Hard-working):
Conscientiousness tends to be self-
disciplined, organized, dutiful and
mindful of details. The conscientious
person likes to plan things in life with
determination (Oliver and Srivastava
1999).They are well-planned, organized,
and purposeful, which leads to setting
goals. They always work diligently,
conscientiously complete their tasks, and
fulfill their duties for the achievement of
their goals (Barrick, Mount, and Strauss,
1993).Conscientious people do things
that have a strong sense of purpose, so we
assume that they will go to the exhibition
shows for specific goal and objective.
They will have a detailed plan in mind
before they go. Bruck and Allen (2003)
explained that conscientious people can
be good at planning, organizing and have
good time management. They take on
responsibilities and successfully deal
with tasks in their work. At the same time
they also can be good dealing with family
things. They will not make a conflict
between work and family. It has been
proved that the planning and organizing
skills associated with conscientious
individuals helps them prevent family
conflicts with work from occurring.
Therefore, they may attend the exhibition
shows when they have specific goals.
We expect that people who have a high
score in conscientiousness may tend to
attend the exhibition shows.
Hypothesis 3: Conscientiousness will
have a positive relationship with
attending exhibition shows (public
shows).
Neuroticism: (Sensitive, Moody, Worrying):
Individuals who have a high score in
neuroticism have tendency to have
anxiety, tension, emotional, insecurity,
be inappropriate and melancholy.
Bruckand Allen (2003) found people
who are high on neuroticism find it
difficult to handle the relationship
between work and family. They are not
good at handling the pressure in the work
place. In other studies, researchers also
found that neuroticism has been
negatively associated with life
satisfaction and positively associated
with self-reported stress. In the study
conducted by Fayombo (2010), which
was to investigate the relationship
between personality traits and
psychological resilience among the
Caribbean adolescents, he found that
adolescents who have high score on
neuroticism were negatively associated
UTCC International Journal of Business and Economics
UTTC IJBE | 101
with psychological resilience. Their
ability to adapt to the environment is
relatively poor. Störmer and Fahr (2010)
found that one of the effects of
neuroticism was its apparent effect on
absenteeism in the work place. When
staff encountered neurotic depression it
affected their living conditions and the
state of their work. That can interfere
with their attendance decision but is not
manifested in their health status (Störmer
and Fahr, 2010).
Marzuki (2013) found that neuroticism
was negatively correlated to well-being.
He found lecturers who were always
concerned with irrational ideas found it
difficult to control and were poor in
dealing with stress. Instability, anxiety
and moodiness can lead to low
psychological well-being. A negative
emotional state because of neurotic traits
can limit cognitive potential, create
anxiety and depression (Najib Ahmad
Marzuki, 2013).In a study, the results
showed that the relationship between
neurotic characteristics of people with
anxiety and severe depression showed a
significant positive correlation. The
general trend was that they experienced
negative effects, such as fear, sadness,
embarrassment, anger, guilt and disgust.
The results showed that neuroticism is
actively related with two-dimensional
health, anxiety, insomnia, and severe
depression (Sharma, Kaveri, Sharma and
Yadava, 2010). In Germeijs and Karine’s
(2011) study, neuroticism was found to
be the strongest contributor of
indecisiveness. One possible
explanation is that individuals that score
high in neuroticism are likely to
experience negative emotions in a variety
of situations, and therefore they may
delay to make a decision or fail to decide,
in order to avoid errors (Germeijs and
Karine, 2011).
Individuals who score high in
neuroticism tend to have anxiety, tension
and emotional insecurity. They also can
tend to be very melancholy (McCrae and
Oliver, 2006).In this case, people having
neurotic characteristics might be looking
for the opportunity to walk out and
involve themselves in a different
environment in order to relieve their
negative depressed mood. It is also
possible that their external environment
can help them adjust their emotional
problems.
Hypothesis 4: Neuroticism will have a
positive relationship with attending
exhibition shows (public shows).
Openness to experience: (Creative, Imaginative, Adventurous):
Individuals with a high score in openness
tend to be seeking a variety of new
experiences. They like adventure. They
tend to come out with unusual ideas and
are always brave to try new things with
their non-traditional minds. They are
always curious, interested in a wide
range of creative activities, and fond of
art and, imagination (Costa and McCrae,
1995).On the other hand, people with a
low score in openness have a lack of
interest in artistic activities. Individuals
with a high score in openness to
experience can accept what others do,
say and think, with understanding
(Liebert and Spiegler, 1994).The
adolescents who were open to new
experiences were reported to be more
likely to accept new things and adapt to
the new environments. Faced with a
variety of different situations, they can
hold enthusiasm and excitement rather
than nervousness. It was not surprising
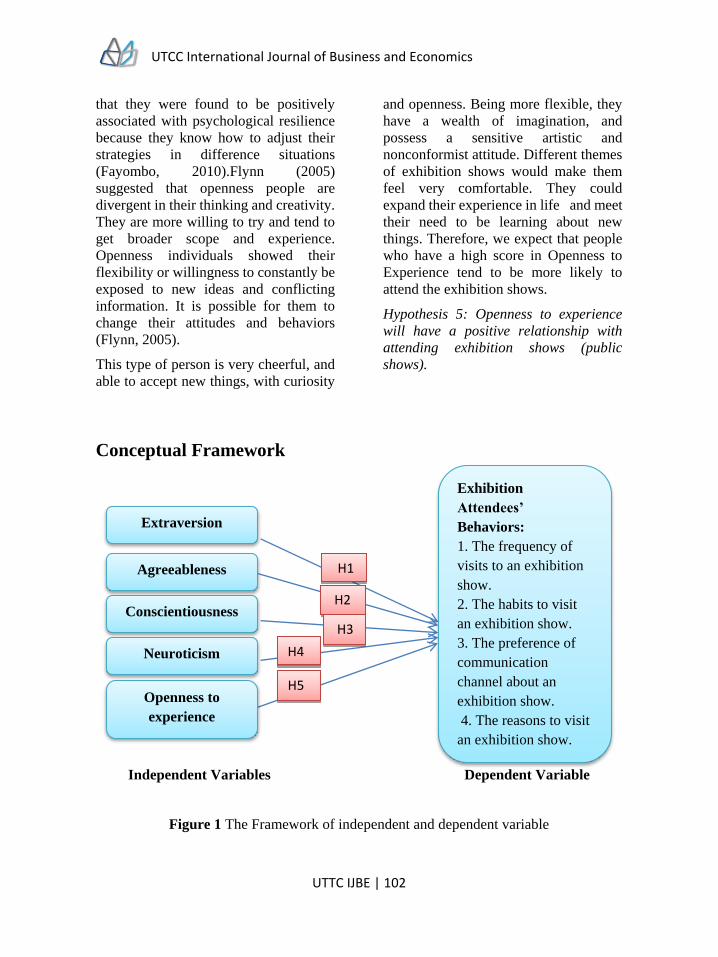
UTCC International Journal of Business and Economics
UTTC IJBE | 102
that they were found to be positively
associated with psychological resilience
because they know how to adjust their
strategies in difference situations
(Fayombo, 2010).Flynn (2005)
suggested that openness people are
divergent in their thinking and creativity.
They are more willing to try and tend to
get broader scope and experience.
Openness individuals showed their
flexibility or willingness to constantly be
exposed to new ideas and conflicting
information. It is possible for them to
change their attitudes and behaviors
(Flynn, 2005).
This type of person is very cheerful, and
able to accept new things, with curiosity
and openness. Being more flexible, they
have a wealth of imagination, and
possess a sensitive artistic and
nonconformist attitude. Different themes
of exhibition shows would make them
feel very comfortable. They could
expand their experience in life and meet
their need to be learning about new
things. Therefore, we expect that people
who have a high score in Openness to
Experience tend to be more likely to
attend the exhibition shows.
Hypothesis 5: Openness to experience
will have a positive relationship with
attending exhibition shows (public
shows).
Conceptual Framework
Independent Variables Dependent Variable
Figure 1 The Framework of independent and dependent variable
Extraversion
Agreeableness
H2 Conscientiousness
H3
Neuroticism H4
H5 Openness to
experience
H1
Exhibition
Attendees’
Behaviors:
1. The frequency of
visits to an exhibition
show.
2. The habits to visit
an exhibition show.
3. The preference of
communication
channel about an
exhibition show.
4. The reasons to visit
an exhibition show.
UTCC International Journal of Business and Economics
UTTC IJBE | 103
To explore the relationship between
different personality traits and exhibition
attendance, we use the Big Five
Personality traits as the basic theory. We
treat different personality traits as
independent variables, and exhibition
attendance as the dependent variable.
Methodology Sampling procedures: A quantitative
approach is used in this study. The study
developed a questionnaire for this
research. The 400 questionnaires were
distributed in these major venues: Queen
Sirikit National Convention Center
(QSNN), Bangkok International Trade
Exhibition Center (BITEC), Exhibition
and Convention Center (IMPACT). By
proportioning with the percentage from
total numbers of questionnaires, the
researcher divided the questionnaires for
collecting data in venues: 100
questionnaires in Queen Sirikit National
Convention Center (QSNCC), 200
questionnaires in IMPACT Arena,
Exhibition and Convention Center(
IMPACT), 100 questionnaires in
Bangkok International Trade &
Exhibition Center (BITEC) .The details
are shown below. The sample was
collected from completed questionnaires
of exhibition attendees. The
questionnaires were distributed from
November 2014 until December 2014.
Participants: In the 400 participants, the
majority of the respondents were females
with 231 or 57.75%, and the rest were
males with 169 respondents or 42.25%.
The majority of respondents were
between ages 21-30 years (28.00%), the
next group was between 31-40 years
(26.25%), and the smallest group of
respondents was older than 60 years of
age (3.75%). There were 58.8% of
respondents who had Bachelor degrees
and17.25% of respondents were higher
than bachelor. There were 34.75% of
respondents who were private company
officers and there were 16.75% of
respondents who owned their own
business. Most respondents’ salary
ranged between 10,000-20,000 baht
(32.00%). From the demographics
information, the respondents cover a
variety of genders, ages, occupations,
and salary ranges.
Instrument and measurement: The
survey instrument was divided into three
parts: Part A: Demographic Information,
general information from attendees,
collected such as gender, age group,
education, occupation and income. Part
B: Attendees’ attendance behaviors, this
part is to investigate exhibition
attendance behaviors. Part C: Attendees’
Personality Traits Types, the
measurement is in order to define the
attendees’ personality trait types. In the
part C, the study chose the Big Five
Inventory which developed by Oliver
and Srivastava (1999) as the
measurement instrument. The Big Five
Inventory is a widely used instrument for
measuring the personality trait
dimensions. The Big Five Inventory
consists of 44 items in order to measure
the Big Five Personality traits:
extraversion, agreeableness,
conscientiousness, neuroticism, and
openness to experience, and will use a 5-
point Likert scale from 1 = ‘strongly
disagree’ to 5 = ‘strongly agree’. In this
study the Big Five Inventory have been
adapted for the research the reduced to 28
items which decreased the reverse-scored
items.
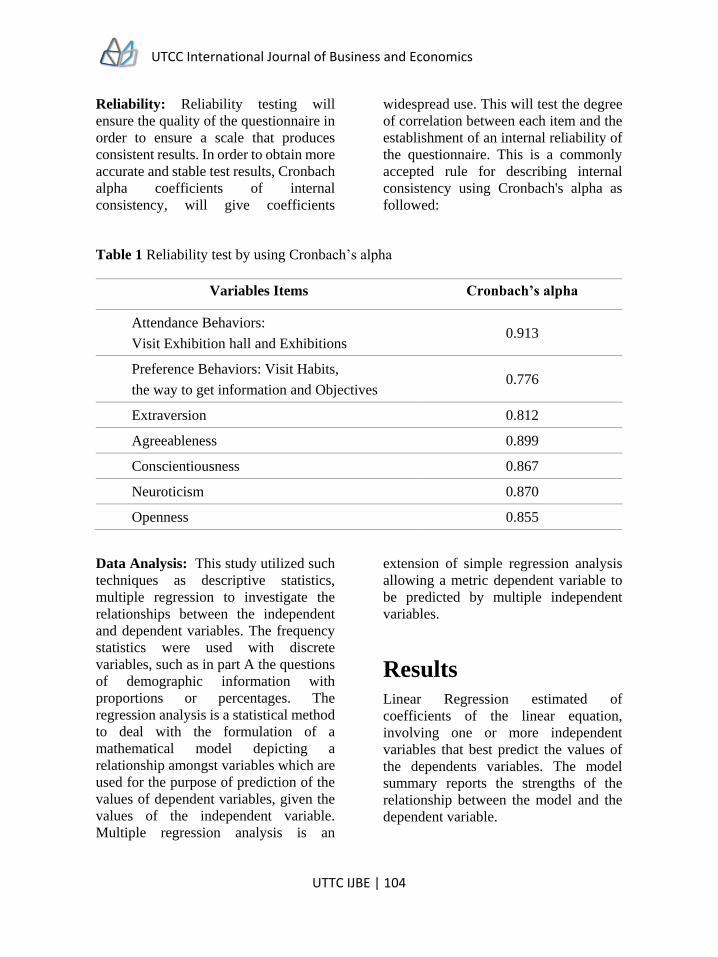
UTCC International Journal of Business and Economics
UTTC IJBE | 104
Reliability: Reliability testing will
ensure the quality of the questionnaire in
order to ensure a scale that produces
consistent results. In order to obtain more
accurate and stable test results, Cronbach
alpha coefficients of internal
consistency, will give coefficients
widespread use. This will test the degree
of correlation between each item and the
establishment of an internal reliability of
the questionnaire. This is a commonly
accepted rule for describing internal
consistency using Cronbach's alpha as
followed:
Table 1 Reliability test by using Cronbach’s alpha
Variables Items Cronbach’s alpha
Attendance Behaviors:
Visit Exhibition hall and Exhibitions 0.913
Preference Behaviors: Visit Habits,
the way to get information and Objectives 0.776
Extraversion 0.812
Agreeableness 0.899
Conscientiousness 0.867
Neuroticism 0.870
Openness 0.855
Data Analysis: This study utilized such
techniques as descriptive statistics,
multiple regression to investigate the
relationships between the independent
and dependent variables. The frequency
statistics were used with discrete
variables, such as in part A the questions
of demographic information with
proportions or percentages. The
regression analysis is a statistical method
to deal with the formulation of a
mathematical model depicting a
relationship amongst variables which are
used for the purpose of prediction of the
values of dependent variables, given the
values of the independent variable.
Multiple regression analysis is an
extension of simple regression analysis
allowing a metric dependent variable to
be predicted by multiple independent
variables.
Results
Linear Regression estimated of
coefficients of the linear equation,
involving one or more independent
variables that best predict the values of
the dependents variables. The model
summary reports the strengths of the
relationship between the model and the
dependent variable.
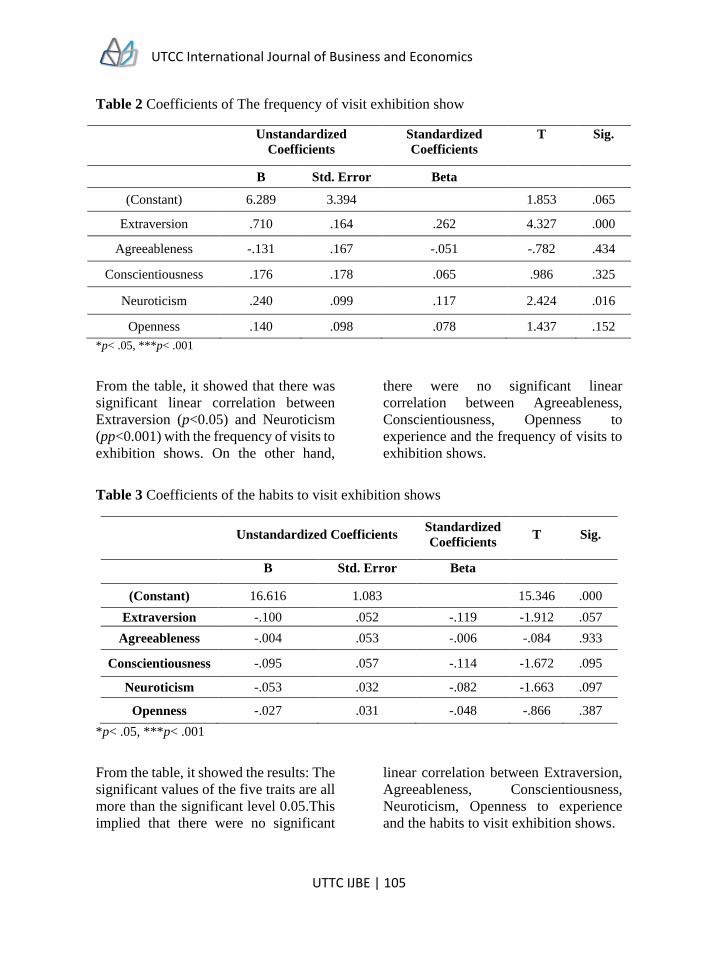
UTCC International Journal of Business and Economics
UTTC IJBE | 105
Table 2 Coefficients of The frequency of visit exhibition show
Unstandardized
Coefficients
Standardized
Coefficients
T Sig.
B Std. Error Beta
(Constant) 6.289 3.394 1.853 .065
Extraversion .710 .164 .262 4.327 .000
Agreeableness -.131 .167 -.051 -.782 .434
Conscientiousness .176 .178 .065 .986 .325
Neuroticism .240 .099 .117 2.424 .016
Openness .140 .098 .078 1.437 .152
*p< .05, ***p< .001
From the table, it showed that there was
significant linear correlation between
Extraversion (p<0.05) and Neuroticism
(pp<0.001) with the frequency of visits to
exhibition shows. On the other hand,
there were no significant linear
correlation between Agreeableness,
Conscientiousness, Openness to
experience and the frequency of visits to
exhibition shows.
Table 3 Coefficients of the habits to visit exhibition shows
Unstandardized Coefficients
Standardized
Coefficients T Sig.
B Std. Error Beta
(Constant) 16.616 1.083 15.346 .000
Extraversion -.100 .052 -.119 -1.912 .057
Agreeableness -.004 .053 -.006 -.084 .933
Conscientiousness -.095 .057 -.114 -1.672 .095
Neuroticism -.053 .032 -.082 -1.663 .097
Openness -.027 .031 -.048 -.866 .387
*p< .05, ***p< .001
From the table, it showed the results: The
significant values of the five traits are all
more than the significant level 0.05.This
implied that there were no significant
linear correlation between Extraversion,
Agreeableness, Conscientiousness,
Neuroticism, Openness to experience
and the habits to visit exhibition shows.
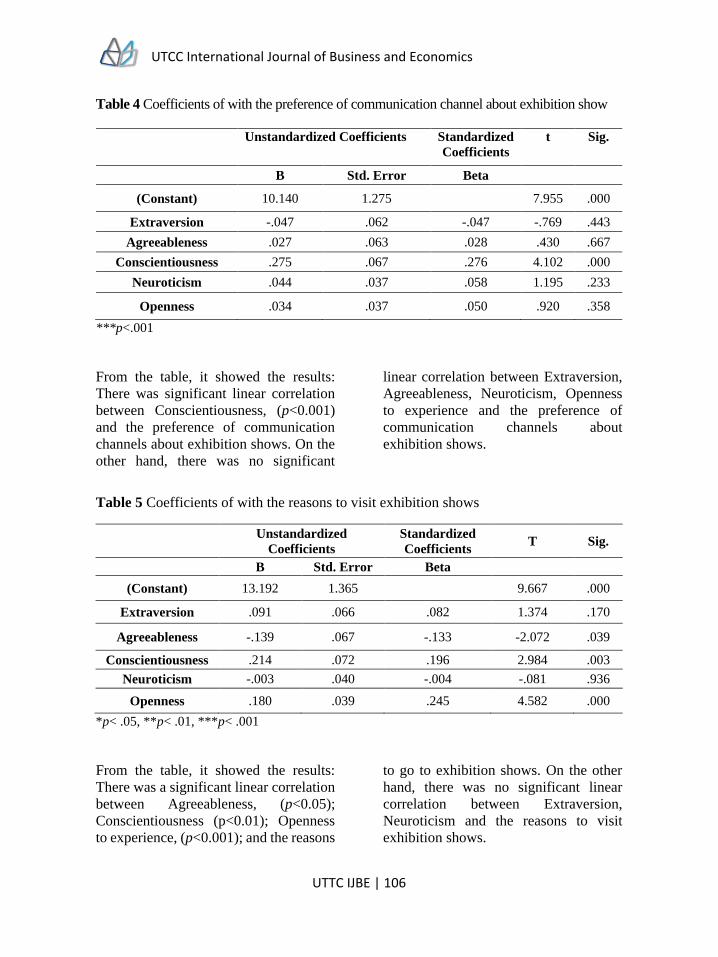
UTCC International Journal of Business and Economics
UTTC IJBE | 106
Table 4 Coefficients of with the preference of communication channel about exhibition show
Unstandardized Coefficients Standardized
Coefficients
t Sig.
B Std. Error Beta
(Constant) 10.140 1.275 7.955 .000
Extraversion -.047 .062 -.047 -.769 .443
Agreeableness .027 .063 .028 .430 .667
Conscientiousness .275 .067 .276 4.102 .000
Neuroticism .044 .037 .058 1.195 .233
Openness .034 .037 .050 .920 .358
***p<.001
From the table, it showed the results:
There was significant linear correlation
between Conscientiousness, (p<0.001)
and the preference of communication
channels about exhibition shows. On the
other hand, there was no significant
linear correlation between Extraversion,
Agreeableness, Neuroticism, Openness
to experience and the preference of
communication channels about
exhibition shows.
Table 5 Coefficients of with the reasons to visit exhibition shows
Unstandardized
Coefficients
Standardized
Coefficients T Sig.
B Std. Error Beta
(Constant) 13.192 1.365 9.667 .000
Extraversion .091 .066 .082 1.374 .170
Agreeableness -.139 .067 -.133 -2.072 .039
Conscientiousness .214 .072 .196 2.984 .003
Neuroticism -.003 .040 -.004 -.081 .936
Openness .180 .039 .245 4.582 .000
*p< .05, **p< .01, ***p< .001
From the table, it showed the results:
There was a significant linear correlation
between Agreeableness, (p<0.05);
Conscientiousness (p<0.01); Openness
to experience, (p<0.001); and the reasons
to go to exhibition shows. On the other
hand, there was no significant linear
correlation between Extraversion,
Neuroticism and the reasons to visit
exhibition shows.
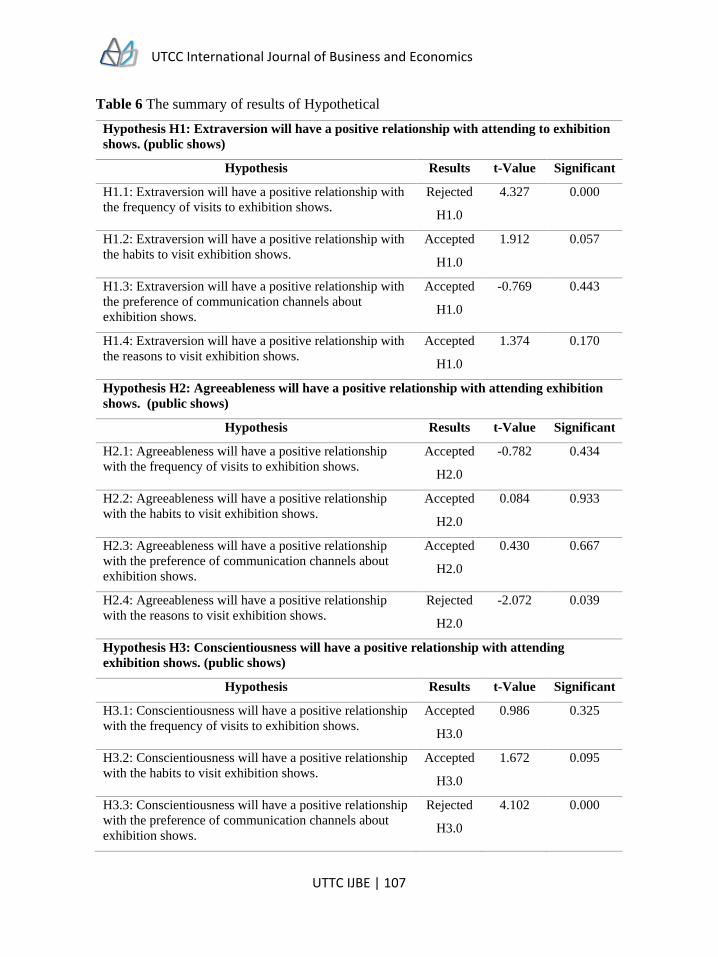
UTCC International Journal of Business and Economics
UTTC IJBE | 107
Table 6 The summary of results of Hypothetical
Hypothesis H1: Extraversion will have a positive relationship with attending to exhibition
shows. (public shows)
Hypothesis Results t-Value Significant
H1.1: Extraversion will have a positive relationship with
the frequency of visits to exhibition shows.
Rejected
H1.0
4.327 0.000
H1.2: Extraversion will have a positive relationship with
the habits to visit exhibition shows.
Accepted
H1.0
1.912 0.057
H1.3: Extraversion will have a positive relationship with
the preference of communication channels about
exhibition shows.
Accepted
H1.0
-0.769 0.443
H1.4: Extraversion will have a positive relationship with
the reasons to visit exhibition shows.
Accepted
H1.0
1.374 0.170
Hypothesis H2: Agreeableness will have a positive relationship with attending exhibition
shows. (public shows)
Hypothesis Results t-Value Significant
H2.1: Agreeableness will have a positive relationship
with the frequency of visits to exhibition shows.
Accepted
H2.0
-0.782 0.434
H2.2: Agreeableness will have a positive relationship
with the habits to visit exhibition shows.
Accepted
H2.0
0.084 0.933
H2.3: Agreeableness will have a positive relationship
with the preference of communication channels about
exhibition shows.
Accepted
H2.0
0.430 0.667
H2.4: Agreeableness will have a positive relationship
with the reasons to visit exhibition shows.
Rejected
H2.0
-2.072 0.039
Hypothesis H3: Conscientiousness will have a positive relationship with attending
exhibition shows. (public shows)
Hypothesis Results t-Value Significant
H3.1: Conscientiousness will have a positive relationship
with the frequency of visits to exhibition shows.
Accepted
H3.0
0.986 0.325
H3.2: Conscientiousness will have a positive relationship
with the habits to visit exhibition shows.
Accepted
H3.0
1.672 0.095
H3.3: Conscientiousness will have a positive relationship
with the preference of communication channels about
exhibition shows.
Rejected
H3.0
4.102 0.000
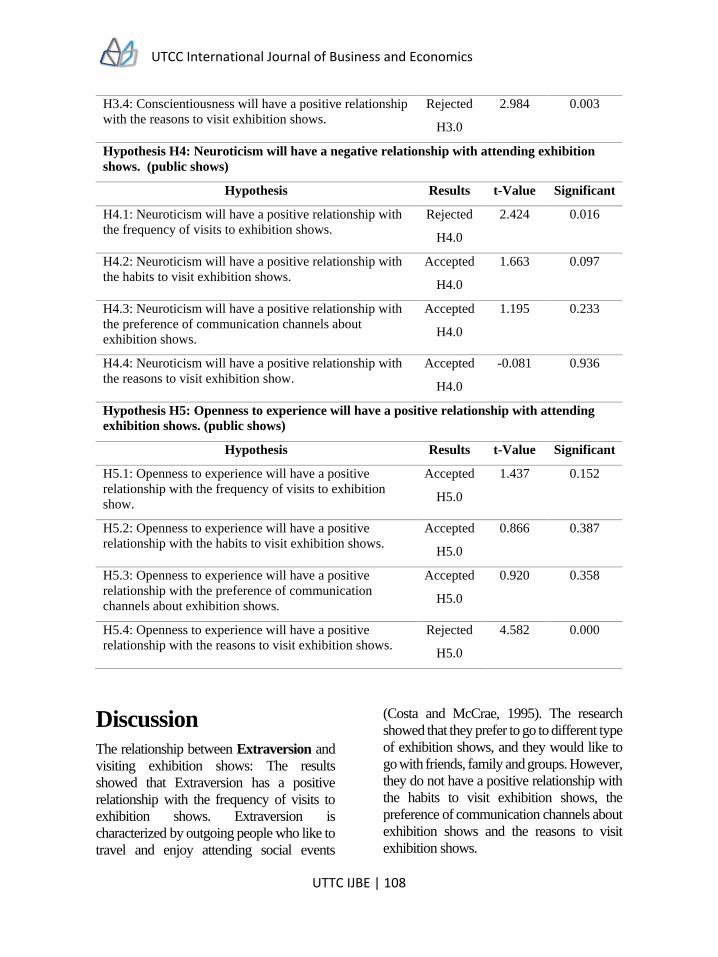
UTCC International Journal of Business and Economics
UTTC IJBE | 108
H3.4: Conscientiousness will have a positive relationship
with the reasons to visit exhibition shows.
Rejected
H3.0
2.984 0.003
Hypothesis H4: Neuroticism will have a negative relationship with attending exhibition
shows. (public shows)
Hypothesis Results t-Value Significant
H4.1: Neuroticism will have a positive relationship with
the frequency of visits to exhibition shows.
Rejected
H4.0
2.424 0.016
H4.2: Neuroticism will have a positive relationship with
the habits to visit exhibition shows.
Accepted
H4.0
1.663 0.097
H4.3: Neuroticism will have a positive relationship with
the preference of communication channels about
exhibition shows.
Accepted
H4.0
1.195 0.233
H4.4: Neuroticism will have a positive relationship with
the reasons to visit exhibition show.
Accepted
H4.0
-0.081 0.936
Hypothesis H5: Openness to experience will have a positive relationship with attending
exhibition shows. (public shows)
Hypothesis Results t-Value Significant
H5.1: Openness to experience will have a positive
relationship with the frequency of visits to exhibition
show.
Accepted
H5.0
1.437 0.152
H5.2: Openness to experience will have a positive
relationship with the habits to visit exhibition shows.
Accepted
H5.0
0.866 0.387
H5.3: Openness to experience will have a positive
relationship with the preference of communication
channels about exhibition shows.
Accepted
H5.0
0.920 0.358
H5.4: Openness to experience will have a positive
relationship with the reasons to visit exhibition shows.
Rejected
H5.0
4.582 0.000
Discussion The relationship between Extraversion and
visiting exhibition shows: The results
showed that Extraversion has a positive
relationship with the frequency of visits to
exhibition shows. Extraversion is
characterized by outgoing people who like to
travel and enjoy attending social events
(Costa and McCrae, 1995). The research
showed that they prefer to go to different type
of exhibition shows, and they would like to
go with friends, family and groups. However,
they do not have a positive relationship with
the habits to visit exhibition shows, the
preference of communication channels about
exhibition shows and the reasons to visit
exhibition shows.
UTCC International Journal of Business and Economics
UTTC IJBE | 109
The relationship between Agreeableness
and visiting exhibition shows: The results
showed that Agreeableness have a positive
relationship with the reasons to visit
exhibition shows. As previous study showed,
agreeableness is associated with kindness,
warm and helpful, involves being compliant
with requests from others (Costa and
McCrae, 1995).Agreeableness is defined as
the tendency to act in altruistic, sympathetic
and helpful way to others (Rorhman and
Coetzer, 2003). Agreeableness is associated
with kindness, warmth and being helpful. It
involves being compliant with requests from
others. They are more willing to comply
with requests to volunteer(Gustavo, Morris,
Knight, and de Guzman, 2005).In this case,
they would like go to exhibition shows for
same reasons that agreeableness suspended
their own interests for the good of a social
group and their friends. They go to
exhibition shows for seeing new products, for
shopping, for gathering new ideas and for
seeking business opportunities. But they do
not have a positive relationship with the
frequency of visits to exhibition shows, the
habits to visit exhibition shows or the
preference of communication channels about
exhibition shows.
The relationship between
Conscientiousness and visiting exhibition
shows: It’s showed that Conscientiousness
has a positive relationship with the preference
of communication channels about exhibition
shows and the reasons to visit exhibition
shows. Conscientiousness is the tendency to
be self-disciplined, organized, dutiful and
mindful of details. They like to plan things in
the lives with determination. That explains
why that when Conscientiousness decides to
go exhibition shows, they will do the research
and look for the information before going to
the show. Conscientiousness is well-
planned, organized, and purposeful, which
leads to setting goals. Individuals who are
high in conscientiousness are responsible,
dependable, and persistent in the life
(Barrick, Mount, and Strauss, 1993). Bruck
and Allen (2003) explained that
conscientious people can be good at
planning, organizing and having good time
management. They are responsible and deal
with tasks in the workplace. Meanwhile they
also can be good in dealing with family
things. They will not make a conflict
between work and family. They set goals
and do things that have a strong sense of
purpose. They go to the exhibition shows
with specific goals and reasons. However,
they do not have the positive relationship
with the frequency of visits to exhibition
shows and the habits to visit exhibition
shows.
The relationship between Neuroticism and
visiting exhibition shows: The study found
that Neuroticism showed a positive
relationship with the frequency of visit
exhibition show. Individuals who are a high
score in neuroticism have a tendency for
having anxiety, tension, emotional, insecure,
and being melancholy(McCrae and Oliver,
2006).They experience negative effects, such
as fear, sadness; embarrassment, anger and
guilt. The results showed that they would
like to go different types of exhibition shows.
Results also indicated they would like to go
for relaxation and adjust their moods. In this
way exhibition shows can help them get rid
of their depression. But there is no positive
relationship between neuroticism and the
habits to visit exhibition shows, the
preference of communication channels about
exhibition shows and the reasons to visit
exhibition shows.
The relationship between Openness to
experience and visiting exhibition shows:
The results showed that Openness to
experience has a positive relationship with
the reasons to visit exhibition shows. People
UTCC International Journal of Business and Economics
UTTC IJBE | 110
who have a high score in openness tend to be
seeking a variety of new experiences like
being adventure curious and being interested
in wide range of creative activities (Liebert
and Spiegler, 1994). Flynn (2005)
emphasized that Openness to experience is
more willing to try to get a broader scope and
desire more experience. The previous study
showed that the adolescents who were open
to experience have been reported to be more
likely to accept new things and adapt to new
environments. Faced with a variety of
different situations, they can hold enthusiasm
and excitement rather than nervousness
(Fayombo, 2010). They go to exhibition
shows for seeing new products, for shopping,
for gathering new ideas and for seeking
business opportunities. These visits can
increase their experience and help them to get
updated information. However, there is no
positive relationship between openness to
experience, the frequency of visits to
exhibition shows, the habits to visit
exhibition shows and the preference of the
communication channels about exhibition
shows.
Conclusion This study found that the five personality
traits do have impact on the exhibition
attendees’ behaviors and their decisions.
Different personality traits of attendees have
different needs. The results showed
Extraversion and Neuroticism attendees
would like go to visit different types of
exhibition shows. Conscientiousness
attendees like to do some research and
planning before attending an exhibition
show. Agreeableness and Openness
attendees go to exhibition shows for the same
reasons. They like to see new products and
technology. They enjoy gathering new ideas,
industry trends information. They enjoy
relaxing and having fun, talking to the experts
and looking for business opportunities.All
these results can help exhibition organizers
and exhibitors to have a better understanding
of their attendees. It can help organizers
provide better service to their customers and
help them raise attendance levels. They can
better understand the attendees’ needs and
meet those needs. Providing quality service
for the customers and improving the
exhibition attendance are the main goals that
organizers need to focus on. At the same
time, improve business management and
make suitable business strategies to face the
challenges in an increasingly competitive
market.
Implication and
recommendation
For the exhibition exhibitors, they
should organize a variety of different
industries of exhibition shows, in order to
appeal to different personality traits of
attendees to attend the shows. At same time,
the exhibitors need to bring more new goods
and technology advancements to the shows
to meet the needs of the attendees. From the
research results, we showed that the
respondents who attended to the exhibition
shows mostly travel with family. Exhibitors
should accelerate product updates, especially
for the daily life and household products. In
order to increase the exhibition attendance, it
should have more male-related products on
display to attract male attendees’ desires.
Moreover, for the consumer exhibition
shows, the exhibitors should make the
appropriate different price levels to attract
different income levels of the attendees. In
order to meet their different shopping needs
with different purchasing powers.
UTCC International Journal of Business and Economics
UTTC IJBE | 111
For the exhibition organizers, they need to build up a good corporate image
to the public, like IMPACT and BITEC do
now. The exhibition centers should improve
the business management, and improve the
quality of service in the exhibition halls. It
aims to provide customers with a
comfortable, convenient, casual environment
to attract their interest. For the organizers,
they should organize more different types of
exhibitions, invite different industries of
exhibitors to come to display their goods. The
research showed that Agreeableness,
Conscientiousness and Openness have a
positive relationship with the objectives to go
to exhibition shows in order to meet the
different objectives of the different
personality traits of attendees, such as
shopping, seeing new products, gathering
new ideas, relaxing, learning and business
opportunities. Another important thing is the
results showed that people who are older than
51 years of age also like to go to visit
exhibition shows. The exhibition centers
should provide free shuttle bus service for
these older people. Help with their travel, can
be a great aid for them and help increase the
attendance.
For the marketing activities, we found that the top three ways for the
respondents to get the information of the
exhibition shows are: from TV
advertisement, from the internet, and
from billboards. Conscientiousness have
a positive relationship with the ways to
find out about exhibition show
categories, this type of personality trait of
people would like to go looking for the
exhibition shows information from
different channels. In the study, focus
was on the public exhibition shows
(consumer shows), so for the marketing
strategies, the marketers first need to
continue to advertise on TV, and increase
billboard advertisement. As for the
internet, besides the development of
blogs for Pre-Exhibition marketing, the
marketers can use other social Medias to
expand the marketing aspects, such as
advertising on radio, hotel video
programs and shuttle bus advertising.
Marketing on Facebook, We Chat and
Line can be very effective. Sponsorship
is also a very good choice. It is a
commercial investment for the exhibition
organization’s marketing purposes that
do not require the purchase of the media
channels directly for the exhibition
shows and events. Besides, for trade fair
or trade show, which is B-to-B
exposition, there are still other pre-show-
marketing strategies. Such as
telemarketing, direct mail, newsletters,
and advertising on World Wide Web
sites, local and regional edition
newspapers.
Limitation and further
research
The study area is only in the three
Exhibition Centers and a Convention
Center, covering only local citizens of
Bangkok. The scope of the study, limits
only the domestic public exhibition
shows (consumer shows), which is B-to-
C exposition. However, there are still
trade fairs, trade shows (B-to-B
exposition) and Mixed shows which are
open for trade and public visitors. These
types of exhibition shows are also worthy
of study. Moreover, the Big Five
personality traits also have limitations.
These five personality traits can cover
some the personalities of people. There
are many theories of personality traits
UTCC International Journal of Business and Economics
UTTC IJBE | 112
also worth to explore. In addition to the
five personality traits that can influence
people's behavior, there are many other
internal and external factors that can
affect the attendees’ behavior in the
exhibition shows. The future study can
expand the scope of the study, not just
domestic exhibitions, but also the
oversea exhibition shows, expand the
type of research shows, not just the
public exhibition shows. Additionally,
Future research can explore the other
factors that can impact the attendees’
behaviors in the exhibition shows, such
as the aspects from the exhibition
exhibitors or the organizers and try to
study in depth, more personality traits
and the theories to study the impact of the
attendees’ behaviors.
Table 7 The list of table for all the questions for the factors
Attendance Behaviors: Visit Exhibition hall and Exhibitions
1) I have been to Impact Exhibition & Convention Center (IMPACT).
2) I have been to Bangkok, International Trade and Exhibition Centre (BITEC).
3) I have been to Queen Sirikit National Convention Centre (QSNCC).
4) I have been to Bangkok Convention Centre (BCC).
5) I go to Automobiles show.
6) I go to Food industry show.
7) I go to Furniture & Home Appliance show.
8) I go to Retailer Expo shows.
9) I go to Consumer Electronics (Information Technology) show.
10) I go to Fashion & Leather products show.
11) I go to Gifts and household goods show.
12) I go to Gems & Jewelry show.
13) I go to Book Expo show.
14) I go to Wedding Fair.
15) I go to Tourism Festival show.
Preference Behaviors: Visit Habits, the way to get information and Objectives
1) I always go to exhibition shows alone.
2) I always go to exhibition shows with friends.
3) I always go to exhibition shows with family.
4) I always go to exhibition shows with colleagues.
5) I often know about the exhibition shows from TV advertisement.
UTCC International Journal of Business and Economics
UTTC IJBE | 113
6) I often know about the exhibition shows from the billboards.
7) I often know about the exhibition shows from Internet.
8) I often know about the exhibition shows from newspaper.
9) I often know about the exhibition shows from friends.
10) I often go to the exhibition shows for shopping.
11) I often go to the exhibition shows for seeing new products and technology.
12) I often go to the exhibition shows for gathering new ideas and industry trends information.
13) I often go to the exhibition shows for relax and have fun.
14) I often go to the exhibition shows for talk to the experts and learning deep of products.
15) I often go to the exhibition shows for looking for business opportunities.
Extraversion
1) I am talkative
2) I am full of energy
3) I generate a lot of enthusiasm
4) I have an assertive personality
5) I am outgoing, sociable
Agreeableness
1) I am helpful and unselfish with others
2) I have a forgiving nature
3) I am generally trusting
4) I am considerate and kind to almost everyone
5) I like to cooperate with others
Conscientiousness
1) I do a thorough job
2) I am a reliable worker
3) I persevere until the task is finished
4) I do things efficiently
5) I make plans and follows through with them
Neuroticism
1) I am depressed, blue
2) I can be tense
UTCC International Journal of Business and Economics
UTTC IJBE | 114
3) I am worried a lot
4) I can be moody
5) I get nervous easily
Openness
1) I am original, comes up with new ideas
2) I am curious about many different things
3) I am ingenious, a deep thinker
4) I have an active imagination
5) I am inventive
6) I value artistic, aesthetic experiences
7) I like to reflect, play with ideas
8) I am sophisticated in art, music, or literature
References
Ceyhan Aldemir and Gül Bayraktaroğlu (2004), “Determining Effect of Personality Traits
on Voter Behavior Using Five Factor Personality Inventory,” Journal of
Faculty of Business, Vol. 5, No. 2, 129-147.
Barrick R Murray., Mount K Michael, and Strauss P. Judy (1993), “Conscientiousness
and Performance of Sales Representatives: Test of the Mediating Effects of
Goal Setting,” Journal of Applied Psychology, Vol. 78, No. 5, 715-722.
Borghans Lex, Duckworth L.Angela, Heckman J.James and Weel ter Bas (2008), “The
Economics and Psychology of Personality Traits,” NBER Working Paper
No. 13810.
Bruck S. Carly and Allen D. Tammy (2003), “The relationship between big five personality
traits, negative affectivity, type A behavior, and work–family conflict,”
Journal of Vocational Behavior 63, 457–472.
Carlo Gustavo, Okun A.Morris, Knight George, de Guzman T. Maria Rosario (2005),
“The interplay of traits and motives on volunteering: agreeableness,
extraversion and prosocial value motivation,” Published in Personality and
Individual Differences 38, 1293-1305.
Costa, Jr. T. Paul and McCrae R. Robert (1995), “Domains and Facets: Hierarchical
Personality Assessment Using the Revised NEO Personality Inventory,”
Journal of Personality Assessment, 64(1), 21-50.
UTCC International Journal of Business and Economics
UTTC IJBE | 115
Engler Barbara (1999), Personality Theories An Introduction, 5th Ed. Houghton Mifflin
College Div.
Farhadi, H., Fatimah, O., Nasir, R. and Wan Shahrazad, W. S. (2012), “Agreeableness and
Conscientiousness as Antecedents of Deviant Behavior in Workplace,” Asian
Social Science, Vol. 8(9),2-7.
Fayombo Grace (2010), “The Relationship between Personality Traits and Psychological
Resilience among the Caribbean Adolescents,” International Journal of
Psychological Studies, Vol. 2, No. 2, 105-116.
Flynn, J. Francis (2005), “Having an Open Mind: The Impact of Openness to
Experience on Interracial Attitudes and Impression Formation,” Journal of
Personality and Social Psychology, Vol. 88, No. 5, 816–826.
Germeijs Veerle and Karine Verschueren (2011), “Verschueren Indecisiveness and Big
Five personality factors: Relationship and specificity,” Personality and
Individual Differences, 50 (7) 1023–1028.
Hede M.Anne, Jago Leo and Deery Margaret ( 2004 ), “Segmentation of Special Event
Attendees Using Personal Values: Relationships with Satisfaction and
Behavioural Intentions,” Journal of Quality Assurance in Hospitality &
Tourism, Vol. 5, No. 2/3/4, 33-55.
Koole L. Sander, Jager Wander, van den Berg E. Agnes, Charles A. J. Vlek and Hofstee
K. B. Willem ( 2001), “On the Social Nature of Personality: Effects of
Extraversion, Agreeableness, and Feedback About Collective Resource Use
on Cooperation in a Resource Dilemma,” Society for Personality and Social
Psychology, Vol. 27(3),289-301.
Sharma Mandeep, Kaveri, Sharma R.Nov and Yadava Amrita (2010), “Personality Factors
as Correlates of Health among Adults,” Journal of the Indian Academy of
Lee Daehui and Palakurthi Radesh (2011), “Marketing strategy to increase exhibition
attendance through controlling and eliminating leisure constraints,”
International CHRIE Conference.
Lee Myong Jae, Yeung Sylvester and Dewald Ben (2010), “An Exploratory Study
Examining the Determinants of Attendance Motivations as Perceived by
Attendees at Hong Kong Exhibitions,” Journal of Convention & Event
Tourism, Vol.11, 195–208.
Liebert M.Robert and Spiegler D. Michael (1994), Personality: Strategies and Issues, 7th
Ed. Brooks/Cole Publishing Company.
Marzuki A.Najib (2013), “The impact of personality on employee well-being,” European
Scientific Journal, Vol.9, No.20, 43-52.
McCrae R. Robert John P. Oliver (2006), “An Introduction to the Five-Factor Model and
Its Applications,” Journal of Personality, Vol.60(2), 175–215.
UTCC International Journal of Business and Economics
UTTC IJBE | 116
Mondok Anita (2012), “Event Management Activity in SMES – Do They Need Educated
Personal,” European Scientific Journal,Vcol. 8, No.4, 127-151.
Nunes, M.A. S. N., Cerri, S. A. and Blanc, N. (2008), “Improving Recommendations by
Using Personality Traitsin User Profiles,” International Conferences on
Knowledge Management and New Media Technology, Graz, Austria.
Oliver P. John and Srivastava Sanjay (1999), “The Big Five Trait Taxonomy: History,
Measurement, and Theoretical Perspectives,” In Handbook of Personality:
Theory and Research, 2th Ed. New York: Guilford, 102-138.
Revelle William (2007), “Experimental Approaches to the Study of Personality,” Appear
in Personality Research Methods B. Robins, C. Fraley and R. Krueger, eds
Guilford.
Robbins P. Stephen and Judge Tim (2007), Essentials of Organizational Behavior, 9 th Ed,
Prentice Hall.
Rorhmann, S.and Coetzer,E. P.( 2003), “The Big Five Personality Dimensions and Job
Performance,” Journal of Industrial Psychology, Vol. 29 (1), 68-74.
Schultz P. Duane and Schultz E. Sydney (2012), Theories of Personality, 10th Ed, Jon-
David Hague.
Severt Denver, Wang Youcheng, Chen Po-Ju and Breiter Deborah (2007), “Examining the
motivation, perceived performance, and behavioral intentions of convention
attendees: Evidence from a regional conference,” Tourism
Management,Vol.28,399–408.
Sharp Daryl (1987), PERSONALITY TYPES Jung’s Model of Typology, 1 st Ed, Inner City
Books.
Smith M.Timothy, Hama Kazuyo, Smith M. Paul (2003), “The effect of successful trade
show attendance on future show interest: exploring Japanese attendee
perspectives of domestic and offshore international events,” Journal of
Business & Industrial Marketing, Vol. 18 NO. 4/5 403-418.
Störmer Susi and Fahr René (2010), “Individual Determinants of Work Attendance:
Evidence on the Role of Personality,” IZA Discussion, Paper No. 492.
Triandis C. Harry and Suh M. Eunkook (2002), “Cultural Influences on Personality,” Annu.
Rev. Psychol, Vol.53, 133–160.
Whitfield Julie, Dioko A. N.Leonardo (Don), Webber Don, and Zhang Lingue (2012),
“Attracting Convention and Exhibition Attendance to Complex Mice Venues:
Emerging Data from Macao,” International Journal of Tourism Research,
Vol. 16 (2), 169–179.
Siu Noel Yee-Man , Wan Penny Yim King , Dong Ping ( 2012), “The impact of the
services cape on the desire to stay in convention and exhibition centers: The
case of Macao,” International Journal of Hospitality Management, Vol.31,
236–246.
UTCC International Journal of Business and Economics
UTTC IJBE | 117
Shahila Zafar and Meenakshi, K (2012), “A study on the relationship between
extroversion-introversion and risk-taking in the context of second language
acquisition,” International Journal of Research Studies in Language
Learning, Vol. (1), 33-40.

UTCC International Journal of Business and Economics
UTTC IJBE | 118
UTCC International Journal of Business and Economics
UTTC IJBE | 119
UTCC International Journal of Business and Economics (UTCC IJBE)
Volume 10 Number 1, April 2018
Bank-specific and macroeconomic factors
related to bank profitability and stock return
in Thailand
Junevio Antonio Silva Ximenes1, Li Li2 2School of Business, University of the Thai Chamber of Commerce [email protected], [email protected]
Abstract The study investigated the relationship of bank-specific and macroeconomic factors on
bank profitability and stock return of commercial banks listed in Stock Exchange of
Thailand (SET). The study used multiple regression of quarterly data from 2004-2013.
Bank profitability and stock return were used as dependent variables. While, bank-specific
and macroeconomic variables were used as independent variables. The dummy variable of
Financial Sector Master Plan also used in the study.
The results showed that asset size, capital adequacy, liquidity, main source of banks
funding have positive and significant relationship on bank profitability. Dummy variable
has positive and significant relationship on stock return. While, operational efficiency,
credit risk, inflation rate and real interest rate have negative and significant relationship on
bank profitability and stock return. Asset quality and GDP are insignificant to bank
profitability and stock return.
Keywords: Bank-Specific, Macroeconomic,
bank profitability, stock return
UTCC International Journal of Business and Economics
UTTC IJBE | 120
Introduction
Banking industry is important for an
economic activity. Banks contribute to
the allocation of funds from people who
deposit money and those who need funds
for their business activity and thus
support the economic growth of a
country. However, banking sector
performance also might suffer both from
the mistake decision of bank
management and financial crisis that
happened in a country. Therefore, the
assessment on bank profitability and
stock return is important because of its
importance to financial stability and
economic growth.
After the 1997 financial crisis, the
Government of Thailand had an intention
to bring Thai commercial banks back to
profitability (ADB Report 2011). The
implementation of Financial Sector
Master Plan (FSMP) phase I and II
(2004-2014) results few players in
banking sector. The study aimed to know
the extent to which bank internal and
external factors related to Thailand
commercial bank profitability and stock
return during the period.
Bank’s ultimate goal is to get profit and
maximize shareholders wealth. Many
literatures have done study on bank
profitability before and after the crisis in
Thailand. However, there is still little
attention on the effect of the
implementation of FSMP on both bank
profitability and stock return. In addition,
the study combined bank-specific and
macroeconomic factors to see the
relationship on bank profitability and
stock returns in Thailand.
The research tried to identify the extent
to which the bank-specific (such as asset
size, capital adequacy, asset quality,
liquidity, main source of banks funding,
operational efficiency and credit risk)
and macroeconomic factors (such as
GDP growth rate, inflation, real interest
rate and dummy FSMP) have significant
relationship on the Return on Assets,
Return on Equity, Net Interest Margin
and stock return. The scope of the study
focused commercial banks listed in Stock
Exchange of Thailand over the period of
2004-2013.
Literature review Group of country studies on
the determinants of bank
profitability
Previous studies evaluate the
determinants of bank profitability on
group of country. Molyneux & Thornton
(1992) used capital ratio, liquidity ratio
and interest rate as determinants of bank
profitability across 18 European
countries between 1986 and 1989. Bonin
et al (2005) used ROA as dependent
variable on bank performance for 11
transition countries from 1996-2000.
Albertazzi & Gambacorta (2009) found
that GDP growth rate exerts a positive
effect on ROE of 10 industrialized
countries from 1981-2003. Karim et al
(2010) found that economic growth and
inflation have positive and significant
effect on Islamic bank profitability in
Africa from 1999-2009.
The study of 10 Middle East and North
Africa countries during the period of
2000-2008 by Olson & Zoubi (2011)
confirmed that bank size has positive
impact on the bank profitability. Li
(2013) in the study of accounting-based
and market-based performance of banks
in 8 Asian emerging markets showed that
UTCC International Journal of Business and Economics
UTTC IJBE | 121
ROA and NIM are significantly
positively associated to capital adequacy.
Perera et al (2013) showed that bank size
is positively associated with bank
profitability in South Asian countries.
Yilmaz (2013) found that credit risk is
important determinants of bank
profitability in emerging markets.
Finally, Almazari (2014) used
comparative study between Saudi Arabia
and Jordan to find the impact of internal
factors on bank profitability from 2005-
2011.
Single country studies on the
determinants of bank
profitability
Others based their study of bank profitability
on single country. Mamatzakis and
Remoundos (2003) concluded that variables
related to management decision have major
impact on Greek commercial banks
profitability. Athanasoglou et al (2008) found
the evidence that the profitability of Greek
banks is shaped by bank-specific and
macroeconomic factors. Kosmidou et al
(2005) found that efficiency in expense
management and bank size are significant
determinants of banks profitability in United
Kingdom. Javaid et al (2011) showed that
total assets, equity to total assets, deposit to
total assets and loans to total assets are the
major determinants of banks profitability in
Pakistan. Some literatures showed positive
relationship between size and bank
profitability (Sufian, 2009; Davydenko,
2010; Sufian, 2011; Alper & Anbar, 2011;
Muda et.al, 2013; Tabari et al., 2013). Other
showed negative relationship (Ben Naceur &
Goaied, 2008; Sufian & Chong, 2008; Syafri,
2012). Even effect on bank size is not
important (Athanasoglou et al, 2008) or
insignificant (Zeitun, 2012).
Capital adequacy used as internal
determinants of bank profitability (Aburime,
2008; Athanasoglou et al 2008). Most
literatures showed that capitalization have a
positive impact on bank profitability (Sufian
& Chong, 2008; Ben Naceur & Goaied,
2008; Sufian, 2009; Davydenko, 2010;
Syafri, 2012; Tabari et al., 2013). Some study
showed that better capitalized bank seems to
be more profitable (Dietrich & Wanzenried,
2009). Ali et al (2011) find that ROA
negatively affected by capital while ROE
positively affected by capital. Bilal et al
(2013) find that capital ratio has significant
association with ROE.
Asset quality is important determinants of
bank profitability. Some literature showed
positive and significant on bank profitability
(Kosmidou et al., 2005) while other showed
negative and significant on bank profitability
(Alper & Anbar, 2011). However, Sufian &
Kamarudin (2012) concluded that all bank-
specific determinants influence the
profitability of the Bangladeshi banking
sector except asset quality. Liquidity also
used as the determinants of bank profitability.
Some literatures show that liquidity has
negative impact to profitability (Davydenko,
2010; Hasan et al, 2013) or positively related
to profitability (Sufian, 2011). Other found
that it is varied among the types of bank
studied (Sufian, 2009).
Deposits are the main source for the
financing of the banks. Some literatures
showed the positive and significant
relationship between deposit and profitability
(Javaid et al, 2011; Gul et al., 2011). Other
found the negative relationship (Davydenko,
2010). Cost-income ratio used to measure the
impact of efficiency on bank profitability.
Guru et al (2002); Kosmidou et al (2005) and
Sastrosuwito & Suzuki (2011) showed that
efficient expenses management is significant
factor in explaining bank profitability.
UTCC International Journal of Business and Economics
UTTC IJBE | 122
Previous literatures showed that cost-income
ratio has negative effect on profitability
(Syafri, 2012; Tabari et al., 2013; Hasan et al,
2013).
Credit risk is used as determinants of bank
profitability. Theory suggests that increased
exposure to credit risk is normally associated
with decrease firm profitability. Chantapong
(2005) found that domestic and foreign banks
in Thailand reduced their credit exposure
during the crisis years and improved their
profitability during the post-crisis years.
Some literatures showed that credit risk is
negatively related to bank profitability
(Athanasoglou et al 2008; Sufian & Chong,
2008; Davydenko, 2010; Sufian, 2011; Ali et
al, 2011; Bilal et al, 2013). Others found the
positive relationship between credit risk and
profitability (Sufian, 2009; Syafri, 2012)
Factors affect profitability of banking sector
might change when there is changes in
macroeconomic environment. Previous
study showed macroeconomic factors as the
profitability determinants (Abduh et al,
2012). Some study found positive
relationship (Dietrich & Wanzenried, 2009;
Sufian, 2011; Ali et al., 2011; Alper & Anbar,
2011; Gul et al, 2011). Others found negative
relationship (Sufian & Chong, 2008; Sufian
& Kamarudin, 2012; Hasan et al, 2013).
Previous studies on bank-
specific, macroeconomic
factors and stock return
Stock return is the benefits enjoyed by
the investor over an investment made.
Return is the motivating factors that
cause investor to invest money in stocks.
Return means the profit earned as a result
of increase in stock prices (Jeyanthi &
William, 2010, p. 86). Previous studies
showed that bank-specific and
macroeconomic factors are determinants
of stock return. For example, Kasman &
Kasman (2011) used some bank specific
variables and efficiency to find the
relationship for stock performance.
Drobetz et al (2007) examined the
importance of bank-specific fundamental
variables in explaining the cross-section
of expected bank stock return. In
addition, macroeconomic factors are
widely used on study of stock returns
(Tangjitprom, 2012). There is significant
relationship between macroeconomic
factors and stock returns (Cole et al,
2008; Ibrahim & Agbaje, 2013; Saeed &
Akhter, 2012). However, others found
insignificant relationship (Tu & Li, 2013;
Luthra & Mahajan, 2014).
Data and methodology Data
The study used secondary data of 11 Thai
commercial banks listed in Stock
Exchange of Thailand. The data consists
of 440 observations of quarterly data
from 2004-2013 with some missing data.
The bank-specific and stock return data
were obtained from banks website and
Stock Exchange of Thailand Market
Analysis and Reporting Tool
(SETSMART). Macroeconomic data
were obtained from Bank of Thailand
website.
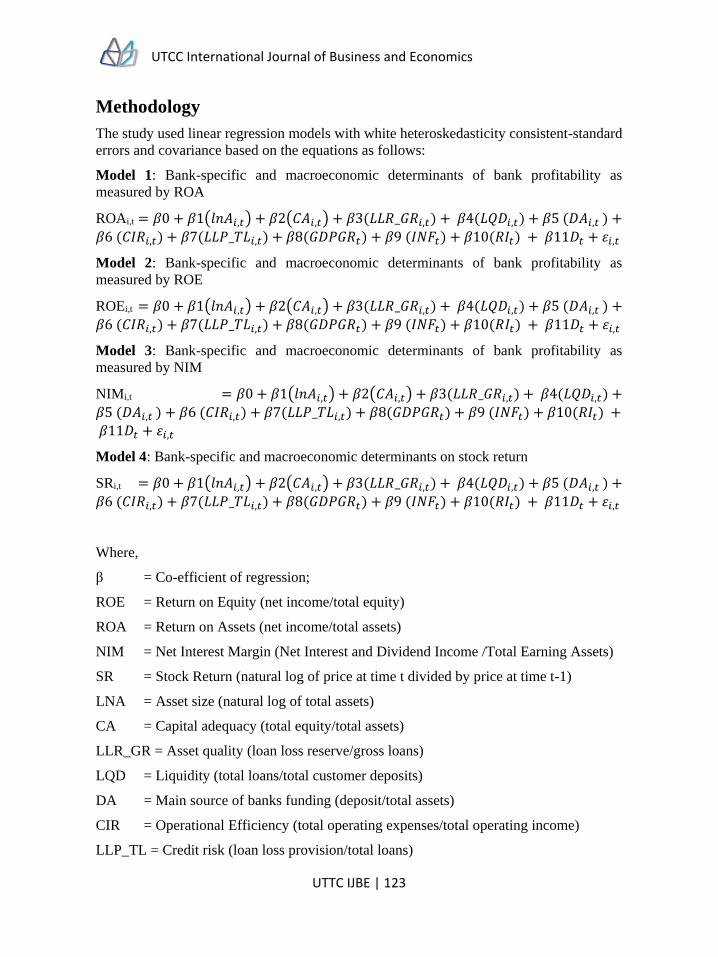
UTCC International Journal of Business and Economics
UTTC IJBE | 123
Methodology
The study used linear regression models with white heteroskedasticity consistent-standard
errors and covariance based on the equations as follows:
Model 1: Bank-specific and macroeconomic determinants of bank profitability as
measured by ROA
ROAi,t = 𝛽0 + 𝛽1(𝑙𝑛𝐴𝑖,𝑡) + 𝛽2(𝐶𝐴𝑖,𝑡) + 𝛽3(𝐿𝐿𝑅_𝐺𝑅𝑖,𝑡) + 𝛽4(𝐿𝑄𝐷𝑖,𝑡) + 𝛽5 (𝐷𝐴𝑖,𝑡 ) +
𝛽6 (𝐶𝐼𝑅𝑖,𝑡) + 𝛽7(𝐿𝐿𝑃_𝑇𝐿𝑖,𝑡) + 𝛽8(𝐺𝐷𝑃𝐺𝑅𝑡) + 𝛽9 (𝐼𝑁𝐹𝑡) + 𝛽10(𝑅𝐼𝑡) + 𝛽11𝐷𝑡 + 𝜀𝑖,𝑡
Model 2: Bank-specific and macroeconomic determinants of bank profitability as
measured by ROE
ROEi,t = 𝛽0 + 𝛽1(𝑙𝑛𝐴𝑖,𝑡) + 𝛽2(𝐶𝐴𝑖,𝑡) + 𝛽3(𝐿𝐿𝑅_𝐺𝑅𝑖,𝑡) + 𝛽4(𝐿𝑄𝐷𝑖,𝑡) + 𝛽5 (𝐷𝐴𝑖,𝑡 ) +
𝛽6 (𝐶𝐼𝑅𝑖,𝑡) + 𝛽7(𝐿𝐿𝑃_𝑇𝐿𝑖,𝑡) + 𝛽8(𝐺𝐷𝑃𝐺𝑅𝑡) + 𝛽9 (𝐼𝑁𝐹𝑡) + 𝛽10(𝑅𝐼𝑡) + 𝛽11𝐷𝑡 + 𝜀𝑖,𝑡
Model 3: Bank-specific and macroeconomic determinants of bank profitability as
measured by NIM
NIMi,t = 𝛽0 + 𝛽1(𝑙𝑛𝐴𝑖,𝑡) + 𝛽2(𝐶𝐴𝑖,𝑡) + 𝛽3(𝐿𝐿𝑅_𝐺𝑅𝑖,𝑡) + 𝛽4(𝐿𝑄𝐷𝑖,𝑡) +
𝛽5 (𝐷𝐴𝑖,𝑡 ) + 𝛽6 (𝐶𝐼𝑅𝑖,𝑡) + 𝛽7(𝐿𝐿𝑃_𝑇𝐿𝑖,𝑡) + 𝛽8(𝐺𝐷𝑃𝐺𝑅𝑡) + 𝛽9 (𝐼𝑁𝐹𝑡) + 𝛽10(𝑅𝐼𝑡) +
𝛽11𝐷𝑡 + 𝜀𝑖,𝑡
Model 4: Bank-specific and macroeconomic determinants on stock return
SRi,t = 𝛽0 + 𝛽1(𝑙𝑛𝐴𝑖,𝑡) + 𝛽2(𝐶𝐴𝑖,𝑡) + 𝛽3(𝐿𝐿𝑅_𝐺𝑅𝑖,𝑡) + 𝛽4(𝐿𝑄𝐷𝑖,𝑡) + 𝛽5 (𝐷𝐴𝑖,𝑡 ) +
𝛽6 (𝐶𝐼𝑅𝑖,𝑡) + 𝛽7(𝐿𝐿𝑃_𝑇𝐿𝑖,𝑡) + 𝛽8(𝐺𝐷𝑃𝐺𝑅𝑡) + 𝛽9 (𝐼𝑁𝐹𝑡) + 𝛽10(𝑅𝐼𝑡) + 𝛽11𝐷𝑡 + 𝜀𝑖,𝑡
Where,
β = Co-efficient of regression;
ROE = Return on Equity (net income/total equity)
ROA = Return on Assets (net income/total assets)
NIM = Net Interest Margin (Net Interest and Dividend Income /Total Earning Assets)
SR = Stock Return (natural log of price at time t divided by price at time t-1)
LNA = Asset size (natural log of total assets)
CA = Capital adequacy (total equity/total assets)
LLR_GR = Asset quality (loan loss reserve/gross loans)
LQD = Liquidity (total loans/total customer deposits)
DA = Main source of banks funding (deposit/total assets)
CIR = Operational Efficiency (total operating expenses/total operating income)
LLP_TL = Credit risk (loan loss provision/total loans)
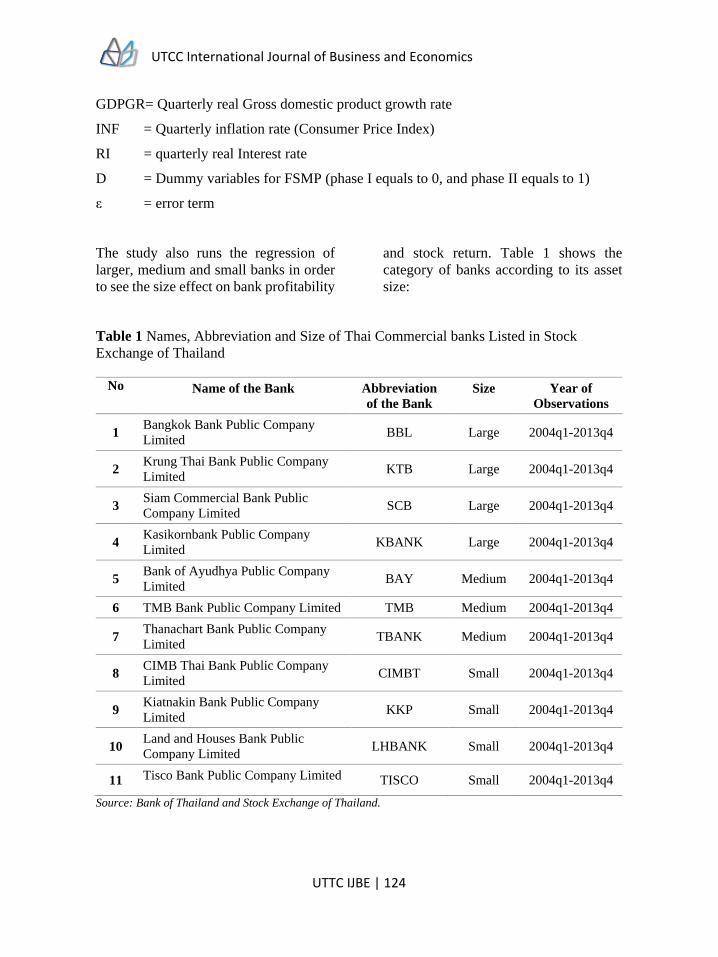
UTCC International Journal of Business and Economics
UTTC IJBE | 124
GDPGR= Quarterly real Gross domestic product growth rate
INF = Quarterly inflation rate (Consumer Price Index)
RI = quarterly real Interest rate
D = Dummy variables for FSMP (phase I equals to 0, and phase II equals to 1)
ε = error term
The study also runs the regression of
larger, medium and small banks in order
to see the size effect on bank profitability
and stock return. Table 1 shows the
category of banks according to its asset
size:
Table 1 Names, Abbreviation and Size of Thai Commercial banks Listed in Stock
Exchange of Thailand
No Name of the Bank Abbreviation
of the Bank
Size Year of
Observations
1 Bangkok Bank Public Company
Limited BBL Large 2004q1-2013q4
2 Krung Thai Bank Public Company
Limited KTB Large 2004q1-2013q4
3 Siam Commercial Bank Public
Company Limited SCB Large 2004q1-2013q4
4 Kasikornbank Public Company
Limited KBANK Large 2004q1-2013q4
5 Bank of Ayudhya Public Company
Limited BAY Medium 2004q1-2013q4
6 TMB Bank Public Company Limited TMB Medium 2004q1-2013q4
7 Thanachart Bank Public Company
Limited TBANK Medium 2004q1-2013q4
8 CIMB Thai Bank Public Company
Limited CIMBT Small 2004q1-2013q4
9 Kiatnakin Bank Public Company
Limited KKP Small 2004q1-2013q4
10 Land and Houses Bank Public
Company Limited LHBANK Small 2004q1-2013q4
11 Tisco Bank Public Company Limited TISCO Small 2004q1-2013q4
Source: Bank of Thailand and Stock Exchange of Thailand.
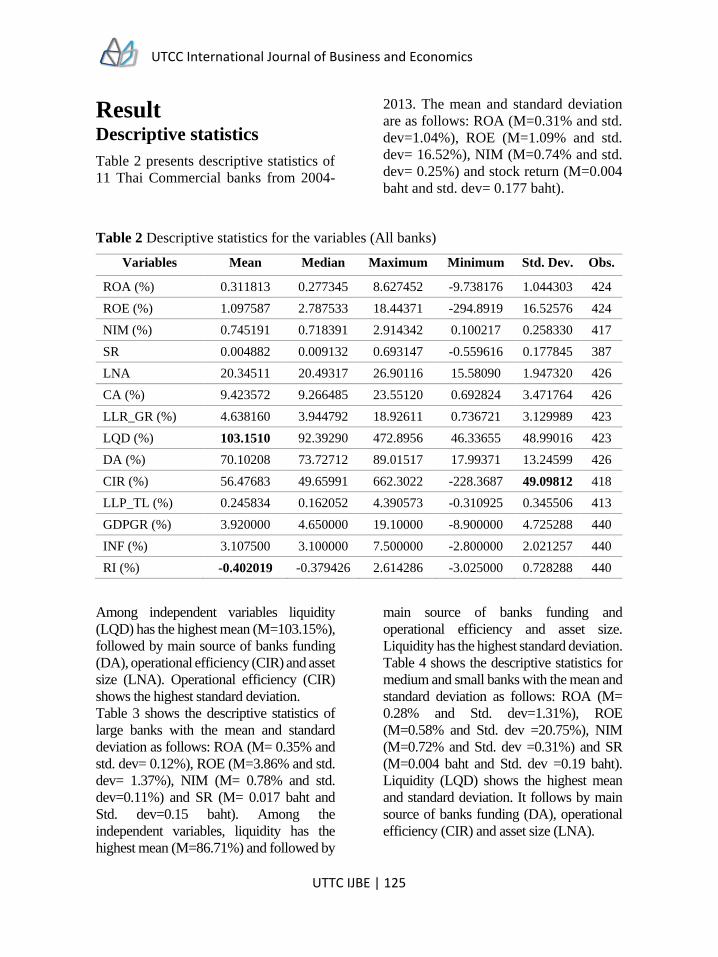
UTCC International Journal of Business and Economics
UTTC IJBE | 125
Result Descriptive statistics
Table 2 presents descriptive statistics of
11 Thai Commercial banks from 2004-
2013. The mean and standard deviation
are as follows: ROA (M=0.31% and std.
dev=1.04%), ROE (M=1.09% and std.
dev= 16.52%), NIM (M=0.74% and std.
dev= 0.25%) and stock return (M=0.004
baht and std. dev= 0.177 baht).
Table 2 Descriptive statistics for the variables (All banks)
Variables Mean Median Maximum Minimum Std. Dev. Obs.
ROA (%) 0.311813 0.277345 8.627452 -9.738176 1.044303 424
ROE (%) 1.097587 2.787533 18.44371 -294.8919 16.52576 424
NIM (%) 0.745191 0.718391 2.914342 0.100217 0.258330 417
SR 0.004882 0.009132 0.693147 -0.559616 0.177845 387
LNA 20.34511 20.49317 26.90116 15.58090 1.947320 426
CA (%) 9.423572 9.266485 23.55120 0.692824 3.471764 426
LLR_GR (%) 4.638160 3.944792 18.92611 0.736721 3.129989 423
LQD (%) 103.1510 92.39290 472.8956 46.33655 48.99016 423
DA (%) 70.10208 73.72712 89.01517 17.99371 13.24599 426
CIR (%) 56.47683 49.65991 662.3022 -228.3687 49.09812 418
LLP_TL (%) 0.245834 0.162052 4.390573 -0.310925 0.345506 413
GDPGR (%) 3.920000 4.650000 19.10000 -8.900000 4.725288 440
INF (%) 3.107500 3.100000 7.500000 -2.800000 2.021257 440
RI (%) -0.402019 -0.379426 2.614286 -3.025000 0.728288 440
Among independent variables liquidity
(LQD) has the highest mean (M=103.15%),
followed by main source of banks funding
(DA), operational efficiency (CIR) and asset
size (LNA). Operational efficiency (CIR)
shows the highest standard deviation.
Table 3 shows the descriptive statistics of
large banks with the mean and standard
deviation as follows: ROA (M= 0.35% and
std. dev= 0.12%), ROE (M=3.86% and std.
dev= 1.37%), NIM (M= 0.78% and std.
dev=0.11%) and SR (M= 0.017 baht and
Std. dev=0.15 baht). Among the
independent variables, liquidity has the
highest mean (M=86.71%) and followed by
main source of banks funding and
operational efficiency and asset size.
Liquidity has the highest standard deviation.
Table 4 shows the descriptive statistics for
medium and small banks with the mean and
standard deviation as follows: ROA (M=
0.28% and Std. dev=1.31%), ROE
(M=0.58% and Std. dev =20.75%), NIM
(M=0.72% and Std. dev =0.31%) and SR
(M=0.004 baht and Std. dev =0.19 baht).
Liquidity (LQD) shows the highest mean
and standard deviation. It follows by main
source of banks funding (DA), operational
efficiency (CIR) and asset size (LNA).
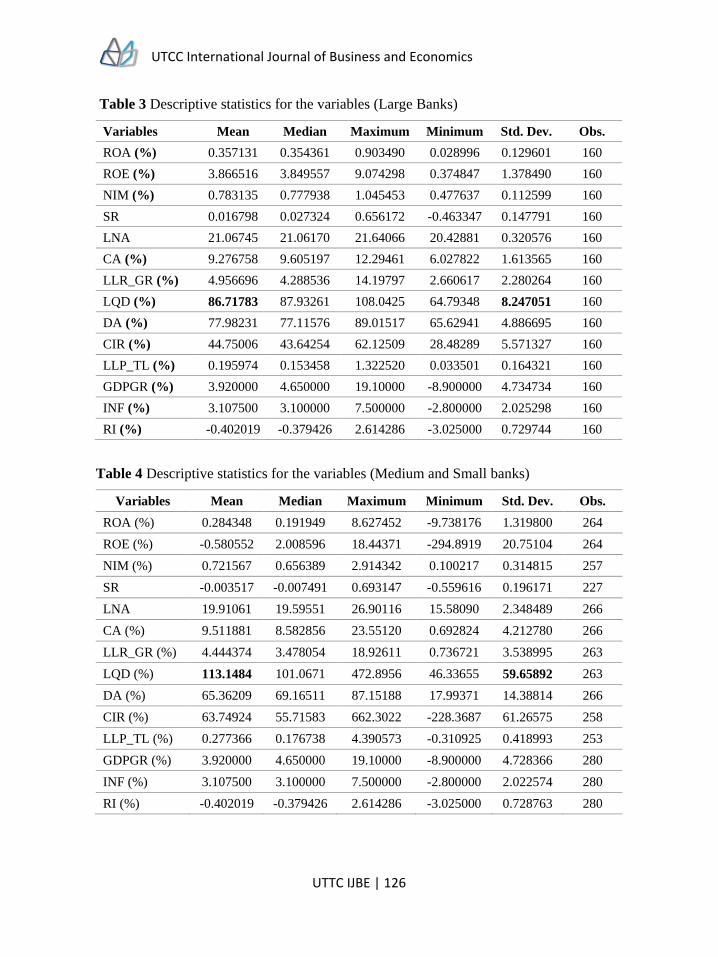
UTCC International Journal of Business and Economics
UTTC IJBE | 126
Table 3 Descriptive statistics for the variables (Large Banks)
Variables Mean Median Maximum Minimum Std. Dev. Obs.
ROA (%) 0.357131 0.354361 0.903490 0.028996 0.129601 160
ROE (%) 3.866516 3.849557 9.074298 0.374847 1.378490 160
NIM (%) 0.783135 0.777938 1.045453 0.477637 0.112599 160
SR 0.016798 0.027324 0.656172 -0.463347 0.147791 160
LNA 21.06745 21.06170 21.64066 20.42881 0.320576 160
CA (%) 9.276758 9.605197 12.29461 6.027822 1.613565 160
LLR_GR (%) 4.956696 4.288536 14.19797 2.660617 2.280264 160
LQD (%) 86.71783 87.93261 108.0425 64.79348 8.247051 160
DA (%) 77.98231 77.11576 89.01517 65.62941 4.886695 160
CIR (%) 44.75006 43.64254 62.12509 28.48289 5.571327 160
LLP_TL (%) 0.195974 0.153458 1.322520 0.033501 0.164321 160
GDPGR (%) 3.920000 4.650000 19.10000 -8.900000 4.734734 160
INF (%) 3.107500 3.100000 7.500000 -2.800000 2.025298 160
RI (%) -0.402019 -0.379426 2.614286 -3.025000 0.729744 160
Table 4 Descriptive statistics for the variables (Medium and Small banks)
Variables Mean Median Maximum Minimum Std. Dev. Obs.
ROA (%) 0.284348 0.191949 8.627452 -9.738176 1.319800 264
ROE (%) -0.580552 2.008596 18.44371 -294.8919 20.75104 264
NIM (%) 0.721567 0.656389 2.914342 0.100217 0.314815 257
SR -0.003517 -0.007491 0.693147 -0.559616 0.196171 227
LNA 19.91061 19.59551 26.90116 15.58090 2.348489 266
CA (%) 9.511881 8.582856 23.55120 0.692824 4.212780 266
LLR_GR (%) 4.444374 3.478054 18.92611 0.736721 3.538995 263
LQD (%) 113.1484 101.0671 472.8956 46.33655 59.65892 263
DA (%) 65.36209 69.16511 87.15188 17.99371 14.38814 266
CIR (%) 63.74924 55.71583 662.3022 -228.3687 61.26575 258
LLP_TL (%) 0.277366 0.176738 4.390573 -0.310925 0.418993 253
GDPGR (%) 3.920000 4.650000 19.10000 -8.900000 4.728366 280
INF (%) 3.107500 3.100000 7.500000 -2.800000 2.022574 280
RI (%) -0.402019 -0.379426 2.614286 -3.025000 0.728763 280
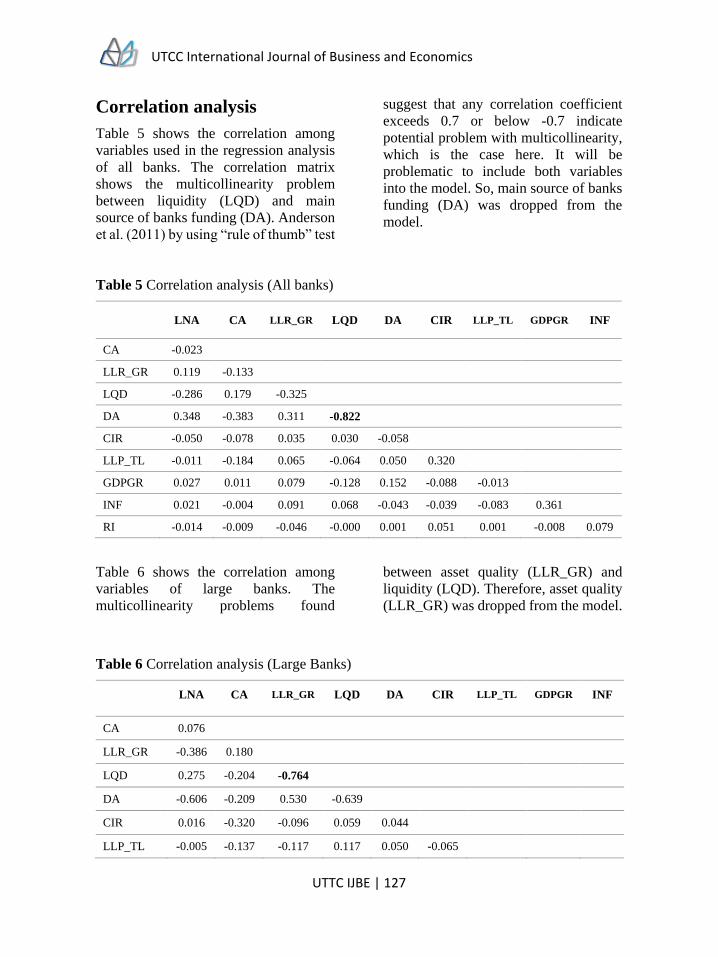
UTCC International Journal of Business and Economics
UTTC IJBE | 127
Correlation analysis
Table 5 shows the correlation among
variables used in the regression analysis
of all banks. The correlation matrix
shows the multicollinearity problem
between liquidity (LQD) and main
source of banks funding (DA). Anderson
et al. (2011) by using “rule of thumb” test
suggest that any correlation coefficient
exceeds 0.7 or below -0.7 indicate
potential problem with multicollinearity,
which is the case here. It will be
problematic to include both variables
into the model. So, main source of banks
funding (DA) was dropped from the
model.
Table 5 Correlation analysis (All banks)
LNA CA LLR_GR LQD DA CIR LLP_TL GDPGR INF
CA -0.023
LLR_GR 0.119 -0.133
LQD -0.286 0.179 -0.325
DA 0.348 -0.383 0.311 -0.822
CIR -0.050 -0.078 0.035 0.030 -0.058
LLP_TL -0.011 -0.184 0.065 -0.064 0.050 0.320
GDPGR 0.027 0.011 0.079 -0.128 0.152 -0.088 -0.013
INF 0.021 -0.004 0.091 0.068 -0.043 -0.039 -0.083 0.361
RI -0.014 -0.009 -0.046 -0.000 0.001 0.051 0.001 -0.008 0.079
Table 6 shows the correlation among
variables of large banks. The
multicollinearity problems found
between asset quality (LLR_GR) and
liquidity (LQD). Therefore, asset quality
(LLR_GR) was dropped from the model.
Table 6 Correlation analysis (Large Banks)
LNA CA LLR_GR LQD DA CIR LLP_TL GDPGR INF
CA 0.076
LLR_GR -0.386 0.180
LQD 0.275 -0.204 -0.764
DA -0.606 -0.209 0.530 -0.639
CIR 0.016 -0.320 -0.096 0.059 0.044
LLP_TL -0.005 -0.137 -0.117 0.117 0.050 -0.065

UTCC International Journal of Business and Economics
UTTC IJBE | 128
GDPGR -0.096 -0.011 0.185 -0.208 0.183 -0.082 -0.042
INF -0.170 0.006 0.067 0.058 0.089 -0.053 -0.059 0.391
RI 0.069 -0.015 -0.001 0.006 -0.015 -0.005 0.029 -0.004 0.107
Table 7 presents the correlation among
variables of medium and small banks.
The correlation analysis shows
multicollinearity problem between
liquidity (LQD) and main source of
banks funding (DA). So, this study drops
main source of banks funding (DA) from
the model.
Table 7 Correlation analysis: Medium and small banks
LNA CA LLR_GR LQD DA CIR LLP_TL GDPGR INF
CA 0.001
LLR_GR 0.183 -0.201
LQD -0.201 0.189 -0.336
DA 0.189 -0.422 0.313 -0.842
CIR 0.055 -0.085 0.055 -0.017 0.032
LLP_TL 0.074 -0.199 0.110 -0.112 0.135 0.320
GDPGR 0.058 0.019 0.021 -0.157 0.191 -0.114 -0.007
INF 0.080 -0.010 0.108 0.081 -0.076 -0.057 -0.107 0.337
RI -0.027 -0.010 -0.075 -0.004 0.013 0.070 -0.009 -0.011 0.052
Regression results
Table 8 shows the regression result of all
banks using least squares with White
heteroskedasticity-consistent standard
errors & covariance. The AR terms were
added to correct the serial correlation
problem.
Asset size (LNA) has positive and
significant relationship on ROE. It
suggests that banks with large assets
could have higher degree of product and
loan diversification than small banks
(Avaravci & Çalim, 2013) and thus
achieves higher profitability (Alper &
Anbar, 2013). Capital adequacy (CA) has
positive and significant relationship on
ROA and NIM, indicates banks ability to
absorb the potential losses and could
increase bank profitability.
Operational efficiency (CIR) has
negative and significant relationship on
ROA, ROE and NIM. It is consistent
with the previous studies (Almazari,
2014; Athanasoglou et al, 2008; Syafri,
2012 and Zeitun, 2012). It indicates that
the efficient bank will generate huge
profit than inefficient banks due to high
expenses. Credit risk (LLP_TL) has
negative and significant relationship on
ROA and ROE. This result is consistent
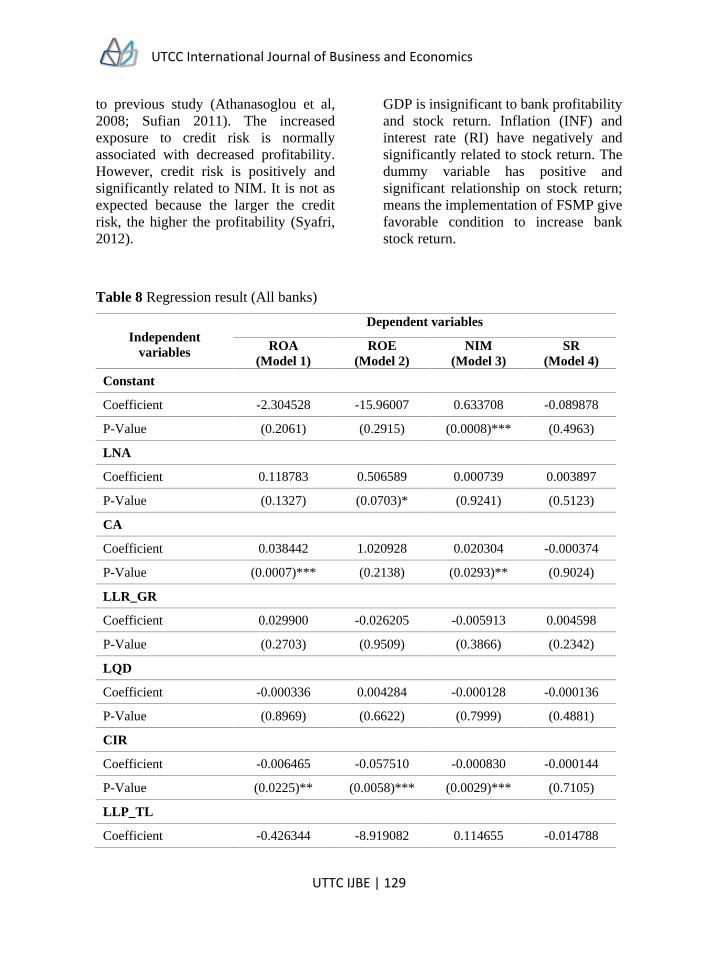
UTCC International Journal of Business and Economics
UTTC IJBE | 129
to previous study (Athanasoglou et al,
2008; Sufian 2011). The increased
exposure to credit risk is normally
associated with decreased profitability.
However, credit risk is positively and
significantly related to NIM. It is not as
expected because the larger the credit
risk, the higher the profitability (Syafri,
2012).
GDP is insignificant to bank profitability
and stock return. Inflation (INF) and
interest rate (RI) have negatively and
significantly related to stock return. The
dummy variable has positive and
significant relationship on stock return;
means the implementation of FSMP give
favorable condition to increase bank
stock return.
Table 8 Regression result (All banks)
Independent
variables
Dependent variables
ROA
(Model 1)
ROE
(Model 2)
NIM
(Model 3)
SR
(Model 4)
Constant
Coefficient -2.304528 -15.96007 0.633708 -0.089878
P-Value (0.2061) (0.2915) (0.0008)*** (0.4963)
LNA
Coefficient 0.118783 0.506589 0.000739 0.003897
P-Value (0.1327) (0.0703)* (0.9241) (0.5123)
CA
Coefficient 0.038442 1.020928 0.020304 -0.000374
P-Value (0.0007)*** (0.2138) (0.0293)** (0.9024)
LLR_GR
Coefficient 0.029900 -0.026205 -0.005913 0.004598
P-Value (0.2703) (0.9509) (0.3866) (0.2342)
LQD
Coefficient -0.000336 0.004284 -0.000128 -0.000136
P-Value (0.8969) (0.6622) (0.7999) (0.4881)
CIR
Coefficient -0.006465 -0.057510 -0.000830 -0.000144
P-Value (0.0225)** (0.0058)*** (0.0029)*** (0.7105)
LLP_TL
Coefficient -0.426344 -8.919082 0.114655 -0.014788

UTCC International Journal of Business and Economics
UTTC IJBE | 130
P-Value (0.0040)*** (0.0017)*** (0.0022)*** (0.5913)
GDPGR
Coefficient 0.004700 -0.049914 -0.000193 0.003133
P-Value (0.3922) (0.4284) (0.9197) (0.1100)
INF
Coefficient 0.001673 0.293149 0.000728 -0.020240
P-Value (0.8710) (0.2888) (0.9292) (0.0010)***
RI
Coefficient 0.007328 -0.415626 -0.011753 -0.070887
P-Value (0.7537) (0.2226) (0.3256) (0.0001)***
DUMMYFSMP
Coefficient 0.072203 2.411372 -0.069221 0.087144
P-Value (0.4393) (0.1854) (0.2519) (0.0003)***
R-Squared 0.572929 0.195202 0.384110 0.224007
Prob (F-statistic) 0.000000 0.000000 0.0000000 0.000000
Durbin-Watson 1.736005 2.028702 2.117681 1.986144
Observation 386 398 398 353
***, ** and * indicate significance level at 1%, 5% and 10% respectively.
Table 9 Regression result of large and medium and small banks
Independent
variables
Dependent variables
ROA (Model 1) ROE (Model 2) NIM (Model 3) SR (Model 3)
Large
banks
Medium
& Small
banks
Large
banks
Medium
& Small
banks
Large
banks
Medium
& Small
banks
Large
banks
Medium
& Small
banks
Constant
Coefficient 3.694106 -2.539684 39.09838 -22.72747 -0.828586 0.576012 1.932277 -0.086780
P-Value (0.0093)*** (0.2009) (0.0011)*** (0.2541) (0.4645) (0.0023)*** (0.1485) (0.5606)
LNA
Coefficient -0.129478 0.121223 -1.125182 0.500039 0.016065 -0.004955 -0.057130 0.003235
P-Value (0.0183)** (0.1330) (0.0079)*** (0.0882)* (0.7439) (0.4616) (0.1768) (0.6368)
CA
Coefficient 0.014837 0.046918 -0.286881 1.179439 0.016861 0.026248 0.001125 -0.000988
P-Value (0.0053)*** (0.0033)*** (0.0000)*** (0.2101) (0.0216)** (0.0026)*** (0.8999) (0.7311)
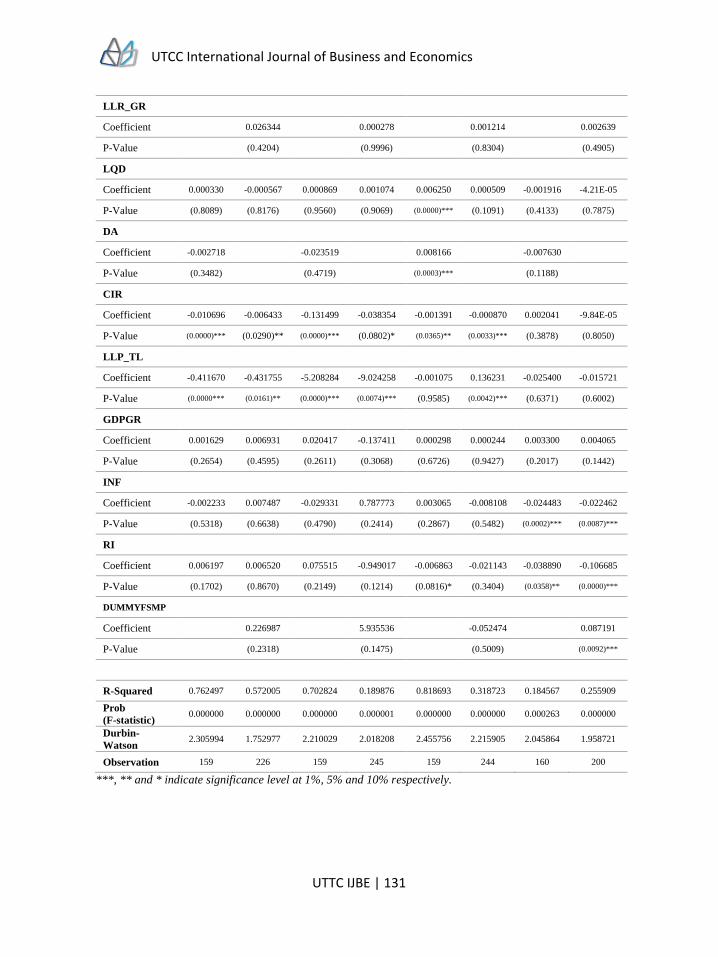
UTCC International Journal of Business and Economics
UTTC IJBE | 131
LLR_GR
Coefficient 0.026344 0.000278 0.001214 0.002639
P-Value (0.4204) (0.9996) (0.8304) (0.4905)
LQD
Coefficient 0.000330 -0.000567 0.000869 0.001074 0.006250 0.000509 -0.001916 -4.21E-05
P-Value (0.8089) (0.8176) (0.9560) (0.9069) (0.0000)*** (0.1091) (0.4133) (0.7875)
DA
Coefficient -0.002718 -0.023519 0.008166 -0.007630
P-Value (0.3482) (0.4719) (0.0003)*** (0.1188)
CIR
Coefficient -0.010696 -0.006433 -0.131499 -0.038354 -0.001391 -0.000870 0.002041 -9.84E-05
P-Value (0.0000)*** (0.0290)** (0.0000)*** (0.0802)* (0.0365)** (0.0033)*** (0.3878) (0.8050)
LLP_TL
Coefficient -0.411670 -0.431755 -5.208284 -9.024258 -0.001075 0.136231 -0.025400 -0.015721
P-Value (0.0000*** (0.0161)** (0.0000)*** (0.0074)*** (0.9585) (0.0042)*** (0.6371) (0.6002)
GDPGR
Coefficient 0.001629 0.006931 0.020417 -0.137411 0.000298 0.000244 0.003300 0.004065
P-Value (0.2654) (0.4595) (0.2611) (0.3068) (0.6726) (0.9427) (0.2017) (0.1442)
INF
Coefficient -0.002233 0.007487 -0.029331 0.787773 0.003065 -0.008108 -0.024483 -0.022462
P-Value (0.5318) (0.6638) (0.4790) (0.2414) (0.2867) (0.5482) (0.0002)*** (0.0087)***
RI
Coefficient 0.006197 0.006520 0.075515 -0.949017 -0.006863 -0.021143 -0.038890 -0.106685
P-Value (0.1702) (0.8670) (0.2149) (0.1214) (0.0816)* (0.3404) (0.0358)** (0.0000)***
DUMMYFSMP
Coefficient 0.226987 5.935536 -0.052474 0.087191
P-Value (0.2318) (0.1475) (0.5009) (0.0092)***
R-Squared 0.762497 0.572005 0.702824 0.189876 0.818693 0.318723 0.184567 0.255909
Prob
(F-statistic) 0.000000 0.000000 0.000000 0.000001 0.000000 0.000000 0.000263 0.000000
Durbin-
Watson 2.305994 1.752977 2.210029 2.018208 2.455756 2.215905 2.045864 1.958721
Observation 159 226 159 245 159 244 160 200
***, ** and * indicate significance level at 1%, 5% and 10% respectively.
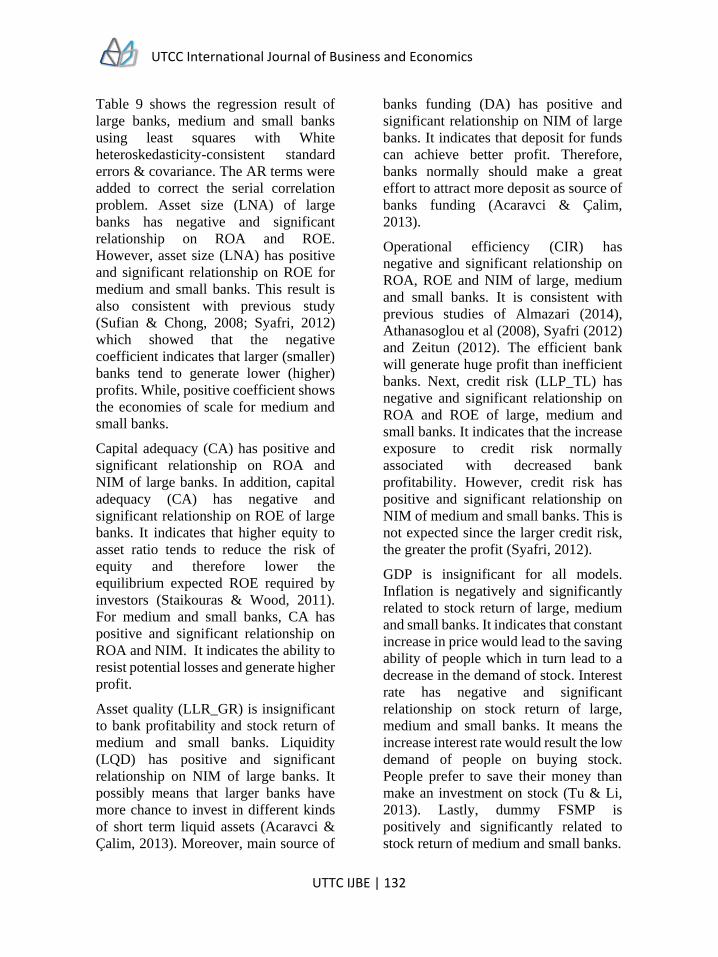
UTCC International Journal of Business and Economics
UTTC IJBE | 132
Table 9 shows the regression result of
large banks, medium and small banks
using least squares with White
heteroskedasticity-consistent standard
errors & covariance. The AR terms were
added to correct the serial correlation
problem. Asset size (LNA) of large
banks has negative and significant
relationship on ROA and ROE.
However, asset size (LNA) has positive
and significant relationship on ROE for
medium and small banks. This result is
also consistent with previous study
(Sufian & Chong, 2008; Syafri, 2012)
which showed that the negative
coefficient indicates that larger (smaller)
banks tend to generate lower (higher)
profits. While, positive coefficient shows
the economies of scale for medium and
small banks.
Capital adequacy (CA) has positive and
significant relationship on ROA and
NIM of large banks. In addition, capital
adequacy (CA) has negative and
significant relationship on ROE of large
banks. It indicates that higher equity to
asset ratio tends to reduce the risk of
equity and therefore lower the
equilibrium expected ROE required by
investors (Staikouras & Wood, 2011).
For medium and small banks, CA has
positive and significant relationship on
ROA and NIM. It indicates the ability to
resist potential losses and generate higher
profit.
Asset quality (LLR_GR) is insignificant
to bank profitability and stock return of
medium and small banks. Liquidity
(LQD) has positive and significant
relationship on NIM of large banks. It
possibly means that larger banks have
more chance to invest in different kinds
of short term liquid assets (Acaravci &
Çalim, 2013). Moreover, main source of
banks funding (DA) has positive and
significant relationship on NIM of large
banks. It indicates that deposit for funds
can achieve better profit. Therefore,
banks normally should make a great
effort to attract more deposit as source of
banks funding (Acaravci & Çalim,
2013).
Operational efficiency (CIR) has
negative and significant relationship on
ROA, ROE and NIM of large, medium
and small banks. It is consistent with
previous studies of Almazari (2014),
Athanasoglou et al (2008), Syafri (2012)
and Zeitun (2012). The efficient bank
will generate huge profit than inefficient
banks. Next, credit risk (LLP_TL) has
negative and significant relationship on
ROA and ROE of large, medium and
small banks. It indicates that the increase
exposure to credit risk normally
associated with decreased bank
profitability. However, credit risk has
positive and significant relationship on
NIM of medium and small banks. This is
not expected since the larger credit risk,
the greater the profit (Syafri, 2012).
GDP is insignificant for all models.
Inflation is negatively and significantly
related to stock return of large, medium
and small banks. It indicates that constant
increase in price would lead to the saving
ability of people which in turn lead to a
decrease in the demand of stock. Interest
rate has negative and significant
relationship on stock return of large,
medium and small banks. It means the
increase interest rate would result the low
demand of people on buying stock.
People prefer to save their money than
make an investment on stock (Tu & Li,
2013). Lastly, dummy FSMP is
positively and significantly related to
stock return of medium and small banks.
UTCC International Journal of Business and Economics
UTTC IJBE | 133
Conclusion and
discussion
The study examines the relationship of
bank-specific and macroeconomic
factors on bank profitability and stock
return in Thailand over the period of
2004-2013. The sample includes 11
commercial banks listed in Stock
Exchange of Thailand. It is important to
notice that regression result of asset size
different between large banks and
medium and small banks. It means that
there are economies of scale for small
(and medium) banks and diseconomies
of scale for large banks (Sufian & Chong,
2008).
Capital adequacy of large banks also
found to be negative and significant to
ROE. Capital adequacy requirement
limits the risk profile of investment of
large banks and thus affect on its ability
to reach their target level of profitability
(Almazari, 2013). Liquidity of large
banks has positive and significant
relationship to bank profitability. It
indicates that large banks have more
opportunities to invest in short term
liquid assets. In addition, DA of large
banks is positive and significant to bank
profitability. Banks normally should
make great effort to attract more deposit
as source of banks funding (Acaravci &
Çalim, 2013). Larger banks possibly
more involve in fulfilling depositor’s
obligations than investment (Ongore &
Kusa, 2013).
Another important result is that
operational efficiency is negatively and
significantly related to bank profitability
of large, medium and small banks. The
inefficient banks will generate small
profit even it is larger, medium or small
banks (Syafri, 2012). Credit risk is
negatively and significantly related to
bank profitability. The possibility is that
banks in Thailand during the
implementation of FSMP have increased
their loan loss provision for future
economic uncertainty due to large
amount of non-performing loans. This
argument is supported by the report
released by Bank of Thailand which
stated that banks increased the ratio of
actual loan loss provision to regulatory
loan loss provision to 168.3% (BOT
press release No.4/2014).
The findings are considered important
for policy makers and bank managers.
Recommendations were given based on
the empirical results: First, banks need to
maintain its liquidity due to their ability
to meet its obligations when depositors
want to withdraw funds and also when
borrowers want to make sure that their
cash needs will be met by banks. Second,
banks need to reduce the cost of
operations as it will minimize the
incidence of bank failure and thus
strengthen shareholder confidence and
the public through the better performance
of banks. Third, the study recommends
the necessity to improve other activities
as sources of funds. Fourth, banks need
to carefully identify the potential risks
amidst growing economic risk and rising
bad loans by maintaining higher loan loss
provision as it will sustain banks for the
worst scenarios in economic conditions.
This study only focuses on commercial
banks listed in Stock Exchange of
Thailand. For future study, all banks need
to include in order getting more picture
of the impact of the implementation of
FSMP. Periods before the
implementation of FSMP are also
important to consider.
UTCC International Journal of Business and Economics
UTTC IJBE | 134
References
Abduh, M., Omar, M., & Mesic, E. (2012). Profitability determinants of Islamic and
conventional banks in Malaysia: a panel regression approach. Paper presented at
the Terengganu International Business and Economic Conference (TiBEC III),
Malaysia.
Aburime, T. U. (2008). Determinants of Bank Profitability: Company-Level Evidence
from Nigeria. Available at SSRN 1106825.
Acaravci, S. K., & Çalim, A. E. (2013). Turkish Banking Sector's Profitability Factors.
International Journal of Economics & Financial Issues (IJEFI), 3(1).
Albertazzi, U., & Gambacorta, L. (2009). Bank profitability and the business cycle. Journal
of Financial Stability, 5(4), 393-409. doi: http://dx.doi.org/10.1016/j.jfs.2008.
10.002
Ali, K., Akhtar, M. F., & Ahmed, H. Z. (2011). Bank-Specific and Macroeconomic
Indicators of Profitability-Empirical Evidence from the Commercial Banks of
Pakistan. International Journal of Business and Social Science, 2(6), 235-242.
Almazari, A. A. (2013). Capital Adequacy, Cost Income Ratio and the Performance of
Saudi Banks. International Journal of Academic Research in Accounting, Finance
& Management Sciences, 3(4), 284-293.
Almazari, A. A. (2014). Impact of Internal Factors on Bank Profitability: Comparative
Study between Saudi Arabia and Jordan. Journal of Applied Finance & Banking,
4(1), 125-140.
Alper, D., & Anbar, A. (2011). Bank specific and macroeconomic determinants of
commercial bank profitability: empirical evidence from Turkey. Business and
Economics Research Journal, 2(2), 139-152.
Anderson, D. R., Sweeney, D. J., & Williams, T. A. (2011). Statistics for Business and
Economics, Eleventh Edition: South-Western Cengage Learning.
Athanasoglou, P. P., Brissimis, S. N., & Delis, M. D. (2008). Bank-specific, industry-
specific and macroeconomic determinants of bank profitability. Journal of
International Financial Markets, Institutions and Money, 18(2), 121-136. doi:
http://dx.doi.org/10.1016/j.intfin.2006.07.001
Bank of Thailand (2013). Performance of the Thai Banking System in 2013 [Press
Release]. Retrieved November 17, 2014, from
www.bot.or.th/English/FinancialInstitutions/New_Publications/KeyDevFI/Perfro
manceBank/Documents/n0457e.pdf
Ben Naceur, S., & Goaied, M. (2008). The Determinants of Commercial Bank Interest
Margin and Profitability: Evidence from Tunisia. Frontiers in Finance &
Economics, 5(1).
UTCC International Journal of Business and Economics
UTTC IJBE | 135
Bilal, M., Saeed, A., Gull, A. A., & Akram, T. (2013). Influence of Bank Specific and
Macroeconomic Factors on Profitability of Commercial Banks: A Case Study of
Pakistan. Research Journal of Finance and Accounting, 4(2), 117-126.
Bonin, J. P., Hasan, I., & Wachtel, P. (2005). Bank performance, efficiency and ownership
in transition countries. Journal of Banking & Finance, 29(1), 31-53. doi:
http://dx.doi.org/10.1016/j.jbankfin.2004.06.015
Chantapong, S. (2005). Comparative Study of Domestic and Foreign Bank Performance in
Thailand: The Regression Analysis. Economic Change and Restructuring, 38(1),
63-83. doi: 10.1007/s10644-005-4523-5
Cole, R. A., Moshirian, F., & Wu, Q. (2008). Bank stock returns and economic growth.
Journal of Banking & Finance, 32(6), 995-1007. doi:
http://dx.doi.org/10.1016/j.jbankfin.2007.07.006
Davydenko, A. (2010). Determinants of Bank Profitability in Ukraine. Undergraduate
Economic Review, 7(1), 2.
Dietrich, A., & Wanzenried, G. (2009). What determines the profitability of commercial
banks? New evidence from Switzerland. Paper presented at the 12th Conference of
the Swiss Society for Financial Market Researches, Geneva. Discussion Paper.
Drobetz, W., Erdmann, T., & Zimmermann, H. (2007). Predictability in the cross-section
of European bank stock returns.
Gul, S., Irshad, F., & Zaman, K. (2011). Factors Affecting Bank Profitability in Pakistan.
The Romanian Economic Journal, 39, 61-87.
Hasan, N., Shaari, N., Palanimally, Y., & Haji-Mohamed, R. (2013). The Impact of
Macroeconomic and Bank Specific Components on the Return of Equity in
Malaysia. Interdisciplinary Journal of Contemporary Research in Business, 5(2),
106-126.
Ibrahim, T. M., & Agbaje, O. M. (2013). The Relationship between Stock Return and
Inflation in Nigeria. European Scientific Journal, 9(4).
Javaid, S., Anwar, J., Zaman, K., & Gafoor, A. (2011). Determinants of Bank Profitability
in Pakistan: Internal Factor Analysis. Mediterranean Journal of Social Sciences,
2(1), 59.
Jeyanthi, B. J. Q., & William, S. J. M. A. (2010). Bank Stock Performance since the 2000s.
CURIE Journal, 3(1), 82-93.
Karim, B. K., Sami, B. A. M., & Hichem, B.-K. (2010). Bank-specific, Industry-specific
and Macroeconomic Determinants of African Islamic Banks' Profitability.
International Journal of Business & Management Science, 3(1), 39-56.
Kasman, S., & Kasman, A. (2011). Efficiency, Productivity and Stock Performance:
Evidence from the Turkish Banking Sector. Panoeconomicus, 58(3), 355-372. doi:
10.2298/PAN1103355K
UTCC International Journal of Business and Economics
UTTC IJBE | 136
Kosmidou, K., Tanna, S., & Pasiouras, F. (2005). Determinants of profitability of domestic
UK commercial banks: panel evidence from the period 1995-2002. Paper
presented at the Money Macro and Finance (MMF) Research Group Conference.
Li, L. (2013). Market-based vs. Accounting-based Performance of Banks in Asian
Emerging Markets. Asian Journal of Business Research(Special Issue), 14-31.
Luthra, M., & Mahajan, S. (2014). Impact of Macro factors on BSE Bankex. International
Journal of Current Research and Academic Review, 2(2), 179-186.
Mamatzakis, E., & Remoundos, P. (2003). Determinants of Greek commercial banks
profitability, 1989-2000. Spoudai, 53(1), 84-94.
Molyneux, P., & Thornton, J. (1992). Determinants of European bank profitability: A note.
Journal of Banking & Finance, 16(6), 1173-1178. doi:
http://dx.doi.org/10.1016/0378-4266(92)90065-8
Muda, M., Shaharuddin, A., & Embaya, A. (2013). Comparative Analysis of Profitability
Determinants of Domestic and Foreign Islamic Banks in Malaysia. International
Journal of Economics & Financial Issues (IJEFI), 3(3).
Olson, D., & Zoubi, T. A. (2011). Efficiency and bank profitability in MENA countries.
Emerging Markets Review, 12(2), 94-110. doi: http://dx.doi.org/10.1016/j.
ememar.2011.02.003
Ongore, V. O., & Kusa, G. B. (2013). Determinants of Financial Performance of
Commercial Banks in Kenya. International Journal of Economics and Financial
Issues, 3(1), 237-252.
Perera, S., Skully, M., & Chaudrey, Z. (2013). Determinants of Commercial Bank
Profitability: South Asian Evidence. Asian Journal of Finance & Accounting, 5(1),
365-380.
Saeed, S., & Akhter, N. (2012). Impact of Macroeconomic Factors on Bank Index in
Pakistan. Interdisciplinary Journal of Contemporary Research in Business, 4(6).
Sastrosuwito, S., & Suzuki, Y. (2011). Post Crisis Indonesian Banking System
Profitability: Bank-Specific, Industry-Specific, and Macroeconomic
Determinants. Paper presented at the 2nd international research symposium in
service management Yogyakarta, Indonesia.
Staikouras, C. K., & Wood, G. E. (2011). The determinants of European bank profitability.
International Business & Economics Research Journal (IBER), 3(6).
Sufian, F. (2009). Determinants of bank profitability in a developing economy: empirical
evidence from the China banking sector. Journal of Asia-Pacific Business, 10(4),
281-307.
Sufian, F. (2011). Profitability of the Korean banking sector: panel evidence on bank-
specific and macroeconomic determinants. Journal of Economics and
Management, 7(1), 43-72.
UTCC International Journal of Business and Economics
UTTC IJBE | 137
Sufian, F., & Chong, R. R. (2008). Determinants of Bank profitability in a developing
economy: Empirical evidence from the Philippines. Asian Academy of
Management Journal of Accounting and Finance, 4(2), 91-112.
Sufian, F., & Kamarudin, F. (2012). Bank-Specific and Macroeconomic Determinants of
Profitability of Bangladesh’s Commercial Banks. Bangladesh Development
Studies, 35(4).
Syafri. (2012). Factors Affecting Bank Profitability in Indonesia. Paper presented at the
The 2012 International Conference on Business and Management 6-7 September
2012, Phuket-Thailand. http://www.caalinteduorg.com/ibsm2012/ejournal/018
Mix-Syafri-Factors_Affecting_Bank_ Profitability.pdf
Tabari, N. A. Y., Ahmadi, M., & Toyeh, M. S. (2013). The Effective Factors on
Profitability of Commercial Banks in Iran. World of Sciences Journal, 1(9), 1-9.
Tangjitprom, N. (2012). The Review of Macroeconomic Factors and Stock Returns.
International Business Research, 5(8).
Tu, L., & Li, L. (2013). The Impact of Macro-Economic Factors on Banking Industry Stock
Return in China. Journal of Finance, Investment, Marketing and Administration,
3(1), 200-218.
Yılmaz, A. A. (2013). Profitability of Banking System: Evidence From Emerging Markets.
Paper presented at the WEI International Academic Conference, Turkey.
Zeitun, R. (2012). Determinants of Islamic and Conventional Banks Performance in GCC
Countries Using Panel Data Analysis. Global Economy and Finance Journal, 5(1),
53-72.

UTCC International Journal of Business and Economics
UTTC IJBE | 138
UTCC International Journal of Business and Economics
UTTC IJBE | 139
UTCC International Journal of Business and Economics (UTCC IJBE)
Volume 10 Number 1, April 2018
The impact of social media on hospitality
brand and image
Chanin Yoopetch College of Management, Mahidol University
Abstract
Social media is one of the most important and cost-effective tools for businesses to promote
their brand. Brand equity is known to have influence on the consumer’s decision to adopt
the brand. This paper examines consumers' perception towards social media used by
hospitality firms (e.g. hotels and airlines) in order to create corporate image and to support
brand equity. The author used data from semi-structure interviews. The samples are
business travellers having experiences with the social media application of the hospitality
firms. The results indicated that using social media has crucial role in determining the
corporate image and brand equity. Hospitality firms used several types of social media,
including text and video formats in order to convey intended information to the customers.
Findings are discussed with regard to their implications for the image and brand promotions
through the social media of the firms.
Keywords: Social media, Corporate image, Brand equity
UTCC International Journal of Business and Economics
UTTC IJBE | 140
Introduction
In today’s business world, new
technology can change the way of
communication between the businesses
and the customers. With social media, a
company can send the information and
share news to their customers much
faster with much less cost. In response to
the trend of adopting social media,
hospitality firms participate and make
friends with their users or potential
customers. In the past recent years, the
competition in hospitality has never been
more intense and the customers have
several new choices of companies for the
hospitality products and services that
they can support. Therefore, as a tool to
strengthen their strategy, a large number
of hospitality firms- ranging from
airlines, hotels to restaurants- introduced
their social media tools, such as
Facebook, YouTube and Twitter,
through the Internet websites and mobile
applications, in the attempt to familiarize
with the customers and to build long-
term relationship with their customers.
Schivinski & Dabrowski (2016) noted
that the communication through social
media communication has been
systematically applied by most
businesses to improve the impression of
the brands towards the target customers.
With the extensive uses of social media,
however, little research has been
conducted about the application of social
media towards corporate image and
brand equity from the perception of the
customers (Dailey, 2009). Due to the
increasing importance of social media in
branding and corporate image building, it
is essential for hospitality managers to
understand more clearly about how to
better use the social media to achieve
business objectives.
Literature review
Definition of social media
Social media are new information
network and information technology
using a form of communication utilizing
interactive and user-produced content,
and interpersonal relationships are
created and maintained (Diga &
Kelleher, 2009). Typical social media
network services could be content
sharing, web communities, and Internet
forums (Sensis, 2011). According to
Eysenbach (2008), at least five major
features of social media are easy to
identify, including social networking and
social interaction, participation, the use
of different providers (e.g. search
engines, blog spaces, etc.) openness, and
collaboration (between both users and
user groups).
The most popular social networking sites
have changed over the years. Here is a
few of the popular sites based on
communication and brand exposure
criteria, including Facebook, LinkedIn,
MySpace, and Twitter (Turner & Shah,
2011). Nevertheless, YouTube is one of
the trendiest social networks people are
using both on the web and mobile right
now (Miletsky, 2014).
Various usage of social media to promote
the brand, including the crisis, for
example, from the study of Hsu &
Lawrence (2016), social media can be a
highly effective tool to deal with the
product recall crisis and to regain trust
from the customers. In addition, Bruhn,
Schoenmueller, & Schäfer (2012) noted
that the impact of social media on the
UTCC International Journal of Business and Economics
UTTC IJBE | 141
firms can divide into two levels of
communication, including firm‐created
and user‐generated social media
communication.
Brand equity
Brand equity is known as one of the
important concepts in marketing
literature. In addition, the concept is also
adopted in the financial studies, where
researchers attempt to quantify the brand
equity of the corporation and further to be
compared and to explore the change of
the brand equity over time (Simon and
Sullivan, 1993). Brand awareness is a
predecessor of brand equity and the
brand equity can be considered the
market outcome of the firm (Huang, &
Sarigöllü, 2014; Silverman, Sprott, &
Pascal, 1999). The monetary value of the
brand is reflected in the response of the
consumers to the brand, including how
much they are willing to pay for the
particular brand (Christodoulides and de
Chernatony, 2010; Hemsley-Brown,
Melewar, Nguyen, & Wilson, 2016).
Bruhn et al., (2012) suggested that social
media can be useful for the firms to
promote the brand equity. Khanna,
Jacob, & Yadav (2014) indicated that
usage of social media can improve the
touch points with the customers through
many channels of social media, such as
Facebook and YouTube. The frequent
visibility of the brand can directly affect
perception of the customers.
This study focused on the consumer
perspective, which is based on the
foundation that the influence of brands
lies in the minds of consumers (Leone et
al., 2006). The early work of Aaker
(1991) provided the definition of brand
equity as the viewpoint of customers
towards the combination of many
characteristics of the brand, including
brand awareness, perceived quality,
brand associations, brand loyalty and
other proprietary assets.
Corporate image
Keller (1993) defined corporate image as
perceptions of an organization reflected
in the associations held in consumers’
memory. Nguyen and LeBlanc (1998)
defined corporate image as a subjective
knowledge, or attitude such as ideology,
corporate name, reputation and quality of
delivery system. All of these
characteristics contribute to build the
corporate image. Kandampully and Hu
(2007) further stated that corporate
image consisted of two main
components. The first aspect is
functional component, such as the
tangible characteristics that can be
measured and evaluated easily. The
second one is emotional component,
including feelings, attitudes and beliefs
that people have towards the
organization. The emotional component
is considered a consequence from
accumulative experiences that customers
have with the passage of time with the
organization.
In addition, corporate image is defined as
the overall impression left in the
customers’ mind as a result of
accumulative feelings, ideas, attitudes
and experiences with the organization,
stored in memory, transformed into a
positive/negative meaning, retrieved to
reconstruct image and recalled when the
name of the organization is heard or
brought to ones’ mind (Kazoleas et al.,
2001; Hatch et al., 2003). Thus, corporate
image is a result of communication
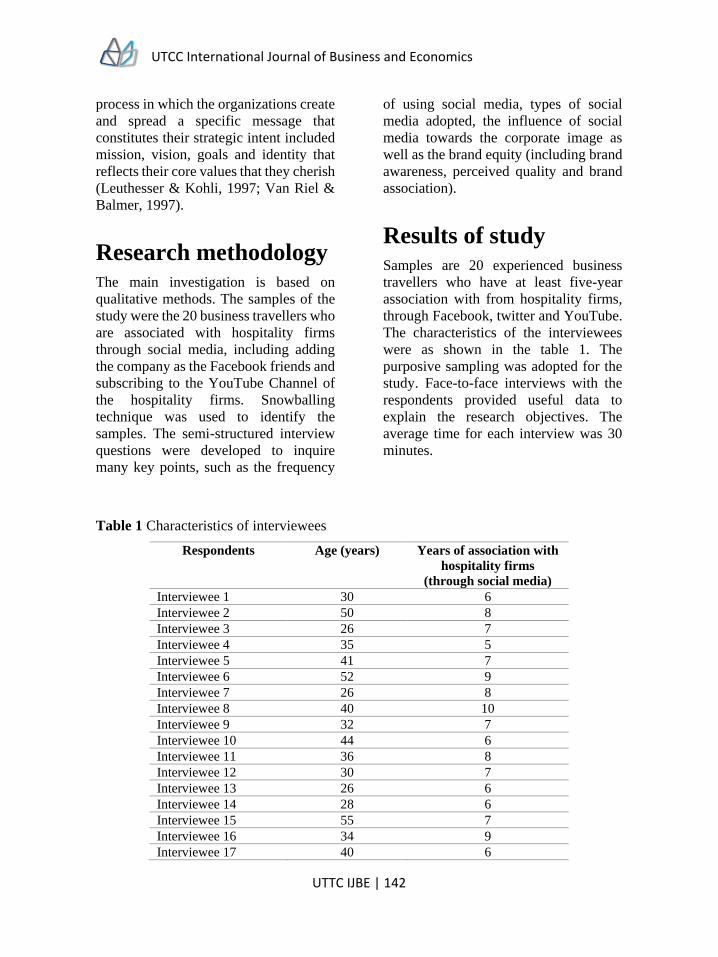
UTCC International Journal of Business and Economics
UTTC IJBE | 142
process in which the organizations create
and spread a specific message that
constitutes their strategic intent included
mission, vision, goals and identity that
reflects their core values that they cherish
(Leuthesser & Kohli, 1997; Van Riel &
Balmer, 1997).
Research methodology The main investigation is based on
qualitative methods. The samples of the
study were the 20 business travellers who
are associated with hospitality firms
through social media, including adding
the company as the Facebook friends and
subscribing to the YouTube Channel of
the hospitality firms. Snowballing
technique was used to identify the
samples. The semi-structured interview
questions were developed to inquire
many key points, such as the frequency
of using social media, types of social
media adopted, the influence of social
media towards the corporate image as
well as the brand equity (including brand
awareness, perceived quality and brand
association).
Results of study
Samples are 20 experienced business
travellers who have at least five-year
association with from hospitality firms,
through Facebook, twitter and YouTube.
The characteristics of the interviewees
were as shown in the table 1. The
purposive sampling was adopted for the
study. Face-to-face interviews with the
respondents provided useful data to
explain the research objectives. The
average time for each interview was 30
minutes.
Table 1 Characteristics of interviewees
Respondents Age (years) Years of association with
hospitality firms
(through social media)
Interviewee 1 30 6
Interviewee 2 50 8
Interviewee 3 26 7
Interviewee 4 35 5
Interviewee 5 41 7
Interviewee 6 52 9
Interviewee 7 26 8
Interviewee 8 40 10
Interviewee 9 32 7
Interviewee 10 44 6
Interviewee 11 36 8
Interviewee 12 30 7
Interviewee 13 26 6
Interviewee 14 28 6
Interviewee 15 55 7
Interviewee 16 34 9
Interviewee 17 40 6
UTCC International Journal of Business and Economics
UTTC IJBE | 143
Interviewee 18 29 9
Interviewee 19 38 7
Interviewee 20 43 10
Respondents’ usage of social
media of the hospitality firms
From 20 respondents, the findings show
that the three most frequency used social
media by respondents are Facebook,
Instagram, and Twitter. The reasons in
using of social media of most
respondents included communicating
and connecting with friends, relatives,
and other people; sharing information
such as photos, thoughts, and feelings;
and updating news, trend, and upcoming
events. For example, one respondent said
like “I use social media to keep connect
with friends and family, to share
information, and to get to know the news
or things happen in daily” (Interviewee
1). Another respondent stated “Social
media is a good way to contact friends,
stay updated with new trends and
fashion, and stay on track with work for
college and personal businesses”
(Interviewee 6).
In terms of the frequency of using social
media, the results indicated that every
respondent use social media in everyday
and for many times a day. As one
respondent said that “I use social media
most of the time a day. I always check for
up-to-dated newsfeed every time if I am
free. I can say I access to Facebook every
hour (at least once) and I watch some
videos on YouTube every day as well”
(Interviewee 20). Another respondent
also said that “I use social media on a
daily basis and multiple hours a day
because I am always curious what my
friends and family are up to”
(Interviewee 5).
Hospitality firms on social
media
The majority of respondents identified
that hospitality firms, particularly hotel
chained businesses, used social media to
promote their brands. The most popular
social media used by those hospitality
firms are Facebook and Instagram. For
example, “Hotel firms like Hyatt,
Starwood, IHG released their own
mobile apps. Also many businesses have
used Facebook, Instagram, and other
social media to promote their
businesses” (Interviewee 9), said by one
respondent. Another respondent stated
that “Starwood promotes their brands on
Instagram because nowadays everyone
uses this application. It helps them to
attract more customers. Wyndham,
Marriott and Hilton also have mobile
application” (Interviewee 12). “This is
one way to advertise their brand with less
expense so many brands using this
strategy such as Centara hotel group,
Hilton, Marriott and Oriental”
(Interviewee 16), said by one respondent.
Building corporate image
through social media
When the hospitality firms use social
media to promote their brands, most of
respondents thought that the image of
those firms would be high in technology,
trendy, and helpful. For example, “By
UTCC International Journal of Business and Economics
UTTC IJBE | 144
using online channel, which is cost-
effective and easy to reach out people, it
is very useful for both the firms and
customers as it is very convenient.
Moreover, it can be seen as being trendy
and high tech to use this technology to
promote their brands as well”
(Interviewee 3), said by one respondent.
One of the interviewee said that “I found
these hospitality firms that promote their
brands through social media are very
high tech and helpful as it's very easy for
me to see their properties in many
pictures. At the same time, people who
already went there can come and do
comments on those pictures to share their
experiences as well” (Interviewee 19).
Besides, one respondent also said that “It
is helpful as it will be easier and quicker
to distribute the news to customers in
different places at once” (Interviewee
14).
Social media on brand equity
Next findings further generate that half of
respondents though the brand has higher
value because they use social media,
where as another half of respondent did
not think so. For respondents who say
yes, most of them agreed that the brand
has higher value from using social media
because they try to develop themselves to
fit with today’s trend. For example, one
interviewee stated that “I agree because
it's like they do care their customers and
try to develop their service all the times”
(Interviewee 2). Another respondent said
that “I think it can have higher value
from utilizing social media as people can
look at them as being trendy and adapt
themselves to today's way of
communication. Moreover, people can
choose one brand over another if they see
their brand names more often”
(Interviewee 6). “Using social media
adds value to the brand because it
implies customers that such brand keeps
developing itself, follow the trend, and
know how to reach the customers”
(Interviewee 13).
Moreover, most of respondents agreed
that social media could raise the
awareness of people in those brands. As
one interviewee stated that “I support
using social media because it is
convenient for firms to reach out people
promoting themselves to raise their
brand awareness. It is also faster and
cost effective than traditional way”
(Interviewee 8). With social media, the
hospitality firms not only provided
information about services, special
offers, and shared experiences of other
customers, but also allowed and
encouraged the customers to respond
their feedback to the firms. In the end, the
customers constantly help promoting and
creating the brand and the image for these
hospitality companies.
Discussions
As portrayed in the results, social media
has been adopted and widely used by
hotels, because of several benefits,
including cost effectiveness, high level of
responsiveness with the customers, and
brand and image creation. The findings
show that the three most frequency used
social media by respondents are
Facebook, Instagram, and Twitter. This
is supported by Kuvykaite and
Piligrimiene (2013) and Tuten (2008),
suggesting that the social media,
including Facebook and Twitter, are
highly used, based on communication
and brand exposure.
UTCC International Journal of Business and Economics
UTTC IJBE | 145
When the hospitality firms use social
media to promote their brands, most of
respondents thought that the image of
those firms would be high in technology,
trendy, and helpful. According to Gilpin
(2010), many businesses expanded their
use of social media to drive innovation in
their products and services. Correa et al.,
(2010) further implied that businesses are
already coming to terms with the need to
integrate their social media efforts with
their content strategy, and are seeing the
impact of social media in terms of lead
generation. Despite, people are more
likely to communicate through both
word-of-mouth and social media when
they are engaged with the product,
service, or idea.
Additionally, this study also found that
most of respondents supported the idea of
using social media to support the
company image and brand equity,
comparing with the traditional media
because social media can raise the
awareness of people in those brands.
Social media marketing concepts and
techniques basically consist of increase
brand awareness of services, increase
sales, educate and inform customers,
improve customer service, and monitor
brand reputation (Bruhn et al., 2012;
Khanna et al., 2014).
Figure 1 summarized the integrated
relationship among several crucial
factors. Firstly, stakeholders, including
current customers and other social media
users, contributed their data and
information into the overall format of the
firm’s social media. Secondly, combined
information through social media helped
forming the corporate image. Thirdly,
repeated and clear corporate image can
develop the brand equity in the
perception of the customers.
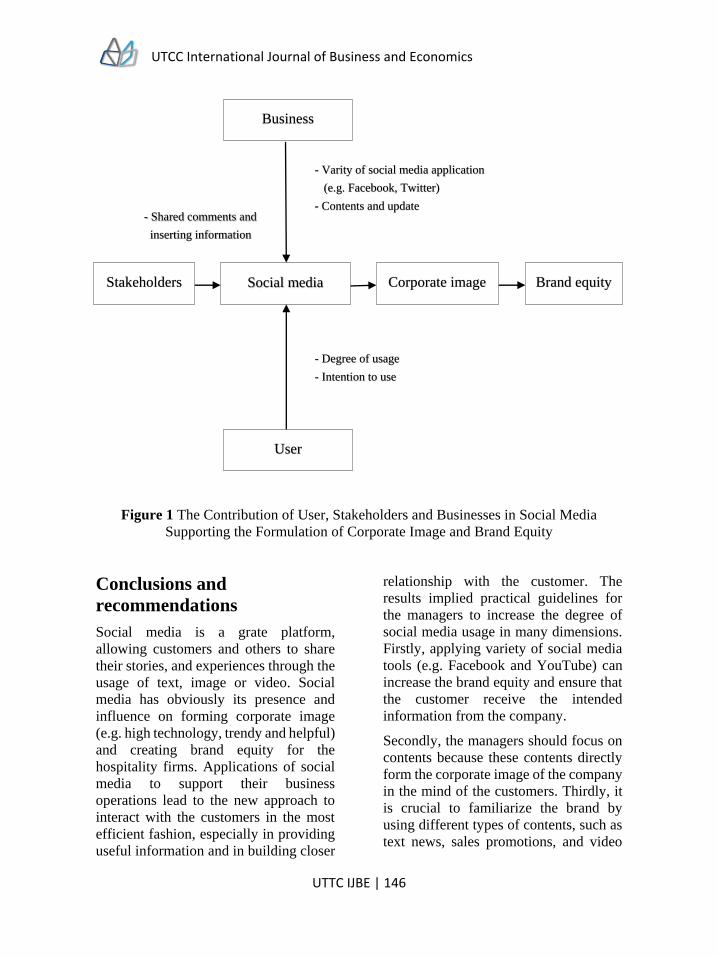
UTCC International Journal of Business and Economics
UTTC IJBE | 146
Figure 1 The Contribution of User, Stakeholders and Businesses in Social Media
Supporting the Formulation of Corporate Image and Brand Equity
Conclusions and
recommendations
Social media is a grate platform,
allowing customers and others to share
their stories, and experiences through the
usage of text, image or video. Social
media has obviously its presence and
influence on forming corporate image
(e.g. high technology, trendy and helpful)
and creating brand equity for the
hospitality firms. Applications of social
media to support their business
operations lead to the new approach to
interact with the customers in the most
efficient fashion, especially in providing
useful information and in building closer
relationship with the customer. The
results implied practical guidelines for
the managers to increase the degree of
social media usage in many dimensions.
Firstly, applying variety of social media
tools (e.g. Facebook and YouTube) can
increase the brand equity and ensure that
the customer receive the intended
information from the company.
Secondly, the managers should focus on
contents because these contents directly
form the corporate image of the company
in the mind of the customers. Thirdly, it
is crucial to familiarize the brand by
using different types of contents, such as
text news, sales promotions, and video
Business
Social media Stakeholders Corporate image Brand equity
User
- Varity of social media application
(e.g. Facebook, Twitter)
- Contents and update
- Degree of usage
- Intention to use
- Shared comments and
inserting information
UTCC International Journal of Business and Economics
UTTC IJBE | 147
clips, to encourage the customers to
engage more with the brand, products
and services. In addition, due to the
effectiveness of using social media, the
hospitality firms can offer special
promotion through ‘only’ social media to
encourage the customers to frequently
visit the social media channels and to
share the information with their friends.
Directions for further
research
There are many great opportunities for
the research in the field of social media
to investigate the specific types of social
media and their influence on the image
and brand equity. In addition, researchers
can further conduct the quantitative study
in order to understand more clearly about
the strength of relationship among these
factors. Additionally, the researchers
may study in other industries about
different types of products or services so
that the generalization of the findings can
be enhanced. It is also interesting to
conduct the more in-depth study among
the firms in the same industry (e.g.
airline) to find out about how the degree
of using social media affects the
corporate image and brand equity.
Cultural aspects of adopting social media
among consumers with diverse
background can help the managers
understand more about how to apply the
social media tools to different groups of
customers. Additionally, according to
Bruhn et al., (2012), the levels of social
media communication can be further
explored in the deeper levels in terms of
firm-level and consumer-level impacts
and quantitative studies may be useful to
investigate and compare the levels of
impacts so that the companies can later
improve their communication strategy to
meet with their business goals.
References
Aaker, D. A. (2009). Managing brand equity. Simon and Schuster.
Bruhn, M., Schoenmueller, V., & Schäfer, D. B. (2012). Are social media replacing
traditional media in terms of brand equity creation? Management Research
Review, 35(9), 770 – 790.
Christodoulides, G., & De Chernatony, L. (2010). Consumer-based brand equity
conceptualization and measurement: A literature review. International journal of
research in marketing, 52(1), 43-66.
Correa, T., Hinsley, A. W., & De Zuniga, H. G. (2010). Who interacts on the Web?: The
intersection of users’ personality and social media use. Computers in Human
Behavior, 26, 247-253.
Dailey, P. R. (2009). Social Media: Finding Its Way Into Your Business Strategy and
Culture. The Linkage Leader, 1-20.
Diga, M., & Kelleher, T. (2009). Social media use, perceptions of decision-making power,
and public relations roles. Public Relations Review, 35(4), 440-442.
UTCC International Journal of Business and Economics
UTTC IJBE | 148
Dijkmans, C., Kerkhof, P., & Beukeboom, C. J. (2015). A stage to engage: Social media
use and corporate reputation. Tourism Management, 47, 58-67.
Eysenbach, G. (2008). Medicine 2.0: social networking, collaboration, participation,
apomediation, and openness. Journal of medical Internet research, 10(3) :e22.
DOI: 10.2196/jmir.1030
Gilpin, D. (2010). Organizational Image Construction in a Fragmented Online Media
Environment. Journal of Public Relations Research, 22(3), 265-287.
Hatch, M.J., Schultz, M., & Williamson, J. (2003). Bringing the corporation into corporate
branding. European Journal of Marketing, 37(7/8), 1041-1064.
Huang, R., & Sarigöllü, E. (2014). How brand awareness relates to market outcome, brand
equity, and the marketing mix. In Fashion Branding and Consumer Behaviors (pp.
113-132). Springer New York.
Hemsley-Brown, J., Melewar, T. C., Nguyen, B., & Wilson, E. J. (2016). Exploring brand
identity, meaning, image, and reputation (BIMIR) in higher education: A special
section. Journal of Business Research, 69(8), 3019-3022.
Hsu, L., & Lawrence, B. (2016). The role of social media and brand equity during a product
recall crisis: A shareholder value perspective. International Journal of Research
in Marketing, 33(1), 59-77.
Kandampully, J., & Hu, H.H. (2007). Do hoteliers need to manage image to retain loyal
customers?. International Journal of Contemporary Hospitality Management,
19(6), 435 – 443.
Kazoleas, D., Kim, Y., & Moffit, M. A. (2001). Institutional image: a case study. Corporate
Communications: An International Journal, 6(4), 205-216.
Keller, K.L. (1993). Conceptualizing, measuring and managing customer-based brand
equity. Journal of Marketing, 57, 1-22.
Khanna, M., Jacob, I., & Yadav, N. (2014). Identifying and analyzing touchpoints for
building a higher education brand. Journal of Marketing for Higher Education,
24(1), 122-143.
Kuvykaite, R., & Piligrimiene, Z. (2013). Communication in Social Media for Company’s
Image Formation. Economics and Management, 18(2), 305-317.
Leone, R. P., Rao, V. R., Keller, K. L., Luo, A. M., McAlister, L., & Srivastava, R. (2006).
Linking brand equity to customer equity. Journal of Service Research, 9(2), 125-
138.
Leuthesser, L., & Kohli, C. (1997). Corporate identity: the role of mission statements.
Business Horizons, 40, 59-66.
Miletsky, J. (2010). Principles of Internet Marketing: New Tools and Methods for Web
Developers. Course Technology, Cengage Learning.
UTCC International Journal of Business and Economics
UTTC IJBE | 149
Nguyen, N., & LeBlanc, G. (1998). The mediating role of corporate image on customers’
retention decisions: an investigation in financial services. International Journal of
Bank Marketing, 16(2), 52-65.
Schivinski, B., & Dabrowski, D. (2016). The effect of social media communication on
consumer perceptions of brands. Journal of Marketing Communications, 22(2),
189-214.
Sensis. (2011). What Australian people and business are doing with social media. Sensis
Social Media Report, 1-36.
Silverman, S. N., Sprott, D. E., & Pascal, V. J. (1999). Relating consumer-based sources
of brand equity to market outcomes. Advances in Consumer Research Volume,
26(1), 352-358.
Simon, C. J., & Sullivan, M. W. (1993). The measurement and determinants of brand
equity: a financial approach. Marketing science, 12(1), 28-52.
Turner, J., & Shah, R. (2011). How to make money with social media: an insider’s guide
on using new and emerging media to grow your business. New Jersey: Pearson
Education.
Tuten, T. L. (2008). Advertising 2.0: Social Media Marketing in a Web 2.0 World.
Greenwood Publishing Group.
Van Riel, C.B.M., & Balmer, J.M.T. (1997). Corporate identity: the concept, its
measurement and management. European Journal of Marketing, 31(5/6), 340-55.

UTCC International Journal of Business and Economics
UTTC IJBE | 150
UTCC International Journal of Business and Economics
UTTC IJBE | 151
UTCC International Journal of Business and Economics (UTCC IJBE)
Volume 10 Number 1, April 2018
The moderating role of residents’ involvement
on perception of mice impacts
Patcharaporn Mahasuweerachai
Faculty of Business Administration and Accountancy
Khon Kaen University
Abstract
The purposes of this paper were to examine the effects of residents’ perceptions of
positive/negative economic impacts, positive/negative sociocultural impacts, and positive/
negative environmental impacts on their perception of the overall MICE impact and to
analyze whether these effects vary according to residents’ involvement in MICE
development. Data was collected via survey with a convenience sample of 412 Khon
Kaen’s city residents in Thailand. The results of a structural equation modeling revealed
that perception of positive economic, positive sociocultural, and negative environmental
impacts significantly affect the perceived overall MICE impact. Furthermore, the findings
revealed the difference in magnitude of those effects on the overall impact across different
levels of residents’ involvement. This study extends previous studies by providing a more
insightful explanation of how the perceived overall MICE impact is shaped and whether
that can be enhanced by residents’ involvement.
Keywords: Residents’ involvement, Resident’ perceptions,
MICE impacts, Social exchange theory, Multiple group analysis
UTCC International Journal of Business and Economics
UTTC IJBE | 152
Introduction
Business events, including meetings,
incentives, conventions, and exhibitions
(MICE) contribute enormous economic
impacts to host cities. Accordingly, local
governments are encouraged to promote
their cities as destinations for business
events. To become an established MICE
destination requires huge investment in
terms of a well-developed infrastructure
system and other event facilities. As
recognized by previous studies, the
selection criteria for a MICE destination
comprise ease of accessibility, venue
space, variety of restaurants and
entertainment, image and reputation of
the host destination, local support, safety
and security, and costs (DiPietro, Breiter,
Rompf, & Godlewska, 2008).
In developing a MICE destination, and in
a comparable manner to tourism, local
residents are an integral element in the
development process. This is because the
MICE industry can bring both positive
and negative impacts to the host
community. It is generally perceived that
MICE tourists generate economic
benefits, such as income, job
opportunities, and taxation revenue to
local and central government, but they
simultaneously increase sociocultural
and environment problems, such as waste
and pollution issues and environmental
damage to the community (Almeida-
García, Peláez-Fernández, Balbuena-
Vázquez, & Cortés-Macias, 2016;
Andereck & Nyaupane, 2011).
Therefore, local government may face
challenges gaining support from the
community if the consequences of the
development are perceived by local
residents to be negative. Without active
support from local residents, MICE
development cannot have success in the
long term. Therefore, there is a need for
local governments and policy makers to
understand how local communities
perceive the benefits and costs generated
by the MICE industry, especially what
aspects of those perceptions have the
most weight on residents’ overall
evaluation of the MICE industry and
under what conditions those perceptions
can be altered.
Understanding local community
perceptions and their support for tourism
has been an ongoing research topic in the
tourism literature (Almeida-García, et
al., 2016; Stylidis, Biran, Sit, & Szivas,
2014). Many of the studies on this issue
have long been focused on examining
residents’ perceptions of tourism impacts
and their support for tourism
development. These empirical studies
have revealed that if residents perceive
the overall tourism impacts to be
positive, they are more likely to support
tourism development (Almeida-García,
et al., 2016; Gursoy, Chi, & Dyer, 2010;
T. H. Lee, 2013; Nunkoo & Gursoy,
2012). The literature has revealed that
residents’ decisions on whether to
support tourism developments depends
on their overall judgment of the tourism
impacts; although these findings can be
applied in the MICE development
context, several questions must be
answered. These questions include what
aspects of MICE impacts are perceived
as positive or negative, how much each
of those impacts influences residents’
overall evaluation, and whether these
effects vary depending on the level of
residents’ involvement. Yoon, Gursoy,
and Chen (2001) recommended that
community involvement should be
considered when seeking to understand
UTCC International Journal of Business and Economics
UTTC IJBE | 153
what drives residents to support (or,
conversely, oppose) MICE development.
To answer these questions within the
context of MICE development, the
objectives of this study were:
(1) to test a conceptual model designed
to explains how residents’
perceptions of positive and negative
MICE outcomes concerning
economic, sociocultural, and
environmental impacts influence
residents’ perceptions of the overall
MICE impact; and
(2) to test the moderating effect of
residents’ involvement on those
effects.
The results of this study provide a better
understanding of how local residents
perceives and feels about the MICE
industry. The model helps local
governments to identify which factors
have more impact on overall judgments
regarding the MICE industry. In
addition, by testing the moderating
effect, the study reveals whether the
levels of residents’ involvement can alter
the strength and direction of those factors
on residents’ perceptions of overall
MICE impacts.
Theoretical framework
and hypotheses
Perception of MICE impacts
In tourism research, social exchange
theory (SET) has been extensively used
to understand why local communities
support or resist tourism. Following this
approach, this study applied SET as a
background framework: it has been
considered the most influential
theoretical perspective in explaining
social behavior in both sociology and
social psychology since the 1920s
(Cropanzano & Mitchell, 2005). As
discussed by Cook, Cheshire, Rice and
Nakagawa (2013), within SET, an
interaction among individuals in the
society or within social behavior is
considered as an exchange between at
least two parties: in essence, individual
or group interaction is formed based on
an exchange of resources, either in
tangible or intangible forms. Social
exchange theory posits that two persons
will enter an exchange if they believe or
expect to gain more then they lose: i.e.,
individuals will contribute to society if
they expect their future returns to be
higher than their future obligations.
In the tourism context, SET explains that
residents are more likely to favor tourism
if they assess that benefits it offers are
higher than the costs incurred therefrom
(Gursoy, et al., 2010; Nunkoo &
Ramkissoon, 2011; Wang & Chen,
2015). Assessment of tourism differs
between residents who perceive future
benefits and those who perceive future
obligations (Gursoy, Jurowski, & Uysal,
2002). In essence, residents are more
likely to evaluate the tourism industry
positively if they believe they would
benefit from it, whereas those who
perceive unpleasant outcomes are more
likely to assess it negatively (Andereck,
Valentine, Knopf, & Vogt, 2005).
Building on SET, empirical studies over
recent years have reinforced the theory
that residents’ attitudes toward tourism
are influenced by their perception of the
outcomes generated by the industry.
Several studies have categorized the
UTCC International Journal of Business and Economics
UTTC IJBE | 154
outcomes of tourism development into
the two aspects of positive and negative
impacts, as perceived by local residents
(Boley, McGehee, Perdue, & Long,
2014; T. H. Lee, 2013; Nunkoo &
Ramkissoon, 2011; Vargas-Sánchez,
Oom do Valle, da Costa Mendes, &
Silva, 2015; Wang & Chen, 2015).
Findings from these studies have
revealed that residents’ attitudes toward
tourism development are positively
related to perceived positive impacts and,
conversely, are negatively associated
with perceived negative outcomes (Ko &
Stewart, 2002).
Numerous studies have examined the
consequences of tourism development in
three major dimensions: economic,
sociocultural, and environmental
(Almeida-García, et al., 2016; Andereck
& Nyaupane, 2011; Dyer, Gursoy,
Sharma, & Carter, 2007; Kim, Uysal, &
Sirgy, 2013; Stylidis, et al., 2014).
Regarding the economic aspects, past
studies have revealed that local residents
perceive economic impacts in both
positive and negative senses (Dyer, et al.,
2007; Yoon, et al., 2001). Specifically,
job opportunities, income generated from
tourism activities, taxation revenue, and
investment for small business are often
perceived as positive economic
outcomes, whereas increasing costs of
living and housing are viewed as
negative consequences of the tourism
industry. Regarding the effects on
residents’ support for tourism
development, several studies have
revealed that residents’ perceptions of
economic impacts are positively related
with attitudes toward tourism (Dyer, et
al., 2007; Stylidis, et al., 2014). As
regards the sociocultural impact, the
majority of local communities have been
found to view tourism development as
not only providing benefits to the
community in terms of the quality of life,
cultural exchange, residents’ sense of
community, and the preservation of local
culture and history, but also resulting in
more crime and vandalism in the
community, traffic problems, and over-
crowdedness in public areas (Almeida-
García, et al., 2016; Kim, et al., 2013;
Stylidis, et al., 2014). Concerning the
relationship between the perceived
sociocultural impacts and attitudes
toward tourism development, mixed
findings have been revealed in the
previous studies. Several of them
reported positive effects of sociocultural
aspects on residents’ support for tourism
(Stylidis, et al., 2014); other studies
found no significant effects of negative
social impacts on residents’ attitudes
toward tourism (Dyer, et al., 2007; Yoon,
et al., 2001). Regarding the
environmental impacts of tourism, local
people have been found to believe that
their community would benefit from the
industry in terms of improving public
facilities, living utilities systems, and
preserving the environment, but would,
conversely, face the costs of
environmental pollution and damage to
the local ecosystem and natural
environment (Almeida-García, et al.,
2016; Ko & Stewart, 2002). Residents’
perceptions of environmental
consequences have been found to
influence attitudes toward tourism,
through direct and/or indirect effects
(Almeida-García, et al., 2016; Stylidis, et
al., 2014; Yoon, et al., 2001).
Furthermore, several studies
(Carmichael, 2000; Chen, 2016; Vargas-
Sánchez, et al., 2015; Yoon, et al., 2001)
have observed that residents’ perceptions
of outcomes from the tourism industry
may not directly influence attitudes
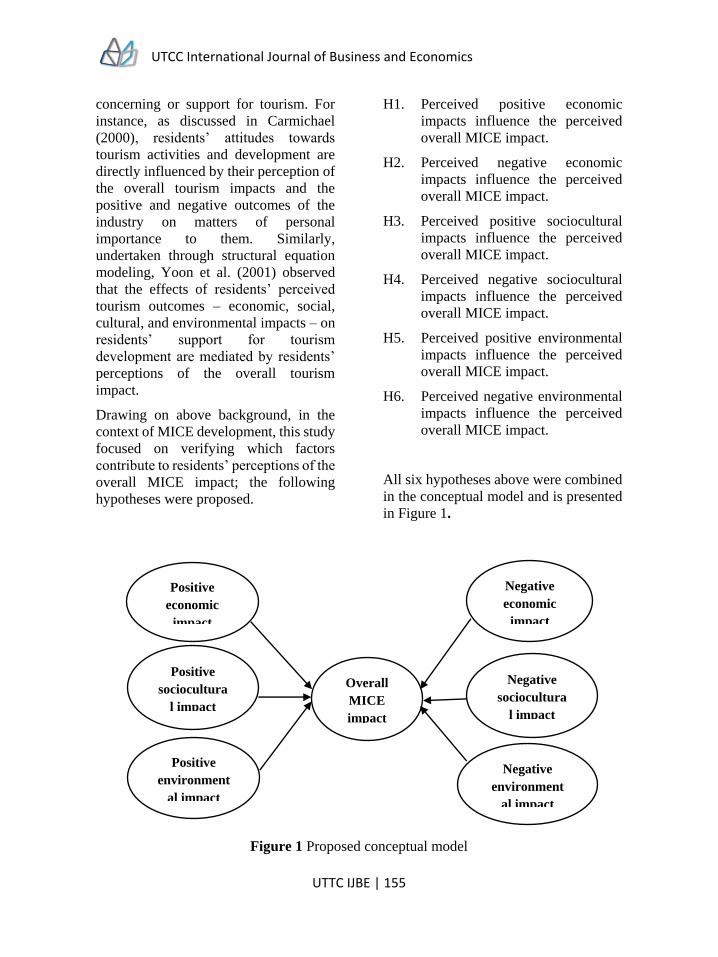
UTCC International Journal of Business and Economics
UTTC IJBE | 155
concerning or support for tourism. For
instance, as discussed in Carmichael
(2000), residents’ attitudes towards
tourism activities and development are
directly influenced by their perception of
the overall tourism impacts and the
positive and negative outcomes of the
industry on matters of personal
importance to them. Similarly,
undertaken through structural equation
modeling, Yoon et al. (2001) observed
that the effects of residents’ perceived
tourism outcomes – economic, social,
cultural, and environmental impacts – on
residents’ support for tourism
development are mediated by residents’
perceptions of the overall tourism
impact.
Drawing on above background, in the
context of MICE development, this study
focused on verifying which factors
contribute to residents’ perceptions of the
overall MICE impact; the following
hypotheses were proposed.
H1. Perceived positive economic
impacts influence the perceived
overall MICE impact.
H2. Perceived negative economic
impacts influence the perceived
overall MICE impact.
H3. Perceived positive sociocultural
impacts influence the perceived
overall MICE impact.
H4. Perceived negative sociocultural
impacts influence the perceived
overall MICE impact.
H5. Perceived positive environmental
impacts influence the perceived
overall MICE impact.
H6. Perceived negative environmental
impacts influence the perceived
overall MICE impact.
All six hypotheses above were combined
in the conceptual model and is presented
in Figure 1.
Figure 1 Proposed conceptual model
Positive
economic
impact
Positive
sociocultura
l impact
Negative
environment
al impact
Overall
MICE
impact
Positive
environment
al impact
Negative
economic
impact
Negative
sociocultura
l impact
UTCC International Journal of Business and Economics
UTTC IJBE | 156
Moderating role of residents’
involvement
It has been suggested that to succeed in
tourism development, the government
and policy makers should involve local
community in the process (Sheldon &
Abenoja, 2001; Stylidis, et al., 2014;
Tosun, 2000). Involvement is a construct
that has been used to explain human
behavior in several disciplines. An
explanation of the involvement concept
varies according to the context in which
it is explained. In tourism perspectives,
residents’ involvement refers to
residents’ voluntary participation in
community activities or working
cooperatively with other residents on
community projects (Tosun, 2000).
Previous tourism development studies
have revealed that the greater the level of
residents’ involvement in tourism, the
more positive their attitudes toward it (T.
H. Lee, 2013; Nicholas, Thapa, & Ko,
2009). Additionally, the literature has
emphasized that attitudes toward
tourism, particularly negative attitudes,
can be improved if residents have greater
involvement or engagement in tourism
activities (Allen, Long, Perdue, &
Kieselbach, 1988; Lundberg, 2016). Lee
(2013) suggested that involvement has a
direct effect on how residents perceive
the benefits and costs generated by
tourism, which in turn affects their
support for tourism. However,
Nyaupane, Morais and Dowler (2006)
argued that residents’ involvement does
not directly influence perceptions of
tourism’s impacts, but rather influences
them indirectly through interaction with
other factors. This argument was
supported by the recent empirical study
of Lundberg (2016). With the underlying
assumption that the relationship between
the importance of tourism impacts and
resident group types is moderated by
local involvement, Lundberg’s study
revealed that the effects of residence type
on the perceived importance of economic
impacts was moderated by the level of
participation in the tourism development.
Based on the above discussion, this study
postulated that the effects of residents’
perceptions of the positive and negative
MICE dimensions’ impacts on
perceptions of the overall MICE impact
vary according to level of involvement.
The underlying premise of this study is
that the effect of residents’ perceived
positive impacts on the perceived overall
MICE impact is stronger – and,
concomitantly, the influence of
perceived negative outcomes on
perceived overall impact is weaker – in
residents who have high involvement
with MICE development than those who
have low involvement.
Method
Sample and data collection
This study was conducted in Khon Kaen
city in Thailand during May–June 2014.
Khon Kaen is located in the northeast of
Thailand and is the second-largest
province in this region. According to the
Tourism Authority of Thailand, Khon
Kaen is not recognized as top
destinations for tourism in Thailand.
However, it was promoted by the
Thailand Exhibition and Convention
Bureau (TCEB) as Thailand’s 5th
official MICE destination in 2013. To
create awareness of the residents and
potential customers, a signing ceremony
of the Memorandum of Understanding
between TCEB and the city was held
UTCC International Journal of Business and Economics
UTTC IJBE | 157
with more than 350 participants from
government agencies and local
entrepreneurs. With the support of
TCEB, the city created the 4-year
roadmap to highlight Khon Kaen city as
the hub of convention and exhibition in
the Greater Mekong Sub-region (GMS).
According to TCEB’s statistics, 280,440
MICE visitors visited Khon Kaen and
spent the equivalent of THB 730 million.
In order to satisfy the objectives of this
study, a sample survey with self-report
questionnaire was used to collect data.
Following the suggestion of Hair, Black,
Babin and Anderson (2010), this study
required a minimum of 300 samples to
ensure the collection of reasonably stable
results for structural equation modeling.
Based on convenience sampling, Khon
Kaen city residents were approached and
invited to participate in the survey. To
ensure that all respondents qualified for
the research, the field researchers asked
the residents whether they had awareness
of Khon Kaen as an official destination
for convention and exhibition. After
residents were informed of the purposes
of the research, a self-administered
questionnaire was distributed to those
who qualified and agreed to participate.
In total, 441 questionnaires were
collected and checked for completeness.
This process resulted in removing 29
questionnaires because they were
incomplete and missing important
information. After elimination, a sample
of 412 responses was retained for
analysis.
Measurement
Data used to test the hypothesized
conceptual model (Figure 1) were
collected by a self-report questionnaire.
The study instrument comprised of scales
measuring an endogenous construct,
which was perception of the overall
MICE impact (OMI) and six exogenous
constructs including perceived positive
economic impact (PE), perceived
negative economic impact (NE),
perceived positive sociocultural impact
(PS), perceived negative sociocultural
impact (NS), perceived positive
environmental impact (PN), and
perceived negative environmental impact
(NN). The attributes of all constructs
were identified from an extensive review
of the related studies. Each exogenous
construct was measured with multiple-
item as presented in Table 1. These 18
statements (e.g., MICE industry
increases employment opportunities for
local residents; MICE industry increases
the cost of living) were developed based
on prior studies on residents’ perceptions
of tourism impact that employed well-
established scales (Dyer, et al., 2007;
Gursoy & Rutherford, 2004; Ko &
Stewart, 2002; C. K. Lee, Kang, Long, &
Reisinger, 2010).
To measure perception of the overall
MICE impact (OMI), the participants
were asked to express their level of
agreement on a single statement
“Overall, the MICE industry produces
more positive impacts than negative
ones”. Operationalizing a single variable
to measure the perceived overall impact
was supported by prior studies (e.g.
Assaker, et al., 2011; Chen & Tsai, 2007;
Soon-Ho, et al., 2009). All of the
measurement statements on perception of
MICE impacts were scored on a five-
point Likert scale in which 1 represented
“strongly disagree”, 2 represented
“disagree”, 3 represented “neutral”, 4
represented “agree”, and 5 represented
“strongly agree”. Further, residents’
UTCC International Journal of Business and Economics
UTTC IJBE | 158
involvement was captured by asking the
participants to rate their level of
involvement in development of the
MICE industry in Khon Kaen on a five-
point Likert scale, where 1 represented
‘not at all involved’ and 5 represented
‘very highly involved’. The
questionnaire also included the close-
ended questions regarding the
respondents’ demographic
characteristics (e.g., gender, age,
occupation and residence duration).
Data analysis
The statistical analysis in this study was
employed as follows. The frequency
analysis was carried out to describe the
respondents’ demographic
characteristics. A structural equation
modeling (SEM) under the two-step
modeling approach (Anderson &
Gerbing, 1988) was employed to test the
proposed conceptual model and its
corresponding hypothesized
relationships. As suggested by Anderson
and Gerbing (1988), before testing the
hypothesized conceptual model, the
validity of the constructs and a good fit
of measurement model was developed.
This process was carried out by a
confirmatory factor analysis (CFA). In
addition, the reliability of the constructs
were examined by Cronbach’s alpha and
composite reliability (CR).The validity
of the constructs were tested by
standardized loadings of the
measurement items of each construct and
average variance extracted (AVE). Once
the study’s theoretical model was tested
by SEM, the moderating effects of
involvement were analyzed by multiple
group analysis.
Results
Demographic characteristics
of respondents
Of the 412 samples, there were 233
female (56.6%) and 179 male (43.3%)
respondents. The majority of the
respondents (43.2%) were 31–40 years
old. Approximately 26% of the
respondents were 30 years old or less,
while 23.5% were 41–50 years old.
Concerning occupation, the largest
category (34.7%) worked as public
servants, while 28.6% of the respondents
worked in the business sector. The third
largest occupation category (27.7%)
were self-employed. Regarding
residence duration, most of the
respondents (57.5%) had lived in Khon
Kaen city for over 20 years.
Approximately 13.6% of the respondents
had been resident for 6–10 years, while
14.6% had lived in the city for 11–20
years. The remainder had lived in the
community for 5 years or less.
Measurement model
The reliability of the constructs was
assessed by Cronbach’s alpha and
composite reliability (CR). As presented
in Table 1, the analyses showed that all
the constructs had a Cronbach’s alpha
value and CR higher than the suggested
threshold of 0.70 (Hair, et al., 2010),
signifying consistency among the
multiple indicators of the construct. The
constructs’ validity was determined by
standardized loadings of the
measurement items of each construct and
average variance extracted (AVE). The
CFA results showed that all the
standardized loadings had a value greater
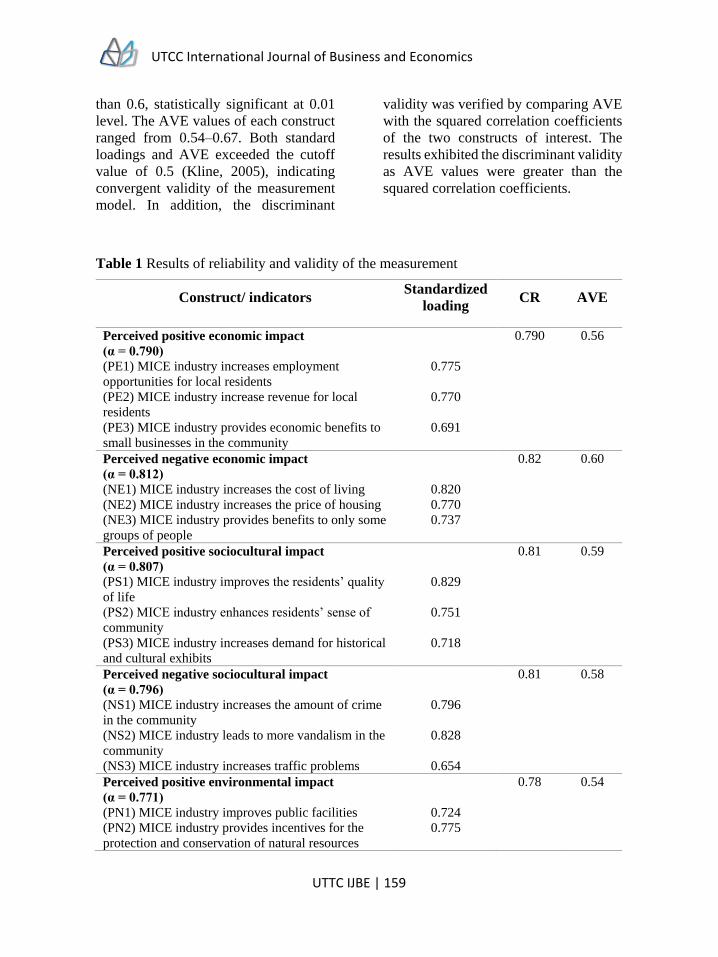
UTCC International Journal of Business and Economics
UTTC IJBE | 159
than 0.6, statistically significant at 0.01
level. The AVE values of each construct
ranged from 0.54–0.67. Both standard
loadings and AVE exceeded the cutoff
value of 0.5 (Kline, 2005), indicating
convergent validity of the measurement
model. In addition, the discriminant
validity was verified by comparing AVE
with the squared correlation coefficients
of the two constructs of interest. The
results exhibited the discriminant validity
as AVE values were greater than the
squared correlation coefficients.
Table 1 Results of reliability and validity of the measurement
Construct/ indicators Standardized
loading CR AVE
Perceived positive economic impact
(α = 0.790)
(PE1) MICE industry increases employment
opportunities for local residents
(PE2) MICE industry increase revenue for local
residents
(PE3) MICE industry provides economic benefits to
small businesses in the community
0.775
0.770
0.691
0.790 0.56
Perceived negative economic impact
(α = 0.812)
(NE1) MICE industry increases the cost of living
(NE2) MICE industry increases the price of housing
(NE3) MICE industry provides benefits to only some
groups of people
0.820
0.770
0.737
0.82 0.60
Perceived positive sociocultural impact
(α = 0.807)
(PS1) MICE industry improves the residents’ quality
of life
(PS2) MICE industry enhances residents’ sense of
community
(PS3) MICE industry increases demand for historical
and cultural exhibits
0.829
0.751
0.718
0.81 0.59
Perceived negative sociocultural impact
(α = 0.796)
(NS1) MICE industry increases the amount of crime
in the community
(NS2) MICE industry leads to more vandalism in the
community
(NS3) MICE industry increases traffic problems
0.796
0.828
0.654
0.81 0.58
Perceived positive environmental impact
(α = 0.771)
(PN1) MICE industry improves public facilities
(PN2) MICE industry provides incentives for the
protection and conservation of natural resources
0.724
0.775
0.78 0.54
UTCC International Journal of Business and Economics
UTTC IJBE | 160
(PN3) MICE industry improves water and electricity
systems
0.694
Perceived negative environmental impact
(α = 0.853)
(NN1) MICE industry results in more litter in the
community
(NN2) MICE industry causes more air pollution
(NN3) MICE industry increases noise
0.688
0.864
0.897
0.86 0.67
To test the overall measurement of the
model, the CFA was analyzed using the
maximum likelihood method estimation.
The CFA results yielded the following
goodness-of-fit statistics: 𝜒(120)2 =
304.439, p < .001, 𝜒2 /df = 2.537,
RMSEA = .061, CFI = .951, TLI = .938,
SRMR = .045, indicating a fair fit of the
overall measurement model to the data
(Hair, et al., 2010; Hu & Bentler, 1999;
Kline, 2005; MacCallum, Browne, &
Sugawara, 1996).
Structural model
Drawing on SET and the empirical
results of prior research on tourism
impact, this study hypothesized that
residents’ perceptions of the overall
MICE impact is influenced by their
perceptions on each dimension,
comprising positive/negative economic
impacts, positive/negative sociocultural
impacts, and positive/negative
environmental impacts. These
hypotheses were tested by SEM.
The results of the hypotheses tests are
presented in Table 2. The SEM indicated
that H1, H3, and H6 are supported at the
0.05 significance level, while H2, H4,
and H5 are not supported. In essence,
residents’ OMI perceptions are
influenced by PE, PS, and NN
perceptions. The goodness-of-fit
statistics of this model were 𝜒(132)2 =
333.507, p < .001, 𝜒2 /df = 2.526,
RMSEA = .061, CFI = .952, TLI = .937,
SRMR = .044.
Table 2 Hypotheses tests (N=412)
Research hypothesis Standardized coefficients t-Value Results H1: Positive economic
impactOverall MICE impact
0.382 3.458** Supported
H2: Negative economic impact
Overall MICE impact
-0.056 -0.514 Not
supported
H3: Positive sociocultural
impact Overall MICE impact
0.269 3.027** Supported
H4: Negative sociocultural impact
Overall MICE impact
0.051 0.866 Not
supported
H5: Positive environmental
impact Overall MICE impact
0.134 1.931 Not
supported
H6: Negative environmental
impact Overall MICE impact
-0.127 -2.17* Supported
*𝜌 < 0.05, **𝜌 < 0.01
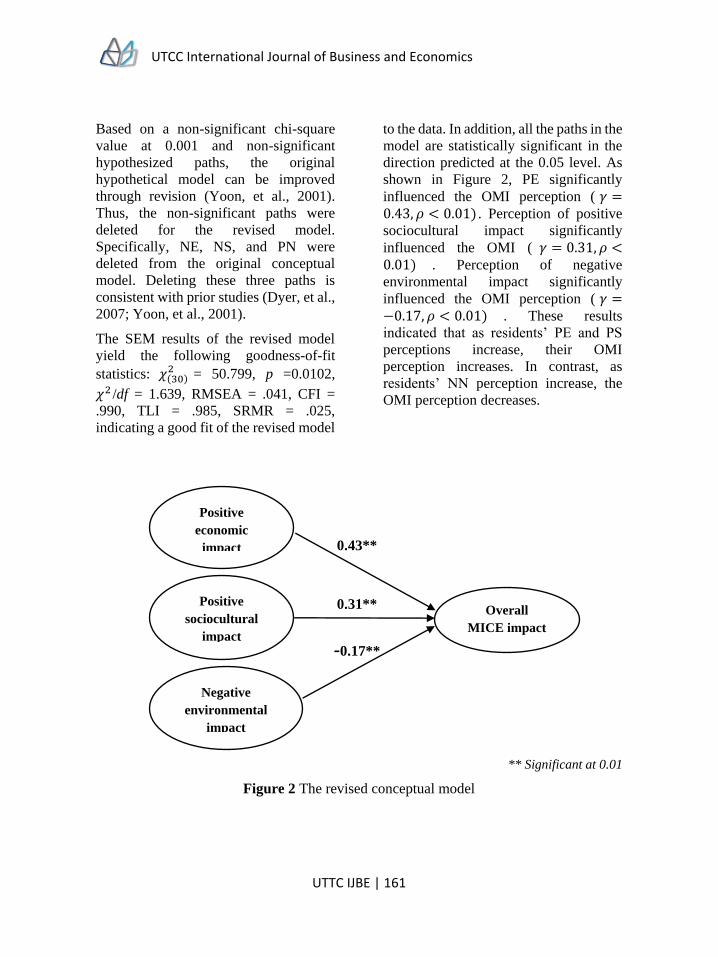
UTCC International Journal of Business and Economics
UTTC IJBE | 161
Based on a non-significant chi-square
value at 0.001 and non-significant
hypothesized paths, the original
hypothetical model can be improved
through revision (Yoon, et al., 2001).
Thus, the non-significant paths were
deleted for the revised model.
Specifically, NE, NS, and PN were
deleted from the original conceptual
model. Deleting these three paths is
consistent with prior studies (Dyer, et al.,
2007; Yoon, et al., 2001).
The SEM results of the revised model
yield the following goodness-of-fit
statistics: 𝜒(30)2 = 50.799, p =0.0102,
𝜒2 /df = 1.639, RMSEA = .041, CFI =
.990, TLI = .985, SRMR = .025,
indicating a good fit of the revised model
to the data. In addition, all the paths in the
model are statistically significant in the
direction predicted at the 0.05 level. As
shown in Figure 2, PE significantly
influenced the OMI perception ( 𝛾 =0.43, 𝜌 < 0.01) . Perception of positive
sociocultural impact significantly
influenced the OMI ( 𝛾 = 0.31, 𝜌 <0.01) . Perception of negative
environmental impact significantly
influenced the OMI perception ( 𝛾 =−0.17, 𝜌 < 0.01) . These results
indicated that as residents’ PE and PS
perceptions increase, their OMI
perception increases. In contrast, as
residents’ NN perception increase, the
OMI perception decreases.
** Significant at 0.01
Figure 2 The revised conceptual model
Positive
sociocultural
impact
Positive
economic
impact
Negative
environmental
impact
Overall
MICE impact
0.43**
0.31**
-0.17**
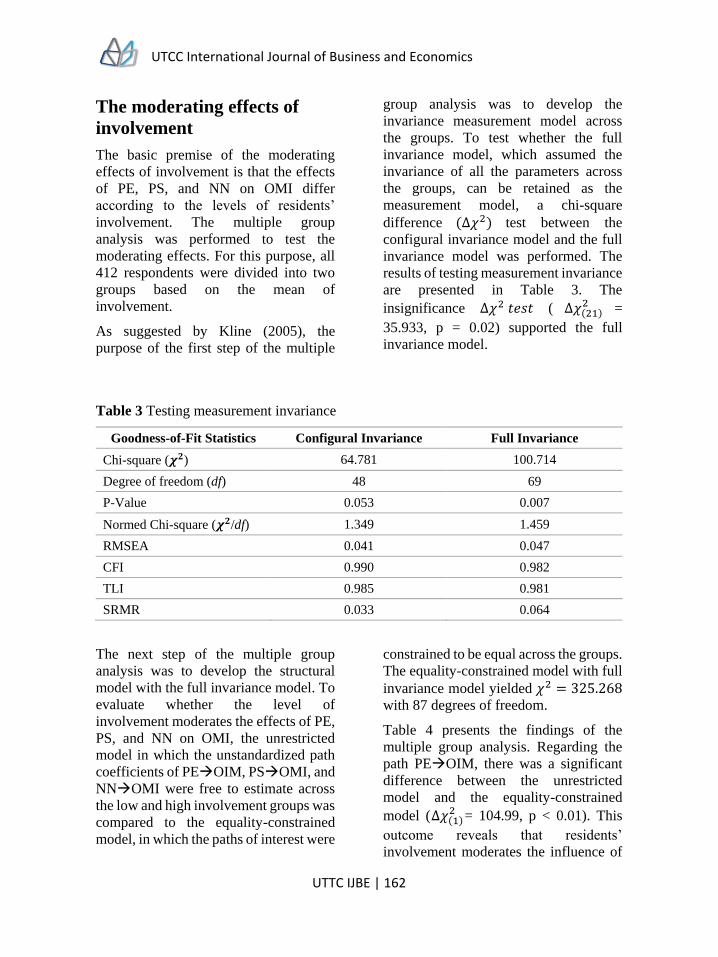
UTCC International Journal of Business and Economics
UTTC IJBE | 162
The moderating effects of
involvement
The basic premise of the moderating
effects of involvement is that the effects
of PE, PS, and NN on OMI differ
according to the levels of residents’
involvement. The multiple group
analysis was performed to test the
moderating effects. For this purpose, all
412 respondents were divided into two
groups based on the mean of
involvement.
As suggested by Kline (2005), the
purpose of the first step of the multiple
group analysis was to develop the
invariance measurement model across
the groups. To test whether the full
invariance model, which assumed the
invariance of all the parameters across
the groups, can be retained as the
measurement model, a chi-square
difference (∆𝜒2) test between the
configural invariance model and the full
invariance model was performed. The
results of testing measurement invariance
are presented in Table 3. The
insignificance ∆𝜒2 𝑡𝑒𝑠𝑡 ( ∆𝜒(21)2 =
35.933, p = 0.02) supported the full
invariance model.
Table 3 Testing measurement invariance
Goodness-of-Fit Statistics Configural Invariance Full Invariance
Chi-square (𝝌𝟐) 64.781 100.714
Degree of freedom (df) 48 69
P-Value 0.053 0.007
Normed Chi-square (𝝌𝟐/df) 1.349 1.459
RMSEA 0.041 0.047
CFI 0.990 0.982
TLI 0.985 0.981
SRMR 0.033 0.064
The next step of the multiple group
analysis was to develop the structural
model with the full invariance model. To
evaluate whether the level of
involvement moderates the effects of PE,
PS, and NN on OMI, the unrestricted
model in which the unstandardized path
coefficients of PEOIM, PSOMI, and
NNOMI were free to estimate across
the low and high involvement groups was
compared to the equality-constrained
model, in which the paths of interest were
constrained to be equal across the groups.
The equality-constrained model with full
invariance model yielded 𝜒2 = 325.268
with 87 degrees of freedom.
Table 4 presents the findings of the
multiple group analysis. Regarding the
path PEOIM, there was a significant
difference between the unrestricted
model and the equality-constrained
model (∆𝜒(1)2 = 104.99, p < 0.01). This
outcome reveals that residents’
involvement moderates the influence of
UTCC International Journal of Business and Economics
UTTC IJBE | 163
PE on the OMI. The effects of the
positive impacts on the OMI were
significantly stronger in the low
involvement group (𝛽 = 0.62, 𝜌 < .01)
than in the high involvement group (𝛽 =0.32, 𝜌 > .05 ). Concerning the path
PSOIM, the significance
∆𝜒2 𝑡𝑒𝑠𝑡 ( ∆𝜒(1)2 =117.648, p < 0.01)
suggested that the effect of the PS impact
on the perceived OMI was significantly
stronger in the high involvement group
( 𝛽 = 0.66, 𝜌 < .01 ) than in the low
involvement group (𝛽 = 0.28, 𝜌 < .01).
Regarding the path NNOMI, the
significance ∆𝜒2 𝑡𝑒𝑠𝑡 (∆𝜒(1)2 =144.301, p
< 0.01) suggested that the effect of the
NN impacts on the perceived OMI was
significantly stronger in the low
involvement group ( 𝛽 = −0.27, 𝜌 <.01) than in the high involvement group
(𝛽 = −0.05, 𝜌 > .05).
Table 4 Results of multiple group analysis: Unconstrained model with full invariance
measurement
Path
Unstandardized estimate
𝝌𝟐
∆𝝌𝟐 Low involvement High involvement
PEOIM 0.62 0.32 220.46 104.99**
PSOIM 0.28 0.66 207.62 117.64**
NNOIM -0.27 -0.05 180.96 144.301**
Discussion and
conclusion
This study contributes to the literature on
MICE destination development by
examining how residents’ perceptions of
the overall MICE impact are formed and
whether it can be improved. Specifically,
this study sought to verify the effects of
perceived positive and negative MICE
outcomes on evaluations of the overall
impact of MICE and to test whether those
effects are moderated by residents’
involvement.
Drawing conclusions from the two-step
SEM approach, the findings revealed that
residents’ perceptions of positive
economic, positive sociocultural, and
negative environmental impacts were
found to significantly predict their
perception of the overall impact, whereas
perceived negative economic, negative
sociocultural, and positive
environmental outcomes were found to
have no significant effects on the
perceived overall impact. This should not
be surprising since the findings were
consistent with those of prior studies
(Almeida-García, et al., 2016; Dyer, et
al., 2007; Stylidis, et al., 2014; Yoon, et
al., 2001), in which residents’
evaluations of the consequences of the
MICE industry varied. Some perceive
only positive aspects, others foresee only
negative outcomes, and the remainder
predict both positive and negative
impacts.
As the SEM yielded a non-significant
chi-square value at 0.001, the original
conceptual model was revised to improve
UTCC International Journal of Business and Economics
UTTC IJBE | 164
the model’s fit. Following suggestions
from previous studies on tourism
development, the non-significant paths
were deleted. The results from the CFA
and SEM revealed a good fit of the final
model, which explains 64.5% of variance
in perception of the overall MICE
impact. The results of this study support
prior studies in that positive effects of
positive economic and positive
sociocultural impacts on overall impact
were found (Dyer, et al., 2007; Stylidis,
et al., 2014; Yoon, et al., 2001). This
implies that local residents are more
likely to evaluate the overall MICE
impact positively if they perceive that the
MICE industry generates employment
opportunities, income, and other
economic benefits for the local
community, in addition to improving
residents’ quality of life, increasing
demand for historical and cultural
exhibits, and providing cultural
exchange. Furthermore, this study found
that perceived economic benefits have
stronger effects than perceived
socioeconomic benefit on the perceived
overall impact. This supports the
argument of Gursoy and Rutherford
(2004) that local residents are more likely
to focus all their attention on positive
economic outcomes over other positive
aspects generated by the tourism industry
when they perceive that the local
economy is enduring poor conditions.
Regarding perceived environmental
impacts, several studies have found that
residents only predict negative
environmental outcomes from the
tourism industry (Stylidis, et al., 2014).
As discussed by Dyer et al. (2007), if
local residents become conscious of
negative outcomes, they are more likely
to focus attention on them when
evaluating the overall impacts of the
tourism industry. Consistent with the
prior literature, this study found that in
the context of MICE development,
residents’ perceptions of the overall
MICE impact are more likely to be
diluted when residents believe that the
MICE industry results in more
environmental pollution in the
community.
Further, the findings from the multiple
group analysis reported the difference in
the effects of perceived economic,
sociocultural, and environmental impacts
on the overall impact across different
levels of involvement. The residents’
perceptions of positive socioeconomic
impact had a larger effect on the
perceived overall impact when residents’
involvement was high. Conversely,
perceived negative environmental had
more influence on the perceived overall
impact when residents’ involvement was
low. These findings resemble the
observation of Almeida-García et al.
(2016) that residents who have positive
attitudes toward tourism are those who
often participate in local community
groups or activities. Furthermore, in
Lundberg’s (2016) study, local
involvement was found to influence how
residents perceive sociocultural impacts
as important aspects when evaluating
tourism. In essence, involvement
provides local residents with some
control over activities in which they
participate, leading them to more
favorable perceptions of the overall
impact (Boley, et al., 2014).
Implications
The conceptual model developed
throughout this study may help local
government assess the community
UTCC International Journal of Business and Economics
UTTC IJBE | 165
perception of MICE impacts, especially
for cities with similar features as Khon
Kaen city. It is important to note that
residents who perceive the overall impact
of MICE to be beneficial, they are tend to
support the development of the MICE
industry in their communities (Almeida-
García, et al., 2016; Gursoy, et al., 2010;
T. H. Lee, 2013; Nunkoo & Gursoy,
2012). Drawing from the empirical
results of this study, it implies that if local
residents have confidence that the MICE
industry will provide more jobs and
income to the community or other
economic benefits, they are more likely
to favor MICE development. Even if they
believe that the MICE industry has
generated negative impacts to the
community such as air and noise
pollution. Therefore, local government
may highlight positive economic benefits
of the MICE industry when seeking to
gain supports from the community.
Having said that does not mean that local
government should hide the negative
impacts of the MICE industry from local
residents. Instead, all possible outcomes
should be addressed. MICE city planners
should not concern that if residents know
about negative impacts, they will against
the development. As suggested by the
current study, residents who involve in
the process of development are tend to
favor the MICE industry even if they
aware about negative outcomes.
Therefore, it is recommended that local
governments should provide residents
with opportunities to participate in or
voice their opinions about MICE
development. As being involved in any
MICE activities or development
processes can direct residents’ attention
to the positive consequences of being a
MICE destination as well as provide
them with some control over activities
causing negative outcomes to the
community.
Limitations and future
research
It is important to note that there are issues
that limit the generalizability of the
current study. First, as is the case with
convenience sampling, the sample may
not represent the larger population. In
addition, the study area of this research is
restricted to only one city on a particular
time. To overcome this aspect, the results
of this study should be tested in other
MICE cities. Further, this study assumed
that the respondents understand the
concept of MICE development.
However, it has been suggested that the
level of tourism knowledge is associated
with resident’s attitude toward the
tourism development. Therefore, future
research on this aspect should be
extended to examine the backgrounds of
residents in terms of the level of MICE
knowledge. Moreover, it would be
fruitful to examine other factors that can
influence residents’ perceptions and
attitudes toward MICE development.
Acknowledgments
The author wishes to acknowledge
Thailand Convention and Exhibition
Bureau (TCEB) for funding the
fieldwork of this study.
UTCC International Journal of Business and Economics
UTTC IJBE | 166
References
Allen, L. R., Long, P. T., Perdue, R. R., & Kieselbach, S. (1988), “ The Impact Of Tourism
Development On Residents' Perceptions Of Community Life”, Journal of Travel
Research, 27: 16-21.
Almeida-García, F., Peláez-Fernández, M. Á., Balbuena-Vázquez, A., & Cortés-Macias,
R. (2016), “Residents' perceptions of tourism development in Benalmádena
(Spain)”, Tourism Management, 54: 259-274.
Andereck, K. L., & Nyaupane, G. P. (2011), “Exploring the Nature of Tourism and Quality
of Life Perceptions among Residents’, Journal of Travel Research, 50(3): 248-
260.
Andereck, K. L., Valentine, K. M., Knopf, R. C., & Vogt, C. A. (2005), “Residents’
perceptions of community tourism impacts”, Annals of Tourism Research, 32(4):
1056-1076.
Anderson, J. C., & Gerbing, D. W. (1988), “Structural equation modeling in practice: A
review and recommended two-step approach”, Psychological Bulletin, 103(3):
411-423.
Assaker, G., Vinzi, V. E., & O’Connor, P. (2011), “Examining the effect of novelty
seeking, satisfaction, and destination image on tourists’ return pattern: A two
factor, non-linear latent growth model”, Tourism Management, 32(4): 890-901.
Boley, B. B., McGehee, N. G., Perdue, R. R., & Long, P. (2014), “Empowerment and
resident attitudes toward tourism: Strengthening the theoretical foundation through
a Weberian lens”, Annals of Tourism Research, 49: 33-50.
Carmichael, B. A. (2000), “A matrix model for resident attitudes and behaviours in a
rapidly changing tourist area”, Tourism Management, 21: 601-611.
Chen, C. Y. (2016), “The Impact of the Chinese Tourism Market on Taiwan Residents’
Attitudes”, Journal of Quality Assurance in Hospitality & Tourism, 17(1): 1-23.
Chen, C. and Tsai, D. (2007), “How destination image and evaluative factors affect
behavioral intentions?”, Tourism Management, 28: 1115–22.
Cook, K. S., Cheshire, C., Rice, E. R., & Nakagawa, S. (2013), Social exchange theory,
Handbook of social psychology: 61-88: Springer.
Cropanzano, R., & Mitchell, M. S. (2005), “Social Exchange Theory: An Interdisciplinary
Review”, Journal of Management, 31(6): 874-900.
DiPietro, R. B., Breiter, D., Rompf, P., & Godlewska, M. (2008), “An Exploratory Study
of Differences among Meeting and Exhibition Planners in their Destination
Selection Criteria”, Journal of Convention & Event Tourism, 9(4): 258-276.
Dyer, P., Gursoy, D., Sharma, B., & Carter, J. (2007), “Structural modeling of resident
perceptions of tourism and associated development on the Sunshine Coast,
Australia”, Tourism Management, 28(2): 409-422.
UTCC International Journal of Business and Economics
UTTC IJBE | 167
Gursoy, D., Chi, C. G., & Dyer, P. (2010), “Locals’ Attitudes toward Mass and Alternative
Tourism: The Case of Sunshine Coast, Australia”, Journal of Travel Research,
49(3): 381-394.
Gursoy, D., Jurowski, C., & Uysal, M. (2002), “Resident attitudes: A Structural Modeling
Approach”, Annals of Tourism Research, 29(1): 79-105.
Hair, J. F., Black, W. C., Babin, B. J., & Anderson, R. E. (2010), Multivariate Data
Analysis, 7th Ed. Upper Saddle River, NJ: Prentice Hall.
Hu, L. t., & Bentler, P. M. (1999), “Cutoff criteria for fit indexes in covariance structure
analysis: Conventional criteria versus new alternatives”, Structural Equation
Modeling: A Multidisciplinary Journal, 6(1): 1-55.
Kim, K., Uysal, M., & Sirgy, M. J. (2013), “How does tourism in a community impact the
quality of life of community residents?”, Tourism Management, 36: 527-540.
Kline, R. B. (2005), Principles and Practice of Structural Equation Modeling, 2nd Ed. New
York: The Guilford Press.
Ko, D.W., & Stewart, W. P. (2002), “A structural equation model of residents’ attitudes
for tourism development”, Tourism Management, 23(5): 521–530.
Lee, C. K., Kang, S. K., Long, P., & Reisinger, Y. (2010), “Residents' perceptions of casino
impacts: A comparative study”, Tourism Management, 31(2): 189-201.
Lee, T. H. (2013), “Influence analysis of community resident support for sustainable
tourism development”, Tourism Management, 34: 37-46.
Lundberg, E. (2016), “The importance of tourism impacts for different local resident
groups: A case study of a Swedish seaside destination”, Journal of Destination
Marketing & Management.
MacCallum, R. C., Browne, M. W., & Sugawara, H. M. (1996), “Power analysis and
determination of sample size for covariance structure modeling”, Psychological
Methods, 1(2): 130-149.
Nicholas, L. N., Thapa, B., & Ko, Y. J. (2009), “Residents’ perspectives of a world heritage
site: The Pitons Management Area, St. Lucia”, Annals of Tourism Research, 36(3):
390-412.
Nunkoo, R., & Gursoy, D. (2012), “Residents’ support for tourism: An Identity
Perspective”, Annals of Tourism Research, 39(1): 243-268.
Nunkoo, R., & Ramkissoon, H. (2011), “Developing a community support model for
tourism”, Annals of Tourism Research, 38(3): 964-988.
Nyaupane, G. P., Morais, D. B., & Dowler, L. (2006), “The role of community involvement
and number/type of visitors on tourism impacts: A controlled comparison of
Annapurna, Nepal and Northwest Yunnan, China”, Tourism Management, 27(6):
1373-1385.
UTCC International Journal of Business and Economics
UTTC IJBE | 168
Sheldon, P. J., & Abenoja, T. (2001), “Resident attitudes in a mature destination: the case
of Waikiki”, Tourism Management, 22(5): 435-443.
Soon-Ho, K., Hye-Sook, H., Holland, S., & Byon, K. K. (2009), “Structural relationships
among involvement, destination brand equity, satisfaction and destination visit
intentions: The case of Japanese outbound travelers”, Journal of Vacation
Marketing, 15(4): 349-365.
Stylidis, D., Biran, A., Sit, J., & Szivas, E. M. (2014), “Residents' support for tourism
development: The role of residents' place image and perceived tourism impacts”,
Tourism Management, 45: 260-274.
Tosun, C. (2000), “Limits to community participation in the tourism development process
in developing countries”, Tourism Management, 21(6): 613-633.
Vargas-Sánchez, A., Oom do Valle, P., da Costa Mendes, J., & Silva, J. A. (2015),
“Residents' attitude and level of destination development: An international
comparison”, “Tourism Management, 48: 199-210.
Wang, S., & Chen, J. S. (2015), “The influence of place identity on perceived tourism
impacts”, Annals of Tourism Research, 52: 16-28.
Yoon, Y., Gursoy, D., & Chen, J. S. (2001), “Validating a tourism development theory
with structural equation modeling”, Tourism Management, 22(4): 363-372.
UTCC International Journal of Business and Economics
UTTC IJBE | 169
UTCC International Journal of Business and Economics (UTCC IJBE)
Volume 10 Number 1, April 2018
The effects of experiential value, technology
acceptance and satisfaction on users’ intention
to continue using - A case study of an English
online dictionary in Guangxi, China
Guangpei Wei1, Thitikan Satchabut2 2School of Business, University of the Thai Chamber of Commerce [email protected], [email protected]
Abstract The This paper is a case study on the influence of three factors – experiential value,
technology acceptance and satisfaction – on the activities of users of an English online
dictionary. Variables of experiential value that were explored in this study include
aesthetics, escapism, service excellence, and return on investment (ROI) for the consumer.
Variables of technology acceptance that were explored in this study include perceived
usefulness, perceived ease of use, and perceived enjoyment. Another variable, user
satisfaction, was also measured. Data was collected from 384 English online dictionary
user in Guangxi province, China via a questionnaire. The sample consisted of (160) men
(41.2%) and (224) women (59.8%); a majority were aged 21 to 30 years, and a majority of
them had studied at university. It was found using regression analysis that quality of
service, consumer ROI, perceived ease of use and perceived enjoyment significantly
influenced respondents’ intentions to continue using the online English dictionary.
However, some respondents also recommended that the online dictionary publishers
should make interpretations more understandable, improve the correctness of
pronunciation of words, and make the website more navigable and user-friendly. This
paper provides an insight into how online English dictionary businesses could enhance user
satisfaction among consumers in terms of experiential value and technology acceptance.
Keywords: satisfaction, continuance intention, Guangxi, China
Paper type: Research Paper
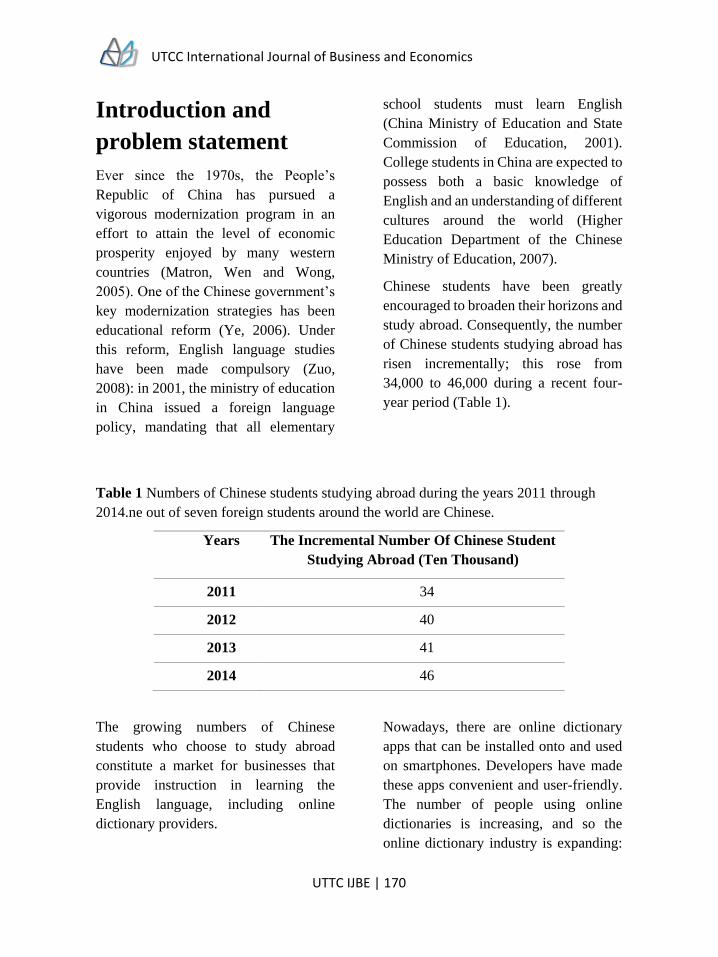
UTCC International Journal of Business and Economics
UTTC IJBE | 170
Introduction and
problem statement
Ever since the 1970s, the People’s
Republic of China has pursued a
vigorous modernization program in an
effort to attain the level of economic
prosperity enjoyed by many western
countries (Matron, Wen and Wong,
2005). One of the Chinese government’s
key modernization strategies has been
educational reform (Ye, 2006). Under
this reform, English language studies
have been made compulsory (Zuo,
2008): in 2001, the ministry of education
in China issued a foreign language
policy, mandating that all elementary
school students must learn English
(China Ministry of Education and State
Commission of Education, 2001).
College students in China are expected to
possess both a basic knowledge of
English and an understanding of different
cultures around the world (Higher
Education Department of the Chinese
Ministry of Education, 2007).
Chinese students have been greatly
encouraged to broaden their horizons and
study abroad. Consequently, the number
of Chinese students studying abroad has
risen incrementally; this rose from
34,000 to 46,000 during a recent four-
year period (Table 1).
Table 1 Numbers of Chinese students studying abroad during the years 2011 through
2014.ne out of seven foreign students around the world are Chinese.
Years The Incremental Number Of Chinese Student
Studying Abroad (Ten Thousand)
2011 34
2012 40
2013 41
2014 46
The growing numbers of Chinese
students who choose to study abroad
constitute a market for businesses that
provide instruction in learning the
English language, including online
dictionary providers.
Nowadays, there are online dictionary
apps that can be installed onto and used
on smartphones. Developers have made
these apps convenient and user-friendly.
The number of people using online
dictionaries is increasing, and so the
online dictionary industry is expanding:
UTCC International Journal of Business and Economics
UTTC IJBE | 171
new companies are entering this industry,
and competition has become fierce. Most
of these companies use loss-leader
marketing strategies: they offer free
services in an effort to attract more users.
As a result, users’ switching costs are
very low, and so marketers in these
companies mainly focus on the
willingness of consumers to continue
using their online dictionary apps.
The aim of this study is to investigate
how experiential value, technology
acceptance and satisfaction affect
people’s willingness to continue using an
online dictionary.
Literature review
The relationship between
experiential value and
satisfaction
Mathwick et al. (2001) proposed that
consumer value is largely built on
experiential perception, which in turn is
derived from the product consumption
process. They advised that a
multidimensional conceptualization is
needed in order to understand
comprehensively how consumers value a
product or service. It is important for
researchers to understand each individual
dimension of consumer value exists and
the ways in which they relate to one
other. Mathwick et al. developed the
experiential value scale (EVS) to
measure the following four sub-
dimensions of consumer experiential
value:
Aesthetics. This consists of two major
features: visual appeal, and
entertainment. In the EVS model, visual
appeal is defined as the experience that is
perceived through the senses (hearing,
tasting, sighting, touching) of the specific
environment. Entertainment is the value
that is derived in a sensory way from the
service environment or service itself; it is
the extent to which those excite a
consumer. Aesthetics have a strong
influence on a consumer’s intention to
use a product or service.
Escapism. The escapism value is created
by consumers themselves. It is an inner
feeling, a sense of initiative and self-
oriented experience along the
consumption process. This induces a
consumer to feel temporarily involved in
a specific imaginary environment; the
consumer essentially enters an imaginary
world (Huizinga, 1955). The escapism
value can induce a consumer to become
addicted to a service or product.
Service excellence. A consumer detects
this when a service provider offers good
service performance and demonstrates
expertise. Service excellence occurs
when service providers meet the
consumer’s expectation.
Consumer ROI. This is a utilitarian
concept: it consists of economic,
temporal, behavioral, and psychological
aspects of the process of consumption.
Consumer ROI is defined as the amount
of utility the consumer obtains from the
UTCC International Journal of Business and Economics
UTTC IJBE | 172
consumption activity in exchange for his
or her money, time, and effort. Normally,
the consumer expects the value of service
to exceed his or her involvement (money,
time, effort).
A consumer’s satisfaction is affected by
the consumer’s perceived value. For
example, when consumers encounter a
higher quality product, they will believe
they are obtaining a greater value for
their involvement (or transactions, i.e.
money, time, effort). This increase in the
perceived value will lead an increase in
overall satisfaction toward the product
(Cottet and Plichon, 2006).
Experiential value has been emphasized
as a new basis modern market value
(Prahalad and Ramaswamy, 2013).
Woodruff and Gardial (1993) claimed
that value and satisfaction are
intertwined in this perception of value.
Satisfaction could be considered as the
value derived from using a product,
hence the term ‘experiential’ (ibid).
Fundamentally, consumer satisfaction is
a culmination of a series of consumer
experiences, or the outcome of positive
experiences minus negative experiences
(Meyer and Schwager, 2007).
Consumer experience with products or
services is associated with consumer
expectation. An increase in consumer
experiential value can actually make
consumers feel more satisfied. The
factors that affect experiential value
might also have a positive influence on
overall satisfaction (Petrick and Norman,
2001).
In this study, experiential value was
chosen to measure consumer satisfaction,
and the correlation between experiential
value and consumer satisfaction was also
explored. This paper addresses a
significant knowledge gap: there have
been few previous studies into the
experiential value of online dictionary
products.
The relationship between
technology acceptance and
satisfaction
Around The technology acceptance
theory (TAM) was proposed by Davis
(1986). In marketing literature, TAM is
widely used within fields such as
information systems (IS), information
technology (IT) and information services
to either explain the adoption of a
particular technology or to assess its
usage (Kleijnen and De Ruyter, 2004).
According to the TAM theory, there are
two determinants – perceived usefulness
(or PU), and perceived ease of use (or
PEOU) – that determine a person’s
eagerness to adopt a technology:
Perceived usefulness is viewed as a
utilitarian factor that has an impact on a
user’s willingness to use a technology
(Davis, 1989). Perceived usefulness is
the consumer’s perception of the extent
to which the technology improves
working performance or efficiency
(Klopping and Mckinney, 2004). Since
higher working performance or
efficiency will return a higher reward, the
UTCC International Journal of Business and Economics
UTTC IJBE | 173
consumer will adopt a new technology
with these properties (Ramayah, 2006).
Perceived usefulness is a critical
motivation factor: the more useful the
consumer perceives a product to be, the
more likely he or she will decide to adopt
it (Bhattacherjee, 2001)
Perceived ease of use is a hedonic factor
that has an impact on a consumer’s
decision on whether or not to use a
technology (Davis, 1989). Perceived ease
of use refers to the consumer's perception
that it might be easy to interact with the
specific technology (Koufaris, 2002).
Technologies often enrich people’s lives;
however, the nature of technology is
often complicated, and first-time users
might encounter a steep learning curve or
struggle in their efforts to use a
technology.
For technology product marketers, it is
important to consider the consumer’s
learning process toward a specific
technology since complexity will deter
him or her from adopting or continuing
to use the product. The greater the
perceived ease of use of a technology, the
more likely and more frequently the
consumer will use it (Wallace and
Barkhi, 2007). Davis(1992) stated that
perceived ease of use should be
considered as one of the technology
acceptance factors in the ATM model.
According to the technology acceptance
model, perceived ease of use is the extent
to which the consumer is relieved of
physical and mental effort involved in
using the technology. PEOU is therefore
associated with user-friendliness: the less
effort required to use a technology, the
more user-friendly the consumer will
perceive it to be. Some scholars have
claimed that if the use of a technology is
effortless, then users will consider it to be
useful (Bruner, 2005).
Perceived enjoyment (or PE) is defined
as perceived playfulness, a consumer’s
perception of having fun from using a
specific technology (Davis, 1992).
Within the technology acceptance model
framework, perceived enjoyment is an
intrinsic motivation that drives the
performance of an activity (Nash, 2003).
Moon and Kim (2001) introduced
perceived enjoyment as a new factor that
reflects users' intrinsic intentions to use
the World Wide Web. The intrinsic
factor in the technology acceptance
model is defined as perceived enjoyment;
an interchangeable term is perceived
playfulness, although the former term is
used throughout this paper.
Perceived enjoyment is the intrinsic
factor that has a positive impact on a
person’s intention to use a product. It is a
feeling of delight that could influence or
generate that individual’s attitude
towards a specific technology
(Venkatesh, 2000). Triandis (1979)
claimed that feelings of delight, pleasure
and joy have an impact on an individual's
behaviour in such a way that he or she is
motivated to use a product more
frequently. In today’s advanced
economy, consumers often have a wide
range of products to choose from, and
UTCC International Journal of Business and Economics
UTTC IJBE | 174
some scholars have argued that
functionality is no longer a priority in
their decisions on which products they
intend to use (Calisir, 2004). The
intrinsic factor has become more
important in the consumer's decision-
making process. ‘Feeling free’ will make
the consumer perceive the whole process
as pleasurable, which means that
perceived ease of use has a positive
impact on perceived enjoyment.
Enjoyment is a reaction that determines
the consumer's evaluation of the
performance (Luo, 2005).
Recently, academics have investigated
the relationships between technology
acceptance factors and consumer
satisfaction. Saade and Bahli (2004)
claimed that, in the technology field,
perceived ease of use is an essential
element of consumer satisfaction; thus,
consumer satisfaction could be estimated
by measuring perceived ease of use. The
higher the consumer’s perceived ease of
use, the more likely he or she will feel
satisfied with and motivated into using a
product (Chiu, 2009; Cheung and Lee,
2005; Mäntymäki, 2009). Technology
acceptance factors influence what is
termed ‘e-satisfaction’ (Teerling and
Huizingh, 2010). Perceived usefulness is
one part of consumer expectation, which
in turn is related to consumer satisfaction
(Chea, 2005). Perceived enjoyment
determines the consumer’s willingness to
revisit a website, and it shares a direct
positive relationship with consumer’s
satisfaction. As mentioned, there have
been few previous studies in which the
technology acceptance model has been
applied to the online dictionary industry.
The difference between
experiential value and
technology acceptance
Experience an online dictionary is a
combination of application technology
and services offered to consumers. Based
on this understanding, technology
acceptance factors relate to the
technology aspects, and experiential
value relates to services offered to
consumers. If the dimensions for
measuring satisfaction in a study are
comprehensive, a more accurate
prediction of consumer’s intentions to
continue using a product can be forecast.
In addition, the perception of escapism is
similar to the perception of perceived
enjoyment. But there are still some
differences between these two
perceptions; for this paper, these
perceptions have been considered in the
pursuit of different goals. The English
online dictionary industry is highly
specialized. Users who are not native
English speakers value an amenable
English-speaking environment. Online
dictionary providers need to create a
sense of escapism if they are to attract
consumers; they need to create an
attractive English environment, one in
which consumers can immerse in an
imaginary world (Huizinga, 1955).
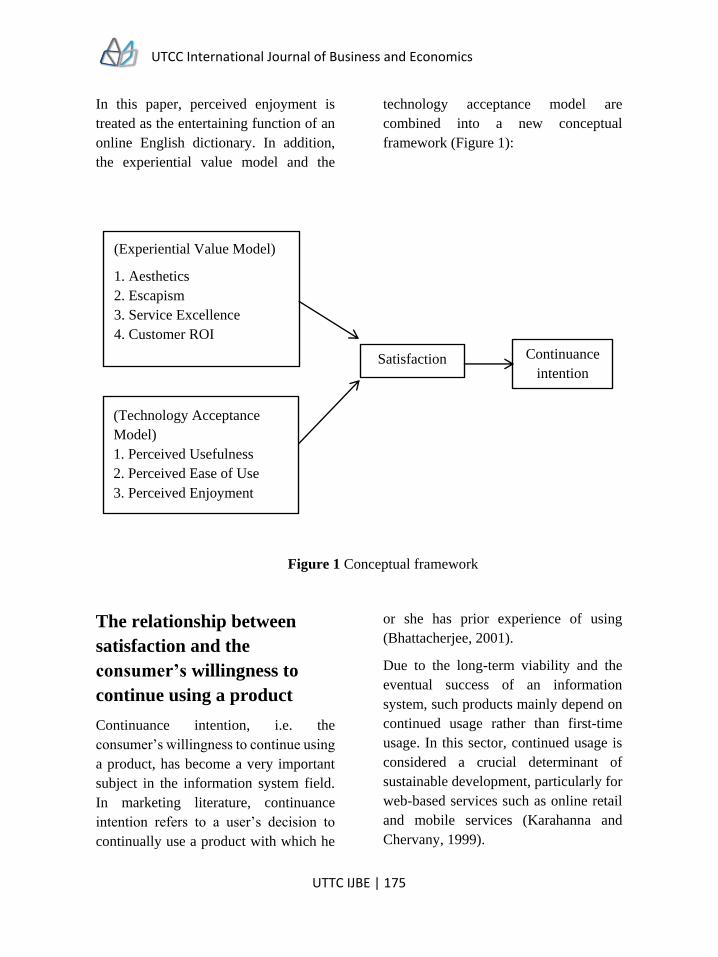
UTCC International Journal of Business and Economics
UTTC IJBE | 175
In this paper, perceived enjoyment is
treated as the entertaining function of an
online English dictionary. In addition,
the experiential value model and the
technology acceptance model are
combined into a new conceptual
framework (Figure 1):
Figure 1 Conceptual framework
The relationship between
satisfaction and the
consumer’s willingness to
continue using a product
Continuance intention, i.e. the
consumer’s willingness to continue using
a product, has become a very important
subject in the information system field.
In marketing literature, continuance
intention refers to a user’s decision to
continually use a product with which he
or she has prior experience of using
(Bhattacherjee, 2001).
Due to the long-term viability and the
eventual success of an information
system, such products mainly depend on
continued usage rather than first-time
usage. In this sector, continued usage is
considered a crucial determinant of
sustainable development, particularly for
web-based services such as online retail
and mobile services (Karahanna and
Chervany, 1999).
(Experiential Value Model)
1. Aesthetics
2. Escapism
3. Service Excellence
4. Customer ROI
Satisfaction
Continuance
intention
(Technology Acceptance
Model)
1. Perceived Usefulness
2. Perceived Ease of Use
3. Perceived Enjoyment
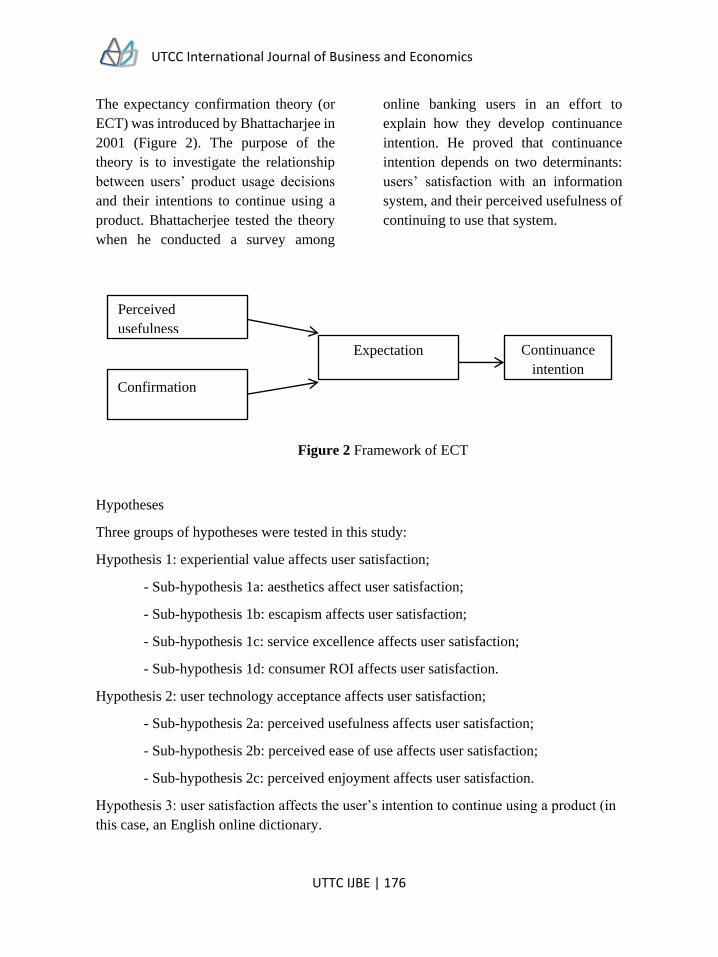
UTCC International Journal of Business and Economics
UTTC IJBE | 176
The expectancy confirmation theory (or
ECT) was introduced by Bhattacharjee in
2001 (Figure 2). The purpose of the
theory is to investigate the relationship
between users’ product usage decisions
and their intentions to continue using a
product. Bhattacherjee tested the theory
when he conducted a survey among
online banking users in an effort to
explain how they develop continuance
intention. He proved that continuance
intention depends on two determinants:
users’ satisfaction with an information
system, and their perceived usefulness of
continuing to use that system.
Figure 2 Framework of ECT
Hypotheses
Three groups of hypotheses were tested in this study:
Hypothesis 1: experiential value affects user satisfaction;
- Sub-hypothesis 1a: aesthetics affect user satisfaction;
- Sub-hypothesis 1b: escapism affects user satisfaction;
- Sub-hypothesis 1c: service excellence affects user satisfaction;
- Sub-hypothesis 1d: consumer ROI affects user satisfaction.
Hypothesis 2: user technology acceptance affects user satisfaction;
- Sub-hypothesis 2a: perceived usefulness affects user satisfaction;
- Sub-hypothesis 2b: perceived ease of use affects user satisfaction;
- Sub-hypothesis 2c: perceived enjoyment affects user satisfaction.
Hypothesis 3: user satisfaction affects the user’s intention to continue using a product (in
this case, an English online dictionary.
Perceived
usefulness
Continuance
intention
Expectation
Confirmation
UTCC International Journal of Business and Economics
UTTC IJBE | 177
Methodology
Research design
Data was collected using a questionnaire,
which consisted of four sections as below
table 2 showing. (1) Demographic.
Respondents were asked to state their
age, gender, education level, occupation
and income level. (2)Variables affecting
satisfaction. Respondents were asked
questions that concerned technology
acceptance and experiential value. In this
study, the four dimensions of experiential
value were considered (aesthetics,
escapism, service excellence and
consumer ROI); each dimension was
measured using three items. Technology
acceptance among the respondents was
evaluated in terms of their perceived
usefulness, perceived ease of use, and
perceived enjoyment. (3) Satisfaction.
This section contained three items. (4)
Continuance intention. This section
contained three items.
Table 2 Questionnaire
Variables affecting satisfaction (I found that ..................)
Aesthetics
Online dictionary’s website attractive
Online dictionary’s website has a clean and simple presentation
the icon of online dictionary is beautiful
Escapism
online dictionary released me from the difficulty of studying
online dictionary involved me in English thinking
learning with online dictionary was just like playing a fun game
Service excellence
the interpretation on online dictionary is understandable
The online dictionary application is compatible with my phone
the pronunciation on online dictionary is precisely genuine
Customer ROI
using online dictionary is worthy of my time
UTCC International Journal of Business and Economics
UTTC IJBE | 178
online dictionary has valuable information
online dictionary is convenient for my life
Perceived usefulness
Interpretation on online dictionary always helps me understand the context better.
The English news on online dictionary website makes me more interested in studying
English.
The translation from online dictionary is always correct.
Online dictionary enhanced my effectiveness on the study.
Perceived ease of use
Online dictionary is very easy to install on my phone.
Online dictionary website was easy to navigate.
Online dictionary is very easy to upgrade to the latest version.
People learned to use online dictionary very quickly.
Perceived enjoyment
I almost forgot the time while I was using online dictionary
the reading articles on online dictionary is entertaining
the audio material in online dictionary are enjoyable
the pictures in online dictionary are amusing
Satisfaction (How much are you satisfied with.............)
The translation of online dictionary
the experience of using online dictionary
the experience of using online dictionary
Continuance intention
I will continue to use online dictionary as my first choice for translation services
I will recommend online dictionary to my friends
I will use online dictionary more frequently than used to
UTCC International Journal of Business and Economics
UTTC IJBE | 179
Sample
The target population in this study was
Internet users living in Guangxi
province, China. Since this population is
large and it is almost impossible to
determine how many people in Guangxi
use English online dictionaries,
Cochran’s (1953) formula for yielding a
representative sample of an unknown
population size was used.
The sample size of this study is
calculated by using W.G. Cochran
(1953) formula with 95% confidential
level, the formula is presented as below:
Where: Is size of sample, Is proportion (0.5), = (1- )=0.5, is probability
of error (0.5), Represents confidence if the confidence is at 95%, z =1.96
The result of the sample size of this study is:
384 people
After substituting the numbers into the
W.G. Cochran (1953) formula, the result
numbers of the sample is 384 people.
Data collection
384 questionnaires were proportionally
distributed to English online dictionary
users in all 14 districts of Guangxi
province. Due to limited time and the
expansive geographical area, the
questionnaires were distributed only via
social media (WeChat and QQ).
Reliability test
The reliability test is a process to indicate
the correlation among items, scale or
instrument in each set variables. The
reliability was measured by cronbach’s
alpha coefficient. The cut-off level of
cronbach’s alpha has to be at least 0.7 or
greater than 0.7, that can keep an item in
an adequate scale; additionally, the cut-
off level that higher than 0.8 is
considered a “good scale” (cronbach,
1951). The table 5 below presented the
reliability of all factors in this survey
questionnaire.
0n p q p e
z
2
2
0e
pqzn
2
2
0e
pqzn
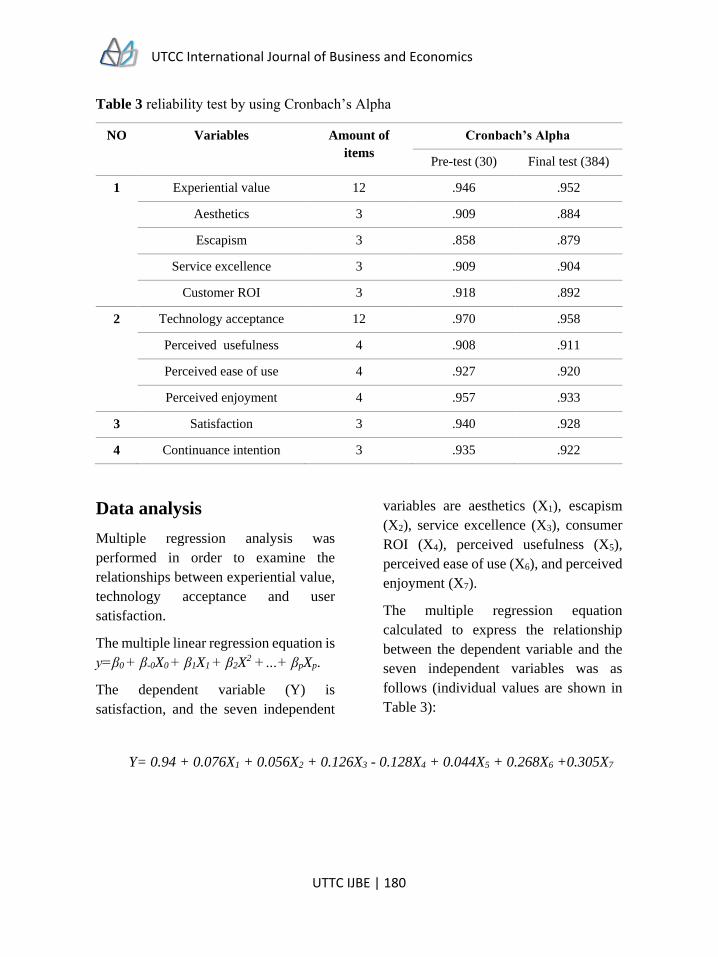
UTCC International Journal of Business and Economics
UTTC IJBE | 180
Table 3 reliability test by using Cronbach’s Alpha
NO Variables Amount of
items
Cronbach’s Alpha
Pre-test (30) Final test (384)
1
Experiential value 12 .946 .952
Aesthetics 3 .909 .884
Escapism 3 .858 .879
Service excellence 3 .909 .904
Customer ROI 3 .918 .892
2 Technology acceptance 12 .970 .958
Perceived usefulness 4 .908 .911
Perceived ease of use 4 .927 .920
Perceived enjoyment 4 .957 .933
3 Satisfaction 3 .940 .928
4 Continuance intention 3 .935 .922
Data analysis
Multiple regression analysis was
performed in order to examine the
relationships between experiential value,
technology acceptance and user
satisfaction.
The multiple linear regression equation is
y=β0 + β-0X0 + β1X1 + β2X2 +…+ βpXp.
The dependent variable (Y) is
satisfaction, and the seven independent
variables are aesthetics (X1), escapism
(X2), service excellence (X3), consumer
ROI (X4), perceived usefulness (X5),
perceived ease of use (X6), and perceived
enjoyment (X7).
The multiple regression equation
calculated to express the relationship
between the dependent variable and the
seven independent variables was as
follows (individual values are shown in
Table 3):
Y= 0.94 + 0.076X1 + 0.056X2 + 0.126X3 - 0.128X4 + 0.044X5 + 0.268X6 +0.305X7
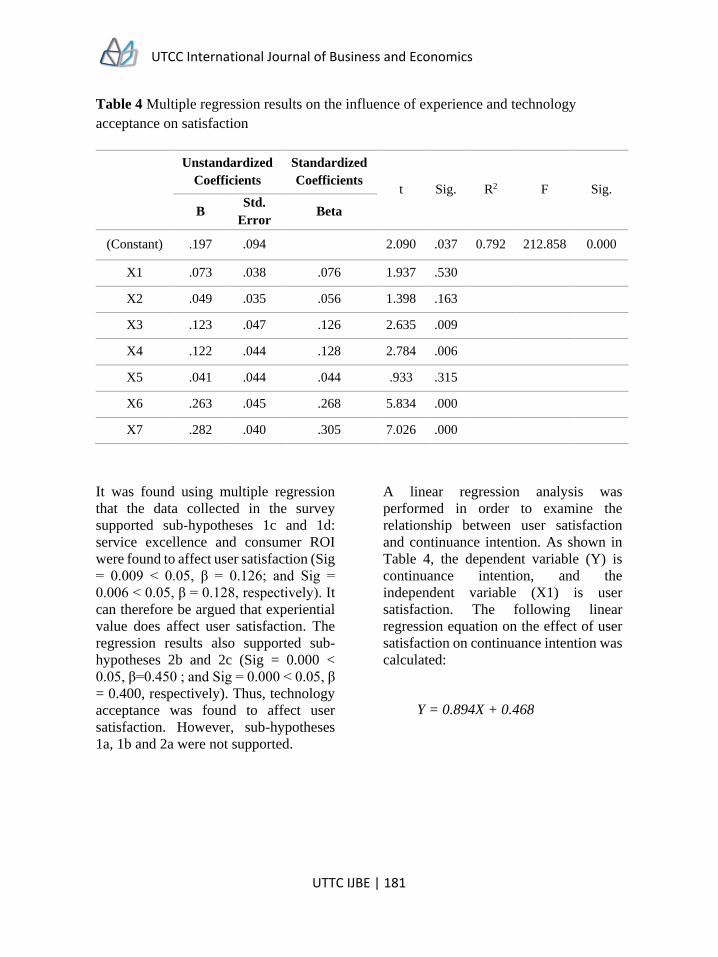
UTCC International Journal of Business and Economics
UTTC IJBE | 181
Table 4 Multiple regression results on the influence of experience and technology
acceptance on satisfaction
Unstandardized
Coefficients
Standardized
Coefficients t Sig. R2 F Sig.
B Std.
Error Beta
(Constant) .197 .094 2.090 .037 0.792 212.858 0.000
X1 .073 .038 .076 1.937 .530
X2 .049 .035 .056 1.398 .163
X3 .123 .047 .126 2.635 .009
X4 .122 .044 .128 2.784 .006
X5 .041 .044 .044 .933 .315
X6 .263 .045 .268 5.834 .000
X7 .282 .040 .305 7.026 .000
It was found using multiple regression
that the data collected in the survey
supported sub-hypotheses 1c and 1d:
service excellence and consumer ROI
were found to affect user satisfaction (Sig
= 0.009 < 0.05, β = 0.126; and Sig =
0.006 < 0.05, β = 0.128, respectively). It
can therefore be argued that experiential
value does affect user satisfaction. The
regression results also supported sub-
hypotheses 2b and 2c (Sig = 0.000 <
0.05, β=0.450 ; and Sig = 0.000 < 0.05, β
= 0.400, respectively). Thus, technology
acceptance was found to affect user
satisfaction. However, sub-hypotheses
1a, 1b and 2a were not supported.
A linear regression analysis was
performed in order to examine the
relationship between user satisfaction
and continuance intention. As shown in
Table 4, the dependent variable (Y) is
continuance intention, and the
independent variable (X1) is user
satisfaction. The following linear
regression equation on the effect of user
satisfaction on continuance intention was
calculated:
Y = 0.894X + 0.468
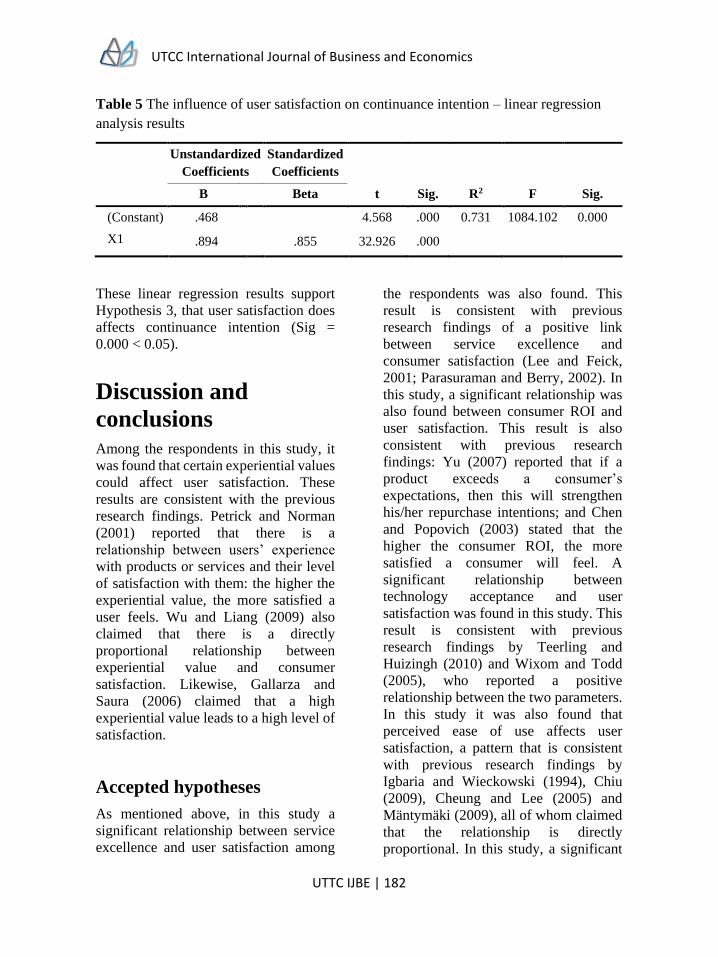
UTCC International Journal of Business and Economics
UTTC IJBE | 182
Table 5 The influence of user satisfaction on continuance intention – linear regression
analysis results
Unstandardized
Coefficients
Standardized
Coefficients
t Sig. R2 F Sig. B Beta
(Constant) .468 4.568 .000 0.731 1084.102 0.000
X1 .894 .855 32.926 .000
These linear regression results support
Hypothesis 3, that user satisfaction does
affects continuance intention (Sig =
0.000 < 0.05).
Discussion and
conclusions
Among the respondents in this study, it
was found that certain experiential values
could affect user satisfaction. These
results are consistent with the previous
research findings. Petrick and Norman
(2001) reported that there is a
relationship between users’ experience
with products or services and their level
of satisfaction with them: the higher the
experiential value, the more satisfied a
user feels. Wu and Liang (2009) also
claimed that there is a directly
proportional relationship between
experiential value and consumer
satisfaction. Likewise, Gallarza and
Saura (2006) claimed that a high
experiential value leads to a high level of
satisfaction.
Accepted hypotheses
As mentioned above, in this study a
significant relationship between service
excellence and user satisfaction among
the respondents was also found. This
result is consistent with previous
research findings of a positive link
between service excellence and
consumer satisfaction (Lee and Feick,
2001; Parasuraman and Berry, 2002). In
this study, a significant relationship was
also found between consumer ROI and
user satisfaction. This result is also
consistent with previous research
findings: Yu (2007) reported that if a
product exceeds a consumer’s
expectations, then this will strengthen
his/her repurchase intentions; and Chen
and Popovich (2003) stated that the
higher the consumer ROI, the more
satisfied a consumer will feel. A
significant relationship between
technology acceptance and user
satisfaction was found in this study. This
result is consistent with previous
research findings by Teerling and
Huizingh (2010) and Wixom and Todd
(2005), who reported a positive
relationship between the two parameters.
In this study it was also found that
perceived ease of use affects user
satisfaction, a pattern that is consistent
with previous research findings by
Igbaria and Wieckowski (1994), Chiu
(2009), Cheung and Lee (2005) and
Mäntymäki (2009), all of whom claimed
that the relationship is directly
proportional. In this study, a significant
UTCC International Journal of Business and Economics
UTTC IJBE | 183
relationship between technology
acceptance and user satisfaction was
found. Similar results were reported by
Koufaris (2002), and by Thong and Tam
(2006).
Rejected sub-hypotheses
Sub-hypothesis 1a was not supported by
the regression results. This conflicts with
some previous research findings that
aesthetic value can influence consumer
satisfaction (Petrick and Norman, 2001),
particularly during an online service
encounter (Wang and Minor, 2010). Sub-
hypothesis 1b was also rejected. This too
conflicts with previous research findings
by Verhagen and Merikivi (2011) and Ha
and Jang (2010), who claimed that
hedonic aspects have a strong impact on
consumer satisfaction. Sub-hypothesis
2a was also rejected.
The main reason why the findings in this
paper are identical to those in many
previous studies might be that this study
also concerns consumer’s satisfaction.
However, there are some differences
between this paper and previous studies.
For instance, this paper is based on a
survey in China, whereby the sample
consisted of users who using English
online dictionary.
Recommendations
Online dictionary providers should
ensure that they deliver excellent service
and ensure good consumer ROI. Online
dictionary providers should ensure that
definitions of words in their dictionaries
are easy to understand; they should
attempt to explain the meanings of words
using plain language (or ‘layman’s
terms’).
Some respondents in this study suggested
that online dictionary providers should
improve word pronunciation. They could
source pronunciations of words such as
“karaoke” from native speakers from
authorized sources such as the BBC or
VOA; they could also provide
pronunciations of a word in different
accents, e.g. British and American
accents. Many respondents in this study
felt that when visiting an online
dictionary web page, it is always
interrupted by a timed advertisement.
Some respondents felt that online
dictionaries do not often provide
valuable information. However, this is a
subjective assessment: a certain
definition of a word might be useful to
one reader, but not to another.
The results in this study also provide
online English dictionary providers with
a better understanding of how to enhance
user satisfaction in terms of technology
acceptance. It was found that perceived
ease of use and perceived enjoyment
affect consumer satisfaction. Online
dictionary marketers therefore need to
take these dimensions into account.
Some respondents remarked that online
dictionary providers should make their
websites easy to navigate. The navigation
process should be simple enough that the
user can go directly to the service he or
she wants. Some respondents also hinted
that online dictionary providers should
make it easy for users to upgrade to their
latest versions, and provide notification
reminding them when it is time to
upgrade.
UTCC International Journal of Business and Economics
UTTC IJBE | 184
Limitations of the
study and
recommendations for
further research
1. This study was limited to users who
were using online English dictionary in
Guangxi China. Due to limitations in
terms of population and time, the
findings of this study cannot be
generalized to other dictionaries’
destinations. Other destinations and
different sampling territory should be
considered in future studies.
2. In this study, experiential value and
technology acceptance were identified as
the antecedents of both satisfaction and
user’s continuance to continue using.
However, there might be other factors
that affect those two variables. Other
predictors such as brand, motivation and
expectation should be explored in future
studies.
References
Ajzen, I., & Fishbein, M. (1980). Understanding attitudes and predicting social behavior.
Agarwal, R., & Prasad, J. (1999). Are individual differences germane to the acceptance of
new information technologies? Decision sciences, 30(2), 361-391.
Amoroso, D. L., & Hunsinger, D. S. (2009). Understanding consumers’ acceptance of
online purchasing. Journal of Information Technology Management, 20(1), 15-
41.
Bhattacherjee, A. (2001). Understanding information systems continuance: an expectation-
confirmation model. MIS quarterly, 351-370.
Barsky, J., & Nash, L. (2003). Customer satisfaction application lying concepts to industry-
wide measures. Cornell Hotel and Restaurant Administration Quarterly, 44(5-6),
173-183.
Bollen, K. A. (1989). Structural equations with latent variables. Series in probability and
mathematical statistics.
Bruner, G. C., & Kumar, A. (2005). Explaining consumer acceptance of handheld Internet
devices. Journal of business research, 58(5), 553-558.
Calisir, F., & Calisir, F. (2004). The relation of interface usability characteristics, perceived
usefulness, and perceived ease of use to end-user satisfaction with enterprise
resource planning (ERP) systems. Computers in human behavior, 20(4), 505-
515.
UTCC International Journal of Business and Economics
UTTC IJBE | 185
Cardozo, R. N. (1965). An experimental study of customer effort, expectation, and
satisfaction. Journal of marketing research, 244-249.
Chea, S., & Luo, M. M. (2005). E-Service Customer Retention: The Roles of Negative
Affectivity and Perceived Switching Costs. AMCIS 2005 Proceedings, 35.
Chen, I. J., & Popovich, K. (2003). Understanding customer relationship management
(CRM) People, process, and technology. Business process management journal,
9(5), 672-688.
Cheung, M. K., & Lee, M. K. (2005). Research framework for consumer satisfaction with
internet shopping. City University of Hong Kong, China. Sprouts: Working
Papers on Information Systems, 5(26), 5-26.
Chiu, C. M., Lin, H. Y., Sun, S. Y., & Hsu, M. H. (2009). Understanding customers' loyalty
intentions towards online shopping: an integration of technology acceptance
model and fairness theory. Behaviour & Information Technology, 28(4), 347-
360.
China Ministry of Education, & State Commission of Education. (1996). the opinion on
the reform and development of teacher education. China: China Ministry of
Education. State Commission of Education
China Ministry of Education and Training. (March 16, 1999). The opinion on adjusting the
structure of teacher education institutions. China: Ministry of Education
Cottet, P., Lichtlé, M. C., & Plichon, V. (2006). The role of value in services: a study in a
retail environment. Journal of Consumer Marketing, 23(4), 219-227.
Cyr, D., Head, M., & Ivanov, A. (2006). Design aesthetics leading to m-loyalty in mobile
commerce. Information & Management, 43(8), 950-963.
Davis Jr, F. D. (1986). A technology acceptance model for empirically testing new end-
user information systems: Theory and results (Doctoral dissertation,
Massachusetts Institute of Technology).
Eggert, A., & Ulaga, W. (2002). Customer perceived value: a substitute for satisfaction in
business markets?. Journal of Business & industrial marketing, 17(2/3), 107-118.
Fornell, C. (1992). A national customer satisfaction barometer: the Swedish experience.
the Journal of Marketing, 6-21.
Gallarza, M. G., & Saura, I. G. (2006). Value dimensions, perceived value, satisfaction and
loyalty: an investigation of university students’ travel behaviour. Tourism
management, 27(3), 437-452.
UTCC International Journal of Business and Economics
UTTC IJBE | 186
Galletta, D. F., & Lederer, A. L. (1989). Some cautions on the measurement of user
information satisfaction*. Decision Sciences, 20(3), 419-434.
Ha, J., & Jang, S. S. (2010). Perceived values, satisfaction, and behavioral intentions: The
role of familiarity in Korean restaurants. International Journal of Hospitality
Management, 29(1), 2-13.
Ha, S., & Stoel, L. (2009). Consumer e-shopping acceptance: Antecedents in a technology
acceptance model. Journal of Business Research, 62(5), 565-571.
Hirschman, E. C., & Holbrook, M. B. (1982). Hedonic consumption: emerging concepts,
methods and propositions. The Journal of Marketing, 92-101.
Holbrook, M. B., & Corfman, K. P. (1985). Quality and value in the consumption
experience: Phaedrus rides again. Perceived quality, 31(2), 31-57.
Holbrook, M. B. (1994). The nature of customer value: an axiology of services in the
consumption experience. Service quality: New directions in theory and practice,
21, 21-71.
Holbrook, M. B. (2001). The millennial consumer in the texts of our times: Exhibitionism.
Journal of Macromarketing, 21(1), 81-95.
Higher Education Department of the Ministry of Education. (2007). College English
curriculum requirements. Beijing: Tsinghua University Press.
Huizinga, J. (1955). Homo Ludens: A Study of the Play-element in Culture. Beacon Press.
Igbaria, M., Schiffman, S. J., & Wieckowski, T. J. (1994). The respective roles of perceived
usefulness and perceived fun in the acceptance of microcomputer technology.
Behaviour & Information Technology, 13(6), 349-361.
Igbaria, M., Zinatelli, N., Cragg, P., & Cavaye, A. L. (1997). Personal computing
acceptance factors in small firms: a structural equation model.MIS quarterly,
279-305.
Karahanna, E., Straub, D. W., & Chervany, N. L. (1999). Information technology adoption
across time: a cross-sectional comparison of pre-adoption and post-adoption
beliefs. MIS quarterly, 183-213.
Keng, C. J., Huang, T. L., Zheng, L. J., & Hsu, M. K. (2007). Modeling service encounters
and customer experiential value in retailing: An empirical investigation of
shopping mall customers in Taiwan. International Journal of Service Industry
Management, 18(4), 349-367.
Keng, C. J., & Ting, H. Y. (2009). The acceptance of blogs: using a customer experiential
value perspective. Internet Research, 19(5), 479-495.
UTCC International Journal of Business and Economics
UTTC IJBE | 187
Klopping, I. M., & McKinney, E. (2004). Extending the technology acceptance model and
the task-technology fit model to consumer e-commerce. Information
Technology, Learning, and Performance Journal, 22 (1), 35.
Koufaris, M. (2002). Application lying the technology acceptance model and flow theory
to online consumer behavior. Information systems research, 13(2), 205-223.
Kuo, Y. F. (2003). A study on service quality of virtual community websites.Total Quality
Management and Business Excellence, 14(4), 461-473.
Lee, C. S., & Bang, S. B. (2004). The effects of shopping value on online purchasing
intention: focus on product attribute importance as intervening variables. Korean
Marketing Research, 19(2), 41-69.
Lee, E. J., Uniremidy, C. A., & Overby, J. W. (2004). Creating value for online shoppers:
implications for satisfaction and loyalty.
Lee, H. J., Lim, H., Jolly, L. D., & Lee, J. (2009). Consumer lifestyles and adoption of
high-technology products: a case of South Korea. Journal of International
Consumer Marketing, 21(2), 153-167.
Lee, J., Lee, J., & Feick, L. (2001). The impact of switching costs on the customer
satisfaction-loyalty link: mobile phone service in France. Journal of services
marketing, 15(1), 35-48.
Lee, K., Khan, S., & Mirchandani, D. (2013). Hierarchical effects of product attributes on
actualized innovativeness in the context of high-tech products.Journal of
Business Research, 66(12), 2634-2641.
Liao, Z., & Shi, X. (2009). Consumer perceptions of internet-based e-retailing: an
empirical research in Hong Kong. Journal of Services Marketing, 23(1), 24-30.
Lin, C.S.,Wu,S.,& Tsai, R. J. (2005). Integrating perceived playfulness into expectation-
confirmation model for web portal context. Information & management, 42(5),
683-693.
Luarn, P., & Lin, H. H. (2005). Toward an understanding of the behavioral intention to use
mobile banking. Computers in human behavior, 21(6), 873-891.
Mäntymäki, M. (2009). Customer in social virtual worlds. Proceedings from The 22nd
Blede-Conference E-Enablement: Facilitating an Open, Effective and
Representative e-Society.Bled, Slovenia.
Mathwick, C., Malhotra, N., & Rigdon, E. (2001). Experiential value: conceptualization,
measurement and application in the catalog and Internet shopping
environment☆. Journal of retailing, 77(1), 39-56.
UTCC International Journal of Business and Economics
UTTC IJBE | 188
Mathwick, C., Malhotra, N., & Rigdon, E. (2002). The effect of dynamic retail experiences
on experiential perceptions of value: An Internet and catalog comparison.Journal
of Retailing, 78(1), 51–60.
Marton, F., Wen, Q., & Wong, K. C. (2005). ‘Read a hundred times and the meaning will
application ear...’Changes in Chinese University students’ views of the temporal
structure of learning. Higher Education, 49(3), 291-318.
Meyer, C.; Schwager, A. 2007. Understanding customer experience, Harvard Business
Review (2): 117–126.
Miller, J. A. (1997). Exploring Satisfaction, Modifying Models, Elicing Expectations,
Posing Problems and Making Measurement of Consumer Satisfaction and
Dissatisfaction.
Min, Q., & Shenghua, X. (2007, September). An extended expectation confirmation model
for information systems continuance. In Wireless Communications, Networking
and Mobile Computing, 2007. WiCom 2007. International Conference on (pp.
3879-3882). IEEE.
Moon, J. W., & Kim, Y. G. (2001). Extending the TAM for a World-Wide-Web context.
Information & management, 38(4), 217-230.
Muylle, S., Moenaert, R., & Despontin, M. (2004). The conceptualization and empirical
validation of web site user satisfaction. Information & management, 41(5), 543-
560.
Nadiri, H. and Hussain, K. (2005), “Perceptions of service quality in North Cyprus hotels”,
International Journal of Contemporary Hospitality Management, Vol. 17, No. 6,
pp. 469-480.
Nicholls, J. A. F., Gilbert, G. R., & Roslow, S. (1998). Parsimonious measurement of
customer satisfaction with personal service and the service setting. Journal of
Consumer Marketing, 15(3), 239-253.
Oh, H. (1999). Service quality, customer satisfaction, and customer value: A holistic
perspective. International Journal of Hospitality Management, 18(1), 67-82.
Oliver, Richard L. (1981). What is Customer Satisfaction, Wharton Magazine, 5, pp.36-
41.
Parasuraman, A., Zeithaml, V., & Berry, L. (2002). SERVQUAL: a multiple-item scale for
measuring consumer perceptions of service quality. Retailing: critical concepts,
64(1), 140.
UTCC International Journal of Business and Economics
UTTC IJBE | 189
Petrick, J. F., Morais, D. D., & Norman, W. C. (2001). An examination of the determinants
of entertainment vacationers’ intentions to revisit. Journal of Travel Research,
40(1), 41-48.
Prahalad, C. K., & Ramaswamy, V. (2013). The future of competition: Co-creating unique
value with customers. Harvard Business Press.
Ramayah, T. (2006). Interface characteristics, perceived ease of use and intention to use an
online library in Malaysia. Information Development, 22 (2), 123-133.
Saadé, R., & Bahli, B. (2005). The impact of cognitive absorption on perceived usefulness
and perceived ease of use in on-line learning: an extension of the technology
acceptance model. Information & management, 42 (2), 317-327.
Shang, R. A., Chen, Y. C., & Shen, L. (2005). Extrinsic versus intrinsic motivations for
consumers to shop on-line. Information & Management, 42(3), 401-413.
Shanka, T., & Taylor, R. (2005). Assessment of university campus café service: The
students' perceptions. Asia Pacific Journal of Tourism Research, 10(3), 329-340.
Shieh, K. F., & Ming-Sung, C. (2007). An empirical study of experiential value and
lifestyles and their effects on satisfaction in adolescents: An example using
online gaming. Adolescence, 42(165), 199.
Shih, H. P. (2004). An empirical study on predicting user acceptance of e-shopping on the
Web. Information & Management, 41(3), 351-368.
Singh, J. (1991). Understanding the structure of consumers’ satisfaction evaluations of
service delivery. Journal of the Academy of Marketing Science, 19(3), 223-244.
Sweeney, J. C., & Soutar, G. N. (2001). Consumer perceived value: The development of a
multiple item scale. Journal of retailing, 77(2), 203-220.
Taylor, S., & Todd, P. (1995). Assessing IT usage: The role of prior experience. MIS
quarterly, 561-570.
Thong, J. Y., Hong, S. J., & Tam, K. Y. (2006). The effects of post-adoption beliefs on the
expectation-confirmation model for information technology continuance.
International Journal of Human-Computer Studies, 64(9), 799-810.
Triandis, H. C. (1979). Values, attitudes, and interpersonal behavior. InNebraska
symposium on motivation. University of Nebraska Press.
Van der Heijden, H. (2003). Factors influencing the usage of websites: the case of a generic
portal in The Netherlands. Information & management, 40 (6), 541-549.
UTCC International Journal of Business and Economics
UTTC IJBE | 190
Venkatesh, V. (2000). Determinants of perceived ease of use: Integrating control, intrinsic
motivation, and emotion into the technology acceptance model. Information
systems research, 11(4), 342-365.
Verhagen, T., & Van Dolen, W. (2009). Online purchase intentions: A multi-channel store
image perspective. Information & Management, 46(2), 77-82.
Verhagen, T., Feldberg, F., van den Hooff, B., Meents, S., & Merikivi, J. (2011).
Satisfaction with virtual worlds: An integrated model of experiential value.
Information & Management, 48(6), 201-207.
Wang, S.T., Cheng, M.S. (2003), Experiential Marketing: the concept of effectively
execute experiential value model from view point of people and strategic flow,
2003 Conference on Elevating Executing Ability in Taiwan, Taoyang County:
National Central University, Department of Business Administration.
Wang, Y. J., Hernandez, M. D., & Minor, M. S. (2010). Web aesthetics effects on perceived
online service quality and satisfaction in an e-tail environment: The moderating
role of purchase task. Journal of Business Research, 63(9), 935-942.
Wang, L. (2010). Higher education governance and university autonomy in
China. Globalisation, Societies and Education, 8(4), 477-495.
Wixom, B. H., & Todd, P. A. (2005). A theoretical integration of user satisfaction and
technology acceptance. Information systems research, 16(1), 85-102.
Wolfinbarger, M., & Gilly, M. C. (2001). Shopping online for freedom, control, and fun.
California Management Review, 43(2), 34-55.
Woodruff, R. B., Schumann, D. W., & Gardial, S. F. (1993). Understanding value and
satisfaction from the customer's point of view. Survey Of Business-University
Of Tennessee, 29, 33-33.
Woodside, A. G., Frey, L. L., & Daly, R. T. (1990). Linking service quality, customer
satisfaction, and behavioral intention. Journal of health care marketing, (9), 5-
17.
Wu, C. H. J., & Liang, R. D. (2009). Effect of experiential value on customer satisfaction
with service encounters in luxury-hotel restaurants. International Journal of
Hospitality Management, 28(4), 586-593.
Xu, S., & Connelly, F. M. (2009). Narrative inquiry for teacher education and
development: Focus on English as a foreign language in China. Teaching and
Teacher Education, 25(2), 219-227.
UTCC International Journal of Business and Economics
UTTC IJBE | 191
Xie, A. (2001). The Development and Reform of Teacher Education in China: Theoretical
Issues. Asia-Pacific Journal of Teacher Education & Development, 4(2), 41-59.
Ye, L. (2006). On" New Basic Education": Inquiry and understanding of contemporary
Chinese school reform.
Yu, S. H. (2007). An empirical investigation on the economic consequences of customer
satisfaction. Total quality management, 18(5), 555-569.
Yuan Yi-hua,(2003) “Research on the Relationship between Customers’ Satisfaction and
Experimental Marketing, Experimental Value” National Taipei University of
Technology & science, Institute of Commerce Automation and Management,
Master’s Thesis.
UTCC International Journal of Business and Economics
UTTC IJBE | 192
Guide for authors
University of the Thai Chamber of Commerce International Journal of Business and
Economics (UTCC IJBE) is published by University of the Thai Chamber of Commerce,
and Thailand Management Association. It is published twice yearly in a spring and fall
edition and is directed toward the needs of academia, practitioners, executives, researchers,
students, and the general public interested in business management (i.e., Marketing,
Service Management, Innovation and Design in Business, Finance, Banking, Accounting,
Economics, Insurance and Risk Management, Production, Industrial and Operation
Management, Strategic Management and Management, International and Global Business
Management, Entrepreneurships, Organization Behavior, Business Ethics, Business Law,
Business System, Hospitality and Tourism Management, Human Resource Management,
and Office and Facility Management).
UTCC International Journal of Business and Economics
UTTC IJBE | 193
Editorial policy
The UTCC IJBE is designed as a forum
for current research, opinions, and
identification of trends in business
management. The opinions expressed are
those of the authors and do not
necessarily reflect the opinions of the
Editors, the Editorial Review Board, or
University of the Thai Chamber of
Commerce, and Thailand Management
Association.
The copyright of all published material
belongs to University of the Thai
Chamber of Commerce, with future use
rights reserved. This, however, does not
limit the author’s right to use his or her
own material.
Objectives
The editorial objectives of UTCC IJBE
are to advance knowledge and science
and to stimulate greater thought and
effort in the fields of business
management, and by providing readers
with:
Novel and useful information;
New business management theory or
techniques;
Research explaining about business
management thought and practice;
Articles in subject areas which have
significant current impact on thought
and practice in business
management.
Content
The UTCC IJBE will mainly consider for
publication three types of articles:
1. Articles that report empirical
research on business management
issues.
2. Articles that report on the
development of methodologies and
techniques that can enhance business
management decision making.
3. Articles that report the application of
decision tools to generic or specific
business management problems.
Manuscripts should be between 4,000
and 6,000 words, typically 15-20 single-
spaced, typewritten pages. Articles of
shorter length are also acceptable. Only
rarely will it be possible to publish a
manuscript of more than 6,000 words.
Review
Articles are considered for publication if
they have not been published or accepted
for publication elsewhere and are not
being concurrently considered
elsewhere. Authors will usually be
notified of acceptance, rejection, or need
for revision within 16 weeks of
submission.
No manuscript is accepted for UTCC
IJBE until it has been reviewed by the
Editor or one of the Associate Editors
and at least two outside reviewers who
are experts in their respective fields.
All manuscripts are judged on their
contribution to the advancement of the
science and/or practice of business
management. The editors expect all
manuscripts to follow accepted standards
for scholarly work. Manuscripts are
judged not only on depth and scope of
ideas presented and their contribution to
the field, but also on their clarity,
organization, readability, and
comprehensibility.
UTCC International Journal of Business and Economics
UTTC IJBE | 194
Manuscripts should be written in a
manner that is interesting and readable to
both practitioners and academics. It is
beneficial to include a section regarding
managerial implications and discussion
of the consequences of applying the
proposed ideas. Technical terms should
be defined.
Manuscript
preparation
Manuscripts should be typed single-
spaced in 12-point type using Times
Roman or similar type. Use single
spacing in endnote references. Please
allow the text to wrap, rather than
entering a RETURN or LINEFEED after
every line.
Manuscripts should be submitted
electronically, preferably in Microsoft
Word, to the Editors at the following e-
mail address: [email protected] or
[email protected]. it is
not possible to submit an electronic copy,
send four (4) copies of the manuscript to
the Editors. Nonelectronic submissions
require more time to administer, so
authors should be aware that the
processing time for their manuscripts
will be longer.
The sections of the manuscript should be
placed in the following order: Cover
page, Title page, Authors, Abstract (on a
page by itself) and Body, Illustrations,
Citation, References, and Appendices.
Cover page
The cover page should include the title of
the manuscript and the authors’ name(s)
in the order in which they will be printed.
The following information should be
provided for each co-author: name, title,
university/company name, mailing
address, telephone number, facsimile
number, and e-mail address. Please
indicate which co-author will serve as the
primary contact for the Journal.
In addition to any acknowledgment of
financial or technical assistance, this
page should include each author’s title,
present position, and complete address
and telephone number. Please keep
professional titles succinct.
Title page
Type the title in bold type, all caps,
single-spaced, and centered across the
top of the first page, in 14 point Times
New Roman, as illustrated above.
Authors
The author(s), affiliation(s), mailing
address(es), and e-mail address(es)
should be single-spaced and centered on
the line below the title, in 12 point bold
Times New Roman for the author(s), and
in normal Times New Roman for the
remainders. One line space should be
used to separate author(s) from the paper
title. Please do not use titles such as Dr.,
Professor, etc.
Abstract (on a page by itself),
and body
Introduce the paper with an abstract of
approximately 100-200 words, in 12
point Times New Roman. Begin with the
centered heading “Abstract”. All body
paragraphs should begin flush left (no
paragraph indent) and right justified.
Single-space the body of the paper. Use
12 point Times New Roman throughout.
UTCC International Journal of Business and Economics
UTTC IJBE | 195
Figures and tables should be placed as
close as possible to where they are cited.
First-level headings state the table or
figure number. All tables and images
should be embedded into the file and
sized appropriately. All photographs
should be sampled at 300 dpi (dots per
inch). Keep in mind that web graphics are
typically sampled at 72 dpi. Photographs
must be properly sized and positioned in
the body of the paper.
Illustrations
(Tables and figures)
Each illustration should be numbered
consecutively within its series type
(Table 1, Table 2, Figure 1, Figure 2). If
illustrations appear in appendices, they
should be numbered consecutively, but
separately from body illustrations (e.g.,
Table A-1, Figure A-1). In the text, refer
to tables and figures by their numbers.
Avoid using “above,” “below,”
“preceding,” and similar terms. All
Tables and Figures must have titles.
Titles for each Table and Figure should
be descriptive but not lengthy. The title
should be in bold letters at the top of the
Table or Figure.
Tables and Figures should be called
“Table” or “Figure” and should be
followed by a blank line and then the title
for the table or figure also in bold letters
at the top of the table or figure.
For Journal purposes, tables and figures
are defined as follows: a table is
comprised of rows and columns of
numbers and/or text; a figure is a chart,
graph, diagram, map, drawing, or any
other nontext item that is not a table.
Tables should be typed in the following
style:
General design
For more effective communication and
better quality reproduction when printed,
tables and figures should be kept as
simple and uncluttered as possible, while
conveying all necessary information.
Details
Footnotes should appear directly below
illustrations, flush with the left edge, and
they should be designated by small
letters, rather than asterisks or numerals.
Column or row heads should be
footnoted only if the footnote applies to
all items in the column or row. Complete
source information must be provided for
illustrations copied or derived from other
sources. This complete information
should be provided and an author-date
citation should be given in a source note
on the illustration. (Source notes are
sized and placed like footnotes, below
any footnotes for the illustration.)
If elements on an illustration are not
labelled, but represent certain categories,
items, or amounts, a complete key
(legend) should be included. Make sure
that necessary measures of statistical
significance are reported with each
illustration. Designate units (percent,
dollars, hours, etc.) in column and row
headings (tables) or in element labels or
keys (figures). Separate from each figure,
give numerical values for all points, bars,
pie slices, etc., so that they can be readily
reproduced by the typesetter, if
necessary. Double-check formulae and
mathematical terms and equations for
consistency, readability, and accuracy.
Add extra space between characters to
clarify and separate the terms, and be
sure that sub and superscript
relationships are clear. Check for
UTCC International Journal of Business and Economics
UTTC IJBE | 196
opening and closing parenthesis and
brackets. Write the names of Greek and
special characters in the margin. Use tab
indents or column alignment, rather than
spaces, to align columns and indent
headings.
English (USA) spelling should be used;
foreign terms not commonly used in
English (USA) should be italicized.
Regarding mathematical
notation
The percent sign (%) should be used in
text and in tables. Mathematical notation
must be clear within the text and
illustrations. All equations must be very
clearly typed. Display (separate line)
equations should be aligned to the left
margin. Italic type is used for letters in
equations, except for trigonometric
functions and logarithm abbreviations,
which are plain (normal) type. Matrices
and vectors are in boldface type. (If these
cannot be typed in italic and boldface,
italic type can be indicated by a hand-
drawn straight underline and boldface by
a wavy underline). Unusual and Greek
symbols should be typed in the text using
the Symbol capability. If no Symbol
capability is possible, such special
characters should be identified by name
in a marginal note. (This is important; the
editor may be not familiar with these
symbols and may have difficulty
producing the correct one without a
marginal note.) For equations that might
be too long to type in a 6” column,
indicate appropriate breaks.
Citation
The UTCC IJBE follows the reference
format of Academy of Management
Journal. This format is available at the
AMJ'swebsitehttp://aom.pace.edu/amjne
w/style_guide.html. The use of footnotes
is discouraged.
References
References are to be listed alphabetically,
last name first, followed by publication
date in parentheses. Use full first name,
not just initials. The reference list should
be typed single-spaced in 12-point type.
Please let the Endnotes wrap rather than
using tabs or returns at the end of internal
lines. Do not use indents, tabs, or
symbols to delineate your paragraphs.
Instead, use two hard returns between
each reference.
Proceedings/ Journal articles:
Supaporn Kiattisin (2007), “Detection of
an Acute Leukemia Using an Active
Contour Model,” Proceedings of the 4th
International Joint Conference on
Computer Science and Software
Engineering, May 3-4, 2007, Hotel
Sofitel Raja Orchid, Khon Kaen,
Thailand.
Chirapandu, S. & Yoopetch, C. (2009),
“Bank Credit Card Adoption Criteria and
Marketing Implications,” International
Journal of Business in Asia, Vol.1, No. 1,
pp. 1- 20.
Books:
Akachai Apisakkul & Thasana
Boonkwan (2004), Strategic
Management, 4th Ed. New York:
McGraw-Hill Irwin.
Authors are responsible for the accuracy
of their references. Check them carefully.
Readers’ questions and comments about
incomplete and inaccurate References
will be referred to the article authors with
UTCC International Journal of Business and Economics
UTTC IJBE | 197
a follow-up by the Editor. All authors of
a referenced work should be listed; et al.
should not be used in the Reference list.
Undefined acronyms should not be used.
Appendices
If any mathematical proof or development is
used but not critical to the exposition of the
main argument of the manuscript, authors
should include it in an appendix. An
appendix may also be used for the
mathematical material that may be beyond
the level of the average reader.
Permissions
Submitting a manuscript to UTCC IJBE
constitutes an assignment of copyright to
the Journal and a guarantee that the work
is original. It also indicates that the
author(s) owns it, and that no part of it
has been previously published in
substantially the same form, that it is not
being published or considered for
publication elsewhere, and that any use
of others’ materials is by permission or
falls within fair use standards of
copyright law. The author(s) is
responsible for obtaining any necessary
permission from copyright holders and
for paying any necessary fees. Extensive
paraphrasing is considered disguised
copying; permission is required.
Portions of an item, such as some of the
data from a table, or part of a graphic
representation of a model, can be used
without permission if they are properly
credited with full and exact source
information and do not comprise a
significant portion of the submitted
article. Copies of written permissions
should be submitted with the final
manuscript.
Electronic submission
Manuscripts should be submitted
electronically, preferably in Microsoft
Word, to the Editors at the following e-
mail address: [email protected] or
[email protected]. If it
is not possible to submit an electronic
copy, send three (3) copies of the
manuscript to the Editors. Nonelectronic
submissions require more time to
administer, so authors should be aware
that the processing time for their
manuscripts will be longer.
When the authors are notified of
acceptance, they will be asked to
provide the final, accepted version of the
article on in electronic format containing
the article text files.
Online Submission Manuscripts should be submitted
electronically at http://ijbejournal.com/,
in Microsoft Word.
The sections of the manuscript should be
placed in the following order: Cover
page, Title page, Authors, Abstract (on a
page by itself) and Body, Illustrations,
Citation, References, and Appendices.

UTCC International Journal of Business and Economics
UTTC IJBE | 198
Related Documents