© 2019 JETIR March 2019, Volume 6, Issue 3 www.jetir.org (ISSN-2349-5162) JETIR1903L35 Journal of Emerging Technologies and Innovative Research (JETIR) www.jetir.org 249 CONSUMERS’ PERCEPTION TOWARDS HEALTH DRINKS WITH SPECIAL REFERENCE TO RAYALASEEMA REGION 1 Mr. P. Ziaulla Khan Research Scholar Department of Management SK University, Ananthapuramu. 2 Prof. K. Venugopal Rao Professor Faculty of Commerce and Management Studies SK University, Ananthapuramu. Abstract India, the world’s largest malt based drinks market, accounts for 22% of the world’s retail volume sales. These drinks are traditionally consumed as milk substitutes and marketed as a nutrition drinks, mainly consumed by the old, the young and the sick. Available health drinks in market can be considered as follows: Horliks, Boost, Viva, Maltova, Complain, Glucon-D, Bournvita, Amul, Pediasure white drinks account for almost two thirds, of the market Glaxosmithklime (GKS). The study has been taken on the topic “Consumers’ perception towards health drinks with special reference to Rayalaseema region “to know the over view functions and strategy and also to find the best health drink. Conclusion drawn from the test of difference was that a significant difference existed on the factor of consumers’ perception towards health drinks across gender, age, occupation, educational qualification, marital status, monthly income, family type and family size is accepted. Key words: Consumers’ Perception, Health Drinks, Small Towns and Rayalaseema region. Introduction Consumer is the king in modern marketing world. Consumer behavior and attitude helps to determine effective technique and strategies by the marketers for attaining great competition advantage in the market. Consumer behavior able changes make “Yesterday’s luxuries are today’s necessaries”. In the modern and competitive world people must do heavy work both mentally and physically to survive successfully. So that they required more energy and stamina for that they want nutritious and health drinks. Health is man’s precious possession. It influences all his activities and shapes his destiny. An understanding of health is the basis of all health care. Health is wealth. This indicates the importance of health. Health, in fact is a key to education, success, good citizenship and happy life. Without good health an individual cannot perform efficiently. When compared to the other food supplements, health drinks stand the top most of any other thing in this world.

Welcome message from author
This document is posted to help you gain knowledge. Please leave a comment to let me know what you think about it! Share it to your friends and learn new things together.
Transcript
© 2019 JETIR March 2019, Volume 6, Issue 3 www.jetir.org (ISSN-2349-5162)
JETIR1903L35 Journal of Emerging Technologies and Innovative Research (JETIR) www.jetir.org 249
CONSUMERS’ PERCEPTION TOWARDS
HEALTH DRINKS WITH SPECIAL
REFERENCE TO RAYALASEEMA REGION
1Mr. P. Ziaulla Khan
Research Scholar
Department of Management
SK University, Ananthapuramu.
2Prof. K. Venugopal Rao
Professor
Faculty of Commerce and Management Studies
SK University, Ananthapuramu.
Abstract
India, the world’s largest malt based drinks market, accounts for 22% of the world’s retail volume
sales. These drinks are traditionally consumed as milk substitutes and marketed as a nutrition drinks, mainly
consumed by the old, the young and the sick. Available health drinks in market can be considered as follows:
Horliks, Boost, Viva, Maltova, Complain, Glucon-D, Bournvita, Amul, Pediasure white drinks account for
almost two thirds, of the market Glaxosmithklime (GKS). The study has been taken on the topic
“Consumers’ perception towards health drinks with special reference to Rayalaseema region “to know the
over view functions and strategy and also to find the best health drink. Conclusion drawn from the test of
difference was that a significant difference existed on the factor of consumers’ perception towards health
drinks across gender, age, occupation, educational qualification, marital status, monthly income, family type
and family size is accepted.
Key words: Consumers’ Perception, Health Drinks, Small Towns and Rayalaseema region.
Introduction
Consumer is the king in modern marketing world. Consumer behavior and attitude helps to determine
effective technique and strategies by the marketers for attaining great competition advantage in the market.
Consumer behavior able changes make “Yesterday’s luxuries are today’s necessaries”. In the modern and
competitive world people must do heavy work both mentally and physically to survive successfully. So that
they required more energy and stamina for that they want nutritious and health drinks. Health is man’s
precious possession. It influences all his activities and shapes his destiny. An understanding of health is the
basis of all health care. Health is wealth. This indicates the importance of health. Health, in fact is a key to
education, success, good citizenship and happy life. Without good health an individual cannot perform
efficiently. When compared to the other food supplements, health drinks stand the top most of any other
thing in this world.
© 2019 JETIR March 2019, Volume 6, Issue 3 www.jetir.org (ISSN-2349-5162)
JETIR1903L35 Journal of Emerging Technologies and Innovative Research (JETIR) www.jetir.org 250
Review of literature
Shopiya (2009) evaluated the satisfaction level of malted health drink consumers in
Gobichettipalayam town. Sample population of health drink consumers surveyed in Gobichettipalayam town
exhibited their preferences for Horlicks brand. Consumers’ associates Horlicks with the features like:
reasonable priced, well-balanced i.e., quality, right in quantity measure, hygienically packed, recommended
by doctor, contents high vitamins and minerals. The study suggested the competitive brands of malted health
drink manufactures to focus more on framing better strategy to attract more number of consumers to their
brand and retain as loyal consumers of their brand.
Kumar (2010) stated that socio-economic status of health drink consumers’ like: their age, gender,
marital status, education, occupation, income etc., does not influence the satisfaction level of the consumers,
as health drink buyers are more conscious in buying highly nutritional and protein rich dietary supplement
products. The study concluded that majority of the Coimbatorians prefer buying Horlicks and Boost. The
study suggested the manufacturers of other popular health drinks to create more awareness on the benefits of
buying branded health drink brand in order to popularize the brand among the potential buyers.
Suma Devi et al., (2010) in their article. The study admitted that the consumer preference and
satisfaction are closely related to a specific brand. The study suggested that the health drink manufacturers
to market their product more economical package and adopt better promotional strategies to retain their
market share.
Thangaraj et al., (2014) the researchers found that consumer’s purchase decision is strongly
influenced various factors like: personnel influence, family, situations, social class culture, individual
differences in education, knowledge, interest, attitudes, personality, values, availability of resources and
involvement level. The researcher mentioned that most of the respondents were preferred Boost (46.70 per
cent) for its quality (72per cent) and influenced by TV (70.60 per cent). The researcher concluded the
consumers had expressed high degree of satisfaction with selected brands of health drinks.
Harikaran (2014) measured Coimbatorians level of satisfaction towards selected branded health
drinks. The study claims that consumers of health drinks are mostly influenced by the convenience features
of the beverages consumption. The study classified and listed the consumers ‘satisfaction for different brands
i.e., the consumers are Horlicks brand are found to satisfied with the product quality, Complan consumers
are influenced by the energy feature of the product and consumers of other brands are found to influenced
by the brand reputation and trust features.
Ali and Mohamed (2015) the study inferred that majority of the salaried class households prefer
buying health drinks in the study city and they are found to be moderately satisfied with the price of branded
health drinks marketed in their region. The sample consumers have claimed that they prefer to buy branded
health drinks influenced by its quality and sold in hygienically packets.
Muthu (2015) the study found that the people of Woriyur are well aware of brand Horlicks (health
drink) and the consumers expressed high degree of satisfied with easy available of this brand in the market.
© 2019 JETIR March 2019, Volume 6, Issue 3 www.jetir.org (ISSN-2349-5162)
JETIR1903L35 Journal of Emerging Technologies and Innovative Research (JETIR) www.jetir.org 251
The study suggested the manufacturer to attract the prospective buyers and to investigate their product
awareness level, preferences, satisfaction between competitive health drink brands in the market.
Veerakumar and Venkadasubramaniam (2016) the study stated that consumers selected health drinks
based on the product price, package size, external appeal of the package, promotional activities, healthy
features highlighted and the taste of the product. The study claims that price of the product significantly
influences its selection by the consumers in Pollachi.
Sekar and Thangavel (2016) the article ensured that four brands of health drinks are very popular in
Coimbatore district i.e., Horlicks, Complan, Boost and Bournvita. The sample consumers surveyed in rural
and urban areas exhibited claimed that they prefer buying health drinks for its taste, influenced by
advertisement promotions and easy availability of the products in the market.
Dave and Paliwal (2016) studied on consumers’ perception and consumption practices of malted
health drinks in Udaipur city. The study observed that nearly 24.50 per cent of the sample surveyed rarely
(irregular) purchase malt–based drinks, as they found malted health drinks are priced higher and its influences
their family spending features. Rests of the 75.50 per cent of the consumers surveyed in Udaipur had claimed
that they prefer buying health drinks influenced by the product taste, flavor and color (white, brown, green
or sunrise yellow color) of the branded health drinks like: Chocolate, Badam or Pista or Kesar mix etc.
Shiny and Franco (2017) the article claimed that consumers in Kanyakumari District preference
consumption for its qualities like: supply of required amount of energy, boosting immunity power and
support in weight gain. The article also listed the most preferred health brands among consumers in
Kanyakumari District are Horlicks, Boost and Pediasure.
Ravi and Bhagat (2018) the sample consumers claim that they like to consume health drinks as it’s a
good substitution for regular meals and it is also considered as highly energetic. Bengalurians are found to
be satisfied with product taste, price, packages and nutritional features of health drinks.
Nivethitha (2019) the study commented that out of the 100 consumers surveyed, 20 per cent of the
sample population claimed satisfaction with Horlicks (the parent brand). whereas, the study inferred that 57
per cent of the samples consumers’ claimed satisfaction with: Junior Horlicks (18 per cent), Mother Horlicks
(17 per cent), Horlicks Women (15 per cent) and Horlicks Chocolate delight (7 per cent). Rests of the 13 per
cent of the consumers were found to be satisfied with the extended brands like: Horlicks Kesar Badam (6 per
cent), Horlicks Lite (5 per cent), Horlicks Elaichi flavour (2 per cent), Horlicks Growth (4 per cent) and
Horlicks Protein (6 per cent). Cent percent of the samples claim satisfaction with the advertisement and
promotional steps taken by the marketers for promoting the products.
Research Problem
In the recent years’ manufactures producing Health drinks are playing an important role in full filling
the need of the consumers. Many new companies which have established name in the field of business have
also emerged as the manufactures of new brands of Health drinks as a result number of Health drinks such
as Horlicks, Boost, Viva, Milo, Maltova, etc., are available. The consumer’s need and preference are
© 2019 JETIR March 2019, Volume 6, Issue 3 www.jetir.org (ISSN-2349-5162)
JETIR1903L35 Journal of Emerging Technologies and Innovative Research (JETIR) www.jetir.org 252
changing as per the current market scenario. Goods are produced for the purpose of consumption. The aim
of marketing is to meet and satisfy consumer’s needs and wants, perceptions, preferences and shopping and
buying behavior. But knowing consumer is not simple. Consumer may state their needs and wants but act
otherwise Consumer’s preference various from brand to brand on the basis of quality, price advertisement
etc., and consumers’ preference also vary with their income, age, sex or other. Major Seven brands of health
drinks are available in the study area. The study covers all these brands of health drinks. This research work
has been carried out to know why these health drinks are needed and what nutritional values are included in
them.
Research Objectives
1. To study the socio economic profile and awareness of rural consumers towards Health drinks.
2. To examine the differences in the perception of consumers across the socio demographic variables.
Research Hypotheses
H01: There is no significant difference in perception of consumers with respect to socio demographic
variables.
H01.1: There is no significant difference in perception of consumers with respect to gender.
H01.2: There is no significant difference in perception of consumers with respect to age.
H01.3: There is no significant difference in perception of consumers with respect to marital status.
H01.4: There is no significant difference in perception of consumers with respect to occupation.
H01.5: There is no significant difference in perception of consumers with respect to qualification.
H01.6: There is no significant difference in perception of consumers with respect to monthly income.
H01.7: There is no significant difference in perception of consumers with respect to family type.
H01.8: There is no significant difference in perception of consumers with respect to family size.
Research Methodology
Sample Design:
Our target population involves the users, deciders and buyers of Health Drinks. The users include the
old and the young population. The deciders and the buyers mostly include the house wives who buy the
product from the market, out of those 326 respondents were selected through convenience sampling with
care being taken to get responses from consumers of different age groups and different family sizes.
Tools for Analysis
Z-test and
One-way ANOVA
© 2019 JETIR March 2019, Volume 6, Issue 3 www.jetir.org (ISSN-2349-5162)
JETIR1903L35 Journal of Emerging Technologies and Innovative Research (JETIR) www.jetir.org 253
Data Analysis & Results
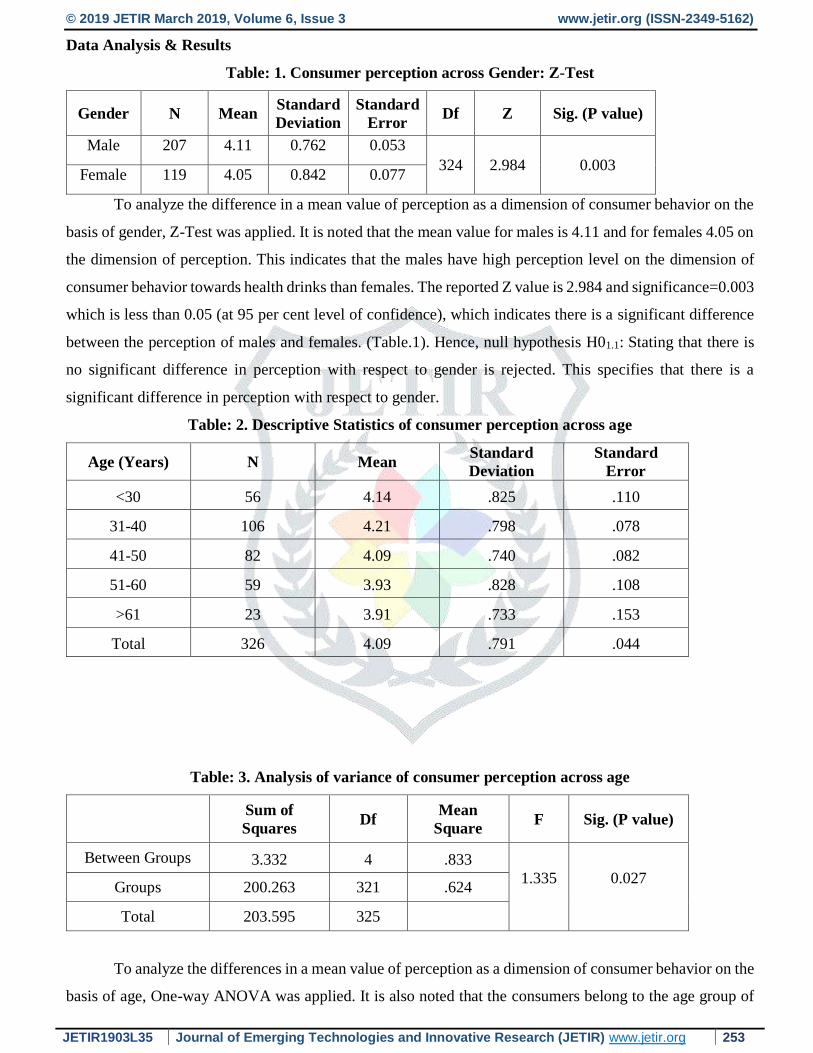
Table: 1. Consumer perception across Gender: Z-Test
Gender N Mean Standard
Deviation
Standard
Error Df Z Sig. (P value)
Male 207 4.11 0.762 0.053
324 2.984 0.003 Female 119 4.05 0.842 0.077
To analyze the difference in a mean value of perception as a dimension of consumer behavior on the
basis of gender, Z-Test was applied. It is noted that the mean value for males is 4.11 and for females 4.05 on
the dimension of perception. This indicates that the males have high perception level on the dimension of
consumer behavior towards health drinks than females. The reported Z value is 2.984 and significance=0.003
which is less than 0.05 (at 95 per cent level of confidence), which indicates there is a significant difference
between the perception of males and females. (Table.1). Hence, null hypothesis H01.1: Stating that there is
no significant difference in perception with respect to gender is rejected. This specifies that there is a
significant difference in perception with respect to gender.
Table: 2. Descriptive Statistics of consumer perception across age
Age (Years) N Mean Standard
Deviation
Standard
Error
<30 56 4.14 .825 .110
31-40 106 4.21 .798 .078
41-50 82 4.09 .740 .082
51-60 59 3.93 .828 .108
>61 23 3.91 .733 .153
Total 326 4.09 .791 .044
Table: 3. Analysis of variance of consumer perception across age
Sum of
Squares Df
Mean
Square F Sig. (P value)
Between Groups 3.332 4 .833
1.335
0.027
Groups 200.263 321 .624
Total 203.595 325
To analyze the differences in a mean value of perception as a dimension of consumer behavior on the
basis of age, One-way ANOVA was applied. It is also noted that the consumers belong to the age group of
© 2019 JETIR March 2019, Volume 6, Issue 3 www.jetir.org (ISSN-2349-5162)
JETIR1903L35 Journal of Emerging Technologies and Innovative Research (JETIR) www.jetir.org 254
below 31-40 obtained maximum mean value of 4.21 on the dimension of perception. This indicates that the
consumers belong to this age group have high satisfaction level on the dimension of consumer perception
towards health drinks however consumers belong to the age group of above 61 showed the lowest satisfaction
(mean= 3.91) as compared to other age group consumers. The result of One-way ANOVA test shows that F
value= 1.335 and significance= 0.027 which is less than 0.05 (at 95 per cent level of confidence), which
indicates there is a significant difference between the perception of different age group of consumers (Table.
3). Hence, null hypothesis H01.2: Stating that there is no significant difference in consumer perception with
respect to age is rejected. This specifies that there is a significant difference in consumer perception with
respect to age.
Marital status
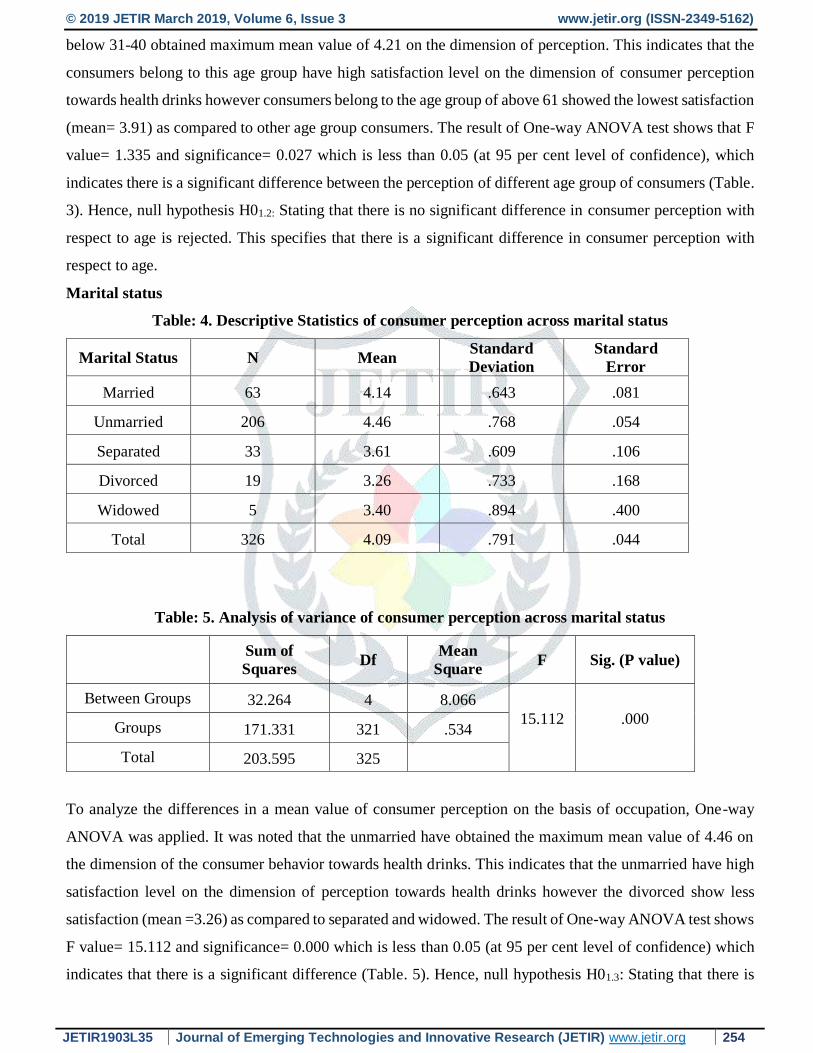
Table: 4. Descriptive Statistics of consumer perception across marital status
Marital Status N Mean Standard
Deviation
Standard
Error
Married 63 4.14 .643 .081
Unmarried 206 4.46 .768 .054
Separated 33 3.61 .609 .106
Divorced 19 3.26 .733 .168
Widowed 5 3.40 .894 .400
Total 326 4.09 .791 .044
Table: 5. Analysis of variance of consumer perception across marital status
Sum of
Squares Df
Mean
Square F Sig. (P value)
Between Groups 32.264 4 8.066
15.112
.000
Groups 171.331 321 .534
Total 203.595 325
To analyze the differences in a mean value of consumer perception on the basis of occupation, One-way
ANOVA was applied. It was noted that the unmarried have obtained the maximum mean value of 4.46 on
the dimension of the consumer behavior towards health drinks. This indicates that the unmarried have high
satisfaction level on the dimension of perception towards health drinks however the divorced show less
satisfaction (mean =3.26) as compared to separated and widowed. The result of One-way ANOVA test shows
F value= 15.112 and significance= 0.000 which is less than 0.05 (at 95 per cent level of confidence) which
indicates that there is a significant difference (Table. 5). Hence, null hypothesis H01.3: Stating that there is
© 2019 JETIR March 2019, Volume 6, Issue 3 www.jetir.org (ISSN-2349-5162)
JETIR1903L35 Journal of Emerging Technologies and Innovative Research (JETIR) www.jetir.org 255
no significant difference in consumer perception with respect to occupation is rejected. This specifies that
there is a significant difference in consumer perception with respect to occupation.
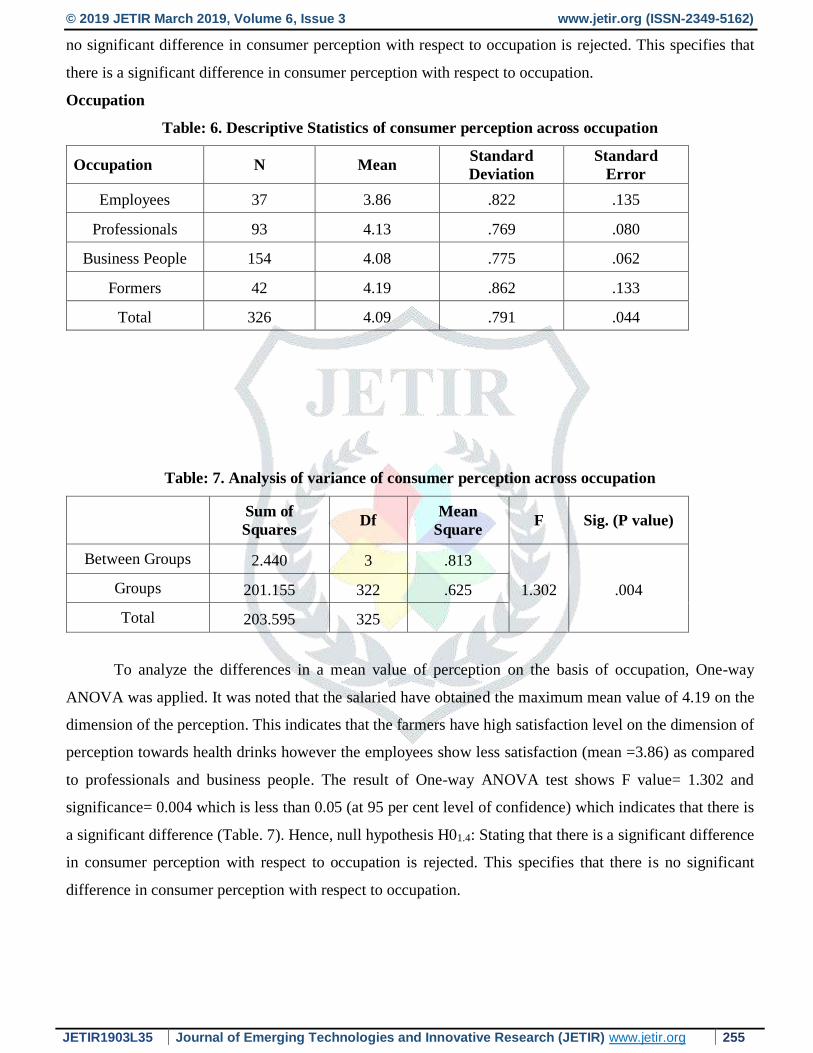
Occupation
Table: 6. Descriptive Statistics of consumer perception across occupation
Occupation N Mean Standard
Deviation
Standard
Error
Employees 37 3.86 .822 .135
Professionals 93 4.13 .769 .080
Business People 154 4.08 .775 .062
Formers 42 4.19 .862 .133
Total 326 4.09 .791 .044
Table: 7. Analysis of variance of consumer perception across occupation
Sum of
Squares Df
Mean
Square F Sig. (P value)
Between Groups 2.440 3 .813
1.302 .004 Groups 201.155 322 .625
Total 203.595 325
To analyze the differences in a mean value of perception on the basis of occupation, One-way
ANOVA was applied. It was noted that the salaried have obtained the maximum mean value of 4.19 on the
dimension of the perception. This indicates that the farmers have high satisfaction level on the dimension of
perception towards health drinks however the employees show less satisfaction (mean =3.86) as compared
to professionals and business people. The result of One-way ANOVA test shows F value= 1.302 and
significance= 0.004 which is less than 0.05 (at 95 per cent level of confidence) which indicates that there is
a significant difference (Table. 7). Hence, null hypothesis H01.4: Stating that there is a significant difference
in consumer perception with respect to occupation is rejected. This specifies that there is no significant
difference in consumer perception with respect to occupation.
© 2019 JETIR March 2019, Volume 6, Issue 3 www.jetir.org (ISSN-2349-5162)
JETIR1903L35 Journal of Emerging Technologies and Innovative Research (JETIR) www.jetir.org 256
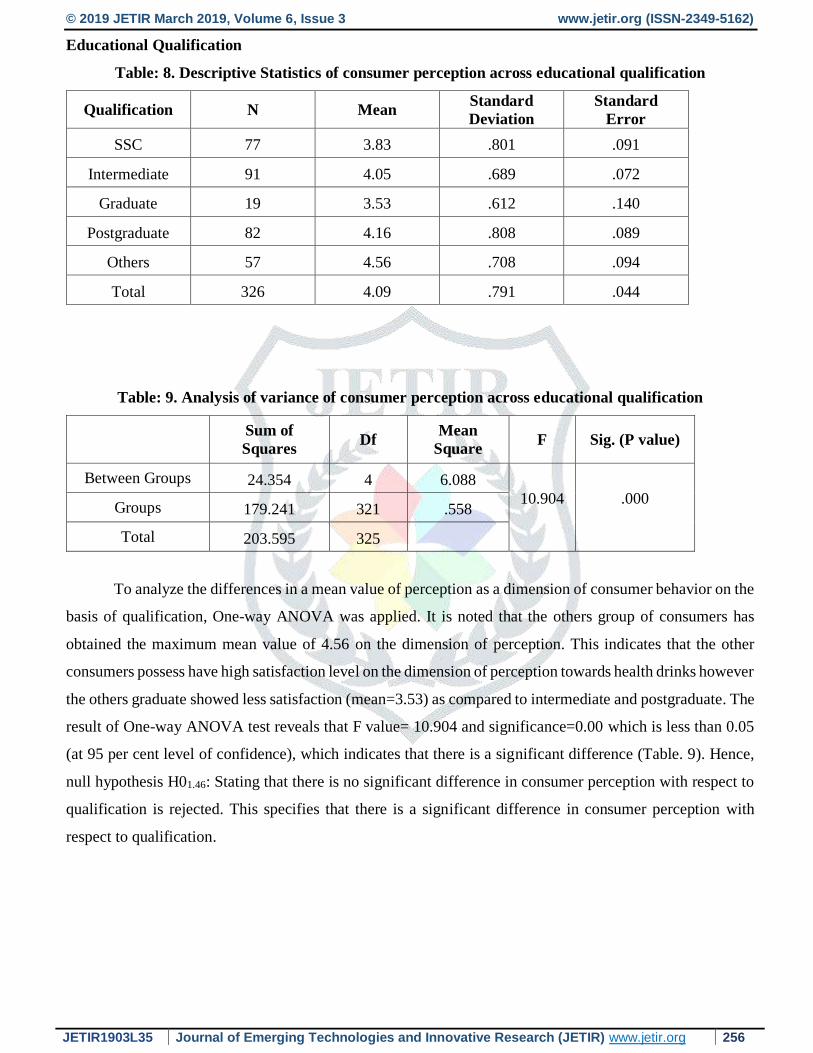
Educational Qualification
Table: 8. Descriptive Statistics of consumer perception across educational qualification
Qualification N Mean Standard
Deviation
Standard
Error
SSC 77 3.83 .801 .091
Intermediate 91 4.05 .689 .072
Graduate 19 3.53 .612 .140
Postgraduate 82 4.16 .808 .089
Others 57 4.56 .708 .094
Total 326 4.09 .791 .044
Table: 9. Analysis of variance of consumer perception across educational qualification
Sum of
Squares Df
Mean
Square F Sig. (P value)
Between Groups 24.354 4 6.088
10.904
.000
Groups 179.241 321 .558
Total 203.595 325
To analyze the differences in a mean value of perception as a dimension of consumer behavior on the
basis of qualification, One-way ANOVA was applied. It is noted that the others group of consumers has
obtained the maximum mean value of 4.56 on the dimension of perception. This indicates that the other
consumers possess have high satisfaction level on the dimension of perception towards health drinks however
the others graduate showed less satisfaction (mean=3.53) as compared to intermediate and postgraduate. The
result of One-way ANOVA test reveals that F value= 10.904 and significance=0.00 which is less than 0.05
(at 95 per cent level of confidence), which indicates that there is a significant difference (Table. 9). Hence,
null hypothesis H01.46: Stating that there is no significant difference in consumer perception with respect to
qualification is rejected. This specifies that there is a significant difference in consumer perception with
respect to qualification.
© 2019 JETIR March 2019, Volume 6, Issue 3 www.jetir.org (ISSN-2349-5162)
JETIR1903L35 Journal of Emerging Technologies and Innovative Research (JETIR) www.jetir.org 257
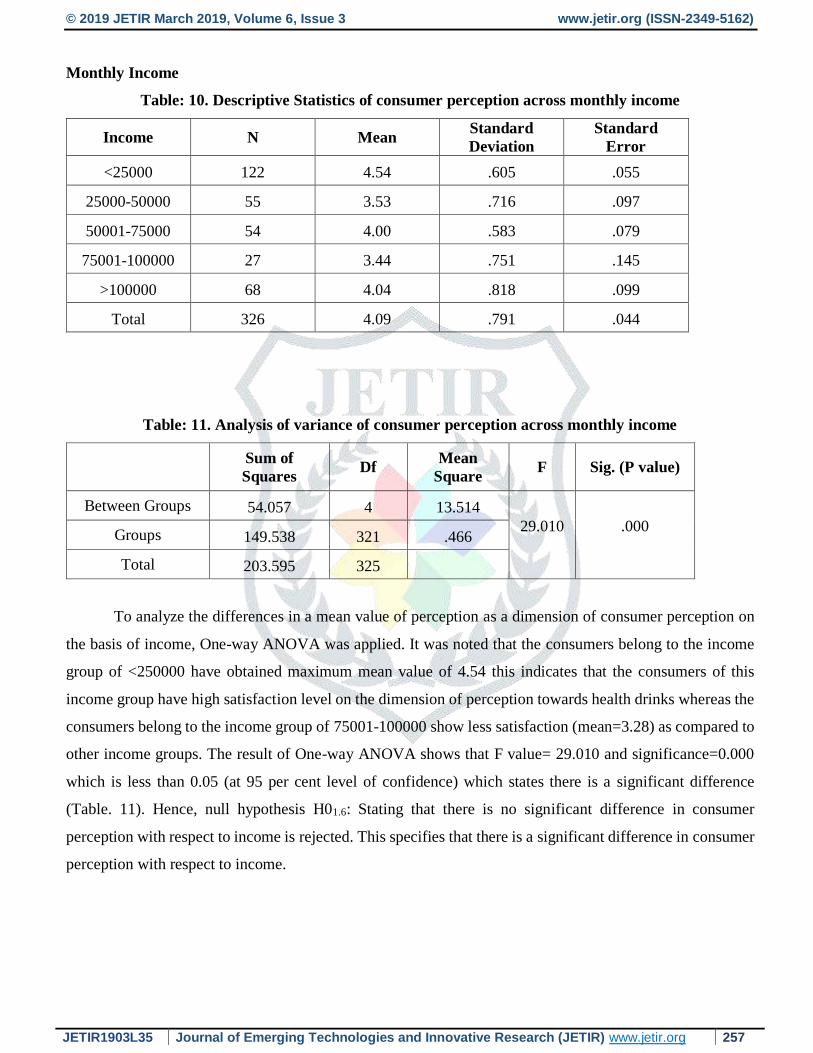
Monthly Income
Table: 10. Descriptive Statistics of consumer perception across monthly income
Income N Mean Standard
Deviation
Standard
Error
<25000 122 4.54 .605 .055
25000-50000 55 3.53 .716 .097
50001-75000 54 4.00 .583 .079
75001-100000 27 3.44 .751 .145
>100000 68 4.04 .818 .099
Total 326 4.09 .791 .044
Table: 11. Analysis of variance of consumer perception across monthly income
Sum of
Squares Df
Mean
Square F Sig. (P value)
Between Groups 54.057 4 13.514
29.010
.000
Groups 149.538 321 .466
Total 203.595 325
To analyze the differences in a mean value of perception as a dimension of consumer perception on
the basis of income, One-way ANOVA was applied. It was noted that the consumers belong to the income
group of <250000 have obtained maximum mean value of 4.54 this indicates that the consumers of this
income group have high satisfaction level on the dimension of perception towards health drinks whereas the
consumers belong to the income group of 75001-100000 show less satisfaction (mean=3.28) as compared to
other income groups. The result of One-way ANOVA shows that F value= 29.010 and significance=0.000
which is less than 0.05 (at 95 per cent level of confidence) which states there is a significant difference
(Table. 11). Hence, null hypothesis H01.6: Stating that there is no significant difference in consumer
perception with respect to income is rejected. This specifies that there is a significant difference in consumer
perception with respect to income.
© 2019 JETIR March 2019, Volume 6, Issue 3 www.jetir.org (ISSN-2349-5162)
JETIR1903L35 Journal of Emerging Technologies and Innovative Research (JETIR) www.jetir.org 258
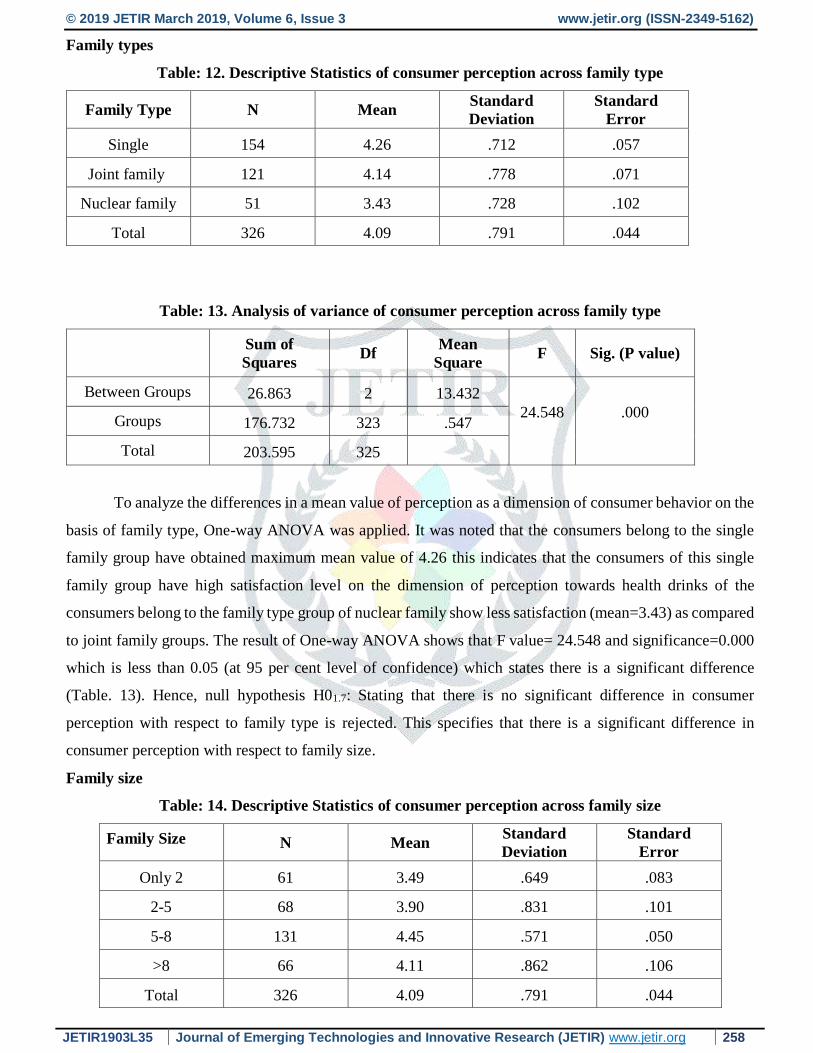
Family types
Table: 12. Descriptive Statistics of consumer perception across family type
Family Type N Mean Standard
Deviation
Standard
Error
Single 154 4.26 .712 .057
Joint family 121 4.14 .778 .071
Nuclear family 51 3.43 .728 .102
Total 326 4.09 .791 .044
Table: 13. Analysis of variance of consumer perception across family type
Sum of
Squares Df
Mean
Square F Sig. (P value)
Between Groups 26.863 2 13.432
24.548
.000
Groups 176.732 323 .547
Total 203.595 325
To analyze the differences in a mean value of perception as a dimension of consumer behavior on the
basis of family type, One-way ANOVA was applied. It was noted that the consumers belong to the single
family group have obtained maximum mean value of 4.26 this indicates that the consumers of this single
family group have high satisfaction level on the dimension of perception towards health drinks of the
consumers belong to the family type group of nuclear family show less satisfaction (mean=3.43) as compared
to joint family groups. The result of One-way ANOVA shows that F value= 24.548 and significance=0.000
which is less than 0.05 (at 95 per cent level of confidence) which states there is a significant difference
(Table. 13). Hence, null hypothesis H01.7: Stating that there is no significant difference in consumer
perception with respect to family type is rejected. This specifies that there is a significant difference in
consumer perception with respect to family size.
Family size
Table: 14. Descriptive Statistics of consumer perception across family size
Family Size N Mean Standard
Deviation
Standard
Error
Only 2 61 3.49 .649 .083
2-5 68 3.90 .831 .101
5-8 131 4.45 .571 .050
>8 66 4.11 .862 .106
Total 326 4.09 .791 .044
© 2019 JETIR March 2019, Volume 6, Issue 3 www.jetir.org (ISSN-2349-5162)
JETIR1903L35 Journal of Emerging Technologies and Innovative Research (JETIR) www.jetir.org 259
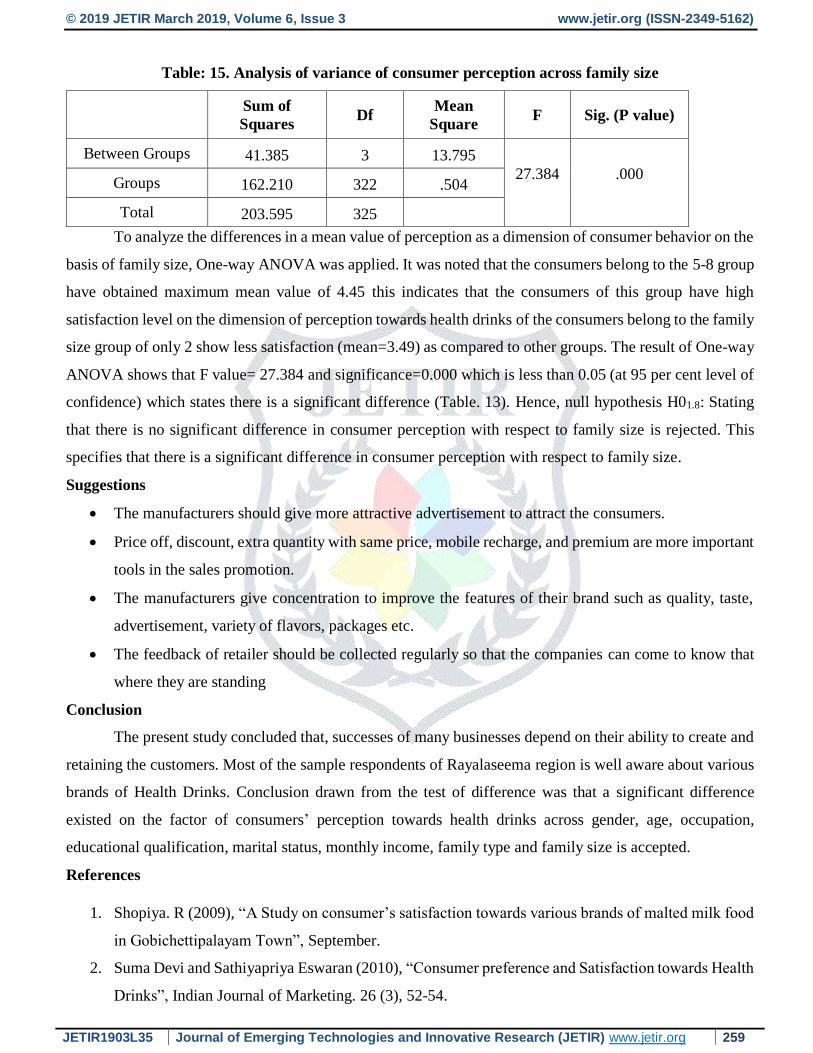
Table: 15. Analysis of variance of consumer perception across family size
Sum of
Squares Df
Mean
Square F Sig. (P value)
Between Groups 41.385 3 13.795
27.384
.000
Groups 162.210 322 .504
Total 203.595 325
To analyze the differences in a mean value of perception as a dimension of consumer behavior on the
basis of family size, One-way ANOVA was applied. It was noted that the consumers belong to the 5-8 group
have obtained maximum mean value of 4.45 this indicates that the consumers of this group have high
satisfaction level on the dimension of perception towards health drinks of the consumers belong to the family
size group of only 2 show less satisfaction (mean=3.49) as compared to other groups. The result of One-way
ANOVA shows that F value= 27.384 and significance=0.000 which is less than 0.05 (at 95 per cent level of
confidence) which states there is a significant difference (Table. 13). Hence, null hypothesis H01.8: Stating
that there is no significant difference in consumer perception with respect to family size is rejected. This
specifies that there is a significant difference in consumer perception with respect to family size.
Suggestions
The manufacturers should give more attractive advertisement to attract the consumers.
Price off, discount, extra quantity with same price, mobile recharge, and premium are more important
tools in the sales promotion.
The manufacturers give concentration to improve the features of their brand such as quality, taste,
advertisement, variety of flavors, packages etc.
The feedback of retailer should be collected regularly so that the companies can come to know that
where they are standing
Conclusion
The present study concluded that, successes of many businesses depend on their ability to create and
retaining the customers. Most of the sample respondents of Rayalaseema region is well aware about various
brands of Health Drinks. Conclusion drawn from the test of difference was that a significant difference
existed on the factor of consumers’ perception towards health drinks across gender, age, occupation,
educational qualification, marital status, monthly income, family type and family size is accepted.
References
1. Shopiya. R (2009), “A Study on consumer’s satisfaction towards various brands of malted milk food
in Gobichettipalayam Town”, September.
2. Suma Devi and Sathiyapriya Eswaran (2010), “Consumer preference and Satisfaction towards Health
Drinks”, Indian Journal of Marketing. 26 (3), 52-54.
© 2019 JETIR March 2019, Volume 6, Issue 3 www.jetir.org (ISSN-2349-5162)
JETIR1903L35 Journal of Emerging Technologies and Innovative Research (JETIR) www.jetir.org 260
3. Thangaraj. B, Prakash .M and. Nandhini. S (2014), “A Study on Consumer Satisfaction towards
Health Drinks”, Global Journal for Research Analysis. 3 (1), 11-13.
4. Harikaran. S (2014), “A Study on Customer Satisfaction towards Health Drinks Products (With
Special Reference to Coimbatore City)”, International Journal of Research in Commerce, It &
Management. 4 (12), 37-41.
5. Mubarak Ali. E and Hadi Mohamed. G (2015), “Consumer Satisfaction towards Selected Health
Drinks in Tiruchirappalli Town”, International Journal of Management (IJM). 6 (1), 226-232.
6. Gomathy Muthu (2015), “A study on the awareness of consumption of health food drinks by children,
Adolescents and young adults with special reference to woriyur”, International Journal of Art &
Humanity Science. 2(4), 1-7.
7. Veerakumar K. and Venkadasubramaniam. A (2016), “A study on consumer satisfaction towards
selected health drinks in Pollachi Taluk”, International Journal of Multidisciplinary Research &
Modern Education. 2(1), 112-115.
8. Sekar. P and Thangavel. S (2016), “A study on consumers’ perception & buying pattern towards
health drinks with special reference to rural areas of Coimbatore district”, International Journal of
Applied Research. 2(4), 187-191.
9. Dave K.K. and Rachna Paliwal (2016), “A Study on Consumer Perception on Malted Health Food
Drinks in Udaipur City”, International Journal of Management & Corporate Affairs. 2(5), 1-26.
10. Shiny.S and Eugine Franco (2017), “Brand Preference and the Purpose of Using Malted Food Drinks:
A Field Study in Kanyakumari District”, South India, International Journal of Research-
Granthaalayah. 5(4), 69-82.
11. Shilpa Sarvani Ravi and Shikha Bhagat (2018), “Analysis of Health Drinks: What is Satisfying
Consumer's Thirst?”, Indian Journal of Marketing. 48(9).
12. Nivethitha. S (2019), “A Study on Customer Satisfaction towards Horlicks with Special Reference to
Udumalpet Taluk”, International Journal of Scientific Research and Review. 8(1), 359-368.
Related Documents