IJER © Serials Publications 13(7), 2016: 2569-2585 ISSN: 0972-9380 AN EMPIRICAL STUDY ON CONSUMERS’ PERCEPTION TOWARDS MOBILE BRANDS IN SAUDI ARABIA Abstract: The downfall of Nokia and Blackberry; the popularity of iPhone and the success of Samsung mobiles have interesting implications towards business strategy. The mobile sector works in a continuously changing environment.. Function of phone like calling, emailing, GPS, playing music, scanning were almost same andsatisfying in all brands. The respondents felt the difference in terms of camera, internet surfing, after sale service and resale value.Bulk of the respondents said that they are satisfied with their phones still they want to change. If they are satisfied and still want to change their phones, this points out that there is no problem in the current brand but they want to benefit or use the advances in the new products.Finally factor analysis was conducted to identify the factors responsible for mobile phone preference. Key words: Consumer behavior, Mobile phones; Service; Resale; Saudi Arabia Since the introduction of first cellular device by Motorola Corporation in 1973, thissector has seen a lot of changes in last 45 years. The downfall of Nokia and Blackberry; the popularity of iPhone and the success of Samsung mobiles have very interesting implications towards business strategy. The mobile sector works in a continuously changing environment. Some of the important characteristics of this environment are changing technologies like operating systems, internet usage, camera functions, office functions, increasing competition and ever-increasing demand of customers. In the present market condition almost all digital and technological product in a particular segment are similar to each other. Configuration of almost all products is almost same in a particular price group. It is becoming difficult for product manufacturer to attract and maintain customers based on features and specifications. Now, marketers are finding it difficult to succeed using traditional Segmentation, Targeting and Position (STP) approach. Environment is so dynamic that companies are finding it difficult to develop and sustain its Unique Selling Proposition (USP). Moreover, today a customer is looking beyond product. This insight into the present levels of satisfaction and, in * Assistant Professor, Prince Sattam bin Abdulaziz University, Al Kharj, Kingdom of Saudi Arabia, E-mail: [email protected]

Welcome message from author
This document is posted to help you gain knowledge. Please leave a comment to let me know what you think about it! Share it to your friends and learn new things together.
Transcript
IJER © Serials Publications13(7), 2016: 2569-2585
ISSN: 0972-9380
AN EMPIRICAL STUDY ON CONSUMERS’PERCEPTION TOWARDS MOBILE BRANDS INSAUDI ARABIA
Abstract: The downfall of Nokia and Blackberry; the popularity of iPhone and the successof Samsung mobiles have interesting implications towards business strategy. The mobilesector works in a continuously changing environment.. Function of phone like calling,emailing, GPS, playing music, scanning were almost same andsatisfying in all brands. Therespondents felt the difference in terms of camera, internet surfing, after sale service andresale value.Bulk of the respondents said that they are satisfied with their phones still theywant to change. If they are satisfied and still want to change their phones, this points outthat there is no problem in the current brand but they want to benefit or use the advances inthe new products.Finally factor analysis was conducted to identify the factors responsiblefor mobile phone preference.
Key words: Consumer behavior, Mobile phones; Service; Resale; Saudi Arabia
Since the introduction of first cellular device by Motorola Corporation in 1973, thissectorhas seen a lot of changes in last 45 years. The downfall of Nokia and Blackberry; thepopularity of iPhone and the success of Samsung mobiles have very interestingimplications towards business strategy. The mobile sector works in a continuouslychanging environment. Some of the important characteristics of this environment arechanging technologies like operating systems, internet usage, camera functions, officefunctions, increasing competition and ever-increasing demand of customers. In thepresent market condition almost all digital and technological product in a particularsegment are similar to each other. Configuration of almost all products is almost samein a particular price group. It is becoming difficult for product manufacturer to attractand maintain customers based on features and specifications. Now, marketers arefinding it difficult to succeed using traditional Segmentation, Targeting and Position(STP) approach. Environment is so dynamic that companies are finding it difficult todevelop and sustain its Unique Selling Proposition (USP). Moreover, today a customeris looking beyond product. This insight into the present levels of satisfaction and, in
* Assistant Professor, Prince Sattam bin Abdulaziz University, Al Kharj, Kingdom of Saudi Arabia,E-mail: [email protected]
2570 Mohammad Rumzi Tausif
particular, the key elements of satisfaction are valuable to those in this sector as itallows them to concentrate and reinforce the crucial aspects which would lead on onehand to a higher level of satisfaction amongst customers; while, on the other hand, forthe companies higher profitability and the ability to sustain its brand image in this eraof cut throat competition.
Customer satisfaction is the most important factor leading to profitability in mobilemanufacturing companies. The challenge for mobile companies is to provide variedand unique features, lower costs, faster processor speed, while improving the qualityof their service, and increase customer satisfaction. In today’s highly dynamic business,environment features and specifications of products can be critical to a mobile’s success.In addition, now a day is the hardware, software and service has become very importantfactors towards the phone’s success.
Literature on studying customers’ perception regarding mobiles in Saudi Arabia ismissing. This present study aims to fill up this gap by studying the elements of customer’ssatisfaction with the mobile sector. The aim of this study is to give insights that wouldhelp the companies to assess and re-structure its current approachto sustain and prosper.This assumes huge significance in light of the current downfall of Nokia and Blackberryand immense increase in the popularity of Samsung.
Moreover, this study will aim at the young population who studies in Colleges.Martensen (2007) studied the satisfaction level and brand loyalty among teens. Thisstudy suggests that satisfaction level among teen is much higher compared to adults.However, loyalty among teen is less. There is very weak relationship betweensatisfaction and loyalty. Sahay and Sharma (2010), in their study found that youngerage group is passionate about their brands. They love their brands, while older agegroup has a strong brand relationship with their brands. Various factors because ofwhich their relationship develops with brands are financial constraints, maturity etc.Children and adolescents will have a far more dominant role in the decision makingprocess. And According to Yang (et al,. 2015) it is possible to use personal traits inpredicting a user’s brand preferences.
REVIEW OF LITERATURE
Hacklin, Battistini and Krogh (2013) viewed that in the ever-changing markets andtechnology, companies are changing their strategies and approaches, so as to capturevalue. Many sectors such as energy, pharma, health care and nutrition products, areundergoing very fast changes. One sector where changes are very drastic is thetelecommunication sector. The findings of a study by Kımıloglu (et al., 2010) clearlyshowthat purchasing a mobile phone is a high involvement item. There are variousconsiderations in renewing or purchasing of this product. As products become advancemore importance will be given to engineering, physical, functional and technologicalperspective. Similarly as these products are becoming indispensable part of humanlife hence, factors like image, trendiness and attractiveness plays a big role in purchasedecisions.
An Empirical Study on Consumers’ Perception towards Mobile Brands... 2571
Many studies have been conducted all over the world on customer satisfaction,service industry and mobile industry, previous studies like Chi, (et al,. 2009) says thatbrand identity and brand recall are directly related and will affect the purchaseintentionof the customer. In another study Sethi and Chandel (2009), have drawn aninference that while buying a smart phone brand is the most important attribute, nextmost important is price followed by purpose of buying. According to study conductedby Riyath and Musthafa, (2014), price of the mobile plays the most vital role in brandchoice. Nair (2013) in their study suggest that price is not at all an obstacle for customersof various age groups, rather other features like physical appearance are moreimportant. Singla gives almost similar results and Bansal (2011) in a study also suggeststhat price is not the main reason for choosing a mobile. Another study by Singla andBansal (2011) show that consumers give preference not only to price of cell phone butalso to the availability and look as second priority and then to others. For Nair (2013)price is no more an obstacle for the various age groups, as we find that it is rated assecondary to other features, such as physical appearance.Riyath and Musthafa (2014)state that price of the mobile plays the most vital role in brand choice. The results alsoshow that the perceived usefulness, perceived ease of use, and perceived enjoymenthave a significant positive relationship with customer satisfaction of the mobiletelecommunication service in the region.
According to Ariff (et al., 2012) most important factor affecting satisfaction ofcustomers of the mobile service is customer perceived emotional value. Yang (et al.,2015) analyzed the possible use personal traits in predicting user brand preference.Mahjoub (et al., 2015) have tried to find relation between maintenance and loyalty.According to their study companies who intend to enhance their profit by creatingloyalty must consider maintenance.According to their study brand, equity has adominant effect on customer satisfaction. Dhital (2012), in her study has concludedthat brand attributes effect the buying decision of people of all age groups andeducational background. Sethi and Chandel (2015) found that customers establishedhigher loyalty toward a brands when they are more satisfied. Dib and Msallam (2015)found that the dominant factor affecting customer satisfaction of the mobile phoneservices was customers’ perceived emotional value. Shah (2013) conducted a studyon customer satisfaction of Samsung mobile. The study shows that there is a positiverelationship between the satisfaction level and brand name. A study by Khan (et al.,2016), also shows similar results.
Study conducted by Karjaluoto (et al. 2005) states that choice of mobile phone isdependent on seven basic factors, theyare: price, innovative services, multimedia,design, brand name and basic properties, looks, and reliability. Another studyconducted by Gyawalifound that consumers give a lot of importance performance,features, outlook, and brand name rather than price. Androulidakis (2011) foundthat users could be grouped in well-defined categories according to the brand of themobile phone they are usingwhen the customer purchases a smart phone, brand isthe most important attribute used as a selection variable while purchasing, followed
2572 Mohammad Rumzi Tausif
by price and purpose respectively. For Chun (et al., 2013) consumers’ satisfactionwas affected by factors such as needs fulfillment, performance improvement, easeof use, security/privacy, and influence of the peer. As per the study conducted byChun (et al., 2013), consumers satisfaction is affected by many factors like needsfulfillment, performance improvement, privacy, influence of the peer, ease of use.Study conducted by N. Khan (et al., 2014), suggests, innovation plays a very importantrole in satisfying a customer.
METHODOLOGY AND DATA ANALYSIS
This study targeted the students of Prince Sattan bin Abdulaziz University in theKingdom of Saudi Arabia. This choice of sample very much suited the study as thebrand preference of adolescents is to be studied as they have a higher satisfactionlevel and lower loyalty (Martensen, 2007) and are passionate about their brands (Sahayand Sharma, 2010). Further a modified version of stratified sampling is done where asample of students from all the eight semesters is taken. In total of 234 questionnairesare filled in by the sample respondents out of which only 154 samples were selected.The remaining questionnaires were not analyzed owing to incomplete entries. Besidesthe personal detail of the respondents, there were two question related to satisfactionfrom their present brand of mobile and wishing to change their phones in future apartfrom ten yes/no type of questions related to features of mobile brands like operatingsystem, camera, games, service centers, GPS, internet surfing scanning, calling function,music and resale value. Further, there were forty questions on 5 point Likert scalewith statements related to mobile brand preferences.
The questionnaire first attempts to test the difference between users of IOS, Androidand other operating systems. The other operating system includes Symbian, Microsoftand Blackberry. The difference between these operating systems is seen in terms ofrespondents who want to change their phone in future and those who don’t. ANOVAis to be used to test for difference between respondents desire to change their phonesin future. The researcher assumes that there would be a difference between the studysatisfactions with different users of mobile phones. Hence a set of hypotheses areused to test for difference with respect to camera, games, internet surfing, socialnetworking and resale value. Here we would be using t-test to check for significance.For both ANOVA and t-test, SPSS (16) is used and the significance is tested at fivepercent level of significance. A p-value of less than 0.05 leads to the rejection of thenull hypothesis and vice versa.
Hypothesis 1
Null Hypothesis: There is no significant difference between users of IOS, android and othersin terms of wishing to change their phones in future.Alternate Hypothesis: There is a significant difference between users of IOS, android andothers in terms of wishing to change their phones in future
An Empirical Study on Consumers’ Perception towards Mobile Brands... 2573
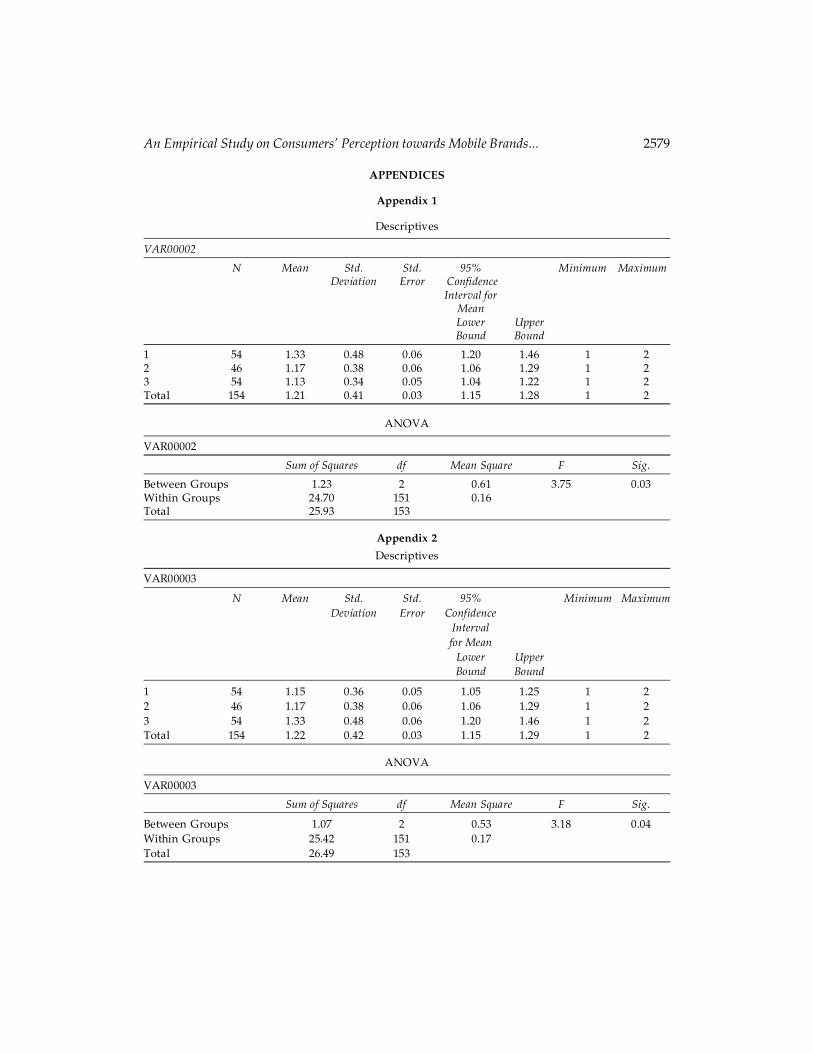
As the p value is less than 0.05, hence the alternate hypothesis is accepted whichindicates that there is a difference between the users of different operating systems(Appendix 1). An inference can be drawn that for a significant number of respondentsoperating system is an important aspect while choosing a mobile phone. Only becauseof operating system, some of the most popular brands like Nokia and Blackberry failed,because their operating systems were not able to compete with Android and IOS. Thehighest score was for Apple users (1.33) followed by Samsung users (1.17) and lastlyby other users (1.12). Score near to 1 indicated more of the willingness to change theirphone in future and score near to 2 indicated their non-willingnessto change theirphone in future. In fact only iPhone users had a score greater than the mean score(1.21), indicating a higher non-willingness to change their phones in future.
Hypothesis 2
Null Hypothesis: There is no significant difference between users of IOS, android andsatisfaction with their present brand of mobile.Alternate Hypothesis: There is a significant difference between users of IOS, android andsatisfaction with their present brand of mobile.
As the p value is less than 0.05, hence the alternate hypothesis is accepted whichindicates that there is a difference between the users of different operating systems(Appendix 2). The highest score was for other users (1.33) followed by Samsung user(1.17) and lastly by other users (1.14). Score near to 1 indicated satisfaction towards thepresent mobile while a score closer to 2 indicated dissatisfaction to the present mobile.In fact only users of other brands (Blackberry, Nokia, LG etc.) had a core more than themean value (1.22). An inference can be drawn that for a significant number of respondentsoperating system is an important aspect while choosing a mobile phone. The fate ofNokia and Blackberry has changed because of their outdated operating systems only.
Hypothesis 3
There is no significant difference between wishing to change the phone in future and satisfactionwith the present brand of mobile.
There is a significant difference between wishing to change the phone in future and satisfactionwith the present brand of mobile.
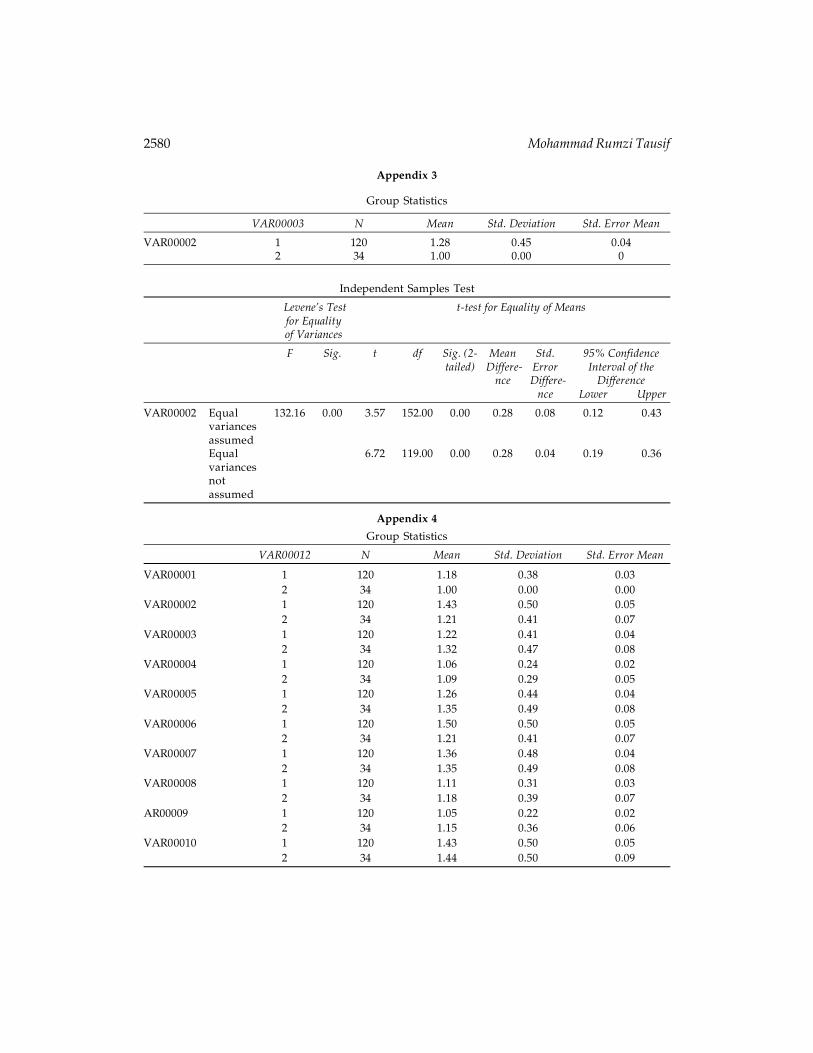
For the hypothesis that p value is again less than 0.05, indicating that there is asignificant difference between those who want to change their phone in future andthose who don’t want to change their phones in future in terms of satisfaction fromtheir phones (Appendix 3). This infers that a person may go for a change in futureeven if he is satisfied with his present brand of mobile. This very much indicates to thesuccess which companies achieve by updating their phones like iPhone 4 to iPhone 4sto iPhone 5 to iPhone 6 and now finally iPhone 7. Similarly for Samsung users galaxy5 to galaxy 6 and likewise.
2574 Mohammad Rumzi Tausif
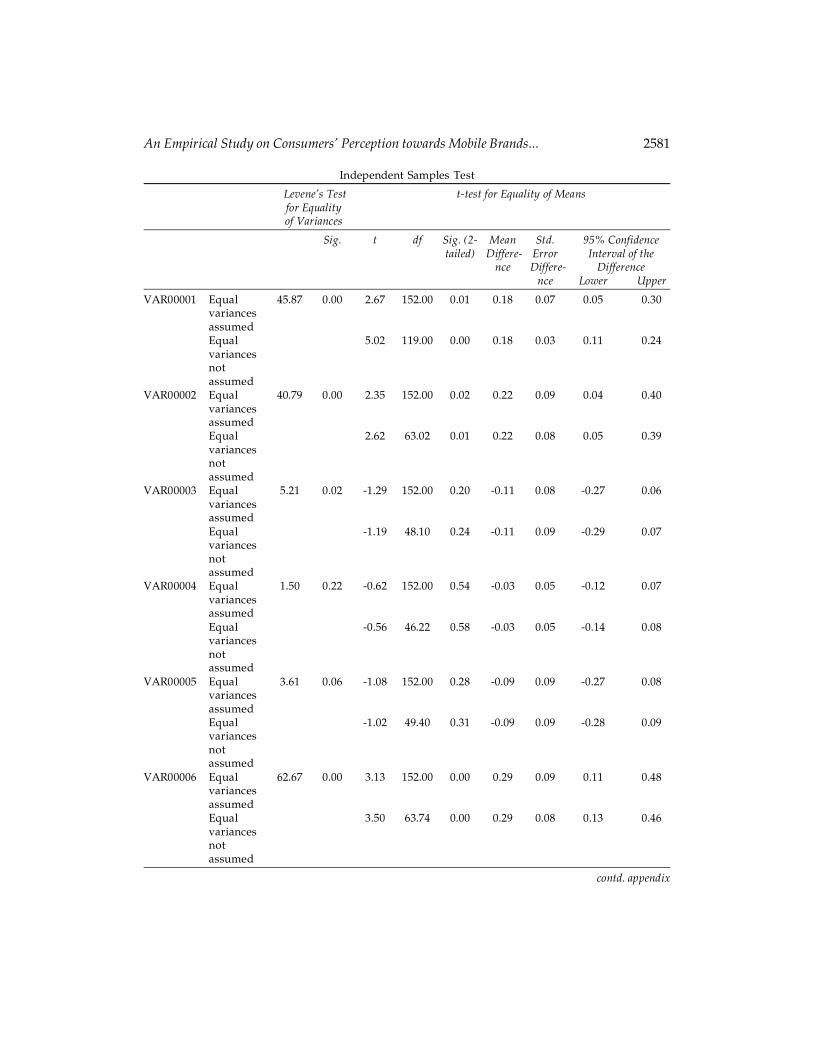
For getting, an insight into the points of difference between different phones typesusing ten hypotheses. Among the ten hypotheses, only four of them are found to besignificant. Based on Students t-test five alternate hypotheses were found to besignificant (Appendix 4). These significant alternate hypotheses are:
Alternate Hypothesis 4: There is a significant difference between those who want tochange their phone in future and those who do not for those whose phone also doubles up ascamera
From this hypothesis, it can be concluded that for a significant number ofrespondents camera is a very important feature while choosing the next phone(Appendix 4). Sharp Corporation of Japan launched the first mobile with camera inthe year 2000. Since the launch of this mobile, there has been a huge demand amongcustomer for mobiles with camera. Mobiles with camera have changed in terms ofquality and features at a very fast pace. What started as a simple VGA phones, soonsprint launched first mega pixel camera. This new technology became hugely popularamong customers. All mobile manufacturers started producing mobile phones withcameras and most of them started differentiated themselves based on camera qualityand features. What started as 1.3 mega pixel, soon there was 3.2 mega pixels the 5, the8 and so on. In 2000 Nokia launched a phone Pureview 808 which had 42 mega pixelcameras. Some companies like HTC and LG diversified further and went on to create3D cameras, which were not that successful.
Then in 2003 companies started launching mobiles with dual cameras (Back andFront). A new work to English vocabulary was added because of this front camera‘Selfie’. Now a day’s front camera is called selfie camera. Many new features haveadded to mobile cameras like zoom facility, flashlight. Now some latest trends arefront camera flash, dual rear camera. From the above developments, it becomes quiteclear how important camera is for a mobile. There are many customers whose finaldecision of buying mobile depends on camera quality.
AlternateHypothesis 5: There is a significant difference between those who want to changetheir phone in future and those who do not in terms of using phone for playing games
In line with the results of previous hypothesis, here also a sizable number ofrespondents are giving importance to gaming capabilities of the mobile, as an importantfeature while choosing a mobile.Gaming is another very important distinguished factorfor mobiles. What started as simple game of Tetris in 1994 was soon followed by avery popular game by Nokia called snake. Since then all mobile companies havelaunched hundreds of variants of games. Mobile gaming took a new dimension withthe advent of touch screen smart phones and faster internet capabilities. Today thereare many games available at android and iTunes. Games like Pokémon Go have becomea new rage among youngsters. Looking at the tremendous demand for gaming mobilephone manufactures are targeting these game lovers with mobile phones having fasterprocessors, larger RAMS and better internet capabilities. Android App store has moregame compared to Apple play store, even the quantity of free games is more on
An Empirical Study on Consumers’ Perception towards Mobile Brands... 2575
Androids play store. A big customer segment chooses a mobile because of its gamingcapabilities.
AlternateHypothesis 6: There is a significant difference between those who want tochange their phone in future and those who don’t in terms of using phone for availability ofservice centers.
A large number of respondents make a choice of their mobile phone based on howwell the phone connects with availability of service centers. Since mobile is technologicallyadvanced, sophisticated and costly device customers give a lot of importance to aftersales service. Most of the customer prefers to buy mobile phones whose service center isavailable in their city. Many good mobiles have failed not because of their quality orfeatures but because of their poor after sales service. One of the reasons of success ofiPhone and Samsung is the availability of after sales service centers.
Alternate Hypothesis 7: There is a significant difference between those who want tochange their phone in future and those who don’t in terms of use phone for internet surfingand viewing videos.
For a significant number of respondents internet surfing speed and ease is animportant factor while choosing their next phone. This implies that those who giveimportance to internet will choose phones which have large screen. Resolution of thedisplay should be good, RAM should be good. Mobile must have latest internetcapabilities like 4g LTE, Wifi etc. First Internet enabled phone was created by AT&T in1997, then NTT DOCOMO, commercially internet has gained importance after the launchof touch screen smart phone with 3G, WIFI and now 4G capabilities. Many customersare choosing their mobile only on its internet capabilities.
Alternate Hypothesis 8: There is a significant difference between those who want tochange their phone in future and those who do not in terms of being concerned with the resalevalue of the phone (Appendix 8).
For a sizable number of respondents resale value is the most important factorwhile buying a new phone. Mobile technology is changing very fast; most of thecustomers are always looking of upgrading their mobiles. Since people are changingtheir sets very fast, they also want good money for their old hand sets. Most customersprefer to go for popular brands and models so that it will be easier for them to sellthem at a good cost.
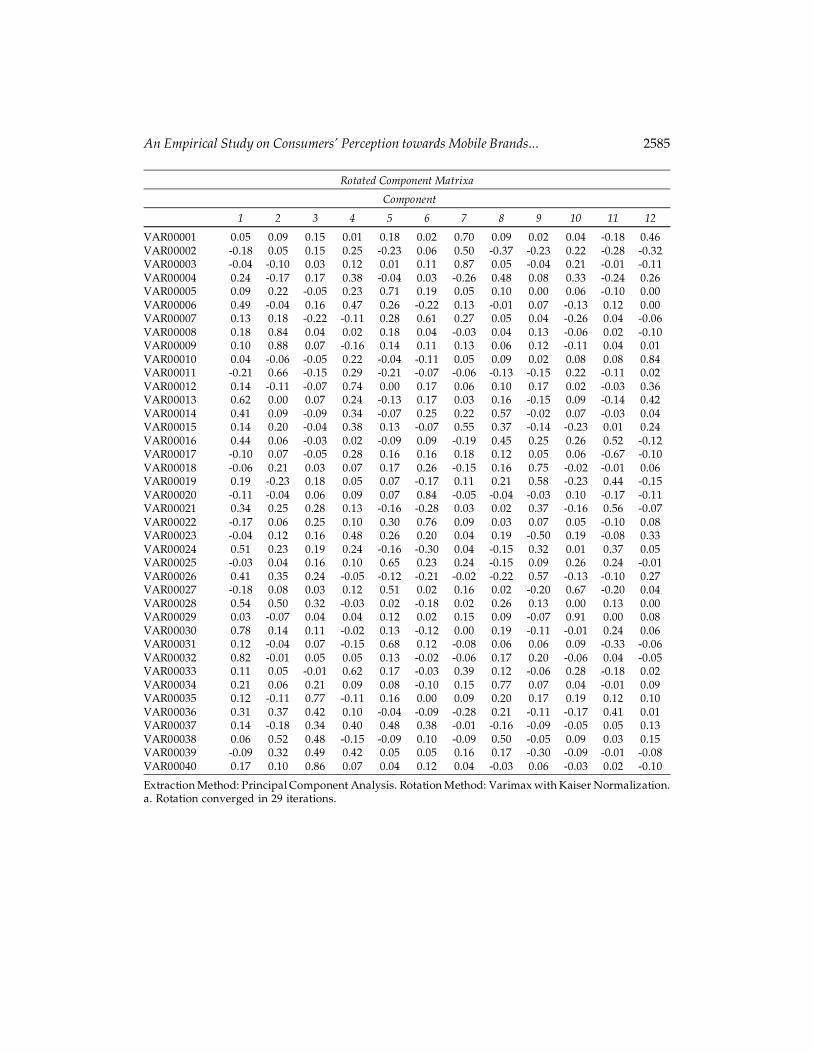
In the final section of the questionnaire an exhaustive list of forty statements relatedto mobile phones are used to understand the factors responsible for mobile phonepreference. These statements are based on Likert scale and factor analysis would beused to reduce these forty statements into a few factors. The target respondents areuniversity students. A 5-point interval Likert scale to examine how stronglyrespondents agree (5) or disagree (1) with statements to measure variables in thehypotheses of this research will be used. Attempts will be made to identify the importantfactors involved in the customers’ satisfaction. For this purpose, the technique of factor
2576 Mohammad Rumzi Tausif
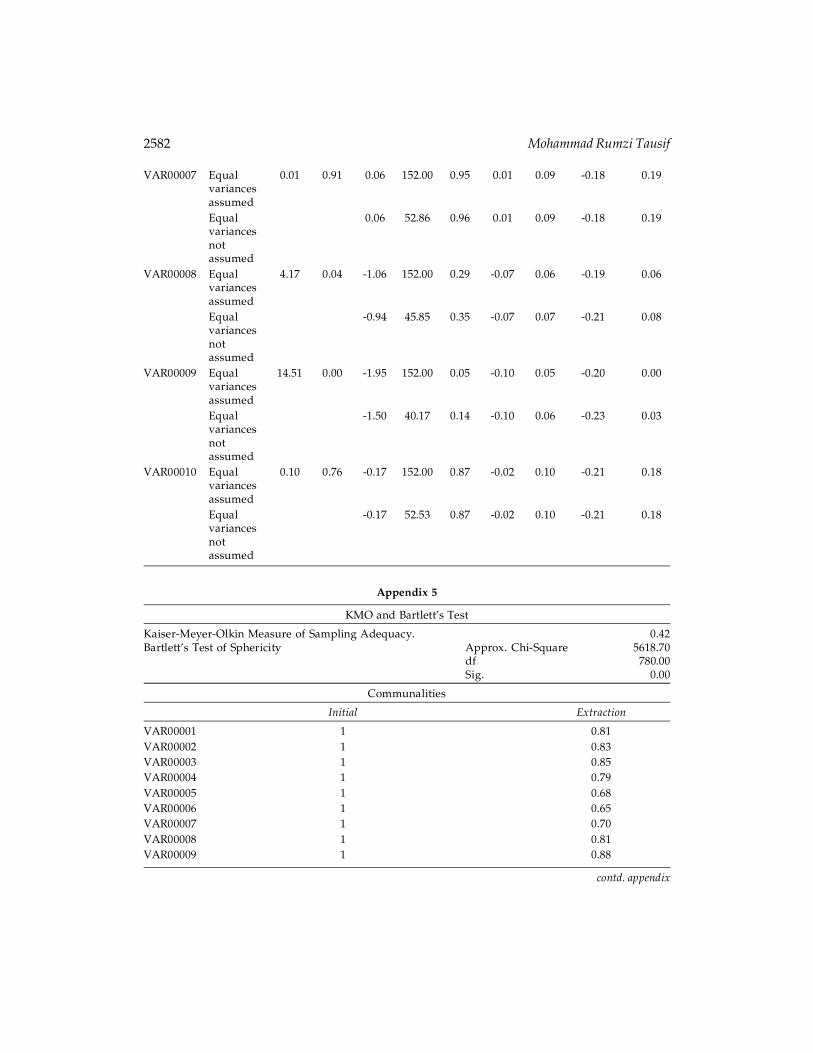
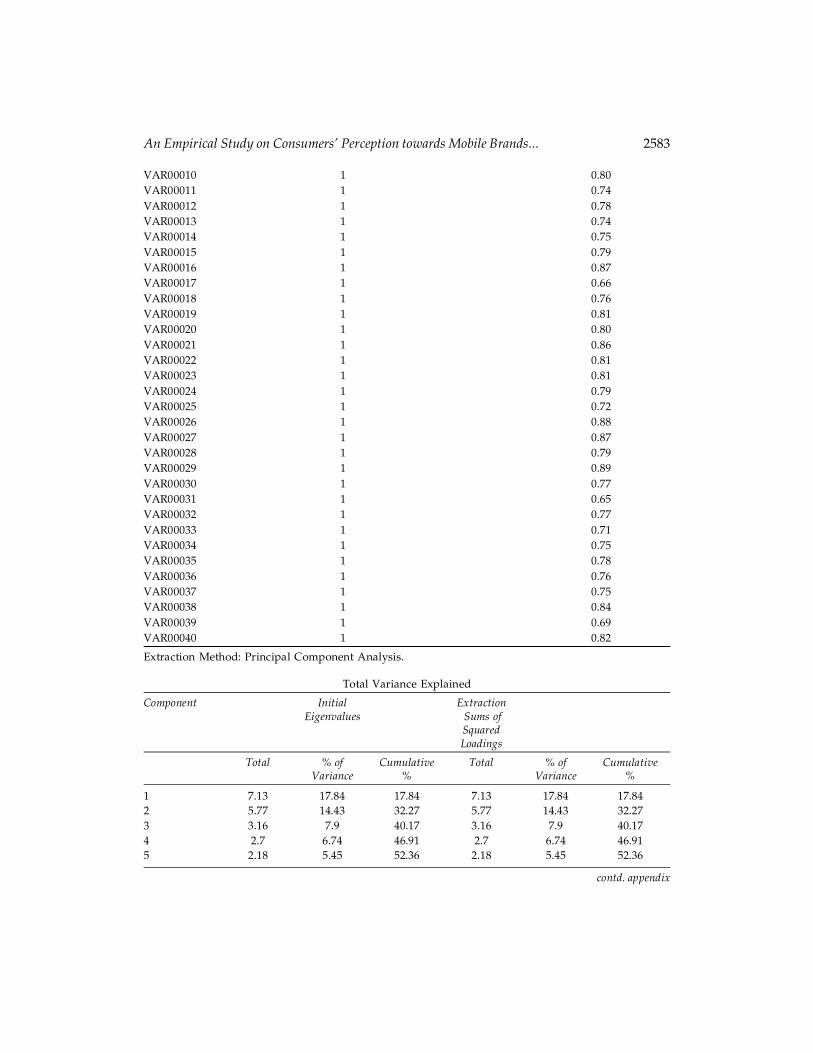
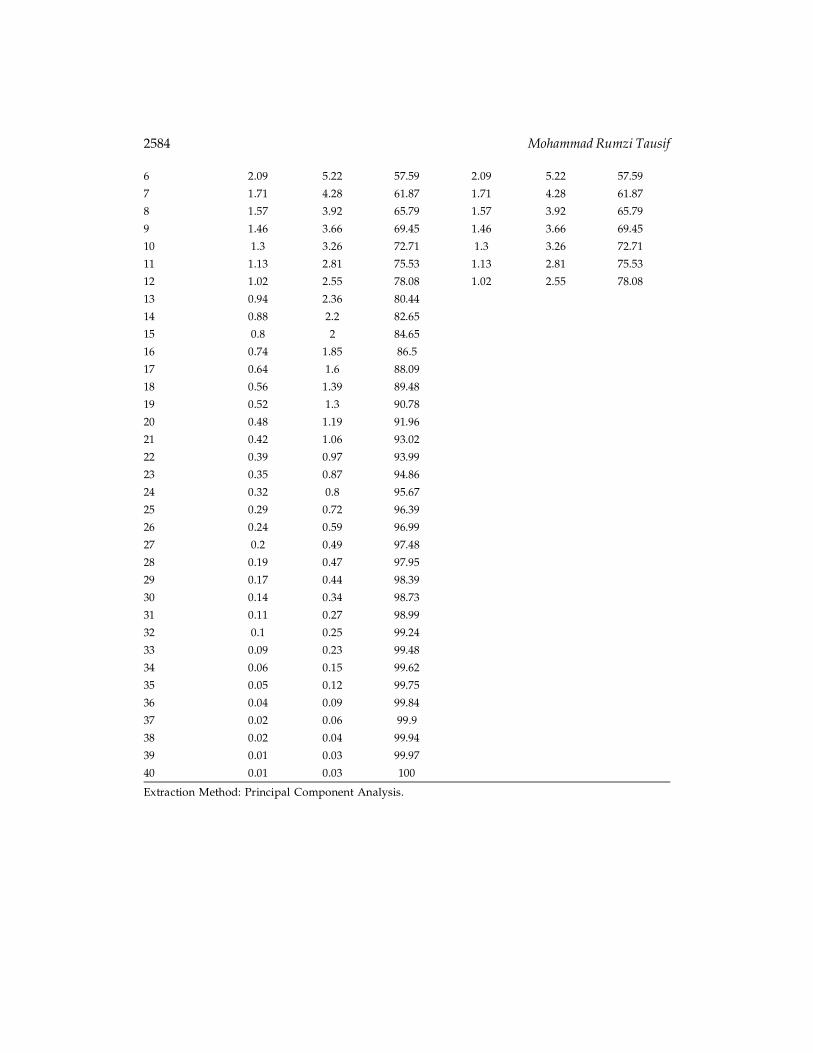
analysis will be used. Obviously there would be many factors, which will be affectingindividuals purchase decision. The raw data will be summarized into smaller sets oflinear composites that would preserve most of the information in the original data set.The data will be subjected to principal component analysis, a method categorized underthe broad area of factor analysis. The variables will be reduced to few variables throughVarimax rotation with Kaiser Normalization. Regarding the pre-analysis testing for thesuitability of the entire sample for factor analysis Kaiser-Meyer-Olkin measure ofsampling adequacy and the Bartlett’s test of Sphericity will be used. This will indicatethat the sample was suitable for factor analyticprocedures.
Finally, factor analysis extracts twelve factors. Kaiser-Meyer-Olkin Measure ofSampling Adequacywas fair at 0.42 and the Bartlett’s Test of Sphericity was significant(Appendix 5). Factor 1 can be attributed to Internet features in the mobiles. Factor 2represented by price. Factor 3 represented by connectivity features. Factor 4 representedby advertisement. Factor 5 relates to predetermined decision-making. Factor 6 relatesto the hardware capacity/operating system. Factor 7 is brand image. Factor 8 is relatedto ease features. Factor 9 is related to sim. Factor 10 related to camera. Factor 11 isrelated recommendation and Factor 12 with design of the mobile.
CONCLUSION
Three important features identified by this study are camera, games and internet surfingcapabilities. One of the importantthings, which emerged from this study, is thatservicescame as an important factor in choosing mobile phone brands. Most of theproduct manufacturers today are differentiating on the basis of services, especiallyafter sale services, a product success depends more on its services then its featuresand specifications. Today manufacturers are giving a lot of importance to the service,recent success of companies like Samsung has been more because of their service ratherthan product. Another important factor that was identified was related to the resalevalue of the mobile brands. It is evident that resale value is an important factor whilechoosing mobile brands. This can be related to the question where in the respondentswere asked to how often they change phones. Majority of the respondents said thatthey are satisfied with their phones still they want to change. If they are satisfied andstill want to change their phones, this points out that there is no problem in the currentbrand but they want to benefit or use the advances in the new products.This can beused for conducting further studies. This may lead to some interesting observationson consumer behavior and service in context of countries like Saudi Arabia.
Further studies could be conducted to understand the effect of technologicalchanges, how these fast technological changes are, effect the choice of mobiles. Studycan also be conducted to study the effect of brand loyalty. Are customers of this sectorare brand loyal?.
Function of phone like calling, emailing, GPS, playing music, scanning were almostsatisfying in all brands. The respondents felt the difference in terms of camera, internet
An Empirical Study on Consumers’ Perception towards Mobile Brands... 2577
surfing and resale value. Meaning thereby, in these aspects improvements can be madeby brands to outshine others.More over the factors which led to purchase of a particularbrand that identified by this study can be divided into internal and external features.Internal features can be identified with internet, connectivity, operating system, easefeatures, SIM size, number of SIM, memory slot,camera and mobile design whilefeatures like price, advertisement, predetermined decision-making, brand image andrecommendationcan be identified as external factors. So in order to make a particularmore saleable both these internal and external factors need to be improved uponcontinuously.
References
Anderson E A and Sullivan M W (1993), “The Antecedents and Consequences of CustomerSatisfaction for Firms”, Marketing Science, Vol. 12, Spring, pp. 125-143.
Androulidakis, I,. Kandus, G. (2011), Mobile Phone Brand Categorization vs. Users’ SecurityPractices. ETASR - Engineering, Technology & Applied Science Research. 1(2). 30 – 35.
Ariff, M S, Fen, H S and Ismail, K. (2012). Relationship between customers perceived values,satisfaction and loyalty of mobile phone users. Review of Integrative Business and EconomicsResearch. 1(1). 126 – 135.
Bloemer, J. M. M. and Kasper, J. D. P. (1995), “The Complex Relationship Between ConsumerSatisfaction and Brand Loyalty”, Journal of Economic Psychology, Vol. 16, pp. 311-329.
Chi, H K., Yeh, H R. and Yang, Y T (2009). The Impact of Brand Awareness on ConsumerPurchase Intention: The Mediating Effect of Perceived Quality and Brand Loyalty. TheJournal of International Management Studies, 4 (1). 135 - 144
Chun, S G., Chung, D. and Shin, Y B. (2013). Are Students Satisfied with the use of SmartphoneApps?. Issues in Information Systems. 14 (2). 23 – 33.
Dhital, M (2012). Study on Brand Preference of Mobile Phones in Kathmandu. http://www.academia.edu/6884015/STUDY_ON_BRAND_PREFERENCE_OF_MOBILE_PHONES_IN_KATHMANDU. 1 – 55.
Dib, Hayanand Al-Msallam, Samaan (2015). The Effects of the Determinants of CustomerSatisfaction on Brand Loyalty, Journal of Research in Business and Management Volume 3- Issue 3 pp: 01-12.
Gyawali, A. (2015). Brand Preference of Mobile Phones in Nepal: with Special Reference toKathmandu Valley. INTELLECTUALS: An International Refereed Journal of Commerce &Management: IIRJCM, 1 (1). 32 – 44.
Hacklin, F., B. Battistini, G. von Krogh (2013). Strategic choices in converging industries. MITSloan Management Review, Vol. 55, No. 1, pp. 65-73.
Hallowell R (1996), The Relationships of Customer Satisfaction, Customer Loyalty, andProfitability: An Empirical Study, International Journal of Service Industry Management,Vol. 7, No. 4, pp. 27-42.
Karjaluoto, H., Karvonen,J., Kesti, M., Koivumki.T., Manninen, M., Pakola, J. Ristola. and A.Salo, J. (2005). Factors Affecting Consumer Choice of Mobile Phones: Two Studies fromFinland, Journal of Euromarketing, 14(3) : 59 – 82.
2578 Mohammad Rumzi Tausif
Khan, M N., Rizwan, M., Islam, F., Aabdeen, Z., and Rehman, M. (2016). The Effect of BrandEquity of Mobile Phones on Customer Satisfaction: An Empirical Evidence from Pakistan.American Journal of Business and Society. 1(1). 1 -7.
Khan, N., Salam, S., and Sherpao, A. (2014). Impact of Innovation on Customer Satisfactionand Brand Loyalty: A Case Study of Professionals. International Journal of ManagementSciences. 3 (9). 663 - 672.
Kimiloglu, H., Nasir, V A., and Nasir, S. (2010). Discovering behavioral segments in the mobilephone markets. Journal of Consumer Marketing. 27/5. 401 – 413.
Mahjoub, H., Kordnaeij, A. and Moayad, F M. (2015). The Effect of Self-Congruency onCustomer Behavior and Involvement. International Journal of Marketing Studies 7 (3). 139 –147.
Martensen, A., (2007) Tweens’ satisfaction and brand loyalty in the mobile phonemarket, Young Consumers, 8 (2). 108 - 116.
Martensen A. & F. Hansen (2002) ‘Children’s Knowledge and Interpretation of CommercialAdvertising’. Children – Consumption, Advertising and Media. Copenhagen: CopenhagenBusiness School Press/Samfundslitteratur.
Nair, A. (2013). A Study on the Effects of the Marketing Mix with regards to the ConsumerPurchase Behavior of Mobile Phones with special reference to Product Features.https://alysanair.files.wordpress.com/2013/07/a-study-on-the-effects-of-marketing-mix-in-the-mobile-phone-industry.pdf. 1 - 64.
Riyath, M I M and Mustafa, S L (2014). Factors Affecting Mobile Phone Brands Preference:Empirical Study on Sri Lankan University Students. Proceedings, 4th InternationalSymposium, SEUSL. 378 – 389.
Sahay, A. and Sharma, N. (2010). Brand Relationships and Switching Behaviour for HighlyUsed Products in Young Consumers. VIKALPA 35 (1). 15 -30.
SamiaMassoud and Omprakash K G (2003), Consumer Perception and Attitude TowardMobile Communication, International Journal of Mobile Communications, Vol. 1, No. 4,pp. 390-408.
Sethi, A. and Chandel, A. (2015). Consumer Buying Preference towards Entry LevelSmartphone. I J A B E R, 13, ( 3). 1173-1189.
Shah, N P (2013). Customer Satisfaction of Samsung Mobile Hand set Users. Voice ofResearch.2(3). 76 – 79.
Singla, S., Bansal, S. (2011), A study on the factors affecting choice criteria of consumers formobile handsets A comparative analysis in Ludhiana & Sangrur districts. Asian Journal ofManagement Research. 2(1). 443 - 456.
TajzadehNamin A. A. and Vahid, R., (2012). The Role of Attitudes and Decision Makinig onProduct Choice, Case Study: Cellular Phones. International Business Research 5 (5). 132 –146.
Yang, C., Pan, S., Mahmud, J., Yang, H., and Srinivasan, P. (2015). Using Personal Traits ForBrand Preference Prediction. Conference Proceedings on Empirical Methods in NaturalLanguage Processing, 86–96.
Zeithaml V and Bitner M J (2000), Services Marketing: Integrating Customer-Focus Across the Firm,2nd Edition, McGraw-Hill, New York.
An Empirical Study on Consumers’ Perception towards Mobile Brands... 2579
APPENDICES
Appendix 1
Descriptives
VAR00002
N Mean Std. Std. 95% Minimum MaximumDeviation Error Confidence
Interval forMean
Lower UpperBound Bound
1 54 1.33 0.48 0.06 1.20 1.46 1 22 46 1.17 0.38 0.06 1.06 1.29 1 23 54 1.13 0.34 0.05 1.04 1.22 1 2Total 154 1.21 0.41 0.03 1.15 1.28 1 2
ANOVA
VAR00002
Sum of Squares df Mean Square F Sig.
Between Groups 1.23 2 0.61 3.75 0.03Within Groups 24.70 151 0.16 Total 25.93 153
Appendix 2
Descriptives
VAR00003
N Mean Std. Std. 95% Minimum MaximumDeviation Error Confidence
Intervalfor Mean
Lower UpperBound Bound
1 54 1.15 0.36 0.05 1.05 1.25 1 22 46 1.17 0.38 0.06 1.06 1.29 1 23 54 1.33 0.48 0.06 1.20 1.46 1 2Total 154 1.22 0.42 0.03 1.15 1.29 1 2
ANOVA
VAR00003
Sum of Squares df Mean Square F Sig.
Between Groups 1.07 2 0.53 3.18 0.04Within Groups 25.42 151 0.17 Total 26.49 153
2580 Mohammad Rumzi Tausif
Appendix 3
Group Statistics
VAR00003 N Mean Std. Deviation Std. Error Mean
VAR00002 1 120 1.28 0.45 0.04 2 34 1.00 0.00 0
Independent Samples Test
Levene’s Test t-test for Equality of Meansfor Equalityof Variances
F Sig. t df Sig. (2- Mean Std. 95% Confidencetailed) Differe- Error Interval of the
nce Differe- Differencence Lower Upper
VAR00002 Equal 132.16 0.00 3.57 152.00 0.00 0.28 0.08 0.12 0.43variancesassumed
Equal 6.72 119.00 0.00 0.28 0.04 0.19 0.36variancesnotassumed
Appendix 4
Group Statistics
VAR00012 N Mean Std. Deviation Std. Error Mean
VAR00001 1 120 1.18 0.38 0.03 2 34 1.00 0.00 0.00VAR00002 1 120 1.43 0.50 0.05 2 34 1.21 0.41 0.07VAR00003 1 120 1.22 0.41 0.04 2 34 1.32 0.47 0.08VAR00004 1 120 1.06 0.24 0.02 2 34 1.09 0.29 0.05VAR00005 1 120 1.26 0.44 0.04 2 34 1.35 0.49 0.08VAR00006 1 120 1.50 0.50 0.05 2 34 1.21 0.41 0.07VAR00007 1 120 1.36 0.48 0.04 2 34 1.35 0.49 0.08VAR00008 1 120 1.11 0.31 0.03 2 34 1.18 0.39 0.07AR00009 1 120 1.05 0.22 0.02 2 34 1.15 0.36 0.06VAR00010 1 120 1.43 0.50 0.05 2 34 1.44 0.50 0.09
An Empirical Study on Consumers’ Perception towards Mobile Brands... 2581
Independent Samples Test
Levene’s Test t-test for Equality of Meansfor Equalityof Variances
Sig. t df Sig. (2- Mean Std. 95% Confidencetailed) Differe- Error Interval of the
nce Differe- Differencence Lower Upper
VAR00001 Equal 45.87 0.00 2.67 152.00 0.01 0.18 0.07 0.05 0.30variancesassumed
Equal 5.02 119.00 0.00 0.18 0.03 0.11 0.24variancesnotassumed
VAR00002 Equal 40.79 0.00 2.35 152.00 0.02 0.22 0.09 0.04 0.40variancesassumed
Equal 2.62 63.02 0.01 0.22 0.08 0.05 0.39variancesnotassumed
VAR00003 Equal 5.21 0.02 -1.29 152.00 0.20 -0.11 0.08 -0.27 0.06variancesassumed
Equal -1.19 48.10 0.24 -0.11 0.09 -0.29 0.07variancesnotassumed
VAR00004 Equal 1.50 0.22 -0.62 152.00 0.54 -0.03 0.05 -0.12 0.07variancesassumed
Equal -0.56 46.22 0.58 -0.03 0.05 -0.14 0.08variancesnotassumed
VAR00005 Equal 3.61 0.06 -1.08 152.00 0.28 -0.09 0.09 -0.27 0.08variancesassumed
Equal -1.02 49.40 0.31 -0.09 0.09 -0.28 0.09variancesnotassumed
VAR00006 Equal 62.67 0.00 3.13 152.00 0.00 0.29 0.09 0.11 0.48variancesassumed
Equal 3.50 63.74 0.00 0.29 0.08 0.13 0.46variancesnotassumed
contd. appendix
2582 Mohammad Rumzi Tausif
VAR00007 Equal 0.01 0.91 0.06 152.00 0.95 0.01 0.09 -0.18 0.19variancesassumed
Equal 0.06 52.86 0.96 0.01 0.09 -0.18 0.19variancesnotassumed
VAR00008 Equal 4.17 0.04 -1.06 152.00 0.29 -0.07 0.06 -0.19 0.06variancesassumed
Equal -0.94 45.85 0.35 -0.07 0.07 -0.21 0.08variancesnotassumed
VAR00009 Equal 14.51 0.00 -1.95 152.00 0.05 -0.10 0.05 -0.20 0.00variancesassumed
Equal -1.50 40.17 0.14 -0.10 0.06 -0.23 0.03variancesnotassumed
VAR00010 Equal 0.10 0.76 -0.17 152.00 0.87 -0.02 0.10 -0.21 0.18variancesassumed
Equal -0.17 52.53 0.87 -0.02 0.10 -0.21 0.18variancesnotassumed
Appendix 5
KMO and Bartlett’s Test
Kaiser-Meyer-Olkin Measure of Sampling Adequacy. 0.42Bartlett’s Test of Sphericity Approx. Chi-Square 5618.70 df 780.00 Sig. 0.00
Communalities
Initial Extraction
VAR00001 1 0.81VAR00002 1 0.83VAR00003 1 0.85VAR00004 1 0.79VAR00005 1 0.68VAR00006 1 0.65VAR00007 1 0.70VAR00008 1 0.81VAR00009 1 0.88
contd. appendix
An Empirical Study on Consumers’ Perception towards Mobile Brands... 2583
VAR00010 1 0.80VAR00011 1 0.74VAR00012 1 0.78VAR00013 1 0.74VAR00014 1 0.75VAR00015 1 0.79VAR00016 1 0.87VAR00017 1 0.66VAR00018 1 0.76VAR00019 1 0.81VAR00020 1 0.80VAR00021 1 0.86VAR00022 1 0.81VAR00023 1 0.81VAR00024 1 0.79VAR00025 1 0.72VAR00026 1 0.88VAR00027 1 0.87VAR00028 1 0.79VAR00029 1 0.89VAR00030 1 0.77VAR00031 1 0.65VAR00032 1 0.77VAR00033 1 0.71VAR00034 1 0.75VAR00035 1 0.78VAR00036 1 0.76VAR00037 1 0.75VAR00038 1 0.84VAR00039 1 0.69VAR00040 1 0.82
Extraction Method: Principal Component Analysis.
Total Variance Explained
Component Initial ExtractionEigenvalues Sums of
SquaredLoadings
Total % of Cumulative Total % of CumulativeVariance % Variance %
1 7.13 17.84 17.84 7.13 17.84 17.842 5.77 14.43 32.27 5.77 14.43 32.273 3.16 7.9 40.17 3.16 7.9 40.174 2.7 6.74 46.91 2.7 6.74 46.915 2.18 5.45 52.36 2.18 5.45 52.36
contd. appendix
2584 Mohammad Rumzi Tausif
6 2.09 5.22 57.59 2.09 5.22 57.59
7 1.71 4.28 61.87 1.71 4.28 61.87
8 1.57 3.92 65.79 1.57 3.92 65.79
9 1.46 3.66 69.45 1.46 3.66 69.45
10 1.3 3.26 72.71 1.3 3.26 72.71
11 1.13 2.81 75.53 1.13 2.81 75.53
12 1.02 2.55 78.08 1.02 2.55 78.08
13 0.94 2.36 80.44
14 0.88 2.2 82.65
15 0.8 2 84.65
16 0.74 1.85 86.5
17 0.64 1.6 88.09
18 0.56 1.39 89.48
19 0.52 1.3 90.78
20 0.48 1.19 91.96
21 0.42 1.06 93.02
22 0.39 0.97 93.99
23 0.35 0.87 94.86
24 0.32 0.8 95.67
25 0.29 0.72 96.39
26 0.24 0.59 96.99
27 0.2 0.49 97.48
28 0.19 0.47 97.95
29 0.17 0.44 98.39
30 0.14 0.34 98.73
31 0.11 0.27 98.99
32 0.1 0.25 99.24
33 0.09 0.23 99.48
34 0.06 0.15 99.62
35 0.05 0.12 99.75
36 0.04 0.09 99.84
37 0.02 0.06 99.9
38 0.02 0.04 99.94
39 0.01 0.03 99.97
40 0.01 0.03 100
Extraction Method: Principal Component Analysis.
An Empirical Study on Consumers’ Perception towards Mobile Brands... 2585
Rotated Component Matrixa
Component
1 2 3 4 5 6 7 8 9 10 11 12
VAR00001 0.05 0.09 0.15 0.01 0.18 0.02 0.70 0.09 0.02 0.04 -0.18 0.46VAR00002 -0.18 0.05 0.15 0.25 -0.23 0.06 0.50 -0.37 -0.23 0.22 -0.28 -0.32VAR00003 -0.04 -0.10 0.03 0.12 0.01 0.11 0.87 0.05 -0.04 0.21 -0.01 -0.11VAR00004 0.24 -0.17 0.17 0.38 -0.04 0.03 -0.26 0.48 0.08 0.33 -0.24 0.26VAR00005 0.09 0.22 -0.05 0.23 0.71 0.19 0.05 0.10 0.00 0.06 -0.10 0.00VAR00006 0.49 -0.04 0.16 0.47 0.26 -0.22 0.13 -0.01 0.07 -0.13 0.12 0.00VAR00007 0.13 0.18 -0.22 -0.11 0.28 0.61 0.27 0.05 0.04 -0.26 0.04 -0.06VAR00008 0.18 0.84 0.04 0.02 0.18 0.04 -0.03 0.04 0.13 -0.06 0.02 -0.10VAR00009 0.10 0.88 0.07 -0.16 0.14 0.11 0.13 0.06 0.12 -0.11 0.04 0.01VAR00010 0.04 -0.06 -0.05 0.22 -0.04 -0.11 0.05 0.09 0.02 0.08 0.08 0.84VAR00011 -0.21 0.66 -0.15 0.29 -0.21 -0.07 -0.06 -0.13 -0.15 0.22 -0.11 0.02VAR00012 0.14 -0.11 -0.07 0.74 0.00 0.17 0.06 0.10 0.17 0.02 -0.03 0.36VAR00013 0.62 0.00 0.07 0.24 -0.13 0.17 0.03 0.16 -0.15 0.09 -0.14 0.42VAR00014 0.41 0.09 -0.09 0.34 -0.07 0.25 0.22 0.57 -0.02 0.07 -0.03 0.04VAR00015 0.14 0.20 -0.04 0.38 0.13 -0.07 0.55 0.37 -0.14 -0.23 0.01 0.24VAR00016 0.44 0.06 -0.03 0.02 -0.09 0.09 -0.19 0.45 0.25 0.26 0.52 -0.12VAR00017 -0.10 0.07 -0.05 0.28 0.16 0.16 0.18 0.12 0.05 0.06 -0.67 -0.10VAR00018 -0.06 0.21 0.03 0.07 0.17 0.26 -0.15 0.16 0.75 -0.02 -0.01 0.06VAR00019 0.19 -0.23 0.18 0.05 0.07 -0.17 0.11 0.21 0.58 -0.23 0.44 -0.15VAR00020 -0.11 -0.04 0.06 0.09 0.07 0.84 -0.05 -0.04 -0.03 0.10 -0.17 -0.11VAR00021 0.34 0.25 0.28 0.13 -0.16 -0.28 0.03 0.02 0.37 -0.16 0.56 -0.07VAR00022 -0.17 0.06 0.25 0.10 0.30 0.76 0.09 0.03 0.07 0.05 -0.10 0.08VAR00023 -0.04 0.12 0.16 0.48 0.26 0.20 0.04 0.19 -0.50 0.19 -0.08 0.33VAR00024 0.51 0.23 0.19 0.24 -0.16 -0.30 0.04 -0.15 0.32 0.01 0.37 0.05VAR00025 -0.03 0.04 0.16 0.10 0.65 0.23 0.24 -0.15 0.09 0.26 0.24 -0.01VAR00026 0.41 0.35 0.24 -0.05 -0.12 -0.21 -0.02 -0.22 0.57 -0.13 -0.10 0.27VAR00027 -0.18 0.08 0.03 0.12 0.51 0.02 0.16 0.02 -0.20 0.67 -0.20 0.04VAR00028 0.54 0.50 0.32 -0.03 0.02 -0.18 0.02 0.26 0.13 0.00 0.13 0.00VAR00029 0.03 -0.07 0.04 0.04 0.12 0.02 0.15 0.09 -0.07 0.91 0.00 0.08VAR00030 0.78 0.14 0.11 -0.02 0.13 -0.12 0.00 0.19 -0.11 -0.01 0.24 0.06VAR00031 0.12 -0.04 0.07 -0.15 0.68 0.12 -0.08 0.06 0.06 0.09 -0.33 -0.06VAR00032 0.82 -0.01 0.05 0.05 0.13 -0.02 -0.06 0.17 0.20 -0.06 0.04 -0.05VAR00033 0.11 0.05 -0.01 0.62 0.17 -0.03 0.39 0.12 -0.06 0.28 -0.18 0.02VAR00034 0.21 0.06 0.21 0.09 0.08 -0.10 0.15 0.77 0.07 0.04 -0.01 0.09VAR00035 0.12 -0.11 0.77 -0.11 0.16 0.00 0.09 0.20 0.17 0.19 0.12 0.10VAR00036 0.31 0.37 0.42 0.10 -0.04 -0.09 -0.28 0.21 -0.11 -0.17 0.41 0.01VAR00037 0.14 -0.18 0.34 0.40 0.48 0.38 -0.01 -0.16 -0.09 -0.05 0.05 0.13VAR00038 0.06 0.52 0.48 -0.15 -0.09 0.10 -0.09 0.50 -0.05 0.09 0.03 0.15VAR00039 -0.09 0.32 0.49 0.42 0.05 0.05 0.16 0.17 -0.30 -0.09 -0.01 -0.08VAR00040 0.17 0.10 0.86 0.07 0.04 0.12 0.04 -0.03 0.06 -0.03 0.02 -0.10
Extraction Method: Principal Component Analysis. Rotation Method: Varimax with Kaiser Normalization.a. Rotation converged in 29 iterations.
Related Documents