Comparisons of growth performance of Nile tilapia (Oreochromis niloticus) fingerlings fed different inclusion levels of black soldier fly (Hermetia illucens) pre-pupae meal diets and its effect on the physical characteristics of the feed by NIKLAAS JAKOBUS GROENEWALD Thesis presented in fulfilment of the requirements for the degree of Master of Science in Agriculture (Aquaculture) at Stellenbosch University Supervisor: Dr Elsje Pieterse Co-supervisor: Dr Khalid Salie Department of Animal Science, Faculty of AgriSciences March 2018

Welcome message from author
This document is posted to help you gain knowledge. Please leave a comment to let me know what you think about it! Share it to your friends and learn new things together.
Transcript
Comparisons of growth performance of Nile tilapia (Oreochromis
niloticus) fingerlings fed different inclusion levels of black
soldier fly (Hermetia illucens) pre-pupae meal diets and its effect
on the physical characteristics of the feed
by
NIKLAAS JAKOBUS GROENEWALD
Thesis presented in fulfilment of the requirements for the degree of
Master of Science in Agriculture (Aquaculture)
at
Stellenbosch University
Supervisor: Dr Elsje Pieterse
Co-supervisor: Dr Khalid Salie
Department of Animal Science, Faculty of AgriSciences
March 2018

ii
Declaration
By submitting this thesis electronically, I declare that the entirely of the work contained therein is my own,
original work, that I am the sole author thereof (save to the extent explicitly otherwise stated), that reproduction
and publication thereof by Stellenbosch University will not infringe any party rights and that I have not
previously in its entirely or in part submitted it for obtaining any qualification.
Date: March 2018
Copyright © 2018 Stellenbosch University
All rights reserved
Stellenbosch University https://scholar.sun.ac.za
iii
Summary
The nutritional composition of fish and the health benefit associated with the consumption thereof makes it a
valuable food and feed source for both humans and animals. However, with the increasing size of the world’s
population and the demand for fish and other fishery products, an increased amount of pressure is being
placed on wild catch fisheries. As a result, the latter are becoming stagnant, or declining, in many regions
around the world. Aquaculture has, to some extent, been able to relieve the pressure placed on wild catch
fisheries. Yet, a major downfall is that it still relies on wild caught fish to be used as a protein source for many
aquaculture fish species. Various alternative protein sources has been investigated for use in aquaculture
feeds to replace conventional and unsustainable protein sources, such as fishmeal. Among the various
alternative animal protein sources, the use of insects are gaining popularity as a promising and sustainable
solution. Insects are a natural food source for many fish species and have relatively balanced amino- and
fatty acid profiles, while it is also highly effective in integrated waste management (IWM) systems. The
objective of the study was to investigate the effects of different inclusion levels of black soldier fly (BSF)
(Hermetia illucens) pre-pupae meal in the diets of Nile tilapia (Oreochromis niloticus) fingerlings (n = 630) on
the growth performance, fillet yield and feed quality. Six diets were compared: BSF0 (0 %; the control diet),
BSF5 (5 %), BSF10 (10 %), BSF15.6 (15.6 %), BSF20 (20 %) and BSF25 (25 %; the summit diet). There
were no significant differences in the final average body weight, feed intake, average daily gain (ADG) and
conditioning factor (CF) between the different treatments. There was no significant difference for the feed
conversion ratio (FCR) of BSF0 (1.35) and BSF5 (1.50), however FCR was lower (P≤0.05) for BSF10 (1.63)
relative to BSF0, and worsened with increasing inclusion levels. The FCR was not significantly different
between BSF10 and BSF15.6 (1.79), but BSF10 did have a significantly lower FCR than BSF20 (1.97) and
BSF25 (1.91), whilst the latter two did not differ (P>0.05) from each other. During the preparation of the
experimental feed, the inclusion of a binder was required in BSF20 and BSF25 in order to prevent complete
crumbling with the extrusion process. The use of a binder changed the hardness and floating characteristics
of diets BSF20 and BSF25, which may have had an influence on differences in FCR. There was no
significant difference observed for specific growth rate (SGR) between BSF0 (2.05), BSF5 (1.91) and BSF10
(1.73), or between diets BSF10 through to BSF25 (1.62). Treatment BSF10 was thus not significantly
different from any treatment diets. Treatment BSF0 was the only diet with a SGR significantly higher than
BSF15 (1.68), BSF20 (1.60) and BSF25 (1.62). The protein efficiency ratio (PER) of BSF0 (2.02) and BSF5
(1.82) did not differ significantly from each other. The PER of BSF0 differed significantly from BSF10 (1.68),
BSF15.6 (1.55), BSF20 (1.40) and BSF25 (1.43). The difference could be linked to the increasing lipid
content of the feeds which is known to adverse effect the digestibility of the feeds. The carcass yield was not
significantly different between any of the treatments, where all the yields (percentage body weight) ranged
from 81.63 g (BSF20) to 83.5 g (BSF0). The fillet yield did show some variation, but the results are not very
accurate (R2=0.094) due to the methodology of filleting. Furthermore, no significant differences were
observed for the proximate composition (moisture, crude protein, lipid and ash) of the fillets. The inclusion
Stellenbosch University https://scholar.sun.ac.za
iv
level of the BSF pre-pupae meal showed a statistically significant influence on the unit density, sinking
velocity, water uptake and leaching rate of the pellets. However, the effect of binder used in BSF20 and
BSF25 may have had an influence on these results. All unit densities differed significantly from each other,
increasing with higher BSF pre-pupae inclusion levels. The control (BSF0) and BSF5 had a sinking velocity
of 0 (floating pellets), while the feed only started sinking with inclusion levels of 10 % BSF pre-pupae meal
(BSF10, 4.44 cm/s). Faster sinking velocities were observed with increasing inclusion levels of BSF pre-
pupae meal. Water uptake was generally higher in BSF0 compared to other treatments for all the
timeframes, except for the shortest submersion time (5 min), where BSF15.6 (288.60 %) had a significantly
higher water uptake than all the other diets. Due to the disintegration of the pellets over time, the water
uptake was expressed as a percentage of feed remaining rather than initial quantity used. The feed
remaining was used to determine disintegration rate. Factors such as lipid content and interactions between
ingredients may have indirectly influenced feed quality parameters. The study did not generate enough
evidence to verify the claim that BSF pre-pupae meal can be used as a viable alternative protein source to
conventional sources in Nile tilapia feeds, due to variability in water stability and inclusion of a binder that
were not accounted for. However, it was found that inclusion levels of up to 25 % can be used without any
effect on the body composition, and up to 5 % without compromising the growth parameters. Therefore, it is
recommended to use an inclusion level of 5 % BSF pre-pupae meal to maintain the growth performance. For
future studies, it is suggested to use defatted BSF pre-pupae meal for potentially higher inclusion levels of
the meal for comparative growth results relative to conventional protein sources – as the higher lipid content
may adversely affect the binding ability and the feed quality.
Stellenbosch University https://scholar.sun.ac.za
v
Opsomming
Die voedingswaarde van vis en die gesondheidsvoordele wat met die verbruik daarvan gepaard gaan, maak
dit 'n waardevolle voedsel- en voedingsbron vir beide mens en dier. Alhoewel, met die toename in die wêreld
se bevolking en die vraag na vis en ander visseryprodukte word daar toenemend druk op wildvang vissery
geplaas. Gevolglik stagneer of verminder wildvang vissery in baie streke regoor die wêreld. Akwakultuur het
tot 'n mate die druk op wildvang vissery ligter gemaak. 'n Groot tekortkoming is egter dat akwakultuur
nogsteeds staatmaak op die gebruik van wilde vis as 'n proteïenbron vir baie akwakultuurvisse. Navorsing
word voordurend gedoen op die gebruik van verskeie alternatiewe proteïenbronne in akwakultuurvoere om
konvensionele en nie-volhoubare proteïenbronne, soos vismeel, te vervang. Die gebruik van insekte as 'n
belowende en volhoubare oplossing raak egter meer gewild in vergelyking met verskeie ander alternatiewe
dierlike proteïenbronne. Insekte is uiteraard 'n natuurlike voedselbron vir baie visspesies en het 'n
gebalanseerde amino- en vetsuurprofiel, terwyl dit ook hoogs effektief is in geïntegreerde afvalbestuurstelsels.
Die doel van die studie was om die effek van verskillende Swart Soldaat Vlieg (SSV) (Hermetia illucens) pre-
papie meel insluitingsvlakke in die diëte van Nyl tilapia (Oreochromis niloticus) vingervissies (n = 630) op die
groeiprestasie, filet opbrengs en voergehalte te ondersoek. Ses diëte is met mekaar vergelyk: SSV0 (0 %; die
kontrole dieet), SSV5 (5 %), SSV10 (10 %), SSV15.6 (15.6 %), SSV20 (20 %) en SSV25 (25 %; die toppunt
dieet). Daar was geen betekenisvolle verskille in die finale gemiddelde liggaamsgewig, voerinname,
gemiddelde daaglikse toename en kondisioneringsfaktor tussen die verskillende behandelings nie. Daar was
geen beduidende verskil vir die voer omskakeling verhouding (VOV) van SSV0 (1.35) en SSV5 (1.50) nie,
maar die VOV was laer (P≤0.05) vir SSV10 (1.63) relatief tot SSV0, en het versleg met die toename in
insluitingsvlak. Die VOV het nie betekenisvol tussen SSV10 en SSV15.6 (1.79) verskil nie, maar SSV10 het 'n
beduidende laer VOV as SSV20 (1.97) en SSV25 (1.91) gehad, terwyl die laaste twee nie van mekaar verskil
(P>0.05) het nie.
Tydens die voorbereiding van die eksperimentele voer is die insluiting van 'n bindmiddel benodig in BSF20 en
BSF25 om te verhoed dat die ekstrusieproses volledig verkrummel. Die gebruik van bindmiddel het egter die
hardheid en drywende eienskappe van diëte BSF20 en BSF25 verander, wat die verskille van FCR beïnvloed
het. Daar was geen betekenisvolle verskille waargeneem vir die spesifieke groeikoers tussen SSV0 (2.05),
SSV5 (1.91) en SSV10 (173) nie, of tussen diëte SSV10 tot SSV25 (1.62) nie. Behandeling SSV10 was dus
nie betekenisvol anders as enige ander behandelingsdieet nie. SSV0 was die engiste dieet wat ‘n spesifieke
groeikoers beduidend hoër as SSV15 (1.68), SSV20 (1.60) en SSV25 (1.62) gehad het. Die proteïen
doeltreffendheid verhouding van SSV0 (2.02) en SSV5 (1.82) het nie betekenisvol van mekaar verskil nie. Die
proteïen doeltreffendheid verhouding van SSV0 het betekenisvol van SSV10 (1.68), SSV15.6 (1.55), SSV20
(1.40) en SSV25 (1.43) verskil. Hierdie verskil kan egter aan die toenemende lipiedinhoud van die voer
gekoppel word, aangesien dit bekend is dat die lipiedinhoud die verteerbaarheid van die voer nadelig kan
beïnvloed. Die karkasopbrengs het nie betekenisvol tussen enige van die behandelings verskil nie, waar al die
opbrengste (persentasie liggaamsgewig) van 81.63 g (SSV20) tot 83.5 g (SSV0) gewissel het. Die opbrengs
Stellenbosch University https://scholar.sun.ac.za
vi
van die filet het 'n mate van variasie getoon, maar die resultate is nie baie akkuraat nie (R2=0.094), moontlik
as gevolg van metodologie van filetering. Daar is verder geen betekenisvolle verskille vir die proksimale
samestelling (vog, ruwe proteïen, lipied en as) waargeneem nie. Die insluitingsvlakke van SSV pre-papie meel
het 'n statistiese betekenisvolle invloed op die eenheidsdigtheid, sinksnelheid, wateropname en uitlogsyfer
van die voer gehad. Die effek van die bindmiddel wat in BSF20 en BSF25 gebruik word, kon egter die resultate
beïnvloed het. Al die eenheidsdigthede het betekenisvol van mekaar verskil, waar digtheid met elke hoër
insluitingsvlak van SSV pre-papie toegeneem het. Die kontrole (SSV0) en SSV5 het ‘n sinksnelheid van 0
(drywende korrels) gehad. Die voer het egter eers begin sink met insluitingsvlakke vanaf 10 % SSV pre-papie
meel (SSV10, 4.44 cm/s). Vinniger sinkingsnelhede was waargeneem met toenemende insluiting vlakke.
Wateropname was oor die algemeen hoër in SSV0 in vergelyking met ander behandelings van al die tye,
behalwe vir die kortste onderdompelingstyd (5 min), waar SSV15.6 (288.60 %) ‘n betekenisvolle hoër
wateropname as al die ander diëte gehad het. As gevolg van die disintegrasie van korrels met die verloop van
tyd, was die wateropname uitgedruk as 'n persentasie van die oorblywende voer eerder as die aanvanklike
hoeveelheid wat gebruik is. Die oorblywende voer was gebruik om die desintegrasietempo te bepaal. Faktore
soos die lipiedinhoud en interaksies tussen bestanddele kon indirek die voergehalteparameters beïnvloed het.
Die studie het nie genoeg bewyse gelewer om die eis te verifieer dat SSV pre-papie meel as 'n lewensvatbare
alternatiewe proteïenbron gebruik kan word vir konvensionele bronne in Nyl tilapia voer nie,as gevolg van
veranderlikheid in waterstabiliteit en insluiting van 'n bindmiddel wat nie in ag geneem is nie. Daar is egter
gevind dat insluitingsvlakke van tot 25 % gebruik kan word sonder enige effek op die liggaamsamestelling en
tot 5 % sonder om die groeiparameters in gedrang te bring. Daarom kan die aanbeveling gemaak word om 'n
insluiting vlak van 5 % SSV pre-papie meel te gebruik om die groeiprestasie te handhaaf. Vir toekomstige
studies word dit aanbeveel om ontvette SSV pre-papie meel te gebruik vir moontlike hoër insluitingvlakke van
die meel vir vergelykbare groeiverslae relatief tot konvensionele proteïenbronne – aangesien die hoër
lipiedinhoud die bindingsvermoë en gehalte van die voer nadelig kan beïnvloed.
Stellenbosch University https://scholar.sun.ac.za

vii
Acknowledgements
I would like to thank everyone who contributed to the completion of my thesis, both directly and indirectly.
Firstly my supervisors Dr Elsje Pieterse and Dr Khalid Salie for your patience in guiding me through these
unchartered waters. A big thanks goes out to the support staff at the Department of Animal Sciences for
assisting with lab work where necessary, as well as towards Gail Jordaan with regards to helping out with my
statistics. I would specifically like to thank my mother, Helene Kuntzsch, for always being there for me when
times got tough and encouraging me to push on in the face of adversity.
This project was made possible with funding from the NRF (National Research Fund) and AgriProtein. Thank
you to all that made this possible, this has been a truly unforgetfull experience.
Stellenbosch University https://scholar.sun.ac.za

viii
Notes
The language and style used in this thesis are in accordance with the requirements of the South African Journal
of Animal Science. This thesis represents a compilation of manuscripts where each chapter is an individual
entity and some repetition between chapters is therefore unavoidable.
Stellenbosch University https://scholar.sun.ac.za
ix
Abbreviations
AA Amino acid
AGD Average daily gain
ANOVA Analysis of variance
BM Bone meal
BSF Black soldier fly
CF Conditioning factor
COS Chicken offal silage
CP Crude protein
CSM Cottonseed meal
DO Dissolved oxygen
EAA Essential amino acids
EFA Essential fatty acids
ER Expansion ratio
FI Feed intake
FW Final weight
GLM The general linear model
HFM Hydrolysed feather meal
HUFA Highly unsaturated fatty acids
ICLARM The International Center for Living Aquatic Resources Management
IW Initial weight
IWM Integrated waste management
MUSFA Mono-unsaturated fatty acids
NEAA Non-essential amino acids
NRC National Research Council
PBM Poultry by-product meal
PUFA Polyunsaturated fatty acids
RAS Recirculatory aquaculture systems
SFA Saturated fatty acids
SBM Soy bean meal
SGR Specific growth rate
Stellenbosch University https://scholar.sun.ac.za
Contents
Abbreviations .................................................................................................................................................. ix
Chapter 1 ........................................................................................................................................................ 1
General introduction ....................................................................................................................................... 1
1.1 References ...................................................................................................................... 2
Chapter 2 ........................................................................................................................................................ 3
2.1 Introduction ...................................................................................................................... 3
2.2 Protein sources in aquaculture ........................................................................................ 3
2.3 The black soldier fly (H. illucens) ..................................................................................... 5
2.3.1 Nutritional composition of BSF ..................................................................................... 5
2.4 The Nile tilapia (Oreochromis niloticus) ........................................................................... 9
2.4.1 Nutritional requirements ............................................................................................. 10
2.4.2 Water quality requirements ........................................................................................ 19
2.4.3 Feed parameters/measurements ............................................................................... 21
2.5 Conclusion..................................................................................................................... 23
2.6 References .................................................................................................................... 24
Chapter 3 ........................................................................................................................................................ 32
3.1 Introduction .................................................................................................................... 33
3.2 Materials and methods .................................................................................................. 35
3.2.1 Experimental procedures ........................................................................................... 35
3.2.2 Unit density ................................................................................................................ 35
3.2.3 Sinking velocity .......................................................................................................... 36
3.2.4 Water uptake and disintegration ................................................................................ 36
3.2.5 Disintegration rate...................................................................................................... 38
3.2.6 Water uptake ............................................................................................................. 38
3.3 Statistical analysis ......................................................................................................... 39
3.4 Results and discussion .................................................................................................. 39
3.4.1 Unit density ................................................................................................................ 39
3.4.2 Sinking velocity .......................................................................................................... 40
3.4.3 Water uptake and disintegration rate ......................................................................... 41
3.5 Conclusions ................................................................................................................... 44
3.6 References .................................................................................................................... 45
Stellenbosch University https://scholar.sun.ac.za
Chapter 4 ........................................................................................................................................................ 47
4.1 Introduction .................................................................................................................... 47
4.2 Material and methods .................................................................................................... 50
4.2.1 Experimental procedure ............................................................................................. 50
4.2.2 Experimental feed ...................................................................................................... 52
4.2.3 Water quality .............................................................................................................. 55
4.2.4 Analytical procedures ................................................................................................ 56
4.2.5 Statistical analysis ..................................................................................................... 57
4.3 Results and discussion .................................................................................................. 58
4.4 Conclusion..................................................................................................................... 60
4.5 References .................................................................................................................... 61
Chapter 5 ........................................................................................................................................................ 63
Abstract .......................................................................................................................................................... 63
5.1 Introduction .................................................................................................................... 63
5.2 Material and methods .................................................................................................... 65
5.2.1 Experimental system ................................................................................................. 65
5.2.2 Experimental feed ...................................................................................................... 65
5.2.3 Experimental procedure ............................................................................................. 65
5.3 Proximate analysis ........................................................................................................ 66
5.3.1 Moisture content ........................................................................................................ 66
5.3.2 Protein content .......................................................................................................... 66
5.3.3 Lipid content .............................................................................................................. 67
5.3.4 Ash content................................................................................................................ 67
5.4 Statistical analysis ......................................................................................................... 67
5.5 Results and discussion .................................................................................................. 67
5.6 Conclusions ................................................................................................................... 71
5.7 References .................................................................................................................... 72
Chapter 6 ...................................................................................................................................................... 74
General conclusion ....................................................................................................................................... 74
Future recommendations: ............................................................................................................................ 74
Stellenbosch University https://scholar.sun.ac.za

Stellenbosch University https://scholar.sun.ac.za
1
Chapter 1
General introduction
Fish and fishery products are important contributors to food security, while it also provides a healthy
source of protein, minerals and fatty acids (FAO, 2016). The annual per capita consumption of fish has shown
a steady growth in developing regions (5.2 kg in 1961 to 18.8 kg in 2013). Developed countries have a sizeable
and growing share of imported fish relative to domestic fish due to static and declining domestic fishery
production. In 2013, 17 % of global animal protein consumption was fish, which accounted for 6.7 % of all
protein consumed the same year (FAO, 2016). The total world capture fisheries increased from 90.2 million
tons to 93.4 million tons in 2009 to 2014, whilst total aquaculture fisheries increased from 55.7 million to 73.8
million tons (FAO, 2016). Whether the per capita consumption of fish increases or not, the demand for fish and
related products is expected to increase due to the growing world’s population (FAO, 2012). In 2014, the world
aquaculture production of fish (which includes its non-food uses) accounted for 44.1 % of the total production,
which is more than the 31.1 % reported in 2004 (FAO, 2016). Aquaculture is a recognized method of animal
production which contributes to the global protein requirement for the growing world’s population (Lucas &
Southgate, 2012).
The high protein and fatty acid content are some of the factors that make fishmeal the conventional
protein source used in aquaculture (El-Sayed, 2006). A major problem faced by the aquaculture industry is the
cost of nutrition, of which protein (specifically fishmeal) is the most expensive ingredient (El-Sayed, 2006;
Webster & Chhorn, 2006). Apart from the cost of fishmeal, the sustainability of its use as a protein source has
become a major concern (Lucas & Southgate, 2012). In response, various alternative protein sources have
been investigated with the intent to substitute, at least to some extent, the use of fishmeal in fish feed
formulations (Tacon et al., 1983; Viola & Zohar, 1984; Tacon & Jackson, 1985)
In countries where animal protein is limited, insects have regularly been used as an alternative protein
source (Riggi et al., 2013). Insects are effective in recycling and utilizing organic waste for growth. They are
also high in protein and fat (Pretorius, 2011; Nijdam et al., 2012) and therefore, promising for the replacement
of conventional proteins such as fish meal and soya oilcake meal (Sealey et al., 2011; Kroeckel et al., 2012).
This study investigated the suitability and nutritional value of black soldier fly (BSF) (Hermetia illucens)
pre-pupae meal as an alternative protein source and supplement to fishmeal for the production of Nile tilapia
(Oreochromis niloticus). Various inclusion levels of BSF pre-pupae meal were formulated into Nile tilapia diets
to investigate its effect on growth performance, fillets and feed quality. The protocol for this trial (SU-ACUD15-
00035) was approved by the Animal Ethics Committee of the University of Stellenbosch
Stellenbosch University https://scholar.sun.ac.za
2
1.1 References
El-Sayed, A.-F.M., 2006. Tilapia culture. In : Aquaculture. CABI publishing, UK.
Food and Agriculture Organization of the United Nations (FAO), 2012. The State of World Fisheries and
Aquaculture 2012. http://www.fao.org/3/a-i2727e.pdf. Rome.
Food and Agriculture Organization of the United Nations (FAO), 2016. The State of World Fisheries and
Aquaculture 2016. http://www.fao.org/3/a-i5555e.pdf. Rome.
Kroeckel, S., Harjes, A.G.E., Roth, I., Katz, H., Wuertz, S., Susenbeth, A. & Schulz, C., 2012. When a turbot
catches a fly: Evaluation of a pre-pupae meal of the Black Soldier Fly (Hermetia illucens) as fish meal
substitute - Growth performance and chitin degradation in juvenile turbot (Psetta maxima). Aquac. 364,
345-352.
Lucas, J.S. & Southgate, P.C., 2012. Aquaculture: Farming aquatic animals and plant. Blackwell Publishing
Ltd., UK.
Nijdam, D., Rood, T. & Westhoek, H., 2012. The price of protein: Review of land use and carbon footprints
from life cycle assessments of animal food products and their substitutes. Food. Policy. 37(6), 760-770.
Pretorius, Q., 2011. The evaluation of larvae of Musca domestica (common house fly) as protein source for
broiler production. Stellenbosch: Stellenbosch University.
Riggi, L., Veronesi, M., Verspoor, R., MacFarlane, C. & Tchibozo, S., 2013. Exploring entomophagy in
Northern Benin-practices, perceptions and possibilities. In: Bugs for life. London, UK.
Sealey, W.M., Gaylord, T.G., Barrows, F.T., Tomberlin, J.K., McGuire, M.A., Ross, C. & St‐Hilaire, S., 2011.
Sensory analysis of rainbow trout, Oncorhynchus mykiss, fed enriched black soldier fly pre-pupae,
Hermetia illucens. J. World. Aquac. Soc. 42(1), 34-45.
Tacon, A.G.J. & Jackson, A.J., 1985. Utilization of conventional and unconventional protein sources in practical
fish feeds. Nutr. Feed. Fish. 119-145.
Tacon, A.G.J., Jauncey, K., Falaye, A., Pantha, M., MacGowan, I. & Stafford, E.A., 1983. The use of meat and
bone meal and hydrolyzed feather meal and soybean meal in practical fry and fingerling diets for
Oreochromis niloticus. In: Proceedings of the First International Symposium on Tilapia in Aquaculture.
pp. 356-365.
Viola, S. & Zohar, G., 1984. Nutritional study with market size tilapia hybrid Oreochromis in intensive culture.
Protein levels and sources. Isr. J. Aquac. 36, 3-15.
Webster, C.D. & Chhorn, L., 2006. Tilapia: biology, culture and nutrition. CRC Press.
Stellenbosch University https://scholar.sun.ac.za
3
Chapter 2
Literature review
2.1 Introduction
Nutrition represents more than 50% of operating costs in intensive aquaculture operations, with protein
being the most expensive dietary component (El-Sayed, 2006; Webster & Chhorn, 2006). This makes well-
balanced and affordable diets an important focus for the success and sustainability of tilapia cultures. To
reduce production costs, detailed and accurate information on nutrient requirements are necessary (Webster
& Chhorn, 2006). The challenge faced by tilapia farmers and nutritionists (particularly in developing countries)
is the development of commercial, cost effective tilapia feeds using local, cheap and unconventional resources
and ingredients (El-Sayed, 2006). This review focusses on the nutritional profile and the use of black soldier
fly (BSF) (Hermetia illucens) as an alternative protein source in aquaculture feed. Furthermore, the nutritional
and water quality requirements of Nile tilapia (Oreochromis niloticus) for optimum growth, feed quality
parameters, requirement of fish feed and its production, and the impact of physical pellet quality on the
biological response of fish will be discussed.
2.2 Protein sources in aquaculture
Feed production is a major contributor towards the occupation of land, dependence of water,
acidification and climate change, where fishmeal and soy meal are mainly linked to these impacts (Mungkung
et al., 2013; Sánchez-Muros et al., 2014). Hence, there is a drive to reduce the use of the above-mentioned
meals. Various investigations have been conducted to determine the suitability of alternative protein sources
in aquaculture feeds. However, the alternative protein sources should not have adverse effects on the growth
and health of farmed aquatic species (Webster, 2006). Several animal by-products have been evaluated as a
potential substitute for fish meal in tilapia diets (Webster & Chhorn, 2006). El-sayed (1998) investigated poultry
by-product meal (PBM), shrimp meal, meat meal (M) and bone meal (BM) as alternative protein sources for
Nile tilapia. Hydrolysed feather meal (HFM) was also investigated in previous studies as a protein source in
fish feed (Tacon & Metian, 2013).
Various studies have also been conducted on the assessment of plant protein in tilapia diets. Some
plant sources include oilseed plants such as soy bean meal (SBM) (Tacon et al., 1983; Viola & Zohar, 1984;
Abdelghany, 1997), cottonseed meal (CSM) (Jackson et al., 1982; El-Sayed, 1987; El-Sayed, 1990) rapeseed
meal (Jackson et al., 1982), copra, peanut and sunflower meals (Jackson et al., 1982). Spiruline (Olvera-
Novoa et al., 1998), azolla meal (Santiago & Lovell, 1988) and duckweed (Essa, 1997) are among the aquatic
plants that have been investigated for use in aquaculture feed. Cssava leaf meal (Ng & Wee, 1989), maize
(gluten) (Wu et al., 1995), lucerne (Olvera-Novoa et al., 1990) and coffee pulp (Ulloa Rojas & Van Weerd,
1997) have also been investigated.
Stellenbosch University https://scholar.sun.ac.za
4
A deficiency in certain essential amino acids (EAA) is one of the major issues with plant protein sources
as it requires supplementation with other feedstuffs (Ogunji et al., 2008a). However, blending certain oilseed
cakes or by-products and vegetable feedstuffs can provide a balanced amino acid (AA) profile. Yet, such a
blend may contain anti-nutrients which either limit their use in compound feeds or require further processing –
increasing feed production costs (El-Sayed, 2006; Sánchez-Muros et al., 2014). Other issues related to the
use of vegetable feedstuffs include low palatability and a high proportion of fibre and non-starch
polysaccharides which limits inclusion levels. This requires the addition of AA or high value protein sources
with a better digestibility and AA balance to mitigate the effects and/or nutritional shortcoming of vegetable
based feedstuffs (Sánchez-Muros et al., 2014).
Insects are generally seen as pests, but the fact is that many are considered an important food source
(Womeni et al., 2009). The role of insects as a food source is particularly important in developing and poorer
countries where animal protein is limited (Riggi et al., 2013). Although the evaluation of insects as a potential
foodstuff for animals started in the early 1900’s it only recently started receiving attention for its use in fish
feeds with increased attention given from 2006 onward (Calvert et al., 1969; Ogunji et al., 2006). Insect farming
has a relatively low carbon footprint and land use requirement (Blonk et al., 2008). Furthermore, insects are
poikilothermic (Nijdam et al., 2012) which make them effective food converters as they do not use energy to
produce body heat.
Insects have been usefully implemented in the agricultural sector as recyclers of organic waste. They
are capable of utilizing and converting waste for their requirements, thereby developing these wastes into high
protein and fat sources to potentially replace more expensive fish meal and soya oilcake meal (Sealey et al.,
2011; Kroeckel et al., 2012). Furthermore, food (i.e. biological) waste is becoming an increasingly important
aspect of integrated waste management (IWM) systems. Currently, one third of all food produced (1.3 billion
metric tons) is wasted or lost, having consequential negative environmental and economic effects (Gustavsson
et al., 2011). The majority of waste management is orientated around composting (Bauhus & Meiwes, 1994).
By making use of the insect’s ability of bioconversion, an alternative waste management system can be utilized
to convert waste into valuable biomass and by-products.
Recent feeding experiments using insect based diets have been performed on fish species such as
Mozambique tilapia (Oreochromis mossambicus), catfish (Clarias gariepinus) (Alegbeleye et al., 2012),
channel catfish (Ictalurus punctatus) (Bondari & Sheppard, 1987), rainbow trout (Oncorhunchus mykiss) (St-
Hilaire et al., 2007a; Sealey et al., 2011), Atlantic salmon (Salmo salar) (Lock et al., 2014) tilapia (Oreochromis
niloticus) (Ogunji et al., 2008b), blue tilapia (Oreochromis aureus) (Bondari & Sheppard, 1987) and turbot
(Psetta maxima) (Kroeckel et al., 2012). Depending on the fish species, substitutions above 30 % mostly
reduced their growth rate. Ogunji et al. (2008a) partially replaced fishmeal with house fly (HF) larvae meal as
a protein supplement in Nile tilapia diets at 15%, 25%, 35%, 45%, 55% and 68%. They found HF larvae meal
to be a suitable replacement.
Stellenbosch University https://scholar.sun.ac.za
5
BSF pre-pupae meal has a good feed value and an amino acid composition which is comparable to
commercial proteins sources (e.g., soy and fish) (Newton et al., 2005a; Barroso et al., 2014; Surendra et al.,
2016), while its bioconversion ability can contribute to aquaculture’s sustainability factor and the production of
valuable by-products (Zhu et al., 2015). BSF pre-pupae meal has the potential to function as an alternative
protein source, while it is also a solution for the implementation of more sustainable and green practices.
Hence, this study selected BSF pre-pupae meal as a potential protein replacement for commercial protein
sources in fish diets. Furthermore, the self-harvesting action of BSF pre-pupae can aid in commercial
production of the product.
2.3 The black soldier fly (H. illucens)
The black soldier fly (BSF) (H. illucens) was first observed in 1930 in the sugarcane fields of the Hilo
Sugar Company in Hawaii (Hardy, 1960). It has a wasp-like appearance, and is distributed worldwide, primarily
throughout tropical and subtropical regions (James, 1935; Sheppard et al., 1994). BSF is considered a non-
pest species (Sheppard et al., 1994), as it rarely enter homes during its adult stage (Furman et al., 1959). In
fact, it lives off stored fat reserves (Newton et al., 2005a) and eliminates/minimises house fly breeding
(McCallan, 1974). It can be differentiated from other stratiomyids by its large size, the two translucent spots
on the second tergum (abdominal segment) and a clear spot on the second sternum (James, 1947; Hardy,
1960).
BSF larvae are found naturally in manures, decaying fruits and vegetables as well as decomposing
animals, thereby presenting a wide range of suitable habitats (James, 1947; Sheppard et al., 1994). BSF utilize
food waste to support its life cycle (Surendra et al., 2016). The females deposit about 500 eggs at a time,
generally in dry crevices close to the larval feed source, and hatch after approximately four days at 24 °C
(Booth & Sheppard, 1984). Depending on feed availability, the metamorphosis of the larvae to pre-pupae and
then pupae happens within two weeks (Furman et al., 1959). During the pre-pupae stage they migrate in an
attempt to pupate. This is the most desired harvest stage due to a self-harvesting action that can be
implemented using the flies natural migratory instinct (Sheppard et al., 1994).
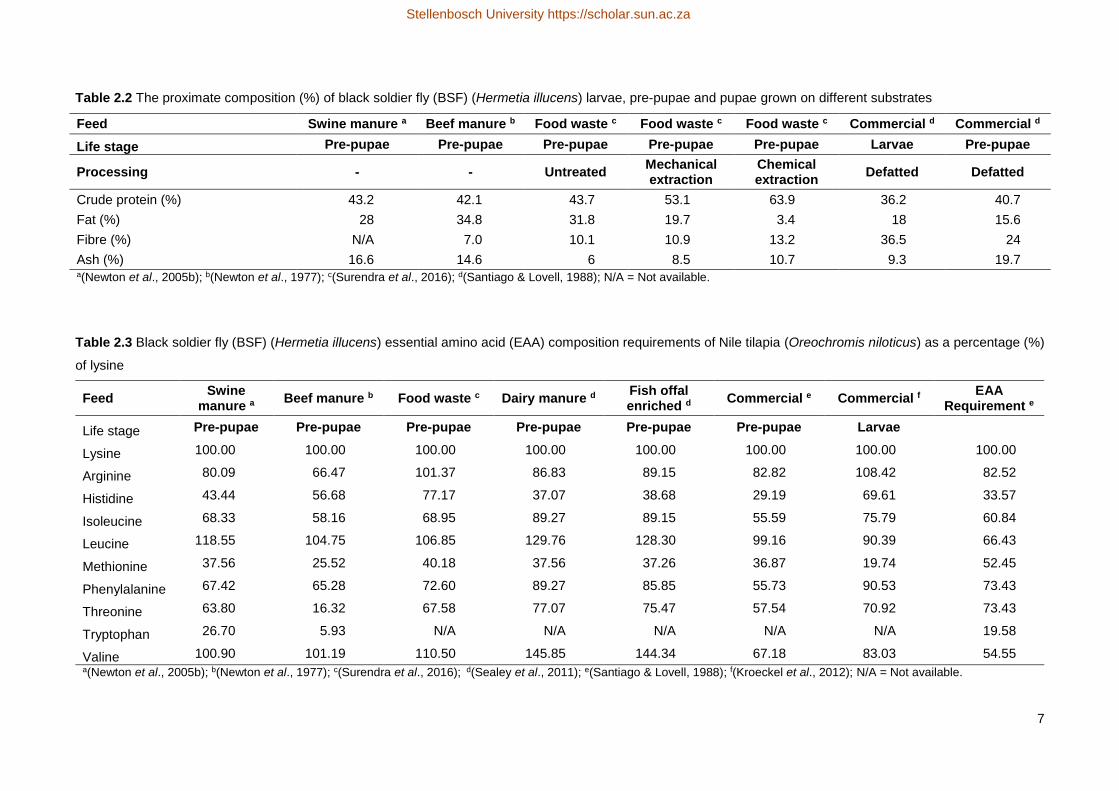
2.3.1 Nutritional composition of BSF
BSF maggot meal nutrient composition influences the way it is utilized by fish (Ogunji et al., 2008a). The
mineral and proximate composition of BSF at different life stages and substrates used are shown in Table 2.1
and Table 2.2, respectively. Crude protein and fat content differ with the life stage and substrate used for BSF
(St-Hilaire et al., 2007b; Sánchez-Muros et al., 2014). Processing (Fasakin et al., 2003), drying (Aniebo &
Owen, 2010), harvesting time (Atteh & Ologbenla, 1993) and age (Aniebo & Owen, 2010) are also factors that
influence their nutritional value. Newton et al. (2005a) suggest that fractioning (separation of components,
such as oil) could increase the protein content up to 40 %. In support, Surendra et al. (2016) reported an
increase and decrease in protein and lipid content by 18 % and 38 %, respectively, by making use of a
Stellenbosch University https://scholar.sun.ac.za
6
mechanical press, and 46 % and 90 % by making use of chemical extraction, respectively (Table 2.2.2).
Mechanically defatted pre-pupae meal used by Kroeckel et al. (2012) also showed a higher and lower protein
and fat content, respectively.
The data illustrates that BSF pre-pupae meal has a high enough protein content to fulfil dietary protein
requirements of Nile tilapia in all life stages, which ranges from 45 % for the first feeding to 28 % in brood stock
(El-Sayed, 2006). A difference in proximate composition reflects variation in diets.
2.3.1.1 Protein and amino acids
The crude protein content of untreated BSF can range from 36 % to 44 % (Table 2.2.2). BSF pre-pupae
meal has a good feed value and amino acid composition comparable to that of commercial feed ingredients
such as soy and fish meal (Newton et al., 2005a; Barroso et al., 2014; Surendra et al., 2016).
Table 2.3 compares the amino acid composition of different life stages and substrates used to the
requirements of Nile tilapia. Although most of the EAA requirements will be met, there will still be a deficiency
in some which can be balanced using pure amino acids, these differences are however smaller or larger than
that for fishmeal and soyabean meal.
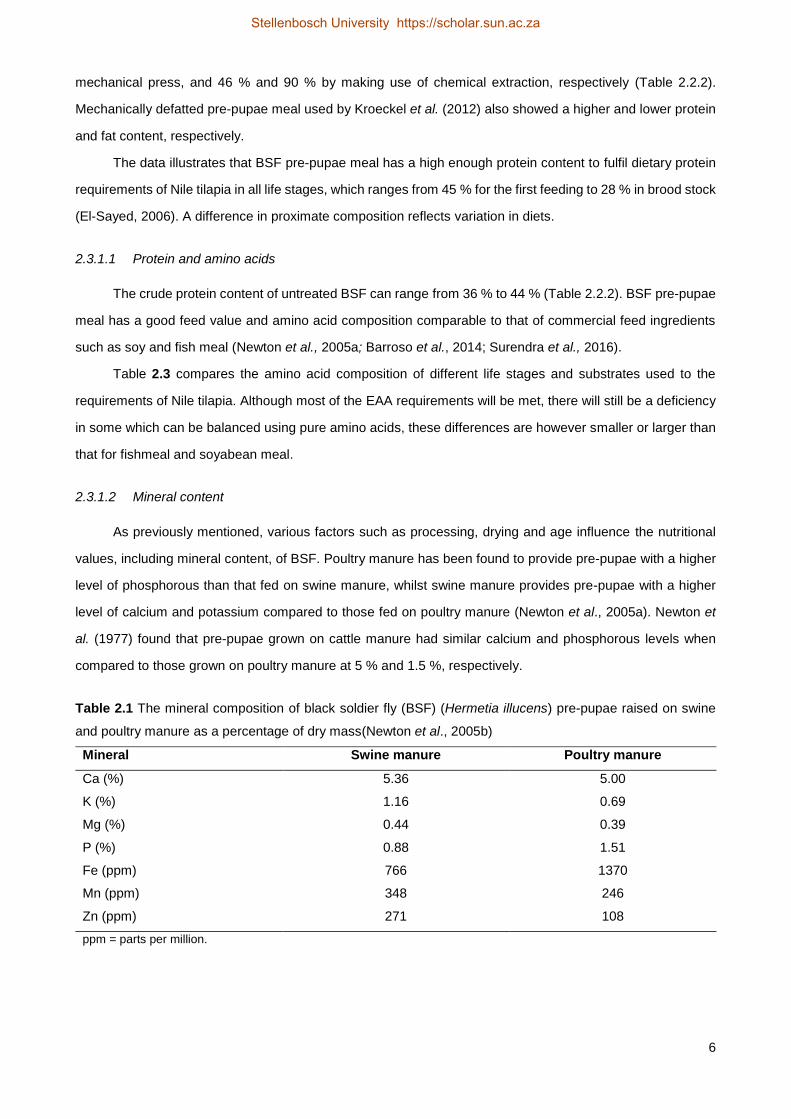
2.3.1.2 Mineral content
As previously mentioned, various factors such as processing, drying and age influence the nutritional
values, including mineral content, of BSF. Poultry manure has been found to provide pre-pupae with a higher
level of phosphorous than that fed on swine manure, whilst swine manure provides pre-pupae with a higher
level of calcium and potassium compared to those fed on poultry manure (Newton et al., 2005a). Newton et
al. (1977) found that pre-pupae grown on cattle manure had similar calcium and phosphorous levels when
compared to those grown on poultry manure at 5 % and 1.5 %, respectively.
Table 2.1 The mineral composition of black soldier fly (BSF) (Hermetia illucens) pre-pupae raised on swine
and poultry manure as a percentage of dry mass(Newton et al., 2005b)
Mineral Swine manure Poultry manure
Ca (%) 5.36 5.00
K (%) 1.16 0.69
Mg (%) 0.44 0.39
P (%) 0.88 1.51
Fe (ppm) 766 1370
Mn (ppm) 348 246
Zn (ppm) 271 108
ppm = parts per million.
Stellenbosch University https://scholar.sun.ac.za
Stellenbosch University https://scholar.sun.ac.za
7
Table 2.2 The proximate composition (%) of black soldier fly (BSF) (Hermetia illucens) larvae, pre-pupae and pupae grown on different substrates
Feed Swine manure a Beef manure b Food waste c Food waste c Food waste c Commercial d Commercial d
Life stage Pre-pupae Pre-pupae Pre-pupae Pre-pupae Pre-pupae Larvae Pre-pupae
Processing - - Untreated Mechanical extraction
Chemical extraction
Defatted Defatted
Crude protein (%) 43.2 42.1 43.7 53.1 63.9 36.2 40.7
Fat (%) 28 34.8 31.8 19.7 3.4 18 15.6
Fibre (%) N/A 7.0 10.1 10.9 13.2 36.5 24
Ash (%) 16.6 14.6 6 8.5 10.7 9.3 19.7 a(Newton et al., 2005b); b(Newton et al., 1977); c(Surendra et al., 2016); d(Santiago & Lovell, 1988); N/A = Not available.
Table 2.3 Black soldier fly (BSF) (Hermetia illucens) essential amino acid (EAA) composition requirements of Nile tilapia (Oreochromis niloticus) as a percentage (%)
of lysine
Feed Swine
manure aBeef manure b Food waste c Dairy manure d
Fish offal enriched d
Commercial e Commercial fEAA
Requirement e
Life stage Pre-pupae Pre-pupae Pre-pupae Pre-pupae Pre-pupae Pre-pupae Larvae
Lysine 100.00 100.00 100.00 100.00 100.00 100.00 100.00 100.00
Arginine 80.09 66.47 101.37 86.83 89.15 82.82 108.42 82.52
Histidine 43.44 56.68 77.17 37.07 38.68 29.19 69.61 33.57
Isoleucine 68.33 58.16 68.95 89.27 89.15 55.59 75.79 60.84
Leucine 118.55 104.75 106.85 129.76 128.30 99.16 90.39 66.43
Methionine 37.56 25.52 40.18 37.56 37.26 36.87 19.74 52.45
Phenylalanine 67.42 65.28 72.60 89.27 85.85 55.73 90.53 73.43
Threonine 63.80 16.32 67.58 77.07 75.47 57.54 70.92 73.43
Tryptophan 26.70 5.93 N/A N/A N/A N/A N/A 19.58
Valine 100.90 101.19 110.50 145.85 144.34 67.18 83.03 54.55 a(Newton et al., 2005b); b(Newton et al., 1977); c(Surendra et al., 2016); d(Sealey et al., 2011); e(Santiago & Lovell, 1988); f(Kroeckel et al., 2012); N/A = Not available.
Stellenbosch University https://scholar.sun.ac.za
Stellenbosch University https://scholar.sun.ac.za
8
Table 2.4 The fatty acid composition of black soldier fly (BSF) (Hermetia illucens) grown on various feed sources, presented as a percentage of totals
Feed Food waste a Commercial b Commercial c Swine manure dDairy cow manure e
Fish offal enriched e
Life Stage Pre-pupae Pre-pupae Larvae Pre-pupae Pre-pupae Pre-pupae
Saturated fatty acids
Lauric 44.90 47.00 43.40 49.34 23.60 37.10
Myristic 8.30 6.50 7.90 6.83 5.10 6.30
Palmitic 13.50 15.00 13.20 10.48 9.80 17.30
Stearic 2.10 2.20 2.80 2.78 6.50 2.00
Unsaturated fatty acids
Monounsaturated fatty acids
Palmitoleic 2.40 N/A 2.30 3.45 6.30 7.60
Oleic 12.00 14.00 14.60 11.81 22.70 18.80
Polyunsaturated fatty acids
Linoleic 9.90 9.40 15.20 3.68 6.80 5.90
α-Linolenic 0.10 0.80 0.70 0.08 0.00 0.50
Stearidonic - <0.10 0.00 - 0.00 0.50
Highly unsaturated fatty acids
Eicosapentanoic 0.00 0 .00 0.00 0.00 0.10 3.50
Docosapentaenoic 0.00 <0.10 0.00 0.00 0.00 0.35
Docosahexaenoic 0.00 <0.10 0.00 0.00 0.00 1.70
Total fatty acids
Saturated fatty acids 69.90 71.60 67.10 N/A N/A N/A
Monounsaturated fatty acids 14.90 17.30 16.90 N/A N/A N/A
Omega-6 fatty acids - - 15.20 - - -
Omega-3 fatty acids - - 0.70 - - -
Polyunsaturated fatty acids 12.50 10.20 15.90 - - - a(Surendra et al., 2016); c(Kroeckel et al., 2012); c(Barroso et al., 2014); d(St-Hilaire et al., 2007b); e(Sealey et al., 2011); N/A = Not applicable.
Stellenbosch University https://scholar.sun.ac.za
9
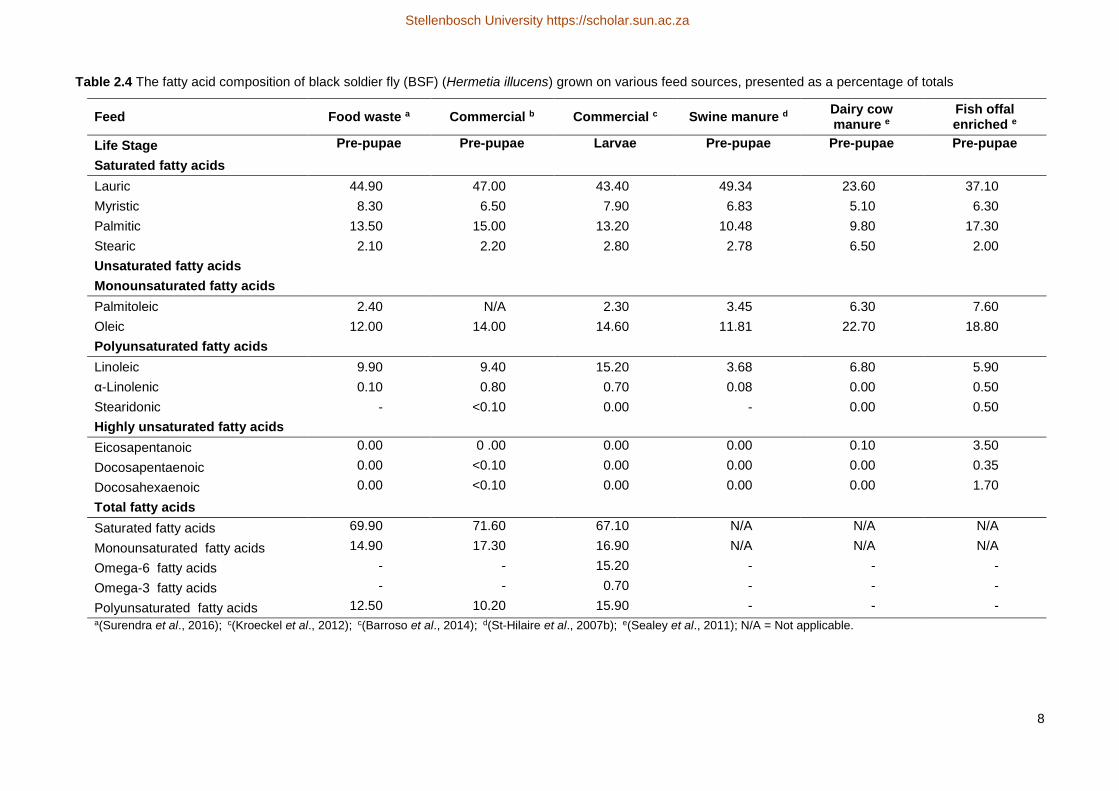
2.3.1.3 Lipids and fatty acids
The total lipid content of BSF far exceeds the requirements of Nile tilapia, which generally varies from
10-15 % (El-Sayed, 2006). The essential fatty acid composition of BSF, however, may vary depending on the
substrate used as growth medium (Table 2.4). Various studies (St-Hilaire et al., 2007b; Sealey et al., 2011;
Kroeckel et al., 2012; Barroso et al., 2014; Surendra et al., 2016) have confirmed that BSF contains the fatty
acids which are deemed essential for fish feeds, including saturated fatty acids (SFA), monounsaturated fatty
acids (MUFA) and polyunsaturated fatty acids (PUFA). Some have also reported negligible amounts of highly
unsaturated fatty acids.
2.4 The Nile tilapia (Oreochromis niloticus)
Tilapia are tropical fresh water fish species that belong to the Cichlidae family, endemic to Africa, Jordan
and Israel. They are the most adaptable and successfully cultured species worldwide (Webster & Chhorn,
2006). Nile tilapia (O. niloticus), blue tilapia (O. aureus) and hybrid combinations of these species are the most
important tilapia species in aquaculture (Webster & Chhorn, 2006). The Cichlidae family can be distinguished
from other bony fishes by an interrupted lateral line running superior along the anterior part of the fish, and
inferior along the posterior portion, as well by a single nostril on either side of the snout. They have smooth,
large scales on their back and flanks, with smaller scales on their chest and their belly area. Furthermore, they
have a dark spot on the upper posterior corner of the operculum, and one on the anterior basal corner of the
soft dorsal fin, dubbed the “tilapia mark” (Webster & Chhorn, 2006). A vertical banding in the caudal fin of both
sexes of Nile tilapia, and the grey-pink pigmentation of the gular region, is what can be used to distinguish Nile
tilapia from blue tilapia (Webster & Chhorn, 2006).
Nile tilapia is the fastest growing (Lucas & Southgate, 2012) and most popular cultured (Halver & Hardy,
2002) of the tilapia species, found in many countries around the world. In the past two decades, Nile tilapia
represented more than 60% of the total market value of farmed tilapia (El-Sayed, 2006).
Technological development and improvements in the past three decades regarding reproduction,
system designs, disease prevention and control, water management and feeding practices is what fuelled their
rapid global expansion. The continuous technological improvements and expansion in the industry is resulting
in the replacement of traditional extensive systems with semi-intensive to intensive systems (Webster &
Chhorn, 2006). Increasing domestic and international market demand for tilapia is expected to maintain this
trend (Webster & Chhorn, 2006).
Generally, tilapia can start reproducing at 5-6 months of age, spawning every 6-8 weeks at 25-32 °C.
Nile tilapia are mouth brooders where the number of eggs depend on the size of the fish and can be up to
2000 at a time. However, overpopulation in ponds can become problematic when most of the fish do not reach
market size. The latter can be due to early reproductive capability, high breeding frequency and high larval
Stellenbosch University https://scholar.sun.ac.za
10
survival rate. Monosex culture, farming with only the faster growing males, is a practice used to overcome this
issue. This practise can make use of manual sexing, hybridization or sex reversal (Halver & Hardy, 2002).
In their juvenile tilapia stage, Nile tilapia will feed on phytoplankton and detritus, and become more
omnivorous and filter feed using gill rakers as they develop into adults (Wohlfarth & Hulata, 1983). When
stocked at lower densities, tilapia are efficient in utilizing natural food sources from where they obtain a
significant amount of protein. Generally, lower protein diets are used under these circumstances (Webster &
Chhorn, 2006). Semi-intensive systems make use of affordable, locally available feedstuffs such as rice bran,
corn meal, copra meal, coffee pulp, brewery by-products and combinations thereof to supplement natural food
(Webster & Chhorn, 2006). These feedstuffs are often deficient in protein, vitamins and minerals, and are
mainly utilized as an energy source. Increased stocking densities require the use of more nutritionally complete
feeds as the contribution of natural food decreases (Webster & Chhorn, 2006). When raised in intensive
systems (i.e. raceways and cages), tilapia rely solely on prepared feeds for all their nutrient requirements. The
protein content of feeds used in intensive systems are usually 32 %. Highly concentrated feeds may be desired
in recirculatory aquaculture systems as operating costs are high and excess organic material are typically
avoided (Halver & Hardy, 2002).
Sinking, floating and non-pelleted forms of feed are all accepted by tilapia. Even though tilapia are
capable of utilizing non-pelleted feed effectively, it is not consumed efficiently. When using high quality feeds,
the processing of the feed into pellets is recommended to reduce waste and costs. Non-pelleted feeds (crumble
and meal forms) are used for fry and fingerlings. For growing out tilapia to a marketable size (500 g), farmers
usually make use of a one size pellet of approximately 3-4 mm in diameter and 6-10 mm in length. Unlike most
fin-fish, tilapia tend to chew pellets rather than to swallow them immediately (Halver & Hardy, 2002). Feeding
rates depend on factors such as natural food availability, size, species, digestible energy/protein (DE/P) and
water quality, and are inversely related to the size of the fish (Halver & Hardy, 2002). Hence, these factors
should be taken into account when feeding rates are investigated.
2.4.1 Nutritional requirements
2.4.1.1 Protein and amino acids
Protein is the most expensive dietary component in intensive aquaculture, representing roughly 50 % of
the total feed costs (El-Sayed, 2006; Webster & Chhorn, 2006). The protein requirements for tilapia in
freshwater are show in Table 2.6. The protein requirement varies, depending on the life stage of the fish where
brood stock, juveniles and adults require 35-45 %, 30-40 % and 20-30 %, respectively (El-Sayed, 2006).
Protein requirements are higher for younger fish with a low body weight. For example, fish of 0.8 g have a
protein requirement of 40 %, whereas 40 g fish have a requirement of only 30 % (Siddiqui et al., 1988).
Experimental data indicates that small and grow-out fish should be fed 36 % and 30-32 % crude protein as
part of their balanced diets, respectively (Halver & Hardy, 2002). Protein requirements for fish can also vary
from 30-50 %, depending on factors such as the protein quality, water quality (i.e. water salinity, water
Stellenbosch University https://scholar.sun.ac.za
11
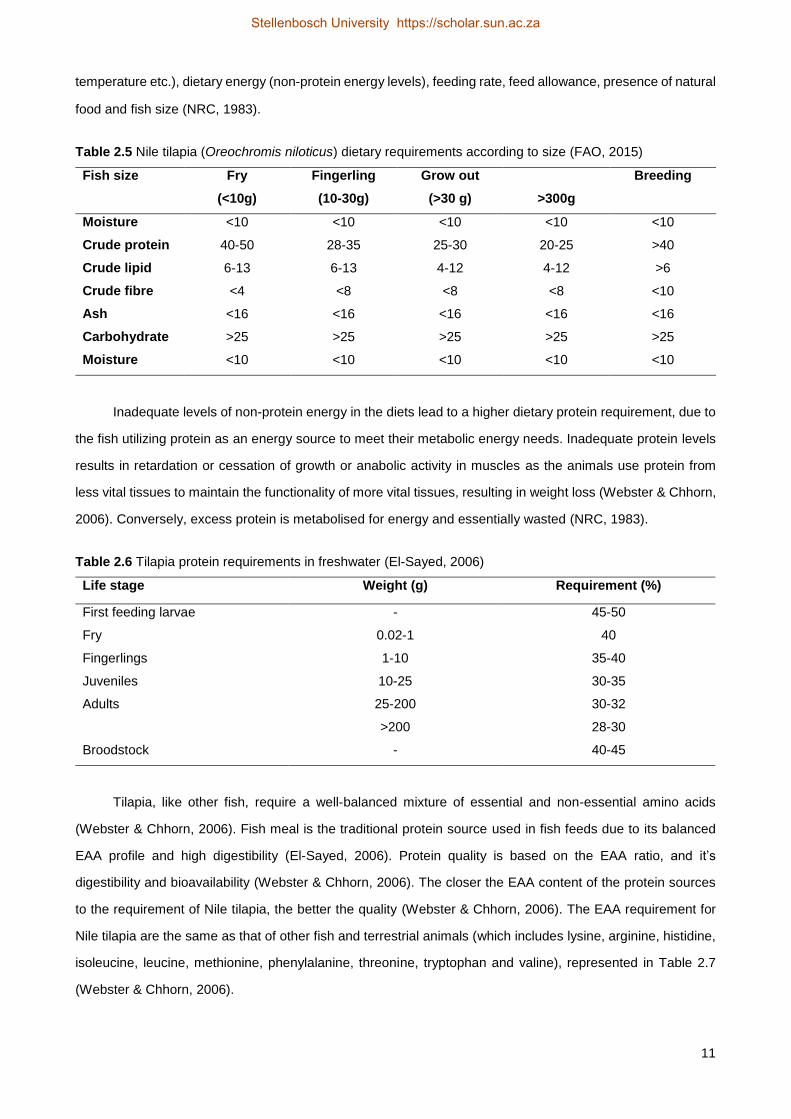
temperature etc.), dietary energy (non-protein energy levels), feeding rate, feed allowance, presence of natural
food and fish size (NRC, 1983).
Table 2.5 Nile tilapia (Oreochromis niloticus) dietary requirements according to size (FAO, 2015)
Fish size Fry
(<10g)
Fingerling
(10-30g)
Grow out
(>30 g) >300g
Breeding
Moisture <10 <10 <10 <10 <10
Crude protein 40-50 28-35 25-30 20-25 >40
Crude lipid 6-13 6-13 4-12 4-12 >6
Crude fibre <4 <8 <8 <8 <10
Ash <16 <16 <16 <16 <16
Carbohydrate >25 >25 >25 >25 >25
Moisture <10 <10 <10 <10 <10
Inadequate levels of non-protein energy in the diets lead to a higher dietary protein requirement, due to
the fish utilizing protein as an energy source to meet their metabolic energy needs. Inadequate protein levels
results in retardation or cessation of growth or anabolic activity in muscles as the animals use protein from
less vital tissues to maintain the functionality of more vital tissues, resulting in weight loss (Webster & Chhorn,
2006). Conversely, excess protein is metabolised for energy and essentially wasted (NRC, 1983).
Table 2.6 Tilapia protein requirements in freshwater (El-Sayed, 2006)
Life stage Weight (g) Requirement (%)
First feeding larvae - 45-50
Fry 0.02-1 40
Fingerlings 1-10 35-40
Juveniles 10-25 30-35
Adults 25-200 30-32
>200 28-30
Broodstock - 40-45
Tilapia, like other fish, require a well-balanced mixture of essential and non-essential amino acids
(Webster & Chhorn, 2006). Fish meal is the traditional protein source used in fish feeds due to its balanced
EAA profile and high digestibility (El-Sayed, 2006). Protein quality is based on the EAA ratio, and it’s
digestibility and bioavailability (Webster & Chhorn, 2006). The closer the EAA content of the protein sources
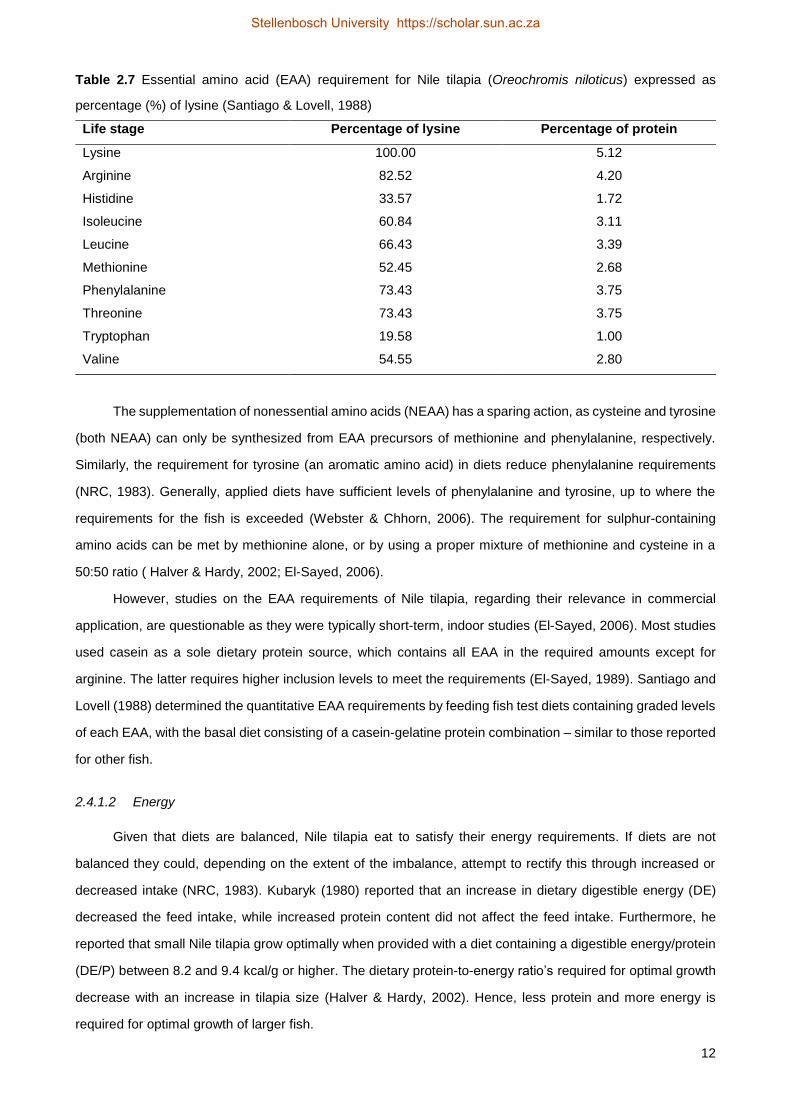
to the requirement of Nile tilapia, the better the quality (Webster & Chhorn, 2006). The EAA requirement for
Nile tilapia are the same as that of other fish and terrestrial animals (which includes lysine, arginine, histidine,
isoleucine, leucine, methionine, phenylalanine, threonine, tryptophan and valine), represented in Table 2.7
(Webster & Chhorn, 2006).
Stellenbosch University https://scholar.sun.ac.za
12
Table 2.7 Essential amino acid (EAA) requirement for Nile tilapia (Oreochromis niloticus) expressed as
percentage (%) of lysine (Santiago & Lovell, 1988)
Life stage Percentage of lysine Percentage of protein
Lysine 100.00 5.12
Arginine 82.52 4.20
Histidine 33.57 1.72
Isoleucine 60.84 3.11
Leucine 66.43 3.39
Methionine 52.45 2.68
Phenylalanine 73.43 3.75
Threonine 73.43 3.75
Tryptophan 19.58 1.00
Valine 54.55 2.80
The supplementation of nonessential amino acids (NEAA) has a sparing action, as cysteine and tyrosine
(both NEAA) can only be synthesized from EAA precursors of methionine and phenylalanine, respectively.
Similarly, the requirement for tyrosine (an aromatic amino acid) in diets reduce phenylalanine requirements
(NRC, 1983). Generally, applied diets have sufficient levels of phenylalanine and tyrosine, up to where the
requirements for the fish is exceeded (Webster & Chhorn, 2006). The requirement for sulphur-containing
amino acids can be met by methionine alone, or by using a proper mixture of methionine and cysteine in a
50:50 ratio ( Halver & Hardy, 2002; El-Sayed, 2006).
However, studies on the EAA requirements of Nile tilapia, regarding their relevance in commercial
application, are questionable as they were typically short-term, indoor studies (El-Sayed, 2006). Most studies
used casein as a sole dietary protein source, which contains all EAA in the required amounts except for
arginine. The latter requires higher inclusion levels to meet the requirements (El-Sayed, 1989). Santiago and
Lovell (1988) determined the quantitative EAA requirements by feeding fish test diets containing graded levels
of each EAA, with the basal diet consisting of a casein-gelatine protein combination – similar to those reported
for other fish.
2.4.1.2 Energy
Given that diets are balanced, Nile tilapia eat to satisfy their energy requirements. If diets are not
balanced they could, depending on the extent of the imbalance, attempt to rectify this through increased or
decreased intake (NRC, 1983). Kubaryk (1980) reported that an increase in dietary digestible energy (DE)
decreased the feed intake, while increased protein content did not affect the feed intake. Furthermore, he
reported that small Nile tilapia grow optimally when provided with a diet containing a digestible energy/protein
(DE/P) between 8.2 and 9.4 kcal/g or higher. The dietary protein-to-energy ratio’s required for optimal growth
decrease with an increase in tilapia size (Halver & Hardy, 2002). Hence, less protein and more energy is
required for optimal growth of larger fish.
Stellenbosch University https://scholar.sun.ac.za
13
Traditionally, metabolisable energy (ME) is preferred above gross energy (GE) and digestible energy
(DE), as it accounts for energy loss from protein metabolism – providing a more accurate estimate on their
requirement for growth. Unfortunately, the determination of ME is difficult due to problems associated with
collecting fish metabolites. Moreover, it is suspected that the ME offers little advantage over DE since energy
lost from urine is low (El-Sayed, 2006). El-Sayed (2006) suggests that it may be more appropriate to use DE
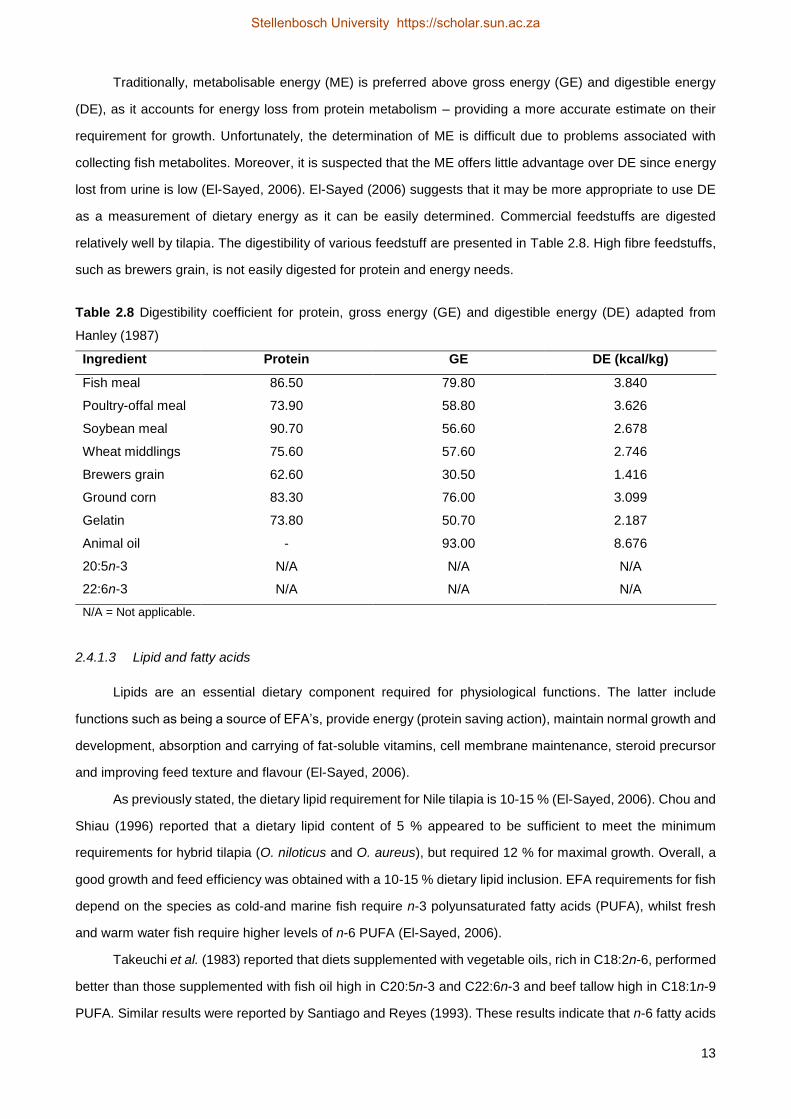
as a measurement of dietary energy as it can be easily determined. Commercial feedstuffs are digested
relatively well by tilapia. The digestibility of various feedstuff are presented in Table 2.8. High fibre feedstuffs,
such as brewers grain, is not easily digested for protein and energy needs.
Table 2.8 Digestibility coefficient for protein, gross energy (GE) and digestible energy (DE) adapted from
Hanley (1987)
Ingredient Protein GE DE (kcal/kg)
Fish meal 86.50 79.80 3.840
Poultry-offal meal 73.90 58.80 3.626
Soybean meal 90.70 56.60 2.678
Wheat middlings 75.60 57.60 2.746
Brewers grain 62.60 30.50 1.416
Ground corn 83.30 76.00 3.099
Gelatin 73.80 50.70 2.187
Animal oil - 93.00 8.676
20:5n-3 N/A N/A N/A
22:6n-3 N/A N/A N/A
N/A = Not applicable.
2.4.1.3 Lipid and fatty acids
Lipids are an essential dietary component required for physiological functions. The latter include
functions such as being a source of EFA’s, provide energy (protein saving action), maintain normal growth and
development, absorption and carrying of fat-soluble vitamins, cell membrane maintenance, steroid precursor
and improving feed texture and flavour (El-Sayed, 2006).
As previously stated, the dietary lipid requirement for Nile tilapia is 10-15 % (El-Sayed, 2006). Chou and
Shiau (1996) reported that a dietary lipid content of 5 % appeared to be sufficient to meet the minimum
requirements for hybrid tilapia (O. niloticus and O. aureus), but required 12 % for maximal growth. Overall, a
good growth and feed efficiency was obtained with a 10-15 % dietary lipid inclusion. EFA requirements for fish
depend on the species as cold-and marine fish require n-3 polyunsaturated fatty acids (PUFA), whilst fresh
and warm water fish require higher levels of n-6 PUFA (El-Sayed, 2006).
Takeuchi et al. (1983) reported that diets supplemented with vegetable oils, rich in C18:2n-6, performed
better than those supplemented with fish oil high in C20:5n-3 and C22:6n-3 and beef tallow high in C18:1n-9
PUFA. Similar results were reported by Santiago and Reyes (1993). These results indicate that n-6 fatty acids
Stellenbosch University https://scholar.sun.ac.za
14
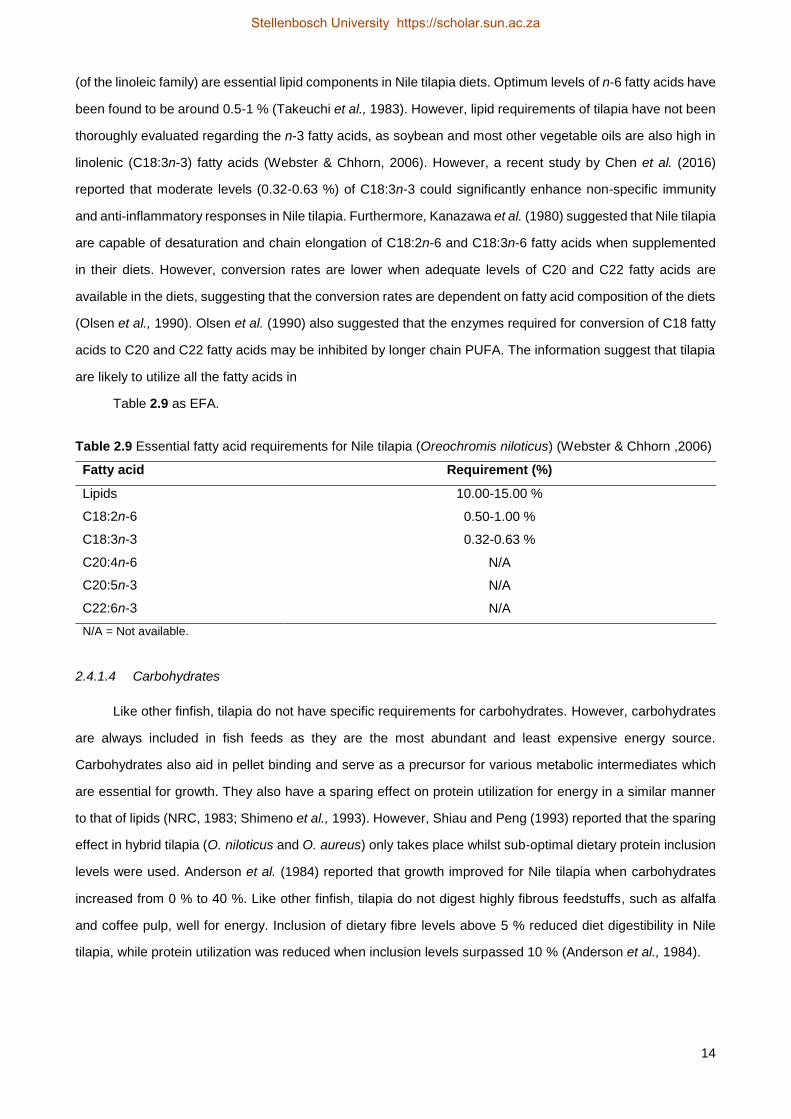
(of the linoleic family) are essential lipid components in Nile tilapia diets. Optimum levels of n-6 fatty acids have
been found to be around 0.5-1 % (Takeuchi et al., 1983). However, lipid requirements of tilapia have not been
thoroughly evaluated regarding the n-3 fatty acids, as soybean and most other vegetable oils are also high in
linolenic (C18:3n-3) fatty acids (Webster & Chhorn, 2006). However, a recent study by Chen et al. (2016)
reported that moderate levels (0.32-0.63 %) of C18:3n-3 could significantly enhance non-specific immunity
and anti-inflammatory responses in Nile tilapia. Furthermore, Kanazawa et al. (1980) suggested that Nile tilapia
are capable of desaturation and chain elongation of C18:2n-6 and C18:3n-6 fatty acids when supplemented
in their diets. However, conversion rates are lower when adequate levels of C20 and C22 fatty acids are
available in the diets, suggesting that the conversion rates are dependent on fatty acid composition of the diets
(Olsen et al., 1990). Olsen et al. (1990) also suggested that the enzymes required for conversion of C18 fatty
acids to C20 and C22 fatty acids may be inhibited by longer chain PUFA. The information suggest that tilapia
are likely to utilize all the fatty acids in
Table 2.9 as EFA.
Table 2.9 Essential fatty acid requirements for Nile tilapia (Oreochromis niloticus) (Webster & Chhorn ,2006)
Fatty acid Requirement (%)
Lipids 10.00-15.00 %
C18:2n-6 0.50-1.00 %
C18:3n-3 0.32-0.63 %
C20:4n-6 N/A
C20:5n-3 N/A
C22:6n-3 N/A
N/A = Not available.
2.4.1.4 Carbohydrates
Like other finfish, tilapia do not have specific requirements for carbohydrates. However, carbohydrates
are always included in fish feeds as they are the most abundant and least expensive energy source.
Carbohydrates also aid in pellet binding and serve as a precursor for various metabolic intermediates which
are essential for growth. They also have a sparing effect on protein utilization for energy in a similar manner
to that of lipids (NRC, 1983; Shimeno et al., 1993). However, Shiau and Peng (1993) reported that the sparing
effect in hybrid tilapia (O. niloticus and O. aureus) only takes place whilst sub-optimal dietary protein inclusion
levels were used. Anderson et al. (1984) reported that growth improved for Nile tilapia when carbohydrates
increased from 0 % to 40 %. Like other finfish, tilapia do not digest highly fibrous feedstuffs, such as alfalfa
and coffee pulp, well for energy. Inclusion of dietary fibre levels above 5 % reduced diet digestibility in Nile
tilapia, while protein utilization was reduced when inclusion levels surpassed 10 % (Anderson et al., 1984).
Stellenbosch University https://scholar.sun.ac.za
15
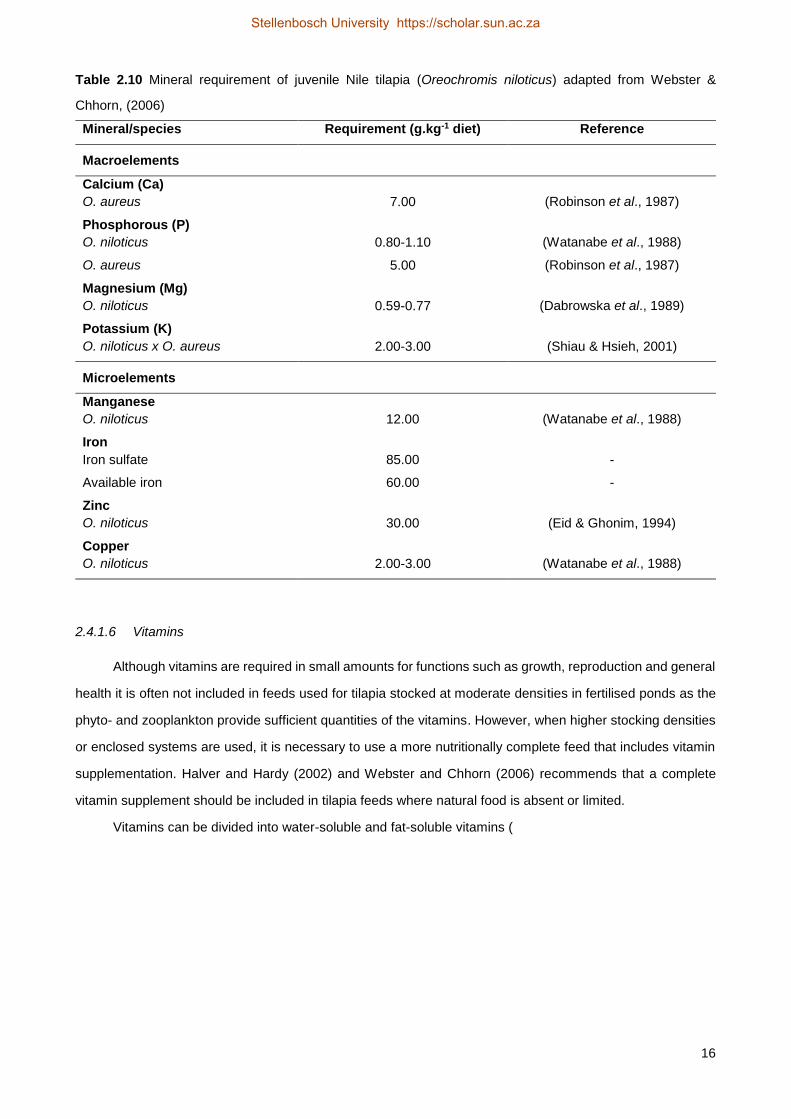
2.4.1.5 Minerals
Minerals are required in fish diets for tissue formation and various metabolic functions such as
osmoregulation, acid-base balance as well as muscle and nerve functions. Limited information is available on
the mineral requirements of Nile tilapia, but it is suggested that they have similar minerals requirements as
other fish and are capable of absorbing minerals from their environment (Webster & Chhorn, 2006).
Calcium (Ca) and phosphorous (P) is absorbed efficiently via the gills and gut, respectively, in
O. mossambicus. However, P is usually the limiting mineral in most natural waters. This entails the inclusion
of P in diets without providing it in excess (as it is a component of eutrophication) which could be problematic
for water quality (Luquet, 1991). Robinson et al. (1987) reported that Ca should be supplemented at 5-7 g/kg
in low-calcium water for adequate bone mineralization and growth of blue tilapia (O. aureus). Takeuchi et al.
(1983) and Watanabe et al. (1988) recommended that an available P inclusion level of 0.8-1.0 % should be
maintained in Nile tilapia diets. The availability of P is significantly influenced by the source as monocalcium,
monoammonium and monosodium (water-soluble sources) have a higher availability than dicalcium and
tricalcium phosphate. Furthermore, Watanabe et al. (1988) recommended a dietary manganese (Mn) inclusion
of 12 mg/kg feed for Nile tilapia. Symptoms of Mn deficiency include high mortality, anorexia and poor growth.
Dabrowska et al. (1989) reported that dietary Mn levels of 0.59-0.77 g are sufficient for optimum performance
of Nile tilapia. Symptoms related to diets deficient in magnesium (Mg) include poor growth and abnormal tissue
mineralisation. Furthermore, when supplied in an excess of 3.2 g/kg Mg, growth depression may result if fish
are fed low (24%) protein diets. Like P, the dietary requirement of iron (Fe) for tilapia is affected by the source
(Dabrowska et al., 1989). Kleemann et al. (2003) reported that 60 mg/kg of available Fe is necessary to
maintain normal bodily functions for Nile tilapia. For optimum growth, it is suggested that other minerals such
as potassium, zinc and copper are included at 2-3 g/kg (O. niloticus x O. aureus) (Shiau & Hsieh ,2001),
30 mg/kg (O. niloticus) (Eid & Ghonim, 1994) and 2-3 mg/kg (O. niloticus) (Watanabe et al., 1988),
respectively. The mineral requirements for juvenile Nile tilapia are shown in Table 2.10.
Stellenbosch University https://scholar.sun.ac.za
16
Table 2.10 Mineral requirement of juvenile Nile tilapia (Oreochromis niloticus) adapted from Webster &
Chhorn, (2006)
Mineral/species Requirement (g.kg-1 diet) Reference
Macroelements
Calcium (Ca)
O. aureus 7.00 (Robinson et al., 1987)
Phosphorous (P)
O. niloticus 0.80-1.10 (Watanabe et al., 1988)
O. aureus 5.00 (Robinson et al., 1987)
Magnesium (Mg)
O. niloticus 0.59-0.77 (Dabrowska et al., 1989)
Potassium (K)
O. niloticus x O. aureus 2.00-3.00 (Shiau & Hsieh, 2001)
Microelements
Manganese
O. niloticus 12.00 (Watanabe et al., 1988)
Iron
Iron sulfate 85.00 -
Available iron 60.00 -
Zinc
O. niloticus 30.00 (Eid & Ghonim, 1994)
Copper
O. niloticus 2.00-3.00 (Watanabe et al., 1988)
2.4.1.6 Vitamins
Although vitamins are required in small amounts for functions such as growth, reproduction and general
health it is often not included in feeds used for tilapia stocked at moderate densities in fertilised ponds as the
phyto- and zooplankton provide sufficient quantities of the vitamins. However, when higher stocking densities
or enclosed systems are used, it is necessary to use a more nutritionally complete feed that includes vitamin
supplementation. Halver and Hardy (2002) and Webster and Chhorn (2006) recommends that a complete
vitamin supplement should be included in tilapia feeds where natural food is absent or limited.
Vitamins can be divided into water-soluble and fat-soluble vitamins (
Stellenbosch University https://scholar.sun.ac.za
17
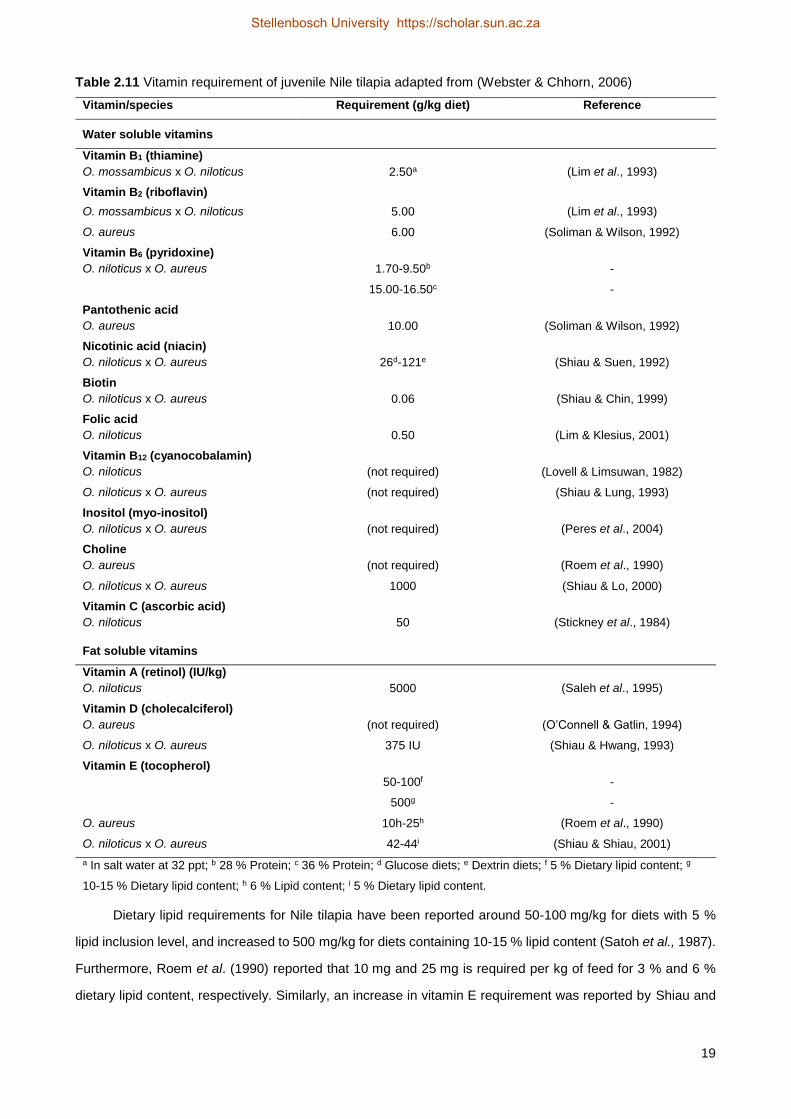
Table 2.11). From most of the general symptoms, mortalities, poor growth and poor feed efficiency
appear to be among the most common symptoms among various vitamin deficiencies. Of the B-vitamins,
tilapia shows to have a requirement for vitamin B1 (thiamine), B2 (riboflavin), and B6 (pyridoxine). Lovell and
Limsuwan (1982) reported that Nile tilapia are capable of producing vitamin B12 (cyanocobalamin) in their
intestinal tract via bacterial synthesis. Similarly, Roem et al. (1990) reported that O. aureus are capable of
meeting their pantothenic acid, choline and potentially other vitamin requirements in recirculatory aquaculture
systems (RAS) by feeding on bacteria. Inositol synthesis in the liver and kidney occurs to a degree in numerous
fish species, but some species require supplementation to meet metabolic needs in culture systems (NRC,
1983). Furthermore, Peres et al. (2004) concluded that common feedstuffs should contain sufficient levels of
required vitamins to meet the metabolic needs for Nile tilapia.
Poor growth, high mortalities and eye cataracts are among the various signs related to riboflavin
deficiency. Soliman and Wilson (1992) reported that 6 mg/kg of riboflavin is required for freshwater juvenile
O. aureus. Lim et al. (1995) reported that tilapia are highly sensitive to pyridoxine deficiencies. Furthermore,
the requirement for riboflavin has been found to be affected by the dietary protein levels. Shiau et al. (1987)
reported that optimum levels for maintaining growth were 1.7-9.55 mg/kg and 15-16.5 mg/kg for 28 % and
36 % protein content in diets, respectively. Deficiency symptoms include anorexia, convulsions, high
mortalities and unusual neurological signs within 2-3 weeks of being deprived of riboflavin (Lim et al., 1995).
Pantothenic acid is a vital vitamin for tilapia. Soliman and Wilson (1992) reported high mortality, anaemia and
severe hyperplasia of gill lamellae in blue tilapia fed diets deficient in pantothenic acid. Shiau and Hsieh (1992)
reported that niacin requirements are influenced by dietary carbohydrates. Fish fed glucose and dextrin diets
required 26 mg/kg and 121 mg/kg of niacin, respectively. Niacin deficiency symptoms included haemorrhages,
gill edema and deformed snouts (Shiau & Hsieh, 1992). Furthermore, 10 mg/kg of calcium d-pantothenate was
sufficient to meet minimum requirements. Shiau and Chin (1999) found that O. niloticus and O. aureus hybrids
fed biotin deficient diets showed poor growth and low body biotin concentrations. A dietary inclusion of
0.06 mg/kg biotin was sufficient to inhibit the above-mentioned deficiency symptoms. Nile tilapia fed diets free
of folic acid supplementation resulted in reduced weight gain, feed intake and feed efficiency relative to Nile
tilapia fed diet supplemented with 0.5 mg/kg folic acid. However, they still produced less red blood cells than
Nile tilapia fed diets with a 1 mg/kg folic acid inclusion level or higher. The suggested folic acid supplementation
level is 0.5-1.0 mg/kg diet (Lim et al., 2011). Choline requirements are influenced by methionine levels present
in the diet. Roem et al. (1990) suggested that excess methionine in diets may provide sufficient methyl groups
required for choline synthesis. Shiau and Lo (2000) reported that 1000 mg/kg choline is required in the diets
of juvenile O. niloticus x O. aureus hybrid tilapia to maintain optimum growth and biological functions. Ascorbic
acid (vitamin C) requirement for Nile tilapia is 50 mg/kg diet. Typical deficiency symptoms are shown when the
vitamin C requirements are not met. Since vitamin C is relatively unstable, a sizable margin of allowance needs
to be in place for large amounts lost during feed processing and storage (Stickney et al., 1984).
Stellenbosch University https://scholar.sun.ac.za
18
In terms of the fat soluble vitamins, Saleh et al. (1995) reported that retinol (vitamin A) requirements for
Nile tilapia are about 5000 UI/kg feed. High mortalities, blindness and abnormal swimming are among the
symptoms reported in Nile tilapia diets without supplementation of vitamin A. Over supplementation
(40000 UI/kg) may result in hypervitaminosis, causing high mortalities, reduced weight gain and impaired
skeletal formation among other symptoms. Shiau and Hwang (1993) reported that the optimum inclusion level
of vitamin D for juvenile hybrid tilapia is 375 IU/kg. Poor growth and food efficiency, and low haemoglobin and
hepatosomatic index levels were reported for fish fed diets without vitamin D (O’Connell & Gatlin ,1994).
Stellenbosch University https://scholar.sun.ac.za
19
Table 2.11 Vitamin requirement of juvenile Nile tilapia adapted from (Webster & Chhorn, 2006)
Vitamin/species Requirement (g/kg diet) Reference
Water soluble vitamins
Vitamin B1 (thiamine)
O. mossambicus x O. niloticus 2.50a (Lim et al., 1993)
Vitamin B2 (riboflavin)
O. mossambicus x O. niloticus 5.00 (Lim et al., 1993)
O. aureus 6.00 (Soliman & Wilson, 1992)
Vitamin B6 (pyridoxine)
O. niloticus x O. aureus 1.70-9.50b -
15.00-16.50c -
Pantothenic acid
O. aureus 10.00 (Soliman & Wilson, 1992)
Nicotinic acid (niacin)
O. niloticus x O. aureus 26d-121e (Shiau & Suen, 1992)
Biotin
O. niloticus x O. aureus 0.06 (Shiau & Chin, 1999)
Folic acid
O. niloticus 0.50 (Lim & Klesius, 2001)
Vitamin B12 (cyanocobalamin)
O. niloticus (not required) (Lovell & Limsuwan, 1982)
O. niloticus x O. aureus (not required) (Shiau & Lung, 1993)
Inositol (myo-inositol)
O. niloticus x O. aureus (not required) (Peres et al., 2004)
Choline
O. aureus (not required) (Roem et al., 1990)
O. niloticus x O. aureus 1000 (Shiau & Lo, 2000)
Vitamin C (ascorbic acid)
O. niloticus 50 (Stickney et al., 1984)
Fat soluble vitamins
Vitamin A (retinol) (IU/kg)
O. niloticus 5000 (Saleh et al., 1995)
Vitamin D (cholecalciferol)
O. aureus (not required) (O’Connell & Gatlin, 1994)
O. niloticus x O. aureus 375 IU (Shiau & Hwang, 1993)
Vitamin E (tocopherol)
50-100f -
500g -
O. aureus 10h-25h (Roem et al., 1990)
O. niloticus x O. aureus 42-44i (Shiau & Shiau, 2001)
a In salt water at 32 ppt; b 28 % Protein; c 36 % Protein; d Glucose diets; e Dextrin diets; f 5 % Dietary lipid content; g
10-15 % Dietary lipid content; h 6 % Lipid content; i 5 % Dietary lipid content.
Dietary lipid requirements for Nile tilapia have been reported around 50-100 mg/kg for diets with 5 %
lipid inclusion level, and increased to 500 mg/kg for diets containing 10-15 % lipid content (Satoh et al., 1987).
Furthermore, Roem et al. (1990) reported that 10 mg and 25 mg is required per kg of feed for 3 % and 6 %
dietary lipid content, respectively. Similarly, an increase in vitamin E requirement was reported by Shiau and
Stellenbosch University https://scholar.sun.ac.za
20
Shiau (2001) with increased lipid content. The vitamin E requirements increased from 42-44 mg/kg to 60-
66 mg/kg when lipid content increased from 5 % to 12 %.
2.4.2 Water quality requirements
Water quality is a crucial aspect for successful aquaculture practices. The major water quality
parameters and their interrelationships affect health and growth, and are among the determining factors
relating to the success or failure of an aquaculture practice. The global introduction of tilapia for aquacultural
purposes has introduced this fish species to countries where environmental conditions are outside their natural
tolerance limits – resulting in conventional land-based systems being unsuitable for farming tilapia.
Environmental parameters discussed in this chapter include dissolved oxygen (DO), water temperature,
ammonia-, nitrate and nitrite and pH. (El-Sayed, 2006)
2.4.2.1 Temperature
One of the most important factors affecting physiology, growth and reproduction in fish is temperature.
Tilapia are thermophilic fish, but known to tolerate a wide range of temperature fluctuations allowing them to
be cultivated at various climates, including tropical, subtropical and temperate climates (El-Sayed, 2006;
Webster & Chhorn, 2006). Due to natural selection, the further tilapia are from the equator, the more tolerant
they become to the cold (Sifa et al., 2002).
The way in which temperature affects tilapia depends on the size, strain, species, duration of exposure,
culture systems and environmental factors (El-Sayed, 2006). Yashouv (1960) found that extended periods of
exposure to low temperatures (6-7 °C) renders fish unable to maintain their body temperature The culture
system and environmental factors has an effect on the response of tilapia to the water temperature. Rearing
tilapia in 200-300 cm deep water gave significantly higher survival rates relative to 50 cm deep water. In fact,
in the deeper water the fish are capable of evading sub-optimal temperatures towards the surface and bottom
in winter and summer, respectively. (El-Sayed et al., 1996)
Balarin and Haller (1982), Chervinski (1982), Philippart and Ruwet (1982) and Wohlfarth and Hulata
(1983) summarizes the general effect and temperature requirements for tilapia. For normal development,
reproduction and growth, tilapia (depending on the exact species) have a required range of 25-30 °C, but can
tolerate 20-35 °C fairly well. Furthermore, reduced feeding activity and no reproduction occurs at temperatures
below 20 °C. Feeding reportedly stops at 16 °C. The upper and lower lethal limits for tilapia are 42 °C and
8-12 °C, respectively. Similarly, Fukusho (1968) and Beamish (1970) reported that the lower and upper lethal
limits for Nile tilapia are 10.5 °C and 42 °C, respectively, with an optimum range of 27-30 °C. Also, it is well
known that temperature has an effect on levels of dissolved oxygen (DO) where higher water temperature
results in lower DO levels. For the current study it was important to maintain the temperature of the water at
the optimum range.
Stellenbosch University https://scholar.sun.ac.za
21
2.4.2.2 Dissolved oxygen
Factors such as photosynthesis, respiration and diet fluctuations affects the level of dissolved oxygen
in the water, which in turn affects the feeding, growth and metabolism of the fish (El-Sayed, 2006). According
to Tsadik and Kutty (1987), low DO levels limits respiration, growth and metabolic activities of the fish.
Tilapia can tolerate DO levels as low as 0.1-0.5 mg/l (Tsadik & Kutty, 1987), but can tolerate levels as
low as 0 mg/l if they have access to surface air due to their capability of utilizing air from the air-water interface
(El-Sayed, 2006). Furthermore, tilapia are better adapted to low DO levels than most teleost’s, with fast
saturation and offloads of dissolved oxygen from haemoglobin to tissues (Balarin & Haller, 1982). This
functionality aids the fish in supplying oxygen to meet higher metabolic needs (due to respiration) in water with
higher temperatures and lower DO (El-Sayed, 2006). Morgan (1972) reported that tilapia could also tolerate
oxygen super saturation of up to 400 %, which may occur at times of high photosynthesis.
Stress, due to handling, can increase the oxygen consumption by up to 150-300 % relative to resting
rate and can remain at this level for up to 3 h (Ross & Ross, 1983). El-Sayed (2006) recommends that after
handling the fish should be returned to water with high levels of DO and not fed for at least one hour. Although
tilapia can survive at sub-optimal DO levels, their water (especially in pond systems) should be maintained
above 2 mg/l at dawn as prolonged and frequent exposure to low DO levels reduce their growth and
metabolism, induce stress and lowers disease resistance (Teichert-Coddington & Green, 1993). However,
proper care and aeration techniques should be used, as it could upsurge settled matter and increase
suspension and turbidity in water (El-Sayed, 2006).
2.4.2.3 Ammonia and nitrite and nitrate
Exposure to ammonia has been found to reduce blood oxygen content, due to a reduction of red blood
cells and haemolytic anaemia (Ahmed et al., 1992). El-Shafai et al. (2004) reported that NH3 levels at
0.07-0.14 mg/l was toxic to Nile tilapia, resulting in reduced growth rates. Furthermore, they recommend that
NH3 should be maintained below 0.1 mg/l (UAI-N mg/l). The oxidation of ammonia produces nitrite (NO2),
which, when further oxidized by nitrifying bacteria, turns into nitrate (NO3). Nitrite is highly toxic to fish, which
can lead to growth retardation and disruption of physiological functions (El-Sayed, 2006). Even though nitrate
is relatively non-toxic to tilapia, prolonged exposure may decrease their immune systems and result in
mortalities (Plumb, 1997).
Fish excrete nitrogenous waste in the form of ammonia. The ammonia exists as non-ionized (NH3) and
ionized (NH4+) compounds which are toxic and non-toxic to fish, respectively. The toxicity of ammonia
correlates with the pH of the water and is influenced (to a lesser extent) by the water’s temperature and DO
concentration (Chervinski,1982). Water pH and the exposure period have a relationship with ammonia.
Soderherg (1997) reports that the higher the pH levels (above neutral), the more non-toxic NH4+ is converted
to the toxic NH3. Furthermore, toxicity increases with increased temperature. Total toxic ammonia increased
from <1 % to 80-90 % when the water’s pH increases from 7 to 10, under similar conditions (temperature at
Stellenbosch University https://scholar.sun.ac.za
22
24-32 °C) (Webster & Chhorn, 2006). When exposed briefly, blue tilapia (O. aureus) was not affected by the
NH3 concentration of 0.91 mg/l at a pH of 9. However, a reduced specific growth rate (SGR) was experienced
when NH3 levels were increased to 1.81 mg/l (Hargreaves & Kucuk, 2001). Raud et al. (1988) reported lethal
concentrations for red tilapia (O. mossambicus x O. niloticus) fry at 6.6 ppm, 4.07 ppm and 2.88 ppm for
exposure periods of 48 h, 72 h and 96 h, respectively. The high tolerance was related to high levels of DO
(7-10.1 mg/l).
2.4.2.4 pH (hydrogen ion concentration)
Tilapia can survive at pH ranges between 4-11 (Balarin & Hatton, 1979), but grow best in near neutral
or slightly alkaline water (Webster & Chhorn, 2006). Symptoms of high or low water pH include damage of gill
epithelial cells and a reduction in nitrogenous excretion efficiency (El-Sayed, 2006).
2.4.3 Feed parameters/measurements
Along with meeting the nutritional requirements of animals, feed also needs to accommodate the
behaviour of the animal. What differentiates aquaculture feed from land animal feeds is the requirement for it
to be pelleted (except meal-type feeds for younger fish) (Webster & Chhorn, 2006), and to be water stable for
maximum utilization (Webster & Chhorn, 2006; Ighwela et al., 2013). It is well known that physical properties
and the composition of feed as well as the processing method has an effect on the physical quality (i.e. water
stability) of the pellet. As feed is the highest expense in aquaculture practices, efficient use is of prime
importance for reducing costs. Obaldo et al. (2002) defines water stability of pellets as the degree of retention
of physical integrity with minimal disintegration and nutrient leaching in water before it is consumed.
Due to the worsening effect of submersion time on water quality (Ighwela et al., 2013), the feeding
behaviour of the animal should be accounted for as it will influence the requirements relating to water stability.
For faster eating finfish (i.e. catfish and trout) (Chen & Jenn, 1992), the feed should only be stable for a few
minutes, whereas slower eating species (i.e. shrimp) may require several hours to consume their feed (Tacon,
1996). Therefore, the feed of the latter should be stable for a few hours. Animals may also manipulate feeds.
Unlike most finfish, tilapia tend to chew pellets instead of swallowing then immediately, especially if they are
slightly too big (Halver & Hardy, 2002).
Guerrero (1980) reported that smaller fish (fingerlings and juveniles) performed better when provided
with a mash diet, while larger fish performed better on pelleted diets. Also, pellets with higher moisture content
were better utilized than dryer feed, but resulted in higher leaching rates. The performance of tilapia may also
be influenced by the feed colour, especially in intensive systems. El-Sayed (2004) reported that fish fed darker
(red and dark blue) colour diets performed better than those fed lighter (green and yellow) colour diets. Red
colour diets performed the best, and yellow the poorest. El-Sayed (2006) suggested that the effect of colour
on Nile tilapia should be investigated further.
Stellenbosch University https://scholar.sun.ac.za
23
2.4.3.1 Composition
Functional properties of some feedstuff may be less desirable than others, and can only be included in
limited quantities (Lim & Cuzon, 1994). Hard ingredients or those that have low binding abilities (e.g., rice, oat
and hulls) may weaken pellets (Lim & Cuzon, 1994) and require a binding agent, as shown in Table 2.12, to
improve water stability (Stivers, 1971). Hygroscopic ingredients (e.g., salt and sugar) absorb and increase the
moisture content of stored feed and can reduce its quality even before it is added to the water (Hastings, 1970).
Ingredients with a high lipid content may result in reduced expandability and binding ability of feed due to
reduced compression resulting from over lubrication. Consequently, the pellets will break easily when handled
or moistened by water. Furthermore, a high lipid content reduces starch gelatinization as it covers the particle
surface of the carbohydrates. In cases where the feed requires a high fat content, oil can be added in the form
of a spray to the finished diet (Hastings, 1970). Gelatinization improves the durability and digestibility of the
feed and nutrients, respectively (Chang & Wang, 1998). Also, interactions can be disrupted as a result of
protein denaturation at elevated temperatures, which may reduce expansion (Guy, 1994). Various studies
have reported that protein has an inverse relationship with the expansion ratios (Kannadhason &
Muthukumarappan, 2010; Kannadhason et al., 2011; Sayed et al., 2014).
2.4.3.2 Manufacturing
The manufacturing of feeds entails the mixing and processing of ground ingredients into uniform feed
particles for the fish, which can be either meals, crumbles, sinking or floating pellets (Webster & Chhorn, 2006).
Pelleting of fish feeds can be done either by steam pelleting or extrusion (Webster & Chhorn, 2006). However,
it is important to compensate for the nutrients lost during the processing of the feed. Ingredients affect the
nutritional value of the feed and the physical properties such as the water stability (Lim & Cuzon, 1994).
Grinding increases surface area for improved gelatinization (Hastings, 1970), allows for homogenous mixing,
uniform pellet texture, higher acceptability and digestibility (Stickney & Lovell, 1977). The expansion ratio (ER)
of feed is dependent of the temperature and moisture content, and how they interact with the feed ingredients,
and is directly related (inversely) to feed density (Chang, 1992).
Generally steam pelleting is used in developing countries due to its lower cost and production of sinking
pellets (Webster & Chhorn, 2006). Extrusion, on the other hand, can be used to produce floating pellets, but
is more expensive (Webster & Chhorn, 2006). Extrusion cooking in aquaculture feeds has the advantage that
it increases feed digestibility and conversion, improves control over pellet density, improves water stability and
durability, improves production efficiency and versatility (Chang & Wang, 1998). Hilton et al. (1981) reported
improved feed efficiency, prolonged gastric emptying, and lower weight gain for trout that were fed extruded
feed compared to steam-pelleted feed. The results were attributed to improved water and physical stability of
extruded feed over steam-pelleted feed. Furthermore, extrusion helps with reducing residual fine particles, the
improvement of water quality, feed consumption and growth performance of fish (Lucas & Southgate, 2012).
Webster and Chhorn (2006) suggests that the ability of extruded feed to float allows for a better observation
Stellenbosch University https://scholar.sun.ac.za
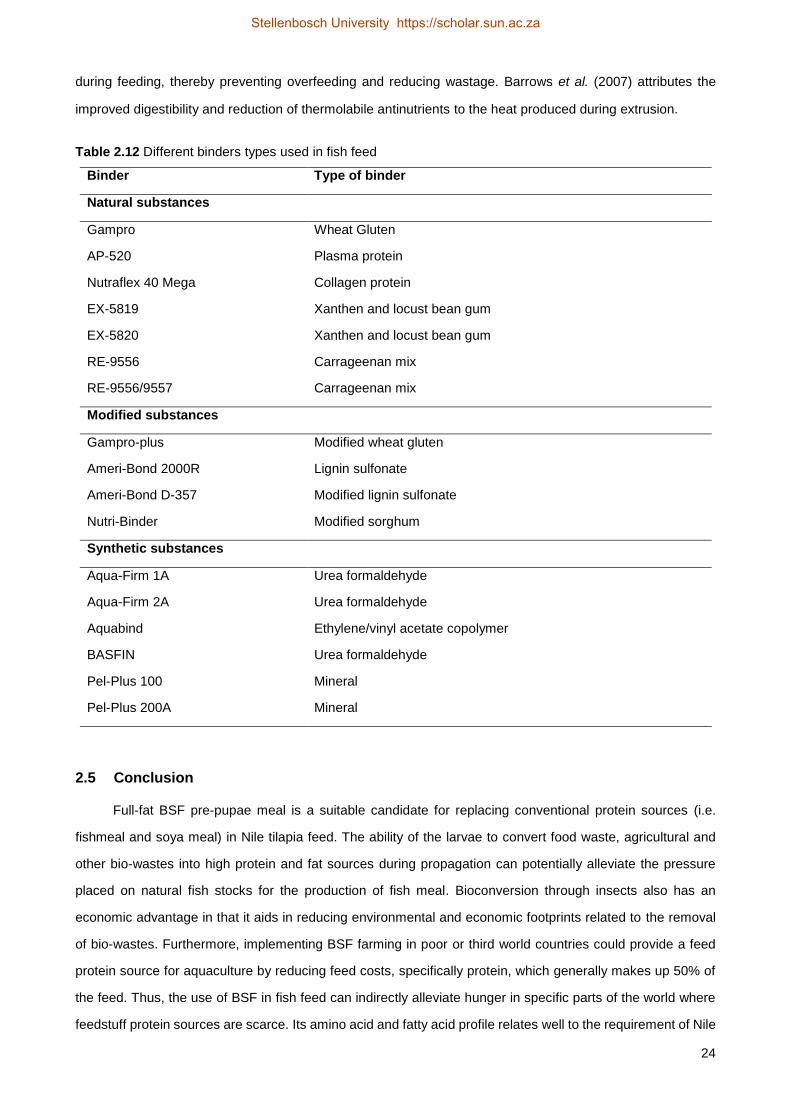
24
during feeding, thereby preventing overfeeding and reducing wastage. Barrows et al. (2007) attributes the
improved digestibility and reduction of thermolabile antinutrients to the heat produced during extrusion.
Table 2.12 Different binders types used in fish feed
Binder Type of binder
Natural substances
Gampro Wheat Gluten
AP-520 Plasma protein
Nutraflex 40 Mega Collagen protein
EX-5819 Xanthen and locust bean gum
EX-5820 Xanthen and locust bean gum
RE-9556 Carrageenan mix
RE-9556/9557 Carrageenan mix
Modified substances
Gampro-plus Modified wheat gluten
Ameri-Bond 2000R Lignin sulfonate
Ameri-Bond D-357 Modified lignin sulfonate
Nutri-Binder Modified sorghum
Synthetic substances
Aqua-Firm 1A Urea formaldehyde
Aqua-Firm 2A Urea formaldehyde
Aquabind Ethylene/vinyl acetate copolymer
BASFIN Urea formaldehyde
Pel-Plus 100 Mineral
Pel-Plus 200A Mineral
2.5 Conclusion
Full-fat BSF pre-pupae meal is a suitable candidate for replacing conventional protein sources (i.e.
fishmeal and soya meal) in Nile tilapia feed. The ability of the larvae to convert food waste, agricultural and
other bio-wastes into high protein and fat sources during propagation can potentially alleviate the pressure
placed on natural fish stocks for the production of fish meal. Bioconversion through insects also has an
economic advantage in that it aids in reducing environmental and economic footprints related to the removal
of bio-wastes. Furthermore, implementing BSF farming in poor or third world countries could provide a feed
protein source for aquaculture by reducing feed costs, specifically protein, which generally makes up 50% of
the feed. Thus, the use of BSF in fish feed can indirectly alleviate hunger in specific parts of the world where
feedstuff protein sources are scarce. Its amino acid and fatty acid profile relates well to the requirement of Nile
Stellenbosch University https://scholar.sun.ac.za
25
tilapia. Furthermore, previous studies have successfully replaced conventional protein sources in other fish
feeds by up to 30 %, without having any negative effects on the growth parameters. An important factor to
take into account is the relatively high lipid content of full-fat BSF pre-pupae meal. This may have adverse
effects on the physical characteristics of fish feed due to its lubricating effect during the extrusion process.
Based on previous studies, there shows to be potential for the use of BSF in Nile tilapia feeds.
2.6 References
Abdelghany, A.E., 1997. Optimum ratio between anchovy fish meal and soy protein concentrate in formulated
diets for Nile tilapia (Oreochromis niloticus L.). In: Proceedings from the Fourth International Symposium
on tilapia in Aquaculture. Ed: Fitzimmons, K. pp. 31-39.
Ahmed, N.A., El-Serafy, S.S., El-Shafey, A.A.M. & Abdel-Hamid, N.H., 1992. Effect of ammonia on some
haematological parameters of Oreochromis niloticus. In: Proceedings of Zoological Society of Arab
Republic of Egypt 23. Vol. 23. pp. 155-160.
Alegbeleye, W.O., Obasa, S.O., Olude, O.O., Otubu, K. & Jimoh, W., 2012. Preliminary evaluation of the
nutritive value of the variegated grasshopper (Zonocerus variegatus L.) for African catfish Clarias
gariepinus (Burchell. 1822) fingerlings. Aquac. Res. 43(3), 412-420.
Anderson, J., Jackson, A.J., Matty, A.J. & Capper, B.S., 1984. Effects of dietary carbohydrate and fibre on the
tilapia Oreochromis niloticus (Linn.). Aquac. 37(4), 303-314.
Aniebo, A.O. & Owen., O.J., 2010. Effects of age and method of drying on the proximate composition of
housefly larvae (Musca domestica Linnaeus) meal (HFLM). P. J. Nutr. 9(5), 485-487.
Atteh, J.O. & Ologbenla, F.D., 1993. Replacement of fish meal with maggots in broiler diets: effects on
performance and nutrient retention. N. J. Anim. Prod. 20(1), 44–49.
Balarin, J.D. & Haller, R.D., 1982. The intensive culture of tilapia in tanks, raceways and cages. Rec. Adv.
Aquac. 1, 265-355.
Balarin, J.D. & Hatton, J.P., 1979. Tilapia: A guide to their biology and culture in Africa.
Barroso, F.G., De Haro, C., Sánchez-Muros, M.J., Venegas, E., Martínez-Sánchez, A. & Pérez-Bañón, C.,
2014. The potential of various insect species for use as food for fish. Aquac. 422, 193-201.
Barrows, F.T., Stone, D.A. & Hardy, R.W., 2007. The effects of extrusion conditions on the nutritional value of
soybean meal for rainbow trout (Oncorhynchus mykiss). Aquac. 265(1), 244-252.
Bauhus, J. & Meiwes, K.J., 1994. Potential use of plant residue wastes in forests of northwestern Germany.
For. Ecol. Manag. 66(1-3), 87-106.
Beamish, F.W.H., 1970. Influence of temperature and salinity acclimation on temperature preferenda of the
euryhaline fish tilapia nilotica. J. Fish. B. Can. 27(7), 1209-1214.
Blonk, H., Kool, A., Luske, B., De Waart, S. & Ten Pierick, E., 2008. Milieueffecten van Nederlandse
consumptie van eiwitrijke producten: gevolgen van vervanging van dierlijke eiwitten anno 2008. In: Blonk
Milieu Advies.
Stellenbosch University https://scholar.sun.ac.za
26
Bondari, K. & Sheppard, D.C., 1987. Soldier fly, Hermetia illucens L., larvae as feed for channel catfish,
Ictalurus punctatus (Rafinesque), and blue tilapia, Oreochromis aureus (Steindachner). Aquac. Fish.
Man. 18(3), 209-220.
Booth, D.C. & Sheppard, C., 1984. Oviposition of the black soldier fly, Hermetia illucens (Diptera:
Stratiomyidae): eggs, masses, timing, and site characteristics. Environ. Entomol. 13(2), 421-423.
McCallan, E., 1974. Hermetia illucens (L.) (Diptera, Stratiomyidae), a cosmopolitan American species long
established in Australia and New Zealand. Entomol. Mo. Magazine. 109, 232-234.
Calvert, C.C., Martin, R.D. & Morgan, N.O., 1969. House fly pupae as food for poultry. J. Econ. Entomol. 62(4).
Chang, C.N., 1992. Study of the Mechanism of Starchy Biopolymer Extrudate. Rutgers University.
Chang, Y.K. & Wang, S.S., 1998. Advances in Extrusion Technology. In: International Symposium on Animal
and Aquaculture Feedstuffs by Extrusion Technology. Eds: Chang, Y.K. & Wang S.S. Sao Paulo:
Technomic Pub. Co.
Chen, C., Sun, B., Guan, W., Bi, Y., Li, P., Ma, J., … Xie, Q., 2016. N-3 essential fatty acids in Nile tilapia,
Oreochromis niloticus: Effects of linolenic acid on non-specific immunity and anti-inflammatory
responses in juvenile fish. Aquac. 450, 250-257.
Chen, H.Y. & Jenn, J.S., 1992. Increased pellet water stability by the supplementation of phospholipid and its
effects on shrimp growth. A. Fish. Sci. 5, 211-217.
Chervinski, J., 1982. Environmental physiology of tilapias. In: The Biology and Culture of Tilapias. 7, 119-128.
Chou, B.S. & Shiau, S.Y., 1996. Optimal dietary lipid level for growth of juvenile hybrid tilapia, Oreochromis
niloticus x Oreochromis aureus. Aquac. 143(2), 185-195.
Dabrowska, H., Meyer-Burgdorff, K. & Günther, K.D., 1989. Interaction between dietary protein and
magnesium level in tilapia (Oreochromis niloticus). Aquac. 76(3-4), 277-291.
Eid, AE. & Ghonim, S.I., 1994. Dietary zinc requirement of fingerling Oreochromis niloticus. Aquac. 119(2-3),
259-264.
El-Sayed, A.-F.M., 1987. Protein and energy requirements of Tilapia zillii. Michigan State University, East
Lansing, Michigan.
El-Sayed, A.-F.M., 1989. Evaluation of semipurified test diets for Tilapia zillii fingerlings. J. World. Aquac. Soc.
20(4), 240-244.
El-Sayed, A.-F.M., 1990. Long-term evaluation of cottonseed meal as a protein source for Nile tilapia,
Oreochromis niloticus (Linn.). Aquac. 84(3-4), 315-320.
El-Sayed, A.-F.M., 2004. Feed colour affects growth, feed utilization of Nile tilapia. Glob. Aquac. Adv. 7(2), 76.
El-Sayed, A.-F.M., 2006. Tilapia culture. In : Aquaculture. CABI publishing, UK.
El-Sayed, A.-F.M., El-Ghobashy, A. & Al-Amoudi, M.M., 1996. Effects of pond depth and water temperature
on the growth, mortality and body composition of Nile tilapia, Oreochromis niloticus (L.). Aquac. Res.,
27(9), 681-687.
Stellenbosch University https://scholar.sun.ac.za
27
El-Shafai, S.A., El-Gohary, F.A., Nasr, F.A., Van der Steen, N.P. & Gijzen, H.J., 2004. Chronic ammonia
toxicity to duckweed-fed tilapia (Oreochromis niloticus). Aquac. 232(1), 117-127.
Essa, M.A., 1997. Utilization of some aquatic plants in diets for Nile tilapia, Oreochromis niloticus, fingerlings.
Egypt. J. Aquat. Biol. Fish. 1(2), 19-34.
Food and Agriculture Organization of the United Nations (FAO), 2015. Aquaculture Feed and Fertilizer
Resources Information System.
Fasakin, E.A., Balogun, A.M. & Ajayi, O.O., 2003. Evaluation of full‐fat and defatted maggot meals in the
feeding of clariid catfish Clarias gariepinus fingerlings. Aquac. Res. 34(9), 733-738.
Fukusho, K., 1968. The specific difference of temperature responses among Cichlid fishes genus tilapia. Bull.
Jpn. Soc. Sci. Fish. 34, 103-111.
Furman, D.P., Young, R.D. & Catts, P.E., 1959. Hermetia illucens (Linnaeus) as a factor in the natural control
of Musca domestica Linnaeus. J. Econ. Entomol. 52(5), 917-921.
Guerrero, R.D., 1980. Studies on the feeding of tilapia nilotica in floating cages. Aquac. 20(3), 169-175.
Gustavsson, J., Cederberg, C., Sonesson, U., Van Otterdijk, R. & Meybeck, A., 2011. Global food losses and
food waste. FAO. Rome, Italy.
Guy, R.C.E., 1994. Raw materials for extrusion cooking processes. In: The Technology of Extrusion Cooking.
pp. 52-72.
Halver, J.E. & Hardy, R.W., 2002. In: Fish Nutrition. Academic press.
Hanley, F., 1987. The digestibility of foodstuffs and the effects of feeding selectivity on digestibility
determinations in tilapia, Oreochromis niloticus (L). Aquac. 66(2), 163-179.
Hardy, D., 1960. Diptera: Nematocera-Brachycera (except Dolichopodidae). In: Insects of Hawaii. Vol. 10.
Hargreaves, J.A. & Kucuk, S., 2001. Effects of diel un-ionized ammonia fluctuation on juvenile hybrid striped
bass, channel catfish, and blue tilapia. Aquac. 195(1), 163-181.
Hastings, W.H., 1970. Study of pelleted fish foods stability in water. In: Report of the 1970 Workshop on Fish
Feed Technology and Nutrition, Warmwater Fish Cultural Laboratories. Arkansas, USA. pp. 7-19.
Hilton, J.W., Cho, C.Y. & Slinger, S.J., 1981. Effect of extrusion processing and steam pelleting diets on pellet
durability, pellet water absorption, and the physiological response of rainbow trout (Salmo gairdneri R.).
Aquac. 25(2-3), 185-194.
Ighwela, K.A., Bin Ahmad, A. & Abol-Munafi, A.B., 2013. Water stability and nutrient leaching of different levels
of maltose formulated fish pellets. Glob. Vet. 10(6), 638-642.
Jackson, A.J., Capper, B.S. & Matty, A.J., 1982. Evaluation of some plant proteins in complete diets for the
tilapia, Sarotherodon mossambicus. Aquac. 27(2), 97-109.
James, M.T., 1935. The genus Hermetia in the United States (Diptera: Stratiomyidae). Bull. Brooklyn. Entomol.
Soc. 30(4), 165-170.
James, M.T., 1947. The flies that cause myiasis in man. US Department of Agriculture.
Stellenbosch University https://scholar.sun.ac.za
28
Kanazawa, A.S., Teshima, M.S. & Awal, M.A., 1980. Requirements of tilapia zillii for essential fatty acids. Bull.
Jpn. Soc. Sci. Fish. 46, 1353-1356.
Kannadhason, S. & Muthukumarappan, K., 2010. Effect of starch sources on properties of extrudates
containing DDGS. Int. J. Food Prop. 13(5), 1012-1034.
Kannadhason, S., Muthukumarappan, K. & Rosentrater, K.A., 2011. Effect of starch sources and protein
content on extruded aquaculture feed containing DDGS. Food. Bioproc. Tech. 4(2), 282-294.
Kleemann, G.K., Barros, M.M., Pezzato, L.E., Sampaio, F.G., Ferrari, J.C., Valle, J.B., … Zuanon, J., 2003.
Iron requirement for Nile tilapia Oreochromis niloticus. World Aquac. 82.
Kroeckel, S., Harjes, A.G.E., Roth, I., Katz, H., Wuertz, S., Susenbeth, A. & Schulz, C., 2012. When a turbot
catches a fly: Evaluation of a pre-pupae meal of the Black Soldier Fly (Hermetia illucens) as fish meal
substitute - Growth performance and chitin degradation in juvenile turbot (Psetta maxima). Aquac. 364,
345-352.
Kubaryk, J.M., 1980. Effect of Diet, Feeding Schedule and Sex on Food Consumption, Growth and Retention
of Protein and Energy by Tilapia. Auburn University.
Lim, C. & Cuzon, G., 1994. Water stability of shrimp pellet: a review. Asian. Fish. Sci. 7(2-3), 115-126.
Lim, C. & Klesius, P.H., 2001. Influence of dietary levels of folic acid on growth response and resistance of
Nile tilapia, Oreochromis niloticus to Streptococcus iniae. In: Sixth Asian Fisheries Forum. Book of
Abstracts. Vol. 150.
Lim, C., Leamaster, B. & Brock, J.A., 1993. Riboflavin requirement of fingerling red hybrid tilapia grown in
seawater. J. World Aquac. Soc. 24(4), 451-458.
Lim, C., LeaMaster, B.R. & Brock, J.A., 1995. Pyridoxine requirement of fingerling red hybrid tilapia grown in
seawater. J. Appl. Aquac. 5(2), 49-60.
Lim, C., Yildirim‐Aksoy, M., Barros, M.M. & Klesius, P., 2011. Thiamin requirement of Nile tilapia, Oreochromis
niloticus. J. World Aquac. Soc. 42(6), 824-833.
Lock, E.J., Arsiwalla, T. & Waagbø, R., 2014. Insect meal: A promising source of nutrients in the diet of Atlantic
salmon (Salmo salar). In: Insects to Feed The World. p. 74.
Lovell, R.T. & Limsuwan, T., 1982. Intestinal synthesis and dietary nonessentiality of vitamin B12 for tilapia
nilotica. Trans. Am. Fish. Soc. 111(4), 485-490.
Lucas, J.S. & Southgate, P.C., 2012. Aquaculture: Farming aquatic animals and plant. Blackwell Publishing
Ltd., UK.
Luquet, P., 1991. Tilapia, Oreochromis spp. In: Handbook of Nutrient Requirement of Finfish. Ed: Wilson, R.P.
CRC Press, Boca Raton, FL. pp. 169-179.
Morgan, P.R., 1972. Causes of mortality in the endemic tilapia of Lake Chilwa (Malawi). Hydrobiologia.
40(1), 101-119.
Stellenbosch University https://scholar.sun.ac.za
29
Mungkung, R., Aubin, J., Prihadi, T.H., Slembrouck, J., Van Der Werf, H.M.G. & Legendre, M., 2013. Life cycle
assessment for environmentally sustainable aquaculture management: A case study of combined
aquaculture systems for carp and tilapia. J. Clean. Prod. 57, 249-256.
National Research Council (NRC), 1983. Nutrient requirements of warmwater fishes and shellfishes. Vol. 12.
National Academy of Science, Washington, USA. pp. 102.
Newton, G.L., Booram, C.V., Barker, R.W. & Hale, O.M., 1977. Dried larvae meal as a supplement for swine.
J. Anim. Sci. 44(3), 395-400.
Newton, G.L., Sheppard, D.C., Watson, D.W., Burtle, G.J., Dove, C.R., Tomberlin, J.K. & Thelen, E.E., 2005a.
The black soldier fly, Hermetia illucens, as a manure management/resource recovery tool. Symposium
on the State of the Science of Animal Manure and Waste Management, 5-7.
Newton, L., Sheppard, C., Watson, D.W., Burtle, G. & Dove, R., 2005b. Using the black soldier fly, Hermetia
illucens, as avalue-added tool for management of swine manure. Journal of Chemical Information and
Modeling.
Ng, W.K. & Wee, K.L., 1989. The nutritive value of cassava leaf meal in pelleted feed for Nile tilapia. Aquac.
83(1-2), 45-58.
Nijdam, D., Rood, T. & Westhoek, H., 2012. The price of protein: Review of land use and carbon footprints
from life cycle assessments of animal food products and their substitutes. Food. Policy. 37(6), 760-770.
O’Connell, J.P. & Gatlin, D.M., 1994. Effects of dietary calcium and vitamin D3 on weight gain and mineral
composition of the blue tilapia (Oreochromis aureus) in low-calcium water. Aquac. 125(1-2), 107-117.
Obaldo, L.G., Divakaran, S. & Tacon, A.G., 2002. Method for determining the physical stability of shrimp feeds
in water. Aquac. Res. 33(5), 369-377.
Ogunji, J.O., Toor, R.U.A.S., Schulz, C. & Kloas, W., 2008a. Growth performance, nutrient utilization of Nile
tilapia Oreochromis niloticus fed housefly maggot meal (magmeal) diets. Turk. J. Fish. Aquat. Sci. 8(1),
141-147.
Ogunji, J.O., Kloas, W., Wirth, M., Schulz, C. & Rennert, B., 2006. Housefly maggot meal (Magmeal): An
emerging substitute of fishmeal in tilapia diets. Bonn, Germany.
Ogunji, J.O., Kloas, W., Wirth, M., Schulz, C. & Rennert, B., 2008b. Housefly maggot meal (magmeal) as a
protein source for Oreochromis niloticus (Linn.). 21(3), 319-331.
Olsen, R.E., Henderson, R.J. & McAndrew, B.J., 1990. The conversion of linoleic acid and linolenic acid to
longer chain polyunsaturated fatty acids by tilapia (Oreochromis) nilotica in vivo. Fish Phys. Biochem.
8(3), 261-270.
Olvera-Novoa, M.A., Campos, S.G., Sabido, M.G. & Palacios, C.A.M., 1990. The use of alfalfa leaf protein
concentrates as a protein source in diets for tilapia (Oreochromis mossambicus). Aquac. 90(3-4),
291-302.
Stellenbosch University https://scholar.sun.ac.za
30
Olvera-Novoa, M.A., Dominguez-Cen, L.J., Olvira- castillo, L. & Martinez-Palacios, C.A., 1998. Effect of the
use of the microalga Spirulina maxima as fish meal replacement in diets for tilapia, Oreochromis
mossambicus (Peters), fry. Aquac. Res. 29, 709-715.
Peres, H., Lim, C. & Klesius, P.H., 2004. Growth, chemical composition and resistance to Streptococcus iniae
challenge of juvenile Nile tilapia (Oreochromis niloticus) fed graded levels of dietary inositol. Aquac.
235(1), 423-432.
Philippart, J.C. & Ruwet, J.C. 1982., Ecology and distribution of tilapias. In: The Biology and Culture of Tilapias.
Vol. 7. pp. 15–60.
Plumb, J.A. 1997., Infectious diseases of tilapia. In: Tilapia Aquaculture in the Americas. Vol. 1. pp. 212-228.
Raud, S.K., Hasbollah, D. & Law, Q.T., 1988. Effects of unionized ammonia on red tilapia (Oreochromis
mossambicus/O. niloticus hybrid) fry. In: ICLARM Conference Proceedings.
Riggi, L., Veronesi, M., Verspoor, R., MacFarlane, C. & Tchibozo, S., 2013. Exploring entomophagy in
Northern Benin-practices, perceptions and possibilities. In: Bugs for life. London, UK.
Robinson, E.H., LaBomascus, D., Brown, P.B. & Linton, T.L. 1987., Dietary calcium and phosphorus
requirements of Oreochromis aureus reared in calcium-free water. Aquac. 64(4), 267-276.
Roem, A.J., Stickney, R.R. & Kohler, C.C., 1990. Vitamin requirements of blue tilapias in a recirculating water
system. Progr. Fish-Cultur. 52(1), 15-18.
Ross, B. & Ross, L.G., 1983. The oxygen requirements of Oreochromis niloticus under adverse conditions. In:
Proceedings of the International Symposium on Tilapia Aquaculture. Israel. pp. 134-143.
Saleh, G., Eleraky, W. & Gropp, J.M., 1995. A short note on the effects of vitamin A hypervitaminosis and
hypovitaminosis on health and growth of tilapia nilotica (Oreochromis niloticus). J. Appl. Ichth. 11(3-4),
382-385.
Sánchez-Muros, M.J., Barroso, F.G. & Manzano-Agugliaro, F., 2014. Insect meal as renewable source of food
for animal feeding: a review. J. Clean. Prod. 65, 16-27.
Santiago, C.B. & Lovell, R.T., 1988. Amino acid requirements for growth of nile tilapia. The J. Nutr. 118(12),
1540-1546.
Santiago, C.B. & Reyes, O.S., 1993. Effects of dietary lipid source on reproductive performance and tissue
lipid levels of Nile tilapia Oreochromis niloticus (Linnaeus) broodstock. J. Appl. Ichth. 9(1), 33-40.
Satoh, S., Takeuchi, T. & Watanabe, T. 1987., Requirement of tilapia for alpha-tocopherol. Bull. Jpn. Soc. Sci.
Fish. 53, 119-124.
Sealey, W.M., Gaylord, T.G., Barrows, F.T., Tomberlin, J.K., McGuire, M.A., Ross, C. & St‐Hilaire, S., 2011.
Sensory analysis of rainbow trout, Oncorhynchus mykiss, fed enriched black soldier fly pre-pupae,
Hermetia illucens. J. World. Aquac. Soc. 42(1), 34-45.
Sheppard, D.C., Newton, G.L., Thompson, S.A. & Savage, S., 1994. A value added manure management
system using the black soldier fly. Biores. Tech. 50(3), 275-279.
Stellenbosch University https://scholar.sun.ac.za
31
Shiau, S.-Y. & Lung, C.-Q. 1993. No dietary vitamin B12 required for juvenile tilapia Oreochromis niloticus x O.
aureus. Comp. Biochem. Physiol. Part A: Physiol. 105(1), 147-150.
Shiau, S., Chuang, J.L. & Sun, C.L., 1987. Inclusion of soybean meal in tilapia (Oreochromis niloticus x O.
aureus) diets at two protein levels. Aquac. 65(3-4), 251-261.
Shiau, S.Y. & Chin, Y.H., 1999., Estimation of the dietary biotin requirement of juvenile hybrid tilapia,
Oreochromis niloticus x O. aureus. Aquac. 170(1), 71-78.
Shiau, S.Y. & Hsieh, H.L., 1997. Vitamin B6 requirements of tilapia Oreochromis niloticus x O. Aureus fed two
dietary protein concentrations. Fish. Sci. 63, 1002-1007.
Shiau, S.Y. & Hsieh, J.F., 2001. Quantifying the dietary potassium requirement of juvenile hybrid tilapia
(Oreochromis niloticus x O. aureus). Brit. J. Nutr. 85(2), 213-218.
Shiau, S.Y. & Hwang, J.Y., 1993. Vitamin D requirements of juvenile hybrid tilapia Oreochromis niloticus x O.
aureus. Nippon Suisan Gakkaishi. 59(3), 553-558.
Shiau, S.Y. & Lo, P.S., 2000. Dietary choline requirements of juvenile hybrid tilapia, Oreochromis niloticus x
O. aureus. The J. Nutr. 130(1), 100-103.
Shiau, S.Y. & Peng, C.Y., 1993. Protein-sparing effect by carbohydrates in diets for tilapia, Oreochromis
niloticus x O. aureus. Aquaculture, 117(3-4), 337-334.
Shiau, S.Y. & Shiau, L.F., 2001. Re-evaluation of the vitamin E requirements of juvenile tilapia (Oreochromis
niloticus x O. aureus). Anim. Sci. 72(3), 529-534.
Shiau, S.Y. & Suen, G.S., 1992. Estimation of the niacin requirements for tilapia fed diets containing glucose
or dextrin. The J. Nutr. 122(10), 2030.
Shimeno, S., Ming, D. & Takeda, M., 1993. Metabolic response to dietary carbohydrate to lipid ratios in
Oreochromis niloticus. Bull. Jpn. Soc. Sci. Fish. 59(5), 827-833.
Siddiqui, A.Q., Howlader, M.S. & Adam, A.A., 1988. Effects of dietary protein levels on growth, feed conversion
and protein utilization in fry and young Nile tilapia, Oreochromis niloticus. Aquac. 70(1-2), 63-73.
Sifa, L., Chenhong, L., Dey, M., Gagalac, F. & Dunham, R., 2002. Cold tolerance of three strains of Nile tilapia,
Oreochromis niloticus, in China. Aquac. 213(1), 123-129.
Soliman, A.K. & Wilson, R.P., 1992. Water-soluble vitamin requirements of tilapia. 2. Riboflavin requirement
of blue tilapia, Oreochromis aureus. Aquac. 104(3-4), 309-314.
St-Hilaire, S., Cranfill, K., McGuire, M.A., Mosley, E.E., Tomberlin, J.K., Newton, L., … Irving, S., 2007b. Fish
offal recycling by the black soldier fly produces a foodstuff high in omega-3 fatty acids. J. World. Aquac.
Soc. 38(2), 309-313.
St-Hilaire, S., Sheppard, C., Tomberlin, J.K., Irving, S., Newton, L., McGuire, M.A., … Sealey, W., 2007a. Fly
pre-pupae as a feedstuff for rainbow trout, Oncorhynchus mykiss. J. World. Aquac. Soc. 38(1), 59-67.
Stickney, R.R. & Lovell, T., 1977. Nutrition and feeding of channel catfish. Alabama Agricultural Experiment
Station.
Stellenbosch University https://scholar.sun.ac.za
32
Stickney, R.R., McGeachin, R.B., Lewis, D.H., Marks, J., Riggs, A., Sis, R.F., … Wurts, W., 1984. Response
of tilapia aurea to dietary vitamin C. J. World. Aquac. Soc. 15(1-4), 179-185.
Stivers, T., 1971. Feed manufacturing. In: In Gaudet, JL Report of the 1970 workshop of fish feed technology
and nutrition. Resour. Publ. Bur. Sport. Fish. New York. pp. 14-42.
Surendra, K.C., Olivier, R., Tomberlin, J.K., Jha, R. & Khanal, S.K., 2016. Bioconversion of organic wastes
into biodiesel and animal feed via insect farming. Renew. Energy. 98, 197-202.
Tacon, A.G.J., 1996. Nutritional studies in crustaceans and the problems of applying research findings to
practical farming systems. Aquac. Nutri. 2(3), 165-174.
Tacon, A.G.J., Jauncey, K., Falaye, A., Pantha, M., MacGowan, I. & Stafford, E.A., 1983. The use of meat and
bone meal and hydrolyzed feather meal and soybean meal in practical fry and fingerling diets for
Oreochromis niloticus. In: Proceedings of the First International Symposium on Tilapia in Aquaculture.
pp. 356-365.
Tacon, A.G.J. & Metian, M., 2013. Fish matters: Importance of aquatic foods in human nutrition and global
food supply. Rev. Fish. Sci. 21(1), 22-38.
Takeuchi, T., Satoh, S. & Watanabe, T., 1983. Requirement of tilapia nilotica for essential fatty acids. Bull.
Jpn. Soc. Sci. Fish.
Teichert-Coddington, D. & Green, B.W., 1993. Tilapia yield improvement through maintenance of minimal
oxygen concentrations in experimental grow-out ponds in Honduras. Aquac. 118(1-2), 63-71.
Tsadik, G.G. & Kutty, M.N., 1987. Influence of Ambient Oxygen on Feeding and Growth of the Tilapia,
Oreochromis niloticus (Linnaeus).
Ulloa Rojas, J. & Van Weerd, J.H., 1997. The growth and feed utilization of Oreochromis aureus fingerlings
fed diets with various coffee pulp levels.
Viola, S. & Zohar, G., 1984. Nutritional study with market size tilapia hybrid Oreochromis in intensive culture.
Protein levels and sources. Isr. J. Aquac. 36, 3-15.
Watanabe, T., Satoh, S. & Takeuchi, T., 1988. Availability of minerals in fish meal to fish. Asian Fish. Sci. 1(2),
75-195.
Webster, C.D. & Chhorn, L., 2006. Tilapia: biology, culture and nutrition. CRC Press.
Wohlfarth, G.W. & Hulata, G., 1983. Applied genetics of tilapias. ICLARM studies and review. Philippines.
Womeni, H.M., Linder, M., Tiencheu, B., Mbiapo, F.T., Villeneuve, P., Fanni, J. & Parmentier, M., 2009. Oils
of insects and larvae consumed in Africa: potential sources of polyunsaturated fatty acids. Oleagineux.
Corps. Gras. Lipides. 16(4), 230-235.
Wu, Y.V., Rosati, R., Sessa, D.J. & Brown, P., 1995. Utilization of corn gluten feed by Nile tilapia. Progr. Fish.
Cult. 57(4), 305-309.
Yashouv, A., 1960. Effect of low temperatures on tilapia nilotica and tilapia galilaea. Bamidgeh. 12(3), 62-66.
Zhu, F.X., Yao, Y.L., Wang, S.J., Du, R.G., Wang, W.P., Chen, X.Y., … Yang, H.Q., 2015. Housefly maggot-
treated composting as sustainable option for pig manure management. Waste Management, 35, 62-67.
Stellenbosch University https://scholar.sun.ac.za
33
Chapter 3
The effect of varying inclusion levels of black soldier fly (Hermetia illucens) pre-
pupae on Nile tilapia (Oreochromis niloticus) feed characteristics
Abstract
The effects of black soldier fly (BSF) (Hermetia illucens) pre-pupae meal on bulk density, sinking
velocity, water absorption and disintegration were investigated for six treatments with increasing BSF inclusion
levels. The six inclusion levels were 0 % (control diet) (BSF0), 5 % (BSF5), 10 % (BSF10), 15.6 % (BSF15.6),
20 % (BSF20) and 25 % (BSF25). Pellet density was significantly different among all treatments, with higher
inclusion levels of BSF resulting in increased unit densities. The control (BSF0) and BSF5 had a sinking
velocity of zero (floating pellets). The pellets only started sinking at inclusion levels of 10 % and higher which
may be attributed to increased unit density. Water uptake was significantly different among most treatments,
with BSF0 having the highest degree of water uptake for all time frames (stability of pellets were tested over
time) except for the shortest time frame of 5 min. BSF15.6 had the highest absorption rate and degree of
disintegration. The latter was significantly higher than all other treatments, which may be attributed to BSF15.6
having the highest lipid content of diets without the use of a binder. When attempting to extrude BSF20 and
BSF25 little to no binding was observed, which prompted the inclusion of a pellet binder to prevent complete
loss of feed. BSF20 and BSF25 were the only diets where pellet binders were used due to excessive crumbling
observed during extrusion. There appears to be a relationship between lipid content and bulk density, with
bulk density increasing with higher lipid contents (attributed to a lubrication effect). Lubrication during extrusion
reduces gelatinization, and thus the expandability and binding ability of the feed, resulting in a more compact
pellet with weaker structural stability which requires a binding agent to stay intact. The use of defatted BSF
pre-pupae meal should be investigated, and binders should be included in similar levels for feed with a lower
degree of physical differences.
Key words: Black soldier fly, pre-pupae, Nile tilapia, feed characteristics, bulk density, sinking velocity, water
absorption
Stellenbosch University https://scholar.sun.ac.za
34
3.1 Introduction
The most expensive component in the aquaculture industry is feed, making up more than 50 % of its
operating costs (El-Sayed, 2006). With this in mind, it goes without saying that optimization of nutritional
components, such as the production thereof, is of high importance. Aquaculture feeds requires pelleting
(except meal-type feeds for younger fish) (Webster & Chhorn, 2006), and must be water stable (Webster &
Chhorn, 2006; Keri Alhadi Ighwela et al., 2013) to ensure efficient utilization. Furthermore, animal behaviour
(e.g., feeding rate) needs to be accounted for due to the worsening effect of submersion on water quality. For
example, tilapia chew pellets (Halver & Hardy, 2002), which is a factor to consider when feed is manufactured
to meet certain water quality parameters. Low quality feeds are characterized by immediate dispersion when
immersed, disintegration during transportation or sinking velocities outside specifications (Haubjerg et al.,
2015). It also raises farming costs by reducing uptake and results in pollution of water environments.
Inclusion levels of certain feedstuffs are limited by their functional properties. For example, the inclusion
levels of rice and oat hulls are limited due to their hardness which may weaken the pellets (Lim & Cuzon,
1994). Inclusion levels of lipids are also limited due to their diminishing effect on compression and over
lubrication during extrusion, in turn reducing expansion and binding ability of feed, thereby increasing
breakability and reducing floatability of feed (Hastings, 1970). Over lubrication also reduces gelatinization
during extrusion, which is an important reaction during extrusion as it improves the durability and digestibility
of feedstuffs (Chang & Wang, 1998).
Also, the gelatinization of starch promotes molecular interlinking (binding) and is a major factor
influencing the ability of starch to expand during the extrusion process (Chinnaswamy & Hanna, 1988). Starch
consists of two chains of glucose molecules, i.e. amylose and amylopectin (Tharanathan, 1995). These
molecules react differently during the extrusion process. Their ratio in starch determines the physical structural
changes that occur (Davidson et al., 1984). Amylopectin is primarily responsible for expansion when exposed
to high extrusion temperatures (Davidson et al., 1984). Sankaranandh Kannadhason et al. (2011) attributed
lower expansion in corn-starch diets relative to cassava and potato starch due to the lower amylopectin
proportions in corn. Increasing levels of amylopectin in diets produce a more homogenous and sticky texture,
which is light and elastic, whilst amylose reduces expansion and produces a harder pellet (Mercier & Feillet,
1975). Kannadhason and Muthukumarappan (2010), Sayed et al. (2014) and Sankaranandh Kannadhason et
al. (2011) reported that the source and inclusion level of starch has a significant influence on the binding
capacity and expansion ratio of the feed during extrusion. In fact, cassava and potato starches were better
suited for floating and sinking pellets, respectively, whilst corn starch improved the durability.
Unit density is useful in predicting what the floatability of extrudates are, especially for species such as
Nile tilapia where floating feed is preferred (Ayadi et al., 2016). Increased protein levels in feed have also been
reported to increase the unit density and sinking velocity of feed (Kannadhason et al., 2011), which may be
due to its binding ability (Cheftel et al., 1985). Exposure of feed to elevated temperatures and shear pressure
during extrusion could denature and alter the structure of proteins (Kannadhason et al., 2011). These actions
Stellenbosch University https://scholar.sun.ac.za
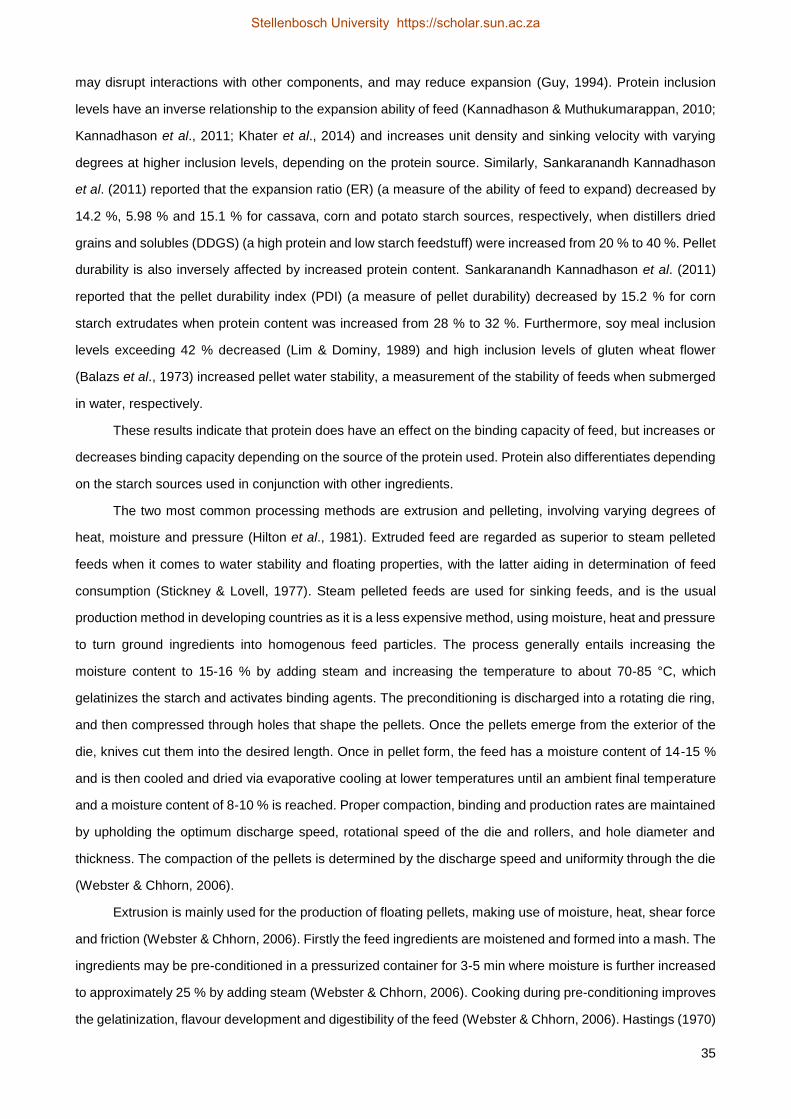
35
may disrupt interactions with other components, and may reduce expansion (Guy, 1994). Protein inclusion
levels have an inverse relationship to the expansion ability of feed (Kannadhason & Muthukumarappan, 2010;
Kannadhason et al., 2011; Khater et al., 2014) and increases unit density and sinking velocity with varying
degrees at higher inclusion levels, depending on the protein source. Similarly, Sankaranandh Kannadhason
et al. (2011) reported that the expansion ratio (ER) (a measure of the ability of feed to expand) decreased by
14.2 %, 5.98 % and 15.1 % for cassava, corn and potato starch sources, respectively, when distillers dried
grains and solubles (DDGS) (a high protein and low starch feedstuff) were increased from 20 % to 40 %. Pellet
durability is also inversely affected by increased protein content. Sankaranandh Kannadhason et al. (2011)
reported that the pellet durability index (PDI) (a measure of pellet durability) decreased by 15.2 % for corn
starch extrudates when protein content was increased from 28 % to 32 %. Furthermore, soy meal inclusion
levels exceeding 42 % decreased (Lim & Dominy, 1989) and high inclusion levels of gluten wheat flower
(Balazs et al., 1973) increased pellet water stability, a measurement of the stability of feeds when submerged
in water, respectively.
These results indicate that protein does have an effect on the binding capacity of feed, but increases or
decreases binding capacity depending on the source of the protein used. Protein also differentiates depending
on the starch sources used in conjunction with other ingredients.
The two most common processing methods are extrusion and pelleting, involving varying degrees of
heat, moisture and pressure (Hilton et al., 1981). Extruded feed are regarded as superior to steam pelleted
feeds when it comes to water stability and floating properties, with the latter aiding in determination of feed
consumption (Stickney & Lovell, 1977). Steam pelleted feeds are used for sinking feeds, and is the usual
production method in developing countries as it is a less expensive method, using moisture, heat and pressure
to turn ground ingredients into homogenous feed particles. The process generally entails increasing the
moisture content to 15-16 % by adding steam and increasing the temperature to about 70-85 °C, which
gelatinizes the starch and activates binding agents. The preconditioning is discharged into a rotating die ring,
and then compressed through holes that shape the pellets. Once the pellets emerge from the exterior of the
die, knives cut them into the desired length. Once in pellet form, the feed has a moisture content of 14-15 %
and is then cooled and dried via evaporative cooling at lower temperatures until an ambient final temperature
and a moisture content of 8-10 % is reached. Proper compaction, binding and production rates are maintained
by upholding the optimum discharge speed, rotational speed of the die and rollers, and hole diameter and
thickness. The compaction of the pellets is determined by the discharge speed and uniformity through the die
(Webster & Chhorn, 2006).
Extrusion is mainly used for the production of floating pellets, making use of moisture, heat, shear force
and friction (Webster & Chhorn, 2006). Firstly the feed ingredients are moistened and formed into a mash. The
ingredients may be pre-conditioned in a pressurized container for 3-5 min where moisture is further increased
to approximately 25 % by adding steam (Webster & Chhorn, 2006). Cooking during pre-conditioning improves
the gelatinization, flavour development and digestibility of the feed (Webster & Chhorn, 2006). Hastings (1970)
Stellenbosch University https://scholar.sun.ac.za
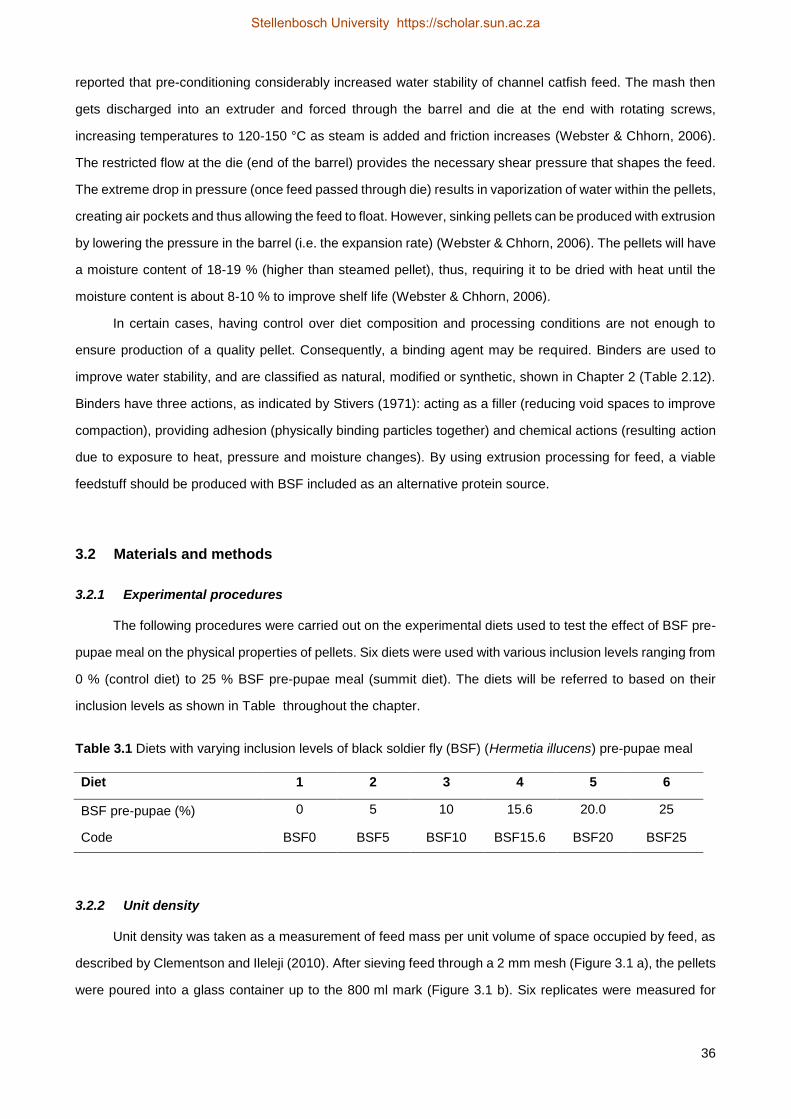
36
reported that pre-conditioning considerably increased water stability of channel catfish feed. The mash then
gets discharged into an extruder and forced through the barrel and die at the end with rotating screws,
increasing temperatures to 120-150 °C as steam is added and friction increases (Webster & Chhorn, 2006).
The restricted flow at the die (end of the barrel) provides the necessary shear pressure that shapes the feed.
The extreme drop in pressure (once feed passed through die) results in vaporization of water within the pellets,
creating air pockets and thus allowing the feed to float. However, sinking pellets can be produced with extrusion
by lowering the pressure in the barrel (i.e. the expansion rate) (Webster & Chhorn, 2006). The pellets will have
a moisture content of 18-19 % (higher than steamed pellet), thus, requiring it to be dried with heat until the
moisture content is about 8-10 % to improve shelf life (Webster & Chhorn, 2006).
In certain cases, having control over diet composition and processing conditions are not enough to
ensure production of a quality pellet. Consequently, a binding agent may be required. Binders are used to
improve water stability, and are classified as natural, modified or synthetic, shown in Chapter 2 (Table 2.12).
Binders have three actions, as indicated by Stivers (1971): acting as a filler (reducing void spaces to improve
compaction), providing adhesion (physically binding particles together) and chemical actions (resulting action
due to exposure to heat, pressure and moisture changes). By using extrusion processing for feed, a viable
feedstuff should be produced with BSF included as an alternative protein source.
3.2 Materials and methods
3.2.1 Experimental procedures
The following procedures were carried out on the experimental diets used to test the effect of BSF pre-
pupae meal on the physical properties of pellets. Six diets were used with various inclusion levels ranging from
0 % (control diet) to 25 % BSF pre-pupae meal (summit diet). The diets will be referred to based on their
inclusion levels as shown in Table throughout the chapter.
Table 3.1 Diets with varying inclusion levels of black soldier fly (BSF) (Hermetia illucens) pre-pupae meal
3.2.2 Unit density
Unit density was taken as a measurement of feed mass per unit volume of space occupied by feed, as
described by Clementson and Ileleji (2010). After sieving feed through a 2 mm mesh (Figure 3.1 a), the pellets
were poured into a glass container up to the 800 ml mark (Figure 3.1 b). Six replicates were measured for
Diet 1 2 3 4 5 6
BSF pre-pupae (%) 0 5 10 15.6 20.0 25
Code BSF0 BSF5 BSF10 BSF15.6 BSF20 BSF25
Stellenbosch University https://scholar.sun.ac.za
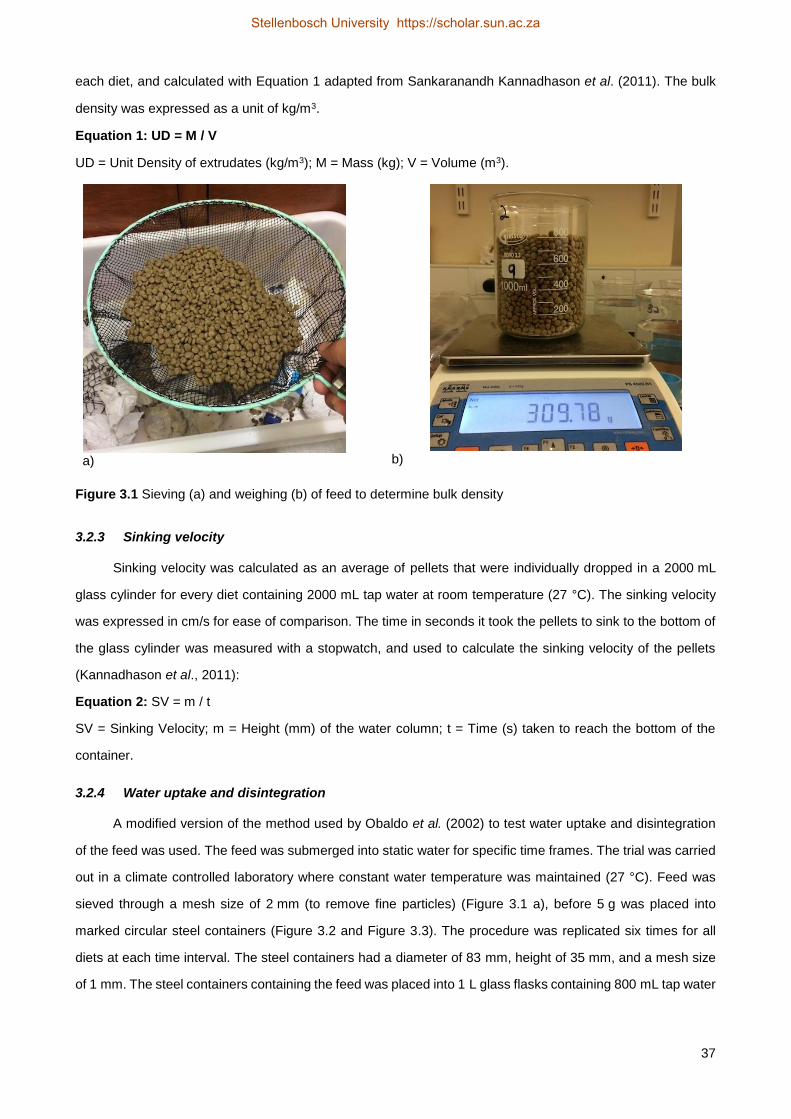
37
each diet, and calculated with Equation 1 adapted from Sankaranandh Kannadhason et al. (2011). The bulk
density was expressed as a unit of kg/m3.
Equation 1: UD = M / V
UD = Unit Density of extrudates (kg/m3); M = Mass (kg); V = Volume (m3).
a) b)
Figure 3.1 Sieving (a) and weighing (b) of feed to determine bulk density
3.2.3 Sinking velocity
Sinking velocity was calculated as an average of pellets that were individually dropped in a 2000 mL
glass cylinder for every diet containing 2000 mL tap water at room temperature (27 °C). The sinking velocity
was expressed in cm/s for ease of comparison. The time in seconds it took the pellets to sink to the bottom of
the glass cylinder was measured with a stopwatch, and used to calculate the sinking velocity of the pellets
(Kannadhason et al., 2011):
Equation 2: SV = m / t
SV = Sinking Velocity; m = Height (mm) of the water column; t = Time (s) taken to reach the bottom of the
container.
3.2.4 Water uptake and disintegration
A modified version of the method used by Obaldo et al. (2002) to test water uptake and disintegration
of the feed was used. The feed was submerged into static water for specific time frames. The trial was carried
out in a climate controlled laboratory where constant water temperature was maintained (27 °C). Feed was
sieved through a mesh size of 2 mm (to remove fine particles) (Figure 3.1 a), before 5 g was placed into
marked circular steel containers (Figure 3.2 and Figure 3.3). The procedure was replicated six times for all
diets at each time interval. The steel containers had a diameter of 83 mm, height of 35 mm, and a mesh size
of 1 mm. The steel containers containing the feed was placed into 1 L glass flasks containing 800 mL tap water
Stellenbosch University https://scholar.sun.ac.za
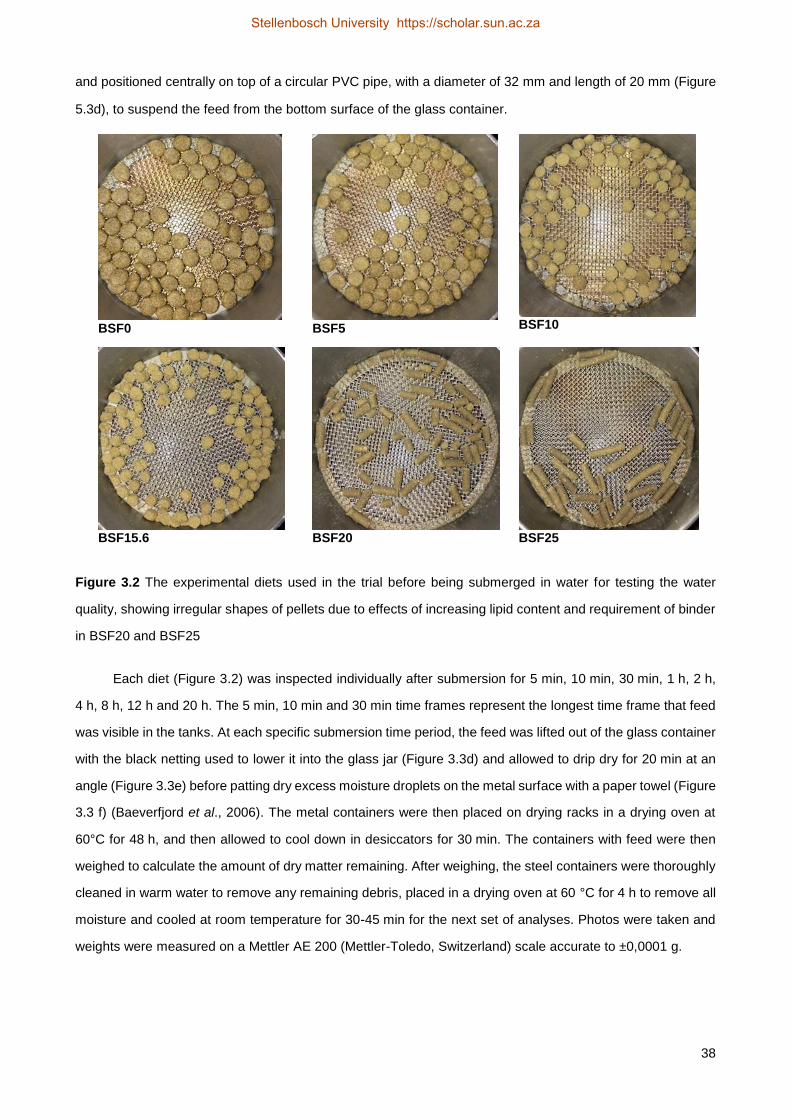
38
and positioned centrally on top of a circular PVC pipe, with a diameter of 32 mm and length of 20 mm (Figure
5.3d), to suspend the feed from the bottom surface of the glass container.
Figure 3.2 The experimental diets used in the trial before being submerged in water for testing the water
quality, showing irregular shapes of pellets due to effects of increasing lipid content and requirement of binder
in BSF20 and BSF25
Each diet (Figure 3.2) was inspected individually after submersion for 5 min, 10 min, 30 min, 1 h, 2 h,
4 h, 8 h, 12 h and 20 h. The 5 min, 10 min and 30 min time frames represent the longest time frame that feed
was visible in the tanks. At each specific submersion time period, the feed was lifted out of the glass container
with the black netting used to lower it into the glass jar (Figure 3.3d) and allowed to drip dry for 20 min at an
angle (Figure 3.3e) before patting dry excess moisture droplets on the metal surface with a paper towel (Figure
3.3 f) (Baeverfjord et al., 2006). The metal containers were then placed on drying racks in a drying oven at
60°C for 48 h, and then allowed to cool down in desiccators for 30 min. The containers with feed were then
weighed to calculate the amount of dry matter remaining. After weighing, the steel containers were thoroughly
cleaned in warm water to remove any remaining debris, placed in a drying oven at 60 °C for 4 h to remove all
moisture and cooled at room temperature for 30-45 min for the next set of analyses. Photos were taken and
weights were measured on a Mettler AE 200 (Mettler-Toledo, Switzerland) scale accurate to ±0,0001 g.
BSF0 BSF5 BSF10
BSF15.6 BSF20 BSF25
Stellenbosch University https://scholar.sun.ac.za
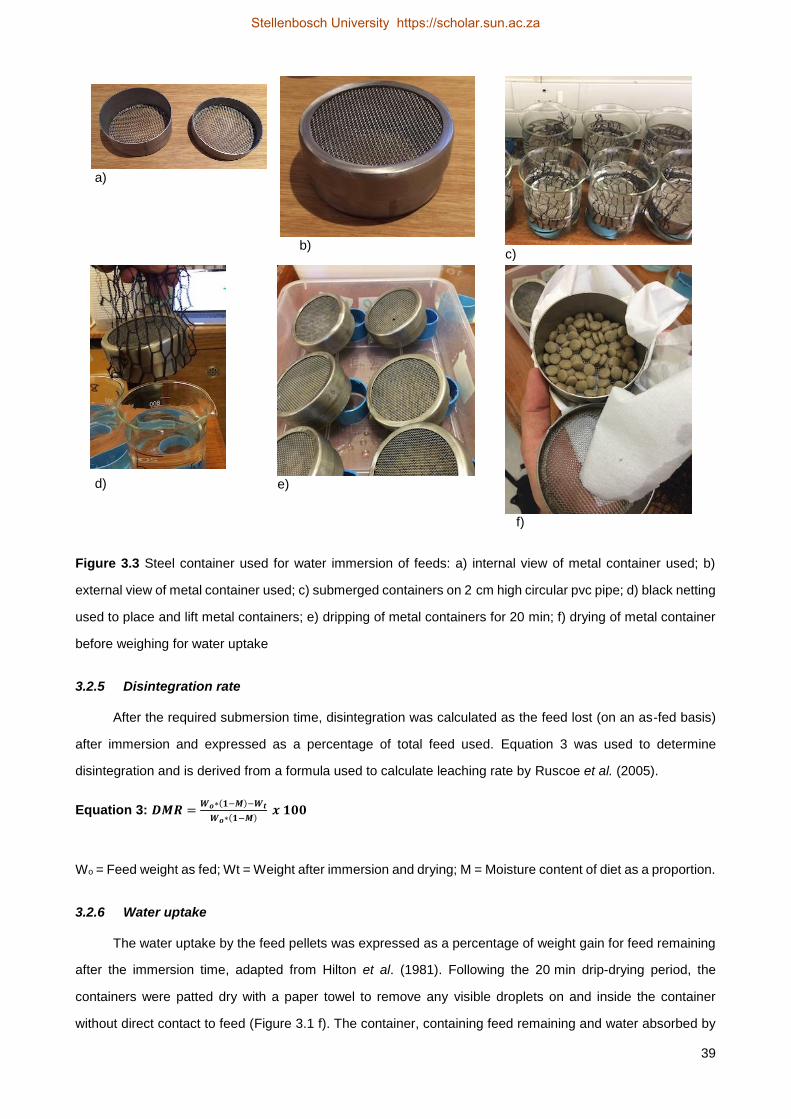
39
a)
b) c)
d) e)
f)
Figure 3.3 Steel container used for water immersion of feeds: a) internal view of metal container used; b)
external view of metal container used; c) submerged containers on 2 cm high circular pvc pipe; d) black netting
used to place and lift metal containers; e) dripping of metal containers for 20 min; f) drying of metal container
before weighing for water uptake
3.2.5 Disintegration rate
After the required submersion time, disintegration was calculated as the feed lost (on an as-fed basis)
after immersion and expressed as a percentage of total feed used. Equation 3 was used to determine
disintegration and is derived from a formula used to calculate leaching rate by Ruscoe et al. (2005).
Equation 3: 𝑫𝑴𝑹 =𝑾𝒐∗(𝟏−𝑴)−𝑾𝒕
𝑾𝒐∗(𝟏−𝑴) 𝒙 𝟏𝟎𝟎
Wo = Feed weight as fed; Wt = Weight after immersion and drying; M = Moisture content of diet as a proportion.
3.2.6 Water uptake
The water uptake by the feed pellets was expressed as a percentage of weight gain for feed remaining
after the immersion time, adapted from Hilton et al. (1981). Following the 20 min drip-drying period, the
containers were patted dry with a paper towel to remove any visible droplets on and inside the container
without direct contact to feed (Figure 3.1 f). The container, containing feed remaining and water absorbed by
Stellenbosch University https://scholar.sun.ac.za
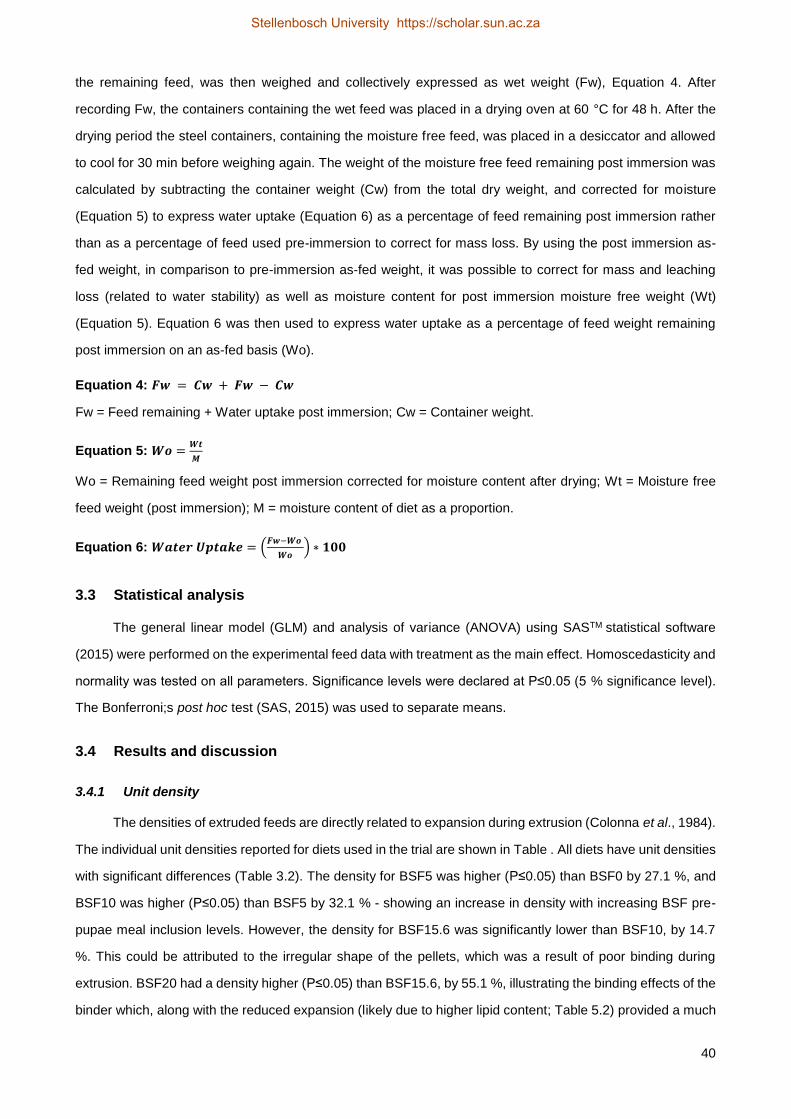
40
the remaining feed, was then weighed and collectively expressed as wet weight (Fw), Equation 4. After
recording Fw, the containers containing the wet feed was placed in a drying oven at 60 °C for 48 h. After the
drying period the steel containers, containing the moisture free feed, was placed in a desiccator and allowed
to cool for 30 min before weighing again. The weight of the moisture free feed remaining post immersion was
calculated by subtracting the container weight (Cw) from the total dry weight, and corrected for moisture
(Equation 5) to express water uptake (Equation 6) as a percentage of feed remaining post immersion rather
than as a percentage of feed used pre-immersion to correct for mass loss. By using the post immersion as-
fed weight, in comparison to pre-immersion as-fed weight, it was possible to correct for mass and leaching
loss (related to water stability) as well as moisture content for post immersion moisture free weight (Wt)
(Equation 5). Equation 6 was then used to express water uptake as a percentage of feed weight remaining
post immersion on an as-fed basis (Wo).
Equation 4: 𝑭𝒘 = 𝑪𝒘 + 𝑭𝒘 − 𝑪𝒘
Fw = Feed remaining + Water uptake post immersion; Cw = Container weight.
Equation 5: 𝑾𝒐 =𝑾𝒕
𝑴
Wo = Remaining feed weight post immersion corrected for moisture content after drying; Wt = Moisture free
feed weight (post immersion); M = moisture content of diet as a proportion.
Equation 6: 𝑾𝒂𝒕𝒆𝒓 𝑼𝒑𝒕𝒂𝒌𝒆 = (𝑭𝒘−𝑾𝒐
𝑾𝒐) ∗ 𝟏𝟎𝟎
3.3 Statistical analysis
The general linear model (GLM) and analysis of variance (ANOVA) using SASTM statistical software
(2015) were performed on the experimental feed data with treatment as the main effect. Homoscedasticity and
normality was tested on all parameters. Significance levels were declared at P≤0.05 (5 % significance level).
The Bonferroni;s post hoc test (SAS, 2015) was used to separate means.
3.4 Results and discussion
3.4.1 Unit density
The densities of extruded feeds are directly related to expansion during extrusion (Colonna et al., 1984).
The individual unit densities reported for diets used in the trial are shown in Table . All diets have unit densities
with significant differences (Table 3.2). The density for BSF5 was higher (P≤0.05) than BSF0 by 27.1 %, and
BSF10 was higher (P≤0.05) than BSF5 by 32.1 % - showing an increase in density with increasing BSF pre-
pupae meal inclusion levels. However, the density for BSF15.6 was significantly lower than BSF10, by 14.7
%. This could be attributed to the irregular shape of the pellets, which was a result of poor binding during
extrusion. BSF20 had a density higher (P≤0.05) than BSF15.6, by 55.1 %, illustrating the binding effects of the
binder which, along with the reduced expansion (likely due to higher lipid content; Table 5.2) provided a much
Stellenbosch University https://scholar.sun.ac.za
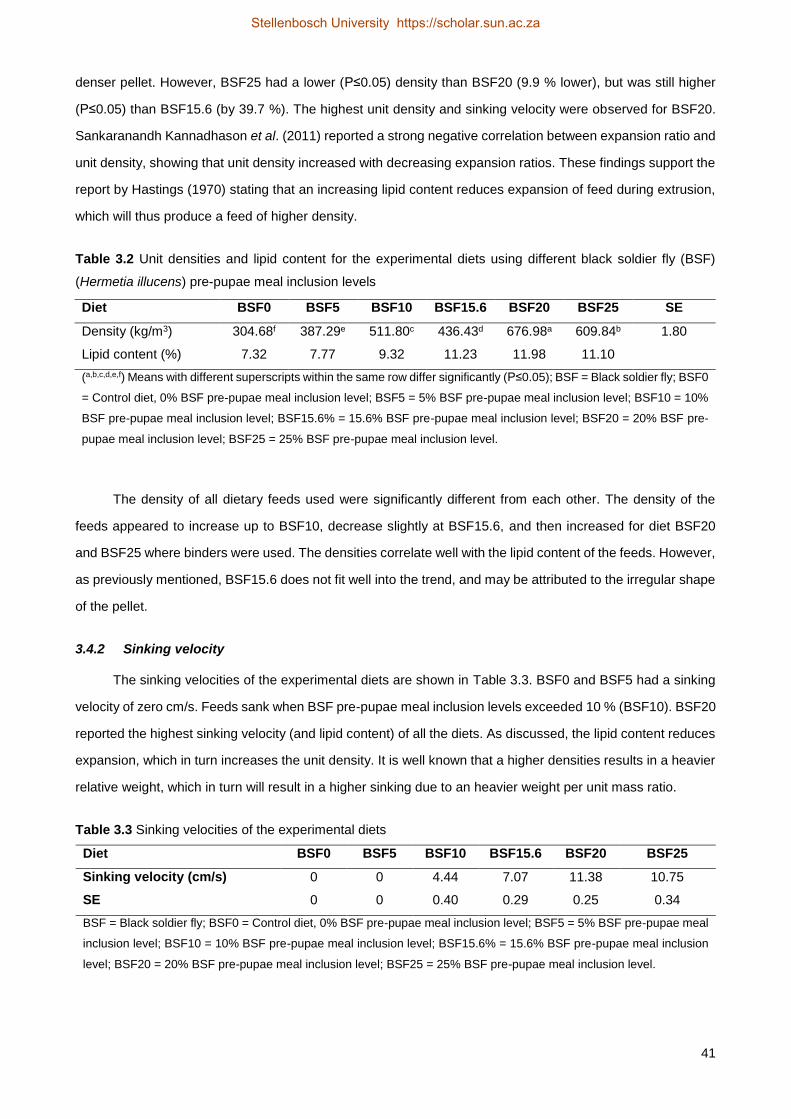
41
denser pellet. However, BSF25 had a lower (P≤0.05) density than BSF20 (9.9 % lower), but was still higher
(P≤0.05) than BSF15.6 (by 39.7 %). The highest unit density and sinking velocity were observed for BSF20.
Sankaranandh Kannadhason et al. (2011) reported a strong negative correlation between expansion ratio and
unit density, showing that unit density increased with decreasing expansion ratios. These findings support the
report by Hastings (1970) stating that an increasing lipid content reduces expansion of feed during extrusion,
which will thus produce a feed of higher density.
Table 3.2 Unit densities and lipid content for the experimental diets using different black soldier fly (BSF)
(Hermetia illucens) pre-pupae meal inclusion levels
The density of all dietary feeds used were significantly different from each other. The density of the
feeds appeared to increase up to BSF10, decrease slightly at BSF15.6, and then increased for diet BSF20
and BSF25 where binders were used. The densities correlate well with the lipid content of the feeds. However,
as previously mentioned, BSF15.6 does not fit well into the trend, and may be attributed to the irregular shape
of the pellet.
3.4.2 Sinking velocity
The sinking velocities of the experimental diets are shown in Table 3.3. BSF0 and BSF5 had a sinking
velocity of zero cm/s. Feeds sank when BSF pre-pupae meal inclusion levels exceeded 10 % (BSF10). BSF20
reported the highest sinking velocity (and lipid content) of all the diets. As discussed, the lipid content reduces
expansion, which in turn increases the unit density. It is well known that a higher densities results in a heavier
relative weight, which in turn will result in a higher sinking due to an heavier weight per unit mass ratio.
Table 3.3 Sinking velocities of the experimental diets
Diet BSF0 BSF5 BSF10 BSF15.6 BSF20 BSF25
Sinking velocity (cm/s) 0 0 4.44 7.07 11.38 10.75
SE 0 0 0.40 0.29 0.25 0.34
BSF = Black soldier fly; BSF0 = Control diet, 0% BSF pre-pupae meal inclusion level; BSF5 = 5% BSF pre-pupae meal
inclusion level; BSF10 = 10% BSF pre-pupae meal inclusion level; BSF15.6% = 15.6% BSF pre-pupae meal inclusion
level; BSF20 = 20% BSF pre-pupae meal inclusion level; BSF25 = 25% BSF pre-pupae meal inclusion level.
Diet BSF0 BSF5 BSF10 BSF15.6 BSF20 BSF25 SE
Density (kg/m3) 304.68f 387.29e 511.80c 436.43d 676.98a 609.84b 1.80
Lipid content (%) 7.32 7.77 9.32 11.23 11.98 11.10
(a,b,c,d,e,f) Means with different superscripts within the same row differ significantly (P≤0.05); BSF = Black soldier fly; BSF0
= Control diet, 0% BSF pre-pupae meal inclusion level; BSF5 = 5% BSF pre-pupae meal inclusion level; BSF10 = 10%
BSF pre-pupae meal inclusion level; BSF15.6% = 15.6% BSF pre-pupae meal inclusion level; BSF20 = 20% BSF pre-
pupae meal inclusion level; BSF25 = 25% BSF pre-pupae meal inclusion level.
Stellenbosch University https://scholar.sun.ac.za
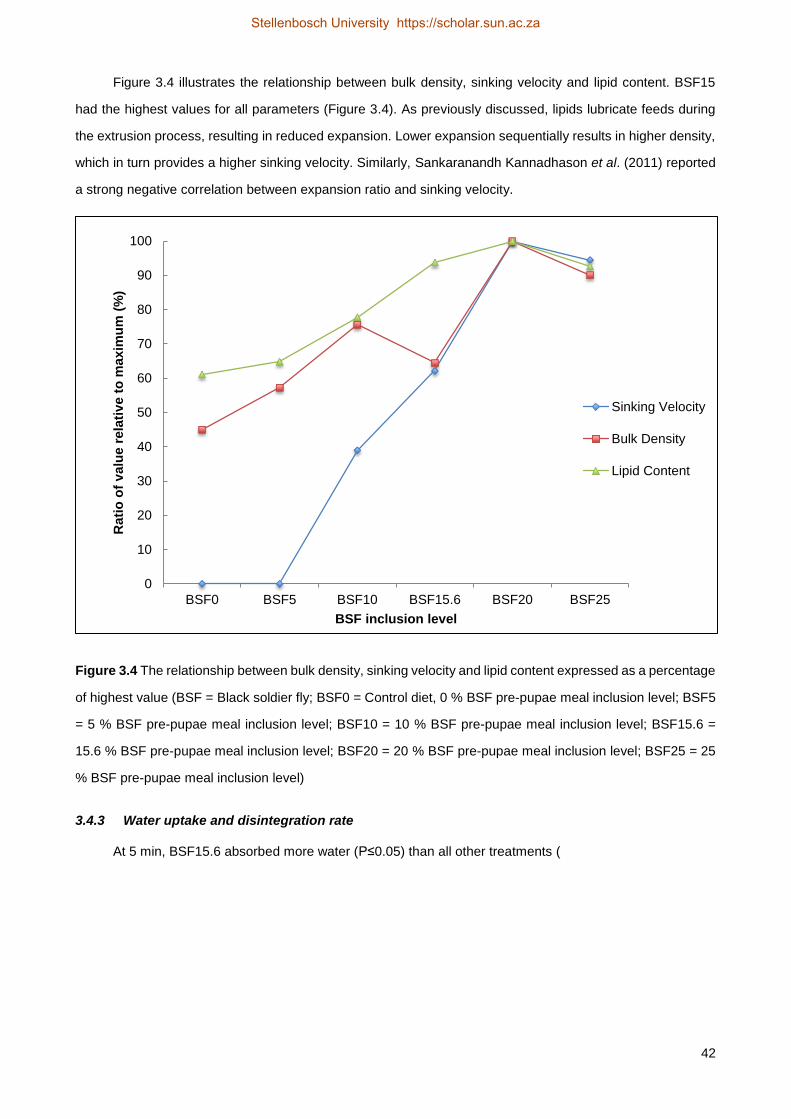
42
Figure 3.4 illustrates the relationship between bulk density, sinking velocity and lipid content. BSF15
had the highest values for all parameters (Figure 3.4). As previously discussed, lipids lubricate feeds during
the extrusion process, resulting in reduced expansion. Lower expansion sequentially results in higher density,
which in turn provides a higher sinking velocity. Similarly, Sankaranandh Kannadhason et al. (2011) reported
a strong negative correlation between expansion ratio and sinking velocity.
Figure 3.4 The relationship between bulk density, sinking velocity and lipid content expressed as a percentage
of highest value (BSF = Black soldier fly; BSF0 = Control diet, 0 % BSF pre-pupae meal inclusion level; BSF5
= 5 % BSF pre-pupae meal inclusion level; BSF10 = 10 % BSF pre-pupae meal inclusion level; BSF15.6 =
15.6 % BSF pre-pupae meal inclusion level; BSF20 = 20 % BSF pre-pupae meal inclusion level; BSF25 = 25
% BSF pre-pupae meal inclusion level)
3.4.3 Water uptake and disintegration rate
At 5 min, BSF15.6 absorbed more water (P≤0.05) than all other treatments (
0
10
20
30
40
50
60
70
80
90
100
BSF0 BSF5 BSF10 BSF15.6 BSF20 BSF25
Rati
o o
f v
alu
e r
ela
tiv
e t
o m
axim
um
(%
)
BSF inclusion level
Sinking Velocity
Bulk Density
Lipid Content
Stellenbosch University https://scholar.sun.ac.za
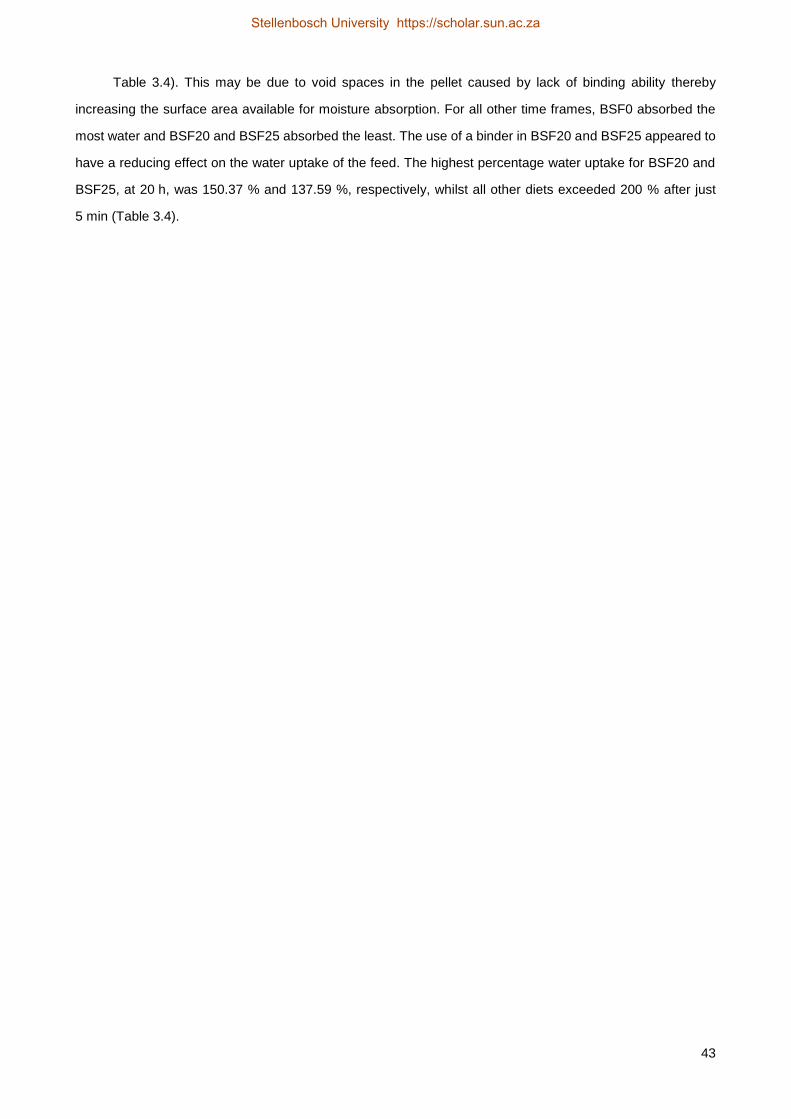
43
Table 3.4). This may be due to void spaces in the pellet caused by lack of binding ability thereby
increasing the surface area available for moisture absorption. For all other time frames, BSF0 absorbed the
most water and BSF20 and BSF25 absorbed the least. The use of a binder in BSF20 and BSF25 appeared to
have a reducing effect on the water uptake of the feed. The highest percentage water uptake for BSF20 and
BSF25, at 20 h, was 150.37 % and 137.59 %, respectively, whilst all other diets exceeded 200 % after just
5 min (Table 3.4).
Stellenbosch University https://scholar.sun.ac.za
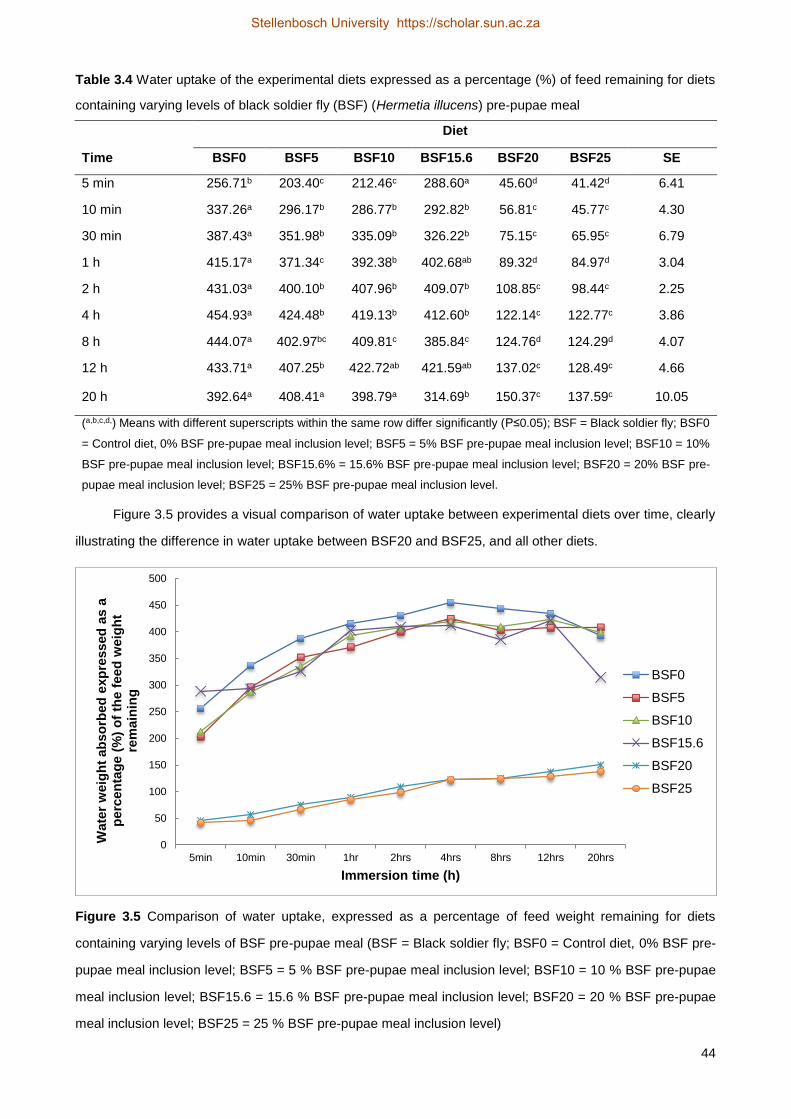
44
Table 3.4 Water uptake of the experimental diets expressed as a percentage (%) of feed remaining for diets
containing varying levels of black soldier fly (BSF) (Hermetia illucens) pre-pupae meal
Diet
Time BSF0 BSF5 BSF10 BSF15.6 BSF20 BSF25 SE
5 min 256.71b 203.40c 212.46c 288.60a 45.60d 41.42d 6.41
10 min 337.26a 296.17b 286.77b 292.82b 56.81c 45.77c 4.30
30 min 387.43a 351.98b 335.09b 326.22b 75.15c 65.95c 6.79
1 h 415.17a 371.34c 392.38b 402.68ab 89.32d 84.97d 3.04
2 h 431.03a 400.10b 407.96b 409.07b 108.85c 98.44c 2.25
4 h 454.93a 424.48b 419.13b 412.60b 122.14c 122.77c 3.86
8 h 444.07a 402.97bc 409.81c 385.84c 124.76d 124.29d 4.07
12 h 433.71a 407.25b 422.72ab 421.59ab 137.02c 128.49c 4.66
20 h 392.64a 408.41a 398.79a 314.69b 150.37c 137.59c 10.05
(a,b,c,d,) Means with different superscripts within the same row differ significantly (P≤0.05); BSF = Black soldier fly; BSF0
= Control diet, 0% BSF pre-pupae meal inclusion level; BSF5 = 5% BSF pre-pupae meal inclusion level; BSF10 = 10%
BSF pre-pupae meal inclusion level; BSF15.6% = 15.6% BSF pre-pupae meal inclusion level; BSF20 = 20% BSF pre-
pupae meal inclusion level; BSF25 = 25% BSF pre-pupae meal inclusion level.
Figure 3.5 provides a visual comparison of water uptake between experimental diets over time, clearly
illustrating the difference in water uptake between BSF20 and BSF25, and all other diets.
Figure 3.5 Comparison of water uptake, expressed as a percentage of feed weight remaining for diets
containing varying levels of BSF pre-pupae meal (BSF = Black soldier fly; BSF0 = Control diet, 0% BSF pre-
pupae meal inclusion level; BSF5 = 5 % BSF pre-pupae meal inclusion level; BSF10 = 10 % BSF pre-pupae
meal inclusion level; BSF15.6 = 15.6 % BSF pre-pupae meal inclusion level; BSF20 = 20 % BSF pre-pupae
meal inclusion level; BSF25 = 25 % BSF pre-pupae meal inclusion level)
0
50
100
150
200
250
300
350
400
450
500
5min 10min 30min 1hr 2hrs 4hrs 8hrs 12hrs 20hrs
Wate
r w
eig
ht
ab
so
rbed
exp
ressed
as a
p
erc
en
tag
e (
%)
of
the f
eed
weig
ht
rem
ain
ing
Immersion time (h)
BSF0
BSF5
BSF10
BSF15.6
BSF20
BSF25
Stellenbosch University https://scholar.sun.ac.za
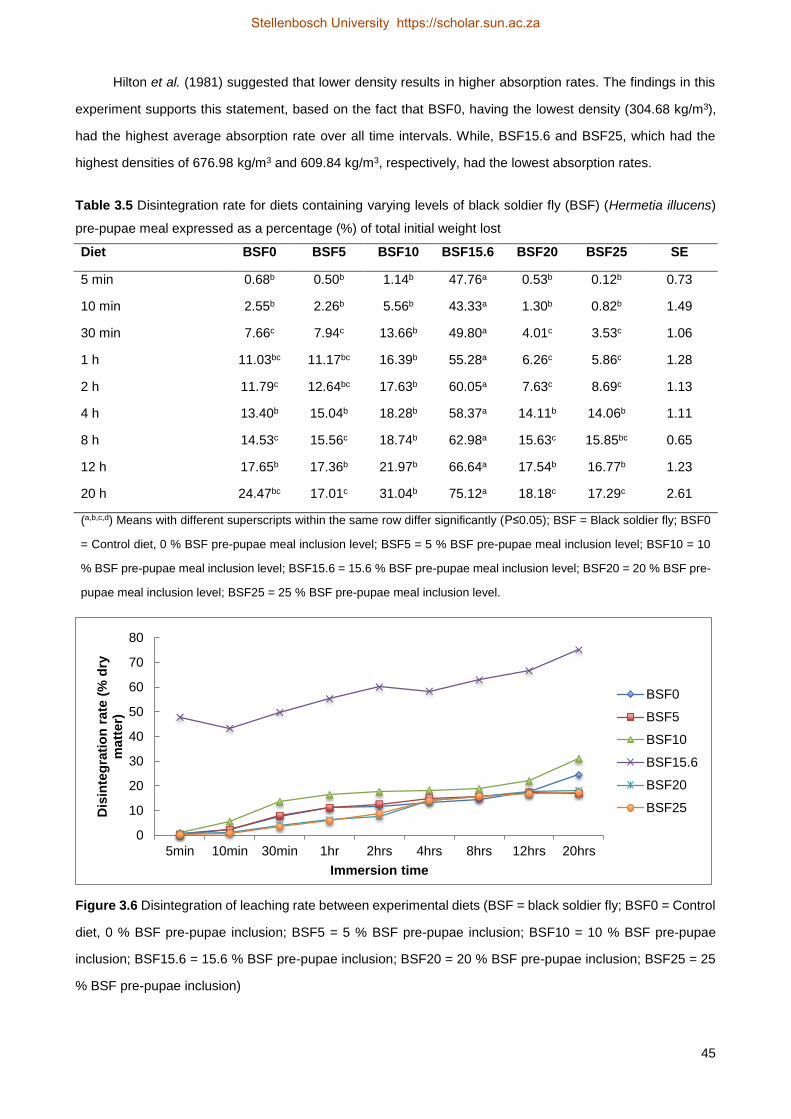
45
Hilton et al. (1981) suggested that lower density results in higher absorption rates. The findings in this
experiment supports this statement, based on the fact that BSF0, having the lowest density (304.68 kg/m3),
had the highest average absorption rate over all time intervals. While, BSF15.6 and BSF25, which had the
highest densities of 676.98 kg/m3 and 609.84 kg/m3, respectively, had the lowest absorption rates.
Table 3.5 Disintegration rate for diets containing varying levels of black soldier fly (BSF) (Hermetia illucens)
pre-pupae meal expressed as a percentage (%) of total initial weight lost
Diet BSF0 BSF5 BSF10 BSF15.6 BSF20 BSF25 SE
5 min 0.68b 0.50b 1.14b 47.76a 0.53b 0.12b 0.73
10 min 2.55b 2.26b 5.56b 43.33a 1.30b 0.82b 1.49
30 min 7.66c 7.94c 13.66b 49.80a 4.01c 3.53c 1.06
1 h 11.03bc 11.17bc 16.39b 55.28a 6.26c 5.86c 1.28
2 h 11.79c 12.64bc 17.63b 60.05a 7.63c 8.69c 1.13
4 h 13.40b 15.04b 18.28b 58.37a 14.11b 14.06b 1.11
8 h 14.53c 15.56c 18.74b 62.98a 15.63c 15.85bc 0.65
12 h 17.65b 17.36b 21.97b 66.64a 17.54b 16.77b 1.23
20 h 24.47bc 17.01c 31.04b 75.12a 18.18c 17.29c 2.61
(a,b,c,d) Means with different superscripts within the same row differ significantly (P≤0.05); BSF = Black soldier fly; BSF0
= Control diet, 0 % BSF pre-pupae meal inclusion level; BSF5 = 5 % BSF pre-pupae meal inclusion level; BSF10 = 10
% BSF pre-pupae meal inclusion level; BSF15.6 = 15.6 % BSF pre-pupae meal inclusion level; BSF20 = 20 % BSF pre-
pupae meal inclusion level; BSF25 = 25 % BSF pre-pupae meal inclusion level.
Figure 3.6 Disintegration of leaching rate between experimental diets (BSF = black soldier fly; BSF0 = Control
diet, 0 % BSF pre-pupae inclusion; BSF5 = 5 % BSF pre-pupae inclusion; BSF10 = 10 % BSF pre-pupae
inclusion; BSF15.6 = 15.6 % BSF pre-pupae inclusion; BSF20 = 20 % BSF pre-pupae inclusion; BSF25 = 25
% BSF pre-pupae inclusion)
0
10
20
30
40
50
60
70
80
5min 10min 30min 1hr 2hrs 4hrs 8hrs 12hrs 20hrs
Dis
inte
gra
tio
n r
ate
(%
dry
m
att
er)
Immersion time
BSF0
BSF5
BSF10
BSF15.6
BSF20
BSF25
Stellenbosch University https://scholar.sun.ac.za
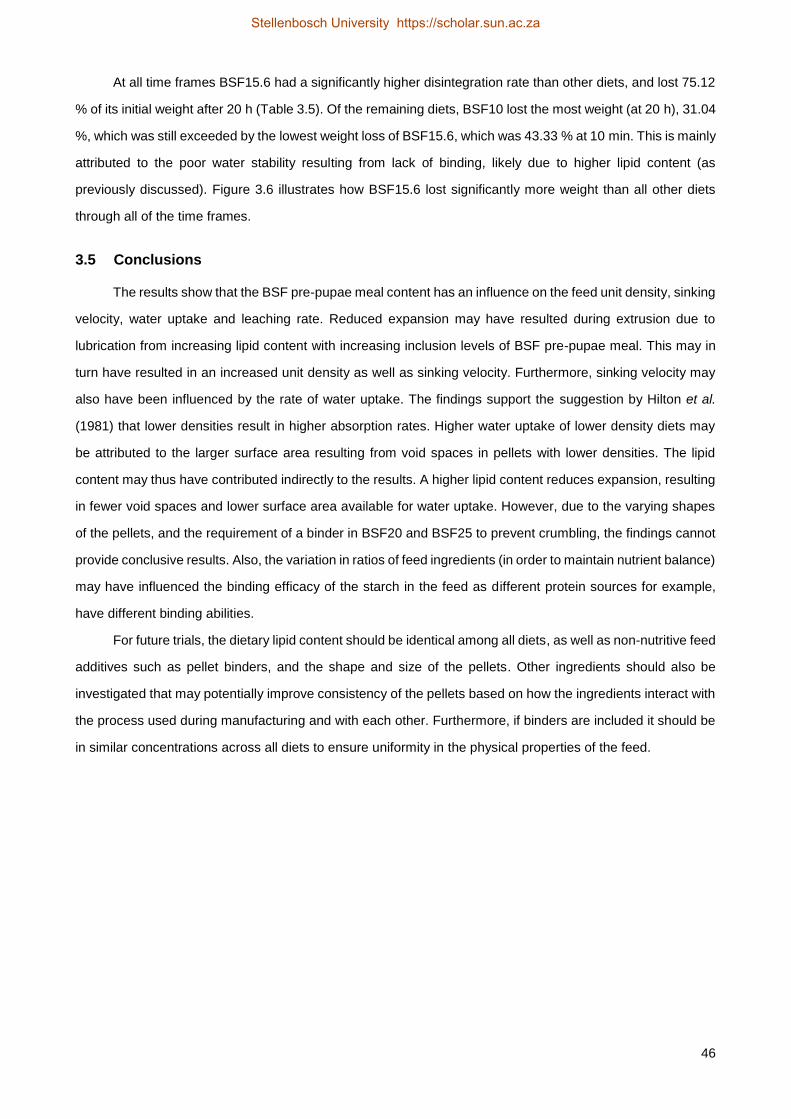
46
At all time frames BSF15.6 had a significantly higher disintegration rate than other diets, and lost 75.12
% of its initial weight after 20 h (Table 3.5). Of the remaining diets, BSF10 lost the most weight (at 20 h), 31.04
%, which was still exceeded by the lowest weight loss of BSF15.6, which was 43.33 % at 10 min. This is mainly
attributed to the poor water stability resulting from lack of binding, likely due to higher lipid content (as
previously discussed). Figure 3.6 illustrates how BSF15.6 lost significantly more weight than all other diets
through all of the time frames.
3.5 Conclusions
The results show that the BSF pre-pupae meal content has an influence on the feed unit density, sinking
velocity, water uptake and leaching rate. Reduced expansion may have resulted during extrusion due to
lubrication from increasing lipid content with increasing inclusion levels of BSF pre-pupae meal. This may in
turn have resulted in an increased unit density as well as sinking velocity. Furthermore, sinking velocity may
also have been influenced by the rate of water uptake. The findings support the suggestion by Hilton et al.
(1981) that lower densities result in higher absorption rates. Higher water uptake of lower density diets may
be attributed to the larger surface area resulting from void spaces in pellets with lower densities. The lipid
content may thus have contributed indirectly to the results. A higher lipid content reduces expansion, resulting
in fewer void spaces and lower surface area available for water uptake. However, due to the varying shapes
of the pellets, and the requirement of a binder in BSF20 and BSF25 to prevent crumbling, the findings cannot
provide conclusive results. Also, the variation in ratios of feed ingredients (in order to maintain nutrient balance)
may have influenced the binding efficacy of the starch in the feed as different protein sources for example,
have different binding abilities.
For future trials, the dietary lipid content should be identical among all diets, as well as non-nutritive feed
additives such as pellet binders, and the shape and size of the pellets. Other ingredients should also be
investigated that may potentially improve consistency of the pellets based on how the ingredients interact with
the process used during manufacturing and with each other. Furthermore, if binders are included it should be
in similar concentrations across all diets to ensure uniformity in the physical properties of the feed.
Stellenbosch University https://scholar.sun.ac.za
47
3.6 References
Ayadi, F., Rosentrater, K.A., Muthukumarappan, K. & Kannadhason, S., 2016. Effects of amylose-to-
amylopectin ratios on binding capacity of DDGS/Soy-Based Aquafeed Blends. J. Food. Res. 5(5), 43.
Baeverfjord, G., Refstie, S., Krogedal, P. & Åsgård, T., 2006. Low feed pellet water stability and fluctuating
water salinity cause separation and accumulation of dietary oil in the stomach of rainbow trout
(Oncorhynchus mykiss). Aquac. 261(4), 1335-1345.
Balazs, G.H., Ross, E. & Brooks, C.C., 1973. Preliminary studies on the preparation and feeding of crustacean
diets. Aquac. 2, 369-377.
Chang, Y.K. & Wang, S.S., 1998. Advances in Extrusion Technology. In: International Symposium on Animal
and Aquaculture Feedstuffs by Extrusion Technology. Eds: Chang, Y.K. & Wang S.S. Sao Paulo:
Technomic Pub. Co.
Cheftel, J.C., Cuq, J.L. & Lorient, D., 1985. Amino acids, peptides, and proteins. Food Chem. 2, 245-369.
Chinnaswamy, R. & Hanna, M.A., 1988. Optimum extrusion‐cooking conditions for maximum expansion of
corn starch. J. Food Sci. 53(3), 834-836.
Clementson, C.L. & Ileleji, K.E., 2010. Variability of bulk density of distillers dried grains with solubles (DDGS)
during gravity-driven discharge. Biores. Tech. 101(14), 5459-5468.
Davidson, V.J., Paton, D., Diosady, L.L. & Larocque, G., 1984. Degradation of wheat starch in a single screw
extruder: Characteristics of extruded starch polymers. J. Food Sci. 49(2), 453-458.
El-Sayed, A.-F.M., 2006. Tilapia culture. In : Aquaculture. CABI publishing, UK.
Guy, R.C.E., 1994. Raw materials for extrusion cooking processes. In: The Technology of Extrusion Cooking.
pp. 52-72.
Halver, J.E. & Hardy, R.W., 2002. In: Fish Nutrition. Academic press.
Hastings, W.H., 1970. Study of pelleted fish foods stability in water. In: Report of the 1970 Workshop on Fish
Feed Technology and Nutrition, Warmwater Fish Cultural Laboratories. Arkansas, USA. pp. 7-19.
Haubjerg, A.F., Veje, C.T., Jørgensen, B.N., Simonsen, B. & Løvgreen, S., 2015. Structural properties and
mechanical durability of extruded fish feed. J. Food Proc. Eng. 38(6), 621-631.
Hilton, J.W., Cho, C.Y. & Slinger, S.J., 1981. Effect of extrusion processing and steam pelleting diets on pellet
durability, pellet water absorption, and the physiological response of rainbow trout (Salmo gairdneri R.).
Aquac. 25(2-3), 185-194.
Ighwela, K.A., Bin Ahmad, A. & Abol-Munafi, A.B., 2013. Water stability and nutrient leaching of different levels
of maltose formulated fish pellets. Glob. Vet. 10(6), 638-642.
Kannadhason, S. & Muthukumarappan, K., 2010. Effect of starch sources on properties of extrudates
containing DDGS. Int. J. Food Prop. 13(5), 1012-1034.
Kannadhason, S., Muthukumarappan, K. & Rosentrater, K.A., 2011. Effect of starch sources and protein
content on extruded aquaculture feed containing DDGS. Food. Bioproc. Tech. 4(2), 282-294.
Stellenbosch University https://scholar.sun.ac.za
48
Khater, E.S.G., Bahnasawy, A.H. & Ali, S.A., 2014. Physical and mechanical properties of fish feed pellets. J.
Food Proc.Tech. 5(10).
Lim, C. & Cuzon, G., 1994. Water stability of shrimp pellet: a review. Asian. Fish. Sci. 7(2-3), 115-126.
Lim, C. & Dominy, W., 1989. Utilization of plant protein by warmwater fish. In: Proceedings of World Congress
on Vegetable Protein Utilization in Human Foods and Animal Feedstuffs. Ed: Applewhite, T.H.
pp. 245-251.
Mercier, C. & Feillet, P., 1975. Modification of carbohydrate components by extrusion-cooking of cereal
products. Cereal Chem. 52, 283-297.
Obaldo, L.G., Divakaran, S. & Tacon, A.G., 2002. Method for determining the physical stability of shrimp feeds
in water. Aquac. Res. 33(5), 369-377.
Ruscoe, I.M., Jones, C M., Jones, P.L. & Caley, P., 2005. The effects of various binders and moisture content
on pellet stability of research diets for freshwater crayfish. Aquac. Nutr. 11(2), 87-93.
Stickney, R.R. & Lovell, T., 1977. Nutrition and feeding of channel catfish. Alabama Agricultural Experiment
Station.
Stivers, T., 1971. Feed manufacturing. In: In Gaudet, JL Report of the 1970 workshop of fish feed technology
and nutrition. Resour. Publ. Bur. Sport. Fish. New York. pp. 14-42.
Tharanathan, R.N., 1995. Starch: The polysaccharide of high abundance and usefulness. J. Sci. Ind. Res.
54(8), 452-458.
Webster, C.D. & Chhorn, L., 2006. Tilapia: biology, culture and nutrition. CRC Press.
Stellenbosch University https://scholar.sun.ac.za
49
Chapter 4
Influence of black soldier fly (Hermetia illucens) pre-pupae meal on growth
performance and feed utilization of Nile tilapia (Oreochromis niloticus)
Abstract
The effect of different inclusion levels of full-fat black soldier fly (BSF) pre-pupae meal on the growth
and feed utilization of Nile tilapia was investigated in a recirculatory aquaculture system (RAS). A summit diet
with 25 % BSF pre-pupae (BSF25), and a dilution with 0 % BSF pre-pupae (BSF0) was formulated according
to the ideal amino acid profile for Nile tilapia. The diets were blended to contain 0 % (control) (BSF0), 5 %
(BSF5), 10 % (BSF10), 15.60 % (BSF15), 20 % (BSF20) and 25 % (BSF25) BSF pre-pupae meal, respectively.
A total of 630 juvenile Nile tilapia (45-95 g) were randomly allocated to treatment diets with seven replicates
per treatment. Fish were hand fed twice per day to apparent satiation over a 30 day period. The initial and final
weights were not significantly different between treatments. However, feed utilization (specific growth rate,
protein efficiency ratio and feed conversion ratio) differed (P≤0.05) among diets. Lipid content and pellet water
stability had a direct and inverse relationship with increasing inclusion levels of BSF pre-pupae meal,
respectively. The study concluded that full-fat BSF pre-pupae meal should not exceed 5% without assessing
additives for increasing pellet water stability. It is suggested to use defatted BSF pre-pupae meal when higher
inclusion levels are to be attempted, as the high lipid content of full-fat BSF pre-pupae may have adverse
effects on the characteristics of the feed used.
Key words: Black Soldier Fly, growth performance, feed utilization, Nile tilapia, alternative protein sources, pre-
pupae meal
4.1 Introduction
The aquaculture industry has conventionally used fishmeal as the main protein source in the aqua feed
industry due its high protein content, balanced essential amino acid (EAA) profile, inclusion of essential fatty
acids (EFA), highly digestible energy, minerals and vitamins (El-Sayed, 2006). These advantages, along with
laws preventing the use of many meat meals (due to disease risk), has resulted in fish being an indispensable
protein source in fish feeds (Sánchez-Muros et al., 2014). The increase in demand and competition for fishmeal
has resulted in fishmeal being the most expensive protein commodity in aquaculture feeds (El-Sayed, 2006).
As a result, the affordability of fish feeds may be problematic for developing countries; the price of fishmeal
almost tripled in a period of eight years, increasing from around US$500/t in 2000 to around US$1200/t in
2008 (Lucas & Southgate, 2012). Hence, developing countries will be unable to afford fishmeal as a major
protein source in commercial fish feeds, and it will have to be replaced by a less expensive, locally available
Stellenbosch University https://scholar.sun.ac.za
50
protein source (El-Sayed, 2006). Another major concern with the use of fishmeal as a protein source is its
sustainability; the aquaculture industry consumed 3.06 million tons (56 %) of world fishmeal production in 2006
(Lucas & Southgate, 2012).
Some alternative animal protein sources investigated include hydrolysed feather meal (HFM), poultry
by product meal (PBM), shrimp meal, chicken offal silage (COS) and meat (M) and bone meal (BM). These
protein sources have relatively high protein contents and good amino acid profiles, but may be deficient in
certain amino acids. NRC (1983) and Tacon and Jackson (1985) reported that the most limiting amino acids
for alternative terrestrial protein sources are methionine (M, BM and HFM), isoleucine (BM) and lysine (PBM
and HFM). Viola and Zohar (1984) attributed poor performance of HFM diets to deficiency in amino acids and
energy. However, Tacon et al. (1983) found that only 30 % of fish meal protein could be effectively replaced
by HFM in Nile tilapia diets, even with the supplementation of lysine, methionine and histidine. El-Sayed (1998)
reported significantly poorer feed and protein efficiency ratios and growth performance when PBM, shrimp
meal and M and BM replaced a 30 % fishmeal diet by 47 %, 50 % and 40 %, respectively. Wu et al. (1999)
reported that an inclusion of 6 % M and BM as a fishmeal replacement had no effect on the growth performance
for Nile tilapia.
Nile tilapia diets can be formulated to contain high percentages of plant protein (Ogunji et al., 2008a;
FAO, 2015). Soy bean meal is a common protein source used in fish feed as it has the most balanced amino
acid profile among plant protein sources available required by most fish (El-Sayed, 2006). It’s relatively high
digestibility and protein content has made it a readily accepted protein source in fish feeds (Sánchez-Muros et
al., 2014). Lim and Dominy (1989) suggested that soya is the most studied plant protein source due to it being
readily available, having consistent quality and being more affordable than most other protein sources. Shiau
et al. (1987) reported that SBM can partially replace fish meal in diets with protein levels below optimum (24
%), but requires supplementation of methionine to prevent depressed growth when replacing 30 % of fish meal
in diets with a 32 % protein content. In support, Jackson et al. (1982) reported growth reduction when 50 % or
more fishmeal was replaced with SBM, which was attributed to the methionine deficiency and the presence of
anti-nutritional factors such as trypsin inhibitors and lectin. However, the diets used by Jackson et al.(1982)
were formulated for protein content (iso-nitrogenous) and not amino acid composition and digestible energy,
which may have influenced growth parameters. Rapeseed and canola meal have carbohydrates that are highly
indigestible and have anti-nutritional factors limiting its use in fish feeds, but is a readily used feedstuff in
livestock and poultry diets (Webster & Chhorn, 2006). In support, Jackson et al. (1982) reported a significant
reduction in weight gain with rapeseed inclusion levels of 63 % and higher. Similarly, inclusion levels of
cottonseed meal (CSM) are also limited by anti-nutritional factors (i.e. gossypol) and low lysine content
(Webster & Chhorn, 2006). However, pre-press solvent-extracted CSM has proved to be acceptable in
O. mossambicus diets by up to 50 %. CSM with low gossypol levels can be included in the same quantities as
SBM in O. niloticus and O. aureus hybrid diets (Viola & Zohar, 1984). Cottonseed cake at 19.4 % inclusion
levels have been reported to reduce weight gain and feed efficiency in Nile tilapia (Ofojekwu & Ejike, 1984).
Stellenbosch University https://scholar.sun.ac.za
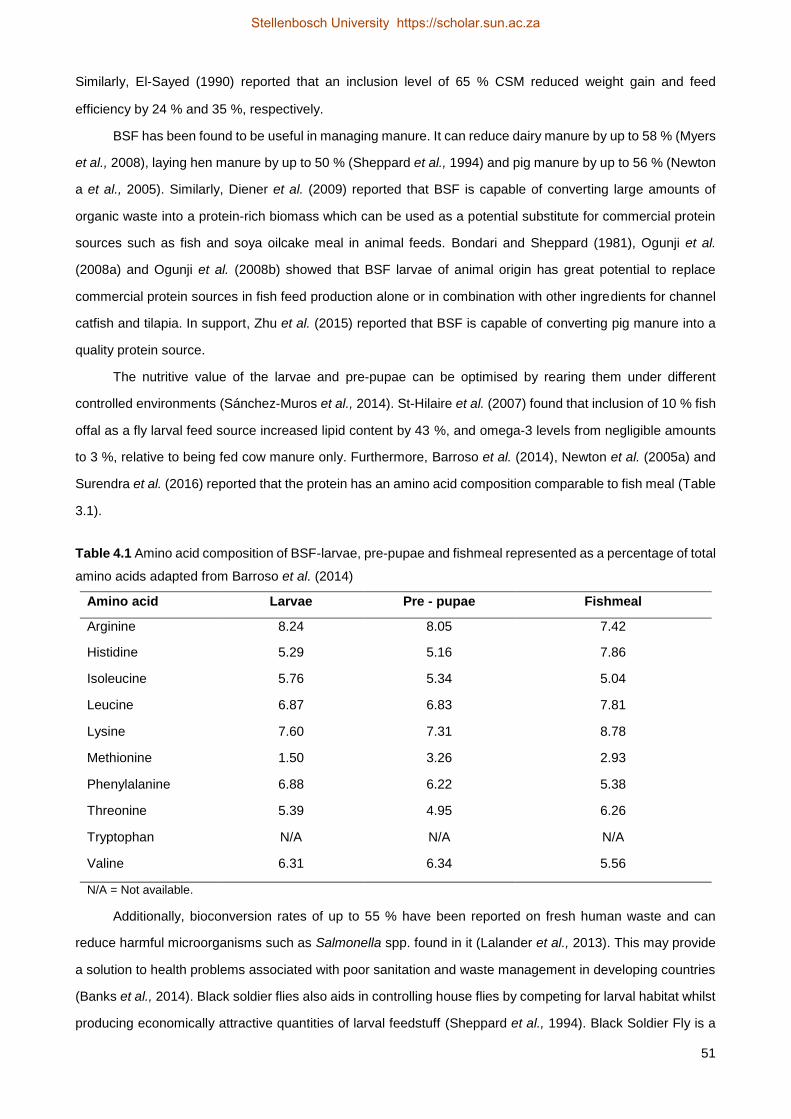
51
Similarly, El-Sayed (1990) reported that an inclusion level of 65 % CSM reduced weight gain and feed
efficiency by 24 % and 35 %, respectively.
BSF has been found to be useful in managing manure. It can reduce dairy manure by up to 58 % (Myers
et al., 2008), laying hen manure by up to 50 % (Sheppard et al., 1994) and pig manure by up to 56 % (Newton
a et al., 2005). Similarly, Diener et al. (2009) reported that BSF is capable of converting large amounts of
organic waste into a protein-rich biomass which can be used as a potential substitute for commercial protein
sources such as fish and soya oilcake meal in animal feeds. Bondari and Sheppard (1981), Ogunji et al.
(2008a) and Ogunji et al. (2008b) showed that BSF larvae of animal origin has great potential to replace
commercial protein sources in fish feed production alone or in combination with other ingredients for channel
catfish and tilapia. In support, Zhu et al. (2015) reported that BSF is capable of converting pig manure into a
quality protein source.
The nutritive value of the larvae and pre-pupae can be optimised by rearing them under different
controlled environments (Sánchez-Muros et al., 2014). St-Hilaire et al. (2007) found that inclusion of 10 % fish
offal as a fly larval feed source increased lipid content by 43 %, and omega-3 levels from negligible amounts
to 3 %, relative to being fed cow manure only. Furthermore, Barroso et al. (2014), Newton et al. (2005a) and
Surendra et al. (2016) reported that the protein has an amino acid composition comparable to fish meal (Table
3.1).
Table 4.1 Amino acid composition of BSF-larvae, pre-pupae and fishmeal represented as a percentage of total
amino acids adapted from Barroso et al. (2014)
Amino acid Larvae Pre - pupae Fishmeal
Arginine 8.24 8.05 7.42
Histidine 5.29 5.16 7.86
Isoleucine 5.76 5.34 5.04
Leucine 6.87 6.83 7.81
Lysine 7.60 7.31 8.78
Methionine 1.50 3.26 2.93
Phenylalanine 6.88 6.22 5.38
Threonine 5.39 4.95 6.26
Tryptophan N/A N/A N/A
Valine 6.31 6.34 5.56
N/A = Not available.
Additionally, bioconversion rates of up to 55 % have been reported on fresh human waste and can
reduce harmful microorganisms such as Salmonella spp. found in it (Lalander et al., 2013). This may provide
a solution to health problems associated with poor sanitation and waste management in developing countries
(Banks et al., 2014). Black soldier flies also aids in controlling house flies by competing for larval habitat whilst
producing economically attractive quantities of larval feedstuff (Sheppard et al., 1994). Black Soldier Fly is a
Stellenbosch University https://scholar.sun.ac.za
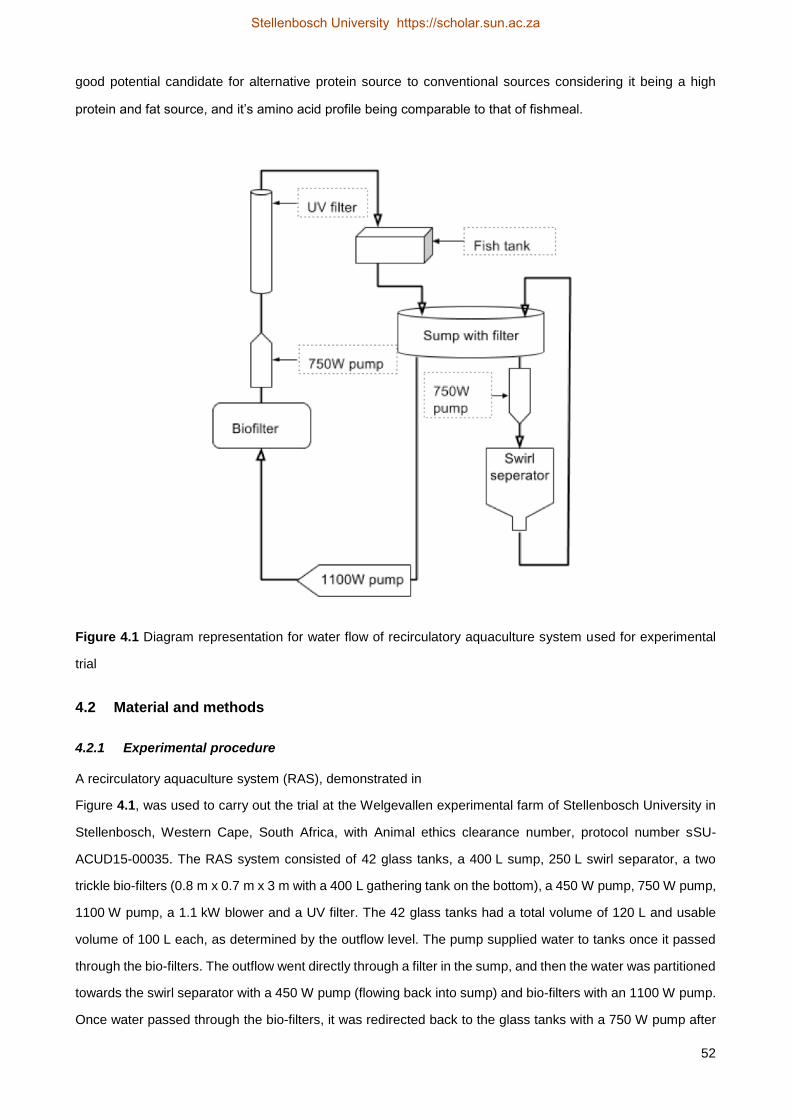
52
good potential candidate for alternative protein source to conventional sources considering it being a high
protein and fat source, and it’s amino acid profile being comparable to that of fishmeal.
Figure 4.1 Diagram representation for water flow of recirculatory aquaculture system used for experimental
trial
4.2 Material and methods
4.2.1 Experimental procedure
A recirculatory aquaculture system (RAS), demonstrated in
Figure 4.1, was used to carry out the trial at the Welgevallen experimental farm of Stellenbosch University in
Stellenbosch, Western Cape, South Africa, with Animal ethics clearance number, protocol number sSU-
ACUD15-00035. The RAS system consisted of 42 glass tanks, a 400 L sump, 250 L swirl separator, a two
trickle bio-filters (0.8 m x 0.7 m x 3 m with a 400 L gathering tank on the bottom), a 450 W pump, 750 W pump,
1100 W pump, a 1.1 kW blower and a UV filter. The 42 glass tanks had a total volume of 120 L and usable
volume of 100 L each, as determined by the outflow level. The pump supplied water to tanks once it passed
through the bio-filters. The outflow went directly through a filter in the sump, and then the water was partitioned
towards the swirl separator with a 450 W pump (flowing back into sump) and bio-filters with an 1100 W pump.
Once water passed through the bio-filters, it was redirected back to the glass tanks with a 750 W pump after
Stellenbosch University https://scholar.sun.ac.za
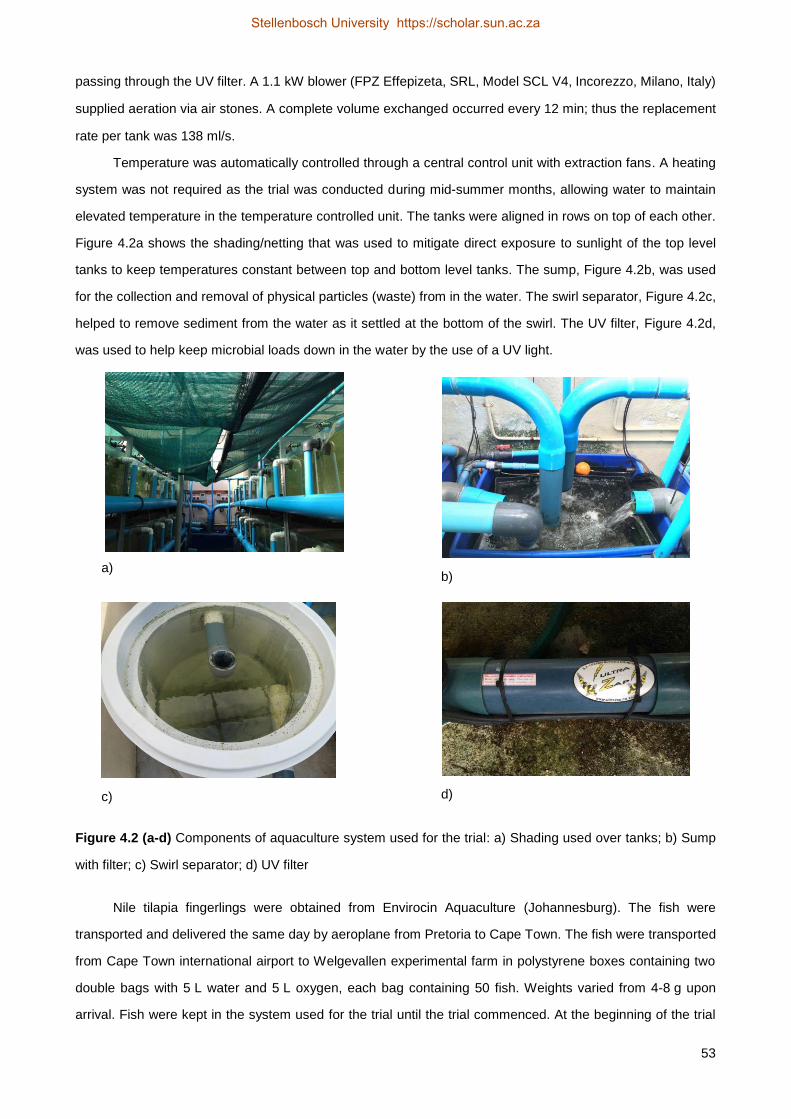
53
passing through the UV filter. A 1.1 kW blower (FPZ Effepizeta, SRL, Model SCL V4, Incorezzo, Milano, Italy)
supplied aeration via air stones. A complete volume exchanged occurred every 12 min; thus the replacement
rate per tank was 138 ml/s.
Temperature was automatically controlled through a central control unit with extraction fans. A heating
system was not required as the trial was conducted during mid-summer months, allowing water to maintain
elevated temperature in the temperature controlled unit. The tanks were aligned in rows on top of each other.
Figure 4.2a shows the shading/netting that was used to mitigate direct exposure to sunlight of the top level
tanks to keep temperatures constant between top and bottom level tanks. The sump, Figure 4.2b, was used
for the collection and removal of physical particles (waste) from in the water. The swirl separator, Figure 4.2c,
helped to remove sediment from the water as it settled at the bottom of the swirl. The UV filter, Figure 4.2d,
was used to help keep microbial loads down in the water by the use of a UV light.
a) b)
c) d)
Figure 4.2 (a-d) Components of aquaculture system used for the trial: a) Shading used over tanks; b) Sump
with filter; c) Swirl separator; d) UV filter
Nile tilapia fingerlings were obtained from Envirocin Aquaculture (Johannesburg). The fish were
transported and delivered the same day by aeroplane from Pretoria to Cape Town. The fish were transported
from Cape Town international airport to Welgevallen experimental farm in polystyrene boxes containing two
double bags with 5 L water and 5 L oxygen, each bag containing 50 fish. Weights varied from 4-8 g upon
arrival. Fish were kept in the system used for the trial until the trial commenced. At the beginning of the trial
Stellenbosch University https://scholar.sun.ac.za
54
the fish had a recorded starting weight of 45-95 g. At the start of the trial a total of 630 fish were recorded,
weighed and measured before being placed into tanks (15 fish per tank). In an effort to mitigate dominance
and size related competition, the fish were grouped into weight intervals varying no more than 5 g. One of
each weight group was randomly allocated to each treatment, and were randomly and evenly distributed
between treatments.
Performance was expressed with the feed conversion ratio (FCR), specific growth rate (SGR), protein
efficiency ratio (PER), feed intake (FI), hepatosomatic index (HSI), conditioning factor (Cf), percentage weight
gain (WG) and average daily gain (ADG) as indicated:
Equation 7: FCR = Food fed (g) / Live weight gain (g)
Equation 8: SGR = (ln W2-ln W1 / T2-T1) x 100
Equation 9: PER = Live weight gain (g) / Protein fed (g)
Equation 10: FI = Total feed calculated / (Initial + Final number of animals / 2)
Equation 11: HSI = (Liver weight (g) / Total fish weight (g)) x 100
Equation 12: Cf = W2 / (L2)3 x 100
Equation 13: WG (%) = mean final weight / mean initial weight x 100
Equation 14: SR (%) = F2 / F1 x 100
For equation one to eight, abbreviations below apply:
W1 = Initial weight of fish; W2 = Final weight of fish; T1 = Begin of experiment (day); T2 = End of experiment
(day); F1 = Number of fish at end of experiment; F2 = Number of fish at beginning of experiment; L2 = Standard
length.
Average daily gain (ADG) was calculated by means of fitting a simple linear regression of weight over
time (days) for each tank, the slope of the regression represents the rate of change and as such ADG. Other
parameters investigated at the end of the trial included survival rate (SR). All the experimental fish were
weighed weekly.
4.2.2 Experimental feed
The fish were fed a commercial tilapia diet for adaption and holding period supplied by Montego pet
foods (product code T3206i). The feed was in granular form with a length of 1-2 mm, and had a protein and
lipid content of 32 % and 6 %, respectively.
Two diets, a summit (BSF25) and dilution diet (BSF0) were formulated according to the ideal amino acid
profile of Nile tilapia. BSF0 contained no BSF pre-pupae meal while BSF25 contained 25% BSF meal. These
diets were blended in specific ratios to yield six treatment diets (A protein percentage and digestible
energy/protein (DE/P) ratio of 36 % and 8.3 kcal/g have been shown to provide maximum growth for Nile tilapia
(Halver & Hardy, 2002). The diets were formulated for 36 % protein and 15 % fat. However, in order to maintain
a balanced amino acid profile in both diets, the dilution and summit diets were formulated to have a 36 %
Stellenbosch University https://scholar.sun.ac.za
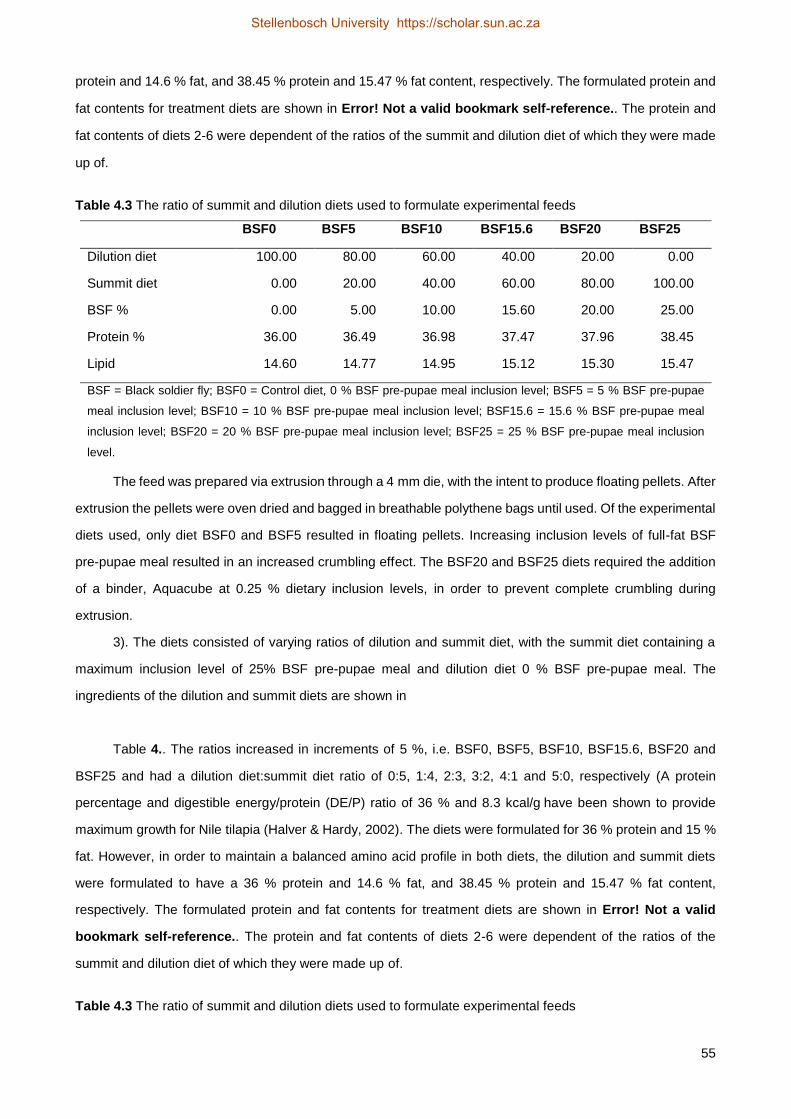
55
protein and 14.6 % fat, and 38.45 % protein and 15.47 % fat content, respectively. The formulated protein and
fat contents for treatment diets are shown in Error! Not a valid bookmark self-reference.. The protein and
fat contents of diets 2-6 were dependent of the ratios of the summit and dilution diet of which they were made
up of.
Table 4.3 The ratio of summit and dilution diets used to formulate experimental feeds
BSF0 BSF5 BSF10 BSF15.6 BSF20 BSF25
Dilution diet 100.00 80.00 60.00 40.00 20.00 0.00
Summit diet 0.00 20.00 40.00 60.00 80.00 100.00
BSF % 0.00 5.00 10.00 15.60 20.00 25.00
Protein % 36.00 36.49 36.98 37.47 37.96 38.45
Lipid 14.60 14.77 14.95 15.12 15.30 15.47
BSF = Black soldier fly; BSF0 = Control diet, 0 % BSF pre-pupae meal inclusion level; BSF5 = 5 % BSF pre-pupae
meal inclusion level; BSF10 = 10 % BSF pre-pupae meal inclusion level; BSF15.6 = 15.6 % BSF pre-pupae meal
inclusion level; BSF20 = 20 % BSF pre-pupae meal inclusion level; BSF25 = 25 % BSF pre-pupae meal inclusion
level.
The feed was prepared via extrusion through a 4 mm die, with the intent to produce floating pellets. After
extrusion the pellets were oven dried and bagged in breathable polythene bags until used. Of the experimental
diets used, only diet BSF0 and BSF5 resulted in floating pellets. Increasing inclusion levels of full-fat BSF
pre-pupae meal resulted in an increased crumbling effect. The BSF20 and BSF25 diets required the addition
of a binder, Aquacube at 0.25 % dietary inclusion levels, in order to prevent complete crumbling during
extrusion.
3). The diets consisted of varying ratios of dilution and summit diet, with the summit diet containing a
maximum inclusion level of 25% BSF pre-pupae meal and dilution diet 0 % BSF pre-pupae meal. The
ingredients of the dilution and summit diets are shown in
Table 4.. The ratios increased in increments of 5 %, i.e. BSF0, BSF5, BSF10, BSF15.6, BSF20 and
BSF25 and had a dilution diet:summit diet ratio of 0:5, 1:4, 2:3, 3:2, 4:1 and 5:0, respectively (A protein
percentage and digestible energy/protein (DE/P) ratio of 36 % and 8.3 kcal/g have been shown to provide
maximum growth for Nile tilapia (Halver & Hardy, 2002). The diets were formulated for 36 % protein and 15 %
fat. However, in order to maintain a balanced amino acid profile in both diets, the dilution and summit diets
were formulated to have a 36 % protein and 14.6 % fat, and 38.45 % protein and 15.47 % fat content,
respectively. The formulated protein and fat contents for treatment diets are shown in Error! Not a valid
bookmark self-reference.. The protein and fat contents of diets 2-6 were dependent of the ratios of the
summit and dilution diet of which they were made up of.
Table 4.3 The ratio of summit and dilution diets used to formulate experimental feeds
Stellenbosch University https://scholar.sun.ac.za
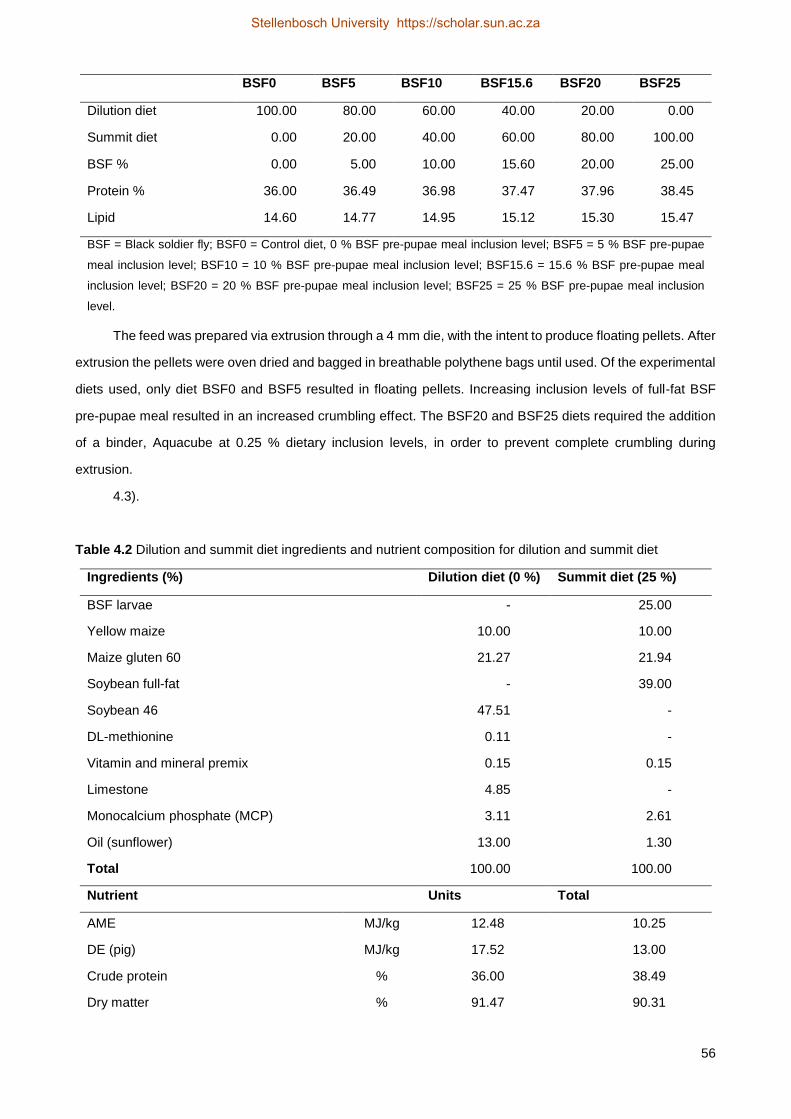
56
BSF0 BSF5 BSF10 BSF15.6 BSF20 BSF25
Dilution diet 100.00 80.00 60.00 40.00 20.00 0.00
Summit diet 0.00 20.00 40.00 60.00 80.00 100.00
BSF % 0.00 5.00 10.00 15.60 20.00 25.00
Protein % 36.00 36.49 36.98 37.47 37.96 38.45
Lipid 14.60 14.77 14.95 15.12 15.30 15.47
BSF = Black soldier fly; BSF0 = Control diet, 0 % BSF pre-pupae meal inclusion level; BSF5 = 5 % BSF pre-pupae
meal inclusion level; BSF10 = 10 % BSF pre-pupae meal inclusion level; BSF15.6 = 15.6 % BSF pre-pupae meal
inclusion level; BSF20 = 20 % BSF pre-pupae meal inclusion level; BSF25 = 25 % BSF pre-pupae meal inclusion
level.
The feed was prepared via extrusion through a 4 mm die, with the intent to produce floating pellets. After
extrusion the pellets were oven dried and bagged in breathable polythene bags until used. Of the experimental
diets used, only diet BSF0 and BSF5 resulted in floating pellets. Increasing inclusion levels of full-fat BSF
pre-pupae meal resulted in an increased crumbling effect. The BSF20 and BSF25 diets required the addition
of a binder, Aquacube at 0.25 % dietary inclusion levels, in order to prevent complete crumbling during
extrusion.
4.3).
Table 4.2 Dilution and summit diet ingredients and nutrient composition for dilution and summit diet
Ingredients (%) Dilution diet (0 %) Summit diet (25 %)
BSF larvae - 25.00
Yellow maize 10.00 10.00
Maize gluten 60 21.27 21.94
Soybean full-fat - 39.00
Soybean 46 47.51 -
DL-methionine 0.11 -
Vitamin and mineral premix 0.15 0.15
Limestone 4.85 -
Monocalcium phosphate (MCP) 3.11 2.61
Oil (sunflower) 13.00 1.30
Total 100.00 100.00
Nutrient Units Total
AME MJ/kg 12.48 10.25
DE (pig) MJ/kg 17.52 13.00
Crude protein % 36.00 38.49
Dry matter % 91.47 90.31
Stellenbosch University https://scholar.sun.ac.za
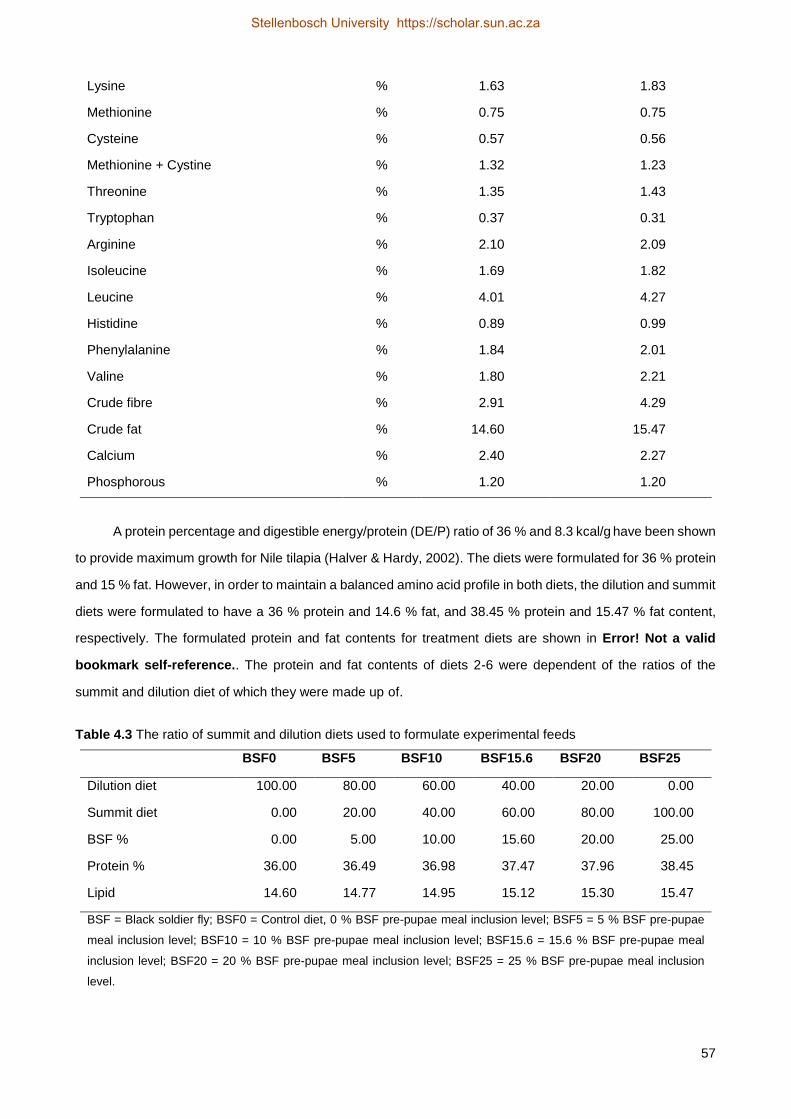
57
Lysine % 1.63 1.83
Methionine % 0.75 0.75
Cysteine % 0.57 0.56
Methionine + Cystine % 1.32 1.23
Threonine % 1.35 1.43
Tryptophan % 0.37 0.31
Arginine % 2.10 2.09
Isoleucine % 1.69 1.82
Leucine % 4.01 4.27
Histidine % 0.89 0.99
Phenylalanine % 1.84 2.01
Valine % 1.80 2.21
Crude fibre % 2.91 4.29
Crude fat % 14.60 15.47
Calcium % 2.40 2.27
Phosphorous % 1.20 1.20
A protein percentage and digestible energy/protein (DE/P) ratio of 36 % and 8.3 kcal/g have been shown
to provide maximum growth for Nile tilapia (Halver & Hardy, 2002). The diets were formulated for 36 % protein
and 15 % fat. However, in order to maintain a balanced amino acid profile in both diets, the dilution and summit
diets were formulated to have a 36 % protein and 14.6 % fat, and 38.45 % protein and 15.47 % fat content,
respectively. The formulated protein and fat contents for treatment diets are shown in Error! Not a valid
bookmark self-reference.. The protein and fat contents of diets 2-6 were dependent of the ratios of the
summit and dilution diet of which they were made up of.
Table 4.3 The ratio of summit and dilution diets used to formulate experimental feeds
BSF0 BSF5 BSF10 BSF15.6 BSF20 BSF25
Dilution diet 100.00 80.00 60.00 40.00 20.00 0.00
Summit diet 0.00 20.00 40.00 60.00 80.00 100.00
BSF % 0.00 5.00 10.00 15.60 20.00 25.00
Protein % 36.00 36.49 36.98 37.47 37.96 38.45
Lipid 14.60 14.77 14.95 15.12 15.30 15.47
BSF = Black soldier fly; BSF0 = Control diet, 0 % BSF pre-pupae meal inclusion level; BSF5 = 5 % BSF pre-pupae
meal inclusion level; BSF10 = 10 % BSF pre-pupae meal inclusion level; BSF15.6 = 15.6 % BSF pre-pupae meal
inclusion level; BSF20 = 20 % BSF pre-pupae meal inclusion level; BSF25 = 25 % BSF pre-pupae meal inclusion
level.
Stellenbosch University https://scholar.sun.ac.za
58
The feed was prepared via extrusion through a 4 mm die, with the intent to produce floating pellets. After
extrusion the pellets were oven dried and bagged in breathable polythene bags until used. Of the experimental
diets used, only diet BSF0 and BSF5 resulted in floating pellets. Increasing inclusion levels of full-fat BSF
pre-pupae meal resulted in an increased crumbling effect. The BSF20 and BSF25 diets required the addition
of a binder, Aquacube at 0.25 % dietary inclusion levels, in order to prevent complete crumbling during
extrusion.
4.2.2.1 Feeding regime
The juvenile tilapia were hand-fed twice a day at 09:00 and 17:00 until apparent satiation, based on
observation of feeding behaviour. The fish were sampled every five days, and only fed in the evenings due to
handling stress in the mornings. The amount of feed dispensed was minimum 4% and maximum 10% of body
weight of the fish.
Feeding rations were adjusted after every sampling. Feeding sessions consisted of 3-5 rounds of
feeding small amounts of feed at a time. Roughly 25 % of total daily feed allocation provided in first round,
thereafter the fish were fed a small amount of feed until apparent satiation. Diets 5 and 6 were given feed
10 min prior to feeding the other diets to allocated tanks, as the binder in these feeds called for submersion
time to soften. Losses of uneaten food due to fragmentation and dissolution of pellets were not quantified; thus
food consumption is based on virtual feed intake. Specimens appeared to have a higher feeding rate at the
17:00 feeding time than 09:00; roughly 40% of allotted feed was consumed in the morning and the remaining
60 % during the later feeding. The feed allotted was recorded daily to determine growth performance and feed
utilization at the end of the trial.
4.2.3 Water quality
Daily measurements were taken of water temperature, dissolved oxygen, pH and ammonia. The pH, ammonia
and dissolved oxygen were monitored using a water quality meter, model 8603 Handheld IP67 Combo
PH/COND./D.O (Figure 4.3.3a). Ammonia and nitrate was measured using a handheld calorimeter, HACH
DR/850, shown in Figure 4.3.3b.
Stellenbosch University https://scholar.sun.ac.za
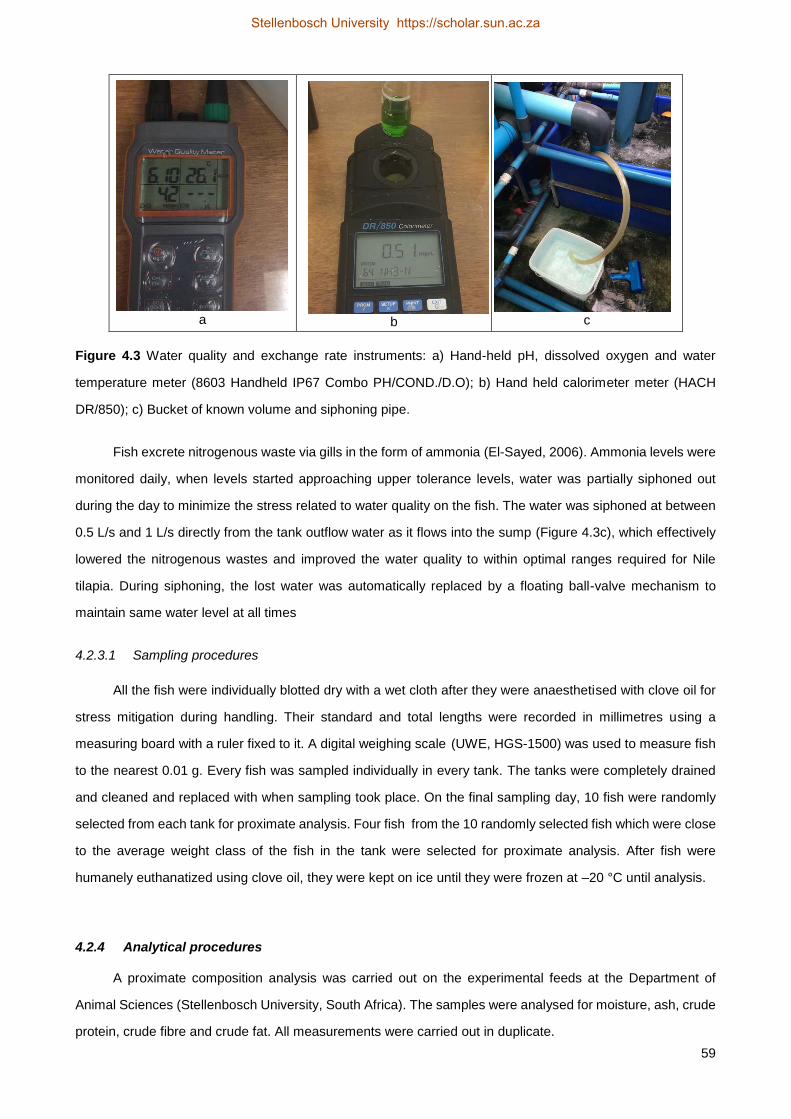
59
a b c
Figure 4.3 Water quality and exchange rate instruments: a) Hand-held pH, dissolved oxygen and water
temperature meter (8603 Handheld IP67 Combo PH/COND./D.O); b) Hand held calorimeter meter (HACH
DR/850); c) Bucket of known volume and siphoning pipe.
Fish excrete nitrogenous waste via gills in the form of ammonia (El-Sayed, 2006). Ammonia levels were
monitored daily, when levels started approaching upper tolerance levels, water was partially siphoned out
during the day to minimize the stress related to water quality on the fish. The water was siphoned at between
0.5 L/s and 1 L/s directly from the tank outflow water as it flows into the sump (Figure 4.3c), which effectively
lowered the nitrogenous wastes and improved the water quality to within optimal ranges required for Nile
tilapia. During siphoning, the lost water was automatically replaced by a floating ball-valve mechanism to
maintain same water level at all times
4.2.3.1 Sampling procedures
All the fish were individually blotted dry with a wet cloth after they were anaesthetised with clove oil for
stress mitigation during handling. Their standard and total lengths were recorded in millimetres using a
measuring board with a ruler fixed to it. A digital weighing scale (UWE, HGS-1500) was used to measure fish
to the nearest 0.01 g. Every fish was sampled individually in every tank. The tanks were completely drained
and cleaned and replaced with when sampling took place. On the final sampling day, 10 fish were randomly
selected from each tank for proximate analysis. Four fish from the 10 randomly selected fish which were close
to the average weight class of the fish in the tank were selected for proximate analysis. After fish were
humanely euthanatized using clove oil, they were kept on ice until they were frozen at –20 °C until analysis.
4.2.4 Analytical procedures
A proximate composition analysis was carried out on the experimental feeds at the Department of
Animal Sciences (Stellenbosch University, South Africa). The samples were analysed for moisture, ash, crude
protein, crude fibre and crude fat. All measurements were carried out in duplicate.
Stellenbosch University https://scholar.sun.ac.za
60
4.2.4.1 Moisture content
Two clean and dry crucibles containing 2 g of feed sample were dried at 105 °C in an oven for 24 h. The
methodology of analysis was according to the Association of Official Analytical Chemist International (AOAC,
2002), official method 934.01.
Equation 15: % Moisture = ((A+B)-C / B x 100)
A = Weight of empty and dry crucible; B = Weight of empty dried test sample; C = Weight of crucible and
moisture free test sample.
4.2.4.2 Crude protein content
The Dumas combustion method was used to determine crude protein (CP) content with the use of a
LECO FP 528 (LECO FP 528, USA). Methodology was carried out according to AOAC (2002), official method
4.2.07. A sample of known mass (± 0.1g) was placed in a folded foil cup and combusted at ± 900 °C in the
presence of oxygen. The gasses released were absorbed in special columns, where nitrogen was separated
and the concentration thereof used to calculate crude protein content with the conversion factor of 6.25. Total
crude protein was calculated using Equation 16.
Equation 16: CP (%) = Nitrogen (%) x 6.25
4.2.4.3 Crude fat content
The crude fat content was determined using acid hydrolysis. The process consists of acid hydrolysis
using hydrochloride followed by extraction of hydrolysed lipids with mixed ethers. A sample of 2 g was placed
in a test tube and mixed with 2 ml ethanol and 10 ml hydrochloride, and boiled for 30 min in a water bath. After
cooling to room temperature (30 min), the sample was poured into a separating funnel and rinsed with 10 ml
ethanol. Then 25 ml of diethyl ether and petroleum ether was added to the test tube and shaken for 1 min. The
upper portion of the solution was then poured off after which 15 ml diethyl ether and 25 ml petroleum ether
was added and the proses repeated. After the second portion was poured off, the cup containing the solution
was placed in a sand bath at 30°C until all the ether evaporated. After evaporation, Equation was used to
calculate crude fat content. The methodology was carried out according to official method 954.02 (AOAC,
2000).
Equation 17: % Fat = ((A-B)/Sample mass) x 100)
A = Collective mass of cup and fat; B= Mass of cup.
4.2.4.4 Crude fibre content
The crude fibre content was determined with the Fibretec system. After the 1 g sample was weighed off and
placed in its crucible, 150 ml of preheated sulphuric acid was added to the tube. Once the acid, containing the
sample, was brought to boil at 100 °C, the temperature was lowered to 65 °C and maintained at this
temperature for 30 min. The solution was then extracted with a suction pump and the sample washed (three
Stellenbosch University https://scholar.sun.ac.za
61
times) with 150 ml hot distilled water. The sample was then rinsed (three times) with 20 ml acetone to remove
any traces of water, and placed in a drying oven at 100 °C for 48 h. After drying, the sample was cooled for
30 min and then placed in ash oven at 500 °C for 6 h. The percentage crude fibre was calculated using
Equation 7.
Equation 7: % Crude fibre = A − B
Mass of sample x 100
A = Mass (g) of residue in crucible after drying; B = Mass (g) of residue in crucible after ashing.
The nitrogen free extract (NFE) was determined with Equation 8.
Equation 8: NFE = 100 – (moisture + ash + protein + fat + fibre)
4.2.4.5 Ash Content
The 2 g sample used for moisture determination was used to calculated values for ash content. The sample
and original crucible was placed in a furnace at 500 °C (temperature gradually increased) for 6 h. The
samples were allowed to cool for 2 h, and then placed in desiccators to cool for 30 min. The ash content was
calculated with Equation .
Equation 20: %Ash = ((D-A) / B) x 100
D = Mass (g) of crucible and sample after ashing; A = Mass (g) of dry crucible; B = Mass (g) of sample.
4.2.5 Statistical analysis
The general linear model (GLM) and analysis of variance (ANOVA) procedures using SASTM statistical
software (2015) were performed on tanks with treatment as the main effect. Homoscedasticity and normality
were tested on all parameters. Significance levels were declared at P≤0.05 (5 % significance level). The
Bonferroni’s post hoc test (SAS, 2015) was used to separate means. The ADG was determined by fitting a
simple linear regression of weight over time. The proximate compositions of the diets used are represented in
Table 3.4. Initial and final weights were used to compare growth parameters. All weight classes were well
represented in all treatments at the start of the trial, thus they were not included as a covariate in the final
models.
Table 4.4 Proximate composition of experimental diets (DM basis) with different inclusion levels of black soldier
fly (BSF) (Hermetia illucens) pre-pupae meal
Proximate analysis (%) BSF0 BSF5 BSF10 BSF15.6 BSF20 BSF25
Moisture 5.8 6.4 6.7 6.8 4.2 4.9
Crude protein 34.6 33.2 31.5 31.2 33.7 32.0
Crude lipid 7.3 7.8 9.3 11.2 12.0 11.1
Crude fibre 1.7 2.1 2.9 3.6 3.5 3.2
NFE 44.1 44.7 44.0 41.8 40.5 42.9
Stellenbosch University https://scholar.sun.ac.za
62
4.3 Results and discussion
The differences in the diets observed for crude protein and fat content differed to that formulated for
(Table 4.4). The crude protein was formulated to increase by 0.49 % with the increasing inclusion levels of
BSF25. Instead, the increasing ratios of the summit diet resulted in a decrease in the crude protein content.
Crude protein content ranged from 31.5 % to 34.56 %, and crude fat ranged from 7.32 % to 11.98 % (Table
4.4). The increased levels of fat content appear to be related to the increase in inclusion levels. Hence, the
more BSF pre-pupae meal added, the higher the crude lipid content. Similar problems were reported by
Talamuk (2016) and Newton et al. (2005b).
Growth parameters, feed utilization and conditioning factor (CF) are shown in Table . There were no
differences between initial weight (IW), final weight (FW), feed intake (FI), average daily gain (AGD), initial
conditioning factor (CF) and final CF between any of the treatments. The only significant differences observed
with regards to growth performance was that of feed conversion ratio (FCR), specific growth rates (SGR) and
protein efficiency ratio (PER) (Table ). The FCR of BSF0 (1.35) did not differ significantly (P>0.05) from FCR
of BSF5 (1.50), but did differ significantly from BSF10 (1.63). BSF5 and BSF10 did not differ significantly from
each other with regards to FCR, but FCR of BSF5 differed (P≤0.05) from FCR of BSF15.6 (1.79). There was
no significant difference between the FCR of BSF10 and BSF15.6. However, BSF10 did have a lower (P≤.05)
FCR from BSF20 (1.97) and BSF25 (1.91). The SGR were not significantly different between diets BSF0
(2.05), BSF5 (1.91) and BSF10 (1.73). The only significant difference in SGR was between BSF0 and BSF15.6
(1.68), BSF20 (1.60) and BSF25 (1.62), respectively. There was no significant difference in SGR through diet
BSF5 to BSF25. The PER of BSF0 (2.02) and BSF5 (1.82) did not differ significantly from each other. The
PER of BSF0 (2.02) did however differ significantly from BSF10 (1.68), BSF15.6 (1.55), BSF20 (1.40) and
BSF25 (1.43). The differences in PER may be attributed to decreased digestibility generally
Ash 6.5 5.9 5.6 5.5 6.2 6.1
BSF = Black soldier fly; BSF0 = Control diet, 0 % BSF pre-pupae meal inclusion level; BSF5 = 5 % BSF pre-pupae
meal inclusion level; BSF10 = 10 % BSF pre-pupae meal inclusion level; BSF15.6 = 15.6 % BSF pre-pupae meal
inclusion level; BSF20 = 20 % BSF pre-pupae meal inclusion level; BSF25 = 25 % BSF pre-pupae meal inclusion
level.
Stellenbosch University https://scholar.sun.ac.za
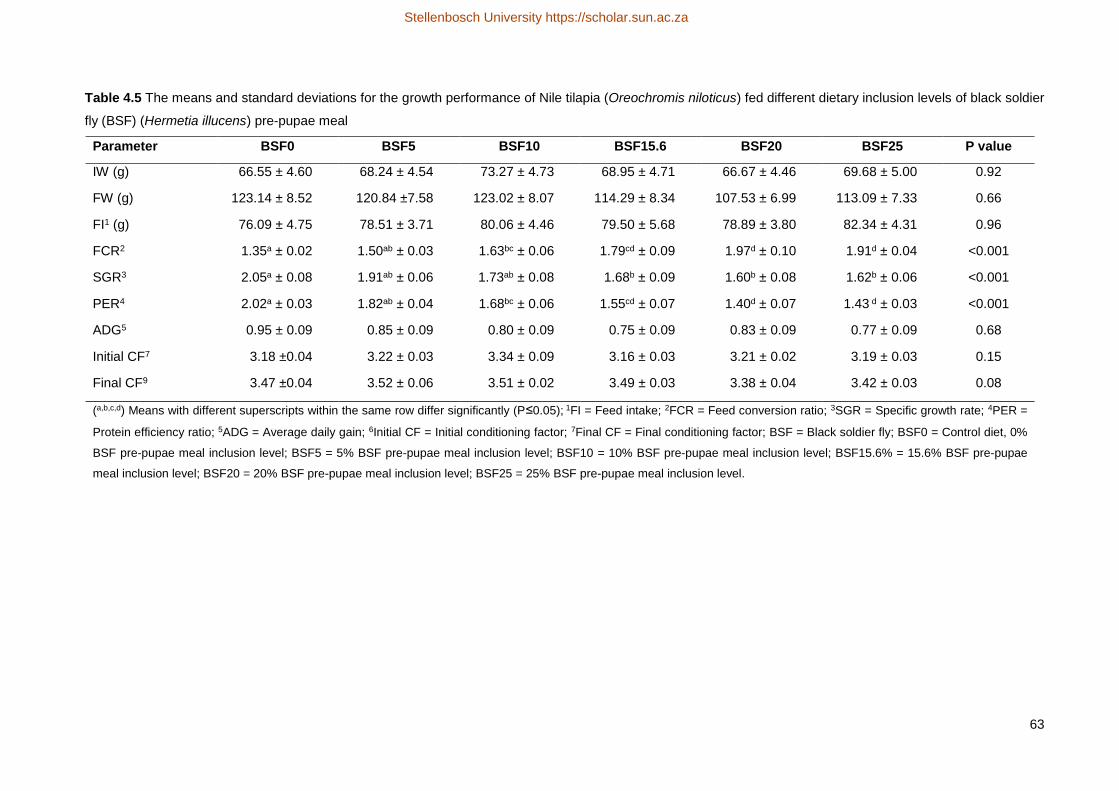
Stellenbosch University https://scholar.sun.ac.za
63
Table 4.5 The means and standard deviations for the growth performance of Nile tilapia (Oreochromis niloticus) fed different dietary inclusion levels of black soldier
fly (BSF) (Hermetia illucens) pre-pupae meal
Parameter BSF0 BSF5 BSF10 BSF15.6 BSF20 BSF25 P value
IW (g) 66.55 ± 4.60 68.24 ± 4.54 73.27 ± 4.73 68.95 ± 4.71 66.67 ± 4.46 69.68 ± 5.00 0.92
FW (g) 123.14 ± 8.52 120.84 ±7.58 123.02 ± 8.07 114.29 ± 8.34 107.53 ± 6.99 113.09 ± 7.33 0.66
FI1 (g) 76.09 ± 4.75 78.51 ± 3.71 80.06 ± 4.46 79.50 ± 5.68 78.89 ± 3.80 82.34 ± 4.31 0.96
FCR2 1.35a ± 0.02 1.50ab ± 0.03 1.63bc ± 0.06 1.79cd ± 0.09 1.97d ± 0.10 1.91d ± 0.04 <0.001
SGR3 2.05a ± 0.08 1.91ab ± 0.06 1.73ab ± 0.08 1.68b ± 0.09 1.60b ± 0.08 1.62b ± 0.06 <0.001
PER4 2.02a ± 0.03 1.82ab ± 0.04 1.68bc ± 0.06 1.55cd ± 0.07 1.40d ± 0.07 1.43 d ± 0.03 <0.001
ADG5 0.95 ± 0.09 0.85 ± 0.09 0.80 ± 0.09 0.75 ± 0.09 0.83 ± 0.09 0.77 ± 0.09 0.68
Initial CF7 3.18 ±0.04 3.22 ± 0.03 3.34 ± 0.09 3.16 ± 0.03 3.21 ± 0.02 3.19 ± 0.03 0.15
Final CF9 3.47 ±0.04 3.52 ± 0.06 3.51 ± 0.02 3.49 ± 0.03 3.38 ± 0.04 3.42 ± 0.03 0.08
(a,b,c,d) Means with different superscripts within the same row differ significantly (P≤0.05); 1FI = Feed intake; 2FCR = Feed conversion ratio; 3SGR = Specific growth rate; 4PER =
Protein efficiency ratio; 5ADG = Average daily gain; 6Initial CF = Initial conditioning factor; 7Final CF = Final conditioning factor; BSF = Black soldier fly; BSF0 = Control diet, 0%
BSF pre-pupae meal inclusion level; BSF5 = 5% BSF pre-pupae meal inclusion level; BSF10 = 10% BSF pre-pupae meal inclusion level; BSF15.6% = 15.6% BSF pre-pupae
meal inclusion level; BSF20 = 20% BSF pre-pupae meal inclusion level; BSF25 = 25% BSF pre-pupae meal inclusion level.
Stellenbosch University https://scholar.sun.ac.za
64
associated with increased lipid content in feeds, but this statement cannot be confirmed due to variations in
feed characteristics which may also have had an influence.
Although experimental diets had a similar nutritional composition and met all the nutritional requirements
of Nile tilapia, differences were observed in feed utilization with regard to FCR, SGR and PER. A worsening
trend was observed on FCR, SGR and PER with increasing inclusion levels of BSF pre-pupae meal, especially
FGR and PER. Pellet water stability worsened with increasing inclusion levels of BSF pre-pupae meal. The
growth parameters may have been influenced by reduced water stability due to reducing binding ability with
increasing inclusion levels, and potentially reduced digestibility due to the use of a binder in BSF20 and BSF25.
Diets BSF20 and BSF25 required a binder to avoid crumbling during extrusion, and displayed excellent water
stability with near zero wastage during feeding, whilst BSF15.6 had very poor water stability. However, there
were no significant differences between diet BSF15.6 (no binder and poor water stability) and BSF20 and
BSF25 (with binder and excellent water stability) with regards to FCR, SGR and PER. It is well known that fish,
like terrestrial animals, feed to satisfy their energy requirements. No significant difference in feed intake was
observed between treatment diets, suggesting that protein to energy ratios (P/E) was similar between
treatments and thus, did not affect intake. Variation in growth parameters may be related to digestibility and
nutrient availability of feed.
Given the limitations around the differences between the diets relating to the influence of increasing lipid
levels and the use of a binder in BSF20 and BSF25, the results may have been different if all diets had similar
physical properties and inclusion levels of the feed binder. The effects of BSF pre-pupae meal, increasing lipid
levels and binders related to feed quality are were discussed in Chapter 3.
4.4 Conclusion
This study demonstrates that BSF pre-pupae meal may be a viable alternative protein source for Nile tilapia.
However, flaws related to feed characteristics may render the results inaccurate. Inclusion levels of up to 5%
did not compromise growth parameters. However, due to limitations related to variation in feed stability and
the use of a binder, the results may have been different if the binder was included equally in all diets. It is
recommended that future studies make use of defatted BSF pre-pupae meal rather than full-fat meal. Also, to
test the water stability on all diets/treatments prior to the commencement of the trial, so that the necessary
measures can be put in place to maintain the uniformity of the feed quality. Furthermore, even though the
summit diet had significantly poorer results for the growth parameters, they are still acceptable relative to
industry standards and other diets.
Stellenbosch University https://scholar.sun.ac.za
65
4.5 References
Banks, I.J., Gibson, W.T. & Cameron, M.M., 2014. Growth rates of black soldier fly larvae fed on fresh human
faeces and their implication for improving sanitation. Trop. Med. Int. Health, 19(1), 14-22.
Barroso, F.G., De Haro, C., Sánchez-Muros, M.J., Venegas, E., Martínez-Sánchez, A. & Pérez-Bañón, C.,
2014. The potential of various insect species for use as food for fish. Aquac. 422, 193-201.
Bondari, K. & Sheppard, D.C., 1981. Soldier fly larvae as feed in commercial fish production. Aquac. 24,
103-109.
Diener, S., Zurbrügg, C. & Tockner, K., 2009. Conversion of organic material by black soldier fly larvae:
establishing optimal feeding rates. Waste Man. Res. 27(6), 603-610.
El-Sayed, A.-F.M., 1990. Long-term evaluation of cottonseed meal as a protein source for Nile tilapia,
Oreochromis niloticus (Linn.). Aquac. 84(3-4), 315-320.
El-Sayed, A.-F.M., 1998. Total replacement of fish meal with animal protein sources in Nile tilapia,
Oreochromis niloticus (L.), feeds. Aquac. Res. 29(4), 275-280.
El-Sayed, A.-F.M., 2006. Tilapia culture. In : Aquaculture. CABI publishing, UK.
Food and Agriculture Organization of the United Nations (FAO), 2015. Aquaculture Feed and Fertilizer
Resources Information System.
Halver, J.E. & Hardy, R.W., 2002. In: Fish Nutrition. Academic press.
Jackson, A.J., Capper, B.S. & Matty, A.J., 1982. Evaluation of some plant proteins in complete diets for the
tilapia, Sarotherodon mossambicus. Aquac. 27(2), 97-109.
Lalander, C., Diener, S., Magri, M.E., Zurbrugg, C., Lindstrom, A. & Vinneras, B., 2013. Faecal sludge
management with the larvae of the black soldier fly (Hermetia illucens) - From a hygiene aspect. Sci. Tot.
Environ. 458, 312-318.
Lim, C. & Dominy, W., 1989. Utilization of plant protein by warmwater fish. In: Proceedings of World Congress
on Vegetable Protein Utilization in Human Foods and Animal Feedstuffs. Ed: Applewhite, T.H.
pp. 245-251.
Lucas, J.S. & Southgate, P.C., 2012. Aquaculture: Farming aquatic animals and plant. Blackwell Publishing
Ltd., UK.
Myers, H.M., Tomberlin, J.K., Lambert, B.D. & Kattes, D., 2008. Development of black soldier fly (Diptera:
Stratiomyidae) larvae fed dairy manure. Environ. Entomol. 37(1), 11-15.
National Research Council (NRC), 1983. Nutrient requirements of warmwater fishes and shellfishes. Vol. 12.
National Academy of Science, Washington, USA. pp. 102.
Newton, G.L., Sheppard, D.C., Watson, D.W., Burtle, G.J., Dove, C.R., Tomberlin, J.K. & Thelen, E.E., 2005b.
The black soldier fly, Hermetia illucens, as a manure management/resource recovery tool. Symposium
on the State of the Science of Animal Manure and Waste Management, 5-7.
Stellenbosch University https://scholar.sun.ac.za
66
Newton, L., Sheppard, C., Watson, D.W., Burtle, G. & Dove, R., 2005a. Using the black soldier fly, Hermetia
illucens, as avalue-added tool for management of swine manure. Journal of Chemical Information and
Modeling.
Ofojekwu, P.C. & Ejike, C., 1984. Growth response and feed utilization in the tropical cichlid Oreochromis
niloticus (Linn.). fed on cottonseed-based artificial diets. Aquac. 42(1), 27-36.
Ogunji, J.O., Toor, R.U.A.S., Schulz, C. & Kloas, W., 2008a. Growth performance, nutrient utilization of Nile
tilapia Oreochromis niloticus fed housefly maggot meal (magmeal) diets. Turk. J. Fish. Aquat. Sci. 8(1),
141-147.
Ogunji, J.O., Kloas, W., Wirth, M., Schulz, C. & Rennert, B., 2008b. Housefly maggot meal (magmeal) as a
protein source for Oreochromis niloticus (Linn.). 21(3), 319-331.
Sánchez-Muros, M.J., Barroso, F.G. & Manzano-Agugliaro, F., 2014. Insect meal as renewable source of food
for animal feeding: a review. J. Clean. Prod. 65, 16-27.
Sheppard, D.C., Newton, G.L., Thompson, S.A. & Savage, S., 1994. A value added manure management
system using the black soldier fly. Biores. Tech. 50(3), 275-279.
Shiau, S., Chuang, J.L. & Sun, C.L., 1987. Inclusion of soybean meal in tilapia (Oreochromis niloticus x O.
aureus) diets at two protein levels. Aquac. 65(3-4), 251-261.
St-Hilaire, S., Cranfill, K., McGuire, M.A., Mosley, E.E., Tomberlin, J.K., Newton, L., … Irving, S., 2007. Fish
offal recycling by the black soldier fly produces a foodstuff high in omega-3 fatty acids. J. World. Aquac.
Soc. 38(2), 309-313.
Surendra, K.C., Olivier, R., Tomberlin, J.K., Jha, R. & Khanal, S.K., 2016. Bioconversion of organic wastes
into biodiesel and animal feed via insect farming. Renew. Energy. 98, 197-202.
Tacon, A.G.J. & Jackson, A.J., 1985. Utilization of conventional and unconventional protein sources in practical
fish feeds. Nutr. Feed. Fish. 119-145.
Tacon, A.G.J., Jauncey, K., Falaye, A., Pantha, M., MacGowan, I. & Stafford, E.A., 1983. The use of meat and
bone meal and hydrolyzed feather meal and soybean meal in practical fry and fingerling diets for
Oreochromis niloticus. In: Proceedings of the First International Symposium on Tilapia in Aquaculture.
pp. 356-365.
Talamuk, R., 2016. Comparisons of growth performance of African catfish (Clarias gariepinus) fingerlings fed
different inclusion levels of black soldier fly (Hermetia illucens) larvae meal diets. Stellenbosch University.
Viola, S. & Zohar, G., 1984. Nutritional study with market size tilapia hybrid Oreochromis in intensive culture.
Protein levels and sources. Isr. J. Aquac. 36, 3-15.
Webster, C.D. & Chhorn, L., 2006. Tilapia: biology, culture and nutrition. CRC Press.
Wu, Y.V., Tudor, K.Y., Brown, P. & Rosati, R.R., 1999. Substitution of plant protein and meat and bone meal
for fish meal in diets for Nile tilapia. N. Am. J. Aquac. 61(1), 58-63.
Zhu, F.X., Yao, Y.L., Wang, S.J., Du, R.G., Wang, W.P., Chen, X.Y., … Yang, H.Q., 2015. Housefly maggot-
treated composting as sustainable option for pig manure management. Waste Management, 35, 62-67.
Stellenbosch University https://scholar.sun.ac.za
67
Chapter 5
The effect of varying inclusion levels of black soldier fly (Hermetia illucens) (full-fat
pre-pupae meal) in feed on Nile tilapia (Oreochromis niloticus) fillets
Abstract
The effects of black soldier fly (BSF) (Hermetia illucens) pre-pupae meal on body composition and yield
of Nile tilapia (Oreochromis niloticus) were investigated for six treatments with increasing BSF inclusion levels.
The six inclusion levels were 0 % (control diet) (BSF0), 5 % (BSF5), 10 % (BSF10), 15.6 % (BSF15.6), 20 %
(BSF20) and 25 % (BSF25). No significant difference in the final body weight and carcass yield was observed
between the treatments. The only significant difference was for fillet yield between BSF5 (53.64 %) and BSF20
(50.72 %), but the yields may be inaccurate as indicated by the low R2 value (0.094). Thawing loss, due to
freezing, for BSF25 (5.36 %) was higher (P≤0.05) than that of BSF0 (3.91 %) and BSF10 (3.77 %). The
hepatosomatic index (HSI) for BSF20 and BSF25 was significantly higher than BSF0, BSF5 and BSF10. There
were no differences (P>0.05) for body composition parameters measured (i.e. moisture, crude protein, lipid
and ash content) for the fillets between any of the treatments. This study concluded that full-fat BSF pre-pupae
meal can be included in Nile tilapia diets by up to 25 % of the “as fed” diets without any effect on the fillet
composition, final body weight or carcass yield, whilst the HSI differed significantly when inclusion levels
exceeded 20 % of the total diet.
Key words: Black soldier fly, pre-pupae meal, Nile tilapia, carcass yield
5.1 Introduction
Fish are rich in vitamins, minerals, fatty acids and proteins (including all essential amino acids). In fact,
its high nutritional value makes it an important food source for humans (Murray & Burt, 2001). Fish make up
more than 50 % of the total animal protein intake in underdeveloped countries (i.e. Africa and Asia), providing
an important source of essential fatty acids (EFA) and other important micronutrients (FAO, 2016). Fish and
mammals (e.g., beef) consist of the same principal constituents (Table ). The chemical composition of fish is
affected by numerous factors such as species, age, environment and season (Huss, 1995; Murray & Burt,
2001). Other factors affecting the chemical composition of fish include feed intake, activity level and spawning.
The chemical composition of fish is of importance to the processor, nutritionist, cook and consumer.
Processors require information on the nature of the raw material in order to apply suitable processing methods,
while nutritionists need to know its nutritional content (Murray & Burt, 2001). For example, knowing the lipid
content and composition may be of importance to a cook or consumer due to its influence on taste (Johansson
et al., 2000) and the preparation required (Murray & Burt, 2001), and to a producer owing to its influence on
shelf life (related to oxidative activity of lipids) (Kjær et al., 2008).
Stellenbosch University https://scholar.sun.ac.za
68
Table 5.1 Principal constituents of fish, adapted from Huss (1995)
Constitution Fish (Normal fillet variation) Beef (Isolated muscle)
Protein (%) 16-21 20
Lipid (%) 0.2-25 3
Carbohydrate (%) <0.50 1
Ash (%) 1.2-1.5 1
Water (%) 66-81 75
Fish protein is highly digestible, with small portions of connective tissues (Steffens et al., 2006).
Structural protein in fish have a similar amino acid composition to corresponding proteins in mammalian muscle
(Table ). It consists of a combination of amino acids that are comparable to that of meat, milk and eggs, which
is highly suited to the nutritional requirements of humans (Murray & Burt, 2001). To utilize diets for its full
potential, amino acids must be present in the correct proportions (Murray & Burt, 2001). In contrast to cereal
and grain proteins, fish proteins contain relatively high lysine and methionine concentrations (Murray & Burt,
2001). The use of fishmeal in grain based diets increases the biological value thereof by providing amino acids
which would otherwise be insufficient (Huss, 1995).
Table 5.2 General essential amino acid (EAA) composition of fish, milk, beef and eggs as a percentage (%)
of lysine, adapted from Huss (1995).
Amino-acid Fish Milk Beef Eggs
Lysine 100.00 100.00 100.00 100.00
Tryptophan 11.36 19.75 11.83 27.94
Histidine 22.73 32.10 40.86 32.35
Phenylalanine 44.32 65.43 48.39 79.41
Leucine 95.45 125.93 88.17 123.53
Isoleucine 68.18 88.89 55.91 104.41
Threonine 52.27 54.32 45.16 80.88
Methionine-cystine 45.45 53.09 31.18 48.53
Valine 68.18 93.83 53.76 119.12
It has been shown that the lipid composition of fish, taking all species into account, has the highest level
of variation compared to other constituents and an inverse relationship with water content (Murray & Burt,
2001). Furthermore, there may be a variation in the lipid distribution throughout the flesh of fish. For instance,
the concentration of lipid may be double in muscles close to the head compared to that in the tail of Pacific
salmon (Murray & Burt, 2001). Fish use their stored lipids as energy reserves during spawning and migration
(Huss, 1995). Ighwela et al. (2014) reported an increased HSI with increased dietary energy levels in Nile
tilapia diets. This may be attributed to the storing effect of excess energy from carbohydrates as lipids in the
Stellenbosch University https://scholar.sun.ac.za
69
liver. Assessment of the HSI is an useful and a widely practiced measurement tool in assessing food value.
Lipids are located in subcutaneous tissue, belly flap muscle, as well as the general muscle structure of the fish
(Huss, 1995). Fish muscle consists of light and dark muscle, with the latter containing a higher concentration
of fat and certain minerals (Murray & Burt, 2001). Fats are normally concentrated close to myocommata and
in-between the light and dark muscle (Kiessling et al., 1991). Freshwater fish have a slightly lower content of
polyunsaturated fatty acids (PUFA) (four to six double bonds) than corresponding lipids from marine fish
(Stansby & Hall, 1967). Fish oils contain the linoleic and linolenic acids regarded as essential fatty acids (EFA)
in human nutrition, as humans cannot synthesize these naturally. These EFA, along with other essential PUFA
help to prevent arteriosclerosis, skin diseases and are associated with neurological benefits in growing children
(Huss, 1995). The carbohydrates constitution in fish muscle are generally very low, usually less than 1%, but
up to 2% in dark muscle of some species (Murray & Burt, 2001). The potential influence of BSF on the Nile
tilapia fillets are unclear, and thus requires investigation.
5.2 Material and methods
5.2.1 Experimental system
The trial was carried out as described in Chapter 4, Section 4.2.1.
5.2.2 Experimental feed
Composition of experimental feed and inclusion levels were discussed in Chapter 4, Section 4.2.2.
5.2.3 Experimental procedure
The description of the treatment diets, quantity of Nile tilapia used and the feeding procedure are
described in Chapter 4. On the final sampling day (day 30), 10 fish per tank were euthanized using clove oil,
and immediately placed on ice in foam boxes, vacuum sealed and frozen at -20 °C. Four fish close to the
average weight per tank were selected for proximate analysis from each tank. Hence, with seven tanks a total
of 28 fish were selected to represent each diet (treatment). Weights were recorded before fish were
euthanized, as well as after defrosting to take moisture loss into account. Fish designated for proximate
analysis were defrosted overnight (12 h) in a fridge at 4 °C. Once defrosted, the fish were rinsed with freshwater
for 2 seconds to remove excess mucus, and dried with a paper towel before weighing. Water loss was
determined through the difference in weight and expressed as a percentage of the initial body weight (Vieira
et al., 2009; Ahamed Ali, 1988). All of the fish were gutted, dressed and individually filleted by hand. After
removal of the head, dorsal, ventral and tail fins, fillets were removed from the skeletal structure and skin
before being weighed to obtain the fillet yield (Figure .1). Livers were removed and weighed individually to
determine the hepatosomatic index (HSI). The fillet yield was calculated as a percentage of the initial body
weight before freezing (Clement & Lovell, 1994). One person carried out filleting in a standardized manner for
comparison between treatment diets to attempt to maintain uniformity during the procedure. After the weight
Stellenbosch University https://scholar.sun.ac.za
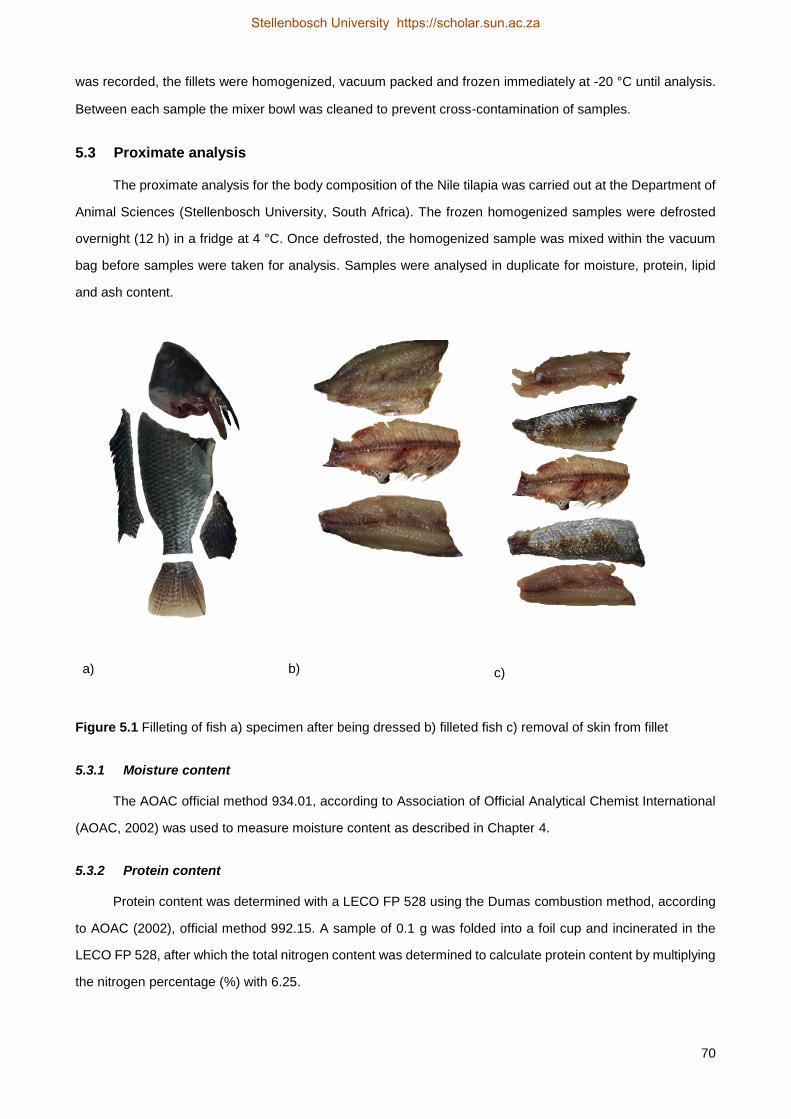
70
was recorded, the fillets were homogenized, vacuum packed and frozen immediately at -20 °C until analysis.
Between each sample the mixer bowl was cleaned to prevent cross-contamination of samples.
5.3 Proximate analysis
The proximate analysis for the body composition of the Nile tilapia was carried out at the Department of
Animal Sciences (Stellenbosch University, South Africa). The frozen homogenized samples were defrosted
overnight (12 h) in a fridge at 4 °C. Once defrosted, the homogenized sample was mixed within the vacuum
bag before samples were taken for analysis. Samples were analysed in duplicate for moisture, protein, lipid
and ash content.
a) b) c)
Figure 5.1 Filleting of fish a) specimen after being dressed b) filleted fish c) removal of skin from fillet
5.3.1 Moisture content
The AOAC official method 934.01, according to Association of Official Analytical Chemist International
(AOAC, 2002) was used to measure moisture content as described in Chapter 4.
5.3.2 Protein content
Protein content was determined with a LECO FP 528 using the Dumas combustion method, according
to AOAC (2002), official method 992.15. A sample of 0.1 g was folded into a foil cup and incinerated in the
LECO FP 528, after which the total nitrogen content was determined to calculate protein content by multiplying
the nitrogen percentage (%) with 6.25.
Stellenbosch University https://scholar.sun.ac.za
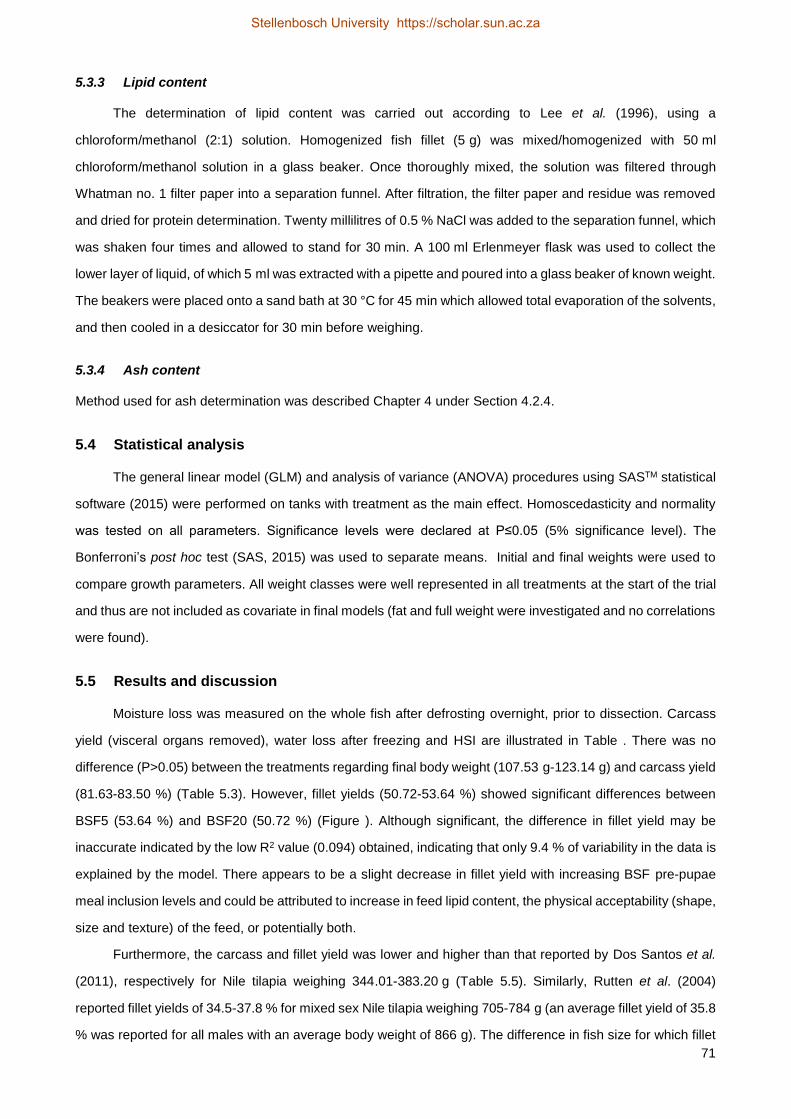
71
5.3.3 Lipid content
The determination of lipid content was carried out according to Lee et al. (1996), using a
chloroform/methanol (2:1) solution. Homogenized fish fillet (5 g) was mixed/homogenized with 50 ml
chloroform/methanol solution in a glass beaker. Once thoroughly mixed, the solution was filtered through
Whatman no. 1 filter paper into a separation funnel. After filtration, the filter paper and residue was removed
and dried for protein determination. Twenty millilitres of 0.5 % NaCl was added to the separation funnel, which
was shaken four times and allowed to stand for 30 min. A 100 ml Erlenmeyer flask was used to collect the
lower layer of liquid, of which 5 ml was extracted with a pipette and poured into a glass beaker of known weight.
The beakers were placed onto a sand bath at 30 °C for 45 min which allowed total evaporation of the solvents,
and then cooled in a desiccator for 30 min before weighing.
5.3.4 Ash content
Method used for ash determination was described Chapter 4 under Section 4.2.4.
5.4 Statistical analysis
The general linear model (GLM) and analysis of variance (ANOVA) procedures using SASTM statistical
software (2015) were performed on tanks with treatment as the main effect. Homoscedasticity and normality
was tested on all parameters. Significance levels were declared at P≤0.05 (5% significance level). The
Bonferroni’s post hoc test (SAS, 2015) was used to separate means. Initial and final weights were used to
compare growth parameters. All weight classes were well represented in all treatments at the start of the trial
and thus are not included as covariate in final models (fat and full weight were investigated and no correlations
were found).
5.5 Results and discussion
Moisture loss was measured on the whole fish after defrosting overnight, prior to dissection. Carcass
yield (visceral organs removed), water loss after freezing and HSI are illustrated in Table . There was no
difference (P>0.05) between the treatments regarding final body weight (107.53 g-123.14 g) and carcass yield
(81.63-83.50 %) (Table 5.3). However, fillet yields (50.72-53.64 %) showed significant differences between
BSF5 (53.64 %) and BSF20 (50.72 %) (Figure ). Although significant, the difference in fillet yield may be
inaccurate indicated by the low R2 value (0.094) obtained, indicating that only 9.4 % of variability in the data is
explained by the model. There appears to be a slight decrease in fillet yield with increasing BSF pre-pupae
meal inclusion levels and could be attributed to increase in feed lipid content, the physical acceptability (shape,
size and texture) of the feed, or potentially both.
Furthermore, the carcass and fillet yield was lower and higher than that reported by Dos Santos et al.
(2011), respectively for Nile tilapia weighing 344.01-383.20 g (Table 5.5). Similarly, Rutten et al. (2004)
reported fillet yields of 34.5-37.8 % for mixed sex Nile tilapia weighing 705-784 g (an average fillet yield of 35.8
% was reported for all males with an average body weight of 866 g). The difference in fish size for which fillet
Stellenbosch University https://scholar.sun.ac.za
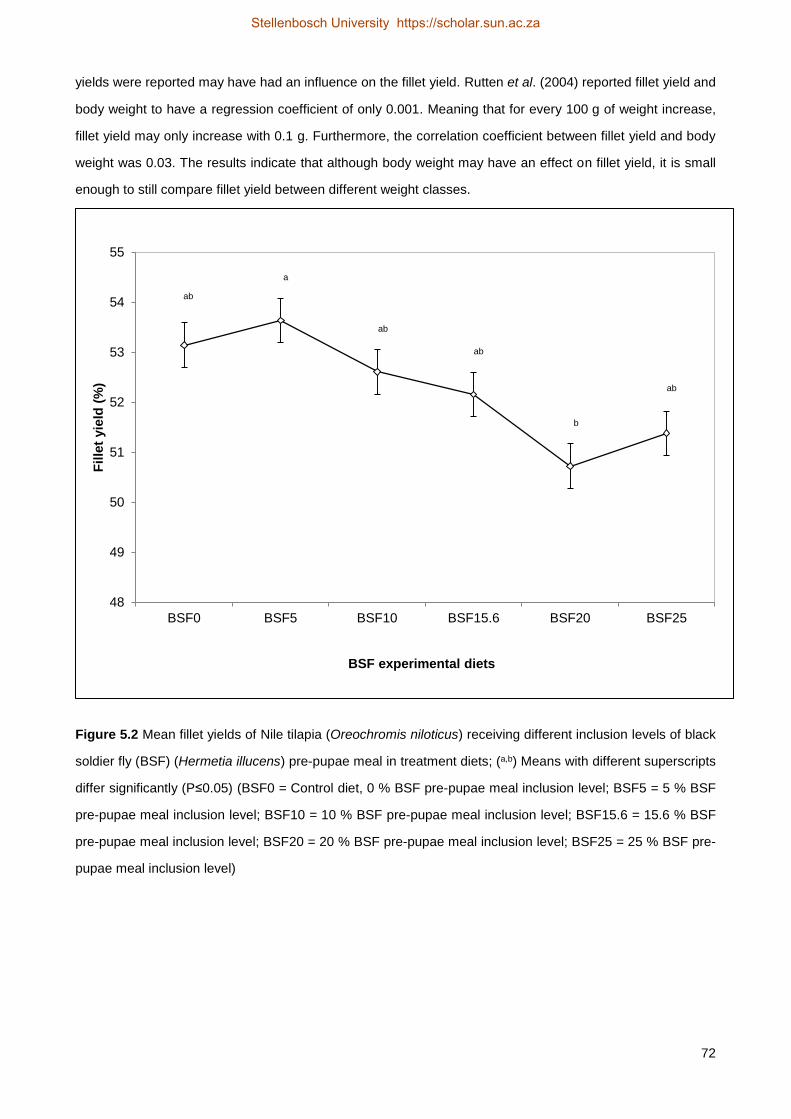
72
yields were reported may have had an influence on the fillet yield. Rutten et al. (2004) reported fillet yield and
body weight to have a regression coefficient of only 0.001. Meaning that for every 100 g of weight increase,
fillet yield may only increase with 0.1 g. Furthermore, the correlation coefficient between fillet yield and body
weight was 0.03. The results indicate that although body weight may have an effect on fillet yield, it is small
enough to still compare fillet yield between different weight classes.
Figure 5.2 Mean fillet yields of Nile tilapia (Oreochromis niloticus) receiving different inclusion levels of black
soldier fly (BSF) (Hermetia illucens) pre-pupae meal in treatment diets; (a,b) Means with different superscripts
differ significantly (P≤0.05) (BSF0 = Control diet, 0 % BSF pre-pupae meal inclusion level; BSF5 = 5 % BSF
pre-pupae meal inclusion level; BSF10 = 10 % BSF pre-pupae meal inclusion level; BSF15.6 = 15.6 % BSF
pre-pupae meal inclusion level; BSF20 = 20 % BSF pre-pupae meal inclusion level; BSF25 = 25 % BSF pre-
pupae meal inclusion level)
ab
a
ab
ab
b
ab
48
49
50
51
52
53
54
55
BSF0 BSF5 BSF10 BSF15.6 BSF20 BSF25
Fille
t yie
ld (
%)
BSF experimental diets
Stellenbosch University https://scholar.sun.ac.za
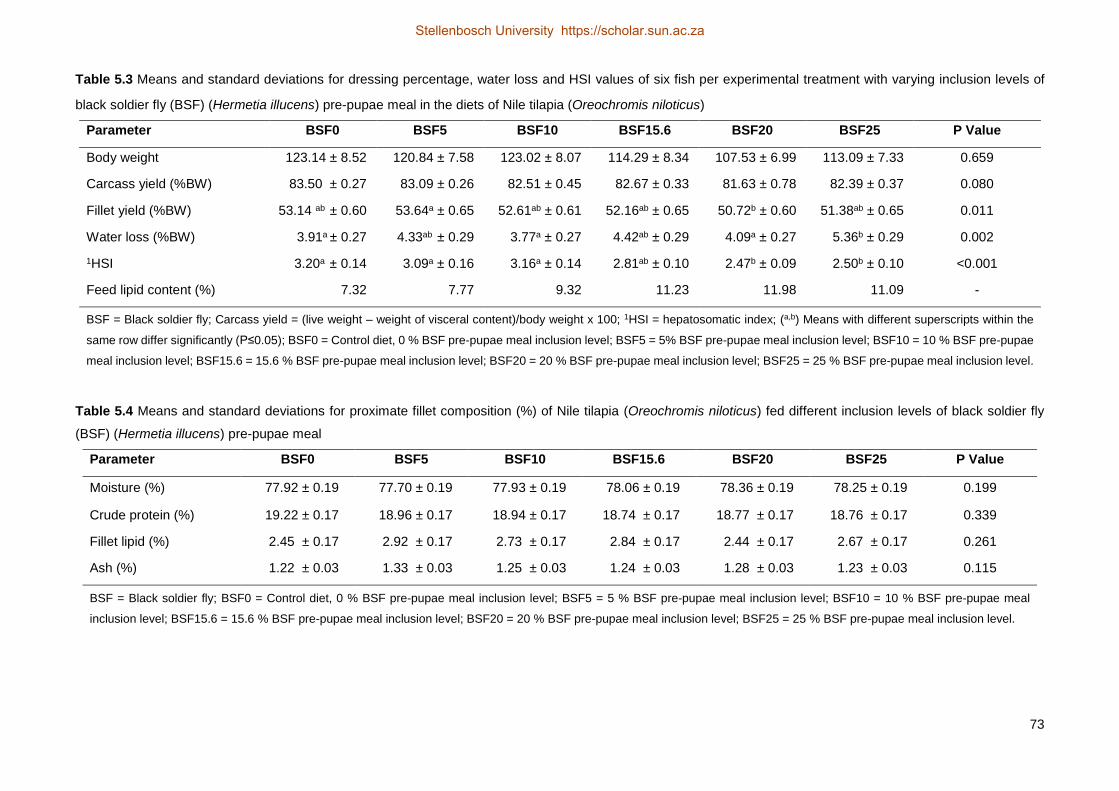
73
Table 5.3 Means and standard deviations for dressing percentage, water loss and HSI values of six fish per experimental treatment with varying inclusion levels of
black soldier fly (BSF) (Hermetia illucens) pre-pupae meal in the diets of Nile tilapia (Oreochromis niloticus)
Parameter BSF0 BSF5 BSF10 BSF15.6 BSF20 BSF25 P Value
Body weight 123.14 ± 8.52 120.84 ± 7.58 123.02 ± 8.07 114.29 ± 8.34 107.53 ± 6.99 113.09 ± 7.33 0.659
Carcass yield (%BW) 83.50 ± 0.27 83.09 ± 0.26 82.51 ± 0.45 82.67 ± 0.33 81.63 ± 0.78 82.39 ± 0.37 0.080
Fillet yield (%BW) 53.14 ab ± 0.60 53.64a ± 0.65 52.61ab ± 0.61 52.16ab ± 0.65 50.72b ± 0.60 51.38ab ± 0.65 0.011
Water loss (%BW) 3.91a ± 0.27 4.33ab ± 0.29 3.77a ± 0.27 4.42ab ± 0.29 4.09a ± 0.27 5.36b ± 0.29 0.002
1HSI 3.20a ± 0.14 3.09a ± 0.16 3.16a ± 0.14 2.81ab ± 0.10 2.47b ± 0.09 2.50b ± 0.10 <0.001
Feed lipid content (%) 7.32 7.77 9.32 11.23 11.98 11.09 -
BSF = Black soldier fly; Carcass yield = (live weight – weight of visceral content)/body weight x 100; 1HSI = hepatosomatic index; (a,b) Means with different superscripts within the
same row differ significantly (P≤0.05); BSF0 = Control diet, 0 % BSF pre-pupae meal inclusion level; BSF5 = 5% BSF pre-pupae meal inclusion level; BSF10 = 10 % BSF pre-pupae
meal inclusion level; BSF15.6 = 15.6 % BSF pre-pupae meal inclusion level; BSF20 = 20 % BSF pre-pupae meal inclusion level; BSF25 = 25 % BSF pre-pupae meal inclusion level.
Table 5.4 Means and standard deviations for proximate fillet composition (%) of Nile tilapia (Oreochromis niloticus) fed different inclusion levels of black soldier fly
(BSF) (Hermetia illucens) pre-pupae meal
Parameter BSF0 BSF5 BSF10 BSF15.6 BSF20 BSF25 P Value
Moisture (%) 77.92 ± 0.19 77.70 ± 0.19 77.93 ± 0.19 78.06 ± 0.19 78.36 ± 0.19 78.25 ± 0.19 0.199
Crude protein (%) 19.22 ± 0.17 18.96 ± 0.17 18.94 ± 0.17 18.74 ± 0.17 18.77 ± 0.17 18.76 ± 0.17 0.339
Fillet lipid (%) 2.45 ± 0.17 2.92 ± 0.17 2.73 ± 0.17 2.84 ± 0.17 2.44 ± 0.17 2.67 ± 0.17 0.261
Ash (%) 1.22 ± 0.03 1.33 ± 0.03 1.25 ± 0.03 1.24 ± 0.03 1.28 ± 0.03 1.23 ± 0.03 0.115
BSF = Black soldier fly; BSF0 = Control diet, 0 % BSF pre-pupae meal inclusion level; BSF5 = 5 % BSF pre-pupae meal inclusion level; BSF10 = 10 % BSF pre-pupae meal
inclusion level; BSF15.6 = 15.6 % BSF pre-pupae meal inclusion level; BSF20 = 20 % BSF pre-pupae meal inclusion level; BSF25 = 25 % BSF pre-pupae meal inclusion level.
Stellenbosch University https://scholar.sun.ac.za
Stellenbosch University https://scholar.sun.ac.za
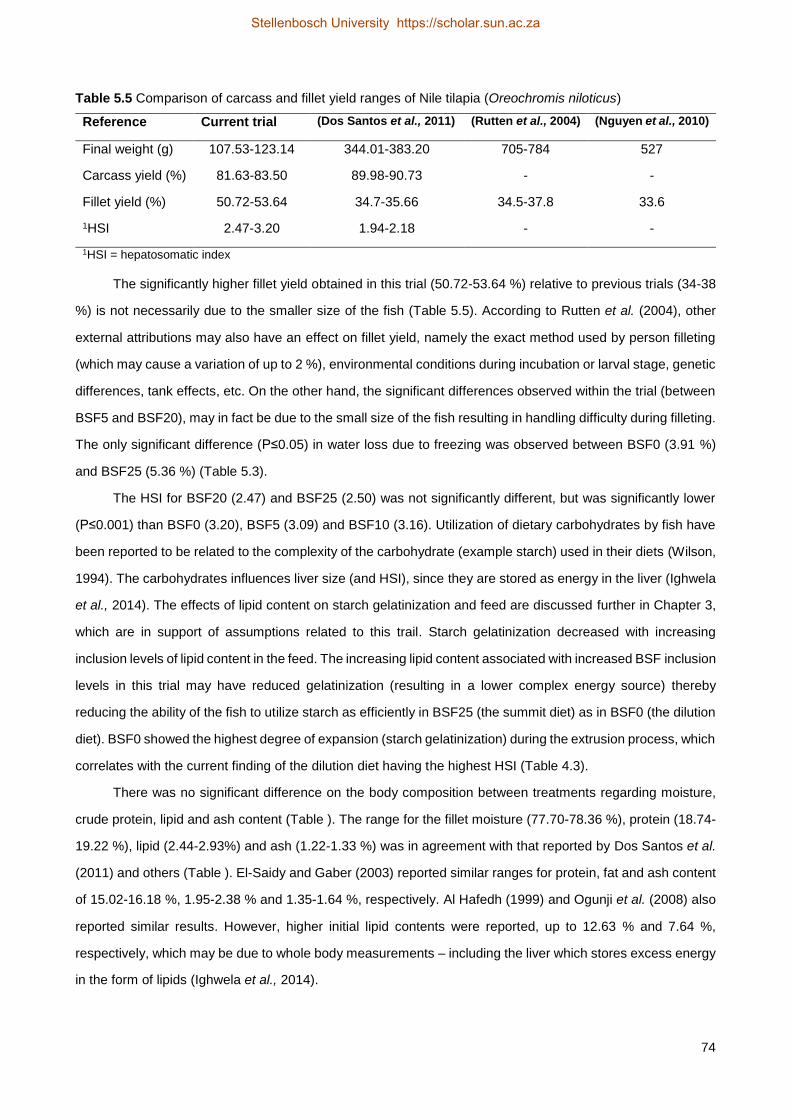
74
Table 5.5 Comparison of carcass and fillet yield ranges of Nile tilapia (Oreochromis niloticus)
Reference Current trial (Dos Santos et al., 2011) (Rutten et al., 2004) (Nguyen et al., 2010)
Final weight (g) 107.53-123.14 344.01-383.20 705-784 527
Carcass yield (%) 81.63-83.50 89.98-90.73 - -
Fillet yield (%) 50.72-53.64 34.7-35.66 34.5-37.8 33.6
1HSI 2.47-3.20 1.94-2.18 - -
1HSI = hepatosomatic index
The significantly higher fillet yield obtained in this trial (50.72-53.64 %) relative to previous trials (34-38
%) is not necessarily due to the smaller size of the fish (Table 5.5). According to Rutten et al. (2004), other
external attributions may also have an effect on fillet yield, namely the exact method used by person filleting
(which may cause a variation of up to 2 %), environmental conditions during incubation or larval stage, genetic
differences, tank effects, etc. On the other hand, the significant differences observed within the trial (between
BSF5 and BSF20), may in fact be due to the small size of the fish resulting in handling difficulty during filleting.
The only significant difference (P≤0.05) in water loss due to freezing was observed between BSF0 (3.91 %)
and BSF25 (5.36 %) (Table 5.3).
The HSI for BSF20 (2.47) and BSF25 (2.50) was not significantly different, but was significantly lower
(P≤0.001) than BSF0 (3.20), BSF5 (3.09) and BSF10 (3.16). Utilization of dietary carbohydrates by fish have
been reported to be related to the complexity of the carbohydrate (example starch) used in their diets (Wilson,
1994). The carbohydrates influences liver size (and HSI), since they are stored as energy in the liver (Ighwela
et al., 2014). The effects of lipid content on starch gelatinization and feed are discussed further in Chapter 3,
which are in support of assumptions related to this trail. Starch gelatinization decreased with increasing
inclusion levels of lipid content in the feed. The increasing lipid content associated with increased BSF inclusion
levels in this trial may have reduced gelatinization (resulting in a lower complex energy source) thereby
reducing the ability of the fish to utilize starch as efficiently in BSF25 (the summit diet) as in BSF0 (the dilution
diet). BSF0 showed the highest degree of expansion (starch gelatinization) during the extrusion process, which
correlates with the current finding of the dilution diet having the highest HSI (Table 4.3).
There was no significant difference on the body composition between treatments regarding moisture,
crude protein, lipid and ash content (Table ). The range for the fillet moisture (77.70-78.36 %), protein (18.74-
19.22 %), lipid (2.44-2.93%) and ash (1.22-1.33 %) was in agreement with that reported by Dos Santos et al.
(2011) and others (Table ). El-Saidy and Gaber (2003) reported similar ranges for protein, fat and ash content
of 15.02-16.18 %, 1.95-2.38 % and 1.35-1.64 %, respectively. Al Hafedh (1999) and Ogunji et al. (2008) also
reported similar results. However, higher initial lipid contents were reported, up to 12.63 % and 7.64 %,
respectively, which may be due to whole body measurements – including the liver which stores excess energy
in the form of lipids (Ighwela et al., 2014).
Stellenbosch University https://scholar.sun.ac.za
75
The experimental diets had an increasing lipid content associated with increasing levels of BSF pre-
pupae meal ranging from 7.32 % to 11.98 % (Chapter 3, Table 3.4). Hanley (1991) reported that increasing
dietary lipid content, ranging from 5.1 % to 12.4 %, had a slight, but non-significant effect on whole body
moisture (73-75 %) and protein (13.8-15.2 %) content. Yet, it significantly increased carcass (12 % in control
to 7.9%) and visceral (1.3-18.5%) lipid levels. No variation in biomass indicates an inverse relationship
between moisture, protein and lipid content, as moisture is displaced with increasing lipid and protein levels,
and visa-versa. Hanley's (1991) findings supports the results from this trial. The Pearson’s correlation
coefficient’s (r) and accompanying p-values showed that protein and fat had a moderately, but significant,
negative correlation of r = -0.543 (P = <0.001) and r = -0.414 (P = 0.006), respectively. Due to considerable
differences between fish tissues (Steffens et al., 2006), proximate whole body composition cannot be
compared to fillet composition. Furthermore, no literature was found on the effects of BSF pre-pupae meal on
the proximate body composition of Nile tilapia.
5.6 Conclusions
Based on the findings from the analyses in this trial, it is unclear whether BSF pre-pupae meal has a
distinctive influence (positively or negatively) on the fillet yield of Nile tilapia. However, there are signs that
there might be a slight inverse relationship between the BSF pre-pupae meal inclusion level and fillet yield.
The lack of significant difference in carcass yield demonstrates that the difference in fillet yield might be due
to human error during the filleting process which is intensified by the small filleting size of the fish. The study
demonstrate that BSF pre-pupae meal inclusion levels of up to 25% in Nile tilapia diets had no effect on body
composition. Based on the results obtained, BSF pre-pupae meal could potentially be incorporated into Nile
tilapia diets without changing the proximate composition of the fillet. However, this cannot be regarded as a
conclusion due to external factors (the variation in feed characteristics) that could have influenced the fillet
composition. Furthermore, it is recommended to harvest larger fish so as to mitigate the potential effects of
human error during filleting. It is also advised to investigate how the ingredients affect the degree of
gelatinization of the processed feed. Among other factors, the lipid content may have an effect on the degree
of gelatinization. Gelatinization affects the availability of certain nutrients such as carbohydrates (making it
more digestible with a higher degree of gelatinization), which affects the available energy and HSI of Nile
tilapia. Therefore, the degree of gelatinization can have an indirect effect on HSI of Nile tilapia (higher degree
of gelatinization can increase the HSI due to greater availability of digestible energy), since tilapia store excess
available energy in their liver deposits. Also, the inconsistent inclusion of pellet binder may have influenced
the result to a certain extend.
Stellenbosch University https://scholar.sun.ac.za
76
5.7 References
Abdel-Tawwab, M., Ahmad, M.H., Khattab, Y.A.E. & Shalaby, A.M.E., 2010. Effect of dietary protein level,
initial body weight, and their interaction on the growth, feed utilization, and physiological alterations of
Nile tilapia, Oreochromis niloticus (L.). Aquac. 298(3), 267-274.
Ahamed Ali, S., 1988. Water stability of prawn feed pellets prepared using different binding materials with
special reference to tapioca. Indian J. Fish. 35(1), 46-51.
Al Hafedh, Y.S., 1999. Effects of dietary protein on growth and body composition of Nile tilapia, Oreochromis
niloticus L. Aquac. Res. 30(5), 385-393.
Clement, S. & Lovell, R.T., 1994. Comparison of processing yield and nutrient composition of cultured Nile
tilapia (Oreochromis niloticus) and channel catfish (Ictalurus punctatus). Aquac. 119(2-3), 299-310.
Dos Santos, L.D., Furuya, W.M., Da Silva, L.C.R., Matsushita, M. & De Castro Silva, T.S., 2011. Dietary
conjugated linoleic acid (CLA) for finishing Nile tilapia. Aquac. Nutr. 17(2).
El-Saidy, D.M.S.D. & Gaber, M.M.A., 2003. Replacement of fish meal with a mixture of different plant protein
sources in juvenile Nile tilapia, Oreochromis niloticus (L.) diets. Aquac. Res. 34(13), 1119-1127.
Food and Agriculture Organization of the United Nations (FAO), 2016. The State of World Fisheries and
Aquaculture 2016. http://www.fao.org/3/a-i5555e.pdf. Rome.
Hanley, F., 1991. Effects of feeding supplementary diets containing varying levels of lipid on growth, food
conversion, and body composition of Nile tilapia, Oreochromis niloticus (L.). Aquac. 93, 323-334.
Huss, H.H., 1995. Quality and quality changes in fresh fish. Vol. 348. Rome.
Ighwela, K.A., Ahmad, A.B. & Abol-Munafi, A.B., 2014. The selection of viscerosomatic and hepatosomatic
indices for the measurement and analysis of Oreochromis niloticus condition fed with varying dietary
maltose levels. Int. J. Fauna Biol. Stud. IJFBS. 1, 18-20.
Johansson, L., Kiessling, A., Kiessling, K.-H. & Berglund, L., 2000. Effects of altered ration levels on sensory
characteristics, lipid content and fatty acid composition of rainbow trout (Oncorhynchus mykiss). Food
Qual. Pref. 11(3), 247-254.
Kiessling, A., Storebakken, T., Åsgård, T. & Kiessling, K.-H., 1991. Changes in the structure and function of
the epaxial muscle of rainbow trout (Oncorhynchus mykiss) in relation to ration and age: I. Growth
dynamics. Aquac. 93(4), 373-387.
Kjær, M., Todorčević, M., Torstensen, B. & Vegusdal, A., 2008. Dietary n-3 HUFA affects mitochondrial fatty
acid β-oxidation capacity and susceptibility to oxidative stress in Atlantic salmon. Lipids. 43(9), 813-827.
Lee, C.M., Trevino, B. & Chaiyawat, M., 1996. A simple and rapid solvent extraction method for determining
total lipids in fish tissue. J. AOAC Int. 79(2), 487-492.
Murray, J. & Burt, J.R., 2001. The composition of fish.
Nguyen, N.H., Ponzoni, R.W., Abu-Bakar, K.R., Hamzah, A., Khaw, H.L. & Yee, H.Y., 2010. Correlated
response in fillet weight and yield to selection for increased harvest weight in genetically improved farmed
tilapia (GIFT strain), Oreochromis niloticus. Aquac. 305(1), 1-5.
Stellenbosch University https://scholar.sun.ac.za
77
Ogunji, J.O., Kloas, W., Wirth, M., Schulz, C. & Rennert, B., 2008. Housefly maggot meal (magmeal) as a
protein source for Oreochromis niloticus (Linn.). 21(3), 319-331.
Rutten, M.J., Bovenhuis, H. & Komen, H., 2004. Modeling fillet traits based on body measurements in three
Nile tilapia strains (Oreochromis niloticus L.). Aquac. 231(1), 113-122.
Stansby, M.E. & Hall, A.S., 1967. Chemical composition of commercially important fish of the United States.
Fish. 3(4), 29-46.
Steffens, W., 2006. Freshwater fish – wholesome foodstuffs. Bulg. J. Agric. Sci. 12(2), 320.
Vieira, C., Diaz, M.T., Martínez, B. & García-Cachán, M.D. 2009. Effect of frozen storage conditions
(temperature and length of storage) on microbiological and sensory quality of rustic crossbred beef at
different states of ageing. Meat Sci. 83(3), 398-404.
Wilson, R.P., 1994. Utilization of dietary carbohydrate by fish. Aquac. 124(1-4), 67-80.
Stellenbosch University https://scholar.sun.ac.za
78
Chapter 6
General conclusion
The dependence on wild catch fisheries has been alleviated to a large extent through aquaculture
practices over the past few decades. However, the reliance on fishmeal as a conventional protein source in
aquaculture feeds present long-term sustainability issues. The world’s population is growing and will require a
higher output of fish as a protein source. The findings in this study showed that full-fat BSF pre-pupae meal
has the potential to supplement fishmeal in the diets of Nile tilapia as inclusion levels of up to 5 % had no
significant negative effect on any of the growth parameters investigated. Furthermore, there were no significant
difference in the final weights between any of the treatment classes.
No significant difference in carcass yield was observed between treatments. A significant differences in
fillet yield was observed for the BSF20 treatment, but this may be attributed to human error during the filleting
due to the small size of the fish. There was no significant difference in the proximate composition of the fillets
between treatments. The study concludes that carcass yield and the proximate composition of Nile tilapia fillets
(moisture, protein, lipids and ash content) were unaffected by the inclusion of full-fat BSF pre-pupae meal.
Variation in feed stability and the necessary use of a binder at inclusion levels of 20 % and 25 % may
have been different had all pellets been equal in terms of stability and overall quality. The BSF pre-pupae meal
had an influence on the unit density, sinking velocity, water uptake and leaching rate of pellets. The reduced
feed quality may be associated with the increasing lipid contents with increasing BSF pre-pupae meal.
Future recommendations:
It is recommended that future studies use defatted, instead of full-fat, BSF pre-pupae meal as a protein
source to ensure optimal gelatinization and binding of the feed. The water stability should also be tested for all
diets before carrying out an experimental trial. In addition, uniform experimental diets, with regard to quality
parameters, should be used. Further studies should be carried out over a longer feeding period to ensure that
the fish grow large enough for harvesting, thereby mitigating the potential influence of human error related to
filleting. The current trial was conducted over 30 days and the period was sufficient to obtain six measuring
points as measurements were taken every five days. However, the trial was ended at 30 days due to worsening
water quality related to carrying capacity of the RAS. Therefore, future studies should take this into account
during the experimental design stage.
Stellenbosch University https://scholar.sun.ac.za

79
Stellenbosch University https://scholar.sun.ac.za
Related Documents