©FUNPEC-RP www.funpecrp.com.br Genetics and Molecular Research 14 (4): 17916-17926 (2015) Comparative transcriptome analysis of Nile tilapia (Oreochromis niloticus) in response to alkalinity stress Y. Zhao, J. Wang, J. Thammaratsuntorn, J.W. Wu, J.H. Wei, Y. Wang, J.W. Xu and J.L. Zhao Key Laboratory of Freshwater Aquatic Genetic Resources, Shanghai Ocean University, Shanghai, China Corresponding author: J.L. Zhao E-mail: [email protected] Genet. Mol. Res. 14 (4): 17916-17926 (2015) Received September 12, 2015 Accepted November 23, 2015 Published December 22, 2015 DOI http://dx.doi.org/10.4238/2015.December.22.16 ABSTRACT. To identify genes of potential importance to alkalinity tolerance, RNA sequencing (RNA-Seq) was performed to survey gill transcriptome profiles from freshwater (FW) and alkaline water (AW) exposed Nile tilapia (Oreochromis niloticus). A total of 22,724,036 (AW)/16,461,040 (FW) single-end reads were generated in which 20,304,348 (AW)/14,681,290 (FW) reads (90.0/89.72%) were aligned to the reference genome. Differential expression analysis revealed 302 up-regulated and 193 down- regulated genes between AW- and FW-exposed fish. These differentially expressed genes were enriched in several Gene Ontology (GO) terms related to “stress response”, “heme binding”, and “carbonate dehydratase activity”. Meanwhile, significant KEGG pathways were enriched in energy metabolism, including nitrogen and sulfur metabolism. These results demonstrate the response of Nile tilapia exposed to alkaline-water and might provide valuable information to further understand the molecular mechanisms of adaptation of fish to alkaline environments. Key words: Alkalinity stress; Nile tilapia; Transcriptome; Carbonate

Welcome message from author
This document is posted to help you gain knowledge. Please leave a comment to let me know what you think about it! Share it to your friends and learn new things together.
Transcript

©FUNPEC-RP www.funpecrp.com.brGenetics and Molecular Research 14 (4): 17916-17926 (2015)
Comparative transcriptome analysis of Nile tilapia (Oreochromis niloticus) in response to alkalinity stress
Y. Zhao, J. Wang, J. Thammaratsuntorn, J.W. Wu, J.H. Wei, Y. Wang, J.W. Xu and J.L. Zhao
Key Laboratory of Freshwater Aquatic Genetic Resources, Shanghai Ocean University, Shanghai, China
Corresponding author: J.L. ZhaoE-mail: [email protected]
Genet. Mol. Res. 14 (4): 17916-17926 (2015)Received September 12, 2015Accepted November 23, 2015Published December 22, 2015DOI http://dx.doi.org/10.4238/2015.December.22.16
ABSTRACT. To identify genes of potential importance to alkalinity tolerance, RNA sequencing (RNA-Seq) was performed to survey gill transcriptome profiles from freshwater (FW) and alkaline water (AW) exposed Nile tilapia (Oreochromis niloticus). A total of 22,724,036 (AW)/16,461,040 (FW) single-end reads were generated in which 20,304,348 (AW)/14,681,290 (FW) reads (90.0/89.72%) were aligned to the reference genome. Differential expression analysis revealed 302 up-regulated and 193 down-regulated genes between AW- and FW-exposed fish. These differentially expressed genes were enriched in several Gene Ontology (GO) terms related to “stress response”, “heme binding”, and “carbonate dehydratase activity”. Meanwhile, significant KEGG pathways were enriched in energy metabolism, including nitrogen and sulfur metabolism. These results demonstrate the response of Nile tilapia exposed to alkaline-water and might provide valuable information to further understand the molecular mechanisms of adaptation of fish to alkaline environments.
Key words: Alkalinity stress; Nile tilapia; Transcriptome; Carbonate

17917Transcriptome of O. niloticus under alkalinity stress
©FUNPEC-RP www.funpecrp.com.brGenetics and Molecular Research 14 (4): 17916-17926 (2015)
INTRODUCTION
Alkaline water is usually characterized by relatively high pH and bicarbonate (HCO3-)
and carbonate (CO32-) concentrations. High-carbonate-alkalinity is considered a major stressor
on fishes in alkaline water. High pH may inhibit ammonia excretion and increase CO2 excretion in fishes living in alkaline water (Parra and Baldisserotto, 2007). Several fish species are able to survive in such harsh environments (Wilkie and Wood, 1996). For example, Alcolapia grahami, a well-studied alkaline-resistant fish, inhabits Lake Magadi (pH 10) Kenya (Seegers and Tichy, 1999), Lahontan cutthroat trout (Oncorhynchus clarki henshawi) inhabits Pyramid Lake (pH 9.4), Nevada (Coleman and Johnson, 1988), and Amur ide (Leuciscus waleckii) inhabits Dali Nor Lake (pH 8.25-9.6), China (Xu et al., 2013a,b). These fishes have evolved special strategies to overcome problems associated with ammonia excretion and acid-base regulation in alkaline environments (Wilkie and Wood, 1996; Bergman et al., 2003; Wang et al., 2003).
In contrast, alkalinity causes several abnormal behavioral, physiological, and biochemical reactions and even quick death in freshwater teleosts exposed to alkaline water (Yao et al., 2010). Freshwater fishes can endure alkalinity up to a certain extent (pH close to 8) depending on the species or individuals (Lei et al., 1985). Under such conditions, fishes must maintain their homeostasis by activating complex regulatory mechanisms including those for acid-base and osmotic control, nitrogen and respiratory metabolism, and immune system. Few studies have focused on molecular genetic responses stimulated by carbonate-alkalinity stress in fishes (Perry and Gilmour, 2006). Metabolic alkalosis induced by intra-arterial infusion of NaHCO3 was reported to be accompanied by a marked increase in the Cl-/HCO3
- exchanger mRNA hybridization signal in the rainbow trout gills (Sullivan et al., 1996). No significant changes were noticed in the expression of three lungfish genes, Na+/HCO3
- cotransporter (NBC), V-type H+-ATPase, and carbonic anhydrase, in gill and kidney tissue 4 and 8 h following a 1-h infusion of base (NaHCO3) (Gilmour et al., 2007). DNA microarray was used for expression profiling in Japanese medaka (Oryzias latipes; Yao et al., 2012). After exposure to high carbonate-alkalinity solution containing NaHCO3 and Na2CO3 (carbonate alkalinity = 30.4 ± 0.4 mM, pH = 9.2 ± 0.0) for 96 h, 512 genes were up-regulated and 501 genes were down-regulated in the gills. Most of the genes were associated with stress response, energy regulation pathways, immune system, iron, and osmotic, or acid-base acclimation; these genes included carbonic anhydrase, Na+, K+-ATPase, and V-H-ATPase. However, the previous studies were fragmentary and inconclusive about the complex molecular genetic response to alkalinity stress or about the mechanism of alkaline tolerance in fishes.
With the emergence of high-throughput (next-generation) sequencing, RNA sequencing (RNA-Seq) can be applied to transcriptome studies across the whole genome. Compared to the traditional cDNA microarrays, RNA-Seq is more sensitive in detecting all the expressed genes (Hale et al., 2011). Since gene expression generally changes very significant under abiotic stress compared to that under control conditions, RNA-Seq has been widely used to profile differential gene expression and pathways under certain environmental stress (Dugas et al., 2011; Teets et al., 2012). The Nile tilapia (Oreochromis niloticus), which inhabits freshwater, is one of the most important commercially cultured species. It is also a good model organism for studies on ionic and osmotic acclimation in euryhaline teleosts (Wang et al., 2009). Recently, selective breeding program on Nile tilapia has been initiated in China to improve their growth and alkaline tolerance. The strains with better performance could be important for the rural regions having large saline-alkaline open waters.
17918Y. Zhao et al.
©FUNPEC-RP www.funpecrp.com.brGenetics and Molecular Research 14 (4): 17916-17926 (2015)
In the present study, we obtained the first high throughput data for the alkalinity stress responses in Nile tilapia using an Illumina sequencing platform. Transcriptome sequences from gills were assembled into contigs, function annotation and gene ontology (GO) analyses were performed, and candidate genes involved in alkalinity stress response were identified. These results provide a valuable resource for unveiling the mechanisms for alkaline tolerance, as well as for facilitating the genetic improvement of tilapias.
MATERIAL AND METHODS
Ethics statement
All experiments were performed according to the Guide for the Care and Use of Laboratory Animals of China. This study was approved by the Committee on the Ethics of Animal Experiments of Shanghai Ocean University.
Fish and carbonate-alkalinity exposure
Nile tilapias were obtained from fishery farm of the Shanghai Ocean University. They were maintained in a water circulation system at 26° ± 2°C under a 12-h light:12-h dark photoperiod.
Carbonate-alkalinity solution, prepared using NaHCO3 and de-chlorinated filtered tap water, was maintained in a plastic tank and aerated for 24 h before use. The carbonate alkalinity [expressed in millimolar (mM) concentration] was determined every day throughout the exposure period by acidimetric titrations. Exposure tests were conducted in 200-L tanks. Ninety percent solution in the test tanks was changed daily. The fish were exposed to freshwater (FW; carbonate alkalinity = 1.1 ± 0.1 mM, pH = 7.5 ± 0.2) and alkaline water (AW; carbonate alkalinity = 30.4 ± 0.4 mM, pH = 9.1 ± 0.2) for 96 h; each treatment had three tanks, each with 10 fishes. This alkalinity concentration was used because our previous study indicated that growth of tilapia was greatly affected at this concentration (Zhao et al. 2013). The fishes were not fed during the stress experiment.
Tissue sampling and RNA extraction
Based on a previous report (Lavado et al., 2013) about their importance under hyperosmotic and hypersaline conditions, gills of 12 fishes (6 from FW and 6 from AW) were collected and stored in liquid nitrogen for RNA isolation.
Total RNA was extracted from the gills using TRIZOL Kit (Invitrogen, Carlsbad, CA, USA) following manufacturer instructions. RNA samples were digested by DNaseI to remove possible genomic DNA contamination. Equal amounts of the RNA samples from FW and AW were then pooled together for cDNA synthesis and sequencing.
cDNA library construction and sequencing
RNA-Seq library preparation and sequencing was carried out by Oebiotech Lab (Shanghai, China). cDNA libraries were prepared from 2.5 μg total RNA using Illumina TruSeq RNA Sample Preparation Kit (Illumina, San diego, CA, USA) following the manufacturer protocol. The final library had an average 270-bp fragment size and a 400-ng final yield. The library was sequenced on
17919Transcriptome of O. niloticus under alkalinity stress
©FUNPEC-RP www.funpecrp.com.brGenetics and Molecular Research 14 (4): 17916-17926 (2015)
Illumina Hiseq2500 sequencing system. Adaptor sequences were trimmed and reads with low quality or length less than 10 were removed by the Trim Galore software.
Read mapping and differential expression analysis
The reads were processed and aligned with the O. niloticus reference genome (oni_ref_Orenil1.1, ftp: //ftp.ncbi.nlm.nih.gov/genomes/Oreochromis_niloticus/Assembled_chromosomes/seq/) using TopHat v1.0.12 (Trapnell et al., 2009). Alignment was performed with TopHat, which incorporates the Bowtie v0.11.3 algorithm (Langmead et al., 2009). TopHat initially removes a portion of reads based on the quality information accompanying each read and then maps the reads to the reference genome. It allows multiple alignments per read (up to 40 by default) and a maximum of 2 mismatches when mapping reads to the reference. The minimum/maximum intron length was set as 50/50,000 bp.
TopHat builds a database of potential splice junctions and confirms these by comparing the previously unmapped reads against the database of putative junctions. Default parameters for TopHat were used.
The aligned read files were processed by Cufflinks v0.8.0 (Trapnell et al., 2010). Reads were assembled into transcripts, their abundance was estimated, and tests for differential expression and regulation between different samples were performed. Cufflinks uses normalized RNA-Seq fragment counts to measure the relative abundance of transcripts.
The unit of measurement was fragments per kilobase of exon per million fragments mapped (FPKM). Confidence intervals for FPKM estimates were calculated using a Bayesian inference method (Jiang and Wong, 2009).
Functional annotation
GO annotations of O. niloticus genome were downloaded from Ensembl BioMart (http://asia.ensembl.org/biomart/martview/5addcfdd189de6499addf439b3d7c206). The GO terms asso-ciated with transcriptome contigs were then obtained to describe the genes in the areas of biologi-cal processes, molecular functions, and cellular components.
KEGG pathways were assigned to the assembled contigs using the online KEGG Automatic Annotation Server (KAAS; http://www.genome.jp/kaas-bin/kaas_main; Moriya et al., 2007). The Bi-directional Best Hit (BBH) method was used to obtain KEGG Orthology (KO) assignment.
Quantitative reverse transcription-PCR (qRT-PCR)
To validate RNA-Seq results, 27 genes with high level of significance or important stress-responding functions were selected for qRT-PCR analysis with β-actin as the reference gene. Total RNA was reverse-transcribed with SuperScript III First-Strand Synthesis System for qRT-PCR (Ta-kara, Dalian, China) and amplified with SYBR Green PCR Master Mix (Takara). β-actin was detected as the internal normalization control. The primers used for mRNA detection are listed in Table S1. Briefly, qRT-PCR was performed using MyiQ5 Real-time PCR Detection System (Bio-Rad, Hercules, CA, USA). The PCR conditions were: 50°C for 2 min, 95°C for 10 min, 40 cycles at 95°C for 15 s, and 60°C for 1 min. The PCR data were analyzed with the ABI 7500 SDS software. The comparative CT method (2-ΔΔCt method) was used to analyze the expression of the target genes.

17920Y. Zhao et al.
©FUNPEC-RP www.funpecrp.com.brGenetics and Molecular Research 14 (4): 17916-17926 (2015)
RESULTS
Transcriptome sequencing, assembly, and alignment
To obtain comprehensive understanding of the differences in expression between AW- and FW-exposed Nile tilapia, we performed deep sequencing of RNA samples from the fish gills. A total of 22,724,036 (AW)/16,461,040 (FW) single-reads were generated. After the removal of ambiguous nucleotides and low-quality sequences (Phred quality scores <20), a total of 22,553,326 (AW)/16,362,920 (FW) cleaned reads (98.6/99.0%) were obtained (Table 1). Of the total 20,304,348 (AW)/14,681,290 (FW) reads (90.0/89.72%) aligned to the reference genome, 19,612,054 (AW)/14,119,220 (FW) reads were unique (Table 2). All the RNA-Seq data generated in this study have been deposited in the NCBI SRA database (Accession Nos. SRR2074560 and SRR2074567).
Identification of differentially expressed genes
Differentially expressed genes (DEGs) were identified by calculating the ratio of FW versus AW FPKM values. Between AW- and FW-exposed fishes, 495 DEGs were identified with P value ≤0.05 and fold-change ≥2 (see Table S2). Among these genes, 302 were up-regulated and 193 were down-regulated.
We further examined 27 typical DEGs related to signal transduction, cellular stress response, acid-base and ion regulation, metabolism, immune response, and reproduction processes. Overall, the expression patterns of these genes were in agreement with the RNA-Seq and qRT-PCR analyses with minor differences observed in their expression levels (Figure 1). Only a single gene did not show consistency of expression in the two assays. Thus, these genes showing similar patterns of mRNA abundance in RNA-Seq analysis and qRT-PCR, validated the genome-wide expression profiling of gills in response to AW stress.
Functional annotation
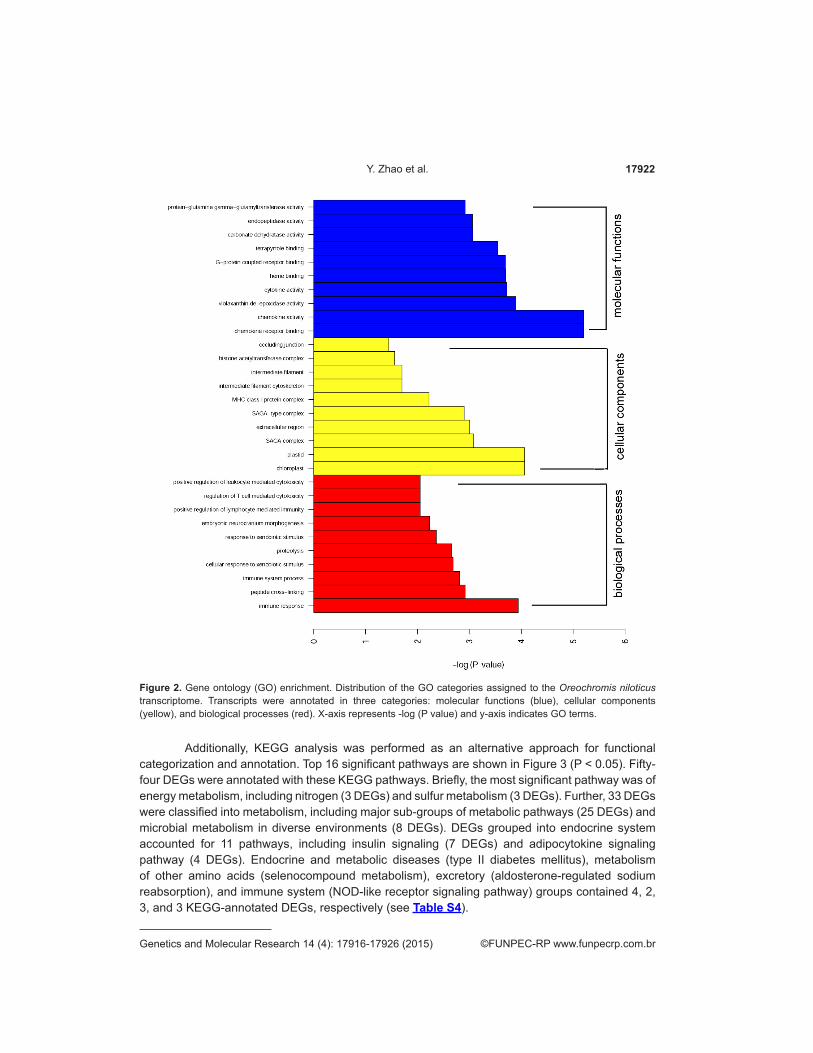
GO-enrichment analyses were conducted on the DEGs; the top 30 significant GO terms in each group are shown in Figure 2. In response to AW stress, we observed significant gene
Table 1. Summary of RNA-Seq data.
Sample Raw reads Raw bases Trim reads Trim bases Trim reads (%) Trim bases (%)
AW 22,724,036 1,158,925,836 22,553,326 1,143,849,274 99.2 98.6FW 16,461,040 839,513,040 16,362,920 831,113,407 99.4 99.0
AW = alkaline water; FW = freshwater.
Sample Total reads Total mapped Multiple mapped Unique mapped Reads map to ‘+’ Reads map to ‘-’ Non-splice reads Splice reads
AW 22,553,326 20,304,348 692,294 19,612,054 9,800,932 9,811,122 15,121,839 4,490,215FW 16,362,920 14,681,290 562,070 14,119,220 7,055,256 7,063,964 10,794,447 3,324,773
Table 2. RNA-Seq sequence reads mapping to Tilapia Oreochromis niloticus genome.
AW = alkaline water; FW = freshwater.

17921Transcriptome of O. niloticus under alkalinity stress
©FUNPEC-RP www.funpecrp.com.brGenetics and Molecular Research 14 (4): 17916-17926 (2015)
enrichment of several GO terms in gills that related to stress response including “cellular response to xenobiotic stimulus (GO: 0071466)” [3 genes]. The expression of more stimulus-related genes in AW-exposed fishes was consistent with the extreme environmental stress. GO-enrichment analysis indicated that the up-regulated genes were enriched in “heme binding (GO: 0020037)” [8 genes], “electron carrier activity (GO: 0009055)” [6 genes]”, “ATP biosynthetic process (GO: 0006754)” [2 genes], and “oxidoreductase activity (GO: 0016712)” [3 genes], while the down-regulated genes were enriched in “heme binding (GO: 0020037)” [1 gene], and “electron carrier activity (GO: 0009055)” [1 gene]. Genes in the molecular function category of “oxidoreductase activity” and “electron carrier activity” are widely studied and recognized to associate with oxidative stress and in adaptation to environmental stimuli in coupling with mitochondrial functions. It was also suggested that under severe osmotic and alkaline stress more energy was consumed than in the freshwater environment. The increased energy requirement leads to active proteolysis in the gill, which was observed as the DEGs enrichment in “proteolysis (GO: 0006508)”. In the present study, DEGs were also enriched in “carbonate dehydratase activity (GO: 0004089)” and “transport vesicle membrane (GO: 0030658)”, suggesting their important roles in regulating homeostasis of various substrates in response to the AW stress; this was consistent with previous reports on AW stress adaptation (see Table S3).
Figure 1. Differentially expressed genes validated by qRT-PCR. The white columns represent results of RNA-Seq, and the black columns indicate results of qRT-PCR. X-axis represents gene name and y-axis indicates log2 ratio [freshwater (FW)/alkaline water (AW)].
17922Y. Zhao et al.
©FUNPEC-RP www.funpecrp.com.brGenetics and Molecular Research 14 (4): 17916-17926 (2015)
Additionally, KEGG analysis was performed as an alternative approach for functional categorization and annotation. Top 16 significant pathways are shown in Figure 3 (P < 0.05). Fifty-four DEGs were annotated with these KEGG pathways. Briefly, the most significant pathway was of energy metabolism, including nitrogen (3 DEGs) and sulfur metabolism (3 DEGs). Further, 33 DEGs were classified into metabolism, including major sub-groups of metabolic pathways (25 DEGs) and microbial metabolism in diverse environments (8 DEGs). DEGs grouped into endocrine system accounted for 11 pathways, including insulin signaling (7 DEGs) and adipocytokine signaling pathway (4 DEGs). Endocrine and metabolic diseases (type II diabetes mellitus), metabolism of other amino acids (selenocompound metabolism), excretory (aldosterone-regulated sodium reabsorption), and immune system (NOD-like receptor signaling pathway) groups contained 4, 2, 3, and 3 KEGG-annotated DEGs, respectively (see Table S4).
Figure 2. Gene ontology (GO) enrichment. Distribution of the GO categories assigned to the Oreochromis niloticus transcriptome. Transcripts were annotated in three categories: molecular functions (blue), cellular components (yellow), and biological processes (red). X-axis represents -log (P value) and y-axis indicates GO terms.

17923Transcriptome of O. niloticus under alkalinity stress
©FUNPEC-RP www.funpecrp.com.brGenetics and Molecular Research 14 (4): 17916-17926 (2015)
DISCUSSION
RNA-Seq and qRT-PCR data indicated that the expression of mitogen-activated protein kinase (MAPK), eukaryotic translation initiation factor 4E-binding protein 3 (EIF4EBP3), insulin receptor substrate 1-like, and insulin-like growth factor-binding protein 5-like in tilapia gill tissue was up-regulated under high alkalinity stress. The MAPK are key elements of protein phosphorylation cascades that integrate and amplify signals from osmosensors to activate appropriate downstream targets mediating physiological acclimation (Kultz, 2001). EIF4EBP3 belongs to the EIF4E-binding protein family, which regulates EIF4E activity by preventing its assembly into the EIF4F complex. It mediates the regulation of protein translation through the MAPK and mammalian target of rapamycin (mTOR) signal transduction pathways (Poulin et al., 1998). mTOR plays important roles in response to stress, including activation of autophagy (Jung et al., 2010) and modulation of
Figure 3. KEGG pathway analysis. Red columns represent significant enrichment pathways (P ≤ 0.05), and blue columns indicate insignificantly pathways (P > 0.05). X-axis represents KEGG pathway terms and y-axis indicates -log (P value).

17924Y. Zhao et al.
©FUNPEC-RP www.funpecrp.com.brGenetics and Molecular Research 14 (4): 17916-17926 (2015)
protein synthesis (Sengupta et al., 2010). These responses can conserve energy and promote survival during prolonged periods of stress (Teets et al., 2012). Insulin-like growth factor I is identified in long-term systemic response. The effect of this hormone is fine-tuned at the cellular level via adjustment of the expression and membrane insertion of the corresponding hormone receptors (Yadav, 2010). The presence of MAPK, EIF4EBP3, and insulin-like growth factor I with high level of significance suggested that there should be a complex alkalinity signal transduction network in fishes for integration and amplification, and this network might include MAPK, mTOR signaling pathways, and systemic response. These signal transduction pathways control effector mechanisms responsible for acclimation to changes in the environmental alkalinity.
At circumneutral pH (pH 6-8), ammonia excretion is mainly dependent upon the suitable NH3 partial pressure gradients between the blood and the unstirred boundary layers of the gill (Randall and Ip, 2006). In this model, hydration of CO2 in the unstirred boundary layers of the gills provide H+ to trap NH3 as NH4
+, as it diffuses across the branchial epithelium (Wright et al., 1989). This effectively creates a “sink” that continuously favors NH3 diffusion. In alkaline water, there is less H+ available for transforming NH3 into NH4
+. When freshwater fishes are exposed to alkali water, there is an immediate reduction in ammonia excretion rate and a corresponding increase in plasma ammonia concentration (Wright, 1993). High ammonia concentration may pose potentially lethal problems for fishes (Parra and Baldisserotto, 2007). In our study, increases in the expression of carbonic anhydrase (CA), ammonium transporter Rh-type C 2-like, and glutamine synthetase (GS) were found under high alkalinity stress. CA catalyzes the hydration of CO2 to provide H+ and HCO3
- (Fisher et al., 1996; Whitman et al., 2000). Ammonium transporter is electroneutral and may regulate transepithelial ammonia secretion (Han et al., 2006). GS plays an essential role in the metabolism of nitrogen by catalyzing the condensation of glutamate and ammonia to form glutamine, which is considered less or non-toxic (Eisenberg et al., 1987). Thus, we hypothesized that increased expression of CA, ammonium transporter, and GS can reduce toxicity of high ammonia concentration in fishes under alkalinity stress.
Many highly expressed proteins involved in the regulation of ion transport were also observed; these included sodium-coupled monocarboxylate transporter 1, voltage-dependent anion-selective channel protein 2-like, sodium/potassium-transporting ATPase subunit alpha-1-like, solute carrier family 25 member 39, sodium/calcium exchanger 1-like, and ATP-sensitive inward rectifier potassium channel 1-like. We consider all these as candidate genes to maintain acid-base and ion balance directly during the high alkalinity stress. Similar to the previous studies, identification of genes encoding for oxidation-reduction such as cytochrome P450 suggests a high energy demand for tilapia acclimation to alkalinity stress. Furthermore, glutathione S-transferases, serine/threonine-protein kinase, and heat-shock 70-kDa proteins were rapidly up-regulated during alkalinity stress, suggesting that they were fundamentally important in the alkalinity stress response of fish. Heat-shock proteins target damaged proteins to the proteasome to prevent accumulation of dysfunctional proteins and to recycle peptides and amino acids (Goldberg, 2003), suggesting possibly high level of autophagy under alkalinity stress.
In conclusion, comparative transcriptome study conducted on Nile tilapia exposed to alkaline and fresh water identified a relatively large number of genes that displayed distinct differences in their expression in gills. We identified significant DEGs encoding important modulators of alkaline stress adaptation and tolerance, including carbonic anhydrases, glutamine synthetase, cytochrome P450. Further analysis revealed that several well-known signaling pathways and functional categories of genes were significantly enriched, including the pathways of

17925Transcriptome of O. niloticus under alkalinity stress
©FUNPEC-RP www.funpecrp.com.brGenetics and Molecular Research 14 (4): 17916-17926 (2015)
“mTOR signaling”, “EIF2 signaling”, and “superpathway of cholesterol biosynthesis” and functional categories of “response to stimulus”, “heme binding”, and “transporter activity”. Overall, this study demonstrated transcriptome changes in Nile tilapia in response to alkaline stress. The results set a foundation for further analyses on alkaline-responsive candidate genes, which would help in better understanding of teleost adaptation under extreme environmental stress and ultimately benefit future breeding for alkaline-tolerant fish strains.
Conflicts of interest
The authors declare no conflict of interest.
ACKNOWLEDGMENTS
Research supported by the China Agriculture Research System (Grant #CARS-49-4B to J.-L. Zhao), the Youth Scholars of Shanghai Higher Education Institutions, China (Grant #A1-2035-14-0010-9 to Y. Zhao), the National Key Technology R&D Program (Grant #2012BAD26B03), and the Shanghai Collaborative Innovation Center for Aquatic Animal Genetics and Breeding (Grant #ZF1206).
Supplementary material
REFERENCES
Bergman AN, Laurent P, Otiang’a-Owiti G, Bergman HL, et al. (2003). Physiological adaptations of the gut in the Lake Magadi tilapia, Alcolapia grahami, an alkaline- and saline-adapted teleost fish. Comp. Biochem. Physiol. A Mol. Integr. Physiol. 136: 701-715.
Coleman ME and Johnson VK (1988). Summary of trout management at Pyramid Lake, Nevada, with emphasis on Lahontan cutthroat trout 1954-1987. In: Status and management of interior stocks of cutthroat trout (Gresswell RE, ed.). Vol. Symposium 4, American Fisheries Society, Bethesda, 107-115.
Dugas DV, Monaco MK, Olsen A, Klein RR, et al. (2011). Functional annotation of the transcriptome of Sorghum bicolor in response to osmotic stress and abscisic acid. BMC Genomics 12: 514.
Eisenberg D, Almassy RJ, Janson CA, Chapman MS, et al. (1987). Some evolutionary relationships of the primary biological catalysts glutamine synthetase and RuBisCO. Cold Spring Harb. Symp. Quant. Biol. 52: 483-490.
Fisher M, Gokhman I, Pick U and Zamir A (1996). A salt-resistant plasma membrane carbonic anhydrase is induced by salt in Dunaliella salina. J. Biol. Chem. 271: 17718-17723.
Gilmour KM, Euverman RM, Esbaugh AJ, Kenney L, et al. (2007). Mechanisms of acid-base regulation in the African lungfish Protopterus annectens. J. Exp. Biol. 210: 1944-1959.
Goldberg AL (2003). Protein degradation and protection against misfolded or damaged proteins. Nature 426: 895-899.Hale MC, Xu P, Scardina J, Wheeler PA, et al. (2011). Differential gene expression in male and female rainbow trout embryos
prior to the onset of gross morphological differentiation of the gonads. BMC Genomics 12: 404.Han KH, Croker BP, Clapp WL, Werner D, et al. (2006). Expression of the ammonia transporter, rh C glycoprotein, in normal
and neoplastic human kidney. J. Am. Soc. Nephrol. 17: 2670-2679.Jiang H and Wong WH (2009). Statistical inferences for isoform expression in RNA-Seq. Bioinformatics 25: 1026-1032.Jung CH, Ro SH, Cao J, Otto NM, et al. (2010). mTOR regulation of autophagy. FEBS Lett. 584: 1287-1295.Kultz D (2001). Evolution of osmosensory MAP Kinase signaling pathways. Amer. Zool. 41: 743-757.Langmead B, Trapnell C, Pop M and Salzberg SL (2009). Ultrafast and memory-efficient alignment of short DNA sequences to
the human genome. Genome Biol. 10: R25.Lavado R, Aparicio-Fabre R and Schlenk D (2013). Effects of salinity acclimation on the pesticide-metabolizing enzyme
flavin-containing monooxygenase (FMO) in rainbow trout (Oncorhynchus mykiss). Comp. Biochem. Physiol. C Toxicol. Pharmacol. 157: 9-15.

17926Y. Zhao et al.
©FUNPEC-RP www.funpecrp.com.brGenetics and Molecular Research 14 (4): 17916-17926 (2015)
Lei YZ, Dong SL and Shen CG (1985). Study on the toxicity of carbonate-alkaline to fishes. J. Fish. China 9: 171-183.Moriya Y, Itoh M, Okuda S, Yoshizawa AC, et al. (2007). KAAS: an automatic genome annotation and pathway reconstruction
server. Nucleic Acids Res. 35: W182-W185.Parra JEG and Baldisserotto B (2007). Effect of water pH and hardness on survival and growth of freshwater Teleosts. In: Fish
osmoregulation (Kapoor BG, ed.). Science Publishers, Enfield, 135-150.Perry SF and Gilmour KM (2006). Acid-base balance and CO2 excretion in fish: unanswered questions and emerging models.
Resp. Physiol. Neurobiol. 154: 199-215.Poulin F, Gingras AC, Olsen H, Chevalier S, et al. (1998). 4E-BP3, a new member of the eukaryotic initiation factor 4E-binding
protein family. J. Biol. Chem. 273: 14002-14007.Randall DJ and Ip YK (2006). Ammonia as a respiratory gas in water and air-breathing fishes. Respir. Physiol. Neurobiol. 154:
216-225.Seegers L and Tichy H (1999). The Oreochromis alcalicus flock (Teleostei: Cichlidae) from Lakes Natron and Magadi, Tanzania
and Kenya, with descriptions of two new species. Ichthyol. Explor. Freshwaters 10: 97-146.Sengupta S, Peterson TR and Sabatini DM (2010). Regulation of the mTOR complex 1 pathway by nutrients, growth factors,
and stress. Mol. Cell 40: 310-322. Sullivan GV, Fryer JN and Perry SF (1996). Localization of mRNA for proton pump (H+-ATPase) and Cl-/HCO3
- exchanger in rainbow trout gill. Can. J. Zool. 74: 2095-2103.
Teets NM, Peyton JT, Colinet H, Renault D, et al. (2012). Gene expression changes governing extreme dehydration tolerance in an Antarctic insect. Proc. Natl. Acad. Sci. U. S. A. 109: 20744-20749.
Trapnell C, Pachter L and Salzberg SL (2009). TopHat: discovering splice junctions with RNA-Seq. Bioinformatics 25: 1105-1111.
Trapnell C, Williams BA, Pertea G, Mortazavi A, et al. (2010). Transcript assembly and quantification by RNA-Seq reveals unannotated transcripts and isoform switching during cell differentiation. Nat. Biotechnol. 28: 511-515.
Wang PJ, Lin CH, Hwang LY, Huang CL, et al. (2009). Differential responses in gills of euryhaline tilapia, Oreochromis mossambicus, to various hyperosmotic shocks. Comp. Biochem. Physiol. A Mol. Integr. Physiol. 152: 544-551.
Wang YS, Gonzalez RJ, Patrick ML, Grosell M, et al. (2003). Unusual physiology of scale-less carp, Gymnocypris przewalskii, in Lake Qinghai: a high altitude alkaline saline lake. Comp. Biochem. Physiol. A Mol. Integr. Physiol. 134: 409-421.
Whitman MC, Strohmaier J, O’Boyle K, Tingem JM, et al. (2000). The isolated major histocompatibility complex class I alpha3 domain binds beta2m and CD8alphaalpha dimers. Mol. Immunol. 37: 141-149.
Wilkie MP and Wood CM (1996). The adaptations of fish to extremely alkaline environments. Comp. Biochem. Phys. B Biochem. Mol. Biol. 113: 665-673.
Wright PA (1993). Nitrogen excretion and enzyme pathways for urea-genesis in freshwater tilapia (Oreochromis niloticus). Physiol. Zool. 66: 881-901.
Wright PA, Randall DJ and Perry II SF (1989). Fish gill water boundary layer: a site of linkage between carbon dioxide and ammonia excretion. J. Comp. Physiol. B 158: 627-635.
Xu J, Ji P, Wang B, Zhao L, et al. (2013a). Transcriptome sequencing and analysis of wild Amur Ide (Leuciscus waleckii) inhabiting an extreme alkaline-saline lake reveals insights into stress adaptation. PLoS One 8: e59703.
Xu J, Li Q, Xu L, Wang S, et al (2013b). Gene expression changes leading extreme alkaline tolerance in Amur ide (Leuciscus waleckii) inhabiting soda lake. BMC Genomics 14: 682.
Yadav SK (2010). Heavy metals toxicity in plants: An overview on the role of glutathione and phytochelatins in heavy metal stress tolerance of plants. S. Afr. J. Bot. 76: 167-179.
Yao ZL, Lai QF, Zhou K, Rizalita RE, et al. (2010). Developmental biology of medaka fish (Oryzias latipes) exposed to alkalinity stress. J. Appl. Ichthyol. 26: 397-402.
Yao ZL, Wang H, Chen L, Zhou K, et al. (2012). Transcriptomic profiles of Japanese medaka (Oryzias latipes) in response to alkalinity stress. Genet. Mol. Res. 11: 2200-2246.
Zhao LH, Jia JH, Zhang YH, Ren BC, et al. (2013). Growth comparison among three strains of Oreochromis niloticus juvenile in net cage under different salinity-alkalinity waters. South China Fish. Sci. 9: 1-7.
Related Documents


![Biomarkers in Nile Tilapia Oreochromis niloticus niloticus ... · biomarker measurements in Nile tilapia from the river Nile [2,23]. Therefore as a consequence, in this study I present](https://static.cupdf.com/doc/110x72/5ebc4a0fc30023287c3a7364/biomarkers-in-nile-tilapia-oreochromis-niloticus-niloticus-biomarker-measurements.jpg)