Abstract Number: 002-0075 COMPARISON OF TQM AND ISO 9000 EFFECTS IN COMPANY PERFORMANCE: AN EMPIRICAL STUDY IN SPANISH COMPANIES SECOND WORLD CONFERENCE ON POM AND 15TH ANNUAL POM CONFERENCE, CANCUN, MEXICO, APRIL 30 - MAY 3, 2004. AUTHORS: Micaela Martínez-Costa University of Murcia, Spain [email protected] Facultad de Economía y Empresa, Campus de Espinardo 30100, Murcia Phone: +34968367801 Fax: + 34 968 367537 Angel R. Martínez-Lorente Polytechnic University of Cartagena, Spain [email protected] Facultad de Ciencias de la Empresa, Paseo Alfonso XIII, 50, 30203, Cartagena Phone: +34968325618 Fax: +34968327008

Comparison of Tqm and Iso 9000
Dec 31, 2015
TQM
Welcome message from author
This document is posted to help you gain knowledge. Please leave a comment to let me know what you think about it! Share it to your friends and learn new things together.
Transcript
Abstract Number: 002-0075
COMPARISON OF TQM AND ISO 9000 EFFECTS IN COMPANY
PERFORMANCE: AN EMPIRICAL STUDY IN SPANISH COMPANIES
SECOND WORLD CONFERENCE ON POM AND 15TH ANNUAL POM
CONFERENCE, CANCUN, MEXICO, APRIL 30 - MAY 3, 2004.
AUTHORS:
Micaela Martínez-Costa
University of Murcia, Spain
Facultad de Economía y Empresa, Campus de Espinardo 30100, Murcia
Phone: +34968367801 Fax: + 34 968 367537
Angel R. Martínez-Lorente
Polytechnic University of Cartagena, Spain
Facultad de Ciencias de la Empresa, Paseo Alfonso XIII, 50, 30203, Cartagena
Phone: +34968325618 Fax: +34968327008
- 2 -
COMPARISON OF TQM AND ISO 9000 EFFECTS IN COMPANY
PERFORMANCE: AN EMPIRICAL STUDY IN SPANISH COMPANIES
ABSTRACT
The effect of Total Quality Management (TQM) and ISO 9000 on performance has
been extensively analysed by researchers, but this sort of research has usually been developed
in separated cells. However, there are few articles analysing the effect of both systems within
the same sample of companies. Our paper analyses both the effect of a TQM system and the
ISO 9000 implementation in company performance. A structured questionnaire using the
Flynn et al. (1994) scale for measuring TQM has been used to get the data. A postal survey to
nearly 3000 industrial Spanish companies with more than 100 employees was sent. This
questionnaire was answered by 713 quality managers. The results show a positive
relationship between TQM application and hard and soft results while only an improvement
in hard results after the ISO 9000 implementation has been found.
1. INTRODUCTION
Over the last two decades quality management has been an important research topic as
it can be seen by the important number of publications in scientific journals (Martínez et al.,
1998). This interest has mainly been motivated by the success’ stories of companies that, after
applying some sort of quality management, have increased their productivity and results.
In this way, many researchers have analysed the impact of TQM implementation on
business performance inquiring into the mechanisms that could make possible the
improvement in management (Elmuti and AlDiab, 1995; Mohrman et al,. 1995; Powell, 1995;
Hendricks and Singhal, 1996; Forker et al., 1997; Choi and Eboch, 1998; Easton and Jarrell,
1998; Adams et al., 1999; Dow et al., 1999; Terziovski and Samson, 1999 and 2000; Hua et
al., 2000; Zhang, 2000; Hendricks and Singhal, 2001a and 2001b).
- 3 -
Since 1987, when the ISO 9000 series of standards appeared, a big amount of papers
about motivation for registration, costs and benefits of certification and its effects upon
company performance have been published. (Rayner and Porter, 1991; Askey and Dale, 1994;
Brecka, 1994; Vloeberghs and Bellens, 1996; Ebrahimpour et al., 1997; Meegan and Taylor,
1997; Brown et al, 1998, Anderson et al., 1999; Huarng et al., 1999; Hughes et al., 2000; Sun,
2000; Withers and Ebrahimpour, 2000; Gotzamani and Tsiotras, 2002) Most of these papers
were descriptive.
In many occasions, these studies regarding ISO 9000 have confused the standards
prescriptions with a total quality management system although, at the beginning, it was just as
a quality assurance system. In fact, many papers have studied the ISO 9000 impact in
performance referencing the TQM system.
Even though TQM and ISO 9000 have several differences in their principles that put the
certification far underneath (Martinez and Martinez, 2004), they also have some aspects in
common that could justify their joint analysis. However, this sort of research has usually been
developed in separated cells. Just a few researchers have compared the joint effect of TQM
and ISO 9000 within the same sample (Terziovski et al., 1997; Ismail and Hashmi, 1999; Sun,
1999; Rahman, 2001).
This paper attempts to analyse the ISO 9000 and TQM impact in company performance.
Our objective is to clarify the effect of each system according to their different nature.
Moreover, we will also analyse the way in which ISO 9000 contribute to TQM
implementation and the joint effect of both systems when they are implemented at the same
time in a company in order to point out any possible synergy between them.
- 4 -
2. LITERATURE REVIEW
Along the revised literature it was generally found a positive effect of TQM on company
results. There are papers analysing the relationship of TQM with product quality and other
non financial results (Shetty, 1993; Elmuti and AlDiab, 1995; Mohrman et al,. 1995; Powell,
1995; Forker et al., 1997; Choi and Eboch, 1998; Dow et al., 1999; Terziovski and Samson,
1999 and 2000; Zhang, 2000). Others have analysed the effect on financial results (Easton and
Jarrell, 1998; Hua et al., 2000; Hendricks and Singhal, 2001a) and there are also papers
analysing the effect of TQM on the stock market value (Hendricks and Singhal, 1996; Easton
and Jarrell, 1998; Adams et al., 1999; Hendricks and Singhal, 2001b).
TQM has been considered mostly as one variable formed by many dimensions.
Previous papers have analysed the effect of the TQM variable over all kinds of results.
However, it has been found another group of research that relate each TQM dimension with
results (Mohrman et al., 1995; Powell, 1995; Forza and Filippini, 1998; Anderson and Sohal,
1999; Dow et al., 1999; Samson and Terziovski, 1999; Curkovic et al., 2000; Martínez-
Lorente et al., 2000). The purpose of this kind of research is to obtain evidence about the most
influential TQM dimensions for improving performance. In this sense, the general agreement
is that the most influential dimensions are those that Powell (1995) considers as intangible,
behavioural factors like leadership, organisational skill and culture, executive commitment,
open organisation and empowerment. For example, Dow et al. (1999) found that only 3 TQM
dimensions -employee commitment, shared vision and customer focus- had a positive
relationship with product quality. Anderson and Sohal (1999) found that the most important
TQM dimensions were leadership and customer focus. Samson and Terziovski (1999)
identified the variables of leadership, workforce management and customer focus as the most
- 5 -
important. Therefore, TQM dimensions of top management support, workforce management,
employee attitudes and behaviour and customer relationship are the most important according
to the literature.
There are many papers on ISO 9000, but most of them are merely based on case studies or
are descriptive or prescriptive (Ebrahimpour et al., 1997; Withers and Ebrahimpour, 2000).
Moreover, only a small number analyse the relationship between ISO 9000 and company
results. This relationship is not clear according to the literature. Some papers show a positive
relationship between certification and results (Romano, 2000; Withers and Ebrahimpour,
2000; Santos and Escanciano, 2002). The positive results shown by many of them are often
mainly based on improvements in the rate of defects (Sun, 2000; Withers and Ebrahimpour,
2000) Other papers present a less optimistic vision of its benefits (Terziovski et al, 1997;
Simmons, 1999; Lima et al, 2000; Sun, 2000; Hua et al., 2000; Aarts and Vos, 2001; Singels
et al., 2001; Wayhan et al. 2002). Heras et al. (2002b) found a positive relationship between
company results and ISO 9000 certification. However, they later showed that the causal
relationship could be in the contrary way, that is, more profitable companies implemented the
ISO 9000 certification more (Heras et al., 2002a). Häversjö (2000) had reached the same
conclusion for Danish industry.
The most important reasons for obtaining ISO 9000 certification have been reported as of
external type, that is, they try to get it either because of pressure from customers and suppliers
or as a marketing tool (Rayner and Porter, 1991; Askey and Dale, 1994; Vloeberghs, 1996;
Ebrahimpour et al, 1997; Brown et al, 1998, Anderson et al., 1999; Hughes et al. , 2000;
Withers and Ebrahimpour, 2000). However, several papers show that the results from
certification depend on the type of company motivation for deciding to get it (Brecka, 1994;
Meegan and Taylor, 1997; Huarng et al., 1999; Hughes et al., 2000; Sun, 2000; Gotzamani
and Tsiotras, 2002, Terziovski et al., 2003). These authors state that companies that obtain
- 6 -
ISO 9000 certification motivated by external reasons but who do not believe that it can really
help them to improve quality and efficiency get worse results than those that believe that ISO
9000 can be a good way to reduce quality costs. In this sense, Sun (2000) suggests that in
order to get benefits from ISO 9000 certification, this norm must be seen as a way towards
TQM.
A minor group of researchers has compared the joint effects of TQM and ISO 9000 and
they agree in pointing out that TQM implementation leads to better results in more aspects
than ISO 9000 certification (Terziovski et al., 1997). However, one of the benefits attributable
to the standard is that it constitutes a good first step towards a TQM system, raising awareness
on quality amongst workers and creating a good climate to implement it (Taylor, 1995;
Tummala and Tang, 1996; Baena López, 1998; Skrabec, 1999; Sun, 2000; Escanciano et al. ,
2001).
There is even another group of researchers that affirm that the ISO 9000 certification has
more impact on company performance when it is implemented with the objective of
continuing and finally implementing a TQM system (Brecka, 1994; Meegan and Taylor,
1997; Huarng et al., 1999; Hughes et al., 2000; Sun, 2000; Gotzamani and Tsiotras, 2002).
It is important to point out that the literature shows that the TQM dimensions that best
influence companies’ results (the soft variables) are those that have a lesser weight in ISO
9000. Moreover, the points of TQM with more importance for ISO 9000 (basically process
control) do not have a significant positive effect on company results.
After having classified and revised the literature regarding TQM/ISO 9000 in company
performance the following hypotheses regarding the effect of TQM and ISO 9000 have been
tested.
- 7 -
Hypotheses related with TQM:
H1: There is a positive relationship between TQM and company results
This hypothesis has been extensively tested in the literature. Our work only try to add
a new confirmation to the knowledge on this topic.
H2: The “soft” variables of TQM are the most influential in obtaining benefits from TQM
When TQM is divided into its core principles for the analysis, the majority of authors
report that these variables are the most important for getting better results. It contrasts with
the traditional view of quality management as quality control.
Hypotheses related with ISO 9000:
H3: There is no positive relationship between ISO 9000:1994 and company results
There are no clear conclusions regarding its benefits. On the contrary, it has been
pointed out that the most influential aspects of quality management are those not comprised in
the standard requisites.
H4: Internal motivation to get the certification is positively related to the benefits obtained
from certification
As it is stated in Huarng (1998), Van der Wiele et al. (2000), Withers and
Ebrahimpour (2001) and Singels et al. (2001), the ISO 9000 standards are so generic that only
the spirit in which the company want to apply them will change management and improve
performance.
Hypotheses related with the joint effect ISO 9000-TQM
H5: Companies registered by ISO 9000 after being applying TQM obtain fewer benefits
from ISO than companies that implement ISO firstly
- 8 -
This hypothesis is based on the previous ones. If performance is only improved by
TQM implementation then, a company that had implemented TQM previously to ISO 9000
will not improve its results when it decide to implement the norm since these will have been
improved before. For the same reason the following hypothesis will be tested,
H6: Companies applying TQM and ISO 9000 have no better results than companies only
applying TQM
3. POPULATION, SAMPLE AND METHODOLOGY
This research focus in industrial companies since ISO 9000 was originally created for
this kind of companies. In fact, the new version of the standard in 2000 had even to adapt the
vocabulary to service companies. Moreover, ISO 9000-service companies show different
characteristics than industrial, as it is related in the specialized literature regarding this issue
(Beaumont et al., 1997; Brah et al., 2000; McAdam and Canning, 2001; Gustafsson et al.,
2003).
Population was comprised by Spanish industrial companies with more than 100
employees and included in the “SABI” database. This database was employed because it
offers financial as well as general information that later could be used.
The study was addressed to the whole population with the aim of obtaining
generalizable results. In addition, this is the predominant focus in operations management
(Rungtusanatham et al., 2003). Total population was comprised of 2986 companies.
Data was gathered by a postal questionnaire sent to the companies in the population.
This methodology is widely recognised for confirmatory studies in operations management
since publications in more rigorous scientific journals apply it, being quality management and
specifically, ISO 9000, one of the five premium areas of interest (Rungtusanatham et al.,
- 9 -
2003). The questionnaire was pre-tested by some academics and companies in the Region of
Murcia.
Questionnaires were sent to the attention of the “quality manager” without specifying the
name of the manager, since the database did not contain this information. Inside each envelope
we included a presentation letter, a questionnaire and a pre-paid addressed envelope to be
returned with the fulfilled questionnaire. In the letter, quality managers were offered a future
summary of final conclusions.
The first sending to 2986 companies was made in March 2003. In May 2003, with the
objective of improving the response rate, as advised by Frohlich (2002), a second sending was
done to 1500 randomly selected companies that had not responded the first time.
From the originally sent 2986 letters, 36 were returned due to unknown address (it was
supposed that those companies had probably changed their address or were extinguished), and
12 that initially were supposed to be manufacturing were services, so, the population was
finally composed of 2938 companies.
The number of valid received questionnaires was 713. It constitutes a response rate of
24,27%. Response rate is usually interpreted as evidence of the interest showed for the
research by managers. In this sense, a nearly 25% response rate is a considerable success with
Spanish companies and is higher than the suggested minimum in Malhotra and Grover (1998).
Variables
TQM
In order to measure TQM implementation the scale of Flynn et al. (1994) was chosen.
It is appropriate for manufacturing companies and is validated and accepted as a good
measurement of TQM in the literature. In fact, Malhotra and Grover (1998) advice to use
previously tested scales in the literature and, as an example of a good scale to be used, they
- 10 -
propose in their conclusions to use the Flynn et al. scale for measuring total quality
management practices in organizations.
In addition to that scale, in order to have another measurement of results directly
obtained from the implementation of TQM, we asked directly to the manager if the company
had implemented a TQM system. As we have also measured this issue with a perceptual
scale, the information provided by the directive can be tested for veracity.
ISO 9000
It is a categorical variable indicating if the company is or not certified.
Company Performance
Although there is not a clear performance definition in the literature, there is a general
agreement that it should not be limited just to the financial results (Quinn and Rohrbaugh,
1983; Venkatraman and Ramanujam, 1986) since it would be a partial vision of the business
situation (Curkovic et al., 2000).
Another debate regarding performance is the use of primary or secondary sources. In this
sense, it is recommended to use both in order to test if there is a convergence between them
(Venkatraman and Ramanujam, 1986).
Two types of measures of company results were used for this research: a subjective one
(respondents’ opinions) and an objective one (financial data). Both types of measures have
their problems. Reliability of subjective measures depends on the sincerity and good
information of managers. Financial data are influenced by the sector situation and this is
difficult to isolate from the analysis. Therefore, the use of both types may improve the
validity of results.
The subjective measure tried to assess the operational results of the company. Managers
were asked on how their companies compared with their competitors on:
- 11 -
? Production costs.
? Fast delivery.
? Flexibility to change production volume and adapt stocks.
? Cycle time.
? Internal quality
? External quality
? Customer satisfaction
? Market share
? Employees satisfaction
In addition to this, we asked managers about specific improvements in these measures
from the date they implemented TQM and ISO 9000, so we have evidence about not only
their results comparing with competitors but also compared with the situation in which they
were before the implementation of any of the quality systems.
Financial measures were two:
? Productivity
? ROA
The 3 last years average was used in order to avoid possible external events that could
affect these measurements if only the last year was used..
The questions had to be responded on a 1 to 7 scale: 1 far below competitors, 7 far over
competitors. This scale was different from the rest of questions (5 point-scale). It was made in
this way because according to some authors (Lissitz and Green, 1975), scales with more than
5 points are less reliable, and also because our pretest proved that 5 point scales were easier to
answer and it could improve the response rate. However, regarding performance, as the last
two questions asked the manager to position himself from strong worsening to strong

- 12 -
improvement in the company from the certification/TQM implementation, companies would
probably only answer from the middle of the scale to the end. Consequently, with a 5-point
scale we would only have had 3 points. With a 7-point scale information would be richer. In
the pre-test this suspicion was confirmed so we decided to apply the 7-point scale just for
performance measurement.
Summing up, this research collects hard results information from a primary source (the
survey to the quality managers) and financial data from a secondary source (SABI database).
4. ANALYSIS AND RESULTS
4.1 Reliability and validity
The first step in our research is to evaluate if the scales of measurement are reliable and
valid.
The Cronbach alpha has been calculated for each of them and is presented in table 1.
In order to maximise the reliability some items have been deleted, with the condition of
leaving at least three items in each scale (number of items in brackets).
TABLE 1-RELIABILITY ANALYSIS
Scale Cronbach alpha Leadership (4) 0,8202 Rewards system (3) 0,8157 Process control (3) 0,7925 Feedback (3) 0,8597 Process management (3) 0,8501 New product’s design (4) 0,7699 Interfunctional design (3) 0,7134 Selection (3) 0,8539 Teamwork (3) 0,8781 Suppliers relationship (4) 0,7305 Customers orientation (3) 0,7363 Performance (9) 0,8295
As it can be seen, all the scales are reliable (values higher to 0.7)
Content validity in our research can be assumed, at least in the TQM scale, since it has
been previously tested in the literature (Flynn et al., 1994).
- 13 -
Construct validity can be tested by convergent and discriminant validity. The last is
usually checked by applying factorial analysis to each scale and seeing if all its components
score in an only factor with eigenvalue higher than 1. All the scales except performance
scored in one factor. Performance scale’s items weighted into two factors, as shown in table 2.
TABLE 2-FACTORIAL ANALYSIS OF PERFORMANCE
Factor 1 Factor 2 Unit production costs Manufacturing quality
Fast delivery Design quality Flexibility Customers satisfaction Cycle time Market share
Employees satisfaction
According to these results, the performance scale should be divided into two scales.
Factor 1 was called “hard results” since variables that correlated with this factor were more
easily measured and mainly related with costs. Factor 2 was called “soft results” since its
variables are more difficult to measure and mainly related with quality.
The Cronbach alpha was calculated again for the new scales. The result was 0,7290 for
hard factor and 0,8134 for soft factor, so in later analysis we will introduce two scales of
qualitative results instead of one.
Convergent validity is theoretically grounded on the basis that one scale used to
measure one concept is correlated with another with the same purpose. In our questionnaire
we introduced a direct question about the implementation of TQM. We are able to test if both
measurements are correlated. As one of them is a categorical variable we did an analysis of
variance (ANOVA) comparing the means of values for each scale, dividing the sample into
companies that said to be applying TQM and companies that did not. Table 3 shows the
results.
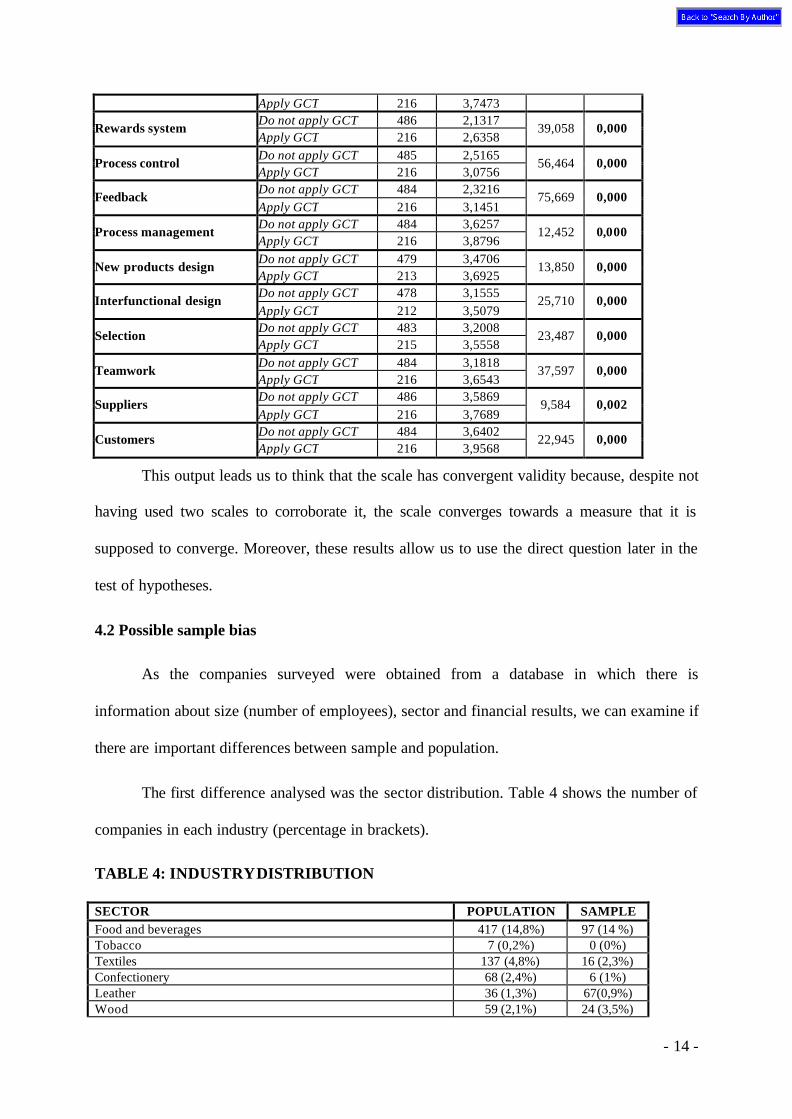
TABLE 3: CONVERGENT VALIDITY
N Mean F Sig. Leadership Do not apply GCT 486 3,4729 17,869 0,000
- 14 -
Apply GCT 216 3,7473 Do not apply GCT 486 2,1317
Rewards system Apply GCT 216 2,6358
39,058 0,000
Do not apply GCT 485 2,5165 Process control
Apply GCT 216 3,0756 56,464 0,000
Do not apply GCT 484 2,3216 Feedback
Apply GCT 216 3,1451 75,669 0,000
Do not apply GCT 484 3,6257 Process management
Apply GCT 216 3,8796 12,452 0,000
Do not apply GCT 479 3,4706 New products design
Apply GCT 213 3,6925 13,850 0,000
Do not apply GCT 478 3,1555 Interfunctional design
Apply GCT 212 3,5079 25,710 0,000
Do not apply GCT 483 3,2008 Selection
Apply GCT 215 3,5558 23,487 0,000
Do not apply GCT 484 3,1818 Teamwork
Apply GCT 216 3,6543 37,597 0,000
Do not apply GCT 486 3,5869 Suppliers
Apply GCT 216 3,7689 9,584 0,002
Do not apply GCT 484 3,6402 Customers
Apply GCT 216 3,9568 22,945 0,000
This output leads us to think that the scale has convergent validity because, despite not
having used two scales to corroborate it, the scale converges towards a measure that it is
supposed to converge. Moreover, these results allow us to use the direct question later in the
test of hypotheses.
4.2 Possible sample bias
As the companies surveyed were obtained from a database in which there is
information about size (number of employees), sector and financial results, we can examine if
there are important differences between sample and population.
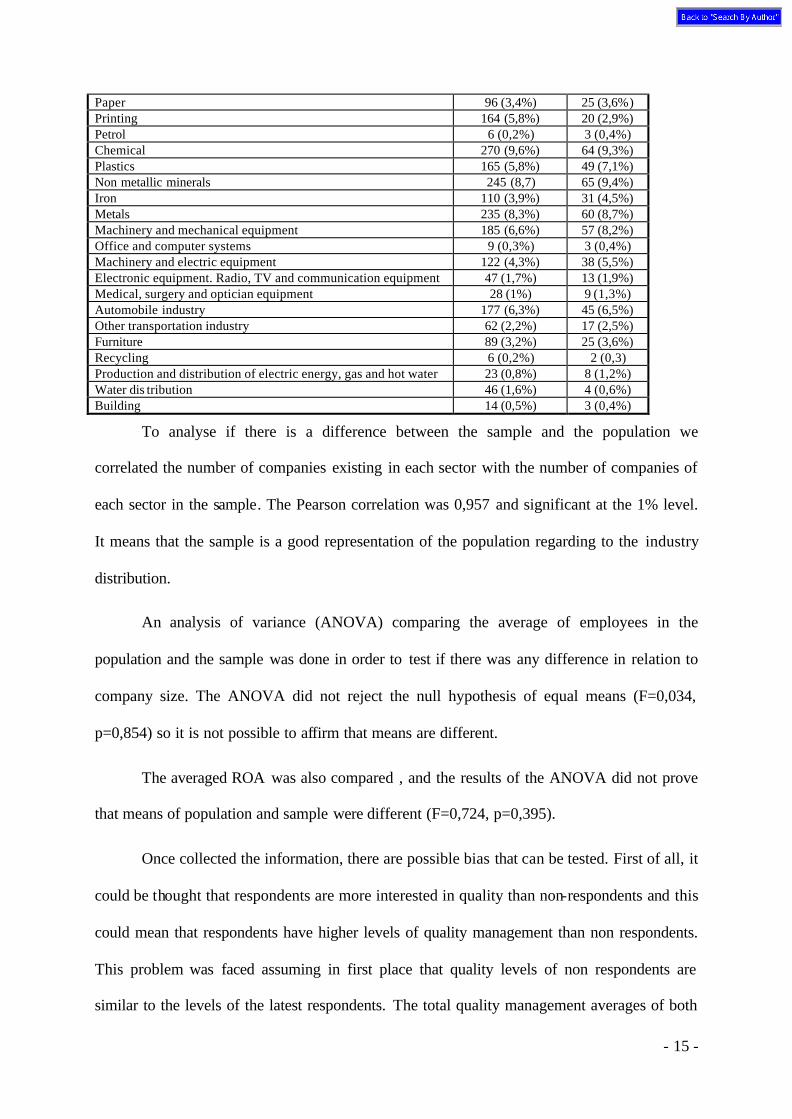
The first difference analysed was the sector distribution. Table 4 shows the number of
companies in each industry (percentage in brackets).
TABLE 4: INDUSTRY DISTRIBUTION
SECTOR POPULATION SAMPLE Food and beverages 417 (14,8%) 97 (14 %) Tobacco 7 (0,2%) 0 (0%) Textiles 137 (4,8%) 16 (2,3%) Confectionery 68 (2,4%) 6 (1%) Leather 36 (1,3%) 67(0,9%) Wood 59 (2,1%) 24 (3,5%)
- 15 -
Paper 96 (3,4%) 25 (3,6%) Printing 164 (5,8%) 20 (2,9%) Petrol 6 (0,2%) 3 (0,4%) Chemical 270 (9,6%) 64 (9,3%) Plastics 165 (5,8%) 49 (7,1%) Non metallic minerals 245 (8,7) 65 (9,4%) Iron 110 (3,9%) 31 (4,5%) Metals 235 (8,3%) 60 (8,7%) Machinery and mechanical equipment 185 (6,6%) 57 (8,2%) Office and computer systems 9 (0,3%) 3 (0,4%) Machinery and electric equipment 122 (4,3%) 38 (5,5%) Electronic equipment. Radio, TV and communication equipment 47 (1,7%) 13 (1,9%) Medical, surgery and optician equipment 28 (1%) 9 (1,3%) Automobile industry 177 (6,3%) 45 (6,5%) Other transportation industry 62 (2,2%) 17 (2,5%) Furniture 89 (3,2%) 25 (3,6%) Recycling 6 (0,2%) 2 (0,3) Production and distribution of electric energy, gas and hot water 23 (0,8%) 8 (1,2%) Water dis tribution 46 (1,6%) 4 (0,6%) Building 14 (0,5%) 3 (0,4%)
To analyse if there is a difference between the sample and the population we
correlated the number of companies existing in each sector with the number of companies of
each sector in the sample. The Pearson correlation was 0,957 and significant at the 1% level.
It means that the sample is a good representation of the population regarding to the industry
distribution.
An analysis of variance (ANOVA) comparing the average of employees in the
population and the sample was done in order to test if there was any difference in relation to
company size. The ANOVA did not reject the null hypothesis of equal means (F=0,034,
p=0,854) so it is not possible to affirm that means are different.
The averaged ROA was also compared , and the results of the ANOVA did not prove
that means of population and sample were different (F=0,724, p=0,395).
Once collected the information, there are possible bias that can be tested. First of all, it
could be thought that respondents are more interested in quality than non-respondents and this
could mean that respondents have higher levels of quality management than non respondents.
This problem was faced assuming in first place that quality levels of non respondents are
similar to the levels of the latest respondents. The total quality management averages of both
- 16 -
the first ten days respondents and the latter 10 days was then compared. No important
differences (F=2,821; p=0,094) were detected. On the other side, we compared the quality
means of respondents in the first and second survey. We again did not find any difference
(F=3,596; p=0,058).
Another possible bias is the person who answers the questionnaire. We compared the
quality means between all the possible respondents and did not find any difference (F=0,830;
p=0,563).
Explained all that, it cannot be affirmed that our sample is biased in those aspects.
However, we can not defend that the sample is not biased by another fact that could not been
checked.
4.3 Test of hypotheses
TQM hypotheses
In order to test the effect of TQM over company results we count on two continuous
variables: TQM (the mean of points in each dimension) and results (as concluded from the
factorial analysis we have hard, soft, ROA and productivity, these last two as the average
during the last three years). The way to find any relationship between two continuous
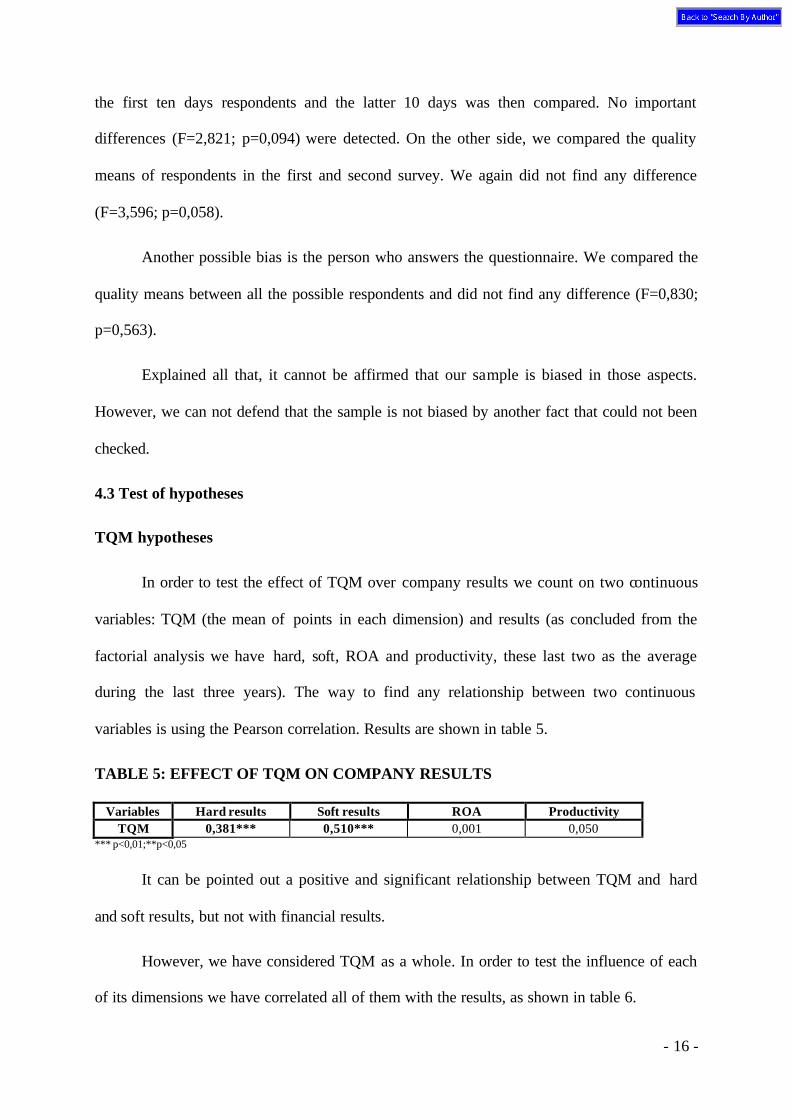
variables is using the Pearson correlation. Results are shown in table 5.
TABLE 5: EFFECT OF TQM ON COMPANY RESULTS
Variables Hard results Soft results ROA Productivity TQM 0,381*** 0,510*** 0,001 0,050
*** p<0,01;**p<0,05
It can be pointed out a positive and significant relationship between TQM and hard
and soft results, but not with financial results.
However, we have considered TQM as a whole. In order to test the influence of each
of its dimensions we have correlated all of them with the results, as shown in table 6.
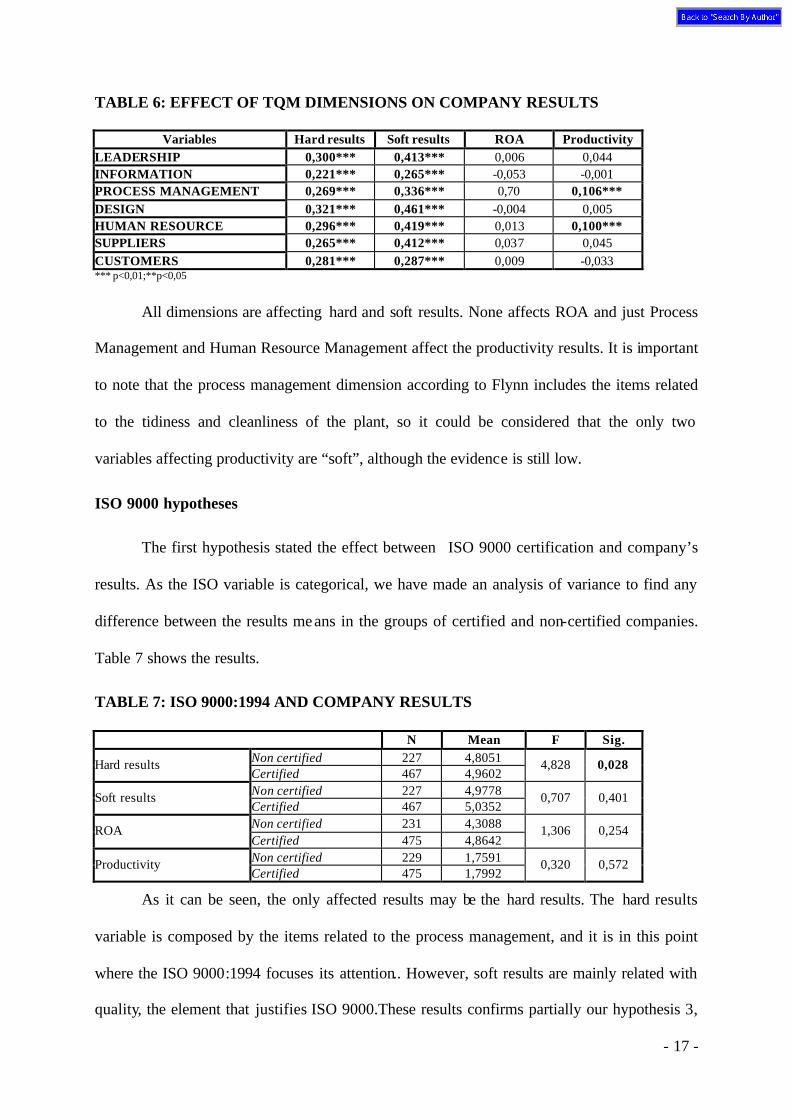
- 17 -
TABLE 6: EFFECT OF TQM DIMENSIONS ON COMPANY RESULTS
Variables Hard results Soft results ROA Productivity LEADERSHIP 0,300*** 0,413*** 0,006 0,044 INFORMATION 0,221*** 0,265*** -0,053 -0,001 PROCESS MANAGEMENT 0,269*** 0,336*** 0,70 0,106*** DESIGN 0,321*** 0,461*** -0,004 0,005 HUMAN RESOURCE 0,296*** 0,419*** 0,013 0,100*** SUPPLIERS 0,265*** 0,412*** 0,037 0,045 CUSTOMERS 0,281*** 0,287*** 0,009 -0,033 *** p<0,01;**p<0,05
All dimensions are affecting hard and soft results. None affects ROA and just Process
Management and Human Resource Management affect the productivity results. It is important
to note that the process management dimension according to Flynn includes the items related
to the tidiness and cleanliness of the plant, so it could be considered that the only two
variables affecting productivity are “soft”, although the evidence is still low.
ISO 9000 hypotheses
The first hypothesis stated the effect between ISO 9000 certification and company’s
results. As the ISO variable is categorical, we have made an analysis of variance to find any
difference between the results means in the groups of certified and non-certified companies.
Table 7 shows the results.
TABLE 7: ISO 9000:1994 AND COMPANY RESULTS
N Mean F Sig. Non certified 227 4,8051 Hard results Certified 467 4,9602
4,828 0,028
Non certified 227 4,9778 Soft results Certified 467 5,0352
0,707 0,401
Non certified 231 4,3088 ROA Certified 475 4,8642
1,306 0,254
Non certified 229 1,7591 Productivity Certified 475 1,7992
0,320 0,572
As it can be seen, the only affected results may be the hard results. The hard results
variable is composed by the items related to the process management, and it is in this point
where the ISO 9000:1994 focuses its attention.. However, soft results are mainly related with
quality, the element that justifies ISO 9000.These results confirms partially our hypothesis 3,
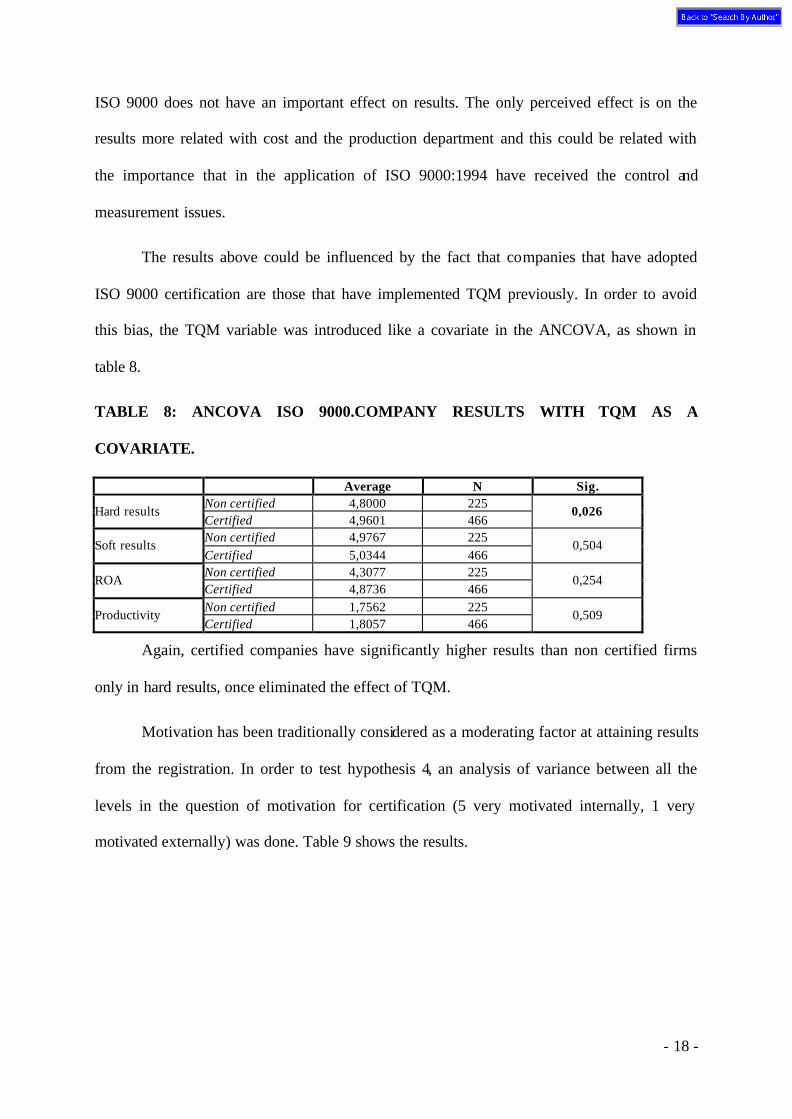
- 18 -
ISO 9000 does not have an important effect on results. The only perceived effect is on the
results more related with cost and the production department and this could be related with
the importance that in the application of ISO 9000:1994 have received the control and
measurement issues.
The results above could be influenced by the fact that companies that have adopted
ISO 9000 certification are those that have implemented TQM previously. In order to avoid
this bias, the TQM variable was introduced like a covariate in the ANCOVA, as shown in
table 8.
TABLE 8: ANCOVA ISO 9000.COMPANY RESULTS WITH TQM AS A
COVARIATE.
Average N Sig. Non certified 4,8000 225
Hard results Certified 4,9601 466
0,026
Non certified 4,9767 225 Soft results
Certified 5,0344 466 0,504
Non certified 4,3077 225 ROA
Certified 4,8736 466 0,254
Non certified 1,7562 225 Productivity
Certified 1,8057 466 0,509
Again, certified companies have significantly higher results than non certified firms
only in hard results, once eliminated the effect of TQM.
Motivation has been traditionally considered as a moderating factor at attaining results
from the registration. In order to test hypothesis 4, an analysis of variance between all the
levels in the question of motivation for certification (5 very motivated internally, 1 very
motivated externally) was done. Table 9 shows the results.
- 19 -
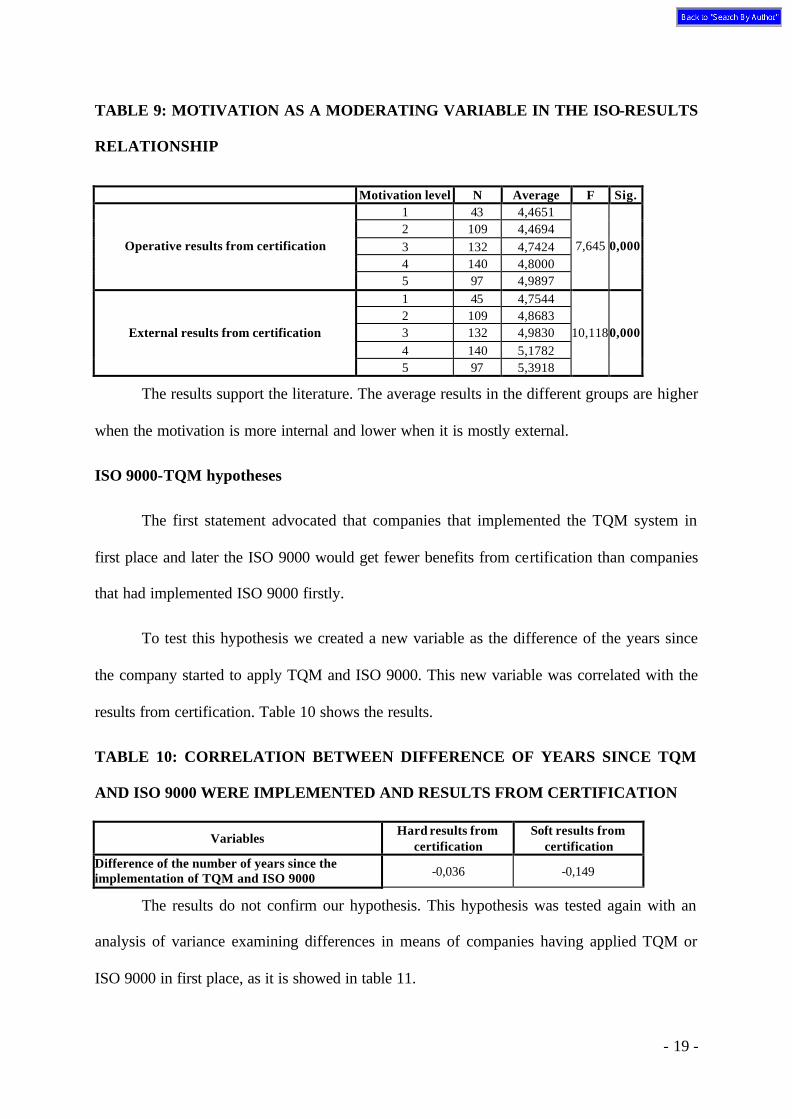
TABLE 9: MOTIVATION AS A MODERATING VARIABLE IN THE ISO-RESULTS
RELATIONSHIP
The results support the literature. The average results in the different groups are higher
when the motivation is more internal and lower when it is mostly external.
ISO 9000-TQM hypotheses
The first statement advocated that companies that implemented the TQM system in
first place and later the ISO 9000 would get fewer benefits from certification than companies
that had implemented ISO 9000 firstly.
To test this hypothesis we created a new variable as the difference of the years since
the company started to apply TQM and ISO 9000. This new variable was correlated with the
results from certification. Table 10 shows the results.
TABLE 10: CORRELATION BETWEEN DIFFERENCE OF YEARS SINCE TQM
AND ISO 9000 WERE IMPLEMENTED AND RESULTS FROM CERTIFICATION
Variables Hard results from
certification Soft results from
certification Difference of the number of years since the implementation of TQM and ISO 9000 -0,036 -0,149
The results do not confirm our hypothesis. This hypothesis was tested again with an
analysis of variance examining differences in means of companies having applied TQM or
ISO 9000 in first place, as it is showed in table 11.
Motivation level N Average F Sig. 1 43 4,4651 2 109 4,4694 3 132 4,7424 4 140 4,8000
Operative results from certification
5 97 4,9897
7,645 0,000
1 45 4,7544 2 109 4,8683 3 132 4,9830 4 140 5,1782
External results from certification
5 97 5,3918
10,118 0,000
- 20 -
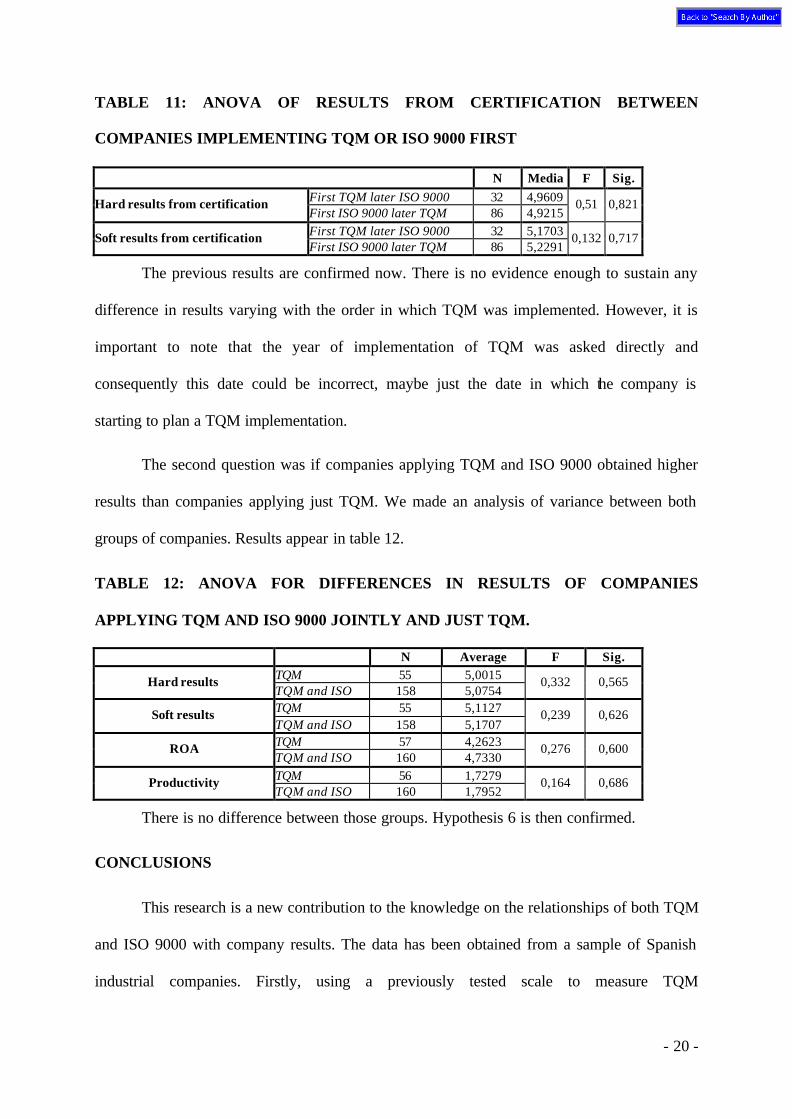
TABLE 11: ANOVA OF RESULTS FROM CERTIFICATION BETWEEN
COMPANIES IMPLEMENTING TQM OR ISO 9000 FIRST
N Media F Sig. First TQM later ISO 9000 32 4,9609 Hard results from certification First ISO 9000 later TQM 86 4,9215
0,51 0,821
First TQM later ISO 9000 32 5,1703 Soft results from certification First ISO 9000 later TQM 86 5,2291
0,132 0,717
The previous results are confirmed now. There is no evidence enough to sustain any
difference in results varying with the order in which TQM was implemented. However, it is
important to note that the year of implementation of TQM was asked directly and
consequently this date could be incorrect, maybe just the date in which the company is
starting to plan a TQM implementation.
The second question was if companies applying TQM and ISO 9000 obtained higher
results than companies applying just TQM. We made an analysis of variance between both
groups of companies. Results appear in table 12.
TABLE 12: ANOVA FOR DIFFERENCES IN RESULTS OF COMPANIES
APPLYING TQM AND ISO 9000 JOINTLY AND JUST TQM.
N Average F Sig. TQM 55 5,0015 Hard results TQM and ISO 158 5,0754
0,332 0,565
TQM 55 5,1127 Soft results TQM and ISO 158 5,1707
0,239 0,626
TQM 57 4,2623 ROA TQM and ISO 160 4,7330
0,276 0,600
TQM 56 1,7279 Productivity TQM and ISO 160 1,7952
0,164 0,686
There is no difference between those groups. Hypothesis 6 is then confirmed.
CONCLUSIONS
This research is a new contribution to the knowledge on the relationships of both TQM
and ISO 9000 with company results. The data has been obtained from a sample of Spanish
industrial companies. Firstly, using a previously tested scale to measure TQM
- 21 -
implementation, the effect of different dimensions of TQM on different measures of company
results was evaluated. Results were measured according two objective financial data (ROA
and productivity) and subjective internal data. These subjective data were divided after a
factorial analysis in two measures, hard results and soft results. Hard results were results more
related with costs and soft results were more related with quality.
Our analysis does not let us to affirm that all kinds of results considered are
significantly better for TQM companies since the financial results were not affected according
to our findings. However, financial results can be measured following different criteria and
are affected by multiple factors that we were not able to isolate in this research. Moreover, all
TQM dimensions were positively correlated with the two measures of qualitative results
considered. Two of these dimensions were also slightly correlated with an objective result,
productivity: the human resource management dimension and the tidiness and cleanliness of
the workplace dimension. In summary, it can be concluded that our research is a new support
to the advantages of adopting a TQM policy.
The ISO 9000 standard affects mostly to hard results. It seems logical since ISO 9000
is basically a process management-oriented quality assurance system. The moderating effect
of motivation is supported by this research since it has been found that internally motivated
companies get more benefits from certification than externally motivated ones.
We did not find any evidence to support that companies that had implemented a TQM
system obtained less benefits from registration than the ones having applied ISO 9000 first.
However, we have the problem of the date of TQM implementation. What we found is that
the ISO 9000 does not add any value to companies that have previously implemented a TQM
system. Therefore, companies with a TQM system had no incentives to get an ISO 9000
certification unless their clients or other organisations do it compulsory for them.
- 22 -
REFERENCES
Aarts, F., E. Vos. 2001. The impact of ISO registration on New Zealand firms performance: A
financial perspective. The TQM Magazine, 13(3), 180-191.
Adams, G., G. McQueen, K. Seawright. 1999. Revisiting the price impact of quality awards.
Omega, 27, 595-604.
Anderson, M., A. Sohal. 1999. A study of the relationship between quality management
practices and performance in small businesses. International Journal of Quality & Reliability
Management, 16 (9), 859-877.
Anderson, S.W., J.D. Daly, M.F. Johnson. 1999. Why Firms Seek ISO 9000 Certification:
Regulatory Compliance or Competitive Advantage?. Production and Operations
Management, 8 (1), 28-43.
Askey, J.M., B.G. Dale. 1994. From ISO 9000 Series Registration to Total Qua lity
Management: An Examination. Quality Management Journal, July, 67-76.
Baena López, R. 1998. ISO 9000: Un buen comienzo hacia la calidad total. Alta Dirección,
197, 49-56.
Beaumont, N.B., A.M. Sohal, M Terziovski. 1997. Comparing quality management practices
in the Australian service and manufacturing industries. International Journal of Quality and
Reliability Management, 14 (8), 814-833.
Brah, S.A., Y.L. Wong, B. Madhu Rao. 2000. TQM and business performance in the service
sector: A Singapore study. International Journal of Operations and Production Management,
20 (11), 1293-1312.
- 23 -
Brecka, J. 1994. Study finds that gains with ISO 9000 registration increase over time. Quality
Progress, May, 20-21.
Brown, A., T. Van der Wiele, K. Loughton. 1998. Smaller Enterprises´ Experiences with ISO
9000. International Journal of Quality & Reliability Management, 15 (3), 273-285.
Choi, T.Y., K. Eboch. 1998. The TQM paradox: relations among TQM practices, plant
performance, and customer satisfaction. Journal of Operations Management, 17, 59-75.
Curkovic, S., S. Vickery, C. Dröge. 2000. Quality-related action programs: Their impact on
quality performance and firm performance, Decision Sciences, 31 (4), 885-905.
Dow, D., D. Samson, S. Ford. 1999. Exploding the myth: Do all quality management
practices contribute to superior quality performance? Production and Operations
Management, 8 (1), 1-27.
Easton, G.S., S.L. Jarrell. 1998. The effects of Total Quality Management on corporate
performance: an empirical investigation, Journal of Business, 71 (2), 253-307.
Ebrahimpour, M., B. Withers, N. Hikmet. 1997. Experiences of US and Foreign-Owned
Firms: a New Perspective on ISO 9000 Implementation. International Journal of Production
Research, 37 (2), 567-576.
Elmuti, D., T.F. AlDiab. 1995. Improving quality and organizational effectiveness go hand in
hand through Deming management system. Journal of Business Strategies, 12 (1), 86-98.
Escanciano, C., E. Fernández, C. Vázquez. 2001. Influence of ISO 9000 certification on the
progress of Spanish industry towards TQM. International Journal of Quality and Reliability
Management, 18 (5), 481-494.
- 24 -
Forker, L.B., D. Mendez, J.C. Hershauer. 1997. Total quality management in the supply
chain: What is its impact on performance? International Journal of Production Research, 35
(6), 1681-1701.
Forza, C., R. Filippini. 1998. TQM impact on quality conformance and customer satisfaction:
a causal model. International Journal of Production Economics, 55, 1-20.
Frohlich, M.T. 2002. Techniques for improving response rates in OM survey research.
Journal of Operations Management, 20, 53-62.
Gotzamani, K.D., G.D. Tsiotras. 2002. The true motives behind ISO 9000 certification. Their
effect on the overall certification benefits and their long term cont ribution towards TQM.
International Journal of Quality and Reliability Management, 19 (2), 151-169.
Gustafsson, A., L. Nilsson, M.D. Johnson. 2003. The role of quality practices in service
organizations. International Journal of Service Industry Management. 14 (2), 232-244.
Häversjö, T. 2000. The financial effects of ISO 9000 registration for Danish companies.
Managerial Auditing Journal, 15 (1&2), 47-52.
Hendricks, K.B., V.R. Singhal. 1996. Quality awards and the market value of the firm: an
empirical investigation. Management Science, 42 (3), 415-436.
Hendricks, K.B., V.R. Singhal. 2001a. Firm characteristics, total quality management and
financial performance. Journal of Operations Management, 19, 269-285.
Hendricks, K.B., V.R. Singhal. 2001b. The long-run stock price performance of firms with
effective TQM programs. Management Science, 47 (3), 359-368.
Heras, I., M. Casadesús, G.P.M. Dick. 2002b. ISO 9000 certification and the bottom line: A
comparative study of the profitability of Basque region companies. Managerial Auditing
Journal, 17 (1&2), 72-78.
- 25 -
Heras, I., G.P.M. Dick, M. Casadesús. 2002a. ISO 9000 registration impact on sales and
profitability: A longitudinal analysis of performance before and after accreditation.
International journal of Quality and Reliability Management, 19 (6), 774-791.
Hua, H., K.S. Chin, H. Sun, Y. Xu. 2000. An empirical study on quality management
practices in Shangai manufacturing industries. Total Quality Management, 11 (8), 1111-1122.
Huarng, F. 1998. Integrating ISO 9000 with TQM spirits: A survey. Industrial Management
& Data Systems, 98 (8), 373-379.
Huarng, F., C. Horng, C. Chen. 1999. A study of ISO 9000 process, motivation and
performance. Total Quality Management, 10 (7), 1009-1025.
Hughes, T., T. Williams, P. Ryall. 2000. It is not what you achieve it is the way you achieve
it. Total Quality Management, 11 (3), 329-340.
Ismail, M. Y., M. S. J. Hashmi. 1999. The state of quality management in the Irish
manufacturing industry. Total Quality Management, 10 (6), 853-862.
Lima, M.A.M., M. Resende, L. Hasenclever. 2000. Quality certification and performance of
Brazilian firms: An empirical study. International Journal of Production Economics, 66, 143-
147.
Lissitz, R.W., S. B. Green. 1975. Effect of the number of scale points on reliability: A Monte
Carlo approach. Journal of Applied Psychology, 60 (1), 10-13.
Malhotra, M.K., V. Grover. 1998. An assessment of survey research in POM: From constructs
to theory. Journal of Operations Management, 16, 407-425.
Martínez Lorente, A.R., F.W. Dewhurst, A. Gallego Rodríguez. 2000. Relating TQM,
marketing and business performance: an exploratory study. International Journal of
Production Research, 38 (14), 3227-3246.
- 26 -
Martínez Lorente, A.R., M. Martínez Costa. 2004. ISO 9000 & TQM: substitutives or
complementaries? An empirical study in industrial companies. International Journal of
Quality and Reliability Management, 21 (3) (In press).
Martinez-Lorente, A. R., F. W. Dewhurst, B. D. Dale. 1998. Total quality management:
origins and evolution of the term. The TQM Magazine, 10 (5), 378-386.
McAdam, R., N. Canning. 2001. ISO in the service sector: Perceptions of small professional
firms. Managing Service Quality, 11 (2), 80-92.
Meegan, S.T., W.A. Taylor. 1997. Factors influencing a successful transition from ISO 9000
to TQM. International Journal of Quality and Reliability Management, 14 (2), 100-117.
Mohrman, S.A., R.V. Tenkasi, E.E.III Lawler, G .E. Jr. Ledford. 1995. Total quality
management practice and outcomes in the largest US firms. Employee Relations, 17 (3), 26-
41.
Powell, T.C. 1995. Total Quality Management as competitive advantage: a review and
empirical study. Strategic Management Journal, 16, 15-37.
Quinn, R.E., J. Rohrbaugh. 1983. A spatial model of effectiveness criteria towards a
competing values approach of organizational analysis. Management Science, 29 (3), 363-377.
Rahman, S. 2001. A comparative study of TQM practice and organizational performance of
SMEs with and without ISO 9000 certification. International Journal of Quality and
Reliability Management, 18 (1), 35-49.
Rayner, P., L.J. Porter. 1991. BS5750/ISO 9000- The Experience of Small and Medium-Sized
Firms. International Journal of Quality & Reliability Management, 8 (6), 16-28.
Romano, P. 2000 ISO 9000: What Is Its Impact on Performance? Quality Management
Journal, 7 (3), 38-56.
- 27 -
Rungtusanatham, M.J., T. Y. Choi, D. G. Hollingworth, Z. Wu, C. Forza. 2003. Survey
research in operations management: Historical analysis. Journal of Operations Management,
343, 1-14.
Samson, D., M. Terziovski. 1999. The relationship between total quality management
practices and operational performance. Journal of Operations Management, 17, 393-409.
Santos, L., C. Escanciano. 2002. Benefits of the ISO 9000:1994 system. Some considerations
to reinforce competitive advantage. International Journal of Quality & Reliability
Management. 19 (2), 321-344.
Shetty, Y.K. 1993. The quest for quality excellence: lessons from the Malcom Baldrige
National Quality Award. SAM Advanced Management Journal, 58 (42), 34-40.
Simmons, B.L. 1999. The Relationship Between ISO 9000 and Business Performance: Does
Registration Really Matters? Journal of Managerial Issues, 11 (3), 330-343.
Singels, J., G. Rüel, H. Van der Water 2001. ISO 9000 series. Certification and performance.
International Journal of Quality and Reliability Management, 18 (1), 62-75.
Skrabec, Q. R. Jr. 1999. Quality assurance revisited. Industrial Management, Nov.-Dec., 6-9.
Sun, H. 1999. The pattern of implementing TQM versus ISO 9000 at the beginning of the
1990s. International Journal of Quality and Reliability Management, 16 (3), 201-214.
Sun, H. 2000. Total Quality Management, ISO 9000 Certification and Performance
Improvement. International Journal of Quality & Reliability Management, 17 (2), 168-179.
Taylor, W.A. 1995. Senior executives and ISO 9000: attitudes, behaviours and commitment.
International Journal of Quality & Reliability Management, 12 (4), 40-57.
- 28 -
Terziovski, M., D. Samson. 1999. The link between total quality management practice and
organizational performance. International Journal of Quality & Reliability Management, 16
(3), 226-237.
Terziovski, M., D. Samson. 2000. The effect of company size on the relationship between
TQM strategy and organizational performance. The TQM Magazine, 12 (2), 144-148.
Terziovski, M., D. Samson, D. Dow. 1997. The Business Value of Quality Management
Systems Certification. Evidence from Australia and New Zealand. Journal of Operations
Management, 15, 1-18.
Terziovski, M., D. Power, A. S. Sohal. 2003. The longitudinal effects of the ISO 9000
certification process on business performance. European Journal of Operational Research,
146, 580-595.
Tummala, V.M. Rao, C.L. Tang. 1996. Strategic quality management, Malcom Baldrige and
European quality awards and ISO 9000 certification: Core concepts and comparative analysis.
International Journal of Quality &Reliability Management, 13 (4), 8-38.
Van der Wiele, T., B. Dale, R. Williams. 2000. Business improvement through quality
management systems. Management Decision, 38 (1), 19-23.
Venkatraman, N., V. Ramanujam. 1986. Measurement of business performance in strategy
research: A comparison of approaches. Academy of Management Review, 1 (4), 801-814.
Vloeberghs, D., J. Bellens. 1996. Implementing the ISO 9000 Standards. Quality Progress,
June.
Wayhan, V. B., E. T. Kirche, B. M. Khumawala. 2002. ISO 9000 certification: The financial
performance implications. Total Quality Management, 13 (2), 217-231.
- 29 -
Withers, B., M. Ebrahimpour. 2000. Does ISO 9000 Affect the Dimensions of Quality Used
for Competitive Advantage? European Management Journal, 18 (4), 431-443.
Withers, B.E., M. Ebrahimpour. 2001. Impact of ISO 9000 registration on European firms: A
case analysis. Integrated Manufacturing Systems, 12 (2), 139-151.
Zhang, Z. 2000. Developing a model of quality management methods and evaluating their
effects on business performance. Total Quality Management, 11 (1), 129-137.
The authors would like to thank the financial support provided by Fundación Séneca for this
research.
- 30 -
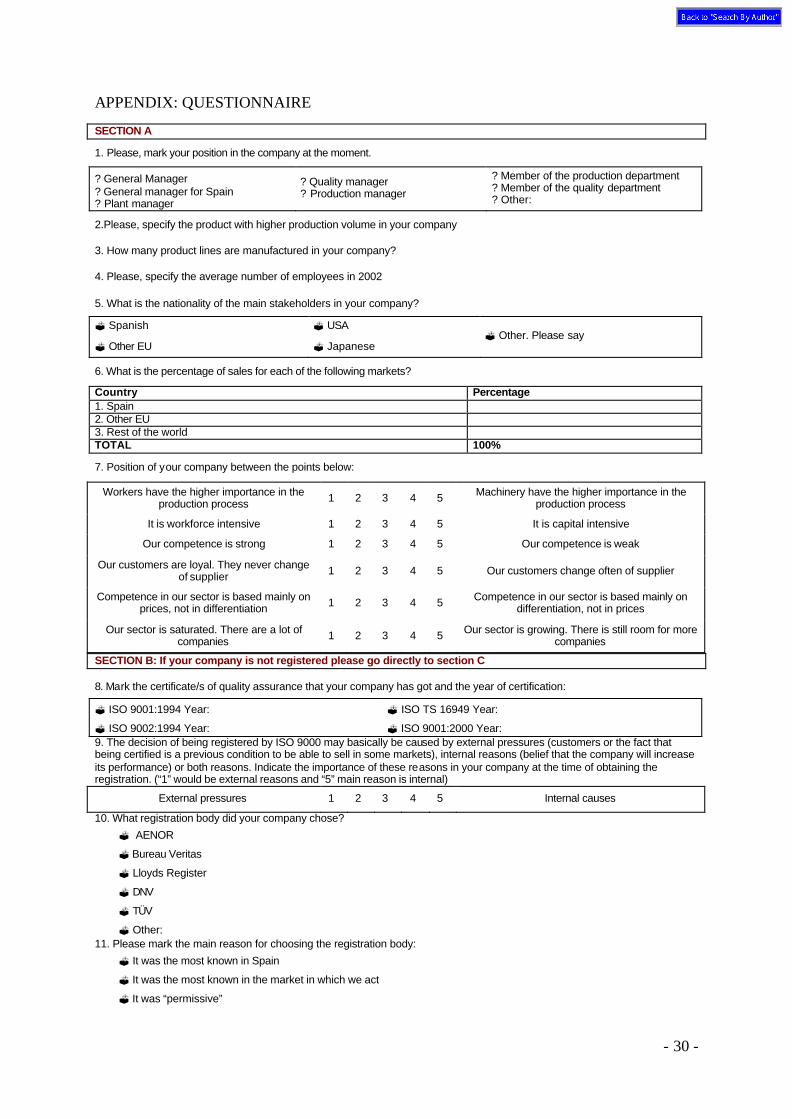
APPENDIX: QUESTIONNAIRE SECTION A
1. Please, mark your position in the company at the moment.
? General Manager ? General manager for Spain ? Plant manager
? Quality manager ? Production manager
? Member of the production department ? Member of the quality department ? Other:
2.Please, specify the product with higher production volume in your company
3. How many product lines are manufactured in your company?
4. Please, specify the average number of employees in 2002
5. What is the nationality of the main stakeholders in your company?
? Spanish
? Other EU
? USA
? Japanese ? Other. Please say
6. What is the percentage of sales for each of the following markets?
Country Percentage 1. Spain 2. Other EU 3. Rest of the world TOTAL 100%
7. Position of your company between the points below:
Workers have the higher importance in the production process 1 2 3 4 5 Machinery have the higher importance in the
production process
It is workforce intensive 1 2 3 4 5 It is capital intensive
Our competence is strong 1 2 3 4 5 Our competence is weak
Our customers are loyal. They never change of supplier 1 2 3 4 5 Our customers change often of supplier
Competence in our sector is based mainly on prices, not in differentiation 1 2 3 4 5 Competence in our sector is based mainly on
differentiation, not in prices
Our sector is saturated. There are a lot of companies 1 2 3 4 5 Our sector is growing. There is still room for more
companies
SECTION B: If your company is not registered please go directly to section C
8. Mark the certificate/s of quality assurance that your company has got and the year of certification:
? ISO 9001:1994 Year:
? ISO 9002:1994 Year:
? ISO TS 16949 Year:
? ISO 9001:2000 Year: 9. The decision of being registered by ISO 9000 may basically be caused by external pressures (customers or the fact that being certified is a previous condition to be able to sell in some markets), internal reasons (belief that the company will increase its performance) or both reasons. Indicate the importance of these reasons in your company at the time of obtaining the registration. (“1” would be external reasons and “5” main reason is internal)
External pressures 1 2 3 4 5 Internal causes
10. What registration body did your company chose?
? AENOR
? Bureau Veritas
? Lloyds Register
? DNV
? TÜV
? Other: 11. Please mark the main reason for choosing the registration body:
? It was the most known in Spain
? It was the most known in the market in which we act
? It was “permissive”
- 31 -
Completely disagree
Completely
agree
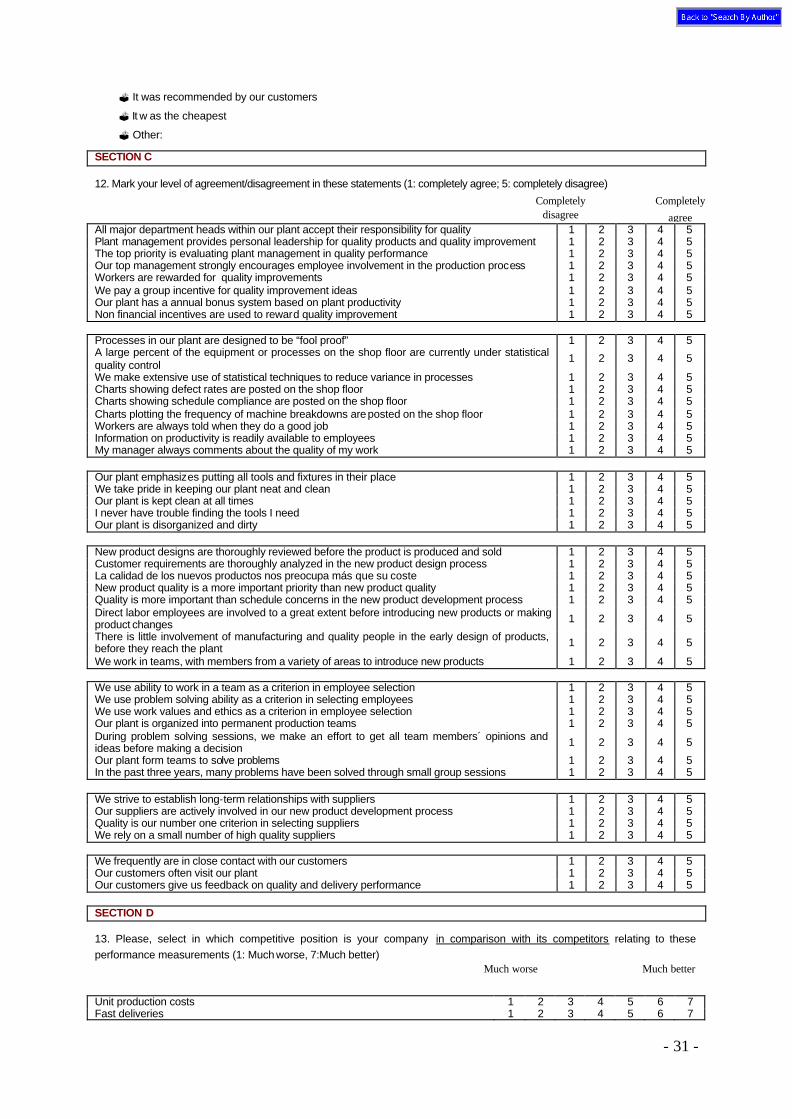
? It was recommended by our customers
? It w as the cheapest
? Other:
SECTION C
12. Mark your level of agreement/disagreement in these statements (1: completely agree; 5: completely disagree)
All major department heads within our plant accept their responsibility for quality 1 2 3 4 5 Plant management provides personal leadership for quality products and quality improvement 1 2 3 4 5 The top priority is evaluating plant management in quality performance 1 2 3 4 5 Our top management strongly encourages employee involvement in the production process 1 2 3 4 5 Workers are rewarded for quality improvements 1 2 3 4 5 We pay a group incentive for quality improvement ideas 1 2 3 4 5 Our plant has a annual bonus system based on plant productivity 1 2 3 4 5 Non financial incentives are used to reward quality improvement 1 2 3 4 5 Processes in our plant are designed to be “fool proof” 1 2 3 4 5 A large percent of the equipment or processes on the shop floor are currently under statistical quality control
1 2 3 4 5
We make extensive use of statistical techniques to reduce variance in processes 1 2 3 4 5 Charts showing defect rates are posted on the shop floor 1 2 3 4 5 Charts showing schedule compliance are posted on the shop floor 1 2 3 4 5 Charts plotting the frequency of machine breakdowns are posted on the shop floor 1 2 3 4 5 Workers are always told when they do a good job 1 2 3 4 5 Information on productivity is readily available to employees 1 2 3 4 5 My manager always comments about the quality of my work 1 2 3 4 5 Our plant emphasizes putting all tools and fixtures in their place 1 2 3 4 5 We take pride in keeping our plant neat and clean 1 2 3 4 5 Our plant is kept clean at all times 1 2 3 4 5 I never have trouble finding the tools I need 1 2 3 4 5 Our plant is disorganized and dirty 1 2 3 4 5 New product designs are thoroughly reviewed before the product is produced and sold 1 2 3 4 5 Customer requirements are thoroughly analyzed in the new product design process 1 2 3 4 5 La calidad de los nuevos productos nos preocupa más que su coste 1 2 3 4 5 New product quality is a more important priority than new product quality 1 2 3 4 5 Quality is more important than schedule concerns in the new product development process 1 2 3 4 5 Direct labor employees are involved to a great extent before introducing new products or making product changes 1 2 3 4 5
There is little involvement of manufacturing and quality people in the early design of products, before they reach the plant 1 2 3 4 5
We work in teams, with members from a variety of areas to introduce new products 1 2 3 4 5 We use ability to work in a team as a criterion in employee selection 1 2 3 4 5 We use problem solving ability as a criterion in selecting employees 1 2 3 4 5 We use work values and ethics as a criterion in employee selection 1 2 3 4 5 Our plant is organized into permanent production teams 1 2 3 4 5 During problem solving sessions, we make an effort to get all team members´ opinions and ideas before making a decision 1 2 3 4 5
Our plant form teams to solve problems 1 2 3 4 5 In the past three years, many problems have been solved through small group sessions 1 2 3 4 5 We strive to establish long-term relationships with suppliers 1 2 3 4 5 Our suppliers are actively involved in our new product development process 1 2 3 4 5 Quality is our number one criterion in selecting suppliers 1 2 3 4 5 We rely on a small number of high quality suppliers 1 2 3 4 5 We frequently are in close contact with our customers 1 2 3 4 5 Our customers often visit our plant 1 2 3 4 5 Our customers give us feedback on quality and delivery performance 1 2 3 4 5 SECTION D
13. Please, select in which competitive position is your company in comparison with its competitors relating to these performance measurements (1: Much worse, 7:Much better)
Unit production costs 1 2 3 4 5 6 7 Fast deliveries 1 2 3 4 5 6 7
Much worse Much better
- 32 -
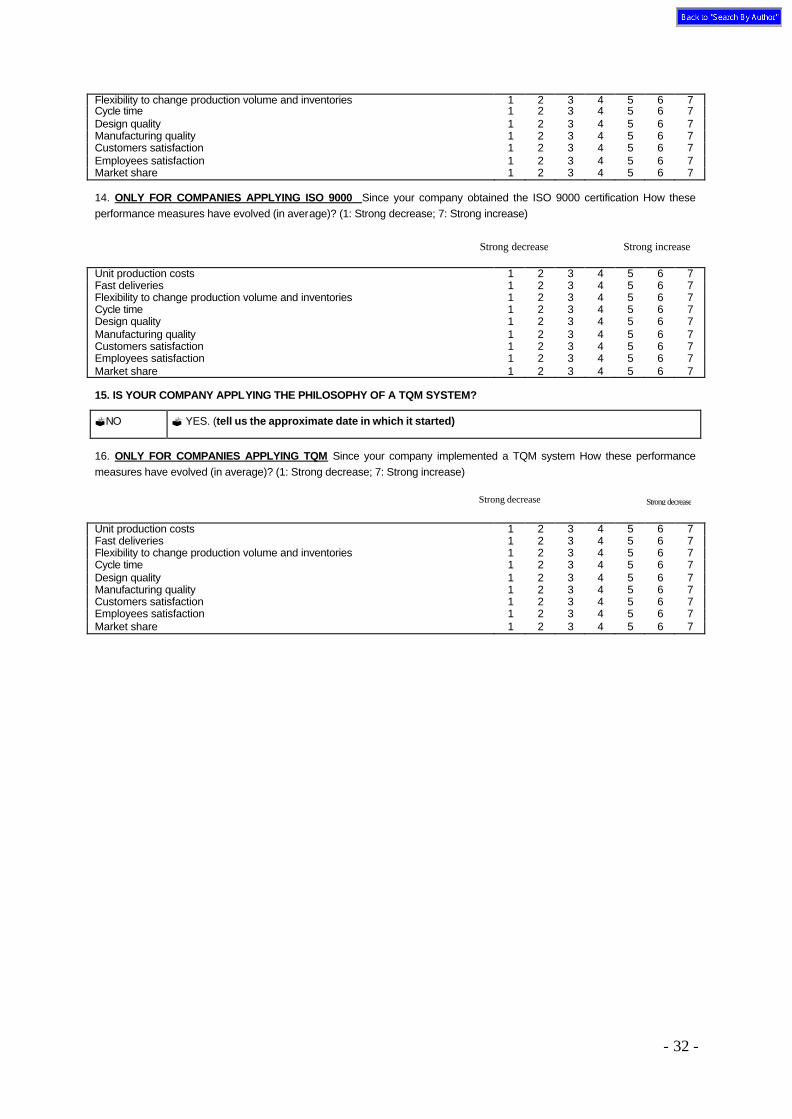
Flexibility to change production volume and inventories 1 2 3 4 5 6 7 Cycle time 1 2 3 4 5 6 7 Design quality 1 2 3 4 5 6 7 Manufacturing quality 1 2 3 4 5 6 7 Customers satisfaction 1 2 3 4 5 6 7 Employees satisfaction 1 2 3 4 5 6 7 Market share 1 2 3 4 5 6 7
14. ONLY FOR COMPANIES APPLYING ISO 9000 Since your company obtained the ISO 9000 certification How these performance measures have evolved (in average)? (1: Strong decrease; 7: Strong increase)
Unit production costs 1 2 3 4 5 6 7 Fast deliveries 1 2 3 4 5 6 7 Flexibility to change production volume and inventories 1 2 3 4 5 6 7 Cycle time 1 2 3 4 5 6 7 Design quality 1 2 3 4 5 6 7 Manufacturing quality 1 2 3 4 5 6 7 Customers satisfaction 1 2 3 4 5 6 7 Employees satisfaction 1 2 3 4 5 6 7 Market share 1 2 3 4 5 6 7 15. IS YOUR COMPANY APPLYING THE PHILOSOPHY OF A TQM SYSTEM?
?NO ? YES. (tell us the approximate date in which it started)
16. ONLY FOR COMPANIES APPLYING TQM Since your company implemented a TQM system How these performance measures have evolved (in average)? (1: Strong decrease; 7: Strong increase)
Unit production costs 1 2 3 4 5 6 7 Fast deliveries 1 2 3 4 5 6 7 Flexibility to change production volume and inventories 1 2 3 4 5 6 7 Cycle time 1 2 3 4 5 6 7 Design quality 1 2 3 4 5 6 7 Manufacturing quality 1 2 3 4 5 6 7 Customers satisfaction 1 2 3 4 5 6 7 Employees satisfaction 1 2 3 4 5 6 7 Market share 1 2 3 4 5 6 7
Strong decrease
Strong decrease
Strong decrease Strong increase
Related Documents