Electronic copy available at: http://ssrn.com/abstract=1924124 1 Comparing Patent Litigation across Europe: A First Look * Nicolas van Zeebroeck ECARES Solvay Brussels School of Economics and Management Université libre de Bruxelles 50, avenue F.D. Roosevelt ‐ CP114 1050 Brussels Belgium [email protected] Stuart Graham College of Management Georgia Institute of Technology 800 West Peachtree St. NW Atlanta, GA30308 USA [email protected] September 2011 Abstract Due to its fragmentation and the difficulty of collecting data, European patent litigation has rarely been investigated across the various nations in which it occurs. This paper overcomes this vacuum, analyzing a never‐before available dataset on patent actions in seven European countries during 2000‐2010. We observe striking differences in the likelihood of reaching a final decision in patent litigation across jurisdictions, with much larger relative frequencies of decisions in some countries (e.g., the Netherlands) than in others (e.g., the UK). Litigation intensities also vary widely across technological areas, although the split among the types of court action (e.g., patent validity versus infringement) tends to be more regular, regardless of field. The variability we find in incidence across technological fields suggests differences in the dynamics of patent enforcement across industries, possibly due to differential costs or higher asymmetries of information or stakes in the outcomes. The cross‐country patterns we find also highlight institutional differences across countries, all of which drive the costs and incentives to use the various courts, and help confirm the fragmentation in European technology markets. This article thus adds evidence to the ongoing policy debate about the incidence of forum shopping in Europe, and the extent to which lower predictability and legal certainty may be affecting the returns to firms from engaging in technological innovation and entering markets across the continent. Keywords: patents, patent litigation, technology markets, cross‐country analysis, industry analysis. * Nicolas van Zeebroeck acknowledges funding from FNRS. We thank Darts‐IP for supplying data and Pierre Véron, Emmanuel Cornu, Jean‐Christophe Troussel, Bruno Vandermeulen, Willem Hoyng, Eric Sergheraert and other practitioners for fruitful discussions and advice. All opinions and errors are ours alone.

Welcome message from author
This document is posted to help you gain knowledge. Please leave a comment to let me know what you think about it! Share it to your friends and learn new things together.
Transcript

Electronic copy available at: http://ssrn.com/abstract=1924124
1
Comparing Patent Litigation across Europe: A First Look*
Nicolas van Zeebroeck
ECARES Solvay Brussels School of Economics
and Management Université libre de Bruxelles
50, avenue F.D. Roosevelt ‐ CP114 1050 Brussels
Belgium [email protected]
Stuart Graham College of Management
Georgia Institute of Technology 800 West Peachtree St. NW
Atlanta, GA30308 USA
September 2011
Abstract Due to its fragmentation and the difficulty of collecting data, European patent litigation has rarely been investigated across the various nations in which it occurs. This paper overcomes this vacuum, analyzing a never‐before available dataset on patent actions in seven European countries during 2000‐2010. We observe striking differences in the likelihood of reaching a final decision in patent litigation across jurisdictions, with much larger relative frequencies of decisions in some countries (e.g., the Netherlands) than in others (e.g., the UK). Litigation intensities also vary widely across technological areas, although the split among the types of court action (e.g., patent validity versus infringement) tends to be more regular, regardless of field. The variability we find in incidence across technological fields suggests differences in the dynamics of patent enforcement across industries, possibly due to differential costs or higher asymmetries of information or stakes in the outcomes. The cross‐country patterns we find also highlight institutional differences across countries, all of which drive the costs and incentives to use the various courts, and help confirm the fragmentation in European technology markets. This article thus adds evidence to the ongoing policy debate about the incidence of forum shopping in Europe, and the extent to which lower predictability and legal certainty may be affecting the returns to firms from engaging in technological innovation and entering markets across the continent. Keywords: patents, patent litigation, technology markets, cross‐country analysis, industry analysis.
* Nicolas van Zeebroeck acknowledges funding from FNRS. We thank Darts‐IP for supplying data and Pierre Véron, Emmanuel Cornu, Jean‐Christophe Troussel, Bruno Vandermeulen, Willem Hoyng, Eric Sergheraert and other practitioners for fruitful discussions and advice. All opinions and errors are ours alone.
Electronic copy available at: http://ssrn.com/abstract=1924124
2
1. IntroductionPatenting rates have grown enormously around the globe during the last decades, revealing increasing focus on the role played by intellectual property (IP) rights in the world’s knowledge‐based economies (WIPO, 2010). As a result, disputes over IP increasingly capture the media and top managers’ attention.1 Given the very tight coupling of competitive conditions, the returns from R&D, and isolating mechanisms like IP (Rumelt 1984), the enforcement of IP rights such as patents is a critical concern among both corporate executives and policy makers alike. Scholars in economics, management, and law have highlighted the importance and advanced our understanding of how IP disputes develop, and what drives their settlement or lack thereof. A large body of prior research, using United State’s system as a backdrop, has touched on the determinants of these suits, their costs, and the impacts they have on economic growth, entrepreneurship and fair competition (Priest and Klein 1984; Lanjouw and Schankerman 2001, 2004; Bessen and Meurer 2006, 2008). But patent litigation is not the peculiar province of the United States. In 2011, for example, Samsung Electronics Co. and Apple, Inc. conducted a series of patent litigation battles in different jurisdictions across the European continent. In August 2011, Apple won a Europe‐wide preliminary injunction against Samsung’s sale of several of its electronic devices which were found to infringe a European patent held by Apple.2 In September, a German court in Dusseldorf ordered a similar injunction, preventing Samsung Co. from displaying a Galaxy‐brand tablet in a Berlin trade show.3 The European patent enforcement system, due to national borders and institutional differences, offers to researchers a rich opportunity study patent strategy in a comparative context. But the complexity and fragmentation of the European patent litigation system has thus far frustrated attempts to quantify the intensity, diversity and consequences of pan‐European patent litigation. Primarily, this paucity of empirical research has been due to the absence of reliable data sources. Two notable exceptions are Cremers (2004) and Harhoff (2009). Cremers (2004) documents and investigates the determinants of patent infringement suits in Germany during 1993‐1995, based on a detailed case‐level dataset covering disputes filed in the three primary German patent courts. Harhoff (2009) analyzes the potential benefits and costs of a unified patent litigation system in Europe, and in so doing summarizes the empirical evidence available to date. These as well as other theoretical and empirical studies on this issue (see e.g. Weatherall et al. (2003)) stress the scarcity of
1 See, for instance, Ellen Rosen (2011). “HTC‐Apple, Oracle, Google, Kodak, FBI Warning Seal: Intellectual Property.” Bloomberg, September 8, 2011. Available at: http://www.bloomberg.com/news/2011‐09‐08/htc‐apple‐oracle‐google‐eastman‐kodak‐intellectual‐property.html (last accessed September 8, 2011). 2 The Dutch court found that Samsung’s devices infringed upon Apple’s European software patent 2,059,868, covering scrolling in mobile photo galleries. Devindra Hardawar (2011). “Apple scores another patent win: Dutch judge bans Samsung Galaxy S sales.” Mobile Beat, August 24. Available at: http://venturebeat.com/2011/08/24/apple‐scores‐another‐patent‐win‐dutch‐judge‐bans‐samsung‐galaxy‐s‐sales (last accessed September 7, 2011). 3 Jun Yang (2011). ” Samsung Puts Galaxy 10.1 Tablet on Hold as Apple Wins German Court Order.” Bloomberg, September 5. Available at: http://www.bloomberg.com/news/2011‐09‐04/apple‐wins‐german‐injunction‐on‐new‐galaxy‐tab.html (last accessed September 7, 2011).

3
European patent litigation data and the difficulty of formulating detailed policy recommendations in its absence. These studies, as well as high‐stakes competitive legal battles like those fought by Apple and Samsung, serve to highlight the unanswered yet critically important research questions in this area of inquiry. For instance: How frequent is patent litigation in different countries, and across different technologies and industries? How frequently do separate cases in more than one European nation arise out of the same dispute? And what are the patterns of different types of disputes – such as patent invalidity and infringement – across nations, technologies, and industries? Each of these questions raises important issues of system design and industrial competition, useful to firms planning their business strategies and to governmental actors as they contemplate policy shifts such as the oft‐debated unitary European patent. While heretofore these questions have gone unanswered, the objective of this paper is to help fill this lacuna in our understanding. It is the first study of which we are aware that provides substantial empirical evidence on the incidence and outcomes of court‐ordered patent disputes in several European countries. We base our analysis on a recently‐released proprietary dataset, containing approximately 9000 judicial patent decisions from seven European countries, published during the period 2000‐2009. These decisions were collected and manually analyzed by Darts‐IP, a Belgium‐based information company. We estimate that they include approximately 90% of all patent litigation decisions in France, Holland, and the UK during 2000‐2009, about 70% from the UK (2000‐2009) and Italy (2004‐2009), approximately 60% for Belgium and Spain, and about 40% for Germany (we estimate our German coverage to be 30% during 2000‐2003, and 50% from 2004‐2009). In our analysis, we employ these data to empirically assess the frequency of and patterns in European patent litigation at the country and multi‐country level of analysis, and segment these findings at the individual patent, the patent family, and the patent‐technology level. In so doing, we offer for the first time an empirically based, grounded view of an important competitive environment that has been generally guided only by the rough estimates made by patent law practitioners in the various court jurisdictions. Our results demonstrate that the frequency of patents reaching a judgment in litigation varies widely across European countries, beyond the differences associated with the quantity of domestic stocks of enforceable patents. Patent disputes for which a decision is lodged appear comparatively frequent in the Netherlands and France compared to their incidence in other countries, and are higher in the event than experienced practitioners’ estimates. While we find that suits in Germany, Spain and the UK are more in line with reported estimates (e.g. Harhoff 2009, Holzer 2005), our coverage in these countries is also less complete, raising the possibility that practitioners’ estimates in these jurisdictions are also low. Second, we find that patent litigation varies widely across technology sectors, with 60% of decisions focused in industrial processes, civil engineering and consumer goods, as well as
4
machinery and transport technology classes. In contrast, pharmaceuticals and chemical patents each represent only about 8% of all litigation decisions. Despite its low aggregate share of cases, the pharmaceuticals sector nonetheless exhibits some of the highest case decision rates in specific international patent classes (IPC), consistent with Lanjouw and Schankerman’s (2001) findings in the U.S. In fact, among the 10 primary IPC classes (four digits) showing the highest case decision rates, five belong to pharmaceutical classes in our data. Finally, we observe that court actions in which patent validity and / or infringement are at issue also varies significantly across countries and technology sectors. The main policy implication of our study is derived from the salient patterns that we observe in patent litigation across technologies and countries. Such patterns highlight both the fragmentation and heterogeneity of the European patent system, as well as the fundamentally different market dynamics that likely shape patent enforcement strategies of firms across industries. These patterns also underline the varying predictability and legal certainty that innovators, competitors, and other economic actors experience in the fragmented European system. Our teaching in this article is organized in six sections. Immediately following this introduction, section 2 assesses the literature on the law and economics of litigation, bridging distinctions between this literature and our European study environment. In section 3, we review the main distinctive features of the national patent systems in the major European countries in order to highlight the institutional differences across European nations that relate to our data analysis. Section 4 describes our patent case law dataset and details our method for matching these litigation cases to patents and patent families. In section 5, we examine different trends and patterns in patent litigation in the 6 EU countries for which the data are the most comprehensive (Belgium, France, Germany, Spain, the Netherlands and the UK), and section 6 concludes.
2. TheEconomicsofPatentLitigationScholars have given a good deal of attention to the economics of litigation, addressing the basic question: Under conditions of conflict, what circumstances lead to parties being unable to bargain to a cooperative private solution, driving them instead to endure costly public ordering (court) solutions? Early work by Priest and Kline (1984) has led to several stylized models, including Lanjouw and Lerner (1998), that help explain the parties’ choices between litigating and cooperating in the patent infringement context. These models, however, usually consider the simplest alternative of settling versus litigating to judgment, and so abstract away from the complexity and dynamic nature of patent disputes. As illustrated in Figure 1, exit (which may include a settlement among the parties) can actually occur at many different stages in the dispute process: Parties can settle prior to filing a court action, or at any point in time during the court proceedings. Even when a case goes to final judgment, the losing party may appeal the decision to a higher court, or choose to exit at that point. Information about what is actually transpiring in a patent conflict among competitors is therefore often hidden from researchers. Figure 1 also illustrates the difficulty in empirically

5
studying litigation: the universe of potential patent‐based conflicts, even those detected by the parties involved, is unobservable in any systematic way. Patent litigation studies, which have come primarily from the United States, have therefore investigated elements that may be observed or inferred: Research has examined patent cases filed in the first instance at trial court (e.g., Lanjouw and Schankerman, 2001; 2004), on appeal to higher courts (e.g., Dunner, 1995, examining outcomes at the Court of Appeal of the Federal Circuit or CAFC), or particular court proceedings (e.g., Lanjouw and Lerner, 2001, investigating preliminary injunctions). Inferences have also been made about what occurs when a case is started (suit filing) but not completed (final court judgment), with some assuming that a settlement has occurred, although in reality exit may occur for other reasons. It is a truism of research into patent litigation that empirical researchers are always forced by circumstances to investigate a selected sample of conflicts. No study to our knowledge has been able to adequately overcome this limitation in doing research in this area.
Figure 1 about here Figure 1 also highlights the notion that the probability of litigating (versus the alternative of settling) first depends upon the patentee detecting a conflicting situation (typically an infringement). Provided that a conflict is observed, there are different factors driving parties to select either court‐ordered solutions or cooperative settlements. In Lanjouw and Lerner (1998)’s model, the most prominent factors are the legal costs and the stakes (the transfer between parties). Increasing litigation costs tend to encourage cooperative settlements in their static model. In Europe, given that litigation costs tend to be lower than in the US,4 we would therefore expect, all else equal, that cases in Europe have a lower likelihood of settlement on account of costs, compared with their U.S. counterparts. Nevertheless, since judgment amounts also tend to be lower in European litigation, partly due to the absence of punitive damages,5 then all else equal the stakes would be lower in Europe, also working in favor a cooperative solution. In reality, litigation costs are rarely evenly distributed over the life of the suit, and the “lumpy” arrival of costs can generate sub‐games within the structure of the suit, and create strong incentives for settlement at different stages in the process. Moreover, shocks may drive changes in the cost structure as information is revealed and the level of suit complexity changes. The likelihood of reaching a settlement after filing but prior to a final judgment is therefore far from zero, and suggests a level of complexity not captured in the static models. Building on these basic considerations, the law and economics literature has developed several theories to help explain why legal disputes fail to settle, including hidden information
4 In a recent survey of patent attorneys in the U.S. (AIPLA, 2009), total patent litigation costs were estimated at $1.3m when the risked transfer did not exceed $1m; $5m with a transfer amount between $1m‐25m; and $11m when the transfer exceeded $25m. In European litigation, the cost to prosecute disputes is substantially lower: it ranges between €100,000 and €400,000 per side in most continental jurisdictions for a transfer amount of about €1m (van Pottelsberghe, 2009), although total costs would be less than double these estimated amounts due to court fees paid only once (Harhoff, 2009). 5 No punitive damages are awarded by European courts, hence the only compensation awarded must be based on established lost profits of the patent owner or revenues of the infringer). For instance, in France in 1998, the high court in Paris awarded an average amount of just €21,343 in IP infringement cases (Ladas & Parry (2010): http://www.ladas.com/Litigation/ForeignPatentLitigation/France_Patent_Lit.html).

6
(Nalebuff 1987; Spier 1992); divergent expectations (Priest and Klein 1984; Yildiz 2004; Galasso 2007); and asymmetric stakes, or positive litigation externalities (Meurer 1989; Siegelman and Waldfogel 1996; Lanjouw and Lerner 1998). Studies of patent litigation in the US context have typically emphasized the second and third factors, since it has been assumed that litigants are sophisticated parties with detailed knowledge of the relevant technology and market. In Europe, however, these elements may cut against settlement, given the language, cultural, and institutional differences among the various countries. And, regardless of geography, the difference in resources and sophistication among parties –such as between large and small firms– have been shown to drive significant differences in litigation incidence (Lanjouw and Schankerman 2004).
3. TheDifferentLitigationSystemsacrossEuropeDespite the progressive harmonization of IP laws in Europe, patent litigation systems remain widely heterogeneous among the European countries we analyze. Key differences derive from laws and institutions; others result from practice and case law. In terms of institutional settings, two major differences relate to whether jurisdictions have adopted specialized patent courts, and whether litigants are permitted or required to address infringement and nullity claims within the same court and suit. In general, national systems in which more patent litigation occurs have created specialized patent courts, or specialized sections within national or district courts, at least for first instance (trial) cases. In practice, however, most patent courts are semi‐specialized (as in the Netherlands or Spain) or not specialized at all (as in Belgium). In most countries we study, courts are allowed to rule on nullity and infringement claims simultaneously. Germany, however, stands out with its dual system: In its system, infringement and nullity are examined in different courts, in different cities. Table 1 summarizes the main features of the national patent litigation systems we study. In addition to the above institutional differences, there is also heterogeneity among jurisdictions in terms of costs associated with the proceedings, from a low average of 50k‐100k€ for a medium‐intensity case in Belgium and Spain, to a high of between 150k‐1500k€ for a medium‐intensity case in the UK). There is also variance in the amount of awarded damages and the time lag from filing to final decision, from an average 12 months in the Netherlands to 24‐36 months in Belgium and Italy. Moreover, we see that some jurisdictions, such as Belgium and the Netherlands, apply (either currently or previously) cross‐border injunctions that go beyond the common EU Regulation 44/2001 on the applicability of national decisions within the European Union (see below). These features highlight the substantial heterogeneity in the various national innovation systems, which substantially determines the observed patterns of patent litigation (e.g., costs and damages).
Table 1 about here Goods and services are routinely sold across Europe by entities based in different countries, and therefore cross‐border infringement and patent actions are common. But because the European patent litigation system is fragmented along national and institutional lines, several considerations loom large, not the least of which is the difference between the way infringement and nullity actions are prosecuted. By European regulation, national courts exert exclusive jurisdiction over questions about the validity of their domestic patents, and it is therefore not possible to nullify, for instance, a German patent with a Dutch decision

7
(even if the decision corresponds to the same EPO patent). Nullity challenges are therefore necessarily a national issue. Infringement actions, however, are frequently of an international nature, either because infringement in one country is allegedly performed by an entity residing in another country, or because infringement is observed in multiple European countries. As a result, nothing prevents a single dispute to be brought simultaneously before multiple courts across Europe. However, Harhoff (2009)’s projections suggest that duplicate actions should be uncommon in Europe. This may be partly explained by the EU Regulation 44/2001, which provides that the enforcement and recognition of judgments are applicable in most European countries.6
4. ThepatentcaselawdatasetWith the institutional details of the various European patent courts as background, we now move to an empirical examination of patent litigation across Europe, the first of which we are aware. Our study exploits a new proprietary dataset of patent litigation across Europe, which has heretofore been unavailable to researchers. These data were provided by Darts‐IP, a Belgian‐based company offering information on IP case law to practitioners, diligently collected over the last several years. The dataset we use for analysis (a subset of the Darts‐IP database), contains 8,745 judicial decisions issued in 2000‐2009 from 7 European countries: Belgium, France, Germany, Italy, the Netherlands, Spain, and the United Kingdom. According to the data provider, these data cover between 40% and 90% of the judicial patent decisions published in the focal countries. Patent litigation has been studied previously, primarily in the United States (Lanjouw and Schankerman, 2001, 2004). While these previous studies used “suit filing” data, our dataset departs from the setting generally examined in earlier works in two important respects (see Figure 1). First, we observe judgments across different Court levels (first instance, appeal, Supreme Court), which previous studies typically could not do. Second, our unit of observation is not the case filing, but is instead the court decision. Just as previous litigation studies could not observe the selection that led to a case arriving at the court, our data do not allow us to observe the universe of cases filed or to determine what cases settled before reaching a decision by a court. What our data do show are the cases that received a decision issued by a court (whatever its nature). Whereas earlier works typically analyzed litigation in the shadow of (unobserved) infringement, our study examines court decisions in the shadow of (unobserved) patent suit filing. Nevertheless, for some of the countries we investigate, our data derived from “court decisions” are virtually identical to the population of “patent suits filed” in that country. As a matter of process, in several nations, formal decisions come very quickly and are a matter of common – virtually universal – procedure.
6 The main thrust of that Regulation is that once a judgment has been obtained in one European country, it should be enforceable in all countries where these conventions apply. This may however become less straightforward in practice.

8
In France and Belgium, courts almost always issue a formal decision publicizing a settlement or suit abandonment, which we observe in our data.7 We also observe these publication decisions for the Netherlands to a lesser extent, since the patent court seldom closes or dismisses a suit before reaching a decision on the merits.8 Because most infringement actions in the courts of these three nations start with a preliminary injunction, court decisions tend to follow the filing of the suit quickly in time – and our data do include preliminary injunctions. As a result, our data for these three countries most closely mirrors a “cases filed” dataset. In the UK, where costs are comparatively high and settlement during suit is relatively common, the difference between the population of filed cases and our “decided cases” sample should be more substantial.9 Little is known on settlement rates in Germany, Spain and Italy, but to the extent that infringement actions start with a preliminary injunction in these countries, such cases will also be included in our data.
4.1CoverageIt is important for statistical purposes to develop estimates of the share of cases or decisions that our sample comprises. That task is a challenging one, due to the absence of official registers of patent judgments in most countries. While information is sparse, we are aided in assessing the completeness of our data by a set of practitioners’ estimates. The two main surveys available for the countries covered in our data are provided by Holzer (2005) and by a study performed under the German Presidency in 2007. Both sources provide estimates by country of the number of patent cases filed per annum, which we reproduce in Table 2. To compare these, we asked the data provider to report to us the share of decisions in each court system that they have been able to obtain.10 We report these figures in the second row of Table 2, showing that Darts‐IP estimates its coverage to be 90% complete between 2000‐2009 in France and the Netherlands. In Belgium, Italy, Spain and the UK,11 they estimate a 60‐80% coverage, while in Germany their estimated yield rate is comparatively low, with our dataset estimated to comprise only about half the available decisions.
7 By procedure, French and Belgian courts are among the rare jurisdictions to issue official communications (a desist order) whenever a case is abandoned. Véron (2010) indicates that 17% of all patent cases filed at the Court of Paris result in such desist orders, almost surely due to a settlement between the parties. In addition, as soon as a case is filed to a Tribunal de Grande Instance in France and Belgium, a judge (‘Juge de mise en état’) will meet the parties’ counsels to examine the nature of the claims, the regularity and legality of the procedure, and their main arguments. If anything is missing to initiate the actual proceedings in Court, the judge will issue an order (‘ordonnance de mise en état’) to the failing party, requesting her to hand over its arguments, conclusions, or any missing information. Over time, the responsibilities of the ‘juge de mise en état’ in France have been extended, leading to a growing number of such orders, which do appear in our data, and hence reveal the existence of a case filing (Véron, 2010). 8 According to Dutch lawyers and a patent court judge we interviewed, the share of cases that settle before reaching a decision on the merits in the Netherlands is between 10 and 15%. 9 Holzer (2005)’s figures suggest that about half of the cases filed are settled before judgment in the UK. 10 While Darts‐IP has subject‐matter expertise and proximity to courts that may lead to confidence in their accuracy, as a commercial provider they may also have incentives to inflate their estimates. We therefore remain agnostic as to their estimates. 11 In the UK, our data could be matched to the official Patent High Court diary and appeared to include over 90% of all cases decided in the period 2000‐2009. An estimated 40% of the cases from the diary are reported as ‘settled’ and do not appear in our data. To the extent that there are cases that may settle before even being scheduled for a hearing and appearing in the diary, this share is however only a lower‐bound estimate of settlements in the UK.

9
The comparison in Table 2 offers an order of magnitude view into the completeness of our dataset, and how consistent practitioners’ estimates are compared with the data provider’s coverage. In France, the Netherlands and Belgium, where we expect to see a comparatively small difference between filed and judged cases, the data provider’s estimates of judgments exceeds the practitioners’ reported estimates of all filed cases by 4‐44%.12 In other countries, the data provider’s estimates of judgments are lower than the practitioners’ estimates of filed cases, by about 20% in Germany, 40% in the UK, and 50% in Italy.13 Although very rough, these figures may indicate the relative frequency of settlements in the different jurisdictions, or may be the result of under‐inclusion in our data.14
Table 2 about here Overall, the third row of Table 2 gives a first order estimate of patent litigation decisions in 7 European countries, representing about 1360 judgments per year. Of these, 41% were rendered in Germany, 25% in France, 12.5% in Spain, 9.5% in Italy, 5% in the Netherlands, 3% in the UK, and 2.5% in Belgium. By and large, the available evidence suggest to us that we have a useful dataset upon which to conduct analysis of, and to draw about, the state of European patent litigation.
4.2NatureofactionsDarts‐IP conducts a manual analysis of each decision, employing structured descriptors to qualify legal issues raised in the suit, such as infringement and validity challenges. Accordingly, we are able to conduct a detailed analysis of the legal posture of the various cases we observe. We approach this analysis with some caution, however, since these determinations are based on the judgment of the provider, and cannot be independently verified. Nevertheless, there are grounds to have confidence in these descriptions, insofar as Darts‐IP’s business model is to sell these results to attorneys who will demand quality, and exercise quality control, rewarding or punishing Dart‐IP based on their accuracy. Table 3 presents descriptive statistics on types of actions. Among the 4,054 decisions for which such descriptors are available (representing 51% of all decisions in the 5 countries where such descriptors are available), 25.0% are stand alone nullity actions, and 57% are related to patent infringement actions. Among these, 36% of the decisions on infringement also include claims concerning the validity of the focal patent(s), suggesting that infringement was answered with a patentability counterclaim by the accused infringer. Overall, patent validity was addressed in about 45.6% of the classified decisions in our
12 Note however that our counts are judgments, not cases, and that our data may contain multiple judgments over a single case, so that our numbers are not really comparable with the practitioners’ estimates. However, we observe that only 30% of all litigated families in the 7 countries in our dataset were involved in more than one decision within the same country. Also note that the practitioners’ estimates are based on filing dates (e.g. 2003), whereas our figures are based on judgment dates. We therefore look at judgments rendered 2 years later (e.g. 2005), the average decision lag being about 2 years, but the cohorts will not perfectly match. 13 Note that these figures should be taken with great care as the cohorts of cases we compare do not perfectly match: the practitioners provide estimates of the cases filed in a certain year (around 2003), whereas we report figures on the number of cases judged two years later (in 2005), the average decision lag being about 2 years. 14 Clearly, under‐inclusion of records in our dataset may be due either to failure by the data provider to collect the data, or because some suits may be filed, and settled, without experiencing a formal court decision.

10
dataset. The remaining types of actions represent about 18% of the cases and largely relate to issues of ownership and inventor rights.
Table 3 about here In terms of issues raised, we find heterogeneity across countries.15 In France, the ratio of infringement actions to standalone invalidation actions is 60%/18%, and thus similar to what we observed in the Netherlands (61%/29%). In Spain and the UK, this ratio is on the order of 45% infringement actions compared to 30% standalone nullity challenges. In Germany, the ratio of infringement actions to standalone nullity challenges is 57%/34%. This relatively high share of standalone nullity actions we observe in Germany may be a consequence of its bifurcated court system.16 When compared to the pool of “filed” patent suits, we suspect that our dataset has more coverage in some nations (e.g., France and Holland) compared to others (e.g., UK and Germany). To test the hypothesis that the patterns we find in litigation‐type distributions are not different for “early” cases when compared to “late” cases, we examine French cases, since for these records we believe our data both mirror filings and for which we know whether the cases are “early” or “late” decisions. When we exclude preliminary actions and settlements that we may not observe in other countries, the ratio of infringement to stand‐alone nullity actions remains qualitatively unchanged (59%/21% v. 60%/18% for the full sample), but the share of nullity challenges rises by about 10%. We surmise that this latter increase reflects rise in the hazard of invalidity counterclaims that would exist in any case that is “older,” since the defendant has had relatively more time to prepare a defense and to raise nullity claims (and more incentive, if as we suspect cases that are fought longer are also more costly and thus likely to be based on a more valuable asset).
4.3MatchingdecisionstopatentsWhile aggregate statistics at the country level are informative, a more precise analysis required us to match individual court decisions to auxiliary data on patents. We match suits to patent data using the legally “disputed” patent numbers, which fortunately commonly appear somewhere in the full transcript of legal decisions. Darts‐IP has been able to manually extract such patent numbers in 75% of the records.17 We matched these identifiers to the PatStat patent dataset, i.e. EPO’s Worldwide Patent Statistics Database (EPO 2008).18 After machine matching the publication numbers and, where necessary, manually cleaning
15 The share of cases we were able to analyze (for which decision types are available from Darts‐IP) varies between a low of 32% in Spain, 41 and 43% respectively in Germany and in the Netherlands, to 66% in France and a high of 87% in the UK. 16 For Germany, these figures need to be taken with great care, as they may be strongly biased by the availability of decisions across courts, given that – except for the Supreme Court – each court can only deal either with the validity, or with all the other types of disputes. Therefore, if the decisions from the Federal Patent Court are under‐sampled in our data as the case may be, then our figures will underestimate the true share of nullity challenges. In the other countries, given that all courts may deal with both types of arguments, there is no reason why decisions in our data should have been selected on one particular type of decisions. 17 We have no reason to believe that the unavailability of patent numbers is driven by any systemic factor other than the availability and workload of legal experts working for Darts‐IP in the corresponding languages. It is for instance not related with the year of judgment (the share of decisions taken in each country‐period is consistent across decisions with or without patent numbers) or with particular courts. 18 Also known as ‘PatStat’. The edition we used in this study is Edition April 2008 (EPO 2008).

11
the data to harmonize publication number formats, we matched in excess of 98% of the identifiers available to us.19 Table 4 reports the frequencies and shares of national judicial decisions for which patent numbers were both available and successfully matched to PatStat. In these data, patent numbers were less commonly available for decisions from the UK (71%), Spain (52%), and were virtually missing from all Italian decisions.20 To create an analysis sample, we discarded records for which we had no matched patent number, and all Italian decisions due to the very small share of matched cases. This operation produced a dataset of 6,430 decisions from 6 countries (Belgium, France, Germany, Spain, the Netherlands and the UK), covering 74% of all judicial decisions in the original dataset.21 Among the sample of all decisions available to us from these six countries, the average country yield in our patent‐number matched set is 78%.
Table 4 about here In addition to creating a patent‐level analysis dataset, we also created a patent‐family level sample. We generated this alternate set to minimize the incidence of double counts and to provide a window into cross‐border cases on “equivalent” patents protected in multiple countries.22 Different definitions of patent families have been proposed in the literature (see e.g. Graham, Hall, Harhoff, and Mowery 2003; Dernis and Khan 2004; Graham and Harhoff 2006), each of which is based on priority documents. The methods differ in the character of the priority documents that patents must share to be considered equivalents. According to the most inclusive definition, two publications are equivalents as soon as they have one priority number in common.23 Following Graham and Harhoff (2006), we prefer a more conservative (restrictive) definition in which two patents are considered equivalents (hence part of the same family) if and only if they share the exact same set of priority documents. We use this definition to generate a list of patents belonging to each family in PatStat using the Innotec Patent Citation Project data (Harhoff 2008).
Table 5 about here
Table 5 provides statistics on the highest court level reached by each patent family involved in a decision in our final dataset. It shows that overall 63% of litigated patent families do not show a decision beyond the first instance (trial), 26% end during appeal, and 10.5% are reviewed by the country’s highest jurisdiction. However, the Netherlands is an outlier with 91% of patent families showing no decision in a court beyond the first instance (trial). Shares of families for which we show decisions beyond the first instance in other countries range between a high of 43% in Germany and a low of 36% in Belgium. These differences may stem
19 When a match could not be made, it was generally due to unreadable numbers in the primary data. 20 We have no reason to believe that the unavailability of patent numbers is driven by any systemic factor other than the availability and workload of legal experts working for Darts‐IP in the corresponding languages. It is for instance not related with the year of judgment (the share of decisions taken in each country‐period is consistent across decisions with or without patent numbers) or with particular courts. 21 A probit estimate of the likelihood of appearing in our final dataset on country and time dummies does not indicate any significant bias in the selection, except for small negative effects with Spain and the UK. 22 The definition of what is an “equivalent” patent is controversial. See Graham and Harhoff (2009). 23 Sometimes this definition is even extended to second‐order priorities, i.e. indirect priorities in common through a third patent with which the two documents share a priority.

12
from institutional differences, or from different expectations with respect to probabilities of a judgment being overturned on appeal.
5. PatternsinpatentlitigationinEuropeWe set out to examine cross‐country propensities and time trends in the incidence of litigation.24 Wanting to account for differences in the scale of the respective economies, we compute different litigation rates for country c in year t. Following Lanjouw and Schankerman (2001), we compare litigated patents in our data with patents filed in the same year, and the number of court decisions in a given year with patents in force in the same year. We specify two different classes of indicators. First, the litigation rate per patent should reflect the likelihood of a litigation decision being lodged for a patent filed in a given country‐year. The variable LRPct, defined in Equation 1, is the share of patents from a given country‐year cohort (c,t) that has reached a judgment in the focal country:
(1) The second indicator is a country litigation intensity, which should ideally compare the number of patent disputes in a given country with the population of enforceable patents in the country. Unfortunately, assessing the universe of enforceable patents requires patent‐level data on renewals and maintenance lapses that are unavailable to us. We therefore approximate the universe of enforceable patents in a given country‐year by employing the number of patents filed in the same year as the typical disputed patent in the country. The variable LRAct defined in Equation 2 is the number of decisions in the focal country (c) and year (t) relative to the number of patents of the same average age in the same country:
(2) Where agec is the average age of patents at the time of judgment in country c (summarized in Table A1 in the appendix). Despite substantial variation in institutional settings and workloads, the delay we find is in fact remarkably stable across the 6 countries we studied. This delay ranges between a minimum of 12.00 years in Belgium to a maximum of 13.72 years in France, with an average across all decisions of 13.25 years. Alternatively, the variable LRGct is the number of patent cases decided in country c and year t relative to the country GDP25 expressed in billions of dollars, as detailed in Equation 3. This
24 Unless otherwise specified, all following tables and figures are based on patent litigation cases decided in the six focal countries (Belgium, France, Germany, Spain, the Netherlands, and the UK) over the period 2000‐2009. 25 We use OECD’s GDP figures in US dollars at constant prices and constant exchange rates.

13
latter measure therefore captures the litigation intensity relative to the size of the domestic market:
(3) Table 6 reports the three litigation rates we have calculated per country, both before and after adjusting for missing cases. In terms of litigation incidences within a patent cohort (LRP) and in decisions per patent filed (LRA), the Netherlands has the highest rates with about 15 patent cases per 1000 patent families filed in the same year, and 29 decisions per 1000 patent families filed of the same age. Holland ranks lower however in terms of decisions per GDP unit (0.19 decisions per billion $ GDP). Litigation rates appear relatively high in France, with about 9 families being involved in a decided case and 23 decisions per 1000 families filed. Germany exhibits relatively low rates in terms of patent weights (3.2 litigated patents and 7.6 decisions per 1000 patents filed), but ranks highest with respect to decisions per GDP unit (0.37), this latter reflecting the higher patenting intensity (patents filed per GDP unit) in Germany compared to the other countries in the sample. The UK shows the lowest litigation rates, with barely 0.05 decisions per GDP unit, and less than 1 litigated patent per family filed.
Table 6 about here All of these estimates must be read in context, however. Recall that in several countries (France, Belgium, and the Netherlands), our data is more likely to show a decision compared to the pool of actual litigation events, which seemingly would inflate the above rates compared to other nations (Germany, for instance). To better compare our measured rates with the existing literature, we derived litigation data from the United States Federal Judicial Center, focusing on filed cases from 1980‐2008. We find that the patent litigation intensity (LRA) in the USA (25 disputes per 1000 patents) is comparable in magnitude with Belgium, the Netherlands, and France, which may reflect that our data in these three countries is more likely to be more reflective of suit filings. It is interesting to note, however, that on the LRG measure, the USA ranks fourth (between the Netherlands and France) in GDP terms (with 0.22 disputes per $billion GDP), well below Germany and Spain. Given that we surmise that our court decision data for these countries may be under‐representative of all patent suits, this finding suggests that patent suits as a share of economic activity in these nations may actually be significantly higher than in the U.S., a jurisdiction criticized as being “highly litigious” as respects patent rights (Bessen and Meurer 2008).
5.1TechnologypatternsinpatentlitigationWe turn next to examining the technology‐specific characteristics of patent litigation across Europe. In order to investigate the intensity of patent disputes in different fields, we rely on the ISI‐OST‐INPI classification (OST 1993), which includes 7 broad technology categories.26
26 Note that the use of an alternative taxonomy based on EPO Joint Clusters (Archontopoulos et al. 2007) yields comparable results, except for the pharmaceuticals sector which exhibits very low litigation intensities and the chemicals sectors that is split into 3 different categories with very different litigation rates (organic chemistry

14
Table 7 reports, for each aggregate class and country, the class‐share of patent filings in the period 1980‐2004,27 the share of cases we observe, and the rate (the number of patent suits in our data per 1000 patents filed in the cohort, adapted from Equation 2).28 Consistent with findings in Lanjouw and Schankerman for suit filing in the United States, overall court decision intensity is highest in the “pharmaceuticals and biotechnology” sector (3 patent decisions per 1000 patents filed).29 We also find the rate comparatively high in the “industrial processes” and “consumer goods and civil engineering” classes (2.4 litigated patents in 1000 patents filed). In other classes, the litigation rates vary between 1.4 (“electricity and electronics,” “chemistry and materials,” “machines and transport”) and 1.6 (“instruments”).
Table 7 about here These averages nonetheless mask considerable heterogeneity across countries (see Figure A1 in the appendix). For example, “industrial processes” and “consumer goods and civil engineering” represent a substantial share of patent cases in Spain (about 30% each), and represent classes in which these rates are highest (2.3 and 2.9 litigated patents per 1000 applications respectively). “Industrial process” disputes also represent the largest share of cases in the Netherlands (27% of the cases), France, and Germany (each 20%). Overall, “pharmaceuticals and biotechnology” patents are more likely to have a decision lodged than other patents in 5 of the 7 countries (but interestingly not in Germany and Spain). When we look at classes outside of “pharmaceuticals and biotechnology,” class rankings tend to be country‐specific, which may be driven by either country‐level factors or characteristics of industrial organization. In the case of “consumer goods and civil engineering”, however, the rate is highest for 2 rankings out of 7 countries. “Industrial processes” patents comprise a quarter of court actions across all countries, and show decision rates ranked second or third highest in 5 countries. Consistently unlikely to show a decision are “machines and transport” and “chemicals and materials” patents among all countries. Since we suspect that our dataset has more coverage in some nations than others, like the operation we performed and reported in Table 3 we compare in Table 7 the technology distribution in litigation for “late” or “more complete” French cases. By excluding preliminary actions and settlements that we may not observe in other countries, we are able to analyze a subsample that is more comparable with the later progress of cases available in other nations. Our figures clearly show a strong consistency in the statistics between the two French litigation samples. While these findings must be recognized as representative only for France, they do help to give us a window in the differences between “early” and “late” progress cases, at least in one important litigation venue in Europe.
exhibits the highest litigation rates in most countries, but polymers among the lowest). This is due to a different allocation of some crowded IPC4 classes to joint clusters compared to OST classes. 27 90% of all patents litigated in 2000‐2009 in our sample belong to this period. 28 Note however that these rates are not adjusted for missing cases. Therefore one should compare litigation rates across industries, but not across countries. 29 Filing in this sense counts both granted patents that were filed in the focal country, and also validated from an EPO grant. In this case, when summing across nations, because we are dealing with patent families we do not double‐count patents that may be validated from the EPO in more than one nation.

15
We examine the variation in relative court decision rates across technological fields over time, and graph our findings in Figure 2. While in every technological area the rates follow an inverted U‐shape evolution over time, this pattern is an artifact of right censoring. As we showed earlier, the average age of patents at the time of judgment is consistently around 13 years in all countries, suggesting that many cases for patents issued in the 2000s have not yet arrived in the data.
Figure 2 about here More interesting in Figure 2 is the evolution in relative decision rates across technological fields, i.e. the evolution in the ranking of technological fields with the highest rates, about which we make two observations. First, with the exception of “pharmaceuticals and biotechnology” patents, all OST fields follow a reasonably parallel evolution in decision per patent intensities (although the rate for “chemicals and materials” patents starts declining earlier than the other 5 classes). Second, three distinct patterns emerge. A group with low decision rates is formed by the “chemicals and materials,” “instruments,” “electricity and electronics,” and “machines and transport” classes. A second group follows a parallel evolution but with substantially higher rates in the middle filing periods (1985‐1999): the “consumer goods and civil engineering” and “industrial processes” classes. Finally, “pharmaceuticals and biotechnology” patents are clearly an outlier, showing by far the highest decision rates in the first three patent cohorts (1980 to 1994), but falling to average rates in the two youngest patent cohorts. This evolution, when compared to the other fields, may suggest that the timing of litigation in this area is systematically different than in others, i.e. patents may tend to be litigated later in this field than in others. This finding is consistent with the lags in the innovation process observed generally in this technology space (e.g., lengthy product development, clinical testing, and regulatory delays)(Higgins and Graham, 2009).
Table 8 about here In order to test this “pharmaceutical delay” hypothesis, we computed the average age of patents, from date of first application to date of judgment in each OST class (as in Table A1). The results are reported in Table 8 by country. They reveal that the age of patents in our suit data varies significantly across technological fields, much more so than across countries. In most countries, “consumer goods and civil engineering” patents are on average involved in a suit relatively early after filing, followed by patents from the “electrical and electronics,” “industrial processes” and “machines and transport” classes, which are typically one to two years younger at the time of decision than the average patent in our data. But two sectors systematically show older patents on average in our case data: the “pharmaceuticals and biotechnology” and “chemicals” technologies, in which patents reach a decision between 1 and 4.5 years later than other litigated patents in all countries. This means that the average age difference between patents reaching a court decision in these two classes as compared with other classes is approximately 4 years in most countries (with the exception of a 3‐year difference in the UK and a 9 year difference in Spain). This added delay among patents litigated in the “pharmaceutical and biotechnology” space suggests a solution to the patterns we observed in Figure 2, adding evidence that patents in the pharmaceutical and chemical technologies tend to be litigated later than in other sectors.

16
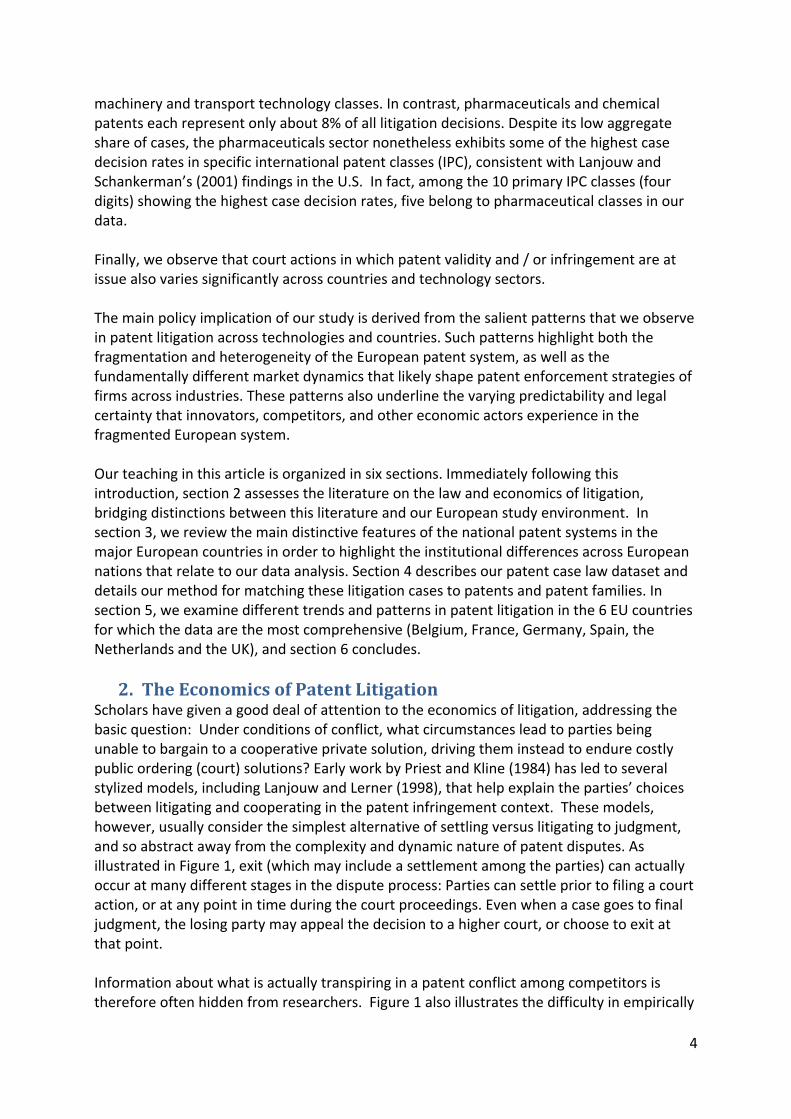
Table 9 about here
The very large discrepancies in cases‐per‐patent rates and time to closure of observed cases across technological fields may suggest that patent litigation is particularly concentrated in some areas. To shine more light upon this issue, we examine more closely the incidence of cases in our data occurring in individual IPC4 classes. Figure A2 in the appendix shows the frequency distribution of the number of patent families involved in our cases per IPC4, and confirms that patents in a large share of IPC4 classes never reach the court decision stage in the patent cases in our sample, whereas a small share of IPC4 classes have seen many such actions (over 50). To learn more about these findings, we apply four alternative filters to select the most relevant IPC4 classes, selecting: (a) the union of the top 10 classes with the largest number of patents filed in the period 1980‐2004; (b) the top 10 classes with the largest number of judicial decisions in the period 2000‐2009; (c) the top 10 classes with the highest case‐per‐patent rates; and (d) the top 10 classes with the lowest case‐per‐patent rates.30 Due to classes in the intersection, we are left with 28 IPC4 classes that belong to one or more of these categorizations. These are summarized in Table 9 with country statistics and listed by decreasing case‐per‐patent rates. We find that class E04G, civil engineering technologies for building aids such as scaffolding, shuttering and building implements, shows the highest incidence of decisions‐per‐patent (overall, as well as in almost all countries). Class G07F follows, a class categorized in the ‘Instruments’ OST group for coin‐freed apparatus. While we observe a particularly high rate in these classes in France, excluding the French decisions does not remove either of these classes from the 10 classes with highest decision‐per‐patent incidence. Technologies in storage or transport of articles or materials (class B65D), categorized in the industrial processing OST group, is also high on the ranking. Three pharmaceutical and biotechnology classes follow in the top 7 classes (A61Q, A61P, A61K). Important differences across countries appear here as well. Two classes within the fourth quartile in terms of filings that also have a very low number of cases‐per‐patent (nearly 0%) are related to the automotive industry: B60T and F02D, classes covering brake control systems and combustion engines control technology respectively.
5.2TechnologypatternsinnatureofactionsFigure 3 shows the share of actions by type across focal patents assigned to the 7 primary OST classes. Overall, about 58% of the cases correspond to infringement actions, less than half of which (22% of the decisions in total) involve invalidity counterclaims by defendants (noted as ‘Infr+Nullity’ in Figure 2). Standalone nullity actions account for about a quarter of the cases in our data (26%), and the remaining 16% are a mix of other types of actions, generally related to ownership and inventor issues. These shares are fairly stable across OST classes. In particular, the shares of pure infringement and standalone nullity actions are
30 In order not to select the very atypical IPC4 classes with only a couple patents and meaninglessly high litigation rate due to only one or two of them being litigated, we select the IPC4 classes with the lowest litigation rates among the fourth quartile of IPC classes (by number of filings in the 6 countries).

17
quite stable, with the difference between maximum and minimum not exceeding 8% in either type. Hybrid actions (involving infringement and validity claims) vary more widely across technological areas: In the consumer goods area, hybrid actions represent a 27% share of the cases while in the chemicals and pharmaceuticals areas the share is about 15%. In these two technology classes, “Other issues” comprise a quarter of the cases, which may reflect that the “Other” category includes issues relating to supplementary protection certificates peculiar to the pharmaceuticals industry.
Figure 3 about here Figure 4 shows results generated from conducting these same analyses upon cases involving patents assigned to the 10 IPC4 classes showing the highest decisions‐per‐case ratios in our data. The share of each action type over these 10 classes is consistent with the overall figures across all OST classes (32% of infringement actions without validity counterclaims, 18% infringement actions with validity counterclaims, and 28% standalone nullity actions). But variation between these IPC classes appears wider than across aggregated OST classes. In particular, pure infringement actions comprise only 19% of cases in the E04D class (roof coverings) while invalidation challenges account for only 24% of cases in the A01G class (horticulture, forestry and watering). Both types of actions show a much higher share among patents in the G07F class (coin‐freed apparatuses) with about 37% each. “Other” actions are most frequent in the pharmaceutical and human necessity classes: A61K (23%), A61P (28%), and particularly A61Q (‘Specific use of cosmetics preparations’, 55%). These high shares are driven mainly by a large number of inventor rights‐related disputes in France, especially in class A61Q.
Figure 4 about here
6. ConcludingremarksThere is ample evidence that patent litigation is a critical issue, because it conditions the enforcement of patents and therefore helps to set their value and competitive significance in the market. The balancing act that courts must undertake, in deciding questions of the scope of validity and infringement, helps determine the incentives to innovate, to commercialize, to litigate, and to copy from competitors. If courts fail to enforce valid patent rights, or do so too generously in favor of infringers, then infringement will tend to be a dominant strategy. If courts impose complex rules and procedures so that enforcement is made more expensive, then the threat of infringement actions may not be credible, with patent owners enforcing fewer rights at the margin. Similarly, excessively strong IP rights, enforced too severely by courts at a relatively inexpensive price, may produce a greater supply of infringement actions, with possible reduced entry due to excessively high threats of litigation. Nevertheless the effective operation of the patent system is predicated upon market players having the capacity to challenge invalid patents at reasonable prices, and so courts face a delicate balancing act between procedural and substantive rules of law, which will invariably affect the cost of litigation, and the relative attractiveness of enforcement and infringement. Guellec and van Pottelsberghe (2007), Harhoff (2009) and van Pottelsberghe (2009) have argued that the European patent system, due to the fragmentation of its litigation system, is

18
far from optimal. Their studies, as well as many other formal and empirical analyses of IP litigation, have been limited, however, by the lack of empirical evidence in Europe. While these studies have been produced in number for the United States (see e.g. Lanjouw and Schankerman (2001, 2004), or Bessen and Meurer (2005, 2006, 2007, 2008)), this paper for the first time offers a similar view into several of the major patenting jurisdictions in Europe. And it is clear that Europe is not monolithic in how it approaches patent enforcement, nor is the U.S. model a good one from which to draw inferences about European patent litigation. Using new and never‐before analyzed data on patent litigation in several of the largest European countries, this study offers a first view into the complex and fragmented European patent litigation environment. This exceptionally rich data source provided the opportunity for a first cross‐country empirical analysis of patent litigation in Europe. Our analysis provides well supported orders of magnitude and identifies country, technology and procedural patterns in European patent litigation, which significantly contribute to our knowledge of legal disputes over European patent rights. The results both challenge and complement practitioners’ estimates of the frequency of patent litigation in Europe, which have heretofore been used as a baseline (e.g. Harhoff 2009, van Pottelsberghe and Mejer 2008). While our data are consistent with practitioners’ annual estimates during the 2000s, they also suggest substantially different rates in suit settlement across different countries (with, e.g., higher settlement rates in the UK than in the Netherlands). Our data also offer evidence for countries where such estimates were not previously available, i.e. Italy (an estimated 150 cases per year), Belgium (50 cases per year), and Spain (220 cases per year). Overall, our data suggest that the seven European countries we studied experience cumulatively approximately 1,360 patent judgments per year, significantly more than what is currently documented. And this figure is likely a conservative one, since there are clearly some cases – especially in UK and Germany – that settle after filing but before a formal court decision and which are unobserved by us in this dataset. Not surprisingly, we find that decision‐per‐patents‐filed rates are significantly higher in the nations for which we believe our data is most representative of all filed cases (e.g., in the Netherlands, with about 15 patents subject to court decisions per 1000 patents filed, and in France, with about 9 patens subject to a court decision per 1000 filed). That compares with lower rates in Germany and Spain (about 3.5 patents in our courts database per 1000 filed), and in the UK (less than 1 patent involved in a case decision for each 1000 filed), where we believe our dataset less completely mirrors suit filings, and is more representative of cases that have reached a significant milestone in the litigation process. These selection issues notwithstanding, when we calculate patent‐suit decisions per GDP unit (this latter as a proxy for the size of the market), we find substantial differences, with variation in the numerators and denominators across nations (e.g., this ratio is seven times larger in Germany than for Holland). In the UK, for instance, the GDP ratio is 0.04 decided suits per $ Billion, while France (all suits) shows 0.27 decided suits per $billion GDP and Germany (for which we believe we have only later suits) shows 0.37 decided suits per $billion GDP. When we compare this latter with the calculated figure from the United States of 0.22 per $ Billion based on all filings (from the Federal Judicial Centre), it suggests that Germany may be an extremely litigious patent environment. Still much more empirical

19
evidence is needed in this area, especially as respects Germany where our data are admittedly not as complete. Based on the manual analysis of a large share of the decisions in our dataset conducted by the data provider, we are able to identify the type of action based on the nature of the claims addressed in each judgment. It appears that standalone nullity actions represent about a quarter of European patent litigation cases in our data. Infringement actions account for roughly 60%, with about a quarter overall giving rise to an additional nullity counterclaim by the defendant, thus qualifying as “hybrid” cases. Such hybrid cases are very rare in Germany due to its dual litigation system in which infringement and nullity are heard by different courts. The remaining 15% of all European cases consist of other types of actions, mostly related to ownership and employee‐inventor issues. Because we had patent numbers involved in many of our records, we were able to match over 78% of all decisions in Belgium, France, Germany, Spain, Holland and the UK to the Patstat (EPO 2008) database, allowing us to analyze litigation at the patent‐family and technology‐area levels. Generally speaking, patent litigation is more likely in the pharmaceutical area than in any other, but this technology propensity is very country‐sensitive. For instance, in the Netherlands, court decisions are almost 6 times more likely in the pharmaceutical area than in electricity and electronics. In our German suit sample, we find that court decisions are 4 times more likely in the mechanical engineering, machines and transport area than in pharmaceuticals. While we surmise that these patterns may due to the heterogeneity in the degree of specialization and competition in each industry across countries, they may also betray different approaches to enforcement across industries. We find, however, that the nature of legal actions does not appear to differ widely across industries, with for instance the share of infringement and nullity challenges being generally equal across technological areas, with “hybrid challenges” being a notable exception across fields. Our analysis suggests that the dynamics of patent litigation and its practices are substantially different from country to country and from technology to technology. Following the theoretical models of Priest and Klein (1984) and Lanjouw and Lerner (1998), the difference in patent litigation incidences across industries may suggest in particular that the fixed cost to engage in litigation is not perceived evenly across industries, that the stakes are lower or higher across industries, that the asymmetries of information vary substantially (possibly influenced by the predictability of the courts decisions), or any combination of these. More research is therefore desirable to aid in uncovering how these different litigation systems perform in an otherwise unified Europe. The differences that our data uncover in the rates and incidence across countries may be driven by technological specialization (which we know to exist among the patent‐heavy countries of France, Germany and the UK) or by institutional differences. These latter may pertain to litigation costs (much higher in the UK than in continental courts) or to the “attractiveness” of each system with regard to different types of disputes or situations. While our findings suggest that opportunities for and instances of forum shopping exist in Europe, more research is needed in this area.

20
Overall, our data tend to confirm the heterogeneity of the European patent litigation system. Some commentators suggest that such variability results in uncertainty, and that a solution may lie in a unified system through a Central European Patent Court (Harhoff 2009; van Pottelsberghe 2009). Noting that research has shown that higher harmonization and consistency of decisions across courts and time leads to easier and faster settlement (Galasso and Schankerman 2010), there may be value in such a suggestion. While we remain agnostic about such a solution, we believe that our data and analyses, which offer some tantalizing first insights into the system of European patent litigation, deserve to be complemented by more research in this area.
ReferencesAmerican Intellectual Property Law Association (2009). Report of the Economic Survey.
Archontopoulos, E., D. Guellec, N. Stevnsborg, B. van Pottelsberghe de la Potterie, and N. van Zeebroeck (2007), When small is beautiful: Measuring the evolution and consequences of the voluminosity of patent applications at the EPO, Information Economics and Policy 19(2), 103–32.
Bessen, J. and M. J. Meurer (2005), Lessons for Patent Policy from Empirical Research on Patent Litigation, Lewis & Clark Law Review 9(1), 1‐27.
Bessen, J. and M. Meurer (2006), Patent litigation with endogenous disputes, The American Economic Review 96(2), 77‐81.
Bessen, J. and M. Meurer (2007), The Private Costs of Patent Litigation, Boston University School of Law Working Paper No. 07‐08.
Bessen J. and M.J. Meurer (2008), Patent failure: How judges, bureaucrats, and lawyers put innovators at risk, Princeton University Press.
Bretonnière, J.F. and G. Corman (2005), France: How to stop counterfeiting from being a profitable activity, IP Value 2005, London, Globe White Page, pp. 230‐232.
Brinkhof, J. (2005), The Netherlands: Enforcement of patents: Rambo Lawyers and cowboy judges?, IP Value 2005, London, Globe White Page, pp. 263‐266.
Cremers, C. (2004), Determinants of Patent Litigation in Germany, ZEW Discussion Paper 04‐72.
Dernis, H. and M. Khan (2004), Triadic Patent Families Methodology, STI Working Paper 2004/2, OECD, Paris.
Dunner, D., J. Jakes and J. Karceski (2005), A Statistical Look at the Federal Circuit’s Patent Decisions: 1982‐1994, 5 FED. CIR. B.J. 151.
EPO (2008), Patent Statistical Database, Edition 04/2008.
Galasso, A. (2007). Broad Cross‐License Agreements and Persuasive Patent Litigation: Theory and Evidence from the Semiconductor Industry. STICERD discussion paper EI‐45.
Galasso, A. and M. Schankerman (2010), Patent Thickets, Courts and the Market for Innovation, The RAND Journal of Economics 41(3), 472‐503.
Graham, S., B. Hall, D. Harhoff and D. Mowery (2003), Patent quality control: A comparison of U.S. patent re‐examinations and European patent oppositions, in Cohen, W. and S. Merril (2003), Committee on Intellectual Property Rights in the Knowledge‐Based Economy, National Research Council.
Graham, S. and D. Harhoff (2006), Can Post Grant Reviews Improve Patent System Design? A Twin Study of European and US Patents, CEPR Discussion Paper No. 5680, CEPR London.
Guellec, D., and B. van Pottelsberghe de la Potterie (2007), The economics of the European patent system, Oxford, Oxford University Press.
Harhoff, D. (2008), Patent citation project – Patstat Equivalents Dataset – Edition 04/2008, Downloaded from http://www.inno‐tec.bwl.uni‐muenchen.de/forschung/forschungsprojekte/patent_cit_project/index.html on 18/02/2009.
Harhoff, D. (2009), Economic Cost‐Benefit Analysis of a Unified and Integrated European Patent Litigation System, Final Report Tender No. MARKT/2008/06/D.
Higgins, M. and S. Graham (2009), Balancing innovation and access: patent challenges tip the scales, Science 326(5951), 370‐372.

21
Holzer, W. (2005), Patent Litigation in Europe – An Adventure, Presentation held at the Seminar on IPR Protection in Europe: Reaching the European Market, July 19‐20 2005, Bangkok, http://www.ecap‐project.org/fileadmin/ecapII/pdf/en/activities/national/thailand/20050719_20/holzer_patent_litigation_europe1.pdf.
Lanjouw, J. and J. Lerner (1998), The Enforcement of Intellectual Property Rights: A Survey of the Empirical Literature, Annales d'Economie et de Statistique 49/50, 223‐246.
Lanjouw , J. and J. Lerner (2001), Tilting the Table? The Predatory Use of Preliminary Injunctions, Journal of Law and Economics 44(573), 575‐576.
Lanjouw, J. and M. Schankerman (2001), Characteristics of Patent Litigation: A Window on Competition, The RAND Journal of Economics 32, 129‐151.
Lanjouw, J. and M. Schankerman (2004), Protecting Intellectual Property Rights: Are Small Firms Handicapped?, Journal of Law and Economics 47(1), 45‐74.
Meurer, M. (1989), The Settlement of Patent Litigation, RAND Journal of Economics 20, 77‐91.
Nalebuff, B. (1987), Credible Pretrial Negotiation, RAND Journal of Economics 18, 198‐210.
Observatoire des Sciences et Techniques (OST) (1993), Science et Technologie Indicateurs 1994, Economica, Paris.
Perani, P. (2005), Italy: The enforcement of IP rights, IP Value 2005, London, Globe White Page, pp. 249‐251.
Pitz, J. and G. Hermann (2005), Germany: Interplay between opposition proceedings and patent litigation, IP Value 2005, London, Globe White Page, pp. 233‐236.
Priest, G. and B. Klein (1984), The Selection of disputes for Litigation, Journal of Legal Studies 8, 1‐56.
Rumelt, D. (1984), Towards a Strategic Theory of the Firm, in Competitive Strategic Management, R. B.Lamb, Ed. Engelwood Cliffs, NJ: Prentice‐Hall, 566‐570.
Siegelman, P. and J. Waldfogel (1999). Toward a Taxonomy of Disputes: New Evidence Through the Prism of the Priest/Klein Model. Journal of Legal Studies, 28(1): 101‐130.
Spier, K. (1992). The Dynamics of pre‐trial negotiation. Review of Economic Studies, 59(1): 93‐108.
van Pottelsberghe de la Potterie, B. (2009), Lost property: The European patent system and why it doesn’t work, Bruegel Blueprint No. 9, Brussels.
van Pottelsberghe de la Potterie, B. and M. Mejer (2008), The London Agreement and the cost of patenting in Europe, Bruegel Working Paper 2008/5, Brussels.
Vandermeulen, B. (2005), Cross‐border patent litigation in Belgium: the next generation, published on http://www.twobirds.com/English/News/Articles/Pages/Crossborder_patent_litigation_in_Belgium.aspx.
Véron, P. (2010), Les contentieux de brevets d’invention en France, Etude statistique 2000‐2009, available at http://www.veron.com/.
Vidal‐Quadras, M. (2005), Spain: Enforcing IP rights, IP Value 2005, London, Globe White Page, pp. 291‐294.
Weatherall, K., E. Webster and L. Bentley (2009), IP Enforcement in the UK and Beyond: A Literature Review, SABIP Report (Number EC001).
WIPO (2010). World Intellectual Property Indicators 2010. Economics and Statistics Division. September.
Yildiz, M. (2004) Waiting to Persuade. Quarterly Journal of Economics, 119(1): 223‐249.

22
TablesandFigures
Figure 1 – Schematic of patent dispute
Note: Further options may still be possible after an appeal (such as going to the Highest Court).
Some stages in may not exist in certain jurisdictions or situations.
Figure 2 – Evolution in litigation rates per technological class across periods (EU6)

23
Figure 3 – Types of litigation actions across primary ISI‐OST‐INPI classes
OST1=Electrical engineering and Electronics; OST2=Instruments; OST3=Chemicals and Materials;
OST4=Pharmaceuticals and Biotechnology; OST5=Industrial processes; OST6=Mechanical engineering, Machines and Transport; OST7=Consumer goods and Civil engineering
Figure 4 – Types of litigation actions across 10 most litigated IPC4 classes

24
Table 1 – Main features of the European patent litigation systems we study and the US
Country Belgium France Germany Italy Netherlands Spain UK USA
Average costs 50‐100k€ 50‐200k€ 50‐250k€ 200‐400k€ 60‐200k€ 50‐100k€ 150‐1500k€ 5000k€
Damages Low Low Average Low (capped by licensing
rates) Average Low High Very High
Punitive damages No No No No No No Sometimes (exemplary damages)
Yes
Separate trial for damages No No Yes No No No Yes No
Average time to final decision 24‐36 mth 18‐24 mth 12‐18 mth 24‐36 mth 12 mth 12‐18 mth 24‐36 mth 18‐42 mth
Specialized courts No Semi
(Paris only) Yes,
some courts No Semi No Yes
Yes (first appellate court only)
Courts (first instance) 5 since 2007 10 in 2000 1 since 2009
Validity: 1 Infring.: 12
12 1 16 2 (for England & Wales)
94
Separate track for validity challenges
No No Yes No No No No No
Supreme Court Jurisdiction Procedural
only Procedural
only Full Full Full
In some cases only
Full Full
Pan‐European applicability (beyond EU Reg. 44/2001)
Yes No No No Yes No No N.A.
Preliminary injunctions Yes + Saisie‐description
Yes + Saisie‐contrefaçon
Only in limited situations
Yes Yes
(Kort Geding) Yes Yes Yes
Sources: AIPLA 2009, Harhoff 2009, van Pottelsberghe 2009, Cremers 2004, Bretonnière and Corman 2005, Pitz and Hermann 2005, Brinkhof 2005, Perani 2005, Vidal‐Quadras 2005, Vandermeulen 2005, CJA 2006 (http://ec.europa.eu/internal_market/indprop/docs/patent/studies/pli_appendices_en.pdf), Bundespatentgericht brochure 2009, Ladas &
Parry 2010 (http://www.ladas.com/Litigation/ForeignPatentLitigation/France_Patent_Lit.html), analysis of Federal Judicial Center Data, 2000‐2008, Freshfields 2007 (http://www.freshfields.com/publications/pdfs/2007/dec19/20313.pdf, http://www.freshfields.com/publications/pdfs/2007/dec19/20310.pdf)

25
Table 2 – Estimated availability of actual cases in the data
BE DE ES FR GB IT NL TOTAL*
(A) Judgments in 2005 in our data 26 321 119 355 32 106 72 912
(B) Yield rate according to data provider 0,60 0,50 0,60 0,90 0,80 0,70 0,90 0,67
(C) Theoretical judgments per year =(A/B) 43 642 198 394 40 151 80 1351
(D) Cases filed according to Holzer (2005) 700 300 85 70 1155
(E) Cases filed according to German Presidency 30 870 459 54 285 50 1748
(F) Estimates of all cases filed =(D+E)/2 30 785 380 70 285 60 1609
(G) F‐C ‐13 143 ‐15 30 134 ‐20 258
(H) G/F ‐0,44 0,18 ‐0,04 0,42 0,47 ‐0,33 0,16
* Total excluding Spain
Table 3 – Types of action among analyzed decisions by jurisdiction
Type of action FR FR (final only) DE ES NL UK Total
Infringement 1192 60,4% 917 58,8% 622 56,8% 172 44,4% 169 60,8% 146 45,6% 2301 56,8%
…of which involved nullity counterclaims 565 47,4% 541 59,0% 108 17,4% 37 21,5% 35 20,7% 82 56,2% 827 35,9%
Standalone nullity 351 17,8% 334 21,4% 377 34,4% 118 30,5% 81 29,1% 95 29,7% 1022 25,2%
…total decisions involving validity issues 916 46,4% 875 56,1% 485 44,3% 155 40,1% 116 41,7% 177 55,3% 1849 45,6%
Other (ownership, employee inventor, etc.) 430 21,8% 309 19,8% 97 8,9% 97 25,1% 28 10,1% 79 24,7% 731 18,0%
Total known 1973 64,0% 1560 81,1% 1096 40,8% 387 32,1% 278 42,7% 320 85,6% 4054 50,7%
Total unknown 1110 36,0% 364 18,9% 1587 59,2% 817 67,9% 373 57,3% 54 14,4% 3941 49,3%
Total 3083 1924 2683 1204 651 374 7995

26
Table 4 – Number of judicial decisions with patent numbers and matching rate to PatStat
Country Decisions Without pat. nb. With pat. nb. Unmatched Matched to PatStat
Belgium 214 32 15,0% 182 85,0% 1 0,5% 181 99,5%
France 3.083 622 20,2% 2.461 79,8% 32 1,3% 2429 98,7%
Germany 2.683 293 10,9% 2.390 89,1% 39 1,6% 2351 98,4%
Italy 517 453 87,6% 64 12,4% 14 21,9% 50 78,1%
Spain 1.204 543 45,1% 661 54,9% 23 3,5% 638 96,5%
The Netherlands 651 84 12,9% 567 87,1% 5 0,9% 562 99,1%
United Kingdom 374 101 27,0% 273 73,0% 4 1,5% 269 98,5%
Total 8.726 2.128 24,4% 6.598 75,6% 118 1,4% 6.480 98,2%
Table 5 – Highest level of decision per patent family in each country
Highest level reached in courts
Country Families Mean 1st Instance (1) Appeal (2) Review (3) Median
Belgium 157 1.38 100 63.7% 54 34.4% 3 1.9% 1st Instance
France 2586 1.47 1517 58.7% 931 36.0% 138 5.3% 1st Instance
Germany 1999 1.65 1143 57.2% 405 20.3% 451 22.6% 1st Instance
The Netherlands 871 1.11 793 91.0% 60 6.9% 17 2.0% 1st Instance
United Kingdom 289 1.43 172 59.5% 109 37.7% 8 2.8% 1st Instance
Total 5902 1.52 3725 63.1% 1559 26.4% 617 10.5% 1st Instance
Cases with level data available only. Levels not available in Spain.
Table 6 – Litigation rates per country per 1000 patent families
Based on actual data Adjusted for missing data
MissingCases
Filings / GDP
% EP in Natl pats Country LRP LRA LRG LRP LRA LRG
Belgium 6,12 20,80 0,09 10,20 34,66 0,15 40% 4,15 29%
Germany 1,28 3,06 0,15 3,21 7,65 0,37 60% 42,39 42%
Spain 2,34 5,78 0,18 3,90 9,64 0,31 40% 28,90 59%
France 8,30 20,88 0,24 9,23 23,20 0,27 10% 10,45 33%
France (final only) 6,51 13,56 0,16 7,23 15,07 0,17 10% 10,45 33%
Netherlands 13,77 25,81 0,17 15,30 28,68 0,19 10% 5,97 33%
United Kingdom 0,56 1,57 0,03 0,75 2,09 0,04 25% 15,54 16%
USA (*) 25,17 0,22
LRP is computed for patents filed in the period 1985‐2000. LRA and LRG are computed based on decisions taken in 2000‐2009 and the cohort of patents filed 12 to 14 years earlier depending on the country average age of patent at time of judgment. USA figures computed from data supplied from the Federal Judicial Center for the
years 2000‐2005 available at http://www.icpsr.umich.edu.

27
Table 7 – Litigation rates per technological class across countries (1980‐2004)
BE DE ES FR FR (final only) GB NL EU6
OST Class P% L% LR P% L% LR P% L% LR P% L% LR P% L% LR P% L% LR P% L% LR P% L% LR
Elec. Eng. & Electronics 9,5 11,8 4,6 17,7 14,1 0,7 9,7 8,7 1,3 16,6 15,0 4,5 16,6 12,6 2,8 19,4 17,2 0,5 15,0 7,9 3,0 17,3 13,2 1,4
Instruments 10,3 17,4 6,3 14,8 14,1 0,8 11,2 6,0 0,8 14,1 14,0 5,0 14,1 14,1 3,7 15,5 13,9 0,5 12,1 10,5 4,9 14,5 12,8 1,6
Chemicals & Materials 17,5 17,4 3,7 11,9 7,0 0,5 17,4 7,8 0,7 9,7 8,7 4,5 9,7 8,5 3,2 11,4 12,9 0,6 13,0 10,6 4,6 11,1 8,5 1,4
Pharma & Biotech 8,0 17,4 8,1 4,5 5,3 1,0 10,2 7,8 1,1 4,9 8,8 9,0 4,9 8,4 6,3 5,7 20,5 2,0 6,2 17,2 15,7 4,6 7,7 3,0
Industrial processes 21,0 15,2 2,7 17,1 21,1 1,1 19,6 30,6 2,3 16,5 20,2 6,1 16,5 21,8 4,9 15,2 13,6 0,5 22,9 27,3 6,7 17,1 22,4 2,4
Machines & Transport 16,6 7,3 1,6 21,3 19,9 0,8 16,7 9,4 0,8 23,2 15,5 3,3 23,2 16,0 2,5 18,3 11,3 0,3 15,7 11,0 3,9 20,6 16,0 1,4
Cons. goods & Civil Eng. 17,0 13,5 2,9 12,8 18,7 1,3 15,2 29,7 2,9 15,0 17,7 5,9 15,0 18,6 4,6 14,5 10,6 0,4 15,1 15,4 5,7 14,7 19,4 2,4
P%: Share of patent filings. L%: Share of litigation cases. LR: Litigated patents per 1000 patents in the cohort. Double counts possible due to multiple IPC classes per patent (no fractional counts).
Table 8 – Age of litigated patents at time of judgment per country and OST class*
OST Class BE DE ES FR GB NL EU6
Elec. Eng. &Electronics 11.2 14.1 15.9 14.6 12.5 13.6 14.3
Instruments 10.5 14.4 18.0 16.2 14.0 13.9 15.2
Chemicals&Materials 14.1 16.2 20.0 18.1 14.6 15.3 17.0
Pharma &Biotech 14.0 17.0 20.8 18.3 14.9 15.4 17.4
Industrialprocesses 11.2 13.4 12.5 15.0 13.0 11.4 13.6
Machines & Transport 9.8 13.3 15.7 14.7 13.1 12.4 14.0
Cons. goods& Civil Eng. 10.7 12.6 11.4 14.3 11.9 11.6 13.0
Mean 11.7 14.4 16.3 15.9 13.4 13.4 14.9* Age measured from the earliest priority date in the family to suit closing.
Observed patterns are robust to the use of grant years instead of priority years.
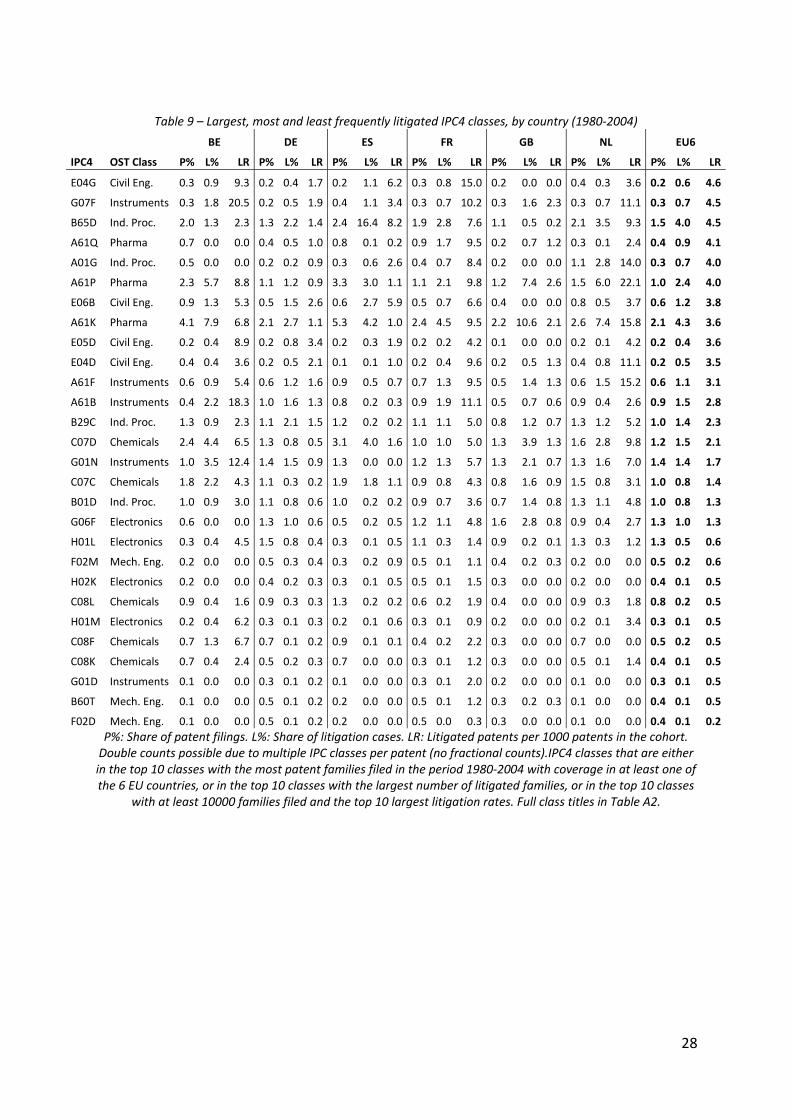
28
Table 9 – Largest, most and least frequently litigated IPC4 classes, by country (1980‐2004)
BE DE ES FR GB NL EU6
IPC4 OST Class P% L% LR P% L% LR P% L% LR P% L% LR P% L% LR P% L% LR P% L% LR
E04G Civil Eng. 0.3 0.9 9.3 0.2 0.4 1.7 0.2 1.1 6.2 0.3 0.8 15.0 0.2 0.0 0.0 0.4 0.3 3.6 0.2 0.6 4.6
G07F Instruments 0.3 1.8 20.5 0.2 0.5 1.9 0.4 1.1 3.4 0.3 0.7 10.2 0.3 1.6 2.3 0.3 0.7 11.1 0.3 0.7 4.5
B65D Ind. Proc. 2.0 1.3 2.3 1.3 2.2 1.4 2.4 16.4 8.2 1.9 2.8 7.6 1.1 0.5 0.2 2.1 3.5 9.3 1.5 4.0 4.5
A61Q Pharma 0.7 0.0 0.0 0.4 0.5 1.0 0.8 0.1 0.2 0.9 1.7 9.5 0.2 0.7 1.2 0.3 0.1 2.4 0.4 0.9 4.1
A01G Ind. Proc. 0.5 0.0 0.0 0.2 0.2 0.9 0.3 0.6 2.6 0.4 0.7 8.4 0.2 0.0 0.0 1.1 2.8 14.0 0.3 0.7 4.0
A61P Pharma 2.3 5.7 8.8 1.1 1.2 0.9 3.3 3.0 1.1 1.1 2.1 9.8 1.2 7.4 2.6 1.5 6.0 22.1 1.0 2.4 4.0
E06B Civil Eng. 0.9 1.3 5.3 0.5 1.5 2.6 0.6 2.7 5.9 0.5 0.7 6.6 0.4 0.0 0.0 0.8 0.5 3.7 0.6 1.2 3.8
A61K Pharma 4.1 7.9 6.8 2.1 2.7 1.1 5.3 4.2 1.0 2.4 4.5 9.5 2.2 10.6 2.1 2.6 7.4 15.8 2.1 4.3 3.6
E05D Civil Eng. 0.2 0.4 8.9 0.2 0.8 3.4 0.2 0.3 1.9 0.2 0.2 4.2 0.1 0.0 0.0 0.2 0.1 4.2 0.2 0.4 3.6
E04D Civil Eng. 0.4 0.4 3.6 0.2 0.5 2.1 0.1 0.1 1.0 0.2 0.4 9.6 0.2 0.5 1.3 0.4 0.8 11.1 0.2 0.5 3.5
A61F Instruments 0.6 0.9 5.4 0.6 1.2 1.6 0.9 0.5 0.7 0.7 1.3 9.5 0.5 1.4 1.3 0.6 1.5 15.2 0.6 1.1 3.1
A61B Instruments 0.4 2.2 18.3 1.0 1.6 1.3 0.8 0.2 0.3 0.9 1.9 11.1 0.5 0.7 0.6 0.9 0.4 2.6 0.9 1.5 2.8
B29C Ind. Proc. 1.3 0.9 2.3 1.1 2.1 1.5 1.2 0.2 0.2 1.1 1.1 5.0 0.8 1.2 0.7 1.3 1.2 5.2 1.0 1.4 2.3
C07D Chemicals 2.4 4.4 6.5 1.3 0.8 0.5 3.1 4.0 1.6 1.0 1.0 5.0 1.3 3.9 1.3 1.6 2.8 9.8 1.2 1.5 2.1
G01N Instruments 1.0 3.5 12.4 1.4 1.5 0.9 1.3 0.0 0.0 1.2 1.3 5.7 1.3 2.1 0.7 1.3 1.6 7.0 1.4 1.4 1.7
C07C Chemicals 1.8 2.2 4.3 1.1 0.3 0.2 1.9 1.8 1.1 0.9 0.8 4.3 0.8 1.6 0.9 1.5 0.8 3.1 1.0 0.8 1.4
B01D Ind. Proc. 1.0 0.9 3.0 1.1 0.8 0.6 1.0 0.2 0.2 0.9 0.7 3.6 0.7 1.4 0.8 1.3 1.1 4.8 1.0 0.8 1.3
G06F Electronics 0.6 0.0 0.0 1.3 1.0 0.6 0.5 0.2 0.5 1.2 1.1 4.8 1.6 2.8 0.8 0.9 0.4 2.7 1.3 1.0 1.3
H01L Electronics 0.3 0.4 4.5 1.5 0.8 0.4 0.3 0.1 0.5 1.1 0.3 1.4 0.9 0.2 0.1 1.3 0.3 1.2 1.3 0.5 0.6
F02M Mech. Eng. 0.2 0.0 0.0 0.5 0.3 0.4 0.3 0.2 0.9 0.5 0.1 1.1 0.4 0.2 0.3 0.2 0.0 0.0 0.5 0.2 0.6
H02K Electronics 0.2 0.0 0.0 0.4 0.2 0.3 0.3 0.1 0.5 0.5 0.1 1.5 0.3 0.0 0.0 0.2 0.0 0.0 0.4 0.1 0.5
C08L Chemicals 0.9 0.4 1.6 0.9 0.3 0.3 1.3 0.2 0.2 0.6 0.2 1.9 0.4 0.0 0.0 0.9 0.3 1.8 0.8 0.2 0.5
H01M Electronics 0.2 0.4 6.2 0.3 0.1 0.3 0.2 0.1 0.6 0.3 0.1 0.9 0.2 0.0 0.0 0.2 0.1 3.4 0.3 0.1 0.5
C08F Chemicals 0.7 1.3 6.7 0.7 0.1 0.2 0.9 0.1 0.1 0.4 0.2 2.2 0.3 0.0 0.0 0.7 0.0 0.0 0.5 0.2 0.5
C08K Chemicals 0.7 0.4 2.4 0.5 0.2 0.3 0.7 0.0 0.0 0.3 0.1 1.2 0.3 0.0 0.0 0.5 0.1 1.4 0.4 0.1 0.5
G01D Instruments 0.1 0.0 0.0 0.3 0.1 0.2 0.1 0.0 0.0 0.3 0.1 2.0 0.2 0.0 0.0 0.1 0.0 0.0 0.3 0.1 0.5
B60T Mech. Eng. 0.1 0.0 0.0 0.5 0.1 0.2 0.2 0.0 0.0 0.5 0.1 1.2 0.3 0.2 0.3 0.1 0.0 0.0 0.4 0.1 0.5
F02D Mech. Eng. 0.1 0.0 0.0 0.5 0.1 0.2 0.2 0.0 0.0 0.5 0.0 0.3 0.3 0.0 0.0 0.1 0.0 0.0 0.4 0.1 0.2
P%: Share of patent filings. L%: Share of litigation cases. LR: Litigated patents per 1000 patents in the cohort. Double counts possible due to multiple IPC classes per patent (no fractional counts).IPC4 classes that are either in the top 10 classes with the most patent families filed in the period 1980‐2004 with coverage in at least one of the 6 EU countries, or in the top 10 classes with the largest number of litigated families, or in the top 10 classes
with at least 10000 families filed and the top 10 largest litigation rates. Full class titles in Table A2.
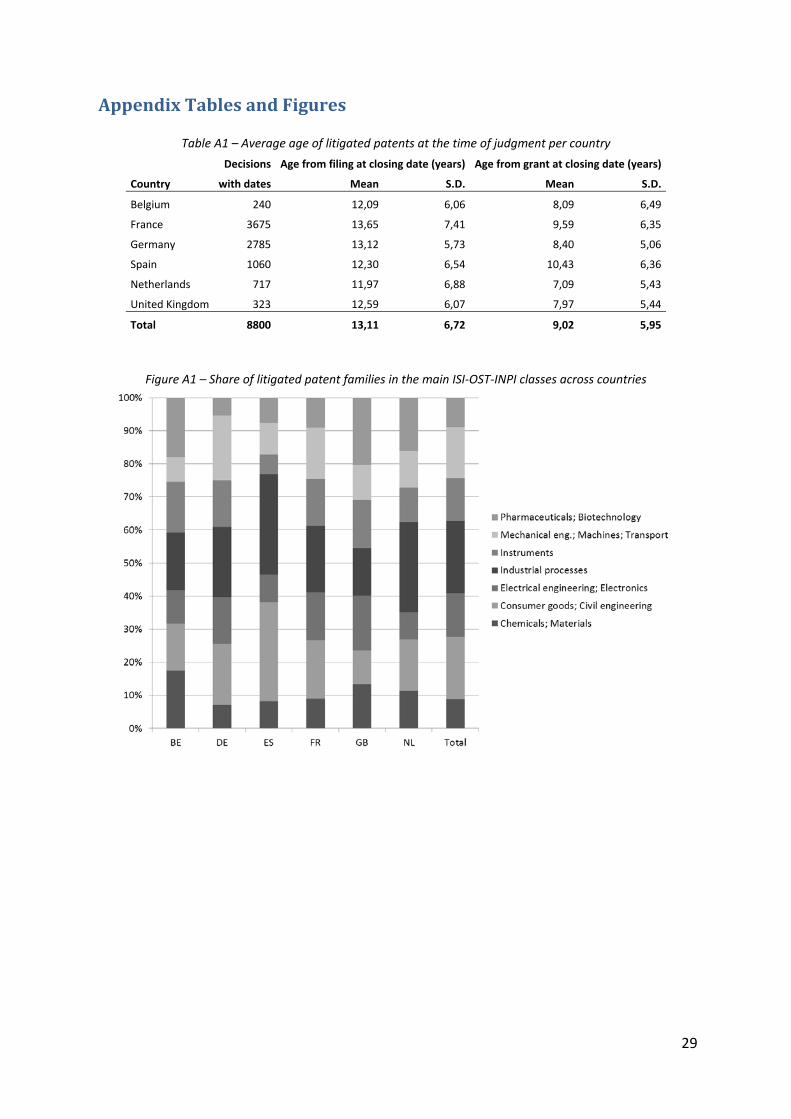
29
AppendixTablesandFigures
Table A1 – Average age of litigated patents at the time of judgment per country
Decisions Age from filing at closing date (years) Age from grant at closing date (years)
Country with dates Mean S.D. Mean S.D.
Belgium 240 12,09 6,06 8,09 6,49
France 3675 13,65 7,41 9,59 6,35
Germany 2785 13,12 5,73 8,40 5,06
Spain 1060 12,30 6,54 10,43 6,36
Netherlands 717 11,97 6,88 7,09 5,43
United Kingdom 323 12,59 6,07 7,97 5,44
Total 8800 13,11 6,72 9,02 5,95
Figure A1 – Share of litigated patent families in the main ISI‐OST‐INPI classes across countries

30
Figure A2 – Frequency distribution of the number of litigated families across IPC4 (decisions in 2000‐2009)
Table A2 – Description of select IPC4 classes
IPC4 OST7 Title
E04G Civil Eng. Scaffolding, forms, shuttering, building implements or other building aids G07F Instruments Coin‐freed or like apparatus B65D Ind. Proc. Containers for storage or transport of articles or materials A61Q Pharma Specific use of cosmetics or similar toilet preparations A01G Ind. Proc. Horticulture, forestry, watering A61P Pharma Specific therapeutic activity of chemical compounds or medicinal preparations E06B Civil Eng. Fixed or movable closures for openings in buildings, vehicles, fences, or like enclosures A61K Pharma Preparations for medical, dental, or toilet purposes E05D Civil Eng. Hinges or other suspension devices for doors, windows, or wings E04D Civil Eng. Roof coverings sky‐lights gutters roof‐working tools A61F Instruments Filters implantable into blood vessels, prostheses orthopaedic, nursing or contraceptive devices A61B Instruments Diagnosissurgery identification B29C Ind. Proc. Shaping or joining of plastics shaping of substances in a plastic state C07D Chemicals Heterocycliccompounds G01N Instruments Investigating or analysing materials by determining their chemical or physical properties C07C Chemicals Acyclic or carbocycliccompounds B01D Ind. Proc. Separationmethods, includingfilters G06F Electronics Electric digital data processing H01L Electronics Semiconductor devices electric solid state devices not otherwise provided for F02M Mech. Eng. Supplying combustion engines in general with combustible mixtures or constituents thereof H02K Electronics Dynamo‐electric machines C08L Chemicals Compositions of macromolecularcompounds H01M Electronics Processes or means, e.g. batteries, for the direct conversion of chemical energy into electrical energy C08F Chemicals Macromolecular compounds obtained by reactions only involving carbon‐to‐carbon unsaturated bondsC08K Chemicals Use of inorganic or non‐macromolecular organic substances as compounding ingredients G01D Instruments Measuring for measuring 2+ variables, tariff metering apparatus B60T Mech. Eng. Vehicle brake control systems or parts thereof brake control systems, or parts thereof, in general F02D Mech. Eng. Controlling combustion engines
Related Documents