Coastal and Wetland Essential Biodiversity Variables (EBV) from Space Frank E. Muller-Karger, Erin Hestir, Kevin Turpie, Dar Roberts, David Humm, Steve Ostermann, Noam Izenberg, Mary Keller, Frank Morgan, Robert Frouin, Arnold Dekker, Royal Gardner, James Goodman, Blake Schaeffer, Brian Franz, Heidi Dierssen, Ray Najjar, Natassa Romanou, Maria Tzortziou

Welcome message from author
This document is posted to help you gain knowledge. Please leave a comment to let me know what you think about it! Share it to your friends and learn new things together.
Transcript
Coastal and Wetland Essential Biodiversity Variables
(EBV) from Space
Frank E. Muller-Karger, Erin Hestir, Kevin Turpie, Dar Roberts, David Humm, Steve Ostermann, Noam Izenberg, Mary Keller, Frank Morgan, Robert Frouin, Arnold Dekker, Royal Gardner, James Goodman, Blake Schaeffer, Brian Franz, Heidi Dierssen, Ray Najjar, Natassa Romanou, Maria Tzortziou
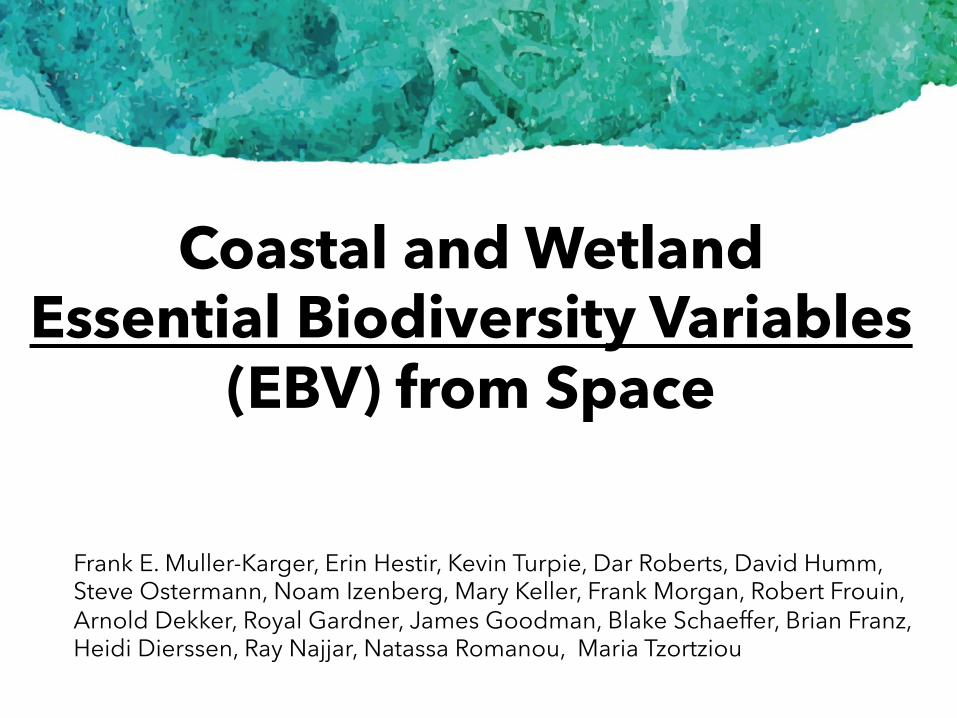
Water and life – no two features more completely define planet Earth
Biology thrives where water and land come together
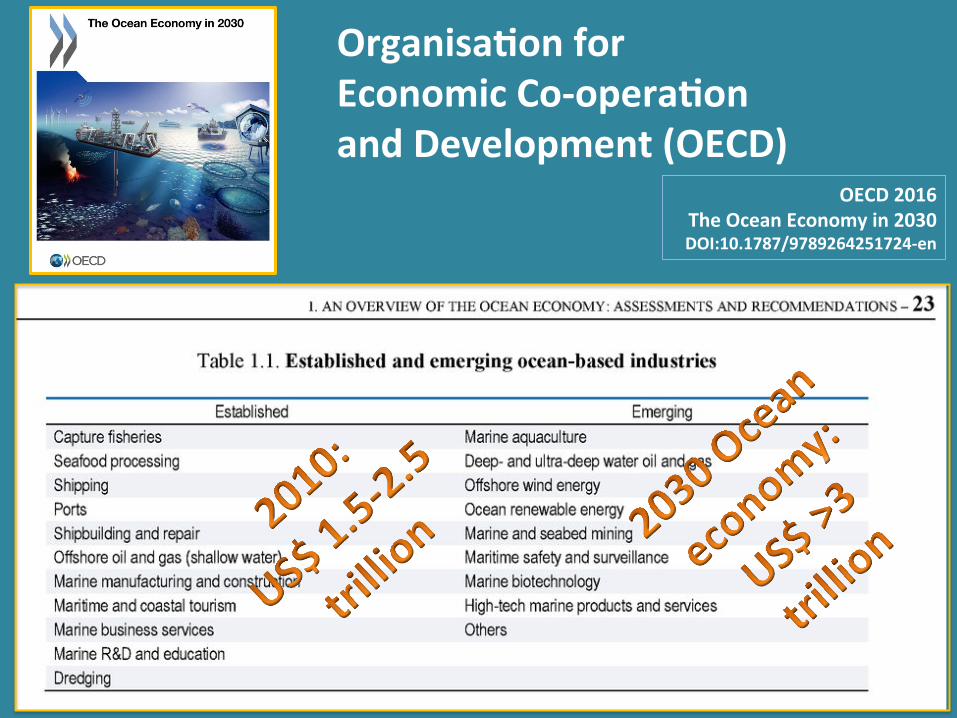
OECD2016TheOceanEconomyin2030DOI:10.1787/9789264251724-en
OrganisaBonforEconomicCo-operaBonandDevelopment(OECD)
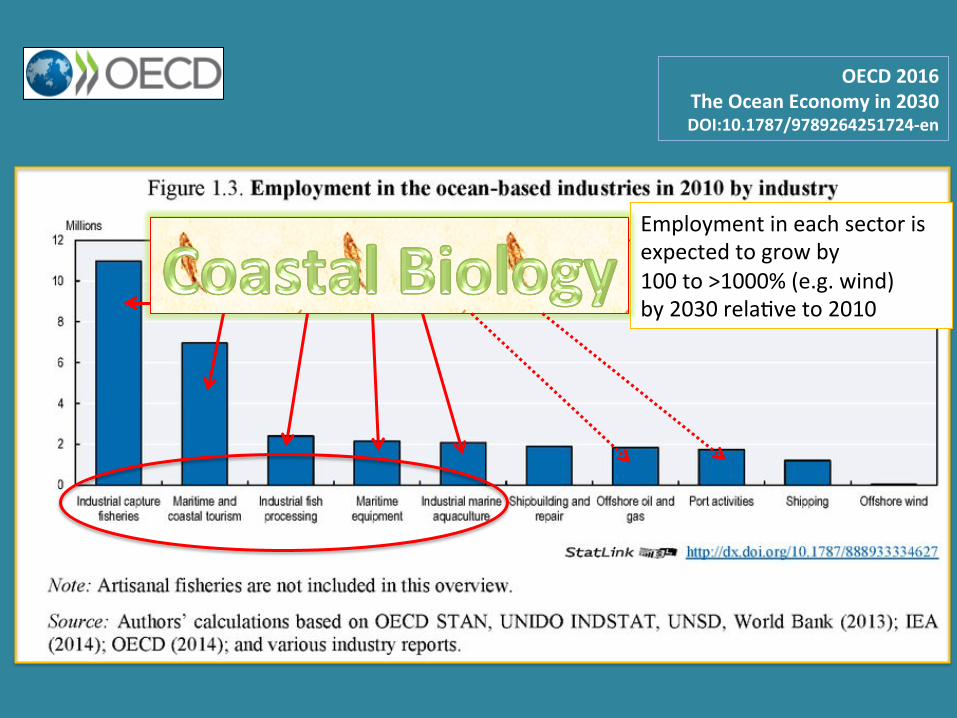
OECD2016TheOceanEconomyin2030DOI:10.1787/9789264251724-en
Employmentineachsectorisexpectedtogrowby100to>1000%(e.g.wind)by2030rela?veto2010

European Union Marine Strategy Framework Direc7ve Canada Oceans Act and Oceans Strategy US Oceans Act of 2000 and Na7onal Ocean Policy Implementa7on Plan Agenda 2030 – United Na7ons Sustainable Development Goals (SDG)
Na7onal and Interna7onal Frameworks
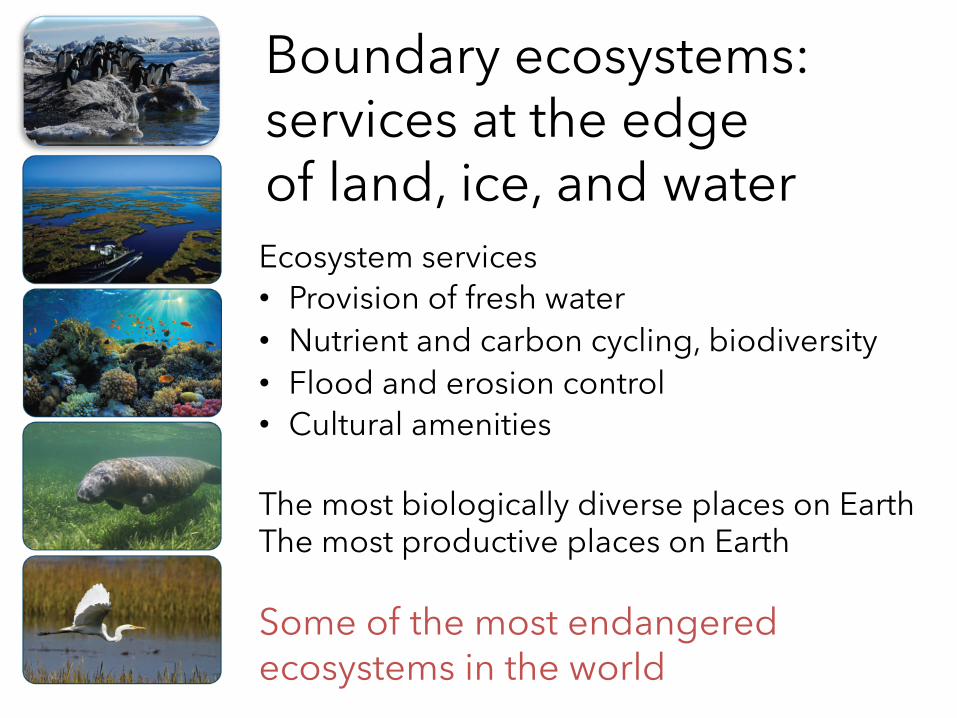
Boundary ecosystems: services at the edge of land, ice, and water Ecosystem services • Provision of fresh water • Nutrient and carbon cycling, biodiversity • Flood and erosion control • Cultural amenities
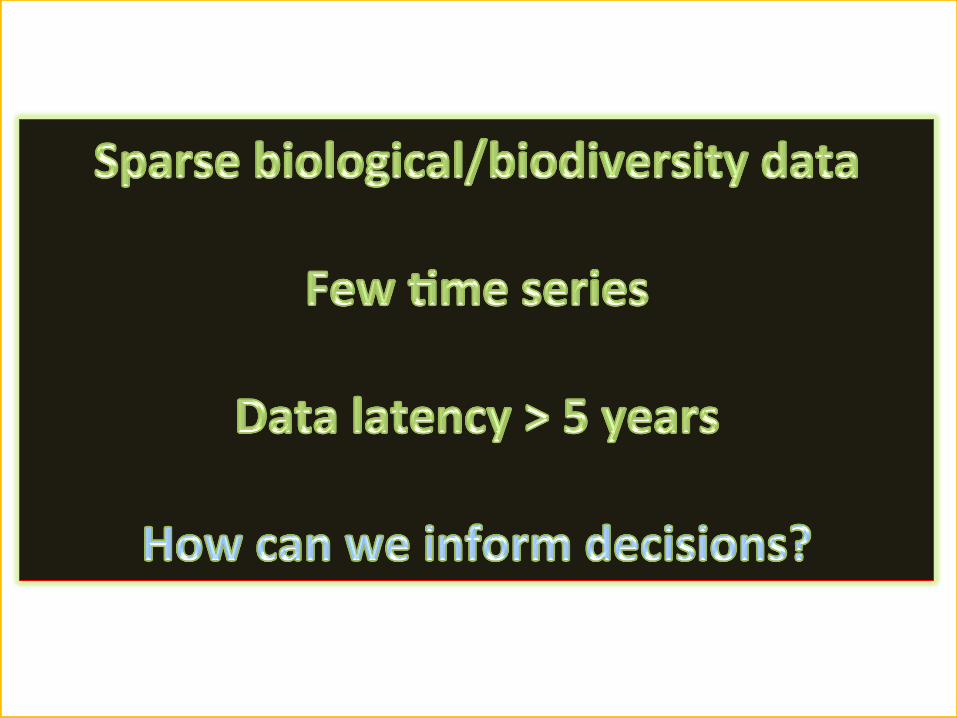
The most biologically diverse places on Earth The most productive places on Earth Some of the most endangered ecosystems in the world
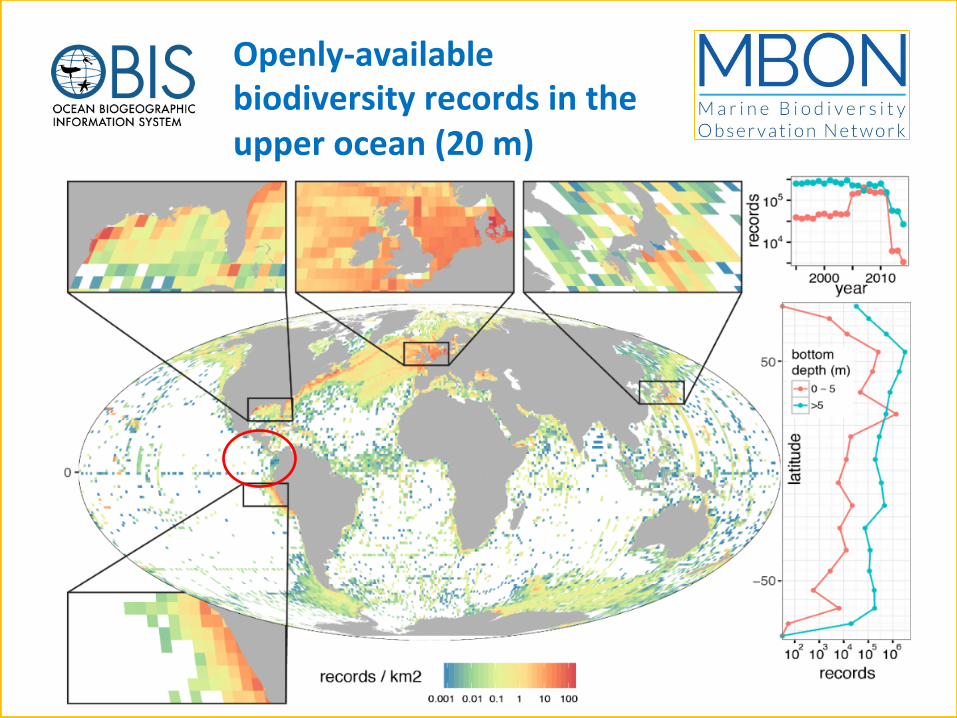
Openly-availablebiodiversityrecordsintheupperocean(20m)
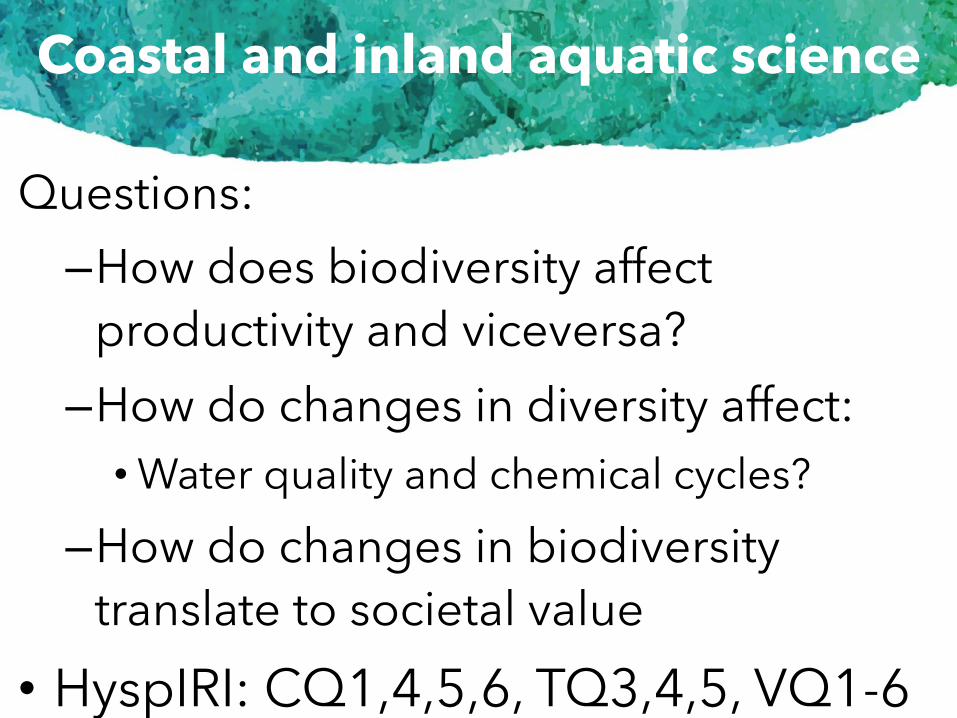
Coastal and inland aquatic science
Questions: – How does biodiversity affect
productivity and viceversa? – How do changes in diversity affect:
• Water quality and chemical cycles? – How do changes in biodiversity
translate to societal value • HyspIRI: CQ1,4,5,6, TQ3,4,5, VQ1-6
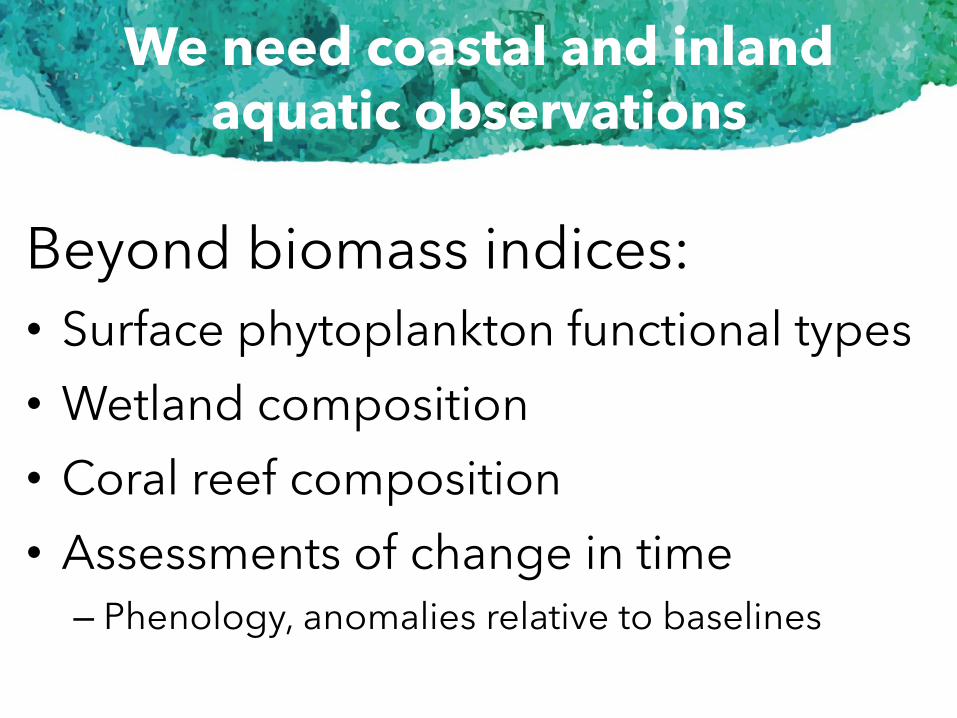
We need coastal and inland aquatic observations
Beyond biomass indices: • Surface phytoplankton functional types • Wetland composition • Coral reef composition • Assessments of change in time
– Phenology, anomalies relative to baselines
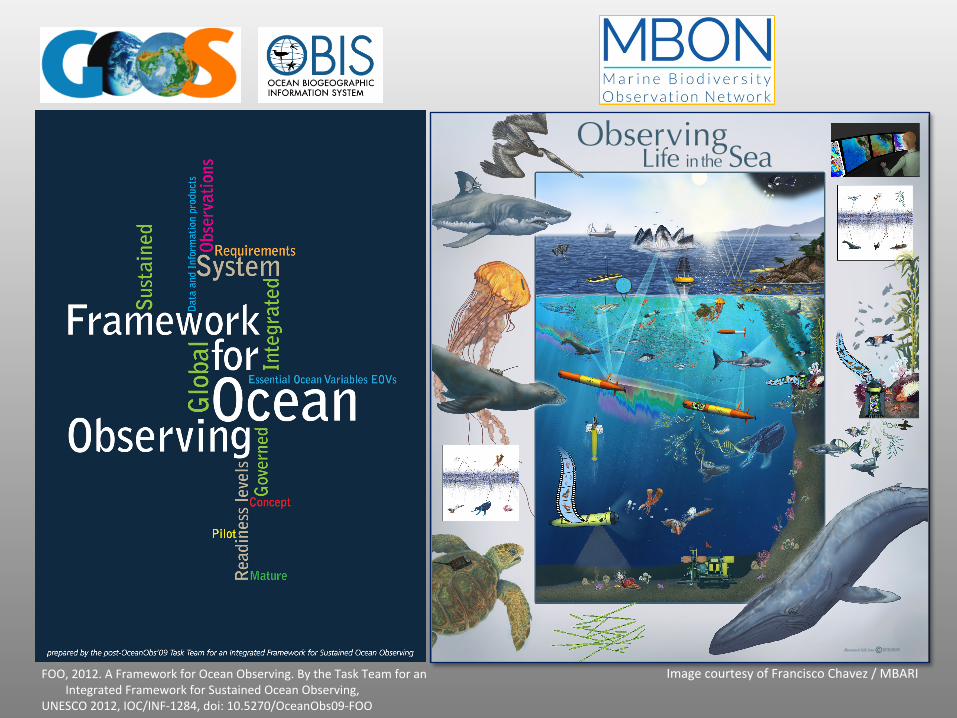
Illustration by Kelly Lance© 2016 MBARI
Life in the SeaObserving
ImagecourtesyofFranciscoChavez/MBARIFOO,2012.AFrameworkforOceanObserving.BytheTaskTeamforanIntegratedFrameworkforSustainedOceanObserving,
UNESCO2012,IOC/INF-1284,doi:10.5270/OceanObs09-FOO
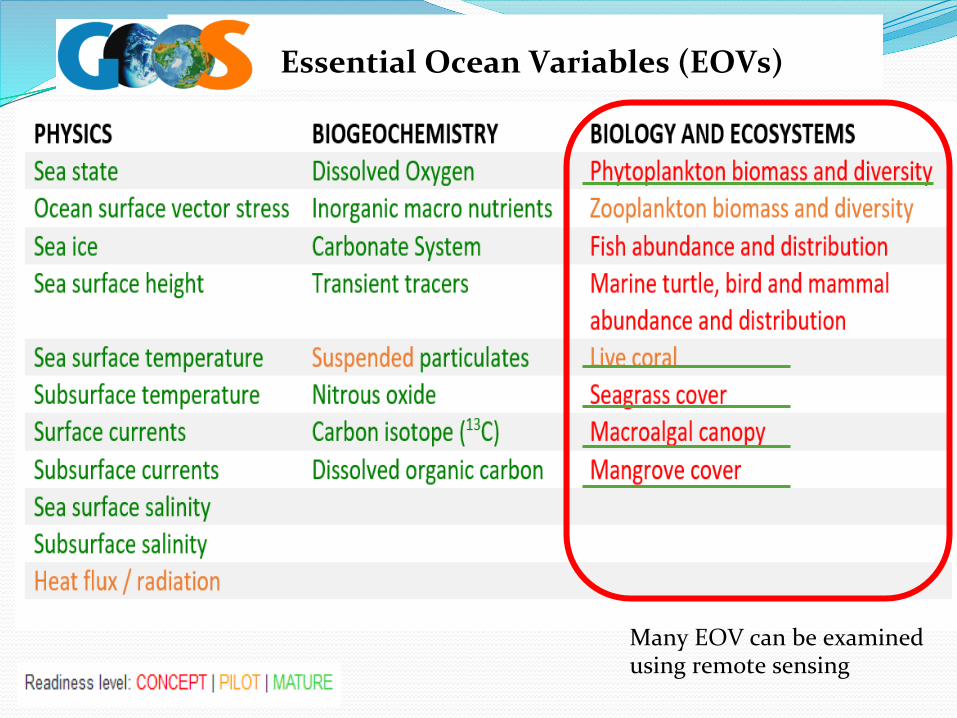
EssentialOceanVariables(EOVs)
ManyEOVcanbeexaminedusingremotesensing
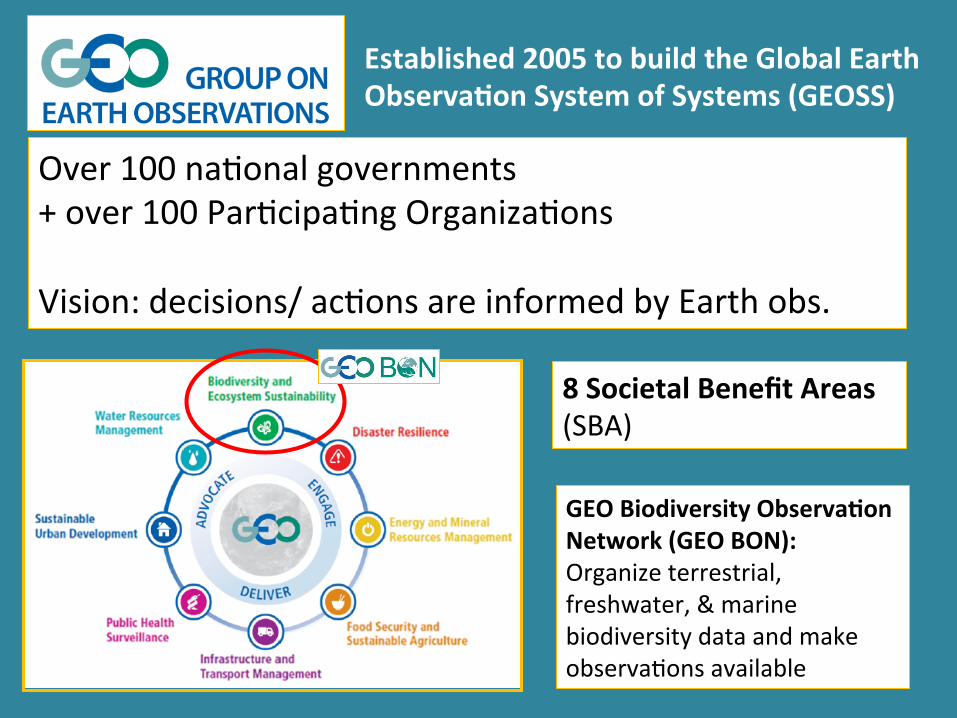
Over100na?onalgovernments+over100Par?cipa?ngOrganiza?onsVision:decisions/ac?onsareinformedbyEarthobs.
8SocietalBenefitAreas(SBA)
GEOBiodiversityObservaBonNetwork(GEOBON):Organizeterrestrial,freshwater,&marinebiodiversitydataandmakeobserva?onsavailable
Established2005tobuildtheGlobalEarthObservaBonSystemofSystems(GEOSS)
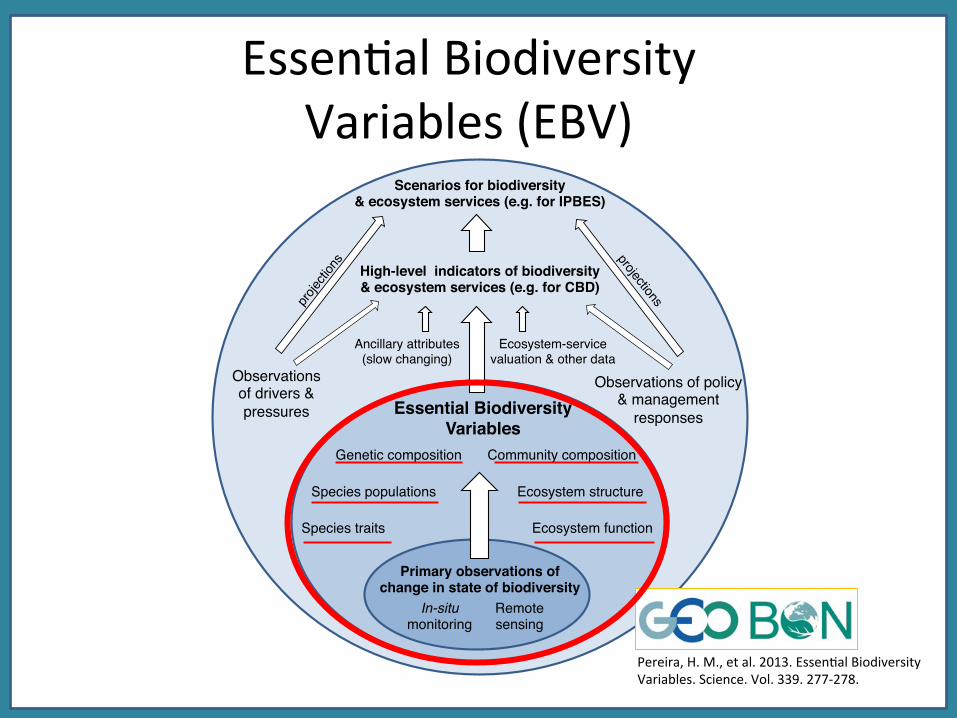
Essen?alBiodiversityVariables(EBV)
Primary observations of !change in state of biodiversity!
In-situ monitoring!
Remote sensing!
Essential Biodiversity Variables!
Genetic composition !
Species traits !
Species populations!
Community composition !
Ecosystem structure!
Ecosystem function!
High-level indicators of biodiversity & ecosystem services (e.g. for CBD) !
Ancillary attributes!(slow changing)!
Ecosystem-service valuation & other data!
Scenarios for biodiversity !& ecosystem services (e.g. for IPBES) !
Observations of drivers & pressures !
Observations of policy & management
responses!
Pereira,H.M.,etal.2013.Essen?alBiodiversityVariables.Science.Vol.339.277-278.
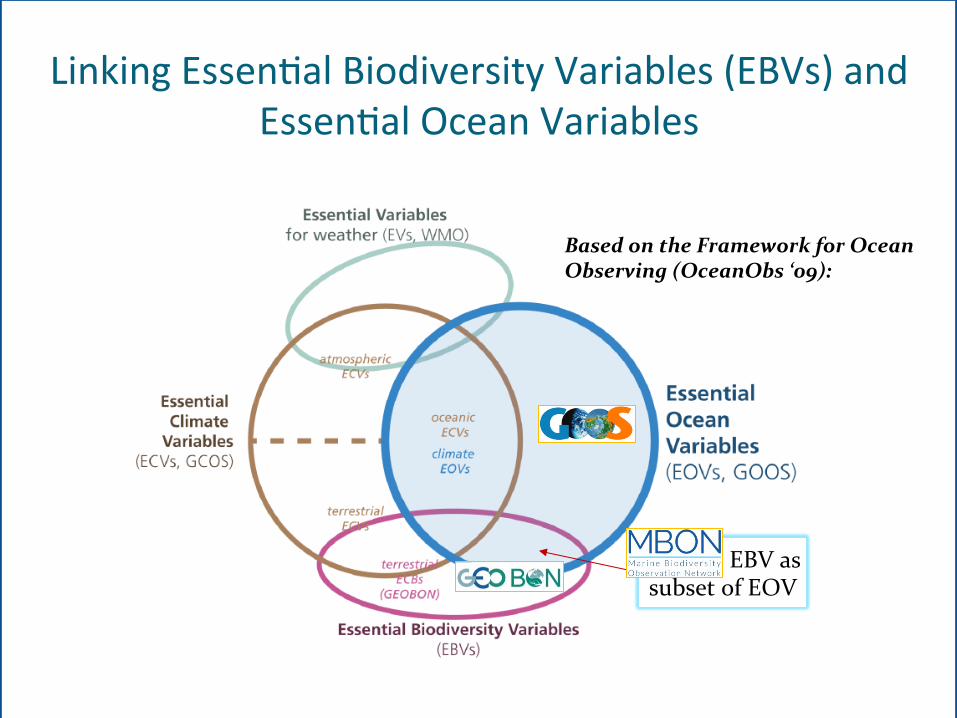
MarineEBVassubsetofEOV
LinkingEssen?alBiodiversityVariables(EBVs)andEssen?alOceanVariables
BasedontheFrameworkforOceanObserving(OceanObs‘09):
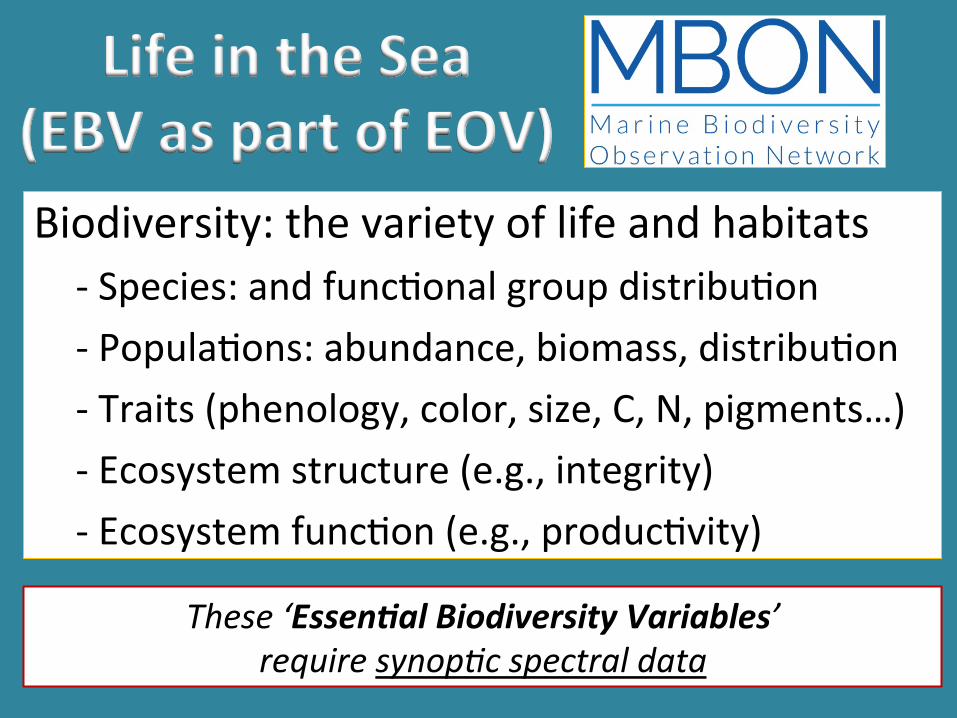
Biodiversity:thevarietyoflifeandhabitats-Species:andfunc?onalgroupdistribu?on-Popula?ons:abundance,biomass,distribu?on-Traits(phenology,color,size,C,N,pigments…)
-Ecosystemstructure(e.g.,integrity)-Ecosystemfunc?on(e.g.,produc?vity)
LifeintheSea(EBVaspartofEOV)
These‘Essen%alBiodiversityVariables’requiresynop0cspectraldata
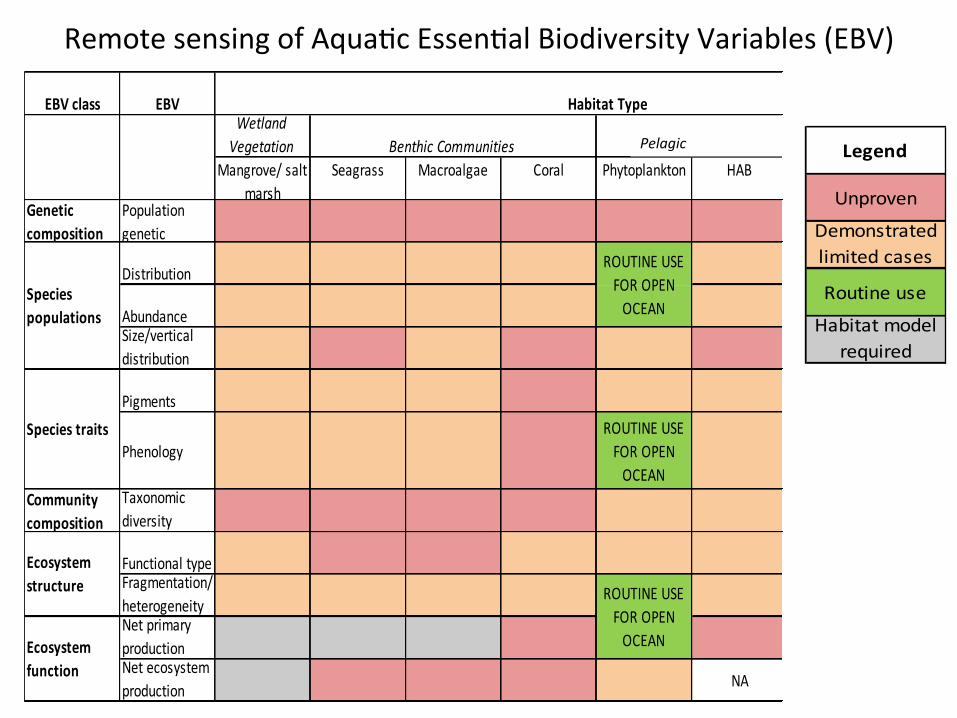
RemotesensingofAqua?cEssen?alBiodiversityVariables(EBV)
EBVclass EBVWetlandVegetation
Mangrove/saltmarsh
Seagrass Macroalgae Coral Phytoplankton HAB Fish,Zoo-plankton
Apexpredator Legend
Geneticcomposition
Populationgenetic
Unproven
DistributionDemonstratedlimitedcases
Abundance Routineuse
Size/verticaldistribution
Habitatmodelrequired
Pigments NA NA
PhenologyROUTINEUSEFOROPENOCEAN
Communitycomposition
Taxonomicdiversity
FunctionaltypeFragmentation/heterogeneityNetprimaryproduction NA NA
Netecosystemproduction NA NA NA
HabitatType
BenthicCommunities
ROUTINEUSEFOROPENOCEAN
ROUTINEUSEFOROPENOCEAN
Ecosystemstructure
Ecosystemfunction
Speciespopulations
Speciestraits
PelagicOrganisms
EBVclass EBVWetlandVegetation
Mangrove/saltmarsh
Seagrass Macroalgae Coral Phytoplankton HAB Fish,Zoo-plankton
Apexpredator Legend
Geneticcomposition
Populationgenetic
Unproven
DistributionDemonstratedlimitedcases
Abundance Routineuse
Size/verticaldistribution
Habitatmodelrequired
Pigments NA NA
PhenologyROUTINEUSEFOROPENOCEAN
Communitycomposition
Taxonomicdiversity
FunctionaltypeFragmentation/heterogeneityNetprimaryproduction NA NA
Netecosystemproduction NA NA NA
HabitatType
BenthicCommunities
ROUTINEUSEFOROPENOCEAN
ROUTINEUSEFOROPENOCEAN
Ecosystemstructure
Ecosystemfunction
Speciespopulations
Speciestraits
PelagicOrganismsPelagic
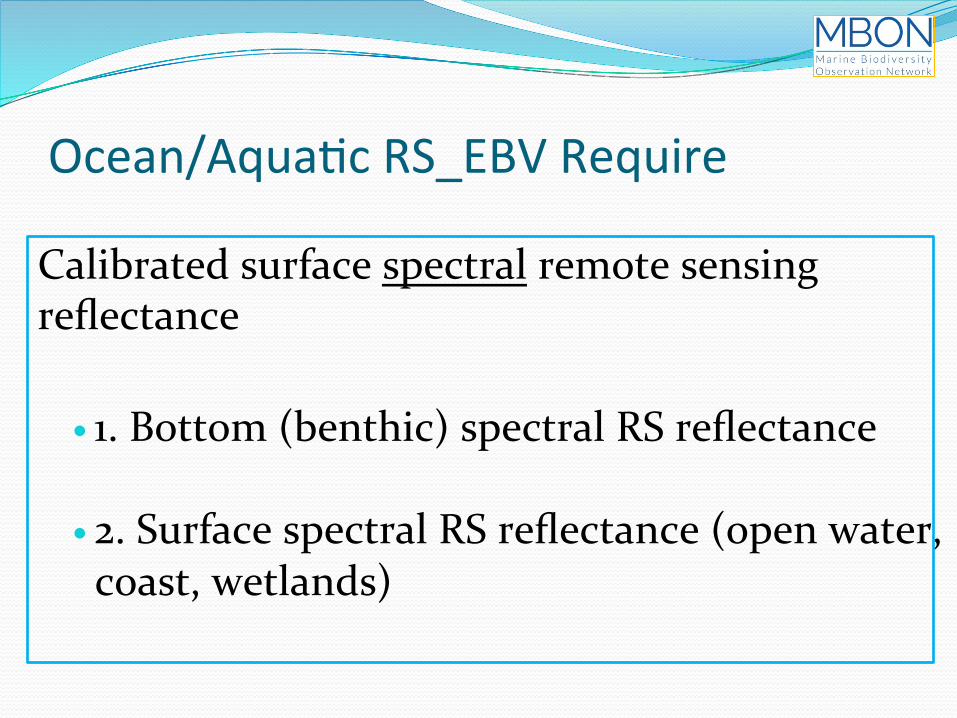
Ocean/Aqua?cRS_EBVRequireCalibratedsurfacespectralremotesensingreflectance
� 1.Bottom(benthic)spectralRSreflectance
� 2.SurfacespectralRSreflectance(openwater,coast,wetlands)
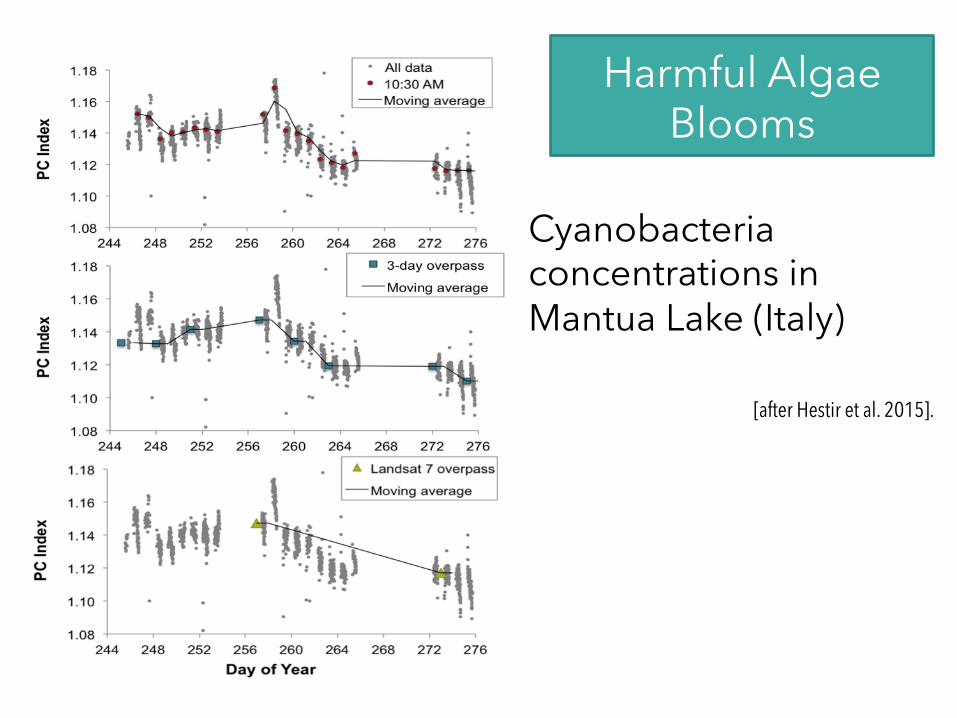
Cyanobacteria concentrations in Mantua Lake (Italy)
[after Hestir et al. 2015].
Harmful Algae Blooms
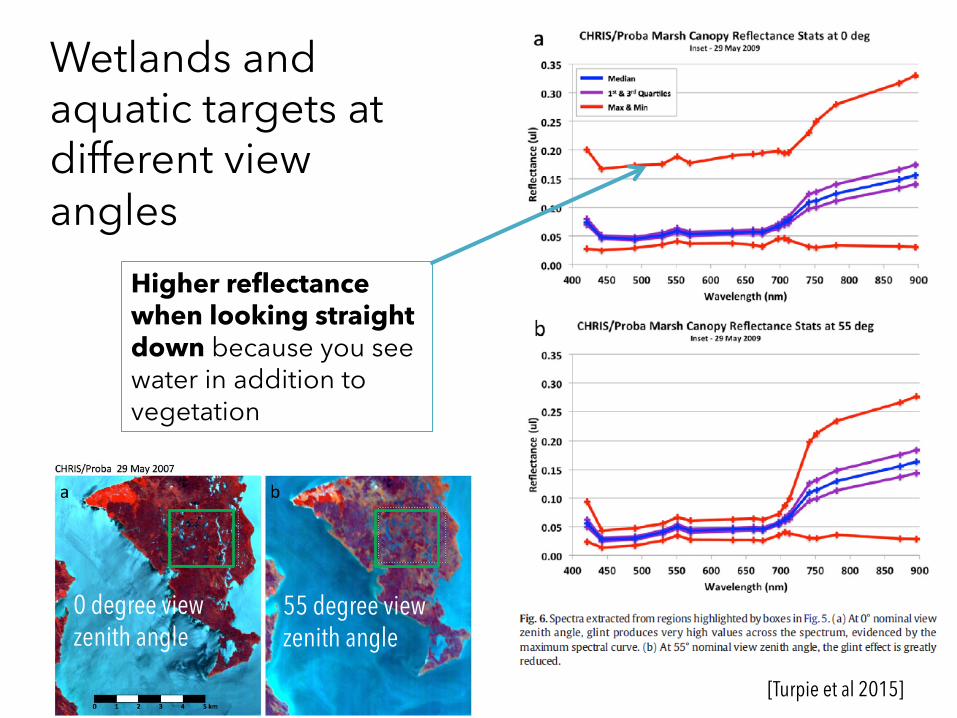
Wetlands and aquatic targets at different view angles
[Turpie et al 2015]
Higher reflectance when looking straight down because you see water in addition to vegetation
55 degree view zenith angle
0 degree view zenith angle
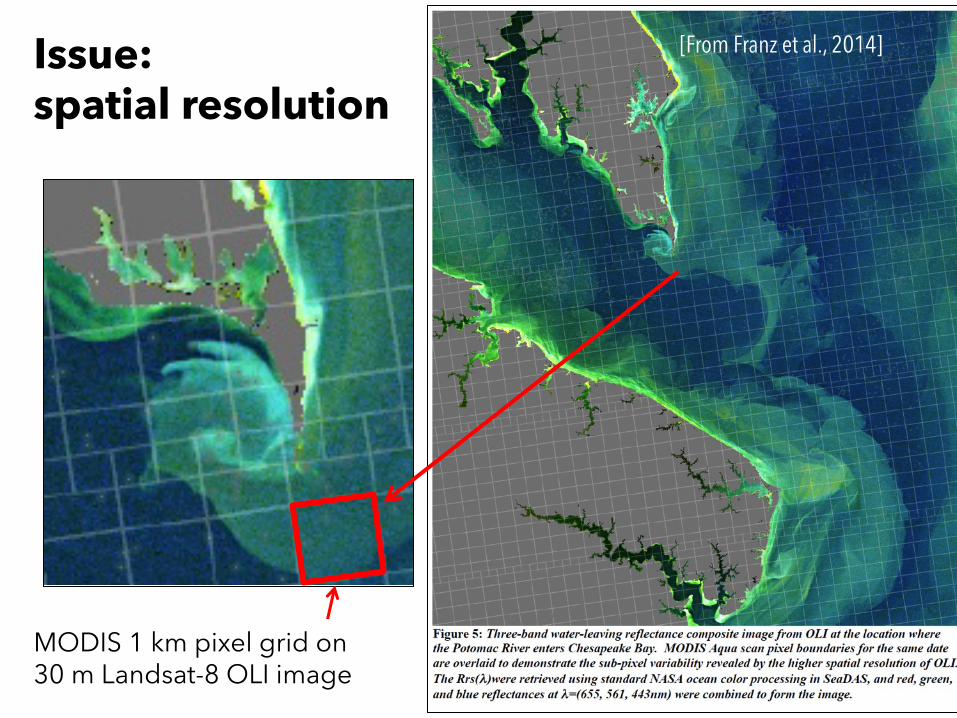
Issue: spatial resolution
[From Franz et al., 2014]
MODIS 1 km pixel grid on 30 m Landsat-8 OLI image
WavelengthWavelength
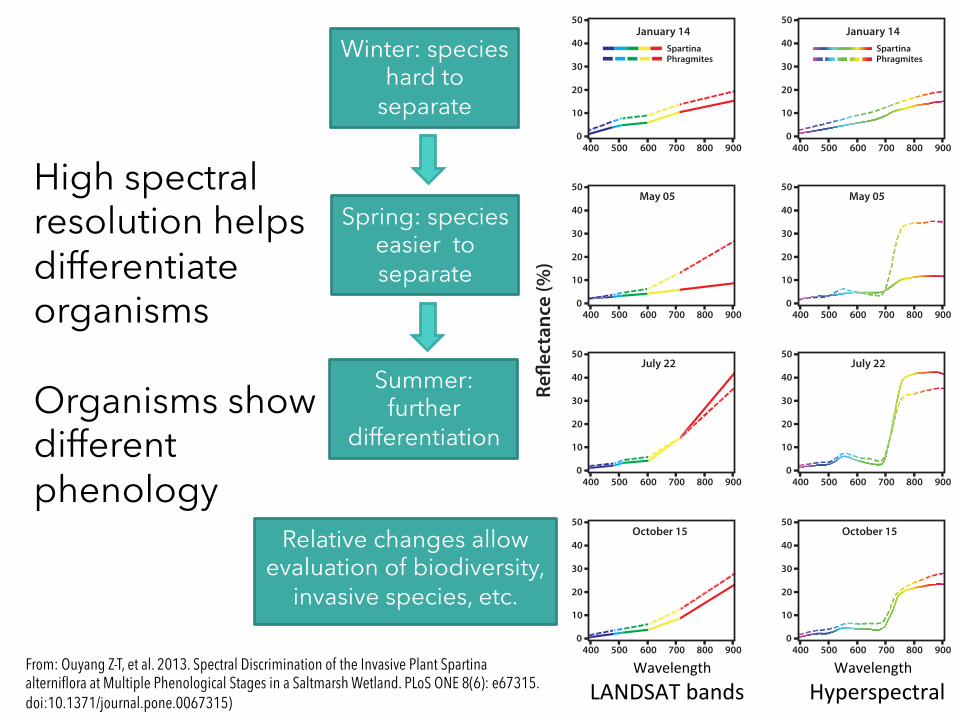
LANDSATbandsHyperspectral
High spectral resolution helps differentiate organisms Organisms show different phenology
From: Ouyang Z-T, et al. 2013. Spectral Discrimination of the Invasive Plant Spartina alterniflora at Multiple Phenological Stages in a Saltmarsh Wetland. PLoS ONE 8(6): e67315. doi:10.1371/journal.pone.0067315)
Winter: species hard to
separate
Spring: species easier to separate
Summer: further
differentiation
Relative changes allow evaluation of biodiversity,
invasive species, etc.
SpartinaPhragmites
January 1450
40
30
20
10
0400 500 600 700 800 900
May 0550
40
30
20
10
0400 500 600 700 800 900
July 2250
40
30
20
10
0400 500 600 700 800 900
October 1550
40
30
20
10
0400 500 600 700 800 900
SpartinaPhragmites
January 1450
40
30
20
10
0400 500 600 700 800 900
May 0550
40
30
20
10
0400 500 600 700 800 900
July 2250
40
30
20
10
0400 500 600 700 800 900
October 1550
40
30
20
10
0400 500 600 700 800 900
Wavelength (nm)
Refle
ctan
ce (%
)
SpartinaPhragmites
January 1450
40
30
20
10
0400 500 600 700 800 900
May 0550
40
30
20
10
0400 500 600 700 800 900
July 2250
40
30
20
10
0400 500 600 700 800 900
October 1550
40
30
20
10
0400 500 600 700 800 900
SpartinaPhragmites
January 1450
40
30
20
10
0400 500 600 700 800 900
May 0550
40
30
20
10
0400 500 600 700 800 900
July 2250
40
30
20
10
0400 500 600 700 800 900
October 1550
40
30
20
10
0400 500 600 700 800 900
Wavelength (nm)
Refle
ctan
ce (%
)
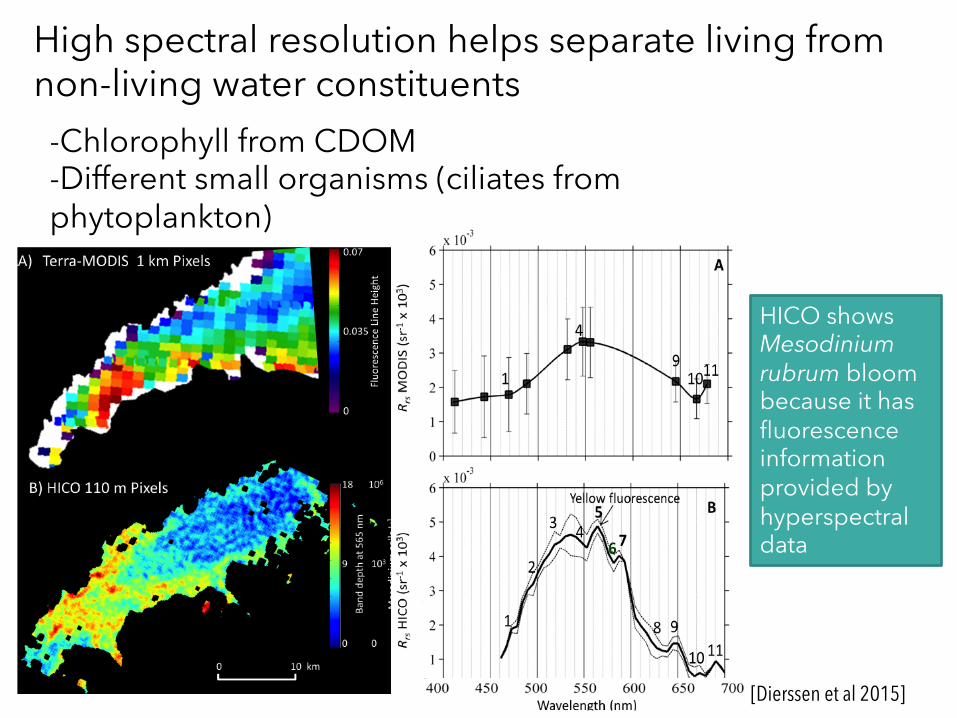
[Dierssen et al 2015]
-Chlorophyll from CDOM -Different small organisms (ciliates from phytoplankton)
High spectral resolution helps separate living from non-living water constituents
HICO shows Mesodinium rubrum bloom because it has fluorescence information provided by hyperspectral data
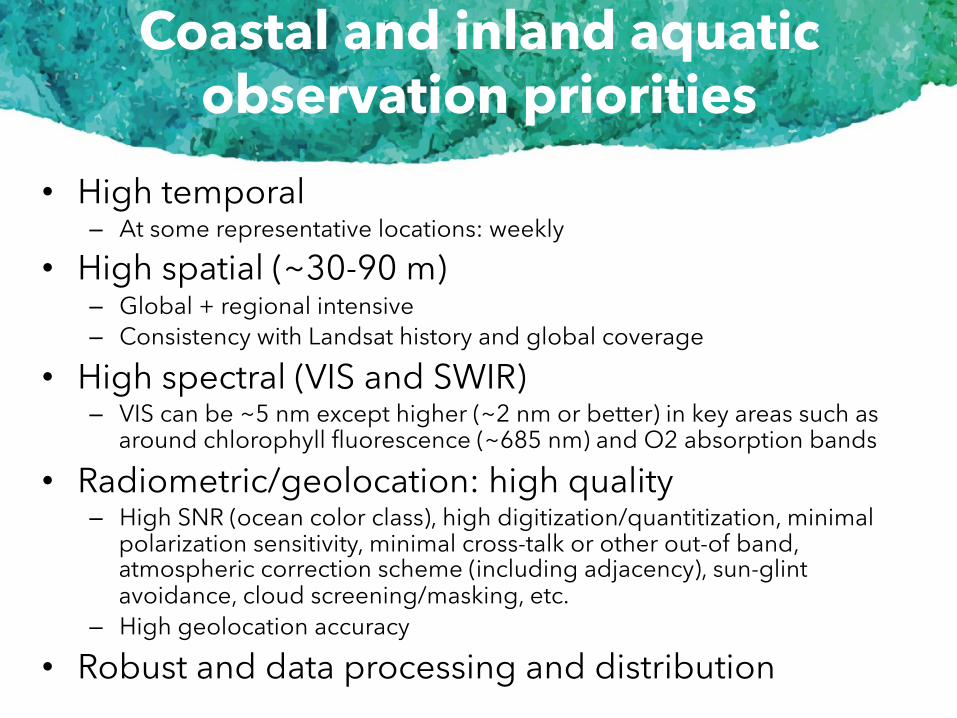
Coastal and inland aquatic observation priorities
• High temporal – At some representative locations: weekly
• High spatial (~30-90 m) – Global + regional intensive – Consistency with Landsat history and global coverage
• High spectral (VIS and SWIR) – VIS can be ~5 nm except higher (~2 nm or better) in key areas such as
around chlorophyll fluorescence (~685 nm) and O2 absorption bands
• Radiometric/geolocation: high quality – High SNR (ocean color class), high digitization/quantitization, minimal
polarization sensitivity, minimal cross-talk or other out-of band, atmospheric correction scheme (including adjacency), sun-glint avoidance, cloud screening/masking, etc.
– High geolocation accuracy
• Robust and data processing and distribution

Possible observation technique: (Technology Readiness Level: TRL >6-7, now!)
àCurrent HyspIRI global concept Increase temporal coverage through: -Agile spacecraft (pointing) -Multiple spacecraft (e.g., Sentinel 2a,b & 3; commercial)
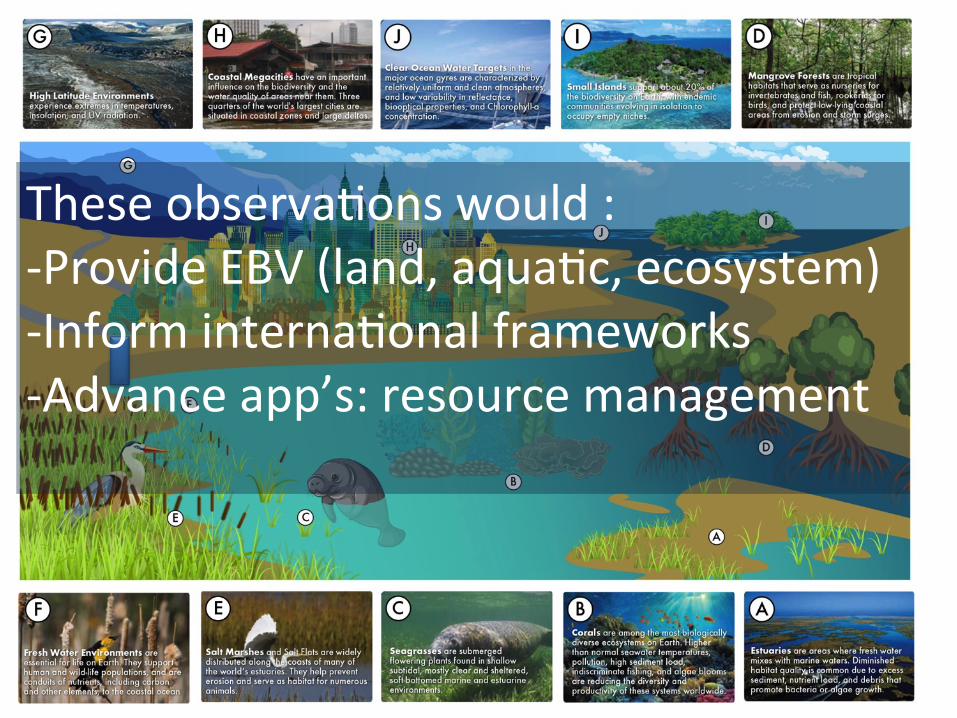
Theseobserva?onswould:-ProvideEBV(land,aqua?c,ecosystem)-Informinterna?onalframeworks-Advanceapp’s:resourcemanagement
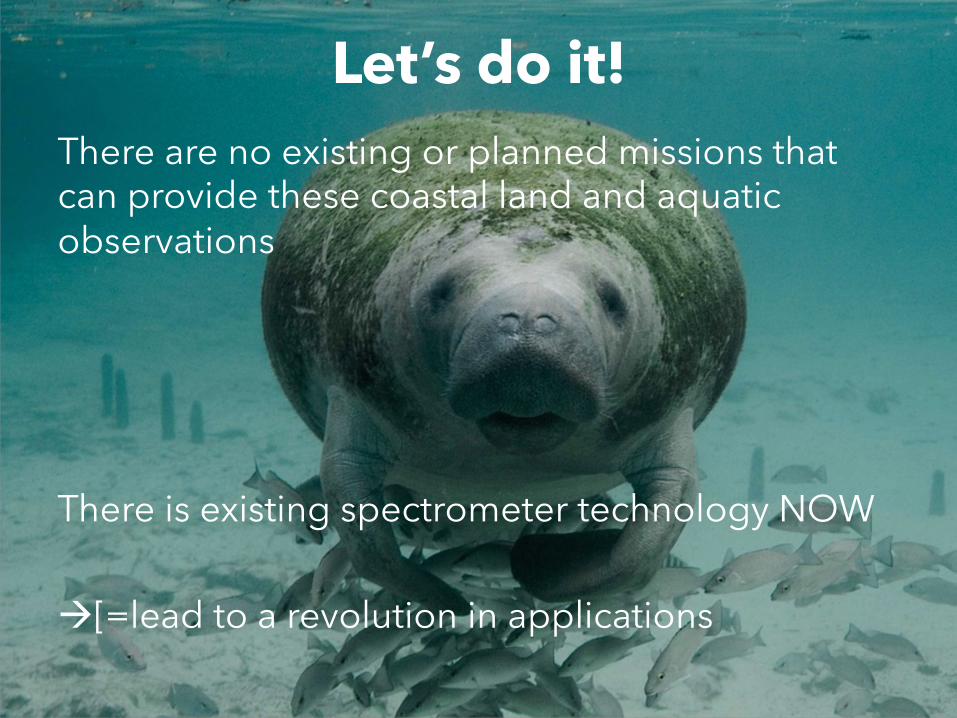
Let’s do it! There are no existing or planned missions that can provide these coastal land and aquatic observations There is existing spectrometer technology NOW
à[=lead to a revolution in applications
Related Documents