VOLUME NO. 5 (2015), ISSUE NO. 11 (NOVEMBER) ISSN 2231-5756 A Monthly Double-Blind Peer Reviewed (Refereed/Juried) Open Access International e-Journal - Included in the International Serial Directories Indexed & Listed at: Ulrich's Periodicals Directory ©, ProQuest, U.S.A., EBSCO Publishing, U.S.A., Cabell’s Directories of Publishing Opportunities, U.S.A., Open J-Gage, India [link of the same is duly available at Inflibnet of University Grants Commission (U.G.C.)], Index Copernicus Publishers Panel, Poland with IC Value of 5.09 & number of libraries all around the world. Circulated all over the world & Google has verified that scholars of more than 4600 Cities in 180 countries/territories are visiting our journal on regular basis. Ground Floor, Building No. 1041-C-1, Devi Bhawan Bazar, JAGADHRI – 135 003, Yamunanagar, Haryana, INDIA http://ijrcm.org.in/

Welcome message from author
This document is posted to help you gain knowledge. Please leave a comment to let me know what you think about it! Share it to your friends and learn new things together.
Transcript
VOLUME NO. 5 (2015), ISSUE NO. 11 (NOVEMBER) ISSN 2231-5756
A Monthly Double-Blind Peer Reviewed (Refereed/Juried) Open Access International e-Journal - Included in the International Serial Directories Indexed & Listed at:
Ulrich's Periodicals Directory ©, ProQuest, U.S.A., EBSCO Publishing, U.S.A., Cabell’s Directories of Publishing Opportunities, U.S.A.,
Open J-Gage, India [link of the same is duly available at Inflibnet of University Grants Commission (U.G.C.)],
Index Copernicus Publishers Panel, Poland with IC Value of 5.09 & number of libraries all around the world.
Circulated all over the world & Google has verified that scholars of more than 4600 Cities in 180 countries/territories are visiting our journal on regular basis.
Ground Floor, Building No. 1041-C-1, Devi Bhawan Bazar, JAGADHRI – 135 003, Yamunanagar, Haryana, INDIA
http://ijrcm.org.in/
VOLUME NO. 5 (2015), ISSUE NO. 11 (NOVEMBER) ISSN 2231-5756
INTERNATIONAL JOURNAL OF RESEARCH IN COMMERCE, IT & MANAGEMENT A Monthly Double-Blind Peer Reviewed (Refereed/Juried) Open Access International e-Journal - Included in the International Serial Directories
http://ijrcm.org.in/
ii
CONTENTS
Sr. No.
TITLE & NAME OF THE AUTHOR (S) Page No.
1. THE ROLE OF TRANSFORMATIVE IT CAPABILITY ON INCREASING ORGANIZATIONAL INNOVATIVENESS TO SUSTAIN COMPETITIVE ADVANTAGE DR. TEGUH WIDODO
1
2. AN INVESTIGATION IN TO DEMOGRAPHIC PROFILE AND QUALITY OF WORK LIFE AMONG WOMEN EMPLOYEES WITH SPECIAL REFERENCE TO PRIVATE SECTOR BANKS IN COIMBATORE DISTRICT DR. S. SARAVANAN & K. ELAMATHI
9
3. SHARE SPLIT ANNOUNCEMENT AND MARKET REACTION: EVIDENCE FROM PUBLIC COMPANY IN INDONESIA STOCK EXCHANGE I PUTU INDRA PERMANA WISTAWAN, SUTRISNO T. & DR. ERWIN SARASWATI
13
4. AWARENESS OF REVERSE MORTGAGE AMONG THE SENIOR CITIZENS: A CASE STUDY OF SBI, KADAPA DR. D. MARUTHI PRASAD
18
5. CASH CONVERSION CYCLE APPROACH TO LIQUIDITY ANALYSIS: CASE OF INDIAN STEEL INDUSTRY D. AKILANDESWARI & DR. A. VIJAYAKUMAR
21
6. A CRITICAL STUDY ON THE PRESENT POSITION OF MANAGEMENT EDUCATION IN ASSAM DR. ARABINDA DEBNATH & PRODIPTA RONGPIPI
27
7. READING HABITS AMONG TEACHERS IN COLLEGES DR. VIBHAVARI B.HATE
31
8. A STUDY ON THE SOCIO-ECONOMIC CONDITIONS OF WORKERS OF FIREWORKS IN SIVAKASI ASHOK KUMAR J & DR. S. MATHIVANNAN
38
9. EFFECT OF EMOTIONAL INTELLIGENCE ON JOB SATISFACTION AMONG ACADEMICS OF UNIVERSITIES IN KANO STATE: A CONCEPTUAL MODEL DR. ABDU JAFAR BAMBALE, DR. BALARABE A. JAKADA, SULAIMAN IBRAHIM KASSIM, USMAN AHMAD KUMO & RABIU HASSAN
41
10. THE EMERGENCE OF ENTREPRENEURSHIP EDUCATION: DEVELOPMENT, TRENDS AND CHALLENGES DR. N. KESAVAN & R. SANGEETHA
44
11. EMPLOYEE ATTRITION AND RETENTION IN BPO FIRMS IN GURGAON ANJU THAPLIYAL
46
12. AN APPRAISAL OF FERTILIZER SUBSIDY IN INDIA BALA DEVI
53
13. A STUDY ON THE IMPACT OF SOCIAL MEDIA ON THE PURCHASE DECISION OF COLLEGE STUDENTS WITH SPECIAL REFERENCE TO KOZHIKODE DISTRICT YAHIYA M.P & DR. M. SARAVANAN
57
14. A STUDY ON THE CONSUMER RIGHTS AWARENESS LEVEL AMONG RURAL PEOPLE WITH SPECIAL REFERENCE TO MAMPAD PANCHAYATH OF MALAPPURAM DISTRICT IN KERALA RAFEEQUE M.T & DR. M. SARAVANAN
62
15. A STUDY CONDUCTED TO ANALYSE THE AWARENESS AND SATISFACTION LEVEL AMONG THE ONLINE BANKING CUSTOMERS IN KOTTAYAM DISTRICT, KERALA CAMILLO JOSEPH & AMRITA WILSON
65
16. ASSESSMENT OF TAX IMPLICATION ON MERGER AND ACQUISITION IN NIGERIA OKEWOLE, JACOB AKINTUNDE, OLAITAN, OLATUNDE OLUMIDE & AFOLABI THEOPHILUS ABIOLA
72
17. GROWTH AND DEVELOPMENT AND THE FINANCIAL HEALTH OF CO-OPERATIVE CREDIT SYSTEM IN INDIA POMPI DAS SENGUPTA
76
18. e-COMMERCE PROBLEMS & PROSPECTS IN INDIA SALIM KHAN & SUGANDHA KHANDELWAL
82
19. PROPOSED GST IN INDIA: PERSPECTIVES & RESULTS PRIYA SHARMA & SAVITA
85
20. WHISTLEBLOWING IN INDIAN PERSPECTIVE: A STEP TOWARDS BETTER CORPORATE GOVERNANCE SRISHTI BHATIA
88
REQUEST FOR FEEDBACK & DISCLAIMER 93
VOLUME NO. 5 (2015), ISSUE NO. 11 (NOVEMBER) ISSN 2231-5756
INTERNATIONAL JOURNAL OF RESEARCH IN COMMERCE, IT & MANAGEMENT A Monthly Double-Blind Peer Reviewed (Refereed/Juried) Open Access International e-Journal - Included in the International Serial Directories
http://ijrcm.org.in/
iii
CHIEF PATRON PROF. K. K. AGGARWAL
Chairman, Malaviya National Institute of Technology, Jaipur (An institute of National Importance & fully funded by Ministry of Human Resource Development, Government of India)
Chancellor, K. R. Mangalam University, Gurgaon Chancellor, Lingaya’s University, Faridabad
Founder Vice-Chancellor (1998-2008), Guru Gobind Singh Indraprastha University, Delhi Ex. Pro Vice-Chancellor, Guru Jambheshwar University, Hisar
FOUNDER PATRON LATE SH. RAM BHAJAN AGGARWAL
Former State Minister for Home & Tourism, Government of Haryana Former Vice-President, Dadri Education Society, Charkhi Dadri Former President, Chinar Syntex Ltd. (Textile Mills), Bhiwani
FORMER CO-ORDINATOR DR. S. GARG
Faculty, Shree Ram Institute of Business & Management, Urjani
ADVISORS PROF. M. S. SENAM RAJU
Director A. C. D., School of Management Studies, I.G.N.O.U., New Delhi
PROF. M. N. SHARMA Chairman, M.B.A., Haryana College of Technology & Management, Kaithal
PROF. S. L. MAHANDRU Principal (Retd.), Maharaja Agrasen College, Jagadhri
EDITOR PROF. R. K. SHARMA
Professor, Bharti Vidyapeeth University Institute of Management & Research, New Delhi
CO-EDITOR DR. BHAVET
Faculty, Shree Ram Institute of Engineering & Technology, Urjani
EDITORIAL ADVISORY BOARD DR. RAJESH MODI
Faculty, Yanbu Industrial College, Kingdom of Saudi Arabia
PROF. SANJIV MITTAL University School of Management Studies, Guru Gobind Singh I. P. University, Delhi
PROF. ANIL K. SAINI Chairperson (CRC), Guru Gobind Singh I. P. University, Delhi
DR. SAMBHAVNA Faculty, I.I.T.M., Delhi
VOLUME NO. 5 (2015), ISSUE NO. 11 (NOVEMBER) ISSN 2231-5756
INTERNATIONAL JOURNAL OF RESEARCH IN COMMERCE, IT & MANAGEMENT A Monthly Double-Blind Peer Reviewed (Refereed/Juried) Open Access International e-Journal - Included in the International Serial Directories
http://ijrcm.org.in/
iv
DR. MOHENDER KUMAR GUPTA
Associate Professor, P. J. L. N. Government College, Faridabad
DR. SHIVAKUMAR DEENE Asst. Professor, Dept. of Commerce, School of Business Studies, Central University of Karnataka, Gulbarga
ASSOCIATE EDITORS PROF. NAWAB ALI KHAN
Department of Commerce, Aligarh Muslim University, Aligarh, U.P.
PROF. ABHAY BANSAL Head, Department of I.T., Amity School of Engineering & Technology, Amity University, Noida
PROF. A. SURYANARAYANA Department of Business Management, Osmania University, Hyderabad
PROF. V. SELVAM SSL, VIT University, Vellore
DR. PARDEEP AHLAWAT Associate Professor, Institute of Management Studies & Research, Maharshi Dayanand University, Rohtak
DR. S. TABASSUM SULTANA Associate Professor, Department of Business Management, Matrusri Institute of P.G. Studies, Hyderabad
SURJEET SINGH Asst. Professor, Department of Computer Science, G. M. N. (P.G.) College, Ambala Cantt.
FORMER TECHNICAL ADVISOR AMITA
Faculty, Government M. S., Mohali
FINANCIAL ADVISORS DICKIN GOYAL
Advocate & Tax Adviser, Panchkula
NEENA Investment Consultant, Chambaghat, Solan, Himachal Pradesh
LEGAL ADVISORS JITENDER S. CHAHAL
Advocate, Punjab & Haryana High Court, Chandigarh U.T.
CHANDER BHUSHAN SHARMA Advocate & Consultant, District Courts, Yamunanagar at Jagadhri
SUPERINTENDENT SURENDER KUMAR POONIA
VOLUME NO. 5 (2015), ISSUE NO. 11 (NOVEMBER) ISSN 2231-5756
INTERNATIONAL JOURNAL OF RESEARCH IN COMMERCE, IT & MANAGEMENT A Monthly Double-Blind Peer Reviewed (Refereed/Juried) Open Access International e-Journal - Included in the International Serial Directories
http://ijrcm.org.in/
v
CALL FOR MANUSCRIPTS We invite unpublished novel, original, empirical and high quality research work pertaining to recent developments & practices in the areas of Computer Science & Applications; Commerce; Business; Finance; Marketing; Human Resource Management; General Management; Banking; Economics; Tourism Administration & Management; Education; Law; Library & Information Science; Defence & Strategic Studies; Electronic Science; Corporate Governance; Industrial Relations; and emerging paradigms in allied subjects like Accounting; Accounting Information Systems; Accounting Theory & Practice; Auditing; Behavioral Accounting; Behavioral Economics; Corporate Finance; Cost Accounting; Econometrics; Economic Development; Economic History; Financial Institutions & Markets; Financial Services; Fiscal Policy; Government & Non Profit Accounting; Industrial Organization; International Economics & Trade; International Finance; Macro Economics; Micro Economics; Rural Economics; Co-operation; Demography: Development Planning; Development Studies; Applied Economics; Development Economics; Business Economics; Monetary Policy; Public Policy Economics; Real Estate; Regional Economics; Political Science; Continuing Education; Labour Welfare; Philosophy; Psychology; Sociology; Tax Accounting; Advertising & Promotion Management; Management Information Systems (MIS); Business Law; Public Responsibility & Ethics; Communication; Direct Marketing; E-Commerce; Global Business; Health Care Administration; Labour Relations & Human Resource Management; Marketing Research; Marketing Theory & Applications; Non-Profit Organizations; Office Administration/Management; Operations Research/Statistics; Organizational Behavior & Theory; Organizational Development; Production/Operations; International Relations; Human Rights & Duties; Public Administration; Population Studies; Purchasing/Materials Management; Retailing; Sales/Selling; Services; Small Business Entrepreneurship; Strategic Management Policy; Technology/Innovation; Tourism & Hospitality; Transportation Distribution; Algorithms; Artificial Intelligence; Compilers & Translation; Computer Aided Design (CAD); Computer Aided Manufacturing; Computer Graphics; Computer Organization & Architecture; Database Structures & Systems; Discrete Structures; Internet; Management Information Systems; Modeling & Simulation; Neural Systems/Neural Networks; Numerical Analysis/Scientific Computing; Object Oriented Programming; Operating Systems; Programming Languages; Robotics; Symbolic & Formal Logic; Web Design and emerging paradigms in allied subjects.
Anybody can submit the soft copy of unpublished novel; original; empirical and high quality research work/manuscript anytime in M.S. Word format after preparing the same as per our GUIDELINES FOR SUBMISSION; at our email address i.e. [email protected] or online by clicking the link online submission as given on our website (FOR ONLINE SUBMISSION, CLICK HERE).
GUIDELINES FOR SUBMISSION OF MANUSCRIPT
1. COVERING LETTER FOR SUBMISSION:
DATED: _____________
THE EDITOR
IJRCM
Subject: SUBMISSION OF MANUSCRIPT IN THE AREA OF .
(e.g. Finance/Mkt./HRM/General Mgt./Engineering/Economics/Computer/IT/ Education/Psychology/Law/Math/other, please
specify)
DEAR SIR/MADAM
Please find my submission of manuscript entitled ‘___________________________________________’ for possible publication in one
of your journals.
I hereby affirm that the contents of this manuscript are original. Furthermore, it has neither been published elsewhere in any language
fully or partly, nor is it under review for publication elsewhere.
I affirm that all the co-authors of this manuscript have seen the submitted version of the manuscript and have agreed to their inclusion
of names as co-authors.
Also, if my/our manuscript is accepted, I agree to comply with the formalities as given on the website of the journal. The Journal has
discretion to publish our contribution in any of its journals.
NAME OF CORRESPONDING AUTHOR :
Designation :
Institution/College/University with full address & Pin Code :
Residential address with Pin Code :
Mobile Number (s) with country ISD code :
Is WhatsApp or Viber active on your above noted Mobile Number (Yes/No) :
Landline Number (s) with country ISD code :
E-mail Address :
Alternate E-mail Address :
Nationality :
VOLUME NO. 5 (2015), ISSUE NO. 11 (NOVEMBER) ISSN 2231-5756
INTERNATIONAL JOURNAL OF RESEARCH IN COMMERCE, IT & MANAGEMENT A Monthly Double-Blind Peer Reviewed (Refereed/Juried) Open Access International e-Journal - Included in the International Serial Directories
http://ijrcm.org.in/
vi
NOTES:
a) The whole manuscript has to be in ONE MS WORD FILE only, which will start from the covering letter, inside the manuscript. pdf.
version is liable to be rejected without any consideration.
b) The sender is required to mention the following in the SUBJECT COLUMN of the mail:
New Manuscript for Review in the area of (e.g. Finance/Marketing/HRM/General Mgt./Engineering/Economics/Computer/IT/
Education/Psychology/Law/Math/other, please specify)
c) There is no need to give any text in the body of mail, except the cases where the author wishes to give any specific message w.r.t.
to the manuscript.
d) The total size of the file containing the manuscript is expected to be below 1000 KB.
e) Abstract alone will not be considered for review and the author is required to submit the complete manuscript in the first
instance.
f) The journal gives acknowledgement w.r.t. the receipt of every email within twenty four hours and in case of non-receipt of
acknowledgment from the journal, w.r.t. the submission of manuscript, within two days of submission, the corresponding author
is required to demand for the same by sending a separate mail to the journal.
g) The author (s) name or details should not appear anywhere on the body of the manuscript, except the covering letter and the
cover page of the manuscript, in the manner as mentioned in the guidelines.
2. MANUSCRIPT TITLE: The title of the paper should be bold typed, centered and fully capitalised.
3. AUTHOR NAME (S) & AFFILIATIONS: Author (s) name, designation, affiliation (s), address, mobile/landline number (s), and
email/alternate email address should be given underneath the title.
4. ACKNOWLEDGMENTS: Acknowledgements can be given to reviewers, guides, funding institutions, etc., if any.
5. ABSTRACT: Abstract should be in fully italicized text, ranging between 150 to 300 words. The abstract must be informative and explain
the background, aims, methods, results & conclusion in a SINGLE PARA. Abbreviations must be mentioned in full.
6. KEYWORDS: Abstract must be followed by a list of keywords, subject to the maximum of five. These should be arranged in alphabetic
order separated by commas and full stop at the end. All words of the keywords, including the first one should be in small letters, except
special words e.g. name of the Countries, abbreviations.
7. JEL CODE: Provide the appropriate Journal of Economic Literature Classification System code (s). JEL codes are available at
www.aeaweb.org/econlit/jelCodes.php, however, mentioning JEL Code is not mandatory.
8. MANUSCRIPT: Manuscript must be in BRITISH ENGLISH prepared on a standard A4 size PORTRAIT SETTING PAPER. It should be free
from any errors i.e. grammatical, spelling or punctuation. It must be thoroughly edited at your end.
9. HEADINGS: All the headings must be bold-faced, aligned left and fully capitalised. Leave a blank line before each heading.
10. SUB-HEADINGS: All the sub-headings must be bold-faced, aligned left and fully capitalised.
11. MAIN TEXT:
THE MAIN TEXT SHOULD FOLLOW THE FOLLOWING SEQUENCE:
INTRODUCTION
REVIEW OF LITERATURE
NEED/IMPORTANCE OF THE STUDY
STATEMENT OF THE PROBLEM
OBJECTIVES
HYPOTHESIS (ES)
RESEARCH METHODOLOGY
RESULTS & DISCUSSION
FINDINGS
RECOMMENDATIONS/SUGGESTIONS
CONCLUSIONS
LIMITATIONS
SCOPE FOR FURTHER RESEARCH
REFERENCES
APPENDIX/ANNEXURE
The manuscript should preferably range from 2000 to 5000 WORDS.
VOLUME NO. 5 (2015), ISSUE NO. 11 (NOVEMBER) ISSN 2231-5756
INTERNATIONAL JOURNAL OF RESEARCH IN COMMERCE, IT & MANAGEMENT A Monthly Double-Blind Peer Reviewed (Refereed/Juried) Open Access International e-Journal - Included in the International Serial Directories
http://ijrcm.org.in/
vii
12. FIGURES & TABLES: These should be simple, crystal CLEAR, centered, separately numbered & self explained, and titles must be above
the table/figure. Sources of data should be mentioned below the table/figure. It should be ensured that the tables/figures are referred
to from the main text.
13. EQUATIONS/FORMULAE: These should be consecutively numbered in parenthesis, horizontally centered with equation/formulae
number placed at the right. The equation editor provided with standard versions of Microsoft Word should be utilised. If any other
equation editor is utilised, author must confirm that these equations may be viewed and edited in versions of Microsoft Office that
does not have the editor.
14. ACRONYMS: These should not be used in the abstract. The use of acronyms is elsewhere is acceptable. Acronyms should be defined
on its first use in each section: Reserve Bank of India (RBI). Acronyms should be redefined on first use in subsequent sections.
15. REFERENCES: The list of all references should be alphabetically arranged. The author (s) should mention only the actually utilised
references in the preparation of manuscript and they are supposed to follow Harvard Style of Referencing. Also check to make sure
that everything that you are including in the reference section is duly cited in the paper. The author (s) are supposed to follow the
references as per the following:
All works cited in the text (including sources for tables and figures) should be listed alphabetically.
Use (ed.) for one editor, and (ed.s) for multiple editors.
When listing two or more works by one author, use --- (20xx), such as after Kohl (1997), use --- (2001), etc, in chronologically ascending
order.
Indicate (opening and closing) page numbers for articles in journals and for chapters in books.
The title of books and journals should be in italics. Double quotation marks are used for titles of journal articles, book chapters,
dissertations, reports, working papers, unpublished material, etc.
For titles in a language other than English, provide an English translation in parenthesis.
Headers, footers, endnotes and footnotes should not be used in the document. However, you can mention short notes to elucidate
some specific point, which may be placed in number orders after the references.
PLEASE USE THE FOLLOWING FOR STYLE AND PUNCTUATION IN REFERENCES:
BOOKS
Bowersox, Donald J., Closs, David J., (1996), "Logistical Management." Tata McGraw, Hill, New Delhi.
Hunker, H.L. and A.J. Wright (1963), "Factors of Industrial Location in Ohio" Ohio State University, Nigeria.
CONTRIBUTIONS TO BOOKS
Sharma T., Kwatra, G. (2008) Effectiveness of Social Advertising: A Study of Selected Campaigns, Corporate Social Responsibility, Edited
by David Crowther & Nicholas Capaldi, Ashgate Research Companion to Corporate Social Responsibility, Chapter 15, pp 287-303.
JOURNAL AND OTHER ARTICLES
Schemenner, R.W., Huber, J.C. and Cook, R.L. (1987), "Geographic Differences and the Location of New Manufacturing Facilities,"
Journal of Urban Economics, Vol. 21, No. 1, pp. 83-104.
CONFERENCE PAPERS
Garg, Sambhav (2011): "Business Ethics" Paper presented at the Annual International Conference for the All India Management
Association, New Delhi, India, 19–23
UNPUBLISHED DISSERTATIONS
Kumar S. (2011): "Customer Value: A Comparative Study of Rural and Urban Customers," Thesis, Kurukshetra University, Kurukshetra.
ONLINE RESOURCES
Always indicate the date that the source was accessed, as online resources are frequently updated or removed.
WEBSITES
Garg, Bhavet (2011): Towards a New Gas Policy, Political Weekly, Viewed on January 01, 2012 http://epw.in/user/viewabstract.jsp
VOLUME NO. 5 (2015), ISSUE NO. 11 (NOVEMBER) ISSN 2231-5756
INTERNATIONAL JOURNAL OF RESEARCH IN COMMERCE, IT & MANAGEMENT A Monthly Double-Blind Peer Reviewed (Refereed/Juried) Open Access International e-Journal - Included in the International Serial Directories
http://ijrcm.org.in/
1
THE ROLE OF TRANSFORMATIVE IT CAPABILITY ON INCREASING ORGANIZATIONAL INNOVATIVENESS TO SUSTAIN COMPETITIVE ADVANTAGE
DR. TEGUH WIDODO DEAN
SCHOOL OF APLLIED SCIENCE TELKOM UNIVERSITY
BANDUNG, INDONESIA
ABSTRACT This basic research applys a causality model to explain the relationship between IT Capability and organizational innovativeness impact on competitive advantage. All of those latent variables are revealed through a set of indicator variables that can be measured through a survey. Data sample are collected from 210 Telkom’s managers who were responsible in achieving business targets, and analyzed using SEM Lisrel statistic software. There are at least two groups of controversial opinions in concluding the relationship between IT capability and competitive advantage. The first group argues that the IT capabilities have impact on competitive advantage because these capabilities help organizations to innovate, and those are able to create uniqueness. The second group concluded that IT capability has no effect on the competitive advantage due the fact that IT investment are easily duplicated by competitors. With triple-loop learning approach, IT capabilities are then analysed and classified into tree levels of capabilities to find a capability which has close relation to sustainable competitive advantage. The grand theoretical model and the empirical evidence provide an important foundation to develop a comprehensive theory for formulating the role of IT capabilities on organizational innovativeness leads to sustainable competitive advantage. Management should develop capability to provide infrastructure for information exchange, operationalize new conception, and reconfigurable IT resources. This new dynamic and contextual IT capability, is then called as Transformative IT Capability.
KEYWORDS
transformative IT capability, triple-loop learning, organizational innovativeness, sustainable competitive advantage.
1. INTRODUCTION esource base view of the firm theorized that the success of the company is not only determined by external factors but also by internal factors (Grant, 1991). Sustainable competitive advantage gained when companies have and use their resources and competences which are valuable, rare, difficult to be imitated, and there is no substitution (Barney, 1991). As an internal resources, IT can be viewed as a strategic asset that is able to cope with the dynamic
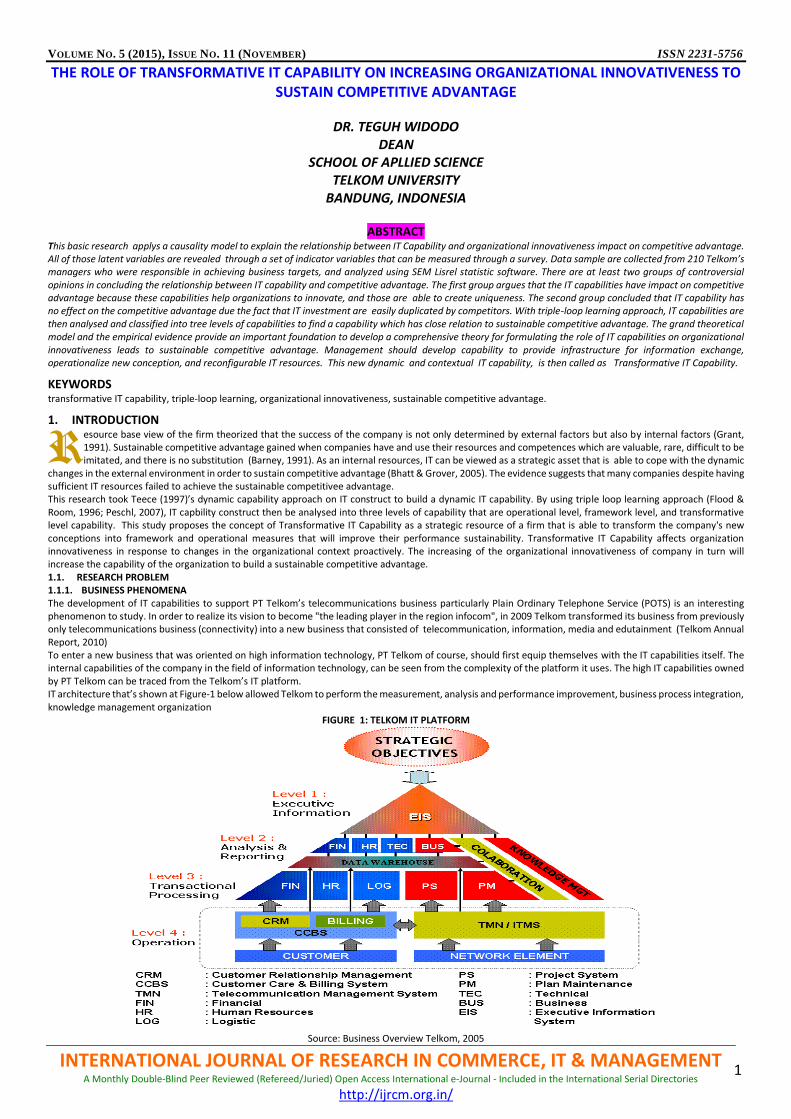
changes in the external environment in order to sustain competitive advantage (Bhatt & Grover, 2005). The evidence suggests that many companies despite having sufficient IT resources failed to achieve the sustainable competitivee advantage. This research took Teece (1997)’s dynamic capability approach on IT construct to build a dynamic IT capability. By using triple loop learning approach (Flood & Room, 1996; Peschl, 2007), IT capbility construct then be analysed into three levels of capability that are operational level, framework level, and transformative level capability. This study proposes the concept of Transformative IT Capability as a strategic resource of a firm that is able to transform the company's new conceptions into framework and operational measures that will improve their performance sustainability. Transformative IT Capability affects organization innovativeness in response to changes in the organizational context proactively. The increasing of the organizational innovativeness of company in turn will increase the capability of the organization to build a sustainable competitive advantage. 1.1. RESEARCH PROBLEM 1.1.1. BUSINESS PHENOMENA The development of IT capabilities to support PT Telkom’s telecommunications business particularly Plain Ordinary Telephone Service (POTS) is an interesting phenomenon to study. In order to realize its vision to become "the leading player in the region infocom", in 2009 Telkom transformed its business from previously only telecommunications business (connectivity) into a new business that consisted of telecommunication, information, media and edutainment (Telkom Annual Report, 2010) To enter a new business that was oriented on high information technology, PT Telkom of course, should first equip themselves with the IT capabilities itself. The internal capabilities of the company in the field of information technology, can be seen from the complexity of the platform it uses. The high IT capabilities owned by PT Telkom can be traced from the Telkom’s IT platform. IT architecture that’s shown at Figure-1 below allowed Telkom to perform the measurement, analysis and performance improvement, business process integration, knowledge management organization
FIGURE 1: TELKOM IT PLATFORM
Source: Business Overview Telkom, 2005
R
VOLUME NO. 5 (2015), ISSUE NO. 11 (NOVEMBER) ISSN 2231-5756
INTERNATIONAL JOURNAL OF RESEARCH IN COMMERCE, IT & MANAGEMENT A Monthly Double-Blind Peer Reviewed (Refereed/Juried) Open Access International e-Journal - Included in the International Serial Directories
http://ijrcm.org.in/
2
Telkom’s IT capabilities that had been advanced, were developed to support POTS business. Theoretically, IT capability is a strategic asset that can be a source of sustainable competitive advantage (Bhatt & Grover at. al). But the facts show that Telkom's POTS business that was supported by such advanced IT capabilities was not able to prevent the declining POTS business performance since the last five years, both in terms of operating revenue, number of customers and the level of use.
TABLE 1: POTS BUSINESS PERFORMANCE
POTS Performance 2006 2007 2008 2009 2010
Revenue (B IDR) 16.467 19.683 16.709 14.286 12.940
Customer (1000) 8.709 8.685 8.630 8.377 8.303
Source: Telkom Anual Report 2010. 1.1.2. EFFECT OF IT CAPABILITY ON SUSTAINABLE COMPETITIVE ADVANTAGE At least there are two schools of thought that had controversy in concluding the relationship between IT capability and competitive advantage. The first faction was Farrel (2003), Wheeler (2002), Zahra (2002), Sambamurthy (2003) who concluded that IT capability impact on competitive advantage. Bharadwaj (2000), Dehning & Stratopoulos (2003), Mata, Fuerst, Barney (1995), Santhanam & Hartono (2003) gave a more specific reason that IT capability was able to create uniqueness and therefore contributes to competitive advantage. The second group was derived from Clemons (1986), Carr (2003), Kettinger, Grover, Guha & Fresh (1994) researches, oppositely concluded that IT had no effect on sustainable competitive advantage due to IT capabilities was accessible to competitors and IT investments easily duplicated by competitors as well. The diversity of perspectives in IT study very likely to cause controversy in the relationship among them. The phenomenon of business and research gap above shows that the persistence of the problem of the relationship between IT capability and sustainable competitive advantage that needs to be further investigated. The gap provides an opportunity for this research to find the form of IT capability that could potentially increase the organizational innovativeness as a firm strategic resource. It creates the uniqueness and socially complex so It’s difficult to be imitated, hence impact on sustainable competitive advantage of the firm. 1.2. PURPOSE This study aims to fill the view gap of the influence of the IT Capability on Sustainable Competitive Advantage by testing the conceptual model presented in Figure 4. This study utilizes a triple-loop learning approach to classify IT capabilities and choose transformative IT capability as a strategic resource that can drive organizational innovativeness that lead to sustainable competitive advantage. As a practical contribution of this research is providing recommendation in the development of IT capabilities in firms that support the creation of sustainable competitive advantage.
2. LITERATURE REVIEW Research on organizational capabilities is influenced by the resource-based views of the firm (RBV) theory that argued that the company can gain a competitive advantage and superior long-term performance through the management of resources (Barney, 1991). Capability reflects the company's ability to combine resources so as to achieve superior performance. Capability involves not only the ability to produce efficiently, but also to gain knowledge of a variety of activities such as the capability to increase productivity, to understand the process and product design, ability to build production facilities efficiently and to keep abreast of changes in information technology. Capability has various attributes such as speed, consistency of process, agility, cross-functionality, and core competencies (Stalk, et al., 1994). Feeny and Willcocks (1998) said that there were nine capabilities that form the foundation of the company, namely: leadership, business-systems-thinking, relationship building, architectural planning, contract facilitation, run information technology, monitoring contact, the purchase was formalized, and vendor development. Capabilities include know-how of the entire process, cognition, and minimal essential routines for running a productive process (Christensen, 1994; Barney, 1999; Bharadwaj, 2000; Byrd, 2001). Routines are continuously improved through the learning process. The interaction between the organization and its external environment can bring new know-how, innovative product, process or organizational management. The ability to make things run in a different way that can be understood as an internal innovation capabilities that no other company is the technological capabilities of the organization. Teece (1992) used the term organizational capability refers to the ability of the company to organize, manage, and coordinate a set of activities. Capability is the capacity of the company to do a combination of assets through organizational processes to effect the desired end goal. Lado (1992) as cited by Agusty (1998) in conceptualizing sustainable competitive advantage from the perspective of the resource-based theory (RBV), submitted four components of a company's distinctive competencies which include managerial competence, competency-based resources or inputs, process competence or transformation, and product-market competence or competency-based output. These competencies emerged in the form of innovative capabilities can be a source of sustainable competitive advantage. These will be difficult to imitate by competitors when forming a complex relationship with the company's distinctive capabilities and resources. Dynamic capabilities focuses on strategic response to environmental change (Winter, 2003). Included in this sense is the ability to transform existing resources into the company resources that create new value in changing environmental conditions (Eisenhardt and Martin, 2000). Teece, Pisano and Shuen (1987) proposed the concept of dynamic capabilities as an alternative model of RBV because it reflects an organization's ability to achieve the new innovative forms of competitive advantage in the hypercompetitive environment. Technological capabilities is the ability to absorpt the specific technology companies to solve technical problems (Nicholls-Nixon, 1995). Cohen and Levinthal (1990) looked at the absorption capability as the company's ability to evaluate, assimilate and utilize external knowledge for commercial purposes. Technological absorptive capability can encourage product innovation activities (Jones et al, 2000). Capabilities of an enterprise can not be replicated by another enterprise because those capabilities can not be explicitly defined and codified. Organizational capability is a set of skills, routines, and complementary assets and is a part of the tacit knowledge and non-formal, which is based on procedural knowledge, and not easily transferred (Nelson, 1991 as cited by Vogel et.al). IT capability is a capability at the enterprise level in using information technology to differentiate its competitors (Henderson and Venkatraman, 1993). Bharadwaj (2000) as cited by Lee & Anderson, 2006 further defines IT capabilities as a firm's ability to mobilize and hold IT-based resources in combination with other resources and capabilities (Bharadwaj, 2000, p. 171). Bharadwaj examine the relationship between IT capability and firm performance by conceptualizing the IT capabilities as consisting of (1) IT infrastructure components; (2) IT human resources; and (3) intangible IT-enabled resources. Capabilities include the ownership and control of IT hardware, software, executive systems, proprietary software, shared services, IT human skills, and the process is the capability of the elements that are internally integrated and interrelated with business goals (King, 2002). Internal IT capability will be a source of competitive advantage if it has a value that is tested, rare, and imitabilitasnya (Prahalad & Hamel, 1990; Stalk, et al., 1994; Wernerfelt, 1984). IT capabilities generate a competitive advantage if it is able to produce products and services by: (1) low cost so the price is competitive. (2) The added value of creating a product / service that offers the features / functionality that is different and very attractive, (3) Quick to execute the process, (4) Nimble and quick in adapting the needs of a changing market, (5) Innovation: continuous supply of creative products and services of value to customers, and (6) Customer service: Improve responsiveness to customer needs (Barney, 1995, 1997; Bharadwaj and Varadarajan & Fahey, 1993; Clemons, 1986; Dehning & Stratopoulos, 2003; Feeney, 1988). Internally, IT capability directs to the goal of efficiency through process integration, efficiency, streamlining the value chain strategy. IT capability should also be measured based on internal functional efficiency and cost reduction of functional processes. The effort to reduce costs is done by integrating the value chain and supply chain, eliminate redundant processes or processes that don’t have value-added to reduce the cost (Stalk et al., 1994; Sethi & King, 1994). Externally, IT capabilities aimed to add value to the customer and the service. Competence consists of the ability of IT to integrate IT functions such as IT for business applications, the central support (helpdesk) and present it to the customer as an added value for customers (Prahalad & Hamel, 1990). IT competence is also greatly contribute to the execution of the strategy, providing differentiated products and services. Competitors are not easy to imitate and replicate the IT competence (Christensen, 1992).
VOLUME NO. 5 (2015), ISSUE NO. 11 (NOVEMBER) ISSN 2231-5756
INTERNATIONAL JOURNAL OF RESEARCH IN COMMERCE, IT & MANAGEMENT A Monthly Double-Blind Peer Reviewed (Refereed/Juried) Open Access International e-Journal - Included in the International Serial Directories
http://ijrcm.org.in/
3
IT capabilities can be used to build cooperative relationships between individuals and groups within a department and between a company and its partners. When an organization has the capability of IT that is directed to establish a better activity than its rivals, then the capability of IT has become a distinctive IT competency and be a potential competitive advantage (Christensen, 1999). IT capability has three main dimensions: (a) the acquisition of IT resources, such as technology assets (Rose et al, 1996) IT objects (Tippins and Sohi, 2003) and the entire IT infrastructure (Bharadwaj, 2000, Fenny and Wilcocks, 1998); (b) Development of IT resources through close to relationships IT business, such as IT business partnership (Rose et al, 1996), a partnership of IT (Bharadwaj et al, 1999) and (c) Leveraging IT resources such as technical IT skills (Mata et al, 1995, Tippins and Sohi, 2003 Ray et al, 2005) and IT resources. On the basis of this three-dimensional Bharadwaj et al, 2004 defines IT capabilities as the company's ability to acquire, hold, and boost its IT resources to establish and support the business strategy and value chain activities. The third dimension is the result of the analysis of the construct of IT capabilities at the corporate level, and from the standpoint of the IT unit itself. Monideepa Tarafdar & Steven R. Gordon (2005) found that IT capability affects the organization's ability to innovate, and the different aspects of IT capabilities influence the innovation process. Study of Farrell (2003), Wheeler (2002) and Zahra (2002) stated that IT plays a role in encouraging and directing the formulation of business strategies and as a tool to achieve growth and create competitive advantage. Besides, Sambamurthy (2003) added that IT capability helped organizations to innovate. By adopting the RBV theory, Bharadwaj (2000) conceptualized and classified IT capabilities into three dimensions: (1). IT Infrastructure in the form of physical IT assets such as computers, software, hardware, communication technology, database and shared technical platform (sharable technical platforms); (2). IT human resources in the form of technical IT skills such as programming skills, managerial and leadership skills of IT functions such as IT project management; (3). Infrastructure IT-enabled intangible benefits of IT in the form of hidden, which indirectly increase organizational effectiveness, such as customer orientation, knowledge assets and synergy. Bhatt and Grover, (2005) parsed source of IT-based competitive advantage with IT capabilities differentiate into capability value, competitive capability and dynamic IT capability. Based on the identification of Bhatt & Grover, (2005) et.al. they suggested four dimensions of IT capability, namely: (1) the quality of the IT infrastructure, (2) IT business experience, (3) infrastructure relationship, and (4) organizational learning as an antecedent of competitive advantage. In his research Bhatt & Grover, (2005) et.al found a variety of IT impact on competitive advantage: (1) The higher the quality of the IT infrastructure is not a positive influence on the company's competitive advantage. (2) The higher the IT business experience a weak effect on the company's competitive advantage. (3) The higher the infrastructure relationship had positive and significant impact on the competitive advantage of the company. Ray, Muhana and Barney (2005) synthesized the IT process-oriented and resource-based theory (RBV) concluded that the key to successful use of IT on performance depends on the capabilities of the tasital IT and IT capabilitie were socially complex. Explicit capabilities such as technical IT skills, and IT spending on generic can not be considered as a source of competitive advantage. Dynamic IT capabilities which were developed by Pavlou and El Sawy (2006), which added dimension with reconfiguration capabilities to keep pace with changing environment. So the dynamic IT capability consists of four dimensions, namely (1) IT infrastructure, (2) IT human resources, (3) IT-enabled intangible and (4) IT that can be reconfigured. Selection priority is the main factor of IT usage and IT capability and competence development (Sanders and Premus, 2002). To achieve the desired results of an organization, working on the basis of the context, framework and action. Action is reciprocal elementary reactions companies on the operational level, while the framework and context touches conception changes lead to changes in the norms and mental maps. Dynamic capabilities included specific processes and organizational strategic value of the company that gave birth to transform existing resources into a resource company that created new value in changing environmental conditions (Eisenhardt and Martin, 2000). With regard to dynamic enterprise IT capabilities, this study emphasizes that the key success factor in the competition is the ability to transform the IT companies in the original innovative thinking and fundamentals of a change in the context of the company into the operational framework and measures of IT companies. The ability is judged by the speed and accuracy of the company to understand the changing of company context, the agility of the new configuration, the speed of transforming into the operational aspects of the IT company that support innovation. Competency of IT functional units in the enterprise and IT users determine the amount of IT capabilities to support transformation process of the company: the ability to translate fundamentals changes desired by the company into the framework and the operational level of a company's IT quickly and accurately. IT applications play an important role in the quality assurance processes, for example by adopting a particular application such as service level guarantee, then variance can be detected. This low-order adoption of IT application creates an innovation, but it doesn’t change the existing norms. Higher order adoption of IT applications such as to collect information on customer preferences to develop a new perception of the market. This application enables the company see the market clearly, i.e. to segment the market based on a particular way and choose a specific segment for targeted marketing. Information market modify the mental map of strategic marketing decision makers. Changes in strategic level of course must be articulated with it down into the level of action, such as changing the procedure. The first instance of IT application above, is used to keep the operation runs correctly (the thing right) but does’t necessarily have the right things. In the second example the application helps the company to choose the right things and new, then followed up by the action level correctly. The change in government policy on competition (changes context), threats the corporate performance in the long term because it will encourage the potential competitors to entry, so company must respons it properly, by transmorming to the new business for example. The IT application should facilitate the business transformation in the context of changes.
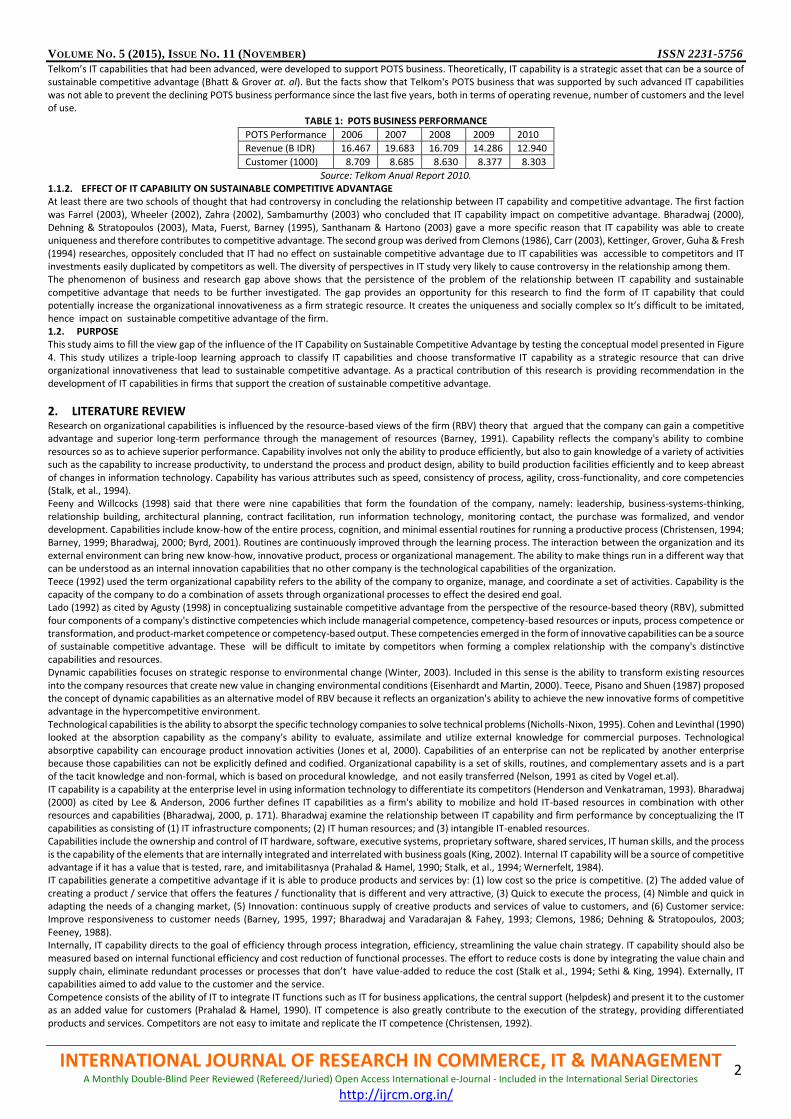
FIGURE 2: IT CAPABILITY ANALYSIS
Source: Developed for this research
IT capabilities on the first loop is operational IT capability. Capabilities at this level allows to support operational innovations such as IT capabilities to accelerate customer service time. Unfortuenetly IT capability at this level is now easily obtained either by the innovation itself, by procurement or outsourcing, so it is not a source of differentiation in the long run for a competing company. The second circle of IT capability makes it possible to support the company's business process changes resulted from changes in the frame work of company that is in effect. For example, if the company wants to increase the valuation of foreign markets, then company adopts a new financial management system based on a particular system. IT capabilities on the this IT Capability circle is named frame work capability.
VOLUME NO. 5 (2015), ISSUE NO. 11 (NOVEMBER) ISSN 2231-5756
INTERNATIONAL JOURNAL OF RESEARCH IN COMMERCE, IT & MANAGEMENT A Monthly Double-Blind Peer Reviewed (Refereed/Juried) Open Access International e-Journal - Included in the International Serial Directories
http://ijrcm.org.in/
4
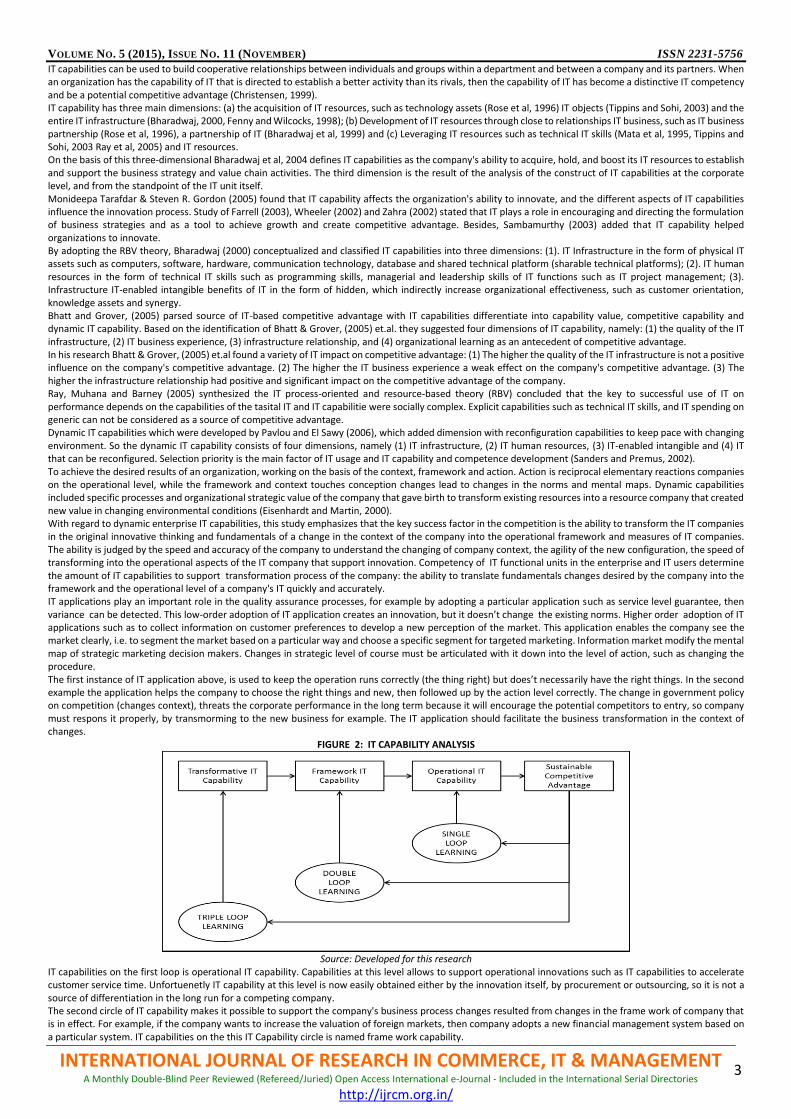
The third circle is the capability of the IT contextual which include the ability to rapidly translate new conception of the company as a response to changes in the context of the company. The company response can be change in business, infrastructure, organizational and corporate culture that must be executed until the operational level. The ability is achieved by the involvement of IT human resources, especially managerial level in the triple - loop organizational learning in the form of shared vision in the learning group. The learning activity that enables IT management directly involved in the formation of mental maps together with other organizational functions in order to solve the company's strategic problems. This mental map is a guideline for the next IT management in formulating future strategic planning of IT within the context faced by the company. The ability to understand the changes in context, perception, values and transforming the company into a framework and operationally IT action allows the company able to quickly reconfigure IT, capable of selecting a technology platform that is effective and efficient in supporting the transformation of the company. IT support to the company's transformation also can be extracted from its ability to provide the infrastructure that encourages the exchange of external and internal information in an interactive way, data storage and enterprise strategic information that is easily accessible in accordance with the authority, in accordance with the data processing and applications used to realize business processes and administration and on-line management information systems. Administration and business process changes as a result of the company's transformation can be done quickly and accurately. The exchange of external information in an interactive web-based information is needed by the company to facilitate interaction with stakeholders, such as customer service, service suppliers, service information to shareholders and the public information about the company. The need of internal information exchanges accelerates the exchange of information between levels of management from top to bottom and vice versa and exchange of information horizontally to support administratives and businesss processes itself. A set of IT capabilities which consists of the ability to roll up the new concept, the ability to provide a means of exchange of information and the ability to reconfigure that IT capability, forms a new concept of IT capability called by the Transformative IT Capability Transformative that is propositionized as follows: PROPOSITION Transformative IT Capability is a bundle of IT capability that emphasis on the capability to transform the new conception of the firm, produced by triple loop learning, to the operational level, capability to reconfigure the IT resources easily, and capability to provide information exchange infrastructure. These capabilities able to drive organizational innovativeness, hence, perform a strategic resource of the firm, and create a sustainable competitive advantage.
FIGURE 3: PYTOGRAPHY MODEL OF TRANSFORMATIVE IT CAPABILITY
Source: developed for this research
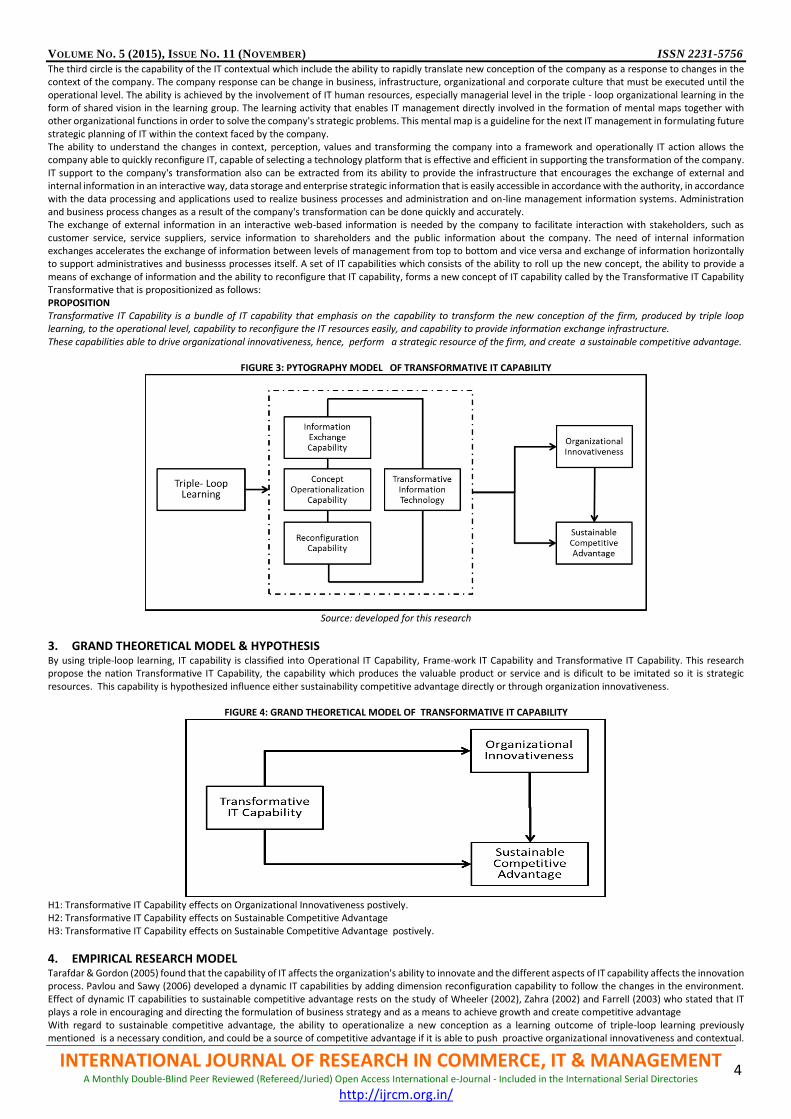
3. GRAND THEORETICAL MODEL & HYPOTHESIS By using triple-loop learning, IT capability is classified into Operational IT Capability, Frame-work IT Capability and Transformative IT Capability. This research propose the nation Transformative IT Capability, the capability which produces the valuable product or service and is dificult to be imitated so it is strategic resources. This capability is hypothesized influence either sustainability competitive advantage directly or through organization innovativeness.
FIGURE 4: GRAND THEORETICAL MODEL OF TRANSFORMATIVE IT CAPABILITY
H1: Transformative IT Capability effects on Organizational Innovativeness postively. H2: Transformative IT Capability effects on Sustainable Competitive Advantage H3: Transformative IT Capability effects on Sustainable Competitive Advantage postively.
4. EMPIRICAL RESEARCH MODEL Tarafdar & Gordon (2005) found that the capability of IT affects the organization's ability to innovate and the different aspects of IT capability affects the innovation process. Pavlou and Sawy (2006) developed a dynamic IT capabilities by adding dimension reconfiguration capability to follow the changes in the environment. Effect of dynamic IT capabilities to sustainable competitive advantage rests on the study of Wheeler (2002), Zahra (2002) and Farrell (2003) who stated that IT plays a role in encouraging and directing the formulation of business strategy and as a means to achieve growth and create competitive advantage With regard to sustainable competitive advantage, the ability to operationalize a new conception as a learning outcome of triple-loop learning previously mentioned is a necessary condition, and could be a source of competitive advantage if it is able to push proactive organizational innovativeness and contextual.
VOLUME NO. 5 (2015), ISSUE NO. 11 (NOVEMBER) ISSN 2231-5756
INTERNATIONAL JOURNAL OF RESEARCH IN COMMERCE, IT & MANAGEMENT A Monthly Double-Blind Peer Reviewed (Refereed/Juried) Open Access International e-Journal - Included in the International Serial Directories
http://ijrcm.org.in/
5
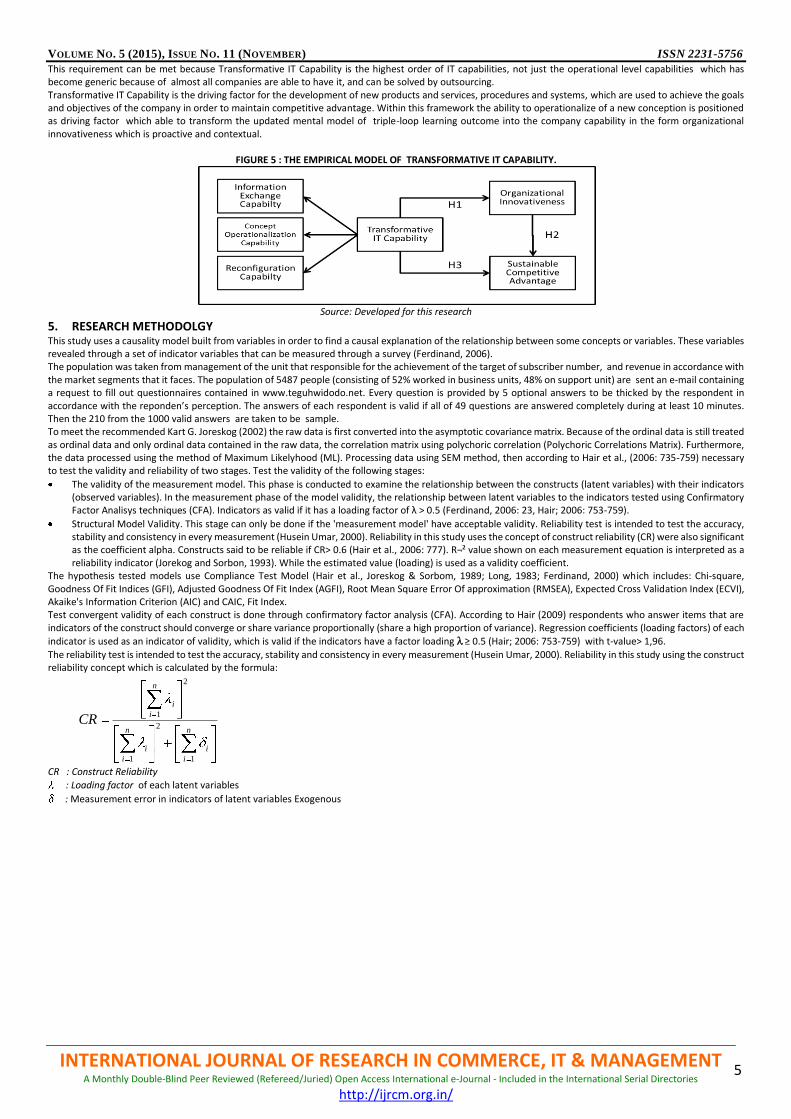
This requirement can be met because Transformative IT Capability is the highest order of IT capabilities, not just the operational level capabilities which has become generic because of almost all companies are able to have it, and can be solved by outsourcing. Transformative IT Capability is the driving factor for the development of new products and services, procedures and systems, which are used to achieve the goals and objectives of the company in order to maintain competitive advantage. Within this framework the ability to operationalize of a new conception is positioned as driving factor which able to transform the updated mental model of triple-loop learning outcome into the company capability in the form organizational innovativeness which is proactive and contextual.
FIGURE 5 : THE EMPIRICAL MODEL OF TRANSFORMATIVE IT CAPABILITY.
Source: Developed for this research
5. RESEARCH METHODOLGY This study uses a causality model built from variables in order to find a causal explanation of the relationship between some concepts or variables. These variables revealed through a set of indicator variables that can be measured through a survey (Ferdinand, 2006). The population was taken from management of the unit that responsible for the achievement of the target of subscriber number, and revenue in accordance with the market segments that it faces. The population of 5487 people (consisting of 52% worked in business units, 48% on support unit) are sent an e-mail containing a request to fill out questionnaires contained in www.teguhwidodo.net. Every question is provided by 5 optional answers to be thicked by the respondent in accordance with the reponden’s perception. The answers of each respondent is valid if all of 49 questions are answered completely during at least 10 minutes. Then the 210 from the 1000 valid answers are taken to be sample. To meet the recommended Kart G. Joreskog (2002) the raw data is first converted into the asymptotic covariance matrix. Because of the ordinal data is still treated as ordinal data and only ordinal data contained in the raw data, the correlation matrix using polychoric correlation (Polychoric Correlations Matrix). Furthermore, the data processed using the method of Maximum Likelyhood (ML). Processing data using SEM method, then according to Hair et al., (2006: 735-759) necessary to test the validity and reliability of two stages. Test the validity of the following stages:
The validity of the measurement model. This phase is conducted to examine the relationship between the constructs (latent variables) with their indicators (observed variables). In the measurement phase of the model validity, the relationship between latent variables to the indicators tested using Confirmatory Factor Analisys techniques (CFA). Indicators as valid if it has a loading factor of λ > 0.5 (Ferdinand, 2006: 23, Hair; 2006: 753-759).
Structural Model Validity. This stage can only be done if the 'measurement model' have acceptable validity. Reliability test is intended to test the accuracy, stability and consistency in every measurement (Husein Umar, 2000). Reliability in this study uses the concept of construct reliability (CR) were also significant as the coefficient alpha. Constructs said to be reliable if CR> 0.6 (Hair et al., 2006: 777). R¬² value shown on each measurement equation is interpreted as a reliability indicator (Jorekog and Sorbon, 1993). While the estimated value (loading) is used as a validity coefficient.
The hypothesis tested models use Compliance Test Model (Hair et al., Joreskog & Sorbom, 1989; Long, 1983; Ferdinand, 2000) which includes: Chi-square, Goodness Of Fit Indices (GFI), Adjusted Goodness Of Fit Index (AGFI), Root Mean Square Error Of approximation (RMSEA), Expected Cross Validation Index (ECVI), Akaike's Information Criterion (AIC) and CAIC, Fit Index. Test convergent validity of each construct is done through confirmatory factor analysis (CFA). According to Hair (2009) respondents who answer items that are indicators of the construct should converge or share variance proportionally (share a high proportion of variance). Regression coefficients (loading factors) of each
indicator is used as an indicator of validity, which is valid if the indicators have a factor loading ≥ 0.5 (Hair; 2006: 753-759) with t-value> 1,96.
The reliability test is intended to test the accuracy, stability and consistency in every measurement (Husein Umar, 2000). Reliability in this study using the construct reliability concept which is calculated by the formula: CR : Construct Reliability
: Loading factor of each latent variables
: Measurement error in indicators of latent variables Exogenous
n
i
i
n
i
i
n
i
i
CR
1
2
1
2
1
VOLUME NO. 5 (2015), ISSUE NO. 11 (NOVEMBER) ISSN 2231-5756
INTERNATIONAL JOURNAL OF RESEARCH IN COMMERCE, IT & MANAGEMENT A Monthly Double-Blind Peer Reviewed (Refereed/Juried) Open Access International e-Journal - Included in the International Serial Directories
http://ijrcm.org.in/
6
TABLE 2: REALIBILIT TEST
Var
iab
leS
Ind
icat
or
Std
. Lo
adin
g
Fact
or
(λ)
T -
Val
ue
Std
. Lo
adin
g Fa
cto
r (λ
)^2
Std
. Err
or
(δ)
Co
nst
ruct
R
elia
bili
ty
REM
AR
KS
TIC KPI1 0,68 12,08 0,46 0,33 0,94
REL
IAB
LE
KPI2 0,67 12,42 0,45 0,31
KPI3 0,67 11,03 0,45 0,31
KPI4 0,75 13 0,56 0,34
KOK1 0,82 15,18 0,67 0,45
KOK2 0,82 15,49 0,67 0,45
KOK3 0,81 13,34 0,66 0,41
KRK1 0,83 15,19 0,69 0,19
KRK2 0,83 15,96 0,69 0,41
KRK3 0,86 15,04 0,74 0,5
POI KOP1 0,69 0,48 0,51 0,84
REL
IAB
LE
KOP2 0,69 13,49 0,48 0,72
KOP3 0,54 8,74 0,29 0,48
KOP4 0,75 13,23 0,56 0,51
KOP5 0,72 12,96 0,52 0,48
KOP6 0,71 0,50 0,56
SCA KBB1 0,65 0,42 0,48 0,88
REL
IAB
LE
KBB2 0,7 11,09 0,49 0,52
KBB3 0,66 14,29 0,44 0,48
KBB4 0,68 11,79 0,46 0,65
KBB5 0,59 9,88 0,35 0,39
KBB6 1,33 5,88 1,77 0,39
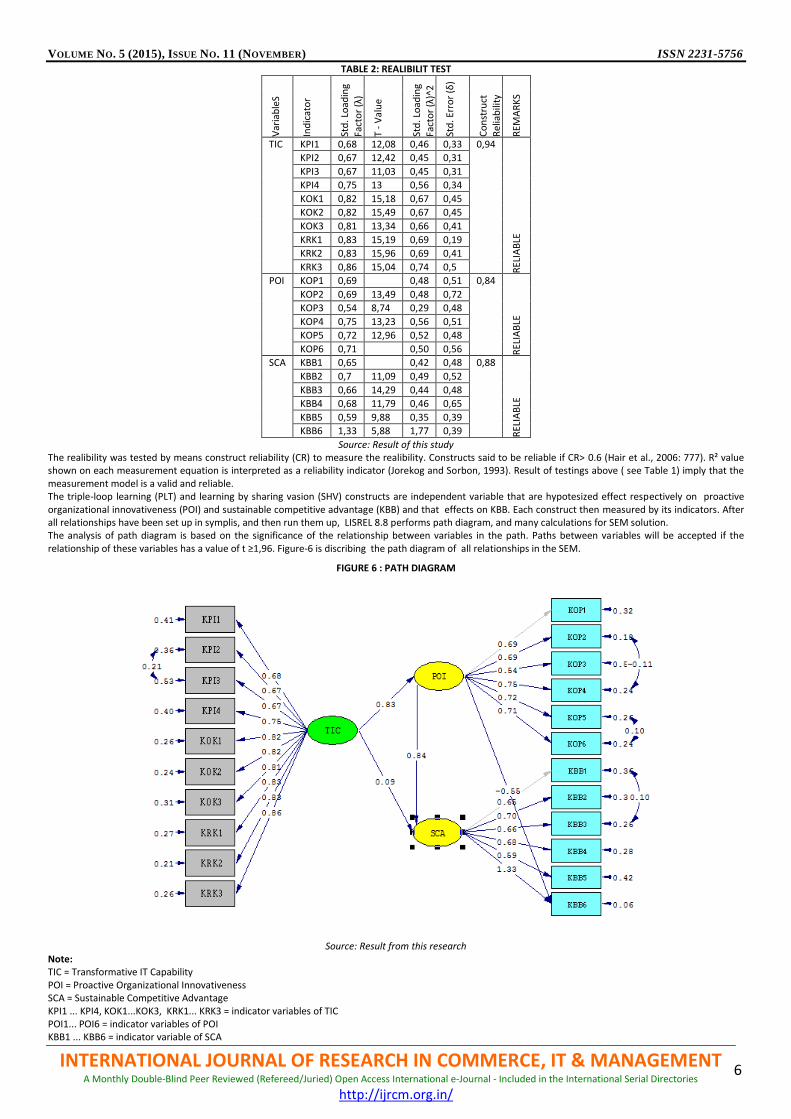
Source: Result of this study The realibility was tested by means construct reliability (CR) to measure the realibility. Constructs said to be reliable if CR> 0.6 (Hair et al., 2006: 777). R² value shown on each measurement equation is interpreted as a reliability indicator (Jorekog and Sorbon, 1993). Result of testings above ( see Table 1) imply that the measurement model is a valid and reliable. The triple-loop learning (PLT) and learning by sharing vasion (SHV) constructs are independent variable that are hypotesized effect respectively on proactive organizational innovativeness (POI) and sustainable competitive advantage (KBB) and that effects on KBB. Each construct then measured by its indicators. After all relationships have been set up in symplis, and then run them up, LISREL 8.8 performs path diagram, and many calculations for SEM solution. The analysis of path diagram is based on the significance of the relationship between variables in the path. Paths between variables will be accepted if the relationship of these variables has a value of t ≥1,96. Figure-6 is discribing the path diagram of all relationships in the SEM.
FIGURE 6 : PATH DIAGRAM
Source: Result from this research
Note: TIC = Transformative IT Capability POI = Proactive Organizational Innovativeness SCA = Sustainable Competitive Advantage KPI1 ... KPI4, KOK1...KOK3, KRK1... KRK3 = indicator variables of TIC POI1... POI6 = indicator variables of POI KBB1 ... KBB6 = indicator variable of SCA
VOLUME NO. 5 (2015), ISSUE NO. 11 (NOVEMBER) ISSN 2231-5756
INTERNATIONAL JOURNAL OF RESEARCH IN COMMERCE, IT & MANAGEMENT A Monthly Double-Blind Peer Reviewed (Refereed/Juried) Open Access International e-Journal - Included in the International Serial Directories
http://ijrcm.org.in/
7
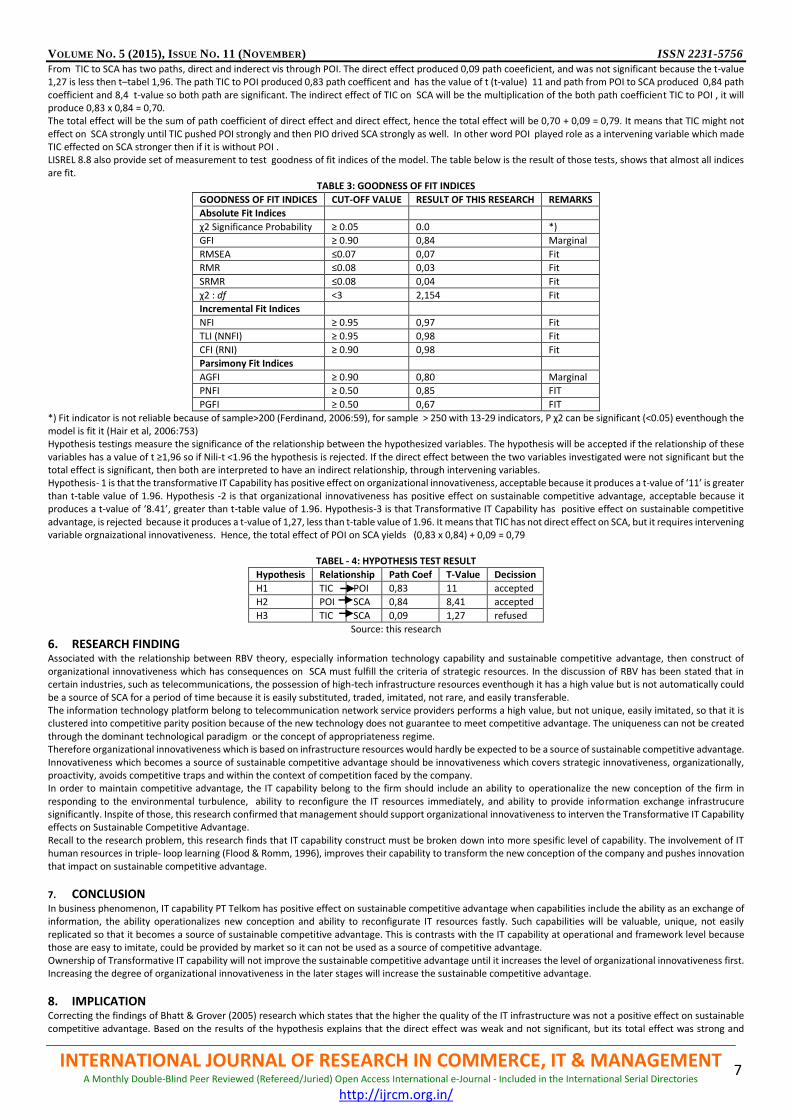
From TIC to SCA has two paths, direct and inderect vis through POI. The direct effect produced 0,09 path coeeficient, and was not significant because the t-value 1,27 is less then t–tabel 1,96. The path TIC to POI produced 0,83 path coefficent and has the value of t (t-value) 11 and path from POI to SCA produced 0,84 path coefficient and 8,4 t-value so both path are significant. The indirect effect of TIC on SCA will be the multiplication of the both path coefficient TIC to POI , it will produce 0,83 x 0,84 = 0,70. The total effect will be the sum of path coefficient of direct effect and direct effect, hence the total effect will be 0,70 + 0,09 = 0,79. It means that TIC might not effect on SCA strongly until TIC pushed POI strongly and then PIO drived SCA strongly as well. In other word POI played role as a intervening variable which made TIC effected on SCA stronger then if it is without POI . LISREL 8.8 also provide set of measurement to test goodness of fit indices of the model. The table below is the result of those tests, shows that almost all indices are fit.
TABLE 3: GOODNESS OF FIT INDICES
GOODNESS OF FIT INDICES CUT-OFF VALUE RESULT OF THIS RESEARCH REMARKS
Absolute Fit Indices
χ2 Significance Probability ≥ 0.05 0.0 *)
GFI ≥ 0.90 0,84 Marginal
RMSEA ≤0.07 0,07 Fit
RMR ≤0.08 0,03 Fit
SRMR ≤0.08 0,04 Fit
χ2 : df <3 2,154 Fit
Incremental Fit Indices
NFI ≥ 0.95 0,97 Fit
TLI (NNFI) ≥ 0.95 0,98 Fit
CFI (RNI) ≥ 0.90 0,98 Fit
Parsimony Fit Indices
AGFI ≥ 0.90 0,80 Marginal
PNFI ≥ 0.50 0,85 FIT
PGFI ≥ 0.50 0,67 FIT
*) Fit indicator is not reliable because of sample>200 (Ferdinand, 2006:59), for sample > 250 with 13-29 indicators, P χ2 can be significant (<0.05) eventhough the model is fit it (Hair et al, 2006:753) Hypothesis testings measure the significance of the relationship between the hypothesized variables. The hypothesis will be accepted if the relationship of these variables has a value of t ≥1,96 so if Nili-t <1.96 the hypothesis is rejected. If the direct effect between the two variables investigated were not significant but the total effect is significant, then both are interpreted to have an indirect relationship, through intervening variables. Hypothesis- 1 is that the transformative IT Capability has positive effect on organizational innovativeness, acceptable because it produces a t-value of ‘11’ is greater than t-table value of 1.96. Hypothesis -2 is that organizational innovativeness has positive effect on sustainable competitive advantage, acceptable because it produces a t-value of ‘8.41’, greater than t-table value of 1.96. Hypothesis-3 is that Transformative IT Capability has positive effect on sustainable competitive advantage, is rejected because it produces a t-value of 1,27, less than t-table value of 1.96. It means that TIC has not direct effect on SCA, but it requires intervening variable orgnaizational innovativeness. Hence, the total effect of POI on SCA yields (0,83 x 0,84) + 0,09 = 0,79
TABEL - 4: HYPOTHESIS TEST RESULT
Hypothesis Relationship Path Coef T-Value Decission
H1 TIC POI 0,83 11 accepted
H2 POI SCA 0,84 8,41 accepted
H3 TIC SCA 0,09 1,27 refused
Source: this research
6. RESEARCH FINDING Associated with the relationship between RBV theory, especially information technology capability and sustainable competitive advantage, then construct of organizational innovativeness which has consequences on SCA must fulfill the criteria of strategic resources. In the discussion of RBV has been stated that in certain industries, such as telecommunications, the possession of high-tech infrastructure resources eventhough it has a high value but is not automatically could be a source of SCA for a period of time because it is easily substituted, traded, imitated, not rare, and easily transferable. The information technology platform belong to telecommunication network service providers performs a high value, but not unique, easily imitated, so that it is clustered into competitive parity position because of the new technology does not guarantee to meet competitive advantage. The uniqueness can not be created through the dominant technological paradigm or the concept of appropriateness regime. Therefore organizational innovativeness which is based on infrastructure resources would hardly be expected to be a source of sustainable competitive advantage. Innovativeness which becomes a source of sustainable competitive advantage should be innovativeness which covers strategic innovativeness, organizationally, proactivity, avoids competitive traps and within the context of competition faced by the company. In order to maintain competitive advantage, the IT capability belong to the firm should include an ability to operationalize the new conception of the firm in responding to the environmental turbulence, ability to reconfigure the IT resources immediately, and ability to provide information exchange infrastrucure significantly. Inspite of those, this research confirmed that management should support organizational innovativeness to interven the Transformative IT Capability effects on Sustainable Competitive Advantage. Recall to the research problem, this research finds that IT capability construct must be broken down into more spesific level of capability. The involvement of IT human resources in triple- loop learning (Flood & Romm, 1996), improves their capability to transform the new conception of the company and pushes innovation that impact on sustainable competitive advantage.
7. CONCLUSION
In business phenomenon, IT capability PT Telkom has positive effect on sustainable competitive advantage when capabilities include the ability as an exchange of information, the ability operationalizes new conception and ability to reconfigurate IT resources fastly. Such capabilities will be valuable, unique, not easily replicated so that it becomes a source of sustainable competitive advantage. This is contrasts with the IT capability at operational and framework level because those are easy to imitate, could be provided by market so it can not be used as a source of competitive advantage. Ownership of Transformative IT capability will not improve the sustainable competitive advantage until it increases the level of organizational innovativeness first. Increasing the degree of organizational innovativeness in the later stages will increase the sustainable competitive advantage.
8. IMPLICATION Correcting the findings of Bhatt & Grover (2005) research which states that the higher the quality of the IT infrastructure was not a positive effect on sustainable competitive advantage. Based on the results of the hypothesis explains that the direct effect was weak and not significant, but its total effect was strong and
VOLUME NO. 5 (2015), ISSUE NO. 11 (NOVEMBER) ISSN 2231-5756
INTERNATIONAL JOURNAL OF RESEARCH IN COMMERCE, IT & MANAGEMENT A Monthly Double-Blind Peer Reviewed (Refereed/Juried) Open Access International e-Journal - Included in the International Serial Directories
http://ijrcm.org.in/
8
significant due to the presence of indirect effect thank to an intervening variables included in the model, namely organizational innovativeness. This supported the previous researces who stated that IT capability increased organizational innovativeness (Tarafdar & Gordon, 2005). In the other hand this study supported RBV theory and dynamic capability approach in developing IT resources as a strategic resources. Transformative IT capability requires that firm should develop information exchange capability to support communication among individual or unit who are working in the firm, and to provide information to out side organization, mainly the key stake holder, to store the data the which is easy to access. Information exchange capability can be fulfilled by the following ways: 1. Developing on-line management information system integrated for the purposes of all stakeholders. 2. Providing the IT resources that support knowledge management. 3. Providing high-speed data access to and from the company's strategic data source. 4. Recording the desire of customers, employees, shareholders and the company's key community Transformative IT Capability also contains the ability to
operationalize the company's transformation as a manifestation of a new conception of the company. The concept of the operationalization capabilities requires the following matters: 1. Ability to integrate and combine existing IT resources into innovative combinations. 2. Ability to promote the role of IT resources as a factor enabling and driving the company's transformation 3. Encouraging IT resources to translate the new conception into a new business systems, procedures and IT operations. To maintain a sustainable competitive advantage, the management should develope the ability to: 1. reconfigure IT resources to meet technologies changing and market requirement. 2. reconfigure IT to support business processes changings 3. reconfigure IT competence follows the new company norms
9. LIMITATION AND NEXT RESEARCH AGENDA The samples was only taken from the population of a single organizations, public owned company, not included other telcos. Respondents were taken from the incumbent company, that were existed as a state-owned enterprise. Meanwhile, the new entrants in the telecommunications industry in Indonesia is a purely private company. This difference is likely to produce bias in the empirical implications of these findings when it will be applied to the overall telecommunications industry without adjustment. This research has not put it ‘time’ as a variable in the model, so it is not able to describe the time lag about the effect of antecedent variables on its consequence variable. Some of this weakness is likely to be the cause of why the index of non-statistical fitness model, GFI and AGFI only reached at marginal levels, respectively of 0.84 and 0.80 lower than the reference index value vis 0.9. The next research need to include either other telcos or other industries which intensively use IT and operating in a competitive market.
REFERENCES 1. Barney J.B. (1991). Firm resources and sustained competitive advantage. Journal of Management 17(March 1991): 99-120. 2. Barney J.B. (2001). Resource-based of competitive advantage: A ten-year retrospective on the resource-based view. Journal of Management 27(2001) 643-
650. 3. Barney, J.B. & Clark, D.N. (2008). Resource-Based Theory: Creating and Sustaining Competitive Advantage. New York: Oxford University Press. 4. Bhatt, G., & Grover, V. (2005). Types of information technology capabilities and their role in competitive advantage: an empirical study. /Journal of
management information systems/, /22/(2), 253-278. http://search.ebscohost.com. 5. Cunha, A. (2009). Convergence And Innovation In Telecommunication Services:: An Assessment From The Perspective Of The Complementary Assets And
Dynamic Capabilities Theories. International Journal Of Innovation & Technology Management, 6(1), 41-58. 6. Eisenhardt, K. M., & Martin, J. A. (2000). Dynamic Capabilities: What Are They?. Strategic Management Journal, 21(10/11), 1105 7. Ferdinand, A. (2006). Management Research Methods. Research Guidelines for Thesis Writing, Thesis, Dissertation and Management Sciences. Badan
Penerbit Universitas Diponegoro. Semarang. 8. Flood R.L., & Romm N.R.A. (1996). Contours of diversity management and triple loop learning. Kybernetes, 25(7/8), 154-163. Retrieved March 12, 2010,
from Sciences Module. (Document ID: 224357101). 9. Ganesh D. Bhatt and Varun Grover (2005). Types of Information Technology Capabilities and Their Role in Competitive Advantage. Journal of Management
Information Systems/Fall 2005. Vol. 22. No. 2. pp. 253-277. 10. Monideepa Tarafdar & Steven R. Gordon (2005). How Information Technology Capabilities Influence Organizational Innovation College of Business
Administration University of Toledo, Toledo, OH, USA. Information Technology Management Babson College, Babson Park, MA, USA 11. Paul A. Pavlou & Omar A. El Sawy (2006). From IT-leveraging Competence to Competitive Advantage in Turbulent Environments: The Case of New Product
Development (NPD). European Journal of Information Systems (2006)15, 183–199. 12. Pavlou PA (2004). IT-enabled dynamic capabilities in new product development: Building a competitive advantage in turbulent environments. ProQuest
Information and Learning Company. 13. Tarafdar & Gordon, 2005. How Information Technology Capabilities Influence Organizational Innovation. College of Business Administration University of
Toledo, Toledo, OH, USA. 14. Teece, D., Pisano, G. and Shuen, A. (1997) 'Dynamic capabilities and strategic management', Strategic Management Journal 18: 509-533. 15. Vogel A. Myles (2005). Leveraging information technology competencies and capabilities for a competitive advantage. ProQuest Information and Learning
Company, UMI Number 3165264. 16. Wernerfelt, B. (1984). A Resource-based View of the Firm. Strategic Management Journal, 5(2), 171-180. Retrieved from EBSCOhost. 17. Zahra, S., Sapienza, H., & Davidsson, P. (2006). Entrepreneurship and dynamic capabilities: a review, model and research agenda. /Journal of management
studies/, /43/(4), 917-955. http://search.ebscohost.com.
VOLUME NO. 5 (2015), ISSUE NO. 11 (NOVEMBER) ISSN 2231-5756
INTERNATIONAL JOURNAL OF RESEARCH IN COMMERCE, IT & MANAGEMENT A Monthly Double-Blind Peer Reviewed (Refereed/Juried) Open Access International e-Journal - Included in the International Serial Directories
http://ijrcm.org.in/
9
AN INVESTIGATION IN TO DEMOGRAPHIC PROFILE AND QUALITY OF WORK LIFE AMONG WOMEN EMPLOYEES WITH SPECIAL REFERENCE TO PRIVATE SECTOR BANKS IN COIMBATORE DISTRICT
DR. S. SARAVANAN PROFESSOR & HEAD
DEPARTMENT OF COMMERCE WITH INFORMATION TECHNOLOGY DR. N. G. P. ARTS & SCIENCE COLLEGE
COIMBATORE
K. ELAMATHI RESEARCH SCHOLAR
DEPARTMENT OF COMMERCE WITH INFORMATION TECHNOLOGY DR. N. G. P. ARTS & SCIENCE COLLEGE
COIMBATORE
ABSTRACT Quality of work life is generic phase that covers a person’s feelings about every dimension of work including economic rewards and benefits, job security, working conditions, organizational and interpersonal relationships and its intrinsic meaning in a person’s life. Beukema (1987) describes QWL as the degree to which employees are able to shape their jobs actively, in accordance with their options, interests and needs. It is the degree of power an organization gives to its employees to design their work. This definition emphasizes the individual’s choice of interest in carrying out the task. However, this definition differs from the former which stresses on the organization that designs the job to meet employees’ interest. This definition provides an insight that the satisfying work environment is considered to provide better QWL. The researcher has also highlighted some aspects that needed suggestions for further improvement of the quality of work life of the employees at the organization. Hence the purpose of this study is relevant and important for effective and prompt delivery of banking services to the development of economy and also development of their own life quality.
KEYWORDS quality of work life, women employees, private sector bank employees qwl, Coimbatore district.
PREAMBLE n a developing country like India, the importance of the banking industry is even more critical because the availability of capital is limited and the task of mobilizing resources to certain sectors of the economy is a challenging one. In a general sense, financial institutions have been charged with the task of accelerating economic growth and revitalizing the industrial and agrarian sectors of the country. (Chawla, 1987). Banking industry is a very important tool in
the construction of economic structure of any country and it plays a significant role in the economic development of a developing country. Internationalization of both public and private sector organizations has rapidly changed the complexion of human resource management. The internationalization of organization makes human resource management more challenging because it raises a number of new issues like cross cultural training, compensation and benefits etc. As such the human resource should be viewed with an international perspective (Terry.L. Leap). Without predicting human behavior at a particular point of the time and guiding them in proper direction, service organizations cannot survive and prosper. Efficient human resource and their commitment is essential for effective management of organization. The management of four Ms i.e., Money, Materials, Machines and Men is essentially carried on by human resource of the organization. Stressing this point of view, McGregor observed that effectiveness of organizations would be doubled if managements could discover how to tap unrealized potential present in their human resources. The depreciation that results in all other factors of production in the long run doesn’t result in case of human resource. In fact, the vice versa is true. Human resources with proper organization and motivation can grow and develop their potential in the long run. Bimal Jalan, the formerly Governor of Reserve Bank of India rightly pointed out that, “Capital and technology are replicable but not human capital which needs to be viewed as a valuable resource for the achievement of competitive advantage even in the banking sector”. Quality of work life is an approach concerned with the overall climate of work and the impact that the work has on people as well as on organizational effectiveness.
RATIONALE FOR THE STUDY The role of women has been changing substantially over the last decade and a half, both inside and outside homes. In addition to their role within households, they are now having a larger role in the outside world also, especially in the labour market. It has often been argued that women face a segmented labour market with sector specific jobs and often gender specific wages assigned to them. However, the world is witnessing a significant change in this traditional thinking regarding ability of women to work only in a few specific sectors. Gone are the days when women were employed mostly as low paid casual workers in agricultural and construction activities. Economic development involves investment in various sectors of economy. Participation of women in economic activity is common in all the developed countries but the extent of participation is different in every country. The economic development of a nation depends much on the quality of its human resources. Women in India by tradition and culture have for generations taken a self-effacing role. Today women have not only safely encoded themselves in the job situations but also proved themselves as professionals and executives in many fields and have found acceptance in the society. The organisation must lead in developing a climate for skill development and appropriate behaviour of the staff whereby the quality of care is improved. Higher level administrative policies and legislation can provide incentives for bank personnel to keep their knowledge and skills up-to-date and they can expand opportunities for continuing education. Organisational support to women employees in banking to make such changes may also be needed. The study aims at determining the employees’ satisfaction on an investigation of demographic condition and quality of work life among the women employees working in private sector banks in Coimbatore District. The report may be helpful for the management to identify the present level of satisfaction level of the employees on various factors effecting quality of work life. The researcher has taken a genuine effort to bring out useful in formations regarding the perception about various factors effecting quality of work life. The researcher has also highlighted some aspects that needed suggestions for further improvement of the quality of work life of the employees at the organization. Hence the purpose of this study is relevant and important for effective and prompt delivery of banking services to the development of economy and also development of their own life quality.
REVIEW OF LITERATURE Vicente Royela et.al., (2008) in their article analyzed the similarities between the academic and the institutional approaches to define quality of work life, Their main conclusions are that quality of work life is increasingly important for policy makers. Lau and May (2007) examined empirically how the perceived image of a company’s Quality of Work Life will affect its market and financial performances. The study suggested that companies with high quality of work life
I
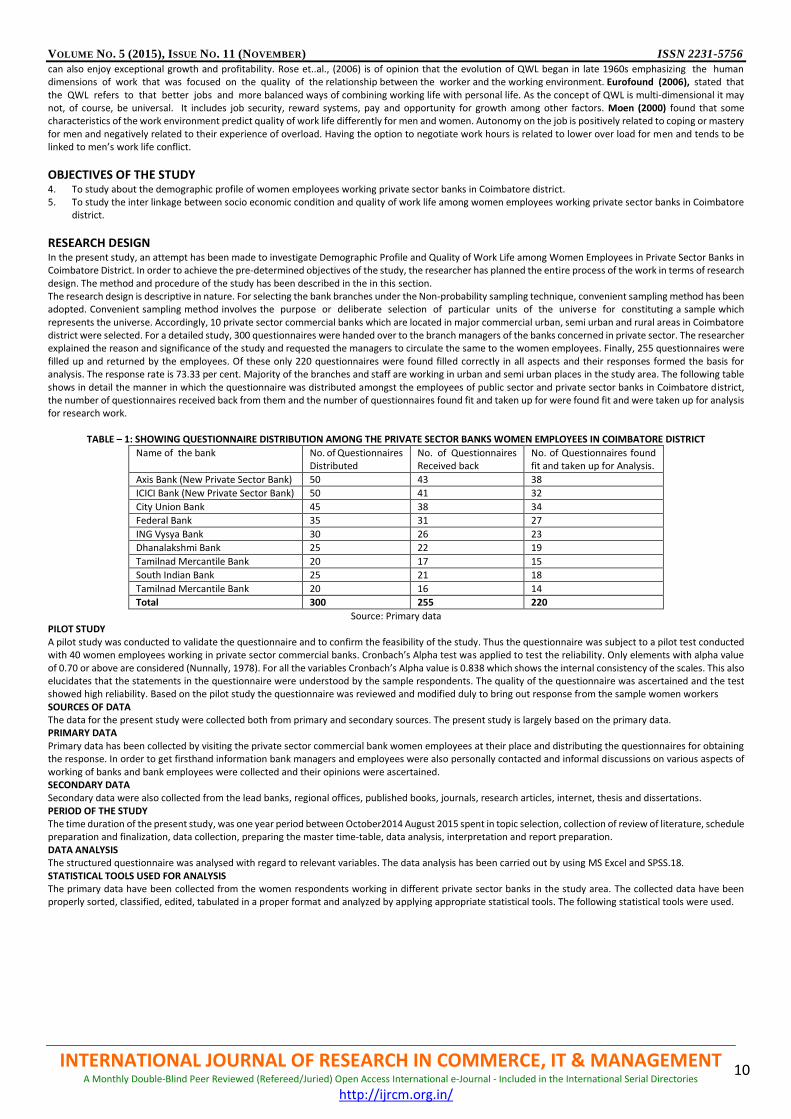
VOLUME NO. 5 (2015), ISSUE NO. 11 (NOVEMBER) ISSN 2231-5756
INTERNATIONAL JOURNAL OF RESEARCH IN COMMERCE, IT & MANAGEMENT A Monthly Double-Blind Peer Reviewed (Refereed/Juried) Open Access International e-Journal - Included in the International Serial Directories
http://ijrcm.org.in/
10
can also enjoy exceptional growth and profitability. Rose et..al., (2006) is of opinion that the evolution of QWL began in late 1960s emphasizing the human dimensions of work that was focused on the quality of the relationship between the worker and the working environment. Eurofound (2006), stated that the QWL refers to that better jobs and more balanced ways of combining working life with personal life. As the concept of QWL is multi-dimensional it may not, of course, be universal. It includes job security, reward systems, pay and opportunity for growth among other factors. Moen (2000) found that some characteristics of the work environment predict quality of work life differently for men and women. Autonomy on the job is positively related to coping or mastery for men and negatively related to their experience of overload. Having the option to negotiate work hours is related to lower over load for men and tends to be linked to men’s work life conflict.
OBJECTIVES OF THE STUDY 4. To study about the demographic profile of women employees working private sector banks in Coimbatore district. 5. To study the inter linkage between socio economic condition and quality of work life among women employees working private sector banks in Coimbatore
district.
RESEARCH DESIGN In the present study, an attempt has been made to investigate Demographic Profile and Quality of Work Life among Women Employees in Private Sector Banks in Coimbatore District. In order to achieve the pre-determined objectives of the study, the researcher has planned the entire process of the work in terms of research design. The method and procedure of the study has been described in the in this section. The research design is descriptive in nature. For selecting the bank branches under the Non-probability sampling technique, convenient sampling method has been adopted. Convenient sampling method involves the purpose or deliberate selection of particular units of the universe for constituting a sample which represents the universe. Accordingly, 10 private sector commercial banks which are located in major commercial urban, semi urban and rural areas in Coimbatore district were selected. For a detailed study, 300 questionnaires were handed over to the branch managers of the banks concerned in private sector. The researcher explained the reason and significance of the study and requested the managers to circulate the same to the women employees. Finally, 255 questionnaires were filled up and returned by the employees. Of these only 220 questionnaires were found filled correctly in all aspects and their responses formed the basis for analysis. The response rate is 73.33 per cent. Majority of the branches and staff are working in urban and semi urban places in the study area. The following table shows in detail the manner in which the questionnaire was distributed amongst the employees of public sector and private sector banks in Coimbatore district, the number of questionnaires received back from them and the number of questionnaires found fit and taken up for were found fit and were taken up for analysis for research work.
TABLE – 1: SHOWING QUESTIONNAIRE DISTRIBUTION AMONG THE PRIVATE SECTOR BANKS WOMEN EMPLOYEES IN COIMBATORE DISTRICT
Name of the bank No. of Questionnaires Distributed
No. of Questionnaires Received back
No. of Questionnaires found fit and taken up for Analysis.
Axis Bank (New Private Sector Bank) 50 43 38
ICICI Bank (New Private Sector Bank) 50 41 32
City Union Bank 45 38 34
Federal Bank 35 31 27
ING Vysya Bank 30 26 23
Dhanalakshmi Bank 25 22 19
Tamilnad Mercantile Bank 20 17 15
South Indian Bank 25 21 18
Tamilnad Mercantile Bank 20 16 14
Total 300 255 220
Source: Primary data PILOT STUDY A pilot study was conducted to validate the questionnaire and to confirm the feasibility of the study. Thus the questionnaire was subject to a pilot test conducted with 40 women employees working in private sector commercial banks. Cronbach’s Alpha test was applied to test the reliability. Only elements with alpha value of 0.70 or above are considered (Nunnally, 1978). For all the variables Cronbach’s Alpha value is 0.838 which shows the internal consistency of the scales. This also elucidates that the statements in the questionnaire were understood by the sample respondents. The quality of the questionnaire was ascertained and the test showed high reliability. Based on the pilot study the questionnaire was reviewed and modified duly to bring out response from the sample women workers SOURCES OF DATA The data for the present study were collected both from primary and secondary sources. The present study is largely based on the primary data. PRIMARY DATA Primary data has been collected by visiting the private sector commercial bank women employees at their place and distributing the questionnaires for obtaining the response. In order to get firsthand information bank managers and employees were also personally contacted and informal discussions on various aspects of working of banks and bank employees were collected and their opinions were ascertained. SECONDARY DATA Secondary data were also collected from the lead banks, regional offices, published books, journals, research articles, internet, thesis and dissertations. PERIOD OF THE STUDY The time duration of the present study, was one year period between October2014 August 2015 spent in topic selection, collection of review of literature, schedule preparation and finalization, data collection, preparing the master time-table, data analysis, interpretation and report preparation. DATA ANALYSIS The structured questionnaire was analysed with regard to relevant variables. The data analysis has been carried out by using MS Excel and SPSS.18. STATISTICAL TOOLS USED FOR ANALYSIS The primary data have been collected from the women respondents working in different private sector banks in the study area. The collected data have been properly sorted, classified, edited, tabulated in a proper format and analyzed by applying appropriate statistical tools. The following statistical tools were used.
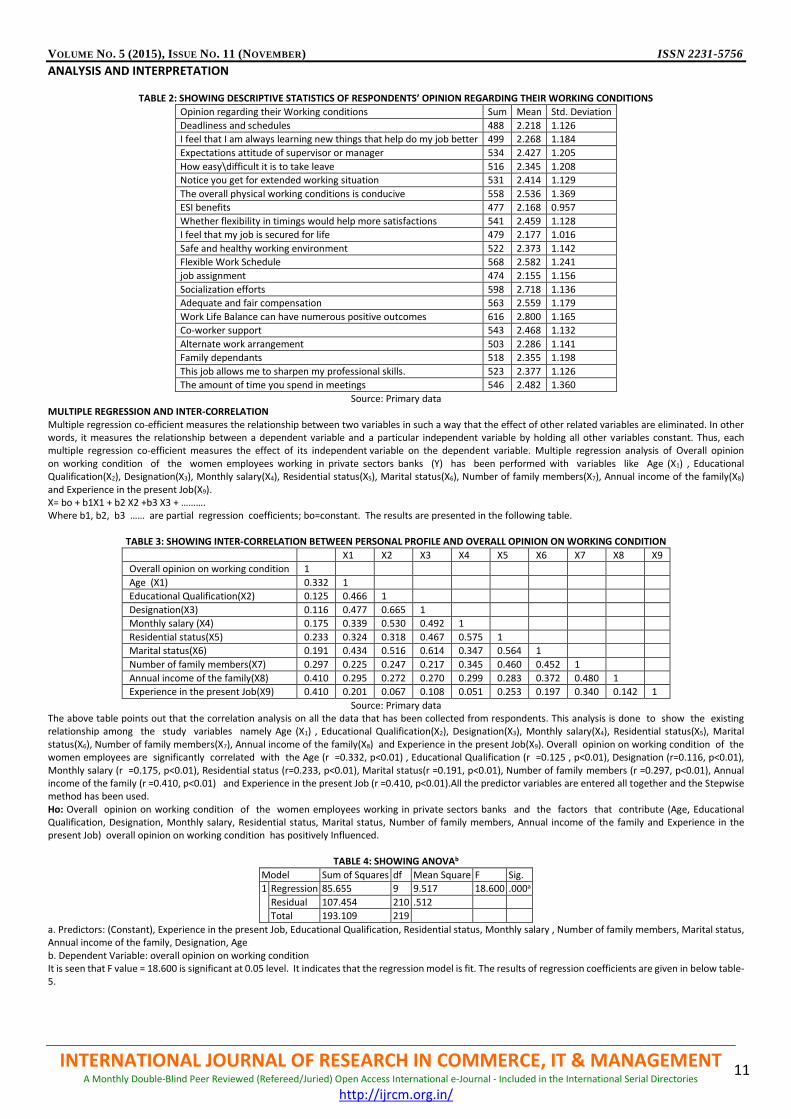
VOLUME NO. 5 (2015), ISSUE NO. 11 (NOVEMBER) ISSN 2231-5756
INTERNATIONAL JOURNAL OF RESEARCH IN COMMERCE, IT & MANAGEMENT A Monthly Double-Blind Peer Reviewed (Refereed/Juried) Open Access International e-Journal - Included in the International Serial Directories
http://ijrcm.org.in/
11
ANALYSIS AND INTERPRETATION
TABLE 2: SHOWING DESCRIPTIVE STATISTICS OF RESPONDENTS’ OPINION REGARDING THEIR WORKING CONDITIONS
Opinion regarding their Working conditions Sum Mean Std. Deviation
Deadliness and schedules 488 2.218 1.126
I feel that I am always learning new things that help do my job better 499 2.268 1.184
Expectations attitude of supervisor or manager 534 2.427 1.205
How easy\difficult it is to take leave 516 2.345 1.208
Notice you get for extended working situation 531 2.414 1.129
The overall physical working conditions is conducive 558 2.536 1.369
ESI benefits 477 2.168 0.957
Whether flexibility in timings would help more satisfactions 541 2.459 1.128
I feel that my job is secured for life 479 2.177 1.016
Safe and healthy working environment 522 2.373 1.142
Flexible Work Schedule 568 2.582 1.241
job assignment 474 2.155 1.156
Socialization efforts 598 2.718 1.136
Adequate and fair compensation 563 2.559 1.179
Work Life Balance can have numerous positive outcomes 616 2.800 1.165
Co-worker support 543 2.468 1.132
Alternate work arrangement 503 2.286 1.141
Family dependants 518 2.355 1.198
This job allows me to sharpen my professional skills. 523 2.377 1.126
The amount of time you spend in meetings 546 2.482 1.360
Source: Primary data MULTIPLE REGRESSION AND INTER-CORRELATION Multiple regression co-efficient measures the relationship between two variables in such a way that the effect of other related variables are eliminated. In other words, it measures the relationship between a dependent variable and a particular independent variable by holding all other variables constant. Thus, each multiple regression co-efficient measures the effect of its independent variable on the dependent variable. Multiple regression analysis of Overall opinion on working condition of the women employees working in private sectors banks (Y) has been performed with variables like Age (X1) , Educational Qualification(X2), Designation(X3), Monthly salary(X4), Residential status(X5), Marital status(X6), Number of family members(X7), Annual income of the family(X8) and Experience in the present Job(X9). X= bo + b1X1 + b2 X2 +b3 X3 + ………. Where b1, b2, b3 …… are partial regression coefficients; bo=constant. The results are presented in the following table.
TABLE 3: SHOWING INTER-CORRELATION BETWEEN PERSONAL PROFILE AND OVERALL OPINION ON WORKING CONDITION
X1 X2 X3 X4 X5 X6 X7 X8 X9
Overall opinion on working condition 1
Age (X1) 0.332 1
Educational Qualification(X2) 0.125 0.466 1
Designation(X3) 0.116 0.477 0.665 1
Monthly salary (X4) 0.175 0.339 0.530 0.492 1
Residential status(X5) 0.233 0.324 0.318 0.467 0.575 1
Marital status(X6) 0.191 0.434 0.516 0.614 0.347 0.564 1
Number of family members(X7) 0.297 0.225 0.247 0.217 0.345 0.460 0.452 1
Annual income of the family(X8) 0.410 0.295 0.272 0.270 0.299 0.283 0.372 0.480 1
Experience in the present Job(X9) 0.410 0.201 0.067 0.108 0.051 0.253 0.197 0.340 0.142 1
Source: Primary data The above table points out that the correlation analysis on all the data that has been collected from respondents. This analysis is done to show the existing relationship among the study variables namely Age (X1) , Educational Qualification(X2), Designation(X3), Monthly salary(X4), Residential status(X5), Marital status(X6), Number of family members(X7), Annual income of the family(X8) and Experience in the present Job(X9). Overall opinion on working condition of the women employees are significantly correlated with the Age (r =0.332, p<0.01) , Educational Qualification (r =0.125 , p<0.01), Designation (r=0.116, p<0.01), Monthly salary (r =0.175, p<0.01), Residential status (r=0.233, p<0.01), Marital status(r =0.191, p<0.01), Number of family members (r =0.297, p<0.01), Annual income of the family (r =0.410, p<0.01) and Experience in the present Job (r =0.410, p<0.01).All the predictor variables are entered all together and the Stepwise method has been used. Ho: Overall opinion on working condition of the women employees working in private sectors banks and the factors that contribute (Age, Educational Qualification, Designation, Monthly salary, Residential status, Marital status, Number of family members, Annual income of the family and Experience in the present Job) overall opinion on working condition has positively Influenced.
TABLE 4: SHOWING ANOVAb
Model Sum of Squares df Mean Square F Sig.
1 Regression 85.655 9 9.517 18.600 .000a
Residual 107.454 210 .512
Total 193.109 219
a. Predictors: (Constant), Experience in the present Job, Educational Qualification, Residential status, Monthly salary , Number of family members, Marital status, Annual income of the family, Designation, Age b. Dependent Variable: overall opinion on working condition It is seen that F value = 18.600 is significant at 0.05 level. It indicates that the regression model is fit. The results of regression coefficients are given in below table-5.
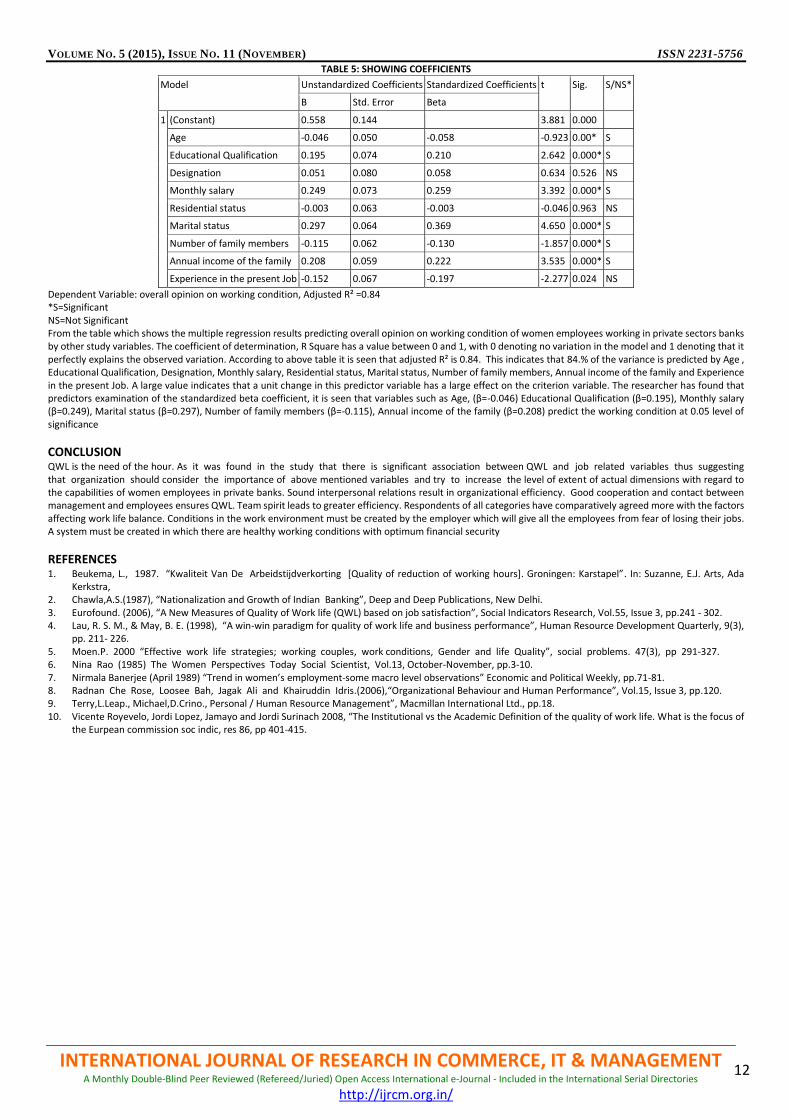
VOLUME NO. 5 (2015), ISSUE NO. 11 (NOVEMBER) ISSN 2231-5756
INTERNATIONAL JOURNAL OF RESEARCH IN COMMERCE, IT & MANAGEMENT A Monthly Double-Blind Peer Reviewed (Refereed/Juried) Open Access International e-Journal - Included in the International Serial Directories
http://ijrcm.org.in/
12
TABLE 5: SHOWING COEFFICIENTS
Model Unstandardized Coefficients Standardized Coefficients t Sig. S/NS*
B Std. Error Beta
1 (Constant) 0.558 0.144 3.881 0.000
Age -0.046 0.050 -0.058 -0.923 0.00* S
Educational Qualification 0.195 0.074 0.210 2.642 0.000* S
Designation 0.051 0.080 0.058 0.634 0.526 NS
Monthly salary 0.249 0.073 0.259 3.392 0.000* S
Residential status -0.003 0.063 -0.003 -0.046 0.963 NS
Marital status 0.297 0.064 0.369 4.650 0.000* S
Number of family members -0.115 0.062 -0.130 -1.857 0.000* S
Annual income of the family 0.208 0.059 0.222 3.535 0.000* S
Experience in the present Job -0.152 0.067 -0.197 -2.277 0.024 NS
Dependent Variable: overall opinion on working condition, Adjusted R² =0.84 *S=Significant NS=Not Significant From the table which shows the multiple regression results predicting overall opinion on working condition of women employees working in private sectors banks by other study variables. The coefficient of determination, R Square has a value between 0 and 1, with 0 denoting no variation in the model and 1 denoting that it perfectly explains the observed variation. According to above table it is seen that adjusted R² is 0.84. This indicates that 84.% of the variance is predicted by Age , Educational Qualification, Designation, Monthly salary, Residential status, Marital status, Number of family members, Annual income of the family and Experience in the present Job. A large value indicates that a unit change in this predictor variable has a large effect on the criterion variable. The researcher has found that predictors examination of the standardized beta coefficient, it is seen that variables such as Age, (β=-0.046) Educational Qualification (β=0.195), Monthly salary (β=0.249), Marital status (β=0.297), Number of family members (β=-0.115), Annual income of the family (β=0.208) predict the working condition at 0.05 level of significance
CONCLUSION QWL is the need of the hour. As it was found in the study that there is significant association between QWL and job related variables thus suggesting that organization should consider the importance of above mentioned variables and try to increase the level of extent of actual dimensions with regard to the capabilities of women employees in private banks. Sound interpersonal relations result in organizational efficiency. Good cooperation and contact between management and employees ensures QWL. Team spirit leads to greater efficiency. Respondents of all categories have comparatively agreed more with the factors affecting work life balance. Conditions in the work environment must be created by the employer which will give all the employees from fear of losing their jobs. A system must be created in which there are healthy working conditions with optimum financial security
REFERENCES 1. Beukema, L., 1987. “Kwaliteit Van De Arbeidstijdverkorting [Quality of reduction of working hours]. Groningen: Karstapel”. In: Suzanne, E.J. Arts, Ada
Kerkstra, 2. Chawla,A.S.(1987), “Nationalization and Growth of Indian Banking”, Deep and Deep Publications, New Delhi. 3. Eurofound. (2006), “A New Measures of Quality of Work life (QWL) based on job satisfaction”, Social Indicators Research, Vol.55, Issue 3, pp.241 - 302. 4. Lau, R. S. M., & May, B. E. (1998), “A win-win paradigm for quality of work life and business performance”, Human Resource Development Quarterly, 9(3),
pp. 211- 226. 5. Moen.P. 2000 “Effective work life strategies; working couples, work conditions, Gender and life Quality”, social problems. 47(3), pp 291-327. 6. Nina Rao (1985) The Women Perspectives Today Social Scientist, Vol.13, October-November, pp.3-10. 7. Nirmala Banerjee (April 1989) “Trend in women’s employment-some macro level observations” Economic and Political Weekly, pp.71-81. 8. Radnan Che Rose, Loosee Bah, Jagak Ali and Khairuddin Idris.(2006),“Organizational Behaviour and Human Performance”, Vol.15, Issue 3, pp.120. 9. Terry,L.Leap., Michael,D.Crino., Personal / Human Resource Management”, Macmillan International Ltd., pp.18. 10. Vicente Royevelo, Jordi Lopez, Jamayo and Jordi Surinach 2008, “The Institutional vs the Academic Definition of the quality of work life. What is the focus of
the Eurpean commission soc indic, res 86, pp 401-415.
VOLUME NO. 5 (2015), ISSUE NO. 11 (NOVEMBER) ISSN 2231-5756
INTERNATIONAL JOURNAL OF RESEARCH IN COMMERCE, IT & MANAGEMENT A Monthly Double-Blind Peer Reviewed (Refereed/Juried) Open Access International e-Journal - Included in the International Serial Directories
http://ijrcm.org.in/
13
SHARE SPLIT ANNOUNCEMENT AND MARKET REACTION: EVIDENCE FROM PUBLIC COMPANY IN INDONESIA STOCK EXCHANGE
I PUTU INDRA PERMANA WISTAWAN RESEARCH SCHOLAR
UNIVERSITY OF BRAWIJAYA IN MALANG INDONESIA
SUTRISNO T. PROFESSOR
UNIVERSITY OF BRAWIJAYA IN MALANG INDONESIA
DR. ERWIN SARASWATI
LECTURER UNIVERSITY OF BRAWIJAYA IN MALANG
INDONESIA
ABSTRACT Share split is one of corporate activities done by the management to signal company’s prospect. Share split phenomenon could be explained theoretically by signaling theory and trading range theory. The market reaction in this research is divided into two proxies, abnormal return and trading volume activities. The model used in this research is multiple regressions with the objective of testing the effect of abnormal return and trading volume activity to share split. The samples used during this research are 60 within 2008-2014. This research used 11 day event study to observe the market reaction on the announcement of share split. The result shows that higher split causes higher level of abnormal return and trading volume activity. It also shows market reaction on the announcement of share split. The reaction on the announcement of share split in two models indicates that the company succeeds to signal their good news of share split to the market. Moreover, the result also shows that split factor may give positive signal to the capital market that is in line with signaling theory.
KEYWORDS share split, abnormal return, trading volume activity.
INTRODUCTION apital market is a place for those who have funds excess to channel it those who need the funds by trading the securities (Tandelilin, 2010:26). Security trading happens when the information coming into the market is responded by the investors. Capital market is an efficient market if the price of all traded securities reflects all the information (Fama, 1970). The concept of efficient markets explains an adjustment of securities price into the new price in response
to the information coming into the market. One of the issuer activities that potentially generate efficient information is corporate action. Corporate action is company policy taken by the managements to improve company’s performance for short or long term. Share split is an example of corporate actions that has the potential of generating market reaction. The purpose of share split is to split the shares into multiple shares. In addition to the number of shares, par value per share will also change. Although the number of shares increases by a specific multiple, the most common example of split ratios are 2-for-1 or 4-for-1, the total price value of the shares remains the same compared to the pre-split amounts because the split does not add any real value. Trading range theory reveals that the purpose of share split is to restore the share price into the price range desired by the company, so it can reach the market. An affordable price of the market will attract potential investors’ interest and eventually improve the trading liquidity of the shares (Wulff, 2002). Abnormal increase of trading around the period of share split announcement will cause market reaction. The companies outlined two reasons of share split. First, share prices are not too expensive, so it could increase the number of shareholders and increase the liquidity of share trading. Second, share split is done to restore price and size of the average trading share to a desired range. Management tries to send a positive signal to the market through the activities of share split. This is in line with signaling theory, where managers are trying to send information to shareholders and potential investors (Louis and Robinson, 2005). Share split is a common phenomenon Indonesia. Public companies such as PT Telkom Indonesia (Persero) Tbk. (TLKM) in 2013, PT Astra International Tbk. (ASII) in 2013, and PT JAPFA Tbk. (JPFA) in 2013 did share split with the factors of 1:5, 1:10, and 1:5. The board of directors of each company disclosed various objectives of the share split, including to make the market more animated, to reach retail investors, and also to make lower the price of outstanding shares (Latif and Sukirno, 2012). Those reasons can be explained theoretically by trading range theory and signaling theory. Brigham and Daves (2010:605) revealed that share split is still a puzzling phenomenon in economics. This happens because the company does not receive a direct impact on cash flow from the action. Ewijaya and Indriantoro (1999) argued that, in line with the assumption of efficient market, share split from the perspective of accounting does not affect cash flow. Even though it does not directly influence company's performance, many companies still do this action. Setyawan and Hartono (2001) argued that share split contains other information that is not easily predicted by investors because each manager has a different motivation in doing share split. Researches linking share split and market reaction have found different results. Chou, Lee, and Chen (2005), Dhar and Chhaochharia (2008), and Wulff (2002) found that market had a positive reaction to share split. However, other researches found that market did not react on share splits significantly (Brennan and Hughes, 1991; Gupta and Gupta, 2007; and Sutrisno, Yuniartha, and Susilowati, 2000). Gupta and Gupta (2007) found that there was no reaction from the market brought by the announcement of share splits in India. This is because most shares announced to be split are traded at a low price. In other words, market does not always react positively to the share splits. Researches showing the existence of share split effect on market due to the content of information support signaling theory and trading range theory. On the contrary, the contradictive result, which found that share split have no effect on the market reaction (no information content), support efficient market hypothesis (Suntoro and Subekti, 2003). According to efficient market hypothesis, corporate action such as share split does not give any signal to the shareholders in the capital market (Setyawan and Hartono, 2001). This research is conducted to strengthen the researches that have been done before. This research examines split factor as the determinants of market reaction. Split factor is information awaited by the market, which is the main characteristic of the share split, and it becomes the basis for the investors to react in the
C
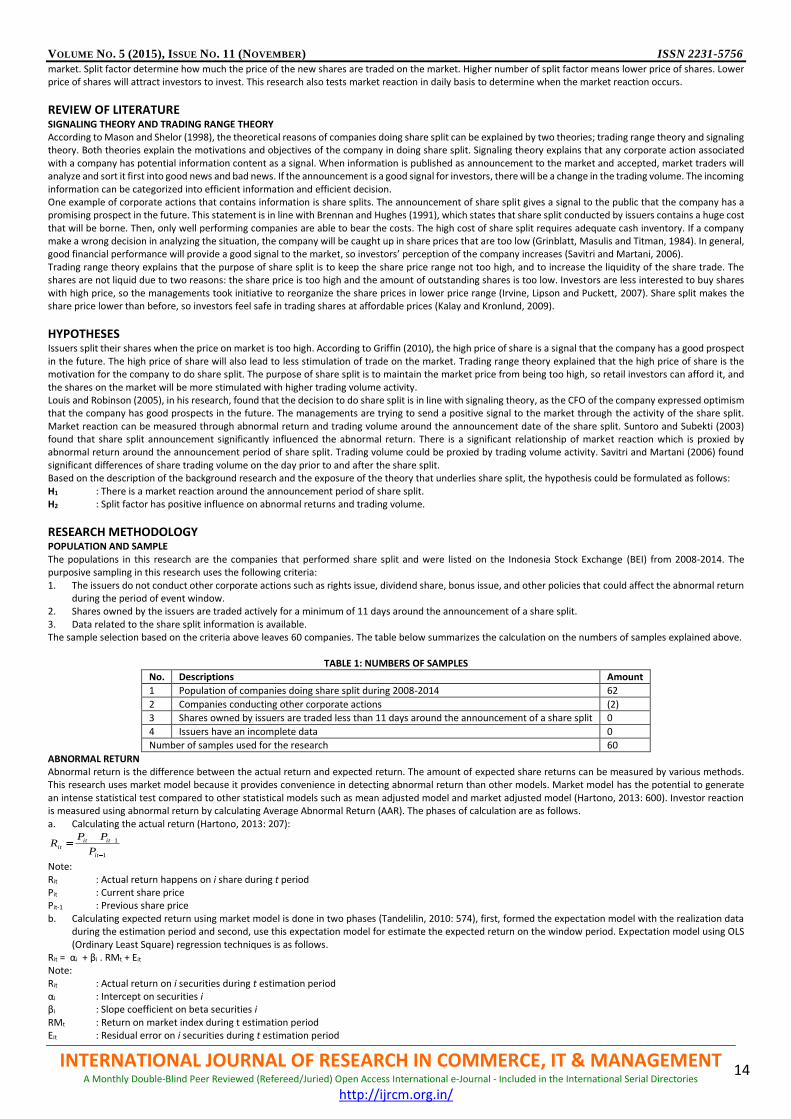
VOLUME NO. 5 (2015), ISSUE NO. 11 (NOVEMBER) ISSN 2231-5756
INTERNATIONAL JOURNAL OF RESEARCH IN COMMERCE, IT & MANAGEMENT A Monthly Double-Blind Peer Reviewed (Refereed/Juried) Open Access International e-Journal - Included in the International Serial Directories
http://ijrcm.org.in/
14
market. Split factor determine how much the price of the new shares are traded on the market. Higher number of split factor means lower price of shares. Lower price of shares will attract investors to invest. This research also tests market reaction in daily basis to determine when the market reaction occurs.
REVIEW OF LITERATURE SIGNALING THEORY AND TRADING RANGE THEORY According to Mason and Shelor (1998), the theoretical reasons of companies doing share split can be explained by two theories; trading range theory and signaling theory. Both theories explain the motivations and objectives of the company in doing share split. Signaling theory explains that any corporate action associated with a company has potential information content as a signal. When information is published as announcement to the market and accepted, market traders will analyze and sort it first into good news and bad news. If the announcement is a good signal for investors, there will be a change in the trading volume. The incoming information can be categorized into efficient information and efficient decision. One example of corporate actions that contains information is share splits. The announcement of share split gives a signal to the public that the company has a promising prospect in the future. This statement is in line with Brennan and Hughes (1991), which states that share split conducted by issuers contains a huge cost that will be borne. Then, only well performing companies are able to bear the costs. The high cost of share split requires adequate cash inventory. If a company make a wrong decision in analyzing the situation, the company will be caught up in share prices that are too low (Grinblatt, Masulis and Titman, 1984). In general, good financial performance will provide a good signal to the market, so investors’ perception of the company increases (Savitri and Martani, 2006). Trading range theory explains that the purpose of share split is to keep the share price range not too high, and to increase the liquidity of the share trade. The shares are not liquid due to two reasons: the share price is too high and the amount of outstanding shares is too low. Investors are less interested to buy shares with high price, so the managements took initiative to reorganize the share prices in lower price range (Irvine, Lipson and Puckett, 2007). Share split makes the share price lower than before, so investors feel safe in trading shares at affordable prices (Kalay and Kronlund, 2009).
HYPOTHESES Issuers split their shares when the price on market is too high. According to Griffin (2010), the high price of share is a signal that the company has a good prospect in the future. The high price of share will also lead to less stimulation of trade on the market. Trading range theory explained that the high price of share is the motivation for the company to do share split. The purpose of share split is to maintain the market price from being too high, so retail investors can afford it, and the shares on the market will be more stimulated with higher trading volume activity. Louis and Robinson (2005), in his research, found that the decision to do share split is in line with signaling theory, as the CFO of the company expressed optimism that the company has good prospects in the future. The managements are trying to send a positive signal to the market through the activity of the share split. Market reaction can be measured through abnormal return and trading volume around the announcement date of the share split. Suntoro and Subekti (2003) found that share split announcement significantly influenced the abnormal return. There is a significant relationship of market reaction which is proxied by abnormal return around the announcement period of share split. Trading volume could be proxied by trading volume activity. Savitri and Martani (2006) found significant differences of share trading volume on the day prior to and after the share split. Based on the description of the background research and the exposure of the theory that underlies share split, the hypothesis could be formulated as follows: H1 : There is a market reaction around the announcement period of share split. H2 : Split factor has positive influence on abnormal returns and trading volume.
RESEARCH METHODOLOGY POPULATION AND SAMPLE The populations in this research are the companies that performed share split and were listed on the Indonesia Stock Exchange (BEI) from 2008-2014. The purposive sampling in this research uses the following criteria: 1. The issuers do not conduct other corporate actions such as rights issue, dividend share, bonus issue, and other policies that could affect the abnormal return
during the period of event window. 2. Shares owned by the issuers are traded actively for a minimum of 11 days around the announcement of a share split. 3. Data related to the share split information is available. The sample selection based on the criteria above leaves 60 companies. The table below summarizes the calculation on the numbers of samples explained above.
TABLE 1: NUMBERS OF SAMPLES
No. Descriptions Amount
1 Population of companies doing share split during 2008-2014 62
2 Companies conducting other corporate actions (2)
3 Shares owned by issuers are traded less than 11 days around the announcement of a share split 0
4 Issuers have an incomplete data 0
Number of samples used for the research 60
ABNORMAL RETURN Abnormal return is the difference between the actual return and expected return. The amount of expected share returns can be measured by various methods. This research uses market model because it provides convenience in detecting abnormal return than other models. Market model has the potential to generate an intense statistical test compared to other statistical models such as mean adjusted model and market adjusted model (Hartono, 2013: 600). Investor reaction is measured using abnormal return by calculating Average Abnormal Return (AAR). The phases of calculation are as follows. a. Calculating the actual return (Hartono, 2013: 207):
1
1
it
ititit
P
PPR
Note: Rit : Actual return happens on i share during t period Pit : Current share price Pit-1 : Previous share price b. Calculating expected return using market model is done in two phases (Tandelilin, 2010: 574), first, formed the expectation model with the realization data
during the estimation period and second, use this expectation model for estimate the expected return on the window period. Expectation model using OLS (Ordinary Least Square) regression techniques is as follows.
Rit = αi + βi . RMt + Eit Note: Rit : Actual return on i securities during t estimation period αi : Intercept on securities i βi : Slope coefficient on beta securities i RMt : Return on market index during t estimation period Eit : Residual error on i securities during t estimation period
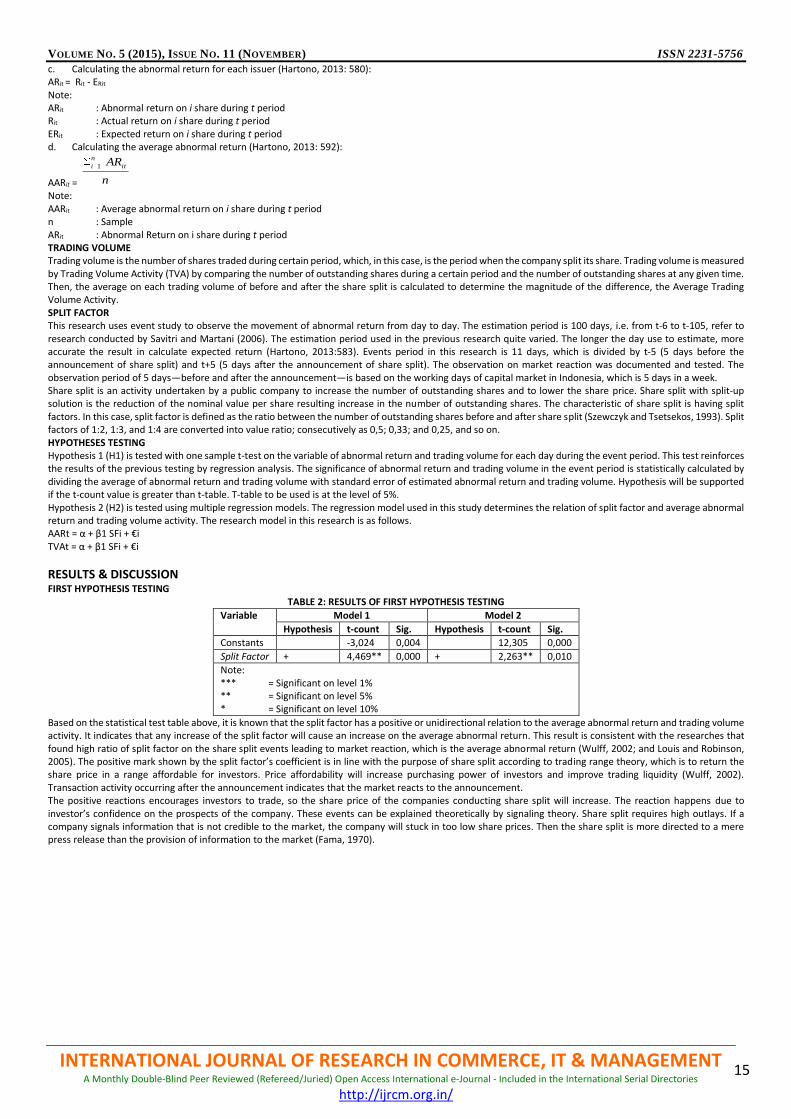
VOLUME NO. 5 (2015), ISSUE NO. 11 (NOVEMBER) ISSN 2231-5756
INTERNATIONAL JOURNAL OF RESEARCH IN COMMERCE, IT & MANAGEMENT A Monthly Double-Blind Peer Reviewed (Refereed/Juried) Open Access International e-Journal - Included in the International Serial Directories
http://ijrcm.org.in/
15
c. Calculating the abnormal return for each issuer (Hartono, 2013: 580): ARit = Rit - ERit
Note: ARit : Abnormal return on i share during t period Rit : Actual return on i share during t period ERit : Expected return on i share during t period d. Calculating the average abnormal return (Hartono, 2013: 592):
AARit = n
ARit
n
i 1
Note: AARit : Average abnormal return on i share during t period n : Sample ARit : Abnormal Return on i share during t period TRADING VOLUME Trading volume is the number of shares traded during certain period, which, in this case, is the period when the company split its share. Trading volume is measured by Trading Volume Activity (TVA) by comparing the number of outstanding shares during a certain period and the number of outstanding shares at any given time. Then, the average on each trading volume of before and after the share split is calculated to determine the magnitude of the difference, the Average Trading Volume Activity. SPLIT FACTOR This research uses event study to observe the movement of abnormal return from day to day. The estimation period is 100 days, i.e. from t-6 to t-105, refer to research conducted by Savitri and Martani (2006). The estimation period used in the previous research quite varied. The longer the day use to estimate, more accurate the result in calculate expected return (Hartono, 2013:583). Events period in this research is 11 days, which is divided by t-5 (5 days before the announcement of share split) and t+5 (5 days after the announcement of share split). The observation on market reaction was documented and tested. The observation period of 5 days—before and after the announcement—is based on the working days of capital market in Indonesia, which is 5 days in a week. Share split is an activity undertaken by a public company to increase the number of outstanding shares and to lower the share price. Share split with split-up solution is the reduction of the nominal value per share resulting increase in the number of outstanding shares. The characteristic of share split is having split factors. In this case, split factor is defined as the ratio between the number of outstanding shares before and after share split (Szewczyk and Tsetsekos, 1993). Split factors of 1:2, 1:3, and 1:4 are converted into value ratio; consecutively as 0,5; 0,33; and 0,25, and so on. HYPOTHESES TESTING Hypothesis 1 (H1) is tested with one sample t-test on the variable of abnormal return and trading volume for each day during the event period. This test reinforces the results of the previous testing by regression analysis. The significance of abnormal return and trading volume in the event period is statistically calculated by dividing the average of abnormal return and trading volume with standard error of estimated abnormal return and trading volume. Hypothesis will be supported if the t-count value is greater than t-table. T-table to be used is at the level of 5%. Hypothesis 2 (H2) is tested using multiple regression models. The regression model used in this study determines the relation of split factor and average abnormal return and trading volume activity. The research model in this research is as follows. AARt = α + β1 SFi + €i TVAt = α + β1 SFi + €i
RESULTS & DISCUSSION FIRST HYPOTHESIS TESTING
TABLE 2: RESULTS OF FIRST HYPOTHESIS TESTING
Variable Model 1 Model 2
Hypothesis t-count Sig. Hypothesis t-count Sig.
Constants -3,024 0,004 12,305 0,000
Split Factor + 4,469** 0,000 + 2,263** 0,010
Note: *** = Significant on level 1% ** = Significant on level 5% * = Significant on level 10%
Based on the statistical test table above, it is known that the split factor has a positive or unidirectional relation to the average abnormal return and trading volume activity. It indicates that any increase of the split factor will cause an increase on the average abnormal return. This result is consistent with the researches that found high ratio of split factor on the share split events leading to market reaction, which is the average abnormal return (Wulff, 2002; and Louis and Robinson, 2005). The positive mark shown by the split factor’s coefficient is in line with the purpose of share split according to trading range theory, which is to return the share price in a range affordable for investors. Price affordability will increase purchasing power of investors and improve trading liquidity (Wulff, 2002). Transaction activity occurring after the announcement indicates that the market reacts to the announcement. The positive reactions encourages investors to trade, so the share price of the companies conducting share split will increase. The reaction happens due to investor’s confidence on the prospects of the company. These events can be explained theoretically by signaling theory. Share split requires high outlays. If a company signals information that is not credible to the market, the company will stuck in too low share prices. Then the share split is more directed to a mere press release than the provision of information to the market (Fama, 1970).
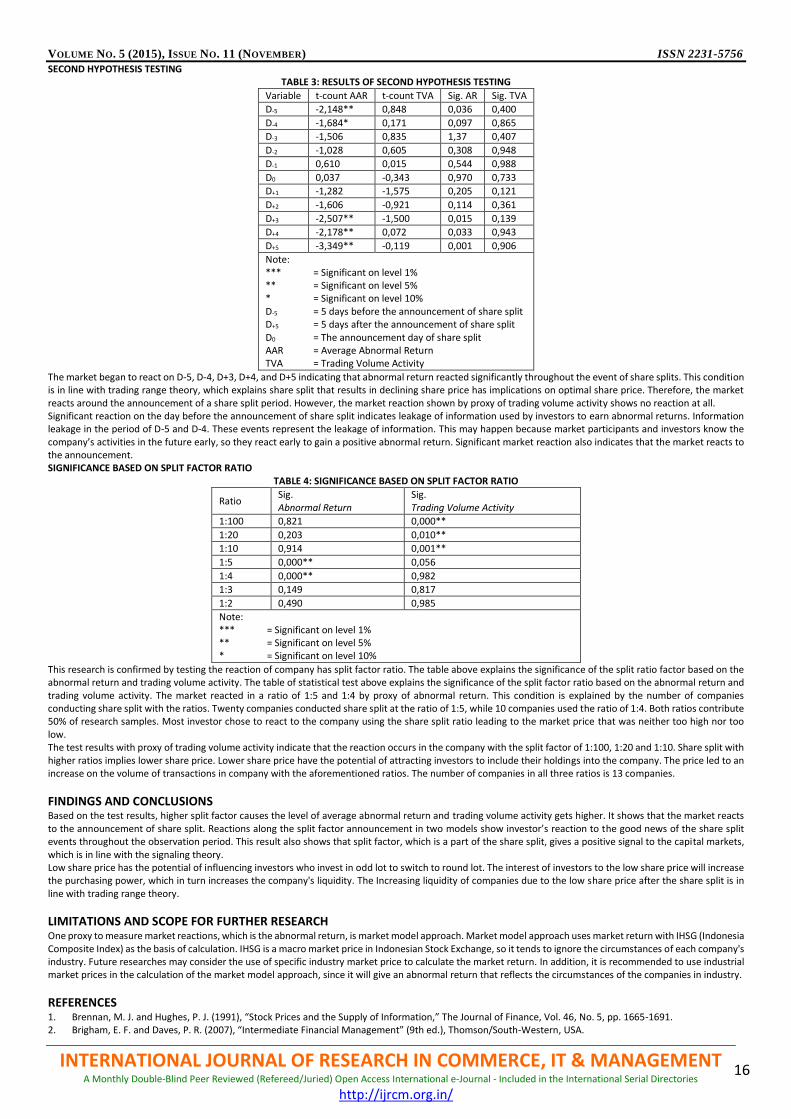
VOLUME NO. 5 (2015), ISSUE NO. 11 (NOVEMBER) ISSN 2231-5756
INTERNATIONAL JOURNAL OF RESEARCH IN COMMERCE, IT & MANAGEMENT A Monthly Double-Blind Peer Reviewed (Refereed/Juried) Open Access International e-Journal - Included in the International Serial Directories
http://ijrcm.org.in/
16
SECOND HYPOTHESIS TESTING TABLE 3: RESULTS OF SECOND HYPOTHESIS TESTING
Variable t-count AAR t-count TVA Sig. AR Sig. TVA
D-5 -2,148** 0,848 0,036 0,400
D-4 -1,684* 0,171 0,097 0,865
D-3 -1,506 0,835 1,37 0,407
D-2 -1,028 0,605 0,308 0,948
D-1 0,610 0,015 0,544 0,988
D0 0,037 -0,343 0,970 0,733
D+1 -1,282 -1,575 0,205 0,121
D+2 -1,606 -0,921 0,114 0,361
D+3 -2,507** -1,500 0,015 0,139
D+4 -2,178** 0,072 0,033 0,943
D+5 -3,349** -0,119 0,001 0,906
Note: *** = Significant on level 1% ** = Significant on level 5% * = Significant on level 10% D-5 = 5 days before the announcement of share split D+5 = 5 days after the announcement of share split D0 = The announcement day of share split AAR = Average Abnormal Return TVA = Trading Volume Activity
The market began to react on D-5, D-4, D+3, D+4, and D+5 indicating that abnormal return reacted significantly throughout the event of share splits. This condition is in line with trading range theory, which explains share split that results in declining share price has implications on optimal share price. Therefore, the market reacts around the announcement of a share split period. However, the market reaction shown by proxy of trading volume activity shows no reaction at all. Significant reaction on the day before the announcement of share split indicates leakage of information used by investors to earn abnormal returns. Information leakage in the period of D-5 and D-4. These events represent the leakage of information. This may happen because market participants and investors know the company’s activities in the future early, so they react early to gain a positive abnormal return. Significant market reaction also indicates that the market reacts to the announcement. SIGNIFICANCE BASED ON SPLIT FACTOR RATIO
TABLE 4: SIGNIFICANCE BASED ON SPLIT FACTOR RATIO
Ratio Sig. Abnormal Return
Sig. Trading Volume Activity
1:100 0,821 0,000**
1:20 0,203 0,010**
1:10 0,914 0,001**
1:5 0,000** 0,056
1:4 0,000** 0,982
1:3 0,149 0,817
1:2 0,490 0,985
Note: *** = Significant on level 1% ** = Significant on level 5% * = Significant on level 10%
This research is confirmed by testing the reaction of company has split factor ratio. The table above explains the significance of the split ratio factor based on the abnormal return and trading volume activity. The table of statistical test above explains the significance of the split factor ratio based on the abnormal return and trading volume activity. The market reacted in a ratio of 1:5 and 1:4 by proxy of abnormal return. This condition is explained by the number of companies conducting share split with the ratios. Twenty companies conducted share split at the ratio of 1:5, while 10 companies used the ratio of 1:4. Both ratios contribute 50% of research samples. Most investor chose to react to the company using the share split ratio leading to the market price that was neither too high nor too low. The test results with proxy of trading volume activity indicate that the reaction occurs in the company with the split factor of 1:100, 1:20 and 1:10. Share split with higher ratios implies lower share price. Lower share price have the potential of attracting investors to include their holdings into the company. The price led to an increase on the volume of transactions in company with the aforementioned ratios. The number of companies in all three ratios is 13 companies.
FINDINGS AND CONCLUSIONS Based on the test results, higher split factor causes the level of average abnormal return and trading volume activity gets higher. It shows that the market reacts to the announcement of share split. Reactions along the split factor announcement in two models show investor’s reaction to the good news of the share split events throughout the observation period. This result also shows that split factor, which is a part of the share split, gives a positive signal to the capital markets, which is in line with the signaling theory. Low share price has the potential of influencing investors who invest in odd lot to switch to round lot. The interest of investors to the low share price will increase the purchasing power, which in turn increases the company's liquidity. The Increasing liquidity of companies due to the low share price after the share split is in line with trading range theory.
LIMITATIONS AND SCOPE FOR FURTHER RESEARCH One proxy to measure market reactions, which is the abnormal return, is market model approach. Market model approach uses market return with IHSG (Indonesia Composite Index) as the basis of calculation. IHSG is a macro market price in Indonesian Stock Exchange, so it tends to ignore the circumstances of each company's industry. Future researches may consider the use of specific industry market price to calculate the market return. In addition, it is recommended to use industrial market prices in the calculation of the market model approach, since it will give an abnormal return that reflects the circumstances of the companies in industry.
REFERENCES 1. Brennan, M. J. and Hughes, P. J. (1991), “Stock Prices and the Supply of Information,” The Journal of Finance, Vol. 46, No. 5, pp. 1665-1691. 2. Brigham, E. F. and Daves, P. R. (2007), “Intermediate Financial Management” (9th ed.), Thomson/South-Western, USA.
VOLUME NO. 5 (2015), ISSUE NO. 11 (NOVEMBER) ISSN 2231-5756
INTERNATIONAL JOURNAL OF RESEARCH IN COMMERCE, IT & MANAGEMENT A Monthly Double-Blind Peer Reviewed (Refereed/Juried) Open Access International e-Journal - Included in the International Serial Directories
http://ijrcm.org.in/
17
3. Chou, R. K., Lee, W.-C. and Chen, S.-S. (2005), “The Market Reaction Around Ex-Dates of Stock Splits Before and After Decimalization,” Review of Pacific Basin Financial Markets and Policies, Vol. 8, No. 2, pp. 201-216.
4. Dhar, S. and Chhaochharia, S. (2008), “Market Reaction Around the Share Splits and Bonus Issues: Some Indian Evidence,” Social Science Research Network, pp. 1-24.
5. Ewijaya and Indriantoro, N. (1999), “Analisis Pengaruh Pemecahan Saham terhadap Harga Saham,” Jurnal Riset Akuntansi Indonesia, Vol. 2, pp. 52-56. 6. Fama, E. F. (1970), “Efficient Capital Markets: A Review of Theory and Empirical Work,” The Journal of Finance, Vol. 25, No. 2, pp. 28-30. 7. Griffin, C. H. (2010), “Abnormal Returns and Stock Splits: The Decimalized vs. Fractional System of Stock Price Quotes,” International Journal of Business &
Management, Vol. 5, No. 12, pp. 3-14. 8. Grinblatt, M. S., Masulis, R. W. and Titman, S. (1984), “The valuation effects of stock splits and stock dividends,” Journal of Financial Economics, Vol. 13, No.
7, pp. 461-490. 9. Gupta, A. and Gupta, O. P. (2007), “Market Reaction to Stock Market Splits: Evidence from India,” The ICFAI Journal of Applied Finance, Vol. 13, No. 1, pp. 6-
12. 10. Hartono, J. (2013), “Teori Portofolio dan Analisis Investasi” (7th ed.), BPFE, Yogyakarta, Indonesia. 11. Irvine, P., Lipson, M. and Puckett, A. (2007), “Tipping,” Review of Financial Studies, Vol. 20 No. 3, pp. 741-768. 12. Kalay, A. and Kronlund, M. (2009), “Stock Splits – Information or Liquidity?” University of Chicago, USA. 13. Latif, S. and Sukirno (2012), “Astra Ajukan Share Split Saham 1:10,” Retrieved March 30, 2015, from http://bisnis.news.viva.co.id/news/read/291712-astra-
ajukan-stock-split-saham-1-10. 14. Louis, H. and Robinson, D. (2005), “Do Managers Credibly Use Accruals to Signal Private Information? Evidence From the Pricing of Discretionary Accruals
Around Stock Splits,” Journal of Accounting and Economics, Vol. 39, No. 2, pp. 361-380. 15. Mason, H. B. and Shelor, R. M. (1998), “Stock Split An Institutional Investor Preference,” The Financial Review, Vol. 33, No. 4, pp. 33-46. 16. Savitri, M. and Martani, D. (2006), “The Analysis Impact of Stock Splits and Reverse Share Splits on Share Return and Volume: The Case of Jakarta Stock
Exchange,” Journal of Finance, pp. 1-16. 17. Setyawan, I. R. and Hartono, J. (2001), “The Simulataneity of Dividend and Capital Structure Decisions: The Case of Indonesia Capital Market,” Gadjah Mada
International Journal of Business, Vol. 3, No. 1. 18. Suntoro, D. and Subekti, I. (2003), “Kandungan Informasi atas Peristiwa Stock Split,” Jurnal Riset Akuntansi Kontemporer (TEMA), Vol. 4, No. 2, pp. 119–132. 19. Sutrisno, W., Yuniartha, F. and Susilowati, S. (2000), “Pengaruh Stock Split terhadap Likuiditas dan Return Saham di Bursa Efek Jakarta,” Jurnal Manajemen
Dan Kewirausahaan, Vol. 2, No. 2, pp. 1-13. 20. Szewczyk, S. H. and Tsetsekos, G. P. (1993), “The Effect of Managerial Ownership on Stock Split Induced Abnormal Return,” The Financial Review, Vol. 28,
No. 3, pp. 351-370. 21. Tandelilin, E. (2010), “Portofolio dan Investasi: Teori dan Aplikasi,” Kanisius, Yogyakarta, Indonesia. 22. Wulff, C. (2002), “The Market Reaction to Stock Splits — Evidence From Germany,” Schmalenbach Business Review, Vol. 54, pp. 270-297.
VOLUME NO. 5 (2015), ISSUE NO. 11 (NOVEMBER) ISSN 2231-5756
INTERNATIONAL JOURNAL OF RESEARCH IN COMMERCE, IT & MANAGEMENT A Monthly Double-Blind Peer Reviewed (Refereed/Juried) Open Access International e-Journal - Included in the International Serial Directories
http://ijrcm.org.in/
18
AWARENESS OF REVERSE MORTGAGE AMONG THE SENIOR CITIZENS: A CASE STUDY OF SBI, KADAPA
DR. D. MARUTHI PRASAD
ASSOCIATE PROFESSOR DEPARTMENT OF MBA
BALAJI INSTITUTE OF IT & MANAGEMENT KADAPA
ABSTRACT
The present study finds that reverse mortgage is a fantastic product and this would be the best pension plan. Many senior citizens could be attracted and also show the interest towards it if it is properly take to the needy people. Banks have failure in marketing the product in India effectively. Dewan Housing, a largest housing finance company in India could sell only 4 -5 reverse mortgage loan during last two years. This reveals that the efforts of the banks are poor in marketing the product.
KEYWORDS reverse mortgage, sbi, senior citizens.
INTRODUCTION everse mortgage scheme has been launched in India in the year 2007 by the then finance minister Shri. Chidambaram. It may be said that the scheme is still at infant stage and India is now getting ready for the reverse mortgage market. Based on the population’s age profile, family system and geographic dispersal of the target group, it could be early days in India for the reverse mortgage market. According to a report from Celent, a boston-based financial
research and consulting firm, the current market size for reverse mortgage is 3 million house holds and will grow to 6 million by 2015, but, only less than 500 applicants have availed the reverse mortgage loan since its inception. It is very less percentage when compared to market size for reverse mortgage. So, there is a need to study for finding out the probable reasons for this slow pickup in the growing market for reverse mortgage.
STATEMENT OF THE PROBLEM Retirement makes the people financially lean. They might be rich in fixed assets but poor in earning. If anyone take a look at individual’s balance sheet, they will find that the house is the largest asset as most of the people spend their entire earnings towards acquiring of own house. Many senior citizens, either by inheritance or by virtue of building assets, with the intention of passing them to their successors, have fixed properties in names, but they were not able to convert it into constant regular incomes as those properties are illiquid in nature. The sons and daughters also leaving them alone without taking proper care in that old age. Their expectations that their sons would take care of them in the old age wouldn’t become true. Leading life after getting in to the old age, only with illiquid assets without proper financial support or any regular income and any support from the successors, can be a very bad experience. The rising cost of living, health care and other amenities compound the problem significantly. Weakened capacity of earning at this age makes the life miserable. To overcome this problem and to create liquidity for the fixed assets without loosing the title of the property, Government of India in its 2007-08 budget proposed a scheme Reverse Mortgage in some of the banks in India. But the response from the customers seems to be very less. Why there is no expected response from the customers? Do the senior citizens aware of this scheme? The media through which the banks tried to propagate this scheme? Are the banks getting failure in attracting the customers? Isn’t the Reverse Mortgage beneficial one? These are the questions to be answered.
THE CONCEPT OF REVERSE MORTGAGE A Reverse Mortgage is a mortgage just opposite to normal mortgage. In a reverse mortgage, senior citizens who hold a house or property, but lack a regular source of income can pledge their property with a bank or housing finance company and get a loan. The bank or housing finance company will pay that loan amount in regular instalments. It is an arrangement whereby a home owner borrows against his or her home equity and receives regular payments from the bank until the total payments reach a predetermined limit. The good thing is that the person who mortgage the property can stay in the house for his life and continue to receive the much needed regular payments. So, the owner can stay in his house and also get paid for it. The concept of reverse mortgage seeks to enable the senior citizens owning the houses to meet their expenses without selling their house. The bank will have the right to sell off the property after the incumbent passes away or leaves the place, and to recover the loan. It passes on any extra amount to the legal heirs. A reverse mortgage simply opposite to conventional mortgage in the sense that in a conventional mortgage, the home owner makes monthly amortized payment to the bank or housing finance company from where he or she got the house loan and after each payment, his or equity increases within the property and after the end of the term, the loan amount is fully paid and the property is released from the lender. In the reverse mortgage, bank or housing finance company will pay the house owner in a regular monthly instalments by mortgaging his or her property. To sanction the loan, the bank or the housing finance company makes an evaluation of the current value of the home and decides the likely life of the applicant, the percentage of value of the property that they are willing to sanction as loan and the rate of interest. In normal conditions, the loan amount should be lower than 60-70 percent of the market value of the property. Here, there is an option to applicants either to take the loan amount in a single lump-sum or in fixed monthly instalments. The value of the property will be revised from time to time by both the parties. If there is a rise in the value of the property, applicants will have the option of increasing the quantum of loan, and they do so, are given the incremental amount in lump-sum. If they opted for the monthly payment scheme, this amount is appropriately increased. The principal plus interest accrue at the bank while the applicants live on in the home for the lengths of their lives or until they decide to sell the property, whichever is earlier. If they decide to sell the property, they have to clear all the loan. On the death of the owner of the property, the heirs to the property decide either to redeem the loan or sell it and take the residual amount that accrue from the sale after clearing the bank loan. To become eligible for reverse mortgage, the applicant must be at least 62 years old and own his residence. They must also submit an application to the lender and have the property inspected. Here, the lender may ask to repair the house if it needs. The size of the reverse mortgage depends on many factors such as the age of the borrower, the type of the mortgage sought, the value and location of the property, the equity of the borrower and the current rare of interest. The borrower may receive the loan amount in one of the following three ways: a) Through lump sum payment b) A series of fixed payments c) A line of credit to be drawn upon when the borrower needs money. There are three types of reverse mortgages: FHA insured reverse mortgage—in this type, the borrower receives a guarantee that payments will continue to be made even if the lender defaults. Lender insured reverse mortgage—under this, the lender provide periodic payments and a line of credit for as long as the borrower lives in the home. Uninsured reverse mortgage—these offer a fixed number of payments, and the loan balance then becomes due at the end of that period.
R
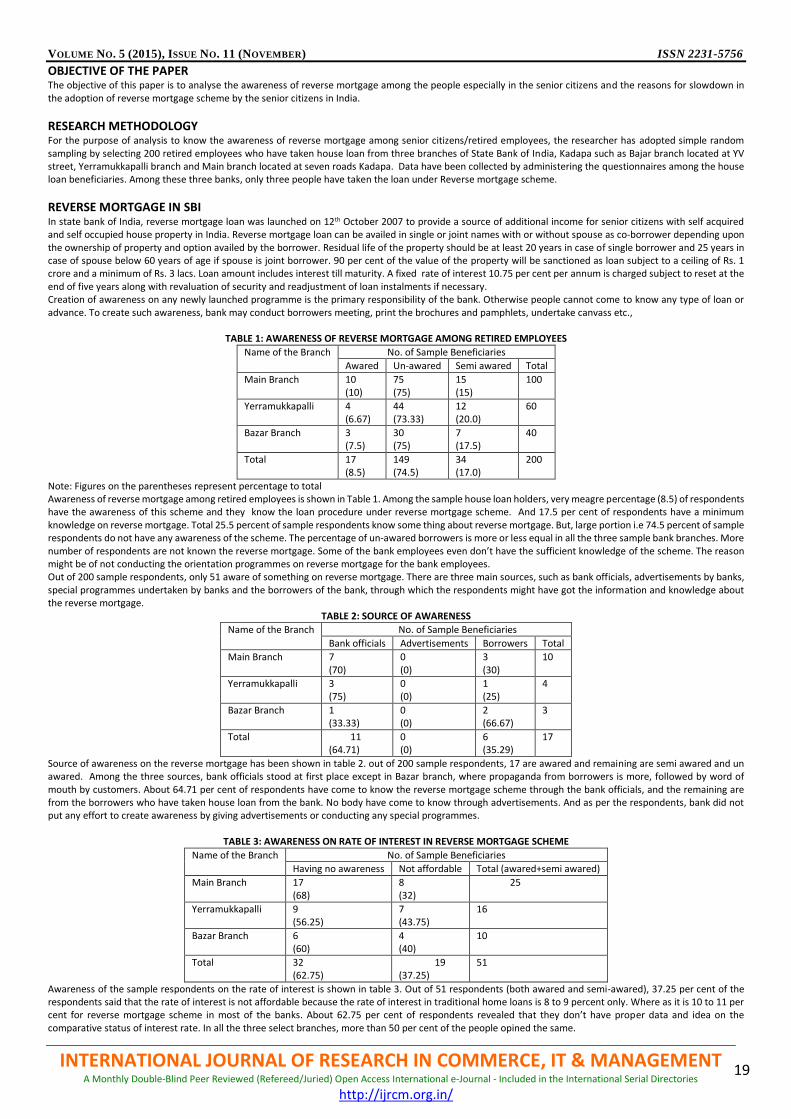
VOLUME NO. 5 (2015), ISSUE NO. 11 (NOVEMBER) ISSN 2231-5756
INTERNATIONAL JOURNAL OF RESEARCH IN COMMERCE, IT & MANAGEMENT A Monthly Double-Blind Peer Reviewed (Refereed/Juried) Open Access International e-Journal - Included in the International Serial Directories
http://ijrcm.org.in/
19
OBJECTIVE OF THE PAPER The objective of this paper is to analyse the awareness of reverse mortgage among the people especially in the senior citizens and the reasons for slowdown in the adoption of reverse mortgage scheme by the senior citizens in India.
RESEARCH METHODOLOGY For the purpose of analysis to know the awareness of reverse mortgage among senior citizens/retired employees, the researcher has adopted simple random sampling by selecting 200 retired employees who have taken house loan from three branches of State Bank of India, Kadapa such as Bajar branch located at YV street, Yerramukkapalli branch and Main branch located at seven roads Kadapa. Data have been collected by administering the questionnaires among the house loan beneficiaries. Among these three banks, only three people have taken the loan under Reverse mortgage scheme.
REVERSE MORTGAGE IN SBI In state bank of India, reverse mortgage loan was launched on 12th October 2007 to provide a source of additional income for senior citizens with self acquired and self occupied house property in India. Reverse mortgage loan can be availed in single or joint names with or without spouse as co-borrower depending upon the ownership of property and option availed by the borrower. Residual life of the property should be at least 20 years in case of single borrower and 25 years in case of spouse below 60 years of age if spouse is joint borrower. 90 per cent of the value of the property will be sanctioned as loan subject to a ceiling of Rs. 1 crore and a minimum of Rs. 3 lacs. Loan amount includes interest till maturity. A fixed rate of interest 10.75 per cent per annum is charged subject to reset at the end of five years along with revaluation of security and readjustment of loan instalments if necessary. Creation of awareness on any newly launched programme is the primary responsibility of the bank. Otherwise people cannot come to know any type of loan or advance. To create such awareness, bank may conduct borrowers meeting, print the brochures and pamphlets, undertake canvass etc.,
TABLE 1: AWARENESS OF REVERSE MORTGAGE AMONG RETIRED EMPLOYEES
Name of the Branch No. of Sample Beneficiaries
Awared Un-awared Semi awared Total
Main Branch 10 (10)
75 (75)
15 (15)
100
Yerramukkapalli 4 (6.67)
44 (73.33)
12 (20.0)
60
Bazar Branch 3 (7.5)
30 (75)
7 (17.5)
40
Total 17 (8.5)
149 (74.5)
34 (17.0)
200
Note: Figures on the parentheses represent percentage to total Awareness of reverse mortgage among retired employees is shown in Table 1. Among the sample house loan holders, very meagre percentage (8.5) of respondents have the awareness of this scheme and they know the loan procedure under reverse mortgage scheme. And 17.5 per cent of respondents have a minimum knowledge on reverse mortgage. Total 25.5 percent of sample respondents know some thing about reverse mortgage. But, large portion i.e 74.5 percent of sample respondents do not have any awareness of the scheme. The percentage of un-awared borrowers is more or less equal in all the three sample bank branches. More number of respondents are not known the reverse mortgage. Some of the bank employees even don’t have the sufficient knowledge of the scheme. The reason might be of not conducting the orientation programmes on reverse mortgage for the bank employees. Out of 200 sample respondents, only 51 aware of something on reverse mortgage. There are three main sources, such as bank officials, advertisements by banks, special programmes undertaken by banks and the borrowers of the bank, through which the respondents might have got the information and knowledge about the reverse mortgage.
TABLE 2: SOURCE OF AWARENESS
Name of the Branch No. of Sample Beneficiaries
Bank officials Advertisements Borrowers Total
Main Branch 7 (70)
0 (0)
3 (30)
10
Yerramukkapalli 3 (75)
0 (0)
1 (25)
4
Bazar Branch 1 (33.33)
0 (0)
2 (66.67)
3
Total 11 (64.71)
0 (0)
6 (35.29)
17
Source of awareness on the reverse mortgage has been shown in table 2. out of 200 sample respondents, 17 are awared and remaining are semi awared and un awared. Among the three sources, bank officials stood at first place except in Bazar branch, where propaganda from borrowers is more, followed by word of mouth by customers. About 64.71 per cent of respondents have come to know the reverse mortgage scheme through the bank officials, and the remaining are from the borrowers who have taken house loan from the bank. No body have come to know through advertisements. And as per the respondents, bank did not put any effort to create awareness by giving advertisements or conducting any special programmes.
TABLE 3: AWARENESS ON RATE OF INTEREST IN REVERSE MORTGAGE SCHEME
Name of the Branch No. of Sample Beneficiaries
Having no awareness Not affordable Total (awared+semi awared)
Main Branch 17 (68)
8 (32)
25
Yerramukkapalli 9 (56.25)
7 (43.75)
16
Bazar Branch 6 (60)
4 (40)
10
Total 32 (62.75)
19 (37.25)
51
Awareness of the sample respondents on the rate of interest is shown in table 3. Out of 51 respondents (both awared and semi-awared), 37.25 per cent of the respondents said that the rate of interest is not affordable because the rate of interest in traditional home loans is 8 to 9 percent only. Where as it is 10 to 11 per cent for reverse mortgage scheme in most of the banks. About 62.75 per cent of respondents revealed that they don’t have proper data and idea on the comparative status of interest rate. In all the three select branches, more than 50 per cent of the people opined the same.
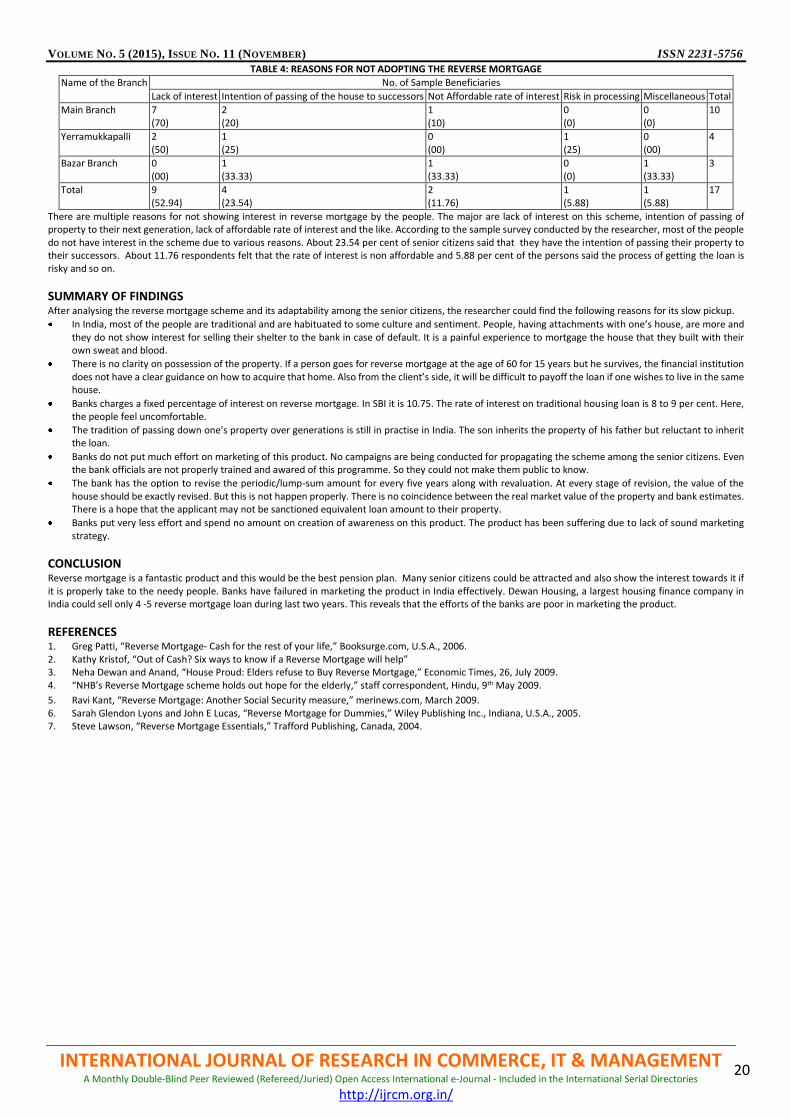
VOLUME NO. 5 (2015), ISSUE NO. 11 (NOVEMBER) ISSN 2231-5756
INTERNATIONAL JOURNAL OF RESEARCH IN COMMERCE, IT & MANAGEMENT A Monthly Double-Blind Peer Reviewed (Refereed/Juried) Open Access International e-Journal - Included in the International Serial Directories
http://ijrcm.org.in/
20
TABLE 4: REASONS FOR NOT ADOPTING THE REVERSE MORTGAGE
Name of the Branch No. of Sample Beneficiaries
Lack of interest Intention of passing of the house to successors Not Affordable rate of interest Risk in processing Miscellaneous Total
Main Branch 7 (70)
2 (20)
1 (10)
0 (0)
0 (0)
10
Yerramukkapalli 2 (50)
1 (25)
0 (00)
1 (25)
0 (00)
4
Bazar Branch 0 (00)
1 (33.33)
1 (33.33)
0 (0)
1 (33.33)
3
Total 9 (52.94)
4 (23.54)
2 (11.76)
1 (5.88)
1 (5.88)
17
There are multiple reasons for not showing interest in reverse mortgage by the people. The major are lack of interest on this scheme, intention of passing of property to their next generation, lack of affordable rate of interest and the like. According to the sample survey conducted by the researcher, most of the people do not have interest in the scheme due to various reasons. About 23.54 per cent of senior citizens said that they have the intention of passing their property to their successors. About 11.76 respondents felt that the rate of interest is non affordable and 5.88 per cent of the persons said the process of getting the loan is risky and so on.
SUMMARY OF FINDINGS After analysing the reverse mortgage scheme and its adaptability among the senior citizens, the researcher could find the following reasons for its slow pickup.
In India, most of the people are traditional and are habituated to some culture and sentiment. People, having attachments with one’s house, are more and they do not show interest for selling their shelter to the bank in case of default. It is a painful experience to mortgage the house that they built with their own sweat and blood.
There is no clarity on possession of the property. If a person goes for reverse mortgage at the age of 60 for 15 years but he survives, the financial institution does not have a clear guidance on how to acquire that home. Also from the client’s side, it will be difficult to payoff the loan if one wishes to live in the same house.
Banks charges a fixed percentage of interest on reverse mortgage. In SBI it is 10.75. The rate of interest on traditional housing loan is 8 to 9 per cent. Here, the people feel uncomfortable.
The tradition of passing down one’s property over generations is still in practise in India. The son inherits the property of his father but reluctant to inherit the loan.
Banks do not put much effort on marketing of this product. No campaigns are being conducted for propagating the scheme among the senior citizens. Even the bank officials are not properly trained and awared of this programme. So they could not make them public to know.
The bank has the option to revise the periodic/lump-sum amount for every five years along with revaluation. At every stage of revision, the value of the house should be exactly revised. But this is not happen properly. There is no coincidence between the real market value of the property and bank estimates. There is a hope that the applicant may not be sanctioned equivalent loan amount to their property.
Banks put very less effort and spend no amount on creation of awareness on this product. The product has been suffering due to lack of sound marketing strategy.
CONCLUSION Reverse mortgage is a fantastic product and this would be the best pension plan. Many senior citizens could be attracted and also show the interest towards it if it is properly take to the needy people. Banks have failured in marketing the product in India effectively. Dewan Housing, a largest housing finance company in India could sell only 4 -5 reverse mortgage loan during last two years. This reveals that the efforts of the banks are poor in marketing the product.
REFERENCES 1. Greg Patti, “Reverse Mortgage- Cash for the rest of your life,” Booksurge.com, U.S.A., 2006. 2. Kathy Kristof, “Out of Cash? Six ways to know if a Reverse Mortgage will help” 3. Neha Dewan and Anand, “House Proud: Elders refuse to Buy Reverse Mortgage,” Economic Times, 26, July 2009. 4. “NHB’s Reverse Mortgage scheme holds out hope for the elderly,” staff correspondent, Hindu, 9th May 2009.
5. Ravi Kant, “Reverse Mortgage: Another Social Security measure,” merinews.com, March 2009. 6. Sarah Glendon Lyons and John E Lucas, “Reverse Mortgage for Dummies,” Wiley Publishing Inc., Indiana, U.S.A., 2005. 7. Steve Lawson, “Reverse Mortgage Essentials,” Trafford Publishing, Canada, 2004.
VOLUME NO. 5 (2015), ISSUE NO. 11 (NOVEMBER) ISSN 2231-5756
INTERNATIONAL JOURNAL OF RESEARCH IN COMMERCE, IT & MANAGEMENT A Monthly Double-Blind Peer Reviewed (Refereed/Juried) Open Access International e-Journal - Included in the International Serial Directories
http://ijrcm.org.in/
21
CASH CONVERSION CYCLE APPROACH TO LIQUIDITY ANALYSIS: CASE OF INDIAN STEEL INDUSTRY
D. AKILANDESWARI RESEARCH SCHOLAR
DEPARTMENT OF COMMERCE ERODE ARTS & SCIENCE COLLEGE
ERODE
DR. A. VIJAYAKUMAR ASSOCIATE PROFESSOR
ERODE ARTS & SCIENCE COLLEGE ERODE
ABSTRACT
The management of current assets and current liabilities can have significant impact on both the liquidity and profitability of the firm. Basically, corporate liquidity is examined using traditional ratios such as current ratio and quick ratio. These ratios measures liquidity at a given point of time. On the other hand, dynamic view measures ongoing liquidity from the firm’s operations. As the firm’s ongoing liquidity is a function of its Cash (Conversion) Cycle, it will be more appropriate and evaluate effectiveness of working capital management by Cash Conversion Cycle (CCC), rather than traditional liquidity measures. The purpose of the present study is to investigate the implications of the CCC as an indicator of liquidity on profitability of selected companies in Indian Steel Industry. In Multiple Regression Model, rate of return on assets is used as dependent variable. As independent variables, Accounts Receivables Period (ARP), Inventory Conversion Period (ICP), and Average Payment Period (APP) used as explanatory variables and Size, Growth, Leverage, GDP growth is used as control variables in the model. Empirical results of the study found a significant negative relationship between profitability and ARP, ICP and CCC for a sample of Indian Steel Industry.
KEYWORDS cash conversion cycle, liquidity, indian steel industry, working capital, accounts receivables period, inventory conversion period and accounts payable period.
INTRODUCTION orking capital management, which deals with the management of current assets and current liabilities, is very important in corporate finance because it directly affects the liquidity and profitability of the firm (Deloof, 2003; Raheman and Nasar, 2007). The current assets of a typical manufacturing firm or even a distributing firm account for more than half of the firm’s total assets. Deloof (2003) held that same proportion that the accounts
receivables and inventories comprise a substantial percentage of the total assets of a firm. Excessive levels of current assets can easily result in a firm realizing a substandard return on investment. However, firms with too few current assets may incur shortages and difficulties in maintaining smooth operations (Van Horne and Wachowicz, 2005). Profitability is the rate of return of firm’s investment. An unwarranted high investment in current assets would reduce this rate of return (Vishnani, 2007). The purpose of working capital management is to manage the firm’s current accounts so as to attain a desired balance between profitability and risk (Ricci and Vito, 2000). Shin and Soenen (1998) found that efficient working capital management is an integral component of the overall corporate strategy towards creating shareholder value. Efficient working capital management involves planning and controlling the current assets and current liabilities in a manner that eliminates the risk of inability of a firm to meet due short term obligations and to avoid excessive investment in these assets on the other hand (Eljelly, 2004). Smith (1980) and Reheman and Nasr (2007) also observed that working capital management is important because of its effects on the firm’s profitability and risk and consequently its value. The way in which working capital is managed can have a significant impact on both the liquidity and profitability of the firm (Deloof, 2003). The decisions that tend to maximize profitability tend to minimize the chances of adequate liquidity. Conversely, focusing almost entirely on liquidity will tend to reduce the potential profitability of the firm. A firm can have larger sales with a generous credit policy, which extends the cash cycle. In this, the longer cash conversion cycle may result in higher profitability. However, the traditional view of the relationship between cash conversion cycle and corporate profitability is that, ceteris paribus, a longer cash conversion cycle hurts the profitability of a firm (Deloof, 2003; Smith, 1980).
CONJECTURAL FRAMEWORK Liquidity management is necessary for all business, small, medium or large because it means collecting cash from customers in time so that having no difficulty in paying short-term debts. Therefore, when a business does not manage its liquidity well, it will have cash shortages and will results in difficulty in paying obligations. As a result, in addition to profitability, liquidity management is vital for ongoing concerns. Corporate liquidity is examined from two distinct dimensions: static or dynamic view (Farris and Hutchison, 2002). The static view is based on commonly used traditional ratios, such as current ratio and quick ratio, calculated from the balance sheet accounts. These traditional measures of liquidity are incompetent measures that cannot provide detailed and accurate about liquidity management effectiveness (Jose et al., 1996). These ratios measures liquidity at a given point of time. Liquidity for the ongoing firm is not reliant on the liquidation value of its assets, but rather on the operating cash flow generated by these assets (Soenen, 1993). On the other hand, dynamic view measures ongoing liquidity from the firm’s operations. As a dynamic measure of the time takes a firm to go from cash outflow to cash inflow which is measured by Cash Conversion Cycle (CCC) introduced by Hager (1976) and has been recommended by Largy and Stickney (1980), Kamath (1989) and others. Drawing attention to limitations of traditional liquidity ratio, Richards and Laughlin (1980), Kamath (1989), Gentry et al., (1990), and Schilling (1996) have insisted on using ongoing liquidity measures in working capital management. Ongoing liquidity refers to the inflows and outflows of cash through the as the product acquisition, production, sales, payment and collection process takes place overtime. As the firm’s ongoing liquidity is a function of its cash (conversion) cycle, it will be more appropriate and evaluate effectiveness of working capital management by cash conversion cycle, rather than traditional liquidity measures.
CASH CONVERSION CYCLE (CCC) In text books related to finance, CCC is maintained in the context of working capital management (Keown et al., 2003). The cash conversion cycle is used as a comprehensive measure of working capital as it shows the time lag between expenditure for the purchase of raw material and the collection of sales of finished goods (Padachi, 2006, and Eljelly, 2004). CCC = RCP + ICP – APP In the above formula, the three variables to which CCC is dependent are defined as follows; RCP – Receivables Collection Period (in days) = (Accounts Receivables / Sales) * 365
W
VOLUME NO. 5 (2015), ISSUE NO. 11 (NOVEMBER) ISSN 2231-5756
INTERNATIONAL JOURNAL OF RESEARCH IN COMMERCE, IT & MANAGEMENT A Monthly Double-Blind Peer Reviewed (Refereed/Juried) Open Access International e-Journal - Included in the International Serial Directories
http://ijrcm.org.in/
22
ICP – Inventory Conversion Period (in days) = (Inventory / Cost of goods sold) * 365 APP – Accounts Payable Period (in days) = (Accounts Payables / Cost of goods sold) * 365 There seems to be strong relation between the cash conversion cycle of a firm and its profitability. The three different components of CCC (accounts receivables, inventory and accounts payables) can be managed in different way in order to maximize profitability. It is an indication of how long a firm can carry on if it was to stop its operations or it indicates the time gap between purchase of goods and collection of sales. The optimum level of inventory will have a direct effect on profitability since it will release working capital resources which in turn will be invested in the business cycle, or will increase inventory levels in order to respond to higher product demand. Similarly, both credit policy from suppliers and credit period granted to customers will have an impact on profitability. In order to understand the way working capital is managed, CCC and its components will be statistically analysed. Cash Conversion Cycle likely to be negative as well as positive. A positive result indicates the number of days a company must borrow or tie up capital while awaiting payment from a customer. A negative result indicates the number of days a company has received cash from sales before it must pay its suppliers (Hutchison et al., 2007). Of course the ultimate goal is having low CCC, if possible negative. Because the shorter the CCC, the more efficient the company in managing its cash flow. The purpose of this part of analysis is to investigate the implications of the CCC as an indicator of liquidity on profitability of selected companies in Indian Steel Industry.
REVIEW OF LITERATURE In a study by Kamath (1989), it has been concluded that there is a reverse relationship between cash conversion cycle and profitability. In another study of Shin and Soenen (1998), a sample consisting of American manufacturing firms for the period of 1974-1995 has been analysed and a statistically negative relationship between cash conversion cycle and profitability has been confirmed. To test the relationship between working capital management and corporate profitability, Deloof (2003) used a sample of 1009 large Belgian non-financial firms for a period of 1992-1996. He discussed possible relationships between cash conversion cycle and profitability by dividing cash conversion cycle into its components (inventory, account receivables and account payables period). Results of the study have concluded that increase in all of these periods affect profitability negatively. Lazaridis and Tryfonidis (2006) conducted a cross sectional study by using a sample of 131 firms listed on the Athens Stock Exchange for the period of 2001-2004 and found cash conversion cycle affects profitability negatively. Eljelly (2004) empirically examined the relationship between profitability and liquidity as measured by current ratio and cash conversion cycle on a sample of 929 Joint stock companies in Saudi Arabia. It has been concluded that the effect of cash conversion cycle on profitability is stronger than the effect of current ratio on it and found significant negative relationship between the firm’s profitability and its liquidity level. Raheman and Nasr (2007) studied the effect of different variables of working capital management including cash conversion cycle on the profitability of 94 Pakistani firm listed on Karachi Stock Exchange for a period between 1999-2004 and found that as cash conversion cycle increases, it leads to decreasing profitability of the firm. Garcia-Teruel and Martinez-Solano (2007) collected data for 8872 SMEs from Spain for the period 1996-2002 and tested the effects of working capital management on profitability. The results demonstrated that shortening cash conversion cycle improves the profitability. Falope and Ajilore (2009) used a sample of 50 Nigerian quoted non-financial firms for the period 1996-2005. They found a significant negative relationship between net operating profitability and the average collection period, inventory turnover in days, average payment period and cash conversion cycle. Mathuva (2009) examined the influence of working capital management components on corporate profitability by using a sample of 30 listed on the Nairobi- Stock Exchange (NSE) for the periods 1993 to 2008. He found that there exists a highly significant negative relationship between the time it takes for firms to collect cash from their customers and profitability. Amarjit Gill, Nahum Biger and Neil Mathur (2010) studied the relationship between the cash conversion cycle and profitability and found significant relationship between them. However, the study conducted by Katerina Lyroudi and Lazoridis (2000) in the Food Industry of Greece found that there was positive relationship between CCC and return on assets. Among the studies conducted in the Indian context showed both the positive and negative association between liquidity and profitability. Amit K. Mallik, Debdas Rakshit (2005) studied the relationship between liquidity and profitability in the context of Indian Pharmaceutical industry and concluded that no definite relationship can be established between liquidity and profitability. Vijayakumar and Venkatachalam (1995) in their study on Tamil Nadu Sugar Industry with regard to relationship between liquidity and profitability concluded that liquidity was negatively associated with profitability. On the basis of these researches done in different countries, methodology has been formulated. From the above reviews, the researcher concludes the most of the studies support the general notion that there is a negative relationship between liquidity and profitability. In order to test this general notion, the researcher postulates the following hypothesis “Firms liquidity negatively affects profitability”
VARIABLES SPECIFICATIONS AND EMPIRICAL MODEL The primary aim of this part of analysis is to investigate the impact of working capital management (liquidity) on corporate profitability of Indian steel companies. This is achieved by developing a similar empirical framework first used by Shin and Soenen (1998) and the subsequent work of Deloof (2003). The analysis of data employs the use of correlation and a multiple regression model that consists of both liquidity and profitability. For this purpose, four different models using the various components of liquidity and profitability are considered. This helps analyzing changes in the results due to different measures of liquidity and profitability. THE EXPLANATORY VARIABLES This study investigates the effects of accounts receivables period, inventory conversion period, accounts payables period and cash conversion cycle on firms profitability. The dependent variable of the regression model is return on assets (PR). Accounts Receivables Period (ARP) used as proxy for the inventory policy is also an independent variable obtained as account receivables /sales *365. Inventory Conversion Period (ICP) used as proxy for the inventory policy is also an independent variable derived as inventory / cost of sales *365. Average Payment Period (APP) used as proxy for the payment policy is also an independent variable. It is calculated by dividing accounts payable by purchases and multiplying the result by 365. The Cash Conversion Cycle (CCC) used a comprehensive measure of liquidity is another independent variable, and is measured by adding ARP to ICP and then subtracting the APP. All the above variables have relationship that ultimately affects liquidity of the firm. It is expected that there is a negative relationship between profitability on the one hand and the measures of liquidity (number of days accounts receivables, inventory and accounts payables and cash conversion cycle) on the other hand. This is consistent with the view that the time lag between expenditure for the purchase of raw materials and the collection of sales of finished goods can be too long, and that decreasing the time lag increase profitability. CONTROL VARIABLES In various literature reviews, various studies have used the control variables along with the main variables of liquidity (working capital) in order to have an opposite analysis of working capital management on the profitability of firms (Deloof, 2003 and Eljelly, 2004). On the same lines, along with working capital variables, the present study has taken into considerations some control variables relating to firms such as the size of the firm, the growth in its sales and its financial leverage. The size of the firm (SIZE) has been measured by the natural logarithm of its total sales. The growth of the firm (GROWTH) is measured by variations in its annual sales value with reference to previous year’s sales [(salest-salest-1)/salest-1]. Moreover, the financial leverage (LEV) was taken as the debt to equity ratio of each firm for the whole sample evolution of the economic cycle using the GDPGR variable, which measures the real annual GDP growth. Table 1 below summaries the definitions and theoretical predicted signs.
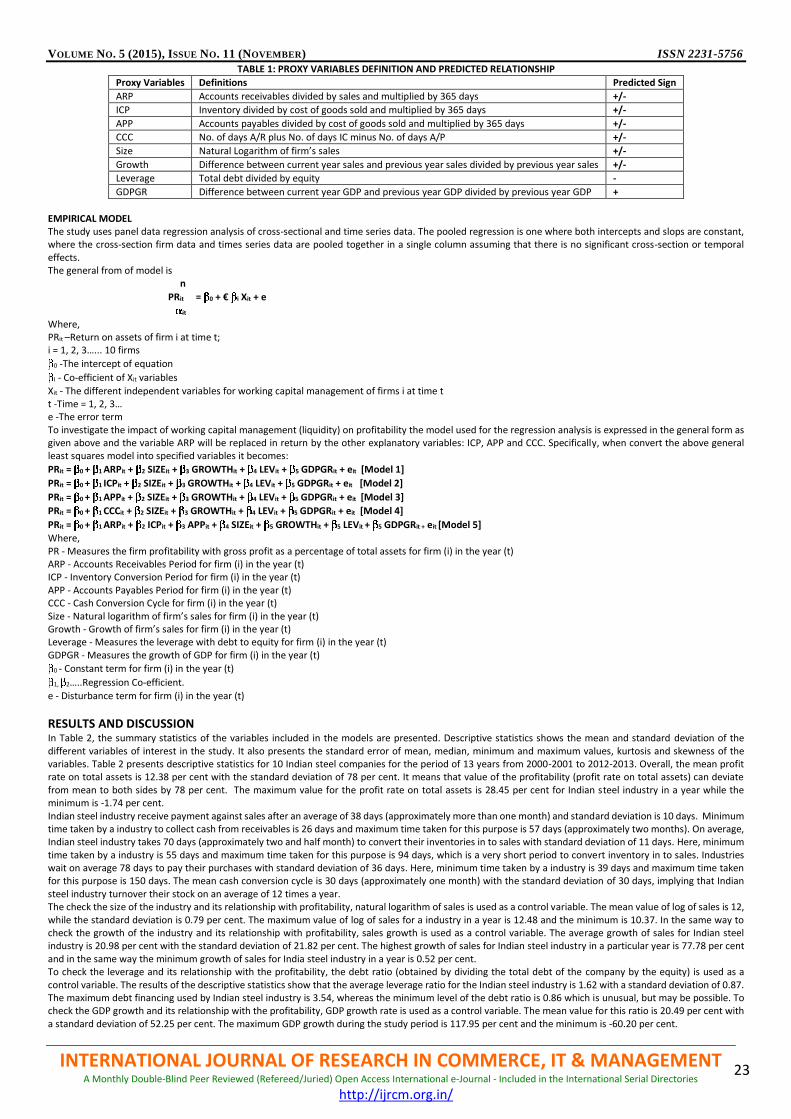
VOLUME NO. 5 (2015), ISSUE NO. 11 (NOVEMBER) ISSN 2231-5756
INTERNATIONAL JOURNAL OF RESEARCH IN COMMERCE, IT & MANAGEMENT A Monthly Double-Blind Peer Reviewed (Refereed/Juried) Open Access International e-Journal - Included in the International Serial Directories
http://ijrcm.org.in/
23
TABLE 1: PROXY VARIABLES DEFINITION AND PREDICTED RELATIONSHIP
Proxy Variables Definitions Predicted Sign
ARP Accounts receivables divided by sales and multiplied by 365 days +/-
ICP Inventory divided by cost of goods sold and multiplied by 365 days +/-
APP Accounts payables divided by cost of goods sold and multiplied by 365 days +/-
CCC No. of days A/R plus No. of days IC minus No. of days A/P +/-
Size Natural Logarithm of firm’s sales +/-
Growth Difference between current year sales and previous year sales divided by previous year sales +/-
Leverage Total debt divided by equity -
GDPGR Difference between current year GDP and previous year GDP divided by previous year GDP +
EMPIRICAL MODEL The study uses panel data regression analysis of cross-sectional and time series data. The pooled regression is one where both intercepts and slops are constant, where the cross-section firm data and times series data are pooled together in a single column assuming that there is no significant cross-section or temporal effects. The general from of model is n
PRit = 0 + € i Xit + e
it
Where, PRit –Return on assets of firm i at time t; i = 1, 2, 3…... 10 firms
0 -The intercept of equation
I - Co-efficient of Xit variables
Xit - The different independent variables for working capital management of firms i at time t t -Time = 1, 2, 3… e -The error term To investigate the impact of working capital management (liquidity) on profitability the model used for the regression analysis is expressed in the general form as given above and the variable ARP will be replaced in return by the other explanatory variables: ICP, APP and CCC. Specifically, when convert the above general least squares model into specified variables it becomes:
PRit = 0 + 1 ARPit + 2 SIZEit + 3 GROWTHit + 4 LEVit + 5 GDPGRit + eit [Model 1]
PRit = 0 + 1 ICPit + 2 SIZEit + 3 GROWTHit + 4 LEVit + 5 GDPGRit + eit [Model 2]
PRit = 0 + 1 APPit + 2 SIZEit + 3 GROWTHit + 4 LEVit + 5 GDPGRit + eit [Model 3]
PRit = 0 + 1 CCCit + 2 SIZEit + 3 GROWTHit + 4 LEVit + 5 GDPGRit + eit [Model 4]
PRit = 0 + 1 ARPit + 2 ICPit + 3 APPit + 4 SIZEit + 5 GROWTHit + 5 LEVit + 5 GDPGRit + eit [Model 5]
Where, PR - Measures the firm profitability with gross profit as a percentage of total assets for firm (i) in the year (t) ARP - Accounts Receivables Period for firm (i) in the year (t) ICP - Inventory Conversion Period for firm (i) in the year (t) APP - Accounts Payables Period for firm (i) in the year (t) CCC - Cash Conversion Cycle for firm (i) in the year (t) Size - Natural logarithm of firm’s sales for firm (i) in the year (t) Growth - Growth of firm’s sales for firm (i) in the year (t) Leverage - Measures the leverage with debt to equity for firm (i) in the year (t) GDPGR - Measures the growth of GDP for firm (i) in the year (t)
0 - Constant term for firm (i) in the year (t)
1, 2…..Regression Co-efficient.
e - Disturbance term for firm (i) in the year (t)
RESULTS AND DISCUSSION In Table 2, the summary statistics of the variables included in the models are presented. Descriptive statistics shows the mean and standard deviation of the different variables of interest in the study. It also presents the standard error of mean, median, minimum and maximum values, kurtosis and skewness of the variables. Table 2 presents descriptive statistics for 10 Indian steel companies for the period of 13 years from 2000-2001 to 2012-2013. Overall, the mean profit rate on total assets is 12.38 per cent with the standard deviation of 78 per cent. It means that value of the profitability (profit rate on total assets) can deviate from mean to both sides by 78 per cent. The maximum value for the profit rate on total assets is 28.45 per cent for Indian steel industry in a year while the minimum is -1.74 per cent. Indian steel industry receive payment against sales after an average of 38 days (approximately more than one month) and standard deviation is 10 days. Minimum time taken by a industry to collect cash from receivables is 26 days and maximum time taken for this purpose is 57 days (approximately two months). On average, Indian steel industry takes 70 days (approximately two and half month) to convert their inventories in to sales with standard deviation of 11 days. Here, minimum time taken by a industry is 55 days and maximum time taken for this purpose is 94 days, which is a very short period to convert inventory in to sales. Industries wait on average 78 days to pay their purchases with standard deviation of 36 days. Here, minimum time taken by a industry is 39 days and maximum time taken for this purpose is 150 days. The mean cash conversion cycle is 30 days (approximately one month) with the standard deviation of 30 days, implying that Indian steel industry turnover their stock on an average of 12 times a year. The check the size of the industry and its relationship with profitability, natural logarithm of sales is used as a control variable. The mean value of log of sales is 12, while the standard deviation is 0.79 per cent. The maximum value of log of sales for a industry in a year is 12.48 and the minimum is 10.37. In the same way to check the growth of the industry and its relationship with profitability, sales growth is used as a control variable. The average growth of sales for Indian steel industry is 20.98 per cent with the standard deviation of 21.82 per cent. The highest growth of sales for Indian steel industry in a particular year is 77.78 per cent and in the same way the minimum growth of sales for India steel industry in a year is 0.52 per cent. To check the leverage and its relationship with the profitability, the debt ratio (obtained by dividing the total debt of the company by the equity) is used as a control variable. The results of the descriptive statistics show that the average leverage ratio for the Indian steel industry is 1.62 with a standard deviation of 0.87. The maximum debt financing used by Indian steel industry is 3.54, whereas the minimum level of the debt ratio is 0.86 which is unusual, but may be possible. To check the GDP growth and its relationship with the profitability, GDP growth rate is used as a control variable. The mean value for this ratio is 20.49 per cent with a standard deviation of 52.25 per cent. The maximum GDP growth during the study period is 117.95 per cent and the minimum is -60.20 per cent.
VOLUME NO. 5 (2015), ISSUE NO. 11 (NOVEMBER) ISSN 2231-5756
INTERNATIONAL JOURNAL OF RESEARCH IN COMMERCE, IT & MANAGEMENT A Monthly Double-Blind Peer Reviewed (Refereed/Juried) Open Access International e-Journal - Included in the International Serial Directories
http://ijrcm.org.in/
24
PEARSON’S CORRELATION CO-EFFICIENT ANALYSIS Consistent with Shin and Soenen (1998), Table 3 provides the Pearson correlation for the variables used in the regression model. Pearson’s correlation analysis is used for data to see the relationship between variables such as those between liquidity (working capital management) and profitability. If efficient working capital management increases profitability, one should expect a negative relationship between the measures of working capital management and profitability variable. There is a negative relationship between gross profitability on the one hand and the measures of working capital management on the other hand. This is consists with the view that the time lag between expenditure for purchases of raw material and the collection of sales of finished goods can be too long, and that decreasing this time lag increases profitability. Table 3 shows that the profitability is negatively related to ARP. The negative relationship of profitability and ARP is consistent with the view that the less time taken by the customer to pay their bills, the more cash is available to replenish the inventory hence leading to more sales which results to an increase in profitability. The table also shows that the profitability is negatively related to ICP. The negative relationship between profitability and ICP can be explained by the fact that industry takes more time in selling inventory, it will adversely affect its profitability due high amount of holding cost. The positive relationship between profitability and APP can be explained by the fact that lagging payments to suppliers ensures that the industry has some cash to purchase more inventory for sales thus increasing its sales levels hence boosting its profits. The negative relationship between profitability and CCC is consistent with the view that the time lag between the expenditure for the purchases of raw materials and the collection of sales of finished goods can be too long and that decreasing the time lag increases profitability (Deloof, 2003). Industry size is positively related to profitability. This means that larger industry report higher profits compared to smaller industry. This may be due to larger industry ability to exploit their economies of scale. Growth, which could be an indicator of a industry business opportunities, is an important factor allowing industry to enjoy improved profitability, as can be seen in the positive sign for the variable growth. With reference to other control variables, leverage and GDPGR, profitability is negatively associated with leverage whereas profitability is positively associated with GDPGR. This efficiency will lead to increasing its profitability. The results of correlation analysis indicate that as far as Indian steel industry are concerned, the liquidity management very significantly and strongly affects their profitability. RELATIONSHIP BETWEEN ACCOUNTS RECEIVABLE PERIOD (ARP) AND PROFITABILITY The results of the regression (Model 1) of ARP with profitability along with other control variables presented in Table 4. The results of this regression indicate that, consistent with Deloof (2003) and Raheman and Nasr (2007) a negative and significant relationship exists between the ARP and profitability in the Indian Steel Industry. This result suggests that industry can improve their profitability by reducing the number of days accounts receivables are outstanding. The result can also be interpreted as the less time takes for customers to pay their bills, the more cash is available to replenish inventory hence the higher the sales realized leading to higher profitability of the industry. The negative coefficient on the ARP suggests that an increase in the number of days accounts receivable by 1 day is associated with a decline in profitability. Consistent with Lazaridis and Tryfonidis (2006), this finding implies that managers can improve profitability by reducing the credit period granted to their customers. This finding implies that a more restrictive credit policy giving customers less time to make their payments improves performance. The size of the industry showed a significant negative relationship with profitability. The results of the regression indicate that the coefficient of growth (as measured by growth of sales) on profitability showed significant and positive relationship with profitability. The study used the debt ratio (measured by debt divided by equity) as a proxy for leverage, it shows a negative relationship with the profitability. This means that, when the leverage of the industry increases, it will adversely affect its profitability. Similarly, GDP growth of the country showed a significant positive relationship with profitability. It reflects that if the country’s GDP increases, the profitability of Indian Steel Industry will also increases. The model’s adjusted R2 is 0.83 per cent with an F-value of 13.07 which is significant (p<0.01). The Durbin Watson statistics is 1.68. RELATIONSHIP BETWEEN INVENTORY CONVERSION PERIOD (ICP) AND PROFITABILITY In Model 2, regression is run using Inventory Conversion Period (ICP) in days as an independent variable as a replacement for Accounts Receivables Period (ARP). The other variables are the same as they have been in the first regression. The result of the regression model is presented in Table 4. It is evident from the table that the co-efficient of inventory conversion period in days is negative in Indian steel industry. Consistent with Reheman and Nasr (2007) and Lezaridis and Tryfonidis (2006) a negative relationship exist between Inventory Conversion Period (ICP) and profitability. This result suggests that the increase or decrease in the ICP in days affects profitability of the industry. It can be interpreted that if inventory takes more time to sell, it will adversely affect profitability. The co-efficient on the other control variables are significant as in case of first regression model. The size is negatively related to profitability and this is significant at 1 per cent level. The results of the regression also showed that growth of sales is positively related to industry profitability. Similarly, the results showed that use of leverage have negative impact on industry profitability. Further, the GDP growth of country is positively related to industry profitability. The model’s adjusted R2 is 87 per cent with an F-value of 16.46 which is significant (p<0.01). The Durbin Watson statistics is 1.80. RELATIONSHIP BETWEEN AVERAGE PAYMENT PERIOD (APP) AND PROFITABILITY The third regression is run using the Average Payment Period (APP) as an independent variable as a substitute of Inventory Conversion Period (ICP) in days. The other control variables are same as they have been in first and second regression. The results of the regression model are presented in Table 4. In model 3, the co-efficient on the average payment period is positive and significant. This suggests that an increase in the number of days accounts payable by 1 day is associated with an increase in profitability. The positive relationship can be explained in two ways. First, contrary to Deloof (2003) and Raheman and Nasr (2007), this finding holds the more profitable industry waits longer to pay their bills. This implies that they withhold their payment to suppliers so as to take advantage of the cash available for their working capital needs. Second, this result makes economic sense in that the longer a industry delays its payments to its creditors, the higher the level of working capital levels it reserves and uses in order to increase profitability. This finding is in line with the working capital management rule that industry should strive to lag their payments to creditors as much as possible, taking care not to spoil their business relationship with them. Consistent with the other models, the industry size is negatively related to profitability, growth and GDP growth being positively related to profitability. Whereas an increase in the use of debt decreases profitability. The models adjusted R2 83 per cent with an F- value of 12.86 which is significant (p<0.01). The Durbin Watson statistic is 1.89. RELATIONSHIP BETWEEN CASH CONVERSION CYCLE (CCC) AND PROFITABILITY In fourth regression model, cash conversion cycle is used as an independent variable instead of ARP, ICP and APP. the other variable are kept the same as they were in first three regressions. The results of the fourth regression model are presented in Table 4. Consistent with Deloof (2003), Raheman and Nasr (2007) and Shin and Soenen (1998), a negative relationship exists between the Cash Conversion Cycle (CCC) and profitability. This supports the notion that the CCC is negatively related with profitability. Shin and Soenen (1998) argued that the negative relation between profits and the cash conversion cycle could be explained by the market power or the market share, i.e., a shorter CCC because of bargaining power by the suppliers and /or the customers as well as higher profitability due to market dominance. The negative relationship between the industry CCC and profitability can also be explained by the fact minimizing the investment in current assets can help in boosting profits. This ensures the liquid cash is not maintained in the business for long and that it is use to generate profits for the industry. The all other control variables showed similar findings as in the case of first three regression equations and significantly affecting profitability. The model’s adjusted R2 is 72 per cent with an F-value of 10.65 which is significant (p<0.01). The Durbin Watson statistics is 10.65. Model 5 acts as a control model for the variables under study. The model was run so as to provide an indicator as to the most significant variables affecting the study. The model shows that all the variables included are significant. In this model, the ARP, ICP, Size and Leverage are negatively related with industry profitability while APP, Growth and GDPGR variables exhibit a positive relationship. The model’s adjusted R2 is 84 per cent with an F-value of 10.25 which is significant (p<0.01). The Durbin Watson statistics is 10.25.
CONCLUSION The study of empirical relationship between liquidity and profitability is one of the areas of performance of corporate enterprise. This study has shown that Indian steel industry has been able to achieve high scores on the various components of working capital and this has positive impact on its profitability. Empirical results of the study found a significant negative relationship between profitability and Accounts Receivable Period (ARP), Inventory Conversion Period (ICP) and Cash
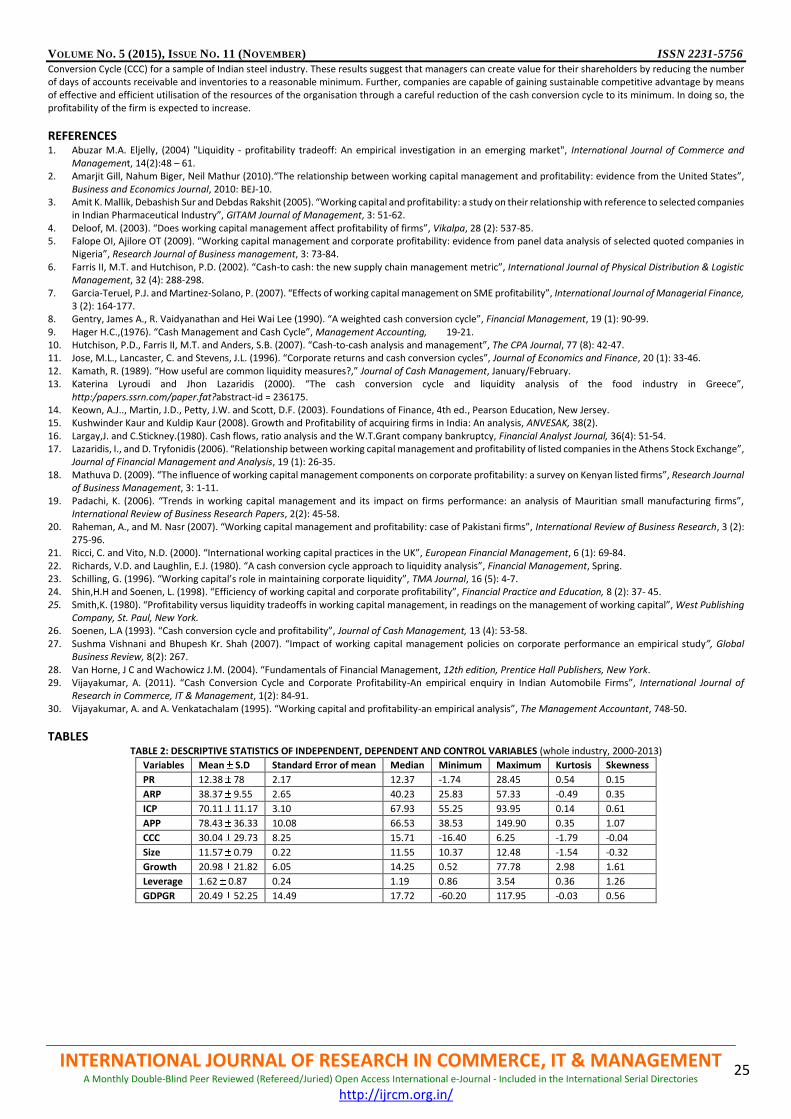
VOLUME NO. 5 (2015), ISSUE NO. 11 (NOVEMBER) ISSN 2231-5756
INTERNATIONAL JOURNAL OF RESEARCH IN COMMERCE, IT & MANAGEMENT A Monthly Double-Blind Peer Reviewed (Refereed/Juried) Open Access International e-Journal - Included in the International Serial Directories
http://ijrcm.org.in/
25
Conversion Cycle (CCC) for a sample of Indian steel industry. These results suggest that managers can create value for their shareholders by reducing the number of days of accounts receivable and inventories to a reasonable minimum. Further, companies are capable of gaining sustainable competitive advantage by means of effective and efficient utilisation of the resources of the organisation through a careful reduction of the cash conversion cycle to its minimum. In doing so, the profitability of the firm is expected to increase.
REFERENCES 1. Abuzar M.A. Eljelly, (2004) "Liquidity ‐ profitability tradeoff: An empirical investigation in an emerging market", International Journal of Commerce and
Management, 14(2):48 – 61. 2. Amarjit Gill, Nahum Biger, Neil Mathur (2010).“The relationship between working capital management and profitability: evidence from the United States”,
Business and Economics Journal, 2010: BEJ-10. 3. Amit K. Mallik, Debashish Sur and Debdas Rakshit (2005). “Working capital and profitability: a study on their relationship with reference to selected companies
in Indian Pharmaceutical Industry”, GITAM Journal of Management, 3: 51-62. 4. Deloof, M. (2003). “Does working capital management affect profitability of firms”, Vikalpa, 28 (2): 537-85. 5. Falope OI, Ajilore OT (2009). “Working capital management and corporate profitability: evidence from panel data analysis of selected quoted companies in
Nigeria”, Research Journal of Business management, 3: 73-84. 6. Farris II, M.T. and Hutchison, P.D. (2002). “Cash-to cash: the new supply chain management metric”, International Journal of Physical Distribution & Logistic
Management, 32 (4): 288-298. 7. Garcia-Teruel, P.J. and Martinez-Solano, P. (2007). “Effects of working capital management on SME profitability”, International Journal of Managerial Finance,
3 (2): 164-177. 8. Gentry, James A., R. Vaidyanathan and Hei Wai Lee (1990). “A weighted cash conversion cycle”, Financial Management, 19 (1): 90-99. 9. Hager H.C.,(1976). “Cash Management and Cash Cycle”, Management Accounting, 19-21. 10. Hutchison, P.D., Farris II, M.T. and Anders, S.B. (2007). “Cash-to-cash analysis and management”, The CPA Journal, 77 (8): 42-47. 11. Jose, M.L., Lancaster, C. and Stevens, J.L. (1996). “Corporate returns and cash conversion cycles”, Journal of Economics and Finance, 20 (1): 33-46. 12. Kamath, R. (1989). “How useful are common liquidity measures?,” Journal of Cash Management, January/February. 13. Katerina Lyroudi and Jhon Lazaridis (2000). “The cash conversion cycle and liquidity analysis of the food industry in Greece”,
http:/papers.ssrn.com/paper.fat?abstract-id = 236175. 14. Keown, A.J.., Martin, J.D., Petty, J.W. and Scott, D.F. (2003). Foundations of Finance, 4th ed., Pearson Education, New Jersey. 15. Kushwinder Kaur and Kuldip Kaur (2008). Growth and Profitability of acquiring firms in India: An analysis, ANVESAK, 38(2). 16. Largay,J. and C.Stickney.(1980). Cash flows, ratio analysis and the W.T.Grant company bankruptcy, Financial Analyst Journal, 36(4): 51-54. 17. Lazaridis, I., and D. Tryfonidis (2006). “Relationship between working capital management and profitability of listed companies in the Athens Stock Exchange”,
Journal of Financial Management and Analysis, 19 (1): 26-35. 18. Mathuva D. (2009). “The influence of working capital management components on corporate profitability: a survey on Kenyan listed firms”, Research Journal
of Business Management, 3: 1-11. 19. Padachi, K. (2006). “Trends in working capital management and its impact on firms performance: an analysis of Mauritian small manufacturing firms”,
International Review of Business Research Papers, 2(2): 45-58. 20. Raheman, A., and M. Nasr (2007). “Working capital management and profitability: case of Pakistani firms”, International Review of Business Research, 3 (2):
275-96. 21. Ricci, C. and Vito, N.D. (2000). “International working capital practices in the UK”, European Financial Management, 6 (1): 69-84. 22. Richards, V.D. and Laughlin, E.J. (1980). “A cash conversion cycle approach to liquidity analysis”, Financial Management, Spring. 23. Schilling, G. (1996). “Working capital’s role in maintaining corporate liquidity”, TMA Journal, 16 (5): 4-7. 24. Shin,H.H and Soenen, L. (1998). “Efficiency of working capital and corporate profitability”, Financial Practice and Education, 8 (2): 37- 45. 25. Smith,K. (1980). “Profitability versus liquidity tradeoffs in working capital management, in readings on the management of working capital”, West Publishing
Company, St. Paul, New York. 26. Soenen, L.A (1993). “Cash conversion cycle and profitability”, Journal of Cash Management, 13 (4): 53-58. 27. Sushma Vishnani and Bhupesh Kr. Shah (2007). “Impact of working capital management policies on corporate performance an empirical study”, Global
Business Review, 8(2): 267. 28. Van Horne, J C and Wachowicz J.M. (2004). “Fundamentals of Financial Management, 12th edition, Prentice Hall Publishers, New York. 29. Vijayakumar, A. (2011). “Cash Conversion Cycle and Corporate Profitability-An empirical enquiry in Indian Automobile Firms”, International Journal of
Research in Commerce, IT & Management, 1(2): 84-91. 30. Vijayakumar, A. and A. Venkatachalam (1995). “Working capital and profitability-an empirical analysis”, The Management Accountant, 748-50.
TABLES TABLE 2: DESCRIPTIVE STATISTICS OF INDEPENDENT, DEPENDENT AND CONTROL VARIABLES (whole industry, 2000-2013)
Variables Mean S.D Standard Error of mean Median Minimum Maximum Kurtosis Skewness
PR 12.38 78 2.17 12.37 -1.74 28.45 0.54 0.15
ARP 38.37 9.55 2.65 40.23 25.83 57.33 -0.49 0.35
ICP 70.11 11.17 3.10 67.93 55.25 93.95 0.14 0.61
APP 78.43 36.33 10.08 66.53 38.53 149.90 0.35 1.07
CCC 30.04 29.73 8.25 15.71 -16.40 6.25 -1.79 -0.04
Size 11.57 0.79 0.22 11.55 10.37 12.48 -1.54 -0.32
Growth 20.98 21.82 6.05 14.25 0.52 77.78 2.98 1.61
Leverage 1.62 0.87 0.24 1.19 0.86 3.54 0.36 1.26
GDPGR 20.49 52.25 14.49 17.72 -60.20 117.95 -0.03 0.56
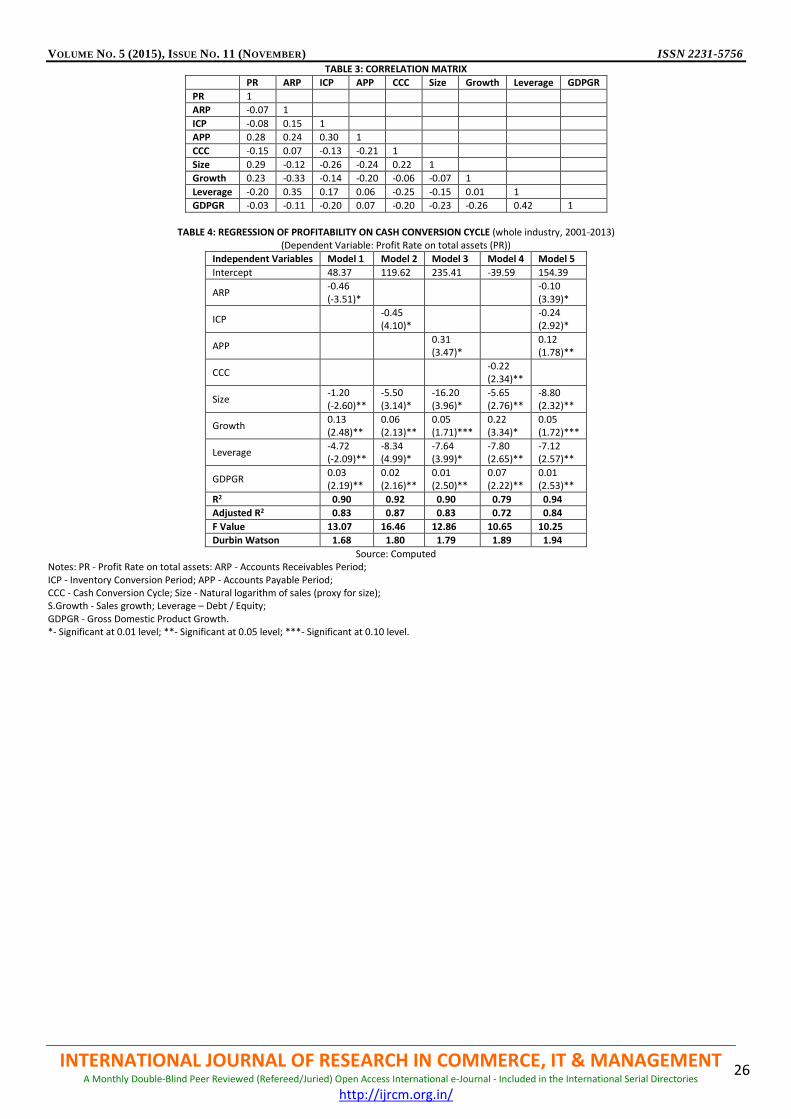
VOLUME NO. 5 (2015), ISSUE NO. 11 (NOVEMBER) ISSN 2231-5756
INTERNATIONAL JOURNAL OF RESEARCH IN COMMERCE, IT & MANAGEMENT A Monthly Double-Blind Peer Reviewed (Refereed/Juried) Open Access International e-Journal - Included in the International Serial Directories
http://ijrcm.org.in/
26
TABLE 3: CORRELATION MATRIX
PR ARP ICP APP CCC Size Growth Leverage GDPGR
PR 1
ARP -0.07 1
ICP -0.08 0.15 1
APP 0.28 0.24 0.30 1
CCC -0.15 0.07 -0.13 -0.21 1
Size 0.29 -0.12 -0.26 -0.24 0.22 1
Growth 0.23 -0.33 -0.14 -0.20 -0.06 -0.07 1
Leverage -0.20 0.35 0.17 0.06 -0.25 -0.15 0.01 1
GDPGR -0.03 -0.11 -0.20 0.07 -0.20 -0.23 -0.26 0.42 1
TABLE 4: REGRESSION OF PROFITABILITY ON CASH CONVERSION CYCLE (whole industry, 2001-2013)
(Dependent Variable: Profit Rate on total assets (PR))
Independent Variables Model 1 Model 2 Model 3 Model 4 Model 5
Intercept 48.37 119.62 235.41 -39.59 154.39
ARP -0.46 (-3.51)*
-0.10 (3.39)*
ICP -0.45 (4.10)*
-0.24 (2.92)*
APP 0.31 (3.47)*
0.12 (1.78)**
CCC -0.22 (2.34)**
Size -1.20 (-2.60)**
-5.50 (3.14)*
-16.20 (3.96)*
-5.65 (2.76)**
-8.80 (2.32)**
Growth 0.13 (2.48)**
0.06 (2.13)**
0.05 (1.71)***
0.22 (3.34)*
0.05 (1.72)***
Leverage -4.72 (-2.09)**
-8.34 (4.99)*
-7.64 (3.99)*
-7.80 (2.65)**
-7.12 (2.57)**
GDPGR 0.03 (2.19)**
0.02 (2.16)**
0.01 (2.50)**
0.07 (2.22)**
0.01 (2.53)**
R2 0.90 0.92 0.90 0.79 0.94
Adjusted R2 0.83 0.87 0.83 0.72 0.84
F Value 13.07 16.46 12.86 10.65 10.25
Durbin Watson 1.68 1.80 1.79 1.89 1.94
Source: Computed Notes: PR - Profit Rate on total assets: ARP - Accounts Receivables Period; ICP - Inventory Conversion Period; APP - Accounts Payable Period; CCC - Cash Conversion Cycle; Size - Natural logarithm of sales (proxy for size); S.Growth - Sales growth; Leverage – Debt / Equity; GDPGR - Gross Domestic Product Growth. *- Significant at 0.01 level; **- Significant at 0.05 level; ***- Significant at 0.10 level.
VOLUME NO. 5 (2015), ISSUE NO. 11 (NOVEMBER) ISSN 2231-5756
INTERNATIONAL JOURNAL OF RESEARCH IN COMMERCE, IT & MANAGEMENT A Monthly Double-Blind Peer Reviewed (Refereed/Juried) Open Access International e-Journal - Included in the International Serial Directories
http://ijrcm.org.in/
27
A CRITICAL STUDY ON THE PRESENT POSITION OF MANAGEMENT EDUCATION IN ASSAM
DR. ARABINDA DEBNATH HEAD
DEPARTMENT OF HUMANITIES & SOCIAL SCIENCE B. B. ENGINEERING COLLEGE
KOKRAJHAR
PRODIPTA RONGPIPI RESEARCH SCHOLAR
ASSAM DOWNTOWN UNIVERSITY GUWAHATI
ABSTRACT
Through this paper an attempt is being taken to carry out a critical study on the present position of management education in Assam. With a view to systematize the discussion on the topic referred to here, the entire paper is divided into three parts. The first part entitled, “Theoretical Approach” which includes an Introduction, Meaning and concept of management education, Objective of the study, Methodology of the study and Significant of the study. The second part entitled “Management education in Assam” is a comprehensive study where its present position is reflected through status of the curriculum, teaching procedures and learning systems. The third part entitled Conclusion, where some major findings are identified and some suitable suggestions are also given.
KEYWORDS
management, education.
THEORETICAL APPROACH 1.1. INTRODUCTION
otwithstanding its immense importance in producing entrepreneurs for the socio-economic development, the prevailing system of management education in Assam miserably failed to contribute towards this aspect. It is because of the fact that the design of curriculum, selection of teachers, teaching methodology with the education policy adopted by the Assam Govt. for imparting management education are not exercised appropriately in the context
of producing entrepreneurs for the socio-economic development of the State . Due to the devoid of above mentioned factors, the expenditure of management education incurred in Assam cannot be utilized in productive way for the overall socio-economic development of the state. The absence of practical approach in the management education system cannot encourage the qualified management educated persons towards the field of business and industries. It is observed that there is a high possibility in developing socio-economic situation of Assam by utilizing those management qualified persons for the socio-economic development if they are made by systematic management education having pragmatic approach affectively. 1.2. MEANING AND CONCEPT OF MANAGEMENT EDUCATION Management education is an academic discipline by which students are taught to be business leaders, managers and university professors in business education. Management education focuses on producing efficient and successful future business leaders who can be able to tackle difficult complex situation. Through theory and knowledge of management practice, students learn how to develop the leadership capabilities necessary to run a team of workers. Part of the curriculum focuses on assessing and evaluating teams in order to examine the role as a manager. People who specialize in management education must be able to adapt to changes in laws, regulations and trends. The present world is full of competition and many new technologies are emerging each day. To survive in this challenging environment, management education plays a vital role. Management Education can trigger the entrepreneurial spirit in a society. The liberalization of Indian economy has encouraged the growth of management education both in graduate and post graduate program. Because of the huge demand, many institutes have started management courses in the past few years. Management education can also help in enhancing the existing skills of the students. In the recent years, management education has attained a very important position in the realm of higher education in India. It has carved a niche for itself amongst other professional courses like engineering, medical etc. The prime reason behind this is mainly the element of job certainty that came to be associated with anyone possessing this degree/diploma. This was primarily because with India liberalizing in 1991, there was an urgent need for skilled and professional manpower to man the private organizations. 1.3. OBJECTIVE OF THE STUDY The basic objective of the study is to analyse the present position of management education in Assam. The study examine as to how the management education can contribute towards the socio economic development of Assam. Inorder to fulfill the basic objective following three specific objectives have been taken under study:- I. To review the present curriculum of management education in Assam. II. To critically analyse the present teaching and learning system of existing management education of Assam. III. To evaluate the Government policy. 1.4. RESEARCH QUESTION In order to examine the above specific objectives, the following Research Questions (R.Q) are taken under study and these questions are explained in the appropriate content of the Part II. R.Q. I. Is the present curriculum of Management education in Assam designed according to the need of its social demand and requirement? R.Q. II. Is the present teaching and learning system of Management education in Assam made scientifically and systematically? R.Q. III. Is the existing Government policy appropriate and scientific? 1.5. METHODOLOGY OF THE STUDY The study is based on both primary and secondary data. The primary data are compiled by the technique of field survey, personal interview and questionnaires. It is estimated that there are nine Universities imparting management education in Assam out of which five are Government universities, one is Government Institute and three are private universities. It is not easily possible to conduct a throughout study on all of these universities. So only two Universities from Government and two from private Universities are taken, considering its seniority as shown below:
N
VOLUME NO. 5 (2015), ISSUE NO. 11 (NOVEMBER) ISSN 2231-5756
INTERNATIONAL JOURNAL OF RESEARCH IN COMMERCE, IT & MANAGEMENT A Monthly Double-Blind Peer Reviewed (Refereed/Juried) Open Access International e-Journal - Included in the International Serial Directories
http://ijrcm.org.in/
28
TABLE NO. 1: LIST OF UNIVERSITIES IMPARTING MANAGEMENT EDUCATION IN ASSAM
Sl Name Location Type Level Year of Establishment
Courses offered
1 Gauhati University Gopinath Bordoloi Nagar, Guwahati
University State University
1948 BBA, MBA, PGDHRM, PGDSMM, PGDBM, PGDFM, PGDIM, PGDBFS & Ph. D.
2 Dibrugarh University Dibrugarh University State University
1965 BBA, MBA & Ph. D.
3 Assam DonBosco University
Azara, Guwahati University Private University
2009 MBA & Ph. D.
4 Assam Downtown University
Panikhaiti, Guwahati University Private University
2010
BBA, MBA & Ph. D.
Source: Compiled from field survey and personal interview In order to elicit the views and attitude of various relevant persons through questionnaires a group of 100 respondents are constituted as follows:
TABLE NO. 2: LIST OF RESPONDENTS
Category Number
Teacher 36
Student 45
Educationalist (Chancellor, Vice-Chancellor, Registrar, Senior Educated Citizen) . 19
total 100
Source: Field survey and Personal Interview. On the other hand the secondary data are compiled from various books, journals, newspapers and reports and relevant websites. Both primary and secondary data are analysed and explained with the help of various statistical techniques such as tabular, diagram, time series analysis. 1.6. SIGNIFICANT OF THE STUDY The study of Management Education is immensely important for producing entrepreneurs for socio economic development of Assam. The development of management education not only helps in enhancing economic aspects such as Human Resource Development, Marketing and Financial Development but also can contribute towards the upliftment of social position by providing adequate and quality goods and services creating employment opportunities, industrialization, national income etc. Hence it is to be said that management education can create a strong foundation on which overall socio economic development of a state or a country can be definitely expected. It is the reason why there is the need of carrying out a careful research work on the topic referred to here, so that in case of Assam a quality management education can be built up and this education will provide a strong basis of overall socio economic development of Assam.
MANAGEMENT EDUCATION IN ASSAM Like other states of India, management education in Assam is borrowed from western country. Inorder to enhance the social benefit from management education its prevailing system in Assam should be immediately reformed. In this paper a discussion is made only on three important dimensions of management education in Assam. The study attempts to examine and review these three dimensions and observe as how far this part of management education can contribute towards the socio economic development of Assam along with identifying various problems. 2.1. CURRICULUM OF MANAGEMENT EDUCATION IN ASSAM: To make the management education effective and beneficial towards the state, its curriculum should be designed in the light of its socio economic environment. In this connection below we discuss the curriculum of four selected Universities as how far these are designed considering the requirement of socio economic position of Assam. 2.1.1. IN GAUHATI UNIVERSITY The MBA programme at Gauhati University is a two year, full-time programme, approved by AICTE. “The program aims to groom students into competent professional managers with: 1. a capacity to learn & adapt to national & international environment. 2. an orientation towards achieving excellence, maintaining high ethical standards. 3. a capacity to work effectively & efficiently, both individually & in groups.” It is a two year programme, each consisting of two semesters and the students spend eight weeks on a summer project in a business organization. The programme offers dual specialization in the areas of Marketing, Finance, Personnel Management, Production Management. 2.1.2. IN DIBRUGARH UNIVERSITY The Centre of Management Studies of Dibrugarh University offers 2-year full time Master of Business Administration (MBA) Programme. The programme offers dual specialization in the areas of “Marketing management (MM)/Financial Management (FM)/Human Resource Management (HRM)/Systems Management (SM) Small Business and Entrepreneurship Development (SBED).” 2.1.3. IN ASSAM DON BOSCO UNIVERSITY The Don Bosco Institute of Management offers Master of Business Administration (MBA) program,which is a two-year full time program for graduate students from all disciplines who aspire to choose a career in Management. “DBIM follows a trimester system - one academic year consisting of three trimesters. Hence, the two-year program would have a total of six trimesters.” Each trimester/term lasts for four months (inclusive of contact hours, holidays, exam schedules, etc) The Elective courses are categorized under Areas of Concentration (AoC). Students can opt for any elective or a group of electives from the same or under different areas of concentration. The AoCs and the elective courses are defined by functional areas and are Marketing, Accounting & Finance, Human Resource, Information Systems/Operation, General Management 2.1.4. IN ASSAM DOWNTOWN UNIVERSITY The Assam Down Town University offers “two years full time MBA program with specializations in Marketing, Finance, Human Resource, Operations and Administration.” The MBA program offers a lucrative career option to both experienced professionals as well as freshers. QUESTIONNAIRE ANALYSIS In order to elicit the views of selected respondents regarding the prevailing curriculum the following questions is put to them. Q.1. According to you what is the level of suitability associated with the prevailing curriculum of management education in selected four universities with the socio economic condition of Assam?
Not Suitable To some extent suitable Suitable to a great extent Perfectly Suitable
Against putting this question to 100 respondents 54% respondents said that it is not suitable, whereas 26% respondents said as to some extent suitable. According to 17% respondents, it is suitable to a great extent and remaining 3% respondents opine that perfectly suitable which is depicted in the following diagram.
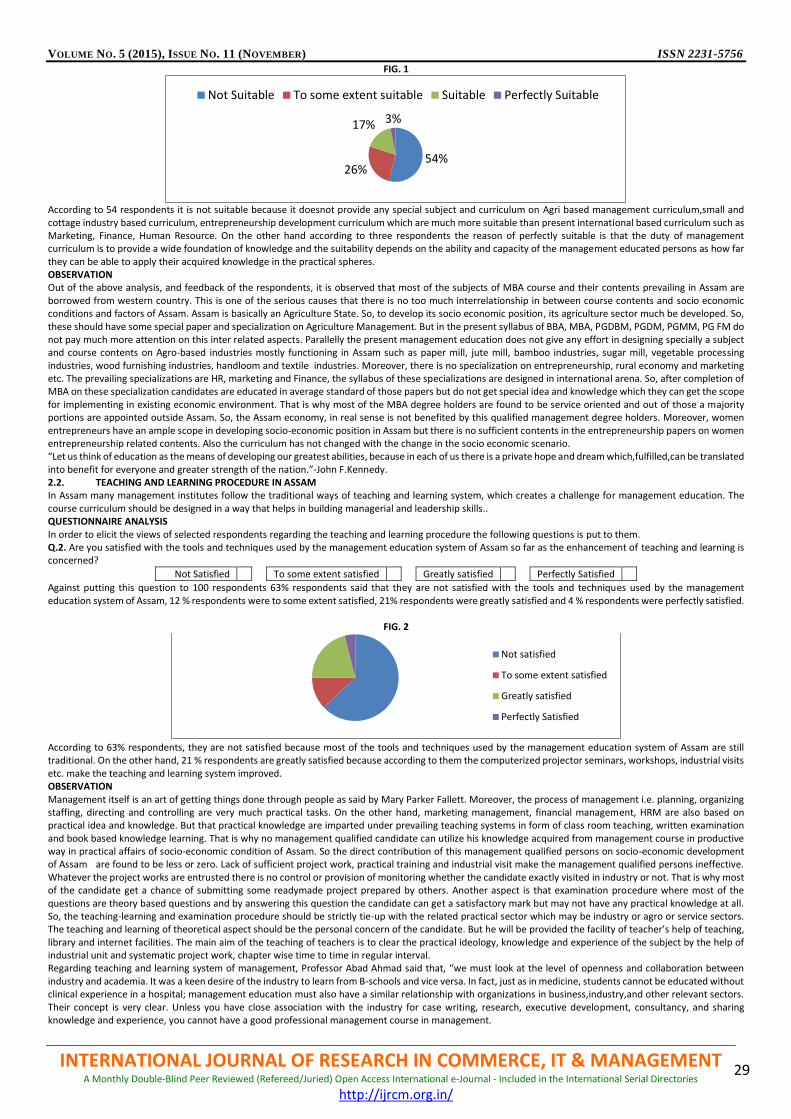
VOLUME NO. 5 (2015), ISSUE NO. 11 (NOVEMBER) ISSN 2231-5756
INTERNATIONAL JOURNAL OF RESEARCH IN COMMERCE, IT & MANAGEMENT A Monthly Double-Blind Peer Reviewed (Refereed/Juried) Open Access International e-Journal - Included in the International Serial Directories
http://ijrcm.org.in/
29
FIG. 1
According to 54 respondents it is not suitable because it doesnot provide any special subject and curriculum on Agri based management curriculum,small and cottage industry based curriculum, entrepreneurship development curriculum which are much more suitable than present international based curriculum such as Marketing, Finance, Human Resource. On the other hand according to three respondents the reason of perfectly suitable is that the duty of management curriculum is to provide a wide foundation of knowledge and the suitability depends on the ability and capacity of the management educated persons as how far they can be able to apply their acquired knowledge in the practical spheres. OBSERVATION Out of the above analysis, and feedback of the respondents, it is observed that most of the subjects of MBA course and their contents prevailing in Assam are borrowed from western country. This is one of the serious causes that there is no too much interrelationship in between course contents and socio economic conditions and factors of Assam. Assam is basically an Agriculture State. So, to develop its socio economic position, its agriculture sector much be developed. So, these should have some special paper and specialization on Agriculture Management. But in the present syllabus of BBA, MBA, PGDBM, PGDM, PGMM, PG FM do not pay much more attention on this inter related aspects. Parallelly the present management education does not give any effort in designing specially a subject and course contents on Agro-based industries mostly functioning in Assam such as paper mill, jute mill, bamboo industries, sugar mill, vegetable processing industries, wood furnishing industries, handloom and textile industries. Moreover, there is no specialization on entrepreneurship, rural economy and marketing etc. The prevailing specializations are HR, marketing and Finance, the syllabus of these specializations are designed in international arena. So, after completion of MBA on these specialization candidates are educated in average standard of those papers but do not get special idea and knowledge which they can get the scope for implementing in existing economic environment. That is why most of the MBA degree holders are found to be service oriented and out of those a majority portions are appointed outside Assam. So, the Assam economy, in real sense is not benefited by this qualified management degree holders. Moreover, women entrepreneurs have an ample scope in developing socio-economic position in Assam but there is no sufficient contents in the entrepreneurship papers on women entrepreneurship related contents. Also the curriculum has not changed with the change in the socio economic scenario. “Let us think of education as the means of developing our greatest abilities, because in each of us there is a private hope and dream which,fulfilled,can be translated into benefit for everyone and greater strength of the nation.”-John F.Kennedy. 2.2. TEACHING AND LEARNING PROCEDURE IN ASSAM In Assam many management institutes follow the traditional ways of teaching and learning system, which creates a challenge for management education. The course curriculum should be designed in a way that helps in building managerial and leadership skills.. QUESTIONNAIRE ANALYSIS In order to elicit the views of selected respondents regarding the teaching and learning procedure the following questions is put to them. Q.2. Are you satisfied with the tools and techniques used by the management education system of Assam so far as the enhancement of teaching and learning is concerned?
Not Satisfied To some extent satisfied Greatly satisfied Perfectly Satisfied
Against putting this question to 100 respondents 63% respondents said that they are not satisfied with the tools and techniques used by the management education system of Assam, 12 % respondents were to some extent satisfied, 21% respondents were greatly satisfied and 4 % respondents were perfectly satisfied.
FIG. 2
According to 63% respondents, they are not satisfied because most of the tools and techniques used by the management education system of Assam are still traditional. On the other hand, 21 % respondents are greatly satisfied because according to them the computerized projector seminars, workshops, industrial visits etc. make the teaching and learning system improved. OBSERVATION Management itself is an art of getting things done through people as said by Mary Parker Fallett. Moreover, the process of management i.e. planning, organizing staffing, directing and controlling are very much practical tasks. On the other hand, marketing management, financial management, HRM are also based on practical idea and knowledge. But that practical knowledge are imparted under prevailing teaching systems in form of class room teaching, written examination and book based knowledge learning. That is why no management qualified candidate can utilize his knowledge acquired from management course in productive way in practical affairs of socio-economic condition of Assam. So the direct contribution of this management qualified persons on socio-economic development of Assam are found to be less or zero. Lack of sufficient project work, practical training and industrial visit make the management qualified persons ineffective. Whatever the project works are entrusted there is no control or provision of monitoring whether the candidate exactly visited in industry or not. That is why most of the candidate get a chance of submitting some readymade project prepared by others. Another aspect is that examination procedure where most of the questions are theory based questions and by answering this question the candidate can get a satisfactory mark but may not have any practical knowledge at all. So, the teaching-learning and examination procedure should be strictly tie-up with the related practical sector which may be industry or agro or service sectors. The teaching and learning of theoretical aspect should be the personal concern of the candidate. But he will be provided the facility of teacher’s help of teaching, library and internet facilities. The main aim of the teaching of teachers is to clear the practical ideology, knowledge and experience of the subject by the help of industrial unit and systematic project work, chapter wise time to time in regular interval. Regarding teaching and learning system of management, Professor Abad Ahmad said that, “we must look at the level of openness and collaboration between industry and academia. It was a keen desire of the industry to learn from B-schools and vice versa. In fact, just as in medicine, students cannot be educated without clinical experience in a hospital; management education must also have a similar relationship with organizations in business,industry,and other relevant sectors. Their concept is very clear. Unless you have close association with the industry for case writing, research, executive development, consultancy, and sharing knowledge and experience, you cannot have a good professional management course in management.
54%26%
17% 3%
Not Suitable To some extent suitable Suitable Perfectly Suitable
Not satisfied
To some extent satisfied
Greatly satisfied
Perfectly Satisfied
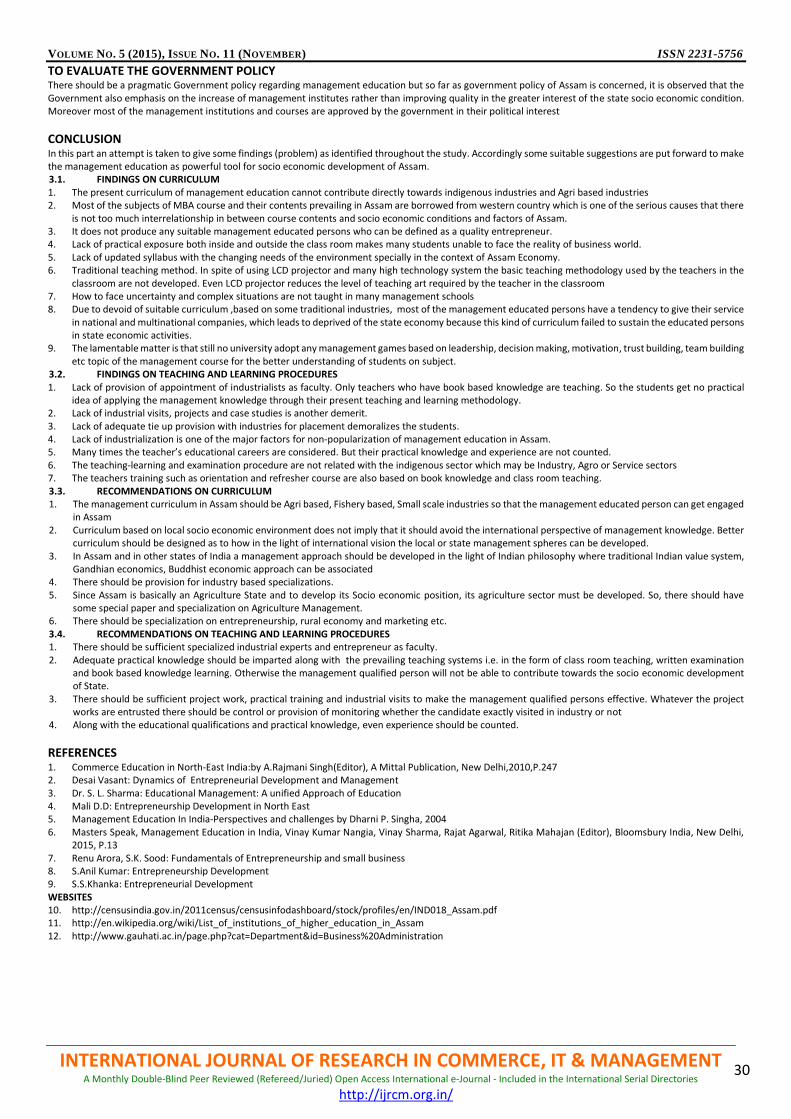
VOLUME NO. 5 (2015), ISSUE NO. 11 (NOVEMBER) ISSN 2231-5756
INTERNATIONAL JOURNAL OF RESEARCH IN COMMERCE, IT & MANAGEMENT A Monthly Double-Blind Peer Reviewed (Refereed/Juried) Open Access International e-Journal - Included in the International Serial Directories
http://ijrcm.org.in/
30
TO EVALUATE THE GOVERNMENT POLICY There should be a pragmatic Government policy regarding management education but so far as government policy of Assam is concerned, it is observed that the Government also emphasis on the increase of management institutes rather than improving quality in the greater interest of the state socio economic condition. Moreover most of the management institutions and courses are approved by the government in their political interest
CONCLUSION In this part an attempt is taken to give some findings (problem) as identified throughout the study. Accordingly some suitable suggestions are put forward to make the management education as powerful tool for socio economic development of Assam. 3.1. FINDINGS ON CURRICULUM 1. The present curriculum of management education cannot contribute directly towards indigenous industries and Agri based industries 2. Most of the subjects of MBA course and their contents prevailing in Assam are borrowed from western country which is one of the serious causes that there
is not too much interrelationship in between course contents and socio economic conditions and factors of Assam. 3. It does not produce any suitable management educated persons who can be defined as a quality entrepreneur. 4. Lack of practical exposure both inside and outside the class room makes many students unable to face the reality of business world. 5. Lack of updated syllabus with the changing needs of the environment specially in the context of Assam Economy. 6. Traditional teaching method. In spite of using LCD projector and many high technology system the basic teaching methodology used by the teachers in the
classroom are not developed. Even LCD projector reduces the level of teaching art required by the teacher in the classroom 7. How to face uncertainty and complex situations are not taught in many management schools 8. Due to devoid of suitable curriculum ,based on some traditional industries, most of the management educated persons have a tendency to give their service
in national and multinational companies, which leads to deprived of the state economy because this kind of curriculum failed to sustain the educated persons in state economic activities.
9. The lamentable matter is that still no university adopt any management games based on leadership, decision making, motivation, trust building, team building etc topic of the management course for the better understanding of students on subject.
3.2. FINDINGS ON TEACHING AND LEARNING PROCEDURES 1. Lack of provision of appointment of industrialists as faculty. Only teachers who have book based knowledge are teaching. So the students get no practical
idea of applying the management knowledge through their present teaching and learning methodology. 2. Lack of industrial visits, projects and case studies is another demerit. 3. Lack of adequate tie up provision with industries for placement demoralizes the students. 4. Lack of industrialization is one of the major factors for non-popularization of management education in Assam. 5. Many times the teacher’s educational careers are considered. But their practical knowledge and experience are not counted. 6. The teaching-learning and examination procedure are not related with the indigenous sector which may be Industry, Agro or Service sectors 7. The teachers training such as orientation and refresher course are also based on book knowledge and class room teaching. 3.3. RECOMMENDATIONS ON CURRICULUM 1. The management curriculum in Assam should be Agri based, Fishery based, Small scale industries so that the management educated person can get engaged
in Assam 2. Curriculum based on local socio economic environment does not imply that it should avoid the international perspective of management knowledge. Better
curriculum should be designed as to how in the light of international vision the local or state management spheres can be developed. 3. In Assam and in other states of India a management approach should be developed in the light of Indian philosophy where traditional Indian value system,
Gandhian economics, Buddhist economic approach can be associated 4. There should be provision for industry based specializations. 5. Since Assam is basically an Agriculture State and to develop its Socio economic position, its agriculture sector must be developed. So, there should have
some special paper and specialization on Agriculture Management. 6. There should be specialization on entrepreneurship, rural economy and marketing etc. 3.4. RECOMMENDATIONS ON TEACHING AND LEARNING PROCEDURES 1. There should be sufficient specialized industrial experts and entrepreneur as faculty. 2. Adequate practical knowledge should be imparted along with the prevailing teaching systems i.e. in the form of class room teaching, written examination
and book based knowledge learning. Otherwise the management qualified person will not be able to contribute towards the socio economic development of State.
3. There should be sufficient project work, practical training and industrial visits to make the management qualified persons effective. Whatever the project works are entrusted there should be control or provision of monitoring whether the candidate exactly visited in industry or not
4. Along with the educational qualifications and practical knowledge, even experience should be counted.
REFERENCES 1. Commerce Education in North-East India:by A.Rajmani Singh(Editor), A Mittal Publication, New Delhi,2010,P.247 2. Desai Vasant: Dynamics of Entrepreneurial Development and Management 3. Dr. S. L. Sharma: Educational Management: A unified Approach of Education 4. Mali D.D: Entrepreneurship Development in North East 5. Management Education In India-Perspectives and challenges by Dharni P. Singha, 2004 6. Masters Speak, Management Education in India, Vinay Kumar Nangia, Vinay Sharma, Rajat Agarwal, Ritika Mahajan (Editor), Bloomsbury India, New Delhi,
2015, P.13 7. Renu Arora, S.K. Sood: Fundamentals of Entrepreneurship and small business 8. S.Anil Kumar: Entrepreneurship Development 9. S.S.Khanka: Entrepreneurial Development WEBSITES 10. http://censusindia.gov.in/2011census/censusinfodashboard/stock/profiles/en/IND018_Assam.pdf 11. http://en.wikipedia.org/wiki/List_of_institutions_of_higher_education_in_Assam 12. http://www.gauhati.ac.in/page.php?cat=Department&id=Business%20Administration
VOLUME NO. 5 (2015), ISSUE NO. 11 (NOVEMBER) ISSN 2231-5756
INTERNATIONAL JOURNAL OF RESEARCH IN COMMERCE, IT & MANAGEMENT A Monthly Double-Blind Peer Reviewed (Refereed/Juried) Open Access International e-Journal - Included in the International Serial Directories
http://ijrcm.org.in/
31
READING HABITS AMONG TEACHERS IN COLLEGES
DR. VIBHAVARI B.HATE LIBRARIAN
KARMAVIR MAHAVIDYALAYA MUL
ABSTRACT
An education system of a country plays a key role in achieving the development of society. It determines the destiny of its nationals. Colleges are the first door steps towards higher education, opening new vistas of knowledge to learners and making them responsive and responsible to the problems of society. Apart from teaching the respective subjects, these are supposed to develop and sharpen the abilities of learning among students. The effectiveness of a teaching system depends upon the teaching skills of teachers. An attempt has been made to study the reading habits of teachers at Wardha District affiliated to RTM, Nagpur University and based on the findings conclusions have been drawn and suggestions have been offered.
KEYWORDS reading habits, education system.
INTRODUCTION eading is the act of interpreting printed and written words; it is a basic tool of education and one of the important skills in day today life. We live in the world of print and electronic media of communication, reading helps in acquiring newer ideas, in providing the needed information, seek support for our ideas and also help in adding to personal pleasure and broaden our mental horizon. Reading helps in improving vocabulary. Librarians are expected to
perform dual tasks of selecting acquiring, organizing and disseminating of reading materials and to cater to the requisites of the users. Promoting library use and reading habit are much tougher and challenging jobs. Working for inculcation of reading habit among faculty members community is more relevant in college libraries. Programs and activities for promoting reading habit and library use have to be diverse according to the faculty member intensity, college libraries plays a significant role to play in rendering effective service to the readers. (Srivastavat, 1979) Reading is one of the four language skills: reading, listening, writing and speaking. Reading and listening are also called receptive skills because we receive a message. The word “read“ is explained in dictionaries mainly as ability to look and understand written words. It involves making sense of the text, it is also a process of taking information from written text and following the writer´s ideas. Although reading is sometimes called a passive skill because the reader does not produce messages, it requires being active in the process of reading. In this age of knowledge explosion, reading as a means of communication continuous to enjoy the significance and respect it had from times immemorial. It takes its place as a way of receiving ideas, along with listening to people directly listening to the radio, watching the television and other electronic media of Communication the place occupied by books and other printed material in the advancement of knowledge and facilitation of communication is unique. The ability to read is not only basis of education but also an essential prerequisite of a civilized society. Education is the right of all in a democratic society. And for each person in order to be educated there is an irreducible minimum of information and understanding, which must be acquired, and this minimum is constantly increasing. This quantity of reading material in the form of newspapers, magazines, pamphlets and books has increased to staggering heights. This trend reveals the fact that the growing popularity of media communication like TV and Cinema has not admonished the innate urge of the young and old to go inform more reading materials. Of all the valuable skills the average person learns in his lifetime, the ability to read is the most universal and useful. One of the major goals of the school library is to inspire a love for reading to promote a reading culture among its Users. This implies the need to create the awareness of written letters, the need to read not only textbooks but also to engage in creative, leisurely, and pleasurable reading. Reading is usually a private act, a personal and individual relationship with a book; but then, it is the environment as long as it is favourable, which according to Gault encourages the setting up of this relationship. The school library must in this case serve as the needed environment. And this it should do, by integrating itself completely into the educational system to achieve the overall objectives of the school. And what, better ways are there to do this than to stimulate the intellectual growth of the child through the provision of appropriate Instructional materials for teachers and reading materials for students. It should go further by not only transforming itself into a research centre of some sort where students are taught how to sift data through independent reading, but also by providing a workshop setting for supervised studies of individuals and groups. (Gault, 1982)
AIMS AND OBJECTIVES OF THE STUDY The study has been carried out with following aims and objectives
To analyze the reading habits among college faculty members.
The information sources they use to meet teaching and research needs and to study how for the libraries are able to meet their need.
To find out Professional Contribution of faculty members.
To study which literature is widely used for general reading.
To study the difficulties to developing reading habits.
To study the library Services are helpful for their reading faculty members and research needs
To study the willingness of teachers to use and read online literature
SCOPE AND LIMITATIONS OF THE STUDY The present study has been confined to analysis of “Reading Habits among Teachers in Colleges affiliated to Rashtrasant Tukadoji Maharaj, Nagpur University, at Wardha District.” The study has been taken up with following limitations
The reliability of the fact depends on the honesty of the respondents.
The socio-economic status and nature of the college teachers has not been taken into consideration, which may affect the facts.
The geographical limitation is Wardha District
RESEARCH METHODOLOGY Research Methodology followed is Descriptive and Investigative. Survey method has been adopted for collection of data by distributing the questionnaires. Questionnaires were distributed personally to the faculty members of Science, Commerce and Arts college faculty of Wardha district, by taking the permission of the principals to carry out the study for this project. The Random sampling technique was used for distribution of questionnaire to the faculty members
R
VOLUME NO. 5 (2015), ISSUE NO. 11 (NOVEMBER) ISSN 2231-5756
INTERNATIONAL JOURNAL OF RESEARCH IN COMMERCE, IT & MANAGEMENT A Monthly Double-Blind Peer Reviewed (Refereed/Juried) Open Access International e-Journal - Included in the International Serial Directories
http://ijrcm.org.in/
32
FINDINGS OF THE STUDY Out of 300 questionnaires distributed to the faculty members, 239 (80%) responded. The faculty wise response was 81 (81%) from Science faculty 36 (72%) from commerce and 122 (81%) are from Arts teachers respectively. PERSONAL DETAILS OF THE FACULTY MEMBERS Based on the data analysis in Chapter-IV, following are the findings of the study:
Maximum respondents were of the age group of 41-50 forming 36.8% followed by 33.1% belonging to the age group of 31-40 and 16.3% belonging to the age group of above 50 years and very low percent of 13.8 belongs to the age group of Under 30. 72.4% are males and 27.6% are females.
31% of the faculty members are with Master of Philosophy, and 13.4% are with Doctorate in Philosophy. 5.4% of the faculty members are having both Master of Philosophy and Doctorate in Philosophy.
70.7% of the faculty members are designated as Assistant Professor, followed by 24.7% designated as Associate Professor, 2.1% as Professor and 2.5% are Principal.
In Science faculty, 44.4% have published papers in National journals and 30.9% faculties have published papers in International Journals. 34.6% have presented papers in National level Conferences, and 19.8% have presented papers in International level Conferences. Only 7.4% faculty members have book publications.
In Commerce faculty, 27.8% have published papers in National journals and 8.3% faculties have published papers in International Journals. 47.2% have presented papers in National level Conferences, and 22.2% have presented papers in International level Conferences. Only 8.3% faculty members in commerce have book publications.
In Arts faculty, 30.3% have published papers in National journals and 18.9% faculties have published papers in International Journals. 50.8% have presented papers in National level Conferences, and 24.6% have presented papers in International level Conferences. Only 9% faculty members in Arts have book publications.
The percentage of Ph. D’s is more in Commerce forming 41.7% followed by Science with 33.3%.
In commerce majority of faculty members are with more than sixteen years of experience forming 66.7% followed by arts faculty with 41.8%.
Teachers from Science faculty only have membership of International Associations. Teachers from Arts and Commerce faculties have membership of National and Local Associations.
INFORMATION NEEDS OF FACULTY MEMBERS
Science teachers reported highly sought option for Product. Material, Equipment and Apparatus related information. The information related to Theoretical/Basic/Scientific and Technological Research, Experimental Designs, Methods, Process and Procedures, Results and Applications, Standards and Specifications frequently required. Economic and Marketing, Social and Political related information is rarely required.
Types of information needs of commerce faculty shows highly sought option for Economic and Marketing related information. Theoretical / Basic/ Scientific & Technological / Research; State of Arts and Reviews; Experimental Designs, Product. Material, Equipment and Apparatus; Statistical; Standards and Specifications related information they frequently use. Methods, Process and Procedures; Computer Program and Model Building related information needs are rare.
Types of information needs of Arts faculty shows highly sought option for Social and Political related option while Theoretical /Basic/Scientific & Technological Research; State of Arts and Reviews; Results and Applications; Statistical related information is frequently required. Experimental Designs; Scientific and Technical News; Statistical related information is rarely required.
USE OF INFORMATION BY FACULTY MEMBERS
Analysis of use of information of science faculty shows that the maximum respondent that 65.4% highly sought and used information for the teaching purpose. The maximum of 43.2% frequently collected and used information for examination work and 32.1% frequently collected and used information for fundamental research. 34.6% frequently collected and used information for planning activities and 28.4% for guiding research. 29.6% highly collected and used information for Laboratory purpose, 33.3% frequently collected and used information for writing and publishing paper/ books/reports.
Analysis of use of information of commerce faculty shows that maximum of 44.4% highly sought and collected used information for the teaching purpose. The maximum of 36.1% frequently collected and used information for examination and 33.3% highly sought, collected and used information for fundamental research, 33.3% occasionally collected and used information for planning activities. 30.6% frequently collected and used information for writing and publishing paper/books/reports. The majority of 38.9% frequently collected and used information for participating in conferences/ seminars etc, 41.7% frequently collected and used information for delivering lectures/ speeches/ address etc.
Analysis of use of information of Arts faculty shows that the majority of 43.4% highly sought, collected and used information for the teaching purpose, 29.5% frequently collected and used information for examination work.
MOTIVATION TO SEEK INFORMATION
From the respondent of the science faculty regarding motivation to seek information, it is observed that the majority i.e. 33.3%are highly motivated to seek information regularly for research thirst in their own field. The majority of 40.7% are frequently motivated to seek information regularly for visibility among friends and colleagues and 37% are occasionally motivated to seek information regularly for desire to have edge over others. The majority of 34.6% are frequently motivated to seek information regularly for desire to gain recognition in their own field and 33.3% are frequently motivated to seek information regularly to qualify for promotion. 34.6% are highly motivated to seek information regularly with desire to achieve professional excellence and 40.7% are highly motivated to seek information regularly for self satisfaction and self improvement.
From the respondent of the commerce faculty regarding motivation to seek information, it is observed that 36.1%are frequently motivated to seek information regularly for research thirst in their own field while 61.1% frequently motivated to seek information regularly for visibility among friends and colleagues. 38.9% are occasionally motivated to seek information regularly for desire to have edge over others and 50% frequently motivate to seek information regularly for desire to gain recognition in their own field. 38.9% are highly motivated to seek information regularly to qualify for promotion while 33.3% are highly motivated to seek information regularly for desire to achieve professional excellence. 41.7% are highly motivated to seek information regularly for self satisfaction and self improvement.
From the respondent of the Arts faculty regarding motivation to seek information, it is observed that 30.3% are highly motivated to seek information regularly for Research thirst in their own field while 33.6% are frequently motivated to seek information regularly for visibility among friends and colleagues. 30.3% are occasionally motivated to seek information regularly for desire to have edge over others while 32% are frequently motivated to seek information regularly for desire to gain recognition in their own field. 26.2% are frequently motivated to seek information regularly to qualify for promotion and 31.1% are highly motivated to seek information regularly for desire to achieve professional excellence.
USE OF VARIOUS TYPES OF SOURCES
The study of formal source of information used by the faculty of science shows that 66.7% books are most often used to obtain the information, while 37% opinioned that they most often use Hand books/Year books/Directories/manuals/Treaties to meet their information requirement. 34.6% often used Dictionaries/Encyclopedias to meet the information requirement, while 35.8% occasionally used learned periodicals to obtain the information. 29.6% often used Review Journals/Abstracting Journals to obtain the required information while 39.5% often used Proceedings of Conferences/Workshops to obtain required information. Theses and Dissertations are occasionally used by 30.9% to obtain required information and Patents and Trademarks are rarely used by 29.6% to obtain required information.
VOLUME NO. 5 (2015), ISSUE NO. 11 (NOVEMBER) ISSN 2231-5756
INTERNATIONAL JOURNAL OF RESEARCH IN COMMERCE, IT & MANAGEMENT A Monthly Double-Blind Peer Reviewed (Refereed/Juried) Open Access International e-Journal - Included in the International Serial Directories
http://ijrcm.org.in/
33
The study of formal source of information used by the faculty of Commerce reveals that 50% of the respondents most often used books and 38.9% often used Hand books, Yearbooks, Directories, Manuals, and Treaties to meet their information need. 44.4% of respondents often used Dictionaries and Encyclopedias and 47.2% often used learned periodicals to meet their information need.
The study of formal source of information used by the faculty of Arts reveals that all the respondent used books to meet their information needs, however the majority of 36.9% opinioned that they often used books followed by 23.8% using books most often. 29.5% of respondents often used Hand books/Year books/Directories/manuals/Treaties, 30.3% respondent occasionally used Dictionaries and Encyclopedias while 23.8% occasionally used learned periodicals to meet their information needs. Review and Abstracting Journals are occasionally and often used by 32.8% while 28.7% of the respondents often used proceedings of conferences and workshops to meet their information needs.
The study of document significant by the respondents of Science faculty reveals that books are most preferred due to the simple presentation of text (53.1%) easy accessibility (32.1%), wide subject coverage (25.9%). Reference books are mostly used for their format and appearance (18.5%) and non availability of information (21%) in other forms. Journals are more preferred for bibliographical reference (32.1%) currency of up to date material (38.3%). are found in Reports and digests are preferred by 25.9% for higher standard of presentation. Patent/Standard/Specification and reference books are reported to be non available documents by 21% of respondents. Patent, specifications and Standards are regarded as status symbols by 30.9% respondents and 24.7% preferred journal article for prestige, priority and recognitions.
Commerce faculty reveals that books are most preferred due to the simple presentation of text (61.1%) easy accessibility (33.3%). Reference books are mostly used for their format and appearance (38.9%) wide subject coverage (25%) and higher standard of presentation (36.1%). Journals are more preferred for currency of up to date material (44.4%).Reports and digests are reported to be non available documents by 25% of respondents. Patent, specifications and Standards are regarded as status symbols by majority (30.6%) respondents and 27.8% for prestige, priority and recognitions.
Arts faculty reveals that books are most preferred due to the simple presentation of text (28.7%) easy accessibility (24.6%) and higher standard of presentation (18%). Journals are more preferred for currency of up to date material (18.9%).Reports and digests are reported to be non available documents by majority (18.9%) of respondents.
The study of document significant by the respondents of science faculty reveals that the majority of 30.9% thinks that the information given in the books is obsolete and 35.8% thinks that there is lack of better index. The majority i.e. 27.2% thinks that time lag is more in reference books. The majority of 34.6% thinks that the journals have narrow coverage. The majority of 32.1% thinks that the reports and digests has bad coverage and biased referencing, poor quality and 27.2% opinioned that they are expensive to own in the library.
The study of document significant by the respondents of commerce faculty reveals that the majority of 33.3% thinks that the information given in the books is obsolete and 25% thinks that there is lack of better index. The majority of 33.3% thinks that the reference books have biased referencing and 38.9% thinks that the coverage is bad. The majority i.e. 33.3% thinks that time lag is more for Journals and the majority of 30.6% thinks that the journals have narrow coverage. The majority of 22.2% opinioned that reference books, journals, reports and digests are of poor quality.
The study of document significant by the respondents of arts faculty reveals that the majority are of opinion that the information given in reports and standards is obsolete (24.6%), coverage is bad (24.6%) and narrow (50%), lack of proper index (30.3%), biased referencing (51.6%) and poor quality (20.5%).
The study of reading or consulting documents by faculty of science reveals that proceedings of conference, seminars and workshops (34.6%), technical reports (30.9%), patents, trademarks, standards and specifications etc (29.6%) and thesis and dissertations (22.2%) are read or consulted by majority about a year back. The majority read or consulted the learned journals in their own field (35.8%), abstracting and indexing journals (37%) and annual review and review articles about a month back. The majority read or consulted Encyclopedia/ Manuals/ Handbooks etc (33.3%) and Government publications (24.7%) about a week back and Books in their discipline (66.7%) and Newspaper/Newspaper Clippings (45.7%) during the reported week.
The study of reading or consulting documents by faculty of commerce reveals that majority read or consulted about a month back learned journals in their own field (41.7%) proceedings of conference, seminars and workshops (33.3%), annual review and review articles (36.1%) encyclopedia, manuals, handbooks etc (38.9%). The majority read or consulted the abstracting and indexing journals (33.3%) and Government publications (36.1%) and about a week back. The majority read or consulted books in their discipline (52.8%) and newspaper and newspaper clippings (33.3%) during the reported week.
The study of reading or consulting documents by faculty of arts reveals that majority of 26.2% read or consulted abstracting and indexing journals about a year back. The majority of respondents read or consulted learned journals in their own field (29.5%) proceedings of conference, seminars and workshops (29.5%), annual review and review articles (26.2%) about a month back. Encyclopedia, manuals, handbooks etc were consulted by majority (23.8%) during last week. The majority read or consulted the abstracting and indexing journals (26.2%) about a year back. The majority read or consulted books in their discipline (27%) about a week back.
INFORMATION NEEDED FOR DAY TO DAY ACTIVITIES
The study reveals that among the science faculty the majority (46.9%) always obtained information for maintaining contact with colleagues within the institution through computer network (30.9%). They very often obtained information through personal correspondence (37%). The majority often obtained information by discussing with colleagues outside the institution (37%), through fax or email (30.9%) and through telephone (29.6%) and by attending meetings, symposia, conferences etc. (30.9%) and (33.3%) through consultant.
Among the commerce faculty the majority (52.8%) always obtained information for maintaining contact with colleagues within the institution through discussing with colleagues outside the institution (38.9%) through telephone (30.6%) through fax or email (25%)and very often through computer network (27.8%).They rarely obtained information through personal correspondence (27.8%) and by attending meetings, Symposia, Conferences etc. (27.8%) and through consultants (27.8%). The majority of 52.8% rarely visit other organizations.
The study reveals that among the arts faculty the majority (41%) very often obtained information for maintaining contact with colleagues within the institution through discussing with colleagues outside the institution (26.2%) through personal correspondence (28.7%). The majority of arts faculty seldom obtained information through telephone (29.5%) through fax or email (23.8%) through computer network (33.6%) and by exchange of pre-prints and monographs (27%), through consultants (24.6%) and by visits to other organizations (59%).
USE OF LIBRARY AND INFORMATION CENTRE
The teachers of arts faculty visiting the library weekly are 68.85% followed by Commerce teachers with 66.7% and Science teachers with 55.6%. Among the daily visitors to the library, the commerce teachers dominate with around 30.5%, followed by Science with 27.2% and arts teachers with 26.23 %. The science teachers opinioned that only 1.2% rarely visit the library 4.9% monthly and 11.1% fortnightly. The commerce teacher visits daily and weekly and 2.8% visit the library rarely. The arts teachers opinioned that 2.46% visits the library fortnightly and the similar visit monthly.
The study of average time spent on reading material on field of specialization by the science teachers shows that around 30.9% spend more than 6 hours per week followed by 29.6% with 1-2hours, while 22.2% spend 2-4 hours and merely 6.2% spend less than one hour reading per week. Among the commerce teachers around 49.2% spend 1-2 hours in a week followed by 19.4% up to 2-4 hours per week. Merely 9.2% spend more than 6 hours per week. Among the arts teachers the majority of 41.8% spend 1-2 hours, per week followed by 23.8% spending around 2-4 hours per week. Around 9% of the arts teacher spends more than 6 hours per week and around 9.8% for less than one hour per week.
As far as leisure time reading is concerned, 30.9% science teachers spend 1-2 hours per week followed by 24.7% spending 2-4 hours, and merely 7.4% spending more than 6 hours reading per week. 27.8% Commerce faculty members spend less than one hour and similar percent spending around 1-2 hours per week. Only 5.5% responded that they spend around 4-6 hours for reading per week. 41% arts faculty spend around 1-2 hour per week followed by 25.4% spending 2-4 hours around 12.3% spends 4-6 hours and Only 5.7% responded that they spend more than 6 hours for reading per week.
VOLUME NO. 5 (2015), ISSUE NO. 11 (NOVEMBER) ISSN 2231-5756
INTERNATIONAL JOURNAL OF RESEARCH IN COMMERCE, IT & MANAGEMENT A Monthly Double-Blind Peer Reviewed (Refereed/Juried) Open Access International e-Journal - Included in the International Serial Directories
http://ijrcm.org.in/
34
46.9% science faculty members mostly need to consult subjects, besides their own field specialization and only 9.9% need to consult sometimes. Among the commerce faculty the majority i.e. 55.6% did not responded and the maximum responded i.e. 36.1% mostly needs to consult other subjects and 8.3% consults sometimes. Among the commerce faculty 52.5% mostly consult the subject other than their specialization.
The study of personal subscription to the periodicals and journals by the faculty members reveals that the majority of the respondents does not subscribe the periodicals or journals personally and depends on library or other sources.
READING INTERESTS OF FACULTY MEMBERS
Reading interest of science faculty reveals that the majority prefers to read text books (61.7%) with top priority. The science faculty gives high priority to journals and periodicals (53.1%) followed by research reports (49.4%). The lowest priority is given to poetry (70.4%) followed by novels and humors (63%).
Commerce faculty gives top priority to text books (41.7%) and popular magazines (41.7%). High priority is given to research reports (52.8%) followed by text books (36.1%) and Journals and periodicals (36.1%). Low priority is given to humors (69.4%) followed by poetry and dramas (61.1%) etc.
Arts faculty gives top priority to text books (39.3%) and research reports (37.7%). High priority is given to Journals and periodicals (47.5%) followed by popular magazines (40.2%). Low priority is given to poetry (47.5%) followed by novels and travel stories (45.1%).
OPINION ABOUT DOCUMENT AVAILABILITY IN RESPECTIVE INSTITUTIONS
Science teachers responded that books (65.4%) Reference books (48.1%) and current periodicals (35.8%) are adequate. News paper clippings (44.4%) are partially adequate followed by back journals, conference and seminar proceedings (38.3%). 54.3% opinioned that bibliographies are inadequate followed by reprints and photocopies (51.9%). 19.8% of respondents reported that technical reports, patents and standards are grossly inadequate followed by indexing, abstracting and reviewing periodicals (13.6%).
Majority of Commerce faculty members are of opinion that current periodicals (48.6%) and reference books (41.7%) are adequate. Around 50% of the respondents think that indexing, abstracting and reviewing periodicals are partially adequate and 41.7% thinks that the back journals are partially adequate. 44.4% respondents think that Technical Reports/Patents/Standards etc. are inadequate and 30.6% thinks that dissertation and thesis are inadequate.
Arts faculty members reveal that the majority are of opinion that books(43.4%) are adequate, 45.1% opinioned that reference books are partially adequate; 40.8% opinioned that current periodicals are partially adequate; 32.8% opinioned that back journals are partially adequate; 32.8% opinioned that Indexing/Abstracting/Reviewing periodicals are grossly inadequate; 30.3% opinioned that Technical Reports/Patents/Standards etc. are inadequate. Dissertation /Theses (33.6%) and Bibliographies (32%) are partially adequate.
HABIT OF USING LIBRARY AND INFORMATION SERVICES
Science faculty respondents show that the borrowing privileges are given low priority by 34.6% and 27.2% of the respondents are not using the services. These services are given top priority by only 12.3%. The reference services are given middle priority by 43.2%. Referral services are given middle priority by 44.4% faculty members. Latest addition lists is known to 42% and gives them middle priority. Photocopying services are known with middle priority to 42% while 18.5% respondents do not use the services. The majority of respondents (35.8%) are not using Inter Library Loan services.
Commerce faculty respondents show that 36.1% gives top priority and 33.3% gives middle priority to borrowing privileges. The majority of respondents gives referral services (41.7%); Latest addition list (44.4%); photocopying services (36.1%) translation services (41.7%) low priority. The majority of 41.7% are not aware of Inter library loan services. 36.1% respondent use current content services and 41.7% use selective dissemination of information services with middle priority.
Arts faculty reveals that the interlibrary loan service (42.6%) Translation Services (39.3%) selective Dissemination of Information (28.7%) and any other services than mention (78.7%) are not been used by the respondents. Browsing privilege (36.1%) and bibliographic services (32%) are given low priority by commerce faculty. Middle priority is given to reference services (32.8%); referral services (46.7%); Latest addition lists (36.5%); selective dissemination of information (28.7%); current content services (34.4%) and photocopying services (34.4%) are given middle priority.
INTERNET USE
93.8% Science teachers use internet for education (65.4%) and email (53.1%) and very often use for literature search (30.9%) and health purpose (24.7%). They also use Internet for downloading courseware (34.6%) followed by for entertainment and news (29.6%) and social networking (28.4%).
Use of internet by commerce faculty reveals that majority of 75% use internet. The majority i.e. 58.3% always use internet for education purpose and 27.8% use internet for entertainment purpose. The majority i.e. 33.3% have responded to use of internet for news. The majority of 27.8% did not respond to use of internet for social networking, downloading software, tutorial, courseware, literature search and international collaborations.
Use of internet by arts faculty reveals that majority of 75.4% use internet. The study reveals that the majority (41.8%) always use internet for education purpose, while 23.8% often use internet for entertainment, 21.3% always use for knowing news, 19.7% rarely use internet for sport purpose. The majority (27.9%) always use internet for e-mail, while 27% rarely use internet for Social networking, 25.4% often use internet for downloading software, 22.1% very often use internet for literature search.
Majority of respondents from Science are frequently motivated to search information for desire to keep up to date information (46.9%) to develop contact with the other faculty members (35.8%) on Internet and for collaborative research (33.3%). Majority of Commerce faculties are frequently motivated to search information for further communication (47.2%), for Collaborative research (36.1%) desire to keep up to date information (36.1%) and for problem solving (36.1%). Majority of Arts faculty is frequently motivated to search information for desire to keep up to date information (35.2%), for problem solving (34.4%) and to develop contact (32%).
USE OF ELECTRONIC SOURCES
E-resources in the form e-books are used by science faculties (66.7%) followed by e-journals by commerce faculty (61.1%). The majority of databases are used by science faculty (38.3%) followed by arts faculty (24.6%). The e-resources are mostly used as reference documents (63.9%) and technical reports (27.8%) by commerce faculty. The majority of commerce faculty (36.1%) use open access followed by arts faculties (33.6%).
Majority of science faculties (54.3%) use online databases. The most preferred database is Science Direct used by 43.2% faculties followed by Chemical Abstract (28.4%), SCISEARCH (25.9%), BIOSIS and Physics Abstracts (22.2%). The study reveals that majority of commerce faculties (98.9%) and arts faculties (94.4%) do not use online databases.
The study reveals that out of the respondents only 34.6% science faculties, 27.8% commerce faculties and 22.1% arts faculties use N-list databases. USE OF SEARCH ENGINES
Science faculty reveals that Google (75.3%) is the most preferred search engine followed by Yahoo (54.3%) while the least preferred search engines are Mamma, Dog pile and Excite (14.8%) followed by Hot Boat (13.6 %).
Commerce faculty reveals that Google (75%) is most preferred search engine followed by Yahoo(58.3%) and the least preferred are Mama and Dog pile (22.2%) followed by Hotbot and Excite (27.8%).
Arts faculty reveals that Google (61.4%) is most preferred search engine followed by Yahoo (50%) and the least preferred is Excite (13.1%) followed by Dog pile (13.9%).
The study of Internet search techniques used by faculty reveals that majority of the respondents are not aware of search techniques and the majority of the respondents are using Boolean Operators and case sensitivity. The least preferred are phrase searching and wild card and truncation followed by proximity search (18.5%).
Slow speed of the Internet followed by downloading problem, information overload, finding relevant information and lack of training are the problems faced by the faculty members while accessing Internet.
VOLUME NO. 5 (2015), ISSUE NO. 11 (NOVEMBER) ISSN 2231-5756
INTERNATIONAL JOURNAL OF RESEARCH IN COMMERCE, IT & MANAGEMENT A Monthly Double-Blind Peer Reviewed (Refereed/Juried) Open Access International e-Journal - Included in the International Serial Directories
http://ijrcm.org.in/
35
READING ON INTERNET IN LEISURE TIME
Reading on internet during leisure time by science faculties reveals that majority of 43.2% often reads online news followed by e-books (24.7%), sports information (18.5%). The online magazines are very often read by 19.8% respondents. The majority of respondents rarely read sales information (34.6%) followed by movie review, health information and comic strips (25.9%), horoscope and weather report (24.7%), job information (23.5%), Jokes (22.2%) and stories and novels (21%). Playing games on internet during leisure time is least preferred by the respondents
Commerce faculties reveal that majority of 36.1% often reads online magazines. The majority of 22.2% always read e-books. The majority of respondents rarely read online news (61.1%)followed by movie review(38.9 %), comic strips (33.3%)health information and job information (30.6%).Playing games on internet (16.7%) during leisure time is rarely preferred by the respondents followed by stories and novels(19.4%).
Arts faculties reveals that majority of respondents is not reading on internet during leisure periods. OPINION ABOUT USER EDUCATION
The study of effective method of users education reveals that the majority of science faculties are of opinion that they should be educated in how the libraries should be used (51.9%) followed by how to locate the information in libraries, and how to consult documents (33.3%) and effective searching of www (30.9%). The majority of commerce faculties are of opinion that education is needed on how to consult the documents (50%) followed by how the libraries are used effectively (47.2%), information to be located and effective searching of www (44.4%).The majority of arts faculties are of opinion that they should be trained on how information is located (41.8%) followed by effective use of www (37.7%) how the libraries can be used effectively (35.2) and how the documents can be consulted (31.1%)
GENERAL READING HABITS
General reading habit of science faculty reveals that the majority of 98.8% are reading news paper, followed by Magazines (84%) and general knowledge books (80.2%) only 38.3% are reading novels and 23.5% classical literature. Same trend is followed by commerce and arts faculties with the only exception that the classical literature is preferred to magazines by arts faculties.
The study of preference of language as general reading habits of science faculty reveals that English and Marathi. Commerce and Arts faculty reveals that the majority preferred Marathi followed by English and Hindi language.
Language preferred by the respondents who are reading newspaper reveals that all the faculties preferred to read in Marathi language followed by English and the least preferred language is Hindi.
The study of topic/areas of reading of newspaper among the science faculties reveals that the majority never preferred editorial (28.4%) however (25.9%) percent opinioned that they preferred editorial in the newspapers. The majority of 44.4% preferred science and technology followed by national news (37%), International news (32.1%), about famous people (27.2%) and university/education news (22.2%). Commerce faculty reveals that the majority always preferred editorial (36.1%) followed by articles (33.3%) and university/education news (33.3%), business/economics news(30.6%). The majority often preferred to read Literature (33.3%) followed by religions and opinions (27.8%). Arts faculty reveals that the majority always preferred editorial (35.2%) followed by national news (32%) and International News (27%).
The study of fiction reading habits of science faculty reveals that the majority of 33.3% respondents always read scientific fictions. The majority often read detective (34.6%). However the majority opinioned that They never read on romance (51.9%) followed by classics (46.9%), fantasy (40.7%), adventure (39.5%) and historical (29.4%). Commerce faculty reveals that very few of the commerce faculty read on romance, detective, classical, and scientific, adventure, fantasy and historical literature.
79% science faculty members are member of Public libraries followed by commerce with 52.8% and arts faculty with 44.3%. The study reveals that the majority of 77.8% of science faculty and commerce faculty and 65.6% arts faculty feels that the library literature is useful to develop the reading habits.
VIEWS ABOUT LIBRARY COLLECTION
42.5% science faculty opinioned that the collection is good and 37.5% opinioned that the collection is very good. Among the commerce faculties the majority i.e. 47.2% opinioned that the collection is good and 38.9% opinioned that the collection is very good. The majority of arts faculty (53.8%) opinioned that The library collection is good.
The majority of the faculties are satisfied with the assistance provided in locating the documents by the library staff. The library staff provides assistance in locating the manual catalogue, computerized catalogues, books and documents, Current periodicals, reference books and online information.
DIFFICULTIES IN DEVELOPING READING HABITS
Difficulties faced by science faculties reveals that they are facing problems in developing the reading habits in general but the majority of respondent opinioned that they have little difficulties due to Inadequate resources of parent library (49.4%) followed by locating suitable sources. and problem of understanding research reports and statistics (48.1%), Getting information quickly (46.9%),problem of Finding time to look for / to read information (45.7%), Inadequate reference services / referral services and . lack of proper guidance(43.2%), No library facilities in the nearby vicinity of the work place and no library automation (40.7%), material available in different languages and getting up to date material (39.5%)
Difficulties faced by commerce faculties reveals that they are facing problems in developing the reading habits in general but the majority of respondent opinioned that they have little difficulties locating suitable sources (44.4%) followed by understanding research reports and statistics (36.1%). The majority of respondents faced considerable problem of finding time to look for / to read information (41.7%) followed by getting information quickly (38.9%).
Arts faculties reveals that they are facing problems in developing the reading habits in general but the majority of respondent opinioned that they have little difficulties locating suitable sources (43.4%) followed non availability of library facilities in the nearby vicinity of the work place (42.6%), finding time to look for / to read information (39.3%),understanding research reports and statistics (37.7%) inadequate resources of parent library (36.1%),material available in different languages (34.4%), getting up to date material (32.8%) and poor organization of reading material on shelves(29.5%).
The data was collected from 24 respondents i.e. College Librarians. All the librarians possess Master degree in Library Science and Nine (37.5%) of them have passed NET/SET and Five (20.83%) librarian possessed Doctor of Philosophy in library science. Out of 24 libraries under study only 11 libraries are having semi-professional staff ranging from one to five. The study of financial sources of library revels that 75% of libraries obtain finances for libraries through parent institution followed by 66.7% from membership fees, 54.2% from fine collection, and 41.7% through UGC and 16.7% through contribution from State Government. The budget under each head is increasing year wise for proper maintenance of libraries.
The analysis of current library stock shows that 54.1% libraries under study has less than 10,000 book collection. Regarding the back volumes of the periodicals 5 (20.8%) libraries have less than 50 volumes and only GSC, Wardha has 4000 back volumes of periodicals. The study of reference books shows that 14(58.3%) libraries have less than 1000 reference books and two libraries NACSC, Wardha (4849) and ASM, Pulgaon (4035) has more reference books.
The analysis of preference of language for general reading habits as reported by the librarian reveals that the faculties prefer all the languages i.e. English, Marathi and Hindi.
The study of library resources subscribed for reading habits reveals that Magazines are most preferred source subscribed followed by Newspaper and Indian periodical. However it is observed that foreign Journals are least preferred compared to other library sources.
The study of availability of computers in library reveals that 62.5% libraries have computers and 37.5% do not have computer facility at the libraries.
Most preferred library software is LIBMAN software used by 37.5% of libraries followed by LIBSOFT used by 8.3%
29.2% libraries are connected to central computer with 54.17% libraries having internet connection in the libraries. The average per week internet users varying from 15 to 200 Accessibility of N-list is available at only 33.3% college libraries.
Teachers need various types of information viz. theoretical, reviews, experimental designs, production materials, computer programs etc. Reviews, State of Arts, Production Material, Economic Marketing, and Statistical data are occasionally required by the faculty. Standards and specifications are also rarely used by the teachers.
VOLUME NO. 5 (2015), ISSUE NO. 11 (NOVEMBER) ISSN 2231-5756
INTERNATIONAL JOURNAL OF RESEARCH IN COMMERCE, IT & MANAGEMENT A Monthly Double-Blind Peer Reviewed (Refereed/Juried) Open Access International e-Journal - Included in the International Serial Directories
http://ijrcm.org.in/
36
The main purpose of collecting and using the information by faculty members is teaching purpose. Examination work was reported with occasionally required parameter, Fundamental research- rarely required. Frequently the information is used for writing and publishing papers and participating in seminars and conferences.
Librarians opined that the indexing and abstracting services provided are satisfactory while 33.3% stated it as poor. Circulation, Content page, OPAC, Display Board, News paper clipping, SDI, CAS, reference service are in good and excellent categories. E-content promotion service is not satisfactory as stated by 45.8% Librarians.
Librarians adopt various methods and activities to promote reading habits among faculty members and students viz. Orientation of teachers, Library Activities, Teacher Based Activities, Open access system, Book-reviews, Audio/Video sessions, etc.
Only 5 (20.8%) Librarians stated that the collection in their library is Very Good while 16 (66.7%) said it is Good and 3 (12.5%) said, it is Fair.
91.7% librarians provide assistance in using manual catalogues, 58.3% in using OPAC. 95.8 % libraries provide assistance in use of books, current periodicals and reference books. 66.6% libraries also assist in using online information.
According to the librarians maximum staff co-operate whole heartedly to the users and in few cases non cooperative. Indifferent attitude was also observed in few cases. Rarely is it discouraging.
Librarians provide assistance to the faculty members in conducting their research at personal level in selection of research topics, research tools, in preparation of bibliography and by providing them bibliographies for research purpose. 95.8% Librarians are satisfied with the services they offer in their libraries.
CONCLUSIONS The following conclusion can are drawn based on the study
The information needs of teachers in Wardha district varies from faculty to faculty. Science teachers need Product Material, Equipment and Apparatus related information Theoretical/Basic/Scientific and Technological Research, Experimental Designs, Methods, Process and Procedures, Results and Applications, Standards and Specifications more frequently. The Commerce teachers mostly require Economic and Marketing related information and they also use Theoretical / Basic/ Scientific & Technological / Research related information. Types of information needs of Arts faculty shows highly sought option for Social and Political related option while Theoretical /Basic/Scientific & Technological Research; State of Arts and Reviews; Results and Applications; Statistical related information is frequently required. Patent related information is again occasionally required for science teachers.
All the teachers use the information for teaching and research purpose though the percentage varies in arts, commerce and science. Science teachers use the information for laboratory works, writing research papers and for setting up and using equipments also. Commerce teachers use the information for fundamental research, Guiding & sharing information with members of the team and also for guiding research. Arts teacher make use of information for Fundamental research, planning activities, guiding research and for preparing speech.
Research thirst in own field, Self satisfaction/self improvement and desire to achieve professional excellence are the main motivators for seeking information for science teachers. Need to qualify for promotion, Self satisfaction/self improvement and desire to achieve professional excellence are the motivators for commerce teachers. Research thirst, Desire to gain recognition, Self satisfaction/self improvement are the motivators for arts teachers. These conclusions have been drawn from the highly sought options by maximum number of teachers.
Most frequently used sources of information by science teachers are books, Hand books/Year books/Directories/manuals/Treaties, Review Journals/Abstracting Journals, e-journals and they also attend seminars and conferences regularly for getting latest developments in their fields. Commerce teachers use books more frequently and rarely use CD-ROM Databases and e-journals. They do discuss with colleagues and attend seminars and conferences regularly. Arts teachers use Books, Hand books /Year books/ Directories / manuals / Treaties, Dictionaries / Encyclopedias and Learned periodicals most frequently. They also discuss with colleagues and attend seminars and conferences regularly.
Books are more frequently used by teachers because of Simple presentation of text, Format & Appearance, Easy Accessibility and wide subject coverage. Reference books for Format & Appearance and easy accessibility. Journals for Currency & up to date material, prestige & priority and higher standard of presentation. Reports for Bibliographical Reference. Patents are used for Prestige, priority and recognition and as a status symbol.
Some teachers do not prefer books due to various reasons like Information given is obsolete, Lack of better index and narrow coverage. Reference books for obsolete information, time lag and expensive to own. Journals for narrow coverage. Reports for biased referencing and poor quality. Patents for non-availability.
The teachers try to collect the information for day to day activities Personal contact and discussions with Colleagues, through Computer Networks and by attending meetings, Symposia, Conferences etc.
Arts teachers visit libraries more followed by science and then commerce. The teachers mostly need to consult subjects, besides their own field specialization. However the personal subscription to journals is less.
The teachers have given top priority for the use of Text books, Journal / Periodicals, Popular magazines and Research reports while low priority to Novels, Poetry, Humors, Short stories and Dramas.
The teachers think that text books and reference book collection in their institute is adequate but journal, Dissertation /Theses and Indexing/Abstracting/Reviewing periodicals are partially inadequate.
Borrowing privileges, Reference Services, Referral Services and Latest addition lists are the services rated as top priority but Photocopying Services, Inter Library Loan Services, Translation Services are rated as low priority services by the teachers.
Teachers use Internet mostly for education, news, e-mail and literature search purposes. Often it is used for social networking downloading the courseware and software. Motivation factors are Collaborative Research and desire to keep up to date.
Limited use of e-books, e-journals and databases is observed. N-LIST facility is also available only in few colleges. Google is the most favoured search engine. The teachers are not fully aware of search techniques but use Boolean operators and case sensitivity options. Slow speed connectivity and downloading problems are the main problems faced by teachers in accessing online information. Internet reading in leisure time is not a popular phenomenon among teachers.
The teachers recommended proper and well planned user education programmes from their libraries in order to enhance their reading habits.
News paper is the preferred source of information for leisure reading followed by magazines and general knowledge books. Teachers possess the membership of public libraries and are of the opinion that the public libraries also help them in improving their reading habits.
Getting information quickly, getting up to date material, Lack of proper guidance, Poor organization of reading material are some of the difficulties reported by teachers in development of their general reading habits.
Librarians are working hard to improve the reading culture among students and teachers by arranging various activities viz Orientation of teachers, Open access system, Project work method, Classroom library, Celebration of library week, Storytelling method, Book-banks, Quiz-competitions, Book-reviews, Animating stories, Drama, Group-discussion, Audio/Video sessions, Communication Skills Workshops, etc.
SUGGESTIONS The challenge for teachers today is to learn new methodologies, new content and new ways of thinking. In order to teach students to read and to maintain
their reading engagement, teachers must read extensively.
VOLUME NO. 5 (2015), ISSUE NO. 11 (NOVEMBER) ISSN 2231-5756
INTERNATIONAL JOURNAL OF RESEARCH IN COMMERCE, IT & MANAGEMENT A Monthly Double-Blind Peer Reviewed (Refereed/Juried) Open Access International e-Journal - Included in the International Serial Directories
http://ijrcm.org.in/
37
The user awareness/orientation programmes/information literacy programmes should be effective and innovative. The librarians should work hard in this direction. The teachers should be trained in locating, evaluating and using the information from traditional resources as well as from modern sophisticated tools. Librarians should assist faculty Members in learning the use of OPAC, search engines, E-mail and CD-ROM techniques and inform them of the websites databases available through the various networks.
Special awareness programmes should be conducted for creating awareness about and inculcating skills to retrieval of relevant information from online resources.
The libraries should organize extension and promotion activities viz.
Teachers should be asked to make presentations at faculty meetings and in-services based on their recent readings.
Teachers need to be encouraged to share their experience and research in journals that researchers will read.
The arrangement of books on the shelves should be as per the classification order so as to ensure an easy and quick way of locating required reading materials.
There is a need for separate reading room for faculty members, and provide newspapers, magazines, national and international journals, reference books etc., to have the latest information.
Library should arranged book exhibition frequently which can be help to create the interest among the faculty members and which will help to improve the reading habits as well as developing the knowledge.
College management should provide infrastructural facilities to the college libraries.
Reading habits cannot be developed in a day. It’s a constant process to be pacified from time to time by motivation. Motivation includes better work culture, infrastructural and other library facilities and feedback from the higher authorities.
Rewards be offered to the readers on the basis of the knowledge and information. He/she acquired from regular reading.
Keeping in view of the trends in information sharing and lack of appropriate bibliographic retrieval tools, it is suggested that union catalogue of holding college libraries in Wardha District may be compiled especially for journals, reports and Thesis. This would facilitate inter-library loan among the libraries.
Libraries should provide accessibility to N-List services.
In the light of the growing importance of the youth in the affairs of the country, the National Book Trust took an initiative to frame a National Action Plan for the Readership Development among the Youth (NAPRDY) and entrusted the job of undertaking the first ever National Youth Readership Survey from the perspective of book reading habit to the National Council of Applied Economic Research (NCAER). On the similar lines, University Grants Commission can also plan such survey and plan policy for Readership Development among Teachers.
REFERENCES 1. Gault, M. (1982). The Future of the Book: Part II - The Changing Role of Reading. Paris, Unesco. 2. Srivastava, A. P. (1989). Librarian and user interaction. University News, 27 (13), 1-5. 3. Srivastavat. (1979). Problems Faced in the Libraries and Suggestions to Improve Reading Habits. Kanada. 4. What is Reading? (n.d.). Retrieved May 12, 2013, from http://coerll.utexas.edu/methods /modules/reading/01/
VOLUME NO. 5 (2015), ISSUE NO. 11 (NOVEMBER) ISSN 2231-5756
INTERNATIONAL JOURNAL OF RESEARCH IN COMMERCE, IT & MANAGEMENT A Monthly Double-Blind Peer Reviewed (Refereed/Juried) Open Access International e-Journal - Included in the International Serial Directories
http://ijrcm.org.in/
38
A STUDY ON THE SOCIO-ECONOMIC CONDITIONS OF WORKERS OF FIREWORKS IN SIVAKASI
ASHOK KUMAR J RESEARCH SCHOLAR SRI SRNM COLLEGE
SATTUR
DR. S. MATHIVANNAN HEAD
DEPARTMENT OF COMMERCE SRI SRNM COLLEGE
SATTUR
ABSTRACT The development of any country depends upon its industrial development. Of course, the industrial development is the only main tool, for the image of any nation. The growth of industries in a country paves way for the effective utilization of its abundant resources like capital, material, men and Chemicals. In India, Fireworks occupy a predominant position in the industrial development of the country. The firework is one of the labour intensive industries. It has very high employment potential. Employee satisfaction is the terminology used to describe whether workers are happy and contented and fulfilling their desires and needs at work. This paper highlights the socio economic conditions relating fireworks industry in sivakasi.
KEYWORDS fireworks, workers, industry.
INTRODUCTION he development of any country depends upon its industrial development. Of course, the industrial development is the only main tool, for the image of any nation. The growth of industries in a country paves way for the effective utilization of its abundant resources like capital, material, men and Chemicals. In India, Fireworks occupy a predominant position in the industrial development of the country. The firework is one of the labour intensive industries. It has
very high employment potential. Employee satisfaction is the terminology used to describe whether employees are happy and contented and fulfilling their desires and needs at work. This paper highlights the perception of the employees relating to the job satisfaction at standard fireworks industry in sivakasi. “The worker is the principal instrument for the fulfillment of the targets of play and in the achievement of economic progress”.2 Generally, these labour problems comprises the problem of social security, minimum standard of living, working hours, working conditions, Accidents, sickness, old age benefits, health care, education, culture and recreational facilities. In brief, the scope of labour problems may be classified as socio-economic conditions, working conditions and welfare measures. The government of India trying its level best to extend good working condition of factories to various employees, so that workers may not be exploited by the industrialists. Fireworks industry is the labour intensive industry. Fireworks are mostly used for pleasure. The art and science of making Fireworks is known as pyrotechnics. It is derived from the Greek words ‘PYR’ (FIRE) ‘Techne’ (an art). The role of Fireworks industry in economic development has undergone a marked change over the years. But this will not reflect in the socio-economic conditions of workers in Fireworks. The living conditions of workers are being stagnant. The number of accidents in Fireworks industry is increasing every year. The accident results not only in the loss of materials but also in the loss of workers. Though the compensations are paid to the family of the worker, it does not give a complete solution for their family. There is an urgent need to analyze the socio-economic conditions of workers in Fireworks. So, the researcher is trying to undertake research in this aspect.
STATEMENT OF THE PROBLEM Fireworks industry plays a vital role in the promotion and development of economy of Sivakasi. The large numbers of Fireworks factories in India particularly in Sivakasi, are unorganized units and hence, the Fireworks factories are mainly employing unskilled or semiskilled workers who are neither educationally qualified nor technically experienced. Sivakasi provides employment opportunity to the Fireworks workers throughout the year but development of their living condition does not grow. Some important facilities are not available for small scale Fireworks factories. Many accidents occurred in Fireworks factories due to uneducated labour and absence of facilities. The death of workers in an accident affects not only to their family but also the entire society. In this situation the researcher finds it necessary to analyze the socio-economic conditions of workers of Fireworks.
REVIEW OF LITERATURE In order to undertake this research, the researcher has reviewed the following literature. M. Balasubramanian3(1993) in his dissertation titled, “Socio-economic Conditions of Labourers in Fireworks Industry - A Study with Reference to Sivakasi Town” has made an attempt to study the socio-economic conditions of employees. V. Alagappan4 (1997) in his study titled, “A Study of Fireworks Industry with Special Reference to Sivakasi” has made attempt to study the growth and development of Fireworks industry in Sivakasi. S. Binthia5(1998) in her study titled, “A study on Working and Living Conditions of Workers in Sundaravel Fireworks Industry in Sivakasi” has noted that working conditions and Safety measures in the Fireworks factories. Vignesh6(2001) in his study entitled, “A Study on the Growth and Problems of Fireworks Industry with Reference to J.K Fireworks” has analysed the growth of Fireworks. The study has also focused the problems of Fireworks units. S. Sridhar7(2003) in his study on “A Study on the Working Conditions of Workers in Fireworks Industry in Sivakasi” has noted that the safety measures in the Fireworks factories. S. Karuppasamy8(2005) in his study titled, “Workers Attitude Towards Fire Accidents in Fireworks Factories in Virudhunagar District” was made an attempt to study the growth of Fireworks and also he has focused the problem of Fire accident in Virudhunagar District. S.Chandra Bose9(2006) in her study on “Socio-economic Conditions of Workers of Fireworks Industries in Virudhunagar District” has analysed the workers’ socio economics conditions of the Fireworks industries in Virudhunagar District. V. Revathi10(2011) in his study on “A Study on the Socio-economic Conditions of Printing Industry in Sivakasi” has made an attempt to study the socio-economic conditions of printing industry labourers.
T
VOLUME NO. 5 (2015), ISSUE NO. 11 (NOVEMBER) ISSN 2231-5756
INTERNATIONAL JOURNAL OF RESEARCH IN COMMERCE, IT & MANAGEMENT A Monthly Double-Blind Peer Reviewed (Refereed/Juried) Open Access International e-Journal - Included in the International Serial Directories
http://ijrcm.org.in/
39
SCOPE OF THE STUDY In Virudhunagar District, Sivakasi occupies a notable place in the industrial map of India. Because of the concentration of the Fireworks, match works and printing works. It is an industrial town and busy business town. People from all over the country come to Virudhunagar District to have business contact. A number of business people come and stay to do their business here. The researcher is going to make an attempt to analyse the socio-economic conditions of workers in Fireworks industry. The study focuses on eliciting the living conditions of workers of Fireworks and their families. It also covers other areas like workers experience, working condition and economic conditions of Fireworks workers.
OBJECTIVES OF THE STUDY The study is undertaken with the following objectives: 1. To study the growth and development of Fireworks factories. 2. To analyse the profile of workers in Fireworks factories. 3. To analyse the socio-economic conditions of Fireworks workers. 4. To suggest measures to be taken to develop the socio-economic conditions of workers of Fireworks.
PERIOD OF THE STUDY The study was conducted from December 2014 to April 2015. The interview was conducted formally through natural conversation in the vernacular language (i.e.) Tamil and it was recorded by the researcher in the interview schedule.
METHODOLOGY The study is empirical in nature. The study has used both primary data and secondary data. PRIMARY DATA In order to have an in-depth analysis of the research problem, the information is to be obtained from the Fireworks workers. Interview schedule has been used for this purpose. SECONDARY DATA The secondary data were collected from the standard books, research articles. Article published and Inspectors of factories. SAMPLING DESIGN In Sivakasi, there are 166 Fireworks factories. There is large number of Fireworks workers in Sivakasi. Therefore, the researcher undertakes a sample study of 150 workers selected conveniently from the Fireworks factories in Sivakasi. LIMITATIONS OF THE STUDY The following are the limitations of the study: 1. The collected data from sample respondents are first hand information. In the source of field survey, a few respondents are little bit reluctant to come out
openly. 2. The secondary data gathered from standard books and journals and agencies connected with fire industries might possess inherent limitations in respects of
exact statistics.
MAJOR FINDINGS The following are the major findings of survey conducted for this study: Majority of the respondents 62.67 percent are females. 44.67 per cent of the respondents are illiterate. 40.67 per cent of the informants are residing in rural area. The analysis of the total average income of the household respondents is up to Rs.1, 02,546.00
out of which the average income of the respondents is Rs.70, 574. 00 and the balance Rs.31, 972 is the average income of the household. Out of 15 industries, total average income of Arasan Fireworks Industry is higher.
The overall per capita income of the study area comes to Rs.26, 339.00. In this regard, the researcher brings to the picture that per capita income of Sun Fireworks is higher and per capita income of Rajarathinam Fireworks is lower.
Regarding this, the researcher pointed out, the Engel’s Law of Family Expenditure has been proved in practice undoubtedly. Because lower income groups and workers spend more on necessaries like food, clothing and shelter and a little amount on non-necessary items. The survey reveals the fact that the consumption expenditure of food alone comes to 69.8 per cent of the total expenditure in the study area. When we analyse the industry-wise consumption expenditure on food, majority of the respondents in Krishnasamy Fireworks and Sri Ram Fireworks spend 77.4 per cent and 77.5 per cent of income respectively. Only a smaller percentage of income is spent on rent, education, medical, social ceremonies, clothing, fuel and lighting and entertainment namely 3.4 per cent, 7.7 per cent, 2.3 per cent, 1.8 per cent 7.2 per cent, 5.7 per cent and 2.1 per cent respectively in the study area.
As far as asset position considered that decides the financial status of the respondents in Sivakasi town. Some 126 respondents possess consumer durables like T.V., Furniture and Audio system at home for entertainment purpose. About 124 respondents own utensils, 114 respondents own building and only 21 respondents own land. Respondents do not possess more cattle and poultry as they are not able to look after. More than 141 respondents own assets like jewels.
Most of the workers (93.33%) are worked under contractual basis. One third of the respondents (74.67%) are earning between Rs. 1001 and Rs. 2000.
SUGGESIONS 1. As far as the safety measures are concerned, the risk of fire and explosion is ever present in the fireworks industry besides health hazards. 2. Installation of emergency doors, fire resistance, warning siren and training in using them are necessary to minimize the damages of fire. 3. Loan facilities for emergency requirement and for marriage occasion may also be instituted by the industry.
CONCLUSION The fireworks industries in Sivakasi of Virudhunagar District, all economic backwardness of workers are under estimated for their development. This area is remaining economically backward due to low rainfall and dry climatic lands which affect the rural places of Sivakasi, and the another side is a suitable climate for the production of crackers, therefore, many fireworks industries are situated in and around Sivakasi. Even though these industries are helps to improve the economic status of an employer and the country, but it fails to develop the economic status and living conditions of fireworks workers due to the lack of strict enforcement of rules and regulations of Government, unawareness of the workers and no separate union for claiming their rights. Fireworks industry creates more employment potential for the economic prosperity to their workers in this study area. Then only this block can claim success. Even though fireworks industry cannot claim complete success in this area, it can definitely offer something to the well being of the worker’s life. Owning to the socio-economic significance of such concern, the existence of the fireworks is greatly justified in the study area.
VOLUME NO. 5 (2015), ISSUE NO. 11 (NOVEMBER) ISSN 2231-5756
INTERNATIONAL JOURNAL OF RESEARCH IN COMMERCE, IT & MANAGEMENT A Monthly Double-Blind Peer Reviewed (Refereed/Juried) Open Access International e-Journal - Included in the International Serial Directories
http://ijrcm.org.in/
40
REFERENCES 1. Agarwal, B.L., Basic Statistics, Whiley Eastern Limited, New Delhi, 1991. 2. Anderson, J., Durstron, H.B. and Mullicent Poole, Thesis and Assignment Writing, Willey Eastern Limited, New Delhi, 1970. 3. Approach to Print, Hand Book of British, Federation of Master Printers, London. 4. Bhusan, Y.K., Fundamental of Business Organisation and Management, Sultan and Sons, New Delhi, Reprint 2006. 5. Charles W. Latham, Offset Press Operating, Graphic Art Technical Foundation Incorporated, U.S.A. 6. Dale Yoder, Personnel Management and Industrial Relations, Prentice Hall of India Private Limited, New Delhi, 1995. 7. Dhingara, I.C., Indian Economy, Sultan and Sons, New Delhi. 8. Gupta, C.B., An Introduction to Statistical Method, Ramprasad and Sons, Agra, 1972.
VOLUME NO. 5 (2015), ISSUE NO. 11 (NOVEMBER) ISSN 2231-5756
INTERNATIONAL JOURNAL OF RESEARCH IN COMMERCE, IT & MANAGEMENT A Monthly Double-Blind Peer Reviewed (Refereed/Juried) Open Access International e-Journal - Included in the International Serial Directories
http://ijrcm.org.in/
41
EFFECT OF EMOTIONAL INTELLIGENCE ON JOB SATISFACTION AMONG ACADEMICS OF UNIVERSITIES IN KANO STATE: A CONCEPTUAL MODEL
DR. ABDU JAFAR BAMBALE ASSOCIATE PROFESSOR
BAYERO UNIVERSITY KANO
DR. BALARABE A. JAKADA
SR. LECTURER BAYERO UNIVERSITY
KANO
SULAIMAN IBRAHIM KASSIM LECTURER
FEDERAL UNIVERSITY DUTSE
USMAN AHMAD KUMO
PRINCIPAL AUDITOR NIGERIAN POLICE ACADEMY
WUDIL
RABIU HASSAN LECTURER
BAYERO UNIIVERSITY KANO
ABSTRACT
Emotional intelligence and job satisfaction are two concept of high interest in modern work environment. They serve as a competitive edge in personal and organizational life. The educational system or lecturing profession is one of those within which the individuals could reap great advantage from the knowledge of emotional intelligence owing to recurring human interaction that exist among the lecturers and between the lecturers and students. The study aim to examine the relationship between lecturers emotional intelligence and their job satisfaction in Universities within kano state. Result from literature survey revealed a significant relationship between emotional intelligence and job satisfaction. The study intend to use Wong and Low emotional intelligence scale (WLES)to measure emotional intelligence and the scale of Mcdonald and Mclintyre (2007) to measure job satisfaction, the study will use regression for analysis.
KEYWORDS emotional intelligence, lecturers, job satisfaction.
1. INTRODUCTION ne of the biggest challenges facing organizations (Private or Public) is to retain their talented, experienced, committed and effective employees and to exploit their full potential for the betterment of the organization. Job satisfaction has been found to be one of the most important factors in this regard Corneliben(2006). Employees who are satisfied with their job are less likely to search for another job and may not quit from their job (Corneliben 2006).
Satisfaction itself was viewed by Robbins (1998) as the contentment felt when a need is fulfilled. There are various factors that determine satisfaction in the work place, some are related to job factors (like pay, work, and supervision), and other factors relate to individual /personal characteristic (demographic) and other social and group factors (Shajahan & Shajahan, 2004). In every organization individuals bring with them some drives/needs that affect their performance, studying how needs and drives result in performance and how reward on such performance result in job satisfaction is an unavoidable exercise in every type of organization that strive for prosperity (Saif, Nawaz, Jan & Khan, 2012). There is no one single universally accepted definition of job satisfaction, different scholars defined it in a different way. Job satisfaction was defined by Locke and Narthan (1976) as pleasurable or positive emotional state resulting from the appraisal of one’s job or job experience, this denotes that the happier a person is in the work setting, the more satisfied he/she will be with the job (Rice et al. 1991). Job satisfaction has been viewed as how people feel about different aspects of their job (Shootarcan, Lar, Ameli & 2012). In a different perspective Hoppoch (1935) views job satisfaction as a stable and balanced arrangement of environmental, physiological, psychological situations at work place. It has been argued that job satisfaction plays a crucial role in every type of organization with the respect to employee retention, commitment, and his outcome or productivity while the lack of job satisfaction may bring about unwanted job attitude and behaviors like absenteeism, poor judgment, defensive behavior, hostility, and reduction in creativity and job turnover (Mandip, Ali, Godulika & Kamna, 2012; Cornerbelin 2006). This justified the argument of Mitchel and Lasan, (1987) that job satisfaction is generally recognized in the organizational behavior field as most important and frequently studied job attitude. In another perspective job satisfaction has been argued to be very relevant in determining lecturer’s commitment (Awang, Ahmad & Zin, 2010). The importance of job satisfaction led to the development of different researches and theories to explain job satisfaction (Smerek & Peterson 2007; Bhatti 2013; Elsy, Luc & Eric 2009; Kucel, &, Bufi, 2013; Aziri 2011; Zampetakis & Kafetsios 2008).
O
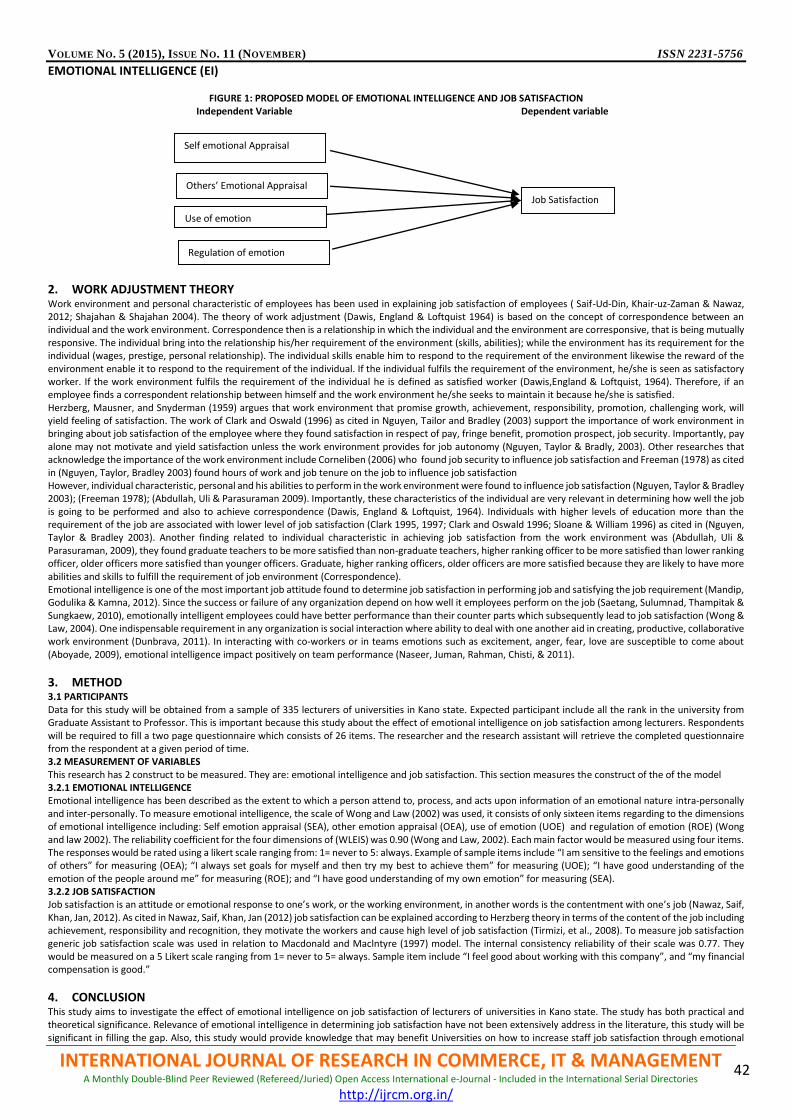
VOLUME NO. 5 (2015), ISSUE NO. 11 (NOVEMBER) ISSN 2231-5756
INTERNATIONAL JOURNAL OF RESEARCH IN COMMERCE, IT & MANAGEMENT A Monthly Double-Blind Peer Reviewed (Refereed/Juried) Open Access International e-Journal - Included in the International Serial Directories
http://ijrcm.org.in/
42
EMOTIONAL INTELLIGENCE (EI)
FIGURE 1: PROPOSED MODEL OF EMOTIONAL INTELLIGENCE AND JOB SATISFACTION Independent Variable Dependent variable
2. WORK ADJUSTMENT THEORY Work environment and personal characteristic of employees has been used in explaining job satisfaction of employees ( Saif-Ud-Din, Khair-uz-Zaman & Nawaz, 2012; Shajahan & Shajahan 2004). The theory of work adjustment (Dawis, England & Loftquist 1964) is based on the concept of correspondence between an individual and the work environment. Correspondence then is a relationship in which the individual and the environment are corresponsive, that is being mutually responsive. The individual bring into the relationship his/her requirement of the environment (skills, abilities); while the environment has its requirement for the individual (wages, prestige, personal relationship). The individual skills enable him to respond to the requirement of the environment likewise the reward of the environment enable it to respond to the requirement of the individual. If the individual fulfils the requirement of the environment, he/she is seen as satisfactory worker. If the work environment fulfils the requirement of the individual he is defined as satisfied worker (Dawis,England & Loftquist, 1964). Therefore, if an employee finds a correspondent relationship between himself and the work environment he/she seeks to maintain it because he/she is satisfied. Herzberg, Mausner, and Snyderman (1959) argues that work environment that promise growth, achievement, responsibility, promotion, challenging work, will yield feeling of satisfaction. The work of Clark and Oswald (1996) as cited in Nguyen, Tailor and Bradley (2003) support the importance of work environment in bringing about job satisfaction of the employee where they found satisfaction in respect of pay, fringe benefit, promotion prospect, job security. Importantly, pay alone may not motivate and yield satisfaction unless the work environment provides for job autonomy (Nguyen, Taylor & Bradly, 2003). Other researches that acknowledge the importance of the work environment include Corneliben (2006) who found job security to influence job satisfaction and Freeman (1978) as cited in (Nguyen, Taylor, Bradley 2003) found hours of work and job tenure on the job to influence job satisfaction However, individual characteristic, personal and his abilities to perform in the work environment were found to influence job satisfaction (Nguyen, Taylor & Bradley 2003); (Freeman 1978); (Abdullah, Uli & Parasuraman 2009). Importantly, these characteristics of the individual are very relevant in determining how well the job is going to be performed and also to achieve correspondence (Dawis, England & Loftquist, 1964). Individuals with higher levels of education more than the requirement of the job are associated with lower level of job satisfaction (Clark 1995, 1997; Clark and Oswald 1996; Sloane & William 1996) as cited in (Nguyen, Taylor & Bradley 2003). Another finding related to individual characteristic in achieving job satisfaction from the work environment was (Abdullah, Uli & Parasuraman, 2009), they found graduate teachers to be more satisfied than non-graduate teachers, higher ranking officer to be more satisfied than lower ranking officer, older officers more satisfied than younger officers. Graduate, higher ranking officers, older officers are more satisfied because they are likely to have more abilities and skills to fulfill the requirement of job environment (Correspondence). Emotional intelligence is one of the most important job attitude found to determine job satisfaction in performing job and satisfying the job requirement (Mandip, Godulika & Kamna, 2012). Since the success or failure of any organization depend on how well it employees perform on the job (Saetang, Sulumnad, Thampitak & Sungkaew, 2010), emotionally intelligent employees could have better performance than their counter parts which subsequently lead to job satisfaction (Wong & Law, 2004). One indispensable requirement in any organization is social interaction where ability to deal with one another aid in creating, productive, collaborative work environment (Dunbrava, 2011). In interacting with co-workers or in teams emotions such as excitement, anger, fear, love are susceptible to come about (Aboyade, 2009), emotional intelligence impact positively on team performance (Naseer, Juman, Rahman, Chisti, & 2011).
3. METHOD 3.1 PARTICIPANTS Data for this study will be obtained from a sample of 335 lecturers of universities in Kano state. Expected participant include all the rank in the university from Graduate Assistant to Professor. This is important because this study about the effect of emotional intelligence on job satisfaction among lecturers. Respondents will be required to fill a two page questionnaire which consists of 26 items. The researcher and the research assistant will retrieve the completed questionnaire from the respondent at a given period of time. 3.2 MEASUREMENT OF VARIABLES This research has 2 construct to be measured. They are: emotional intelligence and job satisfaction. This section measures the construct of the of the model 3.2.1 EMOTIONAL INTELLIGENCE Emotional intelligence has been described as the extent to which a person attend to, process, and acts upon information of an emotional nature intra-personally and inter-personally. To measure emotional intelligence, the scale of Wong and Law (2002) was used, it consists of only sixteen items regarding to the dimensions of emotional intelligence including: Self emotion appraisal (SEA), other emotion appraisal (OEA), use of emotion (UOE) and regulation of emotion (ROE) (Wong and law 2002). The reliability coefficient for the four dimensions of (WLEIS) was 0.90 (Wong and Law, 2002). Each main factor would be measured using four items. The responses would be rated using a likert scale ranging from: 1= never to 5: always. Example of sample items include “I am sensitive to the feelings and emotions of others” for measuring (OEA); “I always set goals for myself and then try my best to achieve them” for measuring (UOE); “I have good understanding of the emotion of the people around me” for measuring (ROE); and “I have good understanding of my own emotion” for measuring (SEA). 3.2.2 JOB SATISFACTION Job satisfaction is an attitude or emotional response to one’s work, or the working environment, in another words is the contentment with one’s job (Nawaz, Saif, Khan, Jan, 2012). As cited in Nawaz, Saif, Khan, Jan (2012) job satisfaction can be explained according to Herzberg theory in terms of the content of the job including achievement, responsibility and recognition, they motivate the workers and cause high level of job satisfaction (Tirmizi, et al., 2008). To measure job satisfaction generic job satisfaction scale was used in relation to Macdonald and Maclntyre (1997) model. The internal consistency reliability of their scale was 0.77. They would be measured on a 5 Likert scale ranging from 1= never to 5= always. Sample item include “I feel good about working with this company”, and “my financial compensation is good.”
4. CONCLUSION This study aims to investigate the effect of emotional intelligence on job satisfaction of lecturers of universities in Kano state. The study has both practical and theoretical significance. Relevance of emotional intelligence in determining job satisfaction have not been extensively address in the literature, this study will be significant in filling the gap. Also, this study would provide knowledge that may benefit Universities on how to increase staff job satisfaction through emotional
Self emotional Appraisal
Others’ Emotional Appraisal
Job Satisfaction
Use of emotion
Regulation of emotion
VOLUME NO. 5 (2015), ISSUE NO. 11 (NOVEMBER) ISSN 2231-5756
INTERNATIONAL JOURNAL OF RESEARCH IN COMMERCE, IT & MANAGEMENT A Monthly Double-Blind Peer Reviewed (Refereed/Juried) Open Access International e-Journal - Included in the International Serial Directories
http://ijrcm.org.in/
43
intelligence. Therefore, Findings of this study will provide directions and hints for development of human capital policies, training programs, management practices and management development programs to the academic staff that can help ensure employees’ job satisfaction in the Universities system.
REFERENCES 1. Abdullah, M.M., Uli.J., Parasuraman,B. (2009). Job satisfaction among secondary school teachers. Jurnal Kemanusiaan, 1, 54-70 2. Aboyade, W. A. (2009). Influence of job motivation, emotional intelligence and self-concept on job performance among library workers in federal universities
in Nigeria. A publish Doctoral dissertation Mat NO. 34364, University of Ibadan, Nigeria 3. Awang, Z., Hanim, J.H., & Mohammed, N.Z. (2010). Modeling job satisfaction and work commitment among lecturers. Journal of Statistical Modeling and
Analytic.1 ( 2), 45-59 4. Azir, B. (2011). Job satisfaction: a literature review. Management research and practice. 3 (4), 77-86 5. Clark A. E. (1997). Job satisfaction and gender: Why are women so happy at work? Labor Economics, 4, 341-372 6. Corneliben, T. (2006). Job characteristics as determinants of job satisfaction and labor mobility. 7. Dawiss et al. (1967). “Manual for the Minnesota Satisfaction Questionnaire” (Minnesota Studies in vocational rehabilitation, No. 22), Minneapolis: University
of Minnesota 8. Institute of Quantitative Economic Research, University of Hannover, Germany, DISCUSSION PAPER NO. 334. [email protected] 9. Kafetsios, K., Leonidas, A.Z. (2008). Emotional intelligence and job satisfaction: Testing the mediatory role of positive and negative affect at work. Personality
and Individual Differences, 44, 712–722 available at online at www.sciencedirect.com 10. Kucel, A., Bufí, M. (2013). Job satisfaction. Revista de Economía Aplicada Número 61 (XXI), 29- 55 11. Law, K.S., Wong, C.S., & Song, L.J. (2004). The construct and criterion validity of emotional intelligence and its Potential utility for management studies.
Journal of Applied Psychology, 89, 483-496 12. Locke, E.A., & Nathan, G.P. (1990). Theory of goal setting and task performance. EnglewoodCliffs, N.J.: Prentice-Hall. 248-250. 13. Mandip, G., Ali, S.F., Barkha, G., Godulika,D., & Lad Kamna, L.(2012). Emotional intelligence as a forecaster of job satisfaction amongst the faculty of
Professional Institutes of Central Indian City, Indore. ISCA Journal of Management Sciences, 1(1), 37-43, 14. Naseer, Z., Chishti, S., Rahman, F., & Juman, N.(2011). Impact of emotional intelligence on team performance in higher education institutes. International
Online Journal of Educational Sciences, 3(1), 30-46. 15. Nguyen, A., Jim Taylor, Bradley,S.(2003). Relative pay and job satisfaction: some new evidence. Munich Personal repec Archive. Development and Policies
Research Centre. 16. Robbins, S., & Stephen P. (1998). Organizational behavior: Concepts, controversies and Applications. Prentice-Hall 17. Saetang, J., Sulumnad, K., Thampitak, P., and Sungkaew, T. (2010). Factors affecting perceived job performance among staff: a case study of Ban Karuna
juvenile vocational training centre for boys. The Journal of Behavioural Science, 5,(1), 33-45 18. Saif-ud-Din, Khair-uz-Zaman, & Nawaz, A. (2012). Impacts of demographic variables on job satisfaction of the Academicians in Universities of NWFP, Pakistan.
Bulletin of Education and Research, 32(1), 53-68 19. Shajahan, D. S., & Shajahan, L. (2004). Organization behavior. New Age International Publications. 20. Shooshtarian, Z., Ameli, F., & Amini Lari, M. ( 2013). The effect of labor's emotional intelligence on their job satisfaction, job performance and commitment.
Iranian Journal of Management Studies (IJMS), 6,(1), 27-43 21. Tirmizi, A, M., Malik, M.I., & Mahmood-ul-Hasan, M. (2008). Measuring satisfaction: An investigation regarding age, tenure and job satisfaction of white
collar employees. Availableat:http://icbm.bangkok.googlepages.com/3.Muhammad.Ali.Tirmizi.PAR.pdf 22. Wong. C.S., & Law. K.S. (2002). “The effects of leader and follower emotional intelligence on performance and attitude: An Exploratory Study”. The Leadership
Quarterly, 13,( 3), 243–274.
VOLUME NO. 5 (2015), ISSUE NO. 11 (NOVEMBER) ISSN 2231-5756
INTERNATIONAL JOURNAL OF RESEARCH IN COMMERCE, IT & MANAGEMENT A Monthly Double-Blind Peer Reviewed (Refereed/Juried) Open Access International e-Journal - Included in the International Serial Directories
http://ijrcm.org.in/
44
THE EMERGENCE OF ENTREPRENEURSHIP EDUCATION: DEVELOPMENT, TRENDS AND CHALLENGES
DR. N. KESAVAN ASST. PROFESSOR
DDE ANNAMALAI UNIVERSITY
ANNAMALAI NAGAR
R. SANGEETHA RESEARCH SCHOLAR, BHARATHIAR UNIVERSITY, COIMBATORE; &
ASST. PROFESSOR DEPARTMENT OF COMMERCE
SDNB VAISHNAV COLLEGE FOR WOMEN SHANTI NAGAR
ABSTRACT
The present study finds that social-constructionist perspective conceptualizes learning as a relational, social and enacted process/practice as a way of being and acting. It is not simply a question of thinking about a new pedagogical technique but rather involves reconceptualising how one views entrepreneurial education and learning. The purpose of introducing the use of reflexive practice into entrepreneurial education is to enable the provision of a more informative pedagogy. Such a pedagogical position provides entrepreneurs with the opportunity to think about their own learning and growth, to create for them a space to reflect and consider the depth of their lived experiences and practices. It is a way of seeking to expand and explore the interconnection between experiences and knowing as practicing entrepreneurs. The process of a reflexive critique offers the suggestion that if entrepreneurial education is to make an impact on how entrepreneurs understand their practice and the process of social learning, then this learning must reflect the dynamic and continuous life experiences and the struggles that entrepreneurs face in their daily activities. The establishment of an open learning space is very important to allow the generation of ideas, a space to practice or test the manner in which they can be used in everyday practice. This idea of reflecting on one's practice through questioning and challenging exiting norms can create opportunities to contemplate the efficiency of one's judgments and actions for balancing identity and practice as a member of a community and a wider society. Practicing, in the context of this article, is about rehearsing, renewing and reshaping, seeking to balance and mediate the exploitation and exploring of actionable knowledge, through the roles of experimentation in order to foster the questioning of exiting practices. This suggests that practices help both on the process and outcomes, the emergent practice. Taking this collective view of learning enables a situated mode of learning which encompasses the dynamic unknown to be a central element in the generation of challenges or questioning of existing practices.
KEYWORD entrepreneurship education.
INTRODUCTION ntrepreneurship has emerged over the last two decades as the most potential economic force, the world has ever experienced. With that expansion, has come a similar increase in the field of Entrepreneurship Education. The recent growth and development in the curricula and programs devoted to Entrepreneurship and new-venture creation have been remarkable the number of Colleges and Universities that offer courses related to Entrepreneurship
has grown from a handful in the 1970's to over 1800 in 2010. In the midst of this huge expansion remains the challenge of complete academic legitimacy for Entrepreneurship. While it can be argued that some legitimacy has been attained in the current state of Entrepreneurship Education, there are critical challenges that lie ahead. This article focuses on the trends and challenges in Entrepreneurship Education for the 21st century.
ENTREPRENEURSHIP EDUCATION Even though Entrepreneurial Education is quite a new phenomenon in higher education, as a field of enquiry it is one of the most rapidly growing areas of research. However, there is a widespread consensus that traditional pedagogical methods of learning alone or instructional methods alone are insufficient to develop entrepreneurs to deal with complexity of running and creating innovating business opportunities. As a consequence there is a growing need to cultivate innovative ways of thinking and new modes of pedagogy to fully enhance and develop entrepreneurial approaches. Entrepreneurial Learning has shifted attention towards LEARNING FOR as opposed to LEARNING ABOUT Entrepreneurship. A social constructionist perspective draws recognition to the importance of inter-subjective knowledge exchange as a means of developing entrepreneurial learning. While there are numerous approaches to a social constructionist paradigm, the critical features of the perspective provide the manner by which WE come to experience the social world. The approach suggests developing a pedagogical approach which explores the social processes that constitute entrepreneurial undertaking. Hence shift the focus away from the traditional positivist approaches to Entrepreneurial Learning. The researcher seeks to contribute to the growing need to cultivate innovative ways thinking, diverse skills and new modes of behavior to fully enhance and develop new approaches to Entrepreneurial Education. Entrepreneurship education is a new phenomenon, even though the entrepreneurs emerged before several decades in the country. The necessity of the Entrepreneurship Education and the various ideologies about Entrepreneurship is necessary to be taught to the younger generation. There is urgent need to develop our country in a very quick and positive manner through Entrepreneurship Education. It is a tough task taken by various institutions both by educational institutions as well as special training institutions. Colleges conduct Special Career Oriented Programmes as well as Value Based Education Programmes for the students. A paper on Entrepreneurship is included in the curriculum. Many Colleges conduct Seminars and Conferences at different levels that induce the students to participate for a tough competition over the topic. It not only allows the students' capacity to present the seminar, but also forces the students to involve in research about Entrepreneurship. This makes the students and research scholars to analyze, appreciate the need for Entrepreneurship. The curriculum specified course forces the students to carry out small Entrepreneurship ventures, which they complete it with full enthusiasm. Many Colleges conduct Entrepreneurship Training Program which provides training in jewellery designing, fabric painting, printing, embroidery, jute products, potdesigning, artificial floral arrangement, tailoring etc. This boosts up the entrepreneurial quality as well as the self-confidence in the students for pursuing a career in such businesses.
ENTREPRENEURIAL DEVELOPMENT As entrepreneurs engage in practice, they become the creators of their own knowledge and experiences, establishing a sense of self and identity with a community. It also trains them to overcome the tensions that an entrepreneur encounters in the course of human interaction during the processes of inquiry, mediation and
E
VOLUME NO. 5 (2015), ISSUE NO. 11 (NOVEMBER) ISSN 2231-5756
INTERNATIONAL JOURNAL OF RESEARCH IN COMMERCE, IT & MANAGEMENT A Monthly Double-Blind Peer Reviewed (Refereed/Juried) Open Access International e-Journal - Included in the International Serial Directories
http://ijrcm.org.in/
45
negotiation as the entrepreneur learns and engages in practical training (Boud, Keogh& Walker, 1985; Reynolds &Vince, 2004; Schon, 1983). From a reflexive perspective, learning is a rhetorical responsive activity where both educator and learner involve in active participation in the creation of new ideas through engaging with one another in a reflexive critique of their current practices. This means both Educator and Learner acts as co-participating practitioners in a relational learning process, while considering such a pedagogical approach that places the learner and educator in a practical world. Learning is generated through human interactions arising from engagement with real world issues, through inviting inquiry into the dynamics of the interaction specifically, ideas of co-authored action become central as educator -learner relation of power are repositioned from that of the expert/teacher and learner (where the teacher impose their belief and values) to that of shared responsibility for the emergency of new practices of learning. What is being suggested here is that entrepreneurial pedagogy needs to embrace the use of reflexive critiques in order to develop reflexive awareness in their everyday actions, which is fundamental to making sense of and constructing the realities one experiences. Helping the entrepreneurs become more aware of their practical enactments or the manner of accounting for and shaping their experiences, the questioning practice can help to reveal situated and embodied knowing. This is not a rational way of ordering but rather a way of accounting by which the entrepreneur makes connections with others, themselves and their social communities. The impact of this approach on entrepreneurial educational pedagogy is that it moves focus from theoretical basis to actual practice.
ENTREPRENEUR KNOWLEDGE Reflexivity as a critique implies the questioning of one's practice and assumptions. It seeks to make the practitioner become aware of their practice and the assumptions which underlie how they make sense of their actions and the knowing that is gained from the experience. Rather than accepting preordained methods and principles, reflexivity as a critique of inquiry searches patterns of knowing while continually questioning existing practices. In others, the practitioner knows the manner in which they become knowledgeable becomes the focus of critique, coupled with the awareness of the social collective and how social tensions are complicit in the construction of knowledge. Reflexivity is a process of looking outwards to the entrepreneur's social community/environment, to the social, political and cultural artifacts and assumptions which structure practices and looking inwards in order to challenge the processes by which one can make sense of the world. As a conceptual perspective, reflexivity recognizes the complex interrelations which exist between social tensions and knowing as a way of reframing emancipator objectives in practice. Such reflexive critique provides the entrepreneur with the power to think about the details of their practice and actions, to steer their emotions, and to move and question their established practices.
TRAINING AND PEDAGOGICAL SYSTEM These qualities are central to reflexivity, as well as a practice orientation based on the idea of critical choice, as one learns by enacting. Reflexivity as a pedagogical tool encourages a critique of the manner in which an entrepreneur views and understands their practice, their experiences and dominant assumptions. In this sense the educator/learner constructs an understanding that they are co-responsible of their learning, by incorporating it into practice. As a result practical activities of learning are created between the educator and learner-as they construct meaning to a situation they encounter, the resulting practice is the articulation of their sense making. Above all it places the entrepreneur at the centre of experience. They are active participants in the construction and enactment of their own practice, letting them sense that they are collaboratively shaping something as they interact'. In this regard, learning as a relational practice can be seen as a way of establishing connections by creating shared meanings through the questioning and challenging of current practice, engaging with issues in an embodied way rather than logical deconstruction of the issue at hand. Current pedagogical methods ignore the complexity of social practice and its shared construction. In this the responsibility for learning is directly shifted to the learner, but it does mean placing the educator as a collaborator in the process of learning. This process can be achieved through the creation of a reflexive questioning/critiquing by encouraging learners to recognize their taken-for-granted assumptions and how they construct their own practices. This involves drawing emphasis to a reflexive process of creating reflexive questioning though interaction and helping learners to both understand and recognize moments when practices breakdown, are challenged or called into question, and in which they are forced or given the opportunity to rethink how and why they act in the manner they do. This reflexive critique encourages the learner to question their ways of being, understanding, and acting in the world by encouraging them to create an awareness of their own beliefs, assumptions and the impact on their learning.
CONCLUSION A social-constructionist perspective conceptualizes learning as a relational, social and enacted process/practice as a way of being and acting. It is not simply a question of thinking about a new pedagogical technique but rather involves reconceptualising how one views entrepreneurial education and learning. The purpose of introducing the use of reflexive practice into entrepreneurial education is to enable the provision of a more informative pedagogy. Such a pedagogical position provides entrepreneurs with the opportunity to think about their own learning and growth, to create for them a space to reflect and consider the depth of their lived experiences and practices. It is a way of seeking to expand and explore the interconnection between experiences and knowing as practicing entrepreneurs. The process of a reflexive critique offers the suggestion that if entrepreneurial education is to make an impact on how entrepreneurs understand their practice and the process of social learning, then this learning must reflect the dynamic and continuous life experiences and the struggles that entrepreneurs face in their daily activities. The establishment of an open learning space is very important to allow the generation of ideas, a space to practice or test the manner in which they can be used in everyday practice. This idea of reflecting on one's practice through questioning and challenging exiting norms can create opportunities to contemplate the efficiency of one's judgments and actions for balancing identity and practice as a member of a community and a wider society. Practicing, in the context of this article, is about rehearsing, renewing and reshaping, seeking to balance and mediate the exploitation and exploring of actionable knowledge, through the roles of experimentation in order to foster the questioning of exiting practices. This suggests that practices help both on the process and outcomes, the emergent practice. Taking this collective view of learning enables a situated mode of learning which encompasses the dynamic unknown to be a central element in the generation of challenges or questioning of existing practices.
REFERENCES 1. Anderson.J & Gold.J (2006). Its' all action, its' all learning: action learning in "SMES Journal of European Inductrial Training, 30(6), 441-445. 2. The Journal of Entrepreneurship, vol 22, no.2, sep 2013135-155
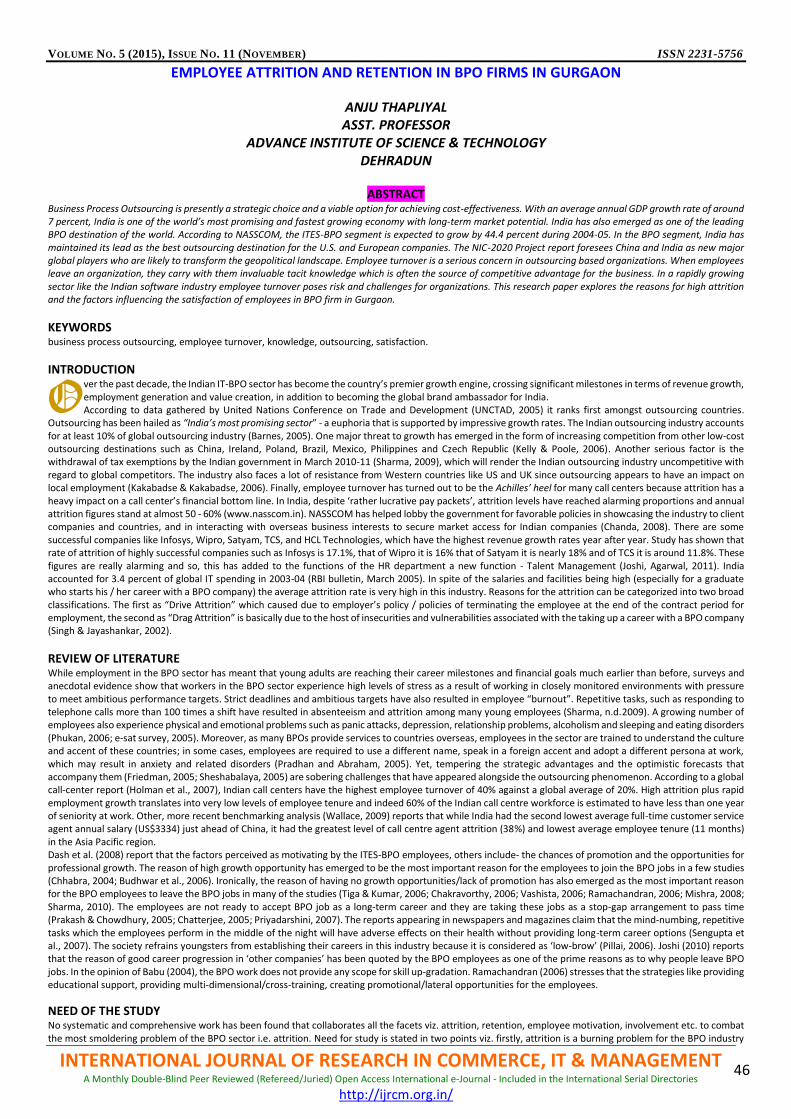
VOLUME NO. 5 (2015), ISSUE NO. 11 (NOVEMBER) ISSN 2231-5756
INTERNATIONAL JOURNAL OF RESEARCH IN COMMERCE, IT & MANAGEMENT A Monthly Double-Blind Peer Reviewed (Refereed/Juried) Open Access International e-Journal - Included in the International Serial Directories
http://ijrcm.org.in/
46
EMPLOYEE ATTRITION AND RETENTION IN BPO FIRMS IN GURGAON
ANJU THAPLIYAL ASST. PROFESSOR
ADVANCE INSTITUTE OF SCIENCE & TECHNOLOGY DEHRADUN
ABSTRACT
Business Process Outsourcing is presently a strategic choice and a viable option for achieving cost-effectiveness. With an average annual GDP growth rate of around 7 percent, India is one of the world’s most promising and fastest growing economy with long-term market potential. India has also emerged as one of the leading BPO destination of the world. According to NASSCOM, the ITES-BPO segment is expected to grow by 44.4 percent during 2004-05. In the BPO segment, India has maintained its lead as the best outsourcing destination for the U.S. and European companies. The NIC-2020 Project report foresees China and India as new major global players who are likely to transform the geopolitical landscape. Employee turnover is a serious concern in outsourcing based organizations. When employees leave an organization, they carry with them invaluable tacit knowledge which is often the source of competitive advantage for the business. In a rapidly growing sector like the Indian software industry employee turnover poses risk and challenges for organizations. This research paper explores the reasons for high attrition and the factors influencing the satisfaction of employees in BPO firm in Gurgaon.
KEYWORDS business process outsourcing, employee turnover, knowledge, outsourcing, satisfaction.
INTRODUCTION ver the past decade, the Indian IT-BPO sector has become the country’s premier growth engine, crossing significant milestones in terms of revenue growth, employment generation and value creation, in addition to becoming the global brand ambassador for India. According to data gathered by United Nations Conference on Trade and Development (UNCTAD, 2005) it ranks first amongst outsourcing countries.
Outsourcing has been hailed as “India’s most promising sector” - a euphoria that is supported by impressive growth rates. The Indian outsourcing industry accounts for at least 10% of global outsourcing industry (Barnes, 2005). One major threat to growth has emerged in the form of increasing competition from other low-cost outsourcing destinations such as China, Ireland, Poland, Brazil, Mexico, Philippines and Czech Republic (Kelly & Poole, 2006). Another serious factor is the withdrawal of tax exemptions by the Indian government in March 2010-11 (Sharma, 2009), which will render the Indian outsourcing industry uncompetitive with regard to global competitors. The industry also faces a lot of resistance from Western countries like US and UK since outsourcing appears to have an impact on local employment (Kakabadse & Kakabadse, 2006). Finally, employee turnover has turned out to be the Achilles’ heel for many call centers because attrition has a heavy impact on a call center’s financial bottom line. In India, despite ‘rather lucrative pay packets’, attrition levels have reached alarming proportions and annual attrition figures stand at almost 50 - 60% (www.nasscom.in). NASSCOM has helped lobby the government for favorable policies in showcasing the industry to client companies and countries, and in interacting with overseas business interests to secure market access for Indian companies (Chanda, 2008). There are some successful companies like Infosys, Wipro, Satyam, TCS, and HCL Technologies, which have the highest revenue growth rates year after year. Study has shown that rate of attrition of highly successful companies such as Infosys is 17.1%, that of Wipro it is 16% that of Satyam it is nearly 18% and of TCS it is around 11.8%. These figures are really alarming and so, this has added to the functions of the HR department a new function - Talent Management (Joshi, Agarwal, 2011). India accounted for 3.4 percent of global IT spending in 2003-04 (RBI bulletin, March 2005). In spite of the salaries and facilities being high (especially for a graduate who starts his / her career with a BPO company) the average attrition rate is very high in this industry. Reasons for the attrition can be categorized into two broad classifications. The first as “Drive Attrition” which caused due to employer’s policy / policies of terminating the employee at the end of the contract period for employment, the second as “Drag Attrition” is basically due to the host of insecurities and vulnerabilities associated with the taking up a career with a BPO company (Singh & Jayashankar, 2002).
REVIEW OF LITERATURE While employment in the BPO sector has meant that young adults are reaching their career milestones and financial goals much earlier than before, surveys and anecdotal evidence show that workers in the BPO sector experience high levels of stress as a result of working in closely monitored environments with pressure to meet ambitious performance targets. Strict deadlines and ambitious targets have also resulted in employee “burnout”. Repetitive tasks, such as responding to telephone calls more than 100 times a shift have resulted in absenteeism and attrition among many young employees (Sharma, n.d.2009). A growing number of employees also experience physical and emotional problems such as panic attacks, depression, relationship problems, alcoholism and sleeping and eating disorders (Phukan, 2006; e-sat survey, 2005). Moreover, as many BPOs provide services to countries overseas, employees in the sector are trained to understand the culture and accent of these countries; in some cases, employees are required to use a different name, speak in a foreign accent and adopt a different persona at work, which may result in anxiety and related disorders (Pradhan and Abraham, 2005). Yet, tempering the strategic advantages and the optimistic forecasts that accompany them (Friedman, 2005; Sheshabalaya, 2005) are sobering challenges that have appeared alongside the outsourcing phenomenon. According to a global call-center report (Holman et al., 2007), Indian call centers have the highest employee turnover of 40% against a global average of 20%. High attrition plus rapid employment growth translates into very low levels of employee tenure and indeed 60% of the Indian call centre workforce is estimated to have less than one year of seniority at work. Other, more recent benchmarking analysis (Wallace, 2009) reports that while India had the second lowest average full-time customer service agent annual salary (US$3334) just ahead of China, it had the greatest level of call centre agent attrition (38%) and lowest average employee tenure (11 months) in the Asia Pacific region. Dash et al. (2008) report that the factors perceived as motivating by the ITES-BPO employees, others include- the chances of promotion and the opportunities for professional growth. The reason of high growth opportunity has emerged to be the most important reason for the employees to join the BPO jobs in a few studies (Chhabra, 2004; Budhwar et al., 2006). Ironically, the reason of having no growth opportunities/lack of promotion has also emerged as the most important reason for the BPO employees to leave the BPO jobs in many of the studies (Tiga & Kumar, 2006; Chakravorthy, 2006; Vashista, 2006; Ramachandran, 2006; Mishra, 2008; Sharma, 2010). The employees are not ready to accept BPO job as a long-term career and they are taking these jobs as a stop-gap arrangement to pass time (Prakash & Chowdhury, 2005; Chatterjee, 2005; Priyadarshini, 2007). The reports appearing in newspapers and magazines claim that the mind-numbing, repetitive tasks which the employees perform in the middle of the night will have adverse effects on their health without providing long-term career options (Sengupta et al., 2007). The society refrains youngsters from establishing their careers in this industry because it is considered as ‘low-brow’ (Pillai, 2006). Joshi (2010) reports that the reason of good career progression in ‘other companies’ has been quoted by the BPO employees as one of the prime reasons as to why people leave BPO jobs. In the opinion of Babu (2004), the BPO work does not provide any scope for skill up-gradation. Ramachandran (2006) stresses that the strategies like providing educational support, providing multi-dimensional/cross-training, creating promotional/lateral opportunities for the employees.
NEED OF THE STUDY No systematic and comprehensive work has been found that collaborates all the facets viz. attrition, retention, employee motivation, involvement etc. to combat the most smoldering problem of the BPO sector i.e. attrition. Need for study is stated in two points viz. firstly, attrition is a burning problem for the BPO industry
O
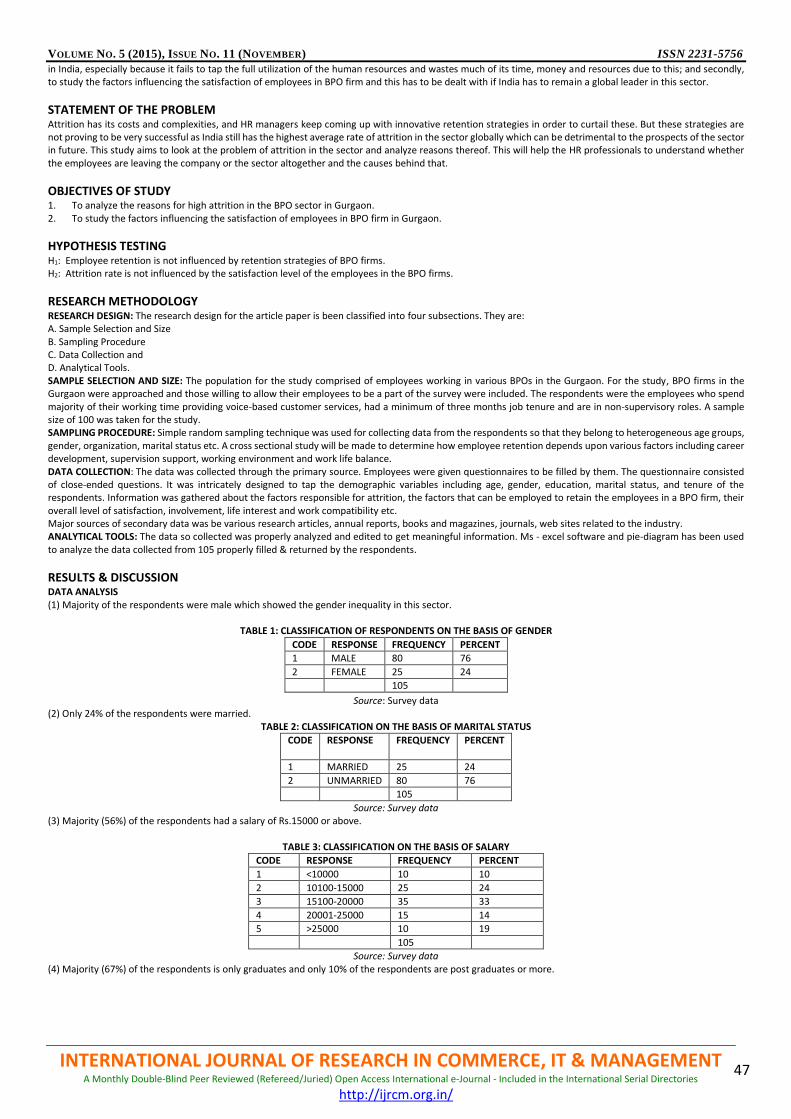
VOLUME NO. 5 (2015), ISSUE NO. 11 (NOVEMBER) ISSN 2231-5756
INTERNATIONAL JOURNAL OF RESEARCH IN COMMERCE, IT & MANAGEMENT A Monthly Double-Blind Peer Reviewed (Refereed/Juried) Open Access International e-Journal - Included in the International Serial Directories
http://ijrcm.org.in/
47
in India, especially because it fails to tap the full utilization of the human resources and wastes much of its time, money and resources due to this; and secondly, to study the factors influencing the satisfaction of employees in BPO firm and this has to be dealt with if India has to remain a global leader in this sector.
STATEMENT OF THE PROBLEM Attrition has its costs and complexities, and HR managers keep coming up with innovative retention strategies in order to curtail these. But these strategies are not proving to be very successful as India still has the highest average rate of attrition in the sector globally which can be detrimental to the prospects of the sector in future. This study aims to look at the problem of attrition in the sector and analyze reasons thereof. This will help the HR professionals to understand whether the employees are leaving the company or the sector altogether and the causes behind that.
OBJECTIVES OF STUDY 1. To analyze the reasons for high attrition in the BPO sector in Gurgaon. 2. To study the factors influencing the satisfaction of employees in BPO firm in Gurgaon.
HYPOTHESIS TESTING H1: Employee retention is not influenced by retention strategies of BPO firms. H2: Attrition rate is not influenced by the satisfaction level of the employees in the BPO firms.
RESEARCH METHODOLOGY RESEARCH DESIGN: The research design for the article paper is been classified into four subsections. They are: A. Sample Selection and Size B. Sampling Procedure C. Data Collection and D. Analytical Tools. SAMPLE SELECTION AND SIZE: The population for the study comprised of employees working in various BPOs in the Gurgaon. For the study, BPO firms in the Gurgaon were approached and those willing to allow their employees to be a part of the survey were included. The respondents were the employees who spend majority of their working time providing voice-based customer services, had a minimum of three months job tenure and are in non-supervisory roles. A sample size of 100 was taken for the study. SAMPLING PROCEDURE: Simple random sampling technique was used for collecting data from the respondents so that they belong to heterogeneous age groups, gender, organization, marital status etc. A cross sectional study will be made to determine how employee retention depends upon various factors including career development, supervision support, working environment and work life balance. DATA COLLECTION: The data was collected through the primary source. Employees were given questionnaires to be filled by them. The questionnaire consisted of close-ended questions. It was intricately designed to tap the demographic variables including age, gender, education, marital status, and tenure of the respondents. Information was gathered about the factors responsible for attrition, the factors that can be employed to retain the employees in a BPO firm, their overall level of satisfaction, involvement, life interest and work compatibility etc. Major sources of secondary data was be various research articles, annual reports, books and magazines, journals, web sites related to the industry. ANALYTICAL TOOLS: The data so collected was properly analyzed and edited to get meaningful information. Ms - excel software and pie-diagram has been used to analyze the data collected from 105 properly filled & returned by the respondents.
RESULTS & DISCUSSION DATA ANALYSIS (1) Majority of the respondents were male which showed the gender inequality in this sector.
TABLE 1: CLASSIFICATION OF RESPONDENTS ON THE BASIS OF GENDER
Source: Survey data (2) Only 24% of the respondents were married.
TABLE 2: CLASSIFICATION ON THE BASIS OF MARITAL STATUS
CODE RESPONSE
FREQUENCY
PERCENT
1 MARRIED 25 24
2 UNMARRIED 80 76
105
Source: Survey data (3) Majority (56%) of the respondents had a salary of Rs.15000 or above.
TABLE 3: CLASSIFICATION ON THE BASIS OF SALARY
CODE RESPONSE FREQUENCY PERCENT
1 <10000 10 10
2 10100-15000 25 24
3 15100-20000 35 33
4 20001-25000 15 14
5 >25000 10 19
105
Source: Survey data (4) Majority (67%) of the respondents is only graduates and only 10% of the respondents are post graduates or more.
CODE RESPONSE FREQUENCY PERCENT
1 MALE 80 76
2 FEMALE 25 24
105
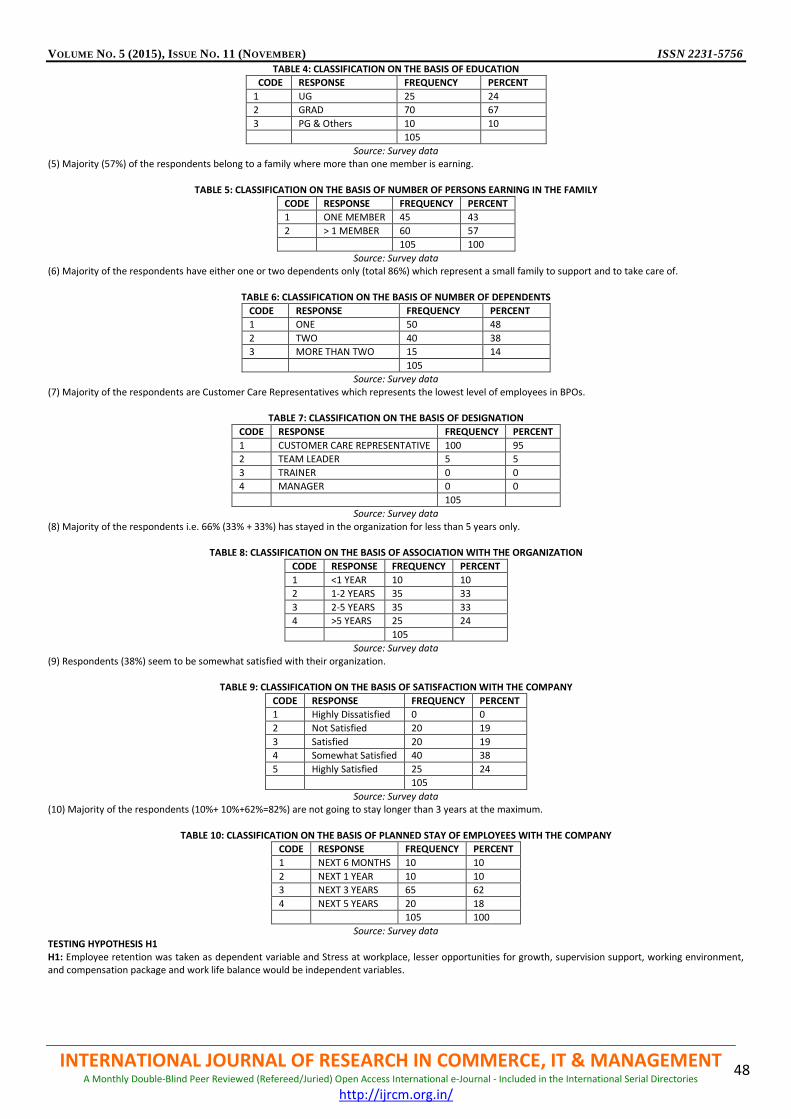
VOLUME NO. 5 (2015), ISSUE NO. 11 (NOVEMBER) ISSN 2231-5756
INTERNATIONAL JOURNAL OF RESEARCH IN COMMERCE, IT & MANAGEMENT A Monthly Double-Blind Peer Reviewed (Refereed/Juried) Open Access International e-Journal - Included in the International Serial Directories
http://ijrcm.org.in/
48
TABLE 4: CLASSIFICATION ON THE BASIS OF EDUCATION
CODE RESPONSE FREQUENCY PERCENT
1 UG 25 24
2 GRAD 70 67
3 PG & Others 10 10
105
Source: Survey data (5) Majority (57%) of the respondents belong to a family where more than one member is earning.
TABLE 5: CLASSIFICATION ON THE BASIS OF NUMBER OF PERSONS EARNING IN THE FAMILY
CODE RESPONSE FREQUENCY PERCENT
1 ONE MEMBER 45 43
2 > 1 MEMBER 60 57
105 100
Source: Survey data (6) Majority of the respondents have either one or two dependents only (total 86%) which represent a small family to support and to take care of.
TABLE 6: CLASSIFICATION ON THE BASIS OF NUMBER OF DEPENDENTS
CODE RESPONSE FREQUENCY PERCENT
1 ONE 50 48
2 TWO 40 38
3 MORE THAN TWO 15 14
105
Source: Survey data (7) Majority of the respondents are Customer Care Representatives which represents the lowest level of employees in BPOs.
TABLE 7: CLASSIFICATION ON THE BASIS OF DESIGNATION
CODE RESPONSE FREQUENCY PERCENT
1 CUSTOMER CARE REPRESENTATIVE 100 95
2 TEAM LEADER 5 5
3 TRAINER 0 0
4 MANAGER 0 0
105
Source: Survey data (8) Majority of the respondents i.e. 66% (33% + 33%) has stayed in the organization for less than 5 years only.
TABLE 8: CLASSIFICATION ON THE BASIS OF ASSOCIATION WITH THE ORGANIZATION
CODE RESPONSE FREQUENCY PERCENT
1 <1 YEAR 10 10
2 1-2 YEARS 35 33
3 2-5 YEARS 35 33
4 >5 YEARS 25 24
105
Source: Survey data (9) Respondents (38%) seem to be somewhat satisfied with their organization.
TABLE 9: CLASSIFICATION ON THE BASIS OF SATISFACTION WITH THE COMPANY
CODE RESPONSE FREQUENCY PERCENT
1 Highly Dissatisfied 0 0
2 Not Satisfied 20 19
3 Satisfied 20 19
4 Somewhat Satisfied 40 38
5 Highly Satisfied 25 24
105
Source: Survey data (10) Majority of the respondents (10%+ 10%+62%=82%) are not going to stay longer than 3 years at the maximum.
TABLE 10: CLASSIFICATION ON THE BASIS OF PLANNED STAY OF EMPLOYEES WITH THE COMPANY
CODE RESPONSE FREQUENCY PERCENT
1 NEXT 6 MONTHS 10 10
2 NEXT 1 YEAR 10 10
3 NEXT 3 YEARS 65 62
4 NEXT 5 YEARS 20 18
105 100
Source: Survey data TESTING HYPOTHESIS H1 H1: Employee retention was taken as dependent variable and Stress at workplace, lesser opportunities for growth, supervision support, working environment, and compensation package and work life balance would be independent variables.
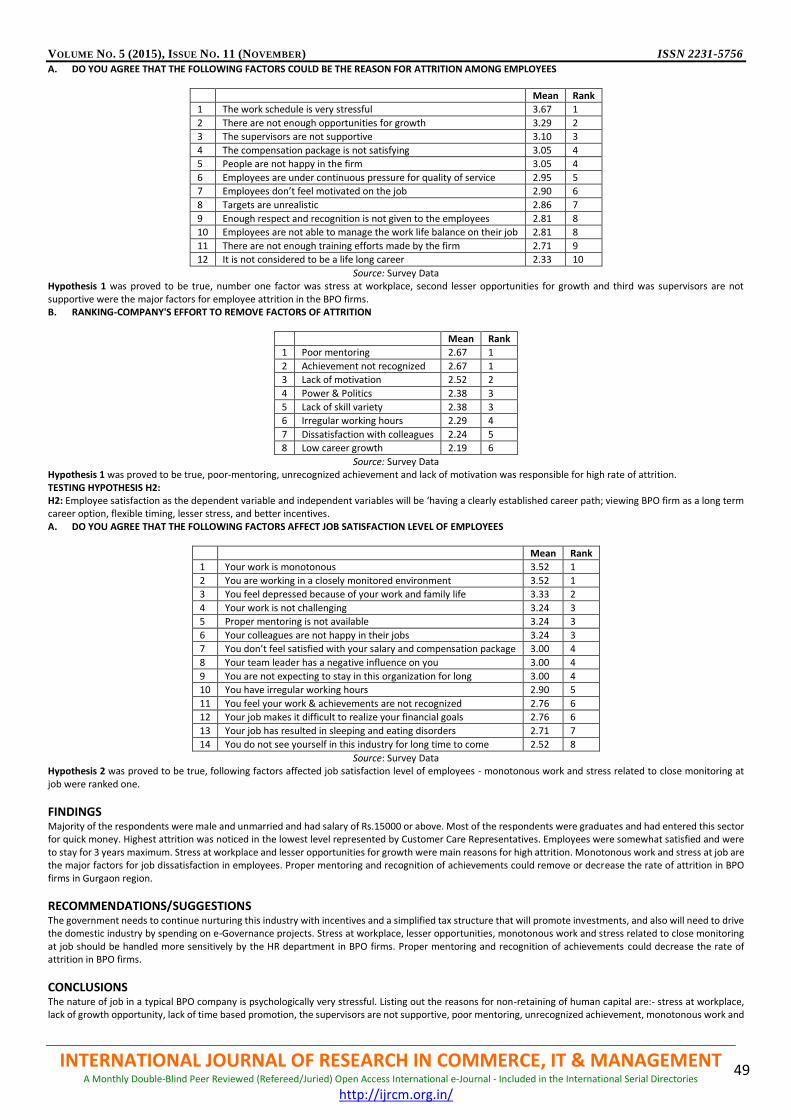
VOLUME NO. 5 (2015), ISSUE NO. 11 (NOVEMBER) ISSN 2231-5756
INTERNATIONAL JOURNAL OF RESEARCH IN COMMERCE, IT & MANAGEMENT A Monthly Double-Blind Peer Reviewed (Refereed/Juried) Open Access International e-Journal - Included in the International Serial Directories
http://ijrcm.org.in/
49
A. DO YOU AGREE THAT THE FOLLOWING FACTORS COULD BE THE REASON FOR ATTRITION AMONG EMPLOYEES
Mean Rank
1 The work schedule is very stressful 3.67 1
2 There are not enough opportunities for growth 3.29 2
3 The supervisors are not supportive 3.10 3
4 The compensation package is not satisfying 3.05 4
5 People are not happy in the firm 3.05 4
6 Employees are under continuous pressure for quality of service 2.95 5
7 Employees don’t feel motivated on the job 2.90 6
8 Targets are unrealistic 2.86 7
9 Enough respect and recognition is not given to the employees 2.81 8
10 Employees are not able to manage the work life balance on their job 2.81 8
11 There are not enough training efforts made by the firm 2.71 9
12 It is not considered to be a life long career 2.33 10
Source: Survey Data Hypothesis 1 was proved to be true, number one factor was stress at workplace, second lesser opportunities for growth and third was supervisors are not supportive were the major factors for employee attrition in the BPO firms. B. RANKING-COMPANY'S EFFORT TO REMOVE FACTORS OF ATTRITION
Mean Rank
1 Poor mentoring 2.67 1
2 Achievement not recognized 2.67 1
3 Lack of motivation 2.52 2
4 Power & Politics 2.38 3
5 Lack of skill variety 2.38 3
6 Irregular working hours 2.29 4
7 Dissatisfaction with colleagues 2.24 5
8 Low career growth 2.19 6
Source: Survey Data Hypothesis 1 was proved to be true, poor-mentoring, unrecognized achievement and lack of motivation was responsible for high rate of attrition. TESTING HYPOTHESIS H2: H2: Employee satisfaction as the dependent variable and independent variables will be ‘having a clearly established career path; viewing BPO firm as a long term career option, flexible timing, lesser stress, and better incentives. A. DO YOU AGREE THAT THE FOLLOWING FACTORS AFFECT JOB SATISFACTION LEVEL OF EMPLOYEES
Mean Rank
1 Your work is monotonous 3.52 1
2 You are working in a closely monitored environment 3.52 1
3 You feel depressed because of your work and family life 3.33 2
4 Your work is not challenging 3.24 3
5 Proper mentoring is not available 3.24 3
6 Your colleagues are not happy in their jobs 3.24 3
7 You don’t feel satisfied with your salary and compensation package 3.00 4
8 Your team leader has a negative influence on you 3.00 4
9 You are not expecting to stay in this organization for long 3.00 4
10 You have irregular working hours 2.90 5
11 You feel your work & achievements are not recognized 2.76 6
12 Your job makes it difficult to realize your financial goals 2.76 6
13 Your job has resulted in sleeping and eating disorders 2.71 7
14 You do not see yourself in this industry for long time to come 2.52 8
Source: Survey Data Hypothesis 2 was proved to be true, following factors affected job satisfaction level of employees - monotonous work and stress related to close monitoring at job were ranked one.
FINDINGS Majority of the respondents were male and unmarried and had salary of Rs.15000 or above. Most of the respondents were graduates and had entered this sector for quick money. Highest attrition was noticed in the lowest level represented by Customer Care Representatives. Employees were somewhat satisfied and were to stay for 3 years maximum. Stress at workplace and lesser opportunities for growth were main reasons for high attrition. Monotonous work and stress at job are the major factors for job dissatisfaction in employees. Proper mentoring and recognition of achievements could remove or decrease the rate of attrition in BPO firms in Gurgaon region.
RECOMMENDATIONS/SUGGESTIONS The government needs to continue nurturing this industry with incentives and a simplified tax structure that will promote investments, and also will need to drive the domestic industry by spending on e-Governance projects. Stress at workplace, lesser opportunities, monotonous work and stress related to close monitoring at job should be handled more sensitively by the HR department in BPO firms. Proper mentoring and recognition of achievements could decrease the rate of attrition in BPO firms.
CONCLUSIONS The nature of job in a typical BPO company is psychologically very stressful. Listing out the reasons for non-retaining of human capital are:- stress at workplace, lack of growth opportunity, lack of time based promotion, the supervisors are not supportive, poor mentoring, unrecognized achievement, monotonous work and
VOLUME NO. 5 (2015), ISSUE NO. 11 (NOVEMBER) ISSN 2231-5756
INTERNATIONAL JOURNAL OF RESEARCH IN COMMERCE, IT & MANAGEMENT A Monthly Double-Blind Peer Reviewed (Refereed/Juried) Open Access International e-Journal - Included in the International Serial Directories
http://ijrcm.org.in/
50
stress related to close monitoring at job. The HR professionals need to redesign the HR policies for the industry without comprising on the cost competitiveness of the Indian BPO industry, to retain the employees in the organizations and India’s position as the low cost destination for business process outsourcing worldwide.
SCOPE FOR FURTHER RESEARCH Ironically, in spite of the tremendous growth potential of the sector, attrition rate and the manpower crisis is dampening the growth of the sector. Another problem being faced by the BPO industry is “Poaching”. Poaching refers to taking away the experienced professionals by competitors by offering them better salary, benefits than the competitor. This study is limited to few variables and to BPO’s in Gurgaon (NCR) only. Further study can be taken up with other variables influencing employee attrition rate in BPO’s in India.
REFERENCES 1. Babu, Ramesh P. (2004), “Cyber coolies in BPO - insecurities and vulnerabilities of non- standard work”, Economic and Political Weekly, Vol. 39, No.05, pp.
492-497 2. Barnes, P.C. 2005. Outsourcing: A review of trends and some management issues. Management Services, Vol. 49 (4), pp. 42-44. 3. Chakravorthy, Bhaswati (2006, November 21), “Grumbling workers, anxious boss- BPO E-sat 2006”, Retrieved from http://www.dqindia.com/
content/top_stories/2005/105111001.asp, Accessed on 10th April 2011 4. Chanda Rupa, (2008), “India and services outsourcing in Asia”. Indian Institute of Management, Bannerghatta Road Bangalore, India, the Singapore Economic
Review, Vol. 53 (3), pp. 1–29. 5. Chatterjee, Rituparna (2005, December 27), “Too content to move- how companies in high-attrition industries are holding on to their employees”, Retrieved
from http://www.businessstandard.com/backend/microsite/site18/innerpage8.php, Accessed on14th August 2011. 6. Chhabra, Mohit (2004, November 08), “DQ-IDC India survey: BPO E-sat 2004”, Retrieved from http://www.dqindia.com/content/top_stories
/2004/104110801.asp, Accessed on 10th April 2011. 7. Dash, Mihir, Singh, Anubha & Vivekanand (2008), “Motivation in ITES industry: dimensionality with reference to Herzberg's theory”, ICFAI Journal of
Organizational Behaviour, Vol. 7, No. 2, pp. 18-27. 8. E-sat survey (2005), by IDC India Ltd for Dataquest magazine, Retrieved from http://dqindia.ciol.com/content/industrymarket/bpo/2005/105121103.asp,
Accessed on March 2011. 9. Friedman T (2005), The World is Flat: A Brief History of the Twenty-first Century. New York: Farrar, Straus and Giroux. 10. Holman D, Batt R and Holtgrewe U (2007), The Global Call Centre Report: International Perspectives on Management and Employment. Report of the Global
Call Centre Network (US format). Retrieved from http://www.ilr.cornell.edu/globalcallcenter/upload/GCC-Intl-Rept-US-Version. PDF (accessed 2 Jan. 2010). 11. Joshi Ashwini Avinash, Agarwal Preeti (2011), “Talent a Critical Driver of Corporate Performance and Competitive Advantage” International Conference on
Technology and Business Management, pp. 1325. 12. Joshi, Bhasmang (2010), “Why people leave BPO/KPO jobs?” Retrieved from www.orkut.com, Accessed on 18 March 2011. 13. Kakabadse, N., & Kakabadse, A.(2006 sssobal IT sourcing: Analysis, developments and best practice considerations. In P. Barrar & R. Gervais (Eds.), Global
outsourcing strategies: An international reference on effective outsourcing relationships: 49-64. Hampshire: Gower Publishing Limited. 14. Kelly, T., & Poole, D. 2006. The evolution of outsourcing. In P. Barrar & R. Gervais (Eds.), Global outsourcing strategies: An international reference on effective
outsourcing relationships: 43-48. Hampshire: Gower Publishing Limited. 15. Mishra S.C. (2008, September 08), “BPOs losing their charm?” Retrieved from http://indiajobsite.blogspot.com, Accessed on 10th September 2011 16. Nasscom (2007) ‘Indian ITES-BPO industry – fact sheet’. New Delhi: National Association of Software and Service Companies. 17. Phukan P.J. (2006), The Changing Face of Indian Youth: Thanks to the BPO Industry, Retrieved from http://www.path2usa.com/articles/articl
e_bpo_121505.html, accessed on February, 2011. 18. Pillai, Anandan. (2006), “HR Issues in BPO”, HRM Review, May, pp. 21-29. 19. Pradhan, J.P. and V. Abraham. (2005), “Social and Cultural Impact of Outsourcing: Emerging Issues from Indian Call Centers”, Harvard Asia Quarterly, Vol.
9(3), pp. 22–30. 20. Prakash, S. and Chowdhury, R. (2004), “Managing attrition in BPO”, In search of Excellence, Cool Avenues, Retrieved from http://www.coolavenues.com/
know/hr/s_1.php. Accessed on February 06, 2011. 21. Priyadarshini, H.S. (2007), “Human resource (HR) issues in BPO sector”. Paper presented at the two day national seminar on Human Resource Development:
New Paradigms and Directions at Mangalore University on 17th and 18th, March. 22. Ramachandran, Sunder. (2006, February 15), “BPO buzz- Creating the leaders of the future”, Retrieved from www.bpo.tcp.in Accessed on 5th March 2011. 23. Reserve Bank of India, “Reserve Bank of India Bulletin – March”, 2005. 24. Sharma, S. n.d. (2009), “Human issues in call centers and BPO industry—A report”, www.BPOindia.org, Accessed on June 1, 2011. 25. Sharma, Sanjeev (2010), “High attrition rate: A big challenge”, Retrieved from www.bpoindia.org, Accessed on 15th February 2011. 26. Sheshabalaya A (2005), Rising Elephant. New Delhi: Macmillan Sengupta, Snigdha, Singh, Shelley & Moses, Nelson Vinod. (2007), “BPO industry report -
World’s Back Office Comes of Age”, Business World, pp. 75-76. 27. Singh Shelley & Jayashankar Mitu (2002), “The BPO Boom,” Business World, January, pp 28-37. 28. Singh Shelley (2003), “Keeping ‘em from straying,” Business World, August, pp 25-27 29. Tiga, Pallavi & Kumar Susheel K. (2006), “HR challenges in the BPO industry – A case study in a captive BPO firm”, Unpublished Summer project. IIMB,
Bangalore 30. Vashista, Avinash (2006), “Business Process Outsourcing- Exciting growth phase in The Hindu Survey of Indian Industry”, Chennai: M/s Kasturi & Sons Ltd,
pp. 186-190. 31. Wallace C (2009), “An overview of the Indian contact centre industry”, In: Thite M and Russell R (eds) The Next Available Operator: Managing Human
Resources in Indian Business Process Outsourcing Industry. New Delhi: Sage, pp. 13–32.
APPENDIX/ANNEXURE QUESTIONNAIRE
EMPLOYEE ATTRITION AND RETENTION IN BPO FIRMS IN GURGAON Researcher: Ms. Anju Thapliyal Dear Respondents, The present study is an attempt to understand the trends in employee attrition and retention in BPO firms in the Gurgaon region. Information provided by you will be kept strictly confidential. 1. Personal Information Name : ………………………………. Age : ……………..years Sex : Male Female Marital Status : Married Unmarried Monthly Gross Salary
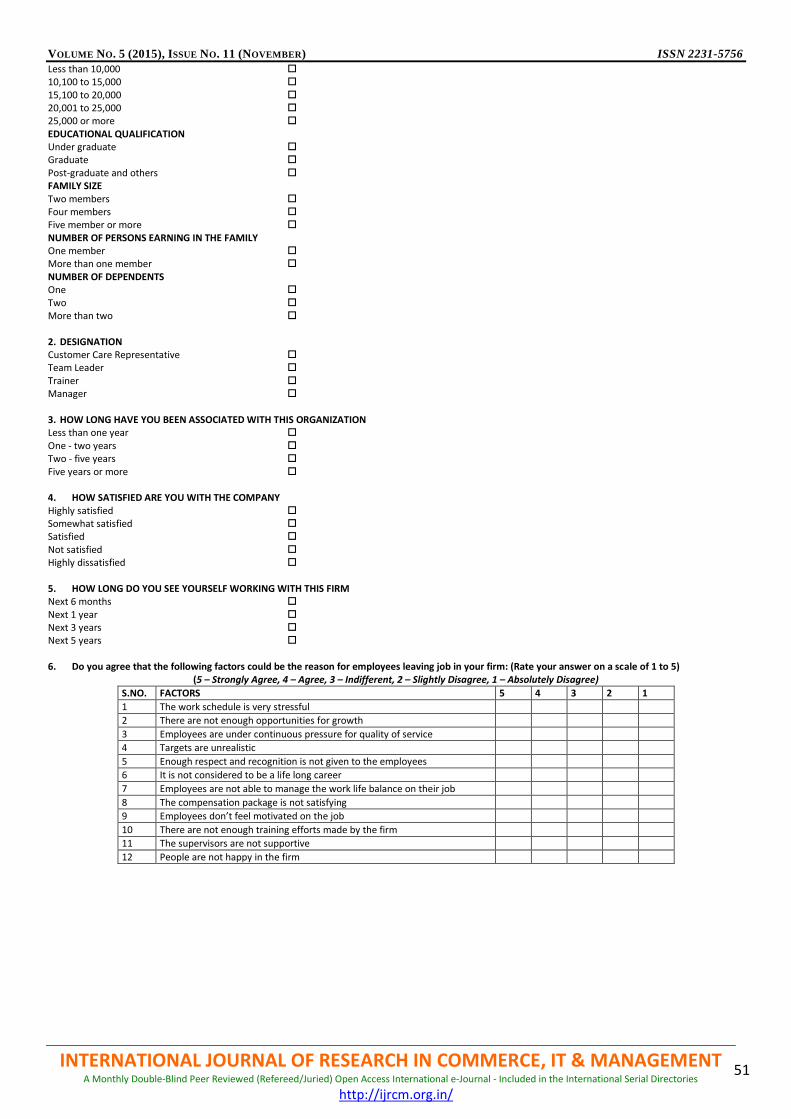
VOLUME NO. 5 (2015), ISSUE NO. 11 (NOVEMBER) ISSN 2231-5756
INTERNATIONAL JOURNAL OF RESEARCH IN COMMERCE, IT & MANAGEMENT A Monthly Double-Blind Peer Reviewed (Refereed/Juried) Open Access International e-Journal - Included in the International Serial Directories
http://ijrcm.org.in/
51
Less than 10,000 10,100 to 15,000 15,100 to 20,000 20,001 to 25,000 25,000 or more EDUCATIONAL QUALIFICATION Under graduate Graduate Post-graduate and others FAMILY SIZE Two members Four members Five member or more NUMBER OF PERSONS EARNING IN THE FAMILY One member More than one member NUMBER OF DEPENDENTS One Two More than two 2. DESIGNATION Customer Care Representative Team Leader Trainer Manager 3. HOW LONG HAVE YOU BEEN ASSOCIATED WITH THIS ORGANIZATION Less than one year One - two years Two - five years Five years or more 4. HOW SATISFIED ARE YOU WITH THE COMPANY Highly satisfied Somewhat satisfied Satisfied Not satisfied Highly dissatisfied 5. HOW LONG DO YOU SEE YOURSELF WORKING WITH THIS FIRM Next 6 months Next 1 year Next 3 years Next 5 years 6. Do you agree that the following factors could be the reason for employees leaving job in your firm: (Rate your answer on a scale of 1 to 5)
(5 – Strongly Agree, 4 – Agree, 3 – Indifferent, 2 – Slightly Disagree, 1 – Absolutely Disagree)
S.NO. FACTORS 5 4 3 2 1
1 The work schedule is very stressful
2 There are not enough opportunities for growth
3 Employees are under continuous pressure for quality of service
4 Targets are unrealistic
5 Enough respect and recognition is not given to the employees
6 It is not considered to be a life long career
7 Employees are not able to manage the work life balance on their job
8 The compensation package is not satisfying
9 Employees don’t feel motivated on the job
10 There are not enough training efforts made by the firm
11 The supervisors are not supportive
12 People are not happy in the firm
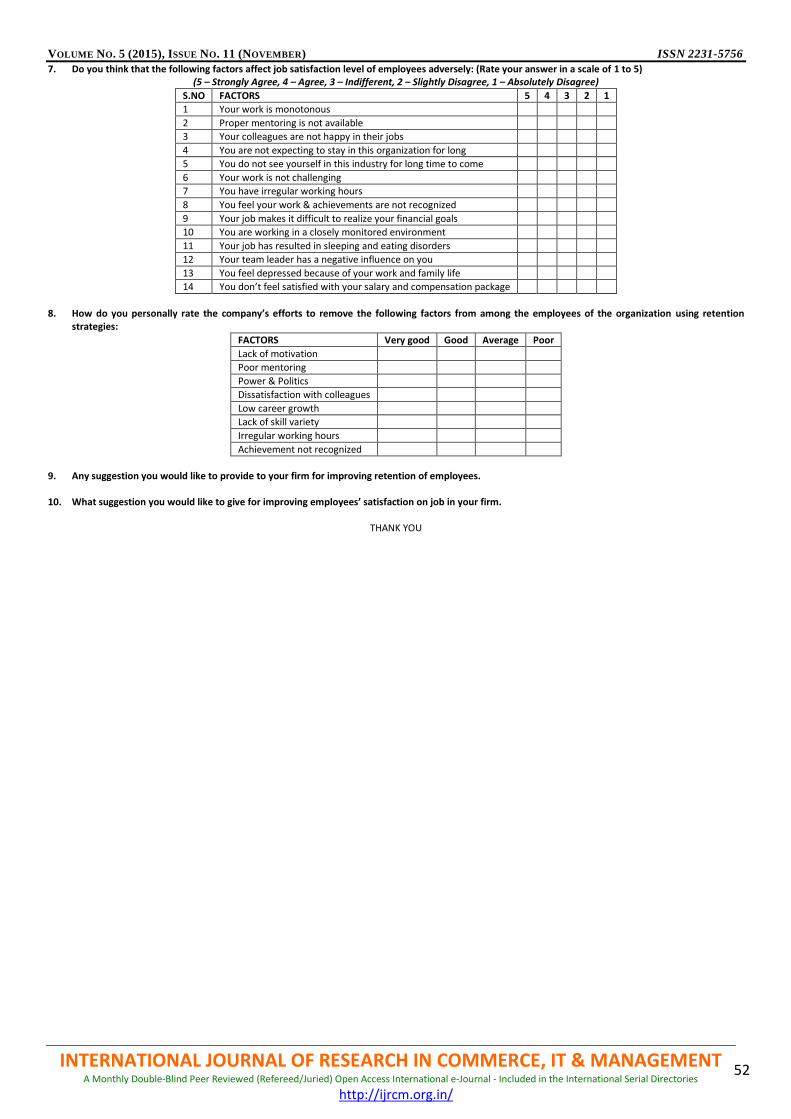
VOLUME NO. 5 (2015), ISSUE NO. 11 (NOVEMBER) ISSN 2231-5756
INTERNATIONAL JOURNAL OF RESEARCH IN COMMERCE, IT & MANAGEMENT A Monthly Double-Blind Peer Reviewed (Refereed/Juried) Open Access International e-Journal - Included in the International Serial Directories
http://ijrcm.org.in/
52
7. Do you think that the following factors affect job satisfaction level of employees adversely: (Rate your answer in a scale of 1 to 5) (5 – Strongly Agree, 4 – Agree, 3 – Indifferent, 2 – Slightly Disagree, 1 – Absolutely Disagree)
S.NO FACTORS 5 4 3 2 1
1 Your work is monotonous
2 Proper mentoring is not available
3 Your colleagues are not happy in their jobs
4 You are not expecting to stay in this organization for long
5 You do not see yourself in this industry for long time to come
6 Your work is not challenging
7 You have irregular working hours
8 You feel your work & achievements are not recognized
9 Your job makes it difficult to realize your financial goals
10 You are working in a closely monitored environment
11 Your job has resulted in sleeping and eating disorders
12 Your team leader has a negative influence on you
13 You feel depressed because of your work and family life
14 You don’t feel satisfied with your salary and compensation package
8. How do you personally rate the company’s efforts to remove the following factors from among the employees of the organization using retention
strategies:
FACTORS Very good Good Average Poor
Lack of motivation
Poor mentoring
Power & Politics
Dissatisfaction with colleagues
Low career growth
Lack of skill variety
Irregular working hours
Achievement not recognized
9. Any suggestion you would like to provide to your firm for improving retention of employees.
10. What suggestion you would like to give for improving employees’ satisfaction on job in your firm.
THANK YOU
VOLUME NO. 5 (2015), ISSUE NO. 11 (NOVEMBER) ISSN 2231-5756
INTERNATIONAL JOURNAL OF RESEARCH IN COMMERCE, IT & MANAGEMENT A Monthly Double-Blind Peer Reviewed (Refereed/Juried) Open Access International e-Journal - Included in the International Serial Directories
http://ijrcm.org.in/
53
AN APPRAISAL OF FERTILIZER SUBSIDY IN INDIA
BALA DEVI ASST. PROFESSOR
DEPARTMENT OF ECONOMICS K. L. P COLLEGE
REWARI, HARYANA
ABSTRACT This paper tracks the genesis and the evolution of fertilizer subsidy. Paper deals with Nutrient Based Subsidy scheme in particular and analyses its role in changing the fertilizer use pattern and its effect on fertilizer subsidy bill. Paper also analyses the reasons for increase in fertilizer subsidy bill and governments response to it. Problems caused by fertilizer subsidy have also been highlighted but instead of doing away with fertilizer subsidy better policy making has been advocated for fertilizer sector as government's policies till now has been mostly in reaction to situation rather than a well thought long term policy framework.
KEYWORDS nutrient based subsidy (NBS), NPK (nitrogen, potassium and phosphorus) ratio, fertilizer subsidy, fertilizer Pool equalization charge (FPEC), fertilizer retention price Scheme (FRPS).
INTRODUCTION ertilizer prices are administrated by government in most countries to fulfill two main objectives firstly to provide fertilizers in domestic market at an affordable and stable price so that agriculture productivity can be increased by using higher amount of fertilizers and secondly to encourage domestic industry by ensuring a fair return on investment. Similar has been the case in India. India currently produces 80 percent of its domestic urea requirement
but is largely dependent on imports for potassium and phosphorus fertilizers (Economic survey 2013-14), potassium fertilizers is mostly imported due to lack of raw material in India. Fertilizer subsidy has played an important role in benefiting farmers and consumers at the same time by ensuring reasonable and stable fertilizer prices , at the same time governments fertilizer policy has also encouraged domestic production of fertilizer by ensuring a fair return on investment .Fertilizer subsidy has been criticized as it is a huge fiscal burden on the government and is responsible for deterioration in soil health quality caused by imbalanced use of fertilizer, this paper analyses all these.
OBJECTIVES OF THE STUDY 1. To analyze the effect of Nutrient Based Subsidy (NBS) on fertilizer subsidy bill. 2. To analyze the effect of Nutrient Based Subsidy (NBS) effect on use of NPK ratio. 3. To analyze the benefits and adverse effects of Fertilizer subsidy.
RESEARCH METHODOLOGY This is a descriptive analytical study based on secondary data taken from Fertilizer Association of India, Economic Survey, Government of India and various another sources.
GENESIS AND EVOLUTION OF FERTILIZER SUBSIDY In India application of chemical fertilizers was first started in 1920's in tea plantation in a limited scale, but it was only in 1943-44 when measures were undertaken to promote use of fertilizers on a larger scale .However till mid 1960's government provided little or no subsidy as prior to 1965 Central Fertilizer Pool (CFP) procured all the fertilizer i.e. both domestic and imported and CFP regulated the distribution price. There was little or no subsidy as CFC made profit in 18 years between 1945-46 to 1963-64. After 1965 in order to encourage domestic production of fertilizer government stopped procurement of domestic fertilizer by CFP and allowed domestic manufacturer to market their products, but prices mostly remained fixed by government. But there were two spikes in fertilizer prices one in 1964-65 due to devaluation of rupee and second in 1974-75 due to increase in oil and gas prices in proceeding year. The price increased both for imported and domestically produced fertilizer but the price increase was much more for imported fertilizer. So in 1974 government introduced Fertilizer Pool Equalization Charge (FPEC) whereby domestic manufacturers were to contribute per tonne into FPEC which was used to subsidize imported fertilizer but the funds in FPEC were not enough to cover the government subsidy, so government had to contribute towards it. This can be said to be the starting point of fertilizer subsidy in India and which was between 1973-74 and 1975-76 nothing but an import subsidy (Jaime Quizon,1985). In order to promote domestic fertilizer industry and to shield domestic consumers from fluctuating international fertilizer prices, government in 1977 introduced 'Fertilizer Retention Price Scheme ' (FRPS) on recommendation of Maratha committee (Fertilizer policy, GOI), under FRPS retention price was fixed for each plant, which guaranteed a post tax 12% return on net worth of plant. Apart from encouraging domestic production of fertilizer it also started subsidy for domestic fertilizer production. Indian fertilizer subsidy policy since 1973-74 has been two pronged, it seeks to make fertilizer available to farmers at affordable and stable price , it also seek to increase domestic fertilizer production by ensuring a fair return to domestic fertilizer producers. FRPS helped in increasing fertilizer production by developing domestic industry and it also helped in increasing the consumption of fertilizers, however it is criticized for promoting inefficiency thus leading to huge fiscal burden of subsidies. In early 1990's India faced twin problem of high fiscal deficit and BOP crisis , to counter it government increased the urea prices by 40 percent .Government was also forced to reconsider its fertilizer policy as in 1990-91 fertilizer subsidy had reached Rs 4389 crore which was 0.85 % of GDP of that year. In 1991 Joint Parliamentary Committee on Fertilizer Pricing was set up, the committee submitted its report in 1992 , the committee did not recommend total deregulation but recommended for decontrolling phosphorus(P) and potassium(K) fertilizers however the committee was against withdrawal of Retention Price Scheme for urea. Then Finance Minister Manmohan Singh pushed hard to eliminate urea subsidy also, but most fertilizer companies lobbied against it, also legislators resisted withdrawal of urea subsidy as they feared backlash from farmers. Government implemented committee’s recommendations. Despite the earlier 40 percent increase in urea prices in 1991, it was still cheaper than deregulated phosphorus and potassium fertilizer, so farmers begin to use more of urea. ''This is when the imbalanced use of fertilizers began '' (Pratam Narayan ex director general of Fertilizer Association of India). This change in pricing pattern led to decrease in consumption of potassium and phosphorus fertilizers and increase in consumption of nitrogen fertilizer. To avoid this imbalanced use of fertilizers government introduced ad hoc Concession scheme for phosphorus and potassium fertilizers. Further in order to rein the urea subsidy and to make urea units more efficient and globally competitive government introduced New Pricing Scheme (NPS) for urea units in 2003, currently "Modified NPS 3" has been notified in April 2014. Government has also notified New Investment Policy-2012 to facilitate fresh investment in urea sector.
INTRODUCTION OF NUTRIENT BASED SUBSIDY (NBS) Despite above measures taken by the government fertilizer subsidy has remained high and had increased from Rs 28019 crore in 2006-07 to 99494 crore in 2008-09 which was 1.78 % of total GDP at market price in 2008-09.This level of fertilizer subsidy was totally unsustainable and forced the government to re think on its
F
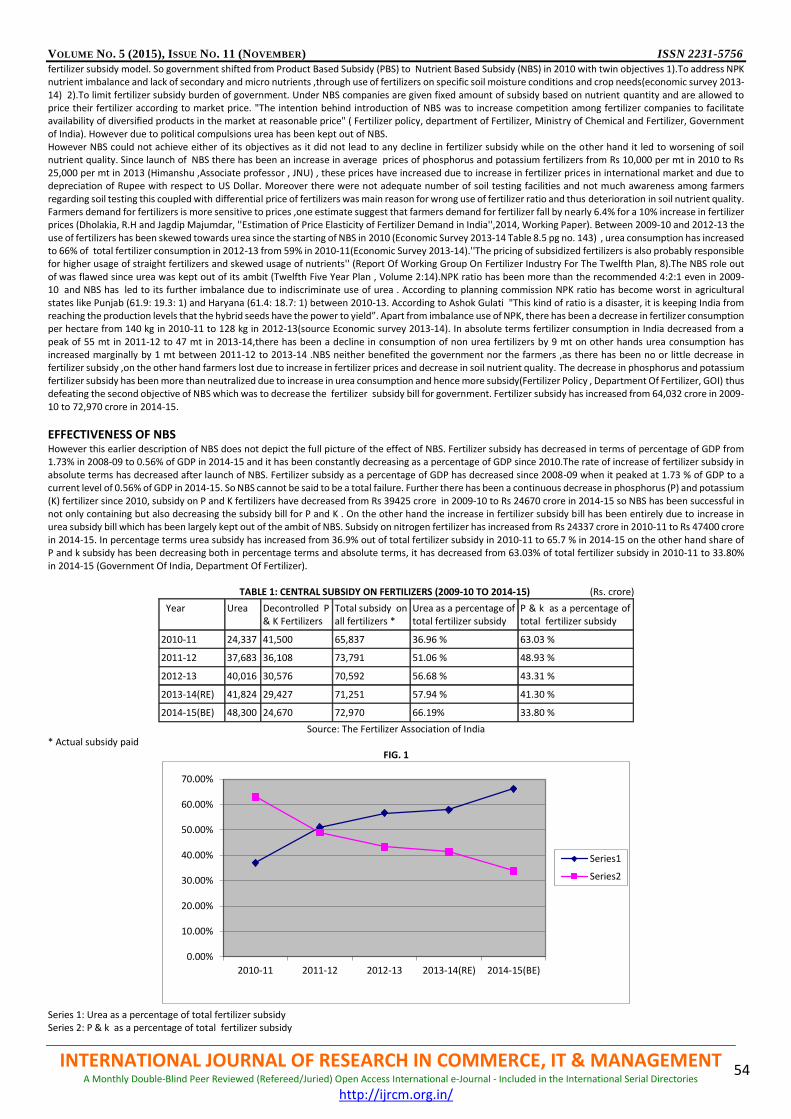
VOLUME NO. 5 (2015), ISSUE NO. 11 (NOVEMBER) ISSN 2231-5756
INTERNATIONAL JOURNAL OF RESEARCH IN COMMERCE, IT & MANAGEMENT A Monthly Double-Blind Peer Reviewed (Refereed/Juried) Open Access International e-Journal - Included in the International Serial Directories
http://ijrcm.org.in/
54
fertilizer subsidy model. So government shifted from Product Based Subsidy (PBS) to Nutrient Based Subsidy (NBS) in 2010 with twin objectives 1).To address NPK nutrient imbalance and lack of secondary and micro nutrients ,through use of fertilizers on specific soil moisture conditions and crop needs(economic survey 2013-14) 2).To limit fertilizer subsidy burden of government. Under NBS companies are given fixed amount of subsidy based on nutrient quantity and are allowed to price their fertilizer according to market price. "The intention behind introduction of NBS was to increase competition among fertilizer companies to facilitate availability of diversified products in the market at reasonable price" ( Fertilizer policy, department of Fertilizer, Ministry of Chemical and Fertilizer, Government of India). However due to political compulsions urea has been kept out of NBS. However NBS could not achieve either of its objectives as it did not lead to any decline in fertilizer subsidy while on the other hand it led to worsening of soil nutrient quality. Since launch of NBS there has been an increase in average prices of phosphorus and potassium fertilizers from Rs 10,000 per mt in 2010 to Rs 25,000 per mt in 2013 (Himanshu ,Associate professor , JNU) , these prices have increased due to increase in fertilizer prices in international market and due to depreciation of Rupee with respect to US Dollar. Moreover there were not adequate number of soil testing facilities and not much awareness among farmers regarding soil testing this coupled with differential price of fertilizers was main reason for wrong use of fertilizer ratio and thus deterioration in soil nutrient quality. Farmers demand for fertilizers is more sensitive to prices ,one estimate suggest that farmers demand for fertilizer fall by nearly 6.4% for a 10% increase in fertilizer prices (Dholakia, R.H and Jagdip Majumdar, ''Estimation of Price Elasticity of Fertilizer Demand in India'',2014, Working Paper). Between 2009-10 and 2012-13 the use of fertilizers has been skewed towards urea since the starting of NBS in 2010 (Economic Survey 2013-14 Table 8.5 pg no. 143) , urea consumption has increased to 66% of total fertilizer consumption in 2012-13 from 59% in 2010-11(Economic Survey 2013-14).''The pricing of subsidized fertilizers is also probably responsible for higher usage of straight fertilizers and skewed usage of nutrients'' (Report Of Working Group On Fertilizer Industry For The Twelfth Plan, 8).The NBS role out of was flawed since urea was kept out of its ambit (Twelfth Five Year Plan , Volume 2:14).NPK ratio has been more than the recommended 4:2:1 even in 2009-10 and NBS has led to its further imbalance due to indiscriminate use of urea . According to planning commission NPK ratio has become worst in agricultural states like Punjab (61.9: 19.3: 1) and Haryana (61.4: 18.7: 1) between 2010-13. According to Ashok Gulati "This kind of ratio is a disaster, it is keeping India from reaching the production levels that the hybrid seeds have the power to yield”. Apart from imbalance use of NPK, there has been a decrease in fertilizer consumption per hectare from 140 kg in 2010-11 to 128 kg in 2012-13(source Economic survey 2013-14). In absolute terms fertilizer consumption in India decreased from a peak of 55 mt in 2011-12 to 47 mt in 2013-14,there has been a decline in consumption of non urea fertilizers by 9 mt on other hands urea consumption has increased marginally by 1 mt between 2011-12 to 2013-14 .NBS neither benefited the government nor the farmers ,as there has been no or little decrease in fertilizer subsidy ,on the other hand farmers lost due to increase in fertilizer prices and decrease in soil nutrient quality. The decrease in phosphorus and potassium fertilizer subsidy has been more than neutralized due to increase in urea consumption and hence more subsidy(Fertilizer Policy , Department Of Fertilizer, GOI) thus defeating the second objective of NBS which was to decrease the fertilizer subsidy bill for government. Fertilizer subsidy has increased from 64,032 crore in 2009-10 to 72,970 crore in 2014-15.
EFFECTIVENESS OF NBS However this earlier description of NBS does not depict the full picture of the effect of NBS. Fertilizer subsidy has decreased in terms of percentage of GDP from 1.73% in 2008-09 to 0.56% of GDP in 2014-15 and it has been constantly decreasing as a percentage of GDP since 2010.The rate of increase of fertilizer subsidy in absolute terms has decreased after launch of NBS. Fertilizer subsidy as a percentage of GDP has decreased since 2008-09 when it peaked at 1.73 % of GDP to a current level of 0.56% of GDP in 2014-15. So NBS cannot be said to be a total failure. Further there has been a continuous decrease in phosphorus (P) and potassium (K) fertilizer since 2010, subsidy on P and K fertilizers have decreased from Rs 39425 crore in 2009-10 to Rs 24670 crore in 2014-15 so NBS has been successful in not only containing but also decreasing the subsidy bill for P and K . On the other hand the increase in fertilizer subsidy bill has been entirely due to increase in urea subsidy bill which has been largely kept out of the ambit of NBS. Subsidy on nitrogen fertilizer has increased from Rs 24337 crore in 2010-11 to Rs 47400 crore in 2014-15. In percentage terms urea subsidy has increased from 36.9% out of total fertilizer subsidy in 2010-11 to 65.7 % in 2014-15 on the other hand share of P and k subsidy has been decreasing both in percentage terms and absolute terms, it has decreased from 63.03% of total fertilizer subsidy in 2010-11 to 33.80% in 2014-15 (Government Of India, Department Of Fertilizer).
TABLE 1: CENTRAL SUBSIDY ON FERTILIZERS (2009-10 TO 2014-15) (Rs. crore)
Year Urea Decontrolled P & K Fertilizers
Total subsidy on all fertilizers *
Urea as a percentage of total fertilizer subsidy
P & k as a percentage of total fertilizer subsidy
2010-11 24,337 41,500 65,837 36.96 % 63.03 %
2011-12 37,683 36,108 73,791 51.06 % 48.93 %
2012-13 40,016 30,576 70,592 56.68 % 43.31 %
2013-14(RE) 41,824 29,427 71,251 57.94 % 41.30 %
2014-15(BE) 48,300 24,670 72,970 66.19% 33.80 %
Source: The Fertilizer Association of India * Actual subsidy paid
FIG. 1 Series 1: Urea as a percentage of total fertilizer subsidy Series 2: P & k as a percentage of total fertilizer subsidy
0.00%
10.00%
20.00%
30.00%
40.00%
50.00%
60.00%
70.00%
2010-11 2011-12 2012-13 2013-14(RE) 2014-15(BE)
Series1
Series2
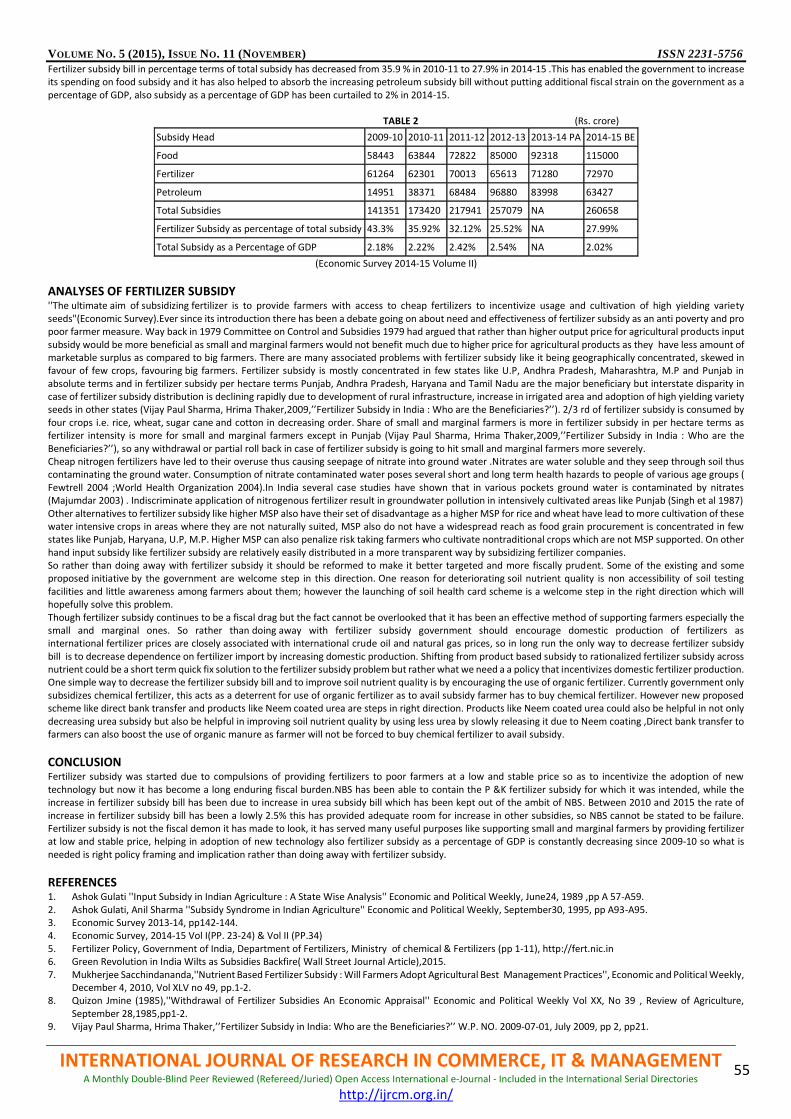
VOLUME NO. 5 (2015), ISSUE NO. 11 (NOVEMBER) ISSN 2231-5756
INTERNATIONAL JOURNAL OF RESEARCH IN COMMERCE, IT & MANAGEMENT A Monthly Double-Blind Peer Reviewed (Refereed/Juried) Open Access International e-Journal - Included in the International Serial Directories
http://ijrcm.org.in/
55
Fertilizer subsidy bill in percentage terms of total subsidy has decreased from 35.9 % in 2010-11 to 27.9% in 2014-15 .This has enabled the government to increase its spending on food subsidy and it has also helped to absorb the increasing petroleum subsidy bill without putting additional fiscal strain on the government as a percentage of GDP, also subsidy as a percentage of GDP has been curtailed to 2% in 2014-15.
TABLE 2 (Rs. crore)
Subsidy Head 2009-10 2010-11 2011-12 2012-13 2013-14 PA 2014-15 BE
Food 58443 63844 72822 85000 92318 115000
Fertilizer 61264 62301 70013 65613 71280 72970
Petroleum 14951 38371 68484 96880 83998 63427
Total Subsidies 141351 173420 217941 257079 NA 260658
Fertilizer Subsidy as percentage of total subsidy 43.3% 35.92% 32.12% 25.52% NA 27.99%
Total Subsidy as a Percentage of GDP 2.18% 2.22% 2.42% 2.54% NA 2.02%
(Economic Survey 2014-15 Volume II)
ANALYSES OF FERTILIZER SUBSIDY ''The ultimate aim of subsidizing fertilizer is to provide farmers with access to cheap fertilizers to incentivize usage and cultivation of high yielding variety seeds"(Economic Survey).Ever since its introduction there has been a debate going on about need and effectiveness of fertilizer subsidy as an anti poverty and pro poor farmer measure. Way back in 1979 Committee on Control and Subsidies 1979 had argued that rather than higher output price for agricultural products input subsidy would be more beneficial as small and marginal farmers would not benefit much due to higher price for agricultural products as they have less amount of marketable surplus as compared to big farmers. There are many associated problems with fertilizer subsidy like it being geographically concentrated, skewed in favour of few crops, favouring big farmers. Fertilizer subsidy is mostly concentrated in few states like U.P, Andhra Pradesh, Maharashtra, M.P and Punjab in absolute terms and in fertilizer subsidy per hectare terms Punjab, Andhra Pradesh, Haryana and Tamil Nadu are the major beneficiary but interstate disparity in case of fertilizer subsidy distribution is declining rapidly due to development of rural infrastructure, increase in irrigated area and adoption of high yielding variety seeds in other states (Vijay Paul Sharma, Hrima Thaker,2009,’’Fertilizer Subsidy in India : Who are the Beneficiaries?’’). 2/3 rd of fertilizer subsidy is consumed by four crops i.e. rice, wheat, sugar cane and cotton in decreasing order. Share of small and marginal farmers is more in fertilizer subsidy in per hectare terms as fertilizer intensity is more for small and marginal farmers except in Punjab (Vijay Paul Sharma, Hrima Thaker,2009,’’Fertilizer Subsidy in India : Who are the Beneficiaries?’’), so any withdrawal or partial roll back in case of fertilizer subsidy is going to hit small and marginal farmers more severely. Cheap nitrogen fertilizers have led to their overuse thus causing seepage of nitrate into ground water .Nitrates are water soluble and they seep through soil thus contaminating the ground water. Consumption of nitrate contaminated water poses several short and long term health hazards to people of various age groups ( Fewtrell 2004 ;World Health Organization 2004).In India several case studies have shown that in various pockets ground water is contaminated by nitrates (Majumdar 2003) . Indiscriminate application of nitrogenous fertilizer result in groundwater pollution in intensively cultivated areas like Punjab (Singh et al 1987) Other alternatives to fertilizer subsidy like higher MSP also have their set of disadvantage as a higher MSP for rice and wheat have lead to more cultivation of these water intensive crops in areas where they are not naturally suited, MSP also do not have a widespread reach as food grain procurement is concentrated in few states like Punjab, Haryana, U.P, M.P. Higher MSP can also penalize risk taking farmers who cultivate nontraditional crops which are not MSP supported. On other hand input subsidy like fertilizer subsidy are relatively easily distributed in a more transparent way by subsidizing fertilizer companies. So rather than doing away with fertilizer subsidy it should be reformed to make it better targeted and more fiscally prudent. Some of the existing and some proposed initiative by the government are welcome step in this direction. One reason for deteriorating soil nutrient quality is non accessibility of soil testing facilities and little awareness among farmers about them; however the launching of soil health card scheme is a welcome step in the right direction which will hopefully solve this problem. Though fertilizer subsidy continues to be a fiscal drag but the fact cannot be overlooked that it has been an effective method of supporting farmers especially the small and marginal ones. So rather than doing away with fertilizer subsidy government should encourage domestic production of fertilizers as international fertilizer prices are closely associated with international crude oil and natural gas prices, so in long run the only way to decrease fertilizer subsidy bill is to decrease dependence on fertilizer import by increasing domestic production. Shifting from product based subsidy to rationalized fertilizer subsidy across nutrient could be a short term quick fix solution to the fertilizer subsidy problem but rather what we need a a policy that incentivizes domestic fertilizer production. One simple way to decrease the fertilizer subsidy bill and to improve soil nutrient quality is by encouraging the use of organic fertilizer. Currently government only subsidizes chemical fertilizer, this acts as a deterrent for use of organic fertilizer as to avail subsidy farmer has to buy chemical fertilizer. However new proposed scheme like direct bank transfer and products like Neem coated urea are steps in right direction. Products like Neem coated urea could also be helpful in not only decreasing urea subsidy but also be helpful in improving soil nutrient quality by using less urea by slowly releasing it due to Neem coating ,Direct bank transfer to farmers can also boost the use of organic manure as farmer will not be forced to buy chemical fertilizer to avail subsidy.
CONCLUSION Fertilizer subsidy was started due to compulsions of providing fertilizers to poor farmers at a low and stable price so as to incentivize the adoption of new technology but now it has become a long enduring fiscal burden.NBS has been able to contain the P &K fertilizer subsidy for which it was intended, while the increase in fertilizer subsidy bill has been due to increase in urea subsidy bill which has been kept out of the ambit of NBS. Between 2010 and 2015 the rate of increase in fertilizer subsidy bill has been a lowly 2.5% this has provided adequate room for increase in other subsidies, so NBS cannot be stated to be failure. Fertilizer subsidy is not the fiscal demon it has made to look, it has served many useful purposes like supporting small and marginal farmers by providing fertilizer at low and stable price, helping in adoption of new technology also fertilizer subsidy as a percentage of GDP is constantly decreasing since 2009-10 so what is needed is right policy framing and implication rather than doing away with fertilizer subsidy.
REFERENCES 1. Ashok Gulati ''Input Subsidy in Indian Agriculture : A State Wise Analysis'' Economic and Political Weekly, June24, 1989 ,pp A 57-A59. 2. Ashok Gulati, Anil Sharma ''Subsidy Syndrome in Indian Agriculture'' Economic and Political Weekly, September30, 1995, pp A93-A95. 3. Economic Survey 2013-14, pp142-144. 4. Economic Survey, 2014-15 Vol I(PP. 23-24) & Vol II (PP.34) 5. Fertilizer Policy, Government of India, Department of Fertilizers, Ministry of chemical & Fertilizers (pp 1-11), http://fert.nic.in 6. Green Revolution in India Wilts as Subsidies Backfire( Wall Street Journal Article),2015. 7. Mukherjee Sacchindananda,''Nutrient Based Fertilizer Subsidy : Will Farmers Adopt Agricultural Best Management Practices'', Economic and Political Weekly,
December 4, 2010, Vol XLV no 49, pp.1-2. 8. Quizon Jmine (1985),''Withdrawal of Fertilizer Subsidies An Economic Appraisal'' Economic and Political Weekly Vol XX, No 39 , Review of Agriculture,
September 28,1985,pp1-2. 9. Vijay Paul Sharma, Hrima Thaker,’’Fertilizer Subsidy in India: Who are the Beneficiaries?’’ W.P. NO. 2009-07-01, July 2009, pp 2, pp21.
VOLUME NO. 5 (2015), ISSUE NO. 11 (NOVEMBER) ISSN 2231-5756
INTERNATIONAL JOURNAL OF RESEARCH IN COMMERCE, IT & MANAGEMENT A Monthly Double-Blind Peer Reviewed (Refereed/Juried) Open Access International e-Journal - Included in the International Serial Directories
http://ijrcm.org.in/
56
WEBSITES 10. http://economictimes.indiatimes.com/articles how/48375182.cms? 11. http://www.livemint.com/ 12. www.faidelhi.org/
VOLUME NO. 5 (2015), ISSUE NO. 11 (NOVEMBER) ISSN 2231-5756
INTERNATIONAL JOURNAL OF RESEARCH IN COMMERCE, IT & MANAGEMENT A Monthly Double-Blind Peer Reviewed (Refereed/Juried) Open Access International e-Journal - Included in the International Serial Directories
http://ijrcm.org.in/
57
A STUDY ON THE IMPACT OF SOCIAL MEDIA ON THE PURCHASE DECISION OF COLLEGE STUDENTS WITH SPECIAL REFERENCE TO KOZHIKODE DISTRICT
YAHIYA M.P RESEARCH SCHOLAR
SREE NARAYANA GURU COLLEGE K. G. CHAVADI
DR. M. SARAVANAN
ASST. PROFESSOR DEPARTMENT OF INTERNATIONAL BUSINESS
SREE NARAYANA GURU COLLEGE K. G. CHAVADI
ABSTRACT
The use of social media is growing rapidly. For marketing professionals, social media is a new outlet that can potentially be used to help increase the interest in a product or service. In this paper, we report, analyze and interpret the results of a survey that asked several questions concerning the relationship between social media use and the overall impact social-media marketing has on purchase behavior. In addition to demographics, key questions included the membership status in several social-media sites and the frequency of visit to these sites as well as the frequency with which selected opinions were expressed during these visits. Our analysis provides preliminary statistical evidence to help evaluate the impact of social-media usage on customer purchase. This has implications for customer lifetime value (CLV) considerations, as well as related interest for advertisers deciding whether investments in social-media are cost effective and if so, which ones?
KEYWORDS social media, consumer, buying decision, communication, word of mouth (WOM).
INTRODUCTION he advent of social media has grown tremendously today. It’s the only media which does not have any ‘hartals’ or ‘lock outs’ and practically no vacation. The advent of this media led to the growth of mobile users in kerala. Thus, Kerala is one of the supreme market for Handset and technological devises producers at recent times. Most of the people are buying product or services through social media. It plays a significant role to influence the purchase
decision of people in Kerala. This study mainly focusing to the buying decision of college students regards to social media. The major intention of social media is to communicate. Hence, it can be said that social media is not a new or alien concept. People were communicating even before communication tools were invented. Discussions have always existed but the speed to which the connections happened changed eventually which gave rise to social media platforms. Traditionally these discussions used to spread through word of mouth (WOM). Social media has recently become part of mainstream culture and business world where people have started using digital technologies for networking, socializing, information gathering and spreading. Social media, in one form, or another has been around since the 1970’s. Although the look and feel has changed greatly since the early days, the communication concept remains the same. Today technology allows for a greater interaction and real-time communication but similar to its roots, social media allows individuals to broadcast to the masses. According to internet world stats (2011), once in the last 11 years Internet users have grown up from 360 million in 2000 to 2267 million in 2011. Moreover, focusing India alone, it has 122 million internet users in 2013, which was 5 million in 2000, against a population of 1189 million. There are 45 million Face book users registered as on March 31, 2012. It shows an internet penetration of 10.2%. Latest trend noticed these days is that people are asking each other for their Face book IDs rather than noting down cell numbers. This shows the intensity of people for using social media websites. These days, there are social and user-generated sites for just about every activity one can imagine. There are social shopping sites, social financial planning sites, websites for getting reviews for book, movie, or an applications , sites to share your goals and meet like-minded people, sites to plan your travels and share them with others, and sites to help you make decisions on just about anything. Hence, this enormous number of internet and social media users in the world and in India has raised the importance and interest on the topic. Across networks, a good or bad experience will be shared, potentially on a huge scale, Between 7,00,000 and 1.3 million blog posts are made daily and, according to Google, a new blog post is being created every second of every day (James, 2009). This new environment has fundamentally changed the relationship between the brand and the consumer. Concerning this changing relationship between brand and consumer, this study is about how social media influences consumers.
STATEMENT OF THE PROBLEM Social media basically is a new age of technology that includes various online tools that enable people communicate easily through internet to share information and resources like words, pictures, videos and audios etc. These new trends and changed face of communication among consumers have given rise to new kind of opportunities for organizations to understand their customers and even employees, connecting them and linking them to create a social business. Companies have never before had the opportunity to talk to millions of customers, send out messages, get fast feedback, and experiment with offers at relatively low costs. In addition, never before have millions of consumers had the ability to talk to each other, criticizing or recommending products without knowledge or input from a company. However, Social Media influence the buying behavior of people. Especially college students, those who made purchase decision while using various social media sites. The study aims at understanding the usual habit of college students towards social media and to identify the most preferred social media to influence purchase decision. Companies have started using social media to influence the youth knowing that purchasing decision of youth is greatly influenced by it. The study analyses the usage pattern and reliability of social media which they rely on it.
OBJECTIVES OF THE STUDY 1. To Know the usual habit of college students towards social media 2. To identify the most preferred social media to influence purchase decision 3. To know the usage pattern and reasons why the youth purchase products and services using information obtained on social media platform
T
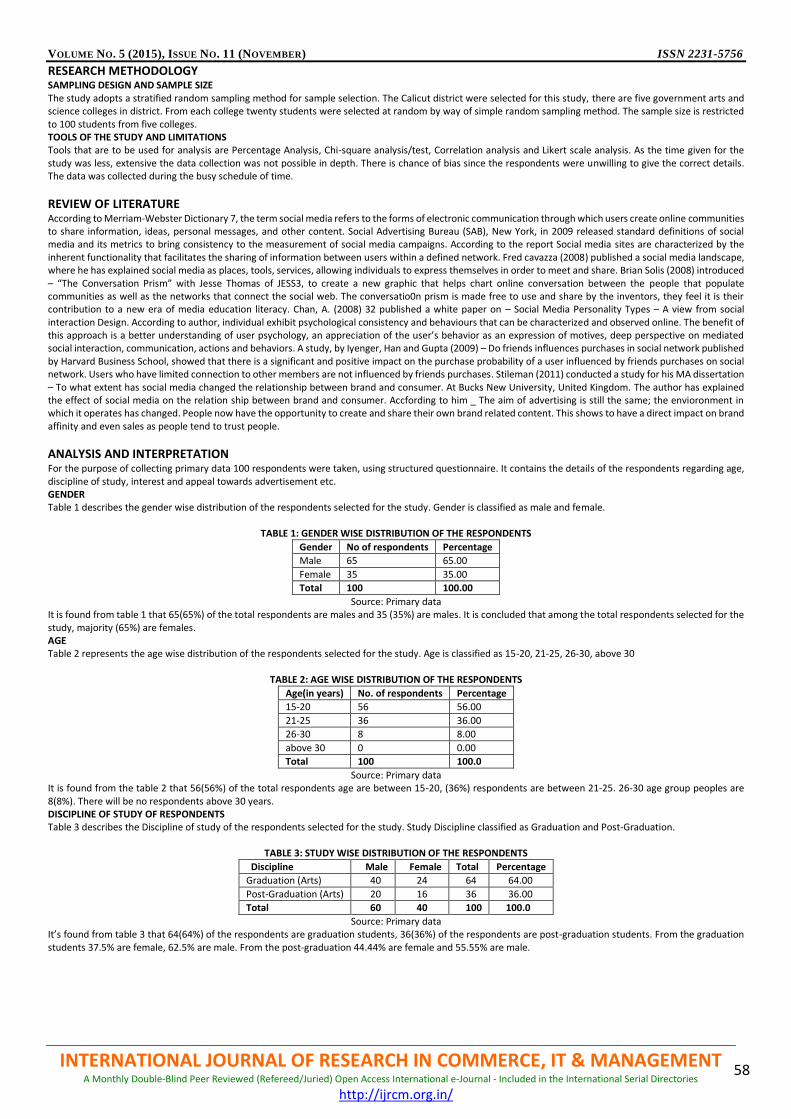
VOLUME NO. 5 (2015), ISSUE NO. 11 (NOVEMBER) ISSN 2231-5756
INTERNATIONAL JOURNAL OF RESEARCH IN COMMERCE, IT & MANAGEMENT A Monthly Double-Blind Peer Reviewed (Refereed/Juried) Open Access International e-Journal - Included in the International Serial Directories
http://ijrcm.org.in/
58
RESEARCH METHODOLOGY SAMPLING DESIGN AND SAMPLE SIZE The study adopts a stratified random sampling method for sample selection. The Calicut district were selected for this study, there are five government arts and science colleges in district. From each college twenty students were selected at random by way of simple random sampling method. The sample size is restricted to 100 students from five colleges. TOOLS OF THE STUDY AND LIMITATIONS Tools that are to be used for analysis are Percentage Analysis, Chi-square analysis/test, Correlation analysis and Likert scale analysis. As the time given for the study was less, extensive the data collection was not possible in depth. There is chance of bias since the respondents were unwilling to give the correct details. The data was collected during the busy schedule of time.
REVIEW OF LITERATURE According to Merriam-Webster Dictionary 7, the term social media refers to the forms of electronic communication through which users create online communities to share information, ideas, personal messages, and other content. Social Advertising Bureau (SAB), New York, in 2009 released standard definitions of social media and its metrics to bring consistency to the measurement of social media campaigns. According to the report Social media sites are characterized by the inherent functionality that facilitates the sharing of information between users within a defined network. Fred cavazza (2008) published a social media landscape, where he has explained social media as places, tools, services, allowing individuals to express themselves in order to meet and share. Brian Solis (2008) introduced – “The Conversation Prism” with Jesse Thomas of JESS3, to create a new graphic that helps chart online conversation between the people that populate communities as well as the networks that connect the social web. The conversatio0n prism is made free to use and share by the inventors, they feel it is their contribution to a new era of media education literacy. Chan, A. (2008) 32 published a white paper on – Social Media Personality Types – A view from social interaction Design. According to author, individual exhibit psychological consistency and behaviours that can be characterized and observed online. The benefit of this approach is a better understanding of user psychology, an appreciation of the user’s behavior as an expression of motives, deep perspective on mediated social interaction, communication, actions and behaviors. A study, by Iyenger, Han and Gupta (2009) – Do friends influences purchases in social network published by Harvard Business School, showed that there is a significant and positive impact on the purchase probability of a user influenced by friends purchases on social network. Users who have limited connection to other members are not influenced by friends purchases. Stileman (2011) conducted a study for his MA dissertation – To what extent has social media changed the relationship between brand and consumer. At Bucks New University, United Kingdom. The author has explained the effect of social media on the relation ship between brand and consumer. Accfording to him _ The aim of advertising is still the same; the envioronment in which it operates has changed. People now have the opportunity to create and share their own brand related content. This shows to have a direct impact on brand affinity and even sales as people tend to trust people.
ANALYSIS AND INTERPRETATION For the purpose of collecting primary data 100 respondents were taken, using structured questionnaire. It contains the details of the respondents regarding age, discipline of study, interest and appeal towards advertisement etc. GENDER Table 1 describes the gender wise distribution of the respondents selected for the study. Gender is classified as male and female.
TABLE 1: GENDER WISE DISTRIBUTION OF THE RESPONDENTS
Gender No of respondents Percentage
Male 65 65.00
Female 35 35.00
Total 100 100.00
Source: Primary data It is found from table 1 that 65(65%) of the total respondents are males and 35 (35%) are males. It is concluded that among the total respondents selected for the study, majority (65%) are females. AGE Table 2 represents the age wise distribution of the respondents selected for the study. Age is classified as 15-20, 21-25, 26-30, above 30
TABLE 2: AGE WISE DISTRIBUTION OF THE RESPONDENTS
Age(in years) No. of respondents Percentage
15-20 56 56.00
21-25 36 36.00
26-30 8 8.00
above 30 0 0.00
Total 100 100.0
Source: Primary data It is found from the table 2 that 56(56%) of the total respondents age are between 15-20, (36%) respondents are between 21-25. 26-30 age group peoples are 8(8%). There will be no respondents above 30 years. DISCIPLINE OF STUDY OF RESPONDENTS Table 3 describes the Discipline of study of the respondents selected for the study. Study Discipline classified as Graduation and Post-Graduation.
TABLE 3: STUDY WISE DISTRIBUTION OF THE RESPONDENTS
Discipline Male Female Total Percentage
Graduation (Arts) 40 24 64 64.00
Post-Graduation (Arts) 20 16 36 36.00
Total 60 40 100 100.0
Source: Primary data It’s found from table 3 that 64(64%) of the respondents are graduation students, 36(36%) of the respondents are post-graduation students. From the graduation students 37.5% are female, 62.5% are male. From the post-graduation 44.44% are female and 55.55% are male.
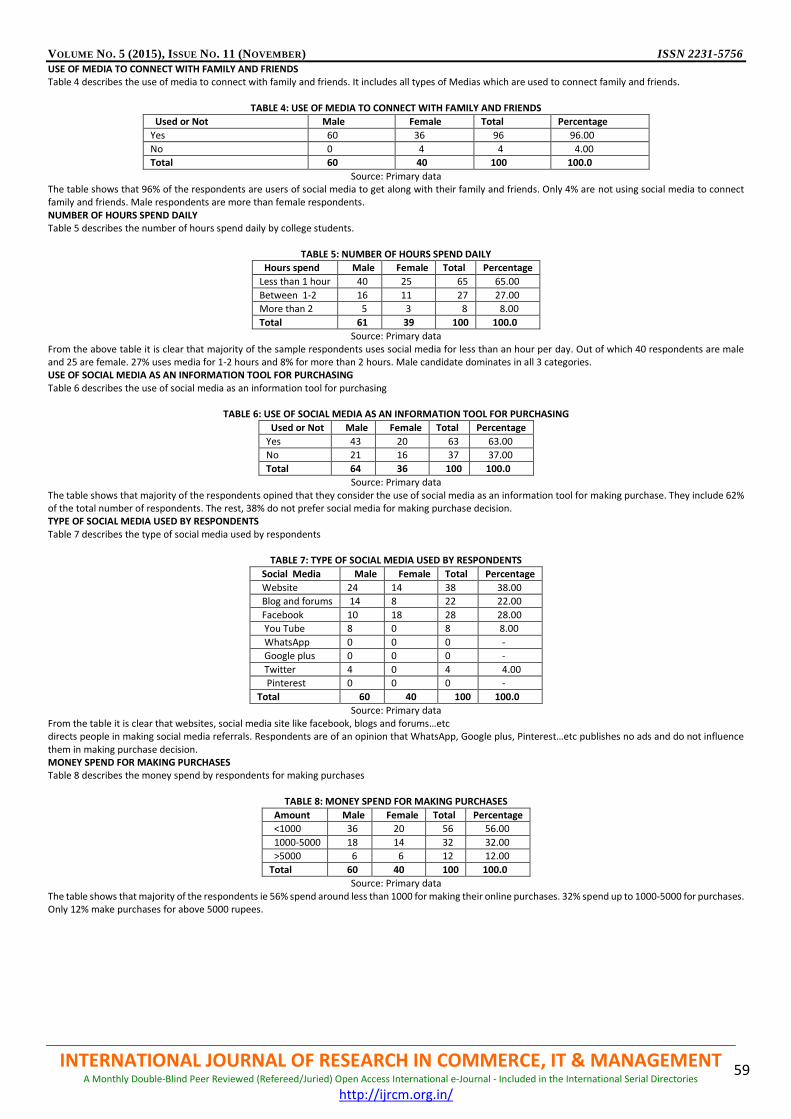
VOLUME NO. 5 (2015), ISSUE NO. 11 (NOVEMBER) ISSN 2231-5756
INTERNATIONAL JOURNAL OF RESEARCH IN COMMERCE, IT & MANAGEMENT A Monthly Double-Blind Peer Reviewed (Refereed/Juried) Open Access International e-Journal - Included in the International Serial Directories
http://ijrcm.org.in/
59
USE OF MEDIA TO CONNECT WITH FAMILY AND FRIENDS Table 4 describes the use of media to connect with family and friends. It includes all types of Medias which are used to connect family and friends.
TABLE 4: USE OF MEDIA TO CONNECT WITH FAMILY AND FRIENDS
Used or Not Male Female Total Percentage
Yes 60 36 96 96.00
No 0 4 4 4.00
Total 60 40 100 100.0
Source: Primary data The table shows that 96% of the respondents are users of social media to get along with their family and friends. Only 4% are not using social media to connect family and friends. Male respondents are more than female respondents. NUMBER OF HOURS SPEND DAILY Table 5 describes the number of hours spend daily by college students.
TABLE 5: NUMBER OF HOURS SPEND DAILY
Hours spend Male Female Total Percentage
Less than 1 hour 40 25 65 65.00
Between 1-2 16 11 27 27.00
More than 2 5 3 8 8.00
Total 61 39 100 100.0
Source: Primary data From the above table it is clear that majority of the sample respondents uses social media for less than an hour per day. Out of which 40 respondents are male and 25 are female. 27% uses media for 1-2 hours and 8% for more than 2 hours. Male candidate dominates in all 3 categories. USE OF SOCIAL MEDIA AS AN INFORMATION TOOL FOR PURCHASING Table 6 describes the use of social media as an information tool for purchasing
TABLE 6: USE OF SOCIAL MEDIA AS AN INFORMATION TOOL FOR PURCHASING
Used or Not Male Female Total Percentage
Yes 43 20 63 63.00
No 21 16 37 37.00
Total 64 36 100 100.0
Source: Primary data The table shows that majority of the respondents opined that they consider the use of social media as an information tool for making purchase. They include 62% of the total number of respondents. The rest, 38% do not prefer social media for making purchase decision. TYPE OF SOCIAL MEDIA USED BY RESPONDENTS Table 7 describes the type of social media used by respondents
TABLE 7: TYPE OF SOCIAL MEDIA USED BY RESPONDENTS
Social Media Male Female Total Percentage
Website 24 14 38 38.00
Blog and forums 14 8 22 22.00
Facebook 10 18 28 28.00
You Tube 8 0 8 8.00
WhatsApp 0 0 0 -
Google plus 0 0 0 -
Twitter 4 0 4 4.00
Pinterest 0 0 0 -
Total 60 40 100 100.0
Source: Primary data From the table it is clear that websites, social media site like facebook, blogs and forums…etc directs people in making social media referrals. Respondents are of an opinion that WhatsApp, Google plus, Pinterest…etc publishes no ads and do not influence them in making purchase decision. MONEY SPEND FOR MAKING PURCHASES Table 8 describes the money spend by respondents for making purchases
TABLE 8: MONEY SPEND FOR MAKING PURCHASES
Amount Male Female Total Percentage
<1000 36 20 56 56.00
1000-5000 18 14 32 32.00
>5000 6 6 12 12.00
Total 60 40 100 100.0
Source: Primary data The table shows that majority of the respondents ie 56% spend around less than 1000 for making their online purchases. 32% spend up to 1000-5000 for purchases. Only 12% make purchases for above 5000 rupees.
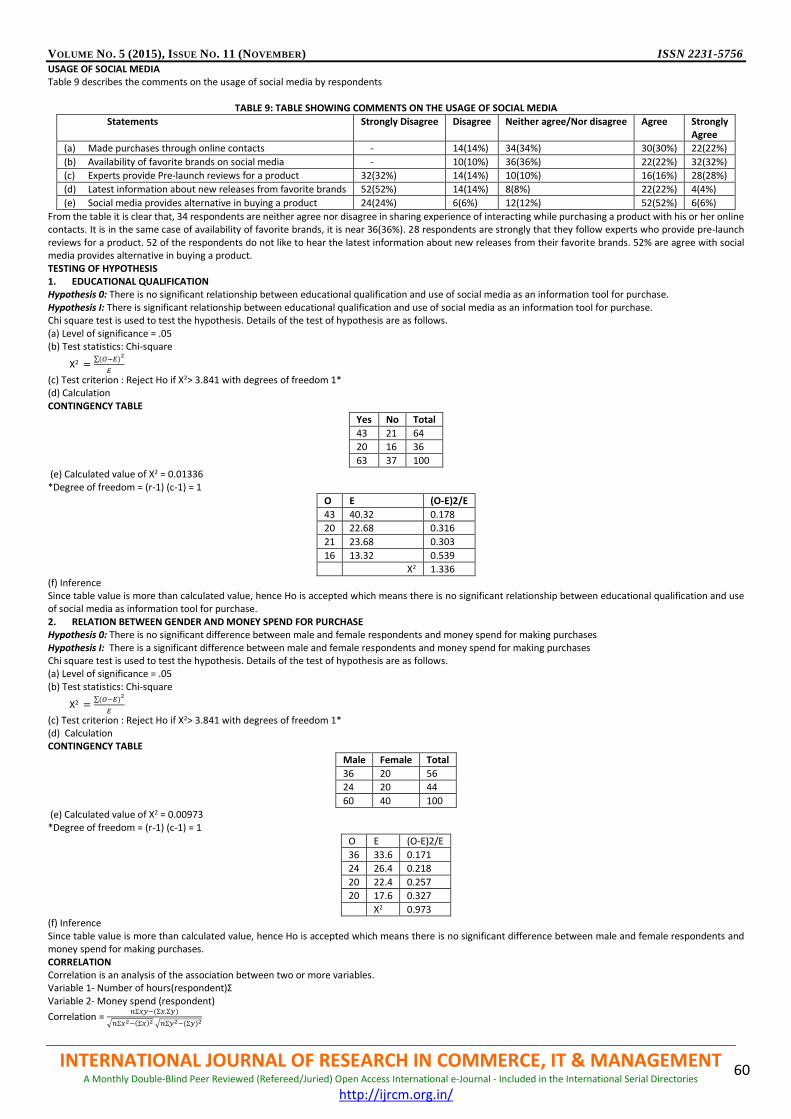
VOLUME NO. 5 (2015), ISSUE NO. 11 (NOVEMBER) ISSN 2231-5756
INTERNATIONAL JOURNAL OF RESEARCH IN COMMERCE, IT & MANAGEMENT A Monthly Double-Blind Peer Reviewed (Refereed/Juried) Open Access International e-Journal - Included in the International Serial Directories
http://ijrcm.org.in/
60
USAGE OF SOCIAL MEDIA Table 9 describes the comments on the usage of social media by respondents
TABLE 9: TABLE SHOWING COMMENTS ON THE USAGE OF SOCIAL MEDIA
Statements Strongly Disagree Disagree Neither agree/Nor disagree Agree Strongly Agree
(a) Made purchases through online contacts - 14(14%) 34(34%) 30(30%) 22(22%)
(b) Availability of favorite brands on social media - 10(10%) 36(36%) 22(22%) 32(32%)
(c) Experts provide Pre-launch reviews for a product 32(32%) 14(14%) 10(10%) 16(16%) 28(28%)
(d) Latest information about new releases from favorite brands 52(52%) 14(14%) 8(8%) 22(22%) 4(4%)
(e) Social media provides alternative in buying a product 24(24%) 6(6%) 12(12%) 52(52%) 6(6%)
From the table it is clear that, 34 respondents are neither agree nor disagree in sharing experience of interacting while purchasing a product with his or her online contacts. It is in the same case of availability of favorite brands, it is near 36(36%). 28 respondents are strongly that they follow experts who provide pre-launch reviews for a product. 52 of the respondents do not like to hear the latest information about new releases from their favorite brands. 52% are agree with social media provides alternative in buying a product. TESTING OF HYPOTHESIS 1. EDUCATIONAL QUALIFICATION Hypothesis 0: There is no significant relationship between educational qualification and use of social media as an information tool for purchase. Hypothesis I: There is significant relationship between educational qualification and use of social media as an information tool for purchase. Chi square test is used to test the hypothesis. Details of the test of hypothesis are as follows. (a) Level of significance = .05 (b) Test statistics: Chi-square
X2 =∑(𝑂−𝐸)
2
𝐸
(c) Test criterion : Reject Ho if X2> 3.841 with degrees of freedom 1* (d) Calculation CONTINGENCY TABLE
Yes No Total
43 21 64
20 16 36
63 37 100
(e) Calculated value of X2 = 0.01336 *Degree of freedom = (r-1) (c-1) = 1
O E (O-E)2/E
43 40.32 0.178
20 22.68 0.316
21 23.68 0.303
16 13.32 0.539
X2 1.336
(f) Inference Since table value is more than calculated value, hence Ho is accepted which means there is no significant relationship between educational qualification and use of social media as information tool for purchase. 2. RELATION BETWEEN GENDER AND MONEY SPEND FOR PURCHASE Hypothesis 0: There is no significant difference between male and female respondents and money spend for making purchases Hypothesis I: There is a significant difference between male and female respondents and money spend for making purchases Chi square test is used to test the hypothesis. Details of the test of hypothesis are as follows. (a) Level of significance = .05 (b) Test statistics: Chi-square
X2 =∑(𝑂−𝐸)
2
𝐸
(c) Test criterion : Reject Ho if X2> 3.841 with degrees of freedom 1* (d) Calculation CONTINGENCY TABLE
Male Female Total
36 20 56
24 20 44
60 40 100
(e) Calculated value of X2 = 0.00973 *Degree of freedom = (r-1) (c-1) = 1
O E (O-E)2/E
36 33.6 0.171
24 26.4 0.218
20 22.4 0.257
20 17.6 0.327
X2 0.973
(f) Inference Since table value is more than calculated value, hence Ho is accepted which means there is no significant difference between male and female respondents and money spend for making purchases. CORRELATION Correlation is an analysis of the association between two or more variables. Variable 1- Number of hours(respondent)Ʃ Variable 2- Money spend (respondent)
Correlation = 𝑛Ʃ𝑥𝑦−(Ʃ𝑥.Ʃ𝑦)
√𝑛Ʃ𝑥2−(Ʃ𝑥)2 √𝑛Ʃ𝑦2−(Ʃ𝑦)2
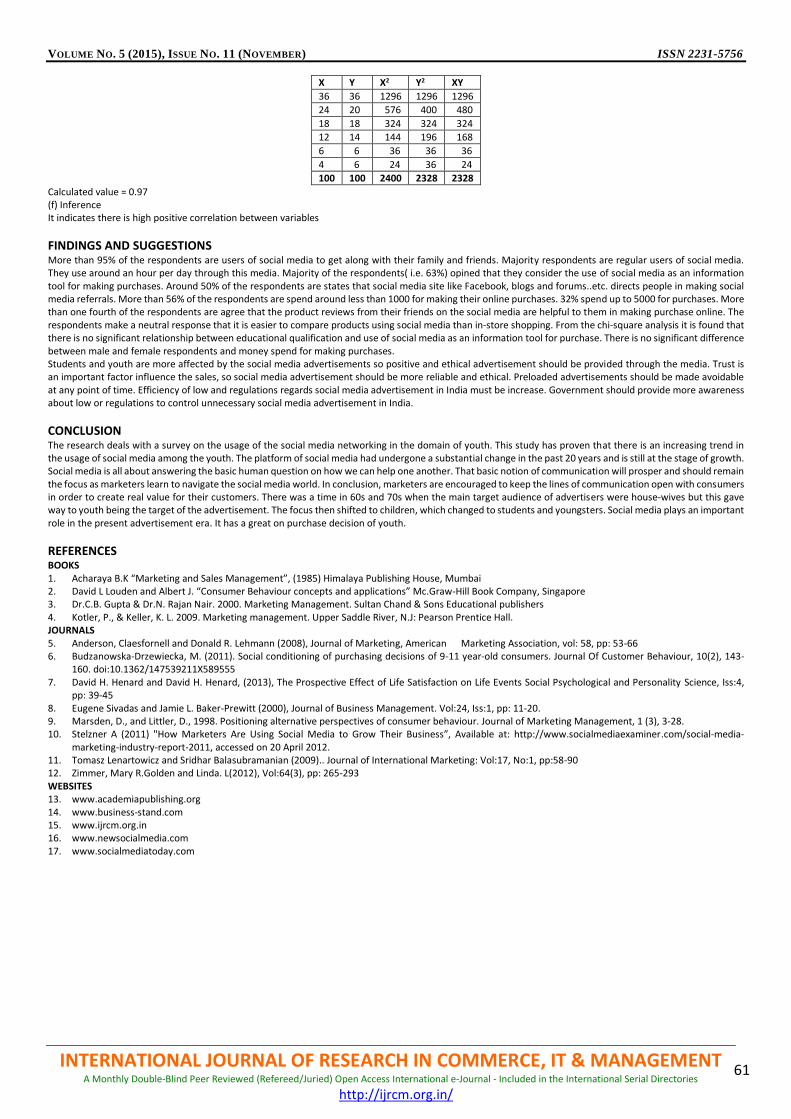
VOLUME NO. 5 (2015), ISSUE NO. 11 (NOVEMBER) ISSN 2231-5756
INTERNATIONAL JOURNAL OF RESEARCH IN COMMERCE, IT & MANAGEMENT A Monthly Double-Blind Peer Reviewed (Refereed/Juried) Open Access International e-Journal - Included in the International Serial Directories
http://ijrcm.org.in/
61
X Y X2 Y2 XY
36 36 1296 1296 1296
24 20 576 400 480
18 18 324 324 324
12 14 144 196 168
6 6 36 36 36
4 6 24 36 24
100 100 2400 2328 2328
Calculated value = 0.97 (f) Inference It indicates there is high positive correlation between variables
FINDINGS AND SUGGESTIONS More than 95% of the respondents are users of social media to get along with their family and friends. Majority respondents are regular users of social media. They use around an hour per day through this media. Majority of the respondents( i.e. 63%) opined that they consider the use of social media as an information tool for making purchases. Around 50% of the respondents are states that social media site like Facebook, blogs and forums..etc. directs people in making social media referrals. More than 56% of the respondents are spend around less than 1000 for making their online purchases. 32% spend up to 5000 for purchases. More than one fourth of the respondents are agree that the product reviews from their friends on the social media are helpful to them in making purchase online. The respondents make a neutral response that it is easier to compare products using social media than in-store shopping. From the chi-square analysis it is found that there is no significant relationship between educational qualification and use of social media as an information tool for purchase. There is no significant difference between male and female respondents and money spend for making purchases. Students and youth are more affected by the social media advertisements so positive and ethical advertisement should be provided through the media. Trust is an important factor influence the sales, so social media advertisement should be more reliable and ethical. Preloaded advertisements should be made avoidable at any point of time. Efficiency of low and regulations regards social media advertisement in India must be increase. Government should provide more awareness about low or regulations to control unnecessary social media advertisement in India.
CONCLUSION The research deals with a survey on the usage of the social media networking in the domain of youth. This study has proven that there is an increasing trend in the usage of social media among the youth. The platform of social media had undergone a substantial change in the past 20 years and is still at the stage of growth. Social media is all about answering the basic human question on how we can help one another. That basic notion of communication will prosper and should remain the focus as marketers learn to navigate the social media world. In conclusion, marketers are encouraged to keep the lines of communication open with consumers in order to create real value for their customers. There was a time in 60s and 70s when the main target audience of advertisers were house-wives but this gave way to youth being the target of the advertisement. The focus then shifted to children, which changed to students and youngsters. Social media plays an important role in the present advertisement era. It has a great on purchase decision of youth.
REFERENCES BOOKS 1. Acharaya B.K “Marketing and Sales Management”, (1985) Himalaya Publishing House, Mumbai 2. David L Louden and Albert J. “Consumer Behaviour concepts and applications” Mc.Graw-Hill Book Company, Singapore 3. Dr.C.B. Gupta & Dr.N. Rajan Nair. 2000. Marketing Management. Sultan Chand & Sons Educational publishers 4. Kotler, P., & Keller, K. L. 2009. Marketing management. Upper Saddle River, N.J: Pearson Prentice Hall. JOURNALS 5. Anderson, Claesfornell and Donald R. Lehmann (2008), Journal of Marketing, American Marketing Association, vol: 58, pp: 53-66 6. Budzanowska-Drzewiecka, M. (2011). Social conditioning of purchasing decisions of 9-11 year-old consumers. Journal Of Customer Behaviour, 10(2), 143-
160. doi:10.1362/147539211X589555 7. David H. Henard and David H. Henard, (2013), The Prospective Effect of Life Satisfaction on Life Events Social Psychological and Personality Science, Iss:4,
pp: 39-45 8. Eugene Sivadas and Jamie L. Baker-Prewitt (2000), Journal of Business Management. Vol:24, Iss:1, pp: 11-20. 9. Marsden, D., and Littler, D., 1998. Positioning alternative perspectives of consumer behaviour. Journal of Marketing Management, 1 (3), 3-28. 10. Stelzner A (2011) "How Marketers Are Using Social Media to Grow Their Business”, Available at: http://www.socialmediaexaminer.com/social-media-
marketing-industry-report-2011, accessed on 20 April 2012. 11. Tomasz Lenartowicz and Sridhar Balasubramanian (2009).. Journal of International Marketing: Vol:17, No:1, pp:58-90 12. Zimmer, Mary R.Golden and Linda. L(2012), Vol:64(3), pp: 265-293 WEBSITES 13. www.academiapublishing.org 14. www.business-stand.com 15. www.ijrcm.org.in 16. www.newsocialmedia.com 17. www.socialmediatoday.com
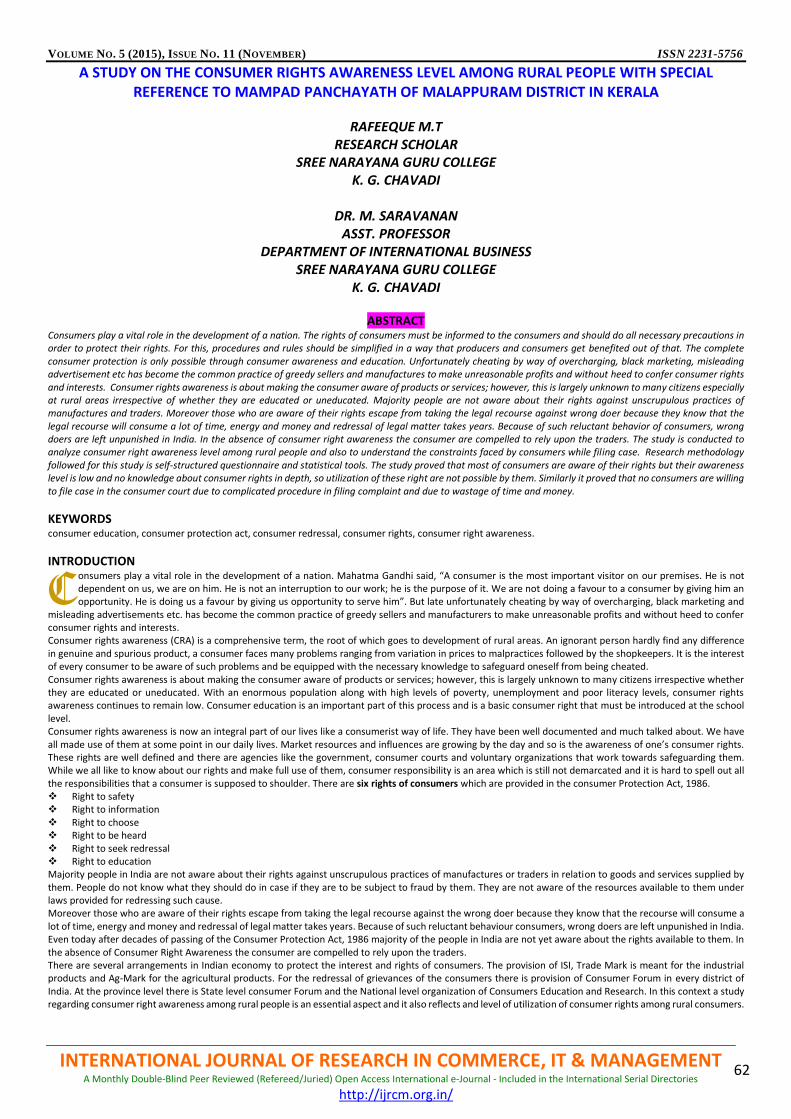
VOLUME NO. 5 (2015), ISSUE NO. 11 (NOVEMBER) ISSN 2231-5756
INTERNATIONAL JOURNAL OF RESEARCH IN COMMERCE, IT & MANAGEMENT A Monthly Double-Blind Peer Reviewed (Refereed/Juried) Open Access International e-Journal - Included in the International Serial Directories
http://ijrcm.org.in/
62
A STUDY ON THE CONSUMER RIGHTS AWARENESS LEVEL AMONG RURAL PEOPLE WITH SPECIAL REFERENCE TO MAMPAD PANCHAYATH OF MALAPPURAM DISTRICT IN KERALA
RAFEEQUE M.T RESEARCH SCHOLAR
SREE NARAYANA GURU COLLEGE K. G. CHAVADI
DR. M. SARAVANAN
ASST. PROFESSOR DEPARTMENT OF INTERNATIONAL BUSINESS
SREE NARAYANA GURU COLLEGE K. G. CHAVADI
ABSTRACT
Consumers play a vital role in the development of a nation. The rights of consumers must be informed to the consumers and should do all necessary precautions in order to protect their rights. For this, procedures and rules should be simplified in a way that producers and consumers get benefited out of that. The complete consumer protection is only possible through consumer awareness and education. Unfortunately cheating by way of overcharging, black marketing, misleading advertisement etc has become the common practice of greedy sellers and manufactures to make unreasonable profits and without heed to confer consumer rights and interests. Consumer rights awareness is about making the consumer aware of products or services; however, this is largely unknown to many citizens especially at rural areas irrespective of whether they are educated or uneducated. Majority people are not aware about their rights against unscrupulous practices of manufactures and traders. Moreover those who are aware of their rights escape from taking the legal recourse against wrong doer because they know that the legal recourse will consume a lot of time, energy and money and redressal of legal matter takes years. Because of such reluctant behavior of consumers, wrong doers are left unpunished in India. In the absence of consumer right awareness the consumer are compelled to rely upon the traders. The study is conducted to analyze consumer right awareness level among rural people and also to understand the constraints faced by consumers while filing case. Research methodology followed for this study is self-structured questionnaire and statistical tools. The study proved that most of consumers are aware of their rights but their awareness level is low and no knowledge about consumer rights in depth, so utilization of these right are not possible by them. Similarly it proved that no consumers are willing to file case in the consumer court due to complicated procedure in filing complaint and due to wastage of time and money.
KEYWORDS
consumer education, consumer protection act, consumer redressal, consumer rights, consumer right awareness.
INTRODUCTION onsumers play a vital role in the development of a nation. Mahatma Gandhi said, “A consumer is the most important visitor on our premises. He is not dependent on us, we are on him. He is not an interruption to our work; he is the purpose of it. We are not doing a favour to a consumer by giving him an opportunity. He is doing us a favour by giving us opportunity to serve him”. But late unfortunately cheating by way of overcharging, black marketing and
misleading advertisements etc. has become the common practice of greedy sellers and manufacturers to make unreasonable profits and without heed to confer consumer rights and interests. Consumer rights awareness (CRA) is a comprehensive term, the root of which goes to development of rural areas. An ignorant person hardly find any difference in genuine and spurious product, a consumer faces many problems ranging from variation in prices to malpractices followed by the shopkeepers. It is the interest of every consumer to be aware of such problems and be equipped with the necessary knowledge to safeguard oneself from being cheated. Consumer rights awareness is about making the consumer aware of products or services; however, this is largely unknown to many citizens irrespective whether they are educated or uneducated. With an enormous population along with high levels of poverty, unemployment and poor literacy levels, consumer rights awareness continues to remain low. Consumer education is an important part of this process and is a basic consumer right that must be introduced at the school level. Consumer rights awareness is now an integral part of our lives like a consumerist way of life. They have been well documented and much talked about. We have all made use of them at some point in our daily lives. Market resources and influences are growing by the day and so is the awareness of one’s consumer rights. These rights are well defined and there are agencies like the government, consumer courts and voluntary organizations that work towards safeguarding them. While we all like to know about our rights and make full use of them, consumer responsibility is an area which is still not demarcated and it is hard to spell out all the responsibilities that a consumer is supposed to shoulder. There are six rights of consumers which are provided in the consumer Protection Act, 1986. Right to safety Right to information Right to choose Right to be heard Right to seek redressal Right to education Majority people in India are not aware about their rights against unscrupulous practices of manufactures or traders in relation to goods and services supplied by them. People do not know what they should do in case if they are to be subject to fraud by them. They are not aware of the resources available to them under laws provided for redressing such cause. Moreover those who are aware of their rights escape from taking the legal recourse against the wrong doer because they know that the recourse will consume a lot of time, energy and money and redressal of legal matter takes years. Because of such reluctant behaviour consumers, wrong doers are left unpunished in India. Even today after decades of passing of the Consumer Protection Act, 1986 majority of the people in India are not yet aware about the rights available to them. In the absence of Consumer Right Awareness the consumer are compelled to rely upon the traders. There are several arrangements in Indian economy to protect the interest and rights of consumers. The provision of ISI, Trade Mark is meant for the industrial products and Ag-Mark for the agricultural products. For the redressal of grievances of the consumers there is provision of Consumer Forum in every district of India. At the province level there is State level consumer Forum and the National level organization of Consumers Education and Research. In this context a study regarding consumer right awareness among rural people is an essential aspect and it also reflects and level of utilization of consumer rights among rural consumers.
C
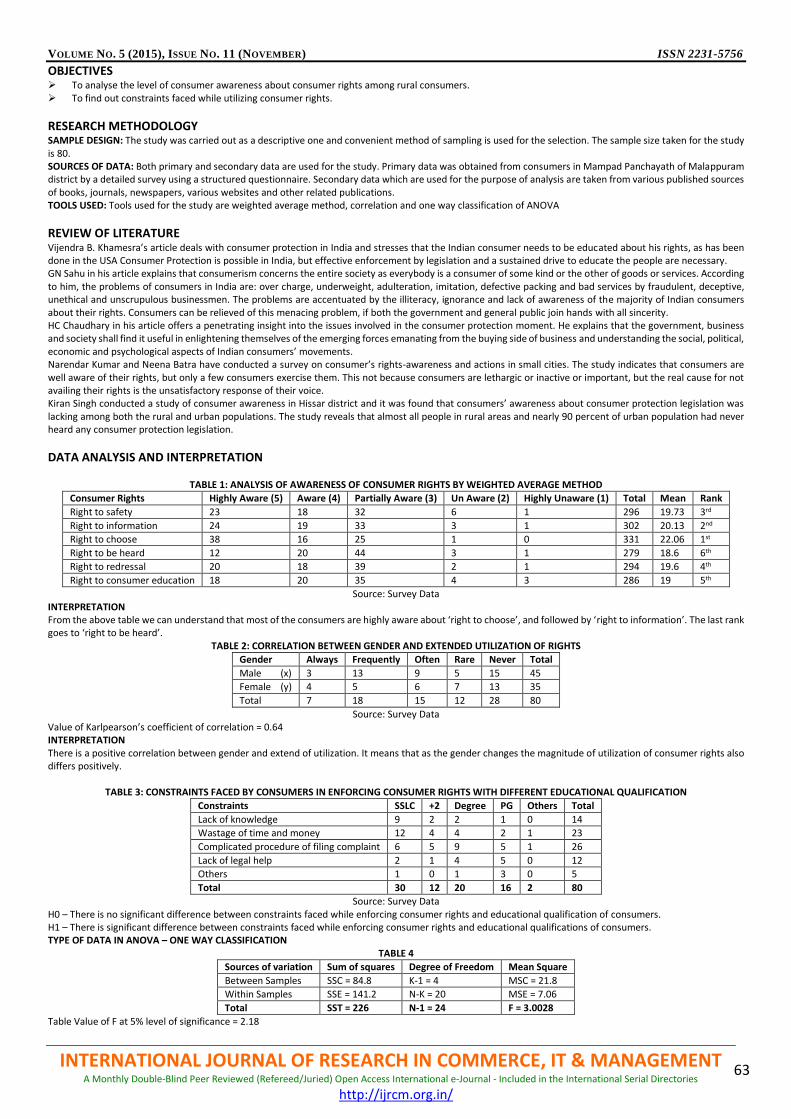
VOLUME NO. 5 (2015), ISSUE NO. 11 (NOVEMBER) ISSN 2231-5756
INTERNATIONAL JOURNAL OF RESEARCH IN COMMERCE, IT & MANAGEMENT A Monthly Double-Blind Peer Reviewed (Refereed/Juried) Open Access International e-Journal - Included in the International Serial Directories
http://ijrcm.org.in/
63
OBJECTIVES To analyse the level of consumer awareness about consumer rights among rural consumers. To find out constraints faced while utilizing consumer rights.
RESEARCH METHODOLOGY SAMPLE DESIGN: The study was carried out as a descriptive one and convenient method of sampling is used for the selection. The sample size taken for the study is 80. SOURCES OF DATA: Both primary and secondary data are used for the study. Primary data was obtained from consumers in Mampad Panchayath of Malappuram district by a detailed survey using a structured questionnaire. Secondary data which are used for the purpose of analysis are taken from various published sources of books, journals, newspapers, various websites and other related publications. TOOLS USED: Tools used for the study are weighted average method, correlation and one way classification of ANOVA
REVIEW OF LITERATURE Vijendra B. Khamesra’s article deals with consumer protection in India and stresses that the Indian consumer needs to be educated about his rights, as has been done in the USA Consumer Protection is possible in India, but effective enforcement by legislation and a sustained drive to educate the people are necessary. GN Sahu in his article explains that consumerism concerns the entire society as everybody is a consumer of some kind or the other of goods or services. According to him, the problems of consumers in India are: over charge, underweight, adulteration, imitation, defective packing and bad services by fraudulent, deceptive, unethical and unscrupulous businessmen. The problems are accentuated by the illiteracy, ignorance and lack of awareness of the majority of Indian consumers about their rights. Consumers can be relieved of this menacing problem, if both the government and general public join hands with all sincerity. HC Chaudhary in his article offers a penetrating insight into the issues involved in the consumer protection moment. He explains that the government, business and society shall find it useful in enlightening themselves of the emerging forces emanating from the buying side of business and understanding the social, political, economic and psychological aspects of Indian consumers’ movements. Narendar Kumar and Neena Batra have conducted a survey on consumer’s rights-awareness and actions in small cities. The study indicates that consumers are well aware of their rights, but only a few consumers exercise them. This not because consumers are lethargic or inactive or important, but the real cause for not availing their rights is the unsatisfactory response of their voice. Kiran Singh conducted a study of consumer awareness in Hissar district and it was found that consumers’ awareness about consumer protection legislation was lacking among both the rural and urban populations. The study reveals that almost all people in rural areas and nearly 90 percent of urban population had never heard any consumer protection legislation.
DATA ANALYSIS AND INTERPRETATION
TABLE 1: ANALYSIS OF AWARENESS OF CONSUMER RIGHTS BY WEIGHTED AVERAGE METHOD
Consumer Rights Highly Aware (5) Aware (4) Partially Aware (3) Un Aware (2) Highly Unaware (1) Total Mean Rank
Right to safety 23 18 32 6 1 296 19.73 3rd
Right to information 24 19 33 3 1 302 20.13 2nd
Right to choose 38 16 25 1 0 331 22.06 1st
Right to be heard 12 20 44 3 1 279 18.6 6th
Right to redressal 20 18 39 2 1 294 19.6 4th
Right to consumer education 18 20 35 4 3 286 19 5th
Source: Survey Data INTERPRETATION From the above table we can understand that most of the consumers are highly aware about ‘right to choose’, and followed by ‘right to information’. The last rank goes to ‘right to be heard’.
TABLE 2: CORRELATION BETWEEN GENDER AND EXTENDED UTILIZATION OF RIGHTS
Gender Always Frequently Often Rare Never Total
Male (x) 3 13 9 5 15 45
Female (y) 4 5 6 7 13 35
Total 7 18 15 12 28 80
Source: Survey Data Value of Karlpearson’s coefficient of correlation = 0.64 INTERPRETATION There is a positive correlation between gender and extend of utilization. It means that as the gender changes the magnitude of utilization of consumer rights also differs positively.
TABLE 3: CONSTRAINTS FACED BY CONSUMERS IN ENFORCING CONSUMER RIGHTS WITH DIFFERENT EDUCATIONAL QUALIFICATION
Constraints SSLC +2 Degree PG Others Total
Lack of knowledge 9 2 2 1 0 14
Wastage of time and money 12 4 4 2 1 23
Complicated procedure of filing complaint 6 5 9 5 1 26
Lack of legal help 2 1 4 5 0 12
Others 1 0 1 3 0 5
Total 30 12 20 16 2 80
Source: Survey Data H0 – There is no significant difference between constraints faced while enforcing consumer rights and educational qualification of consumers. H1 – There is significant difference between constraints faced while enforcing consumer rights and educational qualifications of consumers. TYPE OF DATA IN ANOVA – ONE WAY CLASSIFICATION
TABLE 4
Sources of variation Sum of squares Degree of Freedom Mean Square
Between Samples SSC = 84.8 K-1 = 4 MSC = 21.8
Within Samples SSE = 141.2 N-K = 20 MSE = 7.06
Total SST = 226 N-1 = 24 F = 3.0028
Table Value of F at 5% level of significance = 2.18
VOLUME NO. 5 (2015), ISSUE NO. 11 (NOVEMBER) ISSN 2231-5756
INTERNATIONAL JOURNAL OF RESEARCH IN COMMERCE, IT & MANAGEMENT A Monthly Double-Blind Peer Reviewed (Refereed/Juried) Open Access International e-Journal - Included in the International Serial Directories
http://ijrcm.org.in/
64
INTERPRETATION Calculated value is more than table value and hence the null hypothesis is rejected. Therefore it is concluded there is significant difference between constraints faced by consumers in enforcing consumer rights and educational qualification.
CONCLUSION Consumer right awareness is about making the consumer aware of products or services; however, this is largely unknown to many citizens irrespective of whether they are educated or uneducated. With enormous population along with high levels of poverty, unemployment, and poor literacy levels, consumer rights awareness continues to remain low. Consumer education is the only way to reduce the wrongful behaviours of the manufacturers and traders. So Government and related parties takes necessary actions to educate the consumers and the basic consumer rights must be introduced at the school level itself. In this study, we have studied the consumer right awareness level among rural people with special reference to Mampad Panchayath. The study proved that most of the consumers are aware of their rights but their awareness level is low and no knowledge about consumer rights in depth, so utilization of these rights are not possible by them. Similarly, it proved that no consumers are willing to file case in the consumer court due to complicated procedure of filing complaint and due to wastage of time and money and it is suggested to conduct consumer education and consumer awareness programs, public campaigns, consumer adalaths, introduce special courts for consumer redressal, government should take necessary actions to minimise the procedure of filing case, speed up the redressal programs and provide various support to the consumers for their redressal.
REFERENCES 1. Arsi, HB Singh ( 1992 ): “Awakening of Consumer”. In CFBP Silver Juble Souvenir ( 1966-91), Bombay: CFBP, p.35. 2. Arunchalam, S ( 1983 ): “Towards Providing Effective After Sales Service”, In : The Indian Journal of Marketing, Vol. 14, Nos.1-2 (September-October), pp 27-
30 3. Bajaj, Ramakrishnan ( 1990 ) “Preface to consumer Awareness: Initiatives from Government, Industry & Consumer Organizations,” New Delhi: ASSOCHAM 4. Balakrishnan S. ( 1987 ): “Protecting the Consumer”. In: Southern Economist, Vol. 26 Nos, 1-2 (1-15 May), pp. 57-60. 5. Barowalia JN ( 1996 ) “Commentary on the Consumer Protection Act, 1986” : Delhi, Universal Law Publishing Co. Pvt Ltd. 6. Bellur VV ( 1987 ) “Marketing Research – Theory and Practice”, Mumbai: Himalaya Publishing House 7. Deewan, Vijay Kumar ( 1991 ): “Consumer Should Wake Up and Assert Their Legal Rights” In: Consumer Protection Reporter, Vol. No. 3 (March), pp.381-85 8. Dr. KN Bhatt, Prof. Suresh Misra&Sapna Chadah ( 2010 ) “Consumer, Consumerism and Consumer Protection – Indian Context” 9. Dr. SR Myneni and Dr. Y Pratap Reddy ( 2012 ) “Consumer Protection Law” 10. Krishna Keshav ( 2012 ) “Consumer Protection Act, 1986” 11. Lizzy, EA (1993) “Consumer Redressal Agencies” How effective - Kerala Experience”, Economic and Political Weekly ( Augest 7-14), pp. 7-31 12. Prof. SS Singh, Prof. Suresh Misra&Sapna Chadah ( 2010 ) “Consumer Education and Empowerment – Laws, Policies and Strategies”
VOLUME NO. 5 (2015), ISSUE NO. 11 (NOVEMBER) ISSN 2231-5756
INTERNATIONAL JOURNAL OF RESEARCH IN COMMERCE, IT & MANAGEMENT A Monthly Double-Blind Peer Reviewed (Refereed/Juried) Open Access International e-Journal - Included in the International Serial Directories
http://ijrcm.org.in/
65
A STUDY CONDUCTED TO ANALYSE THE AWARENESS AND SATISFACTION LEVEL AMONG THE ONLINE BANKING CUSTOMERS IN KOTTAYAM DISTRICT, KERALA
CAMILLO JOSEPH ASST. PROFESSOR
NIRMALAGIRI COLLEGE KANNUR UNIVERSITY
NIRMALAGIRI
AMRITA WILSON CLERK
SOUTH INDIAN BANK SUMERU TOWERS
ABSTRACT
Banking in India witnessed a revolution with the coming of internet and whole functioning of banks are also changed. In order to cope up with changing environment banks are presenting new modes of services in front of customers to make the transactions easier. Out of that Online Banking draws more attention in the current scenario. With online banking facilities customer can do the banking facilities anywhere at any time with access of internet. People can use their laptops or computers or even smart phones to do money transfer, pay bills through online or even check the balance in your accounts. People everywhere in India is accessing Online Banking facility and using online facility for their day to day transactions. In this scenario it is essential to conduct a study to know the awareness level of people about online banking and their satisfaction level from the usage of online banking. The study was conducted mainly based on Kottayam in Kerala the first district with cent percent literacy rate. Kottayam is also a place where economically advanced, moderate and backward people resides. Thus findings can be reflects the opinion people from every stream. The people are aware about online banking, and they have used online banking but their satisfaction level is too low. So the banks have to formulate and implement new strategies that will attract the customers in using online banking facility and to increase their satisfaction level.
KEYWORDS online banking, internet banking, satisfaction level.
INTRODUCTION he technology is changing every aspects of banking industry. The revolution or the changes in the information technology is creating a tremendous impact in the day to day aspects of banking industry. The manual process of book keeping has changed to the use of computers for transaction processing. Computerization is automating the routine and manual operations to direct transaction processing. The banking hour concept has started losing their
meaning with the advent of tele banking, home banking and ATM’s. The banking premise term itself in not restricted to the banking premise itself but to any place where the customers could login be it his home or his office. Cash a medium for exchange is being replaced by debit cards, credit cards, smartcards etc. The communication that is happening between or within branches or banks is being replaced with typed letter on paper to electronic media through email. The banks are taking advantage of the technologies available for reducing the cost of operation, better efficiency and to give better service to the customers.
ONLINE BANKING AND ITS SERVICES Online banking may put to an end to the usage of calculator and paper based bank statements or bulky ledger, thereby leading to greater savings in paper, postage and time. Internets services enable checking account statement and incorporate add on features like funds transfer. With their built in security, accountability, low cost and efficiency, they are on set to replace the money in its conventional sense of trading. Apart from personal banking, there is a variety of organisation providing to the corporate the services such as trade services, cash management, credit services loan etc. Online banking offers the lowest transaction cost among all the conventional electronic delivery channels including ATM. A tech savvy bank customer can better manage his or her funds and payments than before. Most importantly, the customer will get all the financial data all the time i.e. 24*7*365. Any time any where access to internet banking doesn’t really need to be a bank. It can even be a group of innovative persons with no bank branch at all, just working through alliances and leading the field because of their superior capabilities through focus and innovation advantage. Online banking facility of each financial institution has many features and capacities in common but also have some that are application specific. The common features that fall into several categories:
A customer can perform non transactional task through online banking, including: 1) Viewing account balances. 2) Viewing recent transactions. 3) Downloading bank statements. 4) Viewing images of paid cheque. 5) Ordering cheque book. 6) Download periodic account statements. 7) Downloading application for M-banking, E-banking.
Bank customers can transact banking task through online banking, including: 1) Fund transfer between linked accounts. 2) Paying third party including bill payment. 3) Investment purchase or sale. 4) Loan applications and transactions, such as repayments of enrolments. 5) Register utility builders and make bill payments.
Financial institution administration.
Management of multiple users having varying levels of authority.
Transaction approval process.
The process of banking has become much faster
T
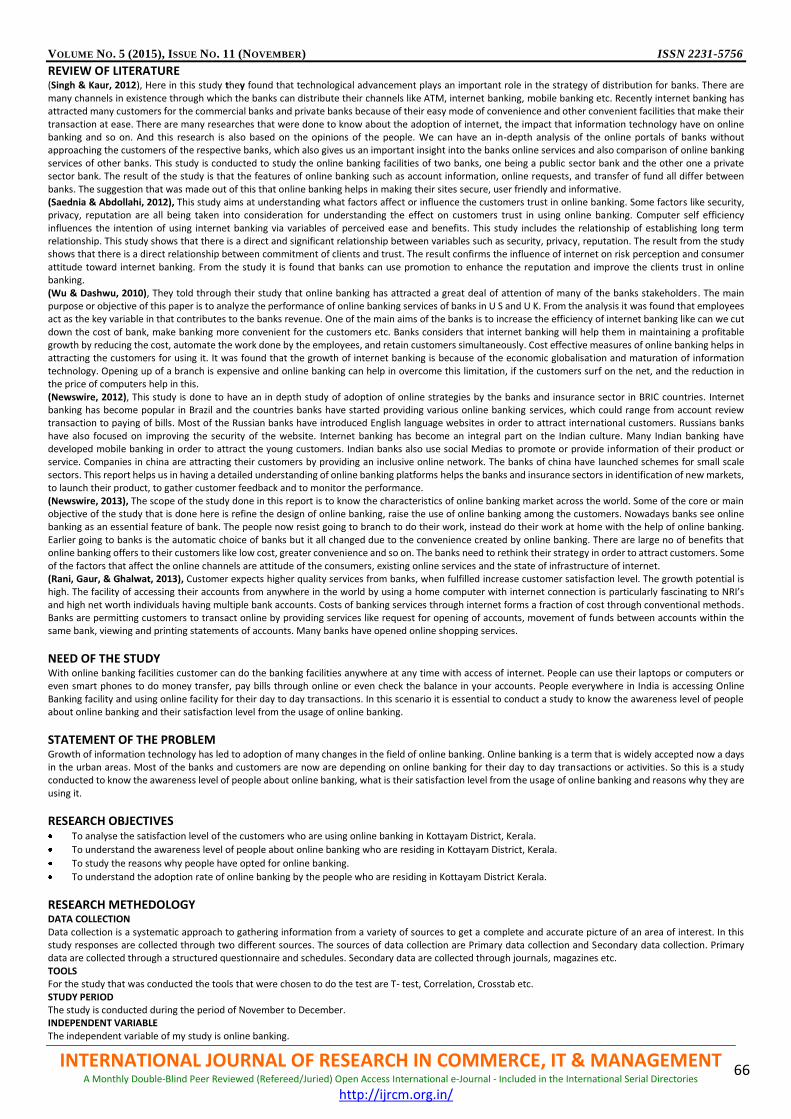
VOLUME NO. 5 (2015), ISSUE NO. 11 (NOVEMBER) ISSN 2231-5756
INTERNATIONAL JOURNAL OF RESEARCH IN COMMERCE, IT & MANAGEMENT A Monthly Double-Blind Peer Reviewed (Refereed/Juried) Open Access International e-Journal - Included in the International Serial Directories
http://ijrcm.org.in/
66
REVIEW OF LITERATURE (Singh & Kaur, 2012), Here in this study they found that technological advancement plays an important role in the strategy of distribution for banks. There are many channels in existence through which the banks can distribute their channels like ATM, internet banking, mobile banking etc. Recently internet banking has attracted many customers for the commercial banks and private banks because of their easy mode of convenience and other convenient facilities that make their transaction at ease. There are many researches that were done to know about the adoption of internet, the impact that information technology have on online banking and so on. And this research is also based on the opinions of the people. We can have an in-depth analysis of the online portals of banks without approaching the customers of the respective banks, which also gives us an important insight into the banks online services and also comparison of online banking services of other banks. This study is conducted to study the online banking facilities of two banks, one being a public sector bank and the other one a private sector bank. The result of the study is that the features of online banking such as account information, online requests, and transfer of fund all differ between banks. The suggestion that was made out of this that online banking helps in making their sites secure, user friendly and informative. (Saednia & Abdollahi, 2012), This study aims at understanding what factors affect or influence the customers trust in online banking. Some factors like security, privacy, reputation are all being taken into consideration for understanding the effect on customers trust in using online banking. Computer self efficiency influences the intention of using internet banking via variables of perceived ease and benefits. This study includes the relationship of establishing long term relationship. This study shows that there is a direct and significant relationship between variables such as security, privacy, reputation. The result from the study shows that there is a direct relationship between commitment of clients and trust. The result confirms the influence of internet on risk perception and consumer attitude toward internet banking. From the study it is found that banks can use promotion to enhance the reputation and improve the clients trust in online banking. (Wu & Dashwu, 2010), They told through their study that online banking has attracted a great deal of attention of many of the banks stakeholders. The main purpose or objective of this paper is to analyze the performance of online banking services of banks in U S and U K. From the analysis it was found that employees act as the key variable in that contributes to the banks revenue. One of the main aims of the banks is to increase the efficiency of internet banking like can we cut down the cost of bank, make banking more convenient for the customers etc. Banks considers that internet banking will help them in maintaining a profitable growth by reducing the cost, automate the work done by the employees, and retain customers simultaneously. Cost effective measures of online banking helps in attracting the customers for using it. It was found that the growth of internet banking is because of the economic globalisation and maturation of information technology. Opening up of a branch is expensive and online banking can help in overcome this limitation, if the customers surf on the net, and the reduction in the price of computers help in this. (Newswire, 2012), This study is done to have an in depth study of adoption of online strategies by the banks and insurance sector in BRIC countries. Internet banking has become popular in Brazil and the countries banks have started providing various online banking services, which could range from account review transaction to paying of bills. Most of the Russian banks have introduced English language websites in order to attract international customers. Russians banks have also focused on improving the security of the website. Internet banking has become an integral part on the Indian culture. Many Indian banking have developed mobile banking in order to attract the young customers. Indian banks also use social Medias to promote or provide information of their product or service. Companies in china are attracting their customers by providing an inclusive online network. The banks of china have launched schemes for small scale sectors. This report helps us in having a detailed understanding of online banking platforms helps the banks and insurance sectors in identification of new markets, to launch their product, to gather customer feedback and to monitor the performance. (Newswire, 2013), The scope of the study done in this report is to know the characteristics of online banking market across the world. Some of the core or main objective of the study that is done here is refine the design of online banking, raise the use of online banking among the customers. Nowadays banks see online banking as an essential feature of bank. The people now resist going to branch to do their work, instead do their work at home with the help of online banking. Earlier going to banks is the automatic choice of banks but it all changed due to the convenience created by online banking. There are large no of benefits that online banking offers to their customers like low cost, greater convenience and so on. The banks need to rethink their strategy in order to attract customers. Some of the factors that affect the online channels are attitude of the consumers, existing online services and the state of infrastructure of internet. (Rani, Gaur, & Ghalwat, 2013), Customer expects higher quality services from banks, when fulfilled increase customer satisfaction level. The growth potential is high. The facility of accessing their accounts from anywhere in the world by using a home computer with internet connection is particularly fascinating to NRI’s and high net worth individuals having multiple bank accounts. Costs of banking services through internet forms a fraction of cost through conventional methods. Banks are permitting customers to transact online by providing services like request for opening of accounts, movement of funds between accounts within the same bank, viewing and printing statements of accounts. Many banks have opened online shopping services.
NEED OF THE STUDY With online banking facilities customer can do the banking facilities anywhere at any time with access of internet. People can use their laptops or computers or even smart phones to do money transfer, pay bills through online or even check the balance in your accounts. People everywhere in India is accessing Online Banking facility and using online facility for their day to day transactions. In this scenario it is essential to conduct a study to know the awareness level of people about online banking and their satisfaction level from the usage of online banking.
STATEMENT OF THE PROBLEM Growth of information technology has led to adoption of many changes in the field of online banking. Online banking is a term that is widely accepted now a days in the urban areas. Most of the banks and customers are now are depending on online banking for their day to day transactions or activities. So this is a study conducted to know the awareness level of people about online banking, what is their satisfaction level from the usage of online banking and reasons why they are using it.
RESEARCH OBJECTIVES To analyse the satisfaction level of the customers who are using online banking in Kottayam District, Kerala.
To understand the awareness level of people about online banking who are residing in Kottayam District, Kerala.
To study the reasons why people have opted for online banking.
To understand the adoption rate of online banking by the people who are residing in Kottayam District Kerala.
RESEARCH METHEDOLOGY DATA COLLECTION Data collection is a systematic approach to gathering information from a variety of sources to get a complete and accurate picture of an area of interest. In this study responses are collected through two different sources. The sources of data collection are Primary data collection and Secondary data collection. Primary data are collected through a structured questionnaire and schedules. Secondary data are collected through journals, magazines etc. TOOLS For the study that was conducted the tools that were chosen to do the test are T- test, Correlation, Crosstab etc. STUDY PERIOD The study is conducted during the period of November to December. INDEPENDENT VARIABLE The independent variable of my study is online banking.
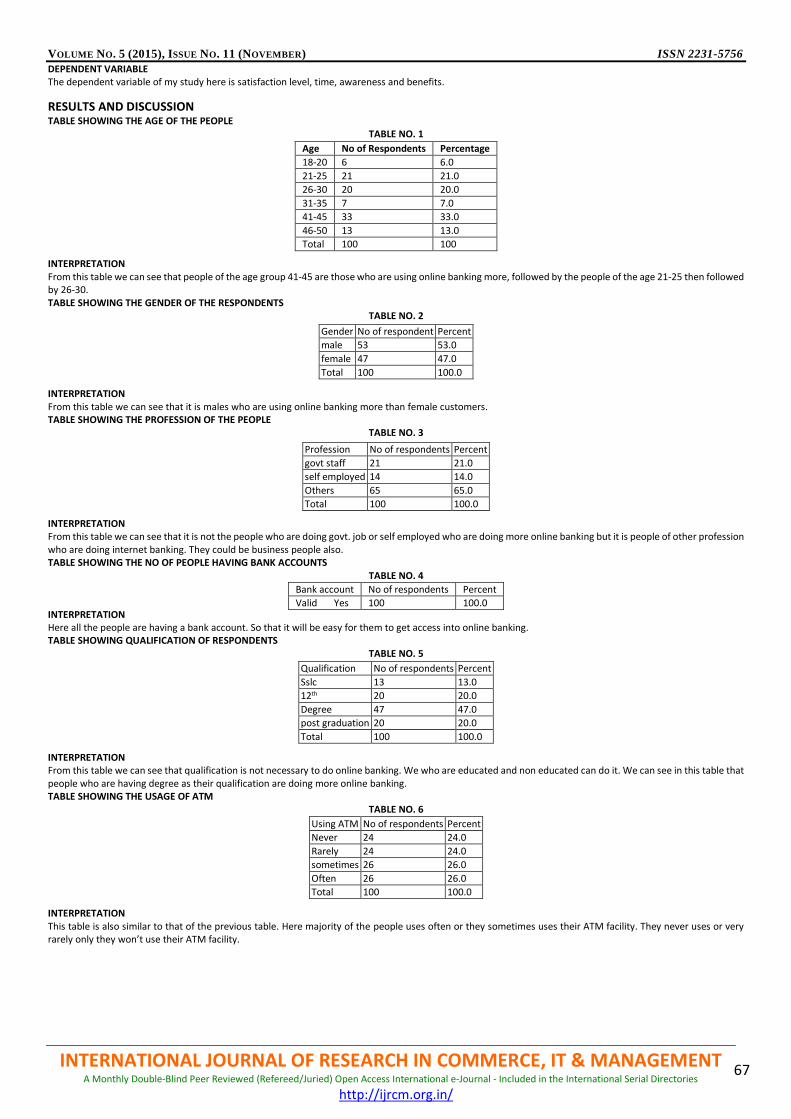
VOLUME NO. 5 (2015), ISSUE NO. 11 (NOVEMBER) ISSN 2231-5756
INTERNATIONAL JOURNAL OF RESEARCH IN COMMERCE, IT & MANAGEMENT A Monthly Double-Blind Peer Reviewed (Refereed/Juried) Open Access International e-Journal - Included in the International Serial Directories
http://ijrcm.org.in/
67
DEPENDENT VARIABLE The dependent variable of my study here is satisfaction level, time, awareness and benefits.
RESULTS AND DISCUSSION TABLE SHOWING THE AGE OF THE PEOPLE
TABLE NO. 1 INTERPRETATION From this table we can see that people of the age group 41-45 are those who are using online banking more, followed by the people of the age 21-25 then followed by 26-30. TABLE SHOWING THE GENDER OF THE RESPONDENTS
TABLE NO. 2 INTERPRETATION From this table we can see that it is males who are using online banking more than female customers. TABLE SHOWING THE PROFESSION OF THE PEOPLE
TABLE NO. 3 INTERPRETATION From this table we can see that it is not the people who are doing govt. job or self employed who are doing more online banking but it is people of other profession who are doing internet banking. They could be business people also. TABLE SHOWING THE NO OF PEOPLE HAVING BANK ACCOUNTS
TABLE NO. 4 INTERPRETATION Here all the people are having a bank account. So that it will be easy for them to get access into online banking. TABLE SHOWING QUALIFICATION OF RESPONDENTS
TABLE NO. 5 INTERPRETATION From this table we can see that qualification is not necessary to do online banking. We who are educated and non educated can do it. We can see in this table that people who are having degree as their qualification are doing more online banking. TABLE SHOWING THE USAGE OF ATM
TABLE NO. 6 INTERPRETATION This table is also similar to that of the previous table. Here majority of the people uses often or they sometimes uses their ATM facility. They never uses or very rarely only they won’t use their ATM facility.
Age No of Respondents Percentage
18-20 6 6.0
21-25 21 21.0
26-30 20 20.0
31-35 7 7.0
41-45 33 33.0
46-50 13 13.0
Total 100 100
Gender No of respondent Percent
male 53 53.0
female 47 47.0
Total 100 100.0
Profession No of respondents Percent
govt staff 21 21.0
self employed 14 14.0
Others 65 65.0
Total 100 100.0
Bank account No of respondents Percent
Valid Yes 100 100.0
Qualification No of respondents Percent
Sslc 13 13.0
12th 20 20.0
Degree 47 47.0
post graduation 20 20.0
Total 100 100.0
Using ATM No of respondents Percent
Never 24 24.0
Rarely 24 24.0
sometimes 26 26.0
Often 26 26.0
Total 100 100.0
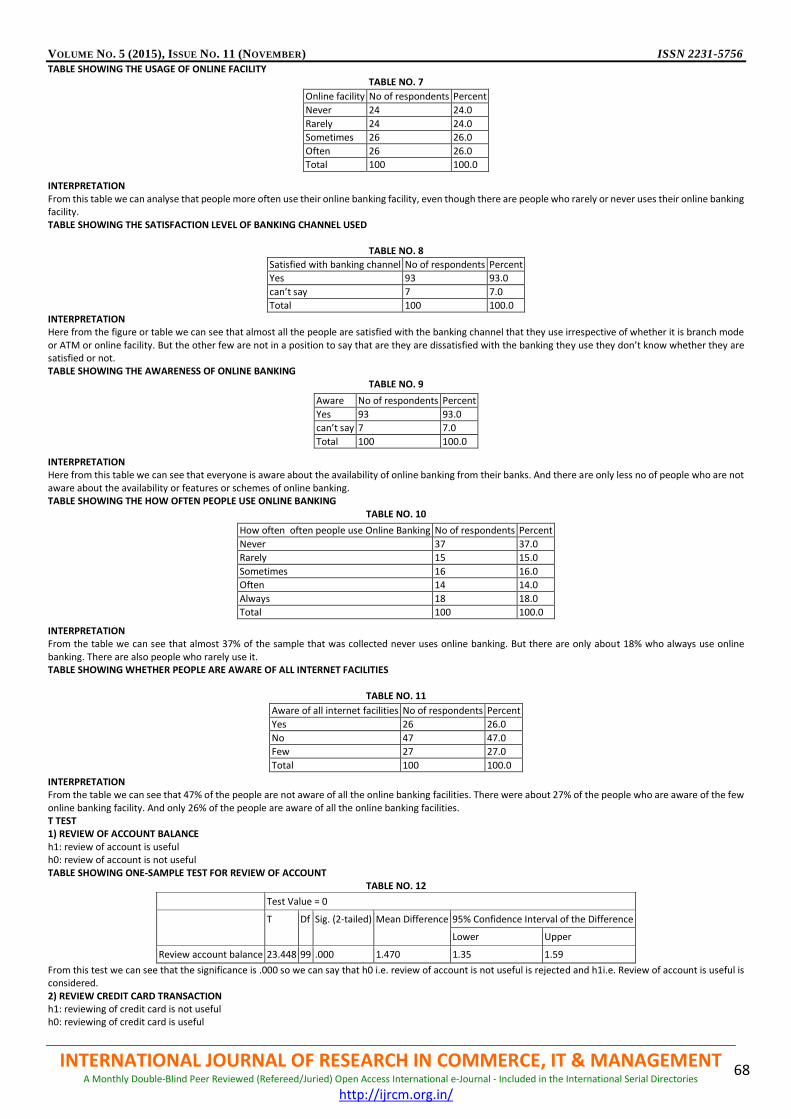
VOLUME NO. 5 (2015), ISSUE NO. 11 (NOVEMBER) ISSN 2231-5756
INTERNATIONAL JOURNAL OF RESEARCH IN COMMERCE, IT & MANAGEMENT A Monthly Double-Blind Peer Reviewed (Refereed/Juried) Open Access International e-Journal - Included in the International Serial Directories
http://ijrcm.org.in/
68
TABLE SHOWING THE USAGE OF ONLINE FACILITY TABLE NO. 7
INTERPRETATION From this table we can analyse that people more often use their online banking facility, even though there are people who rarely or never uses their online banking facility. TABLE SHOWING THE SATISFACTION LEVEL OF BANKING CHANNEL USED
TABLE NO. 8
Satisfied with banking channel No of respondents Percent
Yes 93 93.0
can’t say 7 7.0
Total 100 100.0
INTERPRETATION Here from the figure or table we can see that almost all the people are satisfied with the banking channel that they use irrespective of whether it is branch mode or ATM or online facility. But the other few are not in a position to say that are they are dissatisfied with the banking they use they don’t know whether they are satisfied or not. TABLE SHOWING THE AWARENESS OF ONLINE BANKING
TABLE NO. 9 INTERPRETATION Here from this table we can see that everyone is aware about the availability of online banking from their banks. And there are only less no of people who are not aware about the availability or features or schemes of online banking. TABLE SHOWING THE HOW OFTEN PEOPLE USE ONLINE BANKING
TABLE NO. 10 INTERPRETATION From the table we can see that almost 37% of the sample that was collected never uses online banking. But there are only about 18% who always use online banking. There are also people who rarely use it. TABLE SHOWING WHETHER PEOPLE ARE AWARE OF ALL INTERNET FACILITIES
TABLE NO. 11
INTERPRETATION From the table we can see that 47% of the people are not aware of all the online banking facilities. There were about 27% of the people who are aware of the few online banking facility. And only 26% of the people are aware of all the online banking facilities. T TEST 1) REVIEW OF ACCOUNT BALANCE h1: review of account is useful h0: review of account is not useful TABLE SHOWING ONE-SAMPLE TEST FOR REVIEW OF ACCOUNT
TABLE NO. 12
Test Value = 0
T Df Sig. (2-tailed) Mean Difference 95% Confidence Interval of the Difference
Lower Upper
Review account balance 23.448 99 .000 1.470 1.35 1.59
From this test we can see that the significance is .000 so we can say that h0 i.e. review of account is not useful is rejected and h1i.e. Review of account is useful is considered. 2) REVIEW CREDIT CARD TRANSACTION h1: reviewing of credit card is not useful h0: reviewing of credit card is useful
Online facility No of respondents Percent
Never 24 24.0
Rarely 24 24.0
Sometimes 26 26.0
Often 26 26.0
Total 100 100.0
Aware No of respondents Percent
Yes 93 93.0
can’t say 7 7.0
Total 100 100.0
How often often people use Online Banking No of respondents Percent
Never 37 37.0
Rarely 15 15.0
Sometimes 16 16.0
Often 14 14.0
Always 18 18.0
Total 100 100.0
Aware of all internet facilities No of respondents Percent
Yes 26 26.0
No 47 47.0
Few 27 27.0
Total 100 100.0
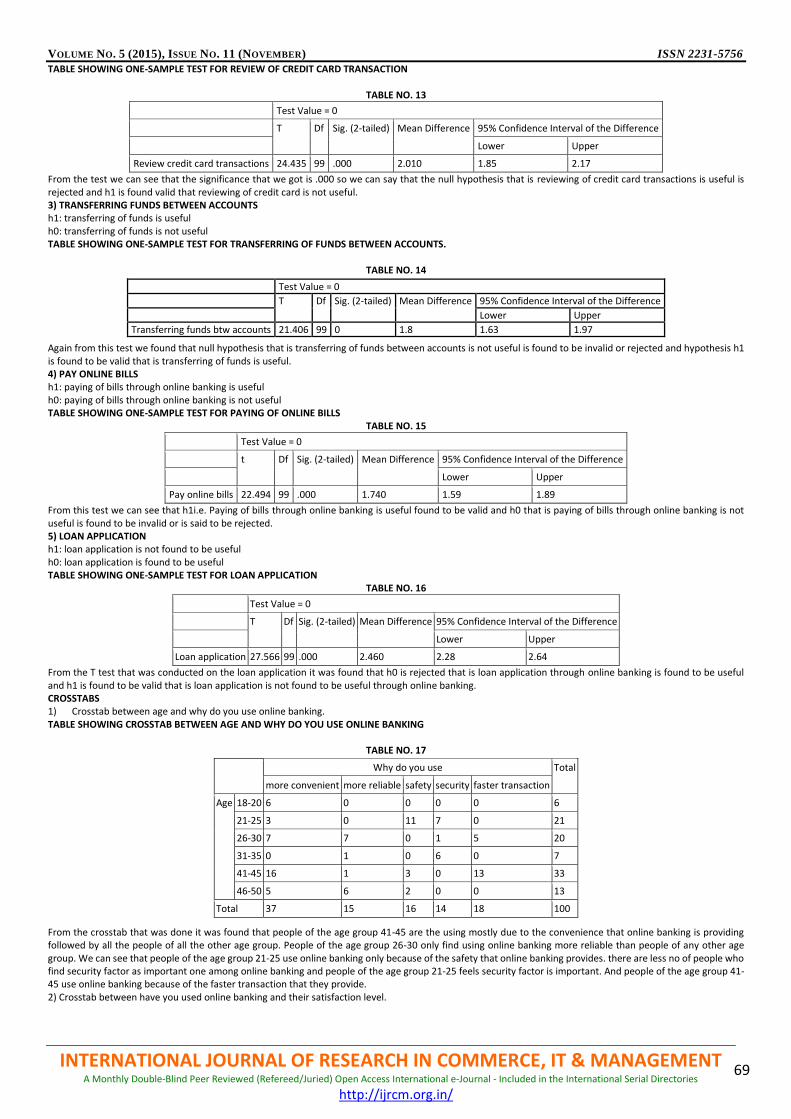
VOLUME NO. 5 (2015), ISSUE NO. 11 (NOVEMBER) ISSN 2231-5756
INTERNATIONAL JOURNAL OF RESEARCH IN COMMERCE, IT & MANAGEMENT A Monthly Double-Blind Peer Reviewed (Refereed/Juried) Open Access International e-Journal - Included in the International Serial Directories
http://ijrcm.org.in/
69
TABLE SHOWING ONE-SAMPLE TEST FOR REVIEW OF CREDIT CARD TRANSACTION
TABLE NO. 13
Test Value = 0
T Df Sig. (2-tailed) Mean Difference 95% Confidence Interval of the Difference
Lower Upper
Review credit card transactions 24.435 99 .000 2.010 1.85 2.17
From the test we can see that the significance that we got is .000 so we can say that the null hypothesis that is reviewing of credit card transactions is useful is rejected and h1 is found valid that reviewing of credit card is not useful. 3) TRANSFERRING FUNDS BETWEEN ACCOUNTS h1: transferring of funds is useful h0: transferring of funds is not useful TABLE SHOWING ONE-SAMPLE TEST FOR TRANSFERRING OF FUNDS BETWEEN ACCOUNTS.
TABLE NO. 14
Again from this test we found that null hypothesis that is transferring of funds between accounts is not useful is found to be invalid or rejected and hypothesis h1 is found to be valid that is transferring of funds is useful. 4) PAY ONLINE BILLS h1: paying of bills through online banking is useful h0: paying of bills through online banking is not useful TABLE SHOWING ONE-SAMPLE TEST FOR PAYING OF ONLINE BILLS
TABLE NO. 15
Test Value = 0
t Df Sig. (2-tailed) Mean Difference 95% Confidence Interval of the Difference
Lower Upper
Pay online bills 22.494 99 .000 1.740 1.59 1.89
From this test we can see that h1i.e. Paying of bills through online banking is useful found to be valid and h0 that is paying of bills through online banking is not useful is found to be invalid or is said to be rejected. 5) LOAN APPLICATION h1: loan application is not found to be useful h0: loan application is found to be useful TABLE SHOWING ONE-SAMPLE TEST FOR LOAN APPLICATION
TABLE NO. 16
Test Value = 0
T Df Sig. (2-tailed) Mean Difference 95% Confidence Interval of the Difference
Lower Upper
Loan application 27.566 99 .000 2.460 2.28 2.64
From the T test that was conducted on the loan application it was found that h0 is rejected that is loan application through online banking is found to be useful and h1 is found to be valid that is loan application is not found to be useful through online banking. CROSSTABS 1) Crosstab between age and why do you use online banking. TABLE SHOWING CROSSTAB BETWEEN AGE AND WHY DO YOU USE ONLINE BANKING
TABLE NO. 17
From the crosstab that was done it was found that people of the age group 41-45 are the using mostly due to the convenience that online banking is providing followed by all the people of all the other age group. People of the age group 26-30 only find using online banking more reliable than people of any other age group. We can see that people of the age group 21-25 use online banking only because of the safety that online banking provides. there are less no of people who find security factor as important one among online banking and people of the age group 21-25 feels security factor is important. And people of the age group 41-45 use online banking because of the faster transaction that they provide. 2) Crosstab between have you used online banking and their satisfaction level.
Test Value = 0
T Df Sig. (2-tailed) Mean Difference 95% Confidence Interval of the Difference
Lower Upper
Transferring funds btw accounts 21.406 99 0 1.8 1.63 1.97
Why do you use Total
more convenient more reliable safety security faster transaction
Age 18-20 6 0 0 0 0 6
21-25 3 0 11 7 0 21
26-30 7 7 0 1 5 20
31-35 0 1 0 6 0 7
41-45 16 1 3 0 13 33
46-50 5 6 2 0 0 13
Total 37 15 16 14 18 100
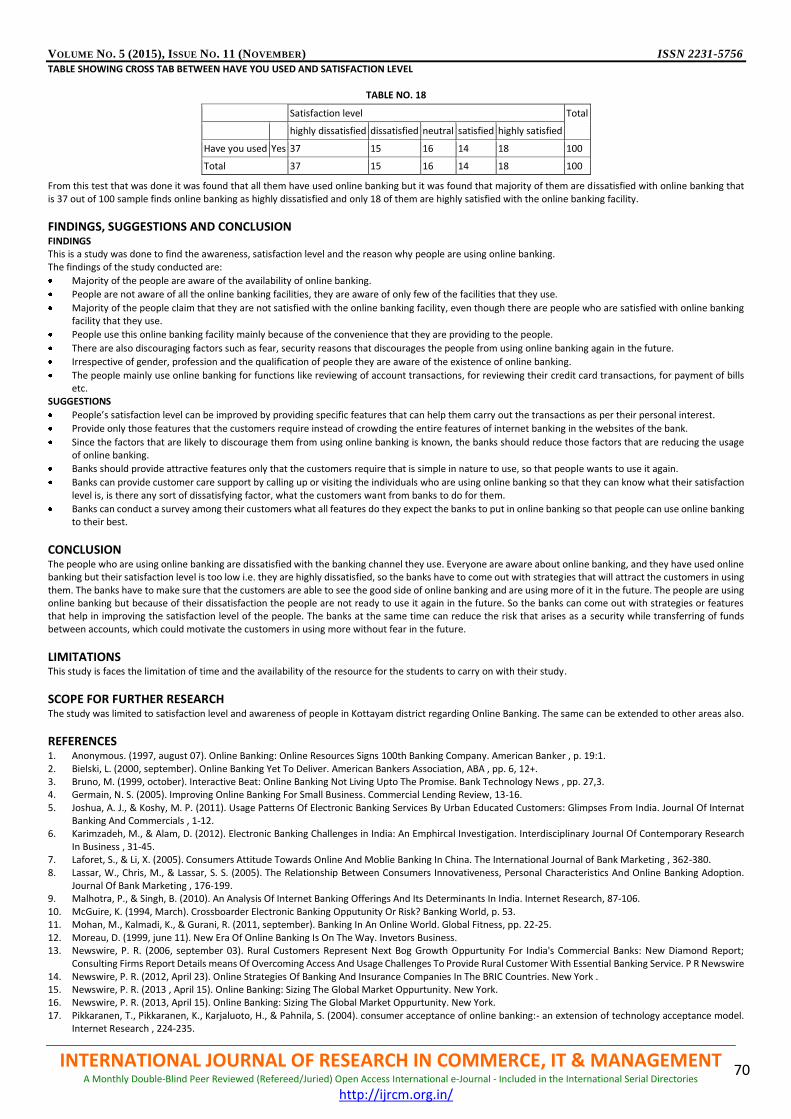
VOLUME NO. 5 (2015), ISSUE NO. 11 (NOVEMBER) ISSN 2231-5756
INTERNATIONAL JOURNAL OF RESEARCH IN COMMERCE, IT & MANAGEMENT A Monthly Double-Blind Peer Reviewed (Refereed/Juried) Open Access International e-Journal - Included in the International Serial Directories
http://ijrcm.org.in/
70
TABLE SHOWING CROSS TAB BETWEEN HAVE YOU USED AND SATISFACTION LEVEL
TABLE NO. 18 From this test that was done it was found that all them have used online banking but it was found that majority of them are dissatisfied with online banking that is 37 out of 100 sample finds online banking as highly dissatisfied and only 18 of them are highly satisfied with the online banking facility.
FINDINGS, SUGGESTIONS AND CONCLUSION FINDINGS This is a study was done to find the awareness, satisfaction level and the reason why people are using online banking. The findings of the study conducted are:
Majority of the people are aware of the availability of online banking.
People are not aware of all the online banking facilities, they are aware of only few of the facilities that they use.
Majority of the people claim that they are not satisfied with the online banking facility, even though there are people who are satisfied with online banking facility that they use.
People use this online banking facility mainly because of the convenience that they are providing to the people.
There are also discouraging factors such as fear, security reasons that discourages the people from using online banking again in the future.
Irrespective of gender, profession and the qualification of people they are aware of the existence of online banking.
The people mainly use online banking for functions like reviewing of account transactions, for reviewing their credit card transactions, for payment of bills etc.
SUGGESTIONS
People’s satisfaction level can be improved by providing specific features that can help them carry out the transactions as per their personal interest.
Provide only those features that the customers require instead of crowding the entire features of internet banking in the websites of the bank.
Since the factors that are likely to discourage them from using online banking is known, the banks should reduce those factors that are reducing the usage of online banking.
Banks should provide attractive features only that the customers require that is simple in nature to use, so that people wants to use it again.
Banks can provide customer care support by calling up or visiting the individuals who are using online banking so that they can know what their satisfaction level is, is there any sort of dissatisfying factor, what the customers want from banks to do for them.
Banks can conduct a survey among their customers what all features do they expect the banks to put in online banking so that people can use online banking to their best.
CONCLUSION The people who are using online banking are dissatisfied with the banking channel they use. Everyone are aware about online banking, and they have used online banking but their satisfaction level is too low i.e. they are highly dissatisfied, so the banks have to come out with strategies that will attract the customers in using them. The banks have to make sure that the customers are able to see the good side of online banking and are using more of it in the future. The people are using online banking but because of their dissatisfaction the people are not ready to use it again in the future. So the banks can come out with strategies or features that help in improving the satisfaction level of the people. The banks at the same time can reduce the risk that arises as a security while transferring of funds between accounts, which could motivate the customers in using more without fear in the future.
LIMITATIONS This study is faces the limitation of time and the availability of the resource for the students to carry on with their study.
SCOPE FOR FURTHER RESEARCH The study was limited to satisfaction level and awareness of people in Kottayam district regarding Online Banking. The same can be extended to other areas also.
REFERENCES 1. Anonymous. (1997, august 07). Online Banking: Online Resources Signs 100th Banking Company. American Banker , p. 19:1. 2. Bielski, L. (2000, september). Online Banking Yet To Deliver. American Bankers Association, ABA , pp. 6, 12+. 3. Bruno, M. (1999, october). Interactive Beat: Online Banking Not Living Upto The Promise. Bank Technology News , pp. 27,3. 4. Germain, N. S. (2005). Improving Online Banking For Small Business. Commercial Lending Review, 13-16. 5. Joshua, A. J., & Koshy, M. P. (2011). Usage Patterns Of Electronic Banking Services By Urban Educated Customers: Glimpses From India. Journal Of Internat
Banking And Commercials , 1-12. 6. Karimzadeh, M., & Alam, D. (2012). Electronic Banking Challenges in India: An Emphircal Investigation. Interdisciplinary Journal Of Contemporary Research
In Business , 31-45. 7. Laforet, S., & Li, X. (2005). Consumers Attitude Towards Online And Moblie Banking In China. The International Journal of Bank Marketing , 362-380. 8. Lassar, W., Chris, M., & Lassar, S. S. (2005). The Relationship Between Consumers Innovativeness, Personal Characteristics And Online Banking Adoption.
Journal Of Bank Marketing , 176-199. 9. Malhotra, P., & Singh, B. (2010). An Analysis Of Internet Banking Offerings And Its Determinants In India. Internet Research, 87-106. 10. McGuire, K. (1994, March). Crossboarder Electronic Banking Opputunity Or Risk? Banking World, p. 53. 11. Mohan, M., Kalmadi, K., & Gurani, R. (2011, september). Banking In An Online World. Global Fitness, pp. 22-25. 12. Moreau, D. (1999, june 11). New Era Of Online Banking Is On The Way. Invetors Business. 13. Newswire, P. R. (2006, september 03). Rural Customers Represent Next Bog Growth Oppurtunity For India's Commercial Banks: New Diamond Report;
Consulting Firms Report Details means Of Overcoming Access And Usage Challenges To Provide Rural Customer With Essential Banking Service. P R Newswire 14. Newswire, P. R. (2012, April 23). Online Strategies Of Banking And Insurance Companies In The BRIC Countries. New York . 15. Newswire, P. R. (2013 , April 15). Online Banking: Sizing The Global Market Oppurtunity. New York. 16. Newswire, P. R. (2013, April 15). Online Banking: Sizing The Global Market Oppurtunity. New York. 17. Pikkaranen, T., Pikkaranen, K., Karjaluoto, H., & Pahnila, S. (2004). consumer acceptance of online banking:- an extension of technology acceptance model.
Internet Research , 224-235.
Satisfaction level Total
highly dissatisfied dissatisfied neutral satisfied highly satisfied
Have you used Yes 37 15 16 14 18 100
Total 37 15 16 14 18 100
VOLUME NO. 5 (2015), ISSUE NO. 11 (NOVEMBER) ISSN 2231-5756
INTERNATIONAL JOURNAL OF RESEARCH IN COMMERCE, IT & MANAGEMENT A Monthly Double-Blind Peer Reviewed (Refereed/Juried) Open Access International e-Journal - Included in the International Serial Directories
http://ijrcm.org.in/
71
18. Qureshi, T. M., Zafar, K., & Khan, B. (2008). Customer Acceptance Of Online Banking In Developing Economies. Journal Of Internet Banking And Commerce , 1-9.
19. Rahman, A., & Milgram, B. L. (2001). Women And Micro credit In Rural Bengladesh: An Anthropological Study Of Grameen Bank Lending. Anthropologica , 281:281.
20. Rani, P., Gaur, A., & Ghalwat, S. (2013). Analytical Framework Of The Factors Affecting Customer Satisfaction Through E-banking. Journal Of Marketing And Technology , 63-75.
21. Raven, P. v., Huang, X., & Kim, B. B. (2007). E-business In Developing Countries: A Comparison Of China And India. International Journal Of E-business , 91-108.
22. Rexha, N., Kingshott, R. P., & Aw, A. S. (2003). Impact Of Relational PlanOn Adoption Of Electronic Banking. The Journal Of Services Marketing , 53-65. 23. Saednia, H., & Abdollahi, H. (2012). Factor Affecting Client Trust In Online Banking- A Case Study Of Saman Bank. International Journal Of Economics And
Business Modelling , 149-151. 24. Sarel, D., & Marmorstein, H. (2003). Marketing Online Banking Services: The Voice Of the Customer.Journal Of Financial Services Marketing , 106-118. 25. Sharma, N. (2012). An Emphirical Study Of Rural Customer's Satisfaction From E-banking In India.Journal Of Internet Banking And Commerce , 1-17. 26. Singh, T., & Kaur, M. (2012). Internet Banking: Content Analysis of Selected Indian Public And Private Sector Banks Online Portals. Journal Of Internet Banking
And Commerce , 1-10. 27. Sleetor, D. (2005, october). Online Banking In Quick Books. CPA Technology Advisor , pp. 44-45. 28. Stoneman, B. (2002, december 17). Online BankingFocus Shifts To The Essentials. American Banker, p. 4A. 29. Vaish, N. (2010, november 01). Key To Future: Pocket Banking May Be The Next Big Thing As Mobiles Become Smarter And Money Savvy. India Today . 30. Wolfe, D. (2007, january 03). In Brief:-Online Resources In Cell Phone Banking. American Banker, p. 9. 31. Wu, D., & Dashwu, D. (2010). Performance Evaluation And Risk Analysis Of Online Banking Services. Kybernetes , 723-734.
VOLUME NO. 5 (2015), ISSUE NO. 11 (NOVEMBER) ISSN 2231-5756
INTERNATIONAL JOURNAL OF RESEARCH IN COMMERCE, IT & MANAGEMENT A Monthly Double-Blind Peer Reviewed (Refereed/Juried) Open Access International e-Journal - Included in the International Serial Directories
http://ijrcm.org.in/
72
ASSESSMENT OF TAX IMPLICATION ON MERGER AND ACQUISITION IN NIGERIA
OKEWOLE, JACOB AKINTUNDE LECTURER
DEPARTMENT OF ACCOUNTANCY THE OKE OGUN POLYTECHNIC
SAKI
OLAITAN, OLATUNDE OLUMIDE LECTURER
DEPARTMENT OF ACCOUNTANCY THE OKE OGUN POLYTECHNIC
SAKI
AFOLABI THEOPHILUS ABIOLA LECTURER
DEPARTMENT OF ACCOUNTANCY THE OKE OGUN POLYTECHNIC
SAKI
ABSTRACT This paper intends to assess the tax implication on merger and acquisition. Merger is the coming together of two or more entities. Merger and acquisition could be used interchangeably. Acquisition arises when an entity takes over another entity. The global economic distress forced some corporate organizations to naturally die as many were unable to fulfill their obligations to various stakeholders. Many organizations adopted merger and acquisition options without taking cognizance to the impact of taxation on such schemes. In lieu of this, the paper showcases various tax effects and provisions relating to merger and acquisition in Nigeria. The author appraises existing journals as a secondary source of information. Before the merger and acquisition it is statutorily mandatory for consolidating entities to seek for the approval from the Federal Inland Revenue Service. It has been observed that many consolidated organizations failed to consult tax authority for approval and many tax advantages that ought to have enjoyed eluded such organizations. It concluded that there is a tax impact on merger and acquisition and the organizations were not taken advantage of the tax incentives underlining the schemes.
KEYWORDS
merger, acquisition, tax legislation.
INTRODUCTION erger and acquisitions are used interchangeably. The term merger is the joining or coming together of two or more companies to form a larger company that can face the global economic challenges. Merger is defined as any amalgamation of an undertaking or any part of the undertaking or interest of two or companies or the undertaking (FIRS, 2006). Merger and acquisition provides many advantages to the entity concerned like technology, finance and
many more benefit to be derived. Acquisition however is different from merger as it is viewed a scenario where an entity buy over another entity. Balogun (1999) defined merger as a situation where two or more companies appropriately of the same size come together with the shareholders and directors of all the companies supporting the combination and continuing to have an interest in the combined business. According Akinsulire (2014), he used the word consolidation for both the two concept. he further defined consolidation as the joining of two or more companies, generally of equal size and market power, to form an entirely new entity. Merger is a scheme adopted by entities to achieve synergy. Kusum (2014), viewed merger as unification of two entities into single entity while he opined that acquisition is when an entity takes over another entity and absorbs the same. There are various reasons for merger and acquisition entities in Nigeria. Foreign investors see it as an avenue to gain entrance into Nigerian capital market. Acquisition provides access to existing structures, possibly with any required permits and assets in place. Entity may equally merge to increase market share through merging with or buying smaller rivals. Merger and acquisition is another way of making an entity to remain in the market. There are many tax consequences as many entities come together to form a single entity. Such consequences ranging from cost cutting, tax advantage, formation of synergies and lager market participation etc. The Federal Inland Revenue service in 2006 sanctioned about seven banks for neglecting their legal obligation relating to tax on mergers and acquisition. The tax implications still vary from various types of strategies adopted for the M&A. The buyers and sellers perspective with reference to neutrality of tax should be properly dealt with in the subject matter concerned. According to Kumu (2014), opined that the tax law starts from the transfer of assets during amalgamation of the companies. He furthered cited the stand of the Indian tax law on the merger and acquisition to start from the capital gains tax. In Nigeria, before consolidation of two or more entities there must be approval from the various regulatory bodies, such regulatory bodies are: security and exchange commission, Federal Inland Revenue service, corporate affairs commission, Nigerian stock exchange and federal high court. The area of concerned in this paper is the various provisions available to entities that adopt option of merger and acquisition. The implication of merger and acquisition start from the approval of merger and acquisition by the Federal Inland Revenue Service. The Company Income Tax Act in Section 29(12) Cap 21, LFN, 2004 provides that “no merger, take-over, transfer or restructuring of the trade or business carried on by a company shall take place without having obtained the Service’s direction under sub-section 9 of this section and clearance with respect to any tax that may be due and payable under the Capital Gains Tax Act”. The implication of this provision is that the approval of the Federal Inland Revenue Service is a necessary condition for the completion of the process in a merger or acquisition bid. Therefore, no merger or acquisition bids would be fully consummated without the companies involved having obtained consent from the FIRS. This is also applicable the entities in the case of the demerger.
LITERATURE REVIEW Merger and acquisition are global business term used to achieve growth and survival of entities. Merger entails coming together two or more firms to become a bigger firm while acquisition is the taking of a small by a big firm which are both pursuing similar motive (Amedu, 2004; Bello, 2004; Katty, 2004). According to Soludo (2002) opined that the mergers and acquisitions are aimed at achieving cost effectiveness through economies of large scale and diversification and expansion of business activities to improve performance. Thomas (2013) opined that mergers and acquisition take place primarily to take ownership advantage. Ownership advantages emanate when a change in ownership of a target company is expected to provide a source of value creation either by increase the target
M
VOLUME NO. 5 (2015), ISSUE NO. 11 (NOVEMBER) ISSN 2231-5756
INTERNATIONAL JOURNAL OF RESEARCH IN COMMERCE, IT & MANAGEMENT A Monthly Double-Blind Peer Reviewed (Refereed/Juried) Open Access International e-Journal - Included in the International Serial Directories
http://ijrcm.org.in/
73
company cash flow or decrease the risk. The potential of tax management has been totally ignored. There is a tax advantage that can be taken by the acquiring entity that will definitely increase the cash flow ( Martynova and Renneboog, 2008). Decreasing the tax burden of the target firm is an important way the acquiring firm can generate ownership advantage. It was discovered that both predator and the target companies do focus their interest on the cost effectiveness of the economies of large rather than the tax advantage imbided in mergers and acquisition. Though, mergers and acquisitions are recent phenomenon in Nigeria. The provision has not been really made in the confine of the tax law. Consolidation activity has so much increase in the recent time in Nigeria. Consolidated entities are being compelled to comply with the available provision within the confine of the Company Income Tax Act. Osayaba and Oluwole (2012) concluded that tax legislation has not been made to cater for the merger and acquisition. Kusum (2014) suggested that legislation start from capital transfer which has been catered for under the Capital Gains Transfer Act of the tax legislation with reference to Indian Tax Legislation. Swiss tax system and switcherland’s extensive network of tax treaties offer attractive structure for merger and acquisition. For example in Switzerland, individuals holding their shares as private assets benefit tax exeption from capital gain tax when selling their shares but dividends income is subject to tax (KPMG International,2014). In contrary to the above contributors, FIRS in its information circular issued in 2006 made it clear under CITA provision that no entities should merged without the prior approval from the Service.
METHODOLOGY Desk research has been followed to complete this paper. The author exploited the existing journal and articles written by various contributors in the subject matter concerned. The author also used applies research in line with the desk research via internal. The researcher sought for materials and published articles on the internet. Reference was also made to newspapers and circulars from the Federal Inland revenue Service.
THEORETICAL FRAMEWORKS The most efficient two theories of mergers and acquisitions are synergetic and disciplinary theories propounded by Manne (1965); Mead (1968) and Jensen, (1988) which was termed as efficiency theory of mergers and acquisitions. Synergetic merger theory holds that firm managers achieve efficiency gains by combining an efficient target with their businesses and then improve the target performance. Disciplinary theory opined that merger and acquisition disciplined the target firms’ managers who pursue the objectives other than profit maximization. Another theory supporting mergers and acquisitions is that empire- building which was propounded by Baumol (1967) and later developed by Mueller in 1969. Baumol and Mueller opined that the mergers and acquisitions were schemes used to build business empire. Non of the theorist stated above had not viewed tax implication on mergers and acquisition. In order to make this piece effective the writer adopted synergizing theory to support this write up. There are a lot of tax incentives that can be claimed by both the acquired and the acquiring companies. It is suggested that through the synergy of mergers and acquisitions both the prey and predator companies can effective reduced their tax burden. Kumu (2014), suggested that the combining firms may also facilitate more efficient behavior on their own part by reducing their taxes. Through merger and acquisition an entity could effectively reduce their tax liabilities and then increase firm incentive to invest in another business.
EMPIRICAL REVIEW Merger and acquisition could be used interchangeably. Merger is simply coming together of two more entity form a single entity. Acquisition is a situation whereby an entity absorbed another entity to form a bigger entity which could stand the challenges in the market. Acquisition is the take- over of one entity by one company of sufficient share in another company to give the acquiring company the control over the acquired entity (FIRS, 2006). Consolidation could also be used to refer to scheme of merger and combination. Essence of merger ranges from one entity to another which may be synergy. The reason is best known to the entities concerned. Synergy is the working together of two or more organizations especially when the result is greater than the sum of their individual effects or capabilities.
TYPES OF MERGER AND ACQUISITION SCHEME Acquisition could be coming together of companies but different stages in the process of producing and selling of products in the industry, this is referred to as vertical acquisition. It could involve combination of two or more in the same level in the industry; this is referred to as horizontal integration. Organizations in different lines of business could come together to form a business empire this is often called conglomerate merger.
REASONS FOR MERGER AND ACQUISITION There are various reasons why entities merged. These reasons are determined by various challenges rocking such entities. Many foreign investors see merger and acquisition as an avenue to gain an entry in to Nigeria capital market. Another reason may be to increase the market share of the entity this was in the case of many banks in Nigeria. For example United Bank for Africa and Standard Bank Plc in 2006 merged and became a major key player in the banking industries. Surviving entities may also adopt merger and acquisition scheme to remain in the market. Many banks in Nigeria adopted this method in order not to be push out of the industry. Merger and acquisition could used to build Business Empire. In respectful of various reasons for amalgamations it is pertinent to know the impact tax on the activities. Kumu (2014), suggested that whether the tax incentives encourage merger activities is important to know their implication on merger activities. He furthered juxtaposed that tax impact on the properly structuring of the disposition and acquisition of company can have impart on the economic transaction of both parties. TAX IMPLICATION There various regulatory authorities involved in the merger and acquisition. Business combinations are always subject to the approval of Securities and Exchange Commission. According to Investment and Security Acts, 2007, entities must seek for the approval of SEC before such scheme could be adopted. Registered companies are subject to the authority of Corporate Affairs Commission in respect of all entities operations. Federal Inland Revenue Service comes in the aspect of the taxation. The commercial activities involved in the scheme of M& A make the tax consideration to be difficult. Even though the tax implication has the advantage and disadvantage, but the entities are expected to allow tax to have effect on various transactions taken place during merger and acquisition. From the start, the merging companies are required to submit to the FIRS, copies of the scheme of merger and acquisition scheme of arrangement on the consolidation request for its study and proper evaluation in order to ensure that taxes which may result from the companies’ transactions are correctly assessed and collected. Herein lies the relevance of the Service’s powers under section 29(9) (i) to require either of the companies directly affected by any direction which is under the consideration of the Service to guarantee or give security to its satisfaction for payment in full of all tax due or to become due by the company which is selling or transferring such asset or business. Among the procedures to be followed in merger and acquisition is the approval from the FIRS. The implication could be viewed in three major headings: The formation of new company and cessation of the acquired. COMMENCEMENT OF NEW COMPANY Merger and acquisition mark an end of merged entities and a new company emerges. The commencement is applicable to the new company. New entity is expected to file a return to the Federal Inland Revenue Service. This return must be filed within eighteen months of the incorporation or six months after the first accounting year. Section 29(3) recommended whichever is earlier for the filing of the audited financial statement. Basis of assessment of the new entity will be: for the first year of assessment, the basic period start from the date the new entity commenced to 31st December of the same year, the following year of assessment shall be from the date of commencement till twelve months calendar. The third year of assessment shall be base on preceding year basis. There is also right of election that could be exercised by the new company base on the effective tax planning. There are circumstances whereby the company’s Board of Directors may set aside the commencement rule. Firstly, if the merged parties are connected persons and the new entity could be presented as an on-going business. Lastly where the new company is reconstituted business the company may set aside the commencement rule.
VOLUME NO. 5 (2015), ISSUE NO. 11 (NOVEMBER) ISSN 2231-5756
INTERNATIONAL JOURNAL OF RESEARCH IN COMMERCE, IT & MANAGEMENT A Monthly Double-Blind Peer Reviewed (Refereed/Juried) Open Access International e-Journal - Included in the International Serial Directories
http://ijrcm.org.in/
74
Company Income Tax Act does not specify whether there is a capital allowance claimable. Since the assets are transferred based on the carrying amount not at fair value it is assumed that there is no capital allowance that can be claimed by the new company but could claim the annual allowance on the tax written down value of the assets transferred. Likewise the new company may acquired losses, this has been permitted by the Act to be absorbed into the new entities. CESSATION OF THE OLD BUSINESSES The merger and acquisition lead to cessation merged parties. The cessation rule is applicable to the ceased entities unless the entities are connected and where the company is reconstituted to take over a particular trade. The capital gains arising from the disposal of shares during merger has been exempted from the capital gain tax unless the shareholders are paid in cash.(Capital Gains Tax Act,2004, S.32A). Taxes and Deductibility of Related Expenses Stamp Duties Duty payment will arise on the share capital of the new company, subject to the provisions of Section 104 of the Stamp Duties Act, in relation to capital and duty relief. CONSOLIDATED EXPENSES Fees paid to statutory bodies such as SEC, NSE, CBN, Land Authorities etc, including professionals like accountants, stockbrokers, issuing houses, and solicitors are regarded as capital in nature and will therefore not be allowed as deductible expenses by virtue of Section 27(a) of CITA. TAXATION OF CONSOLIDATION FEES Fees paid to professionals for services rendered in connection with consolidation will be subject to VAT and WHT at the rates of 5% and 10% respectively. TAX INDEMNIFICATION Section 29(9)(i) of CITA provides that the Service may require the new company to guarantee or give security for payment in full, for any tax due or that may become due by any of the ceased companies. Approval for Pension Scheme The new company will need to obtain a Joint Tax Board (JTB) approval for its staff pension scheme. STATUS OF A SURVIVING COMPANY IN RELATION TO TAXATION It is a possibility that one of the merging companies survives and its old name or a new name to inherit the assets, liabilities, reserves and entire operations of the merging parties. Where this happens, the following points must be noted: The surviving company must file its returns in line with the provisions of section 55(3)(a) of CITA. Commencement rules under section 29(3) of CITA will not apply to the surviving company, as it will be regarded as an existing company. The surviving company will not be allowed to claim investment allowance on the assets which were transferred to it and will also not claim initial allowance on such assets. The surviving company may however claim annual allowance only on the tax written down Values (TWDV) of the assets transferred to it. The surviving company may not inherit the unabsorbed losses and capital allowances of the merging companies, except it is proved that the new business is a reconstituted company. All fees payable on merger bids or consolidation will be liable to VAT and WHT just like it is applicable on the emergence of a new company. Stamp duties will be paid on the increase in share capital and the company will have to obtain its own staff pension scheme approval from the JTB.
TAX IMPLICATION TO SHAREHOLDERS OF THE MERGED ENTITY Shareholders of the merged companies are assessable to tax incentives for selling their share or investment. The receipts from the disposal of their investments could be taxable and non taxable. If they are taxable the shareholders are expected to pay capital gain tax to the relevant tax authority. Allotment of shares by the merging company to the shareholders are often exempted from take . Kumu (2014) opined that there is an argument on whether there is going to be imposition of tax on the shares allotted to the shareholders. This will be determined by the tax legislation relating to the merger and acquisition in each country. According to Company Income Tax Act Section 25(9), if the shares are transferred with the payment of full amount to the transferor then capital gain tax will be levied on the gain arising from the transfer. Asset may also be transferred once the full amount has been paid by the merged to the acquired companies, the gain arises should be charged under Capital Gain Tax Act. However, S.32 of the Capital Gain tax Act, 2004, provides that person shall not be chargeable under capital gain tax Act in respect of any gain arising from the transferring of shares Capital allowance could also be claimed on the asset transferred to the new company. Company Income Tax Act do not made provision for the capital allowance on merger and acquisition. International Accounting Standard 22, provide that the assets, liabilities and reserves must be recorded at their carrying balances, implying that merger does not permit asset to be written down in their fair value at consolidation. The new company will therefore be entitled to claim initial allowance and annual allowance is claimable on the tax written down value. Losses could be absorbed by the new company if it can be proved that the new company carries on the same business and losses incurred have not be absorbed by the new company. These could carry forward and set off against the income of the entity concerned in future. It is also required for the stamp duty to be raised if the new entity issue new shares. According to stamp duty Act, 2004 Section 104, the duty share be paid on new shares issued by the new company.
DISCUSSION It was discovered that there is no specific provision for mergers and acquisitions scheme. Various provisions made were either under the Capital Gain Tax Act and other related tax laws. This was furthered found by the various contributors to tax implications of merger and acquisition. Many entities involved in the scheme did not even aware of the tax advantage of the scheme. Many were even sanctioned before they were compelled to seek for the approval of the tax authority. If the approval stage is really observed by the entities involved in mergers’ scheme they would have saved the extra cost from court cases for failing to comply with provision of the tax law.
RECOMMENDATIONS This paper suggests that the Federal Inland Revenue Service through its board enacts a tax legislation that would be specific and applied on the scheme. Such legislation should be published in the national dailies. This will serve as awareness to all entities that would be found in such scheme in future. The demerger scheme will soon be taken place as many would be recovering from the global economic distress, therefore adequate and proper tax legislation should be made available for this future scheme.
CONCLUSION The Federal Inland Revenue Service should enforce tax issue from the start of the scheme as many approving organizations could not be escaped. Tax issues have major impact on the successful completion of merger and acquisition schemes, post integration. Early involvement and development of a tax efficient plan will maximize the return on the arrangement. Tax legislation could be simplified and rationalized in respect merger and acquisition as found that complexity of the tax effect could lead to tax evasion.
REFERENCES 1. Capital Gain Tax Act, Cap 21, LFN, 2004. 2. Federal Inland Revenue Service Information Circular (2006): Tax Implication on Mergers and Acquisition 3. Kumu (2014): Tax implication on Merger and Acquisition Process. Journal of Business and Social Science Research, Volume 3. 4. Onikoyi (2012) : Mergers and Acquisitions and Banks Performance in Nigeria, JORIND 10.
VOLUME NO. 5 (2015), ISSUE NO. 11 (NOVEMBER) ISSN 2231-5756
INTERNATIONAL JOURNAL OF RESEARCH IN COMMERCE, IT & MANAGEMENT A Monthly Double-Blind Peer Reviewed (Refereed/Juried) Open Access International e-Journal - Included in the International Serial Directories
http://ijrcm.org.in/
75
5. Osayaba Giwa Osagie and Oluseun Oluwole (2013): Mergers and Acquisitions in Nigeria: Current Issue, Investment to Sub Saharan Africa. 6. Tarr A.J. (2002): Tax Consideration for Buyers and Sellers of Companies, Metropolitan Corporate Counsel Magazine. 7. Thomas Belz, Leslie Robinson and Martin Ruff (2013): Tax Avoidance as a Driver of Mergers and Acquisitions, Mannheim University.
VOLUME NO. 5 (2015), ISSUE NO. 11 (NOVEMBER) ISSN 2231-5756
INTERNATIONAL JOURNAL OF RESEARCH IN COMMERCE, IT & MANAGEMENT A Monthly Double-Blind Peer Reviewed (Refereed/Juried) Open Access International e-Journal - Included in the International Serial Directories
http://ijrcm.org.in/
76
GROWTH AND DEVELOPMENT AND THE FINANCIAL HEALTH OF CO-OPERATIVE CREDIT SYSTEM IN INDIA
POMPI DAS SENGUPTA RESEARCH SCHOLAR KOLHAN UNIVERSITY
CHAIBASA
ABSTRACT The cooperative banks in India started functioning almost 100 years ago. Co-operative credit institutions constitute the major source of institutional credit for agricultural and non- agricultural purposes as well. Co-operative banks have been working at the village, district and State levels. Co-operative banks in India are registered under the Co-operative Societies Act. (1904).The major development in the growth of cooperative institutions came during 1930- 1950, when Reserve Bank of India played the pioneering role in guiding and supporting the cooperatives. However, during this phase, signs of sickness in the Indian rural cooperative movement were evident. From 1990 onwards there was an increasing realization of the disruptive effects of intrusive state patronage and politicization of the co-operatives, especially financial cooperatives, which resulted in poor governance and management and the consequent impairment of their financial health. Though many studies have been done at the National level and at various State levels, not much has been done for Jharkhand which is relatively a new State. In order to analyze the growth of co-operatives in Jharkhand it is important to study its growth at the National level. The present study is an attempt to analyze the growth of co-operative credit in India for a period of 2001-2002 to 2010-1011.For the study purpose secondary data has been collected from relevant sources. The study reveals that there has been an improvement in certain areas such as number of offices, number of District Co-operative Banks, etc. However, there are certain persistent problems such as overdue problem, increase in management cost and fall in membership that shows there is an urgent need to revisit the working of co-operatives.
KEYWORDS co-operatives, governance, management, pioneering.
INTRODUCTION he history of the Co-operative Credit movement in India can be divided in four phases. In the First Phase (1900-30), the Co-operative Societies Act was passed (1904) and “cooperation” became a provincial subject by 1919. The major development during the (Second Phase 1930-50) was the pioneering role played by RBI in guiding and supporting the cooperatives. However, even during this phase, signs of sickness in the Indian rural cooperative movement
were becoming evident. The 1945 Co-operative Planning Committee had discerned these signs in the movement, finding that a large number of cooperatives were saddled with the problem of frozen assets “Because of heavy overdue in repayment.” Even so, also in the Third Phase (1950-90), the way forward was seen to lie in Co-operative Credit Societies. The All India Rural Credit Survey was set up which not only recommended state partnership in terms of equity but also partnership in terms of governance and management. NABARD(National Bank for Agriculture and Rural Development) was also created during this phase. The Fourth Phase from 1990s onwards saw an increasing realization of the disruptive effects of intrusive state patronage and politicization of the cooperatives, especially financial cooperatives, which resulted in poor governance and management and the consequent impairment of their financial health. A number of Committees were therefore set up to suggest reforms in the sector. There was evident increase in almost all parameters such as number of district co-operatives, membership, employees, etc.
REVIEW OF LITERATURE 1. GOVERNMENT OF INDIA (2005)- FINAL REPORT OF THE TASK FORCE ON REVIVAL OF CO-OPERATIVE CREDIT INSTITUTIONS The Task Force was set up by Government of India in August 2004 to suggest an action plan for reviving rural co-operative credit institutions including legal measures necessary for facilitating this process. The co-operative movement was started in our country over 100 years back on the initiative of the government. The growth of the co-operative is studied in four phases. The major development in the co-operative movement was done during the second phase (1930-1950) due to the pioneering role played by the Reserve Bank of India. The co-operative credit structure has a wide network and at present, on an average there is one primary agricultural credit societies (PACs) for every six villages. However at present the financial position of the system is getting weak and is deteriorating. The Task Force feels financial restructuring alone cannot address the problems of the co-operative sector. It is important to address the root causes of the weaknesses of the co-operatives. 2. KHURANA.M.L. He opined that co-operative was consciously sought after by India at the beginning of the 20th century. It was Nicholson, who brought the concept of ‘co-operative’ from Germany and was known as Raiffeisen type of village credit society. This acted as a catalyst and this set in motion the birth of co-operative credit institutions. These institutions tried to substitute the money lenders. The present Indian Co-operative Law provides a model for countries with agrarian economies. Initially, the co-operative institutions were governed by the Companies Act. The Company Law provided for excessive control over by the government agencies. This led to the passage of Company Societies Act in 1942. From time to time several committees have been formed to suggest ways and means for improving the working of the co-operatives. 3. PRABAL.K.SEN According to Professor Prabal Sen co-operative credit sector helps in developing banking habits among the poorer sections of the society and also helps in mobilizing savings. As the approach of co-operative bank is largely informal, it provides greater and easy accessibility to the customers particularly from the middle and lower income groups of the society. Though co-operative sector has made significant contribution to the socio-economic development of the country, yet even after years of financial sector reforms, these institutions continue to be plagued by lack of ‘stability’ and ‘efficiency’. State Laws govern the formation, registration, operation and winding up of co-operative banks. Such pervasive dominance by the State needs to be moderated and banking institutions ought to be given a requisite degree of autonomy. 4. CATANACH.I.J. Indian Co-operative Societies Act became a Law due to the deliberate efforts of the British Officials. The Act wanted to put a check on the activities of the money lenders and also wanted to provide an alternative to the farmers. It was Nicholson who brought the concept of co-operatives from Germany and this was the initiation of the process of co-operatives in our country. With time and support from the Government there was a rapid spread of co-operative banks across the country.
IMPORTANCE OF THE STUDY The present work is expected to have considerable significance in the economy of Jharkhand. The future of rural economy in Jharkhand and for that matter in any Indian State depends upon the performance of the Co-operative Credit Institutions. If the rural economy is to be made strong, then the Co-operative Credit Institutions have to play a positive role. And for that it is important to study the growth of co-operatives in India so that we may analyze the pace of development of co-operatives in Jharkhand. So for that we need to know the pace of development at the national level.
T
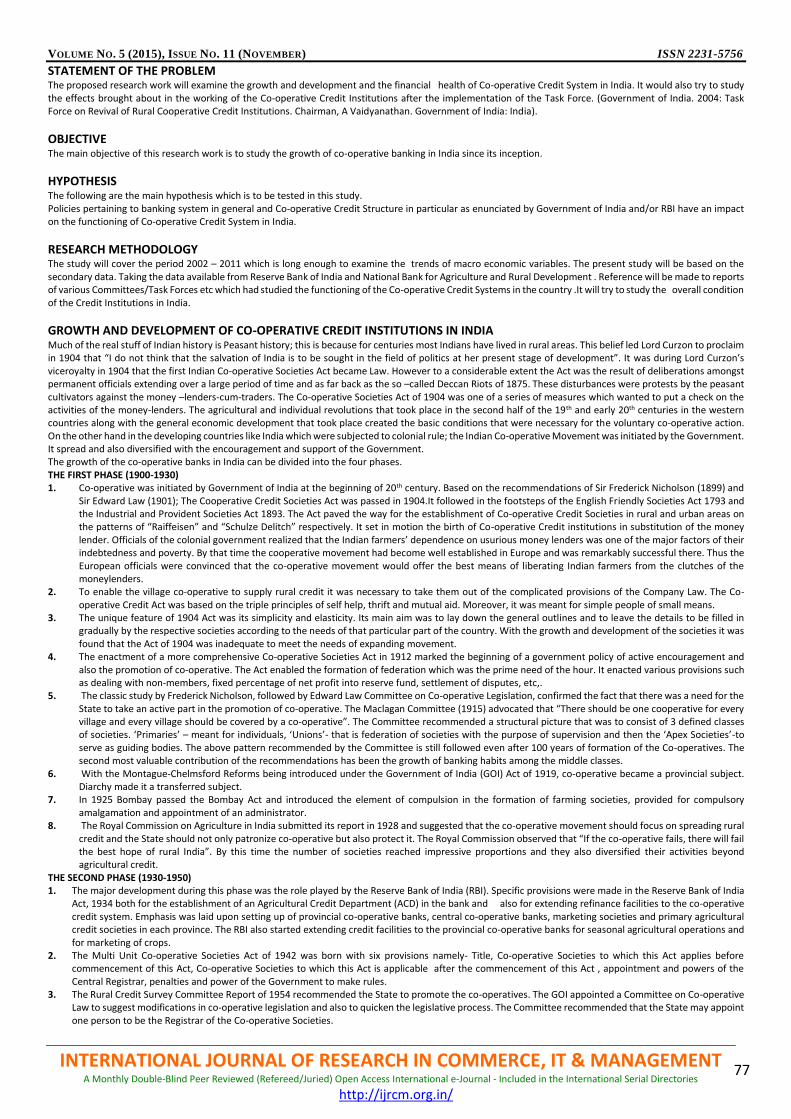
VOLUME NO. 5 (2015), ISSUE NO. 11 (NOVEMBER) ISSN 2231-5756
INTERNATIONAL JOURNAL OF RESEARCH IN COMMERCE, IT & MANAGEMENT A Monthly Double-Blind Peer Reviewed (Refereed/Juried) Open Access International e-Journal - Included in the International Serial Directories
http://ijrcm.org.in/
77
STATEMENT OF THE PROBLEM The proposed research work will examine the growth and development and the financial health of Co-operative Credit System in India. It would also try to study the effects brought about in the working of the Co-operative Credit Institutions after the implementation of the Task Force. (Government of India. 2004: Task Force on Revival of Rural Cooperative Credit Institutions. Chairman, A Vaidyanathan. Government of India: India).
OBJECTIVE The main objective of this research work is to study the growth of co-operative banking in India since its inception.
HYPOTHESIS The following are the main hypothesis which is to be tested in this study. Policies pertaining to banking system in general and Co-operative Credit Structure in particular as enunciated by Government of India and/or RBI have an impact on the functioning of Co-operative Credit System in India.
RESEARCH METHODOLOGY The study will cover the period 2002 – 2011 which is long enough to examine the trends of macro economic variables. The present study will be based on the secondary data. Taking the data available from Reserve Bank of India and National Bank for Agriculture and Rural Development . Reference will be made to reports of various Committees/Task Forces etc which had studied the functioning of the Co-operative Credit Systems in the country .It will try to study the overall condition of the Credit Institutions in India.
GROWTH AND DEVELOPMENT OF CO-OPERATIVE CREDIT INSTITUTIONS IN INDIA Much of the real stuff of Indian history is Peasant history; this is because for centuries most Indians have lived in rural areas. This belief led Lord Curzon to proclaim in 1904 that “I do not think that the salvation of India is to be sought in the field of politics at her present stage of development”. It was during Lord Curzon’s viceroyalty in 1904 that the first Indian Co-operative Societies Act became Law. However to a considerable extent the Act was the result of deliberations amongst permanent officials extending over a large period of time and as far back as the so –called Deccan Riots of 1875. These disturbances were protests by the peasant cultivators against the money –lenders-cum-traders. The Co-operative Societies Act of 1904 was one of a series of measures which wanted to put a check on the activities of the money-lenders. The agricultural and individual revolutions that took place in the second half of the 19th and early 20th centuries in the western countries along with the general economic development that took place created the basic conditions that were necessary for the voluntary co-operative action. On the other hand in the developing countries like India which were subjected to colonial rule; the Indian Co-operative Movement was initiated by the Government. It spread and also diversified with the encouragement and support of the Government. The growth of the co-operative banks in India can be divided into the four phases. THE FIRST PHASE (1900-1930) 1. Co-operative was initiated by Government of India at the beginning of 20th century. Based on the recommendations of Sir Frederick Nicholson (1899) and
Sir Edward Law (1901); The Cooperative Credit Societies Act was passed in 1904.It followed in the footsteps of the English Friendly Societies Act 1793 and the Industrial and Provident Societies Act 1893. The Act paved the way for the establishment of Co-operative Credit Societies in rural and urban areas on the patterns of “Raiffeisen” and “Schulze Delitch” respectively. It set in motion the birth of Co-operative Credit institutions in substitution of the money lender. Officials of the colonial government realized that the Indian farmers’ dependence on usurious money lenders was one of the major factors of their indebtedness and poverty. By that time the cooperative movement had become well established in Europe and was remarkably successful there. Thus the European officials were convinced that the co-operative movement would offer the best means of liberating Indian farmers from the clutches of the moneylenders.
2. To enable the village co-operative to supply rural credit it was necessary to take them out of the complicated provisions of the Company Law. The Co-operative Credit Act was based on the triple principles of self help, thrift and mutual aid. Moreover, it was meant for simple people of small means.
3. The unique feature of 1904 Act was its simplicity and elasticity. Its main aim was to lay down the general outlines and to leave the details to be filled in gradually by the respective societies according to the needs of that particular part of the country. With the growth and development of the societies it was found that the Act of 1904 was inadequate to meet the needs of expanding movement.
4. The enactment of a more comprehensive Co-operative Societies Act in 1912 marked the beginning of a government policy of active encouragement and also the promotion of co-operative. The Act enabled the formation of federation which was the prime need of the hour. It enacted various provisions such as dealing with non-members, fixed percentage of net profit into reserve fund, settlement of disputes, etc,.
5. The classic study by Frederick Nicholson, followed by Edward Law Committee on Co-operative Legislation, confirmed the fact that there was a need for the State to take an active part in the promotion of co-operative. The Maclagan Committee (1915) advocated that “There should be one cooperative for every village and every village should be covered by a co-operative”. The Committee recommended a structural picture that was to consist of 3 defined classes of societies. ‘Primaries’ – meant for individuals, ‘Unions’- that is federation of societies with the purpose of supervision and then the ‘Apex Societies’-to serve as guiding bodies. The above pattern recommended by the Committee is still followed even after 100 years of formation of the Co-operatives. The second most valuable contribution of the recommendations has been the growth of banking habits among the middle classes.
6. With the Montague-Chelmsford Reforms being introduced under the Government of India (GOI) Act of 1919, co-operative became a provincial subject. Diarchy made it a transferred subject.
7. In 1925 Bombay passed the Bombay Act and introduced the element of compulsion in the formation of farming societies, provided for compulsory amalgamation and appointment of an administrator.
8. The Royal Commission on Agriculture in India submitted its report in 1928 and suggested that the co-operative movement should focus on spreading rural credit and the State should not only patronize co-operative but also protect it. The Royal Commission observed that “If the co-operative fails, there will fail the best hope of rural India”. By this time the number of societies reached impressive proportions and they also diversified their activities beyond agricultural credit.
THE SECOND PHASE (1930-1950) 1. The major development during this phase was the role played by the Reserve Bank of India (RBI). Specific provisions were made in the Reserve Bank of India
Act, 1934 both for the establishment of an Agricultural Credit Department (ACD) in the bank and also for extending refinance facilities to the co-operative credit system. Emphasis was laid upon setting up of provincial co-operative banks, central co-operative banks, marketing societies and primary agricultural credit societies in each province. The RBI also started extending credit facilities to the provincial co-operative banks for seasonal agricultural operations and for marketing of crops.
2. The Multi Unit Co-operative Societies Act of 1942 was born with six provisions namely- Title, Co-operative Societies to which this Act applies before commencement of this Act, Co-operative Societies to which this Act is applicable after the commencement of this Act , appointment and powers of the Central Registrar, penalties and power of the Government to make rules.
3. The Rural Credit Survey Committee Report of 1954 recommended the State to promote the co-operatives. The GOI appointed a Committee on Co-operative Law to suggest modifications in co-operative legislation and also to quicken the legislative process. The Committee recommended that the State may appoint one person to be the Registrar of the Co-operative Societies.
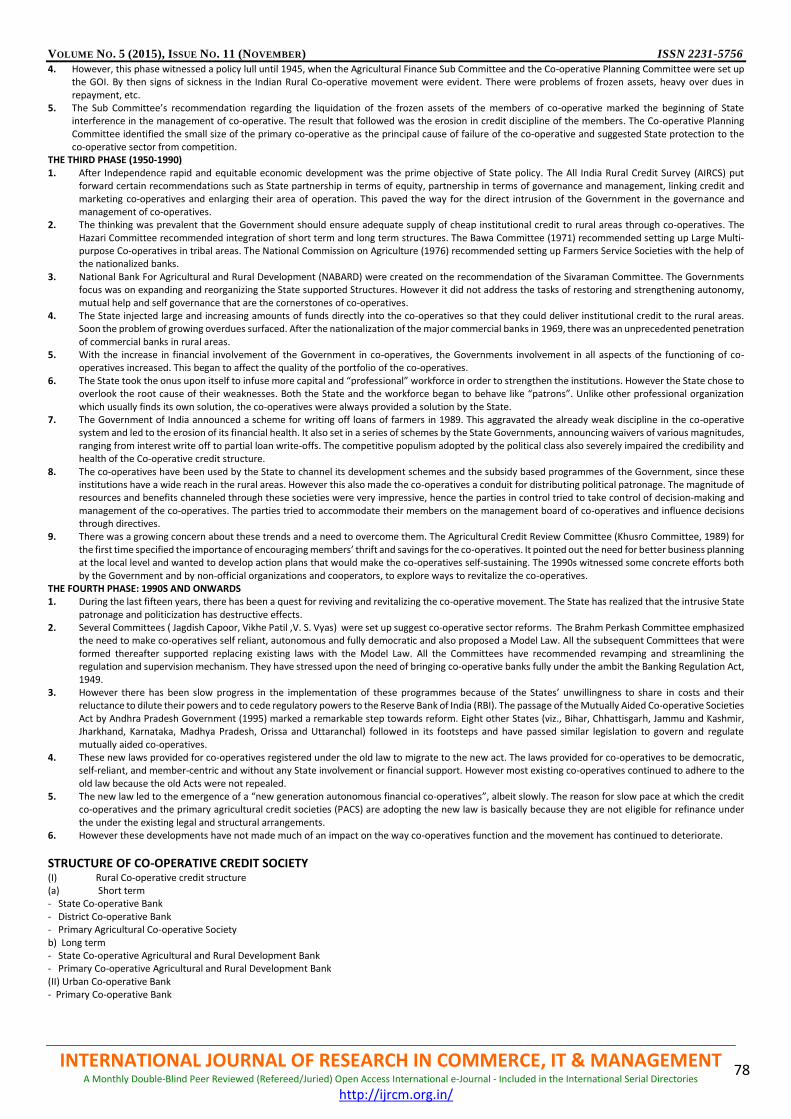
VOLUME NO. 5 (2015), ISSUE NO. 11 (NOVEMBER) ISSN 2231-5756
INTERNATIONAL JOURNAL OF RESEARCH IN COMMERCE, IT & MANAGEMENT A Monthly Double-Blind Peer Reviewed (Refereed/Juried) Open Access International e-Journal - Included in the International Serial Directories
http://ijrcm.org.in/
78
4. However, this phase witnessed a policy lull until 1945, when the Agricultural Finance Sub Committee and the Co-operative Planning Committee were set up the GOI. By then signs of sickness in the Indian Rural Co-operative movement were evident. There were problems of frozen assets, heavy over dues in repayment, etc.
5. The Sub Committee’s recommendation regarding the liquidation of the frozen assets of the members of co-operative marked the beginning of State interference in the management of co-operative. The result that followed was the erosion in credit discipline of the members. The Co-operative Planning Committee identified the small size of the primary co-operative as the principal cause of failure of the co-operative and suggested State protection to the co-operative sector from competition.
THE THIRD PHASE (1950-1990) 1. After Independence rapid and equitable economic development was the prime objective of State policy. The All India Rural Credit Survey (AIRCS) put
forward certain recommendations such as State partnership in terms of equity, partnership in terms of governance and management, linking credit and marketing co-operatives and enlarging their area of operation. This paved the way for the direct intrusion of the Government in the governance and management of co-operatives.
2. The thinking was prevalent that the Government should ensure adequate supply of cheap institutional credit to rural areas through co-operatives. The Hazari Committee recommended integration of short term and long term structures. The Bawa Committee (1971) recommended setting up Large Multi-purpose Co-operatives in tribal areas. The National Commission on Agriculture (1976) recommended setting up Farmers Service Societies with the help of the nationalized banks.
3. National Bank For Agricultural and Rural Development (NABARD) were created on the recommendation of the Sivaraman Committee. The Governments focus was on expanding and reorganizing the State supported Structures. However it did not address the tasks of restoring and strengthening autonomy, mutual help and self governance that are the cornerstones of co-operatives.
4. The State injected large and increasing amounts of funds directly into the co-operatives so that they could deliver institutional credit to the rural areas. Soon the problem of growing overdues surfaced. After the nationalization of the major commercial banks in 1969, there was an unprecedented penetration of commercial banks in rural areas.
5. With the increase in financial involvement of the Government in co-operatives, the Governments involvement in all aspects of the functioning of co-operatives increased. This began to affect the quality of the portfolio of the co-operatives.
6. The State took the onus upon itself to infuse more capital and “professional” workforce in order to strengthen the institutions. However the State chose to overlook the root cause of their weaknesses. Both the State and the workforce began to behave like “patrons”. Unlike other professional organization which usually finds its own solution, the co-operatives were always provided a solution by the State.
7. The Government of India announced a scheme for writing off loans of farmers in 1989. This aggravated the already weak discipline in the co-operative system and led to the erosion of its financial health. It also set in a series of schemes by the State Governments, announcing waivers of various magnitudes, ranging from interest write off to partial loan write-offs. The competitive populism adopted by the political class also severely impaired the credibility and health of the Co-operative credit structure.
8. The co-operatives have been used by the State to channel its development schemes and the subsidy based programmes of the Government, since these institutions have a wide reach in the rural areas. However this also made the co-operatives a conduit for distributing political patronage. The magnitude of resources and benefits channeled through these societies were very impressive, hence the parties in control tried to take control of decision-making and management of the co-operatives. The parties tried to accommodate their members on the management board of co-operatives and influence decisions through directives.
9. There was a growing concern about these trends and a need to overcome them. The Agricultural Credit Review Committee (Khusro Committee, 1989) for the first time specified the importance of encouraging members’ thrift and savings for the co-operatives. It pointed out the need for better business planning at the local level and wanted to develop action plans that would make the co-operatives self-sustaining. The 1990s witnessed some concrete efforts both by the Government and by non-official organizations and cooperators, to explore ways to revitalize the co-operatives.
THE FOURTH PHASE: 1990S AND ONWARDS 1. During the last fifteen years, there has been a quest for reviving and revitalizing the co-operative movement. The State has realized that the intrusive State
patronage and politicization has destructive effects. 2. Several Committees ( Jagdish Capoor, Vikhe Patil ,V. S. Vyas) were set up suggest co-operative sector reforms. The Brahm Perkash Committee emphasized
the need to make co-operatives self reliant, autonomous and fully democratic and also proposed a Model Law. All the subsequent Committees that were formed thereafter supported replacing existing laws with the Model Law. All the Committees have recommended revamping and streamlining the regulation and supervision mechanism. They have stressed upon the need of bringing co-operative banks fully under the ambit the Banking Regulation Act, 1949.
3. However there has been slow progress in the implementation of these programmes because of the States’ unwillingness to share in costs and their reluctance to dilute their powers and to cede regulatory powers to the Reserve Bank of India (RBI). The passage of the Mutually Aided Co-operative Societies Act by Andhra Pradesh Government (1995) marked a remarkable step towards reform. Eight other States (viz., Bihar, Chhattisgarh, Jammu and Kashmir, Jharkhand, Karnataka, Madhya Pradesh, Orissa and Uttaranchal) followed in its footsteps and have passed similar legislation to govern and regulate mutually aided co-operatives.
4. These new laws provided for co-operatives registered under the old law to migrate to the new act. The laws provided for co-operatives to be democratic, self-reliant, and member-centric and without any State involvement or financial support. However most existing co-operatives continued to adhere to the old law because the old Acts were not repealed.
5. The new law led to the emergence of a “new generation autonomous financial co-operatives”, albeit slowly. The reason for slow pace at which the credit co-operatives and the primary agricultural credit societies (PACS) are adopting the new law is basically because they are not eligible for refinance under the under the existing legal and structural arrangements.
6. However these developments have not made much of an impact on the way co-operatives function and the movement has continued to deteriorate.
STRUCTURE OF CO-OPERATIVE CREDIT SOCIETY (I) Rural Co-operative credit structure (a) Short term - State Co-operative Bank - District Co-operative Bank - Primary Agricultural Co-operative Society b) Long term - State Co-operative Agricultural and Rural Development Bank - Primary Co-operative Agricultural and Rural Development Bank (II) Urban Co-operative Bank - Primary Co-operative Bank
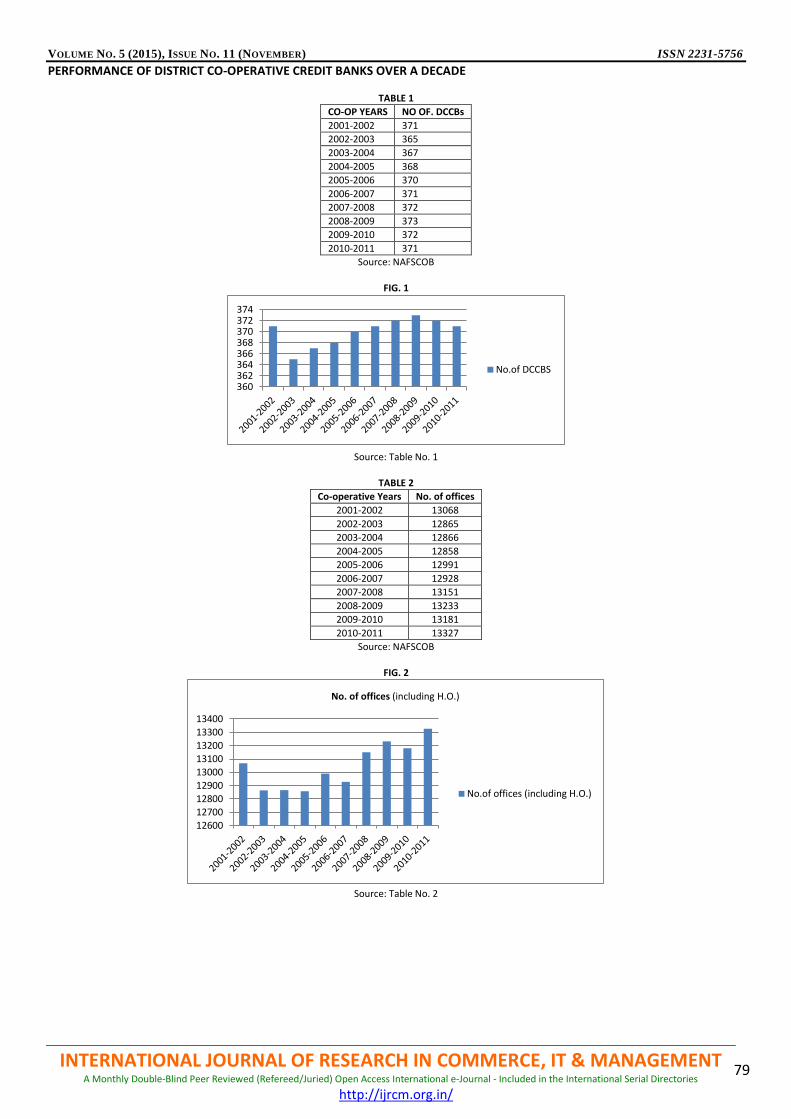
VOLUME NO. 5 (2015), ISSUE NO. 11 (NOVEMBER) ISSN 2231-5756
INTERNATIONAL JOURNAL OF RESEARCH IN COMMERCE, IT & MANAGEMENT A Monthly Double-Blind Peer Reviewed (Refereed/Juried) Open Access International e-Journal - Included in the International Serial Directories
http://ijrcm.org.in/
79
PERFORMANCE OF DISTRICT CO-OPERATIVE CREDIT BANKS OVER A DECADE
TABLE 1
CO-OP YEARS NO OF. DCCBs
2001-2002 371
2002-2003 365
2003-2004 367
2004-2005 368
2005-2006 370
2006-2007 371
2007-2008 372
2008-2009 373
2009-2010 372
2010-2011 371
Source: NAFSCOB
FIG. 1
Source: Table No. 1
TABLE 2
Co-operative Years No. of offices
2001-2002 13068
2002-2003 12865
2003-2004 12866
2004-2005 12858
2005-2006 12991
2006-2007 12928
2007-2008 13151
2008-2009 13233
2009-2010 13181
2010-2011 13327
Source: NAFSCOB
FIG. 2
Source: Table No. 2
360362364366368370372374
No.of DCCBS
126001270012800129001300013100132001330013400
No. of offices (including H.O.)
No.of offices (including H.O.)
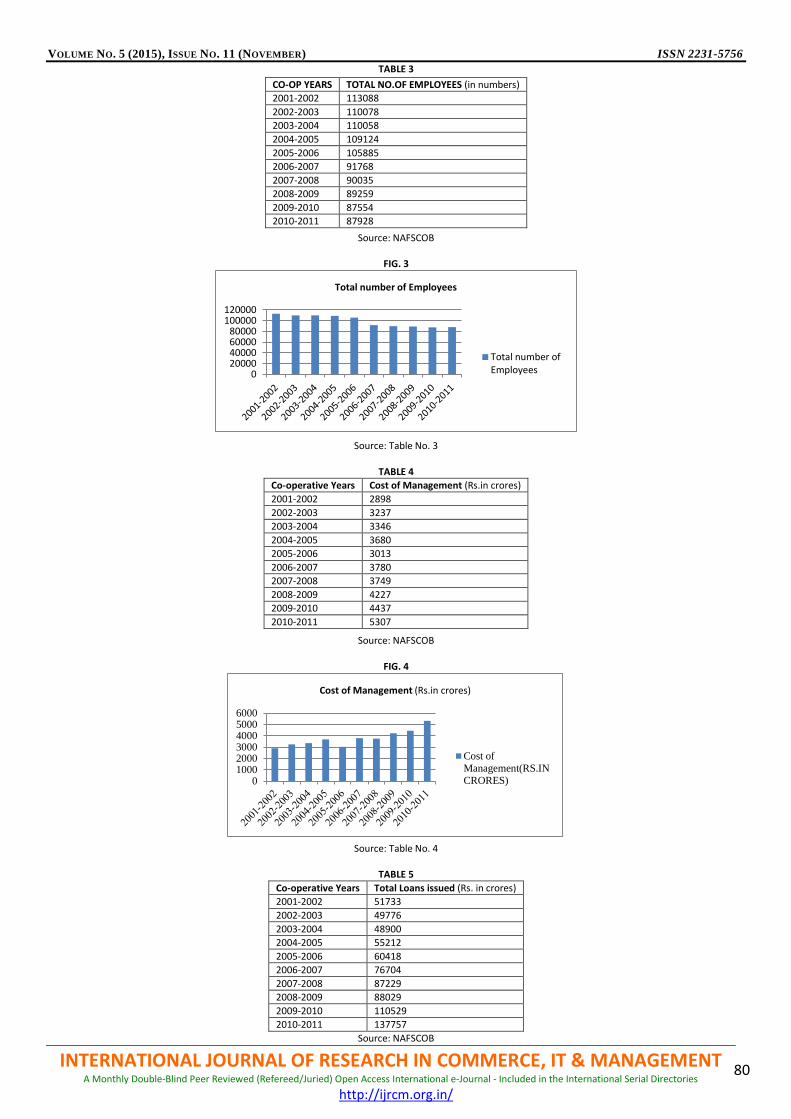
VOLUME NO. 5 (2015), ISSUE NO. 11 (NOVEMBER) ISSN 2231-5756
INTERNATIONAL JOURNAL OF RESEARCH IN COMMERCE, IT & MANAGEMENT A Monthly Double-Blind Peer Reviewed (Refereed/Juried) Open Access International e-Journal - Included in the International Serial Directories
http://ijrcm.org.in/
80
TABLE 3
Source: NAFSCOB
FIG. 3
Source: Table No. 3
TABLE 4
Source: NAFSCOB
FIG. 4
Source: Table No. 4
TABLE 5
Co-operative Years Total Loans issued (Rs. in crores)
2001-2002 51733
2002-2003 49776
2003-2004 48900
2004-2005 55212
2005-2006 60418
2006-2007 76704
2007-2008 87229
2008-2009 88029
2009-2010 110529
2010-2011 137757
Source: NAFSCOB
CO-OP YEARS TOTAL NO.OF EMPLOYEES (in numbers)
2001-2002 113088
2002-2003 110078
2003-2004 110058
2004-2005 109124
2005-2006 105885
2006-2007 91768
2007-2008 90035
2008-2009 89259
2009-2010 87554
2010-2011 87928
Co-operative Years Cost of Management (Rs.in crores)
2001-2002 2898
2002-2003 3237
2003-2004 3346
2004-2005 3680
2005-2006 3013
2006-2007 3780
2007-2008 3749
2008-2009 4227
2009-2010 4437
2010-2011 5307
020000400006000080000
100000120000
Total number of Employees
Total number ofEmployees
0100020003000400050006000
Cost of Management (Rs.in crores)
Cost of
Management(RS.IN
CRORES)
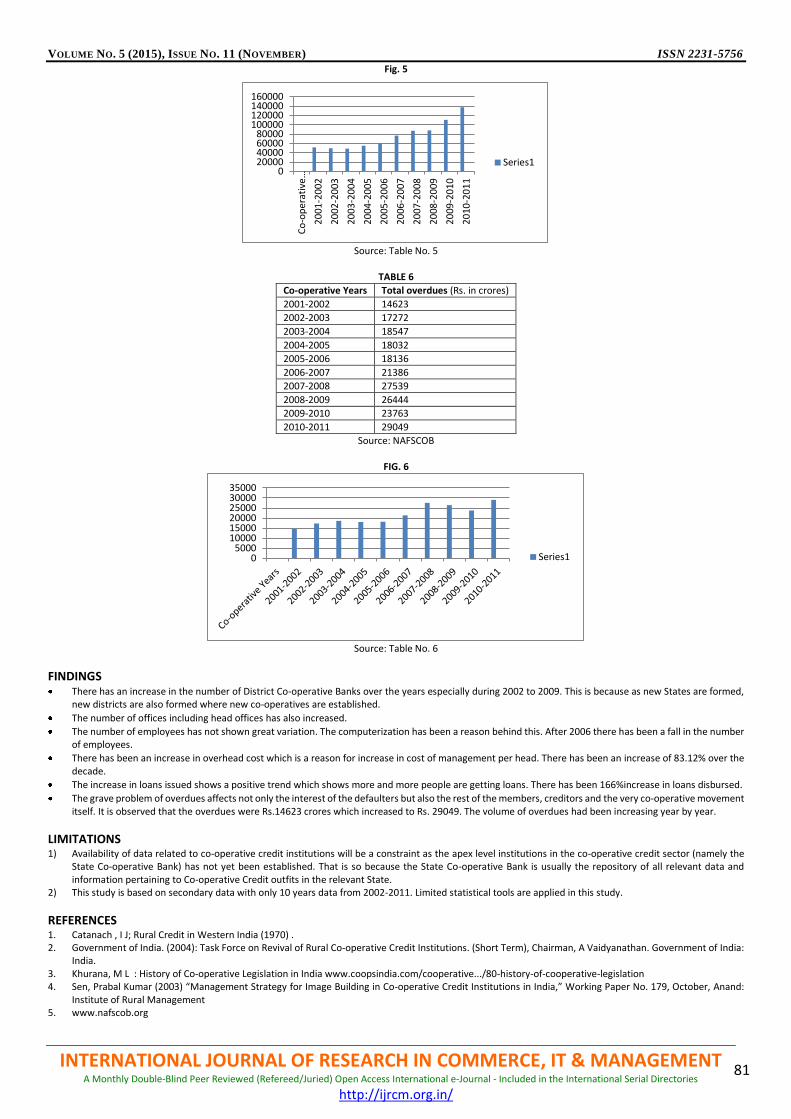
VOLUME NO. 5 (2015), ISSUE NO. 11 (NOVEMBER) ISSN 2231-5756
INTERNATIONAL JOURNAL OF RESEARCH IN COMMERCE, IT & MANAGEMENT A Monthly Double-Blind Peer Reviewed (Refereed/Juried) Open Access International e-Journal - Included in the International Serial Directories
http://ijrcm.org.in/
81
Fig. 5
Source: Table No. 5
TABLE 6
Co-operative Years Total overdues (Rs. in crores)
2001-2002 14623
2002-2003 17272
2003-2004 18547
2004-2005 18032
2005-2006 18136
2006-2007 21386
2007-2008 27539
2008-2009 26444
2009-2010 23763
2010-2011 29049
Source: NAFSCOB
FIG. 6
Source: Table No. 6
FINDINGS There has an increase in the number of District Co-operative Banks over the years especially during 2002 to 2009. This is because as new States are formed,
new districts are also formed where new co-operatives are established.
The number of offices including head offices has also increased.
The number of employees has not shown great variation. The computerization has been a reason behind this. After 2006 there has been a fall in the number of employees.
There has been an increase in overhead cost which is a reason for increase in cost of management per head. There has been an increase of 83.12% over the decade.
The increase in loans issued shows a positive trend which shows more and more people are getting loans. There has been 166%increase in loans disbursed.
The grave problem of overdues affects not only the interest of the defaulters but also the rest of the members, creditors and the very co-operative movement itself. It is observed that the overdues were Rs.14623 crores which increased to Rs. 29049. The volume of overdues had been increasing year by year.
LIMITATIONS 1) Availability of data related to co-operative credit institutions will be a constraint as the apex level institutions in the co-operative credit sector (namely the
State Co-operative Bank) has not yet been established. That is so because the State Co-operative Bank is usually the repository of all relevant data and information pertaining to Co-operative Credit outfits in the relevant State.
2) This study is based on secondary data with only 10 years data from 2002-2011. Limited statistical tools are applied in this study.
REFERENCES 1. Catanach , I J; Rural Credit in Western India (1970) . 2. Government of India. (2004): Task Force on Revival of Rural Co-operative Credit Institutions. (Short Term), Chairman, A Vaidyanathan. Government of India:
India. 3. Khurana, M L : History of Co-operative Legislation in India www.coopsindia.com/cooperative.../80-history-of-cooperative-legislation 4. Sen, Prabal Kumar (2003) “Management Strategy for Image Building in Co-operative Credit Institutions in India,” Working Paper No. 179, October, Anand:
Institute of Rural Management 5. www.nafscob.org
020000400006000080000
100000120000140000160000
Co
‐op
era
tive
…
20
01-2
00
2
20
02-2
00
3
20
03-2
00
4
20
04-2
00
5
20
05-2
00
6
20
06-2
00
7
20
07-2
00
8
20
08-2
00
9
20
09-2
01
0
20
10-2
01
1
Series1
05000
100001500020000250003000035000
Series1
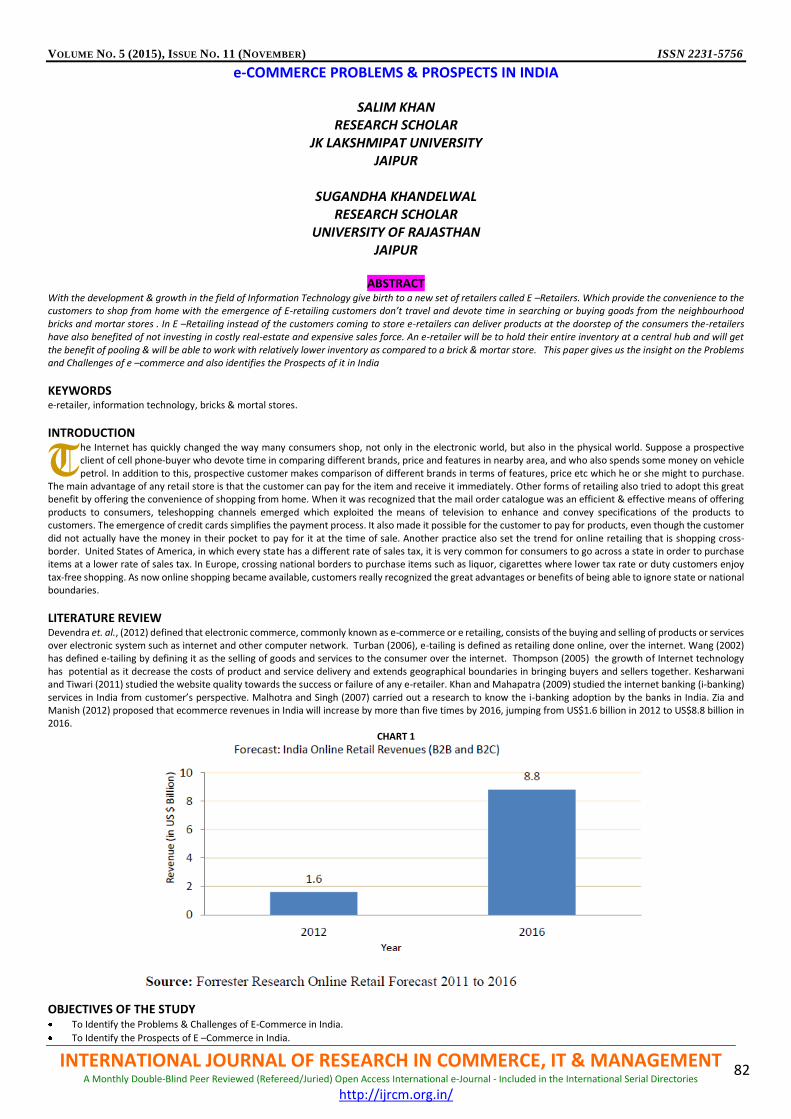
VOLUME NO. 5 (2015), ISSUE NO. 11 (NOVEMBER) ISSN 2231-5756
INTERNATIONAL JOURNAL OF RESEARCH IN COMMERCE, IT & MANAGEMENT A Monthly Double-Blind Peer Reviewed (Refereed/Juried) Open Access International e-Journal - Included in the International Serial Directories
http://ijrcm.org.in/
82
e-COMMERCE PROBLEMS & PROSPECTS IN INDIA
SALIM KHAN RESEARCH SCHOLAR
JK LAKSHMIPAT UNIVERSITY JAIPUR
SUGANDHA KHANDELWAL
RESEARCH SCHOLAR UNIVERSITY OF RAJASTHAN
JAIPUR
ABSTRACT With the development & growth in the field of Information Technology give birth to a new set of retailers called E –Retailers. Which provide the convenience to the customers to shop from home with the emergence of E-retailing customers don’t travel and devote time in searching or buying goods from the neighbourhood bricks and mortar stores . In E –Retailing instead of the customers coming to store e-retailers can deliver products at the doorstep of the consumers the-retailers have also benefited of not investing in costly real-estate and expensive sales force. An e-retailer will be to hold their entire inventory at a central hub and will get the benefit of pooling & will be able to work with relatively lower inventory as compared to a brick & mortar store. This paper gives us the insight on the Problems and Challenges of e –commerce and also identifies the Prospects of it in India
KEYWORDS e-retailer, information technology, bricks & mortal stores.
INTRODUCTION he Internet has quickly changed the way many consumers shop, not only in the electronic world, but also in the physical world. Suppose a prospective client of cell phone-buyer who devote time in comparing different brands, price and features in nearby area, and who also spends some money on vehicle petrol. In addition to this, prospective customer makes comparison of different brands in terms of features, price etc which he or she might to purchase.
The main advantage of any retail store is that the customer can pay for the item and receive it immediately. Other forms of retailing also tried to adopt this great benefit by offering the convenience of shopping from home. When it was recognized that the mail order catalogue was an efficient & effective means of offering products to consumers, teleshopping channels emerged which exploited the means of television to enhance and convey specifications of the products to customers. The emergence of credit cards simplifies the payment process. It also made it possible for the customer to pay for products, even though the customer did not actually have the money in their pocket to pay for it at the time of sale. Another practice also set the trend for online retailing that is shopping cross-border. United States of America, in which every state has a different rate of sales tax, it is very common for consumers to go across a state in order to purchase items at a lower rate of sales tax. In Europe, crossing national borders to purchase items such as liquor, cigarettes where lower tax rate or duty customers enjoy tax-free shopping. As now online shopping became available, customers really recognized the great advantages or benefits of being able to ignore state or national boundaries.
LITERATURE REVIEW Devendra et. al., (2012) defined that electronic commerce, commonly known as e-commerce or e retailing, consists of the buying and selling of products or services over electronic system such as internet and other computer network. Turban (2006), e-tailing is defined as retailing done online, over the internet. Wang (2002) has defined e-tailing by defining it as the selling of goods and services to the consumer over the internet. Thompson (2005) the growth of Internet technology has potential as it decrease the costs of product and service delivery and extends geographical boundaries in bringing buyers and sellers together. Kesharwani and Tiwari (2011) studied the website quality towards the success or failure of any e-retailer. Khan and Mahapatra (2009) studied the internet banking (i-banking) services in India from customer’s perspective. Malhotra and Singh (2007) carried out a research to know the i-banking adoption by the banks in India. Zia and Manish (2012) proposed that ecommerce revenues in India will increase by more than five times by 2016, jumping from US$1.6 billion in 2012 to US$8.8 billion in 2016.
CHART 1
OBJECTIVES OF THE STUDY To Identify the Problems & Challenges of E-Commerce in India.
To Identify the Prospects of E –Commerce in India.
T
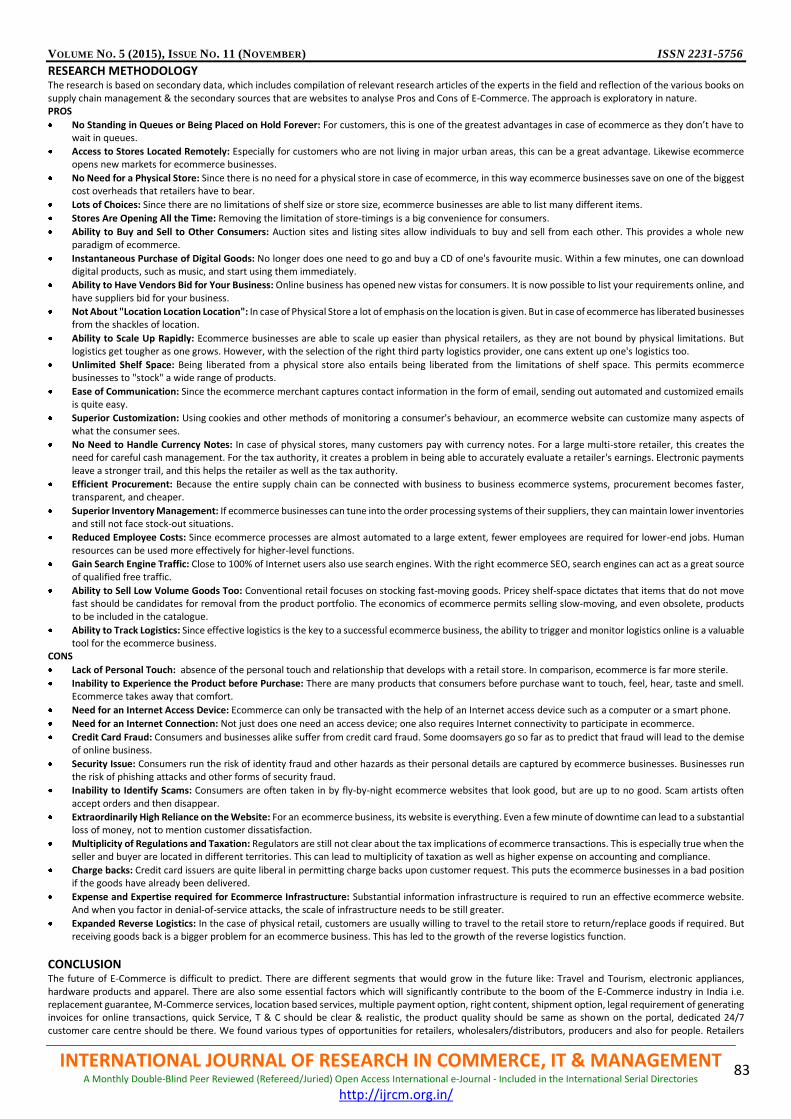
VOLUME NO. 5 (2015), ISSUE NO. 11 (NOVEMBER) ISSN 2231-5756
INTERNATIONAL JOURNAL OF RESEARCH IN COMMERCE, IT & MANAGEMENT A Monthly Double-Blind Peer Reviewed (Refereed/Juried) Open Access International e-Journal - Included in the International Serial Directories
http://ijrcm.org.in/
83
RESEARCH METHODOLOGY The research is based on secondary data, which includes compilation of relevant research articles of the experts in the field and reflection of the various books on supply chain management & the secondary sources that are websites to analyse Pros and Cons of E-Commerce. The approach is exploratory in nature. PROS
No Standing in Queues or Being Placed on Hold Forever: For customers, this is one of the greatest advantages in case of ecommerce as they don’t have to wait in queues.
Access to Stores Located Remotely: Especially for customers who are not living in major urban areas, this can be a great advantage. Likewise ecommerce opens new markets for ecommerce businesses.
No Need for a Physical Store: Since there is no need for a physical store in case of ecommerce, in this way ecommerce businesses save on one of the biggest cost overheads that retailers have to bear.
Lots of Choices: Since there are no limitations of shelf size or store size, ecommerce businesses are able to list many different items.
Stores Are Opening All the Time: Removing the limitation of store-timings is a big convenience for consumers.
Ability to Buy and Sell to Other Consumers: Auction sites and listing sites allow individuals to buy and sell from each other. This provides a whole new paradigm of ecommerce.
Instantaneous Purchase of Digital Goods: No longer does one need to go and buy a CD of one's favourite music. Within a few minutes, one can download digital products, such as music, and start using them immediately.
Ability to Have Vendors Bid for Your Business: Online business has opened new vistas for consumers. It is now possible to list your requirements online, and have suppliers bid for your business.
Not About "Location Location Location": In case of Physical Store a lot of emphasis on the location is given. But in case of ecommerce has liberated businesses from the shackles of location.
Ability to Scale Up Rapidly: Ecommerce businesses are able to scale up easier than physical retailers, as they are not bound by physical limitations. But logistics get tougher as one grows. However, with the selection of the right third party logistics provider, one cans extent up one's logistics too.
Unlimited Shelf Space: Being liberated from a physical store also entails being liberated from the limitations of shelf space. This permits ecommerce businesses to "stock" a wide range of products.
Ease of Communication: Since the ecommerce merchant captures contact information in the form of email, sending out automated and customized emails is quite easy.
Superior Customization: Using cookies and other methods of monitoring a consumer's behaviour, an ecommerce website can customize many aspects of what the consumer sees.
No Need to Handle Currency Notes: In case of physical stores, many customers pay with currency notes. For a large multi-store retailer, this creates the need for careful cash management. For the tax authority, it creates a problem in being able to accurately evaluate a retailer's earnings. Electronic payments leave a stronger trail, and this helps the retailer as well as the tax authority.
Efficient Procurement: Because the entire supply chain can be connected with business to business ecommerce systems, procurement becomes faster, transparent, and cheaper.
Superior Inventory Management: If ecommerce businesses can tune into the order processing systems of their suppliers, they can maintain lower inventories and still not face stock-out situations.
Reduced Employee Costs: Since ecommerce processes are almost automated to a large extent, fewer employees are required for lower-end jobs. Human resources can be used more effectively for higher-level functions.
Gain Search Engine Traffic: Close to 100% of Internet users also use search engines. With the right ecommerce SEO, search engines can act as a great source of qualified free traffic.
Ability to Sell Low Volume Goods Too: Conventional retail focuses on stocking fast-moving goods. Pricey shelf-space dictates that items that do not move fast should be candidates for removal from the product portfolio. The economics of ecommerce permits selling slow-moving, and even obsolete, products to be included in the catalogue.
Ability to Track Logistics: Since effective logistics is the key to a successful ecommerce business, the ability to trigger and monitor logistics online is a valuable tool for the ecommerce business.
CONS
Lack of Personal Touch: absence of the personal touch and relationship that develops with a retail store. In comparison, ecommerce is far more sterile.
Inability to Experience the Product before Purchase: There are many products that consumers before purchase want to touch, feel, hear, taste and smell. Ecommerce takes away that comfort.
Need for an Internet Access Device: Ecommerce can only be transacted with the help of an Internet access device such as a computer or a smart phone.
Need for an Internet Connection: Not just does one need an access device; one also requires Internet connectivity to participate in ecommerce.
Credit Card Fraud: Consumers and businesses alike suffer from credit card fraud. Some doomsayers go so far as to predict that fraud will lead to the demise of online business.
Security Issue: Consumers run the risk of identity fraud and other hazards as their personal details are captured by ecommerce businesses. Businesses run the risk of phishing attacks and other forms of security fraud.
Inability to Identify Scams: Consumers are often taken in by fly-by-night ecommerce websites that look good, but are up to no good. Scam artists often accept orders and then disappear.
Extraordinarily High Reliance on the Website: For an ecommerce business, its website is everything. Even a few minute of downtime can lead to a substantial loss of money, not to mention customer dissatisfaction.
Multiplicity of Regulations and Taxation: Regulators are still not clear about the tax implications of ecommerce transactions. This is especially true when the seller and buyer are located in different territories. This can lead to multiplicity of taxation as well as higher expense on accounting and compliance.
Charge backs: Credit card issuers are quite liberal in permitting charge backs upon customer request. This puts the ecommerce businesses in a bad position if the goods have already been delivered.
Expense and Expertise required for Ecommerce Infrastructure: Substantial information infrastructure is required to run an effective ecommerce website. And when you factor in denial-of-service attacks, the scale of infrastructure needs to be still greater.
Expanded Reverse Logistics: In the case of physical retail, customers are usually willing to travel to the retail store to return/replace goods if required. But receiving goods back is a bigger problem for an ecommerce business. This has led to the growth of the reverse logistics function.
CONCLUSION The future of E-Commerce is difficult to predict. There are different segments that would grow in the future like: Travel and Tourism, electronic appliances, hardware products and apparel. There are also some essential factors which will significantly contribute to the boom of the E-Commerce industry in India i.e. replacement guarantee, M-Commerce services, location based services, multiple payment option, right content, shipment option, legal requirement of generating invoices for online transactions, quick Service, T & C should be clear & realistic, the product quality should be same as shown on the portal, dedicated 24/7 customer care centre should be there. We found various types of opportunities for retailers, wholesalers/distributors, producers and also for people. Retailers
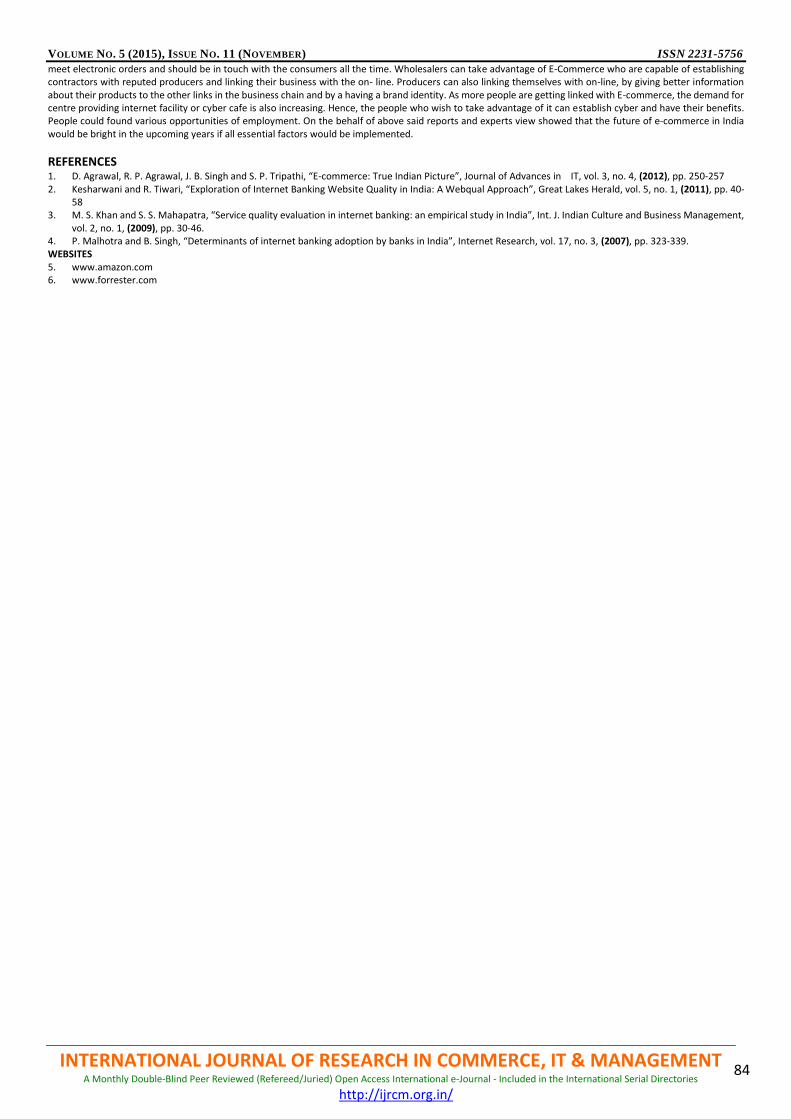
VOLUME NO. 5 (2015), ISSUE NO. 11 (NOVEMBER) ISSN 2231-5756
INTERNATIONAL JOURNAL OF RESEARCH IN COMMERCE, IT & MANAGEMENT A Monthly Double-Blind Peer Reviewed (Refereed/Juried) Open Access International e-Journal - Included in the International Serial Directories
http://ijrcm.org.in/
84
meet electronic orders and should be in touch with the consumers all the time. Wholesalers can take advantage of E-Commerce who are capable of establishing contractors with reputed producers and linking their business with the on- line. Producers can also linking themselves with on-line, by giving better information about their products to the other links in the business chain and by a having a brand identity. As more people are getting linked with E-commerce, the demand for centre providing internet facility or cyber cafe is also increasing. Hence, the people who wish to take advantage of it can establish cyber and have their benefits. People could found various opportunities of employment. On the behalf of above said reports and experts view showed that the future of e-commerce in India would be bright in the upcoming years if all essential factors would be implemented.
REFERENCES 1. D. Agrawal, R. P. Agrawal, J. B. Singh and S. P. Tripathi, “E-commerce: True Indian Picture”, Journal of Advances in IT, vol. 3, no. 4, (2012), pp. 250-257 2. Kesharwani and R. Tiwari, “Exploration of Internet Banking Website Quality in India: A Webqual Approach”, Great Lakes Herald, vol. 5, no. 1, (2011), pp. 40-
58 3. M. S. Khan and S. S. Mahapatra, “Service quality evaluation in internet banking: an empirical study in India”, Int. J. Indian Culture and Business Management,
vol. 2, no. 1, (2009), pp. 30-46. 4. P. Malhotra and B. Singh, “Determinants of internet banking adoption by banks in India”, Internet Research, vol. 17, no. 3, (2007), pp. 323-339. WEBSITES 5. www.amazon.com 6. www.forrester.com
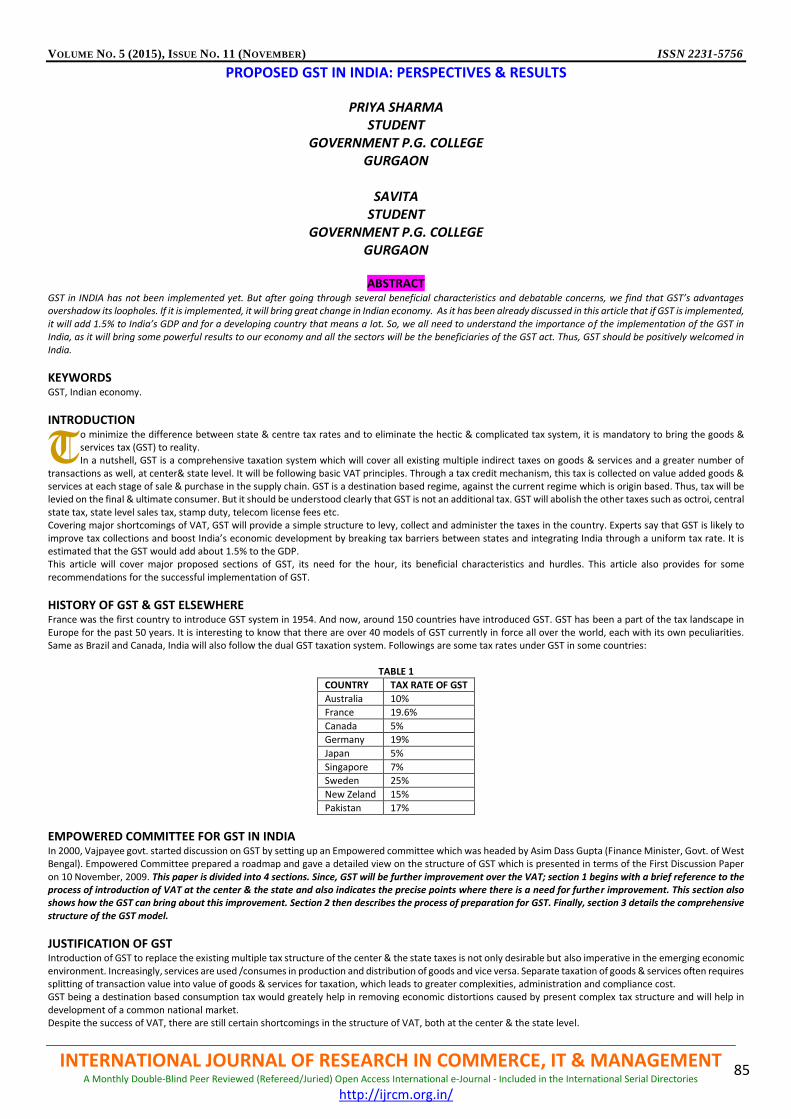
VOLUME NO. 5 (2015), ISSUE NO. 11 (NOVEMBER) ISSN 2231-5756
INTERNATIONAL JOURNAL OF RESEARCH IN COMMERCE, IT & MANAGEMENT A Monthly Double-Blind Peer Reviewed (Refereed/Juried) Open Access International e-Journal - Included in the International Serial Directories
http://ijrcm.org.in/
85
PROPOSED GST IN INDIA: PERSPECTIVES & RESULTS
PRIYA SHARMA STUDENT
GOVERNMENT P.G. COLLEGE GURGAON
SAVITA
STUDENT GOVERNMENT P.G. COLLEGE
GURGAON
ABSTRACT GST in INDIA has not been implemented yet. But after going through several beneficial characteristics and debatable concerns, we find that GST’s advantages overshadow its loopholes. If it is implemented, it will bring great change in Indian economy. As it has been already discussed in this article that if GST is implemented, it will add 1.5% to India’s GDP and for a developing country that means a lot. So, we all need to understand the importance of the implementation of the GST in India, as it will bring some powerful results to our economy and all the sectors will be the beneficiaries of the GST act. Thus, GST should be positively welcomed in India.
KEYWORDS GST, Indian economy.
INTRODUCTION o minimize the difference between state & centre tax rates and to eliminate the hectic & complicated tax system, it is mandatory to bring the goods & services tax (GST) to reality. In a nutshell, GST is a comprehensive taxation system which will cover all existing multiple indirect taxes on goods & services and a greater number of
transactions as well, at center& state level. It will be following basic VAT principles. Through a tax credit mechanism, this tax is collected on value added goods & services at each stage of sale & purchase in the supply chain. GST is a destination based regime, against the current regime which is origin based. Thus, tax will be levied on the final & ultimate consumer. But it should be understood clearly that GST is not an additional tax. GST will abolish the other taxes such as octroi, central state tax, state level sales tax, stamp duty, telecom license fees etc. Covering major shortcomings of VAT, GST will provide a simple structure to levy, collect and administer the taxes in the country. Experts say that GST is likely to improve tax collections and boost India’s economic development by breaking tax barriers between states and integrating India through a uniform tax rate. It is estimated that the GST would add about 1.5% to the GDP. This article will cover major proposed sections of GST, its need for the hour, its beneficial characteristics and hurdles. This article also provides for some recommendations for the successful implementation of GST.
HISTORY OF GST & GST ELSEWHERE France was the first country to introduce GST system in 1954. And now, around 150 countries have introduced GST. GST has been a part of the tax landscape in Europe for the past 50 years. It is interesting to know that there are over 40 models of GST currently in force all over the world, each with its own peculiarities. Same as Brazil and Canada, India will also follow the dual GST taxation system. Followings are some tax rates under GST in some countries:
TABLE 1
COUNTRY TAX RATE OF GST
Australia 10%
France 19.6%
Canada 5%
Germany 19%
Japan 5%
Singapore 7%
Sweden 25%
New Zeland 15%
Pakistan 17%
EMPOWERED COMMITTEE FOR GST IN INDIA In 2000, Vajpayee govt. started discussion on GST by setting up an Empowered committee which was headed by Asim Dass Gupta (Finance Minister, Govt. of West Bengal). Empowered Committee prepared a roadmap and gave a detailed view on the structure of GST which is presented in terms of the First Discussion Paper on 10 November, 2009. This paper is divided into 4 sections. Since, GST will be further improvement over the VAT; section 1 begins with a brief reference to the process of introduction of VAT at the center & the state and also indicates the precise points where there is a need for further improvement. This section also shows how the GST can bring about this improvement. Section 2 then describes the process of preparation for GST. Finally, section 3 details the comprehensive structure of the GST model.
JUSTIFICATION OF GST Introduction of GST to replace the existing multiple tax structure of the center & the state taxes is not only desirable but also imperative in the emerging economic environment. Increasingly, services are used /consumes in production and distribution of goods and vice versa. Separate taxation of goods & services often requires splitting of transaction value into value of goods & services for taxation, which leads to greater complexities, administration and compliance cost. GST being a destination based consumption tax would greately help in removing economic distortions caused by present complex tax structure and will help in development of a common national market. Despite the success of VAT, there are still certain shortcomings in the structure of VAT, both at the center & the state level.
T
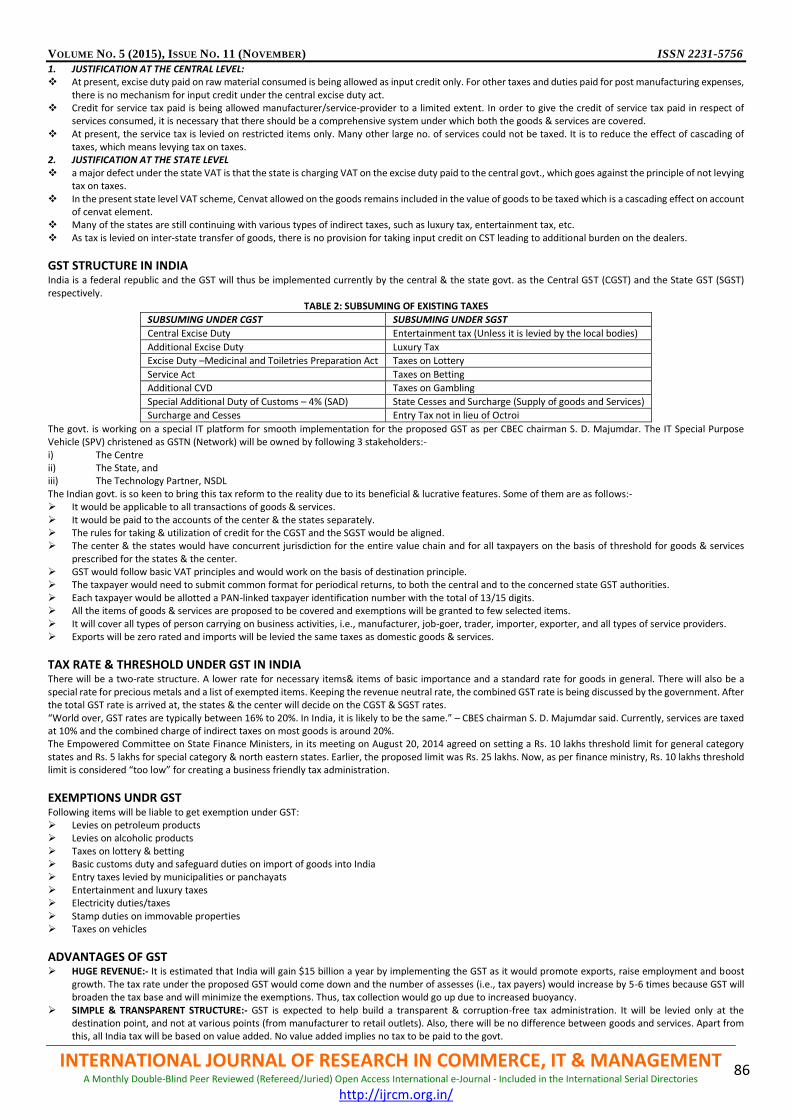
VOLUME NO. 5 (2015), ISSUE NO. 11 (NOVEMBER) ISSN 2231-5756
INTERNATIONAL JOURNAL OF RESEARCH IN COMMERCE, IT & MANAGEMENT A Monthly Double-Blind Peer Reviewed (Refereed/Juried) Open Access International e-Journal - Included in the International Serial Directories
http://ijrcm.org.in/
86
1. JUSTIFICATION AT THE CENTRAL LEVEL: At present, excise duty paid on raw material consumed is being allowed as input credit only. For other taxes and duties paid for post manufacturing expenses,
there is no mechanism for input credit under the central excise duty act. Credit for service tax paid is being allowed manufacturer/service-provider to a limited extent. In order to give the credit of service tax paid in respect of
services consumed, it is necessary that there should be a comprehensive system under which both the goods & services are covered. At present, the service tax is levied on restricted items only. Many other large no. of services could not be taxed. It is to reduce the effect of cascading of
taxes, which means levying tax on taxes. 2. JUSTIFICATION AT THE STATE LEVEL a major defect under the state VAT is that the state is charging VAT on the excise duty paid to the central govt., which goes against the principle of not levying
tax on taxes. In the present state level VAT scheme, Cenvat allowed on the goods remains included in the value of goods to be taxed which is a cascading effect on account
of cenvat element. Many of the states are still continuing with various types of indirect taxes, such as luxury tax, entertainment tax, etc. As tax is levied on inter-state transfer of goods, there is no provision for taking input credit on CST leading to additional burden on the dealers.
GST STRUCTURE IN INDIA India is a federal republic and the GST will thus be implemented currently by the central & the state govt. as the Central GST (CGST) and the State GST (SGST) respectively.
TABLE 2: SUBSUMING OF EXISTING TAXES
SUBSUMING UNDER CGST SUBSUMING UNDER SGST
Central Excise Duty Entertainment tax (Unless it is levied by the local bodies)
Additional Excise Duty Luxury Tax
Excise Duty –Medicinal and Toiletries Preparation Act Taxes on Lottery
Service Act Taxes on Betting
Additional CVD Taxes on Gambling
Special Additional Duty of Customs – 4% (SAD) State Cesses and Surcharge (Supply of goods and Services)
Surcharge and Cesses Entry Tax not in lieu of Octroi
The govt. is working on a special IT platform for smooth implementation for the proposed GST as per CBEC chairman S. D. Majumdar. The IT Special Purpose Vehicle (SPV) christened as GSTN (Network) will be owned by following 3 stakeholders:- i) The Centre ii) The State, and iii) The Technology Partner, NSDL The Indian govt. is so keen to bring this tax reform to the reality due to its beneficial & lucrative features. Some of them are as follows:- It would be applicable to all transactions of goods & services. It would be paid to the accounts of the center & the states separately. The rules for taking & utilization of credit for the CGST and the SGST would be aligned. The center & the states would have concurrent jurisdiction for the entire value chain and for all taxpayers on the basis of threshold for goods & services
prescribed for the states & the center. GST would follow basic VAT principles and would work on the basis of destination principle. The taxpayer would need to submit common format for periodical returns, to both the central and to the concerned state GST authorities. Each taxpayer would be allotted a PAN-linked taxpayer identification number with the total of 13/15 digits. All the items of goods & services are proposed to be covered and exemptions will be granted to few selected items. It will cover all types of person carrying on business activities, i.e., manufacturer, job-goer, trader, importer, exporter, and all types of service providers. Exports will be zero rated and imports will be levied the same taxes as domestic goods & services.
TAX RATE & THRESHOLD UNDER GST IN INDIA There will be a two-rate structure. A lower rate for necessary items& items of basic importance and a standard rate for goods in general. There will also be a special rate for precious metals and a list of exempted items. Keeping the revenue neutral rate, the combined GST rate is being discussed by the government. After the total GST rate is arrived at, the states & the center will decide on the CGST & SGST rates. “World over, GST rates are typically between 16% to 20%. In India, it is likely to be the same.” – CBES chairman S. D. Majumdar said. Currently, services are taxed at 10% and the combined charge of indirect taxes on most goods is around 20%. The Empowered Committee on State Finance Ministers, in its meeting on August 20, 2014 agreed on setting a Rs. 10 lakhs threshold limit for general category states and Rs. 5 lakhs for special category & north eastern states. Earlier, the proposed limit was Rs. 25 lakhs. Now, as per finance ministry, Rs. 10 lakhs threshold limit is considered “too low” for creating a business friendly tax administration.
EXEMPTIONS UNDR GST Following items will be liable to get exemption under GST: Levies on petroleum products Levies on alcoholic products Taxes on lottery & betting Basic customs duty and safeguard duties on import of goods into India Entry taxes levied by municipalities or panchayats Entertainment and luxury taxes Electricity duties/taxes Stamp duties on immovable properties Taxes on vehicles
ADVANTAGES OF GST HUGE REVENUE:- It is estimated that India will gain $15 billion a year by implementing the GST as it would promote exports, raise employment and boost
growth. The tax rate under the proposed GST would come down and the number of assesses (i.e., tax payers) would increase by 5-6 times because GST will broaden the tax base and will minimize the exemptions. Thus, tax collection would go up due to increased buoyancy.
SIMPLE & TRANSPARENT STRUCTURE:- GST is expected to help build a transparent & corruption-free tax administration. It will be levied only at the destination point, and not at various points (from manufacturer to retail outlets). Also, there will be no difference between goods and services. Apart from this, all India tax will be based on value added. No value added implies no tax to be paid to the govt.
VOLUME NO. 5 (2015), ISSUE NO. 11 (NOVEMBER) ISSN 2231-5756
INTERNATIONAL JOURNAL OF RESEARCH IN COMMERCE, IT & MANAGEMENT A Monthly Double-Blind Peer Reviewed (Refereed/Juried) Open Access International e-Journal - Included in the International Serial Directories
http://ijrcm.org.in/
87
LESSER TAX BURDEN:-GST will bring about a change on the tax firmament by redistributing the burden of taxation equitably between manufacturing & services. The rates under GST will be kept very low as compared to the existing tax rates. Also, taxes which can’t be set off will be reduced to a considerable rate.
REDUCED DISTORTIONS:- GST will reduce distortions by completely switching to the destination principle. You follow any route; the tax given to the govt. will remain the same.
CREATION OF A TAX NEUTRAL SUPPLY CHAIN:- Entry tax, octroi etc. will be there, but as is evident, these are also being removed under GST. Thus, it will make the supply chain perfectly neutral to taxes.
REDUCED PRICES:- As the tax rate will reduce, it will have direct impact on the cost of goods & services. The prices will fall in the long run as dealers might pass on the benefits of the reduced tax to the consumers.
EASY COMPLIANCE:- As all inter-state dealers will be e-registered and correspondence with them will be by e-mail, the compliance level will improve substantially.
DEBATABLE CONCERNS Irrespective of the beneficial characteristics, still there are some loopholes that GST will have to face. Some of them are mentioned below:- DUAL- GST MODEL:-The best GST systems across the world use a single GST system, while India has opted for a dual GST model. Critics claim that CGST &
SGST are nothing but new names for central excise/service tax, VAT & CST. Hence, GST brings nothing new to the table. VAGUE:- The all new cenvat credit rules, 2014 do little to clarify eligibility for input credits by using general term such as- “any good which has no relationship
whatsoever with the manufacturer of a final product” and “services used primarily for personal use or consumption of any employee”. So, a hard look must be taken towards this as well.
ARTIFICIAL STATEMENT:- Threshold limit of traders with turnover below Rs.10 lakhs need not register is a concept brought from VAT system. This can cause ambiguity. Also, the argument that small traders can’t be handled by the system is not true.
FEAR AMONG STATES:-Some states, such as Madhya Pradesh, Chhattisgarh, and Tamil Nadu fear that if the uniform tax rate is lower than their existing rates, it will hit their tax revenue. So, the central govt. has offered to compensate the states in case of a loss in revenue. This further has hindered the progress in GST talks with states.
RECOMMENDATIONS FOR SUCCESSFUL IMPLEMENTATION OF GST IN INDIA FROM CORPORATE’S POINT OF VIEW:- Various Industry bodies, industry automobile sector body MAIT, have unanimously , in their budget
recommendations to the govt., sought speedy implementation of GST to make tax system in the country simpler. Stating that “GST is expected to address several issues under the current scheme of taxation of goods and services by the centre and states,” the industry body recommended that the draft GST legislation be published at the earliest.
Similarly, CEAMA—Industry chamber for the consumer electronics- sought immediate interventions from the government on various issues, including implementation of GST. In its recommendations, the industry said, ”rapid implementation of uniform GST is needed in order to decrease compliance burden for businesses as well as reduce paper work while making tax system simpler and transparent.” FROM GOVERNMENT’S POINT OF VIEW:- President Pranab Mukharjee said states are needed to come on board and develop an appropriate mechanism to
roll out goods & services Act(GST) “ If you want GST , unless we can get the states on board through some mechanism, we will have difficulties,” Mukharjee said.
Government has to bring the GST to the reality. Even after getting implemented, if it remains vague for the people and doesn’t provide desired results, then it can create a big problem for everyone. FROM INDIVIDUAL’S POINT OF VIEW:- Individuals are expecting a lot from the GST, as it will reduce their tax burden and will help uplift the Indian economy.
As exports will be zero rated after the implementation of GST, so it will encourage people to export and it will bring more foreign currency to India.
CONCLUSION GST in INDIA has not been implemented yet. But after going through several beneficial characteristics and debatable concerns, we find that GST’s advantages overshadow its loopholes. If it is implemented, it will bring great change in Indian economy. As it has been already discussed in this article that if GST is implemented, it will add 1.5% to India’s GDP and for a developing country that means a lot. So, we all need to understand the importance of the implementation of the GST in India, as it will bring some powerful results to our economy and all the sectors will be the beneficiaries of the GST act. Thus, GST should be positively welcomed in India.
REFERENCES 1. Goods and Services Tax in India, Notes by CA R.K. Bhalla WEBSITES 2. dor.gov.in/gstintro 3. gstindia.com 4. m.firstpost.com 5. m.thehindu.com 6. m.thehindubusinessline.com 7. www.telegraphindia.com
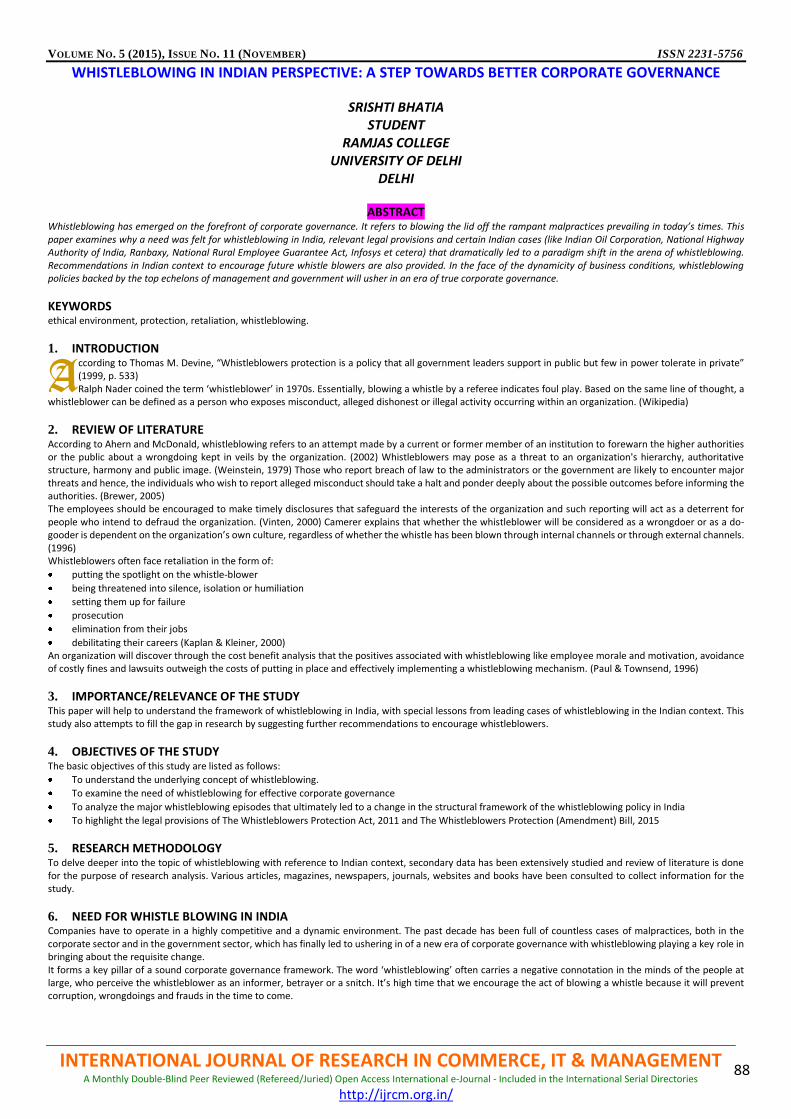
VOLUME NO. 5 (2015), ISSUE NO. 11 (NOVEMBER) ISSN 2231-5756
INTERNATIONAL JOURNAL OF RESEARCH IN COMMERCE, IT & MANAGEMENT A Monthly Double-Blind Peer Reviewed (Refereed/Juried) Open Access International e-Journal - Included in the International Serial Directories
http://ijrcm.org.in/
88
WHISTLEBLOWING IN INDIAN PERSPECTIVE: A STEP TOWARDS BETTER CORPORATE GOVERNANCE
SRISHTI BHATIA STUDENT
RAMJAS COLLEGE UNIVERSITY OF DELHI
DELHI
ABSTRACT Whistleblowing has emerged on the forefront of corporate governance. It refers to blowing the lid off the rampant malpractices prevailing in today’s times. This paper examines why a need was felt for whistleblowing in India, relevant legal provisions and certain Indian cases (like Indian Oil Corporation, National Highway Authority of India, Ranbaxy, National Rural Employee Guarantee Act, Infosys et cetera) that dramatically led to a paradigm shift in the arena of whistleblowing. Recommendations in Indian context to encourage future whistle blowers are also provided. In the face of the dynamicity of business conditions, whistleblowing policies backed by the top echelons of management and government will usher in an era of true corporate governance.
KEYWORDS ethical environment, protection, retaliation, whistleblowing.
1. INTRODUCTION ccording to Thomas M. Devine, “Whistleblowers protection is a policy that all government leaders support in public but few in power tolerate in private” (1999, p. 533) Ralph Nader coined the term ‘whistleblower’ in 1970s. Essentially, blowing a whistle by a referee indicates foul play. Based on the same line of thought, a
whistleblower can be defined as a person who exposes misconduct, alleged dishonest or illegal activity occurring within an organization. (Wikipedia)
2. REVIEW OF LITERATURE According to Ahern and McDonald, whistleblowing refers to an attempt made by a current or former member of an institution to forewarn the higher authorities or the public about a wrongdoing kept in veils by the organization. (2002) Whistleblowers may pose as a threat to an organization's hierarchy, authoritative structure, harmony and public image. (Weinstein, 1979) Those who report breach of law to the administrators or the government are likely to encounter major threats and hence, the individuals who wish to report alleged misconduct should take a halt and ponder deeply about the possible outcomes before informing the authorities. (Brewer, 2005) The employees should be encouraged to make timely disclosures that safeguard the interests of the organization and such reporting will act as a deterrent for people who intend to defraud the organization. (Vinten, 2000) Camerer explains that whether the whistleblower will be considered as a wrongdoer or as a do-gooder is dependent on the organization’s own culture, regardless of whether the whistle has been blown through internal channels or through external channels. (1996) Whistleblowers often face retaliation in the form of:
putting the spotlight on the whistle-blower
being threatened into silence, isolation or humiliation
setting them up for failure
prosecution
elimination from their jobs
debilitating their careers (Kaplan & Kleiner, 2000) An organization will discover through the cost benefit analysis that the positives associated with whistleblowing like employee morale and motivation, avoidance of costly fines and lawsuits outweigh the costs of putting in place and effectively implementing a whistleblowing mechanism. (Paul & Townsend, 1996)
3. IMPORTANCE/RELEVANCE OF THE STUDY This paper will help to understand the framework of whistleblowing in India, with special lessons from leading cases of whistleblowing in the Indian context. This study also attempts to fill the gap in research by suggesting further recommendations to encourage whistleblowers.
4. OBJECTIVES OF THE STUDY The basic objectives of this study are listed as follows:
To understand the underlying concept of whistleblowing.
To examine the need of whistleblowing for effective corporate governance
To analyze the major whistleblowing episodes that ultimately led to a change in the structural framework of the whistleblowing policy in India
To highlight the legal provisions of The Whistleblowers Protection Act, 2011 and The Whistleblowers Protection (Amendment) Bill, 2015
5. RESEARCH METHODOLOGY To delve deeper into the topic of whistleblowing with reference to Indian context, secondary data has been extensively studied and review of literature is done for the purpose of research analysis. Various articles, magazines, newspapers, journals, websites and books have been consulted to collect information for the study.
6. NEED FOR WHISTLE BLOWING IN INDIA Companies have to operate in a highly competitive and a dynamic environment. The past decade has been full of countless cases of malpractices, both in the corporate sector and in the government sector, which has finally led to ushering in of a new era of corporate governance with whistleblowing playing a key role in bringing about the requisite change. It forms a key pillar of a sound corporate governance framework. The word ‘whistleblowing’ often carries a negative connotation in the minds of the people at large, who perceive the whistleblower as an informer, betrayer or a snitch. It’s high time that we encourage the act of blowing a whistle because it will prevent corruption, wrongdoings and frauds in the time to come.
A
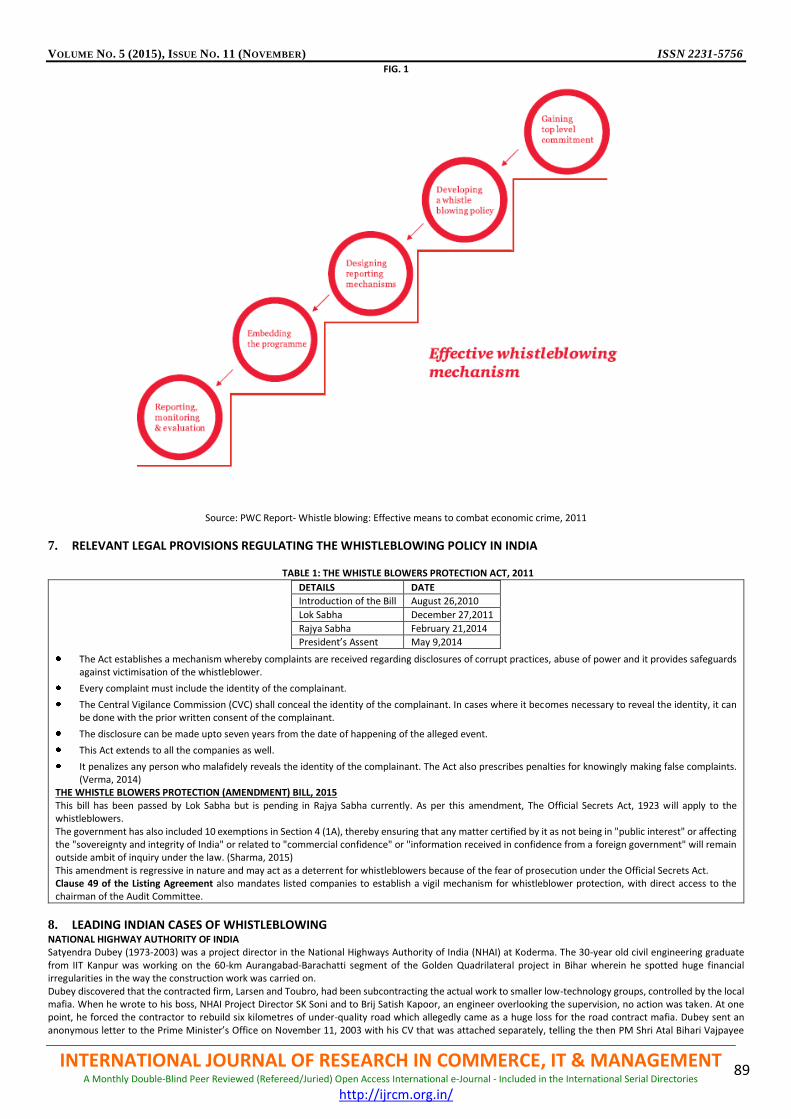
VOLUME NO. 5 (2015), ISSUE NO. 11 (NOVEMBER) ISSN 2231-5756
INTERNATIONAL JOURNAL OF RESEARCH IN COMMERCE, IT & MANAGEMENT A Monthly Double-Blind Peer Reviewed (Refereed/Juried) Open Access International e-Journal - Included in the International Serial Directories
http://ijrcm.org.in/
89
FIG. 1
Source: PWC Report- Whistle blowing: Effective means to combat economic crime, 2011
7. RELEVANT LEGAL PROVISIONS REGULATING THE WHISTLEBLOWING POLICY IN INDIA
TABLE 1: THE WHISTLE BLOWERS PROTECTION ACT, 2011
DETAILS DATE
Introduction of the Bill August 26,2010
Lok Sabha December 27,2011
Rajya Sabha February 21,2014
President’s Assent May 9,2014
The Act establishes a mechanism whereby complaints are received regarding disclosures of corrupt practices, abuse of power and it provides safeguards against victimisation of the whistleblower.
Every complaint must include the identity of the complainant.
The Central Vigilance Commission (CVC) shall conceal the identity of the complainant. In cases where it becomes necessary to reveal the identity, it can be done with the prior written consent of the complainant.
The disclosure can be made upto seven years from the date of happening of the alleged event.
This Act extends to all the companies as well.
It penalizes any person who malafidely reveals the identity of the complainant. The Act also prescribes penalties for knowingly making false complaints. (Verma, 2014)
THE WHISTLE BLOWERS PROTECTION (AMENDMENT) BILL, 2015 This bill has been passed by Lok Sabha but is pending in Rajya Sabha currently. As per this amendment, The Official Secrets Act, 1923 will apply to the whistleblowers. The government has also included 10 exemptions in Section 4 (1A), thereby ensuring that any matter certified by it as not being in "public interest" or affecting the "sovereignty and integrity of India" or related to "commercial confidence" or "information received in confidence from a foreign government" will remain outside ambit of inquiry under the law. (Sharma, 2015) This amendment is regressive in nature and may act as a deterrent for whistleblowers because of the fear of prosecution under the Official Secrets Act. Clause 49 of the Listing Agreement also mandates listed companies to establish a vigil mechanism for whistleblower protection, with direct access to the chairman of the Audit Committee.
8. LEADING INDIAN CASES OF WHISTLEBLOWING NATIONAL HIGHWAY AUTHORITY OF INDIA Satyendra Dubey (1973-2003) was a project director in the National Highways Authority of India (NHAI) at Koderma. The 30-year old civil engineering graduate from IIT Kanpur was working on the 60-km Aurangabad-Barachatti segment of the Golden Quadrilateral project in Bihar wherein he spotted huge financial irregularities in the way the construction work was carried on. Dubey discovered that the contracted firm, Larsen and Toubro, had been subcontracting the actual work to smaller low-technology groups, controlled by the local mafia. When he wrote to his boss, NHAI Project Director SK Soni and to Brij Satish Kapoor, an engineer overlooking the supervision, no action was taken. At one point, he forced the contractor to rebuild six kilometres of under-quality road which allegedly came as a huge loss for the road contract mafia. Dubey sent an anonymous letter to the Prime Minister’s Office on November 11, 2003 with his CV that was attached separately, telling the then PM Shri Atal Bihari Vajpayee
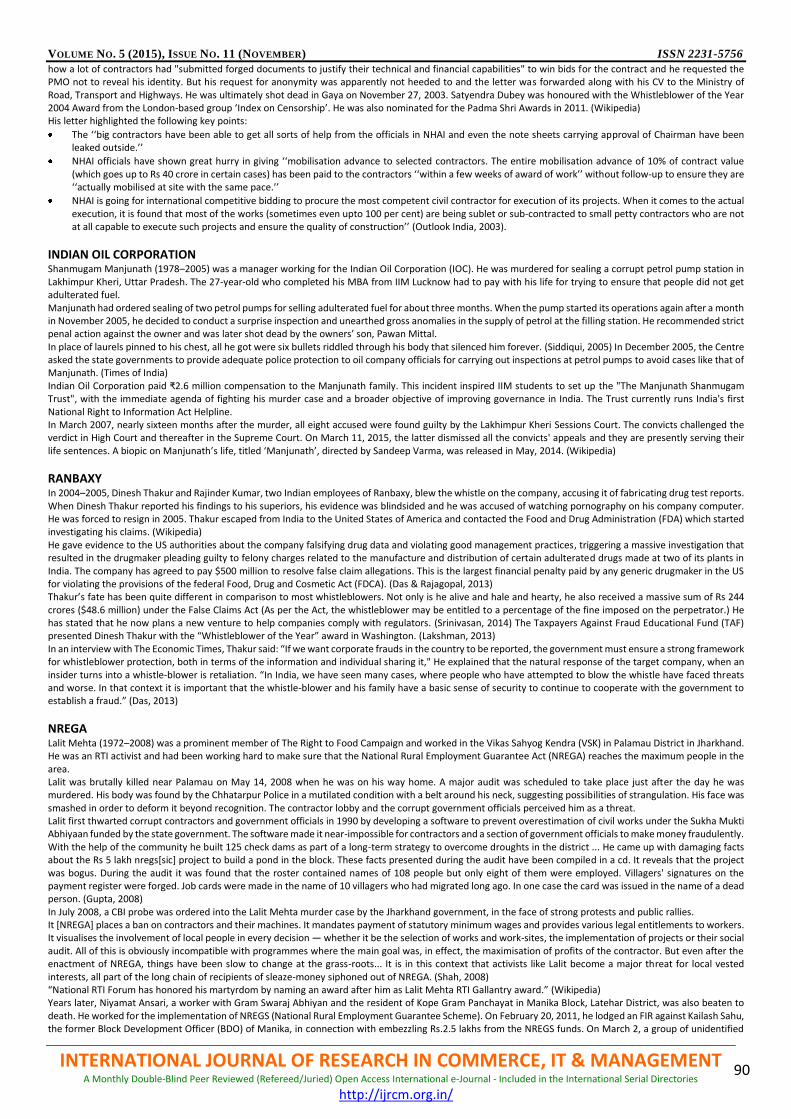
VOLUME NO. 5 (2015), ISSUE NO. 11 (NOVEMBER) ISSN 2231-5756
INTERNATIONAL JOURNAL OF RESEARCH IN COMMERCE, IT & MANAGEMENT A Monthly Double-Blind Peer Reviewed (Refereed/Juried) Open Access International e-Journal - Included in the International Serial Directories
http://ijrcm.org.in/
90
how a lot of contractors had "submitted forged documents to justify their technical and financial capabilities" to win bids for the contract and he requested the PMO not to reveal his identity. But his request for anonymity was apparently not heeded to and the letter was forwarded along with his CV to the Ministry of Road, Transport and Highways. He was ultimately shot dead in Gaya on November 27, 2003. Satyendra Dubey was honoured with the Whistleblower of the Year 2004 Award from the London-based group ‘Index on Censorship’. He was also nominated for the Padma Shri Awards in 2011. (Wikipedia) His letter highlighted the following key points:
The ‘‘big contractors have been able to get all sorts of help from the officials in NHAI and even the note sheets carrying approval of Chairman have been leaked outside.’’
NHAI officials have shown great hurry in giving ‘‘mobilisation advance to selected contractors. The entire mobilisation advance of 10% of contract value (which goes up to Rs 40 crore in certain cases) has been paid to the contractors ‘‘within a few weeks of award of work’’ without follow-up to ensure they are ‘‘actually mobilised at site with the same pace.’’
NHAI is going for international competitive bidding to procure the most competent civil contractor for execution of its projects. When it comes to the actual execution, it is found that most of the works (sometimes even upto 100 per cent) are being sublet or sub-contracted to small petty contractors who are not at all capable to execute such projects and ensure the quality of construction’’ (Outlook India, 2003).
INDIAN OIL CORPORATION Shanmugam Manjunath (1978–2005) was a manager working for the Indian Oil Corporation (IOC). He was murdered for sealing a corrupt petrol pump station in Lakhimpur Kheri, Uttar Pradesh. The 27-year-old who completed his MBA from IIM Lucknow had to pay with his life for trying to ensure that people did not get adulterated fuel. Manjunath had ordered sealing of two petrol pumps for selling adulterated fuel for about three months. When the pump started its operations again after a month in November 2005, he decided to conduct a surprise inspection and unearthed gross anomalies in the supply of petrol at the filling station. He recommended strict penal action against the owner and was later shot dead by the owners’ son, Pawan Mittal. In place of laurels pinned to his chest, all he got were six bullets riddled through his body that silenced him forever. (Siddiqui, 2005) In December 2005, the Centre asked the state governments to provide adequate police protection to oil company officials for carrying out inspections at petrol pumps to avoid cases like that of Manjunath. (Times of India) Indian Oil Corporation paid ₹2.6 million compensation to the Manjunath family. This incident inspired IIM students to set up the "The Manjunath Shanmugam Trust", with the immediate agenda of fighting his murder case and a broader objective of improving governance in India. The Trust currently runs India's first National Right to Information Act Helpline. In March 2007, nearly sixteen months after the murder, all eight accused were found guilty by the Lakhimpur Kheri Sessions Court. The convicts challenged the verdict in High Court and thereafter in the Supreme Court. On March 11, 2015, the latter dismissed all the convicts' appeals and they are presently serving their life sentences. A biopic on Manjunath’s life, titled ‘Manjunath’, directed by Sandeep Varma, was released in May, 2014. (Wikipedia)
RANBAXY In 2004–2005, Dinesh Thakur and Rajinder Kumar, two Indian employees of Ranbaxy, blew the whistle on the company, accusing it of fabricating drug test reports. When Dinesh Thakur reported his findings to his superiors, his evidence was blindsided and he was accused of watching pornography on his company computer. He was forced to resign in 2005. Thakur escaped from India to the United States of America and contacted the Food and Drug Administration (FDA) which started investigating his claims. (Wikipedia) He gave evidence to the US authorities about the company falsifying drug data and violating good management practices, triggering a massive investigation that resulted in the drugmaker pleading guilty to felony charges related to the manufacture and distribution of certain adulterated drugs made at two of its plants in India. The company has agreed to pay $500 million to resolve false claim allegations. This is the largest financial penalty paid by any generic drugmaker in the US for violating the provisions of the federal Food, Drug and Cosmetic Act (FDCA). (Das & Rajagopal, 2013) Thakur’s fate has been quite different in comparison to most whistleblowers. Not only is he alive and hale and hearty, he also received a massive sum of Rs 244 crores ($48.6 million) under the False Claims Act (As per the Act, the whistleblower may be entitled to a percentage of the fine imposed on the perpetrator.) He has stated that he now plans a new venture to help companies comply with regulators. (Srinivasan, 2014) The Taxpayers Against Fraud Educational Fund (TAF) presented Dinesh Thakur with the “Whistleblower of the Year” award in Washington. (Lakshman, 2013) In an interview with The Economic Times, Thakur said: “If we want corporate frauds in the country to be reported, the government must ensure a strong framework for whistleblower protection, both in terms of the information and individual sharing it," He explained that the natural response of the target company, when an insider turns into a whistle-blower is retaliation. “In India, we have seen many cases, where people who have attempted to blow the whistle have faced threats and worse. In that context it is important that the whistle-blower and his family have a basic sense of security to continue to cooperate with the government to establish a fraud.” (Das, 2013)
NREGA
Lalit Mehta (1972–2008) was a prominent member of The Right to Food Campaign and worked in the Vikas Sahyog Kendra (VSK) in Palamau District in Jharkhand. He was an RTI activist and had been working hard to make sure that the National Rural Employment Guarantee Act (NREGA) reaches the maximum people in the area. Lalit was brutally killed near Palamau on May 14, 2008 when he was on his way home. A major audit was scheduled to take place just after the day he was murdered. His body was found by the Chhatarpur Police in a mutilated condition with a belt around his neck, suggesting possibilities of strangulation. His face was smashed in order to deform it beyond recognition. The contractor lobby and the corrupt government officials perceived him as a threat. Lalit first thwarted corrupt contractors and government officials in 1990 by developing a software to prevent overestimation of civil works under the Sukha Mukti Abhiyaan funded by the state government. The software made it near-impossible for contractors and a section of government officials to make money fraudulently. With the help of the community he built 125 check dams as part of a long-term strategy to overcome droughts in the district ... He came up with damaging facts about the Rs 5 lakh nregs[sic] project to build a pond in the block. These facts presented during the audit have been compiled in a cd. It reveals that the project was bogus. During the audit it was found that the roster contained names of 108 people but only eight of them were employed. Villagers' signatures on the payment register were forged. Job cards were made in the name of 10 villagers who had migrated long ago. In one case the card was issued in the name of a dead person. (Gupta, 2008) In July 2008, a CBI probe was ordered into the Lalit Mehta murder case by the Jharkhand government, in the face of strong protests and public rallies. It [NREGA] places a ban on contractors and their machines. It mandates payment of statutory minimum wages and provides various legal entitlements to workers. It visualises the involvement of local people in every decision — whether it be the selection of works and work-sites, the implementation of projects or their social audit. All of this is obviously incompatible with programmes where the main goal was, in effect, the maximisation of profits of the contractor. But even after the enactment of NREGA, things have been slow to change at the grass-roots... It is in this context that activists like Lalit become a major threat for local vested interests, all part of the long chain of recipients of sleaze-money siphoned out of NREGA. (Shah, 2008) “National RTI Forum has honored his martyrdom by naming an award after him as Lalit Mehta RTI Gallantry award.” (Wikipedia) Years later, Niyamat Ansari, a worker with Gram Swaraj Abhiyan and the resident of Kope Gram Panchayat in Manika Block, Latehar District, was also beaten to death. He worked for the implementation of NREGS (National Rural Employment Guarantee Scheme). On February 20, 2011, he lodged an FIR against Kailash Sahu, the former Block Development Officer (BDO) of Manika, in connection with embezzling Rs.2.5 lakhs from the NREGS funds. On March 2, a group of unidentified
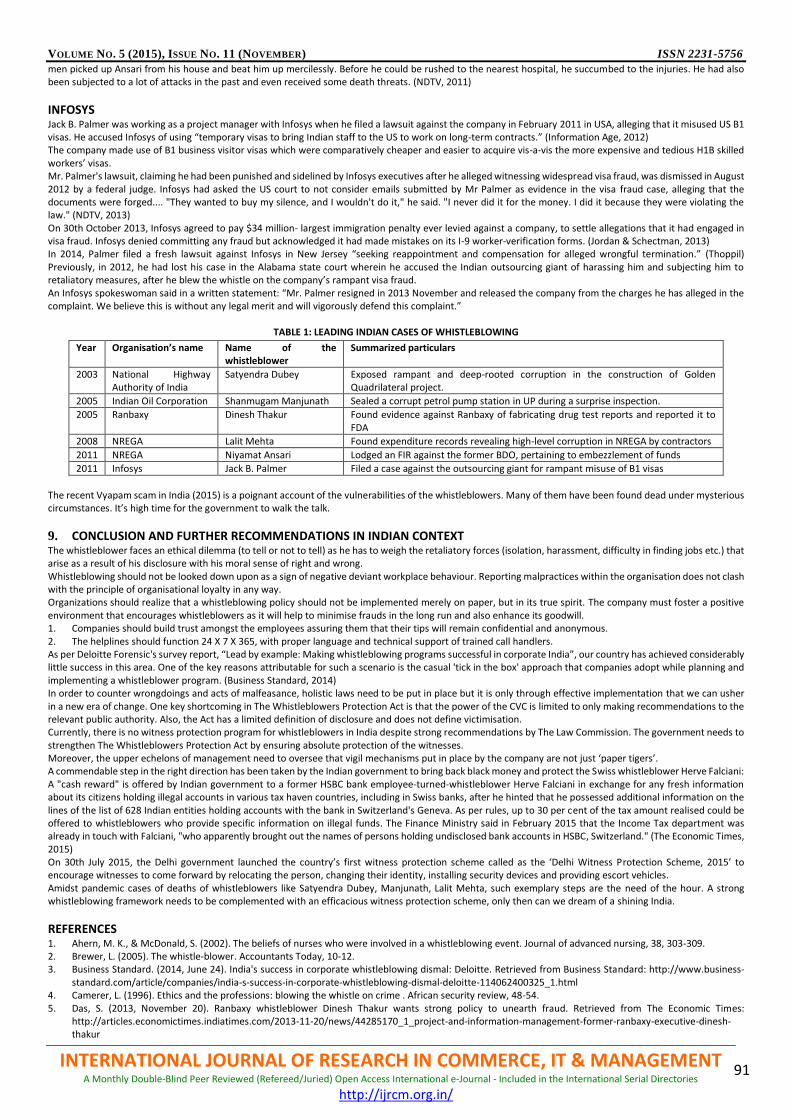
VOLUME NO. 5 (2015), ISSUE NO. 11 (NOVEMBER) ISSN 2231-5756
INTERNATIONAL JOURNAL OF RESEARCH IN COMMERCE, IT & MANAGEMENT A Monthly Double-Blind Peer Reviewed (Refereed/Juried) Open Access International e-Journal - Included in the International Serial Directories
http://ijrcm.org.in/
91
men picked up Ansari from his house and beat him up mercilessly. Before he could be rushed to the nearest hospital, he succumbed to the injuries. He had also been subjected to a lot of attacks in the past and even received some death threats. (NDTV, 2011)
INFOSYS Jack B. Palmer was working as a project manager with Infosys when he filed a lawsuit against the company in February 2011 in USA, alleging that it misused US B1 visas. He accused Infosys of using “temporary visas to bring Indian staff to the US to work on long-term contracts.” (Information Age, 2012) The company made use of B1 business visitor visas which were comparatively cheaper and easier to acquire vis-a-vis the more expensive and tedious H1B skilled workers’ visas. Mr. Palmer's lawsuit, claiming he had been punished and sidelined by Infosys executives after he alleged witnessing widespread visa fraud, was dismissed in August 2012 by a federal judge. Infosys had asked the US court to not consider emails submitted by Mr Palmer as evidence in the visa fraud case, alleging that the documents were forged.... "They wanted to buy my silence, and I wouldn't do it," he said. "I never did it for the money. I did it because they were violating the law." (NDTV, 2013) On 30th October 2013, Infosys agreed to pay $34 million- largest immigration penalty ever levied against a company, to settle allegations that it had engaged in visa fraud. Infosys denied committing any fraud but acknowledged it had made mistakes on its I-9 worker-verification forms. (Jordan & Schectman, 2013) In 2014, Palmer filed a fresh lawsuit against Infosys in New Jersey “seeking reappointment and compensation for alleged wrongful termination.” (Thoppil) Previously, in 2012, he had lost his case in the Alabama state court wherein he accused the Indian outsourcing giant of harassing him and subjecting him to retaliatory measures, after he blew the whistle on the company’s rampant visa fraud. An Infosys spokeswoman said in a written statement: “Mr. Palmer resigned in 2013 November and released the company from the charges he has alleged in the complaint. We believe this is without any legal merit and will vigorously defend this complaint.”
TABLE 1: LEADING INDIAN CASES OF WHISTLEBLOWING
The recent Vyapam scam in India (2015) is a poignant account of the vulnerabilities of the whistleblowers. Many of them have been found dead under mysterious circumstances. It’s high time for the government to walk the talk.
9. CONCLUSION AND FURTHER RECOMMENDATIONS IN INDIAN CONTEXT The whistleblower faces an ethical dilemma (to tell or not to tell) as he has to weigh the retaliatory forces (isolation, harassment, difficulty in finding jobs etc.) that arise as a result of his disclosure with his moral sense of right and wrong. Whistleblowing should not be looked down upon as a sign of negative deviant workplace behaviour. Reporting malpractices within the organisation does not clash with the principle of organisational loyalty in any way. Organizations should realize that a whistleblowing policy should not be implemented merely on paper, but in its true spirit. The company must foster a positive environment that encourages whistleblowers as it will help to minimise frauds in the long run and also enhance its goodwill. 1. Companies should build trust amongst the employees assuring them that their tips will remain confidential and anonymous. 2. The helplines should function 24 X 7 X 365, with proper language and technical support of trained call handlers. As per Deloitte Forensic's survey report, “Lead by example: Making whistleblowing programs successful in corporate India”, our country has achieved considerably little success in this area. One of the key reasons attributable for such a scenario is the casual 'tick in the box' approach that companies adopt while planning and implementing a whistleblower program. (Business Standard, 2014) In order to counter wrongdoings and acts of malfeasance, holistic laws need to be put in place but it is only through effective implementation that we can usher in a new era of change. One key shortcoming in The Whistleblowers Protection Act is that the power of the CVC is limited to only making recommendations to the relevant public authority. Also, the Act has a limited definition of disclosure and does not define victimisation. Currently, there is no witness protection program for whistleblowers in India despite strong recommendations by The Law Commission. The government needs to strengthen The Whistleblowers Protection Act by ensuring absolute protection of the witnesses. Moreover, the upper echelons of management need to oversee that vigil mechanisms put in place by the company are not just ‘paper tigers’. A commendable step in the right direction has been taken by the Indian government to bring back black money and protect the Swiss whistleblower Herve Falciani: A "cash reward" is offered by Indian government to a former HSBC bank employee-turned-whistleblower Herve Falciani in exchange for any fresh information about its citizens holding illegal accounts in various tax haven countries, including in Swiss banks, after he hinted that he possessed additional information on the lines of the list of 628 Indian entities holding accounts with the bank in Switzerland's Geneva. As per rules, up to 30 per cent of the tax amount realised could be offered to whistleblowers who provide specific information on illegal funds. The Finance Ministry said in February 2015 that the Income Tax department was already in touch with Falciani, "who apparently brought out the names of persons holding undisclosed bank accounts in HSBC, Switzerland." (The Economic Times, 2015) On 30th July 2015, the Delhi government launched the country’s first witness protection scheme called as the ‘Delhi Witness Protection Scheme, 2015’ to encourage witnesses to come forward by relocating the person, changing their identity, installing security devices and providing escort vehicles. Amidst pandemic cases of deaths of whistleblowers like Satyendra Dubey, Manjunath, Lalit Mehta, such exemplary steps are the need of the hour. A strong whistleblowing framework needs to be complemented with an efficacious witness protection scheme, only then can we dream of a shining India.
REFERENCES 1. Ahern, M. K., & McDonald, S. (2002). The beliefs of nurses who were involved in a whistleblowing event. Journal of advanced nursing, 38, 303-309. 2. Brewer, L. (2005). The whistle-blower. Accountants Today, 10-12. 3. Business Standard. (2014, June 24). India's success in corporate whistleblowing dismal: Deloitte. Retrieved from Business Standard: http://www.business-
standard.com/article/companies/india-s-success-in-corporate-whistleblowing-dismal-deloitte-114062400325_1.html 4. Camerer, L. (1996). Ethics and the professions: blowing the whistle on crime . African security review, 48-54. 5. Das, S. (2013, November 20). Ranbaxy whistleblower Dinesh Thakur wants strong policy to unearth fraud. Retrieved from The Economic Times:
http://articles.economictimes.indiatimes.com/2013-11-20/news/44285170_1_project-and-information-management-former-ranbaxy-executive-dinesh-thakur
Year Organisation’s name Name of the whistleblower
Summarized particulars
2003 National Highway Authority of India
Satyendra Dubey Exposed rampant and deep-rooted corruption in the construction of Golden Quadrilateral project.
2005 Indian Oil Corporation Shanmugam Manjunath Sealed a corrupt petrol pump station in UP during a surprise inspection.
2005 Ranbaxy Dinesh Thakur Found evidence against Ranbaxy of fabricating drug test reports and reported it to FDA
2008 NREGA Lalit Mehta Found expenditure records revealing high-level corruption in NREGA by contractors
2011 NREGA Niyamat Ansari Lodged an FIR against the former BDO, pertaining to embezzlement of funds
2011 Infosys Jack B. Palmer Filed a case against the outsourcing giant for rampant misuse of B1 visas
VOLUME NO. 5 (2015), ISSUE NO. 11 (NOVEMBER) ISSN 2231-5756
INTERNATIONAL JOURNAL OF RESEARCH IN COMMERCE, IT & MANAGEMENT A Monthly Double-Blind Peer Reviewed (Refereed/Juried) Open Access International e-Journal - Included in the International Serial Directories
http://ijrcm.org.in/
92
6. Das, S., & Rajagopal, D. (2013, May 15). Dinesh Thakur: Meet the man who won Rs 244 cr for blowing the whistle against Ranbaxy. Retrieved from The Economic Times: http://articles.economictimes.indiatimes.com/2013-05-15/news/39282156_1_ranbaxy-drugs-rashmi-barbhaiya-largest-drug-maker
7. Devine, T. M. (1999). The Whistleblower Protection Act of 1989: Foundation for the Modern Law of Employment Dissent. Administrative Law Review, 51, 533.
8. Gupta, A. K. (2008, June 30). NREGA activists who paid with their lives Lalit Mehta (Jharkhand) . Retrieved from Down To Earth: http://www.downtoearth .org.in/coverage/nrega-activists-who-paid-with-their-lives-lalit-mehta-jharkhand-4727
9. Information Age. (2012, April 13). Infosys visa fraud whistleblower goes public. Retrieved September 28, 2015, from Information Age: http://www.infor mation-age.com/it-management/outsourcing-and-supplier-management/2098343/infosys-visa-fraud-whistleblower-goes-public
10. Jordan, M., & Schectman, J. (2013, October 31). U.S. Probes Companies in Wake of Infosys Case. Retrieved from The Wall Street Journal: http://www.wsj.com/ articles/SB10001424052702303843104579170202910758892
11. Kaplan, B., & Kleiner, B. H. (2000). Bruce Kaplan, Brian H. KleinerNew developments concerning discrimination for whistle blowing. Equal Opportunities International, 19, 75-77.
12. Lakshman, N. (2013, October 26). Ranbaxy whistleblower honoured. Retrieved from The Hindu: http://www.thehindu.com/business/Industry/ranbaxy-whistleblower-honoured/article5273776.ece
13. NDTV. (2011, March 3). Activist beaten to death for exposing NREGA scam in Jharkhand . Retrieved from NDTV: http://www.ndtv.com/india-news/activist-beaten-to-death-for-exposing-nrega-scam-in-jharkhand-448910
14. NDTV. (2013, October 31). Who is Infosys whistleblower Jack Palmer? Retrieved from NDTV: http://profit.ndtv.com/news/corporates/article-who-is-infosys-whistleblower-jack-palmer-371036
15. Outlook India. (2003, December 10). Death of a Dream. Retrieved September 27, 2015, from Outlook India: http://www.outlookindia.com/article/death-of-a-dream/222297
16. Paul, R. J., & Townsend, J. B. (1996). Don’t Kill the Messenger! Whistle-Blowing in America-A Review with Recommendations. Employee Responsibilities and Rights Journal, 9, 149-161.
17. Securities and Exchange Board of India. (2003). Report of the Committee on Corporate Governance. 18. Shah, M. (2008, May 22). The real radicalism of NREGA. Retrieved from The Hindu: http://www.thehindu.com/todays-paper/tp-opinion/the-real-radicalism-
of-nrega/article1262802.ece 19. Sharma, N. (2015, May 16). Amendment to whistleblower protection law sparks outrage among civil society activists. Retrieved from The Economic Times:
http://articles.economictimes.indiatimes.com/2015-05-16/news/62239569_1_whistleblowers-protection-act-official-secrets-act-complaint 20. Siddiqui, P. I. (2005, November 23). IOC whistle-blower murdered. Retrieved from Times of India: http://timesofindia.indiatimes.com/india/IOC-whistle-
blower-murdered/articleshow/1304769.cms 21. Srinivasan, S. (2014, April 1). Cheap drugs and the millionaire whistleblower. Retrieved from New Internationalist Magazine: http://newint.org/features/
2014/04/01/drugs-india-whistleblower/ 22. The Economic Times. (2015, March 23). Black money: India offers cash reward to HSBC whistleblower. Retrieved from The Economic Times:
http://articles.economictimes.indiatimes.com/2015-03-23/news/60404317_1_hsbc-list-herve-falciani-indian-account-holders 23. Thoppil, D. A. (2014, October 3). Infosys Whistleblower Files Another Lawsuit. Retrieved from The Wall Street Journal: http://www.wsj.com/articles/infosys-
whistleblower-files-another-lawsuit-1412324348 24. Times of India. (2005, December 13). Manjunath effect: Centre asks states to protect oil firm officials. Retrieved from Times of India:
http://timesofindia.indiatimes.com/india/Manjunath-effect-Centre-asks-states-to-protect-oil-firm-officials/articleshow/1329809.cms 25. Verma, S. (2014, May 18). Salient Features of the Whistleblowers Protection Act in India. Retrieved from Desi Kanoon- Law, Economics and Politics:
http://www.desikanoon.co.in/2014/05/salient-features-of-whistleblowers.html 26. Vinten, G. (2000). Whistleblowing towards quality. The TQM Magazine, 12, 166 - 171. 27. Weinstein, D. (1979). Bureaucratic Opposition. New York: Pergamon Press. 28. Wikipedia. (n.d.). Lalit Mehta. Retrieved September 27, 2015, from Wikipedia: https://en.wikipedia.org/wiki/Lalit_Mehta 29. Wikipedia. (n.d.). Ranbaxy Laboratories. Retrieved September 27, 2015, from Wikipedia: https://en.wikipedia.org/wiki/Ranbaxy_Laboratories 30. Wikipedia. (n.d.). Satyendra Dubey. Retrieved September 27, 2015, from Wikipedia: https://en.wikipedia.org/wiki/Satyendra_Dubey 31. Wikipedia. (n.d.). Shanmugam Manjunath. Retrieved September 27, 2015, from Wikipedia: https://en.wikipedia.org/wiki/Shanmugam_Manjunath 32. Wikipedia. (n.d.). Whistleblower. Retrieved September 29, 2015, from Wikipedia: https://en.wikipedia.org/wiki/Whistleblower
VOLUME NO. 5 (2015), ISSUE NO. 11 (NOVEMBER) ISSN 2231-5756
INTERNATIONAL JOURNAL OF RESEARCH IN COMMERCE, IT & MANAGEMENT A Monthly Double-Blind Peer Reviewed (Refereed/Juried) Open Access International e-Journal - Included in the International Serial Directories
http://ijrcm.org.in/
93
REQUEST FOR FEEDBACK
Dear Readers At the very outset, International Journal of Research in Commerce, IT & Management (IJRCM) acknowledges & appreciates your efforts in showing interest in our present issue under your kind perusal. I would like to request you to supply your critical comments and suggestions about the material published in this issue as well as on the journal as a whole, on our E-mail [email protected] for further improvements in the interest of research. If you have any queries, please feel free to contact us on our E-mail [email protected]. I am sure that your feedback and deliberations would make future issues better – a result of our joint effort. Looking forward an appropriate consideration. With sincere regards Thanking you profoundly Academically yours Sd/- Co-ordinator
DISCLAIMER The information and opinions presented in the Journal reflect the views of the authors and not of the Journal or its Editorial Board or the Publishers/Editors. Publication does not constitute endorsement by the journal. Neither the Journal nor its publishers/Editors/Editorial Board nor anyone else involved in creating, producing or delivering the journal or the materials contained therein, assumes any liability or responsibility for the accuracy, completeness, or usefulness of any information provided in the journal, nor shall they be liable for any direct, indirect, incidental, special, consequential or punitive damages arising out of the use of information/material contained in the journal. The journal, neither its publishers/Editors/ Editorial Board, nor any other party involved in the preparation of material contained in the journal represents or warrants that the information contained herein is in every respect accurate or complete, and they are not responsible for any errors or omissions or for the results obtained from the use of such material. Readers are encouraged to confirm the information contained herein with other sources. The responsibility of the contents and the opinions expressed in this journal are exclusively of the author (s) concerned.
VOLUME NO. 5 (2015), ISSUE NO. 11 (NOVEMBER) ISSN 2231-5756
INTERNATIONAL JOURNAL OF RESEARCH IN COMMERCE, IT & MANAGEMENT A Monthly Double-Blind Peer Reviewed (Refereed/Juried) Open Access International e-Journal - Included in the International Serial Directories
http://ijrcm.org.in/
IV
Related Documents