Classification: Social sciences (Sustainability Science) Characterising Climate Change Discourse on Social Media During Extreme Weather Events Nicholas Roxburgh, a Kong Joo Shin, b Dabo Guan, c * William Rand, d Shunsuke Managi b ,Robin Lovelace e and Jing Meng f * Corresponding author: [email protected]; +44 (0)1603 59 2337. a School of Earth and Environment, University of Leeds, Leeds, LS2 9JT, U.K. b Department of Urban & Environmental Engineering, 744 Motooka Nishi-ku, Fukuoka, Japan. c School of International Development, University of East Anglia, Norwich, NR4 7TJ, U.K. d Poole College of Management, North Carolina State University, Raleigh, NC 27695, U.S. e Institute for Transport Studies, University of Leeds, Leeds, LS2 9JT, U.K. f Department of Politics and International Studies, University of Cambridge, Cambridge, UK Keywords: twitter; climate change; extreme weather; social media; public perception.

Welcome message from author
This document is posted to help you gain knowledge. Please leave a comment to let me know what you think about it! Share it to your friends and learn new things together.
Transcript

Classification: Social sciences (Sustainability Science) Characterising Climate Change Discourse on Social Media During Extreme Weather Events Nicholas Roxburgh,a Kong Joo Shin,b Dabo Guan,c* William Rand,d Shunsuke Managib
,Robin Lovelacee and Jing Mengf * Corresponding author: [email protected]; +44 (0)1603 59 2337. a School of Earth and Environment, University of Leeds, Leeds, LS2 9JT, U.K. b Department of Urban & Environmental Engineering, 744 Motooka Nishi-ku, Fukuoka, Japan. c School of International Development, University of East Anglia, Norwich, NR4 7TJ, U.K. d Poole College of Management, North Carolina State University, Raleigh, NC 27695, U.S. e Institute for Transport Studies, University of Leeds, Leeds, LS2 9JT, U.K. f Department of Politics and International Studies, University of Cambridge, Cambridge, UK Keywords: twitter; climate change; extreme weather; social media; public perception.

Abstract When extreme weather events occur, people often turn to social media platforms to share information, opinions and experiences. One of the topics commonly discussed is the role climate change may or may not have played in influencing an event. Here, we examine Twitter posts that mentioned climate change in the context of three high-magnitude extreme weather events – Hurricane Irene, Hurricane Sandy and Snowstorm Jonas – in order to assess how the framing of the topic and the attention paid to it can vary between events. We also examine the role that contextual factors can play in shaping climate change coverage on the platform. We find that criticism of climate change denial dominated during Irene, while political and ideological struggle frames dominated during Sandy. Discourse during Jonas was, in contrast, more divided between posts about the scientific links between climate change and the events, and posts contesting climate science in general. The focus on political and ideological struggle frames during Sandy reflects the event’s occurrence at a time when the Occupy movement was active and the 2012 US Presidential Election was nearing. These factors, we suggest, also contributed to climate change being a more prominent discussion point during Sandy than during Irene or Jonas. The Jonas frames, meanwhile, hint at lesser public understanding of how climate change may influence cold weather events when compared with tropical storms. Overall, our findings demonstrate how event characteristics and short-term socio-political context can play a critical role in determining the lenses through which climate change is viewed. Significance statement When extreme weather events occur, people often turn to social media platforms to share information, opinions and experiences. One of the topics commonly discussed is the role climate change may or may not have played in influencing an event. We examine Twitter posts that mentioned climate change in the context of Hurricane Irene, Hurricane Sandy and Snowstorm Jonas. We find that event characteristics and short-term socio-political context played a critical role in determining the frames through which climate change was viewed and the attention the topic received in each case. Our results contribute to improving understanding of the dynamics of climate change discourse on social media and the factors that can affected it.
Introduction In recent years, the East Coast of the United States has played host to a succession of high-magnitude extreme weather events including Hurricane Irene in 2011, Hurricane Sandy in 2012 and Snowstorm Jonas in 2016. While these events cannot be singularly attributed to climate change (1, 2), the apparent upswing in the frequency of large storms in the region is consistent with scientific expectations in a warming world (1, 3–7). Consequently, the storms have stimulated renewed debate on climate change amongst the American public and within the country’s media and political spheres. Changes in the frequency and intensity of extreme weather will likely be the most prominent, near-term way in which many people experience the effects of climate change (7–9). Several studies have suggested that personal experience of extreme weather events that are associated with climate change has the potential to boost climate change belief, risk perception, and willingness to act (10–14). Therefore, when they occur, such events represent politically important moments for those wishing to influence popular perceptions around climate change. They offer the opportunity to discuss one of the most significant effects of climate change – increasingly severe extreme weather – while public attention is high and while the science has an elevated newsworthiness. However, the extent and manner of influence on public perception will in large part depend on whether the links between extreme events and climate change enter the public consciousness, and on how the links are framed.
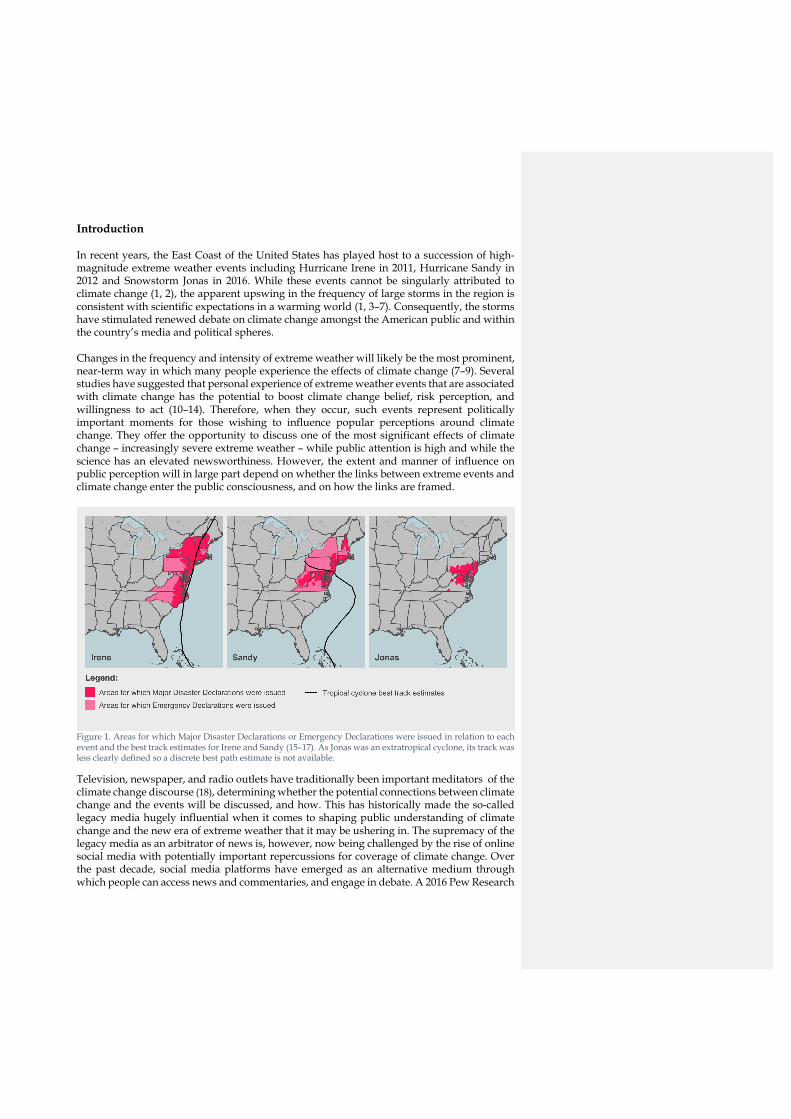
Figure 1. Areas for which Major Disaster Declarations or Emergency Declarations were issued in relation to each event and the best track estimates for Irene and Sandy (15–17). As Jonas was an extratropical cyclone, its track was less clearly defined so a discrete best path estimate is not available.
Television, newspaper, and radio outlets have traditionally been important meditators of the climate change discourse (18), determining whether the potential connections between climate change and the events will be discussed, and how. This has historically made the so-called legacy media hugely influential when it comes to shaping public understanding of climate change and the new era of extreme weather that it may be ushering in. The supremacy of the legacy media as an arbitrator of news is, however, now being challenged by the rise of online social media with potentially important repercussions for coverage of climate change. Over the past decade, social media platforms have emerged as an alternative medium through which people can access news and commentaries, and engage in debate. A 2016 Pew Research
Center survey found that 62% of American adults now “get” news on social media sites, with 18% doing so regularly (19). The growth of social media as a source of news means platforms like Facebook and Twitter are joining legacy media as important mediators of discourse on climate change. This may be especially true during extreme weather events when use of social media and interest in climate change tend to simultaneously spike (20). However, the implications of this are yet to be fully understood and the nature of social media discourse around climate change during times of extreme weather is yet to be thoroughly characterised. This paper makes a contribution to filling this gap in understanding by analysing Twitter posts that mentioned climate change in relation to Hurricane Irene, Hurricane Sandy and Snowstorm Jonas (see Fig. 1 for an overview of the areas affected; see SI Appendix A for descriptions of how each event may have been influenced by climate change). The study considers the prominence of climate change as a topic during each event; the spatial and temporal distribution of posts; and the ways in which the issue was framed. The potential implications of the findings for our understanding of public perceptions around the relationship between climate change and extreme weather is then discussed. Further details on each event are provided in the SI Appendix B. Results The study considers tweets posted in the days immediately before, during and after each of the extreme weather events. The event datasets that we gathered consist of a near-comprehensive set of posts that contain keywords associated with each storm (see Materials and Methods for more detail). In all, the Irene dataset contains 3.29 million posts, the Sandy dataset contains 11.60 million posts and the Jonas dataset contains 1.71 million posts. Terms pertaining to climate change were identified in 6,286 of the Irene posts, 99,823 of the Sandy posts and 5,326 of the Jonas posts. Different users were responsible for posting 94.9% of these climate change tweets in the case of Irene, 61.9% in the case of Sandy and 82.0% in the case of Jonas.
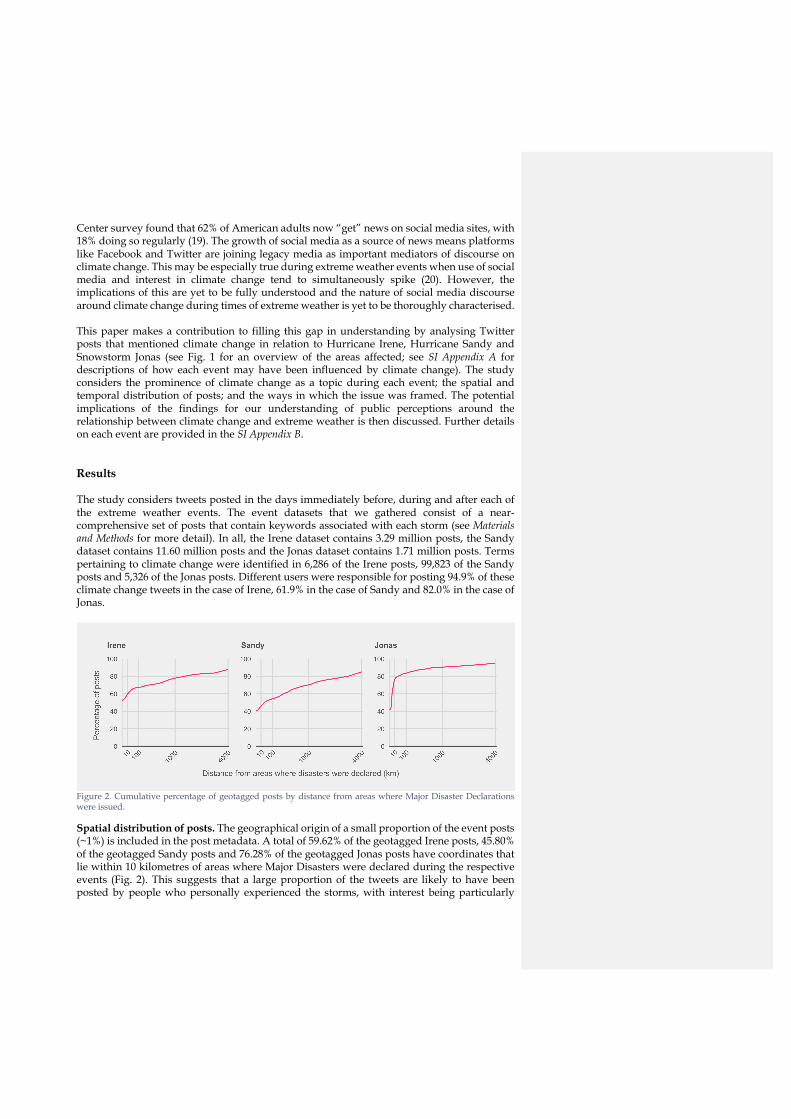
Figure 2. Cumulative percentage of geotagged posts by distance from areas where Major Disaster Declarations were issued.
Spatial distribution of posts. The geographical origin of a small proportion of the event posts (~1%) is included in the post metadata. A total of 59.62% of the geotagged Irene posts, 45.80% of the geotagged Sandy posts and 76.28% of the geotagged Jonas posts have coordinates that lie within 10 kilometres of areas where Major Disasters were declared during the respective events (Fig. 2). This suggests that a large proportion of the tweets are likely to have been posted by people who personally experienced the storms, with interest being particularly

localised to the affected areas in the case of Jonas and relatively widespread in the case of Sandy. Temporal dynamics of posts. The temporal dynamics of the climate change posts are shown in Fig. 3. The dashed line, t, represents the moment of the New Jersey landfall in the case of Irene and Sandy, and the approximate midpoint of the snowfall over the Atlantic states in the case of Jonas. The average hourly number of climate change posts prior to t was 24.25 for Irene, 113.39 for Sandy and 76.86 for Jonas. Over the 72-hour period following t, the average climbed to 68.22 for Irene and 938.88 for Sandy, but fell to 32.29 for Jonas – very substantial shifts in each instance. The proportion of event posts that the climate change tweets constituted also varied over time, with the relative significance of climate change as a discussion point increasing after t in each instance. Prior to t, climate change posts constituted 0.07% of all Irene posts, 0.26% of all Sandy posts and 0.30% of all Jonas posts, while after t the figures rose to 0.38%, 1.16% and 0.35% respectively. Notably, these averages mask numerous short-lived fluctuations, the most dramatic of which are driven by the retweeting of particular posts rather than by surges in the creation of original content.
Figure 3. The leftmost charts show the absolute frequency of posts that mentioned climate change during each event on an hourly basis, while the rightmost charts show the proportion of all posts during each hour that mentioned climate change. The dashed line, t, represents the moment of the New Jersey landfall in the case of Irene and Sandy, and the approximate midpoint of the snowfall over the Atlantic states in the case of Jonas. Dates and times are in accordance with the Eastern Time Zone.
Retweets. On Twitter, re-posted tweets are known as retweets. The practice of retweeting is commonly employed by users to share with their own followers a tweet that another user has

posted. Such posts constitute 76.2% of the Irene climate change tweets, 54.9% of the Sandy climate change tweets, and 66.8% of the Jonas climate change tweets. The proportion of posts that are retweets in the main Sandy and Jonas datasets is slightly lower at 48.9% and 64.9% respectively. However, in the case of Irene, the difference is very significant as only 29.5% of the posts in the main Irene dataset are retweets. As Fig. 4 shows, the distribution of retweets across posts is akin to a Pareto Distribution – a small proportion of the posts attracted a large proportion of the retweets. The unequal distribution is particularly pronounced in the case of Irene with retweets of a single post ultimately constituting 57.8% of the entire climate change posts.
Figure 4. Number of time the top twenty climate change retweets from each event were shared, ordered by frequency.
Frames invoked in the most frequently retweeted posts. In order to identify the frames through which climate change was viewed during the events, we assessed the most frequently retweeted climate change posts in each dataset against a frame coding schema (Table 1) and assigned each post to the frame that best matched the content of the post (see Materials and Methods for more detail). As the assessed posts constituted a significant portion of the total climate change posts, the findings provide a good sense of the frames through which many users will have viewed the topic. As illustrated in Fig. 5, each dataset is characterised by notably different principal climate change frames. For Irene, the retweet discourse was dominated by a post that engaged in criticism of climate change denial and affirmed the existence of climate change (SS2). This post also had a secondary frame of a political dimension, as it specifically cited a Republican politician known for having described climate change as a “hoax”. In the case of Sandy, meanwhile, the political or ideological struggle frame (PIS) was the most prevalent. Many of the posts that fall within this frame made reference to the 2012 presidential campaign which was drawing towards a conclusion around the time that Sandy struck. Criticism of the media was also a common theme within the PIS frame. In particular, a perceived lack of airtime and column inches given to the topic of climate change when Hurricane Sandy and the Presidential Election were being discussed was frequently raised as an issue. Criticism of those promoting contrarian views (SS2) and posts emphasising the links between climate change and extreme weather events (EX) also had a notable presence. In the case of Jonas, two frames were dominant, rather than one. Marginally leading the way in cumulative retweets was the extremes frame (EX), with many of the posts highlighting the ways in which climate change could exacerbate snowstorms such as Jonas. The second frame, however, was the contested science frame (CS1). The posts that fell within this category tended to cite the snowstorm as evidence that climate change was not occurring.
Commented [JM(-S1]: CS or CS1?
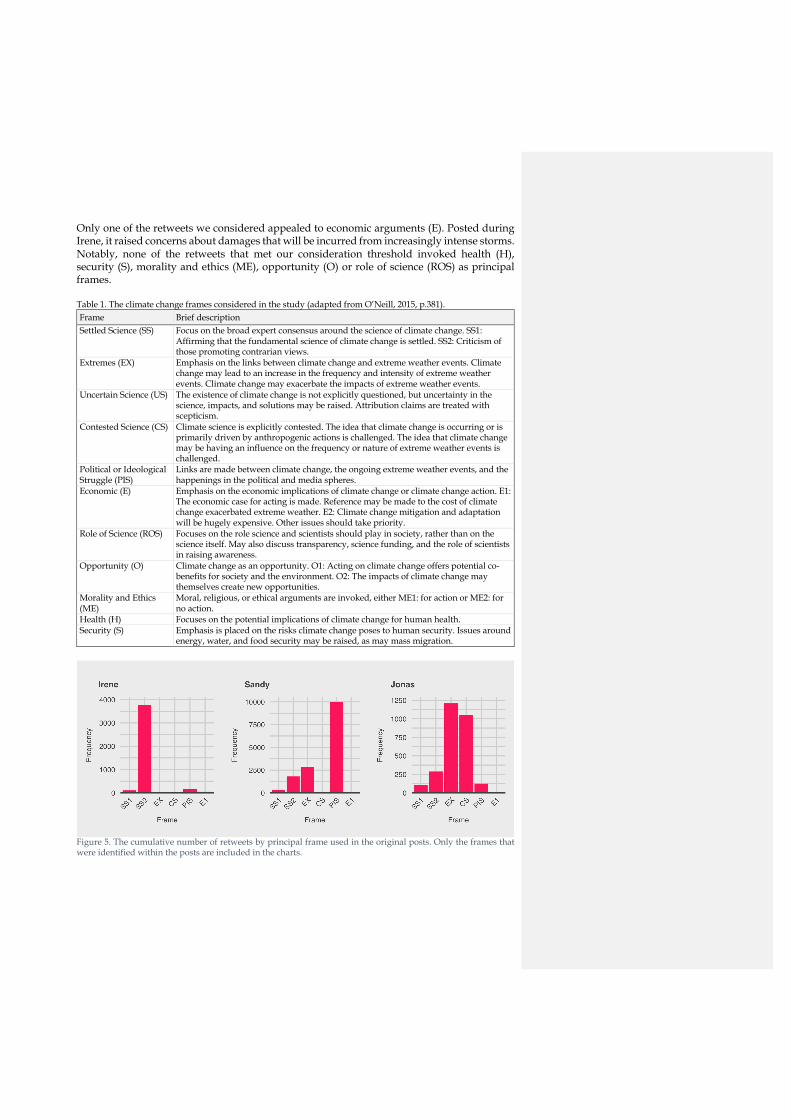
Only one of the retweets we considered appealed to economic arguments (E). Posted during Irene, it raised concerns about damages that will be incurred from increasingly intense storms. Notably, none of the retweets that met our consideration threshold invoked health (H), security (S), morality and ethics (ME), opportunity (O) or role of science (ROS) as principal frames. Table 1. The climate change frames considered in the study (adapted from O’Neill, 2015, p.381). Frame Brief description Settled Science (SS) Focus on the broad expert consensus around the science of climate change. SS1:
Affirming that the fundamental science of climate change is settled. SS2: Criticism of those promoting contrarian views.
Extremes (EX) Emphasis on the links between climate change and extreme weather events. Climate change may lead to an increase in the frequency and intensity of extreme weather events. Climate change may exacerbate the impacts of extreme weather events.
Uncertain Science (US) The existence of climate change is not explicitly questioned, but uncertainty in the science, impacts, and solutions may be raised. Attribution claims are treated with scepticism.
Contested Science (CS) Climate science is explicitly contested. The idea that climate change is occurring or is primarily driven by anthropogenic actions is challenged. The idea that climate change may be having an influence on the frequency or nature of extreme weather events is challenged.
Political or Ideological Struggle (PIS)
Links are made between climate change, the ongoing extreme weather events, and the happenings in the political and media spheres.
Economic (E) Emphasis on the economic implications of climate change or climate change action. E1: The economic case for acting is made. Reference may be made to the cost of climate change exacerbated extreme weather. E2: Climate change mitigation and adaptation will be hugely expensive. Other issues should take priority.
Role of Science (ROS) Focuses on the role science and scientists should play in society, rather than on the science itself. May also discuss transparency, science funding, and the role of scientists in raising awareness.
Opportunity (O) Climate change as an opportunity. O1: Acting on climate change offers potential co-benefits for society and the environment. O2: The impacts of climate change may themselves create new opportunities.
Morality and Ethics (ME)
Moral, religious, or ethical arguments are invoked, either ME1: for action or ME2: for no action.
Health (H) Focuses on the potential implications of climate change for human health. Security (S) Emphasis is placed on the risks climate change poses to human security. Issues around
energy, water, and food security may be raised, as may mass migration.
Figure 5. The cumulative number of retweets by principal frame used in the original posts. Only the frames that were identified within the posts are included in the charts.
Discussion The overall attention that each event drew on Twitter appears to reflect, at least in part, the socio-economic impact the storms had in the Northeastern region of the United States. Sandy caused the greatest damage, resulted in the most fatalities and attracted the most posts, while Jonas caused the least damage, resulted in the fewest fatalities and attracted the fewest posts (21, 22). Irene, meanwhile, lay somewhere in between on each count (23). These differences in the overall impact of the events are likely to have contributed to the differing number of climate change tweets posted during each storm. However, discrepancies in the proportion of posts that mention climate change across the events suggest other factors were also important in determining the attention paid to the topic. Sandy, in particular, stands out with 0.86% of all event posts mentioning climate change – a figure far in excess of the 0.19% of Irene posts and 0.31% of Jonas posts that raised the subject. The depth of user engagement in talking about climate change is also somewhat greater in the case of Sandy, with more users posting multiple climate change tweets. Sandy. The politically charged context in which Sandy occurred seems to have been an important factor in spurring much of the attention paid to climate change during the event. The Occupy movement, which began shortly after Irene had struck in 2011, was well established by the time Sandy rode up the East Coast and the United States presidential election of 2012 was drawing to a climax – election day was the 6 November, while the storm made landfall on the evening of 29 October. The most frequently retweeted post was written by @YourAnonNews, an account controlled by the hactivist group Anonymous – a group that was closely entwined with the Occupy movement at the time. The post implied links between the storm and climate change, while arguing that climate change was not being adequately discussed in the public and political spheres. The second most retweeted post was written by Al Gore, the former Vice President of the United States and prominent environmentalist. He called for people to work together to “solve the climate crisis,” stating that “Sandy is a warning”. Common topics in the other widely retweeted posts included the perceived lack of media coverage of the climate change issue, its lack of prominence in the election campaigns, and the endorsement of Barack Obama by the then Mayor of New York City because of the president’s support for action on climate change. Although some of these posts represented little more than news reports, a substantial number of them seem to have been implicitly or explicitly using Sandy as a means to push climate change up the political agenda and to raise public consciousness of the issue. Notably, the news outlets that have traditionally been influential in shaping the popular discourse in the United States were amongst the most frequently retweeted and referenced during Sandy.1 This demonstrates, as Bruns and Burgess (24) note, that Twitter is not separate from, but increasingly embedded into the larger media landscape, complementing rather than replacing traditional information sources. Interestingly, during Irene and Jonas, traditional sources of authority were much less prominent. This was typically because they were not posting rather than because they were not being retweeted. Lower profile groups and non-affiliated individuals were therefore more important in driving climate change discussion during Irene and Jonas. As previously mentioned, discussion of climate change within the Sandy dataset increased dramatically in both relative and absolute terms following the storm’s New Jersey landfall – an increase which was largely sustained in the days immediately afterwards. This indicates that landfall was something of a catalyst for climate change discussion and it shows that
1 Example include posts from the New York Times, CBS News, Time, and the then CNN presenter, Piers Morgan.
climate change as a discussion point had greater longevity than many other discussion points. This relatively greater longevity, we hypothesise, was because climate change discussions were largely a product of reflection on the meaning and implications of the event. To a degree, this theory also holds for Irene and Jonas. In both absolute and relative terms, climate change posts increased after Irene’s New Jersey landfall, although much of this was down to a single post. While climate change posts only increased in relative terms following Jonas, many of the Jonas posts that did not fall under the contested science (CS) frame were posted after the midpoint of the event. Irene. In both absolute and relative terms, there were significantly fewer posts pertaining to climate change within the Irene dataset, compared to the Sandy dataset – this despite both storms being tropical cyclones and both making landfall in the Northeastern United States within 430 days of one another. Several factors may have contributed to this. Firstly, the storm occurred during a less politically charged period. Secondly, while Irene caused substantial damage and disruption in places, its overall impact was not as historically significant as Sandy’s. We therefore speculate that it may not have been regarded as so historically anomalous and therefore suggestive of climate change. Thirdly, given major tropical cyclone landfalls are relatively unusual in the Northeastern United States, Sandy had the additional notability over Irene of having occurred so soon after another significant storm. Fourthly, discussion of climate change during Sandy was boosted by numerous high profile public figures speaking out on the issue. For example, posts by Al Gore, Ian Somerhalder, Ricky Gervais and Naomi Klein were all widely retweeted. Similarly, statements by the likes of the Mayor of New York City and articles by news organisations and campaign groups helped draw attention to the subject as evidenced by their presence in the lists of top retweets (see SI Appendix D2). Much of this was lacking during Irene. Growth in Twitter’s user base in the time between Irene and Sandy is also likely to have swelled the number of posts in the latter case – the number of online adults using Twitter in the United States increased by 33% between August 2011 and December 2012 (25; see SI Appendix E). However, this user base growth cannot explain the greater relative importance of the climate change topic in the Sandy dataset. Another notable difference between the Irene and Sandy climate change data is that the Irene data is characterised by proportionally greater numbers of retweets and fewer examples of multiple postings by users – features that point to lesser user engagement in the topic of climate change. Consequently, not only did Sandy generate broader interest in the subject, it also seems to have generated deeper interest. The post that dominates the retweets in the Irene climate change data shares an affinity with the political and ideological frame that characterises many of the Sandy posts, even though its primary focus is on criticising climate change denial. However, other frames noted in the Sandy and Jonas tweets are notable only by their relative or absolute absence from the top Irene retweets. Jonas. Like Irene, Jonas attracted far fewer climate change tweets than Sandy did, both in absolute and relative terms. The gulf in the number of posts is especially large if growth in the user base is considered – the number of online adults in the United States using Twitter grew by 50% in the interval between Sandy and Jonas (see SI Appendix E). However, in relative terms, climate change was a more significant topic in within the Jonas dataset when compared with the Irene dataset. This may be partially explained by larger numbers of climate change sceptics posting on the topic during Jonas than in the case of Irene. As individuals and groups concerned with climate change were also active, the posts by sceptics served to bolster the total number of climate change posts. While Jonas occurred in a presidential election year like Sandy did, it struck earlier in the campaign cycle. Reflecting this, the election campaigns did not feature prominently in the posts. The Occupy movement had also waned in the time since

Sandy. Notably, the Jonas climate change posts also contained few references to the Paris climate accord which was adopted just a month prior to the storm. “Paris” was mentioned in just 0.19% of the posts (see SI Appendix E). Indeed, contextual references to contemporary socio-political events were less common in the Jonas climate change posts than in the other event datasets. The two main framings seen in the Jonas retweets – the extremes frame (EX) and the contested science frame (CS) – are distinct from those seen in the Irene and Sandy retweets. The greater presence of the contested science frame in the Jonas posts is unsurprising given extreme cold weather events are not likely to fit with many people’s image of what might be expected to happen in a warming world. Consistent with previous research (26), we find that the posts contesting climate science typically expressed certainty that anthropogenic climate change is a hoax and we find that such posts tended to focus on politics rather than science. Indeed, many of them utilised hashtags associated with right wing groups and characterised those who believe in climate change as liberals while invoking contemptuous language. By contrast, the extremes (EX) frame posts focused on articulating the scientific links between Jonas and climate change. We suggest that by sharing these posts users hoped to inform others of the possible links between climate change and the storm, recognising that potential links between climate change and cold weather events are not necessarily intuitive or well-known. Users may also have wanted to close down speculation that Jonas disproved climate change. That the extremes (EX) frame was, in relative terms, used less frequently in the case of Irene and Sandy suggests the links between climate change and tropical cyclones are thought to be better known and therefore in less need of articulating. Given Jang and Hart (27) found that hoax frames typically prevail in the Twitter discourse within the United States, the parity of hoax and non-hoax frames during Jonas and the dominance of non-hoax frames during Irene and Sandy, represents a departure from the norm. It suggests that extreme weather events not only increase the profile of climate change as a topic on Twitter, they tangibly alter the balance of frames used to discuss the issue, at least for a short while. The relative absence of the political or ideological struggle (PIS) frame and relative lack of criticism of those promoting contrarian views (SS2) is notable in the Jonas data. One of the consequences of this is that the adversarial language invoked during Irene and Sandy by supporters of action on climate change has largely been replaced by factual argument. This, we suggest, may reflect a belief that factual argument is needed to contest climate change denial when seemingly counterintuitive evidence is encountered and used to contest the science. Conclusions In this study, we examined the nature of climate change discussions on Twitter during Hurricane Irene, Hurricane Sandy and Snowstorm Jonas. We found that the degree of attention the topic received varied, both in absolute and relative terms, between the events. Furthermore, the way the topic tended to be framed also differed in each case. When the growth of the Twitter user base is accounted for, it is clear that Sandy garnered by far the greatest attention, followed at a distance by Irene and then Jonas. This sequence reflects the relative socio-economic impact each storm had in the Northeastern region of the United States. However, the magnitude of the difference between Irene and Sandy in terms of climate change posts is more than would be expected based on impact alone. Instead, it seems that the socio-political context in which the Sandy occurred helped draw particularly substantial attention to the topic. That said, factors such as the storms exceptional size (28) and its ranking
Commented [JM(-S2]: to recognise?
as the second-costliest cyclone to hit the United States since 1990 (17) will likely also have contributed to the tweet tally. The role the mainstream media played in focusing attention on the subject during Sandy appears to have been significant as well. Several news outlets posted tweets that were widely shared, and content that news outlets posted elsewhere on the internet was also frequently cited – something which points to the continued importance of the legacy media. During Irene and Jonas, few mainstream news outlets posted on the subject. While this may help explain the smaller number of climate change posts the events generated in both relative and absolute terms, it is notable that thousands of tweets were still posted on the topic in each case. This shows how non-traditional actors are still able to give the issue voice through posting on the platform. In respect to frames, we found that the meteorological characteristics of the storms and the socio-political context in which they occurred both played an important role in shaping the lenses through which climate change was viewed during each event. Particularly notable was the relative absence of the contested science (CS) and uncertain science (US) frames within the top Irene and Sandy retweets given that hoax frames have been found to normally prevail in the Twitter discourse within the United States (27). Even during Jonas, the contested science (CS) frame trailed behind the extremes (EX) frame. This clearly indicates that extreme weather events cause a significant shift in the balance of climate change coverage on Twitter towards non-hoax perspectives. An important caveat to our findings is that the events we have considered occurred at different points over a four-and-a-half-year period. As we discuss in greater depth in SI Appendix E, both the Twitter ecosystem and societal attitudes towards climate change evolved over this period with implications for the comparability of the events. Consequently, it is important to recognise the events as situated in time. With this in mind, we recommend that future studies consider how the frames used in climate change posts have changed over the years. We also suggest research be done to assess whether extreme weather events have a discernible lasting impact on the frames used to discuss the topic. As Weber and Stern note (29), accurate or not, media reports have the capacity to influence people’s thoughts and feelings. Although they were referring to traditional media reports, what they say is also applicable to social media posts – a 2016 Pew Research Center survey found that 20% of social media users in the United States had changed their views on a political or social issue because of something they saw on social media (25). This makes the rise in the number of posts expressing concern about climate change during extreme weather events important. The more posts there are that express concern, the more people are likely to see them, and so the greater the potential for building support for action on the issue. Even if the posts do not influence the views of other users, the elevated profile they give to the issue can still be politically important and can feedback into future coverage of extreme weather events through raising awareness of potential links between weather extremes and climate change. Materials and methods Data source. For each of the extreme weather events under consideration we collected datasets of related tweets along with their associated metadata. The Irene and Jonas datasets were gathered using the Twitter Streaming API in near real-time, while the Sandy tweets were acquired post hoc using Gnip’s Historical PowerTrack API. The latter tool provides paid-for access to the entire historical archive of public Twitter data and was necessary because the huge volume of Sandy related tweets that were posted as the storm made landfall exceeded

our capacity to collect the complete population of posts using the Twitter Streaming API. Posts pertaining to climate change were extracted from each of the event datasets using a standardised set of search rules. A detailed description of how event relevant posts and posts pertaining to climate change were identified is presented in SI Appendix C. Basic data attributes. Once the climate change related tweets were extracted from the main event datasets, the basic attributes of the climate change posts were explored. Firstly, the relative composition of retweets to non-retweets was calculate both at an aggregate level and temporally. The retweets were identified through the presence of the character string “RT” at the start of posts. Secondly, the number of times each retweeted post was shared was analysed. This was done through calculating the frequency of occurrence of each unique string in the subset of posts previously identified as retweets. This means that only retweets made during the timeframe of the dataset are considered. It should be noted that modified retweets and retweets of retweets will be counted as distinct from unmodified retweets of the original as they will not return string matches. Thirdly, the number of unique users who posted tweets was calculated using the user IDs provided in the metadata. Spatial distribution of posts. The geographical origin of posts was also assessed by analysing the geolocation metadata that is included in the datasets. As providing geolocation data with posts is optional for users of the Twitter platform, this geolocation data is not available for all posts. In fact, less than 2% of the event posts are geotagged. Consequently, geolocation data is distinctly sparse for the Irene and Jonas climate change posts. Geographical analysis was therefore performed on the event datasets as a whole rather than being restricted to the subset of climate change posts. We assume that the spatial distribution of climate change posts will hold similarities with the spatial distribution of event posts, though a degree of deviation is likely. In order to assess the cumulative percentage of geotagged posts by distance from areas where Major Disaster Declarations were issued, shapefiles showing areas were Major Disasters had been declared for each event were downloaded from the FEMA website (15) and merged. The distance of the geotagged posts from the merged shapefiles was then calculated. This was done with the aid of the ‘gBuffer’ function from the R package ‘rgeos’ (30) and the ‘over’ function from the R package ‘sp’ (31). Climate change discourse. Two methods were used to explore the discourse in the datasets. The first was based on the approach developed by O’Neill et al. (32) for assessing how climate change is framed in media reports. Climate change related posts that were retweeted sufficiently frequently as to collectively exceed 0.2% of total climate change related tweets were assessed against a frame coding schema and assigned to the frame category that best matched the content of the post. The schema included fifteen frames (see Table 1). These were derived, for the most part, from the schema set out in O’Neill et al. (32), although supplemental frames were added and the definitions of others were adjusted to better reflect the nature of the frames we identified in the datasets when piloting the schema (details of the alterations made are provided in SI Appendix C). The coding process followed the guidance provided in O’Neill et al. (32). Twelve retweets met the threshold conditions for assessment in the case of Irene, twenty-six in the case of Sandy, and sixty-three in the case of Jonas. Acknowledgments Special thanks go to Corinne Le Quéré, Ruth Lawford-Rolf, David Darmon, Arjuna Ariyaratne and Andrew Evans for their help. Thanks also go to the University of Leeds’ Climate and Geohazard Services for providing financial assistance for data acquisition.
Commented [JM(-S3]: There are just 11 frames in Table 1.

References 1. Knutson TR, et al. (2010) Tropical cyclones and climate change. Nat Geosci 3(3):157–
163. 2. Elsner JB, Kossin JP, Jagger TH (2008) The increasing intensity of the strongest
tropical cyclones. Nature 455(7209):92–95. 3. Emanuel K (2005) Increasing destructiveness of tropical cyclones over the past 30
years. Nature 436(7051):686–688. 4. Villarini G, Vecchi G (2013) Projected Increases in North Atlantic Tropical Cyclone
Intensity from CMIP5 Models. J Clim 26(10):3231–3240. 5. Changnon SA, Changnon D, Karl TR (2006) Temporal and Spatial Characteristics of
Snowstorms in the Contiguous United States. Am Meteorol Soc 45(August 2006):1141–1155.
6. Kunkel KE, et al. (2013) Extreme Storms: State of Knowledge. Am Meteorol Soc 94(4):499–514.
7. NASEM (2016) Attribution of Extreme Weather Events in the Context of Climate Change (The National Academies Press, Washington DC) doi:10.17226/21852.
8. Coumou D, Rahmstorf S (2012) A decade of weather extremes. Nat Clim Chang 2(7):491–496.
9. Trenberth KE (2012) Framing the way to relate climate extremes to climate change. Clim Change 115(2):283–290.
10. Spence A, Poortinga W, Butler C, Pidgeon NF (2011) Perceptions of climate change and willingness to save energy related to flood experience. Nat Clim Chang 1(1):46–49.
11. Rudman LA, McLean MC, Bunzl M (2013) When truth is personally inconvenient, attitudes change the impact of extreme weather on implicit support for green politicians and explicit climate-change beliefs. Psychol Sci 24(11):1–7.
12. Myers TA, Maibach EW, Roser-Renouf C, Akerlof K, Leiserowitz AA (2012) The relationship between personal experience and belief in the reality of global warming. Nat Clim Chang 3(4):343–347.
13. Deryugina T (2013) How do people update? The effects of local weather fluctuations on beliefs about global warming. Clim Change 118(2):397–416.
14. Egan PJ, Mullin M (2012) Turning personal experience into political attitudes: the effect of local weather on Americans’ perceptions about global warming. J Polit 74(3):796–809.
15. FEMA (2016) Disaster Declarations. Available at: https://www.fema.gov/disasters?field_state_tid_selective=All&field_disaster_type_term_tid=All&field_disaster_declaration_type_value=All&items_per_page=20 [Accessed May 15, 2016].
16. Avila LA, Cangialosi J (2011) Tropical Cyclone Report: Hurricane Irene (AL092011) Available at: http://www.nhc.noaa.gov/data/tcr/AL092011_Irene.pdf.
17. Blake ES, Kimberlain TB, Berg RJ, Cangialosi JP, Beven II JL (2012) Tropical Cyclone Report: Hurricane Sandy (AL182012) Available at: http://www.nhc.noaa.gov/data/tcr/AL182012_Sandy.pdf.
18. Leiserowitz A, Smith N, Marlon JR (2010) Americans’ Knowledge of Climate Change (New Haven, CT) Available at: http://environment.yale.edu/climate/files/ClimateChangeKnowledge2010.pdf.
19. Gottfried J, Shearer E (2016) News Use Across Social Media Platforms 2016 Available at: http://assets.pewresearch.org/wp-content/uploads/sites/13/2016/05/PJ_2016.05.26_social-media-and-news_FINAL-1.pdf.
20. Kirilenko AP, Molodtsova T, Stepchenkova SO (2015) People as sensors: Mass media and local temperature influence climate change discussion on Twitter. Glob Environ
Chang 30:92–100. 21. Horton R, et al. (2014) Northeast. Climate Change Impacts in the United States: The Third
National Climate Assessment (U.S. Global Change Research Program), pp 371–395. 22. Sharf S (2016) Economics Of A Blizzard: Winter Storm Jonas Is A Win For Whole
Foods But A Loss For Hourly Workers. Forbes. Available at: https://www.forbes.com/sites/samanthasharf/2016/01/22/economics-of-a-blizzard-winter-storm-jonas-is-a-win-for-whole-foods-but-a-loss-for-hourly-workers/#2ab9617f513b [Accessed July 18, 2017].
23. Lubchenco J, Furgione L (2012) Service Assessment: Hurricane Irene, August 21-30, 2011 (Silver Spring).
24. Bruns A, Burgess J (2014) Crisis Communication in Natural Disasters: The Queensland Floods and Christchurch Earthquakes. Twitter and Society, eds Weller K, Bruns A, Burgess J, Mahrt M, Puschmann C (Peter Lang, New York), pp 373–384.
25. Greenwood S, Perrin A, Duggan M (2016) Social Media Update 2016 Available at: http://assets.pewresearch.org/wp-content/uploads/sites/14/2016/11/10132827/PI_2016.11.11_Social-Media-Update_FINAL.pdf.
26. Jacques PJ, Knox CC (2016) Hurricanes and hegemony: A qualitative analysis of micro-level climate change denial discourses. Env Polit 25(5):831–852.
27. Jang SM, Hart PS (2015) Polarized frames on “‘climate change’” and “‘global warming’” across countries and states: Evidence from Twitter big data. Glob Environ Chang 32:11–17.
28. Halverson JB, Rabenhorst T (2013) Hurricane Sandy: The Science and Impacts of a Superstorm. Weatherwise 66(2):14–23.
29. Weber EU, Stern PC (2011) Public Understanding of Climate Change in the United States. Am Psychol 66(4):315–328.
30. Bivand R, Rundel C, Pebesma E, Stuetz R, Hufthammer K (2017) rgeos: Interface to Geometry Engine - Open Source.
31. Pebesma E, et al. (2018) sp: Classes and Methods for Spatial Data. 32. O’Neill S, Williams HT, Kurz T, Wiersma B, Boykoff M (2015) Dominant frames in
legacy and social media coverage of the IPCC Fifth Assessment Report. Nat Clim Chang 5(4):380–385.
Related Documents