EVALUATION OF FACIAL SOFT TISSUE CHANGES AND SURGICAL OUTCOME OF ORTHOGNATHIC SURGERY Submitted for the degree of DOCTOR OF PHILOSOPHY of the Faculty of Medicine UNIVERSITY OF LONDON MURAT SONCUL, BDS (TURKEY) Department of Oral and Maxillofacial Surgery Eastman Dental Institute University College London 2002

Welcome message from author
This document is posted to help you gain knowledge. Please leave a comment to let me know what you think about it! Share it to your friends and learn new things together.
Transcript

EVALUATION OF FACIAL SOFT TISSUE CHANGES AND SURGICAL
OUTCOME OF ORTHOGNATHIC SURGERY
Submitted for the degree of
DOCTOR OF PHILOSOPHY
of the Faculty of Medicine
UNIVERSITY OF LONDON
MURAT SONCUL, BDS (TURKEY)
Department of Oral and Maxillofacial Surgery
Eastman Dental Institute
University College London
2002

ProQuest Number: U642665
All rights reserved
INFORMATION TO ALL USERS The quality of this reproduction is dependent upon the quality of the copy submitted.
In the unlikely event that the author did not send a complete manuscript and there are missing pages, these will be noted. Also, if material had to be removed,
a note will indicate the deletion.
uest.
ProQuest U642665
Published by ProQuest LLC(2015). Copyright of the Dissertation is held by the Author.
All rights reserved.This work is protected against unauthorized copying under Title 17, United States Code.
Microform Edition © ProQuest LLC.
ProQuest LLC 789 East Eisenhower Parkway
P.O. Box 1346 Ann Arbor, Ml 48106-1346

ABSTRACTThe prediction of soft tissue changes and surgical outcome are main concerns
in orthognathic surgery carried out to resolve functional and aesthetic
problems. This study programme validated and used the optical surface
scanner for assessment of facial appearance for orthognathic surgery
treatment planning and postoperative review. The reproducibility of head
position for the scans was tested using a headrest, a spirit level and a vertical
beam of laser light. The results were analysed using thin-plate splines, a
novel morphometric analysis and a useful tool for clinical research. The error
due to variation in head position was insignificant. This study found the optical
surface scanner an accurate, non-invasive, and user-friendly tool. It was
comparable to cephalography with additional advantages of a 3D system.
The presentation of Caucasoid facial patterns in the media determines
people's notions of beauty. In line with the homogenisation of culture
throughout the world, the panel in this study, although formed of racially
different individuals, shared a common base for the assessment and
judgement of beauty. Caucasian facial features were perceived more familiar,
standard, and beautiful. The best-ranked Afro-Caribbean and Oriental
subjects in this study had facial features similar to Caucasians. Facial
symmetry, alar base and vermilion border were strong markers for facial
beauty according to this study. The chin was coincident and the mid-face was
anterior to the facial plane in the most beautiful faces. Other features for a
beautiful face indicated by this study included shorter lips, upper incisor
exposure of 4-5 mm, equal facial thirds in the vertical height, equal alar base
width and intercanthal distance, and equal interlimbus distance and
commissural width.
The ratios of the soft tissue changes after correction of Class II and Class III
skeletal deformities were quantified and analysed (n=102) using the optical
surface scanner and thin-plate splines morphometric analysis for accurate
surgical planning. The ratio of soft to hard tissue movement decreased further
lateral to the facial midline and on suspended tissues like the lips compared to
tissues firmly attached to the underlying structures like subnasale and

pogonion. The soft to hard tissue change ratio was 1:1 on the pogonion but
decreased gradually on the labiomental groove (90%) and subcomissural
regions (50%). The subnasale projected 80% of the skeletal movement, but
the effect on subalar and supracomissural tissues on the upper lip decreased
down to 35%. The nasal tip was least affected by 30% despite an 80%
change on paranasal regions. The interaction of one lip with the other, and
with the incisors affected the lips as well as the skeletal movement. The upper
lip vermilion projected up to 75% of the surgical change and the upper
vermilion width increased from 7.2±2.3 mm to 8.7±2.1 mm which was
statistically significant (p<0.05), but the mean lower lip vermilion width
increased from 9.9±2.4 mm to 10.4±2.2 mm which was not significant
(p>0.05). The prediction of soft tissue changes after orthognathic surgery can
be difficult because these changes depend on various factors including;
muscle attachments, proximity of the soft tissues to the underlying bone, the
geometrical shape of the bones, soft tissue elasticity, thickness, surgical
technique and the magnitude of surgical movement. However, this study
highlighted the regions of the face significantly affected by the osteotomy
movements.
The role of the occlusal wafer and training elastics in postoperative
proprioception was evaluated. The patients (n=100) were randomly divided
into three groups; a) training elastics and occlusal wafer, b) elastics but no
wafer and, c) no elastics and no wafer, for the first 2 postoperative weeks.
The findings indicated that routine use of occlusal wafers and training elastics
did not lead to a significant difference in the postoperative occlusion. The
theoretical value of providing proprioceptive guidance was concluded to be
more comforting for the surgeon than the patient. However, it is believed to
provide a visible means of clinical assessment. Results of this investigation
would contribute significantly in diagnosis, treatment planning and
postoperative management of orthognathic surgery patients.

DEDICATED TO MY FATHER,
MEHMET SAIT SONCUL (1933-1991)

Living is no laughing matter:
you must live with great seriousness
like a squirrel, for example-
I mean without looking for something beyond and above living,
I mean living must be your whole occupation.
NAZIM HiKMET (RAN)February 1948

ACKNOWLEDGEMENTSI would like to thank my supervisors Dr. Anwar Bamber and Professor
Malcolm Harris for their valuable advice, guidance and encouragement
throughout my studies. I am also deeply indebted to Dr. Alf Linney, Dr. Robin
Richards and Dr. Robin Hennessy for their help and guidance with the optical
surface scanner and thin-plate splines. I would especially like to thank all the
patients who agreed to take part in this study; it would be impossible to
produce this work without their cooperation. I am also grateful to the nurses
and all the clinical personnel for their help, and especially Ms. Susan Woodley
for being a great friend throughout my studies.
I would also like to acknowledge Hacettepe University (Ankara, Turkey) for
providing funding to undertake this study. My very special thanks go to
Professor Ferda Tasar for trusting and supporting younger generations to
build a brighter future.
Thanks from the bottom of my heart to my friends, especially Dr. Nurgül
Komerik and Mr. Necip Varan for their endless support, understanding and
offering a shoulder to cry on when I needed, and to my family for their
unconditional love and for teaching me to work hard to follow my dreams.
And finally, to Prashant, my partner and closest friend; Thank you for always
being there for me, I learned so much from you!

Declaration
I hereby certify that the work embodied in this thesis is the result of my own
investigations, except where otherwise stated.
Murat Soncul
2001
London

Table of contents
TABLE OF CONTENTS
ABSTRACT 2ACKNOWLEDGEMENTS 6DECLARATION 7TABLE OF CONTENTS 8LIST OF FIGURES AND TABLES 12CHAPTER 1- INTRODUCTION AND REVIEW OF
THE LITERATURE 221.1 Aesthetics of the human face 231.2 Early approaches to facial aesthetics 241.3 What is aesthetics? 271.4 Search for perfection 281.5 Assessment of the face 34
1.5.1 Upper third of the face 351.5.2 Middle third of the face 361.5.3 Lower third of the face 39
1.6 Profile view analysis 42 1.7- Evaluation of soft tissue changes following
orthognathic surgery 431.7.1 Maxillary procedures 451.7.2 Mandibular Procedures 531.7.3 Bimaxillary Procedures 621.7.4 Summary 64
1.8 Imaging of facial soft tissues and morphometriesof the human face 67
1.8.1 The Lateral Cephalograph 681.8.2 Photogrammetry 691.8.3 Morphoanalysis 711.8.4 Moire Topography 711.8.5 Stereolithography and 3-D CT Scans 721.8.6 The End of the Millennium 731.8.7 The Optical Surface Scanner 75
1.9 Morphometries 77

'able of contents
CHAPTER 2- STATEMENT OF THE PROBLEMAND AIMS AND OBJECTIVES 81
2.1 Statement of the problem 822.2 Aims and objectives 89
CHAPTER 3- REVIEW OF ETHNIC FACIAL AESTHETICS 903.1 Introduction 913.2 Aims 963.3 Materials and methods 97
3.3.1 Selection of subjects 973.3.2 Selection of panel 993.3.3 Method of panel assessment 1003.3.4 Clinical facial measurements 101
3.4 Results 1033.4.1 Panel assessment 1033.4.2 Analytical statistics of panel assessment 1103.4.3 Facial measurements 1123.4.4 Analytical statistics of measurements 115
3.5 Discussion 117
CHAPTER 4- VALIDATION OF THE OPTICALSURFACE SCANNER 123
4.1 Introduction 1244.2 The comparison of the optical surface scan images
to cephalographs for soft tissue analysis afterorthognathic surgery. 127
4.2.1 Aims 1274.2.2 Materials and methods 1284.2.3 Results 1324.2.4 Discussion 137
4.3 Reproducibility of the head position foroptical surface scans. 141
4.3.1 Aims 1424.3.2 Materials and methods 1424.3.3 Results 1464.3.4 Discussion 150

Table of contents
CHAPTER 5- EVALUATION OF FACIAL SOFT TISSUECHANGES AFTER ORTHOGNATHIC SURGERY
5.1 Introduction5.2 Aims5.3 Patients and methods5.4 Results
5.4.1 Class II5.4.1.1 Single jaw cases5.4.1.2 Bimaxillary cases
5.4.2 Class III5.4.2.1 Single jaw5.4.2.2 Bimaxillary cases
5.5 Discussion
154155 157 157165166 166 168 172172173 186
CHAPTER 6- THE EFFECT OF ORTHOGNATHIC SURGERY ON THE UPPER AND LOWER LIP VERMILION WIDTH
6.1 Introduction6.2 Aim6.3 Patients and methods6.3 Results
6.4.1 The control group6.4.2 Class II subjects6.4.3 Class III subjects
6.4 Discussion6.5 Conclusion
196197197198 200
200
203204 207 211
CHAPTER 7- THE ROLE OF TRAINING ELASTICS AND THE OCCLUSAL WAFER AFTER ORTHOGNATHIC SURGERY
7.1 Introduction7.2 Aim7.3 Patients and methods7.4 Results7.4 Discussion7.5 Conclusion
212213217217219226229
10
Table of contents
CHAPTER 8- SUMMARY AND CONCLUSIONS 2318.1 Summary and conclusions 232
8.1.1 Review of ethnic facial aesthetics 2338.1.2 Validation of the optical surface scanner 2348.1.3 The evaluation of facial soft tissue changes after
orthognathic surgery 2368.1.4 The role of training elastics and the occlusal wafer
after orthognathic surgery 2398.2 Suggestions for further research 241
REFERENCES 242
APPENDICES 265
PUBLICATIONS 290
11

List of figures and tables
LIST OF FIGURES
Figure 1.1- Black basalt and marble statues of Cleopatra VII. 25
Figure 1.2- Marble portrait of Alexander the Great, dating to about 150 years. 25
Figure 1.3- Head of a Warrior by Leonardo da Vinci, which was produced asa study for “The Battle of Anghiari” (1504-1506) 26
Figure 1.4- The upper, middle, and lower facial thirds may be defined as the distance from trichion to glabella, glabella to subnasale, and subnasale to gnathion, respectively. 35
Figure 1.5- A) Intercanthal distance B) Interpupillary distance. 36
Figure 1.6-A well proportioned Caucasian face is divided by six vertical lines which go from helix to helix forming five equal portions, the middle one of which includes the nose, should be equal to the width of the eye. 38
Figure 1.7- The ratio of the vertical distance from subnasale (SN) to upper lip stomion and that from upper lip stomion to soft-tissue gnathion (Gn) is about 1:2. 40
Figure 1.8-Angles used for profile analysis: (a) nasofrontal angle,(b) nasofacial angle, (c) nasolabial angle. 43
Figure 2.1- Michelangelo’s ‘David’ (1501-1504) (left), da Vinci’s ‘Portrait of Isabella d’Este’ (1499) (middle), and Dürer’s ‘Portrait of a Young Venetian Woman’ (1505) (right). 83
Figure 2.2- The conception of beauty has differed from one culture to theother. A reserve head from the reign of Khufu during the Fourth Dynasty (left), the ‘Head of a Blond Youth’ made around 485 BC (middle), a male head from Benin made around 15*̂ century (right) show the difference between the concept of beauty for ancient Egyptians, ancient Greeks and Africans. 83
Figure 2.3- The media imposing Caucasian features as an ideal; on the left, the cover of a beauty and fashion magazine published in the UK, in the middle the cover of a worldwide magazine published in India and on the right, a Korean model appearing in a worldwide magazine’s Korean version. 84
12

List of figures and tables
Figure 2.4- The conventional lateral cephalograph is unable to show complex 3D structures of the skull and facial soft tissues (left), whereas, optical surface scans is a 3D imaging system, which can illustrate the facial soft tissues with high degree of accuracy (right). 86
Figure 2.5- Occlusal wafer (top), and training elastics (bottom). 88Figure 3.1- The left image is the painted wooden coffin of Passenhor, Thebes,
700 BC. The image on the right is a sculpture of Cleopatra VII. 92Figure 3.2- The bronze trophy head from Benin, Nigeria (around 1550-1650)
shows the typical African beauty. 92
Figure 3.3- Head of emperor Augustus as an example of Roman norms. 93
Figure 3.4- Ideas of beauty and perfection change with time and culture. 93
Figure 3.5- Cavalry sports helmet from Rochester, Britain, (late Ist-early 2nd century AD) shows the similarity of the Western European Caucasian facial characteristics to today. 93
Figure 3.6- The replica of Michelangelo's 'David' in Caesar's Palace (left).The Venus detail from 'The birth of Venus' (1485) by Botticelli in Florence (right). 94
Figure 3.7- The self-portrait of Dürer at the age of 28 (1500), who produced similarly perfect portraits due to his great interest and knowledge of human facial proportions (from Alte Pinakothek, Munich) as well as his unique talent. 95
Figure 3.8- Leonardo da Vinci's 'Study of Grotesque Heads' (1490) from the Royal Library, Windsor Castle and 'Head of a Woman' (1510) from Musee Bonnat, Bayonne. 95
Figure 3.9- The 48 subjects included in the study. 98Figure 3.10- Clinical measurements were taken using a Vernier calliper. 102
Figure 3.11- The chin position was assessed by drawing a horizontal line from upper tragus, parallel to the Frankfort plane, then a vertical line (facial plane) was drawn from glabella to the soft tissue menton, perpendicular to the horizontal line. The position of the chin was measured in relation to the vertical line. 103
Figure 3.12- Ranking of Oriental females by surgeons. 104
13

List of figures and tables
Figure 3.13- Ranking of Oriental males by surgeons. 104Figure 3.14- Ranking of Afro-Caribbean females by surgeons. 104
Figure 3.15- Ranking of Afro-Caribbean males by surgeons. 105Figure 3.16- Ranking of Caucasian females by surgeons. 105Figure 3.17- Ranking of Caucasian males by surgeons. 105
Figure 3.18- Ranking of Oriental females by orthodontists. 106Figure 3.19- Ranking of Oriental males by orthodontists. 106Figure 3.20- Ranking of Afro-Caribbean females by orthodontists. 106Figure 3.21 - Ranking of Afro-Caribbean males by orthodontists. 107Figure 3.22- Ranking of Caucasian females by orthodontists. 107
Figure 3.23- Ranking of Caucasian males by orthodontists. 107Figure 3.24- Ranking of Oriental females by laymen. 108Figure 3.25- Ranking of Oriental males by laymen. 108Figure 3.26- Ranking of Afro-Caribbean females by laymen. 108Figure 3.27- Ranking of Afro-Caribbean males by laymen. 109Figure 3.28- Ranking of Caucasian females by laymen. 109Figure 3.29- Ranking of Caucasian males by laymen. 109Figure 3.30- Ranking of subjects by the Malaysian panel. 110Figure 3.31- Mean alar base width in the 12 subjects with the best and
the 12 subjects with the worst mean ranks. 116Figure 3.32- Numbers of subjects with and without chin deviation in the 12
most and least beautiful subjects. 117Figure 4.1- The optical surface scanner set-up. 125
Figure 4.2- Various views of the optical surface scan. 126
Figure 4.3- Maxillary incisor exposure, nasolabial and labiomental angles,as measured on an optical surface scan. 129
Figure 4.4- Nasofacial and nasomental angles on an optical surfacescanner image. 129
Figure 4.5- Nasal tip projection measurement on a surface scan. 130
Figure 4.6- Nasal tip measurement on a cephalograph usingsurrogate Frankfort plane. 132
Figure 4.7- The 95% confidence intervals of mean clinical, cephalometric and optical surface scan (OSS) upper incisor exposure measurements preoperative and postoperative showing no difference between these methods. 133
14
List o f figures and tables
Figure 4.8- The 95% confidence intervals of mean cephalometric and optical surface scan (OSS) nasolabial angle measurements preoperative and postoperative showing no difference between these methods. 135
Figure 4.9- The 95% confidence intervals of mean cephalometric andoptical surface scan (OSS) nasofacial angle measurements preoperative and postoperative. 135
Figure 4.10- The 95% confidence intervals of mean cephalometric andoptical surface scan (OSS) nasomental angle measurements preoperative and postoperative. 136
Figure 4.11- The 95% confidence intervals of mean cephalometric andoptical surface scan (OSS) labiomental angle measurements preoperative and postoperative. 136
Figure 4.12- The 95% confidence intervals of mean nasal tip projection change after the surgery for the cephalograph and the optical surface scan. 137
Figure 4.13- The use of a spirit level to align the Frankfort plane parallelto the ground. 143
Figure 4.14: Lateral view optical surface scan (left), and frontal view optical surface scan (right) showing landmarks used for this investigation. 144
Figure 4.15- A graphic output of the thin-plate splines analysis afterthe digitisation of a preoperative optical surface scan. 145
Figure 4.16- Graphic output of the thin-plate splines where the head positionwas intended to remain constant. 145
Figure 4.17- 95% confidence interval of the mean bending energies of 12 scansof 5 subjects in the lateral view. 147
Figure 4.18- 95% confidence interval of the mean bending energies of 12 scansof 5 subjects in the frontal view. 148
Figure 4.19- Graphic output of thin-plate splines showing the change after bimaxillary surgery with the 6-mm advancement of the maxilla and 3-mm set back of the mandible. 149
Figure 4.20- Thin-plate splines showing change in head position with chinmoving inferiorly (left) and with chin moving superiorly (right). 149
15
List of figures and tables
Figure 4.21- The tilting of the head around the axial plane on the frontal viewof optical surface scans shown using thin-plate splines analysis. 150
Figure 5.1- Five markers electronically placed on 3-D pre and postoperative optical surface scans on: 1. left endocanthion, 2. left exocanthion,3. right endocanthion, 4. right exocanthion, 5. soft tissue nasion. 159
Figure 5.2- The colour map displaying the regions characterised with differentmagnitude of soft tissue change. 162
Figure 5.3- The landmarks used for thin-plate splines analysis on the truelateral view of the optical surface scans. 164
Figure 5.4- The comparison of percentile soft tissue changes between singleJaw Class II and III cases. 179
Figure 5.5- The comparison of percentile soft tissue changes between bimaxillary Class II and III cases that underwent a maxillary impaction and a mandibular procedure. 179
Figure 5.6- The comparison of soft tissue changes in Class III casesundergoing 3-mm, 6-mm and 9-mm advancement and impaction with a mandibular setback. 180
Figure 5.7- The thin-plate splines graphical analysis obtained after thesuperimposition of pre and postoperative optical surface scans' lateral profiles. 181
Figure 5.8- The range of percentile values for soft tissue change afterorthognathic surgery. 185
Figure 5.9- Optical surface scans showing the preoperatively existing concave outline of the upper lip which straightened after maxillary advancement and formation of a lip seal. 187
Figure 5.10- When a semi-circular shaped bone is advanced at point 1, the other points on the circumference of the circle bilaterally (2a, 2b, 3a, 3b) move relatively less, in other words, degree of projection of advancement on soft tissues decreases gradually towards the back. 189
Figure 5.11- The incisive and mental slips of the orbicularis oris muscle are the deepest fibres, which are attached to the bone near the midline, well away from the alveolar margin and the mucous membrane of the lips is also firmly attached to them. 190
16

List o f figures and tables
Figure 5.12- The attachments of levator anguii oris and nasalis muscles in the paranasal region (left), and the soft tissue change in the region after maxillary advancement compared to the adjacent soft tissues (right). 191
Figure 5.13- The preoperative (left) and postoperative (right) optical surfacescans showing the change in the paranasal regions, indicated by the red arrows. 191
Figure 5.14- The eversion of the lower lip after mandibular setback. 193Figure 6.1- The localisation of landmarks; a) labrale superius, b) stomion,
c) labrale inferius clinically. The upper vermilion width (1) was measured from labrale superius to the stomion on cubid's bow, and the lower vermilion width (2) was measured from the stomion to labrale inferius at the midline. 200
Figure 6.2- The means and standard deviations of upper to lower lip vermilion width ratios for Caucasian, Afro Caribbean and Oriental control subjects. (n=60) (p>0.05) 201
Figure 6.3- The mean and standard deviation of bivermilion widthmeasurements for Caucasian, Afro Caribbean and Oriental control subjects. (n=60) 201
Figure 6.4- The mean and 95% confidence intervals of upper and lower vermilion width measurements for Class II subjects pre and postoperatively (mm). 204
Figure 6.5- The mean and 95% confidence intervals of upper and lower vermilion width measurements for Class III subjects pre and postoperatively (mm). (*p=0.02) 205
Figure 6.6- The interference of the upper incisors to the location of lower lip. 210Figure 7.1- An occlusal wafer. 215
Figure 7.2- The mean and SD preoperative and postoperative overjetmeasurements (mm) taken at T1, T2 and T3 for Class II and Class III subjects in Groups A (wafer and elastics), B (wafer), and C (nil). 220
Figure 7.3- The postoperative changes in overjet between T1 and T2 in threerandomisation groups. 222
17

List of figures and tables
Figure 7.4- The means of postoperative change of overjet between T1 (just before the patient is discharged from the ward),72 (2 weeks postoperatively), and 73 (6 months postoperatively).a) 71 -72, b) 72-73, c) 71 -73. 224
18

List of figures and tables
LIST OF TABLES
Table 3.1- Subjects in the investigation. 97Table 3.2- The panel consisting of 9 sub-panels. 99
Table 3.3- Summary data of facial measurements in 3 ethnic groups 112
Table 3.4- Comparison of the facial measurements between the mostbeautiful subjects in 3 ethnic groups. 113
Table 3.5- Comparison of the facial measurements between the leastbeautiful subjects in 3 ethnic groups. 114
Table 3.6- Summery of facial measurements for the 12 most beautiful and12 least beautiful subjects (mean ± SD). 116
Table 4.1- The means and standard deviations of clinical, cephalometricand lasergraphic pre and postoperative upper incisor exposure. 133
Table 4.2- The mean and standard deviation cephalometric and lasergraphic pre and postoperative measurements;
a) nasolabial angle, b) nasofacial angle, c) nasomental angle andd) labiomental angle . 134
Table 4.3- The means and standard deviations of the bending energies for5 subjects (g.cm /̂sec )̂ a) in the lateral view, b) in the frontal view. 147
Table 5.1 - Summary of treatment plans. 160Table 5.2- The mean±S.D. soft tissue changes and their percentile
proportions to bony surgical change for single jaw Class II advancement cases that unden/vent a bilateral sagittal split osteotomy. 167
Table 5.3- The mean±S.D. soft tissue changes and their percentile proportions to bony surgical change for bimaxillary Class II cases that underwent a maxillary impaction and a bilateral sagittal split osteotomy. 169
Table 5.4- The mean±S.D. soft tissue changes and their percentile proportions to bony surgical change for bimaxillary Class II cases that underwent a maxillary impaction, bilateral sagittal split osteotomy and a genioplasty procedure. 170
19
List o f figures and table;
Table 5.5- The mean±S.D. soft tissue changes and their percentile proportions to bony surgical change for bimaxillary Class II cases that underwent a bilateral sagittal split osteotomy, maxillary impaction, and a maxillary horizontal shift. 171
Table 5.6- The mean±S.D. soft tissue changes and their percentile proportions to bony surgical change for single jaw Class III cases that underwent a bilateral sagittal split osteotomy. 173
Table 5.7- The meantS.D. soft tissue changes and their percentile proportions to bony surgical change for bimaxillary Class III cases that unden/vent a maxillary impaction and a setback by bilateral sagittal split osteotomy. 175
Table 5.8- The meantS.D. soft tissue changes and their percentile proportions to bony surgical change for bimaxillary Class III cases that undenvent a maxillary impaction, 3-mm maxillary advancement and a bilateral sagittal split osteotomy. 176
Table 5.9- The meantS.D. soft tissue changes and their percentile proportionsto bony surgical change for bimaxillary Class III cases that underwent a maxillary impaction, 6-mm maxillary advancement and a bilateral sagittal split osteotomy. 177
Table 5.10-The meantS.D. soft tissue changes and their percentile proportions to bony surgical change for bimaxillary Class III cases that underwent a maxillary impaction, 9-mm maxillary advancement
and a bilateral sagittal split osteotomy. 178Table 5.11- The direction of movements for landmarks on the soft tissue
profile for Class II cases (n=38). 182Table 5.12- The direction of movements for landmarks on the soft tissue
profile for Class III cases (n=46). 184Table 6.1- The upper and lower vermilion widths, upper to lower vermilion
width ratios of 60 control subjects. 202Table 6.2- The means ± SD for pre and postoperative upper and lower
vermilion widths of Class II and Class III subjects. 206Table 7.1- The summary of patients included in the trial 218Table 7.2- The postoperative change in overjet between T1 and T2 in three
randomisation groups. 221
20

List of figures and tables
Table 7.3- The means and standard deviations of postoperative change of overjet between T1 (just before the patient is discharged from the ward), T2 (2 weeks postoperatively) and T3(6 months postoperatively). 223
Table 7.4- The p values after comparing means of overjet measurements taken at different times (T1, T2, T3) for all groups (N.S.= Not significant). 225
21

Chapter I_____________________________________________________________________ Introduction
CHAPTER I
INTRODUCTION
AND
REVIEW OF THE LITERATURE
22

Chapter I_____________________________________________________________________ Introduction
1.1 Aesthetics of the human face
Facial aesthetics is an important daily issue, which interests many people
around the globe. It affects several issues including self-esteem and other
parts of human psychology. A beautiful human face inspires pleasure and
interest and often attracts attention.
Facial appearances tend to influence the opinion of those we meet. Etcoff
(1994) claims that even two month-old infants prefer to gaze at the same
faces that adults find more attractive. There is a natural and sometimes
unconscious attraction to a beautiful person. Whether this indicates that there
may be some inherent predisposition towards certain types of appearance, or
not, is unknown.
Our attitude to our own physiognomy and body structure is a potent factor in
the emotional and intellectual development of the individual. Schilder (1999),
in ‘The Image and Appearance of the Human Body’, says that we should not
underrate the importance of beauty in human life. “Beauty can be a promise
of complete satisfaction and can lead up to this complete satisfaction. Our
own beauty or ugliness will not only figure in the image we get about
ourselves, but will also figure in the image others build up about us and which
will be taken back again into ourselves. The body image is the result of social
life. Beauty and ugliness are certainly not phenomena in the single individual,
but are social phenomena of the utmost importance. They regulate and thus
become the basis for our sexual and social activities." Beauty is interrelated
and identified with the secondary sexual characteristics.
23
Chapter I_____________________________________________________________________ Introduction
Darwin suggested that beauty was a form of sexual selection for mating
purposes and Freud states, “The science of aesthetics examines the
conditions under which we experience beauty. It can not give an explanation
of the nature and genesis of beauty." (Parisi 1999).
Many patients with facial deformities have problems in coming to terms with
their facial disfigurement, which they try to hide or mask. Their ability to
overcome the problem depends on their attitude and personality and upon the
feedback and support they get from their environment. One patient with a
treated facial deformity defined happiness as,"when you go around the
supermarket without anyone staring at you" (Moss et ai, 1995).
1.2 Early approaches to facial aesthetics
Ever since man has tried to define the different components of beauty in
order to be able to reproduce it in art, he has searched for formulae of beauty
and its measurement (Gonzales-Ulloa, 1962). With the development of
Egyptian culture in the Nile valley approximately 5000 years ago, aesthetic
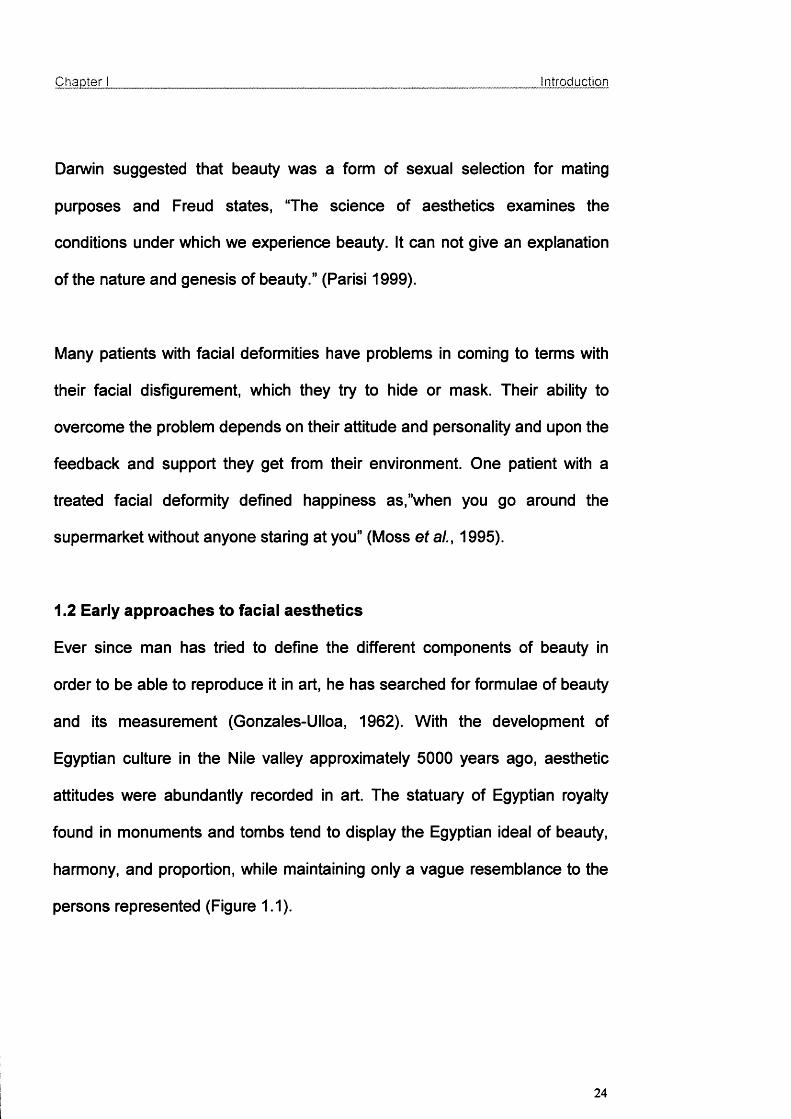
attitudes were abundantly recorded in art. The statuary of Egyptian royalty
found in monuments and tombs tend to display the Egyptian ideal of beauty,
harmony, and proportion, while maintaining only a vague resemblance to the
persons represented (Figure 1.1).
24
Chapter Introduction
Figure 1.1- Black basalt statue of Cleopatra VII. The State Hermitage, St Petersburg.
Courtesy of The British Museum (left). Marble statue of Cleopatra VII. 1st century B.C.
Courtesy of Musei Capitolini, Rome (right).
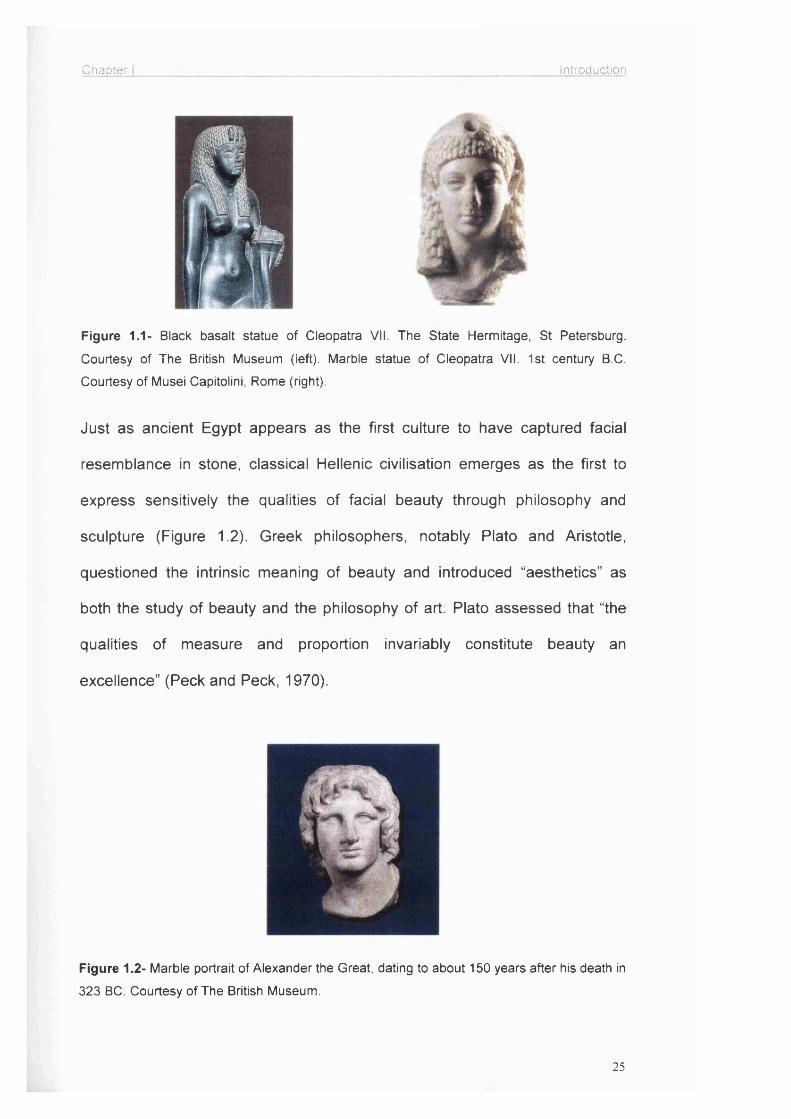
Just as ancient Egypt appears as the first culture to have captured facial
resemblance in stone, classical Hellenic civilisation emerges as the first to
express sensitively the qualities of facial beauty through philosophy and
sculpture (Figure 1.2). Greek philosophers, notably Plato and Aristotle,
questioned the intrinsic meaning of beauty and introduced “aesthetics” as
both the study of beauty and the philosophy of art. Plato assessed that “the
qualities of measure and proportion invariably constitute beauty an
excellence” (Peck and Peck, 1970).
Figure 1.2- Marble portrait of Alexander the Great, dating to about 150 years after his death in
323 BC. Courtesy of The British Museum.
25
Chapter I____________________________________________________________________ Introduction
Just like the ancient sculptures and paintings from the Egyptians, Greeks,
Romans, and many other great civilisations, famous artists during the last
millennium, especially during the Renaissance conveyed to us the perception
of beauty in their times with their immaculate work. As early as the 15^
century, artists like Albrecht Dürer and Leonardo da Vinci studied the human
body and facial proportions. Dürer (1591) studied facial disharmonies and
gave a series of measurements, from which he created his ‘ideal face’
(Gonzales-Ulloa, 1962). He is the first artist who is known to have painted a
self-portrait (Figure 3.7) and had a great knowledge of human facial
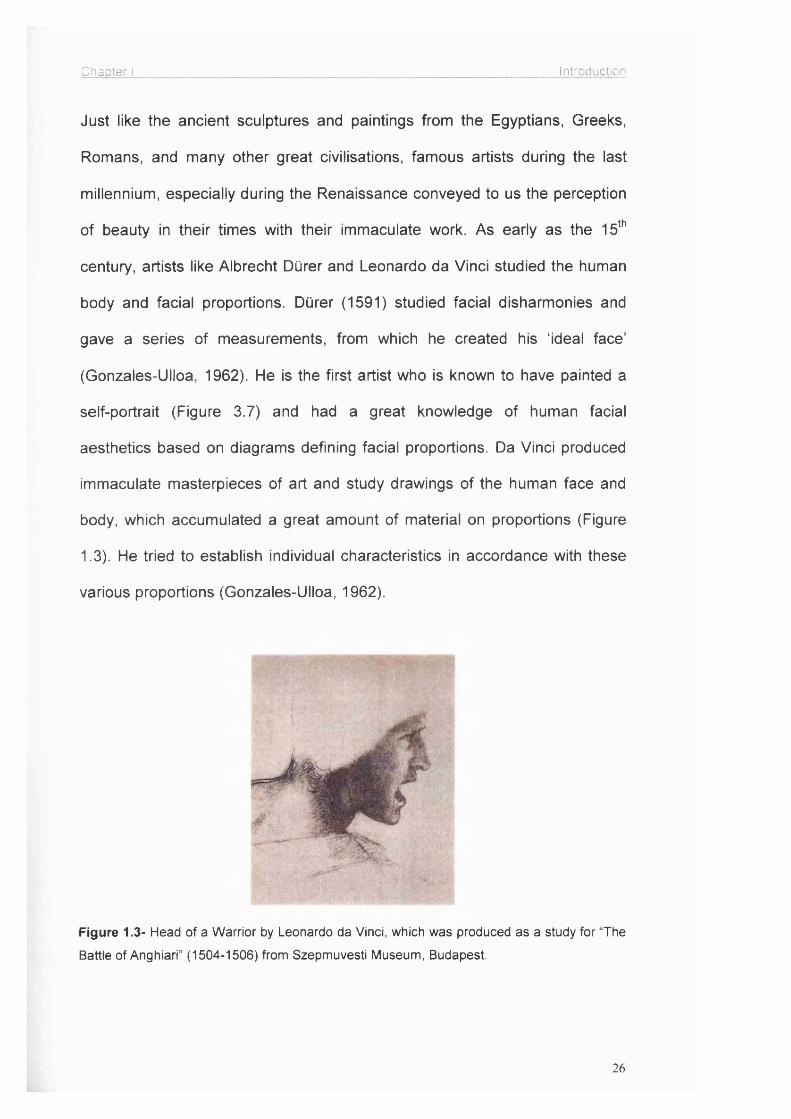
aesthetics based on diagrams defining facial proportions. Da Vinci produced
immaculate masterpieces of art and study drawings of the human face and
body, which accumulated a great amount of material on proportions (Figure
1.3). He tried to establish individual characteristics in accordance with these
various proportions (Gonzales-Ulloa, 1962).
Figure 1.3- Head of a Warrior by Leonardo da Vinci, which was produced as a study for “The
Battle of Anghiari” (1504-1506) from Szepmuvesti Museum, Budapest.
26

Chapter I_____________________________________________________________________ introduction
Apart from artists, and surgeons such as Gonzales-Ulloa (1962), Lee and Lee
(1979), Farkas and Posnick (1992), Parkas et al. (1999), also orthodontists;
Merrifield (1966), Ricketts (1982) have tried to establish norms and guidelines
for assessment of a beautiful face.
1.3 What is aesthetics?
Aesthetics is concerned with the study of of beauty together with ethics, logic,
politics, and metaphysics, and is a branch of philosophy. The understanding
of beauty is considered as a subjective concept, hence the saying "beauty is
in the eye of the beholder” by M. Hungerford (Knowles, 2001).
Questions like “what is beauty”, and “is there any difference between the
concept of beauty and attractiveness” have not been clearly answered, but it
has been possible to define facial beauty as the harmony and balance in the
proportions of all facial structures, both soft and hard tissues.
Ricketts (1982) states that “a beautiful face will have rhythm and rhythm is
produced by the dynamic action of proportion on a uniform recurrence”. The
word ‘rhythm’ means to flow. Rhythm is seen in time, dimension, music, and
poetry. It is pleasing to the ear, the eye, and the psyche. The beautiful human
face has rhythm, both transversely or in width and height.
Although some aspects of the judgement of facial beauty may be influenced
by culture or individual history, the general geometric features of the face that
give rise to a perception of beauty may be universal (Moss et a/., 1995).
27

Chapter I_____________________________________________________________________ Introduction
1.4 Search for perfection
Many studies have been done on evaluation and perception of facial
aesthetics using different methodology. Basically these studies can be divided
into two categories;
1) The studies that assessed the perception of facial beauty between groups
of people by using different type of panels.
2) The studies which tried to establish quantitative measurements, ‘the golden
proportions' and characteristic features for a beautiful face.
Riedel (1950) traced the soft tissue outline from the cephalometric
radiographs of 24 children and asked 72 orthodontists to rate them as good,
fair, or poor. He found that there was greater agreement on poor profiles than
those that were considered good. He concluded that the relation of the
maxillary and mandibular apical bases in an anteroposterior dimension (ANB
angle), the convexity of the skeletal pattern (N -A -Pg angle), and the relation
of anterior teeth to the face and the respective apical bases were important
influences in the soft tissue outline. He also evaluated the facial profiles of 30
Seattle ‘princesses' from cephalometric radiograph (Riedel, 1957). These
females were selected by public opinion and were considered to be beautiful
and to have charming personalities. It was observed that the profile was
closely related to the skeletal and dental structures. The long axis of the
maxillary and mandibular incisors crossed exactly at the A - Pogonion line in
nine cases with a maximum deviation of 3 mm from this line in nine others.
He concluded “the general concepts of acceptable facial aesthetics are
28

Chapter i_____________________________________________________________________ introduction
apparently in good agreement with standards established by orthodontists on
the basis of a stable occlusion". Iliffe (1960) conducted an interesting study
of preferences in feminine beauty. He made arrangements with a major
London newspaper to publish twelve photographs of female faces taken
under uniform conditions. The girls, aged twenty to twenty five, were carefully
selected to represent various facial types. Nearly 4300 readers responded to
the request to rank the twelve faces according to their pleasing facial
aesthetics or ‘prettiness’. Each response was correlated to the age, sex, and
occupation of the respondent. He concluded that a common basis for judging
facial beauty indeed existed, and men and women of all ages in all parts of
England in almost all occupations shared that basis. Martin (1964), a
sociologist, examined the relationship between racial groups and judgement
of female beauty by males. He asked a panel to rank ten black and white
facial photographs of Afro-Caribbean females from the least Negroid to the
most Negroid. The least Negroid type was understood to have the most
Caucasian appearance. After the panel ranked the photographs, three groups
of men, fifty Caucasian Americans, fifty Afro-Caribbean Americans and fifty
Africans were asked to rank the photographs according to attractiveness.
They strongly supported the proposition that Caucasian and Afro-Caribbean
Americans share a common aesthetic standard for judging beauty, the
Caucasian facial model. This study also confirmed that Caucasian features
were considered more attractive than Negroid features in American society.
However, the African group rated Caucasian facial features ‘attractive’ less
often than either of the American groups.
29

Chapter 1________________________ introduction
Peck and Peck (1970) made a similar study on the faces of beauty contest
winners, and unlike Riedel (1957), concluded that the lay public admire a
fuller and more protrusive dentofacial relationship than one based on
orthodontic standards. Cox and Van der Linden (1971) compared the
aesthetic assessment of 10 orthodontists and 10 laypersons based on full
head silhouettes for good facial balance, and reported that the subjects with
poor facial aesthetics had convex faces. Foster (1973) used six groups of
professionals and laymen to evaluate male and female faces at ages 8, 12,
16, and as adults. His results showed that there was a general agreement
between the groups for age and gender of the full-face silhouette profiles. All
groups related full profiles to the female and to the younger ages and straight
profiles to male and to older age groups. In a similar study. Lines et al. (1978)
found significant differences in evaluations of facial profile silhouettes among
orthodontists, oral surgeons, other dental professionals and laypersons.
Although orthodontists were more critical in their assessments than oral
surgeons, both were significantly different in their evaluations from the other
two groups. It was also observed that males had larger noses and chins than
the females.
Andersen at a/. (1979) studied differences in perceptions of dentofacial
morphology among orthodontists, general dental practitioners, and parents of
patients. Significant differences were found between the evaluations of the
parents and the professional groups, but no significant differences between
the evaluations by orthodontists and general dental practitioner. Ricketts
(1982) did a profound study in facial beauty by using measurements of
30

Chapter I_____________________________________________________________________ Introduction
plaster models of subjects with normal occlusion and lateral and frontal
cephalometrics. He used frontal view photographs from advertisements in the
magazines. Variations of the beautiful photographic models were analysed
together with computerised composites of patients with ideal occlusions.
Several key relationships were found like the association of canine width with
soft tissue nasal width in the smile. The study strongly suggested that
aesthetics could indeed be made scientifically rather than the need to resort
to subjective perceptions as in the past.
Bell et al. (1979) reported that laymen's ratings of an individual's profile are
similar to the ratings given by dental specialists in orthodontics and oral
surgery, but they tend to perceive others as more normal than dental
specialists. It was also reported that oral surgeons and orthodontists evaluate
facial profiles similarly. Dunlevy at ai. (1987) assessed composite
photographs of 19 female patients who underwent bilateral sagittal split
osteotomy advancement and showed general agreement among laymen,
orthodontists, and oral and maxillofacial surgeons concerning patients’
improvement in facial appearance following orthognathic surgery. The panel
were asked to rank the patients in order of improvement in facial appearance.
Lundstrom at ai. (1987) set up a panel, which consisted of 20 individuals
(orthodontists, artists, laymen, senior orthodontic students, and junior
orthodontic students). They made independent aesthetic evaluations of the
facial appearance of 64 subjects (32 of each sex). The panel showed good
31

Chapter I_____________________________________________________________________introduction
agreement in ranking the subjects in five categories; very good-looking, good
looking, average, disharmonious, and very disharmonious.
Kerr and O'Donnel (1990) used a panel of orthodontists, dental students, art
students, and the parents of the children undergoing orthodontic treatment
who assessed full face and profile photographic transparencies of 60 subjects
divided equally among Angle Class I, II, and III malocclusions, taken before
and after treatment. The Class I subjects were rated more attractive than
subjects with Class n and Class m malocclusions. Art students and parents of
children were less critical in the appraisal of facial attractiveness than
orthodontists or dental students. Czarnecki et al. (1993) assessed the role of
the nose, lips, and chin in achieving a balanced facial profile. Five hundred
and forty five professionals evaluated constructed androgynous facial
silhouettes. The silhouettes had varied nose, lip, and chin relationships as
well as changes in the facial angle and angle of convexity. These varied facial
profiles were graded on the basis of most preferred to the least preferred. It
was found that in men a straighter profile was preferred in comparison with a
slightly convex profile for the females. Among the various unfavourable
combinations, the worst ones were either an extremely recessive chin or
those with excessively convex faces. More lip protrusion was found
acceptable for both male and female faces when either a large nose or a
large chin was present.
Moss at ai. (1995) used a 3-dimensional technique in analysing facial
aesthetics. Forty men and women with a Class I skeletal pattern and
32

Chapter I_____________________________________________________________________ Introduction
occlusion were scanned and an average face was obtained for each group.
The averages were compared with those derived from a group of 9 men and
15 women employed as professional models. The group of professional
models were further analysed to see whether they measured up to the
“golden proportions” described by the ancient Greeks. The groups did not fit
the “golden proportions” and they instead represented a range of
malocclusions and a wide range of cephalometric values. A group of normal
Asian teenagers were also scanned to investigate ethnic differences.
Freihofer and Mooren (1997) showed the variations in personal views and
perception. Ten unbalanced profile drawings were given to seven
experienced surgeons with the request that they draw the profile line they
would like to give to these patients. The evaluation showed that some
surgeons drew profiles which resembled each other to some extent in
proportions and inclinations, while others produced variations without any
evident regularity and basic concept. Cochrane et al. (1997, 1999)
manipulated black and white photographs from 4 Class I adult Caucasians to
produce Class II and Class III malocclusions and long face profiles for each
individual. Each series of photographs were shown to 40 Caucasian
orthodontists (20 of each gender) and 40 Caucasian adult laymen (20 of each
gender). The assessors were asked to rank each series in order, from the
most pleasing to the least pleasing facial profile. The only significant
difference was between orthodontists and non-orthodontists.
33

Chapter I_____________________________________________________________________ Introduction
In summary, numerous studies show that the 'perception' of beauty differs
significantly amongst different cultures, racial groups, genders, age groups,
and between health professionals and 'laymen'. Clearly therefore, the search
for 'the perfect face' will be infinite and individual; however facial
characteristics presented by the patient as a problem can be analysed by the
surgeon and the orthodontist using existing methods for assessment of the
sections of the face and its components.
1.5 Assessment of the face
In order to assess a face in frontal view, the total face height is divided in
three parts. The upper, middle, and lower facial thirds may be defined as the
distance from trichion to glabella, glabella to subnasale, and subnasale to
gnathion, respectively (Figure 1.4). In an ideal face, all facial thirds are equal
and the upper lip constitutes one third of the lower facial height (Zaoli, 1994).
Koury and Epker (1992) stated that the ratio of the upper, middle, and the
lower facial thirds to the total facial height in a normal beautiful Caucasian is
0.30, 0.35, and 0.35 respectively.
34

Chapter Introduction
Figure 1.4- The upper, middle, and lower facial thirds may be defined as the distance from
trichion to glabella, glabella to subnasale, and subnasale to gnathion, respectively.
1.5.1 Upper third of the face
Forehead
The upper facial third is perhaps the most variable, since it is affected by the
hairline and hairstyle. The morphology of the upper facial third may be
quantified by calculating the ratio of the bitemporal width (Ft - Ft) to the height
of the upper facial third (Tr - G). According to Epker et al. (1995), the ratio for
Caucasians is approximately 2.20. Values less than 2.20 should indicate a
long/narrow third; greater than 2.20 a short/wide third. Shape and symmetry
of the temporal areas, frontal areas, eyebrows, and supraorbital rims are also
observed.
35
Chapter Introduction
1.5.2 Middle third of the face
The morphology of the middle third of the face is quantified by calculating the
ratio of the bizygomatic width (Zy - Zy) to the height of the middle third (G -
Sn). Again according to Epker et al. (1995), this ratio is approximately 2.20 in
female Caucasians, and 2.30 in males.
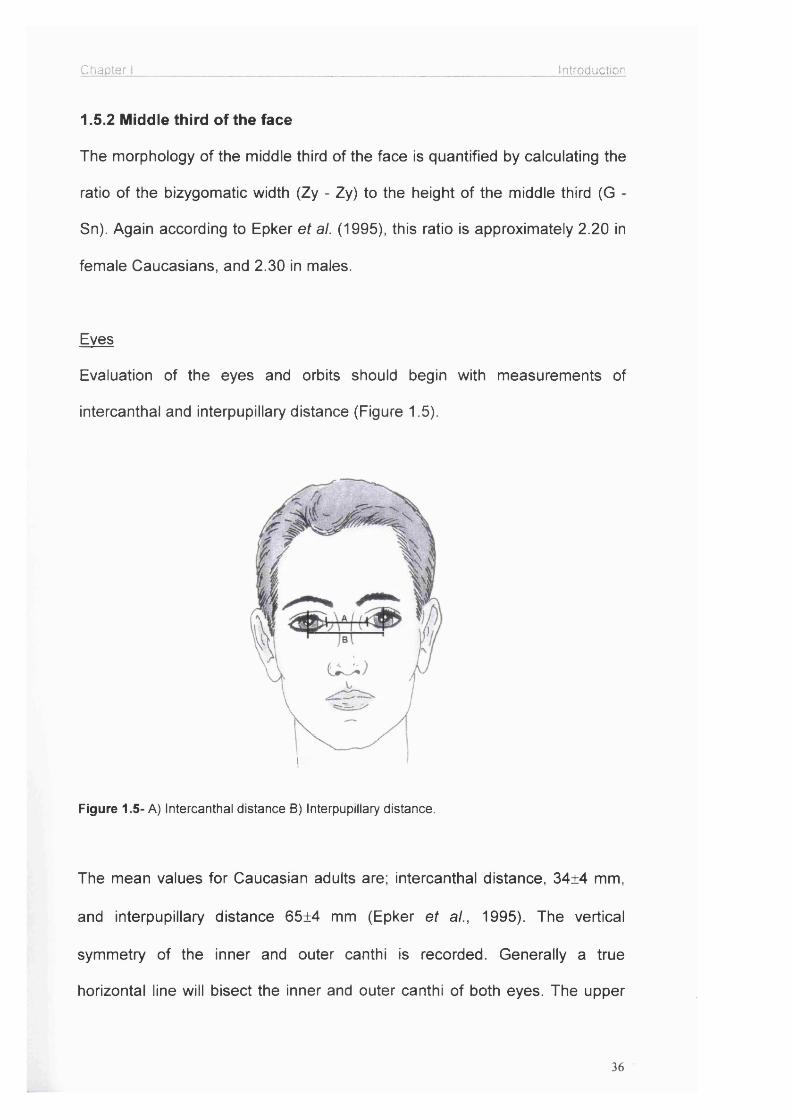
Eves
Evaluation of the eyes and orbits should begin with measurements of
intercanthal and interpupillary distance (Figure 1.5).
i
Figure 1.5- A) Intercanthal distance B) Interpupillary distance.
The mean values for Caucasian adults are; intercanthal distance, 34±4 mm,
and interpupillary distance 65±4 mm (Epker at a/., 1995). The vertical
symmetry of the inner and outer canthi is recorded. Generally a true
horizontal line will bisect the inner and outer canthi of both eyes. The upper
36

Chapter 1___________________________________________________ Introduction
and lower eyelids are evaluated for right to left symmetry and especially for
the presence of ptosis, ectropion, or entropion. Deep-set eyes, as well as
their protrusion, also affect the aesthetic appearance of the face.
Nose
The nose is a subject of special interest in facial aesthetics and cosmetic
surgery. How much the morphology of the nose affects the appearance of the
face is known for centuries. Agnolo Firenzuola in the 16th century expressed
it thus: “Those who do not possess a perfect nose cannot have a beautiful
profile...The nose must be of correct proportions...It should be narrow rather
than wide and tapered from the root to the base...The tip should be turned up
a little and project as if sculptured. The nostrils should be thin and sharp cut."
(Zaoli, 1994).
There are three parameters by which the proportions of the nose can be
determined, namely the length, the width of the base and the height of the tip.
In addition the size, and characteristics of alae, lobule, columella complex are
of aesthetic importance (Skinazi et ai, 1994).
Length- To compare the length of the nose with that of the face; the nose
constitutes the middle third of the height of the face.
Width of the base- In a well proportioned Caucasian face, to establish the
distance which the various parts should have from the midline, it is divided by
six vertical lines which go from helix to helix forming five equal portions, the
middle one of which includes the nose, should be equal to the width of the
37

Chapter Introduction
eye (Figure 1.6). For Caucasians, the width of the alar base should be equal
to the intercanthal distance (Zaoli, 1994; Hunt and Rudge, 1984).
Figure 1.6- A well proportioned Caucasian face is divided by six vertical lines, which go from
helix to helix forming five equal portions, the middle one of which includes the nose should be
equal to the width of the eye.
Examination of the middle third includes assessment of the nasal dorsum and
nasal tip, the fullness of the cheeks and the anteroposterior position of the
infraorbital rims, which should project between 0 - 4 mm in front of the globe
(Fish and Epker, 1987).
Cheeks
Evaluation of the cheeks consists of sequential assessment of the malar
eminences, infraorbital rims, and paranasal areas for symmetry and normal
projection. The malar eminences are normally present 10 ± 2 mm lateral and
38

Chapter I_____________________________________________________________________Introduction
15 ± 5 mm inferior to the lateral canthus (Epker et al., 1995). However, such
precise measurements are unlikely to be validated.
1.5.3 Lower third of the face.
The morphology of the lower facial third may be quantified by calculating the
ratio of the bigonial width (Go - Go) to the height of the lower facial third (Sn -
Gn). The normal ratio is 1.30 (Epker et a!., 1995). Ratios less than the norm
indicate a facial third that is long and/or narrow; values greater than the norm
indicate that the lower third is short and/or wide. The normal vertical length of
the lower third of the face is approximately equal to that of the middle third.
The ratio of the vertical distance from subnasale (SN) to upper lip stomion
and that from upper lip stomion to soft-tissue gnathion (Gn) is about 1:2. The
ratio of the vertical distance from subnasale to the vermilion cutaneous
margin of the lower lip (labrale inferius) and that from the vermilion cutaneous
margin of the lower lip (labrale inferius) to soft tissue menton is about
1:1(Epker ef a/., 1995) (Figure 1.7).
Lips
The lips are extremely important in the overall aesthetics of the face and are
evaluated both at rest and during animation (e.g. smiling). At rest, the
symmetry of the lips relative to the face and the dentition is noted. The lower
lip should show 30 percent more vermilion than the upper (Fish and Epker,
1987). The width of the lips from commissure to commissure in an adult
Caucasian is normally about equal to the interlimbus distance (the distance
from the vertical tangent on the medial point of the junction of the iris and the
39

Chapter Introduction
sclera of one eye to the tangent of the medial point of the junction of the iris
and the sclera of the other eye), (Epker et al., 1995). Farkas et al. (1984)
showed that the upper lip occupied one third of the lower face, while the lower
lip occupied more than one third of the lower face and the chin occupied the
remainder (Figure 1.7). Skin covered 73.5% of the upper lip in males and
68% in females; it covered 63% of the lower lip in males and 61.1% in
females. The remainder was occupied by the vermilion, more on the lower
than on the upper lip and more protruding in females than in males.
1/3
1/3
Figure 1.7- The ratio of the vertical distance from subnasale (SN) to upper lip stomion and
that from upper lip stomion to soft-tissue gnathion (Gn) is about 1:2.
Teeth
Symmetry is the most important factor in producing an aesthetic smile. This
includes the symmetry of both lip movement and tooth exposure. When the
lips are at rest the interlabial distance should be 3.5 mm (Burstone 1967; Fish
and Epker, 1987), and 2-3 mm of upper incisor tips should be seen. The
40
Chapter I__________________________________________________ Introduction
amount of exposed incisor teeth and gingival tissue should also be assessed
while the patient is smiling. The least aesthetic condition exists when no
exposure of the upper teeth occurs during smiling because the teeth are so
superiorly located that despite normal lip movement, they never become
visible. The lower teeth are seldom exposed at rest.
Mandible
Morphology of the mandible is of particular importance as well as the manner
in which the dental arches articulate. The three type of articulation are:
1- Orthognathism; no change in facial profile, normal profile.
2- Retrognathism; the lower lip and chin project backwards.
3- Prognathism; the lower lip and chin project forwards.
The mandibular angles are evaluated with regard to both their symmetry and
fullness as being deficient, normal or excessive. The definition of the
mandibular angles and inferior borders of the mandible is an important
consideration in the neck aesthetics. The mandibular borders become less
well defined when tissue laxity, lipomatosis, chin deficiency, and/or hyoid
bone sag become progressively worse.
Chin
An appreciation of facial harmony is profoundly influenced by the shape, size,
and proportion of the chin relative to the other facial features. The
morphology of the chin is determined by a combination of skeletal and soft
tissue components.
41

Chapter I_________________________________________________________ introduction
In the lower third of the face, lips, the chin and neck-chin line should be
assessed and their relative positions determined.
1.6 Profile view analysis
Looking at each facial third individually and finally at the overall balance is the
basis of profile analysis (Neger, 1959). The position of the orbital rims,
eyeballs and shape of the forehead are noted in order to assess their relative
anteroposterior positions. Normally, the supraorbital rim should project 10 ± 2
mm beyond the globe of the eye (Hunt and Rudge, 1984).
Naso-frontal angle - In a profile view the naso-frontal angle is between two
lines passing through the nasion, the first at a tangent to the glabella , and the
second resting on the dorsum . The size of the angle varies between 125 and
135 degrees (Zaoli, 1994) (Figure 1.8).
Nasofacial angle - This is the angle between a vertical line which touches the
glabella and the chin, and a second one which touches the dorsum of the
nose (Figure 1.8).
The nasolabial angle - This angle is important as it measures the inclination
of the collumella in relation to the position of the upper lip, which is affected
by the angulation of the teeth. The optimum should vary between 90 and 120
degrees. The lines, which form the nasolabial angle, intersect at the
subnasale point. The upper one passes through the most projecting point of
the columella and the lower one touches the muco-cutaneous line of the
42

Chapter Introduction
upper lip. The point at which the lines meet is the subnasale point (Figure
1.8 ).
Figure 1.8-Angles used for profile analysis: (a) nasofrontal angle, (b) nasofacial angle,
(c) nasolabial angle.
1.7- Evaluation of soft tissue changes following orthognathic surgery
The position of the underlying hard tissue is the main determinant of the
overlying soft tissue morphology for the face. Certain parts of the face are
very dependent on the underlying hard tissue support, whereas the relation
and support between lips and teeth, chin and bony chin, cheeks and malar
prominence may vary. Therefore, the changes observed following
orthognathic surgery would be different in different regions of the face. It must
also be noted that many other structural elements enter the configuration of
43

Chapter I_____________________________________________________________________Introduction
the face, like muscles, connective tissue and cartilage, therefore, all parts of
the soft tissue profile do not directly follow the underlying bony structure
(Subtelny, 1959).
Many evaluations of soft tissue changes after orthognathic surgery have been
undertaken, and many correlation of soft tissue to hard tissue movements
have been attempted. Changes in facial aesthetics after orthognathic surgery
should be predictable if the planning is to be satisfactory. The skeletal
elements are moved in a planned and controlled manner, but the soft tissue
drape is not as precisely managed. This is mainly due to the lack of an
agreed conclusion for correlation of soft to hard tissue movements.
Opposing many researchers, Bailey et a/. (1996) compared the soft tissue
changes occurring on patients who had orthognathic surgery and ones who
had only non-surgical orthodontic treatment, and could not find significant
difference between the changes occurring in each group of patients. They
added that, especially in long-term follow-ups, external factors like normal
ageing process could affect the soft tissues so doing isolated observation of
soft tissues was difficult. The small soft tissue changes were probably due to
a combination of hard tissue remodelling and continued maturation.
There is an increased interest in soft tissue changes especially after a better
co-operation between the orthodontist and the maxillofacial surgeon.
44

Chapter I_____________________________________________________________________Introduction
1.7.1 Maxillary procedures
The interest of researchers have been towards mandibular surgery more than
maxillary procedures till the 80s and these few studies were less than
thorough. The sample sizes were small and many of them were mainly
concerned with maxillary lip changes due to maxillary incisor change. Bell and
Dann (1973) described a ratio of 0.7±0.1 for upper lip movement relative to
upper incisor movement in predicting upper lip position after anterior maxillary
osteotomy. They could not present a meaningful correlation between vertical
movement at the upper lip vermilion border and point A and anterior nasal
spine, but described it as a final composite relationship. Two years later, Bell
(1975) drew the attention to the widening of the alar base after Le Fort I
maxillary advancement or impaction. In 1976, Dann et al. investigated the soft
tissue changes occurring after anterior maxillary advancements. Using a
small group of 8 patients, they proposed a horizontal change in the upper lip
to a horizontal change in the upper incisor of 0.5±0.1; a vertical change in the
upper lip to the horizontal change in the upper incisor of 0.3±0.15; a decrease
in the nasolabial angle to the horizontal change in the upper incisor of 1.2±0.3
degrees per millimetre; advancement of the nasal tip in a ratio of 2:7. They
estimated a ratio of 1:2 for soft to hard tissue movement with total maxillary
osteotomy. In addition, they stated that the nasal dorsum was unaffected, the
thickness of the upper lip diminished, the length of the upper lip increased
while the lower lip changed only slightly. Freihofer (1976) emphasised the
importance of elasticity of the upper lip reflecting the movements of the
underlying bones comparing cleft and non-cleft cases. He observed an
increase in upper lip length after maxillary advancement. He presented the
45

Chapter I_____________________________________________________________________Introduction
ratio of movement at subnasale to point A as 4:7 and the ratio of movement
at labrale superius to upper incisor as 5:9, which showed that the free end of
the upper lip advanced nearly half the movement of the dental arch. In a
study done by Carlotti et al. (1986) evaluating the facial changes after
maxillary advancement, the ratio between incisor advancement and lip
advancement was 1:0.9 and the changes in lip length and position of the
nasal tip was not significant. Other variables including tissue thickness over
surgically manipulated bony segments, magnitude of movement,
accompanying vertical movement, and removal of anterior nasal spine were
considered as crucial. In 1989, Stella at al. reported the results of a study
taking all these variables into consideration but their results produced high
standard deviations therefore, clinically relevant correlation between hard and
soft tissue could not be made. Only when lip thickness was considered in a
special grouping of patients with lips thinner than 17 mm, this showed a good
correlation between hard and soft tissue changes. The change in
subnasale/maxillary advancement ratio was 0.5±0.1 but thicker lips produced
a less predictable correlation. Schendel at al. (1976 a, b) investigated the
results of maxillary impaction on soft tissues. Their results indicated that the
ratio of posterior movement of the upper lip to retro positioning of the
maxillary incisor is 0.76:1. Vertical change in the upper lip to vertical
movement of the upper incisor showed a ratio of 0.38:1 and the nasal tip
elevated slightly. There was no explanation offered by the authors for the lack
of consistent upper lip response to superior movement of the maxilla, which
can actually be explained by varying muscular factors. They also failed to
examine the degree the nasal profile, nasolabial angle and nasal base were
46

Chapter 1_____________________________________________________________________Introduction
affected, inversion and thinning of the upper lip, the effect of anterior nasal
spine on soft tissue response for maxillary impaction. In a later study by the
same investigator, 2.4 mm average elevation of the nasal tip with no change
in upper lip length and thickness was reported (Scheldel and Williamson,
1983). Radney and Jacobs (1981) found that the most anterior point on the
upper lip followed approximately 70 percent of the movement of the upper
incisor after maxillary impaction and retraction, but the upper lip followed only
50 percent of the movement of the upper incisor when the maxilla was
impacted and advanced. The vertical change in the upper lip was 40 percent
of the vertical change in the maxillary central incisor. Mansour et al. reported
similar findings to this study in 1983. An approximate ratio of 0.4:1 of vertical
upper lip movement to vertical movement of maxillary incisor was shown. The
0.6:1 ratio of horizontal upper lip movement to the horizontal change in the
maxillary incisor suggested by this study agrees with the results reported by
Lines and Steinhauser (1974). The authors concluded that the upper lip
followed the movement of the underlying skeletal tissue closely in the
horizontal plane for maxillary impaction and the lower border of the upper lip
moved superiorly approximately 40 percent of the vertical maxillary change. A
reduction in the length of the upper lip vermilion border was reported. The
nasolabial angle was unpredictable for impaction cases, but decreased in the
majority of the advancement cases. Radney and Jacob in their study
mentioned above (1981) found that the nasal tip moved superiorly 1 mm for
every 6 mm of maxillary impaction without a significant correlation in the
horizontal direction. They noted that soft tissue change occurred more at
subnasale than at the nasal tip, and increase in the nasolabial angle was less
47

Chapter I_____________________________________________________________________Introduction
than expected when the maxilla was advanced because of the increase in the
collumellar leg of the nasolabial angle. The collumellar leg was prone to
decrease with maxillary impaction. The change in the lower lip was found to
be unpredictable following maxillary intrusion. Bundgaard et al. (1986)
claimed that pronasale and subnasale were not influenced by the change in
maxillary position but the superior sulcus of upper lip followed the underlying
hard tissue with a ratio close to 1:1. On the other hand, stomion followed the
maxilla by 50% horizontally and 30% vertically. The angular displacements of
the maxilla were found to be significantly predictable whereas, vertical and
horizontal displacements were of minor influence. There was low correlation
between the nose and the hard tissue movements, whereas, upper lip was
more correlated to the bony movements. Rosen (1988) observed increases in
nasal tip projection with advancement of the maxilla, but this was not
statistically significant. His results showed that the movements of point A in
both horizontal and vertical dimensions had a significant impact on nasal tip
projection, but the correlation was poor. It was observed that alar rim width
increased with anterior and/or superior repositioning of the maxilla, but
increase in nasal tip projection occurred only when there was an anterior
vector of maxillary movement. Eighty percent of patients undergoing maxillary
impaction in this study had lip shortening ranging from 20 to 50 percent of the
vertical maxillary reduction, but no statistically significant correlation could be
demonstrated for lip shortening versus extent of maxillary impaction.
More recent studies had a different look at the soft tissue changes. The focus
of research turned from the evaluation of the lateral profile to a multi
48

Chapter I__________ Introduction
dimensional evaluation of soft tissues. More researchers started considering
the lips and the nose including their peripheral areas. Widening of the base of
the nose, associated flattening and thinning of the upper lip were stated
typically in most papers as a result of maxillary surgery. All these changes are
secondary to alterations in the regional anatomy associated with surgical
repositioning. In 1991 Sarver and Weissmann summarised the soft tissue
changes associated with maxillary impaction as elevation of the nasal tip,
increase in nasolabial angle, increase in alar base width, shortening of lip
length and changes in upper lip position concurrent with horizontal
movements of the maxilla. They clearly stated that all these changes occurred
in the short term but many of the soft tissue characteristics returned to their
preoperative measurements. Westermark et al. (1991) derived their data to
conclude that Le Fort I osteotomy with advancement and/or impaction
increased alar base width, anterior and superior projection of the nasal tip and
nasolabial angle. They described the alar base suture to reduce alar flaring
and to add to the increase in the nasolabial angle produced by the surgical
procedure. They claimed this technique did not influence the nasal tip
projection significantly. The findings of this study supported earlier studies on
the alar base suture done by Collins and Epker (1982), Wolford (1988) and
Guymon at al. (1988). Guymon at al. (1988) reported a reduced flaring from
11 percent down to 3 percent with alar base suture. Despite all these studies,
Westermark at al. (1991) drew the conclusion that the alar base suture
increased the nasolabial angle due to the suture crossing the midline thus
compressing the soft tissue in the nasolabial region. Schendel and Carlotti
(1991) stated that the subperiosteal dissection and elevation disinserted the
49

Chapter I_____________________________________________________________________Introduction
facial muscles from the nasolabial area and the anterior nasal spine leaving
them free to retract laterally as they normally shortened when elevated
resulting in flaring, widening and elevation of the base of the nose as well as
loss of vermilion show and thinning of the upper lip due to inward rolling of the
lip. The advancement and impaction of the maxilla could also rotate the base
of the nose superiorly along with the closure of nasolabial angle. They pointed
out the lip advancement followed by maxillary advancement by anywhere
from 33% to 60 % of the skeletal movement and suggested this could be
improved up to 90% by the use of V-Y closure of the vestibular incision. The
use of V-Y closure of the vestibular incision supported earlier studies of
Schendel and Williamson (1983), Phillips et a i (1986), Timmins et a i (1986)
and Hackney et a i (1988). According to the results reported by Gassmann et
a i (1989), the nasal tip rotated up with anterior and superior movement and
down with posterior and inferior movement of point A. Only advancement of
point A resulted in an increase in the collumellar angle. Alteration of the
supratip break angle was found to be unpredictable. The authors concluded
that prediction of nasal structure after Le Fort I osteotomy was unpredictable.
Ayoub et a i (1991) evaluated the soft tissue changes following anterior
maxillary setback. They did not observe any significant changes from
subnasale to glabella but the changes were notable in the upper and lower
lips. They reported a decrease in interlabial gap after the posterior and
superior autorotation of the lower lip to achieve a better lip-to-tooth
relationship and an acceptable lip seal. They also pointed out an increase in
the upper lip thickness and a marked increase of nasolabial angle from 92 to
110 degrees. The study defined the movement of the upper lip in terms of
50

Chapter I_____________________________________________________________________Introduction
translation and rotation and the centre of rotation was in the region between
the nasolabial fold and anterior nasal spine. Hack et al. (1993) found strong
correlation between anterior nasal spine and subnasale, superior labial
sulcus, labrale superius one year after surgery but there was no correlation at
the five-year follow-up. Superior labial sulcus and labrale superius followed
point A more closely and this remained observable for the five-year follow-
ups. Labrale superius followed incision superius in a horizontal direction at a
ratio of 0.6:1 and this ratio would be 0.5:1 over the long term whereas, vertical
ratios were not significant and that was probably due to relatively small mean
vertical movements at surgery for their study. Van Butsele at a/. (1995)
investigated the effects of maxillofacial surgery to create lip seal. They found
that the maxillary advancement moved the upper lip 30% upward. They
supported earlier works of Freihofer (1976) and Stella at ai. (1989) as they
stated that lips thinner than 17 mm followed the movement of maxilla better
than thicker lips. They concluded that prediction of the stomion superius to
create a better lip seal was only possible in pure advancement cases. In 1996
Lee at a/, studied the changes after impaction of the maxilla with Le Fort I.
The upper lip moved about one third of the upward movement of point A and
the maxillary incisor while the base and the tip of the nose moved slightly
upward and fon/vard. Changes in the position of the nasal tip were suggested
to occur in the short term after maxillary surgery and disappear by the end of
the first year. Obviously all lower soft tissue points were also affected by the
superior positioning of the maxilla and moved upward significantly. Same
year, de Assis at al. (1996) studied the postoperative nasal changes after
isolated impaction of the maxilla, reporting an increase in nasal height, nasal
51

Chapter I_____________________________________________________________________Introduction
length and collumellar length and a decrease in the angle of tip rotation and
angle of collumellar rotation. Nasolabial angle remained unchanged while the
tip of the nose rotated upward. The nasal tip projection was reported as 1.2
mm after 2.3 mm superior and 1.5 mm posterior repositioning of the maxilla.
McFarlane et al. (1995) worked on the nasal tip deflection. They stated that
subjects with larger nasal tips exhibited more vertical tip deflection due to
transmitting greater forces to the upper lateral cartilages. Their finding as the
most important predictor of vertical nasal tip deflection was the magnitude of
advancement. They also showed that superior repositioning made some
difference at the nasal tip.
The correction of maxillary deficiency is frequently needed in repaired cleft
cases, but only occasionally in non-cleft patients. Inferior positioning of the
maxilla has probably been considered an unstable procedure in the maxilla
(De Mol van Otterloo et a!., 1996; Rotter and Zeitler, 1999) so there are
limited number of publications about the soft tissue changes after this
procedure for non-cleft cases in literature. Most of the existing publications
discuss the stability and the innovations to increase the stability of the
procedure. The purpose of this procedure is, in the majority of the cases, to
increase the facial height and upper incisor exposure. Bell and Scheideman
(1981) reported an increase in the upper lip length, but could not find a
significant correlation between lip lengthening and inferior movement of the
maxilla in their small sample group. They calculated an increase of 3.6±1.8
mm in the upper incisor exposure, 66% average relation of soft to hard tissue
change in the anteroposterior plane and an absolute 2 mm vertical relapse in
52

Chapter i_____________________________________________________________________Introduction
the first two months. They also suggested 1 mm compensation for anticipated
lip length.
1.7.2 Mandibular Procedures
The advancement of the mandible is mostly done to correct dentoskeletal
Class II cases. Early techniques started from step osteotomies of the
mandibular body at the beginning of this century. This was followed by vertical
osteotomies, ramus osteotomies of different sorts with bone grafts, and
sagittal ramus osteotomies (Athanasiou et a/., 1992). More vertical ramus
osteotomies and mandibular coronoidotomies followed until inverted L
osteotomy, 0 osteotomy and sagittal split osteotomy. Mommaerts and Marxer
(1987), evaluating the long term soft tissue changes after mandibular
advancements, found a good correlation of the horizontal change of labrale
inferius, soft tissue B point, soft tissue pogonion, soft tissue gnathion and soft
tissue menton with the horizontal change of bony pogonion and this
correlation became stronger for the points closer to pogonion. The
relationship in the change of the hard and corresponding soft tissue points
seemed to be linear. The angle and the depth of the labiomental fold
correlated well with the vertical change of menton but no correlation was
found with the horizontal change of pogonion. The results of this study
supported findings of former studies by Lines and Steinhauser (1974) and
Quast etal. (1983). Lines and Steinhauser (1974) showed a 1:1 soft and hard
tissue pogonion vector change, whereas, the lower lip moved 62 % of the
distance of the advancement of the lower incisor and 67% at the vermilion
border. Quast at a/. (1983) included long-term follow-up data to take spatial
53

Chapter I_____________________________________________________________________Introduction
changes, remodelling and functional adaptations into consideration. Ratios at
both pogonion and point B were 0.97:1 however; the ratio at labrale inferius
was 0.38:1. The depth of the sublabial furrow decreased by 1.7 mm.
Mommaerts and Marxer (1987) also found the one-to-one ratio between soft
and hard tissue menton vertically. They concluded agreeing the most
compromised linear one-to-one ratio of the chin region for the soft tissue
points to the respective hard tissue points, both horizontally and vertically.
They stated there was no effect of mandibular advancement over labrale
inferius. In addition the soft tissue thickness under menton remained the
same and sublabial furrow depth decreased. Moss et al. (1994) reported that
the advancement executed was most prominent over soft tissue pogonion
and this decreased gradually up to the lower lip. Their study gave a more
visual idea than numbers using a colour coding system over the facial soft
tissue three-dimensionally as a difference from previous works. Van Butsele
et al. (1995) pointed out the flattening of the labiomental fold due to fon/vard
displacement of the lower part of the lip, whereas, the upper part remained
unchanged helping to establish a better lip seal like his co-workers did earlier
(Mommaerts and Marxer, 1987). Keeling etal. (1996) claimed that mandibular
advancement had no long-term effects on the upper lip position, and there
was poor association with the horizontal surgical change on the lower incisor,
point B and pogonion for the lower lip position in the anteroposterior direction.
Their mean horizontal change data also indicated a 1:1 ratio between soft
tissue and osseous pogonion, but they thought this was less certain in the
long-term. They also examined the association between soft tissue thickness
and soft tissue changes but could not find any associations. Albrechtsen and
54
Chapter I_____________________________________________________________________Introduction
Larson (1997) worked on the lower lip cross-sectional area after mandibular
advancement, and suggested that individual variations were too great for this
alone to assist in predicting the postoperative outcome from a patient's
preoperative records. The ratio of soft tissue of the lips to lower incisors in this
study was 0.67:1. The ratio at pogonion was lower than most of the previous
research (0.72:1). Ewing and Ross (1992) reported a 1:1 ratio of soft to hard
tissue advancement at pogonion and point B after mandibular advancement.
Some of their cases unden^/ent advancement genioplasty as well as maxillary
advancement, resulting in the same soft to hard tissue ratio but did not show
consistency. The positional change pattern of the lower lip was very different
depending on the existence of genioplasty in the procedure. The thinning of
the lip was twice as prominent with genioplasty. After genioplasty, an inferior
shifting of the soft tissue pogonion was also observed relative to the bony
pogonion.
Total mandibular setback for the treatment of mandibular prognatism was
also researched widely for its effects on soft tissues. Examination of outline
profiles showed Knowles (1965) the shortness and aversion of upper lip and
an absence of the proper rolled outline as the vermilion border of the lower lip
passed into the skin above the mental prominence. He suggested an
improvement to the lower lip and chin outline and a lengthened upper lip,
which lost the everted outline. Aaronson (1967) reported changes in soft
tissues below superior labial sulcus after subcondylar osteotomy. The least
change occurred in the upper lip and maxillary sulcus of the upper lip,
whereas, the greatest amount of change was seen in the lower lip, the
55

Chapter I_____________________________________________________________________Introduction
mandibular sulcus of the lower lip, and the soft tissue chin. They were all
displaced posteriorly. He also observed a downward displacement of the
lower lip and the soft tissue chin, and a more acute angulation at the
mandibular sulcus contour of the lower lip. Fromm and Lundberg (1970)
reported an increase in the depth of the depression under the lower lip and in
the length of the upper lip. Robinson et al. (1972) reported the results of their
similar surgical intervention on a small group of patients. There was strong
correlation between soft and hard tissue changes in the horizontal plane but
not in the vertical direction in this study. This was mainly due to the landmark
selection, which were appropriate to evaluate horizontal changes. Lines and
Steinhauser (1974) found that the soft tissue chin followed the bony chin in a
ratio very close to one-to-one, but the lower lip at the vermilion border only
followed the lower incisal edge at 75%. Hershey and Smith (1974) reported
0.9 mm of soft tissue repositioning for each 1 mm of skeletal change in the
chin region. It was found that 1 mm of change at pogonion resulted in
approximately 0.8 mm change at inferior labial sulcus and 0.6 mm change at
labrale inferius, which showed a significant correlation. The possible reason
for this differential response was due to the backward rotation of the body of
the mandible during repositioning according to the authors. They showed that
1 mm of posterior change at pogonion was associated with an average 0.2
mm posterior change at labrale superius and that was a significant
relationship. They also claimed flattening of the upper lip and aversion of the
lower lip after the surgical correction of mandibular prognatism. The increase
in the prominence of the lower lip was twice the amount of upper lip flattening.
Weinstein et al. (1982) studied the lip morphology after mandibular setback
56

Chapter I_____________________________________________________________________Introduction
and stated the consequences on the shape and size of the lip due to spatial
changes and added that if the lips were brought together into a new
relationship of contact areas, the interaction between the lips will be
superimposed on that due to surgical manipulation. They also claimed they
could not observe any significant relapse on the lip changes. Fanibunda
(1989), using subsigmoid osteotomy for the surgical procedure, evaluated the
soft tissue changes. He divided the facial profile into sections instead of
investigating single landmark points. The soft tissue chin followed the
movement of the mandible as a whole with a ratio near to one-to-one, and the
maxillary soft tissues from tip of the nose to stomion projected 16% of the
mandibular movement. He noted that nasal tip and nasal base often moved in
the reciprocal direction to its accommodated' preoperative position due to
relaxation of associated tissues. The position of the upper lip was determined
by the lower lip to a certain extent. In most of the cases, posteroinferior
shifting of the upper vermilion border and the lip junction following the lower
lip vermilion border was observed. He also reported a 25% increase of the
facial outline between upper lip vermilion border and lip junction. This change
was 89% for the lower lip outline from the lip junction to the vermilion border.
Soft tissue point B and soft tissue pogonion followed the best fit between the
lip junction and gnathion increasing the concavity at point 8. The section
between soft tissue pogonion and soft tissue gnathion reflected the bony
movement of the corresponding bone section 2.25 times due to either the
dimensional difference between the soft and hard tissue sections or a
tendency to ‘double-chin’ formation after mandibular setback. He also
discussed external factors affecting soft tissue change like ageing, skin water
57
Chapter I_____________________________________________________________________Introduction
content and elasticity. The main weakness of this study was that the
evaluation was done on lateral cephalograms ranging from 9 months to 7
years postoperatively.
Dermaut and De Smit (1989) reported changes in soft tissue thickness after
sagittal split advancement of the mandible. Changes in the upper lip were
less than 1 mm. At the level of upper incisor edge the soft tissue cover
thickened due to the anterior displacement of lower incisor but the tissue
extension at labrale inferius was reduced following flattening of the
labiomental sulcus. The regions lower to that remained unchanged. The
authors also stated that the fonA/ard displacement of labrale inferius was 26%
of the displacement of the lower incisor edge, but point B on the soft tissue
moved 119% of the displacement of its bony correspondent. Likewise the
anterior displacement of soft tissue pogonion was 110% of the change at
bony pogonion. These results were all very close to the ratios given by other
researchers. All landmarks except the gonion, stomion inferius and labrale
inferius moved significantly downwards. The gonion moved upwards due to a
postoperative resorption at the cortical plate,. The other landmarks remained
unchanged. Gjorup and Athanasiou (1991) worked out that posterior
movement at point B and pogonion was accompanied by reductions ranging
from 91% to 103% of the corresponding soft tissues.
Techalertpaisarn and Kuroda (1998) conducted a three-dimensional analysis
so they could evaluate the regions other than the profile line. They claimed
that the greatest amount of soft tissue change was found between soft tissue
58
Chapter I_____________________________________________________________________Introduction
pogonion and labrale inferius, and the amount of dislocation decreased in the
lateral direction. This could be explained in the same manner as the ‘radial
explanation' which suggests degree of advancement decreases gradually
towards the back of the maxilla and mandible as the jaws are U or V shaped
(McCance et al., 1992 a). They reported that the central part of the upper lip
was affected less as this region was supported by the maxilla and the upper
teeth, but the peripheral regions of the upper lip were affected more by the
setback of the mandible. Scheideman et al. (1981) combined the mandibular
setback with advancement genioplasty for the treatment of patients
characterised by mandibular prognathism combined with flat labiomental
sulcus, everted lower lip and an apparent lack of chin prominence, and
observed soft tissue changes. The soft tissue to hard tissue movement ratio
was 0.96:1 at pogonion, which is essentially a one-to-one ratio. This ratio was
appropriate when a moderately large advancement genioplasty and
mandibular setback were planned. The mandibular setback positioned the
chin posteriorly, whereas, the advancement genioplasty repositioned it
anteriorly, producing a negligible overall change in anteroposterior chin
position. The submental length and the labiomental sulcus depth were
unchanged because of the combination of the two procedures. The soft tissue
changes were also associated with genioplasty at variable degrees. A broad
soft tissue pedicle was found to be a reliable method for establishing
predictable soft tissue change as well as maintaining the soft tissue chin
postoperatively.
59

Chapter I_____________________________________________________________________Introduction
The genioplasty procedure was first described by Hofer but the intraoral
approach was introduced by Trauner and Obwegeiser (1957). Some
variations of the horizontal osteotomy were then introduced by Converse
(1964) followed by Hinds and Kent (1969). Advancement genioplasty to
augment the contour of the chin and reduce the chin height would give
different results depending the osteotomy was done either horizontally or
obliquely. McDonnell et al. (1977) presented a 4:3 ratio for surgical
advancement versus horizontal change in the soft tissue chin. This ratio was
given as 0.6 by Bell and Dann (1973) and 0.9 by Dann and Epker (1977).
Busquets and Sasouni (1981), working on the changes in the profile, claimed
that due to the anterior movement at pogonion, soft tissue marks at the lower
face was affected, and the greatest change occurred in the soft tissue
correspondent of the pogonion with less anterior change at the inferior labial
sulcus and the least at labrale inferius regardless of the magnitude of
movement. The soft to hard tissue movement ratio at pogonion was 0.8:1.
Similarly the lower lip was repositioned anteriorly 44% of the movement of
bony pogonion but this correlation was not as high as the other. Gallagher at
a/. (1984) supported the use of the maximised pedicle like his co-worker Bell.
He suggested that when soft tissues of the chin were stretched, the
proportion of soft to hard tissue movement decreased. His findings did not
include any change in labiomental sulcus depth like Scheideman at a i (1981).
As expected, submental length increased. He suggested a 0.75:1 soft to hard
tissue ratio in the horizontal plane. A year ago the same team reported the
soft to hard tissue movement ratio as 0.85:1 for the similar kind of procedure
performed with broad soft tissue pedicle (Bell and Gallagher, 1983). Davis at
60
C hapter I__________ introduction
a/. (1988) reported that soft tissue chin closely followed the bony movement.
The only inferior movement of the soft tissues was found to have occurred
when the bony movement was in that direction, so there was no tendency for
a chin droop. They related this to maximising the pedicle. The changes were
found to be too variable to reach statistical significance. In the study done by
Park et al. (1989), the ratio of soft tissue movement related to hard tissue
movement was 0.97:1 horizontally, which proved a statistical correlation,
whereas, vertically this ratio was 0.26:1, but they drew attention to individual
variations. Vedtofte at ai. (1991) supported the use of pedicled genioplasty for
more predictable soft tissue changes and presented a mean ratio of 0.92:1 for
soft tissue change at pogonion to bone advancement, which was similar to
previous results given by researchers using the same technique (McDonnell
at a/., 1977; Scheideman at a/., 1981; Gallagher at a/., 1984; Park at a/.,
1989; Polido at a/., 1991). This ratio was 0.7:1 at the level of osteotomy. His
finding using the free graft technique was a ratio of 0.53:1 at the soft tissue
pogonion. His observation that the stomion rarely moved interiorly after using
pedicled grafts supported McDonnell at ai. (1977) and Davis at a/. (1988).
Polido at a/. (1991) suggested the 0.88:1 ratio for the soft tissue pogonion to
osseous movement due to a 10% decrease in the thickness of soft tissues.
This could be lessened by the soft tissue pedicle attached to the anterior and
inferior surfaces of the advanced segment as the scar contraction would be
less. Average horizontal soft tissue advancement was reported as 92% of the
horizontal bony movement in Van Sickels’ study (Van Sickels at a/., 1994). He
suggested that as the magnitude of horizontal advancement of hard tissues
increased, the proportional movement of the soft tissues decreased. The soft
61
Chapter I_____________________________________________________________________Introduction
tissues followed the bony movement at a ratio of almost 1:1 up to 8 mm
advancement, but beyond this ratio decreased. He also added that the
vertical bony changes influenced the horizontal soft tissue change. As the
chin vertically shortened, the soft tissues tended to thicken.
After reduction genioplasty performed for the reduction of excessive chin
prominence in the anteroposterior plane, the soft to hard tissue ratio was 1:3
in the horizontal plane and 1:4 in the vertical plane as reported by Hohl and
Epker (1976) and 0.75:1 and 1:1 respectively as reported by Wessberg et al.
(1980). Bell et al. (1981) reported that soft tissue changes were not
proportional to the osseous changes. They gave a 58% ratio for soft to hard
tissue pogonion movement and supported the maximisation of the soft tissue
pedicle to the mobilized chin segment to stabilise the result in the long-term.
1.7.3 Bimaxillary Procedures
The challenge to achieve three-dimensional facial proportionality and occlusal
stability in many patients with complex dentofacial deformities has been met
by the development and use of maxillary, mandibular and chin surgery
techniques in combination with efficient orthodontic treatment. A combined
surgical and orthodontic approach may provide increased treatment efficiency
and optimal aesthetic results (Bell et al., 1986). The soft tissue response to
bimaxillary orthognathic surgery was similar to the response seen in single
jaw procedures except the changes in the nasolabial angle and in the lower
lip and chin region according to Jensen et al. (1992). The conclusion they
reached about the changes in the nasolabial angle was that they were
62

Chapter I_____________________________________________________________________introduction
primarily due to rotational changes of the underlying hard tissues rather than
their anteroposterior and vertical movements, which was discussed by many
authors as a result of single jaw procedures. They reported a poor correlation
between maxillary advancement and the nasolabial angle increase (an
average of 0.65° for every 1 mm of advancement). The ratios presented were
not any different to the ratios suggested for the lower lip and chin regions
after single jaw procedures (72% for lower lip and 100% for pogonion). As
expected, mandibular soft tissues followed maxillary impaction moving
superiorly due to the autorotation of the mandible, but at an unexpected one-
to-one ratio. In the mandible, the weak correlation between the movement of
the lower lip and mandibular hard tissues was attributed to the freeing of the
lower lip from the upper incisors after surgery. This way the lower lip stomion
and labrale inferius showed greater vertical movement (1.13:1 and 1.5:1
respectively) than the underlying hard tissues. Labrale inferius reduced in
thickness due to the same reason. Opposing previous authors, their group of
patients with thicker lips showed more significant changes than thinner lips,
but the range for thickness was different than previous studies observing this
effect (9-11.5 mm and 11.6-13 mm). Nadkarni (1986) proposed that both the
mandibular and the maxillary procedure affected the labiomental sulcus in
opposite directions due to the uncurling of the lower lip. McCance et al. (1992
a, b) did not present any data suggesting the bimaxillary procedure would
affect the soft tissues any different than the effects of procedures performed
on either single jaw. Similarly, Lin and Kerr (1998) reported matching results
to most of the previous studies, which were actually done separately on single
jaw procedures. The main reason for that could be the approach of
63

Chapter 1_____________________________________________________________________Introduction
researchers while evaluating the soft tissue changes as they tend to compare
the soft tissue section with the ‘corresponding’ hard tissue rather than
critically evaluating the reasons, like any effects from a neighbouring tissue,
why the ratios and correlation between some increase and decrease
whereas, some have a one-to-one ratio. The only main different result in this
study (Lin and Kerr, 1998) compared to previous literature was the ratio of
horizontal movement between lower lip and corresponding bony structures
(0.9:1).
1.7.4 Summary
It is evident from previous studies that the soft tissue changes following
orthognathic surgery vary with the regions of the face. The relation and
support between certain parts of the face and the underlying skeletal structure
may be different. Other structural elements like muscles, connective tissues
and cartilages contribute to the configuration of the face, therefore, the soft
tissue profile does not always directly follow the underlying bony structure.
Other external factors like the ageing process have also important effects on
the facial soft tissues.
For maxillary procedures, varying results were reported. Majority of the
research though, proposed a ratio of approximately 50% for soft to hard
tissue movement with maxillary osteotomy as a horizontal change. A vertical
change of approximately 30% in the upper lip to the horizontal change in the
upper incisor was presented by various authors but many others could not
present a meaningful correlation between vertical movement at the upper lip
and maxillary osteotomy. There was no explanation offered for the lack of
64

Chapter I_____________________________________________________________________Introduction
consistent upper lip response to superior movement of the maxilla, which can
actually be explained by varying muscular factors. A decrease in the
nasolabial angle, advancement and elevation of the nasal tip without any
change on the nasal dorsum, and increase in alar base width were among
observations. Many authors concluded that the change in the nasal structure
after Le Fort I osteotomy was unpredictable. Changes in the nose were
suggested to occur in the short term after maxillary surgery but disappeared
by the end of the first year. Many studies failed to record the degree the nasal
profile, the nasolabial angle and the nasal base were affected, inversion and
thinning of the upper lip, and the effect of intact or otherwise anterior nasal
spine on soft tissue response for maxillary impaction. Other factors, including
tissue thickness overlying surgically manipulated bony segments, magnitude
of horizontal movement, and accompanying vertical movement were
considered crucial.
Following mandibular advancements, a good correlation between the bony
pogonion's horizontal change and labrale inferius, soft tissue point B, soft
tissue pogonion, soft tissue gnathion and soft tissue menton was found. This
correlation was stronger for the points close to the pogonion. The hard and
corresponding soft tissue points surgical change relationship seemed to be
linear. A one-to-one soft to hard tissue pogonion change was shown,
whereas, effects on the lower lip were debatable. The results for the lower lip
showed a range from 30% to 70% of the lower incisor advancement. Various
authors reported no effect of mandibular advancement over labrale inferius,
whereas, others reported changes around 40%. It was also suggested that
65

Chapter I_____________________________________________________________________ Introduction
individual variations were too great to assist in predicting the postoperative
outcome. Effects on upper lip position in the anteroposterior direction were
also noted. The majority of the research agreed that the soft tissue
advancement was most prominent at the soft tissue pogonion and this
decreased gradually towards the lower lip. The flattening of the labiomental
fold was observed due to the forward displacement of the lower part of the lip,
whereas, the upper part remained unchanged, helping to establish a better lip
seal. The greatest magnitude of change occurred in the lower lip, the
labiomental sulcus, and the soft tissue chin with mandibular setback. An
increase in the depth of the labiomental sulcus and the upper lip length was
reported. There was also a differential response by the labiomental sulcus
due to the backward rotation of the body of the mandible during repositioning
according to the authors. The debate on the lower lip changes has been
continual; the lower lip at the vermilion border followed the lower incisal edge
at 60% to 75%. A significant relationship was found between posterior change
at pogonion and labrale superius. After the surgical correction of mandibular
prognatism, flattening of the upper lip and aversion of the lower lip were
reported. The maxillary soft tissues from the nasal tip to stomion reflected
approximately 15% of the mandibular movement. Three-dimensional
analyses claimed that the largest amount of soft tissue change was found
between soft tissue pogonion and labrale inferius and the amount of
dislocation decreased in the lateral direction.
The soft tissue responses to bimaxillary orthognathic surgery were reported to
be similar to those seen in single jaw procedures. The changes in the
66

Chapter I_____________________________________________________________________Introduction
nasolabial angle were primarily due to rotational changes of the underlying
hard tissues rather than their anteroposterior and vertical movements, which
was discussed by many authors as being a result of also the single jaw
procedures. In the mandible, the weak correlation between the movement of
the lower lip and mandibular hard tissues was attributed to the freeing of the
lower lip from the upper incisors after surgery. The lower lip stomion and
labrale inferius showed greater vertical movement than the underlying hard
tissues for this reason. Labrale inferius showed a reduction in thickness due
to the same reason.
While evaluating the soft tissue changes, many authors tend to compare the
soft tissue section with the ‘corresponding’ hard tissue rather than critically
evaluating the reasons, like any effects from a neighbouring tissue.
1.8 Imaging of facial soft tissues and morphometries of the human face
The prediction and visualisation of the soft tissue changes of the human face
has been an area of concern in the evaluation and planning for the
orthognathic surgery patients. Recording the facial details to supply materials
for diagnosis and treatment planning started with the early days of
orthodontics. Case (1908) recorded plaster casts of his patients’ faces. Due
to inherent difficulties, this technique was not used widely. Therefore, most of
the work on soft tissue changes has been based on quantitative analysis of
the lateral profile soft tissue outline on the facial midline as recorded on
lateral cephalometric radiographs.
67

Chapter I_____________________________________________________________________Introduction
1.8.1 The Lateral Cephaiograph
The first x-ray pictures of the skull in the standard lateral view were taken by
Pacini and Carrera in 1922 followed by a few other authors but accurate
description of the methods were not given. It was not until 1931 that
Broadbent (1931, 1981) developed standardised methods for the production
of cephalometric radiographs using cephalostats (Rakosi, 1982).
Cephalometric measurements, however, are influenced by several different
sources of error, related to the equipment, procedure and the operator
(Holdaway, 1983). Cephalometric errors fall in two main categories;
systematic and random errors.
Systematic errors arise through magnification and distortion, which can be
calculated from the geometry of the apparatus and can also be measured by
the use of standard scales in the field of view. Random errors arise largely
through uncertainty in the visual identification of radiographic landmarks on
the film. This uncertainty can be due to sharpness, contrast and subjective
element in the identification of some features (Cohen et al., 1984; Cohen
1984; Burke, 1984). Factors like differences in facial expression from one
recording to another may introduce considerable uncertainty in the
reproduction of some soft tissue reference points. Hillesund at al. (1978)
suggested that the radiographs might be taken in relaxed lip position to make
the reproducibility acceptable.
Two-dimensional radiographs allow the evaluation of facial anatomy and
prediction of changes in two dimensions only, anteroposterior and vertical.
68

Chapter I_____________________________________________________________________Introduction
The shape of the face is so complex that its measurement needs an
advanced three-dimensional system.
1.8.2 Photogrammetry
Zeller (1952) was the first to design a method of recording the facial soft
tissues, which could extend laterally from the midline and this was an
example of short-base stereophotogrammetry. In this system, a pair of facial
photographs was recorded in a stereometric camera and was placed in a
plotting machine to produce an accurate three-dimensional record of the face
in the form of a contour map. Unfortunately the mapping equipment was too
large, expensive and not easily accessible. This technique was used to
measure faces by a few researchers like Haga at al. (1964) and McGregor at
al. (1971). An effort to simplify the technique without loss of accuracy was
tried by Burke and Beard (1967) and was used for the assessment of facial
deformity (Burke, 1971). In 1975 Baumrind introduced a technique integrating
hard and soft tissue measurements using stereophotogrammetry, study
models and pairs of cephalometric radiographs. Burke at al. (1983) then used
the technique to measure the change in facial soft tissue morphology after
mandibular surgery. According to Rasse at al. (1991) due to the short time
required to take photographs in this method, the body would remain
motionless to avoid errors. The method was improved in time and made
simpler lowering the cost. Later the system was criticised for being subjective
despite carrying the advantages of a three-dimensional imaging system and
being non-invasive by Burke (1992). He pointed out the necessity for a better
system citing to the laser scanning systems, which had been recently
69

Chapter I_____________________________________________________________________introduction
developed at the time. Actually one of the main disadvantages of the method
is the need for a considerable technical proficiency to draw contour lines
despite many improvements to simplify it. Later Ferrario etal. (1996) obtained
soft tissue measurements using three-dimensional digital infrared
photogrammetry, which analyse only the relative positions of facial soft tissue
landmarks. This system can neither image the internal hard tissue nor the
overlying soft tissue, so was regarded more as a three-dimensional
measuring tool rather than an imaging method. Some advantages were that
the linear measurements were not sensitive to changes in the head posture, it
was a non-invasive technique and was described as inexpensive.
Adding on the principles from the eighteenth century, Lovesey (1966) made
the major leap in the development of a telecentric system for facial recording.
He tried to provide information on the facial dimensions of aircrews to design
better oxygen masks. He was projecting black strips on the side of subjects'
faces and photographing them at a perpendicular point from the projection
axis to produce a contour pattern. This idea was improved and a telecentric
lens was used to photograph the projections and was called contour
photography (Robertson, 1976), and then telecentric photography (Robertson
and Volp, 1981). Contour photography was related to the measurement of
surface areas and slopes, whereas, the latter one was primarily concerned
with linear measurement. Robertson and Volp (1981) stated that this
technique was as accurate as other systems, facial landmarks were easier to
identify than cephalometric radiographs and may be less expensive than the
other systems.
70
Chapter I_____________________________________________________________________Introduction
1.8.3 Morphoanalysis
Using a technique called morphography, morphoanalysis was formed. This
technique also provided a structural language for recording, comparing and
assessing craniofacial structures with standardisation and co-ordination using
radiographs, photographs and lithograms (Rabey, 1977-78 a). The clinical
application of morphoanalysis for oral and maxillofacial surgery dates back to
1963, and with the progress of this technique a centre was formed in
Manchester. In this technique, as a first step histomorphograms were formed
to provide three-dimensional data about the variation in craniofacial structures
in a population and then in the second stage, morphograms of a particular
patient were compared to the populations’ standards to diagnose the three-
dimensional nature of the disharmony (Rabey, 1977-78 b). This equipment
was described as extremely elaborate and expensive and the technique was
time consuming and not very practical for everyday use.
1.8.4 Moire Topography
Moire topography is a three-dimensional optical method of biomorphology
(Hojo, 1981). Optical methods gained great acceptance since they allowed
three-dimensional morphometry without contact at the site of measurement.
Although stereophotogrammetry was seen more accurate than Moire
topography for years, with its simplicity as well as its accuracy (Kawano,
1987), Moire technique gained popularity after its application to morphometry
of large irregular-surfaced three-dimensional objects (Shioiri, 1978). Some of
the problems reported by Kanazawa and Kamiishi (1978) about this method
71

Chapter I_____________________________________________________________________introduction
included the positioning of head as a source of error as the Moire pattern
changed greatly by even fine movements of the face.
1.8.5 Stereolithography and 3-D CT Scans
Stereolithography is a method of organ-model-production based on computed
tomography scans, which enables the representation of complex three-
dimensional anatomical structures. Models of surfaces and internal structures
of organs can be reproduced by polymerisation of UV-sensitive liquid resin
using a laser beam. The principles of stereolithography were developed in
1982 but were first used in 1987 (Bill at al., 1995). The main disadvantages
obviously were the radiation from CT scans and the cost of the procedure. On
the other hand it enables the advantages of 3D modelling of structures
(Anderl at al., 1994). The use of this method was aimed at the skeletal
structures, which were not normally visible rather than soft tissue imaging
(Arvier at al., 1994). 3D computerised tomography was used in combination
with the stereolithography mainly to reproduce models but it was also seen as
a 3D imaging technique for soft and hard tissues. Many researchers reported
it to be an accurate and reliable measuring method (Matteson at al., 1989;
Waitzman at al., 1992). Waitzman at al. (1992) listed some problems
associated with CT images, including window setting, partial volume effects,
spatial uniformity and resolution, scan noise and artefacts to influence the
quality. Kragskov at al. (1997) could not find any evidence that 3D CT scans
were more reliable than conventional cephalographs for standard lateral and
frontal cephalometric points. Despite their value in reproducing 3D models as
these models are exceptionally important for internal hard tissue modelling for
72

Chapter I_____________________________________________________________________introduction
better diagnosis, simulation surgery, and reconstruction of defects (Santler et
al., 1998), they have very limited use for soft tissue imaging especially due to
the fact that repeated investigations are not possible because of the hazards
of radiation from the CT scan to the patient and repeated examination of soft
tissues especially in the postoperative period is essential for orthognathic
surgery.
1.8.6 The End of the Millennium
Kobayashi et al. (1990) used another method for three-dimensional analysis
of facial soft tissue morphology. They marked the reference points on the
face with a black eye-liner and two pairs of photographs were taken
simultaneously at an angle of 25 degrees from right and left sides of the face
with the head in a metal reference frame on which the standard points of
known three-dimensional values were set. From this data the computer
produced a "wire-frame" model of the face in three-dimensions. Although it
was useful for diagnosis, planning and assessment of postoperative changes,
and was easy and economical to use, it did not provide sufficient amount of
data to predict soft tissue change three-dimensionally and was relatively time
consuming as it required manual input of two-dimensional co-ordinates with a
digitiser.
Ayoub et al. (1996) developed a low-cost system called C3D-clinical, which
was based on the use of stereo television cameras and special textured
illumination to provide quick capture times. This system produced a lifelike
view of the face from any viewpoint in a process called photorealistic
73

Chapter I___________ introduction
rendering as well as shaded facial models and "wire-frame". The 3D model of
the face could be rotated, enlarged and measured in three-dimensions and
was based on photogrammetry. This system claimed to be accurate, cost
effective, non-invasive and simple to use. It also provided accurate
superimposition of soft and hard tissue images.
Apart from the optical surface scanner, which was a great leap in 3D imaging
in the 1990’s (section 4.7) Techalertpaisarn and Kuroda (1998) developed an
imaging system and reported their results for facial soft tissue changes in
mandibular prognathic patients. Their system was a high-speed patterned
light-digitising system. They located the patient in a cephalostat and the head
was positioned firmly against a headrest. The measuring unit had two liquid
crystal display projectors and two charge coupled device cameras placed at
either side of the cephalostat at a 45-degree angle to the patient's frontal
view. Black and white stripes were projected on the face and a charge
coupled device (CCD) camera formed three-dimensional co-ordinates of the
facial surface using trigonometric formulae. The authors claimed that the
errors pointed out by Bush and Antonyshyn (1996) for optical surface
scanners were reduced to minimum. The duration of digitisation was only 2
seconds reducing the motion artefact and variable facial expression. The
digitisation error was examined by the authors and differences were found to
be 0.1 to 0.6 mm in all planes. The method error for superimposition used in
this technique was within 0.5 mm for all reference points. None were
considered to have a significant clinical effect.
74

Chapter i_____________________________________________________________________introduction
Another important improvement was reported by Ayoub et al. (1998). They
used their recent C3D software (Ayoub at a/., 1996), which was based on
stereophotogrammetry. A computer controlled slide projector illuminated the
subject with a texture pattern to facilitate stereo matching. Thus a three-
dimensional polygonised face model could be produced which carried the
capabilities of their previous work in 1996. They reported this as an accurate,
non-invasive and cost-effective system, which captured the full face in a
length of time as short as 2 seconds.
Both of the latter systems fulfilled the basic requirements for three-
dimensional capture and would require controlled studies to assess their
accuracy and validity.
1.8.7 The Optical Surface Scanner
Any successful 3D measurement system not only has to be accurate but also
non-invasive to meet the requirements. Arridge and Linney (Arridge at a!.,
1985) designed and built an optical surface scanning system. The first version
of the system had two low power helium-neon laser beams, posing no risk to
the patient’s vision, projected on the face vertically and obliquely and
recorded from the front with a video camera. The reason they used two laser
beams was to eliminate blind spots due to shadowing by prominent features
like the nose. In the later version of the system, a single beam replaced the
two laser beams but the same goal was achieved by using specially set
mirrors reflecting the beam. Full 360-degree information was obtained by
rotation of the subject. The patient was seated in a chair that was rotated on a
75
Chapter i_____________________________________________________________________Introduction
platform under computer control. The patient’s head was located against a
headrest attached to the chair. The chair would rotate 15-30 seconds and the
extent and duration of the rotation would depend on the needs of the
particular scan taken. The data would be recorded by a charge coupled
device (CCD) camera. The acquired image was then produced using
approximately 4000 triangular surface elements and displayed only the facial
surface. A three-dimensional model of the face could be viewed interactively,
manipulated and analysed. This system was reproducible (Bush and
Antonyshyn, 1996; Soncul and Bamber, 2000), non-hazardous to the patient,
had a high resolution and did not involve contact with the patient’s face. Moss
et al. (1987) showed that even a change in the profiles produced by attaching
a small disc of 0.5 mm thick cardboard was easily detectable. It only
presented surface data but could be used together with a limited low dose CT
scan to provide information on bone structure. The same authors used the
two systems together in their latter study (Moss at a/., 1988). A similar study
was conducted by Girod at a/. (1995), who also integrated the 3D CT data of
the skull with 3D surface data acquired by optical scanning and simulated the
planned orthognathic surgery and computed the soft tissue changes resulting
from the shifting of bony segments.
McCance at a i (1992 a, 1992 b) and Moss at a i (1994) used the optical
surface scanning system to analyse the soft tissues of orthognathic surgery
patients and showed it to be simple to use, and non-invasive method of
measuring three-dimensionally. Aung at a i (1995) used the optical surface
scanner and concluded that the surface scanner could be a useful tool for
76

Chapter I_____________________________________________________________________Introduction
rapid facial measurements especially in the nasal and circumoral regions but
added that accurate localisation of landmarks and operator skills were
important in reliability of the results. Bush and Antonyshyn (1996) used a very
similar optical surface scanning system, which became commercially
available. They could clearly visualise all labelled landmarks on the digitised
image with a variance less than 0.6 mm in all planes. They worked on the
head inclination as well and found that the effect of the head inclination on
the reliability of landmark localisation was specific for each landmark and had
to be determined according to the purposes of the scan being taken, but
suggested a head inclination with the Frankfort plane elevated 10 degrees
from the horizontal produced optimal results. They listed some potential
errors. For example significant movement of the subject being scanned
degraded the image and the duration of the procedure was long enough for
the patient to move. Facial expressions during scanning could cause errors.
Coward et al. (1997) also used the same system. They favoured the
technique because being non-invasive it allowed repeated scanning to
produce a suitable image of sufficient resolution to clearly identify the
landmarks.
1.9 Morphometries
Morphometry, in Greek, means shape measurement. It was a standard
application of multivariate analysis till mid 1970’s. The transition of
morphometries into a discipline in its own right as a synthesis of geometry,
statistics and biology can be traced back as far as D’Arcy Thompson's ‘On
Growth and Form’ (1961). Thompson suggested that changes of biological
77

Chapter !_____________________________________________________________________Introduction
form could be modelled and described as mathematical smooth deformations.
There was not much progress in this area until Bookstein described
biorthogonal grid representation (Bookstein, 1978). Even after that methods
suggested by Bookstein (1984 a, 1984 b and 1986), Siegel and Benson
(1982) for analysis of shape in two dimensions were firmly based on the
movement of homologous landmarks, and this is not very suitable for gently
curving surfaces like the human face.
Several methods were used to measure the human face, in studies for
genetics, ethnic forms and norms for facial aesthetics. In orthognathic
surgery, morphometric studies have been done to measure shape change
and are rather limited in number. Euclidean distance matrix analysis (EDMA),
finite element analysis, mesh diagram analysis, thin-plate splines analysis are
reported by authors as methods for morphometries of the human face before
and after orthognathic surgery.
EDMA was proposed for comparison of shapes by Lele and Richtsmeier
(1991) and has been applied in studies of craniofacial structures, and Ayoub
et al. (1994) used it for assessment of chin surgery and reported it as a good
method for quantitative evaluation of surgical change as it did not depend on
a remote frame of reference or superimposition. In this analysis, basically
there are two matrices, one representing the initial structure and the other
representing the second shape and EDMA compares two by the ratios of
each pair of corresponding distances.
78

Chapter I_____________________________________________________________________Introduction
Finite element analysis is described as a system that estimates the
deformation that is expected to result from a specified pattern of stresses
(forces) upon a system. Motoyoshi et al. (1993) used it to observe the
influence of thickness and mechanical properties on changes in facial soft
tissue following simulation of orthognathic surgery.
The mesh diagram analysis is also an application of transformation grids
developed by Thompson (1961). Moorrees and Kean (1958) used it first in
orthodontic patients for their soft and hard tissue evaluations. It is composed
of a grid of rectangles scaled on the upper facial height and the facial depth.
This grid is distorted to fit the proportionate location of a patient's
cephalometric landmarks as compared to the norm to represent how that
individual face deviated from the norm (Lebret, 1985). It is usually applied to
lateral cephalographs but Ferrario at a i (1998) applied it to three-dimensional
space.
Thin-plate splines analysis is based on ideas of Thompson (1961) as well.
This analysis takes thin metal plates as a starting point and presents the
mechanical deformation and shape change as mathematical transformations
enabling quantitative and graphical evaluation of shape change (Bookstein,
1991). Coombes at a i (1991) claimed that the use of thin-plate splines in two-
dimensions was a constraint on the accuracy due to the small number of
homologous points on two curves but suggested use of it for further, in three-
dimensions. Singh at a i (1997) used thin-plate splines and fine element
analysis together for morphometry of cranial base and suggested that each
79

Chapter I_____________________________________________________________________introduction
technique had relative achievements and could provide useful information so
supported the use of any morphometric technique to provide a description,
which could be used to hypothesise a mechanism.
80

Chapter il___________________________________________________________Statement o f the problem
CHAPTER II
STATEMENT OF THE PROBLEM
AND
AIMS AND OBJECTIVES
81
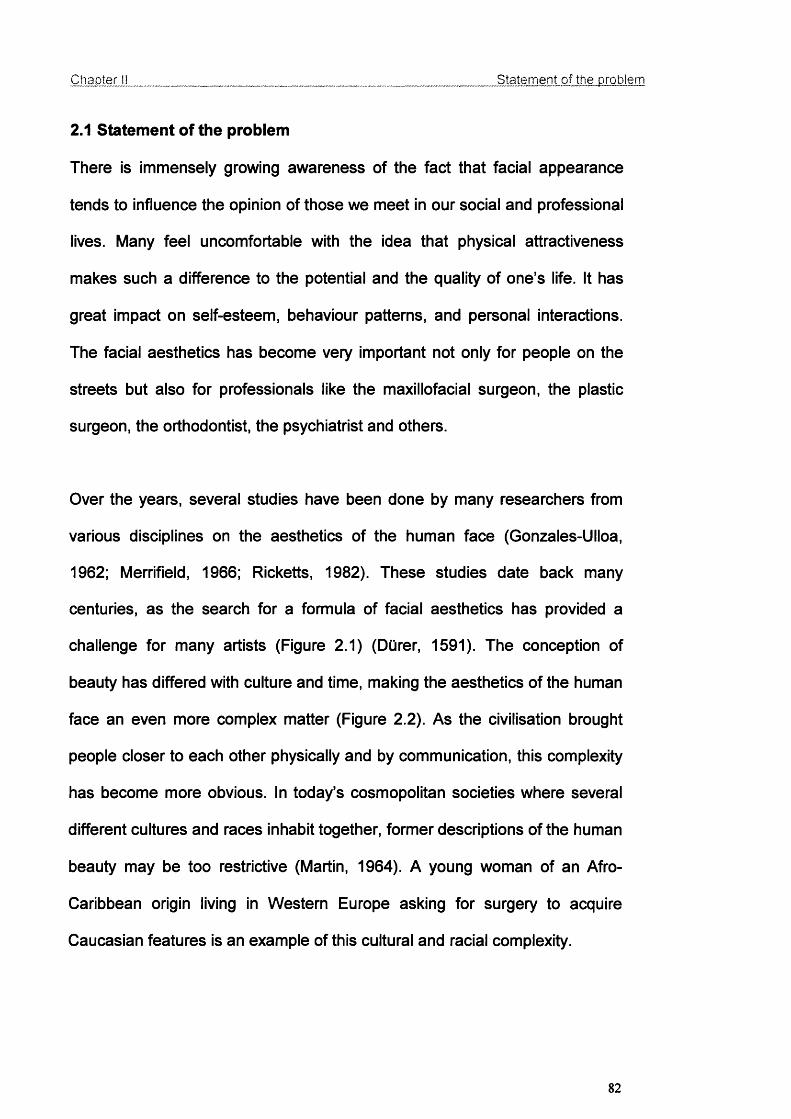
Chapter II___________________________________________________________Statement o f the problem
2.1 Statement of the problem
There is immensely growing awareness of the fact that facial appearance
tends to influence the opinion of those we meet in our social and professional
lives. Many feel uncomfortable with the idea that physical attractiveness
makes such a difference to the potential and the quality of one's life. It has
great impact on self-esteem, behaviour patterns, and personal interactions.
The facial aesthetics has become very important not only for people on the
streets but also for professionals like the maxillofacial surgeon, the plastic
surgeon, the orthodontist, the psychiatrist and others.
Over the years, several studies have been done by many researchers from
various disciplines on the aesthetics of the human face (Gonzales-Ulloa,
1962; Merrifield, 1966; Ricketts, 1982). These studies date back many
centuries, as the search for a formula of facial aesthetics has provided a
challenge for many artists (Figure 2.1) (Dürer, 1591). The conception of
beauty has differed with culture and time, making the aesthetics of the human
face an even more complex matter (Figure 2.2). As the civilisation brought
people closer to each other physically and by communication, this complexity
has become more obvious. In today’s cosmopolitan societies where several
different cultures and races inhabit together, former descriptions of the human
beauty may be too restrictive (Martin, 1964). A young woman of an Afro-
Caribbean origin living in Western Europe asking for surgery to acquire
Caucasian features is an example of this cultural and racial complexity.
82

Chapter II Statement of the problem
Figure 2.1- Masters of art were the first researchers of the human face aesthetics.
Michelangelo’s ‘David’ (1501-1504) at Accademia delle Belle Arti in Florence (left), da Vinci’s
‘Portrait of Isabella d’Este’ (1499) at Musee du Louvre in Paris (middle), and DCirer’s ‘Portrait
of a Young Venetian Woman’ (1505) at Kunsthistorisches Museum in Vienna (right) were
created with the knowledge gathered by the artists’ many observations and sketches on the
proportions of the human face and body.
Figure 2.2- The conception of beauty has differed from one culture to the other. On the left, a
reserve head from the reign of Khufu during the Fourth Dynasty (from Kunsthistorisches
Museum, Vienna), in the middle, the Head of a Blond Youth’ made around 485 BC (from
Acropolis Museum, Athens), and on the right, a male head from Benin made around 15̂ ""
century (from National Museum of African Art) show the difference between the concept of
beauty for ancient Egyptians, ancient Greeks and Africans.
83

Chapter II Statement of the problem
Figure 2.3- The media Imposing Caucasian features as an ideal; on the left, the cover of a
beauty and fashion magazine published in the UK, in the middle, the cover of a worldwide
magazine published in India, and on the right, a Korean model appearing in a worldwide
magazine's Korean version.
The media sources have been imposing the Western European or North
American Caucasian facial features as an ‘ideal’ for facial aesthetics (Figure
2.3). Most of the research done in the field also concentrated on the Western
faces, giving not much information for the rest of the racial identities (Riedel,
1957; Peck and Peck, 1970). The existing research which had concentrated
on facial features of Afro-Caribbean and Oriental individuals is insufficient as
the facial features vary immensely also within these groups (Martin, 1964). It
is difficult to evaluate populations of South-East Asia, for example, using the
Oriental standards since there are differences within these groups. Similar
problems are faced as one tries to categorise an individual from the Indian
sub-continent. The facial features will be extensively different to the Oriental
features and probably more similar to Caucasians. The characteristics of the
Caucasians as described in the scientific literature are also difficult to meet
the features of all Caucasian groups. The difference between the Western
European Caucasian to the Eastern European Caucasian, which is actually
geographically closer to ‘Caucasus’, can be prominent. The cross marriages
84

Chapter II___________________________________________________________ Statement of the problem
between different ethnic groups in today’s cosmopolitan society have also
made this matter more complex. For these reasons, a more up to date
overview of the ethnic facial aesthetics was one of the aims of this study.
Beauty and ugliness are certainly not phenomena in the single individual, but
are social phenomena of the utmost importance. Therefore, people with facial
deformities have sought the help of surgical procedures for the correction of
their disfigurement, which they may have difficulty in coming to terms with.
The diagnosis, treatment planning, prediction and evaluation of the outcomes
of the treatment can be more challenging than the actual surgical procedure
to correct the facial disfigurement. The examination and investigation to point
out the problem is crucial. The major difficulty in examination to reach a
correct diagnosis lies behind the lack of an accurate imaging system. For
decades, long into the last century, lateral skull radiographs have been the
major tool for clinicians to detect three-dimensional deformities on a complex
three-dimensional structure with the limitations of a two-dimensional imaging
technique. These limitations in detecting the problem add to limitations in
following up the outcomes of the correction (Rakosi, 1982). Several
techniques to compensate the limitations of lateral skull radiographs and
recent improvements in cephalometrics did not solve the poor reproducibility
problems although these were accepted as useful clinical tools for diagnosis,
prediction, treatment planning and evaluation of the results in the absence of
anything better (Figure 2.4). Many researchers tried to develop better imaging
techniques including three-dimensional ones but none proved to be
satisfactory (Haga et al., 1964; Burke and Beard, 1967; Robertson and Volp,
85

Chapter II Statement of the problem
1981; Rabey, 1977-78 a,b; Waitzman et ai, 1992). This study aimed to
validate and utilise one of the later 3-dimensional imaging techniques, the
optical surface scanner, which is becoming a widely accepted clinical tool in
determination of facial deformities and the follow up for orthognathic surgery
(Arridge at al., 1985). Its reproducibility was compared with the conventional
cephalograph.
Jt
Figure 2.4- The conventional lateral cephalograph is unable to show complex 3D structures of
the skull and facial soft tissues (left), whereas, optical surface scans is a 3D imaging system,
which can illustrate the facial soft tissues with high degree of accuracy (right).
The prediction and follow-up evaluation of the facial soft tissue changes has
been a problem for maxillofacial surgeons. Although the surgery is performed
by shifting bony structures underlying the soft tissues by correcting the
apparent deformity, the outcome is expected to reflect in the soft tissue mask,
which we see in 3D, and as the need for the patients to be well informed is on
the rise, the need for an accurate three-dimensional imaging tool has become
more essential.
In order to produce both a graphical and a quantitative representation of the
surgical change, this study used the supplementary functions of the optical
surface scanner software, and to enhance and confirm these results, and to
86
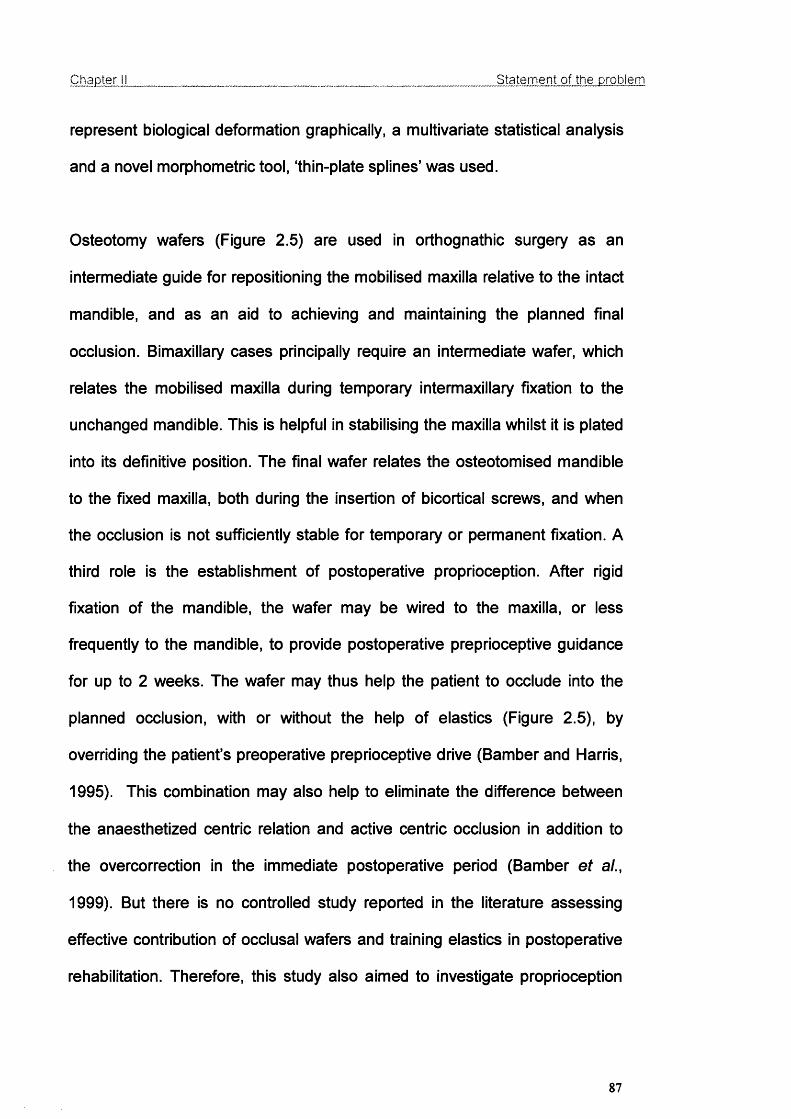
Chapter I!___________________________________________________________Statement o f the problem
represent biological deformation graphically, a multivariate statistical analysis
and a novel morphometric tool, ‘thin-plate splines' was used.
Osteotomy wafers (Figure 2.5) are used in orthognathic surgery as an
intermediate guide for repositioning the mobilised maxilla relative to the intact
mandible, and as an aid to achieving and maintaining the planned final
occlusion. Bimaxillary cases principally require an intermediate wafer, which
relates the mobilised maxilla during temporary intermaxillary fixation to the
unchanged mandible. This is helpful in stabilising the maxilla whilst it is plated
into its definitive position. The final wafer relates the osteotomised mandible
to the fixed maxilla, both during the insertion of bicortical screws, and when
the occlusion is not sufficiently stable for temporary or permanent fixation. A
third role is the establishment of postoperative proprioception. After rigid
fixation of the mandible, the wafer may be wired to the maxilla, or less
frequently to the mandible, to provide postoperative preprioceptive guidance
for up to 2 weeks. The wafer may thus help the patient to occlude into the
planned occlusion, with or without the help of elastics (Figure 2.5), by
overriding the patient’s preoperative preprioceptive drive (Bamber and Harris,
1995). This combination may also help to eliminate the difference between
the anaesthetized centric relation and active centric occlusion in addition to
the overcorrection in the immediate postoperative period (Bamber et al.,
1999). But there is no controlled study reported in the literature assessing
effective contribution of occlusal wafers and training elastics in postoperative
rehabilitation. Therefore, this study also aimed to investigate proprioception
87

Chapter II Statement o f the problem
after orthognathic surgery and observe the effects of final occlusal wafer and
training elastics.
Figure 2.5- Occlusal wafer (top), and training elastics (bottom).
88
Chapter II___________________________________________________________ Statement o f the problem
2.2 Aims and objectives
The overall aims and objectives of this programme were to improve the
diagnosis, planning and prediction of the outcome of orthognathic surgery by:
1. Evaluating the norms of facial aesthetics.
2. Reviewing the differences of facial aesthetics between three ethnic
groups.
3. Validating the use of the optical surface scanner as a three-dimensional
imaging tool by comparing it to a conventional technique and testing its
reproducibility.
4. Investigating the facial soft tissue changes following orthognathic surgery
using the optical surface scanner, and presenting a graphical and
quantitative representation of the change using a morphometric tool, thin-
plate splines.
5. Evaluating the postoperative use of final occlusal wafer and training
elastics and their role in the postoperative proprioception.
89

Chapter III_______________________________________________ Review of ethnic facial aesthetics
CHAPTER
REVIEW OF ETHNIC FACIAL AESTHETICS
90

Chapter III_______________________________________________ Review of ethnic facial aesthetics
3.1 Introduction
Beauty is not an individual phenomenon, but a social phenomenon of the
utmost importance. There is a natural and sometimes unconscious attraction
to a beautiful person.
Ever since man has tried to define the different components of beauty in
order to be able to recreate it in art, he has searched for formulae of beauty
and methods of measurement and appreciation (Gonzales-Ulloa, 1962).
Ancient Egypt was one of the first known cultures to express facial beauty in
art and memorial sculpture in the Nile valley approximately 5000 years ago.
The statuary of Egyptian royalty found in monuments and tombs display the
Egyptian ideal of beauty, harmony, and proportion, while maintaining only a
vague resemblance to the persons represented (Figure 3.1). On the other
hand, the southern parts of the African continent had different ways of
understanding and appreciating beauty (Figure 3.2).
The classical Hellenic culture comes into sight as the first to sensitively
express the qualities of facial beauty through sculpture and philosophy. They
were followed by the Romans (Figures 3.3 and 3.4). The archaeological finds
that date back to Roman Britain shows similar examples (Figure 3.5). Greek
philosophers, notably Plato and Aristotle, questioned the intrinsic meaning of
beauty and introduced 'aesthetics' as both the study of beauty and the
philosophy of art.
91
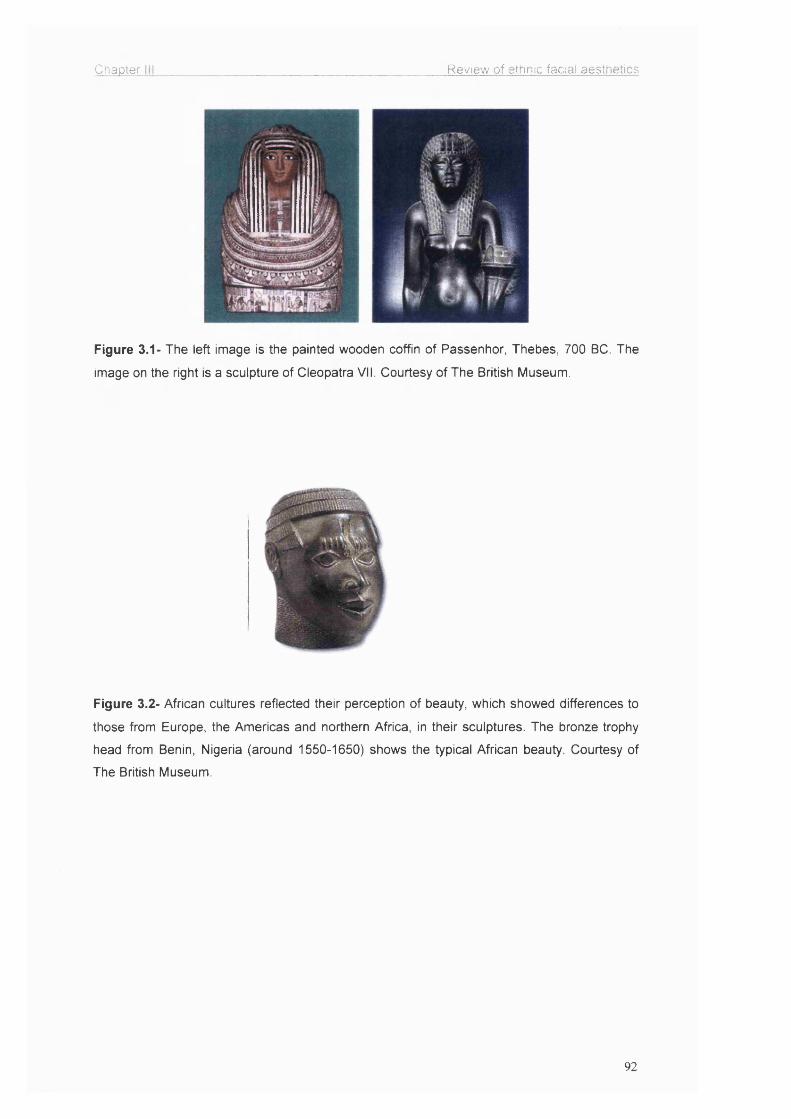
Chapter Review of ethnic facial aesthetics
Figure 3.1- The left image is the painted wooden coffin of Passenhor, Thebes, 700 BC. The
image on the right is a sculpture of Cleopatra VII. Courtesy of The British Museum.
Figure 3.2- African cultures reflected their perception of beauty, which showed differences to
those from Europe, the Americas and northern Africa, in their sculptures. The bronze trophy
head from Benin, Nigeria (around 1550-1650) shows the typical African beauty. Courtesy of
The British Museum.
92

Chapter ill Review of ethnic facial aesthetics
Figure 3.3- Head of Emperor Augustus from Monroë (Nubia), 27-25 BC as an example of
Roman facial aesthetic norms. Courtesy of The British Museum.
Figure 3.4- Ideas of beauty and perfection change with time and culture. For example, ancient
Greek ideals of male beauty can be seen in these marble statues. Courtesy of The British
Museum.
Figure 3.5- Cavalry sports helmet from Rochester, Britain, (late 1 st-early 2nd century AD)
shows the similarity of the Western European Caucasian facial characteristics to today.
Courtesy of The British Museum.
93

Chapter III Review of ethnic facial aesthetics
Just like the ancient sculptures and paintings famous artists during the last
millennium, especially during the Renaissance convey us the perception of
contemporary beauty with their immaculate work (Figure 3.6).
Figure 3.6- The replica of Michelangelo's 'David' in Caesar's Palace (left). The Venus detail
from 'The birth of Venus' (1485) by Botticelli in Florence (right). Such classical models, along
with mathematical ideas of proportion and ratio, were taken up in the 15th century Italy (the
Renaissance) and became the standard by which Western art was made and judged for
centuries, which affected the perception of human facial aesthetics to our time.
As early as 15̂ ̂ century, artists like Dürer and da Vinci studied the human
body and face proportions. Dürer is the first artist who is known to have
painted a self-portrait (Figure 3.7) and he had a great knowledge of human
facial aesthetics based on diagrams defining facial proportions, which are
considered to be applicable to the norms accepted today. Leonardo da Vinci
is another artist of the same era who produced immaculate pieces of art and
many study drawings of the human face and body (Figure 3.8).
94

Chapter III______________________________________________ Review of ethnic facial aesthetics
Figure 3.7- The self-portrait of Dürer at the age of 28 (1500), who produced similarly perfect
portraits due to his great interest and knowledge of human facial proportions (from Alte
Pinakothek, Munich) as well as his unique talent.
Figure 3.8- Leonardo da Vinci's 'Study of Grotesque Heads' (1490) from the Royal Library,
Windsor Castle and 'Head of a Woman' (1510) from Musee Bonnat, Bayonne.
What do we know about people's tastes of facial aesthetics today? Do most
people like the same faces, are they influenced by fashion, or are their
aesthetic preferences as random and diversified as their backgrounds and
experiences? Our tastes are, to a large extent, fostered by our culture and
influenced by multiple factors such as the mass media. Seldom can a
member of society completely isolate himself from these universal influences.
These factors have a profound influence on our aesthetic judgement and
preferences, setting unconscious standards of beauty. Nevertheless, although
some aspects of the judgement of facial beauty may be influenced by culture
95
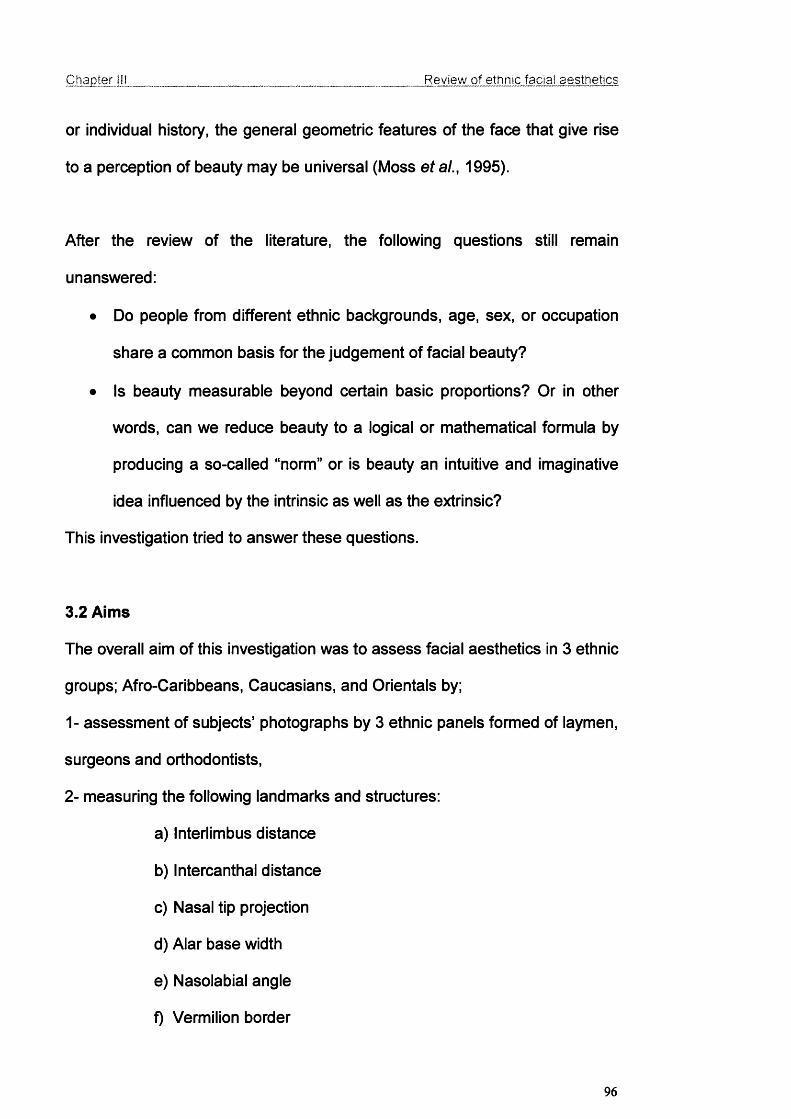
Chapter III_______________________________________________ Review of ethnic facial aesthetics
or individual history, the general geometric features of the face that give rise
to a perception of beauty may be universal (Moss et a/., 1995).
After the review of the literature, the following questions still remain
unanswered:
• Do people from different ethnic backgrounds, age, sex, or occupation
share a common basis for the judgement of facial beauty?
• Is beauty measurable beyond certain basic proportions? Or in other
words, can we reduce beauty to a logical or mathematical formula by
producing a so-called “norm” or is beauty an intuitive and imaginative
idea influenced by the intrinsic as well as the extrinsic?
This investigation tried to answer these questions.
3.2 Aims
The overall aim of this investigation was to assess facial aesthetics in 3 ethnic
groups; Afro-Caribbeans, Caucasians, and Orientals by;
1- assessment of subjects’ photographs by 3 ethnic panels formed of laymen,
surgeons and orthodontists,
2- measuring the following landmarks and structures:
a) Interlimbus distance
b) Intercanthal distance
c) Nasal tip projection
d) Alar base width
e) Nasolabial angle
f) Vermilion border
96

Chapter 111_______________________________________________ Review of ethnic facial aesthetics
g) Lip-incisor relationship
h) Oral commissural width
i) Chin profile.
j) Upper lip length
k) Chin depth
3- analysing a normal ratio of facial soft tissue structure of the least and most
favoured faces in the 3 ethnic groups.
3.3 Materials and methods
3.3.1 Selection of subjects
48 adult males and females (Figure 3.9) between the ages of 18 to 33 from
three different ethnic groups (Afro-Caribbeans, Caucasians, and Orientals)
were included in this investigation. The subjects were labelled from number 1
to 48 (Table 3.1). Black and white photographs were taken in three different
views; frontal, at smiling, and lateral view.
48 subjects in totalSubject number 1 to 8 Oriental females
9 to 16 Oriental males
17 to 24 Afro-Caribbean males
25 to 32 Afro-Caribbean females
33 to 40 Caucasian females
41 to 48 Caucasian males
Table 3.1- Subjects in the investigation
97
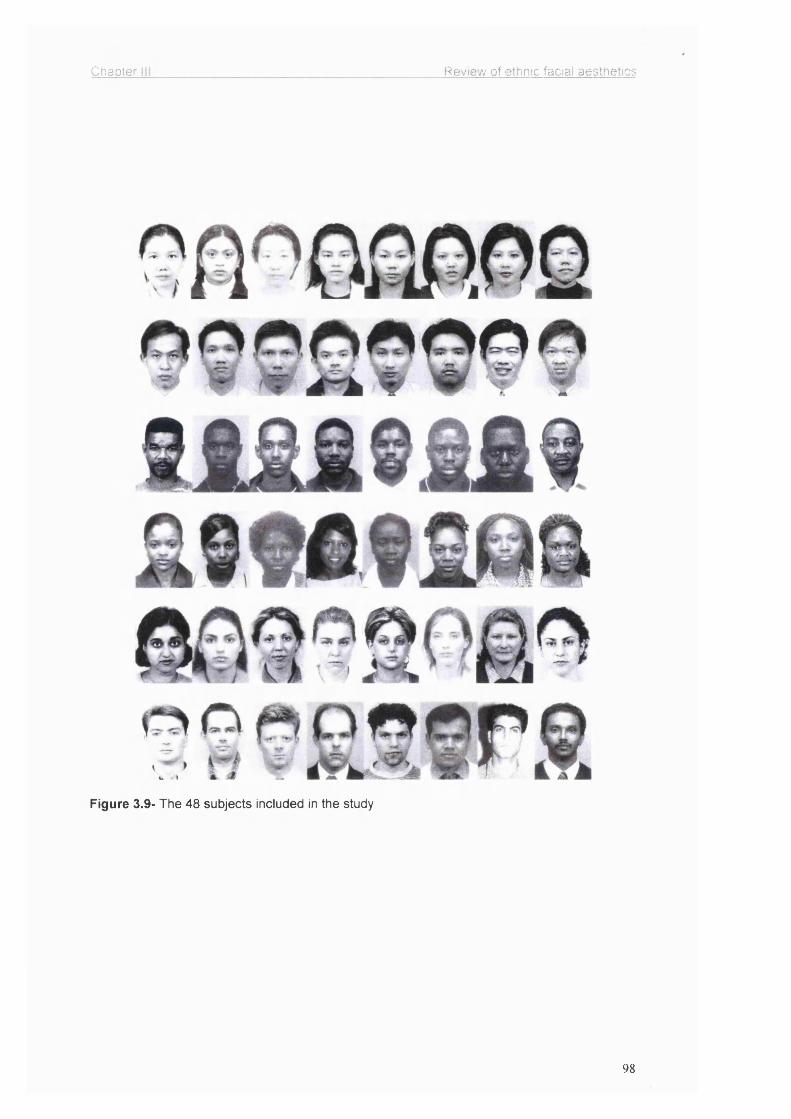
Chapter Review of ethnic facial aesthetics
Figure 3.9- The 48 subjects included in the study
98

Chapter III Review of ethnic facial aesthetics
The subjects were chosen in equal numbers; 8 females and 8 males from
each ethnic group. During the selection of the subjects, all efforts were made
to choose subjects who were representative of these ethnic groups. They
were randomly selected from students and staff at University College London,
Kingsway College, and also the general public. The subjects were
photographed in the Photographic Department at the Eastman Dental
Institute. Three photographs of each subject were taken under same
conditions, by the same photographer and the same camera; two frontal full-
face, one with the face at rest, one with a natural smile and one lateral profile.
In the lateral view the head was positioned so that the Frankfort plane was
parallel to the floor and the median sagital plane of the patient was parallel to
the plane of the film, with the optical axis of the camera lens passing through
the orbitale. The subjects were not wearing any make-up when
photographed.
3.3.2 Selection of panel
An equally mixed panel of 12 maxillofacial surgeons, 12 orthodontists, and 12
laymen were selected from 3 different ethnic groups. Their ages ranged
between 18-40. (Table 3.2)
Afro-Caribbean
Panel (n=36)
Oriental Caucasian
4 Laymen (2 F, 2 M) 4 Laymen (2 F, 2 M) 4 Laymen (2 F, 2 M)
4 Surgeons (2 F, 2 M) 4 Surgeons (2 F, 2 M) 4 Surgeons (2 F, 2 M)
4 Orthodontists (2 F, 2 M) 4 Orthodontists (2 F, 2 M) 4 Orthodontists (2 F, 2M)
KEY: F = Female, M = Male
Table 3.2- The panel consisting of 9 sub-panels.
99

Chapter III_______________________________________________ Review of ethnic facial aesthetics
Although the initial plan was to form the professional panel of consultants,
due to the lack of sufficient number of Afro-Caribbean and Oriental
consultants, the panels were made up from MSc students, senior house
officers and registrars.
3.3.3 Method of panel assessment
The panel assessed and ranked the photographs together in sub-panels by
discussing each case. The photographs were spread on a board in front of
the panel then the panel was asked to rank the most beautiful male/female
subject in each ethnic group as number 1 to the least beautiful male/female
subject as number 8. Where there was a disagreement, the opinion of the
majority was accepted. Every subject was assessed by nine sub-panels. In
this way the most and the least beautiful male and female were identified in
each ethnic group. The data were then collected to be used for statistical
analysis.
Additionally the photographs were sent to Malaysia, and assessed and
ranked by 8 local maxillofacial surgeons individually. This would enable
inclusion of another sub-panel, of Oriental ethnicity in their local milieu, as
opposed to the other sub-panels of different ethnic backgrounds under a
western European influence.
100

Chapter III_______________________________________________ Review o f ethnic facial aesthetics
3.3.4 Clinical facial measurements
The following data were measured clinically and recorded:
a. Skeletal relationship
b. Anterior open bite
c. Overjet
d. Overbite
e. Facial asymmetry
f. Upper dental midline to facial midline
g. Lower dental midline to facial midline
h. Chin point to facial midline
i. Chin position
j. Maxillary incisor exposure at rest
k. Maxillary incisor exposure at smile
I. Upper vermilion width (minimum)
m. Upper vermilion width (maximum)
n. Lower vermilion width
o. Alar base width
p. Intercanthal distance
q. Interlimbus distance
r. Oral commissural width
s. Occlusal plane
t. Nasolabial angle
u. Upper lip length
V. Chin depth
101

Chapter III_______________________________________________Review of ethnic facial aesthetics
All the measurements were taken using a Vernier calliper (Figure 3.10). The
chin position was assessed, by using a combination of Gonzales-Ulloa (1962)
and Obwegeser's (Obwegeser and Marentette, 1986) methods by drawing a
horizontal line from upper tragus, parallel to the Frankfort plane. Then a
vertical line (facial plane) was drawn from glabella to the soft tissue menton,
perpendicular to the horizontal line. The position of the chin was measured in
relation to the vertical line (Figure 3.11). A chin towards to the line was
marked as positive, otherwise negative, i.e. anterior to the vertical line.
Figure 3.10- Clinical measurements were taken using a Vernier calliper.
102

Chapter III Review of ethnic facial aesthetics
Figure 3.11- The chin position was assessed by drawing a horizontal line from upper tragus,
parallel to the Frankfort plane, then a vertical line (facial plane) was drawn from glabella to the
soft tissue menton, perpendicular to the horizontal line. The position of the chin was measured
in relation to the vertical line.
3.4 Results
3.4.1 Panel assessment
The mean rank and the range of ranks awarded to the subjects by the panels
are summarised in charts (Figures 3.12-3.29). The results of the Malaysian
panel are in Figure 3.30.
103

Chapter III Review of ethnic facial aesthetics
Figure 3.12- Ranking of Oriental females by surgeons
Rank
Rank
876543210
- Maximum
□ Median
-Minimum
2 1 8 37 6 5 4Subject number
Figure 3.13- Ranking of Oriental males by surgeons
876543210
-Maximum
□ Median
Minimum
13 9 11 14 12 15 1610Subject number
Figure 3.14- Ranking of Afro-Carlbbean females by surgeons
Ranks
- Maximum
□ Median
- Minimum
30 26 32 27 2928 31 25
Subject number
104
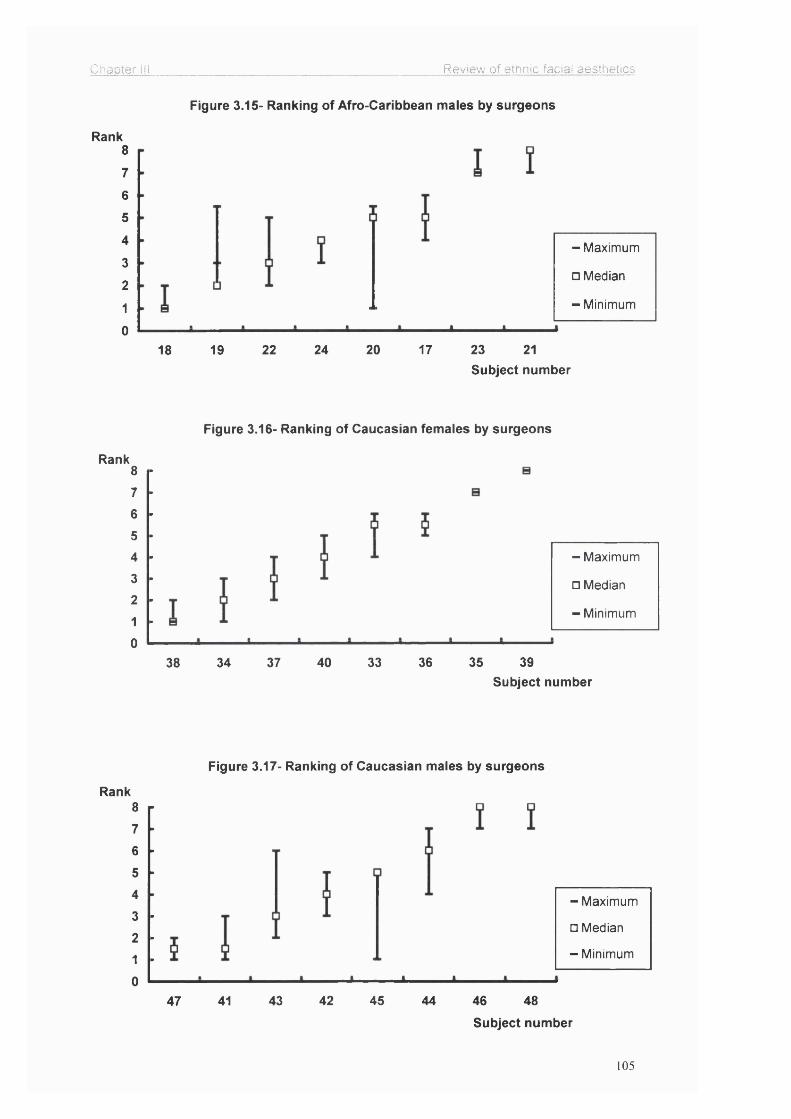
Chapter III Review of ethnic facial aesthetics
Figure 3.15- Ranking of Afro-Caribbean males by surgeons
Rank8
7
6
5
4 -Maximum3
□ Median2
- Minimum1
024 20 17 23 2118 19 22
Rank
Rank
Subject number
Figure 3.16- Ranking of Caucasian females by surgeons
8
76
5432
10
- Maximum
□ Median
- Minimum
37 40 33 36 35 3938 34Subject number
Figure 3.17- Ranking of Caucasian males by surgeons
876
54321
0
- Maximum
□ Median
- Minimum
43 42 45 46 4847 41 44
Subject number
105
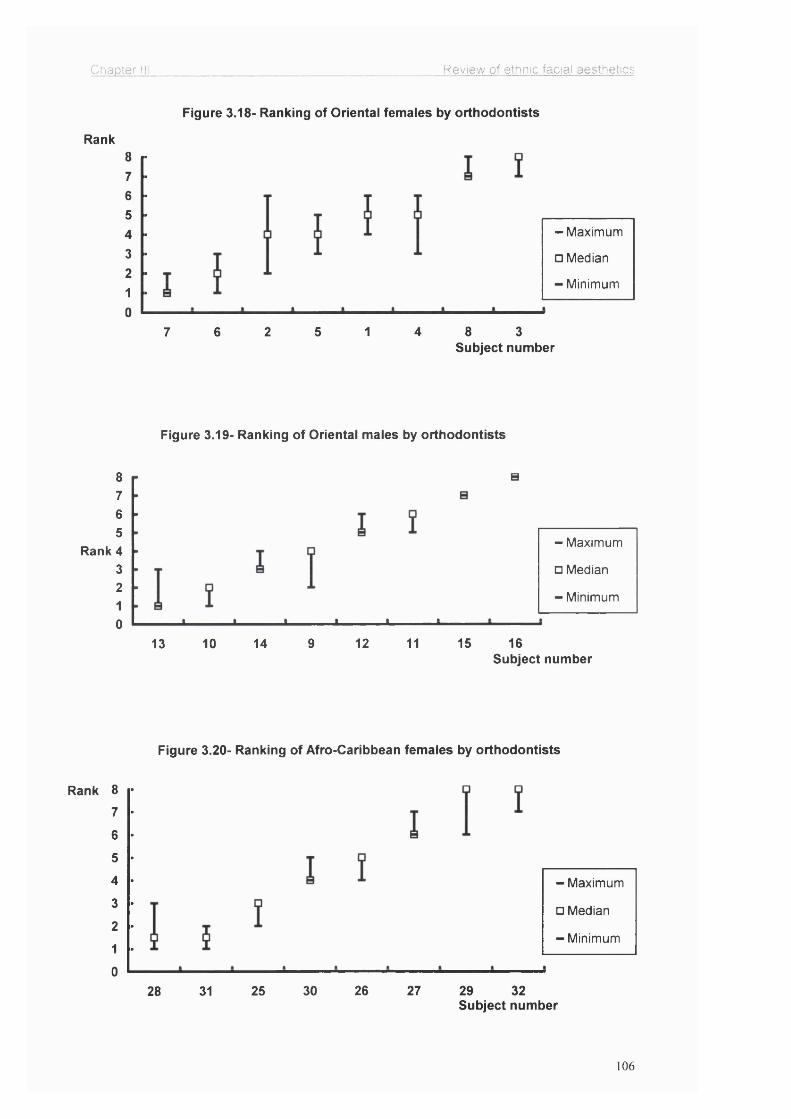
Chapter Hi Review of ethnic facial aesthetics
Figure 3.18- Ranking of Orientai femaies by orthodontists
Rank876543210
- Maximum
□ Median
Minimum
2 1 4 8 37 6 5Subject number
Figure 3.19- Ranking of Orientai maies by orthodontists
8765
Rank 4 3 2 1 0
- Maximum
□ Median
- Minimum
1610 14 9 12 11 1513Subject number
Figure 3.20- Ranking of Afro-Caribbean femaies by orthodontists
Rank 8
7
6
5
4
3
2
1
0
- Maximum
□ Median
- Minimum
30 26 27 29 3228 31 25Subject number
106

Chapter III Review of ethnic facial aesthetics
Figure 3.21- Ranking of Afro-Caribbean males by orthodontists
Rank
Rank
Rank
876543210
- Maximum
□ Median
-Minimum
19 22 24 20 17 23 2118Subject number
Figure 3.22- Ranking of Caucasian females by orthodontists
876
5432
10
- Maximum
□ Median
- Minimum
38 40 36 33 37 35 3934Subject number
Figure 3.23- Ranking of Caucasian males by orthodontists
8765432
10
- Maximum
□ Median
- Minimum
43 45 4642 41 48 4447Subject number
107

Chapter III Review of ethnic facial aesthetics
Figure 3.24- Ranking of Orientai femaies by iaymen
Rank8
76
54
32
1
0
-Maximum
□ Median
-Minimum
6 4 1 2 a 37 5Subject number
Figure 3.25- Ranking of Orientai maies by iaymen
Rank876543210
- Maximum
□ Median
- Minimum
10 13 14 11 9 12 15 16Subject number
Figure 3.26- Ranking of Afro-Caribbean femaies by iaymen
Rank876543210
- Maximum
□ Median
- Minimum
30 26 27 32 2928 31 25Subject number
108

Chapter III Review of ethnic facial aesthetics
Figure 3.27- Ranking of Afro-Caribbean males by laymen
Rank
Rank
876
5432
10
- Maximum
□ Median
Minimum
22 24 20 17 21 2318 19Subject number
Figure 3.28- Ranking of Caucasian females by laymen
876543210
- Maximum
□ Median
- Minimum
37 3938 34 40 36 35 33Subject number
RankFigure 3.29- Ranking of Caucasian males by laymen
8
7
6
5
4
3- Maximum
□ Median2
-Minimum1
04643 45 4842 41 4447
Subject number
109

Chapter III_______________________________________________Review of ethnic facial aesthetics
Rank8 - r « T # V — — — — — — — # — ̂ T
O p '7 - f a — — 0 “ ^ 0 — T 0 0 —
! 0 0 6 -tr — T 0 ^ “ ^ 0 — — 0 — — O
o q5 -^1 — o — 0 0 0 P “ o — — , — — — — —
P
P 0 03-1- 0 O 0 # I " " " O — ^ — 0 " 0 —
2 + —p — i o — o — ij: 0 "0 0 0
1 2 3 4 5 6 7 I 9 10 11 12 13 14 15 16 17 18 19 20 21 22 23 24 25 2S 27 2B 29 30 31 32 33 34 35 36 37 3 t 39 40 41 42 43 44 45 46 47 4<
Subject number ;— — ------------— —------------ --------------- ,- Minimum o Median - Maximum I
Figure 3.30- Ranking of subjects (Subject numbers 1-16; Caucasians, 17-32: Afro-
Caribbeans, 33-48: Orientals) by the Malaysian panel.
3.4.2 Analytical statistics of panel assessment
Rank correlations were calculated between types of panel both within and
between the three groups of operator. All showed high degrees of correlation
(p=. 821), indicating broad agreement in ranking for the 48 subjects.
Estimations were made of the coefficient of variation in ranking
a. For each subject,
b. For each panel type.
Coefficient of variation = Standard Deviation / mean
(Armitage and Berry, 1987)
SD X 100
Parametric and non-parametric tests on coefficients of variation were carried
out as follows:
110

Chapter il!_______________________________________________ Review of ethnic facial aesthetics
a) The difference between the 6 groups of subjects (ANOVA and Kruskal
Wallis tests). These showed no statistically significant difference between the
groups in variation in ranking.
b) The difference between genders (Student T test and Mann - Whitney “u”
test). These showed no statistically significant difference between genders in
the variation in ranking.
c) The difference between ethnic groups of subjects (ANOVA and Kruskal
Wallis tests). These show no statistically significant difference between ethnic
groups in the variation in ranking.
d) The difference between 12 subjects with the highest mean rank and 12
with the lowest mean rank (Student T test and Mann - Whitney “u” test).
These showed a highly statistically significant difference (p< .001) between
the two groups in the variation in ranking. Those with the lowest mean ranks
showed less variation in their ranking.
e) The difference between the 3 types of panel (ANOVA and Kruskal Wallis
tests). These showed no statistically significant difference in variation in
ranking between panels made up of laymen, orthodontists, and surgeons.
Ill

Chapter III Review of ethnic facial aesthetics
3.4.3 Facial measurements
Facial measurements are summarised (Table 3.3) separately for each ethnic
group and gender. Table 3.4 shows the mean of the 2 most beautiful and the
2 least beautiful subjects in each group and gender.
Measurement
(mm)
Afro-Caribbean
N=16
Caucasian
N=16
Oriental
N=16
mean (mm) ± SD
male female male female male female
Overjet 1.9 ± 1.7 2.0 ± 1.6 2.9 ± 2.2 3.4 ±2.8 2.1 ± 2 .8 2.0 ± 0.9
Overbite 1.5 ± 1.2 1.9 ± 1.6 2.1 ± 0.8 2.1± 1.2 2.1±2.1 2.0 ±1.0
Chin position 0.4± 6.3 -2.2 ± 2.2 -2.4±3.6 -4.4± 3.2 0.2±5.1 -1.9±3.8
Max. incisor exposure
2.4+ 1.7 2.6± 1.2 3.3±1.8 4.1±1.5 1.9±1.7 2.7 ±1.9
Upper vermilion 11.0+1.7 10.4+1.5 7.6 ±1.3 6.3 ±1.6 8.1±.1.4 9.3 ±0.9
Lower vermilion 13.0 ±1.9 12.6+1.3 9.5±0.9 8.3 ±2.3 10.0 ±1.4 10.0±1.1
Alar base 43.9±4.1 38.4±5.0 36.2±3.2 31.5±2.2 41.2±4.0 36.0±2.5
Intercanthaldistance
33.8±1.5 34.6+5.6 32.4±2.4 28.5±2.1 35.1 ±2.6 33.1±1.9
Interlimbusdistance
52.8±1.8 50.4±1.7 51.8±2.3 48.0±1.7 52.5±1.6 50.0±1.6
Commissuralwidth
54.9±3.4 52.9+2.3 52.1±3.6 48.5±1.8 51.4±4.8 49.4±4.2
Nasolabialangle
93.1±5.3 94.4+5.0 98.0±6.0 101.0±1.1 91.9±6.5 99.0±7.8
Upper lip length 26.2±2.2 22.8±3.0 23.0±2.0 21.0±2.7 25.0±3.3 22.5±2.1
Chin depth 45.0±8.7 43.6±2.3 47.6±1.8 42.8±2.7 45.5±4.3 42.8±2.9
Table 3.3- Summary data of facial measurements in 3 ethnic groups
Key: Chin position is measured related to the facial plane (Figure 3.11).
112

Chapter III Review of ethnic facial aesthetics
Afro-Caribbean Caucasian Oriental
Measurements
(mm)
male
n=2
female
n=2
male
n=2
female
n=2
male
n=2
female
n=2
Overjet 3.0 2.0 2.0 3.0 4.0 2.0
Overbite 2.5 2.0 2.0 2.5 3.0 1.5
Chin position 2.0 -2.0 0.0 -.05 -1.0 0.0
Max. incisor exposure 4.0 4.0 3.0 4.0 3.0 3.0
Upper vermilion 12.0 10.0 7.0 7.5 9.0 10.0
Lower vermilion 13.5 12.0 10.0 10.0 10.5 11.0
Alar base 38.5 34.0 34.5 30.0 38.0 34.0
Intercanthal distance 34.0 33.5 34.0 30.0 37.0 35.0
Interlimbus distance 52.5 52.0 52.5 49.0 53.0 50.0
Commissural width 50.5 50.0 53.0 50.0 53.0 49.0
Nasolabial angle 97.5 100.0 100.0 97.5 92.5 95.0
Upper lip length 24.0 21.5 23.0 19.0 22.0 20.0
Chin depth 48.0 43.0 47.0 42.5 45.0 41.0
Table 3.4- Comparison of the facial measurements between the most beautiful subjects in 3
ethnic groups.
Key = Chin position is measured in profile view related to the facial plane (Figure 3.11).
The facial measurements in Table 3.4 showed no significant difference
between the most beautiful subjects in different ethnic groups, with the
exception of the alar base width, which is broader in Afro-Caribbeans and
Orientals, and the vermilion border, which is broader in Afro-Caribbeans. This
shows that, generally, the intercanthal distance is equal to the alar base and
similarly, the interlimbus distance is equal to the commissural width in the
most beautiful subjects.
113
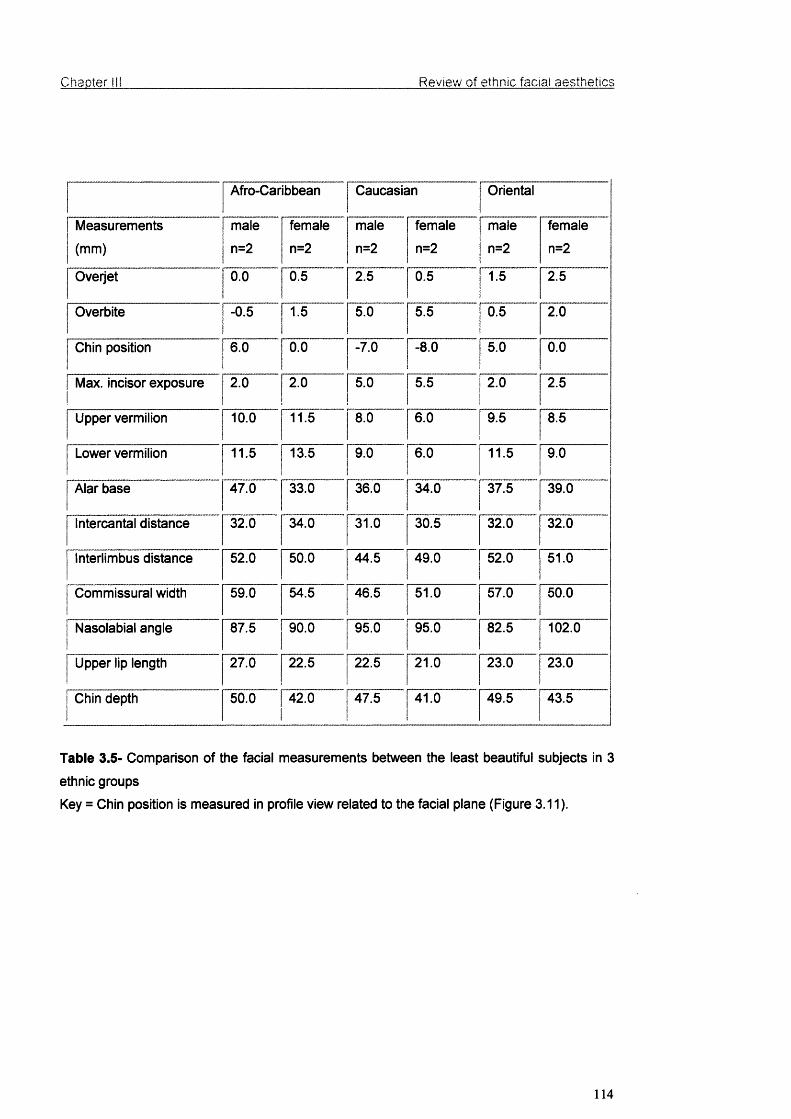
Chapter III Review of ethnic facial aesthetics
Afro-Caribbean Caucasian Oriental
Measurements
(mm)
maie
n=2
female
n=2
maie
n=2
femaie
n=2
male
n=2
female
n=2
Overjet 0.0 0.5 2.5 0.5 1.5 2.5
Overbite -0.5 1.5 5.0 5.5 0.5 2.0
Chin position 6.0 0.0 -7.0 -8.0 5.0 0.0
Max. incisor exposure 2.0 2.0 5.0 5.5 2.0 2.5
Upper vermiiion 10.0 11.5 8.0 6.0 9.5 8.5
Lower vermilion 11.5 13.5 9.0 6.0 11.5 9.0
Aiar base 47.0 33.0 36.0 34.0 37.5 39.0
Intercantai distance 32.0 34.0 31.0 30.5 32.0 32.0
Interlimbus distance 52.0 50.0 44.5 49.0 52.0 51.0
Commissurai width 59.0 54.5 46.5 51.0 57.0 50.0
Nasoiabial angie 87.5 90.0 95.0 95.0 82.5 102.0
Upper lip iength 27.0 22.5 22.5 21.0 23.0 23.0
Chin depth 50.0 42.0 47.5 41.0 49.5 43.5
Table 3.5- Comparison of the facial measurements between the ieast beautiful subjects in 3
ethnic groups
Key = Chin position is measured in profiie view reiated to the faciai plane (Figure 3.11).
114

Chapter III_______________________________________________ Review of ethnic facial aesthetics
3.4.4 Analytical statistics of measurements
1-All variables were entered onto PC using SPSS statistical software
package (SPSS for Windows, Release 10.0.5, Standard version, © SPSS
Inc. 444 N. Michigan Ave., Chicago, Illinois 60 611) for every subject.
2- Comparisons were made between measurements and variables for the 12
subjects with the lowest mean rank (most beautiful) and the 12 with the
highest mean rank (least beautiful). Each group of 12 included 2 subjects
from each gender and each ethnic group.
a. Comparison between frequencies in the case of qualitative variables
(using chi square test) showed statistically significant differences in
facial asymmetry (p< .001).
b. The following measurements showed statistical significant difference:
i. Chin position (p<0.001),
ii. Maxillary incisor relationship (p<0.003),
iii. Alar base width (p<0,009),
iv. Commissural width (p<0.004),
V. Nasolabial angle (p<0.017).
c. Comparison of means in the case of quantitative measurements (using
Student T test, Mann-Whitney "u" tests) showed no significant
difference between the 12 better and the 12 worse except in the case
of alar base width (p< .008) (Figure 3.30) (Table 3.6).
115
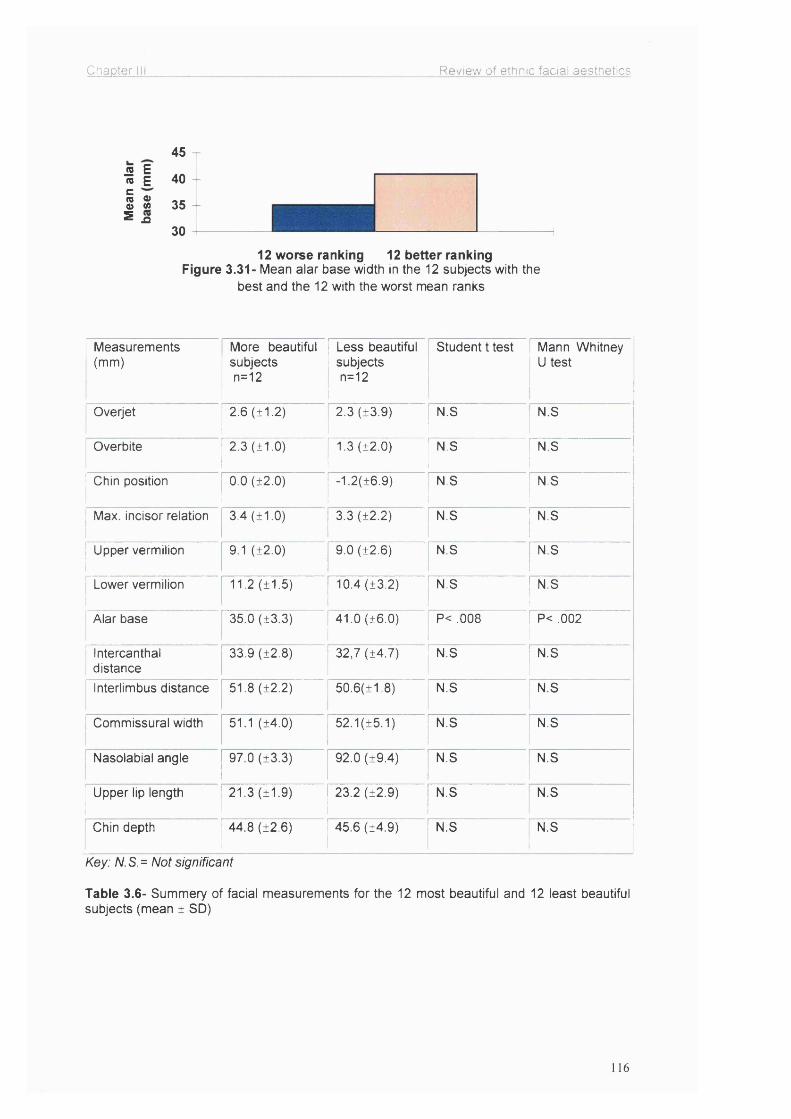
Chapter HI Review of ethnic facial aesthetics
45JS E(0 E 40cs o2 35s n
3012 worse ranking 12 better ranking
Figure 3.31- Mean alar base width in the 12 subjects with the best and the 12 with the worst mean ranks
1 Measurements ' (mm)
More beautiful subjects n=12
Less beautiful subjects n=12
Student t test Mann Whitney U test
Overjet 2.6 (±1.2) 2.3 (±3.9) N.S N.S
Overbite 2.3 (±1.0) 1.3 (±2.0)1
N.S N.S
! Chin position 0.0 (±2.0) -1.2(±6.9) N.S N.S
j Max. incisor relation 3.4 (±1.0) 3.3 (±2.2) N.S N.S
1 Upper vermilion1
9.1 (±2.0) 9.0 (±2.6) N.S N.S
j Lower vermilion 11.2 (±1.5) 10.4 (±3.2) N.S N.S
Alar base 35.0 (±3.3) 41.0 (±6.0) P< .008 P< .002
' Intercanthal I distance
33.9 (±2.8) 32,7 (±4.7) N.S N.S
Interlimbus distance 51.8 (±2.2) 50.6(±1.8) N.S N.S
Commissural width 51.1 (±4.0) 52.1(±5.1) N.S N.S
Nasolabial angle 97.0 (±3.3) 92.0 (±9.4) N.S N.S
1 Upper lip length!
21.3 (±1.9) 23.2 (±2.9) N.S N.S
Chin depth 44.8 (±2.6) 45.6 (±4.9) N.S N.S
Key: N.S.= Not significant
Table 3.6- Summery of facial measurements for the 12 most beautiful and 12 least beautiful subjects (mean ± SD)
116

Chapter III Review of ethnic facial aesthetics
During the comparison of the 12 most beautiful and 12 least beautiful
subjects, the presence or absence of chin deviation appeared to be another
important factor (Figure 3.32).
jS 150V1 10 +
.QE
5■ With chin deviation
□ No chin deviation
Best Worst
Best and worst ranks
Figure 3.32- Numbers of subjects with and without chin deviation in the 12 most and least beautiful subjects
3.5 Discussion
The results of this investigation showed that facial beauty is not a varied
concept when it comes to the 'most beautiful or the 'least beautiful' person.
Variations in individual choice appear to relate to the middle range of appeal.
Statistical analysis of the panel's sub-group assessment showed a general
agreement between different groups with different ethnic backgrounds in the
appreciation of facial beauty; i.e. there was a universal and common basis for
judgement of beauty within the social context of the experiment. The
universality of the outcome is supported by the assessment of the subjects by
8 maxillofacial surgeons in Malaysia, which matched the results of this study.
117
Chapter III_______________________________________________ Review o f ethnic facial aesthetics
The aphorism that facial beauty is purely subjective and that "beauty is in the
eye of the beholder" by M. Hungerford (Knowles, 2001) is not completely
confirmed by these results. Our results demonstrate that facial beauty is to a
certain extent objective and Hungerford was undoubtedly referring to the
middle range where personal attractiveness is in the eye of the beholder, not
beauty. We must distinguish between beauty and attractiveness.
Attractiveness is an overall, multi-dimensional judgement of an individual. It
includes not only facial features, but also facial expression, animation and
personality, which may be modified by make-up, dress, attitude, body shape,
and posture.
Communication technology and the media and their availability around the
globe provide daily reinforcement of commercially selected facial aesthetics.
Psychologists say that our perception of forms depends on the development
of “form concepts". We usually find any diversion from this orientation quite
confusing. Form concepts similarly influence our perception of faces. The
more frequently we observe a particular facial pattern, the more likely we
perceive it as “correct” (Peck and Peck, 1970).
It is largely the mass media that determines our form concepts in the 21®*
century. Newspapers, fashion magazines, films, television are full of
Caucasian/Caucasoid models or actors who automatically determine people's
notions of beauty. Due to the homogenisation of culture throughout the
world, our panel, although formed of racially different individuals, shared a
common base for the assessment and judgement of beauty. If there had
118

Chapter III_______________________________________________ Review o f ethnic facial aesthetics
been individuals available for the panel, who were not in contact or not
influenced by western culture, the results might possibly be significantly
different to what we have achieved. Specifically, the domination of Caucasian
features on the worldwide media means that these facial features appear as
more acceptable, natural, and therefore beautiful.
The convergence of opinions about facial beauty shown by this study does
not mean that every face that fulfils the geometrical criteria and fall into the
anthropometrical categories should be beautiful. There are of course factors
that can not be measured, for example eye expression and facial animation.
Another factor, which is not easily measurable in the perception of beauty, is
the quality of skin.
Because there is little uniformity in the ideal profile, and a great variability in
human faces, the reconstruction of a deformed face or any cosmetic facial
surgery need not be based on a narrow geometrical formula, but is the art of
optimising the craniofacial complex. (Seghers et ai, 1964).
The concept of a golden proportion was described by ancient Greeks and
popularised in orthodontics and surgery as the 'divine proportion' by Ricketts
(1982). He claimed aesthetics could be achieved scientifically rather than
based on the need to resort to subjective perceptions. This study supports
both the norm and the golden proportion suggested by Ricketts, which
certainly can guide a surgeon towards the correction of facial deformity,
however the search for an absolute formula for beauty is not practicable. The
119
Chapter ill_______________________________________________ Review o f ethnic facial aesthetics
knowledge of the appropriate relationships and proportions between the
various parts of the head and face is indispensable. Aesthetic improvement is
a strong motivating factor for many patients who decide to undergo
orthognathic surgery. Hence an adequate training in evaluation and
assessment of facial aesthetics is an important requirement for trainees in
maxillofacial surgery.
As stated, the analysis of the panel assessment and facial measurements in
this investigation indicated that, although there are significant differences in
variability of the facial features in different ethnic groups, the best-ranked
Afro-Caribbean and Oriental subjects had very similar facial features to
Caucasians. Whether this is just a coincidence (because of the small sample
size) or reality, is not well understood. But this similarity has been observed in
the majority of the Afro-Caribbean and Oriental photographic models.
Chin deviation and alar base are strong markers for facial beauty. It is
indicated that generally alar base is wider in both Afro-Caribbeans and
Orientals than Caucasians (Table 3.5). Vermilion border is generally broader
and fuller in Afro-Caribbeans, which is another marker for facial beauty
according to this study. Other features for a beautiful face indicated by this
study are; short lips (19 mm), upper incisor exposure of 4-5 mm, equality of
the facial thirds in vertical height, equality of the alar base width and
intercanthal distance, and equality of the interlimbus distance and
commissural width (Table 3.4).
120

Chapter III_______________________________________________ Review of ethnic facial aesthetics
Gonzales-Ulloa (1962) developed a very useful method in assessing the
facial profile, especially the chin (Figure 3.11). In addition to his ideal profile
lines, this study found that, the mid-face does not coincide with the facial
plane in a beautiful face, which on the contrary gives the impression of a flat
face. The mid-face in the most beautiful subjects in this study were anterior to
the facial plane.
Assessment of the chin position (Figure 3.11) showed that in the most
beautiful subjects the chin is coincident (0.0±3.0 mm) to the facial plane as
suggested by Gonzales-Ulloa (1962). This means a relatively strong chin is
one of the features of a beautiful face in both sexes. This study also supports
the results of the studies done by Ricketts (1982), Farkas et al. (1985), and
Epker at al. (1995). However, in the facial measurements, the mean
interlimbus distance in Caucasians was 52±3 mm for males and 48±3 mm for
females, whereas Ricketts (1982) reported a mean measurement of 65±4mm.
The results of this study contradict to the results of Moss at al. (1995) to some
extent. They found no correlation between beauty and precise proportions or
golden proportion. It has to be pointed out that their results were also based
on cephalometric measurements, which may be unreliable in the assessment
of the facial form due to the errors and limitations of two-dimensional
cephalographs.
121

Chapter 111_______________________________________________ Review of ethnic facial aesthetics
In conclusion, this investigation showed that, to a certain extent, facial beauty
is objective, and precise measurements, proportions and balance is a
practical way of assessment. People from different ethnic groups,
occupations and gender share common bases for evaluation and
appreciation of facial beauty, and there is a universal understanding for
appreciation of facial beauty. The influence of the media and the fashion
world, which depicts Caucasian features, has changed the view of other
ethnic groups about beauty. Although facial features differ racially, Caucasian
features are accepted more widely. In this investigation, in all ethnic groups,
the facial features of the subjects who were ranked as 'most beautiful' were
similar to Caucasian norms.
It is also shown that facial symmetry and alar base width are important
markers for facial beauty. Assessment of the chin showed that in the most
beautiful subjects, the chin was coincident to the facial plane.
Clinical assessment of the face is crucial. Assessment of the facial aesthetics
and diagnosis must be mainly based on experienced clinical observation. The
aid of an improved 3-dimensional imaging tool, like the optical surface
scanner, where available, should be used to support the clinical diagnosis
and help the treatment plan for the correction of facial deformity, especially as
it has the unique advantage of a captured image that can be measured and
manipulated to allow predictive change.
122
Chapter IV________________________________________ Validation of the optical surface scanner
CHAPTER IV
VALIDATION OF THE OPTICAL SURFACE SCANNER
123

Chapter IV__________________ .____________________Validation of the optical surface scanner
4.1 Introduction
The use of three-dimensional graphics for soft tissue evaluation in
orthognathic surgery planning has many advantages over conventional
radiography. The accurate recording and prediction of the facial soft tissue
changes after orthognathic surgery is important for surgeons and
orthodontists. Conventionally two-dimensional radiological and photographic
techniques have been used for this purpose and have often proved to be
inadequate. Secondly, the use of traditional radiography has also limitations
due to unjustified radiation doses from repeated examinations. Recently
several techniques have been introduced for the morphometries of the human
face, the optical surface scanning system being one of the latest major
developments (Linney et al., 1993). This three-dimensional optical scan has
also contributed towards the photo realistic simulation of the postoperative
appearance of a patient (Girod at a/., 1995).
The optical surface scanning system developed by Linney and his co-workers
has been used regularly over the last decade for recording facial soft tissues
(Linney at a/., 1993). This system was designed and is in regular use in
University College London Hospitals. Its range of application has extended
from surgical diagnosis and planning to prostheses and implant design,
clinical growth studies, forensic science, archaeology, psychology research,
sculpture and animation for advertising.
This optical surface scanning system (Figure 4.1) is based on the principle of
triangulation. A beam of low power semiconductor laser light is projected on
124

Chapter IV Validation of the optical surface scanner
to the subject’s face and is distorted to reflect the contour of the surface
anatomy. These reflections are then recorded by a camera situated adjacent
to the laser projector (Linney et al., 1993)
CCD Camera
Laser Projector i
Head rest
Mirrors
Rotating Chair
Figure 4.1- The optical surface scanner set-up.
The subject sits on a rotating platform, facing the camera and is rotated
through 200 degrees in 10 seconds. Up to 258 profiles of the rotating subject
are recorded in a scan (Linney, 1992). Specifically angled mirrors in the
system enable the recording of additional views, so as to avoid the loss of
data caused by the superimposition of prominent parts of the face, like the
nose, on neighbouring facial structures. The angles at which these profiles
125

Chapter IV Validation of the optical surface scanner
are recorded may be programmed to yield finer sampling over areas of
greater interest where more detail is required. The recordings of the camera
are sent to the transputer graphics system, which processes the video signals
to form the scanned image on the video monitor.
Landmarks and facial structures can be recorded within a 0.5-mm accuracy,
which meets the current clinical requirements of accuracy and the
reproducibility for orthognathic surgery assessment and planning (Moss et al.,
1989). The output image is presented on the monitor as a translation of the
surface. This may be observed from any perspective (Figure 4.2) and
measurements can be taken across the surface in three dimensions.
However there is a need to assess its accuracy and compatibility with
conventional cephalography for its potentially wider clinical applications as
systems based on similar principles are being marketed at reasonable costs.
Figure 4.2- Various views of the optical surface scan.
126

Chapter IV________________________________________ Validation of the optical surface scanner
For the validation of the optical surface scanner, two studies were conducted
in this programme (Sections 4.2 and 4.3)
4.2 The comparison of the optical surface scan Images to
cephalographs for soft tissue analysis after orthognathic surgery
4.2.1 Alms
Aims of this study were to compare the conventional cephalographs and
optical surface scanner images (lasergraphs) by measuring;
a) the upper lip-incisor relationship (maxillary incisor exposure),
b) the nasolabial angle,
c) the nasal tip projection,
d) the nasofacial angle,
e) the nasomental angle and
f) the labiomental angle in pre and postoperative orthognathic surgery
patients.
The study also intended to validate the apparent advantages of the optical
surface scanner for orthognathic surgery.
127

Chapter IV________________________________________ Validation of the optical surface scanner
4.2.2 Materials and methods
Thirty bimaxillary osteotomy patients consented to and were included in this
study. The clinical maxillary incisor exposure was measured after 3 minutes’
repose:
a) during the preoperative work-up,
b) 6-8 weeks after surgery,
using a metric Vernier calliper, and on the cephalograph and the optical
surface scan (lasergraph). The nasolabial, nasofacial, nasomental and
labiomental angles and the nasal tip projection are not accessible for
reproducible clinical measurements so were measured only on optical surface
scans and cephalographs, as described in Figures 4.3, 4.4, 4.5.
The lateral skull cephalographs were taken in the conventional manner with
the patient's lips in repose. Optical surface scans were obtained similar to
cephalographs with the Frankfort plane horizontal. For this, the upper margin
of the tragus and the orbitale were located manually and markers were
attached to the patient’s skin. The head position was then adjusted using a
spirit level until the Frankfort plane was horizontal. Head-positioning is
discussed in Section 4.3 in detail.
128

Chapter IV Validation of the optical surface scanner
Nasolabial angle— Stomion
Maxillary incisor margin
Labiomentalangle
Figure 4.3- Maxillary incisor exposure, nasolabial and labiomental angles, as measured on an
optical surface scan.
Nasofacialangle
S^nkfoffP INasomentalangle
Figure 4.4- Nasofacial and nasomental angles on an optical surface scanner image.
129

Chapter IV Validation of the optical surface scanner
Nasion
rankfort P
Nasal tip
Figure 4.5- Nasal tip projection measurement on a surface scan.
Using a three-dimensional graphic display computer programme, the optical
surface scan was retrieved onto the screen and two reference points, one at
stomion superius and the other at the maxillary incisor edge were marked and
the maxillary incisor exposure was determined by measuring the distance
between these two points by the computer programme (Figure 4.3). An
optical surface scan printout (lasergraph) was obtained and the nasolabial
angle as defined by the intersection of two lines; one originating at subnasale
and tangent to the lower border of the nose and the second line from
subnasale to labrale superius, was measured (Figure 4.3). The labiomental
angle is formed by the intersection of two lines originating at the soft tissue B
point, one tangent to labrale inferius and the other one to the pogonion
(Figure 4.3). The nasofacial angle was measured between a vertical line
dropped from the nasion perpendicular to the Frankfort plane and a line
130
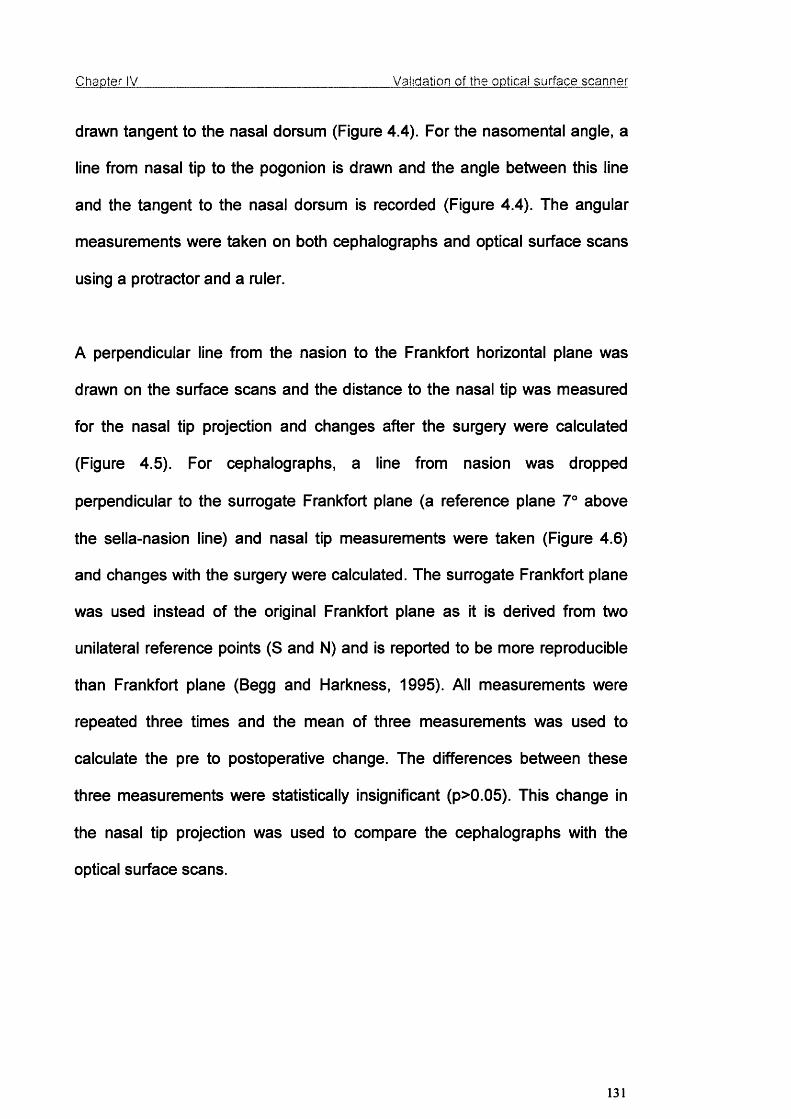
Chapter IV________________________________________ Validation of the optical surface scanner
drawn tangent to the nasal dorsum (Figure 4.4). For the nasomental angle, a
line from nasal tip to the pogonion is drawn and the angle between this line
and the tangent to the nasal dorsum is recorded (Figure 4.4). The angular
measurements were taken on both cephalographs and optical surface scans
using a protractor and a ruler.
A perpendicular line from the nasion to the Frankfort horizontal plane was
drawn on the surface scans and the distance to the nasal tip was measured
for the nasal tip projection and changes after the surgery were calculated
(Figure 4.5). For cephalographs, a line from nasion was dropped
perpendicular to the surrogate Frankfort plane (a reference plane 7° above
the sella-nasion line) and nasal tip measurements were taken (Figure 4.6)
and changes with the surgery were calculated. The surrogate Frankfort plane
was used instead of the original Frankfort plane as it is derived from two
unilateral reference points (S and N) and is reported to be more reproducible
than Frankfort plane (Begg and Harkness, 1995). All measurements were
repeated three times and the mean of three measurements was used to
calculate the pre to postoperative change. The differences between these
three measurements were statistically insignificant (p>0.05). This change in
the nasal tip projection was used to compare the cephalographs with the
optical surface scans.
131

Chapter IV Validation of the optical surface scanner
S urrogate Frankfort p lane
N line
Frankfort horizontal p lane \
Nasal
Figure 4.6- Nasal tip measurement on a cephalograph using surrogate Frankfort plane.
4.2.3 Results
a) The means and standard deviations of the clinical, cephalographic and
optical surface scan (lasergraphic) measurements of maxillary incisor
exposure are presented in Table 4.1 and 95% confidence intervals of
the mean are graphically illustrated in Figure 4.7. Although there was a
significant change between the pre and postoperative maxillary incisor
exposure, the differences between the clinical, cephalograph and
surface scan measurements were not statistically significant (p>0.05).
132
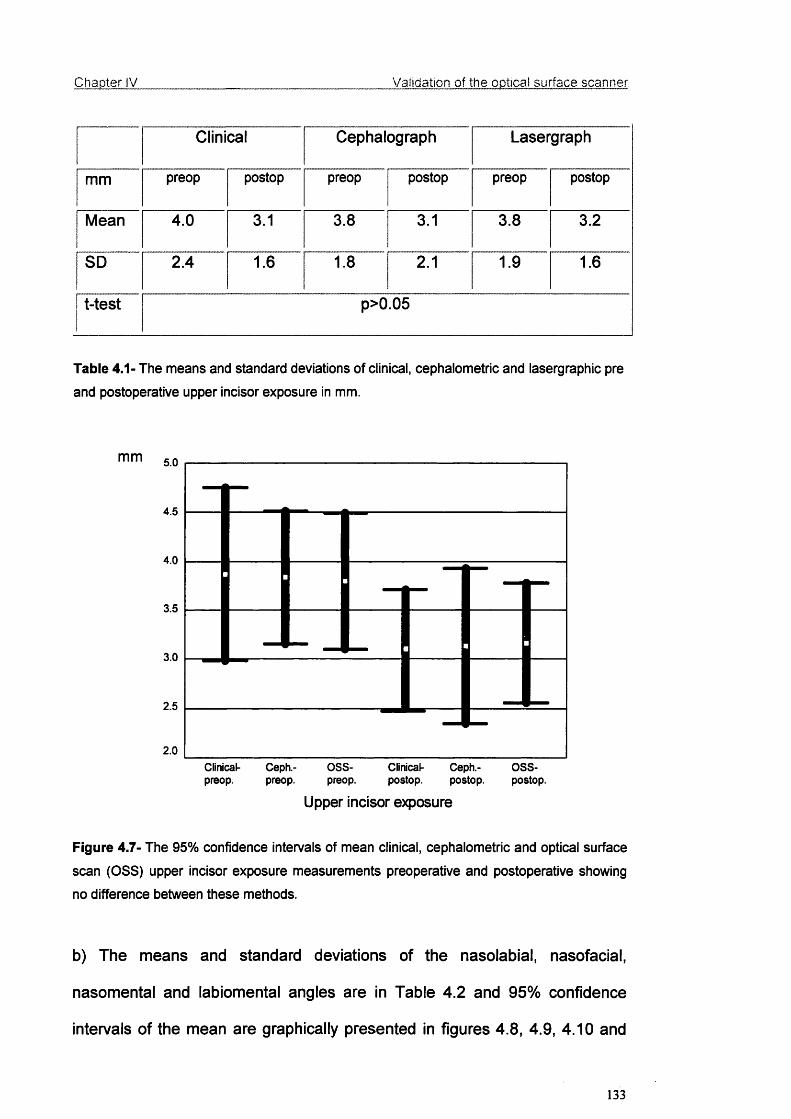
Chapter IV Validation of the optical surface scanner
Clinical Cephalograph Lasergraph
mm preop postop preop postop preop postop
Mean 4.0 3.1 3.8 3.1 3.8 3.2
SD 2.4 1.6 1.8 2.1 1.9 1.6
t-test p>0.05
Table 4.1- The means and standard deviations of clinical, cephaiometric and lasergraphic pre
and postoperative upper incisor exposure in mm.
mm 5.0
4.5
4.0
3.5
3.0
2.5
2.0Clinical- Ceph.- 0 8 8 - Clinlcal- Ceph.- 0 8 8 -
preop. preop. preop. postop. postop. postop.
Upper incisor exposure
Figure 4.7- The 95% confidence intervals of mean clinical, cephaiometric and optical surface
scan (OSS) upper incisor exposure measurements preoperative and postoperative showing
no difference between these methods.
b) The means and standard deviations of the nasolabial, nasofacial,
nasomental and labiomental angles are in Table 4.2 and 95% confidence
intervals of the mean are graphically presented in figures 4.8, 4.9, 4.10 and
133
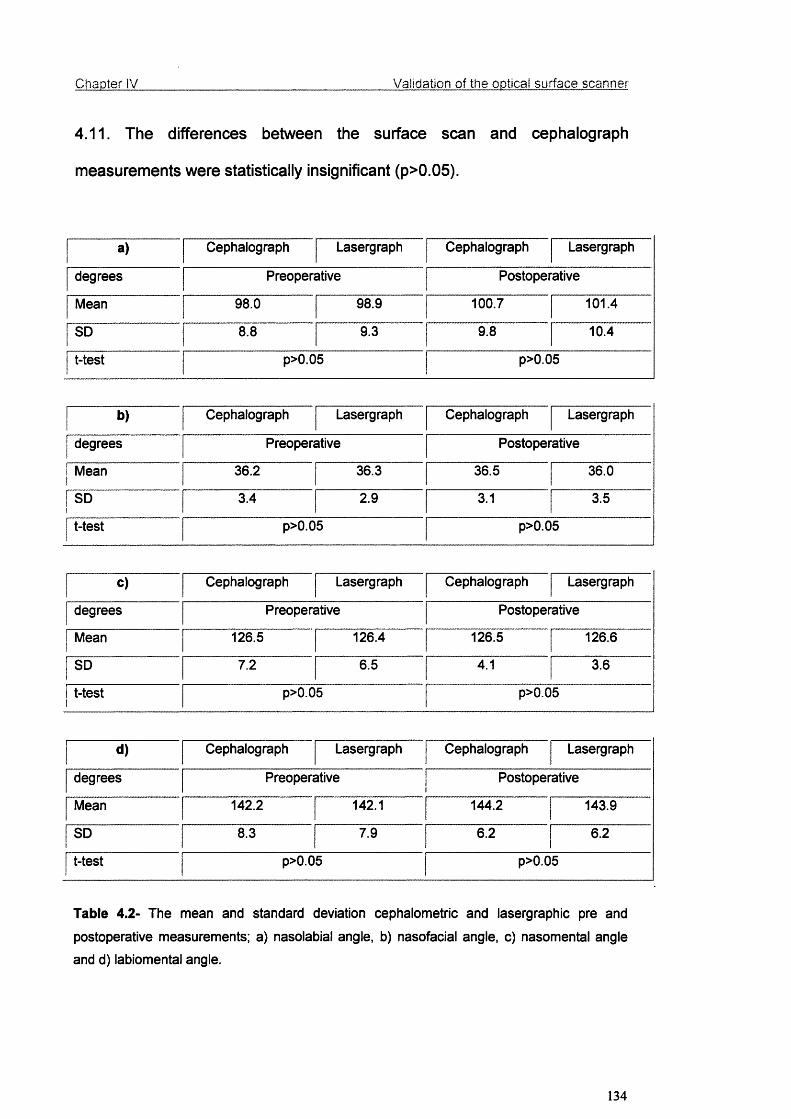
Chapter IV Validation of the optical surface scanner
4.11. The differences between the surface scan and cephalograph
measurements were statistically insignificant (p>0.05).
a) Cephalograph Lasergraph Cephalograph Lasergraph
degrees Preoperative Postoperative
Mean 98.0 98.9 100.7 101.4
SD 8.8 9.3 9.8 10.4
t-test p>0.05 p>0.05
b) Cephalograph Lasergraph Cephalograph Lasergraph
degrees Preoperative Postoperative
Mean 36.2 36.3 36.5 36.0
SD 3.4 2.9 3.1 3.5
t-test p>0.05 p>0.05
c) Cephalograph Lasergraph Cephalograph Lasergraph
degrees Preoperative Postoperative
Mean 126.5 126.4 126.5 126.6
SD 7.2 6.5 4.1 3.6
t-test p>0.05 p>0.05
d) Cephalograph Lasergraph Cephalograph Lasergraph
degrees Preoperative Postoperative
Mean 142.2 142.1 144.2 143.9
SD 8.3 7.9 6.2 6.2
t-test p>0.05 p>0.05
Table 4.2- The mean and standard deviation cephaiometric and lasergraphic pre and
postoperative measurements; a) nasolabial angle, b) nasofacial angle, c) nasomental angle
and d) labiomental angle.
134

Chapter IV Validation of the optical surface scanner
degrees
preop.Ceph.-preop.
Ceph.-postop.
Nasolabial angle
088-
postop.
Figure 4.8- The 95% confidence intervals of mean cephaiometric and optical surface scan
(OSS) nasolabial angle measurements preoperative and postoperative showing no difference
between these methods.
degrees38.0
37.5
37.0
36.5
36.0
35.5
35.0
34.5Ceph.-preop.
088-
preop.Ceph.-postop.
088-
postop.
Nasofacial angle
Figure 4.9- The 95% confidence intervals of mean cephaiometric and optical surface scan
(OSS) nasofacial angle measurements preoperative and postoperative.
135

Chapter IV Validation of the optical surface scanner
degrees130
129
128
127
126
125
124
123Ceph.-preop.
OSS-preop.
Ceph.-postop.
OSS-postop.
Nasomental angle
Figure 4.10- The 95% confidence intervals of mean cephaiometric and optical surface scan
(OSS) nasomental angle measurements preoperative and postoperative.
degrees148
146
144
142
140
138Ceph.-preop.
08 8 -
preop.Ceph.-postop.
0 8 8 -
postop.
Labiomental angle
Figure 4.11- The 95% confidence intervals of mean cephaiometric and optical surface scan
(OSS) labiomental angle measurements preoperative and postoperative.
136

Chapter IV Validation of the optical surface scanner
c) The mean changes in the nasal tip projection for both methods were; 15 ±
12 mm for cephalographs and 14 ± 11 mm for optical surface scans. The
difference between the two methods was not significant (p=0.5) as can be
seen in Figure 4.12 showing the 95% confidence intervals of the means for
this data.
mm 2.2
2.0
1.8
1.6
1.4
1.2
1.0
Ceph. OSS
Nasal tip projection
Figure 4.12- The 95% confidence intervals of mean nasal tip projection change after the
surgery for the cephalograph and the optical surface scan.
4.2.4 Discussion
Soft and hard tissue analyses for preoperative surgical assessment and
postoperative reviews have traditionally been done by measuring various
angles and distances in two dimensions using craniofacial landmarks, planes
and contrived reference points on lateral cephalographs. Although useful, the
137
Chapter IV________________________________________ Validation of the optical surface scanner
system has inherent problems due to geometric complexity, magnification, the
superimposition of craniofacial structures, distortion and low resolution (Bjork
and Solow, 1962; Kragskov et al., 1997). For orthognathic surgery planning
and postoperative follow-up, a technique capable of imaging low-density soft
tissues with accuracy in all planes is required.
The results of this study showed that optical surface scans and
cephalographs were comparable dimensionally as there was no significant
difference in measurements using both of these methods. For lip-incisor
relationship, their accuracy was also comparable to the direct clinical
measurements. Hence we believe that optical surface scans can compliment
or replace the cephalograph in soft tissue analysis for orthognathic surgery
planning and postoperative review.
The optical surface scan is substantially easier to examine and analyse than
the cephalograph and more important, the surface scan image is three-
dimensional and can be viewed immediately from any preferred angle and
position. Furthermore, the reference points on this image stay fixed as it is
rotated. Although not used in this protocol, the measurements can be taken
accurately across the surface as well as in a two dimensional linear manner
(Moss et a/., 1991). It is also possible to focus on a particular surtace section
of the full image such as the nasolabial region and lip relationships.
The surface scan is not subject to magnification as the scale of the image is
standardised by setting the appropriate number of pixels per millimetre. This
138
Chapter IV________________________________________ Validation of the optical surface scanner
gives precise measurements for superimposition and determining the
changes following orthognathic surgery, monitoring facial growth and the
growth of tumours. Being a non-contact procedure, the system avoids any
distortion of the soft tissue surfaces being measured. This system can display
any view of the face in approximately 6 seconds (Moss et a/., 1988), which is
faster than previously reported 3D imaging systems. It is also possible to
demonstrate the soft tissue changes in three dimensions on the whole area of
the face after surgery, whereas this is only possible in the midline using
conventional cephalographs.
For long term follow-up, the optical surface scan is minimally invasive without
the potential hazard of repeated exposure to ionising radiation and has the
convenience of rapidly capturing an image which can be archived
electronically. The images of the patients can also be stored on a hard disk
drive or floppy disks enabling further clinical evaluation and research at a later
date.
However, the procedure requires the patients’ co-operation to keep a
constant position and relaxed facial posture, as any movement during the
recording period of 10 seconds will corrupt the image, resulting in motion
artefacts. A separate study showed that using a headrest and a spirit level
achieved a reproducible head position (Section 4.3) (Soncul and Bamber,
2000). The degree of irregularity of the surface can be another factor, which
reduces the high resolution of the scan. Furthermore, with the application of
thin plate splines analysis (Bookstein, 1991), both area and volumetric
139

Chapter IV________________________________________ Validation of the optical surface scanner
changes in soft tissues can be calculated with greater accuracy, and with the
introduction of this multivariate morphometric analysis the main problem of
the lack of clear statistical method for soft tissue changes is solved.
Optical surface scans of soft tissues in conjunction with cephaiometric
analysis are routinely used in our unit for preoperative surgical assessment,
planning and postoperative review of orthognathic surgery, and their use is
very likely to increase with wider availability of various surface scanners in the
market. The number of units using optical scanners is also increasing since
they entered the imaging systems market. Nowadays with the wider
availability, the cost has gone down to £5000. Considering units performing
orthognathic surgery on an average of 100 patients per annum, the cost of
the system per patient is minimal. The optical scanner serves other useful
purposes for other patients' treatments, e.g. assessing facial swellings,
designing facial prostheses. These three-dimensional surgical simulations
using the surface scans also serve to guide the surgeons, and prepare and
rationalise patients’ expectations.
In conclusion, the surface scan is comparable to a good quality cephalograph
for soft tissue profile assessment but has additional advantages of being
three-dimensional, better quality, electronically storable and minimally
invasive which supersede the traditional radiographic means of soft tissue
analysis for postoperative follow-up.
140

Chapter IV________________________________________ Validation of the optical surface scanner
4.3 Reproducibility of the head position for opticai surface scans
Despite its many potential advantages in clinical applications, there is no
agreed method of standardising head position for the optical laser scanner,
which casts doubts upon the reproducibility of the achieved head position.
Unless the head position is stabilised, the accuracy and the quality of soft
tissue data may be affected. The three-dimensional surface that is presented
to the projected laser light and in turn recorded by the camera is determined
by the head position in any plane. Hence, it is possible that anatomic
landmarks located in the areas of changing contour are affected by head
inclination influencing the accuracy of soft tissue change measurements. This
may be mainly caused by obstruction of some landmarks by others due to an
unsuitable head inclination. Landmarks below the nose can be obscured by
the prominence of the nose in a downward inclined head position. The
procedure requires the patients' co-operation to keep a stable head position
and relaxed facial posture, as any movement during the recording period of
10 seconds will corrupt the image, resulting in motion artefacts.
There are no standardised methods reported for the quantitative evaluation of
3D facial soft tissue data. Hence, we have endeavoured to coerce the thin-
plate splines transformations to validate the standardisation of the head
position for optical scans, which we believe can supplement the conventional
cephaiometric analysis.
The word “morphometries” was first used by Blackith in 1965 and with the
view of it being a standard application of multivariate analysis. It dealt with
141

Chapter IV________________________________________ Validation of the optical surface scanner
“size” and “shape” derived from biological forms. Thompson (1961) suggested
that the changes of biological form could be both modelled and described as
mathematical smooth deformations, forming the basis of “thin-plate splines”.
The thin-plate splines is an interpolating function that can be used to describe
shape change as a deformation of a structure, in this case the change in
head position for a surface scan.
4.3.1 Aims
This study aimed to test the reproducibility of the head position for optical
surface scans by setting;
a) Frankfort horizontal plane parallel to the ground using a spirit level, for
setting horizontal surfaces,
b) Axial plane perpendicular to the ground in frontal view by reflecting a
narrow beam of laser light on the facial midline of the patient.
4.3.2 Materials and methods
Sixty optical surface scans of five subjects, twelve scans each, were taken at
random intervals of 15 minutes to 24 hours. In between the scans, the subject
was asked to walk around and relax. Three of the subjects were females and
two males, three had a Class I skeletal relationship, one Class II and one
Class III, including one with a facial asymmetry.
All the scans were taken by the same investigator following a protocol for the
use of optical surface scanner (Linney, 1992). The subject's head supported
by the head rest was adjusted using a spirit level, an engineering device for
142
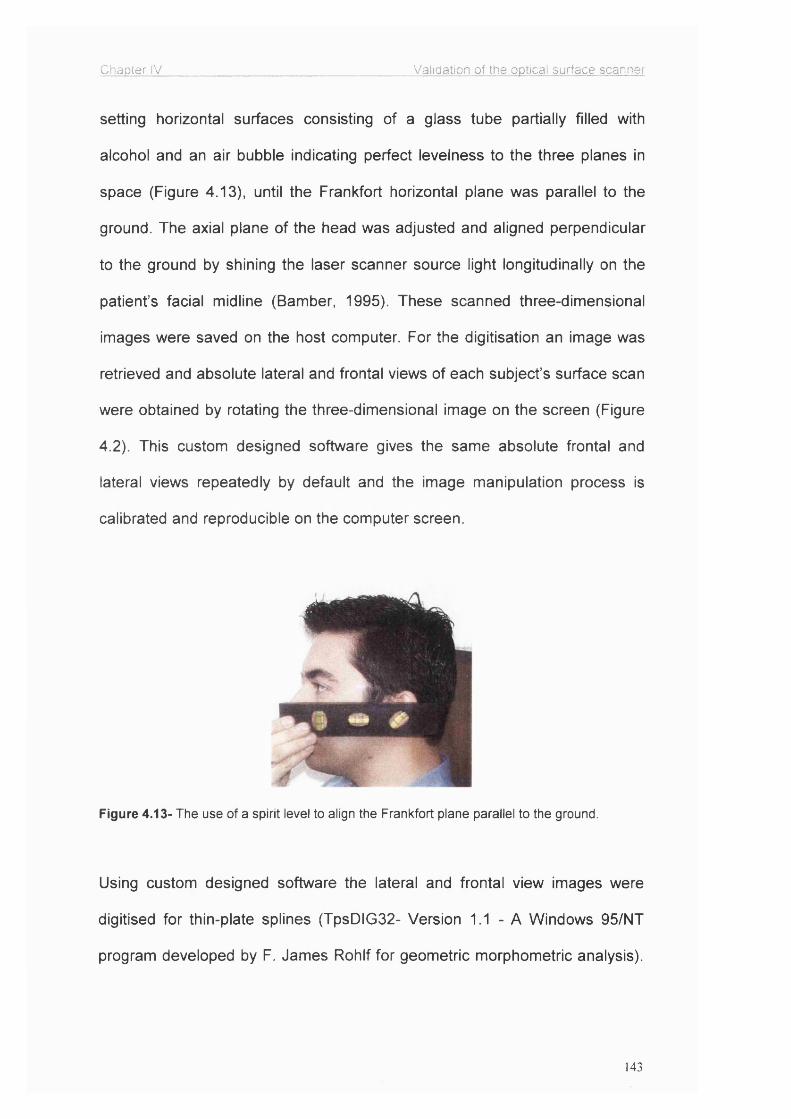
Chapter IV________________________________________Validation of the optical surface scanner
setting horizontal surfaces consisting of a glass tube partially filled with
alcohol and an air bubble indicating perfect levelness to the three planes in
space (Figure 4.13), until the Frankfort horizontal plane was parallel to the
ground. The axial plane of the head was adjusted and aligned perpendicular
to the ground by shining the laser scanner source light longitudinally on the
patient’s facial midline (Bamber, 1995). These scanned three-dimensional
images were saved on the host computer. For the digitisation an image was
retrieved and absolute lateral and frontal views of each subject’s surface scan
were obtained by rotating the three-dimensional image on the screen (Figure
4.2). This custom designed software gives the same absolute frontal and
lateral views repeatedly by default and the image manipulation process is
calibrated and reproducible on the computer screen.
I
Figure 4.13- The use of a spirit level to align the Frankfort plane parallel to the ground.
Using custom designed software the lateral and frontal view images were
digitised for thin-plate splines (TpsDIG32- Version 1.1 - A Windows 95/NT
program developed by F. James Rohlf for geometric morphometric analysis).
143

Chapter IV Validation of the optical surface scanner
The anatomical landmarks digitised on each lateral profile and frontal views of
the scan are illustrated in Figure 4.14.
Figure 4.14: Lateral view optical surface scan (left) showing landmarks used for this
investigation: 1 ) Soft tissue orbitale, 2) Upper margin of the tragus, 3) Soft tissue nasion,
4) Pronasale, 5) Subnasale, 6) Labrale superius, 7) Labrale inferius, 8) Soft tissue pogonion.
Frontal view optical surface scan (right) showing landmarks used for this investigation;
1) Soft tissue nasion, 2) Right lateral canthus, 3) Left lateral canthus, 4) Subnasale,
5) Right alare, 6) Left alare, 7) Right cheilion, 8) Left cheilion, 9) Sublabiale.
The landmarks, which were difficult to localise on the surface scan were
clinically located by small self-adhesive spheres placed as locators before
scanning. The digitised surface scans were then compared to each other
using the thin-plate splines (Figure 4.15) computer programme. This analysis
produced a report giving results in a quantitative and a graphical form (Figure
4.16). The graphic data were derived from a mesh diagram based on co
ordinates of digitised landmarks of the scans.
144

Chapter IV Validation of the optical surface scanner
Figure 4.15- A graphic output of the thin-plate splines analysis after the digitisation of a
preoperative optical surface scan.
Figure 4.16- Graphic output of the thin-plate splines where the head position was intended to
remain constant The distortion of the image is caused by a slight change in the inclination of
the head so that the digitised landmarks moved as a group.
145
Chapter IV________________________________________ Validation of the optical surface scanner
The quantitative data report of the thin-plate splines analysis was based on
the ‘bending energy’ required for the amount of deformation caused by
alteration in the head position between scans. Bending energy is a metaphor
borrowed for use in morphometries from the mechanics of thin metal plates. It
is the hypothetical energy that would be required to bend a metal plate
(Bookstein, 1991). A deformation in the surface scan image (due to an
osteotomy movement and/or a change in the head position) would be
indicated by the change in the baseline landmarks’ position. The bending
energy value for change in head position was calculated for every
combination of 12 scans (66 comparisons in each view) for each subject both
in the lateral and the frontal views, 660 in total. These data were statistically
analysed using parametric tests.
In order to calculate the landmark identification and digitisation method error,
all the landmarks on a single optical surface scan were digitised ten times.
4.3.3 Results
The mean and standard deviations of the bending energy representing the
change in the head position in both the lateral and the frontal views for each
subject are in Table 4.3 and 95% confidence intervals of the means are
illustrated in Figures 4.17 and 4.18.
Since the statistical analysis showed that there was no significant difference
within and between subjects, all the data were integrated. The mean and
standard deviation of bending energy values of all comparisons for the
146

Chapter IV Validation of the optical surface scanner
subjects were; 0.0135 ± 0.0109 g.cm^/sec^ (n=330) for the lateral profile and
0.0090 ± 0.0054 g.cm^/sec^ (n=330) for the frontal view.
a) mean SD b) mean SDSubject A 0.012 0.011 Subject A 0.010 0.005Subject B 0.011 0.006 Subject B 0.013 0.006Subject C 0.019 0.013 Subject 0 0.009 0.006Subject D 0.015 0.015 Subject D 0.007 0.004Subject E 0.014 0.009 Subject E 0.009 1 0.005
Table 4.3- The means and standard deviations of the bending energies for 5 subjects
(g.cm^/sec^) a) in the lateral view, b) in the frontal view.
mm0.025
0.02
0.015
0.01
0.005
71
95% Cl ' Mean
I
A -
izzzzizzziz:B
Figure 4.17- 95% confidence interval of the mean bending energies of 12 scans of 5 subjects
in the lateral view.
147

Chapter IV Validation of the optical surface scanner
mm0.025
0.02
0.015
0.01
0.005
G 95% Cl Dwiean
Fa
7
T. / . 1 iz : / - .1. Z7B
Figure 4.18- 95% confidence interval of the mean bending energies of 12 scans of 5 subjects
in the frontal view.
These bending energy values were compared with the bending energy value
derived from a patient who had a 6-millimetre advancement of the maxilla with
3-millimetre mandibular setback, which was calculated to be 0.51055
g.cm^/sec^ (Figure 4.19). The overall mean bending energy representing a
variation in the head posture, including the digitisation error, was thus less
than 2% of this typical surgical change.
The mean value of bending energy representing the landmark identification
and digitisation error of optical surface scans was 0.0018 ± 0.0012
g.cm^/sec^. This was not statistically significant.
148

Chapter IV Validation of the optical surface scanner
Figure 4.19- Graphic output of thin-plate splines showing the change after bimaxillary surgery
with the 6-mm advancement of the maxilla and 3-mm setback of the mandible.
The effect of change in head position is illustrated in Figure 4.20. The surgical
deformation as a result of osteotomy is more apparent when comparing the
pre and postoperative scans of subjects who have undergone orthognathic
surgery (Figure 4.19).
Figure 4.20- Thin-plate splines showing the change in head position with chin moving
interiorly (left) and with chin moving superiorly (right). When the repeated scans are
compared to each other, the slight changes in the head position are demonstrated as a
rotation of the grid but the images being compared here were otherwise identical, being free
from magnification or movement of landmarks individually.
149
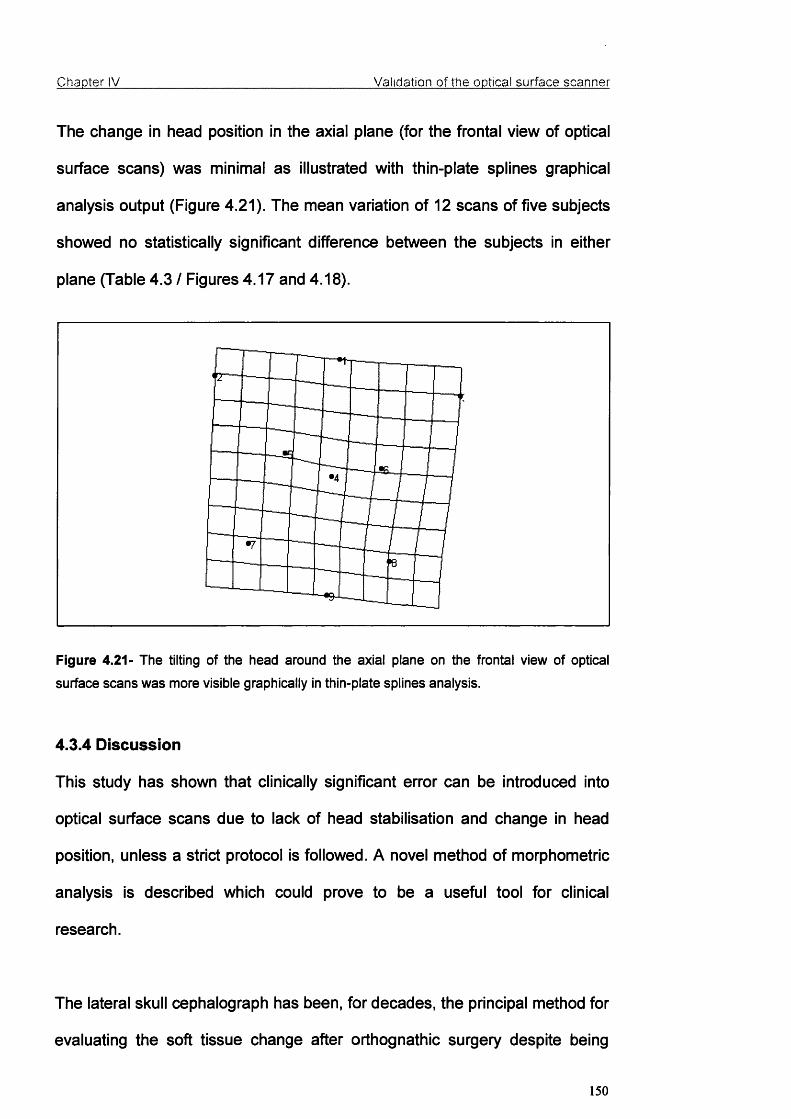
Chapter IV Validation of the optical surface scanner
The change in head position in the axial plane (for the frontal view of optical
surface scans) was minimal as illustrated with thin-plate splines graphical
analysis output (Figure 4.21). The mean variation of 12 scans of five subjects
showed no statistically significant difference between the subjects in either
plane (Table 4.3 / Figures 4.17 and 4.18).
Figure 4.21- The tilting of the head around the axial plane on the frontal view of optical
surface scans was more visible graphically in thin-plate splines analysis.
4.3.4 Discussion
This study has shown that clinically significant error can be introduced into
optical surface scans due to lack of head stabilisation and change in head
position, unless a strict protocol is followed. A novel method of morphometric
analysis is described which could prove to be a useful tool for clinical
research.
The lateral skull cephalograph has been, for decades, the principal method for
evaluating the soft tissue change after orthognathic surgery despite being
150

Chapter IV________________________________________ Validation of the optical surface scanner
based on two-dimensional image with soft tissue recordings limited to an
outline of the lateral profile with poor resolution. Pirttiniemi et al. (1996)
reported that although the head was positioned using a cephalostat, the
geometric error due to head rotation in the cephalograph was up to 3.5
millimetres, which increased further in cases of facial asymmetry. In
comparison, the errors in the optical surface scanner due to head position
recorded by this study were small and insignificant. There is no other similar
study reporting errors in soft tissue surface scans due to change in the head
position to compare the results of this study. Additional advantages of this
system are that three-dimensional surface imaging data in a digital format can
be analysed with greater accuracy in any desired view, and optical surface
scans are stored conveniently by any computer system. If required, a print out
can also be obtained.
In the lateral profile, if the axis of rotation for the head was in the centre of the
head's outline, the bending energy for the change in the head position would
be zero as the grid would rotate evenly around this centre point. The head is
inclined on the neck, however, causing rotation in the grid (Figure 4.20), which
can be easily measured by the thin-plate splines analysis.
The head inclination has a direct effect on the three-dimensional surface data
that can be captured on the digitised image. Depending upon the head
position, some soft tissue landmarks may disappear completely. For this
reason Bush and Antonyshyn (1996) supported a downward inclination of the
151

Chapter IV________________________________________ Validation of the optical surface scanner
Frankfort plane for the head position. However, this increased the error in
other landmarks.
Lundstrom et al. (1992) used the so-called natural head position as a
reproducible position for head inclination in their cephalometric study based
on normal profiles. It is, however, difficult to achieve a reproducible natural
head position in patients with abnormal and disharmonious profile outlines,
facial asymmetry, and posturing habits (Lundstrom at a/., 1991). Earlier
studies reporting the reproducibility of the natural head position in adults
showed an error of 2 degrees (Bjerin, 1957; Moorees and Kean, 1958). In a
separate study, Lundstrom and Lundstrom (1995) reported that the natural
head position, as a cephalometric reference for clinical purposes was not
reproducible. Despite several investigations by many authors to find
reproducible head position, Frankfort horizontal plane remains the most
widely used reference plane for orthognathic surgery (Bamber at a/., 1996).
This study showed that it could be reproduced with a simple technique of
using a spirit level. The orientation of optical surface scans with the Frankfort
horizontal plane also allows synchronisation of the clinical assessment, optical
surface scan, cephalograph and anatomically mounted models for
orthognathic surgery planning.
There are no other cephalograph and optical surface scan studies in the
literature evaluating the position of the head from the frontal view to compare
the results with. All previous investigators used two-dimensional imaging
tools, which only reproduced the lateral facial soft tissue profile for the
152
Chapter IV________________________________________ Validation of the optical surface scanner
analysis. This study, using a three-dimensional imaging tool, evaluated the
head position in true lateral and frontal views; both these views are important
for facial soft tissue analysis for surgeons and orthodontists.
The thin-plate splines analysis, using the mean bending energy was more
appropriate as a multivariate analysis for a three-dimensional image. The
errors in the frontal view of surface scans were less than the lateral view and
clinically insignificant in both views. As a result of this study, it is advised to
adjust the Frankfort horizontal plane parallel, and the frontal view axial plane
perpendicular to the true horizontal plane for a reproducible three-dimensional
optical surface scan.
153

Chapter V______________________________________________bvaiuation of facial soft tissue changes
CHAPTER V
EVALUATION OF FACIAL SOFT TISSUE CHANGES AFTER
ORTHOGNATHIC SURGERY
154

Chapter V______________________________________________Evaluation o f facial soft tissue changes
5.1 Introduction
Optimal aesthetics of the human face has interested many researchers from
various disciplines. Much of the research interest has been focused on
divergence from the norms and correction of these gross facial deformities
with orthognathic surgery has been the accepted solution for many.
As in every surgical intervention, the question must be asked about the
predictability and reproducibility of the results. The osteotomies are performed
on facial bones to correct dentoskeletal deformities but the patients see the
outcome on their soft tissue facemask.
Many studies have been reported with varied results in the past evaluating
facial soft tissues changes after orthognathic surgery. Mostly lateral
cephalographs were used in the past to evaluate the profile changes but the
cephalograph is not the ideal imaging tool, as it is unable to show the three-
dimensional changes of a three-dimensional subject. The results of most of
the previous studies in the literature have presented the changes on the
lateral profile line but the changes caused by orthognathic procedures
extended laterally from the profile line to cover most of the face. Even for an
accurate evaluation of the changes on the profile line, the cephalograph was
inadequate due to the poor image and inherent errors. The soft tissues can
not be observed clearly either because of the low resolution of the image or
superimposition of bony structures on soft tissues, resulting in landmark
digitisation errors.
155

Chapter V_____________________________ Evaluation of facial soft tissue changes
Hence, the search for a viable three-dimensional imaging tool for pre and
postoperative soft tissue assessment continues. Optical systems like
stereophotogrammetry, telecentric photogrammetry, Moire topography, 3D CT
scans were probably the most remarkable methods developed for imaging
facial soft tissues but they all had limitations. They either could not capture
the soft tissue details clearly enough for accurate evaluation or were not easy
to use by someone within the orthognathic surgical team or in some cases too
expensive to be used routinely for repeated examinations of every patient.
The soft tissue data captured from three-dimensional CT scans was not
practicable as the amount of radiation the patient was exposed to was far too
high especially considering the need for repeated examinations after the
surgery.
The optical surface scanning system (Figure 4.1) since it was built by Linney
and his co-workers at University College London, Department of Medical
Physics, has been improved and was used to evaluate effects of orthognathic
surgery on soft tissues. This system consists of a laser source, a charge
coupled device camera, a rotating platform, mirrors and a PC. This system
was described in detail in Section 4.1. The system is accurate, easy to use,
minimally invasive, repeatable, cost-effective, has high resolution, and carries
most of the advantages of a three-dimensional imaging tool. It is also
supported with a comprehensive package of clinical and research software.
Several methods were used to measure the human face for genetics, ethnic
forms and norms for facial aesthetics. In orthognathic surgery literature, the
156
Chapter V______________________________________________Evaluation o f facial soft tissue changes
morphometric studies are rather limited in number. For example, euclidean
distance matrix analysis (EDMA) (Lele and Richtsmeier, 1991; Ayoub et al.,
1994), finite element analysis (Motoyoshi eta!., 1993), mesh diagram analysis
(Moorees and Kean, 1958; Lebret, 1985, Ferrario at a/., 1998), thin-plate
splines analysis (Bookstein, 1991) are reported as methods for
morphometries of the human face before and after orthognathic surgery.
Thin-plate splines analysis, as described earlier, takes thin metal plates as a
starting point and presents the mechanical deformation and shape change as
mathematical transformations enabling quantitative and graphical evaluation.
(Bookstein, 1991).
5.2 Aims
This study aimed to evaluate the soft tissue changes after correction of Class
II and Class III facial deformities with orthognathic surgery using the optical
surface scanner as a three-dimensional imaging tool and thin-plate splines as
a morphometric analysis.
5.3 Patients and methods
One hundred and two patients undergoing orthognathic surgery were
recruited for this part of the study. Sixty-four were females and thirty-eight
were males. Forty-seven of these patients had Class II and fifty-five had
Class III dentoskeletal relationship. Thirty-seven in the Class II group were
females and ten were males, whereas in the Class III group twenty-seven
were females and twenty-eight were males. All patients unden/vent a single
157
Chapter V______________________________________________Evaluation o f facial soft tissue changes
jaw or bimaxillary orthognathic surgical procedure to correct the deformity to a
Class I dentoskeletal relationship. The treatment plans are summarised in
Table 5.1. Optical surface scans of all patients were obtained preoperatively
and 6 months postoperatively using an optical surface scanner system. On
these optical surface scans (lasergraphs) soft tissue changes were evaluated.
On 3D pre and postoperative optical surface scans, the following five markers
were placed electronically;
1- left endocanthion
2- left exocanthion
3- right endocanthion
4- right exocanthion
5- soft tissue nasion
as seen in Figure 5.1.
In order to calculate these five points' identification method error
electronically, five subjects were scanned and these five landmarks were
digitised on the optical scans as seen in Figure 5.1. The digitisation of these
landmarks for each subject was repeated ten times by the same investigator
at separate sessions. Ten different digitisations of each subject's scans were
compared to others using thin-plate splines analysis by superimposing using
these points. The bending energy representing the error in electronic
identification of landmarks was 0.0018 ± 0.0012 g.cm^/sec^. This statistically
insignificant error caused by digitisation constitutes 0.003 of the measured
surgical change.
158

Chapter V Evaluation o f facial soft tissue changes
Figure 5.1- Five markers electronically placed on 3-D pre and postoperative optical surface
scans on: 1. left endocanthion, 2. left exocanthion, 3. right endocanthion, 4. right exocanthion,
5. soft tissue nasion.
159

Chapter V Evaluation o f facial soft tissue changes
Treatment Plan n
Class II 47
Single jaw
procedure
BSSO (Bilateral Sagittal Split
Osteotomy) 18
Bimaxillary
procedure
Maxillary impaction + BSSO 20
Maxillary impaction + BSSO +
genioplasty 4
Maxillary advancement/push back
+ maxillary impaction + BSSO 5
Class III 55
Single jaw
procedure BSSO 5
Bimaxillary
procedure
Maxillary impaction + BSSO 4
Maxillary advancement +
maxillary impaction + BSSO
3-mm
advancement 14
6-mm
advancement 27
9-mm
advancement 5
Table 5.1- Summary of treatment plans
Using these markers, pre and postoperative optical surface scans were
registered over parts of the face unaffected by the surgery. This
superimposition enabled the production of colour maps (Figure 5.2) displaying
difference of surfaces. This analysis was done using the optical surface scan
160

Chapter V______________________________________________Evaluation o f facial soft tissue changes
display software developed by Richards (Department of Medical Physics,
University College London, 1999).
Colour maps displayed the areas and magnitude of change in facial soft
tissues. The face was divided into ten regions based on the tendency of soft
tissue change:
1. Nasal tip
2. Paranasal regions: The bilateral areas of the cheeks adjacent to the
alae of the nose below the zygomatic arches.
3. Subnasale: The junction of the nasal collumella and the upper lip.
4. Subalar region: The middle third of the upper lip below the alar base of
the nose excluding subnasale and the upper vermilion.
5. Supracommissural regions: The adjacent areas of the upper lip to the
subalar region bilaterally above the oral commissures.
6. Upper vermilion: The vermilion of the upper lip.
7. Lower vermilion: The vermilion of the lower lip.
8. Subcommissural regions: The bilateral areas below the oral
commissures lateral to the labiomental fold and the chin.
9. Labiomental groove: The groove below the lower lip and above the
chin.
10. Chin: The circular area around the soft tissue pogonion. (Figure 5.2)
161
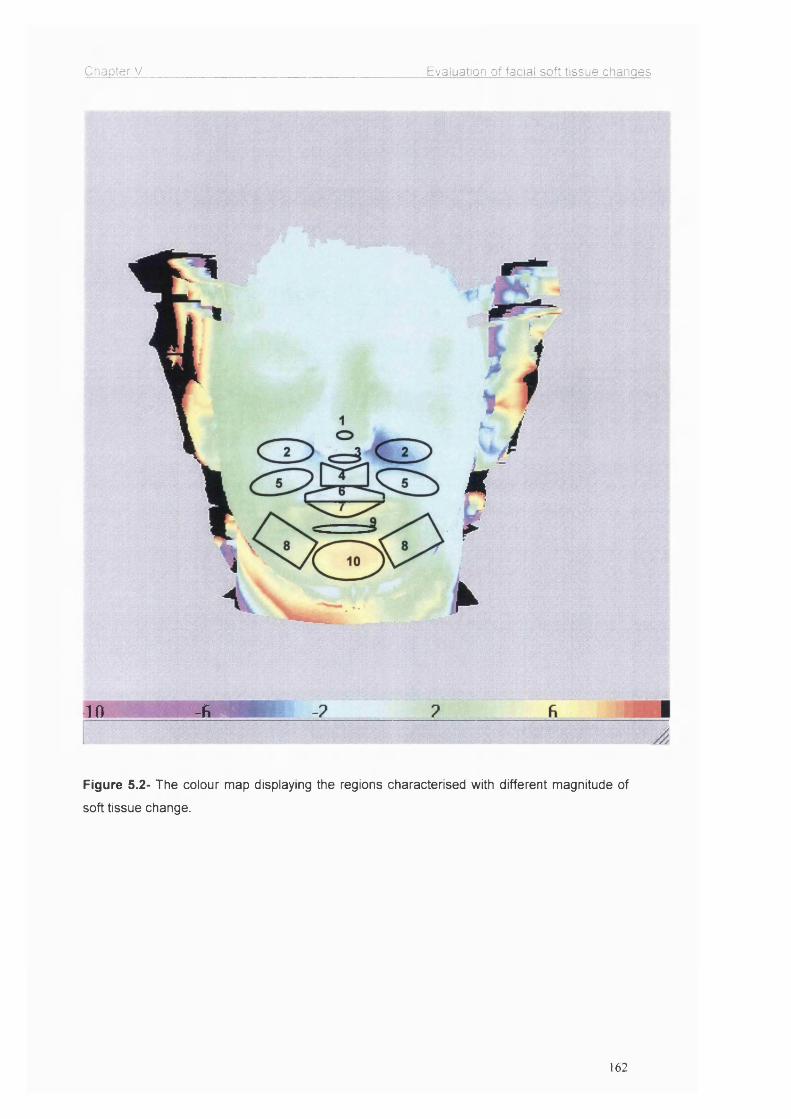
Chapter V Evaluation o f facial soft tissue changes
k
10 -A r
Figure 5.2- The colour map displaying the regions characterised with different magnitude of
soft tissue change.
162

Chapter V______________________________________________Evaluation of facial soft tissue changes
For thin-plate splines analysis, the true lateral view of the optical surface
scans were captured and the following landmarks were identified:
1- Soft tissue nasion
2- Upper border of the tragus
3- Soft tissue orbitale
4- Tip of the nose
5- Subnasale
6- Labrale Superius
7- Stomion Superius
8- Stomion Inferius
9- Labrale Inferius
10- Labiomental Groove
11- Soft tissue pogonion
(Figure 5.3)
These landmarks were digitised using the TpsDIG32™ (A Windows based
software for digitising landmarks for geometric morphometric analyses by
Rohlf. Version 1.14, 1998.) on the lasergraphs. The thin-plate splines analysis
was then performed to compare the preoperative lasergraphs to the
postoperative ones for soft tissue changes. Thin-plate splines analysis was
performed using TpsSplin™ (A program to compare pairs of specimens by
displaying a DArcy Thompson style transformation grid based on a thin-plate
spline by Rohlf. Version 1.15, 1998). Soft tissue nasion, upper border of
tragus and soft tissue orbitale were taken as stationary landmarks for
163

Chapter V Evaluation o f facial soft tissue changes
reference to the movement of other chosen landmarks for the thin-plate
splines analysis.
Figure 5.3- The landmarks used for thin-plate splines analysis on the true lateral view of the
optical surface scans.
The pre and postoperative cephalographs taken during routine clinical
examinations were also digitised and evaluated to check whether the
preoperative treatment plan was achieved during the actual surgical
procedure so that the changes in soft tissues could be compared to bony
movements. The radiographs were traced and digitised by the SSI
Microcad™ digitiser using Opal CogSoft™ (A digitising and orthodontic
analysis software for Windows by Harradine and Chauvet. Version 1.1, 1997-
98).
164

Chapter V______________________________________________Evaluation o f facial soft tissue changes
First, using point A, anterior nasal spine and posterior nasal spine for the
magnitude of maxillary advancement and impaction, and point B and
pogonion for the magnitude of mandibular setback was measured and
achieved movements were recorded. They were also compared to the initial
treatment plan to check whether the treatment plan was reproduced during
the actual surgical procedure.
5.4 Results
The soft tissues were evaluated in order to:
a) Find the amount of soft tissue change by superimposition of optical
surface scans (‘difference of surfaces’ analysis) and,
b) Identify the direction of movements by using thin-plate splines.
By superimposition of 3D optical surface scans, ‘difference of surfaces’
analysis presented the results in a colour map format (Figure 5.2) including
magnitude of movements for infinite number of points on the soft tissue
surface. Class II and III patients were evaluated separately. In each group,
smaller sub-groups were formed based on the type of surgical procedure to
relate the soft tissue change to the amount of bony movement. Four sub
groups were formed in the Class II group, and five in the Class III group. The
treatment plans and grouping with number of patients are summarised in
Table 5.1. Although some patients had different magnitudes of maxillary
impaction, this procedure did not affect the results significantly so these
patients’ results were pooled into one group.
165
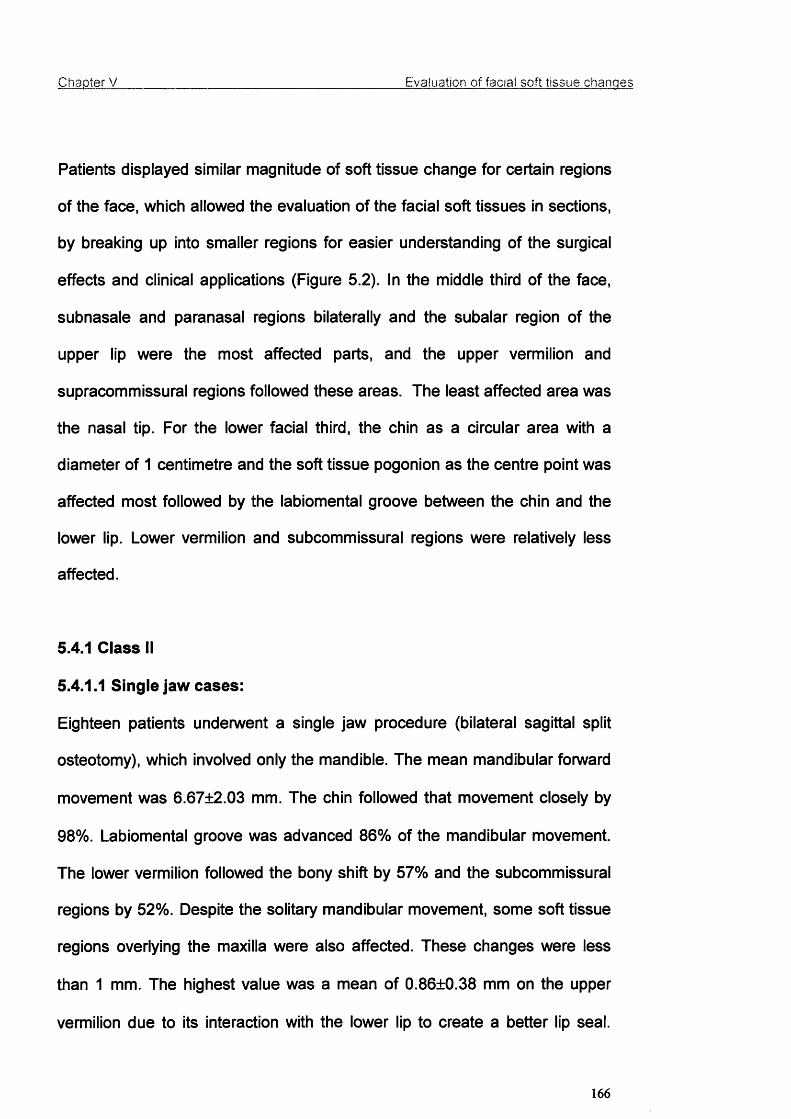
Chapter V______________________________________________Evaluation o f facial soft tissue changes
Patients displayed similar magnitude of soft tissue change for certain regions
of the face, which allowed the evaluation of the facial soft tissues in sections,
by breaking up into smaller regions for easier understanding of the surgical
effects and clinical applications (Figure 5.2). In the middle third of the face,
subnasale and paranasal regions bilaterally and the subalar region of the
upper lip were the most affected parts, and the upper vermilion and
supracommissural regions followed these areas. The least affected area was
the nasal tip. For the lower facial third, the chin as a circular area with a
diameter of 1 centimetre and the soft tissue pogonion as the centre point was
affected most followed by the labiomental groove between the chin and the
lower lip. Lower vermilion and subcommissural regions were relatively less
affected.
5.4.1 Class II
5.4.1.1 Single jaw cases:
Eighteen patients underwent a single jaw procedure (bilateral sagittal split
osteotomy), which involved only the mandible. The mean mandibular fonA/ard
movement was 6.67±2.03 mm. The chin followed that movement closely by
98%. Labiomental groove was advanced 86% of the mandibular movement.
The lower vermilion followed the bony shift by 57% and the subcommissural
regions by 52%. Despite the solitary mandibular movement, some soft tissue
regions overlying the maxilla were also affected. These changes were less
than 1 mm. The highest value was a mean of 0.86+0.38 mm on the upper
vermilion due to its interaction with the lower lip to create a better lip seal.
166

Chapter V Evaluation o f facial soft tissue changes
This was reflected minimally in the rest of the upper lip, the subalar region
had a change of 0.59±0.39 mm, supracommissural regions 0.21±0.22 mm
and subnasale 0.06±0.13 mm. These mean values and percentile proportions
are summarised in Table 5.2.
n=18Mean maxillary movement 0Mean mandibular advancement 6.67±2.03 mm
Mean (mm) S.D. % movement
Nasal tip 0 0 n.a.Paranasal 0 0 n.a.Subnasale 0.06 0.13 n.a.Subalar 0.59 0.39 n.a.Supracommissural 0.21 0.22 n.a.Upper vermilion 0.86 0.38 n.a.Lower vermilion 3.83 1.24 57Subcommissural 3.47 1.28 52Labiomental groove 5.75 1.84 86Chin 6.53 1.99 98
Table 6.2- The mean±S.D. soft tissue changes and their percentile proportions to bony
surgical change for single jaw Class II advancement cases that underwent a bilateral sagittal
split osteotomy.
167

Chapter V______________________________________________Evaluation of facial soft tissue changes
5.4.1.2 Bimaxillary cases:
Twenty-nine patients had a bimaxillary procedure. Twenty of these underwent
a maxillary impaction and a bilateral sagittal split osteotomy on the mandible,
four had a genioplasty procedure and five had a horizontal maxillary shift as
well as maxillary impaction and mandibular osteotomy. The results of the
patients who undenArent maxillary impaction and bilateral sagittal split
osteotomy were compared to the single jaw cases without any maxillary
procedure but only bilateral sagittal split osteotomy, and the difference was
statistically insignificant. It was concluded that a vertical movement of the
maxilla didn’t affect the soft tissues significantly in the anteroposterior plane
so despite different degrees of maxillary impaction, all cases were grouped
together for analysis.
The first group (n=20) undenvent maxillary impaction and mandibular
advancement. The mean magnitude of mandibular advancement was
6.60+0.94 mm. The chin was advanced most by 94%, followed by the
labiomental groove, 80%. The lower vermilion reflected 60% of the
mandibular advancement, whereas subcommissural regions showed 48% of
the change. Although the maxillary procedure did not include a horizontal
shift, the soft tissues overlying the maxilla showed insignificant changes, all
less than 1 mm. The mean values and percentile proportions are summarised
in Table 5.3.
168

Chapter V Evaluation of facial soft tissue changes
n=20Mean maxillary advancement with 0Impaction + impactionMean mandibular advancement 6.60±0.94 mm
Mean (mm) S.D. % movement
Nasal tip 0.21 0.19 n.a.Paranasal 0.26 0.20 n.a.Subnasale 0.28 0.13 n.a.Subalar 0.27 0.13 n.a.Supracommissural 0.06 0.10 n.a.Upper vermilion 0.74 0.27 n.a.Lower vermilion 3.98 0.88 60Subcommissural 3.15 0.67 48Labiomental groove 5.27 0.96 80Chin 6.23 0.94 94
Table 5.3- The mean±S.D. soft tissue changes and their percentile proportions to bony
surgical change for bimaxillary Class II cases that underwent a maxillary impaction and a
bilateral sagittal split osteotomy.
The second group (n=4) of the bimaxillary procedures in Class II patients
underwent maxillary impaction and mandibular advancement as well as a
genioplasty procedure. The mean mandibular advancement was 4.50±1.00
mm but because of the addition of genioplasty, the chin was advanced 136%
of the mandibular advancement achieved by sagittal split osteotomy. Similarly
the labiomental groove was advanced 111% of the mandibular osteotomy.
The lower vermilion and subcommissural regions' changes were similar to
other groups. The lower vermilion reflected 64%, and subcommissural
169

Chapter V Evaluation of facial soft tissue changes
regions 54% of the mandibular advancement The soft tissues corresponding
the maxilla displayed insignificant changes, all less than 1 mm. The mean
values and percentile proportions of change are summarised in Table 5.4.
n=4Mean maxillary advancement with 0impaction + impactionMean mandibular advancement 4.50+1.00 mm + aug genio
Mean (mm) S.D. % movement
Nasal tip 0.25 0.05 n.a.Paranasal 0.40 0.18 n.a.Subnasale 0.20 0.14 n.a.Subalar 0.35 0.10 n.a.Supracommissural 0.08 0.15 n.a.Upper vermilion 0.90 0.26 n.a.Lower vermilion 2.88 0.48 64Subcommissural 2.43 0.68 54Labiomental groove 5.00 0.82 111Chin 6.13 0.63 136
Table 5.4- The mean±S.D. soft tissue changes and their percentile proportions to bony
surgical change for bimaxillary Class II cases that underwent a maxillary impaction, bilateral
sagittal split osteotomy and a genioplasty procedure.
The third group (n=5) of the bimaxillary procedures underwent mandibular
advancement and maxillary impaction with a horizontal shift. The mean
mandibular advancement was 2.80+1.10 mm and the mean maxillary
advancement was 4.20±1.64. The chin was advanced most by 99%. The
labiomental groove followed this by 84%. The lower vermilion was affected
more in this group compared to the first two. It projected 79% of the bony
advancement. The soft tissues overlying the maxilla revealed more change as
170

Chapter V Evaluation o f facial soft tissue changes
the maxilla was shifted in the horizontal plane. The paranasal and subalar
regions, and subnasale advanced approximately 65% of the maxillary
change. The nasal tip was least affected, 20%. The mean values and
percentile proportions are summarised in Table 5.5.
n=5Mean maxillary advancement with impaction
4.20±1.64 mm + impaction
Mean mandibular advancement 2.80±1.10 mm
Mean (mm) S.D. % movement
Nasal tip 0.86 0.30 20Paranasal 2.68 1.13 64Subnasale 2.86 1.28 68Subalar 2.76 1.04 66Supracommissural 1.50 0.50 36Upper vermilion 2.06 0.90 49Lower vermilion 2.20 0.76 79Subcommissural 1.18 0.57 42Labiomental groove 2.36 1.11 84Chin 2.76 1.38 99
Table 5.5- The mean±S.D. soft tissue changes and their percentile proportions to bony
surgical change for bimaxillary Class II cases that underwent a bilateral sagittal split
osteotomy, maxillary impaction, and a maxillary horizontal shift.
171

Chapter V______________________________________________Evaluation o f facial soft tissue changes
5.4.2 Class III
Class III patients were evaluated in 5 groups. The first group had single jaw
procedures.
5.4.2.1 Single jaw
Five patients underwent a single jaw procedure (sagittal split osteotomy),
which involved a mandibular setback. The mean achieved mandibular
movement was 5.40±1.34 mm. The chin reflected 100% of the bony shift
while the labiomental groove followed 84% of the mandibular movement. The
lower vermilion followed the bony shift by 70% and the subcommissural
regions by 50%. Although the maxilla was not corrected surgically, medial
regions of the upper lip with the vermilion were affected insignificantly. None
of them were over 1 mm. These mean values and percentile proportions of
soft tissue change are summarised in Table 5.6.
172

Chapter V Evaluation o f facial soft tissue changes
n=5Mean maxillary movement 0
Mean mandibular setback 5.40±1.34 mm
Mean (mm) S.D. % movement
Nasal tip 0 0 n.a.Paranasal 0 0 n.a.Subnasale 0.14 0.22 n.a.Subalar 0.18 0.20 n.a.Supracommissural 0 0 n.a.Upper vermilion 0.86 0.42 n.a.Lower vermilion 3.74 0.99 70Subcommissural 2.70 0.57 50Labiomental groove 4.54 1.33 84Chin 5.40 1.34 100
Table 5.6- The mean±S.D. soft tissue changes and their percentile proportions to bony
surgical change for single jaw Class III cases that underwent a bilateral sagittal split
osteotomy.
S.4.2.2 Bimaxillary cases
Fifty patients had a bimaxillary procedure. Four of these underwent a
maxillary impaction and a bilateral sagittal split osteotomy on the mandible,
and 46 had a maxillary advancement as well as maxillary impaction and
mandibular osteotomy. Fourteen had 3-mm, 27 had 6-mm and 5 had 9-mm
advancement of the maxilla (Table 5.1). The results of the patients who
underwent maxillary impaction and the mandibular setback were compared to
the single jaw cases without any maxillary procedure but only a mandibular
setback, and the difference was statistically insignificant so despite different
173

Chapter V______________________________________________Evaluation of facial soft tissue changes
magnitudes of maxillary impaction, all cases were grouped together for
analysis.
Bimaxillary cases formed the remaining 4 groups for evaluation. The first of
these was the patients who underwent a maxillary impaction and a
mandibular setback (n=4). The mean mandibular shift was 4.75±0.96 mm.
Since this was a setback, the soft tissues showed change in the same
direction. The chin was affected most by 96%. The labiomental groove, by
84%, followed this. Lower vermilion reflected 68% of the mandibular
procedure, whereas subcommissural regions showed 49% of the change.
Although the maxillary procedure did not include a horizontal shift, the soft
tissues corresponding the maxilla displayed very insignificant changes, less
than 1 mm. The mean values and percentile proportions are summarised in
Table 5.7.
The other three groups of bimaxillary procedures were the patients who
underwent maxillary advancement as well as maxillary impaction with a
mandibular procedure. The first of these had 3-mm advancement of the
maxilla (n=14). After evaluating the postoperative lateral skull x-rays, the
mean maxillary advancement was found to be 2.99±0.27 mm and the
mandible was pushed back 2.86±1.23 mm. Among the points corresponding
the maxilla, subnasale, paranasal and subalar regions were the three most
affected areas, 81, 79 and 79% respectively. The effects decreased as
moved laterally in the supracommissural regions to 45%. The nasal tip was
the least affected. It reflected 29% of the maxillary advancement. In the
174

Chapter V Evaluation o f facial soft tissue changes
mandible, the chin was affected the most, reflecting 97% of the mandibular
change. It was closely followed by the labiomental groove, which projected
90% of the mandibular shift. Subcommissural regions were affected less,
46%. The upper and lower vermilions reflected the surgical change very
similar to each other; the upper moved 66% of the surgical change and the
lower 64%. The mean values and percentile proportions are summarised in
Table 5.8.
n=4Mean maxillary advancement with 0Impaction + impactionMean mandibular setback 4.75±0.96 mm
Mean (mm) S.D. % movement
Nasal tip 0 0 n.a.Paranasal 0 0 n.a.Subnasale 0.05 0.10 n.a.Subalar 0.10 0.12 n.a.ISupracommlssural 0 0 n.a.Upper vermilion 0.55 0.21 n.a.Lower vermilion 3.25 0.53 68Subcommissural 2.35 0.44 49Labiomental groove 3.93 0.79 83Chin 4.58 0.99 96
Table 5.7- The mean±S.D. soft tissue changes and their percentile proportions to bony
surgical change for bimaxillary Class III cases that underwent a maxillary impaction and a
setback by bilateral sagittal split osteotomy.
175

Chapter V Evaluation of facial soft tissue changes
n=14Mean maxillary advancement with impaction
2.99±0.27 mm + impaction
Mean mandibuiar setback 2.86±1.23 mm
Mean (mm) S.D. % movement
Nasai tip 0.86 0.86 29Paranasal 2.35 0.46 79Subnasale 2.43 0.51 81Subalar 2.36 0 46 79Supracommissural 1.36 0.46 45Upper vermilion 1.96 0.46 66Lower vermilion 1.84 1.06 64Subcommissurai 1.32 0.93 46Labiomental groove 2.57 1.22 90Chin 2.76 1.28 97
Table 5.8- The mean±S.D. soft tissue changes and their percentile proportions to bony
surgical change for bimaxillary Class III cases that underwent a maxillary impaction, 3-mm
maxillary advancement and a bilateral sagittal split osteotomy.
In the 6-mm advancement group (n=27), the results were similar. The actual
mean maxillary advancement was 5.91 ±0.24 mm and the mandibular setback
was 2.74±1.02 mm. Subnasale, paranasal and subalar regions were the most
affected points overlying the maxilla, 80, 75 and 75% respectively. The effects
of surgical change decreased to 44% in the supracommissural regions. The
nasal tip reflected 33% of the maxillary advancement. In the mandible, the
chin kept to the mandibular shift by 98%. The labiomental groove closely
followed this region adjacent to it, by showing 91% of the mandibular surgical
change. Subcommissural regions were affected less, 47%. The upper
176

Chapter V Evaluation of facial soft tissue changes
vermilion moved 57%, and the lower moved 65% of the surgical change.
These mean values and percentile proportions are summarised in Table 5.9.
n=27Mean maxillary advancement with Impaction
5.91+0.24 mm + impaction
Mean mandibular setback 2.74±1.02 mm
Mean (mm) S.D. % movement
Nasal tip 2.00 1.01 34Paranasal 4.44 0.65 75Subnasale 4.70 0.72 80Subalar 4.40 0.54 75Supracommissural 2.59 0.64 44Upper vermilion 3.34 0.76 57Lower vermilion 1.77 0.81 65Subcommissural 1.28 0.63 47Labiomental groove 2.50 1.02 91Chin 2.69 1.05 98
Table 5.9- The mean±S.D. soft tissue changes and their percentile proportions to bony
surgical change for bimaxillary Class III cases that underwent a maxillary impaction, 6-mm
maxillary advancement and a bilateral sagittal split osteotomy.
The final group had 9-mm advancement of the maxilla (n=5) which was an
actual mean maxillary advancement of 8.97±0.31 mm and a mean
mandibular setback of 2.80±1.30 mm. Subnasale, and paranasal and subalar
regions were again the most affected areas overlying the maxilla, 75, 74 and
72% respectively. The projection of surgical change to soft tissues decreased
in the supracommissural regions to 45%. The nasal tip projected 34% of the
maxillary advancement. In the mandible, the chin displayed all of the surgical
177

Chapter V Evaluation o f facial soft tissue changes
change. The labiomental groove reflected 90% of the mandibular movement.
Subcommissural regions were affected less, 46%. The upper vermilion
moved 49% of the surgical change, whereas the lower projected 71% of the
surgical change. The mean values and percentile proportions are
summarised in Table 5.10.
n=5Mean maxillary advancement with impaction
8.97+0.31 mm + impaction
Mean mandibuiar setback 2.80±1.30 mm
Mean (mm) S.D. % movement
Nasai tip 3.00 0.35 33Paranasal 6.60 0.42 74Subnasale 6.70 0.27 75Subalar 6 50 0.50 72Supracommissural 4.00 0.79 45Upper vermilion 4.40 0.65 49Lower vermilion 2.00 0.87 71Subcommissurai 1.30 0.45 46Labiomental groove 2.52 1.14 90Chin 2.80 1.30 100
Table 5.10- The mean+S.D. soft tissue changes and their percentile prcpcrticns tc bony
surgical change for bimaxillary Class III cases that underwent a maxillary impaction, 9-mm
maxillary advancement and a bilateral sagittal split osteotomy.
Figure 5.4, 5.5 and 5.6 show comparison of the percentile changes between
groups of different treatment plans.
178

Chapter V Evaluation of facial soft tissue changes
% 100
□ Class il ■ Class
Figure 5.4- The comparison of percentile soft tissue changes between single jaw Class II and
III cases.
%
□ Class■ Class III
Figure 5.5- The comparison of percentile soft tissue changes between bimaxillary Class II and
III cases that underwent a maxillary impaction and a mandibular procedure.
179

Chapter V Evaluation of facial soft tissue changes
% 100
3-mm
D6-mm
□ 9-mm
Figure 5.6- The comparison of soft tissue changes (% of the skeletal change) in Class III
cases undergoing 3-mm, 6-mm and 9-mm advancement and impaction with a mandibular
setback.
Using the thin-plate splines analysis, the directions of movements of the
landmarks on the lateral profile outline were observed. Samples of thin-plate
splines graphic changes are demonstrated in Figure 5.7. The landmarks
associated to the areas not affected by the surgery (landmarks 1,2 and 3)
show the unaffected grid in the upper third of the face for both figures. Both
grid systems show the change around the nasal tip (landmark 4), subnasale
(landmark 5), the lips (landmarks 6,7,8 and 9) and the chin (landmarks 10 and
11). The direction of curves of the grid lines shows the direction of
movements of the soft tissue landmarks for Class II and III cases.
180

Chapter V Evaluation of facial soft tissue changes
1
"1 1*2
\ 41 1 } 1
! 4 6I jhW
;-LL.jFigure 5.7- The thin-plate splines graphical analysis obtained after the superimposition of pre
and postoperative optical surface scans' lateral profiles. The image on the left represents the
change in a Class II case, and the image on the right represents the change in a Class III
case. The landmarks associated to the areas not affected by the surgery (landmarks 1,2 and
3) show the unaffected grid in the upper third of the face for both figures. Both grid systems
show the change around the nasal tip (landmark 4), subnasale (landmark 5), the lips
(landmarks 6,7,8 and 9) and the chin (landmarks 10 and 11). The direction of curves of the
grid lines shows the direction of movements of the soft tissue landmarks for Class II and III
cases.
Among Class II patients (n=47), the movement of the maxillary reference
points were insignificant except five patients who had a maxillary horizontal
forward shift.
Genioplasty introduced increased change in the results so 4 patients were
excluded and the remaining 38 patients were analysed for the points
corresponding the mandible. The stomion point on the lower lip moved
forward and up in 19, forward only in 10, forward and down in 9 cases. On
labrale inferius, 22 cases moved fonA/ard and upward, 8 moved solely
foHA/ard, 6 forward and downward. Two of the cases showed no change on
this landmark. The major vector was a fonA/ard and upward component for the
181

Chapter V Evaluation o f facial soft tissue changes
labiomental groove and pogonion (15 cases for labiomental groove and 18 for
pogonion). At the labiomental groove, 15 cases moved solely forward while
14 moved in the same direction as the pogonion. The pogonion moved
forward and downward in 6 cases while the labiomental groove moved
forward and downward in 8 cases. These results are summarised in Table
5.11.
Landmark Direction of movement
n
Stomion inferius 19
------- - 10
9
Labrale Inferius 22
8
6
unchanged 2
Labiomental 15
groove — 15
8
Pogonion 18— - 14
6
Table 5.11- The direction of movements for landmarks on the soft tissue profiie for Ciass
cases (n=38).
182

Chapter V______________________________________________Evaluation o f facial soft tissue changes
Among the Class III patients (Table 5.12) who had a maxillary advancement
and impaction with a mandibular setback (n=46), the nasal tip moved forward
and up in a majority of cases (n=33). In 7 cases, it moved straight forward,
and remained immobile in 6 cases.
The direction of movement for subnasale was forward and up in 27 cases and
forward and down in the other 7. Ten of the cases though moved straight
forward and only 2 remained immobile. From subnasale downwards on the
upper lip, the downward component of the movement became stronger.
Labrale superius moved straight fon/vard in 35 cases, forward and down in 9.
The other two remained constant. On the upper lip stomion, 22 moved
forward with a downward vector while 21 moved straight forward, and 3
remained unchanged.
The movement of the stomion point on the lower lip was more complicated.
Eleven moved fon/vard and down, and 9 solely forward. This landmark also
showed backward movement in 23 cases; 14 with an upward and 9 with a
downward vector. In 3 cases, the stomion inferius remained unchanged.
Below this landmark, backward movement was the major vector. With labrale
inferius, 22 cases moved backward and downward, 9 moved solely backward,
and 11 backward and upward. Four of the cases showed no change of this
landmark. The labiomental groove and pogonion displayed the least
complicated movement. The major vector was backward with and upward
component (21 cases for labiomental groove and 23 for pogonion). On the
183

Chapter V Evaluation of facial soft tissue changes
labiomental groove 18 cases moved solely backward while 17 moved the
same direction for pogonion. On the pogonion 6 moved backward and
downward while 7 moved similarly for labiomental groove. These results are
summarised in Table 5.12.
Landmark Direction of movement nNasal tip 33
* 7unchanged 6
Subnasale 2710
7unchanged 2
Labrale superius 359
unchanged 2Stomion superius ----» 21
22
unchanged 3Stomion inferius . 9
11149
unchanged 3Labrale Inferius 11
922
unchanged...............................................■
4Labiomental groove 21
187
Pogonion 23« _ 17
6Table 5.12- The direction of movements for landmarks on the soft tissue profile for Class cases (n=46).
184
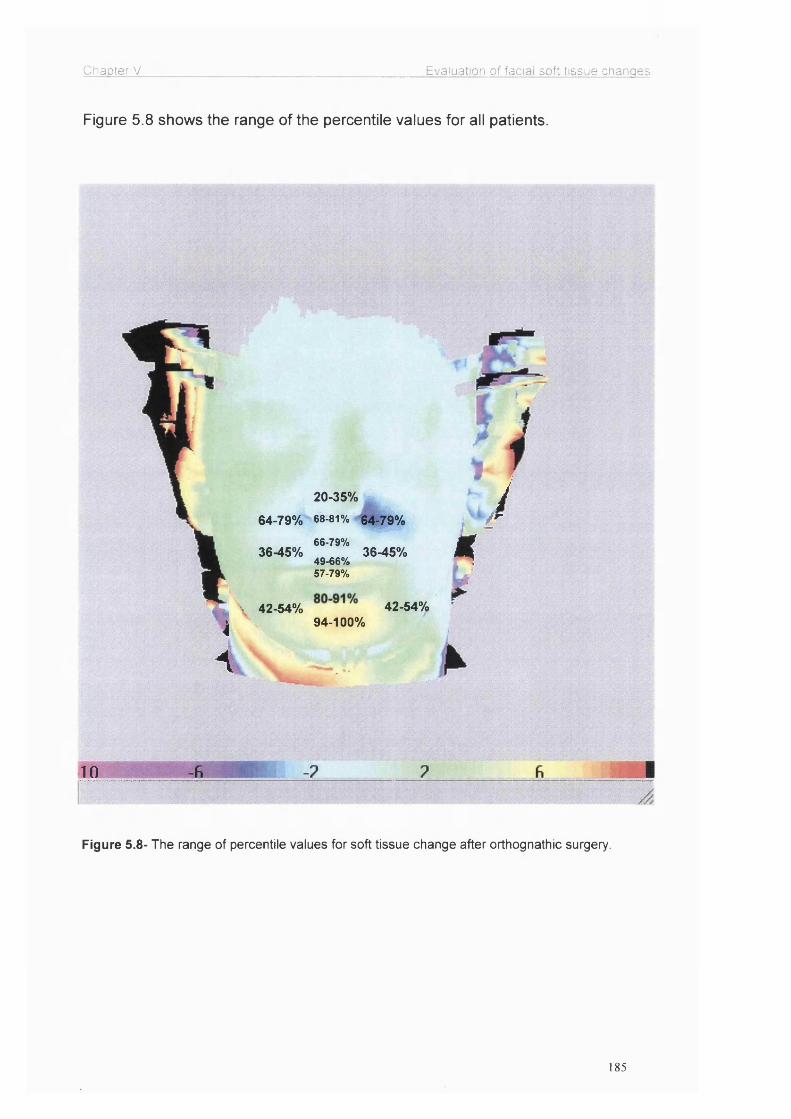
Chapter V Evaluation of facial soft tissue changes
Figure 5.8 shows the range of the percentile values for all patients.
i4
20-35%
64-79% 68-81% 64-79%
66-79%36-45% 36-45%
49-66%57-79%
42.54% 42.54%94-100%
kJ
10
Figure 5.8- The range of percentile values for soft tissue change after orthognathic surgery.
185

Chapter V______________________________________________Evaluation of facial soft tissue changes
5.5 Discussion
This study showed the effects of orthognathic surgery on the facial soft tissue
mask after the correction of Class II and III facial deformities. These changes
differed in various regions of the face in all patients. Other researchers have
not investigated many of the areas investigated in this study, e.g. paranasal
regions, supracommissural and subcommissural regions. This has only been
possible with the use of a reliable three-dimensional imaging tool.
The lips in particular were investigated in greater detail in this study. It was
possible to differentiate the soft tissue responses for the upper and the lower
lips and the vermilion borders in detail by the optical surface scanner. The
Clin was also investigated in greater detail particularly in relation to the
labiomental groove.
Soft tissue changes were studied by many researchers in the last century, but
often reporting contradictory findings. Bell and Dann (1973) reported a
change of 70% for the upper lip movement relative to upper incisor
movement, which was 66-79% for this study. Lines and Steinhauser (1974)
aid Hack et al. (1993) suggested a ratio of 60% though in the latter study
they suggested that this ratio would decrease to 50% over the long term of
fi/e years. On the other hand, the results of Carlotti at al. (1986) were higher
wth a ratio of 90% and later Schendel and Carlotti (1991) suggested this ratio
improvement was due to the use of V-Y closure of the vestibular incision. Our
study was able to investigate the upper lip in greater detail by giving results of
dfferent sections of the upper lip; e.g. the subalar, subcommissural and
186

Chapter V_____________________________________________ Evaluation of facial soft tissue changes
supracommissural regions and the vermilion with the help of the 3D optical
surface scanner.
The anatomical and morphological nature of the upper lip probably
determines the soft tissue movement in relation to the repositioning of the
underlying skeletal structure. The upper lip hangs like a muscular curtain
attached to the anterior nasal spine at the subnasal region which may explain
why that region follows the hard tissue much closely (80%) compared to
lateral areas of the upper lip, the supracommissural regions (45%), and the
unbound end at the upper lip vermilion, especially at the stomion (65%). In
addition, the amount of change depends on factors like the elasticity of the
upper lip, its proximity and contour of the alveolar bone, and the volume of the
potential space at the fornix of the alveolar sulcus. The important extraneous
factor is the relation to the lower lip to form a lip seal. The influence of these
factors is shown in Figure 5.9 where the preoperatively existing concave
outline of the upper lip straightens followed by maxillary advancement.
Figure 5.9- Optical surface scans showing the preoperatively existing concave outline of the
upper lip which straightened after maxillary advancement and formation of a lip seal.
187

Chapter V______________________________________________Evaluation of facial soft tissue changes
Figure 5.9 demonstrates how the differential effect of the maxillary
advancement works towards the correction of the concave outline of the
upper lip. Subnasale and subalar region advanced more than the upper lip
vermilion. The position of the upper lip in relation to the lower lip was altered
by the bimaxillary procedure allowing an increase in the vertical height and a
better lip support by the upper incisors, so the previous drape of the upper lip
with the concave outline compensated for the formation of a lip seal. As the
soft tissues projected the skeletal change more on subnasale and subalar
region than the lateral parts of the upper lip (supracomissural regions), the
mid upper lip gained volume altering the flat appearance.
This decreasing effect of the maxillary movement on the lateral parts of the
upper lip and the soft tissue mask of the middle third of the face is an
important finding. This can be explained by the semi-circular shape of the
maxilla and the muscle attachments. The magnitude of the maxillary
advancement is planned at the central part of the bone corresponding to the
maxillary incisors. When this semi-circular bone is advanced by a certain
magnitude at this point, the other bilateral points on the circumference of the
circle move less, in other words, the degree of projection of the advancement
on soft tissues decreases gradually towards the back (Figure 5.10). This is
also applicable to the mandible since the mandibular bone resembles a semi
circle as well. For these reasons use of an accurate 3D imaging tool for the
evaluation of soft tissues is especially important for the lips. This finding was
supported by McCance et al. (1992 a) and Techalertpaisarn and Kuroda
(1998).
188

Chapter V Evaluation of facial soft tissue changes
3b
Figure 5.10- When a semi-circular shaped bone is advanced at point 1, the other points on
the circumference of the circle bilaterally (2a, 2b, 3a, 3b) move relatively less, in other words,
the degree of projection of the advancement on soft tissues decreases gradually towards the
back.
An additional factor is the muscle attachments. The fibres of orbicularis oris
muscle attach to the upper and lower jaws near the midline, well away from
the alveolar margin. The mucous membrane of the lips is firmly attached to
these deep fibres (McMinn, 1994). This firm attachment of the incisive and
mental slips of the orbicularis oris muscle to the bone near the midline and
the mucous membranes of the lips enables the upper lip on the midline and
the soft tissue pogonion to follow the advancement more closely than the
lateral parts, which are relatively loose (Figure 5.11).
189

Chapter V_____________________________________________ Evaluation o f facial soft tissue changes
Incisive slips
^Montai siips
Figure 5.11- The incisive and mental slips of the orbicularis oris muscle are the deepest
fibres, which are attached to the bone near the midline, well away from the alveolar margin
and the mucous membrane of the lips is also firmly attached to them.
Dann et al. (1976) reported the ratio for nasal tip advancement of 20-35%
similar to this study. Rosen (1988), on the other hand, found the nasal tip
advancement insignificant. Lee et al. (1996) suggested that the nasal tip
changes occurred but disappeared by the end of first year.
The paranasal regions, bilaterally, correspond to the attachment of levator
anguli oris muscle at the canine fossa, and the attachments of the nasalis
muscle (Figure 5.12) (McMinn, 1994). These firm attachments help to explain
the up to 80% reflection of the maxillary advancement to the soft tissues in
the paranasal regions (Figure 5.13). Previous studies did not mention the soft
tissue response at the paranasal regions. Widening of the alar base was
discussed previously, especially when cinch suture technique is not used.
Most of those studies evaluated the facial profile outline or the clinical alar
base width, but not the paranasal region.
190

Chapter V Evaluation of facial soft tissue changes
Levator anguli oris
Nasalis
Figure 5.12- The attachments of levator anguli oris and nasalis muscles in the paranasal
region (left), and the soft tissue change in the region after maxillary advancement compared to
the adjacent soft tissues (right).
r I L . ' t
Figure 5.13- The preoperative (left) and postoperative (right) optical surface scans showing
the change in the paranasal regions, indicated by the red arrows.
191
Chapter V______________________________________________Evaluation of facial soft tissue changes
The amount of the reflection of the mandibular movement to the soft tissues
of the lower facial third was found to be greater. This study reported a 100%
ratio around the soft tissue pogonion, which was supported by many other
researchers. This can be explained by the close proximity of the soft tissue
pogonion to the underlying bone because of the muscle attachments, the
mentalis muscle and the mental slips of the orbicularis oris muscle (Figure
5.11). The semi-circular shape of the mandible, like the maxilla, is again
another effect on the decreasing degree of projection of the mandibular
procedure gradually towards the lateral parts of the mandible (Figure 5.10).
Mommaerts and Marxer (1987) supported the same ratio at the soft tissue
pogonion and added that there was no direct effect of mandibular surgery
over labrale inferius, whereas Lines and Steinhauser (1974) reported a 75%
ratio at the lower lip vermilion border, which was 57 to 79% in this study. 3D
optical surface scans could measure the magnitude of change and
demonstrate a significant aversion of the lower lip (Figure 5.14), which was
also reported by Hershey and Smith (1974). In this study, using the thin-plate
splines analysis, the forward movement of stomion inferius was shown while
labrale inferius was moving backward (Figure 5.14a), displaying the aversion
of the lower lip and increasing the lower vermilion border in many Class III
cases. This was due to the relaxation of the lower lip after the tension caused
by the lower teeth and the alveolar bone was eliminated with a mandibular
setback, and eventually eliminating lip incompetence and forming a better lip
seal.
192

Chapter V Evaluation of facial soft tissue changes
a)
b) c)
Figure 5.14- The eversion of the lower lip after mandibular setback; a) The direction of the
shift of the landmarks; 1- stomion inferius, 2- labrale inferius, 3- labiomental groove, 4- soft
tissue pogonion, b) the preoperative, and c) the postoperative optical surface scans.
The positions of the lips are determined mostly by themselves more than the
underlying bone. Other studies reported a 67% ratio at the lower lip vermilion,
which was as low as 38% according to Quast et al. (1983). The range of
change at the labiomental groove in this study was 80-91%, close to Hershey
and Smith’s (1974) 80% change.
193

Chapter V______________________________________________ Evaluation of facial soft tissue changes
The directions of the movements of the soft tissue points were clearly shown
in this study using thin-plate splines, and they had vertical components as
well as the main horizontal vector. Many researchers stated that the vertical
component of change only followed a vertical movement of the underlying
bone, as with the impaction of the maxilla or the autorotation of the mandible.
Although maxillary impaction did not introduce a significant difference in soft
tissue change, the thin-plate splines revealed the vertical vectors caused by
these procedures. It is difficult to determine the amount of autorotation of the
mandible, but this study reported the deviations in the direction of
movements, again, using thin-plate splines. Since vertical changes did not
make a significant difference to the overall result, we evaluated the
magnitudes of movements regardless, but used these components of
movement to explain the shift of some individual landmarks as in Figure 5.14.
In conclusion, the soft tissue changes following the shift of the underlying
skeletal structures after orthognathic surgery depend on various factors
including; muscle attachments, proximity of the soft tissues to the underlying
bone, the geometrical shape of the bones, soft tissue elasticity, thickness,
surgical technique and the magnitude of surgical movement, hence it can be
difficult to predict. However, there is a general trend as discussed in this study
for the direction and amounts of facial soft tissue changes in the middle and
lower facial thirds.
194

Chapter V______________________________________________Evaluation o f facial soft tissue changes
This study has highlighted the regions of the face significantly affected by the
osteotomy movements and illustrated that soft tissue changes are
quantifiable.
195
Chapter VI_______________________________________ The effect on upper and lower verm ilion width
CHAPTER VI
THE EFFECT OF ORTHOGNATHIC SURGERY ON THE UPPER AND
LOWER LIP VERMILION WIDTH
196

Chapter VI_______________________________________ The effect on upper and lower vermilion width
6.1 Introduction
Lips are an important component of the facial complex, and can be grossly
affected by the movement of the maxilla and the mandible but the degree of
change is influenced by several factors. The surgical movements of facial
bones produce lip movements which can be predicted, whereas the
contraction of surgical incisions and alteration in muscle tone have unknown
effects.
The literature review revealed no controlled study of lip vermilion width
changes following orthognathic surgery. The difficulties are current imaging
techniques for recording lip changes, which are crude, although clinical
measurement techniques of soft tissues are sensitive. Therefore a better
understanding of the relationship between hard tissue movement and
overlying soft tissue response is essential in order to improve the desired soft
tissue outcome after orthognathic surgery.
6.2 Aims
The aims of this study were to analyse the upper and lower lip vermilion
widths for Caucasian, Afro-Caribbean and Oriental controls, and to
investigate the upper and lower lip vermilion width changes after orthognathic
surgery in skeletal Class II and III patients.
197

Chapter VI_______________________________________ The effect on upper and lower verm ilion width
6.3 Patients and methods
Sixty subjects were recruited for the first part of this study to measure the
upper and lower lip vermilion widths in order to set up a normative data.
Three groups of twenty control subjects representing Caucasians, Afro-
Caribbeans and Orientals were formed. These control subjects were chosen
randomly from the members of public. In the Caucasian group, 11 were males
and 9 were females. 13 of these had Class I, 3 had Class II / division 1 and 4
had Class III dentoskeletal relationship. The Afro Caribbean group had 12
male and 8 female subjects, 11 of which were dentoskeletally Class I, 2 were
Class II / division 1 and 7 were Class III. In the Oriental group, 7 males and
13 females took part. Fourteen of these were Class I, 1 was Class II / division
2 and 5 were Class III dentoskeletally.
For the second phase, thirty-seven non-cleft patients undergoing orthognathic
surgery were included. Nineteen of these were Class II / division 1 and
eighteen were Class III dentoskeletally. Nine of the 19 Class II patients
underwent 4 to 6-millimetre maxillary impaction along with fonvard
advancement of the mandible by sagittal split osteotomy. Five of these had 4-
millimetre and 4 had 6-millimetre impactions. Seven underwent only
mandibular advancement of the mandible by sagittal split osteotomy. The
other three underwent a 3-millimetre advancement two of which were 4-
millimetre impactions and one 8-millimetre downfracture of the maxilla as well
as the mandibular procedure. Sixteen of the 18 Class III patients underwent
maxillary advancements; 2 had 3-millimetre, 12 had 6-millimetre and 2 had 9-
millimetre, which were accompanied by a set back of the mandible with
198

Chapter VI_______________________________________ The effect on upper and lower verm ilion width
bilateral sagittal split osteotomy for a Class I skeletal relationship. One of the
3-millimetre advancement, 6 of the 6-millimetre advancement and 1 of the 9
millimetre advancement cases had 2 to 4-millimetre impaction. Two remaining
cases unden/vent 4-millimetre maxillary impaction without any maxillary
advancement.
The vermilion width of each subject in both phases of the study was
measured from labrale superius (upper vermilion margin) to the stomion (free
margin of the lip) on highest point of cubit’s bow on the upper lip, and from
stomion to labrale inferius (lower vermilion margin) on the lower lip at the
midline when the lips were relaxed (Figure 6.1). The patients were asked to
sit upright and lick their lips followed by a swallowing action and gaze in the
horizon with their lips in relaxed position for the reproducibility of
measurements. All measurements were taken during the preoperative work
up and six months postoperatively after the swelling of soft tissues had settled
down using a Vernier calliper. The measurements were repeated three times
and the means of these measurements were used for the final evaluation.
The paired student t-test was used for comparing the changes.
199

Chapter VI The effect on upper and lower vermilion width
Labrale Super!us
Stomlon
Labrale Infer!us
Figure 6.1- The localisation of landmarks; a) labrale superius, b) stomion, c) labrale inferius
clinically. The upper vermilion width (1) was measured from labrale superius to the stomion on
cubid’s bow, and the lower vermilion width (2) was measured from the stomion to labrale
inferius at the midline.
6.4 Results
6.4.1 The control group
The values recorded after measuring upper and lower lip vermilion widths and
the upper to lower lip vermilion width ratios are in Table 6.1. The mean upper
to lower lip vermilion ratio for Caucasians was 0.73±0.11. This ratio for Afro-
Caribbeans and Orientals were 0.76±0.07 and 0.76±0.08 respectively (Figure
6.2). The mean bivermilion widths (total vermilion width=sum of upper and
lower vermilion widths when the lips are relaxed) were calculated for
Caucasians, Afro-Caribbeans and Orientals and these values were 17.1 ±2.99
mm, 23.3+1.45 mm and 15.6±1.94 mm respectively (Figure 6.3). The
differences between the upper and lower lip vermilion width ratios between
the three groups were statistically insignificant (p>0.05). The difference
200

Chapter VI The effect on upper and lower vermilion width
between the mean bivermilion widths of Afro-Caribbeans was significantly
broader than Caucasians and Orientals (p<0.05).
Caucasian Afro-Carlbbean Oriental
Figure 6,2- The means and standard deviations of upper to lower lip vermilion width ratios for
Caucasian, Afro Caribbean and Oriental control subjects. (n=60) (p>0.05)
mm
Caucasian Afro-Caribbean Oriental
Figure 6.3- The mean and standard deviation of bivermilion width measurements for
Caucasian, Afro Caribbean and Oriental control subjects. (n=60)
201

Chapter VI The effect on upper and lower vermilion width
a) Caucasian groupupper vermilion width (mm)
lower vermilion width (mm)
vermilion ratio gender skeletal relationship
1 8 11 0.72 M Class 12 7 10 0.7 M Class 13 7 10 0.7 F Class 14 6 9 0.66 F Class 15 7 11 0.63 M Class 16 8 11 0.72 M Class 17 6 8 0.75 F Class 18 7 10 0.7 F Class 19 6 9 0.66 F Class I10 7 10 0.7 F Class 111 1 5 9 0.55 F Class 112 1 6 6 1 F Class II / div 113 1 6 9 0.66 M Class 114 1 8 11 0.72 M Class III15 1 8 10 0.8 M Class III16 1 9 11 0.81 1 M Class III17 1 8 10 0.8 1 F Class II / div 118 1 10 16 0.62 1 M Class III19 1 8 10 0.8 1 M Class II / div 120 1 7 7 1 1 M Class 1
b) Afro-Caribbean groupupper vermilion width (mm)
lower vermilion width (mm)
vermilion ratio gender skeletal relationship
1 10 14 0.71 F Class 12 10 13 0.76 M Class 13 9 13 0.69 F Class 14 9 13 0.69 M Class III5 11 13 0.84 M Class III
6 10 11 0.91 M Class 1
7 10 13 0.76 M Class 18 10 14 0.71 M Class III9 11 14 0.78 M Class 110 9 12 0.75 F Class 111 10 14 0.71 M Class III12 12 14 0.86 M Class II / divi
13 9 13 0.69 M Class III14 10 14 0.71 M Class 1
15 11 13 0.85 M Class 1
16 9 13 0.69 F Class II / divi17 10 14 0.71 F Class III18 10 13 0.77 F Class 119 12 14 0.86 F Class III
20 9 13 0.69 F Class 1
202

Chapter Vi The effect on upper and lower vermilion width
c) Oriental groupupper vermilion width (mm)
iower vermilion width (mm)
vermiiion ratio gender skeletai relationship
1 7 10 0.7 F Class 12 9 12 0.75 M Class 13 7 9 0.77 F Class 14 6 8 0.75 F Class 15 7 9 0.77 M Class 16 6 7 0.85 M Class 17 6 9 0.66 F Class III8 7 10 0.7 M Class 1
6 8 0.75 F Class 110 6 9 0.66 M Class 111 1 6 7 0.66 F Class 112 1 7 10 0.7 F Class III13 1 7 7 1 F Class 114 1 8 10 0.8 F Class II / div 215 1 6 7 0.86 M Class III16 1 7 9 0.77 F Class 117 1 6 8 0.75 F Class 118 1 7 9 0.77 F Class III19 1 7 10 0.7 F Class 120 1 6 9 0.66 M Class III
Table 6.1- The upper and lower vermilion widths, upper to lower vermilion width ratios of 60
control subjects.
6.4.2 Class II subjects
Figure 6.4 shows the pre and postoperative means and 95% confidence
intervals for the upper and lower vermilion widths (mm) of Class II subjects
that underwent mandibular advancement with or without maxillary impaction.
The changes in these patients were not significant (p>0.05). When the Class
II subjects who underwent maxillary impaction and mandibular advancement
were separated from the rest of the group, there was still no significant
change on the upper and lower lip vermilion widths (p>0.05). Despite the
insignificance, the minute change on the upper and lower vermilion widths
were same as the change occurred in the group who did not undergo
maxillary impaction. When the subjects who had a 3-millimetre maxillary
203
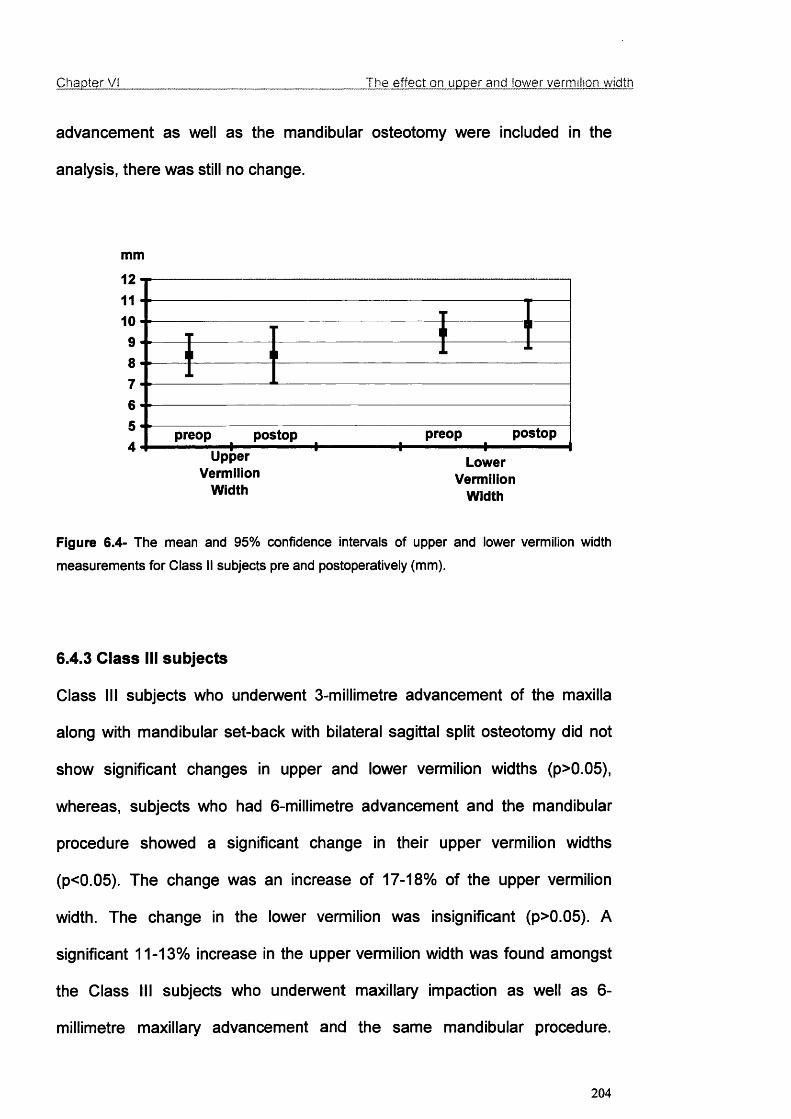
Chapter VI The effect on upper and lower vermilion width
advancement as well as the mandibular osteotomy were included in the
analysis, there was still no change.
mm
121110987654
I t1
T 1 I ^I
preop postop preop postop
VermilionWidth
LowerVermilion
Width
Figure 6.4- The mean and 95% confidence Intervals of upper and lower vermilion width
measurements for Class II subjects pre and postoperatively (mm).
6.4.3 Class III subjects
Class III subjects who underwent 3-millimetre advancement of the maxilla
along with mandibular set-back with bilateral sagittal split osteotomy did not
show significant changes in upper and lower vermilion widths (p>0.05),
whereas, subjects who had 6-millimetre advancement and the mandibular
procedure showed a significant change in their upper vermilion widths
(p<0.05). The change was an increase of 17-18% of the upper vermilion
width. The change in the lower vermilion was insignificant (p>0.05). A
significant 11-13% increase in the upper vermilion width was found amongst
the Class III subjects who unden/vent maxillary impaction as well as 6-
millimetre maxillary advancement and the same mandibular procedure.
204
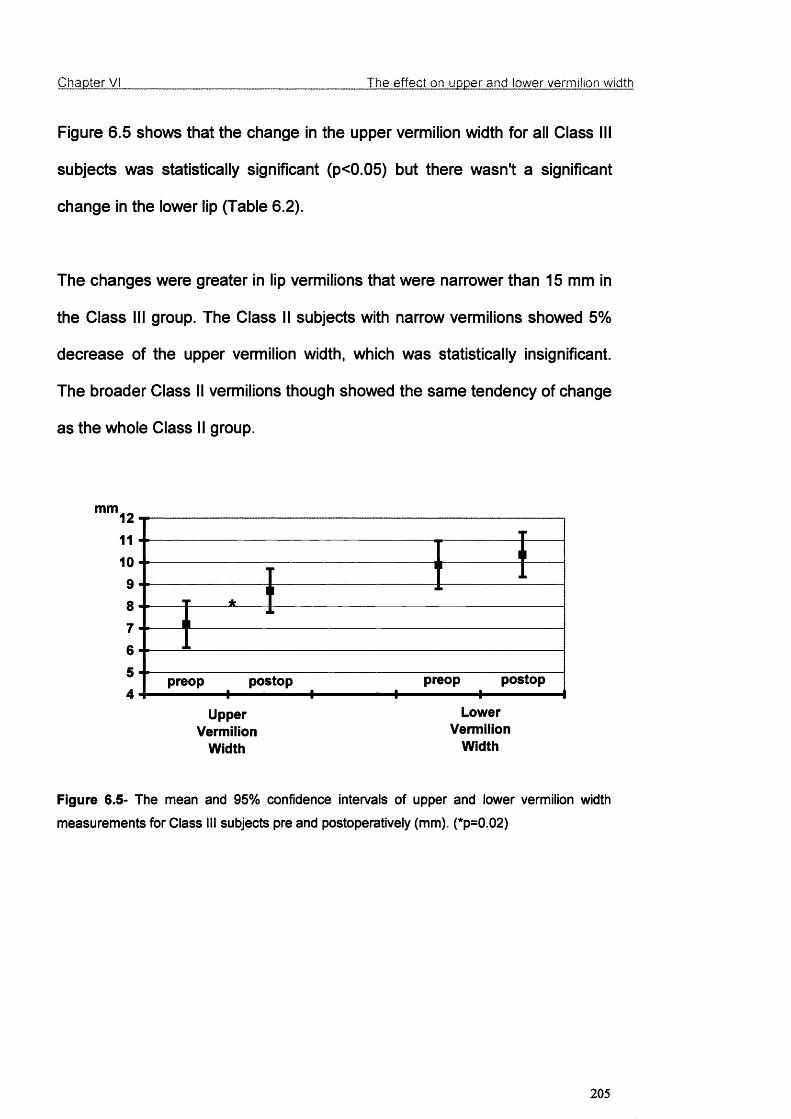
Chapter VI The effect on upper and lower vermilion width
Figure 6.5 shows that the change in the upper vermilion width for all Class III
subjects was statistically significant (p<0.05) but there wasn't a significant
change in the lower lip (Table 6.2).
The changes were greater in lip vermilions that were narrower than 15 mm in
the Class III group. The Class II subjects with narrow vermilions showed 5%
decrease of the upper vermilion width, which was statistically insignificant.
The broader Class II vermilions though showed the same tendency of change
as the whole Class II group.
mm1211109
87
654
UpperVermilion
Width
11_ 11
1r *
1
11
preop postop preop postop -------------------- I I - I 1-------------------1
LowerVermiiion
Width
Figure 6.5- The mean and 95% confidence intervals of upper and lower vermilion width
measurements for Class III subjects pre and postoperatively (mm). (*p=0.02)
205

Chapter VI The effect on upper and lower vermilion width
Class II preoperative postoperative
Upper vermilion width 8.38±1.80 8.38+2.47
Lower vermilion width 9.46±1.78 9.85±2.12
Class III
Upper vermilion width 7.18±2.30 8.71±2.14
Lower vermilion width 9.88±2.37 10.35±2.21
Table 6.2- The means ± SD for pre and postoperative upper and lower vermilion widths of
Class II and Class III subjects.
The change of upper vermilion width was irregular in the Class II group (5
decreased, 4 increased, 7 remained same) but the mean showed an
insignificant decrease of 4%. This change was more regular among Class III
subjects (9 increased, 3 remained the same) and the mean showed a marked
increase of 18%.
The change of lower vermilion width at the midline was irregular in the Class II
group (8 decreased, 3 increased, 5 remained same) and the mean showed a
slight decrease of 3%. The irregularity of this change was similar for Class III
subjects, but they mostly tended to increase (6 increased, 2 decreased, 4
remained the same) and the mean showed a less increase than the other
widths, an insignificant 4%.
206

Chapter VI_______________________________________ The e ffect on upper and lower vermilion width
6.5 Discussion
This study showed that in Class III cases the surgery had a significant effect
on upper vermilion width, whereas in Class II cases the lips were not
significantly affected and the changes were unpredictable. Advancement of
the maxilla and advancement or setback of the mandible had direct affects on
vermilion width, whereas maxillary impaction and down fracture did not have
a significant affect. Another important finding is that patients with narrower
vermilions were affected more. The reason that the effect of surgery on upper
lip vermilion is significant may be that the upper lip is usually narrower and
less bulky than the lower. The orthognathic surgery procedure did not have
significant effect on the lower vermilion.
There are very few studies in literature assessing the lips after orthognathic
surgery. The existing studies either included lips within a general evaluation of
facial profiles or assessed either the upper or the lower lip after a single jaw
procedure. As the results of these studies differ greatly, it is almost impossible
to compare them for a better evaluation of the lips together. Furthermore,
profile evaluations were favoured and frontal assessment of lips was
performed by a limited number of researchers. Most of these studies
evaluated the ratio of movement of the upper and/or the lower lip to the
movement of the hard tissues lying underneath and rotational movements of
lips resulting in change in the vermilion width was not observed.
For this study, the clinical measurements were taken two days before and six
months after the operation. This was reported to be a sufficient time after the
207

Chapter VI_______________________________________ The e ffect on upper and lower vermilion width
surgery for the soft tissues to settle down by Stella et al. (1989) and Dann at
a/. (1976).
Oliver (1982) investigated the changes in lip broadness and strain with
orthodontic treatment and surgery and reported that the lip broadness was an
important factor to influence the change, broader vermilions being able to
absorb changes more easily than narrow ones, which is supported by this
study. Furthermore, the narrower parts of the vermilions were even more
affected than the broader parts; for example, the change in the upper
vermilion width was more distinct at the midline than the broader lateral parts.
Gjorup and Athanasiou (1991) reported similar results. According to Freihofer
(1976), increased vermilion broadness (>17 mm) produced a less predictable
correlation between soft and hard tissue changes. In this study, the changes
in the vermilions in the range of 10-15 mm were more predictable than the
vermilions broader than 15 mm.
Adaptation of the lip posture is also dependent on their resting positions on
teeth and pressures due to position. Proffit and Phillips (1988) studied the
pressures following different applications of orthognathic surgery and stated
the decrease in resting pressures of the upper and lower lip respectively after
maxillary advancement by Le Fort I and mandibular advancement by sagittal
split osteotomy. This decrease in the resting pressure was affecting the lip
posture after orthognathic surgery.
208
Chapter VI_______________________________________ The effect on upper and lower vermilion width
Previous studies were done on cross-sectional evaluations based on
cephalographs, whereas for this study, direct clinical measurements were
taken ruling out the error of an imaging technique in the results.
The effect of surgery on the lip depends on many factors, these include the
thickness of the tissues overlying bony segments, the magnitude of
movements and accompanying vertical vectors of movement, lip posture and
strain, position of the teeth supporting soft tissues, and the surgical technique.
Stella et al. (1989) suggested that the mass of soft tissue content in thick lips
assisted in absorbing a larger amount of maxillary advancement, helped by
the effect of “dead space” especially in maxillary retrognathic patients where
usually an air pocket exists between the maxillary dentoalveolar structures
and upper lip labial mucosa.
Burstone (1967) emphasised the effect of the interlabial gap, which is
described as the space between upper and lower vermilions at rest, stating
that the effect of surgery on the lips was greater where the preoperative
interlabial gap was wider. This is closely related to the attempt to produce an
oral seal. Patients seeking the help of orthognathic surgery with Class II and
III skeletal relationships may have incompetent lips and may tend to
compensate for their skeletal deformity creating a pseudo lip seal (Lines and
Steinhauser, 1974). When the skeletal deformity is corrected, the relocation
of the lip does not need a forced lip seal, and may result with greater change
in the posture and size of the lips (Mommaerts and Marxer, 1987).
209
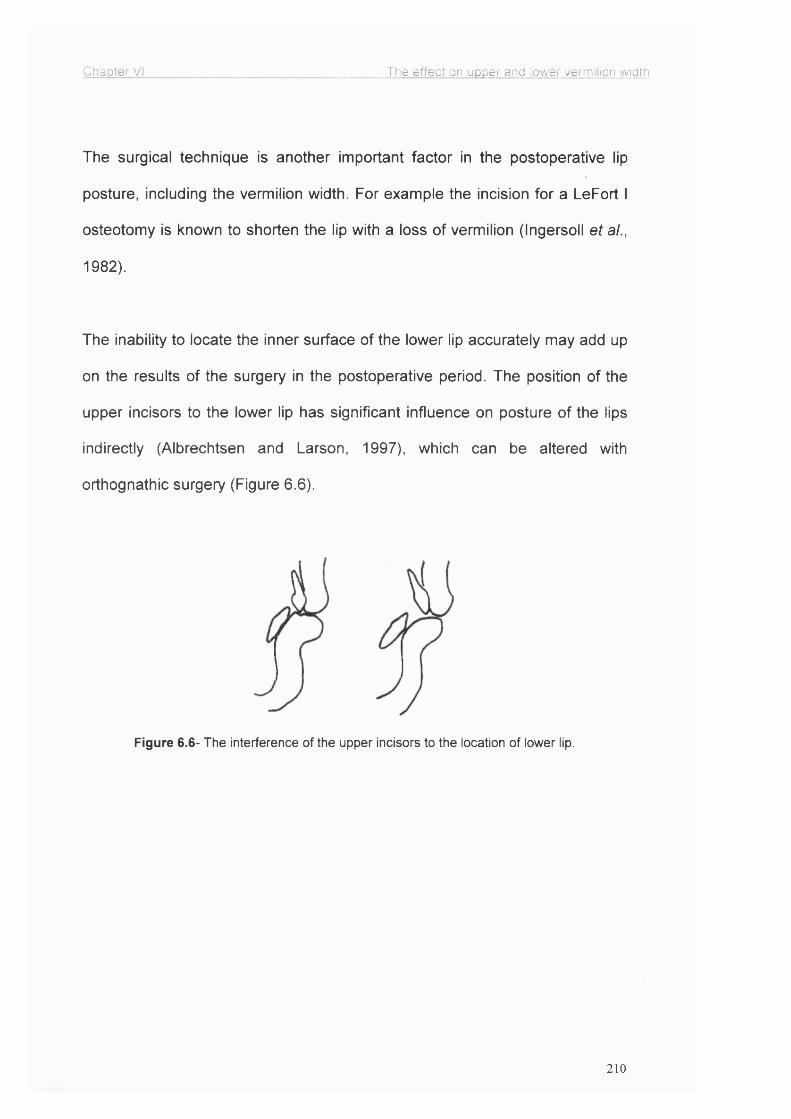
Chapter VI The effect on upper and lower vermiiion width
The surgical technique is another important factor in the postoperative lip
posture, including the vermilion width. For example the incision for a LeFort I
osteotomy is known to shorten the lip with a loss of vermilion (Ingersoll et al.,
1982).
The inability to locate the inner surface of the lower lip accurately may add up
on the results of the surgery in the postoperative period. The position of the
upper incisors to the lower lip has significant influence on posture of the lips
indirectly (Albrechtsen and Larson, 1997), which can be altered with
orthognathic surgery (Figure 6.6).
Figure 6.6- The interference of the upper incisors to the location of lower lip.
210

Chapter VI_______________________________________ The effect on upper and lower vermilion width
6.6 Conclusion
• The increase in the lip vermilion width was significant and predictable in
upper lips of Class III patients.
• The change was more significant in lips with a bivermilion width (upper
vermilion width + lower vermilion width) narrower than 15 mm for Class III
patients. Broadness of the lips was found to be an important factor.
• Upper lip vermilion width was affected significantly whereas the lower lip
vermilion width was not.
• Other indirect factors affecting the vermilion width of lips after orthognathic
surgery included presence of increased interlabial gap prior to surgery,
strain of lips due to incompetence and change in the position of incisors by
orthodontic treatment.
211
Chapter VII______________ The role of training elastics and occlusal wafer
CHAPTER VII
THE ROLE OF TRAINING ELASTICS AND THE OCCLUSAL WAFER
AFTER ORTHOGNATHIC SURGERY
212

Chapter Vil__________________________________ The role of training elastics and occlusal wafer
7.1 Introduction
In addition to clinically planned and surgically executed skeletal changes that
were expected to correct the facial deformity, orthognathic surgery has other
biological sequels. These include muscle atrophy, denervation, scar
contraction at surgical site, decreased muscle mass, myofibrosis and
morphological alterations of the condyle. During the postoperative period the
clinician and the patient may also face some complications due to decreased
muscle extensibility and strength, hypomobility, increased fatigability, internal
derangement of the TMJ and alterations to the efficiency and the length of
masticatory muscles.
With the introduction of bone plates and screws and the elimination of
prolonged intermaxillary fixation, the probability of these clinical squeals is
decreased. Nevertheless a rehabilitation protocol is important for patients
after orthognathic surgery to regain neuromuscular function and reduce the
discomfort of any undesired consequence. This rehabilitation protocol apart
from strict oral hygiene usually involves the use of:
a. The occlusal wafer
b. Training elastics
c. Range-of-motion exercises
d. Therapeutic devices (which may be required in patients unresponsive
to initial stages of the protocol.)
Osteotomy wafers (Figure 7.1) are used in orthognathic surgery as an
intermediate guide for repositioning the mobilised maxilla relative to the intact
213

Chapter VU__________________________________ The role of training elastics and occlusal wafer
mandible, and as an aid to achieving and maintaining the planned final
occlusion (Irving et al., 1984). Bimaxillary cases principally require an
intermediate wafer, which relates the mobilised maxilla during temporary
intermaxillary fixation to the unchanged mandible. This is helpful in stabilising
the maxilla whilst it is plated into its definitive position. The final wafer relates
the osteotomised mandible to the fixed maxilla, both during the insertion of
bicortical screws, and when the occlusion is not sufficiently stable for
temporary or permanent fixation. A third role is the establishment of
postoperative proprioception. After rigid fixation of the mandible, the wafer
may be wired to the maxilla, or less frequently to the mandible, to provide
postoperative proprioceptive guidance for up to 2 weeks. The wafer may thus
help the patient to occlude into the planned occlusion, with or without the help
of elastics, by overriding the patient’s preoperative preprioceptive drive
(Bamber and Harris, 1995). This combination may also help to eliminate the
difference between the anaesthetized centric relation and active centric
occlusion in addition to the overcorrection in the immediate postoperative
period (Bamber at a!., 1999). But there is no controlled study reported in the
literature assessing effective contribution of occlusal wafers and training
elastics in postoperative rehabilitation.
214
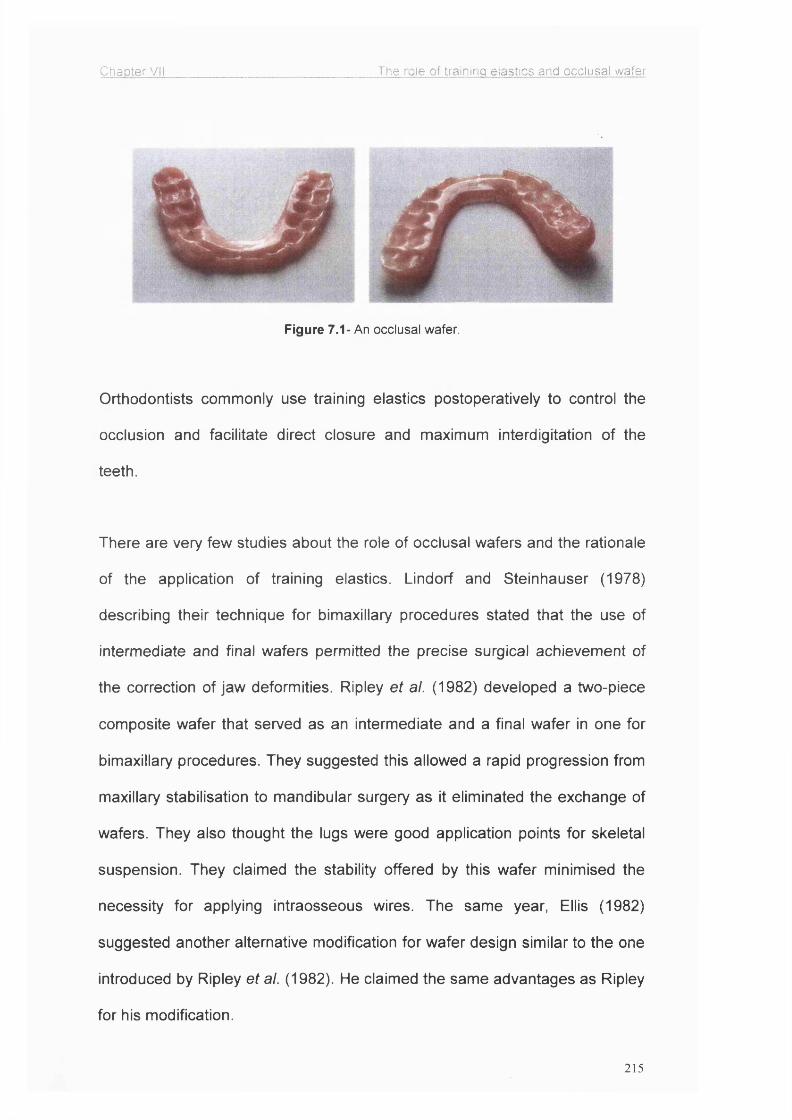
Chapter VII The role of training elastics and occlusal wafer
Figure 7.1- An occlusal wafer.
Orthodontists commonly use training elastics postoperatively to control the
occlusion and facilitate direct closure and maximum interdigitation of the
teeth.
There are very few studies about the role of occlusal wafers and the rationale
of the application of training elastics. Lindorf and Steinhauser (1978)
describing their technique for bimaxillary procedures stated that the use of
intermediate and final wafers permitted the precise surgical achievement of
the correction of jaw deformities. Ripley et al. (1982) developed a two-piece
composite wafer that served as an intermediate and a final wafer in one for
bimaxillary procedures. They suggested this allowed a rapid progression from
maxillary stabilisation to mandibular surgery as it eliminated the exchange of
wafers. They also thought the lugs were good application points for skeletal
suspension. They claimed the stability offered by this wafer minimised the
necessity for applying intraosseous wires. The same year, Ellis (1982)
suggested another alternative modification for wafer design similar to the one
introduced by Ripley at ai. (1982). He claimed the same advantages as Ripley
for his modification.
215

Chapter VII__________________________________ The role of training elastics and occlusal wafer
Jacobs and Sinclair (1983) focused on the use of orthodontic mechanics by
elastics postoperatively after removal of the wafer but did not mention their
use during the time the wafer was in, but that could be because their patients
underwent intermaxillary fixation.
In the beginning of the rigid fixation of bony segments, the role of wafers was
not only limited to be a simple interocclusal wafer to provide stability during
fixation and to accommodate limited jaw function with minimal occlusal
interference. Fridrich and Williamson (1989) modified the wafers by
increasing their thickness in order to avoid breakage during function, whereas
Schwestka et al. (1990) introduced the 'sandwich splint' to improve the
reproduction of pre and postoperative vertical dimensions from model surgery
to actual operation. Quick release wafers were introduced to allow the
reduction of operating time and precise tooth positioning with postoperative
orthodontics (Seward and Foreman, 1972; Lee, 1991). Block and Hoffman
(1987) developed a removable wafer to improve patients' postoperative oral
hygiene.
Chemello at si. (1994) in their study examining the long-term stability of
orthognathic surgery procedures stated that the removal of the wafer in the
postoperative period causing the autorotation of the mandible superiorly
influenced the change of vertical height after the operation.
Bamber and Harris (1995) evaluated the effects of wafer thickness on the
postoperative result. They showed, contrary to expectations, that there was
216

Chapter VII__________________________________ The role o f training elastics and occlusal wafer
no advantage in using the thin and fragile wafer, and in major vertical moves
the thicker wafer was more accurate. They also suggested overcorrection of
the anteroposterior position to anticipate musculoskeletal relapse inducing
forces, and use of immediate postoperative training elastics and the final
wafer for 2 weeks to overcome the difference between the anaesthetised
centric relation and active centric occlusion by 'proprioceptive' training.
7.2 Aim
The overall aim of this study was to investigate the role of the occlusal wafer
and training elastics in the postoperative period of orthognathic surgery.
7.3 Patients and methods
One hundred and eleven patients undergoing orthognathic surgery consented
for this study but patients whom the orthodontist thought needed the training
elastics for the best outcome of their treatment in the postoperative period but
randomly included in either group B or C were excluded from the study later
(n=11). The remaining 100 patients were randomised into three groups for
contrasting wafer and training elastic application during the 2 weeks following
the surgical procedure. These randomisation groups were;
1. Group A: Patients to wear the final occlusal wafer and training elastics for
2 postoperative weeks.
2. Group B: Patients to wear the final occlusal wafer but without training
elastics for 2 postoperative weeks.
3. Group C: Patients to wear neither a final occlusal wafer nor training
elastics for the same period postoperatively.
217

Chapter Vil The role of training elastics and occlusal wafer
The patients included are summarised in Table 7.1.
Class II Class III n=100Group A 12 21 F 23 33
M 10
Group B 17 16 F 21 33
M 12
Group 0 17 17 F 20 34
M 14
Total 46 54 100
Table 7 .1 -The summary of patients included in the trial
Intermediate wafers were used for all patients. Final wafers were used to
position the jaws in the final set-up but was removed before extubation for
patients in Group C. Training elastics were applied to all patients in Group A
and were kept for 2 weeks following the surgical procedure. Likewise, no
training elastics were applied to patients of Groups B and C. They were
applied after the 2-week period for those who needed the guidance applied
by the forces of these elastics. Patients whom the orthodontist thought
needed the training elastics for the best outcome of their treatment in the
postoperative period but randomly included in either group B or C were
excluded from the study (n=11). The final number of patients included in the
randomisation was 100.
In order to evaluate the role of occlusal wafers and training elastics, overjet
and overbite measurements and observations of the occlusion were done
twice before the surgical procedure, 3 weeks, and one day before the
admission to the ward. Postoperatively, the overjet measurements were
218
Chapter VII__________________________________ The role of training elastics and occlusal wafer
recorded the day the patient was discharged from the ward (T1), the day the
wafer and training elastics were removed (T2) (or the end of 2"^ postoperative
week for patients who were not wearing them, i.e. patients in randomisation
Group C), and six months after the surgical procedure (T3). SPSS statistical
software package (SPSS for Windows, Release 10.0.5, Standard Version, ©
SPSS Inc. 1989-1999, 444 N. Michigan Ave, Chicago, Illinois 60 611) was
used for the statistical analysis. In order to allow easy reach and to avoid
interference for the accuracy of the measurement of overjet, the wafer was
cut away in the central incisor region, exposing the central incisors for clinical
measurements and observations (Figure 7.1). The observations included the
ability to bite into the indentation of the wafer, presence of anterior or
posterior open-bites, and possible external factors avoiding a successful bite,
e.g. pain, infection or problems with the fitting of the wafer.
7.3 Results
The mean preoperative and postoperative overjet measurements taken at T1,
T2 and T3 for Class II and Class III subjects in Groups A, B, and C are shown
in Figure 7.2.
219

Chapter VII The role of training elastics and occlusal wafer
Group A
□ preoperative
□ T1
□ 12□ T3
■ preoperative
□ 11 □ T2
■ T3
Class II Class III
mm
Group B
Class II Class III
□ preoperative
HT1
□ 12□ T3
■ preoperative□ T1
□ T2
■ T3
mm 12
10864
20
-2-4-6-810
Î
Group C
□ preoperative
□ T1
□ T2
□ T3
■ preoperative
□ T1
□ T2
■ T 3
Class Class
Figure 7.2- The mean and SD preoperative and postoperative overjet measurements (mm)
taken at T1, T2 and T3 for Class II and Class III subjects in Groups A (wafer and elastics), B
(wafer), and C (nil).
220
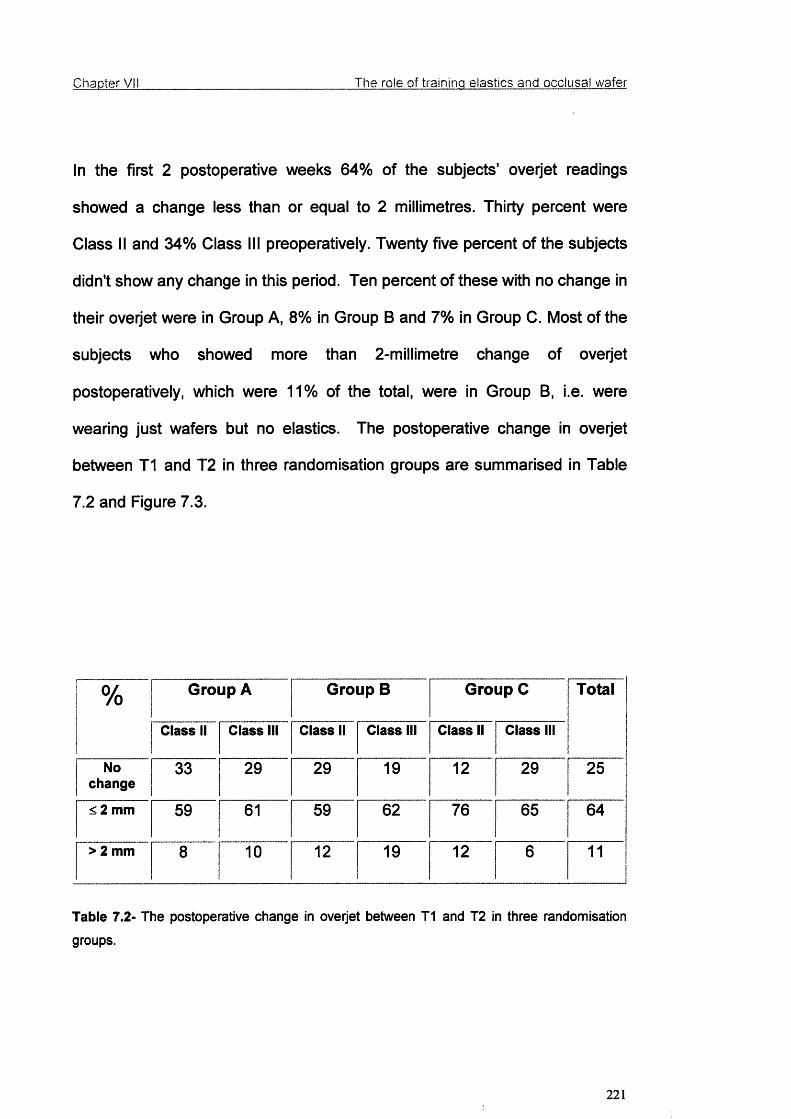
Chapter VII The role of training elastics and occlusal wafer
In the first 2 postoperative weeks 64% of the subjects’ overjet readings
showed a change less than or equal to 2 millimetres. Thirty percent were
Class II and 34% Class III preoperatively. Twenty five percent of the subjects
didn't show any change in this period. Ten percent of these with no change in
their overjet were in Group A, 8% in Group B and 7% in Group C. Most of the
subjects who showed more than 2-millimetre change of overjet
postoperatively, which were 11% of the total, were in Group B, i.e. were
wearing just wafers but no elastics. The postoperative change in overjet
between T1 and T2 in three randomisation groups are summarised in Table
7.2 and Figure 7.3.
% Group A Group B Group C Total
Class II Class III Class II Class III Class II Class III
Nochange
33 29 29 19 12 29 25
< 2 mm 59 61 59 62 76 65 64
> 2 mm 8 10 12 19 12 6 11
Table 7.2- The postoperative change in overjet between T1 and 12 in three randomisation
groups.
221

Chapter VII The role of training elastics and occlusal wafer
Group A- Class II
□ No change□ <2 mm□ >2 mm
Group B- Class
Group A- Class
□ No change B<2 mm□ >2 mm
Group B- Class
□ No change□ <2 mm□ >2 mm
Group C- Class II
□ No change□ <2 mm□ >2 mm
Group C- Class
□ No change□ <2 mm□ >2 mm
□ No change□ <2 mm□ >2 mm
Figure 7.3- The postoperative changes in overjet between T 1 and T2 in three randomisation groups.
222

Chapter VII The role o f training elastics and occlusal wafer
The mean change in overjet in the 6-month postoperative period was highest
in Group B for both Class II and III subjects. The Class II subjects in Group C
followed this closely. Group A and Class III subjects in Group C displayed the
least change in their overjet postoperatively.
The change in overjet was more in the first 2 weeks (T1-T2) compared to the
following 5 months (T2-T3) for all groups. In all groups, this difference was
greater among Class III subjects, more prominent in Group A. These results
are summarised in Table 7.3 and Figure 7.4.
mm Group A
Class II Class III
T1-T2 0.93±1.16 1.00+0.95
T2-T3 0.50±0.67 0.24+0.44
T1-T3 1.17±1.19 1.14+1.01
Group B
Class II Class III
T1-T2 1.12+1.27 1.19+0.83
T2-T3 0.59+1.00 0.50+0.63
T1-T3 1.53+1.33 1.44+1.03
Group C
Class II Class III
T1-T2 1.06±0.75 0.82+0.73
T2-T3 0.53+0.94 0.29+0.47
T1-T3 1.35+0.93 0.88+0.93
Table 7.3- The means ± standard deviations (mm) of postoperative change of overjet
between T 1 (just before the patient is discharged from the ward), T2 (2 weeks postoperatively)
and T3 (6 months postoperatively)
223

Chapter VII The role of training elastics and occlusal wafer
Postoperative change in overjet (T1-T2)
Class II Class III
Postoperative change in overJet (T2-T3)
mm2
1.5
1
0.5
0Class II Class
□ A ■ B□ C
Postoperative change in overJet (T1-T3)
Class II Class
□ A
■ B
□ C
Figure 7.4- The means of postoperative change of overjet between T1 (just before the patient
is discharged from the ward), T2 (2 weeks postoperatively) and T3 (6 months postoperatively).
a) T1-T2, b) T2-T3, c) T1-T3.
224

Chapter Vil The role of training elastics and occlusal wafer
Student t test was performed to compare the means of overjet measurements
for each group. The results of these statistical analyses are summarised in
Table 7.4.
p Group A
Class II Class III All
T1-T2 N.S N.S. N.S.
T2-T3 N.S. 0.02 N.S.
T1-T3 N.S. N.S. N.S.
Group B
Class II Class III All
T1-T2 N.S. 0.004 0.023
T2-T3 N.S. N.S. N.S.
T1-T3 N.S. 0.001 0.050
Group C
Class II Class III All
T1-T2 N.S. N.S. N.S.
T2-T3 0.034 N.S. N.S.
T1-T3 0.002 N.S. N.S.
Table 7.4- The p values after comparing means of overjet measurements taken at different
times (T1, T2, T3) for aii groups (N.S.= Not significant)
225

Chapter Vil__________________________________ The role of training elastics and occlusal wafer
These values showed that the difference between the mean overjet
measurements of Class III cases in Group B while they were wearing the
occlusal wafer (T1-T2) and Class II cases in Group C after 2 postoperative
weeks (T2-T3) were statistically significant. The difference between the mean
overjet measurements of Class III members of Group A between T2 and T3
was also statistically significant.
When means of overjet measurements taken at T1, T2 and T3 were
compared between Groups A, B and C, the difference was statistically
insignificant.
7.4 Discussion
The mean change in overjet in the six-month postoperative period (T1-T3)
was highest in Group B, which was closely followed by Class II subjects in
Group C. Group A and Class III subjects of Group C displayed the least
change of overjet postoperatively (Figure 7.4). When statistical tests were
applied, there was a significant change of overjet for Class III subjects of
Group B within the first 2 postoperative weeks (T1-T2) but not for the
following 5 months of the postoperative period (T2-T3). The same
significance of change was found for the same group in the whole six-month
period (T1-T3). Although Class II subjects did not show a statistically
significant change of overjet, when the whole Group B was evaluated
statistically, significant change was found for T1-T2 and T1-T3 (Table 7.4).
226

Chapter VII__________________________________ The role o f training elastics and occlusal wafer
The change of overjet was significant mainly amongst Class III subjects in
Group B, whereas Class II subjects remained more stable, 29% showing no
change and 59% less than 2-millimetre change during the first 4 weeks
postoperatively (Table 7.2). The highest percentage of cases that did not
experience any change in their overjet during the same period was in Group
A. Also only a low percentage of the cases in Group A (8% for Class II, 10%
for Class III) showed more than 2-millimetre change. These were not
considered to be extraordinary findings since this group received the
guidance of both occlusal wafer and training elastics. On the other hand,
percentage of Class II subjects in Group B and Class III subjects in Group C
showing no change in their overjet measurements were close to the
percentage in Group A (Table 7.2). In the freely floating Group C, 76% of
Class II cases and 65% of Class III cases showed less than 2-millimetre
change, which was contrary to expectation (Table 7.2) (Figure 7.3). This was
an observation many clinicians may find favourable since the first few weeks
postoperatively is the period most relapse is expected to take place and in
this group where no guidance of occlusal wafers and training elastics were
present, majority of the subjects showed a magnitude of change in overjet
which would not grossly influence the expected postoperative result.
The cases that were included in this study were overcorrected. Preoperatively
Class II cases were overcorrected to an edge-to-edge incisor relationship to
allow for the natural immediate relapse, and to eliminate the difference
between the anaesthetised centric relation and active conscious upright
centric occlusion. One would expect the immediate postoperative overjet
227

Chapter Vil__________________________________ The role of training elastics and occlusal wafer
readings (T1) should be close to zero for those edge-to-edge cases. The
findings of this study support this for the mean T1 overjet measurements of
Group C Class II patients. In Groups A and B, the mean immediate
postoperative overjet measurements (11) are approximately 2 millimetres
(Figure 7.2). Although occlusal wafers worn by subjects in Groups A and B
were expected to offer additional guidance into this overcorrected occlusion,
the subjects often could not bite into the occlusal wafer according to the
measurements and clinical observations. This finding makes it worth
questioning the guidance role of the occlusal wafer. The similarity of T1
readings of Groups A and B may also suggest the presence of training
elastics do not make a great change at this early stage.
Another important clinical observation was the relief on patients' face when
the occlusal wafer was removed at the end of 2 weeks. Not surprisingly,
patients found it more comfortable to occlude after the removal of occlusal
wafers. This can be seen as a decrease in the T2 overjet measurements of
Class II cases of Groups A and B, which are taken after the removal of
occlusal wafers (Figure 7.2). The slight increase in the T3 overjet
measurements of the same cases, which are taken 6 months postoperatively,
suggests the settling of occlusion during this period.
Despite these observed short-term variations, the overall result of all cases in
three groups had similar successful outcome. This is also supported by the
statistically insignificant difference between the mean overjet measurements
of Groups A, B and 0 taken at T1, T2 and T3. These similarities suggest that
228

Chapter VII__________________________________ The role of training elastics and occlusal wafer
the use of occlusal wafers and training elastics did not make a significant
difference to the final outcome, which was satisfactory in all three groups,
including Group C. The patients in Groups A and B found the occlusal wafers
quite difficult to cope with and very discomforting especially during a period
when patients are suffering from other discomforting factors. They also
pointed out to the difficulties the wafers and elastics introduced while trying to
maintain a good oral hygiene, which is very important in the early
postoperative period when the oral mucosa is healing and can be prone to
infection. The theoretical value of providing proprioceptive guidance is
probably more comforting for the surgeon than the patient. However, it does
provide a visible means of clinical assessment.
7.5 Conclusion
According to the findings of this investigation the use of occlusal wafers and
training elastics as a routine do not lead to a significant difference in the
postoperative occlusion. On the contrary, occlusal wafers may interfere in
patients' adaptation to their new occlusion and may add extra discomfort
rather than offering guidance in the early postoperative period.
On the other hand, postoperative rehabilitation is known to be crucial for
patients to regain neuromuscular function and reduce the discomfort so
postoperative range-of-motion exercises gain more importance to reprogram
muscles to the new occlusion enhancing postoperative proprioception.
229

Chapter VII__________________________________ The role of training elastics and occlusal wafer
The results of this study are based on overjet measurements only. However,
a more thorough investigation is suggested to determine the role of occlusal
wafers and training elastics and to the follow-up the occlusion in the early
postoperative period with possible use of 3-dimensional intraoral imaging.
The difficulty that the investigators faced was the lack of a 3-dimensional
imaging system that would take detailed records of the occlusion, discarding
the obscurity that is caused by the wafer.
230

Chapter VIII____________________________________________________ Summary and conclusions
CHAPTER VIII
SUMMARY AND CONCLUSIONS
231

Chapter VIII____________________________________________________ Summary and conclusions
8.1 Summary and conclusions
Facial appearance has a great impact on one's self-esteem, behaviour, and
social and professional interactions. Many may feel uncomfortable by the fact
that physical attractiveness makes difference to one's quality of life.
Therefore, people who are not happy with their facial appearance often seek
help of surgical procedures for the correction of their disfigurement.
The diagnosis of facial deformity, treatment planning, surgical prediction and
the evaluation of the outcome of orthognathic surgery are just as challenging
as the actual surgical procedure.
This study programme;
a) evaluated the concept of facial aesthetics; reviewing the differences
between three ethnic groups, i.e. Caucasians, Afro-Caribbeans, and
Orientals using a multiracial panel.
b) sought solutions to the questions that arise before and after
orthognathic surgical correction of facial disharmony, using a three-
dimensional imaging tool, the Optical Surface Scanner.
c) used a novel morphometric analysis, Thin-Plate Splines, for the
accurate quantitative evaluation and better graphical visualisation of
the facial soft tissue changes.
d) investigated postoperative rehabilitation with the occlusal wafer and
training elastics to restore proprioception. Also observed the effect of
overcorrection on the final occlusion.
232

Chapter Vi 11____________________________________________________ Summary and conclusions
8.1.1 Review of ethnic facial aesthetics
a) The evaluation of the facial soft tissue components showed that
although the multi-dimensional judgment of attractiveness may differ
from one individual to another, the concept of facial beauty was to a
great extent shared by all.
b) The normal ranges for facial symmetry, alar base width and the
vermilion border ratio were found to be strong markers of facial beauty.
c) In most beautiful faces, the chin coincided with the facial plane. This is
a vertical line drawn from glabella perpendicular to the Frankfort plane.
Given this position of the chin, the mid-face was anterior to the facial
plane. The homogenised conformity of the world culture was reflected
by the panel in this study, which although formed of three independent
ethnic groups, appeared to share a common basis for the assessment
of facial beauty. The Caucasian facial features were perceived more
familiar, standard, and beautiful, therefore, as the aesthetic norm.
Communication technology, the media, and their availability around the globe
provide daily reinforcement of commercially selected facial aesthetics. Peck
and Peck (1970) suggested that the more frequently we observed a particular
facial pattern, the more likely we perceived it as “correct”. The presentation of
Caucasoid facial patterns in the media determines people's notions of beauty.
233

Chapter VIII____________________________________________________ Summary and conclusions
8.1.2 Validation of the optical surface scanner
Although the assessment of facial aesthetics and diagnosis of facial deformity
must be mainly based on experienced clinical observation, the aid of an
improved imaging tool with the paramount advantage of capturing the three-
dimensional details of the face accurately is crucial to support the clinical
diagnosis and help the treatment plan for the correction of the deformity.
Conventionally two-dimensional radiological and photographic techniques
have been used for this purpose and have often proved to be inadequate.
The optical surface scanning system developed by Linney and his co-workers
(Linney et al., 1993) has been used regularly over the last decade for
recording facial soft tissues three-dimensionally. With the anticipation that the
optical surface scanner could be a reliable tool for the preoperative
assessment, diagnosis, treatment plan, prediction and postoperative
evaluation of the outcomes of orthognathic surgery, this programme of study
aimed to validate its application.
a) The optical surface scanner was compared to conventional
cephalography - there were no significant geometrical differences
between these methods.
b) However, the optical surface scanner was a reliable tool for three-
dimensional assessment, and diagnosis of the facial deformity, and
should replace the cephalograph for soft tissue analysis for the
following reasons:
234
Chapter VIII____________________________________________________ Summary and conclusions
i. Optical surface scans are substantially easier to analyse than
radiographs, and can be viewed from any preferred angle.
ii. The surface scan is not subject to magnification, and therefore
gives precise measurements enabling superimposition and the
determination of the changes following surgery.
iii. Linear measurements of the optical surface scanner are
identical with clinical measurements.
iv. As a non-contact procedure, the system avoids any distortion of
the soft tissue surfaces being measured.
V. This scanner is free of harmful radiation, so repeated
investigations for long-term follow-up are without potential
morbidity.
c) The disadvantages of the scanning procedure are:
i. The need for patients to keep a constant position and relaxed
facial posture during the recording period of 10 seconds.
ii. The standardisation of head inclination is essential to capture
all the required landmarks. For instance, head inclination could
obscure subnasal and alar measurements. Therefore, this
study tested and showed that these errors could be eliminated
by using a spirit level to set the patient's Frankfort plane
horizontal against a headrest, together with a narrow vertical
beam of laser light initially on the facial midline to achieve the
optimum head/facial posture. The use of a headrest as a
support stabilised the head position avoiding movement.
235
Chapter VIII____________________________________________________ Summary and conclusions
8.1.3 The evaluation of facial soft tissue changes after orthognathic
surgery
In orthognathic surgery, as in every surgical intervention, surgical planning
based on a reliable prediction of outcome depends on the data from accurate
and reproducible postoperative measurements. This study programme
showed;
a) the optical surface scanner could capture soft tissue changes and
measure the linear, area and volumetric differences after the surgical
correction of Class II and III facial deformities. The facility of these
measurements is eminently suitable for clinical practice.
b) Thin-Plate Splines proved to be a highly accurate morphometric tool,
which showed the direction and degree of vector movement of any
chosen landmark. Its invaluable application was that of an accurate
complimentary research tool.
c) Many regions of the face, which had not been previously investigated,
e.g. paranasal regions, supracomissural and subcomissural regions
(angles of the mouth) were accessible for measurement using the
optical surface scanner. This enabled the lips to be investigated in
detail, differentiating the responses of the upper and the lower
vermilion borders.
d) The medial region of the upper lip was found to follow closely the
movements of the underlying hard tissue, presumably due to the
muscle attachments into and lateral to the anterior nasal spine. An
additional determining factor is the semi-circular contour of the
236

Chapter VIII____________________________________________________ Summary and conclusions
underlying dentoalveolar surface. This would explain the limited
movement of the more lateral supracomissural and subcomissural
regions. An additional important influence on the labial contour is the
postoperative facilitation to establish a comfortable lip seal. Hence, the
optical surface scans showed differential maxillary soft tissue
advancement. It is of interest to note that this advancement did not
alter the nasolabial angle, which was presumably maintained by the
fon/vard and upward displacement of the collumella by the septum.
This was seen in the projection of the nasal tip, which moved 20-35%
of the maxillary advancement,
e) Changes in the chin were studied particularly in relation to the
labiomental groove and the lower lip. The magnitude of projection of
the mandibular movement to the soft tissues of the lower facial third
was found to be greater. As has been established, the pogonion
moves as a 1:1 ratio compared to the underlying skeletal change.
However, the labiomental groove moved 80-90% of the skeletal
change reflecting the opening of the groove with advancement. The
lower lips showed 60-70% conformity of movement of the mandible
both with advancements and setbacks. Eversion of the lip is a
movement by which the lip is rotated outwards revealing more
vermilion. The three-dimensional surface scans confirmed the eversion
of the lower lip with a mandibular setback. This was seen with the
Thin-Plate Splines analysis clearly showing the forward movement of
stomion inferius and simultaneous backward movement of labrale
inferius exposing increased lower vermilion. With advancement, there
237
Chapter VIII____________________________________________________ Summary and conclusions
was a corresponding inversion of the lower lip. However, there was not
a significant Thin-Plate Splines change in these landmarks in the
mandibular advancement of the Class II cases, i.e. minimal change in
the exposed vermilion. With maxillary advancement, the exposed
upper vermilion increased significantly. Thin-Plate Splines analysis
showed labrale inferius moving forwards with simultaneous downward
movement of stomion superius.
f) As with the maxilla, the subcomissural regions (the areas below the
angle of the mouth) showed decreased changes again presumably due
to the lack of influence of the underlying mandible due to its contour.
Optical surface scans of the soft tissues in conjunction with cephalometric
analysis are routinely used in our unit for preoperative surgical assessment,
planning and postoperative review of orthognathic surgery, and their use is
very likely to increase with wider availability of various surface scanners in the
market.
238
Chapter VIII____________________________________________________ Summary and conclusions
8.1.4 The role of training elastics and the occiusal wafer after
orthognathic surgery
In addition to clinically observed changes that were planned to correct the
facial deformity, orthognathic surgery has other biological consequences,
including decreased muscle extensibility and strength, hypomobility, and
increased fatigability. A rehabilitation protocol involving the use of an occlusal
wafer, training elastics with exercises is thought to be important for patients
after orthognathic surgery to regain neuromuscular function, reduce the
discomfort of any undesired consequence, guide the patient into the new
occlusion facilitating direct closure and maximum interdigitation of the teeth,
and help to reprogram the muscles, enhancing postoperative proprioception.
The last section of this programme investigated the role of the occlusal wafer
and training elastics in the first two postoperative weeks by their randomised
application to three groups.
a) The findings of this investigation indicated that routine use of occlusal
wafers and training elastics did not lead to a significant difference in
the postoperative occlusion. On the contrary, many patients reported
additional discomfort caused by occlusal wafers. Hence, the theoretical
value of providing proprioceptive guidance was concluded to be more
comforting for the surgeon and the orthodontist than the patient.
However, it is believed to provide a visible means of clinical
assessment.
b) This part of the study also confirmed that despite routine
overcorrection, i.e. a planned edge-to-edge wafer occlusion for
239

Chapter VIII____________________________________________________ Summary and conclusions
mandibular advancement and a Class II / division 1 wafer occlusion for
mandibular setbacks, all cases were observed to achieve a final Class
I incisor relationship. We are unsure whether this is a result of
neuromuscular and facial restraint or true proprioceptive adaptation
determined by the occlusion.
In summary, this programme evaluated the concept of facial aesthetics in
relation to the perception of beauty by individuals and sought solutions to the
questions that arise for the correction of facial disfigurement with orthognathic
surgery by using a three-dimensional imaging tool, the optical surface
scanner with the help of a novel morphometric analysis, the thin-plate splines,
for accurate evaluation of the problem and better visualisation of facial soft
tissue changes with graphic and quantitative presentations which helped the
explanations of the surgical outcomes, and investigated the devices used for
early postoperative rehabilitation, the occlusal wafer and training elastics for
their role in proprioception.
It is anticipated that the results of this work will contribute significantly in
diagnosis of facial deformity, planning of orthognathic surgery and its
outcome.
240
Chapter VIII____________________________________________________ Summary and conclusions
8.2 Suggestions for further research
This programme of study used the optical surface scanner as a reliable 3D
imaging tool. The developments in 3D imaging techniques will continue with
the advancement of technology and it would be advisable to test and use
these new tools as they become available.
This study investigated the role of occlusal wafers and training elastics based
on clinical overjet measurements. However, a more thorough investigation,
possibly using a three-dimensional intraoral imaging tool is suggested. The
difficulty faced in this study was the lack of such a system, which would take
detailed records of the occlusion obscured by the occlusal wafer itself.
241

References
REFERENCES
242
_____________________________________________________________________________ References
Aaronson AS (1967). A cephalometric investigation of the surgical correction
of mandibular prognatism. Angle Orthod 37: 251-260.
Albrechtsen LA, Larson BE (1997). Changes in lower lip cross-sectional area
subsequent to mandibular advancement surgery. Int J Adult Orthod
Orthognath Surg 12: 287-296.
Anderl H, Zur Nedden D, Muhlbauer W, Twerdy K, Zanon E, Wicke K, Knapp
R (1994). CT-guided stereolithography as a new tool in craniofacial surgery.
Br J Plast Surg 47: 60-64.
Andersen BP, Boersma H, Linden PGM, Moore A W (1979). Perception of
dentofacial morphology. J Am Dent Assoc 98: 209-213.
Armitage P, Berry G (1987). Statistical methods in medical research. Second
Edition. Blackwell, London.
Arridge S, Moss JP, Linney AD, James DR (1985). Three dimensional
digitization of the face and skull. Int J Maxillofac Surg 13: 136-143.
Arvier, JF, Barker TM, Yau YY, D’Urso PS, Atkinson RL, McDermant GR
(1994). Maxillofacial biomodelling. Br J Oral Maxillofac Surg 32: 276-283.
Athanasiou AE, Mavreas D, Toutountzakis N, Ritzau M (1992). Skeletal
stability after correction of mandibular prognatism by vertical ramus
osteotomy. EurJ Orthod 14: 117-124.
Aung SC, Ngim RC, Lee ST (1995). Evaluation of the laser scanner as a
surface measuring tool and its accuracy compared with direct facial
antropometric measurements. Br J Plast Surg 48: 551-558.
Ayoub AF, Mostafa YA, El Mofty S (1991). Soft tissue response to anterior
maxillary osteotomy. Int J Adult Orthod Orthognath Surg 6: 183-190.
243
References
Ayoub AF, Siebert P, Moos KF, Wray D, Urquhart C, Niblett TB (1998). A
vision based three-dimensional capture system for maxillofacial assessment
and surgical planning. Br J Oral Maxillofac Surg 36; 353-357.
Ayoub AF, Stirrups DR, Moos KF (1994). Assessment of chin surgery by a
coordinate free method. Int J Oral Maxillofac Surg 23: 6-10.
Ayoub AF, Wray D, Moos KF, Siebert P, Jin J, Niblett TB, Urquhart C,
Mowforth P (1996). Three-dimensional modelling for modern diagnosis and
planning in maxillofacial surgery. Int J Adult Orthod Orthognath Surg 11: 225-
233.
Bailey LJ, Collie FM, White RP Jr (1996). Long-term soft tissue changes after
orthognathic surgery. Int J Adult Orthod Orthognath Surg 11: 7-18.
Bamber MA (1995). Recording the facial midline for orthognathic planning. Br
J Oral Maxillofac Surg 33: 112-114.
Bamber MA, Abang Z, Ng WF, Harris M, Linney A (1999). The effect of
posture and anesthesia on the occlusal relationship in orthognathic surgery. J
Oral Maxillofac Surg 57: 1164-1172.
Bamber MA, Firouzal R, Harris M, Linney A (1996). A comparative study of
two arbitrary face-bow transfer systems for orthognathic surgery planning. Int
J Oral Maxillofac Surg 25: 339-343.
Bamber MA, Harris M (1995). The role of occlusal wafer in orthognathic
surgery: a comparison of thick and thin intermediate osteotomy wafers. J
Craniomaxillofac Surg 23: 396-400.
Begg RJ, Harkness M (1995). A lateral cephalometric analysis of the adult
nose. J Oral Maxillofac Surg 53: 1268-1274.
244

______________________________________________________________________________References
Bell WH (1975). Le Fort I Osteotomy for correction of maxillary osteotomies. J
Oral Surg 33: 412-426.
Bell R, Kiyak A, Joondeph DR, McNeill RW, Wallen TR (1979). Perception of
facial profile. J Am Dent Assoc 98: 209-213 .
Bell WH, Dann JJ (1973). Correction of dentofacial deformities by surgery in
the anterior part of the jaws. A study of stability and soft tissue changes. Am J
Orthod 64: 162-187.
Bell WH, Gallagher DM (1983). The versatility of genioplasty using a broad
pedicle. J Oral Maxillofac Surg. 41: 763-769.
Bell WH, Jacobs JD, Quejada JG (1986). Simultaneous repositioning of the
maxilla, mandible and the chin: Treatment planning and analysis of soft
tissues. Am J Orthod Dentofac Orthop 89: 28-50.
Bell WH, Scheideman GB (1981). Correction of vertical maxillary deficiency:
stability and soft tissue changes. J Oral Surg 39: 666-670.
Bill JS, Reuther JF, Dittman W, Kubler N, Meier JL, Pistner H, Wittenberg G
(1995). Stereolithography in oral and maxillofacial operation planning. Int J
Oral Maxillofac Surg 24: 98-103.
Bjerin R (1957). A comparison between the Frankfort horizontal and the sella
turcica-nasion line as reference planes in cephalometric analysis. Acta
Odontol Scand 15: 1-12.
Bjork A, Solow B (1962). Measurements on radiographs. J Dent Res 41: 672-
683.
Blackith RE (1965). Theoretical and Mathematical Biology. Blaisdell, New
York 225-249.
245

References
Block MS, Hoffman D (1987). A removable orthognathic surgical splint. J Oral
Maxillofac Surg 45: 195.
Bookstein FL (1978). The measurement of biological shape and shape
change. In Lecture Notes in Biomathematics, ed. Levin S, Springer-Verlag,
New York 24.
Bookstein FL (1984 a). A statistical method for biological shape comparisons.
J Theo Biol 107: 475-520.
Bookstein FL (1984 b). Tensor biometrics for changes in cranial shape. Ann
Hum Biol 11:413-437.
Bookstein FL (1986). Size and shape spaces for landmark data in two
dimensions. Stat Sci 1: 181-242.
Bookstein, F. L (1991). Morphometric tools for landmark data. Geometry and
biology. Cambridge University Press, New York.
Broadbent BH (1931). A new x-ray technique and its application to
orthodontia. Angle Orthod 1: 45-66
Broadbent BH (1981). A new x-ray technique and its application to
orthodontia. (Reprinted) Angle Orthod 51: 93-114.
Bundgaard M, Melsen B, Terp S (1986). Changes during and following total
maxillary osteotomy (Le Fort I procedure): a cephalometric study. Eur J
Orthod 8: 21-29.
Burke PH (1971). Stereophotogrammetric measurement of normal facial
asymmetry in children. Hum Biol 43: 536-548.
246
_____________________________________________________________________________ References
Burke PH (1984). Angular distortion in the orthopantomogram. Br J Orthod
11: 100-107.
Burke PH (1992). Serial observation of asymmetry in the growing face. Br J
Orthod 19: 273-285.
Burke PH, Banks P, Beard LFH, Tee JE, Hughes 0 (1983).
Stereophotographic measurement of change in facial soft tissue morphology
following surgery. Br J Oral Surg 21: 237-245.
Burke PH, Beard L (1967). Stereophotogrammetry of the face. Am J Orthod
53: 769-782.
Burstone CJ (1967). Lip posture and its significance in treatment planning.
Am J Orthod 53: 262-283.
Bush K, Antonyshyn O (1996). Three-dimensional facial antropometry using a
laser surface scanner: Validation of the technique. Plast Reconst Surg 98:
226-235.
Busquets CJ, Sassouni V (1981). Changes in the integumental profile of the
chin and lower lip after genioplasty. J Oral Surg 39: 499-504.
Carlotti AE, Aschaffenburg PH, Schendel S (1986). Facial changes
associated with surgical advancement of the lip and maxilla. J Oral Maxillofac
Surg 44: 593-596.
Case CS (1908). Dental orthopedia. CS Case Co., Chicago.
Chemello PD, Wolford LM, Buschang H (1994). Occlusal plane alteration in
orthognathic surgery- part II: Long-term stability of results. Am J Orthod
Dentofac Orthop 106: 434-440.
247

References
Cochrane SM, Cunningham SJ, Hunt NP (1997). Perception of facial
appearance by orthodontists and the general public. J Clin Orthod 31: 164-
168.
Cochrane SM, Cunningham SJ, Hunt NP (1999). A comparison of the
perception of facial profile by the general public and 3 groups of clinicians. Int
J Adult Orthod Orthognath Surg 14: 291-295.
Cohen AM (1984). Uncertainty in cephalometrics. Br J Orthod 11: 44-48.
Cohen AM, Ip HH, Linney AD (1984). A preliminary study of computer
recognition and identification of skeletal landmarks as a new method of
cephalometric analysis. Br J Orthod 11:143-154.
Collins PC, Epker BN (1982). The alar base cinch: A technique for prevention
of alar base flaring secondary to maxillary surgery. Oral Surg Oral Med Oral
Pathol 53: 549-553.
Converse JM (1964). Micrognathia. Br J Plast Surg 16: 197-210.
Coombes AM, Moss JP, Linney AD, Richards R, James DR (1991). A
mathematical method for the comparison of three-dimesional changes in the
facial surface. EurJ Orthod 13: 95-110.
Coward TJ, Watson RM, Scott BJJ (1997). Laser scanning for the
identification of repeatable landmarks of the ears and face. Br J Plast Surg
50: 308-314.
Cox NH, Van der Linden FPGM (1971). Facial harmony. Am J Orthod 60:
175-183.
Czarnecki ST, Nanda RS, Currie GF (1993). Perception of a balanced facial
profile. Am J Orthod Dentofac Orthop 104: 180-187.
248
References
Dann JJ, Epker BN (1977). Proplast genioplasty: a retrospective study with
treatment recommendations. Angle Orthod 47: 173-185.
Dann JJ, Fonseca RJ, Bell WH (1976). Soft tissue changes associated with
total maxillary advancement: A preliminary study. J Oral Surg 34: 19-23.
Davis WH, Davis CL, Daly BW (1988). Long-term bony and soft tissue
stability following advancement genioplasty. J Oral Maxillofac Surg 46: 731-
735.
De Assis EA, Starck WJ, Epker BN (1996). Cephalometric analysis of profile
nasal esthetics. Part III. Postoperative changes after isolated superior
repositioning. Int J Adult Orthod Orthognath Surg 11: 279-288.
De Mol van Otterloo JJ, Tuinzig DB, Kostense P (1996). Inferior positioning of
the maxilla by a Le Fort I osteotomy: a review of 25 patients with vertical
maxillary deficiency. J Craniomaxillofac Surg 24: 69-77.
Dermaut LR, De Smit AA (1989). Effects of sagittal split advancement
osteotomy on facial profiles. Eur J Orthod 11: 366-374.
Dunlevy HA, White RP, Proffit WR, Turvey TA (1987). Professional and lay
judgement of facial aesthetic. Int J Adult Orthod Orthognath Surg 3: 151-158.
Dürer A (1591). Della Simmetria del Corpi Humani. Presso D. Nicolini,
Venetia 27,69.
Ellis E, III (1982). Modified splint design for two-jaw surgery. J Clin Orthod 16:
619-622.
Epker BN, Stella JP, Fish LC (1995). Dentofacial Deformities. Second Edition,
Book 1, Mosby, St. Louise, Missouri.
Etcoff NL (1994). Beauty and the beholder. Nature 368: 186-187.
249

References
Ewing W, Ross RB (1992). Soft tissue response to mandibular advancement
and genioplasty. Am J Orthod Dentofac Orthop 101: 550-555.
Fanibunda KB (1989). Changes in the facial profile following correction for
mandibular prognathism. Br J Oral Maxillofac Surg 27: 277-286.
Parkas LG, Hreczko TA, Kolar JO, Munro IR (1985). Vertical and horizontal
proportions of the face in young adult North American Caucasians: Revision
of neoclassical canons. Plast Recons Surg 75: 328-337.
Parkas LG, Katie MJ, Hreczko TA, Deutsch C, Munro IR (1984).
Anthropometric proportions in the upper-lower lip-chin area of the lower face
in young white adults. Am J Orthod 86: 52-60.
Parkas LG, Posnick JC (1992). Growth and development of regional units in
the head and face based on anthropometric measurements. Cleft Palate
Craniofac J 29: 301-302.
Parkas LG, Tompson B, Phillips JH, Katie MJ, Cornfoot ML (1999).
Comparison of anthropometric and cephalometric measurements of the adult
face. J Craniofac Surg 10: 18-25.
Perrario VP, Sforza C, Poggio CE, Serrao G (1996). Facial three-dimensional
morphometry. Am J Orthod Dentofacial Orthop 109: 86-93.
Perrario VP, Sforza C, Schmitt JH, Miani A Jr, Serrao G (1998). A three-
dimensional computerized mesh diagram analysis and its application in soft
tissue facial morphometry. Am J Orthod Dentofac Orthop 114: 404-413.
Pish LC, Epker BN (1987). Dentofacial deformities related to midface
deficiencies. Integrated orthodontic-surgical correction. J Clin Orthod 21: 654-
664.
250
References
Foster EJ (1973). Profile preference among diversified groups. Angle Orthod
43: 34-40.
Freihofer HPM Jr (1976). The lip profile after correction of retromaxillism in
cleft and non-cleft patients. J Maxillofac Surg 4: 136-141.
Freihofer HPM, Mooren RECM (1997). Profiloplasty: Variations in personal
views. J Craniomaxillofac Surg 25: 249-253.
Frid rich KL, Williamson LW (1989). Modification of the interocclusal splint for
orthognathic surgery. J Oral Maxillofac Surg 47: 96-97.
Fromm B, Lundberg M (1970). The soft-tissue facial profile before and after
surgical correction of mandibular protrusion. Acta Odontol Scand 28: 157-
177.
Gallagher DM, Bell WH, Storum KA (1984). Soft tissue changes associated
with advancement genioplasty performed concomitantly with superior
positioning of the maxilla. J Oral Maxillofac Surg 42: 238-242.
Girod S, Keeve E, Girod B (1995). Advances in interactive craniofacial
surgery planning by 3D simulation and visualization. Int J Oral Maxillofac Surg
24: 120-125.
Gjorup H, Athanasiou AE (1991). Soft tissue and dentoskeletal profile
changes associated with mandibular setback osteotomy. Am J Orthod
Dentofac Orthop 100: 312-323.
Gonzales-Ulloa M (1962). Quantitative principles in cosmetics surgery of the
face (profileplasty). Plast Reconstr Surg 29: 186-198.
251

_____________________________________________________________________________ References
Guymon M, Crosby D, Wolford LM (1988). The alar base cinch suture to
control nasal width in maxillary osteotomies. Int J Adult Orthod Orthognath
Surg 3: 89-95.
Hack GA, de Mol van Otterloo JJ, Nanda R (1993). Long term stability and
prediction of soft tissue changes after Le Fort I surgery. Am J Orthod
Dentofac Orthop 104: 544-555.
Hackney FL, Nishioka GJ, Van Sickels JE (1988). Frontal soft tissue
morphology with double V-Y closure following Le Fort I osteotomy. J Oral
Maxillofac Surg 46: 850-855.
Haga M, Ukiya M, Koshihara Y, Ota Y (1964). Stereophotogrammetric study
of the face. Bull Tokyo Dent Coll 50: 10-24.
Hershey HG, Smith LH (1974). Soft-tissue profile change associated with
surgical correction of the prognathic mandible. Am J Orthod 65: 483-502.
Hillesund E, Fjeld D, Zachrisson BU (1978). Reliability of soft-tissue profile in
cephalometrics. Am J Orthod 74: 537-550.
Hinds EC, Kent JN (1969). Genioplasty: The versitality of horizontal
osteotomy. J Oral Surg 27: 690-700.
Hohl TH, Epker BN (1976). Macrogenia: a study of treatment results, with
surgical recommendations. Oral Surg Oral Med Oral Pathol 41: 545-567.
Hojo K (1981). Facial asymmetry using the Moire technique. Shikwa Gakuho
81: 1203-37.
Holdaway R A (1983) A soft tissue cephalometric analysis and its use in
orthodontic treatment planning. Am J Orthod 84: 1 - 28.
252

References
Hunt NP, Rudge S J (1984). Facial profile and orthognathic surgery. Br J
Orthod 11: 126-136.
Iliffe AH (1960). A study of preferences in feminine beauty. Br J Psychol 51:
267-273.
Ingersoll SK, Peterson LJ, Weinstein S (1982). Influence of horizontal incision
on upper lip morphology. J Dent Res 61:218 (abstract)
Irving SP, Costa LE, Salisbury PL (1984). The occlusal wafer: A simple
technique for construction and its use in maxillofacial surgery. Laryngoscope
94: 1036-1041.
Jacobs JD, Sinclair PM (1983). Principles of orthodontic mechanics in
orthognathic surgery cases. Am J Orthod 84: 399-407.
Jensen AC, Sinclair PM, Wolford LM (1992). Soft tissue changes associated
with double jaw surgery. Am J Orthod Dentofac Orthop 101: 266-275.
Kanazawa E, Kamiishi H (1978). Evaluation of facial osteotomy with the aid of
Moire Contourography. J Maxillofac Surg 6: 233-238.
Kawano Y (1987). Three dimensional analysis of the face in respect of
zygomatic fractures and evaluation of the surgery with the aid of Moire
topography. J Craniomaxillofac Surg 15: 68-74.
Keeling SD, LaBanc JP, Van Sickels JE, Bays RA, Cavalières C, Rugh JD
(1996). Skeletal change at surgery as a predictor of long-term soft tissue
profile change after mandibular advancement. J Oral Maxillofac Surg 54: 134-
144.
Kerr WJS, O Donnel JM (1990). Panel perception of facial attractiveness. Br J
Orthod 17: 299-304.
253

References
Knowles CC (1965). Changes in the profile following surgical reduction of
mandibular prognatism. Br J Plast Surg 18: 432-434.
Knowles E (2001). The concise Oxford dictionary of quotations. Fourth
edition. Oxford University Press, London.
Kobayashi T, Ueda K, Honma K, Sasakura H, Hanada K, Nakajima T (1990).
Three-dimensional analysis of facial morphology before and after
orthognathic surgery. J Craniomaxillofac Surg 18: 68-73.
Koury ME, Epker BN (1992). Maxillofacial Aesthetics; Anthropometries of the
maxillofacial region. J Oral Maxillofac Surg 50: 806-820.
Kragskov J, Bosch C, Gyldensted C, Sindet-Pedersen S (1997). Comparison
of the reliability of craniofacial anatomical landmarks based on cephalometric
radiographs and three-dimensional CT scans. Cleft Palate Craniofac J 34:
111-116.
Lebret LML (1985). The mesh diagram, a guide to its use in clinical
orthodontics. In: Introduction to radiographic cephalometry. eds. Jacobson A,
Canfield W. Lea & Febiger, Philadelphia 90-106.
Lee DY, Bailey LJ, Proffit WR (1996). Soft tissue changes after superior
repositioning of the maxilla with Le Fort I osteotomy: 5 year follow-up. Int J
Adult Orthod Orthognath Surg 11: 301-311.
Lee L, Lee KL (1979). A study of facial proportions and sketching of facial
contours. Ear Nose Throat J, 58: 150-158.
Lee RT (1991). A splint for immediate surgical orthognathic fixation and
release during orthodontic treatment. Eur J Orthod 13: 209-211.
254

___________________ References
Lele S, Richtsmeier JT (1991). Euclidean distance matrix analysis; A
coordinate free approach for comparing biological shapes using landmark
data. Am J Phys Antropol 86: 415-427.
Lin SS, Kerr WJS (1998). Soft and hard tissue changes in Class III patients
treated by bimaxillary surgery. Eur J Orthod 20: 25-33.
Lindorf HH, Steinhauser EW (1978). Correction of jaw deformities involving
simultaneous osteotomy of the mandible and maxilla. J Maxillofac Surg 6:
239-244.
Lines PA, Lines RR, Lines CA (1978). Profilemetrics and facial aesthetics. Am
J Orthod 73: 648-657.
Lines PA, Steinhauser EW (1974). Soft tissue changes in relationship to
movement of hard structures in orthognathic surgery: A preliminary report. J
Oral Surg 32: 891-896.
Linney A (1992). The protocol for optical laser scanner- Department of
medical physics. University College London, London.
Linney AD, Tan AC, Richards R, Gardner J, Grindrod S, Moss JP (1993).
Three dimensional visualization of data on human anatomy: diagnosis and
surgical planning. J Audiov Media Med 16:4-10.
Lovesey EJ (1966). A method for determining facial contours by shadow
projection. Royal Aircraft Establishment Technical Report 66: 192.
Lundstrom A, Forsberg CM, Peck S, McWilliam J (1992). A proportional
analysis of the soft tissue facial profile in young adults with normal occlusion.
Angle Orthod 62: 127-133.
255

References
Lundstrom A, Forsberg C-M, Westergren H, Lundstrom FA (1991). A
comparison between estimated and registered natural head posture. Eur J
Orthod 13: 59-64.
Lundstrom A, Lundstrom F (1995). The Frankfort horizontal as a basis for
cephalometric analysis. Am J Orthod Dentofac Orthop 107: 537-540.
Lundstrom A, Woodside DO, Popovich F (1987). Panel assessments of facial
profile related to mandibular growth direction. Eur J Orthod 9: 271-278.
Mansour S, Burstone C, Legan H (1983). An evaluation of soft tissue changes
resulting from Le Fort I maxillary surgery. Am J Orthod 84: 37-47.
Martin JG (1964). Racial ethnocentrism and judgement of beauty. J Soc
Psychol 63: 59-63.
Matteson SR, Bechtold W, Phillips C, Staab EV (1989). A method for three-
dimensional image reformation for quantitative cephalometric analysis. J Oral
Maxillofac Surg 47: 1053-1061.
McCance AM, Moss JP, Fright WR, James DR, Linney AD (1992 a). A three-
dimensional analysis of soft and hard tissue changes following bimaxillary
orthognathic surgery in skeletal class III patients. Br J Oral Maxillofac Surg
30: 305-312.
McCance AM, Moss JP, Wright WR, Linney AD, James DR (1992 b). A three-
dimensional soft tissue analysis of 16 skeletal Class III patients following
bimaxillary surgery. Br J Oral Maxillofac Surg 30: 221-232.
McDonnell JP, McNeill RW, West RA (1977). Advancement genioplasty: A
retrospective cephalometric analysis of osseous and soft tissue changes. J
Oral Surg 35: 640-647.
256

_____________________________________________________________________________ References
McFarlane RB, Frydman WL, McCabe SB, Mamandras AM (1995).
Identification of nasal morphologic features that indicate susceptibility to nasal
tip deflection with the Le Fort I osteotomy. Am J Orthod Dentofac Orthop 107:
259-267.
McGregor AR, Newton I, Gilder RS (1971). A stereophotogrammetric method
of studying facial changes following the loss of teeth. Med Biol lllus 71: 75-82.
McMinn RMH (1994). Last’s anatomy; regional and applied. Ninth edition.
Churchill-Livingstone, London 447-449.
Merrifield LL (1966). The profile line as an aid in critically evaluating facial
aesthetics . Am J Orthod 52: 804-822.
Mommaerts MY, Marxer H (1987). A cephalometric analysis of the long term,
soft tissue profile changes which accompany the advancement of the
mandible by sagittal split ramus osteotomies. J Craniomaxillofac Surg 15:
127-131.
Moorrees CFA, Kean MR (1958). Natural head position, a basic consideration
in the interpretation of cephalometric radiographs. Am J Phys Antropol 16:
213-234.
Moss JP, Coombes AM, Linney AD, Campos J (1991). Methods of three
dimensional analysis of patients with asymmetry of the face. Proc Finn Dent
Soc 87: 47-53.
Moss JP, Grindrod SR, Linney AD, Arridge SR, James D (1988). A computer
system for the interactive planning and prediction of maxillofacial surgery. Am
J Orthod Dentofac Orthop 94: 469-475.
Moss JP, Linney AD, Grindrod SR, Arridge SR, Clifton JS (1987). Three-
dimensional visualisation of the face and skull using computerized
tomography and laser scanning techniques. Eur J Orthod 9: 247-253.
257

References
Moss JP, Linney AD, Grindrod SR, Mosse CA (1989). A laser scanning
system for the measurement of facial surface morphology. Opt Laser Eng
10:179-190.
Moss JP, Linney AD, Lowey MN (1995). The use of three-dimensional
techniques in facial aesthetics. Semin Orthod 1: 99-104.
Moss JP, McCance AM, Fright WR, Linney AD, James DR (1994). A three-
dimensional soft tissue analysis of fifteen patients with Class II, division 1
malocclusions after bimaxillary surgery. Am J Orthod Dentofac Orthop 105:
430-437.
Motoyoshi M, Yoshizumi A, Nakajima A, Kishi M, Namura S (1993). Finite
element model of facial soft tissue: Effects of thickness and stiffness on
changes following simulation of orthognathic surgery. J Nihon Univ Sch Dent
35: 118-123.
Nadkarni PG (1986). Soft tissue profile changes associated with orthognathic
surgery for bimaxillary protrusion. J Oral Maxillofac Surg 44: 851-854.
Neger M (1959). A quantitative method for the evaluation of the soft tissue
facial profile. Am J Orthod. 45: 738-751.
Oliver BM (1982). The influence of lip thickness and strain on upper lip
response to incisor retraction. Am J Orthod 82: 141-151.
Park HS, Ellis E III, Fonseca RJ, Reynolds ST, Mayo KH (1989). A
retrospective study of advancement genioplasty. Oral Surg Oral Med Oral
Pathol 67: 481-489.
Parisi T (1999). Civilization and its discontent. An antropology for the future?
Twayne Publications, New York.
258

_____________________________________________________________________________ References
Peck H, Peck S (1970). A concept of facial esthetics. Angle Orthod 40: 284-
317.
Phillips C, Devereux JP, Camilla-Tulloch JF, Tucker MR (1986). Full face soft
tissue response to surgical maxillary intrusion. Int J Adult Orthod Orthognath
Surg 4: 299-304.
Pirttiniemi P, Miettinen J, Kantomaa T (1996). Combined effects of errors in
frontal-view asymmetric diagnosis. Eur J Orthod 18: 629-636.
Polido WD, De Clairfont Regis L, Bell WH (1991). Bone resorption, stability
and soft tissue changes following large chin advancements. J Oral Maxillofac
Surg 49: 251-256.
Proffit WR, Phillips C (1988). Adaptations in lip posture and pressure
following orthognathic surgery. Am J Orthod Dentofacial Orthop 93: 294-302.
Quast DC, Biggerstaff RH, Haley JV (1983). The short-term and long-term
soft-tissue profile changes accompanying mandibular advancement surgery.
Am J Orthod 84: 29-36.
Rabey GP (1977-78 a). Current principles of morphoanalyis and their
implications in oral surgical practice. Br J Oral Surg 15: 97-109.
Rabey GP (1977-78 b). Morphoanalysis of craniofacial disharmony. Br J Oral
Surg 15: 110-120.
Radney LJ, Jacobs JD (1981). Soft tissue changes associated with surgical
total maxillary intrusion. Am J Orthod 80: 191-212.
Rakosi T (1982). Cephalometry and teleradiography; An atlas and manual of
cephalometric radiography. Wolfe Medical Publications.
259

_____________________________________________________________________________ References
Rasse M, Forkert G, WaldhausI P (1991). Stereophotogrammetry of facial
soft tissue. Int J Oral Maxillofac Surg 20; 163-166.
Ricketts RM, Bench RW, Gugino CF, Hilgers JJ, Schulof RJ (1979).
Bioprogressive therapy. Book 1. Rocky Mountain Orthodontics.
Ricketts RM (1982). The biologic significance of the divine proportion and
Fibonacci series. Am J Orthod 81: 351-370.
Riedel RA (1950). Esthetics and its relation to orthodontic therapy. Angle
Orthod 20: 168-178.
Riedel RA (1957). Analysis of dentofacial relationship. Am J Orthod 43: 103-
119.
Ripley JF, Steed DL, Flanary CM (1982). A composite surgical splint for dual
arch orthognathic surgery. J Oral Maxillofac Surg 40: 687-688.
Robertson NRE (1976). Contour photography. Br J Orthod 3: 105-109.
Robertson NRE, Volp CR (1981). Telecentric photogrammetry: its
development, testing and application. Am J Orthod 80: 623-637.
Robinson SW, Speidel TM, Isaacson RJ, Worms FW (1972). Soft tissue
profile change produced by reduction of mandibular prognathism. Angle
Orthod 42: 227-235.
Rosen HM (1988). Lip-nasal aesthetics following Le Fort I osteotomy. Plast
Reconstr Surg 81: 171-182.
Rotter BE, Zeitler DL (1999). Stability of the Le Fort I maxillary osteotomy
after rigid internal fixation. J Oral Maxillofac Surg 57: 1080-1089.
260

_____________________________________________________________________________ References
Santler G, Karcher H, Ruda C (1998). Indications and limitations of three-
dimensional models in cranio-maxillofacial surgery. J Craniomaxillofac Surg
26: 11-16.
Sarver DM, Weissman SM (1991). Long term soft tissue response to Le Fort I
maxillary superior repositioning. Angle Orthod 61: 267-276.
Scheideman GB, Legan HL, Bell WH (1981). Soft tissue changes with
combined mandibular setback and advancement genioplasty. J Oral Surg 39:
505-509.
Schendel SA, Carlotti AE (1991). Nasal considerations in orthognathic
surgery. Am J Orthod Dentofac Orthop 100: 197-208.
Schendel SA, Eisenfeld JH, Bell WH, Epker BN, Mishelevich D (1976 a). The
long face syndrome: vertical maxillary excess. Am J Orthod 70: 398-408.
Schendel SA, Eisenfeld JH, Bell WH, Epker BN (1976 b). Superior positioning
of the maxilla: Stability and soft tissue osseous relations. Am J Orthod 70:
663-674.
Schendel SA, Williamson LW (1983). Muscle reorientation following superior
repositioning of the maxilla. J Oral Maxillofac Surg 41: 235-241.
Schilder PM (1999). The image and the appearance of the human body
(International Library of Psychology). International Universities Press.
Schwestka R, Roese D, Kuhnt D, Walloschek W (1990). Splint for controlling
vertical position in maxillary osteotomies. J Clin Orthod 24: 427-431.
Seghers MJ, Longacre JJ, Stefano GA (1964). The golden proportion and
beauty. Plast Reconstr Surg 34: 178-186.
261

References
Seward GR, Foreman BG (1972). Quick release locking plates. Br Dent J
132: 366-368.
Shioiri 8 (1978). Studies on symmetry in the normal human face using Moire
topography. J Stomatol Soc Jpn 45: 147-69.
Siegel AF, Benson RH (1982). A robust comparison of biological shapes.
Biometrics 38: 341-350.
Singh GD, McNamara JA Jr, Lozanoff S (1997). Morphometry of the cranial
base in subjects with Class III malocclusion. J Dent Res 76: 694-703.
Skinazi GLS, Lindauer SJ, Isaacson RJ (1994). Chin, nose, and lips. Normal
ratios in young men and women. Am J Orthod Dentofac Orthop 106: 518-523.
Soncul M, Bamber MA (2000). The reproducibility of the head position for a
laser scan using a novel morphometric analysis for orthognathic surgery. Int J
Oral Maxillofac Surg 29: 86-90.
Stella JP, Streater MR, Epker BN, Sinn DP (1989). Predictability of upper lip
soft tissue changes with maxillary advancement. J Oral Maxillofac Surg 47:
697-703.
Subtelny JD (1959). A longitudinal study of soft tissue facial structures and
their profile characteristics, defined in relation to underlying skeletal
structures. Am J Orthod 45: 481-507.
Techalertpaisarn P, Kuroda T (1998). Three-dimensional computer-graphic
demonstration of facial soft tissue changes in mandibular prognathic patients
after mandibular sagittal ramus osteotomy. Int J Adult Orthod Orthognath
Surg 13:217-225.
262
References
Thompson D’A W (1961). On growth and form. Abridged edition, ed. JT
Bonner, (first published 1917). Cambridge University Press.
Timmins DP, Hackney FL, Van Sickels JE (1986). Effect of V-Y closure on
frontal labial morphology following Le Fort I osteotomy. J Oral Maxillofac Surg
44: 11 (abstract).
Trauner RT, Obwegeiser H (1957). The surgical correction of mandibular
prognatism and retrognathia with consideration of genioplasty. Part I. Surgical
procedures to correct mandibular prognatism and reshaping of the chin. Oral
Surg Oral Med Oral Path 10: 677-689.
Van Butsele BLI, Mommaerts MY, Abeloos JSV, De Clercq CAS, Neyt LF
(1995). Creating lip seal by maxillo-facial osteotomies: A retrospective
cephalometric study. J Craniomaxillofac Surg 23: 165-174.
Van Sickels JE, Smith CV, Tiner BD, Jones DL (1994). Hard and soft tissue
predictability with advancement genioplasties. Oral Surg Oral Med Oral Pathol
33: 218-221.
Vedtofte P, Nattestad A, Svendsen H (1991). Soft tissue changes after
advancement genioplasty performed as pedicled or free transplants. J
Craniomaxillofac Surg 19: 304-310.
Waitzman AA, Posnick JC, Armstrong DC, Pron GE (1992). Craniofacial
skeletal measurements based on computed tomography: Part II. Normal
values and growth trends. Cleft Palate Craniofac J 29:118-128.
Weinstein S, Harris EF, Archer SY (1982). Lip morphology and area changes
associated with surgical correction of mandibular prognathism. J Oral Rehab
9: 335-354.
263

_____________________________________________________________________________ References
Wessberg GA, Wolford LM, Epker BN (1980). Interpositional genioplasty for
the short face syndrome. J Oral Surg 38: 584-590.
Westermark AH, Bystedt H, von Konow L, Sallstrom KO (1991). Nasolabial
morphology after Le Fort I osteotomies: Effect of alar base suture. Int J Oral
Maxillofac Surg 20: 25-30.
Wolford LM (1988). Lip-nasal aesthetics following Le Fort I osteotomy-
discussion. Plast Reconstr Surg 81: 180-182.
Zaoli GZ (1994). Aesthetic rhinoplasty. Book 1. Piccin Nuova Libraria
Zeller M (1952). Textbook of stereophotogrammetry. Translated into English
by Miskin. HK Lewis & Co. Ltd., London.
264

Appendices
APPENDICES
265

_____________________________________________________________________________ Appendices
A.1 Information sheet and consent form for the patients participating in
the study
Department of Oral and Maxillofacial Surgery Professor Malcolm Harris Tel 0171 9151056 Dr Anwar Bamber Tel 0171 9151226
Fax: 0171 915 1259 e-mail: [email protected]
EVALUATION OF FACIAL SOFT TISSUE CHANGES
iNFORMATION SHEET
Piease read this information carefully and ask if you don’t understand or would like more information.
The type of surgery you are considering, is known as “Orthognathic Surgery”.
Its purpose is to improve:
a) the alignment of your teeth, the way they meet
b) the relationship between your upper and lower jaws
c) your facial appearance.
For surgery, each patient's operation has to be planned individually, in order
to determine, which method of treatment is best for you. A number of
investigations need to be carried out, which include, a full examination of your
face and mouth, special x-rays of your face and jaws, impressions to make
casts of your teeth and photographs of your face and mouth.
Using this information, a team of orthodontists and surgeons will decide the
treatment options for you.
The assessment and investigations will continue after your operation, as a
part of the follow-up period, to see the result of the operation and determine
whether it was to your and the surgical team’s satisfaction.
266
Appendices
During this period, a research will be taking place, trying to find out the affects
of this surgery, mainly performed on facial bones, on your facial features as
you see them in your daily life. If you volunteer to participate, it will involve
some measurements with a conventional ruler, on your face, routine clinical
photographs and a “laser scan". A laser scan is not much different than a
conventional photograph, but will give us the advantage of evaluating your
face in 3D on a computer screen. It is not like an x-ray, i.e. does not have
radiation.
We will also be trying different treatment options on you. You mav be wearing
a wafer, which is a piece of plastic with slots to accommodate the teeth on the
opposite jaw, and elastics. Both of these are routinely used for guiding you
into your “new bite” after the operation. If you wear either or both of them,
they will help you in that way, but if you don't, your own teeth will find your
new bite. These evaluations will take place during your routine visits to our
clinics and will not require any additional visits or any significant loss of time
for you.
We will be very pleased if you would participate, during your treatment, and
the results of this investigation will help us a lot to evaluate whether we
achieved our goals in your treatment, which will be beneficial to future
patients, undergoing same type of surgery. You will be kept informed of all
relevant facts as the research progresses.
You have no obligation to participate and may withdraw at any time without
giving a reason, and this will not interfere at all with the progress of your
treatment.
Mr. M. Soncul
Dr. M.A. Bamber
Professor M. Harris
267

Appendices
Department of Oral and Maxillofacial Surgery Professor Malcolm Harris Tel 0171 9151056 Dr Anwar Bamber Tel 0171 9151226
Fax: 0171 9151259 e-mail: [email protected]
EVALUATION OF FACIAL SOFT TISSUE CHANGES
CONSENT FORM
Please read this form carefully and ask if you don’t understand or would like more information.
Form of consent to participate in research associated with clinical treatment.
CONSENT BY THE PATIENT
I understand that this study is trying to assess the accuracy and stability of osteotomy operations and I have been asked to help by allowing to take some clinical pre and postoperative records, when I am in the hospital and also in follow-up appointments.The nature of the study and my involvement has been explained to me.
I.................................................................................................................... (full name)
of.................................................................................................................. (address)
hereby fully and freely consent to participate in the above research project.
I understand and acknowledge that the investigation is designed to promote medical knowledge.
I understand that I may withdraw my consent at any stage during the investigation. I acknowledge the purpose of the Investigation and accept any risks involved from the procedures (if any). The nature and purpose of such procedures has been detailed to me in an information sheet and has been explained to me by:
Dr/Mr/Ms..................................................................................................................
Signed..................................................................................... Date..... / ..... / ...........
DECLARATION BY THE INVESTIGATOR
I confirm that I have provided an information sheet and explained the nature and effect of the procedures to the volunteer and that his/her consent has been given freely and voluntarily.
Signed..........................................................................................................................
Name.............................................................................................................................
268

Appendices
Department of Oral and Maxillofacial Surgery Professor Malcolm Harris Tel 0171 9151056 Dr Anwar Bamber Tel 0171 9151226
Fax: 0171 915 1259 e-mail: [email protected]
EVALUATION OF FACIAL SOFT TISSUE CHANGES
CONSENT FORM
Please read this form carefully and ask If you don’t understand or would like more Information.
Form of consent by healthy volunteer to participate In research associated with clinical treatment.
CONSENT BY THE VOLUNTEER
I understand that this study is trying to assess the accuracy and stability of osteotomy operations and I have been asked to help by allowing to take some clinical records as a healthy volunteer.The nature of the study and my involvement has been explained to me.
I.....................................................................................................................(full name)
of.................................................................................................................. (address)
hereby fully and freely consent to participate in the above research project about the evaluation of facial soft tissue changes.
I understand and acknowledge that the investigation is designed to promote medical knowledge.
I understand that I may withdraw my consent at any stage in the investigation. I acknowledge the purpose of the investigation and accept any risks involved from the procedures (if any). The nature and purpose of such procedures has been detailed to me in an information sheet and has been explained to me by:
Dr/Mr/Ms..................................................................................................................
Signed..................................................................................... Date..... / ..... / ...........
DECLARATION BY THE INVESTIGATOR
I confirm that I have provided an information sheet and explained the nature and effect of the procedures to the volunteer and that his/her consent has been given freely and voluntarily.
Signed..........................................................................................................................
Name.............................................................................................................................
269

Appendices
A.2 Data for Chapter 3
Ranking of subjects
Ranking of Subjects by Panels
Subno
gender eo layca laybl layer surca surbi surer ertca ertbl erter
411
1 2.50 1.00 3.00 2.00 3.00 1.00 4.00 2.00 3.00
421
1 5.00 2.00 2.00 4.00 5.00 3.00 1.00 3.00 2.00
431
1 4.00 4.00 5.00 3.00 2.00 6.00 3.00 5.00 4.00
441
1 8.00 8.00 6.00 6.00 7.00 4.00 8.00 8.00 7.00
451
1 2.50 6.00 4.00 5.00 1.00 5.00 6.00 4.00 5.00
461
1 6.00 5.00 7.00 7.00 8.00 8.00 5.00 6.00 6.00
471
1 1.00 3.00 1.00 1.00 1.00 2.00 2.00 1.00 1.00
481
1 7.00 7.00 8.00 8.00 8.00 7.00 7.00 7.00 8.00
171
2 6.00 6.00 5.00 4.00 6.00 6.00 6.00 8.00 6.00
181
2 2.00 1.00 1.00 1.00 1.00 4.00 1.00 3.00 1.00
191
2 1.00 4.00 3.00 6.00 2.00 3.00 3.00 1.00 2.00
201
2 4.00 5.00 6.00 5.00 5.00 1.00 5.00 5.00 5.00
211
2 7.00 7.00 7.00 7.00 8.00 8.00 8.00 6.00 7.00
221
2 3.00 3.00 2.00 2.00 3.00 5.00 4.00 2.00 3.00
231
2 8.00 8.00 8.00 8.00 7.00 7.00 7.00 7.00 8.00
241
2 5.00 2.00 4.00 3.00 4.00 2.00 2.00 4.00 4.00
91
3 5.00 5.00 4.00 3.00 4.00 3.00 2.00 4.00 4.00
101
3 1.00 1.00 1.00 1.00 2.00 1.00 1.00 2.00 2.00
111
3 3.00 4.00 6.00 7.00 3.00 4.00 5.00 6.00 6.00
121
3 7.00 6.00 5.00 5.00 7.00 6.00 6.00 5.00 5.00
131
3 2.00 2.00 2.00 2.00 1.00 2.00 3.00 1.00 1.00
141
3 4.00 3.00 3.00 4.00 5.00 5.00 4.00 3.00 3.00
151
3 6.00 7.00 7.00 6.00 6.00 7.00 7.00 7.00 7.00
270

Appendices
Subno
gender eo layca laybl layer surca surbI surer ertca ertbl erter
161
3 8.00 8.00 8.00 8.00 8.00 8.00 8.00 8.00 8.00
332
1 7.00 4.00 6.00 5.00 4.00 6.00 5.00 4.00 6.00
342
1 1.50 2.00 2.00 2.00 3.00 1.00 2.00 2.00 1.00
352
1 5.00 7.00 5.00 7.00 7.00 7.00 7.00 8.00 7.00
362
1 4.00 5.00 4.00 6.00 6.00 5.00 4.00 6.00 4.00
372
1 6.00 6.00 7.00 3.00 2.00 4.00 6.00 1.00 5.00
382
1 1.50 1.00 1.00 1.00 1.00 2.00 1.00 3.00 2.00
392
1 8.00 8.00 8.00 8.00 8.00 8.00 8.00 7.00 8.00
402
1 3.00 3.00 3.00 4.00 5.00 3.00 3.00 5.00 3.00
252
2 3.00 3.00 2.00 3.00 1.50 3.00 3.00 3.00 2.00
262
2 5.50 5.00 6.00 5.00 6.00 7.00 5.00 4.00 5.00
272
2 5.50 7.00 7.00 7.00 8.00 6.00 6.00 7.00 6.00
282
2 1.00 1.00 1.00 1.00 1.00 1.00 1.50 1.00 3.00
292
2 8.00 8.00 8.00 8.00 7.00 5.00 8.00 6.00 7.00
302
2 4.00 4.00 3.00 4.00 4.00 4.00 4.00 5.00 4.00
312
2 2.00 2.00 4.00 2.00 3.00 2.00 1.50 2.00 1.00
322
2 7.00 6.00 5.00 6.00 5.00 8.00 7.00 8.00 8.00
12
3 6.00 5.00 5.00 5.00 5.00 5.00 6.00 5.00 4.00
22
3 4.50 6.00 6.00 3.00 4.00 6.00 2.00 2.00 6.00
32
3 8.00 8.00 8.00 8.00 8.00 7.00 8.00 8.00 7.00
42
3 4.50 4.00 1.00 4.00 6.00 2.00 5.00 6.00 3.00
52
3 1.00 3.00 4.00 6.00 2.00 3.00 3.00 4.00 5.00
62
3 2.00 1.00 3.00 2.00 1.00 4.00 1.00 3.00 2.00
72
3 3.00 2.00 2.00 1.00 3.00 1.00 4.00 1.00 1.00
82
3 7.00 7.00 7.00 7.00 7.00 8.00 7.00 7.00 8.00
271

Appendices
Ranking of Subjects by Malaysian Panel
Subno
gender eo malayl malay2 malay3 malay4 malayS malayS malay? malay 8
12 3 6 4 6 5 6 5 2 6
22 3 4 1 2 3 4 1 5 4
32 3 8 8 8 8 8 8 8 8
42 3 5 6 5 6 2 6 1 5
52 3 2 5 3 4 5 3 3 2
62 3 3 2 1 2 1 2 6 3
72 3 1 3 4 1 3 4 4 1
82 3 7 7 7 7 7 7 7 7
91 3 2 3 4 4 2 4 3 2
101 3 3 1 3 3 3 1 2 3
111 3 6 5 5 7 4 5 5 6
121 3 5 8 2 5 5 8 4 5
131 3 1 2 1 2 1 3 1 1
141 3 4 6 7 1 6 2 6 4
151 3 7 4 5 6 7 6 7 7
161 3 8 7 8 8 8 7 8 8
171 2 4 3 8 7 6 6 7 4
181 2 2 1 3 3 3 2 1 2
191 2 1 2 1 1 2 3 2 1
201 2 6 5 5 2 4 4 5 6
211 2 7 8 6 6 8 8 6 7
221 2 3 6 4 5 5 1 3 3
231 2 8 7 7 8 7 7 8 8
241 2 5 4 2 4 1 5 4 5
252 2 2 2 1 2 2 1 3 2
262 2 6 4 7 5 5 8 7 6
272 2 5 6 5 4 7 7 4 5
272

Appendices
Subno
gender eo malayl malay2 malayS malay4 malayS malayS malay? malay 8
282 2 1 1 2 1 1 3 1 1
292 2 8 7 8 7 6 6 6 8
302 2 4 3 3 6 4 4 5 4
312 2 3 5 4 3 3 2 2 3
322 2 7 8 6 8 8 5 8 7
332 1 6 6 4 6 4 4 7 6
342 1 1 1 2 2 2 2 2 1
352 1 5 7 7 5 7 6 8 5
362 1 4 5 5 7 6 3 4 4
372 1 7 3 6 4 5 7 3 7
382 1 2 2 1 1 3 1 1 2
392 1 8 8 8 8 8 8 6 8
402 1 3 4 3 3 1 5 5 3
411 1 2 2 3 2 1 3 1 2
421 1 4 5 5 1 2 1 2 4
431 1 3 3 2 4 4 5 4 3
441 1 7 6 8 7 7 8 8 7
451 1 8 4 6 6 8 7 7 8
461 1 5 8 4 8 6 4 6 5
471 1 1 1 1 3 3 2 3 1
481 1 6 7 7 5 5 6 5 6
273
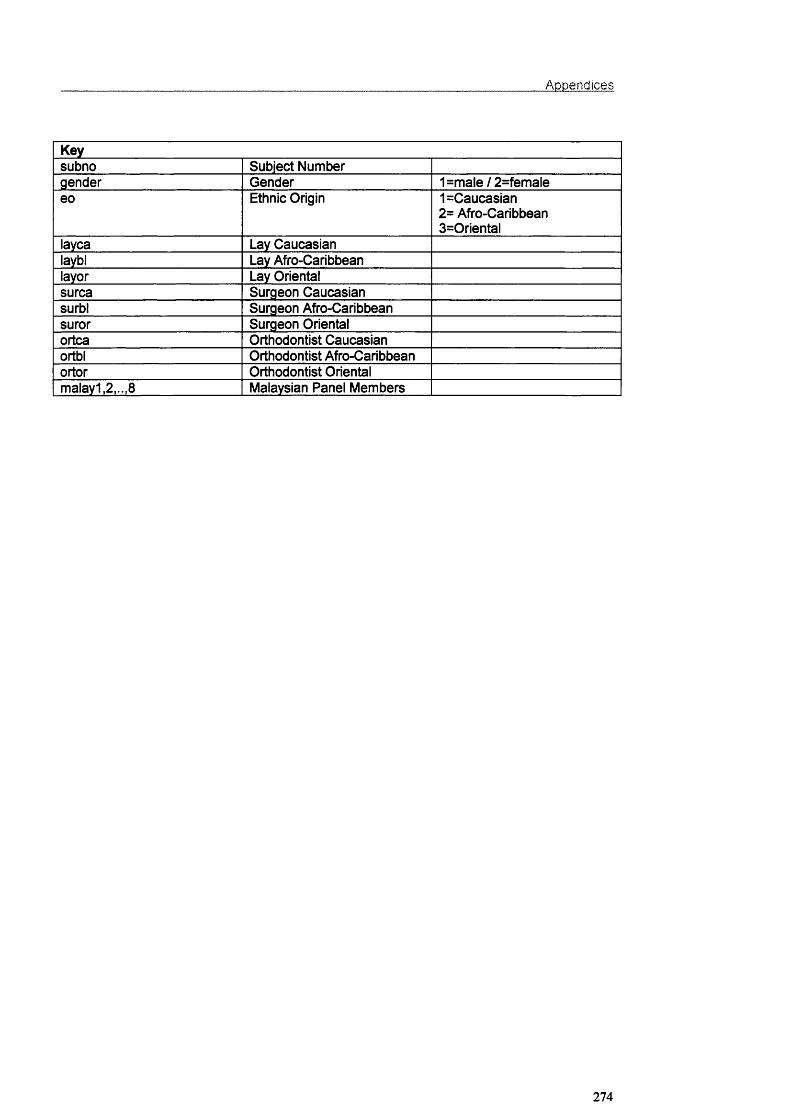
Appendices
Keysubno Subject Numbergender Gender 1=male/2=femaleeo Ethnic Origin 1=Caucasian
2= Afre-Caribbean 3=0riental
layca Lay Caucasianlaybl Lay Afre-Caribbeanlayer Lay Orientalsurca Surgeon Caucasiansurbi Surgeon Afre-Caribbeansurer Surgeon Orientalertca Orthodontist Caucasianertbl Orthodontist Afre-Caribbeanerter Orthodontist Orientalmalayl ,2,...8 Malaysian Panel Members
274
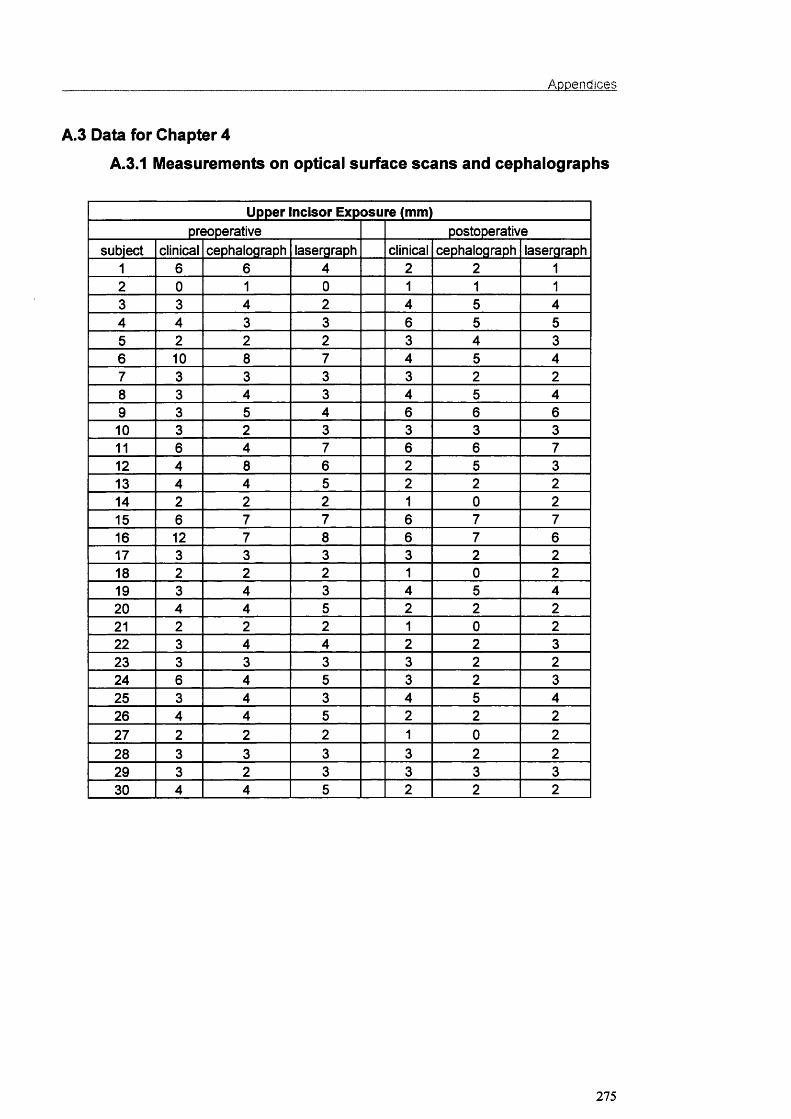
_____________________________________________________________________________ Appendices
A.3 Data for Chapter 4
A.3.1 Measurements on optical surface scans and cephalographs
Upper incisor Exposure (mm)preoperative postoperative
subject clinical cephalograph lasergraph clinical cephalograph lasergraph1 6 6 4 2 2 12 0 1 0 1 1 13 3 4 2 4 5 44 4 3 3 6 5 55 2 2 2 3 4 36 10 8 7 4 5 47 3 3 3 3 2 28 3 4 3 4 5 49 3 5 4 6 6 610 3 2 3 3 3 311 6 4 7 6 6 712 4 8 6 2 5 313 4 4 5 2 2 214 2 2 2 1 0 215 6 7 7 6 7 716 12 7 8 6 7 617 3 3 3 3 2 218 2 2 2 1 0 219 3 4 3 4 5 420 4 4 5 2 2 221 2 2 2 1 0 222 3 4 4 2 2 323 3 3 3 3 2 224 6 4 5 3 2 325 3 4 3 4 5 426 4 4 5 2 2 227 2 2 2 1 0 228 3 3 3 3 2 229 3 2 3 3 3 330 4 4 5 2 2 2
275

Appendices
Nasolabial Angle (degrees)preoperative postoperative
subject cephalograph lasergraph cephalograph lasergraph1 96 96 101 1012 82 82 90 893 99 99 90 914 111 110 120 1195 101 102 105 1076 89 88 90 907 116 114 120 1198 115 114 118 117g 106 111 106 11810 95 97 98 10011 101 113 107 11712 94 97 100 9713 99 100 101 10414 94 95 83 8515 106 112 108 11416 100 87 104 9317 88 88 92 9118 95 99 101 10119 84 86 89 9220 102 102 105 10421 96 94 99 9922 90 93 97 9823 99 101 99 9924 89 90 88 9025 91 90 90 9026 103 103 106 10527 116 114 119 11728 90 93 97 9829 95 97 98 10030 99 100 100 97
276

Appendices
Nasofacial Angle (degrees)preoperative postoperative
subject ceptialograph lasergraph cephalograph lasergraph1 37 36 37 362 39 39 40 413 34 35 35 354 37 37 37 375 41 40 40 406 36 36 34 367 39 38 38 388 39 37 38 379 32 33 33 3310 37 37 37 3711 34 36 37 3712 38 36 37 3613 42 42 42 4214 32 33 33 3315 39 39 39 3816 34 35 35 3517 36 36 37 3618 41 40 41 4119 32 34 32 3220 34 34 36 3521 37 36 37 3622 30 29 30 3023 42 42 43 4224 34 37 36 2725 31 32 33 3226 37 37 36 3727 39 39 39 3928 33 35 33 3429 38 37 37 3730 31 32 33 32
277

Appendices
Nasomental Angle (degrees)preoperative postoperative
subject cephalograph lasergraph cephalograph lasergraph1 132 131 131 1312 119 117 125 1253 120 123 127 1274 121 121 122 1225 126 128 128 1286 131 129 130 1297 134 131 128 1298 114 115 122 1229 121 123 126 12810 121 121 125 12811 121 122 121 12412 123 123 123 12213 141 138 136 13214 127 127 126 12516 128 128 128 12816 122 122 124 12217 137 134 129 13018 139 141 132 13219 125 127 130 13020 122 122 122 12221 127 128 127 12822 121 122 125 12523 124 124 121 12424 122 123 124 12225 132 130 128 12526 131 131 126 12927 114 116 119 12228 141 139 135 13529 132 132 130 12730 127 124 125 124
278
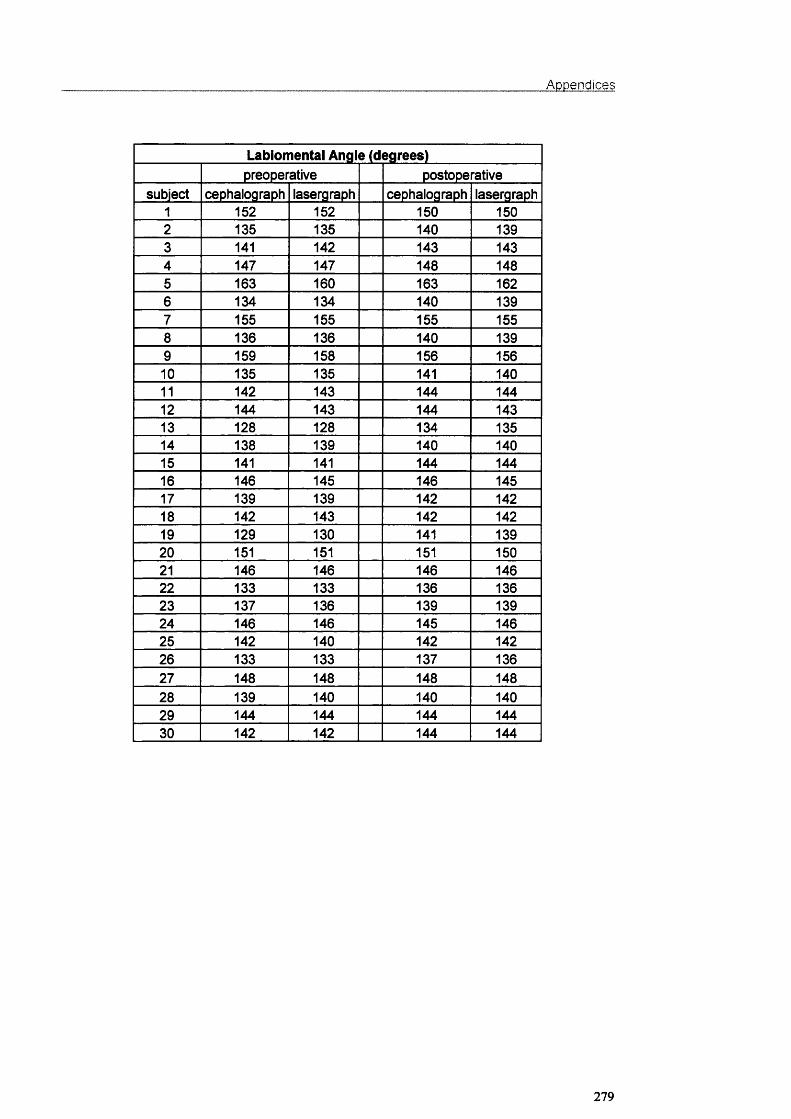
Appendices
Labiomental Angle (degrees)preoperative postoperative
subject cephalograph lasergraph cephaiograph lasergraph1 152 152 150 1502 135 135 140 1393 141 142 143 1434 147 147 148 1485 163 160 163 1626 134 134 140 1397 155 155 155 1558 136 136 140 1399 159 158 156 15610 135 135 141 14011 142 143 144 14412 144 143 144 14313 128 128 134 13514 138 139 140 14015 141 141 144 14416 146 145 146 14517 139 139 142 14218 142 143 142 14219 129 130 141 13920 151 151 151 15021 146 146 146 14622 133 133 136 13623 137 136 139 13924 146 146 145 14625 142 140 142 14226 133 133 137 13627 148 148 148 14828 139 140 140 14029 144 144 144 14430 142 142 144 144
279

Appendices
Nasal Tip (mm)subject cephalograph lasergraph
1 2 32 3 23 2 24 2 25 3 26 1 27 0 08 2 19 2 110 2 111 4 312 1 113 2 214 -2 -115 1 016 4 317 2 318 0 019 1 320 2 221 1 022 1 223 0 024 1 125 1 226 2 127 1 028 0 029 2 130 2 2
280

Appendices
A.3.2 Data for the measurement of head position change
Bending energy for change in head position (g.cm^/sec*)
Subject A Subject B Subject C Subject D Subject E
1:02 0.01162 0.0193 0.00389 0.0033 0.010881:03 0.0205 0.03657 0.00542 0.00422 0.001731:04 0.01327 0.01455 0.00743 0.01312 0.010951:05 0.00608 0.02373 0.01768 0.02171 0.010871:06 0.02225 0.01898 0.0163 0.01802 0.001261:07 0.01338 0.01789 0.01507 0.03952 0.009711:08 0.01939 0.03364 0.00963 0.02362 0.005251:09 0.03413 0.02243 0.01733 0.014 0.001341:10 0.0101 0.06786 0.0306 0.01835 0.001161:11 0.01805 0.03261 0.02077 0.00194 0.015561:12 0.02517 0.02843 0.01272 0.00444 0.00252:03 0.01919 0.0078 0.00263 0.0068 0.014112:04 0.01115 0.00356 0.00852 0.01932 0.01632:05 0.01738 0.0048 0.01319 0.03026 0.00572:06 0.01266 0.01036 0.00808 0.0213 0.010582:07 0.01829 0.0068 0.01151 0.03754 0.00712:08 0.02827 0.0059 0.00896 0.0237 0.005482:09 0.03662 0.00616 0.00729 0.0221 0.01242:10 0.00778 0.02311 0.02209 0.02311 0.01322:11 0.02177 0.00897 0.01312 0.0035 0.022592:12 0.02595 0.00651 0.00942 0.01216 0.011373:04 0.00575 0.00551 0.01011 0.01013 0.007593:05 0.00741 0.00373 0.00846 0.01885 0.009133:06 0.01409 0.01281 0.00908 0.01701 0.003183:07 0.00369 0.0077 0.00771 0.04917 0.007343:08 0.00314 0.00603 0.00936 0.02725 0.004713:09 0.0048 0.00596 0.00764 0.00666 0.004053:10 0.00831 0.01922 0.01663 0.01501 0.001993:11 0.00505 0.0106 0.00956 0.00618 0.00933:12 0.01444 0.01036 0.0082 0.00536 0.005534:05 0.00871 0.00186 0.01415 0.00289 0.015164:06 0.00906 0.00499 0.01095 0.00363 0.042994:07 0.00619 0.00293 0.01005 0.0314 0.025584:08 0.01081 0.00683 0.00188 0.01306 0.007334:09 0.01731 0.00379 0.01445 0.0071 0.043834:10 0.00523 0.02703 0.02216 0.00925 0.047474:11 0.00486 0.01033 0.02196 0.01717 0.014344:12 0.01893 0.00841 0.00428 0.01664 0.049625:06 0.0143 0.00447 0.01109 0.00479 0.050215:07 0.00213 0.00386 0.00434 0.03634 0.023315:08 0.00541 0.00384 0.01344 0.01617 0.008085:09 0.01672 0.00393 0.00765 0.01061 0.055415:10 0.00794 0.02282 0.00398 0.01166 0.059185:11 0.01047 0.01094 0.01201 0.03094 0.037895:12 0.02265 0.00959 0.00923 0.02475 0.053956:07 0.01007 0.00332 0.00905 0.02356 0.007946:08 0.01894 0.00654 0.00793 0.00453 0.005286:09 0.03622 0.00562 0.00355 0.01498 0.00065
281
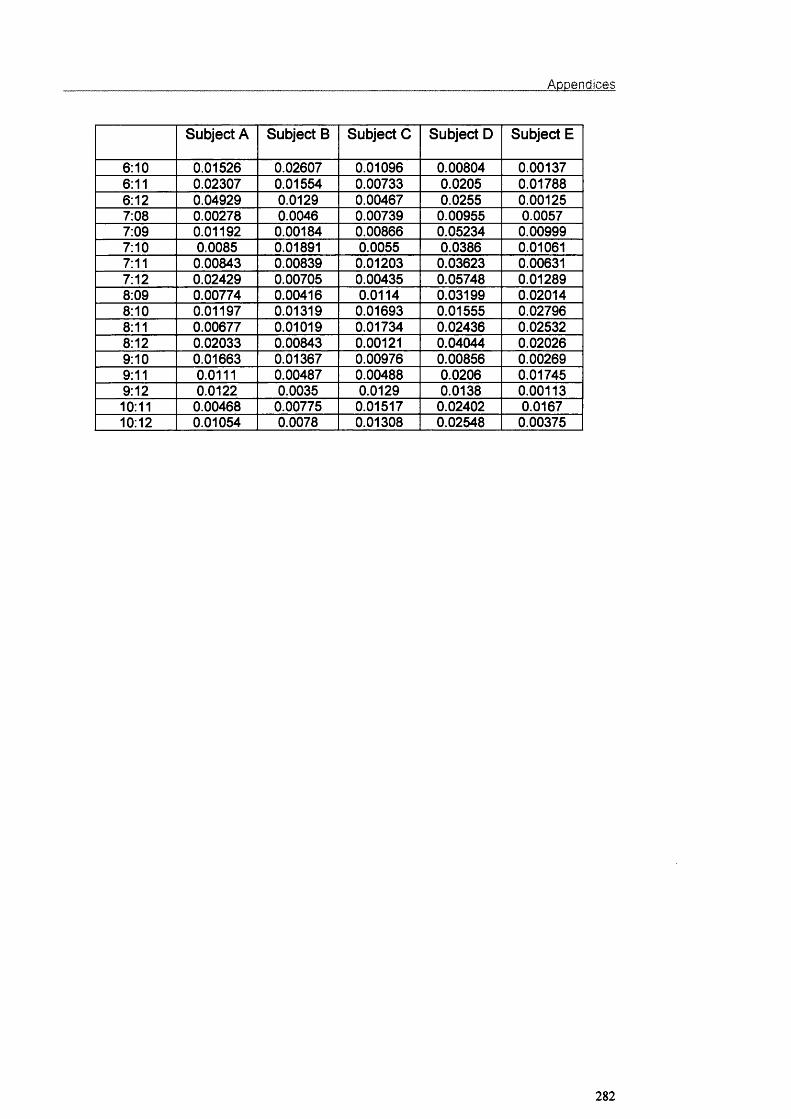
Appendices
Subject A Subject B Subject C Subject D Subject E
6:10 0.01526 0.02607 0.01096 0.00804 0.001376:11 0.02307 0.01554 0.00733 0.0205 0.017886:12 0.04929 0.0129 0.00467 0.0255 0.001257:08 0.00278 0.0046 0.00739 0.00955 0.00577:09 0.01192 0.00184 0.00866 0.05234 0.009997:10 0.0085 0.01891 0.0055 0.0386 0.010617:11 0.00843 0.00839 0.01203 0.03623 0.006317:12 0.02429 0.00705 0.00435 0.05748 0.012898:09 0.00774 0.00416 0.0114 0.03199 0.020148:10 0.01197 0.01319 0.01693 0.01555 0.027968:11 0.00677 0.01019 0.01734 0.02436 0.025328:12 0.02033 0.00843 0.00121 0.04044 0.020269:10 0.01663 0.01367 0.00976 0.00856 0.002699:11 0.0111 0.00487 0.00488 0.0206 0.017459:12 0.0122 0.0035 0.0129 0.0138 0.0011310:11 0.00468 0.00775 0.01517 0.02402 0.016710:12 0.01054 0.0078 0.01308 0.02548 0.00375
282

A.3.3 Data for landmark identification error
Appendices
Bending energy for landmark Identification (g.cm^/sec^)
Frontal Lateral1:02 0.00202 0.001631:03 0.00361 0.003181:04 0.0045 0.003321:05 0.00765 0.003011:06 0.00733 0.002441:07 0.01031 0.002641:08 0.01605 0.004471:09 0.00509 0.004481:10 0.00631 0.002452:03 0.00142 0.002282:04 0.00131 0.002192:05 0.00416 0.001942:06 0.00349 0.001042:07 0.00505 0.002632:08 0.01141 0.004552:09 0.00259 0.00292:10 0.0028 0.001763:04 0.00176 0.001083:05 0.00486 0.000743:06 0.00381 0.001673:07 0.00536 0.000883:08 0.01063 0.001063:09 0.00199 0.000613:10 0.002 0.000244:05 0.00223 0.001794:06 0.00343 0.002534:07 0.00239 0.000794:08 0.00801 0.000994:09 0.00202 0.00064:10 0.00118 0.001045:06 0.00334 0.001155:07 0.00568 0.001035:08 0.00713 0.001735:09 0.00263 0.001045:10 0.00292 0.000816:07 0.0051 0.002216:08 0.00466 0.00426:09 0.00148 0.002316:10 0.0034 0.001457:08 0.00647 0.000637:09 0.00563 0.000537:10 0.00256 0.000898:09 0.00717 0.000698:10 0.0073 0.00122
283
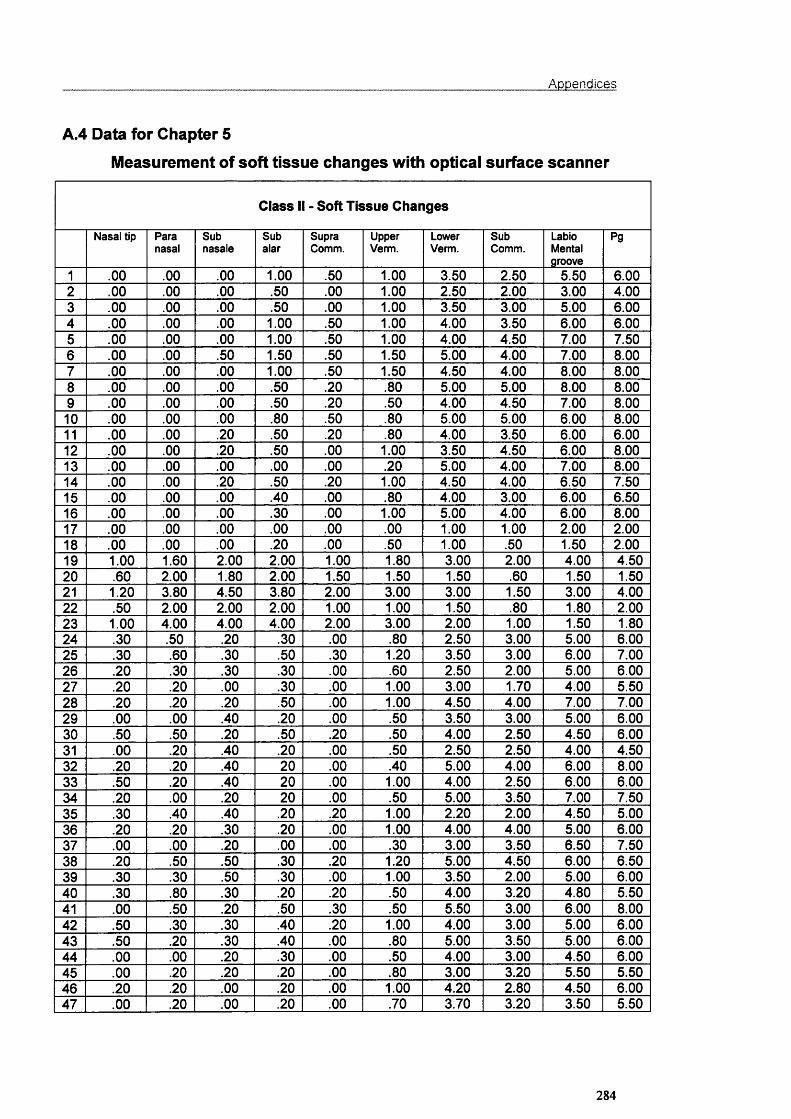
Appendices
A 4 Data for Chapter 5
Measurement of soft tissue changes with optical surface scanner
Class II - Soft Tissue Changes
Nasal tip Paranasal
Subnasale
Subalar
SupraComm.
UpperVerm.
LowerVerm.
SubComm.
LabloMentalgroove
Pg
1 .00 .00 .00 1.00 .50 1.00 3.50 2.50 5.50 6.002 .00 .00 .00 .50 .00 1.00 2.50 2.00 3.00 4.003 .00 .00 .00 .50 .00 1.00 3.50 3.00 5.00 6.004 .00 .00 .00 1.00 .50 1.00 4.00 3.50 6.00 6.005 .00 .00 .00 1.00 .50 1.00 4.00 4.50 7.00 7.506 .00 .00 .50 1.50 .50 1.50 5.00 4.00 7.00 8.007 .00 .00 .00 1.00 .50 1.50 4.50 4.00 8.00 8.008 .00 .00 .00 .50 .20 .80 5.00 5.00 8.00 8.009 .00 .00 .00 .50 .20 .50 4.00 4.50 7.00 8.0010 .00 .00 .00 .80 .50 .80 5.00 5.00 6.00 8.0011 .00 .00 .20 .50 .20 .80 4.00 3.50 6.00 6.0012 .00 .00 .20 .50 .00 1.00 3.50 4.50 6.00 8.0013 .00 .00 .00 .00 .00 .20 5.00 4.00 7.00 8.0014 .00 .00 .20 .50 .20 1.00 4.50 4.00 6.50 7.5015 .00 .00 .00 .40 .00 .80 4.00 3.00 6.00 6.5016 .00 .00 .00 .30 .00 1.00 5.00 4.00 6.00 8.0017 .00 .00 .00 .00 .00 .00 1.00 1.00 2.00 2.0018 .00 .00 .00 .20 .00 .50 1.00 .50 1.50 2.0019 1.00 1.60 2.00 2.00 1.00 1.80 3.00 2.00 4.00 4.5020 .60 2.00 1.80 2.00 1.50 1.50 1.50 .60 1.50 1.5021 1.20 3.80 4.50 3.80 2.00 3.00 3.00 1.50 3.00 4.0022 .50 2.00 2.00 2.00 1.00 1.00 1.50 .80 1.80 2.0023 1.00 4.00 4.00 4.00 2.00 3.00 2.00 1.00 1.50 1.8024 .30 .50 .20 .30 .00 .80 2.50 3.00 5.00 6.0025 .30 .60 .30 .50 .30 1.20 3.50 3.00 6.00 7.0026 .20 .30 .30 .30 .00 .60 2.50 2.00 5.00 6.0027 .20 .20 .00 .30 .00 1.00 3.00 1.70 4.00 5.5028 .20 .20 .20 .50 .00 1.00 4.50 4.00 7.00 7.0029 .00 .00 .40 .20 .00 .50 3.50 3.00 5.00 6.0030 .50 .50 .20 .50 .20 .50 4.00 2.50 4.50 6.0031 .00 .20 .40 .20 .00 .50 2.50 2.50 4.00 4.5032 .20 .20 .40 20 .00 .40 5.00 4.00 6.00 8.0033 .50 .20 .40 20 .00 1.00 4.00 2.50 6.00 6.0034 .20 .00 .20 20 .00 .50 5.00 3.50 7.00 7.5035 .30 .40 .40 .20 .20 1.00 2.20 2.00 4.50 5.0036 .20 .20 .30 .20 .00 1.00 4.00 4.00 5.00 6.0037 .00 .00 .20 .00 .00 .30 3.00 3.50 6.50 7.5038 .20 .50 .50 .30 .20 1.20 5.00 4.50 6.00 6.5039 .30 .30 .50 .30 .00 1.00 3.50 2.00 5.00 6.0040 .30 .80 .30 .20 .20 .50 4.00 3.20 4.80 5.5041 .00 .50 .20 .50 .30 .50 5.50 3.00 6.00 8.0042 .50 .30 .30 .40 .20 1.00 4.00 3.00 5.00 6.0043 .50 .20 .30 .40 .00 .80 5.00 3.50 5.00 6.0044 .00 .00 .20 .30 .00 .50 4.00 3.00 4.50 6.0045 .00 .20 .20 .20 .00 .80 3.00 3.20 5.50 5.5046 .20 .20 .00 .20 .00 1.00 4.20 2.80 4.50 6.0047 .00 .20 .00 .20 .00 .70 3.70 3.20 3.50 5.50
284
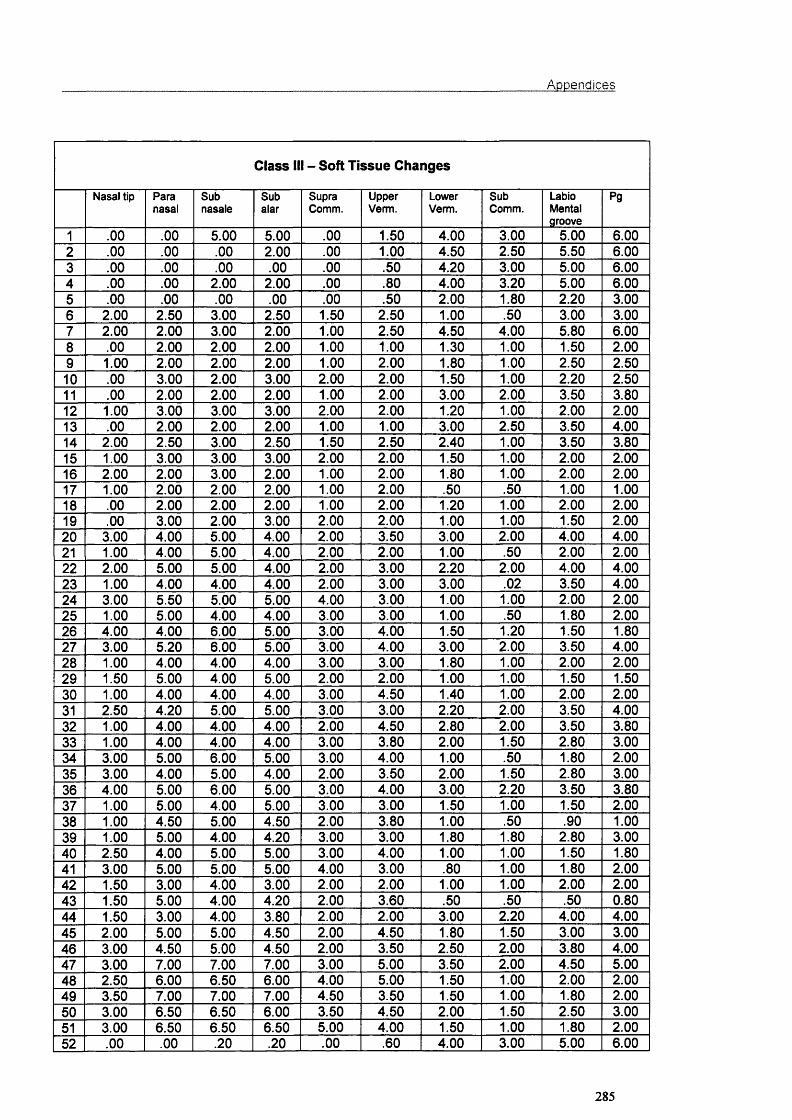
Appendices
Class ill - Soft Tissue Changes
Nasal tip Paranasal
Subnasale
Subalar
SupraComm.
UpperVerm.
LowerVerm.
SubComm.
LabloMentalgroove
Pg
1 .00 .00 5.00 5.00 .00 1.50 4.00 3.00 5.00 6.002 .00 .00 .00 2.00 .00 1.00 4.50 2.50 5.50 6.003 .00 .00 .00 .00 .00 .50 4.20 3.00 5.00 6.004 .00 .00 2.00 2.00 .00 .80 4.00 3.20 5.00 6.005 .00 .00 .00 .00 .00 .50 2.00 1.80 2.20 3.006 2.00 2.50 3.00 2.50 1.50 2.50 1.00 .50 3.00 3.007 2.00 2.00 3.00 2.00 1.00 2.50 4.50 4.00 5.80 6.008 .00 2.00 2.00 2.00 1.00 1.00 1.30 1.00 1.50 2.009 1.00 2.00 2.00 2.00 1.00 2.00 1.80 1.00 2.50 2.5010 .00 3.00 2.00 3.00 2.00 2.00 1.50 1.00 2.20 2.5011 .00 2.00 2.00 2.00 1.00 2.00 3.00 2.00 3.50 3.8012 1.00 3.00 3.00 3.00 2.00 2.00 1.20 1.00 2.00 2.0013 .00 2.00 2.00 2.00 1.00 1.00 3.00 2.50 3.50 4.0014 2.00 2.50 3.00 2.50 1.50 2.50 2.40 1.00 3.50 3.8015 1.00 3.00 3.00 3.00 2.00 2.00 1.50 1.00 2.00 2.0016 2.00 2.00 3.00 2.00 1.00 2.00 1.80 1.00 2.00 2.0017 1.00 2.00 2.00 2.00 1.00 2.00 .50 .50 1.00 1.0018 .00 2.00 2.00 2.00 1.00 2.00 1.20 1.00 2.00 2.0019 .00 3.00 2.00 3.00 2.00 2.00 1.00 1.00 1.50 2.0020 3.00 4.00 5.00 4.00 2.00 3.50 3.00 2.00 4.00 4.0021 1.00 4.00 5.00 4.00 2.00 2.00 1.00 .50 2.00 2.0022 2.00 5.00 5.00 4.00 2.00 3.00 2.20 2.00 4.00 4.0023 1.00 4.00 4.00 4.001 2.00 3.00 3.00 .02 3.50 4.0024 3.00 5.50 5.00 5.00 4.00 3.00 1.00 1.00 2.00 2.0025 1.00 5.00 4.00 4.00 3.00 3.00 1.00 .50 1.80 2.0026 4.00 4.00 6.00 5.00 3.00 4.00 1.50 1.20 1.50 1.8027 3.00 5.20 6.00 5.00 3.00 4.00 3.00 2.00 3.50 4.0028 1.00 4.00 4.00 4.00 3.00 3.00 1.80 1.00 2.00 2.0029 1.50 5.00 4.00 5.00 2.00 2.00 1.00 1.00 1.50 1.5030 1.00 4.00 4.00 4.00 3.00 4.50 1.40 1.00 2.00 2.0031 2.50 4.20 5.00 5.00 3.00 3.00 2.20 2.00 3.50 4.0032 1.00 4.00 4.00 4.00 2.00 4.50 2.80 2.00 3.50 3.8033 1.00 4.00 4.00 4.00 3.00 3.80 2.00 1.50 2.80 3.0034 3.00 5.00 6.00 5.00 3.00 4.00 1.00 .50 1.80 2.0035 3.00 4.00 5.00 4.00 2.00 3.50 2.00 1.50 2.80 3.0036 4.00 5.00 6.00 5.00 3.00 4.00 3.00 2.20 3.50 3.8037 1.00 5.00 4.00 5.00 3.00 3.00 1.50 1.00 1.50 2.0038 1.00 4.50 5.00 4.50 2.00 3.80 1.00 .50 .90 1.0039 1.00 5.00 4.00 4.20 3.00 3.00 1.80 1.80 2.80 3.0040 2.50 4.00 5.00 5.00 3.00 4.00 1.00 1.00 1.50 1.8041 3.00 5.00 5.00 5.00 4.00 3.00 .80 1.00 1.80 2.0042 1.50 3.00 4.00 3.00 2.00 2.00 1.00 1.00 2.00 2.0043 1.50 5.00 4.00 4.20 2.00 3.60 .50 .50 .50 0.8044 1.50 3.00 4.00 3.80 2.00 2.00 3.00 2.20 4.00 4.0045 2.00 5.00 5.00 4.50 2.00 4.50 1.80 1.50 3.00 3.0046 3.00 4.50 5.00 4.50 2.00 3.50 2.50 2.00 3.80 4.0047 3.00 7.00 7.00 7.00 3.00 5.00 3.50 2.00 4.50 5.0048 2.50 6.00 6.50 6.00 4.00 5.00 1.50 1.00 2.00 2.0049 3.50 7.00 7.00 7.00 4.50 3.50 1.50 1.00 1.80 2.0050 3.00 6.50 6.50 6.00 3.50 4.50 2.00 1.50 2.50 3.0051 3.00 6.50 6.50 6.50 5.00 4.00 1.50 1.00 1.80 2.0052 .00 .00 .20 .20 .00 .60 4.00 3.00 5.00 6.00
285

Appendices
Nasal tip Paranasal
Subnasale
Subalar
SupraComm.
UpperVerm.
LowerVerm.
SubComm.
LabloMentalgroove
Pg
53 .00 .00 .00 .20 .00 .50 3.00 2.00 3.20 4.0054 .00 .00 .00 .00 .00 .80 3.20 2.20 4.00 3.5055 .00 .00 .00 .00 .00 .30 2.80 2.20 3.50 3.80
286
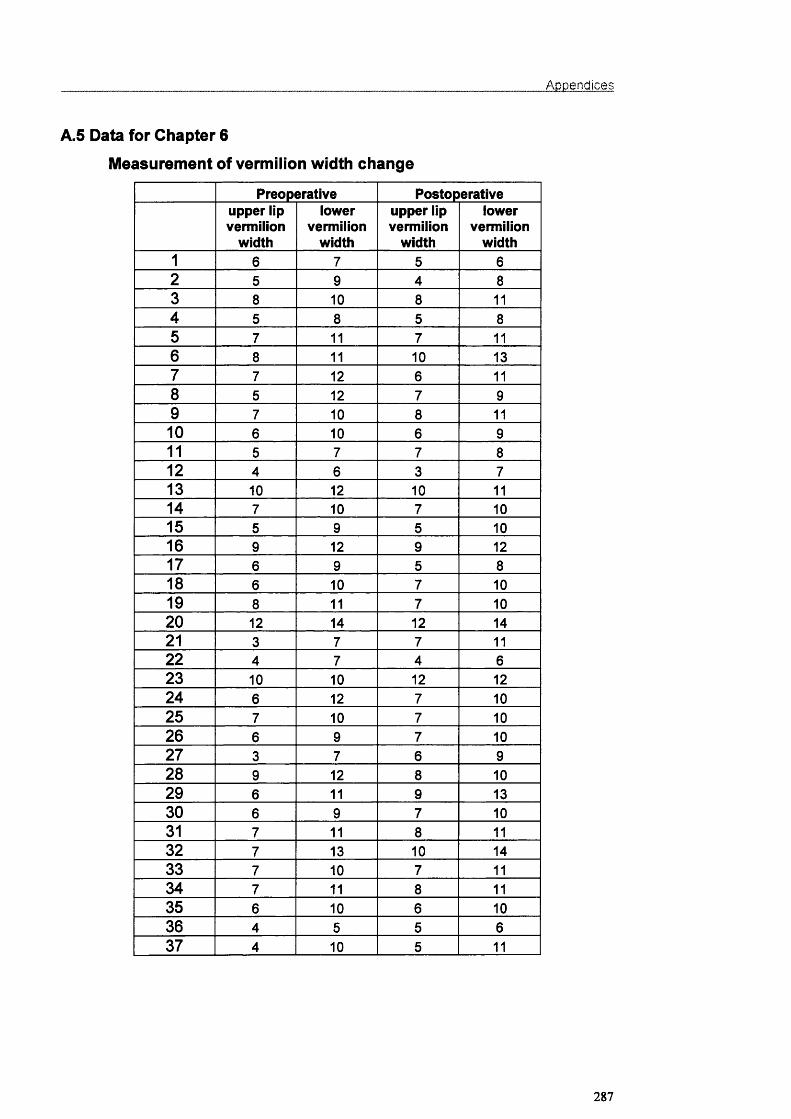
Appendices
A.5 Data for Chapter 6
Measurement of vermilion width change
Preoperative Postoperativeupper lip vermilion
width
lowervermilion
width
upper lip vermilion
width
lowervermilion
width1 6 7 5 62 5 9 4 83 8 10 8 114 5 8 5 85 7 11 7 116 8 11 10 137 7 12 6 118 5 12 7 99 7 10 8 1110 6 10 6 911 5 7 7 812 4 6 3 713 10 12 10 1114 7 10 7 1015 5 9 5 1016 9 12 9 1217 6 9 5 818 6 10 7 1019 8 11 7 1020 12 14 12 1421 3 7 7 1122 4 7 4 623 10 10 12 1224 6 12 7 1025 7 10 7 1026 6 9 7 1027 3 7 6 928 9 12 8 1029 6 11 9 1330 6 9 7 1031 7 11 8 1132 7 13 10 1433 7 10 7 1134 7 11 8 1135 6 10 6 1036 4 5 5 637 4 10 5 11
287
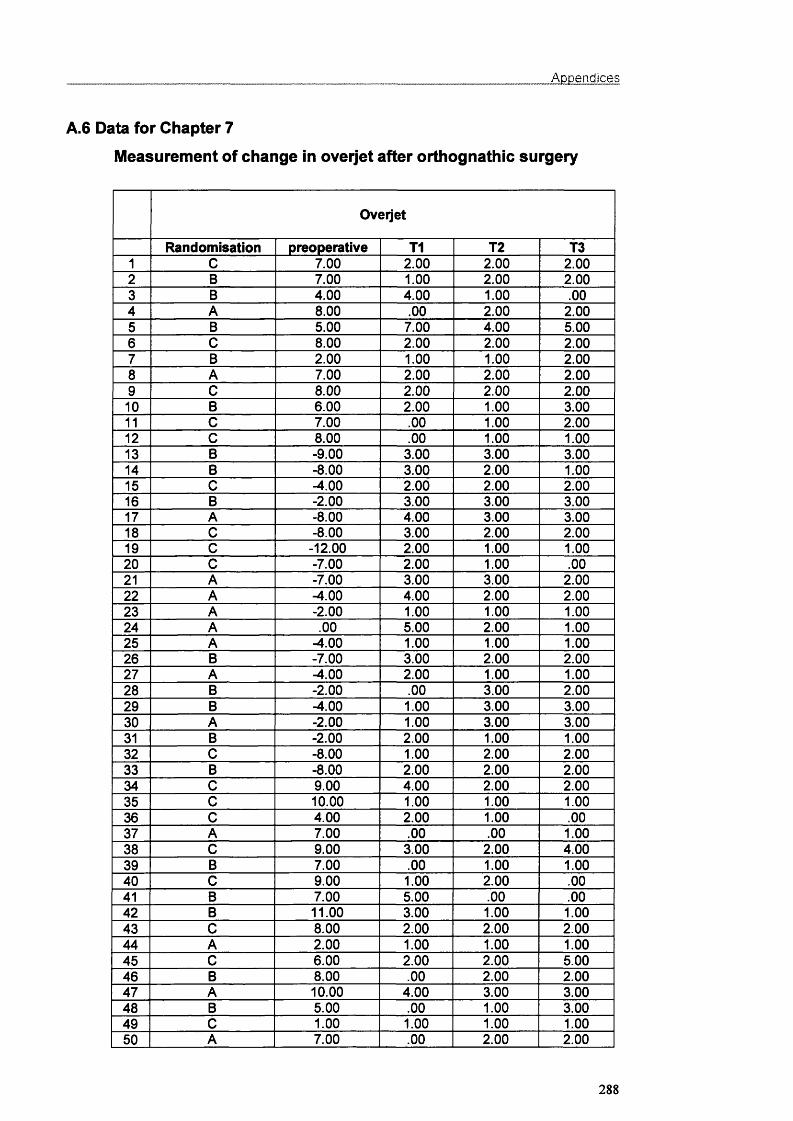
Appendices
A.6 Data for Chapter 7
Measurement of change in overjet after orthognathic surgery
Oveijet
Randomisation preoperative T1 T2 T31 C 7.00 2.00 2.00 2.002 B 7.00 1.00 2.00 2.003 B 4.00 4.00 1.00 .004 A 8.00 .00 2.00 2.005 B 5.00 7.00 4.00 5.006 C 8.00 2.00 2.00 2.007 B 2.00 1.00 1.00 2.008 A 7.00 2.00 2.00 2.009 C 8.00 2.00 2.00 2.0010 B 6.00 2.00 1.00 3.0011 C 7.00 .00 1.00 2.0012 C 8.00 .00 1.00 1.0013 B -9.00 3.00 3.00 3.0014 B -8.00 3.00 2.00 1.0015 C -4.00 2.00 2.00 2.0016 B -2.00 3.00 3.00 3.0017 A -8.00 4.00 3.00 3.0018 C -8.00 3.00 2.00 2.0019 C -12.00 2.00 1.00 1.0020 C -7.00 2.00 1.00 .0021 A -7.00 3.00 3.00 2.0022 A -4.00 4.00 2.00 2.0023 A -2.00 1.00 1.00 1.0024 A .00 5.00 2.00 1.0025 A -4.00 1.00 1.00 1.0026 B -7.00 3.00 2.00 2.0027 A -4.00 2.00 1.00 1.0028 B -2.00 .00 3.00 2.0029 B -4.00 1.00 3.00 3.0030 A -2.00 1.00 3.00 3.0031 B -2.00 2.00 1.00 1.0032 C -8.00 1.00 2.00 2.0033 B -8.00 2.00 2.00 2.0034 C 9.00 4.00 2.00 2.0035 C 10.00 1.00 1.00 1.0036 C 4.00 2.00 1.00 .0037 A 7.00 .00 .00 1.0038 C 9.00 3.00 2.00 4.0039 B 7.00 .00 1.00 1.0040 C 9.00 1.00 2.00 .0041 B 7.00 5.00 .00 .0042 B 11.00 3.00 1.00 1.0043 C 8.00 2.00 2.00 2.0044 A 2.00 1.00 1.00 1.0045 C 6.00 2.00 2.00 5.0046 B 8.00 .00 2.00 2.0047 A 10.00 4.00 3.00 3.0048 B 5.00 .00 1.00 3.0049 C 1.00 1.00 1.00 1.0050 A 7.00 .00 2.00 2.00
288
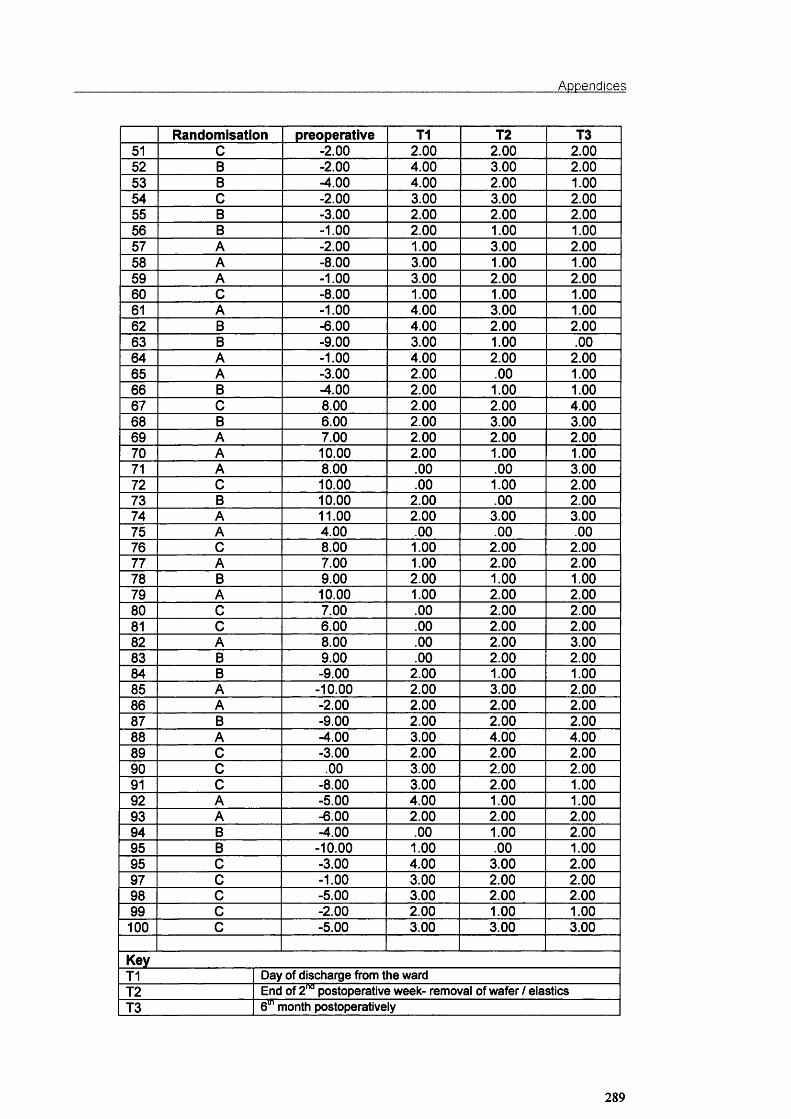
Appendices
Randomisation preoperative T1 T2 T351 C -2.00 2.00 2.00 2.0052 B -2.00 4.00 3.00 2.0053 B -4.00 4.00 2.00 1.0054 C -2.00 3.00 3.00 2.0055 B -3.00 2.00 2.00 2.0056 B -1.00 2.00 1.00 1.0057 A -2.00 1.00 3.00 2.0058 A -8.00 3.00 1.00 1.0059 A -1.00 3.00 2.00 2.0060 C -8.00 1.00 1.00 1.0061 A -1.00 4.00 3.00 1.0062 B -6.00 4.00 2.00 2.0063 B -9.00 3.00 1.00 .0064 A -1.00 4.00 2.00 2.0065 A -3.00 2.00 .00 1.0066 B -4.00 2.00 1.00 1.0067 C 8.00 2.00 2.00 4.0068 B 6.00 2.00 3.00 3.0069 A 7.00 2.00 2.00 2.0070 A 10.00 2.00 1.00 1.0071 A 8.00 .00 .00 3.0072 C 10.00 .00 1.00 2.0073 B 10.00 2.00 .00 2.0074 A 11.00 2.00 3.00 3.0075 A 4.00 .00 .00 .0076 C 8.00 1.00 2.00 2.0077 A 7.00 1.00 2.00 2.0078 B 9.00 2.00 1.00 1.0079 A 10.00 1.00 2.00 2.0080 C 7.00 .00 2.00 2.0081 C 6.00 .00 2.00 2.0082 A 8.00 .00 2.00 3.0083 B 9.00 .00 2.00 2.0084 B -9.00 2.00 1.00 1.0085 A -10.00 2.00 3.00 2.0086 A -2.00 2.00 2.00 2.0087 B -9.00 2.00 2.00 2.0088 A -4.00 3.00 4.00 4.0089 C -3.00 2.00 2.00 2.0090 C .00 3.00 2.00 2.0091 C -8.00 3.00 2.00 1.0092 A -5.00 4.00 1.00 1.0093 A -6.00 2.00 2.00 2.0094 B -4.00 .00 1.00 2.0095 B -10.00 1.00 .00 1.0095 C -3.00 4.00 3.00 2.0097 C -1.00 3.00 2.00 2.0098 C -5.00 3.00 2.00 2.0099 C -2.00 2.00 1.00 1.00100 C -5.00 3.00 3.00 3.00
KeyT1 Day of discharge from the wardT2 End of 2"̂ ̂postoperative week- removal of wafer / elasticsT3 6“̂ month postoperatively
289

Publications
PUBLICATIONS
290

Publications
ABSTRACTS
1. Soncul M, Bamber MA, Harris M (2001). Nasal and paranasal changes
after the correction of maxillary hypoplasia (abstract). J Dent Res 80;
1167.
2. Soncul M, Bamber MA, Harris M (2001). The lip vermilion width changes
in skeletal Class III patients after orthognathic surgery (abstract). J Dent
Res 80:1167.
3. Soncul M, Bamber MA, Harris M (2000). The differences in ethnic
horizontal facial proportions (abstract). J Dent Res 79:1191.
4. Bamber MA, Chios P, Tan Ac, Soncul M, Harris M (1999). Reproducibility
of a point in 3D space and model surgery measurements using a passive
robot arm probe (abstract) J Dent Res 78:1050.
5. Soncul M, Bamber MA, Harris M (1999). The reproducibility of head
position in the anteroposterior and mediolateral planes for lasergraphs
using thin-plate splines analysis (abstract) J Dent Res 78:1062.
6. Soncul M, Bamber MA, Harris M (1998). The reproducibility of head
position for lasergraphs using thin-plate splines (abstract) J Dent Res
77:655.
7. Bamber MA, Ishak I, Soncul M, Harris M, Campos J (1997). The
compatibility of cephalograph and lasergraph for soft tissue analysis
(abstract) J Dent Res 76:1043.
291

Publications
REFEREED PUBLICATIONS
1. Soncul M, Bamber MA (2000). The reproducibility of the head position for
a laser scan using a novel morphometric analysis for orthognathic surgery.
Int J Oral Maxillofac Surg 29; 86-90.
2. Soncul M, Bamber MA (1999). The optical surface scan as an alternative
to the cephalograph for soft tissue analysis for orthognathic surgery. Int J
Adult Orthod Orthognath Surg 14: 277-283.
292
Int. J. Oral Maxillofac. Surg. 2000; 29: 86-90 Printed in D enm ark. A ll rights reserved
Copyright © Munksgaard 2000
IntematmalJournal of
OralSL Maxillofacial Surgery
IS S N 0901-5027
The reproducibility of the head position for a laser scan using a novel morphometric analysis for orthognathic surgery
M. Soncul, M. A. BamberDepartment of Oral and Maxillofacial Surgery, Eastman Dental Institute, University Colllege London Hospitals, University of London,, London, UK
M. Soncul, M. A. Bamber: The reproducibility o f the head position for a laser scan using a novel morphometric analysis for orthognathic surgery. Int. J. Oral Maxillofac. Surg. 2000; 29: 86-90. © Munksgaard, 2000
Abstract. The aim of this study was to evaluate the reproducibility of the head position for a three-dimensional soft tissue laser scan (lasergraph) using thin- plate splines, for orthognathic surgery planning and follow-up. 60 laser scans of five subjects (12 scans per subject) were obtained at specified intervals. The head was positioned in the lateral view using a spirit level, an engineering device for setting horizontal surfaces, to adjust the Frankfort horizontal plane parallel to the ground. The projection of a narrow beam of longitudinal laser light was used to adjust the axial plane for the frontal view. These scanned images (lasergraphs) were digitised and the co-ordinates of the landmarks recorded. The digitised laser scans were compared using thin-plate splines analysis. The mean difference between the scans due to variations in head position was 0.0135±0.0109 g • crn^l sec^ in the lateral view and 0.0090±0.0054 g • cm^/sec^ in the frontal view. This represents an overall distortion error of less than 2% when following up the surgical change of a typical bimaxillary osteotomy case with 6 mm maxillary advancement and 3 mm mandibular set-back. It is concluded that facial laser scans (lasergraphs) with the Frankfort horizontal plane set using a head rest and spirit level, and the axial plane set using projection of a vertical laser light on the facial midline, are highly reproducible.
Key words: head position; optical laser scanner; morphometric analysis.
Accepted for publication 30 August 1999
The use of three-dimensional (3D) graphics for soft tissue evaluation in orthognathic surgery planning is setting new standards and has many advantages over conventional radiography. Recently, several techniques have been introduced for the morphometries of the human face, the optical laser scanning system being one of the latest major developments^. This three-dimensional laser scan has also contributed towards the photorealistic simulation of the postoperative appearance of a patient^.
The optical laser scanning system
was designed at University College London Hospitals, where it is in regular use. All anatomical landmarks and facial structures are recorded within 0.5 mm, which meets the current clinical requirements of accuracy and reproducibility'" ̂ for orthognathic surgery assessment and planning. For a scan, the patient sits in a rotating chair, opposing the camera. A non-hazardous line of helium-neon laser light is projected on the face while the chair is rotated through 200 degrees for 15 seconds (Fig. 1). The distorted laser light reflecting the subject’s facial anatomy is
recorded by the camera connected to the computer. The image is then saved in the computer and can be retrieved at a later date for further analysis. The hard copy of the lasergraph can be printed in full colour or black and white in any required view.
One of the major benefits of this system is the facility to manipulate the image in three dimensions. Thus, one can rotate the image on the computer screen in any direction and angle (Fig. 2) and select points on a standard or customised reference plane. Despite the many potential advantages of the system’’̂ in
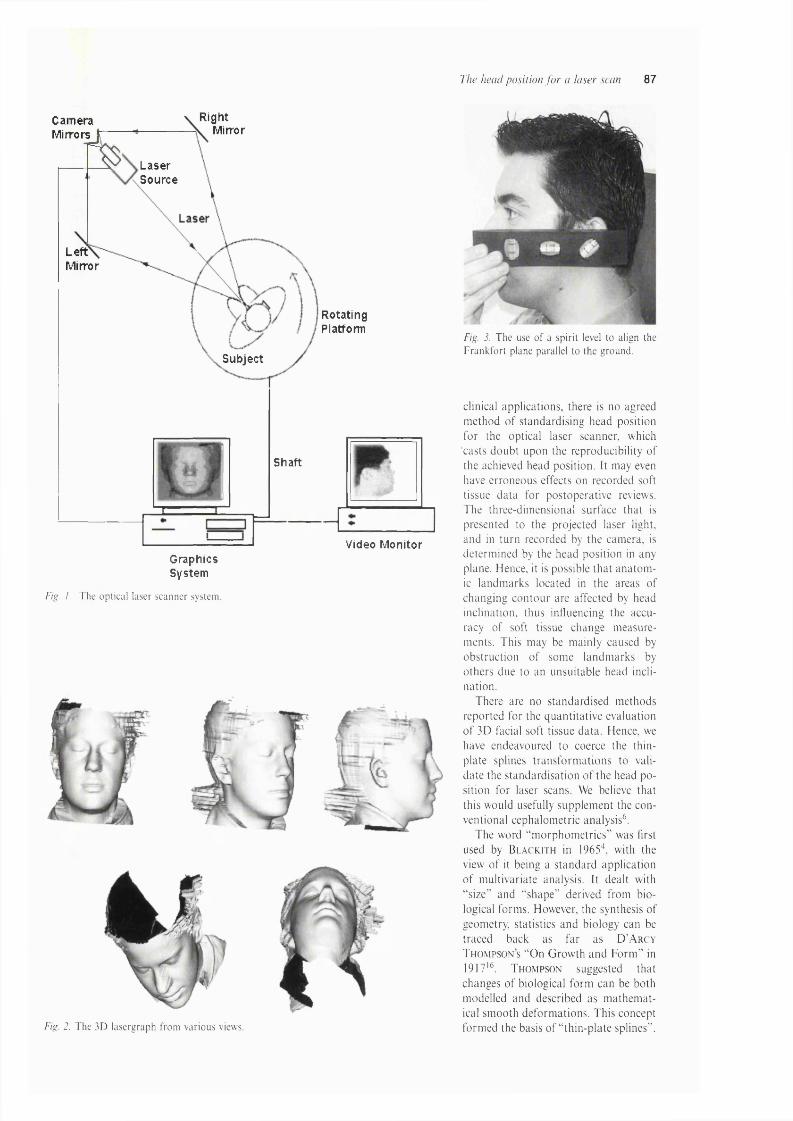
The head position fo r a laser scan 87
CameraMirrors
Right MirrorS Laser
Source
LeftMirror
Subject
Shaft
RotatingPlatform
Video MonitorGraphicsSystem
Fig. 1. The optical laser scanner system.
Fig. 2. The 3D lasergraph from various views.
Fig. J. The use o f a spirit level to align the Frankfort plane parallel to the ground.
clinical applications, there is no agreed m ethod o f standardising head position for the optical laser scanner, which casts doub t upon the reproducibility o f the achieved head position. It may even have erroneous effects on recorded soft tissue da ta for postoperative reviews. The three-dim ensional surface that is presented to the projected laser light, and in tu rn recorded by the cam era, is determ ined by the head position in any plane. Hence, it is possible th a t an a to m ic landm arks located in the areas o f changing con to u r are affected by head inclination, thus influencing the accuracy o f soft tissue change m easurements. This may be m ainly caused by obstruction o f som e landm arks by others due to an unsuitable head inclination.
There are no standard ised m ethods reported for the quantitative evaluation o f 3D facial soft tissue data . Hence, we have endeavoured to coerce the thin- p late splines tran sfo rm atio n s to valida te the standard isation o f the head p o sition for laser scans. We believe that this would usefully supplem ent the conventional cephalom etric analysis^.
The word “m orp h o m etrie s” was first used by B la c k i t h in 1965\ with the view o f it being a s tandard application o f m ultivariate analysis. It dealt with “ size” and “ shape” derived from biological form s. However, the synthesis o f geometry, statistics and biology can be traced back as far as D ’A rcy T h o m p so n s “On G row th and F orm ” in 1917'^. T h om p son suggested th at changes o f biological form can be both m odelled and described as m athem atical sm ooth deform ations. T his concept form ed the basis o f “ th in-p la te splines” .

88 Soncul and Bamber
a
Fig. 4. a) Lateral view lasergraph showing landmarks used for this investigation; 1) Soft tissue orbitale, 2) Upper margin o f tragus, 3) Soft tissue nasion, 4) Pronasale, 5) Subnasale, 6) Labrale superius, 7) Labrale inferius, 8) Soft tissue pogonion. b) Frontal view lasergraph showing landmarks used for this investigation: 1) Soft tissue nasion, 2) Right lateral canthus, 3) Left lateral canthus, 4) Subnasale, 5) Right alare, 6) Left alare, 7) Right cheilion, 8) Left cheilion, 9) Sublab- iale.
The th in-plate spline is an in terpo lating function th a t can be used to describe shape change as a deform ation o f a structure, in this case the change in head position for a lasergraph.
This study aim ed to test the rep roducibility o f the head position for lasergraphs by setting;a. the F ran k fo rt horizon tal p lane p a r
allel to the g round using a spirit level, an engineering device for setting horizon tal surfaces, and
b. the axial p lane perpendicular to the g round in the frontal view, by reflecting a narrow laser light beam on the facial m idline o f the patient.
Material and methods
Sixty laser scans o f five subjects (twelve scans each) were taken at random intervals o f between 15 minutes and 24 hours. In the time between the scans, the subject was asked to walk around and relax. Three o f the subjects were women and two were men; three had a
3
• 1
>2 ,5
>f)
• 7
CFig. 5. a) A graphical output o f thin-plate splines analysis after the digitisation o f a preoperative lasergraph. b) Graphical output of thin-plate splines analysis where the head position was intended to remain constant. The distortion of the image was caused by a slight change in the inclination o f the head so that the digitised landmarks moved as a group, c) Graphical output of thin-plate splines analysis showing the change after bimaxillary surgery with 6 mm advancement o f the maxilla and 3 mm set-back o f the mandible.
Class I skeletal relationship, one had a Class II and one had a Class III ; one subject had a facial asymmetry.
A ll the scans were taken by the same investigator, following a protocol for the use of an optical laser scanner* .̂ The subjects head supported by the head rest was adjusted using a spirit level, an engineering device for setting horizontal surfaces. This consisted of a glass tube partially filled with alcohol and with air bubbles indicating perfect levelness to the three planes in space (Fig. 3). The head
a)
b)
Fig. 6. a) Thin-plate splines analysis showing change in head position with chin moving in- feriorly. b) Thin-plate splines analysis showing change in head position with chin moving superiorly. When the repeated lasergraphs were compared to each other, the slight changes in the head position were demonstrated as a rotation of the grid. The images compared here were otherwise identical, being free from magnification and individual movement o f landmarks.
position was adjusted until the Frankfort horizontal plane was parallel to the ground. The axial plane o f the head was adjusted and aligned perpendicular to the ground by shining the laser scanner source light longitudinally on the patient’s facial midline'. These scanned 3D images were saved on the host computer. For the digitisation process, an image was retrieved and an absolute lateral and frontal view of each subject’s laser scan was obtained by rotating the 3D image on the screen (Fig. 2). This custom-designed software gives the same absolute frontal and lateral views repeatedly by default and the image manipulation process is calibrated and reproducible on the computer screen.
Using custom-designed software, the lateral and frontal view images were digitised for thin-plate splines (TpsDlG32 Version 1.1, a Windows 95/NT program developed by F. James Rohlf for geometric morphometric analysis). The anatomical landmarks digitised on each lateral profile and frontal view of the scan are illustrated in Figs. 4a and 4b.
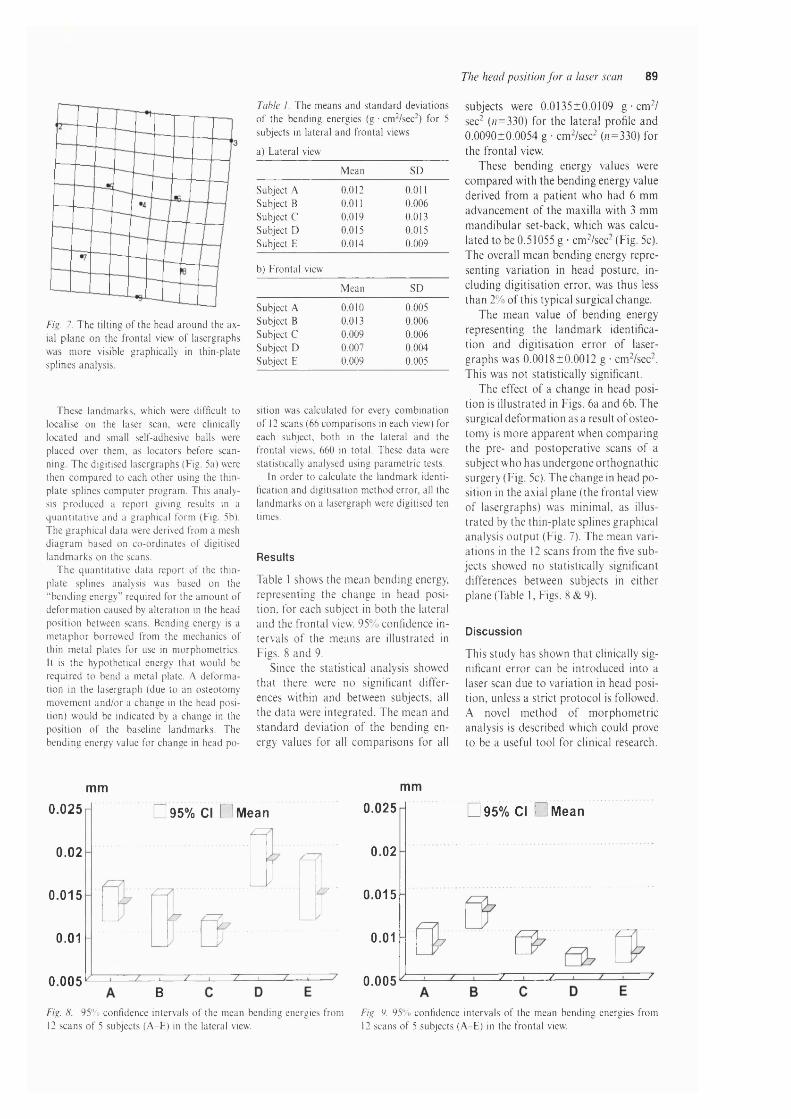
The head position fo r a laser scan 89
Fig. 7. The tilting o f the head around the axial plane on the frontal view o f lasergraphs was more visible graphically in thin-plate splines analysis.
These landmarks, which were difficult to localise on the laser scan, were clinically located and small self-adhesive balls were placed over them, as locators before scanning. The digitised lasergraphs (Fig. 5a) were then compared to each other using the thin- plate splines computer program. This analysis produced a report giving results in a quantitative and a graphical form (Fig. 5b). The graphical data were derived from a mesh diagram based on co-ordinates o f digitised landmarks on the scans.
The quantitative data report of the thin- plate splines analysis was based on the “ bending energy” required for the amount of deformation caused by alteration in the head position between scans. Bending energy is a metaphor borrowed from the mechanics of thin metal plates for use in morphometries. It is the hypothetical energy that would be required to bend a metal plate. A deformation in the lasergraph (due to an osteotomy movement and/or a change in the head position) would be indicated by a change in the position of the baseline landmarks. The bending energy value for change in head po-
Tahle 1. The means and standard deviations o f the bending energies (g ■ cm’ /see-) for 5 subjects in lateral and frontal views
a) Lateral view
Mean SD
Subject A Subject B Subject C Subject D Subject E
0.0120.0110.0190.0150.014
0.0110.0060.0130.0150.009
b) Frontal view
Mean SD
Subject A Subject B Subject C Subject D Subject E
0.010
0.0130.0090.0070.009
0.0050.0060.0060.0040.005
sition was calculated for every combination o f 12 scans (66 comparisons in each view) for each subject, both in the lateral and the frontal views, 660 in total. These data were statistically analysed using parametric tests.
In order to calculate the landmark identification and digitisation method error, all the landmarks on a lasergraph were digitised ten times.
Results
Table 1 shows the m ean bending energy, representing the change in head position, for each subject in both the lateral and the frontal view. 95% confidence intervals o f the m eans are illustrated in Figs. 8 and 9.
Since the statistical analysis showed th at there were no significant differences within and between subjects, all the da ta were integrated. The m ean and standard deviation o f the bending energy values for all com parisons for all
subjects were 0.0135±0.0109 g • cm^/ sec- (n=330) for the lateral profile and 0 .0090±0.0054 g • cm^/sec^ (/r=330) for the frontal view.
These bending energy values were com pared with the bending energy value derived from a patient who had 6 m m advancem ent o f the m axilla with 3 mm m andibu lar set-back, which was calculated to be 0.51055 g • cm ^/sec-(Fig. 5c). The overall m ean bending energy representing varia tion in head posture, including d ig itisation error, was thus less than 2% o f this typical surgical change.
T he m ean value o f bending energy representing the landm ark identification and d ig itisa tion e rro r o f lasergraphs was 0 .0018±0.0012 g • cm^/sec-. This was not statistically significant.
T he effect o f a change in head position is illustrated in Figs. 6a and 6b. The surgical defo rm ation as a result o f osteotom y is m ore apparen t when com paring the pre- and postoperative scans o f a subject w ho has undergone o rthognath ic surgery (Fig. 5c). T he change in head p o sition in the axial plane (the frontal view o f lasergraphs) was m inim al, as illustra ted by the th in-p la te splines graphical analysis o u tp u t (Fig. 7). The m ean varia tions in the 12 scans from the five subjects showed no statistically significant differences between subjects in either plane (Table 1, Figs. 8 & 9).
Discussion
This study has shown th a t clinically significant e rro r can be in troduced into a laser scan due to varia tion in head position, unless a strict pro toco l is followed. A novel m ethod o f m orphom etric analysis is described which could prove to be a useful tool for clinical research.
mm mm
0.025
0.02
0.015
0.01
0.005
□ 95% Cl Ü M ean
± 7 '
B
□ 95% Cl Ü M ean0.025
0.02
0.015
0.01
z z0.005
Fig. H. 95% confidence intervals o f the mean bending energies from Fig. 9. 95% confidence intervals o f the mean bending energies from12 scans o f 5 subjects (A-E) in the lateral view. 12 scans o f 5 subjects (A-E) in the frontal view.

90 Soncul and Bamber
Despite being based on two-dimensional images, with the soft tissue recordings being limited to an outline of the lateral profile with poor resolution, the use of lateral skull cephalographs has for decades been the principal method for evaluating soft tissue change after orthognathic surgery. PiRTTiNiEMi et al.'^ reported that although the head was positioned using a cephalostat, the geometric error due to head rotation in the cephalograph was up to 3.5 mm, which increased further in cases of facial asymmetry. In comparison, the errors in this lasergraph study due to head position were small and statistically insignificant. There is no other similar study reporting errors in soft tissue laser scans due to change in head position with which we can compare the results of this study. Additional advantages of this laser system are that 3D surface imaging data in a digital format can be analysed with greater accuracy in any desired view, and that laser scans can be conveniently stored by any computer system. If required, a print-out can be obtained in colour and black and white.
In the lateral profile, if the axis of rotation for the head was in the centre of the head’s outline, then the bending energy for the change in head position would be zero, since the grid would rotate evenly around this centre point. The head is inclined on the neck, however, causing rotation in the grid (Figs. 6a & 6b) which can be easily measured by the thin-plate splines analysis. The head inclination has a direct effect on the 3D surface data that can be captured on the digitised image. Depending upon the head position, some soft tissue landmarks may disappear completely. For this reason. B u s h & A n t o n y s h y n ̂
supported a downward inclination of the Frankfort plane for head position. However, this increased the error in some other landmarks.
L u n d s t r o m et al.^° used the natural head position as a reproducible position for head inclination in their cephalometric study based on normal profiles. It is, however, difficult to achieve a reproducible natural head position in patients with abnormal and disharmonious profile outlines, facial asymmetry, and posturing habits". Earlier studies reporting the reproducibility of the natural head position in adults showed an error of 2°^'". In a separate study, L u n d s t r o m & L ltndstro m ^̂ reported that the natural head position as a
cephalometric reference for clinical purposes was not reproducible. Despite several investigations by many authors to find a reproducible head position, the Frankfort horizontal plane remains the most widely used reference plane for orthognathic surgery^. This study showed that it can be reproduced with a simple technique of using a spirit level. The orientation of laser scans with the Frankfort horizontal plane also allows synchronisation of clinical assessment, lasergraphs, cephalographs and anatomically mounted models for orthognathic surgery planning.
There are no other cephalograph and lasergraph studies in the literature evaluating head position from the frontal view with which these results can be compared. All previous investigators used two-dimensional imaging tools, which only reproduced the lateral facial soft tissue profile for the analysis. This study, using a three-dimensional imaging tool, evaluated the head position in true lateral and frontal views; both these views are important for facial soft tissue analysis for surgeons and orthodontists.
The thin-plate splines analysis, using the mean bending energy, was thought to be more appropriate as a multivariate analysis for a three-dimensional image. The errors in the frontal view of laser scans were smaller than those in the lateral view, while the errors were clinically insignificant in both views. As a result of this study, it is advised to adjust the Frankfort horizontal plane parallel, and the frontal view axial plane perpendicular, to the true horizontal plane for a reproducible three- dimensional lasergraph.
Acknowledgements.. We would like to thank Dr Alf Linney, Department of Medical Physics and Bioengineering, for his help and Dr. Robin Hennessy, Department of Biology, University College London, for introducing us to the thin-plate splines analysis.
References
1. Bamber MA. Recording the facial midline for orthognathic planning. Br JO ral Maxillofac Surg 1995: 33:112^.
2. Bamber MA, F iro u z a i R, H a r r is M, L inney A. A comparative study of two arbitrary face-bow transfer systems for orthognathic surgery planning. Int J Oral Maxillofac Surg 1996:25; 339-43.
3. B je r in R. a comparison between the Frankfort horizontal and the sella turcica- nasion line as reference planes in cephalo
metric analysis. Acta Odont Scaad 1957: 15: 1-12.
4. B la c k ith RE. Theoretical and mathematical biology. New York: Blaisdell, 1965:225-49.
5. Bush K , A n to n ysh yn Q Three-dimensional facial anthropometry using a laser surface scanner: validation o f the technique. Blast Reconstr Surg 1996:98: 226- 35.
6. F e r ra r io VF, S fo rza C, M ia n i A, T a r ta - GLiA G. Craniofacial morphometry by photographic evaluation. Am J Orthod Dentofacial Orthop 1993:103: 327-37.
7. G iro d S, Keeve E, G iro d B. Advances in interactive craniofacial surgery planning by 3D simulation and visualisation. In t J Oral Maxillofac Surg 1995:24: 120-5.
8. L inney AD. The protocol for optical laser scanner. London: Department ofMedical Physics, UCL, 1992.
9. L inney AD, Tan AC, R ichards R, G a rd n e r J, G r in d ro d S, Moss IP. Three dimensional visualization o f data on human anatomy: diagnosis and surgical planning. J Audiov Media Med 1993:16: 4-10,
10. L u n d s tro m A, Forsbe rg C-M. Peck S, M c W ill ia m j. a proportional analysis of the soft tissue facial profile in young adults with normal occlusion. Angle Orthod 1992: 62: 127-33.
11. L u n d s tro m A, F orsbe rg C-M, Wes- te rg re n H, L u n d s tro m FA. A comparison between estimated and registered natural head posture. Eur J Orthod 1991: 13: 59-64.
12. L u n d s tro m A, L u n d s tro m F. The Frankfort horizontal as a basis for cephalometric analysis. A m J Orthod Dentofacial Orthop 1995:107: 537-40.
13. M oorrees CFA, K ean MR. Natural head position, a basic consideration in the interpretation o f cephalometric radiographs. Am J Phys Anthropol 1958: 16:
213-34.14. Moss JP, L in n e y AD, G rin d ro d SR,
Mosse CA. a laser scanning system for the measurement o f facial surface morphology. Opt Laser Eng 1989:10:179-90.
15. P ir t t in ie m i P, M ie t t in e n J, Kantom aa T. Combined effects o f errors in frontal-view asymmetric diagnosis. Eur J Orthod 1996: 18: 629-36.
16. Thompson D ’A. On growth and form. Cambridge: Cambridge University Press, 1961.
Address:Dr. M. A. BamberDepartment o f Oral and Maxillofacial
Surgery Eastman Dental Institute University o f London 256 Gray’s Inn Road London W C IX 8LD UKTel: +44171 9151226Fax: +44 171 915 1259e-mail: a. bamber@eastman. ucl. ac. uk

277
Murat Soncul, BDS
Mohammed Anwar Bamber,, PhD
Department of Oral and Maxillofacial Surgery
Eastman Dental Institute University College London London, United Kingdom
Reprint requests:Dr M. A, Bamber Department of Oral and Maxillo
facial Surgery Eastman Dental Institute University College London 256 Gray’s Inn Road London W C IX 8LD United Kingdom Fax:+44 (0) 171 915 1226/+44
(0) 171 915 1259 E-mail:
l i l t J . \d iilt O rthod Orthognath Surg Vol. 14, No. 4, 1999
The optical surface scan as an alternative to the cephalograph for soft tissue analysis for orthognathic surgery
The aim of this study was to compare cephalographs and optical surface scanner images (lasergraphs) by measuring the lip- incisor relationship, the nasolabial angle, nasal tip projection, the nasofacial angle, the nasomental angle, and the labiomental angle in pre- and postoperative orthognathic surgery patients. The results showed that the methods were comparable, but the optical surface scan (lasergraph) could be used to greater advantage for pre- and postoperative assessment of soft tissue changes with orthognathic surgery, because of its clarity and 3-dimensional potential. (Inf J Adult Orthod Orthognath Surg 1 9 9 9 ;M :2 7 7 -2 8 3 )
Accurate recording and prediction of fac ia l soft tissue changes after o rthog nathic surgery are important for surgeons and orthodontists. Conventional 2-dimensional radio logic and photographic techniques have been used for this purpose and have often proved to be inadequate. The use of traditional rad iography also has lim itations due to unjustified rad ia tion doses from repeated examinations.
Other human face morphometry techniques that have been reported include M oire topography/^ stereophotogramme- t r y / ' ' m o rp h o an a lys is / and telecentric p h o to g ra p h y and pho tog ram m etry .'^ These are, again, all based on recording 2-dimensionol photographic data. More recent systems include stereolithogrophy^ based on com puted tom ograph ic (CT) scans, which also enables representation of complex anatomic structures in the form of models. Ultrasonography,® based on the use of sound waves to reflect complex deeper structures for 3 -dimensional images, has also been suggested. Currently, magnetic resonance imaging, an alternative to CT, is impracticable, as it is usually used on patients in the supine position.
The optica l surface scanning system deve loped by Linney et o l’ has been used regularly over the lost decade for recording facial soft tissues, and recently its use for the measurement of the lip-in- c isor re la tionsh ip was eva luated w ith good reproducibility.'® Its range of app lication has extended from surgical d iag nosis and planning to prosthesis and imp lan t design, c lin ic a l g row th studies, forensic science, archaeology, psychology research, sculpture, and animation for advertising.
This optica l surface scanning system (Fig 1) is based on the principle of triangulation. A beam of low-power semiconductor loser ligh t is projected onto the subject's face and is distorted to reflect the co n to u r o f the su rface ana tom y. These reflections ore then recorded by a cam era situated a d jacen t to the laser projector. The subject sits on a rotating p latform fac ing the cam era and is rotated through 2 0 0 degrees in 10 seconds. Up to 258 profiles of the rotating subject are recorded in a scan. Specifically angled mirrors in the system enable the recording of additional views, so os

278 Soncul/Bamher
Right mirrorCameramirrors Laser
source
Laser\Left \ mirror
[Rotating'platform
Subject
Shaft
Video monitorGraphics system
Fig 1 The optical surface scanner system.
Fig 2 Various views of the optical surface scan (lasergraph).
to avoid the loss of data caused by the superimposition of prominent ports of the face, such as the nose, on neighboring fa c ia l structures. The angles at w hich these profiles ore recorded may be program m ed to y ie ld finer sam pling over areas of greater interest, where more deta il is requ ired . The record ings o f the camera are sent to the transputer graphics system, w hich processes the v ideo signals to form the scanned image on the video monitor (Fig 1 ).
Landmarks on the facial profile con be reco rded w ith in a 0 .5-m m accuracy, w hich meets c lin ica l requirem ents" for orthognathic surgery planning. The output image is presented on the monitor os a translation of the surface. This may be observed from any perspective (Fig 2), and measurements can be taken across the surface in 3 dimensions. fHowever, there is a need to assess its accuracy and c o m p a t ib i li ty w ith c o n v e n tio n a l
cephalographs for its potentia lly w ider clinical applications os systems based on similar principles are being marketed at reasonable costs.
The aims of this study were to compare conventional cephalographs and optical surface scanner images (lasergraphs) by measuring: f / j the upper lip-incisor exposure, (2) the naso lab ia l ang le, (3) the nasal tip pro jection, (4) the nasofacial angle, (5j the nasomental angle, and (6) the labiomental angle in pre- and postoperative orthognathic surgery patients. The study was also intended to validate the apparent advantages of the optical surface scanner for orthognathic surgery.
Materials and methods
Thirty b im axilla ry osteotomy patients consented to and were included in this study. The clinical upper lip -inc isor exposure was measured after 3 minutes' re-

Iiu J Adult Oi tiiod Ortiiot^iialii Sur^ \'ol. 14, No. 4. 1999 279
Nasolabial angleStomion
Maxillary incisor margin Labiomental angle
Fig 3 Maxillary incisor exposure and nasolabial and labiomental angles, as measured on an optical surface scan.
Nasofacial angle
Frankfort pla Nasomental angle
Fig 4 Nasofacial and nasomental angles on an optical surface scanner image.
Nasion
Nasal tip
Fig 5 Nasal tip projection measurement on a scan.
pose , f irs t d u r in g the p re o p e ra t iv e workup, and again 6 to 8 weeks after surgery using a metric Vernier caliper, and on the cepholograph and the laser- graph. The nasolabial, nasofacial, nasom enta l, and la b io m e n ta l ang les and nasal tip pro jection are not accessible for reproducible c lin ica l measurements, so they were measured only on optical surface scans and cephalographs, as described in Figs 3 to 5.
The lateral skull cephalographs were taken in the conventional manner with the patient's lips in repose. O ptica l surface scans were obtained similar to cephalographs, with the Frankfort plane horizontal (optical scanner designed and built by A. Linney et al. University o f California at Los A nge les , D epartm ent o f M e d ic a l Physics). To do this, the upper margin of the tragus and the orbitale were located manually, and markers were attached to the patient's skin. The head position was then adjusted using a spirit level until the Frankfort plane was horizontal.'^
Using a 3 -dimensional graphics display computer program, the authors retrieved the optica l scanner im age onto the screen; 2 re fe rence p o in ts , 1 at stom ion superius and the other at the m a x il la ry in c is o r e d g e , w e re then marked and the m axillary incisor expo
sure was determined by measuring the distance between these 2 points with the com puter program (Fig 3). An optica l surface scanner p rin to u t (lo se rg raph j was obtained, and the nasolabial angle w as de fined by the in te rsection of 2 lines; the first o rig ina ted at subnasale, tangent to the lower border of the nose, and the second line, from subnasale to lobrale superius, was recorded (Fig 3). The labiomental angle is formed by the intersection of 2 lines orig inating at the soft tissue B p o in t; one is ta ngen t to lobrale inferius and the other is tangent to p o g o n io n (Fig 3). The n a s o fa c ia l angle was measured between a vertical line dropped from nosion perpendicular to the Frankfort plane and a line drawn tangent to the nasal dorsum (Fig 4). For the nasomental ang le, a line from the nasal tip to pogonion was draw n and the angle between this line and the tangent to the nasal dorsum was recorded (Fig 4). The angular measurements were recorded on both cepha log raphs and optical surface scanner images using a protractor and a ruler.
A perpendicular line from nosion (N| to the F rankfort ho rizon ta l p lane was drawn on the surface scans; the distance to the nasal tip was measured for the nasal tip projection, and changes after
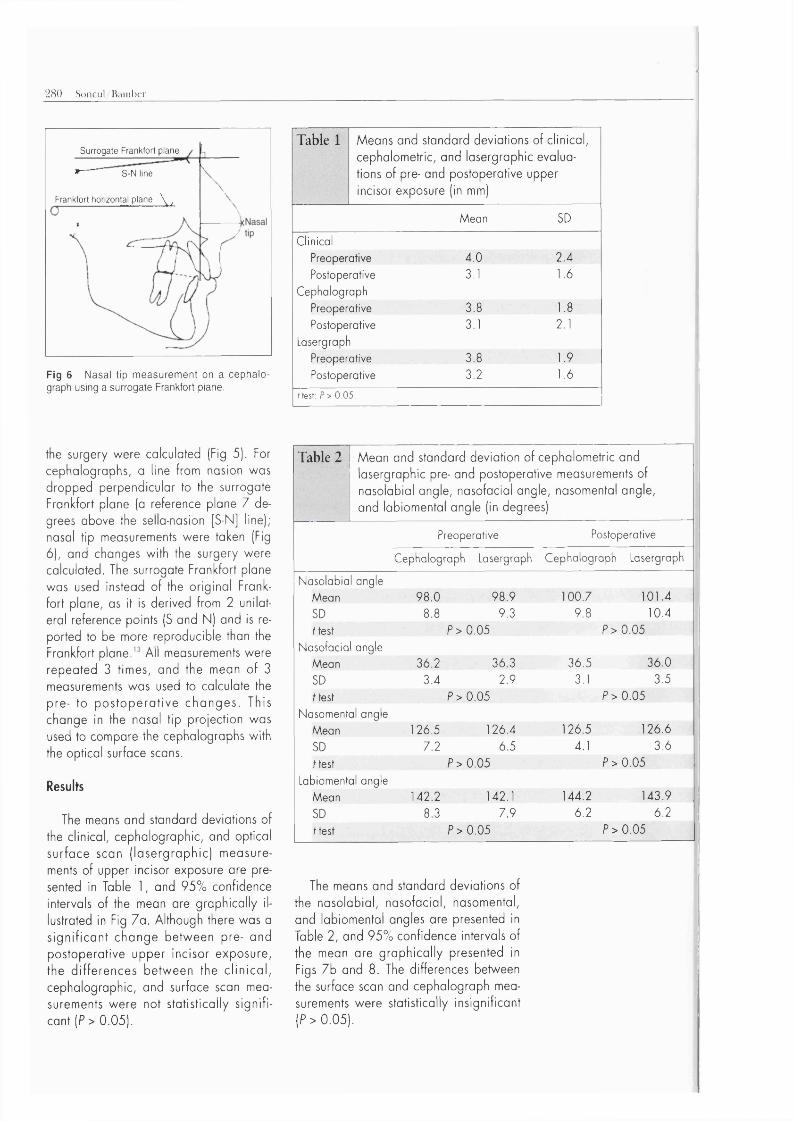
280 Soncul/BainlKT
Surrogate Frankfort plane»— S-N line
Frankfort horizontal plane \ ,
Fig 6 Nasal tip measurement on a cephalo- graph using a surrogate Frankfort plane.
the surgery were calculated (Fig 5). For cephalographs, a line frotn nasion was dropped perpendicular to the surrogate Frankfort plane (a reference plane 7 degrees above the sello-nosion [S-N] line); nasal tip measurements were taken (Fig 6), and changes with the surgery were calculated. The surrogate Frankfort plane was used instead of the orig ina l Frankfort plane, as it is derived from 2 unilateral reference points (5 and N) and is reported to be more reproducible than the Frankfort p la n e .A l l measurements were repeated 3 times, and the mean o f 3 measurements was used to calculate the pre- to p o s to p e ra tiv e ch a n g e s . This change in the nasal tip projection was used to compare the cephalographs with the optical surface scans.
Results
The means and standard deviations of the clinical, cephalographic, and optical surface scan (la se rg ra p h ic ) m easurements of upper incisor exposure ore presented in Table 1, and 95% confidence intervals of the mean are graphica lly illustrated in Fig 7a. Although there was a s ig n if ic a n t change betw een pre- and postoperative upper incisor exposure, the d iffe rences betw een the c lin ic a l, cephalographic, and surface scan measurements w ere not statistica lly s ig n ificant (P > 0.05).
Table 1 Means and standard deviations of clinical, cephalometric, and lasergraphic evaluations of pre- and postoperative upper incisor exposure (in mm)
Mean SD
ClinicalPreoperative 4.0 2.4
Postoperative 3.1 1.6
Cephalograph
Preoperative 3.8 1.8
Postoperative 3.1 2.1
Lasergraph
Preoperative 3.8 1.9
Postoperative 3.2 1.6
ftest: P> 0.05.
Table 2 Mean and standard deviation of cephalometric and lasergraphic pre- and postoperative measurements of nasolabial angle, nasofacial angle, nasomental angle, and labiomental angle (in degrees)
Preoperative Postoperative
Cephalograph Lasergraph Cephalograph Lasergraph
Nasolabial angleMean 9&0 9&9 100.7 101.4SD 8 8 9 ^ 9.8 10.4ftest P>0.05 P>0.05
Nasofacial angle
Mean 3 6 ^ 36 3 3&5 36.0SD 3 ^ 2 9 3.1 3.5ftest P>0.05 P>0.05
Nasomental angle
Mean 126.5 126.4 126.5 126.6SD 7 ^ 6 5 4.1 3.6ftest P>0.05 P>0.05
Labiomental angleMean 142.2 142.1 144.2 143.9SD 8 3 A9 6.2 6.2ftest P>0.05 P>0.05
The means and standard deviations of the nasolabial, nasofacial, nasomental, and labiomental angles are presented in Table 2, and 95% confidence intervals of the mean are g raph ica lly presented in Figs 7b and 8. The differences between the surface scan and cephalograph measurements were statistically insignificant (P > 0 .0 5 ).
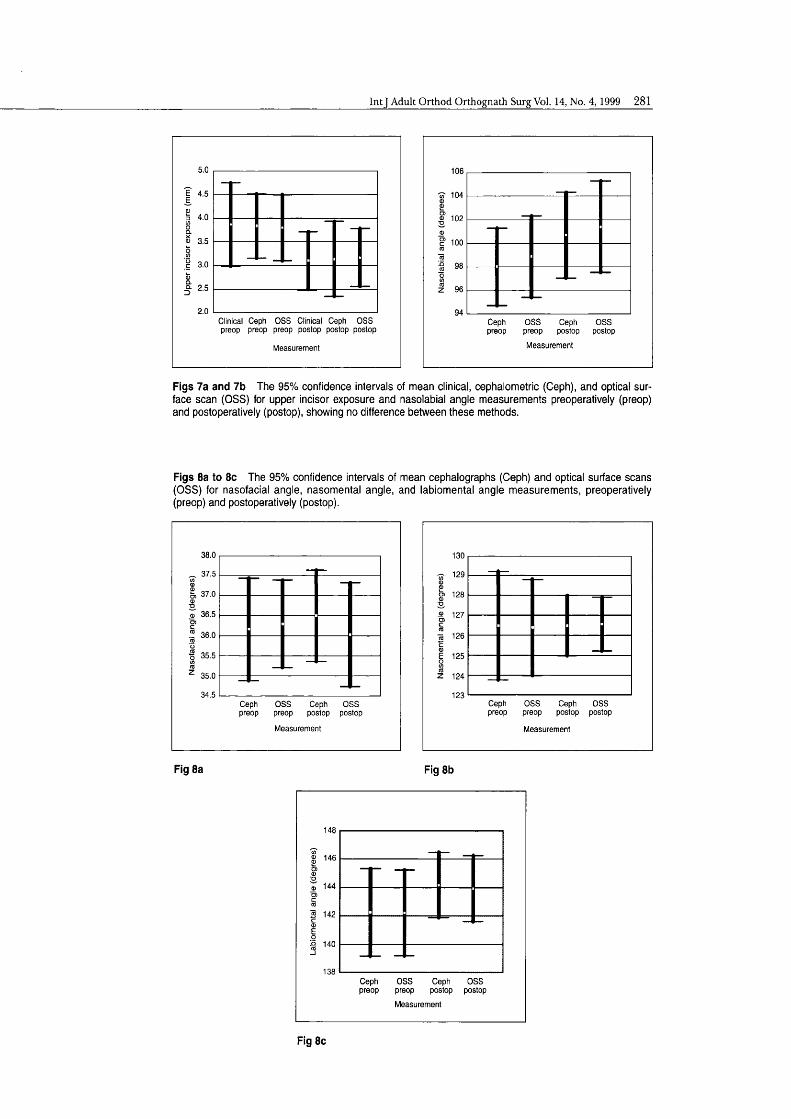
IntJ Adult Orthod Orthognath Surg Vol. 14, No. 4, 1999 281
5.0
I4.0
m 3.5
3.0
Q- 2.5
Clinical Ceph OSS Clinical Ceph OSS preop preop preop postop postop postop
Measurement
106
104
oj 102
100
98
96
94Ceptipreop
OSS preop
Measurement
Cepti OSS postop postop
Figs 7a and 7b The 95% confidence intervals of mean clinical, cephalometric (Ceph), and optical surface scan (OSS) for upper incisor exposure and nasolabial angle measurements preoperatively (preop) and postoperatively (postop), showing no difference between these methods.
Figs 8a to Be The 95% confidence intervals of mean cephalographs (Ceph) and optical surface scans (OSS) for nasofacial angle, nasomental angle, and labiomental angle measurements, preoperatively (preop) and postoperatively (postop).
38.0
37.5
37.0
36.5
™ 36.0
■g 35.5
35.0
Ceptipreop
OSSpreop
Measurement
Cepti OSS postop postop
130
E 125
Z 124
123Ceptipreop
OSSpreop
Cepti OSS postop postop
Measurement
Fig 8a Fig 8b
148
% 146
144
S 142
e 140
138Cephpreop
OSS preopMeasurement
Ceph OSS postop postop
Fig 8c

282 Soncul/Bam ber
2.2
rô 1.2
0.8Cephalograph Optical surface
scan
Measurement
Fig 9 The 95% confidence Intervals of mean nasal tip projection change after the surgery for cephalographs and optical surface scans.
The mean changes in nasal tip projection fo r both methods w ere 1.5 ± 1.2 mm fo r cepha lographs and 1.4 ± 1.1 mm for surface scans. The difference between the 2 methods was not significant (P = 0 .5), as can be seen in Fig 9, which shows the 95% confidence intervals of the means for this data.
Discussion and conclusion
Soft and hard tissue analyses for pre- operative surgical assessment and postoperative reviews have trad itiona lly been done by measuring various angles and distances in 2 dimensions using craniofac ia l landm arks, p lanes, and contrived re fe re n ce p o in ts on la te ra l c e p h a lo graphs. A lthough useful, this method has inherent problems due to geometric complexity, m agn ifica tion , the superim position o f craniofacia l structures, distortion, and low r e s o lu t io n .F o r orthognathic surgery planning and postoperative fo llow-up, a technique capable of im aging low-density soft tissues w ith accuracy in all planes is required.
The results o f this study showed that optical surface scans and cephalographs were com parable dimensionally, os there w ere no s ign ifican t differences in measurements mode w ith both of these methods. For the lip-incisor relationship, measurement accuracy was also com parable
to d ire c t c lin ica l measurements. Hence w e believe that optical surface scans can complement the cephalograph in soft tissue ana lys is fo r o rth o g n a th ic surgery p lanning and postoperative review.
The o p tica l surface scan is substant ia l ly eas ie r to exam ine and a n a lyze than the cephalograph, and more importantly, the surface scan image is 3 -dimensional and can be v iew ed im m ediately from any ang le and pos ition . Furthermore, the reference points on this image rem ain fixed as it is rotated. M easurements can be taken accurately across the surface as well as in a 2-dimensional linear manner, although this was not done in this p ro to co l.'* It is also possible to focus on a particu lar surface section of the full image, such as the nasolabial region and lip relationships.
The surface scan is not subject to magn ifica tion , os the scale o f the im age is standardized by setting the appropria te num ber o f p ixe ls pe r m illim e te r. This gives precise measurements for superimposition and thus the determ ination o f the changes fo llow ing orthognathic surgery, m o n ito r in g o f fa c ia l g ro w th , o r the grow th o f tumors. As a noncontact procedure, the system avoids any distortion o f the soft tissue surfaces being measured. This system can disp lay any view of the face in approxim ately 6 seconds,''' which is faster than prev iously reported 3-di- mensional im aging systems. It is also possible to demonstrate soft tissue changes in 3 dimensions on the whole area o f the face after surgery, whereas this is possible on ly in the m idline w ith conventional cephalographs.
For long-term fo llow -up , the o p tica l surface scan is entirely noninvasive, w ithout the potential hazard o f repeated exposure to ion izing radiation, and has the c o n ve n ie n ce o f ra p id ly c a p tu r in g an im age tha t can be a rch ived e lec tron ically. Images o f the patients can also be stored on a hard disk d rive or flo p p y disks, enabling further clin ical evaluation and research at a later date.
However, the procedure requires the patient's cooperation to keep a constant position and relaxed fac ia l posture, as any movement during the recording pe

IntJ Adult Orthod Orthognath Surg Vol. 14, No. 4 ,1999 283
r io d o f 10 seconds w il l c o r ru p t the im age, resulting in m otion a rtifacts . A s e p a ra te s tudy show ed th a t us ing a headrest and a spirit level achieved a reproducible head position.'^ Also, the degree o f irregularity of the surface reduces the high resolution of the scanned image. Furthermore, with the application o f thin p late splines analysis,'® both area and volumetric changes in soft tissues can be ca lcu la ted w ith g rea te r accuracy, and w ith the introduction o f this multivariate morphometric analysis, the main problem o f the lock o f clear statistical method for soft tissue changes is solved.
O p tica l surface scans o f the soft tissues in conjunction w ith cephalom etric ana lys is are rou tine ly used in our departm ent fo r p reope ra tive surg ica l assessment, p lann ing , and postoperative re v ie w o f o r th o g n a th ic su rge ry , and the ir use w ill very like ly increase w ith w id e r a v a i la b i l i ty o f va rio u s su rface scanners in the market. The number o f u n iv e rs ity d e p a rtm e n ts using o p tic a l scanners has also increased since they en te red the im a g in g systems m arket. N ow adays, w ith w ide r ava ilab ility , the cost has gone dow n to around 5 ,0 0 0 pounds. C ons ide ring the departm ents and practices perfo rm ing orthogna th ic surgery on on average o f 100 patients per year, the cost o f the system per patie n t is m in im a l. The o p tic a l scanner serves o ther useful purposes fo r o ther patients' treatments, eg, facia l swellings o r fa c ia l prostheses. These 3 -d im e n sional surgical simulations using surface scans would also serve to guide the surgeons and the patients.
In conclusion, the surface scan is comparable to a good-quality cephalograph for soft tissue profile assessment but has the additional advantages o f being 3-di- m ensional, e lec tron ica lly storable, and noninvasive—advantages that supersede the traditional radiographic means o f soft tissue analysis for postoperative follow-up.
Acknowledgment
W e are indebted to Dr A lt Linney, senior lecturer at the Department o f Medical Physics and Bioengineering, University College London, for his help in this study.
References
1. Shioiri S. Studies on symmetry in the normal human face using M o ire topography. J Stoma- tol S oc jp n 1 9 7 8 ;4 5 :1 4 7 -1 6 9 .
2. H o jo K. Facial asym m etry using the M o ire te c h n iq u e . S h ik w o G a k u h o 1 9 8 1 ,'S I : 1 2 0 3 -1 2 3 7 .
3. Burke PH. S tereophotogram m etric measurement o f normal facia l asymmetry in children. Hum Biol 1 9 7 1 ;4 3 :5 3 6 -5 4 8 ,
4. Burke PH. Angular distortion in the orthopantomogram. Br J Orthod 1 9 8 4 ;1 1 :1 0 0 -1 0 7 .
5. Robey G P. Current principles o f morphocnoly- sis and their applications in oral surgical practice. Br J O ra l Surg 1 9 7 7 ;1 5 :9 7 -1 0 9 .
6. R obertson NRE, Volp CR. Te lecentric photogram metry: Its development, testing and application. Am J O rthod 1981 ;8 0 :6 2 3 -6 3 7 .
7. Bill JS, Reuther JF, Dittman W , Kubler N , M eier JL, Pistner H, W ittenberg G. Stereolithogrophy in oral and m axillo facial operation planning. IntJ O ra l M axillo foc Surg 1 9 9 5 ;2 4 :9 8 -1 0 3 .
8. Hell B, W alter FA, Schreiber S, Blase H, Bielke G , M eindl S, Stein G. Three-dimensional ultrasonography in maxillo facial surgery. IntJ O ra l M axillo foc Surg 1 9 9 3 ;2 2 :1 7 3 -1 7 7 .
9. Linney AD, Tan AC, Richards R, G ardner J, G rindrod S, Moss JP. Three dimensional visualization of data on human anatomy: Diagnosis and surgical planning. J A ud iov M edia Med 1 9 9 3 ;1 6 :4 -1 0 .
10. Bamber M A , Ishak I, Harris M , Campos J, Linney A, The m axilla ry lip-incisor relationship, using an op tica l laser scanner [abstract]. J Dent Res 1 9 9 7 ;7 6 :1 0 4 3 .
11. Moss JP, Linney AD, G rindrod SR, Mosse CA. A laser scanning system for the measurement o f fa c ia l surface m orphology. O ptics Lasers Eng 1 9 8 9 ;1 0 :1 7 9 -1 9 0 .
12. Soncul M , Bamber M A , Harris M . The reprod u c ib ility o f head pos ition fo r lasergraphs using thin-plate splines [abstract]. J Dent Res 19 9 8 ,7 7 :65 5 .
13. Begg RJ, Harkness M . A lateral cephalometric analysis of the adult nose. J O ra l M axillo fac Surg 1 9 9 5 ;5 3 :1 2 6 8 -1 2 7 4 .
14. B jork A , Solov/ B. M easurem ents on ra d io graphs. J Dent Res 19 6 2 ;4 1 :6 7 2 -6 8 3 .
15. K ragskavJ, Basch C, Glydensted C, Sindet-Pe- tersen S. Comparison of re liability of craniofac ia l anatom ic landmarks based on cephalometric radiographs and three-dimensional CT scans. C le ft Palate C ra n io fa c J 1 9 9 7 ;3 4 : 1 1 1 -1 1 6 .
16. Moss JP, Coombes A M , Linney AD, Campos J. Methods of three dimensional analysis o f patients w ith asymmetry o f the face. Proc Finn Dent Soc 1991 ;8 7 :4 7 -5 3 .
17. Moss JP, G rindrod SR, Linney AD, A rridge SR, James D. A computer system for the interactive p la n n in g and p re d ic tio n o f m a x illo fa c ia l s u rg e ry . Am J O r th o d D e n to fa c O r th o p 1 9 8 8 ;9 4 :4 6 9 -4 7 5 .
1 8. Bookstein FL. Morphometric Tools for Landmark Data. N ew York: Cam bridge University Press, 1991.
Related Documents