AN EXPERIMENTAL AND COMPUTATIONAL FLUID DYNAMICS STUDY OF THE INFLUENCE OF FLUID MIXING AND FLUID STRESS ON DNA PURIFICATION A thesis submitted for the degree of Doctor of Philosophy by Francis Jeremiah Meade Advanced Centre for Biochemical Engineering Department of Biochemical Engineering University College London (UCL)

Welcome message from author
This document is posted to help you gain knowledge. Please leave a comment to let me know what you think about it! Share it to your friends and learn new things together.
Transcript
AN EXPERIMENTAL AND
COMPUTATIONAL FLUID DYNAMICS STUDY
OF THE INFLUENCE OF
FLUID MIXING AND FLUID STRESS
ON DNA PURIFICATION
A thesis submitted for the degree of
Doctor of Philosophy
byFrancis Jeremiah Meade
Advanced Centre for Biochemical Engineering
Department of Biochemical Engineering
University College London (UCL)

ProQuest Number: U643220
All rights reserved
INFORMATION TO ALL USERS The quality of this reproduction is dependent upon the quality of the copy submitted.
In the unlikely event that the author did not send a complete manuscript and there are missing pages, these will be noted. Also, if material had to be removed,
a note will indicate the deletion.
uest.
ProQuest U643220
Published by ProQuest LLC(2016). Copyright of the Dissertation is held by the Author.
All rights reserved.This work is protected against unauthorized copying under Title 17, United States Code.
Microform Edition © ProQuest LLC.
ProQuest LLC 789 East Eisenhower Parkway
P.O. Box 1346 Ann Arbor, Ml 48106-1346

ACKNOWLEDGEMENTS
I would like to offer a very special thanks to Pat, Misti, Tina, and Julia for sharing this
experience with me, Clarissa for sharing me with this experience and Nigel for all his
experience, without whom this would have been infinitely less fun.
I would also like to acknowledge the much appreciated help and support of Parviz, Ann, Barry
and Russ.
And my Parents, and Roisin and M ary....of course.
P2
ABSTRACTInterest in the field o f pure DNA manufacture has been driven in recent years by the explosion
of research into gene therapy. Gene therapy technology offers a new paradigm for treating
human diseases where defective cells are transformed with gene vectors capable o f expressing
therapeutic protein. Administration is often via direct injection of naked or lipid-eoated plasmid
DNA. Plasmid for gene therapy is usually produced in Escherichia coli. The challenge in
manufacturing plasmid is primarily the removal o f impurities like proteins, lipids,
lipopolysaccharides, RNA, non-supercoiled plasmid variants, and host chromosomal DNA.
Long chain polymers, such as DNA, are uniquely prone to chain scission at moderate to high
fluid stresses that commonly occur in biotechnology equipment. Stress-induced degradation of
both plasmid DNA and host chromosomal DNA must be minimised to optimise plasmid yield
and purity. Such degradation plays a critical role during alkaline lysis, a key step in DNA
isolation. The effect o f lysis reagent on DNA stability, the required level o f fluid mixing, the
effect o f the resultant fluid stresses on DNA degradation, and the effect of DNA fragmentation
on subsequent downstream purification performance are all poorly understood. This thesis sets
out to characterise the effect of lysis reagent concentration on DNA so as to determine the
required level of fluid mixing during alkaline lysis, to characterise the effect o f the resultant
fluid stress on DNA degradation and to determine the effects o f stress-induced degradation on
downstream processing. The following paragraphs outline the key finding o f the thesis, which
together provide a framework for the design o f a robust lysis process.
Two novel HPLC-based procedures were developed, based on polyethylenimine and quaternary
amine anion exchange chromatography resins, capable of simultaneously measuring supereoiled
plasmid DNA and chromosomal DNA in process samples, in addition the form of the
chromosomal DNA.
Experiments using E. coli cells containing 6 kb toi 16 kb plasmids showed that cell lysate
should be maintained below 0.13 ± 0.03 M NaOH to prevent irreversible dénaturation of
supereoiled plasmids and above 0.08 M NaOH to ensure complete conversion of chromosomal
DNA to single-stranded form. Conversion of chromosomal DNA to single-stranded form was
shown not to significantly affect its removal during alkaline lysis, but was advantageous for
subsequent purification. Complete conversion o f chromosomal DNA to single-stranded form
enabled complete removal by a variety o f inexpensive and scaleable purification methods,
significantly reducing the cost of plasmid DNA manufacture. Denaturation-renaturation of
DNA, either during alkaline lysis or further downstream, was shown to be an effective method
o f removing non-supercoiled plasmid variants.
p3
The level of mixing required is highly dependent on the sodium hydroxide (NaOH)
concentration in the lysis buffer. More highly concentrated lysis buffer reduced the overall
lysate volume, but rapid mixing was essential to avoid irreversible supereoiled plasmid
degradation. Mixing tanks provided adequate mixing only at low NaOH concentrations.
Opposed jets provided excellent mixing characteristics for lysis buffer addition, and
concentrated NaOH could be used, significantly reducing the volume increase over alkaline
lysis. Opposed jets provided a suitable method for denaturing residual double-stranded
chromosomal DNA downstream of alkaline lysis. Hence, inexpensive methods for single
stranded DNA removal could be utilised to remove all residual chromosomal DNA.
Computational fluid dynamics (CFD) simulations were used to develop appropriate scaling
rules for opposed jets, and the CFD predictions were verified against published experimental
data.
Capillary shear degradation studies with pure solutions of 6kb to 116 kb plasmids and
chromosomal DNA, determined that DNA degraded at capillary entrances, not internally. Large
plasmids degraded at significantly lower fluid flow rates than small plasmids. CFD simulations
were used to determine fluid flow properties (turbulent energy dissipation rates, shear stresses,
elongational stresses and pressure drops) at the entrance to, and within, capillaries and to
correlate breakage of chromosomal and plasmid DNA with fluid flow parameters. Results
indicated that elongational fluid stresses caused significantly more DNA degradation than shear
stresses. An assay to monitor plasmid degradation in dilute solutions was developed using
Picogreen dye, enabling different size plasmids to be used as probes for fluid stress-induced
degradation in large-scale industrial equipment.
Results showed that fluid stresses during alkaline lysis led to chromosomal DNA fragmentation.
Despite causing chromosomal fragmentation, it was shown that fluid stresses during lysis did
not significantly increase chromosomal contamination in cell lysates; chromosomal DNA
removal over alkaline lysis/neutralisation not being a strong function o f chromosomal DNA
size. High levels of fluid stress during the neutralisation step were also shown not to increase
chromosomal DNA contamination. The effects of chromosomal DNA fragment size on its
removal in different downstream purification steps demonstrated which steps were sensitive to
DNA size, enabling better selection o f downstream unit operations based on DNA
fragmentation upstream.
p4
TABLE OF CONTENTS
1 Introduction................................................................................................................. 22
1.1 Gene therapy.....................................................................................................................22
1.1.1 Licensed gene therapies and gene therapy trials.................................................................... 23
1.1.2 Gene vectors.............................................................................................................................23
1.1.3 DNA vectors............................................................................................................................24
1.2 Plasmid DNA manufacture........................................................................................... 25
1.3 Alkaline lysis.................................................................................................................... 29
1.3.1 Problems with alkaline lysis.................................................................................................... 30
1.4 Organisation and aims of the thesis...............................................................................32
1.4.1 Aims of the thesis.....................................................................................................................32
1.4.2 Organisation of the thesis........................................................................................................ 34
2 Mixing and stress in fluids..........................................................................................35
2.1 Introduction.......................................................................................................................35
2.2 Fluid mixing.......................................................................................................................35
2.2.1 Theory of fluid mixing............................................................................................................35
2.2.2 Mixing in stirred vessels......................................................................................................... 37
2.2.3 Mixing in opposed jets............................................................................................................39
2.3 Fluid stress......................................................................................................................... 41
2.3.1 Calculation of fluid stresses.....................................................................................................41
2.3.2 Overview of fluid flows in purification equipment and their associated stresses................. 44
2.3.3 Fluid stresses in stirred vessels.............................................................................................. 45
2.3.4 Fluid stresses in opposed je ts ..................................................................................................46
2.3.5 Fluid stresses in capillaries......................................................................................................46
2.4 DNA degradation by fluid stress.................................................................................. 48
2.4.1 DNA conformation in stagnant solution.................................................................................48
2.4.2 DNA degradation by elongational fluid stress......................................... 52
2.4.3 DNA shear degradation in shear flow.....................................................................................54
2.4.4 DNA degradation in turbulent flow........................................................................................ 54
2.4.5 Other solution properties effecting DNA degradation.............................................................55
2.5 Conclusion......................................................................................................................... 56
3 Computational fluid dynamics:...................................................................................58
3.1 Introduction....................................................................................................................... 58
p5

3.2 Computational fluid dynamics theory and methods.................................................58
3.2.1 Flow geometry and computational grid size.......................................................................... 59
3.2.2 Navier Stokes equations..........................................................................................................60
3.2.3 Turbulence models..................................................................................................................61
3.2.4 Boundary conditions...............................................................................................................62
3.3 Modelling hardware and software...............................................................................63
3.4 CFD modeling of opposed jets lysis reactor................................................................ 64
3.4.1 Model geometry.......................................................................................................................64
3.4.2 CFD model equations..............................................................................................................66
3.4.3 Number of fluid phases...........................................................................................................66
3.4.4 Initial conditions and boundard condtions..............................................................................66
3.4.5 Fluid physical parameters.......................................................................................................67
3.4.6 Heat transfer............................................................................................................................ 67
3.4.7 Surface sharpening algorithm................................................................................................67
3.4.8 Solution convergence and grid-size indepenence.....................................................................67
3.4.9 Model convergence................................................................................................................. 69
3.4.10 Submerged versus non-submerged simulations................................................................. 70
3.4.11 Effect of turbulence model................................................................................... 70
3.4.12 Effect of jet velocity, jet diameter, fluid viscosity and fluid density....................................... 70
3.4.13 Non-equal opposed jets.......................................................................................................71
3.5 CFD modelling of capillary shear device.................................................................... 72
3.5.1 Model geometry...................................................................................................................... 72
3.5.2 Model equations...................................................................................................................... 73
3.5.3 Number of fluid phases........................................................................................................... 73
3.5.4 Initial conditions and boundard condtions..............................................................................73
3.5.5 Heat transfer............................................................................................................................ 73
3.5.6 Grid size convergence and solution convergence..................................................................74
3.5.7 Effect of capillary diameter and fluid velocity.................................................................... 74
3.6 Post-simulation calculations: jets and capillaries......................................................75
3.6.1 Shear rate calculations............................................................................................................. 75
3.6.2 Streamline calculations........................................................................................................... 76
3.7 Conclusion........................................................................................................................77
4 Analytical development...............................................................................................78
4.1 Brief summary of results................................................................................................78
4.2 Introduction......................................................................................................................78
4.3 Materials and methods...................................................................................................80
p6
4.3.1 Materials.................................................................................................................................. 80
4.3.2 Laboratory equipment............................................................................................................. 80
4.3.3 Standard buffer preparation.................................................................................................... 81
4.3.4 Fermentation of plasmids and chromosomal DNA.................................................................81
4.3.5 Standard lysis protocol............................................................................................................ 83
4.3.6 Standard clarification protocol................................................................................................84
4.3.7 Preparation of pure plasmid and chromosomal DNA standards............................................84
4.3.8 Standard analytical techniques................................................................................................ 85
4.3.9 HPLC assay development.......................................................................................................87
4.3.10 Fluorescence assay development.......................................................................................87
4.4 Gel electrophoresis development...................................................................................87
4.5 Anion exchange HPLC development............................................................................ 90
4.5.1 Poros 20 PI HPLC................................................................................................................... 91
4.5.2 Q-Sepharose HPLC................................................................................................................103
4.5.3 Poros 50 HQ and NucleoPac anion exchange resins............................................................ 106
4.6 Hydrophobic interaction chromatography development........................................107
4.6.1 Butyl resins.............................................................................................................................107
4.6.2 Silica....................................................................................................................................... 107
4.7 Fluorescence assay development..................................................................................109
4.7.1 Quantification of sheared plasmid DNA using ethidium bromide....................................... 110
4.7.2 Quantification of sheared plasmid DNA using Picogreen................................................... 111
4.8 Conclusion.......................................................................................................................116
5 Degradation o f DNA by fluid stress........................................................................118
5.1 Brief summary of results...............................................................................................118
5.2 Introduction.....................................................................................................................119
5.3 Materials and methods for CFD simulations............................................................ 121
5.4 Materials and methods for capillary flow experiments........................................... 121
5.4.1 Equipment.............................................................................................................................. 121
5.4.2 Capillary flow device.............................................................................................................121
5.4.3 Determination of PEEK capillary internal diameter.............................................................123
5.4.4 Standard stress-degradation procedure for Rainin capillary shear device............................ 124
5.4.5 Effect of capillary length on plasmid degradation rate.........................................................125
5.4.6 Control 1 : Testing for cavitation...............................;.......................................................... 125
5.4.7 Control 2; Testing for plasmid degradation outside of capillary.......................................... 127
5.4.8 Standard stress-degradation procedure for Hamilton capillary shear device........................ 127
P7
5.5 CFD simulation results.................................................................................................128
5.5.1 Grid size convergence...........................................................................................................128
5.5.2 Comparison of CFD results with analytical predictions....................................................... 130
5.5.3 Effect of capillary diameter on fluid stress and entrance pressure drop.............................. 135
5.5.4 Cavitation..............................................................................................................................138
5.6 Results: stress-induced degradation of plasmids..................................................... 139
5.6.1 Determination of effective capillary internal diameters....................................................... 139
5.6.2 Effect of cavitation................................................................................................................ 143
5.6.3 Plasmid degradation without the narrow bore capillary present..........................................146
5.6.4 Effect of capillary length on plasmid degradation................................................................147
5.6.5 Correlation of plasmid degradation with fluid flow properties............................................150
5.6.6 Effect of plasmid size............................................................................................................152
5.7 Results: stress-induced degradation of chromosomal DNA................................... 153
5.7.1 Effect of strain rate on chromosomal DNA fragment size................................................... 153
5.8 Discussion.......................................................................................................................154
5.8.1 Comparison of internal and external capillary strain rates................................................... 154
5.8.2 Comparison of degradation rates with literature...................................................................156
5.8.3 DNA stretching and scission.................................................................................................159
5.8.4 Comparison of linear DNA and supereoiled plasmid DNA................................................. 163
5.9 Conclusions.....................................................................................................................163
6 A Ikaline lysis.............................................................................................................165
6.1 Brief summary of results..............................................................................................166
6.2 Introduction....................................................................................................................167
6.3 Materials and methods................................................................................................. 167
6.3.1 Standard analytical techniques.............................................................................................167
6.3.2 Control experiments.............................................................................................................. 169
6.3.3 Standard lysis protocols........................................................................................................ 170
6.3.4 Detergent concentration in lysis buffer.................................................................................171
6.3.5 NaOH concentration in lysis buffer: dénaturation of plasmid and chDNA.........................171
6.3.6 Dénaturation time.................................................................................................................. 172
6.3.7 Fluid mixing...........................................................................................................................172
6.3.8 Effect of fluid stress during lysis of plasmid-deficient cells................................................. 174
6.3.9 Effect of fluid stress on the lysis of plasmid-containing cells...............................................175
6.3.10 Effect of fluid stress during neutralisation....................................................................... 175
6.4 Experimental results..................................................................................................... 176
6.4.1 Control experiments.............................................................................................................. 176
p8

6.4.2 Standard lysis protocols.........................................................................................................178
6.4.3 Effect of detergent concentration in lysis buffer...................................................................184
6.4.4 Effect of NaOH in lysis buffer; dénaturation of plasmid and chDNA.................................184
6.4.5 Dénaturation time...................................................................................................................189
6.4.6 Fluid mixing...........................................................................................................................191
6.4.7 Effect of fluid stress on the lysis of plasmid-deficient cells................................................. 196
6.4.8 Effect of fluid stress on the lysis of plasmid-containing cells.............................................. 200
6.4.9 Effect of fluid stress during neutralisation........................................................................... 202
6.5 Discussion....................................................................................................................... 204
6.5.1 DNA dénaturation and mixing requirements....................................................................... 204
6.5.2 Fluid stress-induced DNA degradation.................................................................................205
6.6 Conclusions..................................................................................................................... 208
7 Effect o f DNA dénaturation and fragmentation on downstream processing.... 209
7.1 Brief summary of results.............................................................................................. 209
7.2 Introduction.................................................................................................................... 210
7.3 Materials and methods..................................................................................................210
7.3.1 Filtration.................................................................................................................................210
7.3.2 Precipitation using CTAB..................................................................................................... 211
7.3.3 Calcium chloride precipitation..............................................................................................212
7.3.4 Size exclusion chromatography using Sephacryl SI000...................................................... 212
7.3.5 Anion exchange chromatography: Poros PI and Q-Sepharose............................................ 213
7.3.6 Adsorption using silica gel.................................................................................................... 213
7.4 Experimental results......................................................................................................214
7.4.1 Filtration of clarified alkaline lysates....................................................................................214
7.4.2 Precipitation using CTAB..................................................................................................... 214
7.4.3 Calcium chloride precipitation.............................................................................................. 216
7.4.4 Size exclusion chromatography using Sephacryl S1000 SF................................................ 219
7.4.5 Anion exchange chromatography: Poros PI and Q-Sepharose............................................ 220
7.4.6 Adsorption using silica gel......................................................................... 221
7.5 Conclusion.......................................................................................................................223
8 Design o f an opposed je t mixer for alkaline lysis..................................................223
8.1 Brief summary of results...............................................................................................223
8.2 Introduction.....................................................................................................................223
8.3 Experimental materials and methods.........................................................................223
p9
8.3.1 Jet mixing equipment............................................................................................................ 223
8.3.2 Pure plasmid DNA and NaOH mixing studies......................................................................223
8.3.3 Alkaline lysis mixing studies................................................................................................ 223
8.4 Computational fluid dynamics results.......................................................................223
8.4.1 Materials and methods...........................................................................................................223
8.4.2 Model 1 : Equal diameter, sub-surface jets............................................................................223
Model convergence............................................................................................................................223
8.4.3 Model 2: Equal diameter, non-submerged impinging je ts ................................................... 223
Effect of turbulence model................................................................................................................ 223
8.4.4 Effect of Jet Separation Distance.......................................................................................... 223
8.4.5 Model 3: Different diameter, non-submerged impinging jets.............................................. 223
8.5 Experimental studies....................................................................................................223
8.5.1 Jet mixing studies using pure supereoiled plasmid DNA..................................................... 223
8.5.2 Jet mixing studies using resuspended E. coli cells................................................................223
8.6 Discussion.......................................................................................................................223
8.6.1 Convergence of CFD models................................................................................................ 223
8.6.2 Comparison of CFD mixing with analytical and empirical equations................................ 223
8.6.3 Comparison of CFD Model 1 and Model 2 mixing results with experimental data.............223
8.7 Conclusion..................................................................................................................... 223
9 Discussion ......... 223
9.1 Process research and design methodology..................................................................223
9.1.1 Analytical development.......................................................................................................223
9.1.2 Computational fluid dynamics.............................................................................................. 223
9.1.3 Windows of operation.......................................................................................................... 223
9.1.4 Probes for fluid stress.............................................................................................................223
9.2 DNA purification at manufacturing scale.................................................................223
9.2.1 Scale-up of alkaline lysis........................................................................................................223
9.2.2 Downstream purification strategies....................................................................................... 223
10 Conclusions........................................................................................................... 223
11 Future work........................................................................................................... 22311.1.1 DNA as a probe for fluid stress........................................................................................ 223
11.1.2 Effects of solution properties on DNA degradation.........................................................223
11.1.3 Stress-induced degradation of large plasmids...................................................................223
11.1.4 Investigation of opposed jets at larger scale.....................................................................223
11.1.5 Understanding chromosomal DNA flocculation..............................................................223
11.1.6 Improving downstream purification................................................................................. 223
plO

12 References............................................................................................................. 223
p l i
List of FiguresF ig u r e 1 .1 . S c h e m a t ic r e p r e s e n t a t io n o f s u p e r c o il e d , o p e n -c ir c u l a r , a n d l in e a r is e d p l a s m id
D N A ........................................................................................................................................................................................................25
F ig u r e 1 .2 . M a c r o m o l e c u l e s in E. c o l i b y % D r y C e l l W e ig h t . A d a p t e d f r o m In g r a h m e t
AL., 1 9 8 3 . 2 6
F ig u r e 1.3 S c h e m a t i c o f E. c o l i r e c o m b in a n t c e l l s h o w in g s t r u c t u r e o f c e l l w a l l 31
F ig u r e 2 .1 . P l o t s h o w in g t h e in c r e a s e o f p o w e r in p u t t o a s t ir r e d t a n k o f w a t e r in o r d e r t o
MAINTAIN A CONSTANT MACRO-MIXING TIME OF IS OR ALTERNATIVELY TO MAINTAIN A CONSTANT
MICRO-MDdNG TIME OF 0.3S , AS THE TANK VOLUME INCREASES..............................................................................39
F ig u r e 2 .2 . S c h e m a t ic o f o p p o s e d je t a l k a l in e l y s is m ix e r ............................................................................. 4 0
F ig u r e 2 .3 S c h e m a t ic o f c a p il l a r y e n t r a n c e f l o w .............................................................................................. 4 7
F ig u r e 3.1 L e f t : S c h e m a t ic o f o p p o s e d je t m ix e r ; f o r e q u a l je t s t h e r e g io n m o d e l l e d is
SHADED. R i g h t : S c h e m a t ic s h o w in g t h e s h o w in g b o u n d a r y c o n d it i o n s ............................................65
F ig u r e 3 .2 T o p : S c h e m a t ic s h o w in g m o d e l g e o m e t r y u s e d f o r e q u a l v e l o c it y a n d d ia m e t e r
JETS ( u p p e r r ig h t QUADRANT). BOTTOM: SCHEMATIC SHOWING MODEL GEOMETRY USED FOR NON
EQUAL JETS (u p p e r l e f t AND RIGHT QUADRANTS)..........................................................................................................65
F ig u r e 3 .3 . G r id d is t r ib u t io n f o r e q u a l o p p o s e d jet s im u l a t io n s . D u e t o s y m m e t r y , o n l y t h e
UPPER RIGHTMOST QUADRANT WAS MODELLED FOR EQUAL OPPOSED JETS. THE GRID USED WAS
COARSE AT THE EXTREMITIES OF THE MODEL, BECOMING SIGNIFICANTLY MORE FINE IN THE REGION
WHERE THE JETS IMPINGE...............................................................................................................................................................6 9
F ig u r e 3 .4 S c h e m a t ic s h o w in g t h e c a p il l a r y s h e a r d e v ic e (t o p d ia g r a m ). U s in g f l o w a n d
GEOMETRY SYMMETRY ARGUMENTS, ONLY THE TOP HALF OF THE GEOMETRY NEEDED TO BE
MODELLED (BOTTOM DIAGRAM).................................................................................................................................................73
F ig u r e 3 .5 . S c h e m a t ic o f c a p il l a r y m o d e l g e o m e t r y s h o w in g t h e g r id d is t r i b u t i o n ........................7 4
F ig u r e 4 .1 A g a r o s e g e l s t a n d a r d c u r v e u s in g im p r o v e d m e t h o d w it h l o w m e l t in g p o in t
AGAROSE IN SAMPLES. THE ERROR BARS INDICATE 95% CONFIDENCE INTERVALS....................................... 89
F ig u r e 4 .2 A g a r o s e g e l c o m p a r in g t h e f l u o r e s c e n c e o f d o u b l e - s t r a n d e d v e r s u s s in g l e -
s t r a n d e d D N A BY E t h id iu m B r o m id e ............................................................................................................................. 9 0
F ig u r e 4 .3 P o r o s PI H PL C c h r o m a t o g r a m o f u l t r a - p u r e c h r o m o s o m a l D N A s a m p l e s . 1 )
C h r o m o s o m a l D N A , d o u b l e - s t r a n d e d ; 2 ) D e n a t u r e d c h r o m o s o m a l D N A ....................................9 2
F ig u r e 4 .4 A g a r o s e g e l e l e c t r o p h o r e s is o n h e a t d e g r a d e d p l a s m id D N A s a m p l e s ,
c o n t a in in g o p e n -c ir c u l a r a n d s u p e r c o il e d p l a s m id D N A . 1 ) X-DiGEST, 2 ) 0 .0 M N a O H , 3 )
0 .0 4 M N a O H , 4 ) 0 .0 8 M N a O H , 5 ) 0 .1 2 M N a O H , 6 ) 0 .1 6 M N a O H , 7 ) 0 .2 0 M N a O H
DENATURATION CONCENTRATION............................................................................................................................................. 93
F ig u r e 4 .5 E ff e c t o f N a O H d é n a t u r a t io n c o n c e n t r a t io n o n t h e d o u b l e - s t r a n d e d D N A
H P L C PEAK.......................................................................................................................................................................................... 93
F ig u r e 4 .6 . C h r o m a t o g r a m s o f s u p e r c o il e d p l a s m id D N A , c h r o m o s o m a l D N A , a m ix t u r e o f
PLASMID AND CHROMOSOMAL, AND THE MIXTURE AFTER DENATURATION TO CONVERT THE
CHROMOSOMAL D N A TO SINGLE-STRANDED FORM.........................................................................................................9 4
p l 2
F ig u r e 4 .7 P l o t s h o w i n g H P L C s t a n d a r d c u r v e s g e n e r a t e d u s i n g u l t r a - p u r e s u p e r c o i l e d
PLASMID D N A AND ULTRA-PURE SINGLE-STRANDED CHROMOSOMAL D N A .................................................... 9 6
F ig u r e 4 .8 . H P L C c h r o m a t o g r a m s o f 4 c l a r i f i e d l y s a t e s a m p l e s : 1) H e a t - l y s e d , 2 ) d e n a t u r e d -
RENATURED HEAT-LYSED, 3 ) ALKALINE LYSED, 4 ) DENATURED-RENATURED ALKALINE LYSED............ 9 6
F ig u r e 4 .9 P l o t s h o w i n g d o u b l e - s t r a n d e d D N A in 2 c l a r if ie d l y s a t e s , b y H P L C a s s a y , a s a
FUNCTION OF N a O H DENATURATION CONCENTRATION: l) LYSOZYME AND HEAT LYSIS, II) ALKALINE
LYSIS. 9 7
F ig u r e 4 .1 0 . P l o t o f s s - D N A H P L C p e a k a r e a v e r s u s n u m b e r o f p a s s e s t h r o u g h 0 .007" ID P E E K
CAPILLARY SHEAR DEVICE, FOR A CLARIFIED ALKALINE LYSATE SAMPLE.......................................................... 9 8
F ig u r e 4 .1 1 . A g a r o s e g e l s h o w i n g t h e e f f e c t o f p u s h i n g a c l a r if ie d a l k a l i n e l y s a t e s a m p l e
THROUGH A 0 .0 0 7 " P E E K CAPILLARY ON SUPERCOILED AND OPEN-CIRCULAR PLASMID
CONCENTRATION (P S V p ). FROM LEFT TO RIGHT: 15, 10, 6 , 3 , 0 SYRINGE PASSES..........................................9 9
F ig u r e 4 .1 2 H P L C c h r o m a t o g r a m s o f R N A s e - t r e a t e d c l a r if ie d l y s a t e ( t o p ) , u n t r e a t e d
CLARIFIED LYSATE (MIDDLE) AND T R IS-E D T A (BOTTOM) ARE SHOWN. R N A SE TREATMENT CAUSES
THE DIGESTED R N A TO ELUTE AS A SEPARATE PEAK...................................................................................................100
F ig u r e 4 .1 3 H P L C a r e a v e r s u s s a m p l e d i l u t i o n f o r a c l a r if ie d l y s a t e s a m p l e .............................. 101
F ig u r e 4 .1 4 H P L C s t a n d a r d c u r v e u s i n g p u r e r i b o s o m a l R N A . P u r e r R N A a t 1.8 m g / m l w a s
DIGESTED WITH 0 .1 MG/ML R N A SE AT 3 7 °C FOR 1 HR. THE R N A WAS THEN DILUTED TO VARYING
CONCENTRATIONS AND INJECTED ONTO THE COLUMN................................................................................................ 102
F ig u r e 4 .1 5 C h r o m a t o g r a m s h o w in g p u r e p l a s m id p S v p in je c t io n o n t o Q -S e p h a r o s e H iT r a p
COLUMN. T h e l a r g e p e a k a t 6 5 m in u t e s is s u p e r c o il e d p l a s m id a n d c h r o m o s o m a l D N A .
T h e s m a l l p e a k s a t 5 5 a n d 6 0 m in u t e s a r e s in g l e - s t r a n d e d D N A a n d o p e n - c ir c u l a r
PLASMID, RESPECTIVELY............................................................................................................................................................. 104
F ig u r e 4 .1 6 . S t a n d a r d c u r v e f o r p u r e s u p e r c o i l e d p l a s m i d o n Q - S e p h a r o s e H P L C r e s i n .............104
F ig u r e 4 .1 7 . P l o t o f s i n g l e - s t r a n d e d H P L C a r e a v e r s u s n u m b e r o f p a s s e s o f p u r e
CHROMOSOMAL D N A THROUGH A 0 .0 0 7 ” ID P E E K CAPILLARY FOR A Q-SEPHAROSE COLUMN 105
F ig u r e 4 .1 8 C h r o m a t o g r a m . In j e c t i o n o f 10 0 |i l o f Q i a g e n p u r if ie d p l a s m i d D N A ( p S v p ) a t 3
MINUTES AT 4 0 % BUFFER B . THE PLASMID IS ELUTED IN AN INCREASING N a CL GRADIENT AT ABOUT
4 5 % BUFFER B ................................................................................................................................................................................. 107
F ig u r e 4 .1 9 . C h r o m a t o g r a m s h o w i n g t h e i n j e c t i o n o f a c l a r if ie d a l k a l i n e l y s a t e o n t o a
L i c h r o s o r b s i l i c a c o l u m n a t 2 M N A C L . T h e c o l u m n w a s w a s h e d f o r 3 5 m i n u t e s t o e l u t e
R N A , AND THE D N A WAS ELUTED WITH A DECREASING SALT GRADIENT FROM 21V1 TO 0 M N a C L . 108
F ig u r e 4 .2 0 . A g a r o s e g e l o f c l a r i f i e d a l k a l i n e l y s a t e l o a d o n t o H P L C c o l u m n a n d d s - D N A
FRACTIONS (LANES 4 AND 5 ) AND S S -D N A FRACTIONS (LANES 1 AND 2 ) ..........................................................109
F ig u r e 4 . 2 1 . P l o t s h o w i n g v a r i a t i o n in e t h i d i u m b r o m i d e f l u o r e s c e n c e a s a f u n c t i o n o f
PLASMID CONCENTRATION........................................................................................................................................................1 11
F ig u r e 4 .2 2 . E f f e c t o f p la s m id s t r e s s - i n d u c e d d e g r a d a t i o n t im e in a c a p i l l a r y s h e a r d e v i c e o n
SAMPLE f l u o r e s c e n c e USING ETHIDIUM BROMIDE. SAMPLES WERE DILUTED TO 1 .6 |IG/ML FOR
ASSAY. 10 0 p.L SAMPLE + 100 IL E tB R AT 2 .5 M-G/ML. EACH SAMPLE WAS RUN IN QUADRUPLICATE.
112
pI3
F ig u r e 4 .2 3 . P l o t s h o w in g t h e f l u o r e s c e n c e o f p l a s m id -P ic o g r e e n s o l u t io n s v e r s u s s h e a r t im e
IN A P E E K CAPILLARY..................................................................................................................................................................113
F ig u r e 4 .2 4 . P l o t s h o w in g t h e f l u o r e s c e n c e o f p l a s m id -P ic o g r e e n s o l u t io n s v e r s u s s h e a r t im e
IN A P E E K CAPILLARY..................................................................................................................................................................114
F ig u r e 4 .2 5 . P l o t s h o w in g t h e f l u o r e s c e n c e o f s in g l e - s t r a n d e d l in e a r D N A r e l a t iv e t o
DOUBLE-STRANDED LINEAR D N A AS A FUNCTION OF D N A CONCENTRATION. DATA FROM
M o l e c u l a r P r o b e s , P ic o g r e e n A s s a y P r o c e d u r e ..............................................................................................115
F ig u r e 4 .2 6 P l o t s h o w in g su p e r c o il e d p l a s m id D N A a m o u n t v e r s u s t im e d u r in g c a p il l a r y
SHEAR MEASURED BY BOTH PICOGREEN AND AGAROSE GEL.................................................................................... 116
F ig u r e 5 .1 . S c h e m a t ic o f C a p il l a r y s h e a r d e v ic e ......................................................................................................... 122
F ig u r e 5 .2 . S c h e m a t ic s h o w in g t h e c a p il l a r y s h e a r d e v ic e in c o r p o r a t in g t h e H a m il t o n
SYRINGE PUMP................................................................................................................................................................................... 123
F ig u r e 5 .3 . P l o t s h o w in g t h e e f f e c t o f g r id siz e o n C F D c a l c u l a t e d e n t r a n c e p r e s s u r e d r o p
FOR FLOW FROM A 0 .0 6 2 " ID CAPILLARY INTO A 0 .0 0 7 " ID CAPILLARY AT 5 0 ML/MIN, USING THE LOW
R e K - e m o d e l ..................................................................................................................................................................................129
F ig u r e 5 .4 . P l o t s h o w in g t h e e f f e c t o f g r id siz e o n C F D c a l c u l a t e d e n t r a n c e e n e r g y
DISSIPATION FOR FLOW FROM A 0 .0 6 2 ” ID CAPILLARY INTO A 0 .0 0 7 ” ID CAPILLARY, AT 5 0 ML/MIN,
USING THE L o w RE K -E MODEL............................................................................................................................................... 129
F ig u r e 5 .5 . P l o t s h o w in g t h e e f f e c t o f g r id siz e o n C F D c a l c u l a t e d e n t r a n c e e l o n g a t io n a l
STRAIN FOR FLOW FROM A 0 .0 6 2 ” ID CAPILLARY INTO A 0 .0 0 7 ” ID CAPILLARY, AT 5 0 ML/MIN, USING
THE L o w R e K-E MODEL..............................................................................................................................................................1 30
F ig u r e 5 .6 . T y p ic a l C F D s im u l a t e d c e n t r e l in e p r e s s u r e f o r t h e 0 .0 6 2 ” ID , 10 c m c a p il l a r y
GOING TO A 0 .0 0 7 ” ID , 10 CM CAPILLARY.......................................................................................................................... 131
F ig u r e 5 .7 . C F D s im u l a t e d e n t r a n c e p r e s s u r e d r o p fo r 0 .0 0 7 " P E E K c a p i l l a r y ................................ 131
F ig u r e 5 .8 . C F D s im u l a t e d s t r e a m l in e s f o r 0 .0 0 7 ” c a p il l a r y a t 10 m L /m in f l o w r a t e , u s i n g t h e
LAMINAR FLOW MODEL. © IS THE HALF-CONE ANGLE AT WHICH 90% OF THE FLUID FLOWS INTO THE
CAPILLARY ENTRANCE.................................................................................................................................................................. 131
F ig u r e 5 .9 s h o w s a c o n t o u r p l o t o f t h e s t r a in r a t e w it h in t h e 0 .0 6 2 ” t o 0 .0 0 7 ” c a p il l a r y
SYSTEM, AT A FLOWRATE OF 10 ML/MIN, USING THE LAMINAR FLOW MODEL..................................................132
F ig u r e 5 .1 0 . C o n t o u r s o f e n e r g y d is s ip a t io n in 0 .0 0 7 ” c a p il l a r y s y s t e m 5 0 m l / m i n ......................... 132
F ig u r e 5 .1 1 . P l o t s h o w in g t h e e l o n g a t io n a l s t r a in r a t e a t t h e e n t r a n c e t o t h e c a p il l a r y
VERSUS THE REYNOLDS NUMBER............................................................................................................................................135
F ig u r e 5 .1 2 s h o w s t h e d im e n s io n l e s s e l o n g a t io n a l s t r a in r a t e ( e ’R /u) a t t h e e n t r a n c e t o t h e
CAPILLARY VERSUS THE REYNOLDS NUMBER...................................................................................................................136
F ig u r e 5 .1 3 . P l o t o f e n t r a n c e p r e s s u r e d r o p v e r s u s f l o w r a t e f o r t h e 3 c a p il l a r y s y s t e m s . 137
F ig u r e 5 .1 4 . P l o t o f d im e n s io n l e s s e n t r a n c e p r e s s u r e d r o p , s c a l e d b y d ia m e t e r r a t io t o t h e
POWER OF 0 .8 5 , VERSUS REYNOLDS NUMBER FOR THE 3 CAPILLARY SYSTEMS..............................................137
F ig u r e 5 .1 5 F il l e d -c o n t o u r p l o t s h o w in g a b s o l u t e p r e s s u r e a t c a p il l a r y e n t r a n c e 138
F ig u r e 5 .1 6 . In t e r n a l Ap p e r u n it l e n g t h in 0 .0 1 0 ” P E E K c a p il l a r y v e r s u s f l o w r a t e .................... 139
p l4
F ig u r e 5.17. I n t e r n a l p r e s s u r e d r o p p e r u n i t l e n g t h in 0.007” PEEK c a p i l l a r y v e r s u s
FLOWRATE. THE INTERNAL PRESSURE DROP WAS CALCULATED BASED ON THE TOTAL PRESSURE DROP
ACROSS LONG, MEDIUM AND SHORT CAPILLARY TUBING....................................................................................................140
F ig u r e 5.18. In t e r n a l p r e s s u r e d r o p p e r u n i t l e n g t h in 0.005” PEEK c a p i l l a r y v e r s u s f l o w r a t e .
T h e i n t e r n a l p r e s s u r e d r o p w a s c a l c u l a t e d b a s e d o n t h e t o t a l p r e s s u r e d r o p a c r o s s
LONG, MEDIUM AND SHORT CAPILLARY TUBING .......................................................................................................................140
F ig u r e 5.19. M e a s u r e d e n t r a n c e p r e s s u r e d r o p s a s a f u n c t i o n o f f l o w r a t e f o r t h e t h r e e
DIFFERENT ID PEEK CAPILLARIES..................................................................................................................................................... 141
F ig u r e 5 .2 0 . D i m e n s i o n l e s s e n t r a n c e p r e s s u r e d r o p a s a f u n c t i o n o f R e y n o l d s n u m b e r . T h e
EFFECTIVE CAPILLARY INTERNAL DIAMETERS 0 .0 1 0 7 ” , 0 .0 0 7 5 ” AND 0 .0 0 5 8 ” (A S MEASURED IN
SECTION 5 .6 .1 ) WERE USED TO CALCULATE THE DIMENSIONLESS ENTRANCE PRESSURE DROP FOR
NOMINAL CAPILLARY DIAMETERS 0.01”, 0.007” AND 0.005”, RESPECTIVELY.....................................................142
F ig u r e 5.21. D i m e n s i o n l e s s e n t r a n c e p r e s s u r e d r o p a s a f u n c t i o n o f R e y n o l d s n u m b e r .
E f f e c t iv e c a p i l l a r y i n t e r n a l d i a m e t e r s o f 0.0117”, 0.0075” a n d 0.0058” w e r e u s e d t o
CALCULATE THE DIMENSIONLESS ENTRANCE PRESSURE DROP........................................................................................143
F ig u r e 5.22. E f f e c t o f S o n i c a t i o n o n s u p e r c o i l e d p l a s m i d DNA.....................................................144
F ig u r e 5.23. P l o t s h o w i n g t h e c h a n g e in a b s o r b a n c e o f KI v e r s u s s o n i c a t i o n t i m e a t 5 m i c r o n s
AND 1 MICRONS SONICATION AMPLITUDE...................................................................................................................................... 145
F ig u r e 5 .2 4 . P l o t s h o w i n g c h a n g e in Kl a b s o r b a n c e a t 3 5 0 n m v e r s u s f l o w r a t e in PEEK
CAPILLARY........................................................................................................................................................................................................... 145
F ig u r e 5.25. P l o t s h o w i n g t h e d e c r e a s e in s u p e r c o i l e d p l a s m i d pQR150 v e r s u s n u m b e r o f
PASSES t h r o u g h A 0.007" PEEK CAPILLARY AT 20 ML/MIN, AT 3 DIFFERENT BACKPRESSURES.........146
F ig u r e 5.26 P l o t s h o w i n g t h e f l u o r e s c e n c e o f s u p e r c o i l e d p l a s m i d DNA d u r i n g p l a s m i d
RECIRCULATION THROUGH THE CAPILLARY SHEAR DEVICE WITHOUT THE NARROW BORE CAPILLARY
IN PLACE. S a m p l e s w e r e t a k e n e v e r y 10 m i n u t e s .........................................................................................................147
F ig u r e 5 .2 7 P l o t s h o w i n g t h e d e c r e a s e in s u p e r c o i l e d p l a s m i d p S v p c o n c e n t r a t i o n o v e r
t i m e d u r i n g t w o c a p i l l a r y s h e a r e x p e r i m e n t s . B o t h e x p e r i m e n t s w e r e r u n u n d e r t h e
s a m e c o n d i t i o n s e x c e p t f o r c a p i l l a r y l e n g t h . D a t a p o i n t s s h o w n a r e t h e a v e r a g e t o 2
SEPARATE EXPERIMENTS............................................................................................................................................................................148
F ig u r e 5 .2 8 . A n a g a r o s e g e l o f c a p i l l a r y d e g r a d e d p u r e s u p e r c o i l e d p l a s m i d p S V ^ : L a n e s 1
AND 8 ARE 0 PASSES, LANES 2 AND 7 ARE 11 PASSES, LANES 3 AND 6 ARE 2 3 PASSES, AND LANES 4
AND 5 ARE 4 7 PASSES THROUGH THE CAPILLARY. THE GEL WAS 0 .8% AGAROSE,-50 ML VOLUME 2 X
TEE, AND RUN FOR 2 H A T 3 V /C M .....................................................................................................................................................148
F ig u r e 5.29 P l o t s h o w i n g t h e d e c r e a s e in s u p e r c o i l e d p l a s m i d DNA, a s a p e r c e n t a g e o f
INITIAL SUPERCOILED PLASMID, OVER TIME DURING TWO CAPILLARY SHEAR EXPERIMENTS. D A TA
POINTS REPRESENT THE AVERAGES OF TWO EXPERIMENTS................................................................................................150
F ig u r e 5.30. C o r r e l a t i o n o f s u p e r c o i l e d p l a s m i d pQR150 d e g r a d a t i o n r a t e a g a i n s t s t r a i n
RATE. H o l l o w s y m b o l s a r e v / d s t r a i n r a t e , s o l i d s y m b o l s a r e CFD s t r a i n r a t e ......................151
F ig u r e 5.31. E f f e c t o f e n t r a n c e p r e s s u r e d r o p o n s u p e r c o i l e d p l a s m i d d e g r a d a t i o n r a t e . ... 151
pl5

F ig u r e 5 .3 2 . R e l a t io n s h ip b e t w e e n m e a s u r e d e n t r a n c e p r e s s u r e d r o p s a n d s t r a in r a t e fo r t h e
THREE d if f e r e n t DIAMETER P E E K CAPILLARIES USED............................................................................................152
F ig u r e 5 .3 3 . P l o t s h o w in g t h e e ff e c t o f p l a s m id siz e o n t h e s t r a in r a t e a t w h ic h 4% o f t h e
SUPERCOILED PLASMID IS DEGRADED PER PASS THROUGH A P E E K CAPILLARY............................................ 153
F ig u r e 5 .3 4 . P l o t s h o w in g t h e r e l a t io n s h ip b e t w e e n c h r o m o s o m a l D N A f r a g m e n t siz e a n d t h e
C F D CALCULATED ELONGATIONAL STRAIN RATE AT THE CAPILLARY ENTRANCE...................................... 154
F ig u r e 5 .3 5 . P l o t s h o w in g t h e r e l a t io n s h ip b e t w e e n e n t r a n c e e l o n g a t io n a l s t r a in r a t e a n d
INTERNAL CAPILLARY REYNOLDS NUMBER, FOR THE 3 DIFFERENT DIAMETER P E E K CAPILLARIES
USED IN PLASMID DEGRADATION EXPERIMENTS. THE WIDE LINES INDICATE THE STRAIN RATE WHERE
PLASMID DEGRADATION RATES WERE MEASURED.......................................................................................................... 156
F ig u r e 6 .1 . S c a l e - d o w n s t ir r e d t a n k a l k a l in e l y s is r e a c t o r ........................................................................... 173
F ig u r e 6 .2 . B a r c h a r t s h o w in g t h e e f f e c t o f f r e e z e - t h a w i n g h a r v e s t e d E. c o l i c e l l s o n
C H D N A CONTAMINATION POST-ALKALINE LYSIS...........................................................................................................176
F ig u r e 6 .3 . P l o t sh o w in g t h e e f f e c t o f c e l l r e s u s p e n s io n v o l u m e o n s u p e r c o il e d p l a s m id y ie l d .
E r r o r b a r s r e p r e s e n t o n e s t a n d a r d d e v ia t io n . E a c h d a t a p o in t r e p r e s e n t s t h e a v e r a g e
OF 3 SEPARATE EXPERIMENTS................................................................................................................................................... 177
F ig u r e 6 .4 . B a r c h a r t s h o w in g t h e e f f e c t o f c l a r if ic a t io n m e t h o d o n p l a s m id y ie l d a n d
C H D N A CONTAMINATION...........................................................................................................................................................178
F ig u r e 6 .5 P l o t s h o w in g t h e e ff e c t o n pH o f a d d in g 0 .2 M N a O H t o T E b u f f e r o r c e l l s in
T E BUFFER........................................................................................................................................................................................ 185
F ig u r e 6 .6 P l o t s h o w in g t h e e ff e c t o f s o d iu m h y d r o x id e c o n c e n t r a t io n o n s u p e r c o il e d
PLASMID STABILITY. POROS PI H PL C , PiCOGREEN FLUORESCENCE AND AGAROSE GEL
ELECTROPHORESIS WERE USED TO ASSAY THE SAMPLES FOR SUPERCOILED PLASMID. ERROR BARS
REPRESENT ONE STANDARD DEVIATION............................................................................................................................. 186
F ig u r e 6 .7 .. P l o t o f r e l a t iv e s u p e r c o il e d p l a s m id D N A c o n c e n t r a t io n , C /C o, ( m e a s u r e d b y
P ic o g r e e n f l u o r e s c e n c e ) a g a in s t s o d iu m h y d r o x id e c o n c e n t r a t io n ............................................ 187
F ig u r e 6 .8 . E f f e c t o f N a O H c o n c e n t r a t io n o n s u p e r c o il e d p l a s m id D N A r e c o v e r y in a l k a l in e
LYSATES............................................................................................................................................................................................... 188
F ig u r e 6 .9 . E f f e c t o f N a O H c o n c e n t r a t io n d u r in g a l k a l in e l y s is o n S C p l a s m id , O C p l a s m i d ,
s s - D N A , d s -c h D N A a n d R N A c o n t a m in a t io n in c l a r if ie d l y s a t e s . N o t e : t h e R N A p e a k
AREA WAS DIVIDED BY 15 TO FIT ON THE Y-AXIS...........................................................................................................189
F ig u r e 6 .1 0 P l o t s h o w in g t h e e ff e c t o f s o d iu m h y d r o x id e c o n c e n t r a t io n d u r in g a l k a l in e
LYSIS ON CHROMOSOMAL D N A CONCENTRATION IN CLARIFIED LYSATE.......................................................... 189
F ig u r e 6 .11 T w o - d im e n s io n a l c o n t o u r p l o t s h o w in g t h e c o m b in e d e f f e c t s o f l y s is t im e a n d
SODIUM HYDROXIDE CONCENTRATION ON PLASMID YIELD OVER ALKALINE LYSIS...................................... 190
F ig u r e 6 .1 2 T w o - d im e n s io n a l c o n t o u r p l o t s h o w in g t h e c o m b in e d e f f e c t s o f l y s is t im e a n d
SODIUM HYDROXIDE CONCENTRATION ON PLASMID PURITY OVER ALKALINE LYSIS....................................190
F ig u r e 6 .1 3 . S u p e r c o il e d p l a s m id D N A y ie l d s (C /C o) a s a f u n c t io n o f t im e o f e x p o s u r e o f
PLASMID CONTAINING CELLS TO DENATURING N a O H CONCENTRATIONS. EACH DATA POINT
REPRESENTS THE AVERAGE OF 3 EXPERIMENTS................................................................................................................192
p l6

F ig u r e 6 .1 4 . S c h e m a t ic s h o w in g d if f u s io n o f N a O H in t o r e s u s p e n d e d c e l l s .........................................193
F ig u r e 6 .1 5 B a r c h a r t sh o w in g t h e e ff e c t o f a d d it io n r a t e o f 0 .2 M N a O H t o p u r e
SUPERCOILED PLASMID D N A ................................................................................................................................................... 1 94
F ig u r e 6 .1 6 . P l o t s h o w in g r e l a t io n s h ip b e t w e e n s t ir r e d t a n k m a c r o - m ix in g t im e a n d im p e l l e r
SPEED.....................................................................................................................................................................................................195
F ig u r e 6 .1 7 . P l o t s h o w in g e ff e c t o f im p e l l e r s p e e d a n d N a O H c o n c e n t r a t io n o n S C y ie l d ... 196
F ig u r e 6 .1 8 . E f f e c t o f f l u id s t r a in r a t e o n c h r o m o s o m a l D N A c o n t a m in a t io n in c l a r if ie d
ALKALINE LYSATE, FOR ALKALINE LYSIS IN A CONE-AND-PLATE RHEOMETER. USING CELL PASTE
W t y p e G 2. E a c h d a t a p o in t r e p r e s e n t s 3 s e p a r a t e l y s is e x p e r im e n t s . E r r o r b a r s
REPRESENT ONE STANDARD DEVIATION.............................................................................................................................. 198
F ig u r e 6 .1 9 . E ff e c t o f s h e a r d u r in g a l k a l in e l y s is o n c h r o m o s o m a l D N A c o n t a m in a t io n f o r
WILD-TYPE E. COL/CELLS. EACH DATA POINT REPRESENTS 3 SEPARATE LYSIS EXPERIMENTS. ERROR
BARS REPRESENT ONE STANDARD DEVIATION.................................................................................................................199
F ig u r e 6 .2 0 . E f f e c t o f s h e a r d u r in g a l k a l in e l y s is o n c h r o m o s o m a l D N A c o n t a m in a t io n f o r
WILD-TYPE Æ. CO//CELLS. EACH DATA POINT REPRESENTS 3 SEPARATE LYSIS EXPERIMENTS. ERROR
BARS REPRESENT ONE STANDARD DEVIATION..................................................................................................................199
F ig u r e 6 .21 A g a r o s e g e l o f s h e a r e d c e l l l y s a t e s . 1 ) 3 0 0 1 /s , 2 ) 2 5 0 0 1 /s , 3 ) 2 0 ,0 0 0 1 /s , 4 )
6 0 ,0 0 0 1 /s , 5 ) 1 -D N A DIGEST, 6 ) X -D N A l a d d e r .....................................................................................................2 0 0
F ig u r e 6 .2 2 E f f e c t o f s h e a r r a t e d u r in g S D S l y s is o n s u b s e q u e n t c h r o m o s o m a l D N A siz e
AND CONTAMINATION AFTER ALKALINE LYSIS............................................................................................................... 2 0 0
F ig u r e 6 .2 3 . B a r c h a r t s h o w in g t h e e f f e c t o f f l u id s t r e s s o n p l a s m id y ie l d a n d p l a s m id p u r it y ,
AFTER 15 MINUTES MIXING IN A CONE-AND-PLATE VISCOMETER........................................................................ 201
F ig u r e 6 .2 4 . E f f e c t o f f l u id s t r a in r a t e in P E E K c a p il l a r ie s o n c h r o m o s o m a l D N A
CONTAMINATION. EACH DATA POINT REPRESENTS DUPLICATE EXPERIMENTS.............................................. 201
F ig u r e 6 .2 5 . E f f e c t o f f l u id s t r a in r a t e in P E E K c a p il l a r ie s o n c h r o m o s o m a l D N A
CONTAMINATION. EACH DATA POINT REPRESENTS TRIPLICATE EXPERIMENTS............................................. 2 0 2
F ig u r e 6 .2 6 . P l o t s h o w in g t h e e f f e c t o f f l u id s t r e s s d u r in g n e u t r a l is a t io n o n c h r o m o s o m a l
D N A YIELD, AFTER 15 MINUTES SHEAR IN A CONE-AND-PLATE VISCOMETER............................................... 2 0 3
F ig u r e 6 .2 7 . P l o t s h o w in g t h e e f f e c t o f f l u id s t r e s s d u r in g n e u t r a l is a t io n o n p l a s m id y ie l d
AND PLASMID PURITY, AFTER 10 PASSES THROUGH P E E K CAPILLARIES.......................................................... 2 0 3
F ig u r e 6 .2 8 . P l o t s h o w in g t h e e f f e c t o f im p e l l e r s p e e d o n m ix in g p e r f o r m a n c e a n d f l u id
STRESS IN A 1 0 0 0 L STIRRED TANK. ALL LINES ARE CALCULATED FROM MIXING AND FLUID STRESS
THEORY AS DESCRIBED IN CHAPTER 2 ..................................................................................................................................2 0 7
F ig u r e 7 .1 . E f f e c t o f d e a d - e n d f il t r a t io n o n c h r o m o s o m a l D N A t r a n s m is s io n in a l k a l in e
LYSATES...............................................................................................................................................................................................2 1 4
F ig u r e 7 .2 . E ff e c t o f C T A B c o n c e n t r a t io n o n d o u b l e - a n d s in g l e - s t r a n d e d c h r o m o s o m a l
D N A IN s o l u t io n ......................................................................................................................................................................... 2 1 5
F ig u r e 7 .3 . E ff e c t o f f l u id s t r e s s o n c h r o m o s o m a l r e s u s p e n s i o n ................................................................ 2 1 6
F ig u r e 7 .4 . T h e e f f e c t o f N a O H c o n c e n t r a t io n d u r in g a l k a l in e l y s is o n c h r o m o s o m a l D N A
PRECIPITATION DURING SUBSEQUENT CALCIUM CHLORIDE PRECIPITATION.................................................... 2 1 7
p l7
F ig u r e 7 .5 . E f f e c t o f N a O H c o n c e n t r a t io n o n p l a s m id a n d im p u r it y c o n c e n t r a t io n in c a l c iu m
CHLORIDE PRECIPITATED ALKALINE LYSATES..................................................................................................................2 1 8
F ig u r e 7 .6 . C o n c e n t r a t io n s o f d o u b l e - s t r a n d e d a n d s in g l e - s t r a n d e d c h r o m o s o m a l D N A in
CALCIUM CHLORIDE PRECIPITATED ALKALINE LYSATES.............................................................................................2 1 8
F ig u r e 7 .7 . S u p e r c o il e d p l a s m id D N A c o n c e n t r a t io n a n d D N A im p u r it y c o n c e n t r a t io n in
CLARIFIED ALKALINE LYSATES................................................................................................................................................ 2 1 9
F ig u r e 7 .8 . C h r o m a t o g r a m o f p u r e s u p e r c o il e d p l a s m id in je c t io n a n d p u r e c h r o m o s o m a l D N A
INJECTION ON S e p h a c r y l c o l u m n ..................................................................................................................................... 2 2 0
F ig u r e 7 .9 . P l o t s h o w in g e f f e c t o f c h r o m o s o m a l D N A siz e o n a m o u n t o f D N A e l u t e d f r o m Q -
S e p h a r o s e H i- t r a p c o l u m n ................................................................................................................................................ 221
F ig u r e 7 .1 0 P l o t s h o w in g t h e % c h r o m o s o m a l D N A b e f o r e a n d a f t e r s il ic a g e l t r e a t m e n t .
222
F ig u r e 7 .1 1 . A g a r o s e g e l s h o w in g r e m o v a l o f d e g r a d e d p l a s m id f o r m s u s i n g p H d é n a t u r a t io n
AND SILICA GEL. LEFT LANE: INITIAL HEAT-DEGRADED PURE PLASMID SAMPLE. RiGHT LANE: AFTER
p H DENATURATION, AND 2 HOURS INCUBATION WITH SILICA GEL........................................................................ 2 2 3
F ig u r e 8 .1 . D ia g r a m o f o p p o s e d je t m ix in g d e v i c e ....................................................................................................... 2 2 3
F ig u r e 8 .2 P l o t s h o w in g t h e d e c r e a s e in C F D p r e d ic t e d m a x im u m e n e r g y d is s ip a t io n a s t h e
NUMBER OF GRIDS INCREASED. CONVERGENCE IS SEEN ABOVE 1 0 ,0 0 0 GRIDS..............................................2 2 3
F ig u r e 8 .3 . F il l e d c o n t o u r p l o t s f o r t h e C F D p r e d ic t e d e n e r g y d is s ip a t io n r a t e s b e t w e e n
SUBMERGED JETS. JET VELOCITY WAS 5 M/S, 4 MM ID JETS. ALSO SHOWN ARE THE FLUID
s t r e a m l in e s t h a t e n c o m p a s s 90% OF THE FLUID FLOW...................................................................................... 2 2 3
F ig u r e 8 .4 P l o t s h o w s t h e c o n v e r g e n c e in C F D p r e d ic t e d m a x im u m e n e r g y d is s ip a t io n a s
THE NUMBER OF GRIDS INCREASES. CONVERGENCE IS SEEN ABOVE 1 0 0 0 GRIDS.........................................2 2 3
F ig u r e 8 .5 . C o n t o u r p l o t s o f C F D p r e d ic t e d m a x im u m e n e r g y d is s ip a t io n b e t w e e n o p p o s e d
WATER JETS AT 1 M/S VELOCITY. TOP: K -E MODEL. BOTTOM: LOW RE K -E MODEL. ALSO SHOWN IN
THE PLOTS ARE THE 90% FLOW STREAMLINES. THE PREDICTED ENERGY DISSIPATION IN THE
ELLIPTICAL REGION BETWEEN THE JETS WAS 17 AND 2 3 W /KG FOR THE K -E MODEL AND LOW RE K-E
MODEL, RESPECTIVELY. THE K -E MODEL PREDICTS A SMALL AMOUNT OF ENERGY DISSIPATION IN THE
GAS-PHASE CLOSE TO THE JET IMPINGEMENT REGION; THIS SHOULD NOT AFFECT THE JET MIXING
PERFORMANCE.................................................................................................................................................................................. 2 2 3
F ig u r e 8 .6 P l o t s h o w in g t h e e n e r g y d is s ip a t io n fo r 3 d if f e r e n t ID je t s a s a f u c n t io n o f jet
VELOCITY. T h e o p p o s e d je t s y s t e m s h o u l d b e s c a l e d b y je t v e l o c it y ................................................ 2 2 3
F ig u r e 8 .7 C o n t o u r p l o t s o f s p e e d (t o p ) , e n e r g y d is s ip a t io n ( m id d l e ) a n d s t r a in r a t e
( b o t t o m ) b e t w e e n 4 MM ID OPPOSED JETS, AT 1 M/S AVERAGE JET VELOCITY, MODEL 2 . THE JETS
ENTER FROM THE LEFT AND RIGHT, IMPINGE, AND EXIT RADIALLY.......................................................................2 2 3
F ig u r e 8 .8 . P l o t o f C F D c a l c u l a t e d d im e n s io n l e s s e n e r g y d is s ip a t io n r a t e v e r s u s je t
R e y n o l d s n u m b e r f o r o p p o s e d je t s im p in g in g in a ir (M o d e l 2 ) ............................................................... 2 2 3
F ig u r e 8 .9 . P l o t o f d im e n s io n l e s s m a x im u m s t r a in r a t e v e r s u s R e y n o l d s n u m b e r f o r o p p o s e d
JETS OF WATER IMPINGING IN AIR FOR 3 DIFFERENT DIAMETER JETS....................................................................2 2 3
pis
F ig u r e 8 .1 0 P l o t s h o w in g t h e e f f e c t o f s e p a r a t io n d is t a n c e b e t w e e n t h e je ts o n e n e r g y
DISSIPATION RATE...........................................................................................................................................................................2 2 3
F ig u r e 8 .1 1 . P l o t o f t h e C F D p r e d i c t e d m a x im u m e n e r g y d i s s ip a t io n r a t e v e r s u s n u m b e r o f
GRIDS FOR M o d e l 3 , a t 8 m /s a n d 2 5 .3 7 m /s j e t im p in g e m e n t v e l o c i t i e s . T h e e n e r g y
d i s s ip a t io n r a t e is c o n v e r g e d t o a c o n s t a n t v a l u e a t 7 0 0 GRIDS AND ABOVE .............................. 2 2 3
F ig u r e 8 .1 2 . C o n t o u r p l o t o f t u r b u l e n t e n e r g y d is s ip a t io n r a t e (W /KG ) f o r n o n - e q u a l
DIAMETER OPPOSED JETS OF WATER. THE SYSTEM CONSISTS OF A 0 .5 0 8 MM ID JET AT 2 5 .3 7 M/S JET
VELOCITY (LEFT) IMPACTING A 1 .5 7 4 MM ID JET AT 8 M/S JET VELOCITY (RIGHT)...................................... 2 2 3
F ig u r e 8 .1 3 s h o w s a p l o t o f t h e C F D p r e d ic t e d d im e n s io n l e s s e n e r g y d is s ip a t io n v e r s u s
R e y n o l d s n u m b e r f o r n o n - e q u a l d ia m e t e r o p p o s e d j e t s . A t h ig h Re y n o l d s n u m b e r , t h e
d im e n s io n l e s s m a x im u m e n e r g y d is s ip a t io n is a b o u t 0 .1 0 , WHICH IS SIMILAR TO THE RESULTS
FOR EQUAL DIAMETER OPPOSED JETS................................................................................................................................... 2 2 3
F ig u r e 8 .1 4 . E n e r g y D is s ip a t io n R a t e b e t w e e n t w o s e t s o f o p p o s e d je t s , a s f u n c t io n o f jet
VELOCITY, WHERE THE FLOWRATE OF ONE JET WAS REQUIRED TO BE 3 -TIMES THE FLOWRATE OF THE
OTHER JET. In t h e FIRST SYSTEM, THE DIAMETERS OF THE JETS WERE EQUAL, IN THE SECOND SYSTEM
THE DIAMETERS OF THE JETS WERE NOT EQUAL BUT INSTEAD THEY WERE MOMENTUM BALANCED.
N o t e t h e s ig n if ic a n t v a r ia t io n in e n e r g y d is s ip a t io n r a t e b e t w e e n t h e je t s a s a f u n c t io n
OF JET VELOCITY..............................................................................................................................................................................2 2 3
F ig u r e 8 .1 5 . P l o t s h o w in g t h e m a x im u m s t r a in r a t e b e t w e e n o p p o s e d je t s f o r e q u a l d ia m e t e r
JETS AND DIFFERENT DIAMETER, BUT MOMENTUM BALANCED, JETS...................................................................2 2 3
F ig u r e 8 .1 6 . E f f e c t o f Je t v e l o c it y o n s u p e r c o il e d p l a s m id y ie l d u s in g 0 .4 M N a O H l y s is
BUFFER ................................................................................................................................................................................................. 22 3
F ig u r e 8 .1 7 . E f f e c t o f Je t v e l o c it y o n s u p e r c o il e d p l a s m id y ie l d a n d p u r it y u s in g 0 .2 M o r 0 .4
M N a O H l y s i s b u f f e r ............................................................................................................................................................. 2 2 3
F ig u r e 8 .1 8 . E f f e c t o f R e y n o l d s n u m b e r o n M ix in g p e r f o r m a n c e f o r O p p o s e d M ix in g T e e s .
G r a p h r e p r o d u c e d f r o m T o s u n e t a l . (1 9 8 7 ) . T h e t r ia n g l e s , c ir c l e s a n d s q u a r e s
REPRESENT OPPOSED TEES WITH LEFT : RIGHT DIAMETERS OF 0 .9 : 1 0 .3 MM, 1.8 : 7.1 MM AND 0 .9 : 7.1
MM, RESPECTIVELY ....................................................................................................................................................................... 2 2 3
F ig u r e 8 .1 9 . P l o t s h o w in g t h e q u a l it y o f m ix in g a s a f u n c t io n o f R e y n o l d s n u m b e r in t h r e e
DIFFERENT DIAMETER OPPOSED JETS, NON-SUBMERGED CASE. THIS PLOT IS REPRODUCED FROM THE
DATA OF MAHAJAN ET AL. ( 1 9 9 6 ) ........................................................................................................................................ 2 2 3
F ig u r e 8 .2 0 . P l o t s h o w in g t h e q u a l it y o f m ix in g a s a f u n c t io n o f R e y n o l d s iniumber in t h r e e
DIFFERENT DIAMETER OPPOSED JETS, SUBMERGED CASE. THIS PLOT IS REPRODUCED FROM THE DATA
OF MAHAJAN ET AL. ( 1 9 9 6 ) ......................................................................................................................................................2 2 3
F ig u r e 8 .2 1 . P l o t s h o w in g t h e c o r r e l a t io n b e t w e e n r e l a t iv e m ix in g t im e a n d t h e q u a l it y o f
MICRO-MIXING IN OPPOSED JETS............................................................................................................................................2 2 3
F ig u r e 8 .2 2 . P l o t s h o w in g t h e c o r r e l a t io n b e t w e e n r e l a t iv e m ix in g t im e a n d t h e q u a l it y o f
MICRO-MIXING IN OPPOSED JETS: SUBMERGED CASE.................................................................................................. 2 2 3
p l9
F ig u r e 8 .2 3 . P l o t s h o w in g t h e c o r r e l a t io n b e t w e e n r e l a t iv e m ix in g t im e a n d t h e q u a l it y o f
MICRO-MIXING IN OPPOSED JETS. OPEN SYMBOLS REPRESENT SUBMERGED JETS, FILLED SYMBOLS
REPRESENT NON-SUBMERGED JETS.........................................................................................................................................2 2 3
F ig u r e 8 .2 4 . P l o t sh o w in g t h e K o l m o g o r o f f l e n g t h v e r s u s s t r a in r a t e f o r o p p o s e d je t s a t
THREE DIFFERENT JET DIAMETERS.......................................................................................................................................... 2 2 3
F ig u r e 9 .1 . O r g a n is a t io n o f t h e s is w it h r e s p e c t t o D N A p u r if ic a t io n p r o c e s s d e v e l o p m e n t . 2 2 3
F ig u r e 9 .2 . P l o t s h o w in g t h e e f f e c t o f v e s s e l v o l u m e o n p o w e r r e q u ir e m e n t s f o r m ix i n g . T h e
POWER INPUT AND FLUID STRESSES INCREASE RAPIDLY WITH INCREASING VESSEL SIZE A ND WITH
DECREASING MIXING TIME...........................................................................................................................................................2 2 3
F ig u r e 9 .3 . P l o t s h o w in g t h e f l u i d s t r e s s in a s t i r r e d t a n k a s a f u n c t i o n o f t a n k v o l u m e , a t a
CONSTANT TANK MICRO-MIXING TIME OF 0 .3 S ................................................................................................................2 2 3
p20

L ist of T abl es
T a b l e 1 .1 . A p p l ic a t io n s o f g e n e t h e r a p y . T a k e n f r o m M h a s h il k a r e t a l ., 2 0 0 1 ............................2 3
T a b l e 1 .2 . C u r r e n t p u r if ic a t io n s t r a t e g ie s f o r DNA ....................................................................................... 2 8
T a b l e 2 .1 . D i f f e r e n t f l u id s t r e s s e s t h a t o c c u r w it h In d u s t r ia l p u r if ic a t io n e q u ip m e n t 4 5
T a b l e 2 .2 . P h y s ic a l c h a r a c t e r is t ic s o f DNA m o l e c u l e s . ' T h e r e l a x a t io n t im e s a r e
CALCULATED AT THE CHAIN OVERLAP CONCENTRATION. THE E. COZ,/CHROMOSOME IS TAKEN TO BE
LINEAR. ^ALL c a l c u l a t i o n s ARE BASED ON LINEARISED D N A ............................................................................4 9
T a b l e 2 .3 . L ist o f e q u a t io n s a n d c o n s t a n t s u s e d t o c a l c u l a t e v a l u e s in T a b l e 2 .2 ..........................51
T a b l e 2 .4 . Re f e r e n c e s t o e q u a t io n s u s e d in T a b l e 2 .3 ................................................................................................. 5 2
T a b l e 3 .1 . P h y s ic a l p a r a m e t e r s o f t h e f l u id p h a s e s m o d e l l e d ...........................................................................67
T a b l e 3 .2 . S im u l a t io n s r u n t o c h e c k fo r m o d e l g r id - siz e i n d e p e n d e n c e ..................................................... 6 9
T a b l e 3 .3 . S im u l a t io n s r u n t o e x a m in e t h e e ff e c t o f je t s b e in g s u b m e r g e d .............................................. 7 0
T a b l e 3 .4 . S im u l a t io n s r u n t o e x a m in e t h e e ff e c t o f t u r b u l e n c e m o d e l ................................................... 7 0
T a b l e 3 .5 . S im u l a t io n s o f e q u a l o p p o s e d je ts im p in g in g in a i r .............................................................................71
T a b l e 3 .6 . S im u l a t io n s o f n o n -e q u a l o p p o s e d j e t s ........................................................................................................ 7 2
T a b l e 3 .7 . CFD s im u l a t io n c o n d it io n s e x a m in in g t h e e f f e c t o f c a p il l a r y in t e r n a l d ia m e t e r
AND FLUID VELOCITY ON FLUID STRESSES AND ENERGY DISSIPATION RATES.................................................... 7 5
T a b l e 4 .1 . S h o w in g p r in c ip a l f o r m s o f p l a s m id a n d c h r o m o s o m a l DNA.....................................................7 9
T a b l e 4 .2 . P l a s m id s u s e d in l y s is a n d s h e a r e x p e r im e n t s . ' 12 .5 |i g / m l c h l o r a m p h e n ic o l w a s
USED FOR PLATES, 5 )IG/M L FOR SHAKE-FLASKS............................................................................................................... 8 2
T a b l e 4.3 T a b l e s h o w in g t h e RNA, ds-DNA a n d ss-DNA HPLC p e a k a r e a s f o r 4 s a m p l e s in
TRIPLICATE A N D THE RELATIVE STANDARD DEVIATIONS........................................................................................... 102
T a b l e 5 .1 . N o m in a l ID o f P E E K c a p il l a r ie s , in in c h e s a n d m il l im e t r e s .....................................................12 2
T a b l e 5 .2 . C o m p a r i s o n o f CFD r e s u l t s w ith a n a l y t ic a l l y d e t e r m in e d r e s u l t s . ' A s s u m i n g a n
ENTRANCE ANGLE OF 73 DEGREES, AS PREDICTED BY THE CFD SIMULATION. U SIN G A DISCHARGE
COEFFICIENT OF 0 .8 0 FOR A CONVERGING FLOW INTO A SHORT TUBE........................................................................131
T a b l e 6 .1 . C e l l P a s t e s u s e d in l y s is s t u d ie s ..................................................................................................................... 1 70
T a b l e 6 .2 . Y ie l d s o f p l a s m id a n d c h r o m o s o m a l DNA in 3 £ . co l / c e l l p a s t e s ......................................... 1 80
T a b l e 6 .3 . P la s m id a n d c h r o m o s o m a l DNA y i e l d s a f t e r a l k a l i n e l y s i s f o r p la s m id c o n t a i n i n g
A ND n o n - p la s m id CONTAINING E. COZ,/CELLS. ’SUPERCOILED PLASMID POST-ALKALINE LYSIS
DIVIDED BY INITIAL AM OUNT IN THE CELLS. ^TOTAL OPEN-CIRCULAR PLASMID DNA POST-ALKALINE
LYSIS DIVIDED BY INITIAL AM OUNT IN THE CELLS. ^TOTAL NON-PLASMID DNA DIVIDED BY TOTAL
INITIAL CHROMOSOMAL DNA IN THE CELLS BEFORE LYSIS.............................................................................................. 182
T a b l e 6 .4 . Y ie l d s o f s u p e r c o il e d p l a s m id DNA a n d s a m p l e p u r it y f o r 3 l y s is m e t h o d s ................ 183
T a b l e 7 .1 . M e t h o d s o f s e p a r a t in g sin g l e a n d d o u b l e - s t r a n d e d c h r o m o s o m a l DNA f r o m
SUPERCOILED PLASM ID, AND EFFECTIVENESS OF EACH TECHNIQUE........................................................................... 2 1 0
T a b l e 9 .1 . C h e m ic a l S p e c ie s t o b e a s s a y e d ....................................................................................................................... 2 2 3
p21

1 IntroductionThis chapter describes the rationale for this thesis: a study into the effects o f fluid mixing and
fluid stresses on DNA purification. The principal aim of this work is the improvement o f pure
DNA production processes through a better understanding o f DNA stress-induced degradation
in industrially relevant unit operations. The work presented here primarily focuses on the
primary DNA purification step, cell lysis, but also deals with the knock-on effects o f cell lysis
on downstream purification. This chapter opens with an explanation of the reasons why pure
DNA is an important substance; its emerging clinical importance as a therapeutic and
prophylactic agent making it a novel and exciting area of research within the biopharmaceutical
industry. The current methodologies used for production o f DNA at small to moderate scales
are described, along with the hurdles that have to be overcome to manufacture DNA in
sufficient quantities and at a sufficiently economical price to make it a widely administered
medication o f the future. This chapter then describes in more detail the primary downstream
purification step, cell lysis, and briefly outlines why the physio-chemical properties o f DNA
make it uniquely sensitive during processing to degradation caused by low levels o f fluid
mixing or high levels o f fluid stress. The specific aims o f this thesis are presented, briefly
outlining the experimental and computational studies to be performed to achieve these aims.
This chapter ends with a description of the structure o f this thesis, outlining the purpose o f each
chapter and the information found therein.
1.1 Gene therapy
Interest in the field o f pure DNA manufacture (Ferreira et al., 2000; Prazeres et al., 1999; Levy
et al., 2000) has been driven in recent years by the explosion o f research into gene therapy.
Gene therapy is the delivery o f a functional gene for expression in somatic tissues with the
intent to selectively correct or modulate disease conditions. Gene therapy can theoretically
modify specific genes resulting in a cure following a single administration (Friedman, 1997).
Since the discovery of the structure of DNA by Watson and Crick in 1953, treating disease by
modifying the genes has become the ultimate dream. Four decades later, and more quickly than
anticipated, this dream has become a reality thanks to rapid developments in molecular biology
and recombinant DNA techniques, the discovery o f the polymerase chain reaction, and the
establishment of the Human Genome Project. The advent o f gene therapy and the potential o f
DNA vaccination for the treatment of genetic disorders and acquired diseases has led to an
exponential increase in research interests into gene therapy since the first clinical trials began in
1990 (Marquet et al., 1995; Mountain, 2000).
p22
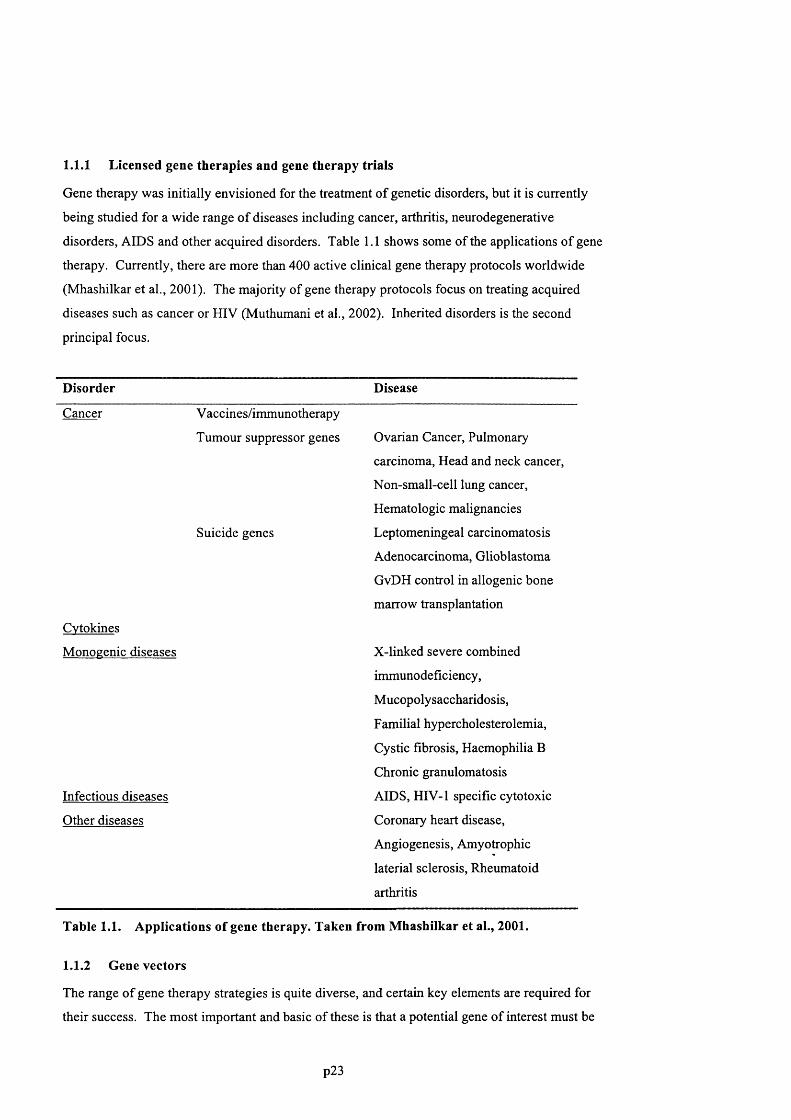
1.1.1 Licensed gene therapies and gene therapy trials
Gene therapy was initially envisioned for the treatment o f genetic disorders, but it is currently
being studied for a wide range o f diseases including cancer, arthritis, neurodegenerative
disorders, AIDS and other acquired disorders. Table 1.1 shows some of the applications o f gene
therapy. Currently, there are more than 400 active clinical gene therapy protocols worldwide
(Mhashilkar et al., 2001). The majority of gene therapy protocols focus on treating acquired
diseases such as cancer or HIV (Muthumani et al., 2002). Inherited disorders is the second
principal focus.
D isorder Disease
Cancer Vaccines/immunotherapy
Tumour suppressor genes Ovarian Cancer, Pulmonary
carcinoma. Head and neck cancer.
Non-small-cell lung cancer.
Hematologic malignancies
Cvtokines
Suicide genes Leptomeningeal carcinomatosis
Adenocarcinoma, Glioblastoma
GvDH control in allogenic bone
marrow transplantation
Monogenic diseases X-linked severe combined
immunodeficiency.
Mucopolysaccharidosis,
Familial hypercholesterolemia.
Cystic fibrosis. Haemophilia B
Chronic granulomatosis
Infectious diseases AIDS, HIV-1 specific cytotoxic
Other diseases Coronary heart disease,
Angiogenesis, Amyotrophic
laterial sclerosis. Rheumatoid
arthritis
Table 1.1. A pplications of gene therapy. Taken from M hashilkar et al., 2001.
1.1.2 Gene vectors
The range o f gene therapy strategies is quite diverse, and certain key elements are required for
their success. The most important and basic of these is that a potential gene o f interest must be
p23
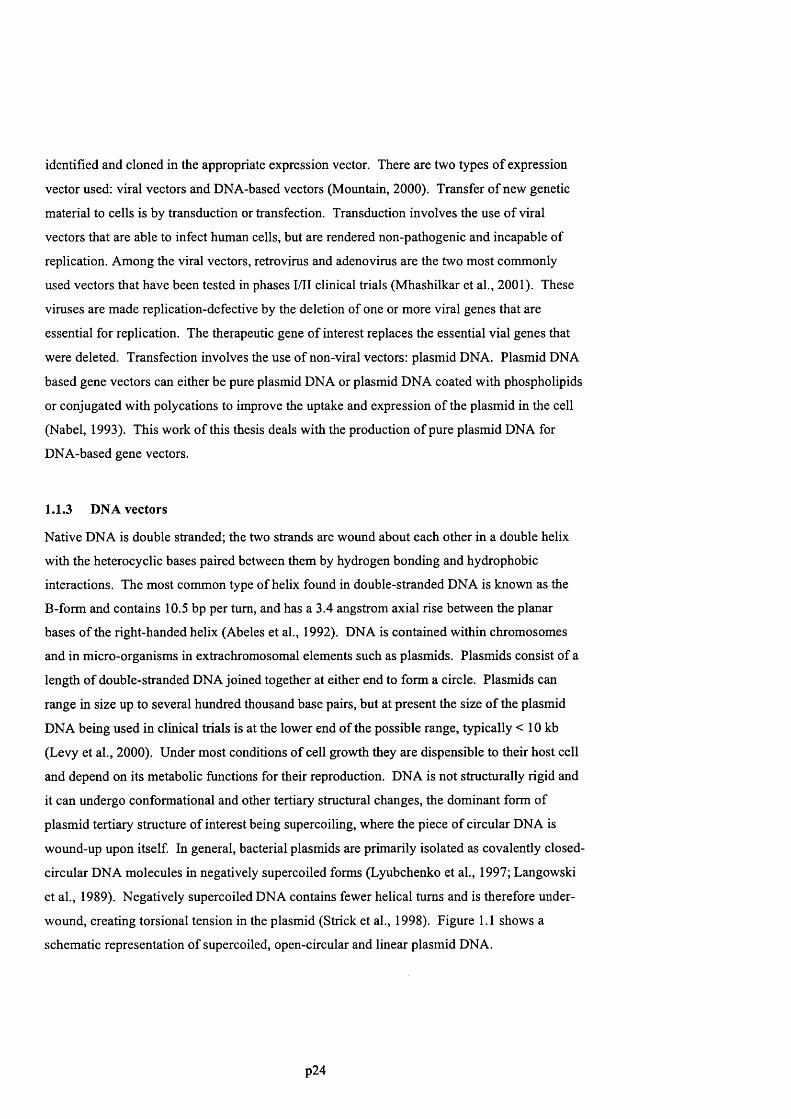
identified and cloned in the appropriate expression vector. There are two types o f expression
vector used: viral vectors and DNA-based vectors (Mountain, 2000). Transfer o f new genetic
material to cells is by transduction or transfection. Transduction involves the use o f viral
vectors that are able to infect human cells, but are rendered non-pathogenic and incapable of
replication. Among the viral vectors, retrovirus and adenovirus are the two most commonly
used vectors that have been tested in phases I/II clinical trials (Mhashilkar et al., 2001). These
viruses are made replication-defective by the deletion of one or more viral genes that are
essential for replication. The therapeutic gene o f interest replaces the essential vial genes that
were deleted. Transfection involves the use o f non-viral vectors: plasmid DNA. Plasmid DNA
based gene vectors can either be pure plasmid DNA or plasmid DNA coated with phospholipids
or conjugated with polycations to improve the uptake and expression o f the plasmid in the cell
(Nabel, 1993). This work o f this thesis deals with the production o f pure plasmid DNA for
DNA-based gene vectors.
1.1.3 DNA vectors
Native DNA is double stranded; the two strands are wound about each other in a double helix
with the heterocyclic bases paired between them by hydrogen bonding and hydrophobic
interactions. The most common type o f helix found in double-stranded DNA is known as the
B-form and contains 10.5 bp per turn, and has a 3.4 angstrom axial rise between the planar
bases o f the right-handed helix (Abeles et al., 1992). DNA is contained within chromosomes
and in micro-organisms in extrachromosomal elements such as plasmids. Plasmids consist o f a
length o f double-stranded DNA joined together at either end to form a circle. Plasmids can
range in size up to several hundred thousand base pairs, but at present the size o f the plasmid
DNA being used in clinical trials is at the lower end o f the possible range, typically < 10 kb
(Levy et al., 2000). Under most conditions o f cell growth they are dispensible to their host cell
and depend on its metabolic functions for their reproduction. DNA is not structurally rigid and
it can undergo conformational and other tertiary structural changes, the dominant form of
plasmid tertiary structure of interest being supercoiling, where the piece o f circular DNA is
wound-up upon itself. In general, bacterial plasmids are primarily isolated as covalently closed-
circular DNA molecules in negatively supereoiled forms (Lyubchenko et al., 1997; Langowski
et al., 1989). Negatively supereoiled DNA contains fewer helical turns and is therefore under
wound, creating torsional tension in the plasmid (Strick et al., 1998). Figure 1.1 shows a
schematic representation o f supereoiled, open-circular and linear plasmid DNA.
p24
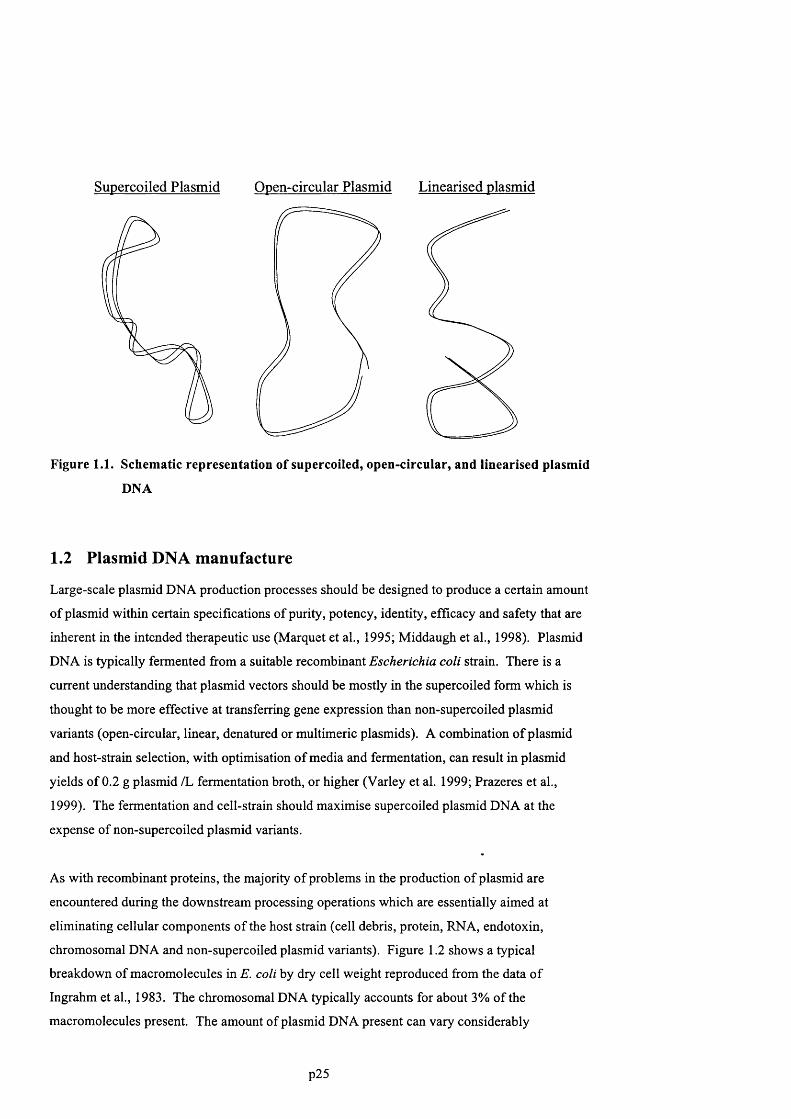
Figure 1.1. Schematic representation of supercoiled, open-circular, and linearised plasmid
DNA
1.2 Plasmid DNA manufacture
Large-scale plasmid DNA production processes should be designed to produce a certain amount
of plasmid within certain specifications of purity, potency, identity, efficacy and safety that are
inherent in the intended therapeutic use (Marquet et al., 1995; Middaugh et al., 1998). Plasmid
DNA is typically fermented from a suitable recombinant Escherichia coli strain. There is a
current understanding that plasmid vectors should be mostly in the supercoiled form which is
thought to be more effective at transferring gene expression than non-supercoiled plasmid
variants (open-circular, linear, denatured or multimeric plasmids). A combination o f plasmid
and host-strain selection, with optimisation o f media and fermentation, can result in plasmid
yields of 0.2 g plasmid /L fermentation broth, or higher (Varley et al. 1999; Prazeres et al.,
1999). The fermentation and cell-strain should maximise supercoiled plasmid DNA at the
expense of non-supercoiled plasmid variants.
As with recombinant proteins, the majority o f problems in the production o f plasmid are
encountered during the downstream processing operations which are essentially aimed at
eliminating cellular components o f the host strain (cell debris, protein, RNA, endotoxin,
chromosomal DNA and non-supercoiled plasmid variants). Figure 1.2 shows a typical
breakdown of macromolecules in E. coli by dry cell weight reproduced from the data o f
Ingrahm et al., 1983. The chromosomal DNA typically accounts for about 3% of the
macromolecules present. The amount of plasmid DNA present can vary considerably
p25
depending on the plasmid eopy number, whieh can vary from 1 to several hundred copies per
cell. High copy number plasmids make up at least 1 % to 3 % o f the macromolecules present
(Varley et al. 1999, Levy et al., 2000).
Following cell harvest, the initial recovery step involves cell lysis. The process of choice for
cell lysis is most often a variation of the alkaline-lysis procedure originally described by
Bimboim (1979). This is certainly a crucial step in the process and the one at whieh most
problems occur (Prazeres et ah, 1999). Alkaline lysis will be discussed in detail in the section
1.3. After cell lysis, the lysate is clarified by centrifugation or filtration to remove flocculated
impurities, followed by several other purification steps to remove protein, endotoxin, RNA and
DNA impurities. In recent years there has been considerable advances in DNA purification.
Table 1.2 lists some of the published techniques for the removal of impurities that are reported
in the published literature. There are now a range of well-understood, low cost, low shear, and
scaleable processes for the removal o f cell debris, protein and RNA. Endotoxins can still be
difficult to reduce to safe levels because they are negatively charged like DNA and because they
have to be reduced to very low levels due to their toxicity. However, a combination of several
of the steps listed in Table 1.2 is usually sufficient to reduce endotoxins to acceptable levels.
C h r om o s o m al DNA
3 %
L i p o p o l y s a c c h a r i d e 41
Lipid 9 %
P e p t i d o g l y c a n3 %
G l y c o g e n
P l a s m id DNA 1 %
P r o t e i n
Figure 1.2. Macroniolecules in E. coli by % Dry Cell Weight. Adapted from Ingrahm et
al., 1983.
Until recently the only method for the removal of chromosomal DNA (chDNA) was
chromatography (Ferreira et al., 2000). This usually consisted o f an initial purification step
(precipitation, filtration or anion exchange chromatography), followed by reversed-phase
(RPC), hydrophobic interaction (HIC) or size exclusion (SEC) chromatography which separated
the chromosomal and plasmid DNA. Because of the high molecular weight of plasmid and
chromosomal DNA, these molecules are excluded from the pores of chromatographic resins
such as AE, HIC and RP. This significantly reduces the binding capacity o f chromatographic
p26

resins 10- to 100- fold lower than typical values for proteins (Ferreira et al., 1998; Chandra et
al., 1992; Prazeres et al., 1998). This significantly increases the cost o f chromatographic
purification. The large size o f DNA molecules makes them difficult to separate on SEC resins,
again, due to the lack o f available resins with sufficient pore size to accommodate DNA
molecules (Moreau et al., 1987; Ferreira et al., 1997). Combined with the high cost o f
chromatographic resins, the potential high dose of plasmid DNA therapies and the prohibitive
cost of chromatographic buffers at manufacturing scale make chromatographic purification a
very expensive purification strategy.
Throughout the supercoiled plasmid purification process, the high molecular mass o f plasmid
and chromosomal DNA make them particularly sensitivity to chain scission by fluid stresses.
Long before the large-scale production of DNA was envisaged, studies by Davison et al. (1959),
Hershey et al. (1960) and Leventhal et al. (1961) showed that chromosomal DNA could be
stretched and fragmented by relatively low levels o f fluid stress in syringes, stirred vessels and
capillaries, respectively. Since then, several studies have confirmed the susceptibility o f
chromosomal DNA to fluid stress, and demonstrated that larger DNA molecules break at
significantly lower levels of stress than smaller DNA molecules. Fluid stress can easily break
the large E. coli chromosome down into much smaller chromosomal fragments. More recent
studies by Levy et al. (1998) have shown that plasmid DNA is also susceptible to degradation
by fluid stresses. I f fluid stress causes one of the strands o f a supercoiled plasmid to break,
supercoiling is lost and an open-circular form is created; therefore, destroying the product o f
interest while simultaneously creating a difficult to remove impurity. If a break occurs in both
strands, at or near the same point, a linear form of the DNA is generated.
Stress degraded plasmid DNA and host chromosomal DNA fragments can be very difficult to
remove due to both their similarities in size, and chemistry, to the supercoiled plasmid. There
are still few available methods for their removal that are both inexpensive and easily scaleable,
as shown in Table 1.2. Because removal o f chromosomal DNA and non-plasmid variants add
significantly to the purification cost it is essential to minimise the formation o f non-plasmid
variants and chromosomal DNA fragments. Currently, there are only limited data on the stress-
induced degradation o f chromosomal and plasmid DNA in typical purification equipment.
p27
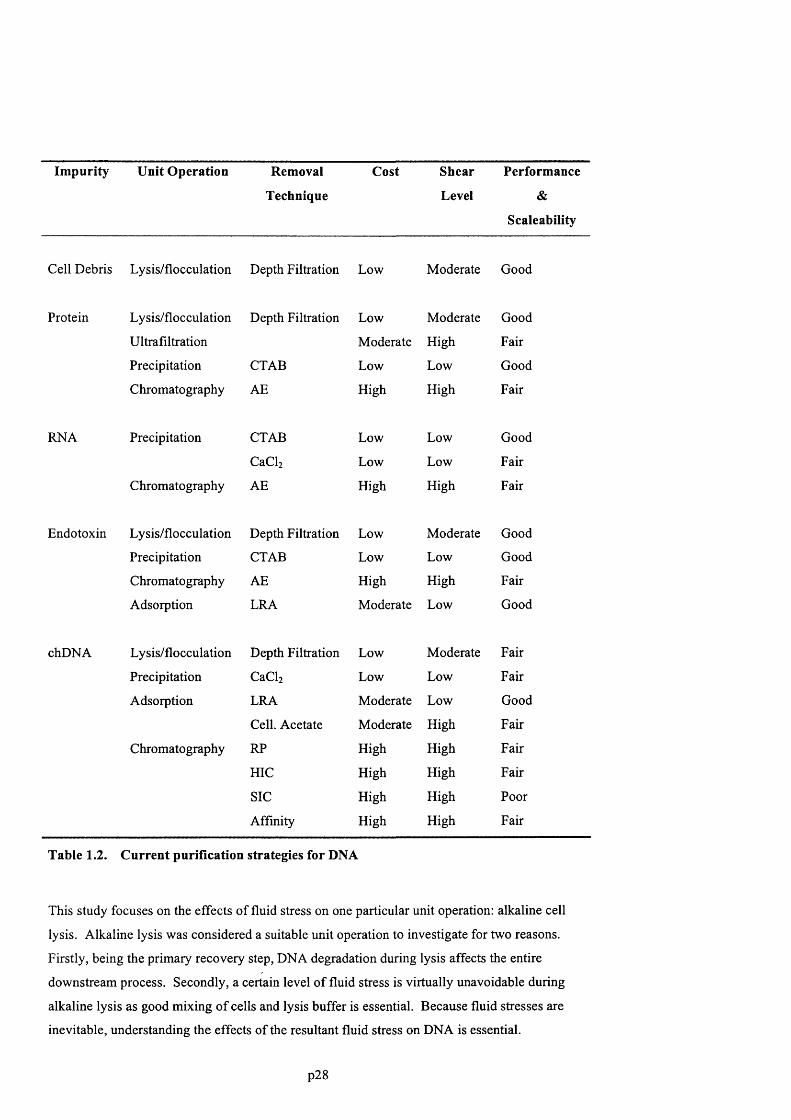
Im purity U nit O peration Removal
Technique
Cost Shear
Level
Perform ance
&
Scaleability
Cell Debris Lysis/flocculation Depth Filtration Eow Moderate Good
Protein Lysis/flocculation Depth Filtration Eow Moderate Good
Ultrafiltration Moderate High Fair
Precipitation CTAB Eow Eow Good
Chromatography AE High High Fair
RNA Precipitation CTAB Eow Eow Good
CaClz Eow Eow Fair
Chromatography AE High High Fair
Endotoxin Lysis/flocculation Depth Filtration Eow Moderate Good
Precipitation CTAB Eow Eow Good
Chromatography AE High High Fair
Adsorption ERA Moderate Eow Good
chDNA Lysis/flocculation Depth Filtration Eow Moderate Fair
Precipitation CaClz Eow Eow Fair
Adsorption ERA Moderate Eow Good
Cell. Acetate Moderate High Fair
Chromatography RP High High Fair
HIC High High Fair
SIC High High Poor
Affinity High High Fair
Table 1.2. C u rren t purification strategies for DNA
This study focuses on the effects of fluid stress on one particular unit operation: alkaline cell
lysis. Alkaline lysis was considered a suitable unit operation to investigate for two reasons.
Firstly, being the primary recovery step, DNA degradation during lysis affects the entire
downstream process. Secondly, a certain level o f fluid stress is virtually unavoidable during
alkaline lysis as good mixing o f cells and lysis buffer is essential. Because fluid stresses are
inevitable, understanding the effects o f the resultant fluid stress on DNA is essential.
p28

1.3 Alkaline lysis
Plasmid DNA for gene therapy is typically produced in E. coli fermentation (Marquet et al.,
1995; Prazeres et al., 1999; Levy et al., 2000). Following cell harvest, the E. coli cells are
typically resuspended in a Tris-EDTA buffer, pH 8.0 (TE). The Tris maintains a pH o f 8.0
where DNA is most stable (Middaugh et al., 1998; Evans et al., 2000). The EDTA serves two
functions: firstly to disrupt the E. coli cell walls by chelating divalent cations, and secondly the
EDTA reduces DNAase activity which relies on divalent cations as cofactors. Sucrose and
Triton are sometimes added to the resuspension buffer to promote cell lysis (Sambrook et al.,
1989). Following resuspension, the cells are lysed. E. coli cells expressing recombinant
proteins are lysed in the biotechnology industry by using mechanical disruption. However,
Carlson et al. (1995) has shown that mechanical disruption equipment, such as high-pressure
homogenisers, microfluidisers and bead-bills, can cause substantial damage to shear sensitive
plasmid DNA. Instead, E. coli cells expressing plasmid for gene therapy are usually lysed
chemically, using either lysozyme and heat (Lee et al., 1996; Sambrook et al., 1989) or a
variation o f the alkaline-lysis procedure. The alkaline lysis procedure was originally developed
by Bimboim et al. (1979) as a laboratory technique for the rapid isolation o f supercoiled
plasmid DNA, and is generally considered the method o f choice for cell lysis (Prazeres et al.,
1999).
In the first stage o f alkaline lysis, the host cells resuspended in TE buffer are mixed with an
alkali solution o f sodium dodecyl sulphate (SDS). The anionic detergent SDS disrupts all the
non-covalent interactions found in the cell wall (Scopes, 1994). A schematic o f the E. coli cell
wall is shown in
Figure 1.3. Electrostatic interactions between the detergent and the cationic sites o f the cell
wall proteins occur, causing protein dénaturation. Each SDS molecule binds to two amino acids
(Igou, 1974) forming SDS-protein complexes. This solubilises the cell membrane causing the
release o f cellular contents. Ciccolini et al. (1999) reported cell solubilisation times on the
order o f a few seconds. The high pH further enhances protein dénaturation (Creighton, 1993)
and causes the irreversible dénaturation of chromosomal DNA. It is known that supercoiled
plasmid DNA denatures at a slightly higher pH than chromosomal DNA. Bimboim et al. (1979)
reported that for the irreversible dénaturation o f the chromosomal DNA, without dénaturation of
plasmid DNA, the pH should be maintained between 12.0 - 12.6. More recently, Thatcher et al.
(1997) have reported that plasmid DNA molecules useful for gene therapy irreversibly denature
at a pH between 12.1 and 12.9, and plasmid goes from a completely intact supercoiled form to a
completely denatured form over a narrow range of about 0.2 pH units.
p29
In the second stage o f alkaline lysis (neutralisation), the pH of the solution is reduced to a value
close to 5.5 by addition o f ice-cold, 3M potassium acetate, pH 5.5. The increase in ionic
strength causes a salting-out o f the SDS, which together with the pH change causes flocculation
o f SDS, denatured protein, cell wall debris and denatured chromosomal DNA. The supercoiled
plasmid DNA remains in solution. Centrifugation or filtration achieves separation of the floe
from the liquor containing the plasmid DNA. It has been reported by Levy et al. (1999) and
Ciccolini et al. (2002) that the flocculate must be handled under low fluid stress conditions to
avoid returning the precipitated chromosomal DNA from the solid to the liquid phase leading to
increased chromosomal contamination. Although alkaline lysis is universally used, there has
not been any published data on what percentage o f the total supercoiled plasmid DNA, or total
chromosomal DNA is removed during alkaline lysis and neutralisation.
1.3.1 Problems with alkaline lysis
Thatcher et al. (1997) has reported that there is an optimal pH for alkaline lysis that is
dependent on the dénaturation pH o f the plasmid being purified. Alkaline lysis is typically
carried out by the addition o f one volume of resuspended cells to one volume of 0.2 M NaOH,
1% SDS to give a cell lysate in 0.1 M NaOH. Although previous work has reported the
importance o f pH during alkaline lysis, no information on the relationship between NaOH
added versus the final pH in the lysate has been published. Measurement of pH during alkali
addition is complicated by the highly viscous nature o f the cell lysate, which together with the
high concentration o f proteins in the lysate, quickly leads to fouling o f the pH probe making
accurate pH measurement impossible. For a particular plasmid, it is necessary to determine by
trial and error the optimal level o f NaOH to add during cell lysis.
The pH of typical alkaline lysis buffer (0.2 M NaOH, 1% SDS) is pH 13.3. The alkaline lysis
reagent should be added and mixed in such a way that local lysis buffer concentration extremes
are avoided, because supercoiled plasmids are known to denature between pH 12 and 13.
However, to date there has not been a detailed study published on the effect of lysis buffer
concentration and lysis buffer mixing on plasmid yield and purity. In addition, physical damage
to chromosomal DNA in the early stages o f the recovery process may complicate further
downstream recovery and purification of the plasmid DNA, particularly if chromosomal DNA
fragments produced by breakage were comparable to the size o f the plasmid DNA. There have
been conflicting reports that fluid stress during cell lysis may or may not cause increased
chromosomal contamination. Ciccolini et al. (2000) stated that increased fluid stress led to
moderate increases in chromosomal DNA contamination, up to 25% chDNA contamination at a
fluid strain rate o f 760 s '. A study by Chamsart et al. (2001) showed that fluid strain rate up to
p30

760 s' did not lead to chromosomal DNA contam ination greater than 2% after further
downstream purification. However, they did not report on chrom osom al contam ination
im m ediately following alkaline lysis and clarification. Inform ation on chromosomal
degradation and final fragment size is needed in the selection o f the most appropriate recovery
and purification steps following the cell lysis operation.
3:.4060)
pep(iclo^tycan cell wall
t ? C-f'
I p l a s t t i in
ttlasina oienilirane DMA
Figure 1.3 Schematic of E. coli recombinant cell showing structure of cell wall.
For alkaline lysis, the need to ensure uniformity o f com position dem ands a short m ixing time in
the lysis reactor. As the cellular contents are released, the rheology o f the lysis solution alters
from an initially N ew tonian state with a viscosity close to w ater to a non-N ew tonian
viscoelastic state (Ciccolini et al. 1998). Under steady fluid stress, the apparent viscosity is
dominated by the higher m olecular w eight o f chrom osom al DNA, with a m axim um viscosity
value 25 to 30 times that o f water. A chieving adequate m ixing during alkaline lysis, while
avoiding high fluid stresses, is not a trivial problem.
Two principle m ixing strategies have been em ployed for alkaline lysis: stirred tanks and static
mixers, both o f w hich are discussed in greater detail in chapter 2. A lkaline lysis in stirred tanks,
at scales up to 15 L, has already been dem onstrated (Cham sart et al., 2000; Theodossiou et al.
p31
1999; Varley et al., 1999). Chamsart reported that following further purification by Qiagen
purification and alcohol precipitation, the purified product contained a satisfactorily low
concentration of chromosomal DNA (< 2% contamination), together with a satisfactory
supercoiled plasmid yield (1 mg/g wet cell weight). O f the static mixers used for alkaline lysis,
two principle types o f have been used for alkaline lysis: conventional in-line static mixers (Wan
et al., 1998) and an opposed jet mixer (Ciccolini et al., 2000). To date, little has been published
on the performance of either o f these static mixers for alkaline lysis. Ciccolini reported high
clarified lysate purity after using opposed jets for alkaline lysis mixing compared to small scale
mixing in a test-tube. Unfortunately, different batches of cell paste were used in the jet and
non-jet lysis experiments.
1.4 Organisation and aims of the thesis
1.4.1 Aims of the thesis
The principal objective o f this thesis will be to determine the effect of fluid stress on plasmid
and chromosomal DNA degradation to better predict and avoid stress-induced degradation
during large-scale plasmid DNA production. Both laboratory experimentation and
Computational Fluid Dynamics modelling will be performed to achieve this goal. The overall
goal o f the thesis has been broken down into the following 5 steps that are presented separately
in chapters 4 to 8:
1. Develop analytical methods to study DNA in both model systems and manufacturing-
scale equipment (chapter 4).
Current analytical techniques are not sufficient to accurately and rapidly measure plasmid
and chromosomal DNA dénaturation and fragmentation. Novel analytical techniques will
have to be developed to analyse the yield and purity o f plasmid and chromosomal DNA
solutions after fluid mixing, and stress-induced degradation, experiments. Development of
new assays to monitor plasmid degradation under highly dilute plasmid concentrations
would enable plasmids to be used as probes for fluid stress in large-scale equipment.
Probes for fluid stress would be particularly useful where the type and magnitude o f fluid
stress in a particular piece o f equipment is poorly understood.
2. Assess the effect of different types of fluid stress on plasmid and chromosomal DNA
stress-induced degradation (chapter 5).
Knowledge o f the magnitude o f fluid stress is not in itself sufficient to determine levels of
DNA degradation; different types o f fluid stress occur in flowing fluids, and the effects of
p32
the different types o f fluid stress on DNA degradation is currently poorly understood. The
principal types o f fluid stresses are shear stresses, elongational stresses and fluctuating
(turbulent) stresses. Different types and magnitudes o f fluid stress are found in different
pieces o f purification equipment. Experimental and CFD studies using pure plasmid and
chromosomal DNA solutions will be performed to better understand which types o f fluid
stress cause DNA degradation.
3. Determine the required level of mixing during alkaline lysis and the effects of the
resultant fluid stresses on DNA yield and purity (chapter 6).
The required level o f mixing will determine what level of fluid stress will be generated
during alkaline lysis. Previous studies by Levy et al. (1999) and Chamsart et al. (2001)
have looked at the effect o f fluid stresses on alkaline lysis over a narrow range of stresses,
in isolation o f what levels o f fluid mixing and stress are likely to occur during lysis.
Determination of the required level of mixing will require understanding the effects of lysis
buffer on both plasmid and chromosomal DNA dénaturation. After determining the
required fluid mixing, the effect o f the resulting fluid stress on plasmid DNA degradation
and chromosomal DNA fragmentation in alkaline lysates will be examined. The effect of
chromosomal DNA size on its removal during alkaline lysis and clarification will also be
studied.
4. Determine the effect of DNA degradation on downstream purification (chapter 7).
After determining the effect o f lysis mixing and stress on chromosomal DNA dénaturation
and size, studies will be performed to assess how the DNA dénaturation and fragment size
affects subsequent downstream purification operations.
5. Develop an improved alkaline lysis reactor (chapter 8).
After elucidating the mixing requirements and the effects o f fluid stress during alkaline
lysis, a goal o f this work will be to design an improved lysis reactor. The improved reactor
is based on mixing using opposed jets. To fully characterise the mixing rates and stress
levels likely to occur in opposed jets, extensive computational fluid dynamics (CFD)
simulations will be used to model the opposed jet lysis reactor, before testing the device
experimentally.
p33
1.4.2 O rganisation of the thesis
C hap ter 1: The rational for the thesis is presented, along with outline o f thesis.
C hap ter 2: The theory o f fluid mixing and fluid stress is presented, along with a description
into the mechanism o f DNA degradation in fluid stress fields.
C hap ter 3; The theory o f computer modelling and analysis of fluid flows to determine mixing
time scales and stress levels is described. This is followed by a detailed description of the
computer modelling techniques that were used in the thesis to model fluid flows in capillaries
and in opposed jets.
C hapters 4 to 8: Experimental results are presented (refer to previous section for chapter
descriptions). Each chapter is divided into:
i) A brief summary of results
ii) An introduction to the studies performed in the chapter
iii) Description o f the Materials and Methods used
iv) Presentation of results
v) Discussion o f results.
C hap ter 9: The methodologies used in this thesis are discussed. The results from all the
previous chapters are amalgamated and examined with respect to designing DNA purification
processes.
C hap ter 10: The conclusions o f this thesis are presented along with potential future work for
which this thesis provides a foundation.
p34
2 Mixing and stress in fluidsThis thesis investigates the effects of fluid mixing and fluid stresses on DNA degradation during
DNA purification processes. In this chapter, the theory o f fluid mixing and fluid shear will be
described. In this thesis, three different pieces o f equipment, stirred tanks, opposed jets and
capillaries, are used in mixing or shear experiments. Fluid mixing and fluid shear theory
specific to each of these devices will be also described. Finally, the current knowledge of the
effect o f fluid stress on DNA macromolecules will be presented.
2.1 Introduction
In many biochemical engineering unit operations fluid mixing is a critical process parameter.
An example of a unit operation where mixing is believed to play an important role is the
alkaline lysis step in DNA purification, discussed in chapter 1, 6 and 8. However, due to
intermolecular forces between fluid molecules all types o f fluid flow generate internal fluid
forces. These internal fluid forces, acting between planes o f moving fluid, are usually reported
on a force per unit area basis, which is defined as fluid stress. More rapidly flowing fluids or
move viscous fluids generate higher levels o f fluid stress within the fluid. These fluid stresses
not only act between planes o f solvent molecules, but also act on solute molecules. Because the
vast majority o f organic and inorganic molecules are small relative to the local variation of fluid
stress, the fluid stress across most molecules is uniform, causing no net deformation o f the
molecule. However, DNA is such a large molecule that internal fluid stresses can actually cause
molecular stretching, leading in extreme cases to chain scission. Hence, the downstream
processing o f DNA is complicated considerably because high levels o f fluid stress must be
avoided. For unit operations such as alkaline lysis, where mixing is important, avoiding DNA
fragmentation is difficult. A thorough understanding o f the fluid mixing requirements, and the
resulting fluid stress effects on DNA breakage, is essential in designing appropriate mixing
equipment.
2.2 Fluid mixing
The theory of fluid mixing is described, followed by more detailed descriptions of fluid mixing
in stirred tanks and opposed jets which are relevant to alkaline lysis.
2.2.1 Theory of fluid mixing
In all liquid-mixing devices, it is necessary to have two elements. Firstly, there must be overall
bulk or convective fluid flow so that no stagnant regions exist within the device. Secondly,
there must be an intensive or high-stress mixing region that is capable o f providing the
reduction in inhomogeneities required. Both these processes require energy to sustain them, the
p35
energy being finally dissipated as heat. In most fluid flow situations, mixing regimes may be
characterised as laminar or turbulent. Laminar flow is associated normally with high viscosity
liquids. At typical rates o f energy input, viscosities greater than about 10 Pa s are required if
the flow is to be truly laminar (Hamby et al., 1992). The solution viscosity during DNA
purification will be significantly lower than this (0.001 - 0.030 Pa s), so that flow will generally
be turbulent.
According to Kolm ogoroff s theory of isotropic turbulence, turbulent motion in a fluid can be
considered as a superposition of a spectrum o f velocity fluctuations and eddy sizes on an overall
mean flow (Levich, 1962). The large primary eddies have large velocity fluctuations of low
frequency. Interaction o f the large eddies with slow-moving streams produces smaller eddies of
high frequency which further disintegrate until finally they are dissipated into heat by viscous
forces. In turbulent fluids, it is very difficult to model the transport phenomena in full physical
detail. Qualitatively, however, the following sequence may be visualised after the feed streams
have met (Hamby et al., 1992).
(a) Distributive mixing. Relatively large eddies exchange positions and convect material so that
macroscopic uniformity of concentration results.
(b) Dispersive mixing. The larger eddies decay in size through the effect of turbulent shear and
a finer-grained mixture is formed. At molecular scale the mixture remains, however, highly
segregated.
(c) Diffusive mixing. Diffusion within the finely dispersed structure operates over short
distances and proceeds to randomise the mixture at the molecular scale, forming a
homogenous mixture.
An indication o f whether a fluid flow will be laminar or turbulent is obtained by calculating the
appropriate Reynolds number for that type o f flow. The Reynolds number is the ratio o f the
inertial to viscous forces (the ratio of the forces causing chaotic motion to the forces
suppressing chaotic motion). Analytical expressions for Reynolds number have been
determined for a wide range o f flow devices, such as pipes, mixing tanks, and jets. Provided the
Reynolds number of the main flow is high enough, Kolmogoroff s theory of local isotropic
turbulence can be used to give some insight into a turbulent flow. Kolmogoroff argued that for
large Reynolds number the smallest eddies are independent of the bulk fluid motion, are
isotropic, and are a function of the local energy dissipation rate (e ) and the kinematic viscosity
(v = |i/p). From dimensional reasoning, the size o f the smallest eddies (the Kolmogoroff length,
^k) is defined as:
p36
%k = [ v ' / E m « r
Equation 2.1
Micro-mixing which is particularly dependent on turbulent eddy size and their associated forces
are likely to be well correlated by energy dissipation rate (Hamby et al., 1992). High turbulent
energy dissipation creates small eddies (from Equation 2.1) leading to faster mixing by
diffusion. The time taken for diffusion to completely mix a species (t) can be related to the size
of the smallest eddies divided by the diffusion rate (D) o f that species, and is given by,
tmicro “ 0.5 7 ^ I AY)
= (v'/"/8D ).
Equation 2.2
For example, if a dilute solution of NaOH (D = l.S x lC ’ mVs) is mixed with water (|i = 1 mPa s,
p = 1000 kg/m^ ) such that the rate of turbulent energy dissipation is 1 W/kg, the Kolmogoroff
length will be about 30 microns and the micro-mixing time will be about 80 ms. In summary,
rapid mixing is best achieved by ensuring high levels o f turbulent energy dissipation.
2.2.2 Mixing in stirred vessels.
Macro-mixing
Mixing time in a stirred tank is a function o f many factors including the geometry and scale o f
the reactor and its operational parameters as well as the physical properties of the fluids. For
geometrically similar vessels, the overall mixing time (distributive mixing time) can be
correlated with the average energy dissipation in the vessel. For example, in fully turbulent
flow in a mechanically agitated vessel (Re> 10,000), Voit et al. (1988) recommend that the
macro-mixing time, tvessei may be calculated from
fvessel 2.3 . Dvessel • average
Equation 2.3
Dyessei is the vessel diameter and e average is the average energy dissipation rate in the vessel. This
equation predicts that as a vessel increases in size, the average energy dissipation rate must
increase to maintain the same macro-mixing time. The average energy dissipation rate in a
stirred vessel can not be directly measured, but can be determined from the power input (P) to
the vessel, where
average ~ P / P Vvessei-
Equation 2.4
For a given geometrically similar vessels and impellers, under turbulent flow conditions
(Coulson et al. 1991), the power input to a stirred tank is related to the impeller speed (N) by
p37
p / p n ’ = k”
Equation 2.5
k” is an experimentally determined constant for a geometrically similar tank-impeller system.
Typical values o f k” are 1 to 5 for a Rushton turbine in a baffled vessel. Hence, based on a
certain overall mixing time requirement, one can calculate the required average energy
dissipation and impeller speed. Typical values of energy dissipation in stirred tanks range from
about 0.2 W/ kg for blending low viscosity liquids, to 4 W/kg for blending pastes and dough
(Hamby et al., 1992). Combining Equation 2.3, Equation 2.4 and Equation 2.5, the macro
mixing time in a stirred tank is inversely proportional to the impeller speed.
vessel tX N
Equation 2.6
Therefore to maintain constant macro-mixing time in different size stirred tanks, simply
maintain the same impeller speed, noting that the power input will increase rapidly as Dyessei -
The flow in a stirred tank is usually turbulent at Reynolds numbers greater than about 1000 to
10000. The Reynolds number (Re), for a stirred tank, is defined as
Re ~ p N Dimpeller / M-
Equation 2.7
M icro-mixing
The energy dissipation in a stirred tank is not uniform, but varies from a maximum near the
impeller to a minimum in the tank extremities. The energy dissipation close to the impeller is
typically 10 to 100 times higher than the average tank energy dissipation,
^max k £av
Equation 2.8
A value for e^ax / £av of 40 is reported for Rushton turbines (Yim et al., 2000) and used in
subsequent calculations. If two solutions are being mixed in a stirred tank, and the solution
being added is fed directly into the impeller, then a considerable amount of micro-mixing
(dispersive and diffusive mixing) will occur while the fluid remains in the region close to the
impeller. This can considerably improve the mixing in a stirred tank for the same overall
power input. Note that the micro-mixing time is only a function o f the energy dissipation rate
near the impeller. Equation 2.2. Therefore, the energy dissipation rate in a stirred tank does not
have to increase as the tank increases in size to maintain a constant micro-mixing time. Thus,
maintaining constant mixing time requires less power, than maintaining a constant macro
mixing time, upon scale-up o f a stirred tank; this is demonstrated in Figure 2.1.
p38
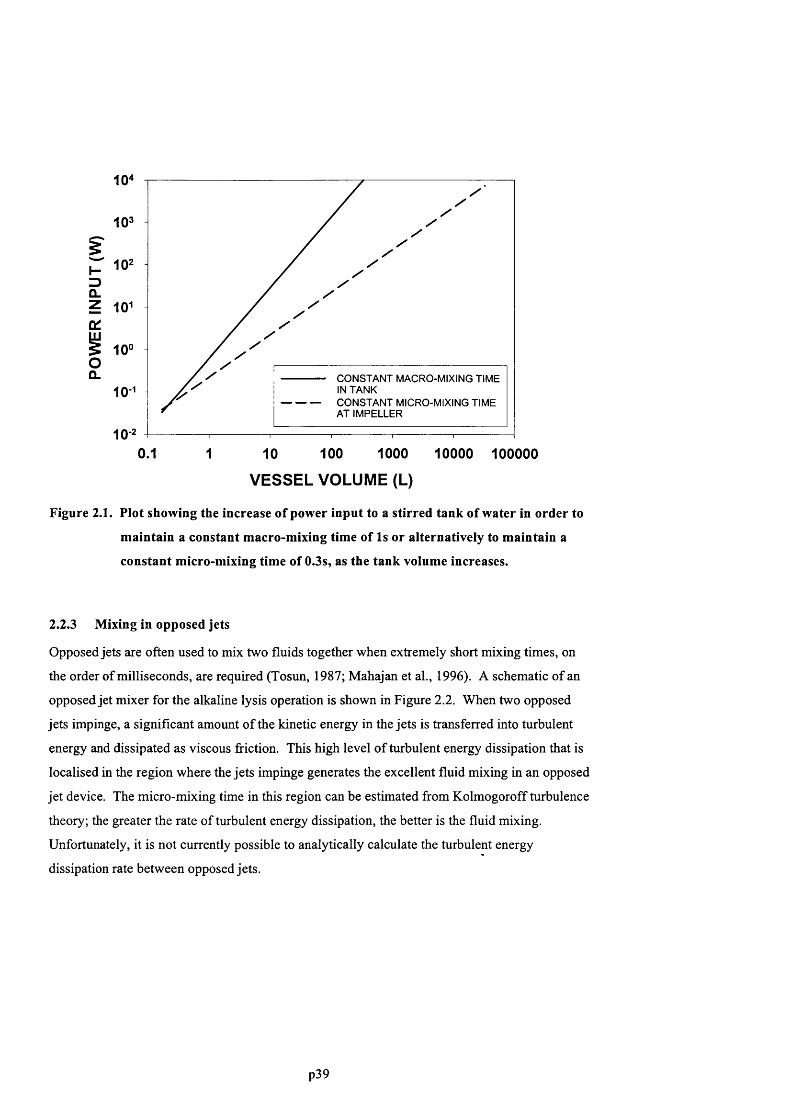
r3û_
10°oQ. CONSTANT MACRO-MIXING TIME
IN TANKCONSTANT MICRO-MIXING TIME AT IMPELLER
0.1 100 1000 10000 1000001 10
VESSEL VOLUME (L)
Figure 2.1. Plot showing the increase of power input to a stirred tank of water in order to
maintain a constant macro-mixing time of Is or alternatively to maintain a
constant micro-mixing time of 0.3s, as the tank volume increases.
2.2.3 Mixing in opposed jets
Opposed jets are often used to mix two fluids together when extremely short mixing times, on
the order of milliseconds, are required (Tosun, 1987; Mahajan et al., 1996). A schematic o f an
opposed Jet mixer for the alkaline lysis operation is shown in Figure 2.2. When two opposed
jets impinge, a significant amount o f the kinetic energy in the jets is transferred into turbulent
energy and dissipated as viscous fi-iction. This high level o f turbulent energy dissipation that is
localised in the region where the jets impinge generates the excellent fluid mixing in an opposed
jet device. The micro-mixing time in this region can be estimated from Kolmogoroff turbulence
theory; the greater the rate of turbulent energy dissipation, the better is the fluid mixing.
Unfortunately, it is not currently possible to analytically calculate the turbulent energy
dissipation rate between opposed jets.
p39
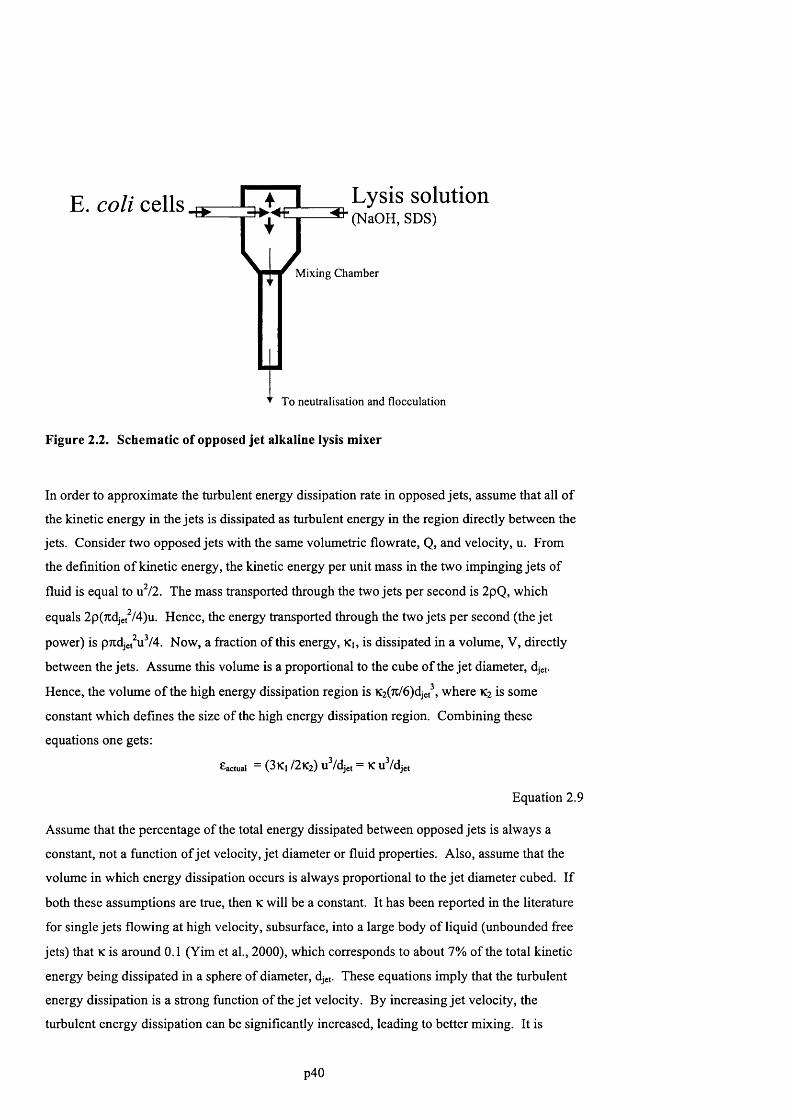
E. c o l i c e l l s ^ - G P L _ Lysis solutionaM ixing Chamber
To neutralisation and flocculation
Figure 2.2. Schematic of opposed jet alkaline lysis mixer
In order to approximate the turbulent energy dissipation rate in opposed jets, assume that all o f
the kinetic energy in the jets is dissipated as turbulent energy in the region directly between the
jets. Consider two opposed jets with the same volumetric flowrate, Q, and velocity, u. From
the definition o f kinetic energy, the kinetic energy per unit mass in the two impinging jets of
fluid is equal to u^/2. The mass transported through the two jets per second is 2pQ, which
equals 2p(7cdjet^/4)u. Hence, the energy transported through the two jets per second (the jet
power) is p7idjet"uV4. Now, a fraction o f this energy, K,, is dissipated in a volume, V, directly
between the jets. Assume this volume is a proportional to the cube o f the jet diameter, djet-
Hence, the volume o f the high energy dissipation region is K2(7c/6)djet , where K2 is some
constant which defines the size of the high energy dissipation region. Combining these
equations one gets:
Eactual = (3 K ] /2 K 2 ) u V d je , = K u V d jet
Equation 2.9
Assume that the percentage of the total energy dissipated between opposed jets is always a
constant, not a function o f jet velocity, jet diameter or fluid properties. Also, assume that the
volume in which energy dissipation occurs is always proportional to the je t diameter cubed. If
both these assumptions are true, then K will be a constant. It has been reported in the literature
for single jets flowing at high velocity, subsurface, into a large body o f liquid (unbounded free
jets) that K is around 0.1 (Yim et al., 2000), which corresponds to about 7% of the total kinetic
energy being dissipated in a sphere of diameter, djef These equations imply that the turbulent
energy dissipation is a strong function of the jet velocity. By increasing je t velocity, the
turbulent energy dissipation can be significantly increased, leading to better mixing. It is
p40

important to note that there is very limited data available on the performance of opposed jets, or
the applicability o f Equation 2.9 to predict jet mixing. Therefore additional investigations are
required to understand the performance of opposed jets.
Once the turbulent energy dissipation is known, the micro-mixing time, tmicro can be estimated
from Kolmogoroff turbulence theory by combining Equation 2.2 and Equation 2.9:t m A 1/2tmicro tX U Ojet
Equation 2.10
The Reynolds number for opposed jets is defined as,
RCjet = p u d je t /p .
Equation 2.11
The jet velocity is u and djjet is the jet nozzle diameter. A jet is fully turbulent at a jet Reynolds
number, Rcjet o f 1000-2000, and laminar below 50-1000 (Unger at al. 1998, Unger et al. 1999).
Applying Equation 2.1, Equation 2.2 and Equation 2.9, 12 mm ID opposed jets of water (p = 1
mPa s, p = 1000 kg/m^) at 3 m/s jet velocities will have an energy dissipation of 225 W/kg. This
energy dissipation rate corresponds to a Kolmogoroff length and a micro-mixing time o f 8
microns and 5 ms, respectively, assuming K= 0.1. One can see that the micro-mixing time for
opposed jets has the potential to be very short. Based on these rough analytical calculations,
energy dissipation between 10 to 100 W/kg in an opposed jet mixer should provide very fast
mixing (< 1 s).
2.3 Fluid stress
Short mixing times are achieved by ensuring high levels o f turbulence in the region o f fluid
mixing. This can be achieved using high impeller speeds in stirred tanks or high jet velocities in
opposed jets. The following section describes how turbulent energy dissipation rate, impeller
speed, jet velocity and fluid velocity gradients relate to the fluid stresses within fluids being
mixed.
2.3.1 Calculation of fluid stresses.
Fluid stresses arise when the fluid is strained (made to flow). The stress (force per unit area) in
a flowing fluid is caused by the interactions o f fluid molecules moving relative to each other
that arise when the fluid is deformed (strained). There are three principal types o f fluid stress
(t) which are o f interest for this thesis: 1) shear stresses, 2) elongational stresses and 3)
p41

chaotically fluctuating (turbulent) stresses. The shear stress on a fluid element is the force per
unit area acting parallel to the surface of the fluid element. The elongational stress on a fluid
element is the force per unit area acting perpendicular to the surface o f the fluid element.
Turbulent stresses consist of a rapidly changing, random fluctuations of both stresses.
If there are stresses present in a flowing liquid, and that liquid contains macromolecules, the
macromolecules will experience the stress, causing the macromolecules to deform. This change
in macromolecular conformation generates strain at the molecular level that can result in
fracture o f macromolecules if the molecular strain is sufficiently high. To calculate whether a
specific macromolecule, such as a piece of DNA, will break in a flowing liquid, we need to
know the magnitude o f stress that causes the piece of DNA to break and compare that to the
magnitude o f the stresses that are present in the liquid. Hence, it is important to be able to
calculate the fluid stresses in a flowing fluid.
Stresses occur in fluids when the fluids are strained, and the stress in the fluid can be calculated
based on the strain. The relationship between stress and strain in a material is known as the
constitutive relation for that material and this relationship can be very different depending on
the fluid. For liquids, the simplest constitutive equation is Newton’s law of viscosity, which
says that the stress at a point in a fluid is directly proportional to the rate of straining at that
point. The rate o f straining at a point is equal to the change o f fluid velocity (velocity gradient)
at that point. By convention, if a fluid element is being strained perpendicular to the direction
o f fluid motion, then the fluid element is undergoing shear strain (y) and is experiencing a shear
stress. I f the fluid element is being strained in the direction the fluid is moving, then the fluid
element is undergoing elongational strain (e) and experiencing an elongational stress. For many
liquids, the shear stress (ts) is proportional to the shear strain rate (y’) and the elongational stress
(Xe) is proportional to the elongational strain rate (e’)
Is = l^y’ (y’ = dy/dt = dVx /dy).
T e = 3 |ie’ (e’ = de/dt = dV^/dx).
Equation 2.12
The constant o f proportionality |i, is called the viscosity o f the solution. is the velocity o f
the fluid in the x-direction, y is the direction perpendicular to the x-direction. Any fluid that
obeys this law is known as a Newtonian fluid (Macosko, 1994). In general, the Newtonian
constitutive equation accurately describes the rheological behaviour of low molecular weight
liquids or dilute aqueous solutions. Knowing the velocity gradient at a point in an aqueous
solution, and knowing the solution viscosity, the fluid stress can be easily calculated from
Newton’s Law.
p42
In addition to the shear and elongational stresses caused by the mean velocity gradient,
turbulent stresses arise due to the additional velocity fluctuations, V (u’ ), that are present in the
flow when there is turbulence. As explained in section 2.2.1 on turbulent mixing, turbulent
fluid flow can be considered as a superposition o f a spectrum o f velocity fluctuations and eddy
sizes on an overall mean flow. The resulting turbulent stresses are partly shear and partly
elongational in character. The magnitude o f stress that a particle experiences is determined
primarily by eddies o f a size comparable to that o f the particle. In the velocity field o f the
determining eddies, the particles experience a dynamic stress according to the Reynolds stress:
Xt = p V (u’ )
Equation 2.13
The relevant equations for determining particle stress (X p), which is dependant on the size o f the
particles (dp) relative to the eddy size (Àk), are (Henzler, 2000):
Xp = 0.0676 p(ve)'^^ (dp / Xk) < dp < 6A.k dissipation range
Xp = 0.22 p(ve)'^^ (dp / Xk)"* 6Xk < dp < 25X,k transition range
Xp = 1.9 p(ve)'^^ (dp / dp > 25Xk inertial range
Equation 2.14
Therefore knowing the particle size and the energy dissipation rate, one can calculate the stress
on a particle. In general, the smaller a particle, the smaller turbulent stress it will experience.
For particles smaller than the Kolmogoroff length, such that they are contained within the
smallest eddies, a rough estimate of the mean turbulent strain rate the particles experience can
be made from the turbulent energy dissipation and kinematic viscosity (Cherry, 1990).
Xt = (e / v)
Equation 2.15
For most polymeric liquids, emulsions and concentrated suspensions, viscosity (p) is not a
constant and is a strong function of the strain rate. Also, many polymeric liquids show time
dependence in their elastic response. This time-dependent response is known as viscoelasticity
and is typical o f all polymeric liquids such as concentrated DNA solutions (Macosko, 1994).
This can significantly complicate fluid stress calculations and frequently only rough estimates
of fluid stress can be made for viscoelastic fluids.
2.3.2 Overview of fluid flows in purification equipment and their associated stresses
As already described, there are 3 principal types o f fluid stress. These shear, elongational and
turbulent fluid stresses can have different effects on DNA molecules in solution, as discussed in
section 2.4. The magnitude o f these stresses will depend on the type o f fluid flow.
p43
(a) Shear flows
A shear flow, where the velocity gradient is perpendicular to the flow direction, is the type o f
fluid flow that occurs within a pipe or between rotating disks under laminar conditions.
Individual fluid elem ents undergo periodic stretching and com pression, while sim ultaneously
rotating in this type o f flow. The stress in a Newtonian fluid is proportional to the strain rate, T =
PY’. N on-Newtonian fluids, such as concentrated DNA solutions can undergo significant shear
thinning (decrease on solution viscosity) at high strain rates, due to the molecules re-orienting in
the flow field (M acosko, 1994).
(b) Elongational Flow
An elongational flow occurs when the velocity gradient is in the same direction as the flow
direction. This type o f fluid flow occurs in nozzles, capillary entrances, jets, and pumps and
between beads in chrom atography columns. Individual fluid elem ents undergo significant
stretching in the flow direction. The stress in a Newtonian fluid is proportional to the
elongational strain rate (e ’), but the constant o f proportionality is 3 times larger, t = 3p£’, than
for laminar shear flow (M acosko, 1994). Non-newtonian fluids, such as solutions o f polym ers,
can undergo significant shear thickening at high elongational strain rates, due to the m olecules
re-orienting and lining up in the flow field. This shear thickening increases the stress pulling
m acrom olecules apart.
(c) Turbulent Flow
Turbulent flows are present in alm ost all biochem ical engineering equipment, while laminar
flow exists only in boundary layers which often are o f subordinate importance'^ The stress that a
particle experiences will vary considerably depending on the size o f the particle. I f particles are
sufficiently small they will be convected within turbulent eddies and not experience the
turbulent stresses between eddies. For smaller DNA molecules like plasmids, high levels o f
energy dissipation are required to produce eddies sufficiently small to stress the plasmids.
Large chrom osom al DNA can experience significant levels o f fluid stress even at low turbulent
energy dissipation rate.
Table 2.1 shows the types o f fluid stresses that occur within some commonly used industrial
processing equipm ent, relevant to plasmid purification. D ifferent equipment generates different
m agnitudes and types o f fluid stresses. Frequently, different types o f fluid stresses are found at
different locations within the same piece o f equipment. By careful design and operation o f
equipment, different fluid stresses can often be m axim ised or minimised.
p44

Equipm ent Elongational Stress Shear Stress T urbulen t Stress
Stirred tanks Low levels At impeller In bulk fluid
Opposed Jets Between jets Low levels Between jets
Centrifuges At feed, discharge Against bowl Against walls
Crossflow filters At entrance Within filter Within filter
Chromatography columns Between beads Between beads Low levels
Filling Needles At entrance Within Needle Within Needle
Table 2.1. D ifferent fluid stresses that occur with Industrial puriflcation equipm ent.
2.3.3 Fluid stresses in stirred vessels
The principal form o f fluid stress in stirred vessels is turbulent stress due to turbulent fluid
mixing. The magnitude o f turbulent stress increases with increased energy dissipation rate,
Equation 2.14. The energy dissipation is determined by the power input to the reactor, which is
a function o f the impeller speed and size. Equation 2.4 and Equation 2.5. Even at very high
average energy dissipation rates for a stirred tank , Eaverage = 10 W/kg, the size of the smallest
eddies far from the impeller, are always larger than about 20 microns. Equation 2.1. Close
to the impeller the energy dissipation rate can be 10 to 100 times higher than the average energy
dissipation, but eddies close to the impeller would still be at least 5 microns in size, significantly
larger than the size o f small plasmids (< 1 pm). As described previously, particles will not
experience significant levels o f turbulent stress if the particles are smaller than the smallest
turbulent eddies. Therefore small plasmid would probably not be affected by turbulent stresses
in stirred vessels. Larger macromolecules, such as chromosomal DNA and large plasmids
would be affected by turbulent stress.
The other form of fluid stress in stirred tanks is due to stress in the fluid boundary layer of the
impeller. For turbulent boundary layers, the formulae for wall shear stress on a rotating
impeller blade in a stirred tank is:
Xbi = 0.029 p vtip (p Vtip L /
Equation 2.16
Here, L is the distance from the leading edge o f the impeller, and V,ip is the impeller tip speed o f
the impeller.
p45

2.3.4 Fluid stresses in opposed jets
The fluid stresses in opposed jets are from a combination o f turbulent and elongational strain
rates. The elongational strain rate, e ’, at the stagnation point between opposed jets can be
roughly estimated assuming the jets behave like a point-sink flow (Odell, 1994):
e’ = u / z
Equation 2.17
u is the jet velocity and z the jet separation. If jet energy dissipation rate. Equation 2.9, is kept
constant, then this equation will predict that the elongational strain rate will decrease as the jet
size increases, assuming the jet separation is kept proportional to the jet diameter.
As well as the stresses due to elongational deformation of the fluid, there are turbulent stresses
due to the turbulent nature of the fluid flow between the jets. The turbulent stresses are
calculated from the energy dissipation rate and the particle size, using Equation 2.9 and
Equation 2.14.
2.3.5 Fluid stresses in capillaries
All the types o f fluid stress (shear, elongational and turbulent) can occur at the entrance to, and
within, capillaries. At Reynolds numbers (Re = pvd/p) below about 2000, the stress inside the
capillary is due to laminar shear; the maximum shear ( iw a ii) occurs along the inside walls of the
capillary and is given by (Coulson, 1991).
"twall, laminar |1 8 U / d
Equation 2.18
For Reynolds numbers above 4000, the flow inside the capillary is fully turbulent. The highest
stress occurs in the boundary layer next to the capillary wall, which is given by
Twall, turbulent = 0.0396 \l (p U ^ ) Re"° ^
Equation 2.19
As well as the shear stress inside the capillary, if the diameter o f the capillary is much smaller
than the diameter of the flow upstream, there is elongational stress at the entrance to the
capillary as the fluid accelerates. There is not an exact analytical solution for the flow at the
entrance to a capillary. If the diameter of the capillary is small compared to the upstream flow
diameter, the flow can be approximated by a point sink flow (Metzner, 1970), as shown in
Figure 2.3. The elongational strain rate in a point sink flow is:
p46
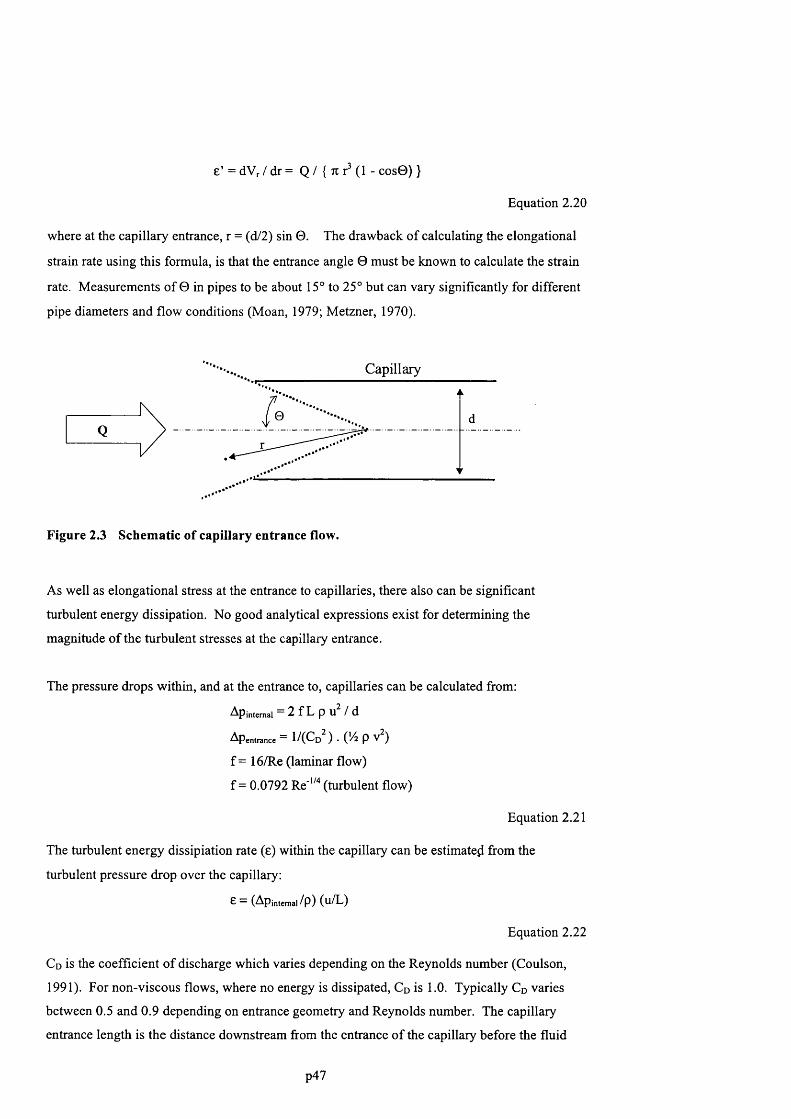
e’ = dVr / d r = Q / {7: ( 1 - cos0) }
Equation 2.20
where at the capillary entrance, r = (d/2) sin 0 . The drawback of calculating the elongational
strain rate using this formula, is that the entrance angle 0 must be known to calculate the strain
rate. Measurements of 0 in pipes to be about 15° to 25° but can vary significantly for different
pipe diameters and flow conditions (Moan, 1979; Metzner, 1970).
C apillary
Figure 2.3 Schematic of capillary entrance flow.
As well as elongational stress at the entrance to capillaries, there also can be significant
turbulent energy dissipation. No good analytical expressions exist for determining the
magnitude o f the turbulent stresses at the capillary entrance.
The pressure drops within, and at the entrance to, capillaries can be calculated from:
Apintemal = 2 f L p uV d
Apentrance “ 1 / ( C d ^ ) - ( % P V^)
f = 16/Re (laminar flow)
f = 0.0792 Re"' ' (turbulent flow)
Equation 2.21
The turbulent energy dissipiation rate (e) within the capillary can be estimate^ from the
turbulent pressure drop over the capillary:
E — (Apintemal/p) (u/L)
Equation 2.22
Cd is the coefficient o f discharge which varies depending on the Reynolds number (Coulson,
1991). For non-viscous flows, where no energy is dissipated, Cd is 1.0. Typically Cd varies
between 0.5 and 0.9 depending on entrance geometry and Reynolds number. The capillary
entrance length is the distance downstream from the entrance o f the capillary before the fluid
p47
velocity distribution is no longer is affected by the capillary entrance, and is given by (Coulson,
1991):
ALentrance = 0.06 d Re (laminar flow)
= 4.4 d Re'^^ (turbulent flow)
Equation 2.23
Applying Equation 2.1 and Equation 2.20 to Equation 2.22 to a flow of water through a 0.25
mm ID capillary at 80 ml/min, then the Reynolds number is 6700, the predicted turbulent wall
stress is 3000 Pa and the average energy dissipation rate within the capillary is 1.3x10^ W/kg.
This level o f turbulent energy dissipation corresponds to a Kolmogoroff length o f 0.9 microns.
At the capillary entrance the elongational strain rate is 1x10^ s ’. Hence, capillaries are capable
o f generating very high stresses and energy dissipation rates.
2.4 DNA degradation by fluid stress
In the previous section, fluid mixing requirements in industrially relevant mixing equipment
were described, as well as the fluid stresses and strains that were likely to be generated. In this
section, the structure of DNA molecules in solution is described, followed by likely effects o f
the different types of fluid stresses (elongational, shear and turbulent) on the DNA polymer.
2.4.1 DNA conformation in stagnant solution
A polymer chain, such as a fragment of DNA, adopts a random-coil conformation in stagnant
solution, a prolate ellipsoid in shape (Sole et al., 1971). The radius o f gyration of this coil can
be several orders o f magnitude smaller than the contour length (stretched-out length) o f the
molecule (Nguyen et al., 1992; Macosko, 1994). Table 2.2 gives some properties o f 3 DNA
molecules o f different sizes: a linear E. coli chromosome, a 50 kb chromosomal fragment, and
plasmid pSVp. The equations and constants used to calculate these values shown are shown in
Table 2.2 and Table 2.3. All three molecules would typically be present during pSVP
purification from E. coli host.
The sizes o f the molecules, in terms of contour length or radius o f gyration, are substantially
different. The relaxation time, which is a measure o f how quickly the molecule returns to its
equilibrium conformation after being deformed, is significantly longer for the larger molecules
(Rouse, 1953). Hence, larger molecules will more easily deform and stretch under the influence
of stress. The coil-overlap concentration is, as the name implies, the concentration o f DNA at
which the total volume enclosed by all of the DNA random-coils is greater than the volume of
the solution, therefore the coils overlap, and entangle. Due to their large size, chromosomal
DNA coils will overlap and entangle with each other, even at low concentrations, while plasmid
p48
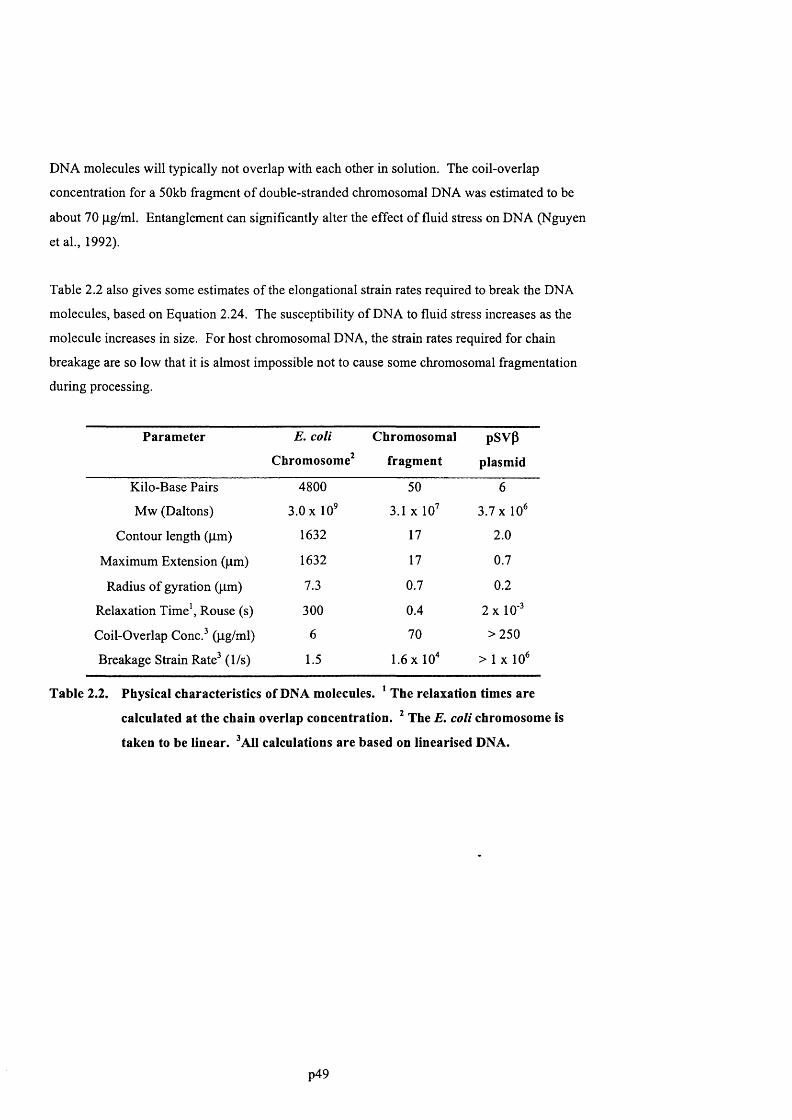
DNA molecules will typically not overlap with each other in solution. The coil-overlap
concentration for a 50kb fragment o f double-stranded chromosomal DNA was estimated to be
about 70 p.g/ml. Entanglement can significantly alter the effect of fluid stress on DNA (Nguyen
et al., 1992).
Table 2.2 also gives some estimates o f the elongational strain rates required to break the DNA
molecules, based on Equation 2.24. The susceptibility of DNA to fluid stress increases as the
molecule increases in size. For host chromosomal DNA, the strain rates required for chain
breakage are so low that it is almost impossible not to cause some chromosomal fragmentation
during processing.
Parameter E. coli
Chromosome^
Chromosomal
fragment
psvp
plasmid
Kilo-Base Pairs 4800 50 6
Mw (Daltons) 3.0 X 10* 3.1 X 10^ 3.7 X 10^
Contour length (jim) 1632 17 2.0
Maximum Extension (pm) 1632 17 0.7
Radius o f gyration (pm) 7.3 0.7 0.2
Relaxation Time', Rouse (s) 300 0.4 2 X 10 3
Coil-Overlap Conc.^ (pg/ml) 6 70 >250
Breakage Strain Rate^ (1/s) 1.5 1.6 X 10" > 1 x 1 0 *
Table 2.2. Physical characteristics of DNA molecules. ' The relaxation times are
calculated at the chain overlap concentration. The E. coli chromosome is
taken to be linear. ^All calculations are based on linearised DNA.
p49

Param eter Value or Equation R ef.
Solvent temperature, T 298 K
Solvent viscosity, Ps 0.001 Pa s
Boltzmann constant, k 1.38x 10'^ J/K
Avogadro’s Number, Nav 6.02E+23 molecules mol ’
Fox-Flory constant, 0 2.25E+23 m of' 1
Number o f DNA base pairs, Ng? 4,000,000 or 50,000 or 6,000
Molecular weight base pair, Mwbp 623 Daltons 2
Axial rise between base pairs, Hgp 0.34 nm 2
Persistence Length o f DNA, Lp 50 nm 3 ,4
Expansion factor for solvent effects 30%
Force required to break ds-DNA chain, Fbreak 450 pN 5
6 kb Plasmid diffusion coefficient, D 4.11E-08 cm^ s ’ 6
Molecular weight molecule, Mw Ngp * M wbp
Contour Length, Lcomour Ngp * Hgp
Maximum extension of intrawound superhelix 2-"'" * Lcontour 7
Length of Kuhn Statistical Rod, Lrod 2Lp 1
Number o f Kuhn Statistical Rods, Nrod Lcontour ! Lj-od 1
End-to-end distance, Ree (l+Ef)*N,od°-^ ♦ Lrod 1
Radius o f Gyration, Rq 6-’'" * Ree 1
Volume of DNA coil, Vdna (0 /2 .5 * N av) * R ee' 1
Coil overlap concentration, c Mw / Vdna*Nav 1
Elongational strain rate to break chain, Ebreak 12 * Fbreak ! (Ps Lcontour )
Intrinsic viscosity, [p.] = 0 Ree / Mw 1
Chain Relaxation time (Zimm model), tzimm — 0.95[p,]psMw/RT 1
Chain Relaxation time (Rouse model), tgouse = 0.61[p]p,sMw/RT 1
Closed chain relaxation time (Rouse), tdosed = D / 2 R^o 6
Table 2.3. L ist of equations and constants used to calculate values in Table 2.2.
p50
Ref. N um ber Reference
1 Nguyen et a l , 1992
2 Abeles et a l , 1992
3 Smith et a l , 1996
4 S trick et a l , 1998
5 Noy et a l , 1997
6 Fishman et a l , 1996
7 Langowski et a l , 1989
8 Odell et a l , 1994
Table 2.4. References to equations used in Table 2.3.
2.4.2 DNA degradation by elongational fluid stress
In dilute solutions, mechano-chemical reactions are restricted to polymers due to the unique
propensity o f polymers to store free-energy upon deformation and to sustain a high level of
stress for a time sufficiently long for chemical reactions to occur. It was shown theoretically by
De Germes (1974) that elongational flow with a velocity gradient parallel to the direction of
flow, is capable o f achieving a large degree of molecular coil extension. A polymer in
elongational flow begins to deform when the force due to hydrodynamic friction across the
molecule exceeds the entropie elasticity that tends to coil it. If the extensional flow is o f
sufficient duration, called quasi-steady flows (QSS), the DNA chains will have time to unravel
and will eventually break in a highly stretched state. An example o f such a flow would be the
flow between opposed jets, or in a bead mill. For a fully extended macromolecule aligned with
the flow, simple calculations by Frenkel (1944) using Stoke's Law for a stretched out chain o f
beads o f total length L, in a steady extensional flow (e’), gave a parabolic distribution o f force
along the chain, the maximum at the centre where scission occurs preferentially. The force on
the molecule, at the midpoint of the chain is given by:
F max — |1 E ’ L ^
Equation 2.24
Ki is 0.085 to 0.100 for DNA (Odell et al., 1994; Bird et al., 1977). Thus, the strain rate at
which the molecule breaks decreases significantly as its molecular weight increases, refer to
Table 2.2. Because the molecule is fully stretched-out, the following relationship between
strain rate at fracture (e’f) and molecular weight was predicted by Frenkel:
p51

e’f a 1/Mw^
Equation 2.25
Atkins et al. (1992), using a QSS flow in opposed jets, observed that DNA molecules break
almost exactly in half which was predicted by Frenkel. They observed breakage o f 1-DNA at
strain rates at and above 6,000 s '. Using Equation 2.24, the stretching force on 50 kb X- DNA
in a constant flow field of 6,000 s ' is about 420 to 490 pN, using an extensional viscosity for
water o f 3 mPa s. In comparison, when individual DNA molecules were stretched using either
microscopy (Noy et al., 1997) or surface tension (Bensimon et al., 1995), the force necessary to
break double-stranded DNA was estimated to be between 500 to 900 pN. Based on the strength
o f the covalent bonds in the backbone of DNA, the strength o f a DNA molecule should be about
5000 pN.
Most elongational flows, however, are short in duration and are called fast transient (FT) flows.
Examples o f FT flows are the entrance flows in syringes and orifices, the flows between beads
in chromatography columns, between the pores in filters, between the lobes o f rotary lobe
pumps and in the entrance regions to cross-flow filters. Davison et al. (1959) performed the
first experiments on stress-induced scission o f DNA by forcing DNA solutions through narrow
syringes. In FT flow it is unlikely that the DNA coil has time to fully unravel before breaking.
Hunkier, Nguyen and Kausch (1996) used tapered orifices to examine the breakage of polymers
in FT flows. They observed that the strain rate for chromosomal DNA breakage was roughly
proportional to the inverse of the molecular weight, and that DNA breakage was still mid-point
chain scission.
£f’ a 1/M/^-''
Equation 2.26
The different exponent in FT flow was rationalised in terms of the yo-yo breakage model for
DNA (Ryskin, 1987) where the DNA molecule only has time to elongate in the middle o f the
chain, either end remaining coiled. Much higher strain rates are achievable in FT flows
compared to QSS flows, and most o f the fluid flow will experience the region of high strain rate
in FT flows, compared to QSS where only a small fraction of the fluid experiences high strain
rate region. Therefore, FT flows can cause significantly more DNA degradation than QSS
flows. The actual force on the molecule, at the midpoint o f an unraveling chain, in an entrance
flow, is given by
Fmax = k” p E L" 0.4 < k” < 0.7
Equation 2.27
p52
Comparing this equation and the previous equation for steady extensional flows, the force
experienced by the molecule is 5- to 10-times greater in FT flows for the same strain rate. For
entrance effect FTF flows, degradation of T7 DNA (38 kb) has been observed by Reese et al.
(1989). Degradation of T7 DNA was observed at strain rates above lO V , corresponding to
forces on a stretched out molecule o f 3000 pN. However, based on the very short residence
time of the DNA molecules in the area of high elongational stress, it is highly unlikely that the
DNA molecules had time to stretch-out before breaking.
2.4.3 DNA shear degradation in shear flow
Most of the early studies of DNA shear degradation were done under conditions o f idealised
laminar flow. For example, early studies in capillary shear flows (Levinthal et al., 1961)
observed scission o f T2 DNA while studying the effects o f hydrodynamic shear. A simple
shear flow, where the velocity gradient is perpendicular to the flow direction, is the type o f fluid
flow that occurs within a pipe or between rotating disks under laminar conditions. A polymer
chain in a simple shear flow is predicted to adopt an elliptical shape (Sole et al. 1971). This
molecule will rotate with the fluid element at an angular velocity proportional to the fluid strain
rate, y’, and is subjected twice per turn to a linear dilation rate, yV2, and compression rate, yV2,
in the diagonals. Only limited expansion o f the molecular coil should be expected (Smith et al.
1999). Although many early studies observed DNA degradation in laminar shear (Bowman et
al., 1972; North et al., 1974; Adam et al., 1977), there is evidence that simple shear flows may
only be capable o f inducing scission in the presence o f intermolecular entanglements or
turbulence (Odell et al., 1992). Although laminar shear flows may be present in the boundary
layers o f impellers at low speeds, DNA degradation in laminar boundary layers is probably
limited, under dilute conditions.
2.4.4 DNA degradation in turbulent flow
Fluid stress-induced degradation o f DNA molecules is seen in turbulent flows (Hershey et al,
1960, Burgi et al., 1962) during impeller mixing in stirred vessels. Turbulent flows have a high
elongational component and have stagnation points between vortices. Therefore the forces on
DNA molecules larger than the sizes of the smallest eddies can be substantial. Detailed studies
into the effects o f turbulence on DNA stress-induced degradation are limited in the scientific
literature.
p53
2.4.5 Other solution properties effecting DNA degradation
Cavitation
DNA degradation is commonly observed in ultrasonic cavitation (Fuciarelli, 1995). Mechanical
degradation in flow occurs in the order of microseconds, and on this time scale no detailed
description of turbulent behaviour is available at present. Cavitating flows usually do not occur
in most downstream purification equipment involving biological materials, but they can occur,
so the engineer must be aware of its extremely detrimental effects on DNA and other biological
molecules.
Chemical Degradation
One mechanism o f DNA chain scission in fluid flows has been shown to be a base-catalysed
hydrolysis o f the phosphate-ester linkage, where it is apparent that the reaction rate is enhanced
by hydroxyl ions at higher pH (Adam et al., 1977). Hydroxyl radicals react readily with both
DNA bases and the deoxyribose sugar to generate nearly 100 different products (Evans et al.,
2000). Therefore the rates of DNA degradation due to fluid stresses should increase at higher
pH. This is particularly relevant to the flow induced degradation of DNA during alkaline lysis.
Although little information is available on the mechanisms of DNA damage that occur during
storage o f highly purified plasmid DNA, it is clear that trace metal ions are able to catalyse
many oxidative processes, including the production of hydroxyl radicals by the reduction of
hydrogen peroxide (Luo et al. 1994). The available data suggests that free radical oxidation of
DNA may occur in vitro through the generation o f superoxide, hydrogen peroxide and hydroxyl
radicles.
One o f the major degradative pathways for DNA in vivo is the two-step process o f depurination
and ^-elimination leading to cleavage o f the phosphodiester backbone (Lindahl et al., 1997).
Since depurination and ^-elimination o f DNA are processes that will occur in almost any
conceivable aqueous solution near neutral pH, this pathway of degradation will also be a major
factor limiting the aqueous stability of plasmid DNA in vitro. The depurination reaction is acid
catalysed. Therefore, when the alkaline lysate is being neutralised, it is important not to over
acidify the lysate and damage the DNA.
Solution Effects
The ionic strength o f the solution critically influences the degree o f condensation o f the
polymer and its overall conformation. In a high ionic strength buffer, the DNA coil will shrink
considerably (Lyubchenko et al., 1997). This decrease in size at high ionic strength is due in
p54

part to the reduction in the electrostatic repulsion o f the charged phosphate groups, and in part
to a decrease in DNA chain stiffness (Smith et al., 1992; Smith et al., 1996). Supercoiled
plasmids at high ionic strength were shown by Levy et al (1998) to be less susceptible to shear
forces.
Solution concentration has been observed to have a significant effect, where a ‘self-protection’
effect has been observed at higher DNA concentrations (Hershey et al., 1960). This may be due
to suppression o f turbulent eddies at higher concentrations of polymer, or a decreased ratio of
OH ions to DNA base pairs. Alternatively, intermolecular interactions between the polymer
chains can affect the degree of stress-induced degradation. For polymer solutions, there are
three relevant concentration, c, regimes:
Dilute, c < c*
Coil overlapping, c * < c < c ^
Entangled, c f < c
The coil overlap concentration, c*, can be estimated from c* ~ c [t | ] , and the entanglement
concentration, c^, can be estimated from c^ ~ 10 c [t | ] , where [t | ] is the intrinsic viscosity. Most
theoretical investigations of DNA stress-induced degradation have been using dilute polymer
solutions.
Increasing the solution temperature has the effects of lowering the activation energy for bond
cleavage which increases the degradation rate, while decreasing the solution viscosity and hence
the stress on the molecule which decreases the degradation rates (Nguyen et al. 1992). These
competing effects often cancel each other out over moderate ranges o f temperature.
The presence of air-liquid interfaces has been shown to significantly increase the rate o f DNA
degradation in high shear systems (Levy et al 1998). The presence o f air-liquid interfaces could
increase the dissolved air in the DNA solution, leading to increased cavitation effects and
increased OH catalysed reaction rates.
2.5 Conclusion
Large macromolecules are known to degrade under conditions o f high fluid stress. Frequently,
the fluid stresses are a result of fluid mixing; the mixing being required to either promote the
blending o f fluids, such as in mixing tanks, or to promote mass transfer for component
separation, such as in chromatography columns or ultrafiltration systems. Reduction o f fluid
stress in these unit operations involves understanding the mixing requirements for that operation
as well as the evolution o f fluid stress. The theory and formulae presented in this chapter
p55
provide a starting point for the estimation of the shear-, elongational- and turbulent- stresses
within those devices that have high levels o f fluid stress. As described in this chapter, the type
o f fluid stress, as well as the magnitude of stress, has been shown to significantly affect DNA
degradation rates. To date, the vast majority o f studies into the degradation of DNA have been
focussed on the degradation on linear DNA. In chapter 5, studies with pure plasmid DNA and
chromosomal DNA will investigate which o f the fluid stresses (shear, elongational and
turbulent) are more likely to cause both plasmid DNA and chromosomal DNA chain scission.
The results o f degradation experiments will be compared to analysed based on the theory o f
DNA stress-induced degradation presented in this chapter. In subsequent chapters, the effect of
fluid stress on DNA chain scission in actual DNA purification unit operations will be
investigated and overall process performance evaluated and optimised with respect to
maximising supercoiled plasmid yield and minimising DNA impurities.
p56

3 Computational fluid dynamics:
3.1 Introduction
The objective o f this thesis is to gain a better insight into the effects that fluid mixing and fluid
stresses have on DNA during its purification. The previous chapter outlined some of the basic
theory of fluid mixing and fluid stress and discussed the effects o f those stresses on DNA. In
chapter 5, stress-induced degradation of pure plasmid and chromosomal DNA solutions will be
studied in capillaries as a model flow system. In addition, the effects o f mixing and fluid
stresses during alkaline lysis will be investigated in chapters 6 and 8, using stirred tanks,
opposed jets and capillaries. In order to understand the effects o f fluid stresses on DNA, it was
essential to characterise the mixing times and fluid stresses in these devices. As explained in
the previous chapter, the fluid stresses are functions of the shear and elongational strain rates as
well as the turbulent energy dissipation. Although formulae exist that can be used to roughly
estimate strain rates and turbulent energy dissipation rates (refer to previous chapter), exact
analytical solutions to the fluid flow equations are not yet available. Therefore, to more
accurately determine these fluid flow parameters, computer modelling o f the fluid flow in
opposed jets and capillaries was performed.
This chapter describes the theory behind the computer modelling of fluid flow, and describes
the methodologies that were used in this thesis. The opposed jet and capillary computer models
were based on laboratory scale equipment used in mixing and shear experiments. All computer
simulation was performed using the Computational Fluid Dynamics (CFD) software CFX from
AEA Technology.
The results o f the CFD simulations of capillary shear devices and opposed jet mixers are
presented in chapter 5 and chapter 8 respectively.
3.2 Computational fluid dynamics theory and methods
As described in chapter 2, fluid mixing requirements and the resulting fluid stress on DNA are
determined by specific fluid flow parameters, such as turbulent energy dissipation and fluid
strain rates. To design and optimise DNA purification equipment, knowledge of these fluid
flow parameters throughout the flow domain is essential. However, it is often difficult, if not
impossible, to determine experimentally all the relevant fluid flow parameters within
manufacturing-scale process equipment. When analytical expressions exist to calculate flow
p57
parameters such as pressure drops, mixing times and fluid stresses, these equations are usually
only valid for very simple flow geometries, providing only rough estimates in more complicated
flow geometries. For most fluid flows through industrially relevant equipment, analytical
expressions are usually not applicable. Hence, detailed knowledge o f actual flow behaviour in
biochemical engineering equipment is frequently poor.
An alternative approach to experimentally determining fluid flow behaviour within a piece of
equipment is to use Computational Fluid Dynamics (CFD). CFD programs use numerical
methods to solve the basic equations describing the conservation of mass, momentum, and heat
in fluids across a flow domain. With the aid o f fluid physical property information and the
appropriate boundary conditions (inlet flowrates, outlet pressures, wall stresses) the fluid flow
equations are solved yielding typically three components o f the velocity, pressure, and
temperature for each point in the flow domain. Ideally, one would like to calculate the flow
field in an entire piece of engineering equipment. However, for the foreseeable future, this task
is well beyond even the most powerful computers available (Versteeg, 1995). In practice,
engineering knowledge o f the system is used to identify the critical regions (‘hot-spots’) where
fluid flow most critically affects equipment performance, for example, the discharge region o f a
centrifuge, the mixing region of opposed jets or the impeller region o f a stirred tank.
CFD has many advantages over more traditional, experimentally based, design methods. CFD
is a more fundamental approach, providing the designer with information about the physics o f
the problem to be solved and providing a complete picture o f the flow. Experimentally, it is
typically neither feasible, nor cost effective, to determine all the fluid flow parameters to the
same detail provided by CFD. In addition, once a CFD model is up and running it is easy to
make small changes in geometry, flowrates or pressures. Alternative designs can be
investigated rapidly. This ability to carry out ‘what i f calculations and investigate alternative
scenarios makes CFD a powerful and flexible design tool.
3.2.1 Flow geometry and computational grid size.
Solving a particular problem involves generating a computer model o f the physical geometry
where the fluid flow of interest occurs (such as the entrance region o f a filling needle or the exit
region o f a centrifuge). Once the geometry is created in the computer, it is discretised into a 3-
dimensional (or 2-dimensional) grid comprising many individual blocks. At each block in the
grid, between 3 and 20 variables are associated: the pressure, the three velocity components,
density, temperature, etc. Furthermore, capturing physically important phenomena such as
turbulence requires extremely fine meshes in parts of the physical domain. Currently grids with
p58
20,000 to 2,000,000 blocks are common, leading to systems with up to 40,000,000 unknowns
(Versteeg, 1995). This discretization (gridding) is straightforward for very simple geometries
such as rectangles or circles, but is a difficult problem for more complicated objects. The
generation of the grid is perhaps the most important stage of setting up a CFD simulation taking
typically 80% of the total effort. This is because the number and distribution o f blocks can
effect whether a solution is obtained, the speed at which it is obtained, and the accuracy o f the
simulation. If too few cells are used in the grid, the fine details o f the flow may not be seen by
the calculation and the conservation of mass, momentum and energy may not be maintained. In
general, the more blocks used in a grid, the more accurate will be the solution, but the more
expensive (running time, computing cost) will be the simulation. In general it is necessary to
solve the flow problem using finer and finer grids to check that the solution is converging, i.e.
that the solution is grid size independent (Versteeg, 1995).
3.2.2 Navier Stokes equations
The basic set o f equations solved by the CFD program for laminar flows comprise equations for
conservation o f mass and momentum; these equations are the continuity equation and
momentum equation, respectively:
6 p / Jt + V # (p U) = 0
Equation 3.1
d (pU) / dt + V » ( p U < 8 ) U ) = B + V«( y
Equation 3.2
Here p is the fluid density, U is the fluid velocity vector, p is the pressure, t is the time and a is
the stress tensor. The relationship between the strains and stresses in a particular substance are
given by a constitutive equation for that substance. For a Newtonian fluid the viscous stresses
are directly proportional to the rates o f strain, and the 3-dimensional stress tensor is given by:
G = -pô + (X -2/3p) V «Uô + p(VU+(VU)’")
Equation 3.3
This is the 3-dimensional equivalent of Equation 2.12 presented in chapter 2. Taken together
Equation 3.1, Equation 3.2 and Equation 3.3 are known as the Navier-Stokes equations. On the
discretised flow domain, the Navier-Stokes equations take the form of a large system of non
linear equations. Except for special cases, no closed-form solutions exist to the Navier-Stokes
equations. The system of non-linear equations is typically solved by an iterative, Newton-like
method, which in turn requires solving a large, sparse system of equations on each iterative step.
That is, the values o f all the variables (velocity, pressure, energy dissipation, etc.) are initially
p59

guessed. These values are then updated by feeding them back into the equations that one is
trying to solve. If the updated values are the same as previous values (to a desired tolerance)
the solution is said to have ‘converged’. Otherwise, the iterative process is repeated, until
convergence is achieved.
3.2.3 Turbulence models
All flows encountered in engineering practice become unstable above a certain Reynolds
number. A chaotic and random state of motion develops in which the velocity and pressure
change continuously with time within substantial regions o f flow. The Navier-Stokes
equations, described in the previous section for laminar flows, are in fact valid for turbulent
flows as well. Turbulent flows are just very complex unsteady laminar flows. However, we are
currently limited in our ability to solve these equations accurately for high Reynolds numbers,
and we have to resort to turbulence modelling which solve transport equations for the Reynolds-
averaged quantities (Versteeg, 1995), which are defined as:
® ( t ) = l / ( 2 d t ) ,J ’'"'‘
Equation 3.4
Here 6 t is a time-scale large relative to the time scale of turbulent fluctuations, and small
relative to the time scale to which we wish to resolve. Applying Reynolds averaging to the
continuity equation and the momentum equation, we obtain
5p / ôt + V • (p U) = 0
Equation 3.5
d (pU) / Ot + V « ( p U 0 U ) = B + V « ( o - p u 0 ul
Equation 3.6
The Reynolds-averaged continuity equation is the same as the equation that has not been
averaged. However, the momentum equation contains an additional turbulent flux term, the
Reynolds stress u 0 u. This term reflects the fact that convective transport due to turbulent
velocity fluctuations will act to enhance mixing, over and above that caused by thermal
fluctuations at the molecular level. Different turbulent models provide different models for the
computation of the Reynolds stress. The most frequently used models are eddy viscosity
models. Eddy viscosity models calculate the Reynolds stresses in terms of known mean
quantities; in the eddy viscosity hypothesis the Reynolds stresses can be linearly related to the
mean velocity gradients in a manner analogous to the relationship between the stress and strain
tensors in laminar Newtonian flow:
p60
-p U 0 U = = -(2/3)pkô-(2/3)PtV «Uô + pT(VU+(VU)"^)
Equation 3.7
Here, k is the turbulent kinetic energy % u , and px is an additional viscosity, called the
turbulent viscosity. Eddy viscosity models are distinguished by the manner in which they
prescribe the eddy viscosity, px-
The k-e eddy viscosity model is the most widely used and validated turbulence model
(Versteeg, 1995). In the k-e model, it is assumed that the eddy-viscosity, px, is equal to p k
/e. The model contains five adjustable constants. The standard K-e model employs values for
the constants that are arrived at by comprehensive data fitting for a wide range o f turbulent
flows. = 0.09, Ok = 1.00, Oe = 1.30, Cie = 1.44, Cze = 1.92. The model performs particularly
well in confined flows, however it shows only moderate agreement in unconfined flows.
An alternative model, the low Reynolds number k-e model, is a modification o f the standard k-e
model to allow calculation of turbulent flows at low Reynolds number, typically in the range
5,000 - 30,000. The model involves a damping of the eddy viscosity when the local turbulent
Reynolds number is low, a modified definition o f e so that it goes to zero at walls and
modifications of the source terms in the e equation. The model used natural boundary
conditions at walls rather than wall functions (discussed in next section), so the equations are
integrated through the laminar sublayer (Versteeg, 1995). The model can be used for flows at
any Reynolds number provided the grid is fine enough for this integration through the sublayer
to be accurate.
3.2.4 Boundary conditions
Flow boundaries
At flow boundaries in the model, the fluid enters and leaves the flow domain. At inlets, the
velocity, turbulent energy and turbulent energy dissipation are specified, and the pressure is
extrapolated from downstream. Generally, the inlet velocity is known but the turbulent energy
and energy dissipation are not known at the inlets. Approximations for the inlet distributions
for K and e in internal flows can be obtained by means o f the following simple assumed forms:
k = 3/2 (UTi)^ ; e = W 1 ; 1 = 0.07R
Equation 3.8
p61

Pressure boundaries
The constant pressure condition is used in situations where exact details of the flow distribution
are unknown but the boundary values of pressure are known. At a pressure boundary, the fluid
pressure is specified, and the velocity and turbulent scalars are extrapolated from upstream.
Wall Boundaries
The wall is the most common boundary encountered in confined fluid flow problems. The no
slip condition (velocities perpendicular and normal to the wall are zero) is the appropriate
condition for the velocity components at solid walls.
For turbulent flows, immediately adjacent to the wall we have an extremely thin viscous sub
layer followed by a buffer layer and a turbulent core. The number o f mesh points required to
resolve all the details in the turbulent layers would be prohibitively large and normally we
employ wall functions to represent the effect o f the wall boundaries. At high Reynolds number
the standard K -e model avoids the need to integrate the model equations right through to the
wall. This model makes use of the universal behaviour o f near wall flows, where the mean
velocity from the wall is related to the distance from the wall through the log-law (Versteeg et
al. 1995). Using the log-law assumption and that the rate o f turbulence production equals the
rate o f dissipation, it is possible to develop wall functions to describe the mean velocity,
turbulence production and turbulence dissipation at walls.
At low Reynolds numbers the log-law is not valid so the above-mentioned wall functions cannot
be used. Wall damping needs to be applied to ensure that viscous stresses take over from more
turbulent Reynolds stresses at low Reynolds numbers and in the viscous sub-layer adjacent to
solid walls. In the low Reynolds number version of the K-e model, the equations are integrated
to the wall through the laminar sublayer (Versteeg, 1995), where the shear stress is proportional
to the strain rate. The standard no-slip conditions with zero values for K and e at the wall
boundary are therefore used.
3.3 Modelling hardware and software
A Hewlett Packard, Vectra VL, with 192 Mbytes RAM, running Windows NT 4.00, was used
for all computations. The CFD modelling software package CFX version 4.2 was used for all
simulations which comprised CFX Build version 4.2, CFX Solver version 4.2 and CFX View
version 4.2.
p62
3.4 CFD modeling of opposed jets lysis reactor.
3.4.1 Model geometry.
The opposed jets mixing device was modelled as 2 opposing pipes inside an infinitely large
chamber, as shown in Figure 3.1. Both equal diameter and non-equal diameter opposed jets
were modelled. Only the fluid flow in the pipes and in a rectangular region directly around
where the jets impinged was modelled, as shown in Figure 3.1. Both the model geometry and
the fluid flow are symmetric in the 6 direction; thus, the three-dimensional geometry could be
converted to a two-dimensional problem by re-writing the geometry in cylindrical co-ordinates,
r, 0, and z. This significantly reduced the size o f the problem and the computational time.
Because this system possessed an axis of symmetry along the centreline of the jets only the top
half o f the geometry needed to be modelled. If equal diameter and equal flowrate jets were
modelled, then the flow system also possessed an axis o f symmetry along the vertical axis
between the jets. In this case, only one quadrant o f the system needed to be modelled, as shown
by the darker shaded region in Figure 3.1.
Figure 3.2 shows in more detail the model geometry that was used for equal jets (top) and non
equal jets (bottom), along with the appropriate boundary conditions. The equal-jets model
consisted of one flow inlet, two pressure outlets, two symmetry boundaries, and three wall
boundaries. Note, that while one wall boundary could have been used to model the wall of the
pipes, using three walls took into account the thickness of the pipe. Initial simulations using
only one wall tended to generate regions of excessive turbulence at the infinitely sharp pipe
outlet. The jets modelled were 0.5, 4 and 12mm internal diameter, and the jet separation was
typically set at twice the jet diameter, unless otherwise noted.
p63
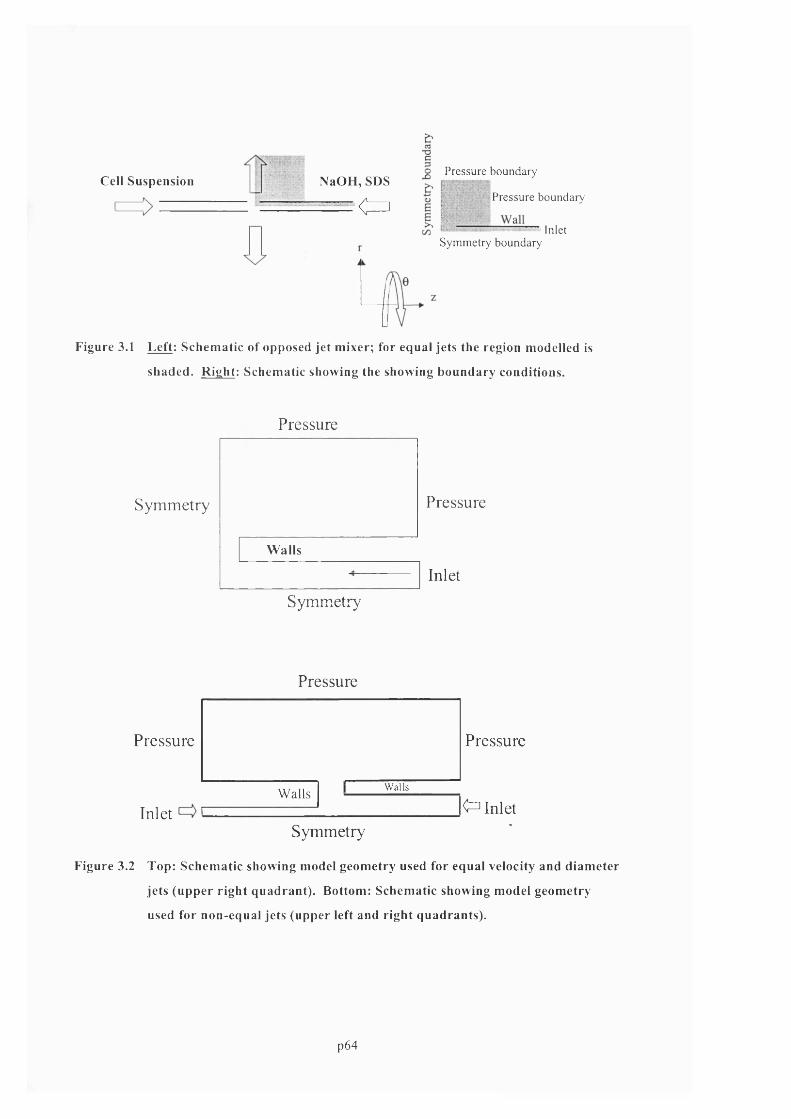
Cell Suspension NaOH, SDSPressure boundary
“ < = 1Pressure boundary
inletSym m etry boundary
Figure 3.1 L eft: Schem atic of opposed jet m ixer; for equal jets the region modelled is
shaded. R igh t: Schematic showing the showing boundary conditions.
Pressure
Symmetry
W alls
Pressure
Inlet
Symmetry
Pressure
Pressure
InletW alls W alls
Pressure
<=i InletSymmetry
Figure 3.2 Top: Schem atic showing model geom etry used for equal velocity and d iam eter
jets (upper righ t quadran t). Bottom: Schem atic showing model geom etry
used for non-equal jets (upper left and righ t quadrants).
p64
3.4.2 CFD model equations
The Navier-Stokes equations with an eddy-diffusion turbulence model, and with appropriate
initial and boundary conditions, were solved across the entire flow domain. Refer to section
3.2.3 for a description o f the relevant fluid flow equations. Both the K-e and low Re K-e
turbulence models were used to model the fluid flow. These turbulence models can be easily
specified in the CFX software.
3.4.3 Number of fluid phases
In practice mixing in an opposed jet device, for alkaline lysis, would involve three distinct fluid
phases: the aqueous phase containing the cell resuspension, the lysis buffer, and air in which the
two liquids impact and mix. Alternatively, if the mixing chamber within which the jets impinge
was small, the mixing chamber could quickly become flooded with cell lysate, in which case the
jets would impinge subsurface and the system would be a two-phase system, as air would be
excluded. If the cell resuspension and lysis buffers are assumed to have the same physical
properties, then the problem can be reduced to one-phase if the mixing chamber is assumed to
be flooded. Opposed jet simulations were run where one, two or three separate phases were
specified:
i) One-phase simulations. These consisted o f two equal jets o f the same liquid impacting
subsurface in a flooded impingement chamber.
ii) Two-phase simulations. These consisted o f two jets of the same liquid impacting in a
chamber filled with air; there were two fluid phases present, liquid and air.
iii) Three-phase simulations. These consisted of two jets o f different liquids impacting in a
chamber filled with air; there were three phases present, two liquid phases and one air phase.
3.4.4 Initial conditions and boundard condtions
For one-phase simulations, the entire model geometry was initially set full o f stagnant liquid.
For two- and three-phase simulations, the entire model geometry was initially set full of
stagnant air. At inlet boundaries, the fluid velocities o f the entering liquid phases were
specified. The pressure was set to atmospheric pressure at the fluid outlets (pressure
boundary). The wall boundary conditions used depended on the turbulence model used, refer to
section 3.2.4. The turbulent energy ( k ) and turbulent energy dissipation (e) at the inlets were
specified based on the recommended values given in the CFX user-manual:
K = 0.002 Ujnlet
e = K'- / 0.2385
Equation 3.9
p65
3.4.5 Fluid physical parameters
In an opposed jet lysis reactor, the phases present before mixing are all Newtonian fluids and
are a) cells resuspended in TE, b) 0.2 M NaOH and c) air in the mixing chamber. Following
mixing of the cells and lysis solution, the fluid becomes visco-elastic. Because the residence
time of the fluid in the jet is on the order o f milliseconds and the time taken for the mixture to
become visco-elastic is on the order of seconds (Ciccolini et al. 1998) the fluid should remain
Newtonian until well after it has left the je t mixer. Therefore, all fluids were modelled as
Newtonian fluids, vastly simplifying the calculations. Table 3.1 lists the physical properties of
the phases modelled.
Phase 1 Phase 2 Phase 3
Water Air NaOH-Water
Density (kg/m^) 997 1.181 1 2 0 0
Viscosity (mPa) 1 .0 0.018 1 .2
Table 3.1. Physical parameters of the fluid phases modelled.
3.4.6 Heat transfer
Initial simulations were run with and without heat transfer included in the model. From the
simulation results it was determined that including heat transfer in the model had a negligible
effect on the final solution (the fluid velocities, pressures, strain rates and turbulent energies
were not significantly affected by heat transfer). Hence, all further simulations were run without
heat transfer in order to save computational time.
3.4.7 Surface sharpening algorithim
Numerical truncation can lead to a blurring of the surfaces between distinct phases in multi
phase simulations. In order to rectify this, the CFX program has an algorithm to sharpen the
surfaces between phases. Simulations were run comparing the results with, and without, surface
sharpening. It was found the use o f the surface sharpening algorithm had no effect on the
overall solution, while using surface sharpening significantly increased the computational time.
Thus, all future calculations were done without surface sharpening.
3.4.8 Solution convergence and grid-size indepenence.
The model geometry was gridded using CFX-Build. Variable rectangular grids were used to
grid the geometry. The grids were designed to be smallest near the jet impingement region.
p66
gradually became larger further from this region. The finer grid in the je t impingement region
was designed to better capture the more rapidly changing fluid flow parameters in that region.
The geometric increase in the variable mesh, from one grid to its neighbour, was set throughout
at 1.1 ± 0.02. Figure 3.3 shows a typical variable mesh and model geometry. Initial jet
simulations used a small number o f large grids (coarse mesh). After grid generation, the CFX
solver program was run to solve the relevant flow equations. The solver program was stopped
when there was no further significant change in the flow variables (velocity, pressure, turbulent
energy and turbulent energy dissipation). The number o f iterations required to solve a particular
problem varied considerably depending on the number o f grids and the number of phases
present and was typically from 1,000 - 100,000 iterations. After obtaining a solution for a
particular grid size, the number o f grids was increased (finer mesh) to determine if the final flow
solution was grid size independent. In theory, for a suitably fine mesh, the final fluid flow
solution should not be a function o f the number o f grids; obviously, a real physical fluid flow is
not a function o f a computer generated mesh size. Only CFD simulations that were found to be
grid size independent were analysed.
p67

i iSSiilnillIll ! 'lliln!S!SSSSSS8l
üœsssssB[iiilOliiiissg
■as Isa ttK MB Si a • B B « 11 > I 11 11
E u niutifMsegcanim
Figure 3.3. Grid distribution for equal opposed jet simulations. Due to symmetry, only the
upper rightmost quadrant was modelled for equal opposed jets. The grid used was coarse
at the extremities of the model, becoming significantly more fine in the region where the
jets impinge.
3.4.9 Model convergence
The following set o f simulations, Table 3.2, were carried out to check if the one-, two, and
three-phase models were grid size independent. Each simulation was run using different size
grids to check for grid size independence. The results are given in chapter 8 . Only grids that
gave grid size independent results were used in subsequent simulations.
Model Djetl
mm
Djet2
mm
Ujetl
m/s
Ujet2
m/s
Phase 1 Phase 2 Phase 3
One-phase 4 4 5 5 Water N/A N/A
Two-phase 4 4 1 1 Water Air N/A
Three-phase 0.5 1 .6 25.4 8 Water NaOH-water Air
Table 3.2. Simulations run to check for model grid-size independence.
p68

3.4.10 Submerged versus non-subm erged sim ulations
Two simulations, presented in Table 3.3, were run to examine the effect on the energy
dissipation of the jets impinging subsurface in a flooded chamber, versus impinging in air.
Simulations were run using the Low Re K - e model.
Model Djet
mm
Ujet
m/s
Phase 1 Phase 2
One-phase 4 5 Water N/A
Two-phase 4 5 Water Air
Table 3.3. Simulations run to examine the effect of jets being subm erged.
3.4.11 Effect of turbulence model.
There are several different turbulence models that are commonly used to model fluid flows. Of
these, by far the most frequently used and validated are the eddy-diffusion models. The two
most common eddy-diffusion turbulence models are the K - e and Low Re K - e turbulence
models. The K -e model is most applicable at high Reynolds numbers, above 10,000. As the
name implies, the Low Re K -e model is applicable at lower Reynolds numbers. Provided the
grid size is suitably fine, the Low Re K -e model should be applicable over all Reynolds
numbers (Versteeg, 1995). Simulations were run to compare the results using the two different
turbulence models. The following two simulations. Table 3.4, were run to compare the effects
o f the K -e and Low Re K -e turbulence models on the simulation results. The results are
presented in chapter 8 .
Model Djet Ujet Phase 1 Phase 2 Turbulence
mm m/s Model
Two-phase 4 1 Water Air K -e
Two-phase 4 1 Water Air Low Re K -e
Table 3.4. Simulations run to examine the effect of turbulence model.
3.4.12 Effect of je t velocity, je t diam eter, fluid viscosity and fluid density
In order to determine the effects o f jet operating conditions, fluid properties and jet scale-up on
jet performance, 19 simulations o f equal opposed jets impinging in air were run, as shown in
p69
Table 3.5. Each simulation was run until convergence was reached. A detailed analysis of the
results o f this series o f simulations is presented in chapter 8 .
Model Djet
mm
Ujet
m/s
Jet
separation
mm
Phase 1
Viscosity
mPa s
Phase 1
Density
kg/m^
Two-phase 0.508 1 0.508 1 1 0 0 0
Two-phase 0.508 2.5 0.508 1 1 0 0 0
Two-phase 0.508 5 0.508 1 1 0 0 0
Two-phase 4 0.5 4 1 1 0 0 0
Two-phase 4 1 4 1 1 0 0 0
Two-phase 4 2.5 4 1 1 0 0 0
Two-phase 4 5 4 1 1 0 0 0
Two-phase 4 1 0 4 1 1 0 0 0
Two-phase 4 2.5 4 5 1 0 0 0
Two-phase 4 1 0 4 5 1 0 0 0
Two-phase 4 1 4 1 2 0 0 0
Two-phase 4 1 1 0 1 1 0 0 0
Two-phase 4 2.5 1 0 1 1 0 0 0
Two-phase 4 5 1 0 1 1 0 0 0
Two-phase 1 2 1 1 2 1 1 0 0 0
Two-phase 1 2 2.5 1 2 1 1 0 0 0
Two-phase 1 2 5 1 2 1 1 0 0 0
Table 3.5. Simulations of equal opposed jets impinging in air.
3.4.13 Non-equal opposed jets
Opposed jets will not be equal if different fluids are used in each Jet, or if each jet is given a
different fluid velocity. In addition, the diameters of the jets can be varied to increase the
velocity and momentum of one o f the jets. For non-equal opposed jets, another variable, the
ratio o f jet diameters, can affect the performance o f the jets. In order to examine the effect of jet
diameter ratio on the performance o f non-equal opposed jets, the following set of simulations
was performed, shown in Table 3.6.
p70
NaOH Qcells ^cells d cells dcells dlysis dlysis
Cone. ! Qlysis / dcells
(M) (m/s) (inch) (mm) (inch)
0.4 0.33 0.5, 2.5, 8 0 . 0 2 0.508 0.005 0.250
0.4 0.33 0.5, 2.5, 8 0 . 0 2 0.508 0.007 0.350
0.4 0.33 0.5, 2.5, 8 0 . 0 2 0.508 0 . 0 1 0 0.500
0.4 0.33 0.5, 2.5, 8 0 . 0 2 0.508 0 . 0 2 0 1 .0 0 0
0.4 0.33 0.5, 2.5, 8 0.062 1.5748 0 . 0 1 0 0.161
0.4 0.33 0.5, 2.5, 8 0.062 1.5748 0 . 0 2 0 0.323
0.4 0.33 0.5, 2.5, 8 0.062 1.5748 0.040 0.645
0.4 0.33 0.5, 2.5, 8 0.062 1.5748 0.062 1 . 0 0 0
0.4 0.33 0.5, 2.5, 8 0.472 1 2 . 0 0 0.076 0.161
0.4 0.33 0.5, 2.5, 8 0.472 1 2 . 0 0 0.152 0.323
0.4 0.33 0.5, 2.5, 8 0.472 1 2 . 0 0 0.305 0.645
0.4 0.33 0.5, 2.5, 8 0.472 1 2 . 0 0 0.472 1 .0 0 0
Table 3.6. Simulations of non-equal opposed jets.
3.5 CFD modelling of capillary shear device
3.5.1 Model geometry
Figure 3.4 shows the model geometry used for the capillary shear device. The model was based
on the actual geometry o f the capillary shear device used in laboratory shear experiments. The
device consisted of a piece of large bore capillary tubing connected to a piece of small bore
capillary tubing, making a sudden and sharp flow constriction. The internal diameter o f the
wide tubing was 0.062 inches (1.57 mm) and the size o f the small tubing was 0.007 inches
(0.178 mm). Similar to the case for opposed jets, described previously, the system has an axis
o f symmetry down the centreline of the capillaries, and can be converted to a two-dimensional
problem using cylindrical co-ordinates.
p71
Wide Capillary
Narrow Capillary
o
Wall B.C.
InletB.C.
Wall B.C.Wall B.C.
Symmetry B.C.
PressureB.C.
Figure 3.4 Schematic showing the capillary shear device (top diagram). Using flow and
geometry symmetry arguments, only the top half of the geometry needed to be
modelled (bottom diagram).
3.5.2 Model equations
The model equations were the same as those used for opposed jets.
3.5.3 Number of fluid phases
All capillary simulations were run using one liquid phase. The liquid phase was taken to have
the properties o f liquid water, with the properties shown in Table 3.1.
3.5.4 Initial conditions and boundard condtions
The entire model geometry was initially set full o f stagnant liquid. At the inlet boundary, the
fluid velocity o f the entering liquid was specified. The pressure was set to atmospheric
pressure at the pressure boundary. The turbulent eddy viscosities and diffusjvities at the inlets
were calculated, as described previously, based on Equation 3.9. The wall boundary conditions
used were those appropriate to the Low Re k-e turbulent model, refer to section 3.2.4.
3.5.5 Heat transfer
Initial simulations were run with, and without, heat transfer being included in the model. As
with opposed jet simulations, it was determined that including heat transfer in the model had
only a negligible effect on the final solution (the fluid velocities, pressures, strain rates and
p72
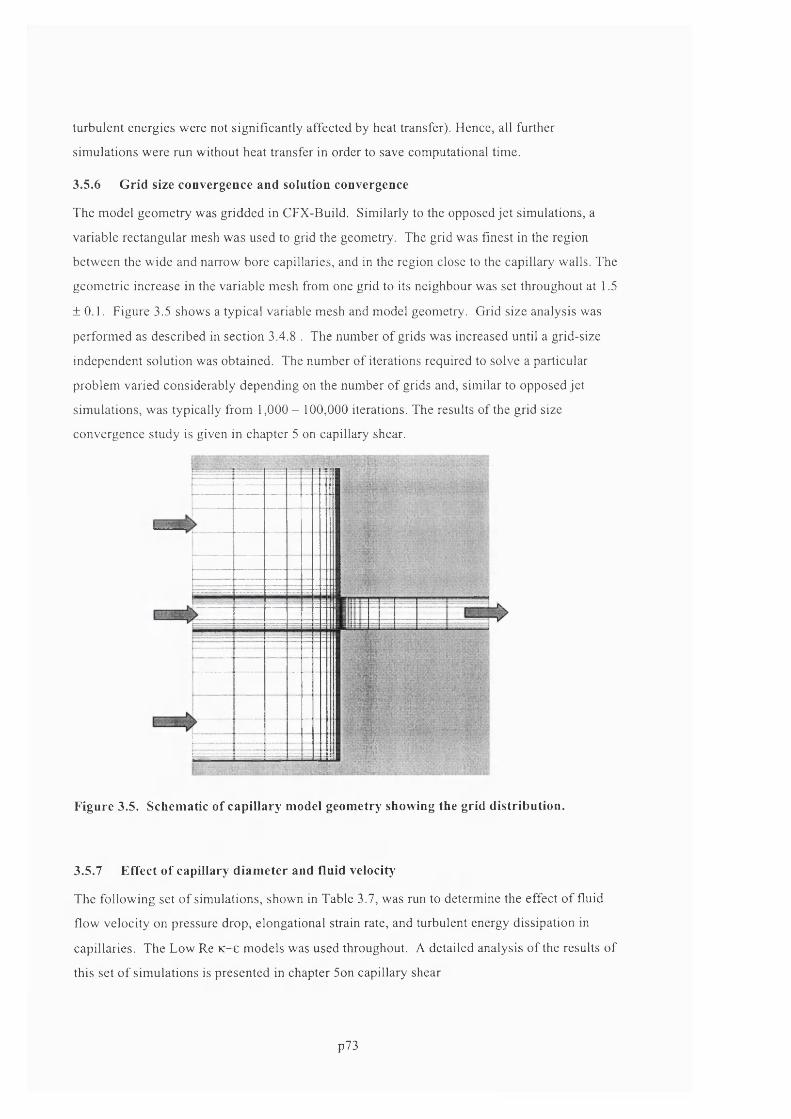
turbulent energies were not signifieantly affeeted by heat transfer). Hence, all further
simulations were run without heat transfer in order to save computational time.
3.5.6 Grid size convergence and solution convergence
The model geometry was gridded in CFX-Build. Similarly to the opposed jet simulations, a
variable rectangular mesh was used to grid the geometry. The grid was finest in the region
between the wide and narrow bore capillaries, and in the region close to the capillary walls. The
geometric increase in the variable mesh from one grid to its neighbour was set throughout at 1.5
±0 .1 . Figure 3.5 shows a typical variable mesh and model geometry. Grid size analysis was
performed as described in section 3.4.8 . The number o f grids was increased until a grid-size
independent solution was obtained. The number of iterations required to solve a particular
problem varied considerably depending on the number of grids and, similar to opposed jet
simulations, was typically from 1,000 - 100,000 iterations. The results of the grid size
convergence study is given in chapter 5 on capillary shear.
Figure 3.5. Schematic of capillary model geometry showing the grid distribution.
3.5.7 Effect of capillary diameter and fluid velocity
The following set o f simulations, shown in Table 3.7, was run to determine the effect o f fluid
flow velocity on pressure drop, elongational strain rate, and turbulent energy dissipation in
capillaries. The Low Re K - e models was used throughout. A detailed analysis o f the results of
this set o f simulations is presented in chapter 5on capillary shear
p73
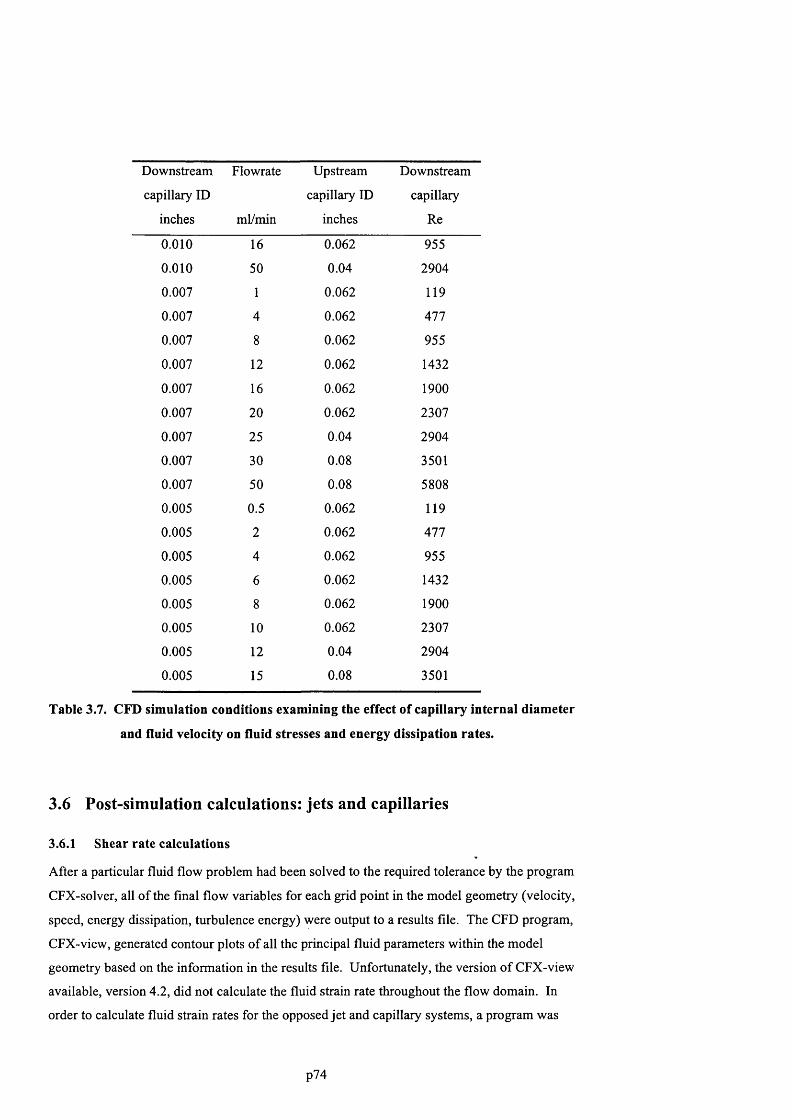
Downstream Flowrate Upstream Downstream
capillary ID capillary ID capillary
inches ml/min inches Re
0 . 0 1 0 16 0.062 955
0 . 0 1 0 50 0.04 2904
0.007 1 0.062 119
0.007 4 0.062 477
0.007 8 0.062 955
0.007 1 2 0.062 1432
0.007 16 0.062 1900
0.007 2 0 0.062 2307
0.007 25 0.04 2904
0.007 30 0.08 3501
0.007 50 0.08 5808
0.005 0.5 0.062 119
0.005 2 0.062 477
0.005 4 0.062 955
0.005 6 0.062 1432
0.005 8 0.062 1900
0.005 1 0 0.062 2307
0.005 1 2 0.04 2904
0.005 15 0.08 3501
Table 3.7. CFD simulation conditions examining the effect of capillary internal diameter
and fluid velocity on fluid stresses and energy dissipation rates.
3.6 Post-simulation calculations: jets and capillaries
3.6.1 Shear rate calculations
After a particular fluid flow problem had been solved to the required tolerance by the program
CFX-solver, all of the final flow variables for each grid point in the model geometry (velocity,
speed, energy dissipation, turbulence energy) were output to a results file. The CFD program,
CFX-view, generated contour plots o f all the principal fluid parameters within the model
geometry based on the information in the results file. Unfortunately, the version o f CFX-view
available, version 4.2, did not calculate the fluid strain rate throughout the flow domain. In
order to calculate fluid strain rates for the opposed jet and capillary systems, a program was
p74

written in FORTRAN that read in the velocity data from the simulation results file and
calculated the local shear rates from the velocity data.
The local shear rate at a point was calculated from the deformation rate tensor, D that in turn is
calculated from the velocity gradient tensor. For cylindrical co-ordinates, r, 0,z, the velocity
gradient tensor, GRAD(V), is calculated from the velocity flow field as follows:
dVr/dr (l/r)(dVr/d0) - (Vg/r) dVr/dZ
GRAD(V) = dVe/dr (l/r)(dVg/d0) - (Vr/r) dVg/dZ
dVz/dr (l/r)(dVz/d0) dVz/dZ
For these symmetric systems, d /d0 = 0 , Vg = 0.
HENCE, GRAD(V) =
dVr/dr
0
dVz/dr
0
- (Vr/r)
0
dVr/dZ
0
dVz/dZ
Equation 3.10
The deformation rate tensor D = grad(V) + grad(V^),
2dVr/dr 0 {dVr/dZ + dVz/dr} D]i D ]2 Di3
D = 0 -2 (Vr/r) 0 = D21 D 22 D23
{dVr/dZ + dVz/dr} 0 2dVz/Dz D31 D32 D33
Equation 3.11
The strain rate, e ’ , = 2^° INVARIANT(D) = D11*D22 + D11*D33 + D22*D33 - D13*D31
Equation 3.12
A program was written in Matlab to create contour plots o f the local strain rate throughout the
flow domain for the opposed jet and capillary systems.
3.6.2 Streamline calculations
A program was written in Matlab to calculate and plot the fluid flow streamlines for the
opposed jet and capillary systems. Matlab has an in-build routine for calculating fluid flow
streamlines based on the velocity field data, which was read in from the CFD results file.
p75
3.7 Conclusion
CFD models were built and simulated for capillaries and opposed jets. Creation o f CFD model
geometries was relatively straightforward using CFX-Build. The majority of the effort involved
in creating the CFD models was determining the grid size independence of the different CFD
models, which is discussed in chapters 5 and 8 .
The principal assumption of the CFD simulations was that the Low Re K -e turbulence model
and K-e turbulence model accurately described the flow behaviour in the capillary and opposed
jet systems. These two models are the most widely used and validated turbulence models, and it
has been shown that these models typically provide accurate predictions for confined fluid
flows; although for unconflned flows their predictions sometimes deviate from experimental
observations (Versteeg, 1995). Therefore it would be expected that the CFD models should
provide accurate predictions for the capillary simulations. The results of the capillary CFD
simulations are presented in chapter 5. The opposed jet flow is only semi-confmed; therefore
the CFD predictions for the opposed jets may not be as accurate. Experimental validation o f the
CFD predictions o f opposed jet flow behaviour is warranted. The results o f opposed jet
simulations are presented in chapter 8 , and CFD predictions are compared to experimental
observations.
p76
4 Analytical development
4.1 Brief summary of results
Novel analytical techniques were developed to quantify supercoiled plasmid DNA and DNA
impurities in pure and in-process samples.
A modified gel electrophoresis procedure was developed to improve the accuracy of supercoiled
plasmid quantification. This procedure involved the addition of low melting point agarose to
DNA samples prior to electrophoresis to reduce sample diffusion from the sample wells prior to
electrophoresis.
Several anion exchange resins and hydrophobic interaction resins were screened for their ability
to quantify supercoiled plasmid DNA. Two novel HPLC-based assays were developed which
were capable o f separately quantifying supercoiled plasmid DNA, open-circular plasmid DNA,
double-stranded chromosomal DNA, single-stranded DNA and RNA in process samples. The
assays were based on Poros PI and Q-Sepharose anion exchange resins. The assays were
automated, fast (< 60 min), robust and accurate (4% to 6 % relative standard deviations for the
different species).
A fluorescent-dye-based assay was developed for monitoring supercoiled plasmid DNA
degradation. This assay was used to monitor supercoiled plasmid degradation under very dilute
conditions, allowing plasmids to be potentially used as shear probes in large-scale equipment.
A modified agarose gel procedure was developed to improve agarose gel accuracy. These
assays were used in subsequent experiments on DNA stress-induced degradation, alkaline lysis
and downstream purification.
4.2 Introduction
Analysis o f experimental samples involved determining the quantity, size and form o f plasmid
DNA and chromosomal DNA molecules. This task was complicated enormously because
native plasmid DNA and chromosomal DNA are chemically identical, differing only in physical
size and topology. This makes plasmid and chromosomal DNA particularly difficult to
distinguish and separate from each other. As a further complication, both plasmid and
chromosomal DNA can be found in several forms in solution. Supercoiled plasmid DNA can
be degraded to open-circular and linear forms by DNAases or fluid stress, or it can be converted
p77

to a compact, denatured form by high pH. Chromosomal DNA can be found as either a single-
or double-stranded helix, depending on whether it has or has not been denatured by high
temperature or high pH. In addition, both plasmid and chromosomal DNA can be broken into
linear fragments o f varying sizes. For example, it is frequently necessary to determine the
concentration o f native supercoiled plasmid DNA from a mixture of double- and single-stranded
chromosomal DNA fragments and supercoiled-, open-circular-, linear-, and denatured-plasmid
forms. Table 4.1 shows the principal forms o f plasmid and chromosomal DNA present in E.
coli cell lysates.
Plasmid DNA
Native forms
Denatured forms
Supercoiled,
ds-DNA
Compact,
ss-form
Open-circular,
ds-DNA
Linear,
ss-DNA
Linear,
ds-DNA
Linear,
ss-DNA
Chromosomal DNA
Native forms
Denatured forms
Linear,
ds-DNA
Linear,
ss-DNA
Table 4.1. Showing principal forms of plasmid and chromosomal DNA.
Total DNA (chromosomal DNA + all plasmid forms) can be quantified colorimetrically
(Sambrook et al. 1989), fluorometrically (Singer et al., 1997; Levy et al., 2000) or by HPLC
(Ferreira et al., 1999). However, these assays do not distinguish between the different DNA
forms. Instead, several assays are required to quantify the different DNA forms. Plasmid DNA
(supercoiled, open-circular and linear forms) can be quantified using agarose gel electrophoresis
(Barton et al., 1995; Sambrook et al., 1989; Wang et al., 1995), but electrophoresis does not
accurately measure chromosomal DNA. Moreover, gel electrophoresis is not very accurate at
quantifying plasmid (a 2 0 % standard deviation between replicate samples is typical) and is time
consuming to run. Chromosomal DNA can be quantified using Quantitative Polymerase Chain
Reaction (qPCR) (Lahijani et al., 1998); however, impurities can interfere with qPCR so
upstream process samples require additional purification before they can be assayed. These
additional purification steps, such as chromatography or filtration, can remove the chromosomal
DNA that one is trying to assay. Another drawback o f qPCR is that it cumbersome, has a slow
tum-around time and is highly susceptible to contamination. Alternatively, southern blot can be
p78
used to estimate chromosomal DNA; however, it is not accurate. Another novel technique for
plasmid analysis is capillary gel electrophoresis (Raucci et al., 2000). This has the advantage of
being able to distinguish different plasmid forms, however, it requires specialised equipment to
run, and it is unknown how it will perform using crude upstream process samples.
This chapter describes the development o f novel electrophoretic-, chromatographic- and
fluorescent-based assays for quantification of plasmid and chromosomal DNA. These new
assays were essential tools in properly analysing the effects o f fluid mixing and fluid stress on
DNA molecules.
4.3 Materials and methods
The following section details the experimental methods used in developing new analytical
techniques for quantifying DNA and RNA.
4.3.1 Materials
RNAse A, 1-ladder, 1-digest, 1 DNA, rRNA, RNAse A and agarose for routine use were
obtained from Sigma (St. Louis, MMO, USA). Poros PI 20 pm resin was obtained from
PerSeptive Biosystems, Inc. (Framingham, MA, USA). I mL Q-Sepharose HP HiTrap columns
were obtained from Amersham Pharmacia Biotech AB (Uppsala, Sweden). Sodium chloride,
sodium hydroxide, Tris-base, boric acid, EDTA, isopropanol and ethanol were obtained from
Merck (Dorset, U.K). Ready-lyse lysozyme was obtained from Epicenter Technologies
(Madison, WI, U.S.A).
4.3.2 Laboratory equipment
Analytical chromatography was performed with a Dionex (Sunnyvale, CA) HPLC system
consisting of a GP40 gradient pump, AS3500 autosampler and AD20 absorbance detector.
Agarose gels were run using a horizontal mini-gel electrophoresis unit from Merck (Dorset,
U.K.). Pulsed-fleld agarose gels were run using a CHEF II mapper from BioRad (Hercules,
California, USA). A purpose-build capillary device was used to degrade chromosomal DNA up
to strain rates o f 10* s ' . The device consisted o f a syringe pump (Hamilton, Nevada, USA),
Beckton Dickenson plastic syringes and precision PEEK capillary tubing (Upchurch Scientific,
WA, U.S.A) o f different length and diameter. A Beckman DU70 UV/visible spectrophotometer
was used for absorbance readings, and a 96 well plate fluorometer, model Fluorocount (Perkin-
Elmer, Boston, USA) was used for fluorescence readings.
p79
4.3.3 Standard buffer preparation
500 mM Tris, pH 8.0 was prepared by dissolving Tris-base or Tris-CI powder in ultra-pure
water and pH adjusting with NaOH or HCl as appropriate. 500 mM EDTA, pH 8.0 was
prepared by dissolving EDTA powder in ultra-pure water and pH adjusting as appropriate.
TE buffer (10 mM Tris, 1 mM EDTA, pH 8.0 unless otherwise stated) was made-up by diluting
500 mM Tris and 500 mM EDTA to the required concentration. TE with RNAse consisted of
TE with 0.1 mg/m RNAse A. RNAse A stock solution at 10 mg/mL in TE was prepared in 1
mM sodium acetate according to Manniatas (Cold Spring Harbor Laboratory Press, Cold Spring
Harbor, NY, 1989). The RNAse A stock solution was heat-treated at 55°C for 30 minutes to
destroy DNAases. Pure RNA stock solutions were prepared by dissolving pure RNA
lyophilised powder in TE buffer at 1 mg/mL. To remove RNA nucleotides, the RNA was
precipitated by adding sodium acetate to 0.3 M concentration, followed by one volume of IPA.
The material was chilled at -20°C overnight, centrifuged in a Beckman benchtop centrifuge at
13 krpm and resuspended in TE buffer. RNA stocks were kept at -80°C for no longer than 2
weeks.
4.3.4 Fermentation of plasmids and chromosomal DNA.
Two E. coli cells strains were selected for analytical development and alkaline lysis studies. E.
coli D H 5a and E. coli DHIO are recombination-deficient suppressing strains used for plating
and growth o f plasmids and cosmids. The bacterial cells were used as wild-type (non-plasmid
DNA containing) and in a recombinant form. In total four different plasmids were fermented
for use in analytical development and alkaline lysis studies: D H 5a pSVP ( 6 kb), D H 5a pQR186
(13 kb), D H 5a pQR150 (20 kb) and DHIO p5176 (113 kb). All fermentations were done at
shake-flask scale except for plasmid pSVP that was produced by 5L fermentation courtesy o f A.
Kay, UCL PhD candidate. Table 4.2 lists the size o f the plasmids used, their copy number and
the antibiotic resistance they convey.
p80
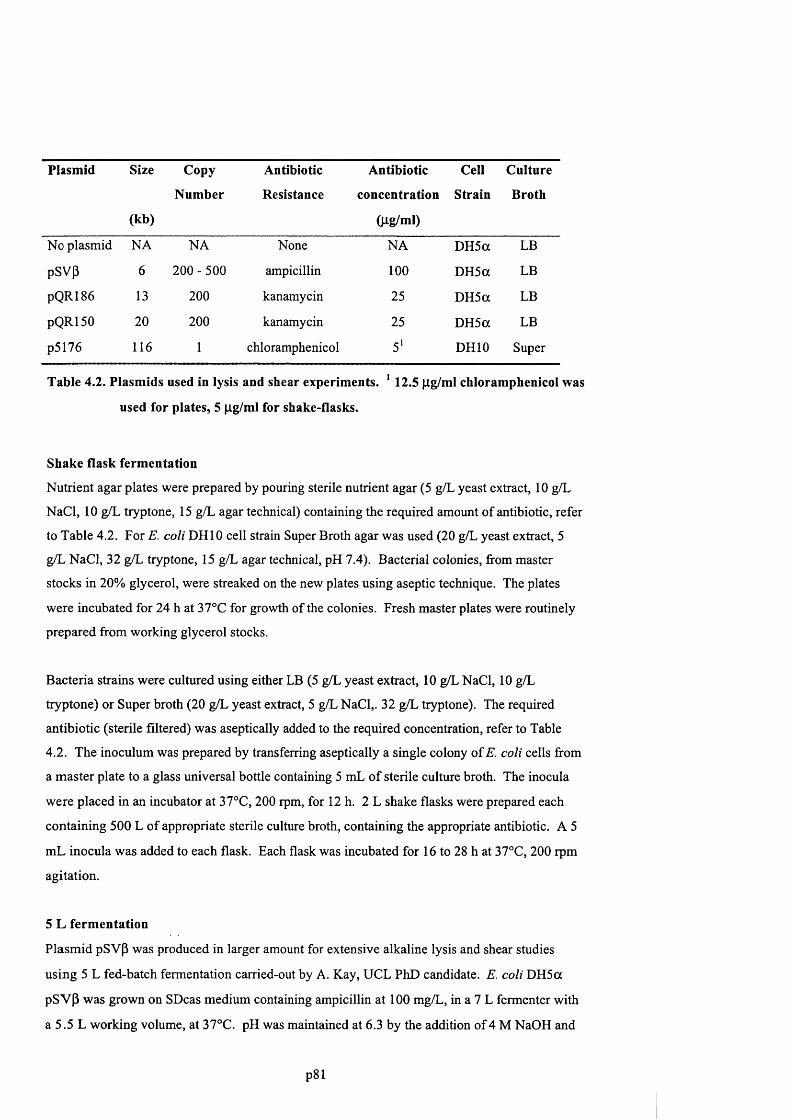
Plasmid Size Copy Antibiotic Antibiotic Cell C ulture
N um ber Resistance concentration Strain Broth
(kb) (pg/ml)
No plasmid NA NA None NA DH5a LB
pSVp 6 200 - 500 ampicillin 1 0 0 DH5a LB
PQR186 13 2 0 0 kanamycin 25 DH5a LB
PQR150 2 0 2 0 0 kanamycin 25 DH5a LB
p5176 116 1 chloramphenicol 5' DHIO Super
Table 4.2. Plasm ids used in lysis and shear experim ents. ' 12.5 pg/ml chloramphenicol was
used for plates, 5 pg/ml for shake-flasks.
Shake flask ferm entation
Nutrient agar plates were prepared by pouring sterile nutrient agar (5 g/L yeast extract, 10 g/L
NaCl, 10 g/L tryptone, 15 g/L agar technical) containing the required amount of antibiotic, refer
to Table 4.2. For E. coli DHIO cell strain Super Broth agar was used (20 g/L yeast extract, 5
g/L NaCl, 32 g/L tiyptone, 15 g/L agar technical, pH 7.4). Bacterial colonies, from master
stocks in 20% glycerol, were streaked on the new plates using aseptic technique. The plates
were incubated for 24 h at 37°C for growth of the colonies. Fresh master plates were routinely
prepared from working glycerol stocks.
Bacteria strains were cultured using either LB (5 g/L yeast extract, 10 g/L NaCl, 10 g/L
tryptone) or Super broth (20 g/L yeast extract, 5 g/L NaCl,. 32 g/L tryptone). The required
antibiotic (sterile filtered) was aseptically added to the required concentration, refer to Table
4.2. The inoculum was prepared by transferring aseptically a single colony o f E. coli cells from
a master plate to a glass universal bottle containing 5 mL o f sterile culture broth. The inocula
were placed in an incubator at 37°C, 200 rpm, for 12 h. 2 L shake flasks were prepared each
containing 500 L o f appropriate sterile culture broth, containing the appropriate antibiotic. A 5
mL inocula was added to each flask. Each flask was incubated for 16 to 28 h at 37°C, 200 rpm
agitation.
5 L ferm entation
Plasmid pSVP was produced in larger amount for extensive alkaline lysis and shear studies
using 5 L fed-batch fermentation carried-out by A. Kay, UCL PhD candidate. E. coli D H5a
pSVP was grown on SDcas medium containing ampicillin at 100 mg/L, in a 7 L fermenter with
a 5.5 L working volume, at 37°C. pH was maintained at 6.3 by the addition of 4 M NaOH and
p81
H3PO4 and DO was maintained at 30 % saturation by adjustment of stirrer speed. The
fermentation was run in batch mode for 15.5 h before switching to fed batch mode for a further
19.5 h. During the fed-batch mode an exponential glucose feed (40% W/V) was employed to
maintain the growth rate at 0.1/h. A linear amino acids feed was used from 20.5 to 35 h.
Cell harvest
All cells were harvested by centrifugation in a Beckman J-10 centrifuge at 10,000 rpm for 40
minutes. Cell paste was frozen at -70°C.
4.3.5 Standard lysis protocol
Alkaline lysis
Prior to lysis, frozen cell paste was resuspended in 0.5 mL TE buffer to 125 g wcw / L, in a 2
mL centrifuge tube. Resuspended cells were lysed using a modification o f the alkaline lysis
method o f Bimboim et al. (1979). One volume of resuspended cells was mixed with one
volume of lysis buffer (0.2 M NaOH, 1% SDS). The sample was mixed gently by inversion for
3 minutes. One volume o f chilled neutralisation buffer (3 M potassium acetate, pH 5.5, 4°C)
was added and mixed gently by inversion. The alkaline lysate was chilled in an ice-bath for 10
minutes.
Froteinase-K digestion
Frozen cell paste was resuspended in 0.5 mL STET buffer (5% sucrose, 25 mM Tris, 10 mM
EDTA, 5% Triton, pH 8.0) to 125 g/L in a 2 mL centrifuge tube. Proteinase-K was added to a
concentration of 0.1 mg/ml and the lysate incubated for 2 h at 55°C, followed by chilling in an
ice-bath for 1 0 minutes.
Lysozyme plus heat lysis
Harvested cells were resuspended in 0.5 mL STET buffer at 125 g wcw / L. Ready-lyse
lysozyme was added to 10 EU/mL and the samples were incubated at 37°C for 1 h with gentle
mixing. The samples were placed in a water bath for 5 minutes at 20°, 70°, 75°, 80°C and
85®C, followed by quenching on ice for 10 minutes.
4.3.6 Standard clarification protocol
AH lysates were centrifuged at 13,000 rpm for 30 min in a Beckman bench-top centrifuge and
the pellets discarded. For alkaline lysates, the supernatant was precipitated with 1 volume of
iso'propanol (IPA). For non-alkaline lysates, 5 M NaCl was added to the supernatant to a
p82
concentration o f 0.3 M, followed by one volume of IPA. All IPA precipitates were centrifuged
ct 13,000 rpm for 30 minutes and the supernatants discarded. The pellets were washed with 70
% ethanol and resuspended in TE with 0.1 mg/ml RNAse to make clarified lysates. The pellet
vas always resuspended in a volume of TE that was equal to the original clarified lysate
\olume.
43.7 Preparation of pure plasmid and chromosomal DNA standards
Plasmid DNA purification
To prepare pure supercoiled plasmid DNA in TE, clarified alkaline lysates were further purified
using Qiagen giga-prep kit according to Qiagen giga-prep handbook (1999). Pure plasmid
DNA was further purified by Q-Sepharose chromatography (Prazeres et al., 1998). After
elution o f the chromatography column, the supercoiled plasmid fraction was collected, ethanol
precipitated, 70% ethanol washed and resuspended in TE. Agarose gel electrophoresis was run
to confirm that the material was essentially pure supercoiled DNA. Clarified alkaline lysates
containing plasmid p5176 were not purified by Qiagen method, but instead were CTAB
precipitated (Lander et al., 2000), washed with TE and resuspended in 1.2 M NaCl. After
resuspension, two volumes o f ethanol were added to precipitate the plasmid, followed by a 70%
ethanol wash and resuspension in TE with 0.1 mg/ml RNAse A.
Chromosomal DNA purification
Wild-type E. coli cells (non-plasmid containing) were resuspended in STET (5% sucrose, 25
mM Tris, 10 mM EDTA, 5% Triton, O.I mg/ml RNAse A, pH 8.0) to 125 g/L. Proteinase-K
was added to a concentration o f 0.1 mg/ml and the lysate incubated for 2 hours at 55°C. 5 M
NaCl was added to a concentration of 0.3 M. One volume of IPA was added while stirring
continuously with a glass rod. The precipitated chromosomal DNA wound around the glass rod
and was removed. The precipitate was washed with 70% ethanol and resuspended in TE with
0.1 mg/ml RNAse A to make pure chromosomal DNA. Chromosomal DNA was further
purified by adsorption to diatomaceous earth (DE) using a modification of the method o f Carter
et al. (1991). DNA was adsorbed to DE at 4M NaCl, washed twice with 2 volumes 2 M NaCl,
once with 1 volume o f 100% ethanol, once with 1 volume of 70% ethanol, and resuspended
with one volume of TE to make ultra-pure chromosomal DNA. Single-stranded DNA was
prepared from double-stranded DNA by dénaturation at 0.1 M NaOH, followed by adjustment
back to pH 8 with 500 mM Tris, pH 7.5.
p83

Size reduction of DNA
Prior to HPLC, all samples containing chromosomal DNA were size reduced by shearing the
samples though a narrow capillary. The samples were placed in a 1 ml syringe and pushed by
hand through a 2 cm length o f PEEK tubing (0.007” ID) at approximately 3 to 6 ml/min.
Samples were then sucked back into the syringe through the same piece of PEEK tubing. This
was repeated 10 times for each sample. Size reduction was always performed before
denaturation-renaturation.
Generation of open-circular plasmid DNA
Pure supercoiled plasmid DNA in TE was degraded at 60 °C over 60 h. Agarose gel
electrophoresis showed that 90% of the original supercoiled plasmid DNA had been degraded to
open-circular and linear plasmid forms.
Standard DNA denaturation-renaturation procedure
One volume of clarified alkaline lysate, or pure supercoiled plasmid DNA in TE, was rapidly
mixed with 1/3 ** volume of 0.2 M NaOH. After 2 to 3 minutes at room temperature, one
volume of 500 mM Tris pH 7.5 was added to each sample.
4.3.8 Standard analytical techniques
Pure DNA and pure RNA standard concentration by UV absorbance
Concentrations o f ultra-pure plasmid DNA, ultra-pure chromosomal DNA, and RNA solutions
in TE were determined by measuring their absorbance at 260 nm in a 1 cm path length quartz
cuvette. Their optical density was measured against TE buffer. Samples were diluted to fall
with the range 0.1 - 0.5 CD at 260nm. An CD of 1.0 was taken to be 50 pg/ml double-stranded
DNA, 40 jig/ml single-stranded DNA and 30 pg/ml RNA. The absorbance at 280 nm was also
measured for DNA samples. Only samples with an OD260nm/OD280nm of 1.85 ± 0.05 were
considered pure (Sambrook et al., 1989).
DNA concentration by Picogreen fluorescence
The total DNA concentrations o f pure and ultra-pure plasmid DNA and chromosomal DNA,
and clarified lysates were determined by Picogreen fluorescence. The flourescence of samples
was measured using a flourescence plate-reader from BioProbes. The flourescene-plate reader
from BioProbes comes with a selection of removeable exeitation and emission wavelength
filters. The optimum combination of filters for a particular assay is determined by the excitation
and emission spectra o f the flourescent dye used. O f the filters that were available, there were
four excitation wavelength filters (360, 460,485 and 530 nm) and four emission wavelength
p84
filters (530, 570, 580 and 590 nm) that could be selected in the flourescence reader. The
excitation and emission filters for Picogreen were set at 485 nm and 530 nm, throughout, as
recommended by Molecular Probes. For ethidium bromide, the 16 possible combinations of
filters were tested to determine the optimum combination.
Samples were diluted to approximately 0.3 ng/ml using ultra-pure water (UPW). Picogreen
stock reagent was diluted 1:200 in UPW. 100 mL of dilute Picogreen solution was added to
100 mL of each sample in a 96-well plate. Ultra-pure plasmid DNA samples, diluted in the
range 0.020 ng/mL to 1 ng/mL were run on each plate as standards. TE buffer was run as a
blank. A linear standard curve was fitted to the fluorescence versus concentration o f the ultra-
pure plasmid standards. The concentration of samples was determined by comparison to the
standard curve.
Determination of supercoiled and open-circular plasmid concentration using agarose gel
Clarified lysates and pure DNA samples were run on 0.8% agarose gels in 3X TAB buffer at 30
V for 2 h using 50 mL volume mini-gels. All samples were RNAse digested for 1 h at 37°C in
0.1 mg/ml RNAse A prior to loading. Samples were loaded at 20 to 200 ng DNA/well, 20 pi
per well. Ultra-pure supercoiled plasmid DNA at 20, 50, 100 and 200 ng/well and 1-DNA
digest were run as standard. Agarose gels were stained for 4 hours in 0.5 pg/ml ethidium
bromide solution on a rocker-plate. Gels were illuminated with UV light (300 nm excitation)
and scanned using a digital camera. Gels were analysed using Scion image gel analysis
software. A standard curve was generated from the band areas o f the pure supercoiled plasmid
standards. Because open-circular plasmid binds more ethidium bromide than the equivalent
supercoiled plasmid, the band areas for open-circular plasmid were divided by 2.5, an
approximate correction factor (Ciccolini et al., 2002) in order to determine open-circular
concentrations.
Determination of chromosomal and large plasmid size by pulsed-field gel electrophoresis
Clarified lysates and pure DNA samples were run on 1.0 % agarose gels, 100 ml, in 0.5 X TBE
buffer at 6 V/cm at 14°C. Switch times used were from 2 s to 16 s and from 1 s to 200 s for
plasmid p5176 and chromosomal DNA, respectively. Run times were 16 h and 24 h for plasmid
p5176 and chromosomal DNA, respectively. Samples were loaded at approximately 500 ng
DNA/well, 20 to 30 pi per well. Agarose gels were stained, scanned and analysed as already
described. A 1-digest mid-range ladder and 1-ladder were run as standards on all gels.
p85
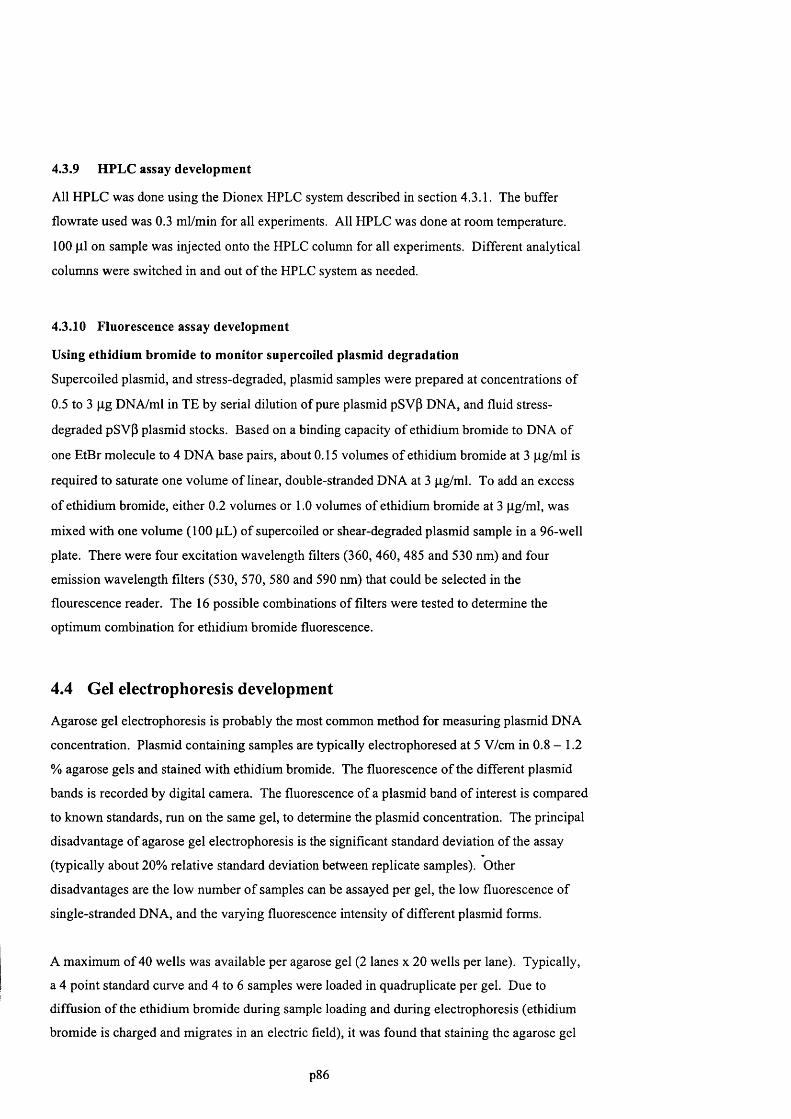
4.3.9 HPLC assay development
All HPLC was done using the Dionex HPLC system described in section 4.3.1. The buffer
flowrate used was 0.3 ml/min for all experiments. All HPLC was done at room temperature.
100 pi on sample was injected onto the HPLC column for all experiments. Different analytical
columns were switched in and out o f the HPLC system as needed.
4.3.10 Fluorescence assay development
Using ethidium bromide to monitor supercoiled plasmid degradation
Supercoiled plasmid, and stress-degraded, plasmid samples were prepared at concentrations of
0.5 to 3 pg DNA/ml in TE by serial dilution of pure plasmid pSVP DNA, and fluid stress-
degraded pSVP plasmid stocks. Based on a binding capacity o f ethidium bromide to DNA of
one EtBr molecule to 4 DNA base pairs, about 0.15 volumes o f ethidium bromide at 3 pg/ml is
required to saturate one volume of linear, double-stranded DNA at 3 pg/ml. To add an excess
of ethidium bromide, either 0.2 volumes or 1.0 volumes of ethidium bromide at 3 pg/ml, was
mixed with one volume (100 pL) o f supercoiled or shear-degraded plasmid sample in a 96-well
plate. There were four excitation wavelength filters (360, 460, 485 and 530 nm) and four
emission wavelength filters (530, 570, 580 and 590 nm) that could be selected in the
flourescence reader. The 16 possible combinations of filters were tested to determine the
optimum combination for ethidium bromide fluorescence.
4.4 Gel electrophoresis development
Agarose gel electrophoresis is probably the most common method for measuring plasmid DNA
concentration. Plasmid containing samples are typically electrophoresed at 5 V/cm in 0.8 - 1.2
% agarose gels and stained with ethidium bromide. The fluorescence o f the different plasmid
bands is recorded by digital camera. The fluorescence of a plasmid band o f interest is compared
to known standards, run on the same gel, to determine the plasmid concentration. The principal
disadvantage of agarose gel electrophoresis is the significant standard deviation of the assay
(typically about 20% relative standard deviation between replicate samples). Other
disadvantages are the low number o f samples can be assayed per gel, the low fluorescence of
single-stranded DNA, and the varying fluorescence intensity o f different plasmid forms.
A maximum of 40 wells was available per agarose gel (2 lanes x 20 wells per lane). Typically,
a 4 point standard curve and 4 to 6 samples were loaded in quadruplicate per gel. Due to
diffusion of the ethidium bromide during sample loading and during electrophoresis (ethidium
bromide is charged and migrates in an electric field), it was found that staining the agarose gel
p86
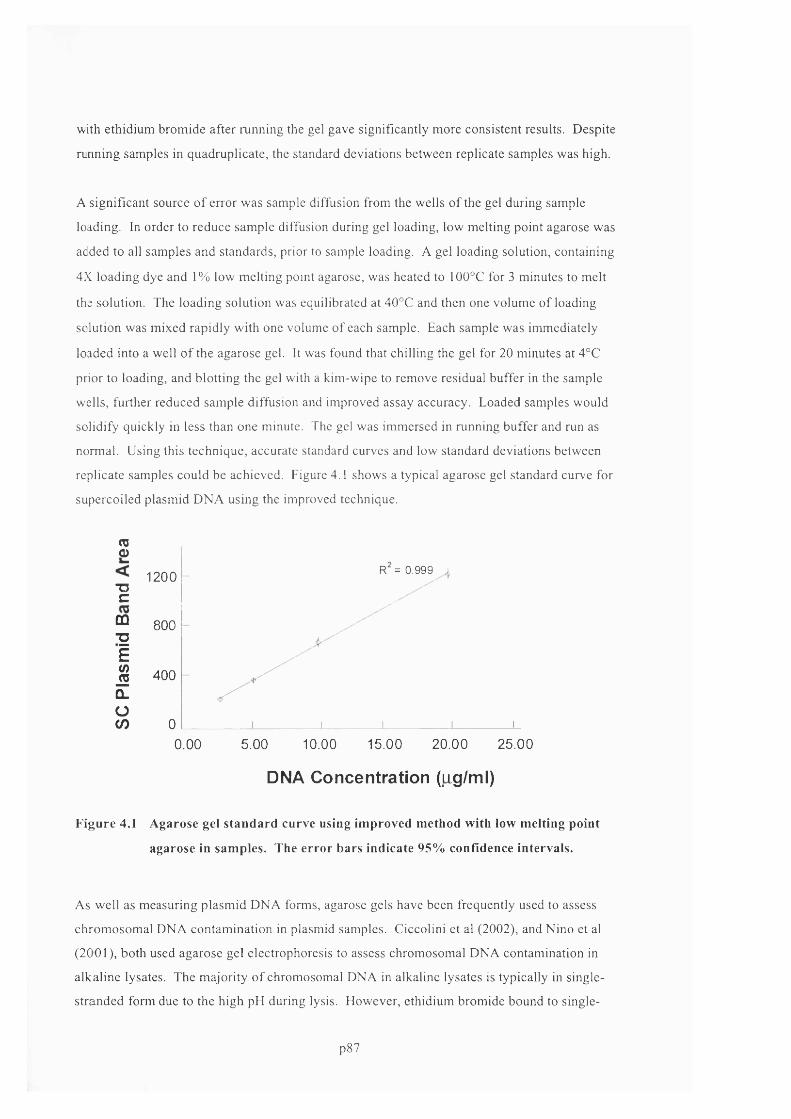
with ethidium brom ide after running the gel gave significantly more consistent results. Despite
running samples in quadruplicate, the standard deviations between replicate samples was high.
A significant source o f error was sample diffusion from the wells o f the gel during sample
loading. In order to reduce sam ple diffusion during gel loading, low melting point agarose was
added to all sam ples and standards, prior to sample loading. A gel loading solution, containing
4X loading dye and 1% low m elting point agarose, was heated to 100°C for 3 minutes to melt
the solution. The loading solution was equilibrated at 40°C and then one volume o f loading
solution was m ixed rapidly with one volume o f each sample. Each sample was immediately
loaded into a well o f the agarose gel. It was found that chilling the gel for 20 minutes at 4°C
prior to loading, and blotting the gel with a kim-wipe to remove residual buffer in the sample
wells, further reduced sam ple diffusion and improved assay accuracy. Loaded samples would
solidify quickly in less than one minute. The gel was immersed in running buffer and run as
normal. Using this technique, accurate standard curves and low standard deviations between
replicate samples could be achieved. Figure 4.1 shows a typical agarose gel standard curve for
supercoiled plasm id DNA using the improved technique.
(Z0)
1200
800
TJ C
m-g E
^ 400Û.o<n 0
R = 0 .9 9 9
0.00 5.00 10.00 15.00 20 .00 25 .00
DNA Concentration (|rg/ml)
Figure 4.1 Agarose gel standard curve using improved method with low melting point
agarose in samples. The error bars indicate 95% confidence intervals.
As well as measuring plasm id DNA forms, agarose gels have been frequently used to assess
chrom osom al DNA contam ination in plasmid samples. Ciccolini et al (2002), and Nino et al
(2001), both used agarose gel electrophoresis to assess chrom osom al DNA contam ination in
alkaline lysates. The m ajority o f chromosomal DNA in alkaline lysates is typically in single
stranded form due to the high pH during lysis. However, ethidium bromide bound to single
p87
stranded DNA fluoresces only weakly compared to double-stranded DNA; hence, measurem ent
o f single-stranded DNA impurities relative to double-stranded supercoiled plasm id may
underestimate the amount o f single-stranded impurities.
In order to assess agarose gel electrophoresis as an analytical technique for measuring
chromosomal DNA, samples o f double-stranded chromosomal DNA o f known concentration
were pH adjusted to pH 8, pH 12, pH 12.5 and pH 13, followed by renaturation to pH 8.0. The
samples were then electrophoresed, stained and scanned. Figure 4.2 shows this agarose gel.
There was a significant reduction in the fluorescence o f the chromosomal DNA samples
between pH 12.0 and 12.5, showing that chromosomal DNA denatures to single-stranded form
in the pH range 12.0 to 12.5. The low fluorescence o f single-stranded DNA relative to double
stranded DNA indicates that agarose gel electrophoresis is not a suitable technique for
measuring chromosomal DNA contamination in alkaline lysates, where the pH o f the lysate
typically exceeds pH 12.0. It was concluded that using agarose gel electrophoresis and
ethidium bromide staining, the amount o f contaminating single-stranded chromosomal DNA
could be significantly under-estimated.
Another potential source o f error using agarose gels to quantify chromosomal DNA
contamination was the effect o f DNA size on the assay. It was observed that that shearing
clarified alkaline lysates immediate prior to loading significantly increased the am ount o f
chromosomal DNA that entered the gel. The DNA within the gel usually fluoresced
significantly higher than the equivalent DNA trapped in the well. Thus, there often appeared to
be increased chromosomal contamination in the sheared clarified lysates, while in fact the
increased DNA in the gel was solely due to the smaller D NA fragments being able to penetrate
the agarose matrix. This made gel electrophoresis particularly unsuitable for quantifying
samples subjected to varying levels o f fluid shear.
p88
pH 13.0 pH 12.5 pH 12.0
I I IpH 8.0
m
Figure 4.2 Agarose gel comparing the fluorescence of double-stranded versus single
stranded DNA by Ethidium Bromide.
4.5 Anion exchange HPLC development
U sing the im proved agarose gel electrophoresis technique, section 4.4, supereoiled, open-
circular and linear plasm id DNA forms could be quantified. However, chrom osom al DNA
could not be quantified using agarose gel electrophoresis. In addition, quantification o f plasmid
forms using gels was labour intensive, slow, and required many replicate samples to reduce
assay error. An accurate, robust and fast analytical technique capable o f sim ultaneously
m easuring supereoiled plasm id DNA, non-supercoiled plasm id forms, and chrom osom al DNA
was required.
A nion exchange HPLC developm ent was performed in collaboration with Pat M cHugh, UCL
PhD candidate. Four different anion exchange HPLC resins were screened: Poros PI and Poros
HQ resins from Poros, Q -Sepharose HP from Pharm acia and NucleoPac from Dionex. All 4
resins were found to be suitable for determining total DNA concentration, but only Poros PI and
Q -Sepharose were able to quantify supereoiled plasm id separately from the other DNA
im purities, after sample pre-treatm ent.
4.5.1 Poros 20 PI HPLC
Ferreira et al. (1999) have recently reported the use o f Poros PI (polyethylenim ine) anionic
exchange resin for the quantification o f plasmid DNA; however, they reported that their assay
did not distinguish between plasm id DNA and chrom osom al DNA impurities. It was
p89

demonstrated, in this thesis, that shallow elution gradients allowed separation o f single-stranded
and double-stranded DNA on the Poros PI resin. A protocol, incorporating a denaturation-
renaturation step, was then developed that converted all chromosomal DNA and plasmid
impurities to single-stranded form leaving supereoiled plasm id DNA double-stranded. This
allowed separation, and hence quantification, o f both supereoiled plasmid and DNA impurities
using Poros PI resin. All HPLC was performed using a Dionex HPLC system with a 4 cm long,
I ml volume, analytical HPLC column.
Separation of single-stranded DNA and double-stranded DNA
Ultra-pure chromosomal DNA was injected onto the Poros PI HPLC column. Figure 4.3,
chromatogram I, shows the elution peak o f double-stranded chromosomal DNA during a
shallow gradient elution from 0.8 M to 1.4 M NaCl over 25 minutes. The double-stranded
DNA eluted as a narrow, single peak despite the size range o f DNA in the sample. Pure single
stranded chromosomal D N A was injected onto the HPLC column. The single-stranded DNA
eluted later than the double-stranded DNA and as a broader peak. Figure 4.3, chromatogram 2.
This indicated that under the conditions used, Poros PI could separate double-stranded from
single-stranded DNA species.
0.063<
2). Ultra-Pure ss-chDNAâC
3
8cI
0.04 -
0.02
O 0.003<
- 0.02
1). Ultra-Pure ds-chDNA
10 30 40 5020
Time (minutes)
Figure 4.3 Poros PI HPLC chromatogram of ultra-pure chromosomal DNA samples. 1)
Chromosomal DNA, double-stranded; 2) Denatured chromosomal DNA
p90
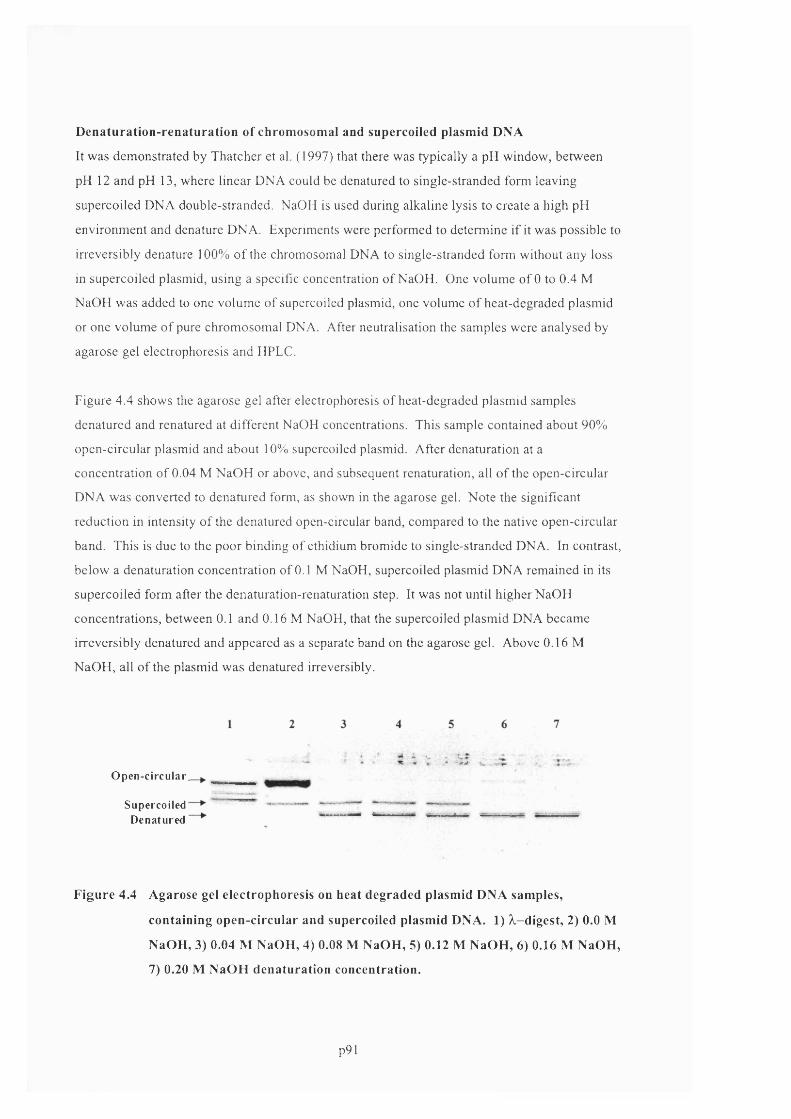
Denaturation-renaturation of chromosomal and supereoiled plasmid DNA
It was dem onstrated by Thatcher et al. (1997) that there was typically a pH window, between
pH 12 and pH 13, where linear DNA could be denatured to single-stranded form leaving
supereoiled DNA double-stranded. NaOH is used during alkaline lysis to create a high pH
environm ent and denature DNA. Experiments were perform ed to determ ine if it was possible to
irreversibly denature 100% o f the chromosomal DNA to single-stranded form without any loss
in supereoiled plasmid, using a specific concentration o f NaOH. One volum e o f 0 to 0.4 M
NaOH was added to one volum e o f supereoiled plasmid, one volume o f heat-degraded plasmid
or one volum e o f pure chrom osom al DNA. After neutralisation the sam ples were analysed by
agarose gel electrophoresis and HPLC.
Figure 4.4 shows the agarose gel after electrophoresis o f heat-degraded plasm id samples
denatured and renatured at different NaOH concentrations. This sample contained about 90%
open-circular plasmid and about 10% supereoiled plasmid. A fter dénaturation at a
concentration o f 0.04 M N aO H or above, and subsequent renaturation, all o f the open-circular
DNA was converted to denatured form, as shown in the agarose gel. N ote the significant
reduction in intensity o f the denatured open-circular band, compared to the native open-circular
band. This is due to the poor binding o f ethidium brom ide to single-stranded DNA. In contrast,
below a dénaturation concentration o f 0.1 M NaOH, supereoiled plasm id DNA rem ained in its
supereoiled form after the denaturation-renaturation step. It was not until higher NaOH
concentrations, between 0.1 and 0.16 M NaOH, that the supereoiled plasm id DNA becam e
irreversibly denatured and appeared as a separate band on the agarose gel. Above 0.16 M
N aO H , all o f the plasm id w as denatured irreversibly.
O pen-c ircu lar .
SupereoiledDenatured
Figure 4.4 Agarose gel electrophoresis on heat degraded plasmid DNA samples,
containing open-circular and supereoiled plasmid DNA. 1) 3,-digest, 2) 0.0 M
NaOH, 3) 0.04 M NaOH, 4) 0.08 M NaOH, 5) 0.12 M NaOH, 6) 0.16 M NaOH,
7) 0.20 M NaOH dénaturation concentration.
p9l
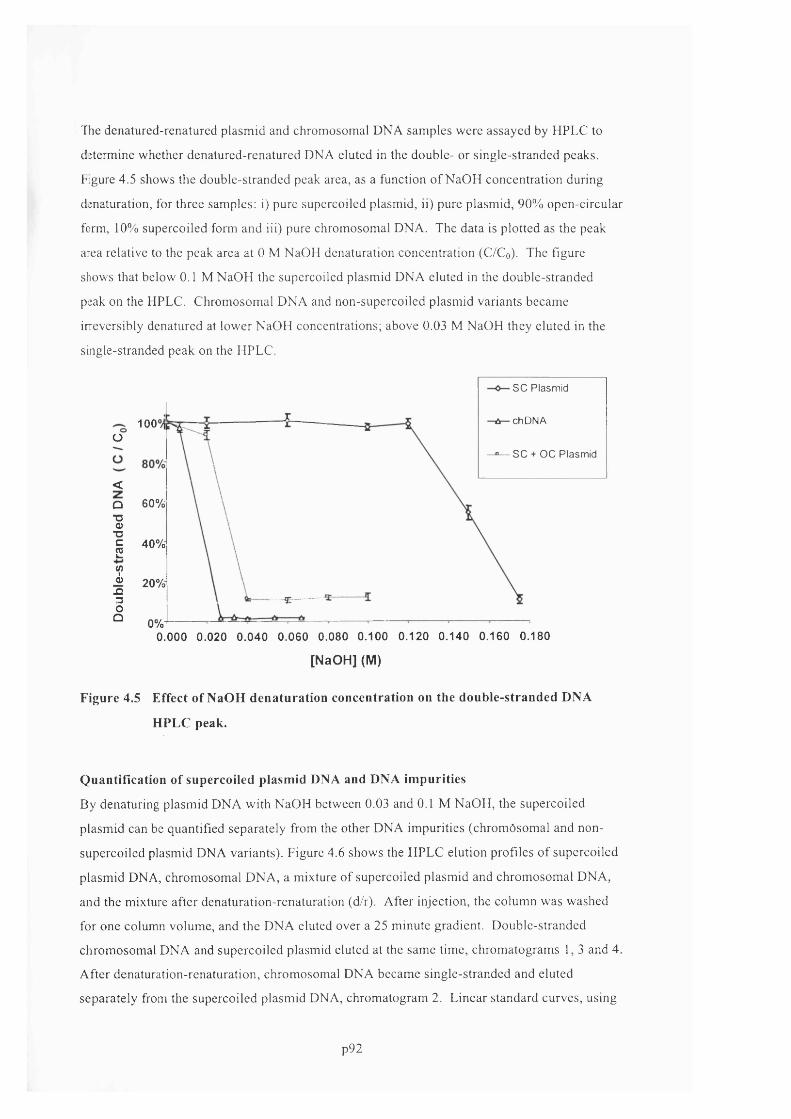
The denatured-renatured plasm id and chromosomal DNA samples were assayed by HPLC to
determine whether denatured-renatured DNA eluted in the double- or single-stranded peaks.
Figure 4.5 shows the double-stranded peak area, as a function o f NaOH concentration during
dénaturation, for three samples: i) pure supereoiled plasmid, ii) pure plasm id, 90% open-circular
form, 10% supereoiled form and iii) pure chromosomal DNA. The data is plotted as the peak
area relative to the peak area at 0 M NaOH dénaturation concentration (C /C o ) . The figure
shows that below 0.1 M NaOH the supereoiled plasmid DNA eluted in the double-stranded
peak on the HPLC. Chrom osom al DNA and non-supercoiled plasm id variants became
irreversibly denatured at lower NaOH concentrations; above 0.03 M NaOH they eluted in the
single-stranded peak on the HPLC.
SC Plasmid
chDNA100Ü
8 0 + 0 0 Plasmid
<Q 60%■o0)■Dc2
40%
?" 20%.o3O^ 0%
gr-----------
0.000 0.020 0.040 0.060 0.080 0.100 0.120 0.140 0.160 0.180
[NaOH] (M)
Figure 4.5 Effect of NaOH dénaturation concentration on the double-stranded DNA
HPLC peak.
Quantification of supereoiled plasmid DNA and DNA impurities
By denaturing plasm id DNA with NaOH between 0.03 and 0.1 M NaOH, the supereoiled
plasm id can be quantified separately from the other DNA impurities (chrom ôsom al and non-
supercoiled plasmid DNA variants). Figure 4.6 shows the HPLC elution profiles o f supereoiled
plasm id DNA, chromosomal DNA, a mixture o f supereoiled plasm id and chrom osom al DNA,
and the mixture after denaturation-renaturation (d/r). After injection, the column was washed
for one column volume, and the DNA eluted over a 25 minute gradient. Double-stranded
chrom osom al DNA and supereoiled plasmid eluted at the same time, chrom atogram s 1, 3 and 4.
A fter denaturation-renaturation, chromosomal DNA became single-stranded and eluted
separately from the supereoiled plasm id DNA, chrom atogram 2. L inear standard curves, using
p92

ultra-pure double-stranded DNA and ultra-pure single-stranded DNA, were obtained in the
range 10 pg to 0.5 jig DNA loaded onto the column, Figure 4.7.
0.050
^ 0.0404. S u p ereo iled P lasm id + chDNA
Q)OC(0n
0.0303. ChDNA
0.020 O tn 0.010
% S u p ereo iled P lasm id + ehDNA, after d/i
1. S u p ereo iled P lasm id
0.0000 10 15 20 25 30 355
Time (minutes)
Figure 4.6. Chromatograms of supereoiled plasmid DNA, chromosomal DNA, a mixture of
plasmid and chromosomal, and the mixture after dénaturation to convert the
chromosomal DNA to single-stranded form.
To demonstrate the utility o f the assay for process samples, a clarified alkaline lysate and a
clarified heat lysate (lysozyme digested followed by heat lysed at 85°C) were assayed by Poros
PI HPLC. Figure 4.8 shows the HPLC chromatograms for both samples, both before and after
the standard dénaturation step described in Materials and Methods section. The double
stranded peak area for the alkaline-lysed sample did not change significantly following
denaturation-renaturation indicating the bulk of the DNA impurities were already single
stranded. In contrast, the heat-lysed sample contained a significant amount o f double-stranded
DNA impurities that were converted to single-stranded DNA after denaturation-renaturation.
The assay showed that the yield o f supereoiled plasmid was 30% higher using heat lysis
compared to alkaline lysis, in this study. Comparison of the double-stranded and single
stranded peak areas showed that the alkaline-lysed sample contained 62% DNA impurities and
the heat-lysed sample contained 77% DNA impurities.
In order to verify that a window existed, between 0.03 M NaOH and 0.1 M NaOH, at which the
denaturation-renaturation step could be performed, the clarified heat-lysate and clarified
alkaline-lysate samples were denatured-renatured over a range o f NaOH concentrations from 0
to 0.07 M NaOH, and assayed by HPLC. Figure 4.9 shows the HPLC double-stranded peak
area only, as a function o f NaOH concentration, for both samples. Above 0.03 M NaOH, the
p93

double-stranded peak areas for both samples remained constant; only supereoiled DNA
remained in the double-stranded peak. This demonstrated that there was a relatively wide
window in NaOH concentration at which the denaturation-renaturation step could be performed.
8000
ooo R2= 0.999
% 6000a
I 4000
2000
4.0 6.0 8.0 10.00.0 2.0
Single-stranded DNA Mass (|Llg)
126 8 100 2 4
Double-stranded DNA Mass (jig)
Figure 4.7 Plot showing HPLC standard curves generated using ultra-pure supereoiled
plasmid DNA and ultra-pure single-stranded chromosomal DNA.
p94

EcoCDCM
m0)oc(ük.o(/)
<
0.04
0.03
0.02 1. Heat Lysed: Not d/r ; V.
0.01] 2. Heat Lysed: After d/r
0 .00 j___3. Alkaline Lysed: Not d/r
j 4. Alkaline Lysed: After d /r
- 0.0115 20 25 30 35 40 45
Time (minutes)Figure 4.8. HPLC chrom atogram s of 4 clarified lysate samples: 1) Heat-lysed, 2)
dena tu red -renatu red heat-lysed, 3) alkaline lysed, 4) denatu red-renatu red
alkaline lysed.
5000
Heat Lysis A lkaline Lysis
2000
0.00 0.01 0.02 0.03 0.04[NaOH] (M)
0.05 0.06 0.07
F igure 4.9 Plot showing double-stranded DNA in 2 clarified lysates, by HPLC assay, as a
function of NaOH dénaturation concentration: i) lysozyme and heat lysis, ii)
alkaline lysis.
p95

Supereoiled plasmid yield on HPLC
Studies were performed to determine what fraction o f supereoiled plasmid injected onto the
column was being recovered after salt elution. Pure plasmid pSVP (Qiagen purified) was
injected on the HPLC system without the HPLC column in place, while running with 1.6 M
NaCl, 10 mM TE (elution buffer conditions). The area o f the DNA peak was recorded as it
passed through the absorbance detector. Pure plasmid was injected onto the HPLC column,
eluted with salt, and its elution peak area recorded. The peak areas with and without the HPLC
column in place were compared to determine the supereoiled plasmid yield over absorption and
elution from the Poros PI column. It was determined that yield o f supereoiled plasmid was only
70 to 90 % depending on batch of Qiagen purified plasmid. This lower than expected yield
could have been to due to impurities still present in the Qiagen-purified plasmid solutions,
giving an artificially high peak area when the column was not in place. Ultra-pure plasmid
DNA (refer to section 4.3.7) was injected onto the HPLC system with and without the Poros PI
column in-line. Supereoiled plasmid yields were now 99% ± 3%.
Effect of chromosomal DNA size on HPLC.
When in-process samples containing large chromosomal DNA molecules were applied to the
HPLC column, a significant fraction o f the chromosomal DNA did not elute from the column
during the salt gradient elution. This DNA was only removed during a 0.2 M NaOH wash o f
the column. In contrast the yield o f plasmid was almost 100%. Experiments were performed to
determine if the low yield o f chromosomal DNA was related to the size of the chromosomal
DNA molecules. Clarified alkaline lysate samples, from wild-type cells, were subjected to fluid
stress by placing each sample in a syringe and manually pushing them through a 5 cm long,
0.01” ID capillary at 3 to 6 mL/min.
Figure 4.10 shows the recovery o f single-stranded DNA from the Poros PI HPLC, as a function
o f the number of capillary passes prior to HPLC sample injection. For this typical clarified
alkaline lysate sample, the amount o f DNA eluted from the HPLC column significantly
increased after the samples were forced through the capillary, reaching a constant after 4 to 8
capillary passes. The 100% yield in Figure 4.10 was based on the HPLC peak area after
fragmenting the chromosomal DNA by pushing the clarified lysate through a 0.007” ID PEEK
capillary, 20-times, at 15 mL/min using the Hamilton syringe pump. The decreased
chromosomal DNA size after shearing evidently prevents the DNA from becoming trapped in
the chromatography resin or irreversibly binding to the chromatography resin.
p96
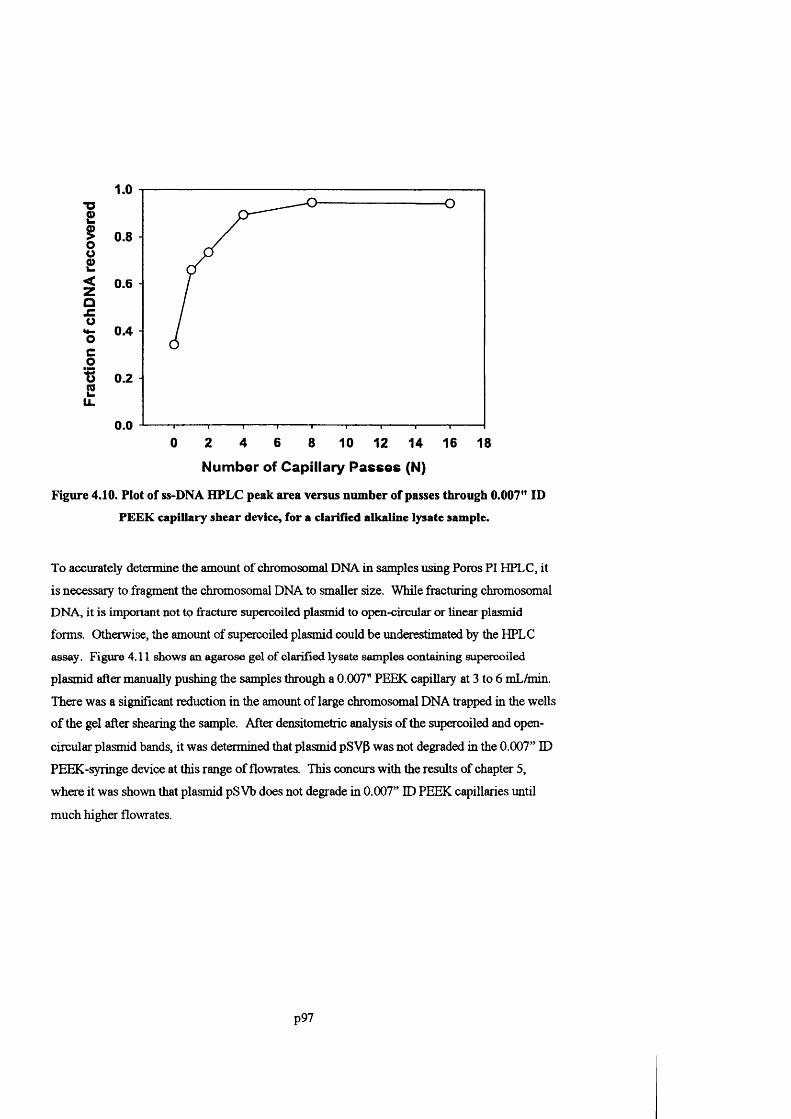
1.0"O2i 0.8 -
< 0.6 a€oco■'82
0.4 -
0.2
U.
0.00 2 4 6 8 10 12 14 16 18
Number of Capillary Passes (N)
Figure 4.10. Plot of ss-DNA HPLC peak area versus number of passes through 0.007" ID
PEEK capillary shear device, for a clarified alkaline lysate sample.
To accurately determine the amount of chromosomal DNA in samples using Poros FI HPLC, it
is necessary to fragment the chromosomal DNA to smaller size. While fracturing chromosomal
DNA, it is important not to fracture supereoiled plasmid to open-circular or linear plasmid
forms. Otherwise, the amount of supereoiled plasmid could be underestimated by the HPLC
assay. Figure 4.11 shows an agarose gel of clarified lysate samples containing supereoiled
plasmid after manually pushing the samples through a 0.007" PΠK capillary at 3 to 6 mL/tnin.
There was a significant reduction in the amount of large chromosomal DNA trapped in the wells
of the gel after shearing the sanqile. After densitometric analysis of the supereoiled and open-
circular plasmid bands, it was determined that plasmid pSVP was not degraded in the 0.007” ID
PEEK-syringe device at this range of flowrates. This concurs with the results of chapter 5,
where it was shown that plasmid pSVb does not degrade in 0.007” ID PEEK capillaries until
much higher flowrates.
p97

LI L2 L3 L4 L5 L6
Well —
SC
Figure 4.11. Agarose gel showing the effect of pushing a clarified alkaline lysate sample
through a 0.007" PEEK capillary on supereoiled and open-circular plasmid
concentration (pSV^). From left to right: 15, 10, 6, 3, 0 syringe passes.
Quantification of RNA
RNA IS the principal nucleic acid contaminant by mass m E. coli alkaline cell lysates. Efficient
clearance of RNA is an essential requirement for any plasmid purification process. RNA can be
assayed colorimetrically by orcinol assay [Sambrook et al.]; however, because the orcinol assay
also measures DNA it requires subtraction of the DNA contribution to the absorbance reading.
Another disadvantage with this assay is that it is prone to interference from the common lysis
buffer components, sucrose. It would be advantageous to be able to quantify RNA while
simultaneously measuring DNA using HPLC. A series of experiments were performed to
evaluate if the Poros PI HPLC resin could be used to quantify RNA in process samples.
Clarified alkaline lysates that were RNAse-treated, and those that were not RNAse-treated, were
injected onto the HPLC column at 20% buffer B (0.8 M NaCl). TE buffer was also injected
onto the column. Figure 4.12 shows the chromatograms following injection and elution with an
increasing salt gradient. Chromatograms I and 2 show that the flowthrough peak for the non-
RNAse treated sample was the same as for TE buffer, all of the RNA and DNA bound to the
column, along with other impurities (that absorb at 260nm). For the sample that was RNAse
treated, there was a large flowthrough peak. This flowthrough peak must have been entirely
due to the digested RNA, chromatogram 3. Following loading and washmg, the bound DNA
eluted during the salt gradient. Other impurities were removed from the column using a 0.2 M
NaOH wash. Thus, by RNAse-treating all samples prior to HPLC, only RNA will elute in the
flowthrough at 0.8 M NaCl load, and the amount of RNA m process samples can be determmed.
p98

0.9
Oocro■e
0.4
\ 3. Clarified alkaline lysate w/ RNase
n<
0.22. Clarified alkaline lysate w/o RNase
1. Buffer
0.010 15 20 25
Time (minutes)30 35 40
Figure 4.12 HPLC chrom atogram s of RNAse-treated clarified lysate (top), untreated
clarified lysate (middle) and Tris-EDTA (bottom ) are shown. RNAse
trea tm ent causes the digested RNA to elute as a separate peak.
A pure sample o f ribosomal RNA and a clarified alkaline lysate were assayed by HPLC for
RNA. The samples were assayed at a range o f dilutions which confirm ed assay linearity over a
20-fold dilution range, R^ = 0.999 for both samples, as shown in Figure 4.13 and Figure 4.14.
100 pi o f diluted sam ple was injected onto the colum n each time. The small contribution o f
EDTA to the flowthrough peak was determined by running a pure TE sample. The EDTA area
was subtracted from the total flowthrough peak area.
An RNA spiking experiment was run to investigate RNA recovery. A clarified lysate sample
was spiked with an equal volume o f RNA stock solution at 0, 50 and 200 pg/m l RNA. Refer to
M aterials and M ethods section for preparation o f RNA stock solution. The samples were then
isopropanol precipitated and assayed for RNA by HPLC. Each sample was repeated in
triplicate. From the standard curve in Figure 4.14, the concentration o f RNA in the clarified
lysate was determ ined from the HPLC assay to be 180 pg/m l. Spike recoveries were 97% ±
9% and 107% ± 12% for the 200 pg/m l and 50 pg/m l RNA spikes respectively.
p99
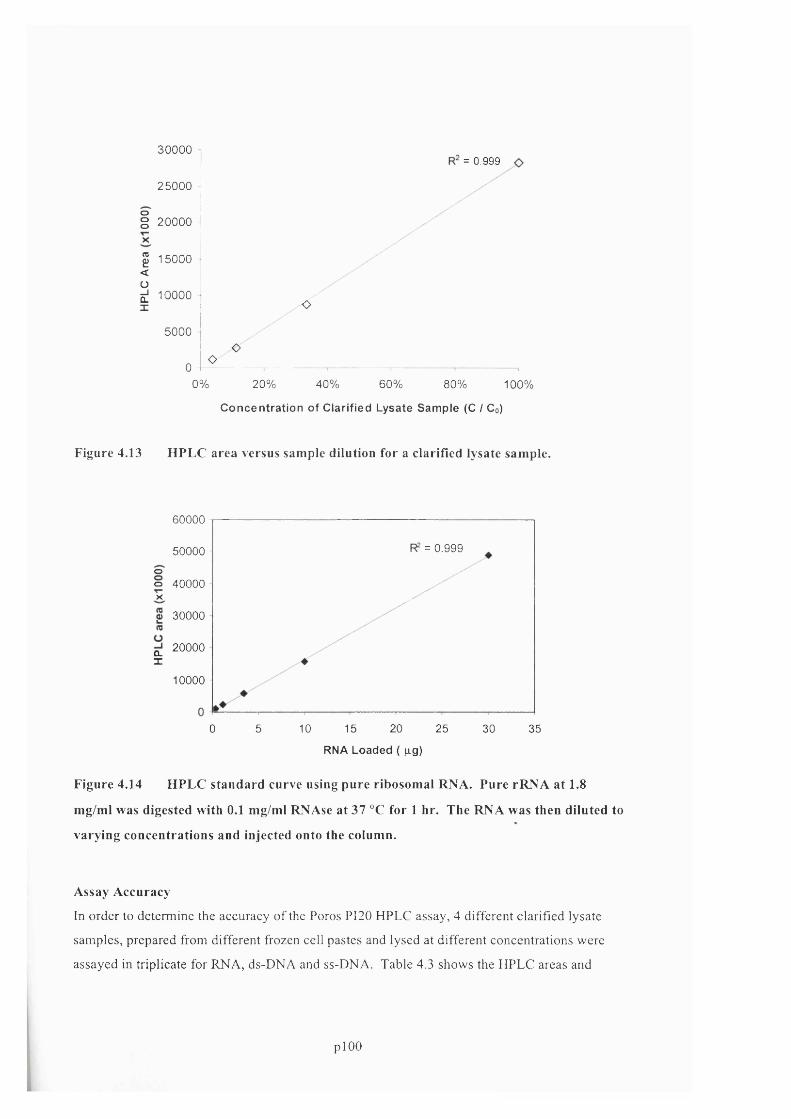
3 0 0 0 0 1
2 5 0 0 0
§ 20000 4
g 1 5 0 0 0 <Oôl 10000 X
Oo
= 0 .999
O
5 0 0 0
00% 20% 40 % 60 % 80% 100%
C o n c e n tra tio n of C larified Lysate S am ple (C I Co)
Figure 4.13 H PL C area versus sam ple dilution for a clarified lysate sam ple.
6 0 0 0 0
= 0 .9 9 95 0 0 0 0
oo 4 0 0 0 0X
3 0 0 0 0
20000Q.X10000
0 10 15 20 2 55 3 0 3 5
RNA Loaded ( pg)
Figure 4.14 H PLC stan d ard curve using p u re ribosom al RNA. Pure rR N A at 1.8
mg/ml was digested with 0.1 mg/ml RNAse at 37 °C for 1 hr. The RNA was then diluted to
varying concentrations and injected onto the column.
Assay A ccuracy
In order to determ ine the accuracy o f the Poros PI20 HPLC assay, 4 different clarified lysate
sam ples, prepared from different frozen cell pastes and lysed at different concentrations were
assayed in triplicate for RNA, ds-DNA and ss-DNA. Table 4.3 shows the HPLC areas and
plOO
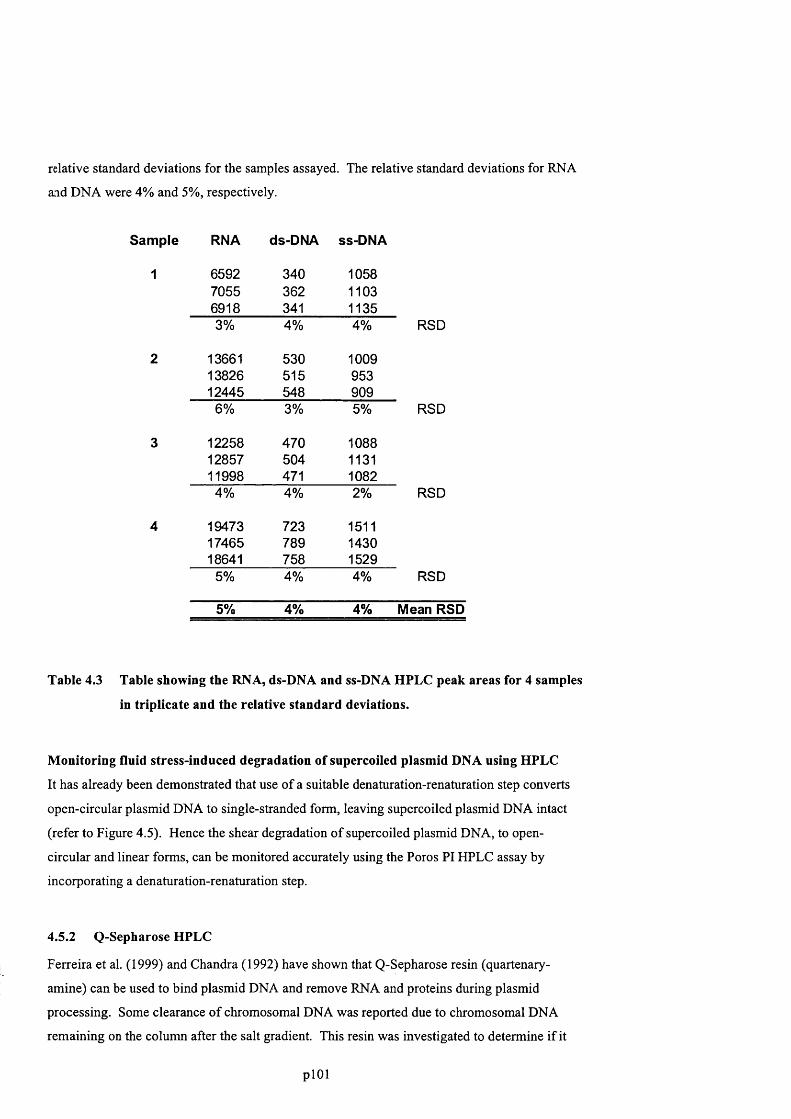
relative standard deviations for the samples assayed. The relative standard deviations for RNA
and DNA were 4% and 5%, respectively.
Sample RNA ds-DNA ss-DNA
1 6592 340 10587055 362 11036918 341 11353% 4% 4% RSD
2 13661 530 100913826 515 95312445 548 909
6% 3% 5% RSD
3 12258 470 108812857 504 113111998 471 10824% 4% 2% RSD
4 19473 723 151117465 789 143018641 758 1529
5% 4% 4% RSD
5% 4% 4% Mean RSD
Table 4.3 Table showing the RNA, ds-DNA and ss-DNA HPLC peak areas for 4 samples
in triplicate and the relative standard deviations.
Monitoring fluid stress-induced degradation of supercoiled plasmid DNA using HPLC
It has already been demonstrated that use of a suitable denaturation-renaturation step converts
open-circular plasmid DNA to single-stranded form, leaving supercoiled plasmid DNA intact
(refer to Figure 4.5). Hence the shear degradation o f supercoiled plasmid DNA, to open-
circular and linear forms, can be monitored accurately using the Poros PI HPLC assay by
incorporating a denaturation-renaturation step.
4.5.2 Q-Sepharose HPLC
Ferreira et al. (1999) and Chandra (1992) have shown that Q-Sepharose resin (quartenary-
amine) can be used to bind plasmid DNA and remove RNA and proteins during plasmid
processing. Some clearance o f chromosomal DNA was reported due to chromosomal DNA
remaining on the column after the salt gradient. This resin was investigated to determine if it
plOl
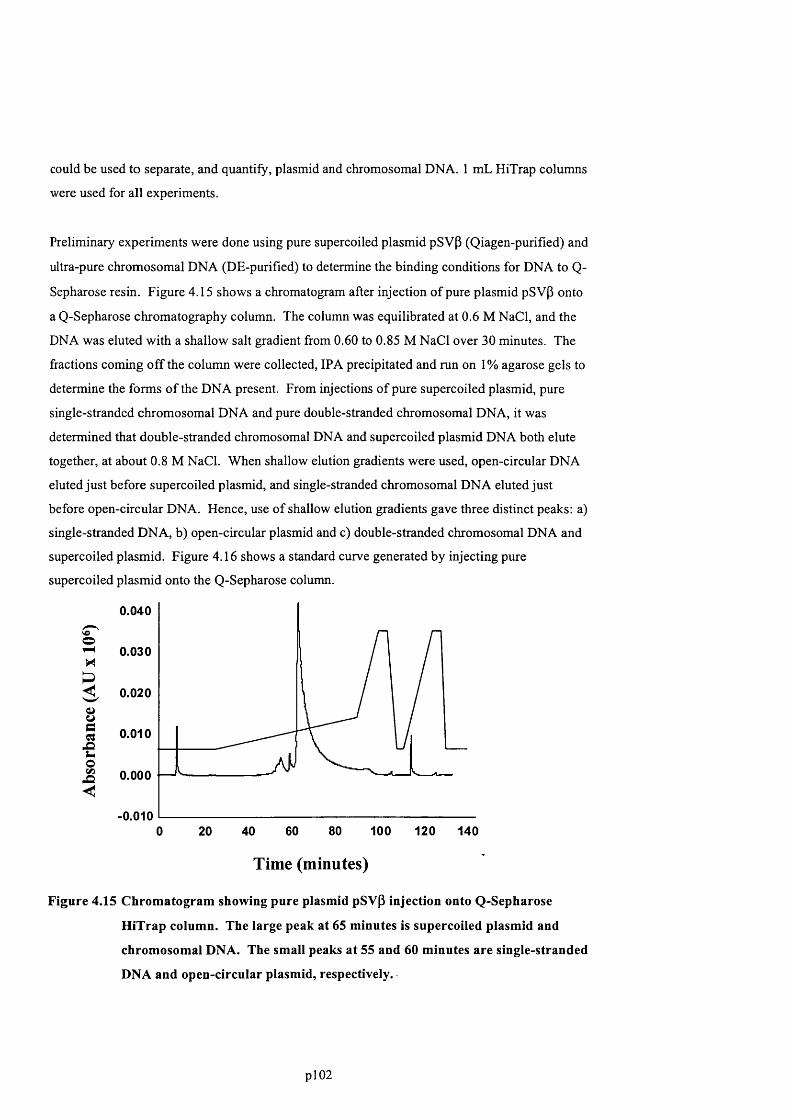
could be used to separate, and quantify, plasmid and chromosomal DNA. 1 mL HiTrap columns
were used for all experiments.
Preliminary experiments were done using pure supercoiled plasmid pSVP (Qiagen-purified) and
ultra-pure chromosomal DNA (DE-purified) to determine the binding conditions for DNA to Q-
Sepharose resin. Figure 4.15 shows a chromatogram after injection o f pure plasmid pSVP onto
a Q-Sepharose chromatography column. The column was equilibrated at 0.6 M NaCl, and the
DNA was eluted with a shallow salt gradient from 0.60 to 0.85 M NaCl over 30 minutes. The
fractions coming off the column were collected, IP A precipitated and run on 1 % agarose gels to
determine the forms o f the DNA present. From injections o f pure supercoiled plasmid, pure
single-stranded chromosomal DNA and pure double-stranded chromosomal DNA, it was
determined that double-stranded chromosomal DNA and supercoiled plasmid DNA both elute
together, at about 0.8 M NaCl. When shallow elution gradients were used, open-circular DNA
eluted just before supercoiled plasmid, and single-stranded chromosomal DNA eluted just
before open-circular DNA. Hence, use of shallow elution gradients gave three distinct peaks: a)
single-stranded DNA, b) open-circular plasmid and c) double-stranded chromosomal DNA and
supercoiled plasmid. Figure 4.16 shows a standard curve generated by injecting pure
supercoiled plasmid onto the Q-Sepharose column.
V00
18C
II<
0.040
0.030
0.020
0.010
0.000
- 0.010100 120 14060 800 20 40
Time (minutes)
Figure 4.15 Chromatogram showing pure plasmid pSVp injection onto Q-Sepharose
HiTrap column. The large peak at 65 minutes is supercoiled plasmid and
chromosomal DNA. The small peaks at 55 and 60 minutes are single-stranded
DNA and open-circular plasmid, respectively.
pl02
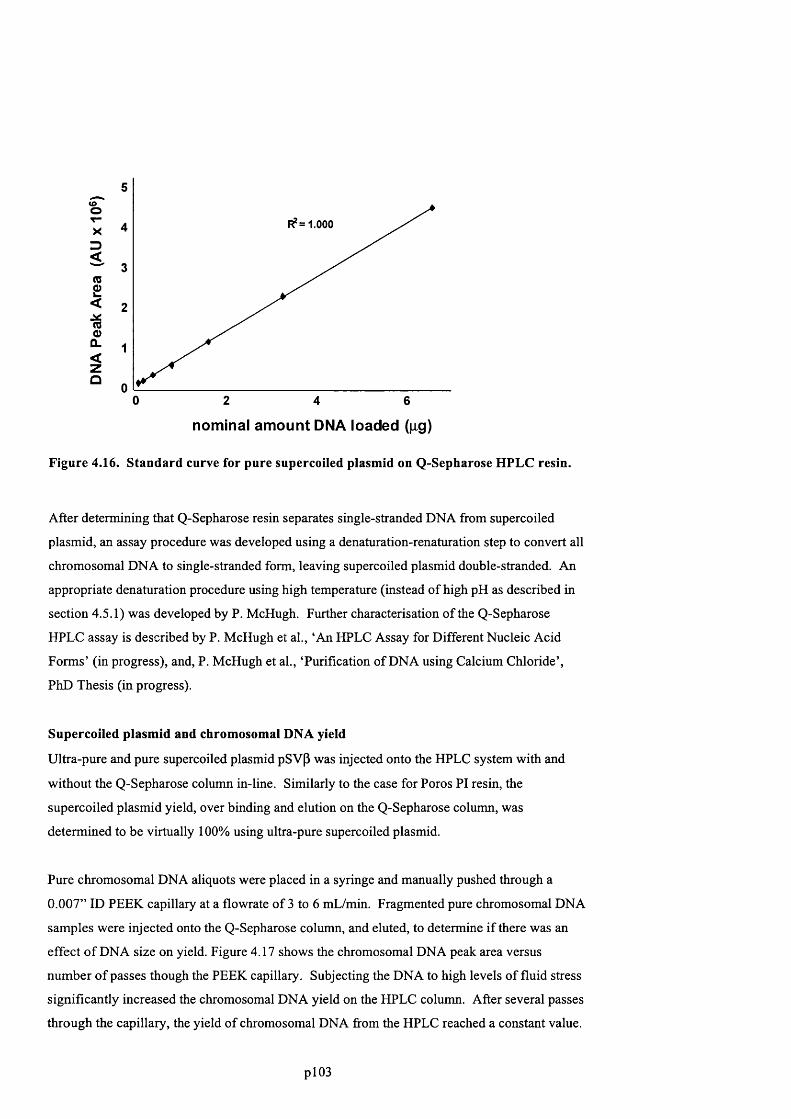
X35 .(0Q)
<DQ.
IQ
5
F?= 1.0004
3
2
1
00 2 4 6
nom inal am o u n t DNA loaded (|ig)
Figure 4.16. Standard curve for pure supercoiled plasmid on Q-Sepharose HPLC resin.
After determining that Q-Sepharose resin separates single-stranded DNA from supercoiled
plasmid, an assay procedure was developed using a denaturation-renaturation step to convert all
chromosomal DNA to single-stranded form, leaving supercoiled plasmid double-stranded. An
appropriate dénaturation procedure using high temperature (instead o f high pH as described in
section 4.5.1) was developed by P. McHugh. Further characterisation o f the Q-Sepharose
HPLC assay is described by P. McHugh et al., ‘An HPLC Assay for Different Nucleic Acid
Forms’ (in progress), and, P. McHugh et al., ‘Purification of DNA using Calcium Chloride’,
PhD Thesis (in progress).
Supercoiled plasmid and chromosomal DNA yield
Ultra-pure and pure supercoiled plasmid pSVP was injected onto the HPLC system with and
without the Q-Sepharose column in-line. Similarly to the case for Poros PI resin, the
supercoiled plasmid yield, over binding and elution on the Q-Sepharose column, was
determined to be virtually 100% using ultra-pure supercoiled plasmid.
Pure chromosomal DNA aliquots were placed in a syringe and manually pushed through a
0.007” ID PEEK capillary at a flowrate o f 3 to 6 mL/min. Fragmented pure chromosomal DNA
samples were injected onto the Q-Sepharose column, and eluted, to determine if there was an
effect o f DNA size on yield. Figure 4.17 shows the chromosomal DNA peak area versus
number o f passes though the PEEK capillary. Subjecting the DNA to high levels of fluid stress
significantly increased the chromosomal DNA yield on the HPLC column. After several passes
through the capillary, the yield o f chromosomal DNA from the HPLC reached a constant value.
pl03
ooo
£<
yQ.X
9001
800-
700-
600-
400-
300
200 O100 -
0 31 2 4 65 7 8 9 10 11
No. Capillary Passes
Figure 4.17. Plot of single-stranded HPLC area versus number of passes of pure
chromosomal DNA through a 0.007” ID PEEK capillary for a Q-Sepharose
column.
Both the Q-Sepharose and Poros PI assay procedures can accurately determine supercoiled
plasmid and chromosomal DNA in process samples. The Q-Sepharose assay had the advantage
that it can quantify the open-circular form of plasmid pSV(3 separately from the supercoiled
form. Preliminary work using a different plasmid, pQRlSG (20 kb), indicated that Q-Sepharose
did not separate the open-circular and supercoiled forms o f this larger plasmid. Because open-
circular and supercoiled plasmid forms are both double-stranded, and similar in size, any
differences in binding to Q-Sepharose must be quite subtle, so it is not surprising that open-
circular and supercoiled separation is size dependant. The Poros PI resin had the advantage that
it could accurately quantify RNA, in contrast to the Q-Sepharose resin. Generally, the Poros PI
resin was used to quantify supercoiled plasmid and DNA impurities in this thesis. This was
because the resin was capable to withstanding high pressures (making it more robust to use on a
day-to-day basis), because the HPLC assay time was shorter, and because open-circular plasmid
levels were generally low after the alkaline lysis step. However, for cases where the amount o f
open-circular plasmid present was of interest, Q-Sepharose chromatography was used.
pl04
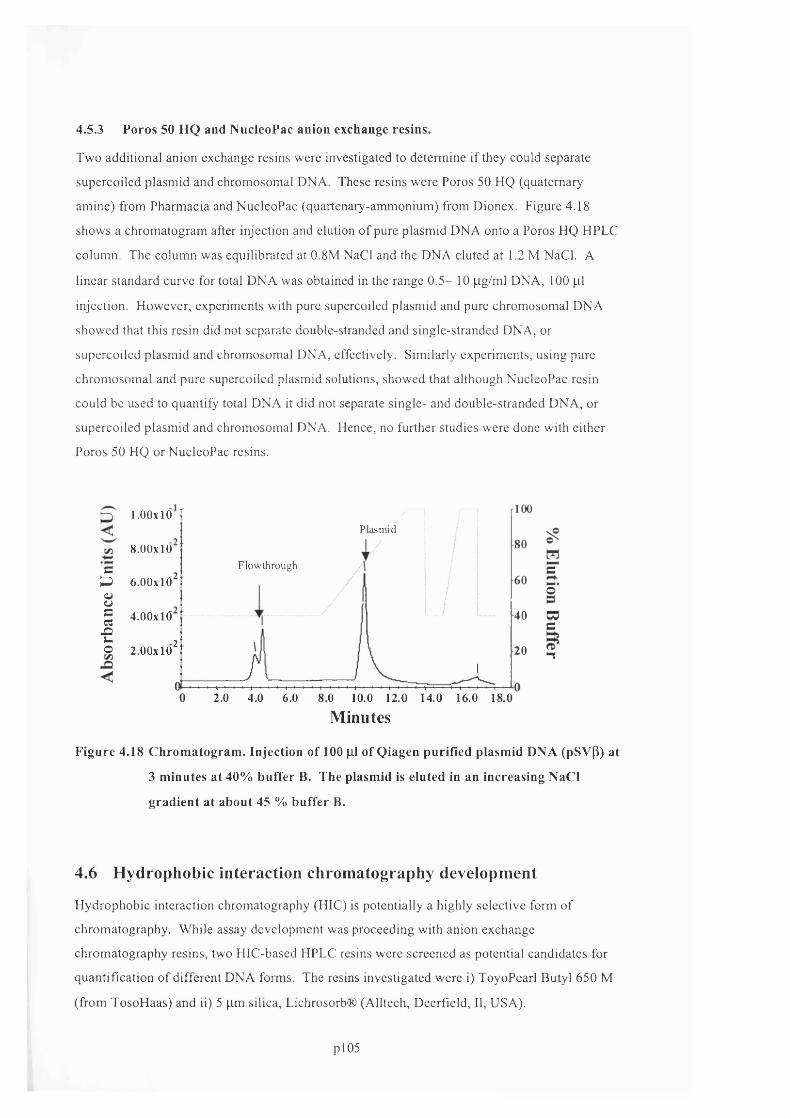
4.5.3 Poros 50 HQ and NucleoPac anion exchange resins.
Two additional anion exchange resins were investigated to determine if they could separate
supercoiled plasmid and chromosomal DNA. These resins were Poros 50 HQ (quaternary
amine) from Pharmacia and NucleoPac (quartenary-ammonium) from Dionex. Figure 4.18
shows a chromatogram after injection and elution o f pure plasmid DNA onto a Poros HQ HPLC
column. The column was equilibrated at 0.8M NaCl and the DNA eluted at 1.2 M NaCl. A
linear standard curve for total DNA was obtained in the range 0 .5- 10 pg/ml DNA, 100 pi
injection. However, experiments with pure supercoiled plasmid and pure chromosomal DNA
showed that this resin did not separate double-stranded and single-stranded DNA, or
supercoiled plasmid and chromosomal DNA, effectively. Similarly experiments, using pure
chromosomal and pure supercoiled plasmid solutions, showed that although NucleoPac resin
could be used to quantify total DNA it did not separate single- and double-stranded DNA, or
supercoiled plasmid and chromosomal DNA. Hence, no further studies were done with either
Poros 50 HQ or NucleoPac resins.
cP8C
suo
1.00x10
8.00x10'^
6.00x10
4.00x10
2.00x10^
P as mid
Flowthrough
40 Cd
2.0 4.0 6.0 8.0 10.0 12.0 14.0 16.0 18.0
Minutes
Figure 4.18 C hrom atogram . Injection of 100 pi of Qiagen purified plasm id DNA (pSV(3) at
3 m inutes at 40% buffer B. The plasmid is eluted in an increasing NaCl
grad ien t at about 45 % buffer B.
4.6 Hydrophobic interaction chromatography development
Hydrophobic interaction chromatography (HIC) is potentially a highly selective form of
chromatography. While assay development was proceeding with anion exchange
chromatography resins, two HIC-based HPLC resins were screened as potential candidates for
quantification of different DNA forms. The resins investigated were i) ToyoPearl Butyl 650 M
(from TosoHaas) and ii) 5 pm silica, Lichrosorb® (Alltech, Deerfield, II, USA).
pl05

4.6.1 Butyl resins.
TosoHaas butyl resins have previously been reported as being able to separate chromosomal
DNA and plasmid DNA (Ram et al., 1999); however, details on chromatography solvents were
not described, and information as to whether the chromosomal DNA was double-stranded or
single-stranded was not supplied. Pure samples o f plasmid or chromosomal DNA were loaded
onto the Butyl column at varying salt concentrations (up to 5 M NaCl, up to 6 M LiCl or up to 5
M ammonium sulphate). For all conditions tested, the DNA did not bind to the resin. No
further work was done using this resin.
4.6.2 Silica
It has previously been reported by Carter et al. (1995), Milton et al. (1998), and Melzak et al.
( 1996) that DNA binds to silica in the presence o f concentrated chaotropic salts such as
guanidine hydrochloride, sodium perchlorate or sodium iodide. Silica resin was investigated to
determine if single- or double-stranded chromosomal DNA, or supercoiled plasmid DNA, had
different binding characteristics to silica. The resin used was a 5 micron silica for HPLC,
Lichrosorb®. Sodium chloride was investigated as the running buffer to determine if high
concentrations o f sodium chloride could be used to bind DNA to silica. Preliminary
experiments were performed with pure plasmid DNA and pure chromosomal DNA solutions. It
was determined that single-stranded DNA bound to silica at 0.8 M NaCl, pH 7.0, while double
stranded DNA bound at 1.8 M NaCl and above. It was determined that RNAse-digested RNA
did not bind to silica at or below 2M NaCl. Between pH 6 and pH 8, the binding capacity
increased marginally as the pH was reduced. Chromatography was run at pH 7.0.
Figure 4.19 shows a chromatogram after injection o f an RNAse-treated clarified lysate onto the
silica column, equilibrated at 2 M NaCl, pH 7.0. The sample was denatured-renatured using the
standard protocol before injection onto the HPLC column. Running a shallow salt gradient
from 2 M NaCl to 0 M NaCl, the double-stranded DNA eluted first, followed by single-stranded
DNA. By incorporating a denaturation-renaturation step, supercoiled plasmid DNA could be
separated from chromosomal DNA and quantified.
p i 06
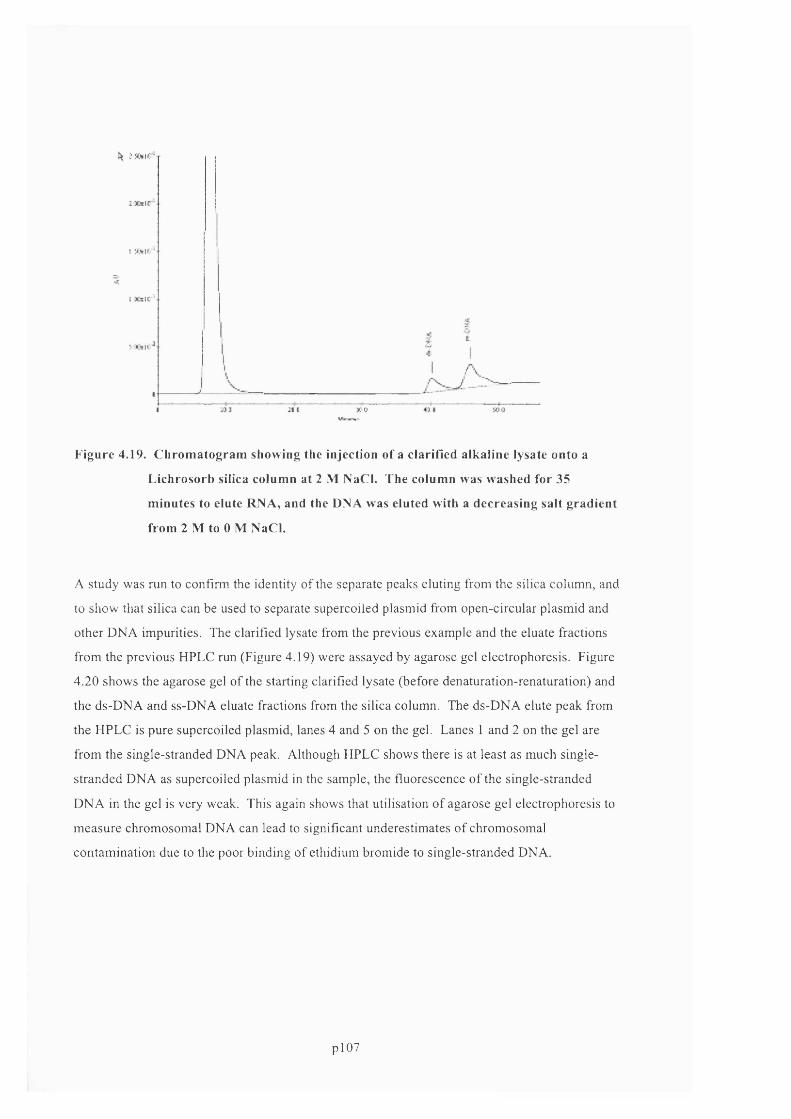
I
I »0
Figure 4.19. C hrom atogram showing the injection of a clarified alkaline lysate onto a
L ichrosorb silica column at 2 M NaCl. The column was washed for 35
m inutes to elute RNA, and the DNA was eluted with a decreasing salt gradient
from 2 M to 0 M NaCl.
A study was run to confirm the identity o f the separate peaks eluting from the silica column, and
to show that silica can be used to separate supercoiled plasmid from open-circular plasm id and
other DNA impurities. The clarified lysate from the previous example and the eluate fractions
from the previous HPLC run (Figure 4.19) were assayed by agarose gel electrophoresis. Figure
4.20 shows the agarose gel o f the starting clarified lysate (before denaturation-renaturation) and
the ds-DNA and ss-DNA eluate fractions from the silica column. The ds-DNA elute peak from
the HPLC is pure supercoiled plasmid, lanes 4 and 5 on the gel. Lanes 1 and 2 on the gel are
from the single-stranded DNA peak. Although HPLC shows there is at least as much single
stranded DNA as supercoiled plasm id in the sample, the fluorescence o f the single-stranded
D N A in the gel is very weak. This again shows that utilisation o f agarose gel electrophoresis to
m easure chromosomal DNA can lead to significant underestim ates o f chromosomal
contam ination due to the poor binding o f ethidium bromide to single-stranded DNA.
pl07
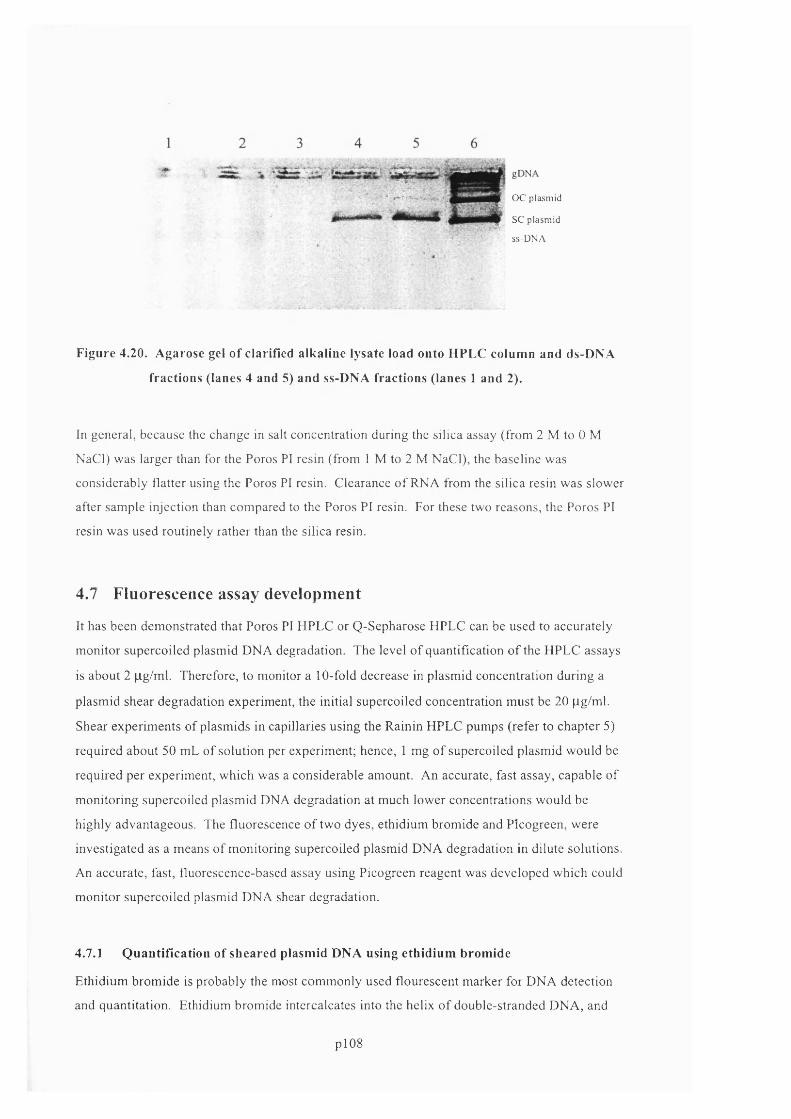
ff/' ' » Ik,
OC plasm id« 4/ vSy 7 ^?>*
SC plasm id
s s-D N A
Figure 4.20. Agarose gel of clarified alkaline lysate load onto HPLC column and ds-DNA
fractions (lanes 4 and 5) and ss-DNA fractions (lanes 1 and 2).
In general, beeause the change in salt concentration during the silica assay (from 2 M to 0 M
NaCl) was larger than for the Poros PI resin (from 1 M to 2 M NaCI), the baseline was
considerably flatter using the Poros PI resin. Clearance o f RNA from the silica resin was slower
after sample injection than com pared to the Poros PI resin. For these two reasons, the Poros PI
resin was used routinely rather than the silica resin.
4.7 Fluorescence assay development
It has been dem onstrated that Poros PI HPLC or Q -Sepharose HPLC can be used to accurately
m onitor supercoiled plasm id DNA degradation. The level o f quantification o f the HPLC assays
is about 2 pg/m l. Therefore, to monitor a 10-fold decrease in plasm id concentration during a
plasm id shear degradation experiment, the initial supercoiled concentration m ust be 20 pg/m l.
Shear experim ents o f plasm ids in capillaries using the Rainin HPLC pumps (refer to chapter 5)
required about 50 mL o f solution per experiment; hence, 1 mg o f supercoiled plasm id would be
required per experim ent, w hich was a considerable amount. An accurate, fast assay, capable o f
m onitoring supercoiled plasm id DNA degradation at much lower concentrations would be
highly advantageous. The fluorescence o f two dyes, ethidium brom ide and Picogreen, were
investigated as a means o f m onitoring supercoiled plasm id DNA degradation in dilute solutions.
An accurate, fast, fluorescence-based assay using Picogreen reagent was developed w hich could
m onitor supercoiled plasmid DNA shear degradation.
4.7.1 Q uantification of sheared plasmid DNA using ethidium brom ide
Ethidium brom ide is probably the most com m only used flourescent m arker for DNA detection
and quantitation. Ethidium bromide intercalcates into the helix o f double-stranded DNA, and
pl08
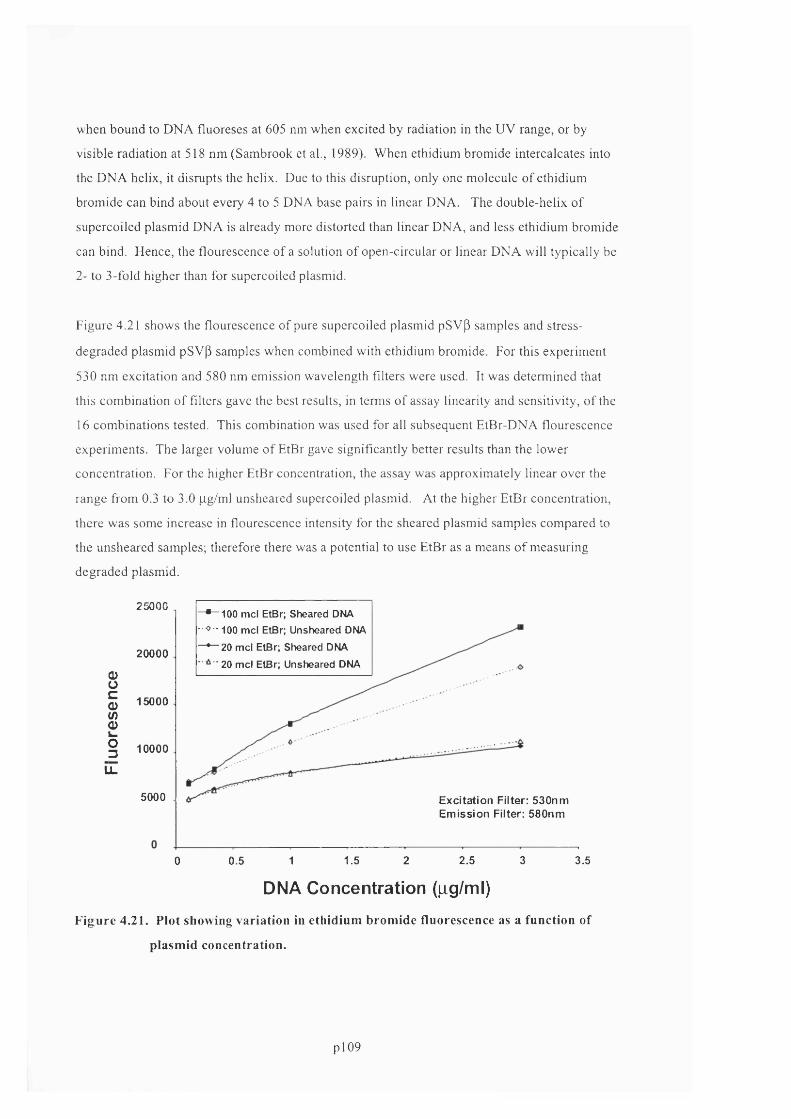
when bound to DNA fluoreses at 605 nm when excited by radiation in the UV range, or by
visible radiation at 518 nm (Sambrook et al., 1989). When ethidium bromide intercalcates into
the DNA helix, it disrupts the helix. Due to this disruption, only one molecule of ethidium
bromide can bind about every 4 to 5 DNA base pairs in linear DNA. The double-helix of
supercoiled plasmid DNA is already more distorted than linear DNA, and less ethidium bromide
can bind. Hence, the flourescence of a solution of open-circular or linear DNA will typically be
2- to 3-fold higher than for supercoiled plasmid.
Figure 4.21 shows the flourescence of pure supercoiled plasmid pSVp samples and stress-
degraded plasmid pSVp samples when combined with ethidium bromide. For this experiment
530 nm excitation and 580 nm emission wavelength filters were used. It was determined that
this combination o f filters gave the best results, in terms of assay linearity and sensitivity, o f the
16 combinations tested. This combination was used for all subsequent EtBr-DNA flourescence
experiments. The larger volume of EtBr gave significantly better results than the lower
concentration. For the higher EtBr concentration, the assay was approximately linear over the
range from 0.3 to 3.0 pg/ml unsheared supercoiled plasmid. At the higher EtBr concentration,
there was some increase in flourescence intensity for the sheared plasmid samples compared to
the unsheared samples; therefore there was a potential to use EtBr as a means o f measuring
degraded plasmid.
25000~ * ~ 1 0 0 m cl EtBr; Sheared DNA
- 0 -- <100 m cl EtBr; U nsheared DNA
~ * ~ 2 0 m cl EtBr; Sheared DNA
20 m cl EtBr; Unsheared DNA20000
8C0)(/)oL-
15000
§ 10000
lE
5000 Excitation Filter: 530nm Em ission Filter: 580nm
1.5 2 2.5 3 3.510 0.5
DNA Concentration (iig/ml)
F igure 4.21. Plot showing variation in ethidium brom ide fluorescence as a function of
plasm id concentration.
pl09

Shear degraded plasmid samples, taken from a capillary shear degradation experiment, were
assayed by EtBr as;say to determine if the assay could be used to monitor supercoiled plasmid
degradation. Figure 4.22 shows the flourescence, after EtBr addition, of samples taken during a
capillary shear experiment. There was a moderate increase in sample flourescence with
increasing degradation time, indicating increased binding of ethidium bromide to open-circular
and linear plasmid forms. However, the last sample showed a decreased flourescence which
was inconsistent with supercoiled degradation. Moreover, agarose gel electrophoresis showed a
significant decrease in supercoiled plasmid over the course o f the shear degradation experiment,
while the EtBr assay predicted a moderate level of supercoiled plasmid degradation. It was
concluded that the EtBr based assay was not suitable for monitoring supercoiled plasmid
degradation.
4.7.2 Quantification of sheared plasmid DNA using Picogreen
Picogreen dye from Molecular Probes is a relatively new flourescent marker for DNA. It has a
very high flourescence increase upon binding to double-stranded DNA, and it flouresces only
weakly in the presence o f single-stranded DNA. Picogreen absorption and emission maxima
when bound to DNA are 502 nm and 523 nm, respectively. Picogreen has been shown to
accurately quantitate DNA at extremely low concentrations, down to 50 pg/ml (Singer et al.
1997). The binding o f both flourescent probes to plasmid was investigated as a means o f
monitoring supercoiled plasmid DNA degradation.
350
300o>oc 250 o% 200 o>o 1503
100
50 60 7030 40 800 10 20
Time (minutes)
Figure 4.22. Effect of plasmid stress-induced degradation time in a capillary shear device
on sample fluorescence using ethidium bromide. Samples were diluted to 1.6
|ig/ml for assay. 100 (il sample + 100 |xl EtBr at 2.5 |ig/ml. Each sample was
run in quadruplicate.
pllO

Picogreen stock reagent from Molecular Probes was diluted 1:200, and one volume of diluted
stock was mixed with one volume of pure supercoiled plasmid over a range o f plasmid
concentrations. Figure 4,23 shows the flourescence versus supercoiled plasmid concentration.
The assay is linear over the range 10 ng/ml to 500 mg/ml, as expected. Also shown is the
flourescence of the samples, after denaturation-renaturation using the standard protocol
described in the Materials and Methods section. There was a small decrease in flourescence
indicating conversion of double-stranded DNA impurities to single-stranded form, leaving the
supercoiled plasmid double-stranded.
To determine whether Picogreen dye binds and flouresces differently when bound to
supercoiled plasmid versus open-circular plasmid, fluid-stress degraded plasmid samples from a
capillary stress-degradation experiment were mixed with Picogreen and the flourescence
measured. Figure 4.24 (top curve) shows the sample flourescence versus time during the
capillary shear experiment. Although agarose gel electrophoresis predicted a moderate level of
supercoiled plasmid shear degradation to open-circular and linear forms, there was no sigificant
change in Picogreen flourescence between the samples (top curve). Hence, it was determined
that direct measurement of the fluorescence of Picogreen in open-circular and supercoiled
plasmid solutions, was not a suitable means of measuring supercoiled plasmid degradation. It
appeared that there was only a small difference in Picogreen fluorescence intensity when bound
to supercoiled versus open-circular plasmid forms.
60000
50000
g 40000 cQ)% 300002o3 200004
10000
0
y = 70.092% + 6953.7 r 2 = 0 . 9 9 9 9
y = 61.562% + 6971.5 r 2 = 0 . 9 9 9 8
Pure pSVB ° Pure pSVB d/r
100 200 300 400 500 600
DNA C oncentration (ng/ml)700 800
Figure 4.23. Plot showing the fluorescence of plasmid-Picogreen solutions versus shear
time in a PEEK capillary.
p i l l
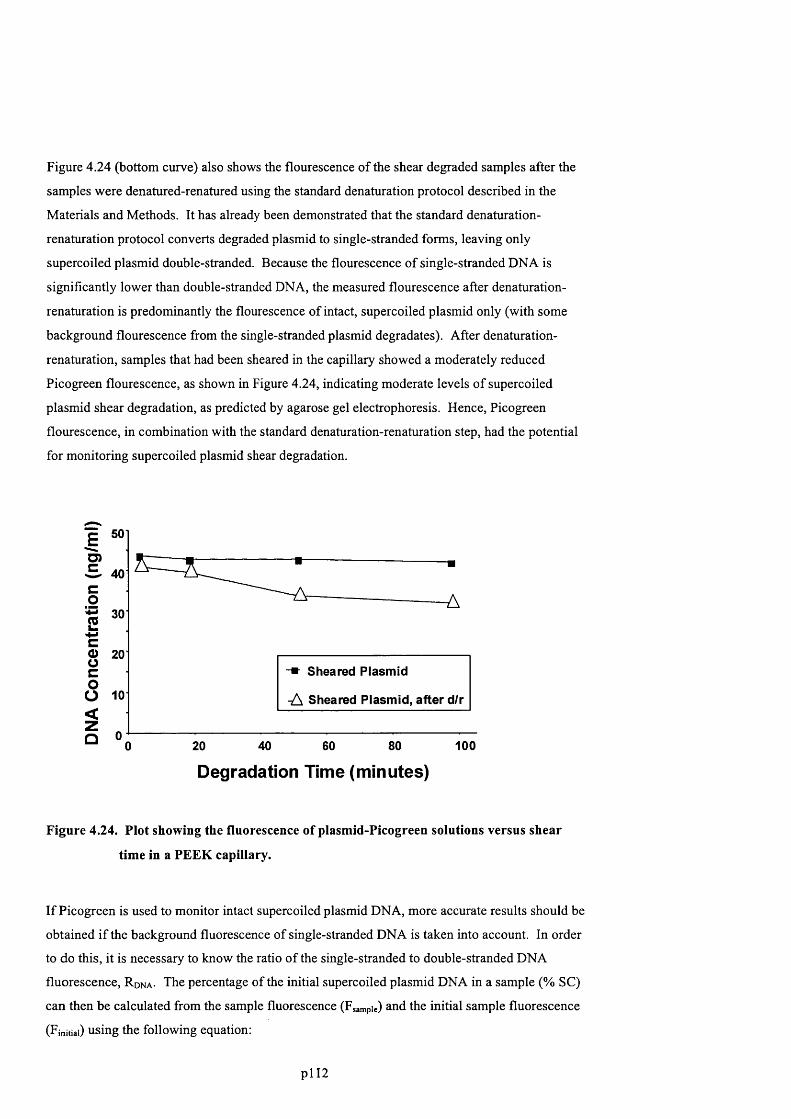
Figure 4.24 (bottom curve) also shows the flourescence o f the shear degraded samples after the
samples were denatured-renatured using the standard dénaturation protocol described in the
Materials and Methods. It has already been demonstrated that the standard denaturation-
renaturation protocol converts degraded plasmid to single-stranded forms, leaving only
supercoiled plasmid double-stranded. Because the flourescence of single-stranded DNA is
significantly lower than double-stranded DNA, the measured flourescence after denaturation-
renaturation is predominantly the flourescence of intact, supercoiled plasmid only (with some
background flourescence from the single-stranded plasmid degradates). After denaturation-
renaturation, samples that had been sheared in the capillary showed a moderately reduced
Picogreen flourescence, as shown in Figure 4.24, indicating moderate levels o f supercoiled
plasmid shear degradation, as predicted by agarose gel electrophoresis. Hence, Picogreen
flourescence, in combination with the standard denaturation-renaturation step, had the potential
for monitoring supercoiled plasmid shear degradation.
O)40
-# Sheared Plasmid
-A Sheared Plasmid, after d/r
100
Degradation Time (minutes)
Figure 4.24. Plot showing the fluorescence of plasmid-Picogreen solutions versus shear
time in a PEEK capillary.
If Picogreen is used to monitor intact supercoiled plasmid DNA, more accurate results should be
obtained if the background fluorescence of single-stranded DNA is taken into account. In order
to do this, it is necessary to know the ratio o f the single-stranded to double-stranded DNA
fluorescence, R d n a - The percentage of the initial supercoiled plasmid DNA in a sample (% S C )
can then be calculated from the sample fluorescence (Fsampie) and the initial sample fluorescence
(Finitiai) using the following equation;
p l I2

% s c - { F s a m p ie ~ ( F in i t i a i *RdNA-) } / (1 " RdNA-)
Equation 4.1
The fluorescence o f single-stranded DNA is typically 1% to 30% of the fluorescence o f double-
stranded DNA, depending on the DNA concentration. The exact value can be determined from
tables supplied from the manufacturer (Molecular Probes, 1998), and is plotted in Figure 4.25.
Under typical DNA conditions used in these experiments, the background fluorescent o f single
stranded DNA did not affect the shear degradation results significantly. The correction using
Equation 4.1, did need to be applied when the supercoiled plasmid samples contained a lot o f
single-stranded impure DNA to begin with, or if most of the supercoiled plasmid was shear
degraded during the shear-degradation experiment. In order to determine the appropriate value
of R d n a , all of the supercoiled plasmid was shear degraded at very high flowrate for 15 minutes
at the end o f each shear degradation experiment. The fluorescence o f the initial undegraded
samples and final fully degraded samples were compared, after denaturation-renaturation, to
determine R d n a - The experimentally determined values o f R d n a were always close to the
predicted values from Figure 4.25.
100.0%
iiI
10.0% -
1.0%
0 . 1%
0.01 0.1 1 10 100
DNA concentration (ng/ml)
IOC
Figure 4.25. Plot showing the fluorescence of single-stranded linear DNA relative to
double-stranded linear DNA as a function of DNA concentration. Data from
Molecular Probes, Picogreen Assay Procedure.
In order confirm that Picogreen fluorescence, in conjunction with a denaturation-renaturation
step, could accurately measure supercoiled plasmid degradation, a capillary fluid stress-
degradation experiment was performed, where significant plasmid degradation was expected.
Plasmid pSV|3 was pumped through a 0.007” ID PEEK capillary at 50 ml/min. Samples were
p l l3
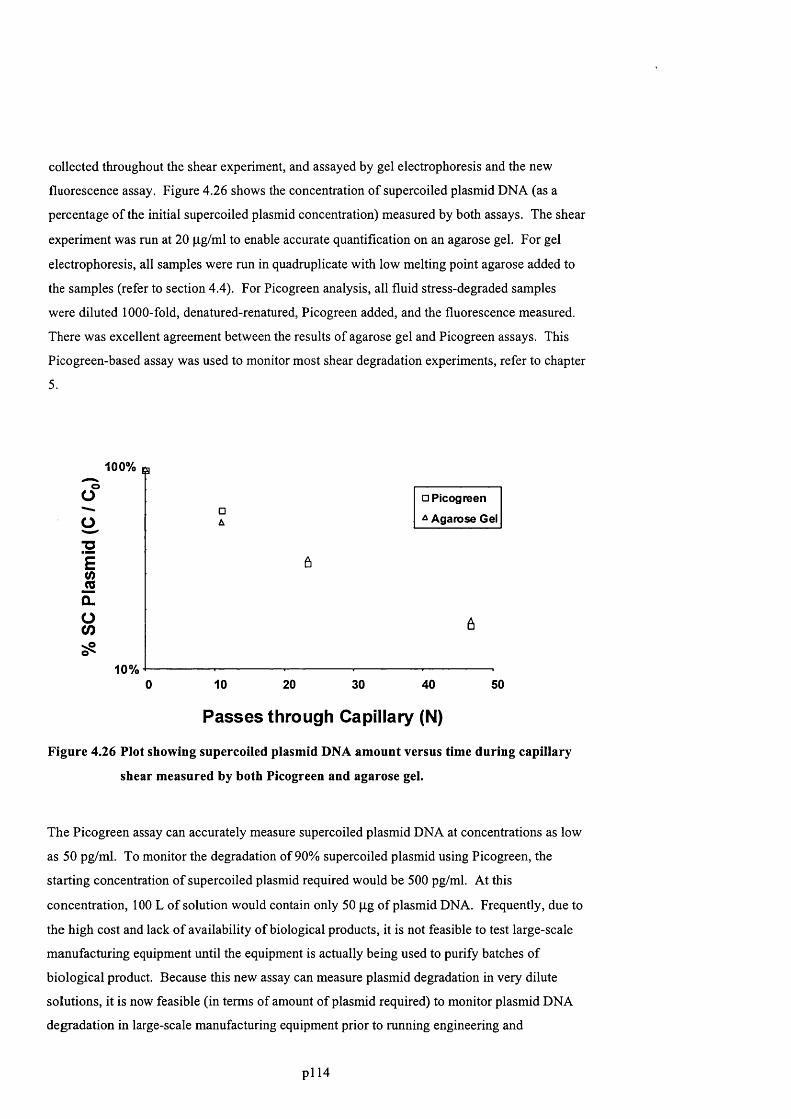
collected throughout the shear experiment, and assayed by gel electrophoresis and the new
fluorescence assay. Figure 4.26 shows the concentration of supercoiled plasmid DNA (as a
percentage o f the initial supercoiled plasmid concentration) measured by both assays. The shear
experiment was run at 20 pg/ml to enable accurate quantification on an agarose gel. For gel
electrophoresis, all samples were run in quadruplicate with low melting point agarose added to
the samples (refer to section 4.4). For Picogreen analysis, all fluid stress-degraded samples
were diluted 1000-fold, denatured-renatured, Picogreen added, and the fluorescence measured.
There was excellent agreement between the results of agarose gel and Picogreen assays. This
Picogreen-based assay was used to monitor most shear degradation experiments, refer to chapter
5.
100% a
o
o
"OÊ%a.oCO
10%
□ Picogreen
Agarose Gel
0 10 20 30 40 50
Passes through Capillary (N)
Figure 4.26 Plot showing supercoiled plasmid DNA amount versus time during capillary
shear measured by both Picogreen and agarose gel.
The Picogreen assay ean accurately measure supercoiled plasmid DNA at concentrations as low
as 50 pg/ml. To monitor the degradation of 90% supercoiled plasmid using Picogreen, the
starting concentration o f supereoiled plasmid required would be 500 pg/ml. At this
concentration, 100 L of solution would contain only 50 pg of plasmid DNA. Frequently, due to
the high cost and lack o f availability of biological products, it is not feasible to test large-scale
manufaeturing equipment until the equipment is actually being used to purify batehes of
biological product. Because this new assay can measure plasmid degradation in very dilute
solutions, it is now feasible (in terms of amount of plasmid required) to monitor plasmid DNA
degradation in large-scale manufacturing equipment prior to running engineering and
pi 14

consistency lots. This would significantly reduce the chance o f unforeseen plasmid degradation
upon scale-up.
4.8 Conclusion
Novel assays were developed that enabled the analysis of experiments carried in the following
four chapters on DNA stress-induced degradation, alkaline lysis, downstream processing and jet
mixing.
An improved agarose gel technique was developed to improve the accuracy o f agarose gels.
Two novel assays based on anion exchange HPLC were developed which were capable of
separately quantifying supercoiled plasmid DNA, open-circular plasmid DNA, double-stranded
chromosomal DNA, single-stranded DNA and RNA in process samples. The HPLC assays
required only 0.5 pg/ml o f sample per assay. The standard deviation of the Poros PI HPLC
assays was 4% and 5% for DNA and RNA, respectively.
A novel assay for monitoring supercoiled plasmid shear degradation in very dilute solutions was
developed based on Picogreen fluorescence and pH dénaturation o f plasmid degradates. This
assay enabled accurate quantification of plasmid degradation rates in capillary flows. This
assay has the potential to be used in conjunction with different size plasmids as a shear probe in
large-scale manufacturing equipment, for cases where fluid stress fields in large-scale
equipment are not well defined.
These assays were used to monitor fluid stress-induced degradation o f supercoiled plasmid in
chapter 5 and were indispensable in quantifying plasmid yield and purity during alkaline lysis
and downstream purification in chapters 6, 7 and 8.
p l l 5
5 Degradation of DNA by fluid stressOne of the objectives of this thesis is to understand the influence of fluid stress on DNA
molecules during the downstream purification of DNA for gene therapy. Different types of
flow fields occur in different types of engineering equipment or in different regions of the same
equipment. The principal types of fluid flows are shear flows, elongational flows and turbulent
flows, giving rise to shear stresses, elongational stresses and fluctuating stresses, respectively.
In order to predict the stress-induced degradation of DNA, it is essential to understand how
different types o f fluid stress affect DNA, as well as the magnitude o f stress required for DNA
chain scission to occur.
While a considerable amount of work has been done to understand the stretching and breaking
o f linear DNA under the influence of fluid stress, DNA flow induced-degradation is still not
fully understood (Hunkier et al., 1996, Nguyen et al., 1992). Moreover, most of the work into
linear DNA chain scission has been performed under dilute conditions where the DNA chains
are not entangled. In contrast, the scission of chromosomal DNA during DNA purification
occurs under concentrated conditions in upstream DNA purification processes. A limited
number of studies have examined the stress-induced degradation o f plasmid DNA (Levy et al.,
1999; Levy et al., 2000). Substantially more work must be performed to understand plasmid
stress-induced degradation.
This chapter presents the results of studies into the degradation o f plasmid and chromosomal
DNA under conditions of controlled fluid stress. The goal o f these studies was to determine
which type o f fluid stress was most important in stress-induced degradation o f plasmid DNA
and chromosomal DNA. This chapter starts with a brief summary o f results, followed by an
introduction explaining the motivation for the work presented in this chapter. The materials and
methods are then described in detail. This is followed by a presentation of the results of
Computational Fluid Dynamics simulations of the fluid shear device, after which the
experimental results using the fluid shear device are presented. This chapter concludes with a
discussion o f the results obtained.
5.1 Brief summary of results
To better understand the effects of fluid stress on DNA fragmentation, pure solutions of three
supercoiled plasmids (6 kb, 20 kb and 116 kb) and chromosomal DNA were degraded by
pumping through different diameter PEEK capillaries at varying flowrates. The effective PEEK
p l l 6
capillary diameters were determined from the best fit to pressure drop data in the laminar flow
regime using Equation 2.21. CFD simulations were run to calculate entrance shear rates and
entrance turbulent energy dissipation rates for each capillary size.
Supercoiled plasmid degradation was shown to occur at the capillary entrances and the
degradation rates observed correlated well against entrance strain rate or entrance pressure drop.
Plasmid degradation in the capillary was shown to be a first order reaction and the plasmid
degradation rate was shown to fit the TABS model for DNA chain scission (Odell et al, 1988).
Larger plasmids were significantly more susceptible to fluid-stress induced chain scission, in
agreement with the results o f Levy et al. (1999).
Pure chromosomal DNA, at a concentration of 150 |ig/ml, was degraded by pushing it through
PEEK capillaries at varying flowrates. Chromosomal DNA fragment size decreased with
increasing elongational strain rate at the capillary entrance. The relationship between fragment
size and strain rate, under more concentrated DNA conditions used here, was similar to that
observed by Thorstenson et al. (1998), but was different to that observed by Nguyen et al.
(1988). These results indicated that partial extension o f the chromosomal DNA was taking
place prior to chain scission. Comparing the degradation o f chromosomal DNA in the chain-
overlapping concentration range, used here, against the dilute concentration range used by
Thorstenson et al. (1998), it appears overlapping o f the polymer chains in solution did not
significantly affect DNA degradation.
5.2 Introduction
To maximise plasmid yield and purity it is important to avoid both plasmid DNA and
chromosomal DNA degradation throughout the downstream purification process (Prazeres et
al., 1999; Marquet et al., 1995). This can be difficult to avoid, as high levels of fluid stress can
occur in industrial purification equipment such as stirred tanks, chromatography columns,
crossflow filters, centrifuges and pumps. High elongational stresses occur between the beads of
chromatography columns, while high turbulent stresses occur in disc-stack centrifuges.
Frequently, different types o f fluid stress can be generated within the same piece of equipment.
For example, high levels o f shear stress can be generated in the boundary layers o f impeller
blades in stirred tanks, while turbulent stress is generated in the bulk fluid in the tank.
Elongational stress occurs at the entrance to crossflow filters, while high levels of shear or
turbulent stress occur within the filter. In order to avoid plasmid and chromosomal DNA
degradation in large-scale process equipment, it is important to understand not only the
magnitude o f the fluid stresses present, but also how different types o f fluid stress (shear stress,
pl lV
efongational stress, turbulent stress) cause DNA degradation. Unfortunately the effects of the
different fluid stresses on chromosomal is still not fully understood (Nguyen et al, 1992).
Moreover the effects o f fluid stresses on supercoiled plasmid DNA is even less understood, due
to the limited number o f studies into stress-induced plasmid degradation.
Levy et al. (1999) investigated the degradation of supercoiled plasmid in capillary device and a
rotating disk device. Increasing fluid stress led to increased supercoiled plasmid degradation
and larger plasmids were observed to be significantly more susceptible to stress-induced
degradation. The fluid strain rates in the capillaries were calculated based on average internal
strain rate for laminar flow. For plasmid pQR150 in clarified lysate, the onset of supercoiled
degradation was observed at a shear strain rate of about 10 s ' . The fluid strain rate in the
rotating disk was calculated based on the average shear strain rate in the laminar boundary layer
of the rotating disk. For plasmid pQR150 in clarified lysate, the onset of supercoiled
degradation was observed at a shear strain rate of about 10 s '\ Therefore, there was a very
significant discrepancy between the shear strain rates at which plasmid was observed to degrade
in capillaries versus in rotating disks. The residence time o f the plasmid in the capillary for one
pass was 0.1 s, which was similar to the residence time of the plasmid in the boundary layer of
the rotating disk, after spinning the disk for 5s. Thus, the fluid stress-induced degradation of
supercoiled plasmid is currently not well understood.
The vast majority o f studies into chromosomal DNA chain scission have been either under
laminar shear stress conditions, or under dilute polymer conditions. Most studies involving
DNA degradation using laminar shear stress have been discounted due to the current
understanding that shear stress alone cannot cause DNA degradation. Unfortunately the other
studies, done under dilute polymer conditions, are not very applicable to DNA purification
conditions. Chromosomal DNA will typically be either at higher concentrated conditions
(entangled) or semi-dilute (coil overlapping), refer to section 2.4.5. Concentration can
significantly affect the behaviour of polymers such as DNA (Macosko, 1994).
In order to examine the effects o f the different types of fluid stresses on DNA degradation, flow
degradation of DNA in capillaries was studied using plasmid pSVP (6 kb), plasmid pQR150 (20
kb), plasmid p5176 (116 kb) and pure chromosomal DNA. Capillaries were chosen as a model
flow device, because capillaries are capable of generating shear, elongational and turbulent
stresses. When fluids flow through capillaries, elongational stresses occur principally at the
capillary entrance, shear stresses occur within the capillary at low Reynolds numbers, and
turbulent stresses within the capillary at high Reynolds numbers. It was planned that by
p l l 8
carefully adjusting capillary flowrates, diameters and lengths, the effects of the different types
of fluid stress on DNA degradation could be differentiated.
The fluid stresses within capillaries can be calculated analytically, however exact analytical
expressions for the fluid stress at capillary entrances are not available. To accurately define the
fluid stresses throughout the capillary shear device, computational fluid dynamics (CFD)
simulations were preformed. This chapter first describes the results CFD simulations run to
characterise the fluid flows both entering and within the capillary device. Secondly this chapter
describes the results o f the DNA shear experiments using the capillary device.
5.3 Materials and methods for CFD simulations
All o f the CFD materials and methods have been presented previously in chapter 3.
5.4 Materials and methods for capillary flow experiments
5.4.1 Equipment
A Rainin HPLC pump (Surrey, UK) with 200 ml/min pump heads, capably of running at
operating pressures o f 6000 psi was used for capillary shear experiments. A Hamilton syringe
pump with PHD 2000 infuse/withdraw controller (Harvard Apparatus, Holliston, MA, USA)
was used for capillary shear experiments. Sonication was performed using a Soniprep 150
(MSE, UK) with a Sanyo controller.
5.4.2 Capillary flow device
Capillary flow experiments were performed using 0.0025” ID to 0.02” nominal ID PEEK
capillary tubing (refer to Table 5.1 for the capillaries diameters dimensions in millimeters).
Solutions o f plasmid or chromosomal DNA were forced through the capillaries at controlled
flowrates using either a Rainin HPLC pump or using a Hamilton syringe pump. The HPLC
pump was used for experiments using plasmids pSVb and pQR150, where high fluid stress
levels were required to break the plasmids. High levels o f fluid stress could not be generated
without creating high pressure drops (> 100 psi) across the capillaries. Note, 1 bar pressure
equals 14.5 psi. The HPLC pump was capable o f operating at high pressure, while the
Hamilton syringe pump could not operate at high pressures. The Hamilton syringe pump was
used for experiments using chromosomal DNA and large plasmid p5176.
p l l 9
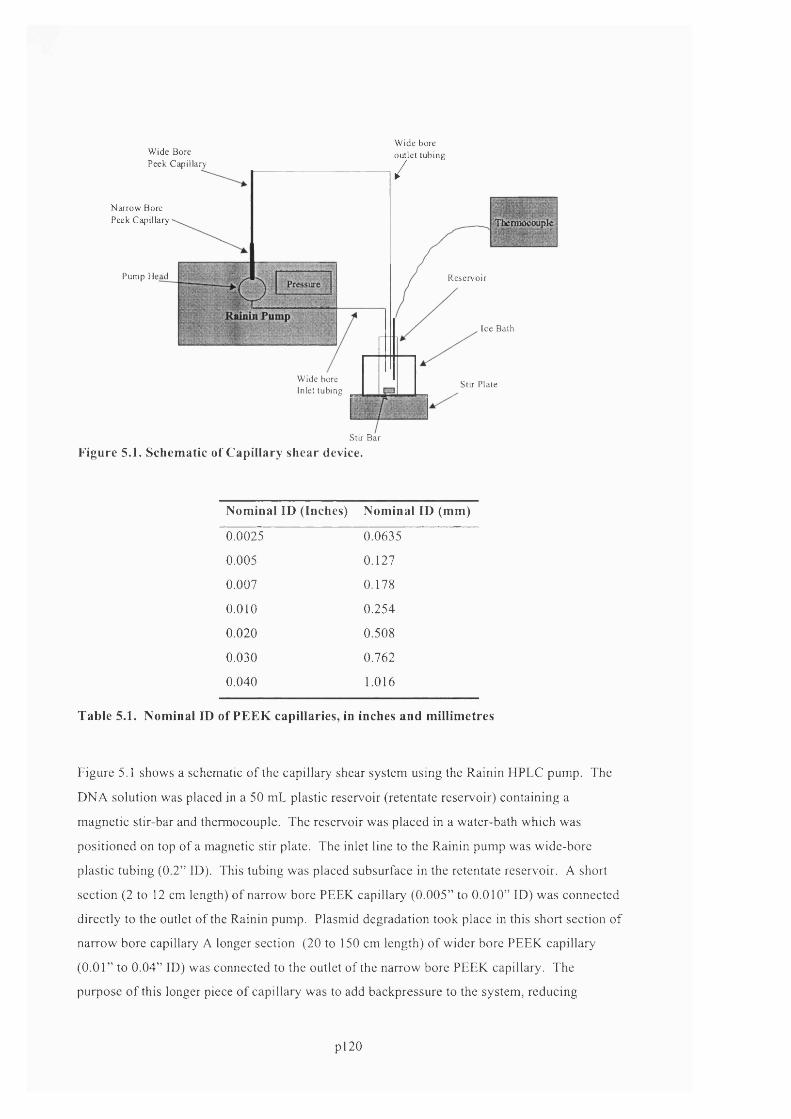
W ide Bore Peek C apillary
N arrow Bore Peek C ap illary
Pum p H ead
W ide bore o u tle t tubing
/
R eservo ir
Ice Bath
W ide bore Inlet tub ing
S tir Bar
Figure 5.1. Schematic of Capillary shear device.
S tir P late
Nominal ID (Inches) Nominal ID (mm)
0.0025 0.0635
0.005 0.127
0.007 0.178
0.010 0.254
0.020 0.508
0.030 0.762
0.040 1.016
Table 5.1. Nominal ID of PEEK capillaries, in inches and millimetres
Figure 5.1 shows a schematic o f the capillary shear system using the Rainin HPLC pump. The
DNA solution was placed in a 50 mL plastic reservoir (retentate reservoir) containing a
magnetic stir-bar and thermocouple. The reservoir was placed in a water-bath which was
positioned on top of a magnetic stir plate. The inlet line to the Rainin pump was wide-bore
plastic tubing (0.2” ID). This tubing was placed subsurface in the retentate reservoir. A short
section (2 to 12 cm length) of narrow bore PEEK capillary (0.005” to 0.010” ID) was connected
directly to the outlet of the Rainin pump. Plasmid degradation took place in this short section of
narrow bore capillary A longer section (20 to 150 cm length) of wider bore PEEK capillary
(0.01” to 0.04” ID) was connected to the outlet of the narrow bore PEEK capillary. The
purpose o f this longer piece of capillary was to add backpressure to the system, reducing
p l 2 0
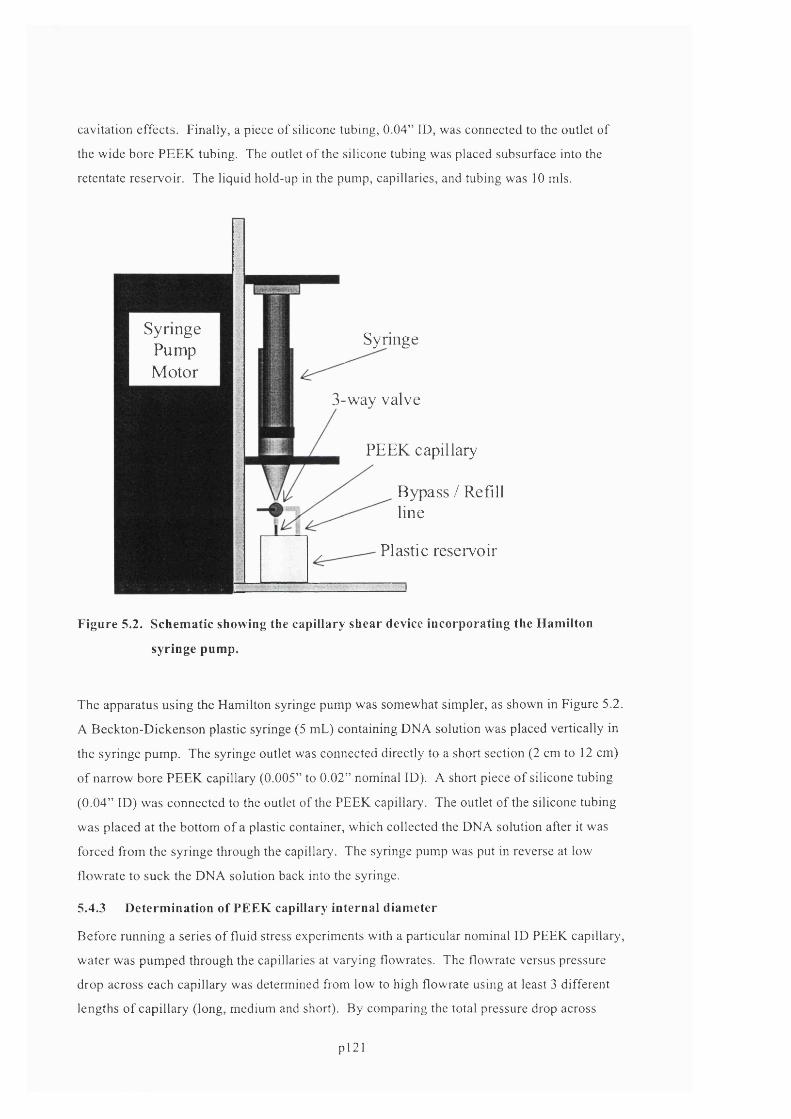
cavitation effects. Finally, a piece of silicone tubing, 0.04” ID, was connected to the outlet of
the wide bore PEEK tubing. The outlet o f the silicone tubing was placed subsurface into the
retentate reservoir. The liquid hold-up in the pump, capillaries, and tubing was 10 mis.
SynngePumpMotor
Syringe
3-way valve
PEEK capillary
Bypass / Refill line
Plastic reservoir
Figure 5.2. Schematic showing the capillary shear device incorporating the Hamilton
syringe pump.
The apparatus using the Hamilton syringe pump was somewhat simpler, as shown in Figure 5.2.
A Beckton-Dickenson plastic syringe (5 mL) containing DNA solution was placed vertically in
the syringe pump. The syringe outlet was connected directly to a short section (2 cm to 12 cm)
o f narrow bore PEEK capillary (0.005” to 0.02” nominal ID). A short piece o f silicone tubing
(0.04” ID) was connected to the outlet of the PEEK capillary. The outlet o f the silicone tubing
was placed at the bottom o f a plastic container, which collected the DNA solution after it was
forced from the syringe through the capillary. The syringe pump was put in reverse at low
flowrate to suck the DNA solution back into the syringe.
5.4.3 Determination of PEEK capillary internal diameter
Before running a series of fluid stress experiments with a particular nominal ID PEEK capillary,
water was pumped through the capillaries at varying flowrates. The flowrate versus pressure
drop across each capillary was determined from low to high flowrate using at least 3 different
lengths of capillary (long, medium and short). By comparing the total pressure drop across
p l 21

capillaries o f different length, the internal capillary pressure drop as a function of flowrate was
calculated, as well as the entrance-exit pressure drop. This is known as the Bagley method
(Macosko, 1994). The actual capillary internal diameter was then determined by choosing a
capillary internal diameter which gave the best fit of Equation 2.21 (internal pressure drop in a
pipe), to the experimentally determined internal pressure drop data taken under laminar flow
conditions (Re < 1000).
5.4.4 Standard stress-degradation procedure for Rainin capillary shear device
Set-up
The Rainin capillary shear device was set-up as shown in Figure 5.1. A narrow bore PEEK
capillary (0.005”, 0.007” or 0.010” nominal ID) was placed at the outlet o f the Rainin pump. A
long section o f wider bore PEEK capillary was connected to the outlet of the narrow bore
capillary. Depending on the diameter of the narrow bore capillary, a different diameter wide
bore capillary was used. The nominal internal diameter o f the wide bore tubing used was
0.010”, 0.020” or 0.040” ID depending on whether a 0.005”, 0.007” or 0.010” nominal ID
narrow bore capillary was used, respectively.
Before each experiment, the system was thoroughly cleaned by placing 100 mL of 0.1 M NaOH
in the retentate reservoir and recirculating the NaOH solution through the system for 10
minutes. Then the system was flushed through with 2 L o f ultra-pure water, followed by 2 L of
TE. All TE buffer used for capillary shear experiments was sparged for 40 minutes with helium
to reduce dissolved gas in the buffer, and then filtered through a 0.2 pm filter to remove
particulates. 30 mL o f TE was placed in the retentate reservoir. At this point, the total volume
o f TE in the system was 40 mL, 30 mL in the reservoir and 10 mL hold-up in the pump and
tubing. A 0.2 pm sterile filter was connected in-line to the silicone tubing downstream o f the
wide-bore capillary, and the TE buffer was recirculated at 5 to 10 mL/min for 40 minutes to
further reduce particulates in the system. The temperature of the TE in the reservoir was
monitored using the temperature probe and adjusted to 20°C ± 0.5°C throughout, by adding ice
to the water bath as needed. Pure plasmid stock (pSVb or pQR150) was added to the system by
filtering the required volume (typically 200 pi) through a 0.2 pm filter into the retentate
reservoir, followed by a 2 mL flush o f the 0.2 pm filter. The plasmid solution was recirculated
at a low flowrate (1 mL/min to 4 mL/min) for 30 minutes. After this, the 0.2 pm in-line filter
was removed, and the system was ready to start a plasmid stress-degradation experiment.
pl22
Operation
Preliminary stress-degradation experiments were typically performed by recirculating the
plasmid solution at a fixed low flowrate for 30 minutes, and then increasing the flowrate in 30
minute increments, until a high flowrate was reached. Most stress-degradation experiments
lasted 2 h to 5 h. The temperature was maintained at 20°C ± 0.5°C throughout. The pressure
drop across the capillary was recorded throughout. 0.5 mL samples were taken every 2 to 30
minutes. At the end o f an experiment, the plasmid was recirculated at a very high flowrate for
30 minutes in order to degrade all of the remaining supercoiled plasmid. All samples were
assayed by agarose gel and/or Picogreen assay incorporating the denaturation-renaturation step.
After determining the flowrate through a capillary at which 1% to 5% degradation o f
supercoiled plasmid was occurring per capillary pass, a second capillary degradation experiment
was performed at that constant flowrate for 2 h. Time course samples were taken throughout.
At the end o f an experiment, the plasmid was recirculated at a very high flowrate for 30 minutes
in order to shear degrade all o f the remaining supercoiled plasmid. All samples were assayed by
Picogreen assay incorporating the denaturation-renaturation step.
5.4.5 Effect of capillary length on plasmid degradation rate
The effect o f capillary length on supercoiled plasmid degradation rate was investigated by
pumping plasmid pSVP or pQRlSG through PEEK capillaries o f varying length. Plasmid pSVP
was pumped at 50 ml/min through 0.007” PEEK capillaries o f 3.3 and 11.0 cm length. Plasmid
pQR150 was pumped at 37 ml/min through 0.010” PEEK capillaries of 3.5 and 11.0 cm length.
Samples were taken throughout and analysed for supercoiled concentration by agarose gel
electrophoresis and/or Picogreen fluorescence. For each plasmid, the first set of experiments
was run using the longer capillaries. Then the capillaries were cut to about 3 cm. The
capillaries were cut in-place; they were not removed from the system. This ensured that the
entrance section o f each capillary was not varied in any way between the long and short
capillary experiments.
5.4.6 Control 1: Testing for cavitation
Monitoring the change of KI absorbance in the capillary shear device
Cavitating systems produce free radicals, and free radicals are known to rapidly degrade DNA
(Fuciarelli et al., 1995). Monitoring the absorbance o f a recirculating potassium iodide solution
is a standard test for cavitation (Lander et al., 1999). Free radicals formed by cavitation react
with the iodide ions in potassium iodide to form molecular iodine, which absorbs at 500 nm. A
solution of 3M potassium iodide (KI) was prepared by dissolving the required amount of
pl23
potassium iodide powder in ultra-pure water. A 30 mL solution o f 3 M KI was placed in the
retentate reservoir o f the capillary shear device and using the Rainin HPLC pump was
recirculated through the system for 2 h. At first, the solution was recirculated at a low flowrate
and then approximately every 20 minutes the flowrate was increased until a high flowrate was
reached. Samples o f KI solution were taken every 5 minutes and their absorbance at 500 nm
measured. This procedure was performed 3 times for 0.005, 0.007 and 0.010” nominal ID
PEEK capillaries. The high and low flowrates used were chosen to extend above and below the
range o f flowrates used during plasmid degradation experiments.
Sonication of supercoiled plasmid
Sonication o f a solution is a standard method o f producing cavitation (Fuciarelli et al, 1995).
To examine the effect of cavitation on supercoiled plasmid, solutions of pure plasmid pSVP, at
10 pg/mL in TE buffer, were sonicated at 20 kHz by placing a sonic probe into a 10 mL
plasmid solution in a plastic tube. The plasmid was sonicated for different lengths o f time, and
at different amplitudes. After sonication, the plasmid solutions were assayed by Picogreen
fluorescence and agarose gel for supercoiled plasmid degradation.
Sonication of Potassium Iodide
As control experiments, solutions of 3 M KI were sonicated at 20 kHz by placing a sonic probe
into 10 mL o f KI solution and sonicating for different lengths o f time, and at different
amplitudes. After sonication, the absorbance o f the samples at 350 nm was measured. As
additional controls, solutions of ultra-pure water were also sonicated and its absorbance at 350
nm measured.
Effect of backpressure on plasmid degradation in Rainin capillary device
Increasing the overall liquid pressure throughout the flow system can usually eliminate
cavitation, such that the pressure of the liquid always remains well above its vapour pressure.
In order to check that a small level of cavitation was not playing a significant role in plasmid
degradation, a wide bore (0.01”, 0.02” or 0.04” ID) capillary was placed immediately
downstream of the narrow bore capillary. By using different lengths o f this ‘backpressure’
capillary, the backpressure could be increased by 10 psi to 140 psi. This increased the pressure
upstream, which should have reduced cavitation if any cavitation was occurring, as a
backpressure o f 1 atmosphere (14.6 psi) is usually sufficient to stop cavitation. Plasmid
degradation rates within the Rainin capillary device were determined for different levels of
backpressure to determine if cavitation was causing plasmid degradation.
pl24
5.4.7 Control 2: Testing for plasmid degradation outside of capillary
The rate o f plasmid degradation in the Rain in capillary system was determined with the narrow
bore capillaries removed. The rest of the capillary system was left in place, including the wide-
bore backpressure capillary, 0.02” nominal ID. This experiment was performed to check that
supercoiled plasmid was only being degraded in the narrow bore capillary and not elsewhere in
the system. Plasmid pQRlSO was recirculated through the system at varying flowrates for
several hours. The highest flowrates tested were well above the flowrates used in typical
plasmid degradation experiments. Samples were taken throughout and tested for supercoiled
plasmid degradation.
5.4.8 Standard stress-degradation procedure for Hamilton capillary shear device
Set-up
The syringe pump capillary-shear device was set-up as shown in Figure 5.2. A 5 mL Beckton-
Dickenson plastic syringe was placed in the syringe pump and connected to the inlet o f a 3-way
valve. The valve had 2 outlets, one outlet was connected to a short piece o f narrow bore
capillary (0.005”, 0.07”, or 0.010” nominal ID). Before each run the syringe, capillary and
silicone tubing was flushed with 50 mL of 0.1 M NaOH, 0.5 L ultra-pure water and 0.3 L TE
buffer.
Operation
The system was emptied o f liquid and the DNA solution to be stress-degraded was placed in the
reservoir. Typically 2 ml of DNA solution was degraded per experiment. Chromosomal DNA
was used at a concentration o f 150 pg/ml; large plasmid p 5 176 was used at a concentration o f 5
pg/ml. Because the Hamilton syringe pump was used to degrade either chromosomal DNA or
plasmid p5I76, the starting DNA was not sterile filtered, as the large DNA would not have
passed freely through a 0.2 pm filter. The DNA solution was sucked into the syringe via the
bypass line. Then the 3-way valve was switched to the capillary outlet, and the syringe pump
forced the DNA solution through the capillary at a specified fixed flowrate into the retentate
reservoir. This was repeated 10- times at a fixed flowrate, after which the flowrate was
increased, and the procedure repeated. 100 pL samples were taken after each capillary pass.
The temperature o f the retentate was room temperature, which was 22°C ± 2 °C .
pl25
5.5 CFD simulation results
The capillary geometry that was modelled was chosen to be identical to the geometry o f the
laboratory shear device. All capillary systems consisted o f a wide bore capillary coming
directly from the pump making a sharp connection with a much narrower bore capillary where
DNA degradation took place. Details of the capillary geometry and fluid flow models are
described in chapter 3.
5.5.1 Grid size convergence
A grid size convergence study was performed for the capillary model consisting o f a 0.062’
capillary constricting to a 0.007” capillary, refer to Figure 3.4. The Low Re K-e turbulence
models was used for all simulations. The flowrate was set at 50 ml/min. Initial simulations
were run using coarse grids, followed by simulations with progressively finer grids. Because
the simulations were being run to determine the entrance elongational shear rates and the
entrance pressure drops, the convergence o f these two fluid properties was monitored as the grid
size was reduced. Figure 5.3, Figure 5.4 and Figure 5.5 show the effect o f grid size on the
entrance pressure drop; the entrance turbulent energy dissipation rate, and the entrance
elongational strain rate. The three flow properties converged to constant values using 30
micron grids or smaller. The 30 micron grids were used for all subsequent simulations.
pl26

1,000 T
Q.
Q£I
Cl
8c
100cHI 10 100 1000
Grid Length at Entrance (microns)
Figure 5.3. Plot from CFD simulation showing the effect of grid size on CFD calculated
entrance pressure drop for flow from a 0.062" ED capillary into a 0.007" ID
capillary at 50 ml/min, using the Low Re K-e model.
i5 coC d
IIHI O
1.0E+07 T
I 1.0E+06 r
1.0E+05100 100010
Grid Length at Entrance (microns)
Figure 5.4. Plot from CFD simulation showing the effect of grid size on CFD calculated
entrance energy dissipation for flow from a 0.062" ID capillary into a 0.007"
ID capillary, at 50 ml/min, using the Low Re K-e model
pl27
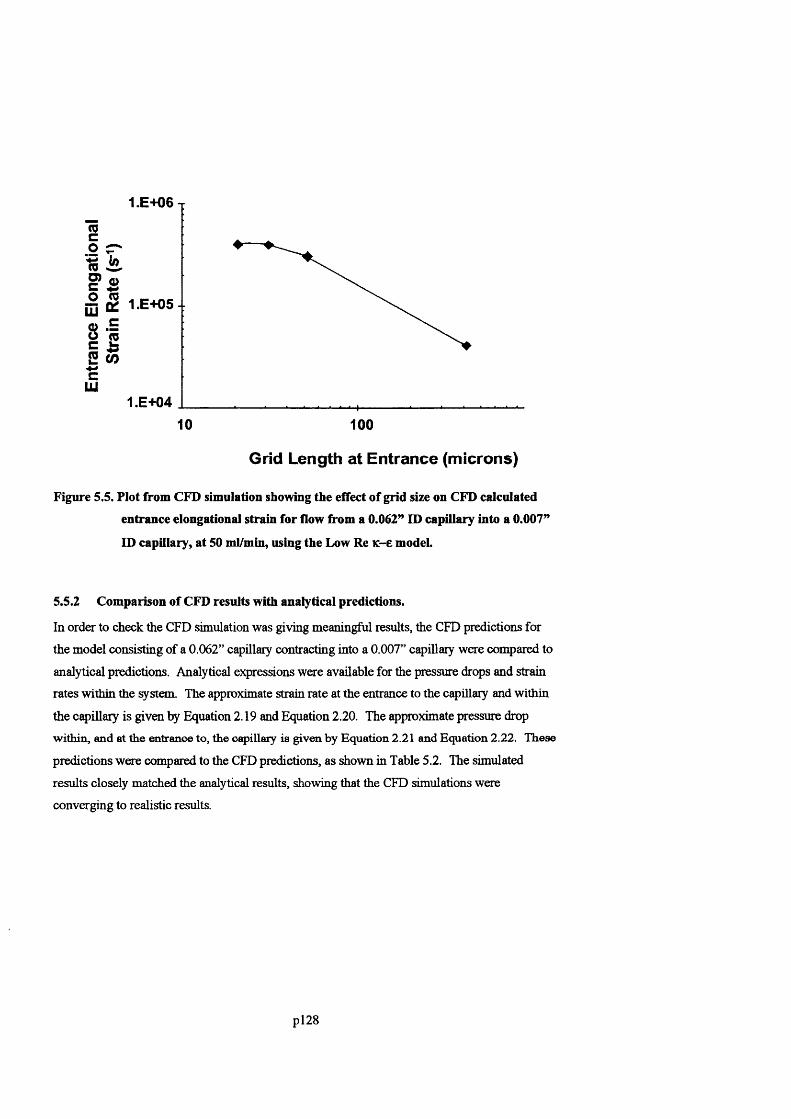
,E+06 T
2 1.E+05-: cë(O
1.E+0410 100
Grid Length at Entrance (microns)
Figure 5.5. Plot from CFD simulation showing the effect of grid size on CFD calculated
entrance elongational strain for flow from a 0.062” ID capillary into a 0.007”
ID capillary, at 50 ml/min, using the Low Re K-e model.
5.5.2 Comparison of CFD results with analytical predictions.
In order to check the CFD simulation was giving meaningful results, the CFD predictions for
the model consisting of a 0.062” capillary contracting into a 0.007” capillary were compared to
analytical predictions. Analytical expressions were available for the pressure drops and strain
rates within the system. The approximate strain rate at the entrance to the capillary and within
the capillary is given by Equation 2.19 and Equation 2.20. The approximate pressure drop
within, and at the entrance to, the capillary is given by Equation 2.21 and Equation 2.22. These
predictions were compared to the CFD predictions, as shown in Table 5.2. The simulated
results closely matched the analytical results, showing that the CFD simulations were
converging to realistic results.
pl28
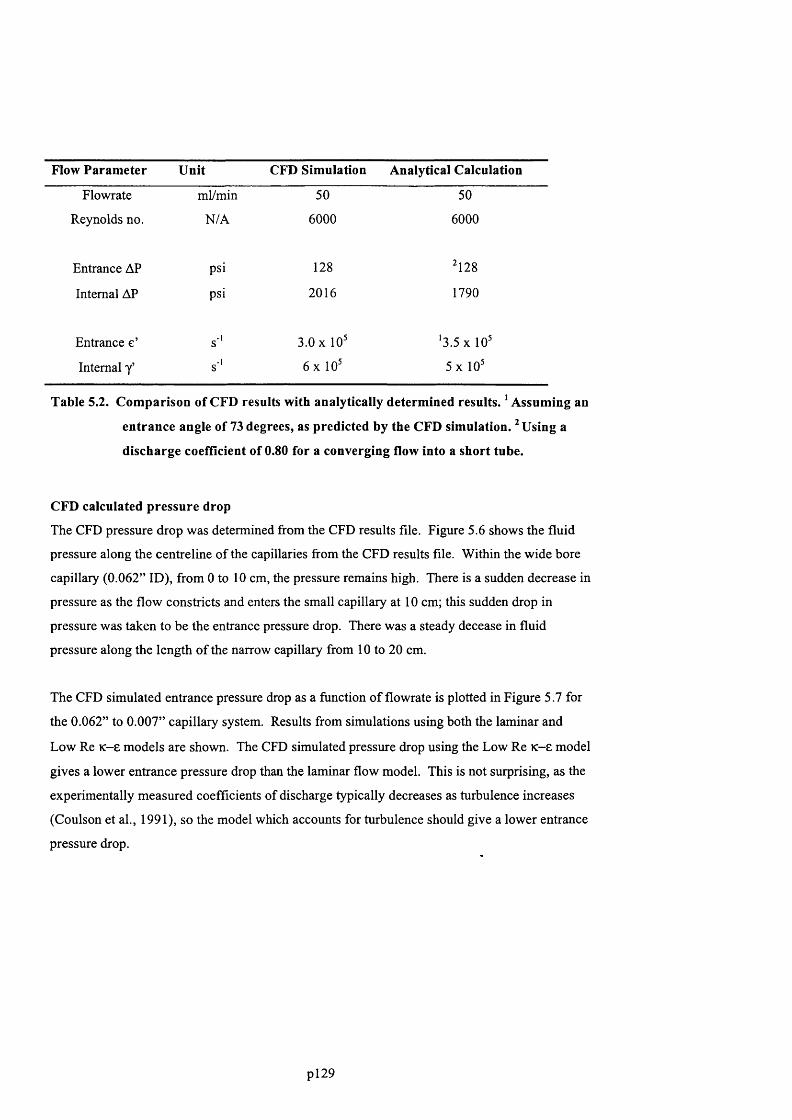
Flow P aram eter Unit CFD Simulation Analytical Calculation
Flowrate ml/min 50 50
Reynolds no. N/A 6000 6000
Entrance AP psi 128 ^128
Internal AP psi 2016 1790
Entrance e’ s'' 3.0 X 10^ '3.5 X 10^
Internal y’ s'' 6 x 1 ^ 5 x 10^
Table 5.2. C om parison of CFD results with analytically determ ined results. ' Assuming an
entrance angle of 73 degrees, as predicted by the CFD simulation. Using a
discharge coefficient of 0.80 for a converging flow into a short tube.
CFD calculated p ressure drop
The CFD pressure drop was determined from the CFD results file. Figure 5.6 shows the fluid
pressure along the centreline of the capillaries from the CFD results file. Within the wide bore
capillary (0.062” ID), from 0 to 10 cm, the pressure remains high. There is a sudden decrease in
pressure as the flow constricts and enters the small capillary at 10 cm; this sudden drop in
pressure was taken to be the entrance pressure drop. There was a steady decease in fluid
pressure along the length of the narrow capillary from 10 to 20 cm.
The CFD simulated entrance pressure drop as a function o f flowrate is plotted in Figure 5.7 for
the 0.062” to 0.007” capillary system. Results from simulations using both the laminar and
Low Re K-e models are shown. The CFD simulated pressure drop using the Low Re K-e model
gives a lower entrance pressure drop than the laminar flow model. This is not surprising, as the
experimentally measured coefficients of discharge typically decreases as turbulence increases
(Coulson et al., 1991), so the model which accounts for turbulence should give a lower entrance
pressure drop.
pl29
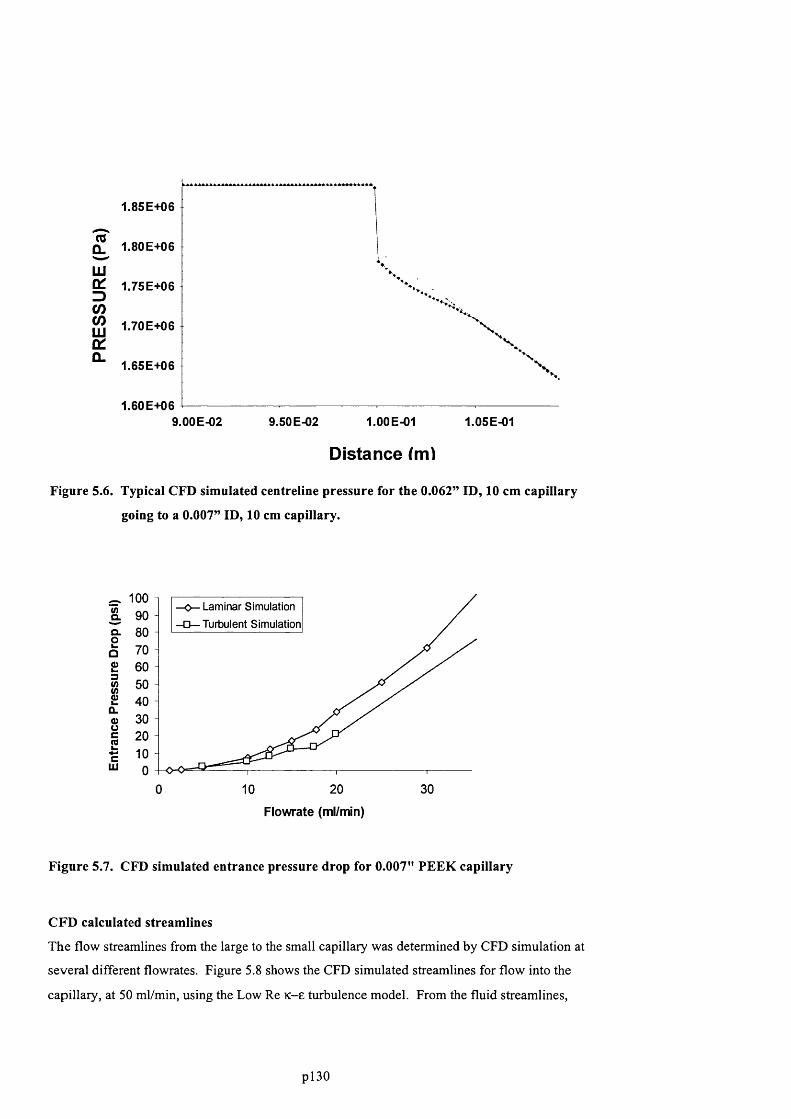
V
1.85E+06
n 1.80E+06
LU^ 1.75E+06
CO
[2 1.70E+06o :^ 1.65E+06
1.60E+069.00E-02 9.50E-02 1.00E-01 1.05E-01
Distance (m)
Figure 5.6. Typical CFD simulated centreline pressure for the 0.062” ID, 10 cm capillary
going to a 0.007” ID, 10 cm capillary.
100Laminar Simulation
Turbulent SimulationQ.
2o2
fQ.8cScUJ
10 20 300
Flowrate (ml/min)
Figure 5.7. CFD simulated entrance pressure drop for 0.007” PEEK capillary
CFD calculated streamlines
The flow streamlines from the large to the small capillary was determined by CFD simulation at
several different flowrates. Figure 5.8 shows the CFD simulated streamlines for flow into the
capillary, at 50 ml/min, using the Low Re K-e turbulence model. From the fluid streamlines.
p l30
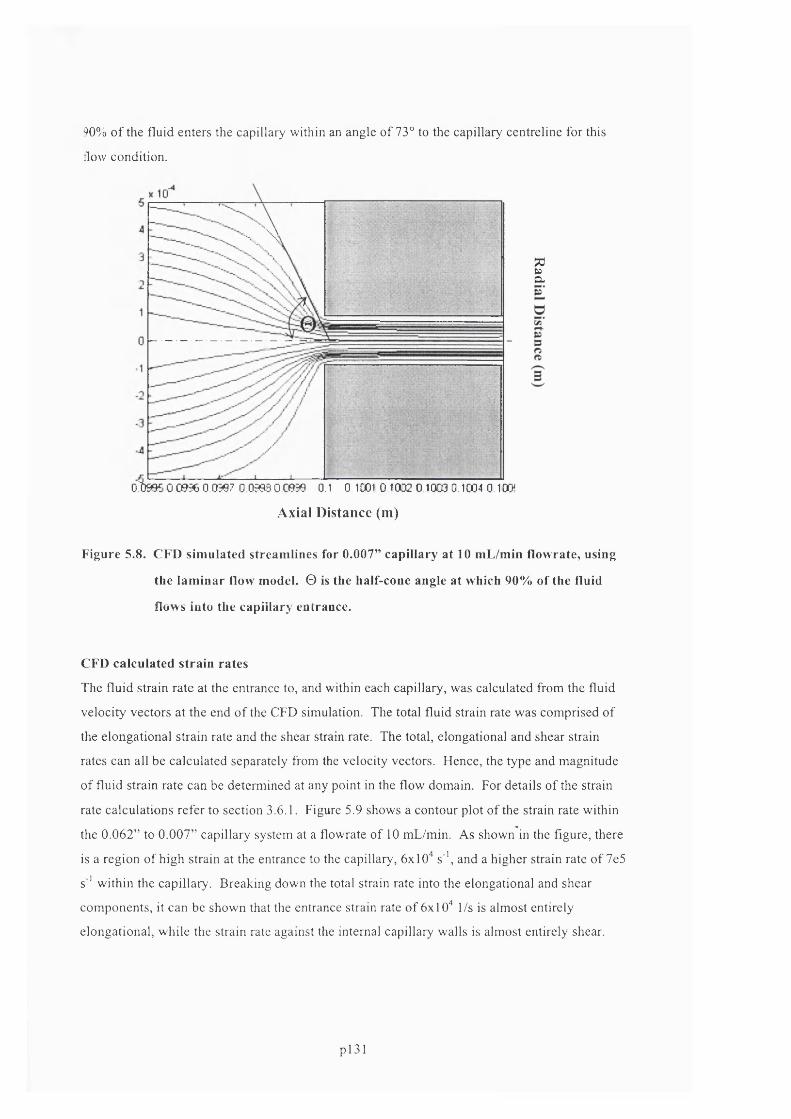
• 0% o f the fluid enters the capillary within an angle of 73° to the capillary centreline for this
flow condition.
... \
7^pCL
o'bsesocæ e 0.0567 0 0993 o œ æ 0.1 0 .1 0 0 1 0 1 0 0 2 0 1 0 0 3 0.1C04 o ioch
Axial Distance (m)
Figure 5.8. CFD sim ulated stream lines for 0.007” capillary at 10 mL/min flowrate, using
the lam inar flow model. 0 is the half-cone angle at which 90% of the fluid
flows into the capillary entrance.
CFD calculated stra in rates
The fluid strain rate at the entrance to, and within each capillary, was calculated from the fluid
velocity vectors at the end o f the CFD simulation. The total fluid strain rate was comprised of
the elongational strain rate and the shear strain rate. The total, elongational and shear strain
rates can all be calculated separately from the velocity vectors. Hence, the type and magnitude
of fluid strain rate can be determined at any point in the flow domain. For details of the strain
rate calculations refer to section 3.6.1. Figure 5.9 shows a contour plot of the strain rate within
the 0.062” to 0.007” capillary system at a flowrate of 10 mL/min. As shown in the figure, there
is a region of high strain at the entrance to the capillary, 6x10“ s ' \ and a higher strain rate of 7e5
s'* within the capillary. Breaking down the total strain rate into the elongational and shear
components, it can be shown that the entrance strain rate of 6x1 O'* 1/s is almost entirely
elongational, while the strain rate against the internal capillary walls is almost entirely shear.
pl31
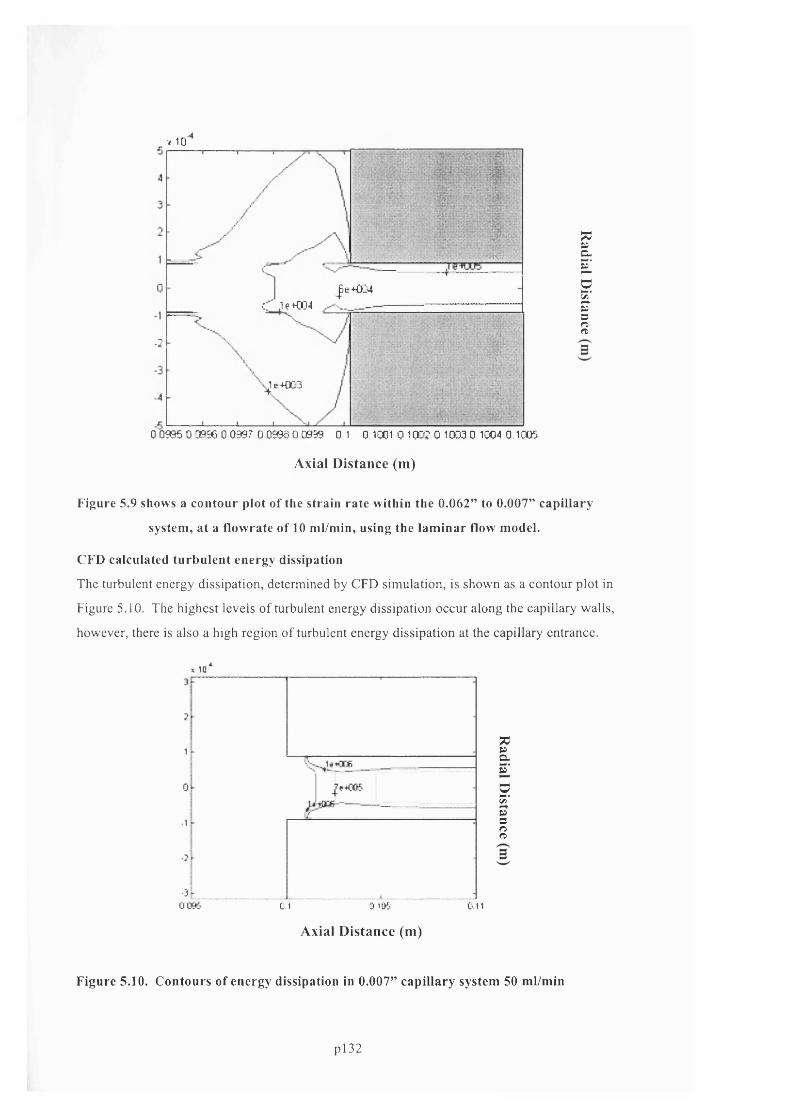
X 10
-2
| è ^ 4 '% J ç +034 —_——-
1.+033
7Cpo.E.'o5Â’S'3rtn>
00995 0 09% 0 0997 0 059600939 0 1 0 1001 0 1 032 0 1033 0 1CS04 0 1005
A xial D is tan ce (m )
Figure 5.9 shows a contour plot of the strain rate within the 0.062” to 0.007” capillary
system, at a flowrate of 10 ml/min, using the laminar flow model.
CFD calculated turbulent energy dissipation
The turbulent energy dissipation, determined by CFD simulation, is shown as a contour plot in
Figure 5.10. The highest levels of turbulent energy dissipation occur along the capillary walls,
however, there is also a high region of turbulent energy dissipation at the capillary entrance.
I id"*
gaSgSo'S3no
Onc I a it>5
A xial D is tan ce (m )
Figure 5.10. Contours of energy dissipation in 0.007” capillary system 50 ml/min
pl3 2
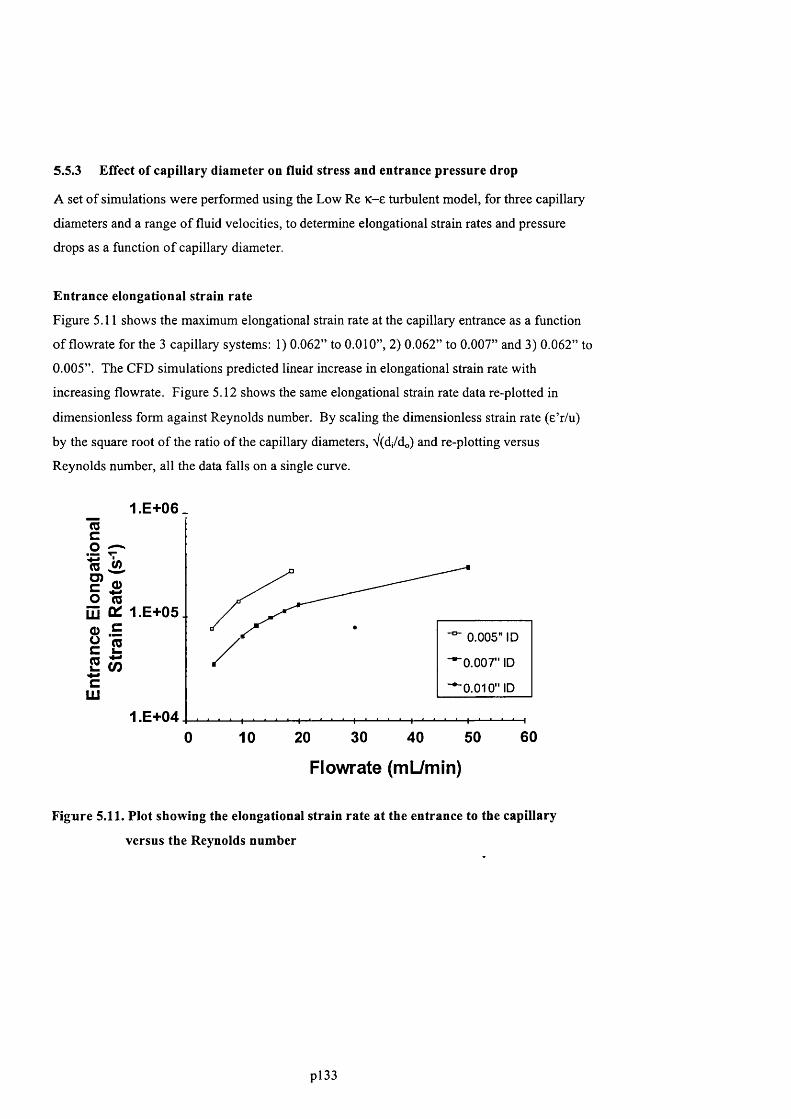
5.5.3 Effect of capillary diameter on fluid stress and entrance pressure drop
A set o f simulations were performed using the Low Re K-e turbulent model, for three capillary
diameters and a range o f fluid velocities, to determine elongational strain rates and pressure
drops as a function o f capillary diameter.
Entrance elongational strain rate
Figure 5.11 shows the maximum elongational strain rate at the capillary entrance as a function
o f flowrate for the 3 capillary systems: 1) 0.062” to 0.010”, 2) 0.062” to 0.007” and 3) 0.062” to
0.005”. The CFD simulations predicted linear increase in elongational strain rate with
increasing flowrate. Figure 5.12 shows the same elongational strain rate data re-plotted in
dimensionless form against Reynolds number. By scaling the dimensionless strain rate (e’r/u)
by the square root o f the ratio o f the capillary diameters, V(d/do) and re-plotting versus
Reynolds number, all the data falls on a single curve.
1 .E + 06.(Q
I S
i l (OcLU
1.E+05.0.005" ID
0.007" ID
0.010" ID
1.E+046030 500 10 20 40
Flowrate (mUmin)
Figure 5.11. Plot showing the elongational strain rate at the entrance to the capillary
versus the Reynolds number
pl33
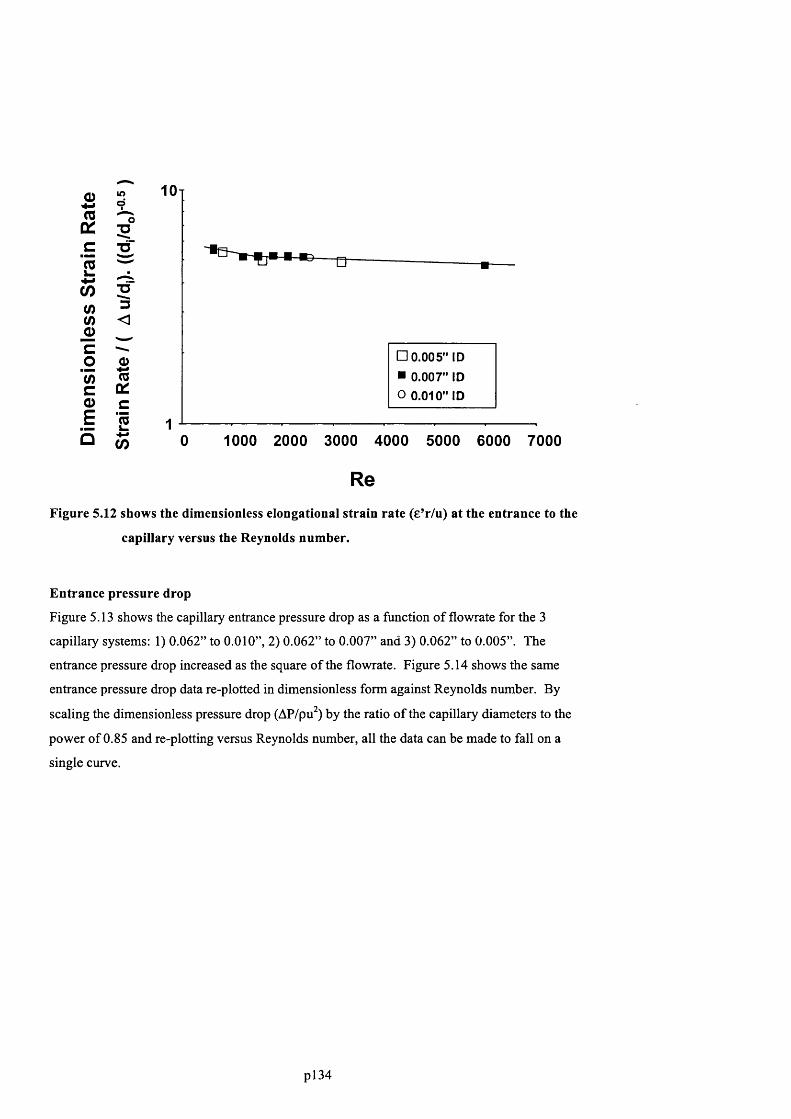
0)
c2%(/)t/i
Ç)cg5)cQ)E
Q
lO9
05"cT
"cT
<
IÜ:cS
(/)
10 t
■ wo
□ 0.005" ID ■ 0.007" ID O 0.010" ID
1000 2000 3000 4000 5000 6000 70000
ReFigure 5.12 shows the dimensionless elongational strain rate (£’r/u) at the entrance to the
capillary versus the Reynolds number.
Entrance pressure drop
Figure 5.13 shows the capillary entrance pressure drop as a function o f flowrate for the 3
capillary systems: 1) 0.062” to 0.010”, 2) 0.062” to 0.007” and 3) 0.062” to 0.005”. The
entrance pressure drop increased as the square of the flowrate. Figure 5.14 shows the same
entrance pressure drop data re-plotted in dimensionless form against Reynolds number. By
scaling the dimensionless pressure drop (AP/pu^) by the ratio o f the capillary diameters to the
power o f 0.85 and re-plotting versus Reynolds number, all the data can be made to fall on a
single curve.
p l34
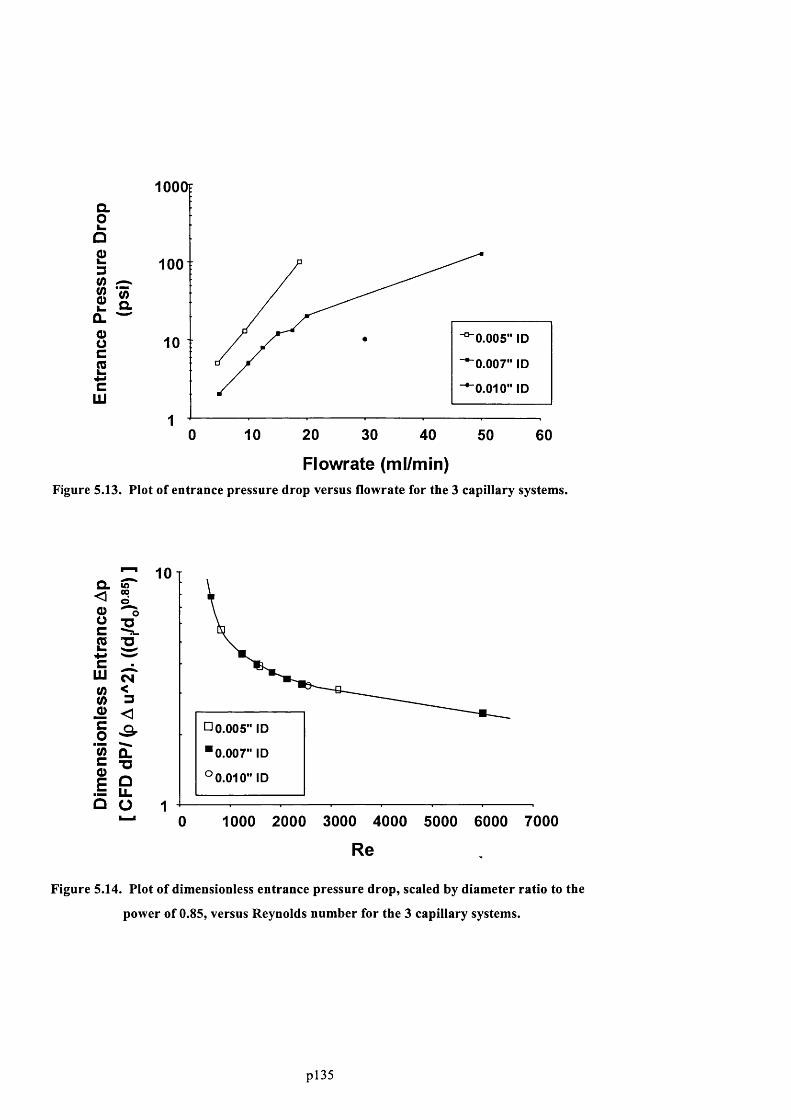
1 0 0 0 F
Q .
100 :
0.005" ID
0.007" ID
0.010" ID
10 2 0 3 0 4 00 5 0 6 0
Flowrate (ml/min)Figure 5.13. Plot of entrance pressure drop versus flowrate for the 3 capillary systems.
I O t
o
<3
<1
OL■DQILo
□ 0.005" ID
0.007" ID
0.010" ID
1 0 0 0 2 0 0 0 3 0 0 0 4 0 0 0 5 0 0 0 6 0 0 0 7 0 0 00
Re
Figure 5.14. Plot of dimensionless entrance pressure drop, scaled by diameter ratio to the
power of 0.85, versus Reynolds number for the 3 capillary systems.
pl35
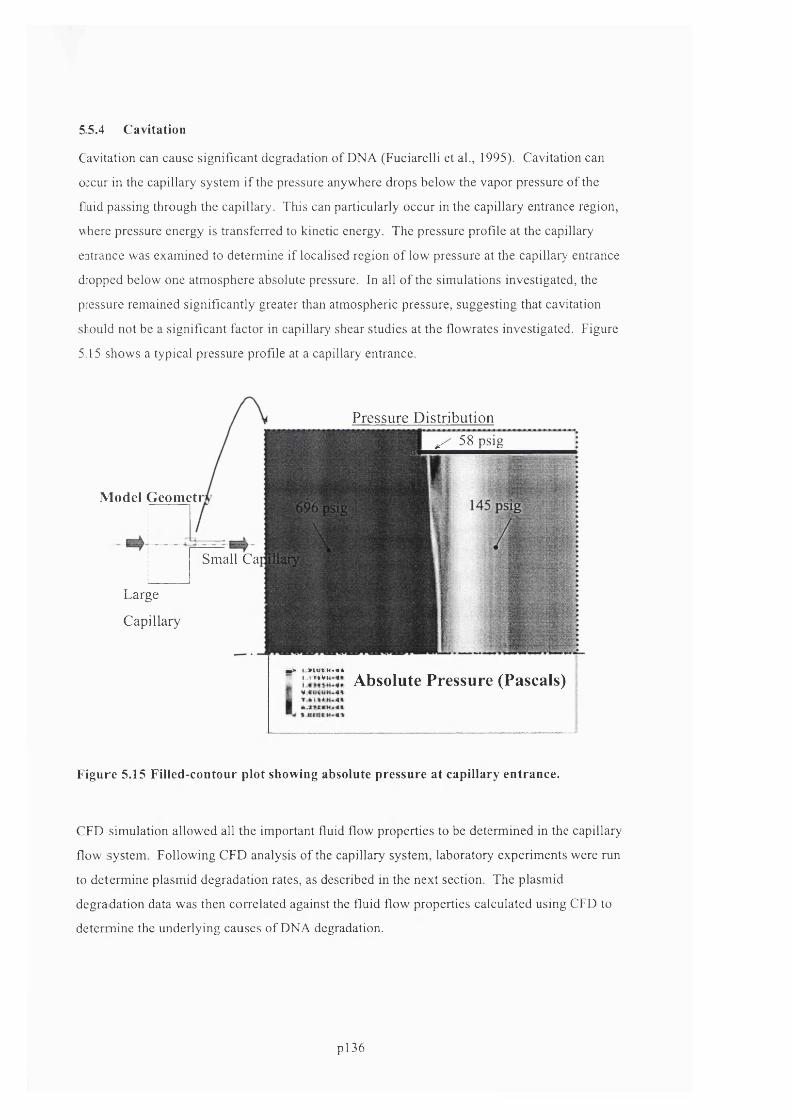
55.4 Cavitation
Cavitation can cause significant degradation of DNA (Fuciarelli et al., 1995). Cavitation can
o:cur in the capillary system if the pressure anywhere drops below the vapor pressure of the
fluid passing through the capillary. This can particularly occur in the capillary entrance region,
vhere pressure energy is transferred to kinetic energy. The pressure profile at the eapillary
entrance was examined to determine if localised region of low pressure at the capillary entrance
dropped below one atmosphere absolute pressure. In all o f the simulations investigated, the
pressure remained significantly greater than atmospheric pressure, suggesting that cavitation
should not be a significant factor in capillary shear studies at the flowrates investigated. Figure
5 15 shows a typical pressure profile at a capillary entrance.
Pressure Distribution
M o d el G e o m e tr
^ 58 psig
Sm all Ca
Large
C apillary
w> t 9cvr«H««* ■ i.jtjiMM Absolute Pressure (Pascals)
Figure 5.15 Filled-contour plot showing absolute pressure at capillary entrance.
CFD simulation allowed all the important fluid flow properties to be determined in the capillary
flow system. Following CFD analysis of the capillary system, laboratory experiments were run
to determine plasmid degradation rates, as described in the next section. The plasmid
degradation data was then correlated against the fluid flow properties calculated using CFD to
determine the underlying causes of DNA degradation.
pl36

5.6 Results: stress-induced degradation of plasmids
Plasmid flow degradation experiments consisted of pumping plasmid solutions through narrow
bore PEEK capillaries o f varying internal diameters and varying lengths. This section first
describes pressure-flow measurements to determine the effective capillary internal diameters,
secondly describes control experiments to ensure plasmid degradation was due to fluid stress in
the capillaries, and thirdly describes the results of the flow degradation experiments.
5.6.1 Determination of effective capillary internal diameters
Before running a series o f stress-degradation experiments with a particular lot o f PEEK
capillary, the flowrate versus pressure profile through different lengths o f capillary was
measured. Figure 5.16, Figure 5.17 and Figure 5.18 show the pressure drop as a function of
capillary flowrate for a 0.01”, 0.007” and 0.005” nominal ID PEEK tubing. Also shown on the
three plots are the analytically calculated internal pressure drops based on Equation 2.21, using
an effective diameter that best fitted the experimental data. Comparison o f pressure versus
flowrate data against analytical calculations gave a convenient means of determining the actual
capillary internal diameters for the various lots of PEEK tubing used. The effective diameters
for the 0.010”, 0.007” and 0.005” ID capillaries were 0.0107”, 0.0075” and 0.0058” ID,
respectively. For all subsequent calculations, the effective internal diameters were used, instead
o f the nominal PEEK diameters.
(QC
S
2.0B est Fit = 0.0107" ID
c1.5
Eo
Q.O
"O0)k.3
1.0
' Long-m edium- Long-short
— B est Fit ,0.5
(0V)S
0.060 2 4 8 10
Flowrate (ml/min)Ffigure 5.16. Internal Ap per unit length in 0.010” PEEK capillary versus flowrate
pl37
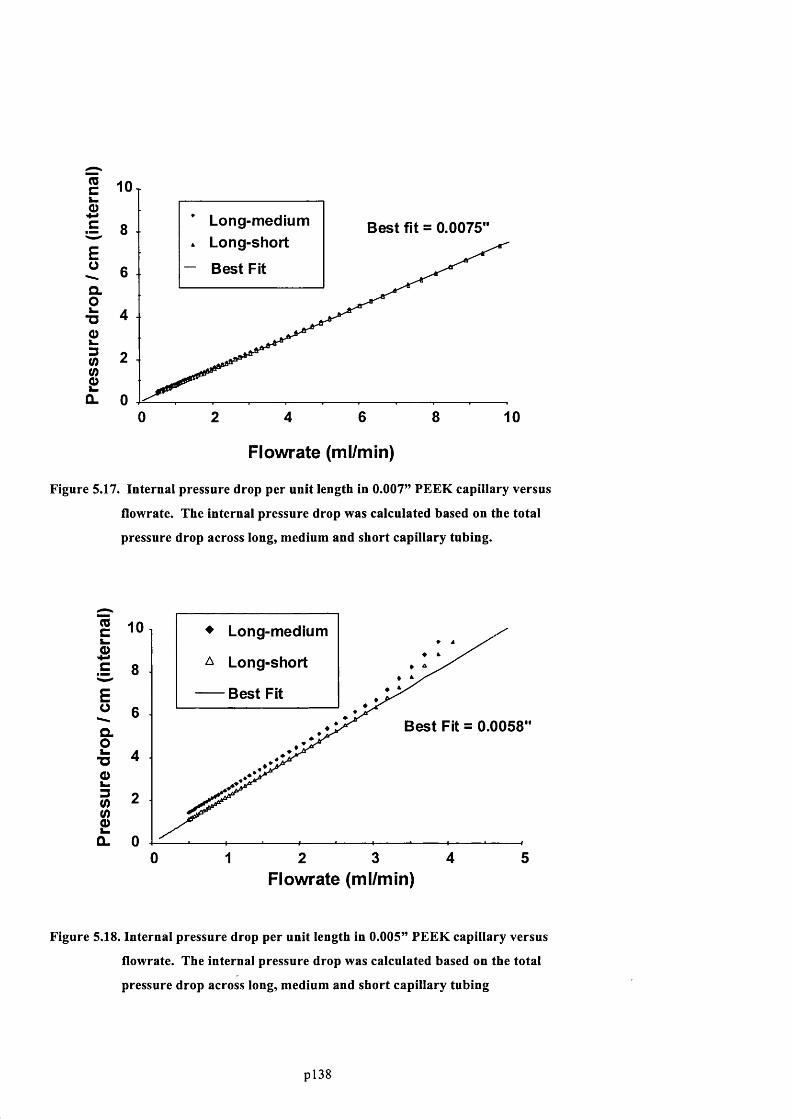
(0cL.sc
Eoaoi-■o£3V>S
10
Long-m ediumL ong-short
B est Fit
B est fit = 0.00758
6
4
2
00 6 8 102 4
Flowrate (ml/min)
Figure 5.17. Internai pressure drop per unit length in 0.007” PEEK capillary versus
flowrate. The internal pressure drop was calculated based on the total
pressure drop across long, medium and short capillary tubing.
(0C
£c
Eoa o
■DOk.3<0
a .
10 ♦ Long-m edium
^ L ong-short
— B est Fit8
6B est Fit = 0.0058
4
2
040 1 3 52
Flowrate (ml/min)
Figure 5.18. Internal pressure drop per unit length in 0.005” PEEK capillary versus
flowrate. The internal pressure drop was calculated based on the total
pressure drop across long, medium and short capillary tubing
pl38
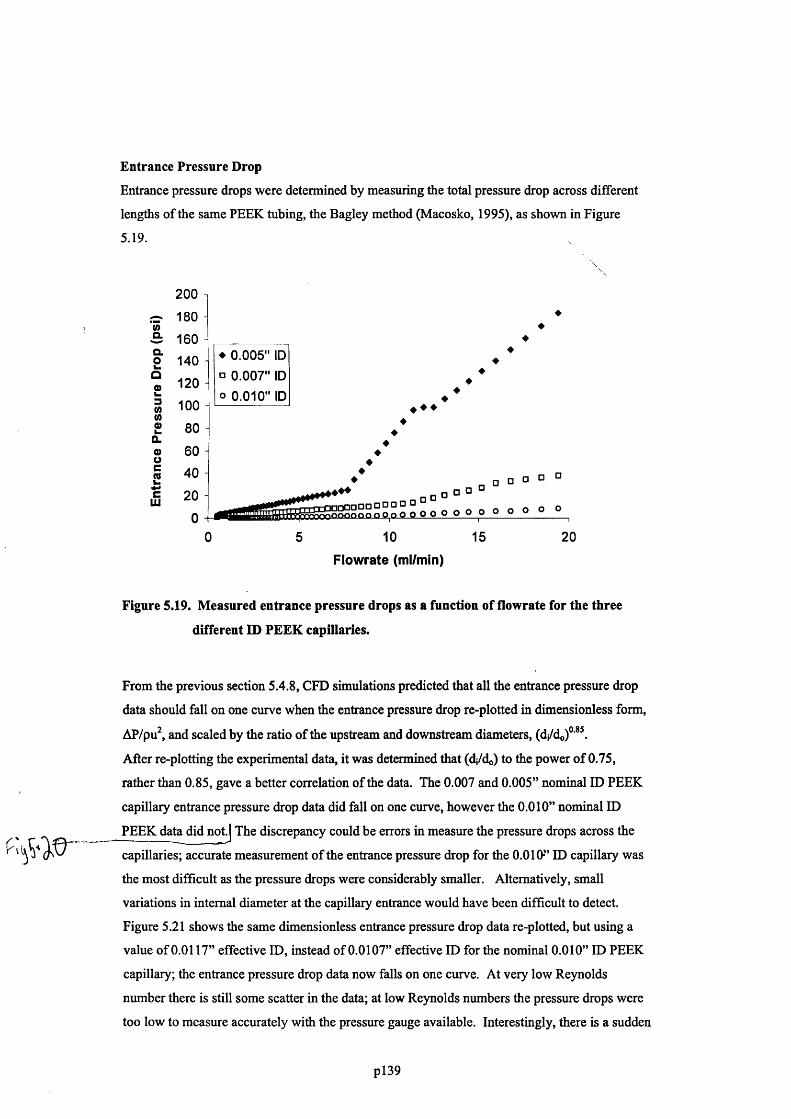
Entrance Pressure Drop
Entrance pressure drops were determined by measuring the total pressure drop across different
lengths of the same PEEK tubing, the Bagley method (Macosko, 1995), as shown in Figure
5.19.
wQ.
aSQ23
0)
0)0 c
1
200180
160
140
120
10080
60
40
20
0
♦ 0.005" ID D 0.007" ID o 0.010" ID
♦ ♦
□ □ D O o♦♦♦
o o o o o qd D
10
Flowrate (ml/min)15 20
Figure 5.19. Measured entrance pressure drops as a function of flowrate for the three
different ID PEEK capillaries.
From the previous section 5.4.8, CFD simulations predicted that all the entrance pressure drop
data should fall on one curve when the entrance pressure drop re-plotted in dimensionless form,
AP/pu^, and scaled by the ratio of the upstream and downstream diameters, (d/do)® ” .
After re-plotting the experimental data, it was determined that (dj/do) to the power o f 0.75,
rather than 0.85, gave a better correlation o f the data. The 0.007 and 0.005” nominal ID PEEK
capillary entrance pressure drop data did fall on one curve, however the 0.010” nominal ID
PEEK data did n o d The discrepancy could be errors in measure the pressure drops across the
capillaries; accurate measurement o f the entrance pressure drop for the 0.010-” ID capillary was
die most difficult as the pressure drops were considerably smaller. Alternatively, small
variations in internal diameter at the capillary entrance would have been difficult to detect.
Figure 5.21 shows the same dimensionless entrance pressure drop data re-plotted, but using a
value o f 0.0117” effective ID, instead of 0.0107” effective ID for the nominal 0.010” ID PEEK
capillary; the entrance pressure drop data now falls on one curve. At very low Reynolds
number there is still some scatter in the data; at low Reynolds numbers die pressure drops were
too low to measure accurately with the pressure gauge available. Interestingly, there is a sudden
pl39

change in entrance pressure drop for all capillaries just below a Reynolds number of 2000,
indicating a change from laminar/transitional to turbulent flow at the capillary entrance.
1.0 Tu>
"O
>Cl
CL<
0.11,000
Re
0.005" ID
* 0.007" ID
o 0.010" ID
10,000
Figure 5.20. Dimensionless entrance pressure drop as a function of Reynolds number. The
effective capillary internal diameters 0.0107”, 0.0075” and 0.0058” (as
measured in section 5.6.1) were used to calculate the dimensionless entrance
pressure drop for nominal capillary diameters 0.01”, 0.007” and 0.005”,
respectively.
1 . 0 TlO
■o
>Q-
Û.<1
0.11,000
k
^ 0.005" ID
0.007" ID
o 0.010" IDk'
Re10,000
Figure 5.21. Dimensionless entrance pressure drop as a function of Reynolds number.
Effective capillary internal diameters of 0.0117”, 0.0075” and 0.0058” were
used to calculate the dimensionless entrance pressure drop.
pl40
5.6.2 Effect of cavitation
The purpose o f the capillary degradation experiments was to determine the effects o f fluid shear
on DNA degradation. However, it was important to check that other effects were not causing
DNA degradation. One phenomenon that could have been present in the capillary system,
leading to plasmid degradation, was cavitation. It is known that cavitation frequently occurs in
high velocity flows, particularly at flow constrictions, and that cavitation can cause severe
chromosomal DNA and plasmid DNA degradation. Cavitation is a process that involves the
formation o f bubbles o f gas in flowing liquids followed by subsequent bubble collapse. Very
high, localised fluid stresses are created at the point where a bubble collapses.
In general, the pressure drops across the capillaries were on the order of 100 to 1600 psi. These
pressures were sufficiently high enough that cavitation effects should be minimal on the
upstream side o f the capillaries. CFD simulations of the fluid flow entering the narrow bore
capillary entrance, refer to section 5.4.8, also indicated that the fluid pressure should be too high
for significant cavitation to occur. To further reduce cavitation, all TE buffer was sparged to
remove dissolved gases. However, it was still possible that a small amount o f cavitation could
be present at the capillary outlet, where a fast moving jet of liquid flows into a slower body of
liquid (Lander et al., 2000). Because cavitation had been shown to rapidly degrade DNA,
several studies were performed to determine if any cavitation was occurring and causing DNA
degradation.
Cavitation using a sonication
Figure 5.22 shows the supercoiled plasmid DNA fluorescence as a function o f time in the
supercoiled plasmid solution at two different sonication amplitudes, using a sonic probe. The
samples were denatured-renatured prior to Picogreen assay as per the standard protocol. At 1
micron sonication amplitude, there was no change in supercoiled plasmid fluorescence, but
there was an immediate reduction in supercoiled plasmid fluorescence at 5 micron amplitude.
Agarose gel electrophoresis showed that 10 minutes sonication at 5 |im amplitude was sufficient
to degrade all o f the supercoiled plasmid DNA. Therefore, sufficiently intense cavitation
quickly degraded supercoiled plasmid pSVp.
pl41
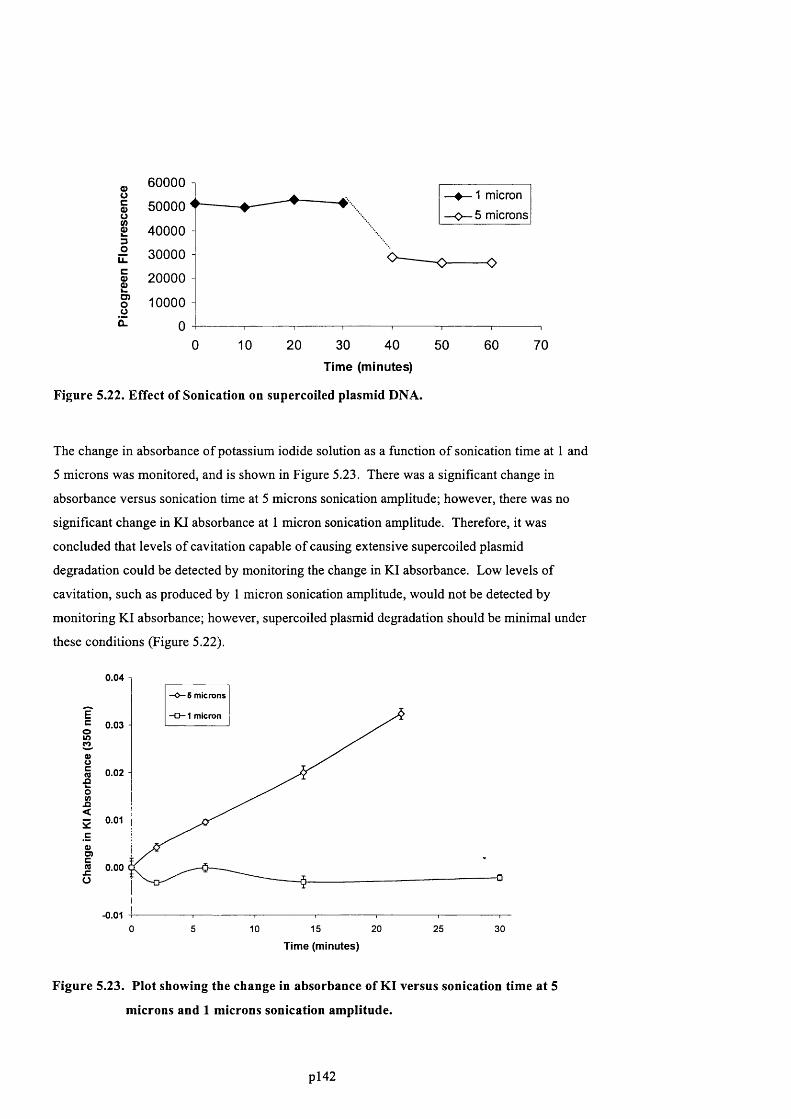
60000Sc ^ 1 micron
O — 5 microns50000ou
£ 400003g 30000
20000ciO)8E
10000
300 10 20 40 50 60 70
Time (minutes)
Figure 5.22. Effect of Sonication on snpercoiled plasmid DNA.
The change in absorbance o f potassium iodide solution as a function o f sonication time at 1 and
5 microns was monitored, and is shown in Figure 5.23. There was a significant change in
absorbance versus sonication time at 5 microns sonication amplitude; however, there was no
significant change in KI absorbance at 1 micron sonication amplitude. Therefore, it was
concluded that levels o f cavitation capable of causing extensive supereoiled plasmid
degradation could be detected by monitoring the change in Kl absorbance. Low levels of
cavitation, such as produced by 1 micron sonication amplitude, would not be detected by
monitoring KI absorbance; however, supereoiled plasmid degradation should be minimal under
these conditions (Figure 5.22).
0.04 -
—O— 5 microns
Ec 0.03
s
1 micron
8cI
0.02
0)O)c1 0.00
- aoi
-0.01 I10 15 20
Time (minutes)25 30
Figure 5.23. Plot showing the change in absorbance of KI versus sonication time at 5
microns and 1 microns sonication amplitude.
pl42

Cavitation in Capillary System; Monitoring KI absorbance
Recirculating potassium iodide solution through the flow system was performed as a standard
test for cavitation. Figure 5.24 shows the solution absorbance at 350 nm as a function of
recirculation flowrate through the capillary device for a 0.01” capillary system. The KI solution
was recirculated for 30 minutes at each flowrate. There was no significant change in
absorbance, indicating that cavitation was not occurring or was occurring only to a very small
extent below the level o f detection o f the assay.
Ec
<
0.250
S 0.200CO
0.150
0.1000)0 c1O 0.050 (/)
0.0001500 50 100
Flowrate (ml/min)Figure 5.24. Plot showing change in KI absorbance at 350 nm versus flowrate in PEEK
capillary.
Cavitation in Capillary System: Effect of backpressure
Based on the change in absorbance while recirculating KI solution through the PEEK capillary
system, it was expected that cavitation should be not occurring to a significant extent within the
system. As a further test, plasmid degradation experiments were performed with different
amounts o f backpressure on the capillary flow device. Backpressure increases the overall
pressure throughout the flow system and hence reduces cavitation. Figure 5.25 shows the
results of three experiments where supereoiled plasmid pQR150 was pumped through a narrow
bore 0.007” ID capillary: a) without a backpressure capillary, b) with a short backpressure
capillary, c) with a long backpressure capillary. The shear degradation rate with the short
backpressure capillary in place (10 psi backpressure) was moderately less than the degradation
rate with no backpressure. Hence, cavitation effects were probably causing a small amount of
plasmid DNA degradation. This small amount of cavitation was probably at too low a level to
be detectable by the KI assay. After significantly increasing the backpressure from 10 psi to
140 psi, by using the longer backpressure capillary, there was no further decrease in plasmid
pl43
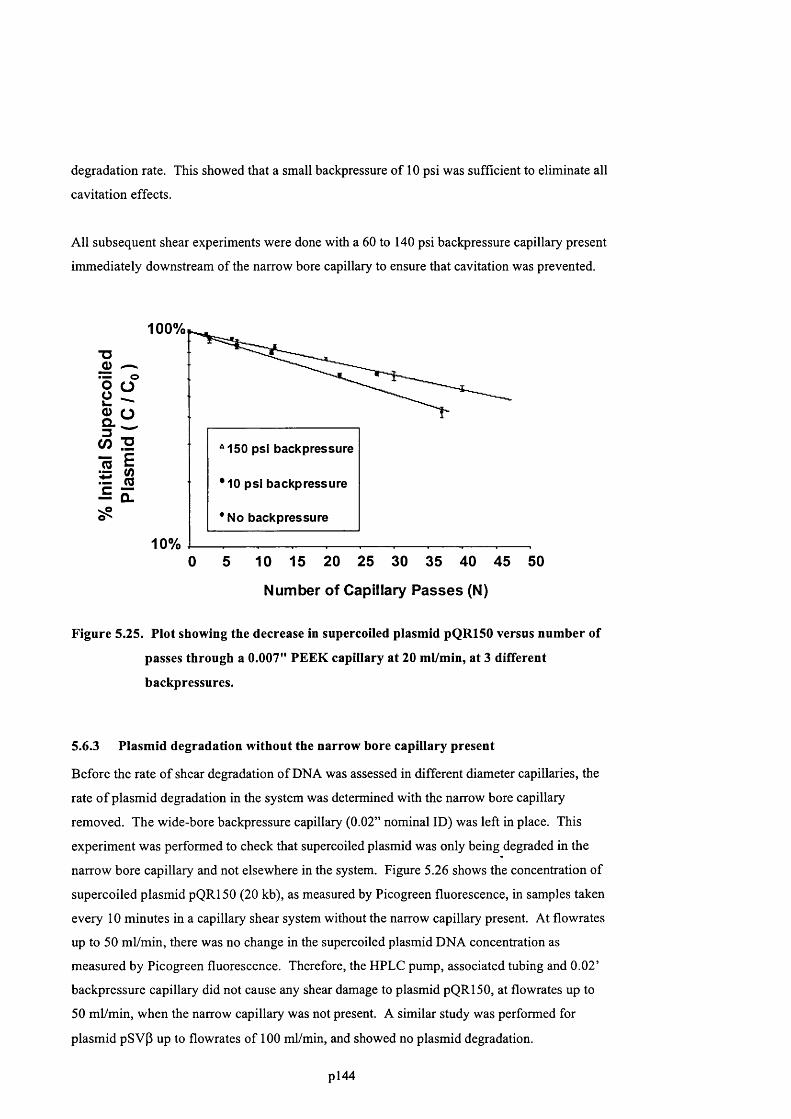
degradation rate. This showed that a small backpressure of 10 psi was sufficient to eliminate all
cavitation effects.
All subsequent shear experiments were done with a 60 to 140 psi backpressure capillary present
immediately downstream of the narrow bore capillary to ensure that cavitation was prevented.
■D0>
CL3
(Q
C
100%
ooÜ
"O
1iS
Li.
^150 psi b ack p ressu re
10 p s i b a c k p re ssu re
No b ack p re ssu re
10%0 5 10 15 20 25 30 35 40 45 50
N um ber of Capillary P a s se s (N)
Figure 5.25. Plot showing the decrease in supereoiled plasmid pQR150 versus number of
passes through a 0.007” PEEK capillary at 20 ml/min, at 3 different
backpressures.
5.6.3 Plasmid degradation without the narrow bore capillary present
Before the rate o f shear degradation o f DNA was assessed in different diameter capillaries, the
rate o f plasmid degradation in the system was determined with the narrow bore capillary
removed. The wide-bore backpressure capillary (0.02” nominal ID) was left in place. This
experiment was performed to check that supereoiled plasmid was only being degraded in the
narrow bore capillary and not elsewhere in the system. Figure 5.26 shows the concentration of
supereoiled plasmid pQR150 (20 kb), as measured by Picogreen fluorescence, in samples taken
every 10 minutes in a capillary shear system without the narrow capillary present. At flowrates
up to 50 ml/min, there was no change in the supereoiled plasmid DNA concentration as
measured by Picogreen fluorescence. Therefore, the HPLC pump, associated tubing and 0.02’
backpressure capillary did not cause any shear damage to plasmid pQR150, at flowrates up to
50 ml/min, when the narrow capillary was not present. A similar study was performed for
plasmid pSVP up to flowrates of 100 ml/min, and showed no plasmid degradation.
pl44
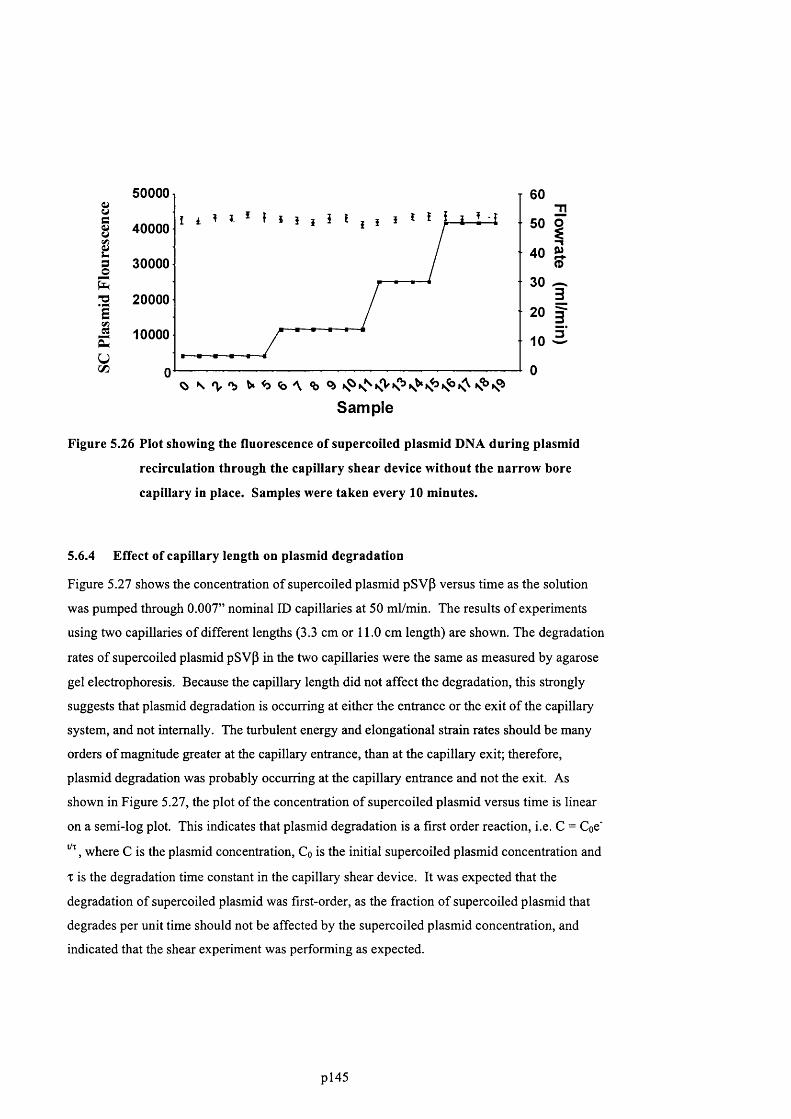
s
IgIk
1IUc/5
50000
40000
30000
20000
10000
0% \ n, «b b' \ %
Sample
T 60Tl
501
40
303
20 310 3
0
Figure 5.26 Plot showing the fluorescence of supereoiled plasmid DNA during plasmid
recirculation through the capillary shear device without the narrow bore
capillary in place. Samples were taken every 10 minutes.
5.6.4 Effect of capillary length on plasmid degradation
Figure 5.27 shows the concentration of supereoiled plasmid pSVP versus time as the solution
was pumped through 0.007” nominal ID capillaries at 50 ml/min. The results o f experiments
using two capillaries of different lengths (3.3 cm or 11.0 cm length) are shown. The degradation
rates of supereoiled plasmid pSVP in the two capillaries were the same as measured by agarose
gel electrophoresis. Because the capillary length did not affect the degradation, this strongly
suggests that plasmid degradation is occurring at either the entrance or the exit of the capillary
system, and not internally. The turbulent energy and elongational strain rates should be many
orders o f magnitude greater at the capillary entrance, than at the capillary exit; therefore,
plasmid degradation was probably occurring at the capillary entrance and not the exit. As
shown in Figure 5.27, the plot of the concentration of supereoiled plasmid versus time is linear
on a semi-log plot. This indicates that plasmid degradation is a first order reaction, i.e. C = Q e '
, where C is the plasmid concentration, Co is the initial supereoiled plasmid concentration and
X is the degradation time constant in the capillary shear device. It was expected that the
degradation o f supereoiled plasmid was first-order, as the fraction o f supereoiled plasmid that
degrades per unit time should not be affected by the supereoiled plasmid concentration, and
indicated that the shear experiment was performing as expected.
pl45
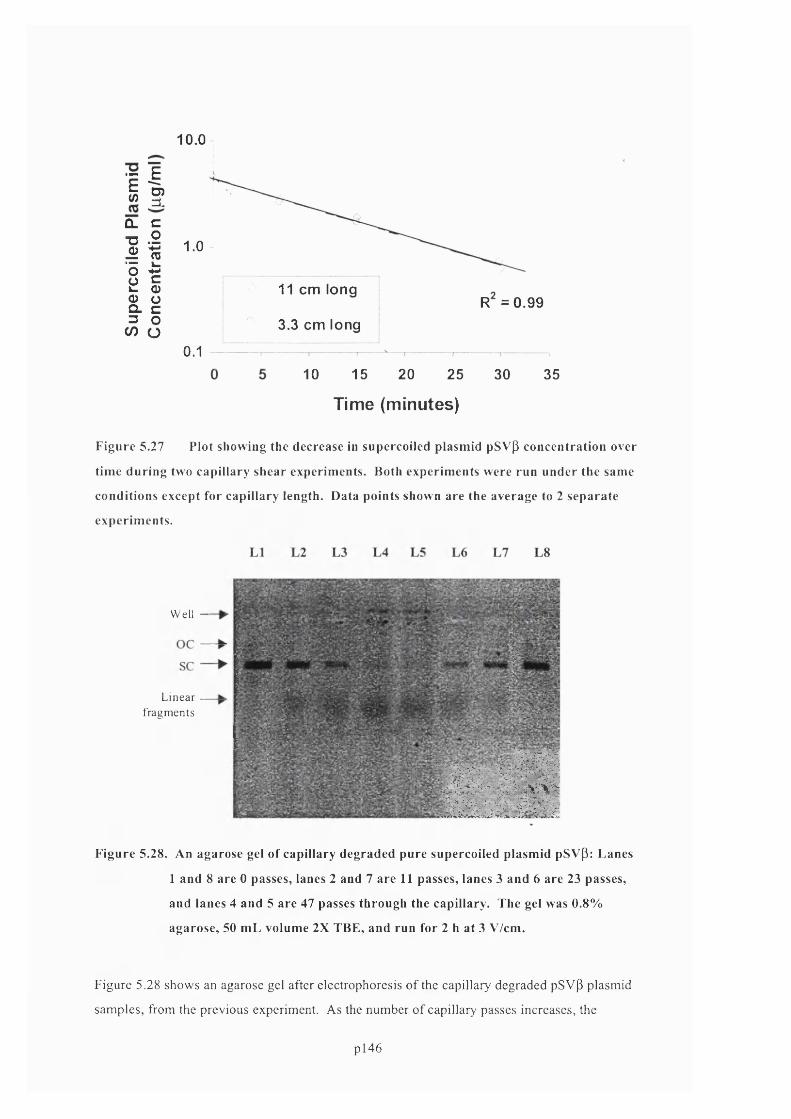
1 0 . 0
1 1û_ c
s iPQ) O Q. C 3 O (/) ü
1.0
11 cm longR = 0.99
3.3 cm long
0.110 15 20 25
Time (minutes)
30 35
Figure 5.27 Plot showing the decrease in supereoiled plasm id pSVp concentration over
time during two capillary shear experim ents. Both experim ents were run under the same
conditions except for capillary length. Data points shown are the average to 2 separate
experim ents.
Well -
Linearfragm ents
s iFigure 5.28. An agarose gel of capillary degraded pure supereoiled plasm id pSV(3: Lanes
1 and 8 are 0 passes, lanes 2 and 7 are 11 passes, lanes 3 and 6 are 23 passes,
and lanes 4 and 5 are 47 passes through the capillary. The gel was 0.8%
agarose, 50 m L volume 2X TEE, and run for 2 h at 3 V/cm.
Figure 5.28 shows an agarose gel after electrophoresis o f the capillary degraded pSVP plasmid
sam ples, from the previous experiment. As the number o f capillary passes increases, the
p i 46

supereoiled plasmid band decreases on the agarose gel. Concurrent with supereoiled plasmid
degradation there was an increase in linear plasmid fragments as shown on the gel. However
there was not an increase of either open-circular plasmid or full-length linear plasmid, which
would be observed above the supereoiled plasmid band on the agarose gel. Therefore,
supereoiled plasmid either degraded directly to plasmid fragments, or any open-circular plasmid
formed was sufficiently more sensitive to fluid stress that it quickly degraded to linear plasmid
fragments and did not accumulate.
The effect of capillary length on the degradation rate of plasmid pQR150 was also investigated
by pumping the plasmid through two capillaries o f different lengths. Figure 5.29 shows the
amount of supereoiled plasmid pQRlSO, as a percentage o f the initial supereoiled plasmid,
versus time during the capillary shear experiment. The supereoiled plasmid concentration was
measured by Picogreen assay. Similar to the shear degradation experiment using plasmid
pSVp, the shear degradation rates o f supereoiled plasmid pQR150 were the same in both the
long (11 cm length) and short (3.5 cm length) capillaries. If plasmid degradation was occurring
inside the capillaries, then the longer capillary should have a degradation rate 3-times higher
than the short capillary. The dotted-lines in Figure 5.29 represent 3-fold higher and 3-fold
lower degradation rates. It is clear from the figure that the degradation rates in the long and
short capillaries were not 3-fold different. Therefore, it is unlikely that plasmid degradation is
occurring to a significant extent within the capillaries.
■oÇ)Ô
<D (tJ> Q.%Oa:
1001/3 rd shear rate
3-times shear rate
11.0 cm 3.5 cm
1025 30 350 10 15 205
Passes Through Capillary (N)
Figure 5.29 Plot showing the decrease in supereoiled plasmid DNA, as a percentage of
initial supereoiled plasmid, over time during two capillary shear experiments.
Data points represent the averages of two experiments.
pl47
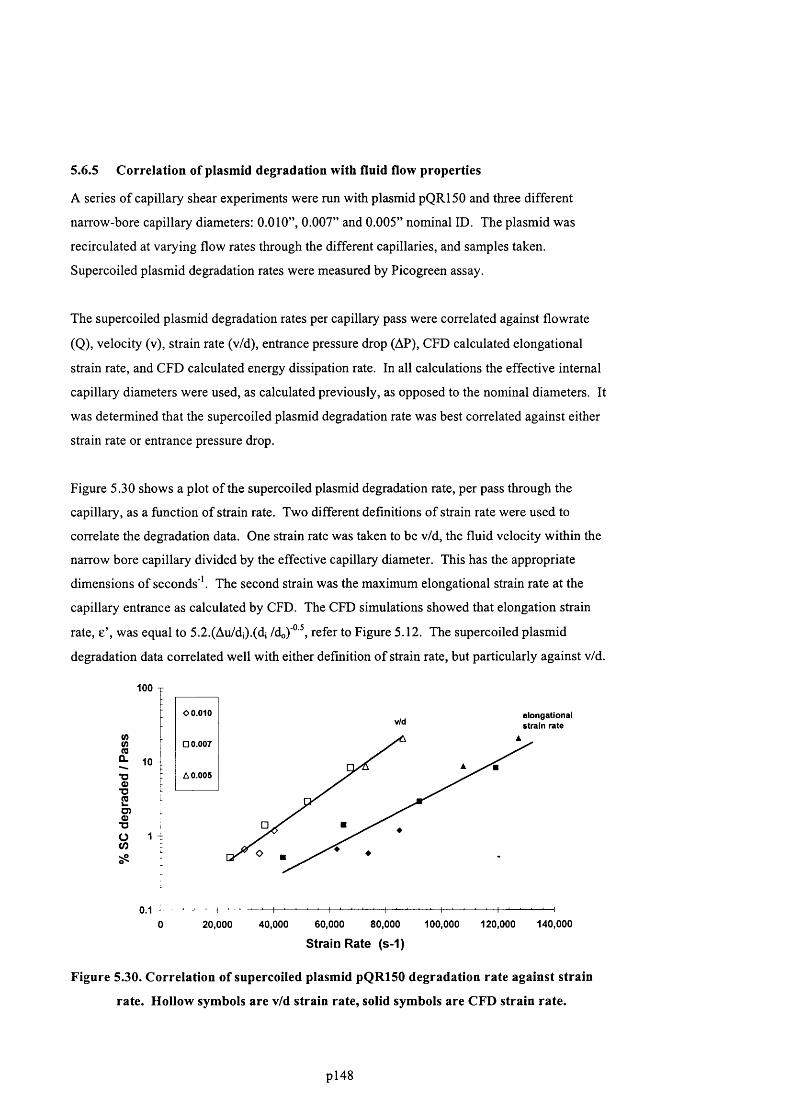
5.6.5 Correlation of plasmid degradation with fluid flow properties
A series o f capillary shear experiments were run with plasmid pQRlSO and three different
narrow-bore capillary diameters: 0.010”, 0.007” and 0.005” nominal ID. The plasmid was
recirculated at varying flow rates through the different capillaries, and samples taken.
Supereoiled plasmid degradation rates were measured by Picogreen assay.
The supereoiled plasmid degradation rates per capillary pass were correlated against flowrate
(Q), velocity (v), strain rate (v/d), entrance pressure drop (AP), CFD calculated elongational
strain rate, and CFD calculated energy dissipation rate. In all calculations the effective internal
capillary diameters were used, as calculated previously, as opposed to the nominal diameters. It
was determined that the supereoiled plasmid degradation rate was best correlated against either
strain rate or entrance pressure drop.
Figure 5.30 shows a plot o f the supereoiled plasmid degradation rate, per pass through the
capillary, as a function o f strain rate. Two different definitions o f strain rate were used to
correlate the degradation data. One strain rate was taken to be v/d, the fluid velocity within the
narrow bore capillary divided by the effective capillary diameter. This has the appropriate
dimensions of seconds '. The second strain was the maximum elongational strain rate at the
capillary entrance as calculated by CFD. The CFD simulations showed that elongation strain
rate, e’, was equal to 5.2.(Au/dj).(di /do)'°^, refer to Figure 5.12. The supereoiled plasmid
degradation data correlated well with either definition o f strain rate, but particularly against v/d.
100
%S.
i■DSS’■DO(0
10
00.010 elongational strain ratev/d
□ 0.007
A 0.005
0.120,000 40,000 60,000 80,000
Strain Rate (s-1)100,000 120,000 140,000
Figure 5.30. Correlation of supereoiled plasmid pQR150 degradation rate against strain
rate. Hollow symbols are v/d strain rate, solid symbols are CFD strain rate.
pl48

Shown in Figure 5.31 is the supereoiled plasmid degradation rate as a function o f entrance
pressure drop. The entrance pressure drop were not measured directly for each capillary
experiment, but knowing the flowrate for each experiment the entrance pressure drop was
obtained from the previously determined entrance pressure drop versus flow rate data, shown
previously in Figure 5.19. The supereoiled degradation rate also correlated well against the
entrance pressure drop. It was not expected that the supereoiled plasmid degradation rate
correlate with both the entrance pressure drop and the entrance strain rate. However, as shown
in Figure 5.32, there is a moderate correlation between the entrance strain rate and the entrance
pressure drop over the range o f strain rates where plasmid pQR150 is degraded.
100 ,0.010
° 0 .0 0 7
^ 0 .0 0 5
0.110 100 1,0001
Entrance Pressure Drop (psi)Figure 5.31. Effect of entrance pressure drop on supereoiled plasmid degradation rate.
1 ,000 T
5♦ 0.005" ID
□ 0 .007" ID
QO 0.010" ID
23
100
qI
8ciLU 10
10000010000v/d (1/s)
Figure 5.32. Relationship between measured entrance pressure drops and strain rate for
the three different diameter PEEK capillaries used.
pl49
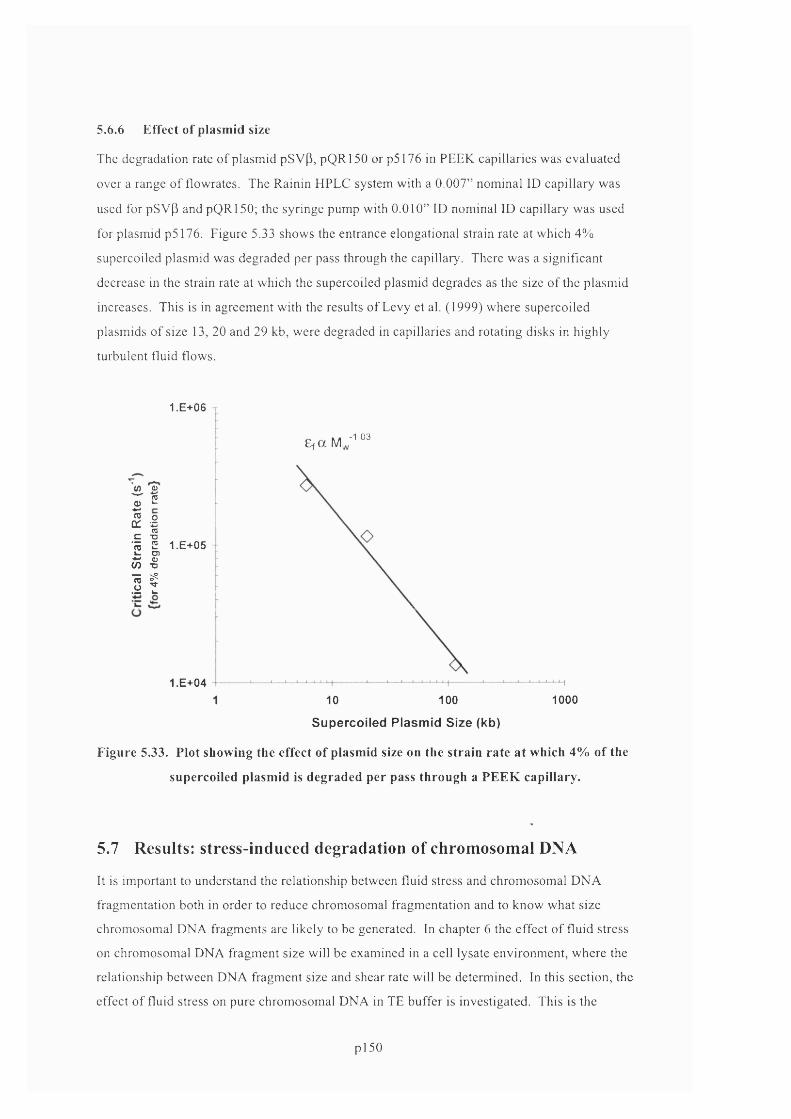
5.6.6 Effect of plasmid size
The degradation rate o f plasm id pSV(3, pQR150 or p5176 in PEEK capillaries was evaluated
over a range o f flowrates. The Rainin HPLC system with a 0.007” nominal ID capillary was
used for pSV(3 and pQR150; the syringe pump with 0.010” ID nominal ID capillary was used
for plasmid p 5 176. Figure 5.33 shows the entrance elongational strain rate at which 4%
supercoiled plasmid was degraded per pass through the capillary. There was a significant
decrease in the strain rate at which the supercoiled plasmid degrades as the size o f the plasmid
increases. This is in agreem ent with the results o f Levy et al. (1999) where supercoiled
plasmids o f size 13, 20 and 29 kb, were degraded in capillaries and rotating disks in highly
turbulent fluid flows.
1.E+06
£f a M, -1.03
a B
Î 'a: B c -S
I I3 !
1.E+05
1.E+0410 100
Supercoiled Plasmid Size (kb)
1000
Figure 5.33. Plot showing the effect of plasmid size on the strain ra te a t which 4% of the
supercoiled plasm id is degraded per pass through a PEEK capillary.
5.7 Results: stress-induced degradation of chromosomal DNA
It is important to understand the relationship between fluid stress and chromosomal DNA
fragm entation both in order to reduce chromosomal fragm entation and to know what size
chromosomal DNA fragments are likely to be generated. In chapter 6 the effect o f fluid stress
on chrom osom al DNA fragm ent size will be examined in a cell lysate environm ent, w here the
relationship between DNA fragment size and shear rate will be determined. In this section, the
effect o f fluid stress on pure chrom osom al DNA in TE buffer is investigated. This is the
p l5 0
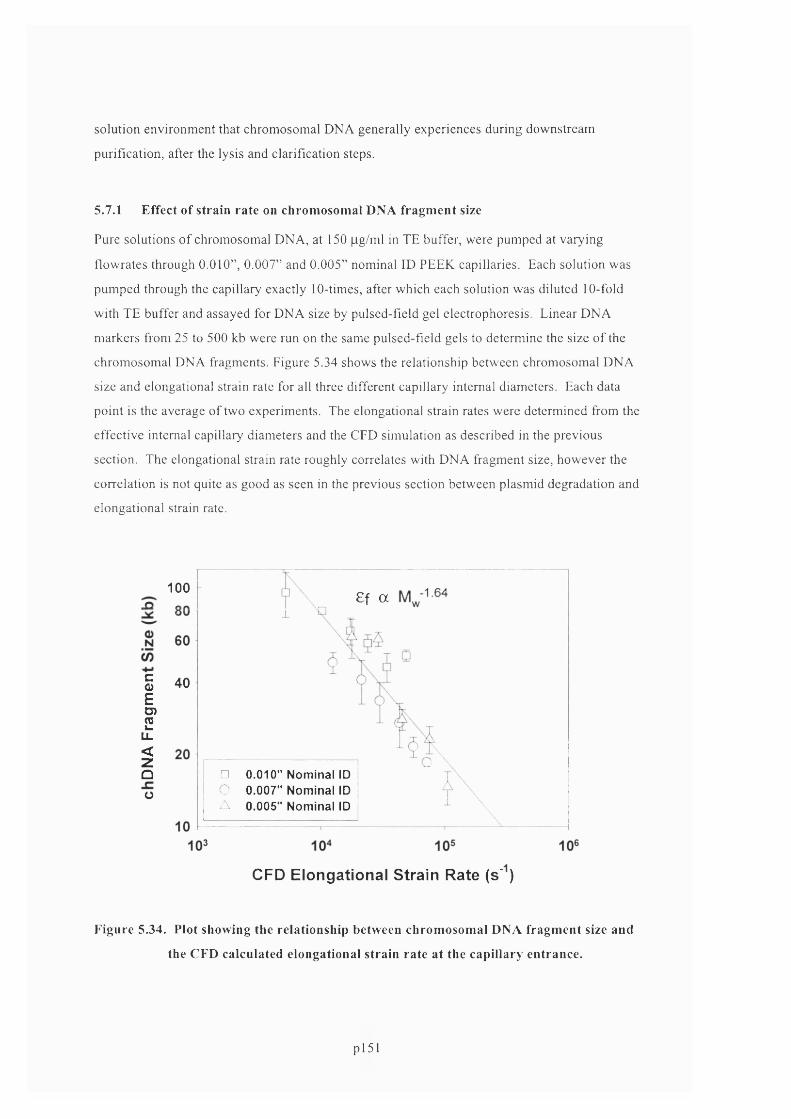
solution environm ent that chrom osom al DNA generally experiences during downstream
purification, after the lysis and clarification steps.
5.7.1 Effect of strain ra te on chromosom al DNA fragm ent size
Pure solutions o f chrom osom al DNA, at 150 pg/m l in TE buffer, were pumped at varying
flow rates through 0.010”, 0.007” and 0.005” nominal ID PEEK capillaries. Each solution was
pum ped through the capillary exactly 10-times, after which each solution was diluted 10-fold
with TE buffer and assayed for DNA size by pulsed-field gel electrophoresis. Linear DNA
m arkers from 25 to 500 kb were run on the same pulsed-field gels to determ ine the size o f the
chrom osom al DNA fragments. Figure 5.34 shows the relationship between chrom osom al DNA
size and elongational strain rate for all three different capillary internal diameters. Each data
point is the average o f two experiments. The elongational strain rates were determ ined from the
effective internal capillary diam eters and the CFD sim ulation as described in the previous
section. The elongational strain rate roughly correlates with DNA fragm ent size, how ever the
correlation is not quite as good as seen in the previous section between plasm id degradation and
elongational strain rate.
1008 f a
coEG)2
u_<z
40
Qo
□ 0.010" N om inal IDO 0.007" N om inal IDA 0.005" N om inal ID
CFD Elongational Strain Rate (s' )
Figure 5.34. Plot showing the relationship between chrom osom al DNA fragm ent size and
the CFD calculated elongational strain ra te at the capillary entrance.
pl51
5.8 Discussion
5.8.1 Comparison of internal and external capillary strain rates
Based on fluid flow experiments with different length capillaries, it was demonstrated that
supercoiled plasmid degradation occurred at the entrance to PEEK capillaries and not within the
capillaries. At the entrance to a capillary, the fluid stresses are primarily elongational fluid
stresses (caused by elongational strain) compared to shear stresses within the capillary (caused
by the shear strain). Over the flowrates used in the plasmid degradation experiments, the CFD
predicted elongational strain rate at the capillary entrance was 4- to 5-fold lower than the
predicted laminar strain rate against the internal capillary wall. Therefore, if plasmid
degradation was due to elongational forces at the capillary entrance, elongational strain must be
significantly more effective at causing plasmid degradation than shear strain. This is not that
surprising as elongational strain causes sustained plasmid stretching, while shear strain causes
periodic stretching and compression together with rotation (Odell et al, 1992; Smith et al.,
1999).
As well as elongational and shear stresses caused by bulk fluid motion, additional fluid stresses
may occur due to fluid turbulence. Fluid flow is generally laminar within capillaries, and at
capillary entrances, below Reynolds numbers of 1000 and turbulent above Reynolds numbers of
4000 (Moan et al., 1979; Coulson et al., 1991). Figure 5.35 shows the Reynolds number within
the PEEK capillaries as a function o f the elongational strain rate at the capillary entrances, for
experiments using plasmid pQR150. Also shown in the plot are the ranges o f Reynolds number
and strain rate over which pQR150 plasmid degradation was observed. It is apparent from the
plot that the Reynolds number for the capillary flows was in the transition range (1000 < Re <
4000) during supercoiled plasmid degradation. Therefore, it is difficult to determine if turbulent
stresses at the capillary entrance, or within the capillary, were present during plasmid
degradation experiments, and causing plasmid degradation.
The CFD simulations predicted that the turbulent energy dissipation is the highest close to the
internal capillary walls, as shown in Figure 5.10. Because the magnitude o f turbulent stress
increases with increasing local energy dissipation rate (refer to Equation 2.1, Equation 2.15 and
Equation 2.14), turbulent stresses should be the highest within the capillary, and not at the
capillary entrance. Average turbulent energy dissipation rates within the capillaries during
plasmid pQR150 degradation experiments were calculated to be 1x10^ to 2x10^ W/kg. This
corresponds to Kolmogoroff length scales o f 3.5 to 4 microns. The pQR150 supercoiled
plasmid radius o f gyration is less than 1 micron, and its maximum extension is about 2 microns;
hence, the supercoiled plasmid is probably too small to experience significant stress due to
pl52

turbulent eddy fluctuations. U sing Equation 2.15 to calculate the turbulent stress inside an
eddy, or Equation 2.14 to calculate the turbulent stress on a particle inside the viscous
dissipation range, the turbulent stress on a 2 micron particle at 2x10⁵ W /kg energy dissipation
should be less than 20 Pa. Com pare this to an elongational stress o f 100 Pa due to elongational
strain rate at the capillary' entrance predicted by CFD simulation. Therefore it is unlikely that
turbulent stress is causing significant plasmid degradation. M oreover, if turbulent stresses were
causing significant plasm id degradation, the highest turbulent energy dissipation rates should be
at the capillary entrance where plasm id degradation was observed, which is contrary to CFD
predictions.
The stress-induced degradation o f plasmid p5176 (116 kb) occurred at significantly lower strain
rates and Reynolds num ber than plasmid pQR150, as shown in Figure 5.33. For plasm id p5176,
degradation occurred at a Reynolds num ber o f about 500. At this Reynolds number, the flow
should be laminar and turbulent stresses should be very low. This supports the conclusion,
using plasmids pSVP and pQR150, that turbulence is not a requirem ent for supercoiled plasmid
degradation.
0.0107" ID 0.0075" ID 0.0058" ID
1e+7
1e+6 -
o(0onc
1e+5 -
2
1e+4 -
TurbulentTransitionalLaminar
1e+310 ®10“
R e y n o ld s n u m b e r
Figure 5.35. Plot showing the relationship between entrance elongational strain ra te and
in ternal capillary Reynolds num ber, for the 3 different d iam eter PEEK
capillaries used in plasm id degradation experim ents. The wide lines indicate
the strain ra te where plasmid degradation rates were m easured.
pl53

5.8.2 Comparison of degradation rates with literature
Comparison of plasmid degradation in capillaries versus rotating disks
Supercoiled plasmid degradation experiments were performed by Levy et al. (1999) using
capillaries and rotating disks. However, the plasmid degradation rates in the two devices were
inconsistent based on the calculated fluid stresses in each device. The capillary diameters used
by Levy et al. were similar to those used in this thesis, and the plasmid degradation rates in
capillaries reported by Levy were similar to the degradation rates observed in this work.
However, experiments o f Levy et al. did not distinguish whether the plasmid was degrading at
the entrance or inside the capillary. In this thesis, experiments showed that supercoiled plasmid
degraded exclusively at the capillary entrance. This was consistent with calculations that
showed the maximum elongational stresses occurred at the capillary entrance and not inside the
capillary.
The analysis o f plasmid degradation, in this thesis, showed that plasmid pQR150 is not
degraded by turbulent stress at energy dissipation rates o f 2x10^ W/kg, as discussed in the
previous section. This is consistent with the theory that particles are primarily degraded by
fluid stress when the Kolmogoroff length scale is smaller than the size of the particles (Henzler,
2000). Levy et al. observed plasmid pQR150 degradation in a rotating disk device at energy
dissipation rates above 2 to 4 x 10 W/kg. This corresponds to a Kolmogoroff length scale of
1.5 to 2 |im. Considering the maximum extension of plasmid pQRlSO is 2 microns, the plasmid
could now be considered as being comparable or larger in size than the smallest turbulent eddies
in the viscous dissipation region. The calculated turbulent stress on the plasmid in the viscous
dissipation region, at 4 x 10 W/kg, is over 100 Pa. Interestingly, this is the about the same
magnitude o f stress at which plasmid pQRI50 was shown to degrade at the entrance to
capillaries, in this thesis. Therefore, capillaries and rotating disks now give consistent levels of
DNA degradation at similar levels o f fluid stress.
For double-stranded linear DNA in a QSS extensional flow, the force required for chain scission
was estimated using Equation 2.24 and the data of Atkins et al. (1992) and determined to be
about 500 pN. In the DNA degradation experiments o f Atkins, the DNA molecules were shown
to be in a fully extended conformation at chain breakage. The data of Reese et al. (1989) was
used to estimate the force required for 38 kb DNA chain scission in a FT extensional flow,
using Equation 2.27, and the force was determined to be about 3000 pN. The calculated value
o f 3000 pN is based on the stretched out length o f the 38 kb DNA fragment. In the FT
extensional flow it is likely that the DNA is not fully stretched, however, so the force o f 3000
pN for chain breakage is probably an over estimate. Supercoiled plasmid DNA pQR150 was
pl54

observed to break at 50x10^ to 100x10^ s'' elongational strain rate at capillary entrances. Using
Equation 2.27 to estimate the force on supercoiled plasmid DNA at 1x10⁵ s'' strain rate, and
using a fully stretched-out covalently-closed length of 2.4 microns and an extensional viscosity
of 3 mPa s, the critical force for chain breakage is 1000 pN. Therefore, the critical force for
plasmid DNA chain breakage in extensional flow is in a similar force range as observed in
studies using linear double-stranded DNA.
TABS Theory
According to the Thermally Activated Bond Scission (TABS) model for polymer degradation
due to fluid stress (Odell et al., 1988) the breakage o f bonds in the DNA molecule will be a
thermally activated process where the rate is determined by an Arrhenius-type equation. The
activation energy for pulling apart a C-C or C -0 bond is a function o f the force applied to the
individual bond being pulled apart. The relation between the rate o f scission Ko, and the
temperature T, according to this model, is given by
Ko — A exp[ —(Uo - f ) / (KT)]
Equation 5.1
Uo is the bond dissociation energy, K is the Boltzmann constant, and f is the reduction in
dissociation energy due to the energy supplied by fluid stress. According to the TABS theory, f
is proportional to the strain rate. It is apparent from this equation that if DNA stress-induced
degradation is a thermally activated process, then plotting log Ko versus strain rate should yield
a straight line. Figure 5.30 shows that for pQR150 plasmid degradation, there is indeed a linear
relationship between log Ko and strain rate. This demonstrates that the TABS theory does
accurately describe supercoiled plasmid DNA degradation in capillaries.
Correlation of plasmid degradation with elongational strain rate
It was determined in this thesis that the degradation rate o f plasmid pQR150 in the capillary
device was well correlated by the entrance elongational strain rate. In contrast, Nguyen et al.
(1988) showed that the degradation rate o f synthetic polymers in Fast Transient flows was not
well correlated against the entrance elongational strain rate; the entrance elongational strain rate
being given by v/d, as for a point-sink flow. Nguyen et al. reported that the degradation rate of
polymer molecules in their orifice flow device was better correlated against the average velocity
o f fluid through the orifice, v, for the 4 different diameter orifices that were used. It should be
noted that Metzner et al. (1970) reported that the elongational strain rate in narrow orifices was
generally proportional to v and not v/d as expected. This is due to the change in angle at which
the flow enters an orifice as the orifice diameter changes. If the strain rate measured by
pl55
Metzner et al. for orifices is correct, then the degradation of DNA observed by Nguyen et al.
would be well correlated by entrance elongational strain rate. In this thesis, the entrance flow
was into a capillary and not an orifice. CFD simulations predicted that the elongational strain
rate was proportional to v/Vd. Therefore, the CFD predicted elongational strain rate (v/Vd ) was
intermediate between the ideal strain rate (v/d) and the orifice strain rate (v).
Aggregation
Hershey et a l, (1961) and Reese et al. (1990) had reported a delay in the onset o f DNA
degradation in recirculating flows. Aggregation had been suggested as a reason for the apparent
delay in DNA degradation, where it takes time for aggregates to break-up. Alternatively, it had
been suggested that the delay time was due to single-stranded nicks accumulating on the DNA
chain. Once enough single-stranded nicks had occurred, then full chain scission proceeded. In
this work, it was observed that the rate of supercoiled plasmid degradation was highly variably
at the start of experiments. Sometimes there was a significant delay in the onset o f degradation,
and sometimes there was even an increase in supercoiled concentration at the start o f an
experiment. However, after filtering all plasmid samples through a 0.2 pm filter prior to
degradation experiments, these variable degradation rates at the start o f experiments completely
disappeared. Therefore, it was concluded that these problems were due to plasmid aggregation.
Plasmid was always filtered immediately prior to degradation experiments as a general rule. It
was still surprising that there was any plasmid aggregation, as all samples were diluted in
filtered buffers to relatively low concentrations for degradation experiments. One o f the
advantages of working with supercoiled plasmid, instead o f linear double-stranded DNA, is that
supercoiled plasmid must be entirely intact; a single nick will reduce it to open-circular plasmid.
In contrast, it is difficult to determine the number o f single-stranded nicks in a linear piece of
DNA.
5.8.3 DNA stretching and scission
Polymer Stretching
A polymer like DNA will start to stretch in any flow where the product o f its'relaxation time, x,
and the elongational strain rate, e, are greater than about 0.5 (Smith et al. 1999). In this case the
molecule will rapidly stretch to about 80% of its fully stretched out contour length.
Alternatively, a polymer will start to stretch if the product of its relaxation time and the shear
strain rate, y’, are greater than about 1. In this case the molecule will stretch gradually as the
product x.y increases. At x.y = 20, the molecule will have stretched to about 40% of its contour
length (Smith et a l , 1999).
x.e’ > 0.5 or x.y’ > 1.0 criteria for molecular stretching to occur
pl56
Equation 5.2
The product of relaxation time and strain rate is known as the Deborah number, De, and will
vary depending on the flow conditions and the polymer size. The relaxation time, X, for a
polymer is a function of its molecular weight raised to a power. Typically, x a ° (Rouse,
1953; Zimm, 1956). For example, the relaxation time o f Z-DNA (48 kb) is about 0.4 s, and the
relaxation time of plasmid pQR150 (20 kb) is about 0.009 s. Hence, X,-DNA (48 kb) will be
significantly stretched at elongational strain rates o f about 2 s '', or shear strain rates o f about 20
s ''. In contrast, shear strain rates on the order of 200 s ', 1000 s'' and 4000s ' were required to
stretch plasmids p5176, pQR150 and pSV(3, respectively.
When performing DNA degradation experiments, careful consideration must be made to the
Deborah number through the flow device. For example, the average shear strain rate in the
0.062” ID tubing (upstream of the narrow capillary tubing where plasmid was degraded) was
always less than 500 s '. Therefore plasmids pSVP and pQR150 should not be significantly
stretched before entering the high stress zone in front of the narrow bore capillary. In contrast,
if A,-DNA had been used in flow degradation experiments, it would be in an extended
conformation before even reaching the narrow bore capillary, which would presumably have
affected its susceptibility to degradation.
Supercoiled DNA Scission
For polymer degradation in extensional flows, if the molecule spends a long time in the
extensional part of the flow field and has time to stretch-out (QSS flow), the critical scission
strain rate will be inversely proportional to the polymer molecular weight squared (Sf a Mw’ ).
This was predicted by Ryskin et al. (1987) and experimentally verified by Odell et al. (1994).
Conversely, if the molecule rapidly enters a FT extensional flow and fractures before stretching,
the critical strain rate will be inversely proportional to molecular weight (£f a Mw"') (Nguyen et
al., 1988). Polymer molecules will typically stretch-out in a time equivalent to their relaxation
time. Therefore, in order to predict QSS or FT breakage the relaxation time of molecules has to
be compared to the time the molecules spend in the elongational region o f the flow.
Analysis o f the CFD predictions o f elongational strain rate at the capillary entrances showed
that the region o f high elongational strain extended only 1 mm out from the entrance o f the
capillary, and reached a maximum strain rate at the capillary entrance. Based on flowrates into
capillaries during flow degradation experiments, the average residence time for a plasmid in the
high stress zone was on the order 0.1 ms. This was considerably shorter than the relaxation
pl57

times for all plasmids used in this work, and for the chromosomal fragments observed. . Thus,
in the capillary flow device, all experiments were performed under FT conditions and the
plasmids should have broken in a non-stretched out configuration. Hence, a log-log plot o f
critical scission strain rate versus plasmid size should yield a straight line with a slope o f -1 .
Figure 5.33 shows that the critical strain rate for supercoiled plasmid degradation is indeed
inversely proportional to molecular weight, with a slope of -1.
Chrom osom al DNA Scission
Chromosomal DNA was fragmented by forcing it through PEEK capillaries at varying flowrates
using a syringe and automated syringe pump. Figure 5.34 shows that the strain rate is
proportional to the molecular weight of the chromosomal DNA fragments to the power o f -1.64.
As already described, an exponent o f -2 indicates DNA degradation in a stretched-out state,
while an exponent o f -1 indicates DNA degradation in a non-deformed conformation. The
exponent o f -1.64 indicates that the DNA is in a partially extended conformation. Based on the
short residence time o f the DNA molecules in the high stress zone at the capillary entrance, it
would be expected that the DNA would be in a non-deformed conformation at chain scission.
The DNA fragments generated during capillary degradation experiments were from 100 to 20
kb. The relaxation time for these fragments will range from about 1 s to 0.1 s. Therefore
elongational strain rates of only 1 to 10 s ' are required to stretch these molecules out. Based on
the geometry o f the syringe, which contained a conical nozzle leading to the peak capillary, the
elongational strain rates upstream of the capillary were likely between 10 and 100 s '. The
chDNA fragments would have experienced these low strain rates for several seconds prior to
entering the high stress zone in front of the capillary. Therefore it is likely that the DNA
molecules were in at least a partly extended state which may explain the exponent o f -1.64.
Degradation o f chromosomal DNA in a non-deformed state is difficult due to the ease at which
it deforms when subjected to low strain rates.
Linear ds-DNA has been degraded in QSS flows by Odell et al. (1994) where the molecule was
shown to degrade in an extended state, with a critical strain rate proportional to the molecular
weight to the power o f -2. Conversely, linear ds-DNA has been degraded at the entrance to
PEEK capillaries and orifices by Gefner et al. (1996) and Thorstenson et al. (1998) at
concentrations up to 40 |ig/mL. Nguyen et al. (1998) observed synthetic polymer degradation
in orifices, and observed a molecular weight exponent o f -1. Using DNA, Gefner observed a
molecular weight exponent of -0 .9 in 200 m NaCl and an exponent o f -1.1 in 5 mM NaCl.
Therefore, it appeared that the molecule was breaking in a predominantly non-deformed
configuration. In contrast, Thorstenson observed a molecular weight exponent of -1.7, similar
pl58
to the value observed in this work. This suggested that the DNA was breaking in a partially
extended state. The DNA fragment sizes were similar in both studies, however, the studies of
Thorstenson et al. were done using DNA in 0 mM NaCl buffer (0 mM NaCl buffer was used in
this thesis), compared to 5 mM and 200 mM buffer used by Oefner et al. A significant increase
in DNA chain stiffness has been observed when buffer ionic strength was decreased from 5 mM
to 0.5 mM NaCl (Smith et al., 1992; Marko et al., 1996). This increase in chain stiffness would
lead to a significantly more extended coil conformation at very low ionic strength making the
DNA significantly more susceptible to stretching. In addition, the experiments o f Thorstenson
et al. used a long piece of medium bore capillary upstream of their degradation capillary, which
would have generated shear stresses on the order o f 5,000 s'*. This strain rate would certainly
have defonned the DNA fragments prior to entering the high shear zone in front of the
capillary, explaining why the DNA degradation results suggest chain scission in a partially
extended state. The experiments o f Nguyen et al. (1988) were performed using an orifice where
the upstream strain rates were very low, preventing any chain stretching prior to entering the
orifice, explaining their observed molecular weight exponent o f -1 .
Thorstenson et al. and Oefner et al. both used orifices to degrade linear DNA, as well as short
narrow-bore capillaries. The observed marginally lower rates o f DNA degradation in orifices
compared to the same internal diameter capillaries. They suggested that the elongational flow
extended somewhat into the capillary, giving the capillary flow a slightly higher strain rate.
Thorstenson observed a small reduction in DNA degradation when 3 mm length capillaries were
used instead of 6 mm length capillaries. This is different to the results observed in this thesis,
where there was no change in degradation rate going from 3 cm to 11.5 cm long capillaries.
The results of Thorstenson can most likely be explained by considering the flow entrance
lengths. The entrance length for a particular flow is the distance from the entrance o f the
capillary to the point at which the flow has become fully developed. Crucially, the entrance
length in the experiments by Thorstenson was from 2 to 4 mm, which is similar in size to the
capillary lengths used (refer to Equation 2.23). Therefore, switching from 3 mm to 6 mm ID
tubing would change the flow profile at the capillary entrance, and hence the elongation stresses
at the entrance. In the experiments used in this thesis, care was taken to use capillaries
significantly longer than the predicted entrance length, in order not to change the entrance flow
characteristics.
DNA concentration
Most o f the theory for polymer stretching and scission is based on isolated molecules. The
theory o f polymer degradation in solutions of overlapping or entangled molecules is extremely
limited at present. For entangled solutions a dependence of critical strain rate on molecular
pl59

weight to the power of 3 has been predicted (Macosko, 1994). However, most of the
degradation studies using DNA have been performed under dilute conditions, c< c* (refer to
section 2.4.5). The studies performed in this thesis, using pure chromosomal DNA, were at a
concentration o f 150 |ig/ml. This concentration was chosen, as it was close to the concentration
at which chromosomal DNA is present in solution during alkaline lysis. At this concentration,
it was predicted that the chromosomal DNA molecules would have been overlapping, but not
entangled, c* < c < c .
Reese et al. (1989) observed breakage of T7 DNA, 38 kb, at an extensional strain rate above lO'*
s'% at dilute conditions. In this thesis, E. coli chromosomal DNA fragments were measured to
be about 75 kb after forcing the DNA through capillaries at a strain rate of 10' s ' (as shown in
Figure 5.34). Therefore, the DNA was less susceptible to fluid stress in this work compared to
the experiments o f Reese. Similarly, extrapolating the size o f the chromosomal fragment sizes
observed by Thorstenson et al. (1998) to lower strain rates, the DNA fragments lengths
generated were approximately 50% smaller than observed in this thesis. Both the experiments
of Reese and Thorstenson had been performed in the dilute DNA concentration range.
However, it has been observed by Hershey et al. (1960) that there is a significant “self
protection” effect at higher DNA concentrations; at higher concentrations DNA is less
susceptible to chain scission. This may explain the higher levels of fluid stress required to
break chromosomal DNA under non-dilute conditions observed in this work.
It was observed in this work that the critical strain rate for DNA breakage was related to the
molecular weight to the power of 1.6, which was similar to the results o f Thorstenson et al.
(1998). Therefore, there did not appear to be a significant effect of coil overlapping on the
mechanism of DNA stretching.
5.8.4 Comparison of linear DNA and supercoiled plasmid DNA
From Figure 5.34, an elongational strain rate of 10 s'" corresponds to an average linear DNA
fragment size of 13 kb after 10 capillary passes. Hence, most linear DNA fragments above
about 17 kb would be degraded at this level o f strain rate. At this same strain rate, the
degradation o f supercoiled plasmid pQR150 would only be about 30% after 10 capillary passes,
from Figure 5.30. This suggests that a 20 kb piece of DNA, it is somewhat less susceptible to
stress degradation if it is supercoiled than if it is linear. Similarly, when supercoiled plasmids
are degraded in capillaries and analysed by agarose gel electrophoresis, the degradation o f
supercoiled plasmid does not correspond to an increase in open-circular plasmid or a single
band linear plasmid (refer to Figure 5.28). It appears that open-circular plasmid and linear
pl60

plasmids degrade to small fragments at a faster rate than the supercoiled plasmid. This is not
surprising, as supercoiled DNA is more compact than linear DNA in solution, and hence should
be less susceptible to fluid shear.
5.9 Conclusions
CFD was used to predict elongational strain rates and turbulent energy dissipation rates within a
capillary shear device. The CFD simulations were shown to converge to realistic solutions
using a sufficient number of simulation grids. The CFD simulations were shown to agree well
with analytical expressions for pressure drop and shear rate where analytical expressions were
available. The CFD predictions were used to analyse DNA breakage experiments and correlate
breakage against entrance elongational strain rate and pressure drop.
Plasmid DNA was shown to degrade in regions of high fluid elongational strain rate at the
entrance to narrow capillaries. High levels o f shear strain within capillaries did not lead to
plasmid DNA chain scission showing that elongational strain is significantly more effective at
causing polymer scission than shear strain. High levels o f turbulent strain were shown not to be
effective at causing plasmid degradation when the plasmids were smaller than the Kolmogoroff
length scale o f the turbulent flow. The force required to break a plasmid DNA chain was
calculated to be roughly similar to the force required to break a linear DNA chain. The
degradation kinetics o f plasmid DNA was shown to agree with Thermally Activated Bond
Scission (TABS) theory, and the strain rate required for plasmid degradation was shown to be
inversely proportional to molecular weight. Downstream processing o f large plasmids will
require careful consideration of fluid stress levels within processing equipment.
The conformation o f chromosomal DNA affected its susceptibility to degradation in regions of
high fluid stress, which in turn was affected by the DNA size and solution properties such as
ionic strength. Chromosomal DNA was shown to break in an extended conformation in
capillary stress experiments, with a dependence. Chromosomal DNA was observed to be
less susceptible to extensional fluid stress compared to the results o f Reese et al. (1989). This
may be due to a “self-protection” effect at the higher chromosomal DNA concentrations used in
this work. Fluid strain rates of 10'* s ' and 10 s'" were observed to fragment chromosomal DNA
down to the size o f large (100 kb) and small (20 kb) plasmids, respectively. Fluid strain rates of
10'* to 10 s ' are common in downstream purification equipment, and hence care must be taken
to avoid creating difficult to remove chromosomal DNA fragments similar in size to plasmid
DNA products.
pl61

Having gained an increased understanding of the effects o f fluid stress on DNA stress-induced
degradation, the effects of fluid stress during the primary downstream purification step, alkaline
lysis, will be examined in the next chapter.
pl62

6 Alkaline lysisThe previous chapter investigated the effects of fluid stress in a model flow system on DNA
degradation in pure solution. This chapter presents the results o f fluid mixing and fluid stress
studies on a specific DNA-purification unit operation: alkaline cell lysis. The purpose o f this
unit operation is the extraction o f the plasmid DNA product from the cell, as well as the
removal of the majority of the cellular impurities. Alkaline cell lysis is the cellular lysis method
most commonly used in DNA purification processes. It was decided to investigate this unit
operation because the effects of fluid mixing and fluid stress were thought to be critical process
parameters during this step. Moreover, this is one o f the most important unit operations in
typical DNA purification processes; as the primary isolation step its performance directly, or
indirectly, affects the feed material into all of the subsequent purification steps.
This chapter is organised as follows: Firstly, a brief summary of results is presented. This is
followed by an introduction into the motivation for the alkaline lysis studies. A detailed
description o f the materials and methods used to study the alkaline lysis is then presented. The
results of the studies are presented as separate sections:
i) Control experiments
ii) Standard lysis protocols
iii) Detergent concentration in lysis buffer
iv) NaOH concentration in lysis buffer: dénaturation o f plasmid and chDNA
v) Dénaturation time
iii) Fluid mixing during lysis
vi) Effect of fluid stress on the lysis of plasmid-deficient cells
vii) Effect of fluid stress on the lysis o f plasmid-containing cells
viii) Effect of fluid stress during neutralisation
Finally this chapter concludes with a discussion into the relevance o f the results obtained.
pl63
6.1 Brief summary of results
Based on the dénaturation conditions for plasmid and chromosomal DNA, the optimal NaOH
concentration at lysis is plasmid dependent, but is typically around 0.1 M. Different supercoiled
plasmids, covering a wide size range from 6 to 116 kb, were all demonstrated to remain in their
native supercoiled form up to specific threshold concentrations of NaOH in the lysis buffer,
typically between 0.12 and 0.18 M NaOH. Above its specific threshold NaOH concentration,
each plasmid completely and irreversibly denatured during alkaline lysis. In contrast,
chromosomal DNA and plasmid variants were demonstrated to denature at significantly lower
concentrations of NaOH in the lysis buffer. Although, high NaOH concentration, close to 0.1
M, did not decrease chromosomal contamination in the clarified alkaline lysate, it did maximise
the dénaturation of chromosomal DNA to single-stranded-form. Achieving the required NaOH
concentration in the lysate can be achieved by adding 1 volume of 0.2 M NaOH to 1 volume o f
cells; however, it was shown that supercoiled plasmid irreversibly denatured when exposed to
neat lysis buffer (0.2 M NaOH) for only a few seconds. Efficient mixing o f equal volumes o f
cells and lysis buffer, to quickly achieve a homogeneous NaOH concentration close to 0.1 M
NaOH, was essential in preventing plasmid degradation.
Experiments with scale-down stirred tanks showed that the mixing time was sufficiently short at
moderate impeller speeds to prevent supercoiled plasmid dénaturation at typical alkaline lysis
buffer concentrations (0.2 M NaOH). High impeller speeds, in stirred tanks, were required
when more concentrated lysis buffer (0.4 M NaOH) was used, generating high levels o f fluid
shear. Significantly shorter mixing times were obtained using opposed jets, at lower levels o f
fluid shear. Opposed jets results are presented in chapter 8.
Fluid stress during alkaline lysis was shown to fragment chromosomal DNA to progressively
shorter pieces as the stress was increased. Exposing chromosomal DNA to fluid stress in cone-
and-plate viscometers and in narrow capillaries, at fluid strain rates ranging from 10 s'" to 10 s'
', only moderately increased the amount o f chromosomal DNA contamination. It appeared that
chromosomal DNA flocculation and removal over lysis and neutralization was only weakly
dependent on DNA size. Typically about 80% to 90% of the chromosomal DNA was removed
over lysis, neutralization and clarification. However, the amount o f chromosomal
contamination in the clarified lysate was strongly dependent on the starting batch of cell paste.
Plasmid pSVp (6kb) was not damaged by fluid shear during alkaline lysis, at shear rates up to
10 s’’ in capillaries. Contrary to previous reports, fluid strain rates up to 10 s'* neutralization
did not affect chromosomal DNA contamination.
pi 64
6.2 Introduction
The goal o f alkaline lysis is to maximise supercoiled plasmid yield and minimise the amount of
impurities. In this thesis only the DNA impurities were considered; the quantity o f other cell
constituents such as cell wall debris, proteins, RNA, and endotoxins were generally not
examined. The reason for not examining non-DNA impurities was essentially because this
thesis set out to examine the effects of fluid dynamics on DNA integrity, not other compounds.
Moreover, reduction of DNA impurities is significantly more important than reduction of other
impurities. DNA impurities are both difficult and expensive to separate from the supercoiled
plasmid product, as described in chapter 1. In contrast, a variety of scaleable and inexpensive
methods exist for removal of non-DNA impurities.
A detailed description of alkaline lysis is given in chapter 1. In general, alkaline lysis involves
the addition of NaOH and detergent to lyse cells, release plasmid product and denature DNA
impurities. This is followed by neutralization and clarification to remove flocculated impurities.
It has been reported that fluid mixing is a critical parameter during alkaline lysis, however,
details o f why mixing is critical have not been reported. Because fluid mixing is the source of
fluid stress during alkaline lysis, it is essential to understand the mixing requirements during
alkaline lysis to properly optimize alkaline lysis with respect to fluid stress. The effects of
NaOH concentration on cell lysis and product quality was examined in detail in order to
ascertain the mixing requirements during alkaline lysis. Studies were then performed to
determine the effects o f mixing conditions and resultant fluid stress based on the supercoiled
plasmid yield, supercoiled plasmid purity (supercoiled plasmid / total DNA), and the
chromosomal DNA contamination in clarified alkaline lysates. The novel HPLC assays
developed in the chapter 4 were used throughout to measure the concentrations of the different
DNA forms, in addition to using agarose gel electrophoresis and Picogreen fluorescence.
6.3 Materials and methods
6.3.1 Standard analytical techniques
Anion exchange HPLC.
Poros PI and Q-Sepharose HPLC (see section 4.5) were used to quantify the various DNA
forms before and after alkaline lysis. Refer to chapter 4 for details o f the HPLC equipment.
HPLC allowed accurate quantification of both the supercoiled plasmid yield and the total DNA
purities. It was of interest to determine not only the amount of DNA impurities present in lysate
samples, but also whether these DNA impurities came from chromosomal DNA or from
degraded plasmid DNA. The DNA impurities consist o f four main DNA forms a) open-circular
pl65
plasmid, b) native chromosomal DNA, c) single-stranded plasmid and d) single-stranded
chromosomal DNA. The HPLC assays could quantify a) open-circular plasmid, b) native
chromosomal DNA and c+d) the total single-stranded DNA. The single-stranded plasmid and
single-stranded chromosomal DNA could not be quantitated separately. Hence, it was not
possible to determine exactly what fraction of the single-stranded DNA impurities were single
stranded plasmid and what fraction was single-stranded chromosomal. Irrespective o f origin, all
single-stranded DNA is chemically and physically similar. Determining what fraction of the
single-stranded DNA is chromosomal can only be definitively achieved by sequence analysis
using qPCR. Development of a qPCR-based assay was a non-trivial task. In order to quantify
the effects of lysis conditions on chromosomal contamination, without having to resort to
qPCR, the effects o f lysis on both plasmid-containing cells and plasmid-deficient cells (non
plasmid containing cells) was investigated. The use of plasmid-deficient cells eliminated any
potential errors associated with trying to separately quantify single-stranded chromosomal
fragments and single-stranded plasmid fragments.
Clarified lysate samples, and pure DNA samples, were assayed by anion exchange HPLC using
Poros PI20 resin and/or Q-Sepharose HP resin. All samples were RNAse digested for 1 hour at
37°C in 0.1 mg/ml RNAse A prior to loading, if they had not already been RNAse-treated. All
samples containing chromosomal DNA were manually sheared 10-times with a 0.007” PEEK
capillary prior to HPLC loading at approximately 3 to 6 mL/min. Clarified lysate samples were
usually run onee without sample pre-treatment and once after denaturation-renaturation using
the standard protocol. The standard denaturation-renaturation protocol involved quickly mixing
1 volume of sample in TE with 1/3" volume of 0.2 M NaOH, to convert all DNA impurities (all
DNA forms except supercoiled plasmid) to single-stranded form. After 2 minutes, 1 volume of
500 mM Tris, pH 8.0 was added. Samples were loaded onto the column at 2 to 100 |ig/ml, 100
jil per injection. The Poros and Q-Sepharose columns were equilibrated for 10 minutes prior to
sample injection at 0.8 M NaCl, 10 mM Tris, pH 8.0 or 0.64 M NaCl, 10 mM Tris, pH 8,
respectively. The flowrate was 0.3 ml/min throughout. After injection, the column was washed
for 10 - 20 minutes with equilibration buffer. RNA was quantitated from the flow-through peak
of the Poros PI column. A salt gradient from 0.8 - 2.0 M NaCl (Poros) or 0.64 to 1.7 M NaCl
(Q-Sepharose) was then applied to the column over 25 minutes (Poros column) or 40 minutes
(Q-Sepharose column). Columns were cleaned with 0.1 M NaOH for 5 minutes at the end of
each sample.
pl66
Picogreen fluorescence
Pure supercoiled plasmid DNA and clarified lysate samples were assayed for supercoiled
concentration using Picogreen fluorescence. Picogreen stock reagent from Bioprobes (CA,
USA) was diluted 1:200 with water and 100 |il was added to 100 p.1 of sample in a 96 well plate.
Samples were excited at 540 nm and fluorescence measured at 600 nm. A pure plasmid DNA
standard curve was generated by running pure plasmid DNA standards from 50 pg to 500 ng.
Samples containing open-circular and linear plasmid, or chromosomal DNA, were denatured
prior to Picogreen analysis using the standard dénaturation protocol described in the previous
section.
6.3.2 Control experiments
Effect of freeze-thawing cell paste on clarified lysate purity
After fermentation, the E. coli cells are typically harvested by batch centrifugation. After
harvest, the cells are typically frozen at -80°C until further use. An experiment was run to
verify that this ffeeze-thaw step was not leading to increased or decreased chromosomal DNA
contamination. D H 5a wild-type cell paste from a 500 mL shake flask fermentation was
harvested by batch centrifugation. Some of the cell paste was alkaline lysed directly after cell
harvest, and some of the cell paste was frozen at -20°C overnight, thawed at room temperature,
and alkaline lysed. Alkaline lysis was performed at 2 mL scale using the standard protocol,
described in chapter 4. Each lysis condition was performed in duplicate, and the clarified
alkaline lysates were assayed by HPLC.
Resuspension Concentration
As per the standard lysis protocol, described in the Materials and Methods section, E. coli cells
were resuspended in 8 mL TE per gram wet cell weight prior to lysis experiments. A study was
performed to determine the effect of resuspension concentration on the supercoiled plasmid
yield. E. coli cell paste containing plasmid pSVP was resuspended in TE at 2, 4, 8, 16 and 32
mL TE/g wcw. 0.5 mL o f resuspended cells was lysed using an equal volume of standard lysis
buffer and neutralised with an equal volume of neutralisation buffer. The clarified lysates were
assays for supercoiled plasmid by Poros PI HPLC. All experiments were done in triplicate.
Effect of clarification conditions.
After alkaline lysis and neutralisation, the batch is clarified to remove flocculated cell debris.
This can be performed using either centrifugation or filtration. A study was performed to
determine the effect o f varying the clarification conditions on plasmid yield and purity. E. coli
D H 5a pSVP cells were alkaline lysed at 2 mL scale using the standard protocol. Neutralisation
pl67
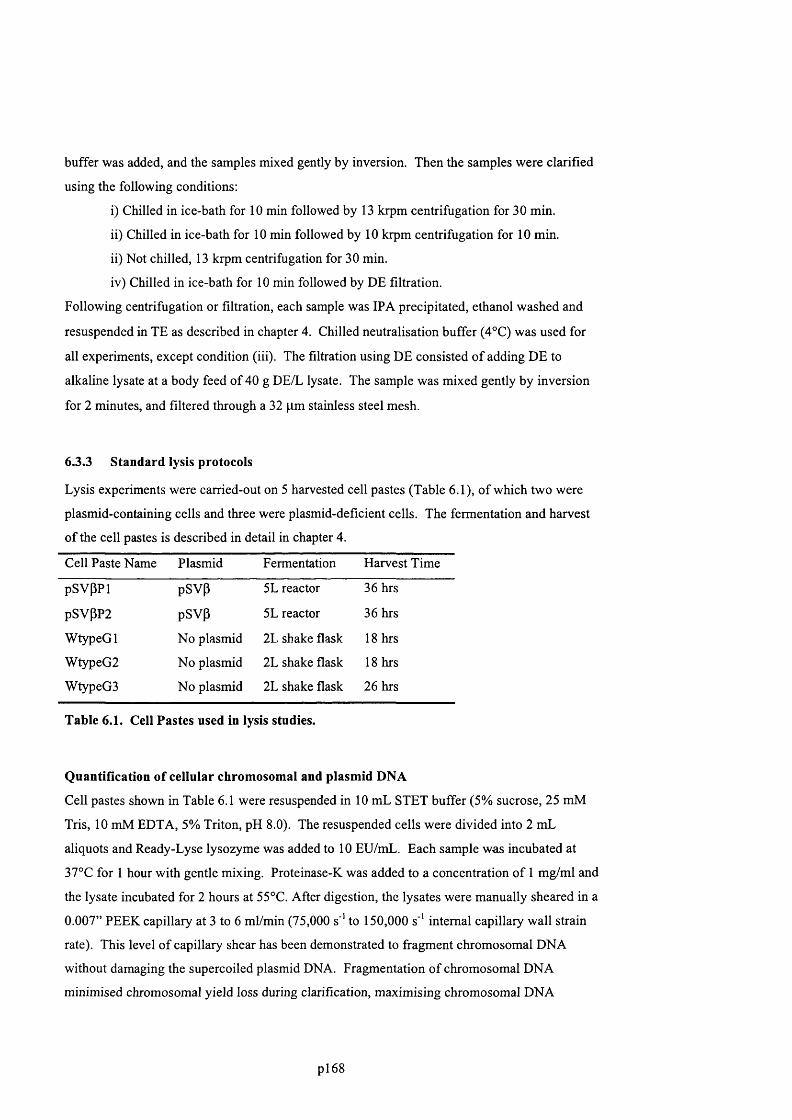
buffer was added, and the samples mixed gently by inversion. Then the samples were clarified
using the following conditions:
i) Chilled in ice-bath for 10 min followed by 13 krpm centrifugation for 30 min.
ii) Chilled in ice-bath for 10 min followed by 10 krpm centrifugation for 10 min.
ii) Not chilled, 13 krpm centrifugation for 30 min.
iv) Chilled in ice-bath for 10 min followed by DE filtration.
Following centrifugation or filtration, each sample was IP A precipitated, ethanol washed and
resuspended in TE as described in chapter 4. Chilled neutralisation buffer (4°C) was used for
all experiments, except condition (iii). The filtration using DE consisted o f adding DE to
alkaline lysate at a body feed of 40 g DE/L lysate. The sample was mixed gently by inversion
for 2 minutes, and filtered through a 32 pm stainless steel mesh.
6.3.3 Standard lysis protocols
Lysis experiments were carried-out on 5 harvested cell pastes (Table 6.1), o f which two were
plasmid-containing cells and three were plasmid-deficient cells. The fermentation and harvest
o f the cell pastes is described in detail in chapter 4.
Cell Paste Name Plasmid Fermentation Harvest Time
psvppi pSVp 5L reactor 36 hrs
pSVpP2 pSVp 5L reactor 36 hrs
WtypeG 1 No plasmid 2L shake flask 18 hrs
WtypeG2 No plasmid 2L shake flask 18 hrs
WtypeG3 No plasmid 2L shake flask 26 hrs
Table 6.1. Cell Pastes used in lysis studies.
Quantification of cellular chromosomal and plasmid DNA
Cell pastes shown in Table 6.1 were resuspended in 10 mL STET buffer (5% sucrose, 25 mM
Tris, 10 mM EDTA, 5% Triton, pH 8.0). The resuspended cells were divided into 2 mL
aliquots and Ready-Lyse lysozyme was added to 10 EU/mL. Each sample was incubated at
37°C for 1 hour with gentle mixing. Proteinase-K was added to a concentration o f 1 mg/ml and
the lysate incubated for 2 hours at 55°C. After digestion, the lysates were manually sheared in a
0.007” PEEK capillary at 3 to 6 ml/min (75,000 s ' to 150,000 s'' internal capillary wall strain
rate). This level o f capillary shear has been demonstrated to fragment chromosomal DNA
without damaging the supercoiled plasmid DNA. Fragmentation of chromosomal DNA
minimised chromosomal yield loss during clarification, maximising chromosomal DNA
pl68

recovery. The clarified lysates were IPA-precipitated, as described in chapter 4, resuspended in
TE and assayed by Poros PI and Q-Sepharose HPLC.
Alkaline lysis and lysozyme-heat lysis
Some or all of the previously described cell pastes (Table 6.1) were resuspended, lysed and
clarified at 2 mL scale using the standard alkaline lysis procedure or the standard lysozyme-heat
lysis procedure described in Materials and Methods, chapter 4. Plasmid yield and chromosomal
contamination was determined by Q-Sepharose and Poros PI HPLC assays.
6.3.4 Detergent concentration in lysis buffer
The two constituents of the alkaline lysis buffer are sodium dodecyl sulphate detergent
(typically 1% w/v) and sodium hydroxide (typically 0.2 M NaOH). SDS plays a critical role
during lysis by disrupting the E. coli cell wall. However, Kieser et al. (1984) reported that
above a certain threshold concentration of SDS, the lysis performance was relatively insensitive
to detergent concentration. To verify that result, pSVP containing cell paste, pSV(3P2, was
alkaline lysed at 2 mL scale using 0.2 M NaOH and either 0.5%, 1% or 2% SDS. The lysate
was neutralised and clarified as per the standard protocol and assayed by Poros PI HPLC. Each
lysis condition was performed in duplicate.
6.3.5 NaOH concentration in lysis buffer: dénaturation of plasmid and chDNA
Using NaOH concentration instead of pH to control DNA dénaturation
Measurement o f pH of TE buffers, lysis buffers and cell lysate was performed using Beckman
pH/ISE meter (Beckman Instruments Inc., CA, USA). The pH probe was calibrated each day
using pH 4, 7 and 10 standards from Fisher Scientific.
Effect of NaOH on pure DNA solutions.
The effect of NaOH concentration on pure supercoiled plasmids in TE was examined to
determine the NaOH concentration range over which plasmids pSVP (6 kb), pQRlSG (13 kb),
pQR186 (20 kb), and p 5 124 (116 kb) irreversibly denature. One volume (0.5 mL) of pure
supercoiled plasmid, at 10 pg/mL to 50 pg/mL in TE, was mixed with one volume of NaOH (0
to 0.4 M NaOH) in a 2 mL tube. After 3 minutes the pH was reduced to pH 8 by the addition of
one volume of 500 mM Tris, pH 7.5. The samples were assayed for intact supercoiled plasmid
by Poros PI HPLC, Picogreen flourescence and agarose gel electrophoresis.
p l69
Effect of NaOH on cell lysate
In order to assess the effect of plasmid and chromosomal DNA dénaturation on plasmid yield
and purity over alkaline lysis, E. coli cells (both plasmid-containing and plasmid-deficient) were
lysed with SDS over a range of NaOH concentrations and for a range of lysis times. To 0.5 mL
of cell resuspension, one volume of 1% SDS, 0 to 0.4 M NaOH was added. Each sample was
mixed gently by inversion. The lysates were neutralised, mixed gently, and clarified as per the
standard protocol described in chapter 4, section 4.3.6. The clarified alkaline lysates were
assayed for supercoiled plasmid, DNA impurities and RNA using Poros PI HPLC, Q-Sepharose,
Picogreen fluorescence and agarose gel electrophoresis.
6.3.6 Dénaturation time
In order to assess the effect of both NaOH concentration and lysis time on lysis performance,
0.5 mL resuspended pSV(3 cells were lysed with one volume of 1% SDS, 0.1 to 0.3 M NaOH,
and mixed gently by inversion. The samples were incubated for 2, 10 or 60 minutes, after
which time one volume of chilled neutralisation buffer was added. The samples were mixed
gently by inversion and clarified as per the standard protocol. All samples were prepared in
duplicate.
6.3.7 Fluid mixing
Degradation rate of supercoiled plasmid in neat lysis buffers
Experiments were carried-out to estimate degradation times o f supercoiled plasmid DNA in
cells exposed to high NaOH concentrations. Resuspended cells (0.2 mL volume) were mixed
rapidly with 30 volumes of 0.5% SDS lysis buffer with 0.1 M, 0.2 M or 0.4 M NaOH. Because
the lysis reagent volume was so much greater than the cell suspension volume, the NaOH
concentration remained essentially the same after addition o f cells. After 5 s, 20 s or 90 s, the
samples were rapidly diluted to 0.1 M NaOH using water while mixing vigourously. Each
sample was then mixed gently for 5 minutes, after which they were neutralised and clarified as
per the standard protocol. The clarified alkaline lysates were assayed by Poros PI HPLC. Each
lysis condition was repeated in triplicate.
Supercoiled plasmid yield at worst-case mixing conditions
2 mL of 0.2 M NaOH was added drop-wise over 100 s to 2 mL volume of resuspended E. coli
D H 5a pSVP cells in TE buffer in a test tube. The test-tube was not mixed until all the NaOH
was added. Then the material was neutralised with 2 volumes o f 500 mM Tris, pH 7.5 and
assayed for supercoiled content by both Picogreen and HPLC assay. A control experiment was
pl70

run where the same volume o f NaOH was added to pure plasm id in TE but m ixed rapidly in less
than 2 s.
S tirred T ank Mixing Studies
Several alkaline lysis experim ents were carried out in a small m echanically agitated vessel to
assess the impact o f m ixing on the yield and quality o f plasm id DNA. The vessel had a
diam eter o f 60 mm, was equipped with a standard 20 mm diameter, 6-bladed Rushton turbine
im peller, and fitted with four vertical baffles, each 8mm wide, equally spaced around the vessel
wall. The dimensions o f the vessel were chosen to be geom etrically sim ilar to stirred tanks
com m only used in mixing studies (Coulson et al., 1991). Figure 6.1 shows the dimensions o f
the stirred tank, baffles and impeller. The total volume o f the vessel was 200 mL.
8 mm
40 mm
20 mm
60 m m
60 mm
Figure 6.1. Scale-down stirred tank alkaline lysis reactor
Before lysing cells in the vessel, the macro-mixing time in the vessel was detem iined as a
function o f impeller speed by performing spiking studies with 5 M NaCl. The vessel was filled
to 200 mL with resuspended cells and a conductivity probe was placed in the vessel. W hile
m ixing at a fixed impeller speed, 50 pi o f 5 M NaCl was injected onto the liquid surface. The
time taken for the conductivity to reach a steady-state, within 5% o f its final value, was
recorded. This was repeated for a selection o f im peller speeds.
The effect o f impeller speed during alkaline lysis on supercoiled plasm id yield was investigated.
100 mL o f resuspended cells was placed in the vessel and lysis buffer was added over 2 minutes
while stirring at set impeller speeds between 0 and 800 rpm. The lysis buffer was added
p l 7 I
subsurface, directly into the outer edge of the impeller blades in all experiments. The first set o f
experiments was carried-out using 0.2 M NaOH, 1% SDS lysis buffer; the second set using 0.4
M NaOH lysis buffer, 1% SDS. Lysis buffer was added subsurface directly into the impeller
blades, and was added to a final concentration of 0.1 M NaOH in all cases. After addition, the
lysate was mixed at 800 rpm impeller speed for 10 minutes. The lysate was then neutralised by
the addition o f one volume of neutralisation buffer at 800 rpm impeller speed and clarified
using the standard protocol. As a control, 0.5 mL of the same resuspended cells were lysed at 2
mL scale using the standard lysis protocol. All lysis experiments were done in duplicate.
6.3.8 Effect of fluid stress during lysis of plasmid-deficient cells.
Effect of fluid stress on chDNA contamination
Wild-type E. coli cell paste (plasmid-deficient) from three separate fermentations (WtypeG 1,
WtypeG2, WtypeGS) were resuspended in TE and lysed with one volume of lysis reagent (0.2
M NaOH, 1% SDS). The lysates were subjected to varying amounts o f fluid stress. Samples
were moderately stressed by straining 1 mL of sample in a cone-and-plate viscometer at 5 to
760 s ', for 10 to 20 minutes. Samples were subjected to high stress by forcing 5 mL of sample
10-times through a 0.010” ID PEEK capillary at flowrates up to 15 mL/min (internal wall strain
rate of 130,000 s '). The samples were then neutralised and clarified using the standard
protocol. The clarified lysate samples were assayed by Poros PI HPLC for chromosomal DNA.
Effect of shear on chromosomal DNA fragment size
Although the previous studies have shown that fluid shear during lysis does not cause a large
increase in chromosomal DNA contamination in clarified lysates; it was o f interest to determine
if fluid shear was causing significant DNA fragmentation. Because single-stranded DNA is
difficult to detect with ethidium bromide in agarose gels, it was advantageous to keep the
chromosomal DNA in double-stranded form. Thus, for the purpose o f assaying the samples by
gel electrophoresis, the lysis operation was initially carried out in the absence of NaOH in the
lysis solution, thus avoiding the dénaturation step. Resuspended D H 5a cells (plasmid-
deficient) were gently mixed with 0.5 % SDS for 20 minutes to lyse the cells: The lysate was
divided into 5 equal aliquots and each aliquot was subjected to a different level of fluid stress.
Each aliquot was placed in a syringe and, using the Hamilton syringe-pump, pushed 10-times
through a 5 cm long, 0.010” ID PEEK capillary at flowrates up to 20 mL/min. Samples o f each
lysate were taken for pulsed-field agarose gel electrophoresis. Samples for pulsed-field
electrophoresis were pre-treated by digesting the cell debris with 0.1 mg/ml Proteinase-K at
55°C for 2 h. The remaining lysates were denatured with one volume o f 0.2 M NaOH, mixed
pl72

gently by inversion, and neutralised and clarified as per the standard protocol. The clarified
alkaline lysates were assayed for chromosomal DNA by Poros PI HPLC.
6.3.9 Effect of fluid stress on the lysis of plasmid-containing cells
E. coli D H 5a pSVP cell pastes were resuspended in TE and lysed with one volume of lysis
reagent (0.2 M NaOH, 1% SDS). The lysates were subjected to varying amounts of fluid stress.
Samples were moderately stressed by straining 1 mL o f sample in a cone-and-plate viscometer
at 5 to 760 s '', for 10 to 20 minutes. Samples were subjected to high stress by forcing 5 mL of
sample 10-times through a 0.010” ID PEEK capillary at flowrates up to 15 mL/min (internal
wall strain rate o f 130,000 s '). The samples were then neutralised and clarified using the
standard protocol. The clarified lysate samples were assayed for supercoiled plasmid DNA by
agarose gel electrophoresis and Poros PI HPLC, and assayed for DNA impurities by Poros PI
HPLC. Plasmid purity was defined as the percentage o f the total DNA that is supercoiled. Non
supercoiled DNA impurities are chromosomal DNA and plasmid degradates (linear, open-
circular and denatured plasmids).
6.3.10 Effect of fluid stress during neutralisation
E. coli D H 5a pSVP cell paste was resuspended in TE and lysed with one volume of lysis
reagent (0.2 M NaOH, 1% SDS). The lysates were neutralised with one volume of
neutralisation buffer. Neutralised cell lysate was moderately stressed by straining 1 mL o f
sample in a cone-and-plate viscometer at 5 to 760 s ', for 10 minutes. Neutralised cell lysate
was subjected to high stress by forcing 5 mL of sample 10-times through a 0.010” ID PEEK
capillary at a strain rate up to 30,000 s''. The samples were then clarified using the standard
protocol. The clarified lysate samples were assayed for supercoiled plasmid DNA by agarose
gel electrophoresis and Poros PI HPLC, and assayed for DNA impurities by Poros PI HPLC.
Plasmid purity was defined as the percentage of the total DNA that is supercoiled. Non
supercoiled DNA impurities are chromosomal DNA and plasmid degradates (linear, open-
circular and denatured plasmids).
6.4 Experimental results
6.4.1 Control experiments
Prior to investigating the effects of fluid mixing and fluid stress during alkaline lysis, several
control experiments were performed to ensure that the storage, resuspension and clarification
pl73
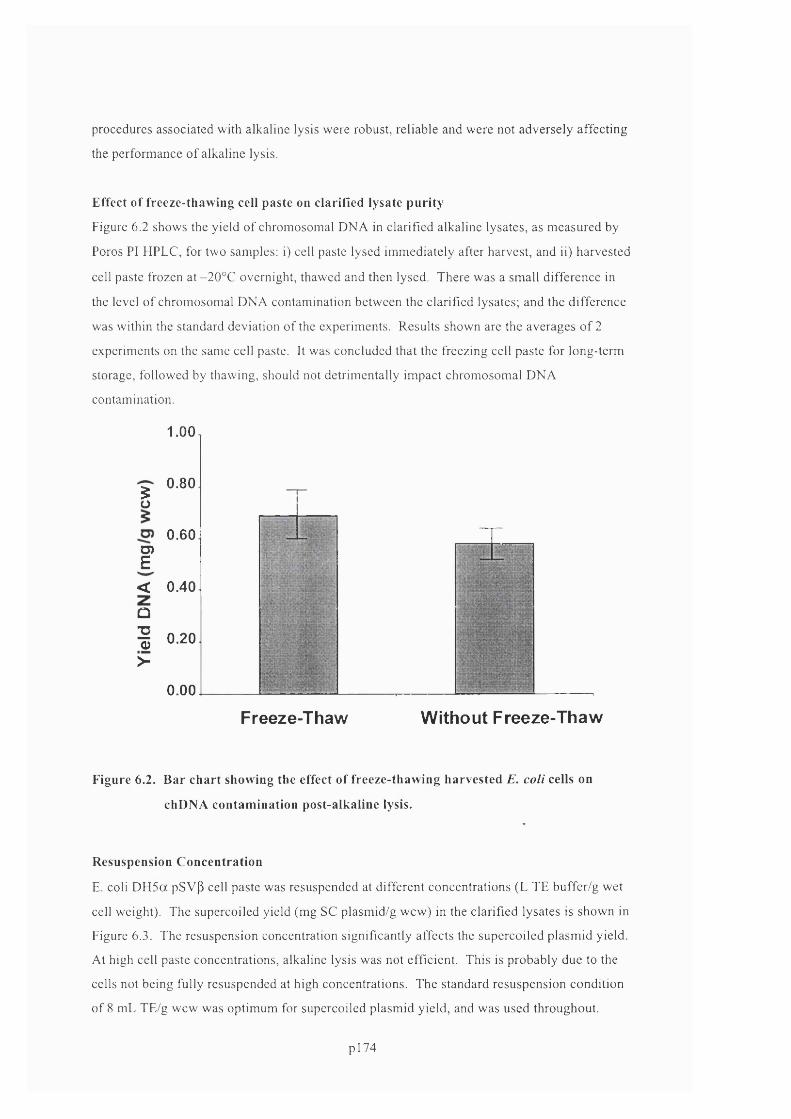
procedures associated with alkaline lysis were robust, reliable and were not adversely affeeting
the performance o f alkaline lysis.
Effect of freeze-thawing cell paste on clarified lysate purity
Figure 6.2 shows the yield o f chromosomal DNA in clarified alkaline lysates, as m easured by
Poros PI HPLC, for two samples: i) cell paste lysed immediately after harvest, and ii) harvested
cell paste frozen at -20°C overnight, thawed and then lysed. There was a small difference in
the level o f chromosomal DNA contamination between the clarified lysates; and the difference
was within the standard deviation o f the experiments. Results shown are the averages o f 2
experiments on the same cell paste. It was concluded that the freezing cell paste for long-term
storage, followed by thawing, should not detrim entally impact chromosomal DNA
contamination.
1.00
0.80
0.60
g
D)E< 0.40
OT30)
>
-T 0 .20
0.00
Freeze-Thaw Without Freeze-Thaw
Figure 6.2. B ar chart show ing the effect of freeze-thawing harvested E. coli cells on
chDNA contam ination post-alkaline lysis.
Resuspension C oncentration
E. coli D H 5a pSVP cell paste was resuspended at different concentrations (L TE buffer/g wet
cell weight). The supercoiled yield (mg SC plasmid/g wcw) in the clarified lysates is shown in
Figure 6.3. The resuspension concentration significantly affects the supercoiled plasm id yield.
At high cell paste concentrations, alkaline lysis was not efficient. This is probably due to the
cells not being fully resuspended at high concentrations. The standard resuspension condition
o f 8 mL TE/g wcw was optimum for supercoiled plasmid yield, and was used throughout.
p l7 4

I0
U)E
T3 0)
X"U1 (/)
Û.O CO
Resuspension Volume (mL7g wcw)
Figure 6.3. Plot showing the effect of cell resuspension volume on supercoiled plasmid
yield. Error bars represent one standard deviation. Each data point
represents the average of 3 separate experiments.
1.0
0 .8
0 .6
0.4
0.2
0 .00 4 6 8 10 12 14 16 182
Effect of clarification conditions.
Figure 6.4 shows the plasmid yield and purity for the four different clarification conditions that
were tested. Each data point is the average o f 2 experiments. There was no significant variation
in plasmid yield or purity between the clarification methods tested. However, for consistency
the standard clarification procedure was used throughout.
pl75
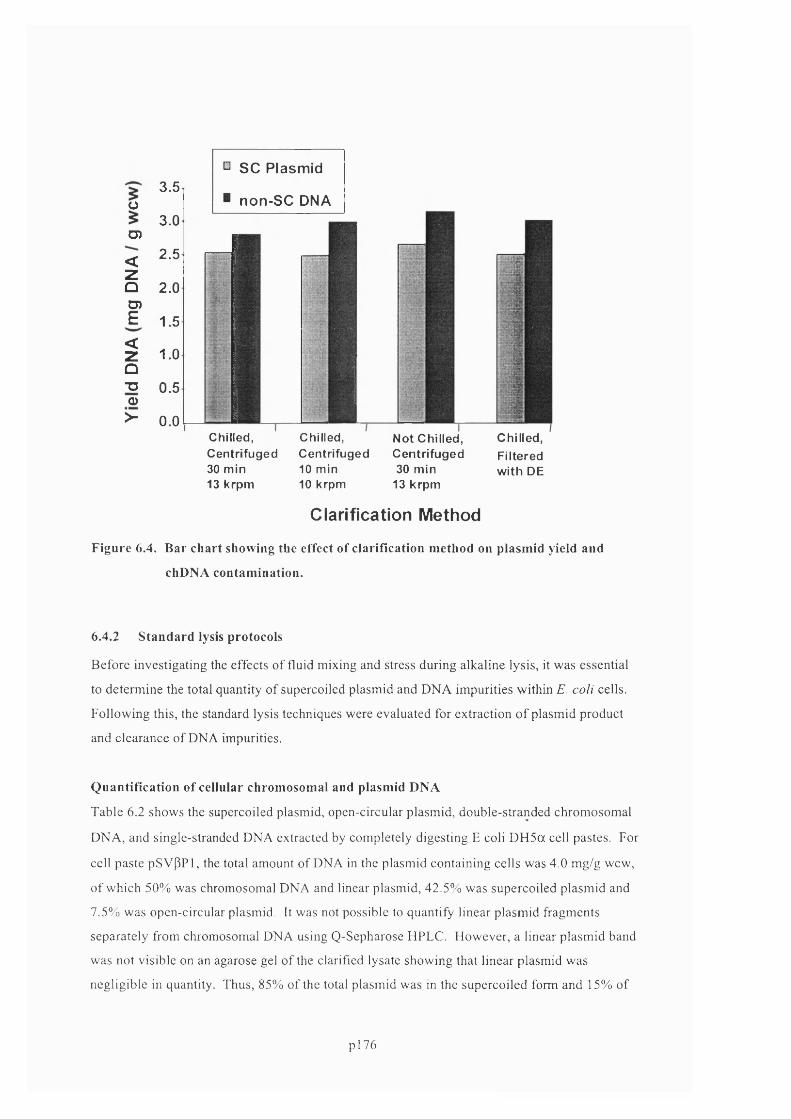
3.5Ü
3.0D)
< 2.5zQ 2.0D)E 1.5<Z 1.0ÛT3 0.50)> 0.0
^ s c Plasm id
■ non-SC DNA
C hilled , C e n tr ifu g e d 30 m in 13 k rpm
C hilled , C e n tr ifu g e d 10 m in 10 krpm
N ot C h illed , C e n tr ifu g e d 30 m in
13 k rp m
C hilled , F ilte re d w ith DE
Clarification Method
Figure 6.4. B ar chart showing the effect of clarification m ethod on plasm id yield and
chDNA contam ination.
6.4.2 S tandard lysis protocols
Before investigating the effects of fluid mixing and stress during alkaline lysis, it was essential
to determine the total quantity of supercoiled plasmid and DNA impurities within E. coli cells.
Following this, the standard lysis techniques were evaluated for extraction o f plasmid product
and clearance of DNA impurities.
Q uantification of cellular chromosom al and plasm id DNA
Table 6.2 shows the supercoiled plasmid, open-circular plasmid, double-stranded chromosomal
DNA, and single-stranded DNA extracted by completely digesting E coli D H 5a cell pastes. For
cell paste pSV pPl, the total amount of DNA in the plasmid containing cells was 4.0 mg/g wcw,
of which 50% was chromosomal DNA and linear plasmid, 42.5% was supercoiled plasmid and
7.5% was open-circular plasmid. It was not possible to quantify linear plasmid fragments
separately from chromosomal DNA using Q-Sepharose HPLC. However, a linear plasmid band
was not visible on an agarose gel of the clarified lysate showing that linear plasmid was
negligible in quantity. Thus, 85% of the total plasmid was in the supercoiled form and 15% of
p l7 6
the plasmid was in the open-circular form. Because some open-circular plasmid will be
generated from the degradation of supercoiled plasmid during the lysis step, there was at most
15% open-circular plasmid present in the cells before digestion. The chromosomal DNA and
supercoiled plasmid DNA yields were similar for cell paste pSV(3P2; however, cell paste
pSVpP2 contained twice as much open-circular plasmid. The amount of chromosomal DNA in
the cell (about 2 mg/g wcw) corresponds to just under 2 copies o f the genome per E. coli cell
(Ingrahm et al, 1999).
The amount of chromosomal DNA in the plasmid-deficient cells harvested after 26 hours
(WtypeG3) was 1.9 mg/g wcw, which was similar to the amount in the plasmid containing cells.
Both the plasmid containing cells (pSVpPl and psvpP2) and 26 hr plasmid-deficient cells were
harvested while the cells were in stationary phase. In contrast, the plasmid-deficient cells
harvested after 18 hrs (WtypeGl or WtypeG2) were in late exponential phase and contained
significantly more chromosomal DNA, 4 .1 mg/g wcw. This amount of chromosomal DNA
corresponds to about 4 copies o f the genome per E. coli cell. Exponentially dividing cells are
known to contain more copies o f their genome than stationary phase cells (Ingrahm et al, 1999),
which may explain the difference in chromosomal DNA observed between the cell pastes.
Although the supercoiled plasmid yields were similar for the batches o f cell paste shown in
Table 1.1, generally there was quite a variation in supercoiled plasmid yield depending on cell
paste. Over the course o f this work, 6 cell pastes containing plasmid pSVp were assessed for
supercoiled plasmid content, with total supercoiled plasmid yields in the range 1.5 to 3.5 mg/g
wcw and chromosomal DNA yields in the range 2 to 5 mg/g wcw. Further details on the
fermentation conditions and fermentation results for the pSVP containing cell pastes are
described in the thesis o f Kay (2002).
Evaluation of standard alkaline lysis
E. coli cells, both plasmid-deficient and plasmid containing, were alkaline lysed, refer to Table
6 .1. The plasmid and chromosomal DNA yields are shown in Table 6.3. The results shown are
the averages o f 2 experiments. The most significant result for the plasmid containing cells was
that the supercoiled plasmid recovered from the cells using standard alkaline lysis was only
47% to 54% of the total supercoiled plasmid in the cells. Later studies (see section 6.4.4)
showed that supercoiled plasmid degradation due to pH or fluid stress was low under the
alkaline lysis conditions used; hence, the low yield was most likely due to either incomplete cell
lysis or entrapment of supercoiled plasmid during neutralisation and flocculation.
pl77

Lysis M ethod Cells SCPlasmidm g /gwcw
OCPlasmidm g /gwcw
ds-chDNAm g /gwcw
ss-chDNAm g /gwcw
S C /TotalDNA
%Proteinase-K PsvbPl 1.7 0.3 1.9 0.1 ± 42%
Digestion ±0.1 ±0.05 ± 0.2 0.03
Proteinase-K PsvbP2 1.7 0.6 2.2 0.1 37%Digestion ±0.2 ±0.1 ±0.3 ±0.05
Proteinase-K WtypeGl N/A N/A 4.0 0.1 N/ADigestion ±0.3 ±0.02
Proteinase-K WtypeG2 N/A N/A 3.9 0.1 ± N/ADigestion ± 0 .2 0.03
Proteinase-K WtypeG3 N/A N/A 1.8 0.1 N/ADigestion ±0.1 ±0.02
Table 6.2. Yields of plasmid and chromosom al DNA in 3 E. coli cell pastes.
HPLC analysis o f clarified alkaline lysate from cell paste pSV|3P 1 showed 62% of the total
DNA recovered was supercoiled plasmid, 15% open-circular plasmid, 8% double-stranded
chromosomal DNA and 15% single-stranded DNA. Single-stranded DNA impurities consisted
of denatured chromosomal DNA and denatured plasmid forms, both o f which are linear, single-
stranded fragments o f DNA. As already discussed, determining the fraction o f single-stranded
DNA contaminants which are chromosomal in origin versus plasmid in origin can only be done
using sequence analysis by PGR (Lahijani et al., 1998). I f all o f the single-stranded DNA
impurities are chromosomal DNA, which is likely due to the relatively low initial levels o f
open-circular DNA in the cells, then 15% o f the total initial chromosomal DNA in the cells was
carried-over into the clarified lysate.
The yield of supercoiled plasmid from cell paste pSVpP2 was similar to that o f pS V PP1.
However, more single-stranded DNA impurity was present in the clarified lysate from cell paste
pSVpP2, which reduced the lysate purity to 36%, compared to 62% purity from cell paste
pSVpPl. Some of this decrease in purity was probably due to the increased open-circular
plasmid content in cell paste pSVpP2; some of the open-circular plasmid will be denatured
during alkaline lysis and carried-over into the clarified lysate. The dénaturation o f open-
circular plasmid is discussed further in this chapter and in chapter 7.
The supercoiled plasmid purity after alkaline lysis (62% and 36%) reported here was lower than
the value of 88% reported by Ciccolini et al (2002). This difference may be due using different
pl78
cell pastes, as well as differences in analytical techniques. Ciccolini et al used agarose gel
electrophoresis to quantify DNA contamination, which tends to underestimate single-stranded
chromosomal DNA contamination (the principal DNA contaminant) due to the poor binding of
ethidium bromide to the single-stranded form of DNA. The supercoiled plasmid purity reported
here is also significantly lower than the values reported by Chamsart et al. (2001) (< 2 %
chromosomal DNA). The lysate samples assayed by Chamsart et al. were purified using Qiagen
columns before assaying for chromosomal DNA, which could potentially have removed a
significant amount of the DNA impurities.
For the plasmid-deficient cells, the amount of chromosomal DNA remaining after alkaline lysis,
as a percentage of chromosomal DNA before lysis was 8%, 15% and 2%, for cell pastes
W typeGl, WtypeG2 and WtypeG3, respectively. Hence, there was a significant variation in the
amount o f chromosomal DNA contamination in the alkaline lysates from the three cell pastes.
The amount of chromosomal DNA contamination in clarified alkaline lysates was a function of
the amount released from the cells, as well as the amount that was removed from solution
during the neutralisation/flocculation step. It was observed that the 26 hour harvested cells
(WtypeG3) did not resuspend completely following addition o f alkaline lysis reagent, so the
low yield o f chromosomal DNA for this cell paste was probably due to poor alkaline cell lysis.
Alkaline lysis alone may not be a suitable lysis technique for this cell paste. For the more easily
lysed cells, harvested after 18 hrs, 8% to 15% of the initial chromosomal DNA was found in the
clarified lysate. By incubating the cells with SDS for 15 minutes before adding NaOH, to
increase lysis efficiency, the amount o f contaminating chromosomal DNA increased to 25% of
the initial amount in the cells. Again, the amount o f contaminating chromosomal DNA in the
clarified alkaline lysates from the wild-type cell pastes was considerably higher than the values
reported by Chamsart et al.
In summary, supercoiled plasmid yields using alkaline lysis were only about 50% of the total
supercoiled plasmid within the cell, supercoiled plasmid purity was about 30% to 60%, and
significant chromosomal DNA contamination occurred in all the clarified alkaline lysates tested.
pl79

LysisMethod
Cells SCPlasmidm g /gwcw
OCPlasmidm g /gwcw
ds-chDNAm g /gwcw
ss-DNA
m g /gwcw
Purity
%
AlkalineLysis
psvpPl 0.9±0.05'(53%)
0.2±0.02
"(67%)
0.1±0.03
0.2±0.04
3(1594)
64%
AlkalineLysis
psvpP2 0.8±0.07'(47%)
0.3±0.01
"(50%)
0.1±0.02
1.1±0.083(52%)
34%
AlkalineLysis
WtypeG1
N/A N/A 0.02 ± 0.006
0.3±0.043(8%0
N/A
AlkalineLysis
WtypeG2
N/A N/A 0.02±0.005
0.6 ±0.08
3 (15%)
N/A
Alkaline Lysis
w/ pre- SDS
WtypeG2
N/A N/A 0.02±0.006
0.8 ±0.05
3 (25%)
N/A
AlkalineLysis
WtypeG3
N/A N/A 0.02±0.008
0.01±0.0033(2%)
N/A
Table 6.3. Plasmid and chromosomal DNA yields after alkaline lysis for plasmid
containing and non-plasmid containing E. coli cells. Supercoiled plasmid
post-alkaline lysis divided by initial amount in the cells. ^Total open-circular
plasmid DNA post-alkaline lysis divided by initial amount in the cells. ^Total
non-plasmid DNA divided by total initial chromosomal DNA in the cells
before lysis.
Evaluation of lysozyme-heat lysis
Using lysozyme and heat to lyse E. coli cells for plasmid extraction is another common lysis
method (Lee et al. 1994). The performance of lysozyme-heat lysis was evaluated for cell paste
pSVP?2. The results shown in Table 6.4 are the averages o f 2 experiments. The supercoiled
plasmid yield using lysozyme-heat lysis was significantly better than alkaline lysis. The
supercoiled plasmid yield using lysozyme followed by heat lysis at 20°C was 92% ± 6% o f the
total supercoiled plasmid in the cell. There was no significant difference between the
supercoiled plasmid yield after heating at 20°, 70° or 75°C, but there was a decrease in
p l80

supercoiled plasmid yield at 80°C, and above. The purity after lysozyme-heat lysis ranged from
28% to 37%, compared to a purity of 35% after alkaline lysis. All of the DNA impurities after
lysozyme-heat lysis were in the double-stranded form, as measured by Poros PI and Q-
Sepharose HPLC assays. Therefore, purification steps to remove chromosomal DNA impurities
after lysozyme-heat lysis (at 20°C to 85°C) must be capable o f removing double-stranded linear
DNA from supercoiled plasmid. In contrast, after alkaline lysis most o f the contaminating
chromosomal DNA was in single-stranded form.
Method Cells SCPlasmidmg / gwcw
Purity
%Lysozyme pSvp, 1.6 37%
+ 20C DH 5a ±0.1
Lysozyme psvp. 1.4 35%+ 70C D H 5a ±0.1
Lysozyme pSVp, 1.5 35%+ 75C DH5a ±0.2
Lysozyme pSvp, 1.3 33%+ 80C DH5a ±0.1
Lysozyme pSVp, 1.2 28%+ 85 C D H5a ±0 .2
Table 6.4. Yields of supercoiled plasmid DNA and sample purity for 3 lysis methods.
From these experiments it was concluded that the principal advantage o f heating the cells after
lysozyme treatment was not increased supercoiled plasmid yield or decreased chromosomal
contamination, but instead was enhanced flocculation and clarification o f the cell debris. The
enhanced flocculation observed after heating was due to increased protein dénaturation at high
temperature.
6.4.3 Effect of detergent concentration in lysis buffer
E. coli cell paste, pSVpP2, was alkaline lysed at 2 mL scale using 0.2 M NaOH with various
amounts o f SDS detergent. The clarified alkaline lysates were assayed by Poros PI HPLC.
There was no significant variation in supercoiled plasmid yield (0.8 ± 0.1 mg/g wcw) and purity
(34% ± 3%) over the SDS concentration range investigated (0.5%, 1% or 2% w/v SDS).
pl81
6.4.4 Effect of NaOH in lysis buffer: dénaturation of plasmid and chDNA
The purpose of the NaOH in lysis buffer is to increase the pH from pH 8 to about pH 12.7. This
pH increase has two principal effects: i) increased cell lysis by denaturing cell wall and cell
membrane constituents and ii) dénaturation of DNA to single-stranded form. It has been
reported by Bimboim et al. (1979) that double-stranded, linear DNA denatures to single
stranded form between pH 12 and pH 13, and that supercoiled plasmid DNA typically
denatures at a slightly higher pH than chromosomal DNA. If supercoiled plasmid DNA is
denatured by high pH, the plasmid is converted to a compact, non-supercoiled form, which
cannot be converted back to native, supercoiled plasmid. It has more recently been
demonstrated by Thatcher et al. (1997), that there is a pH window o f about ± 0.2 pH units below
which no supercoiled plasmid denatures and above which all the supercoiled plasmid denatures
irreversibly. They reported that this pH window lies between pH 12 to pH 13, and varied for
different plasmids. It was suspected that the pH of the lysis buffer affected the mixing
requirements during cell lysis; therefore, the effect o f NaOH concentration and the time o f
exposure to NaOH on supercoiled plasmid yield and purity were studied in detail.
Using NaOH concentration instead of pH to control DNA dénaturation
Due to the high concentration of cell debris which will foul a pH electrode, and the presence of
Tris which can give erroneous pH values with some electrodes, accurately and reproducibly
measuring the pH of alkaline lysate is generally not possible. Figure 6.5 shows the measured
pH as a function o f NaOH concentration in TE buffer and in E. coli cell resuspension. In the
cell solution, there is a small decrease in pH, compared to TE buffer, due to the buffering effect
of the cells. For both systems, at the pH where irreversible DNA dénaturation occurs (pH 12 to
13), a large change in NaOH concentration produces only a small change in pH; hence, the pH
can be accurately adjusted by the addition o f NaOH. This is important since even a small error
in pH measurement (± 0.2 pH units) can lead to significant levels o f supecoiled plasmid
degradation.
During alkaline lysis experiments, both the pH and the NaOH added were routinely monitored.
It was determined over many experiments that lysing at a set NaOH concentration gave
significantly more reproducible results than attempting to lyse cells at a set solution pH. This
was most likely due to the difficulty in measuring pH in an alkaline lysate environment as
already described.
pl82
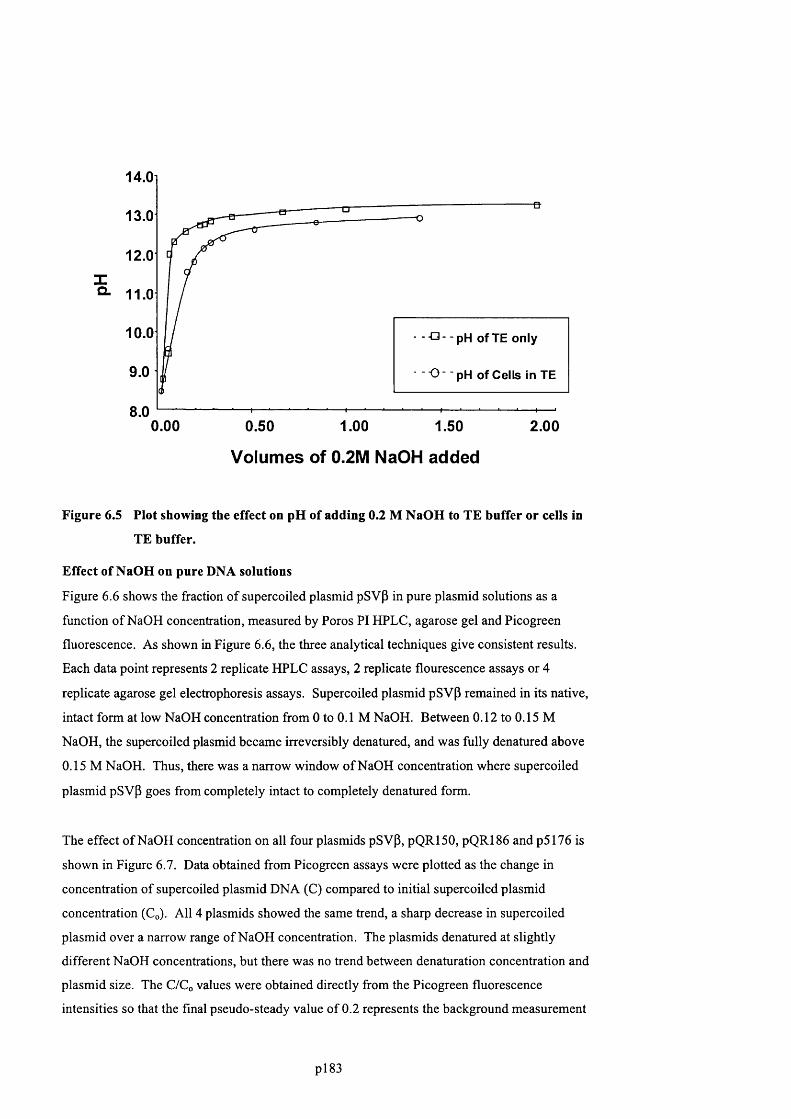
14.0
13.0
12.0
û - 11 .0
10.0 - "O -pH of TE only
9.0 "O pH of Cells in TE
8.00.00 1.000.50 1.50 2.00
Volumes of 0.2M NaOH added
Figure 6.5 Plot showing the effect on pH of adding 0.2 M NaOH to TE buffer or cells in
TE buffer.
Effect of NaOH on pure DNA solutions
Figure 6.6 shows the fraction of supercoiled plasmid pSVP in pure plasmid solutions as a
function of NaOH concentration, measured by Poros PI HPLC, agarose gel and Picogreen
fluorescence. As shown in Figure 6.6, the three analytical techniques give consistent results.
Each data point represents 2 replicate HPLC assays, 2 replicate flourescence assays or 4
replicate agarose gel electrophoresis assays. Supercoiled plasmid pSVP remained in its native,
intact form at low NaOH concentration from 0 to 0.1 M NaOH. Between 0.12 to 0.15 M
NaOH, the supercoiled plasmid became irreversibly denatured, and was fully denatured above
0.15 M NaOH. Thus, there was a narrow window of NaOH concentration where supercoiled
plasmid pSVP goes from completely intact to completely denatured form.
The effect o f NaOH concentration on all four plasmids pSVp, pQR150, pQR186 and p5176 is
shown in Figure 6.7. Data obtained from Picogreen assays were plotted as the change in
concentration of supercoiled plasmid DNA (C) compared to initial supercoiled plasmid
concentration (Co). All 4 plasmids showed the same trend, a sharp decrease in supercoiled
plasmid over a narrow range of NaOH concentration. The plasmids denatured at slightly
different NaOH concentrations, but there was no trend between dénaturation concentration and
plasmid size. The C/Co values were obtained directly from the Picogreen fluorescence
intensities so that the final pseudo-steady value o f 0.2 represents the background measurement
pl83

from irreversibly denatured plasmid. There was a slight decrease in fluorescence between 0 M
and 0.1 M NaOH for all 4 plasmids. This is probably due to the small amount of chromosomal
DNA impurity present in each sample, and not due to plasmid degradation. It has already been
demonstrated in chapter 4 that chromosomal DNA and open-circular DNA denature to single
stranded form between 0.02 and 0.04 M NaOH (refer to Figure 4.3). Based on the dénaturation
characteristics o f pure DNA, the optimum window of operation for alkaline lysis should be
between about 0.04 and 0.12 M NaOH.
5 0 0 0 0 ir
4 0 0 0 0 --Sc0)ug 3 0 0 0 03
i l 20000
0.8
0.6^ H P L C Tîi- Flourescence
♦ Agarose Gel
0 .410000 0.2
0.00.00 0 .0 5 0.10 0 .1 5 0.20
(/}Og3Q.
O3
o(D
NaOH C o ncen tra tion (M)
Figure 6.6 Plot showing the effect of sodium hydroxide concentration on supercoiled
plasmid stability. Poros PI HPLC, Picogreen fluorescence and agarose gel
electrophoresis were used to assay the samples for supercoiled plasmid. Error
bars represent one standard deviation.
120%
60%
♦ psvb 6 kb
□ p Q R iee 13kb
A pQRISO 20 kb
o p5206 116 kb
-X-ChDNA
0.00 0.05 0.10 0.15
Final NaOH Concentration (M)0.20 0.25
Figure 6.7.. Plot of relative supercoiled plasmid DNA concentration, C/Co, (measured by
Picogreen fluorescence) against sodium hydroxide concentration
pl84
Effect of NaOH on cell lysate
Figure 6.8 show the concentration o f supercoiled plasmid in the clarified lysate as a function of
the NaOH concentration during the lysis o f E. coli D H 5a pSV(3 cell paste. Q-Sepharose HPLC,
agarose gel electrophoresis and Picogreen assays were used to measure supercoiled plasmid
content. The assays show the same trend, with an increase in supercoiled plasmid DNA yield as
the NaOH concentration is increased from 0 M to 0.1 M NaOH probably due to improved cell
lysis at higher pH. This was followed by a steady decrease in supercoiled yield at higher NaOH
concentrations, due to supercoiled plasmid DNA dénaturation. The drop in supercoiled plasmid
beyond 0.1 M NaOH was not as dramatic as in pure solutions, possibly due to some buffering of
the solution by the cellular debris.
In order to compare the effect of NaOH concentration on DNA dénaturation in pure solution
versus in cell lysates, it was necessary to know the solution pH during lysis for the two systems.
Because the cells will effect the final pH of the lysis solution, it is important to consistently
resuspend and lyse the cells at the same cell concentration, and to check supercoiled plasmid
dénaturation conditions when a new cell line is used. It should be noted that the pH over which
plasmid degradation occurs is slightly lower for plasmids in cell lysate, as opposed to plasmids
in pure TE buffer. It is unclear whether this measured difference is due to an error in pH
measurement in the lysate solution or due to plasmid DNA being slightly more susceptible to
degradation in a cell lysate environment. ..
Figure 6.9 shows the relative HLPC peak areas of all the nucleic acid species present in the
clarified lysate, as measured by Q-Sepharose assay. The RNA concentration increased as the
lysis concentration increased from 0 M to 0.06 M NaOH, after which the RNA concentration
remained constant. This indicated that cell lysis was slightly less effective at low NaOH
concentrations. Double-stranded chromosomal DNA and open-circular DNA were only present
at very low concentrations below 0.06 M NaOH. This was in agreement with previous studies
(see chapter 4) that chromosomal and open-circular plasmids are fully denatured to single
stranded DNA above 0.04 M NaOH. There was a sharp increase in single-stranded DNA at
NaOH concentrations above 0.15 M, probably due to the supercoiled plasmid being degraded to
single-stranded, denatured form.
p is s
0)
0) o
§ s$ isIIlio
II(0 o ai
[NaOH] (M)
Figure 6.8. Effect of NaOH concentration on snpercoiled plasmid DNA recovery in
alkaline lysates.
m 1 .62
<■o
0)O 0.8 0)
(ü
1Picogreen
" Agarose Gel -H PLC
0.4
L.O
0 .0 0 0.05 0 .1 0 0.15 0 .2 0
2500 -
- ds-DNA.. o 0 0
A ss-DNA...... ds-gDNA
- RNA
.0 • - -Q - -*
E 2000
< 1500
1 0 0 0 '
0 .0 0 0.05 0 .2 00.10 0.15
[NaOH]Figure 6.9. Effect of NaOH concentration during alkaline lysis on SC plasmid, OC
plasmid, ss-DNA, ds-chDNA and RNA contamination in clarified lysates.
Note: the RNA peak area was divided by 15 to fit on the y-axis.
pl86
Lysis o f plasmid-deficient cells enabled accurate quantification of chromosomal DNA
separately from plasmid degradates. Figure 6.10 shows the concentration o f both double- and
single-stranded DNA in the clarified lysate as a function o f NaOH concentration during lysis of
plasmid-deficient cells. Total chromosomal DNA contamination increased in the clarified
lysate as the NaOH concentration increased, probably due to increased cell lysis at higher pH.
Figure 6.10 shows, although an increased concentration o f NaOH did not decrease
chromosomal DNA contamination, that a high NaOH concentration close to 0.1 M NaOH was
necessary to convert the entire chromosomal DNA to single-stranded form. To maximise
plasmid yield and minimise double-stranded chromosomal DNA contamination, it was
concluded that a target lysis concentration close to 0.1 M NaOH was optimum for the E. coli
D H 5a pSVP system. This optimum NaOH concentration may be lower or higher depending on
supercoiled plasmid or cell strain.
100.0%oÜ
—o
- D - ss-ChDNA03Eo0)oE2
.c
1.0%. ds-chDNA
O 0.1%
0.000 0.025 0.050 0.075 0.100 0.125 0.150
NaOH Concentration (M)
Figure 6.10 Plot showing the effect of sodium hydroxide concentration during alkaline
lysis on chromosomal DNA concentration in clarified lysate.
6.4.5 Dénaturation time
Figure 6.11 shows a contour plot of the supercoiled plasmid yield as a function of the NaOH
concentration during lysis of D H 5a pSVP cells and as a function of the lysis time (the time
between the end of lysis buffer addition and the start o f neutralisation). Lysis time did not
strongly affect the supercoiled plasmid yield; only lysate that was maintained at high pH (pH ^
12.3) for 60 minutes showed a moderate decrease in supercoiled plasmid DNA. The amount of
chromosomal DNA contamination was not significantly affected by lysis time either, as shown
pl87
in Figure 6.12. The decrease in sample purity at high NaOH concentration was due to the
decreased supercoiled plasmid yield not an increase in chromosomal DNA contaminant. The
optimum conditions were about 0.09 M NaOH and 10 minutes lysis time.
9 0 -9 5 'A
0.05 0.075 0.10 0,125
Final NaOH C o n c e n tr a tio n (M)
SC Plasmid Yield(% of m axim um yield from Alkaline Lysis)
□ 95% -100%■ 90%-95%
85%-90%■ 80%-85%■ 75%-80%□ 70%-75%□ 65%-70%
60%-65%■ < 60%
Figure 6.11 Two-dim ensional contour plot show ing the com bined effects of lysis time and
sodium hydroxide concentration on plasmid yield over alkaline lysis.
%
w
[NaOH] (m
Plasm id Purity(m g SC I mg Total DNA)
■ <iO%-45%
Q35% -40%
■ 30%-35%
□ 25%-30%
□ 20%-25%
■ 15%-20%
010% -15%
Figure 6.12 Two-dim ensional contour plot showing the com bined effects of lysis time and
sodium hydroxide concentration on plasmid p u rity over alkaline lysis.
6.4.6 Fluid mixing
Prolonged exposure of supercoiled plasmid DNA to NaOH greater than 0.15 M concentration
was demonstrated to cause irreversible plasmid degradation. Because lysis buffer is typically
0.2 M NaOH concentration, plasmid DNA can potentially be degraded if mixing of cells and
pl88
lysis regent is slow, where some of the cell solution can be exposed to high NaOH
concentrations. Therefore, the required mixing time for an alkaline lysis reaction vessel will
depend on the rate o f supercoiled plasmid dénaturation when exposed to concentrated lysis
buffer. The vessel mixing time should be significantly less than the plasmid degradation time.
This degradation time consists of the time taken for the cells to lyse, releasing plasmid DNA,
and the time taken for the plasmid to denature when exposed to inhomogeneous regions of high
NaOH concentration.
Degradation rate of supercoiled plasmid in neat lysis buffers
Figure 6.13 shows the supercoiled plasmid DNA yield as a function of E. coli cell exposure
time to neat lysis buffers (0.2 M NaOH, 1% SDS or 0.4 M NaOH, 1% SDS). The plasmid yield
is shown relative to the plasmid yield in the control at 0.1 M NaOH, 1% SDS. Compared to the
control, there was significant plasmid yield loss even at an exposure time of only a few seconds,
for the 0.2 and 0.4 M NaOH lysis buffer experiments. Based on this data, the mixing time in an
alkaline lysis reactor should be significantly less than 5 s, using 0.2 M NaOH or 0.4 M NaOH
lysis buffers.
"O0)>"DEV)
jOÛ.T3Q)
ÔaOQ.3CO
100
10 -
0.4 M NaOH - O - 0.2 M NaOH
6 8 10 20 40
Time at high pH (s)60 80 100
Figure 6.13. Supercoiled plasmid DNA yields (C/Co) as a function of time of exposure of
plasmid containing cells to denaturing NaOH concentrations. Each data point
represents the average of 3 experiments.
Supercoiled plasmid yield at worst-case mixing conditions
pl89
Having established that high concentrations of NaOH in lysis buffer caused supercoiled plasmid
DNA degradation, and that plasmid DNA degradation occured in less than a few seconds, it was
obvious that the rate of mixing o f lysis buffer and resuspended cells could affect the supercoiled
plasmid yield. It was advantageous to first establish the effect on plasmid yield o f lysis at
"worst-case" mixing conditions. In order to estimate, a priori, worst case plasmid degradation, a
concentration o f 0.125 M NaOH was assume to be the cut-off in NaOH concentration above
which plasmid would be irreversibly denatured. In practice, one volume of 0.2 M NaOH would
be added to one volume of resuspended cells. Under worst case conditions there would be no
mixing, and the cells and lysis buffer would be left to mix by diffusion (top box in Figure 6.14).
Because the diffusion rate o f NaOH is significantly higher than that of E. coli cells, the NaOH
would rapidly diffuse into the cells. If, after expanding by 60%, the NaOH concentration is
uniform (middle box in Figure 6.14), then 60% of the cells will be exposed to 0.125M NaOH,
and 60% of the supercoiled plasmid would be denatured irreversibly. However, because o f
concentration profiles between the plasmid and NaOH phases, a significantly smaller
percentage of cells would be exposed to a high NaOH concentration, maybe 20% (bottom box
in Figure 6.14).
&»ucoUXowz.
3 ! èntffiîsfî M I, etl
NaOH
0.200 M
0.125 M
60% cells
NaOH
NaOH
0.2 M NaOH and Cells before mixing
0.2 M NaOH and Cells as NaOH diffuses into cells
“W orst-case” diffusion
0.2 M NaOH and Cells as NaOH diffuses into cells
“ Fickean” diffusion
Volume
Figure 6.14. Schem atic showing diffusion of NaOH into resuspended cells.
p l9 0

A small-scale experiment was run to determine the actual amount of plasmid degradation under
worst case mixing conditions, as described in Materials and Methods. Figure 6.15 shows the
supercoiled yield for the worst case mixing conditions and for the case o f rapid mixing. There
was a 16 - 18% loss of supercoiled plasmid DNA for the worst case mixing condition. Hence,
under conditions of worst possible mixing, supercoiled plasmid degradation should be less than
about 20% of total supercoiled plasmid, using 0.2 M NaOH lysis buffer. Lysis experiments
were performed in a scaled-down stirred tank and a scaled-down opposed jet device to
determine actual plasmid degradation levels, as a function of NaOH concentration and mixing
times. The results of mixing experiments in stirred tanks are discussed in the following section;
mixing in opposed jets is discussed in chapter 8.
100%100% 100%
. « • 4
82%
0.2 M NaOH Q uickly < 2 s addition tim e
0.2 M NaOH S low ly 100 s addition tim e
Figure 6.15 Bar chart showing the effect of addition rate of 0.2 M NaOH to pure
supercoiled plasmid DNA.
Stirred Tank Mixing Studies
Lysis mixing experiments were performed with a scale-down stirred tank, as described in
Materials and Methods. Figure 6.1 shows a schematic of the scale-down stirred tank and 6-
bladed Rushton impeller. The measured macro-mixing time in the vessel was 10 s to 80s,
depending on impeller speed, as shown in Figure 6.16. Also shown is the theoretical vessel
macro-mixing time that is based on Equation 2.3 to Equation 2.5, in section 37. The calculated
macro-mixing time is in reasonable agreement with the observed macro-mixing time.
For this set o f experiments, the lysis buffer was added subsurface directly into the impeller. In
order to prevent supercoiled plasmid degradation, the lysis buffer needs to rapidly reach a
uniform concentration at the microscopic level. Therefore, the micro-mixing time in the region
close to the impeller is probably a more important criterion of plasmid degradation than the
overall tank macro-mixing time. The micro-mixing time at the impeller could not be easily
pl91
measured, but the theoretically calculated micro-mixing time at the impeller is shown in Figure
6.16. The theoretically calculated micro-mixing time was calculated using Equation 2.1,
Equation 2.2 and Equation 2.8 that are based on Kolmogoroff turbulence theory, as described in
chapter 2. This assumes that the energy dissipation in the region near the impeller Eimpeiier is
significantly higher than the average energy dissipation £av throughout the vessel (Hamby et ah,
1992). A value for Ejmpeiier / £av o f 40, and a solution viscosity o f 0.005 Pa s, were used in these
calculations (Ciccolini et al. 1998). The predicted micro-mixing time varied from a few
seconds up to tens o f seconds depending on impeller speed.
(0LUsI-ÜzX
• Experimentally observed mixing time Theoretical Macro-Mixing Time
Theoretical Micro-Mixing Time
100
80
60
40
20
040040 60 80 100 20020
IMPELLER SPEED (RPM)
Figure 6.16. Plot showing relationship between stirred tank macro-mixing time and
impeller speed.
The effect o f impeller speed and NaOH concentration on supercoiled plasmid yield, during lysis
in the stirred tank, was investigated. Figure 6.17 shows the effect o f lysis reagent concentration
and impeller speed on supercoiled plasmid yield. Each data point is the average of two
experiments. Addition of 0.2 M NaOH lysis reagent to resuspended cells without mixing gave
supercoiled plasmid yield o f 84 %, compared to the control lysis done at 2 mL scale. Lysis
while mixing at 50 rpm and 200 rpm gave 95% and 100% supercoiled plasmid yield,
respectively. Thus, even gentle mixing at 50 rpm is sufficient to reduce supercoiled plasmid
yield loss to only 5%. The vessel mixing time at 50 rpm was measured at 50 seconds; this is
significantly longer than the 5 seconds it takes supercoiled plasmid to degrade in 0.2 M NaOH
lysis buffer. At 50 rpm, the micro-mixing time in the region next to the impeller was estimated
to be about 20 seconds. Excessive plasmid dénaturation is probably avoided by the rapid
diffusion rate o f H* ions, some neutralisation of the NaOH by the cell debris, and because the
p l9 2
lysis reagent concentration of 0.2 M NaOH was not far above the supercoiled plasmid
degradation concentration (0.12 to 0.15 M).
Currently, the alkaline lysis and neutralisation operation involves a 3-fold increase in batch
volume from the resuspended cell volume. This creates a significant expense in terms of capital
equipment at the lysis stage, and downstream, to process this increased batch volume. Instead of
adding 1 volume of 0.2 M NaOH to the cells, to end up at 0.1 M NaOH, one could add 0.33
volumes of 0.4 M NaOH, significantly reducing the volume increase. However, there is
potential for significantly greater plasmid degradation using more concentrated NaOH in the
lysis buffer. Figure 6.17 also shows the plasmid yields using more concentrated 0.4 M NaOH
lysis buffer. Moderate mixing at 200 rpm was not sufficient to prevent significant supercoiled
plasmid degradation (60% SC plasmid yield loss) using 0.4 M NaOH. At a very high impeller
speed of 800 rpm, the yield of plasmid DNA was 100% compared to the small-scale control.
The calculated micro-mixing times at 200 rpm and 800 rpm were 2.3 s and 0.3 s, respectively.
As the NaOH concentration increases in the lysis buffer, mixing time must decrease
significantly to avoid product yield loss.
100%
T3
>-T3
'Ë(A
Q.OW
80%
60%
40%
20%
0.2 M NaOH 0.2 M NaOH 0.2 M NaOH 0 rpm 50 rpm 200 rpm
0.4 M NaOH 0.4 M NaOH 200 rpm 800 rpm
Figure 6.17. Plot showing effect of impeller speed and NaOH concentration on SC yield
6.4.7 Effect of fluid stress on the lysis of plasm id-deficient cells
It was demonstrated in the previous section that moderate to high impeller speeds in stirred
tanks are required during alkaline lysis to prevent plasmid degradation from exposure to poorly
mixed regions of NaOH. The effect of fluid shear on plasmid and chromosomal DNA in an
alkaline lysis environment was studied. It has already been demonstrated by Levy et al. (1999)
that shear rates of the order to 10 s ’ are required to break small plasmids (6 - 20 kb). In
contrast, chromosomal DNA can easily be degraded at shear rates of 10 s ’. Degradation of
pl93
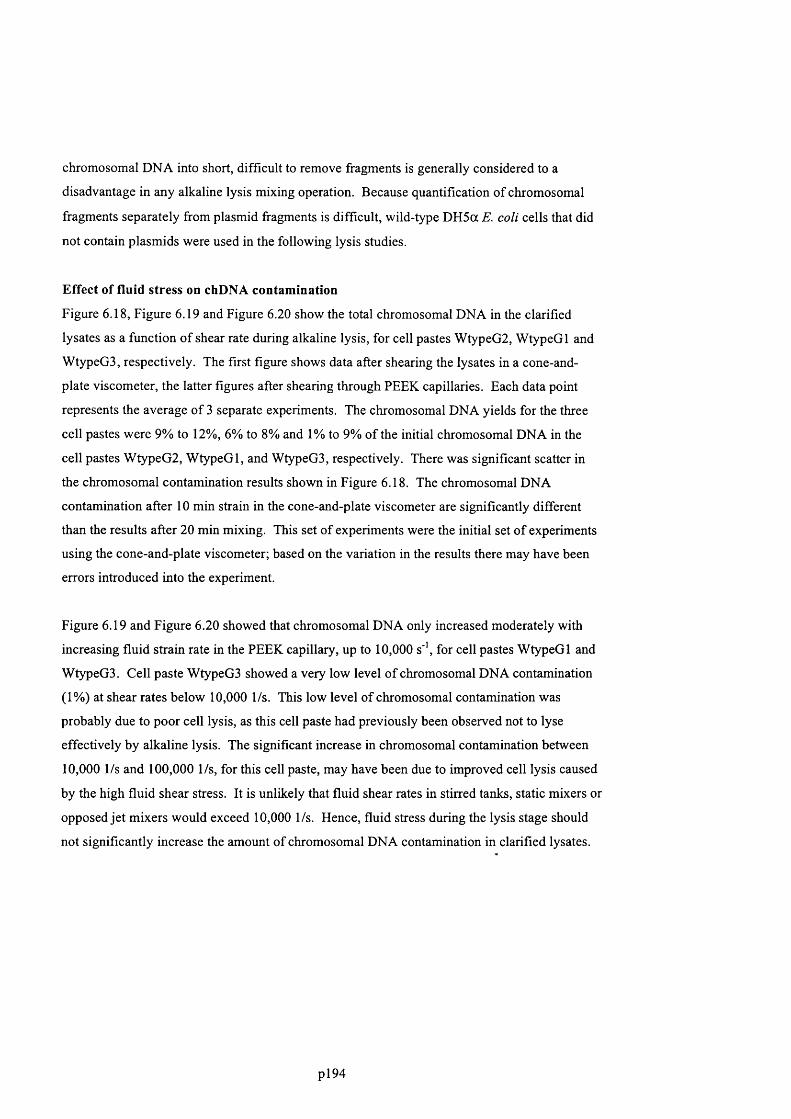
chromosomal DNA into short, difficult to remove fragments is generally considered to a
disadvantage in any alkaline lysis mixing operation. Because quantification of chromosomal
fragments separately from plasmid fragments is difficult, wild-type D H 5a E. coli cells that did
not contain plasmids were used in the following lysis studies.
Effect of fluid stress on chDNA contamination
Figure 6.18, Figure 6.19 and Figure 6.20 show the total chromosomal DNA in the clarified
lysates as a function o f shear rate during alkaline lysis, for cell pastes W typeGl, WtypeGl and
WtypeGS, respectively. The first figure shows data after shearing the lysates in a cone-and-
plate viscometer, the latter figures after shearing through PEEK capillaries. Each data point
represents the average o f 3 separate experiments. The chromosomal DNA yields for the three
cell pastes were 9% to 12%, 6% to 8% and 1% to 9% of the initial chromosomal DNA in the
cell pastes W typeG l, W typeGl, and WtypeGS, respectively. There was significant scatter in
the chromosomal contamination results shown in Figure 6.18. The chromosomal DNA
contamination after 10 min strain in the cone-and-plate viscometer are significantly different
than the results after 20 min mixing. This set of experiments were the initial set o f experiments
using the cone-and-plate viscometer; based on the variation in the results there may have been
errors introduced into the experiment.
Figure 6.19 and Figure 6.20 showed that chromosomal DNA only increased moderately with
increasing fluid strain rate in the PEEK capillary, up to 10,000 s'% for cell pastes W typeGl and
WtypeGS. Cell paste WtypeGS showed a very low level o f chromosomal DNA contamination
(1%) at shear rates below 10,000 1/s. This low level of chromosomal contamination was
probably due to poor cell lysis, as this cell paste had previously been observed not to lyse
effectively by alkaline lysis. The significant increase in chromosomal contamination between
10,000 1/s and 100,000 1/s, for this cell paste, may have been due to improved cell lysis caused
by the high fluid shear stress. It is unlikely that fluid shear rates in stirred tanks, static mixers or
opposed jet mixers would exceed 10,000 1/s. Henee, fluid stress during the lysis stage should
not significantly increase the amount of chromosomal DNA contamination in clarified lysates.
pl94

g
O)£
<zû
1.0
0.8
0.6
0.4
0.2
0.0
O Lysed for 20 minutes while mixing
# Lysed for 10 minutes while mixing
i
200 400 600 800 1000
Mixing Strain Rate (ë )
Figure 6.18. Effect of fluid strain rate on chromosomal DNA contamination in clarified alkaline lysate, for alkaline lysis in a cone-and-plate rheometer. Using cell paste WtypeGl. Each data point represents 3 separate lysis experiments. Error bars represent one standard deviation.
Effect of fluid stress on chDNA fragmentation
Figure 6.21 shows an agarose gel after pulsed-field electrophoresis o f stressed lysate samples.
The gel demonstrates the impact of fluid stress on the size o f double-stranded chromosomal
DNA fragments. The gels were scanned and the results plotted in Figure 6.22 as molecular size
range (kb) o f fragments against shear rate. The gel shows that the breakage o f double-stranded
chromosomal DNA occurs effectively at all shear levels tested, and the chromosomal size
decreased with increasing shear rate. The results shown in Figure 6.22, indicate the
concentration of the chromosomal DNA in the clarified alkaline lysates was not significantly
affected by shear rate and remained about 20% of the total chromosomal DNA in the cells
before lysis. Hence, chromosomal DNA size does not significantly affect the amount o f it that
flocculates during alkaline lysis-neutralisation.
pl95
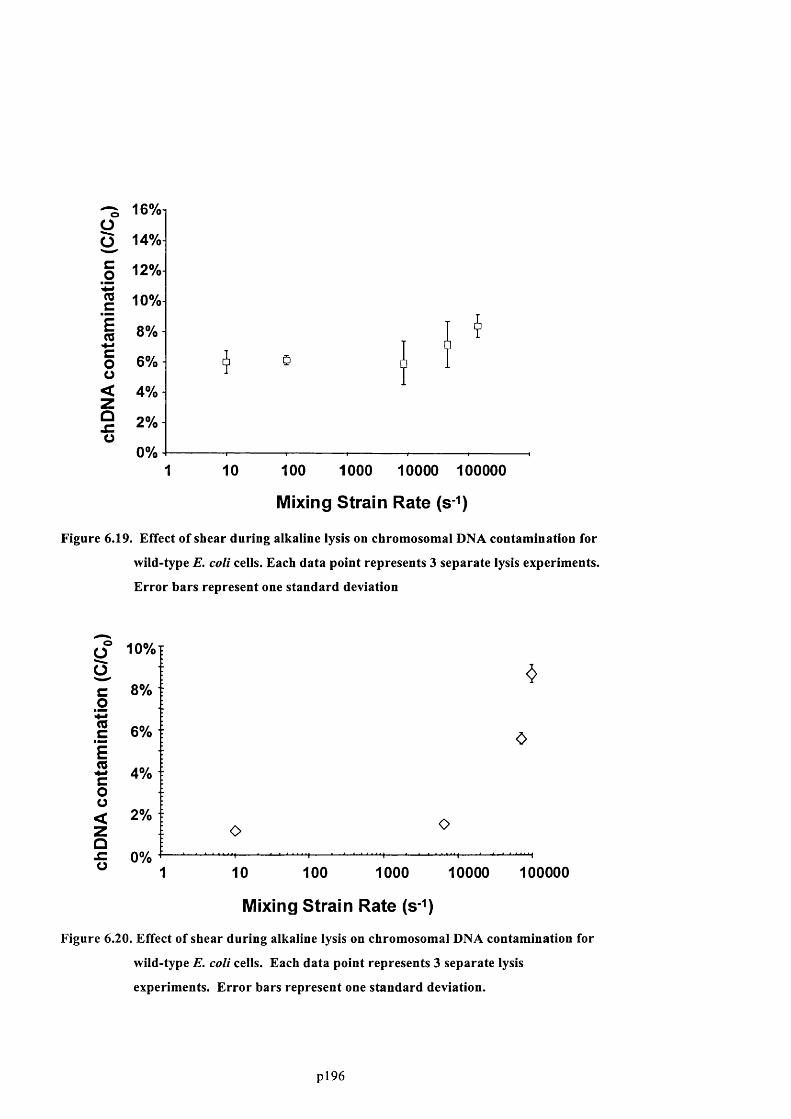
o 16%ioo 14%-co 12%-(Üc 10%-E(0 8%co 6%o< 4%zo 2%o
0% J1 10 100 1000 10000 100000
Mixing Strain Rate (s^)
Figure 6.19. Effect of shear during alkaline lysis on chromosomal DNA contamination for
wild-type E. coli cells. Each data point represents 3 separate lysis experiments.
Error bars represent one standard deviation
o 1 0 % : olo 8 % :otoc
4% i■4-*coo
<z
2 % ■
1000001 0 0 1000 10000
Mixing Strain Rate (s- )
Figure 6.20. Effect of shear during alkaline lysis on chromosomal DNA contamination for
wild-type E. coli cells. Each data point represents 3 separate lysis
experiments. Error bars represent one standard deviation.
pl96
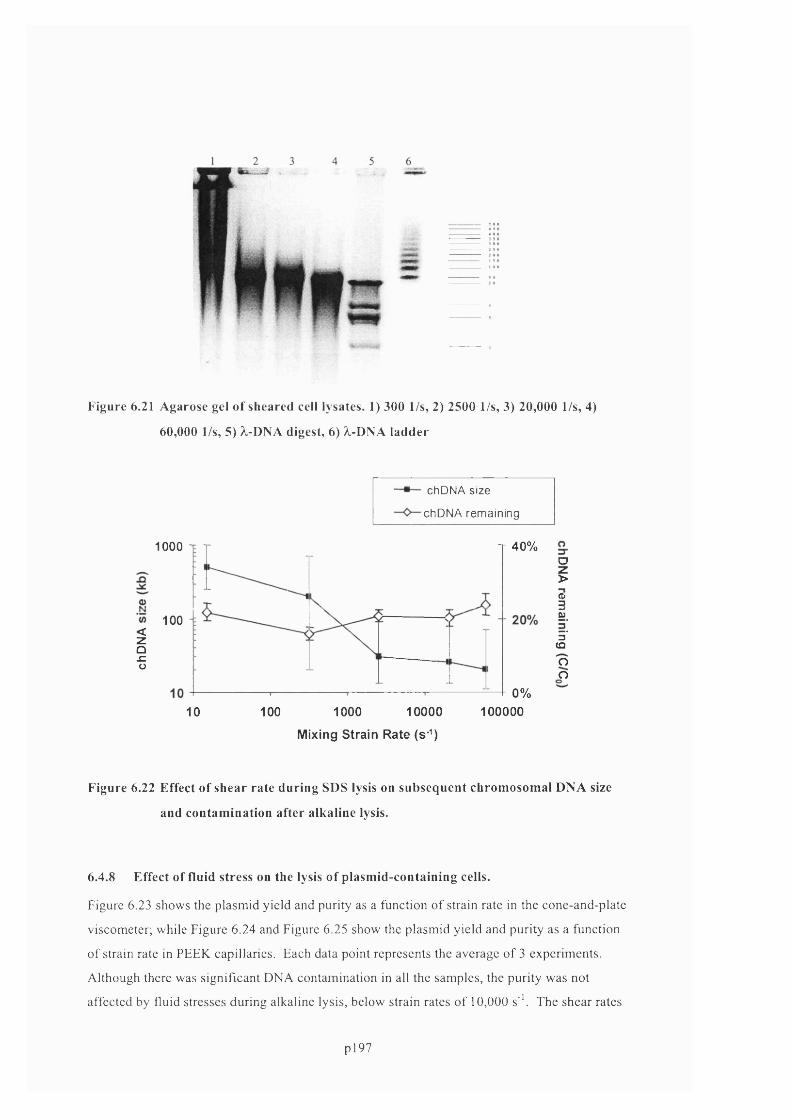
Figure 6.21 Agarose gel of sheared cell lysates. 1) 300 1/s, 2) 2500 1/s, 3) 20,000 1/s, 4)
60,000 1/s, 5) X-DNA digest, 6) 1-DNA ladder
chD N A size
chD N A rem ain ing
gQ.cÜ
T 40%1000
100
0%1000001000 1000010 100
D>o30)3"(Qoo
Mixing Strain Rate (s'^)
Figure 6.22 Effect of shear ra te during SDS lysis on subsequent chrom osom al DNA size
and contam ination after alkaline lysis.
6.4.8 Effect of fluid stress on the lysis of plasm id-containing cells.
Figure 6.23 shows the plasmid yield and purity as a funetion o f strain rate in the cone-and-plate
viscometer; while Figure 6.24 and Figure 6.25 show the plasm id yield and purity as a function
o f strain rate in PEEK capillaries. Each data point represents the average o f 3 experiments.
Although there was significant DNA contamination in all the samples, the purity was not
affected by fluid stresses during alkaline lysis, below strain rates o f 10,000 s'V The shear rates
p l97

used during lysis would have reduced the chromosomal DNA fragment size considerably. Fluid
strain rates below 100,000 s-1 did not detrim entally impact supercoiled plasm id yield, in fact
some increase in supercoiled plasmid yield over alkaline lysis was observed, probably due to
improved cell lysis. Above 100,000 s ’ appeared to have caused some reduction in supercoiled
plasmid yield.
T30
■gE(AçaÛ.Ü(/)
□ sc Y ie ld
[ ] P ur ity
2.0 T 40%
■ 30%g5O) - 20%
O) _ _ E 0.5 - 10%
0.0 0%19 760
CA
O ?
oz
Mixing Strain Rate (s
Figure 6.23. Bar ch a rt showing the effect of fluid stress on plasmid yield and plasm id
purit} , after 15 minutes mixing in a cone-and-plate viscom eter
■D0)
i *JS o) Û- EOCO
- O - S C P la sm id
DNA Im p u ritie s1.0
0.8
0.6
0.4
0.2
0.0100 1000 10000 100000101
Mixing Strain Rate (1/s)
Figure 6.24. Effect of fluid strain ra te in PEEK capillaries on chrom osom al DNA
contam ination. Each data point represents duplicate experim ents.
pl98
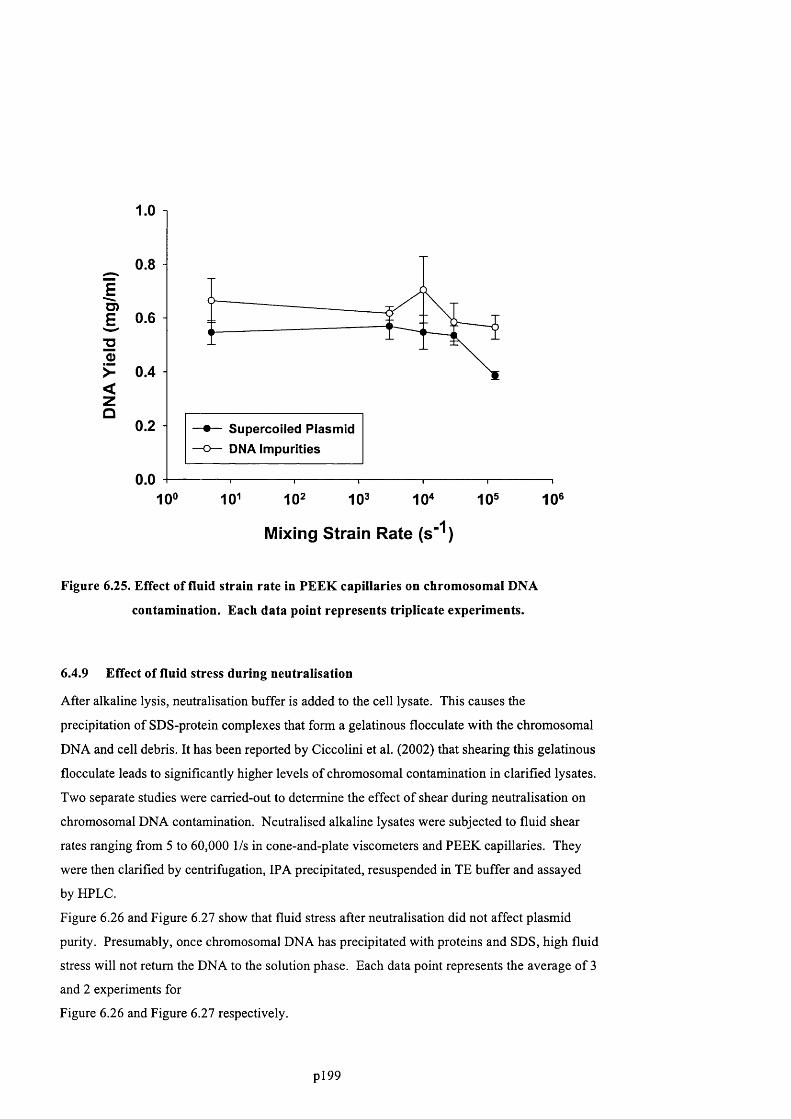
1.0
0.8
O)E 0.6"O<D> 0.4<ZQ
0.2
0.0
Supercoiled Plasmid
DNA Impurities
100 102 1Q3 104
Mixing Strain Rate (s’ )
105 1 0 6
Figure 6.25. Effect of fluid strain rate in PEEK capillaries on chromosomal DNA
contamination. Each data point represents triplicate experiments.
6.4.9 Effect of fluid stress during neutralisation
After alkaline lysis, neutralisation buffer is added to the cell lysate. This causes the
precipitation of SDS-protein complexes that form a gelatinous flocculate with the chromosomal
DNA and cell debris. It has been reported by Ciccolini et al. (2002) that shearing this gelatinous
flocculate leads to significantly higher levels of chromosomal contamination in clarified lysates.
Two separate studies were carried-out to determine the effect of shear during neutralisation on
chromosomal DNA contamination. Neutralised alkaline lysates were subjected to fluid shear
rates ranging from 5 to 60,000 1/s in cone-and-plate viscometers and PEEK capillaries. They
were then clarified by centrifugation, IP A precipitated, resuspended in TE buffer and assayed
by HPLC.
Figure 6.26 and Figure 6.27 show that fluid stress after neutralisation did not affect plasmid
purity. Presumably, once chromosomal DNA has precipitated with proteins and SDS, high fluid
stress will not return the DNA to the solution phase. Each data point represents the average of 3
and 2 experiments for
Figure 6.26 and Figure 6.27 respectively.
pl99
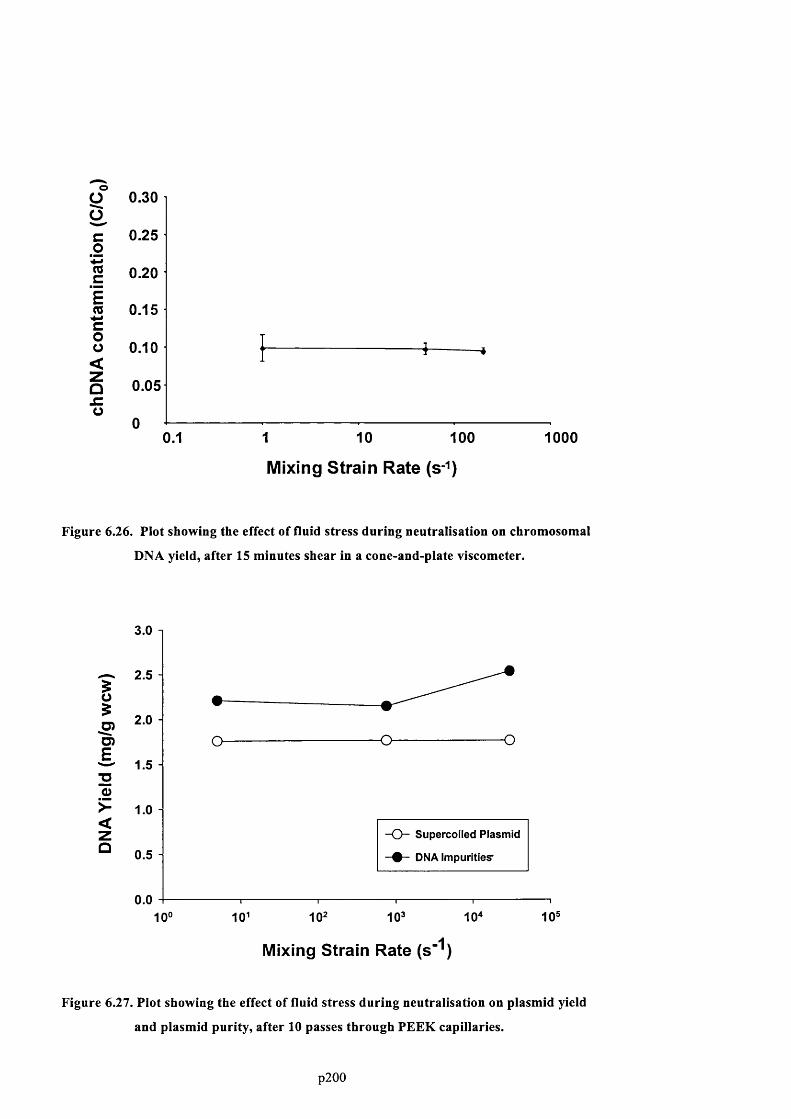
oICo
cÊrocOo<ZÛj=o
0.30
0.25
0.20
0.15
0.10
0.05
0.1 1 10 100 1000
Mixing Strain Rate (s- )
Figure 6.26. Plot showing the effect of fluid stress during neutralisation on chromosomal
DNA yield, after 15 minutes shear in a cone-and-plate viscometer.
3.0 1
B9
D)E
"OQ)
<Z - Q - Supercoiled Plasmid
# DNA impurities'Q
0.010°
Mixing Strain Rate (s“ )
Figure 6.27. Plot showing the effect of fluid stress during neutralisation on plasmid yield
and plasmid purity, after 10 passes through PEEK capillaries.
p200

6.5 Discussion
6.5.1 DNA dénaturation and mixing requirements
Measurement of pH during alkali addition is complicated by the highly viscous nature o f the
cell lysate, which together with the high concentration of proteins in the lysate, quickly leads to
fouling o f the pH probe making accurate pH measurement unfeasible. Instead of monitoring
solution pH, it was determined in this thesis that monitoring the NaOH concentration in the
alkaline lysate provided a more robust, reliable method for controlling cell lysis. Data was
presented in this chapter which showed that addition of NaOH to TE-buffered plasmid solutions
caused native supercoiled plasmid to irreversibly denature over a narrow window of NaOH
concentration. This window was about 0.02 M wide, and typically occurred between 0.12 to
0.18 M NaOH. It was determined that this dénaturation phenomenon was not a function of
plasmid size, over the range of plasmid sizes from 6 kb to 116 kb.
It was demonstrated using plasmid-containing cells, that both supercoiled plasmid yield and
chromosomal DNA contamination were only moderately affected by the NaOH concentration
during alkaline lysis, at NaOH concentrations below the plasmid dénaturation point. Therefore,
based solely on the criteria of maximising supercoiled plasmid yield and minimising DNA
impurities, alkaline lysis should be performed at a low NaOH concentration, significantly less
than 0.1 M, to prevent any possibility of supercoiled plasmid dénaturation. It should be noted
that Thatcher et al (1997) reported that high pH increased chDNA removal, which was contrary
to the observations made in this thesis. In was shown in this thesis that dénaturation of
chromosomal DNA to single-stranded form occurred between 0.02 to 0.04 M NaOH in TE
buffered solutions. It was also shown that a higher concentration of NaOH, typically 0.08 M
NaOH, was required to denature the entire chromosomal DNA in an alkaline lysate
environment. The removal of chromosomal DNA at high NaOH concentrations observed by
Thatcher et al. may in fact have been the conversion o f double-stranded chromosomal DNA to
single-stranded form. Single-stranded DNA does not show-up well on ethidium bromide
stained agarose gels, such as those used by Thatcher et al.
The optimal NaOH concentration during lysis, for conversion o f DNA impurities to single
stranded form while maximising supercoiled plasmid yields, was between 0.08 M and 0.12 M
NaOH. Unfortunately, cell lysis in this NaOH concentration range was significantly more
difficult. The NaOH concentration of the lysis buffer added to the cells was now greater than
the concentration that caused irreversible supercoiled dénaturation. Therefore, to prevent
product degradation, the lysis buffer must be rapidly mixed with the cells. However, to date
there had not been a detailed study published on the relationship between lysis buffer
p201
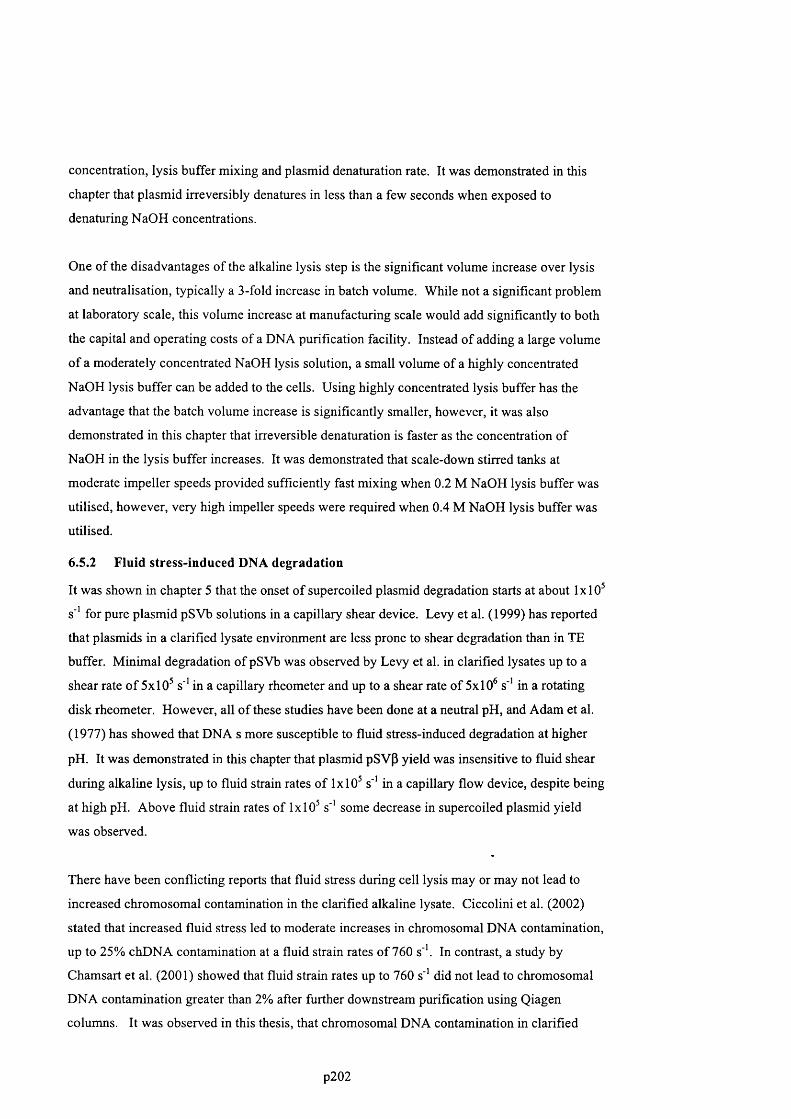
concentration, lysis buffer mixing and plasmid dénaturation rate. It was demonstrated in this
chapter that plasmid irreversibly denatures in less than a few seconds when exposed to
denaturing NaOH concentrations.
One of the disadvantages of the alkaline lysis step is the significant volume increase over lysis
and neutralisation, typically a 3-fold increase in batch volume. While not a significant problem
at laboratory scale, this volume increase at manufacturing scale would add significantly to both
the capital and operating costs of a DNA purification facility. Instead of adding a large volume
of a moderately concentrated NaOH lysis solution, a small volume of a highly concentrated
NaOH lysis buffer can be added to the cells. Using highly concentrated lysis buffer has the
advantage that the batch volume increase is significantly smaller, however, it was also
demonstrated in this chapter that irreversible dénaturation is faster as the concentration of
NaOH in the lysis buffer increases. It was demonstrated that scale-down stirred tanks at
moderate impeller speeds provided sufficiently fast mixing when 0.2 M NaOH lysis buffer was
utilised, however, very high impeller speeds were required when 0.4 M NaOH lysis buffer was
utilised.
6.5.2 Fluid stress-induced DNA degradation
It was shown in chapter 5 that the onset o f supercoiled plasmid degradation starts at about 1x10^
s ' for pure plasmid pSVb solutions in a capillary shear device. Levy et al. (1999) has reported
that plasmids in a clarified lysate environment are less prone to shear degradation than in TE
buffer. Minimal degradation o f pSVb was observed by Levy et al. in clarified lysates up to a
shear rate o f 5x10^ s ' in a capillary rheometer and up to a shear rate o f 5x10^ s'' in a rotating
disk rheometer. However, all o f these studies have been done at a neutral pH, and Adam et al.
(1977) has showed that DNA s more susceptible to fluid stress-induced degradation at higher
pH. It was demonstrated in this chapter that plasmid pSVP yield was insensitive to fluid shear
during alkaline lysis, up to fluid strain rates o f 1x10^ s'' in a capillary flow device, despite being
at high pH. Above fluid strain rates of 1x10^ s'' some decrease in supercoiled plasmid yield
was observed.
There have been conflicting reports that fluid stress during cell lysis may or may not lead to
increased chromosomal contamination in the clarified alkaline lysate. Ciccolini et al. (2002)
stated that increased fluid stress led to moderate increases in chromosomal DNA contamination,
up to 25% chDNA contamination at a fluid strain rates o f 760 s''. In contrast, a study by
Chamsart et al. (2001) showed that fluid strain rates up to 760 s ' did not lead to chromosomal
DNA contamination greater than 2% after further downstream purification using Qiagen
columns. It was observed in this thesis, that chromosomal DNA contamination in clarified
p202
alkaline lysate was typically high (about 20% to 60% compared to supercoiled plasmid), but
varied considerably depending the on the batch o f cell paste lysed. Chromosomal DNA
contamination levels as low as 1% were observed from one batch o f cell paste. In most cases,
chromosomal contamination levels observed were usually similar or higher than the levels
observed by Ciccolini et al. The cell strains were used here were the same as used by Ciccolini
et al, but the novel HPLC assays used here were more sensitive at detecting single-stranded
chromosomal DNA that agarose gel electrophoresis. It was observed in this chapter that the
amount of chromosomal DNA impurity in the clarified alkaline lysate was only moderately
sensitive to fluid stress up to strain rates of IxlO'^ s'V Ciccolini et al. observed the same
moderate increase in chromosomal DNA contamination with strain rate, but over a much narrow
range, 0 to 760 s'*. The low chromosomal DNA impurity levels observed by Chamsart may
possibly be due to chromosomal DNA removal over Qiagen purification or possibly differences
in E. coli cell strain.
In was demonstrated that chromosomal DNA size was very sensitive to fluid stress, and was
degraded to smaller and smaller chromosomal fragments as the shear rate increased from 10* to
10 s'* in a capillary shear device. At a shear rate o f 10 s'* the size of chromosomal DNA
fragments was about 30 kb and decreased to about 20 kb at 10 s'*. The actual shear rate that
chromosomal DNA will experience during alkaline lysis will depend on the required mixing
time and on the method o f mixing. Comparing the chromosomal DNA fragment size as a
function of strain rate in pure solution (chapter 5) versus during alkaline lysis, it is apparent that
chromosomal DNA is more susceptible to fragmentation in an alkaline lysis environment than
in pure TE buffer, pH 8.0. This is expected, as chromosomal DNA will be in single-stranded
form during alkaline lysis, and a single-stranded DNA chain should be weaker than a double
stranded DNA chain.
Figure 6.28 shows the predicted fluid mixing time and fluid strain rates, as a function o f
impeller speed in a 1000 L stirred tank, based on Equation 2.8, Equation 2.15 and Equation
2.16. A density of 1000 kg/m'^ and viscosity of 0.005 Pa s was used for the liquid. The micro
mixing time was calculated based on the energy dissipation rate close to the impeller, while the
macro-mixing time was based on the time to achieve a macroscopic, homogeneous
concentration throughout the tank. There is a significant variation in strain rate depending on
location within the tank. Shown in Figure 6.28 are the strain rates based on the average
turbulent energy dissipation in the tank and on the maximum turbulent energy dissipation at the
impeller. Also shown is the strain rate within the boundary layer o f the impeller. Strain rates in
the impeller boundary layer are significantly higher than the strain rate due to turbulent eddies.
Although only a small percentage of the tank volume passes through the impeller boundary
p203

layer, if mixing proceeds for an hour, often an entire tank volume may pass through the impeller
boundary layer. Hence, careful scale-up and impeller design can be important to reduce fluid
shear.
In order to achieve short mixing times in stirred tanks, high fluid strain rates will occur. The
actual level o f fluid strain that will occur will depend on the micro-mixing time required, which
will depend on the concentration of lysis buffer being added to the cells (refer to section 6.4.6).
Utilisation o f lysis buffers above 0.2 M NaOH concentration will require micro-mixing times no
longer than Is, which (referring to Figure 6.28) will lead to strain rates on the order of 1000 s '’
in the case of the 1000 L stirred tank. Therefore, chromosomal fragments will be generated
within the size range of 20 to 40 kb. The appropriate selection of downstream unit operations
must be made to ensure that these chromosomal DNA fragments can be removed (refer to
chapter 8). The critical strain rate for 116 kb and 20 kb plasmid degradation was shown in
chapter 5 to be 10'’ and 10 s '’, respectively. It is unlikely that shear rates in a stirred vessel
would reach levels o f 10'’ to 10 s '’, therefore, shear-induced degradation of most plasmids,
should not be a concern in stirred tanks.
MACRO-MIXING TIME MICRO-MIXING TIME STRAIN RATE IN IMPELLER BOUNDARY LAYER STRAIN RATE DUE TO AVERAGE TURBULENCE IN VESSEL STRAIN RATE DUE TO HIGH TURBULENCE NEAR IMPELLER
X 1Q0
52LUH-
CO
10 20 40 60 100 200 400 600 1000
IMPELLER SPEED (RPM)
Figure 6.28. Plot showing the effect of impeller speed on mixing performance and fluid
stress in a 1000 L stirred tank. All lines are calculated from mixing and fluid
stress theory as described in chapter 2.
p204

6.6 Conclusions
It was shown that monitoring NaOH concentration during alkaline lysis is a robust method of
controlling plasmid and chromosomal DNA dénaturation, in contrast to monitoring pH which is
difficult to measure accurately in an alkaline lysis environment. It was demonstrated for a range
o f plasmid sizes (from 6 to 116 kb) that supercoiled plasmids irreversibly denature over a
narrow window of sodium hydroxide concentration. The plasmids examined all denatured
between 0.13 ± 0.03 M NaOH. At NaOH concentrations below the plasmid dénaturation
concentration, the rate of degradation of supercoiled plasmid to denatured form was slow (~
10% degradation/hour). Above the critical NaOH concentration, the rate o f plasmid
degradation is very fast, on the order of seconds. It was shown that using the appropriate NaOH
concentration, chromosomal DNA can be completely converted to single-stranded form, leaving
plasmid DNA in its native supercoiled form. The form of chromosomal DNA (single- vs.
double-stranded) and the size of the chromosomal DNA were shown not to significantly affect
its removal over alkaline lysis and neutralisation.
It was shown that the mixing requirements during alkaline lysis were dependent on the NaOH
concentration at which lysis is performed. This in turn is dependent both on the level o f
chromosomal DNA dénaturation that that is required and the increase in batch volume that is
considered acceptable over lysis and neutralisation. It was shown that significant plasmid yield
loss can occur during alkaline lysis buffer addition in stirred tanks, and that the micro-mixing
time in such vessels must be less than the supercoiled plasmid degradation time at high NaOH
concentration (micro-mixing must be complete within seconds).
While the level of chromosomal DNA dénaturation does not significantly affect the quantity of
chromosomal DNA in the clarified lysate, the quantity o f double- versus single-stranded
chromosomal DNA may be a critical factor in its downstream removal. Similarly, while the
level of fluid stress only moderately affects the quantity o f chromosomal DNA in the clarified
lysate, the size of that chromosomal DNA may also be a critical factor in its downstream
removal. Therefore, we conclude that the alkaline lysis step can only be properly optimised by
taking into account its effect on the subsequent downstream purification steps. Chapter 7,
which follows, examines the effect o f chromosomal DNA dénaturation and chromosomal DNA
size on chromosomal DNA downstream removal from the supercoiled plasmid product.
Chapter 8 then describes the design of an improved alkaline lysis reactor based on the
fundamentals studies o f DNA stress-induced degradation (chapter 5), the requirements that
downstream purification puts on alkaline lysis (chapter 7), and the understanding o f the lysis
step (chapter 6).
p205
7 Effect of DNA dénaturation and fragmentation on
downstream processingIt was demonstrated in the previous chapter, where the effect o f fluid mixing and fluid shear on
alkaline cell lysis was studied, that optimisation o f the alkaline lysis operation must be
performed in conjunction with an understanding o f how DNA dénaturation and fragmentation
influence subsequent downstream purification steps. This chapter studies the effects o f DNA
dénaturation and fragmentation on a small selection o f typical DNA purification operations.
The unit operations investigated were:
• Filtration: Various pore sizes
• Precipitation: Calcium Chloride and CTAB
• Size Exclusion Chromatography: Sephacryl S I000 SF
• Anion Exchange Chromatography: Q-Sepharose and Poros PI
• Adsorption: Silica Gel
This chapter starts with a summary o f results, followed by a brief introduction into the motive
for these investigations. The materials and methods used in these experiments are then
described. The experimental results are then presented, and finally this chapter concludes with
a discussion o f the results obtained.
7.1 Brief summary of results
Table 7.1 summarised the experimental results presented in this chapter. It was determined that
several o f the separation techniques investigated were very effective at removing single
stranded chromosomal DNA from supercoiled plasmid based on the differences in chemistry
between single-stranded chromosomal DNA and the double-stranded supercoiled plasmid.
Some of the experimental techniques investigated were marginally effective at removing
chromosomal DNA (both double- and single-stranded forms), based on the size difference
between chromosomal DNA and supercoiled plasmid. There was no technique that was good at
removing double-stranded chromosomal DNA. Therefore, maximising the conversion o f
chromosomal DNA to single-stranded form during alkaline lysis is essential.
p206
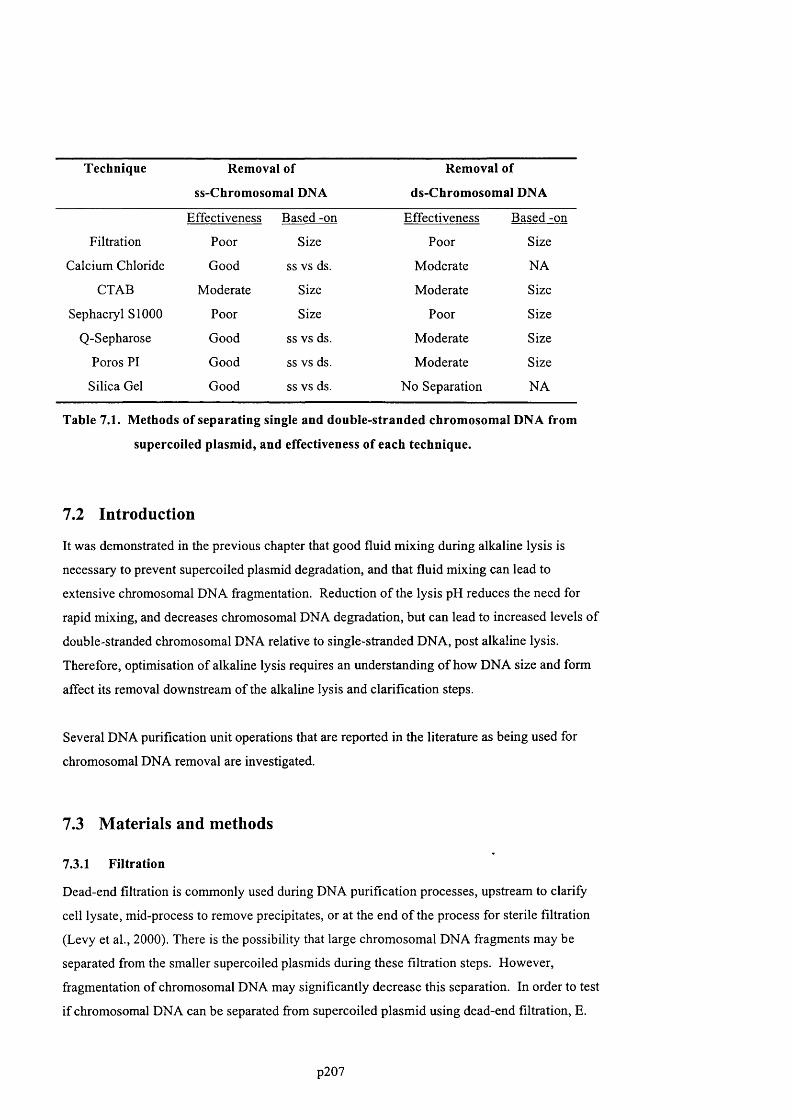
Technique Removal of
ss-Chromosomal DNA
Removal of
ds-Chromosomal DNA
Effectiveness Based -on Effectiveness Based -on
Filtration Poor Size Poor Size
Calcium Chloride Good ss vs ds. Moderate NA
CTAB Moderate Size Moderate Size
Sephacryl SIOOO Poor Size Poor Size
Q-Sepharose Good ss vs ds. Moderate Size
Poros PI Good ss vs ds. Moderate Size
Silica Gel Good ss vs ds. No Separation NA
Table 7.1. Methods of separating single and double-stranded chromosomal DNA from
supercoiled plasmid, and effectiveness of each technique.
7.2 Introduction
It was demonstrated in the previous chapter that good fluid mixing during alkaline lysis is
necessary to prevent supercoiled plasmid degradation, and that fluid mixing can lead to
extensive chromosomal DNA fragmentation. Reduction o f the lysis pH reduces the need for
rapid mixing, and decreases chromosomal DNA degradation, but can lead to increased levels of
double-stranded chromosomal DNA relative to single-stranded DNA, post alkaline lysis.
Therefore, optimisation o f alkaline lysis requires an understanding o f how DNA size and form
affect its removal downstream of the alkaline lysis and clarification steps.
Several DNA purification unit operations that are reported in the literature as being used for
chromosomal DNA removal are investigated.
7.3 Materials and methods
7.3.1 Filtration
Dead-end filtration is commonly used during DNA purification processes, upstream to clarify
cell lysate, mid-process to remove precipitates, or at the end o f the process for sterile filtration
(Levy et al., 2000). There is the possibility that large chromosomal DNA fragments may be
separated from the smaller supercoiled plasmids during these filtration steps. However,
fragmentation o f chromosomal DNA may significantly decrease this separation. In order to test
if chromosomal DNA can be separated from supercoiled plasmid using dead-end filtration, E.
p207

coli D H 5a cell pastes, from plasmid deficient cells, was alkaline lysed. The cells were lysed
and clarified under conditions o f low fluid stress, using the standard lysis and clarification
protocol. 2 mL of clarified alkaline lysate was placed in a syringe and pushed through five
different filters:
1. Whatman 1 filter paper
2. Whatman 42 filter paper
3. 1.2 micron PVDF Millipore filter
4. 0.45 micron PVDF Millipore filter
5. 0.20 micron PVDF Millipore filter
A small plastic filter-holder was used to hold the Whatman filter paper, and connect it to the
syringe. Each filtration experiment was repeated in duplicate, and assayed by Poros PI HPLC.
7.3.2 Precipitation using CTAB
Effect of chromosomal dénaturation
Using pure double- and single-stranded chromosomal DNA, a solution o f 100 |ig/ml double
stranded chromosomal DNA and 100 pg/ml ss-DNA was prepared in TE buffer. A stock
solution of 0.03% CTAB in 20 mM NaCI was prepared. Using the CTAB stock solution, and a
20 mM NaCl solution, a series of CTAB solution from 0 to 0.03% CTAB w/v, 20 mM NaCl,
were prepared. An equal volume of each CTAB solution was added to 0.5 mL of chromosomal
DNA solution. Each sample was mixed gently for 10 minutes and centrifuged at 13 krpm for 20
minutes. To each supernatant, two volumes of 100% ethanol were added to precipitate DNA.
Each sample was centrifuged, as above, to pellet the DNA precipitate. Each pellet was washed
with 70% ethanol, and resuspended in 0.2 mL TE buffer. Each resuspended sample was
assayed by Poros PI HPLC for single- and double-stranded chromosomal DNA.
Effect of chromosomal DNA fragment size on post-CTAB resuspension
In chapter 5, pure double-stranded chromosomal was shear degraded to smaller fragment size
by forcing it through PEEK capillaries at different flowrates. Three of these pure solutions of
chromosomal DNA fragments, at 15,40 and 90 kb average size as determined by pulsed-field
gel electrophoresis, were used for CTAB experiments. Each of the three chromosomal
solutions, at approximately 10 pg/ml, was divided into 12 separate 0.5 mL aliquots. Each
solution was precipitated with one volume of CTAB solution, 0.3% CTAB, 20 mM NaCl. A
solution of pure supercoiled plasmid pSVb, at 10 fig/ml was divided into 12 separate aliquots
and each precipitated using CTAB. Each sample was centrifuged at 13 krpm for 20 minutes to
pellet the DNA. The supernatants were discarded. Each set of samples was then resuspended in
0.5 mL of 0 M to 1.2 M NaCl. Each sample was mixed gently for 10 minutes and then
p208

centrifuged for 20 minutes at 13 krpm. Each supernatant was transferred to a new tube and 5 M
NaCl was added to each sample to a concentration o f 2 M NaCl and mixed for 5 minutes. Each
sample was then diluted 1:5,000 with 2M NaCl and assayed using Picogreen fluorescence
assay.
7.3.3 Calcium chloride precipitation
Effect of dénaturation conditions
The effect of NaOH concentration during alkaline lysis on calcium chloride precipitation of the
clarified lysate was investigated. Clarified alkaline lysates, from a plasmid-containing (pSVP)
and a plasmid-deficient cell paste, were prepared on the 2 mL scale using the standard lysis and
clarification protocol, except that the concentration o f NaOH during lysis was 0, 0.05, 0.075 or
0.10 M NaOH. A 5 M CaCb solution was added to 0.5 mL of each clarified lysate to a
concentration of 0.5 M CaClz. Each sample was mixed on a shaker for 30 min and then
centrifuged at 13 krpm for 30 minutes. The pellets were discarded and each supernatant was
precipitated with 2 volumes of ethanol and centrifuged at 13 krpm for 30 minutes. The pellets
were washed with 70% ethanol and resuspended in 0.3 mL TE. Each sample was assayed by
Poros PI HPLC for supercoiled plasmid, and DNA impurities.
Effect of DNA Shear
Clarified alkaline lysate was prepared from a plasmid-containing, and a plasmid-deficient cell
paste, using the standard lysis protocol. These lysates were stressed by forcing them through a
0.010” PEEK capillary at a one of five different flowrates, 10-times, using a Hamilton syringe
pump. After stressing each sample, they were neutralised and clarified as per the standard
protocol. Each o f the five clarified alkaline lysates was precipitated with 0.5 M CaCb- The
samples were centrifuged, ethanol precipitated, resuspended and assayed as described in the
previous section.
7.3.4 Size exclusion chromatography using Sephacryl SIOOO
A 10 cm long, Pharmacia-XK column was packed with Sephacryl -SIOOO SF chromatography
resin, and equilibrated in TE buffer. 100 pi of pure chromosomal DNA at 40 pg/mL or pure
supercoiled plasmid DNA pSVp at 30 pg/mL was injected onto the Sephacryl column at
flowrates from 0.05 to 1.0 mL/min. The elution of DNA was monitored by absorbance at 260
nm.
p209

7.3.5 Anion exchange chromatography: Poros PI and Q-Sepharose
Pure chromosomal DNA, at approximately 150 pg/mL was fragmented under conditions of
varying fluid stress. Aliquots of DNA, 2 mL, were placed in a plastic syringe and manually
pushed through a 0.01” ID, 0.007" ID or 0.005” ID, 5 cm long PEEK capillary, as described in
Materials and Methods, chapter 5. The size of the chromosomal DNA fragments was
determined by pulsed-field gel electrophoresis.
7.3.6 Adsorption using silica gel
Binding capacity
0.5 mL aliquots o f pure single-stranded chromosomal DNA at 10 pg/ml, 1 M NaCl, 10 mM
Tris, pH 7.0, were placed in 1 mL test-tubes. 0.5 mL of silica gel at solution at 0, 40, 80, 120,
160 and 200 mg/mL in 1.0 M NaCl, 10 mM Tris, pH 7 was added to the tubes. The samples
were moderately mixed for 2 hours on a shaker at room temperature. The samples were
centrifuged at 13 krpm for 5 minutes and the supernatants assayed by Poros PI HPLC for single
stranded DNA content. The supernatants were diluted 1:2 before HPLC assay to reduce the
NaCl concentration in the samples.
Purification of supercoiled plasmid DNA
The ability of silica gel to remove chromosomal DNA from supercoiled plasmid was tested on
CTAB-purified lysate. Clarified alkaline lysate was prepared from E. coli DH5a pSVp cells at
2 mL scale using the standard protocol. The clarified lysate was further purified by CTAB
precipitation (ref). 1 mL of clarified lysate was mixed with 0.1 mL of 0.3% w/v CTAB in 20
mM NaCl. The sample was centrifuged at 13 krpm, 30 minutes. The pellet was resuspended in
0.5 mL o f 1 M NaCl, 10 mM Tris, pH 7.0. The resuspension was precipitates with 1 mL 100%
ethanol and centrifuged at 13 krpm, 30 minutes. The pellet was washed with 70% ethanol and
resuspended in 2 mL Tris, pH 7.0 to make the CTAB-purified lysate. 5 M NaCl was added to
0.5 mL of the CTAB-purified lysate to a concentration of 1 M NaCl, followed by 1 mL of 100
mg/mL silica gel, 1 M NaCl, 10 mM Tris, pH 7.0. The sample was mixed for 2 h on a vortexer-
shaker and then centrifuged at 13 krpm for 5 minutes to pellet the silica. The supernatant was
assayed by Poros PI HPLC for supercoiled plasmid DNA and DNA impurities. The CTAB-
purified lysate, before silica treatment, was also assayed by Poros PI HPLC.
Removal of open-circular plasmid DNA
0.5 mL of pure heat-degraded plasmid (refer to section 4.3.7) was denatured-renatured using the
standard protocol and adjusted to 1 M NaCl. The sample was incubated with silica gel at 200
mg silica/ pg total DNA for 2 h at room temperature with moderate mixing. The sample was
p210

centrifuged at 13 krpm, 5 min to remove the silica. The supernatant was assayed by agarose gel
electrophoresis to determine supercoiled and open-circular plasmid concentration. The original
heat-degraded plasmid was also run on the same gel.
7.4 Experimental results
7.4.1 Filtration of clarified alkaline lysates
Figure 7.1 shows the yield o f chromosomal DNA across the filtration steps, as a function of
filter-type used. Despite the clarified lysate being prepared under conditions o f low shear, to
maximise chromosomal DNA size, the removal of chromosomal DNA across the filters was
low. Hence, separation of supercoiled plasmid DNA and chromosomal DNA across filtration
operations will in general be poor, and therefore fragmentation o f chromosomal DNA will not
significantly affect removal o f chromosomal DNA.
T32Io0)a:<zo.cu
100%
80%
60%
40% '
20%
0 % i -
Whatman 1 Whatman 42 1.2 micron 0.45 micron 0.2 micron
Filter Type
Figure 7.1. Effect of dead-end filtration on chromosomal DNA transmission in alkaline
lysates.
7.4.2 Precipitation using CTAB
Lander et al. (2002) has reported the use of CTAB to precipitate DNA in cell lysates. This
precipitation technique is an excellent way of separating DNA from RNA, cell debris, protein
and endotoxin. Although separation o f chromosomal DNA was minimal during the
precipitation step, they reported some separation of chromosomal DNA through careful
resuspension of the CTAB pellet using an optimum NaCl concentration. The effect of
p211

chromosomal DNA dénaturation and fragmentation on its resuspension using CTAB was
investigated.
Effect of chromosomal dénaturation
Figure 7.2 shows the concentration of both double- and single-stranded chromosomal DNA in a
pure DNA solution as a function of CTAB concentration. The precipitation o f DNA was not
significantly affected by whether it was in double-stranded or single-stranded form. Therefore
CTAB cannot be used to separate DNA based on whether it is in double- or single-stranded
form, and the degree o f chromosomal DNA dénaturation during alkaline lysis should not impact
CTAB performance.
ED)
<ZD
50
40
30
20
10
O ss-chDNA
□ ds-chDNA
0 0.002 0.004 0.006 0.008 0.01 0.012
CTAB (% w/v)
Figure 7.2. Effect of CTAB concentration on double- and single-stranded chromosomal
DNA in solution.
Effect of chromosomal DNA fragment size on post-CTAB resuspension
Lander et al. reported that careful resuspension of CTAB-DNA precipitate at a specific NaCl
concentration provided some separation of supercoiled plasmid DNA from chromosomal DNA
impurities, as the supercoiled plasmid resuspended at a slightly lower NaCl concentration than
the bulk of the chromosomal DNA. Three solutions of chromosomal DNA fragments and one
solution of supercoiled plasmid were precipitated using CTAB, as described in Materials and
Methods. Figure 7.3 shows the concentration of chromosomal DNA and supercoiled plasmid in
solution as a function o f the NaCl concentration used to resuspend the DNA-CTAB pellets. The
small and medium chromosomal DNA fragments resuspended at the same NaCl concentration
p212
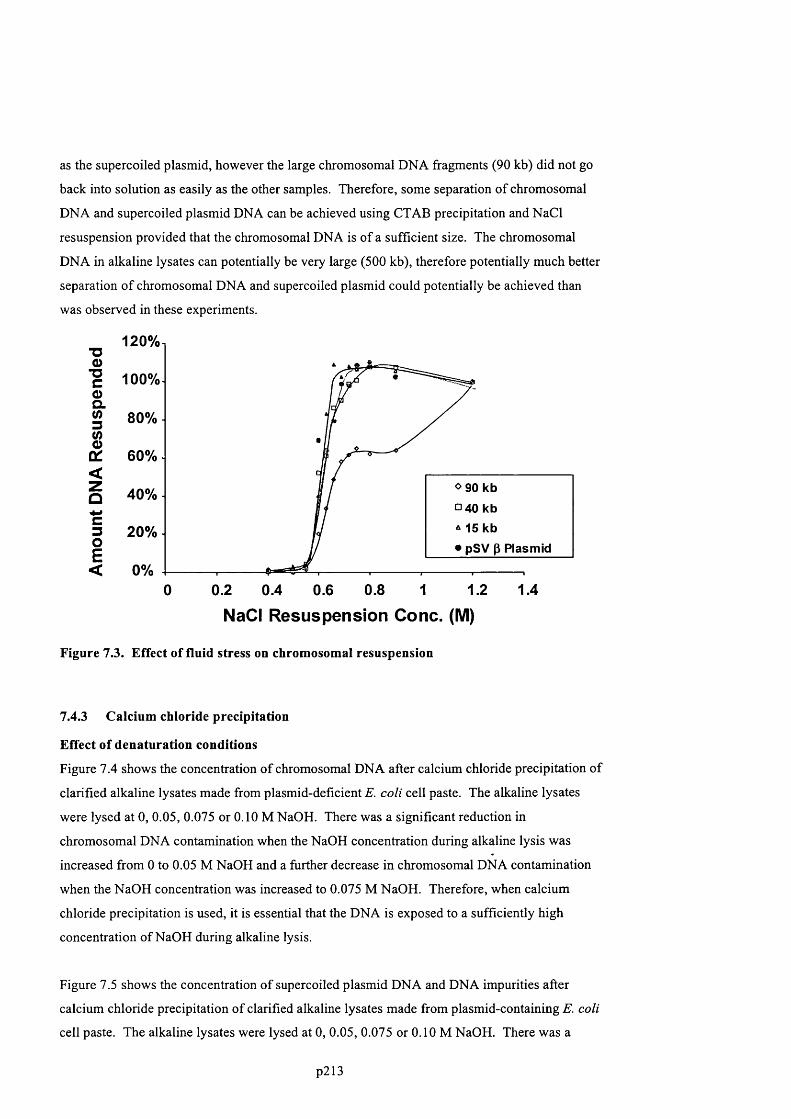
as the supercoiled plasmid, however the large chromosomal DNA fragments (90 kb) did not go
back into solution as easily as the other samples. Therefore, some separation o f chromosomal
DNA and supercoiled plasmid DNA can be achieved using CTAB precipitation and NaCl
resuspension provided that the chromosomal DNA is of a sufficient size. The chromosomal
DNA in alkaline lysates can potentially be very large (500 kb), therefore potentially much better
separation o f chromosomal DNA and supercoiled plasmid could potentially be achieved than
was observed in these experiments.
"O0)
"Uc0)CL(03g
a :<zQ
3OE<
120%
100%
8 0 %
6 0 %
4 0 %
20%
0%
0 90 kb
□40 kb 15 kb
• pSV p Plasmid
0 0 . 2 0 . 4 0 . 6 0 . 8 1 1 . 2 1 . 4
NaCl Resuspension Cone. (M)
Figure 7.3. Effect of fluid stress on chromosomal resuspension
7.4.3 Calcium chloride precipitation
Effect of dénaturation conditions
Figure 7.4 shows the concentration o f chromosomal DNA after calcium chloride precipitation of
clarified alkaline lysates made from plasmid-deficient £. coli cell paste. The alkaline lysates
were lysed at 0, 0.05, 0.075 or 0.10 M NaOH. There was a significant reduction in
chromosomal DNA contamination when the NaOH concentration during alkaline lysis was
increased from 0 to 0.05 M NaOH and a further decrease in chromosomal DNA contamination
when the NaOH concentration was increased to 0.075 M NaOH. Therefore, when calcium
chloride precipitation is used, it is essential that the DNA is exposed to a sufficiently high
concentration o f NaOH during alkaline lysis.
Figure 7.5 shows the concentration o f supercoiled plasmid DNA and DNA impurities after
calcium chloride precipitation o f clarified alkaline lysates made from plasmid-containing E. coli
cell paste. The alkaline lysates were lysed at 0, 0.05, 0.075 or 0.10 M NaOH. There was a
p213
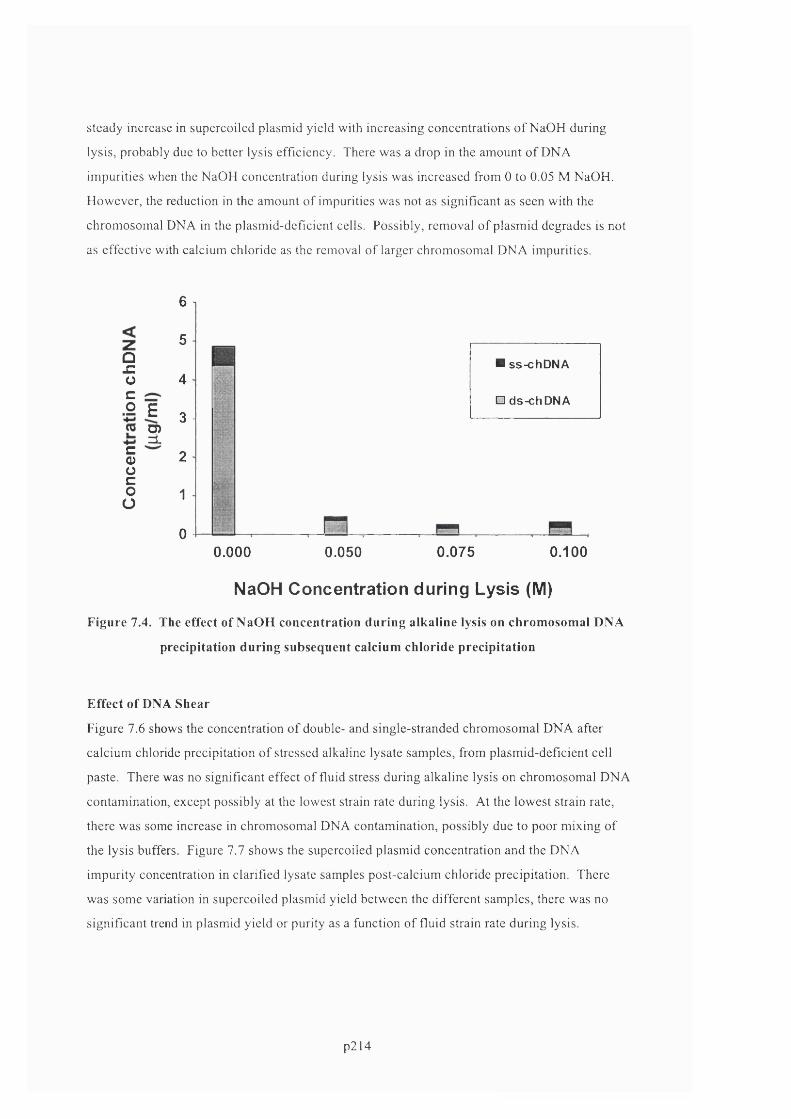
steady increase in supercoiled plasmid yield with increasing concentrations of NaOH during
lysis, probably due to better lysis efficiency. There was a drop in the amount o f DNA
impurities when the NaOH concentration during lysis was increased from 0 to 0.05 M NaOH.
However, the reduction in the amount of impurities was not as significant as seen with the
chromosomal DNA in the plasmid-deficient cells. Possibly, removal of plasmid degrades is not
as effective with calcium chloride as the removal of larger chromosomal DNA impurities.
Û_Coco
c0)oco
u
6 1
5
4
E 3-O):±
2
1
0
■ ss-chDNA
E) ds-chDNA
0.000 0.050 0.075 0.100
NaOH Concentration during Lysis (M)
Figure 7.4. The effect of NaOH concentration during alkaline lysis on chromosomal DNA
precipitation during subsequent calcium chloride precipitation
Effect of DNA Shear
Figure 7.6 shows the concentration o f double- and single-stranded chromosomal DNA after
calcium chloride precipitation of stressed alkaline lysate samples, from plasmid-deficient cell
paste. There was no significant effect of fluid stress during alkaline lysis on chromosomal DNA
contamination, except possibly at the lowest strain rate during lysis. At the lowest strain rate,
there was some increase in chromosomal DNA contamination, possibly due to poor mixing of
the lysis buffers. Figure 7.7 shows the supercoiled plasmid concentration and the DNA
impurity concentration in clarified lysate samples post-calcium chloride precipitation. There
was some variation in supercoiled plasmid yield between the different samples, there was no
significant trend in plasmid yield or purity as a function of fluid strain rate during lysis.
p214

co+32C c z
ilO ^<Zû
90
80
70
60
50
40
30 i
20 10
0
■ DNA Impurities
0SC-plasmid
0.00 0.05 0.075 0.10
NaOH Concentration at Lysis (M)
Figure 7.5. Effect of N aO H concentration on plasmid and im purity concentration in
calcium chloride precipitated alkaline lysates.
QJCoco
• s E(QL-4-»C0)ocoo
§
0.40
0.30
0.20
0.10
0.00
■ ss-chDNA
O ds-chDNA
I I10 6500 72000 99000 115000
Mixing Strain Rate during lysis (s
Figure 7.6. C oncentrations of double-stranded and single-stranded chrom osom al DNA in
calcium chloride precipitated alkaline lysates.
p215
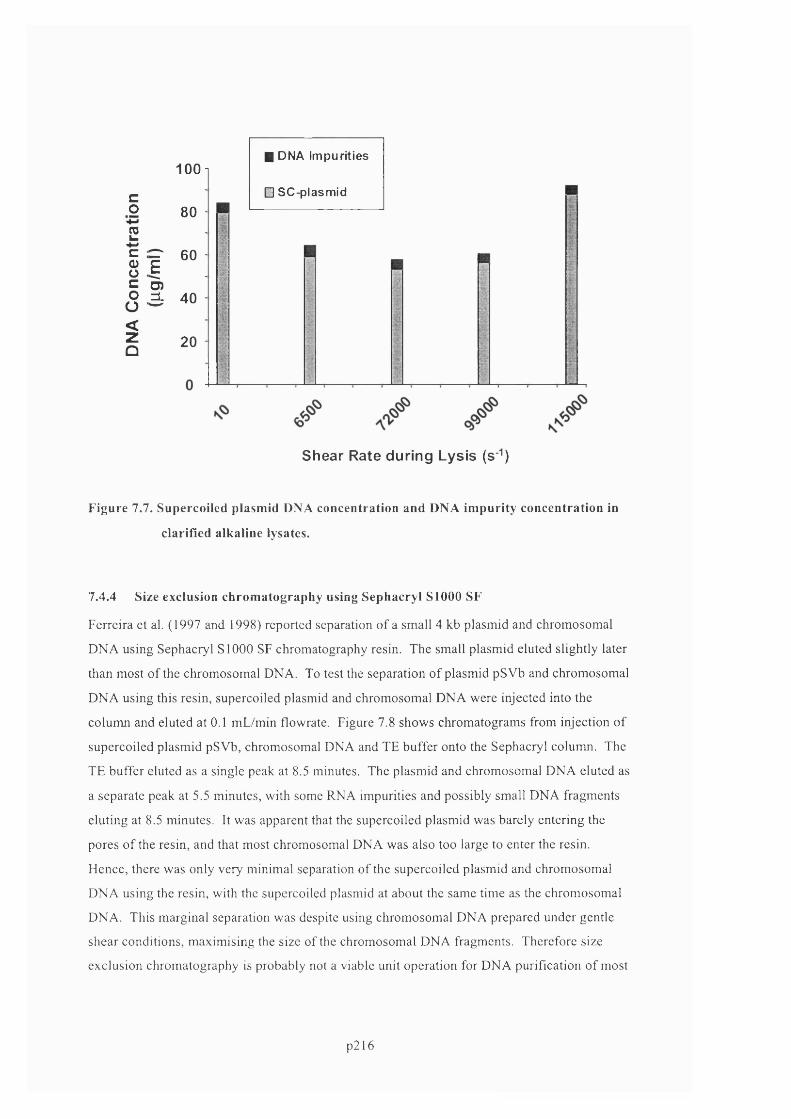
cos4-»c0)o co
0
1û
■ DNA ImpuritiesIOO1
E] SC-plasmid
80
I 60
O)â 40
20
Shear Rate during Lysis (sM)
Figure 7.7. Supercoilcd plasmid DNA concentration and DNA im purity concentration in
clarified alkaline lysates.
7.4.4 Size exclusion chrom atography using Sephacryl SIOOO SF
Ferreira et al. (1997 and 1998) reported separation of a small 4 kb plasmid and ehromosomal
DNA using Sephaeryl SIOOO SF chromatography resin. The small plasmid eluted slightly later
than most o f the chromosomal DNA. To test the separation of plasmid pSVb and chromosomal
DNA using this resin, supercoiled plasmid and chromosomal DNA were injected into the
column and eluted at 0.1 mL/min flowrate. Figure 7.8 shows chromatograms from injection of
supereoiled plasmid pSVb, chromosomal DNA and TE buffer onto the Sephacryl column. The
TE buffer eluted as a single peak at 8.5 minutes. The plasmid and ehromosomal DNA eluted as
a separate peak at 5.5 minutes, with some RNA impurities and possibly small DNA fragments
eluting at 8.5 minutes. It was apparent that the supereoiled plasmid was barely entering the
pores of the resin, and that most chromosomal DNA was also too large to enter the resin.
Hence, there was only very minimal separation of the supereoiled plasmid and chromosomal
DNA using the resin, with the supereoiled plasmid at about the same time as the chromosomal
DNA. This marginal separation was despite using chromosomal DNA prepared under gentle
shear conditions, maximising the size of the chromosomal DNA fragments. Therefore size
exclusion chromatography is probably not a viable unit operation for DNA purification of most
p216
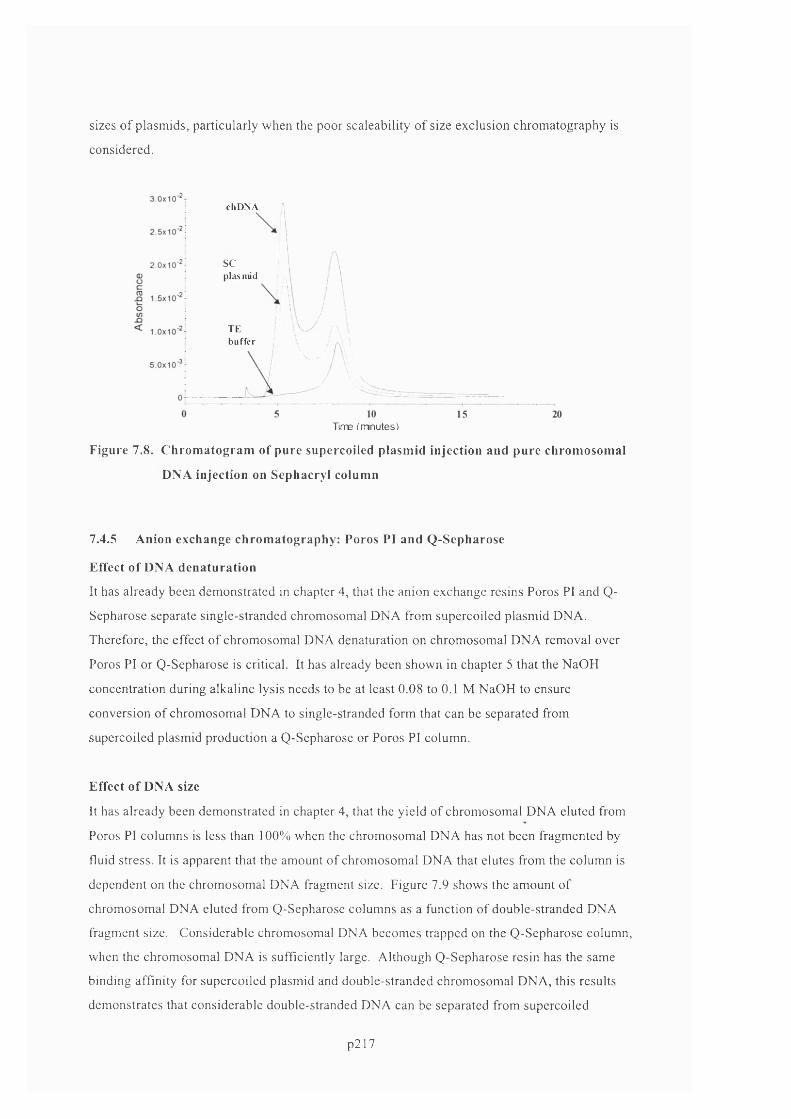
sizes of plasmids, particularly when the poor scaleability of size exclusion chromatography is
considered.
chDNA
SCplasniid
TEbuffer
Time fminutes)
Figure 7.8. C hrom atogram of pure supereoiled plasm id injection and pure chrom osom al
DNA injection on Sephacryl column
7.4.5 Anion exchange chrom atography: Poros PI and Q-Sepharose
Effect of DNA dénaturation
It has already been demonstrated in chapter 4, that the anion exchange resins Poros PI and Q-
Sepharose separate single-stranded ehromosomal DNA from supereoiled plasmid DNA.
Therefore, the effect o f chromosomal DNA dénaturation on chromosomal DNA removal over
Poros PI or Q-Sepharose is critical. It has already been shown in chapter 5 that the NaOH
concentration during alkaline lysis needs to be at least 0.08 to 0.1 M NaOH to ensure
conversion of chromosomal DNA to single-stranded form that can be separated from
supereoiled plasmid production a Q-Sepharose or Poros PI column.
Effect of DNA size
It has already been demonstrated in chapter 4, that the yield of chromosomal DNA eluted from
Poros PI columns is less than 100% when the chromosomal DNA has not been fragmented by
fluid stress. It is apparent that the amount of chromosomal DNA that elutes from the column is
dependent on the chromosomal DNA fragment size. Figure 7.9 shows the amount of
ehromosomal DNA eluted from Q-Sepharose columns as a function of double-stranded DNA
fragment size. Considerable chromosomal DNA becomes trapped on the Q-Sepharose column,
when the chromosomal DNA is sufficiently large. Although Q-Sepharose resin has the same
binding affinity for supereoiled plasmid and double-stranded chromosomal DNA, this results
demonstrates that considerable double-stranded DNA can be separated from supereoiled
p217

plasmid based on the larger size o f chromosomal DNA. To maximise double-stranded
chromosomal DNA removal using Q-Sepharose resin, reduction on fluid stress during lysis is
important.
<Z
E 100%3oo 80% (/)2
60%
^ 40%
E^ 20%
0%o 10 20 30 40 50 60 70 80 900
Average gDNA size (kb)
Figure 7.9. Plot showing effect of chromosomal DNA size on amount of DNA eluted from
Q-Sepharose Hi-trap column.
7.4.6 Adsorption using silica gel
Binding capacity
Silica was demonstrated in chapter 4 to be a suitable resin for separation o f chromosomal DNA
and supereoiled plasmid due to the higher affinity of silica for single-stranded DNA compared
to double-stranded DNA. Following suitable pH treatment to denature chromosomal DNA to
single-stranded form, leaving supereoiled plasmid double-stranded, the chromosomal DNA and
supereoiled plasmid can be separated. Due to the very low cost o f silica gel, it was investigated
as a means of purifying plasmid DNA at manufacturing scale by adsorbing the chromosomal
DNA. It was determined in chapter 4, that at NaCl concentrations less than 1 M NaCl,
supereoiled plasmid did not bind to silica at pH 7.0, while single-stranded DNA did bind.
Experiments were performed to determine the binding capacity o f single-stranded chromosomal
DNA to silica gel at 1 M NaCl, as described in Materials and Methods. The binding capacity of
silica gel for DNA was determined to be about 100 pg ss-DNA/g silica gel, at pH 7.0, 1 M
p218

NaCl. This is about half the binding capacity of Q-Sepharose resin for DNA, reported by
Prazeres et al. (1998). Thus, 2 kg of silica gel would purify 5g o f supereoiled plasmid
containing 4% chromosomal DNA impurity (10 L solution of 200g/L silica gel, 0.5 mg/mL
supereoiled plasmid).
Purification of supereoiled plasmid DNA
Figure 7.10 is a bar graph showing the concentration o f chromosomal DNA in a supereoiled
plasmid sample before and after treatment with silica gel, as described in Materials and
Methods. The chromosomal DNA was reduced from about 35% to about 1% impurity as
measured by HPLC assay. The plasmid DNA yield loss was negligible. Due to the low cost of
silica gel, silica gel adsorption would be suitable method for laboratory scale and pilot scale
plasmid DNA purification. However, because o f its relatively low binding capacity, silica gel
adsorption would probably not be ideal at manufacturing scale.
3CLE
<zo
^ 40%3Q.
^ 30%
O+“OE(/)JSÛ.oCO
20% -
10%
0%Beforesilica
Aftersilica
Figure 7.10 Plot showing the % chromosom al DNA before and after silica gel trea tm ent.
Removal of open-circular plasm id DNA
Separation of open-circular plasmid DNA can also be achieved using silica gel adsorption. As
already shown in chapter 4, open-circular plasmid can be converted to single-stranded form at a
lower pH than supereoiled plasmid. After pH dénaturation, single-stranded plasmid forms can
be separated from supereoiled plasmid forms using silica gel adsorption. Figure 7.11 shows a
heat-degraded plasmid sample containing predominantly open-circular plasmid, with some
supereoiled plasmid, before and after dénaturation and silica gel adsorption. As shown in the
p219
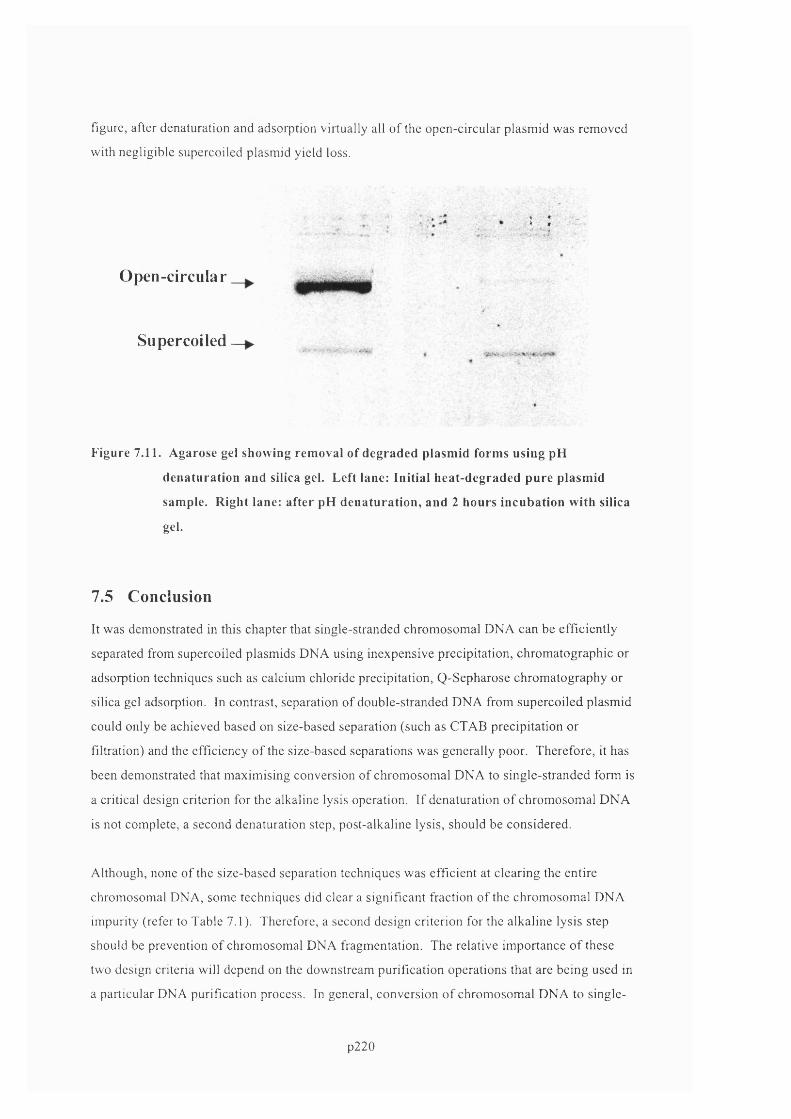
figure, after dénaturation and adsorption virtually all o f the open-circular plasmid was removed
with negligible supereoiled plasmid yield loss.
Open-circular
Supereoiled
Figure 7.11. Agarose gel showing removal of degraded plasmid forms using pH
dénaturation and silica gel. Left lane: Initial heat-degraded pure plasmid
sample. Right lane: after pH dénaturation, and 2 hours incubation with silica
gel.
7.5 Conclusion
It was demonstrated in this chapter that single-stranded chromosomal DNA can be efficiently
separated from supereoiled plasmids DNA using inexpensive precipitation, chromatographic or
adsorption techniques such as calcium chloride precipitation, Q-Sepharose chromatography or
silica gel adsorption. In contrast, separation of double-stranded DNA from supereoiled plasmid
could only be achieved based on size-based separation (such as CTAB precipitation or
filtration) and the efficiency of the size-based separations was generally poor. Therefore, it has
been demonstrated that maximising conversion of chromosomal DNA to single-stranded form is
a critical design criterion for the alkaline lysis operation. If dénaturation of chromosomal DNA
is not complete, a second dénaturation step, post-alkaline lysis, should be considered.
Although, none of the size-based separation techniques was efficient at clearing the entire
chromosomal DNA, some techniques did clear a significant fraction of the chromosomal DNA
impurity (refer to Table 7.1). Therefore, a second design criterion for the alkaline lysis step
should be prevention of chromosomal DNA fragmentation. The relative importance o f these
two design criteria will depend on the downstream purification operations that are being used in
a particular DNA purification process. In general, conversion o f chromosomal DNA to single
p220
stranded form should be significantly more important than prevention of chromosomal
fragmentation, due to the ease o f clearing single-stranded chromosomal DNA compared to
clearing double-stranded chromosomal DNA.
The next chapter will discuss the design of an improved alkaline lysis reactor, based on the
improved understanding o f DNA degradation and alkaline lysis performance and its effect on
downstream purification operations.
p221

8 Design of an opposed jet mixer for alkaline lysisPreviously, chapter 4 presented results into assay development to measure DNA shear-induced
degradation, and chapters 5 and 6 presented results into the effects o f fluid mixing and fluid
shear on DNA degradation in a model flow system and during alkaline lysis. The effect of
DNA dénaturation and DNA fragmentation on overall downstream process performance was
examined in chapter 7. This chapter seeks to apply the knowledge gained from these previous
chapters into designing an improved alkaline lysis step for DNA purification processes. It was
demonstrated in chapter 6 on alkaline lysis, that moderate to high impeller speeds are required
for adequate mixing during alkaline lysis, and that the likely shear rates produced will lead to
significant chromosomal DNA fragmentation. With this in mind, an alternative mixing strategy
consisting o f an opposed jet mixer was examined. Computational Fluid Dynamics simulation,
and laboratory experiment, was performed to understand and predict the performance o f the Jet
mixer.
This chapter starts with a brief summary of results, which is followed by an introduction into
the motivation for designing an opposed Jet lysis reactor. This is followed by a description of
the materials and methods used for the CFD simulation of the Jet mixer and o f the materials and
methods used for the experimental studies of the Jet mixer. The CFD simulation results are then
presented, followed by the experimental results. Finally, the chapter concludes with a
discussion o f the CFD and experimental results.
8.1 Brief summary of results
CFD analysis o f an alkaline lysis operation in an opposed Jet mixer predicted that the rates of
fluid mixing would be very fast and that the levels o f fluid stress would be very low.
Dimensional analysis o f CFD simulation predictions showed the relationship between fluid
stress and mixing times and Jet geometry. Jet flowrate and solution density and viscosity.
Understanding these relationships should allow confident scale-up of Jet mixing devices from
bench-top to manufacturing scale. Experimental studies using the Jet mixer verified the rapid
mixing time obtainable and demonstrated it to be an efficient technique for mixing cells and
lysis buffer during alkaline lysis. Comparison of CFD predictions to experimental observations
demonstrated the validity of the CFD results.
p222
8.2 Introduction
From the studies o f chapter 6 and 7, it was concluded that moderate to high levels o f fluid
mixing, together with low levels of fluid shear, are required during alkaline lysis to optimize
overall process performance. This chapter describes in detail the Computational Fluid
Dynamics analysis, and the experimental verification, o f an improved alkaline lysis reactor
which gave improved performance over more commonly used impeller-driven mixing tanks.
The improved alkaline lysis reactor was an opposed jet mixer consisting o f two jets o f liquid,
one containing cell resuspension, and the other containing lysis buffer. The jets were positioned
directly facing each other such that the jets impacted and mixing o f cells and lysis buffer took
place in the region between the jets.
An inelastic collision between two jets at very high relative velocity causes rapid energy
dissipation in the impingement zone which controls the smallest eddy size within which
molecular diffusion is needed for further micro-mixing. Due to the very short mixing times
attainable in opposed jets (Hamby et al., 1992), and the short exposure time o f the fluids to
regions of high shear (Ciccolini et al., 2002), it was anticipated that an opposed jet device would
provide superior performance to conventional stirred tanks. Opposed jets are widely used in
reaction injection molding (RIM) processing equipment to provide good micro-mixing for
viscous fluids. There is a number of qualitative and quantitative impingement mixing studies
reported in the RJM literature; however, the geometry o f such mixers differs significantly from
that employed here. Several groups have reported on the performance of two opposed Tees for
fluid mixing (Tosun et al., 1987; Forney et al., 1990; Cozewith et al., 1989; O ’Leary et al.,
1985). Again, however, the mixer geometry was not the same as required here for alkaline
lysis. Mahajan et al. (1996) reported on the performance o f opposed jets, similar in design to
the opposed jets used in this work. Using the Bourne reaction to experimentally measure
mixing rates (Hamby et al., 1992) they correlated the performance o f three small scale jets
against jet flow rate and jet diameter. Their study was limited to small-scale jets.
In order to predict the mixing characteristics of opposed jet mixers across a range o f jet
flowrates and jet diameters. Computational Fluid Dynamics (CFD) analysis was performed. As
described in detail in Chapter 3, a computer model o f the opposed jet mixer was created and
flow streamlines, fluid pressures, shear rates and energy dissipation rates within the model were
calculated using CFD simulation. The simulation results were analyzed to determine the
characteristic mixing time within the opposed jet mixer, and to determine the levels o f fluid
stress between the jets. In addition, the fluid dynamics in jets o f varying diameters was
simulated, in order to determine the effects of scaling the unit from bench-top to pilot to
p223

manufacturing scale. After CFD analysis, a small number of experiments were run using an
opposed jet mixing device to lyse E. coli cells containing plasmid pSVp.
8.3 Experimental materials and methods
8.3.1 Je t mixing equipm ent
Two separate Hamilton syringe pumps were used to force lysis solution and resuspended cell
solution into opposed jets; the solutions impinged and were collected below the impingement
region in a plastic container. Figure 8.1 shows a schematic of the opposed jets and the plastic
assembly for aligning the jets. The jets were made o f PEEK tubing, and could be varied from
0.0025” to 0.08” internal diameter (0.06 to 2.0 mm ID). The two jets could be either the same
diameter, or different diameters.
3.2 mm OD SS Tube Bolt Nut Perspex
Fluid 1
Thru-hoie for 1.6 mm OD SS Tube
-> <■ -► -4 -
2 5 m m 5 0 m m
Figure 8.1. D iagram of opposed je t mixing device
25mm
Fluid 2
8.3.2 Pure plasm id DNA and NaOH mixing studies
Pure supereoiled plasmid pSVb at 1 pg/ml in TE was mixed with NaOH (0.2 M, 0.4 M o 1.0 M
NaOH) using the opposed jet mixer. Both the plasmid and NaOH jets were 0.010” ID PEEK
capillaries (0.254 mm ID). The flowrate of the pSVp solution was set to give a jet velocity o f 1
m/s. The flowrate the NaOH solution was set relative to the plasmid flowrate such that the
NaOH concentration after mixing was always 0.1 M NaOH. After mixing 5 mL of plasmid
solution, the solution was neutralised with 2 volumes of 500 mM Tris, pH 7.5. The samples
were assayed for supereoiled plasmid content by Picogreen assay.b
8.3.3 Alkaline lysis mixing studies
To detenuine the performance of opposed jets at mixing resuspended cells and alkaline lysis
buffer, E. coli DH5a pSVb cells were lysed using 1% SDS, 0.2 M NaOH or 2% SDS, 0.4 M
NaOH in the opposed jet mixer, at various flowrates. In all cases, the relative flowrate o f the
p224
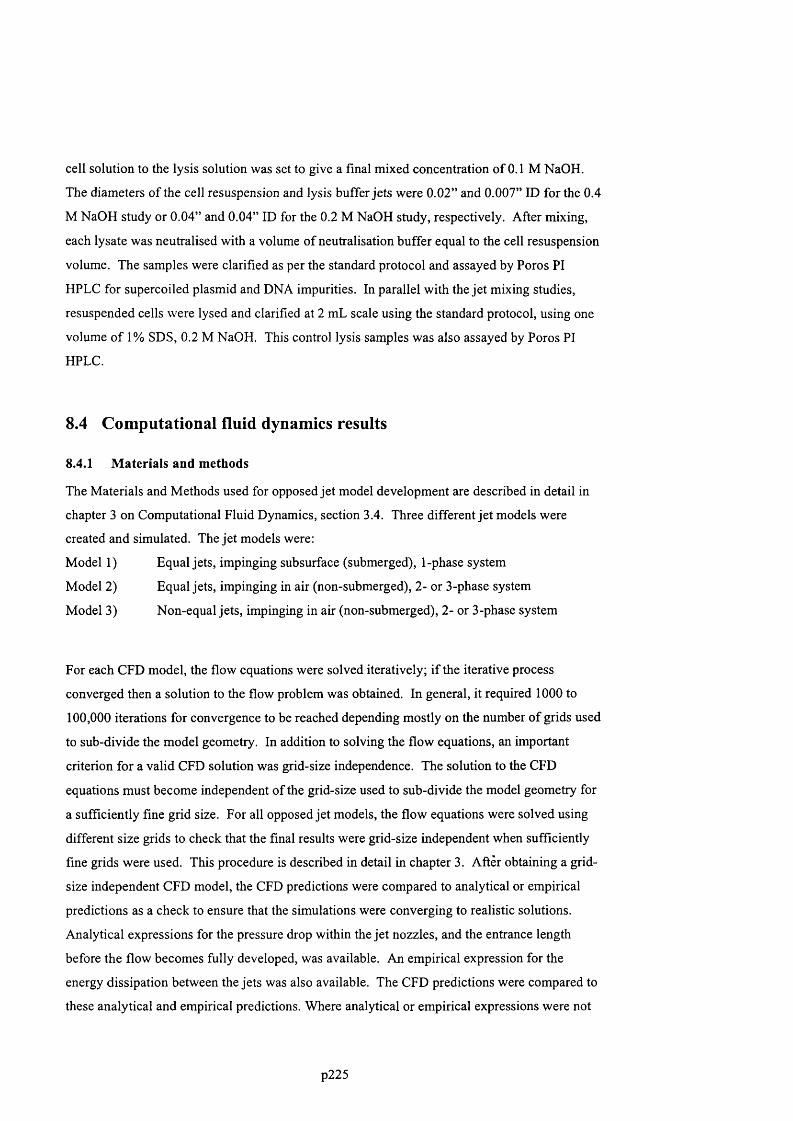
cell solution to the lysis solution was set to give a final mixed concentration of 0.1 M NaOH.
The diameters of the cell resuspension and lysis buffer jets were 0.02” and 0.007” ID for the 0.4
M NaOH study or 0.04” and 0.04” ID for the 0.2 M NaOH study, respectively. After mixing,
each lysate was neutralised with a volume of neutralisation buffer equal to the cell resuspension
volume. The samples were clarified as per the standard protocol and assayed by Poros PI
HPLC for supercoiled plasmid and DNA impurities. In parallel with the Jet mixing studies,
resuspended cells were lysed and clarified at 2 mL scale using the standard protocol, using one
volume of 1% SDS, 0.2 M NaOH. This control lysis samples was also assayed by Poros PI
HPLC.
8.4 Computational fluid dynamics results
8.4.1 M aterials and methods
The Materials and Methods used for opposed jet model development are described in detail in
chapter 3 on Computational Fluid Dynamics, section 3.4. Three different jet models were
created and simulated. The jet models were;
Model 1) Equal jets, impinging subsurface (submerged), 1-phase system
Model 2) Equal jets, impinging in air (non-submerged), 2- or 3-phase system
Model 3) Non-equal jets, impinging in air (non-submerged), 2- or 3-phase system
For eaeh CFD model, the flow equations were solved iteratively; if the iterative process
converged then a solution to the flow problem was obtained. In general, it required 1000 to
100,000 iterations for convergence to be reached depending mostly on the number of grids used
to sub-divide the model geometry. In addition to solving the flow equations, an important
criterion for a valid CFD solution was grid-size independence. The solution to the CFD
equations must become independent of the grid-size used to sub-divide the model geometry for
a sufficiently fine grid size. For all opposed jet models, the flow equations were solved using
different size grids to check that the final results were grid-size independent when sufficiently
fine grids were used. This procedure is described in detail in chapter 3. After obtaining a grid-
size independent CFD model, the CFD predictions were compared to analytical or empirical
predictions as a check to ensure that the simulations were converging to realistic solutions.
Analytical expressions for the pressure drop within the jet nozzles, and the entrance length
before the flow becomes fully developed, was available. An empirical expression for the
energy dissipation between the jets was also available. The CFD predictions were compared to
these analytical and empirical predictions. Where analytical or empirical expressions were not
p225
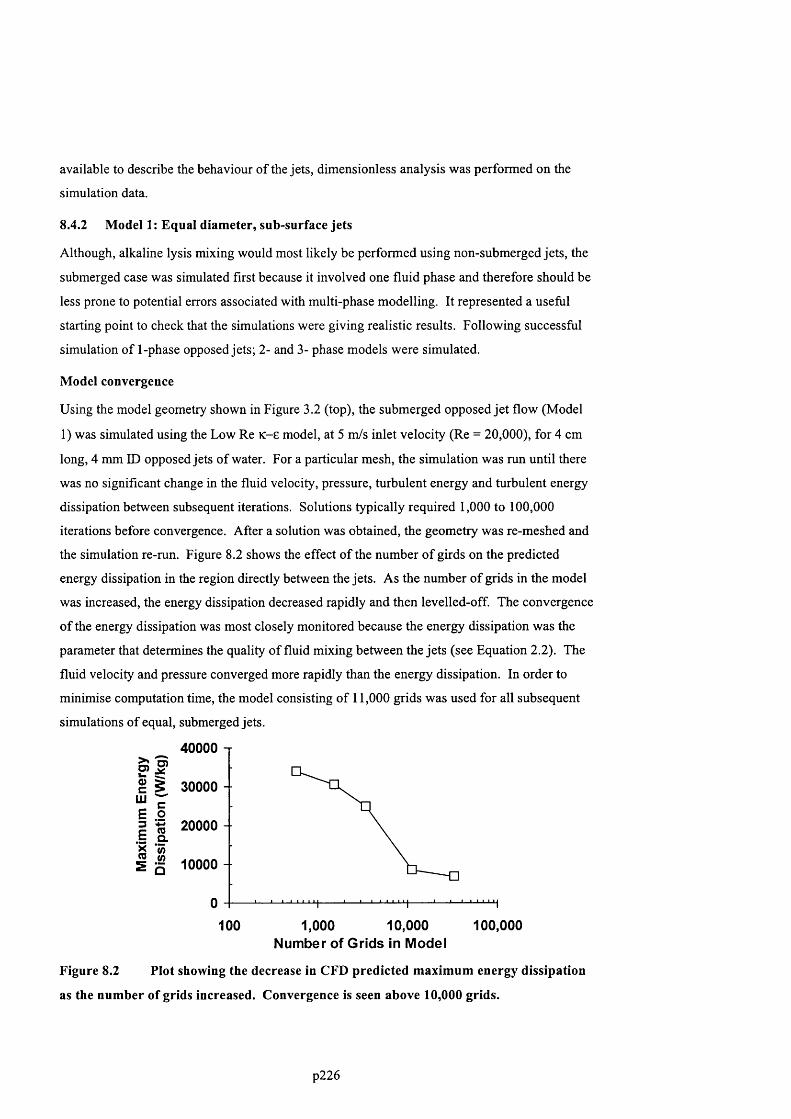
available to describe the behaviour of the jets, dimensionless analysis was performed on the
simulation data.
8.4.2 Model 1: Equal diam eter, sub-surface jets
Although, alkaline lysis mixing would most likely be performed using non-submerged jets, the
submerged case was simulated first because it involved one fluid phase and therefore should be
less prone to potential errors associated with multi-phase modelling. It represented a useful
starting point to check that the simulations were giving realistic results. Following successful
simulation of 1-phase opposed jets; 2- and 3- phase models were simulated.
Model convergence
Using the model geometry shown in Figure 3.2 (top), the submerged opposed jet flow (Model
1) was simulated using the Low Re K-e model, at 5 m/s inlet velocity (Re = 20,000), for 4 cm
long, 4 mm ID opposed jets of water. For a particular mesh, the simulation was run until there
was no significant change in the fluid velocity, pressure, turbulent energy and turbulent energy
dissipation between subsequent iterations. Solutions typically required 1,000 to 100,000
iterations before convergence. After a solution was obtained, the geometry was re-meshed and
the simulation re-run. Figure 8.2 shows the effect o f the number o f girds on the predicted
energy dissipation in the region directly between the jets. As the number of grids in the model
was increased, the energy dissipation decreased rapidly and then levelled-off. The convergence
o f the energy dissipation was most closely monitored because the energy dissipation was the
parameter that determines the quality o f fluid mixing between the jets (see Equation 2.2). The
fluid velocity and pressure converged more rapidly than the energy dissipation. In order to
minimise computation time, the model consisting o f 11,000 grids was used for all subsequent
simulations of equal, submerged jets.
it40000
30000
20000
10000
0100 1,000 10,000 100,000
Number of Grids in Modei
Figure 8.2 Plot showing the decrease in CFD predicted m axim um energy dissipation
as the num ber of grids increased. Convergence is seen above 10,000 grids.
p226
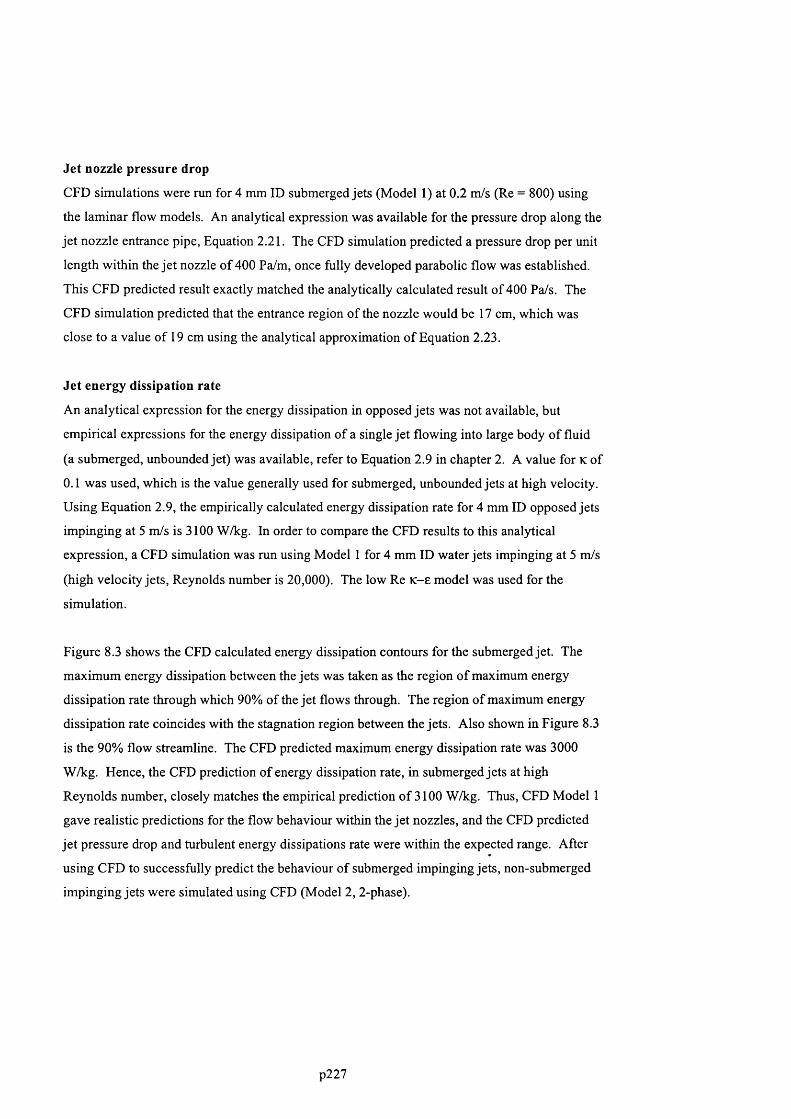
Jet nozzle pressure drop
CFD simulations were run for 4 mm ID submerged jets (Model 1) at 0.2 m/s (Re = 800) using
the laminar flow models. An analytical expression was available for the pressure drop along the
jet nozzle entrance pipe, Equation 2.21. The CFD simulation predicted a pressure drop per unit
length within the jet nozzle of 400 Pa/m, once fully developed parabolic flow was established.
This CFD predicted result exactly matched the analytically calculated result of 400 Pa/s. The
CFD simulation predicted that the entrance region o f the nozzle would be 17 cm, which was
close to a value of 19 cm using the analytical approximation o f Equation 2.23.
Jet energy dissipation rate
An analytical expression for the energy dissipation in opposed jets was not available, but
empirical expressions for the energy dissipation of a single jet flowing into large body of fluid
(a submerged, unbounded jet) was available, refer to Equation 2.9 in chapter 2. A value for k of
0.1 was used, which is the value generally used for submerged, unbounded jets at high velocity.
Using Equation 2.9, the empirically calculated energy dissipation rate for 4 mm ID opposed jets
impinging at 5 m/s is 3100 W/kg. In order to compare the CFD results to this analytical
expression, a CFD simulation was run using Model 1 for 4 mm ID water jets impinging at 5 m/s
(high velocity jets, Reynolds number is 20,000). The low Re K-e model was used for the
simulation.
Figure 8.3 shows the CFD calculated energy dissipation contours for the submerged jet. The
maximum energy dissipation between the jets was taken as the region o f maximum energy
dissipation rate through which 90% of the jet flows through. The region of maximum energy
dissipation rate coincides with the stagnation region between the jets. Also shown in Figure 8.3
is the 90% flow streamline. The CFD predicted maximum energy dissipation rate was 3000
W/kg. Hence, the CFD prediction o f energy dissipation rate, in submerged jets at high
Reynolds number, closely matches the empirical prediction o f 3100 W/kg. Thus, CFD Model 1
gave realistic predictions for the flow behaviour within the jet nozzles, and the CFD predicted
jet pressure drop and turbulent energy dissipations rate were within the expected range. After
using CFD to successfully predict the behaviour of submerged impinging jets, non-submerged
impinging jets were simulated using CFD (Model 2, 2-phase).
p227

OiZX
D0I
Figure 8.3. Filled contour plots for the CFD predicted energy dissipation rates between
subm erged jets. Je t velocity was 5 m/s, 4 mm ID jets. Also shown are the
fluid stream lines that encompass 90% of the fluid flow .
8.4.3 Model 2: Equal d iam eter, non-submerged im pinging jets
The dimensions of Model 2 geometry were the same as Model 1 (refer to Figure 3.2, top).
Model 2 consisted o f liquid jets impinging in air, compared to liquid jets impinging in liquid for
Model 1.
Model Convergence
A set of simulations was run with Model 2 using jets of water at 1 m/s (Re = 4000) to check for
grid-size independence. The Low Re K-e model was the turbulence model used. Figure 8.4
shows the effect o f the number of grids used to sub-divide the flow domain on the energy
dissipation in the region directly between the jets. The CFD predicted maximum energy
dissipation between the jets decreased rapidly as the number of grids increased and converged
above 1500 grids. In order to minimise computation time, the model consisting of 1570 grids
was used for all subsequent simulations of equal, non-submerged jets.
Comparing the grid convergence study for Model 1 with Model 2, the submerged jet model
required significantly more grids for convergence. It was observed in Model 1 that there were
localised regions at the exit of the jet nozzles where significant energy dissipation occurred.
This was caused by high velocity liquid leaving the jet nozzle and entraining stationery liquid.
When a low number of grids were used, the CFD simulation gave an inordinately high energy
dissipation rate in this region. It required long simulation times and a large number o f grids to
p228
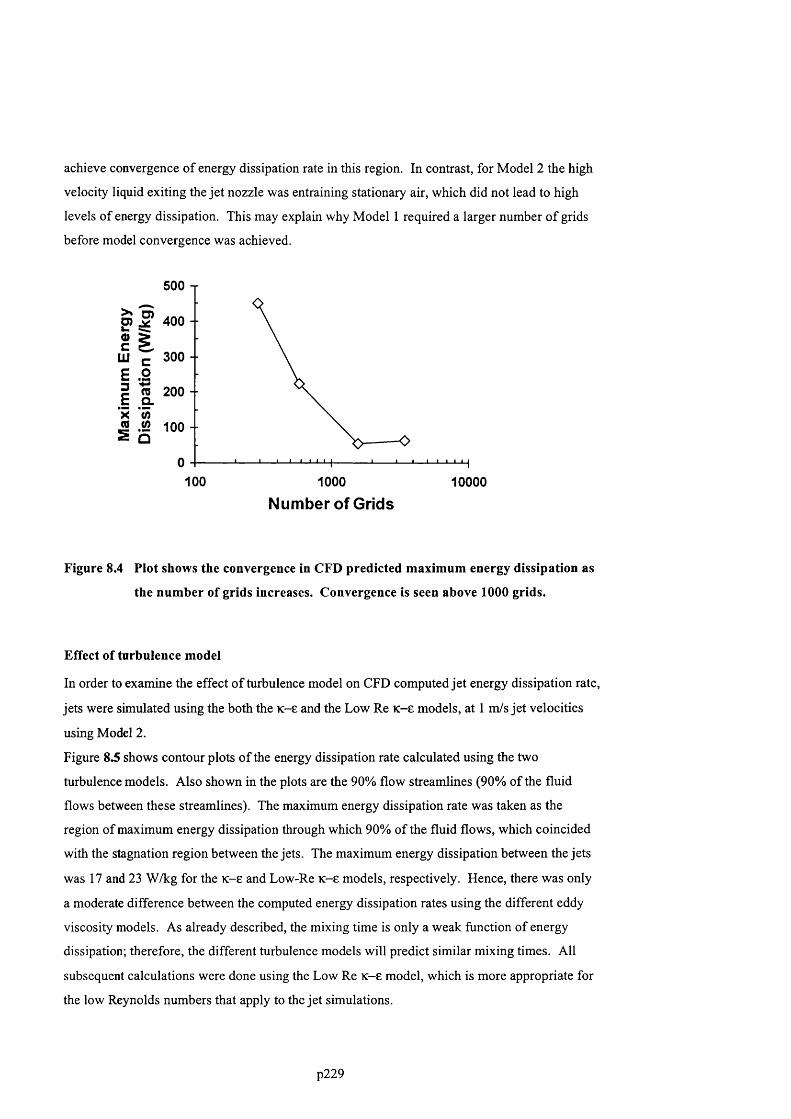
achieve convergence o f energy dissipation rate in this region. In contrast, for Model 2 the high
velocity liquid exiting the jet nozzle was entraining stationary air, which did not lead to high
levels of energy dissipation. This may explain why Model 1 required a larger number o f grids
before model convergence was achieved.
500
O) S 400
s iLU g. 300E P
cs 200 Q.'w.Î2 100 Q
100 1000 10000
Number of Grids
Figure 8.4 Plot shows the convergence in CFD predicted maximum energy dissipation as
the number of grids increases. Convergence is seen above 1000 grids.
Effect of turbulence model
In order to examine the effect o f turbulence model on CFD computed jet energy dissipation rate,
jets were simulated using the both the K-e and the Low Re K-e models, at 1 m/s jet velocities
using Model 2.
Figure 8.5 shows contour plots o f the energy dissipation rate calculated using the two
turbulence models. Also shown in the plots are the 90% flow streamlines (90% of the fluid
flows between these streamlines). The maximum energy dissipation rate was taken as the
region o f maximum energy dissipation through which 90% of the fluid flows, which coincided
with the stagnation region between the jets. The maximum energy dissipation between the jets
was 17 and 23 W/kg for the K-e and Low-Re K-e models, respectively. Hence, there was only
a moderate difference between the computed energy dissipation rates using the different eddy
viscosity models. As already described, the mixing time is only a weak function of energy
dissipation; therefore, the different turbulence models will predict similar mixing times. All
subsequent calculations were done using the Low Re K-e model, which is more appropriate for
the low Reynolds numbers that apply to the jet simulations.
p229

c/3r-f~PRru
Distance (mX
ac/3’f—f-pRCD
--------------------Distance (m) ----------------------Figure 8.5. C ontour plots of CFD predicted m axim um energy dissipation between
opposed w ater jets at 1 m/s velocity. Top: K -e model. Bottom: Low Re K -e model. Also
shown in the plots are the 90% flow stream lines. The predicted energy dissipation in the
elliptical region between the jets was 17 and 23 W /kg for the K -e model and Low Re K -e
model, respectively. The K -e model predicts a small am ount of energy dissipation in the
gas-phase close to the je t im pingem ent region; this should not affect the je t mixing
perform ance.
p230
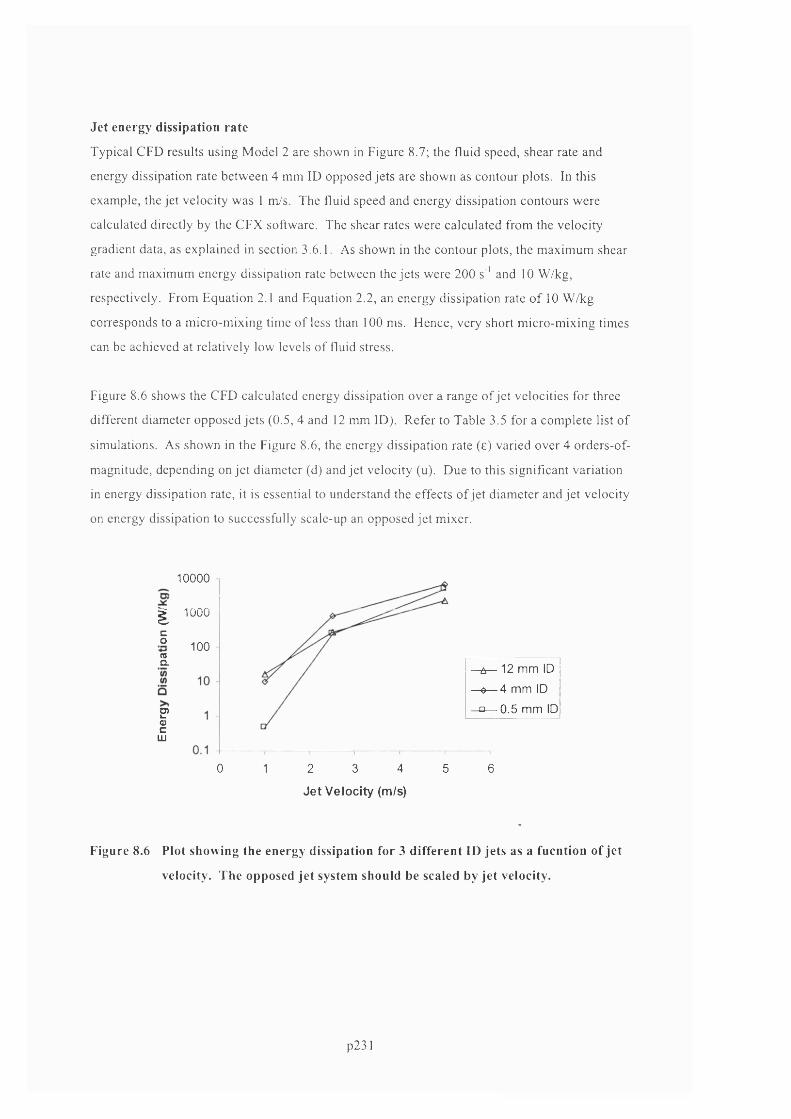
Je t energy dissipation ra te
Typical CFD results using Model 2 are shown in Figure 8.7; the fluid speed, shear rate and
energy dissipation rate between 4 mm ID opposed jets are shown as contour plots. In this
example, the jet velocity was 1 m/s. The fluid speed and energy dissipation contours were
calculated directly by the CFX software. The shear rates were calculated from the velocity
gradient data, as explained in section 3.6.1. As shown in the contour plots, the maxim um shear
rate and maximum energy dissipation rate between the jets were 200 s’’ and 10 W/kg,
respectively. From Equation 2.1 and Equation 2.2, an energy dissipation rate o f 10 W /kg
corresponds to a m icro-m ixing time o f less than 100 ms. Hence, very short m icro-m ixing times
can be achieved at relatively low levels o f fluid stress.
Figure 8.6 shows the CFD calculated energy dissipation over a range o f je t velocities for three
different diameter opposed je ts (0.5, 4 and 12 mm ID). Refer to Table 3.5 for a com plete list o f
simulations. As shown in the Figure 8.6, the energy dissipation rate (e) varied over 4 orders-of-
magnitude, depending on je t diameter (d) and je t velocity (u). Due to this significant variation
in energy dissipation rate, it is essential to understand the effects o f je t diam eter and je t velocity
on energy dissipation to successfully scale-up an opposed je t mixer.
10000
I 1000 -
CO 100%a-A— 12 mm ID
-0— 4 mm ID
-o— 0.5 mm IDS’0)cUJ
0 2 3 4 61 5
Jet Velocity (m/s)
Figure 8.6 Plot showing the energy dissipation for 3 d ifferent ID jets as a fncntion of je t
velocity. The opposed je t system should be scaled by je t velocity.
p231

r-" ' - ...........
erwi
. blK
> if '
m y s ----------- m — ;
asaçs; t. ',. ..sas»j<
Figure 8.7 C ontour plots of speed (top), energy dissipation (middle) and strain ra te
(bottom ) between 4 mm ID opposed jets, at 1 m/s average je t velocity. Model
2. The jets en ter from the left and right, impinge, and exit radially.
p232
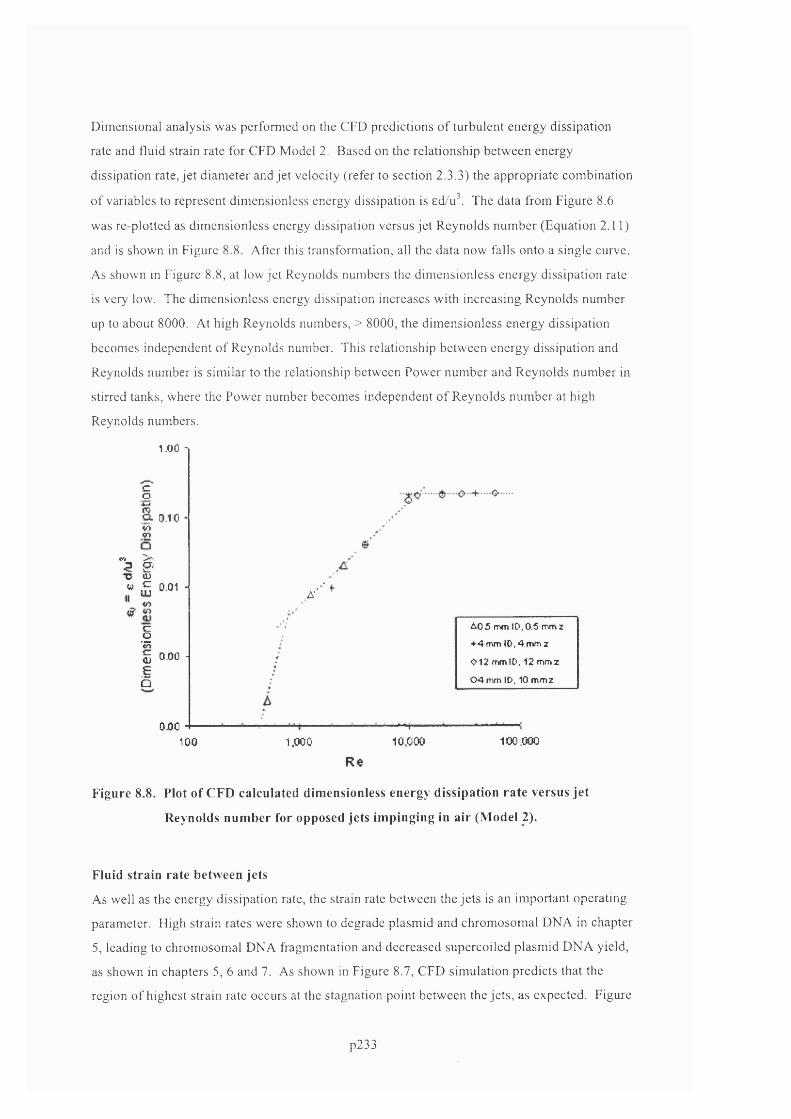
Dimensional analysis was performed on the CFD predictions of turbulent energy dissipation
rate and fluid strain rate for CFD Model 2. Based on the relationship between energy
dissipation rate, jet diameter and Jet velocity (refer to section 2.3.3) the appropriate combination
of variables to represent dimensionless energy dissipation is ed/u^. The data from Figure 8.6
was re-plotted as dimensionless energy dissipation versus jet Reynolds number (Equation 2.11)
and is shown in Figure 8.8. After this transformation, all the data now falls onto a single curve.
As shown in Figure 8.8, at low jet Reynolds numbers the dimensionless energy dissipation rate
is very low. The dimensionless energy dissipation increases with increasing Reynolds number
up to about 8000. At high Reynolds numbers, > 8000, the dimensionless energy dissipation
becomes independent of Reynolds number. This relationship between energy dissipation and
Reynolds number is similar to the relationship between Power number and Reynolds number in
stirred tanks, where the Power number becomes independent o f Reynolds number at high
Reynolds numbers.
1.00 1
c0
1V)«0
0-1C -
"I f « ^ 0.01 -
E ■p£ 0-00 j-iQ
OjOO
A-
A 05 mm ID.0.5 mmz
♦ 4 mm 10,4 mm X
012 rrmlD. 12 mmz
0 4 mm ID. 10 mmz
100 1,000 10,000 100,000
R e
Figure 8.8. Plot of CFD calculated dimensionless energy dissipation ra te versus je t
Reynolds num ber for opposed jets im pinging in a ir (M odel 2).
Fluid strain rate between jets
As well as the energy dissipation rate, the strain rate between the jets is an important operating
parameter. High strain rates were shown to degrade plasmid and chromosomal DNA in chapter
5, leading to chromosomal DNA fragmentation and decreased supercoiled plasmid DNA yield,
as shown in chapters 5, 6 and 7. As shown in Figure 8.7, CFD simulation predicts that the
region of highest strain rate occurs at the stagnation point between the jets, as expected. Figure
p233
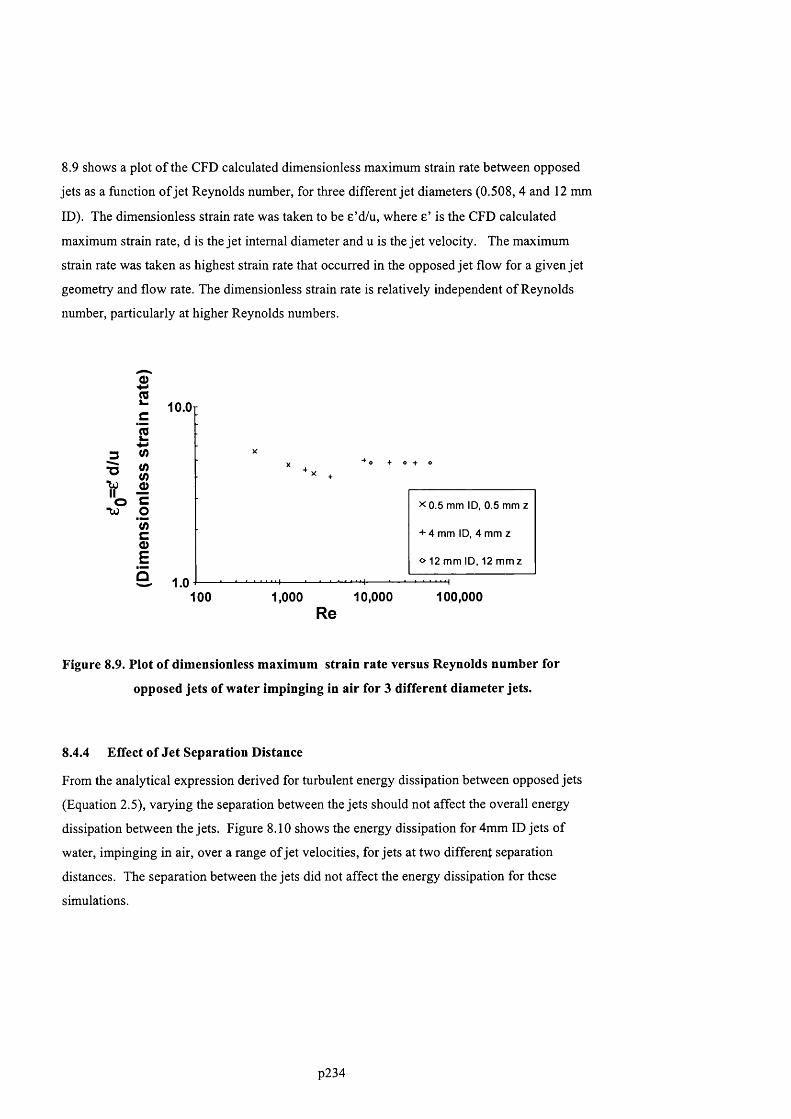
8.9 shows a plot o f the CFD calculated dimensionless maximum strain rate between opposed
jets as a function o f jet Reynolds number, for three different jet diameters (0.508, 4 and 12 mm
ID). The dimensionless strain rate was taken to be e ’d/u, where e’ is the CFD calculated
maximum strain rate, d is the jet internal diameter and u is the jet velocity. The maximum
strain rate was taken as highest strain rate that occurred in the opposed jet flow for a given jet
geometry and flow rate. The dimensionless strain rate is relatively independent of Reynolds
number, particularly at higher Reynolds numbers.
t j
10.0
s2c2«*->i/ii/ii/i0)cg
'</)c0)E& 1.0
100 1,000 10,000 Re
X 0.5 mm ID, 0 .5 mm z
+ 4 mm ID, 4 mm z
o 12 mm ID, 12 mm z
100,000
Figure 8.9. Plot of dimensionless maximum strain rate versus Reynolds number for
opposed jets of water impinging in air for 3 different diameter jets.
8.4.4 Effect of Jet Separation Distance
From the analytical expression derived for turbulent energy dissipation between opposed jets
(Equation 2.5), varying the separation between the jets should not affect the overall energy
dissipation between the jets. Figure 8.10 shows the energy dissipation for 4mm ID jets of
water, impinging in air, over a range o f jet velocities, for jets at two different separation
distances. The separation between the jets did not affect the energy dissipation for these
simulations.
p234
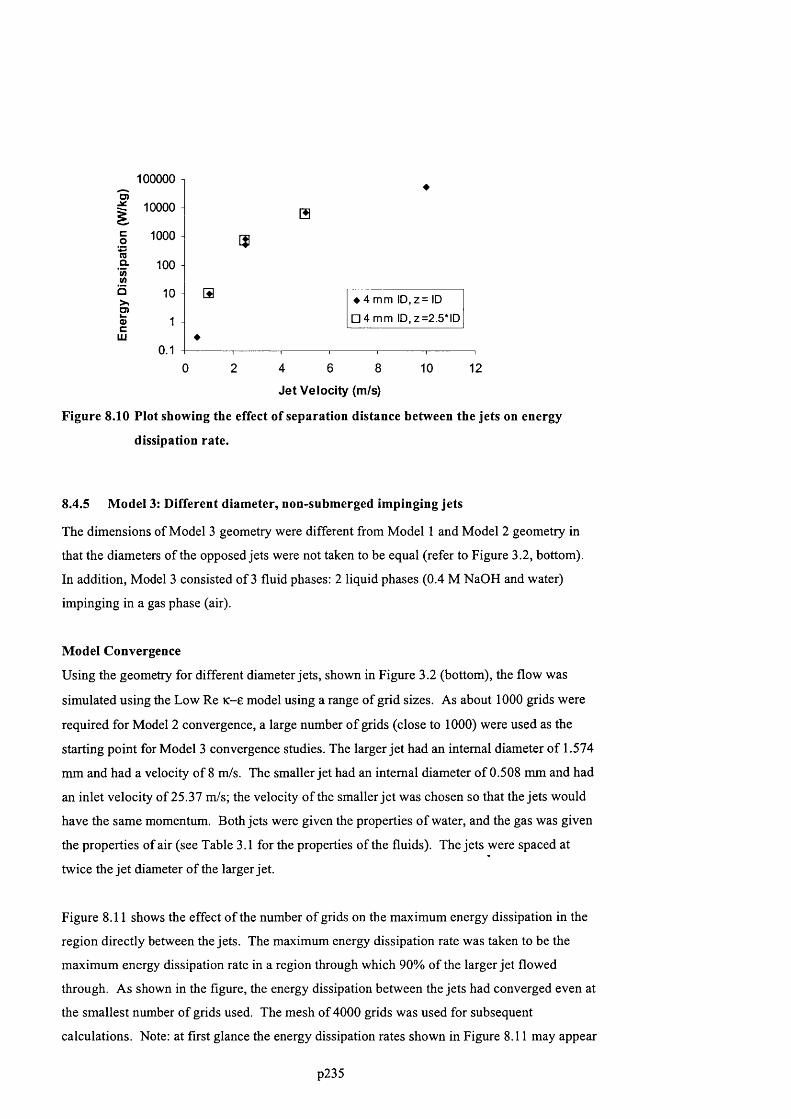
s
>.pQ)C
LU
100000 1
10000
1000
100
10
1
0.1
a
a
♦ 4 m m ID, z = ID
□ 4 m m ID, z = 2 .5 * ID
0 10 122 4 6 8
Jet Velocity (m/s)
Figure 8.10 Plot showing the effect of separation distance between the jets on energy
dissipation rate.
8.4.5 Model 3: Different diameter, non-submerged impinging jets
The dimensions of Model 3 geometry were different from Model 1 and Model 2 geometry in
that the diameters o f the opposed jets were not taken to be equal (refer to Figure 3.2, bottom).
In addition, Model 3 consisted of 3 fluid phases: 2 liquid phases (0.4 M NaOH and water)
impinging in a gas phase (air).
Model Convergence
Using the geometry for different diameter jets, shown in Figure 3.2 (bottom), the flow was
simulated using the Low Re K-e model using a range of grid sizes. As about 1000 grids were
required for Model 2 convergence, a large number o f grids (close to 1000) were used as the
starting point for Model 3 convergence studies. The larger jet had an internal diameter o f 1.574
mm and had a velocity of 8 m/s. The smaller jet had an internal diameter o f 0.508 mm and had
an inlet velocity of 25.37 m/s; the velocity o f the smaller je t was chosen so that the jets would
have the same momentum. Both jets were given the properties o f water, and the gas was given
the properties of air (see Table 3.1 for the properties of the fluids). The jets were spaced at
twice the jet diameter o f the larger jet.
Figure 8.11 shows the effect o f the number o f grids on the maximum energy dissipation in the
region directly between the jets. The maximum energy dissipation rate was taken to be the
maximum energy dissipation rate in a region through which 90% of the larger jet flowed
through. As shown in the figure, the energy dissipation between the jets had converged even at
the smallest number o f grids used. The mesh of 4000 grids was used for subsequent
calculations. Note: at first glance the energy dissipation rates shown in Figure 8.11 may appear
p235

to be inordinately high (300,000 W/kg), leading one to presume that the CFD simulation was
not converged. However, this particular set of CFD simulations was performed at very high jet
impingement velocities. The water jet was given a high velocity of 8 m/s compared to 5 m/s for
Model 2. However, to ensure momentum balanced jets, the NaOH jet had to have a very high
velocity o f 25.37 m/s. As energy dissipation in opposed jets will be expected to roughly scale
as the jet velocity cubed, an energy dissipation rate o f 300,000 W/kg is in fact entirely in-line
with a u dependence. This will be discussed further in the next section on energy dissipation.
400000 T
0)5* 300000
II 1E .2 200000 --
i l2 g 100000
100 1000Num ber of Grids in modei
10000
Figure 8.11. Plot of the CFD predicted maximum energy dissipation rate versus number
of grids for Model 3, at 8 m/s and 25.37 m/s jet impingement velocities. The
energy dissipation rate is converged to a constant value at 700 grids and
above.
Energy dissipation in non-equal opposed jets
Opposed jets will only have equal flowrates if mixing requires equal volumes o f two fluids to be
combined together. This is typically the case in alkaline lysis, when one volume of 0.2 M
NaOH is added to one volume of resuspended cells to end-up with a 0.1 M NaOH solution.
However, to reduce process volumes it would be advantageous to use more concentrated NaOH.
Take for example the case where 1/3" volume of 0.4 M NaOH is added to 1 volume of cells to
end-up with a 0.1 M NaOH solution. The flowrate o f the lysis reagent would be 1/3 * the
flowrate o f the cell resuspension in an opposed jet device. If equal diameter jets were used the
velocity of the lysis reagent jet would be 1 / 3 the velocity cell resuspension jet. Because the
energy dissipation is a very strong function of the jet velocity, e a u , the low velocity o f the
lysis reagent could significantly reduce the quality o f the mixing in the opposed jet mixer.
p236

Alternatively, the diameter of the lysis reagent jet could be reduced. This would increase the
velocity and momentum of the lysis reagent Jet. For example, if the diameter o f the lysis jet was
reduced to the diameter of the cell resuspension jet, then the velocity of the lysis jet would
increase 9-fold, and the momentum 3-fold. Thus, by using a jet diameter ratio of l/3rd, the jets
would impact with equal momentum and with a lot more energy. A contour plot showing the
energy dissipation rate from a typical CFD simulation o f non-equal diameter jets is shown in
Figure 8.12.
100000'-T*
X 10'5
4
3
2
1
0
-1
-2
-3
-4
-5-0.01 -0.008 -0.006 -0.004 -0.002 0 0.002 0.004 0.006 0.008 0.01
Distance (m)
Figure 8.12. C ontour plot of tu rbu len t energy dissipation ra te (W /kg) for non-equal
diam eter opposed jets of water. The system consists of a 0.508 mm ID je t at
25.37 m/s je t velocity (left) impacting a 1.574 mm ID je t at 8 m/s je t velocity
(right).
In order to examine the effect of jet diameter and jet velocity on the mixing characteristics of
non-equal diameter opposed jets, a set of simulations was run using 0.5 mm, 1.58 mm and 12
mm ID opposed jets impinging against smaller diameter jets. The ratio of the smaller jet
diameter to large jet diameter was varied from 0.16:1 to 1:1. Refer to Table 3.6 in chapter 3 for
a complete list of simulations performed. Figure 8.13 shows a plot o f the CFD predicted
dimensionless maximum energy dissipation versus the Reynolds number for non-equal opposed
p237

jets, of 0.5, 1.58 and 12 mm internal diameters. In order to calculate the dimensionless
maximum energy dissipation rate, the geometric average o f the je t velocities was used as the
appropriate je t velocity, and the geometric average o f the je t diameters was used as the
appropriate jet diameter. The Reynolds number was the Reynolds number o f the larger jet.
Similarly to the case o f equal opposed jets, the energy dissipation is a strong function of
Reynolds number at low Reynolds number, but becomes independent o f Reynolds number at
high Reynolds number. The dimensionless maximum energy dissipation rate is about 0.10
which is about half the value predicted by CFD for equal diameter jets. Model 2. The slightly
lower value of 0.10 for non-equal diameter opposed jets is expected as most o f the energy is
supplied by only one o f the jets.
The fact that the CFD predicted dimensionless energy dissipation converged to a value close to
empirically observed values (Yim et al., 2000), and that all three model simulations (Model 1,
Model 2 and Model 3) all give similar predictions o f dimensionless energy dissipation, provides
reassurance that all three CFD models have converged to meaningful results. The CFD results
in Figure 8.13 were obtained over a range of jet velocities, giving a wide range o f jet energy
dissipation rates (from < 1 W/kg to >300,000 W/kg). It should be noted that although very high
energy dissipation rates were obtained (for example 300,000 W/kg in Figure 8.11) when very
high jet velocities were used, the CFD predicted dimensionless energy dissipation o f 0.1 shows
that these high energy dissipation rates were entirely as expected based on the velocity-cubed
dependence of energy dissipation rate.
2 0) c(0</)o cgÜ)coE
Q
1.0000
co0.1000
Q.w(/}6
0.010010000010000100 1000
ReFigure 8.13 shows a plot of the CFD predicted dimensionless energy dissipation versus
Reynolds number for non-equal diameter opposed jets. At high Reynolds
number, the dimensionless maximum energy dissipation is about 0.10, which
is similar to the results for equal diameter opposed jets.
p238
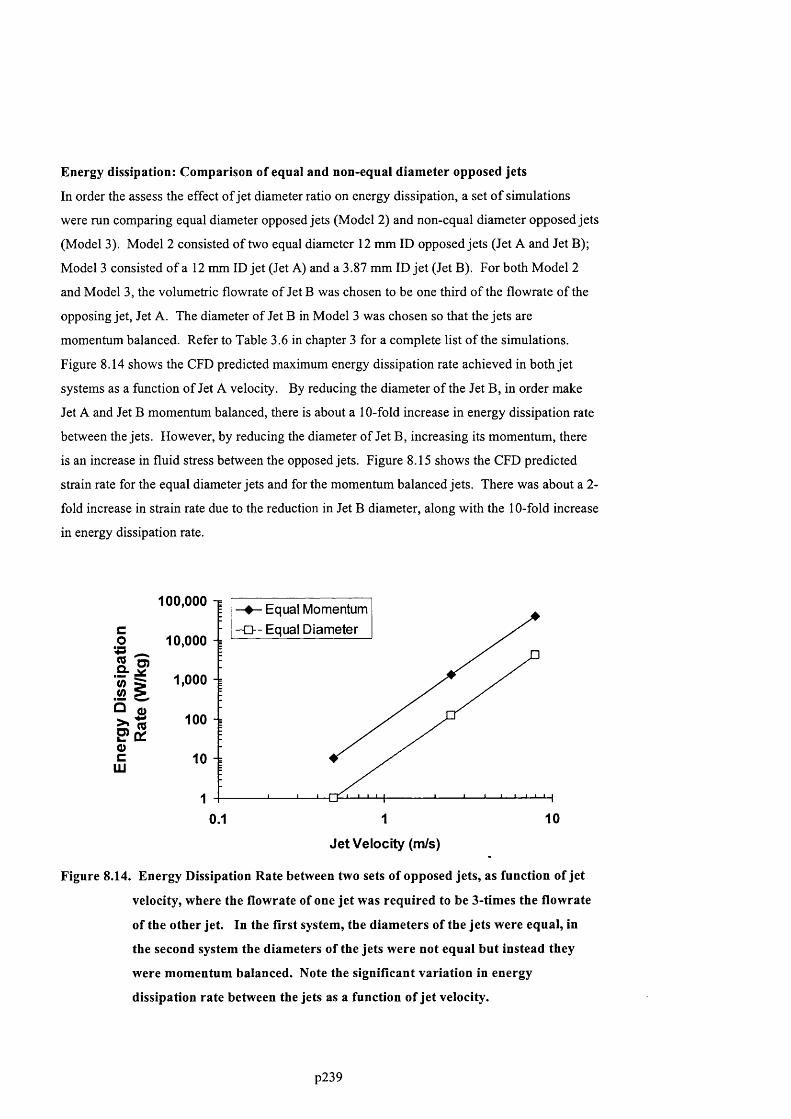
Energy dissipation: Comparison of equal and non-equal diameter opposed jets
In order the assess the effect o f jet diameter ratio on energy dissipation, a set o f simulations
were run comparing equal diameter opposed jets (Model 2) and non-equal diameter opposed jets
(Model 3). Model 2 consisted of two equal diameter 12 mm ID opposed jets (Jet A and Jet B);
Model 3 consisted o f a 12 mm ID jet (Jet A) and a 3.87 mm ID jet (Jet B). For both Model 2
and Model 3, the volumetric flowrate of Jet B was chosen to be one third of the flowrate of the
opposing jet, Jet A. The diameter of Jet B in Model 3 was chosen so that the jets are
momentum balanced. Refer to Table 3.6 in chapter 3 for a complete list o f the simulations.
Figure 8.14 shows the CFD predicted maximum energy dissipation rate achieved in both jet
systems as a function of Jet A velocity. By reducing the diameter o f the Jet B, in order make
Jet A and Jet B momentum balanced, there is about a 10-fold increase in energy dissipation rate
between the jets. However, by reducing the diameter of Jet B, increasing its momentum, there
is an increase in fluid stress between the opposed jets. Figure 8.15 shows the CFD predicted
strain rate for the equal diameter jets and for the momentum balanced jets. There was about a 2-
fold increase in strain rate due to the reduction in Jet B diameter, along with the 10-fold increase
in energy dissipation rate.
Cous
ocm
100,000 — Equal Momentum
Equal Diameter10,000
1,000
Î 100q :
1010.1
Jet Velocity (m/s)
Figure 8.14. Energy Dissipation Rate between two sets of opposed jets, as function of jet
velocity, where the flowrate of one jet was required to be 3-times the flowrate
of the other jet. In the first system, the diameters of the jets were equal, in
the second system the diameters of the jets were not equal but instead they
were momentum balanced. Note the significant variation in energy
dissipation rate between the jets as a function of jet velocity.
p239
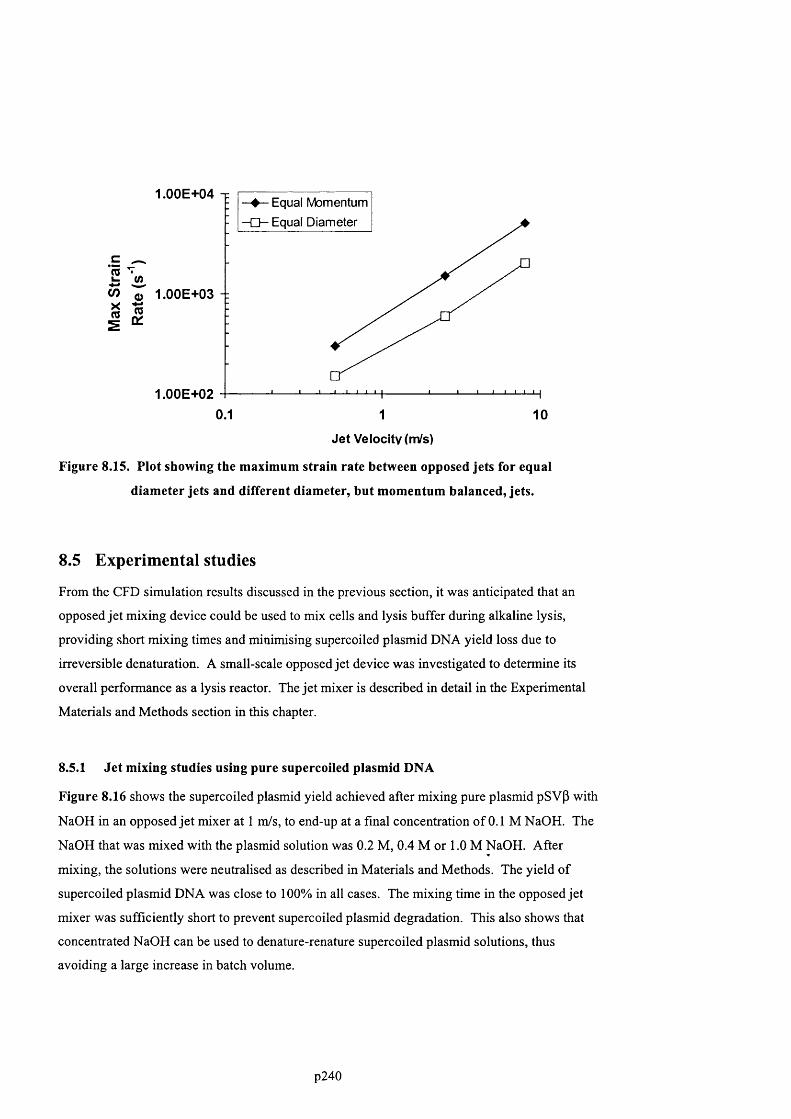
K(0
Ûl
1.00E + 04— Equal Momentum
- a - Equal D iam eter
1.00E+03
1.00E+020.1 1 10
Jet Velocity (nVs)
Figure 8.15. Plot showing the maximum strain rate between opposed jets for equal
diameter jets and different diameter, but momentum balanced, jets.
8.5 Experimental studies
From the CFD simulation results discussed in the previous section, it was anticipated that an
opposed je t mixing device could be used to mix cells and lysis buffer during alkaline lysis,
providing short mixing times and minimising supercoiled plasmid DNA yield loss due to
irreversible dénaturation. A small-scale opposed jet device was investigated to determine its
overall performance as a lysis reactor. The jet mixer is described in detail in the Experimental
Materials and Methods section in this chapter.
8.5.1 Jet mixing studies using pure supercoiled plasmid DNA
Figure 8.16 shows the supercoiled plasmid yield achieved after mixing pure plasmid pSV(3 with
NaOH in an opposed jet mixer at 1 m/s, to end-up at a final concentration o f 0.1 M NaOH. The
NaOH that was mixed with the plasmid solution was 0.2 M, 0.4 M or 1.0 M NaOH. After
mixing, the solutions were neutralised as described in Materials and Methods. The yield of
supercoiled plasmid DNA was close to 100% in all cases. The mixing time in the opposed jet
mixer was sufficiently short to prevent supercoiled plasmid degradation. This also shows that
concentrated NaOH can be used to denature-renature supercoiled plasmid solutions, thus
avoiding a large increase in batch volume.
p240
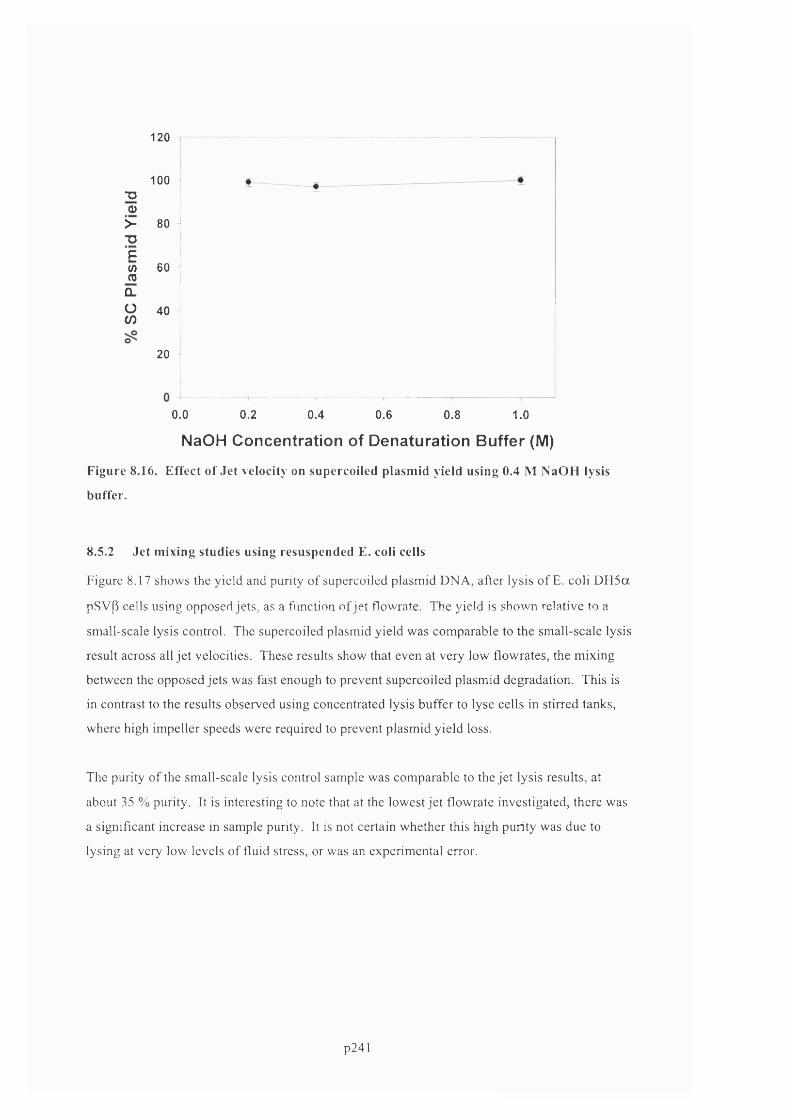
•D<D
>"OË(/)mû.üco
120
100
80
60
40
20
Figure 8
buffer.
0.0 0.2 0.4 0.6 0.8 1.0
NaOH Concentration of Dénaturation Buffer (M)16. Effect of Je t velocity on supercoiled plasm id yield using 0.4 M NaOH lysis
8.5.2 Je t mixing studies using resuspended E. coli cells
Figure 8.17 shows the yield and purity of supercoiled plasmid DNA, after lysis of E. coli D H 5a
pSVP cells using opposed jets, as a function of jet flowrate. The yield is shown relative to a
small-scale lysis control. The supercoiled plasmid yield was comparable to the small-scale lysis
result across all je t velocities. These results show that even at very low flowrates, the mixing
between the opposed jets was fast enough to prevent supercoiled plasmid degradation. This is
in contrast to the results observed using concentrated lysis buffer to lyse cells in stirred tanks,
where high impeller speeds were required to prevent plasmid yield loss.
The purity of the small-scale lysis control sample was comparable to the jet lysis results, at
about 35 % purity. It is interesting to note that at the lowest jet flowrate investigated, there was
a significant increase in sample purity. It is not certain whether this high purity was due to
lysing at very low levels of fluid stress, or was an experimental error.
p241

- o - Yield: 0.4 M NaOH -A - Yield: 0.2 M NaOH
# Purity: 0.4 M NaOH - A Purity: 0.2 M NaOH
3Q_L. 0.8 -0
2
“ 0.6 -
2
1 0 4 -2 Q.ü 0.2 - CO
0.00.01 0.1 1
Jet Velocity (m/s)
Figure 8.17. Effect of Jet velocity on supercoiled plasmid yield and purity using 0.2 M or
0.4 M NaOH lysis buffer.
8.6 Discussion
8.6.1 Convergence of CFD models
Although CFD simulation is no longer considered in its infancy, a sufficient number of
assumptions usually have to be made regarding the governing fluid flow equations that CFD
calculations cannot be unequivocally relied upon. Therefore it is essential to carefully examine
each CFD model to show that it is both internally consistent and giving physically realistic
results. To be internally consistent, a CFD model must be grid size independent; for a given
geometry and flow conditions the CFD results (pressure, velocity and energy dissipation
distributions) must be independent of the number of grids used to subdivide the model
geometry. Grid size convergence studies for opposed jet Model 2 and Model 3 showed that the
CFD results for both models had converged at 1000 grids and above, corresponding to a length
of 40 microns for each individual grid.
p242

It is appropriate to ask why the CFD simulations are converging at this grid size. The Low Re
K-e model was used to model the opposed jet flow. This model does not use wall functions to
model the behaviour o f flows near solid boundaries, but instead integrates the flow equations
through the boundary layer to the wall (refer to sections 3.2.33.2.4). This model should be valid
over all Reynolds numbers provided that the CFD grid is fine enough to resolve the boundary
layers. In a bulk turbulent flow in a Jet nozzle, there will be a laminar sublayer and buffer layer
between the turbulent core and the wall of the jet nozzle. An estimate for the thickness of the
laminar and buffer layers in a pipe is provided by Coulson et al. (1991):
0 < y+ < 5 laminar sublayer
5 < y+ < 30 buffer layer
y+ = (y/d).(f/2)° Re
Equation 8.1
In this equation, y is the thickness of the boundary layer, d is the pipe thickness, f is the friction
factor and Re is the pipe Reynolds number. Using this equation for a 4 mm ID jet o f water at 5
m/s gives a laminar sublayer thickness of 50 microns and a buffer layer o f 300 microns.
Therefore the CFD models converge when the size o f the grids is small enough to resolve the jet
nozzle boundary layer for Models 2 and 3.
CFD Model 1 consisted of opposed jets impinging subsurface in liquid. As explained
previously in this chapter, entrainment of stagnant fluid by the exiting jets gave very high
localised energy dissipation rates in this system, and these high energy dissipation rates did not
converge to realistic valves until 10,000 grids was used subdivide the model geometry. This
model was the only one of the three models that had not fully converged to constant energy
dissipation rates at the highest number of grids tested; there was still about a 20% difference in
CFD predicted energy dissipation rate between the highest numbers o f grids tested. However,
based on the second derivative of energy dissipation rate versus grid number shown in Figure
8.2 is appeared that the CFD model was converging rapidly and that any error in CFD predicted
mixing performance would be small. This is supported by the agreement of CFD Model 1
results with CFD Models 2 and 3 results, by agreement with analytical calculations, by
agreement with empirical calculations and by agreement with other published jet mixing data,
as described in the following sections.
8.6.2 Comparison of CFD mixing with analytical and empirical equations
In order to validate a CFD model it is important to compare the CFD predictions to available
analytical or empirical results. The pressure drop and energy dissipation rate predicted by CFD
was compared to available equations. The analytically calculated pressure drop in the jet
p243
nozzles matched the CFD predictions exactly. The CFD simulations predicted that the energy
dissipation rate at high Reynolds number, for all three jets models, should be 0.1 to 0.2 times
uVd. An empirical or analytical correlation for the energy dissipation in opposed jets could not
be found in the published scientific literature, however the energy dissipation in unbounded
submerged jets can be estimated from the empirical correlation, e = 0.1 uVd (Yim et al., 2000).
Thus, the CFD results compares very favourably to the empirical correlation for energy
dissipation given by Yim. Therefore it is clear that jet Model 1, 2 and 3 are giving realistic
predictions of the fluid flow behaviour.
8.6.3 Comparison of CFD Model 1 and Model 2 mixing results with experimental data
The CFD predicted energy dissipation, e, is given in Figure 8.8, as a function o f jet diameter
and velocity, for equal jets impinging in air, and can be summarised as:
e = (uVd) (3x10 Re)'-^, Re < 800
e = (uVd) (5x10"*. Re)° ^ 800<Re< 10,000
e = 0.2 uVd,Re> 10,000
Equation 8.2
The CFD prediction for energy dissipation can be compared to the results o f Tosun et al. (1987)
where a time-dependent, competitive reaction was used to measure mixing quality in opposed
Tees. Figure 8.18 shows the relationship between mixing quality and Reynolds number in the
opposed Tee system. This figure is reproduced directly from the work o f Tosun et al. (1987).
The mixing quality is defined such that a mixing index o f 1.0 indicates instantaneously fast
mixing and a mixing index o f 0 indicates slow, poor mixing. At Reynolds numbers above
10000 the mixing quality is independent o f Reynolds number, which parallels the CFD
prediction in this thesis (compare to Figure 8.8). Moreover, at Reynolds number below 10,000
there is a rapid decline in mixing performance.
Baldyga et al. (1995) correlated the energy dissipation rate (10^ to lO'* W/kg) in a turbulent free
jet discharging into a tank against the jet mixing performance, using a u^/d dependence of
energy dissipation rate. While they obtained a good match between theory and experiment at
high je t Reynolds numbers greater than 10000, at a lower je t Reynolds numbers of 5200 they
saw a significant deviation between jet mixing performance and theoretical predictions.
Although their system consisted of a free jet discharging into a tank, compared to opposed jets
used in this work, the rapid decrease in jet energy dissipation rate predicted by CFD for opposed
jets may explain some of the results observed by Baldyga for a je t discharging into a tank.
p244

0.9 +
0.8 -0 .7 . .
(3JQ 0 .5 - -
• S 0 . 4 . .
§ O J- 0.2..0.1»0.0
100 1,000 10,000 100,000
Reynolds Number
Figure 8.18. Effect of Reynolds number on Mixing performance for Opposed Mixing
Tees. Graph reproduced from Tosun et al. (1987). The triangles, circles and
squares represent opposed tees with left : right diameters of 0.9 : 10.3 mm, 1.8
: 7.1 mm and 0.9 : 7.1 mm, respectively.
Mahajan et al. (1996) performed a similar study to Tosun, except their jet geometry was similar
to the geometry used in this thesis. Using a competitive chemical reaction, they measured the
mixing quality as a function o f Jet operation flowrate for three different diameter jets. They
performed their mixing study for the case where the opposed jets impinged subsurface (a
flooded impingement chamber) and for the case where the jets impinged in air (an empty
impingement chamber). The relationship between mixing quality and je t Reynolds number that
Mahajan et al. measured is shown in Figure 8.19 and Figure 8.20, for non-submerged and
submerged jets, respectively. It should be noted that Mahajan’s definition o f the mixing index
is such that a mixing index o f 0 represents good, fast mixing and a mixing index of 1 represents
poor, slow mixing. As shown in the figures, there was a significant variation in mixing
performance depending on jet diameter and jet Reynolds number.
In theory the observed mixing index should be a unique function of the jet mixing time.
Therefore, in order to correlate the mixing performance across different je t diameters, Mahajan
et al. plotted the mixing index for each jet against the theoretically calculated jet micro-mixing
time. If the theoretically calculated jet micro-mixing time is correct, the mixing data for all of
the jets should fall on a single-curve. Mahajan et al calculated the micro-mixing time based on
jet energy dissipation rate (Equation 2.2). Their jet energy dissipation rate was calculated based
on the total kinetic energy in the jets being dissipated in a volume, V, between the jets. They
p245

determined that they could achieve a moderate correlation between measured mixing
performance and calculated jet micro-mixing time across all three jets, if they assumed that the
dissipation volume was proportional to the square o f the jet diameter. There were two principal
disadvantages to their correlation. First, the dimensions o f the correlation were not consistent,
as the dissipation volume must be correlated against the cube of a length scale. Second, the
model still failed to correlate all of the data obtained from the opposed jets mixing experiments.
Because Mahajan et al. (1996) have correlated the mixing performance of opposed jets, similar
in design to the jets that were modelled in this thesis, their data offers an ideal opportunity to
test the validity of the CFD model developed in this thesis. The energy dissipation as a function
of jet velocity, jet Reynolds number and jet diameter was calculated based on the CFD model
predictions. Equation 8.2. Then, in the same manner as Mahajan et al., the micro-mixing time
at eaeh jet condition was calculated using Equation 2.2 and plotted against the mixing index, as
shown in Figure 8.21 and Figure 8.22. The CFD model correlates the performance o f the three
opposed jets extremely well across all flowrates tested, for both the non-submerged and
submerged jet cases. This goes a long way to validating the CFD model developed in this
thesis.
0.3
□ 1 mm
0.5 mm
X 0.2 d>■DCO)cXS 0.1
0.010,000100 1,000
Reynolds Num ber
Figure 8.19. Plot showing the quality of mixing as a function of Reynolds num ber in three
different d iam eter opposed jets, non-subm erged case. This plot is reproduced
from the data of M ahajan et al. (1996).
p246
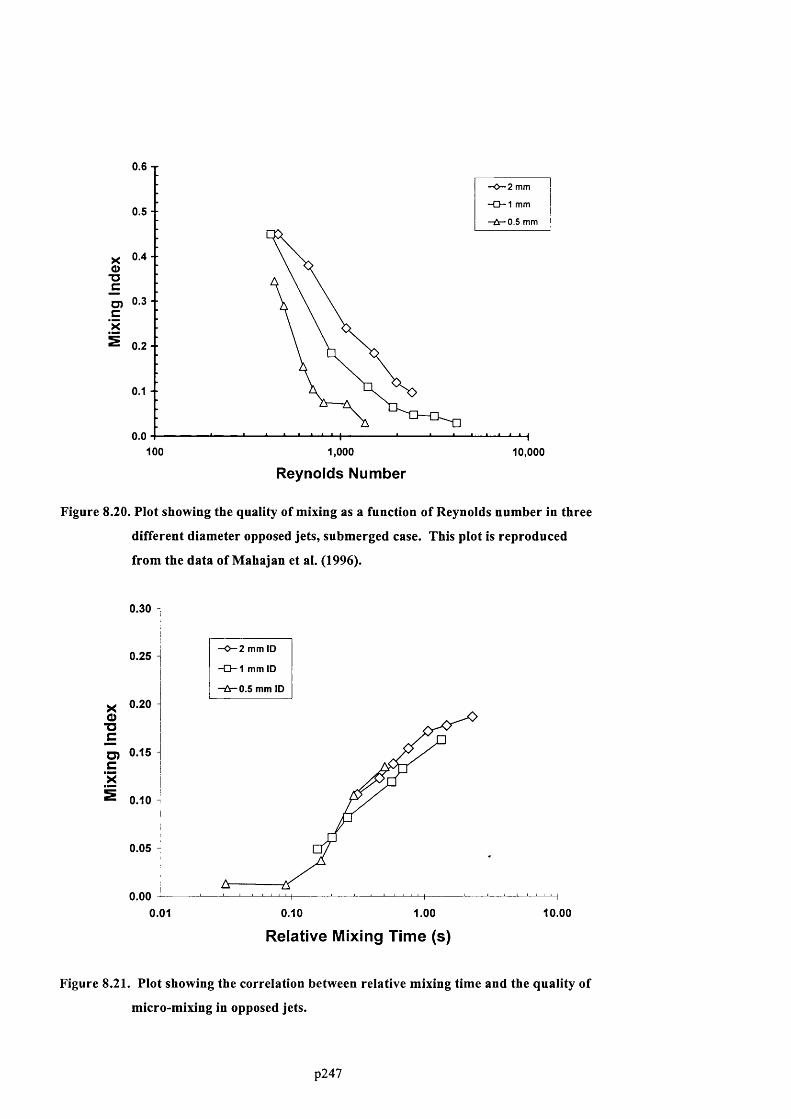
0.6 T
100
-0 -2 mm
- 0 - 1 mm0.5 -
D) 0-3 ■
0.2 -
•0.5 mm I
1,000
Reynolds Number10,000
Figure 8.20. Plot showing the quality of mixing as a function of Reynolds number in three
different diameter opposed jets, snbmerged case. This plot is reproduced
from the data of Mahajan et al. (1996).
0.30
3"Oçoc
0.01
—0 —2 mm ID0.25
- 0 - 1 mm ID
0.5 mm ID
0.20
0.15
0.10
0.05
0.00 -H0.10 1.00
Relative Mixing Time (s)10.00
Figure 8.21. Plot showing the correlation between relative mixing time and the quality of
micro-mixing in opposed jets.
p247
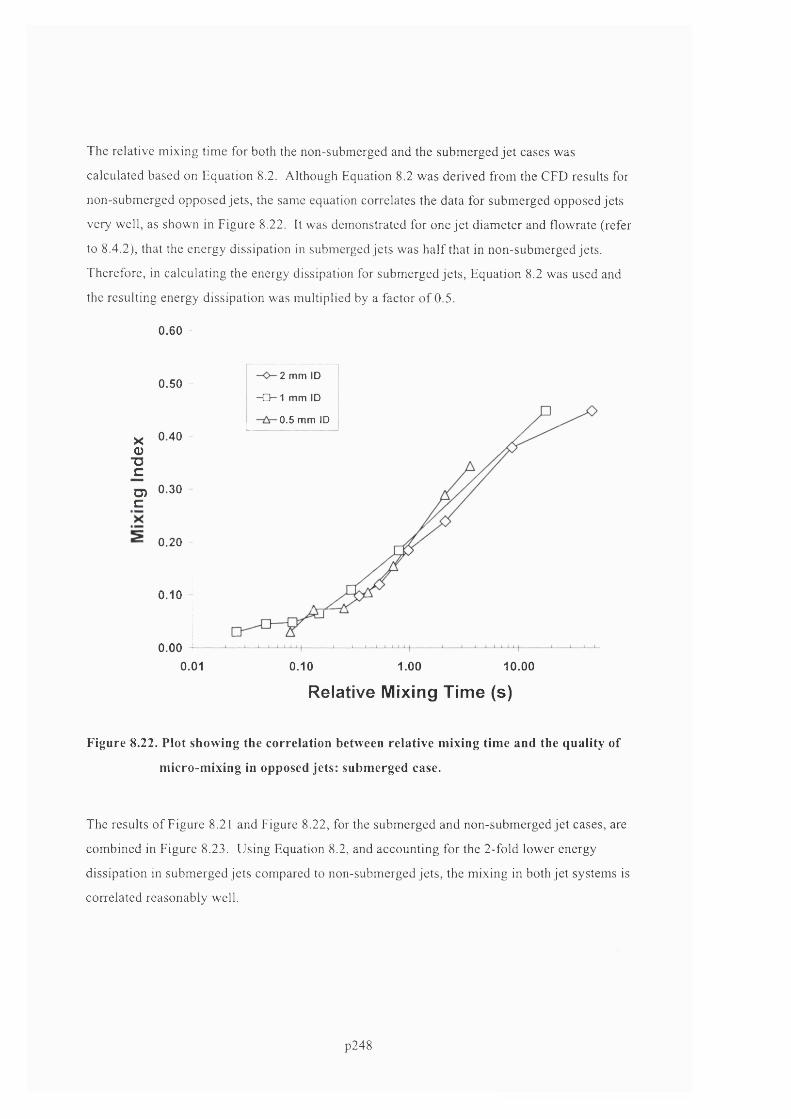
The relative mixing time for both the non-submerged and the submerged jet cases was
calculated based on Equation 8.2. Although Equation 8.2 was derived from the CFD results for
non-submerged opposed jets, the same equation correlates the data for submerged opposed jets
very well, as shown in Figure 8.22. It was demonstrated for one jet diameter and flowrate (refer
to 8.4.2), that the energy dissipation in submerged jets was half that in non-submerged jets.
Therefore, in calculating the energy dissipation for submerged jets. Equation 8.2 was used and
the resulting energy dissipation was multiplied by a factor of 0.5.
0.60
X0
"Oc
U)c
0.50
0.40
0.30
0.20
0.10
0.000.01
2 mm ID
- O - 1 mm ID
0.5 mm ID
0.10 1.00 10.00
Relative Mixing Time (s)
Figure 8.22. Plot showing the correlation between relative mixing time and the quality of
m icro-m ixing in opposed jets: subm erged case.
The results of Figure 8.21 and Figure 8.22, for the submerged and non-submerged jet cases, are
combined in Figure 8.23. Using Equation 8.2, and accounting for the 2-fold lower energy
dissipation in submerged jets compared to non-submerged jets, the mixing in both jet systems is
correlated reasonably well.
p248

0.60
2 mm ID0.50 -
- D - 1 mm ID
X 0-40 Q
"O CQ) 0.30 -CX
0.5 mm ID
^ 0.20
0.10
0.000.01 0.10 1.00 10.00
Relative Mixing Time (s)Figure 8.23. Plot showing the correlation between relative m ixing time and the quality of
m icro-m ixing in opposed jets. Open symbols represen t subm erged jets, filled
symbols represent non-subm erged jets.
In the jet experiment, where E. coli cells were lysed with NaOH in the opposed jet mixer, it was
surprising that the yield of supereoiled plasmid remained high after jet mixing at the lower
range of jet velocities tested. At the low range of jet velocities tested, the fluid flow in the jets
would have been laminar and the CFD predicted energy dissipation rate would have been very
low. Hence, the turbulent eddies would have been large, leading to long micro-mixing times.
Possibly, the small length scales at which these jet mixing experiments were run (0.007” ID
lysis buffer jet equals 178 micron ID) would have reduced the length scale over which diffusion
took place, negating somewhat the requirement for turbulent mixing. The radius of the 0.007”
ID jet was 89 microns, which using Equation 2.2, a viscosity o f 5 mPa s and the diffusion rate
of NaOH, corresponds to a micro-mixing time of 0.6 s. Therefore, even without turbulent
mixing, diffusion of NaOH across the radius of the jets will occur in less than a second. Further
experiments are required to verify the CFD predictions for energy dissipation rate and fluid
stresses at scales larger than the scales investigated here, or investigated by Mahajan et al.
(1996).
p249

Comparison of CFD fluid stress predictions with empirical results
Approximating opposed jets as two facing point sink flows (Metzner et al. 1970), the following
approximation for the fluid strain rate can be derived: e ’ = 0.5 u/d. The CFD model for
opposed jets predicted the same dependence on the jet velocity and jet diameter, however the
maximum strain rate between the jets was substantially higher: e ’ ~ 4.7 u/d. The CFD predicted
maximum strain rate is about 9-fold higher than the analytical prediction. The CFD predicted
average strain rate between the opposed jets was typically 4- to 8-fold lower than the maximum
strain rate, which more closely matches the analytical prediction. It is important to take into
account the maximum strain rate between opposed jets when stress-induced degradation must
be avoided.
Operation and scale-up of opposed jets based on CFD predictions
The relationship between the dimensionless energy dissipation (e d/u^) and Reynolds number,
shown in Figure 8.8, dictates how opposed jet mixing devices should be routinely operated. In
order to operate under robust conditions, the jets should always impinge under turbulent flow
conditions, at Reynolds numbers greater than 10000. For example, a 4 mm ID jet o f water at
2.5 m/s will have a Reynolds number of 20000. A two-fold decrease in jet velocity will reduce
the Reynolds number to 10000, and will reduce the energy dissipation rate 8-fold. However, a
further 2-fold decrease in jet velocity, will reduce the Reynolds number below 10000, and lead
to an further 27-fold reduction in energy dissipation rate. Fluctuations in jet velocity have a
much more significant effect on energy dissipation rate at Reynolds numbers below 10000.
The relationship between the dimensionless energy dissipation (e d/u^) and Reynolds number,
shown in Figure 8.8, also dictates how opposed jet mixing devices should be scaled-up from
laboratory to manufacturing scale. For scale-up of an opposed jet mixer, to maintain constant
mixing conditions between jets of different sizes the energy dissipation rate (e) should be kept
constant. Because e d/u^ is a constant at all Reynolds numbers greater than 10000, maintaining
e constant involves keeping u^/d constant across all scales o f operation. Therefore, as the jet
diameter, d, increases at larger scales of operation, the jet velocity should be,increased slightly
at larger scales. For example, an 8-fold increase in je t diameter necessitates a 2-fold increase in
je t velocity to maintain the same jet mixing time.
Because the dimensionless strain rate is relatively constant across all Reynolds numbers, the
actual strain rate will be approximately equal to u/d across all scales of operation. At larger
scales, the fluid velocity, u, does not need to increase as rapidly as the diameter, d, in order to
maintain constant mixing time, as previously explained. Therefore, at larger scales o f operation.
p250
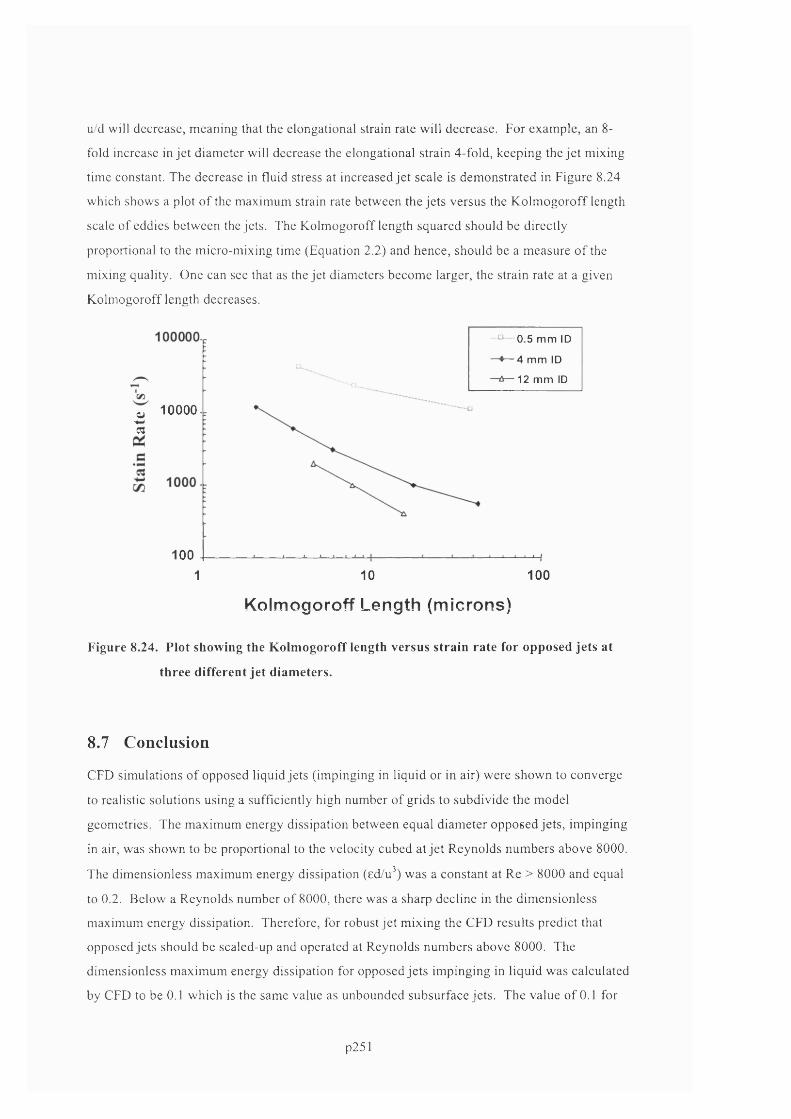
u/d will decrease, meaning that the elongational strain rate will decrease. For example, an 8-
fold increase in jet diameter will decrease the elongational strain 4-fold, keeping the jet mixing
time constant. The decrease in fluid stress at inereased jet scale is demonstrated in Figure 8.24
which shows a plot o f the maximum strain rate between the jets versus the Kolmogoroff length
scale of eddies between the jets. The Kolmogoroff length squared should be directly
proportional to the miero-mixing time (Equation 2.2) and hence, should be a measure o f the
mixing quality. One can see that as the jet diameters become larger, the strain rate at a given
Kolmogoroff length decreases.
Q 5 rnm ID
— 4 mm ID
12 mm ID-■a.
10000 - ,O)-w03
1001001 10
Kolmogoroff Length (microns)
Figure 8.24. Plot showing the Kolmogoroff length versus strain rate for opposed jets at
three different jet diameters.
8.7 Conclusion
CFD simulations of opposed liquid jets (impinging in liquid or in air) were shown to converge
to realistic solutions using a sufficiently high number of grids to subdivide the model
geometries. The maximum energy dissipation between equal diameter opposed jets, impinging
in air, was shown to be proportional to the velocity cubed at jet Reynolds numbers above 8000.
The dimensionless maximum energy dissipation (ed/u^) was a eonstant at Re > 8000 and equal
to 0.2. Below a Reynolds number of 8000, there was a sharp decline in the dimensionless
maximum energy dissipation. Therefore, for robust jet mixing the CFD results predict that
opposed jets should be sealed-up and operated at Reynolds numbers above 8000. The
dimensionless maximum energy dissipation for opposed jets impinging in liquid was calculated
by CFD to be 0.1 which is the same value as unbounded subsurface jets. The value of 0.1 for
p25

the dimensionless energy dissipation rate in jets impinging in liquid, as opposed to 0.2 for jets
impinging in air, is probably due to the increased frictional losses to the surrounding liquid for
jets impinging in liquid. Opposed jets of different diameter were shown to obey the same
qualitative behaviour as equal diameter opposed jets. Based on using a geometric mean velocity
and diameter, the dimensionless maximum energy dissipation at high Reynolds number was
calculated to be 0.1.
The CFD calculated energy dissipation rate in submerged and non-submerged jets was used to
correlate opposed jet mixing performance data against jet diameter and jet velocity. The CFD
simulations were shown not only to correlate jet mixing data across different diameter jets over
the jet velocities tested, but also to correlate mixing performance in subsurface and non
subsurface jets.
CFD simulations of opposed jets were predicted excellent performance as an alkaline lysis
mixer. Firstly, CFD predicted rapid mixing to achieve high levels o f chromosomal DNA
dénaturation without denaturing supercoiled plasmid DNA, and secondly, CFD predicted low
fluid strain rates during mixing to maximise chromosomal DNA fragment size. The excellent
mixing characteristics o f an opposed jet mixer was verified by mixing supercoiled plasmid
DNA with concentrated NaOH while avoiding supercoiled dénaturation and by lysing E coli
plasmid-containing cells with concentrated NaOH and achieving higher plasmid yields than
using conventional stirred tank mixers.
p252
9 DiscussionThe objective of this thesis was to study the influence of fluid mixing and fluid shear during
DNA downstream purification on final product quality. This chapter pulls together the thesis
results, presented in Chapters 4 to 8, to discuss their significance with respect to designing DNA
purification processes.
The relevance of this work is due to the exponentially increasing demand of gene therapy trials
for large quantities o f pure DNA. The manufacture o f pure DNA typically involves the
expression of the genes of interest in a suitable host micro-organism followed by purification of
the required DNA from the aqueous cell suspension. The production o f intact DNA molecules
for gene therapy presents some unique challenges for the biochemical engineer. Principally, the
large size of typical DNA molecules cause them to be highly susceptible to chain scission when
exposed to the fluid mechanical stresses that occur in typical purification equipment such as
mixing devices or chromatography columns. This chain scission can significantly decrease
product yield and purity. Unfortunately, reduction o f fluid stresses in purification equipment is
not a trivial problem; certain levels of fluid mixing/mass transfer are required to separate
product molecules from impurities, and this fluid mixing generates fluid stress. Therefore,
significant research is required into the combined effects o f fluid mixing and fluid stress on the
performance o f DNA purification processes.
This chapter, which discusses the results of the thesis, is divided into two sections.
• Firstly, this chapter discusses the advantages and disadvantages o f the methodologies used
or developed in this thesis for researching or designing novel production processes.
Secondly, this chapter amalgamates the experimental and Computational Fluid Dynamics
results presented in Chapters 4 to 8 to discuss their significance with respect to DNA
purification processes.
p253
9.1 Process research and design methodology
This section discusses the methodologies used in this thesis for researching and developing a
novel production process. In general, the research and development o f bio-separation processes
requires, firstly, a detailed understanding o f the fundamental chemical and physical properties
of bio-molecules and, secondly, knowledge of the chemical and physical environments the bio
molecules will experience. For the biochemical engineer, detailed knowledge of fundamental
chemical and physical properties is typically acquired from the scientific literature, along with
additional information provided from the Basic Research department. The engineer will usually
be required to perform targeted experiments to understand some additional properties o f the bio
molecules that are relevant to the purification environment that the molecules will experience.
Process development will then proceed to understand the behaviour of the bio-molecules in
scale-down purification equipment in order to gain sufficient understanding o f the purification
unit operations with which to confidently design and implement a large-scale purification
process. The experimental methodology used in this thesis was designed with the goal of
understanding the effects of fluid stress on DNA purification from fundamental chemical and
physical properties, through scale-down experimentation, through to manufacturing-scale.
The organisation of the thesis is represented in Figure 9.1. In designing a DNA purification
process to minimise the detrimental effects of fluid stress, it is essential to know how fluid stress
changes as the process is scaled-up (going from left to right in Figure 9.1), which will be
referred to as Scale-up knowledge. It is also important to know how detrimental effects of fluid
stress at each process step affect the performance of subsequent downstream operations (going
from top to bottom in Figure 9.1). This will be referred to as Windows o f Operation
knowledge. In order to gain Scale-up knowledge and Windows o f Operation knowledge
relating to the effects o f fluid stress, certain experimental and design methodologies were
employed in this thesis:
1. Developing the analytical tools to determine DNA quantity, size and conformation
throughout the downstream purification process, from cellular lysis through to the final
product.
2. Using Computational Fluid Dynamics (CFD) to characterise fluid mixing and shear
within fundamental model flow systems and scale-down devices and using those CFD
models to design manufacturing scale devices.
3. Experimentally determining the effects of fluid mixing and fluid shear on DNA
degradation in model systems and in specific unit operations, and then determining the
effect o f DNA structure on the performance o f subsequent downstream purification
steps.
p254

4. Developing an experimental method of measuring plasmid DNA degradation under
highly dilute coneentrations using a novel fluorescence-based assay technique. This
method enables plasmids to be potentially used as probes for fluid mixing and fluid
stress in manufacturing scale equipment.
The advantages and disadvantages of each of these methodologies will now be discussed.
Fundamental Scale-down Manufacturins
C i J
Ch5
Prim ary R ecovery (A lkaline L ysis)
Ch5 Scale-down Stirred Tank
Fundamental: 1. Experiment (M ixing. Shear)I. Experiment (pH, dénaturation)
Fundamental: / Ç Scale-down Opposed JetsI . Experiment (Shear) I . Experiment (M ixing, Shear)
._____ „ ......... 2. CFD (M ixing, Shear)
. ' Assays ._.' Developm ent ;■
C h 4
..... ' V D ow nstream Purification
ChProcess-scale:
I CFD (M ixing Shear)
Ch 8 Ch6 f,
Fundamental:1. Experiment (Shear)2. CFD (Shear)
©PrecipilatMMi D unitration C lirom aiography Filling
Figure 9.1. Organisation of thesis with respect to DNA purification process development.
9.1.1 Analytical development
This investigation into the effects of fluid stress on DNA process streams required the analytical
tools to determine the structure, quantity and purity o f the DNA present. It was essential for
this investigation that the assays used were able to resolve the differences between samples to
the required level o f accuracy, and that the assays were robust and could be performed within a
feasible time. It was apparent early on that the available analytical techniques were inadequate
for resolving the effects of fluid mixing and fluid shear on DNA containing samples. Therefore
a conscious decision had to be made to allocate time towards assay development. The
advantages and disadvantages of developing novel HPLC and fluorescent analytical techniques
shall be discussed separately with respect to assaying alkaline lysate samples and pure plasmid
samples.
p255

Alkaline Lysate samples
The goal of alkaline lysis is to maximise SC plasmid yield and minimise DNA impurity yield;
therefore, it was essential to be able to quantify the SC plasmid product and all of the DNA
impurities. Table 9.1 shows the DNA species present during alkaline lysis and the assays that
can be used. The standard analytical technique for quantifying DNA species is agarose gel
electrophoresis. This technique can be used quantify double-stranded plasmid species (SC, OC
and linearised plasmid), however, the technique is labour intensive and slow to run and requires
many replicates to achieve low standard deviations between replicate samples. Utilisation of
low melting point agarose, presented in chapter 4, reduced sample diffusion and improved
sample accuracy. Picogreen is another standard technique for measuring DNA. This technique
can be modified to measure supercoiled plasmid DNA (Levy et al. 2000). However, because
single-stranded chromosomal DNA fluoresces up to 30% that o f supercoiled plasmid, samples
that contain high levels of DNA impurities, such as alkaline lysates, can give erroneous results
when assayed using this technique.
The principal failing o f agarose gel electrophoresis and Picogreen assays is their inability to
accurately quantify the majority of the DNA impurities. This is partly due to the low binding of
ethidium bromide or Picogreen to single-stranded DNA, and partly due to the diffuse banding of
double- and single-stranded chromosomal DNA on agarose gels. Therefore, it is difficult to
optimise alkaline lysis with respect to chromosomal DNA removal using these analytical
techniques. Development of HPLC assays, using Q-Sepharose and Poros PI anion exchange
resins, allowed more accurate and faster assaying for both plasmid product and DNA impurities.
As the alkaline lysis results presented in chapter 6 showed, both supercoiled plasmid yield and
chromosomal DNA yield were relatively insensitive to fluid stresses during lysis. Therefore the
use o f more accurate assays dispelled the idea that high fluid stresses during lysis produced
significantly more chromosomal DNA.
The new HPLC assays also showed that a high NaOH concentration did not dramatically affect
either supercoiled plasmid or chromosomal DNA yield, but instead was essential for conversion
o f double-stranded chromosomal DNA to single-stranded form. Agarose gel electrophoresis did
not provide accurate information on chromosomal DNA contamination and provided no
information as to whether the chromosomal DNA was in single- or double-stranded form;
therefore, it was not possible to optimise alkaline lysis using the standard agarose gel assay.
Therefore, although considerable time was invested in HPLC assay development, proper
process optimisation of the alkaline lysis step would not have been feasible, otherwise.
p256
Pure plasmid samples
The relevant DNA species during fluid shear experiments were principally the SC plasmid
product, OC and linear plasmid; for these experiments solutions o f pure plasmid DNA were
used. Again, agarose gel electrophoresis was used to quantify plasmid species, however the
same shortcomings o f agarose gel electrophoresis applied, namely low accuracy, labour
intensive procedures and slow tum-around time. Development o f HPLC assays, using Q-
Sepharose and Poros PI anion exchange resins, and modified fluorescence assays using
Picogreen, allowed more accurate and faster assaying o f both plasmid product and DNA
impurities.
Unlike the case for alkaline lysis, the development o f novel assays to monitor pure supercoiled
plasmid shear degradation did not provide additional information over using old assay
techniques. Instead the novel assays vastly increased the number o f experiments that could be
assayed. However, the development o f development o f the modified Picogreen assay will allow
the monitoring o f plasmid degradation under dilute conditions in manufacturing-scale
equipment; this is discussed separately in this chapter.
p257
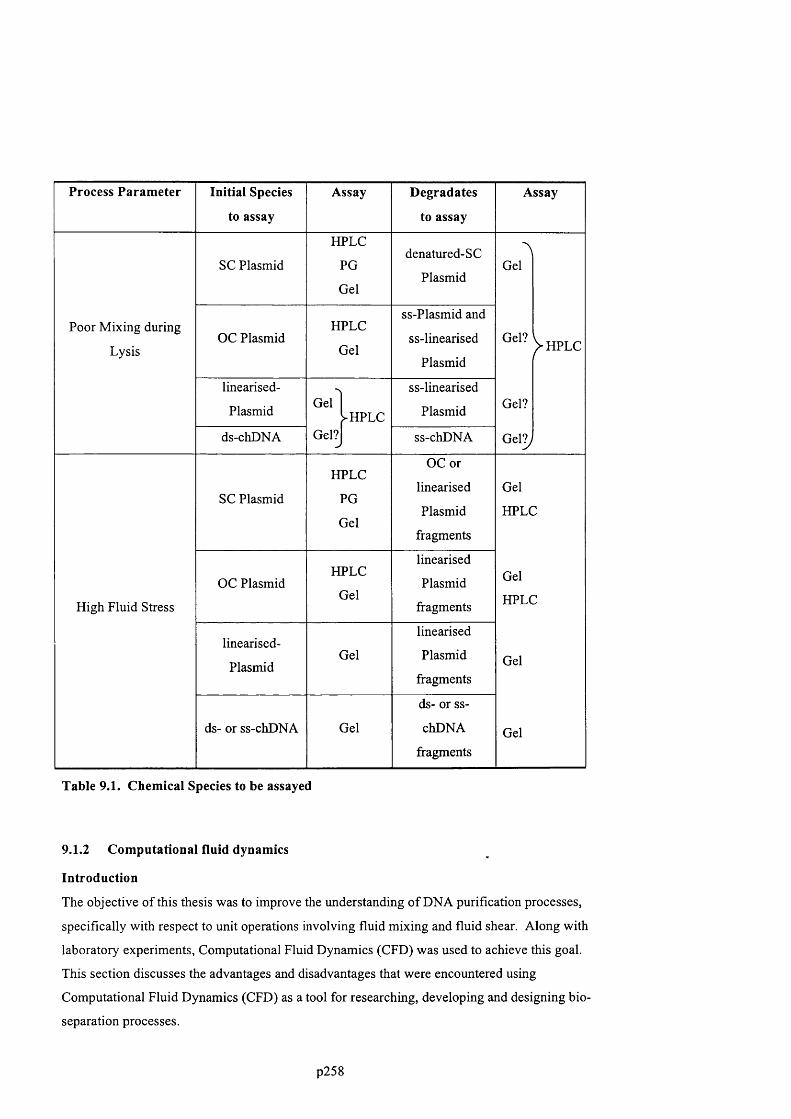
Process Parameter Initial Species Assay Degradates Assay
to assay to assay
SC Plasmid
HPLC
PG
Gel
denatured-SC
Plasmid
AGel
Poor Mixing during
LysisOC Plasmid
HPLC
Gel
ss-Plasmid and
ss-linearised
Plasmid
Gel?V h p l c
linearised-
Plasmid G e ll^HPLC
ss-linearised
Plasmid Gel?
ds-chDNA Gel*^ ss-chDNA Gel?J
SC Plasmid
HPLC
PG
Gel
OC or
linearised
Plasmid
fragments
Gel
HPLC
High Fluid Stress
OC PlasmidHPLC
Gel
linearised
Plasmid
fragments
Gel
HPLC
linearised-
PlasmidGel
linearised
Plasmid
fragmentsGel
ds- or ss-
ds- or ss-chDNA Gel chDNA
fragmentsGel
Table 9.1. Chemical Species to be assayed
9.1.2 Computational fluid dynamics
Introduction
The objective of this thesis was to improve the understanding o f DNA purification processes,
specifically with respect to unit operations involving fluid mixing and fluid shear. Along with
laboratory experiments, Computational Fluid Dynamics (CFD) was used to achieve this goal.
This section discusses the advantages and disadvantages that were encountered using
Computational Fluid Dynamics (CFD) as a tool for researching, developing and designing bio
separation processes.
p258
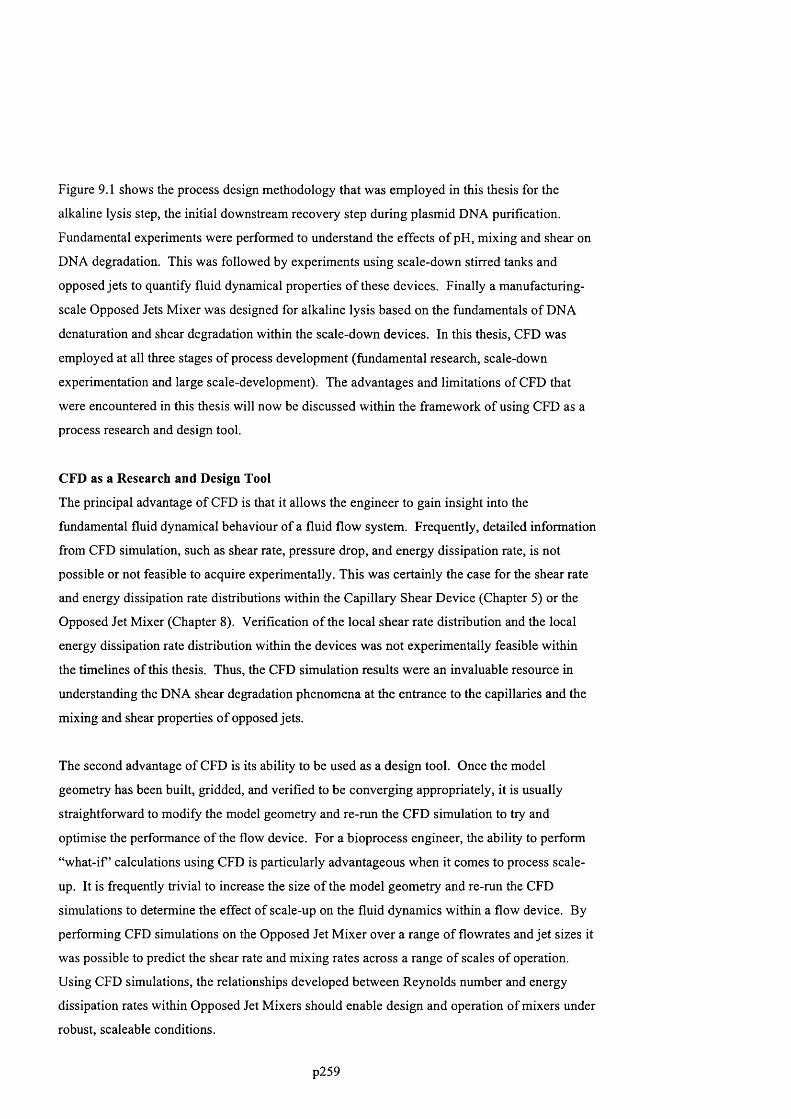
Figure 9.1 shows the process design methodology that was employed in this thesis for the
alkaline lysis step, the initial downstream recovery step during plasmid DNA purification.
Fundamental experiments were performed to understand the effects o f pH, mixing and shear on
DNA degradation. This was followed by experiments using scale-down stirred tanks and
opposed jets to quantify fluid dynamical properties o f these devices. Finally a manufacturing-
scale Opposed Jets Mixer was designed for alkaline lysis based on the fundamentals of DNA
dénaturation and shear degradation within the scale-down devices. In this thesis, CFD was
employed at all three stages o f process development (fundamental research, scale-down
experimentation and large scale-development). The advantages and limitations of CFD that
were encountered in this thesis will now be discussed within the framework of using CFD as a
process research and design tool.
CFD as a Research and Design Tool
The principal advantage of CFD is that it allows the engineer to gain insight into the
fundamental fluid dynamical behaviour of a fluid flow system. Frequently, detailed information
from CFD simulation, such as shear rate, pressure drop, and energy dissipation rate, is not
possible or not feasible to acquire experimentally. This was certainly the case for the shear rate
and energy dissipation rate distributions within the Capillary Shear Device (Chapter 5) or the
Opposed Jet Mixer (Chapter 8). Verifieation o f the loeal shear rate distribution and the local
energy dissipation rate distribution within the devices was not experimentally feasible within
the timelines of this thesis. Thus, the CFD simulation results were an invaluable resource in
understanding the DNA shear degradation phenomena at the entrance to the capillaries and the
mixing and shear properties o f opposed jets.
The second advantage o f CFD is its ability to be used as a design tool. Once the model
geometry has been built, gridded, and verified to be converging appropriately, it is usually
straightforward to modify the model geometry and re-run the CFD simulation to try and
optimise the performance of the flow device. For a bioprocess engineer, the ability to perform
“what-if ’ calculations using CFD is particularly advantageous when it comes to process scale-
up. It is frequently trivial to increase the size o f the model geometry and re-run the CFD
simulations to determine the effect of scale-up on the fluid dynamics within a flow device. By
performing CFD simulations on the Opposed Jet Mixer over a range o f flowrates and jet sizes it
was possible to predict the shear rate and mixing rates across a range of scales o f operation.
Using CFD simulations, the relationships developed between Reynolds number and energy
dissipation rates within Opposed Jet Mixers should enable design and operation of mixers under
robust, scaleable conditions.
p259

Reliability of CFD Simulation Predictions with Respect to Bio-Process Design
The principal disadvantage of CFD modelling arises due to the limitations o f current-day
computers to solve the Navier-Stokes equations for fluid flow. These equations can currently
only be solved exactly for laminar flows. Although nearly all relevant engineer fluid flows are
turbulent in nature, current computers are too slow to solve the Navier-Stokes equations for
turbulent fluid flows. Instead, various turbulent models are used to model the fluid flow
behaviour. All of the current turbulent models are partly empirical in nature, and the
shortcomings of CFD modelling is directly related to the shortcomings of the turbulent model
used. The shortcomings of the different turbulence models require that the CFD user has
extensive knowledge of the limitations of each model, and knows which turbulence models are
most appropriate for specific problems. Even when the most appropriate turbulence models are
applied to solve a fluid dynamics problem, for all but the most basic of flow problems the user
can not be entirely confident that the CFD results will be completely predictive of real-world
flow behaviour.
With the prohibitive capital cost of manufacturing-scale equipment and the necessity o f rapid-
time-to-market for biopharmaceutical products, troubleshooting equipment in the manufacturing
plant must be avoided at all costs. Thus, design of large-scale purification processes requires a
very high degree o f confidence in the performance of each piece o f manufacturing equipment
long before the equipment is used to purify product. The fluid dynamics within purification
equipment critically affects the separation o f the bio-molecules by affecting mass transfer, heat
transfer and fluid stresses. To confidently design a manufacturing-scale process, scale-down
experiments must be run to determine the effects of the fluid dynamics on the bio-separation.
Because CFD modelling alone is not sufficient to predict, with absolute assurance, the fluid
dynamical behaviour o f bio-separation equipment, a bioprocess should never be designed and
built based solely on CFD simulation.
Using CFD to Complement Experimental Research
If CFD modelling must be verified using experiment, what is the advantage o f CFD modelling?
Although CFD simulation results cannot be completely depended upon, assuming the user has
reduced the model geometry to a feasible size and chosen an appropriate turbulence model, in
the majority o f cases the CFD results will be a close approximation to the real flow behaviour.
Therefore, CFD can be an invaluable tool to target which fundamental, scale-down, or
manufacturing-scale experiments need to be performed. For example, in the majority o f cases
the bioprocess design engineer must decide between different designs of equipment for each
unit operation in a process stream. CFD simulations on a range o f process equipment could be
used to determine which pieces o f process equipment are least likely to cause stress-induced to a
p260
biomolecule. After choosing the most appropriate piece o f equipm ent based on CFD
simulation, the performance o f the equipment can be verified experim entally using scale-down
equipment.
N ot only does the CFD simulation help reduce the am ount o f scale-down experiments required,
but the detailed fluid dynamics information obtained from CFD is invaluable when it comes to
understanding how the equipment will behave at large-scale. M oreover, if a CFD m odel for a
piece o f pilot-scale equipment has been developed, it is usually a trivial exercise to increase the
geometry o f the model to simulate the equipment at m anufacturing scale. W hile CFD
simulation can not definitively predict the fluid dynamics perform ance at manufacturing scale,
any CFD predictions of errant fluid dynamical behaviour act as invaluable warnings that
potential problems may arise and should be addressed.
In this thesis, experimental verification o f the CFD model results was not perform ed the
capillary device but was performed for the opposed je ts mixer. W here approximate analytical
expressions for shear rates or energy dissipation rates were available, the CFD results were
close to the analytical calculations. The CFD predictions for the capillary device and opposed
Jet mixers were highly valuable in understanding the behaviour in the devices. The high level
o f extensional shear at capillary entrances predicted by CFD led to experiments that verified
that DNA degradation was occurring at the capillary entrance. Similarly, the CFD prediction
that the mixing rate in the Opposed Jet M ixer decreases rapidly w ith Reynolds numbers below
8000, irrespective o f operating scale, indicates that the perform ance o f the Opposed Jet M ixer at
low Reynolds numbers should be checked experim entally to avoid potential problems w ith poor
mixing. In the end, the CFD predictions for the opposed je ts m ixer accurately matched the
experimental data o f M ahajan et al. (1996).
Allocation of Resources to CFD
The second m ajor disadvantage o f CFD simulation is the user time it requires developing a CFD
model. CFD model development involves creation o f a model geometry using a suitable
computer graphics program, followed by several stages o f gridding the geometry, running the
simulation, and refining the grid, until a convergent solution is obtained. This process can take
from weeks to months depending on the complexity o f the flow geometry and the experience o f
the CFD user. Although having a CFD model o f a piece o f process equipm ent is a valuable
tool, the question arises as to w hether the bioprocess engineers time would be better spent
running scale-down experiments in the laboratory? There is probably no easy answer to this
question.
p261
Currently CFD simulation cannot generally be used to model entire pieces o f process equipment
(instead CFD models are usually based on engineering “hot-spots” within equipment). In
addition, there is currently a lack o f absolute confidence in CFD results; thus, important CFD
predictions need to be verified experimentally. Therefore, based on the time taken to develop
the CFD models used in this thesis, it is the opinion o f the author that the process engineer’s
time is not maximised performing CFD simulation. Instead, the engineer’s time is better spent
approxim ating the fluid dynamical behaviour within the “hot-spots” o f process equipment using
analytical expressions, instead o f using CFD, and then verifying the important analytical
predictions experimentally. The high elongational shear rate at entrance o f the capillary device
discovered through CFD simulations can be analytically approximated from point-sink flow
calculations. Similarly, the decrease in energy dissipation in the opposed je t mixer at low
Reynolds number can be assumed from turbulence theory. Therefore, analytical calculations
can be used to roughly approximate the important CFD results for both the capillary device and
opposed je t mixer, and these calculations can be done in minutes to hours. A competent
bioprocess engineer would then experimentally verify these analytical predictions. In contrast,
the CFD models developed in this required several months o f work (some o f which was training
o f the author with the CFD software package) and the CFD results still required experimental
verification.
I f CFD models o f complicated process equipment were more accurate or faster to develop, then
CFD m odelling would be a significantly enhanced tool for the bioprocess engineer. For
com plicated equipment, analytically approximating the fluid dynamics throughout the flow
dom ain and pin-pointing all the engineering “hot-spots” is significantly more difficult.
Therefore, a CFD model o f the entire piece o f equipment would give significantly more
information than analytical calculations alone. Unfortunately, CFD m odelling o f an entire piece
o f complicated process equipment is still in its infancy and is both time-consuming and
inaccurate. In an academic environment, where fundamental fluid dynamics investigations into
process equipment are being performed, not having the time constraints o f supplying a valuable
biopharm aceutical product to market, CFD provides a valuable insight into the underlying fluid
dynamical behaviour o f bio-separation operations and is probably worth pursuing.
9.1.3 W indow s o f opera tion
A typical purification process consists o f a series o f several purification steps. The goal o f the
developm ent engineer is optimisation o f the process to maximise the final product yield and
purity at the end the entire purification stream. In practice, however, a process is optimised to
maximise product yield and purity over each individual process step, rather than the entire
p262

process. This is because optimisation o f all o f the process variables at once is sim ply too large
an optim isation problem, so instead the problem is broken down into smaller units, each unit
typically being one process step. Sometimes, the set o f process parameters which will maximise
the final product yield and purity, over the entire process, can differ significantly from the set o f
process parameters which optimise each individual process step.
As a hypothetical example, consider the series o f process steps starting with alkaline lysis and
clarification and followed by chromatography. Optimisation o f alkaline lysis and clarification
may involve gentle mixing conditions during lysis to prevent chrom osom al DNA chain scission
due to fluid stress, maximising chromosomal DNA removal during clarification. However,
these gentle mixing conditions may limit the dénaturation o f chromosomal DNA during lysis
leading to poor removal o f the chromosomal DNA over the proceeding chrom atography step.
Therefore, the overall-process optimal conditions may involve better m ixing over lysis,
somewhat poorer chromosomal rem oval over clarification, but significantly better chromosomal
D NA removal over chromatography. In this thesis, an effort was made to follow the effects o f
process changes several steps downstream to observe the overall process effects o f changing
upstream process variables.
It was demonstrated in chapter 6 that low to m oderate levels o f NaOH concentration or fluid
stress did not have a significant effect on the plasmid purity. However, the size and form o f the
chromosomal DNA impurities was significantly affects by the N aOH concentration and fluid
stress. Although chromosomal DNA size and form did not have a significant effect on its
removal over alkaline lysis, it was demonstrated in chapter 7 that this can appreciably affects its
removal in downstream purification steps. It was concluded that alkaline lysis should be
primarily optimised with respect to maximising chrom osom al dénaturation, and alkaline lysis
should be proceeded by unit operations such as Poros PI chrom atography, calcium chloride
precipitation or silica adsorption that are very effective at rem oving single-stranded
chromosomal DNA.
In contrast, it was demonstrated that chromosomal DNA impurities were predom inantly double
stranded after lysozyme and heat lysis below 85°C. A t tem peratures higher than 85°C the
supercoiled plasmid begins to degrade during heat lysis. Therefore, heat lysis should be
optimised with respect to m inim ising chromosomal DNA fragmentation, and the heat lysis step
should be proceeded by unit operations such as Q-Sepharose, CTAB that remove chromosomal
DNA based on its size relative to plasm id DNA.
p263
9.1.4 Probes for fluid stress
W hen designing a plasmid DNA production process to minimise the detrimental effect o f fluid
stress on final product quality, it is essential to be have detailed knowledge o f the fluid dynamic
environm ent DNA molecules will experience within each piece o f equipment in the purification
stream. Therefore, an equally important objective o f this thesis was to investigate and develop
methodologies for determining fluid stress fields in scale-down and industrial equipment. One
m ethod already discussed, knowing the detailed geometry o f the equipment, is to calculate
using CFD simulation the internal strain rates within a piece o f equipment. An alternative and
probably more reliable method o f determining fluid stress levels with equipm ent is to measure
the degradation rate o f known compounds within the equipment.
It has been demonstrated in this thesis that supercoiled plasmids have several unique features
that make them good candidates as probes for fluid stress. Firstly, supercoiled plasmids unlike
linear DNA can only exist as a completely intact double-stranded chain. Just one nick in the
backbone o f a supercoiled molecule will cause it to loose its supercoiling. Therefore,
supercoiled plasmids will respond more homogeneously to a fluid stress field compared to
double-stranded chromosomal DNA molecules that may have many single-stranded nicks
randomly positioned along their backbone. Secondly, supercoiled plasmids are relatively small,
so that from very dilute concentrations to higher concentrations seen in purification processes,
the plasmids should behave as isolated molecules. Therefore the stress-induced degradation
behaviour o f supercoiled plasmid under dilute conditions should be sim ilar to its behaviour at
higher concentrations during plasmid purification. Thirdly, different supercoiled plasmids are
available that have widely different susceptibilities to stress-induced degradation. Fourthly, the
kinetics o f supercoiled plasm id degradation is a simple first-order reaction that appears to
follow the TABS theory for stress-induced molecular bond scission. Finally, it has been
demonstrated that the degradation o f supercoiled plasm id to open-circular plasm id can be
monitored at extremely dilute plasmid concentrations. Therefore, very little supercoiled
plasm id is required for large-scale studies. Although, the analytical techniques developed in
this thesis made supercoiled plasmid an excellent candidate as a probe for fluid stress, the use o f
supercoiled plasmids as a probe has to be demonstrated. This will be highlighted in chapter 10
on future work.
9.2 DNA purification at manufacturing scale
The previous section discussed the methodologies applied to researching and designing a DNA
purification process to minimise the detrimental effects associated with fluid mixing and fluid
stress. A fter applying these methodologies, a more detailed knowledge was acquired of:
p264

• The effect o f the fluid dynamic environm ent on plasm id and chrom osom al DNA molecules.
• The fluid dynamic environment DNA molecules will experience w ithin equipment in the
purification stream, at different scales o f operation.
• How degradation o f plasmid and chromosomal DNA affects final downstream product yield
and purity.
This section amalgamates, and discusses, the experimental and CFD results with respect to the
design o f a DNA purification process.
9.2.1 Scale-up of alkaline lysis.
It was demonstrated in chapter 6 that mixing during alkaline cell lysis can be critical,
particularly when using concentrated lysis buffer. As the cellular contents are released during
alkaline lysis, the rheology o f the lysis solution alters from an initially New tonian state with a
viscosity close to water to a non-Newtonian viscoelastic state (Ciccolini et al. 2000). Under
steady fluid stress, the apparent viscosity is dom inated by the higher m olecular weight o f
chromosomal DNA, w ith a maximum viscosity value 25 to 30 times that o f water. The impact
o f viscoelasticity on mixing is unknown but the literature evidence suggests that for otherwise
similar conditions, the elastic properties o f the solution will reduce flow leading to poorer
mixing. W ith the high lysate viscosity, the effects o f viscoelasticity and the requirements for
rapid mixing, the choice o f a mixing device is not a trivial problem , particularly if chromosomal
fragmentation is to be avoided.
Two principle mixing strategies have been em ployed for alkaline lysis: stirred tanks and static
m ixers, both o f which are discussed in greater detail in chapter 2. Alkaline lysis in stirred tanks
at scales up to 50 L, has already been dem onstrated Cham sart et al. (2000). They showed that,
following further purification by Qiagen purification and alcohol precipitation, alkaline lysate
contained a satisfactorily low concentration o f chromosomal D N A (< 2% contamination),
together with a satisfactory supercoiled plasmid yield (1 mg / g wcw). O f the static mixers used
for alkaline lysis, two principal types o f have been used for alkaline lysis: conventional in-line
static mixers (W an et al., 1998), and je t mixers (Ciccolini et al., 2002). To date, little has been
published on the performance o f either o f these static mixers for alkaline lysis.
I f alkaline lysis is done in a stirred tank, then m oderate to high im peller speeds will be required
to ensure that micro-mixing times are short, avoiding supercoiled plasm id dénaturation. Using
0.2 M NaOH lysis buffer, an impeller speed between 50 rpm to 200 rpm was required in the 200
mL stirred vessel. For 0.4 M NaOH lysis buffer, an im peller speed between 200 rpm and 800
rpm was required to prevent supercoiled plasmid dénaturation. The calculated macro-mixing
p265

time in the 200 mL stirred vessel at 200 rpm and 800 rpm was 9.5 s and 1.2 s, respectively. The
calculated m icro-m ixing time in the stirred vessel at 200 rpm and 800 rpm was 2.9 s and 0.4 s.
In order to scale-up the 200 mL stirred tank to pilot-scale and manufacturing-scale it is
important to m aintain a constant mixing time in the stirred vessel.
In order to scale-up the tank based on constant macro-mixing time the impeller speed, N, must
be maintained constant. However, maintaining the impeller speed constant on scale-up requires
significant pow er input to drive the impeller. Figure 9.2 shows the power requirements as a
function o f scale to achieve macro-mixing times o f 10 s or 1 s. Based on a maximum feasible
impeller m otor pow er o f 100 kW, the maximum tank sizes that can be used to achieve a macro
mixing time o f 1 s is about 700 L. The maximum tank size that can be used to achieve a macro
mixing time o f 10 s is about 10,000 L. Therefore, 0.2 M NaOH can be used as a lysis buffer up
to large-scales o f 10,000 L, while 0.4 M NaOH lysis buffer can only be used up to about 700 L.
A lternatively, the micro-mixing time at the tank impeller could be maintained constant.
M aintaining a constant micro-mixing time close to the impeller requires that the power input to
the tank increases in proportion to the volume o f the tank. This leads to a significant power
input to the tank in large-scale tank, however it requires lower pow er input on scale-up than
m aintaining a constant macro-mixing time. However, maintaining a constant micro-mixing
time at the im peller may not ensure adequate mixing characteristics if lysis buffer is swept
rapidly from the near-im peller region. At large scales, utilisation o f more concentrated lysis
buffers like 0.4 M NaOH would be extremely advantageous, as doubling and tripling the
volumes o f already large batches should be avoided. Unfortunately this requires short mixing
times that are not feasible using stirred tanks at large scale due to power requirements.
As well as problem s associated w ith fluid mixing, there will be an increase in fluid stress within
stirred tanks upon scale-up. It was demonstrated in chapter 5, that elongational stresses degrade
supercoiled and plasm id DNA. In a stirred tank environment elongation stresses will
predom inantly occur between fluctuating turbulent eddies. These turbulent eddies can either
occur in the boundary layer o f the impeller or due to turbulence in the bulk fluid. Figure 9.3
shows the turbulent stresses and impeller boundary stress in a stirred tank as a function o f tank
volume, at a constant micro-mixing time in the near-impeller region o f 0.3 s. The turbulent
stresses within the tank remain constant if the tank is scaled-up to m aintain a constant m icro
mixing time, but there is a considerable increase in impeller boundary stress. I f the tank is
scaled-up based on constant macro-mixing time, rather than micro-m ixing time, then the
increase in fluid stress will be even greater.
p266
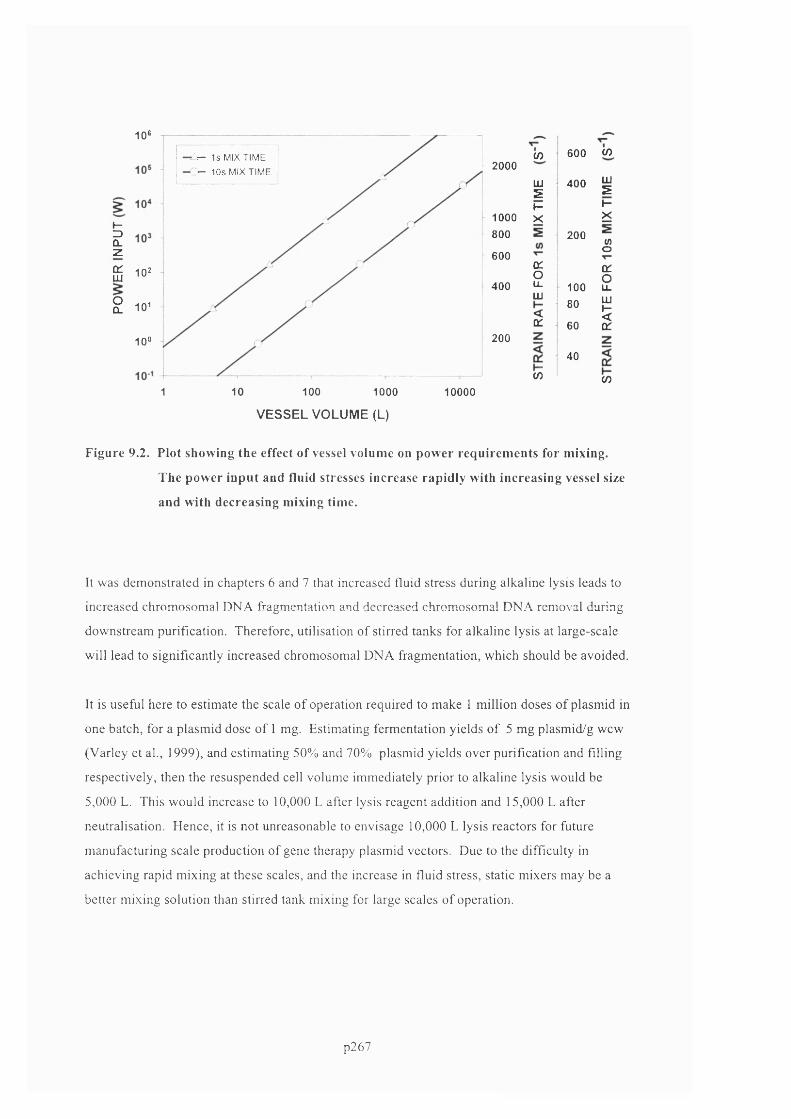
10®
— 1s MIX TIME
- 10s MIX TIME 2000
- 1000 800
H3Û-z 600
S5 1 0 ^
2 10400
20010°
1 10 100 1000 10000
(O
LU
sL-X
Q:oLL
LU
5
CO
600
400
200
10080
60
40
CO
LUsh-X
wo
a:0LL
1
CO
VESSEL VOLUME (L)
F igu re 9.2. P lo t show ing the effect o f vessel volum e on p ow er req u irem en ts for m ixing.
T he pow er in p u t and fluid stresses increase rap id ly w ith increasing vessel size
and w ith decreasing m ixing tim e.
It was dem onstrated in chapters 6 and 7 that increased fluid stress during alkaline lysis leads to
increased chrom osom al DNA fragmentation and decreased chrom osom al DNA removal during
downstream purification. Therefore, utilisation o f stirred tanks for alkaline lysis at large-scale
will lead to significantly increased chromosomal DNA fragm entation, which should be avoided.
It is useful here to estimate the scale o f operation required to make 1 m illion doses o f plasm id in
one batch, for a plasm id dose o f 1 mg. Estimating ferm entation yields o f 5 mg plasm id/g wcw
(Varley et al., 1999), and estim ating 50% and 70% plasm id yields over purification and filling
respectively, then the resuspended cell volume immediately prior to alkaline lysis would be
5,000 L. This would increase to 10,000 L after lysis reagent addition and 15,000 L after
neutralisation. Hence, it is not unreasonable to envisage 10,000 L lysis reactors for future
m anufacturing scale production o f gene therapy plasm id vectors. Due to the difficulty in
achieving rapid m ixing at these scales, and the increase in fluid stress, static mixers may be a
better m ixing solution than stirred tank mixing for large scales o f operation.
p267

10000
— AVERAGE TURBULENT STRAIN RATE IN VESSEL "O TURBULENT STRAIN RATE NEAR IMPELLER
STRAIN RATE IN IMPELLER BOUNDARY LAYER
CO LU
1000o o o
CO
10010-1 10° 101 1Q2 103 104 105
VESSEL VOLUME (L)
Figure 9.3. Plot showing the fluid stress in a stirred tank as a function of tank volume, at
a constant tank micro-mixing time of 0.3 s.
CFD predictions o f opposed je t mixing at different scales o f operation showed that mixing times
in opposed jets can be maintained constant across different scales o f operation by mixing at
appropriate je t velocities. The je t velocities required to achieve excellent mixing characteristics
are well within the range o f practical je t velocities, and increases in scale require only moderate
increases in je t velocity to maintain the same mixing time. In addition, the magnitude o f fluid
stress should actually decrease with increasing je t velocity. Therefore, opposed jets are an
excellent strategy for alkaline lysis mixing with respect to process scale-up.
9.2.2 Downstream purification strategies
Apply second denaturation-renaturation step.
Opposed je t m ixing was demonstrated as a means o f denaturing residual chromosomal DNA
during downstream plasmid purification. It was dem onstrated in chapter 6 that alkaline lysates
typically contained a small amount o f residual double-stranded chromosomal DNA. There are
several effective purification techniques for removing single-stranded chromosomal DNA from
supercoiled plasm id DNA, while in contrast removal o f double-stranded chromosomal DNA is
very difficult and expensive. By denaturing residual chromosomal DNA prior to a single
stranded DNA purification step, residual chromosomal DNA can be virtually eliminated. Use
o f highly concentrated dénaturation buffer avoided an excessive increase in batch volume, but
p268
required very rapid mixing to avoid plasmid degradation, w hich were easily achievable using
opposed jets. I f the entire DNA impurities are not converted to single-stranded form after
alkaline lysis, a second denaturation-renaturation step should be considered prior to purification
steps where chromosomal DNA is being removed. This second denaturation-renaturation step
is feasible if opposed jets are employed to mix in concentrated NaOH, avoiding an excessive
increase in batch volume. . The additional dénaturation step is a highly effective m ethod o f
rem oving residual open-circular plasm id DNA, as shown in chapter 7
Reduction of fluid stress during purification
It was demonstrated in chapter 5, that elongational fluid stresses are more effective at degrading
supercoiled plasm id DNA than shear stresses. Therefore, equipm ent and flow paths should be
designed to minim ise elongational stresses at stages in the purification process where
chromosomal contamination is still high. Due to the susceptibility o f chromosomal D NA to
fluid stress-induced degradation, unit operations that rely on chromosomal DNA size for its
removal should be implemented as early on in the purification sequence as possible. Therefore,
unit operations such as CTAB should be implemented as soon as possible after alkaline lysis. It
may be more effective to alkaline lyse at low concentrations o f NaOH, and reduce fluid mixing
to very low levels. A unit operation such as CTAB can then be used to remove large
chromosomal DNA fragments. This can be followed by a second denaturation-renaturation step
to convert the rem aining chromosomal DNA to single-stranded form, prior to single-stranded
chromosomal DNA removal using Q-Sepharose or Poros PI chromatography.
It was demonstrated in chapter 5 that the stress-induced degradation o f plasm id DNA was
consistent w ith elongational stress causing plasm id strain and subsequent chain scission in fluid
flows that were elongational or between the eddies o f turbulent flows. It was demonstrated that
large plasmids were significantly more susceptible to stress-induced degradation than small
plasmids. Although chromatographic techniques are highly effective at removing single
stranded chromosomal DNA, these techniques generate appreciable levels o f elongational stress
between the chrom atography resin. Therefore, if there is a m ovem ent towards using larger
plasmids for gene therapy unit operations such as precipitation should be utilised to prevent
plasm id degradation.
p269
10 ConclusionsPlasm id and linear DNA degradation in a model flow field was determined to be consistent with
elongational stress causing DNA stretching and subsequent scission. It appeared that DNA was
susceptible to degradation in fluid flows that are highly elongational or between eddies in
turbulent flows when eddies are small enough to impart significant fluid stress onto the DNA
coils. Supercoiled plasmid degradation was well modelled by the TABS theory o f bond
scission. The conformation o f DNA prior to degradation affected its rate o f degradation, which
in turn was affected by DNA size and solution properties such as ionic strength.
N ew HPLC- and fluorescence-based assays for plasmid and chromosomal DNA impurities were
developed. These assays proved essential in determining DNA stress-induced degradation rates
and in understanding and optimising a specific DNA purification step, cell lysis. This
highlighted the importance o f having robust and accurate analytical techniques available to the
bioprocess engineer.
To predict fluid m ixing rates and fluid stress levels within equipm ent. Com putational Fluid
Dynamics (CFD) was utilised. The CFD predictions were validated against experimental
observations and proved extremely useful in understanding the fluid dynam ical behaviour in a
model fluid stress device and in an opposed je t mixer. This demonstrates how CFD is now
becom ing a valuable engineering tool for designing and optim ising bioseparation processes.
For the primary DNA purification unit operation, alkaline cell lysis, it was determ ined that fluid
stress leads to significant chromosomal DNA fragmentation. A lthough this did not significantly
affect chromosomal DNA removal over alkaline lysis and clarification, it was dem onstrated that
chromosomal D NA fragmentation was detrimental depending on the choice o f subsequent
downstream operations. Reduction o f fluid stresses could be achieved at the expense o f poorer
mixing; however it was determined that poor fluid m ixing can lead to supercoiled plasm id yield
loss particularly at high lysis buffer concentrations, and that high lysis buffer concentrations
were required for effective chromosomal DNA dénaturation. Therefore optim isation o f the lysis
step involved understanding the combined effects o f chromosomal DNA fragm entation and
dénaturation on chromosomal D NA removal during subsequent downstream purification. The
lysis step could only be effectively optimised by eonsidering the effects o f lysis on the entire
process stream, a W indows o f Operation approach. Opposed Jets were used to improve mixing
and significantly decrease fluid stress during lysis.
p270
11 Future work
11.1.1 DNA as a probe for fluid stress
It was demonstrated that the degradation o f supercoiled plasm ids can be m easured at extremely
dilute conditions, using a modified fluorescence-based assay, and that plasmids have many
properties that make them suitable molecules to be used as probes for fluid stress in large-scale
equipm ent. The degradation rates o f different size plasmids should be m easured in different
types o f equipment, and in different scales o f equipment, to determine if plasmid degradation
correlates against fluid stress in equipment; and hence can be used as a generic probe for fluid
stress.
Similarly, chromosomal DNA has several properties that makes it useful for monitoring fluid
stress in equipment, particularly the sensitivity o f chrom osom al DNA to fluid stress.
Comparisons o f chromosomal DNA fragment size in different equipment, such as stirred
vessels, chromatography columns and filters should be made to determine if the underlying
m echanism o f chromosomal DNA degradation is fluid elongation stress, and if chromosomal
D NA can then be used as a probe for fluid stress.
11.1.2 Effects of solution properties on DNA degradation
A consistent picture o f DNA degradation in the model flow fields w ithin the capillary flow
device is emerging. The effects o f solution properties such as ionic strength and pH should be
investigated to determine if DNA degradation rates are consistent with current polym er
stretching and scission theories.
11.1.3 Stress-induced degradation of large plasmids
The purification o f large plasmids is complicated enormously due to the susceptibility o f the
large molecules to stress-induced degradation. The effects o f fluid stress in a range o f relevant
engineering equipment require further study.
11.1.4 Investigation of opposed jets at larger scale
CFD predictions o f opposed jets were validated against published experimental DNA for je t
flowrates from about 0.05 to 1.0 L/min, in 0.5 mm to 2 mm ID jets. This was a sufficient
flowrate to use opposed je ts for pilot-scale alkaline lysis operations. It would be interesting to
determ ine if the CFD predictions o f opposed je t performance were valid at larger scales o f
p271
operation. Having developed a CFD model for opposed je ts it w ould be easy to perform more
simulations over a wider range o f je t Reynolds numbers and solution properties to determine if
the CFD predictions o f chapter 8 still apply.
11.1.5 Understanding chromosomal DNA flocculation
It was dem onstrated that the majority o f the chromosomal D NA is typically removed during cell
lysis, neutralisation and clarification. However, residual chromosomal DNA always remains
post-lysis and clarification. The removal o f the chromosomal DNA is only moderately affected
by the size o f the DNA. A better understanding o f the m echanism o f chromosomal DNA
flocculation during lysis and neutralisation is required to better optimise the alkaline lysis step.
11.1.6 Improving downstream purification
Currently, there are only a very limited number o f methods to remove chromosomal DNA
impurities from supercoiled plasmid cheaply and effectively at large-scale. It would be
interesting to determine if utilisation o f a second dénaturation step, post-alkaline lysis, to
denature all residual DNA impurities, followed by Q-Sepharose chromatography, could be used
to remove all the denatured DNA impurities cheaply and effectively. Alternatively, calcium
chloride precipitation, silica absorption or cellulose acetate could be used instead o f Q-
Sepharose, to rem ove single-stranded DNA.
p272
12 References
Abeles, R., Frey, P., Jencks, W. Biochemistry. Jones and B a rtle tt . 1992.
Adam , R., Zimm, B. Shear degradation o f DNA. Nucleic Acids Research. 4, 5, 1513-1536.
1977.
A tkins, E., Taylor, M. Elongational flow studies on DN A in aqueous solution and stress-
induced scission o f the double-helix. Biopolymers. 32, 911-923. 1992.
B aldyga, J., Bourne, J., Gholap, R. The influence o f viscosity on m ixing in je t reactors. 50,
1877-1880. 1995
Barton, M., Harding, P., Zuccarelli, A. General method for detecting and size large plasmid.
A nalytical biochemistry. 226, 235-240. 1995.
Baumann, C., Smith, S., Bloomfield, V., Bustamante, C. Ionic effects on the elasticity o f single
DNA molecules. Proceedings o f the N ational Academy o f Sciences. 94, 6185-6190. 1997.
Bensim on, D., Simon, A. Croquette, V., Bensimon, A. Stretching D NA with a receding
meniscus. Physical Review Letters. 74, 4754-4757. 1995.
Bird, R. Dynamics o f polymers liquids. John W iley, N ew York. 1977.
Bim boim , H ., Doly, J. A rapid alkaline lysis procedure for screening recom binant plasmid DNA. Nucleic Acids Research. 7, 1513-1522. 1979.
Boom, R., Sol, C., Salimans M., Jansen, C., W ertheim-van Dillen, P., van der Noordaa, J.
Rapid and simple method for purification o f nucleic acids. Journal o f clinical microbiology.
28, 3 ,495-503 . 1990.
Bowman, R., Davidson, N. Hydrodynamic shear breakage o f DNA. Biopolymers. 11, 2601-
2624. 1972.
Burgi, E., Hershey, A. Specificity and concentration limit in self-protection against mechanical
breakage o f DNA. Journal o f M olecular Biology. 4, 313-315. 1962.
Carlson, A., Signs, M., Lierman, L., Boor, R., Jim Jem, K. M echanical disruption of
Escherichia coli for plasmid recovery. Biotechnology and bioengineering. 48, 303-315. 1995.
Carrington, S., Odell, J. How do polymers stretch in stagnation point extensional flow-fields?
Journal o f Non-Newtonian Fluid Mechanics. 67, 269-283. 1996.
p273

Carrington, S., Tatham, J., Odell, J. M acromolecular dynam ics in extensional flows: 1.
Birefringence and viscometry. Polymer. 38, 16, 4151-4164. 1997.
Carter, M., M ilton, I. An inexpensive and simple m ethod for DNA purification on silica
particles. Nucleic Acids Research. 21 ,4 ,1044-1045 .
Champion, J., North, P. Determination o f hydrodynamic degradation o f DNA using flow
birefringence techniques. Journal o f Physical Chemistry. 212,1585-1592. 1972.
Chamsart, S.; Patel, H.; Hanak, J.A.J.; Hitchcock, A.G.; N ienow, A.W . Biotechnology and
Bioengineering. The impact o f fluid-dynamic-generated stresses on chDNA and pDNA stability
during alkaline cell lysis for gene therapy products. 75, 4, 387-392. 2001.
Chandra, A., Pankaj, P., Kost, T., Gray, J. Large-scale purification o f plasm id DNA by fast protein liquid chromatography using a Hi-Load Q-Sepharose column. A nalytical Biochemistry. 203, 169-172. 1992.
Cherry, R., kwon, K., Transient Shear Stresses on a Suspension Cell in turbulence.
Biotechnology and Bioengineering. 36, 563-571 1990.
Ciccolini, L., A n engineering study o f the alkaline lysis operation for the recovery o f
supercoiled plasm id DNA for gene therapy. Thesis. Departm ent o f Biochem ical Engineering.
University College London. 2000.
Ciccolini, L., Ayazi Shamlou, P., Titchener-Hooker, N. A mass balance study to assess the
extent o f contam inant removal achieved in the operations for the prim ary recovery o f plasm id
ly^A irom Escherichia coli cqWs. Biotechnology and Bioengineer. 77, 7, 796-805. 2002.
Ciccolini, L., Ayazi Shamlou, P., Titchener-Hooker, N ., W ard, J. Time course o f SDS-alkaline
lysis o f recom binant bacterial cells for plasmid release. B iotechnology and Bioengineering. 60,
6, 768-771. 1998.
Coulson, J., Richardson, J. F., Backhurst, J., Harker, J. Chemical Engineering. Volume 1.
Pergam on Press. Oxford. 1991.
Cozewith, C., Busko, M. Design correlations for m ixing tees. Industrial and Engineering
Chemistry Research. 28, 1521-1530. 1989.
Craft, T., Graham, L., Launder, B. Impinging je t studies for turbulent model assessm ent -I I . An
examination o f the performance o f four turbulent models. Journal o f Heat and Mass Transfer.
36, 10, 2685-2697. 1993.
p274
Creighton, T. Proteins-structure and molecular properties. W .H. Freeman and Company, New
York. 1993.
Danois, B. Shear breakage o f DNA. Biophysical Journal. 24, 489-503. 1978.
Davison, P. The effect o f hydrodynamic shear on the deoxyribonucleic acid from T2 and T4
bacteriophages. Biochemistry. 45, 1560-1568. 1959.
De Gennes, P. Coil-stretch transition o f dilute flexible polymers under ultrahigh velocity
gradients. The Journal o f Chemical Physics. 60, 12, 5030-5042. 1974.
Evans, R., Xu, Z., Bohannon, K., W ang, B., Bruner, M., Volkin, D. Evaluation o f degradation
pathw ays for plasm id DNA in pharmaceutical formulations via accelerated stability studies.
Journal o f Pharm aceutical Sciences. 89, 1, 76-87. 2000.
Feliciello, I., Gianni, C. A modified alkaline lysis m ethod for the preparation o f highly purified
plasm id DNA from Escherichia coli. Analytical Biochemistry. 212, 394-401. 1993
Ferreira, G., Cabral, J., Prazeres, D. A Comparison o f gel filtration chromatographic supports
for plasm id purification. Biotechnology Techniques. 11,6, 417-420. 1997.
Ferreira, G., Cabral, J., Prazeres, D. M onitoring o f process streams in the large-scale production
and purification o f plasmid DNA for gene therapy applications. Pharmaceutical Pharmacology
Com m unications. 5, 57-59. 1999.
Ferreira, G., Cabral, J., Prazeres, D. Purification o f supercoiled plasm id DNA using
chrom atographic processes. Journal o f M olecular Recognition. 11, 250-251. 1998.
Ferreira, G., M onteiro, G., Prazeres, D., Cabral, J. Downstream processing o f plasm id D NA for
gene therapy and DNA vaccine applications. Tibtech. 20, 18, 380-387. 2000.
Fishm an, D., Patterson, G. Light scattering studies o f supercoiled and nicked DNA.
Biopolymers. 38, 535-552. 1996.
Forney, L., Gray, G. Optimum design o f a tee mixer for fast reactions. AIChE Journal. 36 ,11 ,
1773-1776. 1990.
Frenkel, J. Orientation and rupture o f linear macromolecules in a dilute solutions under the
influence o f viscous flow. Acta Physocichim ica U.R.S.S. 19, 1 ,51-76. 1944.
Friedman, T. The road toward human gene therapy - a 25-year perspective. Annals o f
M edicine. 29, 575-577. 1997.
p275
Fuciarelli, A, Sisk, E., Thomas, R., Miler, D. Induction o f base damage in DNA solutions by
ultrasonic cavitation. Free Radical Biology and M edicine. 18, 2, 231-238. 1995.
Ghoniem, S., Chauveteau, G., Moan, M., W olff, C. M echanical degradation o f semi-dilute
polym er solutions in laminar flows. The Canadian Journal o f Chemical Engineering. 59, 450-
454. 1981.
Grenville, R., A new theory improves the correlaton o f blend time for turbulent je t m ixed
vessels. Transcripts IChemE, 74, 391-396. 1996.
Hagerman, P. Flexibility o f DNA. Annual Review o f Biophysics and Biophysical Chemistry.
17, 265-286. 1988.
H am by, N., Edwards, M., Nienow, A. M ixing in the process industries. Butterworth
Heinemann. 1992.
Harrington, R., Zimm, B. Degradation o f polymers by controlled hydrodynam ic shear. 69, 1,
161-175. 1965.
Henzler, H. Particle Stress in Bioreactors. Advances in Biochemical
Engineering/Biotechnology. 67, 35-82. 2000.
Hershey, A., Burgi, E. M olecular homogeneity o f the deoxyribonucleic acid o f phage T2.
Journal o f M olecular Biology. 2, 143-152. 1960.
Hoare, M ., Narendranathan, T., Flint, J., Hey wood-W addington, D., Bell, D., Dunnill, P.
D isruption o f protein precipitates during shear in couette flow and in pumps. Industrial and
Engineering Chem istry Fundamentals. 21, 402-406. 1982.
Hunkier, D., Nguyen, T., Kausch, H. Polym er solutions under elongational flow: 2. An
evaluation o f models o f polymer dynamics for transient and stagnation point flows. Polymer.
37, 4271-4282. 1996.
Igou, D., Lo, J., Clark, D., Mattice, W., Younathan, E. On the nature o f interaction o f dodecyl
sulfate with proteins. Evidence from uncharged polypeptides. Biochemical and Biophysical
Research Communications. 60, 1, 140-145. 1974.
Ingrahm, M aaloe, Neidhardt. Growth o f the Bacterial Cell. Sinauer. 1983
p276

Johnson, D., W ood, P., Hrymak, A. The effect o f geometrical parameters on the flow field o f
an opposed je t RIM mix head: equal flow and matched fluids. The Canadian Journal o f
Chem ical Engineering. 74, 40-48. 1996.
Kieser, T. Factors affecting the isolation o f CCC DNA from Streptomyces lividans and
Escherichia coli. Plasmid. 12, 19-36. 1984.
Lahijani, R., Duhon, M., Lusby, E., Betita, H., M arquet, M. Quantitation o f host cell DNA
contam inate in pharmaceutical-grade plasmid DNA using competitive polymerase chain
reaction and enzyme-linked immunosorbent assay. Human gene therapy. 9, 1173-1180. 1998.
Lander, L., W inters, M., M eacle, F. Process for the scaleable purification o f plasmid DNA..
United States Patent. Num ber 09/745,217. 2000.
Lander, R., M anger, W., Scouloudis, M., Ku, A., Davis, C., Lee, A. Gaulin homogenisation: A
m echanistic study. Biotechnology Progress. 16, 80-85. 2000.
Lander, R., W inters, M., M eacle, F . , Buckland, B., Lee, A. Fractional precipitation o f plasmid
DNA from lysate by CTAB. Biotechnology and Bioengineering. 79, 7, 776-784. 2002.
Langowski, J., Giesen, U. Configurational and dynamic properties o f different length
superhelical DNAs m easured by dynamic light scattering. Biophysical Chemistry. 34, 9-18.
1989.
Larson, R., Perkins, T., Smith, D., Chu, S. Hydrodynamics o f a DNA m olecule in a flow field.
Physical Review E. 5 5 ,2 , 1794-1797. 1997
Lee, A., Sagar, S. A method for large scale plasmid purification. International Patent. WO
96/36706. 1996.
Lee, G., Chrisey, L., Colton, R., D irect measurement o f the forces between complementary
strands o f DNA. Science. 266, 771-773. 1994.
Levich, V. Physico-Chem ical Hydrodynamics. Prentice-Hall, New Jersey. 1962.
Levinthal, C., Davison, P. Degradation o f deoxyribonucleic acid under hydrodynamic shearing
forces. Journal o f M olecular Biology. 3, 674-683. 1961
Levy, M., Ciccolini, L., Yim, S., Tsai, J., Titchener-Hooker, N., Ayazi Shamlou, P., Dunnill, P.
The effects o f material properties and fluid flow intensity on plasmid DNA recovery during cell
lysis. Chemical Engineering Science. 54, 3171-3178. 1999.
p277
Levy, M., Collins, I., Yim, S., Ward, J., Titchener-Hooker, N., Ayazi Shamlou, P., Dunnill, P. Effect o f shear on plasm id DNA in solution. Bioprocess Engineering. 20, 7-13. 1999.
Levy, M., Lotfian, P., O 'K ennedy, R., Lo-Yim, M., Ayazi Shamlou, P. Q uantitation o f supercoiled circular content in plasmid DNA solutions using a fluorescence-based method. Nucleic Acids Research. 28, 12, 1-7. 2000.
Levy, M., O 'K ennedy, R., Ayazi Shamlou, P., Dunnill, P. Biochem ical engineering approaches
to the challenges o f producing pure plasmid DNA. Tibtech. 18, 296-305. 2000.
Lindahl, T., Anderson, A., Rate o f chain breakage at apurinic sites in double-stranded
deoxyribonucleic acid. Biochemistry. 54, 503-512. 1997.
Luo, Y., Han, Z., Chin, S., Linn, S. Three chemically distinct types o f oxidants form ed by iron-
mediated Fenton reactions in the presence o f DNA. Proceedings o f the N ational A cadem y o f
Sciences. 91, 12438-12442. 1994.
Lyubchenko, Y., Shlyakhtenko, S. Visualisation o f supercoiled DNA with atomic force
microscopy m Biophysics. 94, 496-501. 1997.
M acosko, C. Rheology principles, measurements, and applications. W iley-VCH.1994.
p278

M ahajan, A., Kirwan, D. M icromixing Effects in a Two-Impinging-Jets Precipitator", AIChE
Journal, 42, 1801-1890. 1996.
Marko, J. Stretching DNA. Macromolecules. 28 ,8759-8770.1995.
M arquet, M., Horr, N .A., M eek, J.A. Process development for the manufacture o f plasm id DNA
vectors for use in gene therapy. Biopharm. 26-37 1995.
M cHugh, P., M eacle, P., Hoare, M. A HPLC Assay for Different Nucleic Acid Forms, (in
progress)
M cHugh, P. Purification o f DNA using Calcium Chloride. Thesis, (in progress)
M elzak, K., Sherwood, C., turner, R., Haynes, C. Driving forces for DNA adsorption to silica
in perchlorate solutions. Journal o f Colloid and Interface Science. 181, 635-644. 1996.
M etzner, A. B., M etzner, A.P. Stress levels in rapid extensional flows o f polymeric fluids.
Rheolgica Acta. Band 9. 174-181. 1970.
M hashilkar, A., Chada, S., Roth, J., Ramesh, R. Gene therapy therapeutic approaches and
implications. Biotechnology Advances. 19, 279-297. 2001.
M iddaugh, C., Evans, R., Montgomery, D., Casimiro, D. Analysis o f plasm id DNA from a
pharm aceutical perspective. Journal o f Pharmaceutical Sciences. 87, 131-146. 1998.
M oan, M., Chauveteau, 0 . , Ghoniem, S. Entrance effect in capillary flow o f dilute and sem i
dilute polym er solutions. Journal o f Non-Newtonian Fluid Mechanics. 5, 463-474. 1979.
M oreau, N ., Tabary, X., Le Goffic, F. Purification and separation o f various plasm id forms by exclusion chromatography. Analytical Biochemistry. 166, 188-193. 1987.
M ountain, A. Gene therapy: the first decade. Trends in Biotechnology. 18, 119-128. 2000.
M urphy, J., W ibbenm eyer, J., Fox, G., W illson, R. Purification o f plasmid DNA using selective
precipitation by compaction agents. Nature Biotechnology. 17, 822-823. 1999.
M uthumani, K., Kudchodkar, S., Pavlakis, G., W einer, D. Issues for improving m ulti-plasm id
DNA vaccines for HIV-1. Vaccine. 20, 19999-2003. 2002.
Nabel, G. Direct gene transfer with DNA-liposome complexes in melanoma: expression,
biological activity, and lack o f toxicity in humans. Proceedings o f the National Academy o f
Sciences. 90, 11307-11311. 1993.
p279
Nandakumar, M., N orderg, E., M attiasson, B. Integrated flow -injection processing for on-line
quantification o f plasm id DNA during cultivation o f E. coli. B iotechnology and
Bioengineering. 73, 5, 406-411. 2001.
Nguyen, T., Kausch, H. Chain scission in transient extensional flow kinetics and m olecular
weight dependence. Journal o f Non-Newtonian Fluid M echanics. 30, 125-140. 1988.
Nguyen, T., Kausch, H. M echanochemical degradation in transient elongational flow.
Advances in Polym er Sciences. 100, 74-182. 1992.
Nguyen, T., Kausch, H. M echano-chemical degradation o f polym er solution in capillary flow:
laminar and turbulent regime. Chima. 40, 129-135. 1986.
North, P., Champion, J. Hydrodynamic Degradation o f DNA. Journal De Chimie Physique.
71, 10, 1282-1284. 1974.
Noy, A., Vezenov, D., Kayyem, J., Meade, T., Lieber, C. Stretching and breaking duplex DNA
by chemical force microscopy. Chemical Biology. 4, 519-527. 1997.
O ’Leary. C., Forney, L., Optimisation o f in-line mixing at 90° Tee. Industrial and Engineering
Chemistry Process Design and Development. 24, 332-340. 1985.
Odell, J., Keller, A. Rabin, Y. XXXX get Reference
Odell, J., Keller, A ., M uller, A. Thermomechanical degradation o f m acromolecules. Colloid
Polym er Science. 324, 270-307. 1992.
Odell, J., Keller, H. Flow-induced chain fracture o f isolated linear m acromolecules in solution.
Journal o f Polym er Science. 24, 1889-1916. 1986.
Odell, J., Taylor, M. Dynamics and thermomechanical stability o f DNA in solution.
Biopolymers. 34, 1483-1493. 1994.
Oefner, P., M ulligan, J., Davis, R. Efficient random subcloning o f DNA sheared in a
recirculating point-sink flow system. Nucleic Acids Research. 24, 20, 3879-3886. 1996.
Perkins, T., Smith, D., Chu, S. Single polymer dynamics in an elongational flow. Science. 276,
2016-2021. 1997.
Perkins, T., Smith, D., Larson, R., Chu, S. Stretching o f a single tethered polym er in a uniform
flow. Science. 268, 83-87. 1995.
p280

Peterlin, A. Hydrodynam ics o f linear macromolecules. Pure and Applied Chemistry. 12, 563-
586. 1966.
Prazeres, D., Ferreira, G., M onteiro, G., Cooney, C., Cabral, J. Large-scale production o f
pharmaceutical-grade plasmid DNA for gene therapy: problems and bottlenecks. Tibtech. 17,
169-174. 1999.
Prazeres, D., Schluep, T., Cooney, C. Preparative purification o f supercoiled plasmid DNA
using anion-exchange chromatography. Journal o f chromatography A. 806, 31-45. 1998.
Qiagen giga-prep handbook. Need reference.
Ram, N., Cope, K., Durham, D. Scaleable method for the production o f plasm id D NA using
hydrophobic interaction chromatography. Hydrophobic Interaction Chromatography
Conference, Phoenix, Azirona. 1999.
Raucci, G., M aggi, C., Parente, D. Capillary electrophoresis o f supercoiled DNA molecules:
parameters governing the resolution o f topoisomers and their separation from open forms.
Analytical Chemistry. 72, 821-826. 2000.
Reese, H., Zimm, B. Fracture o f polymer chains in extensional flow: experiments with DNA
and an molecular dynamics simulation. Journal o f Chemical Physics. 92, 4, 2650-2662. 1990.
Romanowski, G., Lorenz, M., W achemagel, W. Adsorption o f plasm id DNA to mineral
surfaces and protection against DNAase I. Applied and Environmental M icrobiology. 57, 4,
1057-1061. 1991.
Rouse, P. A theory o f the linear viscoelastic properties o f dilute solutions o f coiling polymers.
The Journal o f Chemical Physics. 2 1 ,7 , 1272-1280. 1953.
Ryskin, G. Calculation o f the effect o f polymer additive in a converging flow. Journal o f Fluid
Mechanics. 178, 423-440. 1987.
Sambrook, J., Fritsch, E., M aniatis, T. M olecular cloning: A laboratory manual, 2"^ edition.
Cold Spring Harbor Laboratory Press, New York. 1989.
Sayers, J., Evans, D., Thomson, J. Identification and eradication o f a denatured D N A isolated
during alkaline lysis-based plasm id purification procedures. Analytical Biochemistry. 241, 186-
189. 1996
p281
Schaer, E., Guichardon, P., Falk, L., Plasari, E. D eterm ination o f local energy dissipation rate
in impinging jets by a chemical reaction method. Chemical Engineering Journal. 72, 125-138.
1999.
Scopes, R. Protein purification; Principles and practice. Springer-Verlag, New York. 1994.
Singer, V., Jones, L., Yue, S., Haugland, R. Characterisation o f Picogreen reagent and
developm ent o f a fluorescence-based solution assay for double-stranded DNA. A nalytical
Biochemistry. 249. 228-238. 1997.
Smith, D., Babcock, H., Chu, S. Single-polymer dynamics in steady shear flow. Science. 283,
1724-1730. 1999.
Smith, D., Chu, S. Response o f flexible polymers to a sudden elongational flow. Science. 281,
1335-1339. 1998.
Smith, S., Cui, Y., Bustamante, C. Over-stretching b-DNA: The elastic response o f individual
double-stranded and single-stranded DNA molecules. Science. 271, 795-799. 1996
Smith, S., Finzi, L., Bustamente, C. Direct mechanical m easurem ents o f the elasticity o f single
DNA molecules by using magnetic beads. Science. 258, 1122-1126. 1992.
Sole, K., Stockmayer, W. Shape o f a random-flight chain. The Journal o f Chem ical Physics.
54, 6, 2756-2757. 1971
Strick. T., A llem and, J., Bensimon, D., Croquette, V, B ehaviour o f Supercoiled DNA.
Biophysical Journal. 74, 2016-2028. 1998.
Talboys, B., Dunnill, P. Effect o f shear on m em brane-associated enzymes: studies o f isolated
progesterone 1 la-hydroxylase complex from Rhizopus nigricans. Biotechnology and
Bioengineering. 27, 1726-1729. 1985.
Thatcher, D., Hitchcock, A., Hanak, J., Varley, D. M ethod o f plasm id D NA production and
purification. International Patent. WO 97/29190. 1997
Theodossiou, I., Dunnill, P. M ethods o f enhancing the recovery o f plasm id genes from
neutralised cell lysate. Bioprocessing Engineering. 20, 147-156. 1999.
Thorstenson, Y., Oefner, P., Davis, R. An automated hydrodynam ic process for controlled,
unbiased DNA shearing. Genome methods. 8, 848-855. 1998.
p282

Tosun, G. A study o f m icrom ixing in tee mixers. Industrial and Engineering Chemistry
Research. 26, 1184-1193. 1987.
Unger, D, Muzzio, F. Laser-induced fluorescence technique for the quantification o f mixing in
impinging jets. A IChE Journal. 45, 12,2477-2486. 1999
Unger, D., M uzzio, P., Brodkey, R. Experimental and numerical characterisation o f viscous
flow and mixing in an impinging je t contractor. The Canadian Journal o f Chemical
Engineering. 76, 546-555. 1998.
Varley, D.L., Hitchcock, A.G., W eiss, A.M.E., Horler, W .A., Cowell, R., Peddie, L., Sharpe,
G., Thatcher, D., Hanak, J. Production o f plasmid DNA for hum an gene therapy using modified
alkaline lysis and expanded bed anion exchange chromatography. Bioseparation. 8, 209-217.
1999.
Versteeg, H., M alalasekera, W. An introduction to computational fluid dynamics. Longman
Group. 1995
Wan, N ., M cNeilly, D., Christopher, C. M ethod for lysing cells. United States Patent. Num ber
5,837,529. 1998.
W ang, M ., Lai, E. Pulsed field separation o f large supercoiled and open-circular DNAs and its
application to bacterial artificial chromosome cloning. Electrophoresis. 16,1-7. 1995.
W ang, M ., Yin, H., Landick, R., Celles, J., Block, S. Stretching D N A w ith optical tweezers.
Biophysical Journal. 72, 1335-1346. 1997.
Yim, S., Shamlou, P. The engineering effects o f fluids flow on freely suspended biological macro-materials and macromolecules. Advances in Biochemical Engineering/Biotechnology.67, 83-122.2000.
Zimm, B. Journal o f Chem ical Physics. 24, 269, 1956.
Zimm, B., Reese, H. The degradation o f T7 DNA in converging flow. Nucleic Acids Research.
18, 15 ,4469- 4470. 1990.
p283
Related Documents