CHINA, EUROPE AND THE GREAT DIVERGENCE: A STUDY IN HISTORICAL NATIONAL ACCOUNTING, 980-1850 Stephen Broadberry, London School of Economics and CAGE, [email protected] Hanhui Guan, Peking University, [email protected] David Daokui Li, Tsinghua University, [email protected] 28 July 2014 File: China7e.doc Abstract: GDP is estimated for China between the late tenth and mid-nineteenth centuries, and combined with population estimates. Chinese GDP per capita was highest during the Northern Song dynasty and declined during the Ming and Qing dynasties. China led the world in living standards during the Northern Song dynasty, but had fallen behind Italy by 1300. At this stage, it is possible that the Yangzi delta was still on a par with the richest parts of Europe, but by 1700 the gap was too large to be bridged by regional variation within China and the Great Divergence had already begun. JEL classification: E100, N350, O100 Keywords: GDP Per Capita; Economic Growth; Great Divergence; China; Europe Acknowledgements: This paper forms part of the project “Reconstructing the National Income of Britain and Holland, c.1270/1500 to 1850”, funded by the Leverhulme Trust, Reference Number F/00215AR. It is also part of the Collaborative Project HI-POD supported by the European Commission's 7th Framework Programme for Research, Contract Number SSH7-CT-2008-225342. David Daokui Li and Hanhui Guan also acknowledge financial support from Humanity and Social Science Promotion Plan of Tsinghua University (2009WKWT007) and National Natural Science Foundation (70973003)

Welcome message from author
This document is posted to help you gain knowledge. Please leave a comment to let me know what you think about it! Share it to your friends and learn new things together.
Transcript
CHINA EUROPE AND THE GREAT DIVERGENCE A STUDY IN HISTORICAL
NATIONAL ACCOUNTING 980-1850
Stephen Broadberry London School of Economics and CAGE SNBroadberrylseacuk
Hanhui Guan Peking University guanhhpkueducn
David Daokui Li Tsinghua University lidksemtsinghuaeducn
28 July 2014
File China7edoc
Abstract GDP is estimated for China between the late tenth and mid-nineteenth centuries
and combined with population estimates Chinese GDP per capita was highest during the
Northern Song dynasty and declined during the Ming and Qing dynasties China led the
world in living standards during the Northern Song dynasty but had fallen behind Italy by
1300 At this stage it is possible that the Yangzi delta was still on a par with the richest parts
of Europe but by 1700 the gap was too large to be bridged by regional variation within China
and the Great Divergence had already begun
JEL classification E100 N350 O100
Keywords GDP Per Capita Economic Growth Great Divergence China Europe
Acknowledgements This paper forms part of the project ldquoReconstructing the National
Income of Britain and Holland c12701500 to 1850rdquo funded by the Leverhulme Trust
Reference Number F00215AR It is also part of the Collaborative Project HI-POD supported
by the European Commissions 7th Framework Programme for Research Contract Number
SSH7-CT-2008-225342 David Daokui Li and Hanhui Guan also acknowledge financial
support from Humanity and Social Science Promotion Plan of Tsinghua University
(2009WKWT007) and National Natural Science Foundation (70973003)
2
1 INTRODUCTION
As a result of recent advances in historical national accounting estimates of GDP per capita
are now available for a number of European economies back to the medieval period
including Britain the Netherlands Italy and Spain (Broadberry Campbell Klein Overton
and van Leeuwen 2014 van Zanden and van Leeuwen 2012 Malanima 2011 Aacutelvarez-
Nogal and Prados de la Escosura 2013) A number of recent studies have also extended this
approach to Asian economies including India and Japan (Broadberry Custodis and Gupta
2014 Bassino Broadberry Fukao Gupta and Takashima 2014) So far however the
economy which has been at the centre of the Great Divergence debate China has been
conspicuously absent from this approach
This paper uses historical national accounting methods to estimate GDP for China
during the Northern Song Ming and Qing dynasties and combines the resulting series with
population estimates to produce GDP per capita An earlier study by Guan and Li (2012)
demonstrated that sufficient information is available for a detailed reconstruction of the
historical national accounts of China using a sectoral approach similar to that adopted by
Broadberry Campbell Klein Overton and van Leeuwen (2011 2014) for Britain This
means that it is no longer necessary to rely on the quantitative conjectures of Maddison
(1998) to track the long term performance of the Chinese economy These new more firmly
grounded estimates of Chinese GDP per capita can be used to compare economic
performance during the Northern Song Ming and Qing dynasties Chinarsquos GDP per capita
reached its peak level during the Northern Song dynasty before entering a long decline
which lasted through the Ming and Qing dynasties and indeed was only decisively reversed
in the second half of the twentieth century (Maddison 1998)
3
The results also shed new light on the timing of the Great Divergence Northern Song
China was richer than Domesday Britain in 1090 but by 1400 Britain was already ahead and
China was certainly poorer than Italy by 1300 By the early Ming dynasty Chinarsquos per capita
GDP had fallen to around 90 per cent of the British level and by the mid-nineteenth century
to around 20 per cent Even allowing for regional variation within China it is clear that the
Great Divergence between China and Western Europe was already well under way during the
eighteenth century before the start of the Industrial Revolution
The paper proceeds as follows Section 2 provides a general overview of data sources
while sections 3 to 6 discuss the derivation of the population and output estimates in the
agricultural industrial and service sectors Section 7 aggregates the sectoral estimates to
produce nominal and real GDP and combines the real GDP estimates with population to
derive real GDP per capita A preliminary assessment of Chinese economic performance is
made in this section by comparing the three dynasties Section 8 then places this performance
in an international perspective by comparing GDP per capita in China with other economies
to shed light on the origins of the Great Divergence Section 9 concludes while an appendix
provides more detailed information on data sources and methods
2 DATA SOURCES
This study draws on a large Chinese historical literature that is based in turn on a solid
foundation of quantitative data collected by the Northern Song Ming and Qing dynasties
China has a long tradition of recording history for the purpose of providing experience and
lessons in national governance for future dynasties To achieve this governments usually
established a special institution with responsibility for compiling and recording laws and
policy and these institutions collected important economic data In addition to this official
4
historical literature there are two additional types of material that have been drawn on in the
estimates provided below a private historical literature and regional gazetteers
The official historical literature includes Shihuo Zhi for each dynasty Shilu and
huidian for the Ming and Qing dynasties and Huiyao for the Northern Song dynasty In a
country with a highly centralised authority local governments had to report information to
the central government and these sources contain much important economic data Shihuo Zhi
originated from the Han dynasty( 202 BC-220 AD) and in ancient Chinese Shi means
agricultural production while huo means production of subsidiary agriculture and textiles
and money circulation For each dynasty Shihuo Zhi recorded data on important areas of
economic life including land institutions households and population taxes and corvee
(unfree labour) monetary institutions salt laws metals and mining fiscal budgets and the
evolution of fiscal institutions Shihuo Zhi thus contains much data on economic activity
including the amount of arable land the total population fiscal revenue and the output of salt
and iron Another important official historical source is Shilu a kind of annual commissioned
by the Emperors to record in detail on a daily basis events that happened in the royal palace
and the whole country Shilu which were generally compiled by highly regarded
contemporary scholars have been accorded high value in the historiography Huiyao and
huidian chiefly recorded laws and institutions Song Huiyao for example provides detailed
information on the legal system of the Song dynasty while Ming huidian and Da Qing
huidian provide information on the administrative laws and regulations of the Ming and Qing
dynasties
The authors of private historical works were sometimes distinguished historians of
their era For example Duanlin Ma the author of Wenxian Tongkao was a famous scholar
5
who wrote a general history of legal and political institutions from remote times to the
Northern Song Tao Li another historian living in the Song dynasty wrote the
historiographical work Xu Zizhitongjian Changbian Privately written historical works also
sometimes recorded important economic data based on the investigative research of the
authors
A gazetteer is a kind of encyclopedia of a particular province prefecture or county It
is known in Chinese as Difang Zhi which means ldquoarea recordrdquo and contains information
about the natural geography human geography and economic geography of the area
Gazetteers provide important economic data for this study particularly where an industry was
concentrated regionally Guangdong Tongzhi Chugao in the reign of the Jiajing Emperor for
example is an important source of data for the iron industry around Foshan town Guangdong
province during the later stages of the Ming dynasty Similarly data on the porcelain industry
of Jingdezhen were taken from Raozhou Fuzhi in Jiangxi Province Both these sources filled
important gaps in the official historical literature at the national level
There are both advantages and disadvantages with each of these three kinds of
historical literature The official historical literature has full national coverage and is highly
systematic but in some cases lacks credibility Since these historical records were designed
to meet the Emperorrsquos need to govern the country the writers sometimes had an incentive to
distort reality Thus for example at the beginning of the Ming dynasty the population and
land data were recorded in a book named Huangce since Emperor Hongwu wanted to know
how much tax revenue could be raised from the people Once this work had been done the
Emperor set a fixed fiscal revenue so that later data on land and population do not reflect real
developments which can only be tracked from other sources The private historical literature
6
is therefore more credible than some of the official historical literature but since it is less
complete it should be seen as complementary to the official historical literature rather than as
a substitute Gazetteers are also more credible than some of the official historical literature
but they are also less complete since they are only available at the sub-national level In
some cases it is possible to simply aggregate area level data to the national level but in other
cases it is necessary to make assumptions about the relationship between areas for which
data are available and the rest of the country
It is worth noting that although some data from the official historical literature are not
very accurate Chinese economic historians have drawn on other sources to publish adjusted
data In addition to referencing the primary sources used in the calculations this study
therefore also makes use of the findings of the pioneers of quantitative economic history in
China including Xia Qi (2009) Zhengzhong Guo (1993 1997) Xi Song (1958) Shengduo
Wang (1995) Lingling Wang (2005) Minsheng Cheng (2008) and Huarui Li (1991 2001)
on Song history and Dixin Xu and Cheng-Ming Wu (1985) Bozhong Li (1998 2010) Ping-
ti Ho (1985) Ray Huang (2001) Xinwei Peng (1965) Hansheng Quan (1991) Yeh-chien
Wang (2004) Yuquan Wang (2007) Xing Fang Junjian Jing and Jinyu Wei (2007) and
Kang Chao (1986) on Ming and Qing history
Although some series are available on an annual basis others are not In particular
although it is possible to track long run trends in grain yields there are no data on annual
fluctuations Since this was the largest sector of the Chinese economy and since grain yield
fluctuations were the key driver of annual fluctuations in GDP even in Britain where
agriculture accounted for a much smaller share of GDP a decision was taken to work towards
obtaining data every 10 years along the lines of Liu and Hwang (1979)
7
3 POPULATION
Before reconstructing GDP from the output side it will be helpful to set out trends in
population which will be needed to derive estimates of GDP per capita the key indicator of
overall economic performance in this study In China population data were systematically
recorded throughout the period covered here in connection with taxation It is generally
accepted that the officials were capable of recording the number of people accurately but that
the institutional details of the tax system at a particular time affected the incentives for the
officials to count particular groups more or less carefully landowners households and
individuals (Perkins 1969 193) Taking account of these factors has allowed historians to
narrow the range of disagreement considerably with the estimates of Liu and Hwang (1979)
commanding widespread support for the Ming and Qing dynasties (Maddison 1998
McEvedy and Jones 1978)
The population data used here are taken from Liu and Hwang (1979) for the Ming and
Qing dynasties and from Jianxiong Ge and Songdi Wu (2000) for the Northern Song dynasty
Ge and Wursquos Northern Song estimates agree broadly with the figures derived by Kent Deng
(2004 43) for the Northern Song dynasty obtained by multiplying the registered households
by a family size of 577 the long term average from years when both household and
population data are available However Ge and Wu suggest a slightly lower family size of
54
The population data are plotted on a log scale in Figure 1 and show rapid growth
during the Northern Song dynasty at an annual rate of 087 per cent Following a substantial
decline during the Mongol interlude population growth returned during the Ming dynasty
8
but at the slower rate of 032 per cent per annum Following another population decline
during the next dynastic change the annual growth rate picked up to 070 per cent during the
Qing dynasty
4 AGRICULTURAL OUTPUT
Agricultural output is estimated mainly from data on the amount of land cultivated the
distribution of different crops and the crop yields per unit of land This section provides an
overview of the sources and methods with more detail provided in Appendix A1 The
standard Chinese measure of land area is the mu which is 115th of a hectare or 16th of an
acre The livestock sector which was much smaller in China than in Europe was also
included using information on additional outputs This output-based approach is more direct
than the alternative consumption approach where agricultural demand is derived from
estimates of real agricultural consumption per person multiplied by the population
Furthermore Ruizhong Liu (1986) questions the reliability of the available data on
consumption per capita during the Qing dynasty which suggest very low estimates of
kilocalorie consumption per capita
Agriculture is first divided up into a number of different sectors covering grain crops
cash crops and subsidiary agricultural outputs For grain crops the starting point for the
estimation of output is the cultivated land area which is derived ultimately from the official
data but also draws upon information obtained from gazetteers and private histories
Although it should clearly be borne in mind that land data were kept primarily for tax
purposes and that people like to avoid taxes biases arising from this are unlikely to be too
large because land is difficult to hide from officials and people need to register their interest
to retain ownership rights (Perkins 1969 217) A more serious worry concerns the lack of a
9
standard measure for the mu which varied between regions and over time although much
effort has been devoted to documenting this (Perkins 1969 218-221)
Figure 2 plots on a log scale the cultivated land area for the Northern Song Ming and
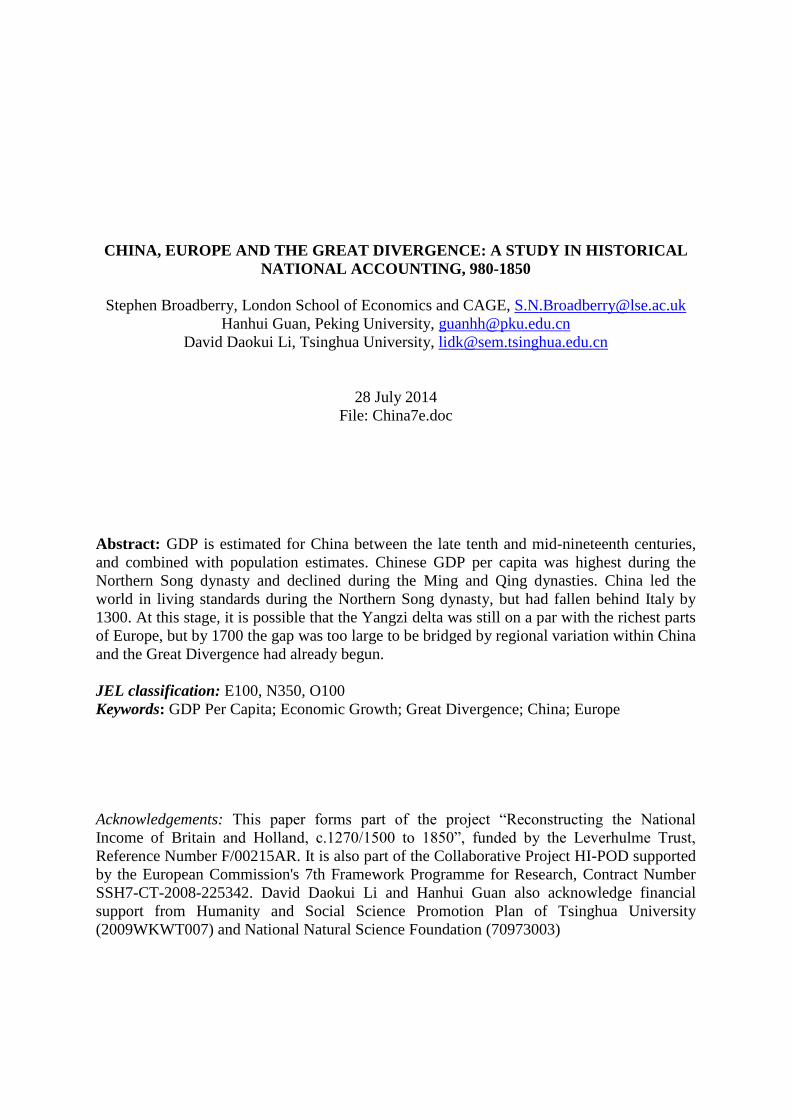
Qing dynasties while Figure 3 plots the same data on a per capita basis As will become clear
later cultivated land per capita plays an important role in determining overall living
standards since agriculture was the largest sector of the economy Although the cultivated
land area grew substantially over time albeit with a major decline between the Northern
Song and Ming dynasties and a smaller decline between the Ming and Qing dynasties it did
not keep pace with the growth of population so that cultivated land per capita declined over
time from a peak of around 9 mu during the Northern Song dynasty to just 3 mu by the late
Qing period The decline during the eighteenth century is broadly consistent with Huangrsquos
(1985 2002) process of involution and would be hard to square with the positive assessment
of Chinese development until the nineteenth century offered by California School writers
such as Pomeranz (2000) and Wong (1997)
The distribution of the cultivated land area between crops is also available from
official sources and the shares of important crops in benchmark years are shown in Table 1
For the Northern Song dynasty Xia Qi (2009) and Hui Wu (1985) suggest that 64 of the
cultivated land area devoted to grain production was in southern China used for growing
rice with the other 36 in north China used for growing wheat They also suggest that 6 of
the cultivated area was used for growing cash crops rather than grain For the Ming dynasty
the breakdown between grain crops was 544 for rice and 456 for wheat (Songyi Guo
2000) Yi Luo (1999) provides an assessment of the Qing crop distribution data against the
detailed crop breakdown for 1914-1918 from Perkins (1969) and the 1952 data from the
10
Statistical Yearbook of China Rice and wheat accounted for 56 per cent of the cultivated area
in 1700 declining to 47 per cent by 1850 with corn potatoes and cash crops all increasing
their shares significantly
Grain yield data are also taken from official sources As noted earlier there are
difficulties of interpretation associated with the variation in the size of a mu over both space
and time but painstaking work by historians to deal with this problem has produced a
consensus that grain yields increased over time (Xia Qi 1999 Yi Luo 1999 Perkins 1969)
However this increase in grain yields was not sufficient to offset the decline in cultivated
land per capita During the Northern Song wheat yields were stable at 210 jin per mu while
husked rice yields increased from 195 to 230 jin per mu (corresponding to an increase in
unhusked rice yields from 390 to 460 jin per mu) with the introduction of high yielding
champa rice (Ping-ti Ho 1956) Average grain yields for wheat and husked rice rose during
the Ming dynasty from 220 jin per mu in 1402 to 256 jin per mu by 1626 and during the
Qing dynasty from 230 jin per mu in 1685 to 295 jin per mu in 1850
Quantities of grain crops are obtained by multiplying grain yields with cultivated
areas to yield the volume of gross output These gross outputs are then multiplied by prices
obtained from the work of modern economic historians including Xia Qi (2009) for the
Northern Song dynasty and Xinwei Peng (1965) for the Ming and Qing dynasties To derive
the value of net output it is necessary to subtract the value of agricultural inputs such as seed
and fertiliser which was assumed to account for 15 per cent of gross output following Xing
Fang (1996) and Yi Luo (1999) It should be noted that since the share of value added was
held constant throughout the period this adjustment does not affect the trend of agricultural
output
11
A number of cash crops including cotton soyabeans rape peanuts tobacco sugar
cane sugar beet and hemp occupied cultivated land The share of cultivated land occupied
by cash crops derived from official sources rose from 6 per cent during the Northern Song
dynasty to 8 per cent during the Qing dynasty with the intermediate level of 765 per cent
during the Ming dynasty being derived as a weighted average of 7 per cent in the northern
dry farmland areas and 82 per cent in the southern paddy farmland areas The value of cash
crops per mu was set at 12 times the value of grain crops per mu following the research of
Yi Luo (1999) Other cash crops such as tea and fruit did not occupy cultivated land but
were important enough to have attracted the attention of officials so that it is possible to
reconstruct trends in output from the production side during the Northern Song and Ming
dynasties and from the consumption side during the Qing dynasty
Subsidiary agricultural output included animal husbandry fisheries and forestry
Although no data are available on the specific outputs estimates of the ratio of subsidiary
agricultural output values to the value of grain outputs are available for the twentieth century
from Perkins (1969) and Guangshao Tu (1984) The ratio in earlier periods was picked to be
consistent with the twentieth century data and a very small increase over time from 10 per
cent during the Northern Song and Ming dynasties to 12 per cent in the Qing dynasty
Figure 4 plots indices of the main categories of agricultural production The index for
grain crops is the same as the index for subsidiary agricultural outputs during the Qing
dynasty since the latter is proportional to the output of grain crops The two indices differ for
earlier periods because the proportional share changes between dynasties Although
subsidiary agricultural output increased by more than population grain output failed to keep
12
pace with population growth so that agricultural output per head declined between the
Northern Song and Qing periods
5 INDUSTRIAL OUTPUT
Industrial output is estimated from official data on quantities produced in state-run industries
quantities purchased by the government in highly regulated industries and revenue raised
from the taxation of less heavily regulated industries Information is also available from
gazetteers and private historical works particularly where an industry was regionally
concentrated Many economic historians have worked on the original data to provide cross-
checks and make up for the shortcomings of individual sources Industry is divided into four
main sectors metals and mining food processing manufacturing and building As in
agriculture the basic approach is to obtain data on the volume and value of each output In
general the gross output values are converted to a value added basis by using the ratio of
inputs to outputs from Baosan Wu and Yusun Wang (1947) throughout the period This
adjustment to a value added basis therefore does not affect the trend of real growth but rather
pins down the level of GDP in current prices In a number of cases such as rice wine and
silver however the ratio of net to gross output values is taken directly from the historical
literature of the time as detailed in Appendix A2
The metals and mining sector includes iron gold silver copper tin and lead There
have been numerous studies of the iron industry since the strong claims of Hartwell (1962)
that China produced as much as 150000 tons of iron in 1078 Many subsequent researchers
argue that Hartwell seriously overestimated iron production in the Northern Song dynasty
and the estimates used here are taken from the work of Sen Liu (1993) obtained by
aggregating the annual quantities of iron used for coining and government purchases For the
13
Ming dynasty the state-run iron industry was based mainly in Zunhua City and the output
estimates are based on the official records The private iron industry is tracked during this
period using tax revenue with the tax rate set at one-fifteenth of output For the Qing
dynasty iron industry output is based on regional data for Guangdong which became the
centre of the iron mining and metallurgical industry Longqian Li (1979) added estimates
from other provinces to the Guangdong data to estimate the total volume of iron production
Information on other metals such as gold silver copper lead and tin is derived using similar
methods from similar sources as outlined in Appendix A2 The data clearly suggest that the
output of the metals and mining sector was much lower during the Ming than during both the
Northern Song and Qing dynasties This seems to be largely the result of developments in the
state-owned sector where there was a sharp decline in both the production of weapons and
the minting of coins A famous politician and historian of the Ming dynasty Qiujun
estimates that the Ming output of the metals and mining sector was about one to two tenths of
the level of the previous dynasty (Daxue Yanyi Bu Vol 29 Shanze Zhili (profits from metals
and mining)) The private sector could not offset such a sharp decline until the Qing dynasty
when the government gave up its prohibition of private production and officials met imperial
demand by purchasing metal products in the market
Food processing is divided into four main sections covering rice wine tea-processing
sugar and other food-processing industries Rice wine output in the Northern Song dynasty is
derived by Huarui Li (2001) from the tax levy on rice wine production During the Ming and
Qing periods by contrast output is estimated from the demand side using per capita rice
wine consumption estimates for benchmark years (Xing Fang et al 2007 Anwu Sizhong
Vol 26) Value added in the tea-processing industry is assumed to be 8 per cent of the value
of the agricultural output of tea in line with the ratio estimated by Zhongli Zhang (1987)
14
Sugar output is estimated for the Qing dynasty from provincial data on Taiwan Guangdong
and Fujian where production was concentrated with an allowance for other areas For the
Ming and Northern Song periods value added in the sugar industry was assumed to be 50 per
cent of that of the tea-processing industry somewhat lower than the ratio of 70 per cent noted
by Zhongli Zhang (1987) for the 1880s when sugar was more widely used Other food
processing industries including grain milling and seed crushing are assumed to grow in line
with agricultural output following the approach of Broadberry Campbell Klein Overton
and van Leeuwen (2011 2014) for England
The key products covered by the manufacturing sector include salt silk cloth cotton
cloth coinage paper porcelain transport equipment and other manufacturing industries
Salt output is taken from the study by Zhengzhong Guo (1997) who collected salt production
data on a regional basis and aggregated it to the national level Silk cloth output is derived
from output data for the industry which was divided between a state-managed sector and a
private sector Data for both sectors are taken from Jinmin Fan and Jin Wen (1993) for the
Qing period and derived from regional data for the Ming period For the Northern Song
dynasty silk output is estimated from the demand side using estimates of silk consumption
per household (Zengyu Wang 1983 Shengduo Wang 1995) After the Yuan dynasty cotton
cloth replaced hemp fabric amongst the lower classes so that cotton textiles became an
important handicraft sector in the Ming and Qing dynasties Output is estimated from the
amount of labour engaged in cotton production work time per labourer and labour
productivity (Xinwu Xu 1992) The coinage industry was significant during the Northern
Song dynasty but negligible in the Ming and Qing dynasties Historical sources suggest that
value added in the coinage industry was 40 per cent of the value of the coinage in the early
Northern Song dynasty declining to 30 per cent by the later stages (Xiaochu Ji Vol 17
15
Wenxian Tongkao Qianbi Kao) The output of the paper industry is estimated during the
Northern Song dynasty by aggregating the amount of paper transported from different regions
to the central government For later periods it is assumed to maintain the same share of
manufacturing output as in the 1880s (ie to grow at the same rate as manufacturing as a
whole) This is equivalent to the standard procedure in economic history of constructing an
industrial production index form a weighted sample of industries Porcelain output during the
Northern Song dynasty is based on the work of Jilang Su (1997) who estimated profits and
costs of porcelain production in South Fujian and Guangdong province which accounted for
half of total production in China For the Ming dynasty porcelain production is estimated
separately for the government and private sectors while for the Qing period estimates for
Jingdezhen are available from Miaotai Liang (1991) Transport equipment and other
manufacturing (fur products metalware furniture clothing stationery and decorations) are
assumed to have grown at the same rate as manufacturing as a whole This is the same
assumption as made for paper during the Ming and Qing dynasties so that these industries
are included in the level of value added but do not distort the rate of growth
Building is assumed to grow in line with population but with an allowance for
urbanization This follows the procedure of Broadberry Campbell Klein Overton and van
Leeuwen (2011 2014) in the estimation of English economic growth 1270-1700 The
population and urbanization data are taken from Jianxiong Ge and Songdi Wu (2005) for the
Northern Song dynasty and from Shuji Cao (2005) for the Ming and Qing dynasties
Indices of industrial production for the four main sectors are plotted in Figure 5
Manufacturing food processing and building all grew rapidly within the Northern Song
Ming and Qing dynasties but with some setback across the dynastic changes Output in
16
metals and mining followed a more volatile path with a burst of rapid growth during the mid-
Song period followed by a period of stagnation after 1078 As noted by Hartwell (1962
1966 1967) the boom was driven by iron Metals and mining remained depressed during the
Ming dynasty before picking up again during the Qing dynasty with a particularly rapid
growth phase during the eighteenth century
6 SERVICE SECTOR OUTPUT
The service sector has received much less attention from economic historians than agriculture
and industry Following Broadberry Campbell Klein Overton and van Leeuwen (2011) the
service sector is broken down into four subsectors commerce finance housing and
government The output of the commercial and financial subsectors is estimated largely from
data on marketed output and tax revenue raised from businessmen by the government For
other services output is estimated largely through tracking the number of workers and the
revenue per worker Unlike agriculture and industry where abundant data are available on
the volume of output in real terms the main measure of service sector output is derived in
current price terms In the next section the ratio of service sector nominal output to the value
of nominal output in agriculture and industry will be used to increase the real output of
agriculture and industry proportionally so as to arrive at a measure of real GDP This
implies a long run constancy in relative prices between services and commodities1
The output of the commercial sector is estimated from data on the value of
agricultural and industrial goods to be distributed It is assumed that all industrial output was
marketed and the share of agricultural output marketed is taken from Hui Wu (1987) This
1 Although there are continuous price series for many commodities price data for services are much more
sporadic However it is possible to show that house rents which formed the largest component of expenditure
on services moved closely together with the price of grain which formed the largest component of expenditure
on commodities during the Qing dynasty (Huanchun Hong 1988) The more limited house rent data from the
Northern Song dynasty are also consistent with this pattern (Minsheng Cheng 2008)
17
series of gross marketed output is projected back from an 1840 benchmark estimate of GDP
in commerce derived using Zhongli Zhangrsquos (1987) estimate of the ratio of GDP in
commerce to GDP in agriculture and industry during the late Qing dynasty The size of the
financial sector during the Qing dynasty is estimated from data on pawn shops benchmarked
on the share of finance in services during the 1880s calculated by Zhongli Zhang (1987) The
ratio from the 1880s is assumed to hold throughout the Ming and Northern Song dynasties
Following Broadberry Campbell Klein Overton and van Leeuwen (2011) it is assumed that
housing and domestic service grew in line with population with an allowance for
urbanisation The total population is decomposed into rural and urban population according
to the urbanisation rate and divided by the average family size to determine the numbers of
households The number of households is then multiplied by the average rent in rural and
urban areas respectively to determine the total housing rent (Xing Fang 1996 92 Huanchun
Hong 1988 271-274 646-647)
Data on the shares of the main service sectors in total service sector output are shown
in Figure 6 The most significant long term trend was the decline in the share of government
which was offset by a growing share of commerce and housing with the share of finance
remaining stable
7 NOMINAL AND REAL GDP AND PER CAPITA REAL GDP
71 Constructing the estimates
Sections 4 to 6 have described how the net output of the agricultural industrial and service
sectors has been derived In the agricultural and industrial sectors the general approach has
been to establish the quantity of each product together with the value of net output in current
prices Aggregating across all sectors produces an estimate of nominal GDP in agriculture
18
and industry during the three dynasties The next step is to arrive at an estimate of
agricultural and industrial GDP in real terms Using 1840 as the benchmark year for all years
the quantity of each product is multiplied by the 1840 price with the same proportional
adjustment for net output as a share of gross output to arrive at net output in 1840 prices
Aggregating across all sectors produces real agricultural and industrial GDP in 1840 prices
However this approach cannot be applied to the service sector where although the
current price value of net output is available obtained from revenue data there are no data on
output volumes or unit prices of individual services The approach used here has been to take
the ratio of nominal GDP in services to nominal GDP in agriculture and industry for each
year between 980 and 1840 This ratio has then been applied to the real GDP of the
agricultural and industrial sectors to estimate aggregate real GDP As noted earlier this
implies a long run constancy in relative prices between services and commodities
Figures 7 and 8 show nominal and real GDP of the Northern Song Ming and Qing
dynasties It is also interesting to put the real GDP data from Figure 8 together with the
population data from Figure 1 to derive real GDP per capita in Figure 9 since real GDP per
capita is the most widely used indicator of the level of material living standards over the long
run
72 Comparing the Northern Song Ming and Qing dynasties
This section sheds light on the long term evolution of the Chinese economy between 980 and
1840 by comparing the growth rate of GDP and the average level of GDP per capita during
the three dynasties Although Chinarsquos territory expanded between the Northern Song and
Ming dynasties and expanded further between the Ming and Qing dynasties it is
19
nevertheless useful to compare these three dynasties First most of the newly extended
territory was sparsely populated so that it did not have a particularly large effect on the
aggregate volume of economic activity Second our main concern is with GDP per capita
which was affected even less by territorial changes The average annual growth rate of real
GDP during the Northern Song Ming and Qing dynasties was 090 035 and 058
respectively although there were also sharp falls in the level of real GDP across dynastic
changes Population outpaced real GDP over the long run so that GDP per capita trended
downwards In constant 1840 prices GDP per capita during the Northern Song dynasty
averaged 265 taels falling to 198 taels in the Ming dynasty and 142 taels in the Qing
dynasty Per capita incomes were thus around three-quarters of the average Northern Song
level during the Ming dynasty and had fallen further to just 54 per cent of the Northern Song
level during the Qing dynasty
This general pattern of economic decline since the Northern Song dynasty is broadly
consistent with much of the literature on Chinese economic performance before the recent
revisionist work of the California School The traditional view of peak Chinese performance
during the Northern Song dynasty is reflected in the work of economic historians such as
Robert Hartwell (1966) Mark Elvin (1973) and Karl August Wittfogel (1957) and can also
be seen as consistent with the view of Chinese science expressed by Joseph Needham (1954)
The very different pattern of long run Chinese economic performance proposed by California
School writers such as Kenneth Pomeranz (2000) and Bin Wong (1997) who deny any
divergence between China and the West before the nineteenth century will be examined
critically in the next section Before moving on to that however it is worth noting that there
is also some contrast with the pattern in Maddison (1998) who produced ldquoguesstimatesrdquo
20
showing per capita GDP rising from $450 in 1990 international prices to $600 during the
Northern Song dynasty before stagnating at $600 until the nineteenth century
In understanding the reasons for the higher level of GDP per capita during the
Northern Song dynasty and the subsequent decline in living standards it is important to bear
in mind the large share of agriculture in economic activity which can be seen in Figure 10
The share of agriculture in current price GDP increased from 631 in the Northern Song to
745 in the Ming before falling back slightly to 678 in the Qing dynasty when it was still
higher than during the Northern Song Given the decline in the cultivated land per capita in
Figure 3 and the failure of grain yields to rise sufficiently to offset this over time this led
inevitably to a decline in living standards over time This represents what Huang (2002) calls
a process of involution with population expansion leading to a growing division of land
holdings driving down living standards towards bare bones subsistence
8 THE GREAT DIVERGENCE
81 Comparing Britain and China
It is possible to compare the new GDP per capita estimates for China with the British
estimates from Broadberry Campbell Klein Overton and van Leeuwen (2011) However to
do so requires converting the estimates for both countries into a common currency Following
the work of Maddison (2001 2010) this is usually done in terms of 1990 international
dollars As well as presenting their series for Britain in terms of constant 1700 pounds
sterling Broadberry Campbell Klein Overton and van Leeuwen (2011) also report figures in
1990 international dollars converting Maddisonrsquos (2010) figure for 1850 from a United
Kingdom to a Great Britain basis If we can establish Chinese GDP per capita as a proportion
21
of British GDP per capita in the mid-nineteenth century we can thus arrive at a figure for
Chinese GDP per capita in 1990 international dollars
We have data for nominal GDP per capita in 1840 in both countries and prices for a
number of important commodities which can be used to convert the nominal GDP per capita
comparison to real terms Table 2 sets out the 1840 price data for seven commodities which
can be grouped into categories covering food and non-food items with the former divided
between unprocessed grain products (wheat and rice) and more processed foods (sugar tea
and salt) The non-food commodities cover textiles (cotton cloth) and metals (bar iron)
Sources are listed in the notes to the table Weights are based on Feinstein (1995) and Horrell
Humphries and Weale (1994) for Britain adapted for China to reflect the importance of rice
production Details are again given in the notes to the table Using British weights the
appropriate price ratio or purchasing power parity (PPP) in 1840 is pound1 = 211 tael while at
Chinese weights the PPP is pound1 = 196 tael Taking the geometric mean of British and Chinese
weights the Fisher index PPP is pound1 = 203 tael The nominal exchange rate in 1840 given by
the silver weight of the tael compared to the pound sterling was pound1 = 320 tael The PPP was
therefore substantially below the exchange rate as found by Allen (2009 540-543) for the
Yangzi Delta in 1820 Note however that the PPP was substantially lower for food (pound1 =
153 tael) than for non-food commodities where the PPP was close to the exchange rate (pound1
= 304 tael) This is again something which Allen (2009 541) found for the Yangzi Delta in
1820 and is explained by the possibility of arbitrage in tradable commodities Food can be
treated as effectively non-tradable because of the high cost of transporting low value but
bulky items
22
Table 3 provides an estimate of Chinese GDP per capita in 1840 benchmarked on
Great Britain Nominal GDP and population are taken directly from this study for China and
from Broadberry Campbell Klein Overton and van Leeuwen (2011) for Britain At the
silver exchange rate Chinese GDP per capita was only 1495 per cent of the British level
However allowing for the lower price level in China by using the PPP suggests that Chinese
GDP per capita was 2357 per cent of the British level Taking the 1840 level of British GDP
per capita in 1990 international dollars as $2521 from Broadberry Campbell Klein
Overton and van Leeuwen (2011) and Chinese GDP per capita in that year as 2357 per cent
of the British level suggests a figure for Chinese GDP per capita in 1990 international dollars
of $594 This is reassuringly close to the figure of $600 suggested by Maddison (2010) for
1850
Table 4 presents the GDP per capita series for both China and Britain for the long
period 980-1850 These estimates suggest that Northern Song China was substantially richer
than Britain at around the time of the Domesday Book in the late eleventh century However
per capita incomes declined in China during the later years of the Northern Song dynasty and
remained at this lower level after the Mongol Interlude With per capita incomes rising in
Britain after the Black Death of 1348 and the recurrent plague outbreaks had significantly
reduced population Britain was already ahead by the first half of the fifteenth century Per
capita incomes stagnated in both China and Britain during the Ming dynasty so that Chinarsquos
per capita income fluctuated around 90 per cent of the British level China then fell further
behind during the Qing dynasty as per capita incomes declined in China and incomes started
to increase rapidly in Britain from the mid-seventeenth century By the mid-nineteenth
century Chinese per capita GDP was just 20 per cent of the British level
23
82 The Little Divergence within Europe
So far we have compared China only with Britain However Britain was a relatively poor
part of Europe in the eleventh century and a relatively rich part by 1850 as can be seen in the
new estimates of GDP per capita presented in Table 5 Before the Black Death struck in
1348 per capita incomes were substantially higher in Italy and Spain than in England and
Holland There then followed a substantial reversal of fortunes between the North Sea Area
and Mediterranean Europe so that by 1800 per capita incomes were substantially higher in
Britain and the Netherlands than in Italy and Spain This ldquoLittle Divergencerdquo accompanied
the ldquoGreat Divergencerdquo between Europe and Asia
83 Reversals of fortune within Asia
Table 6 also suggests a reversal of fortunes within Asia Japan had very low levels of per
capita GDP until 1450 but then experienced episodic growth of the kind seen in Britain and
Holland A phase of positive growth between 1450 and 1600 was followed by a plateau
before a second phase of growth from the 1720s Japanrsquos more rapid growth after the Meiji
Restoration of 1868 which marked the first transition to modern economic growth in Asia
was therefore built on this earlier period of dynamism By contrast Chinese per capita GDP
was on a downward trajectory from its high point during the Northern Song dynasty On
these estimates Japan overtook China during the eighteenth century Like China India
experienced declining GDP per capita from the Mughal peak under Akbar circa 1600 Japan
also pulled decisively ahead of India only during the eighteenth century
84 The Great Divergence
The GDP per capita figures presented here suggest that China was richer than Britain in 1090
However they also suggest that China was certainly poorer than Italy by 1300 During the
24
Ming dynasty Chinese GDP per capita declined so that by the early seventeenth century
despite still being the richest Asian country China had already fallen substantially behind the
leading West European economies in the North Sea Area However we need to be careful
here since a smaller region of China such as the Yangzi Delta may still have been on a par
with Italy in 1500 This would only require per capita incomes in the Yangzi Delta to have
been around 54 per cent higher than in China as a whole which is broadly consistent with the
scale of regional differences within China during the nineteenth century (Li and van Zanden
2012)
But with the rise of Holland during its Golden Age 1570-1650 and Great Britain
from the mid-seventeenth century there can be little doubt that the Great Divergence was
already well underway during the early modern period By this stage the discrepancy
between the aggregate per capita income levels for China and the leading North Sea Area
economies were too large to be bridged by regional variation within China It is worth noting
that Pomeranz (2011) now accepts that his earlier claim of China on a par with Europe as late
as 1800 was exaggerated and he now settles for the earlier date of 1700
9 CONCLUDING COMMENTS
This paper provides estimates of Chinese GDP and relative standing in the world constructed
from the output side between 980 and 1840 covering the Northern Song Ming and Qing
dynasties These GDP estimates are combined with population data to track the path of
average living standards Chinarsquos GDP per capita reached its peak level during the Northern
Song dynasty before entering a long decline which lasted through the Ming and Qing
dynasties Per capita incomes were around three-quarters of the average Northern Song level
25
during the Ming dynasty and had fallen further to just 54 per cent of Northern Song level
during the Qing dynasty
From an international perspective Northern Song China was substantially richer than
Domesday Britain in 1090 but by 1400 Britain had overtaken China During the Ming
dynasty Chinarsquos per capita income fluctuated around 90 per cent of the British level During
the Qing dynasty as per capita incomes declined further in China and incomes started to
increase rapidly in Britain from the mid-seventeenth century China fell increasingly behind
By the mid-nineteenth century Chinarsquos GDP per capita was around 20 per cent of the British
level Although China led the world in living standard during the Northern Song dynasty
China had fallen behind Italy by 1300 At this point however and even until the seventeenth
century it is quite possible that a relatively rich Chinese region such as the Yangzi Delta was
on a par with the most developed parts of Europe But Chinese GDP per capita declined at the
beginning of the Ming dynasty and then stagnated so that by the beginning of the eighteenth
century the gap between China and the most developed parts of Europe was too large to be
bridged by regional variation within China Since China was still the richest Asian country at
this time it is therefore likely that Western Europe was ahead of Asia not just by the
nineteenth century but already by the eighteenth century
26
FIGURE 1 Chinese population during the Northern Song Ming and Qing dynasties
(millions log scale)
Sources Jianxong Ge and Songdi Wu (2005) Liu and Hwang (1979)
27
FIGURE 2 Cultivated land of the Northern Song Ming and Qing dynasties (million mu
log scale)
Sources See Appendix A1 for a detailed discussion of sources and methods
FIGURE 3 Cultivated land per capita of the Northern Song Ming and Qing dynasties
(mu log scale)
Sources See Appendix A1 for a detailed discussion of sources and methods
28
TABLE 1Shares of important crops
1000 1400 1700 1750 1800 1850
Rice 600 502 330 310 290 270
Wheat 230 220 210 200
Barley 70 72 73 72
Millet 80 82 84 82
Corn 00 12 23 35
Potatoes 05 05 08 12
Sorghum 81 83 84 83
Other crops 340 421 94 97 98 96
Cash crops 60 77 110 120 130 150
Total 1000 1000 1000 1000 1000 1000
Sources Hui Wu (1985) Songyi Guo (2000) Yi Luo (1999)
FIGURE 4 Indices of agricultural output (1840=100)
Sources and notes See Appendix A1 for a detailed discussion of sources and methods The
index of grain crops is the same as subsidiary agriculture during the Qing dynasty since
subsidiary agricultural output is assumed proportional to the output of grain crops
29
FIGURE 5 Indices of industrial output (1840=100)
Sources See Appendix A2
FIGURE 6 Subsectoral shares of service sector output
Sources See Appendix A3
30
FIGURE 7 Nominal GDP of the Northern Song Ming and Qing dynasties (million
silver taels log scale)
Sources See Appendices A1 to A3
FIGURE 8 Real GDP of the Northern Song Ming and Qing dynasties (million 1840
taels log scale)
Sources See Appendices A1 to A3
31
FIGURE 9 Real GDP per capita of the Northern Song Ming and Qing dynasties
(1990 international dollars log scale)
Sources See Appendices A1 to A3
FIGURE 10 Agriculturersquos share of GDP during the Northern Song Ming and Qing
dynasties
See Appendix A1
32
TABLE 2 A ChinaGB PPP for 1840
China
taellb
GB
pound per lb
PPP
Tael per pound
Chinese
weights
British
weights
Rice 001407 002500 056 0201 0000
Wheat 000900 000691 130 0134 0335
Sugar 004900 002191 224 0134 0134
Tea 009347 013021 072 0134 0134
Salt 000544 000134 407 0067 0067
Cotton cloth 004195 000402 183 0284 0284
Iron 020690 011301 1044 0046 0046
FOOD 153
OTHER 304
TOTAL 203
Sources and notes
GB
Rice Beveridge (1939 433) The figure of 6s per 12 lb from the Lord Stewardrsquos Department
actually refers to 1830
Wheat UK Board of Trade (1903 70) The figure of 66s 4d per imperial quarter is taken
originally from the London Gazette
Sugar UK Board of Trade (1903 162) The average price per cwt unrefined sugar exclusive
of duty
Tea UK Board of Trade (1903 177) Average price per lb in bond
Salt UK Board of Trade (1903 188) Data originally from Greenwich Hospital
Iron Mitchell (1988 762) English merchant bar iron at Liverpool
Cotton cloth Mitchell (1988 761) Average value of cotton piece goods exported converted
from yards to lb using 1840 ratio from Robson (1957 331)
Weights Based on Feinstein (1995) for the mid-nineteenth century Food and non-food items
have weights of 067 and 033 respectively For the breakdown within food Feinstein (1995)
suggests that grain based products (wheat flour and bread) accounted for around half of
expenditure on food Thus wheat is given a weight of 0335 and rice which was prohibitively
expensive has a weight of zero The remaining expenditure on food has been allocated across
sugar tea and salt with equal weights for sugar and tea and a smaller weight for salt again
broadly consistent with budget studies Within non-food the breakdown between cotton and
iron is in proportion to the value added in these two industries from Horrell et al (1994)
China
Rice Xinwei Peng (1965 850)
Wheat Zheng Guangzu (1990)
Sugar Fu Chongju (1987)
Tea Xiangao Yao (1962 vol 1 582) based on export prices
Salt Qingshi Gao Shihuozhi Yanfa
Iron Kong (1981 509 527) wrought iron
Cotton cloth Xiangao Yao (1962 vol 1 557 616) based on export prices
Weights The weights are the same as for Britain apart from an allowance within food for
rice based on the late-Qing ratio between wheat and rice production (3020) Within non-
food the breakdown between cotton and iron is broadly consistent with the late-Qing shares
of value added in textiles and metals production
33
TABLE 3 A benchmark estimate of ChinaGB GDP per capita in 1840
China
Nominal GDP (million tael) 5337
Population (million) 412
GDP per capita (tael) 1295
England
Nominal GDP (pound million) 49630
Population (million) 18332
GDP per capita (pound) 2707
Exchange rates
Silver exchange rate (tael per pound) 320
PPP (tael per pound) 203
Comparative ChinaGB GDP per capita ()
At silver exchange rate 1495
At PPP 2357
GDP in 1990 international dollars
GB 2521
China 594
Sources and notes Nominal GDP and population from Figures 1 and 7 for China and from
Broadberry Campbell Klein Overton and van Leeuwen (2011) for Britain Silver exchange
rate derived from the silver weight of the tael and pound sterling from van Glahn (1996 133)
and Craig (1953) respectively PPP from Table 2 GDP for Britain in 1990 international
dollars from Broadberry Campbell Klein Overton and van Leeuwen (2011)
34
TABLE 4 GDP per capita levels in China and Britain (1990 international dollars)
China
($1990)
GB
($1990)
ChinaGB
(GB=100)
980 1247
1020 1518
1050 1458
1090 1204 754 1597
1120 1063
1270 759
1300 755
1400 960 1090 881
1450 983 1055 932
1500 1127 1114 1012
1570 968 1143 847
1600 977 1123 870
1650 1110
1700 841 1563 538
1750 685 1710 401
1800 597 2080 287
1840 594 2521 236
1850 594 2997 198
Sources and notes GB Broadberry Campbell Klein Overton and van Leeuwen (2011)
Walker (2012) China Figure 9
35
TABLE 5 GDP per capita levels in Europe (1990 international dollars)
England
GB
Holland
NL
Italy Spain
1270 759 957
1300 755 1482 957
1348 777 876 1376 1030
1400 1090 1245 1601 885
1450 1055 1432 1668 889
1500 1114 1483 1403 889
1570 1143 1783 1337 990
1600 1123 2372 1244 944
1650 1100 2171 1271 820
1700 1630 2403 1350 880
1563
1750 1710 2440 1403 910
1800 2080 2617 1244 962
1752
1820 2133 1953 1376 1087
1850 2997 2397 1350 1144
Sources and notes EnglandGreat Britain Broadberry Campbell Klein Overton and van
Leeuwen (2011) The data refer to the territory of England before 1700 and Great Britain
after 1700 HollandNetherlands van Zanden and van Leuwen (2012) The data refer to
Holland before 1800 and the Netherlands after 1800 Italy Malanima (2011) Spain Aacutelvarez-
Nogal and Prados de la Escosura (2013)
36
TABLE 6 GDP per capita levels in Europe and Asia (1990 international dollars)
England
GB
Holland
NL
Italy Japan China India
730 551
900 476
980 1247
1020 1518
1050 1458
1090 754 1204
1120 1063
1150 508
1280 679 552
1300 755 1482
1400 1090 1245 1601 960
1450 1055 1432 1668 552 983
1500 1114 1483 1403 1127
1570 1143 1783 1337 968
1600 1123 2372 1244 605 977 682
1650 1110 2171 1271 619 638
1700 1563 2403 1350 597 841 622
1750 1710 2440 1403 622 685 573
1800 2080 1752 1244 703 597 569
1850 2997 2397 1350 777 594 556
Sources GB Broadberry Campbell Klein Overton and van Leeuwen (2011) Walker
(2012) HollandNetherlands van Zanden and van Leuwen (2012) Italy Malanima (2011)
China Figure 9 Japan Bassino Broadberry Fukao Gupta and Takashima (2014) India
Broadberry Custodis and Gupta (2014)
37
APPENDIX 1 DATA SOURCES AND METHODS
A1 AGRICULTURE
A11 Grain Crops
A111 Northern Song grain crops
For the amount of cultivated land we can find the official statistics of 976 997 1021 1051
1066 and 1083 from Wenxian Tongkao Tianfu kao Lidai Tianfu Zhizhi2 and Songshi Shihuo
Zhi Nongtian3 However due to the fiscal reform of ldquothe law of two kinds of taxesrdquo land tax
revenue was based on the reported amount of land As a result the actual amount of
cultivated land was under-reported for tax evasion purposes during the middle and late
periods of the Northern Song For example Xia Qi (2009) finds that the actual amount of
cultivated land was far greater than the official amount after 1051 Therefore we follow Xia
Qirsquos method to derive the actual amount of cultivated land during the middle and last stages
Grain yield per mu is available mainly from Song Huiyao Jigao Shihuo and Xu Zizhi
Tongjian Changbian Here we use the average country level estimates from Xia Qi (2009)
and Hui Wu (1985) Grain yields were generally higher in Southern China than in Northern
China while Eastern China had higher yields than Western China Looking at the entire
Northern Song period the grain yield per mu increased gradually According to the data from
Xia Qi (2009) and Hui Wu (1985) Southern China accounted for 64 of the total cultivated
land and Northern China for the remaining 36 They also estimate that 6 of total
cultivated land was occupied by cash crops rather than grain crops The yield of the cash
crops was generally higher than that of the grain crops as will be discussed in detail later
For both Southern China and Northern China the amount of cultivated land is multiplied by
the grain yield per mu to arrive at grain output for each year with separate calculations for
the two regions The regional estimates are then aggregated to arrive at annual estimates of
the grain output of China as a whole The price series of various grain crops are taken from
Xia Qi (2009) and Hansheng Quan (1991) both of whom estimate the price series of rice and
wheat and argue that the prices of other crops (such as millet and beans) are similar to the
price of wheat Using grain production multiplied by the price of the different crops produces
annual estimates of the value of grain output To derive the value of net output in the grain
producing sector it is necessary to subtract the value of agricultural inputs such as seed and
fertilizer which was set at around 15 following the research of Xing Fang (1996) and Yi
Luo (1999)
A112 Ming grain crops
The amount of cultivated land after 1400 can be derived at a 10-year frequency from the data
of Paul K C Liu and Kuo-shu Hwang (1977) and interpolated to arrive at annual estimates
Grain yield per mu is derived by Songyi Guo (2000) from a sample of land rent rate data
covering 37 southern rice areas and 8 northern wheat areas based on three different grades of
land (high middle and low)
Xinwei Peng (1965) records the price series of rice measured in silver throughout the Ming
dynasty based on a 10-year frequency Data on the price of wheat are more limited for this
period but suggest a price of around 80 of the price of rice By taking the shares of rice and
2 Examinations of the historical literature especially concerning the land tax and land tax institutions of
every dynasty 3 History of the Song Dynasty Notes on economic activities Land used by Agriculture
38
wheat in the total cultivated land area and multiplying by the price of rice and wheat
respectively it is possible to arrive at the value of gross output Net output is then derived by
subtracting around 18 of the gross value to account for agricultural inputs such as seed and
fertilizer
A113 Qing grain crops The amount of cultivated land is taken from Yi Luo (1999) for 1685 and 1700 from Zhihong
Shi (2001) for 1724 and 1850 and from Songyi Guo (2000) for 1812 Starting from the
distribution of the main crops in 1914-1918 (Perkins 1969)4 and the crop distribution data5 in
1952 Yi Luo (1999) provides estimates of the geographical distribution of many important
crops during the Qing dynasty shown in Table 1
Recent research suggests that the grain yield per mu increased gradually during the Qing
dynasty (Yi Luo 1999) Grain output is derived by multiplying these grain yields by the
cultivated land area Multiplying these estimates by the price of grain crops then yields output
values Grain crop prices during the Qing dynasty are taken from the work of Xinwei Peng
(1965) Hansheng Quan (1991) and Yeh-chien Wang (2003) for rice and from Guangzu
Zhengrsquos lsquolsquoYibanlurdquo (2003) and Yi Luo (1999) for other crops Net output is derived by
subtracting 18 of the gross value to account for agricultural inputs such as seed and
fertilizer (Yi Luo 1999)
A12 Cash Crops
A121 Northern Song cash crops Although some cash crops occupy cultivated land others do not The amount of cultivated
land occupied by cash crops was about 6 of the total cultivated land Based on research by
Yi Luo (1999) the value of cash crops per mu was about 12 times the average value of the
grain crops per mu6 The output value of the cash crops is thus obtained by multiplying the
amount of cultivated land used for cash crops by the yield per mu
Other cash crops such as tea and fruit which do not occupy cultivated land were important
agricultural products during the Northern Song There are numerous official tea purchasing
records throughout the Northern Song when tea production was strictly regulated by the
government There was also a large amount of ldquoprivate teardquo which is taken into consideration
by referencing Hongsheng Sunrsquos (1986) research Because of the big price gap between
different grades of tea the average price is used to calculate the total output value of the tea
industry following the work of Jinfang Ge (2008) and Minsheng Cheng (2008) According to
Baosan Wu and Yusan Wang (1947) the net value of tea is around 85 of the gross value
A122 Ming cash crops
4 Perkins used data from the Republic of China Agricultural Bureau of Investigation to calculate the crop
distribution in 1914-1918 5 See Statistical Yearbook of China1952 6 Ruizhong Liu (1986) estimates the value of cash crops per mu to be about 2 times the average value of
the grain crops per mu Yi Luo (1999) argues that the return from cash crops could not have been much
higher than this since when a high return cash crop was introduced in a particular area although there may
have been specific geographical factors in some cases it would typically diffuse to other areas thus
reducing the return from cash crops close to the return from grain crops within a short period of time He
argues that 12 times is more reasonable and we use this value in our calculations Philip Huang (1985)
has also researched this phenomenon
39
Northern dry farmland and southern paddy farmland accounted for 456 and 544 of the
total cultivated land area respectively The proportion of cultivated land used for cash crops
was 7 on the northern dry farmland and 82 on the southern paddy farmland so cash
crops accounted for 765 of the total cultivated land As in the Northern Song dynasty the
average value of cash crops (such as cotton soybeans rape peanut tobacco sugar cane
beet hemp maintains etc) per mu on cultivated land was about 12 times the average value
of grain crops per mu Multiplying this cash crop yield per mu by the amount of cultivated
land for cash crops yields the total value of gross output for cash crops on the cultivated land
The production of tea which did not occupy cultivated land can be constructed from the
consumption side Per capita tea consumption during the Ming dynasty was assumed to be
the average of the Northern Song and Qing dynasties and this was multiplied by population
to arrive at total consumption which was assumed to be equal to production As a result of
limited information it is not possible to calculate the value of other cash crops not occupying
cultivated land such as fruits
A123 Qing cash crops
During the Qing Dynasty the average value per mu of cash crops on cultivated land is
assumed to be 12 times the average level of grain crops and the cultivated land for cash
crops accounts for 11-15 of the total cultivated land Other cash crops that did not occupy
cultivated land including tea fruits etc were also important In particular the production of
tea increased sharply during the Qing dynasty Based on the records in Qing Shilu it is
possible to estimate the domestic consumption of tea which amounts to 15 to 18 million
Jin7 per year both before and during the middle period of the Kangxi Emperor and 25 to 34
million Jin per year from the late period of the Kangxi Emperor to the period of the
Yongzheng Emperor and climbing to 69 million Jin per year during the reigns of the
Qianlong and the Jiaqing Emperors Besides the amount of tea consumed domestically the
amount of tea produced for export can also be taken into account China exported about 40 to
50 thousand Dan 8 per year after 1760 The total production of tea each year is estimated by
adding total exports to domestic consumption The value of tea output is then obtained by
multiplying the volume of output by the price of tea with reference to the work of Wenxi Tan
(1994) and Miantang Huang (2008) Net output of tea amounted to 85 of the gross value in
1933 according to Baosan Wu and Yusan Wang (1947) Since tea was a labour intensive
crop without rapid technological progress this ratio was assumed stable from the Northern
Song to the Qing dynasty
A13 Subsidiary Agricultural Output
Subsidiary agriculture includes animal husbandry fisheries forestry and other sidelines
According to Perkins (1969) from 1914 to 1918 the output value of livestock raising9 was
equivalent to 112 of the output value of grain crops in China Guangshao Tu (1984) argues
that the output value of the subsidiary agricultural industries accounted for 196 of the
output value of grain crops in the 1930s In this paper the ratio of the value of subsidiary
agricultural outputs to the value of grain crops is assumed to be 10 during the Northern
Song and the Ming and 12 during the Qing dynasty
A2 INDUSTRIAL OUTPUT
A21 Metal and Mining Industries
7 Jin a unit of weight in ancient China 1 Jin=500 grams 8 Dan a unit of weight in ancient China 1 Dan=100 Jin 9 Not including poultry fisheries and forestry
40
A211 Northern Song metals and mining The most accessible data on the mining and metallurgical industries of ancient China are the
quantities purchased by the government called ke e(r) or tax quota Since the iron industry is
very important to the national economy there are numerous studies of the production of iron
which can be used for reference For other minerals the ke e(r) is used to calculate the output
value
Hartwell (1962) claims that the amount of iron produced in China was about 75000 to
150000 tons in 1078 Many subsequent researchers argue that Hartwell seriously
overestimated iron production Sen Liu (1993) provides alternative estimates of the output of
iron by aggregating the annual quantities of iron used for coinage and the ke e(r) with an
allowance for iron used in daily life and for making tools Sen Liursquos (1993) estimates are
used here
For other metals such as gold silver copper lead and tin the volume of output is estimated
from the ke e(r) following the research of Lingling Wang (2005) and Shengduo Wang
(1995) based on the original data from Xu Zizhi Tongjian Changbian Wenxian Tongkao
Song Huiyao Jigao Because of the governmentrsquos strict regulation of the production of copper
and tin which were used for minting in the Northern Song the gap between real output and
the ke e(r) of every year is very small but the gap for gold and silver is a little larger For the
period 1078-1125 the original data show too steep a decline because they cover only the
southern area of Northern Song China For gold silver copper lead and tin output has been
held constant after 1078 For iron Sen Liursquos (1993) data exclude Sichuan for which a
separate estimate has been made
The price series of gold and silver are taken from Shige Kato (2006) Xia Qi (2009)
Shengduo Wang (1995) and Wencheng Wang (2001) The price of iron is taken from
Lingling Wang (2005) and Minsheng Cheng (2008) while the price series of copper tin
lead vitriol and cinnabar are from Minsheng Cheng (2008) The production of the vitriol
industry can be constructed from the relevant records of Song Huiyao Shihuo Songshi
Shihuozhi Wenxian Tongkao
Since few data are available for the Northern Song coal industry the value of coal output is
estimated on the assumption that the ratio of coal output to iron output was the same during
the Northern Song as during the Ming dynasty Yinxing Song (1954) established that coal
accounted for 70 per cent of the fuel used in the Northern Song iron industry while the share
of fuel in costs is assumed to be the same as Baosan Wu and Yusun Wang (1947) found for
1933 Coal used in porcelain and salt is estimated to be one third of the level used in iron
production
A212 Ming metals and mining
Silver was used universally as currency at the beginning of the Ming dynasty but the
production data are limited The production of silver is determined from the official tax
records of the silver mining industry For the Ming dynasty the tax rate on the silver mining
industry was around 30 which was levied on the amount of silver produced The output
value of the silver mining industry during the Ming dynasty can thus be estimated from the
tax revenue of Ming Shilu
The state-run iron industry was mainly in Zunhua City and the production of the state-run
iron industry can be derived from the official records The production of the private iron
41
industry can be calculated from the tax revenue which can be found in Ming Shilu Daming
Huidian Vol194 and Guangdong Tongzhi Chugao of Jiajing Empero(Qichen Huang 1989)
For the Ming dynasty the tax rate on the iron mining industry was always 666 or 115th of
total output
Information on the production of coal during the Ming dynasty is limited In Tiangong
Kaiwu a famous encyclopedia for manufacturing and technology in ancient China Yingxing
Song mentions that 70 of the fuel used for smelting iron was coal It is therefore possible to
calculate roughly the production value of coal from the production of iron given information
on the share of fuel in total costs Other metal mining industries were small in size The tax
rate on the gold mining industry was 20 so the output value of gold can be estimated from
the tax revenue Tax data on the private copper industry and production data on the state-run
copper industry are available only infrequently but can be used to provide estimates of total
copper production in those years For other mining and metallurgical industries such as lead
and tin output is assumed to move in line with the output of copper consistent with the
situation during the Northern Song dynasty
A213 Qing metals and mining
During the Qing dynasty the government gave up the right to monopolize the mining of
minerals In some provinces there are thus gaps in the data on copper production Abundant
data exist for Yunnan province which was an important centre of copper mining and to
which estimates for other provinces are added based on more fragmentary information
Copper output data come from Zeyi Peng (1962) Since Guangdong became the centre of the
iron mining and metallurgical industry during the late Ming dynasty a similar approach can
be used to estimate the production of iron Data from Longqian Li (1979) are used to estimate
the output of iron in Guangdong to which estimates of output from other provinces are added
to get the total volume of iron production
For coal mining output is estimated from iron output together with the share of coal in the
cost of iron production using data from Yingxing Song (1954) supplemented with an
allowance for coal used in porcelain production and domestic consumption
For the Qing dynasty at least before the mid period of the Qianlong Emperor private capital
was allowed to participate in the mining and metallurgical industries of gold silver and tinbut the data series are also limited here Zhongli Zhang (1987) has estimated the output value
of those three mining and metallurgical industries in 1887 and argues that the output value of
the gold industry was 83 of the iron industry the output value of the silver industry was the
same as the copper industry and the output value of the tin industry was three times that of
the copper industry By assuming that those ratios also held during the early Qing dynasty it
is possible to derive the output value of those three industries By aggregating these data the
total output value of the mining and metallurgical industries during the Qing dynasty can be
estimated
A22 Food Processing
A221 Rice wine industry
For the Northern Song dynasty the production of wine can be calculated by the tax levy on
rice wine production Huarui Li (2001) gathers data on tax revenue from wine production in
Dongjing and Hangzhou two flourishing commercial regions in the Northern Song and uses
it to derive estimates of wine output According to this research 10000 Guan of tax revenue
translates into 8000 to 12000 Dou of wine output The output of rice wine is estimated for
42
some key years and then interpolated log-linearly to calculate the output for other years The
cost of production was about 35 of the gross output value in the wine industry (Huarui Li
1991)
For the Ming dynasty given the scarcity of data on wine production output is estimated from
the demand side Based on data from the Qing dynasty it is assumed that 10 of the
population drank rice wine approximately 250 days per year and consumed one Jin of wine
per day10 Total rice wine consumption can therefore be estimated and it is assumed that
production was roughly equal to consumption This volume information can be combined
with data on the price of wine from Miantang Huang (2008) to derive the value of wine
output during the Ming dynasty As in the Northern Song net output was assumed to be 65
of the gross value The demand approach is also used for estimating rice wine output during
the Qing dynasty
A222 Tea processing industry
According to Zhongli Zhang (1987) value-added in the tea-processing industry in the 1880s
was 8 of the value of tea output This ratio is applied throughout the Northern Song Ming
and Qing dynasties to the tea output data from the agricultural sector
A223 Sugar industry
Zhongli Zhang (1987) estimates that value-added in the sugar industry accounted for 70 of
that of the tea-processing industry in the 1880s In line with qualitative evidence of lower
sugar consumption during earlier times this ratio is set at 50 during the Northern Song and
the same assumption is used for the Ming dynasty During the Qing dynasty sugar was
produced mainly in Taiwan Guangdong and Fujian Data on output in these provinces can be
gathered and an allowance can also be made for other areas such as some parts of Guangxi
Jiangxi Jiangsu and Zhejiang provinces By aggregating this data it is possible to calculate
the output of sugar for China as a whole The price of sugar can be obtained from Miantang
Huang (2008) and Wenxi Tan (1994) and combined with the volume data to derive the value
of output during the Qing dynasty
A224 Other food processing industries
The food-processing industry also includes the milling and oil refining industries for which
few data are available Following Broadberry Campbell Klein Overton and van Leeuwen
(2011) we assume other food processing industries grew in line with agricultural output The
level of other food processing is set in relation to sugar and tea-processing during the 1880s
from Zhongli Zhang (1987)
A23 Manufacturing Industry
A231 Salt
For the Northern Song dynasty salt output is based mainly on the work of Zhengzhong Guo
(1997) who collected data on salt production in different regions and then aggregated it to
arrive at national salt output According to Xia Qi (2009) the price of salt was determined by
the government because of the salt monopoly at that time The data of Baosan Wu and Yusun
Wang (1947) suggest that the net value of salt accounted for 62 of the gross value in 1933
and this ratio is assumed to hold all the way back to the Northern Song dynasty
10 See Xing Fang et al (2007) p426or Bao Shichen (1968) Vol26
43
For the Ming dynasty although salt tax data were recorded in Ming Shilu they do not provide
reliable estimates of salt output which is estimated from the consumption side Salt
consumption per capita is assumed to be the average of the Northern Song and Qing
dynasties and is multiplied by population to arrive at total consumption which is assumed to
be equal to output Ming Shilu also recorded the price of salt measured by silver in some
years The net output of the Ming salt industry was assumed to be 62 of the gross output
The salt output of the Qing dynasty is also based on the research of Zhengzhong Guo (1997)
who collected the data of salt production in most years The price of salt from Wenxi Tan
(1994) is used to calculate the gross value and the net value of salt production amounts to
62 of the gross value
A232 Silk cloth
For the Northern Song dynasty there are no historical materials recording silk cloth
production so output must be estimated using the consumption approach First silk
consumption per household is estimated and then multiplied by the total number of
households to derive total silk consumption in the country as a whole By assuming that total
production is equal to total consumption silk cloth output can be determined on an annual
basis Since raw silk accounts for over 80 of the value of silk cloth all silk cloth prices are
determined by the price of raw silk The data of Baosan Wu and Yusun Wang (1947) suggest
that the net value of silk accounted for 40 of the gross value in 1933 and this ratio is
assumed to hold all the way back to the Northern Song dynasty
For the Ming dynasty the silk cloth industry can be divided into two subsectors the state-
managed sector and the private sector The silk cloth industry managed by the state contained
two parts central and local Silk cloth output from the central government was produced
mainly in Suzhou Songjiang Zhenjiang Hangzhou Jiaxing and Huzhou and recorded in the
official historical literature Total output was about 11000 pieces accounting for one third of
the silk cloth industry managed by the government It is difficult to find data on the privately
managed silk fabric industry which must be estimated using government-provided data on
the number of looms and silk cloth production According to Xinwei Peng (1965) the price
of raw silk can be determined for most years of the Ming dynasty Based on Baosan Wu and
Yusun Wang (1947) the net value of silk fabric was 40 of the gross value
For the Qing dynasty the silk fabric industry can also be divided into two parts the state-
managed sector and the private sector The output data for both sectors are taken from Jinmin
Fan and Wen Jin (1993) The net value of silk fabric was also 40 of the gross value
A233 Cotton cloth
After the Yuan dynasty hemp fabric was replaced by cotton cloth as the wearing of cotton
textiles spread to the lower classes Cotton textiles thus became an important handicraft
sector in the Ming and Qing dynasties Output is estimated from data on the amount of labour
engaged in cotton production work time per labourer and labour productivity or consumption
per person (Fuming Li 2005 Xinwu Xu 1992)
A234 Coinage
Coinage was regulated during the Northern Song dynasty The official unit and metal content
of coinage was Qian Mo which was also strictly regulated by the government From the
beginning of the Song dynasty to the reign of the Shenzong Emperor the government used
the same standard to mint copper coins According to historical information the GDP of the
44
coinage industry amounted to 40 of the value of the coinage in the earlier stage and 30 in
the later stage (Xiaochu Ji Vol 17 Wenxian Tongkao Qianbi Kao)
The Ming government minted a small number of copper coins and did not mint silver coins at
all It is hard to find data for the exact amount Hence the coinage industry in the Ming
dynasty can be assumed to be negligible The same is true for the Qing dynasty
A235 Paper
During the Northern Song dynasty Yuan Feng Jiu Yu Zhi Xu Zi Zhi Tong Jian Chang Pian
and Song Huiyao Jigao Shihuo recorded the amount of paper transported from different
regions to the central government These data can be aggregated to estimate paper output for
the country as a whole (Huaxian Wei 2006) Based on Minsheng Chengrsquos (2008) research
the net value of paper production was 55 of the gross value
The paper industry in the Ming dynasty was well developed with a high degree of variety
flourishing mostly in four provinces Jiangxi Fujian Zhejia and Anhui Since we lack time
series output data for paper during the Ming and Qing dynasties the most neutral way of
allowing for the paper industry is to assume that its share of manufacturing output did not
change from the share estimated by Zhongli-Zhang (1987) for the 1880s This is equivalent to
the standard procedure in economic history of constructing an index of industrial production
from a weighted sample of industries
A236 Porcelain
Porcelain output during the Northern Song dynasty is estimated on the basis of Jilang Su
(1997) who calculated the profits and costs of porcelain production in the south east region
from the numbers of kilns in South Fujian and Guangdong provinces the numbers of firings
by each kiln in every year and the numbers of porcelain products in each kiln per firing We
assume that South Fujian and Guangdong provinces accounted for two-thirds of national
output broadly in line with the share of the south eastern porcelain industry during the Ming
and Qing dynasties
For the Ming dynasty porcelain production is estimated separately for the government and
private sectors and then added together to derive total porcelain production (Miaotai Liang
1991) The data for the government-managed porcelain industry are for imperial kilns while
the data for the privately-managed porcelain industry are based on the number of private kilns
and the average production per kiln Since there are different types of porcelain the average
price has to be used (Sakuma Shigeo 1999) According to Jiangxi sheng da zhi taoshu the
cost of production is 40 of gross output which suggests that the net value of porcelain
production accounted for around 60 of the gross value of porcelain production
For the Qing dynasty the output of Jingdezhen can also be obtained from Miaotai Liang
(1991) covering the period from the Yongzheng Emperor to the Guangxi Emperor
According to Zhongli Zhang (1987) the south eastern porcelain industry centred on
Jingdezhen accounted for 70 of Chinese porcelain output The ratio of net value to gross
value in Qing China is assumed to be the same as during the Ming dynasty
A237 Transport equipment
Based on Zhongli Zhangrsquos (1987) classification the building and repairing of ships
handcarts and oxcarts is categorized under transport equipment within the manufacturing
sector The building and repairing of ships is the most important part of this industry
45
although there are less data on this in the historical materials of the Northern Song The 39
share of transport equipment in manufacturing in the 1880s from Zhongli Zhang (1987) is
assumed to be constant throughout the Northern Song Ming and Qing dynasties
A238 Other manufacturing industries
There are a number of other manufacturing industries for which no systematic production
data are available including fur products metal ware furniture clothing stationery and
jewellery For these industries the same method is used as for the transport equipment
industry The 80 share of other manufacturing to total manufacturing output in the 1880s
from Zhongli Zhang (1987) is assumed to hold throughout the Northern Song Ming and
Qing dynasties
A239 Building
Building is assumed to grow in line with population but with an allowance for urbanization
This follows the procedure of Broadberry Campbell Klein Overton and van Leeuwen
(2011) in the estimation of English economic growth 1270-1700 The population and
urbanization data are taken from Jianxong Ge and Songdi Wu (2005) for the Northern Song
dynasty and from Paul K C Liu and Kuo-shu Hwang (1979) and Shuji Cao (2005) for the
Ming and Qing dynasties
A3 SERVICE SECTOR OUTPUTS
A31 Commerce The output of the commercial sector is estimated indirectly from data on the value of
agricultural and industrial output together with information on the share of output marketed
By taking account of the urbanisation rate of different dynasties and using grain output
minus food consumption seeds and feedstuff Hui Wu (1987) has derived the
commercialisation rate of agriculture as 17 during the Northern Song 16 during the
Ming and 172 during the Qing dynasty before 1840 rising to 207 during the later Qing
after 1840 It is assumed that all industrial output was marketed This series of marketed
agricultural and industrial output is used to project back from 1840 the nominal value added
in commerce which is derived using Zhongli Zhangrsquos (1987) estimate of the ratio of GDP in
commerce to GDP in agriculture and industry for the 1880s
A32 Finance
In the early stage of the Qing dynasty (pre- 1840) finance includes three subsectors pawn
shops Qianzhuang (local banks) and Piaohao (inter-regional banks established by Shanxi
businessmen) The GDP of the financial sector consists of the personal revenue of the
professionals working in these subsectors plus the profits accruing to the capital employed
Data on the numbers of pawn shops and the capital employed can be combined with data on
interest rates to calculate the GDP generated by pawn shops during the Qing dynasty (Qiugen
Liu 1995) Although historical data are unavailable for Qianzhuang and Piaohao Zhongli
Zhang (1987) has estimated GDP for China in the 1880s in Qianzhuang and Piaohao as well
as pawn shops The ratio of the GDP of Qianzhuang and Piaohao to the GDP of pawn shops
is assumed to be the same as during the 1880s throughout the Qing dynasty Combining the
GDP of pawn shops in the early stages of the Qing dynasty with this ratio it is possible to
derive the GDP of the whole financial sector For the Northern Song and Ming dynasties no
financial data are available so the ratio of financial sector GDP to total GDP during the Qing
dynasty is assumed to hold during the other two dynasties This assumes that during the
46
Northern Song and Ming dynasties usurious loans were on a similar scale to transactions
dealt with by Qianzhuang and Piaohao during the Qing dynasty (Wenshu Wang 2008)
A33 Housing and domestic service
Following Broadberry Campbell Klein Overton and van Leeuwen (2011) it is assumed that
housing and domestic service grew in line with population with an allowance for
urbanisation The total population is decomposed into rural and urban population according
to the urbanisation rate and divided by the average family size to determine the number of
households The number of households is then multiplied by the average rent in rural and
urban areas respectively to determine the total housing rent The urbanization data are taken
from Songdi Wu (2005) for the Northern Song dynasty and from Shuji Cao (2005) for the
Ming and Qing dynasties Rent data come from Minsheng Cheng (2008) for the Northern
Song dynasty and from Xing Fang (1996) and Huanchun Hong (1988) for the Qing dynasty
No independent rent data are available for the Ming dynasty but are assumed to be the same
as during the Qing dynasty
A34 Government
Government can be separated into four parts the maintenance of the palace of the dynasty
soldiersrsquo and military officersrsquo pay officialsrsquo emoluments and pensions and the salary of
other office clerks Data for all these parts of government can be obtained from the historical
literature of each dynasty This method can be applied to all three dynasties The number of
soldiers and civil servants and their pay are taken from Hongqi Li (1988) and Shengduo
Wang (1995) for the Northern Song dynasty For the Ming dynasty data for all parts of
government can be obtained from Ming Shilu and Wanli Kuaiji Lu For the Qing dynasty
data are taken from Feng Chen (2008) and Zhihong Shi and Yi Xu (2008)
47
REFERENCES
Primary historical sources
Anwu Sizhong Vol26 (Bao Shichen) Taipei Wenhai Press Company 1968
Collation and Annotation of Mingshi Shihuo Zhi (Mingshi Shihuo Zhi Jiaozhu) (Li Xun)
Peking Zhonghua publishing house 1982
Da Ming huidian Code of the Great Ming Dynasty (Li Dongyang) YangzhouJiangsu
Guangling ancient books sculpture and printing press 1989
Daxue Yanyi Bu Vol29 (Qiujun) Shanghai Shanghai Bookstore Press 2012
Guangdong Tongzhi Chugao in the reign of the Jiajing Emperor (Jing Dai and Chuang Yue)
Beijing Shumu Wenxian Press 1996
Jiangxi sheng da zhi(Wang Zongmu)TaipeiChengwen Press1989
Ming huidian Code of the Ming Dynasty (Shen Shixing) Edited in the Wanli Emperor
Peking Book and literature publishing house 1988
Ming Shilu Beijing Photocopy of Academia Sinica Institute of History and Philology1962 Qing Shilu Peking Zhonghua Publishing House 2008
Qingshi Gao Shihuozhi Yanfa (Zhao erxun) Beijing Zhonghua publishing house 1976
Raozhou Fuzhi in Jiangxi Province (Chen Ce) Taipei Chengwen Press Company 1989
Song Huiyao Jigao (Xu Song) Peking Zhonghua publishing house 1957
Wanli Kuaiji Lu Fiscal notes on the Wanli Emperor (Chuang Xueyan) Peking book and
literature publishing house 1988
Wenxian Tongkao General Textual Research on Some Historical Literature (Ma Duanlin)
Peking Zhonghua publishing house 1986
Xiaochu Ji (Wang Yucheng) Shanghai The Commercial Press 1937
Xu Zizhi Tongjian Changbian (Li Tao) Beijing Zhonghua Book Press 1992
Yiban Lu Zheng Guangzu) Beijing Chinese Bookstore 1990
Yuan Feng Jiu Yu Zhi(Wang cun) Peking Zhonghua publishing house 1984
Secondary sources
Allen Robert (2009) ldquoAgricultural Productivity and Rural Incomes in England and the
Yangtze Delta c 1620 ndash c 1820rdquo Economic History Review 62 525-550
Aacutelvarez-Nogal Carlos and Leandro Prados de la Escosura (2013) ldquoThe Rise and Fall of
Spain 1270-1850rdquo Economic History Review 66 1-37
Bassino Jean-Pascal Stephen Broadberry Kyoji Fukao Bishnupriya Gupta and Masanori
Takashima (2014) ldquoJapan and the Great Divergence 730-1870rdquo London School of
Economics
httpwww2lseacukeconomicHistorywhosWhoprofilessbroadberryaspx
Bernhard Wolfram (1956) ldquoData on the Structure of the Chinese City in the Pre-Industrial
Periodrdquo Economic Development and Cultural Change 5 253-268
Beveridge William (1939) Prices and Wages in England from the Twelfth to the Nineteenth
Century Vol I Price Tables Mercantile Era London Longmans Green
Broadberry Stephen Bruce Campbell Alexander Klein Mark Overton and Bas van
Leeuwen (2011) ldquoBritish Economic Growth 1270-1870 An Output-Based
Approachrdquo London School of Economics
httpwww2lseacukeconomicHistorywhosWhoprofilessbroadberryaspx
Broadberry Stephen Bruce Campbell Alexander Klein Mark Overton and Bas van
Leeuwen (2014) British Economic Growth 1270-1870 Cambridge Cambridge
University Press (forthcoming)
Broadberry Stephen Johann Custodis and Bishnupriya Gupta (2014) ldquoIndia and the Great
Divergence An Anglo-Indian Comparison of GDP per capita 1600-1871rdquo
Explorations in Economic History (forthcoming)
48
Cao Shuji (2005) Chinese Population History Ming Dynasty (Zhongguo Renkoushi Vol4
Ming Dynasty) Shanghai Fudan University Press
Chao Kang (1986) Man and Land in Chinese History An Economic Analysis Stanford
Stanford University Press
Chen Feng (2008) Reserch on Fiscal Policy and Monetary Policy of Qing Dyanaty(Qingdai
Caizheng Zhengce he Huobi Zhengce Yanjiu)Wuhan Wuhan University Press
Cheng Minsheng (2008) Song Dynasty Price Research (Songdai Wujia Yanjiu) Beijing
Peoplersquos Publishing House
Crafts Nicholas and Charles K Harley (1992) ldquoOutput Growth and the Industrial
Revolution A Restatement of the Crafts-Harley Viewrdquo Economic History Review
45 703-730
Craig John (1953) The Mint A History of the London Mint from AD 287 to 1948
Cambridge Cambridge University Press
Deng Kent G (2004) ldquoUnveiling Chinarsquos True Population Statistics for the pre-Modern Era
with Official Census Datardquo Population Review 43 32-69
Elvin Mark (1973) The Pattern of the Chinese Past Stanford Stanford University Press
Fan Jinmin and Jin Wen (1993) Silk History in Jiangnan (Jiangnan Sichoushi Yanjiu)
Beijing Chinese Agriculture Press
Fang Xing (1996) ldquoThe Consumption of Farmers in Jiangnan during Qing Dynastyrdquo
(Qingdai Jiangnan Nongmin de Xiaofei) Researches in Chinese Economic Histroy 3
91-98
Fang Xing Jing Junjian and Wei Jinyu (2007) General History of Chinese Economy Qing
Dynasty Beijing China Social Sciences Press
Feinstein Charles (1995) ldquoChanges in Nominal Wages the Cost of Living and Real Wages
in the United Kingdom over Two Centuries 1780-1990rdquo in Pieter Scholliers and
Vera Zamagni (eds) Labourrsquos Reward Real Wages and Economic Change in 19th-
and 20th-Century Europe Aldershot Elgar 3-36
Fu Chongju (1987) Chengdu Research (Chengdu Tonglan) ChengduBashu
PublishingHouse
Ge Jianxiong and Wu Songdi (2000) Chinese Population History Vol3 (Zhongguo
RenkoushiVol3) Shanghai Fudan University Press
Ge Jinfang (2008) History of Handicraft Industry in Southern Song Dynasty (Nansong
Shougongye Shi) Shanghai Shanghai Ancient Books Publishing House
Guan Hanhui and David Li (2012) ldquoChinese Economic Growth (980-1840)rdquo Peking
University and Tsinghua University
Guo Zhengzhong (1993) Measurement of length capacity and weight from 3 to 10 century
(San Zhi Shisi Shiji Zhongguo de Quanheng Duliang) Beijing China Social Sciences
Press
Guo Zhengzhong (1997) History of Ancient Chinese Salt Industry (Zhongguo Gudai Yanye
Jingjishi) Beijing Peoplersquos Publishing House
Guo Songyi (2000) Grain production and living standards of peasants in the Ming and
Qing dynasties (Mingqing Shiqi de Liangshi Shengchan yu Nongmin Shenghuo
Shuiping) Journal of History Research Institute of Chinese Academy of Social
Sciences Vol1 373-396
Hajnal J (1965) ldquoEuropean Marriage Patterns in Perspectiverdquo in DV Glass and DEC
Eversley (eds) Population in History Essays in Historical Demography London
Edward Arnold 101-143
Hartwell Robert (1962) ldquoA Revolution in the Chinese Iron and Coal Industries During the
Northern Sung 960-1126 ADrdquo Journal of Asian Studies 21 153-162
Hartwell Robert (1966) ldquoMarkets Technology and the Structure of Enterprise in the
49
Development of the Eleventh-Century Chinese Iron and Steel Industryrdquo Journal of
Economic History 26 29-58
Hartwell Robert (1967) ldquoA Cycle of Economic Change in Imperial China Coal and Iron in
Northeast China 750-1350rdquo Journal of the Economic and Social History of the
Orient 10 102-159
Ho Ping-ti (1956) Early-Ripening Rice in Chinese Historyrdquo Economic History Review 9
200-218
Ho Ping-ti (1985) ldquoNansong Zhijin Tudi Shuzi de Kaoshi he Pingjia(Nansong Zhijin Tudi
Shuzi de Kaoshi he Pingjia)rdquo China Social Sciences Press 3 125-160
Hong Huanchun (1988) Economic material of rural Suzhou in Ming and Qing dynasty
(Mingqing Suzhou Nongcun Jingji Ziliao) Nanjing Jiangsu ancient book publishing
press
Horrell Sara Jane Humphries and Martin Weale (1994) ldquoAn Input-Output Table for 1841rdquo
Economic History Review 47 545-566
Huang Miantang (2008) Collation and Annotation of Price Issues in Chinese History
(Zhongguo Lidai Wujia Wenti Kaoshu) Jinan Qilu Press
Huang Philip (1985) The Peasant Economy and Social Change in North China Stanford
CA Stanford University Press
Huang Philip (2002) ldquoDevelopment or Involution in Eighteenth-Century Britain and China
A Review of Kenneth Pomeranzrsquos The Great Divergence China Europe and the
Making of the Modern World Economyrdquo Journal of Asian Studies 61 501-538
Huang Qichen(1989) History of production of iron and steel in 14-17th century China (14-
17 Shiji Zhongguo Gangtie Shengchanshi) Cetral China ancient book
Huang Ray (2001) Fiscal and taxation in 16th Century Ming China(16 Shiji Mingdai
Zhongguo zhi Caizheng yu Shuishou) Beijing Sanlian publishing house Press
Institute of Qing History in Renmin University (1983) Mining Industry in Qing Dynasty
(Qingdai de Kuangye) Beijing Zhonghua publishing house Press
Kato Shige (2006) Research in Gold and Silver in Tang and Song Dynasty (Tangsong
Shidai Jinyin zhi Yanjiu) Beijing Zhonghua Book Company
Kong Lingren (1981) Selective Archives of Kongfu in Qufu (Qufu Kongfu Dangan Ziliao
Xuanbian) Qilu Publising House
Li Bozhong (1998) Agricultural Development in Jiangnan 1620-1850 New York St
Martinrsquos Press
Li Bozhong (2010) Economy in Early Morden China the GDP of Huating-Lou in 1820 (Zhognguo de Zaoqi Jindai Jingji ndash1820yr HuatingndashLouxian Diqu GDP Yanjiu)
Beijing Zhonghua Book Company
Li Bozhong and van Zanden Jan Luiten (2012) ldquoBefore the Great Divergence Comparing
the Yangzi Delta and the Netherlands at the Beginning of the Nineteenth Centuryrdquo
Journal of Economic History 72 956-989
Li Fuming (2005) Institution Moral Principles and Economic Growth Social and
Economic Research in Shanghai during 1500-1840 (Zhidu Lunli yu Jingji Fazhan
Mingqing Shanghai Diqu Shehui Jingji Yanjiu 1500-1840) Beijing Wenshi Press
Li Hongqi (1988) ldquoOfficial Statistics in Song Dynastyrdquo (Songdai Guanyuan Shu de Tongji)
Songshi yanjiu ji 18 78-103
Li Huarui (1991) ldquoDiscussion about Prices and Profits of Liquor (Shilun Songdai Jiujia yu
Jiu de Lirun)rdquoResearches In Chinese Economic History 3
Li Huarui (2001) Production and Taxation of Liquor in the Song Dynasty (Songdai Jiu de
Shengchan he Zhengque) Baoding Hebei University Press
Li Jingshou (2005) Research in Song Dynastyrsquos Commercial Tax (Songdai Shangshui Wenti
Yanjiu) Kunming Yunnan University Press
50
Li Longqian (1979) ldquoSeeds of Capitalism in Guangdongrsquos Mining and Smelting Industry in
the Early Qing Dynasty (Qingdai Qianqi Guangdong Caikuang Yezhuye zhong de
Ziben Zhuyi Mengya)rdquo Academic Research 5
Liang Fangzhong (1980) Statistics of Households Land and Feudal Land Tax in Ancient
China (Zhongguo Lidai Hukou Tiandi Tianfu Tongj) Shanghai Shanghai Renmin
Press
Liang Miaotai (1991) Research on the Urban Economy in Jingdezhen during the Ming and
Qing Dynasties (Mingqing Jingdezhen Chengshi Jingji Yanjiu) Jiangxi Peoplersquos
Publishing House
Liang Taiji and Bao Weimin (2008) Songshi Shihuo Zhi Buzheng Beijing Zhonghua Book
Company
Liu Guanglin ldquoLong-term Changes in Prices Wages and the Size of the Monetary Economy
in Pre-industrial China 1000-1770rdquo Working Paper
Liu Paul K C and Kuo-shu Hwang (1979) ldquoPopulation Change and Economic
Development in Mainland China since 1400rdquo in Chi-ming Hou and Tzongs-hian Yu
(eds) Modern Chinese Economic History Taipei Academia Sinica 61-90
Liu Qiugen (1995) History of Pawn Industry in China (Zhongguo Diandang Zhidushi)
Shanghai Shanghai Guji Publishing House
Liu Ruizhong (1986) ldquoEstimation of Chinese GDP Per Capita and Comparison to United
Kingdom in 1700s (18 Shiji Zhongguo Renjun Guomin Shouru Guji Jiqi yu Yingguo
de Bijiao)rdquo Researches In Chinese Economic History 3 105-120
Liu Sen (1993) ldquoIron Coins and the Production of Iron in the Song Dynasty (Songdai de
Tieqian yu Tiechanliang)rdquo Researches in Chinese Economic History 2 86-90
Liu Ta-chung and Yeh Kung-chia (1965) The Economy of the Chinese Mainland National
Income and Economic Development 1933-1959 Princeton Princeton University
Press
Luo Yi (1999) Population and Economic Growth in the 18th Century (18th Shiji Zhongguo
de Renkou yu Jingji Zengchang) Doctoral Dissertation in School of Economics
Peking University
Maddison Angus (1998) Chinese Economic Performance in the Long Run Beijing Xinhua
Press
Maddison Angus (2001) The World Economy A Millennial Perspective Paris Organisation
for Economic Co-operation and Development
Maddison Angus (2010) ldquoStatistics on World Population GDP and Per Capita GDP 1-2008
ADrdquo Groningen Growth and Development Centre
httpwwwggdcnetMADDISONoriindexhtm
Malanima Paolo (2011) ldquoThe Long Decline of a Leading Economy GDP in Central and
Northern Italy 1300-1913rdquo European Review of Economic History 15 169-219 McEvedy Colin and Richard Jones (eds) (1978) Atlas of World Population History
Harmondsworth Penguin
Mitchell Brian R (1988) British Historical Statistics Cambridge Cambridge University
Press
Needham Joseph (1954) Science and Civilization in China Volume1 Cambridge
Cambridge University Press
Peng Xinwei (1965) Chinese Monetary History (Zhongguo Huobishi) Shanghai Shanghai
People Press
Peng Zeyi(1962)Historical materials of handicrafts development in modern time (Zhongguo
Jindai Shougongyeshi Ziliao) Beijing Sanlianpublishing house
Perkins Dwight H (1969) Agricultural Development in China 1368-1968 Chicago Aldine
Pomeranz Kenneth (2000) The Great Divergence China Europe and the Making of the
51
Modern World Economy Princeton Princeton University Press
Pomeranz Kenneth (2011) ldquoTen Years After Responses and Reconsiderationsrdquo Historically
Speaking 12(4) 20-25 Project Muse
httpsmusejhueduloginauth=0amptype=summaryampurl=journalshistorically_speaki
ngv012124coclanishtml
Robson R (1957) The Cotton Industry in Britain London Macmillan
Qi Xia (2009) History of the Economy in the Song Dynasty (Songdai Jingjishi) Beijing
Zhonghua Book Company
Quan Hansheng (1991) Researches in Chinese Economic History (Zhongguo Jingjishi
Yanjiu) Taipei The New Asia Institute of Advanced Chinese Studies
Sakuma Shigeo(1999) Research on history of porcelain production of Jingde town
(Jingdezhen Yaoyeshi Yanjiu) Tokyo First Publishing house
Shi Zhihong (1994) Small Peasant Economy in Early Qing Dynasty (Qingdai Qianqi de
Xiaonong Jingji) China Social Sciences Press
Shi Zhihong (2001) ldquoRe-estimation of Cultivated Land in China during Early 19th Century
(19 Shiji Shangbanqi de Zhongguo Gengdi Mianji Zaiguji) rdquo Researches in Chinese
Economic History 4 85-97
Shi Zhihong and Yi Xu (2008) Public Finance in Late Qing Dynasty 1851-1894(Wanqing
Caizheng 1851-1894 )Shangahai Shanghai University of Finance and Economics Press
Song Xi (1958) ldquoGeographic distribution of rice production in the Northern Song dynastyrdquo(Beisong
Daomi de Chanliang Fenbu) symposium of research about Song HistoryTaipeiCommittee
of Editor of Chinese books series (National compiling library ) 131-175 Song Yingxing (1954) Tiangong Kaiwu Vol10-11 Shanghai The Commercial Press
Su Jilang (1997) A Spatial Model of the Porcelain Export Industry in South Fujian and
Guangdong a Comparative Analysis (Liangsong Minnan Guangdong Waimaoci
Chanye de Kongjian MoshiYige Bijiao Fenxi) in Chuang Yanhui (ed) Essays on the
History of Ocean Development in China Vol6 Academia Sinica Institute of
Zhongshan Humanity and Social Science Research
Sun Hongsheng (2001) ldquoTea Economy of Tang and Song Dynastyrdquo(Tangsong Chaye Jingji)
Beijing Social Science Literature Press
Tan Wenxi (1994) History of Price in China (Zhongguo Wujiashi) Wuhan Hubei Peoplersquos
publishing House
Tu Guangshao (1984) The Surplus of National Income in China 1931-1936 (Zhongguo
Guomin Shouru de Jiexu1931-1936)Masterrsquos Thesis in School of Economics
Peking University
UK Board of Trade (1903) Report on Wholesale and Retail Prices in the United Kingdom in
1902 with Comparative Statistical Tables for a series of Years (HC321) British
Parliamentary Papers LXVIII
van Zanden Jan Luiten and Bas van Leeuwen (2012) ldquoPersistent but not Consistent The
Growth of National Income in Holland 1347-1807rdquo Explorations in Economic
History 49 119-130
von Glahn Richard (1996) Fountain of Fortune Money and Monetary Policy in China
1000-1700 Berkeley University of California Press
Walker James T (2012) ldquoNational Income in Domesday Englandrdquo University of Reading
Wang Lingling (2005) Research in Mining Industry in Song Dynasty (Songdai Kuangyeye
Yanjiu) Baoding Hebei University Press
Wang Shengduo (1995) Fiscal History in Song Dynasty (Liangsong Caizhengshi) Beijing
Zhonghua Book Press
Wang Shengduo (1995) Monetary History in Song Dynasty (Liangsong Huobishi) Beijing
China Social Sciences Press
52
Wang Wencheng (2001) Studies on Silver Monetization in Song Dynasty (Songdai Baiyin
Huobihua Yanjiu) Kunming Yunnan University Press
Wang Wenshu (2008) Research on usurious loans in Song dynasty (Songdai Jiedaiye
Yanjiu) unpublished dissertation Hebei University China
Wang Yeh-chien (2003) Essays on economic history of Qing dynasty (Qingdai Jingjishi
Lunwenji) Taipei Daoxiang Press
Wang Yuquan(2007) General History of Chinese Economy Qing Dynasty (Zhongguo Jingji
Tongshi Mingdai Jingjijuan) Beijing China Social Sciences Press
Wang Zengyu (1983) Research on military institution of Song dynasty (Songchao Bingzhi
Chutan) Beijing Zhonghua publishing house
Wei Huaxian (2006) Production and Consumption of Four Products in the Song Dynasty
(Songdai Silei Wupin de Shengchan he Xiaofei Yanjiu) Chengdu Sichuan Science amp
Technology Press
Wittfogel Karl August (1957) Oriental Despotism A Comparative Study of Total Power
New Haven Yale University Press
Wong Roy Bin (1997) China Transformed Historical Change and the Limits of European
Experience Ithaca Cornell University Press
Wu Baosan and Wang Yusun (1947) Chinarsquos National Income in 1933(Zhongguo Guomin
Suode 1993yr) Shanghai Zhonghua Book Press
Wu Chengluo (1984) Chinese History of Weights and Measures (Zhongguo
Dulianghengshi) Shanghai Shanghai Book Press
Wu Hui (1985) Researches of Grain Yield in Ancient China (Zhongguo Lidai Liangshi
Muchanliang Yanji) Beijing Agriculture Press
Wu Hui (1998) A estimation on commercialization rate and commercialization volume
about historical grain production ( Lishi shang Liangshi Shangpinlv Shangpinliang
Cegu) Research on Chinese Economic history Vol6pp16-31
Xu Dixin and Wu Cheng-Ming (1985) History of Capitalist Development in China The
Budding of Capitalism Vol1 (Zhongguo Ziben Zhuyi FazhanshiVol1) Beijing
Peoplersquos Publishing House
Xu Xinwu (1992) The history of cotton production in Jiangnan (Jiangnan Tubushi)
Shanghai Social Science Press
Yan Zhongping (1948) Collation and Annotation of Copper Industry in Yunnan during
Qing Dynasty (Qingdai Yunnan Tongzheng Kao) Beijing Zhonghua Book Press
Yao Xiangao (1962) Historical Data About Trade of Modern China (Zhongguo Jindai
Duiwai Maoyishi Ziliao) Beijing China Publishing House
Zhang Zhongli (1987) ldquoEstimates of Chinarsquos National Income in 1880srdquo (Zhongguo
Guomin Shengchan Zongzhi de Culue Guji in 1880s) Nankai Economic Quarterly 1
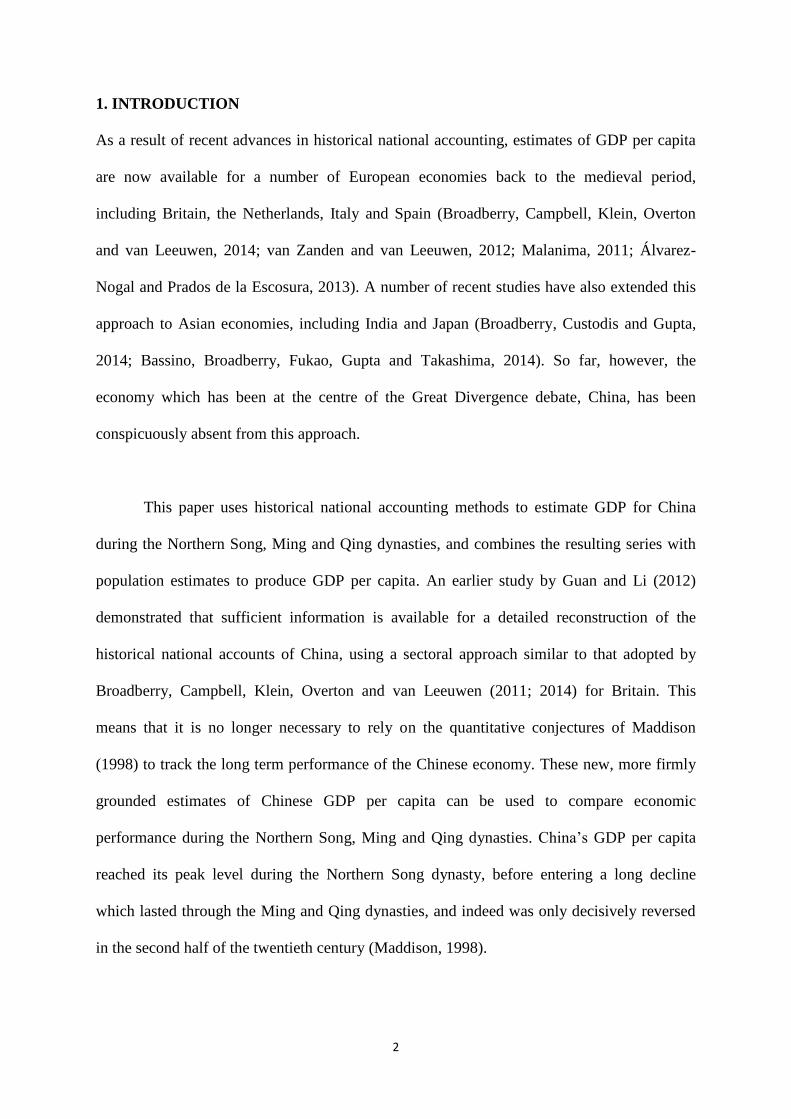
2
1 INTRODUCTION
As a result of recent advances in historical national accounting estimates of GDP per capita
are now available for a number of European economies back to the medieval period
including Britain the Netherlands Italy and Spain (Broadberry Campbell Klein Overton
and van Leeuwen 2014 van Zanden and van Leeuwen 2012 Malanima 2011 Aacutelvarez-
Nogal and Prados de la Escosura 2013) A number of recent studies have also extended this
approach to Asian economies including India and Japan (Broadberry Custodis and Gupta
2014 Bassino Broadberry Fukao Gupta and Takashima 2014) So far however the
economy which has been at the centre of the Great Divergence debate China has been
conspicuously absent from this approach
This paper uses historical national accounting methods to estimate GDP for China
during the Northern Song Ming and Qing dynasties and combines the resulting series with
population estimates to produce GDP per capita An earlier study by Guan and Li (2012)
demonstrated that sufficient information is available for a detailed reconstruction of the
historical national accounts of China using a sectoral approach similar to that adopted by
Broadberry Campbell Klein Overton and van Leeuwen (2011 2014) for Britain This
means that it is no longer necessary to rely on the quantitative conjectures of Maddison
(1998) to track the long term performance of the Chinese economy These new more firmly
grounded estimates of Chinese GDP per capita can be used to compare economic
performance during the Northern Song Ming and Qing dynasties Chinarsquos GDP per capita
reached its peak level during the Northern Song dynasty before entering a long decline
which lasted through the Ming and Qing dynasties and indeed was only decisively reversed
in the second half of the twentieth century (Maddison 1998)
3
The results also shed new light on the timing of the Great Divergence Northern Song
China was richer than Domesday Britain in 1090 but by 1400 Britain was already ahead and
China was certainly poorer than Italy by 1300 By the early Ming dynasty Chinarsquos per capita
GDP had fallen to around 90 per cent of the British level and by the mid-nineteenth century
to around 20 per cent Even allowing for regional variation within China it is clear that the
Great Divergence between China and Western Europe was already well under way during the
eighteenth century before the start of the Industrial Revolution
The paper proceeds as follows Section 2 provides a general overview of data sources
while sections 3 to 6 discuss the derivation of the population and output estimates in the
agricultural industrial and service sectors Section 7 aggregates the sectoral estimates to
produce nominal and real GDP and combines the real GDP estimates with population to
derive real GDP per capita A preliminary assessment of Chinese economic performance is
made in this section by comparing the three dynasties Section 8 then places this performance
in an international perspective by comparing GDP per capita in China with other economies
to shed light on the origins of the Great Divergence Section 9 concludes while an appendix
provides more detailed information on data sources and methods
2 DATA SOURCES
This study draws on a large Chinese historical literature that is based in turn on a solid
foundation of quantitative data collected by the Northern Song Ming and Qing dynasties
China has a long tradition of recording history for the purpose of providing experience and
lessons in national governance for future dynasties To achieve this governments usually
established a special institution with responsibility for compiling and recording laws and
policy and these institutions collected important economic data In addition to this official
4
historical literature there are two additional types of material that have been drawn on in the
estimates provided below a private historical literature and regional gazetteers
The official historical literature includes Shihuo Zhi for each dynasty Shilu and
huidian for the Ming and Qing dynasties and Huiyao for the Northern Song dynasty In a
country with a highly centralised authority local governments had to report information to
the central government and these sources contain much important economic data Shihuo Zhi
originated from the Han dynasty( 202 BC-220 AD) and in ancient Chinese Shi means
agricultural production while huo means production of subsidiary agriculture and textiles
and money circulation For each dynasty Shihuo Zhi recorded data on important areas of
economic life including land institutions households and population taxes and corvee
(unfree labour) monetary institutions salt laws metals and mining fiscal budgets and the
evolution of fiscal institutions Shihuo Zhi thus contains much data on economic activity
including the amount of arable land the total population fiscal revenue and the output of salt
and iron Another important official historical source is Shilu a kind of annual commissioned
by the Emperors to record in detail on a daily basis events that happened in the royal palace
and the whole country Shilu which were generally compiled by highly regarded
contemporary scholars have been accorded high value in the historiography Huiyao and
huidian chiefly recorded laws and institutions Song Huiyao for example provides detailed
information on the legal system of the Song dynasty while Ming huidian and Da Qing
huidian provide information on the administrative laws and regulations of the Ming and Qing
dynasties
The authors of private historical works were sometimes distinguished historians of
their era For example Duanlin Ma the author of Wenxian Tongkao was a famous scholar
5
who wrote a general history of legal and political institutions from remote times to the
Northern Song Tao Li another historian living in the Song dynasty wrote the
historiographical work Xu Zizhitongjian Changbian Privately written historical works also
sometimes recorded important economic data based on the investigative research of the
authors
A gazetteer is a kind of encyclopedia of a particular province prefecture or county It
is known in Chinese as Difang Zhi which means ldquoarea recordrdquo and contains information
about the natural geography human geography and economic geography of the area
Gazetteers provide important economic data for this study particularly where an industry was
concentrated regionally Guangdong Tongzhi Chugao in the reign of the Jiajing Emperor for
example is an important source of data for the iron industry around Foshan town Guangdong
province during the later stages of the Ming dynasty Similarly data on the porcelain industry
of Jingdezhen were taken from Raozhou Fuzhi in Jiangxi Province Both these sources filled
important gaps in the official historical literature at the national level
There are both advantages and disadvantages with each of these three kinds of
historical literature The official historical literature has full national coverage and is highly
systematic but in some cases lacks credibility Since these historical records were designed
to meet the Emperorrsquos need to govern the country the writers sometimes had an incentive to
distort reality Thus for example at the beginning of the Ming dynasty the population and
land data were recorded in a book named Huangce since Emperor Hongwu wanted to know
how much tax revenue could be raised from the people Once this work had been done the
Emperor set a fixed fiscal revenue so that later data on land and population do not reflect real
developments which can only be tracked from other sources The private historical literature
6
is therefore more credible than some of the official historical literature but since it is less
complete it should be seen as complementary to the official historical literature rather than as
a substitute Gazetteers are also more credible than some of the official historical literature
but they are also less complete since they are only available at the sub-national level In
some cases it is possible to simply aggregate area level data to the national level but in other
cases it is necessary to make assumptions about the relationship between areas for which
data are available and the rest of the country
It is worth noting that although some data from the official historical literature are not
very accurate Chinese economic historians have drawn on other sources to publish adjusted
data In addition to referencing the primary sources used in the calculations this study
therefore also makes use of the findings of the pioneers of quantitative economic history in
China including Xia Qi (2009) Zhengzhong Guo (1993 1997) Xi Song (1958) Shengduo
Wang (1995) Lingling Wang (2005) Minsheng Cheng (2008) and Huarui Li (1991 2001)
on Song history and Dixin Xu and Cheng-Ming Wu (1985) Bozhong Li (1998 2010) Ping-
ti Ho (1985) Ray Huang (2001) Xinwei Peng (1965) Hansheng Quan (1991) Yeh-chien
Wang (2004) Yuquan Wang (2007) Xing Fang Junjian Jing and Jinyu Wei (2007) and
Kang Chao (1986) on Ming and Qing history
Although some series are available on an annual basis others are not In particular
although it is possible to track long run trends in grain yields there are no data on annual
fluctuations Since this was the largest sector of the Chinese economy and since grain yield
fluctuations were the key driver of annual fluctuations in GDP even in Britain where
agriculture accounted for a much smaller share of GDP a decision was taken to work towards
obtaining data every 10 years along the lines of Liu and Hwang (1979)
7
3 POPULATION
Before reconstructing GDP from the output side it will be helpful to set out trends in
population which will be needed to derive estimates of GDP per capita the key indicator of
overall economic performance in this study In China population data were systematically
recorded throughout the period covered here in connection with taxation It is generally
accepted that the officials were capable of recording the number of people accurately but that
the institutional details of the tax system at a particular time affected the incentives for the
officials to count particular groups more or less carefully landowners households and
individuals (Perkins 1969 193) Taking account of these factors has allowed historians to
narrow the range of disagreement considerably with the estimates of Liu and Hwang (1979)
commanding widespread support for the Ming and Qing dynasties (Maddison 1998
McEvedy and Jones 1978)
The population data used here are taken from Liu and Hwang (1979) for the Ming and
Qing dynasties and from Jianxiong Ge and Songdi Wu (2000) for the Northern Song dynasty
Ge and Wursquos Northern Song estimates agree broadly with the figures derived by Kent Deng
(2004 43) for the Northern Song dynasty obtained by multiplying the registered households
by a family size of 577 the long term average from years when both household and
population data are available However Ge and Wu suggest a slightly lower family size of
54
The population data are plotted on a log scale in Figure 1 and show rapid growth
during the Northern Song dynasty at an annual rate of 087 per cent Following a substantial
decline during the Mongol interlude population growth returned during the Ming dynasty
8
but at the slower rate of 032 per cent per annum Following another population decline
during the next dynastic change the annual growth rate picked up to 070 per cent during the
Qing dynasty
4 AGRICULTURAL OUTPUT
Agricultural output is estimated mainly from data on the amount of land cultivated the
distribution of different crops and the crop yields per unit of land This section provides an
overview of the sources and methods with more detail provided in Appendix A1 The
standard Chinese measure of land area is the mu which is 115th of a hectare or 16th of an
acre The livestock sector which was much smaller in China than in Europe was also
included using information on additional outputs This output-based approach is more direct
than the alternative consumption approach where agricultural demand is derived from
estimates of real agricultural consumption per person multiplied by the population
Furthermore Ruizhong Liu (1986) questions the reliability of the available data on
consumption per capita during the Qing dynasty which suggest very low estimates of
kilocalorie consumption per capita
Agriculture is first divided up into a number of different sectors covering grain crops
cash crops and subsidiary agricultural outputs For grain crops the starting point for the
estimation of output is the cultivated land area which is derived ultimately from the official
data but also draws upon information obtained from gazetteers and private histories
Although it should clearly be borne in mind that land data were kept primarily for tax
purposes and that people like to avoid taxes biases arising from this are unlikely to be too
large because land is difficult to hide from officials and people need to register their interest
to retain ownership rights (Perkins 1969 217) A more serious worry concerns the lack of a
9
standard measure for the mu which varied between regions and over time although much
effort has been devoted to documenting this (Perkins 1969 218-221)
Figure 2 plots on a log scale the cultivated land area for the Northern Song Ming and
Qing dynasties while Figure 3 plots the same data on a per capita basis As will become clear
later cultivated land per capita plays an important role in determining overall living
standards since agriculture was the largest sector of the economy Although the cultivated
land area grew substantially over time albeit with a major decline between the Northern
Song and Ming dynasties and a smaller decline between the Ming and Qing dynasties it did
not keep pace with the growth of population so that cultivated land per capita declined over
time from a peak of around 9 mu during the Northern Song dynasty to just 3 mu by the late
Qing period The decline during the eighteenth century is broadly consistent with Huangrsquos
(1985 2002) process of involution and would be hard to square with the positive assessment
of Chinese development until the nineteenth century offered by California School writers
such as Pomeranz (2000) and Wong (1997)
The distribution of the cultivated land area between crops is also available from
official sources and the shares of important crops in benchmark years are shown in Table 1
For the Northern Song dynasty Xia Qi (2009) and Hui Wu (1985) suggest that 64 of the
cultivated land area devoted to grain production was in southern China used for growing
rice with the other 36 in north China used for growing wheat They also suggest that 6 of
the cultivated area was used for growing cash crops rather than grain For the Ming dynasty
the breakdown between grain crops was 544 for rice and 456 for wheat (Songyi Guo
2000) Yi Luo (1999) provides an assessment of the Qing crop distribution data against the
detailed crop breakdown for 1914-1918 from Perkins (1969) and the 1952 data from the
10
Statistical Yearbook of China Rice and wheat accounted for 56 per cent of the cultivated area
in 1700 declining to 47 per cent by 1850 with corn potatoes and cash crops all increasing
their shares significantly
Grain yield data are also taken from official sources As noted earlier there are
difficulties of interpretation associated with the variation in the size of a mu over both space
and time but painstaking work by historians to deal with this problem has produced a
consensus that grain yields increased over time (Xia Qi 1999 Yi Luo 1999 Perkins 1969)
However this increase in grain yields was not sufficient to offset the decline in cultivated
land per capita During the Northern Song wheat yields were stable at 210 jin per mu while
husked rice yields increased from 195 to 230 jin per mu (corresponding to an increase in
unhusked rice yields from 390 to 460 jin per mu) with the introduction of high yielding
champa rice (Ping-ti Ho 1956) Average grain yields for wheat and husked rice rose during
the Ming dynasty from 220 jin per mu in 1402 to 256 jin per mu by 1626 and during the
Qing dynasty from 230 jin per mu in 1685 to 295 jin per mu in 1850
Quantities of grain crops are obtained by multiplying grain yields with cultivated
areas to yield the volume of gross output These gross outputs are then multiplied by prices
obtained from the work of modern economic historians including Xia Qi (2009) for the
Northern Song dynasty and Xinwei Peng (1965) for the Ming and Qing dynasties To derive
the value of net output it is necessary to subtract the value of agricultural inputs such as seed
and fertiliser which was assumed to account for 15 per cent of gross output following Xing
Fang (1996) and Yi Luo (1999) It should be noted that since the share of value added was
held constant throughout the period this adjustment does not affect the trend of agricultural
output
11
A number of cash crops including cotton soyabeans rape peanuts tobacco sugar
cane sugar beet and hemp occupied cultivated land The share of cultivated land occupied
by cash crops derived from official sources rose from 6 per cent during the Northern Song
dynasty to 8 per cent during the Qing dynasty with the intermediate level of 765 per cent
during the Ming dynasty being derived as a weighted average of 7 per cent in the northern
dry farmland areas and 82 per cent in the southern paddy farmland areas The value of cash
crops per mu was set at 12 times the value of grain crops per mu following the research of
Yi Luo (1999) Other cash crops such as tea and fruit did not occupy cultivated land but
were important enough to have attracted the attention of officials so that it is possible to
reconstruct trends in output from the production side during the Northern Song and Ming
dynasties and from the consumption side during the Qing dynasty
Subsidiary agricultural output included animal husbandry fisheries and forestry
Although no data are available on the specific outputs estimates of the ratio of subsidiary
agricultural output values to the value of grain outputs are available for the twentieth century
from Perkins (1969) and Guangshao Tu (1984) The ratio in earlier periods was picked to be
consistent with the twentieth century data and a very small increase over time from 10 per
cent during the Northern Song and Ming dynasties to 12 per cent in the Qing dynasty
Figure 4 plots indices of the main categories of agricultural production The index for
grain crops is the same as the index for subsidiary agricultural outputs during the Qing
dynasty since the latter is proportional to the output of grain crops The two indices differ for
earlier periods because the proportional share changes between dynasties Although
subsidiary agricultural output increased by more than population grain output failed to keep
12
pace with population growth so that agricultural output per head declined between the
Northern Song and Qing periods
5 INDUSTRIAL OUTPUT
Industrial output is estimated from official data on quantities produced in state-run industries
quantities purchased by the government in highly regulated industries and revenue raised
from the taxation of less heavily regulated industries Information is also available from
gazetteers and private historical works particularly where an industry was regionally
concentrated Many economic historians have worked on the original data to provide cross-
checks and make up for the shortcomings of individual sources Industry is divided into four
main sectors metals and mining food processing manufacturing and building As in
agriculture the basic approach is to obtain data on the volume and value of each output In
general the gross output values are converted to a value added basis by using the ratio of
inputs to outputs from Baosan Wu and Yusun Wang (1947) throughout the period This
adjustment to a value added basis therefore does not affect the trend of real growth but rather
pins down the level of GDP in current prices In a number of cases such as rice wine and
silver however the ratio of net to gross output values is taken directly from the historical
literature of the time as detailed in Appendix A2
The metals and mining sector includes iron gold silver copper tin and lead There
have been numerous studies of the iron industry since the strong claims of Hartwell (1962)
that China produced as much as 150000 tons of iron in 1078 Many subsequent researchers
argue that Hartwell seriously overestimated iron production in the Northern Song dynasty
and the estimates used here are taken from the work of Sen Liu (1993) obtained by
aggregating the annual quantities of iron used for coining and government purchases For the
13
Ming dynasty the state-run iron industry was based mainly in Zunhua City and the output
estimates are based on the official records The private iron industry is tracked during this
period using tax revenue with the tax rate set at one-fifteenth of output For the Qing
dynasty iron industry output is based on regional data for Guangdong which became the
centre of the iron mining and metallurgical industry Longqian Li (1979) added estimates
from other provinces to the Guangdong data to estimate the total volume of iron production
Information on other metals such as gold silver copper lead and tin is derived using similar
methods from similar sources as outlined in Appendix A2 The data clearly suggest that the
output of the metals and mining sector was much lower during the Ming than during both the
Northern Song and Qing dynasties This seems to be largely the result of developments in the
state-owned sector where there was a sharp decline in both the production of weapons and
the minting of coins A famous politician and historian of the Ming dynasty Qiujun
estimates that the Ming output of the metals and mining sector was about one to two tenths of
the level of the previous dynasty (Daxue Yanyi Bu Vol 29 Shanze Zhili (profits from metals
and mining)) The private sector could not offset such a sharp decline until the Qing dynasty
when the government gave up its prohibition of private production and officials met imperial
demand by purchasing metal products in the market
Food processing is divided into four main sections covering rice wine tea-processing
sugar and other food-processing industries Rice wine output in the Northern Song dynasty is
derived by Huarui Li (2001) from the tax levy on rice wine production During the Ming and
Qing periods by contrast output is estimated from the demand side using per capita rice
wine consumption estimates for benchmark years (Xing Fang et al 2007 Anwu Sizhong
Vol 26) Value added in the tea-processing industry is assumed to be 8 per cent of the value
of the agricultural output of tea in line with the ratio estimated by Zhongli Zhang (1987)
14
Sugar output is estimated for the Qing dynasty from provincial data on Taiwan Guangdong
and Fujian where production was concentrated with an allowance for other areas For the
Ming and Northern Song periods value added in the sugar industry was assumed to be 50 per
cent of that of the tea-processing industry somewhat lower than the ratio of 70 per cent noted
by Zhongli Zhang (1987) for the 1880s when sugar was more widely used Other food
processing industries including grain milling and seed crushing are assumed to grow in line
with agricultural output following the approach of Broadberry Campbell Klein Overton
and van Leeuwen (2011 2014) for England
The key products covered by the manufacturing sector include salt silk cloth cotton
cloth coinage paper porcelain transport equipment and other manufacturing industries
Salt output is taken from the study by Zhengzhong Guo (1997) who collected salt production
data on a regional basis and aggregated it to the national level Silk cloth output is derived
from output data for the industry which was divided between a state-managed sector and a
private sector Data for both sectors are taken from Jinmin Fan and Jin Wen (1993) for the
Qing period and derived from regional data for the Ming period For the Northern Song
dynasty silk output is estimated from the demand side using estimates of silk consumption
per household (Zengyu Wang 1983 Shengduo Wang 1995) After the Yuan dynasty cotton
cloth replaced hemp fabric amongst the lower classes so that cotton textiles became an
important handicraft sector in the Ming and Qing dynasties Output is estimated from the
amount of labour engaged in cotton production work time per labourer and labour
productivity (Xinwu Xu 1992) The coinage industry was significant during the Northern
Song dynasty but negligible in the Ming and Qing dynasties Historical sources suggest that
value added in the coinage industry was 40 per cent of the value of the coinage in the early
Northern Song dynasty declining to 30 per cent by the later stages (Xiaochu Ji Vol 17
15
Wenxian Tongkao Qianbi Kao) The output of the paper industry is estimated during the
Northern Song dynasty by aggregating the amount of paper transported from different regions
to the central government For later periods it is assumed to maintain the same share of
manufacturing output as in the 1880s (ie to grow at the same rate as manufacturing as a
whole) This is equivalent to the standard procedure in economic history of constructing an
industrial production index form a weighted sample of industries Porcelain output during the
Northern Song dynasty is based on the work of Jilang Su (1997) who estimated profits and
costs of porcelain production in South Fujian and Guangdong province which accounted for
half of total production in China For the Ming dynasty porcelain production is estimated
separately for the government and private sectors while for the Qing period estimates for
Jingdezhen are available from Miaotai Liang (1991) Transport equipment and other
manufacturing (fur products metalware furniture clothing stationery and decorations) are
assumed to have grown at the same rate as manufacturing as a whole This is the same
assumption as made for paper during the Ming and Qing dynasties so that these industries
are included in the level of value added but do not distort the rate of growth
Building is assumed to grow in line with population but with an allowance for
urbanization This follows the procedure of Broadberry Campbell Klein Overton and van
Leeuwen (2011 2014) in the estimation of English economic growth 1270-1700 The
population and urbanization data are taken from Jianxiong Ge and Songdi Wu (2005) for the
Northern Song dynasty and from Shuji Cao (2005) for the Ming and Qing dynasties
Indices of industrial production for the four main sectors are plotted in Figure 5
Manufacturing food processing and building all grew rapidly within the Northern Song
Ming and Qing dynasties but with some setback across the dynastic changes Output in
16
metals and mining followed a more volatile path with a burst of rapid growth during the mid-
Song period followed by a period of stagnation after 1078 As noted by Hartwell (1962
1966 1967) the boom was driven by iron Metals and mining remained depressed during the
Ming dynasty before picking up again during the Qing dynasty with a particularly rapid
growth phase during the eighteenth century
6 SERVICE SECTOR OUTPUT
The service sector has received much less attention from economic historians than agriculture
and industry Following Broadberry Campbell Klein Overton and van Leeuwen (2011) the
service sector is broken down into four subsectors commerce finance housing and
government The output of the commercial and financial subsectors is estimated largely from
data on marketed output and tax revenue raised from businessmen by the government For
other services output is estimated largely through tracking the number of workers and the
revenue per worker Unlike agriculture and industry where abundant data are available on
the volume of output in real terms the main measure of service sector output is derived in
current price terms In the next section the ratio of service sector nominal output to the value
of nominal output in agriculture and industry will be used to increase the real output of
agriculture and industry proportionally so as to arrive at a measure of real GDP This
implies a long run constancy in relative prices between services and commodities1
The output of the commercial sector is estimated from data on the value of
agricultural and industrial goods to be distributed It is assumed that all industrial output was
marketed and the share of agricultural output marketed is taken from Hui Wu (1987) This
1 Although there are continuous price series for many commodities price data for services are much more
sporadic However it is possible to show that house rents which formed the largest component of expenditure
on services moved closely together with the price of grain which formed the largest component of expenditure
on commodities during the Qing dynasty (Huanchun Hong 1988) The more limited house rent data from the
Northern Song dynasty are also consistent with this pattern (Minsheng Cheng 2008)
17
series of gross marketed output is projected back from an 1840 benchmark estimate of GDP
in commerce derived using Zhongli Zhangrsquos (1987) estimate of the ratio of GDP in
commerce to GDP in agriculture and industry during the late Qing dynasty The size of the
financial sector during the Qing dynasty is estimated from data on pawn shops benchmarked
on the share of finance in services during the 1880s calculated by Zhongli Zhang (1987) The
ratio from the 1880s is assumed to hold throughout the Ming and Northern Song dynasties
Following Broadberry Campbell Klein Overton and van Leeuwen (2011) it is assumed that
housing and domestic service grew in line with population with an allowance for
urbanisation The total population is decomposed into rural and urban population according
to the urbanisation rate and divided by the average family size to determine the numbers of
households The number of households is then multiplied by the average rent in rural and
urban areas respectively to determine the total housing rent (Xing Fang 1996 92 Huanchun
Hong 1988 271-274 646-647)
Data on the shares of the main service sectors in total service sector output are shown
in Figure 6 The most significant long term trend was the decline in the share of government
which was offset by a growing share of commerce and housing with the share of finance
remaining stable
7 NOMINAL AND REAL GDP AND PER CAPITA REAL GDP
71 Constructing the estimates
Sections 4 to 6 have described how the net output of the agricultural industrial and service
sectors has been derived In the agricultural and industrial sectors the general approach has
been to establish the quantity of each product together with the value of net output in current
prices Aggregating across all sectors produces an estimate of nominal GDP in agriculture
18
and industry during the three dynasties The next step is to arrive at an estimate of
agricultural and industrial GDP in real terms Using 1840 as the benchmark year for all years
the quantity of each product is multiplied by the 1840 price with the same proportional
adjustment for net output as a share of gross output to arrive at net output in 1840 prices
Aggregating across all sectors produces real agricultural and industrial GDP in 1840 prices
However this approach cannot be applied to the service sector where although the
current price value of net output is available obtained from revenue data there are no data on
output volumes or unit prices of individual services The approach used here has been to take
the ratio of nominal GDP in services to nominal GDP in agriculture and industry for each
year between 980 and 1840 This ratio has then been applied to the real GDP of the
agricultural and industrial sectors to estimate aggregate real GDP As noted earlier this
implies a long run constancy in relative prices between services and commodities
Figures 7 and 8 show nominal and real GDP of the Northern Song Ming and Qing
dynasties It is also interesting to put the real GDP data from Figure 8 together with the
population data from Figure 1 to derive real GDP per capita in Figure 9 since real GDP per
capita is the most widely used indicator of the level of material living standards over the long
run
72 Comparing the Northern Song Ming and Qing dynasties
This section sheds light on the long term evolution of the Chinese economy between 980 and
1840 by comparing the growth rate of GDP and the average level of GDP per capita during
the three dynasties Although Chinarsquos territory expanded between the Northern Song and
Ming dynasties and expanded further between the Ming and Qing dynasties it is
19
nevertheless useful to compare these three dynasties First most of the newly extended
territory was sparsely populated so that it did not have a particularly large effect on the
aggregate volume of economic activity Second our main concern is with GDP per capita
which was affected even less by territorial changes The average annual growth rate of real
GDP during the Northern Song Ming and Qing dynasties was 090 035 and 058
respectively although there were also sharp falls in the level of real GDP across dynastic
changes Population outpaced real GDP over the long run so that GDP per capita trended
downwards In constant 1840 prices GDP per capita during the Northern Song dynasty
averaged 265 taels falling to 198 taels in the Ming dynasty and 142 taels in the Qing
dynasty Per capita incomes were thus around three-quarters of the average Northern Song
level during the Ming dynasty and had fallen further to just 54 per cent of the Northern Song
level during the Qing dynasty
This general pattern of economic decline since the Northern Song dynasty is broadly
consistent with much of the literature on Chinese economic performance before the recent
revisionist work of the California School The traditional view of peak Chinese performance
during the Northern Song dynasty is reflected in the work of economic historians such as
Robert Hartwell (1966) Mark Elvin (1973) and Karl August Wittfogel (1957) and can also
be seen as consistent with the view of Chinese science expressed by Joseph Needham (1954)
The very different pattern of long run Chinese economic performance proposed by California
School writers such as Kenneth Pomeranz (2000) and Bin Wong (1997) who deny any
divergence between China and the West before the nineteenth century will be examined
critically in the next section Before moving on to that however it is worth noting that there
is also some contrast with the pattern in Maddison (1998) who produced ldquoguesstimatesrdquo
20
showing per capita GDP rising from $450 in 1990 international prices to $600 during the
Northern Song dynasty before stagnating at $600 until the nineteenth century
In understanding the reasons for the higher level of GDP per capita during the
Northern Song dynasty and the subsequent decline in living standards it is important to bear
in mind the large share of agriculture in economic activity which can be seen in Figure 10
The share of agriculture in current price GDP increased from 631 in the Northern Song to
745 in the Ming before falling back slightly to 678 in the Qing dynasty when it was still
higher than during the Northern Song Given the decline in the cultivated land per capita in
Figure 3 and the failure of grain yields to rise sufficiently to offset this over time this led
inevitably to a decline in living standards over time This represents what Huang (2002) calls
a process of involution with population expansion leading to a growing division of land
holdings driving down living standards towards bare bones subsistence
8 THE GREAT DIVERGENCE
81 Comparing Britain and China
It is possible to compare the new GDP per capita estimates for China with the British
estimates from Broadberry Campbell Klein Overton and van Leeuwen (2011) However to
do so requires converting the estimates for both countries into a common currency Following
the work of Maddison (2001 2010) this is usually done in terms of 1990 international
dollars As well as presenting their series for Britain in terms of constant 1700 pounds
sterling Broadberry Campbell Klein Overton and van Leeuwen (2011) also report figures in
1990 international dollars converting Maddisonrsquos (2010) figure for 1850 from a United
Kingdom to a Great Britain basis If we can establish Chinese GDP per capita as a proportion
21
of British GDP per capita in the mid-nineteenth century we can thus arrive at a figure for
Chinese GDP per capita in 1990 international dollars
We have data for nominal GDP per capita in 1840 in both countries and prices for a
number of important commodities which can be used to convert the nominal GDP per capita
comparison to real terms Table 2 sets out the 1840 price data for seven commodities which
can be grouped into categories covering food and non-food items with the former divided
between unprocessed grain products (wheat and rice) and more processed foods (sugar tea
and salt) The non-food commodities cover textiles (cotton cloth) and metals (bar iron)
Sources are listed in the notes to the table Weights are based on Feinstein (1995) and Horrell
Humphries and Weale (1994) for Britain adapted for China to reflect the importance of rice
production Details are again given in the notes to the table Using British weights the
appropriate price ratio or purchasing power parity (PPP) in 1840 is pound1 = 211 tael while at
Chinese weights the PPP is pound1 = 196 tael Taking the geometric mean of British and Chinese
weights the Fisher index PPP is pound1 = 203 tael The nominal exchange rate in 1840 given by
the silver weight of the tael compared to the pound sterling was pound1 = 320 tael The PPP was
therefore substantially below the exchange rate as found by Allen (2009 540-543) for the
Yangzi Delta in 1820 Note however that the PPP was substantially lower for food (pound1 =
153 tael) than for non-food commodities where the PPP was close to the exchange rate (pound1
= 304 tael) This is again something which Allen (2009 541) found for the Yangzi Delta in
1820 and is explained by the possibility of arbitrage in tradable commodities Food can be
treated as effectively non-tradable because of the high cost of transporting low value but
bulky items
22
Table 3 provides an estimate of Chinese GDP per capita in 1840 benchmarked on
Great Britain Nominal GDP and population are taken directly from this study for China and
from Broadberry Campbell Klein Overton and van Leeuwen (2011) for Britain At the
silver exchange rate Chinese GDP per capita was only 1495 per cent of the British level
However allowing for the lower price level in China by using the PPP suggests that Chinese
GDP per capita was 2357 per cent of the British level Taking the 1840 level of British GDP
per capita in 1990 international dollars as $2521 from Broadberry Campbell Klein
Overton and van Leeuwen (2011) and Chinese GDP per capita in that year as 2357 per cent
of the British level suggests a figure for Chinese GDP per capita in 1990 international dollars
of $594 This is reassuringly close to the figure of $600 suggested by Maddison (2010) for
1850
Table 4 presents the GDP per capita series for both China and Britain for the long
period 980-1850 These estimates suggest that Northern Song China was substantially richer
than Britain at around the time of the Domesday Book in the late eleventh century However
per capita incomes declined in China during the later years of the Northern Song dynasty and
remained at this lower level after the Mongol Interlude With per capita incomes rising in
Britain after the Black Death of 1348 and the recurrent plague outbreaks had significantly
reduced population Britain was already ahead by the first half of the fifteenth century Per
capita incomes stagnated in both China and Britain during the Ming dynasty so that Chinarsquos
per capita income fluctuated around 90 per cent of the British level China then fell further
behind during the Qing dynasty as per capita incomes declined in China and incomes started
to increase rapidly in Britain from the mid-seventeenth century By the mid-nineteenth
century Chinese per capita GDP was just 20 per cent of the British level
23
82 The Little Divergence within Europe
So far we have compared China only with Britain However Britain was a relatively poor
part of Europe in the eleventh century and a relatively rich part by 1850 as can be seen in the
new estimates of GDP per capita presented in Table 5 Before the Black Death struck in
1348 per capita incomes were substantially higher in Italy and Spain than in England and
Holland There then followed a substantial reversal of fortunes between the North Sea Area
and Mediterranean Europe so that by 1800 per capita incomes were substantially higher in
Britain and the Netherlands than in Italy and Spain This ldquoLittle Divergencerdquo accompanied
the ldquoGreat Divergencerdquo between Europe and Asia
83 Reversals of fortune within Asia
Table 6 also suggests a reversal of fortunes within Asia Japan had very low levels of per
capita GDP until 1450 but then experienced episodic growth of the kind seen in Britain and
Holland A phase of positive growth between 1450 and 1600 was followed by a plateau
before a second phase of growth from the 1720s Japanrsquos more rapid growth after the Meiji
Restoration of 1868 which marked the first transition to modern economic growth in Asia
was therefore built on this earlier period of dynamism By contrast Chinese per capita GDP
was on a downward trajectory from its high point during the Northern Song dynasty On
these estimates Japan overtook China during the eighteenth century Like China India
experienced declining GDP per capita from the Mughal peak under Akbar circa 1600 Japan
also pulled decisively ahead of India only during the eighteenth century
84 The Great Divergence
The GDP per capita figures presented here suggest that China was richer than Britain in 1090
However they also suggest that China was certainly poorer than Italy by 1300 During the
24
Ming dynasty Chinese GDP per capita declined so that by the early seventeenth century
despite still being the richest Asian country China had already fallen substantially behind the
leading West European economies in the North Sea Area However we need to be careful
here since a smaller region of China such as the Yangzi Delta may still have been on a par
with Italy in 1500 This would only require per capita incomes in the Yangzi Delta to have
been around 54 per cent higher than in China as a whole which is broadly consistent with the
scale of regional differences within China during the nineteenth century (Li and van Zanden
2012)
But with the rise of Holland during its Golden Age 1570-1650 and Great Britain
from the mid-seventeenth century there can be little doubt that the Great Divergence was
already well underway during the early modern period By this stage the discrepancy
between the aggregate per capita income levels for China and the leading North Sea Area
economies were too large to be bridged by regional variation within China It is worth noting
that Pomeranz (2011) now accepts that his earlier claim of China on a par with Europe as late
as 1800 was exaggerated and he now settles for the earlier date of 1700
9 CONCLUDING COMMENTS
This paper provides estimates of Chinese GDP and relative standing in the world constructed
from the output side between 980 and 1840 covering the Northern Song Ming and Qing
dynasties These GDP estimates are combined with population data to track the path of
average living standards Chinarsquos GDP per capita reached its peak level during the Northern
Song dynasty before entering a long decline which lasted through the Ming and Qing
dynasties Per capita incomes were around three-quarters of the average Northern Song level
25
during the Ming dynasty and had fallen further to just 54 per cent of Northern Song level
during the Qing dynasty
From an international perspective Northern Song China was substantially richer than
Domesday Britain in 1090 but by 1400 Britain had overtaken China During the Ming
dynasty Chinarsquos per capita income fluctuated around 90 per cent of the British level During
the Qing dynasty as per capita incomes declined further in China and incomes started to
increase rapidly in Britain from the mid-seventeenth century China fell increasingly behind
By the mid-nineteenth century Chinarsquos GDP per capita was around 20 per cent of the British
level Although China led the world in living standard during the Northern Song dynasty
China had fallen behind Italy by 1300 At this point however and even until the seventeenth
century it is quite possible that a relatively rich Chinese region such as the Yangzi Delta was
on a par with the most developed parts of Europe But Chinese GDP per capita declined at the
beginning of the Ming dynasty and then stagnated so that by the beginning of the eighteenth
century the gap between China and the most developed parts of Europe was too large to be
bridged by regional variation within China Since China was still the richest Asian country at
this time it is therefore likely that Western Europe was ahead of Asia not just by the
nineteenth century but already by the eighteenth century
26
FIGURE 1 Chinese population during the Northern Song Ming and Qing dynasties
(millions log scale)
Sources Jianxong Ge and Songdi Wu (2005) Liu and Hwang (1979)
27
FIGURE 2 Cultivated land of the Northern Song Ming and Qing dynasties (million mu
log scale)
Sources See Appendix A1 for a detailed discussion of sources and methods
FIGURE 3 Cultivated land per capita of the Northern Song Ming and Qing dynasties
(mu log scale)
Sources See Appendix A1 for a detailed discussion of sources and methods
28
TABLE 1Shares of important crops
1000 1400 1700 1750 1800 1850
Rice 600 502 330 310 290 270
Wheat 230 220 210 200
Barley 70 72 73 72
Millet 80 82 84 82
Corn 00 12 23 35
Potatoes 05 05 08 12
Sorghum 81 83 84 83
Other crops 340 421 94 97 98 96
Cash crops 60 77 110 120 130 150
Total 1000 1000 1000 1000 1000 1000
Sources Hui Wu (1985) Songyi Guo (2000) Yi Luo (1999)
FIGURE 4 Indices of agricultural output (1840=100)
Sources and notes See Appendix A1 for a detailed discussion of sources and methods The
index of grain crops is the same as subsidiary agriculture during the Qing dynasty since
subsidiary agricultural output is assumed proportional to the output of grain crops
29
FIGURE 5 Indices of industrial output (1840=100)
Sources See Appendix A2
FIGURE 6 Subsectoral shares of service sector output
Sources See Appendix A3
30
FIGURE 7 Nominal GDP of the Northern Song Ming and Qing dynasties (million
silver taels log scale)
Sources See Appendices A1 to A3
FIGURE 8 Real GDP of the Northern Song Ming and Qing dynasties (million 1840
taels log scale)
Sources See Appendices A1 to A3
31
FIGURE 9 Real GDP per capita of the Northern Song Ming and Qing dynasties
(1990 international dollars log scale)
Sources See Appendices A1 to A3
FIGURE 10 Agriculturersquos share of GDP during the Northern Song Ming and Qing
dynasties
See Appendix A1
32
TABLE 2 A ChinaGB PPP for 1840
China
taellb
GB
pound per lb
PPP
Tael per pound
Chinese
weights
British
weights
Rice 001407 002500 056 0201 0000
Wheat 000900 000691 130 0134 0335
Sugar 004900 002191 224 0134 0134
Tea 009347 013021 072 0134 0134
Salt 000544 000134 407 0067 0067
Cotton cloth 004195 000402 183 0284 0284
Iron 020690 011301 1044 0046 0046
FOOD 153
OTHER 304
TOTAL 203
Sources and notes
GB
Rice Beveridge (1939 433) The figure of 6s per 12 lb from the Lord Stewardrsquos Department
actually refers to 1830
Wheat UK Board of Trade (1903 70) The figure of 66s 4d per imperial quarter is taken
originally from the London Gazette
Sugar UK Board of Trade (1903 162) The average price per cwt unrefined sugar exclusive
of duty
Tea UK Board of Trade (1903 177) Average price per lb in bond
Salt UK Board of Trade (1903 188) Data originally from Greenwich Hospital
Iron Mitchell (1988 762) English merchant bar iron at Liverpool
Cotton cloth Mitchell (1988 761) Average value of cotton piece goods exported converted
from yards to lb using 1840 ratio from Robson (1957 331)
Weights Based on Feinstein (1995) for the mid-nineteenth century Food and non-food items
have weights of 067 and 033 respectively For the breakdown within food Feinstein (1995)
suggests that grain based products (wheat flour and bread) accounted for around half of
expenditure on food Thus wheat is given a weight of 0335 and rice which was prohibitively
expensive has a weight of zero The remaining expenditure on food has been allocated across
sugar tea and salt with equal weights for sugar and tea and a smaller weight for salt again
broadly consistent with budget studies Within non-food the breakdown between cotton and
iron is in proportion to the value added in these two industries from Horrell et al (1994)
China
Rice Xinwei Peng (1965 850)
Wheat Zheng Guangzu (1990)
Sugar Fu Chongju (1987)
Tea Xiangao Yao (1962 vol 1 582) based on export prices
Salt Qingshi Gao Shihuozhi Yanfa
Iron Kong (1981 509 527) wrought iron
Cotton cloth Xiangao Yao (1962 vol 1 557 616) based on export prices
Weights The weights are the same as for Britain apart from an allowance within food for
rice based on the late-Qing ratio between wheat and rice production (3020) Within non-
food the breakdown between cotton and iron is broadly consistent with the late-Qing shares
of value added in textiles and metals production
33
TABLE 3 A benchmark estimate of ChinaGB GDP per capita in 1840
China
Nominal GDP (million tael) 5337
Population (million) 412
GDP per capita (tael) 1295
England
Nominal GDP (pound million) 49630
Population (million) 18332
GDP per capita (pound) 2707
Exchange rates
Silver exchange rate (tael per pound) 320
PPP (tael per pound) 203
Comparative ChinaGB GDP per capita ()
At silver exchange rate 1495
At PPP 2357
GDP in 1990 international dollars
GB 2521
China 594
Sources and notes Nominal GDP and population from Figures 1 and 7 for China and from
Broadberry Campbell Klein Overton and van Leeuwen (2011) for Britain Silver exchange
rate derived from the silver weight of the tael and pound sterling from van Glahn (1996 133)
and Craig (1953) respectively PPP from Table 2 GDP for Britain in 1990 international
dollars from Broadberry Campbell Klein Overton and van Leeuwen (2011)
34
TABLE 4 GDP per capita levels in China and Britain (1990 international dollars)
China
($1990)
GB
($1990)
ChinaGB
(GB=100)
980 1247
1020 1518
1050 1458
1090 1204 754 1597
1120 1063
1270 759
1300 755
1400 960 1090 881
1450 983 1055 932
1500 1127 1114 1012
1570 968 1143 847
1600 977 1123 870
1650 1110
1700 841 1563 538
1750 685 1710 401
1800 597 2080 287
1840 594 2521 236
1850 594 2997 198
Sources and notes GB Broadberry Campbell Klein Overton and van Leeuwen (2011)
Walker (2012) China Figure 9
35
TABLE 5 GDP per capita levels in Europe (1990 international dollars)
England
GB
Holland
NL
Italy Spain
1270 759 957
1300 755 1482 957
1348 777 876 1376 1030
1400 1090 1245 1601 885
1450 1055 1432 1668 889
1500 1114 1483 1403 889
1570 1143 1783 1337 990
1600 1123 2372 1244 944
1650 1100 2171 1271 820
1700 1630 2403 1350 880
1563
1750 1710 2440 1403 910
1800 2080 2617 1244 962
1752
1820 2133 1953 1376 1087
1850 2997 2397 1350 1144
Sources and notes EnglandGreat Britain Broadberry Campbell Klein Overton and van
Leeuwen (2011) The data refer to the territory of England before 1700 and Great Britain
after 1700 HollandNetherlands van Zanden and van Leuwen (2012) The data refer to
Holland before 1800 and the Netherlands after 1800 Italy Malanima (2011) Spain Aacutelvarez-
Nogal and Prados de la Escosura (2013)
36
TABLE 6 GDP per capita levels in Europe and Asia (1990 international dollars)
England
GB
Holland
NL
Italy Japan China India
730 551
900 476
980 1247
1020 1518
1050 1458
1090 754 1204
1120 1063
1150 508
1280 679 552
1300 755 1482
1400 1090 1245 1601 960
1450 1055 1432 1668 552 983
1500 1114 1483 1403 1127
1570 1143 1783 1337 968
1600 1123 2372 1244 605 977 682
1650 1110 2171 1271 619 638
1700 1563 2403 1350 597 841 622
1750 1710 2440 1403 622 685 573
1800 2080 1752 1244 703 597 569
1850 2997 2397 1350 777 594 556
Sources GB Broadberry Campbell Klein Overton and van Leeuwen (2011) Walker
(2012) HollandNetherlands van Zanden and van Leuwen (2012) Italy Malanima (2011)
China Figure 9 Japan Bassino Broadberry Fukao Gupta and Takashima (2014) India
Broadberry Custodis and Gupta (2014)
37
APPENDIX 1 DATA SOURCES AND METHODS
A1 AGRICULTURE
A11 Grain Crops
A111 Northern Song grain crops
For the amount of cultivated land we can find the official statistics of 976 997 1021 1051
1066 and 1083 from Wenxian Tongkao Tianfu kao Lidai Tianfu Zhizhi2 and Songshi Shihuo
Zhi Nongtian3 However due to the fiscal reform of ldquothe law of two kinds of taxesrdquo land tax
revenue was based on the reported amount of land As a result the actual amount of
cultivated land was under-reported for tax evasion purposes during the middle and late
periods of the Northern Song For example Xia Qi (2009) finds that the actual amount of
cultivated land was far greater than the official amount after 1051 Therefore we follow Xia
Qirsquos method to derive the actual amount of cultivated land during the middle and last stages
Grain yield per mu is available mainly from Song Huiyao Jigao Shihuo and Xu Zizhi
Tongjian Changbian Here we use the average country level estimates from Xia Qi (2009)
and Hui Wu (1985) Grain yields were generally higher in Southern China than in Northern
China while Eastern China had higher yields than Western China Looking at the entire
Northern Song period the grain yield per mu increased gradually According to the data from
Xia Qi (2009) and Hui Wu (1985) Southern China accounted for 64 of the total cultivated
land and Northern China for the remaining 36 They also estimate that 6 of total
cultivated land was occupied by cash crops rather than grain crops The yield of the cash
crops was generally higher than that of the grain crops as will be discussed in detail later
For both Southern China and Northern China the amount of cultivated land is multiplied by
the grain yield per mu to arrive at grain output for each year with separate calculations for
the two regions The regional estimates are then aggregated to arrive at annual estimates of
the grain output of China as a whole The price series of various grain crops are taken from
Xia Qi (2009) and Hansheng Quan (1991) both of whom estimate the price series of rice and
wheat and argue that the prices of other crops (such as millet and beans) are similar to the
price of wheat Using grain production multiplied by the price of the different crops produces
annual estimates of the value of grain output To derive the value of net output in the grain
producing sector it is necessary to subtract the value of agricultural inputs such as seed and
fertilizer which was set at around 15 following the research of Xing Fang (1996) and Yi
Luo (1999)
A112 Ming grain crops
The amount of cultivated land after 1400 can be derived at a 10-year frequency from the data
of Paul K C Liu and Kuo-shu Hwang (1977) and interpolated to arrive at annual estimates
Grain yield per mu is derived by Songyi Guo (2000) from a sample of land rent rate data
covering 37 southern rice areas and 8 northern wheat areas based on three different grades of
land (high middle and low)
Xinwei Peng (1965) records the price series of rice measured in silver throughout the Ming
dynasty based on a 10-year frequency Data on the price of wheat are more limited for this
period but suggest a price of around 80 of the price of rice By taking the shares of rice and
2 Examinations of the historical literature especially concerning the land tax and land tax institutions of
every dynasty 3 History of the Song Dynasty Notes on economic activities Land used by Agriculture
38
wheat in the total cultivated land area and multiplying by the price of rice and wheat
respectively it is possible to arrive at the value of gross output Net output is then derived by
subtracting around 18 of the gross value to account for agricultural inputs such as seed and
fertilizer
A113 Qing grain crops The amount of cultivated land is taken from Yi Luo (1999) for 1685 and 1700 from Zhihong
Shi (2001) for 1724 and 1850 and from Songyi Guo (2000) for 1812 Starting from the
distribution of the main crops in 1914-1918 (Perkins 1969)4 and the crop distribution data5 in
1952 Yi Luo (1999) provides estimates of the geographical distribution of many important
crops during the Qing dynasty shown in Table 1
Recent research suggests that the grain yield per mu increased gradually during the Qing
dynasty (Yi Luo 1999) Grain output is derived by multiplying these grain yields by the
cultivated land area Multiplying these estimates by the price of grain crops then yields output
values Grain crop prices during the Qing dynasty are taken from the work of Xinwei Peng
(1965) Hansheng Quan (1991) and Yeh-chien Wang (2003) for rice and from Guangzu
Zhengrsquos lsquolsquoYibanlurdquo (2003) and Yi Luo (1999) for other crops Net output is derived by
subtracting 18 of the gross value to account for agricultural inputs such as seed and
fertilizer (Yi Luo 1999)
A12 Cash Crops
A121 Northern Song cash crops Although some cash crops occupy cultivated land others do not The amount of cultivated
land occupied by cash crops was about 6 of the total cultivated land Based on research by
Yi Luo (1999) the value of cash crops per mu was about 12 times the average value of the
grain crops per mu6 The output value of the cash crops is thus obtained by multiplying the
amount of cultivated land used for cash crops by the yield per mu
Other cash crops such as tea and fruit which do not occupy cultivated land were important
agricultural products during the Northern Song There are numerous official tea purchasing
records throughout the Northern Song when tea production was strictly regulated by the
government There was also a large amount of ldquoprivate teardquo which is taken into consideration
by referencing Hongsheng Sunrsquos (1986) research Because of the big price gap between
different grades of tea the average price is used to calculate the total output value of the tea
industry following the work of Jinfang Ge (2008) and Minsheng Cheng (2008) According to
Baosan Wu and Yusan Wang (1947) the net value of tea is around 85 of the gross value
A122 Ming cash crops
4 Perkins used data from the Republic of China Agricultural Bureau of Investigation to calculate the crop
distribution in 1914-1918 5 See Statistical Yearbook of China1952 6 Ruizhong Liu (1986) estimates the value of cash crops per mu to be about 2 times the average value of
the grain crops per mu Yi Luo (1999) argues that the return from cash crops could not have been much
higher than this since when a high return cash crop was introduced in a particular area although there may
have been specific geographical factors in some cases it would typically diffuse to other areas thus
reducing the return from cash crops close to the return from grain crops within a short period of time He
argues that 12 times is more reasonable and we use this value in our calculations Philip Huang (1985)
has also researched this phenomenon
39
Northern dry farmland and southern paddy farmland accounted for 456 and 544 of the
total cultivated land area respectively The proportion of cultivated land used for cash crops
was 7 on the northern dry farmland and 82 on the southern paddy farmland so cash
crops accounted for 765 of the total cultivated land As in the Northern Song dynasty the
average value of cash crops (such as cotton soybeans rape peanut tobacco sugar cane
beet hemp maintains etc) per mu on cultivated land was about 12 times the average value
of grain crops per mu Multiplying this cash crop yield per mu by the amount of cultivated
land for cash crops yields the total value of gross output for cash crops on the cultivated land
The production of tea which did not occupy cultivated land can be constructed from the
consumption side Per capita tea consumption during the Ming dynasty was assumed to be
the average of the Northern Song and Qing dynasties and this was multiplied by population
to arrive at total consumption which was assumed to be equal to production As a result of
limited information it is not possible to calculate the value of other cash crops not occupying
cultivated land such as fruits
A123 Qing cash crops
During the Qing Dynasty the average value per mu of cash crops on cultivated land is
assumed to be 12 times the average level of grain crops and the cultivated land for cash
crops accounts for 11-15 of the total cultivated land Other cash crops that did not occupy
cultivated land including tea fruits etc were also important In particular the production of
tea increased sharply during the Qing dynasty Based on the records in Qing Shilu it is
possible to estimate the domestic consumption of tea which amounts to 15 to 18 million
Jin7 per year both before and during the middle period of the Kangxi Emperor and 25 to 34
million Jin per year from the late period of the Kangxi Emperor to the period of the
Yongzheng Emperor and climbing to 69 million Jin per year during the reigns of the
Qianlong and the Jiaqing Emperors Besides the amount of tea consumed domestically the
amount of tea produced for export can also be taken into account China exported about 40 to
50 thousand Dan 8 per year after 1760 The total production of tea each year is estimated by
adding total exports to domestic consumption The value of tea output is then obtained by
multiplying the volume of output by the price of tea with reference to the work of Wenxi Tan
(1994) and Miantang Huang (2008) Net output of tea amounted to 85 of the gross value in
1933 according to Baosan Wu and Yusan Wang (1947) Since tea was a labour intensive
crop without rapid technological progress this ratio was assumed stable from the Northern
Song to the Qing dynasty
A13 Subsidiary Agricultural Output
Subsidiary agriculture includes animal husbandry fisheries forestry and other sidelines
According to Perkins (1969) from 1914 to 1918 the output value of livestock raising9 was
equivalent to 112 of the output value of grain crops in China Guangshao Tu (1984) argues
that the output value of the subsidiary agricultural industries accounted for 196 of the
output value of grain crops in the 1930s In this paper the ratio of the value of subsidiary
agricultural outputs to the value of grain crops is assumed to be 10 during the Northern
Song and the Ming and 12 during the Qing dynasty
A2 INDUSTRIAL OUTPUT
A21 Metal and Mining Industries
7 Jin a unit of weight in ancient China 1 Jin=500 grams 8 Dan a unit of weight in ancient China 1 Dan=100 Jin 9 Not including poultry fisheries and forestry
40
A211 Northern Song metals and mining The most accessible data on the mining and metallurgical industries of ancient China are the
quantities purchased by the government called ke e(r) or tax quota Since the iron industry is
very important to the national economy there are numerous studies of the production of iron
which can be used for reference For other minerals the ke e(r) is used to calculate the output
value
Hartwell (1962) claims that the amount of iron produced in China was about 75000 to
150000 tons in 1078 Many subsequent researchers argue that Hartwell seriously
overestimated iron production Sen Liu (1993) provides alternative estimates of the output of
iron by aggregating the annual quantities of iron used for coinage and the ke e(r) with an
allowance for iron used in daily life and for making tools Sen Liursquos (1993) estimates are
used here
For other metals such as gold silver copper lead and tin the volume of output is estimated
from the ke e(r) following the research of Lingling Wang (2005) and Shengduo Wang
(1995) based on the original data from Xu Zizhi Tongjian Changbian Wenxian Tongkao
Song Huiyao Jigao Because of the governmentrsquos strict regulation of the production of copper
and tin which were used for minting in the Northern Song the gap between real output and
the ke e(r) of every year is very small but the gap for gold and silver is a little larger For the
period 1078-1125 the original data show too steep a decline because they cover only the
southern area of Northern Song China For gold silver copper lead and tin output has been
held constant after 1078 For iron Sen Liursquos (1993) data exclude Sichuan for which a
separate estimate has been made
The price series of gold and silver are taken from Shige Kato (2006) Xia Qi (2009)
Shengduo Wang (1995) and Wencheng Wang (2001) The price of iron is taken from
Lingling Wang (2005) and Minsheng Cheng (2008) while the price series of copper tin
lead vitriol and cinnabar are from Minsheng Cheng (2008) The production of the vitriol
industry can be constructed from the relevant records of Song Huiyao Shihuo Songshi
Shihuozhi Wenxian Tongkao
Since few data are available for the Northern Song coal industry the value of coal output is
estimated on the assumption that the ratio of coal output to iron output was the same during
the Northern Song as during the Ming dynasty Yinxing Song (1954) established that coal
accounted for 70 per cent of the fuel used in the Northern Song iron industry while the share
of fuel in costs is assumed to be the same as Baosan Wu and Yusun Wang (1947) found for
1933 Coal used in porcelain and salt is estimated to be one third of the level used in iron
production
A212 Ming metals and mining
Silver was used universally as currency at the beginning of the Ming dynasty but the
production data are limited The production of silver is determined from the official tax
records of the silver mining industry For the Ming dynasty the tax rate on the silver mining
industry was around 30 which was levied on the amount of silver produced The output
value of the silver mining industry during the Ming dynasty can thus be estimated from the
tax revenue of Ming Shilu
The state-run iron industry was mainly in Zunhua City and the production of the state-run
iron industry can be derived from the official records The production of the private iron
41
industry can be calculated from the tax revenue which can be found in Ming Shilu Daming
Huidian Vol194 and Guangdong Tongzhi Chugao of Jiajing Empero(Qichen Huang 1989)
For the Ming dynasty the tax rate on the iron mining industry was always 666 or 115th of
total output
Information on the production of coal during the Ming dynasty is limited In Tiangong
Kaiwu a famous encyclopedia for manufacturing and technology in ancient China Yingxing
Song mentions that 70 of the fuel used for smelting iron was coal It is therefore possible to
calculate roughly the production value of coal from the production of iron given information
on the share of fuel in total costs Other metal mining industries were small in size The tax
rate on the gold mining industry was 20 so the output value of gold can be estimated from
the tax revenue Tax data on the private copper industry and production data on the state-run
copper industry are available only infrequently but can be used to provide estimates of total
copper production in those years For other mining and metallurgical industries such as lead
and tin output is assumed to move in line with the output of copper consistent with the
situation during the Northern Song dynasty
A213 Qing metals and mining
During the Qing dynasty the government gave up the right to monopolize the mining of
minerals In some provinces there are thus gaps in the data on copper production Abundant
data exist for Yunnan province which was an important centre of copper mining and to
which estimates for other provinces are added based on more fragmentary information
Copper output data come from Zeyi Peng (1962) Since Guangdong became the centre of the
iron mining and metallurgical industry during the late Ming dynasty a similar approach can
be used to estimate the production of iron Data from Longqian Li (1979) are used to estimate
the output of iron in Guangdong to which estimates of output from other provinces are added
to get the total volume of iron production
For coal mining output is estimated from iron output together with the share of coal in the
cost of iron production using data from Yingxing Song (1954) supplemented with an
allowance for coal used in porcelain production and domestic consumption
For the Qing dynasty at least before the mid period of the Qianlong Emperor private capital
was allowed to participate in the mining and metallurgical industries of gold silver and tinbut the data series are also limited here Zhongli Zhang (1987) has estimated the output value
of those three mining and metallurgical industries in 1887 and argues that the output value of
the gold industry was 83 of the iron industry the output value of the silver industry was the
same as the copper industry and the output value of the tin industry was three times that of
the copper industry By assuming that those ratios also held during the early Qing dynasty it
is possible to derive the output value of those three industries By aggregating these data the
total output value of the mining and metallurgical industries during the Qing dynasty can be
estimated
A22 Food Processing
A221 Rice wine industry
For the Northern Song dynasty the production of wine can be calculated by the tax levy on
rice wine production Huarui Li (2001) gathers data on tax revenue from wine production in
Dongjing and Hangzhou two flourishing commercial regions in the Northern Song and uses
it to derive estimates of wine output According to this research 10000 Guan of tax revenue
translates into 8000 to 12000 Dou of wine output The output of rice wine is estimated for
42
some key years and then interpolated log-linearly to calculate the output for other years The
cost of production was about 35 of the gross output value in the wine industry (Huarui Li
1991)
For the Ming dynasty given the scarcity of data on wine production output is estimated from
the demand side Based on data from the Qing dynasty it is assumed that 10 of the
population drank rice wine approximately 250 days per year and consumed one Jin of wine
per day10 Total rice wine consumption can therefore be estimated and it is assumed that
production was roughly equal to consumption This volume information can be combined
with data on the price of wine from Miantang Huang (2008) to derive the value of wine
output during the Ming dynasty As in the Northern Song net output was assumed to be 65
of the gross value The demand approach is also used for estimating rice wine output during
the Qing dynasty
A222 Tea processing industry
According to Zhongli Zhang (1987) value-added in the tea-processing industry in the 1880s
was 8 of the value of tea output This ratio is applied throughout the Northern Song Ming
and Qing dynasties to the tea output data from the agricultural sector
A223 Sugar industry
Zhongli Zhang (1987) estimates that value-added in the sugar industry accounted for 70 of
that of the tea-processing industry in the 1880s In line with qualitative evidence of lower
sugar consumption during earlier times this ratio is set at 50 during the Northern Song and
the same assumption is used for the Ming dynasty During the Qing dynasty sugar was
produced mainly in Taiwan Guangdong and Fujian Data on output in these provinces can be
gathered and an allowance can also be made for other areas such as some parts of Guangxi
Jiangxi Jiangsu and Zhejiang provinces By aggregating this data it is possible to calculate
the output of sugar for China as a whole The price of sugar can be obtained from Miantang
Huang (2008) and Wenxi Tan (1994) and combined with the volume data to derive the value
of output during the Qing dynasty
A224 Other food processing industries
The food-processing industry also includes the milling and oil refining industries for which
few data are available Following Broadberry Campbell Klein Overton and van Leeuwen
(2011) we assume other food processing industries grew in line with agricultural output The
level of other food processing is set in relation to sugar and tea-processing during the 1880s
from Zhongli Zhang (1987)
A23 Manufacturing Industry
A231 Salt
For the Northern Song dynasty salt output is based mainly on the work of Zhengzhong Guo
(1997) who collected data on salt production in different regions and then aggregated it to
arrive at national salt output According to Xia Qi (2009) the price of salt was determined by
the government because of the salt monopoly at that time The data of Baosan Wu and Yusun
Wang (1947) suggest that the net value of salt accounted for 62 of the gross value in 1933
and this ratio is assumed to hold all the way back to the Northern Song dynasty
10 See Xing Fang et al (2007) p426or Bao Shichen (1968) Vol26
43
For the Ming dynasty although salt tax data were recorded in Ming Shilu they do not provide
reliable estimates of salt output which is estimated from the consumption side Salt
consumption per capita is assumed to be the average of the Northern Song and Qing
dynasties and is multiplied by population to arrive at total consumption which is assumed to
be equal to output Ming Shilu also recorded the price of salt measured by silver in some
years The net output of the Ming salt industry was assumed to be 62 of the gross output
The salt output of the Qing dynasty is also based on the research of Zhengzhong Guo (1997)
who collected the data of salt production in most years The price of salt from Wenxi Tan
(1994) is used to calculate the gross value and the net value of salt production amounts to
62 of the gross value
A232 Silk cloth
For the Northern Song dynasty there are no historical materials recording silk cloth
production so output must be estimated using the consumption approach First silk
consumption per household is estimated and then multiplied by the total number of
households to derive total silk consumption in the country as a whole By assuming that total
production is equal to total consumption silk cloth output can be determined on an annual
basis Since raw silk accounts for over 80 of the value of silk cloth all silk cloth prices are
determined by the price of raw silk The data of Baosan Wu and Yusun Wang (1947) suggest
that the net value of silk accounted for 40 of the gross value in 1933 and this ratio is
assumed to hold all the way back to the Northern Song dynasty
For the Ming dynasty the silk cloth industry can be divided into two subsectors the state-
managed sector and the private sector The silk cloth industry managed by the state contained
two parts central and local Silk cloth output from the central government was produced
mainly in Suzhou Songjiang Zhenjiang Hangzhou Jiaxing and Huzhou and recorded in the
official historical literature Total output was about 11000 pieces accounting for one third of
the silk cloth industry managed by the government It is difficult to find data on the privately
managed silk fabric industry which must be estimated using government-provided data on
the number of looms and silk cloth production According to Xinwei Peng (1965) the price
of raw silk can be determined for most years of the Ming dynasty Based on Baosan Wu and
Yusun Wang (1947) the net value of silk fabric was 40 of the gross value
For the Qing dynasty the silk fabric industry can also be divided into two parts the state-
managed sector and the private sector The output data for both sectors are taken from Jinmin
Fan and Wen Jin (1993) The net value of silk fabric was also 40 of the gross value
A233 Cotton cloth
After the Yuan dynasty hemp fabric was replaced by cotton cloth as the wearing of cotton
textiles spread to the lower classes Cotton textiles thus became an important handicraft
sector in the Ming and Qing dynasties Output is estimated from data on the amount of labour
engaged in cotton production work time per labourer and labour productivity or consumption
per person (Fuming Li 2005 Xinwu Xu 1992)
A234 Coinage
Coinage was regulated during the Northern Song dynasty The official unit and metal content
of coinage was Qian Mo which was also strictly regulated by the government From the
beginning of the Song dynasty to the reign of the Shenzong Emperor the government used
the same standard to mint copper coins According to historical information the GDP of the
44
coinage industry amounted to 40 of the value of the coinage in the earlier stage and 30 in
the later stage (Xiaochu Ji Vol 17 Wenxian Tongkao Qianbi Kao)
The Ming government minted a small number of copper coins and did not mint silver coins at
all It is hard to find data for the exact amount Hence the coinage industry in the Ming
dynasty can be assumed to be negligible The same is true for the Qing dynasty
A235 Paper
During the Northern Song dynasty Yuan Feng Jiu Yu Zhi Xu Zi Zhi Tong Jian Chang Pian
and Song Huiyao Jigao Shihuo recorded the amount of paper transported from different
regions to the central government These data can be aggregated to estimate paper output for
the country as a whole (Huaxian Wei 2006) Based on Minsheng Chengrsquos (2008) research
the net value of paper production was 55 of the gross value
The paper industry in the Ming dynasty was well developed with a high degree of variety
flourishing mostly in four provinces Jiangxi Fujian Zhejia and Anhui Since we lack time
series output data for paper during the Ming and Qing dynasties the most neutral way of
allowing for the paper industry is to assume that its share of manufacturing output did not
change from the share estimated by Zhongli-Zhang (1987) for the 1880s This is equivalent to
the standard procedure in economic history of constructing an index of industrial production
from a weighted sample of industries
A236 Porcelain
Porcelain output during the Northern Song dynasty is estimated on the basis of Jilang Su
(1997) who calculated the profits and costs of porcelain production in the south east region
from the numbers of kilns in South Fujian and Guangdong provinces the numbers of firings
by each kiln in every year and the numbers of porcelain products in each kiln per firing We
assume that South Fujian and Guangdong provinces accounted for two-thirds of national
output broadly in line with the share of the south eastern porcelain industry during the Ming
and Qing dynasties
For the Ming dynasty porcelain production is estimated separately for the government and
private sectors and then added together to derive total porcelain production (Miaotai Liang
1991) The data for the government-managed porcelain industry are for imperial kilns while
the data for the privately-managed porcelain industry are based on the number of private kilns
and the average production per kiln Since there are different types of porcelain the average
price has to be used (Sakuma Shigeo 1999) According to Jiangxi sheng da zhi taoshu the
cost of production is 40 of gross output which suggests that the net value of porcelain
production accounted for around 60 of the gross value of porcelain production
For the Qing dynasty the output of Jingdezhen can also be obtained from Miaotai Liang
(1991) covering the period from the Yongzheng Emperor to the Guangxi Emperor
According to Zhongli Zhang (1987) the south eastern porcelain industry centred on
Jingdezhen accounted for 70 of Chinese porcelain output The ratio of net value to gross
value in Qing China is assumed to be the same as during the Ming dynasty
A237 Transport equipment
Based on Zhongli Zhangrsquos (1987) classification the building and repairing of ships
handcarts and oxcarts is categorized under transport equipment within the manufacturing
sector The building and repairing of ships is the most important part of this industry
45
although there are less data on this in the historical materials of the Northern Song The 39
share of transport equipment in manufacturing in the 1880s from Zhongli Zhang (1987) is
assumed to be constant throughout the Northern Song Ming and Qing dynasties
A238 Other manufacturing industries
There are a number of other manufacturing industries for which no systematic production
data are available including fur products metal ware furniture clothing stationery and
jewellery For these industries the same method is used as for the transport equipment
industry The 80 share of other manufacturing to total manufacturing output in the 1880s
from Zhongli Zhang (1987) is assumed to hold throughout the Northern Song Ming and
Qing dynasties
A239 Building
Building is assumed to grow in line with population but with an allowance for urbanization
This follows the procedure of Broadberry Campbell Klein Overton and van Leeuwen
(2011) in the estimation of English economic growth 1270-1700 The population and
urbanization data are taken from Jianxong Ge and Songdi Wu (2005) for the Northern Song
dynasty and from Paul K C Liu and Kuo-shu Hwang (1979) and Shuji Cao (2005) for the
Ming and Qing dynasties
A3 SERVICE SECTOR OUTPUTS
A31 Commerce The output of the commercial sector is estimated indirectly from data on the value of
agricultural and industrial output together with information on the share of output marketed
By taking account of the urbanisation rate of different dynasties and using grain output
minus food consumption seeds and feedstuff Hui Wu (1987) has derived the
commercialisation rate of agriculture as 17 during the Northern Song 16 during the
Ming and 172 during the Qing dynasty before 1840 rising to 207 during the later Qing
after 1840 It is assumed that all industrial output was marketed This series of marketed
agricultural and industrial output is used to project back from 1840 the nominal value added
in commerce which is derived using Zhongli Zhangrsquos (1987) estimate of the ratio of GDP in
commerce to GDP in agriculture and industry for the 1880s
A32 Finance
In the early stage of the Qing dynasty (pre- 1840) finance includes three subsectors pawn
shops Qianzhuang (local banks) and Piaohao (inter-regional banks established by Shanxi
businessmen) The GDP of the financial sector consists of the personal revenue of the
professionals working in these subsectors plus the profits accruing to the capital employed
Data on the numbers of pawn shops and the capital employed can be combined with data on
interest rates to calculate the GDP generated by pawn shops during the Qing dynasty (Qiugen
Liu 1995) Although historical data are unavailable for Qianzhuang and Piaohao Zhongli
Zhang (1987) has estimated GDP for China in the 1880s in Qianzhuang and Piaohao as well
as pawn shops The ratio of the GDP of Qianzhuang and Piaohao to the GDP of pawn shops
is assumed to be the same as during the 1880s throughout the Qing dynasty Combining the
GDP of pawn shops in the early stages of the Qing dynasty with this ratio it is possible to
derive the GDP of the whole financial sector For the Northern Song and Ming dynasties no
financial data are available so the ratio of financial sector GDP to total GDP during the Qing
dynasty is assumed to hold during the other two dynasties This assumes that during the
46
Northern Song and Ming dynasties usurious loans were on a similar scale to transactions
dealt with by Qianzhuang and Piaohao during the Qing dynasty (Wenshu Wang 2008)
A33 Housing and domestic service
Following Broadberry Campbell Klein Overton and van Leeuwen (2011) it is assumed that
housing and domestic service grew in line with population with an allowance for
urbanisation The total population is decomposed into rural and urban population according
to the urbanisation rate and divided by the average family size to determine the number of
households The number of households is then multiplied by the average rent in rural and
urban areas respectively to determine the total housing rent The urbanization data are taken
from Songdi Wu (2005) for the Northern Song dynasty and from Shuji Cao (2005) for the
Ming and Qing dynasties Rent data come from Minsheng Cheng (2008) for the Northern
Song dynasty and from Xing Fang (1996) and Huanchun Hong (1988) for the Qing dynasty
No independent rent data are available for the Ming dynasty but are assumed to be the same
as during the Qing dynasty
A34 Government
Government can be separated into four parts the maintenance of the palace of the dynasty
soldiersrsquo and military officersrsquo pay officialsrsquo emoluments and pensions and the salary of
other office clerks Data for all these parts of government can be obtained from the historical
literature of each dynasty This method can be applied to all three dynasties The number of
soldiers and civil servants and their pay are taken from Hongqi Li (1988) and Shengduo
Wang (1995) for the Northern Song dynasty For the Ming dynasty data for all parts of
government can be obtained from Ming Shilu and Wanli Kuaiji Lu For the Qing dynasty
data are taken from Feng Chen (2008) and Zhihong Shi and Yi Xu (2008)
47
REFERENCES
Primary historical sources
Anwu Sizhong Vol26 (Bao Shichen) Taipei Wenhai Press Company 1968
Collation and Annotation of Mingshi Shihuo Zhi (Mingshi Shihuo Zhi Jiaozhu) (Li Xun)
Peking Zhonghua publishing house 1982
Da Ming huidian Code of the Great Ming Dynasty (Li Dongyang) YangzhouJiangsu
Guangling ancient books sculpture and printing press 1989
Daxue Yanyi Bu Vol29 (Qiujun) Shanghai Shanghai Bookstore Press 2012
Guangdong Tongzhi Chugao in the reign of the Jiajing Emperor (Jing Dai and Chuang Yue)
Beijing Shumu Wenxian Press 1996
Jiangxi sheng da zhi(Wang Zongmu)TaipeiChengwen Press1989
Ming huidian Code of the Ming Dynasty (Shen Shixing) Edited in the Wanli Emperor
Peking Book and literature publishing house 1988
Ming Shilu Beijing Photocopy of Academia Sinica Institute of History and Philology1962 Qing Shilu Peking Zhonghua Publishing House 2008
Qingshi Gao Shihuozhi Yanfa (Zhao erxun) Beijing Zhonghua publishing house 1976
Raozhou Fuzhi in Jiangxi Province (Chen Ce) Taipei Chengwen Press Company 1989
Song Huiyao Jigao (Xu Song) Peking Zhonghua publishing house 1957
Wanli Kuaiji Lu Fiscal notes on the Wanli Emperor (Chuang Xueyan) Peking book and
literature publishing house 1988
Wenxian Tongkao General Textual Research on Some Historical Literature (Ma Duanlin)
Peking Zhonghua publishing house 1986
Xiaochu Ji (Wang Yucheng) Shanghai The Commercial Press 1937
Xu Zizhi Tongjian Changbian (Li Tao) Beijing Zhonghua Book Press 1992
Yiban Lu Zheng Guangzu) Beijing Chinese Bookstore 1990
Yuan Feng Jiu Yu Zhi(Wang cun) Peking Zhonghua publishing house 1984
Secondary sources
Allen Robert (2009) ldquoAgricultural Productivity and Rural Incomes in England and the
Yangtze Delta c 1620 ndash c 1820rdquo Economic History Review 62 525-550
Aacutelvarez-Nogal Carlos and Leandro Prados de la Escosura (2013) ldquoThe Rise and Fall of
Spain 1270-1850rdquo Economic History Review 66 1-37
Bassino Jean-Pascal Stephen Broadberry Kyoji Fukao Bishnupriya Gupta and Masanori
Takashima (2014) ldquoJapan and the Great Divergence 730-1870rdquo London School of
Economics
httpwww2lseacukeconomicHistorywhosWhoprofilessbroadberryaspx
Bernhard Wolfram (1956) ldquoData on the Structure of the Chinese City in the Pre-Industrial
Periodrdquo Economic Development and Cultural Change 5 253-268
Beveridge William (1939) Prices and Wages in England from the Twelfth to the Nineteenth
Century Vol I Price Tables Mercantile Era London Longmans Green
Broadberry Stephen Bruce Campbell Alexander Klein Mark Overton and Bas van
Leeuwen (2011) ldquoBritish Economic Growth 1270-1870 An Output-Based
Approachrdquo London School of Economics
httpwww2lseacukeconomicHistorywhosWhoprofilessbroadberryaspx
Broadberry Stephen Bruce Campbell Alexander Klein Mark Overton and Bas van
Leeuwen (2014) British Economic Growth 1270-1870 Cambridge Cambridge
University Press (forthcoming)
Broadberry Stephen Johann Custodis and Bishnupriya Gupta (2014) ldquoIndia and the Great
Divergence An Anglo-Indian Comparison of GDP per capita 1600-1871rdquo
Explorations in Economic History (forthcoming)
48
Cao Shuji (2005) Chinese Population History Ming Dynasty (Zhongguo Renkoushi Vol4
Ming Dynasty) Shanghai Fudan University Press
Chao Kang (1986) Man and Land in Chinese History An Economic Analysis Stanford
Stanford University Press
Chen Feng (2008) Reserch on Fiscal Policy and Monetary Policy of Qing Dyanaty(Qingdai
Caizheng Zhengce he Huobi Zhengce Yanjiu)Wuhan Wuhan University Press
Cheng Minsheng (2008) Song Dynasty Price Research (Songdai Wujia Yanjiu) Beijing
Peoplersquos Publishing House
Crafts Nicholas and Charles K Harley (1992) ldquoOutput Growth and the Industrial
Revolution A Restatement of the Crafts-Harley Viewrdquo Economic History Review
45 703-730
Craig John (1953) The Mint A History of the London Mint from AD 287 to 1948
Cambridge Cambridge University Press
Deng Kent G (2004) ldquoUnveiling Chinarsquos True Population Statistics for the pre-Modern Era
with Official Census Datardquo Population Review 43 32-69
Elvin Mark (1973) The Pattern of the Chinese Past Stanford Stanford University Press
Fan Jinmin and Jin Wen (1993) Silk History in Jiangnan (Jiangnan Sichoushi Yanjiu)
Beijing Chinese Agriculture Press
Fang Xing (1996) ldquoThe Consumption of Farmers in Jiangnan during Qing Dynastyrdquo
(Qingdai Jiangnan Nongmin de Xiaofei) Researches in Chinese Economic Histroy 3
91-98
Fang Xing Jing Junjian and Wei Jinyu (2007) General History of Chinese Economy Qing
Dynasty Beijing China Social Sciences Press
Feinstein Charles (1995) ldquoChanges in Nominal Wages the Cost of Living and Real Wages
in the United Kingdom over Two Centuries 1780-1990rdquo in Pieter Scholliers and
Vera Zamagni (eds) Labourrsquos Reward Real Wages and Economic Change in 19th-
and 20th-Century Europe Aldershot Elgar 3-36
Fu Chongju (1987) Chengdu Research (Chengdu Tonglan) ChengduBashu
PublishingHouse
Ge Jianxiong and Wu Songdi (2000) Chinese Population History Vol3 (Zhongguo
RenkoushiVol3) Shanghai Fudan University Press
Ge Jinfang (2008) History of Handicraft Industry in Southern Song Dynasty (Nansong
Shougongye Shi) Shanghai Shanghai Ancient Books Publishing House
Guan Hanhui and David Li (2012) ldquoChinese Economic Growth (980-1840)rdquo Peking
University and Tsinghua University
Guo Zhengzhong (1993) Measurement of length capacity and weight from 3 to 10 century
(San Zhi Shisi Shiji Zhongguo de Quanheng Duliang) Beijing China Social Sciences
Press
Guo Zhengzhong (1997) History of Ancient Chinese Salt Industry (Zhongguo Gudai Yanye
Jingjishi) Beijing Peoplersquos Publishing House
Guo Songyi (2000) Grain production and living standards of peasants in the Ming and
Qing dynasties (Mingqing Shiqi de Liangshi Shengchan yu Nongmin Shenghuo
Shuiping) Journal of History Research Institute of Chinese Academy of Social
Sciences Vol1 373-396
Hajnal J (1965) ldquoEuropean Marriage Patterns in Perspectiverdquo in DV Glass and DEC
Eversley (eds) Population in History Essays in Historical Demography London
Edward Arnold 101-143
Hartwell Robert (1962) ldquoA Revolution in the Chinese Iron and Coal Industries During the
Northern Sung 960-1126 ADrdquo Journal of Asian Studies 21 153-162
Hartwell Robert (1966) ldquoMarkets Technology and the Structure of Enterprise in the
49
Development of the Eleventh-Century Chinese Iron and Steel Industryrdquo Journal of
Economic History 26 29-58
Hartwell Robert (1967) ldquoA Cycle of Economic Change in Imperial China Coal and Iron in
Northeast China 750-1350rdquo Journal of the Economic and Social History of the
Orient 10 102-159
Ho Ping-ti (1956) Early-Ripening Rice in Chinese Historyrdquo Economic History Review 9
200-218
Ho Ping-ti (1985) ldquoNansong Zhijin Tudi Shuzi de Kaoshi he Pingjia(Nansong Zhijin Tudi
Shuzi de Kaoshi he Pingjia)rdquo China Social Sciences Press 3 125-160
Hong Huanchun (1988) Economic material of rural Suzhou in Ming and Qing dynasty
(Mingqing Suzhou Nongcun Jingji Ziliao) Nanjing Jiangsu ancient book publishing
press
Horrell Sara Jane Humphries and Martin Weale (1994) ldquoAn Input-Output Table for 1841rdquo
Economic History Review 47 545-566
Huang Miantang (2008) Collation and Annotation of Price Issues in Chinese History
(Zhongguo Lidai Wujia Wenti Kaoshu) Jinan Qilu Press
Huang Philip (1985) The Peasant Economy and Social Change in North China Stanford
CA Stanford University Press
Huang Philip (2002) ldquoDevelopment or Involution in Eighteenth-Century Britain and China
A Review of Kenneth Pomeranzrsquos The Great Divergence China Europe and the
Making of the Modern World Economyrdquo Journal of Asian Studies 61 501-538
Huang Qichen(1989) History of production of iron and steel in 14-17th century China (14-
17 Shiji Zhongguo Gangtie Shengchanshi) Cetral China ancient book
Huang Ray (2001) Fiscal and taxation in 16th Century Ming China(16 Shiji Mingdai
Zhongguo zhi Caizheng yu Shuishou) Beijing Sanlian publishing house Press
Institute of Qing History in Renmin University (1983) Mining Industry in Qing Dynasty
(Qingdai de Kuangye) Beijing Zhonghua publishing house Press
Kato Shige (2006) Research in Gold and Silver in Tang and Song Dynasty (Tangsong
Shidai Jinyin zhi Yanjiu) Beijing Zhonghua Book Company
Kong Lingren (1981) Selective Archives of Kongfu in Qufu (Qufu Kongfu Dangan Ziliao
Xuanbian) Qilu Publising House
Li Bozhong (1998) Agricultural Development in Jiangnan 1620-1850 New York St
Martinrsquos Press
Li Bozhong (2010) Economy in Early Morden China the GDP of Huating-Lou in 1820 (Zhognguo de Zaoqi Jindai Jingji ndash1820yr HuatingndashLouxian Diqu GDP Yanjiu)
Beijing Zhonghua Book Company
Li Bozhong and van Zanden Jan Luiten (2012) ldquoBefore the Great Divergence Comparing
the Yangzi Delta and the Netherlands at the Beginning of the Nineteenth Centuryrdquo
Journal of Economic History 72 956-989
Li Fuming (2005) Institution Moral Principles and Economic Growth Social and
Economic Research in Shanghai during 1500-1840 (Zhidu Lunli yu Jingji Fazhan
Mingqing Shanghai Diqu Shehui Jingji Yanjiu 1500-1840) Beijing Wenshi Press
Li Hongqi (1988) ldquoOfficial Statistics in Song Dynastyrdquo (Songdai Guanyuan Shu de Tongji)
Songshi yanjiu ji 18 78-103
Li Huarui (1991) ldquoDiscussion about Prices and Profits of Liquor (Shilun Songdai Jiujia yu
Jiu de Lirun)rdquoResearches In Chinese Economic History 3
Li Huarui (2001) Production and Taxation of Liquor in the Song Dynasty (Songdai Jiu de
Shengchan he Zhengque) Baoding Hebei University Press
Li Jingshou (2005) Research in Song Dynastyrsquos Commercial Tax (Songdai Shangshui Wenti
Yanjiu) Kunming Yunnan University Press
50
Li Longqian (1979) ldquoSeeds of Capitalism in Guangdongrsquos Mining and Smelting Industry in
the Early Qing Dynasty (Qingdai Qianqi Guangdong Caikuang Yezhuye zhong de
Ziben Zhuyi Mengya)rdquo Academic Research 5
Liang Fangzhong (1980) Statistics of Households Land and Feudal Land Tax in Ancient
China (Zhongguo Lidai Hukou Tiandi Tianfu Tongj) Shanghai Shanghai Renmin
Press
Liang Miaotai (1991) Research on the Urban Economy in Jingdezhen during the Ming and
Qing Dynasties (Mingqing Jingdezhen Chengshi Jingji Yanjiu) Jiangxi Peoplersquos
Publishing House
Liang Taiji and Bao Weimin (2008) Songshi Shihuo Zhi Buzheng Beijing Zhonghua Book
Company
Liu Guanglin ldquoLong-term Changes in Prices Wages and the Size of the Monetary Economy
in Pre-industrial China 1000-1770rdquo Working Paper
Liu Paul K C and Kuo-shu Hwang (1979) ldquoPopulation Change and Economic
Development in Mainland China since 1400rdquo in Chi-ming Hou and Tzongs-hian Yu
(eds) Modern Chinese Economic History Taipei Academia Sinica 61-90
Liu Qiugen (1995) History of Pawn Industry in China (Zhongguo Diandang Zhidushi)
Shanghai Shanghai Guji Publishing House
Liu Ruizhong (1986) ldquoEstimation of Chinese GDP Per Capita and Comparison to United
Kingdom in 1700s (18 Shiji Zhongguo Renjun Guomin Shouru Guji Jiqi yu Yingguo
de Bijiao)rdquo Researches In Chinese Economic History 3 105-120
Liu Sen (1993) ldquoIron Coins and the Production of Iron in the Song Dynasty (Songdai de
Tieqian yu Tiechanliang)rdquo Researches in Chinese Economic History 2 86-90
Liu Ta-chung and Yeh Kung-chia (1965) The Economy of the Chinese Mainland National
Income and Economic Development 1933-1959 Princeton Princeton University
Press
Luo Yi (1999) Population and Economic Growth in the 18th Century (18th Shiji Zhongguo
de Renkou yu Jingji Zengchang) Doctoral Dissertation in School of Economics
Peking University
Maddison Angus (1998) Chinese Economic Performance in the Long Run Beijing Xinhua
Press
Maddison Angus (2001) The World Economy A Millennial Perspective Paris Organisation
for Economic Co-operation and Development
Maddison Angus (2010) ldquoStatistics on World Population GDP and Per Capita GDP 1-2008
ADrdquo Groningen Growth and Development Centre
httpwwwggdcnetMADDISONoriindexhtm
Malanima Paolo (2011) ldquoThe Long Decline of a Leading Economy GDP in Central and
Northern Italy 1300-1913rdquo European Review of Economic History 15 169-219 McEvedy Colin and Richard Jones (eds) (1978) Atlas of World Population History
Harmondsworth Penguin
Mitchell Brian R (1988) British Historical Statistics Cambridge Cambridge University
Press
Needham Joseph (1954) Science and Civilization in China Volume1 Cambridge
Cambridge University Press
Peng Xinwei (1965) Chinese Monetary History (Zhongguo Huobishi) Shanghai Shanghai
People Press
Peng Zeyi(1962)Historical materials of handicrafts development in modern time (Zhongguo
Jindai Shougongyeshi Ziliao) Beijing Sanlianpublishing house
Perkins Dwight H (1969) Agricultural Development in China 1368-1968 Chicago Aldine
Pomeranz Kenneth (2000) The Great Divergence China Europe and the Making of the
51
Modern World Economy Princeton Princeton University Press
Pomeranz Kenneth (2011) ldquoTen Years After Responses and Reconsiderationsrdquo Historically
Speaking 12(4) 20-25 Project Muse
httpsmusejhueduloginauth=0amptype=summaryampurl=journalshistorically_speaki
ngv012124coclanishtml
Robson R (1957) The Cotton Industry in Britain London Macmillan
Qi Xia (2009) History of the Economy in the Song Dynasty (Songdai Jingjishi) Beijing
Zhonghua Book Company
Quan Hansheng (1991) Researches in Chinese Economic History (Zhongguo Jingjishi
Yanjiu) Taipei The New Asia Institute of Advanced Chinese Studies
Sakuma Shigeo(1999) Research on history of porcelain production of Jingde town
(Jingdezhen Yaoyeshi Yanjiu) Tokyo First Publishing house
Shi Zhihong (1994) Small Peasant Economy in Early Qing Dynasty (Qingdai Qianqi de
Xiaonong Jingji) China Social Sciences Press
Shi Zhihong (2001) ldquoRe-estimation of Cultivated Land in China during Early 19th Century
(19 Shiji Shangbanqi de Zhongguo Gengdi Mianji Zaiguji) rdquo Researches in Chinese
Economic History 4 85-97
Shi Zhihong and Yi Xu (2008) Public Finance in Late Qing Dynasty 1851-1894(Wanqing
Caizheng 1851-1894 )Shangahai Shanghai University of Finance and Economics Press
Song Xi (1958) ldquoGeographic distribution of rice production in the Northern Song dynastyrdquo(Beisong
Daomi de Chanliang Fenbu) symposium of research about Song HistoryTaipeiCommittee
of Editor of Chinese books series (National compiling library ) 131-175 Song Yingxing (1954) Tiangong Kaiwu Vol10-11 Shanghai The Commercial Press
Su Jilang (1997) A Spatial Model of the Porcelain Export Industry in South Fujian and
Guangdong a Comparative Analysis (Liangsong Minnan Guangdong Waimaoci
Chanye de Kongjian MoshiYige Bijiao Fenxi) in Chuang Yanhui (ed) Essays on the
History of Ocean Development in China Vol6 Academia Sinica Institute of
Zhongshan Humanity and Social Science Research
Sun Hongsheng (2001) ldquoTea Economy of Tang and Song Dynastyrdquo(Tangsong Chaye Jingji)
Beijing Social Science Literature Press
Tan Wenxi (1994) History of Price in China (Zhongguo Wujiashi) Wuhan Hubei Peoplersquos
publishing House
Tu Guangshao (1984) The Surplus of National Income in China 1931-1936 (Zhongguo
Guomin Shouru de Jiexu1931-1936)Masterrsquos Thesis in School of Economics
Peking University
UK Board of Trade (1903) Report on Wholesale and Retail Prices in the United Kingdom in
1902 with Comparative Statistical Tables for a series of Years (HC321) British
Parliamentary Papers LXVIII
van Zanden Jan Luiten and Bas van Leeuwen (2012) ldquoPersistent but not Consistent The
Growth of National Income in Holland 1347-1807rdquo Explorations in Economic
History 49 119-130
von Glahn Richard (1996) Fountain of Fortune Money and Monetary Policy in China
1000-1700 Berkeley University of California Press
Walker James T (2012) ldquoNational Income in Domesday Englandrdquo University of Reading
Wang Lingling (2005) Research in Mining Industry in Song Dynasty (Songdai Kuangyeye
Yanjiu) Baoding Hebei University Press
Wang Shengduo (1995) Fiscal History in Song Dynasty (Liangsong Caizhengshi) Beijing
Zhonghua Book Press
Wang Shengduo (1995) Monetary History in Song Dynasty (Liangsong Huobishi) Beijing
China Social Sciences Press
52
Wang Wencheng (2001) Studies on Silver Monetization in Song Dynasty (Songdai Baiyin
Huobihua Yanjiu) Kunming Yunnan University Press
Wang Wenshu (2008) Research on usurious loans in Song dynasty (Songdai Jiedaiye
Yanjiu) unpublished dissertation Hebei University China
Wang Yeh-chien (2003) Essays on economic history of Qing dynasty (Qingdai Jingjishi
Lunwenji) Taipei Daoxiang Press
Wang Yuquan(2007) General History of Chinese Economy Qing Dynasty (Zhongguo Jingji
Tongshi Mingdai Jingjijuan) Beijing China Social Sciences Press
Wang Zengyu (1983) Research on military institution of Song dynasty (Songchao Bingzhi
Chutan) Beijing Zhonghua publishing house
Wei Huaxian (2006) Production and Consumption of Four Products in the Song Dynasty
(Songdai Silei Wupin de Shengchan he Xiaofei Yanjiu) Chengdu Sichuan Science amp
Technology Press
Wittfogel Karl August (1957) Oriental Despotism A Comparative Study of Total Power
New Haven Yale University Press
Wong Roy Bin (1997) China Transformed Historical Change and the Limits of European
Experience Ithaca Cornell University Press
Wu Baosan and Wang Yusun (1947) Chinarsquos National Income in 1933(Zhongguo Guomin
Suode 1993yr) Shanghai Zhonghua Book Press
Wu Chengluo (1984) Chinese History of Weights and Measures (Zhongguo
Dulianghengshi) Shanghai Shanghai Book Press
Wu Hui (1985) Researches of Grain Yield in Ancient China (Zhongguo Lidai Liangshi
Muchanliang Yanji) Beijing Agriculture Press
Wu Hui (1998) A estimation on commercialization rate and commercialization volume
about historical grain production ( Lishi shang Liangshi Shangpinlv Shangpinliang
Cegu) Research on Chinese Economic history Vol6pp16-31
Xu Dixin and Wu Cheng-Ming (1985) History of Capitalist Development in China The
Budding of Capitalism Vol1 (Zhongguo Ziben Zhuyi FazhanshiVol1) Beijing
Peoplersquos Publishing House
Xu Xinwu (1992) The history of cotton production in Jiangnan (Jiangnan Tubushi)
Shanghai Social Science Press
Yan Zhongping (1948) Collation and Annotation of Copper Industry in Yunnan during
Qing Dynasty (Qingdai Yunnan Tongzheng Kao) Beijing Zhonghua Book Press
Yao Xiangao (1962) Historical Data About Trade of Modern China (Zhongguo Jindai
Duiwai Maoyishi Ziliao) Beijing China Publishing House
Zhang Zhongli (1987) ldquoEstimates of Chinarsquos National Income in 1880srdquo (Zhongguo
Guomin Shengchan Zongzhi de Culue Guji in 1880s) Nankai Economic Quarterly 1
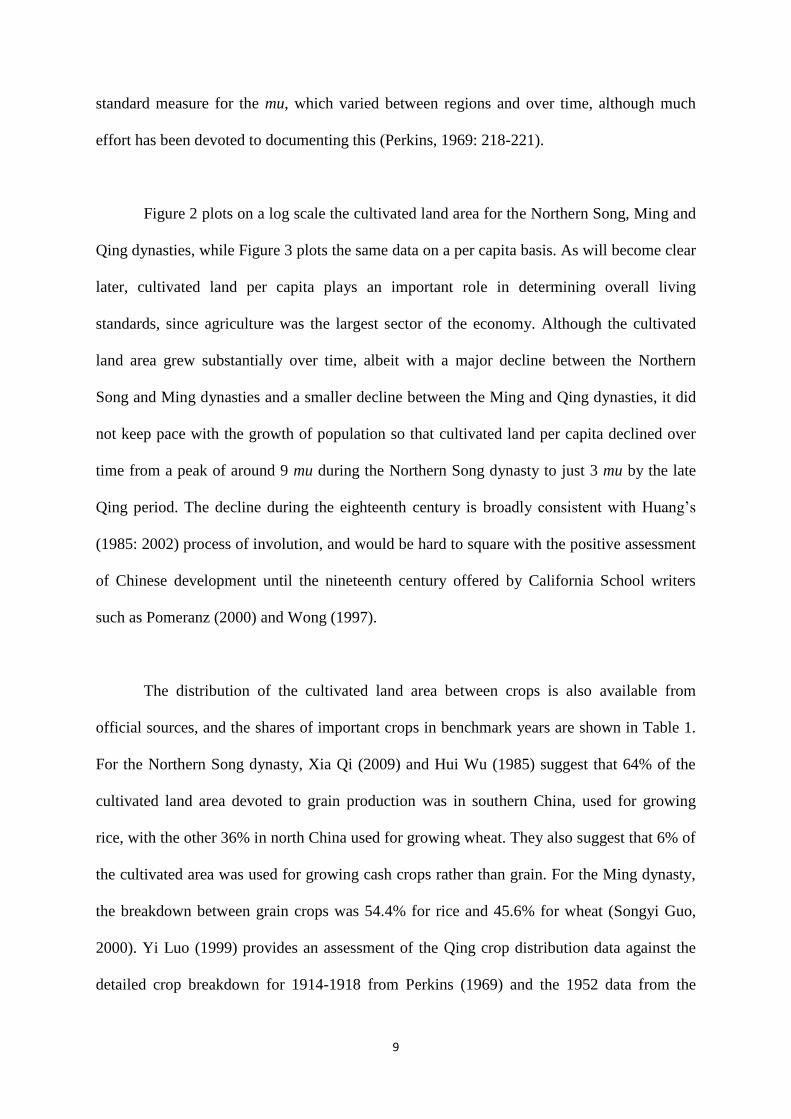
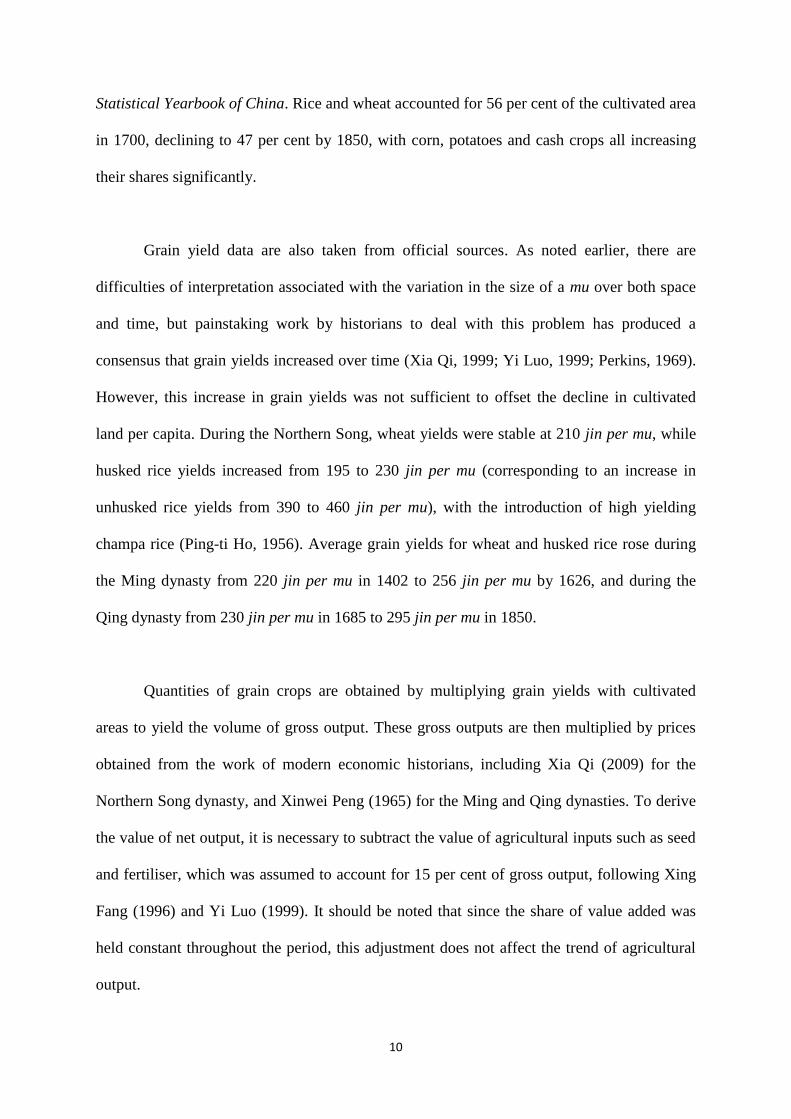
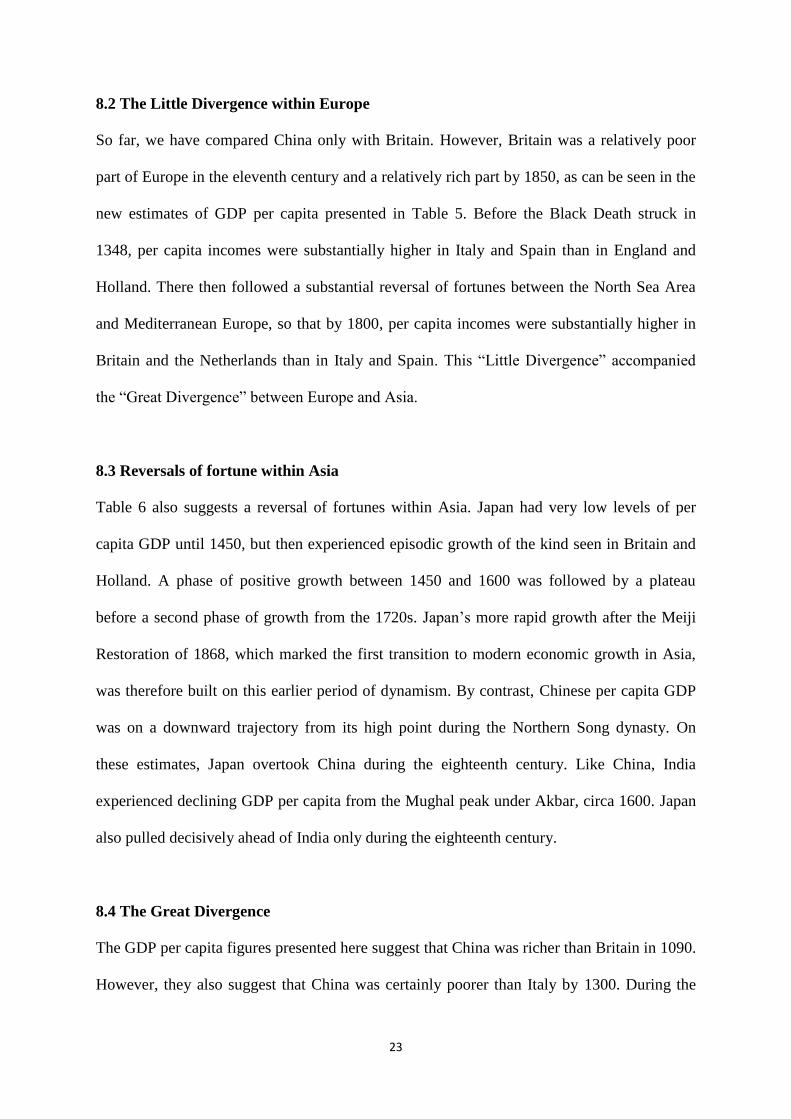
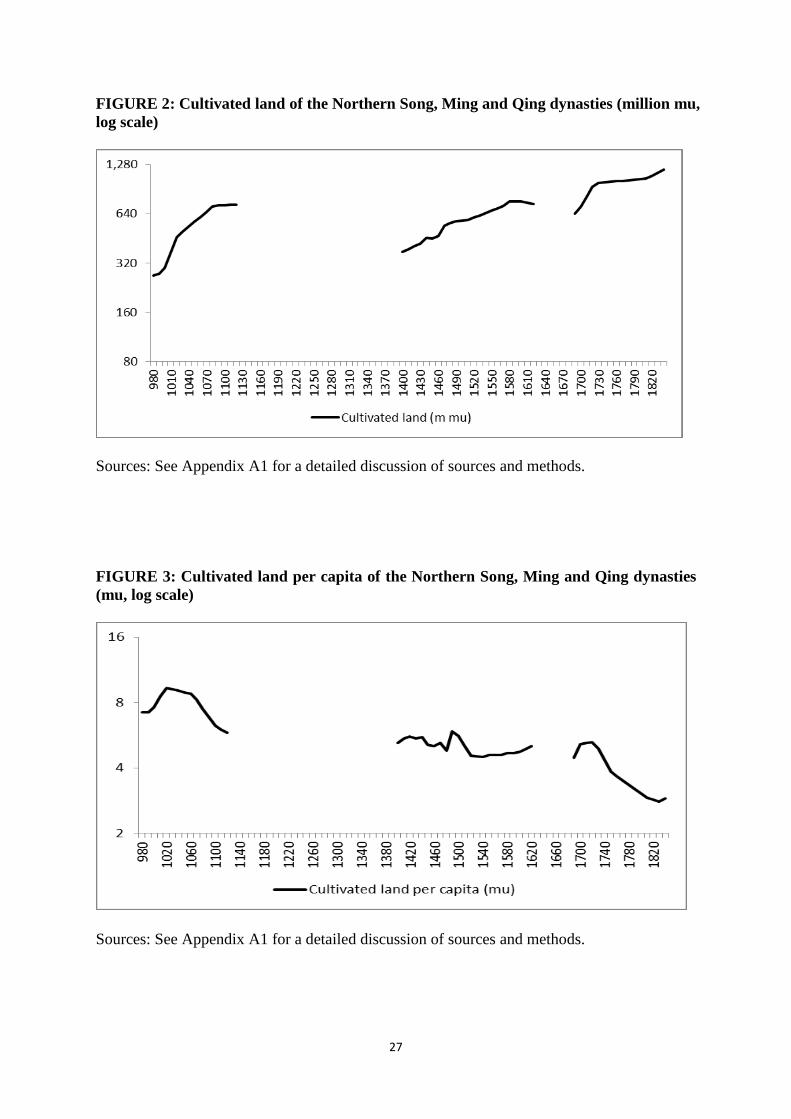
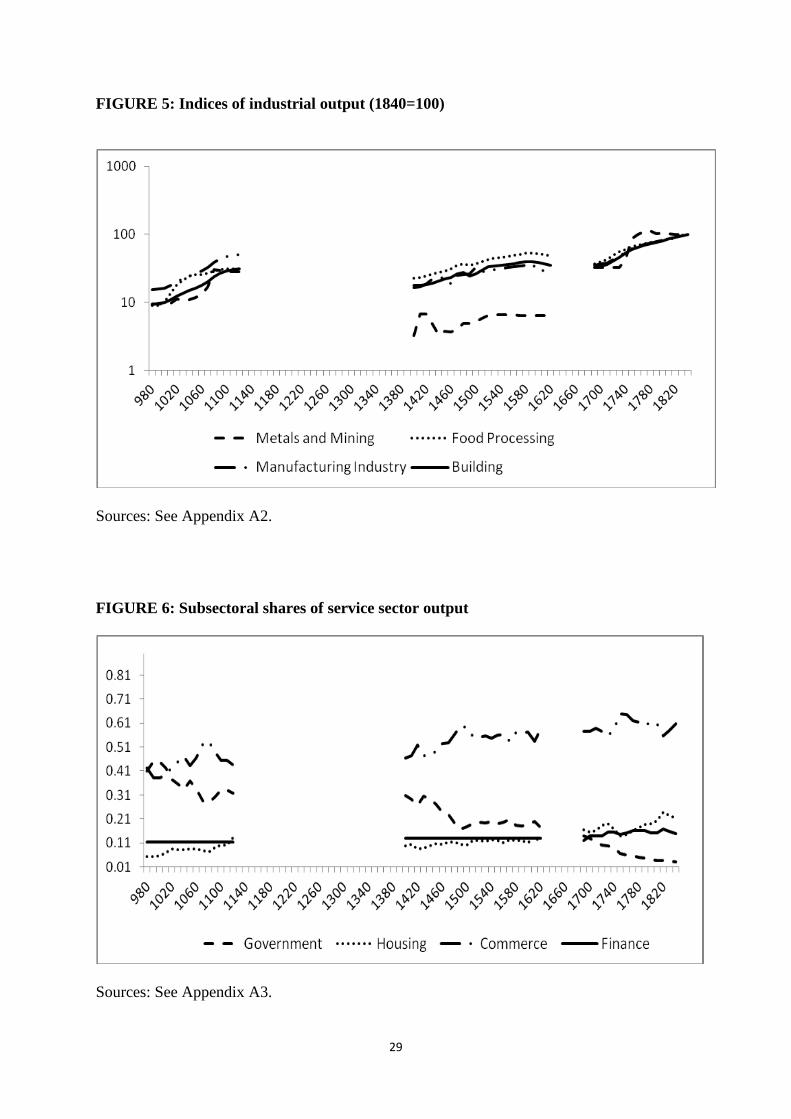
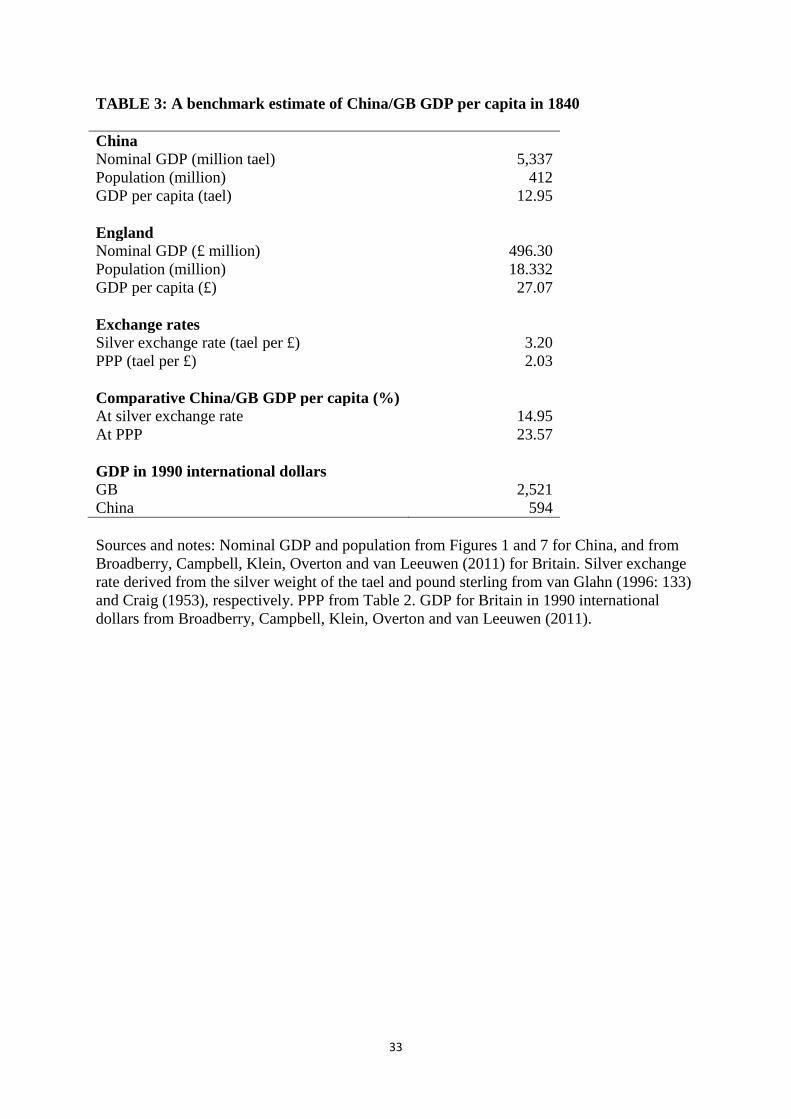
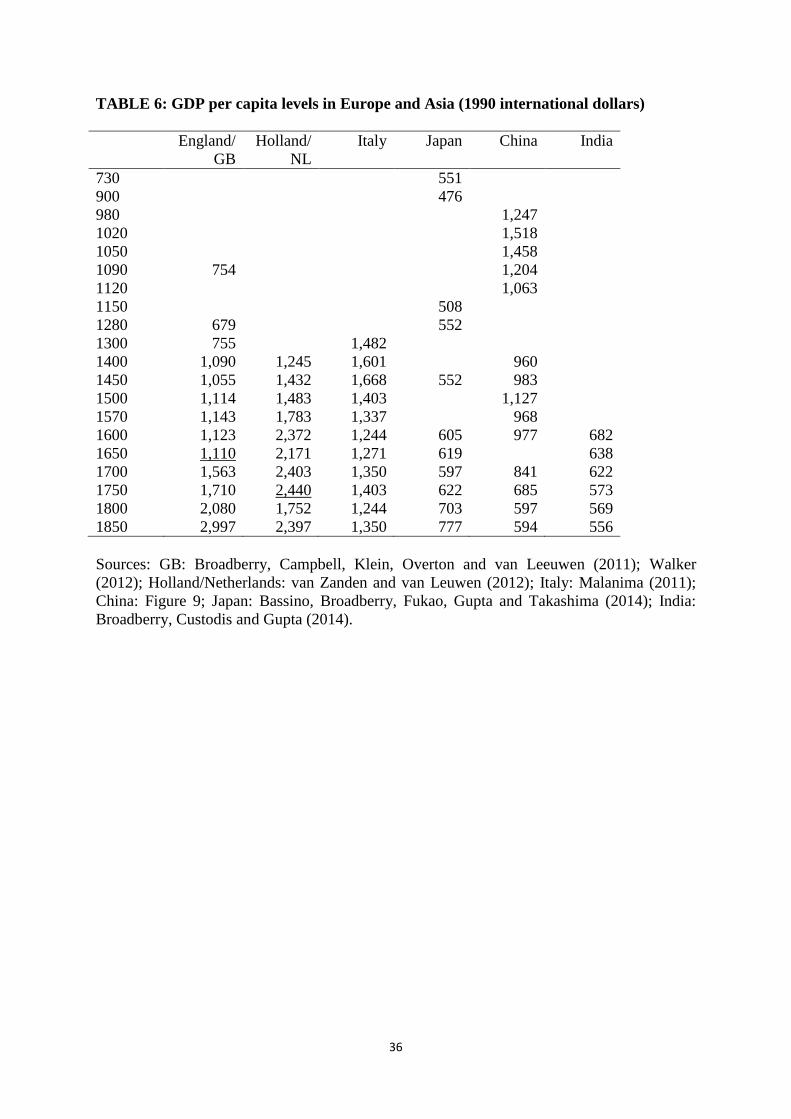
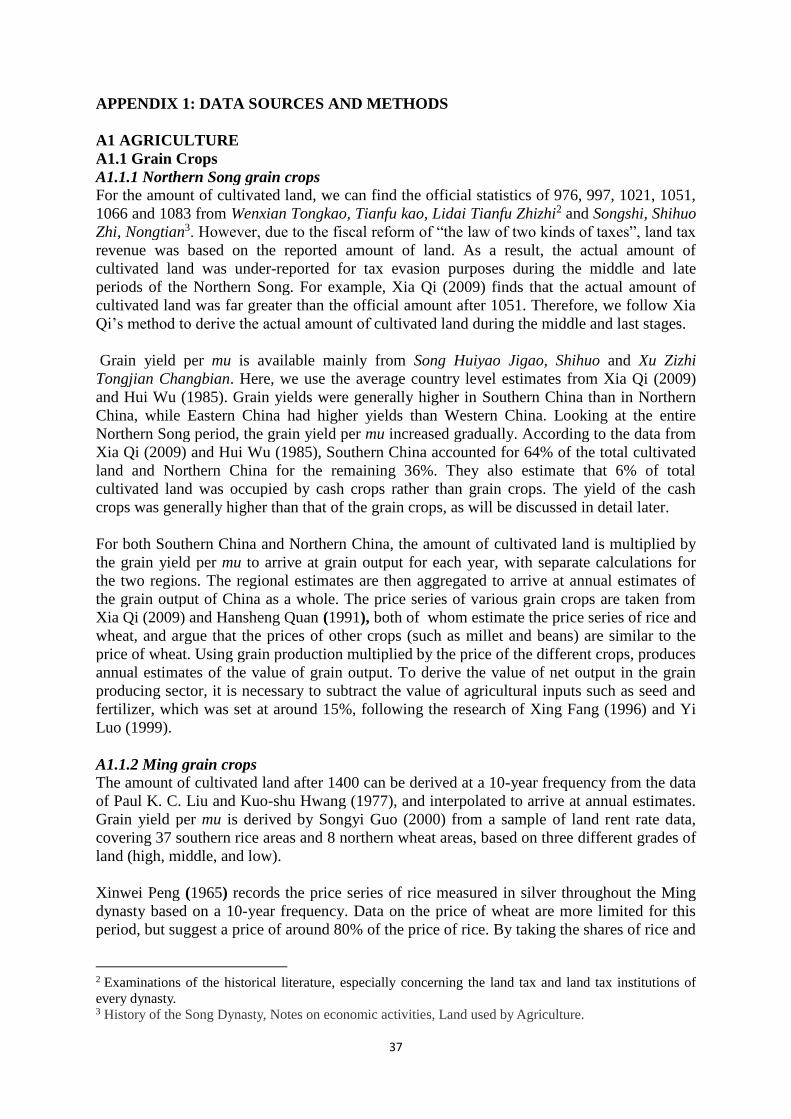
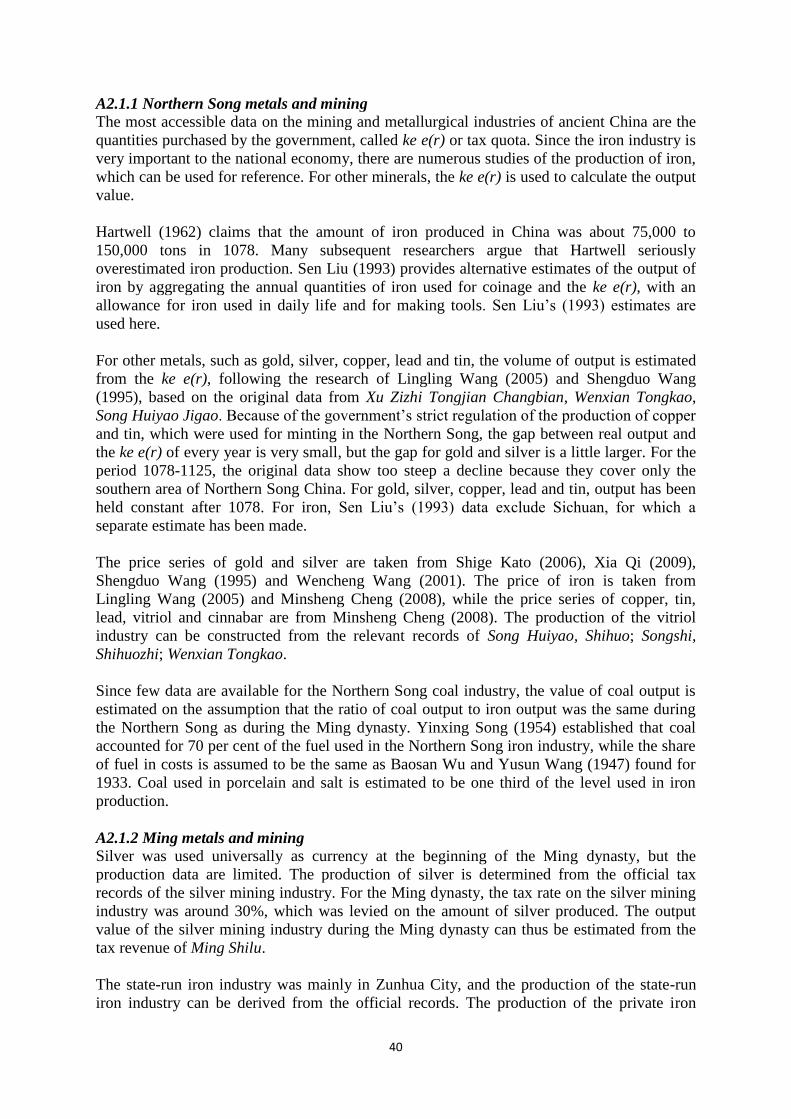
Related Documents