1 The Samurai Bond: Credit Supply and Economic Growth in Pre-War Japan By SERGI BASCO AND JOHN P. TANG* While credit supply growth is associated with exacerbating financial crises, its impact on economic activity and development are unclear. Using bond payments to samurai in nineteenth century Japan as a quasi-natural experiment and exploiting regional variation, we find samurai population shares are positively associated with short run firm establishment, capital investment, and average firm capital. In the long run, initial samurai population share corresponds with per capita output growth and labor reallocation throughout the pre-war period conditional on early adoption of railways. Our results indicate the interaction of credit supply with productivity- enhancing technology provides persistent growth and structural change. Keywords: credit supply, finance-led growth, market access, railways, structural change JEL codes: E51, N15, O47 * Basco: Department of Economics, Universidad Carlos III, Getafe, Spain ([email protected]). Tang: Research School of Economics, Australian National University, 26 LF Crisp Building, Canberra, ACT 2601 Australia ([email protected]). Tang acknowledges financial support from the Australian Research Council (DE120101426). We received useful feedback from Yannick Dupraz, James Fenske, Richard Grossman, Richard Sylla, Zach Ward, and seminar participants at Waseda Univesrity, UC Davis, and Warwick University. We thank Kyoji Fukao for generously sharing data used in this research. Any errors are ours.

Welcome message from author
This document is posted to help you gain knowledge. Please leave a comment to let me know what you think about it! Share it to your friends and learn new things together.
Transcript

1
The Samurai Bond:
Credit Supply and Economic Growth in Pre-War Japan
By SERGI BASCO AND JOHN P. TANG*
While credit supply growth is associated with exacerbating
financial crises, its impact on economic activity and
development are unclear. Using bond payments to samurai in
nineteenth century Japan as a quasi-natural experiment and
exploiting regional variation, we find samurai population shares
are positively associated with short run firm establishment,
capital investment, and average firm capital. In the long run,
initial samurai population share corresponds with per capita
output growth and labor reallocation throughout the pre-war
period conditional on early adoption of railways. Our results
indicate the interaction of credit supply with productivity-
enhancing technology provides persistent growth and structural
change.
Keywords: credit supply, finance-led growth, market access, railways,
structural change
JEL codes: E51, N15, O47
* Basco: Department of Economics, Universidad Carlos III, Getafe, Spain ([email protected]). Tang: Research School of Economics, Australian National University, 26 LF Crisp Building, Canberra, ACT 2601 Australia ([email protected]). Tang acknowledges financial support from the Australian Research Council (DE120101426). We received useful feedback from Yannick Dupraz, James Fenske, Richard Grossman, Richard Sylla, Zach Ward, and seminar participants at Waseda Univesrity, UC Davis, and Warwick University. We thank Kyoji Fukao for generously sharing data used in this research. Any errors are ours.

2
How does the growth of credit supply affect financial and economic
activity? In recent years, negative effects of credit supply growth have been
implicated in the severity of the financial crisis of the past decade, namely
through the accumulation of mortgage debt in the United States (Mian and
Sufi 2009). Jordà et al. (2011) also highlight this relationship, using historical
data to show that credit supply booms are associated with longer, deeper, and
more persistent recessions. These studies offer a counterpoint to the existing
literature on the positive relationship between finance and growth observed
across countries and over time (e.g, Levine 2005).
However, the causal impact of credit supply on economic growth in
both the short and the long run remains an open question due to the challenges
of identification and data availability. We address these problems by using a
historic quasi-natural experiment starting with a large credit supply shock. In
1876, the Japanese government involuntarily commuted the hereditary
pensions of former samurai into government bonds.1 The samurai represented
about five percent of the population, and their pensions were collectively
valued at 210 million yen, which was equivalent to nearly half of the country's
national income in 1876 and six times total government revenue (Flath 2014, p.
33; Yamamura 1967, p. 204).2
To assess the effect of credit supply growth, we use the initial share of
prefectural samurai population at the time of the pension commutation to
proxy for differences in credit availability. Since the pension conversion was
universal, compulsory, and resisted by the samurai themselves, this policy
reform is plausibly exogenous to existing or anticipated local economic
activity. 3 Our identification comes from the within-country variation in
samurai population distribution, which remained fairly stable in most regions
through the late nineteenth century. We hypothesize that, given the highly
1
Samurai were a hereditary class of warriors in pre-modern Japan that were the de facto rulers during the Edo period (1603 to 1867). Their monopolies on political and military power were dissolved following the Meiji restoration in 1868; see the next section for more detail.
2 There were earlier voluntary commutations of samurai pensions in 1873 and 1874, amounting to 36 million yen
2 There were earlier voluntary commutations of samurai pensions in 1873 and 1874, amounting to 36 million yen
in cash and bonds and about one-third of eligible samurai took up the conversion. The 1876 commutation was valued at 174 million yen, paid only in government bonds, and applied to all remaining samurai liabilities.
3 “The effect of [the 1876 pension commutation law] was instantaneous and manifested itself in an epidemic of
samurai riots and lawless demonstrations against the government” (McLaren 1979, p. 562). This culminated in the unsuccessful 1877 Seinan rebellion led by dissatisfied samurai.

3
variable distribution of samurai between regions, this credit supply shock may
account for subsequent differences in financial and industrial activity between
regions. Furthermore, since the economy was in the process of industrializing
and imperfectly integrated during the late nineteenth century, our analysis of
local credit supply provides evidence of both the short run impact on local
economies as well as potential persistence in the long run.
We test our hypothesis that variation in initial credit supply affects
local economic activity by regressing various economic outcomes (per capita
gross prefecture product growth, firm count and size, capital investment) on
samurai population share both over time and at the time of the bond issuance.
This allows us to include both prefecture and year fixed effects in our short
run regressions while for the long run we control only for temporal variation.
We report results using both the full sample of regions as well as the subset
with stable samurai shares.
In the short run (1883-1890), we find that samurai share is positively
associated with an increase in per capita firm numbers and investment levels,
and in capital per firm. Lengthening the coverage to the turn of the century
(1883-1898) reduces both the magnitude and statistical significance of samurai
share on these outcomes, with per capita investment having a positive
correlation. Results using all prefectures and those with stable samurai shares
are comparable, with slightly larger coefficients on samurai share in the latter
group.
We also expand our baseline regression model by adding time varying
regional control variables. First, it could be argued that samurai population
shares could be correlated with other variables that determine credit supply.
For instance, Rajan and Ramcharan (2015) argue that the number of banks can
proxy for the credit supply. Thus, we include number of banks per capita in
our baseline regression. Second, we also include total population as a proxy
for prefectural income since the latter are unavailable in annual series. Our
main results are robust to including these variables.
The effect of samurai share varies by major industry group in both
time periods. A one percent increase in samurai share corresponds with a 29
percent increase in firms per capita across all sectors, with the relationship by
4
sector percentages highest in the primary sector. This is followed by services
and then the secondary sector, which may correspond to differences in initial
average firm counts among the three sectors. The relative contribution shares
remain the same over the longer period of 1883 to 1898. Other measures of
industrial activity, including capital investment per capita and firm
capitalization, also increased with samurai population share and varied by
major sector.
Unlike these direct measures of industrial activity, increased local
credit supply on its own does not directly translate into overall regional
economic development in the short and long run. Only in the presence of
productivity enhancing infrastructure, i.e., railway access, do regions
experience higher output growth per capita and this effect is persistent for over
six decades.
We show this by interacting initial samurai population share with
railway access prior to the first wave of industrialization starting in the mid
1880s. In regions that were integrated earlier into the national market via
railways, a one percent increase in samurai population share accounts for 56
percent of per capita output growth in the first decade following the credit
supply shock. The average share declines to 31 percent on average to the eve
of World War One, and ultimately to 10 percent for the whole period up to
1940. The impact varied by major sectors, with primary industries shrinking
throughout the entire pre-war period while secondary sectors grew strongly in
through the 1920s and tertiary sectors in subsequent decades.
The impact is slightly shorter lived but also observed in the
reallocation of labor away from primary to secondary and, to a lesser extent,
tertiary sectors. The results mirror those for per capita output growth and
indicate long run structural change corresponding with Japan’s transition as a
modern economy. Our interpretation of the results is that the initial credit
supply shock, coupled with growth-promoting investment opportunities and
greater market access, had short and long run positive effects on local
economic activity and structural change.
5
I. Background
While there is a well-established link between financial sector
development and economic growth across countries and overtime (King and
Levine 1993; Rajan and Zingales 1998), less clear is the role of credit supply
on regions within a country over the long run.4 Historically, periods of
economic growth coincided with increased credit intensity, but the overhang
of excess credit in turn magnified the severity of crises and delayed recovery
through debt-deflation pressure on prices and swings in expectations (Jorda et
al 2011; Schularick and Taylor 2012). Most of the literature has focused on
macroeconomic aggregates or use modern data, leaving the within-country
impact and its long run persistence unaddressed.
This paper exploits within-country differences in initial samurai
population shares. This empirical strategy is similar to Mian and Sufi (2009)
which compares ZIP codes in the U.S. to uncover the origins of the mortgage
debt boom in the late 2000s. Similarly, Guiso et al. (2004) exploit regulation
variations within Italy to analyze the effect of local financial development
within an integrated financial system. Mian et al (2017) examine the impact of
credit supply shocks in the United States for the modern period starting in the
1980s. In contrast to these papers, we analyze differences in credit supply
across regions in a financially and physically fragmented economy and for a
longer period of time. Therefore, it allows us to control for aggregate country
shocks and investigate the effect of credit supply growth and its persistence.
Japan in the late nineteenth century provides a useful setting to
examine the role of credit provision on local economic outcomes. Starting in
the Meiji Period (1868-1912), the government implemented numerous reforms
and invested in infrastructure and industrial enterprises to modernize the
economy. By the turn of the century, Japanese manufacturing had reached the
same share of output as the United States and continued to increase in value-
added and capital intensity (Perkins and Tang 2017).
4
The finance-led growth literature uses a variety of measures of financial development like credit availability, assets and liabilities, capital formation, and institutions to assess changes in income and industrial growth. The underlying rationale emphasizes the roles of transaction costs, capital allocation, and risk management in facilitating growth.

6
While its financial sector development, measured both intensively (e.g.,
financial assets, equities) and extensively (e.g., banks, informal
intermediaries), is associated with its overall industrialization (Rousseau 1999;
Tang 2013), a plausible causal trigger to its transition was a large exogenous
shock to its credit supply. This shock was the 1876 involuntary conversion of
hereditary samurai stipends (aka, chitsuroku) into government bonds (aka,
kinroku) worth 173.9 million yen, which was motivated by the drain on public
finances from samurai payments.5 In the years leading up to the conversion,
these payments accounted for one quarter to one third of all government
expenditures in the 1870s (Beasley 1972).6 The bond issuance would improve
the central government's fiscal position while simultaneously provide a major
source of investment capital for agricultural and industrial expansion
(Harootunian 1960, McLaren 1979). The conversion was also sizeable relative
to the existing supply of government bonds: before the issue of the 1876
kinroku bonds, public bonds totaled 51.5 million yen.7 Table I provides the
pension commutation scales into interest bearing bonds, which had a maturity
of thirty years and minimum holding period of five years.8
[Table I]
There were some immediate consequences following the stipend
conversion. First, interest payments by the government fell from 34.6 million
yen before the 1868 Meiji restoration to 12.8 million yen after the 1876
stipend conversion. Second, the banking system expanded rapidly since
chartered national banks were allowed to accept these commutation bonds as
5
This conversion was preceded by a number of events that also affected the economic and social status of samurai. First, the 1868 Charter Oath effectively ended the professional monopolies of samurai warriors on military and government power (Bary 1964). This was followed by the creation of a conscript army in 1873 and the prohibition of sword carrying in 1876.
6 A similar share covered government administration costs and the remainder was for military expenses.
7 This figure includes the 16.6 million yen in public bonds for voluntary pension conversion between 1874 and
1876. 8
Interest payments were made in May for each year of the commutation duration, except for the first year 1877, which was made in November. Adjustments were made for pension conversions near threshold limits to ensure lower income conversion payments did not exceed those at the next higher threshold. Interest would be paid between five and fourteen years, and redemption of all kinroku bonds was completed by 1906. See McLaren (1979, pp 562-566) and Tomita (2005, pp. 14-16) and Table I for details.
7
investment capital.9 These banks increased from 6 in 1876 to 153 over the
next three years, with samurai owning more than three times of their capital in
these banks compared to all other classes combined (ibid, p. 205).10 Their
dominant position in bank ownership remained in place throughout the 1880s,
which coincided with the start of modern economic growth and Japan's
subsequent transition to an industrialized economy (Tang 2013; Rousseau
1999).11
The public finance and banking narratives, however, are incomplete in
that the national budget remained precarious given military expenditures, high
inflation and later deflation, and the small share of bonds (27 percent) invested
in national banks (Tomita 2005).12 The high inflation period immediately
following the pension commutation may have also created uncertainty around
the government’s commitment to fulfill its bond obligations, motivating
samurai to invest their bonds in enterprises or redeem them as soon as possible.
Exacerbating these initial conditions was the lack of capital market integration
in Japan, which persisted until the 1890s once the central bank was established
and its branch network reduced interest rate spreads (Mitchener and Ohnuki
2007). Bonds were also not limited to bank capitalization: between 1876 and
1889, businesses owned by samurai also grew extensively and varied from
small companies to joint-stock corporations (Harootunian 1960).
More importantly, since the samurai were unequally distributed across
regions, their contribution to local economic activity via additional credit may
account for the short and long run regional differences measured more broadly
in industrial activity, income growth and labor allocation (Moriguchi and Saez
2008; Fukao et al 2015). In the period preceding World War Two, regional
inequality rose significantly due largely to shifts away from primary to 9
The 1876 National Bank and Kinroku Public Bond Instrument Issue Ordinances allowed national banks to be established with government bonds paying a (lower) four percent interest rate and the (higher) ratio of paid-in capital of government bonds to 80 percent (Tomita 2005). All bonds would be redeemed up to thirty years after issuance. To facilitate securitization and capital mobilization, stock exchanges were set up in Osaka and Tokyo in 1878.
10 The 1879 breakdown of capital contribution was 76.0 percent samurai (including the kazoku nobility), 14.6
merchants, 3.5 farmers, and 5.7 others. For a list of major financial reforms in the late nineteenth century, see Tang (2013), table 1.
11 The overall macroeconomic effect of the stipend conversion is disputed, however, with some studies alleging
samurai incompetence in investment and management as well as an exaggerated influence of the national banks (Harootunian 1960; Yamamura 1974).
12 Yamamura (1967) finds the samurai contribution to modern Japanese banking modest, and that commoners
played a more important role when private and quasi-banks are included.

8
secondary production. Major metropolitan areas like Tokyo and Osaka
experienced rapid industrialization, and more populated areas grew at the
expense of smaller and more isolated ones following the expansion of the
national railway system (ibid; Tang 2014). In the remaining sections, we
analyze the extent by which regional differences in credit supply may have
affected economic activity and whether these persisted over time.
II. Research Design
A. Data
To investigate the relationship between the local credit supply shock
and later development, we use historic data that provide regional measures of
output, industrial activity, market access, and demography. Collectively, these
data span the period 1880 to 2005 and are disaggregated by the 47 regions
(aka, prefectures) that comprise Japan. Samurai population series are available
annually starting in 1880 and were collected by the Japanese government's
Cabinet Bureau of Statistics (Japan Statistical Association 1962). These
yearbooks also include industrial and demographic data like the number of
firms, amount of capital investment, and total prefectural population. Output
and labor force data by prefecture are available for a number of years in the
pre-war period: 1874, 1890, 1909, 1926, and 1940 (Fukao et al 2015). These
are also separable into the three major sectors of primary, secondary, and
tertiary categories for the entire period of analysis by gross value added.
Railway data are from a handbook of rail station construction, which provide
both dates and location of all stations built starting in the 1870s (Chuo Shoin
1995; Tang 2014).
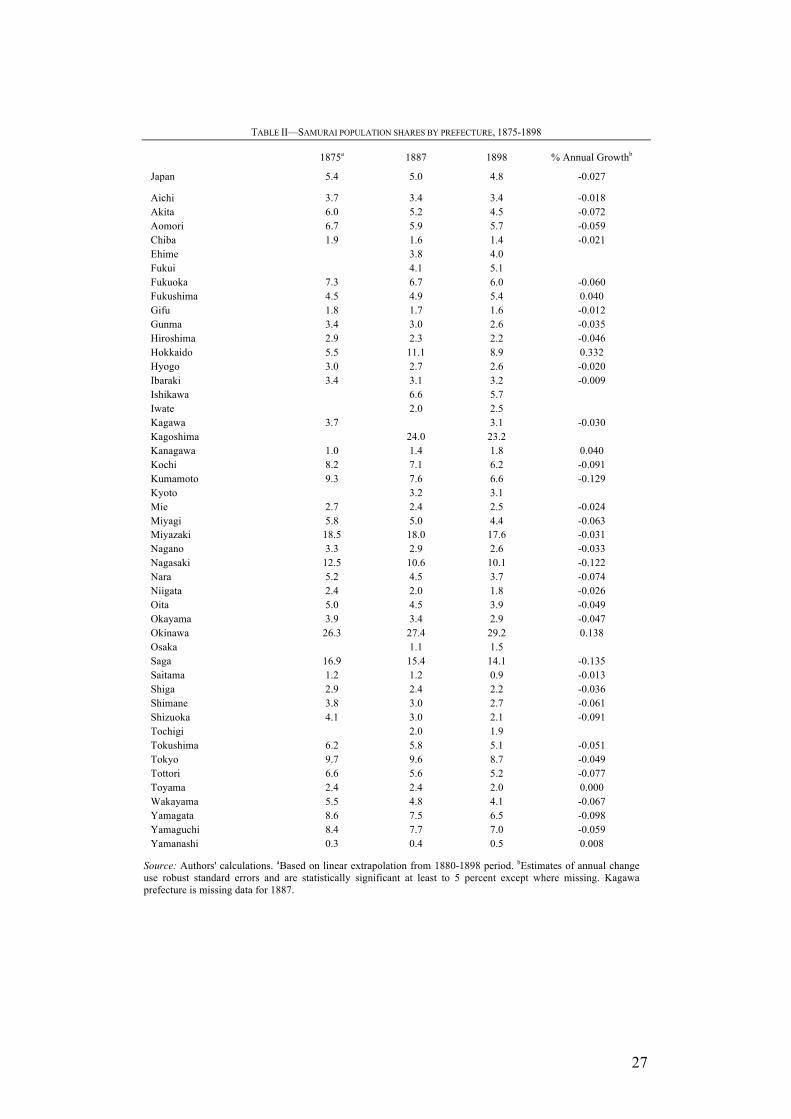
Regression estimates of samurai share over the years 1880 and 1898
indicate that 39 of the 47 had stable trends, as shown in Table II.13 These
shares underscore the relative immobility of samurai between regions during
13
The eight prefectures with unstable trends in samurai population shares are Ehime, Fukui, Ishikawa, Iwate, Kagoshima, Kyoto, Osaka, and Tochigi. In Table II, samurai population shares in 1875 are extrapolated from 1880 to 1898 data, but are not used in the main regression results.
9
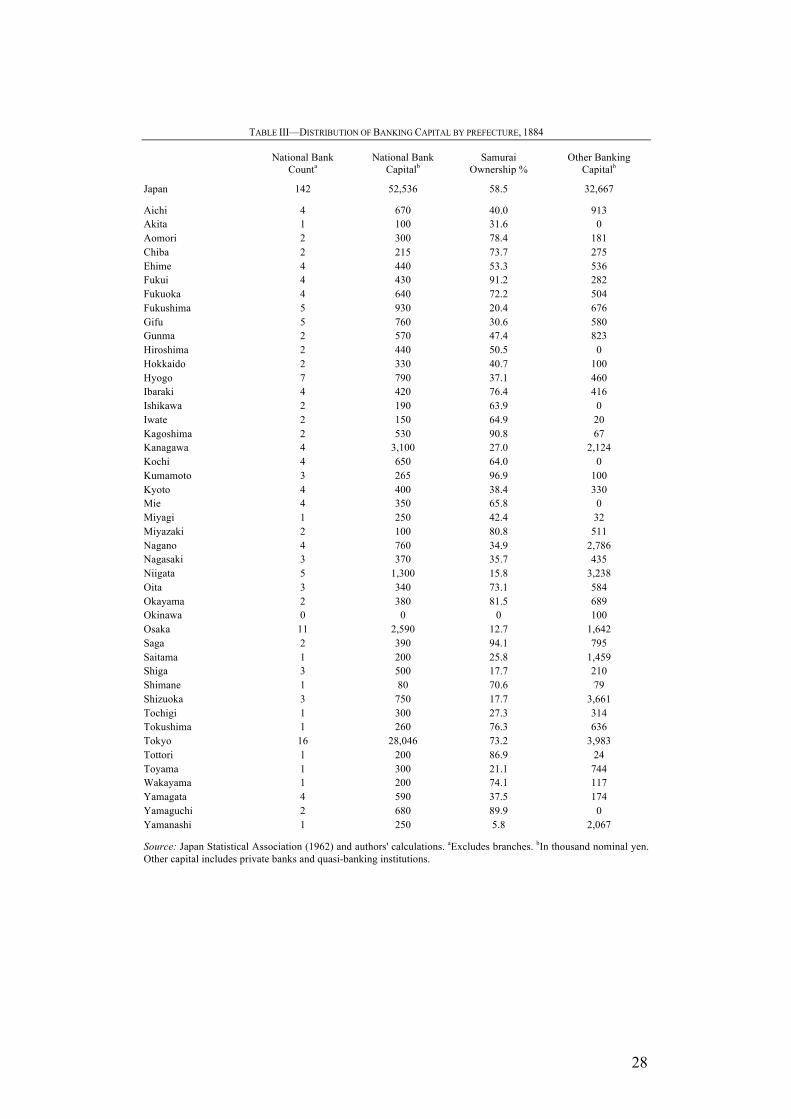
this period, despite efforts by the government to encourage migration. The
investment activity of samurai was similarly localized, as illustrated by with a
regional distribution of national banks and their consistently high ownership
shares by samurai. 14 Table III provides a breakdown of samurai bank
ownership in 1884.
[Tables II and III]
Industrial data from the same official source are disaggregated by three
major sectors and include the number of firms as well as total capital invested,
which allows calculation of average firm capital. We have annual data
available by region between 1883 and 1898, which coincides with the onset of
industrialization in Japan and allows analysis of short run effects from
regional differences in credit (Perkins and Tang 2016). This period also
encompasses the redemption period of nearly all kinroku bonds issued under
the 1876 commutation law, which allows for a direct correspondence between
bond redemption and industrial activity (Tomita 2005).15
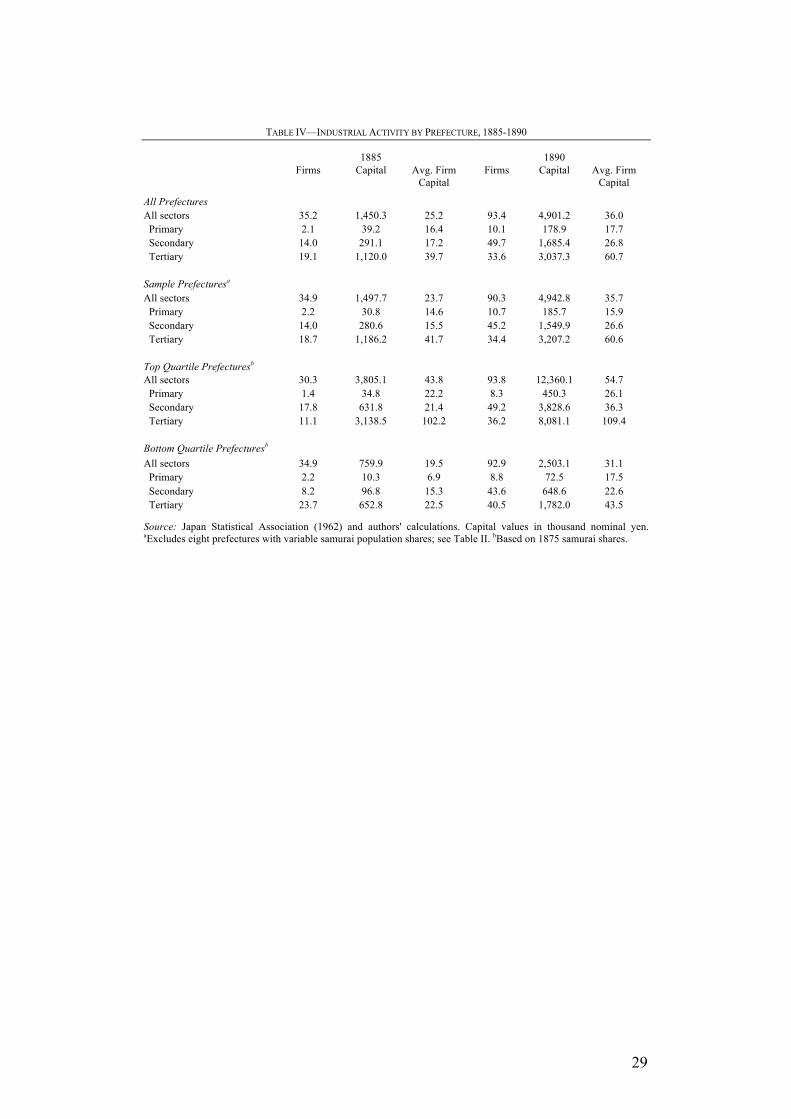
As shown in Table IV, between 1885 and 1890 the average number of
firms across all prefectures nearly trebled to 93.4 firms while average firm
capitalization increased two-fold, from 25,200 to 36,000 nominal yen. The
largest increase in firms occurred in manufacturing and allied industries,
accounting for over half of total firms. Both secondary and tertiary sector
firms increased their average capitalization, with the latter exceeding twice
that of the former. These patterns are similar in the restricted sample of
regions in the second panel of the table, which excludes the eight prefectures
that have unstable samurai population shares during the 1880s and 1890s.
14
Shizume and Tsurumi (2016) describe the evolution of the national banking system starting with the 1876 National Bank Act up to the creation of the central bank, the Bank of Japan, in 1882.
15 Redemption of 7 percent interest, which represented 62 percent of the total bond issue, was completed in
September 1891; 6 percent interest bearing bonds (14 percent) were all redeemed in April 1893; and 5 percent interest bearing bonds (18 percent) in April 1906. Special bonds bearing 10 percent interest (5 percent total bond value) were all redeemed by June 1886.

10
[Table IV]
Compared with either the full or restricted sample, there are notable
differences between the top and bottom quartiles of prefectures based on
samurai population share. Firm numbers grew faster in the top quartile albeit
starting from a slightly lower average, with more of the growth in the tertiary
sector. In particular, the average firm count in the top quartile surpassed the
bottom quartile during this period and was more capitalized throughout the
period. This is the first indication that credit supply may be associated with
extensive manufacturing growth, which we will corroborate with regression
analysis.
The tertiary sector also experienced significant extensive growth, and
while the top quartile did not increase much in average capitalization, it
remained well above the national and bottom quartile averages. This reflects a
widening of the market, particularly in finance as non-national banking firms
expanded during the 1880s and the economy recovered from the Matsukata
deflation in the first half of the decade. Average firm capital rose less quickly
in the secondary sector for the top quartile, but also stayed higher than in the
bottom quartile over the period.
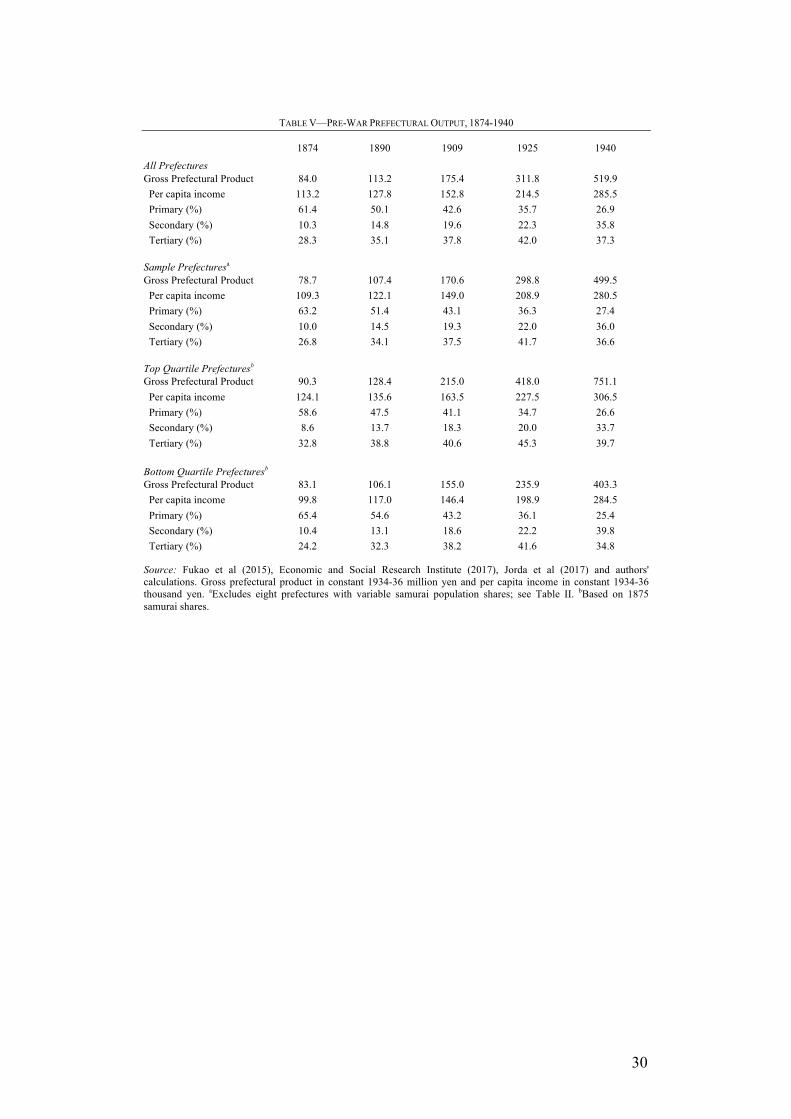
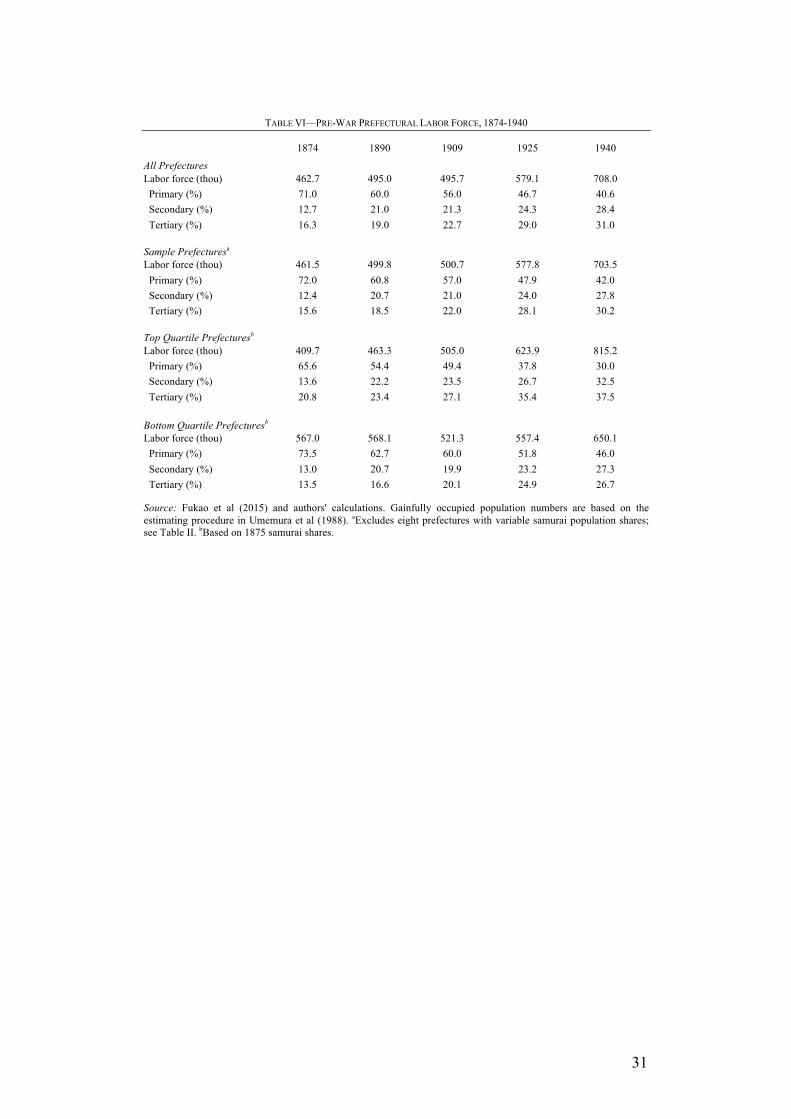
With regard to output and labor, measures by region are shown in
Tables V and VI, respectively, and cover the years between 1874 and 1940.
Throughout this period, Japan steadily increased its per capita income, with
the shares of value from secondary and tertiary sectors growing at the expense
of primary production. The period between 1874 and 1909 shows a near
doubling of secondary sector value, which reached over a third of national
output by 1940 largely due to a shift away from primary production. Labor
shares also shifted away from primary production into the secondary and
tertiary sectors, respectively doubling and trebling their proportion of the labor
force by the end of the period. Similar patterns hold for both the full and
restricted sample of regions.

11
[Tables V and VI]
In the quartile comparison, despite starting at comparable levels of
income at the start of the period, the top quartile of prefectures gradually
increases its lead in both total and per capita output for the next half century.
By the end of the period, the top quartile has nearly twice the total output of
the bottom quartile even as per capita income remains comparable. The two
quartiles also differ in that the share of output from the tertiary sector is
consistently larger albeit with smaller margins over time. For labor, there is a
much more pronounced difference in levels and distribution between sectors.
While the top quartile had a lower average labor force at the start of the period,
the numbers doubled by 1940 and the share in tertiary industries was
persistently higher throughout. We condition for time fixed effects in the
regression analysis described in the next section to see whether these output
differences are due to the samurai credit supply shock or idiosyncratic period
influences.
B. Empirical Strategy
Our working assumption is that samurai population share is a proxy of
credit supply growth. Therefore, to test whether credit supply growth had a
short run effect on economic development, we consider the following equation,
(1) 𝑌!" = 𝛽! + 𝛽! ∗ 𝑆𝑎𝑚𝑢𝑟𝑎𝑖𝑆ℎ𝑎𝑟𝑒!" + 𝛿! + 𝛿! + 𝑒!",
where SamuraiShareit is the population share of samurai in prefecture i and
year t and 𝛿! and 𝛿! are prefecture and year fixed effects, respectively.16
Identification comes from the variation in samurai population share between
regions, and the prefecture fixed effects capture unobserved and time-invariant
differences. The year fixed effects account for idiosyncratic differences over
time. The dependent variable, Yit, is the economic outcome variable (i.e.,
16
While the shares of samurai vary by prefecture and over time, for most prefectures the shares have stable trends during this period; see Table II.

12
number of firms per capita, capital per capita, average firm capitalization). We
have yearly data at prefectural level from 1883 up to 1898. If 𝛽! > 0, it implies
that credit supply growth has a positive short run effect on the outcomes.
To investigate the long run effect, we proceed in analogous way as in
the above equation but use initial population samurai share. As before, our
baseline specification restricts the sample to prefectures with a stable samurai
population share, and we include year fixed effects to account for
idiosyncratic temporal shocks. We omit prefecture fixed effects since our
measure of initial credit supply shock does not vary over time by prefecture.17
We also utilize another exogenous shock in credit demand to analyze
the differential short and long run effect of credit supply across prefectures.
The shock is access to railways, measured as the number of railway stations
per capita in the 1880s. As it has been argued in Tang (2014) and Yamazaki
(2017), the adoption of railways across regions in late nineteenth century
Japan was exogenous and had a positive effect on local development. Other
studies on railway expansion in different countries and over time have
generally found similar positive effects (e.g., Summerhill 2005; Atack et al
2008; Herranz-Loncan 2011; Donaldson, forthcoming). We extend that
literature by testing the hypothesis that credit supply has a more positive effect
on regional development if it goes hand in hand with local latent demand,
particularly investment opportunities that are technology enhancing or
improve market access. This conditional effect of the availability of long-run
investment has anecdotal support in the historical record, with many samurai
and entrepreneurs failing in their ventures due to the immaturity of the
economy and non-viable investments (Harootunian 1960, p. 443).
The following is our reduced form linear regression model using
prefectural data:
(2) ∆𝐺𝑃𝑃𝑝𝑐!" = 𝛽! + 𝛽! ∗ 𝑙𝑛(𝐺𝑃𝑃𝑝𝑐!"!!)+ 𝛽! ∗ 𝑆𝑎𝑚𝑢𝑟𝑎𝑖!! + 𝛽! ∗
𝑆𝑎𝑚𝑢𝑟𝑎𝑖!! ∗ 𝑆𝑡𝑎𝑡𝑖𝑜𝑛𝑠!! + 𝛿! + 𝑒!",
17
A similar approach is used by Banerjee and Iyer (2005), which analyzes the effect of initial distribution of land ownership in colonial India on economic outcomes.
13
where Δ𝐺𝑃𝑃𝑝𝑐!" = 𝑙𝑛(𝐺𝑃𝑃𝑝𝑐!"/𝐺𝑃𝑃𝑝𝑐!"!!) , 𝐺𝑃𝑃𝑝𝑐!" is gross prefecture
product per capita in prefecture i and year t, 𝑆𝑎𝑚𝑢𝑟𝑎𝑖!! is the samurai
population share in 1880, 𝑆𝑡𝑎𝑡𝑖𝑜𝑛𝑠!! is the number of railway stations per
capita in prefecture i in year 1885. The lag term for per capita output controls
for possible income convergence over time between regions. We use railways
in 1885 in our baseline specification because coincides with both the end of
the Matsukata deflationary period, which promoted private investment and the
start of the railway boom, but we also consider for robustness the number of
stations per capita in 1880. As shown in Tang (2014), initial market conditions
create path dependency and industrial agglomeration, so we anticipate a larger
effect in areas that joined the national railway network and market earlier in
the period. Per capita regional output from 1874 to 1940 is measured in
constant 1934-36 yen (Fukao et al. 2015).
The main variable of interest is the interaction between initial samurai
population share (aka, credit supply) and per capita railway stations (aka,
credit demand). 𝛽! > 0 implies that the effect of credit supply on regional
economic development is exacerbated if the prefecture has railways. We then
compute the net effect of credit supply growth for the prefecture with the
average number of railways. Finally, we run this regression for different time
periods, from the short run (up to 1890, per the industrial activity regressions)
through the long run (up to 1940) and intervening years, and in levels of
income per capita. We expect that the effect of the credit supply shock on GPP
growth per capita attenuates over time, varies by sector, and differs by early
rail access.
(3) ∆𝐿𝑎𝑏𝑜𝑟𝑅𝑎𝑡𝑖𝑜!"!" = 𝛽! + 𝛽! ∗ 𝐿𝑎𝑏𝑜𝑟𝑅𝑎𝑡𝑖𝑜!"!"!! + 𝛽! ∗
𝑆𝑎𝑚𝑢𝑟𝑎𝑖!! + 𝛽! ∗ 𝑆𝑎𝑚𝑢𝑟𝑎𝑖!! ∗ 𝑆𝑡𝑎𝑡𝑖𝑜𝑛𝑠!! + 𝛿! + 𝑒!",
Our third model examines structural change between major sectors in
the economy, using changes in the ratio of total laborers 𝐿𝑎𝑏𝑜𝑟𝑅𝑎𝑡𝑖𝑜!"!" in
each of the three sectors of primary, secondary, and tertiary to one of the other
sectors. Labor force ratios are in natural logs. Included covariates, aside from
the lagged labor force ratio term, are the same as in the previous model. The
14
lag term for labor force ratio is included to capture earlier reallocation. As
with that model, we interpret a positive net effect from initial samurai share as
facilitating the transition between the numerator sector relative to that in the
denominator, and show results for the three possible combinations. These
regressions are run for each subperiod up through the entire period between
1874 and 1940. Per existing literature (e.g., Fukao et al., 2015), we expect the
samurai effect to facilitate movement away from the primary sector into the
other two sectors.
III. Results
A. Short Run Industrial Activity
Results from our short run industry level regression analysis are given
in Tables VII through IX, which have as dependent variables per capita firm
counts, per capita investment capital, and average firm capital levels,
respectively. We show both the results from the full panel of prefectures as
well as those for our restricted sample of prefectures. We also separate the
analysis into two periods of 1883-1890 and 1883-1898 to investigate the short
run persistence of the samurai credit shock. Since samurai population share
was largely stable during both decades, its contemporaneous relationship with
the outcome measures is assumed to proxy for the credit supply shock in 1876.
Before showing the regression results, a concern regarding our
exercise is that prefectures may already be different prior to the stipend
conversion. To fully address this concern, we would need to have data from
before the samurai pension commutation. Unfortunately, data on industrial
capital or number of firms by prefecture prior to 1883 is not available. We can,
however, regress per capita income in 1874 on samurai population share in
1880. Whether using the full sample of prefectures or the restricted set with
stable population shares, neither coefficient on samurai population share is
15
statistically significant.18 Therefore, we cannot reject the hypothesis that
Japanese prefectures had the same income before the pension commutation.
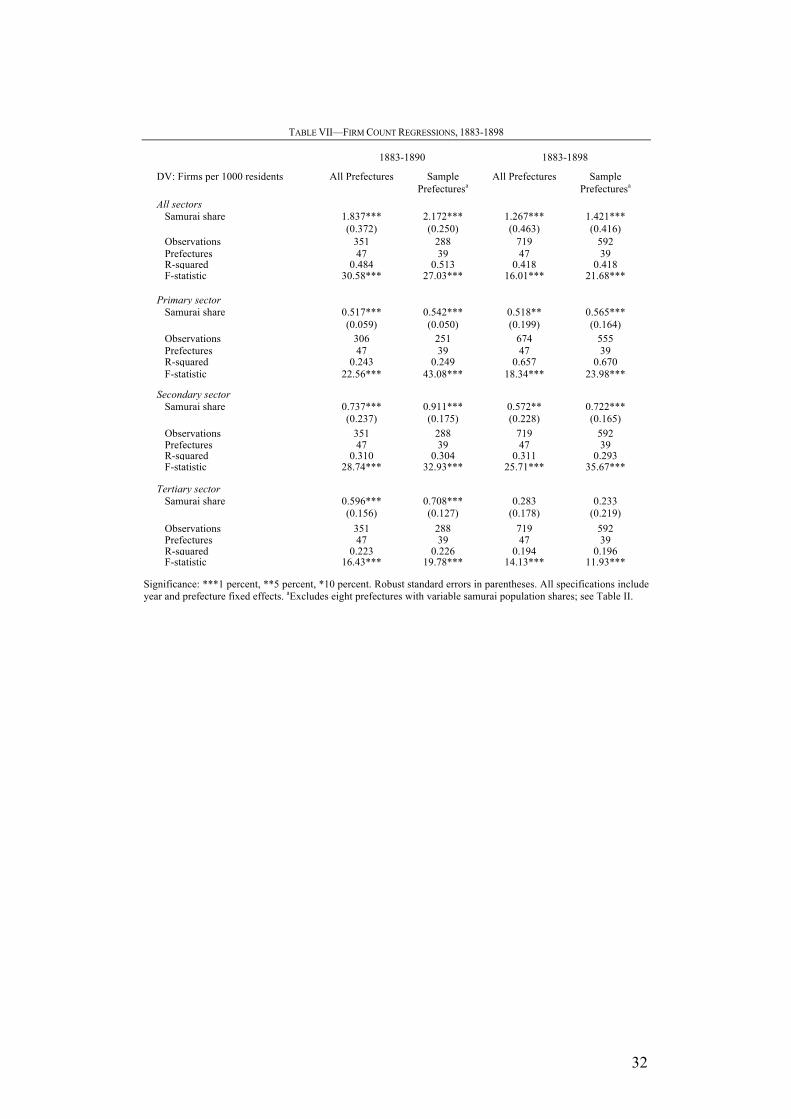
As the regression results in Table VII show, samurai population share
is positively associated with per capita firms in aggregate and by major sector.
A one percent increase in samurai population corresponds with approximately
18 additional firms per one million residents between 1883 and 1890.19 This is
equivalent to 28.5 percent of the average total of per capita firms based on a
period mean of 65 firms per million residents. For the longer period of 1883 to
1898, the average effect is lower, about 15 percent of average per capita firms
out of a mean of 83 firms per million. In the restricted sample, extensive firm
count is statistically significantly larger in the secondary sector relative to the
primary sector in the 1880s, but then diminishes in the following decade. This
is consistent with the decreasing share of output observed in the primary
sector from Table VII.
Between sectors, the corresponding shares of average per capita firms
is 76 percent (primary), 21 percent (secondary), and 28 percent (tertiary) in the
1883 to 1890 period across all prefectures and similar magnitudes in the
restricted sample. In the longer period to 1898, the shares fall to 34 percent
(primary), 14 percent (secondary), and 10 percent (tertiary). Qualitatively
more pronounced is the relationship between samurai population share and
tertiary sector firm numbers, which is statistically significant in the first period
of analysis but not in the longer one extending to the late 1890s. This result is
also supported by historical evidence on samurai bank ownership, which fell
as private banking institutions rose in prominence (at the expense of national
banks that were mainly owned by the samurai).
[Table VII]
For total capital investment, samurai population share is also
contemporaneously correlated with increased investment in the first decade,
18
For the full sample of prefectures, the estimated coefficient is -0.565; for the restricted sample of prefectures with stable population shares, the coefficient is 0.095. Neither is statistically significant to at least the 10 percent level.
19 This is calculated by multiplying the samurai share coefficient by ten (or dividing the coefficient by 100 for
whole number percentage points and then multiplying by 1000).
16
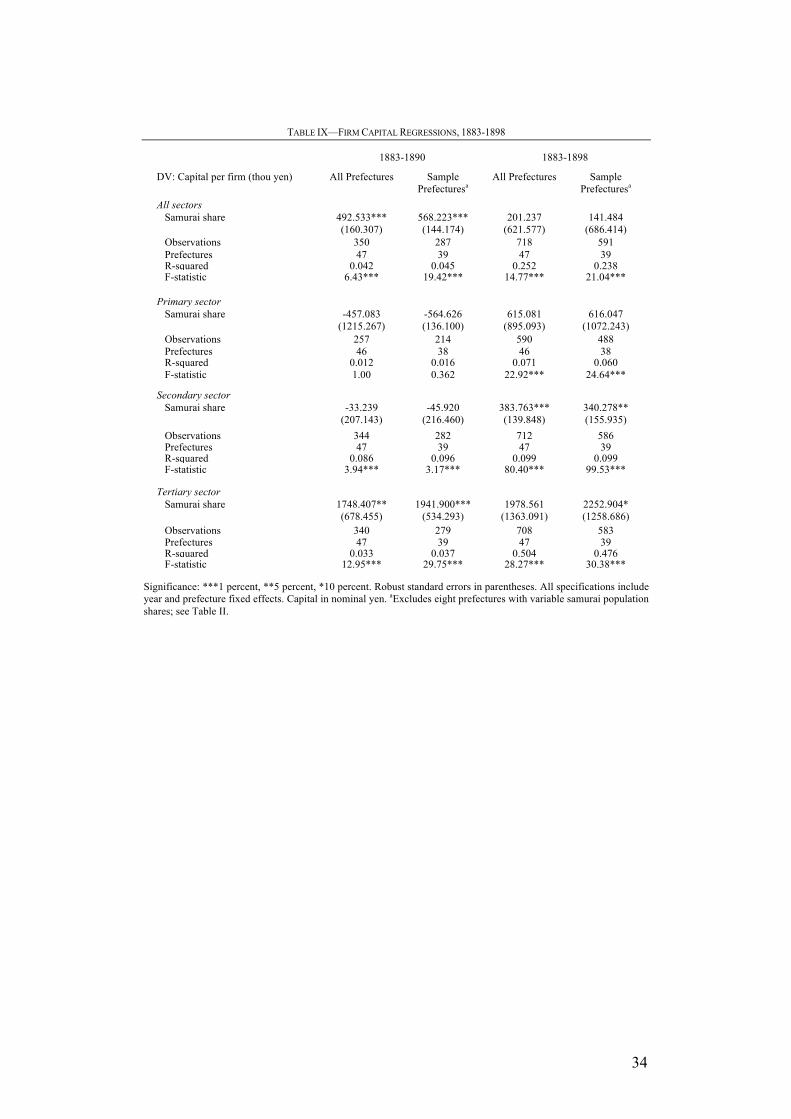
but not for the total period lasting until 1898. As shown in Table VIII, three
quarters of the investment was in the tertiary sector, followed by
manufacturing and allied industries, and about ten percent from primary
production. Our interpretation of the continued growth in both the primary and
secondary sectors during the 1890s, despite an insignificant relationship in the
tertiary sector, is that the availability of investment capital in banking and
finance earlier could sustain other areas of capital growth, i.e., a redistribution
of financial credit to productive areas in the real economy. This point is
corroborated in the average firm capital regressions in Table IX, where tertiary
sector firm capital grew strongly in the 1880s while secondary sector firms
through the 1890s, as well as in the long run analysis utilizing railway access
as a proxy for credit demand.
[Tables VIII and IX]
B. Long Run Output Growth and Labor Reallocation
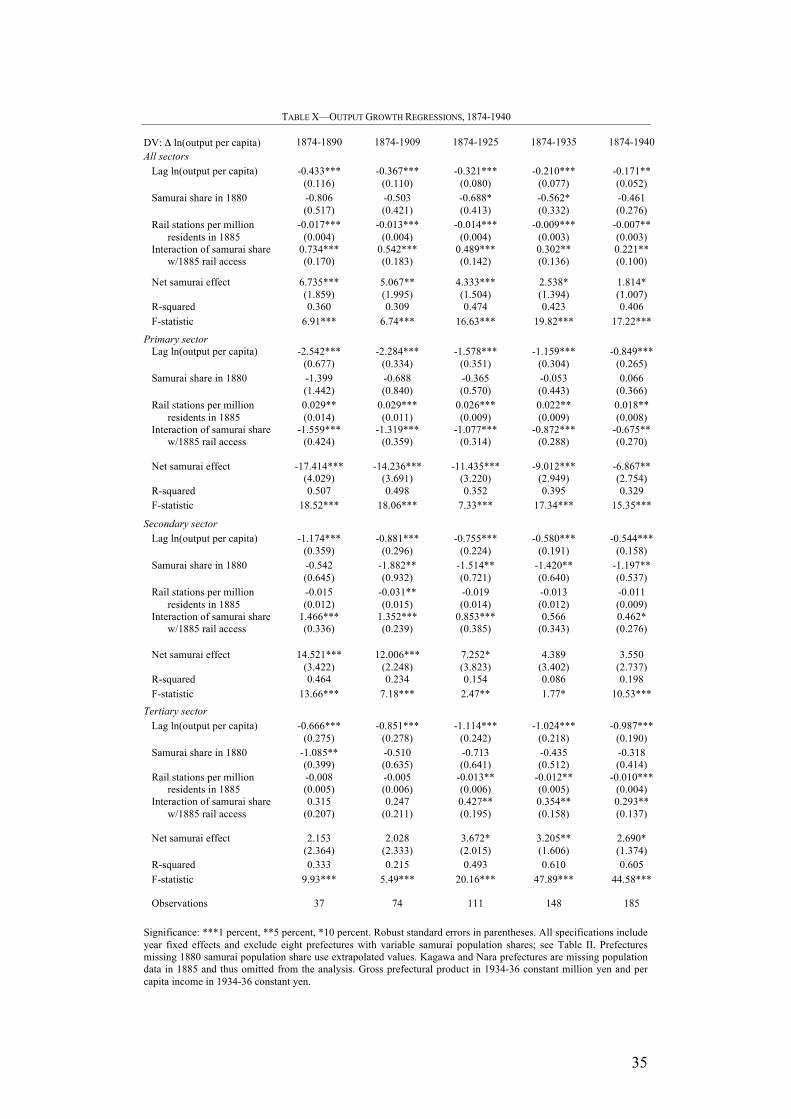
To generalize the economic effects to output as a whole as well as to
differentiate between use of credit supply, we examine regional output growth
over the short and long run and include the adoption of railways. Table X
provides results for increasing periods starting with 1874 and each subsequent
year of available data. Note that the first column, 1874 to 1890, corresponds to
the first decade of industry level outcomes from the previous three tables and
captures two-thirds of the total value of bonds redeemed. In the simple
regression with only samurai population share in 1880 (results not shown),
there is no statistically significant relationship with overall output growth over
this period. Once the effect of railway access is included, however, the net
samurai population share effect across all sectors is positive and represents
55.6 percent of per capita output growth in rail accessible prefectures between
1874 and 1890.20 This effect is statistically significant and persists for the next
20
This is calculated from an average natural log of per capita output growth (all sectors) of 0.121 in prefectures with rail access by 1885 between 1874 and 1890. Similarly, the means for subsequent periods are: 0.166 (1874-1909), 0.212 (1874-1925), 0.181 (1874-1935), and 0.186 (1874-1940). Means for per capita income growth are similar when using the full sample of prefectures regardless of rail access year.

17
four periods lasting until 1940, albeit declining in average share of growth to
9.8 percent over the six decades.21
[Table X]
Our regression analysis also decomposes the effect from the credit
supply shock (i.e., samurai share in 1880) from the productivity shock (i.e.,
per capita rail stations in 1885) and their interaction. The results indicate that
while rail access itself has a slightly negative effect across regions, which may
be due to industrial agglomeration drawing (Tang 2014), this is offset in rail-
accessible regions with higher shares of samurai. Both effects become
insignificant in the very long run, by the 1930s.
When disaggregated by major sector, the decrease in output growth
from primary production is more than compensated by that in both the
secondary and tertiary sectors. The net samurai effect is statistically significant
for the periods up to 1925 in the secondary sector, accounting for the bulk of
the effect on total output growth per capita, while the effect becomes
significant for the tertiary sector only as the period lengthens to the longer run,
in the last three columns. We interpret these findings to be that the credit
supply shock, coupled with rail access, varied in its real impact between the
short and long runs. This evidence is consistent with the historical record of
Japan and other countries, where the economy transitions from primary sector
activity toward capital-intensive manufacturing and then subsequently into
services.
Across all the specifications, credit supply on its own has a weakly
negative or no effect on per capita output. Rail access, which allows for
market access and agglomeration economies, has a mixed effect independently,
but in interaction with credit supply is positive and statistically significant for
the economy as a whole and in both the secondary and tertiary sectors. In
other words, for areas with rail access, increased credit supply is associated
with higher per capita output. This suggests the importance of productive uses
21
The intervening per period growth contributions are 30.5 percent (1874-1909), 20.4 percent (1874-1925), and 14.0 percent (1874-1935). The results from using per capita output in levels are qualitatively similar in statistical significance and length of persistence.

18
for credit, e.g., infrastructure, on directly or indirectly promoting short run,
and for the tertiary sector, long run economic growth.22
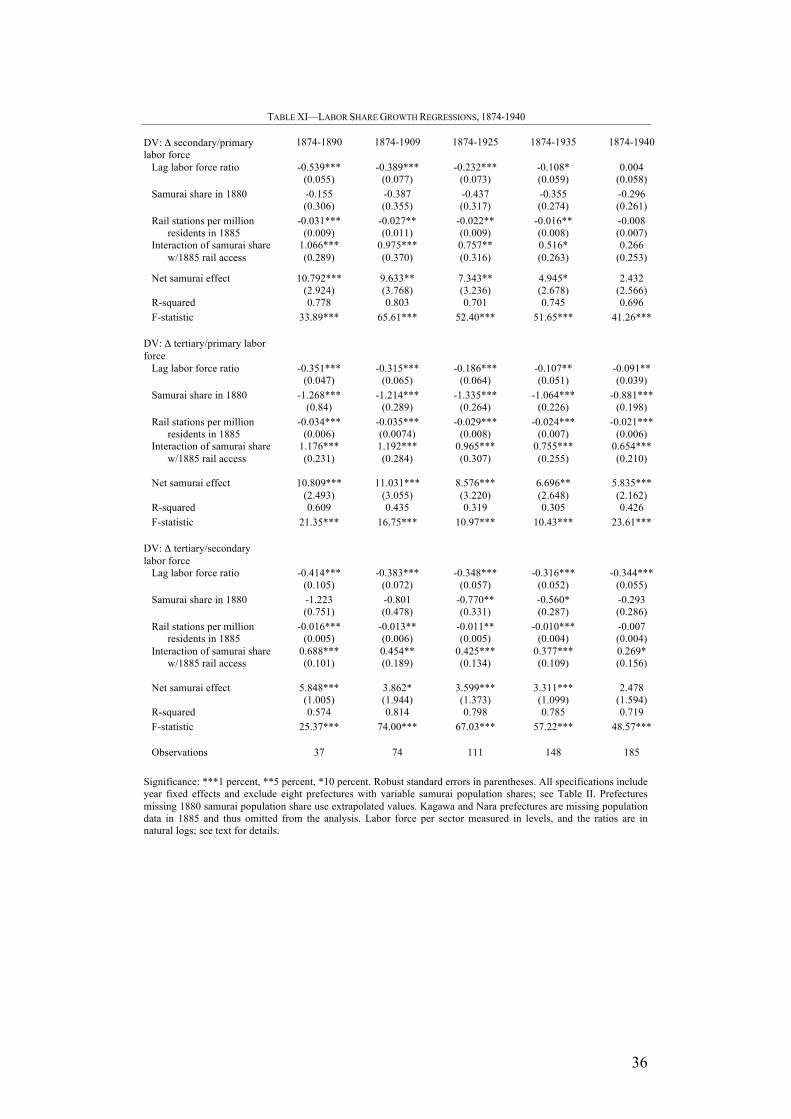
Similar results obtain when analyzing labor share ratios between each
of the three major sectors, shown in Table XI. The net samurai effect inclusive
of early rail access is positive and significant up through 1935 (columns 1 to
4) when comparing the secondary to primary sector. This can be interpreted as
a relative increase in secondary labor force shares: between 1874 and 1890, a
one percent increased in initial samurai population share corresponding to a
15.3 percent increase in the ratio of secondary sector laborers to those in the
primary industries among early-access rail prefectures, rising to 16.5 percent
for the period until 1935.23 That most of these decades coincide with a fairly
stable absolute size in the agricultural labor force underscores the rapid
industrial transition in areas with increased credit and investment opportunities
(Nakamura 1966, p. 143). The long-run effect lasts until 1940 in the
comparison between the tertiary to primary sector labor force shares, although
the former expanded at a slower rate than the secondary sector.24
[Table XI]
IV. Robustness
We check our results for robustness using a variety of alternative
measures that could be masked by initial samurai share. For example, Rajan
and Ramcharan (2015) analyze the effect of credit supply on the boom-bust of
land prices in the United States in the 1920s. Their preferred measure of credit
supply is the number of banks, i.e., financial intermediaries. Although our
exercise and historical episode differ from theirs, it could be the case that the
22
Since the data for the tertiary sector in 1874 are not disaggregated between transport and other services (including finance), we are unable to attribute the growth improvement to direct investment in transport infrastructure or to financial or retail services.
23 The conditional means of sectoral labor ratio growth between secondary and primary sectors are 0.705 (1874-
1890), 0.398 (1874-1909), 0.372 (1874-1925), 0.300 (1874-1935) and 0.280 (1874-1940). 24
For tertiary to primary labor ratio growth, the conditional means are 0.359 (1874-1890), 0.298 (1874-1909), 0.340 (1874-1925), 0.296 (1874-1935), and 0.239 (1874-1940). For the tertiary to secondary comparison, the means for the respective periods are -0.347, -0.099, -0.032, -0.004, and -0.040.
19
effect we identify on credit supply is similarly driven by the number of banks.
This is plausible, despite the relatively small share of commutation bonds
invested in banks relative to the total value of the bond issuance, since earlier
research indicates extensive growth of financial intermediation predicts
modern industrial activity (Tang 2013). Thus, we control for this possible
effect by including the number of banks per capita at the prefecture level in
our baseline regression for the short run period. Banking data come from the
database of banking establishments collected by the Japanese Bankers
Association (2012).
Table XII reports the results of including banks per capita to the earlier
regressions of firms per capita, capital per capita, and firm capitalization. The
first column considers all prefectures and the second column those with stable
samurai population shares. Across both samples and the three measures of
industrial activity, samurai share is positive and statistically significant. In
contrast, while usually positive the coefficient of banks per capita is not
significant in any regression.
[Table XII]
A related concern is that demand factors could be driving our results.
In order to address this concern, we replicate the same regressions with total
population instead of per capita income. Ideally, we would prefer to use the
latter as a demand measure but this variable is not available at the prefecture
level on an annual basis. As Japan had not yet transitioned to modern
economic growth until the late 1890s (Perkins and Tang 2017), total
population may be a good proxy for demand (income) in this earlier period.
The third and fourth columns of Table XII report the coefficients of adding
total population to our baseline regressions. The coefficient on samurai share
remains positive and statistically significant in all regressions. However, total
population is not significant, which corroborates the per capita income
regression results using benchmark years between 1874 and 1940.
For the long run results, we rely on the earliest available data for
prefectures, which were collected starting in 1880. Since the samurai bond
conversion took place in 1876, it may be useful to use pre-conversion samurai

20
shares. To have these, we use linear extrapolation to impute missing years as
well as to extend these series back to the 1870s. Results for 1875 samurai
population shares (not shown) are qualitatively consistent with those using the
1880 shares.
Finally, while the initial distribution of samurai across prefectures may
vary, it is possible that this was not random or exogenous to economic activity.
It may be the case that higher samurai shares may reflect differences in land
productivity, with more fertile areas generating sufficient revenues to support
a larger rentier class. We check for this by using prefectural latitude (Google
Maps 2016) instead of initial samurai share as Japan was a largely agricultural
economy until the end of the nineteenth century. This variable is also
interacted with early rail access per the earlier specifications to assess the
impact of exogenously determined climatic differences on per capita output
growth. The estimates for this specification are shown in Table XIII for all
sectors in each of the subperiods of analysis.
[Table XIII]
In the top panel, the net latitide effect is statistically insignificant for
each of the subperiods. Once initial samurai population share and its
interaction with early rail access are added to the specification, however, the
net samurai effect remains positive and statistically significant for the periods
extending up to 1940. These periods and magnitudes are similar to those
without the latitude variables, and the net latitude effect remains statistically
insignificant across all periods. We interpret these results as indicating an
effect from the 1876 pension commutation and injection of credit as opposed
to any underlying economic differences in the prefectures themselves.
V. Concluding Remarks
Studies on the impact of credit supply on economic growth usually
emphasize the negative relationship with financial crises, neglecting to
highlight potential short and long run benefits and heterogeneity between
21
regions within a country. Our analysis of an exogenous credit supply shock in
late nineteenth century Japan indicates that there are persistent positive effects
for the economy as a whole and by sector. In the short run, we find evidence
of extensive growth in the secondary sector even if much of the credit supply
accumulated in the tertiary. In the long run, the effect on output growth is also
observed to be largest in early years and steadily decreases over the next five
decades, but only in the presence of productivity-enhancing technology (i.e.,
early railway access). Long-run growth investment opportunities allowing
greater market access would allow regions to take advantage of the additional
credit supply made available from the samurai pension conversion.
Whether the effect would have persisted longer is unclear given the
global economic depression in the 1930s and Japanese militarization before
World War II. That said, the credit supply shock varied by sector and region,
with most benefits accruing in tertiary industries and disproportionately in
areas with early access to railways, which may also have spatial effects and
agglomeration economies. The sectoral, temporal, and demand effects are
visible both in per capita income growth as well as labor reallocation between
sectors. These results are suggestive of the joint importance of credit supply
and the opportunity to utilize it in ways that maintain growth over time and
facilitate structural change.
Does the pre-war Japanese case generalize to other economic scenarios
as well? Understandably, in the late nineteenth century the Japanese economy
was fragmented and financially underdeveloped, which may account for the
large observed effects. The exogenous credit supply shock was also extremely
large in relative terms, which may be unrealistic to expect in a modern context.
Nevertheless, the persistence of a positive impact for the entire pre-war period
is remarkable given the rapidity of industrialization and market integration,
and shows that initial conditions may play a strong role in continued and long
run development. Our next steps would include identifying the channels
through which the interaction of credit supply and demand had the most
impact as well as whether there may be negative effects obscured at the
current level of regional analysis, especially for within regional inequality and
returns to labor.
22
REFERENCES
Atack, Jeremy, Michael Haines, and Robert Margo. 2008. "Railroads and the
rise of the factory: evidence for the United States, 1850-70." NBER
Working Paper 14410. Cambridge: National Bureau of Economic Research,
October.
Banerjee, Abhijit and Lakshmi Iyer. 2005. "History, institutions, and
economic performance: the legacy of colonial land tenure systems in India."
American Economic Review, 95(4): 1190-1213.
Beasley, W.G. 1972. The Meiji Restoration. Stanford: Stanford University
Press.
Chuo Shoin. 1995. Ekimei Jiten [Rail Stations in Japan], 5th edition. Japanese
language text. Tokyo: Chuo Shoin Henshubu.
Dehejia, Rajeev and Adriana Lleras-Muney. 2007. "Financial development
and pathways of growth: state branching and insurance laws in the United
States, 1900-1940." Journal of Law and Economics, 50(2): 239-272.
Donaldson, David. Forthcoming. "Railroads of the raj: estimating the impact
of transportation infrastructure." American Economic Review.
Flath, David. 2014. The Japanese Economy, third edition. Oxford: Oxford
University Press.
Fukao, Kyoji, Jean-Pascal Bassino, Tatsuji Makino, Ralph Papryzycki,
Tokihiko Settsu, Masanori Takashima, and Joji Tokui. 2015. Regional
Inequality and Industrial Structure in Japan: 1874-2008. Tokyo: Maruzen
Publishing Company.
Google Maps. 2016. Map of Japan (online). Accessed 22 September 2016:
www.maps.google.com.jp
Guiso, Luigi, Paola Sapienza, and Luigi Zingales. 2004. "Does local financial
development matter?" Quarterly Journal of Economics, 119(3): 929-969.
Harootunian, Harry. 1960. "The economic rehabilitation of the samurai in the
early Meiji Period." Journal of Asian Studies, 19(4): 433-444.
23
Herranz-Loncan, Alfonso. 2011. "The role of railways in export-led growth:
the case of Uruguay, 1870-1913." Economic History of Developing Regions
26(2): 1-33.
Japan Statistical Association. 1962. Nihon Teikoku Tokei Nenkan [Statistical
Yearbook of the Japanese Empire]. Tokyo: Tokyo Ripurinto Shuppansha.
Japanese Bankers Association. 2012. Bank Database Change History.
Accessed 1 June 2012: www.zinginkyo.or.jp/library/hensen/
Jayaratne, Jith and Philip Strahan. 1996. "The finance-growth nexus: evidence
from bank branch deregulation." Quarterly Journal of Economics,
111(1996): 639-671.
Jorda, Oscar, Moritz Schularick, and Alan M. Taylor. 2011. "When credit
bites back: leverage, business cycles, and crises." NBER Working Paper
17621. Cambridge: National Bureau of Economic Research, November.
--- 2017. "Macrofinancial history and the new business cycle facts." NBER
Macroeconomics Annual 2016, volume 31. Eds. Martin Eichenbaum and
Jonathan A. Parker. Chicago: University of Chicago Press.
King, Robert and Ross Levine (1993). "Finance and growth: Schumpeter
might be right," Quarterly Journal of Economics 108(3), 717-737.
Rajan, Raghuram, and Rodney Ramcharan (2015). "The Anatomy of a Credit
Crisis: The Boom and Bust in Farm Land Prices in the United States in the
1920s." American Economic Review, 105(4): 1439-77.
Levine, Ross. 1997. "Financial development and economic growth: views and
agenda." Journal of Economic Literature, 35(2): 688-726.
McLaren, W.W. 1979. Japanese Government Documents. Tokyo: Asiatic
Society of Japan.
Mian, Atif and Amir Sufi. 2009. "The Consequences of Mortgage Credit
Expansion: Evidence from the U.S. Mortgage Default Crisis." Quarterly
Journal of Economics, 124(4): 1449-1496.
Mian, Atif, Amir Sufi, and Emil Verner. 2017. “How do credit supply shocks
affect the real economy? Evidence from the United States in the 1980s.”
Washington Center for Equitable Growth Working Paper 2017-07.
24
Miyajima, Shigeki and Warren Weber. 2001. "A comparison of national banks
in Japan and the United States between 1872 and 1885." Monetary and
Economic Studies 19-1. Tokyo: Bank of Japan.
Mitchener, Kris and Mari Ohnuki. 2007. "Institutions, competition, and capital
market integration in Japan." Journal of Economic History, 69(1): 138-171.
Nakamura, James. 1966. Agricultural production and the economic
development of Japan, 1873-1922. Princton: Princeton University Press.
Perkins, Dwight and John P. Tang. 2017. "East Asian Industrial Pioneers:
Japan, Korea, and Taiwan." The Spread of Modern Industry to the Periphery
since 1871. Eds. Kevin O'Rourke and Jeffrey Williamson. Oxford: Oxford
University Press.
Rajan, Raghuram and Luigi Zingales. 1998. "Financial dependence and
growth." American Economic Review, 88(1998): 559-586.
--- 2001. "Financial systems, industrial structure, and growth." Oxford Review
of Economic Policy, 17(4): 467-482.
Rousseau, Peter. 1999. "Finance, investment, and growth in Meiji-era Japan."
Japan and the World Economy, 11: 185-198.
Schularick, Moritz and Alan M. Taylor. 2012. "Credit booms gone bust:
monetary policy, leverage cycles, and financial crises, 1870-2008."
American Economic Review, 102(2): 1029-1061.
Shizume, Masato and Masayoshi Tsurumi. 2016. "Modernizing the financial
system in Japan during the 19th century: national banks in Japan in the
context of free banking." WINPEC Working Paper Series No. E1607.
Tokyo: Waseda Institute of Political Economy.
Summerhill, William. 2005. "Big social savings in a small laggard economy:
railroad-led growth in Brazil." Journal of Economic History, 65(1): 72-102.
Tang, John P. 2013. "Financial intermediation and late development in Meiji
Japan, 1868 to 1912." Financial History Review, 20(2): 111-135.
--- 2014. "Railroad expansion and industrialization: evidence from Meiji
Japan." Journal of Economic History, 74(3): 863-886.
Tomita, Toshiki. 2005. "Government bonds in the Meiji restoration period."
NRI Papers No. 87. Tokyo: Nomura Research Institute, March.
25
Umemura, Mataji, Keiko Akasaka, Ryoshin Minami, Nobukiyo Takamatsu,
Kurotake Arai, and Shigeru Itoh. 1988. Manpower. Volume 2 in Estimates
of Long-tern Economic Statistics of Japan since 1868. Eds. Kazushi Ohkawa,
Miyohei Shinohara, and Mataji Umemura. Tokyo: Toyo Keizai Shinposha.
Yamamura, Kozo. 1967. "The role of samurai in the development of modern
banking in Japan." Journal of Economic History, 27(2): 198-220.
--- 1974. A Study of Samurai Income and Entrepreneurship: Quantitative
Analyses of Economic and Social Aspects of the Samurai in Tokugawa and
Meiji Japan. Cambridge: Harvard University Press.
Yamazaki, Junichi. 2017. “Railroads, technology adoption, and modern
economic development: evidence from Japan.” Institute of Social and
Economic Research Discussion Paper 1000. Osaka: Institute of Social and
Economic Research.

26
TABLE I—SAMURAI PENSION COMMUTATION SCALES, 1876
Original Annual Income Value (yen) a Conversion Factorb Bond Interest (%)c 70,000 yen or higher 5.0 5
60,000 to 70,000 5.25 5 50,000 to 60,000 5.5 5 40,000 to 50,000 5.75 5 30,000 to 40,000 6.0 5 20,000 to 30,000 6.25 5 10,000 to 20,000 6.5 5 7,000 to 10,000 6.75 5 5,000 to 7,000 7.0 5 2,000 to 5,000 7.25 5 1,000 to 2,000 7.5 5 900 to 1,000 7.75 6 800 to 900 8.0 6 700 to 800 8.25 6 600 to 700 8.5 6 500 to 600 8.75 6 450 to 500 9.0 6 400 to 450 9.25 6 350 to 400 9.5 6 300 to 350 9.75 6 250 to 300 10.0 6 200 to 250 10.25 6 150 to 200 10.5 6 100 to 150 11.0 6 75 to 100 11.5 7 50 to 75 12.0 7 40 to 50 12.5 7 30 to 40 13.0 7 25 to 30 13.5 7
Below 25 14.0 7
Source: McLaren (1979) and Tomita (2005). aFor incomes in perpetuity. Non-hereditary life incomes receive the same interest rates but for half the duration. Non-hereditary fixed term incomes also receive the same interest rates but for shorter durations than hereditary incomes: above 10 years (40 percent); 8 to 10 years (35 percent); 6 to 8 years (30 percent); 4 to 6 years (25 percent); 3 to 4 years (20 percent); and 2 years (15 percent). bScaling factor to convert annual income into total bond capitalization value; e.g., a 6,000 yen annual income would be converted into bonds worth 42,000 yen paying 5 percent interest per year. cRedemption of bonds bearing 7 percent interest was completed in 1891, 6 percent interest in 1893, and 5 percent interest in 1906. See text for more detail.
27
TABLE II—SAMURAI POPULATION SHARES BY PREFECTURE, 1875-1898
1875a 1887 1898 % Annual Growthb
Japan 5.4 5.0 4.8 -0.027 Aichi 3.7 3.4 3.4 -0.018 Akita 6.0 5.2 4.5 -0.072 Aomori 6.7 5.9 5.7 -0.059 Chiba 1.9 1.6 1.4 -0.021 Ehime 3.8 4.0 Fukui 4.1 5.1 Fukuoka 7.3 6.7 6.0 -0.060 Fukushima 4.5 4.9 5.4 0.040 Gifu 1.8 1.7 1.6 -0.012 Gunma 3.4 3.0 2.6 -0.035 Hiroshima 2.9 2.3 2.2 -0.046 Hokkaido 5.5 11.1 8.9 0.332 Hyogo 3.0 2.7 2.6 -0.020 Ibaraki 3.4 3.1 3.2 -0.009 Ishikawa 6.6 5.7 Iwate 2.0 2.5 Kagawa 3.7 3.1 -0.030 Kagoshima 24.0 23.2 Kanagawa 1.0 1.4 1.8 0.040 Kochi 8.2 7.1 6.2 -0.091 Kumamoto 9.3 7.6 6.6 -0.129 Kyoto 3.2 3.1 Mie 2.7 2.4 2.5 -0.024 Miyagi 5.8 5.0 4.4 -0.063 Miyazaki 18.5 18.0 17.6 -0.031 Nagano 3.3 2.9 2.6 -0.033 Nagasaki 12.5 10.6 10.1 -0.122 Nara 5.2 4.5 3.7 -0.074 Niigata 2.4 2.0 1.8 -0.026 Oita 5.0 4.5 3.9 -0.049 Okayama 3.9 3.4 2.9 -0.047 Okinawa 26.3 27.4 29.2 0.138 Osaka 1.1 1.5 Saga 16.9 15.4 14.1 -0.135 Saitama 1.2 1.2 0.9 -0.013 Shiga 2.9 2.4 2.2 -0.036 Shimane 3.8 3.0 2.7 -0.061 Shizuoka 4.1 3.0 2.1 -0.091 Tochigi 2.0 1.9 Tokushima 6.2 5.8 5.1 -0.051 Tokyo 9.7 9.6 8.7 -0.049 Tottori 6.6 5.6 5.2 -0.077 Toyama 2.4 2.4 2.0 0.000 Wakayama 5.5 4.8 4.1 -0.067 Yamagata 8.6 7.5 6.5 -0.098 Yamaguchi 8.4 7.7 7.0 -0.059 Yamanashi 0.3 0.4 0.5 0.008
Source: Authors' calculations. aBased on linear extrapolation from 1880-1898 period. bEstimates of annual change use robust standard errors and are statistically significant at least to 5 percent except where missing. Kagawa prefecture is missing data for 1887.
28
TABLE III—DISTRIBUTION OF BANKING CAPITAL BY PREFECTURE, 1884
National Bank Counta
National Bank Capitalb
Samurai Ownership %
Other Banking Capitalb
Japan 142 52,536 58.5 32,667 Aichi 4
670 40.0 913
Akita 1 100 31.6 0 Aomori 2 300 78.4 181 Chiba 2 215 73.7 275 Ehime 4 440 53.3 536 Fukui 4 430 91.2 282 Fukuoka 4 640 72.2 504 Fukushima 5 930 20.4 676 Gifu 5 760 30.6 580 Gunma 2 570 47.4 823 Hiroshima 2 440 50.5 0 Hokkaido 2 330 40.7 100 Hyogo 7 790 37.1 460 Ibaraki 4 420 76.4 416 Ishikawa 2 190 63.9 0 Iwate 2 150 64.9 20 Kagoshima 2 530 90.8 67 Kanagawa 4 3,100 27.0 2,124 Kochi 4 650 64.0 0 Kumamoto 3 265 96.9 100 Kyoto 4 400 38.4 330 Mie 4 350 65.8 0 Miyagi 1 250 42.4 32 Miyazaki 2 100 80.8 511 Nagano 4 760 34.9 2,786 Nagasaki 3 370 35.7 435 Niigata 5 1,300 15.8 3,238 Oita 3 340 73.1 584 Okayama 2 380 81.5 689 Okinawa 0 0 0 100 Osaka 11 2,590 12.7 1,642 Saga 2 390 94.1 795 Saitama 1 200 25.8 1,459 Shiga 3 500 17.7 210 Shimane 1 80 70.6 79 Shizuoka 3 750 17.7 3,661 Tochigi 1 300 27.3 314 Tokushima 1 260 76.3 636 Tokyo 16 28,046 73.2 3,983 Tottori 1 200 86.9 24 Toyama 1 300 21.1 744 Wakayama 1 200 74.1 117 Yamagata 4 590 37.5 174 Yamaguchi 2 680 89.9 0 Yamanashi 1 250 5.8 2,067
Source: Japan Statistical Association (1962) and authors' calculations. aExcludes branches. bIn thousand nominal yen. Other capital includes private banks and quasi-banking institutions.
29
TABLE IV—INDUSTRIAL ACTIVITY BY PREFECTURE, 1885-1890
1885 1890 Firms Capital Avg. Firm
Capital Firms Capital Avg. Firm
Capital
All Prefectures All sectors 35.2 1,450.3 25.2 93.4 4,901.2 36.0 Primary 2.1 39.2 16.4 10.1 178.9 17.7 Secondary 14.0 291.1 17.2 49.7 1,685.4 26.8 Tertiary 19.1 1,120.0 39.7 33.6 3,037.3 60.7 Sample Prefecturesa All sectors 34.9 1,497.7 23.7 90.3 4,942.8 35.7 Primary 2.2 30.8 14.6 10.7 185.7 15.9 Secondary 14.0 280.6 15.5 45.2 1,549.9 26.6 Tertiary 18.7 1,186.2 41.7 34.4 3,207.2 60.6 Top Quartile Prefecturesb All sectors 30.3 3,805.1 43.8 93.8 12,360.1 54.7 Primary 1.4 34.8 22.2 8.3 450.3 26.1 Secondary 17.8 631.8 21.4 49.2 3,828.6 36.3 Tertiary 11.1 3,138.5 102.2 36.2 8,081.1 109.4 Bottom Quartile Prefecturesb All sectors 34.9 759.9 19.5 92.9 2,503.1 31.1 Primary 2.2 10.3 6.9 8.8 72.5 17.5 Secondary 8.2 96.8 15.3 43.6 648.6 22.6 Tertiary 23.7 652.8 22.5 40.5 1,782.0 43.5
Source: Japan Statistical Association (1962) and authors' calculations. Capital values in thousand nominal yen. aExcludes eight prefectures with variable samurai population shares; see Table II. bBased on 1875 samurai shares.
30
TABLE V—PRE-WAR PREFECTURAL OUTPUT, 1874-1940
1874 1890 1909 1925 1940
Gross Prefectural Product
Capitalization (thou yen) 648 68 326 254 Toyama 1 300 21.1 744 Wakayama 1 200 74.1 117 Yamagata 4 590 37.5 174 Yamaguchi 2 680 89.9 0 Yamanashi 1 250 5.8 2,067
1874 1890 1909 1925 1940
All Prefectures Gross Prefectural Product 84.0 113.2 175.4 311.8 519.9 Per capita income 113.2 127.8 152.8 214.5 285.5 Primary (%) 61.4 50.1 42.6 35.7 26.9 Secondary (%) 10.3 14.8 19.6 22.3 35.8 Tertiary (%) 28.3 35.1 37.8 42.0 37.3
Sample Prefecturesa Gross Prefectural Product 78.7 107.4 170.6 298.8 499.5 Per capita income 109.3 122.1 149.0 208.9 280.5 Primary (%) 63.2 51.4 43.1 36.3 27.4 Secondary (%) 10.0 14.5 19.3 22.0 36.0 Tertiary (%) 26.8 34.1 37.5 41.7 36.6
Top Quartile Prefecturesb Gross Prefectural Product 90.3 128.4 215.0 418.0 751.1 Per capita income 124.1 135.6 163.5 227.5 306.5 Primary (%) 58.6 47.5 41.1 34.7 26.6 Secondary (%) 8.6 13.7 18.3 20.0 33.7 Tertiary (%) 32.8 38.8 40.6 45.3 39.7 Bottom Quartile Prefecturesb Gross Prefectural Product 83.1 106.1 155.0 235.9 403.3 Per capita income 99.8 117.0 146.4 198.9 284.5 Primary (%) 65.4 54.6 43.2 36.1 25.4 Secondary (%) 10.4 13.1 18.6 22.2 39.8 Tertiary (%) 24.2 32.3 38.2 41.6 34.8
Source: Fukao et al (2015), Economic and Social Research Institute (2017), Jorda et al (2017) and authors' calculations. Gross prefectural product in constant 1934-36 million yen and per capita income in constant 1934-36 thousand yen. aExcludes eight prefectures with variable samurai population shares; see Table II. bBased on 1875 samurai shares.
31
TABLE VI—PRE-WAR PREFECTURAL LABOR FORCE, 1874-1940
1874 1890 1909 1925 1940
Gross Prefectural Product
Capitalization (thou yen) 648 68 326 254 Toyama 1 300 21.1 744 Wakayama 1 200 74.1 117 Yamagata 4 590 37.5 174 Yamaguchi 2 680 89.9 0 Yamanashi 1 250 5.8 2,067
1874 1890 1909 1925 1940
All Prefectures Labor force (thou) 462.7 495.0 495.7 579.1 708.0 Primary (%) 71.0 60.0 56.0 46.7 40.6 Secondary (%) 12.7 21.0 21.3 24.3 28.4 Tertiary (%) 16.3 19.0 22.7 29.0 31.0
Sample Prefecturesa Labor force (thou) 461.5 499.8 500.7 577.8 703.5 Primary (%) 72.0 60.8 57.0 47.9 42.0 Secondary (%) 12.4 20.7 21.0 24.0 27.8 Tertiary (%) 15.6 18.5 22.0 28.1 30.2
Top Quartile Prefecturesb Labor force (thou) 409.7 463.3 505.0 623.9 815.2 Primary (%) 65.6 54.4 49.4 37.8 30.0 Secondary (%) 13.6 22.2 23.5 26.7 32.5 Tertiary (%) 20.8 23.4 27.1 35.4 37.5 Bottom Quartile Prefecturesb Labor force (thou) 567.0 568.1 521.3 557.4 650.1 Primary (%) 73.5 62.7 60.0 51.8 46.0 Secondary (%) 13.0 20.7 19.9 23.2 27.3 Tertiary (%) 13.5 16.6 20.1 24.9 26.7
Source: Fukao et al (2015) and authors' calculations. Gainfully occupied population numbers are based on the estimating procedure in Umemura et al (1988). aExcludes eight prefectures with variable samurai population shares; see Table II. bBased on 1875 samurai shares.
32
TABLE VII—FIRM COUNT REGRESSIONS, 1883-1898
1883-1890 1883-1898
DV: Firms per 1000 residents All Prefectures Sample Prefecturesa
All Prefectures Sample Prefecturesa
All sectors Samurai share 1.837***
(0.372) 2.172*** (0.250)
1.267*** (0.463)
1.421*** (0.416)
Observations 351 288 719 592 Prefectures 47 39 47 39 R-squared 0.484 0.513 0.418 0.418 F-statistic 30.58*** 27.03*** 16.01*** 21.68*** Primary sector Samurai share 0.517***
(0.059) 0.542*** (0.050)
0.518** (0.199)
0.565*** (0.164)
Observations 306 251 674 555 Prefectures 47 39 47 39 R-squared 0.243 0.249 0.657 0.670 F-statistic 22.56*** 43.08*** 18.34*** 23.98*** Secondary sector Samurai share 0.737***
(0.237) 0.911*** (0.175)
0.572** (0.228)
0.722*** (0.165)
Observations 351 288 719 592 Prefectures 47 39 47 39 R-squared 0.310 0.304 0.311 0.293 F-statistic 28.74*** 32.93*** 25.71*** 35.67*** Tertiary sector Samurai share 0.596***
(0.156) 0.708*** (0.127)
0.283 (0.178)
0.233 (0.219)
Observations 351 288 719 592 Prefectures 47 39 47 39 R-squared 0.223 0.226 0.194 0.196 F-statistic 16.43*** 19.78*** 14.13*** 11.93***
Significance: ***1 percent, **5 percent, *10 percent. Robust standard errors in parentheses. All specifications include year and prefecture fixed effects. aExcludes eight prefectures with variable samurai population shares; see Table II.

33
TABLE VIII—CAPITAL INVESTMENT REGRESSIONS, 1883-1898
1883-1890 1883-1898
DV: Capital per 1000 residents All Prefectures Sample Prefecturesa
All Prefectures Sample Prefecturesa
All sectors Samurai share 372.909***
(79.673) 403.429***
(92.054) 231.358* (133.928)
237.517* (132.077)
Observations 351 288 719 592 Prefectures 47 39 47 39 R-squared 0.239 0.252 0.217 0.200 F-statistic 13.41*** 56.07*** 9.05*** 17.90*** Primary sector Samurai share 18.271***
(6.447) 19.160***
(6.896) 19.829***
(6.045) 21.424***
(6.446) Observations 306 251 674 555 Prefectures 47 39 47 39 R-squared 0.122 0.126 0.169 0.166 F-statistic 2.38** 5.27*** 19.59*** 29.01*** Secondary sector Samurai share 65.861**
(31.017) 75.876** (35.092)
72.139*** (24.141)
80.750*** (25.673)
Observations 351 288 719 592 Prefectures 47 39 47 39 R-squared 0.169 0.172 0.156 0.163 F-statistic 10.60*** 9.17*** 34.85*** 39.14*** Tertiary sector Samurai share 288.738***
(45.031) 308.454***
(51.984) 141.348
(156.209) 137.697
(158.696) Observations 351 288 719 592 Prefectures 47 39 47 39 R-squared 0.250 0.267 0.197 0.179 F-statistic 27.93*** 109.99*** 8.55*** 13.46***
Significance: ***1 percent, **5 percent, *10 percent. Robust standard errors in parentheses. All specifications include year and prefecture fixed effects. Capital in nominal yen. aExcludes eight prefectures with variable samurai population shares; see Table II.
34
TABLE IX—FIRM CAPITAL REGRESSIONS, 1883-1898
1883-1890 1883-1898
DV: Capital per firm (thou yen) All Prefectures Sample Prefecturesa
All Prefectures Sample Prefecturesa
All sectors Samurai share 492.533***
(160.307) 568.223*** (144.174)
201.237 (621.577)
141.484 (686.414)
Observations 350 287 718 591 Prefectures 47 39 47 39 R-squared 0.042 0.045 0.252 0.238 F-statistic 6.43*** 19.42*** 14.77*** 21.04*** Primary sector Samurai share -457.083
(1215.267) -564.626 (136.100)
615.081 (895.093)
616.047 (1072.243)
Observations 257 214 590 488 Prefectures 46 38 46 38 R-squared 0.012 0.016 0.071 0.060 F-statistic 1.00 0.362 22.92*** 24.64*** Secondary sector Samurai share -33.239
(207.143) -45.920
(216.460) 383.763*** (139.848)
340.278** (155.935)
Observations 344 282 712 586 Prefectures 47 39 47 39 R-squared 0.086 0.096 0.099 0.099 F-statistic 3.94*** 3.17*** 80.40*** 99.53*** Tertiary sector Samurai share 1748.407**
(678.455) 1941.900***
(534.293) 1978.561
(1363.091) 2252.904* (1258.686)
Observations 340 279 708 583 Prefectures 47 39 47 39 R-squared 0.033 0.037 0.504 0.476 F-statistic 12.95*** 29.75*** 28.27*** 30.38***
Significance: ***1 percent, **5 percent, *10 percent. Robust standard errors in parentheses. All specifications include year and prefecture fixed effects. Capital in nominal yen. aExcludes eight prefectures with variable samurai population shares; see Table II.
35
TABLE X—OUTPUT GROWTH REGRESSIONS, 1874-1940
DV: Δ ln(output per capita) 1874-1890 1874-1909 1874-1925 1874-1935 1874-1940 All sectors Lag ln(output per capita) -0.433***
(0.116) -0.367***
(0.110) -0.321***
(0.080) -0.210***
(0.077) -0.171** (0.052)
Samurai share in 1880 -0.806 (0.517)
-0.503 (0.421)
-0.688* (0.413)
-0.562* (0.332)
-0.461 (0.276)
Rail stations per million residents in 1885
-0.017*** (0.004)
-0.013*** (0.004)
-0.014*** (0.004)
-0.009*** (0.003)
-0.007** (0.003)
Interaction of samurai share w/1885 rail access
0.734*** (0.170)
0.542*** (0.183)
0.489*** (0.142)
0.302** (0.136)
0.221** (0.100)
Net samurai effect 6.735*** (1.859)
5.067** (1.995)
4.333*** (1.504)
2.538* (1.394)
1.814* (1.007)
R-squared 0.360 0.309 0.474 0.423 0.406 F-statistic 6.91*** 6.74*** 16.63*** 19.82*** 17.22***
Primary sector Lag ln(output per capita) -2.542***
(0.677) -2.284***
(0.334) -1.578***
(0.351) -1.159***
(0.304) -0.849***
(0.265) Samurai share in 1880 -1.399
(1.442) -0.688 (0.840)
-0.365 (0.570)
-0.053 (0.443)
0.066 (0.366)
Rail stations per million residents in 1885
0.029** (0.014)
0.029*** (0.011)
0.026*** (0.009)
0.022** (0.009)
0.018** (0.008)
Interaction of samurai share w/1885 rail access
-1.559*** (0.424)
-1.319*** (0.359)
-1.077*** (0.314)
-0.872*** (0.288)
-0.675** (0.270)
Net samurai effect -17.414***
(4.029) -14.236***
(3.691) -11.435***
(3.220) -9.012***
(2.949) -6.867** (2.754)
R-squared 0.507 0.498 0.352 0.395 0.329 F-statistic 18.52*** 18.06*** 7.33*** 17.34*** 15.35***
Secondary sector Lag ln(output per capita) -1.174***
(0.359) -0.881***
(0.296) -0.755***
(0.224) -0.580***
(0.191) -0.544***
(0.158) Samurai share in 1880 -0.542
(0.645) -1.882** (0.932)
-1.514** (0.721)
-1.420** (0.640)
-1.197** (0.537)
Rail stations per million residents in 1885
-0.015 (0.012)
-0.031** (0.015)
-0.019 (0.014)
-0.013 (0.012)
-0.011 (0.009)
Interaction of samurai share w/1885 rail access
1.466*** (0.336)
1.352*** (0.239)
0.853*** (0.385)
0.566 (0.343)
0.462* (0.276)
Net samurai effect 14.521***
(3.422) 12.006***
(2.248) 7.252* (3.823)
4.389 (3.402)
3.550 (2.737)
R-squared 0.464 0.234 0.154 0.086 0.198 F-statistic 13.66*** 7.18*** 2.47** 1.77* 10.53*** Tertiary sector Lag ln(output per capita) -0.666***
(0.275) -0.851***
(0.278) -1.114***
(0.242) -1.024***
(0.218) -0.987***
(0.190) Samurai share in 1880 -1.085**
(0.399) -0.510 (0.635)
-0.713 (0.641)
-0.435 (0.512)
-0.318 (0.414)
Rail stations per million residents in 1885
-0.008 (0.005)
-0.005 (0.006)
-0.013** (0.006)
-0.012** (0.005)
-0.010*** (0.004)
Interaction of samurai share w/1885 rail access
0.315 (0.207)
0.247 (0.211)
0.427** (0.195)
0.354** (0.158)
0.293** (0.137)
Net samurai effect 2.153
(2.364) 2.028
(2.333) 3.672* (2.015)
3.205** (1.606)
2.690* (1.374)
R-squared 0.333 0.215 0.493 0.610 0.605 F-statistic 9.93*** 5.49*** 20.16*** 47.89*** 44.58***
Observations 37 74 111 148 185 Significance: ***1 percent, **5 percent, *10 percent. Robust standard errors in parentheses. All specifications include year fixed effects and exclude eight prefectures with variable samurai population shares; see Table II. Prefectures missing 1880 samurai population share use extrapolated values. Kagawa and Nara prefectures are missing population data in 1885 and thus omitted from the analysis. Gross prefectural product in 1934-36 constant million yen and per capita income in 1934-36 constant yen.
36
TABLE XI—LABOR SHARE GROWTH REGRESSIONS, 1874-1940
DV: Δ secondary/primary labor force
1874-1890 1874-1909 1874-1925 1874-1935 1874-1940
Lag labor force ratio -0.539*** (0.055)
-0.389*** (0.077)
-0.232*** (0.073)
-0.108* (0.059)
0.004 (0.058)
Samurai share in 1880 -0.155 (0.306)
-0.387 (0.355)
-0.437 (0.317)
-0.355 (0.274)
-0.296 (0.261)
Rail stations per million residents in 1885
-0.031*** (0.009)
-0.027** (0.011)
-0.022** (0.009)
-0.016** (0.008)
-0.008 (0.007)
Interaction of samurai share w/1885 rail access
1.066*** (0.289)
0.975*** (0.370)
0.757** (0.316)
0.516* (0.263)
0.266 (0.253)
Net samurai effect 10.792*** (2.924)
9.633** (3.768)
7.343** (3.236)
4.945* (2.678)
2.432 (2.566)
R-squared 0.778 0.803 0.701 0.745 0.696 F-statistic 33.89*** 65.61*** 52.40*** 51.65*** 41.26***
DV: Δ tertiary/primary labor force
Lag labor force ratio -0.351*** (0.047)
-0.315*** (0.065)
-0.186*** (0.064)
-0.107** (0.051)
-0.091** (0.039)
Samurai share in 1880 -1.268*** (0.84)
-1.214*** (0.289)
-1.335*** (0.264)
-1.064*** (0.226)
-0.881*** (0.198)
Rail stations per million residents in 1885
-0.034*** (0.006)
-0.035*** (0.0074)
-0.029*** (0.008)
-0.024*** (0.007)
-0.021*** (0.006)
Interaction of samurai share w/1885 rail access
1.176*** (0.231)
1.192*** (0.284)
0.965*** (0.307)
0.755*** (0.255)
0.654*** (0.210)
Net samurai effect 10.809***
(2.493) 11.031***
(3.055) 8.576*** (3.220)
6.696** (2.648)
5.835*** (2.162)
R-squared 0.609 0.435 0.319 0.305 0.426 F-statistic 21.35*** 16.75*** 10.97*** 10.43*** 23.61***
DV: Δ tertiary/secondary labor force
Lag labor force ratio -0.414*** (0.105)
-0.383*** (0.072)
-0.348*** (0.057)
-0.316*** (0.052)
-0.344*** (0.055)
Samurai share in 1880 -1.223 (0.751)
-0.801 (0.478)
-0.770** (0.331)
-0.560* (0.287)
-0.293 (0.286)
Rail stations per million residents in 1885
-0.016*** (0.005)
-0.013** (0.006)
-0.011** (0.005)
-0.010*** (0.004)
-0.007 (0.004)
Interaction of samurai share w/1885 rail access
0.688*** (0.101)
0.454** (0.189)
0.425*** (0.134)
0.377*** (0.109)
0.269* (0.156)
Net samurai effect 5.848***
(1.005) 3.862* (1.944)
3.599*** (1.373)
3.311*** (1.099)
2.478 (1.594)
R-squared 0.574 0.814 0.798 0.785 0.719 F-statistic 25.37*** 74.00*** 67.03*** 57.22*** 48.57***
Observations 37 74 111 148 185 Significance: ***1 percent, **5 percent, *10 percent. Robust standard errors in parentheses. All specifications include year fixed effects and exclude eight prefectures with variable samurai population shares; see Table II. Prefectures missing 1880 samurai population share use extrapolated values. Kagawa and Nara prefectures are missing population data in 1885 and thus omitted from the analysis. Labor force per sector measured in levels, and the ratios are in natural logs; see text for details.
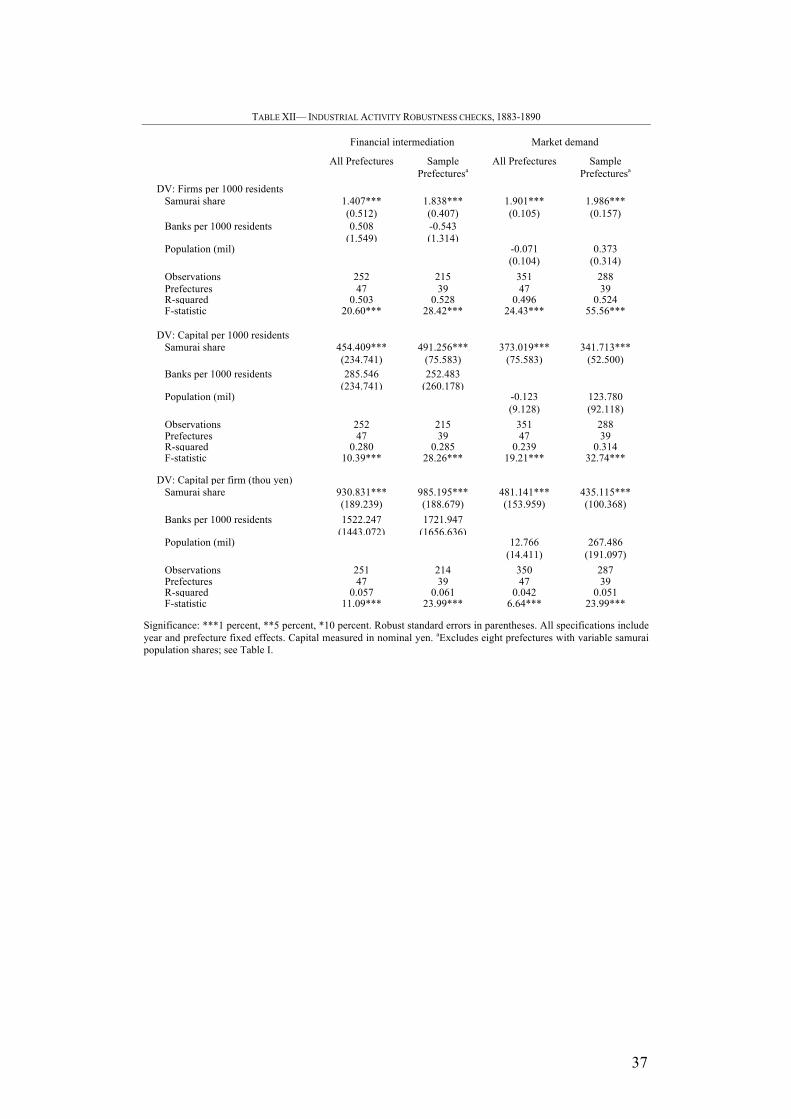
37
TABLE XII— INDUSTRIAL ACTIVITY ROBUSTNESS CHECKS, 1883-1890
Financial intermediation Market demand
All Prefectures Sample Prefecturesa
All Prefectures Sample Prefecturesa
DV: Firms per 1000 residents Samurai share 1.407***
(0.512) 1.838*** (0.407)
1.901*** (0.105)
1.986*** (0.157)
Banks per 1000 residents 0.508 (1.549)
(dasfasf
-0.543 (1.314)
Population (mil) -0.071 (0.104)
0.373 (0.314)
Observations 252 215 351 288 Prefectures 47 39 47 39 R-squared 0.503 0.528 0.496 0.524 F-statistic 20.60*** 28.42*** 24.43*** 55.56*** DV: Capital per 1000 residents Samurai share 454.409***
(234.741) 491.256***
(75.583) 373.019***
(75.583) 341.713***
(52.500) Banks per 1000 residents 285.546
(234.741) 252.483
(260.178)
Population (mil) -0.123 (9.128)
123.780 (92.118)
Observations 252 215 351 288 Prefectures 47 39 47 39 R-squared 0.280 0.285 0.239 0.314 F-statistic 10.39*** 28.26*** 19.21*** 32.74*** DV: Capital per firm (thou yen) Samurai share 930.831***
(189.239) 985.195*** (188.679)
481.141*** (153.959)
435.115*** (100.368)
Banks per 1000 residents 1522.247 (1443.072)
1721.947 (1656.636)
Population (mil) 12.766 (14.411)
267.486 (191.097)
Observations 251 214 350 287 Prefectures 47 39 47 39 R-squared 0.057 0.061 0.042 0.051 F-statistic 11.09*** 23.99*** 6.64*** 23.99***
Significance: ***1 percent, **5 percent, *10 percent. Robust standard errors in parentheses. All specifications include year and prefecture fixed effects. Capital measured in nominal yen. aExcludes eight prefectures with variable samurai population shares; see Table I.

38
TABLE XIII—OUTPUT GROWTH ROBUSTNESS CHECKS, 1874-1940
DV: Δ ln(output per capita) 1874-1890 1874-1909 1874-1925 1874-1935 1874-1940 All sectors Lag ln(output per capita) -0.251*
(0.144) -0.242
(0.092) -0.204***
(0.069) -0.130** (0.057)
-0.117*** (0.041)
Latitude 0.020** (0.008)
0.004 (0.009)
0.007 (0.009)
0.001 (0.007)
0.001 (0.006)
Rail stations per million residents in 1885
0.023 (0.064)
0.046 (0.038)
0.033 (0.030)
0.015 (0.026)
0.012 (0.021)
Interaction of latitude w/1885 rail access
-0.001 (0.001)
-0.001 (0.001)
-0.001 (0.001)
-0.0003 (0.001)
-0.0003 (0.0005)
Net latitude effect 0.014 (0.016)
-0.007 (0.011)
-0.001 (0.010)
-0.003 (0.008)
-0.002 (0.006)
R-squared 0.263 0.234 0.377 0.389 0.379 F-statistic 7.47*** 4.43*** 12.26*** 16.30*** 13.79***
All sectors Lag ln(output per capita) -0.412***
(0.116) -0.371* (0.109)
-0.327*** (0.081)
-0.222*** (0.075)
-0.187*** (0.052)
Samurai share in 1880 -0.426 (0.571)
-0.562 (0.468)
-0.783* (0.400)
-0.939*** (0.346)
-0.792*** (0.288)
Latitude 0.013 (0.010)
-0.003 (0.009)
-0.003 (0.007)
-0.011* (0.006)
-0.010* (0.005)
Rail stations per million residents in 1885
-0.022 (0.051)
0.007 (0.038)
-0.008 (0.028)
-0.022 (0.026)
-0.018 (0.021)
Interaction of samurai share w/1885 rail access
0.694*** (0.182)
0.528*** (0.187)
0.494*** (0.149)
0.352** (0.138)
0.272** (0.106)
Interaction of latitude w/1885 rail access
0.0001 (0.001)
-0.0004 (0.001)
-0.0001 (0.001)
0.0003 (0.001)
0.0002 (0.0005)
Net samurai effect 6.707*** (2.006)
4.860** (2.005)
4.296*** (1.552)
2.677* (1.400)
2.007* (1.041)
Net latitude effect 0.014 (0.013)
-0.008 (0.010)
-0.005 (0.008)
-0.008 (0.007)
-0.007 (0.006)
R-squared 0.388 0.317 0.453 0.439 0.419 F-statistic 10.00*** 5.02*** 12.49*** 16.81*** 14.82***
Observations 37 74 111 148 185 Significance: ***1 percent, **5 percent, *10 percent. Robust standard errors in parentheses. All specifications include year fixed effects and exclude eight prefectures with variable samurai population shares; see Table I. Prefectures missing 1880 samurai population share use extrapolated values. Kagawa and Nara prefectures are missing population data in 1885 and thus omitted from the analysis. Gross prefectural product in 1934-36 constant million yen and per capita income in 1934-36 constant yen.
Related Documents