WM2012 Conference, February 26 – March 1, 2012, Phoenix, Arizona, USA 1 Chemical Characterization and Removal of C-14 from Irradiated Graphite-12010 James Cleaver, Shilo McCrory, Tara E. Smith, and Mary Lou Dunzik-Gougar Idaho State University: 1776 Science Center Dr., Idaho Falls, ID, 83401 ABSTRACT Quantities of irradiated graphite waste are expected to drastically increase, which indicates the need for a graphite waste management strategy. Of greatest concern for long-term disposal of irradiated graphite is carbon-14 (C-14), with a half-life of 5730 years. Study of irradiated graphite from nuclear reactors indicates C-14 is concentrated on the outer 5 mm of the graphite structure. The aim of the research described here is to identify the chemical form of C-14 in irradiated graphite and develop a practical method by which C-14 can be removed. Characterization of pre- and post-irradiation graphite was conducted to determine bond type, functional groups, location and concentration of C-14 and its precursors via the use of surface sensitive characterization techniques. Because most surface C-14 originates from neutron activation of nitrogen, an understanding of nitrogen bonding to graphite may lead to a greater understanding of the formation pathway of C-14. However, no single technique provides a complete picture. Therefore, a portfolio of techniques has been developed, with each technique providing another piece to the puzzle that is the chemical nature of the C-14. Scanning Electron Microscopy (SEM), X-Ray Diffraction (XRD), and Raman Spectroscopy were used to evaluate the morphological features of graphite samples. The concentration, chemical composition, and bonding characteristics of C-14 and its precursors were determined through X-ray Photoelectron Spectroscopy (XPS), Time-of-Flight Secondary Ion Mass Spectrometry (SIMS), and Auger and Energy Dispersive X- ray Analysis Spectroscopy (EDX). High-surface-area graphite foam, POCOFoam ® , was exposed to liquid nitrogen and irradiated. Characterization of this material has shown C-14 to C-12 ratios of 0.035. This information was used to optimize the thermal treatment of graphite. Thermal treatment of irradiated graphite as reported by Fachinger et al. (2007) uses naturally adsorbed oxygen complexes to gasify graphite, thus its effectiveness is highly dependent on the availability of adsorbed oxygen compounds [2]. In research presented, the quantity and form of adsorbed oxygen complexes in pre- and post irradiated graphite was studied using SIMS and XPS. SIMS and XPS detected adsorbed oxygen compounds on both irradiated and unirradiated graphite. During thermal treatment graphite samples are heated in the presence of inert argon gas, which carries off gaseous products released during treatment. Experiments were performed at 900°C and 1400°C to evaluate the selective removal of C-14.

Welcome message from author
This document is posted to help you gain knowledge. Please leave a comment to let me know what you think about it! Share it to your friends and learn new things together.
Transcript

WM2012 Conference, February 26 – March 1, 2012, Phoenix, Arizona, USA
1
Chemical Characterization and Removal of C-14 from Irradiated Graphite-12010
James Cleaver, Shilo McCrory, Tara E. Smith, and Mary Lou Dunzik-GougarIdaho State University: 1776 Science Center Dr., Idaho Falls, ID, 83401
ABSTRACT
Quantities of irradiated graphite waste are expected to drastically increase, which indicates the need for a graphite waste management strategy. Of greatest concern for long-term disposal of irradiated graphite is carbon-14 (C-14), with a half-life of 5730 years. Study of irradiated graphite from nuclearreactors indicates C-14 is concentrated on the outer 5 mm of the graphite structure. The aim of the research described here is to identify the chemical form of C-14 in irradiated graphite and develop a practical method by which C-14 can be removed. Characterization of pre- and post-irradiation graphite was conducted to determine bond type, functional groups, location and concentration of C-14 and its precursors via the use of surface sensitive characterization techniques. Because most surface C-14 originates from neutron activation of nitrogen, an understanding of nitrogen bonding to graphite may lead to a greater understanding of the formation pathway of C-14. However, no single technique provides a complete picture. Therefore, a portfolio of techniques has been developed, with each technique providing another piece to the puzzle that is the chemical nature of the C-14. Scanning Electron Microscopy (SEM), X-Ray Diffraction (XRD), and Raman Spectroscopy were used to evaluate the morphological features of graphite samples. The concentration, chemical composition, and bonding characteristics of C-14 and its precursors were determined through X-ray Photoelectron Spectroscopy (XPS), Time-of-Flight Secondary Ion Mass Spectrometry (SIMS), and Auger and Energy Dispersive X-ray Analysis Spectroscopy (EDX).
High-surface-area graphite foam, POCOFoam®, was exposed to liquid nitrogen and irradiated. Characterization of this material has shown C-14 to C-12 ratios of 0.035. This information was used to optimize the thermal treatment of graphite. Thermal treatment of irradiated graphite as reported by Fachinger et al. (2007) uses naturally adsorbed oxygen complexes to gasify graphite, thus itseffectiveness is highly dependent on the availability of adsorbed oxygen compounds [2]. In research presented, the quantity and form of adsorbed oxygen complexes in pre- and post irradiated graphite was studied using SIMS and XPS. SIMS and XPS detected adsorbed oxygen compounds on both irradiated and unirradiated graphite. During thermal treatment graphite samples are heated in the presence of inert argon gas, which carries off gaseous products released during treatment.Experiments were performed at 900°C and 1400°C to evaluate the selective removal of C-14.

WM2012 Conference, February 26 – March 1, 2012, Phoenix, Arizona, USA
- 2 -
INTRODUCTION
For the past 50 years graphite has been widely used as a moderator, reflector, and fuel matrix in gas-cooled and Russian RMBK reactors. The result is approximately 250,000 metric tons of irradiated graphite waste [1]. The U.S. and other countries are developing advanced nuclear systems coined “Generation IV concepts” as established by the Generation IV International Forum, which institutes protocol for individual countries to lead the development of a reactor concept in which they have particular interest [2]. Deployment of Generation-IV reactors is marked for 2015.
The U.S. has elected to implement the Generation IV concepts under the Next Generation Nuclear Plant (NGNP) initiative in an effort to couple advanced reactor designs with the commercial production of hydrogen [3]. The NGNP program of the U.S. Department of Energy has focused on research and development of the High Temperature Gas-Cooled Reactor (HTGR). The HTGR uses helium coolant, graphite coated fuel particles, a graphite reflector, and other graphite core structural components [4].Operational HTGRs would dramatically add to the present quantity of irradiated graphite waste.
Characterization of existing irradiated graphite indicates the most significant long-lived radioisotope of concern is carbon-14 (C-14). With a half-life of 5,730 years this species is of concern for deep geologic disposal of irradiated graphite because it is readily mobile in groundwater and atmospheric systems [5].Removal of C-14 from large irradiated graphite reactor components may reduce disposal cost, while also allowing the possibility of recycling this very pure nuclear grade material [2]. However, to optimize the removal of C-14, it is important to understand the bonding characteristics, functional groups, location, and concentration of C-14.
Formation of C-14
As graphite is bombarded with neutrons, C-14 is produced through neutron capture by carbon-13 (C-13), nitrogen (N-14), and oxygen-17 (O-17) as seen in Equations 1, 2, and 3 [5].
N-14 +n C-14 +p (Eqn. 1)
C-13 +n C-14 +γ (Eqn. 2)
O-17 +n C-14 +α (Eqn. 3)
Characterization of existing irradiated reactor graphite revealed that C-14 is concentrated on the surface of graphite blocks [6]. The inhomogeneous distribution of C-14 is indicative of the neutron capture of N-14 and O-17. Graphite naturally adsorbs air; consequently, N-14 and O-17 are readily found on the graphite surface. Oxygen and nitrogen adsorption occurs during graphite manufacturing, component assembly, and as a result of air leaks into the reactor coolant gas. The neutron capture cross sections and isotopic abundances of N-14 and O-17 indicate the neutron activation of N-14 is likely the main source of C-14 on the surfaces of irradiated graphite [6]. (See Table II)
Table II. Properties of C-14 Precursors
Species Capture Cross Section (Barns) Isotopic Abundance (%)
N-14 1.8 99.63 (N-14:Nitrogen)
C-13 0.0015 1.07 (C-13:Carbon)
O-17 0.235 0.04 (O-17:Oxygen)

WM2012 Conference, February 26 – March 1, 2012, Phoenix, Arizona, USA
- 3 -
Production of C-14 significantly depends on the amount of nitrogen present. Directly analyzing graphite for C-14 is difficult because it is chemically indistinguishable from C-12. Furthermore, the difference in mass between N-14 and C-14 is only 0.001385 amu, rendering mass spectrometry based techniques ineffective in discriminating between the two. Because C-14 is formed mainly by the neutron activation of N-14, it was theorized that the chemical environment, location, and bonding characteristics of nitrogen in the irradiated graphite would be comparable with the chemical environment, location, and bonding characteristics of C-14. Therefore, characterization emphasized the N-14 pathway to formation of C-14 and the resulting environment in irradiated graphite.
The localization of C-14 on the surface of the graphite dictates the use of surface sensitive characterization techniques, though no single technique provides a complete understanding of the morphological features, chemical environment, location, and bonding characteristics. Therefore, a portfolio of techniques was utilized, with each technique providing another piece of the puzzle that is the formation pathway of C-14. Scanning Electron Microscopy (SEM), X-Ray Diffraction (XRD), and Raman Spectroscopy (Raman) were used to evaluate the graphite’s morphological features. The concentration, chemical composition, and bonding characteristics of N-14, and thus indirectly C-14 were determined through X-ray Photoelectron Spectroscopy (XPS), Secondary Ion Mass Spectroscopy (SIMS), and Energy Dispersive X-ray Analysis (EDX). Understanding the nitrogen bonding characteristics in graphite is expected to lead to a greater understanding of the C-14, which is vital to the optimization of the selective release of C-14 during thermal treatment.
Thermal Treatment
When graphite is heated at a constant temperature under forced convection with an inert gas it oxidizes due to the presence of adsorbed air, thus releasing gasified carbon-oxygen compounds (expected primarily as carbon monoxide) [7]. If optimized this process could be a viable graphite waste management strategy given that it preferentially oxidizes the C-14 enriched surface.
Graphite oxidation kinetics fall into three temperature regimes according to the dominating reaction mechanism. The transition between regimes is highly dependent on the grade of graphite and experimental conditions. The estimated regime transitions are displayed in Table III [7,8,9]. The optimal temperature regime for maximum C-14 removal must be determined experimentally.
Table III. Expected Graphite Oxidation Temperature Regime Boundaries
Regime 1 (°C) Regime 2 (°C)Regime 3
(°C)
<(500-700) (500-700)>, <900 >900
METHOD
Graphite samples were characterized using SEM, XRD, Raman, EDX, XPS, and SIMS prior to irradiation to evaluate the availability and chemical form of N-14 on the graphite’s surface. Thermal treatment was performed for 12 hours on the unirradiated graphite samples to establish a gasification rate, speciation baseline, and determine the percent mass removed.
To increase the quantity of C-14 produced a highly porous graphite foam, POCOFoam®, was selected for analysis because its significant surface area adsorbs more nitrogen than less porous graphite types [10]. In addition, graphite samples were immersed in liquid nitrogen (LN) for 24 hours prior to being

WM2012 Conference, February 26 – March 1, 2012, Phoenix, Arizona, USA
- 4 -
irradiated. The purpose of LN immersion was to increase the neutron-induced production of C-14 to ensure each sample contained measurable quantities of the isotope. Typical C-14 concentrations in existing irradiated reactor graphite are on the order of parts-per-billion, which is too low for meaningful characterization. Sample irradiation took place at the MURR research reactor at the University of Missouri for 120 days in a thermal neutron flux of 6.7 x 10²⁰ neutrons/cm2/s resulting in a total C-14 activity of approximately 1.7 x 10⁻³ MBq/g (4.59x10⁻² μCi/g).
Irradiated graphite samples were characterized using the same surface sensitive techniques and under went thermal treatment at similar conditions as the unirradiated graphite samples to evaluated the selective release of C-14. The full thermal treatment procedure is detailed below.
Characterization
The surface sensitive techniques, SEM, XRD, Raman, EDX, XPS, and SIMS, were employed to characterize the nitrogen complexes. Each technique was chosen to investigate a different aspect of the interaction of N-14 with graphite, and consequently the behavior of C-14.
Analysis was performed on graphite samples at each of the three stages of C-14 production: virgin (unirradiated, non-LN immersion), LN immersed, and irradiated.
Structural Characteristics
SEM was used to identify the polycrystalline nature of the graphite. The implementation of SEM allows the texture, chemical composition, crystalline structure, and subsequently the orientation of the graphite to be viewed on sub-micron scales. The samples were polished prior to running SEM.
XRD was used to identify the phases of carbon present, the degree of crystallinity and graphitization, and the subsequent spacing of the graphite planes. The data was evaluated by fitting a Lorentizian curve with Origin graphing software to find the observed intensity and width of the 002 peak. Changes in the widths and intensities of the peaks are related to changes in the overall crystalline nature of graphite microstructure. The analysis was performed on a Scintag, Inc. X1 Advanced Diffraction System with a copper Kα x-ray source (1.54 Ǻ). The range was from 10.00o- 80.00o at a scan rate of0.05 degrees per minute and a step size of 0.020o with a count time of 0.400 seconds per step.
Raman was used to analyzed the C=C stretching modes of the graphite samples at 1580 cm-1 (G-band); the distortion due to crystallites, impurities, imperfections, and edges at 1350 cm-1 (D-band); and the 1610 cm-1 band which is assigned to glassy amorphous carbon [11]. Raman relies on the inelastic scattering of monochromatic light in the form of a low energy ultra-violet laser to induce shifts in the wave-number, which is known as the Raman Effect. The measurement of these shifts gives information regarding the vibrational, rotational, and other low frequency transitions of the molecules that compose the graphite’s surface. Samples were cut to 2cm2 x 2cm thick pieces and polished for ease in gathering spectra. All measurements were recorded within the range of 1000–1900 cm-1 using a Raman Horiba Jobin Yvon apparatus probing an area of less than 70 angstroms with a 647.1 ηm wavelength krypton ion laser. As described below the signal was unattainable on the graphite surface due to the formation of an amorphous layer, therefore the graphite sample was cut in half lengthwise allowing the Raman spectrum to be obtained from interior surfaces of the graphite.
Chemical Characteristics
The morphological features associated with the elemental and spatial chemical compositions were identified using EDX. Surface preparations for analysis were identical to SEM preparation. Surface areas that exhibited contrasting variations in elemental composition where targeted to map preferential

WM2012 Conference, February 26 – March 1, 2012, Phoenix, Arizona, USA
- 5 -
nitrogen formation locations. The formation locations are denoted by color changes on the surface image after using visual graphing software. The compositional variations were measured with a 30 keV accelerating voltage and a 10mm working distance on an EDX Genesis Quanta 3D FEG.
XPS was used to identify the concentration of surface species and specific carbon-nitrogen bonding types by ejecting core electrons of varying binding energies from the surface atoms. Binding energies are characteristic for each element, and are direct representations of the atomic orbital energies [7]. Thus, the chemical shifts associated with the movement of the elemental peak in the XPS spectrum are associated with changes in the chemical environment of the atoms. These variations lead to changes in the binding energies of the core electrons and can be used to further indicate the bonding structure of the atom. Graphite samples were studied via XPS using a VersaProbe PHI 5000 spectrometer with aluminum Kα radiation (1480.6 eV) and a base pressure of 2.6 x 10⁻⁵ Pa. The deconvoluted nitrogen (N 1s) and carbon (C 1s) peaks were used to determine the relative bonding configurations of the elements within the graphite. The peak shapes were filtered to yield a full-width-half-mass (FWHM) of less than 1.8 eV and as near a Gaussian fit as possible; however, the best fits of the C 1s and N 1s resulted in multiple Gaussian peaks. To ensure accuracy the energy scale was calibrated to reproduce the binding energies of Cu 2p3/2 (932.65 eV) and Au 4f 7/2 (84.00 eV) and the sample charging was corrected by aligning the C 1s peak to 284.8 eV. The core level spectra were fitted using least-squares in AugerScan 3 graphing software. Changes in the atomic concentrations, bonding configurations, and electronic structures of the target species were observed with respect to depth while sputtering the samples at a rate of 0.025 nm/sec.
SIMS was used to identify the carbon-nitrogen bonding configurations and the potential chemical environment by measuring displaced charged atomic and/or molecular species with a mass spectrometer. Graphite samples were analyzed via SIMS (TRIFT I spectrometer by PHI-EVANS). During analysis, samples were kept in a constant ultra-high vacuum environment of 7.3 x 10⁻¹¹ Pa to reduce contamination in the chamber. The focused primary ion beam was rastered over an area of100 µm2 on the sample surface. Secondary ions were measured from a smaller region 20 µm2 located at the center of the sputtered area. The accelerating voltage was set to 15.03 keV in the primary gallium ion source, and -3 keV on the sample surface resulting in a net voltage of 12.03 keV. Sputtering at a rate of 0.022 nm/sec allowed variations in carbon-nitrogen functional groups to be measured with respect to depth. Data was analyzed using WinCadence Version 3.41.
Thermal Treatment
Both active and inactive graphite samples were evaluated. During thermal treatment a graphite sample was placed in the center of the main furnace. Experimental temperatures chosen were within two different temperature regimes (900°C, regime 2; and 1400°C, regime 3). Argon was flowed through the system at 50 standard cubic centimeters per minute (sccm) to carry gasified oxidation products released from the graphite to an inline gas analyzer. The gas analyzer was setup to monitor for CO, CO2, Ar, O2, N2, water, and methane. The gasified products were then oxidized via interaction with copper oxide inside a tube furnace held at 800°C. This ensured all CO was converted to CO2 and thus could be collected in a 4 M NaOH solution. The experimental setup can be seen in Fig. 1.
WM2012 Conference, February 26 – March 1, 2012, Phoenix, Arizona, USA
- 6 -
Fig. 1. Experimental Design for Thermal Treatment of Nuclear Graphite to Remove C-14
During active graphite experiments, collection bottles were sampled with respect to time and analyzed with a liquid scintillation counter (LSC) to evaluate the C-14 release rate. ScintiSafe Plus 50% Cocktail was used as the scintillation cocktail because of its compatibility with basic solutions. Results were compared to a calibration curve generated by a 3.7 x 10⁴ Bq (1μCi) C-14 source using about 30 μg of C per gram of 0.1 M NaOH solution.
Experiments consisted of five non-irradiated and six irradiated POCOFoam® graphite samples. The thermal treatment experimental parameters are summarized in Table IV. The first active graphite thermal treatment experiment was conducted for 12 hours. Preliminary results indicated that the necessary data could be obtained with a shorter run time, so remaining active graphite treatments werereduced to a 10-hour treatment time.
Table IV. Thermal Treatment Experimental Parameters
Inactive Experiments (IE) Active Experiments (AE)
Inactive Experiment
1 and 2
Inactive Experiment 3, 4, and 5
Active Experiment 1
Active Experiment
2, and 3
Active Experiment 4, 5, and 6
Experiment Temperature
(°C)900 1400 900 900 1400
Argon Gas Flow Rate
(sccm)50 50 50 50 50
Graphite Sample Type
Inactive POCOFoam®
Inactive POCOFoam®
Active POCOFoam®
Active POCOFoam®
Active POCOFoam®
Experiment Time (hr) 12 12 12 10 10
Sampling Time (hr) - -
0, 1, 2, 3, 5, 7, 9, 12
0, 1, 2, 3, 4, 7, 10
0, 1, 2, 3, 4, 7, 10
At the end of active experiments, after the graphite had been removed from the furnace and weighed, the sample was returned to the furnace and fully oxidized to determine the total C-14 content in the sample. To ensure complete oxidation the graphite sample was held at 800°C for two hours under 50 sccm forced convection with O2 gas. After complete oxidation the NaOH collection bottle was sampled and analyzed for total C-14 via LSC.
MFC = Mass Flow ControllerG.A. = Gas Analyzer
G.A.
Ar
Furnace
MFC
Oxidizing Furnace
NaOH Collection
Exhaust
Back Flow Prevention
WM2012 Conference, February 26 – March 1, 2012, Phoenix, Arizona, USA
- 7 -
RESULTS
Characterization
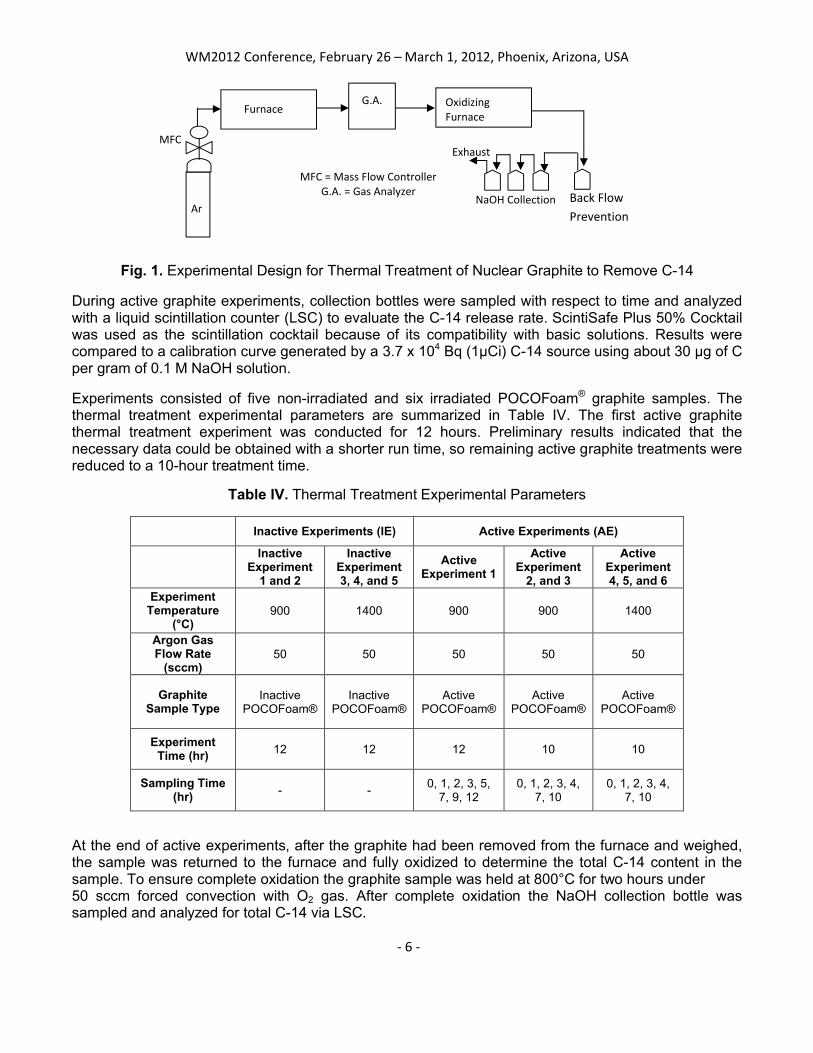
SEM identified the formation of clusters averaging in size from 5 to 10 μm attached to the surface and graphite planes. The surface composition of the clusters was further explored using EDX. The images displayed in Fig. 2 show the location and qualitative concentrations of carbon (red), oxygen (blue), and nitrogen (green) atoms on the irradiated graphite surfaces. The EDX image illustrates that the clusters are preferentially located along plane edges and mainly composed of nitrogen.
Fig. 2. SEM Image of POCOFoam® after irradiated at 50,000x (Left), SEM Image of Irradiated POCOFoam® at 5,000x (Center) and EDX image (Right)
The chemical environment of the graphite surface was investigated using XPS and SIMS.
Analysis of XPS results did not find measurable concentrations of nitrogen on the virgin POCOFoam®
samples. Results from the XPS spectra of the LN immersed samples showed small but measurable concentrations of nitrogen on the surface; the average concentration was 0.34 atom%. The irradiated POCOFoam® surface had larger nitrogen concentrations than the unirradiated samples. This is summarized in Table V. A majority of the remaining atom% found on the virgin and LN immersed samples was oxygen; however, oxygen only comprised ~17.3 atom% of the active samples.
Table V. Relative Concentration of Nitrogen on Graphite at Various Stages
Sample C atom% N atom%
N relative conc. (ppm)
Virgin 98.85 0 0
Liquid Nitrogen
96.38 0.34 3369.56
Active 38.7 36.1 3.61x10⁷
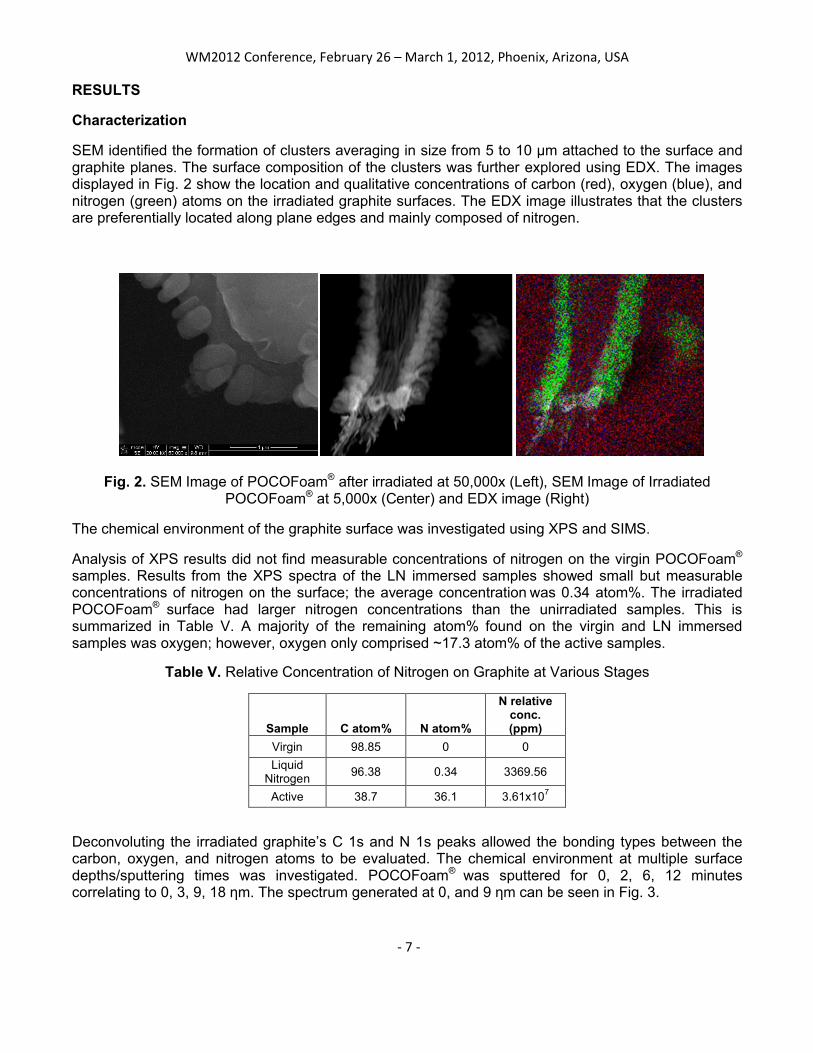
Deconvoluting the irradiated graphite’s C 1s and N 1s peaks allowed the bonding types between the carbon, oxygen, and nitrogen atoms to be evaluated. The chemical environment at multiple surface depths/sputtering times was investigated. POCOFoam® was sputtered for 0, 2, 6, 12 minutes correlating to 0, 3, 9, 18 ηm. The spectrum generated at 0, and 9 ηm can be seen in Fig. 3.
WM2012 Conference, February 26 – March 1, 2012, Phoenix, Arizona, USA
- 8 -
Fig. 3. XPS C 1s Spectra of POCOFoam® sputtered to: 0 ηm (Left), and 9 ηm (Right)
The C 1s peak broadens and splits as a results of irradiation, clearly indicating a disordering of the surface upon irradiation. This disordering alludes to the presence of an amorphous carbon network that can incorporate the absorbed nitrogen atoms. The surface peak (sputtering 0 minutes) is associated with a surface oxide that decreases with depth and C=N bonds that appear deeper within the graphite, clearly indicating strong nitrogen bonding the graphite lattice.
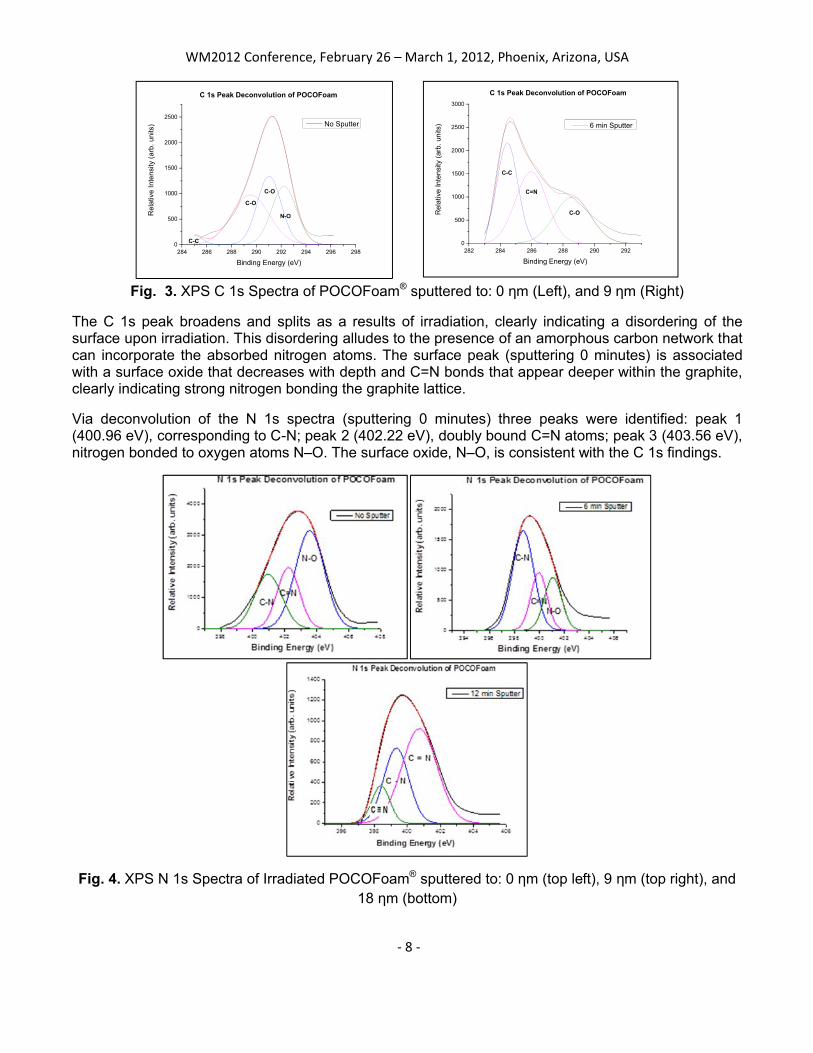
Via deconvolution of the N 1s spectra (sputtering 0 minutes) three peaks were identified: peak 1 (400.96 eV), corresponding to C-N; peak 2 (402.22 eV), doubly bound C=N atoms; peak 3 (403.56 eV), nitrogen bonded to oxygen atoms N–O. The surface oxide, N–O, is consistent with the C 1s findings.
Fig. 4. XPS N 1s Spectra of Irradiated POCOFoam® sputtered to: 0 ηm (top left), 9 ηm (top right), and 18 ηm (bottom)
284 286 288 290 292 294 296 2980
500
1000
1500
2000
2500
C-C
N-O
C-O
C 1s Peak Deconvolution of POCOFoam
Rel
ativ
e In
tens
ity (
arb.
uni
ts)
Binding Energy (eV)
No Sputter
C-O
282 284 286 288 290 2920
500
1000
1500
2000
2500
3000
Rel
ativ
e In
tens
ity (
arb.
uni
ts)
Binding Energy (eV)
6 min Sputter
C 1s Peak Deconvolution of POCOFoam
C=N
C-C
C-O
WM2012 Conference, February 26 – March 1, 2012, Phoenix, Arizona, USA
- 9 -
Results of XPS analysis indicated a majority of the nitrogen is bonded to the irradiated POCOFoam® as a carbon-nitrogen species. The domination of the spectra by the N-O oxide is less significant slightly below the surface and the concentration is immeasurable after 12 min (~18 ηm) of sputtering. The C≡Nalso appears deep within the graphite surface.
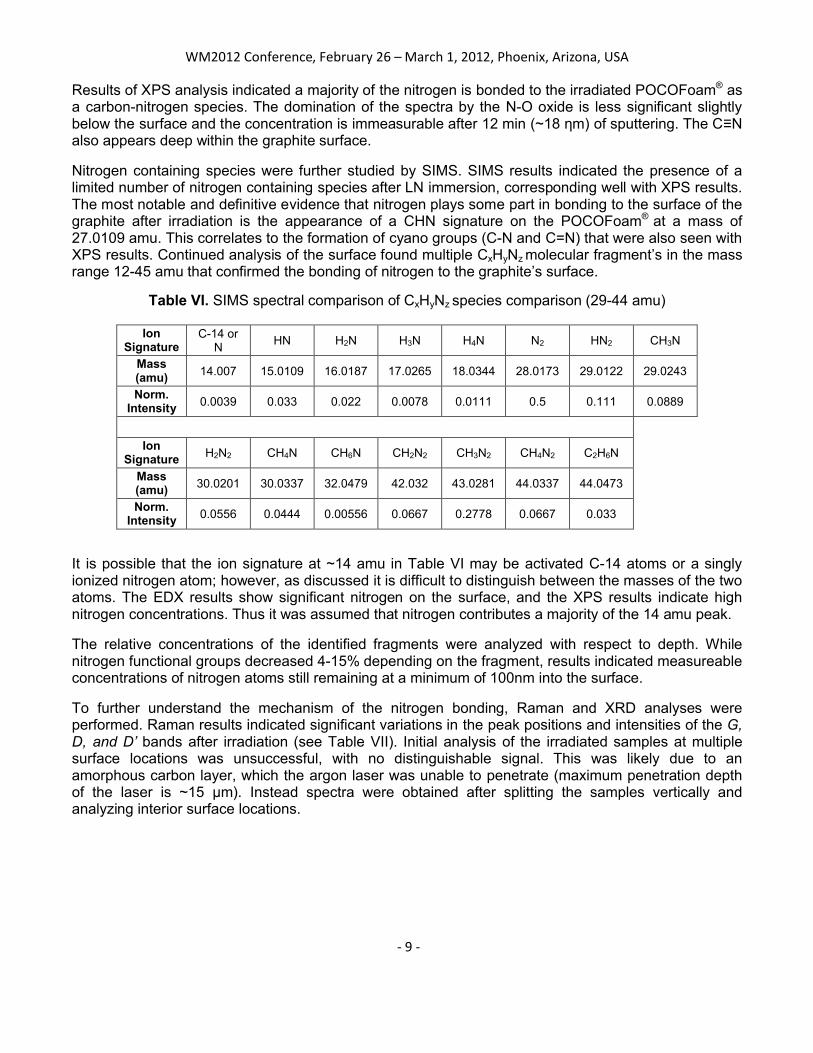
Nitrogen containing species were further studied by SIMS. SIMS results indicated the presence of a limited number of nitrogen containing species after LN immersion, corresponding well with XPS results. The most notable and definitive evidence that nitrogen plays some part in bonding to the surface of the graphite after irradiation is the appearance of a CHN signature on the POCOFoam® at a mass of 27.0109 amu. This correlates to the formation of cyano groups (C-N and C=N) that were also seen with XPS results. Continued analysis of the surface found multiple CxHyNz molecular fragment’s in the mass range 12-45 amu that confirmed the bonding of nitrogen to the graphite’s surface.
Table VI. SIMS spectral comparison of CxHyNz species comparison (29-44 amu)
Ion Signature
C-14 or N
HN H2N H3N H4N N2 HN2 CH3N
Mass (amu) 14.007 15.0109 16.0187 17.0265 18.0344 28.0173 29.0122 29.0243
Norm. Intensity 0.0039 0.033 0.022 0.0078 0.0111 0.5 0.111 0.0889
Ion Signature H2N2 CH4N CH6N CH2N2 CH3N2 CH4N2 C2H6N
Mass (amu) 30.0201 30.0337 32.0479 42.032 43.0281 44.0337 44.0473
Norm.Intensity 0.0556 0.0444 0.00556 0.0667 0.2778 0.0667 0.033
It is possible that the ion signature at ~14 amu in Table VI may be activated C-14 atoms or a singly ionized nitrogen atom; however, as discussed it is difficult to distinguish between the masses of the two atoms. The EDX results show significant nitrogen on the surface, and the XPS results indicate high nitrogen concentrations. Thus it was assumed that nitrogen contributes a majority of the 14 amu peak.
The relative concentrations of the identified fragments were analyzed with respect to depth. While nitrogen functional groups decreased 4-15% depending on the fragment, results indicated measureable concentrations of nitrogen atoms still remaining at a minimum of 100nm into the surface.
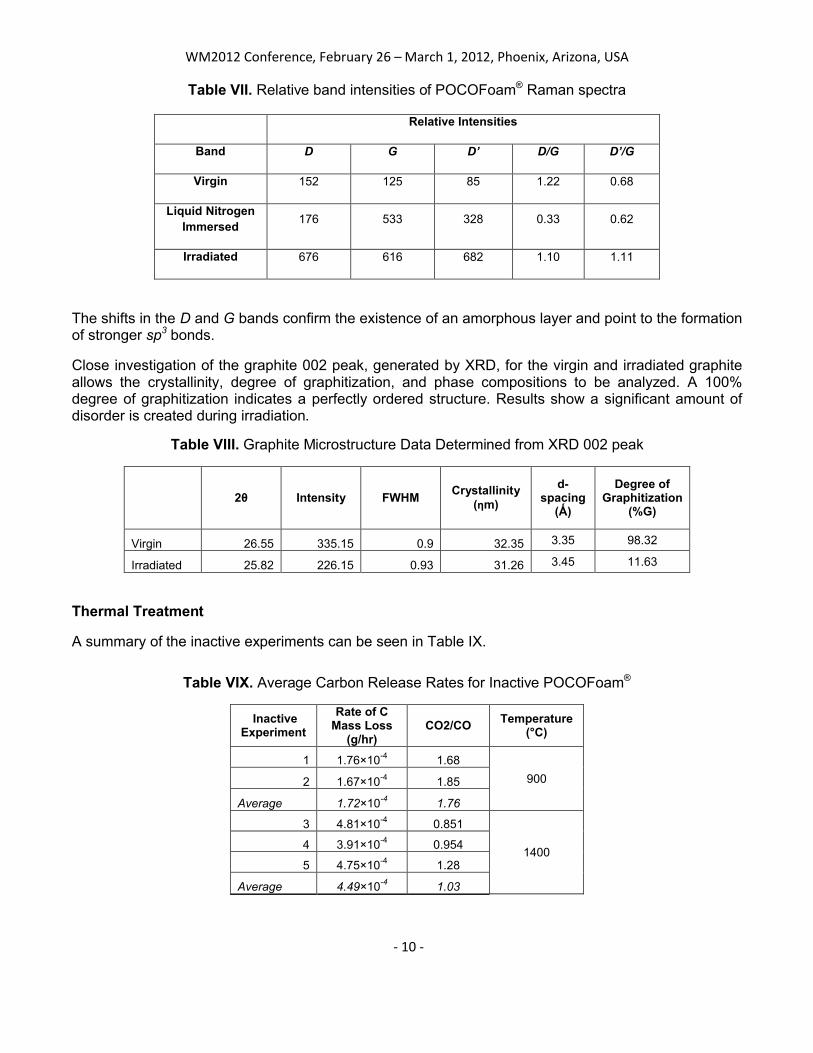
To further understand the mechanism of the nitrogen bonding, Raman and XRD analyses were performed. Raman results indicated significant variations in the peak positions and intensities of the G, D, and D’ bands after irradiation (see Table VII). Initial analysis of the irradiated samples at multiplesurface locations was unsuccessful, with no distinguishable signal. This was likely due to anamorphous carbon layer, which the argon laser was unable to penetrate (maximum penetration depthof the laser is ~15 μm). Instead spectra were obtained after splitting the samples vertically and analyzing interior surface locations.
WM2012 Conference, February 26 – March 1, 2012, Phoenix, Arizona, USA
- 10 -
Table VII. Relative band intensities of POCOFoam® Raman spectra
Relative Intensities
Band D G D’ D/G D’/G
Virgin 152 125 85 1.22 0.68
Liquid NitrogenImmersed
176 533 328 0.33 0.62
Irradiated 676 616 682 1.10 1.11
The shifts in the D and G bands confirm the existence of an amorphous layer and point to the formation of stronger sp3 bonds.
Close investigation of the graphite 002 peak, generated by XRD, for the virgin and irradiated graphite allows the crystallinity, degree of graphitization, and phase compositions to be analyzed. A 100% degree of graphitization indicates a perfectly ordered structure. Results show a significant amount of disorder is created during irradiation.
Table VIII. Graphite Microstructure Data Determined from XRD 002 peak
2θ Intensity FWHMCrystallinity
(ηm)
d-spacing
(Ǻ)
Degree of Graphitization
(%G)
Virgin 26.55 335.15 0.9 32.35 3.35 98.32
Irradiated 25.82 226.15 0.93 31.26 3.45 11.63
Thermal Treatment
A summary of the inactive experiments can be seen in Table IX.
Table VIX. Average Carbon Release Rates for Inactive POCOFoam®
Inactive Experiment
Rate of C Mass Loss
(g/hr)CO2/CO
Temperature (°C)
1 1.76×10⁻⁴ 1.68
9002 1.67×10⁻⁴ 1.85
Average 1.72×10⁻⁴ 1.76
3 4.81×10⁻⁴ 0.851
14004 3.91×10⁻⁴ 0.954
5 4.75×10⁻⁴ 1.28
Average 4.49×10⁻⁴ 1.03

WM2012 Conference, February 26 – March 1, 2012, Phoenix, Arizona, USA
- 11 -
CO and CO2 were the major species released from the graphite. The only other significant quantity release from the unirradiated graphite was N2; however, it was almost two orders of magnitude less than the avulsion of CO and CO2.
A significantly higher quantity of nitrogen, water, and methane were released during active graphite heat-up (25°C to experimental temperature). However, as in the inactive experiments primarily CO and CO2 were released during experimental runs at temperature. A summary of the average active carbon release rates is seen in Table X.
Table X. Average Carbon Release Rates for Active POCOFoam®
Active Experiment
Rate of C Mass Loss (g/hr)
CO2/COTemperature
(°C)1 1.64×10⁻⁴ 1.89
9002 3.85×10⁻⁴ 2.273 1.98×10⁻⁴ 1.99
Average 2.49×10⁻⁴ 2.054 4.52×10⁻⁴ 0.988
14005 4.02×10⁻⁴ 0.9016 4.26×10⁻⁴ 1.14
Average 4.27×10⁻⁴ 1.01
LSC results confirmed significant quantities of C-14 had been produced. The average C-14 activity per sample was determined to be 82,017 Bq (2.22 μCi).
Results indicated the average C-14 release rate was slightly higher at increased temperatures. A summary of the active sample’s activity levels and average C-14 release rates can be seen in Table XI.
Table XI. Graphite Sample Activity and Average C-14 Release Rates
Active Experiment
Total 14C Activity
(Bq)
Initial Sample Mass
(g)
Average 14C Release Rate
(Bq/hr)
Temperature (°C)
1 56,131.95 0.4635 442.12
9002 97,638.78 0.3826 2,975.843 82,526.69 0.5327 1,706.60
Average 1,708.194 95,013.27 0.6319 2,882.68
14005 82,161.99 0.5737 1,442.146 78,628.06 0.5469 1,979.95
Average 82,016.79 0.5219 1,876.79
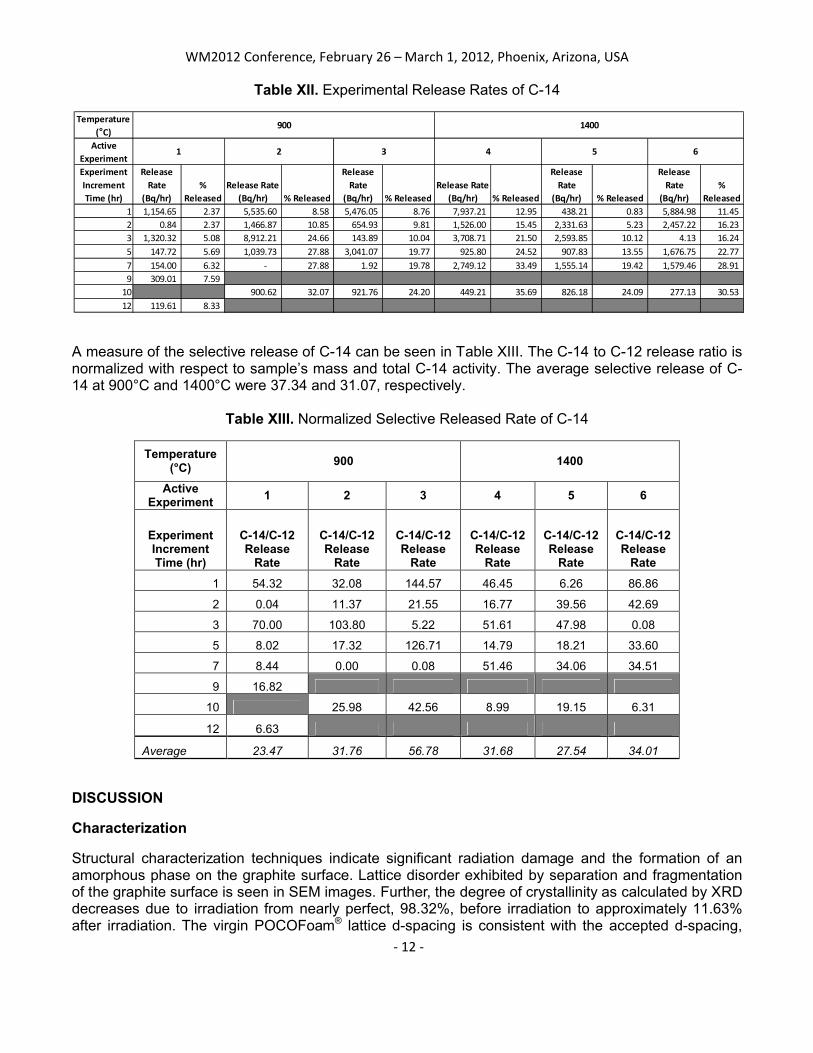
The detailed release rate of C-14 with respect to time can be seen in Table XII. The % released represents the cumulative amount of C-14 released up to that point. At 1400°C, ~10% of the C-14 wasremoved in roughly the first hour, where as at 900°C removal of ~10% of the C-14 occurred duringapproximately 6 hours.
WM2012 Conference, February 26 – March 1, 2012, Phoenix, Arizona, USA
- 12 -
Table XII. Experimental Release Rates of C-14
A measure of the selective release of C-14 can be seen in Table XIII. The C-14 to C-12 release ratio is normalized with respect to sample’s mass and total C-14 activity. The average selective release of C-14 at 900°C and 1400°C were 37.34 and 31.07, respectively.
Table XIII. Normalized Selective Released Rate of C-14
Temperature (°C)
900 1400
Active Experiment
1 2 3 4 5 6
Experiment Increment Time (hr)
C-14/C-12 Release
Rate
C-14/C-12 Release
Rate
C-14/C-12 Release
Rate
C-14/C-12 Release
Rate
C-14/C-12 Release
Rate
C-14/C-12 Release
Rate
1 54.32 32.08 144.57 46.45 6.26 86.86
2 0.04 11.37 21.55 16.77 39.56 42.69
3 70.00 103.80 5.22 51.61 47.98 0.08
5 8.02 17.32 126.71 14.79 18.21 33.60
7 8.44 0.00 0.08 51.46 34.06 34.51
9 16.82
10 25.98 42.56 8.99 19.15 6.31
12 6.63
Average 23.47 31.76 56.78 31.68 27.54 34.01
DISCUSSION
Characterization
Structural characterization techniques indicate significant radiation damage and the formation of an amorphous phase on the graphite surface. Lattice disorder exhibited by separation and fragmentation of the graphite surface is seen in SEM images. Further, the degree of crystallinity as calculated by XRD decreases due to irradiation from nearly perfect, 98.32%, before irradiation to approximately 11.63% after irradiation. The virgin POCOFoam® lattice d-spacing is consistent with the accepted d-spacing,
Temperature (°C)
Active Experiment Experiment Increment Time (hr)
Release Rate
(Bq/hr)%
ReleasedRelease Rate
(Bq/hr) % Released
Release Rate
(Bq/hr) % ReleasedRelease Rate
(Bq/hr) % Released
Release Rate
(Bq/hr) % Released
Release Rate
(Bq/hr)%
Released1 1,154.65 2.37 5,535.60 8.58 5,476.05 8.76 7,937.21 12.95 438.21 0.83 5,884.98 11.45 2 0.84 2.37 1,466.87 10.85 654.93 9.81 1,526.00 15.45 2,331.63 5.23 2,457.22 16.23 3 1,320.32 5.08 8,912.21 24.66 143.89 10.04 3,708.71 21.50 2,593.85 10.12 4.13 16.24 5 147.72 5.69 1,039.73 27.88 3,041.07 19.77 925.80 24.52 907.83 13.55 1,676.75 22.77 7 154.00 6.32 - 27.88 1.92 19.78 2,749.12 33.49 1,555.14 19.42 1,579.46 28.91 9 309.01 7.59
10 900.62 32.07 921.76 24.20 449.21 35.69 826.18 24.09 277.13 30.53 12 119.61 8.33
1 2 3 4 5 6
900 1400

WM2012 Conference, February 26 – March 1, 2012, Phoenix, Arizona, USA
- 13 -
3.35 Ǻ, for crystalline graphite. However, the increase in d-spacing as a result of irradiation is likely due to the formation of dislocation loops in between the basal planes. Raman results also indicate that the irradiation causes significant amorphization of the surface. SEM, XRD, and Raman spectroscopy results all indicate an increase in disorder and disorientation of the carbon atoms in the graphite lattice structure. Disruption to the graphite lattice can provide multiple bonding sites where nitrogen can become chemically bound to the surface.
Chemical analysis mapped variations in the spatial chemical composition of the graphite surface after irradiation. EDX revealed the existence of micron sized opaque clusters consisting mainly of nitrogen preferentially located along the edges of planes. XPS results confirmed increased concentrations of nitrogen on the surface and identified C-N, C=N, and C≡N bonding types between the introduced nitrogen atoms and graphite surface after irradiation. Measurable concentrations of the nitrogen atoms and corresponding bonding types where seen up to a minimum depth of 100 nm, indicating that the nitrogen atoms are chemically bound within the graphite structure. The appearance of the CHN signature in SIMS results indicates the substitution of single nitrogen atoms into displaced carbon atom locations in the graphite lattice. The measurement of multiple N2 containing ions on the surface such as CH2N2 also implies the substitution of N2 diatomic molecules into the graphite lattice. The confirmation of single and diatomic nitrogen atoms substituted into the carbon rings despite irradiation dictates thatC-14 could also be found at these locations. Furthermore, the presence of strongly bonded carbon-nitrogen atoms deep within the graphite structure also indicates C-14 could be found at similar locations. SIMS results indicated that N2 drastically decreases within the first 30 nm of depth indicating it likely exists as a weakly bonded sub layer on the surface of the graphite. Therefore, any C-14 produced as a result of the activation of the weak N2 sub-layer should be readily removed by thermal treatment. This removal may be evidenced by the high initial C-14 release rates seen during the first hour of thermal treatment. At both experimental temperatures a large amount of C-14 was immediately released, then the C-14 release rate declined and picked back up again.
It is important to note that results of XRD, Raman, SIMS, and XPS results analyses indicate that LN immersion does not induce a measureable change in the graphite’s structure.
Thermal Treatment
Results of inactive experiments indicate the higher experiment temperature (1400°C) resulted in a larger carbon release rate and preferential CO avulsion.
The larger release of gasified compounds during heat up of active samples may be a result of the larger concentrations of surface impurities observed via characterization. Further it was expected that active graphite would release more nitrogen-containing species than inactive graphite due to LN immersion.
The active and inactive experiment carbon release rates are comparable. The (total) carbon release rates for inactive graphite at 900°C and 1400°C were 1.72×10⁻⁴ g/hr and 4.49×10⁻⁴ g/hr, respectively. The rates of carbon from activated graphite at 900°C and 1400°C were 2.49×10⁻⁴ g/hr and 4.27×10⁻⁴ g/hr, respectively. The large rate of carbon release at 900°C for active graphite could be attributed to material amorphization. Increasing structural disorder creates more broken bonds that should more readily oxidize. It is possible that the amorphized graphite is no more sensitive to gasification at 1400°C than inactive graphite, because oxidation at this temperature is controlled by reactant and product diffusion through the boundary layer.
The average C-14 removal rates at 900°C and 1400°C were 1,708 Bq/hr (1.04x10⁻⁸ g/hr) and2,101 Bq/hr (1.28x10⁻⁸ g/hr), respectively. Although more C-14 was released at the higher temperature, it is also true that the overall carbon release rate was higher at this temperature. Given the average selective release of C-14 for 900°C and 1400°C, (37.34 and 31.07, respectively), indicating that thermal
WM2012 Conference, February 26 – March 1, 2012, Phoenix, Arizona, USA
- 14 -
treatment is slightly more effective process when operating at 900°C, where 10% of the C-14 could be removed in about 6 hours. A 10% reduction of C-14 lowered the average activity by 7,800 Bq(0.211 μCi).
CONCLUSION
Because C-14 is created through the neutron activation of N-14, understanding the location, bonding configuration, and chemical environment of N-14 may point to similar locations, bonding configurations, and chemical environments in which C-14 is present in irradiated graphite. A greater understanding of the chemical and physical environments of C-14 would help optimize its removal from graphite through thermal treatment.
Characterization of irradiated graphite surfaces indicates irradiation caused significant disruption of the graphite structure. Such disorder is consistent with numerous active sites at which single and diatomicnitrogen could substitute into a graphite ring and covalently bond to the graphite in the carbon ring or to a carbon lacking two neighboring atoms. Results of this research may indicate that N-14 forms strong double and triple bonds to carbon within the graphite structure (a minimum of 12 ηm from the material surface).
Thermal treatment demonstrated that graphite gasifies are a higher rate at 1400°C; however, at 900°C C-14 is more selectively removed. Removing a majority of the most significant long-lived radionuclide would reduce the volume of radioactive waste needing to be sent to a deep geological repository and allow recycle of the remaining nuclear grade graphite to be recycled.
Future work includes the use of inert carrier gas doped with either carbon dioxide or oxygen gas to increase the surface oxidation to further evaluate the selective release of C-14.
WM2012 Conference, February 26 – March 1, 2012, Phoenix, Arizona, USA
- 15 -
References
1. FACHINGER, J., PODRUHZINA, T., VON LENSA, W., “Decontamination of Nuclear Graphite by Thermal Treatment,” Solutions for Graphite Waste, Manchester, UK (March 2007)
2. NUCLEAR ENERGY AGENCY. “Generation IV International Forum.” Technical Secretariat. 2009
3. IDAHO NATIONAL LABORATORY. “Next Generation of Reactors.” https://inlportal.inl.gov/portal/server.pt?open=514&objID=1361&parentname=CommunityPage&parentid=9&mode=2
4. GEN-IV INTERNATIONAL FORUM. “The Very-High-Temperature Reactor (VHTR) is a graphite-moderated, helium-cooled reactor with a thermal neutron spectrum.” http://www.gen-4.org/Technology/systems/vhtr.htm
5. PODRUHZINA, TATJANA. “Graphite as radioactive waste: corrosion behavior under final repository conditions and thermal treatment.” Doctoral Dissertation. 2004.
6. ELECTRIC POWER RESEARCH INSTITUTE, “Graphite Decommissioning: Options for Graphite Treatment, Recycling, or Disposal, including a Discussion of Safety-Related Issues,” EPRI Technical Report 1013091(March 2006)
7. Briggs, D., Seah, M.P. “Practical Surface Analysis by Auger and X-ray Photoelectron Spectroscopy.” John Wiley and Sons, 1983.
8. Yates, J.T. Jr., Madey, T., Erickson, N. “ESCA Study of Carbon Monoxide and Oxygen Adsorption on Tungsten.” XPS PhotoElectron Spectroscopy. Benchmark Papers in Physical Chemistry and Chemical physics V.2. 1978.
9. IAEA. “The Thermal Oxidation of Graphite.” Irradiation Damage in Graphite due to Fast Neutrons in Fission and Fusion Systems. IAEA-TECDOC-1154. April 2000.
10. POCO Graphite, INC. http://www.POCOFoam®.com/tabid/130/Default.aspx
11. Cataldo, F. “A Raman study on radiation-damaged graphite by γ-rays”, Carbon 38 (2000) 623-641, 1999
Related Documents