Supporting Information 1 2 Source Characterization and Removal of N-Nitrosamine Precursors 3 During Activated Sludge Treatment 4 5 Xiaolu Zhang, Daekyun Kim, David L. Freedman, and Tanju Karanfil* 6 Department of Environmental Engineering and Earth Sciences, Clemson University, Anderson, 7 SC 29625 8 9 *Corresponding author phone: (864) 656-7701; e-mail: [email protected] 10 11 12 13 Electronic Supplementary Material (ESI) for Environmental Science: Water Research & Technology. This journal is © The Royal Society of Chemistry 2020

Welcome message from author
This document is posted to help you gain knowledge. Please leave a comment to let me know what you think about it! Share it to your friends and learn new things together.
Transcript
Supporting Information 1 2
Source Characterization and Removal of N-Nitrosamine Precursors 3
During Activated Sludge Treatment 4
5
Xiaolu Zhang, Daekyun Kim, David L. Freedman, and Tanju Karanfil* 6
Department of Environmental Engineering and Earth Sciences, Clemson University, Anderson, 7 SC 29625 8 9
*Corresponding author phone: (864) 656-7701; e-mail: [email protected] 10
11
12 13
Electronic Supplementary Material (ESI) for Environmental Science: Water Research & Technology.This journal is © The Royal Society of Chemistry 2020

Table S1 Selected water quality parameters in wastewater components (after dilution) 14
Samplesa Dilution factors DOCb (mg/L) SUVAc (L·mg-1·m-1) NH3-Nd (mg/L) TNe (mg/L)
U1 250 2.2 1.2 1.4 2.5 U2 250 3.4 1.2 1.6 3.9 F1 150 3.3 1.1 0.5 1.6 F2 150 3.4 1.5 0.1 0.6 L1 N.A.f 26 1.0 22 20 L2 N.A. 55 1.3 40 41 S1 N.A. 15 0.3 0.3 6.0 S2 N.A. 33 1.1 0.2 1.8 S3 N.A. 15 0.3 0.2 1.5 K1 N.A. 16 0.5 N.D.g 0.6 K2 100 16 0.5 N.D. 0.6
a: U1-U2: raw urine samples collected before (U1) and after (U2) taking Zantac, both diluted 250 times in tap water; F1-F2: raw 15 feces samples collected before (F1) and after (F2) taking Zantac, both diluted 150 times in tap water; L1-L2: laundry greywaters 16 collected from washing machine discharges containing laundry detergent only (L1), or laundry detergent plus fabric softener (L2); 17 S1-S3: shower greywater not containing any personal care products (S1), containing shampoo (S2) or body wash only (S3); K1-18 K2: kitchen greywater containing dishwashing detergent (K1), or mixed raw and cooked food waste leachates diluted 100 times in 19 tap water (K2). b: Dissolved organic carbon. c: Specific ultraviolet absorbance measured at 254 nm. d: Ammonia nitrogen. e: Total 20 nitrogen. f: Not applicable because there was no dilution. g: Not detectable (i.e., < 0.02 mg/L). 21 22
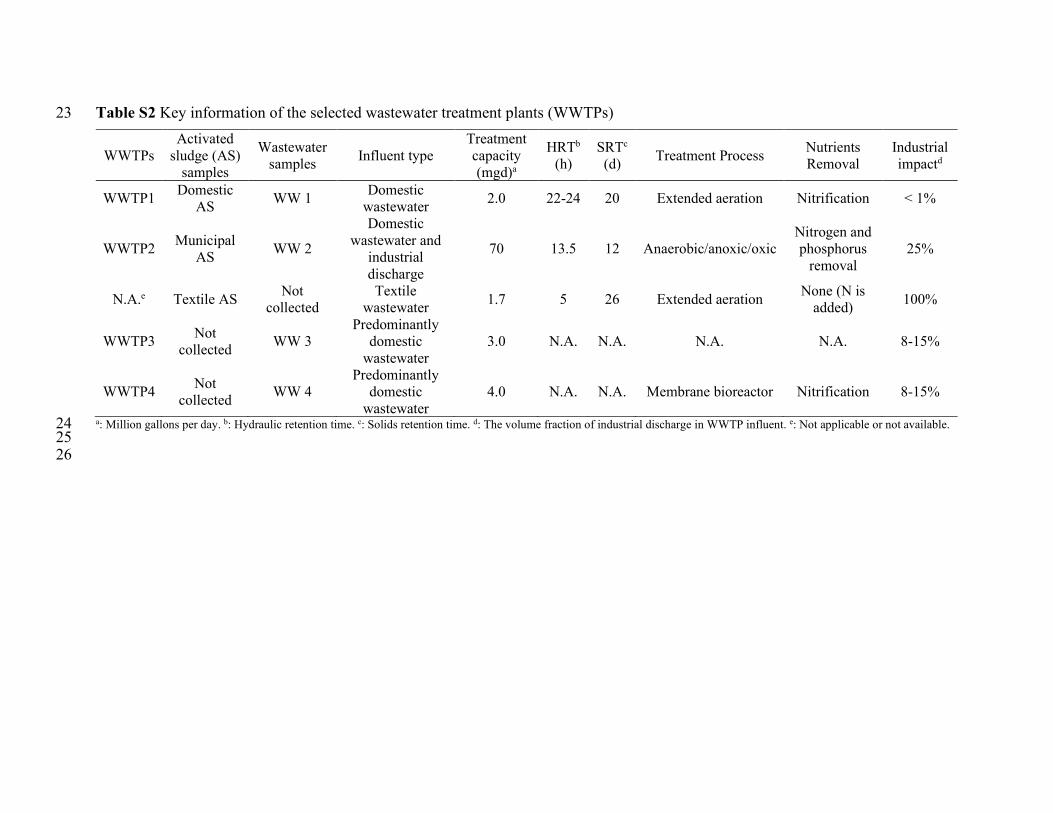
Table S2 Key information of the selected wastewater treatment plants (WWTPs) 23
WWTPs Activated
sludge (AS) samples
Wastewater samples Influent type
Treatment capacity (mgd)a
HRTb (h)
SRTc (d) Treatment Process Nutrients
Removal Industrial impactd
WWTP1 Domestic AS WW 1 Domestic
wastewater 2.0 22-24 20 Extended aeration Nitrification < 1%
WWTP2 Municipal AS WW 2
Domestic wastewater and
industrial discharge
70 13.5 12 Anaerobic/anoxic/oxic Nitrogen and phosphorus
removal 25%
N.A.e Textile AS Not collected
Textile wastewater 1.7 5 26 Extended aeration None (N is
added) 100%
WWTP3 Not collected WW 3
Predominantly domestic
wastewater 3.0 N.A. N.A. N.A. N.A. 8-15%
WWTP4 Not collected WW 4
Predominantly domestic
wastewater 4.0 N.A. N.A. Membrane bioreactor Nitrification 8-15%
a: Million gallons per day. b: Hydraulic retention time. c: Solids retention time. d: The volume fraction of industrial discharge in WWTP influent. e: Not applicable or not available. 24 25 26

Table S3 Selected water quality parameters in wastewater samples 27
Wastewater samples DOC (mg/L) NH3-N (mg/L) SUVA (L·mg-1·m-1) WW1 13 26 2.0 WW2 15 24 2.0 WW3 11 19 2.1 WW4 13 7 1.8
28 29 30

Table S4 Recipe of the mineral solution used to wash and resuspend AS solids 31 Stock solutionsa Chemicals Concentrations (g/L)
A
KH2PO4 8.50 K2HPO4 21.75
Na2HPO4·2H2O 33.40 NH4Cl 0.5
B CaCl2·2H2O 36.40 C MgSO4·7H2O 22.50 D FeCl3·6H2O 0.25
a: To prepare 1 L of the mineral solution, 10 mL of solution A, 1 mL of solution B, C and D, respectively, were added to 987 mL 32 of dechlorinated tap water (OECD, 1992). 33 34 35 36

Table S5 Key physiochemical properties of the seven selected N-nitrosamines 37
N-nitrosamines Chemical structures Molecular weight (g/mol) log Kow
a 10-6 cancer risk levelb
(ng/L)
N-Nitrosodimethylamine (NDMA)
74.0 -0.57 0.7
N-Nitrosodiethylamine (NDEA)
102.1 0.48 0.2
N-Nitrosopyrrolidine (NPYR)
100.1 -0.19 15
N-Nitrosomorpholine (NMOR)
116.1 -0.44 5
N-Nitrosodi-n-propylamine (NDPA)
130.1 1.36 5
N-Nitrosopiperidine (NPIP)
114.1 0.36 3.5
N-Nitrosodi-n-butylamine (NDBA)
158.1 2.63 3
a: US NLM (2019). b: US EPA (2001). 38
39
40
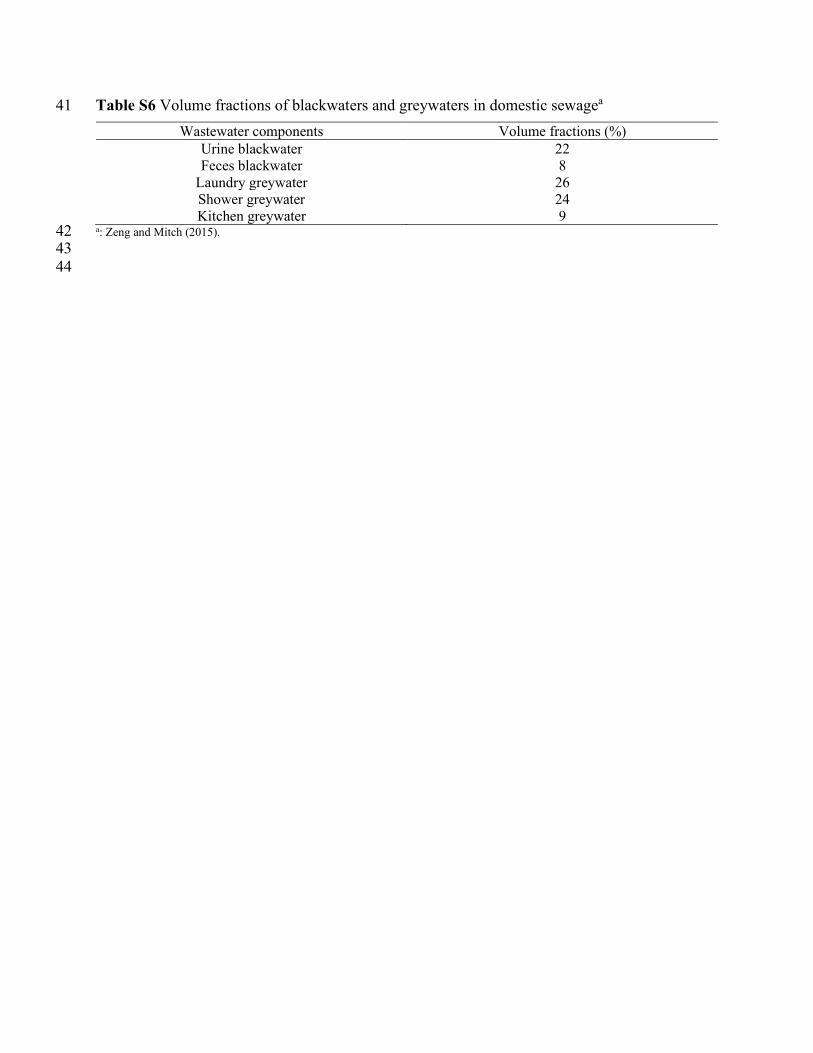
Table S6 Volume fractions of blackwaters and greywaters in domestic sewagea 41 Wastewater components Volume fractions (%)
Urine blackwater 22 Feces blackwater 8
Laundry greywater 26 Shower greywater 24 Kitchen greywater 9
a: Zeng and Mitch (2015). 42 43 44
45
46
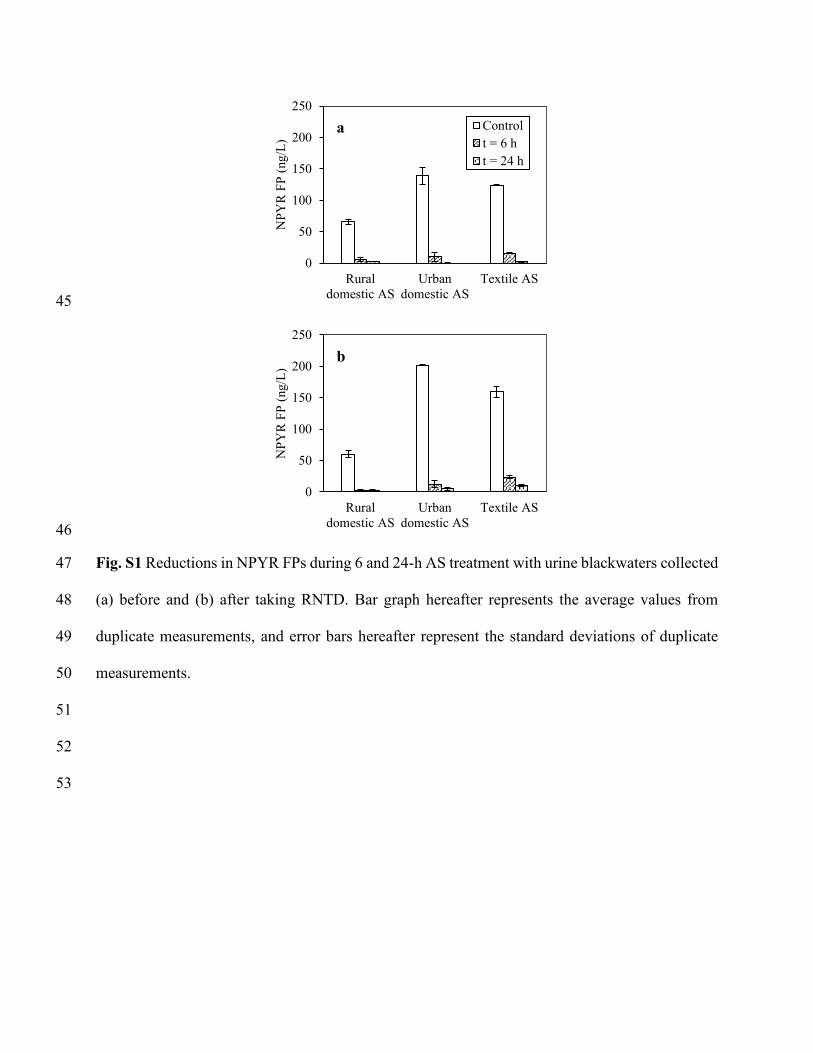
Fig. S1 Reductions in NPYR FPs during 6 and 24-h AS treatment with urine blackwaters collected 47
(a) before and (b) after taking RNTD. Bar graph hereafter represents the average values from 48
duplicate measurements, and error bars hereafter represent the standard deviations of duplicate 49
measurements. 50
51
52
53
0
50
100
150
200
250
Ruraldomestic AS
Urbandomestic AS
Textile ASN
PYR
FP
(ng/
L)
a Controlt = 6 ht = 24 h
0
50
100
150
200
250
Ruraldomestic AS
Urbandomestic AS
Textile AS
NPY
R F
P (n
g/L)
b

54
55
56
Fig. S2 Reductions in NPYR FPs during AS treatment with shower greywaters containing (a) no 57
personal care products (S1), (b) shampoo only (S2), and (c) body wash only (S3). 58
59
60
0
50
100
150
200
250
Ruraldomestic AS
Urbandomestic AS
Textile ASN
PYR
FP
(ng/
L)
a Control t = 6 h t = 24 h
0
20
40
60
80
100
Ruraldomestic AS
Urbandomestic AS
Textile AS
NPY
R F
P (n
g/L)
b
0
20
40
60
80
100
Ruraldomestic AS
Urbandomestic AS
Textile AS
NPY
R F
P (n
g/L)
c

61
62
63
Fig. S3 Reductions in NDBA FPs during AS treatment with shower greywaters containing (a) no 64
personal care products (S1), (b) shampoo only (S2), and (c) body wash only (S3). 65
66 67
0
10
20
30
40
50
60
Ruraldomestic AS
Urbandomestic AS
Textile ASN
DB
A F
P (n
g/L)
a Controlt = 6 ht = 24 h
0
10
20
30
40
50
60
Ruraldomestic AS
Urbandomestic AS
Textile AS
ND
BA
FP
(ng/
L)
b
0
10
20
30
40
50
60
Ruraldomestic AS
Urbandomestic AS
Textile AS
ND
BA
FP
(ng/
L)
c

68
Fig. S4 Reductions in NDBA FP during AS treatment with kitchen greywater containing 69
dishwashing detergent (K1). 70
71
0
20
40
60
80
Ruraldomestic AS
Urbandomestic AS
Textile ASN
DB
A F
P (n
g/L)
Controlt = 6 ht = 24 h

72
Fig. S5 Reductions in NPYR FP during AS treatment with kitchen greywater containing food 73
leachates (K2). 74
75
0
200
400
600
800
1000
Ruraldomestic AS
Urbandomestic AS
Textile ASN
PYR
FP
(ng/
L)
Control t = 6 h t = 24 h

76
77
Fig. S6 Reductions in N-nitrosamine FPs from laundry greywaters containing (a) laundry detergent 78
only (L1), and (b) laundry detergent and fabric softener (L2) during treatment with the urban 79
domestic AS. 80
81
0
50
100
150
200
250
300
0
500
1000
1500
2000
2500
3000
NDMA NDEA NPYR NMOR NPIP NDPA NDBA
Oth
er N
-nitr
osam
ine
FPs
(ng/
L)
ND
MA
FP
(ng/
L)
aControlt = 6 ht = 24 h
0
50
100
150
200
250
300
0
500
1000
1500
2000
2500
3000
NDMA NDEA NPYR NMOR NPIP NDPA NDBA
Oth
er N
-nitr
osam
ine
FPs
(ng/
L)
ND
MA
FP
(ng/
L)
b

82
83
Fig. S7 Reductions in N-nitrosamine FPs from laundry greywaters containing (a) laundry detergent 84
only (L1), and (b) laundry detergent and fabric softener (L2) during treatment with the textile AS. 85
86 87
0
50
100
150
200
250
300
0
500
1000
1500
2000
2500
3000
NDMA NDEA NPYR NMOR NPIP NDPA NDBA
Oth
er N
-nitr
osam
ine
FPs
(ng/
L)
ND
MA
FP
(ng/
L)
aControlt = 6 ht = 24 h
0
50
100
150
200
250
300
0
500
1000
1500
2000
2500
3000
NDMA NDEA NPYR NMOR NPIP NDPA NDBA
Oth
er N
-nitr
osam
ine
FPs
(ng/
L)
ND
MA
FP
(ng/
L)
b
88 89 90 91 92 93 94 95 96 97 98 99 100 101 102 103 104 105 106 107
108
109
110
111
112
113
114
115
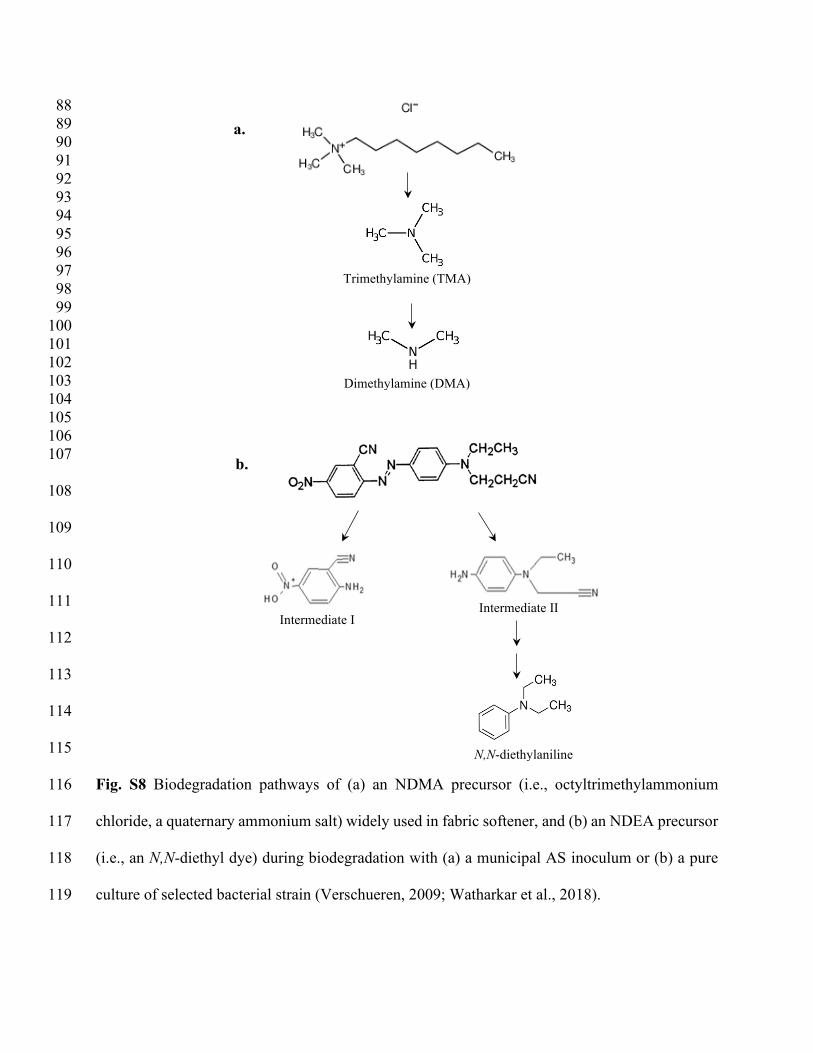
Fig. S8 Biodegradation pathways of (a) an NDMA precursor (i.e., octyltrimethylammonium 116
chloride, a quaternary ammonium salt) widely used in fabric softener, and (b) an NDEA precursor 117
(i.e., an N,N-diethyl dye) during biodegradation with (a) a municipal AS inoculum or (b) a pure 118
culture of selected bacterial strain (Verschueren, 2009; Watharkar et al., 2018). 119
b.
a.
Trimethylamine (TMA)
Dimethylamine (DMA)
Intermediate I Intermediate II
N,N-diethylaniline

Table S7 N-nitrosamine FPs in raw wastewater samples without any AS treatment 120
Wastewater samples Seasona NDMA NDEA NPYR NMOR NDPA NPIP NDBA
WW1 Spring 3650 4 138 21 N.D.b N.M.c 27 Summer 1529 5 99 20 N.D. 29 14
WW2 Spring 2440 10 424 24 N.D. 113 24 Summer 3078 27 304 37 N.D. N.M. 16
WW4 Summer 1849 10 131 12 N.D. N.M. 30 WW5 Summer 2561 13 108 21 N.D. N.M. 14
a: Seasons during which the wastewater samples were collected. b: Not detectable (i.e., < 3 ng/L). c: NPIP FP were not measurable 121 in WW1 collected in spring, WW2 collected in summer, WW3 or WW4, because the target NPIP peak (115 m/z) was interfered 122 with a neighbor peak (114 m/z) on GC spectrum. 123 124 125 126 127

Table S8 Reductions in NDMA FPs during AS treatment with wastewater samples 128
Wastewater samples Seasona
Domestic AS (summer)b
Municipal AS (spring)c
Municipal AS (summer)d Removal
at WWTPse
(%)
6-h removal
(%)
24-h removal
(%)
6-h removal
(%)
24-h removal
(%)
6-h removal
(%)
24-h removal
(%)
WW1 Spring 80 93 63 69 73 85 92 Summer 74 78 71
WW2 Spring 73 86 74 79 69 87 77 Summer 72 83 62
WW3 Summer 74 79 77 83 67 WW4 78 87 76 82 51
a: Seasons during which the wastewater samples were collected. b: AS 1 collected in summer. c: AS 2 collected in spring. d: AS 2 129 collected in summer. e: Determined via measuring NDMA FPs in WWTP primary and secondary effluents. 130 131 132 133

Table S9 Reductions in the other N-nitrosamine (not including NDMA) FPs during AS treatment 134 with wastewater samples 135
N-nitrosamines
Wastewater samples
Rural domestic AS (summer)a Urban domestic AS (summer)a 6-h incubation
(%) 24-h incubation
(%) 6-h incubation
(%) 24-h incubation
(%)
NDEA
WW1b N.M.e N.M. 36 87 WW2c 27 94 56 82 WW3 d N.M. N.M. 100 71 WW4 d 66 92 80 100
NPYR
WW1 91 93 66 90 WW2 94 97 90 99 WW3 97 96 98 93 WW4 93 94 89 96
NMOR
WW1 87 58 -38 9 WW2 -42f -55 7 81 WW3 28 -28 78 64 WW4 64 75 -19 7
NPIP WW1 92 94 N.M. N.M. WW2 N.M.g N.M. 95 98
WW3-WW4 N.M. N.M. N.M. N.M.
NDBA
WW1 100 100 100 100 WW2 100 100 100 100 WW3 100 100 100 100 WW4 72 100 100 100
a: AS collected in summer. b: WW1 collected in spring and summer were treated with the rural and urban domestic AS, respectively. 136 c: WW2 collected in spring and summer were treated with the rural and urban domestic AS, respectively. d: WW3 and WW4 were 137 collected in summer. e: NDEA FPs in WW1 and WW3 were extremely low (i.e., < 10 ng/L), thus not examined during the AS 138 treatment test. f: Increased after the AS treatment. g: NPIP FP from WW1 and WW2 collected in summer, WW3 and WW 4 were 139 not measurable because the target NPIP peak (115 m/z) was interfered with a neighbor peak (114 m/z) on GC spectrum. 140 141

142
143 Fig. S9 Correlation between the reductions of NDMA (or NDEA) FPs and the removal of (a) NH3-144
N, and (b) DOC from wastewater samples (WW1-WW4) during treatment with the rural domestic 145
AS. 146
147 148 149
y = 0.2347x + 57.528R² = 0.5802
y = 1.5714x - 65.393R² = 0.9929
0
20
40
60
80
100
120
50 70 90 110Rem
oval
of N
-nitr
osam
ine
FPs
(%)
Removals of NH3-N (%)
a
NDMANDEA
y = -0.0804x + 81.453R² = 0.0356
y = 0.6903x + 46.106R² = 0.035
0
20
40
60
80
100
120
10 30 50 70Rem
oval
of N
-nitr
osam
ine
FPs
(%)
Removals of DOC (%)
b

1
References 150
The U.S. National Library of Medicine (US NLM), Hazardous Substances Data Bank (HSDB), 151 2019. 152
The Organization for Economic Co-operation and Development (OECD), OECD Guidelines for 153 Testing Chemicals, 1992. 154
US EPA, Integrated Risk Information System, 2001. 155
K. Verschueren, Handbook of Environmental Data on Organic Chemicals, John Wiley & Sons, 156 Ltd., Hoboken, 2009. 157
A. D. Watharkar, S. K. Kadam, R. V. Khandare, P. D. Kolekar, B. Jeon, J. P. Jadhav and S. P. 158 Govindwar, Asparagus densiflorus in a vertical subsurface flow phytoreactor for treatment of real 159 textile effluent: A lab to land approach for in situ soil remediation, Ecotoxicol. Environ. Saf., 2018, 160 161, 70-77. 161
T. Zeng and W. A. Mitch, Contribution of N-nitrosamines and their precursors to domestic sewage 162 by greywaters and blackwaters, Environ. Sci. Technol., 2015, 49, 13158-13167. 163
164
Related Documents