CHAPTER 6 Modern Theory Principles LECTURER SAHEB M. MAHDI

Welcome message from author
This document is posted to help you gain knowledge. Please leave a comment to let me know what you think about it! Share it to your friends and learn new things together.
Transcript

CHAPTER 6
Modern Theory Principles
LECTURER
SAHEB M. MAHDI
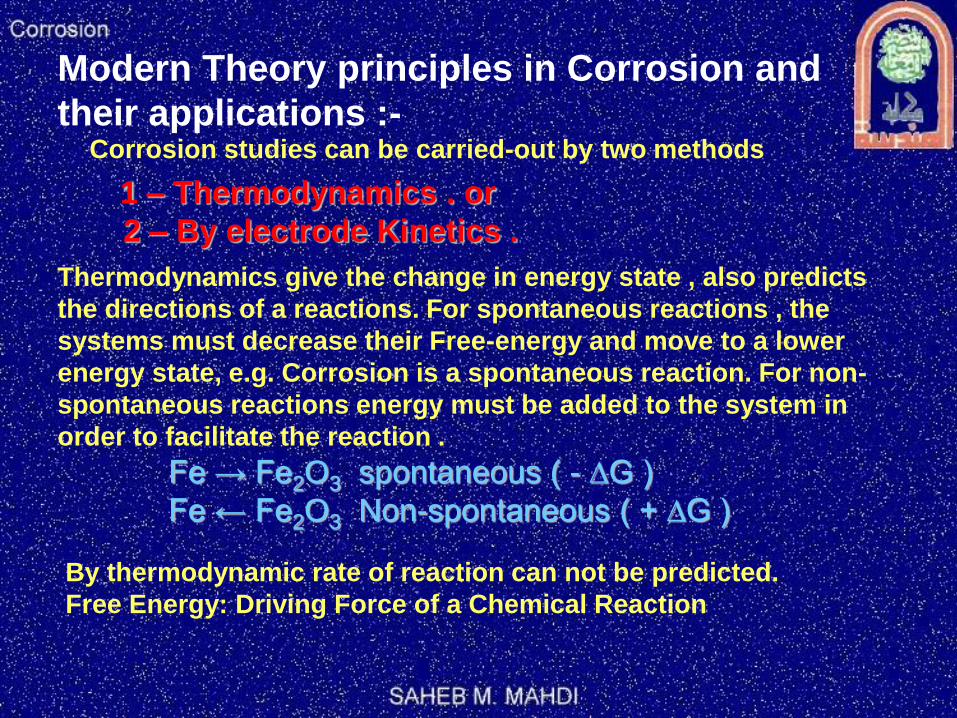
Modern Theory principles in Corrosion and
their applications :- Corrosion studies can be carried-out by two methods
1 – Thermodynamics . or
2 – By electrode Kinetics .
Thermodynamics give the change in energy state , also predicts
the directions of a reactions. For spontaneous reactions , the
systems must decrease their Free-energy and move to a lower
energy state, e.g. Corrosion is a spontaneous reaction. For non-
spontaneous reactions energy must be added to the system in
order to facilitate the reaction .
Fe → Fe2O3 spontaneous ( - ∆G )
Fe ← Fe2O3 Non-spontaneous ( + ∆G )
By thermodynamic rate of reaction can not be predicted.
Free Energy: Driving Force of a Chemical Reaction
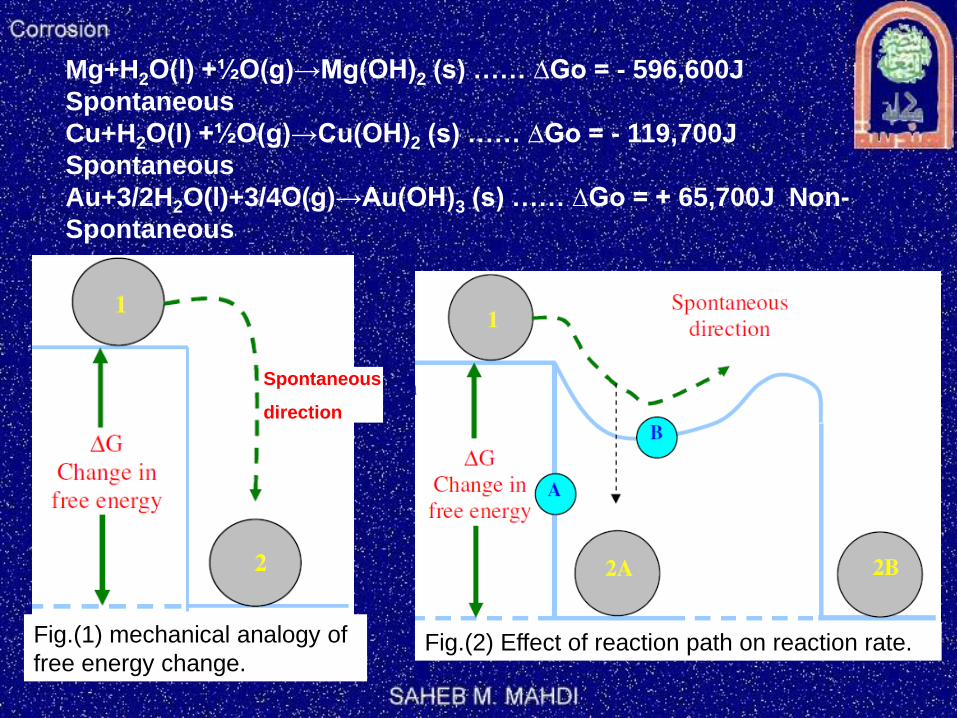
Mg+H2O(l) +½O(g)→Mg(OH)2 (s) …… ∆Go = - 596,600J
Spontaneous
Cu+H2O(l) +½O(g)→Cu(OH)2 (s) …… ∆Go = - 119,700J
Spontaneous
Au+3/2H2O(l)+3/4O(g)→Au(OH)3 (s) …… ∆Go = + 65,700J Non-
Spontaneous
Spontaneous
direction
Fig.(1) mechanical analogy of
free energy change. Fig.(2) Effect of reaction path on reaction rate.
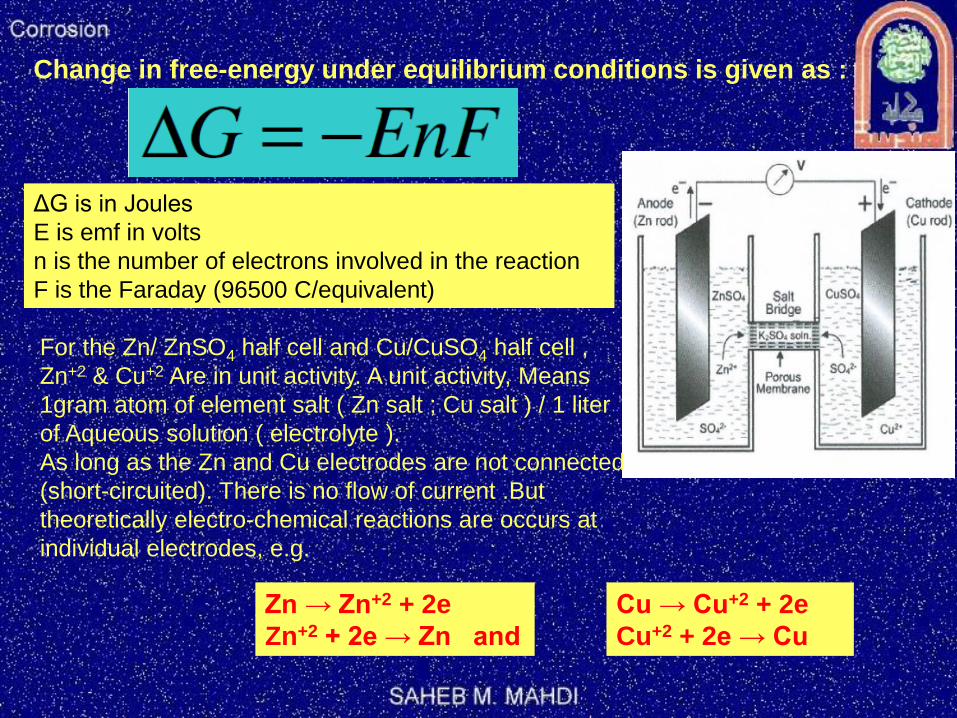
Change in free-energy under equilibrium conditions is given as :
ΔG is in Joules
E is emf in volts
n is the number of electrons involved in the reaction
F is the Faraday (96500 C/equivalent)
For the Zn/ ZnSO4 half cell and Cu/CuSO4 half cell ,
Zn+2 & Cu+2 Are in unit activity. A unit activity, Means
1gram atom of element salt ( Zn salt ; Cu salt ) / 1 liter
of Aqueous solution ( electrolyte ).
As long as the Zn and Cu electrodes are not connected
(short-circuited). There is no flow of current .But
theoretically electro-chemical reactions are occurs at
individual electrodes, e.g.
Zn → Zn+2 + 2e
Zn+2 + 2e → Zn and
Cu → Cu+2 + 2e
Cu+2 + 2e → Cu
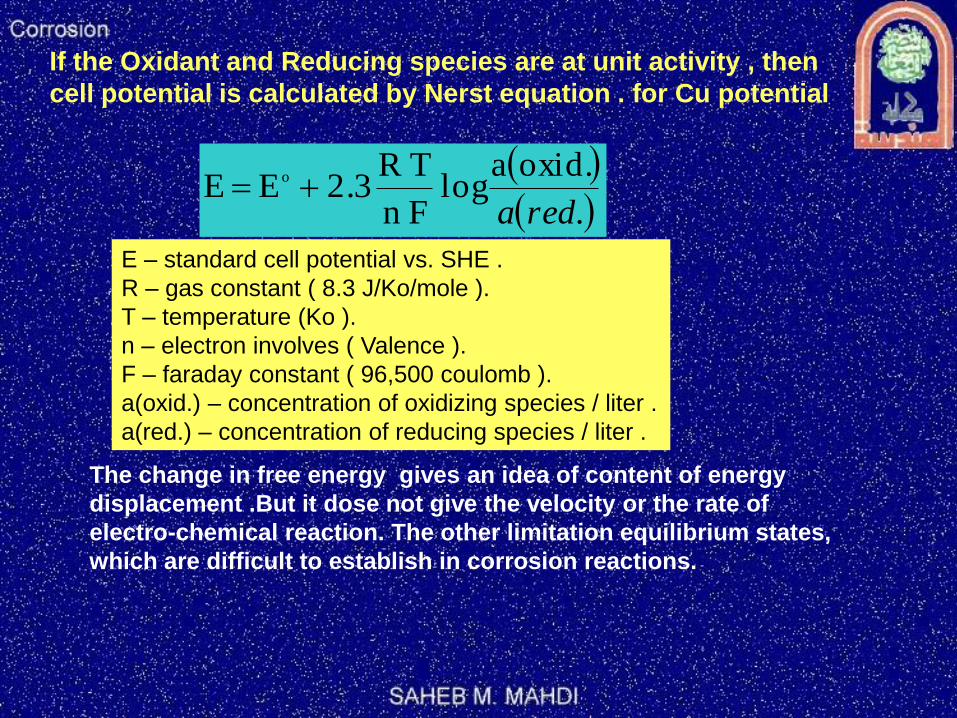
If the Oxidant and Reducing species are at unit activity , then
cell potential is calculated by Nerst equation . for Cu potential
.oxid.a
log Fn
T R 2.3 E E o
reda
E – standard cell potential vs. SHE .
R – gas constant ( 8.3 J/Ko/mole ).
T – temperature (Ko ).
n – electron involves ( Valence ).
F – faraday constant ( 96,500 coulomb ).
a(oxid.) – concentration of oxidizing species / liter .
a(red.) – concentration of reducing species / liter .
The change in free energy gives an idea of content of energy
displacement .But it dose not give the velocity or the rate of
electro-chemical reaction. The other limitation equilibrium states,
which are difficult to establish in corrosion reactions.
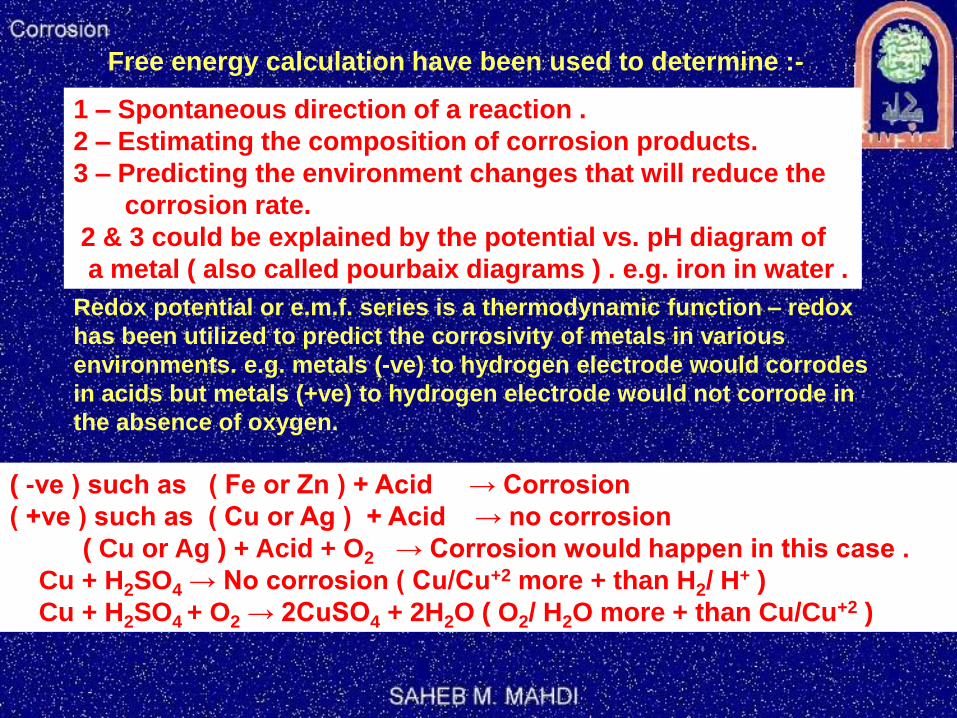
Free energy calculation have been used to determine :-
1 – Spontaneous direction of a reaction .
2 – Estimating the composition of corrosion products.
3 – Predicting the environment changes that will reduce the
corrosion rate.
2 & 3 could be explained by the potential vs. pH diagram of
a metal ( also called pourbaix diagrams ) . e.g. iron in water .
Redox potential or e.m.f. series is a thermodynamic function – redox
has been utilized to predict the corrosivity of metals in various
environments. e.g. metals (-ve) to hydrogen electrode would corrodes
in acids but metals (+ve) to hydrogen electrode would not corrode in
the absence of oxygen.
( -ve ) such as ( Fe or Zn ) + Acid → Corrosion
( +ve ) such as ( Cu or Ag ) + Acid → no corrosion
( Cu or Ag ) + Acid + O2 → Corrosion would happen in this case .
Cu + H2SO4 → No corrosion ( Cu/Cu+2 more + than H2/ H+ )
Cu + H2SO4 + O2 → 2CuSO4 + 2H2O ( O2/ H2O more + than Cu/Cu+2 )
The corrosion rate of a metal decrease in presence of Oxygen
in acids. With the increase in electro-positive character of a
metal ( e.g. Pt , Pb , …..etc ) are un-affected by containing O2 .
Pourbaix Diagram:-
1)Marcel Pourbaix developed potential-pH diagrams to show the
thermodynamic state of most metals in dilute aqueous solutions
2)With pH as abscissa and potential as ordinate, these diagrams
have curves representing chemical and electrochemical equilibria
between metal and aqueous environment
3)These diagrams ultimately show the conditions for immunity,
corrosion or passivation.
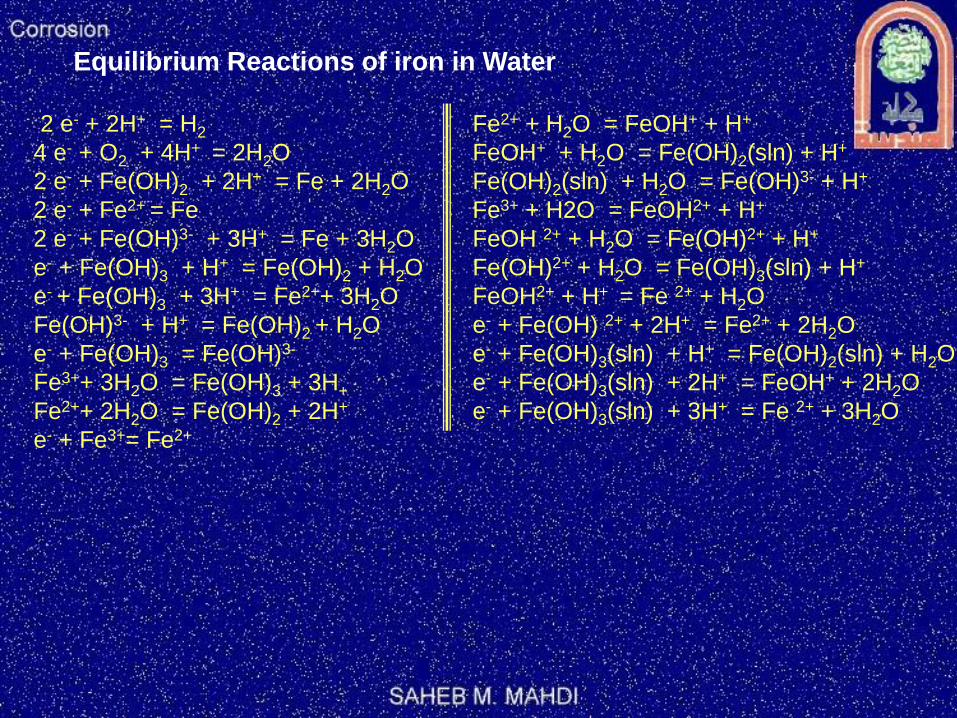
Equilibrium Reactions of iron in Water
2 e- + 2H+ = H2
4 e- + O2 + 4H+ = 2H2O
2 e- + Fe(OH)2 + 2H+ = Fe + 2H2O
2 e- + Fe2+ = Fe
2 e- + Fe(OH)3- + 3H+ = Fe + 3H2O
e- + Fe(OH)3 + H+ = Fe(OH)2 + H2O
e- + Fe(OH)3 + 3H+ = Fe2++ 3H2O
Fe(OH)3- + H+ = Fe(OH)2 + H2O
e- + Fe(OH)3 = Fe(OH)3-
Fe3++ 3H2O = Fe(OH)3 + 3H+
Fe2++ 2H2O = Fe(OH)2 + 2H+
e- + Fe3+= Fe2+
Fe2+ + H2O = FeOH+ + H+
FeOH+ + H2O = Fe(OH)2(sln) + H+
Fe(OH)2(sln) + H2O = Fe(OH)3- + H+
Fe3+ + H2O = FeOH2+ + H+
FeOH 2+ + H2O = Fe(OH)2+ + H+
Fe(OH)2+ + H2O = Fe(OH)3(sln) + H+
FeOH2+ + H+ = Fe 2+ + H2O
e- + Fe(OH) 2+ + 2H+ = Fe2+ + 2H2O
e- + Fe(OH)3(sln) + H+ = Fe(OH)2(sln) + H2O
e- + Fe(OH)3(sln) + 2H+ = FeOH+ + 2H2O
e- + Fe(OH)3(sln) + 3H+ = Fe 2+ + 3H2O
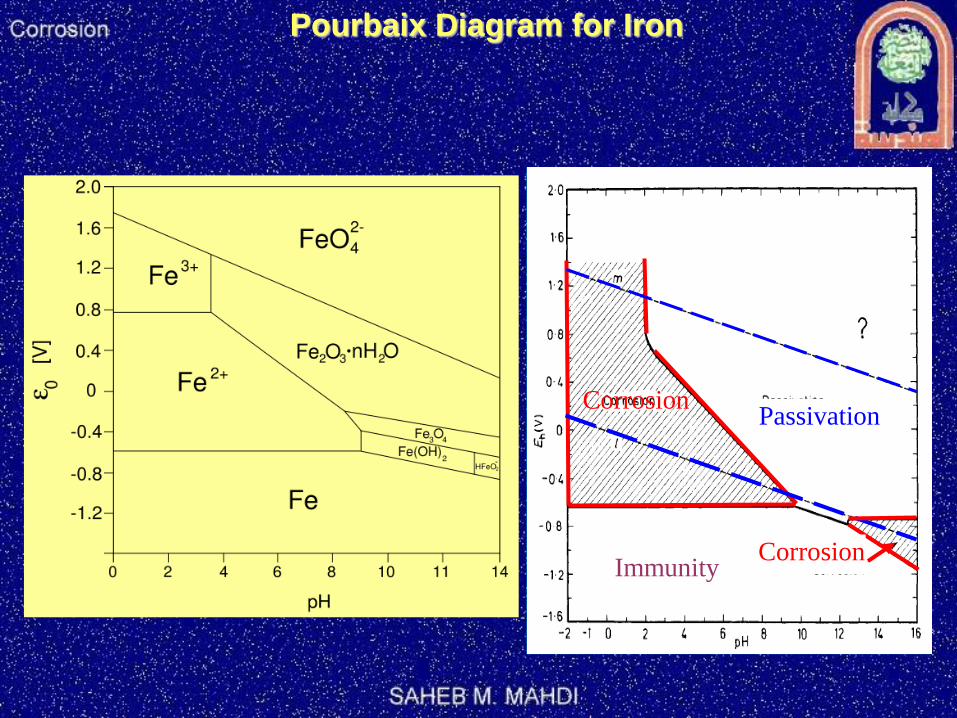
Pourbaix Diagram for Iron
Passivation Corrosion
Corrosion Immunity

Benefits of Pourbaix Diagram
1 -Pourbaix diagrams offer a large volume of thermodynamic
information in a very efficient and compact format.
2 -The information in the diagrams can be beneficially used to
control corrosion of pure metals in the aqueous environment.
By altering the pH and potential to the regions of immunity and
passivation, corrosion can be controlled. For example, on
increasing the pH of environment in moving to slightly alkaline
regions, the corrosion of iron can be controlled.
Changing the potential of iron to more negative values eliminate
corrosion, this technique is called Cathodic protection.
Raising the potentials to more positive values reduces the
corrosion by formation of stable films of oxides on the surface of
transition metals.
Limitations of Pourbaix Diagrams
1)These diagrams are purely based on thermodynamic data
and do not provide any information on the reaction rates.
2)Consideration is given only to equilibrium conditions in
specified environment and factors, such as temperature
and velocity are not considered which may seriously
affect the corrosion rate
3)Pourbaix diagrams deal with pure metals which are not of
much interest to the engineers
2-Electrode Kinetics :- We are interested in what happens when cells such as shown
in fig.(3). In this short-circuited cell , a vigorous reaction
occurs .The zinc Electrode rapidly dissolves in the solution
and simultaneously a rapid evolution of hydrogen is
observed at platinum electrode. Electrons released from the
Zn dissolution and consumed in the hydrogen-reduction
reaction.
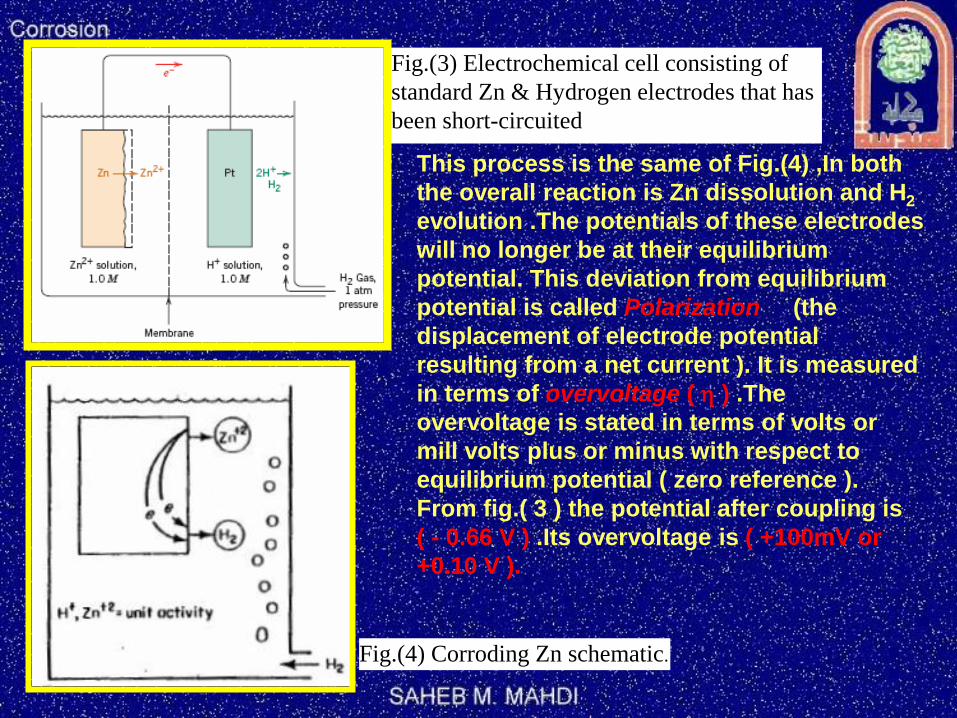
Fig.(3) Electrochemical cell consisting of
standard Zn & Hydrogen electrodes that has
been short-circuited
This process is the same of Fig.(4) ,In both
the overall reaction is Zn dissolution and H2
evolution .The potentials of these electrodes
will no longer be at their equilibrium
potential. This deviation from equilibrium
potential is called Polarization (the
displacement of electrode potential
resulting from a net current ). It is measured
in terms of overvoltage ( h ) .The
overvoltage is stated in terms of volts or
mill volts plus or minus with respect to
equilibrium potential ( zero reference ).
From fig.( 3 ) the potential after coupling is
( - 0.66 V ) .Its overvoltage is ( +100mV or
+0.10 V ).
Fig.(4) Corroding Zn schematic.
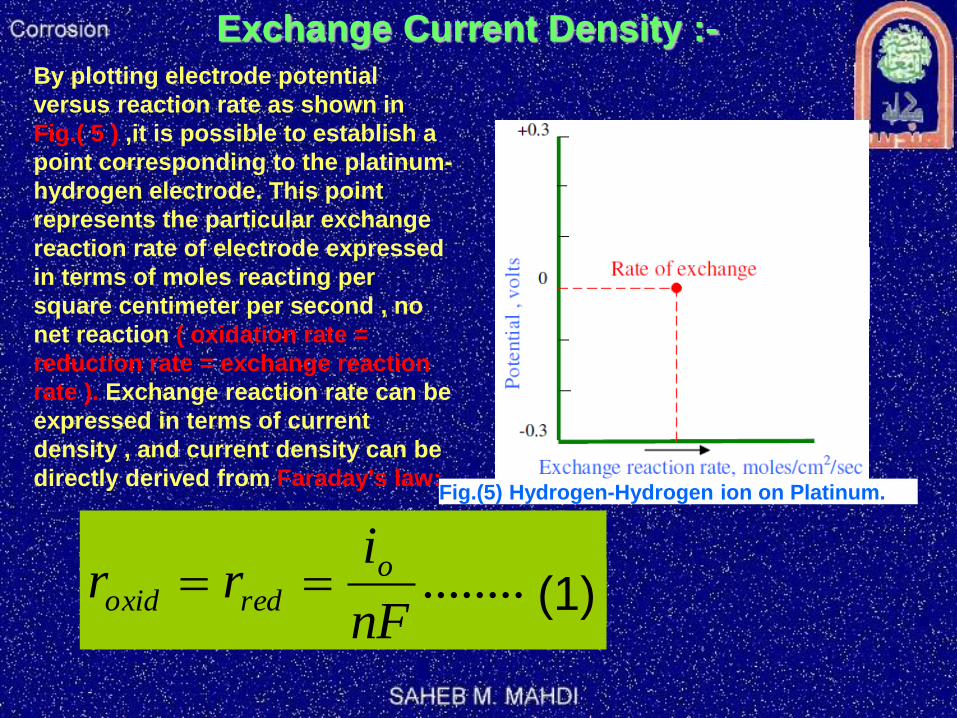
Exchange Current Density :- By plotting electrode potential
versus reaction rate as shown in
Fig.( 5 ) ,it is possible to establish a
point corresponding to the platinum-
hydrogen electrode. This point
represents the particular exchange
reaction rate of electrode expressed
in terms of moles reacting per
square centimeter per second , no
net reaction ( oxidation rate =
reduction rate = exchange reaction
rate ). Exchange reaction rate can be
expressed in terms of current
density , and current density can be
directly derived from Faraday's law: Fig.(5) Hydrogen-Hydrogen ion on Platinum.
*).........(nF
irr o
redoxid (1)
Exchange current density depends on :-
1) Redox potential of a metal.
2) Composition of electrode.
3) Temp. of the system.
4) The ratio of oxidized and reduced spacies.
Polarization : Means the reduction in corrosion rate either by slowing down the
anodic or Cathodic reaction.
Activation Polarization
refers to the condition wherein the reaction rate is controlled by the one
step in the series that occurs at the slowest rate. The term “activation” is
applied to this type of polarization because an activation energy barrier is
associated with this slowest, rate-limiting step.
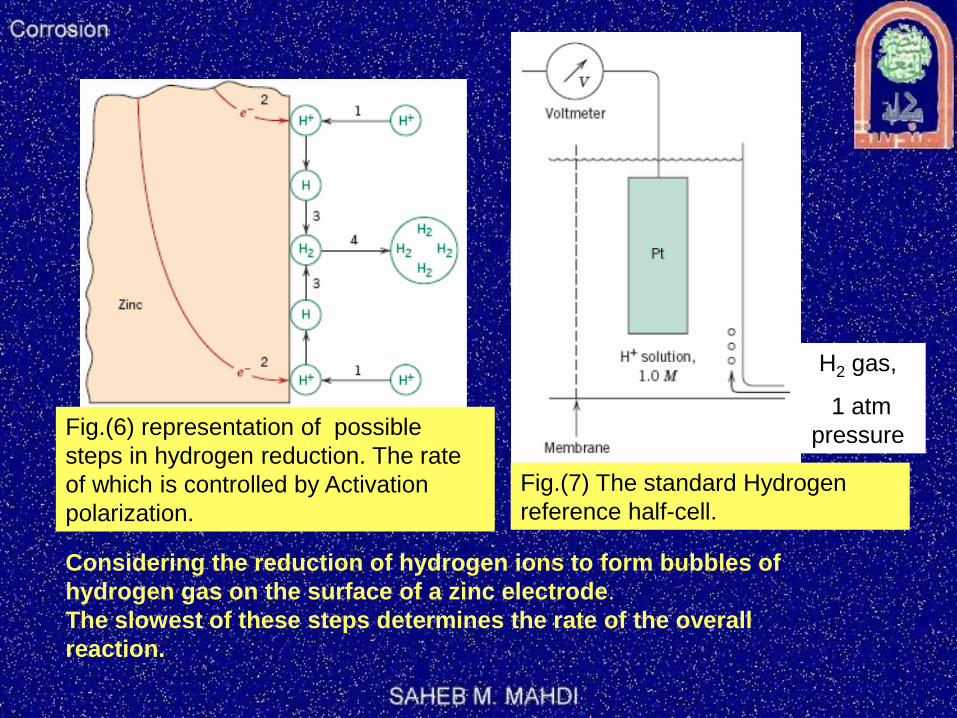
Fig.(6) representation of possible
steps in hydrogen reduction. The rate
of which is controlled by Activation
polarization.
H2 gas,
1 atm
pressure
Fig.(7) The standard Hydrogen
reference half-cell.
Considering the reduction of hydrogen ions to form bubbles of
hydrogen gas on the surface of a zinc electrode.
The slowest of these steps determines the rate of the overall
reaction.

For activation polarization, the relationship between overvoltage ha
and current density i is
o
ai
ilogh Called Tafel equation
Where and io are constants for the particular half-cell. The parameter io
is termed the exchange current density, which deserves a brief
explanation. Equilibrium for some particular half-cell reaction is really a
dynamic state on the atomic level. That is, oxidation and reduction
processes are occurring, but both at the same rate, so that there is no net
reaction. For example, for the standard hydrogen cell ( Fig. 7 ) reduction of
hydrogen ions in solution will take place at the surface of the platinum
electrode according to 2H+ + 2e → H2
With a corresponding rate rred. similarly, hydrogen gas in the solution will
experience oxidation as H2 → 2H+ + 2e
At rate roxid. Equilibrium exists when rred = roxid
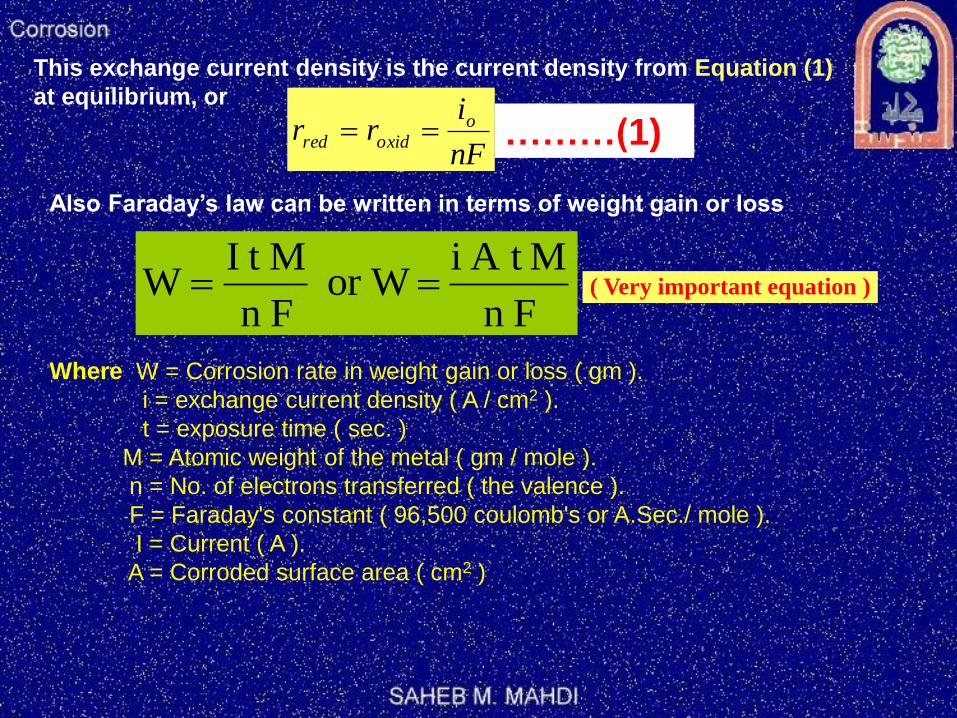
This exchange current density is the current density from Equation (1)
at equilibrium, or
nF
irr o
oxidred
Also Faraday’s law can be written in terms of weight gain or loss
Fn
MA t i or W
Fn
M t IW ( Very important equation )
Where W = Corrosion rate in weight gain or loss ( gm ).
i = exchange current density ( A / cm2 ).
t = exposure time ( sec. )
M = Atomic weight of the metal ( gm / mole ).
n = No. of electrons transferred ( the valence ).
F = Faraday's constant ( 96,500 coulomb's or A.Sec./ mole ).
I = Current ( A ).
A = Corroded surface area ( cm2 )
………(1)
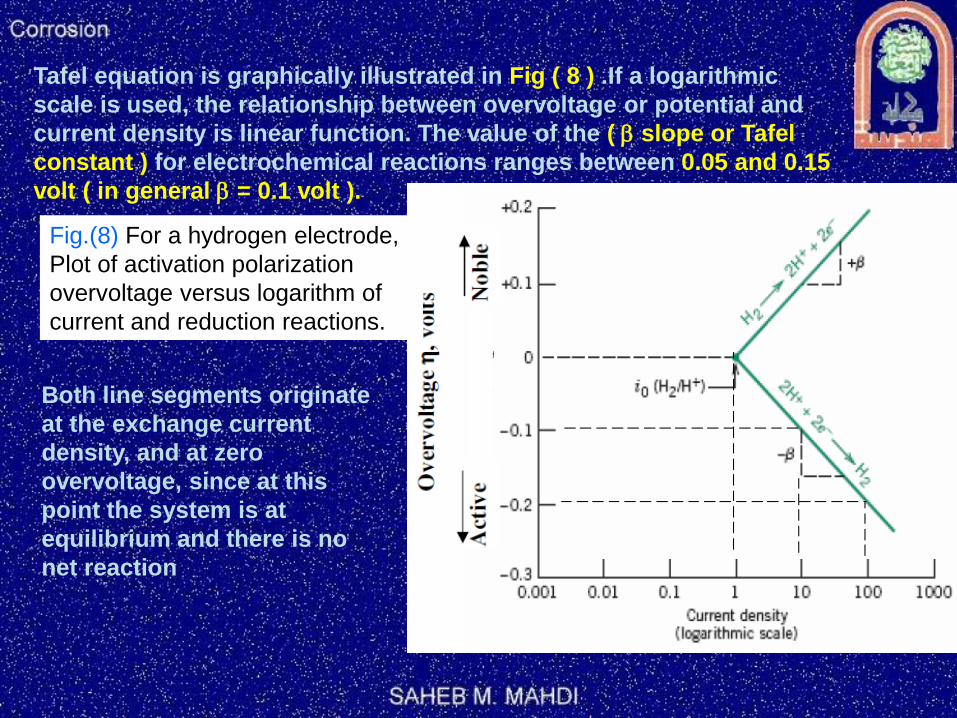
Tafel equation is graphically illustrated in Fig ( 8 ) .If a logarithmic
scale is used, the relationship between overvoltage or potential and
current density is linear function. The value of the ( slope or Tafel
constant ) for electrochemical reactions ranges between 0.05 and 0.15
volt ( in general = 0.1 volt ).
Fig.(8) For a hydrogen electrode,
Plot of activation polarization
overvoltage versus logarithm of
current and reduction reactions.
Both line segments originate
at the exchange current
density, and at zero
overvoltage, since at this
point the system is at
equilibrium and there is no
net reaction
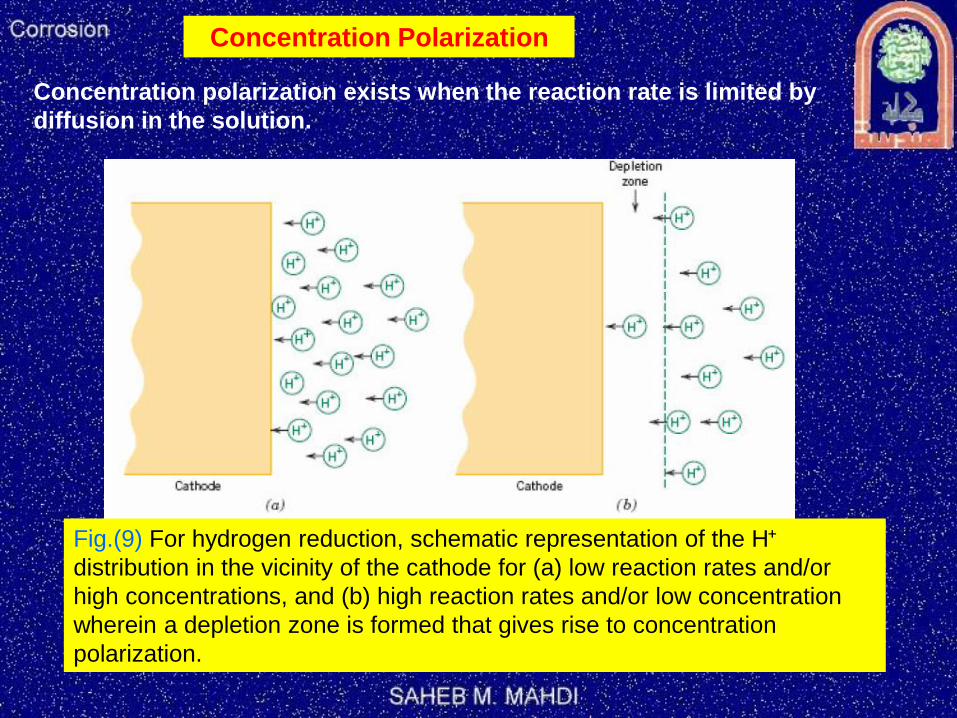
Concentration Polarization
Concentration polarization exists when the reaction rate is limited by
diffusion in the solution.
Fig.(9) For hydrogen reduction, schematic representation of the H+
distribution in the vicinity of the cathode for (a) low reaction rates and/or
high concentrations, and (b) high reaction rates and/or low concentration
wherein a depletion zone is formed that gives rise to concentration
polarization.

In concentration polarization we calculate the limiting diffusion
current density iL .It represent the maximum rate of reduction
possible for a given system; the eq. expressing this parameter is
………(2)
Where iL = limiting diffusion current density .
D = diffusion coefficient of the reaction ions.
C = concentration of the reacting ions in the bulk solution.
X = thickness of the diffusion layer .
The diffusion-layer thickness is influenced by the shape of the particular
electrode, the geometry of the system, and by agitation. If we consider no
activation polarization , then the equation for concentration polarization is :
………(3)
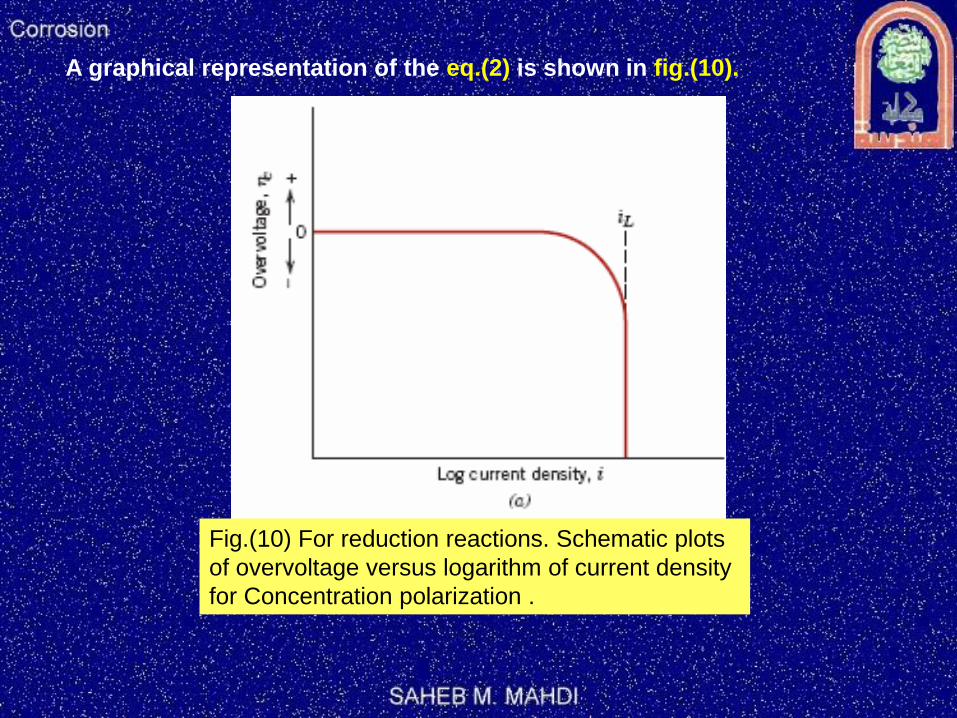
A graphical representation of the eq.(2) is shown in fig.(10).
Fig.(10) For reduction reactions. Schematic plots
of overvoltage versus logarithm of current density
for Concentration polarization .

Fig. (11) illustrate the effects of changing limiting diffusion current on
the shape of the polarization curve encountered during concentration
polarization. As the solution velocity , concentration , or temperature
are increased, limiting diffusion current increases since all of these
factors exert an influence as indicated in eq.(2).
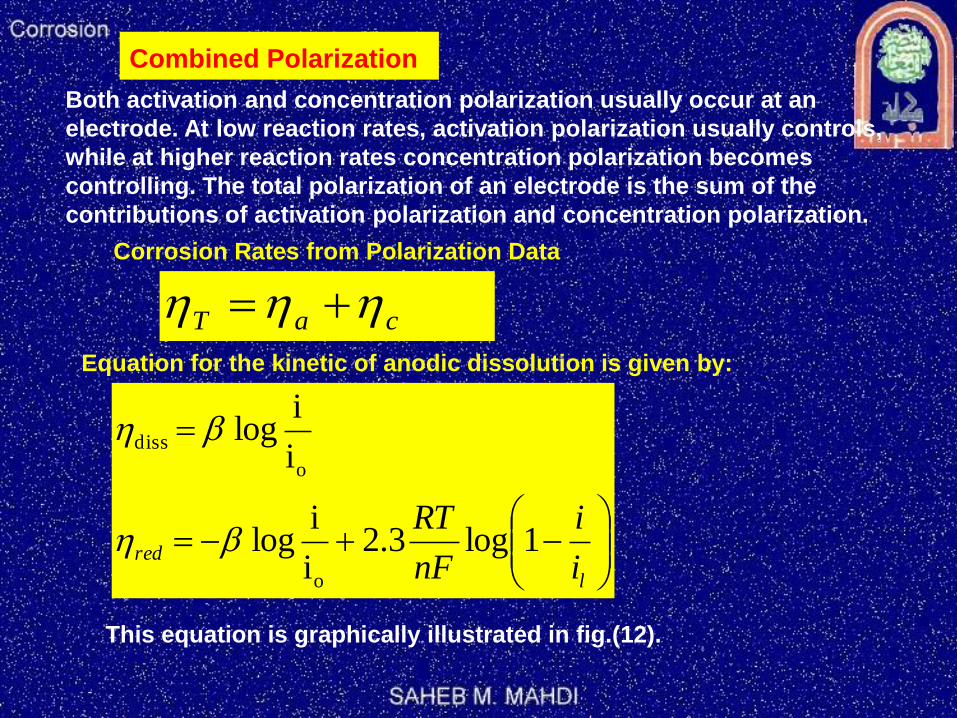
Combined Polarization
Both activation and concentration polarization usually occur at an
electrode. At low reaction rates, activation polarization usually controls,
while at higher reaction rates concentration polarization becomes
controlling. The total polarization of an electrode is the sum of the
contributions of activation polarization and concentration polarization.
Corrosion Rates from Polarization Data
caT hhh
Equation for the kinetic of anodic dissolution is given by:
l
redi
i
nF
RT1log3.2
i
ilog
i
ilog
o
o
diss
h
h
This equation is graphically illustrated in fig.(12).
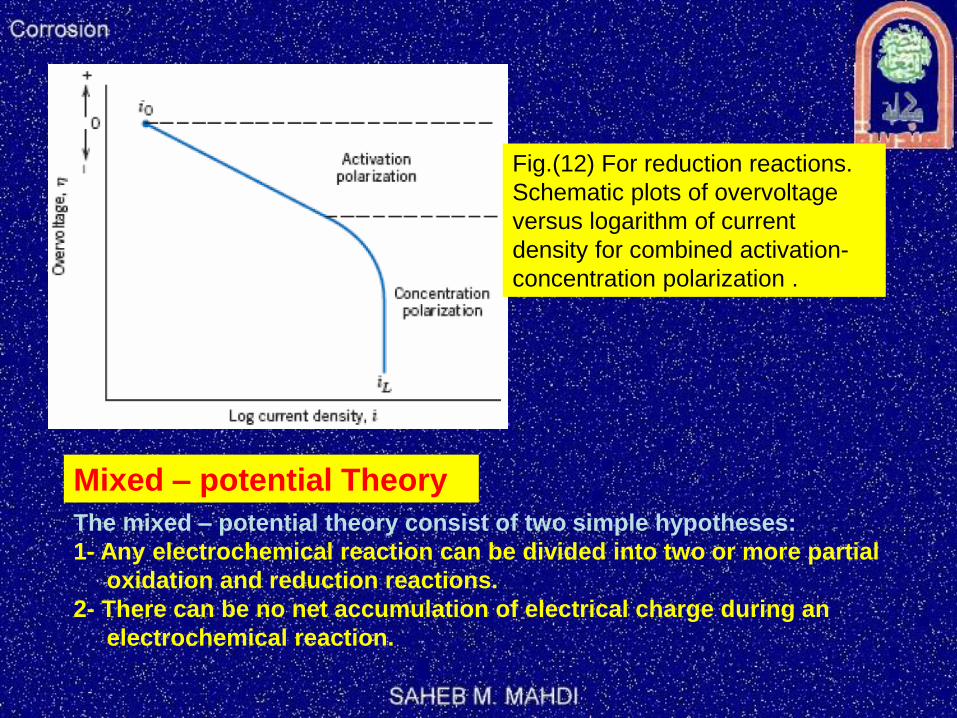
Fig.(12) For reduction reactions.
Schematic plots of overvoltage
versus logarithm of current
density for combined activation-
concentration polarization .
Mixed – potential Theory
The mixed – potential theory consist of two simple hypotheses:
1- Any electrochemical reaction can be divided into two or more partial
oxidation and reduction reactions.
2- There can be no net accumulation of electrical charge during an
electrochemical reaction.
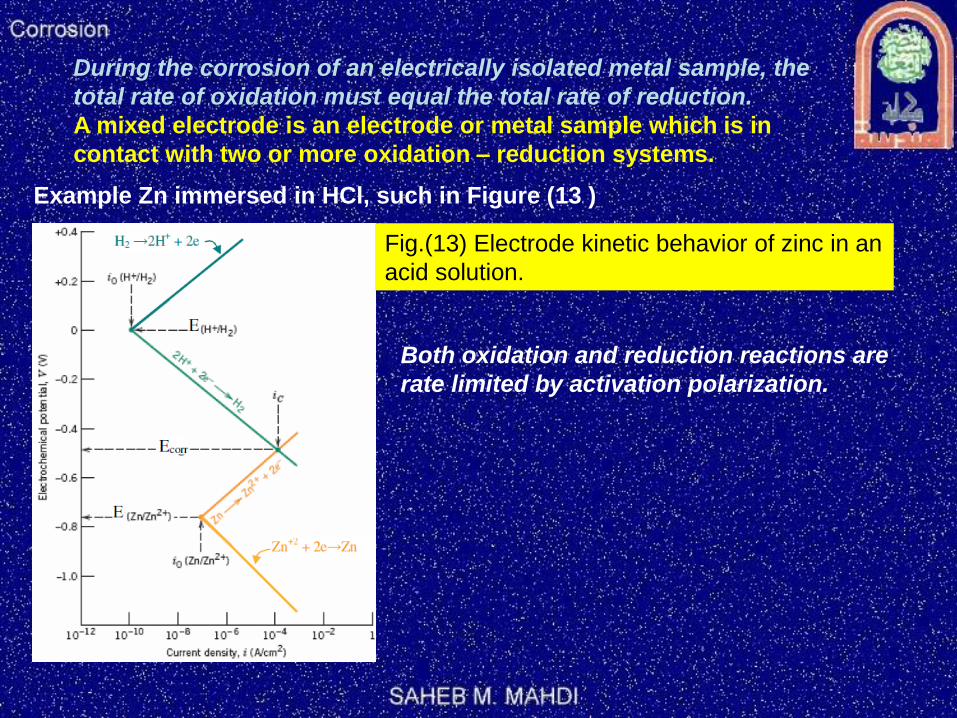
During the corrosion of an electrically isolated metal sample, the
total rate of oxidation must equal the total rate of reduction.
A mixed electrode is an electrode or metal sample which is in
contact with two or more oxidation – reduction systems.
Example Zn immersed in HCl, such in Figure (13 )
Fig.(13) Electrode kinetic behavior of zinc in an
acid solution.
Both oxidation and reduction reactions are
rate limited by activation polarization.
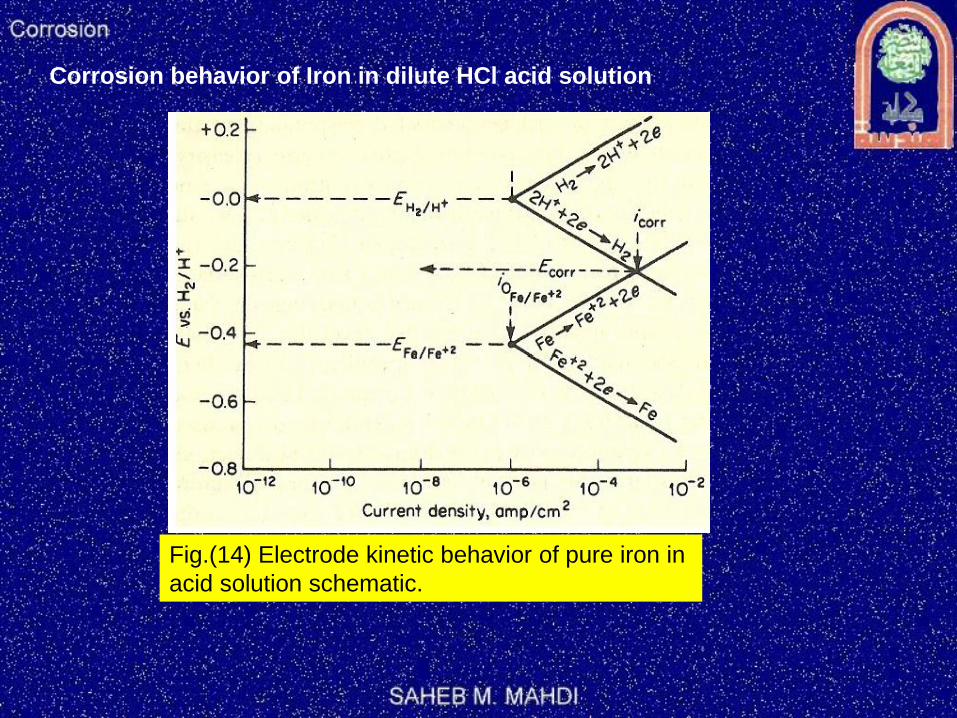
Corrosion behavior of Iron in dilute HCl acid solution
Fig.(14) Electrode kinetic behavior of pure iron in
acid solution schematic.
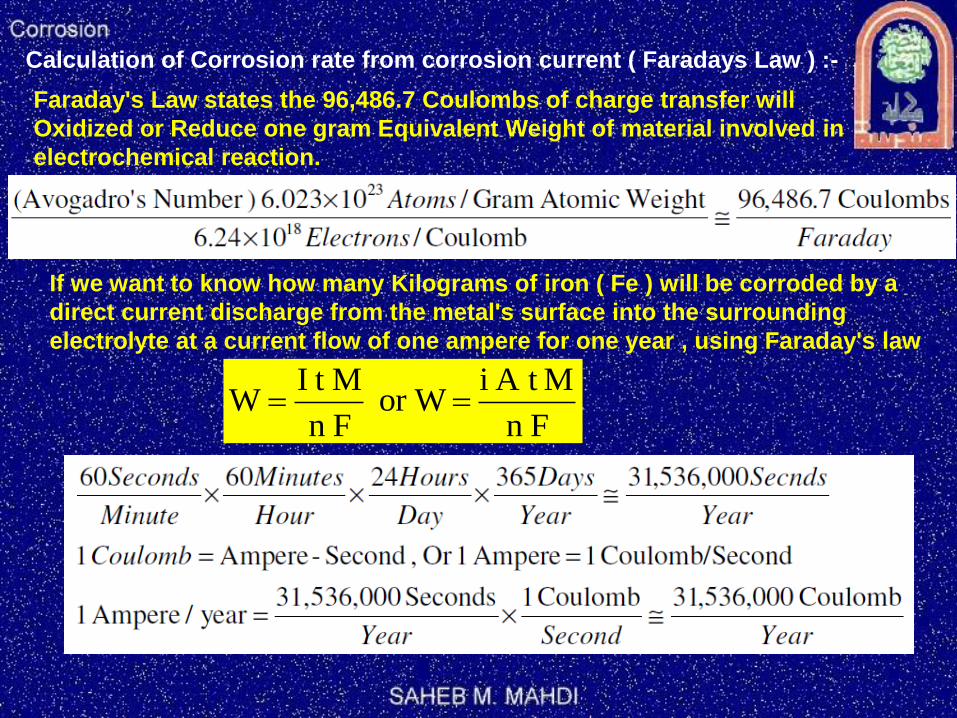
Calculation of Corrosion rate from corrosion current ( Faradays Law ) :-
Faraday's Law states the 96,486.7 Coulombs of charge transfer will
Oxidized or Reduce one gram Equivalent Weight of material involved in
electrochemical reaction.
If we want to know how many Kilograms of iron ( Fe ) will be corroded by a
direct current discharge from the metal's surface into the surrounding
electrolyte at a current flow of one ampere for one year , using Faraday's law
Fn
MA t i or W
Fn
M t IW
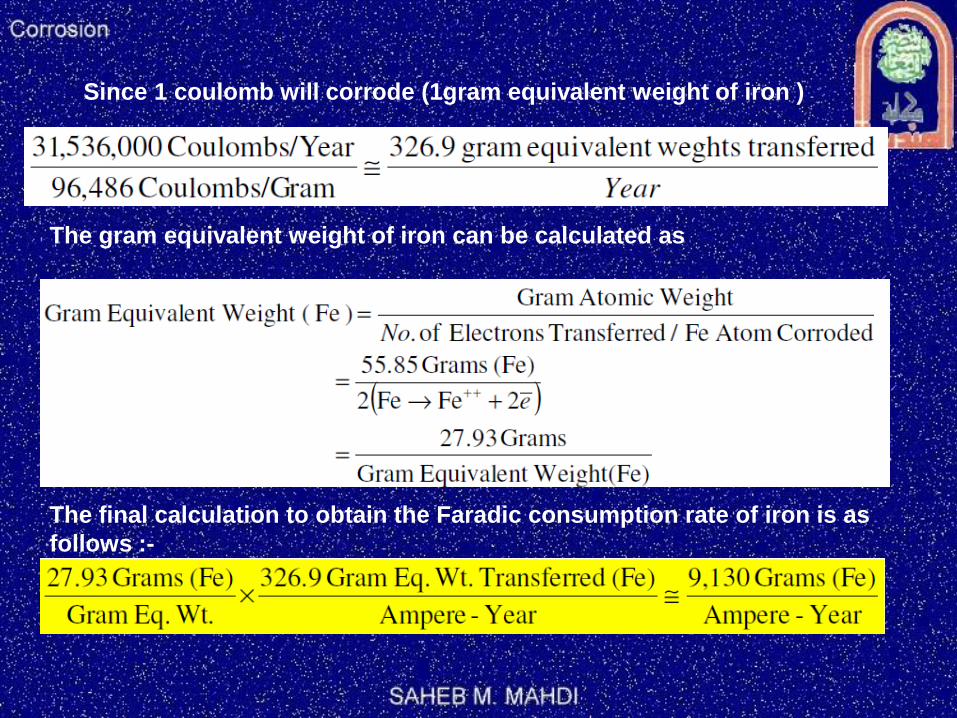
Since 1 coulomb will corrode (1gram equivalent weight of iron )
The gram equivalent weight of iron can be calculated as
The final calculation to obtain the Faradic consumption rate of iron is as
follows :-
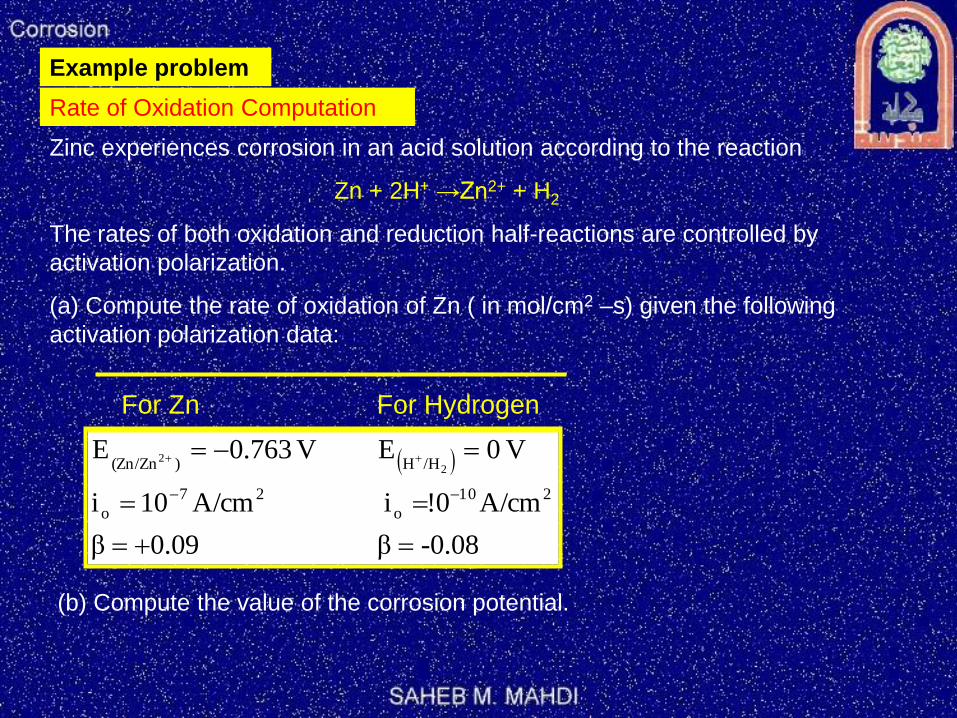
Example problem
Rate of Oxidation Computation
Zinc experiences corrosion in an acid solution according to the reaction
Zn + 2H+ →Zn2+ + H2
The rates of both oxidation and reduction half-reactions are controlled by
activation polarization.
(a) Compute the rate of oxidation of Zn ( in mol/cm2 –s) given the following
activation polarization data:
For Zn For Hydrogen
-0.08β 0.09β
A/cm!0i A/cm10i
V 0E V 0.763E
210
o
27
o
/HH)(Zn/Zn 22
(b) Compute the value of the corrosion potential.

Solution:
(a) To compute the rate of oxidation for Zn, it is firist necessary to establish
relationships in the form of Tafel equation for the potential of both oxidation
and reduction reactions. Next, these two expressions are set equal to one
another, and then we solve for the value of I that is the corrosion current
density, iC. Finally ,the corrosion rate may be calculated using Equation (1).
The two potential expressions are follows: For hydrogen reduction.
oH
H/HHHi
ilogβEE
2
oZn
ZnZn/ZnZni
ilogβEE 2
oH
H/HH i
ilogβE
2
And for Zn oxidation
ZnH EE Now setting leads to
oH
H/HH i
ilogβE
2
oZn
ZnZn/Zn i
ilogβE 2=
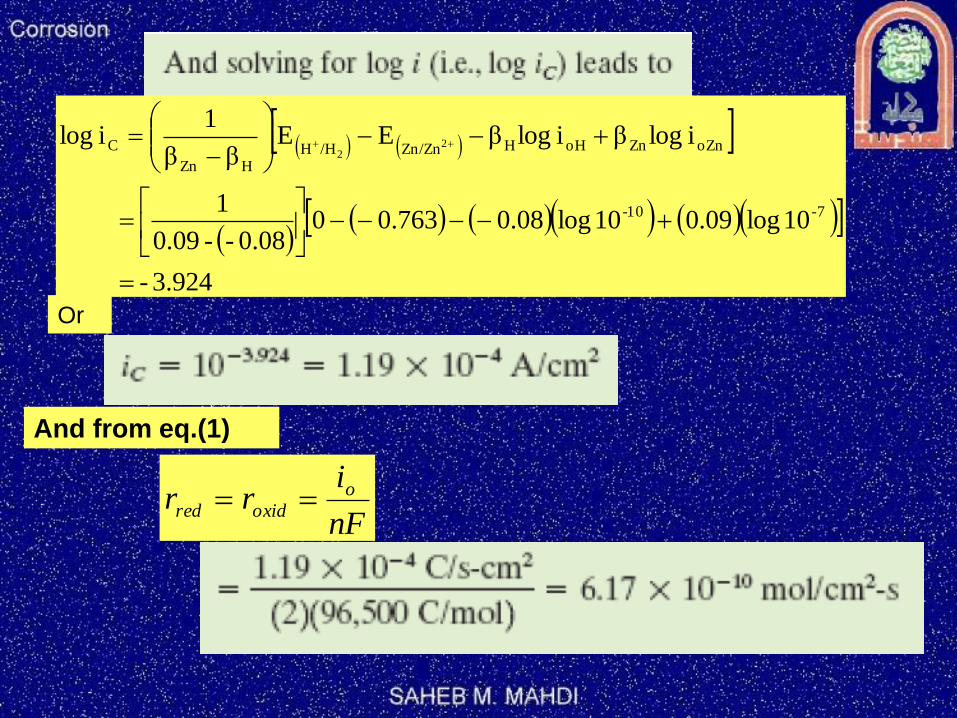
3.924-
10 log0.0910 log0.080.76300.08--0.09
1
i logβi logβEEββ
1i log
7-10-
oZnZnoHHZn/Zn/HHHZn
C 22
Or
And from eq.(1)
nF
irr o
oxidred
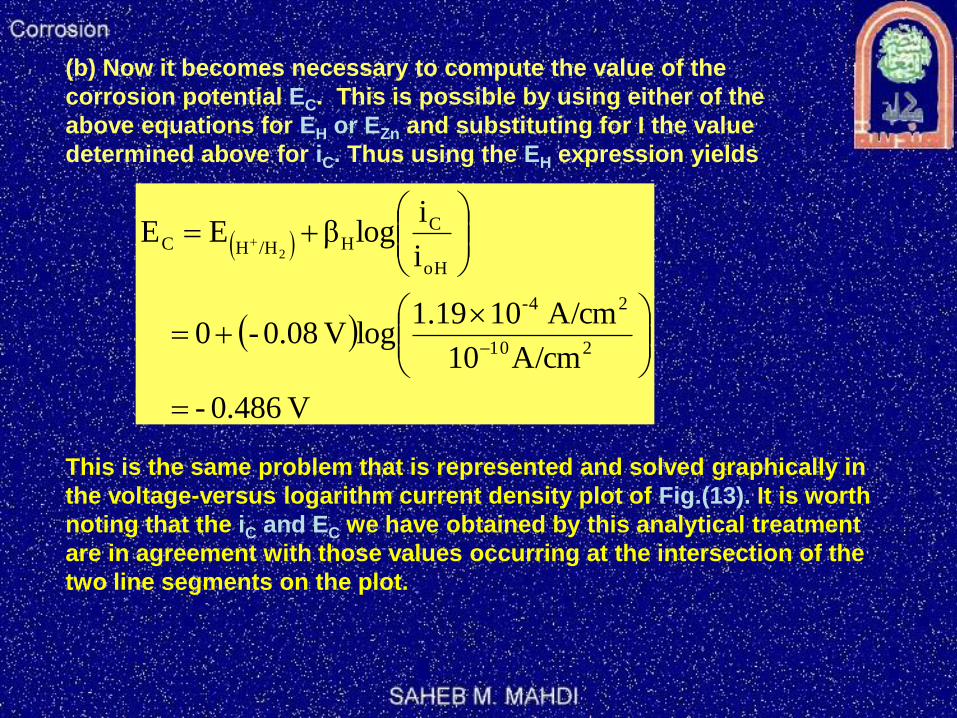
(b) Now it becomes necessary to compute the value of the
corrosion potential EC. This is possible by using either of the
above equations for EH or EZn and substituting for I the value
determined above for iC. Thus using the EH expression yields
V 0.486 -
A/cm10
A/cm 10 1.19logV 0.08- 0
i
ilogβEE
210
24-
oH
CH/HHC
2
This is the same problem that is represented and solved graphically in
the voltage-versus logarithm current density plot of Fig.(13). It is worth
noting that the iC and EC we have obtained by this analytical treatment
are in agreement with those values occurring at the intersection of the
two line segments on the plot.
Related Documents