Predicting the Markets: Chapter 12 Charts: Predicting Currencies Yardeni Research, Inc. March 23, 2020 Dr. Edward Yardeni Chief Investment Strategist Mali Quintana Senior Economist [email protected] Please visit our sites at www.yardeni.com blog.yardeni.com thinking outside the box

Welcome message from author
This document is posted to help you gain knowledge. Please leave a comment to let me know what you think about it! Share it to your friends and learn new things together.
Transcript
Predicting the Markets:Chapter 12 Charts:
Predicting CurrenciesYardeni Research, Inc.
March 23, 2020
Dr. Edward YardeniChief Investment Strategist
Mali QuintanaSenior Economist
Please visit our sites atwww.yardeni.comblog.yardeni.com
thinking outside the box
Table Of Contents Table Of ContentsTable Of Contents
March 23, 2020 / Chapter 12 Charts: Predicting Currencies www.yardeni.com
Yardeni Research, Inc.
Predicting Currencies 1-18
2000 2001 2002 2003 2004 2005 2006 2007 2008 2009 2010 2011 2012 2013 2014 2015 2016 2017 2018 2019 2020 2021 2022-.6
-.4
-.2
.0
.2
.4
.6
.8
1.0
1.2
1.4
1.6
1.8
-.6
-.4
-.2
.0
.2
.4
.6
.8
1.0
1.2
1.4
1.6
1.8
Jan
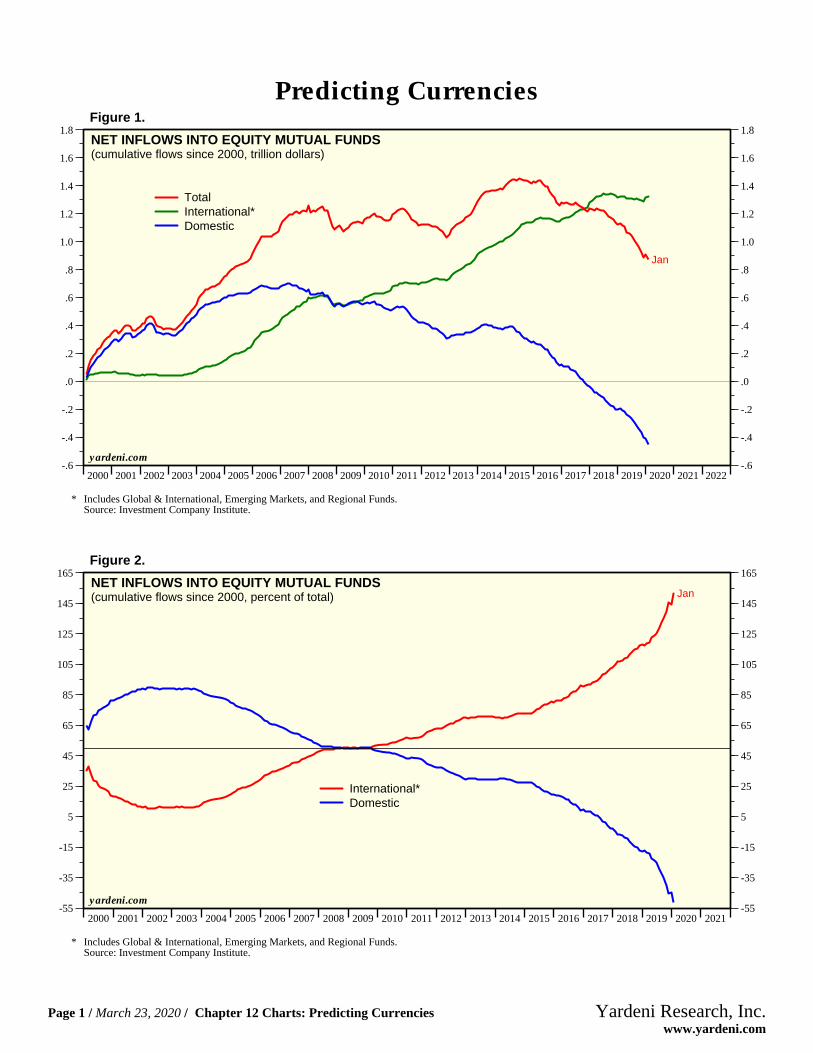
NET INFLOWS INTO EQUITY MUTUAL FUNDS(cumulative flows since 2000, trillion dollars)
TotalInternational*Domestic
* Includes Global & International, Emerging Markets, and Regional Funds.Source: Investment Company Institute.
yardeni.com
Figure 1.
2000 2001 2002 2003 2004 2005 2006 2007 2008 2009 2010 2011 2012 2013 2014 2015 2016 2017 2018 2019 2020 2021-55
-35
-15
5
25
45
65
85
105
125
145
165
-55
-35
-15
5
25
45
65
85
105
125
145
165
JanNET INFLOWS INTO EQUITY MUTUAL FUNDS(cumulative flows since 2000, percent of total)
International*Domestic
* Includes Global & International, Emerging Markets, and Regional Funds.Source: Investment Company Institute.
yardeni.com
Figure 2.
Predicting Currencies
Page 1 / March 23, 2020 / Chapter 12 Charts: Predicting Currencies www.yardeni.com
Yardeni Research, Inc.
52 54 56 58 60 62 64 66 68 70 72 74 76 78 80 82 84 86 88 90 92 94 96 98 00 02 04 06 08 10 12 14 16 18 20 22.1
10.1
20.1
30.1
40.150.160.1
.1
10.1
20.1
30.1
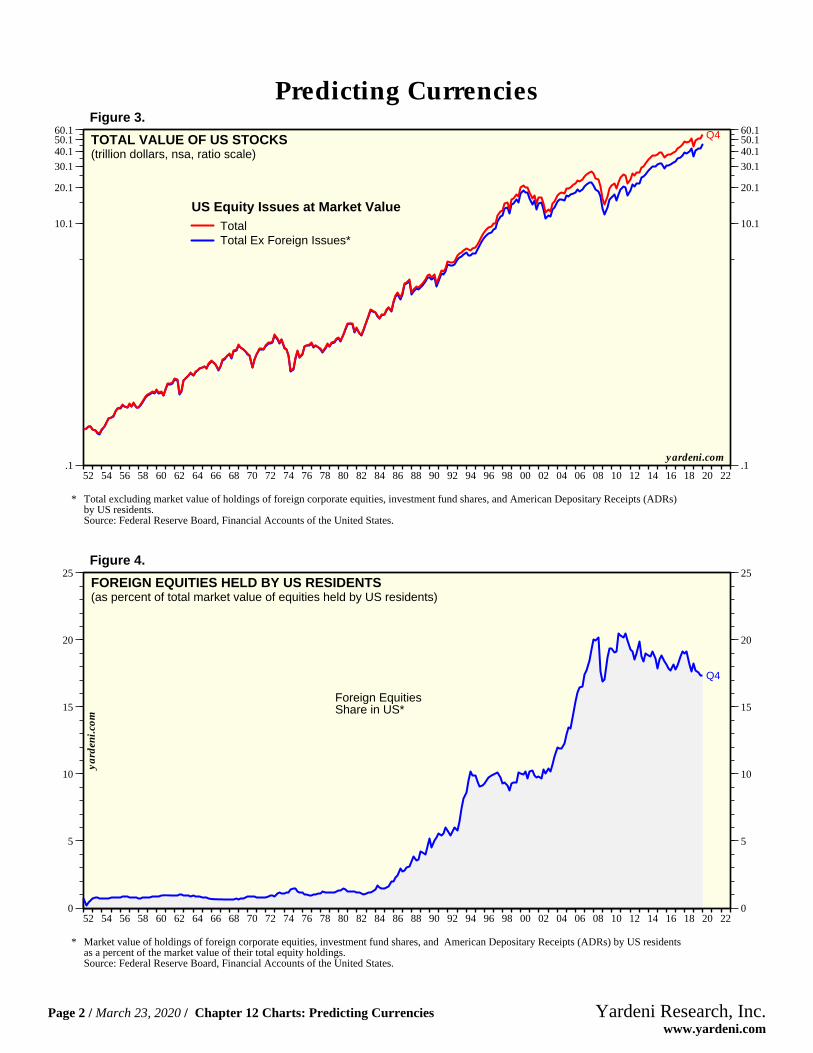
40.150.160.1 Q4TOTAL VALUE OF US STOCKS
(trillion dollars, nsa, ratio scale)
US Equity Issues at Market Value
Total Ex Foreign Issues*Total
* Total excluding market value of holdings of foreign corporate equities, investment fund shares, and American Depositary Receipts (ADRs)by US residents.Source: Federal Reserve Board, Financial Accounts of the United States.
yardeni.com
Figure 3.
52 54 56 58 60 62 64 66 68 70 72 74 76 78 80 82 84 86 88 90 92 94 96 98 00 02 04 06 08 10 12 14 16 18 20 220
5
10
15
20
25
0
5
10
15
20
25
Q4
FOREIGN EQUITIES HELD BY US RESIDENTS(as percent of total market value of equities held by US residents)
Foreign EquitiesShare in US*
* Market value of holdings of foreign corporate equities, investment fund shares, and American Depositary Receipts (ADRs) by US residentsas a percent of the market value of their total equity holdings.Source: Federal Reserve Board, Financial Accounts of the United States.
yard
eni.c
om
Figure 4.
Predicting Currencies
Page 2 / March 23, 2020 / Chapter 12 Charts: Predicting Currencies www.yardeni.com
Yardeni Research, Inc.
59 61 63 65 67 69 71 73 75 77 79 81 83 85 87 89 91 93 95 97 99 01 03 05 07 09 11 13 15 17 19 21 233
153
303
453
6037539031053
3
153
303
453
603753903
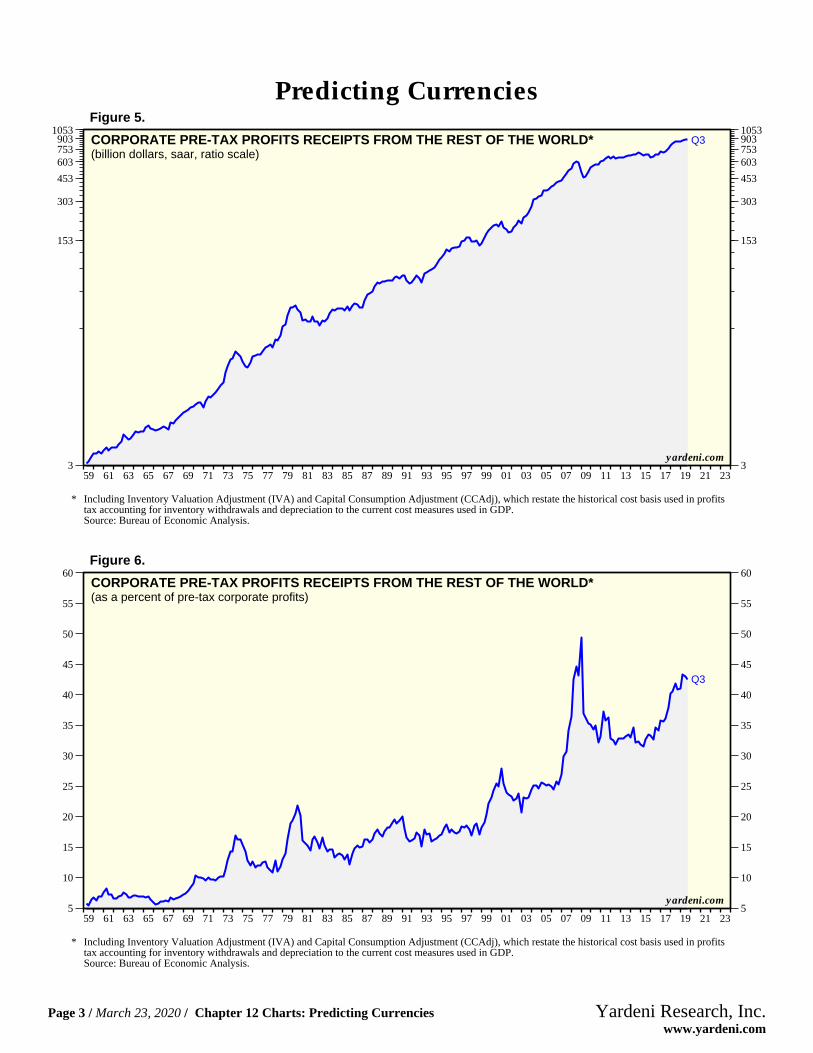
1053Q3CORPORATE PRE-TAX PROFITS RECEIPTS FROM THE REST OF THE WORLD*
(billion dollars, saar, ratio scale)
* Including Inventory Valuation Adjustment (IVA) and Capital Consumption Adjustment (CCAdj), which restate the historical cost basis used in profitstax accounting for inventory withdrawals and depreciation to the current cost measures used in GDP.Source: Bureau of Economic Analysis.
yardeni.com
Figure 5.
59 61 63 65 67 69 71 73 75 77 79 81 83 85 87 89 91 93 95 97 99 01 03 05 07 09 11 13 15 17 19 21 235
10
15
20
25
30
35
40
45
50
55
60
5
10
15
20
25
30
35
40
45
50
55
60
Q3
CORPORATE PRE-TAX PROFITS RECEIPTS FROM THE REST OF THE WORLD*(as a percent of pre-tax corporate profits)
* Including Inventory Valuation Adjustment (IVA) and Capital Consumption Adjustment (CCAdj), which restate the historical cost basis used in profitstax accounting for inventory withdrawals and depreciation to the current cost measures used in GDP.Source: Bureau of Economic Analysis.
yardeni.com
Figure 6.
Predicting Currencies
Page 3 / March 23, 2020 / Chapter 12 Charts: Predicting Currencies www.yardeni.com
Yardeni Research, Inc.
73 75 77 79 81 83 85 87 89 91 93 95 97 99 01 03 05 07 09 11 13 15 17 19 21 230
50
100
150
200
0
50
100
150
200
3/203/20
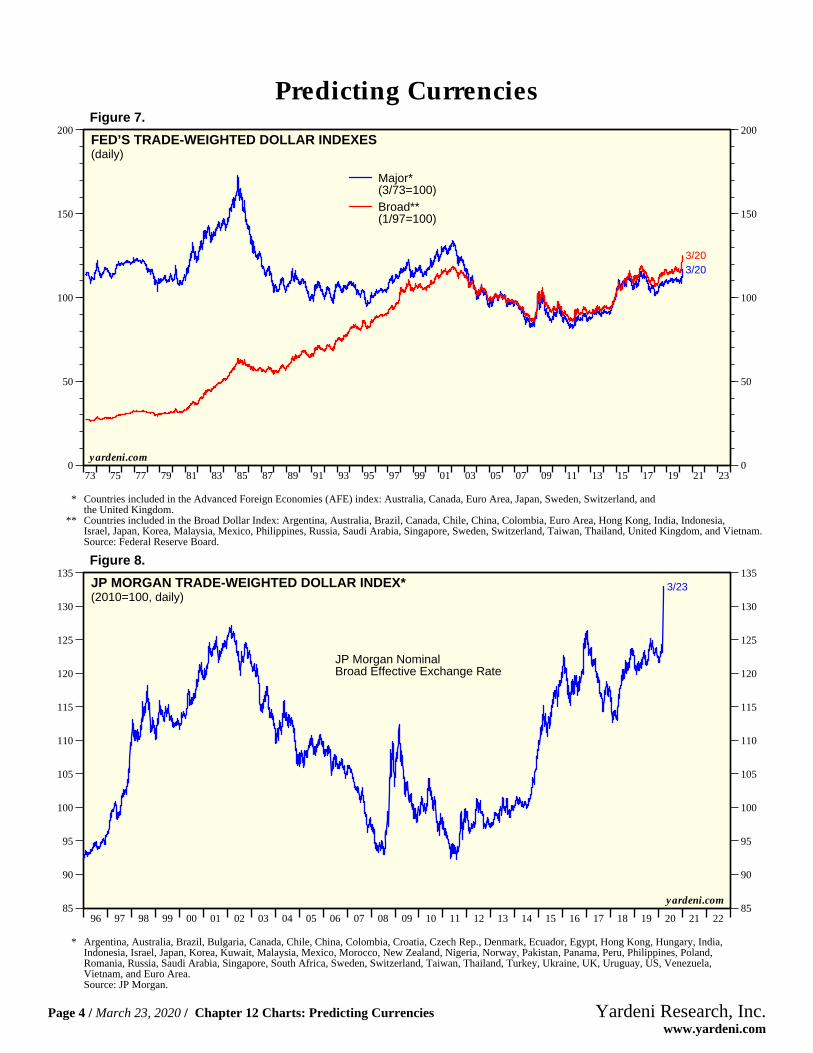
FED’S TRADE-WEIGHTED DOLLAR INDEXES(daily)
Major*(3/73=100)Broad**(1/97=100)
* Countries included in the Advanced Foreign Economies (AFE) index: Australia, Canada, Euro Area, Japan, Sweden, Switzerland, andthe United Kingdom.
** Countries included in the Broad Dollar Index: Argentina, Australia, Brazil, Canada, Chile, China, Colombia, Euro Area, Hong Kong, India, Indonesia,Israel, Japan, Korea, Malaysia, Mexico, Philippines, Russia, Saudi Arabia, Singapore, Sweden, Switzerland, Taiwan, Thailand, United Kingdom, and Vietnam.Source: Federal Reserve Board.
yardeni.com
Figure 7.
96 97 98 99 00 01 02 03 04 05 06 07 08 09 10 11 12 13 14 15 16 17 18 19 20 21 2285
90
95
100
105
110
115
120
125
130
135
85
90
95
100
105
110
115
120
125
130
1353/23JP MORGAN TRADE-WEIGHTED DOLLAR INDEX*
(2010=100, daily)
JP Morgan NominalBroad Effective Exchange Rate
* Argentina, Australia, Brazil, Bulgaria, Canada, Chile, China, Colombia, Croatia, Czech Rep., Denmark, Ecuador, Egypt, Hong Kong, Hungary, India,Indonesia, Israel, Japan, Korea, Kuwait, Malaysia, Mexico, Morocco, New Zealand, Nigeria, Norway, Pakistan, Panama, Peru, Philippines, Poland,Romania, Russia, Saudi Arabia, Singapore, South Africa, Sweden, Switzerland, Taiwan, Thailand, Turkey, Ukraine, UK, Uruguay, US, Venezuela,Vietnam, and Euro Area.Source: JP Morgan.
yardeni.com
Figure 8.
Predicting Currencies
Page 4 / March 23, 2020 / Chapter 12 Charts: Predicting Currencies www.yardeni.com
Yardeni Research, Inc.
96 97 98 99 00 01 02 03 04 05 06 07 08 09 10 11 12 13 14 15 16 17 18 19 20 21 22.015
.020
.025
.030
.035
.015
.020
.025
.030
.035
3/20
yardeni.com
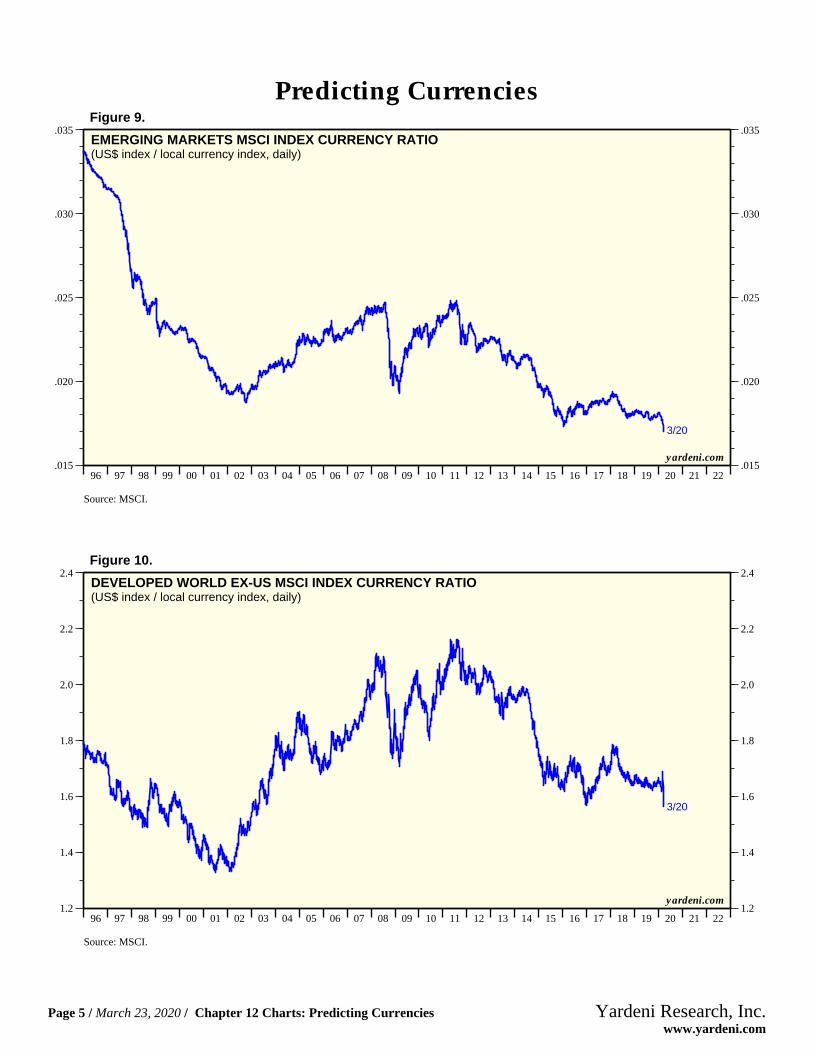
EMERGING MARKETS MSCI INDEX CURRENCY RATIO(US$ index / local currency index, daily)
Source: MSCI.
Figure 9.
96 97 98 99 00 01 02 03 04 05 06 07 08 09 10 11 12 13 14 15 16 17 18 19 20 21 221.2
1.4
1.6
1.8
2.0
2.2
2.4
1.2
1.4
1.6
1.8
2.0
2.2
2.4
3/20
yardeni.com
Source: MSCI.
DEVELOPED WORLD EX-US MSCI INDEX CURRENCY RATIO(US$ index / local currency index, daily)
Figure 10.
Predicting Currencies
Page 5 / March 23, 2020 / Chapter 12 Charts: Predicting Currencies www.yardeni.com
Yardeni Research, Inc.
68 70 72 74 76 78 80 82 84 86 88 90 92 94 96 98 00 02 04 06 08 10 12 14 16 18 20 22 2428
428
828
1228
1628
2028
28
428
828
1228
1628
2028
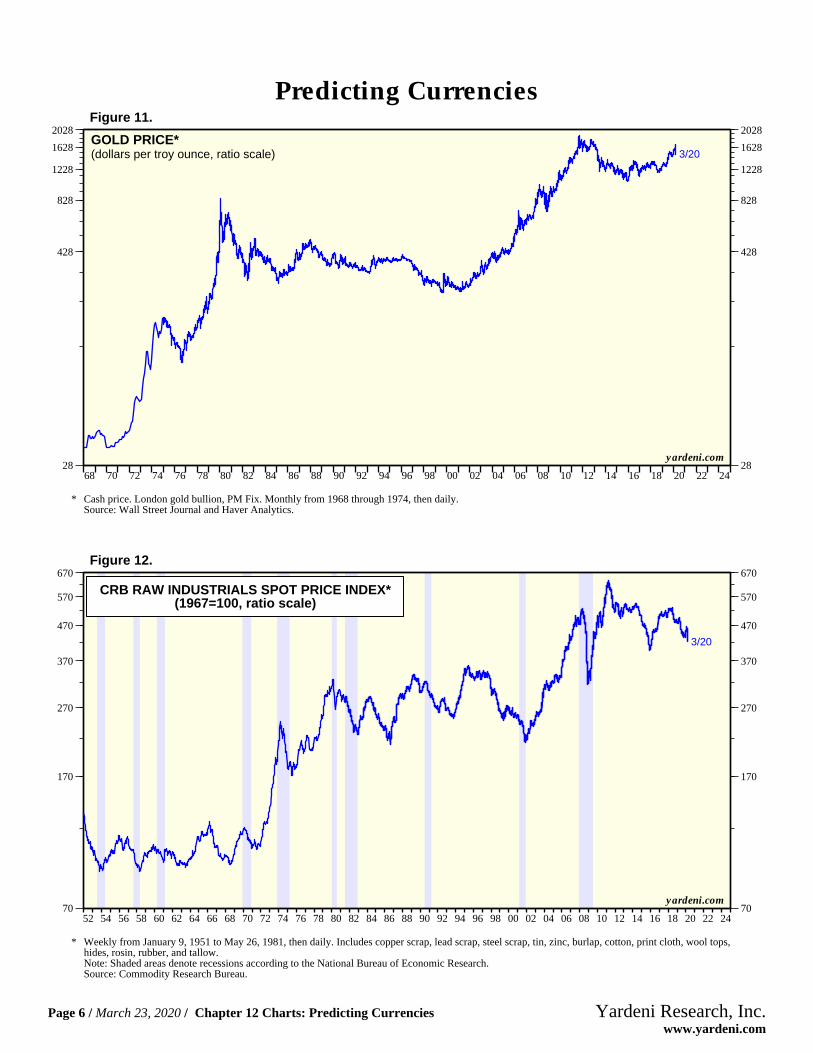
3/20GOLD PRICE*(dollars per troy ounce, ratio scale)
* Cash price. London gold bullion, PM Fix. Monthly from 1968 through 1974, then daily.Source: Wall Street Journal and Haver Analytics.
yardeni.com
Figure 11.
52 54 56 58 60 62 64 66 68 70 72 74 76 78 80 82 84 86 88 90 92 94 96 98 00 02 04 06 08 10 12 14 16 18 20 22 2470
170
270
370
470
570
670
70
170
270
370
470
570
670
CRB RAW INDUSTRIALS SPOT PRICE INDEX*(1967=100, ratio scale)
3/20
* Weekly from January 9, 1951 to May 26, 1981, then daily. Includes copper scrap, lead scrap, steel scrap, tin, zinc, burlap, cotton, print cloth, wool tops,hides, rosin, rubber, and tallow.Note: Shaded areas denote recessions according to the National Bureau of Economic Research.Source: Commodity Research Bureau.
yardeni.com
Figure 12.
Predicting Currencies
Page 6 / March 23, 2020 / Chapter 12 Charts: Predicting Currencies www.yardeni.com
Yardeni Research, Inc.
70 71 72 73 74 75 76 77 78 79 80 81 82 83 843
8
13
18
23
28
33
38
4348
3
8
13
18
23
28
33
38
4348
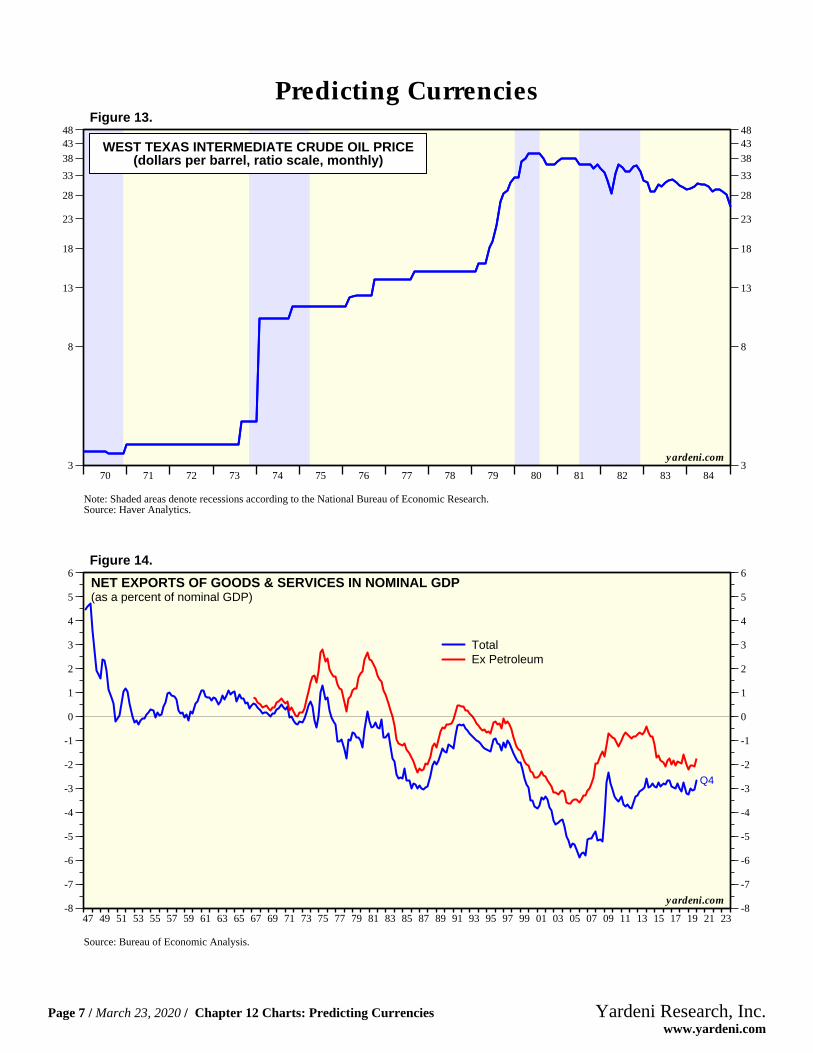
WEST TEXAS INTERMEDIATE CRUDE OIL PRICE(dollars per barrel, ratio scale, monthly)
Note: Shaded areas denote recessions according to the National Bureau of Economic Research.Source: Haver Analytics.
yardeni.com
Figure 13.
47 49 51 53 55 57 59 61 63 65 67 69 71 73 75 77 79 81 83 85 87 89 91 93 95 97 99 01 03 05 07 09 11 13 15 17 19 21 23-8
-7
-6
-5
-4
-3
-2
-1
0
1
2
3
4
5
6
-8
-7
-6
-5
-4
-3
-2
-1
0
1
2
3
4
5
6
Q4
NET EXPORTS OF GOODS & SERVICES IN NOMINAL GDP(as a percent of nominal GDP)
TotalEx Petroleum
Source: Bureau of Economic Analysis.
yardeni.com
Figure 14.
Predicting Currencies
Page 7 / March 23, 2020 / Chapter 12 Charts: Predicting Currencies www.yardeni.com
Yardeni Research, Inc.
85 86 87 88 89 90 91 92 93 94 95 96 97 98 99 00 01 02 03 04 05 06 07 08 09 10 11 12 13 14 15 16 17 18 19 20 21 22-1600
-1400
-1200
-1000
-800
-600
-400
-200
0
200
400
600
800
-1600
-1400
-1200
-1000
-800
-600
-400
-200
0
200
400
600
800
Feb
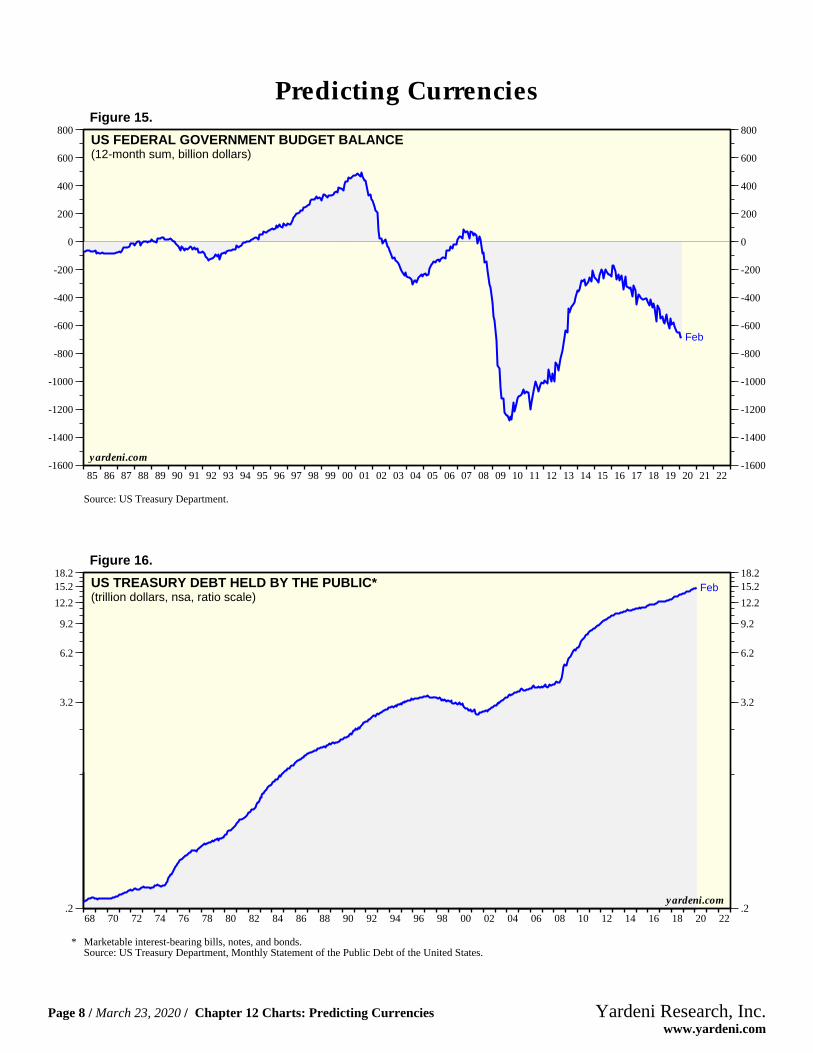
US FEDERAL GOVERNMENT BUDGET BALANCE(12-month sum, billion dollars)
Source: US Treasury Department.
yardeni.com
Figure 15.
68 70 72 74 76 78 80 82 84 86 88 90 92 94 96 98 00 02 04 06 08 10 12 14 16 18 20 22.2
3.2
6.2
9.2
12.2
15.218.2
.2
3.2
6.2
9.2
12.2
15.218.2
FebUS TREASURY DEBT HELD BY THE PUBLIC*(trillion dollars, nsa, ratio scale)
* Marketable interest-bearing bills, notes, and bonds.Source: US Treasury Department, Monthly Statement of the Public Debt of the United States.
yardeni.com
Figure 16.
Predicting Currencies
Page 8 / March 23, 2020 / Chapter 12 Charts: Predicting Currencies www.yardeni.com
Yardeni Research, Inc.
95 96 97 98 99 00 01 02 03 04 05 06 07 08 09 10 11 12 13 14 15 16 17 18 19 20 21 22200
300
400
500
600
700
130
125
120
115
110
105
100
95
90
85
80
3/23
3/20
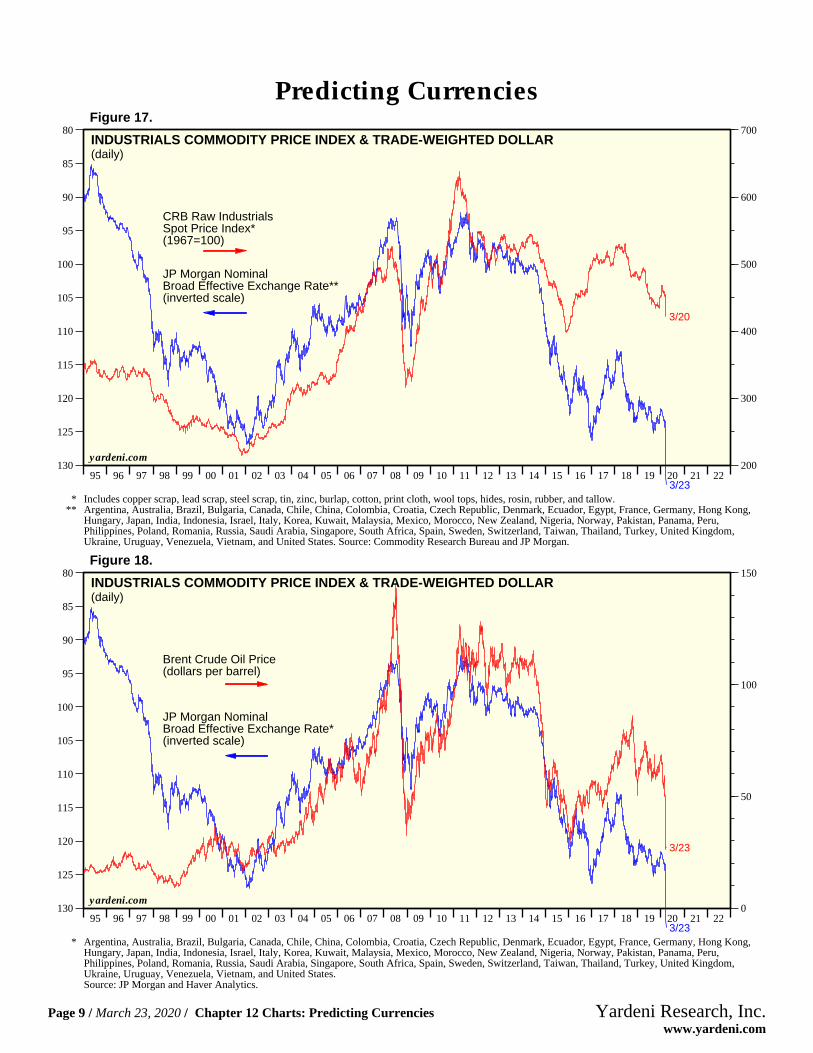
INDUSTRIALS COMMODITY PRICE INDEX & TRADE-WEIGHTED DOLLAR(daily)
JP Morgan NominalBroad Effective Exchange Rate**(inverted scale)
CRB Raw IndustrialsSpot Price Index*(1967=100)
* Includes copper scrap, lead scrap, steel scrap, tin, zinc, burlap, cotton, print cloth, wool tops, hides, rosin, rubber, and tallow.** Argentina, Australia, Brazil, Bulgaria, Canada, Chile, China, Colombia, Croatia, Czech Republic, Denmark, Ecuador, Egypt, France, Germany, Hong Kong,
Hungary, Japan, India, Indonesia, Israel, Italy, Korea, Kuwait, Malaysia, Mexico, Morocco, New Zealand, Nigeria, Norway, Pakistan, Panama, Peru,Philippines, Poland, Romania, Russia, Saudi Arabia, Singapore, South Africa, Spain, Sweden, Switzerland, Taiwan, Thailand, Turkey, United Kingdom,Ukraine, Uruguay, Venezuela, Vietnam, and United States. Source: Commodity Research Bureau and JP Morgan.
yardeni.com
Figure 17.
95 96 97 98 99 00 01 02 03 04 05 06 07 08 09 10 11 12 13 14 15 16 17 18 19 20 21 220
50
100
150
130
125
120
115
110
105
100
95
90
85
80
3/23
3/23
INDUSTRIALS COMMODITY PRICE INDEX & TRADE-WEIGHTED DOLLAR(daily)
JP Morgan NominalBroad Effective Exchange Rate*(inverted scale)
Brent Crude Oil Price(dollars per barrel)
* Argentina, Australia, Brazil, Bulgaria, Canada, Chile, China, Colombia, Croatia, Czech Republic, Denmark, Ecuador, Egypt, France, Germany, Hong Kong,Hungary, Japan, India, Indonesia, Israel, Italy, Korea, Kuwait, Malaysia, Mexico, Morocco, New Zealand, Nigeria, Norway, Pakistan, Panama, Peru,Philippines, Poland, Romania, Russia, Saudi Arabia, Singapore, South Africa, Spain, Sweden, Switzerland, Taiwan, Thailand, Turkey, United Kingdom,Ukraine, Uruguay, Venezuela, Vietnam, and United States.Source: JP Morgan and Haver Analytics.
yardeni.com
Figure 18.
Predicting Currencies
Page 9 / March 23, 2020 / Chapter 12 Charts: Predicting Currencies www.yardeni.com
Yardeni Research, Inc.
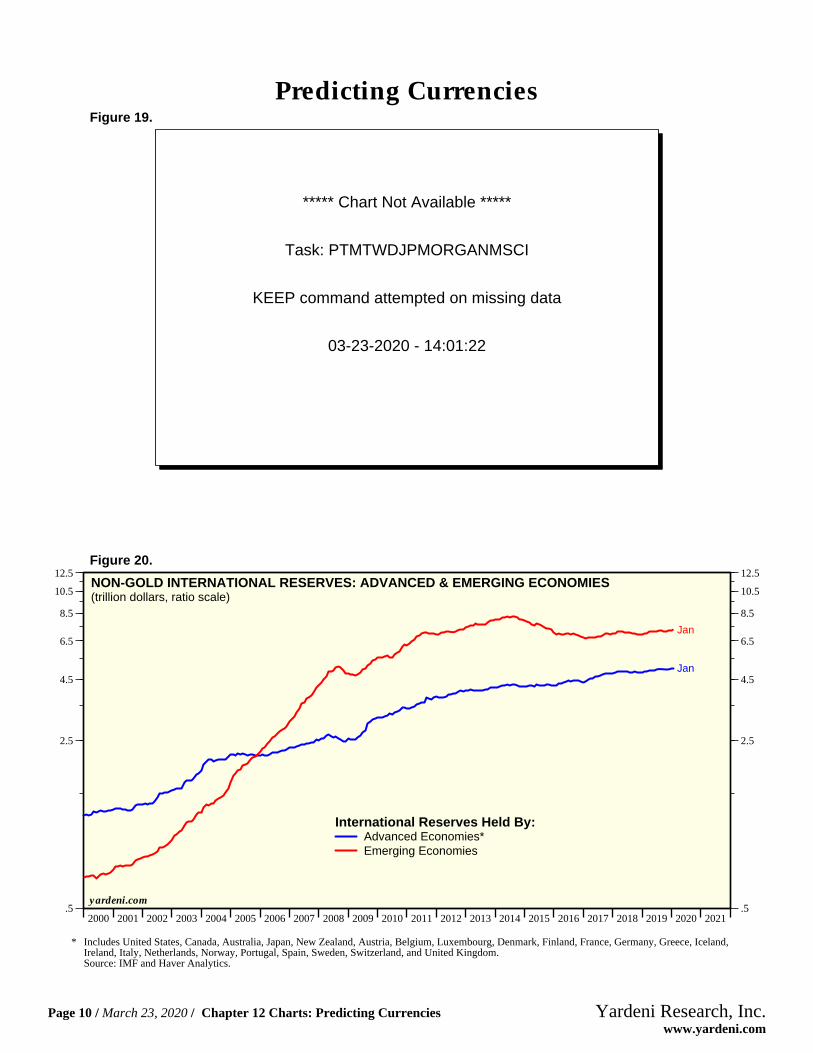
***** Chart Not Available *****
Task: PTMTWDJPMORGANMSCI
KEEP command attempted on missing data
03-23-2020 - 14:01:22
Figure 19.
2000 2001 2002 2003 2004 2005 2006 2007 2008 2009 2010 2011 2012 2013 2014 2015 2016 2017 2018 2019 2020 2021.5
2.5
4.5
6.5
8.5
10.5
12.5
.5
2.5
4.5
6.5
8.5
10.5
12.5
Jan
Jan
NON-GOLD INTERNATIONAL RESERVES: ADVANCED & EMERGING ECONOMIES(trillion dollars, ratio scale)
International Reserves Held By:Advanced Economies*Emerging Economies
* Includes United States, Canada, Australia, Japan, New Zealand, Austria, Belgium, Luxembourg, Denmark, Finland, France, Germany, Greece, Iceland,Ireland, Italy, Netherlands, Norway, Portugal, Spain, Sweden, Switzerland, and United Kingdom.Source: IMF and Haver Analytics.
yardeni.com
Figure 20.
Predicting Currencies
Page 10 / March 23, 2020 / Chapter 12 Charts: Predicting Currencies www.yardeni.com
Yardeni Research, Inc.
2000 2001 2002 2003 2004 2005 2006 2007 2008 2009 2010 2011 2012 2013 2014 2015 2016 2017 2018 2019 2020 2021200
300
400
500
600
700
1.7
1.6
1.5
1.4
1.3
1.2
1.1
1.0
.9
.8
3/20
3/20
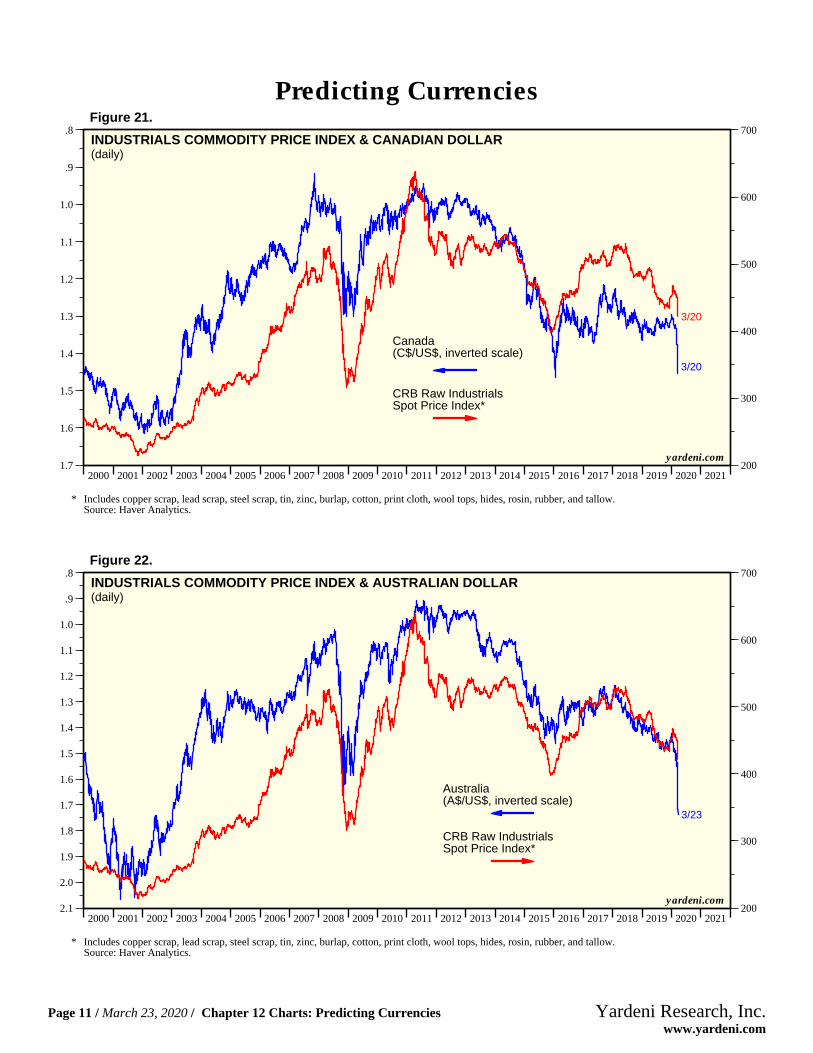
INDUSTRIALS COMMODITY PRICE INDEX & CANADIAN DOLLAR(daily)
CRB Raw IndustrialsSpot Price Index*
Canada(C$/US$, inverted scale)
* Includes copper scrap, lead scrap, steel scrap, tin, zinc, burlap, cotton, print cloth, wool tops, hides, rosin, rubber, and tallow.Source: Haver Analytics.
yardeni.com
Figure 21.
2000 2001 2002 2003 2004 2005 2006 2007 2008 2009 2010 2011 2012 2013 2014 2015 2016 2017 2018 2019 2020 2021200
300
400
500
600
700
2.1
2.0
1.9
1.8
1.7
1.6
1.5
1.4
1.3
1.2
1.1
1.0
.9
.8
3/23
INDUSTRIALS COMMODITY PRICE INDEX & AUSTRALIAN DOLLAR(daily)
CRB Raw IndustrialsSpot Price Index*
Australia(A$/US$, inverted scale)
* Includes copper scrap, lead scrap, steel scrap, tin, zinc, burlap, cotton, print cloth, wool tops, hides, rosin, rubber, and tallow.Source: Haver Analytics.
yardeni.com
Figure 22.
Predicting Currencies
Page 11 / March 23, 2020 / Chapter 12 Charts: Predicting Currencies www.yardeni.com
Yardeni Research, Inc.
60 62 64 66 68 70 72 74 76 78 80 82 84 86 88 90 92 94 96 98 00 02 04 06 08 10 12 14 16 18 20 22-1000
-500
0
500
1000
-1000
-500
0
500
1000
Q4
Q4
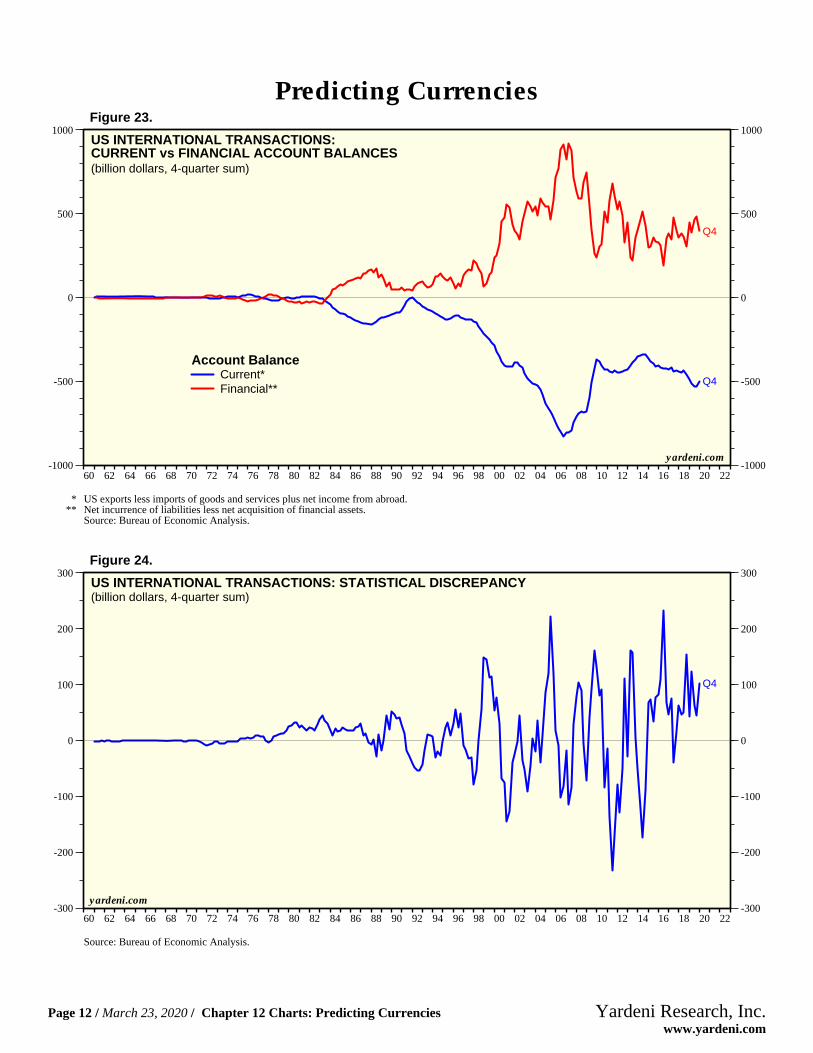
US INTERNATIONAL TRANSACTIONS:CURRENT vs FINANCIAL ACCOUNT BALANCES(billion dollars, 4-quarter sum)
Account BalanceCurrent*Financial**
* US exports less imports of goods and services plus net income from abroad.** Net incurrence of liabilities less net acquisition of financial assets.
Source: Bureau of Economic Analysis.
yardeni.com
Figure 23.
60 62 64 66 68 70 72 74 76 78 80 82 84 86 88 90 92 94 96 98 00 02 04 06 08 10 12 14 16 18 20 22-300
-200
-100
0
100
200
300
-300
-200
-100
0
100
200
300
Q4
US INTERNATIONAL TRANSACTIONS: STATISTICAL DISCREPANCY(billion dollars, 4-quarter sum)
Source: Bureau of Economic Analysis.
yardeni.com
Figure 24.
Predicting Currencies
Page 12 / March 23, 2020 / Chapter 12 Charts: Predicting Currencies www.yardeni.com
Yardeni Research, Inc.

97 98 99 00 01 02 03 04 05 06 07 08 09 10 11 12 13 14 15 16 17 18 19 20 21-700
-600
-500
-400
-300
-200
-100
0
100
200
300
400
500
600
700
800
900
1000
-700
-600
-500
-400
-300
-200
-100
0
100
200
300
400
500
600
700
800
900
1000
Feb
Feb
CHINA: MERCHANDISE TRADE & NON-GOLD INTERNATIONAL RESERVES(billion dollars)
Merchandise Trade Surplus or Deficit(12-month sum)Non-Gold International Reserves(12-month change)
Source: China Customs and Haver Analytics.
yardeni.com
Figure 25.
97 98 99 00 01 02 03 04 05 06 07 08 09 10 11 12 13 14 15 16 17 18 19 20 21-1300
-1200
-1100
-1000
-900
-800
-700
-600
-500
-400
-300
-200
-100
0
100
200
300
400
500
600
700
-1300
-1200
-1100
-1000
-900
-800
-700
-600
-500
-400
-300
-200
-100
0
100
200
300
400
500
600
700
Feb
CHINA: IMPLIED INTERNATIONAL CAPITAL FLOWS*(billion dollars)
* 12-month change in non-gold international reserves minus 12-month sum of the merchandise trade surplus (deficit).Source: China Customs and Haver Analytics.
yardeni.com
Figure 26.
Predicting Currencies
Page 13 / March 23, 2020 / Chapter 12 Charts: Predicting Currencies www.yardeni.com
Yardeni Research, Inc.
96 97 98 99 00 01 02 03 04 05 06 07 08 09 10 11 12 13 14 15 16 17 18 19 20 218.5
8.0
7.5
7.0
6.5
6.0
5.5
0
1
2
3
4
5
Feb
3/23
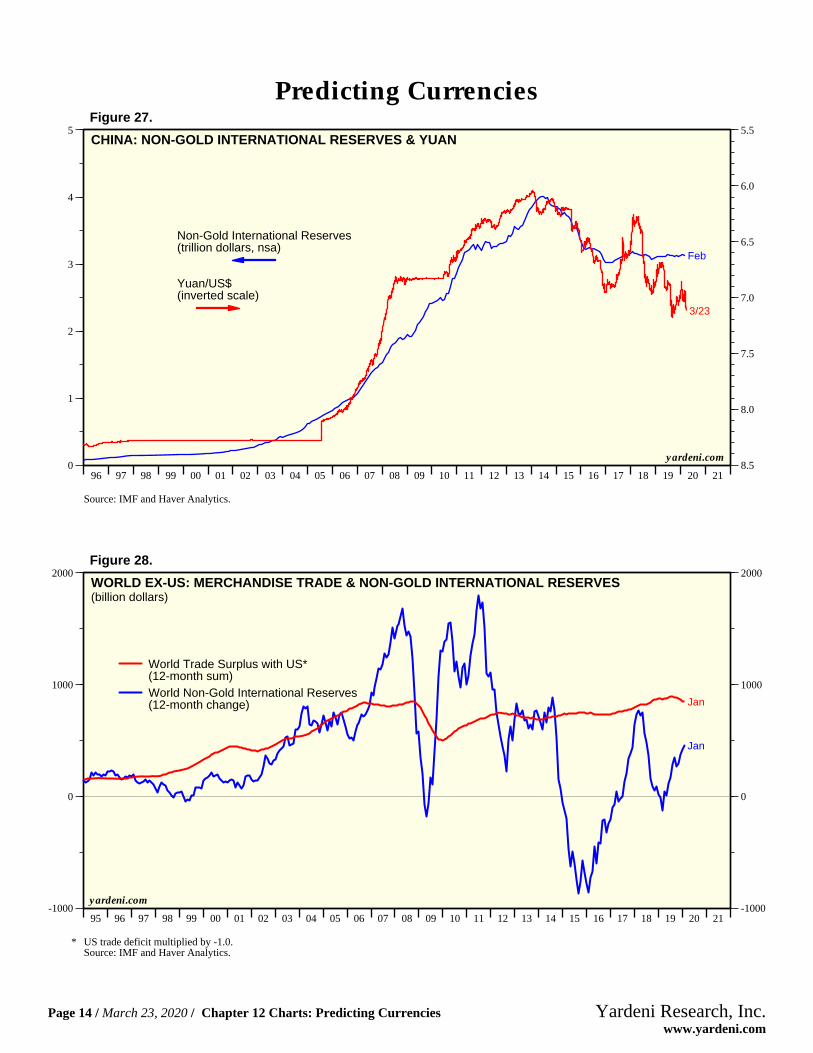
CHINA: NON-GOLD INTERNATIONAL RESERVES & YUAN
Non-Gold International Reserves(trillion dollars, nsa)
Yuan/US$(inverted scale)
Source: IMF and Haver Analytics.
yardeni.com
Figure 27.
95 96 97 98 99 00 01 02 03 04 05 06 07 08 09 10 11 12 13 14 15 16 17 18 19 20 21-1000
0
1000
2000
-1000
0
1000
2000
Jan
Jan
WORLD EX-US: MERCHANDISE TRADE & NON-GOLD INTERNATIONAL RESERVES(billion dollars)
World Trade Surplus with US*(12-month sum)World Non-Gold International Reserves(12-month change)
* US trade deficit multiplied by -1.0.Source: IMF and Haver Analytics.
yardeni.com
Figure 28.
Predicting Currencies
Page 14 / March 23, 2020 / Chapter 12 Charts: Predicting Currencies www.yardeni.com
Yardeni Research, Inc.
95 96 97 98 99 00 01 02 03 04 05 06 07 08 09 10 11 12 13 14 15 16 17 18 19 20 21-2000
-1000
0
1000
2000
-2000
-1000
0
1000
2000
Jan
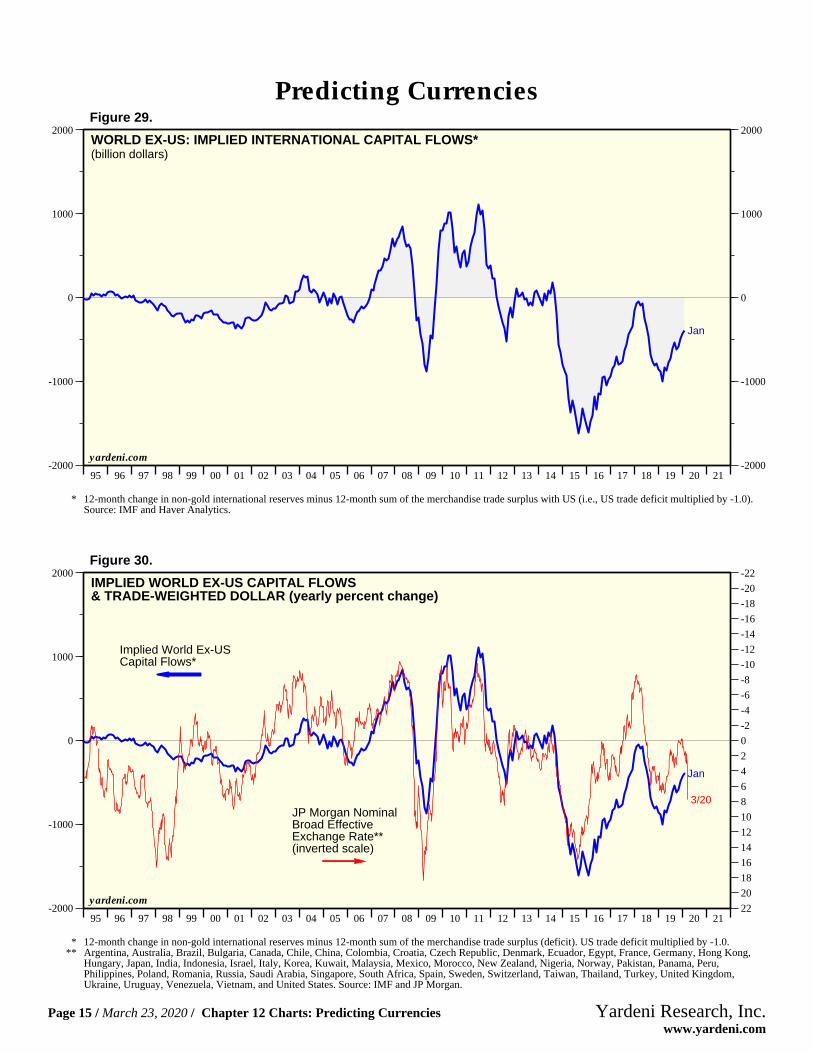
WORLD EX-US: IMPLIED INTERNATIONAL CAPITAL FLOWS*(billion dollars)
* 12-month change in non-gold international reserves minus 12-month sum of the merchandise trade surplus with US (i.e., US trade deficit multiplied by -1.0).Source: IMF and Haver Analytics.
yardeni.com
Figure 29.
95 96 97 98 99 00 01 02 03 04 05 06 07 08 09 10 11 12 13 14 15 16 17 18 19 20 2122
20
18
16
14
12
10
8
6
4
2
0
-2
-4
-6
-8
-10
-12
-14
-16
-18
-20
-22
-2000
-1000
0
1000
2000
Jan
3/20
IMPLIED WORLD EX-US CAPITAL FLOWS& TRADE-WEIGHTED DOLLAR (yearly percent change)
JP Morgan NominalBroad EffectiveExchange Rate**(inverted scale)
Implied World Ex-USCapital Flows*
* 12-month change in non-gold international reserves minus 12-month sum of the merchandise trade surplus (deficit). US trade deficit multiplied by -1.0.** Argentina, Australia, Brazil, Bulgaria, Canada, Chile, China, Colombia, Croatia, Czech Republic, Denmark, Ecuador, Egypt, France, Germany, Hong Kong,
Hungary, Japan, India, Indonesia, Israel, Italy, Korea, Kuwait, Malaysia, Mexico, Morocco, New Zealand, Nigeria, Norway, Pakistan, Panama, Peru,Philippines, Poland, Romania, Russia, Saudi Arabia, Singapore, South Africa, Spain, Sweden, Switzerland, Taiwan, Thailand, Turkey, United Kingdom,Ukraine, Uruguay, Venezuela, Vietnam, and United States. Source: IMF and JP Morgan.
yardeni.com
Figure 30.
Predicting Currencies
Page 15 / March 23, 2020 / Chapter 12 Charts: Predicting Currencies www.yardeni.com
Yardeni Research, Inc.
95 96 97 98 99 00 01 02 03 04 05 06 07 08 09 10 11 12 13 14 15 16 17 18 19 20 21 2220
18
16
14
12
10
8
6
4
2
0
-2
-4
-6
-8
-10
-12
-14
-16
-1000
-500
0
500
1000
1500
2000
Jan
3/20
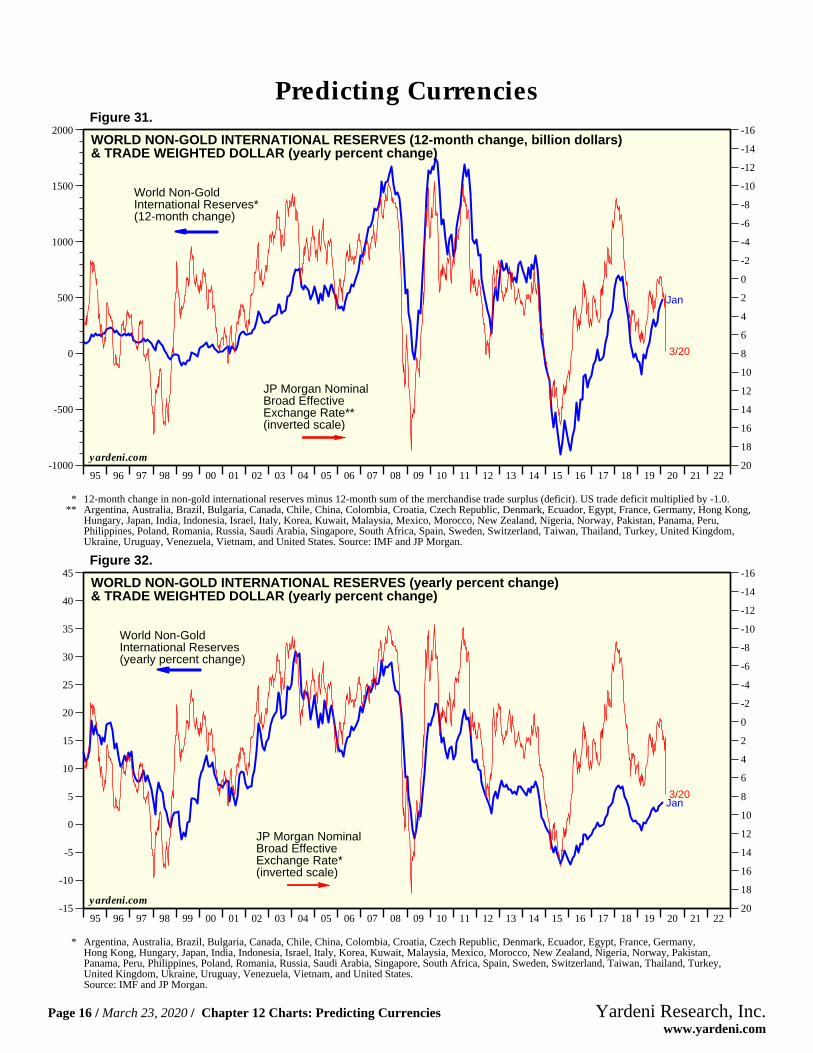
WORLD NON-GOLD INTERNATIONAL RESERVES (12-month change, billion dollars)& TRADE WEIGHTED DOLLAR (yearly percent change)
JP Morgan NominalBroad EffectiveExchange Rate**(inverted scale)
World Non-GoldInternational Reserves*(12-month change)
* 12-month change in non-gold international reserves minus 12-month sum of the merchandise trade surplus (deficit). US trade deficit multiplied by -1.0.** Argentina, Australia, Brazil, Bulgaria, Canada, Chile, China, Colombia, Croatia, Czech Republic, Denmark, Ecuador, Egypt, France, Germany, Hong Kong,
Hungary, Japan, India, Indonesia, Israel, Italy, Korea, Kuwait, Malaysia, Mexico, Morocco, New Zealand, Nigeria, Norway, Pakistan, Panama, Peru,Philippines, Poland, Romania, Russia, Saudi Arabia, Singapore, South Africa, Spain, Sweden, Switzerland, Taiwan, Thailand, Turkey, United Kingdom,Ukraine, Uruguay, Venezuela, Vietnam, and United States. Source: IMF and JP Morgan.
yardeni.com
Figure 31.
95 96 97 98 99 00 01 02 03 04 05 06 07 08 09 10 11 12 13 14 15 16 17 18 19 20 21 2220
18
16
14
12
10
8
6
4
2
0
-2
-4
-6
-8
-10
-12
-14
-16
-15
-10
-5
0
5
10
15
20
25
30
35
40
45
Jan3/20
WORLD NON-GOLD INTERNATIONAL RESERVES (yearly percent change)& TRADE WEIGHTED DOLLAR (yearly percent change)
JP Morgan NominalBroad EffectiveExchange Rate*(inverted scale)
World Non-GoldInternational Reserves(yearly percent change)
* Argentina, Australia, Brazil, Bulgaria, Canada, Chile, China, Colombia, Croatia, Czech Republic, Denmark, Ecuador, Egypt, France, Germany,Hong Kong, Hungary, Japan, India, Indonesia, Israel, Italy, Korea, Kuwait, Malaysia, Mexico, Morocco, New Zealand, Nigeria, Norway, Pakistan,Panama, Peru, Philippines, Poland, Romania, Russia, Saudi Arabia, Singapore, South Africa, Spain, Sweden, Switzerland, Taiwan, Thailand, Turkey,United Kingdom, Ukraine, Uruguay, Venezuela, Vietnam, and United States.Source: IMF and JP Morgan.
yardeni.com
Figure 32.
Predicting Currencies
Page 16 / March 23, 2020 / Chapter 12 Charts: Predicting Currencies www.yardeni.com
Yardeni Research, Inc.
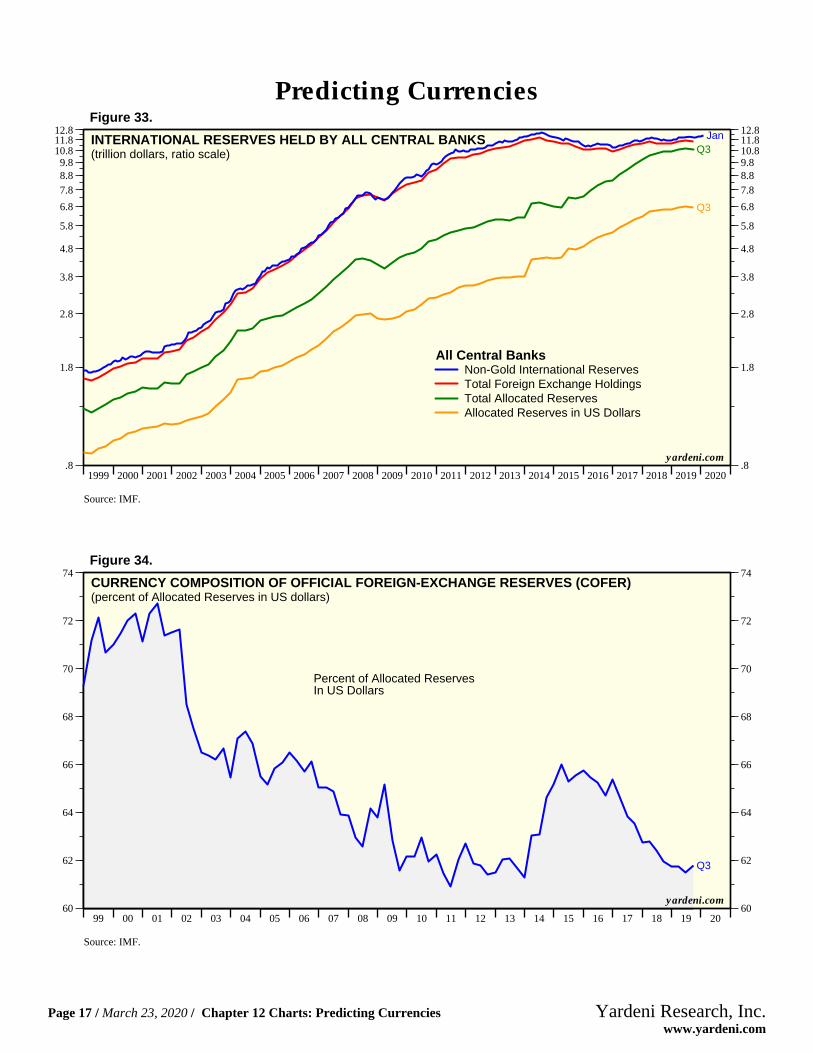
1999 2000 2001 2002 2003 2004 2005 2006 2007 2008 2009 2010 2011 2012 2013 2014 2015 2016 2017 2018 2019 2020.8
1.8
2.8
3.8
4.8
5.8
6.8
7.88.89.810.811.812.8
.8
1.8
2.8
3.8
4.8
5.8
6.8
7.88.89.8
10.811.812.8
Q3Jan
Q3
INTERNATIONAL RESERVES HELD BY ALL CENTRAL BANKS(trillion dollars, ratio scale)
All Central BanksNon-Gold International ReservesTotal Foreign Exchange HoldingsTotal Allocated ReservesAllocated Reserves in US Dollars
Source: IMF.
yardeni.com
Figure 33.
99 00 01 02 03 04 05 06 07 08 09 10 11 12 13 14 15 16 17 18 19 2060
62
64
66
68
70
72
74
60
62
64
66
68
70
72
74
Q3
CURRENCY COMPOSITION OF OFFICIAL FOREIGN-EXCHANGE RESERVES (COFER)(percent of Allocated Reserves in US dollars)
Percent of Allocated ReservesIn US Dollars
Source: IMF.
yardeni.com
Figure 34.
Predicting Currencies
Page 17 / March 23, 2020 / Chapter 12 Charts: Predicting Currencies www.yardeni.com
Yardeni Research, Inc.
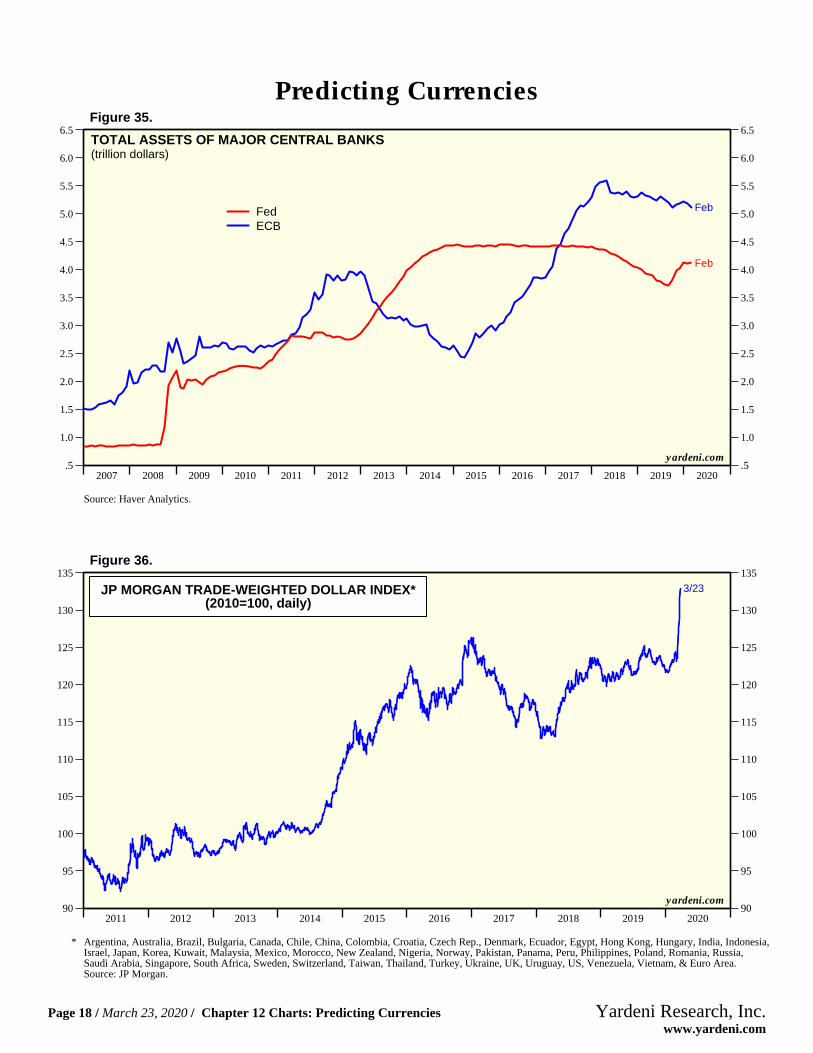
2007 2008 2009 2010 2011 2012 2013 2014 2015 2016 2017 2018 2019 2020.5
1.0
1.5
2.0
2.5
3.0
3.5
4.0
4.5
5.0
5.5
6.0
6.5
.5
1.0
1.5
2.0
2.5
3.0
3.5
4.0
4.5
5.0
5.5
6.0
6.5
Feb
Feb
TOTAL ASSETS OF MAJOR CENTRAL BANKS(trillion dollars)
ECBFed
Source: Haver Analytics.
yardeni.com
Figure 35.
2011 2012 2013 2014 2015 2016 2017 2018 2019 202090
95
100
105
110
115
120
125
130
135
90
95
100
105
110
115
120
125
130
135
JP MORGAN TRADE-WEIGHTED DOLLAR INDEX*(2010=100, daily)
3/23
* Argentina, Australia, Brazil, Bulgaria, Canada, Chile, China, Colombia, Croatia, Czech Rep., Denmark, Ecuador, Egypt, Hong Kong, Hungary, India, Indonesia,Israel, Japan, Korea, Kuwait, Malaysia, Mexico, Morocco, New Zealand, Nigeria, Norway, Pakistan, Panama, Peru, Philippines, Poland, Romania, Russia,Saudi Arabia, Singapore, South Africa, Sweden, Switzerland, Taiwan, Thailand, Turkey, Ukraine, UK, Uruguay, US, Venezuela, Vietnam, & Euro Area.Source: JP Morgan.
yardeni.com
Figure 36.
Predicting Currencies
Page 18 / March 23, 2020 / Chapter 12 Charts: Predicting Currencies www.yardeni.com
Yardeni Research, Inc.
http://blog.yardeni.com
http://blog.yardeni.com
Copyright (c) Yardeni Research, Inc. 2020. All rights reserved. The informationcontained herein has been obtained from sources believed to be reliable, but is notnecessarily complete and its accuracy cannot be guaranteed. No representation orwarranty, express or implied, is made as to the fairness, accuracy, completeness, orcorrectness of the information and opinions contained herein. The views and the otherinformation provided are subject to change without notice. All reports and podcasts posted onwww.yardeni.com, blog.yardeni.com, and YRI’s Apps are issuedwithout regard to the specific investment objectives, financial situation, or particular needsof any specific recipient and are not to be construed as a solicitation or an offer to buy or sellany securities or related financial instruments. Past performance is not necessarily a guideto future results. Company fundamentals and earnings may be mentioned occasionally, butshould not be construed as a recommendation to buy, sell, or hold the company’s stock.Predictions, forecasts, and estimates for any and all markets should not be construed asrecommendations to buy, sell, or hold any security--including mutual funds, futurescontracts, and exchange traded funds, or any similar instruments.
The text, images, and other materials contained or displayed on any Yardeni Research, Inc.product, service, report, email or website are proprietary to Yardeni Research, Inc. andconstitute valuable intellectual property. No material from any part of www.yardeni.com, blog.yardeni.com, and YRI’s Apps may be downloaded, transmitted,broadcast, transferred, assigned, reproduced or in any other way used or otherwisedisseminated in any form to any person or entity, without the explicit written consent ofYardeni Research, Inc. All unauthorized reproduction or other use of material from YardeniResearch, Inc. shall be deemed willful infringement(s) of this copyright and other proprietaryand intellectual property rights, including but not limited to, rights of privacy. YardeniResearch, Inc. expressly reserves all rights in connection with its intellectual property,including without limitation the right to block the transfer of its products and services and/orto track usage thereof, through electronic tracking technology, and all other lawful means,now known or hereafter devised. Yardeni Research, Inc. reserves the right, without furthernotice, to pursue to the fullest extent allowed by the law any and all criminal and civilremedies for the violation of its rights.
The recipient should check any email and any attachments for the presence of viruses.Yardeni Research, Inc. accepts no liability for any damage caused by any virus transmittedby this company’s emails, website, blog and Apps. Additional information available onrequest.
Related Documents