Central East Voltage and Stability Analysis for Marcy FACTS Project – Phase I April 11, 2001 Prepared by NYISO Operations Engineering

Welcome message from author
This document is posted to help you gain knowledge. Please leave a comment to let me know what you think about it! Share it to your friends and learn new things together.
Transcript

Central East Voltage and Stability Analysis for Marcy FACTS Project – Phase I
April 11, 2001Prepared by
NYISO Operations Engineering


Central East Voltage and Stability Analysis for Marcy FACTS Project – Phase I
April 11, 2001
1
Central East Voltage and Stability Analysis for
Marcy FACTS Project – Phase I
1. INTRODUCTION
The Marcy Flexible AC Transmission System (FACTS) project is a joint technology partnership between the New York Power Authority (NYPA), the Electric Power Research Institute (EPRI) and Siemens AG. Phase I of this project is the installation of a 200MVA shunt static compensator (STATCOM) at the Marcy 345kV substation. Using state-of-the-art devices, including GTO thyristors and controls technology, the Marcy STATCOM is a dynamic transmission voltage regulating device functionally similar to the static VAr compensators (SVC) currently in use in the New York Bulk Power System.
This study examines the sensitivity of the Central East stability and voltage limits to the
addition of the STATCOM and the Oakdale shunt capacitor in system operation and proposes revised operating limits respecting the additional transfer capability that is available when these devices are in service. The standard operating mode of the STATCOM will be similar to that of the normal operating modes of the Leeds and Fraser SVCs: maintain output at approximately 0MVAr in the steady-state (pre-contingency) system, and provide maximum automatic voltage regulation to damp system oscillations immediately following a system contingency event, and provide the maximum steady-state post-contingency voltage support to prevent the onset of voltage collapse. 2. RECOMMENDATIONS Based on the report findings, the following are recommended:
1. Revise the Central East Maximum Transfer Levels for use with the Marcy STATCOM
and the Oakdale 345kV shunt capacitor in service, and establish reductions to the Central East adjusted Maximum Transfer Levels to determine Critical Transfer Levels when either Marcy STATCOM or Oakdale capacitor is out of service as summarized in Table 1, below.
2. Establish new Central East stability limits with the Marcy STATCOM in service,
including limits associated with the Leeds and/or Fraser SVCs out of service, and revise the existing Central East stability limits for use when Marcy STATCOM is out of service as summarized in Table 2, below.
2.1. Voltage Limits Table 1 summarizes the recommended Cental East Maximum Transfer Level, Adjusted-MTL, and Critical Transfer Level for the Oakdale capacitor and the Marcy STATCOM for the three limiting contingencies for Central East.

Central East Voltage and Stability Analysis for Marcy FACTS Project – Phase I April 11, 2001
2
Table 1
Recommended Maximum Transfer Levels for use with Marcy FACTS Project Phase I In Service
(Both) Oakdale Capacitor and L/O L/O L/O Marcy STATCOM In Service PHASE II MARCY-SO. N.SCOT #99 HVDC TOWER BUS
MAXIMUM TRANSFER LEVELS 3713 4232 2720 LESS 5% SAFETY MARGIN -185.7 -211.6 -136.0 POST-CONT. PV-20 FLOW -217.4 -203.5 -226.9 POST-CONT. INGHAMS FLOW -143.2 -190.3 -171.4 ADJUSTED M.T.L. 3166.7 3626.6 2185.7 (AS ROUNDED) 3165 3625 2185 SPECIFY # OF UNITS OR CAP BANKS IN SERVICE FITZPATRICK 1 OSWEGO 5 1 OSWEGO 6 1 0 0 0 NINE MILE 2 1 0 0 0 SITHE 1-6 6 0 0 0 MARCY STATCOM 1 -35 0 -45 0 -35 0 LEEDS SVC 1 -35 0 -35 0 -20 0 FRASER SVC 1 -35 0 -35 0 -20 0 MARCY CAPS 2 -45 0 -45 0 -35 0 N.SCOT CAPS 3 -25 0 -25 0 -20 0 LEEDS CAPS 2 -20 0 -20 0 -15 0 FRASER CAPS 2 -20 0 -20 0 -15 0 GILBOA CAP 1 -20 0 -20 0 -15 0 ROTTERDAM CAPS 2 -20 0 -20 0 -15 0 OAKDALE CAP 1 -15 0 -15 0 -15 0 MARCY REACTOR 0 -45 0 -45 0 -35 0 MASS. REACTORS 0 -20 0 -20 0 -15 0 OMS CORRECTION ADD POST-CONT. PV-20 FLOW ADD POST-CONT. INGHAMS FLOW POST-CONTINGENCY C-E OPERATING LIMIT The corresponding Central East adjusted MTL is the quantity used in the calculation of the real-time post-contingency operating limit (critical transfer level).

Central East Voltage and Stability Analysis for Marcy FACTS Project – Phase I
April 11, 2001
3
2.2. Stability Limits The following are recommended Central East Stability Limits based on the detailed stability analyses conducted for the system with the Marcy FACTS Phase I in service.
Table 2 Central East Stability Analysis Recommended Central East Stability Limit
(Includes NYISO 10% Safety Margin)
STATCOM Out of Service STATCOM In Service
Leeds/Fraser SVC Status Leeds/Fraser SVC Status Oswego Sithe Both One Both St.L G/R Both One Both St.L G/R
Units Units I/S I/S O/S O/S I/S I/S O/S O/S
5 5 3100 3000 2950 2700 3100 3050 3050 3050 5 3 3050 2950 2850 2700 3050 3050 3050 3050 5 0 2850 2800 2750 2700 2900 2850 2850 2850
4 5 3100 3000 2950 2700 3100 3100 3050 3050 4 3 3050 2950 2900 2700 3100 3050 3050 3050 4 0 2850 2800 2700 2700 2850 2850 2850 2850
3 5 3050 2950 2900 2700 3050 3050 3000 3000 3 3 3000 2950 2900 2700 3050 3050 3000 3000 3 0 2800 2800 2700 2700 2900 2900 2850 2850
2 5 3050 2900 2850 2800 3100 3050 3050 3000 2 3 2950 2850 2800 2800 3000 3000 3000 2850 2 0 2800 2700 2650 2650 2850 2850 2850 2850
1 5 2800 2800 2800 2800 2900 2900 2900 2900 1 3 2750 2700 2650 2650 2750 2750 2750 2750 1 0 2500 2500 2500 2500 2550 2550 2550 2550
0 5 2400 2400 2400 2400 2400 2400 2400 2400 0 3 2200 2200 2200 2200 2200 2200 2200 2200 0 0 1950 1950 1950 1950 1950 1950 1950 1950
Central East Voltage and Stability Analysis for Marcy FACTS Project – Phase I April 11, 2001
4
3. STUDY ASSUMPTIONS AND METHODOLOGY 3.1. Base Case Development and Analysis A. Base Case Load Flow
The New York portion of the study base case was developed from the NYPP Databank and reviewed by Operating Studies Task Force for the Summer 1999 Operating Study. Areas outside the NYCA were obtained from the 1999 Summer Peak base case developed by NPCC SS-37. The base case was further modified during the analysis of the July 6, 1999 Peak Load Conditions for the NYPP System Operation Advisory Subcommittee. Load and generation were updated based on Summer 2000 studies, and the Marcy STATCOM model was added.
B. SVC Normal Operating Mode For voltage and stability testing any analysis with the Leeds and/or Fraser SVCs in
service, the base case load flows were solved with the SVCs set to minimum ( 0MVAr) output by adjusting their respective voltage schedules. Similarly, analyses with the STATCOM in service, the STATCOM voltage schedule was adjusted to minimize the reactive output in the pre-contingency case.
C. Voltage Collapse Transfer Limits The voltage analysis for the additions of the Marcy FACTS (STATCOM) and Oakdale capacitor continues a review of the Central East voltage collapse transfer limit analysis first reported in “NYPP Central East Voltage Analysis – 1995” (August 1995). Base case load flows and voltage transfer analysis were developed for four scenarios:
1. Base or “as found system” 2. Base system with Oakdale 135MVAr shunt capacitor 3. Base system with Marcy STATCOM in service 4. System with both Oakdale capacitor and Marcy STATCOM in service
D. Stability Limits
This stability analysis continues the same process for Central East limits and confirms the impact of the various generation dispatch configurations on the stability performance of the NY interconnected system. The analysis was performed to benchmark the “as found system” to confirm the existing Central East stability limits, and then repeated with the Marcy STATCOM model in service. The reference Central East stability limits for the existing system have been reported in a series of studies conducted for and following the addition of the Sithe Independence generation in the Oswego area:
Central East Stability Analysis Post Sithe Configuration 2/16/1995 Central East Stability Limits for Three Oswego Complex Units in Service 1/30/1996 Central East Stability Limits for Two Oswego Complex Units in Service 4/17/1996

Central East Voltage and Stability Analysis for Marcy FACTS Project – Phase I
April 11, 2001
5
Central East Stability Limits for One Oswego Complex Unit in Service 4/17/1996 Central East Stability Limits for Zero Oswego Complex Units in Service 6/27/1997
The system representation for the stability analysis is the same base case as the voltage
analysis. Data for the NPCC Areas is consistent the studies cited above. Dynamics data for external areas was obtained from the NERC SDDWG database and the MAAC-ECAR-NPCC (MEN) 1998 Dynamics Assessment. The dynamic model for the Marcy STATCOM was developed by PTI for NYPA specifically for the STATCOM project.
All stability testing was performed with the Chateauguay HVdc terminals out of service, and 1170MW AC Beauharnois generation connected to the Chateauguay – Massena 765kV interconnection. Previous testing for Central East has demonstrated that this is the “worst case scenario. 3.2. Methodology
A. Voltage Collapse Transfer Limits
The analysis was performed using steady state load flow techniques. The NYISO Operations Engineering Voltage Guideline (Method #3, Voltage Collapse Transfer Limits) is used to determine post-contingency maximum and critical transfer levels. This guideline included as Appendix A.
B. NYISO Stability Criteria and Limit Analysis
The stability limits were developed in accordance with New York State Initial Reliability
Rules (New York State Reliability Council, September 10, 1999), Manual for Transmission Interconnection and Expansion (NYISO, September 28, 1999) attachments E, “Guideline for Voltage Analysis,” and F, “Guideline for Stability Analysis and Determination of Stability-based Transfer Limits,” and Basic Criteria for Design and Operation of Interconnected Power Systems (criteria document A-2, Northeast Power Coordinating Council; April 9, 1995). The stability transfer limits reported represent the highest stable test level less the 10% (or 200MW) margin as discussed in the Stability Guideline. Simulation results were evaluated for acceptable damping of rotor angle and system voltage performance.
In order to provide a basis for comparison of Central East stability performance with
respect to Oswego area generation status (including Sithe Independence), and availability of the Leeds and Fraser SVCs, the NYCA generation dispatch was held constant over the range of system conditions examined. Central East flow was controlled by adjusting transfer between Ontario and New England. The phase angle regulators at St. Lawrence (L33P and L34P) maintained constant schedule between Ontario and NYCA.

Central East Voltage and Stability Analysis for Marcy FACTS Project – Phase I April 11, 2001
6
4. CENTRAL EAST DEFINITION
The Central East interface consists of the following transmission circuits:
Central East Interface
Name
Circuit #
Voltage (kV)
Edic - New Scotland Marcy - New Scotland Porter - Rotterdam Porter - Rotterdam Plattsburgh – Sandbar (VT) East Springfield – Inghams ED Inghams CD – Inghams ED
14
UNS-18 30 31
PV20 942 PAR
345 345 230 230 115 115 115
5. DISCUSSION
A. SVCs Operation
In normal system operation, the SVCs are used for mitigating post-contingency voltage oscillations and for post-contingency voltage control, not for steady state pre-contingency voltage support. The existing voltage collapse and stability transfer limits assume that the full dynamic range of the SVCs are available. In order to have the full dynamic capability available, the SVCs are normally in the automatic mode and in the minimum output state. This is defined as the SVC normal state. In the normal state, the SVC output is within a small deadband around zero reactive output. When a significant disturbance occurs, the SVC will automatically switch out of the minimum output state and use its reactive capability to maintain the voltage at the pre-contingency value until the SVC is returned to the minimum output state by the Transmission Owner System Operator. If part of an SVCs dynamic capability is not available or has reduced reactive capability, or is operating in other than normal state, a penalty may be applied to the Central East voltage collapse transfer limits and stability limits.
B. Voltage Collapse Transfer Limit Analysis
The most limiting contingencies for voltage are:
• New Scotland 345kV Bus 99 Fault • Loss of Marcy-South double circuit tower • Loss of Radisson – Sandy Pond HVdc (ISO-NE) at 1200MW

Central East Voltage and Stability Analysis for Marcy FACTS Project – Phase I
April 11, 2001
7
Table 1, above, presented the recommended Maximum Transfer Levels and the corresponding adjusted MTLs based on the analysis of these contingencies for the different scenarios. The following table summarizes the recommended Central East Maximum Transfer Level (MTL):
Determination of Penalty for Out of Service Based on Adjusted Maximum Transfer Levels
Central East Adjusted MTL (MW) (post-contingency flow)
Penalty for Out of Service
Loss of Phase II HVDC
Loss of MS
Northern double circuits
Loss of
N.Scotland # 99 bus
Loss of Phase II HVDC
Loss of MS
Northern double circuits
Loss of
N.Scotland #99 bus
As Found System Base limits (4M, all caps I/S & all reactors O/S)
3195
3665
2140
--
--
--
Oakdale capacitor
I/S
3210
3680
2155
15
15
15
Marcy STATCOM
I/S
3230
3710
2175
35
45
35
The penalties are determined based on the difference between the adjusted MTL for the specific device in service when compared to the as found system MTL for that same contingency. The penalties are different for each contingency, and reflect the relative impact that each particular device has on the voltage support in the system. These Maximum Transfer Levels are summarized in Appendix B (Determination of Maximum and Critical Post-Contingency Transfer Levels). Tables in Appendix B summarize the MTL, calculation of the Adjusted MTL and Critical Transfer Level (Central East Post-contingency Operating limit) for the four scenarios. There is a separate table for each of the three contingencies. A considerable amount of the study preparation and analysis was devoted to “benchmarking” the “as found system” to ensure that results would be consistent with previous study results. Recently, the New Scotland #99 bus contingency has typically been the limiting contingency for voltage in real-time operation. It was critical that the base case and testing of this contingency be consistent with the results of previous studies to ensure that the sensitivity analysis and individual equipment outage penalties remain valid, and that the results of previous studies be reproducible.

Central East Voltage and Stability Analysis for Marcy FACTS Project – Phase I April 11, 2001
8
Comparison of New Scotland Bus Fault MTL
1995 Study As Found 2000
Maximum Transfer Level 2642 2679 Less 5% margin 132 134
PV-20 196 228 Inghams PAR 170 173
Adj. MTL 2143 2144 (as rounded) 2140 2140
The comparison of the adjusted MTLs from the 1995 study compare favorably with those based of the “as found system” for the New Scotland bus fault contingency. As a result of this benchmark, and comparison of intermediate results in the benchmarking process, the individual penalties that were determined in the 1995 study for the existing equipment outages are still applicable.
C. STABILITY LIMIT ANALYSIS
C.1. Base Case Transfer Test Levels
Appendix C includes summaries of the generator combinations and Central East transfer levels tested. It also includes tables summarizing the highest stable test level and stability limits for each of the scenarios tested.
C.2. Stability Test Results The Table 2, below, summarizes the recommended Central East Stability Limits for each of the generation combinations tested in the current or “as found system” (Marcy STATCOM not in service), and the system with the Marcy STATCOM in service. Within each section are tests representing:
• both Leeds and Fraser SVCs in service, • one of either Leeds or Fraser SVC in service, • both Leeds and Fraser SVCs out of service, and • both SVCs out of service and St. Lawrence generation rejection out of service.
The limits in Table 2 include the NYISO stability limit margin (greater of 200MW or 10%) in accordance with the “Guideline for Stability Analysis and Determination of Stability-based Transfer Limits,” and are the recommended limits for each test scenario. The actual Central East highest stable test levels are presented in Appendix C. For each configuration an SVC is assumed to be in service when it is operating in the “normal state” in automatic mode with full capacitive capability available.

Central East Voltage and Stability Analysis for Marcy FACTS Project – Phase I
April 11, 2001
9
C.3. Discussion
The most severe Central East contingency is the phase-phase-ground fault (CE07) on the northern section of the Marcy South transmission (Edic-Fraser and Marcy-Coopers Corners). While the single-phase-to-ground contingencies at the Marcy 345kV or Edic 345kV with delayed clearing have been limiting in previous studies, in all cases tested (SVCs available, all lines in service) in this analysis the Marcy South tower contingency is the most limiting.
When both the Leeds and Fraser SVCs are not available, the most severe contingency for Central East transfers is a phase-phase-ground fault on the New York-Ontario 230kV interconnections between St. Lawrence/FDR (NY) and St. Lawrence/Saunders (Ontario), circuits L33P and L34P. For this contingency there is a special protection system that will reject up to eight St. Lawrence/FDR generators (57 MW each) when armed. All scenarios were examined for both no rejection (MS150) and six-unit rejection (MS156) for this contingency. Six-unit rejection at St. Lawrence/FDR was tested to account for the possible breaker failure during actual eight-unit rejection. In the summary tables the columns headed “St. Lawrence G/R not in service” indicate the stable test level or recommended limit for this condition.
Large capacity contingencies in New England are of particular concern when Central
East is operated at high transfer levels. The Loss of the Radisson – Sandy Pond (Phase II) HVdc interconnection (NE12) was tested at 1200MW in each configuration. All of these tests were stable. The comparison of current stability limits with testing performed in this analysis with the Marcy FACTS (STATCOM) out of service indicates that certain Oswego/Sithe/SVC limits have decreased. These limits currently in use were developed from system representations from 1995 NYPP and 1994 NERC base cases. Significant changes to system representations have occurred in the intervening time. While the actual load in the NYCA has increased from 27,062MW (1995) to 30,311MW (1999), the installed capacity to supply the load and transfers has not increased significantly in that same time. Load flow representations for previous studies used forecast loads of 27,500MW (1995), or about 2500MW less than the current base case of 30,200MW (2000). The higher load levels in the base case require more generation to serve the local load, and provide less available generation to simulate transfers. Additionally, with the increase load (and losses), the increased reactive demand uses reactive resources that would previously have been available for voltage support for higher base case transfers. This generally results in the highest solvable transfer level being 50MW to 150MW lower than previous studies. This is particularly noticeable in the test scenarios with low Oswego/Sithe generation levels.
Representation of EHV generation in the load flows for dynamics testing has been changed to represent the units at gross MW and MVAr with station auxiliary load represented. This change specifically affects the large nuclear and fossil steam units in the Oswego Complex. All major generation reactive capabilities are compared to, and are consistent with, the reactive capability testing requirements of the NYISO Ancillary Services Manual (Voltage Support Services).

Central East Voltage and Stability Analysis for Marcy FACTS Project – Phase I April 11, 2001
10
Testing of the Sithe configurations was conducted to determine the highest limits for Oswego/Sithe combinations valid for either five (5) or six (6) Sithe Independence units in service. The limits demonstrate that no reduction in the Central East stability limit is necessary when only one Sithe Independence unit is out of service.

Central East Voltage and Stability Analysis for Marcy FACTS Project – Phase I
April 11, 2001
11
Appendix A
New York Independent System Operator OPERATIONS ENGINEERING VOLTAGE GUIDELINE
SUBJECT: NYISO Operations Engineering Guideline for Determining Voltage
Constrained Operating Limits. REFERENCES: Operating Policy (OP) #1 : Operation of the Bulk Power System Methods and Procedures (MP) 6-7 : Procedures for Developing and
Approving Operating Limits NYPP 1989 Voltage Study NYPP 1995 Central East Voltage Analysis PURPOSE: This guideline defines the procedure required for the determination of
voltage / reactive constrained limits used for operation of the NYISO bulk power system.
1. INTRODUCTION NYISO Operations Engineering develops voltage/megawatt limits for the bulk power system as described in the NYISO Transmission and Dispatching Operations Manual. These limits are used in conjunction with other limits, i.e. transient stability limits, to operate the New York bulk power system in a secure manner. 2. PROCEDURE The Voltage Contingency Analysis Procedure (VCAP) is used to evaluate the steady state voltage performance of the power system for a series of system conditions. A transmission interface in the vicinity of the area of the system to be studied, is tested by preparing a series of power flow base cases with increasing MW transfer levels across that interface. The pre-contingency cases are then subjected to the most severe voltage contingencies for the area involved. The post-contingency cases are then reviewed for voltage performance at each of the monitored buses being studied to best determine reactive conditions and develop guideline for the operation of the system.
Base Case Preparation A current season NYISO Operating Studies base case is reviewed for thermal and reactive considerations by the Operating Studies Task Force transmission owner representatives (per the NYISO System Analysis Data Manual) and used as the reference case for the study.

Central East Voltage and Stability Analysis for Marcy FACTS Project – Phase I April 11, 2001
12
This case should also be consistent with (transient stability analysis) representational data used to model system generation response for generator contingencies. Since the scope of each study varies, the Operating Study Base Case is modified to study the particular conditions within the scope of the study. Significant changes, additions or modifications from the original base case should be documented in the final report. VCAP Requirements The VCAP requires a list of generators needed to produce appropriate generation shifts to affect the desired interface. These shifts should stress the area sufficiently to cause deteriorated voltage response. Also the shifts used should not cause undue stress in areas not under review . This can have an impact on results (e.g., analysis of the West Central interface should not cause Central East operating limits to be violated). Low voltages in adjacent study areas can drive the voltages down in the area under review. The VCAP requires a list of contingencies to test the interface being studied. This list should include the most severe contingencies for that particular study area. The most severe contingency then determines the operating limits to be implemented. VCAP Operating Philosophy VCAP simulates an increased megawatt flow across an interface, utilizing generator shifts and performing typical, regulating actions as required. LTC transformers are allowed to regulate voltage, phase-shifting transformers regulate a megawatt flow and bulk power system shunt devices are allowed to switch at specified voltage levels. The contingency simulation (post-contingency load flow solution) models these control devices locked at their pre-contingency values. Automatic control devices, such as generators or SVCs, are allowed to respond within their capabilities. For generator contingencies, an inertial load flow solution is used, and all in-service generators represented in the base case participate in the pick-up for the generator loss and variations in system losses. 3. Determination of Operating Limits Various key reactive indicators on the system are monitored from the output of the VCAP runs. Of primary concern is the pre- and post-contingency voltage response of the bulk power system buses. The response of machine and other reactive control devices are closely monitored, as are MW and MVAr flows on critical transmission paths.

Central East Voltage and Stability Analysis for Marcy FACTS Project – Phase I
April 11, 2001
13
Pre-contingency Low Voltage Limits (Method #1) Pre-contingency voltage limits are set based on the most severe post-contingency voltage contingency. As transfers are increased across a particular interface, the bus voltage will fall below the defined post-contingency voltage limit following a contingency. Post-contingency limits are typically 95% of nominal. These limits are maintained in the NYISO System Operating Procedures Manual. A pre-contingency kV limit is determined when the post-contingency voltages falls below the post-contingency low voltage limit. Figure #1 shows a typical curve for voltage analysis the pre- and post-contingency bus voltage is plotted versus the pre-contingency transfer flow. The post-contingency condition is a deciding factor as to whether additional analysis is needed. The figure shows a moderately sloped post-contingency curve indicating there is still reactive reserve in that area on the system. The reserve can exist in the reactive capability of the machines or terminal voltages. When these conditions are met, method #1 should be employed.
Figure 1
TRANSFER
POST - CONTINGENCY VOLTAGE LIMIT
PRE - CONTINGENCY VOLTAGE LIMIT
VOLTAGE CURVES
CASE #1
PRE - CONTINGENCY POST - CONTINGENCY

Central East Voltage and Stability Analysis for Marcy FACTS Project – Phase I April 11, 2001
14
Determination of MW Transfer Limits (Method #2) For systems exhibiting a poor reactive response, pre and post-contingency, other methods must be applied to address operating limits. When the pre and post-contingency curve illustrates a severe slope at the point at which it crosses its post-contingency limit (see figure 2), a megawatt limit in addition to a kV limit is specified. The post-contingency voltage, in this case, falls below the limit beyond the "knee" of the curve. A severe slope on the voltage curves indicates the reactive reserve on the system is depleting rapidly for small increases in transfer. It is also an indication that lines are loaded beyond surge impedance loading (SIL) and machines are operating at maximum excitation levels.
Figure 2
Figure #2 illustrates the limit being violated beyond the "knee" of the curve. The capability of the interface to transfer power across it is rapidly decreasing. As transfers increase, load flow results show severe voltage declines for small increases in transfer. This is caused by the increase in reactive demand of the line to support the transfer and the depletion of the reactive supply in the area. The reactive reserve of the generation in the area provides a measure of the extent the reactive capability of the system has deteriorated. When monitoring the reactive power generated by machines in the vicinity of an interface, the point when machines run out of VArs is the first indication of the area running out of reactive support. From that point on, the transfer can only be supported by more remote reactive sources in the system. This means that as transfers increase further, the voltage will continue to decline at an increasing rate, possibly to a critical level and eventually to the point of voltage collapse.
POST - CONTINGENCY VOLTAGE LIMIT
PRE - CONTINGENCY VOLTAGE LIMIT
VOLTAGE CURVES
CASE #2
TRANSFER
PRE - CONTINGENCY POST - CONTINGENCY
"KNEE" OF
CURVE

Central East Voltage and Stability Analysis for Marcy FACTS Project – Phase I
April 11, 2001
15
Shunt devices on the system increase the capability of the system to transfer power by providing additional reactive support, thus maintaining voltages at a more constant level. However, when the system runs out of it's variable reactive support (generators, SVCs), the voltage decline becomes more pronounced. Figure #3 illustrates the effect of adding capacitors to the system. When considering a megawatt limit, all capacitors available in the area should be switched in-service at the appropriate pre-contingency voltage levels to obtain the maximum transfer capability.
Figure 3
Under these more severe conditions, a megawatt limit should be set in addition to a kV limit. To set this limit, different variables should be considered.
§ Real vs. reactive loading characteristics of lines in the problem area § Transfer levels at which area machines reach maximum reactive output § Hold voltage levels of area generation and LTC transformers § Shunts available to the system
The objective is to avoid post-contingency transfer levels that cannot be supported by
available reactive resources. A megawatt transfer limit is determined by first locating the pre-contingency transfer level that corresponds to the point at which all machines in the area have reached their maximum reactive output for the most severe contingency. A 5% margin is then applied to determine the operating limit. This limit is rounded down to the nearest 25 MW.
MEGAWATTS
VOLTAGE CURVES
NO CAPACITORS ADDED CAPACITORS
POST-CONTINGENCY CURVES
POST-CONTINGENCY LIMIT

Central East Voltage and Stability Analysis for Marcy FACTS Project – Phase I April 11, 2001
16
Voltage Collapse Transfer Limits (Method #3) This analysis is similar to Method #2 and is performed using steady state load flow
techniques. The VCAP process is used to determine post-contingency voltage collapse and critical transfer levels.
Central East transfer cases are prepared utilizing generation shifts and performing typical regulating actions as required to maintain acceptable system voltages. Load Tap Changing (LTC) transformers are allowed to regulate voltage and phase shifting transformers regulate to pre-contingency schedules. Known voltage control devices, such as major generating units in service and switched shunt capacitors/ reactors are fixed for all transfers. A series of load flows are created with the Central East interface flow increased up to and beyond the point at which area reactive resources are depleted.
These transfer cases are then subjected to critical voltage contingencies for the Central East area. Post-contingency solutions require all LTC transformer controls are locked, steady state machine reactive limits enforced and phase angle regulators (PARS) are set at fixed angle. The PSS/e INLF (inertial load flow) solution activity was used for loss of generation or loss of HVdc delivery contingencies. In the INLF solution, the “lost capacity” is redistributed proportionally to all in service generating units.
The study findings indicate for secure operation of the NYISO bulk power system, in addition to the use of pre - and post-contingency voltage limits, it is necessary to limit post-contingency Central East flows for protection against voltage collapse. Power vs. Voltage (PV) curves indicate that the system is capable of maintaining acceptable voltages even at the maximum post-contingency interface flow. Any system change causing post-contingency flows to go beyond this point results in rapidly declining voltages and voltage collapse. In various literature, this point is referred to as the Pmax and Vcritical. For purposes of this study Pmax will be referred to as the Maximum Transfer Level and Vcritical the corresponding voltage level. This analysis looks in detail at the phenomena of Pmax and Vcritical that describe the point where the system passes from stable to unstable operation. The PV curves that illustrate these values are developed from each series of pre- and post-contingency load flow solutions.

Central East Voltage and Stability Analysis for Marcy FACTS Project – Phase I
April 11, 2001
17
After determining the Maximum Transfer Level, adjustments for study margin and equipment outage penalties are applied to determine the appropriate Central East voltage collapse limit or the Critical Transfer Level (CTL).
Central East Voltage and Stability Analysis for Marcy FACTS Project – Phase I April 11, 2001
18

Central East Voltage and Stability Analysis for Marcy FACTS Project – Phase I
April 11, 2001
19
Appendix B Determination of Central East Maximum and
Critical Post-Contingency Transfer Levels

Central East Voltage and Stability Analysis for Marcy FACTS Project – Phase I April 11, 2001
20
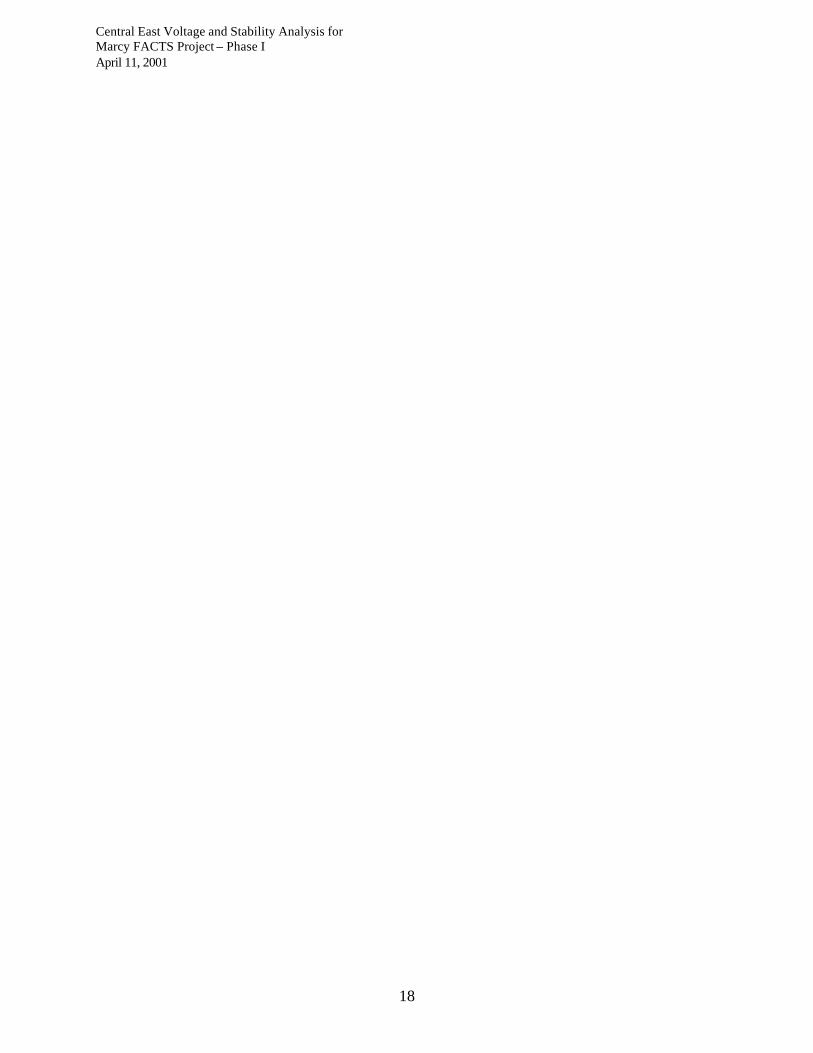
Central East Post-Contingency MTLs for New Scotland #99 Bus Fault
AFS Oakdale Statcom Both 1995 2000 2000 2000 2000 NS99 NS99 NS99 NS99 NS99
MAXIMUM TRANSFER LEVELS 2642 2679 2692 2706 2720 LESS 5% SAFETY MARGIN -132.1 -134.0 -134.6 -135.3 -136.0
POST-CONT. PV-20 FLOW -196.0 -228.0 -228.1 -223.4 -226.9
POST-CONT. INGHAMS FLOW -170.0 -173.0 -171.2 -170.2 -171.4
ADJUSTED M.T.L. 2143.9 2144.1 2158.1 2177.1 2185.7 (AS ROUNDED) 2140 2140 2155 2175 2185 SPECIFY # OF UNITS OR CAP BANKS IN SERVICE FITZPATRICK 1 0 0 0 0 0 OSWEGO 6 1 0 0 0 0 0 NINE MILE 1 1 0 0 0 0 0 NINE MILE 2 1 0 0 0 0 0 SITHE 1-6 6 0 0 0 0 0 MARCY STATCOM 1 LEEDS SVC 1 -20 0 -20 0 -20 0 -20 0 -20 0 FREASER SVC 1 -20 0 -20 0 -20 0 -20 0 -20 0 MARCY CAPS 2 -35 0 -35 0 -35 0 -35 0 -35 0 N.SCOT CAPS 3 -20 0 -20 0 -20 0 -20 0 -20 0 LEEDS CAPS 2 -15 0 -15 0 -15 0 -15 0 -15 0 FRASER CAPS 2 -15 0 -15 0 -15 0 -15 0 -15 0 GILBOA CAP 1 -15 0 -15 0 -15 0 -15 0 -15 0 ROTTERDAM CAPS 2 -15 0 -15 0 -15 0 -15 0 -15 0 OAKDALE CAP 1 MARCY REACTOR 0 -35 0 -35 0 -35 0 -35 0 -35 0
MASS. REACTORS 0 -15 0 -15 0 -15 0 -15 0 -15 0
OMS CORRECTION ADD POST-CONT. PV-20 FLOW
ADD POST-CONT. INGHAMS FLOW
POST-CONTINGENCY C-E OPERATING LIMITS
Central East Voltage and Stability Analysis for Marcy FACTS Project – Phase I
April 11, 2001
21
Post- Fault Voltage vs. Post- Fault Central East MWfor L/O NS 99 Bus Fault
320
330
340
350
360
370
2300 2350 2400 2450 2500 2550 2600 2650 2700 2750 2800
Central East (MW)
Ed
ic (
kV) AFS
Oakdale I/S
Facts I/S
Facts & Oakdale I/S
Post- Fault Voltage vs. Post- Fault Central East MWfor L/O NS 99 Bus Fault
310
320
330
340
350
360
370
2300 2350 2400 2450 2500 2550 2600 2650 2700 2750 2800
Central East (MW)
New
Sco
tland
(kV
)
AFS
Oakdale I/S
Facts I/S
Facts & Oakdale I/S
Central East Voltage and Stability Analysis for Marcy FACTS Project – Phase I April 11, 2001
22
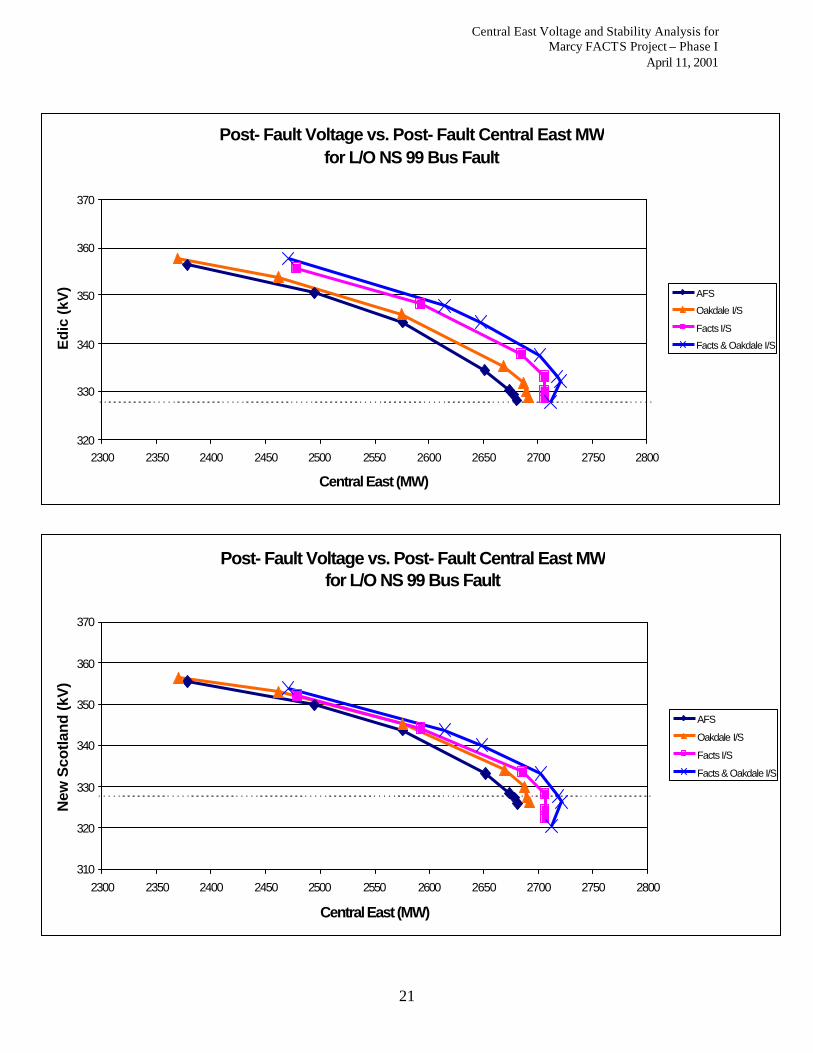
Central East Post-Contingency MTLs for Loss of Marcy South Double Circuit Tower
AFS Oakdale Statcom Both 1995 2000 2000 2000 2000 MSN MSN MSN MSN MSN
MAXIMUM TRANSFER LEVELS 4165 4291 4306 4345 4358 LESS 5% SAFETY MARGIN -208.3 -214.6 -215.3 -217.3 -217.9
POST-CONT. PV-20 FLOW -199.0 -221.9 -223.2 -224.2 -226.4
POST-CONT. INGHAMS FLOW -186.0 -186.4 -186.6 -190.2 -190.7
ADJUSTED M.T.L. 3571.8 3668.2 3680.9 3713.4 3723.0 (AS ROUNDED) 3570 3665 3680 3710 3720 SPECIFY # OF UNITS OR CAP BANKS IN SERVICE FITZPATRICK 1 0 0 0 0 0 OSWEGO 6 1 0 0 0 0 0 NINE MILE 1 1 0 0 0 0 0 NINE MILE 2 1 0 0 0 0 0 SITHE 1-6 6 0 0 0 0 0 MARCY STATCOM 1 LEEDS SVC 1 -35 0 -35 0 -35 0 -35 0 -35 0 FREASER SVC 1 -35 0 -35 0 -35 0 -35 0 -35 0 MARCY CAPS 2 -45 0 -45 0 -45 0 -45 0 -45 0 N.SCOT CAPS 3 -25 0 -25 0 -25 0 -25 0 -25 0 LEEDS CAPS 2 -20 0 -20 0 -20 0 -20 0 -20 0 FRASER CAPS 2 -20 0 -20 0 -20 0 -20 0 -20 0 GILBOA CAP 1 -20 0 -20 0 -20 0 -20 0 -20 0 ROTTERDAM CAPS 2 -20 0 -20 0 -20 0 -20 0 -20 0 OAKDALE CAP 1 MARCY REACTOR 0 -45 0 -45 0 -45 0 -45 0 -45 0
MASS. REACTORS 0 -20 0 -20 0 -20 0 -20 0 -20 0
OMS CORRECTION ADD POST-CONT. PV-20 FLOW
ADD POST-CONT. INGHAMS FLOW
POST-CONTINGENCY C-E OPERATING LIMITS

Central East Voltage and Stability Analysis for Marcy FACTS Project – Phase I
April 11, 2001
23
Post- Fault Voltage vs. Post- Fault Central East MWfor L/O Marcy South North Tower
310
320
330
340
350
360
370
3900 3950 4000 4050 4100 4150 4200 4250 4300 4350 4400
Central East (MW)
New
Sco
tlan
d (
kV)
AFS
Oakdale I/S
Facts I/S
Facts & Oakdale I/S
Post- Fault Voltage vs Post- Fault Central East MWfor L/O Marcy South North Tower
320
330
340
350
360
370
3900 3950 4000 4050 4100 4150 4200 4250 4300 4350 4400
Central East (MW)
Ed
ic (k
V) AFS
Oakdale I/S
Facts I/S
Facts & Oakdale I/S

Central East Voltage and Stability Analysis for Marcy FACTS Project – Phase I April 11, 2001
24
Central East Post-Contingency MTLs for Loss of Phase II HVdc
AFS Oakdale Statcom Both 1995 2000 2000 2000 2000 Phase II Phase II Phase II Phase II Phase II
MAXIMUM TRANSFER LEVELS 3662 3770 3781 3807 3821 LESS 5% SAFETY MARGIN -183.1 -188.5 -189.1 -190.4 -191.1
POST-CONT. PV-20 FLOW -215.0 -241.7 -240.4 -242.7 -244.1
POST-CONT. INGHAMS FLOW -143.0 -142.0 -140.9 -142.3 -142.2
ADJUSTED M.T.L. 3120.9 3197.8 3210.7 3231.7 3243.7 (AS ROUNDED) 3120 3195 3210 3230 3240 SPECIFY # OF UNITS OR CAP BANKS IN SERVICE FITZPATRICK 1 0 0 0 0 0 OSWEGO 6 1 0 0 0 0 0 NINE MILE 1 1 0 0 0 0 0 NINE MILE 2 1 0 0 0 0 0 SITHE 1-6 6 0 0 0 0 0 MARCY STATCOM 1 LEEDS SVC 1 -35 0 -35 0 -35 0 -35 0 -35 0 FREASER SVC 1 -35 0 -35 0 -35 0 -35 0 -35 0 MARCY CAPS 2 -45 0 -45 0 -45 0 -45 0 -45 0 N.SCOT CAPS 3 -25 0 -25 0 -25 0 -25 0 -25 0 LEEDS CAPS 2 -20 0 -20 0 -20 0 -20 0 -20 0 FRASER CAPS 2 -20 0 -20 0 -20 0 -20 0 -20 0 GILBOA CAP 1 -20 0 -20 0 -20 0 -20 0 -20 0 ROTTERDAM CAPS 2 -20 0 -20 0 -20 0 -20 0 -20 0 OAKDALE CAP 1 MARCY REACTOR 0 -45 0 -45 0 -45 0 -45 0 -45 0
MASS. REACTORS 0 -20 0 -20 0 -20 0 -20 0 -20 0
OMS CORRECTION ADD POST-CONT. PV-20 FLOW
ADD POST-CONT. INGHAMS FLOW
POST-CONTINGENCY C-E OPERATING LIMITS

Central East Voltage and Stability Analysis for Marcy FACTS Project – Phase I
April 11, 2001
25
Post- Fault Voltage vs. Post- Fault Central East MWfor L/O Phase 2 HVDC at 1200 MW
320
330
340
350
360
370
3350 3400 3450 3500 3550 3600 3650 3700 3750 3800 3850 3900
Central East (MW)
New
Sco
tlan
d (
kV)
AFS
Oakdale I/S
Facts I/S
Facts & Oakdale I/S
Post- Fault Voltage vs. Post- Fault Central East MWfor L/O Phase 2 HVDC at 1200 MW
320
330
340
350
360
370
3350 3400 3450 3500 3550 3600 3650 3700 3750 3800 3850 3900
Central East (MW)
Ed
ic (k
V)
AFS
Oakdale I/S
Facts I/S
Facts & Oakdale I/S

Central East Voltage and Stability Analysis for Marcy FACTS Project – Phase I April 11, 2001
26

Central East Voltage and Stability Analysis for Marcy FACTS Project – Phase I
April 11, 2001
27
Appendix C Summary of Central East Transfer Test Scenarios
for Stability Testing

Central East Voltage and Stability Analysis for Marcy FACTS Project – Phase I April 11, 2001
28

Central East Voltage and Stability Analysis for Marcy FACTS Project – Phase I
April 11, 2001
29
Table C.1
Central East Testing Scenarios
Oswego Complex (Nuclear and Fossil Units In Service)
Sithe Units In
Service
Central East
Test Transfer Level
Gross Generation
(Oswego Complex)
5/5 Oswego Units 5,6
3448
3875
3,4 3389
0-2 3168
4/5 Oswego Units
5,6
3453
3538
3,4
3390
0-2
3167
3/5 Oswego Units
5,6
3407
2930
3,4
3367
0-2
3124
2/5 Oswego Units
5,6
3392
2025
3,4
3281
0-2
3118
1/5 Oswego Units
5,6
3125
1205
3,4
3060
0-2
2800
0/5 Oswego Units 5,6 2677 0
3,4 2490
0-2 2171

Central East Voltage and Stability Analysis for Marcy FACTS Project – Phase I April 11, 2001
30
Table C.2
Central East Stability Analysis Actual Central East Highest Stable Test Level STATCOM Out of Service STATCOM In Service
Leeds/Fraser SVC Status Leeds/Fraser SVC Status Oswego Sithe Both One Both St.L G/R Both One Both St.L G/R
Units Units I/S I/S O/S O/S I/S I/S O/S O/S
5 5 3448 3335 3280 3023 3452 3400 3397 3397 5 3 3389 3300 3200 3023 3440 3398 3388 3388 5 0 3168 3115 3056 3023 3226 3175 3167 3167
4 5 3453 3335 3300 3013 3500 3450 3397 3397 4 3 3390 3300 3224 3013 3453 3398 3390 3390 4 0 3167 3112 3000 3013 3217 3167 3172 3172
3 5 3407 3300 3242 3022 3444 3399 3344 3344 3 3 3367 3280 3226 3022 3422 3390 3343 3343 3 0 3124 3112 3008 3008 3228 3228 3169 3169
2 5 3392 3227 3170 3170 3445 3422 3389 3389 2 3 3281 3170 3126 3126 3353 3334 3344 3344 2 0 3118 3006 2950 2950 3167 3167 3127 3127
1 5 3120 3125 3125 3125 3223 3223 3223 3223 1 3 3060 3000 2952 2952 3062 3062 3062 3062 1 0 2800 2800 2780 2780 2836 2836 2836 2836
0 5 2677 2668 2668 2668 2688 2671 2671 2671 0 3 2490 2470 2460 2460 2490 2490 2480 2460 0 0 2171 2171 2171 2171 2181 2181 2173 2173

Central East Voltage and Stability Analysis for Marcy FACTS Project – Phase I
April 11, 2001
31
Table C.3
Central East Stability Analysis Recommended Central East Stability Limit
(Includes NYISO 10% Safety Margin)
STATCOM Out of Service STATCOM In Service
Leeds/Fraser SVC Status Leeds/Fraser SVC Status Oswego Sithe Both One Both St.L G/R Both One Both St.L G/R
Units Units I/S I/S O/S O/S I/S I/S O/S O/S
5 5 3100 3000 2950 2700 3100 3050 3050 3050 5 3 3050 2950 2850 2700 3050 3050 3050 3050 5 0 2850 2800 2750 2700 2900 2850 2850 2850
4 5 3100 3000 2950 2700 3100 3100 3050 3050 4 3 3050 2950 2900 2700 3100 3050 3050 3050 4 0 2850 2800 2700 2700 2850 2850 2850 2850
3 5 3050 2950 2900 2700 3050 3050 3000 3000 3 3 3000 2950 2900 2700 3050 3050 3000 3000 3 0 2800 2800 2700 2700 2900 2900 2850 2850
2 5 3050 2900 2850 2800 3100 3050 3050 3000 2 3 2950 2850 2800 2800 3000 3000 3000 2850 2 0 2800 2700 2650 2650 2850 2850 2850 2850
1 5 2800 2800 2800 2800 2900 2900 2900 2900 1 3 2750 2700 2650 2650 2750 2750 2750 2750 1 0 2500 2500 2500 2500 2550 2550 2550 2550
0 5 2400 2400 2400 2400 2400 2400 2400 2400 0 3 2200 2200 2200 2200 2200 2200 2200 2200 0 0 1950 1950 1950 1950 1950 1950 1950 1950
Related Documents


![52407115 Voltage Stability[1]](https://static.cupdf.com/doc/110x72/577d225a1a28ab4e1e97265d/52407115-voltage-stability1.jpg)