Cellular ATP Changes in Acidithiobacillus ferrooxidans Cultures Oxidizing Ferrous Iron and Elemental Sulfur Pakostova E, Mandl M, Omesova Pokorna B, Diviskova E, Lojek A. Author post-print (accepted) deposited by Coventry University’s Repository Original citation & hyperlink: Pakostova, E, Mandl, M, Omesova Pokorna, B, Diviskova, E & Lojek, A 2013, 'Cellular ATP Changes in Acidithiobacillus ferrooxidans Cultures Oxidizing Ferrous Iron and Elemental Sulfur', Geomicrobiology Journal, vol. 30, no. 1, pp. 1-7. https://dx.doi.org/10.1080/01490451.2011.636790 DOI 10.1080/01490451.2011.636790 ISSN 0149-0451 Publisher: Taylor and Francis This is an Accepted Manuscript of an article published by Taylor & Francis in Geomicrobiology Journal on 08/11/2012, available online: http://www.tandfonline.com/10.1080/01490451.2011.636790 Copyright © and Moral Rights are retained by the author(s) and/ or other copyright owners. A copy can be downloaded for personal non-commercial research or study, without prior permission or charge. This item cannot be reproduced or quoted extensively from without first obtaining permission in writing from the copyright holder(s). The content must not be changed in any way or sold commercially in any format or medium without the formal permission of the copyright holders. This document is the author’s post-print version, incorporating any revisions agreed during the peer-review process. Some differences between the published version and this version may remain and you are advised to consult the published version if you wish to cite from it.

Welcome message from author
This document is posted to help you gain knowledge. Please leave a comment to let me know what you think about it! Share it to your friends and learn new things together.
Transcript

Cellular ATP Changes in Acidithiobacillus ferrooxidans Cultures Oxidizing Ferrous Iron
and Elemental Sulfur Pakostova E, Mandl M, Omesova Pokorna B, Diviskova E, Lojek A. Author post-print (accepted) deposited by Coventry University’s Repository Original citation & hyperlink:
Pakostova, E, Mandl, M, Omesova Pokorna, B, Diviskova, E & Lojek, A 2013, 'Cellular ATP Changes in Acidithiobacillus ferrooxidans Cultures Oxidizing Ferrous Iron and Elemental Sulfur', Geomicrobiology Journal, vol. 30, no. 1, pp. 1-7. https://dx.doi.org/10.1080/01490451.2011.636790
DOI 10.1080/01490451.2011.636790 ISSN 0149-0451 Publisher: Taylor and Francis This is an Accepted Manuscript of an article published by Taylor & Francis in Geomicrobiology Journal on 08/11/2012, available online: http://www.tandfonline.com/10.1080/01490451.2011.636790 Copyright © and Moral Rights are retained by the author(s) and/ or other copyright owners. A copy can be downloaded for personal non-commercial research or study, without prior permission or charge. This item cannot be reproduced or quoted extensively from without first obtaining permission in writing from the copyright holder(s). The content must not be changed in any way or sold commercially in any format or medium without the formal permission of the copyright holders. This document is the author’s post-print version, incorporating any revisions agreed during the peer-review process. Some differences between the published version and this version may remain and you are advised to consult the published version if you wish to cite from it.

Title: Cellular ATP changes in Acidithiobacillus ferrooxidans cultures oxidizing ferrous iron
and elemental sulfur
A short title: ATP in A. ferrooxidans
Eva Pakostova,1 Martin Mandl,1 Blanka Omesova Pokorna,1 Eva Diviskova,1 and Antonin
Lojek2
1Department of Biochemistry, Faculty of Science, Masaryk University, 61137 Brno, Czech
Republic
2Institute of Biophysics ASCR, v.v.i., 61265 Brno, Czech Republic
Corresponding author:
Martin Mandl
Department of Biochemistry
Faculty of Science, Masaryk University
Kotlarska 2
61137 Brno, Czech Republic
E-mail: [email protected]
Fax: +420 549492690
Tel: +420 549495728

2
Cellular ATP changes in Acidithiobacillus ferrooxidans cultures oxidizing ferrous iron and
elemental sulfur
ABSTRACT
Cellular ATP content of Acidithiobacillus ferrooxidans cultures was determined with a
bioluminescence assay in relation to batch growth and oxidation of ferrous iron and elemental
sulfur. Inhibitory effects of inorganic substrates and products on luciferase were eliminated.
Extracellular ATP levels were negligible. The ATP content of sulfur-grown cells decreased
anomalously due to a culture pH increase at the stationary phase. Although the rates of growth
and sulfur oxidation reached the original levels, the ATP content of the culture remained
constant because of gradual decrease in the cellular ATP. The maximum ATP levels in A.
ferrooxidans grown with Fe2+ and S0 were 1.16 and 0.33 amol per cell, respectively. The
results defined conditions under which biomass growth could be monitored by the ATP assay
to study biogeochemical activities of acidophilic iron- and sulfur-oxidizing bacteria.
Keywords
Acidithiobacillus, acidophiles, ATP assay, iron-oxidizing bacteria, sulfur-oxidizing bacteria
INTRODUCTION
ATP has been successfully used as a biomarker for viable microorganisms and various
bioluminescence assays have been developed for this purpose (Lundin 2000; Venkateswaran
et al. 2003). The technique has multiple applications in rapid clinical diagnostics and in
industrial microbiology and microbial ecology. Acidophilic chemolithotrophs are intimately
involved in acid production and metal solubilization in coal and metal mine sites and
biomining industry as well as in biogeochemical processes in sulfide mineral deposits

3
(Johnson 2010; Bhatti et al. 2011). Acidithiobacillus ferrooxidans is one of the central
mesophilic bacteria in these processes. In general, while the growth kinetics with basic
substrates has been characterized, the ATP content of A. ferrooxidans is relatively unknown
although it has potential for process monitoring applications in biomining and
geomicrobiology.
The luciferin-luciferase bioluminescence assay for ATP has been successfully employed
to monitor ATP formation in A. ferrooxidans vesicles (Apel et al. 1980), and in cells
separated from the culture and vesicles of moderately thermophilic A. caldus (Dopson et al.
2002). Cellular ATP content in A. ferrooxidans has been determined but it was not monitored
with respect to growth kinetics and specific substrates (Efremenko et al. 2005). Pronk et al.
(1991) used the luciferin-luciferase reaction to analyze ATP in an anaerobic culture A.
ferrooxidans, but the luciferase reaction in the assay was sensitive to inhibition by ferric iron
in the samples. Tsaplina et al. (2007) used the assay to determine cellular ATP content of
iron-oxidizing A. ferrooxidans and other chemolithotrophic acidophiles. However, the
authors’ description of the sampling did not specify the actual physiological conditions of the
bacterial cultures, and the study did not address the relationship between the culture ATP and
growth kinetics. The ATP bioluminescence assay can also be applied to bioleaching solution
samples by concentrating the bacteria by membrane filtration followed by washing and ATP
extraction (Viedma 2007). However, cellular ATP levels are sensitive to experimental
manipulation and treatments that affect the cell physiology. Preliminary ATP data for iron-
oxidizing A. ferrooxidans cultures have been reported (Mandl et al. 2009). Okibe and Johnson
(2011) have used the ATP assay for determination of active bacteria in bioleaching systems.
They tested several mesophilic and thermophilic bacteria and compared total and viable
counts of Leptospirillum ferriphilum with cellular ATP contents. The sampling, sample
treatment as well as some results were different from our study. In addition, Okibe and

4
Johnson (2011) did not test A. ferrooxidans at depth. The above studies brought no specific
information about bacteria oxidizing sulfur substrates.
The purpose of the present study was to measure cellular ATP levels in A. ferrooxidans
cultures under specific physiological conditions and to develop a culture sampling protocol
that eliminates interferences with the ATP assay. Fe2+ and elemental sulfur were used as basic
electron donors, and their oxidation was correlated with growth and substrate oxidation
kinetics.
MATERIALS AND METHODS
Bacteria and Culture Conditions
A. ferrooxidans (CCM 4253) was grown on elemental sulfur (1.5% w/v) using a 5-l bioreactor
as previously described (Pokorna et al. 2007). The culture medium and methods to monitor
cell growth turbidimetrically and sulfate formation (isotachophoresis) have been previously
reported (Janiczek et al. 1998; Ceskova et al. 2002). For inhibition experiments, colloidal
sulfur (sulfur, powder; Riedel-deHaën, Germany) was used as the substrate. Cultures with
iron (9K medium with 159 mM ferrous iron) were incubated in shake flasks on a rotary
shaker (Bouchal et al., 2006). The culture was maintained at about pH 1.7 to avoid the
formation of iron precipitates and to use turbidimetry to measure bacterial density. Samples
(2.4 ml) were mixed with 0.1 ml 85% phosphoric acid before measuring absorbance at 450
nm (Mandl 1984 as modified by D. Kupka). The regression line (r = 0.997, n = 11) for
calibration (A450 versus cell numbers) yielded a slope of 8.55×10⁻¹⁰ ml per cell. The bacterial
numbers based on A450, measured with samples from different growth phases, were always in
agreement with those obtained by microscopic cell counting using a Cyrus chamber.
5
ATP Determination
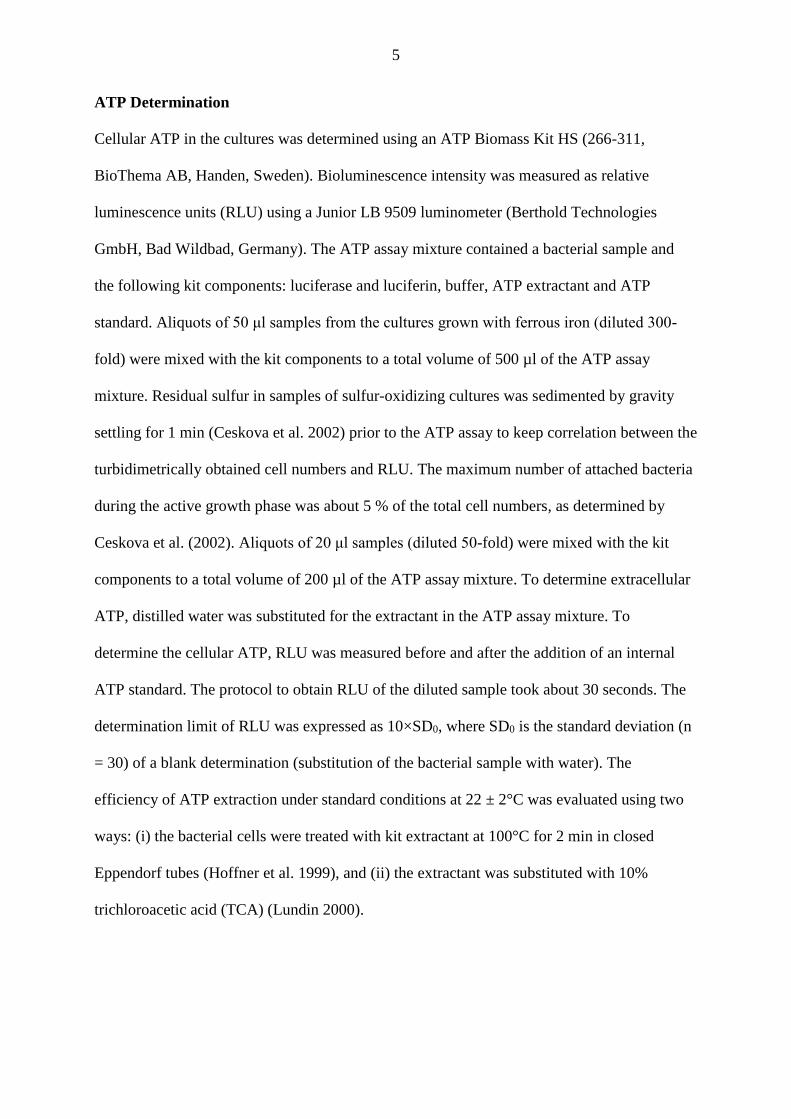
Cellular ATP in the cultures was determined using an ATP Biomass Kit HS (266-311,
BioThema AB, Handen, Sweden). Bioluminescence intensity was measured as relative
luminescence units (RLU) using a Junior LB 9509 luminometer (Berthold Technologies
GmbH, Bad Wildbad, Germany). The ATP assay mixture contained a bacterial sample and
the following kit components: luciferase and luciferin, buffer, ATP extractant and ATP
standard. Aliquots of 50 μl samples from the cultures grown with ferrous iron (diluted 300-
fold) were mixed with the kit components to a total volume of 500 µl of the ATP assay
mixture. Residual sulfur in samples of sulfur-oxidizing cultures was sedimented by gravity
settling for 1 min (Ceskova et al. 2002) prior to the ATP assay to keep correlation between the
turbidimetrically obtained cell numbers and RLU. The maximum number of attached bacteria
during the active growth phase was about 5 % of the total cell numbers, as determined by
Ceskova et al. (2002). Aliquots of 20 μl samples (diluted 50-fold) were mixed with the kit
components to a total volume of 200 µl of the ATP assay mixture. To determine extracellular
ATP, distilled water was substituted for the extractant in the ATP assay mixture. To
determine the cellular ATP, RLU was measured before and after the addition of an internal
ATP standard. The protocol to obtain RLU of the diluted sample took about 30 seconds. The
determination limit of RLU was expressed as 10×SD0, where SD0 is the standard deviation (n
= 30) of a blank determination (substitution of the bacterial sample with water). The
efficiency of ATP extraction under standard conditions at 22 ± 2°C was evaluated using two
ways: (i) the bacterial cells were treated with kit extractant at 100°C for 2 min in closed
Eppendorf tubes (Hoffner et al. 1999), and (ii) the extractant was substituted with 10%
trichloroacetic acid (TCA) (Lundin 2000).

6
RESULTS
ATP Extraction and Inhibitory Effects
The mean levels (± SD) of ATP calculated from triplicate samples of bacteria grown with
elemental sulfur were 0.107 ± 0.013, 0.098 ± 0.014 and 0.0903 ± 0.0073 pmol per reaction
mixture using extraction under the standard conditions, at 100°C, and with TCA, respectively.
The differences between the means were insignificant (P > 0.05). Extending the time course
of extraction for up to 5 h did not increase the recovery of ATP.
The nutrient media used for A. ferrooxidans are acidic and include substrates that
completely inhibited the luciferase activity, although the ATP assay mixture was buffered and
the sample represented only 1/10 of the total volume. Samples of culture media at different
pH values did not significantly impact the luciferase activity between pH of 6 and 1.8. The
IC50 was detected at pH 1.5. A pH 1.4 sample completely inhibited the luciferase activity
(data not shown). The IC50 values for ferrous iron, ferric iron and elemental sulfur were 0.62,
0.22 and 0.78, mM, respectively. The inhibitory effects were reduced to negligible levels by
diluting the elemental sulfur-oxidizing bacteria (SOB) and iron-oxidizing bacteria (IOB)
samples by 50- and 300-fold, respectively.
Cellular ATP and Determination Limit
The sensitivity of ATP determination in different samples may be a general problem in ATP
assays. The ATP kit instructions indicate that the volume of an internal ATP standard (100
nM stock) added to the sample should always be 10 l (i.e., 1 pmol), and the RLU should be
at least 10-fold higher after the internal standard addition. In this study, lower additions of the
internal standard had to be used to obtain sensitive responses with low ATP levels because of
low bacterial numbers in the samples. Aliquots of 1 l (0.1 pmol) undiluted standard and 1 l

7
of 10-fold diluted standard (0.01 pmol) were used for the SOB and IOB samples, respectively.
Figure 1 shows the result for SOB, including a calibration plot of RLU against the cell
number. Similar RLU responses were achieved with IOB samples (data not shown). The
additions of 10l internal standards resulted in responses that were in parallel line with the
abscissa (data not shown). In general, for unknown samples, the volume of the internal
standard should be tested to optimize the sensitive response for the range of bacterial numbers
in the culture.
The determination limits were 34 and 62 RLU in the ATP assay mixture for IOB and
SOB, respectively. For the samples used to construct the calibration curves (e.g., Fig. 1), the
determination limits for bacterial numbers in the original cultures were 3.5×10⁶ and 2.4×10⁷
cells per ml for IOB and SOB (583 and 9600 cells per ATP assay mixture), respectively.
These cell numbers are lower than the initial numbers following culture inoculation,
underscoring the usefulness of ATP bioluminescence methodology for time course studies.
The reason for higher values of determination limits expressed as cell counts and compared to
the literature, is based on the high sample dilution and the criterion for the determination
limit.
Oxidation of Ferrous Iron
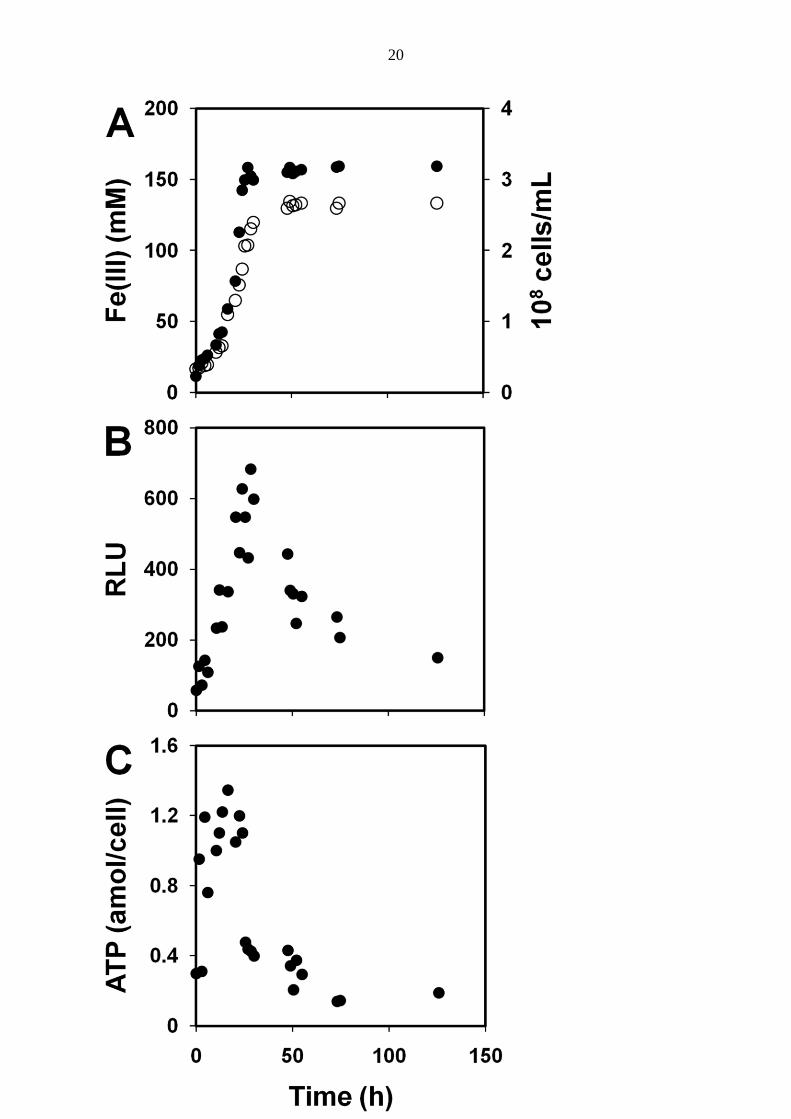
Figure 2 shows the ATP results for an iron-oxidizing culture. Both the growth and iron
oxidation over time were accompanied with an increase in ATP (as RLU) in the culture and
cellular ATP changes. Therefore, the iron-unlimited growth phase could be documented by a
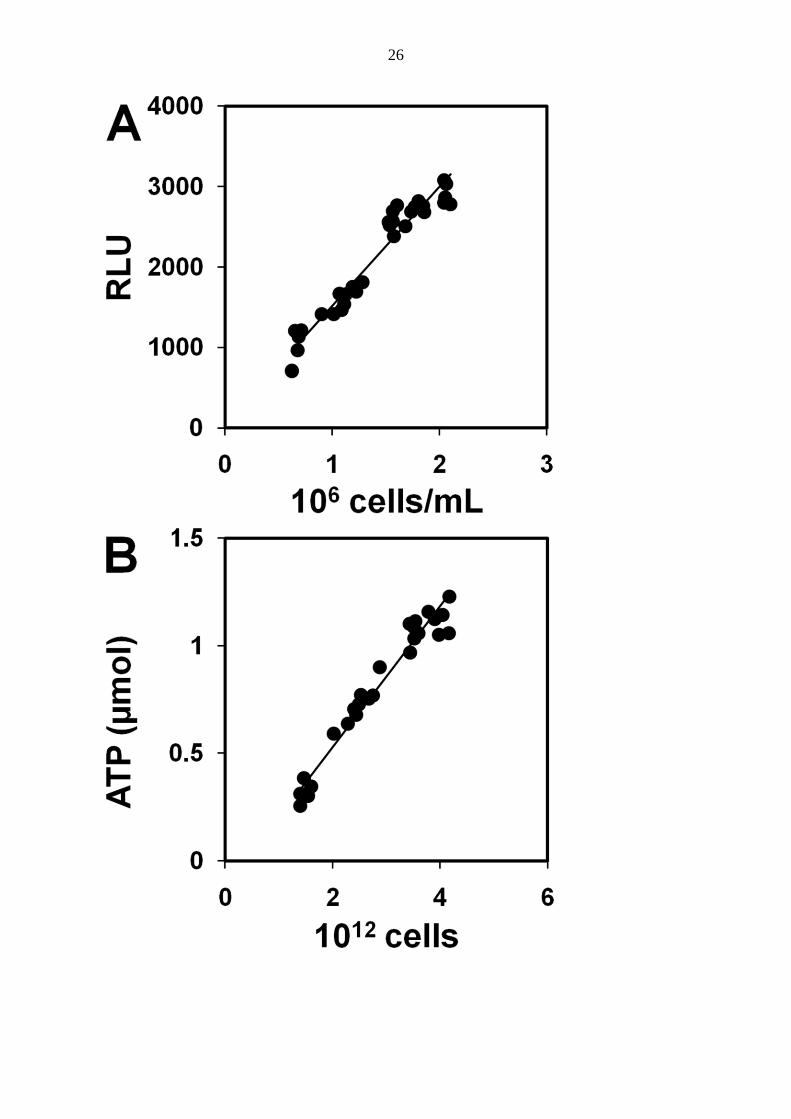
linear relationship between RLU and cell growth (Fig. 3A) to underline RLU as an indicator
of cell growth and substrate oxidation. Depletion of ferrous iron upset this relationship and
clearly separated this phase from active growth. The mean maximum ATP content per cell
was determined from the phase of active growth. Based on the slope in Figure 3B, this value
8
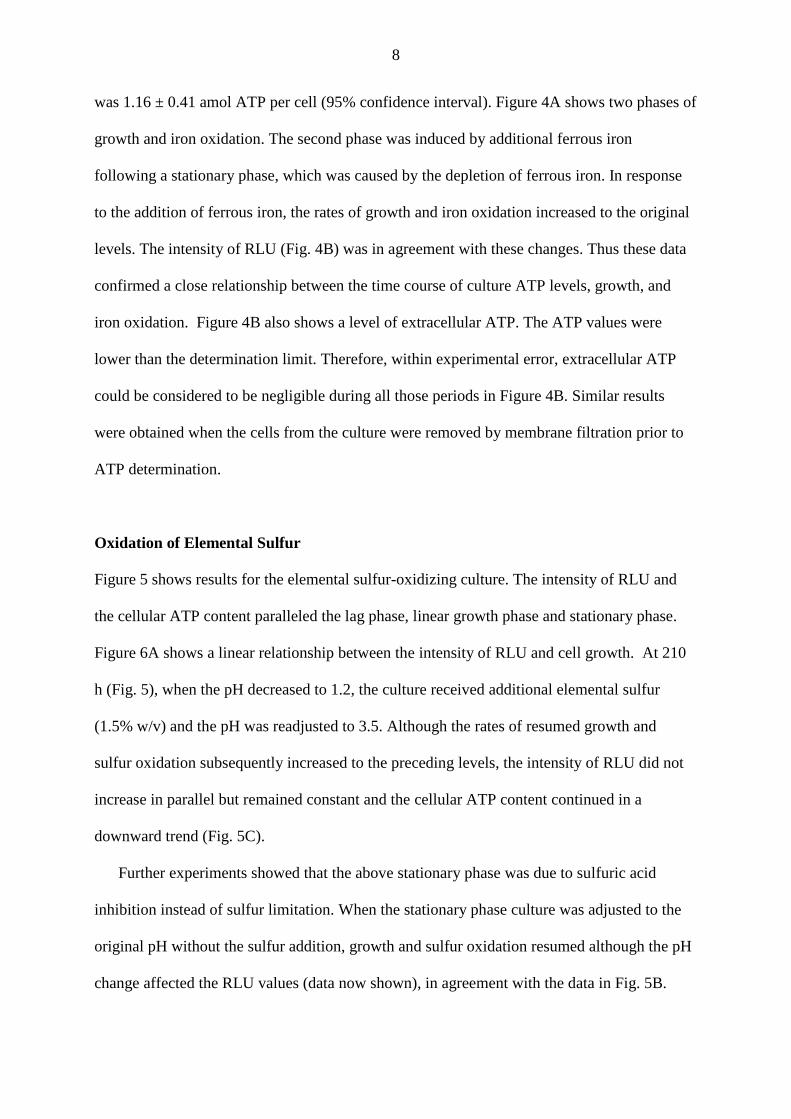
was 1.16 ± 0.41 amol ATP per cell (95% confidence interval). Figure 4A shows two phases of
growth and iron oxidation. The second phase was induced by additional ferrous iron
following a stationary phase, which was caused by the depletion of ferrous iron. In response
to the addition of ferrous iron, the rates of growth and iron oxidation increased to the original
levels. The intensity of RLU (Fig. 4B) was in agreement with these changes. Thus these data
confirmed a close relationship between the time course of culture ATP levels, growth, and
iron oxidation. Figure 4B also shows a level of extracellular ATP. The ATP values were
lower than the determination limit. Therefore, within experimental error, extracellular ATP
could be considered to be negligible during all those periods in Figure 4B. Similar results
were obtained when the cells from the culture were removed by membrane filtration prior to
ATP determination.
Oxidation of Elemental Sulfur
Figure 5 shows results for the elemental sulfur-oxidizing culture. The intensity of RLU and
the cellular ATP content paralleled the lag phase, linear growth phase and stationary phase.
Figure 6A shows a linear relationship between the intensity of RLU and cell growth. At 210
h (Fig. 5), when the pH decreased to 1.2, the culture received additional elemental sulfur
(1.5% w/v) and the pH was readjusted to 3.5. Although the rates of resumed growth and
sulfur oxidation subsequently increased to the preceding levels, the intensity of RLU did not
increase in parallel but remained constant and the cellular ATP content continued in a
downward trend (Fig. 5C).
Further experiments showed that the above stationary phase was due to sulfuric acid
inhibition instead of sulfur limitation. When the stationary phase culture was adjusted to the
original pH without the sulfur addition, growth and sulfur oxidation resumed although the pH
change affected the RLU values (data now shown), in agreement with the data in Fig. 5B.
9
Additional sulfur substrate, after the sulfur depletion occurred (pH maintained above 2),
resulted in new growth and sulfur oxidation and the RLU increased as described with IOB
(data not shown). Therefore, the increase of the pH of the culture was responsible for the
observed cellular ATP decrease (Fig. 5C).
The mean maximum ATP content per cell was determined from the first phase of active
growth and sulfur oxidation. Based on the slope of the linear regression line (Fig. 6B), this
value was 0.327 ± 0.028 amol ATP per cell (95% confidence interval). A similar value of 0.4
amol per cell for SOB under anaerobic conditions with ferric iron as the electron acceptor was
determined (unpublished results). Extracellular ATP levels (Fig. 5B) were negligible within
experimental error and the determination limit. After a long-term culture incubation for up to
900 hours, including repeated additions of elemental sulfur and pH adjustments, extracellular
ATP was detected between 430 and 840 h. The RLU corresponding to extracellular ATP
reached at the most 10% of the RLU value of the culture.
DISCUSSION AND CONCLUSIONS
The ATP Assay and Acidophilic Chemolithotrophs
The results of this study showed that the recovery of ATP using the kit extractant under the
standard conditions was comparable to the sample boiling and TCA based extraction
methods. The ATP assays for acidophilic iron- and sulfur-oxidizing bacteria are subject to
inhibition due to acidity, iron and sulfur substrates, all of which inhibited luciferase activity.
The inhibition has been a long-standing reason (Pronk et al. 1991) for the lack of application
of the ATP-bioluminescence assay to monitor A. ferrooxidans cultures. Tsaplina et al. (2007)
alleviated the inhibitory effects by separating the cells from media by centrifugation.
However, combined with sample storage, their results may not accurately represent the actual
physiological ATP levels. Harvesting of cells by membrane filtration followed by washing

10
has also been used to eliminate inhibitory effects caused by liquid media and bioleaching
solutions (Viedma 2007). However, all these treatments may cause varying losses of cellular
ATP. In our study, the inhibitory sample components were resolved by dilution. Introducing
the diluted sample directly into the ATP assay mixture alleviated these unknown variables
and minimized the delay in measurement of physiological ATP levels and monitoring of A.
ferroooxidans cultures under all substrate conditions. In addition, nontoxic precipitates do not
interfere with the ATP assay to monitor growth. The sensitivity of the bioluminescence assay
allowed sample dilution, except at very low cell counts, to the range of ~103 cells and
subpicomol quantities of ATP per assay. Comparison of these results with data published with
other sample treatment protocols is impractical because of differences in sample matrix,
pretreatment, and toxic constituents as well as criteria for determination limits. When only the
RLU values are used to characterize biomass growth, it is especially important to reduce all
inhibitory factors that may affect the assay. These may be variable during the process. To
obtain the correct ATP content in the culture or per cell, the effects of inhibitory constituents
and sample matrix were overcome by addition of the ATP standard into the sample. Although
our study has been focused on A. ferrooxidans, it is apparent the same approaches may be
applied to other acidophiles.
Differences in Oxidation of Iron and Elemental Sulfur
Ferrous iron and elemental sulfur represent the basic substrates characterizing A. ferrooxidans
activity. Their oxidation is an important aspect of geomicrobiology of sulfide mineral
environments.
Our results were used to determine ATP levels in IOB and SOB cultures and to obtain
data on cellular ATP contents of bacteria. In the case of iron oxidation, the fast ATP assay
was very useful as a tool to monitor growth. The RLUs were proportional to the substrate-
11
unlimited growth and iron oxidation rates. The maximum cellular ATP content of iron-
oxidizing bacteria was similar to the general value of about 2 amol ATP determined for
unstressed bacterial cells (Lundin 2000). Efremenko et al. (2005) reported 270 amol ATP per
cell for A. ferrooxidans, but no details were given regarding the substrate and physiological
conditions, and the value appears to be overestimated. Our value is higher than 0.08 amol per
cell determined by Okibe and Johnson (2011). Different bacterial strains may account for
large variations in cellular ATP contents, as Okibe and Johnson (2011) indicated for two
strains of Leptospirillum ferriphilum. However, there are additional reasons for different ATP
results. Our maximum value was obtained from a substrate-unlimited growth phase where the
cellular ATP content was constant and the results were based on a frequent sampling
schedule. In addition, the relatively low ATP content reported by Okibe and Johnson (2011)
was measured for a cell suspension which had been separated from substrate (pyrite, where
iron may be considered as a dominant substrate) by centrifugation which may cause leakage
of cellular contents.
Okibe and Johnson (2011) showed a gradual decrease in numbers of viable L. ferriphilum
cells following iron depletion, especially after several hours. The corresponding cellular ATP
contents in viable cells were relatively stable during iron oxidation and depletion, equaling
about 10-19 mol ATP per viable cell. While the RLU values were used as a parameter for
active biomass detection, characterizing the long phases of ferrous iron oxidation and
depletion, the results were based on a limited number of experimental data points. It is, of
course, plausible that endogenous metabolism following ferrous iron depletion sustains
relatively high cellular ATP content. However, our ATP data measured for samples near the
end of active growth and beginning of iron limitation in A. ferrooxidans showed large
changes in the RLU and cellular ATP contents and are not in agreement with the ATP values
of endogenous metabolism. The data did not confirm that the changes were related to

12
variation in total and viable biomass, although it was established that the number of viable
cells decreased after an extended time course of ferrous iron depletion. Counting of colonies
using selective overlay media (as described by Johnson and Hallberg, 2007) did not indicate
significant difference between total and viable cell numbers within the above short period of
the active growth end and iron limitation beginning. This is in agreement with earlier data for
A. ferrooxidans (Johnson et al. 2004). The different results in numbers of viable L.
ferriphilum cells (Okibe and Johnson, 2011) emphasize the cell viability differences due to
species.
The large changes in bioluminescence intensity and cellular ATP content occurred
although the number of bacteria did not change significantly during the above short period.
Limitation by the substrate caused an intense decrease in the RLU (Fig. 2B) and cellular ATP
content (Fig. 2C) within few hours. The main decrease in RLU due to ferrous iron limitation
(Fig. 4B) took place within 3 hours, whereas the parallel cell numbers were relatively
constant. Similar results were obtained with a sulfur-oxidizing culture when colloidal
elemental sulfur was added to a cell suspension which had been maintained without sulfur
substrate for 3 days. Following an initial short-term sulfur oxidation without changes in cell
numbers, there was a relatively rapid increase in RLU (data not shown). The relationship
between the cellular ATP and substrate oxidation is predictable. Substrate limitation also
impacts the growth and cellular ATP. During the active growth phase the total and viable
numbers are similar and substrate oxidation is coupled with energy transduction and ATP
formation. The RLU values then can serve as an indicator of growth and substrate limitation
to evaluate the growth curves easily.
In contrast to IOB where no culture pH increase is needed and the used pH decrease had
no impact, the stationary phase SOB cells responded in a specific way after the pH increase.
The pH adjustments, together with additional elemental sulfur to avoid substrate limitation,

13
resulted in renewed growth and sulfur oxidation, but the cellular ATP did not reach the levels
comparable to those preceding the stationary phase. Cellular ATP gradually decreased to
about one third of the level measured during the active growth phase. The physiological
reason for this anomaly is not clear. Thus the RLU intensity as a monitoring method may be
limited to cultures in active growth and substrate oxidation phases that are not affected by
external effects such as the pH increase.
The difference between the maximum cellular ATP contents in SOB and IOB was highly
significant (P < 0.01). The low value for SOB may be the result of continual limitation by the
sulfur substrate due to its low aqueous solubility (Ceskova et al. 2002). Similarly, the low
value obtained for SOB under anaerobic conditions may also be the result of sulfur
insolubility, causing substrate limitation.
From a practical standpoint, although different substrates may affect the maximum
cellular ATP content, its constant value during the active growth phase was in good
agreement with intensity of bioluminescence and cell growth and substrate oxidation, with the
notable exception of SOB cultures under a different metabolic mode due to the culture pH
adjustment. The successful application of bioluminescence intensity to monitor the basic
growth curves in biogeochemical processes is a universal conclusion for both iron and sulfur-
oxidizing cultures.
ACKNOWLEDGEMENTS
We thank Dr. Arne Lundin for helpful discussions. This work was supported by grants
525/08/0697 from the Czech Science Foundation and MSM0021622413 from the Czech
Ministry of Education.

14
REFERENCES
Apel WA, Dugan PR, Tuttle JH. 1980. Adenosine 5'-triphosphate formation in Thiobacillus
ferrooxidans vesicles by H+ ion gradients comparable to those of environmental conditions. J
Bacteriol 142:295-301.
Bhatti TM, Bigham JM, Vuorinen, A, Tuovinen OH. 2011. Weathering of biotite in
Acidithiobacillus ferrooxidans cultures. Geomicrobiolol J 28:130-134.
Bouchal P, Zdrahal Z, Helanova S, Janiczek O, Hallberg KB, Mandl M. 2006. Proteomic and
bioinformatic analysis of iron- and sulfur-oxidizing Acidithiobacillus ferrooxidans using
immobilized pH gradients and mass spectrometry. Proteomics 6:4278-4285.
Ceskova P, Mandl M, Helanova S, Kasparovska J. 2002. Kinetic studies on elemental sulfur
oxidation by Acidithiobacillus ferrooxidans: Sulfur limitation and activity of free and
adsorbed bacteria. Biotechnol Bioeng 78:24-30.
Dopson M, Lindström EB, Hallberg KB. 2002. ATP generation during reduced inorganic
sulfur compound oxidation by Acidithiobacillus caldus is exclusively due to electron transport
phosphorylation. Extremophiles 6:123–129.
Efremenko EN, Azizov RE, Makhlis TA, Abbasov VM, Varfolomeev SD. 2005.
Determination of minimal concentrations of biocorrosion inhibitors by a bioluminescence
method. Appl Biochem Microbiol 41:377-381.

15
Hoffner SE, Jimenez-Misas CA, Lundin A. 1999. Improved extraction and assay of
mycobacterial ATP for rapid drug susceptibility testing. Luminescence 14:255-261.
Janiczek O, Mandl M, Ceskova P. 1998. Metabolic activity of Thiobacillus ferrooxidans on
reduced sulfur compounds detected by capillary isotachophoresis. J Biotechnol 61:225-229
Johnson BD. 2010. The biogeochemistry of biomining. In: Barton LL, Mandl M, Loy A,
editors. Geomicrobiology: Molecular and Environmental Perspective. Dordrecht: Springer. p
401-426.
Johnson DB, Bruhn DF, Roberto FF. 2004. Survival of acidophilic bacteria under conditions
of substrate depletion that occur during culture storage. In: Tsezos M, Hatzikioseyian A,
Remoudaki E, editors. Biohydrometallurgy; a Sustainable Technology in Evolution.
Zografou, Greece: National Technical University of Athens. p 1195-1203.
Johnson DB, Hallberg KB. 2007. Techniques for detecting and identifying acidophilic
mineral-oxidizing microorganisms. In: Rawlings DE and Johnson DB, editors. Biomining.
Heidelberg: Springer. p 237-262.
Lundin A. 2000. Use of firefly luciferase in ATP related assay of biomass, enzymes and
metabolites. Meth Enzymol 305:346-370.
Mandl M. 1984. Growth and respiration kinetics of Thiobacillus ferrooxidans limited by CO2
and O2. Biologia 39: 429-434.

16
Mandl M, Markova R, Lojek A. 2009. ATP measurements in iron-oxidizing Acidithiobacillus
ferrooxidans. Adv Mater Res 71-73:275-278.
Okibe N, Johnson D.B. 2011. A rapid ATP-based method for determining active microbial
populations in mineral leach liquors, Hydrometallurgy 108:195-198.
Pokorna B, Mandl M, Borilova S, Ceskova P, Markova R, Janiczek O. 2007. Kinetic constant
variability in bacterial oxidation of elemental sulfur. Appl Environ Microbiol 73:3752-3754.
Pronk T, Liem K, Bos P, Kuenen JG. 1991. Energy transduction by anaerobic ferric iron
respiration in Thiobacillus ferrooxidans. Appl Environ Microbiol 57:2063-2068.
Tsaplina IA, Zhuravleva AE, Ismailov AD, Zakharchuk LM, Krasil’nikova EN, Bogdanova
TI, Karavaiko GI. 2007. The dependence of intracellular ATP level on the nutrition
mode of the acidophilic bacteria Sulfobacillus thermotolerans and Alicyclobacillus tolerans.
Microbiology 76:654–662.
Venkateswaran K, Hattori N, La Duc MT, Kern R. 2003. ATP as a biomarker of viable
microorganisms in clean-room facilities. J Microbiol Meth 52:367-377.
Viedma P. 2007. Method for detecting presence of acidophilic microorganisms in bioleaching
solution. US Patent No. 7851177.
17
Figure captions
FIG. 1. Relationship between intensity of bioluminescence (expressed in relative
luminescence units, RLU) and cell concentration in the ATP assay mixture with and without
an internal ATP standard. Bacteria were grown aerobically on elemental sulfur until the
culture lowered the pH from 4.0 to 1.5. Samples of bacterial cultures were diluted 50-fold
with mineral salt medium, and the final dilution of the samples in the ATP assay mixture was
500-fold (), r = 0.997. Subsequently, a 1 l aliquot of the ATP standard (0.1 pmol) was
added to each sample (), r = 0.996. The difference between the slopes is insignificant (P >
0.05).
FIG. 2. A: Time course of iron oxidation by A. ferrooxidans. Ferric iron () and cell ()
concentrations in the culture. B: Intensity of bioluminescence in the culture (expressed in
relative luminescence units, RLU, in the ATP assay mixture). C: Cellular ATP content.
FIG. 3. A: Relationship between intensity of bioluminescence (expressed in relative
luminescence units, RLU) and iron-oxidizing cell numbers in the ATP assay mixture, r =
0.946. B: Relationship between total amount of ATP and total cell number in the culture, r =
0.954. The data corresponded to the active growth phase (between the lag and stationary
phases).
FIG. 4. Time course of iron oxidation by A. ferrooxidans in two phases. The second phase
involved an addition of ferrous iron (90 mM) at 161 h. A: Ferric iron () and cell ()
concentrations in the culture. B: Intensity of bioluminescence in the culture (expressed in
18
relative luminescence units, RLU, in the ATP assay mixture,) and the same without bacteria
(extracellular ATP, ).
FIG. 5. Time course of elemental sulfur oxidation by A. ferrooxidans. A: Sulfate () and cell
() concentrations in the culture. B: Intensity of bioluminescence in the culture (expressed in
relative luminescence units, RLU, in the ATP assay mixture,) and the same without bacteria
(extracellular ATP,). C: Cellular ATP content. After 210 h of incubation, the culture
received additional sulfur (1.5% w/v) and pH adjustment from 1.2 to 3.5 after it had reached
the stationary phase.
FIG. 6. A: Relationship between intensity of bioluminescence (expressed in relative
luminescence units, RLU) and elemental sulfur-oxidizing cell numbers in the ATP assay
mixture, r = 0.969. B: Relationship between total amount of ATP and total cell number in the
culture, r = 0.977. The data are presented for the first period (26-96 h) of the active growth
phase.

19
20

21

22

23

24

25
26

27
Related Documents