CALGARY REAL ESTATE MARKET REPORT January 2015 Realty Professionals Cell: 403 831 0842 Email: [email protected] Web: www.jerrycharlton.com

Calgary Housing Market Report Dec 2014
Jul 17, 2015
Welcome message from author
This document is posted to help you gain knowledge. Please leave a comment to let me know what you think about it! Share it to your friends and learn new things together.
Transcript

CALGARYREAL ESTATEMARKET REPORTJanuary 2015
Realty Professionals
Cell: 403 831 0842Email: [email protected]
Web: www.jerrycharlton.com

Market Status
INFORMATION HEREIN DEEMED RELIABLE BUT NOT GUARANTEED SOURCE: CREB Calgary Real Estate Board
+4.0+1.0
+1.5 +3.5
+2.0 +3.0+2.5
2.99
Selle
r’s
Balanced
Buyer’s
monthsof inventory

INFORMATION HEREIN DEEMED RELIABLE BUT NOT GUARANTEED SOURCE: CREB Calgary Real Estate Board
1
2
3
4
Market Status (13 months history)No. of months of inventory
Dec.2013
Jan.2014
Feb.2014
BUYE
R’S
MAR
KET
NEUT
RAL
MAR
KET
SELL
ER’S
MAR
KET 1.91 1.76 1.56
Mar.2014
1.30
Apr.2014
1.49
May2014
1.53
Jun.2014
1.77
Jul.2014
2.00
Aug.2014
2.03 2.14 2.06
Set.2014
Oct.2014
2.16
2.99
Nov.2014
Dec.2014

Average Prices
INFORMATION HEREIN DEEMED RELIABLE BUT NOT GUARANTEED SOURCE: CREB Calgary Real Estate Board
Compared to LAST MONTH,homes areselling for
Month to Month Year to Year
Nov2014
$486,327
Dec2014
$475,036
Dec2013
$454,387
Dec2014
City of Calgary average SOLD price
Compared to LAST YEAR,homes areselling for
more+4.5%Calgary
less–2.3%
$475,036

INFORMATION HEREIN DEEMED RELIABLE BUT NOT GUARANTEED SOURCE: CREB Calgary Real Estate Board
Month to Month Year to Year
Nov2014
$560,709
Dec2014
$550,115 $527,632
Dec2013
Dec2014
$550,115
Single family homes average SOLD price
Compared to LAST MONTH,single family homes areselling for
Compared to LAST YEAR,single family homes areselling for
more+4.3%
Single Familyless
–1.9%
INFORMATION HEREIN DEEMED RELIABLE BUT NOT GUARANTEED SOURCE: CREB Calgary Real Estate Board
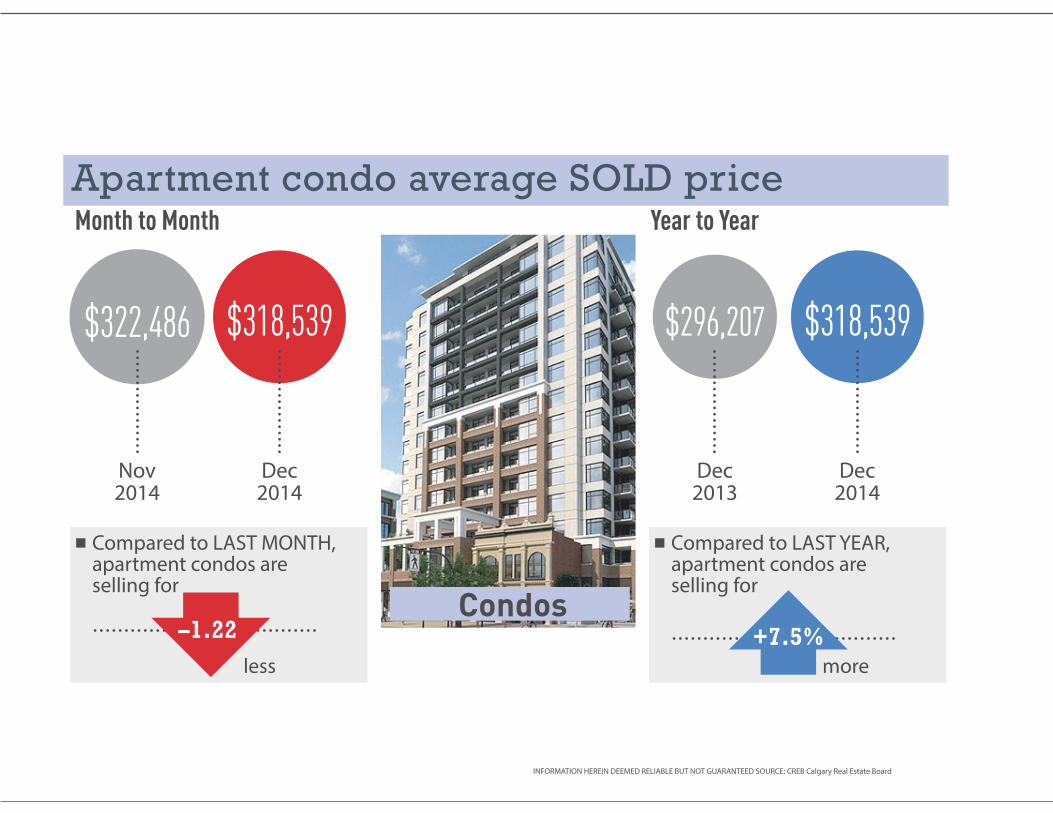
Month to Month Year to Year
Nov2014
$322,486
Dec2014
$318,539 $318,539
Dec2013
$296,207
Dec2014
Apartment condo average SOLD price
Compared to LAST MONTH,apartment condos areselling for
less
Compared to LAST YEAR,apartment condos areselling for
more+7.5%–1.22
lessCondos
INFORMATION HEREIN DEEMED RELIABLE BUT NOT GUARANTEED SOURCE: CREB Calgary Real Estate Board
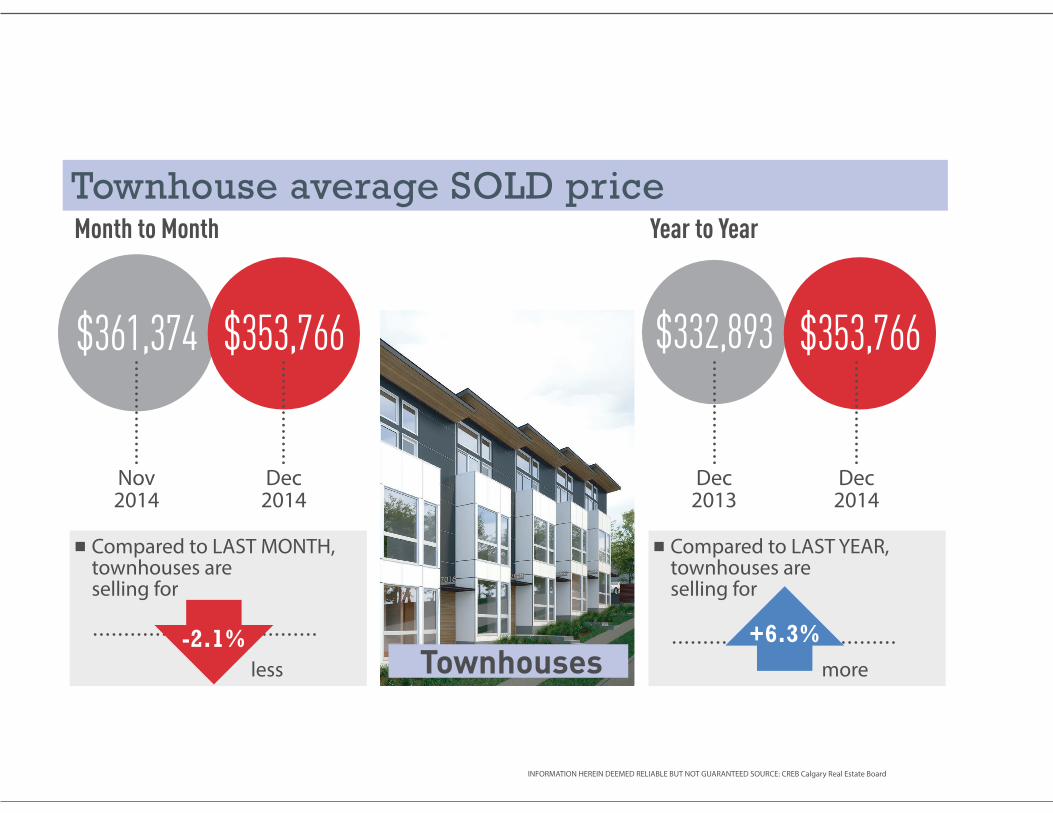
$332,893
Month to Month Year to Year
Nov2014
$361,374
Dec2014
$353,766 $353,766
Dec2013
Dec2014
Townhouse average SOLD price
Compared to LAST MONTH,townhouses areselling for
Compared to LAST YEAR,townhouses areselling for
moreTownhouses+6.3%
less-2.1%
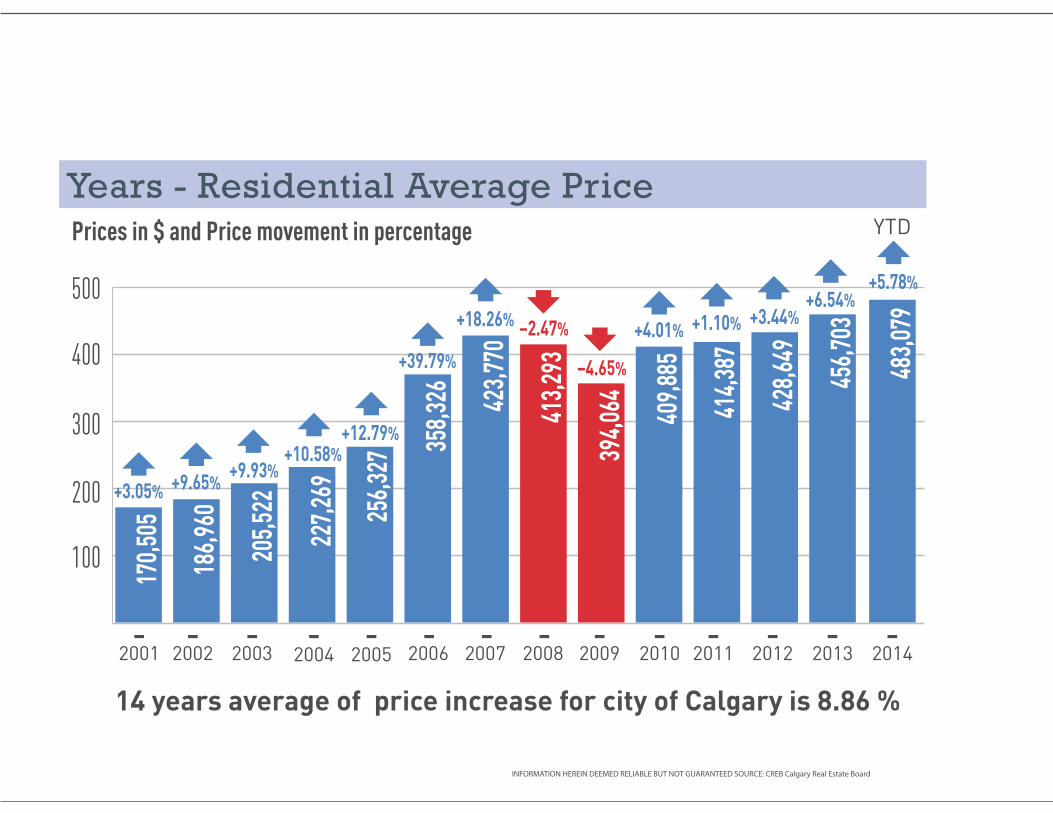
Prices in $ and Price movement in percentage
14 years average of price increase for city of Calgary is 8.86 %
2004 2005 2006 2007 2008 2009 2010 2011 2012 2013
200
100
300
400
500
2014
YTD
Years - Residential Average Price
+12.79%
+39.79%
+18.26% –2.47%
–4.65%
+4.01% +1.10% +3.44%+6.54%
+5.78%
+10.58%
227,2
69
256,3
27
358,3
26 423,7
70
413,2
93
409,8
85
394,0
64 414,3
87
428,6
49
456,7
03
2001 2002 2003
+3.05% +9.65%+9.93%
170,5
05
186,9
60
205,5
22
483,0
79
INFORMATION HEREIN DEEMED RELIABLE BUT NOT GUARANTEED SOURCE: CREB Calgary Real Estate Board

Inventory
INFORMATION HEREIN DEEMED RELIABLE BUT NOT GUARANTEED SOURCE: CREB Calgary Real Estate Board
1,379972
Month to Month Year to Year
Nov2014
Dec2014
1,3792,091
Dec2013
Dec2014
NEW listings
Compared to LAST MONTH,there are
lessnew listings
–34.1%
Compared to LAST YEAR,there are
morenew listings
+41.9

INFORMATION HEREIN DEEMED RELIABLE BUT NOT GUARANTEED SOURCE: CREB Calgary Real Estate Board
0
4,000
3,000
2,000
1,000
5,000
Dec.2013
Jan.2014
Active listings Sold listings
1,171
2,236
1,438
2,524
Feb.2014
1,850
2,892
Listing inventory & SOLD (13 months history)
Mar.2014
2,482
3,233
Apr.2014
2,540
3,794
May2014
2,944
4,504
Jun.2014
2,665
4,726
Jul.2014
2,329
4,659
Aug.2014
2,263
4,596
Set.2014
2,146
4,589
Oct.2014
2,145
4,428
Nov.2014
1,780
3,849
Dec.2014
1,083
3,233

Transactions Data
INFORMATION HEREIN DEEMED RELIABLE BUT NOT GUARANTEED SOURCE: CREB Calgary Real Estate Board
Month to Month Year to Year
Nov2014
15.17%
270 SOLDout of
1,780 allSOLD
Dec2014
Dec2013
14.43%
160 SOLDout of
1,171 allSOLD
Dec2014
13.85%
150 SOLDout of
1,083 allSOLD
13.85%
270 SOLDout of
1,083 allSOLD
Homes sold at or above asking price
Compared to LAST MONTH,there are
less homesselling ator aboveasking price
Compared to LAST YEAR,there are
–8.69%less homesselling ator aboveasking price
-3.89%

INFORMATION HEREIN DEEMED RELIABLE BUT NOT GUARANTEED SOURCE: CREB Calgary Real Estate Board
Month to Month Year to Year
Nov2014
Dec2014
Dec2013
Dec2014
Sellers keptfrom asking
97.94% 97.53%
Sellers keptfrom asking
97.70% 97.53%
Buyers negotiated
2.06% 2.47%Buyers negotiated
2.30% 2.47%
How much buyers negotiated off asking price

INFORMATION HEREIN DEEMED RELIABLE BUT NOT GUARANTEED SOURCE: CREB Calgary Real Estate Board
Month to Month Year to Year
Nov2014
$8,494
Dec2014
Dec2013
Dec2014
$4,720$7,429
Average $ amount SOLD over askingSingle Family
Compared to LAST MONTH,homes sold over listreceived
Compared to LAST YEAR,homes sold over listreceived
Over asking
$more
–36.5%less
–44.4%
$4,720

INFORMATION HEREIN DEEMED RELIABLE BUT NOT GUARANTEED SOURCE: CREB Calgary Real Estate Board
Month to Month Year to Year
Nov2014
46.25%
1,780 SOLDout of
3,849 listed
Dec2014
Dec2013
52.37%
1,083 SOLDout of
3,233 listed
1,171 SOLDout of
2,236 listed
Dec2014
33.50%
1,083 SOLDout of
3,233 listed
Odds of selling(Percentage of Homes Sold VS Listings)
Compared to LAST MONTH,the odds of selling decreasedby
–27.56%
Compared to LAST YEAR,the odds of selling decreasedby
–35.51%
33.50%

INFORMATION HEREIN DEEMED RELIABLE BUT NOT GUARANTEED SOURCE: CREB Calgary Real Estate Board
Over asking
Month to Month Year to Year
Nov2014
$1,704Dec
2014Dec
2013Dec
2014
$1,877 $1,877$1,802
Average $ amount SOLD over askingCondos
Compared to LAST MONTH,condos sold over listreceived
+10.2%
Compared to LAST YEAR,homes sold over listreceived
+4.2%
$more more

INFORMATION HEREIN DEEMED RELIABLE BUT NOT GUARANTEED SOURCE: CREB Calgary Real Estate Board
Month to Month Year to Year
DOM43
DOM46
DOM43
DOM38
Average Days on Market
Dec 2013
Dec 2014
Nov 2014
Dec 2014
Compared to LAST MONTH,homes are selling
slower
Compared to LAST YEAR,homes are selling
faster–11.6% +7.0%
Related Documents