nanomaterials Article Calcium Alginate Beads with Entrapped Iron Oxide Magnetic Nanoparticles Functionalized with Methionine—A Versatile Adsorbent for Arsenic Removal Surbhi Lilhare 1 , Sunitha B. Mathew 1, *, Ajaya K. Singh 1, * and Sónia A. C. Carabineiro 2 Citation: Lilhare, S.; Mathew, S.B.; Singh, A.K.; Carabineiro, S.A.C. Calcium Alginate Beads with Entrapped Iron Oxide Magnetic Nanoparticles Functionalized with Methionine—A Versatile Adsorbent for Arsenic Removal. Nanomaterials 2021, 11, 1345. https://doi.org/ 10.3390/nano11051345 Academic Editor: Vincenzo Vaiano Received: 30 March 2021 Accepted: 17 May 2021 Published: 20 May 2021 Publisher’s Note: MDPI stays neutral with regard to jurisdictional claims in published maps and institutional affil- iations. Copyright: © 2021 by the authors. Licensee MDPI, Basel, Switzerland. This article is an open access article distributed under the terms and conditions of the Creative Commons Attribution (CC BY) license (https:// creativecommons.org/licenses/by/ 4.0/). 1 Department of Chemistry, Govt. V. Y. T. PG Autonomous College, Durg, Chhattisgarh 491001, India; [email protected] 2 LAQV-REQUIMTE, Department of Chemistry, NOVA School of Science and Technology, Universidade NOVA de Lisboa, 2829-516 Caparica, Portugal; [email protected] * Correspondence: [email protected] (S.B.M.); [email protected] (A.K.S.); Tel.: +91-9406207572 (A.K.S.) Abstract: A novel beads adsorbent, consisting of calcium alginate entrapped on magnetic nanoparti- cles functionalized with methionine (MFMNABs), was developed for effective elimination of arsenic from water. The material was characterized by FT-IR (Fourier Transform Infrared Spectroscopy), SEM (Scanning Electron Microscopic), XRD (X-ray Diffraction) and TEM (Transmission Electron Microscopy). The arsenic removal capacity of the material was studied by altering variables such as pH of the solution, contact time, adsorbent dose and adsorbate concentration. The maximal removal of As(III) was 99.56% under optimal conditions with an equilibrium time of 110 min and pH 7.0–7.5. The adsorption followed a second order kinetics and data best fitted the Langmuir isotherm with a correlation coefficient of R 2 = 0.9890 and adsorption capacity (q m ) of 6.6533 mg/g. The thermo- dynamic study showed entropy change (ΔS) and enthalpy change (ΔH) to be 34.32 J mol -1 K and 5.25 kJ mol -1 , respectively. This study proved that it was feasible to treat an As(III) solution with MFMNABs. The synthesized adsorbent was cost-effective, environmentally friendly and versatile, compared to other adsorbents. The adsorption study was carried by low cost spectrophotometric method using N- bromosuccinimide and rhodamine-B developed in our laboratory. Keywords: arsenic (III); adsorption; magnetic nanoparticles; methionine functionalized; calcium alginate; spectrophotometric method 1. Introduction Arsenic is naturally present in the crust of Earth and has long been recognized as highly toxic and carcinogenic, affecting millions of humans in the world [1,2]. Long-term exposure to arsenic gives symptoms such as vomiting, abdominal pain, diarrhea, severe gastrointestinal irritation, gastrointestinal damage, cardiac damage and several types of cancer [3]. It can result in vascular diseases like black foot disease [4,5]. Arsenic can be found in both organic and inorganic forms, as trivalent arsenite (H 3 AsO 3 , HAsO 3 2- or H 2 AsO 3 - ) and pentavalent arsenate (H 3 AsO 4 , HAsO 4 2- ,H 2 AsO 4 - or AsO 4 3- ), of which the first form, As(III) is more noxious than As(V) [6]. In oxidizing conditions, arsenite converts to arsenate, and vice versa under reducing conditions. Inorganic arsenic compounds are more harmful and toxic, compared to organic arsenic compounds [7]. Inorganic and organic arsenic compounds are mainly used to preserve wood and as pesticides [8,9]. It also finds applications in many industries such as pharmaceuticals, paints, pesticide production, leather, textiles, etc. Several food supplements and care products contain trace amounts of arsenic and it is also used in medical products [10]. The maximum permissible limit for As in drinking water is 10 μg/L, as defined by the World Health Organization [11]. Nanomaterials 2021, 11, 1345. https://doi.org/10.3390/nano11051345 https://www.mdpi.com/journal/nanomaterials

Welcome message from author
This document is posted to help you gain knowledge. Please leave a comment to let me know what you think about it! Share it to your friends and learn new things together.
Transcript

nanomaterials
Article
Calcium Alginate Beads with Entrapped Iron Oxide MagneticNanoparticles Functionalized with Methionine—A VersatileAdsorbent for Arsenic Removal
Surbhi Lilhare 1, Sunitha B. Mathew 1,*, Ajaya K. Singh 1,* and Sónia A. C. Carabineiro 2
�����������������
Citation: Lilhare, S.; Mathew, S.B.;
Singh, A.K.; Carabineiro, S.A.C.
Calcium Alginate Beads with
Entrapped Iron Oxide Magnetic
Nanoparticles Functionalized with
Methionine—A Versatile Adsorbent
for Arsenic Removal. Nanomaterials
2021, 11, 1345. https://doi.org/
10.3390/nano11051345
Academic Editor: Vincenzo Vaiano
Received: 30 March 2021
Accepted: 17 May 2021
Published: 20 May 2021
Publisher’s Note: MDPI stays neutral
with regard to jurisdictional claims in
published maps and institutional affil-
iations.
Copyright: © 2021 by the authors.
Licensee MDPI, Basel, Switzerland.
This article is an open access article
distributed under the terms and
conditions of the Creative Commons
Attribution (CC BY) license (https://
creativecommons.org/licenses/by/
4.0/).
1 Department of Chemistry, Govt. V. Y. T. PG Autonomous College, Durg, Chhattisgarh 491001, India;[email protected]
2 LAQV-REQUIMTE, Department of Chemistry, NOVA School of Science and Technology, Universidade NOVAde Lisboa, 2829-516 Caparica, Portugal; [email protected]
* Correspondence: [email protected] (S.B.M.); [email protected] (A.K.S.);Tel.: +91-9406207572 (A.K.S.)
Abstract: A novel beads adsorbent, consisting of calcium alginate entrapped on magnetic nanoparti-cles functionalized with methionine (MFMNABs), was developed for effective elimination of arsenicfrom water. The material was characterized by FT-IR (Fourier Transform Infrared Spectroscopy),SEM (Scanning Electron Microscopic), XRD (X-ray Diffraction) and TEM (Transmission ElectronMicroscopy). The arsenic removal capacity of the material was studied by altering variables such aspH of the solution, contact time, adsorbent dose and adsorbate concentration. The maximal removalof As(III) was 99.56% under optimal conditions with an equilibrium time of 110 min and pH 7.0–7.5.The adsorption followed a second order kinetics and data best fitted the Langmuir isotherm witha correlation coefficient of R2 = 0.9890 and adsorption capacity (qm) of 6.6533 mg/g. The thermo-dynamic study showed entropy change (∆S) and enthalpy change (∆H) to be 34.32 J mol−1 K and5.25 kJ mol−1, respectively. This study proved that it was feasible to treat an As(III) solution withMFMNABs. The synthesized adsorbent was cost-effective, environmentally friendly and versatile,compared to other adsorbents. The adsorption study was carried by low cost spectrophotometricmethod using N- bromosuccinimide and rhodamine-B developed in our laboratory.
Keywords: arsenic (III); adsorption; magnetic nanoparticles; methionine functionalized; calciumalginate; spectrophotometric method
1. Introduction
Arsenic is naturally present in the crust of Earth and has long been recognized ashighly toxic and carcinogenic, affecting millions of humans in the world [1,2]. Long-termexposure to arsenic gives symptoms such as vomiting, abdominal pain, diarrhea, severegastrointestinal irritation, gastrointestinal damage, cardiac damage and several types ofcancer [3]. It can result in vascular diseases like black foot disease [4,5]. Arsenic canbe found in both organic and inorganic forms, as trivalent arsenite (H3AsO3, HAsO3
2−
or H2AsO3−) and pentavalent arsenate (H3AsO4, HAsO4
2−, H2AsO4− or AsO4
3−), ofwhich the first form, As(III) is more noxious than As(V) [6]. In oxidizing conditions,arsenite converts to arsenate, and vice versa under reducing conditions. Inorganic arseniccompounds are more harmful and toxic, compared to organic arsenic compounds [7].Inorganic and organic arsenic compounds are mainly used to preserve wood and aspesticides [8,9]. It also finds applications in many industries such as pharmaceuticals,paints, pesticide production, leather, textiles, etc. Several food supplements and careproducts contain trace amounts of arsenic and it is also used in medical products [10]. Themaximum permissible limit for As in drinking water is 10 µg/L, as defined by the WorldHealth Organization [11].
Nanomaterials 2021, 11, 1345. https://doi.org/10.3390/nano11051345 https://www.mdpi.com/journal/nanomaterials

Nanomaterials 2021, 11, 1345 2 of 21
Several techniques were reported for elimination of arsenic from water, namely oxi-dation [12], alum and iron coagulation [13,14], adsorption and ion-exchange (iron-coatedsand, activated alumina and ion-exchange resin) [15,16], filtration with membranes [17]and reverse osmosis [17]. Most of the methods suffer several shortcomings. Among thesetechnologies, adsorption is cost effective, easy to operate, highly efficient and most popular,since a variety of adsorbents are available [18,19]. Several materials were reported forAs(III) removal, like pyrite fines, activated alumina, fly ash, manganese greensand [20],meso porous silicas with amino-functionalizations [21], Al-loaded Shirasu-zeolite [22],clinoptilolite and other zeolites [23–25]. However, they suffer from some disadvantages,like complexity, high cost, etc.
Alginate has several advantages as it is cheap and easily forms cross-linking with aCaCl2 solution. Ca2+ cations are able to bind two carboxyl moieties of guluronic remains inalginate chains. It is a natural product (natural polysaccharide extracted from brown sea-weeds), which is non-toxic, inexpensive, biodegradable, biocompatible and water soluble.It has been largely used for immobilization of activated carbon (C) [26], carbon nanotubes(C-NT) [27], nanoparticles of TiO2 [28] and magnetite [29], generating novel adsorbentsto eliminate heavy metals, pigments and dyes from wastewater. Pure Magnetic Nanopar-ticles (MNPs) are not applied directly on account of the robust dipole–dipole attractionsbetween the MNPs and the large surface area that might lead to aggregation during theadsorption process. Therefore, magnetic nanoparticles are entrapped into several typesof stabilizers (organic and inorganic), such as activated carbon [30], chitosan [31–34], β-cyclodextrin [35,36] and alginate biopolymer [37–39]. In this work, methionine, a sulfurcontaining amino acid, has been incorporated along with alginate.
In the present study, a new adsorbent MFMNABs (calcium alginate beads with en-trapped iron oxide magnetic nanoparticles functionalized with methionine) has beensynthesized and applied for the removal of As(III). MFMNABs was found to be a cheap,ecofriendly adsorbent for the elimination of arsenic (III) with comparable adsorptioncapacity and recoverability. It is effective given its large surface area and occurrenceof surface amino groups. This adsorbent is evaluated with respect to various variableslike temperature, time, pH, etc. in batch conditions. The adsorption isotherms, kineticsand thermodynamic studies have been performed and found to have advantages likecheapness, simplicity, good reproducibility and high adsorption. Adsorption studies ofAs(III) using ultraviolet-visible (UV-Vis) spectrophotometry and atomic absorption spec-troscopy are reported [40,41]. Herein, a simple spectrophotometric method developed inour laboratory using N-bromosuccinimide and rhodamine-B is used for investigating theadsorption process.
2. Materials and Methods2.1. Materials and Reagents
Sodium arsenite (NaAsO2) (Merck, Mumbai, India), methionine (C5H11NO2S) (Merck,Mumbai, India), N-bromosuccinimide (NBS) (Schmid and Co., Freudenstadt, West Ger-many), rhodamine-B (S.D. Fine Chem. Ltd., Mumbai, India), sodium alginate (C6H9NaO7)[CDH, Delhi, India], ferric chloride hexahydrate (FeCl3·6H2O) [CDH, Delhi, India], ferrouschloride dihydrate (FeCl2·2H2O) [CDH, Delhi, India], NH4OH [AR grade, Mumbai, India]and HCl (Loba Chemie, Mumbai, India) were used. The chemicals were all analyticalgrade and no further purification was made before use. Double distilled water (DDW)was utilized.
A stock solution of As(III) (1000 mg L−1) was obtained by dissolution of 0.1732 g ofanalytical grade NaAsO2 in 100 mL of DDW. A 0.002 M N-bromosuccinimide solution wasobtained by dissolution of 0.178 g of NBS in 100 mL distilled water and kept in an ambercolored bottle. The required working solutions of NBS were prepared by dilution of thestock solution. A 0.001 M of rhodamine-B solution was prepared. Hydrochloric acid wasdiluted with DDW to get 0.01 M HCl.
Nanomaterials 2021, 11, 1345 3 of 21
2.2. Equipments
X-ray diffraction (XRD) (Expert-Pro PW3064/60, Raipur, India) analysis of pow-dered samples was done at 30◦–80◦ and PANalytical 3 kW X’pert Powder-Multifunctional.Fourier transform-infrared spectrometer (FT-IR) (Thermo Nicolet Avtar 370, Cochin, India)was used to obtain the infrared spectra in the 400–4000 cm−1 range using KBr pellets.Scanning Electron Microscopy (SEM) images of MFMNABs were obtained before andafter adsorption (Jeol 6390LA/OXFORD XMX N, Cochin, India). The details of shapeand characteristics features was obtained from Transmission Electron Microscopy (TEM)images (Jeol/JEM 2100, Cochin, India). Systronic UV-visible spectrophotometer-117 (Carry50 scan, Varian, Durg, India) with 1 cm quartz cell (0.1 mL) was used for the measure-ment of absorbance. The pH was measured by a digital pH meter (Systronics model-112,Durg, India).
2.3. Synthesis of Methionine Functionalized Magnetic Nanoparticles (MFMNPs)
The nanoparticles (NPs) were obtained by co-precipitation [42]. Fe(II) and Fe(III) wereco-precipitated by ammonia in hydrothermal conditions. A total of 2.4 g of ferrous chlorideand 4.8 g of ferric chloride were separately dissolved in 50 mL DDW and 15 mL of 1.5 MNH4OH was added dropwise at 25–30 ◦C with stirring, at pH 10. The black precipitateobtained was separated magnetically and washed 4–5 times with DDW. To this 10 mL of0.1% methionine in double distilled water was added dropwise. The content was heatedup to 80 ◦C over 30 min with stirring. The obtained methionine functionalized magneticnanoparticles were separated by applying an external magnet, properly washed with DDWand dried for 2 h at 250 ◦C.
2.4. Preparation of Calcium Alginate Beads with Entrapped Iron Oxide Magnetic NanoparticlesFunctionalized with Methionine (MFMNABs)
A total of 1.5 g sodium alginate was dissolved in 50 mL DDW with stirring for 2 h toyield a viscous homogenous solution. Then, 1 g of methionine modified Fe3O4 NPs wasadded with stirring. Thereafter the mixture was added dropwise to the CaCl2 solution, andMFMNABs were obtained. To get stable beads, the gel beads were kept in CaCl2 solutionfor 24 h. The beads were washed several times with DDW and stored in DDW for later use.The color of beads was reddish brown given the entrapping of the magnetic NPs modifiedby alginate. The synthesis of MFMNABs is presented in Figure 1.
2.5. Procedure for As(III) Analysis
After adsorption, the beads and liquid were separated by normal filter paper and theamount of As(III) in solution was determined spectrophotometrically. To 5 mL of the filtrate0.002 M NBS solution (2.5 mL) was added, where NBS oxidizes As(III) and the unconsumedNBS, corresponding to the concentration of As(III) was determined by addition of 0.001 Mof rhodamine-B (4 mL). The mixture was left for 5 min. The unconsumed NBS bleachedthe color of rhodamine-B and absorbance was measured at 555 nm.

Nanomaterials 2021, 11, 1345 4 of 21Nanomaterials 2021, 11, x FOR PEER REVIEW 4 of 22
Figure 1. Synthetic pathway of MFMNABs.
2.5. Procedure for As(III) Analysis After adsorption, the beads and liquid were separated by normal filter paper and
the amount of As(III) in solution was determined spectrophotometrically. To 5 mL of the filtrate 0.002 M NBS solution (2.5 mL) was added, where NBS oxidizes As(III) and the unconsumed NBS, corresponding to the concentration of As(III) was determined by ad-dition of 0.001 M of rhodamine-B (4 mL). The mixture was left for 5 min. The uncon-sumed NBS bleached the color of rhodamine-B and absorbance was measured at 555 nm.
2.6. Batch Adsorption Studies Batch adsorption studies indicate that As(III) can be adsorbed onto the prepared
modified alginate beads. The experimental parameters were optimized by investigating the various parameters like solution pH (4.0–9.0), time of contact (15–120 min), dosage of adsorbent (0.1–2.0 g) and concentration of As(III) in solution (10–35 mg/L). The pH was adjusted by 0.1 N HCl and 0.1 N NaOH. The appropriate amount of adsorbent (MFMNABs) was added to an aliquot containing a known amount of As(III) with the
Figure 1. Synthetic pathway of MFMNABs.
2.6. Batch Adsorption Studies
Batch adsorption studies indicate that As(III) can be adsorbed onto the preparedmodified alginate beads. The experimental parameters were optimized by investigatingthe various parameters like solution pH (4.0–9.0), time of contact (15–120 min), dosage ofadsorbent (0.1–2.0 g) and concentration of As(III) in solution (10–35 mg/L). The pH wasadjusted by 0.1 N HCl and 0.1 N NaOH. The appropriate amount of adsorbent (MFMNABs)was added to an aliquot containing a known amount of As(III) with the intended initialpH and adequate contact time to reach equilibrium. The absorbance was measured byUV-Vis spectrophotometry at 555 nm. The % amount of As(III) removal was obtained byEquation (1):
% Removal =C0 − Ce
C0× 100 (1)
While the quantity of adsorbed As(III) (qe) was determined from Equation (2):
qe =(C0 − Ce) V
m(2)

Nanomaterials 2021, 11, 1345 5 of 21
where C0 is the initial concentration and Ce is the equilibrium concentration of As(III)(µg/mL), m being the mass of adsorbent (g) and V the solution volume (L) [43].
2.7. Determination of pHpzc (Point of Zero Charge)
In a series of 50 mL conical flasks containing 10 mL of 0.01 M NaCl, 0.1 N of NaOHsolution was added to adjust the initial pH (pHi) in the range 4–9. Then, to each flask, 1.6 gMFMNABs was added and shaken for 24 h on a rotatory shaker at 150 rpm and the finalpH (pHf) was noted. The difference between the initial and final pH (∆pH = pHi − pHf)was plotted against the initial pH (pHi) of the solution. The pH on the horizontal line inthe plot corresponding to ∆pH equal to zero gives pHpzc.
2.8. Adsorption Isotherm
The adsorption efficiency was determined from adsorption isotherms. The adsorptionis studied by obtaining the equilibrium concentration using various isotherms [44,45].Herein, the most common isotherms, namely, Frendlich [46], Langmuir [47] and Temkin [48]were used to find the best model fitting.
Langmuir isotherm: This model was used to assess the adsorption process usingEquation (3):
1qe
=1
qm+
1Km·qe
· 1Ce
(3)
where Km—Langmuir adsorption constant (L/mg) and qm—maximum adsorption capacityof the adsorbent (mg/g). Ce and qe—equilibrium concentration and equilibrium adsorptioncapacities (mg/g) of As(III) ions, respectively. The value of R2 was obtained from the plot1/qe vs. 1/Ce. In addition to this, the dimensional separation factor (RL) was calculated tocharacterize isotherms using Equation (4):
RL =1
1− KLC0(4)
where C0 refers to the initial concentration of adsorbate and KL is the rate of adsorption.The RL value infers that adsorption was irreversible (RL = 0), favorable (0 < RL < 1) linear,(RL = 1) or unfavorable (RL > 1). [49–51].
Freundlich isotherm: This model was used for investigating the adsorption capacityon heterogeneous surfaces and formation of monolayer. It is expressed by Equation (5):
log qe = log KF +1n
log Ce (5)
where KF (L/mg) and n are Freundlich constants signifying, respectively, the adsorptioncapacity and intensity of the system. Ce and qe are equilibrium concentration and equilib-rium adsorption capacity (mg/g) of As(III) ions, respectively. KF and 1/n are calculatedfrom the slope and intercept of log qe versus log Ce plot, respectively.
Temkin isotherm: This model is based on the surface coverage and expressed byEquation (6):
qe = B1 ln KT + B1 ln Ce (6)
where B1 = RT/b, B1 is the Temkin constant dealing with the heat of adsorption (kJ/mol),T represents absolute temperature (K), R the gas constant (8.314 J/mol K) and KT theequilibrium binding constant (L/g). The plot of qe versus ln Ce, enables to determine KTand B1.
2.9. Adsorption Kinetics
Most of the adsorption/desorption processes of many solid substances dependon time.

Nanomaterials 2021, 11, 1345 6 of 21
Pseudo-first-order kinetic model: This model of Lagergren’s kinetic equation for theadsorption of adsorbates from liquid solutions is expressed as follows [52]:
log(qe − qt) = log qe −k1t
2.303(7)
where qe (mg/g) and qt (mg/g) are quantities adsorbed at equilibrium and time t (min),respectively, and k1 (min−1) is the rate constant for pseudo-first-order equation. The valuesof k1 and qe were calculated by plotting log (qe − qt) versus time (t).
Pseudo-second-order kinetic model: This model assumes that adsorption is controlledby chemical adsorption [53]:
tqt
=t
k2q2e− 1
qe(8)
where qe and qt are adsorption capacity (mg/g) at equilibrium and time t (time), and k2(g/g per min) is the rate constant. The values of k2 and qe are calculated from the slope andintercept of the t/qt versus t plot.
Intraparticle diffusion kinetic model: The intraparticle (pore) diffusion mechanism ofAs(III) was studied by using the Weber and Morris model of diffusion [54], following theequation given by:
qt = Kdt1/2 + C (9)
where Kd (mg/g min1/2) is the diffusion rate constant; C (mg/g) is the intercept in thediffusion model. The slope and intercept were obtained by plotting qt versus
√t.
Elovich kinetic model: This model applies satisfactorily to the chemisorption process,which implies multilayer adsorption [55] and is expressed by Equation (10).
qt = α + β ln t (10)
where qt (mg/g) is the amount of As(III) adsorbed for time t (min), α (mg/g min−1) and β(g/mg) are obtained from the slope (β) and intercept (α) of the linear plot of qt versus ln t.
2.10. Regeneration Studies
Desorption studies were made to assess the regeneration capacity of the adsorbent.MFMNABs (1.6 g) were placed in a 100 mL conical flask with 10 µg/mL concentration ofAs(III) and shaken for 110 min in an incubator shaker at 30 ◦C. Beads were separated by amagnet and the concentration of arsenic was measured. Then, MFMNABs were recycledby washing with 0.1 N NaOH and then three times with DDW. The beads were then againadded to a fresh As(III) solution and the reusability was verified.
3. Results and Discussion3.1. Adsorbent Characterization3.1.1. X-ray Diffraction
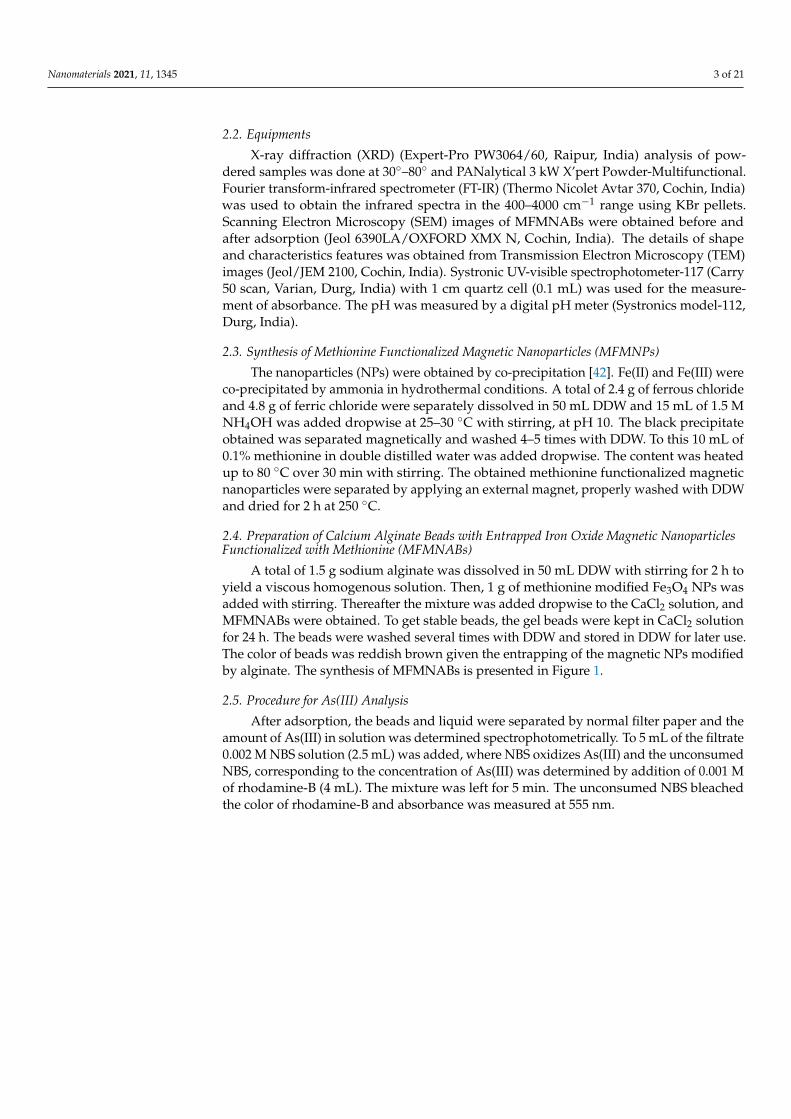
X-ray diffraction (XRD) patterns of MFMNPs, MFMNABs (before adsorption) andMFMNABs (after adsorption) show characteristic peaks, as depicted in Figure 2. The XRDdiffraction pattern obtained for MFMNPs and MFMNABs (before and after adsorption)exhibits consistent peaks at (220), (311), (400), (422), (511) and (440) which is identical to thatStandard JCPDS data [56] reported for Fe3O4 nanoparticles as well as the methionine-coatedFe3O4 nanoparticles [57,58]. The materials show sharp peaks, indicating that particlesare crystalline and of small size and these results matched with the planes of the cubicstructure of Fe3O4 (face-centered cubic) [57].
Nanomaterials 2021, 11, 1345 7 of 21
Nanomaterials 2021, 11, x FOR PEER REVIEW 7 of 22
XRD diffraction pattern obtained for MFMNPs and MFMNABs (before and after ad-sorption) exhibits consistent peaks at (220), (311), (400), (422), (511) and (440) which is identical to that Standard JCPDS data [56] reported for Fe3O4 nanoparticles as well as the methionine-coated Fe3O4 nanoparticles [57,58]. The materials show sharp peaks, indi-cating that particles are crystalline and of small size and these results matched with the planes of the cubic structure of Fe3O4 (face-centered cubic) [57].
The average crystal size (D) of MFMNPs, MFMNABs (before adsorption) and MFMNABs (after adsorption) were determined by the Debye-Scherrer’s Equation (11) [59]: 𝐷 = 𝐾 · 𝜆𝛽 · 𝑐𝑜𝑠𝜃 (11)
where D is average crystal size in A, θ is the peak angle, β is FWHM (Full Width at Half Maximum) of the sharp peaks, λ is the wavelength of X-rays (1.54 A) and K is constant (equal to 0.9). The results are presented in Table 1. The XRD results show that the average size of the particles of MFMNPs was 17.04 nm and after crosslinking with alginate, the mean size of the MFMNABs particles was reduced to 12.95 nm. After adsorption, the average size of MFMNABs was 20.68 nm. The d-spacing and particle size obtained from HR-TEM and XRD data (311) are presented in Table 2.
Figure 2. XRD diffractograms of MFMNPs and MFMNABs (before and after adsorption).
Table 1. Crystal size values obtained by the Debye-Scherrer’s formula.
Substance Most Intense Peak
(2θ, Degree) Most Intense Peak
(θ, Degree) hkl FWHM * of Most Intense
Peak (β, Radian) Size of the
Particles (D, nm) MFMNPs 35.77 17.88 311 0.0144 17.04
MFMNABs (Before adsorption) 35.18 17.59 311 0.035 12.95
MFMNABs (After adsorption)
35.66 17.83 311 0.013 20.68
FWHM * Full width at half maximum height.
Figure 2. XRD diffractograms of MFMNPs and MFMNABs (before and after adsorption).
The average crystal size (D) of MFMNPs, MFMNABs (before adsorption) andMFMNABs (after adsorption) were determined by the Debye-Scherrer’s Equation (11) [59]:
D =K·λ
β·cosθ(11)
where D is average crystal size in Å, θ is the peak angle, β is FWHM (Full Width at HalfMaximum) of the sharp peaks, λ is the wavelength of X-rays (1.54 Å) and K is constant(equal to 0.9). The results are presented in Table 1. The XRD results show that the averagesize of the particles of MFMNPs was 17.04 nm and after crosslinking with alginate, themean size of the MFMNABs particles was reduced to 12.95 nm. After adsorption, theaverage size of MFMNABs was 20.68 nm. The d-spacing and particle size obtained fromHR-TEM and XRD data (311) are presented in Table 2.
Table 1. Crystal size values obtained by the Debye-Scherrer’s formula.
Substance Most Intense Peak(2θ, Degree)
Most Intense Peak(θ, Degree) hkl FWHM * of Most Intense
Peak (β, Radian)Size of the
Particles (D, nm)
MFMNPs 35.77 17.88 311 0.0144 17.04MFMNABs (Before
adsorption) 35.18 17.59 311 0.035 12.95
MFMNABs (Afteradsorption) 35.66 17.83 311 0.013 20.68
FWHM * Full width at half maximum height.
Table 2. Comparison of d-spacing and particle size (D) obtained from HR-TEM and XRD.
HR-TEM XRD
d-spacing (nm) D (nm) d-spacing (nm) D (nm)0.242 12.68 0.254 12.95
Figure 3 shows the size distribution curve of MFMNABs. It was observed that theaverage size calculated by the Debye–Scherrer formula (Equation (11) using XRD data

Nanomaterials 2021, 11, 1345 8 of 21
(12.68 nm) is in close proximity with that calculated by the Bragg’s Equation (12) usingTEM data (12.95 nm) [60].
nλ = 2d·sinθ (12)
where n is an integer and d is interplanar distance.
Nanomaterials 2021, 11, x FOR PEER REVIEW 8 of 22
Table 2. Comparison of d-spacing and particle size (D) obtained from HR-TEM and XRD.
HR-TEM XRD d-spacing (nm) D (nm) d-spacing (nm) D (nm)
0.242 12.68 0.254 12.95
Figure 3 shows the size distribution curve of MFMNABs. It was observed that the average size calculated by the Debye–Scherrer formula (Equation (11) using XRD data (12.68 nm) is in close proximity with that calculated by the Bragg’s Equation (12) using TEM data (12.95 nm) [60]. 𝑛𝜆 = 2𝑑 · 𝑠𝑖𝑛𝜃 (12)
where n is an integer and d is interplanar distance.
4 6 8 10 12 14 16 18 20 22 240
5
10
15
20
Freq
uenc
y (%
)
Particle Size (nm)
Figure 3. Size distribution curve of MFMNABs.
3.1.2. Fourier Transform Infrared Spectroscopy MFMNPs and MFMNABs (before and after adsorption) were studied by Fourier
Transform Infrared Spectroscopy (FTIR) and results are shown in Figure 4. The broad and strong peaks at 3434 cm−1 (MFMNPs) shifted to 3432 cm−1 (MFMNABs-before ad-sorption) and 3458 cm−1 (MFMNABs-after adsorption) are ascribed to stretching vibra-tions of ‒OH and ‒NH2 [61]. The weak peaks at 2921 and 2855 cm−1 in MFMNPs, 2923 and 2851 cm−1 in MFMNABs (before adsorption), and 2923 and 2847 cm−1 in MFMNABs (after adsorption) are ascribed to C–H stretching vibrations [62]. The peak 1628 (MFMNPs) cm−1 assigned to asymmetric stretching of NH3+ get shifted to 1631 cm−1 (MFMNABs-before adsorption) and 1632 cm−1 (MFMNABs-after adsorption). The addi-tional peak at 1414 cm−1 in MFMNABs (before adsorption) is assigned to the symmetric stretching vibration of COO− of sodium alginate [63]. The weak bands observed at 1389 cm−1 (MFMNPs), 1388 (MFMNABs-before adsorption) and 1384 (MFMNABs-before ad-sorption) were attributed to the stretching vibration of the C = O [64] bond and the band at 1120 cm−1 to the bending vibration of NH3 [65]. The peaks at 1037 cm−1 (MFMNPs), shifted to 1028 cm−1 (MFMNABs-before adsorption) and 1026 cm−1 (MFMNABs-after
Figure 3. Size distribution curve of MFMNABs.
3.1.2. Fourier Transform Infrared Spectroscopy
MFMNPs and MFMNABs (before and after adsorption) were studied by FourierTransform Infrared Spectroscopy (FTIR) and results are shown in Figure 4. The broad andstrong peaks at 3434 cm−1 (MFMNPs) shifted to 3432 cm−1 (MFMNABs-before adsorption)and 3458 cm−1 (MFMNABs-after adsorption) are ascribed to stretching vibrations of -OHand -NH2 [61]. The weak peaks at 2921 and 2855 cm−1 in MFMNPs, 2923 and 2851 cm−1 inMFMNABs (before adsorption), and 2923 and 2847 cm−1 in MFMNABs (after adsorption)are ascribed to C–H stretching vibrations [62]. The peak 1628 (MFMNPs) cm−1 assignedto asymmetric stretching of NH3
+ get shifted to 1631 cm−1 (MFMNABs-before adsorp-tion) and 1632 cm−1 (MFMNABs-after adsorption). The additional peak at 1414 cm−1
in MFMNABs (before adsorption) is assigned to the symmetric stretching vibration ofCOO− of sodium alginate [63]. The weak bands observed at 1389 cm−1 (MFMNPs), 1388(MFMNABs-before adsorption) and 1384 (MFMNABs-before adsorption) were attributedto the stretching vibration of the C = O [64] bond and the band at 1120 cm−1 to the bend-ing vibration of NH3 [65]. The peaks at 1037 cm−1 (MFMNPs), shifted to 1028 cm−1
(MFMNABs-before adsorption) and 1026 cm−1 (MFMNABs-after adsorption) indicateC–O stretching vibrations [66]. The presence of a band at 556 cm−1 (MFMNPs), 562 cm−1
MFMNABs (before adsorption) and 560 cm−1 MFMNABs (after adsorption) is due to thevibration of Fe–O bond in Fe3O4 and C–S–C stretching mode [67,68].

Nanomaterials 2021, 11, 1345 9 of 21
Nanomaterials 2021, 11, x FOR PEER REVIEW 9 of 22
adsorption) indicate C–O stretching vibrations [66]. The presence of a band at 556 cm−1 (MFMNPs), 562 cm−1 MFMNABs (before adsorption) and 560 cm−1 MFMNABs (after ad-sorption) is due to the vibration of Fe–O bond in Fe3O4 and C–S–C stretching mode [67,68].
0 500 1000 1500 2000 2500 3000 3500 4000 4500562
1028
13881414
1631
2851
2923
3432
1120
1389 1628
28552921
3434
A
556560
1026
1384
1632
28472923
34581037
B
Wavenumbers (cm− 1 )
C
Tran
smitt
ance
(%)
Figure 4. The FT-IR spectra of (A) MFMNPs, (B) MFMNABs-before adsorption and (C) MFMNABs-after adsorption.
3.1.3. Scanning Electron Microscopy Scanning Electron Microscopy (SEM) was used to characterize the unmodified and
modified beads (before and after adsorption). SEM images of MFMNPs and MFMNABs (before and after adsorption) taken under different magnification is shown in Figure 5. Figure 5a,b reveals that the surface of MFMNPs are much smother as compared to the surface of MFMNABs. Figure 5c,d indicate that after cross-linking with alginate, MFMNABs exhibit rough, multi-layered surface with wide cavities and irregular pores. Figure 5e,f shows that the surface of MFMNABs after adsorption become aggregated with narrow cavities.
(a) (c) (e)
Figure 4. The FT-IR spectra of (A) MFMNPs, (B) MFMNABs-before adsorption and (C) MFMNABs-after adsorption.
3.1.3. Scanning Electron Microscopy
Scanning Electron Microscopy (SEM) was used to characterize the unmodified andmodified beads (before and after adsorption). SEM images of MFMNPs and MFMNABs(before and after adsorption) taken under different magnification is shown in Figure 5.Figure 5a,b reveals that the surface of MFMNPs are much smother as compared to thesurface of MFMNABs. Figure 5c,d indicate that after cross-linking with alginate, MFMNABsexhibit rough, multi-layered surface with wide cavities and irregular pores. Figure 5e,f showsthat the surface of MFMNABs after adsorption become aggregated with narrow cavities.
3.1.4. Transmission Electron Microscopy
The shape and size of adsorbent were examined by transmission electron microscopy(TEM). A matrix with spherical or ellipsoidal particles smaller than 20 nm is seen (Figure 6).The distribution curve shows that the sizes of particles are distributed in the range of6–20 nm and the majority of particle sizes are between 12–14 nm (Figure 3). Most particleswere scattered but some are aggregated indicating stabilization. The structure of the syn-thesized functionalized beads was examined with selected area electron diffraction (SAED).The contrast image show diffraction rings with bright spots depicting the polycrystallinenature of the adsorbent.

Nanomaterials 2021, 11, 1345 10 of 21
Nanomaterials 2021, 11, x FOR PEER REVIEW 9 of 22
adsorption) indicate C–O stretching vibrations [66]. The presence of a band at 556 cm−1 (MFMNPs), 562 cm−1 MFMNABs (before adsorption) and 560 cm−1 MFMNABs (after ad-sorption) is due to the vibration of Fe–O bond in Fe3O4 and C–S–C stretching mode [67,68].
0 500 1000 1500 2000 2500 3000 3500 4000 4500
562
1028
13881414
1631
2851
2923
3432
1120
1389 1628
28552921
3434
A
556560
1026
1384
1632
28472923
3458
1037
B
Wavenumbers (cm− 1 )
C
Tran
smitt
ance
(%)
Figure 4. The FT-IR spectra of (A) MFMNPs, (B) MFMNABs-before adsorption and (C) MFMNABs-after adsorption.
3.1.3. Scanning Electron Microscopy Scanning Electron Microscopy (SEM) was used to characterize the unmodified and
modified beads (before and after adsorption). SEM images of MFMNPs and MFMNABs (before and after adsorption) taken under different magnification is shown in Figure 5. Figure 5a,b reveals that the surface of MFMNPs are much smother as compared to the surface of MFMNABs. Figure 5c,d indicate that after cross-linking with alginate, MFMNABs exhibit rough, multi-layered surface with wide cavities and irregular pores. Figure 5e,f shows that the surface of MFMNABs after adsorption become aggregated with narrow cavities.
(a) (c) (e)
Nanomaterials 2021, 11, x FOR PEER REVIEW 10 of 22
(b) (d) (f)
Figure 5. The SEM images of (a,b) MFMNPs, (c,d) MFMNABs (before adsorption) and (e,f) MFMNABs (after adsorption) under different magnification.
3.1.4. Transmission Electron Microscopy The shape and size of adsorbent were examined by transmission electron micros-
copy (TEM). A matrix with spherical or ellipsoidal particles smaller than 20 nm is seen (Figure 6). The distribution curve shows that the sizes of particles are distributed in the range of 6–20 nm and the majority of particle sizes are between 12–14 nm (Figure 3). Most particles were scattered but some are aggregated indicating stabilization. The structure of the synthesized functionalized beads was examined with selected area electron diffrac-tion (SAED). The contrast image show diffraction rings with bright spots depicting the polycrystalline nature of the adsorbent.
(a) (b)
Figure 6. Transmission Electron Micrograph (TEM) (a) and SAED patterns (b) of MFMNABs.
3.2. pH Effect pH is important for adsorption, as it affects the adsorption capacity of the adsorbent.
The effect of pH on As(III) removal efficiency is shown in Figure 7a. Removal of As(III) was investigated by varying the pH ranging from 4 to 9 under the following conditions: 10 mg/L initial As(III) concentration, 1.0 g dosage, 110 min contact time and room tem-perature (~35 °C). The pH of the sample was adjusted using 0.1 N NaOH or 0.1 N HCl. The percentage removal was obtained at equilibrium and it was found that the percent-age removal (%) was maximal at pH 7.0–7.5. Thus, pH 7 was used for further studies.
Figure 5. The SEM images of (a,b) MFMNPs, (c,d) MFMNABs (before adsorption) and (e,f) MFMNABs (after adsorption)under different magnification.
Nanomaterials 2021, 11, x FOR PEER REVIEW 10 of 22
(b) (d) (f)
Figure 5. The SEM images of (a,b) MFMNPs, (c,d) MFMNABs (before adsorption) and (e,f) MFMNABs (after adsorption) under different magnification.
3.1.4. Transmission Electron Microscopy The shape and size of adsorbent were examined by transmission electron micros-
copy (TEM). A matrix with spherical or ellipsoidal particles smaller than 20 nm is seen (Figure 6). The distribution curve shows that the sizes of particles are distributed in the range of 6–20 nm and the majority of particle sizes are between 12–14 nm (Figure 3). Most particles were scattered but some are aggregated indicating stabilization. The structure of the synthesized functionalized beads was examined with selected area electron diffrac-tion (SAED). The contrast image show diffraction rings with bright spots depicting the polycrystalline nature of the adsorbent.
(a) (b)
Figure 6. Transmission Electron Micrograph (TEM) (a) and SAED patterns (b) of MFMNABs.
3.2. pH Effect pH is important for adsorption, as it affects the adsorption capacity of the adsorbent.
The effect of pH on As(III) removal efficiency is shown in Figure 7a. Removal of As(III) was investigated by varying the pH ranging from 4 to 9 under the following conditions: 10 mg/L initial As(III) concentration, 1.0 g dosage, 110 min contact time and room tem-perature (~35 °C). The pH of the sample was adjusted using 0.1 N NaOH or 0.1 N HCl. The percentage removal was obtained at equilibrium and it was found that the percent-age removal (%) was maximal at pH 7.0–7.5. Thus, pH 7 was used for further studies.
Figure 6. Transmission Electron Micrograph (TEM) (a) and SAED patterns (b) of MFMNABs.
3.2. pH Effect
pH is important for adsorption, as it affects the adsorption capacity of the adsorbent.The effect of pH on As(III) removal efficiency is shown in Figure 7a. Removal of As(III) wasinvestigated by varying the pH ranging from 4 to 9 under the following conditions: 10 mg/Linitial As(III) concentration, 1.0 g dosage, 110 min contact time and room temperature(~35 ◦C). The pH of the sample was adjusted using 0.1 N NaOH or 0.1 N HCl. Thepercentage removal was obtained at equilibrium and it was found that the percentageremoval (%) was maximal at pH 7.0–7.5. Thus, pH 7 was used for further studies.

Nanomaterials 2021, 11, 1345 11 of 21
Nanomaterials 2021, 11, x FOR PEER REVIEW 11 of 22
4 5 6 7 8 970
75
80
85
90
95
100%
Rem
oval
pHpzc= 7.66 pHin
itial-p
Hfin
al
% Removal (a) Point zero charge (b)
pH
-1.5
-1.0
-0.5
0.0
0.5
1.0
1.5
Figure 7. (a) pH effect on the adsorption of As(III) by MFMNABs at initial concentration of 10 µg/mL, adsorbent dose; 1.0 g, contact time; 110 min and, (b) pHpzc (point zero charge) of MFMNABs.
In an aqueous solution, the As(III) species formed are likely to be H3AsO3 and H2AsO3− or HAsO32− anionic forms. Below 9.2, the non-ionic H3AsO3 is the dominant species of As(III) and weak Van der Waals forces are expected between As(III) and MFMNABs. As the pH approaches 7, the amounts of anionic species H2AsO3− tend to in-crease, resulting in more specific binding, leading to enhanced removal of As(III) [69]. The point of zero charge (pHpzc) for MFMNABs value was found to be 7.66 (Figure 7b). The surface is positively charged below this value and small amounts of anionic species are adsorbed due to electrostatic attraction in the pH range 7.0 to 7.5. However, when the pH is higher than the pHpzc value, the adsorbent surface is negatively charged, causing the repulsion force [70,71]. Adsorption may also be due to strong chelation via sulfur and −NH2 group of the adsorbent. N and S atoms are potent donors due to presence of lone pair of electrons [72,73].
The enhanced removal of As(III) at pH 7.0–7.5 may also be attributed to the for-mation of an outer-sphere complex by hydrogen bonding or probably because of inner sphere complex formation through ligand exchange with a hydroxyl group (−OH) on the adsorbent surface. In acidic pH, the highly protonated adsorbent surface is less favoura-ble for inner-sphere complex formation by As(III), which leads to a decrease in removal capacity [74]. At basic pH, presence of large amounts of OH− may compete for adsorption sites with anionic As(III) species which affects the removal capacity of As(III) [74].
3.3. Adsorbent Dose Effect The adsorbent dose effect on the As removal was studied and results are shown in
Figure 8a. The elimination of As(III) in water was investigated by varying the amounts of adsorbent (0.1‒2.0 g). The removal efficiency improved by augmenting the adsorbent amount from 0.1 to 1.6 g. The greater the number of vacant sites on the adsorbent, the greater the capacity of adsorption. As the dosage increased from 0.1 g to 1.6 g in 10
Figure 7. (a) pH effect on the adsorption of As(III) by MFMNABs at initial concentration of 10 µg/mL, adsorbent dose; 1.0 g,contact time; 110 min and, (b) pHpzc (point zero charge) of MFMNABs.
In an aqueous solution, the As(III) species formed are likely to be H3AsO3 andH2AsO3
− or HAsO32− anionic forms. Below 9.2, the non-ionic H3AsO3 is the domi-
nant species of As(III) and weak Van der Waals forces are expected between As(III) andMFMNABs. As the pH approaches 7, the amounts of anionic species H2AsO3
− tend toincrease, resulting in more specific binding, leading to enhanced removal of As(III) [69].The point of zero charge (pHpzc) for MFMNABs value was found to be 7.66 (Figure 7b).The surface is positively charged below this value and small amounts of anionic speciesare adsorbed due to electrostatic attraction in the pH range 7.0 to 7.5. However, when thepH is higher than the pHpzc value, the adsorbent surface is negatively charged, causingthe repulsion force [70,71]. Adsorption may also be due to strong chelation via sulfur and−NH2 group of the adsorbent. N and S atoms are potent donors due to presence of lonepair of electrons [72,73].
The enhanced removal of As(III) at pH 7.0–7.5 may also be attributed to the formationof an outer-sphere complex by hydrogen bonding or probably because of inner sphere com-plex formation through ligand exchange with a hydroxyl group (−OH) on the adsorbentsurface. In acidic pH, the highly protonated adsorbent surface is less favourable for inner-sphere complex formation by As(III), which leads to a decrease in removal capacity [74].At basic pH, presence of large amounts of OH− may compete for adsorption sites withanionic As(III) species which affects the removal capacity of As(III) [74].
3.3. Adsorbent Dose Effect
The adsorbent dose effect on the As removal was studied and results are shown inFigure 8a. The elimination of As(III) in water was investigated by varying the amountsof adsorbent (0.1–2.0 g). The removal efficiency improved by augmenting the adsorbentamount from 0.1 to 1.6 g. The greater the number of vacant sites on the adsorbent, thegreater the capacity of adsorption. As the dosage increased from 0.1 g to 1.6 g in 10 µg/mLof As(III) ions at pH 7, the % removal increased from 92.7% to 95.4%, but afterwards, theremoval remained constant. The optimal dose was 1.6 g.

Nanomaterials 2021, 11, 1345 12 of 21
Nanomaterials 2021, 11, x FOR PEER REVIEW 12 of 22
µg/mL of As(III) ions at pH 7, the % removal increased from 92.7% to 95.4%, but after-wards, the removal remained constant. The optimal dose was 1.6 g.
0.0 0.5 1.0 1.5 2.0
92.5
93.0
93.5
94.0
94.5
95.0
95.5
% R
emov
al
Dose (g)
0 20 40 60 80 100 12089
90
91
92
93
94
95
% Removal
qe(capacity, mg/g)
time(min)
% R
emov
al
0.111
0.112
0.113
0.114
0.115
0.116
0.117
0.118
0.119
q e(Cap
acity
, mg/
g)
(a) (b)
10 15 20 25 30 35
97.5
98.0
98.5
99.0
99.5
% R
emov
al
Concentration of As(III) (μg/mL)
(c)
Figure 8. Effect of Adsorbent dose (a) contact time (b) and initial concentration (c) on the % removal using MFMNABs. Conditions: (a) 10 µg/mL As(III) concentration; pH 7, contact time 110 min, (b) As(III) 10 µg/mL; adsorbent dose 1.6 g; and pH 7 and (c) Adsorbent dose; 1.6 g, contact time 110 min and pH 7.
3.4. Contact Time Effect The removal of As(III) at diverse timings is found in Figure 8b. A total of 10 mL of
As(III) solution (10 mg/L) was taken at 7 pH and 1.6 g of adsorbent was added. The ex-traction of As(III) increases from 90.2% to 94.9% then reaching the steady state in 105 min. After equilibrium, the amount removed remains the same though the agitation time is increased to 120 min. The availability of a large number of vacant sites initially leads to rapid adsorption. However, with time, the number of vacant sites diminish, and elimi-nation slows. It was observed that the maximum % removal of 94.9% was obtained at 110 min.
3.5. Initial Concentration Effect The adsorption of As(III) was followed by varying the arsenic amount (10‒35
µg/mL), with 1.6 g dosage, 110 min contact time and room temperature (~35 °C). In gen-eral, the amount of As(III) removed by MFMNABs first augmented with the rise of the initial concentration of arsenic and the optimal value of 99.56% was observed at 10 µg/mL arsenic concentration. More active sites are available for adsorption of As(III) ions at lower concentrations. With the number of As(III) ions being increased at higher con-
Figure 8. Effect of Adsorbent dose (a) contact time (b) and initial concentration (c) on the % removal using MFMNABs.Conditions: (a) 10 µg/mL As(III) concentration; pH 7, contact time 110 min, (b) As(III) 10 µg/mL; adsorbent dose 1.6 g; andpH 7 and (c) Adsorbent dose; 1.6 g, contact time 110 min and pH 7.
3.4. Contact Time Effect
The removal of As(III) at diverse timings is found in Figure 8b. A total of 10 mLof As(III) solution (10 mg/L) was taken at 7 pH and 1.6 g of adsorbent was added. Theextraction of As(III) increases from 90.2% to 94.9% then reaching the steady state in 105 min.After equilibrium, the amount removed remains the same though the agitation time isincreased to 120 min. The availability of a large number of vacant sites initially leads torapid adsorption. However, with time, the number of vacant sites diminish, and eliminationslows. It was observed that the maximum % removal of 94.9% was obtained at 110 min.
3.5. Initial Concentration Effect
The adsorption of As(III) was followed by varying the arsenic amount (10–35 µg/mL),with 1.6 g dosage, 110 min contact time and room temperature (~35 ◦C). In general, theamount of As(III) removed by MFMNABs first augmented with the rise of the initialconcentration of arsenic and the optimal value of 99.56% was observed at 10 µg/mLarsenic concentration. More active sites are available for adsorption of As(III) ions at lowerconcentrations. With the number of As(III) ions being increased at higher concentrations,less active sites are available for adsorption. Figure 8c shows that As(III) adsorptionis dependent of its initial amount, and when this quantity increases, the adsorption islower. With an increase in the initial amount of As(III), these ions compete for free sitesof the adsorbent, which results in the saturation of more sites. There is a very slight

Nanomaterials 2021, 11, 1345 13 of 21
improvement in adsorption upon an increase in the arsenic amount, more noticeable forlow concentrations (5–10 µg), showing high affinity [75].
3.6. Adsorption Isotherm
Adsorption isotherms were analyzed using the Langmuir (Figure 9A), Freundlich(Figure 9B) and Temkin (Figure 9C) isotherm models to evaluate the best fit with thecorrelation coefficients (R2). Results are presented in Table 3. The data showed thatLangmuir isotherm model was the best fit with a R2 = 0.9890, compared to Freundlich(R2 = 0.9682) and Temkin (R2 = 0.9711) models, proving the homogeneous surface. Themaximum adsorption capacity was 6.6533 mg/g for the MFMNABs. In addition, the valueof the dimensional separation factor (RL) was found to be less than 1, which confirms thatthe adsorption of As(III) is a favorable process.
Nanomaterials 2021, 11, x FOR PEER REVIEW 13 of 22
centrations, less active sites are available for adsorption. Figure 8c shows that As(III) adsorption is dependent of its initial amount, and when this quantity increases, the ad-sorption is lower. With an increase in the initial amount of As(III), these ions compete for free sites of the adsorbent, which results in the saturation of more sites. There is a very slight improvement in adsorption upon an increase in the arsenic amount, more notice-able for low concentrations (5–10 µg), showing high affinity [75].
3.6. Adsorption Isotherm Adsorption isotherms were analyzed using the Langmuir (Figure 9A), Freundlich
(Figure 9B) and Temkin (Figure 9C) isotherm models to evaluate the best fit with the correlation coefficients (R2). Results are presented in Table 3. The data showed that Langmuir isotherm model was the best fit with a R2 = 0.9890, compared to Freundlich (R2 = 0.9682) and Temkin (R2 = 0.9711) models, proving the homogeneous surface. The maximum adsorption capacity was 6.6533 mg/g for the MFMNABs. In addition, the value of the dimensional separation factor (RL) was found to be less than 1, which con-firms that the adsorption of As(III) is a favorable process.
0.5 1.0 1.5 2.0 2.5 3.0
0.7
1.4
2.1
2.8
3.5
4.2
1/q e (m
g/g)
1/Ce (L/mg)
y = 1.5401x + 0.1503 R2 = 0.989
0.6 0.8 1.0 1.2 1.4
0.4
0.6
0.8
1.0
log Ce (mg/L)
y = 0.869x - 0.1013 R2 = 0.9682
log
q e (mg/
g)
(A) (B)
1.2 1.6 2.0 2.4 2.8 3.2
0.2
0.4
0.6
0.8
1.0
1.2
q e (mg/
g)
ln Ce (mg/L)
y = 0.4652x - 0.4256 R2 = 0.9711
(C)
Figure 9. Adsorption isotherms of (A) Langmuir, (B) Freundlich and (C) Temkin for As(III) adsorption onto MFMNABs.
Figure 9. Adsorption isotherms of (A) Langmuir, (B) Freundlich and (C) Temkin for As(III) adsorption onto MFMNABs.
Table 3. Adsorption isotherm parameters for As(III) adsorption by MFMNABs.
Isotherm Values of Parameters
Langmuir qmax (mg g−1)6.6533
KL0.0975
R2
0.989RL
0.3389
Freundlich KF (mg g−1) (mg L−1)n
0.7919n
1.1507R2
0.9682-
Temkin B10.4625
KT (L mg−1)0.3984
R2
0.9711-

Nanomaterials 2021, 11, 1345 14 of 21
3.7. Adsorption Kinetics
Adsorption of As(III) by MFMNABs was modeled using pseudo-first-order(Figure 10A), pseudo-second-order (Figure 10B), Elovich (Figure 10C) and intra-particlediffusion (Figure 10D) models to explain the kinetic data. The values of the kinetic modelparameters are listed in Table 4. The pseudo second order kinetic model shows the highestR2 value of 0.9998. The kinetic results agree with those of different carbon and clay-basedadsorbents [76–78].
Nanomaterials 2021, 11, x FOR PEER REVIEW 14 of 22
Table 3. Adsorption isotherm parameters for As(III) adsorption by MFMNABs.
Isotherm Values of Parameters
Langmuir qmax (mg g−1)
6.6533 KL
0.0975 R2
0.989 RL
0.3389
Freundlich KF (mg g−1) (mg L−1)n
0.7919
n 1.1507
R2
0.9682 -
Temkin B1
0.4625
KT (L mg−1) 0.3984
R2 0.9711
-
3.7. Adsorption Kinetics Adsorption of As(III) by MFMNABs was modeled using pseudo-first-order (Figure
10A), pseudo-second-order (Figure 10B), Elovich (Figure 10C) and intra-particle diffusion (Figure 10D) models to explain the kinetic data. The values of the kinetic model param-eters are listed in Table 4. The pseudo second order kinetic model shows the highest R2 value of 0.9998. The kinetic results agree with those of different carbon and clay-based adsorbents [76–78].
0 15 30 45 60 75 900.0
0.2
0.4
0.6
0.8
1.0
log(
q e−qt) (
mg/
g)
t(min)
y = −0.0094x + 0.9131 R2 = 0.9317
0 15 30 45 60 75 90
0
150
300
450
600
750
t/qt (m
in/g
/mg−1
)t(min)
y = 8.493x +5.778 R2 = 0.9998
(A) (B)
1.5 3.0 4.5 6.0 7.5 9.0
0.1116
0.1128
0.1140
0.1152
0.1164
0.1176
q t (mg/
g)
√t
y = 8.0456x + 0.1099 R2 = 0.9758
1.5 3.0 4.5 6.0 7.5 9.0
1.4
2.1
2.8
3.5
4.2
q e (mg/
g)
ln t (min)
y = 0.397x + 1.0315 R2 = 0.9601
(C) (D)
Figure 10. Adsorption of As(III) onto MFMNABs fitted with the pseudo-first order (A), pseudo-second order (B) in-tra-particle diffusion (C) and Elovich (D) models.
Figure 10. Adsorption of As(III) onto MFMNABs fitted with the pseudo-first order (A), pseudo-second order (B) intra-particle diffusion (C) and Elovich (D) models.
Table 4. Kinetic parameters for adsorption of As(III) onto MFMNABs.
Models Kinetics Parameters
Pseudo-First-Orderk1 (min−1) qe (mg g−1) R2
0.0223 2.492 0.9317Pseudo-Second-
Orderk2 (g mg−1 min−1) qe (mg g−1) R2
0.08 0.1177 0.9998Intra-particle
Diffusionkd (mg g−1 min−1) C (mg g−1) R2
8.0456 0.1099 0.9758
Elovich modelA (mg g−1 min−2) β (g mg−1 min−1) R2
1.01035 0.397 0.9601
3.8. Thermodynamic Parameters
A rise in temperature caused an enlargement in the rate of As(III) adsorption prov-ing [78] that the process is endothermic [79]. The adsorption thermodynamic parameters,i.e., Gibbs free energy (∆G), changes in enthalpy (∆H) and changes in entropy (∆S) werecalculated by the equations:
Nanomaterials 2021, 11, 1345 15 of 21
∆G = −RT ln Kd (13)
ln Kd =∆SR− ∆H
RT(14)
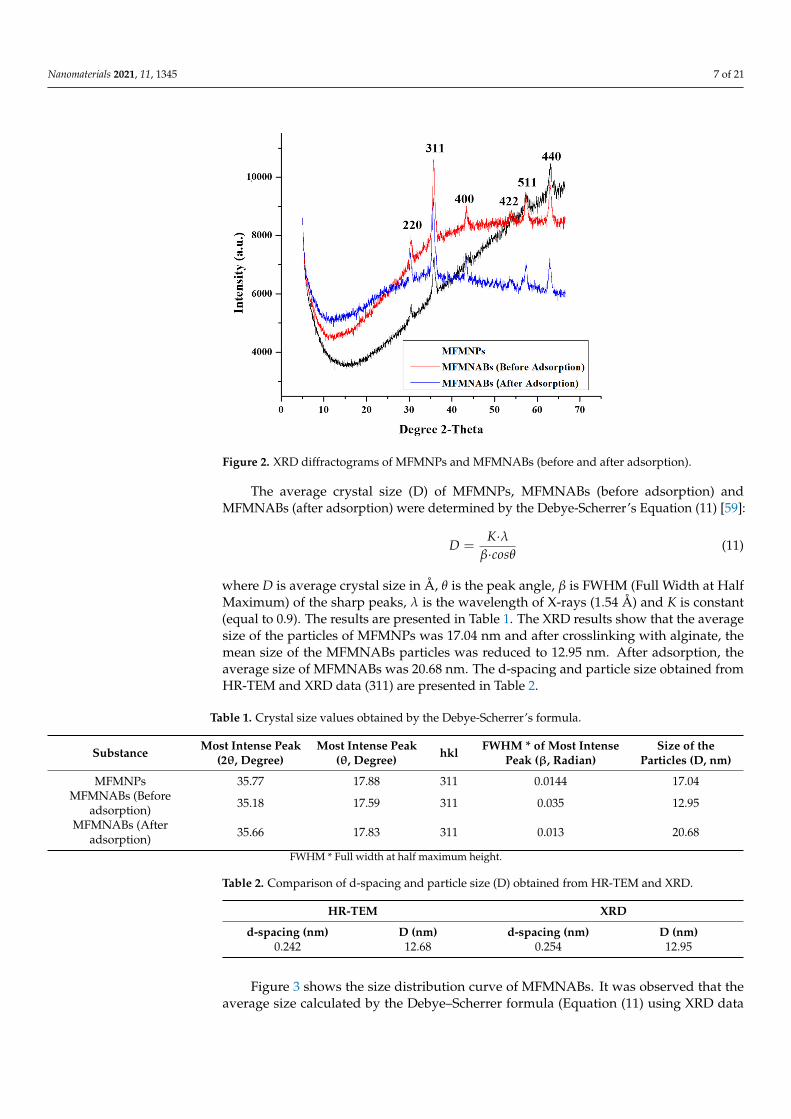
where Kd—equilibrium constant of the Langmuir model (L/g), T—absolute temperature(Kelvin, k) and R—universal gas constant (8.314 kJ/mol K). The values of ∆H and ∆Swere 5.25 KJ/mol and 34.32 J/mol/K, respectively, taken from the slope and the interceptof the linear plot of ln Kd versus 1/T (Figure 11). ∆H has a positive value, confirmingthe endothermicity of the adsorption and the positive values of ∆S suggest a randomnessincrease. A similar endothermic adsorption behavior is found in many pollutant adsorptionsystems in the literature [80,81]. The change in the Gibbs free energy (∆G) was −1.8, −1.97and−2.17 KJ/mol for 30, 40 and 50 ◦C, respectively. ∆G has a negative value, meaning thatthe adsorption of As on the MFMNABs is feasible and spontaneous at all temperatures.
Nanomaterials 2021, 11, x FOR PEER REVIEW 15 of 22
Table 4. Kinetic parameters for adsorption of As(III) onto MFMNABs.
Models Kinetics Parameters
Pseudo-First-Order k1 (min−1) qe (mg g−1) R2
0.0223 2.492 0.9317 Pseudo-Second-
Order k2 (g mg−1 min−1) qe (mg g−1) R2
0.08 0.1177 0.9998 Intra-particle
Diffusion kd (mg g−1 min−1) C (mg g−1) R2
8.0456 0.1099 0.9758
Elovich model A (mg g−1 min−2) β (g mg−1 min−1) R2
1.01035 0.397 0.9601
3.8. Thermodynamic Parameters A rise in temperature caused an enlargement in the rate of As(III) adsorption prov-
ing [78] that the process is endothermic [79]. The adsorption thermodynamic parameters, i.e., Gibbs free energy (ΔG), changes in enthalpy (ΔH) and changes in entropy (ΔS) were calculated by the equations: ∆G = −RT ln K (13)ln K = ΔSR − ΔHRT (14)
where Kd—equilibrium constant of the Langmuir model (L/g), T—absolute temperature (Kelvin, k) and R—universal gas constant (8.314 kJ/mol K). The values of ∆H and ∆S were 5.25 KJ/mol and 34.32 J/mol/K, respectively, taken from the slope and the intercept of the linear plot of ln Kd versus 1/T (Figure 11). ∆H has a positive value, confirming the endo-thermicity of the adsorption and the positive values of ∆S suggest a randomness increase. A similar endothermic adsorption behavior is found in many pollutant adsorption sys-tems in the literature [80,81]. The change in the Gibbs free energy (ΔG) was −1.8, −1.97 and −2.17 KJ/mol for 30, 40 and 50 °C, respectively. ∆G has a negative value, meaning that the adsorption of As on the MFMNABs is feasible and spontaneous at all tempera-tures.
0.00300 0.00306 0.00312 0.00318 0.00324 0.00330
2.05
2.10
2.15
2.20
2.25
2.30
ln k
d
1/T(K−1)
Figure 11. Van ’t Hoff’s plot for adsorption of As(III) on MFMNABs.
Figure 11. Van’t Hoff’s plot for adsorption of As(III) on MFMNABs.
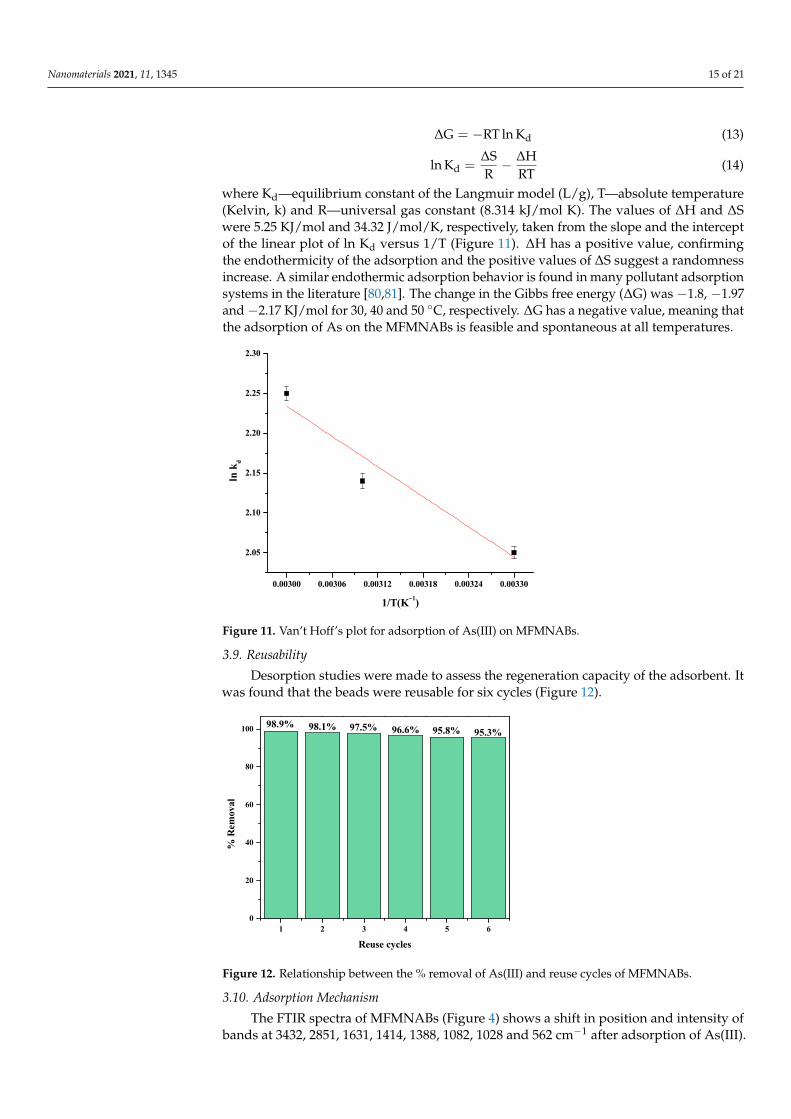
3.9. Reusability
Desorption studies were made to assess the regeneration capacity of the adsorbent. Itwas found that the beads were reusable for six cycles (Figure 12).
Nanomaterials 2021, 11, x FOR PEER REVIEW 16 of 22
3.9. Reusability Desorption studies were made to assess the regeneration capacity of the adsorbent.
It was found that the beads were reusable for six cycles (Figure 12).
1 2 3 4 5 60
20
40
60
80
100
% R
emov
al
Reuse cycles
98.9% 98.1% 97.5% 96.6% 95.8% 95.3%
Figure 12. Relationship between the % removal of As(III) and reuse cycles of MFMNABs.
3.10. Adsorption Mechanism The FTIR spectra of MFMNABs (Figure 4) shows a shift in position and intensity of
bands at 3432, 2851, 1631, 1414, 1388, 1082, 1028 and 562 cm−1 after adsorption of As(III). These results indicate that the O–H, NH2, C–H, COO−, C = O, C–S–C, C–O and Fe–O groups are involved in the adsorption process.
The FTIR spectra of MFMNPs exhibits bands at 1628 and 1390 cm−1 which is at-tributed to C = O and C–O stretching vibrations of the amino acid residues, respectively. The peak corresponding to C–H stretching vibrations of methionine is observed at 2870 cm−1. The band around 3400 cm−1 is assigned to the overlapping of N–H and O–H stretching peaks.
The possible interaction of methionine functionalized groups is supposed to be through N, S and O donor atoms and –OH groups, as shown in Figure 13. The carbox-ylate ion of amino acid can interact with Fe3+ by either bidentate or unidentate modalities, the former being more likely than the latter. N atom of amine group, a potent donor, can make coordinate covalent bond with Fe3+. Sulfur (S) atom is also expected to be a potent donor atom due to its lone pair of electrons [82].
In the acidic pH, the predominant As(III) species, H3AsO3 get adsorbed due to weak Van der Waals forces. At pH 7.0−7.5, adsorption increases due to electrostatic attraction between the positive surface and increase in anionic species. Adsorption may also be due to strong chelation via sulfur and –NH2 groups [72,73]. It may also be attributed to the formation of complex through hydrogen bonding. The shift in the position and decrease in intensity of Fe–O peak indicate the involvement of Fe–O bond also in the adsorption process. The scheme of mechanism of adsorption of As(III) is depicted in Figure 13a and the mechanism of spectrophotometric method used is shown in Figure 13b.
Figure 12. Relationship between the % removal of As(III) and reuse cycles of MFMNABs.
3.10. Adsorption Mechanism
The FTIR spectra of MFMNABs (Figure 4) shows a shift in position and intensity ofbands at 3432, 2851, 1631, 1414, 1388, 1082, 1028 and 562 cm−1 after adsorption of As(III).

Nanomaterials 2021, 11, 1345 16 of 21
These results indicate that the O–H, NH2, C–H, COO−, C = O, C–S–C, C–O and Fe–Ogroups are involved in the adsorption process.
The FTIR spectra of MFMNPs exhibits bands at 1628 and 1390 cm−1 which is attributedto C = O and C–O stretching vibrations of the amino acid residues, respectively. The peakcorresponding to C–H stretching vibrations of methionine is observed at 2870 cm−1. Theband around 3400 cm−1 is assigned to the overlapping of N–H and O–H stretching peaks.
The possible interaction of methionine functionalized groups is supposed to bethrough N, S and O donor atoms and –OH groups, as shown in Figure 13. The carboxylateion of amino acid can interact with Fe3+ by either bidentate or unidentate modalities, theformer being more likely than the latter. N atom of amine group, a potent donor, can makecoordinate covalent bond with Fe3+. Sulfur (S) atom is also expected to be a potent donoratom due to its lone pair of electrons [82].
Nanomaterials 2021, 11, x FOR PEER REVIEW 17 of 22
Figure 13. Mechanism of As(III) adsorption on MFMNABs (a) and reactions used to study the adsorption (b).
Figure 13. Mechanism of As(III) adsorption on MFMNABs (a) and reactions used to study the adsorption (b).
Nanomaterials 2021, 11, 1345 17 of 21
In the acidic pH, the predominant As(III) species, H3AsO3 get adsorbed due to weakVan der Waals forces. At pH 7.0−7.5, adsorption increases due to electrostatic attractionbetween the positive surface and increase in anionic species. Adsorption may also be dueto strong chelation via sulfur and –NH2 groups [72,73]. It may also be attributed to theformation of complex through hydrogen bonding. The shift in the position and decreasein intensity of Fe–O peak indicate the involvement of Fe–O bond also in the adsorptionprocess. The scheme of mechanism of adsorption of As(III) is depicted in Figure 13a andthe mechanism of spectrophotometric method used is shown in Figure 13b.
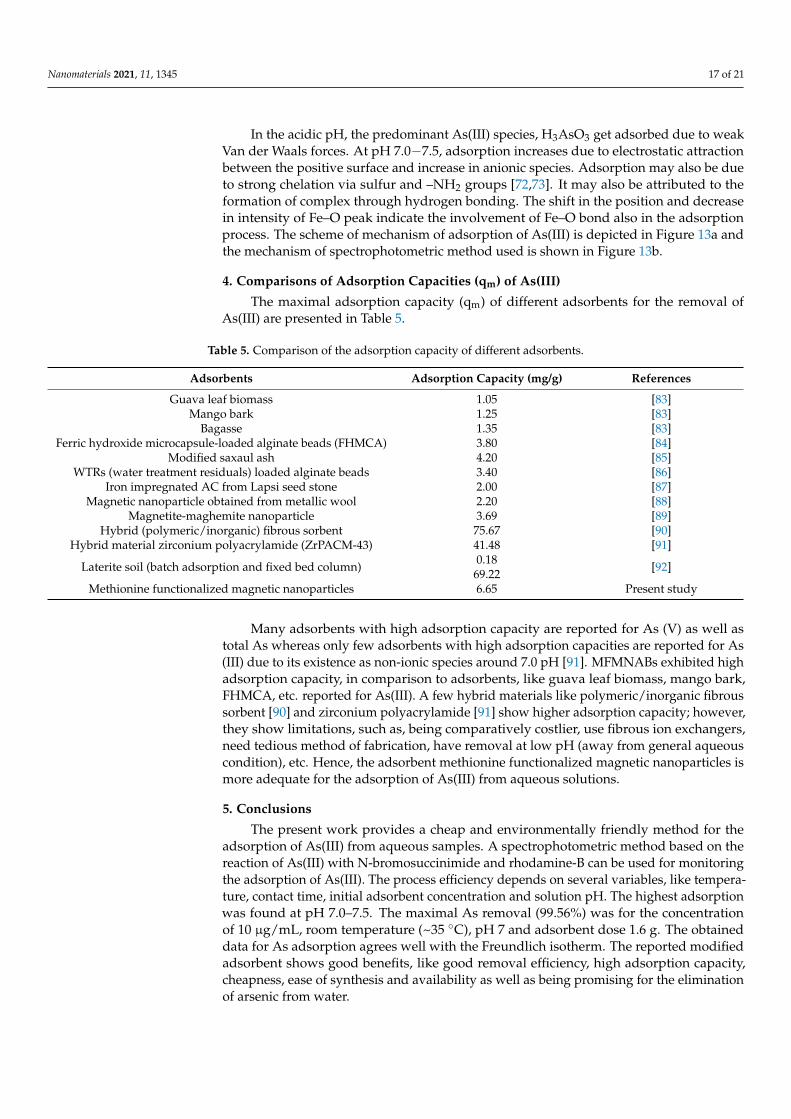
4. Comparisons of Adsorption Capacities (qm) of As(III)
The maximal adsorption capacity (qm) of different adsorbents for the removal ofAs(III) are presented in Table 5.
Table 5. Comparison of the adsorption capacity of different adsorbents.
Adsorbents Adsorption Capacity (mg/g) References
Guava leaf biomass 1.05 [83]Mango bark 1.25 [83]
Bagasse 1.35 [83]Ferric hydroxide microcapsule-loaded alginate beads (FHMCA) 3.80 [84]
Modified saxaul ash 4.20 [85]WTRs (water treatment residuals) loaded alginate beads 3.40 [86]
Iron impregnated AC from Lapsi seed stone 2.00 [87]Magnetic nanoparticle obtained from metallic wool 2.20 [88]
Magnetite-maghemite nanoparticle 3.69 [89]Hybrid (polymeric/inorganic) fibrous sorbent 75.67 [90]
Hybrid material zirconium polyacrylamide (ZrPACM-43) 41.48 [91]
Laterite soil (batch adsorption and fixed bed column) 0.1869.22 [92]
Methionine functionalized magnetic nanoparticles 6.65 Present study
Many adsorbents with high adsorption capacity are reported for As (V) as well astotal As whereas only few adsorbents with high adsorption capacities are reported for As(III) due to its existence as non-ionic species around 7.0 pH [91]. MFMNABs exhibited highadsorption capacity, in comparison to adsorbents, like guava leaf biomass, mango bark,FHMCA, etc. reported for As(III). A few hybrid materials like polymeric/inorganic fibroussorbent [90] and zirconium polyacrylamide [91] show higher adsorption capacity; however,they show limitations, such as, being comparatively costlier, use fibrous ion exchangers,need tedious method of fabrication, have removal at low pH (away from general aqueouscondition), etc. Hence, the adsorbent methionine functionalized magnetic nanoparticles ismore adequate for the adsorption of As(III) from aqueous solutions.
5. Conclusions
The present work provides a cheap and environmentally friendly method for theadsorption of As(III) from aqueous samples. A spectrophotometric method based on thereaction of As(III) with N-bromosuccinimide and rhodamine-B can be used for monitoringthe adsorption of As(III). The process efficiency depends on several variables, like tempera-ture, contact time, initial adsorbent concentration and solution pH. The highest adsorptionwas found at pH 7.0–7.5. The maximal As removal (99.56%) was for the concentrationof 10 µg/mL, room temperature (~35 ◦C), pH 7 and adsorbent dose 1.6 g. The obtaineddata for As adsorption agrees well with the Freundlich isotherm. The reported modifiedadsorbent shows good benefits, like good removal efficiency, high adsorption capacity,cheapness, ease of synthesis and availability as well as being promising for the eliminationof arsenic from water.
Nanomaterials 2021, 11, 1345 18 of 21
Author Contributions: S.L.: investigation, methodology and writing—original draft; S.B.M.: supervi-sion, conceptualization, formal analysis and validation; A.K.S.: data curation, project administration;resources and software; S.A.C.C.: writing—reviewing and editing and visualization. All authorshave read and agreed to the published version of the manuscript.
Funding: Thanks to Pt. Ravishankar Shukla University Research Scholarship (no. 3114/8/Fin./Sch.//2018). This work was also supported by FCT—Fundação para a Ciência e a Tecnologia, I.P., under theScientific Employment Stimulus—Institutional Call (CEECINST/00102/2018) and partially supportedby the Associate Laboratory for Green Chemistry—LAQV and FCT/MCTES (UIDB/50006/2020 andUIDP/50006/2020).
Institutional Review Board Statement: Not applicable.
Informed Consent Statement: Not applicable.
Data Availability Statement: Data will be provided upon request.
Acknowledgments: The authors are grateful for DST-FIST (New Delhi) sponsored by Department ofChemistry. Thanks to NIT Raipur for XRD studies, SAIF Cochin for FTIR, SEM and TEM analysisand. The authors thankful to the Department of Chemistry of the Govt. V.Y.T. PG AutonomousCollege, Durg, Chhattishgarh, India for providing the necessary lab facilities.
Conflicts of Interest: The authors declare they have no conflict of interest.
References1. Xie, L.Y.; Liu, P.; Zheng, Z.Y.; Weng, S.X.; Huang, J.H. Morphology engineering of V2O5/TiO2 nanocomposites with enhanced
visible light-driven photofunctions for arsenic removal. Appl. Catal. B Environ. 2016, 184, 347–354. [CrossRef]2. Al Salehin, P.Z.; Farid Moeinpour, F.; Mohseni Shahri, F.S. Adsorption isotherm and thermodynamic studies of As(III) removal
from aqueous solutions using used cigarette filter ash. Appl. Water Sci. 2019, 9, 172. [CrossRef]3. Tien, V.V.; Bay, D.V.; Thu, D.X.; Chung, T.V. Analysis of arsenic from water by spectrophotometric method. Int. J. Dev. Res. 2015, 5,
4987–4991.4. Lin, G.; Wang, Y.; Li, G.; Wang, S.; Zhang, H.; Li, B. New System for the Spectrophotometric Determination of Arsenic in Water.
In Proceedings of the International Conference on Computer Distributed Control and Intelligent Environmental Monitoring(CDCIEM), Changsha, China, 19–20 February 2011; pp. 385–388.
5. Guzman, A.; Nava, J.L.; Coreno, O.; Rodriguez, I.; Gutierrez, S. Arsenic and fluoride removal from groundwater by electrocoagu-lation using a continuous filter-press reactor. Chemosphere 2016, 144, 2113–2120. [CrossRef] [PubMed]
6. Wu, J.; Zhang, S.D.; Zhu, X.S. Study on the analytical method of inorganic arsenic species in environmental samples. Appl. Ecol.Environ. Res. 2019, 17, 7943–7955. [CrossRef]
7. Sébastien, S. Time to revisit arsenic regulations: Comparing drinking water and rice. BMC Public Health 2014, 14, 465–477.8. Pandey, G.P.; Singh, A.K.; Prasad, S.; Deshmukha, L.; Asthana, A.; Mathew, S.B.; Yoshida, M. Kinetic determination of trace
amount of mercury(II) in environmental samples. Microchem. J. 2016, 128, 55–61. [CrossRef]9. Nekouei, S.; Nekouei, F. Cloud point extraction and spectrophotometry in the determination of As (III) using amaranth in water
samples of rivers located in industrial and non-industrial areas. Curr. Sci. 2014, 107, 1725–1730.10. Bhattacharya, P.; Welch, A.H.; Stollenwerk, K.G.; McLaughlin, M.J.; Bundschuh, J.; Panaullah, G. Arsenic in the environment:
Biology and Chemistry. Sci. Total Environ. 2007, 379, 109–120. [CrossRef]11. WHO. Guidelines for Drinking Water Quality, 4th ed.; World Health Organization: Geneva, Switzerland, 2011; p. 315.12. Leupin, O.X.; Hug, S.J. Oxidation and removal of arsenic (III) from aerated groundwater by filtration through sand and zero-valent
iron. Water Res. 2005, 39, 1729–1740. [CrossRef]13. Bose, P.; Sharma, A. Role of iron in controlling speciation and mobilization of arsenic in subsurface environment. Water Res. 2002,
36, 4916–4926. [CrossRef]14. Masue, Y.; Loeppert, R.H.; Kramer, T.A. Arsenate and arsenite adsorption and desorption behavior on coprecipitated aluminum:
Iron hydroxides. Environ. Sci. Technol. 2007, 41, 837–842. [CrossRef] [PubMed]15. Banerjee, K.; Amy, G.L.; Prevost, M. Kinetic and thermodynamic aspects of adsorption of arsenic onto granular ferric hydroxide
(GFH). Water Res. 2008, 42, 3371–3378. [CrossRef] [PubMed]16. Sperlich, A.; Werner, A.; Genz, A.; Amy, G.; Worch, E.; Jekel, M. Breakthrough behavior of granular ferric hydroxide (GFH)
fixed-bed adsorption filters: Modeling and experimental approaches. Water Res. 2005, 39, 1190–1198. [CrossRef] [PubMed]17. Yoon, J.; Amy, G.; Chung, J.; Sohn, J.; Yoon, Y. Removal of toxic ions (chromate, arsenate, and perchlorate) using reverse osmosis,
nanofiltration, and ultrafiltration membranes. Chemosphere 2009, 77, 228–235. [CrossRef]18. Sanchez-Cantu, M.; Galicia-Aguilar, J.A.; Santamaria-Juarez, D.; Hernandez-Moreno, L.E. Evaluation of the mixed oxides
produced from hydrotalcite-like compound’s thermal treatment in arsenic uptake. Appl. Clay Sci. 2016, 121, 146–153. [CrossRef]19. Singh, R.; Singh, S.; Parihar, P.; Singh, V.P.; Prasad, S.M. Arsenic contamination, consequences and remediation techniques: A
review. Ecotoxicol. Environ. Saf. 2015, 112, 247–270. [CrossRef] [PubMed]

Nanomaterials 2021, 11, 1345 19 of 21
20. Subramanian, K.S.; Viraraghavan, T.; Phommavong, T.; Tanjore, S. Manganese greensand for removal of arsenic in drinking water.Water Qual. Res. J. Can. 1997, 32, 551–561. [CrossRef]
21. Yoshitake, H.; Yokoi, T.; Tatsumi, T. Adsorption behavior of arsenate at transition metal cations captured by amino-functionalizedmesoporous silicas. Chem. Mater. 2003, 15, 1713–1721. [CrossRef]
22. Xu, Y.-H.; Nakajima, T.; Ohki, A. Adsorption and removal of arsenic(V) from drinking water by aluminum-loaded Shirasuzeolite.J. Hazard. Mater. 2002, 92, 275–287. [CrossRef]
23. Elizalde-Gonzalez, M.P.; Mattusch, J.; Einicke, W.-D.; Wennrich, R. Sorption on natural solids for arsenic removal. Chem. Eng. J.2001, 81, 187–195. [CrossRef]
24. Elizalde-Gonzalez, M.P.; Mattusch, J.; Wennrich, R. Application of natural zeolites for preconcentration of arsenic species in watersamples. J. Environ. Monit. 2001, 3, 22–26. [CrossRef] [PubMed]
25. Elizalde-Gonz´alez, M.P.; Mattusch, J.; Wennrich, R.; Morgenstern, P. Uptake of arsenite and arsenate by clinoptiloterich tuffs.Micropor. Mesopor. Mat. 2001, 46, 277–286. [CrossRef]
26. Kim, T.Y.; Jin, H.J.; Park, S.S.; Kim, S.J.; Cho, S.Y. Adsorption equilibrium of copper ion and phenol by powdered activated carbon,alginate bead and alginate-activated carbon bead. J. Ind. Eng. Chem. 2008, 14, 714–719. [CrossRef]
27. Li, Y.; Liu, F.; Xia, B.; Du, Q.; Zhang, P.; Wang, D.; Wang, Z.; Xia, Y. Removal of Copper(II) from aqueous solution by carbonnanotube/calcium alginate composites. J. Hazard. Mater. 2010, 177, 876–880. [CrossRef]
28. Mahmoodi, N.M.; Hayati, B.; Arami, M.; Bahrami, H. Preparation, characterization and dye adsorption properties of biocompati-ble composite (alginate/titania nanoparticle). Desalination 2011, 275, 93–101. [CrossRef]
29. Rocher, V.; Siaugue, J.M.; Cabuil, V.; Bee, A. Removal of organic dyes by magnetic alginate beads. Water Res. 2008, 25, 1290–1298.[CrossRef]
30. Ai, L.H.; Huang, H.Y.; Chen, Z.L.; Wei, X.; Jiang, J. Activated carbon/CoFe2O4 composites: Facile synthesis, magnetic performanceand their potential application for the removal of malachite green from water. Chem. Eng. J. 2010, 156, 243–249. [CrossRef]
31. Tran, H.V.; Tran, L.D.; Nguyen, T.N. Preparation of chitosan/magnetite composite beads and their application for removal of Pb(II) and Ni (II) from aqueous solution. Mater. Sci. Eng. C 2010, 30, 304–310. [CrossRef]
32. Zhou, L.; Liu, Z.; Liu, J.; Huang, Q. Adsorption of Hg (II) from aqueous solution by ethylenediamine-modified magneticcrosslinking chitosan microspheres. Desalination 2010, 258, 41–47. [CrossRef]
33. Lakouraj, M.M.; Hasanzadeh, F.; Zare, E.N. Nanogel and super-paramagnetic nanocomposite of thiacalix[4]arene functionalizedchitosan: Synthesis, characterization and heavy metal sorption. Iran. Polym. J. 2014, 23, 933–945. [CrossRef]
34. Zhou, L.; Wang, Y.; Liu, Z.; Huang, Q. Characteristics of equilibrium, kinetics studies for adsorption of Hg(II), Cu(II), and Ni(II)ions by thiourea-modified magnetic chitosan microspheres. J. Hazard. Mater. 2009, 161, 995–1002. [CrossRef] [PubMed]
35. Bezbaruah, A.N.; Krajangpan, S.; Chisholm, B.J.; Khan, E.; Bermudez, J.J.E. Entrapment of iron nanoparticles in calcium alginatebeads for groundwater remediation applications. J. Hazard. Mater. 2009, 166, 1339–1343. [CrossRef]
36. Lakouraj, M.M.; Mojerlou, F.; Zare, E.N. Nanogel and superparamagnetic nanocomposite based on sodium alginate for sorptionof heavy metal ions. Carbohydr. Polym. 2014, 106, 34–41. [CrossRef]
37. Badruddoza, A.Z.; Rahman, M.T.; Ghosh, S.; Hossain, M.Z.; Shi, J.Z.; Hidajat, K.; Uddin, M.S. β-Cyclodextrin conjugatedmagnetic, fluorescent silica core-shell nanoparticles for biomedical applications. Carbohydr. Polym. 2013, 95, 449–457. [CrossRef]
38. Zhang, X.B.; Wang, Y.; Yang, S.T. Simultaneous removal of Co(II) and 1-Naphthol by core-shell styructured Fe3O4@cyclodextrinmagnetic nanoparticles. Carbohydr. Polym. 2014, 114, 521–529. [CrossRef] [PubMed]
39. Idris, A.; Ismail, N.S.M.; Hassan, N.; Misran, E.; Ngomsik, A.F. Synthesis of magnetic alginate beads based on maghemitenanoparticles for Pb(II) removal in aqueous solution. J. Ind. Eng. Chem. 2012, 18, 1582–1589. [CrossRef]
40. Palas, R.; Mondal, N.K.; Bhattacharya, S.; Das, B.; Das, K. Removal of arsenic(III) and arsenic(V) on chemically modified low-costadsorbent: Batch and column operations. Appl. Water Sci. 2013, 3, 293–309.
41. Monárrez-Cordero, B.E.; Amézaga-Madrid, P.; Leyva-Porras, C.C.; Pizá-Ruiz, P.; Miki-Yoshida, M. Study of the Adsorption ofArsenic (III and V) by Magnetite Nanoparticles Synthetized via AACVD. Mater. Res. 2016, 19, 103–112. [CrossRef]
42. Verma, R.; Asthana, A.; Singh, A.K.; Susan, M.A.B.H. Glycine functionalized magnetic nanoparticle entrapped calcium alginatebeads: A promising adsorbent for removal of Cu (II) ions. J. Environ. Chem. Eng. 2016, 4, 1985–1995.
43. Wang, J.; Pan, K.; He, Q.; Cao, B. Polyacrylonitrile/polypyrrole core/shell nanofiber mat for the removal of hexavalent chromiumfrom aqueous solution. J. Hazard. Mater. 2013, 244, 121–129. [CrossRef] [PubMed]
44. Markandeya; Singh, A.; Shukla, S.P.; Mohan, D.; Singh, N.B.; Bhargava, D.S.; Shukla, R.; Pandey, G.; Yadav, V.P.; Kisk, G.C.; et al.Adsorptive capacity of sawdust for the adsorption of MB dye and designing of two-stage batch adsorber. Cogent Environ. Sci.2015, 1, 1075856. [CrossRef]
45. Shukla, S.P.; Tiwari, S.; Tiwari, M.; Mohan, D.; Pandey, G. Removal of fluoride from aqueous solution using Psidium guajavaleaves. Desalin. Water Treat. 2017, 62, 418–425. [CrossRef]
46. Freundlich, H.Z. Over the adsorption in solution. J. Phys. Chem. 1906, 57, 385–470.47. Langmuir, I. The adsorption of gases on plane surfaces of glass, mica and platinum. J. Am. Chem. Soc. 1916, 40, 1361–1403.
[CrossRef]48. Temkin, M.J.; Pyzhev, V. Kinetics of ammonia synthesis on promoted iron catalysts. Acta Physiochim. URRS 1940, 12, 217–222.49. Naghizadeh, A.; Ghasemi, F.; Derakhshani, E.; Shahabi, H. Thermodynamic, kinetic and isotherm studies of sulfate removal from
aqueous solutions by graphene and graphite nanoparticles. Desalin. Water Treat. 2017, 80, 247–254. [CrossRef]

Nanomaterials 2021, 11, 1345 20 of 21
50. Naghizadeh, A.; Gholami, K. Bentonite and montmorillonite nanoparticles effectiveness in removal of fluoride from watersolutions. J. Water Health 2017, 15, 555–565. [CrossRef]
51. Kamranifar, M.; Naghizadeh, A. Montmorillonite nanoparticles in removal of textile dyes from aqueous solutions: Study ofkinetics and thermodynamics. Iran. J. Chem. Chem. Eng. 2017, 36, 127–137.
52. Lagergren, S. About the theory of so-called adsorption of soluble substances. Kungl. Sven. Vetensk. Handl. 1898, 24, 1–39.53. Bayramoglu, G.; Gursel, I.; Tunali, Y.; Arica, M.Y. Biosorption of phenol and 2-chlorophenol by Funaliatrogii pellets. Bioresour.
Technol. 2009, 100, 2685–2691. [CrossRef] [PubMed]54. Viswanathan, N.; Sundaram, C.S.; Meenakshi, S. Development of multifunctional chitosan beads for fluoride removal. J. Hazard.
Mater. 2009, 167, 325–331. [CrossRef]55. Chien, S.H.; Clayton, W.R. Application of Elovich Equation to the. Kinetics of Phosphate Release and Sorption in Soils. Soil Sci.
Soc. Am. J. 1980, 44, 265–268. [CrossRef]56. JCPDS Data Card. International Center of Diffraction Data; National Bureau of Standards: Washington, DC, USA, 1988.57. Zhao, Y.; Qiu, Z.; Huang, J. Preparation and analysis of Fe3O4 magnetic nanoparticles used as targeted-drug carriers. Chin. J.
Chem. Eng. 2008, 16, 451–455. [CrossRef]58. Karimian, A.; Namvar-Mhaboub, M.; Abbasi, R. Methionine-Coated Fe3O4 Nanoparticles: An Efficient and Reusable Nanomag-
netic Catalyst for the Synthesis of 5-Substituted 1H-Tetrazoles. Russ. J. Org. Chem. 2020, 56, 1646–1653. [CrossRef]59. Singh, M.; Dosanjh, H.S.; Singh, H. Surface modified spinel cobalt ferrite nanoparticles for cationic dye removal: Kinetics and
thermodynamics studies. J. Water Process. Eng. 2016, 11, 152–161. [CrossRef]60. Verma, S.; Mungse, H.P.; Kumar, N.; Choudhary, S.; Jain, S.L.; Sain, B.; Khatri, O.P. Graphene oxide: An efficient and reusable
carbocatalyst for Aza-Michael addition of amines to activated alkenes. Chem. Commun. 2011, 47, 12673–12675. [CrossRef]61. Bera, M.; Gupta, P.; Maji, P.K. Efficacy of ultra-low loading of amine functionalized graphene oxide into glycidol-terminated
polyurethane for high-performance composite material. React. Funct. Polym. 2019, 139, 60–74. [CrossRef]62. Singh, B.P.; Choudhary, V.; Teotia, S.; Gupta, T.K.; Singh, V.N.; Dhakate, S.R.; Mathur, R.B. Solvent Free, Efficient, Industrially
Viable, Fast Dispersion Process Based Amine Modified MWCNT Reinforced Epoxy Composites of Superior Mechanical Properties.Adv. Mater. Lett. 2015, 6, 104–113. [CrossRef]
63. Bindhu, M.R.; Umadevi, M. Green Synthesized Gold Nanoparticles as a Probe for the Detection of Fe3+ Ions in Water. J. Clust. Sci.2013, 24, 1–10. [CrossRef]
64. Navarrete, J.T.L.; Hernandez, V.; Ramırez, F.J. Ir and Raman spectra of L-aspartic acid and isotopic derivatives. Biopolymers 1994,34, 1065–1077. [CrossRef]
65. Tarakeshwar, P.; Manogaran, S. Conformational effects on vibrational frequencies of cysteine and serine: An ab initio study. J.Mol. Struct. Theochem. 1994, 305, 205–224. [CrossRef]
66. Dennis, G.; Harrison, G.; Agnes, K.; Erastus, G. Effect of Biological Control Antagonists Adsorbed on Chitosan Immobilized SilicaNanocomposite on Ralstonia solanacearum and Growth of Tomato Seedlings. Adv. Res. (AIR) 2016, 6, 1–23. [CrossRef]
67. Gayathri, P.; Kumar, A.S. An Iron impurity in multiwalled carbon nanotube complexes with chitosan that biomimics theheme-peroxidase function. Chem. Eur. J. 2013, 19, 17103–17112. [CrossRef] [PubMed]
68. Wolpert, M.; Hellwig, P. Infrared spectra and molar absorption coefficients of the 20 alpha amino acids in aqueous solutions inthe spectral range from 1800 to 500 cm−1. Spectrochim. Acta Part A 2006, 64, 987–1001. [CrossRef]
69. Lin, T.; Wu, J. Adsorption of arsenite and arsenate within activated alumina grains: Equilibrium and kinetics. Wat. Res. 2001, 35,2049–2057. [CrossRef]
70. Linh, N.L.M.; Van, D.H.; Duong, T.; Tinh, M.X.; Khieu, D.Q. Adsorption of Arsenate from Aqueous Solution onto ModifiedVietnamese Bentonite. Adv. Mater. Sci. 2019, 2019, 2710926.
71. Yusuff, A.S. Adsorption of hexavalent chromium from aqueous solution by Leucaena leucocephala seed pod activated carbon:Equilibrium, kinetic and thermodynamic studies. Arab J. Basic Appl. Sci. 2019, 26, 89–102. [CrossRef]
72. Singh, P.; Chauhan, K.; Priya, V.; Singhal, R.K. A greener approach for impressive removal of As(III)/As(V) from an ultra-lowconcentration using a highly efficient chitosan thiomer as a new adsorbent. RSC Adv. 2016, 6, 64946. [CrossRef]
73. Belachew, N.; Rama Devi, D.; Basavaiah, K. Facile green synthesis of L-methionine capped magnetite nanoparticles for adsorptionof pollutant Rhodamine B. J. Mol. Liq. 2016, 224, 713–720. [CrossRef]
74. Zubair, Y.O.; Fuchida, S.; Tokoro, C. Insight into the Mechanism of Arsenic(III/V) Uptake on Mesoporous ZerovalentIron−Magnetite Nanocomposites: Adsorption and Microscopic Studies. Appl. Mater. Interfaces 2020, 12, 49755–49767. [CrossRef][PubMed]
75. Ganzagh, M.A.A.; Yousefpour, M.; Taherian, Z. The removal of mercury (II) from water by Ag supported on nanomesoporoussilica. J. Chem. Biol. 2016, 9, 127–142. [CrossRef]
76. Ayranci, E.; Duman, O. Structural effects on the interactions of benzene and naphthalene sulfonates with activated carbon clothduring adsorption from aqueous solutions. Chem. Eng. J. 2010, 156, 70–76. [CrossRef]
77. Duman, O.; Tunç, S.; Polat, T.G. Adsorptive removal of triarylmethane dye (Basic Red 9) from aqueous solution by sepiolite aseffective and low-cost adsorbent. Appl. Clay Sci. 2015, 109, 22–32. [CrossRef]
78. Duman, O.; Ayranci, E. Adsorptive removal of cationic surfactants from aqueous solutions onto high-area activated carbon clothmonitored by in situ UV spectroscopy. J. Hazard. Mater. 2010, 174, 359–367. [CrossRef]

Nanomaterials 2021, 11, 1345 21 of 21
79. Hassan, A.F.; Abdel-Mohsen, A.M.; Elhadidy, H. Adsorption of arsenic by activated carbon, calcium alginate and their compositebeads. Int. J. Biol. Macromol. 2014, 68, 125–130. [CrossRef]
80. Wang, Z.; Zhu, H.; Wang, X.; Yang, F.; Yang, X. One-pot green synthesis of biocompatible arginine-stabilized magnetic nanoparti-cles. Nanotechnology 2009, 20, 465606. [CrossRef]
81. Duman, O.; Tunç, S.; Polat, T.G. Determination of adsorptive properties of expanded vermiculite for the removal of C. I. Basic Red9 from aqueous solution: Kinetic, isotherm and thermodynamic studies. Micropor. Mesopor. Mat. 2015, 210, 176–184. [CrossRef]
82. Duman, O.; Polat, T.G.; Diker, C.Ö.; Tunç, S. Agar/κ-carrageenan composite hydrogel adsorbent for the removal of MethyleneBlue from water. Int. J. Biol. Macromol. 2020, 160, 823–835. [CrossRef] [PubMed]
83. Mohan, D.; Dey, S.; Dwivedi, S.B.; Shukla, S.P. Adsorption of arsenic using low cost adsorbents: Guava leaf biomass, mango barkand bagasse. Curr. Sci. 2019, 117, 649–661. [CrossRef]
84. Sarkar, P.; Pal, P.; Bhattacharyay, D.; Banerjee, S. Removal of arsenic from drinking water by ferric hydroxide microcapsule-loadedalginate beads in packed adsorption column. J. Environ. Sci. Health A 2010, 45, 1750–1757. [CrossRef] [PubMed]
85. Rahdar, S.; Taghavi, M.; Khaksefidi, R.; Ahmadi, S. Adsorption of arsenic (V) from aqueous solution using modified saxaul ash:Isotherm and thermodynamic study. Appl. Water Sci. 2019, 87, 1–9. [CrossRef]
86. Ocinski, D.; Jacukowicz-Sobala, I.; Kociołek-Balawejder, E. Alginate beads containing water treatment residuals for arsenicremoval from water formation and adsorption studies. Environ. Sci. Pollut. Res. 2016, 23, 24527–24539. [CrossRef] [PubMed]
87. Alarcon, M.; Lopez, M. Technical feasibility of using magnetic nanoparticles obtained from metallic wool for arsenite (As (III))removal from aqueous solutions. J. Nanosci. Technol. 2016, 4, 35–43.
88. Rahman, S.; Yanful, E. Arsenic and chromium removal by mixed magnetite-maghemite nanoparticles and the effect of phosphateon removal. J. Environ. Manag. 2011, 11, 2238–2247.
89. Joshi, S.; Kumari, A.; Banjara, A.; Sharma, M. Use of iron oxide/activated carbon magnetic composite for adsorptive removal ofarsenic from water. Int. J. Adv. Eng. 2019, 1, 9–16.
90. Vatutsina, O.M.; Soldatov, V.S.; Sokolova, V.I.; Johann, J.; Bissen, M.; Weissenbacher, A. A new hybrid (polymer/inorganic) fibroussorbent for arsenic removal from drinking water. React. Funct. Polym. 2007, 67, 184–201. [CrossRef]
91. Mandal, S.; Sahu, M.K.; Patel, R.K. Adsorption studies of arsenic(III) removal from water by zirconium polyacrylamide hybridmaterial (ZrPACM-43). Water Resour. Ind. 2013, 4, 51–67. [CrossRef]
92. Maji, S.K.; Pal, A.; Pal, T. Arsenic removal from real-life groundwater by adsorption on laterite soil. J. Hazard. Mater. 2008, 151,811–820. [CrossRef]
Related Documents