Author: Ida Andersson Examiner: Lars Nilsson Supervisors: Fredrik Innings, Ulrika Brintje and Björn Bergenståhl Building texture The impact of mixing and recipe parameters on mayonnaise quality Lund University Department of Food Technology, Engineering and Nutrition

Welcome message from author
This document is posted to help you gain knowledge. Please leave a comment to let me know what you think about it! Share it to your friends and learn new things together.
Transcript
Author: Ida Andersson Examiner: Lars Nilsson
Supervisors: Fredrik Innings, Ulrika Brintje and Björn Bergenståhl
Building texture -‐The impact of mixing and recipe parameters on
mayonnaise quality
Lund University Department of Food Technology, Engineering and Nutrition

ii
Abstract Mayonnaise is an oil in water emulsion with a high oil content dispersed in a continuous water phase. The egg is used as the emulsifier, which stabilizes the oil droplets in the continuous phase. The objective was to increase the knowledge of the mayonnaise production process and its impact on the mayonnaise quality. The approach was to produce mayonnaise with a high shear rotor-‐stator mixer and vary mixing parameters and recipe parameters to evaluate their impact on the product. The produced mayonnaise was analysed with measurements of the oil droplet size (laser diffraction) and the texture (texture analyser and rheometer). The results from the experiments showed that several parameters have an impact on the properties of mayonnaise. Variations in the recipe showed that oil content, emulsifier content and type of emulsifier have a great influence on the properties of mayonnaise. The addition of thickener to the product significantly impacted both texture and droplet size of the mayonnaise. From the mixing parameters it was concluded that both mixing time and mixing speed during the emulsification has an impact on the texture and droplet size of the mayonnaise. The theory about colloidal glass has been successfully used to explain the complex system of mayonnaise and how building texture could be achieved. The theory of droplet break up in laminar flow was used to explain the droplet sizes obtained in the experiments.
iii
Preface This Master Thesis project was performed in corporation between Tetra Pak processing and the Department of Food Technology, Engineering and Nutrition at Lund University faculty of engineering (LTH). The Master thesis was part of an ongoing project at Tetra Pak processing, which aims to increase the knowledge of the mayonnaise production process and its impact on the mayonnaise quality. The Master Thesis was started in September 2014 and continued until spring 2015. I wish to thank my supervisors Dr. Fredrik Innings and Ulrika Brintje from Tetra Pak and Prof. Björn Bergenståhl at LTH, for all encouragement and support throughout the project. I also want to thank Dr. Christer Rosén from Källbergs for providing valuable knowledge of mayonnaise and egg. At last I want to thank Dan Johansson for help in conducting the experiments as well as the other colleagues at the Department of Food Technology, Engineering and Nutrition for welcoming me.

iv
Table of content 1 Introduction ................................................................................................................. 1
1.1 Objective ............................................................................................................................ 1 1.2 Hypothesis ......................................................................................................................... 1
2 Background .................................................................................................................. 2 2.1 Ingredients ......................................................................................................................... 2
2.1.1 Oil ....................................................................................................................................... 2 2.1.2 Egg ...................................................................................................................................... 2 2.1.3 Vinegar ................................................................................................................................ 3 2.1.4 Mustard .............................................................................................................................. 4 2.1.5 Sugar and salt ..................................................................................................................... 4 2.1.6 Hydrocolloids ...................................................................................................................... 4
2.2 Microstructure ................................................................................................................... 4 2.3 Stability .............................................................................................................................. 5 2.4 Theory of emulsification ..................................................................................................... 5
2.4.1 Thermodynamics in droplet break-‐up ................................................................................ 5 2.4.2 The Laplace pressure .......................................................................................................... 6 2.4.3 Droplet break up in laminar flow ........................................................................................ 6 2.4.4 Droplet break up in turbulent flow ..................................................................................... 7 2.4.5 Re-‐coalescence of droplets ................................................................................................. 8
2.5 Emulsification in practice ................................................................................................... 8 2.5.1 Mixing parameters ............................................................................................................. 8 2.5.2 Recipe parameters .............................................................................................................. 9
3 Method ...................................................................................................................... 10 3.1 Production of mayonnaise ............................................................................................... 10
3.1.1 Mixer ................................................................................................................................. 10 3.1.2 Reference recipes ............................................................................................................. 11 3.1.3 Procedure ......................................................................................................................... 12
3.2 Analysis of mayonnaise .................................................................................................... 13 3.2.1 Technical parameters ....................................................................................................... 13 3.2.2 Quality parameters ........................................................................................................... 14
4 Experimental design ................................................................................................... 16 4.1 Examine reproducibility ................................................................................................... 16 4.2 Mixing parameters ........................................................................................................... 16
4.2.1 Impact of coarse emulsion time and coarse emulsion speed ........................................... 16 4.2.2 Impact of emulsification time and emulsification speed .................................................. 16 4.2.3 Full factorial design ........................................................................................................... 17
4.3 Recipe parameters ........................................................................................................... 17 4.3.1 Dispersed phase ............................................................................................................... 17 4.3.2 Emulsifier .......................................................................................................................... 18 4.3.3 Continuous phase ............................................................................................................. 18
4.4 Low fat products .............................................................................................................. 19 4.4.1 Emulsification time and emulsification speed in low fat products ................................... 19 4.4.2 Dosage in low fat products ............................................................................................... 19
4.5 Statistical analysis ............................................................................................................ 19 4.5.1 One-‐way anova ................................................................................................................. 19 4.5.2 Linear regression .............................................................................................................. 20 4.5.3 Multiple regression analysis ............................................................................................. 20
v
5 Results and discussion ................................................................................................ 21 5.1 Selection of analysis method ............................................................................................ 21 5.2 Statistical analysis of reproducibility ................................................................................ 22 5.3 Mixing parameters ........................................................................................................... 23
5.3.1 Impact of coarse emulsion time and coarse emulsion speed ........................................... 23 5.3.2 Impact of emulsification time and emulsification speed .................................................. 24 5.3.3 Full factorial design ........................................................................................................... 30 5.3.4 Correlations between droplet size, distribution width and Stevens value ....................... 31
5.4 Recipe parameters ........................................................................................................... 33 5.4.1 Impact of the dispersed phase ......................................................................................... 33 5.4.2 Impact of emulsifier .......................................................................................................... 35 5.4.3 Impact of emulsifier type .................................................................................................. 37
5.5 Low fat mayonnaise ......................................................................................................... 38 5.5.1 Impact of emulsification time on low fat and full fat mayonnaise ................................... 38 5.5.2 Impact of emulsification time on low fat and full fat mayonnaise ................................... 40 5.5.3 Impact of dosage .............................................................................................................. 41 5.5.4 Summary low fat products ............................................................................................... 41
5.6 Correlation droplet size and Stevens value – mixing parameters, recipe parameters and low fat products ........................................................................................................................ 42
6 General discussion ..................................................................................................... 43 6.1 Building texture ............................................................................................................... 43
6.1.1 Glass-‐transition ................................................................................................................. 43 6.1.2 Including impact of attraction .......................................................................................... 44 6.1.3 Polydispersity ................................................................................................................... 45
6.2 Droplet break up .............................................................................................................. 46 6.3 Key parameters ................................................................................................................ 46
7 Conclusions ................................................................................................................ 47
8 References ................................................................................................................. 48
9 Appendix ................................................................................................................... 51 9.1 Mixing parameters ........................................................................................................... 51 9.2 Recipe parameters ........................................................................................................... 53 9.3 Low fat products .............................................................................................................. 54 9.4 Multiple regression analysis ............................................................................................. 55 9.5 Recipes ............................................................................................................................ 56 9.6 Oil inlet times ................................................................................................................... 57
1
1 Introduction Mayonnaise is used throughout the world and has a history dating back several centuries (Depree, 2001). It is a semi-‐solid food, which typically consists of oil, egg, vinegar, mustard, salt and sugar. Oil is the main ingredient in mayonnaise and the volume fraction range between 65 and 80 % in a full fat mayonnaise and with lower amounts in low-‐fat products (Ma and Boye, 2013). The semi-‐solid structure of mayonnaise creates an interesting rheological behaviour of the product, which is important for the understanding of mayonnaise and therefore often investigated (Štern et al, 2007). The oil droplet size is the second parameter of interest, due to its ability to influence the appearance, texture and stability of mayonnaise (McClements, 2005). Mayonnaise is an oil in water emulsion with a high oil content dispersed in a continuous water phase, where egg is the emulsifier. Most commonly mayonnaise is produced using a rotor-‐stator mixer (Bengoechea, 2009), where the important process is the break up of oil droplets, also referred to as the emulsification. In parallel with the droplet break up, adsorption of the emulsifier to the newly formed droplets takes place. The fast adsorption is of importance to maintain the integrity of the droplets (Ford et al. 2007).
1.1 Objective The objective of this project was to increase the knowledge of the mayonnaise production process and its impact on the mayonnaise quality. The approach was to produce mayonnaise with a high shear mixer and vary mixing parameters and recipe parameters to evaluate their impact on the product. The produced mayonnaise was analysed regarding both technical and quality parameters to evaluate the effect of the mixing and recipe variations. The droplet size was chosen as the technical parameter and the texture of the mayonnaise was chosen as the quality parameter.
1.2 Hypothesis It is hypothesized that the following parameters have an impact on the technical and quality properties of the mayonnaise:
§ The mixing time during coarse emulsion and emulsification § The speed of the rotor during coarse emulsion and emulsification § The temperature during emulsification § The volume of the dispersed phase § The emulsifier type and content § The pH of the continuous phase § Addition of thickeners to the continuous phase

2
2 Background
2.1 Ingredients
2.1.1 Oil The amount of oil has a great impact on the properties of mayonnaise and is responsible for several of the typical attributes of a mayonnaise. It builds up the viscosity, creating the typical rheological properties of the mayonnaise, which can be perceived both in the package and in the mouth. The oil also has an influence on the flavour and appearance (gloss) of the final product. Different types of oils are used in mayonnaise production and the commonly used ones include rapeseed oil, soybean oil, sunflower oil and olive oil. Since oil has a great impact on the characteristics of the mayonnaise, it is challenging to substitute the oil with thickeners, as required in low-‐fat mayonnaises (Ma and Boye, 2013).
2.1.2 Egg Egg is used as the emulsifier in mayonnaise and is responsible for stabilising the oil droplets in the water phase. Most commonly only egg yolk is used, due to its superior emulsification properties compared to the albumen, but sometimes whole-‐eggs are used. Due to the limited shelf life of fresh egg yolk, preservation techniques such as pasteurization, salting, drying or freezing of the egg yolk is often applied (Anton, 2013). Egg yolk can be separated into two different parts by centrifugation. These are referred to as granules (sediment) and the plasma (supernatant), as shown in figure 1 below. The plasma consists of livetins and LDL. Livetins are different kinds of soluble proteins, including for example α-‐ β-‐ and γ-‐ livetin. LDL is a lipoprotein, which consists of an inner core of triglycerides covered by a monolayer of phospholips, proteins (referred to as apoproteins) and a small part of cholesterol to induce stability, see figure 2. The granules are present in complexes ranging from 0.3 μm up to 2 μm, with the main part consisting of high-‐density-‐lipoproteins (HDL). The HDLs are differing in the structure compared to the LDLs, which results in less solubility in water. The structure of HDL is characterized by two monomers consisting of several β-‐sheet, which form a cleavage where the triglycerides are incorporated. The phosvitins are proteins, which are linked to HDL with phosphocalic bridges. LDLs are also present to a certain extent in the granules and are then referred to as LDLg (Anton, 2007).
Figure 1. A schematic view of the different components present in egg yolk, after Anton (2013).
Egg yolk
Granules
HDL 70%
Phosvitin 16%
LDLg 12%
Plasma
Livetins 15%
LDL 85%

3
The emulsifying properties of egg yolk, derives from the granules, LDLs and livetins. The LDLs has a very flexible structure, which allows the triglycerides to fuse with the oil droplets while the phospholipids and the apoproteins spread at the interface. This process is initiated by the anchoring of an apoprotein to the surface of the lipid droplet, thereafter the protein starts to unfold giving the disruption of the LDL structure (Anton 2013). The livetins have also been found to adsorb at the oil-‐water interface in mayonnaise and impact in emulsion formation (Kisseglou and Sherman, 1983). The emulsifying capacity of the granules is highly dependent on the environmental condition in the emulsion. Mayonnaise has a high ionic strength and a low pH, which affect the solubility of granules. At high ionic strength the phosphocalcic bridges between HDL and phosvitin are weakening, which increase the solubility and hence emulsifying properties, but on the other hand the low pH is decreasing the solubility significantly (Anton, 2013).
As previously mentioned the egg yolk used in the industry is often pre-‐treated, a common method used is spray-‐drying (Moros, 2002). The spray-‐drying process is affecting the properties of the egg yolk, since the proteins are sensitive to thermal treatments. The apoproteins in the LDL and the livetins are thought to be the most heat sensitive proteins, which have shown to start denaturing already at 62-‐65°C. Examining the emulsifying properties with increased thermal treatment, Guilmineau and Kulozik (2007) found a decrease in droplet size and increased viscosity with stronger heat treatment. The increased emulsifying properties are thought to relate to unfolding of apoprotein and livetins, which leads to more surface hydrophobicity and flexibility, thus facilitating the adsorption at the oil interface (Guilmineau and Kulozik, 2007). According to Guilmineau and Kulozik (2006), the heat treatment also creates aggregates between denatured proteins and the granules. Due to weak interactions only made up of hydrophobic interaction, shear forces induced during emulsification are assumed to break these interactions leading to exposed hydrophobic sites with great ability to adsorb at oil-‐water interface (Guilmineau and Kulozik, 2006).
2.1.3 Vinegar An acidifying agent is added to the continuous phase of the mayonnaise, most commonly vinegar is used. Vinegar gives both characteristic flavours and a decrease in pH, which inhibits microbial growth (Ma and Boye, 2013). As mentioned earlier the pH is affecting the solubility of the granules in the egg yolk and the vinegar is therefore thought to have an impact on the emulsification process of mayonnaise.
a) b)
Figure 2. a) A schematic picture of the LDL and its components. b) The adsorption mechanism of LDL, from Anton (2013).

4
2.1.4 Mustard Mustard is added to give taste to the final product and is possible to add either as regular mustard or as mustard powder into the continuous water phase. Harrison and Cunningham (1985) examined the effect of mustard as an emulsifier and found that mustard could aid in stabilizing oil droplets in a continuous water phase.
2.1.5 Sugar and salt Sugar and salt is usually added to mayonnaise as flavourings. The addition of sugar and salt is lowering the water activity of the mayonnaise, which aids in counteracting bacterial growth. Depending on the amount of salt added to the mayonnaise, it can alter the structure on the egg yolk and thereby affect its emulsifying properties as previously mentioned (Ma and Boye, 2013).
2.1.6 Hydrocolloids Hydrocolloids include gums, starches or cellulose, which could be modified chemically or enzymatically. Hydrocolloids acts as functional ingredients and are often added to yield texture in food, they are therefore often referred to as thickeners (Dickinsson, 2003). The hydrocolloids impact the properties by forming networks or by acting as a bulking agent in the continuous phase. Adding hydrocolloids significantly increases the stability of an emulsion, which could be explained by several different interactions such as steric interactions, hydrogen bonding and hydrophobic association (Ma and Boye, 2013). In food production with hydrocolloids, an important step is the solubilisation of hydrocolloids. The dissolution should ensure the individualization of the macromolecule to fully utilize its functional properties. To individualize the macromolecule a dispersing of the hydrocolloids is performed to separate each grain of the powder to prevent formation of lumps, since these are very hard to dissolve. The water uptake is very important and should outcompete the interaction between the macromolecules. During this process it is very important to ensure enough time and a high agitation, although the exact settings are dependent on the properties of the hydrocolloids. Hydrocolloids with weak interactions, such as xanthan and guar gum, are possible to dissolve in cold water while other gums require heating to enable solubilisation (Doublier and Cuvelier, 2014).
2.2 Microstructure Mayonnaise is mostly made up of lipids and therefore the lipids are of great interest when examining the microstructure of mayonnaise. The lipids are in the form of droplets and a variety of sizes can be seen. Due to the high content of the dispersed phase the lipids are tightly packed together, which makes the droplets loose their spherical shape and form a hexagonal form, see figure 3 (McClements, 2005; Ford et al. 1997). Larger droplets tend to have a greater non-‐spherical shape probably because of their lower La Place pressure (McClements, 2005). The size ranges of all droplets are typically broad between 0.1 μm and up to more than 10 μm, with a mean radius of approximately 2 μm. The wide size range of droplets enables the close packaging of droplets and thereby a very high volume of the dispersed phase (up to 80 %) is possible, which would not be able to achieve with a disperse phase consisting of a monodispersed fluid. The lipid droplets are coated with an interfacial layer consisting of surface-‐active proteins and granules from egg yolk (McClements, 2005). The thickness of the film is between 100-‐200 Å and normally 140 Å in average. In the water continuous phase an aggregated network of egg yolk granules is found, these bind to the interfacial film and create a network between the droplets increasing the viscosity and stability of the mayonnaise (Ford et al. 1997).

5
Figure 3. Showing low-‐magnification transmission electron micrograph on mayonnaise with 80 % oil-‐content. Scale bar is 2 μm, from Ford et al. (1997).
2.3 Stability The shelf life of mayonnaise is several months, which places demands on the stability of product. It is important that the product retain characteristics such as, texture, appearance and taste. Both the stability of the emulsion and chemical reactions, such as lipid oxidation, can have influence on these properties (McClements, 2005). Emulsion stability can be divided into creaming, flocculation and coalescence. Creaming is not a problem in full fat mayonnaise since the tight packaging of the oil droplets not allow the oil droplets to rise to the surface. The flocculation process, which leads to aggregation of oil droplets, can be considered a desired process since the aggregation could increase the viscosity of the product (McClements, 2005). Coalescence is the main issue in a mayonnaise product, since it could cause a phase separation leading to oil on the surface of the product. Coalescence occurs when the droplets come into close contact with each other and the interfacial film surrounding the droplet ruptures, leading to formation of larger droplets. In mayonnaise the droplets already are closely packed and therefore it is important with a stable interfacial membrane to hinder coalescence. (McClements, 2005).
2.4 Theory of emulsification The emulsification step is the most important part of the mayonnaise production process and consists of droplet break up and stabilization of the newly formed droplets. To achieve the desired properties of mayonnaise, the oil droplets in emulsion needs to be in the microscale. To create such small droplets, there is a need in decreasing large oil droplets into smaller ones.
2.4.1 Thermodynamics in droplet break-‐up Emulsions consist of two immiscible liquids and are therefore by nature thermodynamically unstable (Tadros, 2013). The process of dispersing the oil in the water can thermodynamically be described by the free energy of droplet formation, see eq 1.
∆𝐺! = 𝛾∆𝐴 − 𝑇∆𝑆! (1)
6
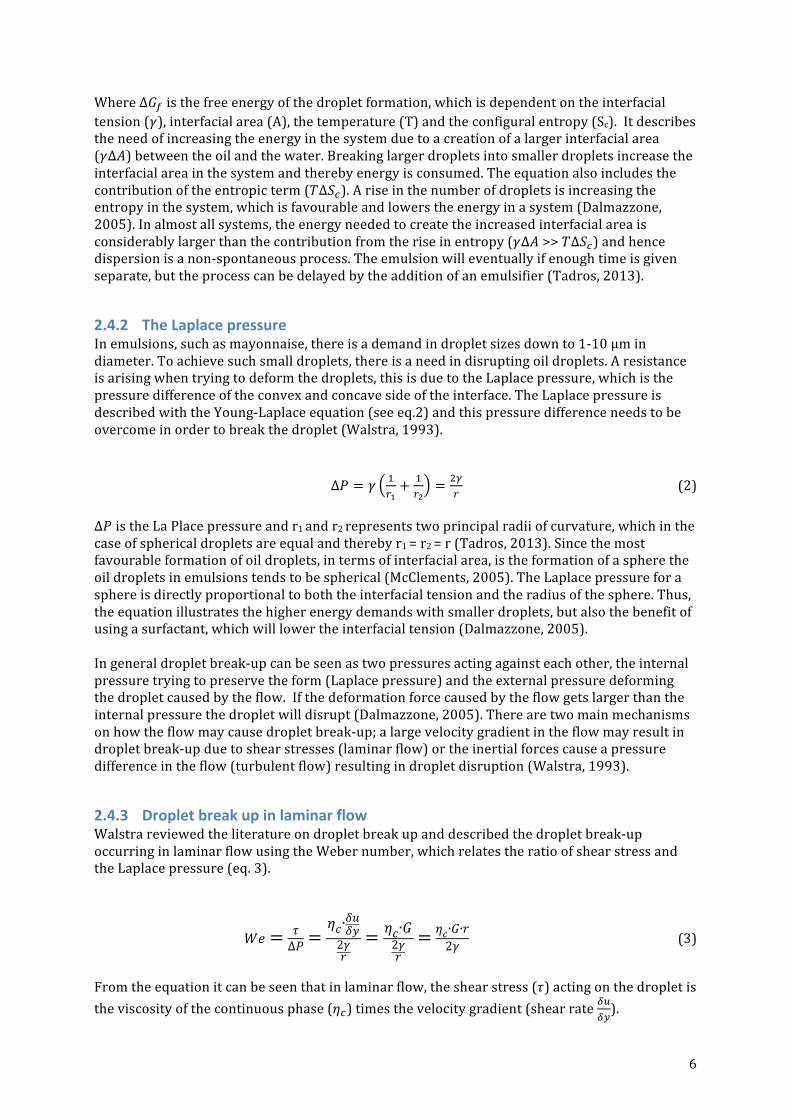
Where ∆𝐺! is the free energy of the droplet formation, which is dependent on the interfacial tension (𝛾), interfacial area (A), the temperature (T) and the configural entropy (Sc). It describes the need of increasing the energy in the system due to a creation of a larger interfacial area (𝛾∆𝐴) between the oil and the water. Breaking larger droplets into smaller droplets increase the interfacial area in the system and thereby energy is consumed. The equation also includes the contribution of the entropic term (𝑇∆𝑆!). A rise in the number of droplets is increasing the entropy in the system, which is favourable and lowers the energy in a system (Dalmazzone, 2005). In almost all systems, the energy needed to create the increased interfacial area is considerably larger than the contribution from the rise in entropy (𝛾∆𝐴 >> 𝑇∆𝑆!) and hence dispersion is a non-‐spontaneous process. The emulsion will eventually if enough time is given separate, but the process can be delayed by the addition of an emulsifier (Tadros, 2013).
2.4.2 The Laplace pressure In emulsions, such as mayonnaise, there is a demand in droplet sizes down to 1-‐10 μm in diameter. To achieve such small droplets, there is a need in disrupting oil droplets. A resistance is arising when trying to deform the droplets, this is due to the Laplace pressure, which is the pressure difference of the convex and concave side of the interface. The Laplace pressure is described with the Young-‐Laplace equation (see eq.2) and this pressure difference needs to be overcome in order to break the droplet (Walstra, 1993).
∆𝑃 = 𝛾 !!!+ !
!!= !!
! (2)
∆𝑃 is the La Place pressure and r1 and r2 represents two principal radii of curvature, which in the case of spherical droplets are equal and thereby r1 = r2 = r (Tadros, 2013). Since the most favourable formation of oil droplets, in terms of interfacial area, is the formation of a sphere the oil droplets in emulsions tends to be spherical (McClements, 2005). The Laplace pressure for a sphere is directly proportional to both the interfacial tension and the radius of the sphere. Thus, the equation illustrates the higher energy demands with smaller droplets, but also the benefit of using a surfactant, which will lower the interfacial tension (Dalmazzone, 2005). In general droplet break-‐up can be seen as two pressures acting against each other, the internal pressure trying to preserve the form (Laplace pressure) and the external pressure deforming the droplet caused by the flow. If the deformation force caused by the flow gets larger than the internal pressure the droplet will disrupt (Dalmazzone, 2005). There are two main mechanisms on how the flow may cause droplet break-‐up; a large velocity gradient in the flow may result in droplet break-‐up due to shear stresses (laminar flow) or the inertial forces cause a pressure difference in the flow (turbulent flow) resulting in droplet disruption (Walstra, 1993).
2.4.3 Droplet break up in laminar flow Walstra reviewed the literature on droplet break up and described the droplet break-‐up occurring in laminar flow using the Weber number, which relates the ratio of shear stress and the Laplace pressure (eq. 3).
𝑊𝑒 = 𝜏∆𝑃 =
𝜂𝑐∙𝛿𝑢𝛿𝑦
2𝛾𝑟
= 𝜂𝑐∙𝐺2𝛾𝑟= 𝜂𝑐∙𝐺∙𝑟
2𝛾 (3)
From the equation it can be seen that in laminar flow, the shear stress (𝜏) acting on the droplet is the viscosity of the continuous phase (𝜂!) times the velocity gradient (shear rate
!"!").
7
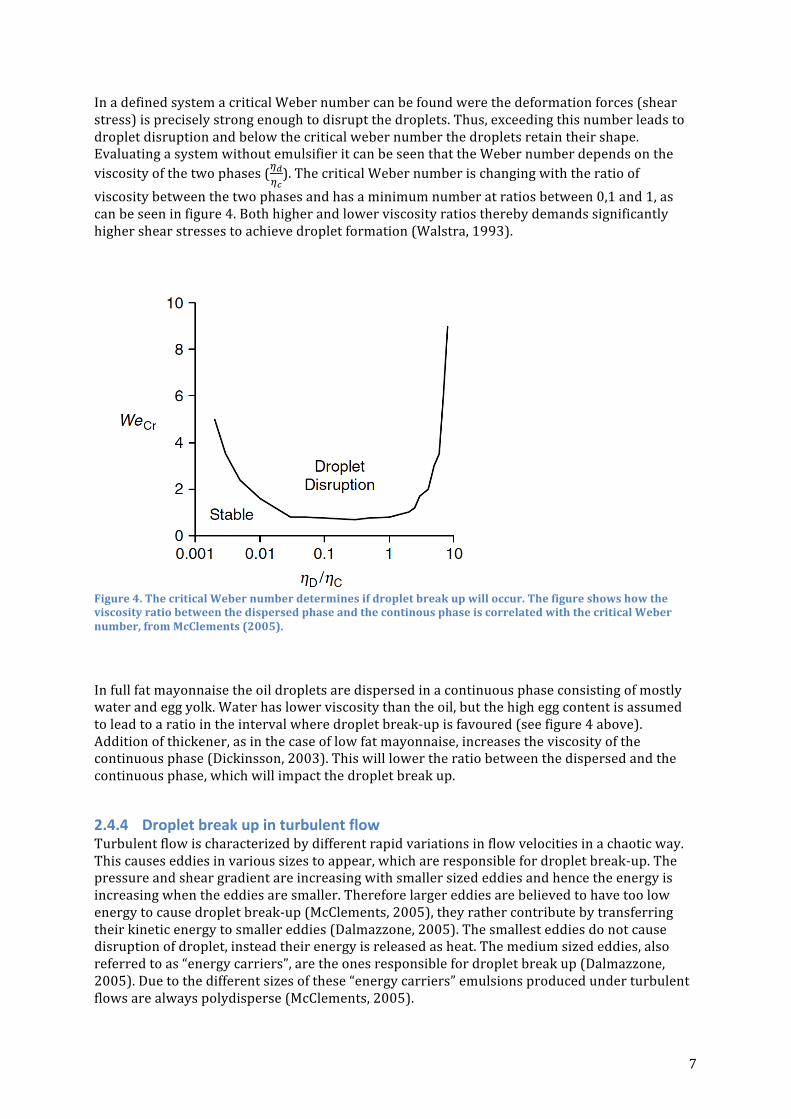
In a defined system a critical Weber number can be found were the deformation forces (shear stress) is precisely strong enough to disrupt the droplets. Thus, exceeding this number leads to droplet disruption and below the critical weber number the droplets retain their shape. Evaluating a system without emulsifier it can be seen that the Weber number depends on the viscosity of the two phases (!!
!!). The critical Weber number is changing with the ratio of
viscosity between the two phases and has a minimum number at ratios between 0,1 and 1, as can be seen in figure 4. Both higher and lower viscosity ratios thereby demands significantly higher shear stresses to achieve droplet formation (Walstra, 1993).
Figure 4. The critical Weber number determines if droplet break up will occur. The figure shows how the viscosity ratio between the dispersed phase and the continous phase is correlated with the critical Weber number, from McClements (2005).
In full fat mayonnaise the oil droplets are dispersed in a continuous phase consisting of mostly water and egg yolk. Water has lower viscosity than the oil, but the high egg content is assumed to lead to a ratio in the interval where droplet break-‐up is favoured (see figure 4 above). Addition of thickener, as in the case of low fat mayonnaise, increases the viscosity of the continuous phase (Dickinsson, 2003). This will lower the ratio between the dispersed and the continuous phase, which will impact the droplet break up.
2.4.4 Droplet break up in turbulent flow Turbulent flow is characterized by different rapid variations in flow velocities in a chaotic way. This causes eddies in various sizes to appear, which are responsible for droplet break-‐up. The pressure and shear gradient are increasing with smaller sized eddies and hence the energy is increasing when the eddies are smaller. Therefore larger eddies are believed to have too low energy to cause droplet break-‐up (McClements, 2005), they rather contribute by transferring their kinetic energy to smaller eddies (Dalmazzone, 2005). The smallest eddies do not cause disruption of droplet, instead their energy is released as heat. The medium sized eddies, also referred to as “energy carriers”, are the ones responsible for droplet break up (Dalmazzone, 2005). Due to the different sizes of these “energy carriers” emulsions produced under turbulent flows are always polydisperse (McClements, 2005).
8
Droplet break-‐up could also be caused by cavitational flow conditions, but this mostly occurs in ultrasonic and high-‐pressure valve homogenizers. A high pressure difference causes a cavitation to be formed in the liquid and the following collapse causes a shock-‐wave that disrupts droplets nearby (McClements, 2005).
2.4.5 Re-‐coalescence of droplets After the creation of a new interfacial area, stabilization with emulsifier is crucial to avoid coalescence of droplets. The final droplet size can be thought of as a combination of droplet break-‐up and re-‐coalescence. Collisions of droplets occur rapidly after they are formed due to Brownian motion and turbulence in the system and the adsorption rate is therefore of importance. Longer adsorption timescales compared to collision timescales could result in an unstabilized surface and a re-‐coalescence (Jafari et al. 2008).
2.5 Emulsification in practice Mayonnaise can be produced either in a continuous production or in a batch production. The emulsification is often divided into two steps. In the first step all ingredients in the continuous phase (water, acid, egg, flavourings) are mixed and the oil is added slowly to create a coarse emulsion, thereafter further disruption of the droplets produces the final mayonnaise (McClements, 2005). Mayonnaise is commonly produced using a high shear rotor-‐stator mixer. These types of mixers consist of a rotating disk (rotor) and a static disc (stator), with a very narrow gap, 100-‐3000 μm. Typical for high shear rotor-‐stator mixers is the high peripheral speed ranging from 10 up to 50 m/s as well as the high shear rates ranging from 20 000 up to 100 000 s-‐1. The high shear mixers also has a very high energy dissipation close to the mixer head, due to the forces generated by the relative motion between the rotor and stator. This leads to a energy dissipation rate in the range of 1000 up to 100 000 m2/s3. The droplet sizes produced in rotor-‐stator mixers range from 0.5 up to 100 μm (Zhang et al. 2012). There are several parameters affecting the properties of mayonnaise and in this report those are divided into mixing parameters and recipe parameters. The impact of the parameters is evaluated with texture and droplet size measurements, since they are expected to have a great impact on the final product (Stern, 2007; McClements, 2005).
2.5.1 Mixing parameters The equipment design is of importance for the produced emulsion. Rotor-‐stator equipment, previously mentioned, often allows for varying the gap between the stator. According to Santana et al. (2013) the size of the gap can vary between 50-‐1000 µm for different food applications, whereas another article proposed gap widths up to 3000 µm (Adler-‐Nissen et al. 2004). The second parameter that could be altered is the speed of the rotor, referred to as the peripheral speed. Two different studies have been found examining the effect of different peripheral speed on full fat mayonnaise, but both studies has lower peripheral speed compared to the typical range between 10-‐50 m/s. Moslavac et al. (2011) performed a study on mayonnaise with 70 % oil content in a small rotor-‐stator mixer and found increased apparent viscosity (at 68 s-‐1) from 168 up to 331 mPas at peripheral speed from 7.9 m/s up to 11.8 m/s. Adler-‐Nissen et al. (2004) varied the peripheral speeds in a full fat mayonnaise from 1m/s up to 9 m/s in a small batch mixer and found decreasing droplet sizes with increased peripheral speeds. The Sauter diameter (D3,2) decreased from approximately 9 μm to 3μm.

9
The time of emulsification can also vary in the production of mayonnaise. Moslavac et al. (2011) increased the emulsification time from 3 to 8 minutes, which resulted in higher apparent viscosity (at 68 s-‐1) for all mayonnaise samples. Another study examined the contribution of emulsification time on the droplet size of the mayonnaise. The emulsification times were varied between 2.5 minutes up to 60 minutes for a full fat mayonnaise and it could be seen that the median particle diameter decreased with residence times up to 20 minutes (Maruyama et al. 2006).
2.5.2 Recipe parameters The ingredients also have an impact on the properties of the mayonnaise. The egg yolk concentration can have an effect on both droplet size distribution and the viscoelastic properties. Bengoechea et al. (2009) found that increasing the amount of liquid egg yolk from 2 wt% to 5 wt% led to a decrease in droplet size and also an increase in viscoelastic properties (higher storage and loss moduli). Bengoechea et al. (2009) suggested that the results are probably due to the possibility of stabilizing a larger interfacial area with an increased amount of emulsifier and thereby a larger number of droplets can be formed. A higher number of droplets leads to more interactions and thereby more pronounced viscoelastic properties (Bengoechea et al. 2009). Another study examined the effect of spray-‐dried egg yolk content on droplet size distribution and found that a minimum in droplet size appeared with an addition of 3,2 % egg powder (1,1 % up to 4,8 % was used) (Moros et al. 2002). Yang et al. (1989) compared the effect of different types of egg yolk on the viscosity and stiffness of the mayonnaise. It was clear that all types of treatment such as salting, pasteurizing, spray-‐drying or freezing increased both viscosity and the stiffness of the mayonnaise. The stability of the product however decreased by spray-‐drying and freezing and examining the microstructure these samples contained larger fat globules. The oil is also one of the parameters affecting the mayonnaise. Stern et al. (2007) reported that oil content have an affect on the rheological properties of mayonnaise. Experiments were performed with oil content ranging from 66 % up to 82 %, with an included thickening agent. The results clearly showed an increase in yield value with increasing oil content.
10
3 Method The mayonnaise was produced using a rotor-‐stator mixer. Variation in both mixing parameters as well as recipe parameters have been made to evaluate the effect on the mayonnaise. To analyse the result both technical and quality parameters were measured on the produced mayonnaise. The droplet size was used as the technical parameter and the texture was used as the quality parameter.
3.1 Production of mayonnaise
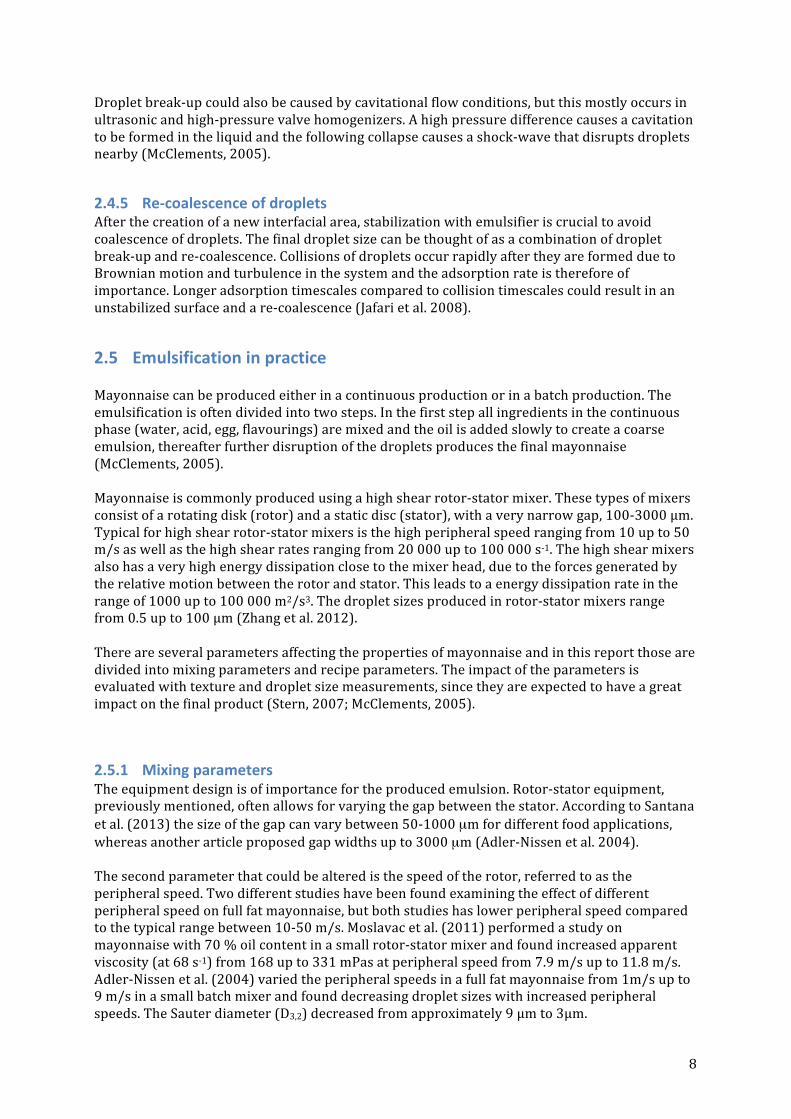
3.1.1 Mixer The mayonnaise was produced using a Tetra Almix B120-‐25VA mixer, which can be seen in figure 5a below. The mixer has a rotor-‐stator device in the bottom of the vessel and the vessel is located on the left side of the bench. The rotor-‐stator device can be seen from above in figure 5b and the standard stator is pictured from the side in figure 5c. The stator in figure 5b is in the lower position, but there is a possibility to raise and lower the stator during the process to obtain low versus high shear In the lower position there is no space between the vessel and the edge of the stator, meaning that all flow must go through the slots of the stator, causing a high shear flow. On the other hand, when the stator is in the upper position (lifted), the flow can go underneath the stator lowering the shearing of the fluid. The designation B120 is referring to the batch mode of the mixer and a rotor head with 120 mm in diameter, while 25VA stands for 25 l in batch size, a possibility to apply a vacuum and the addition of an agitator. The additional agitator is used to obtain a good bulk flow of the product. The rotor and the agitator has opposite directions, the rotor is rotating counter clockwise and the agitator has a clockwise direction. Additional settings for the mixer are stated in table 1.
Figure 5. a) Tetra Almix B120-‐25VA, the vessel is located to the left of the mixer and the display to determine settings for the run is located to the right. b) (on top) The rotor head and stator seen from above. C) (bottom) The standard stator seen from the side.
rotor
stator b)
a)
c)
11
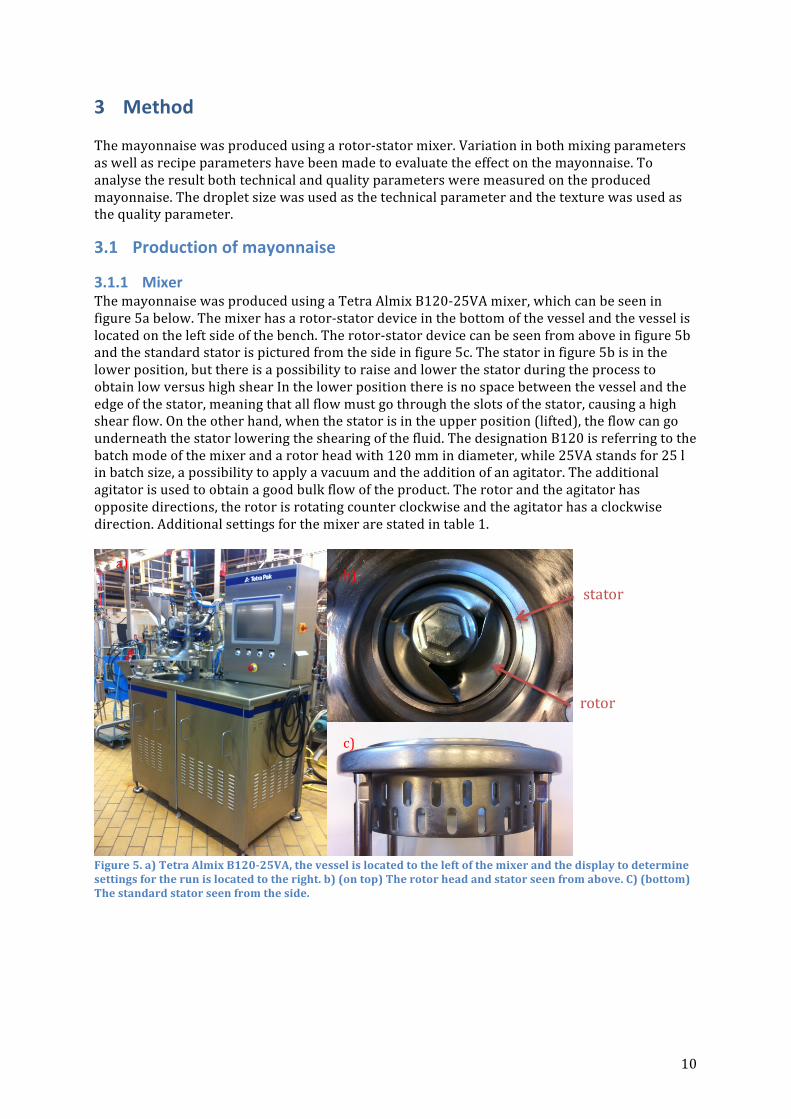
Table 1. Mixer settings applied in the runs.
Setting Value Diameter vessel 34 cm Height vessel 29 cm Stator slots 5*14 mm Gap size 1 mm Vacuum 500 mbar Cold water temperature 5°C Product temperature 15°C
3.1.2 Reference recipes A standard recipe of full fat mayonnaise was used to evaluate mixing parameters, as can be seen in table 2. Evaluating changes caused by recipe parameters was performed with variations of the standard recipe, where the exact amount of ingredients can be found in Appendix 9.5 Recipes. In the low fat products a thickener (Grindstedt FF 1145MF, Danisco, Haderslev) containing acetylated distarch adipate, guar gum and xanthan gum was added and the new recipe can be found in table 3. Mustard and egg yolk was stored in cold room (4°C), while the other ingredients were kept at room temperature (20°C). The egg yolk and mustard was removed from the cold storage in connection to the trials and the temperature was around 4°C, when added to the vessel together with the other ingredients which had been stored in room temperature. Table 2. Reference recipe used to evaluate mixing parameters.
Ingredient Fraction (w/w %) Amount (kg) Water 5.80 1.45 Salt 0.300 0.0750 Sugar 0.300 0.0750
Mustard1 2.50 0.625 Vinegar2 2.10 0.525
Egg yolk liquid3 8.50 2.13 Rapeseed oil4 (Rapsona) 80.5 20.1
Total amount 100 25.0 Table 3. Low fat recipe used to evaluate low fat products.
Ingredient Fraction (w/w %) Amount (kg) Water 36.0 9.00 Salt 1.08 0.269
Thickener5 2.75 0.688 Sugar 0.300 0.0750
Mustard1 2.50 0.625 Vinegar2 2.10 0.525
Egg yolk liquid3 5.28 1.32 Rapeseed oil4 50.0 12.5 Total amount 100 25.0
1 Klassisk Senap finmald, Druvan, Eslöv 2 Ättiksprit 12%, Druvan, Eslöv 3 Äggula saltad 8 % (pastöriserad), Källbergs, Töreboda 4 Svensk rapsolja, Rapsona, AAK, Karlshamn 5 Grindstedt FF 1145, Danisco, Haderslev

12
3.1.3 Procedure The four mixing phases used in mayonnaise production is illustrated in figure 6. During the process at each phase the exact time, temperature and power of the mixer is noted.
Figure 6. Procedure for the mayonnaise production. The process is divided in four steps referred to as; Premixing, Coarse emulsion, Emulsification and Mixing. Where the speed and the position of the stator is marked in the figure.
3.1.3.1 Premixing The process was started with a premixing step of the water phase (except vinegar), where water, salt, sugar, mustard and egg yolk was added to the vessel. The cold water was turned on and a vacuum was applied before the start of the mixer. The speed of the mixer can be seen in figure 6 above and the agitator was set at full speed. The volume of the water phase in full fat products is very small and to cover the mixer head, thereby minimizing the splashing on the walls, the stator was in the lower position. The premixing time was set to 1 minute. The premixing was performed in the same manner for all runs except for the low fat products, which is further described below.
3.1.3.1.1 Low fat products The added hydrocolloids in low fat products required extra time for solubilisation and therefore the premixing time for low fat products was prolonged with one minute. The hydrocolloids were dispersed in oil, in a ratio of 1:3, prior to the addition to prevent any lump formation. The hydrocolloids were added to the water phase at the start of the mixing by suction with vacuum and the inlet hole was placed underneath the water phase level close to the mixer unit.
3.1.3.2 Coarse emulsion The coarse emulsion process was initiated by opening the oil inlet and the stator was lifted to achieve a high flow through the mixer. The oil inlet time was regulated with an orifice in the oil inlet and the oil inlet time for respective orifice can be found in table 19, in Appendix 9.6 Oil inlet times. After addition of the oil, the vinegar was added from the top, with vacuum applied, and a final mixing of 10 s was performed prior to the emulsification start. Both the coarse emulsion time and coarse emulsion speed has been varied during the trials and will be further described in the experimental design. The coarse emulsion time and coarse emulsion speed will hereafter be referred to as CET and CES respectively.
7 / 8 / 9
4
1 / 2 / 3
2
Premixing
60 s
Coarse emulsion
35 / 60 / 85 s
Emulsification
40 / 80 / 160 s
Mixing
120 s
Mixer speed Stator down Stator up
Oil intake
Vinegar intake
Speed

13
3.1.3.3 Emulsification During the emulsification the stator was down to obtain high shear in the mixer and the mixer speed was increased. Both the emulsification time and emulsification speed has been varied during the trials. The emulsification time and emulsification speed will hereafter be referred to as ET and ES respectively.
3.1.3.4 Mixing A final mixing step of 120 s was performed to ensure a homogenous final product. The stator was lifted to increase the flow and the speed was set to 4. After the mixing the mayonnaise is ready and a final check of the product temperature was performed with a manual thermometer in the centre and close to the wall. The mixing step was performed in the same manner for all runs.
3.1.3.5 Sample collection The upper layer of 5-‐10 centimetres mayonnaise was removed manually before collecting the samples. Five plastic containers of 1 litre were thereafter filled with mayonnaise, which were sealed and stored at room temperature until analysis the next day. The sampling was performed in the same manner for all runs.
3.2 Analysis of mayonnaise One day after the production of the mayonnaise in the Tetra Almix, the samples were analysed with respect to technical and quality parameters. The parameters were measured at a temperature of 20°C.
3.2.1 Technical parameters The technical parameter, the droplet size, was measured with laser diffraction. Prior to the measurement possible aggregates in the mayonnaise needs to be broken up, which is achieved by dispersing the mayonnaise into a surfactant solution.
3.2.1.1 Dispersion and laser diffraction 1,5 g mayonnaise was dispersed in beaker containing 300 ml 0.01% SDS (sodium dodecyl sulphate) using Ultra Turrax (IKA-‐Labortechnik, Germany, Staufen) for 15 s. To avoid air bubbles in the measurements of the droplet size, a diaphragm pump (Vacuumbrand, Germany, Wertheim) was used together with a vacuum proved flask to remove incorporated air. The droplet size distribution was analysed with a Laser diffraction instrument (Mastersizer 2000, Malvern Instruments, UK, Workshire). The refractive index for the rapeseed oil was set to 1.474 and the absorption 0,0001. The model used is the general purpose with assumption of spherical particles. Further details regarding dispersion and laser diffraction are presented in Cedergårdh, 2014.
3.2.1.1.1 Droplet size To determine droplet size the mode function was used, see figure 7. This is a measure of the diameter of the most common droplet and thus corresponds to the size at the peak of the droplet size distribution.
3.2.1.1.2 Distribution width To evaluate the polydispersity of the mayonnaise the width of the droplet distributions are evaluated. The width is calculated as the inverse of the distribution height, see eq. 4. A higher number thereby indicate a wider droplet size distribution.

14
𝑑𝑖𝑠𝑡𝑟𝑖𝑏𝑢𝑡𝑖𝑜𝑛 𝑤𝑖𝑑𝑡ℎ = !! (4)
3.2.2 Quality parameters The quality of the product was evaluated with measurement of the texture, using a texture analyser and a rheometer. The texture analyser measures the force compression of the mayonnaise and the value obtained is referred to as the Stevens value. The rheometer is used to perform a shear stress sweep, from which both a yield stress value and the apparent viscosity at 10 s-‐1 for the mayonnaise is obtained.
3.2.2.1 Texture analyser Stevens value was obtained using a Texture Analyser (TA-‐XT2i, Stable Microsystems, UK, Godalming) with a Brookfield Engineering probe. The probe was lowered into a glass beaker containing 100 ml of mayonnaise and the compression force was recorded. The speed of the probe was set to 2.0 mm/s and a trigger force (measurements starts to be recorded) was set to 5.0 g. The Stevens value is the average value of the force compression measured between the 5-‐11 s (see figure 8). To avoid air pockets in the beaker, which could impact the measurements negatively, the mayonnaise samples were transferred into the beaker with a syringe. For further details of the measurements see Cedergårdh, 2014.
0,1 1 10 100
Surface area (%
)
Size (μm)
H Mode
Time(s)0 5 10 15 20 25 30 35
Forc
e(g)
-200
-150
-100
-50
0
50
100
150
200Stevens value
Measured dataStevens value
b) a)
Figure 7. Illustrates the height and the mode value obtained from the droplet distribution measurements.
Figure 8. a) The Brookfield Engineering probe attached to the Texture Analyser, seen from above. b) An example of a curve obtained from meausuring a mayonnaise sample. The values used for the Stevens value is marked in red.

15
3.2.2.2 Rheometer A Rheometer (Kinexus pro+, Malvern Instruments, UK, Worcestershire) was used together with a vane geometry (20 mm in diameter) and serrated cup (22 mm inner diameter), see figure 9. The mayonnaise sample was transferred with a syringe and the sample volume was approximately 35 ml. A shear stress sweep was performed with data points at every 5 Pa and the sampling time was set to 0.5 min. For all shear stress data points the corresponding shear rate and apparent viscosity of the mayonnaise was obtained. For further details of the measurements see Cedergårdh, 2014.
Figure 9. a) Serrated cup used in measurements. b) Vane tool used for measurements.
3.2.2.2.1 Yield stress To extract the Yield stress value the second derivative of the apparent viscosity was calculated and plotted as a function of the shear stress. The shear stress value corresponding to the maxima in the curve of the second derivative of apparent viscosity was interpreted as the Yield stress value.
3.2.2.2.2 Apparent viscosity at 10 s-‐1 To acquire the value of apparent viscosity at shear rate of 10 s-‐1, a graph with the apparent viscosity as a function of the shear rate was used. If the apparent viscosity was not measured at shear rate of exactly 10 reciprocal seconds a linear regression was performed between the data points of apparent viscosity closest to this shear rate value.
b) a)

16
4 Experimental design The trials have been divided into three main parts; mixing parameters, recipe parameters and low fat products. An overview of the different parameters is shown in figure 10 below. Further details of each run are presented below.
4.1 Examine reproducibility To examine the reproducibility of the mixer, three runs with equal settings were performed. The runs were performed at different dates and randomized with other runs (see table 4, run 1-‐3).
4.2 Mixing parameters The initial runs were made with variations in mixing parameters. In this section runs were performed to evaluate the impact of coarse emulsion (time and speed) and emulsification (time and speed). This was performed both with trials where one factor at a time was changed, as well as performing a full factorial design where several factors are changed in parallel to obtain information regarding significance of factors and interaction.
4.2.1 Impact of coarse emulsion time and coarse emulsion speed CET (coarse emulsion time) was evaluated with four different runs (4,5,8 and 11 in table 4) using different orifice plates to obtain different flows. CET was also included in the full factorial design, which is described below. CES (coarse emulsion speed) is evaluated with run 14 and the replicated run (1,2 and 3). Lower speed at 1 was also evaluated, but no stable mayonnaise was obtained and is therefore not included in the tables.
4.2.2 Impact of emulsification time and emulsification speed ET (emulsification time) and ES (emulsification speed) respectively and the combined effect of the two was evaluated with addition of 5 runs, included in table 4 as 15-‐19.
Division of trials
Mixing parameters
Coarse emulsion Emulsizication
Recipe parameters
Dispersed phase Emulsizier Continous
phase
Low fat products
Dosage Emulsizication
Figure 10. Overview of variables investigated in all runs, with mixing parameter, recipe parameter and low fat products as the subdivisions.

17
4.2.3 Full factorial design To evaluate significance of the factors a full factorial design (FFD) with three factors at high and low level was performed. The factors included were CET (coarse emulsion time), ET (emulsification time) and ES (emulsification speed). The centerpoint was also included with one run. The uncoded values of the factors are presented in table 4 (6-‐14). Table 4. Runs performed to evaluate mixing parameters, both including variations in times and speeds as well as mixer design. The run marked with a star is the standard run used to evaluate the recipe changes in the following trials.
Run number
Type of run Coarse emulsion Final emulsion Time (s) Speed Time (s) Speed
1 Replicated run 60 2 80 8 2 Replicated run 60 2 80 8 3 Replicated run 60 2 80 8 4 CET 45 3 40 7 5 CET 155 3 40 7 6 Full factorial design 35 3 40 9 7 Full factorial design 85 3 160 9 8 *Full factorial design 85 3 40 7 9 Full factorial design 35 3 160 7 10 Full factorial design 35 3 160 9 11 Full factorial design 35 3 40 7 12 Full factorial design 85 3 40 9 13 Full factorial design 85 3 160 18,4 14 Centerpoint full
factorial design 60 3 80 8
15 ET and ES 85 3 80 8 16 ET and ES 85 3 40 8 17 ET and ES 85 3 80 7 18 ET and ES 85 3 160 8 19 ET and ES 85 3 80 9
4.3 Recipe parameters The second part with the recipe parameters were evaluated by variations of the dispersed phase, the continous phase and the emulsifier. All recipe runs and their mixing settings are presented in table 5 and will be described in further detail below. Run number 8 in table 4 is used as the standard sample to evaluate effect of recipe changes. The precise recipes for the runs below can be found in Appendix 9.5 Recipes.
4.3.1 Dispersed phase To evaluate the effect of the dispersed phase runs with different oil content was performed. The oil contents were set to 82%, 78%, 76%, 74% and 70% (in the mixing runs oil content of 80.5% was evaluated). The emulsifier was adjusted to maintain the ratio between the oil and egg content. The salt content was also adjusted to maintain the ionic strength, as described earlier this might affect the properties of the egg yolk. The amount of the mustard, vinegar and sugar remained the same, while the water content was finally adjusted to compensate for the mass change of the batch.
18
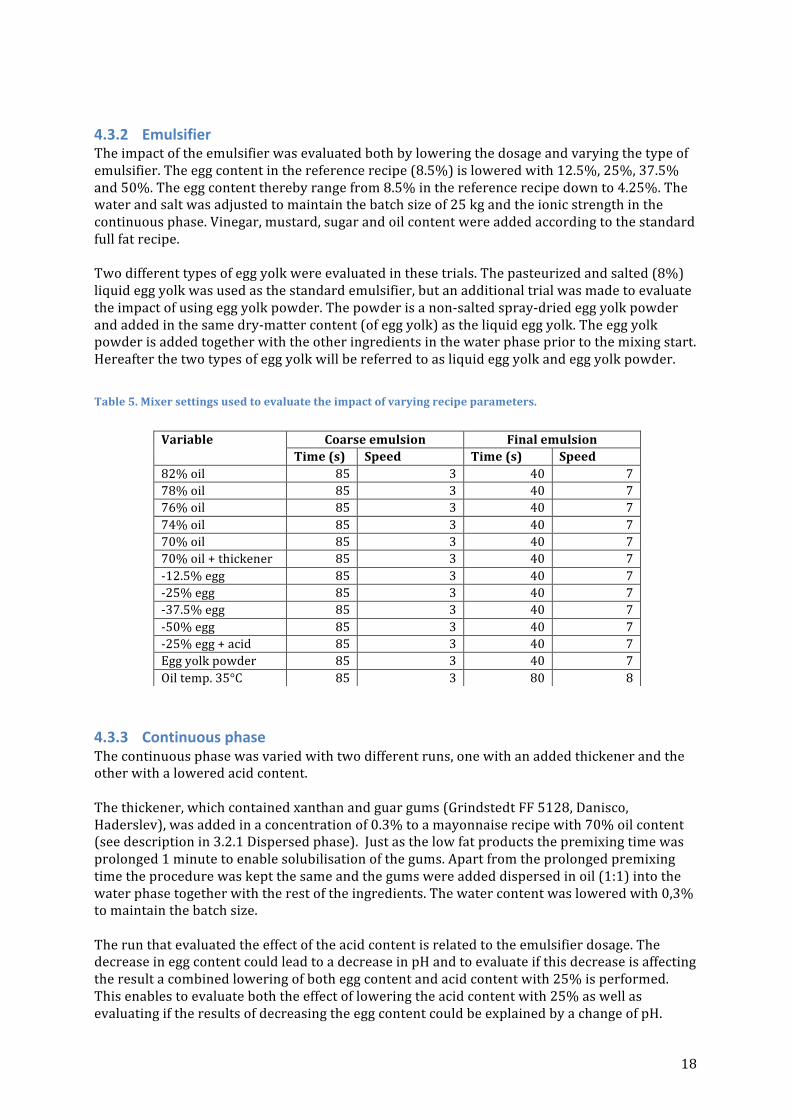
4.3.2 Emulsifier The impact of the emulsifier was evaluated both by lowering the dosage and varying the type of emulsifier. The egg content in the reference recipe (8.5%) is lowered with 12.5%, 25%, 37.5% and 50%. The egg content thereby range from 8.5% in the reference recipe down to 4.25%. The water and salt was adjusted to maintain the batch size of 25 kg and the ionic strength in the continuous phase. Vinegar, mustard, sugar and oil content were added according to the standard full fat recipe. Two different types of egg yolk were evaluated in these trials. The pasteurized and salted (8%) liquid egg yolk was used as the standard emulsifier, but an additional trial was made to evaluate the impact of using egg yolk powder. The powder is a non-‐salted spray-‐dried egg yolk powder and added in the same dry-‐matter content (of egg yolk) as the liquid egg yolk. The egg yolk powder is added together with the other ingredients in the water phase prior to the mixing start. Hereafter the two types of egg yolk will be referred to as liquid egg yolk and egg yolk powder.
Table 5. Mixer settings used to evaluate the impact of varying recipe parameters.
4.3.3 Continuous phase The continuous phase was varied with two different runs, one with an added thickener and the other with a lowered acid content. The thickener, which contained xanthan and guar gums (Grindstedt FF 5128, Danisco, Haderslev), was added in a concentration of 0.3% to a mayonnaise recipe with 70% oil content (see description in 3.2.1 Dispersed phase). Just as the low fat products the premixing time was prolonged 1 minute to enable solubilisation of the gums. Apart from the prolonged premixing time the procedure was kept the same and the gums were added dispersed in oil (1:1) into the water phase together with the rest of the ingredients. The water content was lowered with 0,3% to maintain the batch size. The run that evaluated the effect of the acid content is related to the emulsifier dosage. The decrease in egg content could lead to a decrease in pH and to evaluate if this decrease is affecting the result a combined lowering of both egg content and acid content with 25% is performed. This enables to evaluate both the effect of lowering the acid content with 25% as well as evaluating if the results of decreasing the egg content could be explained by a change of pH.
Variable Coarse emulsion Final emulsion Time (s) Speed Time (s) Speed
82% oil 85 3 40 7 78% oil 85 3 40 7 76% oil 85 3 40 7 74% oil 85 3 40 7 70% oil 85 3 40 7 70% oil + thickener 85 3 40 7 -‐12.5% egg 85 3 40 7 -‐25% egg 85 3 40 7 -‐37.5% egg 85 3 40 7 -‐50% egg 85 3 40 7 -‐25% egg + acid 85 3 40 7 Egg yolk powder 85 3 40 7 Oil temp. 35°C 85 3 80 8
19
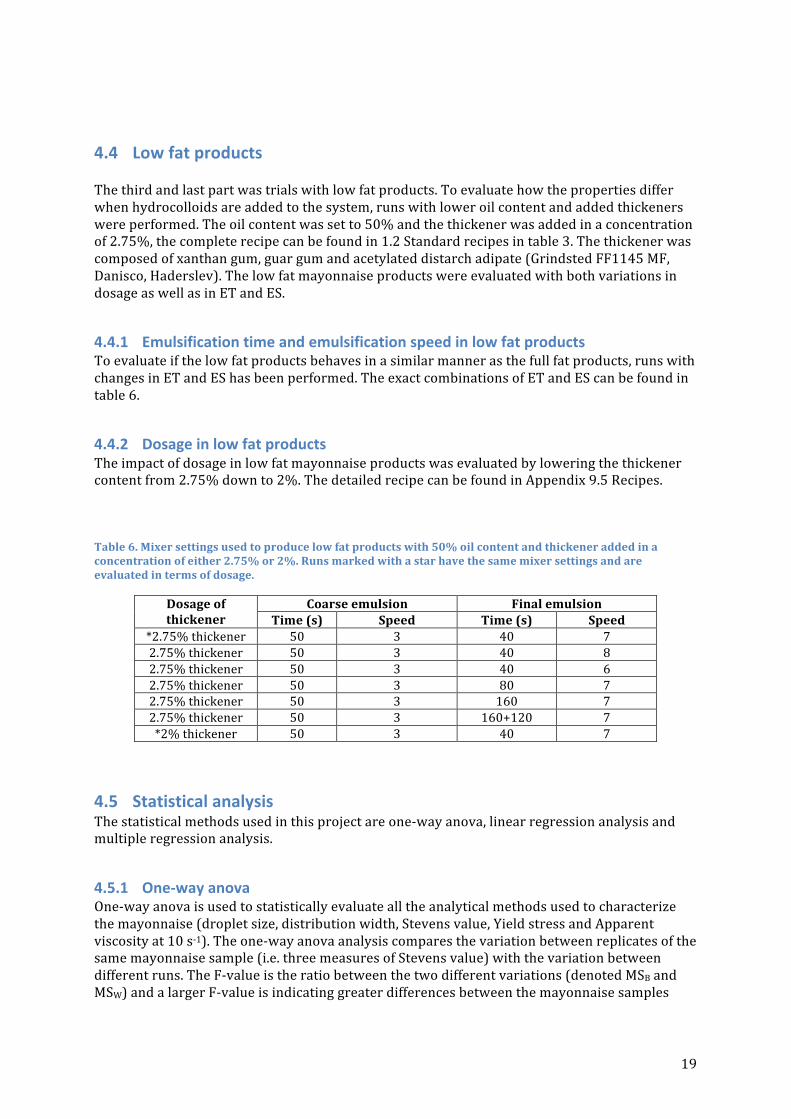
4.4 Low fat products The third and last part was trials with low fat products. To evaluate how the properties differ when hydrocolloids are added to the system, runs with lower oil content and added thickeners were performed. The oil content was set to 50% and the thickener was added in a concentration of 2.75%, the complete recipe can be found in 1.2 Standard recipes in table 3. The thickener was composed of xanthan gum, guar gum and acetylated distarch adipate (Grindsted FF1145 MF, Danisco, Haderslev). The low fat mayonnaise products were evaluated with both variations in dosage as well as in ET and ES.
4.4.1 Emulsification time and emulsification speed in low fat products To evaluate if the low fat products behaves in a similar manner as the full fat products, runs with changes in ET and ES has been performed. The exact combinations of ET and ES can be found in table 6.
4.4.2 Dosage in low fat products The impact of dosage in low fat mayonnaise products was evaluated by lowering the thickener content from 2.75% down to 2%. The detailed recipe can be found in Appendix 9.5 Recipes. Table 6. Mixer settings used to produce low fat products with 50% oil content and thickener added in a concentration of either 2.75% or 2%. Runs marked with a star have the same mixer settings and are evaluated in terms of dosage.
Dosage of thickener
Coarse emulsion Final emulsion Time (s) Speed Time (s) Speed
*2.75% thickener 50 3 40 7 2.75% thickener 50 3 40 8 2.75% thickener 50 3 40 6 2.75% thickener 50 3 80 7 2.75% thickener 50 3 160 7 2.75% thickener 50 3 160+120 7 *2% thickener 50 3 40 7
4.5 Statistical analysis The statistical methods used in this project are one-‐way anova, linear regression analysis and multiple regression analysis.
4.5.1 One-‐way anova One-‐way anova is used to statistically evaluate all the analytical methods used to characterize the mayonnaise (droplet size, distribution width, Stevens value, Yield stress and Apparent viscosity at 10 s-‐1). The one-‐way anova analysis compares the variation between replicates of the same mayonnaise sample (i.e. three measures of Stevens value) with the variation between different runs. The F-‐value is the ratio between the two different variations (denoted MSB and MSW) and a larger F-‐value is indicating greater differences between the mayonnaise samples
20
than within the replicates. The F-‐value is compared with the F-‐critical to determine if the difference is significant. A confidence interval using the t-‐distribution is calculated for the different methods according to the following eq. 5.
𝑋 ± 𝑡!!!,!!!!,!" !! (5)
Where X is the value which the confidence interval is calculated for, 𝑡!!!,!!!!,!"
means that the t-‐
distribution is calculated with two degrees of freedom and significance level of α=0,1 and s is the standard deviation used.
4.5.2 Linear regression Correlations between different analysis methods were evaluated using linear regression. The evaluation of the correlation was evaluated with the R2-‐value, where an R2-‐value closer to 1 is indicating a correlation between the two factors.
4.5.3 Multiple regression analysis A full factorial design was set up with three factors and two levels (High and low). One run in the centerpoint was also added to the design. To evaluate the significance of the factors without influences due to the different units, the factors were centralized and normalized according to eq. 6 below.
𝑥! =!!!!!∆!!
(6) Where 𝑥! is the coded value used in the design matrix (between -‐1 and 1), 𝑋! is the real value (i.e. the time in seconds), 𝑋! is the average value between the low and high level and ∆𝑋! is the step change. The droplet size was chosen as the response variable. A multiple regression analysis was performed in R-‐studio and significance of the factors and interaction was chosen with 90% significance level. A model of the droplet size was obtained with estimated coefficients (since the factors are inserted in eq 6 above). To achieve the coefficients corresponding to the standard units (s and m/s), eq 6 can be rearranged and the final result is a model where the real values can be inserted.

21
5 Results and discussion
5.1 Selection of analysis method The analysis methods of quality parameters and technical parameters are described in section 3.1 Analysis of mayonnaise. The technical parameter is evaluated with droplet size and distribution widths, while the quality parameter, texture, is analysed with three different methods; Stevens value, Yield stress and Apparent viscosity. The correlations between the three different texture methods are evaluated with linear regression as can be seen in figure 11 below.
The R2-‐values of the linear regression between the three texture methods are almost 0,9 for all combinations, which implies a correlation between the texture measurements. Consequently in the report the texture will be represented only by one of the three analytical methods, which will be selected after statistical comparison of the methods. A statistical evaluation of the different methods is performed below to determine which method that exhibit least deviations and hence will be used for further analysis of the results in the report.
R² = 0,89487
0 5 10 15 20 25 30 35 40
0 100 200 300
Apparent viscosity at 10 s-‐1
Stevens value
Correlation Stevens value and Apparent viscosity
R² = 0,92532
0
100
200
300
400
0 100 200 300
Yield stress (Pa)
Stevens value
Correlation Stevens value and Yield stress
R² = 0,91879
0 5 10 15 20 25 30 35 40
0 100 200 300 400 Apparent viscosity at 10 s-‐1
Yield stress (Pa)
Correlation Yield stress and Apparent viscosity
a) b) c)
Figure 11. Linear regressions performed on combination of the quality parameters (Yield stress, Apparent viscosity at 10 s-‐1 and Stevens value). The results are based on all runs throughout the study.

22
5.2 Statistical analysis of reproducibility Statistical evaluation of the reproducibility of the runs was performed using one-‐way-‐Anova, see table 7. The reproducibility of the mixer is evaluated with three replicates in a center point (table 8). The reproducibility is dependent on the deviation arising from the mixing process as well as on the deviations induced by the method used to analyse the results. The table includes the standard deviation (emulsification), which is based on the three replicated runs and evaluated in anova for each analysis method and thereby takes the deviation of the mixing process and the method into account. To be able to compare the deviation of the different analysis methods the relative standard deviation (of the emulsification process) is calculated, where a high number indicate large deviations. To evaluate significance of the results a confidence interval is calculated with t-‐distribution and 90% significance, see eq 5. To evaluate the contribution from the analysis method (in the standard deviation of the emulsification) the standard deviation of each method is calculated based on all runs performed throughout the study (in table Standard deviation -‐ method).
Table 7. The analysis methods used in the trials are evaluated with standard deviation, both for the measurement method and including the contribution from emulsification process. Relative standard deviations and confidence intervals with t-‐distribution and 90% significance level are calculated from the standard deviation of the emulsification process.
Method Standard deviation (method)
Standard deviation
(emulsification)
Relative standard deviation
(emulsification)
Confidence interval (tn=2,α=0,10)
Stevens value 6.54 10.7 5.6 % 22
Yield stress (Pa) 11.5 22.2 11 % 46
Apparent viscosity at 10 s-‐1
1.65 1.97 7.6 % 4.1
Droplet size (μm) 0.0502 0.0457 2.1 % 0.094
Width 0.00548 0.00200 1.9 % 0.0041 Comparing the standard deviation obtained from the method with the standard deviation of the emulsification, it can be seen that there is a contribution both from the method and the mixing process in almost all of the quality and technical parameters. The relative standard deviations show that the texture parameters have larger deviations compared to the technical parameters. The Yield stress values exhibits the largest deviations for the texture parameters, followed by the apparent viscosity. The texture parameter showing the least deviation is thereby Stevens value. Considering both the correlations and the standard deviation of the texture parameters, leads to the decision of using Stevens value to evaluate the texture of mayonnaise.

23
5.3 Mixing parameters The analysis of the mixing parameters includes analysing parameters one at a time as well as the full factorial design. To evaluate significance of the result the confidence interval for respective measurement method is used. The full fat reference recipe is used for all mixing runs. All settings and results from the mixer parameters can be seen in table 8, where the power of the mixer and the average temperature of the product also are included. The run marked with a star is selected as standard run for recipe trials. Table 8. Including settings from both coarse emulsion and emulsification as well as average results from all analysis methods. Recorded power of the mixer and average temperature of mayonnaise is also included. *Standard run for recipe parameters.
Run no. Variable
Mixer procedure Analysis Coarse emulsion Final emulsion Quality parameters Technical
parameters
Time (s)
Speed (m/s)
Time (s)
Speed (m/s)
Power (kW)
Temp. (°C)
Stevens value
Yield stress (Pa)
Apparent viscosity at 10 s-‐1
Size (μm) Width
1 Rep. run 60 2 80 8 6-‐8 -‐ 182 209 26.2 2.13 0.104 2 Rep. run 60 2 80 8 5-‐7 24 193 197 22.8 2.19 0.105 3 Rep. run 60 2 80 8 7-‐8 22 193 222 26.7 2.14 0.107 4 CET 45 3 40 7 5 19 148 170 23.9 3.02 0.093 5 CET 155 3 40 7 5 19 160 183 23.3 3.01 0.104 6 FFD 35 3 40 9 8-‐9 25 165 181 23.0 2.27 0.117 7 FFD 85 3 160 9 7-‐11 35 139 147 20.0 1.94 0.126 8 FFD* 85 3 40 7 5 23 154 171 21.2 2.98 0.113 9 FFD 35 3 160 7 5 25 174 189 24.2 2.17 0.114 10 FFD 35 3 160 9 8-‐10 34 138 167 21.1 1.86 0.129 11 FFD 35 3 40 7 5 22 149 171 20.9 3.08 0.105 12 FFD 85 3 40 9 8 22 179 212 26.2 2.41 0.110 13 FFD 85 3 160 18,4 5 27 198 227 27.5 2.14 0.110 14 FFD 60 3 80 8 6-‐8 24 201 220 26.3 2.16 0.107 15 ET and
ES 85 3 80 8 6-‐8 24 198 228 26.8 2.18 0.106
16 ET and ES
85 3 40 8 6-‐7 20 171 165 20.7 2.66 0.119
17 ET and ES
85 3 80 7 5 19 182 214 28.0 2.55 0.102
18 ET and ES
85 3 160 8 8 30 170 220 27.3 1.94 0.117
19 ET and ES
85 3 80 9 8-‐11 24 210 240 27.7 1.99 0.117
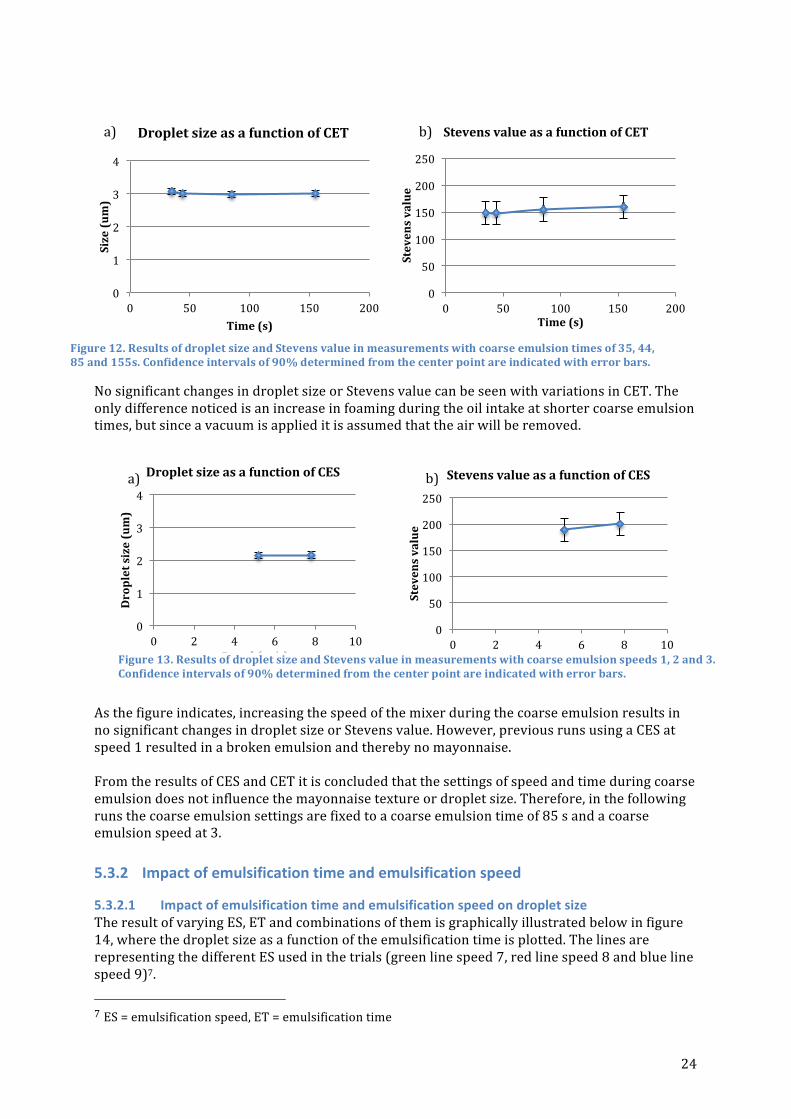
5.3.1 Impact of coarse emulsion time and coarse emulsion speed The results from varying CET and CES are shown in figure 12 and 13 below. The times set for CET are 35, 44, 85 and 155 s and the speeds for CES are 1, 2 and 36.
6 CET = coarse emulsion time, CES = coarse emulsion speed
24
No significant changes in droplet size or Stevens value can be seen with variations in CET. The only difference noticed is an increase in foaming during the oil intake at shorter coarse emulsion times, but since a vacuum is applied it is assumed that the air will be removed.
As the figure indicates, increasing the speed of the mixer during the coarse emulsion results in no significant changes in droplet size or Stevens value. However, previous runs using a CES at speed 1 resulted in a broken emulsion and thereby no mayonnaise. From the results of CES and CET it is concluded that the settings of speed and time during coarse emulsion does not influence the mayonnaise texture or droplet size. Therefore, in the following runs the coarse emulsion settings are fixed to a coarse emulsion time of 85 s and a coarse emulsion speed at 3.
5.3.2 Impact of emulsification time and emulsification speed
5.3.2.1 Impact of emulsification time and emulsification speed on droplet size The result of varying ES, ET and combinations of them is graphically illustrated below in figure 14, where the droplet size as a function of the emulsification time is plotted. The lines are representing the different ES used in the trials (green line speed 7, red line speed 8 and blue line speed 9)7. 7 ES = emulsification speed, ET = emulsification time
0
1
2
3
4
0 50 100 150 200
Size (um)
Time (s)
Droplet size as a function of CET a)
0
50
100
150
200
250
0 50 100 150 200
Stevens value
Time (s)
Stevens value as a function of CET b)
0
1
2
3
4
0 2 4 6 8 10
Droplet size (um)
Speed (m/s)
Droplet size as a function of CES
0
50
100
150
200
250
0 2 4 6 8 10
Stevens value
Speed (m/s)
Stevens value as a function of CES a) b)
Figure 13. Results of droplet size and Stevens value in measurements with coarse emulsion speeds 1, 2 and 3. Confidence intervals of 90% determined from the center point are indicated with error bars.
Figure 12. Results of droplet size and Stevens value in measurements with coarse emulsion times of 35, 44, 85 and 155s. Confidence intervals of 90% determined from the center point are indicated with error bars.
25
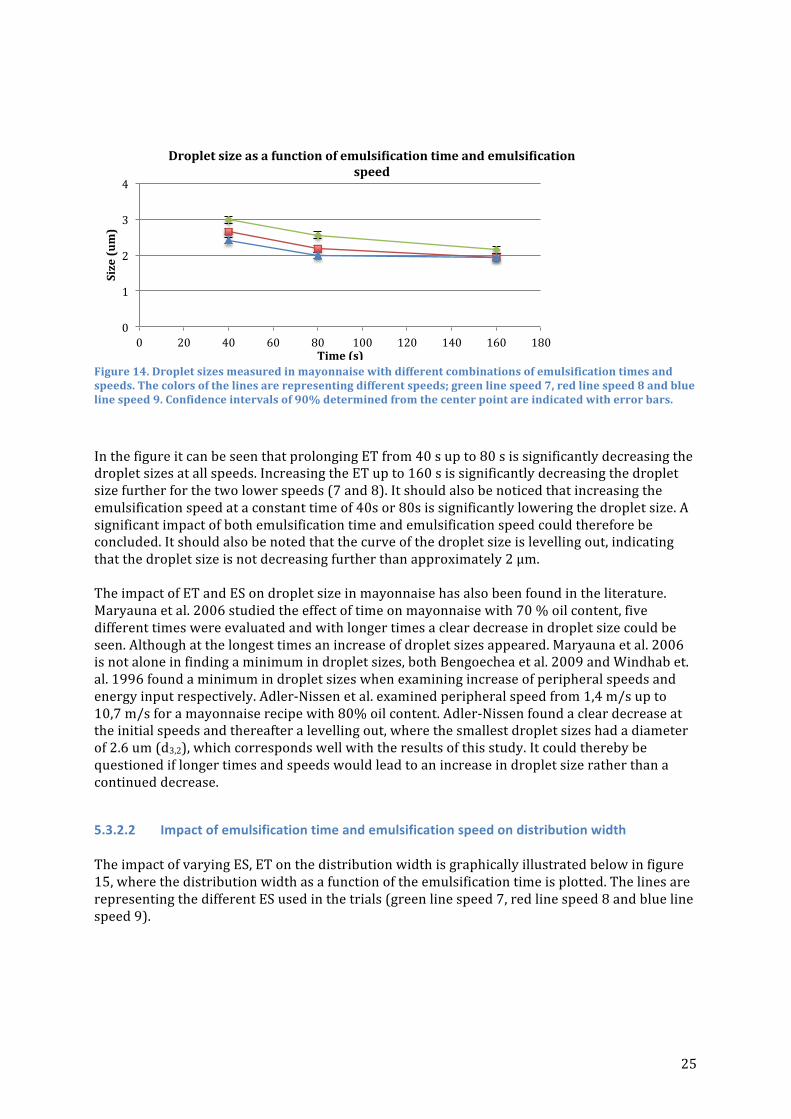
Figure 14. Droplet sizes measured in mayonnaise with different combinations of emulsification times and speeds. The colors of the lines are representing different speeds; green line speed 7, red line speed 8 and blue line speed 9. Confidence intervals of 90% determined from the center point are indicated with error bars.
In the figure it can be seen that prolonging ET from 40 s up to 80 s is significantly decreasing the droplet sizes at all speeds. Increasing the ET up to 160 s is significantly decreasing the droplet size further for the two lower speeds (7 and 8). It should also be noticed that increasing the emulsification speed at a constant time of 40s or 80s is significantly lowering the droplet size. A significant impact of both emulsification time and emulsification speed could therefore be concluded. It should also be noted that the curve of the droplet size is levelling out, indicating that the droplet size is not decreasing further than approximately 2 μm.
The impact of ET and ES on droplet size in mayonnaise has also been found in the literature. Maryauna et al. 2006 studied the effect of time on mayonnaise with 70 % oil content, five different times were evaluated and with longer times a clear decrease in droplet size could be seen. Although at the longest times an increase of droplet sizes appeared. Maryauna et al. 2006 is not alone in finding a minimum in droplet sizes, both Bengoechea et al. 2009 and Windhab et. al. 1996 found a minimum in droplet sizes when examining increase of peripheral speeds and energy input respectively. Adler-‐Nissen et al. examined peripheral speed from 1,4 m/s up to 10,7 m/s for a mayonnaise recipe with 80% oil content. Adler-‐Nissen found a clear decrease at the initial speeds and thereafter a levelling out, where the smallest droplet sizes had a diameter of 2.6 um (d3,2), which corresponds well with the results of this study. It could thereby be questioned if longer times and speeds would lead to an increase in droplet size rather than a continued decrease.
5.3.2.2 Impact of emulsification time and emulsification speed on distribution width
The impact of varying ES, ET on the distribution width is graphically illustrated below in figure 15, where the distribution width as a function of the emulsification time is plotted. The lines are representing the different ES used in the trials (green line speed 7, red line speed 8 and blue line speed 9).
0
1
2
3
4
0 20 40 60 80 100 120 140 160 180
Size (um)
Time (s)
Droplet size as a function of emulsi`ication time and emulsi`ication speed
26
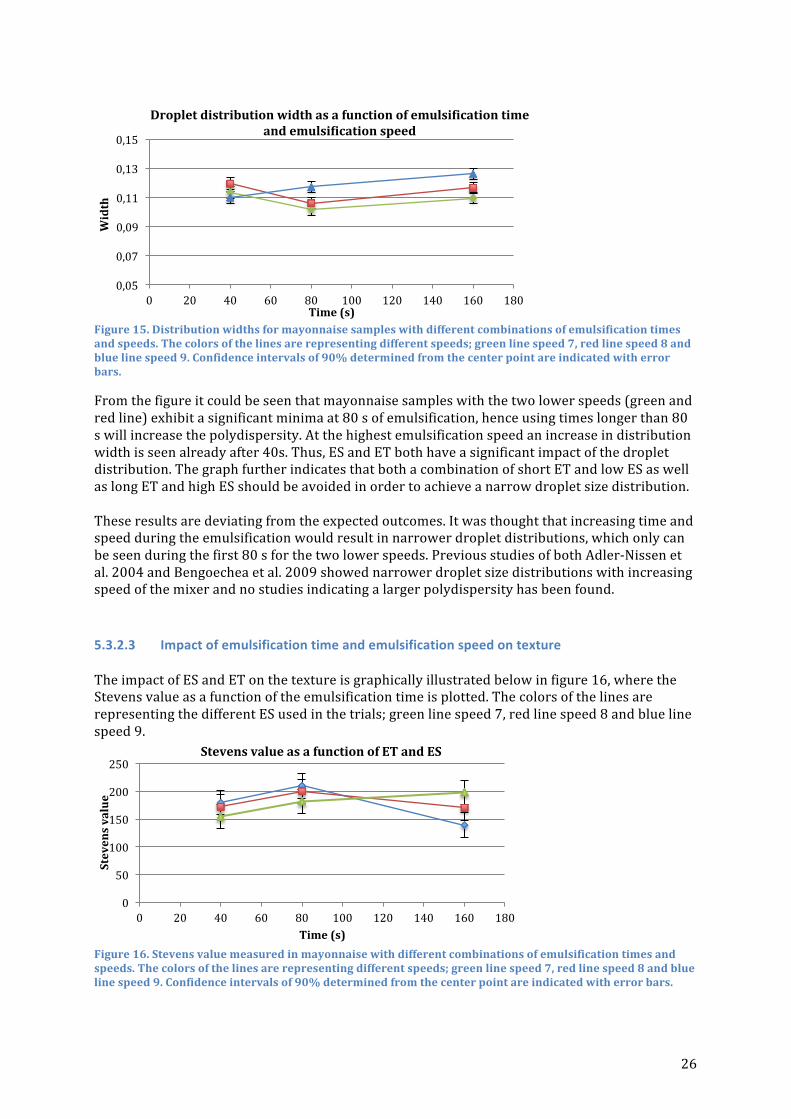
Figure 15. Distribution widths for mayonnaise samples with different combinations of emulsification times and speeds. The colors of the lines are representing different speeds; green line speed 7, red line speed 8 and blue line speed 9. Confidence intervals of 90% determined from the center point are indicated with error bars.
From the figure it could be seen that mayonnaise samples with the two lower speeds (green and red line) exhibit a significant minima at 80 s of emulsification, hence using times longer than 80 s will increase the polydispersity. At the highest emulsification speed an increase in distribution width is seen already after 40s. Thus, ES and ET both have a significant impact of the droplet distribution. The graph further indicates that both a combination of short ET and low ES as well as long ET and high ES should be avoided in order to achieve a narrow droplet size distribution. These results are deviating from the expected outcomes. It was thought that increasing time and speed during the emulsification would result in narrower droplet distributions, which only can be seen during the first 80 s for the two lower speeds. Previous studies of both Adler-‐Nissen et al. 2004 and Bengoechea et al. 2009 showed narrower droplet size distributions with increasing speed of the mixer and no studies indicating a larger polydispersity has been found.
5.3.2.3 Impact of emulsification time and emulsification speed on texture The impact of ES and ET on the texture is graphically illustrated below in figure 16, where the Stevens value as a function of the emulsification time is plotted. The colors of the lines are representing the different ES used in the trials; green line speed 7, red line speed 8 and blue line speed 9.
Figure 16. Stevens value measured in mayonnaise with different combinations of emulsification times and speeds. The colors of the lines are representing different speeds; green line speed 7, red line speed 8 and blue line speed 9. Confidence intervals of 90% determined from the center point are indicated with error bars.
0,05
0,07
0,09
0,11
0,13
0,15
0 20 40 60 80 100 120 140 160 180
Width
Time (s)
Droplet distribution width as a function of emulsi`ication time and emulsi`ication speed
0
50
100
150
200
250
0 20 40 60 80 100 120 140 160 180
Stevens value
Time (s)
Stevens value as a function of ET and ES
27
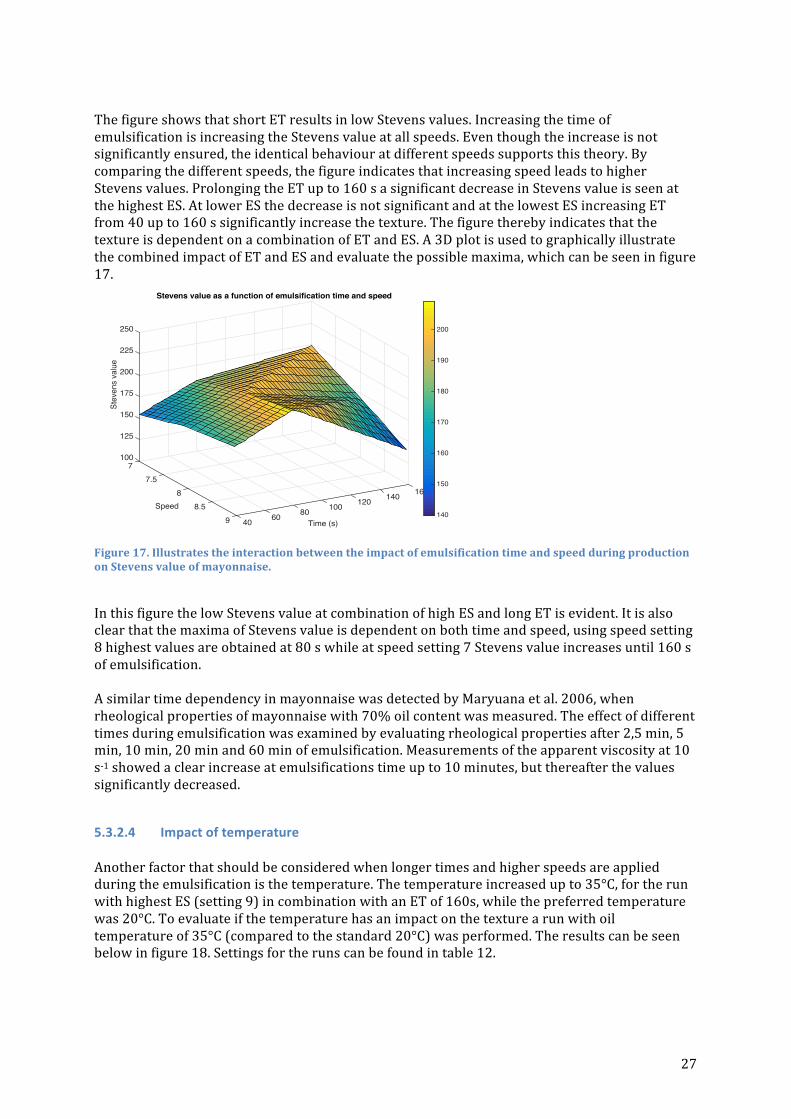
The figure shows that short ET results in low Stevens values. Increasing the time of emulsification is increasing the Stevens value at all speeds. Even though the increase is not significantly ensured, the identical behaviour at different speeds supports this theory. By comparing the different speeds, the figure indicates that increasing speed leads to higher Stevens values. Prolonging the ET up to 160 s a significant decrease in Stevens value is seen at the highest ES. At lower ES the decrease is not significant and at the lowest ES increasing ET from 40 up to 160 s significantly increase the texture. The figure thereby indicates that the texture is dependent on a combination of ET and ES. A 3D plot is used to graphically illustrate the combined impact of ET and ES and evaluate the possible maxima, which can be seen in figure 17.
Figure 17. Illustrates the interaction between the impact of emulsification time and speed during production on Stevens value of mayonnaise.
In this figure the low Stevens value at combination of high ES and long ET is evident. It is also clear that the maxima of Stevens value is dependent on both time and speed, using speed setting 8 highest values are obtained at 80 s while at speed setting 7 Stevens value increases until 160 s of emulsification. A similar time dependency in mayonnaise was detected by Maryuana et al. 2006, when rheological properties of mayonnaise with 70% oil content was measured. The effect of different times during emulsification was examined by evaluating rheological properties after 2,5 min, 5 min, 10 min, 20 min and 60 min of emulsification. Measurements of the apparent viscosity at 10 s-‐1 showed a clear increase at emulsifications time up to 10 minutes, but thereafter the values significantly decreased.
5.3.2.4 Impact of temperature Another factor that should be considered when longer times and higher speeds are applied during the emulsification is the temperature. The temperature increased up to 35°C, for the run with highest ES (setting 9) in combination with an ET of 160s, while the preferred temperature was 20°C. To evaluate if the temperature has an impact on the texture a run with oil temperature of 35°C (compared to the standard 20°C) was performed. The results can be seen below in figure 18. Settings for the runs can be found in table 12.
160140
Stevens value as a function of emulsification time and speed
120100
Time (s)8060409
8.58
Speed
7.5
100
125
150
175
200
225
250
7
Stev
ens
valu
e
140
150
160
170
180
190
200
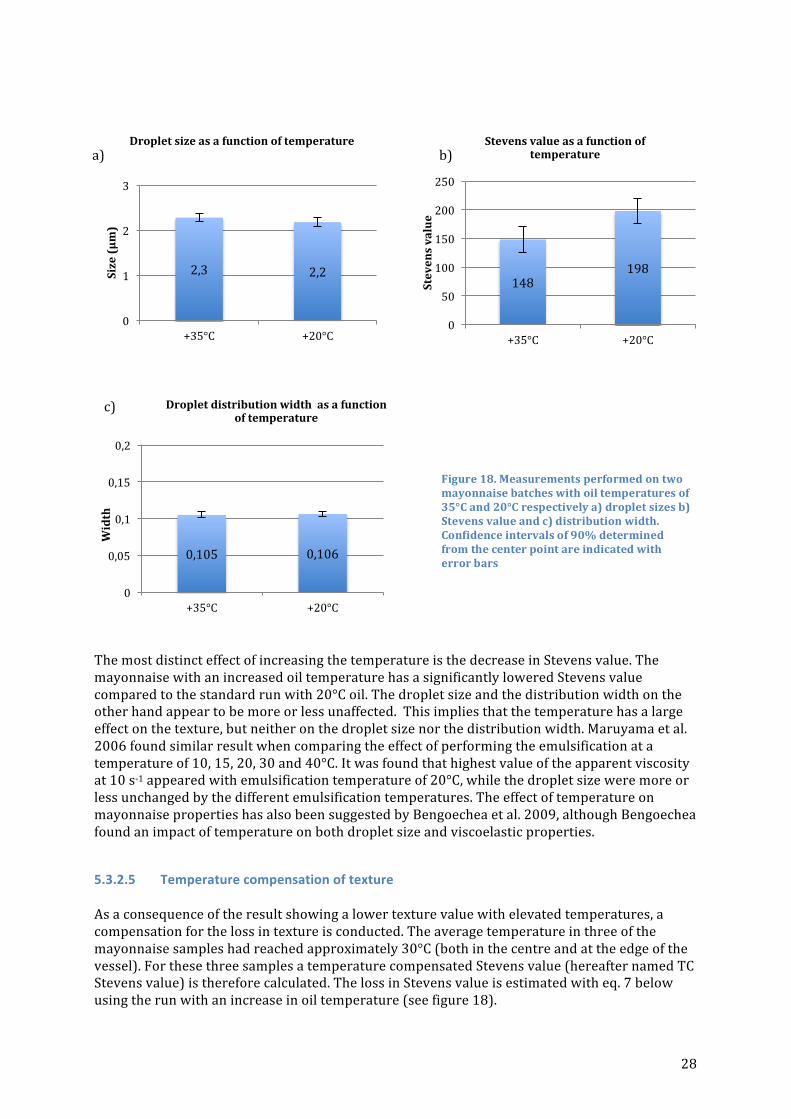
28
The most distinct effect of increasing the temperature is the decrease in Stevens value. The mayonnaise with an increased oil temperature has a significantly lowered Stevens value compared to the standard run with 20°C oil. The droplet size and the distribution width on the other hand appear to be more or less unaffected. This implies that the temperature has a large effect on the texture, but neither on the droplet size nor the distribution width. Maruyama et al. 2006 found similar result when comparing the effect of performing the emulsification at a temperature of 10, 15, 20, 30 and 40°C. It was found that highest value of the apparent viscosity at 10 s-‐1 appeared with emulsification temperature of 20°C, while the droplet size were more or less unchanged by the different emulsification temperatures. The effect of temperature on mayonnaise properties has also been suggested by Bengoechea et al. 2009, although Bengoechea found an impact of temperature on both droplet size and viscoelastic properties.
5.3.2.5 Temperature compensation of texture As a consequence of the result showing a lower texture value with elevated temperatures, a compensation for the loss in texture is conducted. The average temperature in three of the mayonnaise samples had reached approximately 30°C (both in the centre and at the edge of the vessel). For these three samples a temperature compensated Stevens value (hereafter named TC Stevens value) is therefore calculated. The loss in Stevens value is estimated with eq. 7 below using the run with an increase in oil temperature (see figure 18).
2,3 2,2
0
1
2
3
+35°C +20°C
Size (μm)
Droplet size as a function of temperature
148 198
0
50
100
150
200
250
+35°C +20°C
Stevens value
Stevens value as a function of temperature
0,105 0,106
0
0,05
0,1
0,15
0,2
+35°C +20°C
Width
Droplet distribution width as a function of temperature
a) b)
c)
Figure 18. Measurements performed on two mayonnaise batches with oil temperatures of 35°C and 20°C respectively a) droplet sizes b) Stevens value and c) distribution width. Confidence intervals of 90% determined from the center point are indicated with error bars
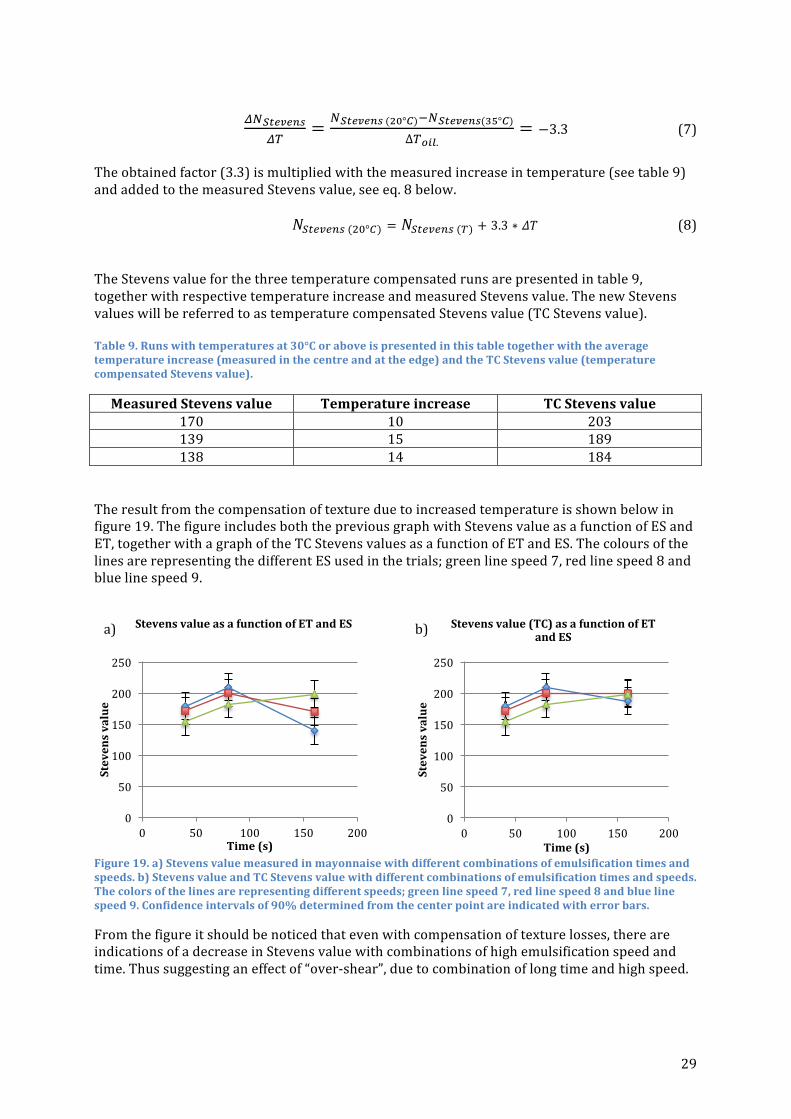
29
!"!"#$#%&
!"= !!"#$#%& (!"°!)!!!"#$#%&(!"°!)
∆!!"#.= −3.3 (7)
The obtained factor (3.3) is multiplied with the measured increase in temperature (see table 9) and added to the measured Stevens value, see eq. 8 below.
𝑁!"#$#%& (!"°!) = 𝑁!"#$#%& (!) + 3.3 ∗ 𝛥𝑇 (8)
The Stevens value for the three temperature compensated runs are presented in table 9, together with respective temperature increase and measured Stevens value. The new Stevens values will be referred to as temperature compensated Stevens value (TC Stevens value). Table 9. Runs with temperatures at 30°C or above is presented in this table together with the average temperature increase (measured in the centre and at the edge) and the TC Stevens value (temperature compensated Stevens value).
Measured Stevens value Temperature increase TC Stevens value 170 10 203 139 15 189 138 14 184
The result from the compensation of texture due to increased temperature is shown below in figure 19. The figure includes both the previous graph with Stevens value as a function of ES and ET, together with a graph of the TC Stevens values as a function of ET and ES. The colours of the lines are representing the different ES used in the trials; green line speed 7, red line speed 8 and blue line speed 9.
Figure 19. a) Stevens value measured in mayonnaise with different combinations of emulsification times and speeds. b) Stevens value and TC Stevens value with different combinations of emulsification times and speeds. The colors of the lines are representing different speeds; green line speed 7, red line speed 8 and blue line speed 9. Confidence intervals of 90% determined from the center point are indicated with error bars.
From the figure it should be noticed that even with compensation of texture losses, there are indications of a decrease in Stevens value with combinations of high emulsification speed and time. Thus suggesting an effect of “over-‐shear”, due to combination of long time and high speed.
0
50
100
150
200
250
0 50 100 150 200
Stevens value
Time (s)
Stevens value as a function of ET and ES
0
50
100
150
200
250
0 50 100 150 200
Stevens value
Time (s)
Stevens value (TC) as a function of ET and ES a) b)

30
5.3.2.6 Impact of work During the emulsification the power of the rotor is recorded and used for evaluation of the impact of applied work on mayonnaise properties. The applied work is calculated by multiplying the average power during the emulsification with the time of emulsification. The average power is calculated for the three mixer speeds (7,8 and 9) and is obtained by using the recorded values from the runs using the respective mixer speed. The results of the droplet size, droplet distribution width and TC Stevens value as a function of applied work are shown in figure 20 below.
Figure 20. All measurements performed with variations in times speeds and plotted as a function of applied work a) droplet size b) Stevens value and c) droplet distribution.
The droplet size measurements show a clear initial decrease in droplet size at applied work lower than 500 kWs, but the curve is levelling out with increased work performed. The Stevens values (TC Stevens values are used) exhibit an initial increase until approximately 600 kWs and increasing the work performed further a decrease in Stevens values starts to appear. Comparing the Stevens value with the distribution width, there are indications of increased distribution width at the amount of applied work corresponding to the start of the decrease in texture.
The results from the impact of work thereby indicate that increasing the work (i.e by increasing time or speed) over a certain limit leads to a simultaneous lowering of the texture and an increase in the distribution width, while the droplet size remains unaffected.
5.3.3 Full factorial design
The full factorial design with droplets size as the response variable also showed that the ES and ET and the combination of the two of them had a significant impact on the droplet size. The estimates of the coefficients, the standard error of the coefficients and the pr values of the significant factors are shown in table 10 below. In Appendix 9.4 Multiple regression analysis, the whole table including the nonr significant factors can be seen.
0
50
100
150
200
250
0 500 1000 1500
Stevens value
Energy (kWs)
TC Stevens value
0
0,5
1
1,5
2
2,5
3
3,5
0 500 1000 1500
Size (μm)
Energy (kWs)
Droplet size
0
0,02
0,04
0,06
0,08
0,1
0,12
0,14
0 500 1000 1500
Width
Energy (kWs)
Droplet distribution width c)
a) b)

31
Table 10. Regression analysis of full factorial design with the significant factors, ES and ET. Significant codes: *** p<0,001, ** p<0,01, * p<0,05, . p<0,1
Regression analysis Estimated coefficient βi
Standard error σ(βi) p-‐value
Intercept 2.28 0,045 3,0*10-‐10*** ES -‐0.246 0,050 0,0018** ET -‐0.315 0,050 0,00039***
ES*ET 0.112 0,055 0,080 . Multiple R-‐squared: 0.91
F-‐statistics: 12 F-‐critical: 7,2
p-‐value: 0,0020
Using eq. 6 in 4.5.3 Multiple Regression analysis the coefficients for the function (uncoded values of the estimates) are obtained and the model can be seen below in eq. 9.
𝑫𝒓𝒐𝒑𝒍𝒆𝒕 𝒅𝒊𝒂𝒎𝒆𝒕𝒆𝒓 = 𝟔,𝟐 − 𝟎,𝟏𝟔 ∙ 𝑬𝑺 − 𝟎,𝟎𝟐𝟎 ∙ 𝑬𝑻 + 𝟎,𝟎𝟎𝟎𝟕𝟎 ∙ 𝑬𝑺 ∙ 𝑬𝑻 (9) This model is a link between the mixing parameters and the droplet size (technical parameter), which is a first step in understanding the relation between the mixing process and the outcome. It could be seen that the R-‐squared value is above 0,91, which indicate a good fit and both the F-‐value and the p-‐value show the significance of the model. However, comparing the standard errors it can be seen that the standard error for 𝑬𝑺 ∙ 𝑬𝑻 is almost half the value of the estimated coefficient, indicating a large margin of error.
5.3.4 Correlations between droplet size, distribution width and Stevens value The results from varying mixing parameters, are used to evaluate correlations between droplet size, distribution width and Stevens value. In the graph below TC Stevens value as a function of droplet size and distribution width is shown, see figure 21.
Figure 21. Stevens value as a function of droplet size and distribution width, with all mixing runs included. Stevens value are represented with temperature compensated runs.8
8 The figure also includes three additional runs, which are not included in the report.
0.13
Stevens value as a function of droplet size and distribution width
0.120.11
Width0.1
0.0943.5
Droplet size (um)
32.5
2
100
150
200
250
1.5
Stev
ens
valu
e
120
140
160
180
200
220
240

32
The figure implies that decreasing droplet sizes results in increasing Stevens values. There are also indications that the Stevens value is increasing with decreasing the distribution widths. Linear regression is performed to further assess the correlations between the three parameters. A significant correlation between the Stevens value and the droplet size is found, which can be seen in figure 22 and table 11.
Figure 22. Stevens value as a function of droplet size from runs with mixer variables. Temperature compensated runs are used.
Table 11. Linear regression of Stevens value as a function of droplet size. Significance level is set to 90% and results in the lower and upper control limits as presented in the table.
Coefficients Standard Error
Lower control limit
Upper control limit p-‐level
Intercept 285 11.2 266 304 1.11*10-‐16 Slope -‐44.7 4.42 -‐52.3 -‐37.1 2.57*10-‐9
The linear regression of Stevens value as a function of droplet size, results in an equation with 285 as the intercept and -‐44,7 as the slope. The lower control limit and upper control limit calculated with 90% probability limits and given in table 11. The standard error is very low compared to the coefficients, indicating a small margin of error. The low p-‐value of each coefficient is suggesting a good fit. Maruyama et al (2007) has previously examined the correlation between rheology and the particle size in mayonnaise. A significant correlation between the apparent viscosity at 100 s-‐1 and DV90 was found and the Pearson’s coefficient (R-‐value) obtained was -‐0.542, which is less prominent than the one achieved in these trials.
y = -‐44.7x + 285 R² = 0.84
0
50
100
150
200
250
0 0,5 1 1,5 2 2,5 3 3,5 4
Stevens value
Size (μm)
Correlation between TC Stevens value and droplet size
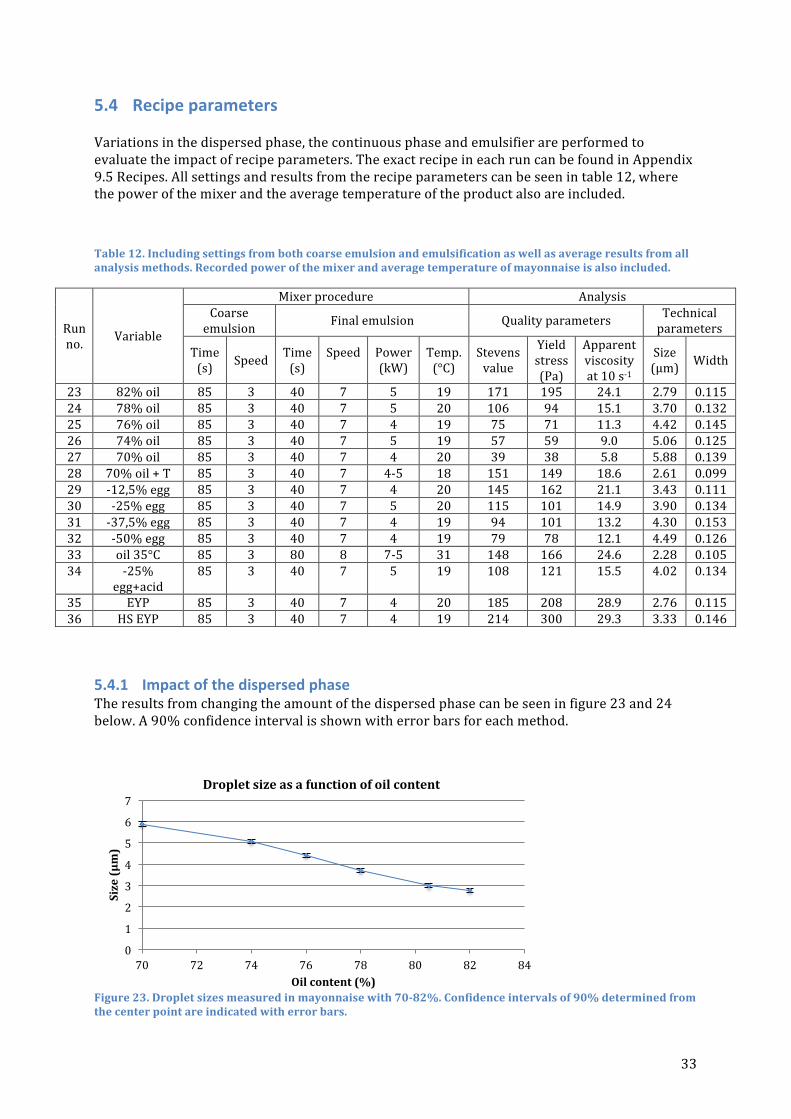
33
5.4 Recipe parameters Variations in the dispersed phase, the continuous phase and emulsifier are performed to evaluate the impact of recipe parameters. The exact recipe in each run can be found in Appendix 9.5 Recipes. All settings and results from the recipe parameters can be seen in table 12, where the power of the mixer and the average temperature of the product also are included.
Table 12. Including settings from both coarse emulsion and emulsification as well as average results from all analysis methods. Recorded power of the mixer and average temperature of mayonnaise is also included.
Run no. Variable
Mixer procedure Analysis Coarse emulsion Final emulsion Quality parameters Technical
parameters
Time (s) Speed Time
(s) Speed
Power (kW)
Temp. (°C)
Stevens value
Yield stress (Pa)
Apparent viscosity at 10 s-‐1
Size (μm) Width
23 82% oil 85 3 40 7 5 19 171 195 24.1 2.79 0.115 24 78% oil 85 3 40 7 5 20 106 94 15.1 3.70 0.132 25 76% oil 85 3 40 7 4 19 75 71 11.3 4.42 0.145 26 74% oil 85 3 40 7 5 19 57 59 9.0 5.06 0.125 27 70% oil 85 3 40 7 4 20 39 38 5.8 5.88 0.139 28 70% oil + T 85 3 40 7 4-‐5 18 151 149 18.6 2.61 0.099 29 -‐12,5% egg 85 3 40 7 4 20 145 162 21.1 3.43 0.111 30 -‐25% egg 85 3 40 7 5 20 115 101 14.9 3.90 0.134 31 -‐37,5% egg 85 3 40 7 4 19 94 101 13.2 4.30 0.153 32 -‐50% egg 85 3 40 7 4 19 79 78 12.1 4.49 0.126 33 oil 35°C 85 3 80 8 7-‐5 31 148 166 24.6 2.28 0.105 34 -‐25%
egg+acid 85 3 40 7 5 19 108 121 15.5 4.02 0.134
35 EYP 85 3 40 7 4 20 185 208 28.9 2.76 0.115 36 HS EYP 85 3 40 7 4 19 214 300 29.3 3.33 0.146
5.4.1 Impact of the dispersed phase The results from changing the amount of the dispersed phase can be seen in figure 23 and 24 below. A 90% confidence interval is shown with error bars for each method.
Figure 23. Droplet sizes measured in mayonnaise with 70-‐82%. Confidence intervals of 90% determined from the center point are indicated with error bars.
0
1
2
3
4
5
6
7
70 72 74 76 78 80 82 84
Size (μm)
Oil content (%)
Droplet size as a function of oil content
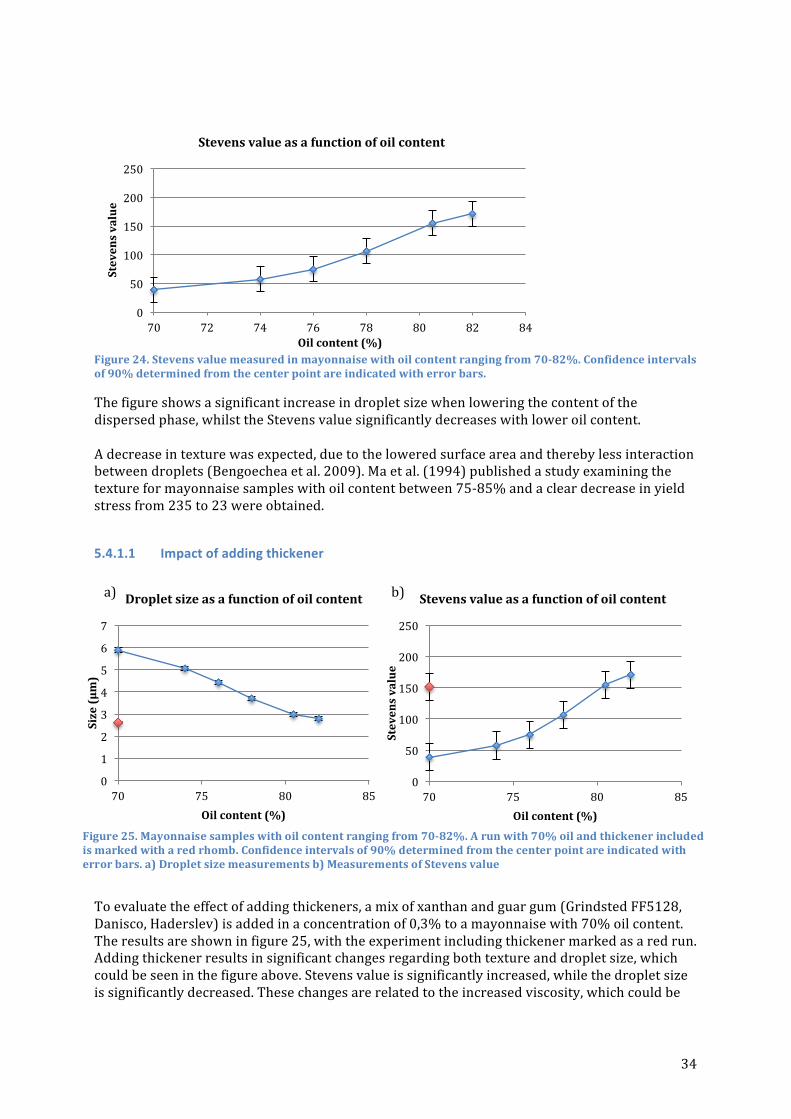
34
Figure 24. Stevens value measured in mayonnaise with oil content ranging from 70-‐82%. Confidence intervals of 90% determined from the center point are indicated with error bars.
The figure shows a significant increase in droplet size when lowering the content of the dispersed phase, whilst the Stevens value significantly decreases with lower oil content. A decrease in texture was expected, due to the lowered surface area and thereby less interaction between droplets (Bengoechea et al. 2009). Ma et al. (1994) published a study examining the texture for mayonnaise samples with oil content between 75-‐85% and a clear decrease in yield stress from 235 to 23 were obtained.
5.4.1.1 Impact of adding thickener
To evaluate the effect of adding thickeners, a mix of xanthan and guar gum (Grindsted FF5128, Danisco, Haderslev) is added in a concentration of 0,3% to a mayonnaise with 70% oil content. The results are shown in figure 25, with the experiment including thickener marked as a red run. Adding thickener results in significant changes regarding both texture and droplet size, which could be seen in the figure above. Stevens value is significantly increased, while the droplet size is significantly decreased. These changes are related to the increased viscosity, which could be
0
50
100
150
200
250
70 72 74 76 78 80 82 84
Stevens value
Oil content (%)
Stevens value as a function of oil content
0
1
2
3
4
5
6
7
70 75 80 85
Size (μm)
Oil content (%)
Droplet size as a function of oil content
0
50
100
150
200
250
70 75 80 85
Stevens value
Oil content (%)
Stevens value as a function of oil content a) b)
Figure 25. Mayonnaise samples with oil content ranging from 70-‐82%. A run with 70% oil and thickener included is marked with a red rhomb. Confidence intervals of 90% determined from the center point are indicated with error bars. a) Droplet size measurements b) Measurements of Stevens value

35
achieved by adding thickeners as described in the background. The mechanism will be further described in the general discussion.
5.4.2 Impact of emulsifier The results of lowering the egg content are seen in figure 26 and 27 below. The egg content in the reference recipe (8.5%) is lowered with 12.5%, 25%, 37.5% and 50%. The egg content thereby range from 8.5% in the reference recipe down to 4.25%.
Figure 26. Droplet sizes measured in mayonnaise with egg content ranging from 4.25-‐8.5%. Confidence intervals of 90% determined from the center point are indicated with error bars.
Figure 27. Stevens value measured in mayonnaise with egg content ranging from 4.25-‐8.5%. Confidence intervals of 90% determined from the center point are indicated with error bars.
A significant decrease in texture and increase in droplet size can be seen in figure 26 and 27 when decreasing the egg content from 8.5% down to 4.25%. The droplet size is increasing significantly between all the examined egg contents (from 8.5% down to 4.25%). The texture is also significantly lowered, which could be seen from the Stevens value when comparing a change from 8.5% to 5.3% in egg content. It could be hypothesized that the increasing droplet size with lower egg content is indicating that there is not sufficient emulsifier to cover the newly created surfaces, which would increase the re-‐coalescence. Although, comparing with literature a previous study performed by Bengoechea et al. showed droplet sizes of 2.7 μm at an emulsifier content of 2% and oil content
0 1 2 3 4 5 6 7
4 5 6 7 8 9
Size (μm)
Egg content (%)
Droplet size as a function of egg content
0
50
100
150
200
250
4 5 6 7 8 9
Stevens value
Egg content (%)
Stevens value as a function of egg content
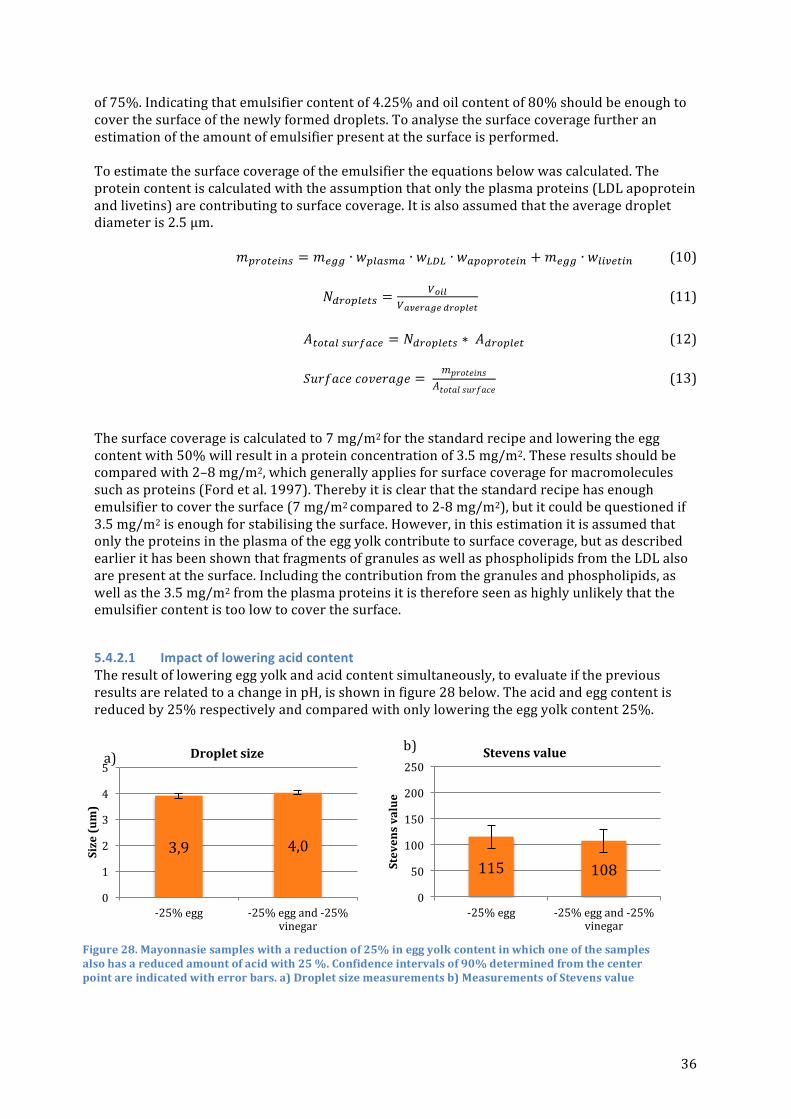
36
of 75%. Indicating that emulsifier content of 4.25% and oil content of 80% should be enough to cover the surface of the newly formed droplets. To analyse the surface coverage further an estimation of the amount of emulsifier present at the surface is performed. To estimate the surface coverage of the emulsifier the equations below was calculated. The protein content is calculated with the assumption that only the plasma proteins (LDL apoprotein and livetins) are contributing to surface coverage. It is also assumed that the average droplet diameter is 2.5 μm.
𝑚!"#$%&'( = 𝑚!"" ∙ 𝑤!"#$%# ∙ 𝑤!"! ∙ 𝑤!"#"!"#$%& +𝑚!"" ∙ 𝑤!"#$%"& (10)
𝑁!"#$%&'( =!!"#
!!"#$!%# !"#$%&' (11)
𝐴!"!#$ !"#$%&' = 𝑁!"#$%&'( ∗ 𝐴!"#$%&' (12)
𝑆𝑢𝑟𝑓𝑎𝑐𝑒 𝑐𝑜𝑣𝑒𝑟𝑎𝑔𝑒 = 𝑚𝑝𝑟𝑜𝑡𝑒𝑖𝑛𝑠
𝐴𝑡𝑜𝑡𝑎𝑙 𝑠𝑢𝑟𝑓𝑎𝑐𝑒 (13)
The surface coverage is calculated to 7 mg/m2 for the standard recipe and lowering the egg content with 50% will result in a protein concentration of 3.5 mg/m2. These results should be compared with 2–8 mg/m2, which generally applies for surface coverage for macromolecules such as proteins (Ford et al. 1997). Thereby it is clear that the standard recipe has enough emulsifier to cover the surface (7 mg/m2 compared to 2-‐8 mg/m2), but it could be questioned if 3.5 mg/m2 is enough for stabilising the surface. However, in this estimation it is assumed that only the proteins in the plasma of the egg yolk contribute to surface coverage, but as described earlier it has been shown that fragments of granules as well as phospholipids from the LDL also are present at the surface. Including the contribution from the granules and phospholipids, as well as the 3.5 mg/m2 from the plasma proteins it is therefore seen as highly unlikely that the emulsifier content is too low to cover the surface.
5.4.2.1 Impact of lowering acid content The result of lowering egg yolk and acid content simultaneously, to evaluate if the previous results are related to a change in pH, is shown in figure 28 below. The acid and egg content is reduced by 25% respectively and compared with only lowering the egg yolk content 25%.
115 108 0
50
100
150
200
250
-‐25% egg -‐25% egg and -‐25% vinegar
Stevens value
Stevens value
3,9 4,0
0
1
2
3
4
5
-‐25% egg -‐25% egg and -‐25% vinegar
Size (um)
Droplet size a)
b)
Figure 28. Mayonnasie samples with a reduction of 25% in egg yolk content in which one of the samples also has a reduced amount of acid with 25 %. Confidence intervals of 90% determined from the center point are indicated with error bars. a) Droplet size measurements b) Measurements of Stevens value

37
The differences in both Stevens value and droplet size between the two runs are very small and comparing with the confidence interval it can be seen that the changes are not significant. Thus, it is concluded that the impact on texture and droplet size, appearing with lowered egg yolk content, cannot be explained by the decrease in pH.
5.4.3 Impact of emulsifier type The results of changing the liquid egg yolk into a spray-‐dried egg yolk powder are shown in figure 29 and 30 below. The egg yolk dry matter content is equal for the two samples.
Figure 29. Droplet sizes measured for mayonnaise samples with liquid egg yolk and spray-‐dried egg yolk powder, with the same dry matter content. Confidence intervals of 90% determined from the center point are indicated with error bars.
Figure 30. Stevens value measured for mayonnaise samples with liquid egg yolk and spray-‐dried egg yolk powder, with the same dry matter content Confidence intervals of 90% determined from the center point are indicated with error bars.
The figures show that changing the type of egg yolk, results in changes of both texture and droplet size of the mayonnaise. The egg yolk powder both decreased the droplet size significantly and increased the Stevens value compared to the liquid egg yolk. These results show that the type of egg yolk has a clear impact on the mayonnaise properties. The result from using egg yolk powder show that spray drying increases the emulsifying properties of mayonnaise, which could be related to the denaturation of proteins linked both to the LDL, livetins and granules.
3.0 2.8
0
1
2
3
4
Liquid egg yolk Egg yolk powder
Size (μm)
Droplet sizes using different egg types
154 185
0,0
50,0
100,0
150,0
200,0
250,0
Liquid egg yolk Egg yolk powder
Stevens value
Stevens value using different egg types
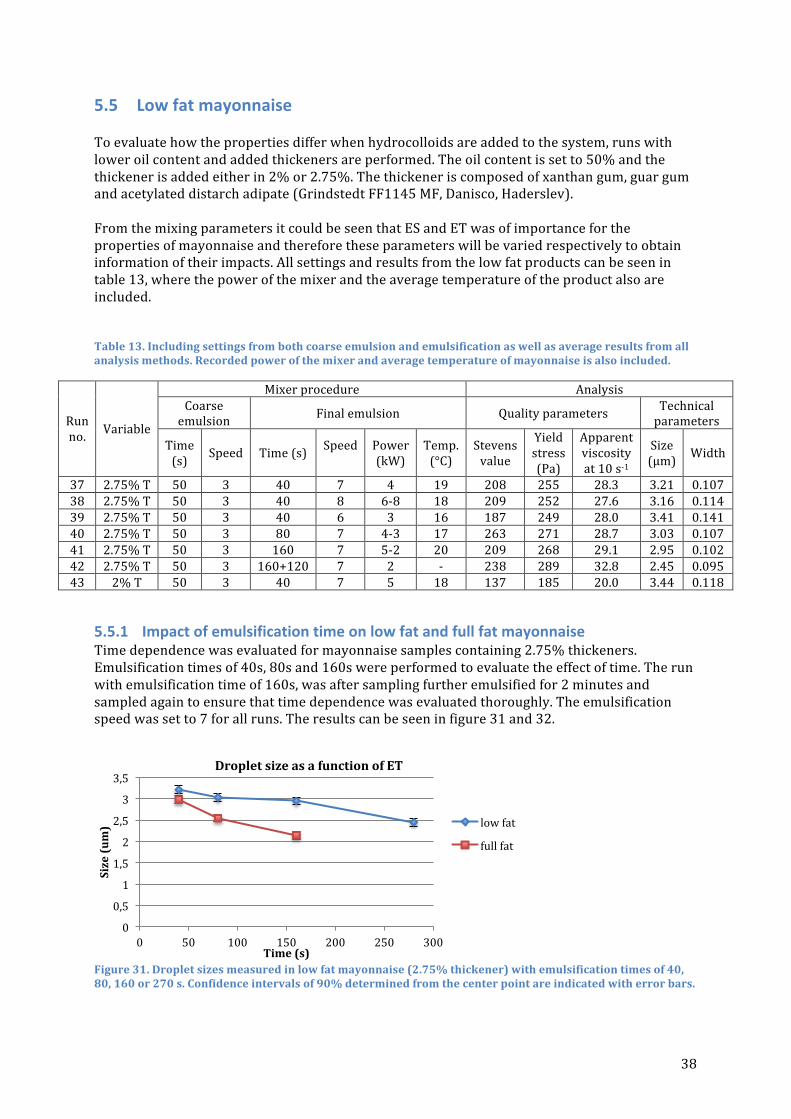
38
5.5 Low fat mayonnaise To evaluate how the properties differ when hydrocolloids are added to the system, runs with lower oil content and added thickeners are performed. The oil content is set to 50% and the thickener is added either in 2% or 2.75%. The thickener is composed of xanthan gum, guar gum and acetylated distarch adipate (Grindstedt FF1145 MF, Danisco, Haderslev). From the mixing parameters it could be seen that ES and ET was of importance for the properties of mayonnaise and therefore these parameters will be varied respectively to obtain information of their impacts. All settings and results from the low fat products can be seen in table 13, where the power of the mixer and the average temperature of the product also are included. Table 13. Including settings from both coarse emulsion and emulsification as well as average results from all analysis methods. Recorded power of the mixer and average temperature of mayonnaise is also included.
Run no. Variable
Mixer procedure Analysis Coarse emulsion Final emulsion Quality parameters Technical
parameters
Time (s) Speed Time (s) Speed
Power (kW)
Temp. (°C)
Stevens value
Yield stress (Pa)
Apparent viscosity at 10 s-‐1
Size (μm) Width
37 2.75% T 50 3 40 7 4 19 208 255 28.3 3.21 0.107 38 2.75% T 50 3 40 8 6-‐8 18 209 252 27.6 3.16 0.114 39 2.75% T 50 3 40 6 3 16 187 249 28.0 3.41 0.141 40 2.75% T 50 3 80 7 4-‐3 17 263 271 28.7 3.03 0.107 41 2.75% T 50 3 160 7 5-‐2 20 209 268 29.1 2.95 0.102 42 2.75% T 50 3 160+120 7 2 -‐ 238 289 32.8 2.45 0.095 43 2% T 50 3 40 7 5 18 137 185 20.0 3.44 0.118
5.5.1 Impact of emulsification time on low fat and full fat mayonnaise Time dependence was evaluated for mayonnaise samples containing 2.75% thickeners. Emulsification times of 40s, 80s and 160s were performed to evaluate the effect of time. The run with emulsification time of 160s, was after sampling further emulsified for 2 minutes and sampled again to ensure that time dependence was evaluated thoroughly. The emulsification speed was set to 7 for all runs. The results can be seen in figure 31 and 32.
Figure 31. Droplet sizes measured in low fat mayonnaise (2.75% thickener) with emulsification times of 40, 80, 160 or 270 s. Confidence intervals of 90% determined from the center point are indicated with error bars.
0
0,5
1
1,5
2
2,5
3
3,5
0 50 100 150 200 250 300
Size (um)
Time (s)
Droplet size as a function of ET
low fat
full fat
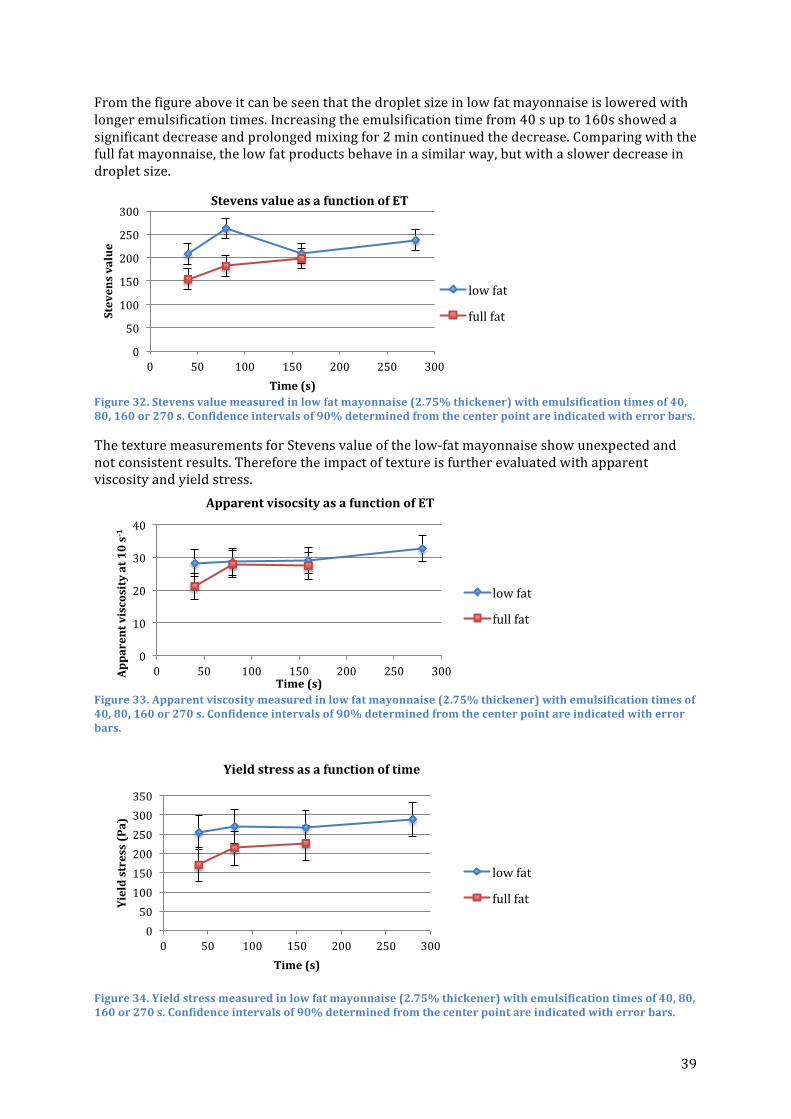
39
From the figure above it can be seen that the droplet size in low fat mayonnaise is lowered with longer emulsification times. Increasing the emulsification time from 40 s up to 160s showed a significant decrease and prolonged mixing for 2 min continued the decrease. Comparing with the full fat mayonnaise, the low fat products behave in a similar way, but with a slower decrease in droplet size.
Figure 32. Stevens value measured in low fat mayonnaise (2.75% thickener) with emulsification times of 40, 80, 160 or 270 s. Confidence intervals of 90% determined from the center point are indicated with error bars.
The texture measurements for Stevens value of the low-‐fat mayonnaise show unexpected and not consistent results. Therefore the impact of texture is further evaluated with apparent viscosity and yield stress.
Figure 33. Apparent viscosity measured in low fat mayonnaise (2.75% thickener) with emulsification times of 40, 80, 160 or 270 s. Confidence intervals of 90% determined from the center point are indicated with error bars.
Figure 34. Yield stress measured in low fat mayonnaise (2.75% thickener) with emulsification times of 40, 80, 160 or 270 s. Confidence intervals of 90% determined from the center point are indicated with error bars.
0
50
100
150
200
250
300
0 50 100 150 200 250 300
Stevens value
Time (s)
Stevens value as a function of ET
low fat
full fat
0
10
20
30
40
0 50 100 150 200 250 300 Apparent viscosity at 10 s-‐1
Time (s)
Apparent visocsity as a function of ET
low fat
full fat
0 50 100 150 200 250 300 350
0 50 100 150 200 250 300
Yield stress (Pa)
Time (s)
Yield stress as a function of time
low fat
full fat
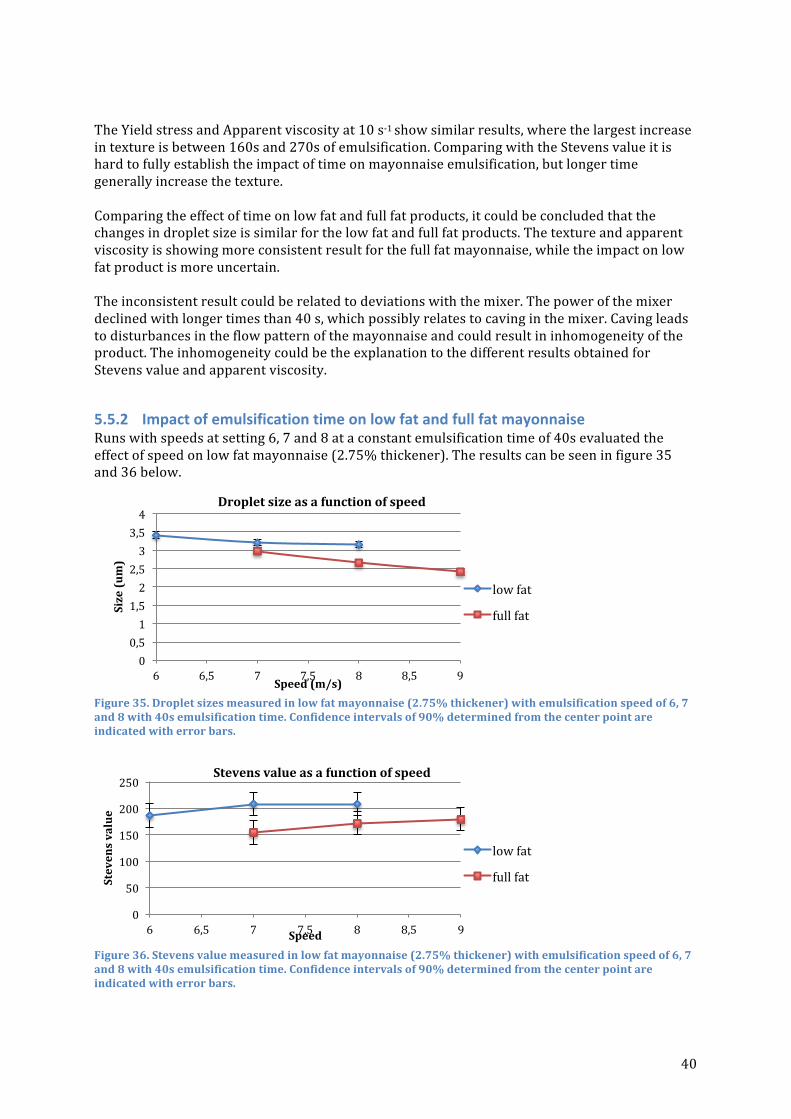
40
The Yield stress and Apparent viscosity at 10 s-‐1 show similar results, where the largest increase in texture is between 160s and 270s of emulsification. Comparing with the Stevens value it is hard to fully establish the impact of time on mayonnaise emulsification, but longer time generally increase the texture. Comparing the effect of time on low fat and full fat products, it could be concluded that the changes in droplet size is similar for the low fat and full fat products. The texture and apparent viscosity is showing more consistent result for the full fat mayonnaise, while the impact on low fat product is more uncertain. The inconsistent result could be related to deviations with the mixer. The power of the mixer declined with longer times than 40 s, which possibly relates to caving in the mixer. Caving leads to disturbances in the flow pattern of the mayonnaise and could result in inhomogeneity of the product. The inhomogeneity could be the explanation to the different results obtained for Stevens value and apparent viscosity.
5.5.2 Impact of emulsification time on low fat and full fat mayonnaise Runs with speeds at setting 6, 7 and 8 at a constant emulsification time of 40s evaluated the effect of speed on low fat mayonnaise (2.75% thickener). The results can be seen in figure 35 and 36 below.
Figure 35. Droplet sizes measured in low fat mayonnaise (2.75% thickener) with emulsification speed of 6, 7 and 8 with 40s emulsification time. Confidence intervals of 90% determined from the center point are indicated with error bars.
Figure 36. Stevens value measured in low fat mayonnaise (2.75% thickener) with emulsification speed of 6, 7 and 8 with 40s emulsification time. Confidence intervals of 90% determined from the center point are indicated with error bars.
0 0,5 1
1,5 2
2,5 3
3,5 4
6 6,5 7 7,5 8 8,5 9
Size (um)
Speed (m/s)
Droplet size as a function of speed
low fat
full fat
0
50
100
150
200
250
6 6,5 7 7,5 8 8,5 9
Stevens value
Speed
Stevens value as a function of speed
low fat
full fat

41
The droplet size measurements of low fat mayonnaise show a significant decrease in texture when increasing the speed from 6 up to 7. The decrease is however smaller compared to the full fat product. The impact of mixer speed on the texture is very small and no significant increase in Stevens value are obtained with higher speeds. The full fat products show similar results and these are also not significant. The similar results are although indicating that the mayonnaise products behave in a similar way, with a small increase in texture with higher mixer speed.
5.5.3 Impact of dosage The impact of changing the dosage from 2.75% down to 2% was evaluated. The results can be seen in figure 37 below.
Figure 37. Measurements of low fat mayonnaise with 50% oil content and two different amounts of thickener, 2.75% and 2% a) droplet size b) Stevens value. Confidence intervals of 90% determined from the center point are indicated with error bars.
Lowering the amount of thickener results in an increase in droplet size and a decrease in texture. The increase in droplet size with lowered amount of thickener is very small, but significant. The texture measurements on the other hand, show a significant decrease with lowered dosage. It is clear from these results that the dosage of the gums are of great importance for the properties of mayonnaise.
5.5.4 Summary low fat products To summarize the findings from evaluating low fat products, it can be concluded that the dosage has greater impact on mayonnaise texture and droplet size, compared to the impact of ES (emulsification speed) and ET (emulsification time). The ES and ET still have an impact, which should not be neglected and especially the deviations found with longer times could be worth examining in further detail. A parameter, which is not taken into account during these trials, is the appearance of the mayonnaise produced. The appearance of the mayonnaise samples produced has been very similar and differences have been difficult to discover until the trials with addition of thickeners. The low fat products differ from the full fat products and appear less shiny and a bit grainier. The explanation to these results could be the procedure of the mayonnaise production. The procedure was kept as similar as possible for the low fat product, compared to the original procedure, to enable comparison of results from full fat trials and low fat trials. For
209
137
0
50
100
150
200
250
2,75% thickener 50% oil 2% thickener 50% oil
Stevens value
Stevens value
3,2 3,4
0
0,5
1
1,5
2
2,5
3
3,5
4
2,75% thickener 50% oil
2% thickener 50% oil
Size (μm)
Droplet size a) b)

42
hydrocolloids the solubilisation is an important step, which were not taken into consideration. This might have been unfavourable for the low fat products and could have affected the final appearance as well as the texture and droplet size of the low fat products. Further trials should therefore be performed to optimize the procedure further for the low fat products.
5.6 Correlation droplet size and Stevens value – mixing parameters, recipe parameters and low fat products
The mixing parameters showed a significant negative correlation between Stevens value and the droplet size with a R2 value of 0,84 (see 5.3.4 Correlations between droplet size, distribution width and Stevens value). To evaluate if the correlation applies with variation in recipe, the runs with recipe variables and low fat mayonnaises are included in figure 38 below.
Figure 38. The correlation between Stevens value and droplet size including all runs performed in the trial. The runs are grouped together according to; mixing parameters, lowering of oil content, lowering of egg content, egg yolk powder, reference sample, low fat products and 35°C oil temperature. The sample marked as “reference sample” is indicating the run with the mixer settings, which are used to evaluate recipe parameters.
In the figure it is shown that the previous evaluated mixing parameters (green triangles) are gathered in a certain area, giving the equation previously obtained (TC Stevens values are used). The trials with lowered oil content or egg content is complying with the linear slope of the mixing parameters and thereby relates well to the correlation previously found. Beneath the mixing parameters there is a pink triangle, which is the experiment with oil added at a temperature of 35°C. In the diagram it is clear that the Stevens value is lowered and that the experiment does not follow the equation obtained. Changing the recipe to include egg yolk powder instead of liquid egg yolk a small deviation is found. This relates to the improved texture, which should be attributed to changes of the proteins and granules due to thermal treatment of the egg yolk. The last deviations found are the low fat trials. The low fat experiments are distributed over a wide area and in order to draw any definite conclusion regarding the effect of low fat products more trials needs to be performed. The trials performed so far with thickeners did show a grainy appearance, which could have affected the texture and droplet size. Additional trials with an optimized procedure need to be performed before any conclusions can be drawn.
0,0
50,0
100,0
150,0
200,0
250,0
300,0
0 1 2 3 4 5 6 7
Stevens value
Size
Correlation Stevens value and droplet size
Changing mixer parameters
Lowering oil content
Lowering egg content
Egg yolk powder
Reference sample
Low fat products
oil temperature 35°C
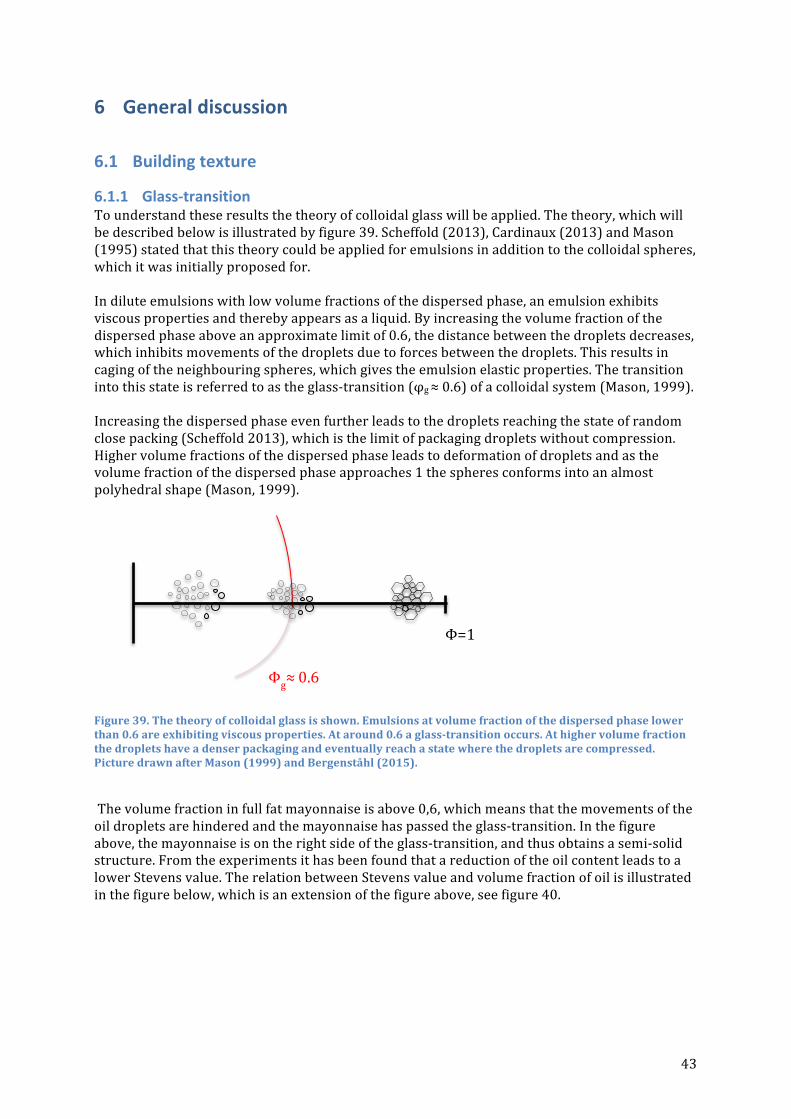
43
6 General discussion
6.1 Building texture
6.1.1 Glass-‐transition To understand these results the theory of colloidal glass will be applied. The theory, which will be described below is illustrated by figure 39. Scheffold (2013), Cardinaux (2013) and Mason (1995) stated that this theory could be applied for emulsions in addition to the colloidal spheres, which it was initially proposed for. In dilute emulsions with low volume fractions of the dispersed phase, an emulsion exhibits viscous properties and thereby appears as a liquid. By increasing the volume fraction of the dispersed phase above an approximate limit of 0.6, the distance between the droplets decreases, which inhibits movements of the droplets due to forces between the droplets. This results in caging of the neighbouring spheres, which gives the emulsion elastic properties. The transition into this state is referred to as the glass-‐transition (φg ≈ 0.6) of a colloidal system (Mason, 1999). Increasing the dispersed phase even further leads to the droplets reaching the state of random close packing (Scheffold 2013), which is the limit of packaging droplets without compression. Higher volume fractions of the dispersed phase leads to deformation of droplets and as the volume fraction of the dispersed phase approaches 1 the spheres conforms into an almost polyhedral shape (Mason, 1999).
Figure 39. The theory of colloidal glass is shown. Emulsions at volume fraction of the dispersed phase lower than 0.6 are exhibiting viscous properties. At around 0.6 a glass-‐transition occurs. At higher volume fraction the droplets have a denser packaging and eventually reach a state where the droplets are compressed. Picture drawn after Mason (1999) and Bergenståhl (2015).
The volume fraction in full fat mayonnaise is above 0,6, which means that the movements of the oil droplets are hindered and the mayonnaise has passed the glass-‐transition. In the figure above, the mayonnaise is on the right side of the glass-‐transition, and thus obtains a semi-‐solid structure. From the experiments it has been found that a reduction of the oil content leads to a lower Stevens value. The relation between Stevens value and volume fraction of oil is illustrated in the figure below, which is an extension of the figure above, see figure 40.
Φ=1
v
Φg≈ 0.6

44
Figure 40. The theory of colloidal glass is used to describe the increase in texture (measured with Stevens value) with higher oil content in the dispersed phase. The Stevens values are indicated with red lines.
6.1.2 Including impact of attraction The appearance of a glass-‐transition is dependent on the interactions between the droplets, which if the droplets are close enough (in comparison to the strength of the forces) leads to caging by the neighbouring droplets (Mason, 1999). A stronger interaction between the droplets thereby leads to an appearance of the glass-‐transition at a lower volume fraction of the dispersed phase. The interaction can be included in the previous figure on the y-‐axis, see figure 41. The nature of the interaction can be either repulsive or attractive (Bergenståhl, 2015).
Figure 41. The impact of interaction between the droplets in the theory of colloidal glass is illustrated in the figure. The increased attraction with lowered droplet size is demonstrated with a red arrow.
In mayonnaise the impact of the interactions is of main importance. As described in the background, the granules of the egg yolk create a network between the oil droplets in the continuous phase. The network between the droplets implies that there are attractive forces in the mayonnaise that could be denoted to the egg yolk. In the figure above the mayonnaise could therefore be described by the lower part below the x-‐axis (figure 41). A correlation between a decrease in droplet size and an increase in texture has been found in the experiments. This correlation can be explained by the increase of area per volume, which is a consequence of the decreased droplet size. The total interface between oil and water is enlarged which leads to increased amount of attractive forces per volume of oil. As figure 41 shows a decrease in droplet size leads to increased attraction, which results in higher Stevens values.
Φ=1
v
Low Medium High Stevens value
Repulsive
Attractive
Interaction
5 μm Droplet size 2 μm
Φ=1
v
Low Medium High
Stevens value

45
The attractive forces are related to the egg yolk and in trials with a reduced amount of egg yolk the texture was significantly decreased. It is assumed that this decrease can be explained by the reduced amount of attractive forces per volume of dispersed phase. Changing the type of emulsifier to a spray-‐dried egg yolk increased the texture of the mayonnaise, which also could be related to an increase in attractive forces. The spray-‐drying process has changed the proteins in the egg yolk, which is further described in the background. Adding thickeners to the system have significant impact on the system. One of the contributions is the ability to create a network, which leads to increased attraction between the droplets and hence an improved texture. The temperature during emulsification also showed a great impact on texture of the mayonnaise. A high temperature imparted the building of texture, which is thought to relate to the adhesion between the droplets. The increase of temperature together with the high shearing forces is believed to have a negative impact of the bridging between the droplets. Anton (2013) reported that the granules ability to form bridges is impaired by high-‐pressure treatment. It is unlikely that the temperature solely could create the decrease in texture, since the egg yolk already is subjected to a heat treatment in the pasteurization of the egg yolk.
6.1.3 Polydispersity The colloidal glass is also affected by the polydispersity of the droplets (Hunter et. al. 2012). Increasing the distribution width of mayonnaise will enable a tighter packaging of the droplets. Hence, a higher volume fraction of oil is possible before the packing limit is reached and the droplet starts to deform. This is illustrated in the figure below (figure 42), where the same Stevens value as in the previous picture will be achieved at higher volume fractions, due to an increase in polydispersity.
Figure 42. The impact of polydispersity on the texture of mayonnaise is illustrated in the picture.
From the experiments the correlation between, Stevens value, droplet size and droplet distribution are evaluated. Figure 22 indicates the relation between Stevens value and the distribution width, where high Stevens value showed a narrow distribution and wider distribution was followed by lower Stevens values. A possible explanation is that the low Stevens value obtained could be explained by the increase in polydispersity as illustrated in figure 42.
Φ=1
v
Very Low Low Medium Stevens value
Repulsive
Attractive
Interaction

46
6.2 Droplet break up The mean droplet size in the experiments performed has been varying between 2-‐6 µm. To explain the variations in droplet size the theory of droplet break up in laminar flow will be discussed. As mentioned earlier the droplet break up in laminar flow can be described with the equation of the critical Weber number. The radius of the droplet size corresponding to the critical Weber number in the system can be formulated by rearranging the equation of the Weber number (see eq. 14).
𝑟 = !!!"∙!!!∙!
(14) The droplet radius is denoted 𝑟, 𝑊𝑒!" is the critical Weber for droplet break up, 𝛾 is the interfacial tension, 𝐺 is the velocity gradient and 𝜂! is the viscosity of the mayonnaise. The equation will first be used to highlight the changes in droplet size obtained in experiments with added thickeners. A run with 70% mayonnaise has been made both with and without thickener included and comparing the two runs a significant reduction in droplet size was found with thickeners added. In the equation above it could be seen that adding thickener, which will increase the viscosity in the mayonnaise, will lead to a lowering of the radius at the critical Weber number allowing droplet break up of smaller droplets. Reducing the amount of oil and egg yolk respectively led to significant increases of the droplet size. A reduced amount of oil is according to the theory of colloidal glass resulting in a decrease in texture. Since the texture is assumed to relate to the viscosity of the mayonnaise it is expected that the reduced amount of oil also result in a decrease of the viscosity in the mayonnaise. Consequently, according to the equation above the mean droplet size will be increased. A similar reasoning can be applied for the reduced egg content, where the decrease in texture is explained by less attraction between droplets. The decrease in texture is assumed to lower the viscosity, resulting in an increased droplet size according to eq. 14.
6.3 Key parameters The results from the experiments show that several parameters, both mixing and recipe variables, have an impact on the properties of mayonnaise. Therefore it is important to compare the parameters against each other in order to find out which of the parameters that possesses the greatest influence. In the experiments with variations in mixing variables, emulsification time and emulsification speed has shown to have a significant impact on the properties of mayonnaise. Stevens values between approximately 140-‐200 are obtained and the changes in droplet size is between 2 µm and 3 µm. These results should be compared with the recipe experiments, where the decrease in oil content and variations related to the emulsifier resulted in significant changes in both texture and droplet size. Stevens values down to 40 and all the way up to 180 as well as droplet sizes between 2.5 µm and 6 µm were obtained. The large variations obtained in the recipe experiments suggest that the recipe parameters generally have a greater influence compared to the mixing parameters. The last parameter to compare with is the impact of thickeners. Addition of 0,3% thickener increased the Stevens value from 40 up to 150 and lowered the droplet size from 6 µm to 3 µm, which show that the impact of recipe parameters can be overcome by thickeners.

47
7 Conclusions It can be concluded from the obtained results that both mixing time and the speed of the rotor during the emulsification (emulsification time and speed) have an impact on the technical (droplet size) and quality parameters (texture). The time and speed prior to the emulsification on the other hand does not significantly impact either the technical or the quality parameters. During the emulsification it is also essential to control the temperature, since an increase of the temperature has significantly lowered the texture of the mayonnaise, meanwhile the droplet size seem less sensitive to temperature increase. The recipe parameters have shown to have an even greater impact on the properties of mayonnaise, compared to the mixing parameters. The volume fraction of the dispersed phase has significantly impacted both technical and quality parameters and high oil content is important to maintain the semi-‐solid structure and also the small droplet size. Reducing the amount of emulsifier is decreasing the texture and increasing the droplet size, which is unfavourable in the production of mayonnaise and the emulsifier content is therefore very important. Replacing the emulsifier with another type (i.e. liquid egg yolk to egg yolk powder) has also shown to have great impact on both technical and quality parameters, probably to changes in the adhesion between droplets. Variations in the continuous phase have resulted in both changed and unchanged properties. Addition of hydrocolloids had a significant impact on both droplet size and texture, which are assumed to relate to their ability in increasing viscosity and creating network in the continuous phase. Varying the acid content with 25% and thereby increasing the pH, did not affect either technical or quality parameters of mayonnaise. To increase the knowledge of the complex system of mayonnaise the theory about colloidal glass has been evaluated and found to conform well to mayonnaise technical and quality properties. To achieve a building of texture in mayonnaise the volume fraction of the dispersed phase can be increased or the droplet size can be decreased. The polydispersity impairs the building of texture, due to a shift in the glass-‐transition. The attractive forces between the oil droplets are also of great importance for the mayonnaise properties, which can be attributed both to the egg yolk as well as the hydrocolloids. The variations in the technical parameter could be explained by the theory of droplet break up in laminar flow, which indicates the strong impact of the viscosity on the droplet size in mayonnaise.
48
8 References
• Adler-‐Nissen, J., Mason, S. L., & Jacobsen, C. (2004). Apparatus for emulsion production in small scale and under controlled shear conditions. Food and bioproducts processing, 82(4), 311-‐319.
• Anton, M., Huopalahti, R., López-‐Fandiño, R., Anton, M., and Schade, R. (2007). Bioactive egg compounds (pp. 1-‐31) Edited by: Huopalahti, R., López-‐Fandiño, R., Anton, M., and Schade, R.. Berlin: Springer.
• Anton, M. (2013). Egg yolk: structures, functionalities and processes. Journal of the Science of Food and Agriculture, 93(12), 2871-‐2880.
• Bengoechea, C., López, M. L., Cordobés, F., & Guerrero, A. (2009). Influence of semicontinuous processing on the rheology and droplet size distribution of mayonnaise-‐like emulsions. Food Science and Technology International, 15(4), 367-‐373
• Bergenståhl, B. (2015). Engineering Aspects of Food Emulsification and Homogenization. Chap: 2. Edited by: Rayner, M. and Dejmek, P., CRC press London
• Cardinaux, F., Mason, T. G., & Scheffold, F. (2013, February). Elasticity and glassy dynamics of dense emulsions. In 4th International Symposium on Slow Dynamics in Complex Systems: Keep Going Tohoku (Vol. 1518, No. 1, pp. 222-‐226). AIP Publishing.
• Cedergårdh, F., (2014) Characterization of commercial mayonnaise products – texture, viscosity and droplet size. Lund University. Master thesis
• Daimer, K., & Kulozik, U. (2009). Oil-‐in-‐water emulsion properties of egg yolk: Effect of enzymatic modification by phospholipase A 2. Food hydrocolloids,23(5), 1366-‐1373.
• Dalmazzone, C. (2005). The mechanical generation of emulsions. Lubrication Science, 17(2), 197-‐237.
• Dawson, K. A. (2002). The glass paradigm for colloidal glasses, gels, and other arrested states driven by attractive interactions. Current opinion in colloid & interface science, 7(3), 218-‐227.
• Depree, J. A., & Savage, G. P. (2001). Physical and flavour stability of mayonnaise. Trends
in Food Science & Technology, 12(5), 157-‐163.
• Dickinson, E. (2003). Hydrocolloids at interfaces and the influence on the properties of dispersed systems. Food hydrocolloids, 17(1), 25-‐39.
• Doublier, J-‐L. and Cuvelier, G., (2014). Carbohydrates in food , chap 7, Vol. 159. Edited by: Eliasson, A. C. CRC press.
• Guilmineau, F., & Kulozik, U. (2007). Influence of a thermal treatment on the functionality of hen’s egg yolk in mayonnaise. Journal of Food Engineering,78(2), 648-‐654.

49
• Guilmineau, F., & Kulozik, U. (2006). Impact of a thermal treatment on the emulsifying properties of egg yolk. Part 2: Effect of the environmental conditions. Food hydrocolloids, 20(8), 1114-‐1123.
• Ford, L. D., Borwankar, R., Martin Jr, R. W., Holcomb, D. N., (1997). Food Emulsion, Third Edition, chap. 8. Edited by: Friberg, S. E., Larsson, K., New York: CRC press
• Harrison, L. J., & Cunningham, F. E. (1985). Factors influencing the quality of mayonnaise: a review. Journal of food quality, 8(1), 1-‐20.
• Hunter, G. L., & Weeks, E. R. (2012). The physics of the colloidal glass transition. Reports on Progress in Physics, 75(6), 066501.
• Jafari, S. M., Assadpoor, E., He, Y., & Bhandari, B. (2008). Re-‐coalescence of emulsion droplets during high-‐energy emulsification. Food hydrocolloids, 22(7), 1191-‐1202.
• Kiosseoglou, V. D., & Sherman, P. (1983). Influence of egg yolk lipoproteins on the
rheology and stability of o/w emulsions and mayonnaise 1. Viscoelasticity of groundnut oil-‐in-‐water emulsions and mayonnaise. Journal of texture studies, 14(4), 397-‐417.
• Mason, T. G., Bibette, J., & Weitz, D. A. (1995). Elasticity of compressed
emulsions. Physical review letters, 75(10), 2051.
• Mason, T. G. (1999). New fundamental concepts in emulsion rheology. Current Opinion in Colloid & Interface Science, 4(3), 231-‐238.
• Ma, Z., & Boye, J. I. (2013). Advances in the design and production of reduced-‐fat and reduced-‐cholesterol salad dressing and mayonnaise: a review. Food and Bioprocess Technology, 6(3), 648-‐670.
• Maruyama, K., Sakashita, T., Hagura, Y., & Suzuki, K. (2007). Relationship between
rheology, particle size and texture of mayonnaise. Food Science and Technology Research, 13(1), 1-‐6.
• McClements, D. J., (2005). Food Emulsions: Principles, Practices, and Techniques, Second
Edition, chap. 6 and 12 Boca Raton: CRC press
• Moros, J. E., Franco, J. M., & Gallegos, C. (2002). Rheology of spray-‐dried egg yolk-‐stabilized emulsions. International journal of food science & technology,37(3), 297-‐307.
• Moslavac, T., Pozderović, A., & Pichler, A. (2011). Influence of process parameters and
composition of the oil phase on rheological properties of mayonnaise. MESO: prvi hrvatski časopis o mesu, 13(2), 101-‐101.
• Rosén, C., (2015) Källbergs, Töreboda. Personal communication
• Santana, R. C., Perrechil, F. A., & Cunha, R. L. (2013). High-‐and low-‐energy emulsifications
for food applications: a focus on process parameters. Food Engineering Reviews, 5(2), 107-‐122.
• Scheffold, F., Cardinaux, F., & Mason, T. G. (2013). Linear and nonlinear rheology of dense
emulsions across the glass and the jamming regimes. Journal of Physics: Condensed Matter, 25(50), 502101.

50
• Štern, P., Mikova, K., Pokorný, J., & Valentová, H. (2007). Effect of oil content on the rheological and textural properties of mayonnaise. Journal of Food and Nutrition Research (Slovak Republic).
• Tadros, T. F. (Ed.). (2013). Emulsion formation and stability. Chap. 1 John Wiley & Sons.
• Walstra, P. (1993). Principles of emulsion formation. Chemical Engineering Science, 48(2), 333-‐349.
• Zhang, J., Xu, S., & Li, W. (2012). High shear mixers: A review of typical applications and studies on power draw, flow pattern, energy dissipation and transfer properties. Chemical Engineering and Processing: Process Intensification, 57, 25-‐41.
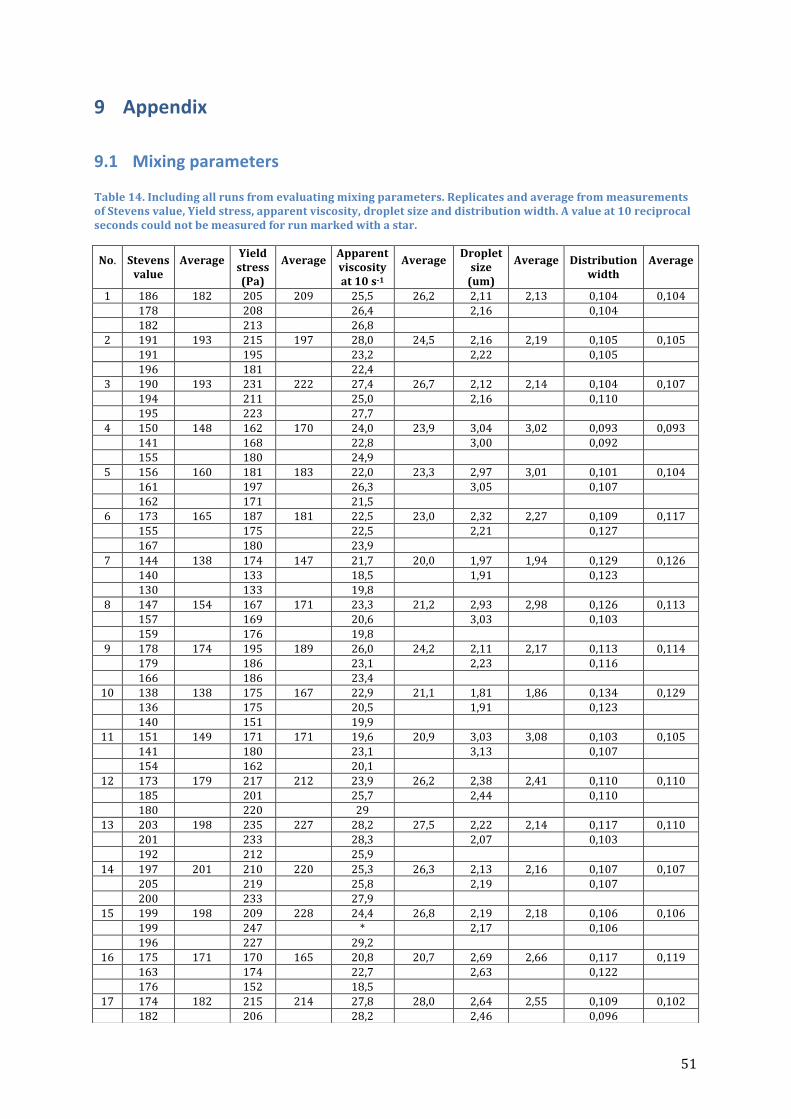
51
9 Appendix
9.1 Mixing parameters Table 14. Including all runs from evaluating mixing parameters. Replicates and average from measurements of Stevens value, Yield stress, apparent viscosity, droplet size and distribution width. A value at 10 reciprocal seconds could not be measured for run marked with a star.
No.
Stevens value
Average
Yield stress (Pa)
Average
Apparent viscosity at 10 s-‐1
Average
Droplet size (um)
Average
Distribution width
Average
1 186 182 205 209 25,5 26,2 2,11 2,13 0,104 0,104
178 208 26,4 2,16 0,104 182 213 26,8 2 191 193 215 197 28,0 24,5 2,16 2,19 0,105 0,105
191 195 23,2 2,22 0,105 196 181 22,4 3 190 193 231 222 27,4 26,7 2,12 2,14 0,104 0,107
194 211 25,0 2,16 0,110 195 223 27,7 4 150 148 162 170 24,0 23,9 3,04 3,02 0,093 0,093
141 168 22,8 3,00 0,092 155 180 24,9 5 156 160 181 183 22,0 23,3 2,97 3,01 0,101 0,104
161 197 26,3 3,05 0,107 162 171 21,5 6 173 165 187 181 22,5 23,0 2,32 2,27 0,109 0,117
155 175 22,5 2,21 0,127 167 180 23,9 7 144 138 174 147 21,7 20,0 1,97 1,94 0,129 0,126
140 133 18,5 1,91 0,123 130 133 19,8 8 147 154 167 171 23,3 21,2 2,93 2,98 0,126 0,113
157 169 20,6 3,03 0,103 159 176 19,8 9 178 174 195 189 26,0 24,2 2,11 2,17 0,113 0,114
179 186 23,1 2,23 0,116 166 186 23,4 10 138 138 175 167 22,9 21,1 1,81 1,86 0,134 0,129
136 175 20,5 1,91 0,123 140 151 19,9 11 151 149 171 171 19,6 20,9 3,03 3,08 0,103 0,105
141 180 23,1 3,13 0,107 154 162 20,1 12 173 179 217 212 23,9 26,2 2,38 2,41 0,110 0,110
185 201 25,7 2,44 0,110 180 220 29 13 203 198 235 227 28,2 27,5 2,22 2,14 0,117 0,110
201 233 28,3 2,07 0,103 192 212 25,9 14 197 201 210 220 25,3 26,3 2,13 2,16 0,107 0,107
205 219 25,8 2,19 0,107 200 233 27,9 15 199 198 209 228 24,4 26,8 2,19 2,18 0,106 0,106
199 247 * 2,17 0,106 196 227 29,2 16 175 171 170 165 20,8 20,7 2,69 2,66 0,117 0,119
163 174 22,7 2,63 0,122 176 152 18,5 17 174 182 215 214 27,8 28,0 2,64 2,55 0,109 0,102
182 206 28,2 2,46 0,096
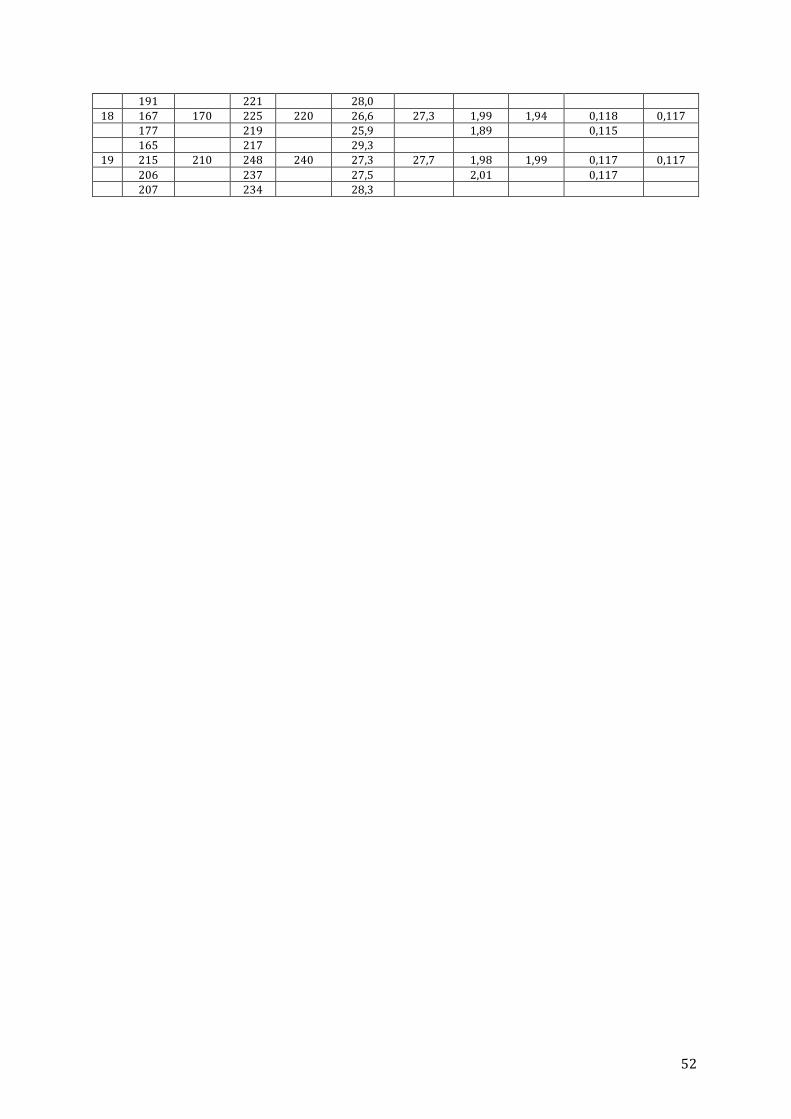
52
191 221 28,0 18 167 170 225 220 26,6 27,3 1,99 1,94 0,118 0,117
177 219 25,9 1,89 0,115 165 217 29,3 19 215 210 248 240 27,3 27,7 1,98 1,99 0,117 0,117
206 237 27,5 2,01 0,117 207 234 28,3
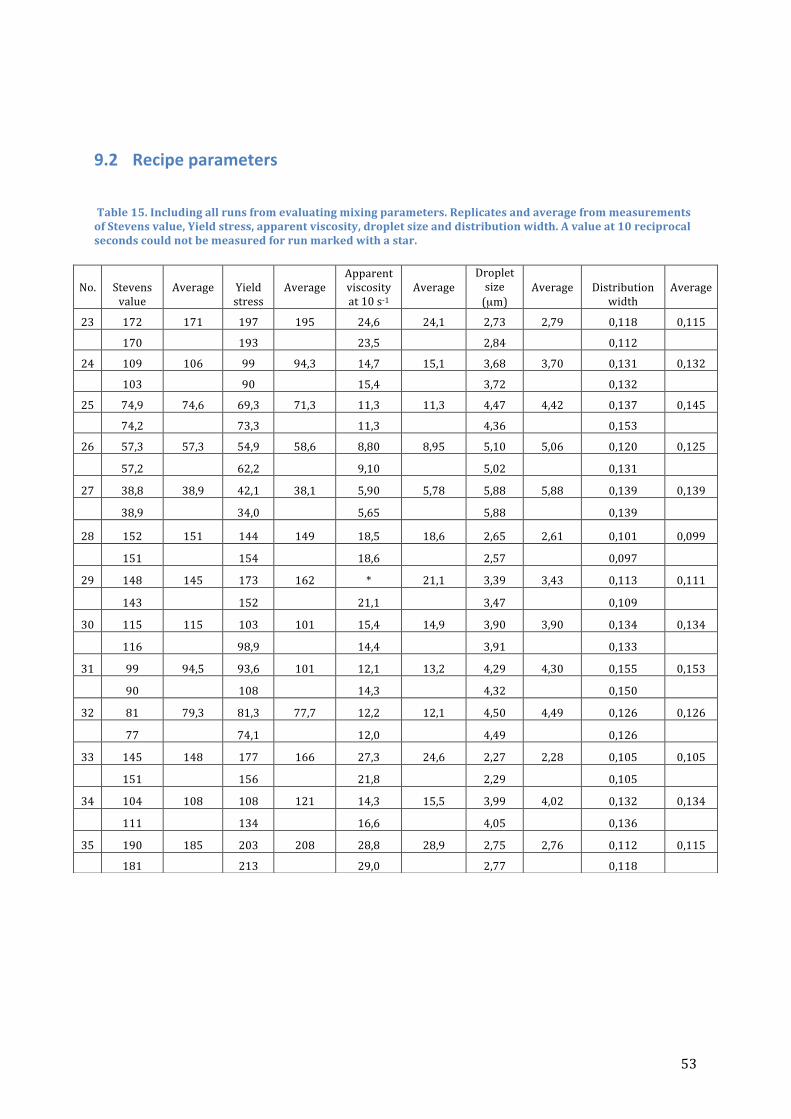
53
9.2 Recipe parameters Table 15. Including all runs from evaluating mixing parameters. Replicates and average from measurements of Stevens value, Yield stress, apparent viscosity, droplet size and distribution width. A value at 10 reciprocal seconds could not be measured for run marked with a star.
No.
Stevens value
Average
Yield stress
Average
Apparent viscosity at 10 s-‐1
Average
Droplet size (µm)
Average
Distribution width
Average
23 172 171 197 195 24,6 24,1 2,73 2,79 0,118 0,115
170
193
23,5
2,84
0,112
24 109 106 99 94,3 14,7 15,1 3,68 3,70 0,131 0,132
103
90
15,4
3,72
0,132
25 74,9 74,6 69,3 71,3 11,3 11,3 4,47 4,42 0,137 0,145
74,2
73,3
11,3
4,36
0,153
26 57,3 57,3 54,9 58,6 8,80 8,95 5,10 5,06 0,120 0,125
57,2
62,2
9,10
5,02
0,131
27 38,8 38,9 42,1 38,1 5,90 5,78 5,88 5,88 0,139 0,139
38,9
34,0
5,65
5,88
0,139
28 152 151 144 149 18,5 18,6 2,65 2,61 0,101 0,099
151
154
18,6
2,57
0,097
29 148 145 173 162 * 21,1 3,39 3,43 0,113 0,111
143
152
21,1
3,47
0,109
30 115 115 103 101 15,4 14,9 3,90 3,90 0,134 0,134
116
98,9
14,4
3,91
0,133
31 99 94,5 93,6 101 12,1 13,2 4,29 4,30 0,155 0,153
90
108
14,3
4,32
0,150
32 81 79,3 81,3 77,7 12,2 12,1 4,50 4,49 0,126 0,126
77
74,1
12,0
4,49
0,126
33 145 148 177 166 27,3 24,6 2,27 2,28 0,105 0,105
151
156
21,8
2,29
0,105
34 104 108 108 121 14,3 15,5 3,99 4,02 0,132 0,134
111
134
16,6
4,05
0,136
35 190 185 203 208 28,8 28,9 2,75 2,76 0,112 0,115
181
213
29,0
2,77
0,118

54
9.3 Low fat products
Table 16. Including all runs from evaluating mixing parameters. Replicates and average from measurements of Stevens value, Yield stress, apparent viscosity, droplet size and distribution width. Run marked with star is not used due to a suspect inaccuracy in the measurement.
No
Stevens value
Average
Yield stress (Pa)
Average
Apparent viscosity at 10 s-‐1
Average
Droplet size (µm)
Average
Distribution width
Average
37 207 208 262 255 29,9 28,3 3,20 3,21 0,103 0,107
210
248
26,6
3,22
0,112
38 211 209 262 252 29,2 27,6 3,16 3,16 0,113 0,114
206
242
26,1
3,15
0,115
39 184 187 256 249 28,1 28,0 3,37 3,41 0,140 0,141
190
242
27,9
3,44
0,142
40 269 263 * 271 28,3 28,7 3,09 3,03 0,106 0,107
258
271
29,0
2,98
0,109
41 226 209 262 268 28,5 29,1 2,93 2,95 0,100 0,102
192
273
29,7
2,97
0,103
42 238 238 312 289 36,1 32,8 2,42 2,45 0,095 0,095
265
29,5
2,48
0,093
43 136 137 186 185 19,9 20,0 3,44 3,44 0,118 0,118
138
183
20,0
3,44
0,118
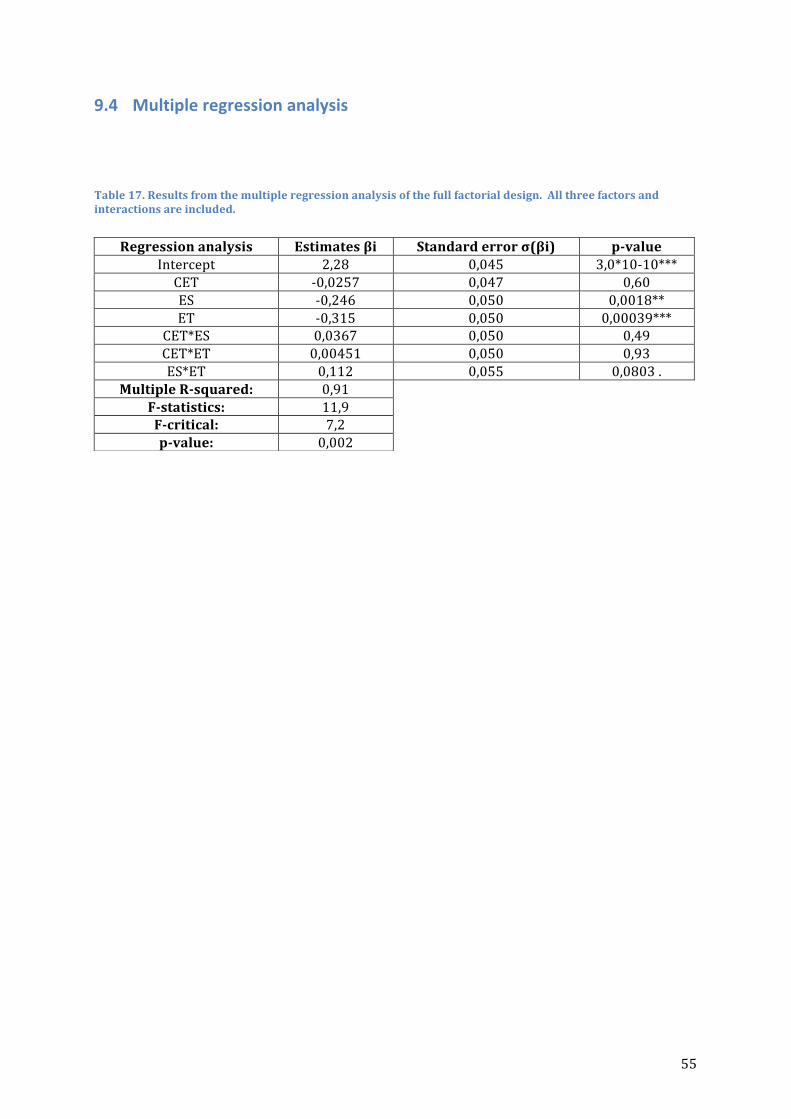
55
9.4 Multiple regression analysis
Table 17. Results from the multiple regression analysis of the full factorial design. All three factors and interactions are included.
Regression analysis Estimates βi Standard error σ(βi) p-‐value Intercept 2,28 0,045 3,0*10-‐10*** CET -‐0,0257 0,047 0,60 ES -‐0,246 0,050 0,0018** ET -‐0,315 0,050 0,00039***
CET*ES 0,0367 0,050 0,49 CET*ET 0,00451 0,050 0,93 ES*ET 0,112 0,055 0,0803 .
Multiple R-‐squared: 0,91 F-‐statistics: 11,9 F-‐critical: 7,2
p-‐value: 0,002

56
9.5 Recipes
Table 18. Including all recipes used throughout the trials. The amounts of ingredients are given in weight percent and the total batch size was 25 kg.
Type of recipe
Water (w/w %)
Salt (w/w %)
Sugar (w/w %)
Mustard (w/w %)
Vinegar 12%
(w/w%)
Egg yolk liquid
(w/w %)
Rapeseed oil
(w/w %) Thickener (w/w %)
Standard recipe 5,80 0,300 0,300 2,50 2,10 8,5 80,5 0
82% oil 4,26 0,180 0,300 2,50 2,10 8,66 82,0 0
78% oil 8,36 0,501 0,300 2,50 2,10 8,24 78,0 0
76% oil 10,4 0,661 0,300 2,50 2,10 8,02 76,0 0
74% oil 12,5 0,822 0,300 2,50 2,10 7,81 74,0 0
70% oil 16,6 1,143 0,300 2,50 2,10 7,39 70,0 0
70% oil + T 16,6 1,143 0,300 2,50 2,10 7,39 70,0 0,3
-‐12.5% egg 6,74 0,419 0,300 2,50 2,10 7,44 80,5 0
-‐25% egg 7,69 0,539 0,300 2,50 2,10 6,38 80,5 0
-‐37.5% egg 8,63 0,658 0,300 2,50 2,10 5,31 80,5 0
-‐50% egg 9,57 0,777 0,300 2,50 2,10 4,25 80,5 0
-‐25% egg and acid 8,21 0,539 0,300 2,50 1,58 6,38 80,5 0
Egg yolk powder 10,1 0,980 0,300 2,50 2,10 3,56 80,5 0
50% oil + 2.75% 36,0 1,08 0,300 2,50 2,10 5,28 50,0 2,75
50% oil + 2% 36,7 1,08 0,300 2,50 2,10 5,28 50,0 2
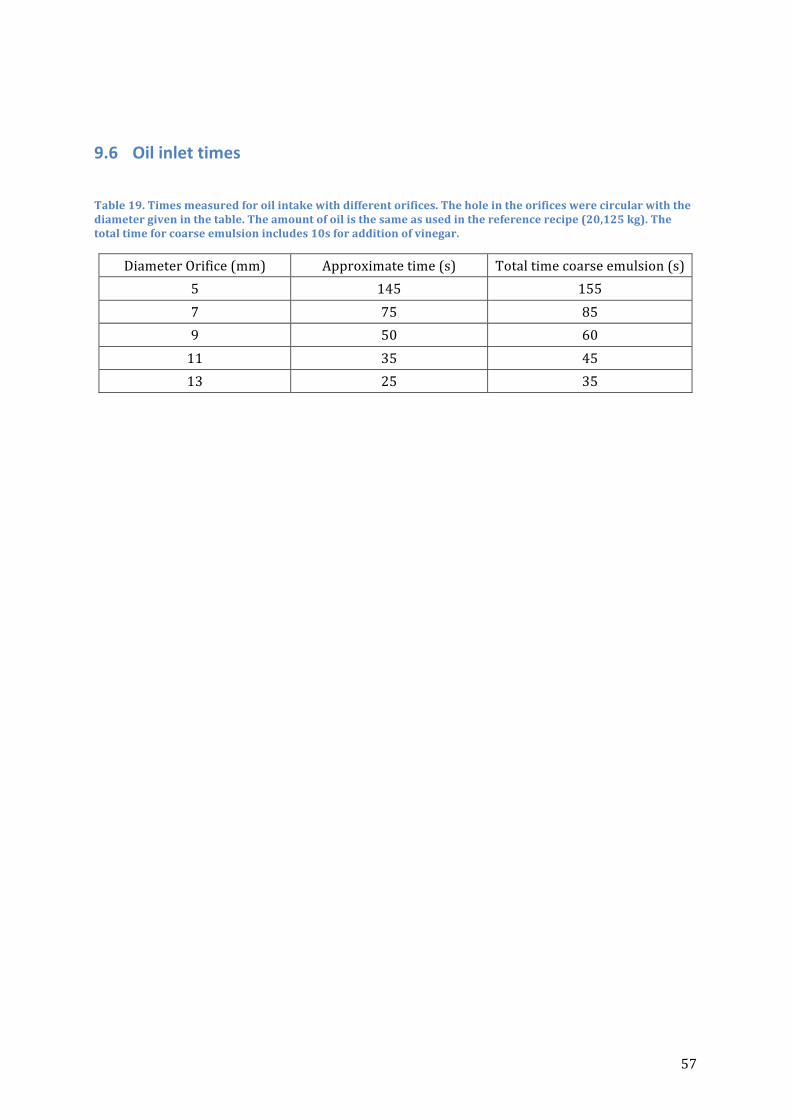
57
9.6 Oil inlet times Table 19. Times measured for oil intake with different orifices. The hole in the orifices were circular with the diameter given in the table. The amount of oil is the same as used in the reference recipe (20,125 kg). The total time for coarse emulsion includes 10s for addition of vinegar.
Diameter Orifice (mm) Approximate time (s) Total time coarse emulsion (s) 5 145 155 7 75 85 9 50 60 11 35 45 13 25 35
Related Documents