Welcome message from author
This document is posted to help you gain knowledge. Please leave a comment to let me know what you think about it! Share it to your friends and learn new things together.
Transcript
A qualitative field study, based on Grounded Theory methodology, has been conducted in the areas around Akuressa in southern Sri Lanka. The method for data collection consisted mainly of semi-structured interviews with local residents. The purpose of the study was to evaluate why people live in high-risk areas. The aim was to do this by looking beyond the purely physical aspect of living with hazards and explore underlying social factors. Four main reasons were identified, namely an overall good living situation, sense of place, difficulties relocating and being well adapted to the situation. Semi-structured interviews were also held with government officials to explore whether they shared the views of the local residents. The study found that there was a consensus regarding several of the different reasons as to why people live in the high-risk areas included in the study. However, some discrepancies were identified in relation to risk awareness and the efficiency of implemented risk reducing measures. Furthermore, the study identifies and explores underlying social factors, such as risk normalisation and risk trade-off, which seems to influence the decision of living in a high-risk area.

Summary
The overall purpose of this thesis is to study reasons why people live in high-risk areas. The study is
focused on one type of hazard, namely floods, and the field study was conducted in the District of
Matara in the southern part of Sri Lanka.
The common conception and often the focus regarding natural disasters, such as floods, is that of
the physical phenomenon. However, by considering a social factor when attempting to understand
the impacts of natural disasters, a more complex situation quickly takes form. This is further
explained by the fact that if humans, or what humans value, are not present, it is simply a natural
phenomenon rather than a natural disaster, whilst the physical occurrence remains unaltered. The
aim of this thesis is therefore to look beyond the purely physical aspects of living with a high level of
hazard exposure and explore the underlying social mechanisms potentially dictating why people live
there.
The thesis is based on a methodology called Grounded Theory where the researchers use the
collected data to form new theories instead of trying to support an existing theory. The main
method of data collection was semi-structured interviews with local residents living in high-risk
areas, as well as with government officials from relevant departments. The data was then analysed
and codes, concepts and categories were constructed in order to identify trends and tendencies.
The findings of this field study reveal a complex system of interdependencies and reasons why
people live in high-areas such as the flood prone areas around Akuressa, Sri Lanka. A brief overview
of some of the findings in this thesis follows below.
Overall good living situation – Many of the respondents seemed happy with the overall living
situation. The annual floods were expressed as one of the few downsides. It appears that risk trade-
off reasoning has resulted in that perceived benefits of living in the areas around Akuressa outweigh
the perceived downsides associated with the floods.
Sense of place – A strong sense of place was expressed both in terms of being born and raised in the
current location, the land and house being passed down through generations as well as a preference
of being close to family and relatives.
Difficulties relocating – The respondents expressed difficulties associated with moving somewhere
else such as a disbelief of finding another place at all, financial constraints as well as a disbelief of
finding an equivalent living situation in a new location. One potential reason behind these problems
is identified as the static housing system.
Well adapted to the situation – Through interviews, informal discussions and field observations it
became evident that many local residents felt well adapted to the current situation. However, this
study identifies that the long-term exposure seems to have normalised the risks associated with
annual floods, which might have a negative impact on their level of preparedness.
Interviews held with government officials revealed a general consensus regarding several of the
main reasons for people living in the high-risk areas around Akuressa. However, some discrepancies
were found when comparing the risk awareness of local residents and government officials. This
study identifies discrepancies which points to potentially misdirected use of resources and inefficient
risk reducing measures.
Many of the findings in this study are supported by existing literature and it is the authors hope that
this study will help shed more light on the complexity surrounding why people live in high-risk areas.
Acknowledgements
The authors would like to extend their sincere gratitude to everyone who made this thesis possible.
The thesis was written at the Division of Risk Management and Societal Safety at Lund University
and was partially funded by a scholarship provided by the Swedish International Development
Cooperation Agency, SIDA. The authors would like to express special gratitude towards;
Nuwan Chamara Rathnayake – For being our translator during the interviews, assisting us during
our stay, and being a good friend.
Per Becker – For being our supervisor and providing valuable guidance and knowledge throughout
the process.
Sri Lanka Red Cross, Matara – For Mr. Vidanagama’s willingness to support the project, asssiting
with finding suitable accomodation and introducing us to the fantastic people at the office.
IFRC Sri Lanka – For believing in the project, providing necessary support during the visa application
process and ensuring our well-being during our stay.
The respondents – For taking the time to be interviewed and the fantastic hospitality. Without their
stories, this thesis would not have been possible.


Table of Contents
1. Introduction ......................................................................................................................... 1
1.1 - Background ................................................................................................................................. 1
1.2 - Purpose ....................................................................................................................................... 1
1.3 - Research Questions ..................................................................................................................... 2
2. Methodology ........................................................................................................................ 3
2.1 - Grounded theory ......................................................................................................................... 3
2.2 - Data collection ............................................................................................................................ 3 Semi structured interviews ........................................................................................................ 3 The use of an interpreter ........................................................................................................... 4 Selection of location and respondents ...................................................................................... 4 Field observations ...................................................................................................................... 7
2.3 - Data analysis ............................................................................................................................... 7
3. Conceptual Framework ......................................................................................................... 9
3.1 - Risk .............................................................................................................................................. 9 Risk awareness ........................................................................................................................... 9 Risk perception .......................................................................................................................... 9
3.2 - Vulnerability .............................................................................................................................. 10
4. Context Analysis ................................................................................................................. 11
4.1 - Sri Lanka .................................................................................................................................... 11
4.2 - Local Context – The District of Matara and the Nilwala River .................................................. 11
5. Results ............................................................................................................................... 15
5.1 - Local residents .......................................................................................................................... 17 Overall good living situation .................................................................................................... 18 Sense of place .......................................................................................................................... 20 Difficulties relocating ............................................................................................................... 22 Well adapted to the situation .................................................................................................. 22
5.2 - Government officials ................................................................................................................. 23
5.3 - Risk awareness of residents and officials .................................................................................. 24 Preparedness ........................................................................................................................... 24 Response .................................................................................................................................. 25 Proposed improvements ......................................................................................................... 27
6. Discussion .......................................................................................................................... 31
6.1 - Risk perception and normalisation ........................................................................................... 31
6.2 - Risk trade-off ............................................................................................................................. 34
6.3 - Officials contra local residents – differentiating views ............................................................. 34
6.4 - Difficulties relocating ................................................................................................................ 36
6.5 - Sense of place............................................................................................................................ 36
6.6 - Comparison of the different interviewee categories location, age group and gender ............. 37
6.7 - Sources of uncertainty and error .............................................................................................. 38
6.8 – Validity & Generalisation ......................................................................................................... 39
7. Conclusion .......................................................................................................................... 41
8. Bibliography ....................................................................................................................... 43
Appendix A – Interview guides ..................................................................................................... II
Interview guide #1 ............................................................................................................................... II
Interview guide #2 .............................................................................................................................. III
Appendix B - Photos .................................................................................................................... IV
1
1. Introduction
1.1 - Background Floods are the most common cause for natural disasters around the world and is a phenomenon
ranging in size from negatively impacting only a few people to whole communities or countries.
However, floods are in many contexts also required for sustained biodiversity, wetlands as well as
agricultural demands. As a result, risk and disaster management regarding floods quickly becomes
complex as there are many interdependent factors to consider (Becker, 2014).
The common conception and often the focus regarding natural disasters, such as floods, is that of
the physical phenomenon. Disasters are often conceived as something overpowering and beyond
human control. However, by considering a social factor when attempting to understand natural
disasters, this general perception appears simplified. This statement is explained by the fact that if
humans are not present, it is simply a natural phenomenon rather than a natural disaster whilst the
physical occurrence remains unaltered (Wisner et al., 2003).
Moreover, different groups and individuals in society are affected by disasters differently and have
different abilities to cope with the events. Several factors can affect this ability, such as income,
living situation, gender, ethnicity and age. These social factors will of course not influence the scale
of the physical phenomenon, but can influence how the community is affected and its ability to cope
with the outcome of the disaster (Wisner et al., 2003). Consequently, to gain a greater
understanding of underlying issues regarding natural disasters it is crucial to not only understand the
physical processes of a disaster but also why people decide to live in areas where these events tend
to occur (Wisner et al., 2003).
Floods, due to several contributing factors, is the most common hazard in Sri Lanka and is
increasingly affecting the residents. The majority of floods in Sri Lanka are caused by rivers
overflowing as they have insufficient capacity to accommodate the heavy rain during the two
monsoon seasons. In addition, deforestation, improper land-use and a growing population may
cause the risks to increase further (Ministry of Disaster Management Sri Lanka, 2012).
The intention of this project is therefore to look beyond the physical aspects of natural disasters in
the areas around Akuressa and Malimboda, Sri Lanka and analyse the social aspects of floods.
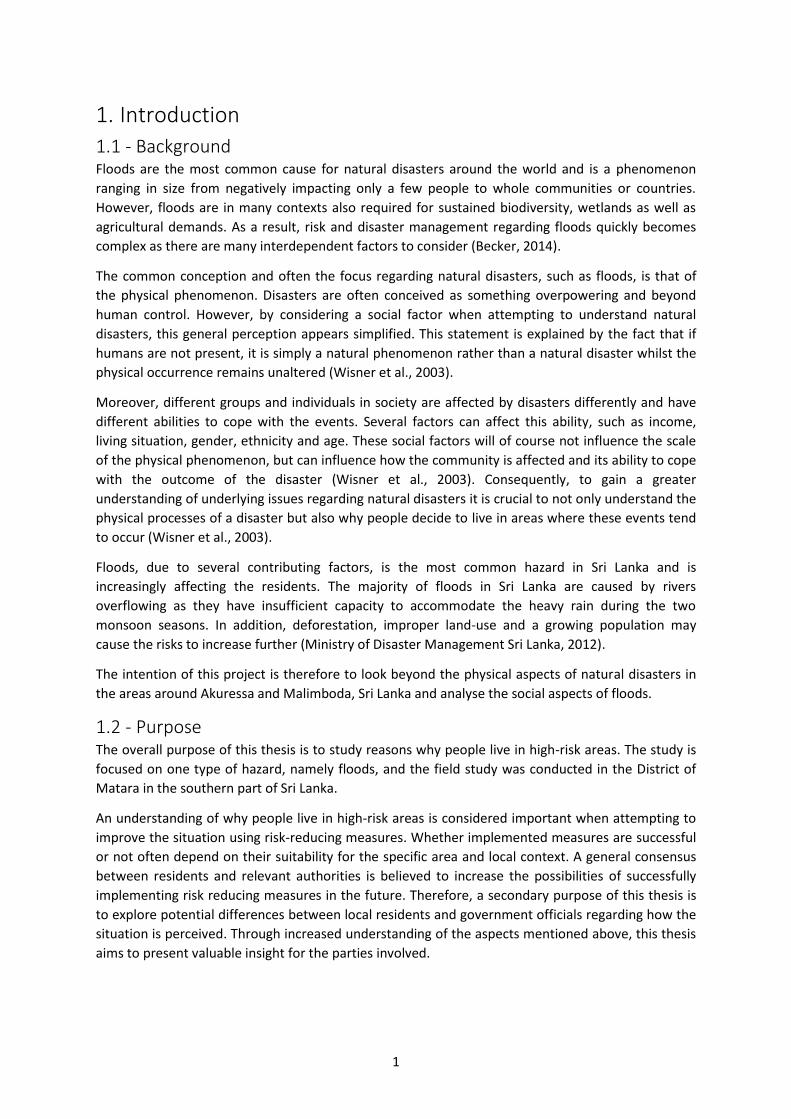
1.2 - Purpose The overall purpose of this thesis is to study reasons why people live in high-risk areas. The study is
focused on one type of hazard, namely floods, and the field study was conducted in the District of
Matara in the southern part of Sri Lanka.
An understanding of why people live in high-risk areas is considered important when attempting to
improve the situation using risk-reducing measures. Whether implemented measures are successful
or not often depend on their suitability for the specific area and local context. A general consensus
between residents and relevant authorities is believed to increase the possibilities of successfully
implementing risk reducing measures in the future. Therefore, a secondary purpose of this thesis is
to explore potential differences between local residents and government officials regarding how the
situation is perceived. Through increased understanding of the aspects mentioned above, this thesis
aims to present valuable insight for the parties involved.
2
1.3 - Research Questions In order to achieve the purpose of the study, the following research questions have been
constructed.
Why do people live in high-risk areas around Akuressa, Sri Lanka, according to the local
residents themselves?
Why do people live in high-risk areas around Akuressa, Sri Lanka, according to government
officials?
How do local residents and government officials perceive the risks in the areas around
Akuressa, Sri Lanka?
3
2. Methodology This section of the report contains information regarding the methodology used for data collection
as well as a descriptive part of how the data was analysed.
2.1 - Grounded theory This thesis is based on a methodology called Grounded Theory with the intention of developing a
new theory based on collected data rather than confirming an existing one. The methodology was
developed in the 1960’s by researchers Barney Glaser and Anselm Strauss when seeing a need for a
methodology facilitating for new theories to be formed based on, or “grounded” in, emerged data.
The process is reversed from many other research methodologies where data instead has the
purpose of confirming existing theories. The methodology was consequently designed to simplify the
creation of new theories. Naturally, there are other methodologies serving this purpose but
Grounded Theory was chosen as it provides a well-established exploratory approach (Charmaz,
2006).
When applying this methodology, it is important to minimise the impact of the researchers’
preconceived ideas regarding the local circumstances. One of the ways to achieve this is by limiting
the research on subjects regarding the specific research questions beforehand. The authors’ focus
prior to the field study was therefore mainly concentrated to methodology and background
(Charmaz, 2006).
Ideally, data collection should continue until theoretical saturation is achieved, meaning no new
concepts or categories emerges during the simultaneous process of coding the data. This would
indicate that sufficient information has been extracted from the area studied. However, it must be
considered a theoretical goal rather than something practically achievable as codes, concepts and
categories are influenced by perspectives, which can develop and change over time. Furthermore, it
is always possible for completely new ideas or thoughts to emerge, even on the last day of a study.
2.2 - Data collection The first step in the Grounded Theory methodology, after defining the research subject and area, is
the data collection. In this study, the data collection was mainly done through interviews with local
residents and government officials in the research area. Moreover, the methodology allows for field
observations made by the researchers to be included in the dataset as well.
Semi structured interviews
The general definition of an interview can be described as the process of verbally eliciting
information from a participant (Longhurst, 2016). There are a number of different ways in which
interviews can be conducted. A structured interview follows a detailed pre-decided questionnaire
and adheres to the boundaries set by that questionnaire. An unstructured interview on the other
hand follows no such pre-decided format and the interviewer allows the participant to decide the
direction of the interview and to tell it their way (Bernard, 2006; Longhurst, 2016).
The interview technique used in this project can be described as the middle-ground between the
two methods mentioned above. The technique, called semi-structured, is often utilised within
Grounded Theory and is characterised by the use of a broad interview guide with some pre-decided,
open-ended questions where participants are encouraged to elaborate freely within the topic of
discussion. Subsequently, there are some pre-decided boundaries to the interview but it is designed
to be flexible within this frame (Bernard, 2006; Longhurst, 2016).
4
Open-ended questions mean that the interviewer does not ask the participant to choose from a
number of set responses but rather promote a freely elaborated answer. The purpose of this is to
make sure that the design of the interview does not exclude any potential responses. The
counterpart of open-ended questions, so called fixed-choice or closed ended, are generally more
time efficient but also significantly more controlling (Bernard, 2006). As a result, that method
introduces the risk of missing out on potential responses that are not previously quantified by the
researcher. The aspect of a less predetermined interview, which is achieved using open-ended
questions, is vital within Grounded Theory since the researcher should aim to influence the
responses as little as possible.
It should however be noted that open-ended questions were difficult to use in some of the
interviews conducted in this study. At times, the open-ended questions resulted in very short
answers from the respondents instead of achieving an intended discussion. There are many factors
that can explain this difficulty. In this case, it is believed the strongest contributor is the use of a
translator making it difficult to have a discussion-based conversation with good flow. To ensure all
subjects were covered and discussed, close-ended questions were from time to time utilized. The
effects of this are elaborated on in chapter 6.
The interviews were structured in three different phases, similar to what is suggested in Höst,
Regnell & Runeson (2006) and the interview guide was developed with the research questions in
mind. Interviews were started with a brief presentation of the context, which the translator assisted
with. This was followed with initial and general questions, such as ”What is your age and
occupation?” proving interesting insight as well as creating a familiar setting through small-talk.
Lastly, the more in-depth questions were discussed regarding hazards, if the interviewee was willing
to move somewhere else etc. All interviews except one was recorded to facilitate further analysis. All
recordings were preceded with a permission from the respondent.
The use of an interpreter
All respondents were speaking Sinhalese resulting in the need for a translator to translate from
Sinhalese to English. This was provided through the local Red Cross branch in Matara. The translator
had previous experience in disaster management field work and had previously functioned as a
translator but with no formal education in the subject. The researchers had no previous experience
of working with a translator and the collaboration required adjustments early on and developed
through joint discussions. Knowledge in the English language differed requiring the level of English to
be adapted accordingly. Even though it took time and effort, the collaboration transitioned from
interpreting answers towards translating them. However, due to the constraints caused by the level
of English, all interviews are believed to be mostly interpreted rather than translated. When a
message is mediated several times between three different parties, and especially from one
language to another, information and certain details can disappear or become misleading (Freed,
1988). This is thus an inevitable source of error in this report.
Selection of location and respondents
Below follows an account of how the location of the study and the respondents were selected.
Location
Interviews were conducted in two different main geographical locations, namely Akuressa and
Malimboda. More information about the sites is found in chapter 4. The single most important
criteria when choosing the location for an interview was that it was flood prone. Therefore, a visit to
the Disaster Management Centre in the town of Matara was initially conducted to gather relevant

5
information before interviews were held. Furthermore, the intention was to speak with people living
in rural, semi-rural and urban settings to have the opportunity to check for any discrepancies. Lastly,
all interviews were held in a geographically limited area. A larger research area would require
greater resources in terms of both time and financial resources as the number of required interviews
to reach saturated data likely would increase.
Local residents
Houses of interest were identified whilst walking around in the areas with the translator. The
translator initiated contact, presented us and asked if they were willing to take part in an interview.
The translator was instructed to present us by explaining that we were university students
interested in learning about their way of life in general. He was specifically instructed not to mention
anything about risks or floods. This approach would allow the interviewee to freely tell us about the
positive and negative things about living in the area and only mention floods should the person
consider it important. However, the introduction given by the translator often included risks and
floods as well which was notable even without knowledge about the Sinhalese language.
Furthermore, an attempt was made to obtain a good variation of those interviewed in terms of age
and gender. Being a qualitative study, this is not required to ensure statistically significant results but
however desirable for the results to be demographically representative. The distribution of residents
in the District of Matara consists roughly of 48% male and 52% female (Ministry of Policy Planning
and Economic Affairs, 2012) and the distribution of those interviewed should ideally be similar to
achieve demographically representable results. The overrepresentation of male respondents (28 out
of 45) can to some extent be explained by the fact that if a male was present when an interview was
conducted, they often considered themselves being the most suitable for taking part in the
interview, making it difficult to accomplish an ideal distribution. This effect was actively attempted
to be limited while at the same time adhering to the local cultural context and tradition.
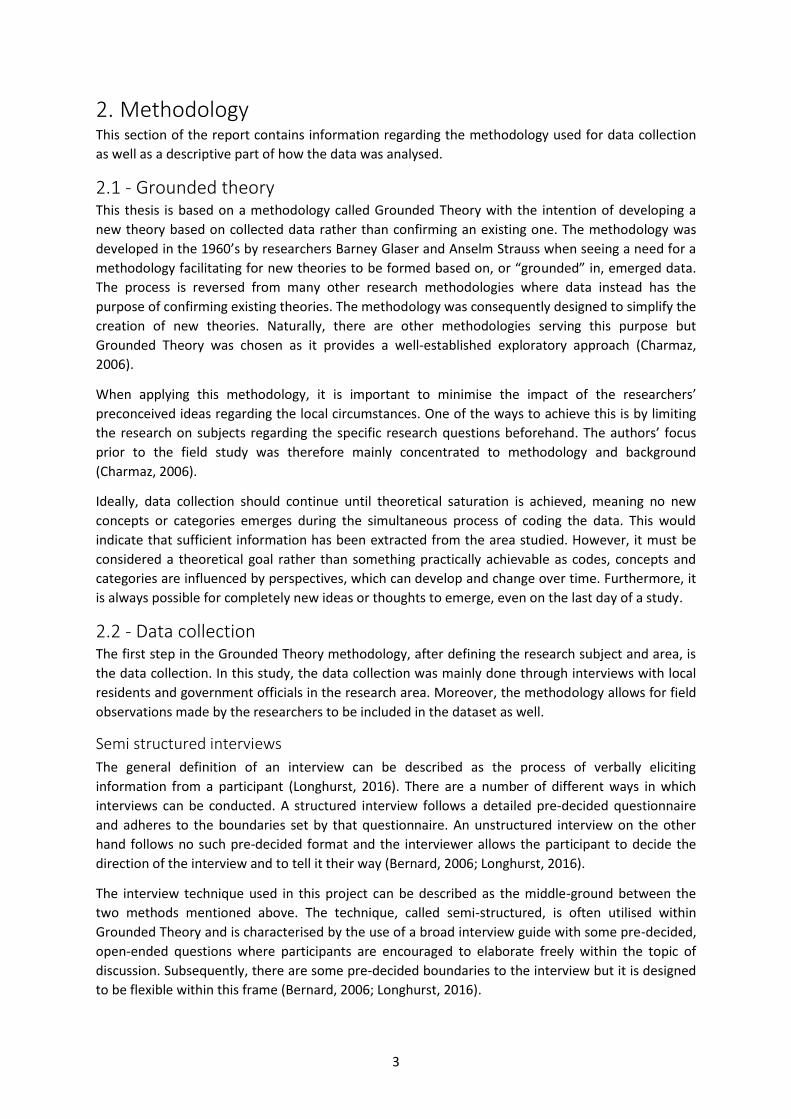
The age and gender distribution in the District of Matara is visualised in Figure 1 below. This
distribution was considered when interviews were conducted but was not fully replicated due to
several contributing factors. First of all, the interviews were conducted during daytime and
weekdays, which meant that close to all children and young people attended school. Secondly, and
similar to the challenges associated with achieving a representable gender distribution, certain age
groups in the families considered themselves more suitable than others to respond. Last but not
least, it is important to note that factors other than demographical ones, such as flood exposure,
had to be considered and sometimes given priority when choosing respondents.
6
Figure 1 - Age distribution in the District of Matara with percentage of total population on the X-axis and age group on the Y-axis (Ministry of Policy Planning and Economic Affairs, 2012).
In terms of the number of conducted interviews, there was not a predefined goal at the beginning of
the interview process. Instead, the desired amount was continuously evaluated throughout the
interview process and defined when fewer and fewer new concepts or categories were formed while
coding. That stage outlined when theoretical saturation had been approached in accordance with
the Grounded Theory methodology.
Throughout the interview stage of the project, a general interview guide was used serving two main
purposes. Firstly, to ensure all subjects of interest were covered in every interview and secondly to
assist in maintaining a similar structure to each interview. This is important to ensure the results can
be comparable. After the first ten interviews, the interview guide was evaluated and underwent
minor updates. A few points were added for better follow-up on some of the subjects. In addition, a
few points were removed and instead rephrased or covered in other parts. These alterations were
however minor in terms of the information obtained from the interviews, and the overall content in
the guides remained very similar as can be observed in Appendix A which include both versions.
The first ten interviews were held in the most rural setting. At the end of the study, this rural area
was revisited to ensure the altered interview guide did not affect the outcome or quality of the
interviews and that the first ten interviews were still applicable. This was done by comparing the
results from the first and last interviews and at the same time checking for theoretical saturation.
Notably, no significant differences were identified.
Government officials
A total of six interviews were held with government official out of which five were recorded. In
addition, a presentation held by the District Irrigation Department was attended which facilitated a
more in-depth understanding of the situation in the district. The most important selection criteria
when choosing who to interview was that the respondent was involved in disaster management

7
and/or had knowledge of the flood situation in the region. Furthermore, it was considered important
the respondents were from different departments of government should the views differ between
different offices for whatever reason. Lastly, all interviews were held with officials in the higher
segments of the organisation in an attempt to speak with people with a good understanding and
overview of the situation. The interviews were held at the interviewees respective offices and was
set up with the help of the interpreter.
The number of conducted interviews with government officials were not determined through
theoretical saturation. Instead, interviews were held with those who were considered important to
talk to based on their position. Interviews were held with people from the following departments:
District Planning Department
Disaster Management Centre
District Irrigation Department
Akuressa Divisional Secretariat
Athuraliya Divisional Secretariat (bordering to Akuressa)
Field observations
When performing a study using Grounded Theory any information may be used to guide the
researcher, whether it is through formal procedures, casual interactions or observations. This allows
the researcher to explore the topic of the study through many different channels (Charmaz, 2006).
Field observations are a good source of information in itself since it allows researchers to observe
everyday life without integrating themselves in the situation, which is likely to affect the study to
some extent. Furthermore, field observations are also considered to provide valuable input to the
interviews since the information gathered about the local insight and context can be used to adapt
and improve the interviews.
Information was gathered by walking around in the areas without formally interviewing anyone.
Spending time just observing everyday life in the Akuressa and Malimboda areas facilitated a better
understanding of the local context. Field observations and informal interactions took place
throughout the field study and was a valuable complementary source of information and knowledge,
especially when coding.
2.3 - Data analysis One of the most basic concepts of the Grounded Theory methodology consists of analysing data on
different levels of detail. The data in this case consist of interviews. Generally, the analysis consists
of four different orders of detail where codes form the lowest and most descriptive level. Later,
concepts and categories based on these individual codes are formed. This is done by identifying
relationships between the individual codes, allowing the researchers to analyse and interpret the
data at a more abstract level compared to the descriptive level of codes. The final step, and the
intention of the Grounded Theory method, is to form a new theory based on the categories,
concepts and codes established (Charmaz, 2006).

8
Figure 2 – Visualisation of the Grounded Theory hierarchy.
The process of coding started as soon as the first interviews were transferred from audio recordings
to text documents. Coding and analysis of the data continued parallel to the interviews throughout
the field study in order to identify trends and concepts of interest which then could be further
explored in later interviews. Below follows an example from the actual field study to put the
theoretical description into a more practical context (Figure 3).
Figure 3 – Example of the Grounded Theory hierarchy from the study
The data analysis was performed with the assistance of the computer software program Nvivo. This
software enables the user to explore data and code its content in different levels, among other
things. The process of coding started out slow as most codes were new and needed to be
constructed for the first time. As the coding progressed, the efficiency of the process increased
considering the fact that codes reoccurred in the interviews. When the interviews started to become
very similar in terms of coding it was assumed that theoretical saturation was sufficiently achieved
and the interviews were ceased.
1. Codes
•1st level of analysis
•Sentence or parapraph level. The most descriptive level.
2. Concepts
•2nd level of analysis
•Formed by similar codes.
3. Categories
•3rd level of analysis
•Concepts covering similar subjects
4. Theory
•4th level of analysis
•Constitutes the highest order of analysis and defines the results of the study
1. Codes
•Good schools, close to hospital, big commercial area
2. Concepts
•Public services
3. Categories
•Benefits of current location
4. Theory
•(Refer to results and discussion)
9
3. Conceptual Framework The following chapter introduces some of the general concepts used throughout this report.
3.1 - Risk There are several recognised ways of defining risk and many probably have their own notions of
what risk is and how it can be managed. One of the more common ways of considering risk in
everyday life is to simply think of it as a potentially negative event that may or may not occur
(Becker, 2014). In the professional field of researchers, risk managers and likewise, the picture
suddenly becomes more complex, especially since there are several different views of how to define
“risk”. This is important to keep in mind as it can be a source of confusion and misunderstanding.
However, the one thing they all have in common is the element of uncertainty. If the outcome is
known and with no possibility to influence it, risk is no longer an applicable concept (Zinn, 2008).
From a technical perspective, the risk of a certain hazard can be described with an equation
consisting of two factors, likelihood and consequence. By multiplying the two factors, the risk of that
hazard can be calculated. Without going into too much detail, these two factors can be described
both qualitatively and qualitatively and in several different ways depending on purpose and context
(Coppola, 2011). However, many argue (see, for example, Renn 1998; Slovic 2001; Coppola 2011)
risk should consist of more than just the technical aspects mentioned above and also include
subjective values which serves a purpose in several different situations. For example, when
determining if a risk should be considered acceptable or not or when comparing risks with different
types of consequences to each other, such as environmental damage and death.
Risk awareness
Risk awareness can in simple terms be described as knowledge and consciousness about the risks
associated with a hazard (Raaijmakers et al., 2008; Luìs et al., 2016). It is often considered that a lack
of awareness regarding a certain risk is likely to result in lacking preparedness in relation to that risk
(Scolobig et al., 2012). This is logical since a person who are not aware that he/she is at risk, is not
likely to take any risk reducing actions. When individuals or communities experience a hazardous
event, their awareness of the risks associated with this hazard tends to increases (Scolobig et al.,
2012). Similarly, when a hazard does not affect an area for a long period of time, the awareness of
the risks associated with this hazard is likely to decline (Raaijmakers et al., 2008).
As mentioned above, risk awareness is often described as knowledge and consciousness about the
risks associated with a hazard, something that is likely to increase with increased experience of the
hazard in question. Within the scope of this report, risk awareness is used in terms of awareness of
the likelihood and physical consequences associated with a certain hazard. When values and feelings
are included in the conception of a hazard, it forms part of the more subjective concept of risk
perception which is described further in the following section.
Risk perception
Studies have shown that risk is often perceived differently than its statistical history. How a risk is
perceived can consequently differ between individuals. The reasons behind this depends on several
different factors which are important to consider when trying to understand the decisions made by
those exposed to certain risks (Coppola, 2011).
How a risk is perceived is to some extent determined simply by the general level of knowledge about
the risk. Some other factors proven to be of importance is if the risk exposure is voluntary or not
(Sjöberg, 2000), if the risk is new or old (Sjöberg, 2000), if the impact is immediate or delayed, if the
10
hazard is controllable or not, if there are many fatalities in one event or few fatalities in many events
(Smith, 2013) and the uncertainty attributed to the risk (Coppola, 2011).
Because of the likely difference in risk perception between different individuals and groups in
society, it is crucial when working with risk management to consider these factors and gain an
understanding for those exposed to certain risks. Otherwise, the process is likely to result in efforts
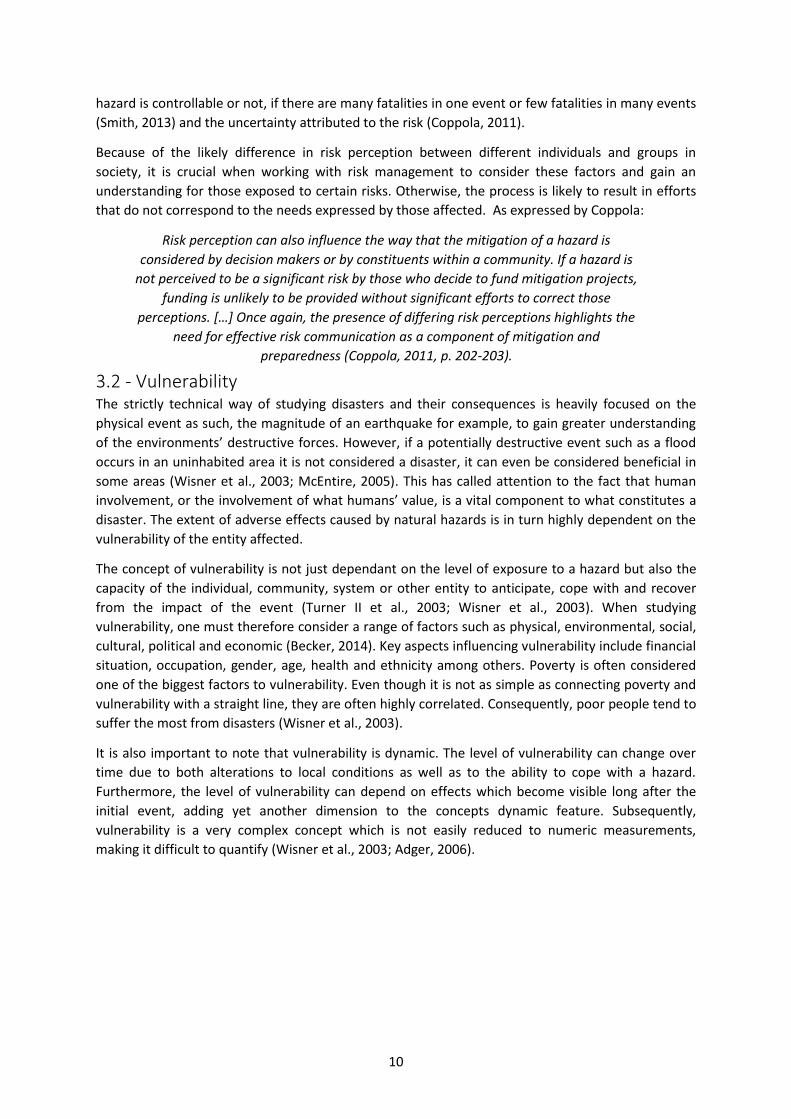
that do not correspond to the needs expressed by those affected. As expressed by Coppola:
Risk perception can also influence the way that the mitigation of a hazard is
considered by decision makers or by constituents within a community. If a hazard is
not perceived to be a significant risk by those who decide to fund mitigation projects,
funding is unlikely to be provided without significant efforts to correct those
perceptions. […] Once again, the presence of differing risk perceptions highlights the
need for effective risk communication as a component of mitigation and
preparedness (Coppola, 2011, p. 202-203).
3.2 - Vulnerability The strictly technical way of studying disasters and their consequences is heavily focused on the
physical event as such, the magnitude of an earthquake for example, to gain greater understanding
of the environments’ destructive forces. However, if a potentially destructive event such as a flood
occurs in an uninhabited area it is not considered a disaster, it can even be considered beneficial in
some areas (Wisner et al., 2003; McEntire, 2005). This has called attention to the fact that human
involvement, or the involvement of what humans’ value, is a vital component to what constitutes a
disaster. The extent of adverse effects caused by natural hazards is in turn highly dependent on the
vulnerability of the entity affected.
The concept of vulnerability is not just dependant on the level of exposure to a hazard but also the
capacity of the individual, community, system or other entity to anticipate, cope with and recover
from the impact of the event (Turner II et al., 2003; Wisner et al., 2003). When studying
vulnerability, one must therefore consider a range of factors such as physical, environmental, social,
cultural, political and economic (Becker, 2014). Key aspects influencing vulnerability include financial
situation, occupation, gender, age, health and ethnicity among others. Poverty is often considered
one of the biggest factors to vulnerability. Even though it is not as simple as connecting poverty and
vulnerability with a straight line, they are often highly correlated. Consequently, poor people tend to
suffer the most from disasters (Wisner et al., 2003).
It is also important to note that vulnerability is dynamic. The level of vulnerability can change over
time due to both alterations to local conditions as well as to the ability to cope with a hazard.
Furthermore, the level of vulnerability can depend on effects which become visible long after the
initial event, adding yet another dimension to the concepts dynamic feature. Subsequently,
vulnerability is a very complex concept which is not easily reduced to numeric measurements,
making it difficult to quantify (Wisner et al., 2003; Adger, 2006).
11
4. Context Analysis This section of the report provides information regarding the Sri Lankan context in general terms as
well as the regional situation for the District of Matara where the field study was conducted.
4.1 - Sri Lanka Sri Lanka has a population of close to 21 million people out of which 18% resides in urban areas (The
World Bank, 2016). A prominent part of the country’s economy is based on agriculture with tea,
rubber, rice and spice production. Apart from this, the textile, IT and tourism sectors are important
contributors to the economy as well (Nationalencyklopedin, 2016).
The history of Sri Lanka stretches back thousands of years with different dynasties and kingdoms.
During recent history, the island has been colonised by the Portuguese, Dutch and English until it
gained its independence in 1948. The country was known as Ceylon until 1972 when the current
name was adopted (Nationalencyklopedin, 2016). Sri Lanka ranks as number 73 out of 188 on the
Human Development Index (HDI) presented yearly by the UNDP. An estimated 53% of the
population aged 15 and older have formal employment, the expected number of years of schooling
is 13.7 and life expectancy at birth is 75 years (United Nations Development Programme, 2015). The
majority of the population are Buddhist (70%), followed by Hindu (13%), Muslim (10%) and
Christians (7%) (Ministry of Policy Planning and Economic Affairs, 2012).
The country was ravaged by a civil war that started in 1983 when the guerrilla group called the
Liberation Tigers of Tamil Eelam (often referred to as the Tamil Tigers) attempted to create their
own sovereign state. The war, which is estimated to have cost more than 100 000 lives, ended when
the Sri Lankan army eventually defeated the Tamil Tigers in 2009 (Nationalencyklopedin, 2016).
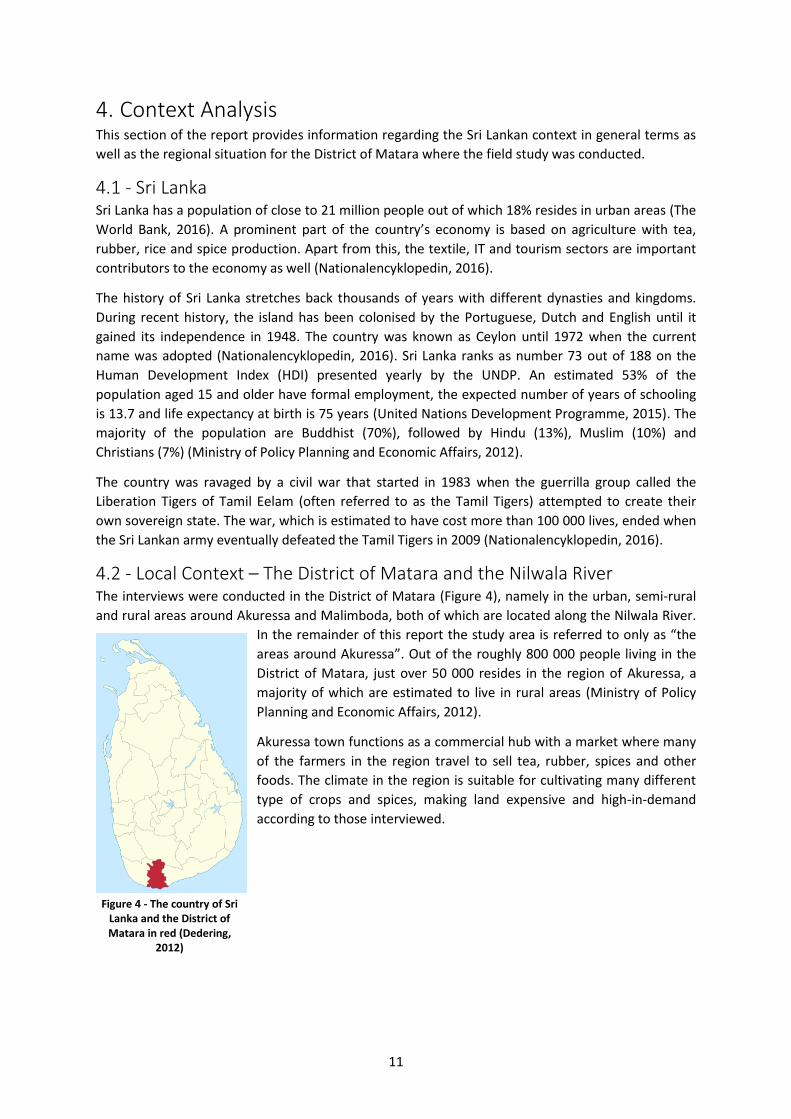
4.2 - Local Context – The District of Matara and the Nilwala River The interviews were conducted in the District of Matara (Figure 4), namely in the urban, semi-rural
and rural areas around Akuressa and Malimboda, both of which are located along the Nilwala River.
In the remainder of this report the study area is referred to only as “the
areas around Akuressa”. Out of the roughly 800 000 people living in the
District of Matara, just over 50 000 resides in the region of Akuressa, a
majority of which are estimated to live in rural areas (Ministry of Policy
Planning and Economic Affairs, 2012).
Akuressa town functions as a commercial hub with a market where many
of the farmers in the region travel to sell tea, rubber, spices and other
foods. The climate in the region is suitable for cultivating many different
type of crops and spices, making land expensive and high-in-demand
according to those interviewed.
Figure 4 - The country of Sri Lanka and the District of Matara in red (Dedering,
2012)
12
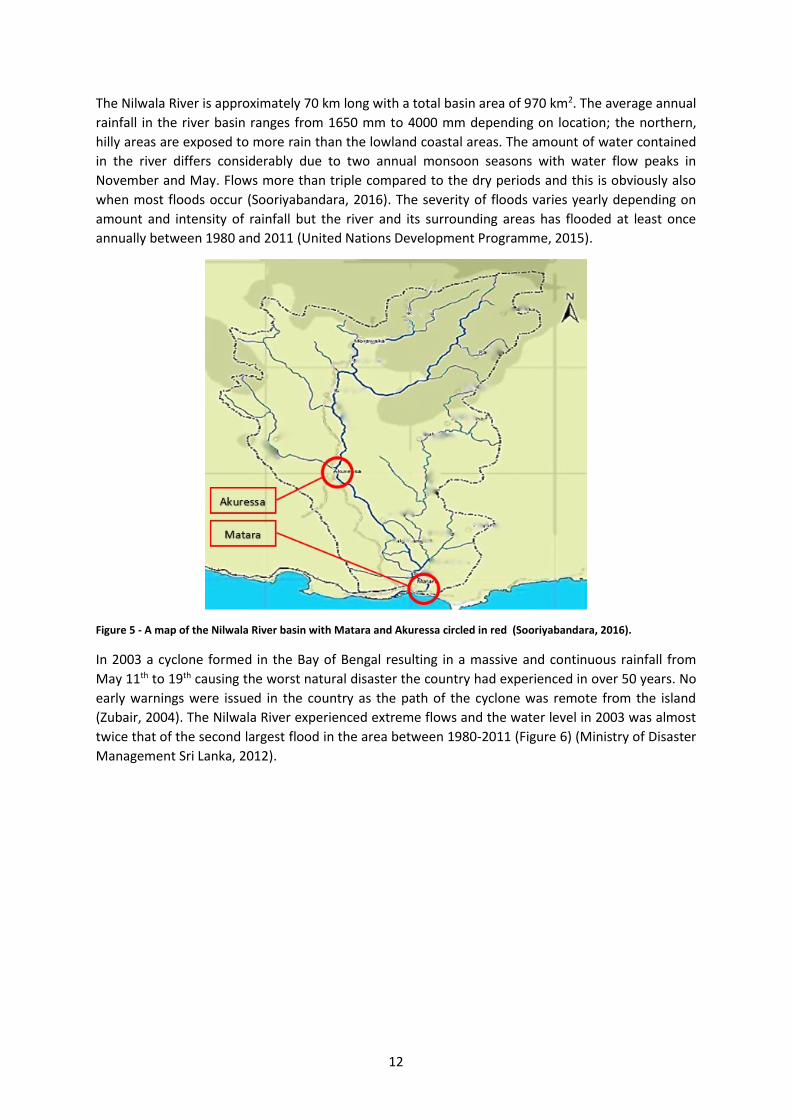
The Nilwala River is approximately 70 km long with a total basin area of 970 km2. The average annual
rainfall in the river basin ranges from 1650 mm to 4000 mm depending on location; the northern,
hilly areas are exposed to more rain than the lowland coastal areas. The amount of water contained
in the river differs considerably due to two annual monsoon seasons with water flow peaks in
November and May. Flows more than triple compared to the dry periods and this is obviously also
when most floods occur (Sooriyabandara, 2016). The severity of floods varies yearly depending on
amount and intensity of rainfall but the river and its surrounding areas has flooded at least once
annually between 1980 and 2011 (United Nations Development Programme, 2015).
Figure 5 - A map of the Nilwala River basin with Matara and Akuressa circled in red (Sooriyabandara, 2016).
In 2003 a cyclone formed in the Bay of Bengal resulting in a massive and continuous rainfall from
May 11th to 19th causing the worst natural disaster the country had experienced in over 50 years. No
early warnings were issued in the country as the path of the cyclone was remote from the island
(Zubair, 2004). The Nilwala River experienced extreme flows and the water level in 2003 was almost
twice that of the second largest flood in the area between 1980-2011 (Figure 6) (Ministry of Disaster
Management Sri Lanka, 2012).

13
Figure 6 – Nilwala River water levels from 1980-2011 at Pitabeddara. The red horizontal line indicates the water level where floods occur (Ministry of Disaster Management Sri Lanka, 2012).
Attempts to mitigate floods were conducted in the 1980’s in a project often referred to as the
Nilwala Project. It consisted of a three-step scheme where step one and step two involved the
construction and completion of embankments and drainage systems along the river. The third step
involving the construction of a dam was cancelled and never completed. These efforts still provide
protection for some areas in the district but far from all (Sooriyabandara, 2016).

14
15
5. Results This chapter consist of results that are of interest in regards to the research questions below.
Why do people live in high-risk areas around Akuressa, Sri Lanka, according to the local
residents themselves?
Why do people live in high-risk areas around Akuressa, Sri Lanka, according to government
officials?
How do local residents and government officials perceive the risk exposure in the areas
around Akuressa, Sri Lanka?
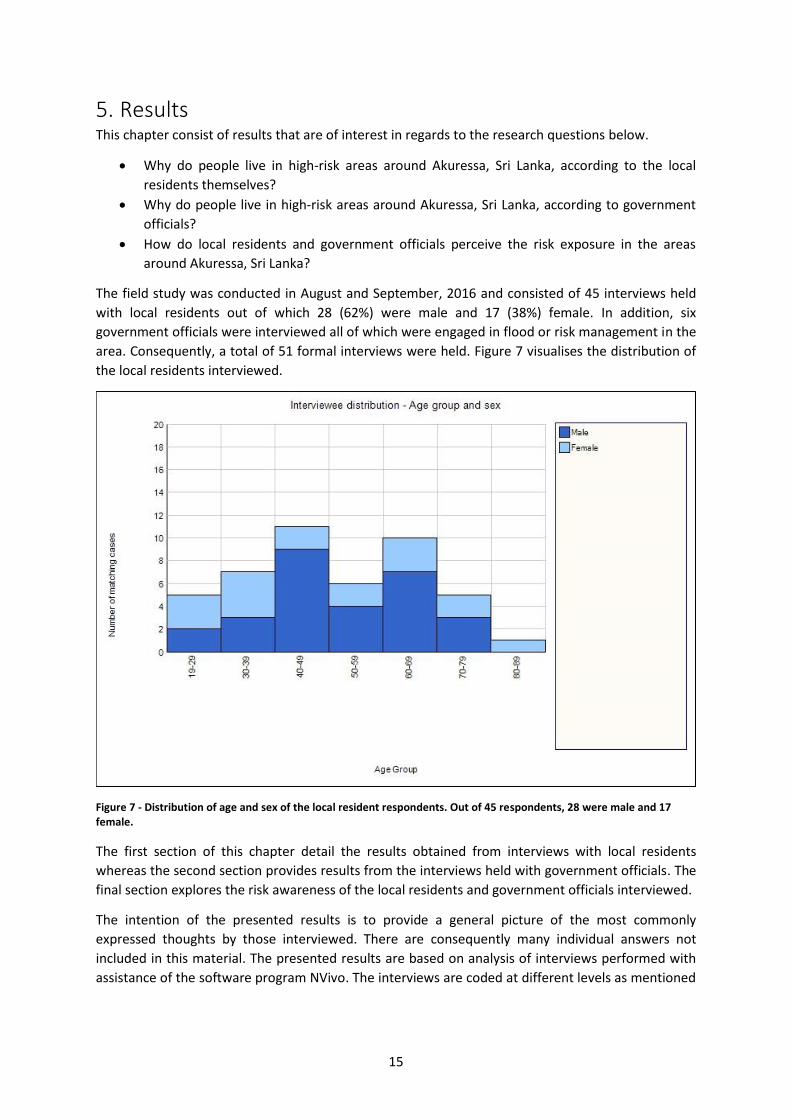
The field study was conducted in August and September, 2016 and consisted of 45 interviews held
with local residents out of which 28 (62%) were male and 17 (38%) female. In addition, six
government officials were interviewed all of which were engaged in flood or risk management in the
area. Consequently, a total of 51 formal interviews were held. Figure 7 visualises the distribution of
the local residents interviewed.
Figure 7 - Distribution of age and sex of the local resident respondents. Out of 45 respondents, 28 were male and 17 female.
The first section of this chapter detail the results obtained from interviews with local residents
whereas the second section provides results from the interviews held with government officials. The
final section explores the risk awareness of the local residents and government officials interviewed.
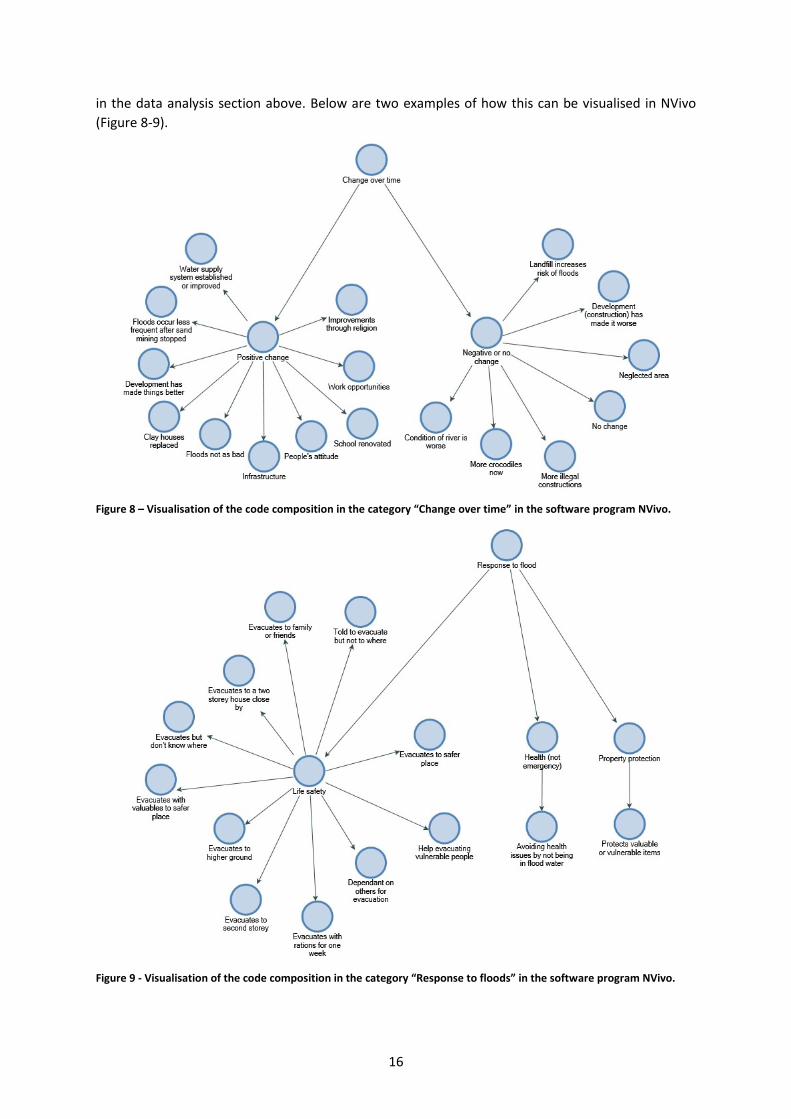
The intention of the presented results is to provide a general picture of the most commonly
expressed thoughts by those interviewed. There are consequently many individual answers not
included in this material. The presented results are based on analysis of interviews performed with
assistance of the software program NVivo. The interviews are coded at different levels as mentioned
16
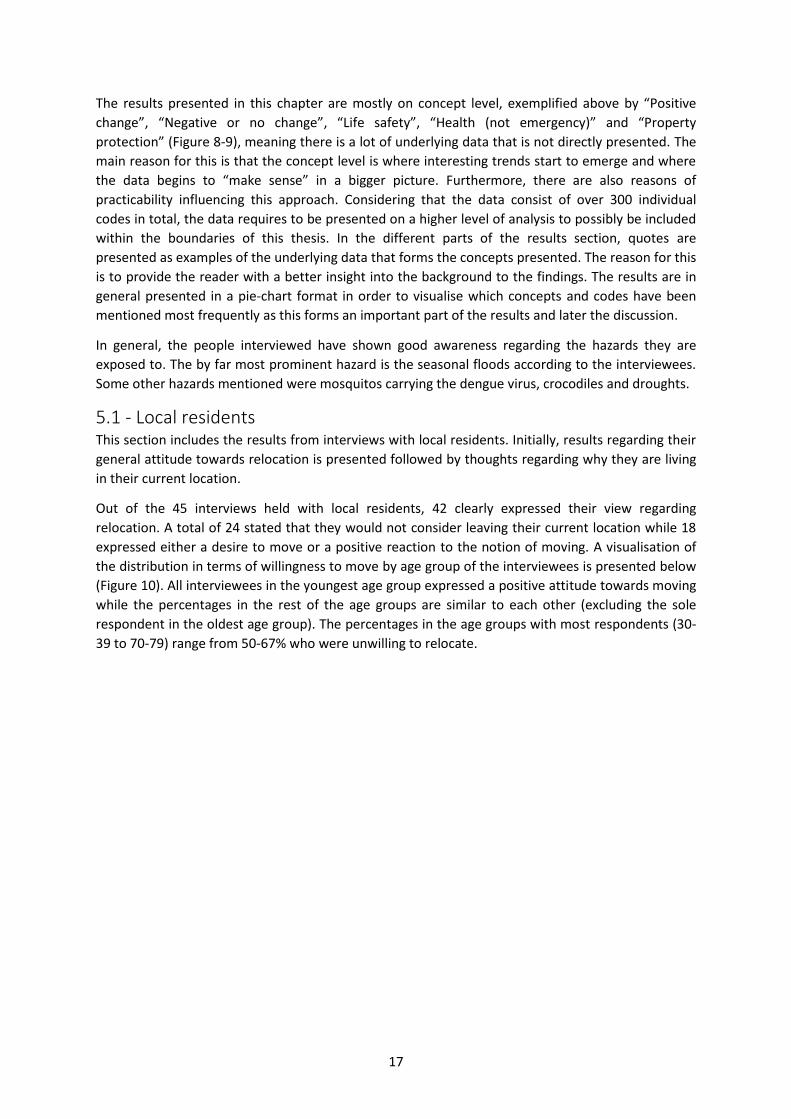
in the data analysis section above. Below are two examples of how this can be visualised in NVivo
(Figure 8-9).
Figure 8 – Visualisation of the code composition in the category “Change over time” in the software program NVivo.
Figure 9 - Visualisation of the code composition in the category “Response to floods” in the software program NVivo.
17
The results presented in this chapter are mostly on concept level, exemplified above by “Positive
change”, “Negative or no change”, “Life safety”, “Health (not emergency)” and “Property
protection” (Figure 8-9), meaning there is a lot of underlying data that is not directly presented. The
main reason for this is that the concept level is where interesting trends start to emerge and where
the data begins to “make sense” in a bigger picture. Furthermore, there are also reasons of
practicability influencing this approach. Considering that the data consist of over 300 individual
codes in total, the data requires to be presented on a higher level of analysis to possibly be included
within the boundaries of this thesis. In the different parts of the results section, quotes are
presented as examples of the underlying data that forms the concepts presented. The reason for this
is to provide the reader with a better insight into the background to the findings. The results are in
general presented in a pie-chart format in order to visualise which concepts and codes have been
mentioned most frequently as this forms an important part of the results and later the discussion.
In general, the people interviewed have shown good awareness regarding the hazards they are
exposed to. The by far most prominent hazard is the seasonal floods according to the interviewees.
Some other hazards mentioned were mosquitos carrying the dengue virus, crocodiles and droughts.
5.1 - Local residents This section includes the results from interviews with local residents. Initially, results regarding their
general attitude towards relocation is presented followed by thoughts regarding why they are living
in their current location.
Out of the 45 interviews held with local residents, 42 clearly expressed their view regarding
relocation. A total of 24 stated that they would not consider leaving their current location while 18
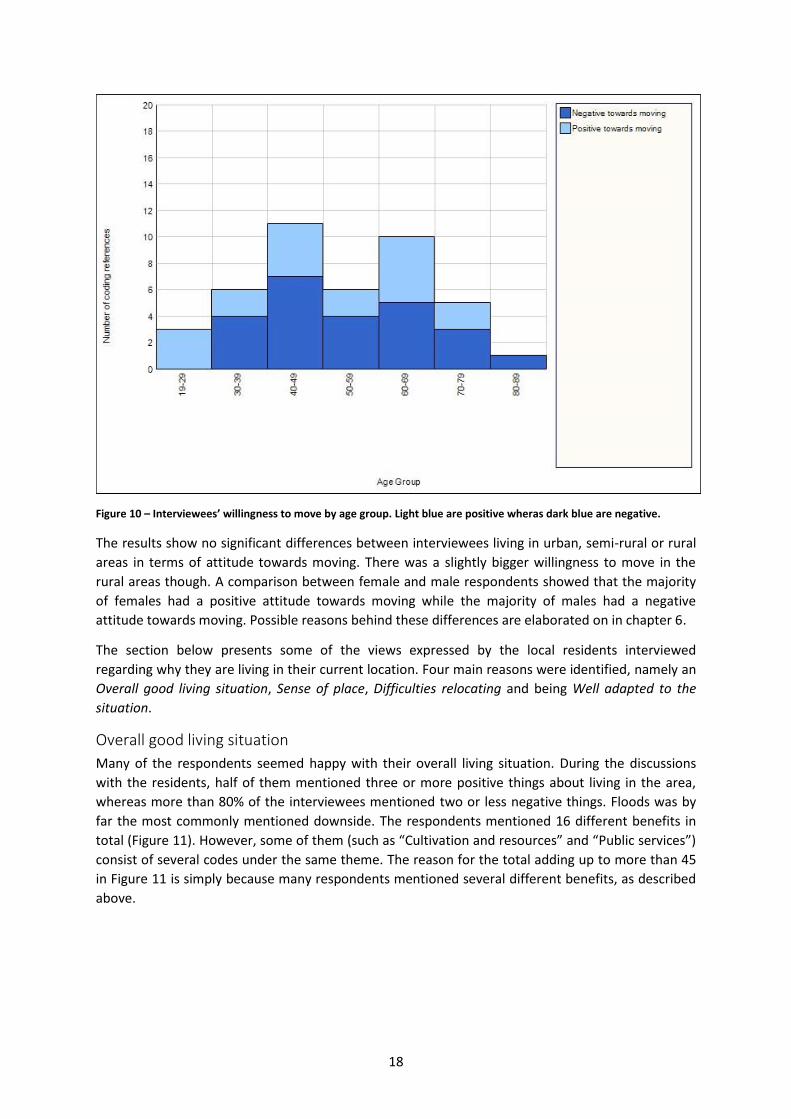
expressed either a desire to move or a positive reaction to the notion of moving. A visualisation of
the distribution in terms of willingness to move by age group of the interviewees is presented below
(Figure 10). All interviewees in the youngest age group expressed a positive attitude towards moving
while the percentages in the rest of the age groups are similar to each other (excluding the sole
respondent in the oldest age group). The percentages in the age groups with most respondents (30-
39 to 70-79) range from 50-67% who were unwilling to relocate.
18
Figure 10 – Interviewees’ willingness to move by age group. Light blue are positive wheras dark blue are negative.
The results show no significant differences between interviewees living in urban, semi-rural or rural
areas in terms of attitude towards moving. There was a slightly bigger willingness to move in the
rural areas though. A comparison between female and male respondents showed that the majority
of females had a positive attitude towards moving while the majority of males had a negative
attitude towards moving. Possible reasons behind these differences are elaborated on in chapter 6.
The section below presents some of the views expressed by the local residents interviewed
regarding why they are living in their current location. Four main reasons were identified, namely an
Overall good living situation, Sense of place, Difficulties relocating and being Well adapted to the
situation.
Overall good living situation
Many of the respondents seemed happy with their overall living situation. During the discussions
with the residents, half of them mentioned three or more positive things about living in the area,
whereas more than 80% of the interviewees mentioned two or less negative things. Floods was by
far the most commonly mentioned downside. The respondents mentioned 16 different benefits in
total (Figure 11). However, some of them (such as “Cultivation and resources” and “Public services”)
consist of several codes under the same theme. The reason for the total adding up to more than 45
in Figure 11 is simply because many respondents mentioned several different benefits, as described
above.

19
Figure 11 – Benefits of living in the current location as expressed by the local residents interviewed.
Respondents from the more rural areas emphasized the importance of cultivation to a greater
extent than those living urban areas. The urban residents did on the other hand mentioned their
appreciation of the public services more often. Regarding the environment and weather, no
significant differences were identified.
As can be seen in the figure above, the four benefits mentioned the most are Environment and
weather, Cultivation and resources, Public services and Nice people. These are evaluated further in
the following sections.
Environment and weather
The most common benefit, which 28 out of 45 respondents mentioned, was the good environment
and weather in the valley. The temperature was considered moderate, not too cold or hot, often
with a nice breeze and the availability of clean water is good compared to other parts of Sri Lanka.
Some interviewees also compared the local environment with the situation in larger cities describing
them as dirty, hot and noisy.
“When compared to other parts of Sri Lanka this is the best place to live in terms of
climate I think. It’s not too hot and not too cold, very nice temperature year around.”
- Interview #6
Cultivation and availability of resources
Close to 50% of the interviewees expressed how the area is suitable for both cultivation and
gathering of resources. Some people, predominantly those living in more rural areas, cultivated their
own crops for their own consumption and/or to sell. However, the area also supplied other valuable
resources such as coconut, jack-fruit, spices and clean drinking water.
“If we lived in an urban area we would have to buy all the things like food supplies
but here we can grow and supply for ourselves. We still buy things like fish, salt and
spices in the city but we can supply a lot of things for ourselves here.”
- Interview #16
28
22
18
10
7
5
5
33
2
11 1
1
1
1
Benefits of current location
Environment and weatherCultivation and resourcesPublic servicesNice peopleGood water supplyGood infrastructureQuiet and peacefulSense of placeJob opportunitiesMuslims well integratedReligious facilities close byRiver close byNo mosquitosNice surroundingsNewly renovated houseClose to family and friends
20
Access to public services
About 40% of those interviewed expressed their appreciation of the easy access to public services
and amenities offered in the town of Akuressa. Several services were mentioned such as hospital,
schools, shops, the large market, banks, government offices and the recently upgraded central bus
stand.
“It’s close to the road, the town and the hospital. A lot of people here live on the top
of mountains but we live close to the city, those are the good things about living
here. At any time we can easily get to the market or any place else.”
- Interview #12
Nice people
Roughly 20% of those interviewed mentioned their appreciation of the nice people in the
community and felt well integrated. Once again, comparisons were made with the people living in
larger cities, which by some were considered to have a different mentality.
“People are good and not aggressive here. They are educated and have sober habits.
In the city there are a lot of people with polluted minds, their characters are not so
good.”
- Interview #8
Sense of place
Sense of place is in this definition an overarching result of different codes and concepts one way or
the other connected to a sense of place. For example, more than half of the respondents were born
in their current place of residence. The land and house had in many of these cases been inherited
through generations, seemingly resulting in a strong connection to the current location.
Furthermore, expressed benefits of the current location included being close to family members and
relatives which also is a clear indication of the concept. Figure 12 below illustrates different concepts
and codes connected to a sense of place. In total, 36 out of 45 local residents interviewed expressed
views associated with a strong sense of place in one way or another which emphasises the
importance of this overarching concept. Several respondents mentioned more than one factor
contributing to a sense of place, which is why the total number of inputs exceed 36. For example, a
majority of the interviewees born in their current location mentioned generational ties, both of
which are included in sense of place.
21
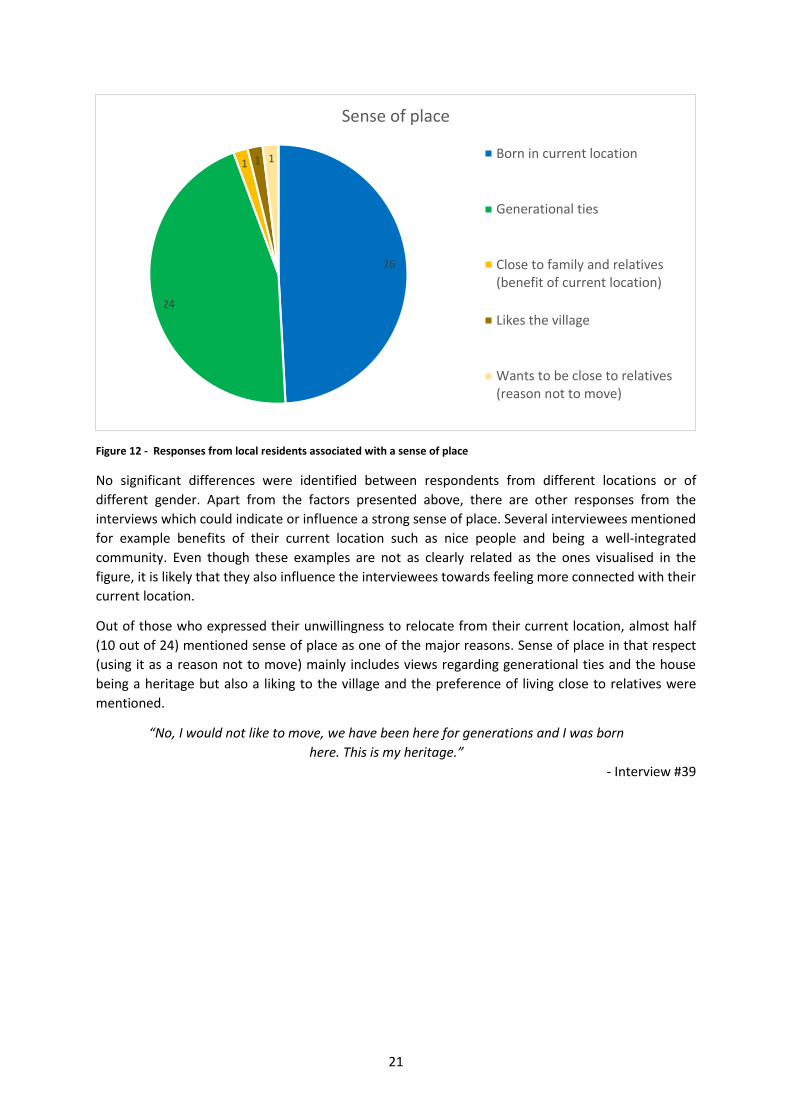
Figure 12 - Responses from local residents associated with a sense of place
No significant differences were identified between respondents from different locations or of
different gender. Apart from the factors presented above, there are other responses from the
interviews which could indicate or influence a strong sense of place. Several interviewees mentioned
for example benefits of their current location such as nice people and being a well-integrated
community. Even though these examples are not as clearly related as the ones visualised in the
figure, it is likely that they also influence the interviewees towards feeling more connected with their
current location.
Out of those who expressed their unwillingness to relocate from their current location, almost half
(10 out of 24) mentioned sense of place as one of the major reasons. Sense of place in that respect
(using it as a reason not to move) mainly includes views regarding generational ties and the house
being a heritage but also a liking to the village and the preference of living close to relatives were
mentioned.
“No, I would not like to move, we have been here for generations and I was born
here. This is my heritage.”
- Interview #39
26
24
1 1 1
Sense of place
Born in current location
Generational ties
Close to family and relatives(benefit of current location)
Likes the village
Wants to be close to relatives(reason not to move)
22
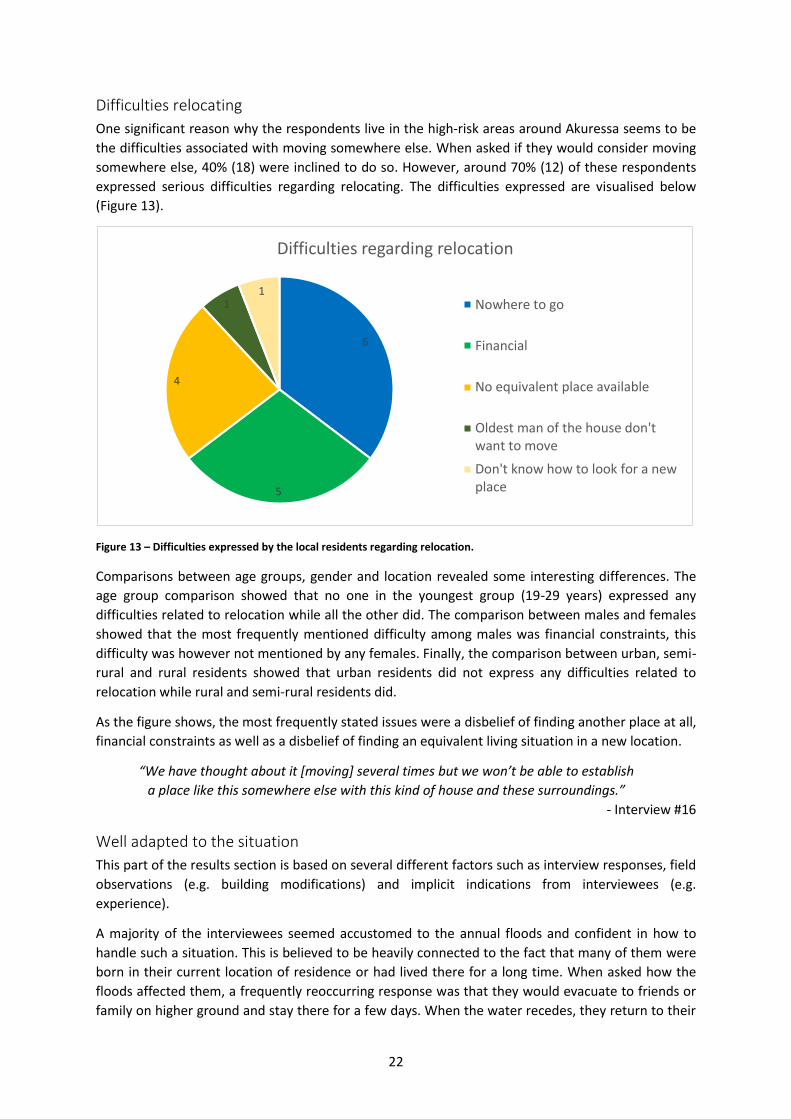
Difficulties relocating
One significant reason why the respondents live in the high-risk areas around Akuressa seems to be
the difficulties associated with moving somewhere else. When asked if they would consider moving
somewhere else, 40% (18) were inclined to do so. However, around 70% (12) of these respondents
expressed serious difficulties regarding relocating. The difficulties expressed are visualised below
(Figure 13).
Figure 13 – Difficulties expressed by the local residents regarding relocation.
Comparisons between age groups, gender and location revealed some interesting differences. The
age group comparison showed that no one in the youngest group (19-29 years) expressed any
difficulties related to relocation while all the other did. The comparison between males and females
showed that the most frequently mentioned difficulty among males was financial constraints, this
difficulty was however not mentioned by any females. Finally, the comparison between urban, semi-
rural and rural residents showed that urban residents did not express any difficulties related to
relocation while rural and semi-rural residents did.
As the figure shows, the most frequently stated issues were a disbelief of finding another place at all,
financial constraints as well as a disbelief of finding an equivalent living situation in a new location.
“We have thought about it [moving] several times but we won’t be able to establish
a place like this somewhere else with this kind of house and these surroundings.”
- Interview #16
Well adapted to the situation
This part of the results section is based on several different factors such as interview responses, field
observations (e.g. building modifications) and implicit indications from interviewees (e.g.
experience).
A majority of the interviewees seemed accustomed to the annual floods and confident in how to
handle such a situation. This is believed to be heavily connected to the fact that many of them were
born in their current location of residence or had lived there for a long time. When asked how the
floods affected them, a frequently reoccurring response was that they would evacuate to friends or
family on higher ground and stay there for a few days. When the water recedes, they return to their
6
5
4
11
Difficulties regarding relocation
Nowhere to go
Financial
No equivalent place available
Oldest man of the house don'twant to move
Don't know how to look for a newplace
23
homes, clean out the debris and rubbish from the flood and move back in. There was an evident
sense of inherent knowledge within many of the interviewees and it is believed that the long-term
exposure to floods has “forced” the inhabitants of this region to find ways of living with this risk.
Some households were fitted with an external stairway leading to an inhabitable roof or a semi-
completed second storey (see Appendix B for picture). Some respondents with this kind of
arrangement stated that they move to the inhabitable roof or second storey when they see signs of
a flood or alternatively use it to store valuables such as furniture during floods.
“No, there’s no need to worry! If there’s a flood we move to the second storey. We
will survive there. […] Normally we open all the doors and windows. If they are closed
the pressure of the water can damage them. If they are open, the water can freely
come in here and we get no damages. We knew before we came here this area was
flood prone, that’s why we built with concrete. […] We only need to clean.”
- Interview #45
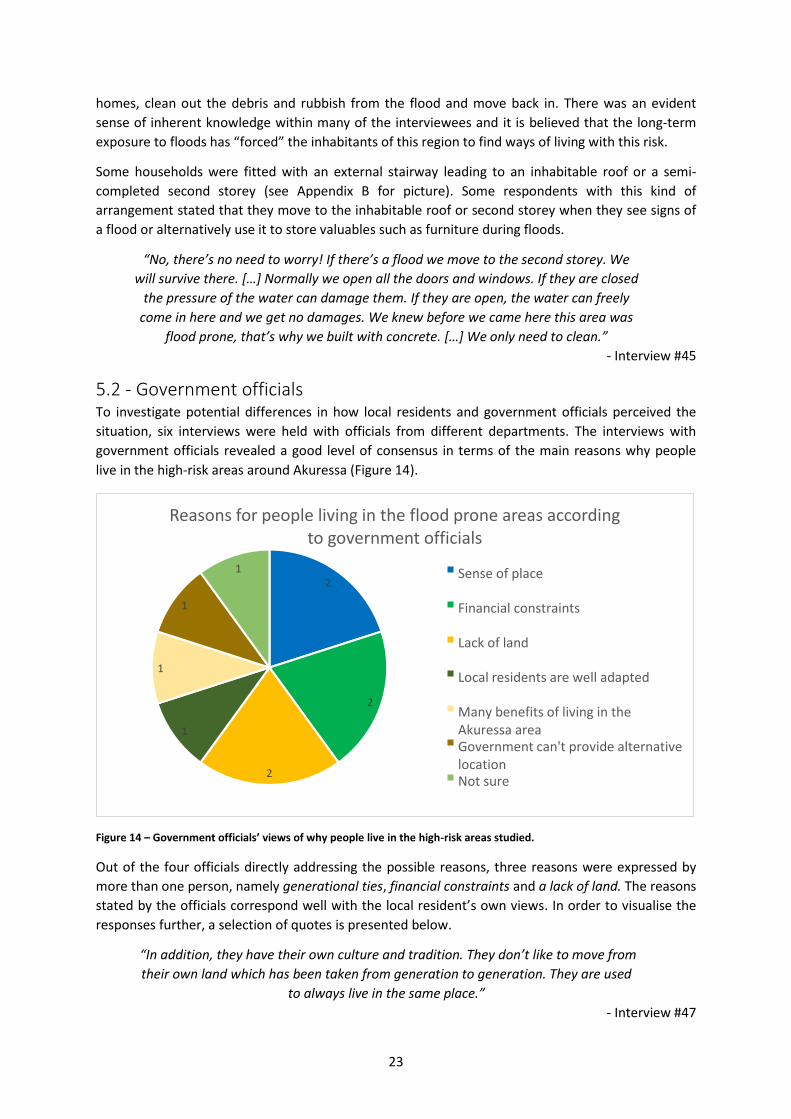
5.2 - Government officials To investigate potential differences in how local residents and government officials perceived the
situation, six interviews were held with officials from different departments. The interviews with
government officials revealed a good level of consensus in terms of the main reasons why people
live in the high-risk areas around Akuressa (Figure 14).
Figure 14 – Government officials’ views of why people live in the high-risk areas studied.
Out of the four officials directly addressing the possible reasons, three reasons were expressed by
more than one person, namely generational ties, financial constraints and a lack of land. The reasons
stated by the officials correspond well with the local resident’s own views. In order to visualise the
responses further, a selection of quotes is presented below.
“In addition, they have their own culture and tradition. They don’t like to move from
their own land which has been taken from generation to generation. They are used
to always live in the same place.”
- Interview #47
2
2
2
1
1
1
1
Reasons for people living in the flood prone areas according to government officials
Sense of place
Financial constraints
Lack of land
Local residents are well adapted
Many benefits of living in the Akuressa areaGovernment can't provide alternative locationNot sure
24
“They have adapted to the situation. Most people have lived here through
generations and that is also why they dislike to move to other places in combination
with their ability to protect their valuables [in the event of a flood]. In case of a flood,
they rush to a safe place and stay there. But there have been lots of fatalities
reported too. In 2003 this whole area went under water. [When there’s a flood] the
water returns after a week and then they can start their lives again. They have their
own strategies; they know how to protect themselves.”
- Interview #49
5.3 - Risk awareness of residents and officials In order to further explore why people live in the high-risk areas studied, it is considered important
to explore the risk awareness, as previously mentioned. This section explores the risk awareness of
local residents and government officials in order to see if the views corresponds or if they perceive
the situation differently.
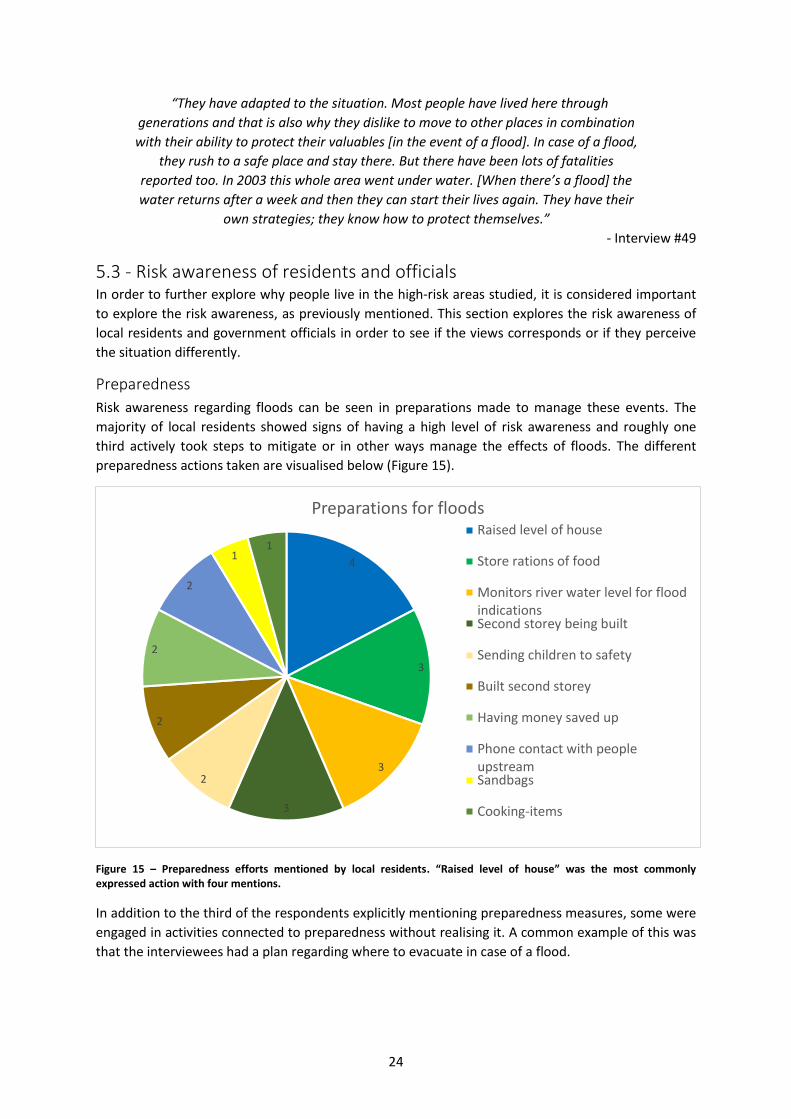
Preparedness
Risk awareness regarding floods can be seen in preparations made to manage these events. The
majority of local residents showed signs of having a high level of risk awareness and roughly one
third actively took steps to mitigate or in other ways manage the effects of floods. The different
preparedness actions taken are visualised below (Figure 15).
Figure 15 – Preparedness efforts mentioned by local residents. “Raised level of house” was the most commonly expressed action with four mentions.
In addition to the third of the respondents explicitly mentioning preparedness measures, some were
engaged in activities connected to preparedness without realising it. A common example of this was
that the interviewees had a plan regarding where to evacuate in case of a flood.
4
3
3
3
2
2
2
2
11
Preparations for floodsRaised level of house
Store rations of food
Monitors river water level for floodindicationsSecond storey being built
Sending children to safety
Built second storey
Having money saved up
Phone contact with peopleupstreamSandbags
Cooking-items
25
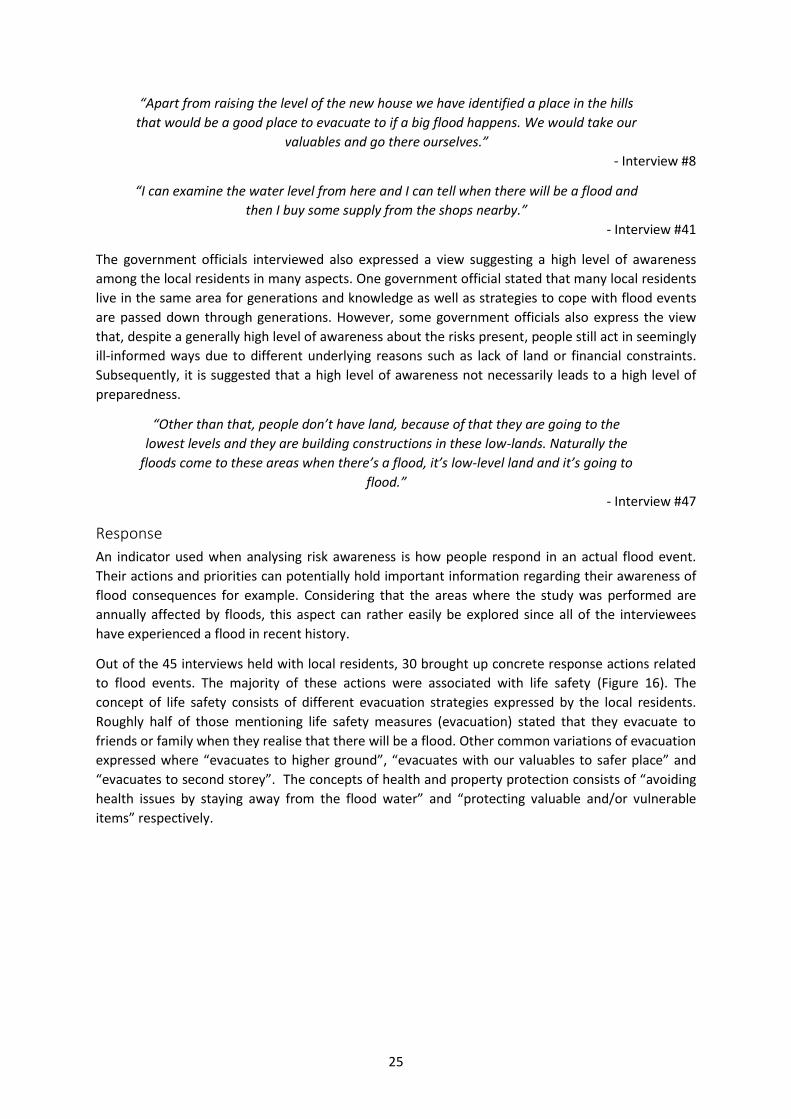
“Apart from raising the level of the new house we have identified a place in the hills
that would be a good place to evacuate to if a big flood happens. We would take our
valuables and go there ourselves.”
- Interview #8
“I can examine the water level from here and I can tell when there will be a flood and
then I buy some supply from the shops nearby.”
- Interview #41
The government officials interviewed also expressed a view suggesting a high level of awareness
among the local residents in many aspects. One government official stated that many local residents
live in the same area for generations and knowledge as well as strategies to cope with flood events
are passed down through generations. However, some government officials also express the view
that, despite a generally high level of awareness about the risks present, people still act in seemingly
ill-informed ways due to different underlying reasons such as lack of land or financial constraints.
Subsequently, it is suggested that a high level of awareness not necessarily leads to a high level of
preparedness.
“Other than that, people don’t have land, because of that they are going to the
lowest levels and they are building constructions in these low-lands. Naturally the
floods come to these areas when there’s a flood, it’s low-level land and it’s going to
flood.”
- Interview #47
Response
An indicator used when analysing risk awareness is how people respond in an actual flood event.
Their actions and priorities can potentially hold important information regarding their awareness of
flood consequences for example. Considering that the areas where the study was performed are
annually affected by floods, this aspect can rather easily be explored since all of the interviewees
have experienced a flood in recent history.
Out of the 45 interviews held with local residents, 30 brought up concrete response actions related
to flood events. The majority of these actions were associated with life safety (Figure 16). The
concept of life safety consists of different evacuation strategies expressed by the local residents.
Roughly half of those mentioning life safety measures (evacuation) stated that they evacuate to
friends or family when they realise that there will be a flood. Other common variations of evacuation
expressed where “evacuates to higher ground”, “evacuates with our valuables to safer place” and
“evacuates to second storey”. The concepts of health and property protection consists of “avoiding
health issues by staying away from the flood water” and “protecting valuable and/or vulnerable
items” respectively.

26
Figure 16 – Distribution of concepts under the category “Response to floods”.
When analysing what relevant government officials express on the topic of response a few
interesting aspects emerge. Firstly, the government officials prioritisation seems to match that of the
local residents well in most cases. According to the officials interviewed, life safety and initiation of
emergency response is of highest importance in the event of a flood. An interesting statement from
one of the government officials, related to a growing issue with crocodiles in the river, brings up
another dimension of the potential consequences of floods:
“Due to the crocodile problem the younger generation can’t swim because no one
touches the river. 10 years ago, everyone in this valley could swim. But the crocodile
problem is a big issue, now no one touches the water resources. And in this area
people dislike to go to the ocean. It’s a big problem because now, if there’s a big
flood, the younger generation can’t swim. The older generation is weak. The
generation in between can survive.”
- Interview #49
Another interesting aspect emerging when comparing views of the local residents to that of
government officials is the seemingly big discrepancy regarding where people evacuate to. The
government has, according to interviews, established a number of safe locations where people can
evacuate to.
“The Divisional Secretariat has been divided into 46 local administrative areas. I’m
responsible for contacting all officers of each local district. There are 46 safe places
introduced by me in collaboration with the DMC [Disaster Management Centre] in
Matara. Just after any hazard [has happened] I have to contact these 46 officers and
inform about an evacuation to the safer place. As well I have to initiate the
immediate action to help people and rescue. […] [The safe places] should not be
prone to floods or any other hazards. Secondly, it should be easily reached, accessible
for the people living in the area. Third, the place should have good facilities and
amenities. Good infrastructure. These are the best places. The majority of the safe
places in Sri Lanka are schools or temples because these have been built on top on
hills as well as public toilets are there. They are usually spacious too.”
- Interview #49
28
4
2
Response to floods
Life safety
Property protection
Health (not emergency)

27
In an interview with one government official it was clear that there was a belief that the majority of
people use these established safe places. However, according to the data collected through
interviews with local residents this does not seem to be the case. As mentioned above, roughly half
of those talking about evacuation explicitly stated that they evacuate to friends or family. There
were some responding that they evacuate to “safe places” and didn’t elaborate further but no one
specifically stated that they evacuate to one of the safe places established by the government. One
interviewee mentions the safe places established by the government and shed further light on the
problems associated with them:
“Also there is a safe place established for the community. When the early warning
group detects signs of flooding everyone has to go here. But if a flood happens
quickly, a flash flood, we wouldn’t have time to go there and that’s why we wanted
to get a boat. The DMC [Disaster Management Centre] have told us that if we don’t
go to the safe place established we will not receive any relief or help in case of flood
emergencies. But we feel it is risky to go this safe place, we could die on the way
there, so we want to go to our parents place instead since it is closer. But if we go
there we will not get any help from the government since they only send evaluators
to this established safe place to assess damages.”
- Interview #4
Proposed improvements
In the following section, proposed improvements to the current situation are presented. Depending
on the responses given it may be possible to identify what the interviewees value and explore their
overall risk awareness. A comparison between local residents and government officials in terms of
proposed improvements is also performed in order to evaluate whether there is a consensus
regarding what needs to be done to improve the situation in the areas around Akuressa.
All of the interviewed local residents (45) expressed suggestions for improvements to the current
situation in the local areas. The vast majority of respondents suggest some form of structural
solution or improvement to the situation. Figure 17 visualises the number of interviewees
mentioning the different kinds of solutions. However, some interviewees mentioned two or more
structural improvements which is not visualised below (Figure 17).
28
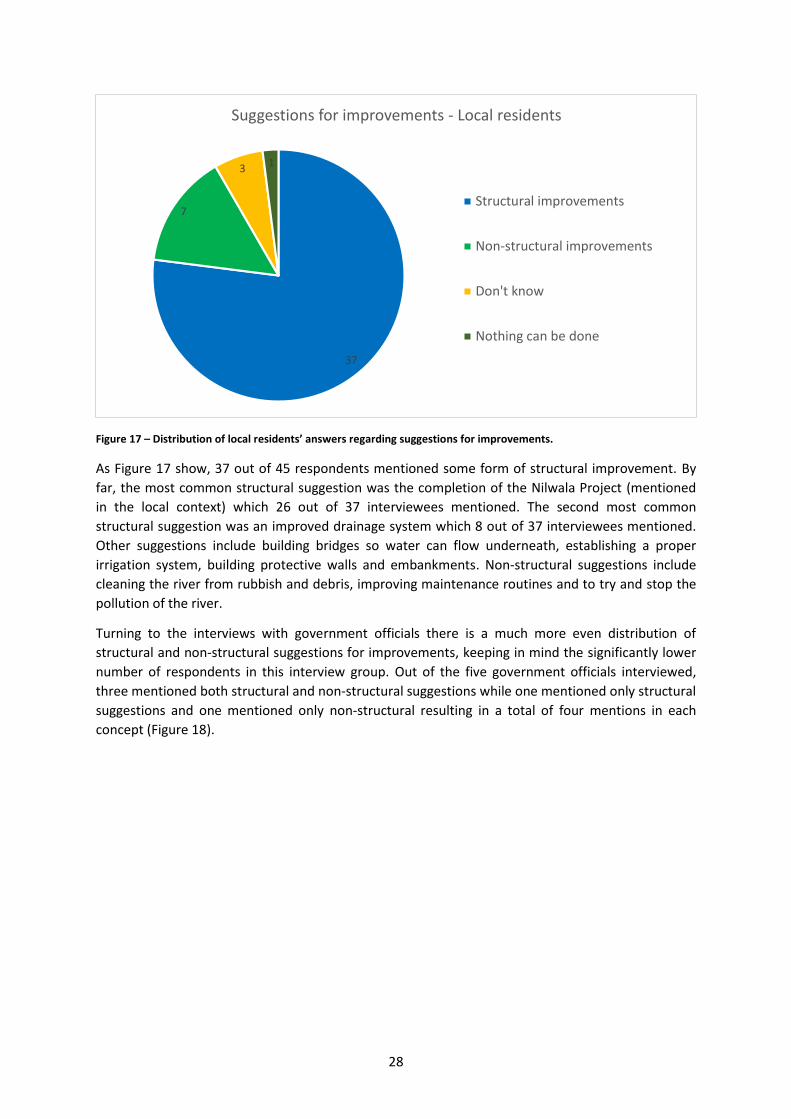
Figure 17 – Distribution of local residents’ answers regarding suggestions for improvements.
As Figure 17 show, 37 out of 45 respondents mentioned some form of structural improvement. By
far, the most common structural suggestion was the completion of the Nilwala Project (mentioned
in the local context) which 26 out of 37 interviewees mentioned. The second most common
structural suggestion was an improved drainage system which 8 out of 37 interviewees mentioned.
Other suggestions include building bridges so water can flow underneath, establishing a proper
irrigation system, building protective walls and embankments. Non-structural suggestions include
cleaning the river from rubbish and debris, improving maintenance routines and to try and stop the
pollution of the river.
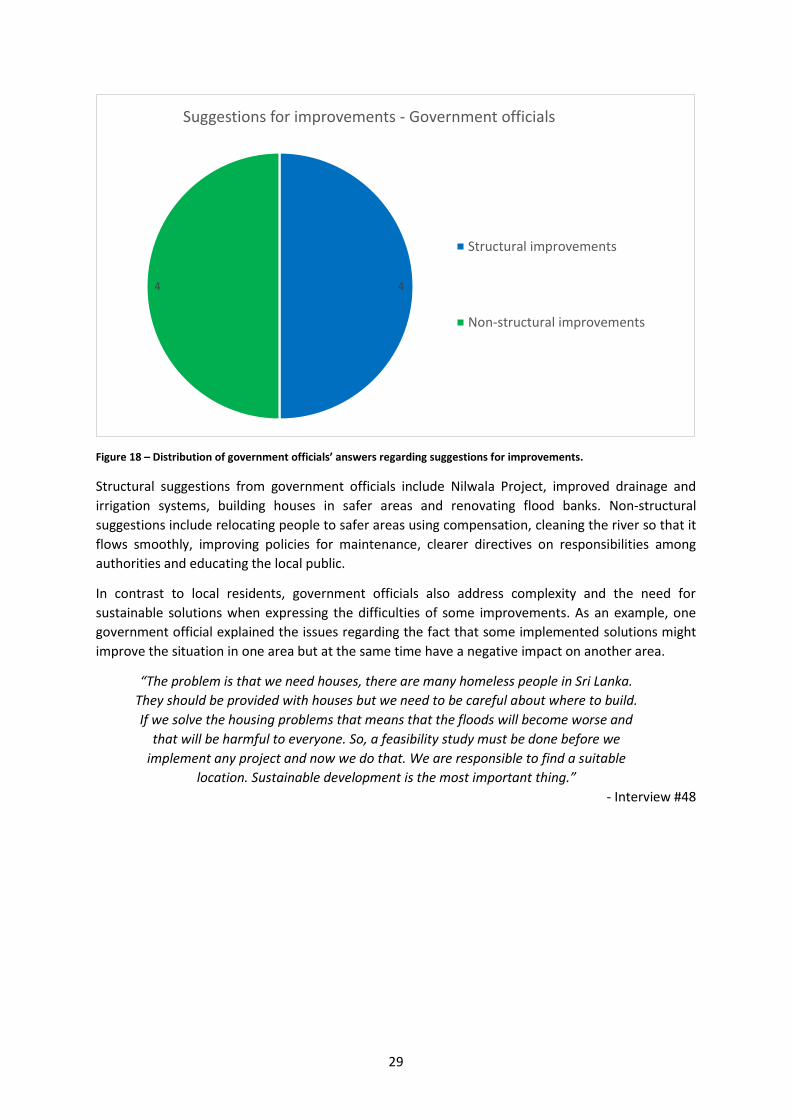
Turning to the interviews with government officials there is a much more even distribution of
structural and non-structural suggestions for improvements, keeping in mind the significantly lower
number of respondents in this interview group. Out of the five government officials interviewed,
three mentioned both structural and non-structural suggestions while one mentioned only structural
suggestions and one mentioned only non-structural resulting in a total of four mentions in each
concept (Figure 18).
37
7
31
Suggestions for improvements - Local residents
Structural improvements
Non-structural improvements
Don't know
Nothing can be done
29
Figure 18 – Distribution of government officials’ answers regarding suggestions for improvements.
Structural suggestions from government officials include Nilwala Project, improved drainage and
irrigation systems, building houses in safer areas and renovating flood banks. Non-structural
suggestions include relocating people to safer areas using compensation, cleaning the river so that it
flows smoothly, improving policies for maintenance, clearer directives on responsibilities among
authorities and educating the local public.
In contrast to local residents, government officials also address complexity and the need for
sustainable solutions when expressing the difficulties of some improvements. As an example, one
government official explained the issues regarding the fact that some implemented solutions might
improve the situation in one area but at the same time have a negative impact on another area.
“The problem is that we need houses, there are many homeless people in Sri Lanka.
They should be provided with houses but we need to be careful about where to build.
If we solve the housing problems that means that the floods will become worse and
that will be harmful to everyone. So, a feasibility study must be done before we
implement any project and now we do that. We are responsible to find a suitable
location. Sustainable development is the most important thing.”
- Interview #48
44
Suggestions for improvements - Government officials
Structural improvements
Non-structural improvements

30

31
6. Discussion This section of the report forms a discussion around the results presented as well as potential trends
emerging from those results. Sections 6.1-6.6 consists of discussions surrounding the findings of the
field study and sections 6.7-6.8 entails reflections about potential uncertainties and sources of error
as well as validity and generalisation.
6.1 - Risk perception and normalisation The vast majority of people interviewed stated that they experience floods annually and in many
cases even several times per year. Consequently, there seems to be a general sense that the floods
are a part of life. Therefore, the local residents living with this hazard appear to normalise the risks
associated with it. Several interviewees did not seem to consider the floods as “disasters” but rather
inconveniences. In case of a flood they would evacuate to friends or relatives for a number of days,
return and clean the house when the water has receded and then move back in.
Somewhat paradoxically, local residents included in the study showed a high level of risk awareness
but in many cases low levels of personal risk perception, which could be one of the reasons for
people living in the high-risk areas. This could also be part of the explanation as to why a relatively
small portion of the interviewees were actively engaged in preparedness actions (considering the
large portion of highly risk aware interviewees). Naturally, risk awareness is a prerequisite for
increased risk perception and preparedness. If you are not aware that you are at risk, you are not
likely to take any risk reducing actions. It begs the question though, is there such a thing as being too
aware of a certain hazard?
Over the last couple of decades there has been a lot of research on risk perception and different
factors that influence risk perception (see, for example, Slovic et al., 1984; Nighswonger Kraus &
Slovic, 1988; Renn, 1998; Sjöberg, 2000). Many influencing factors can be traced back to
psychological biases and cultural context. One influencing factor that is identified in many research
papers is the level of awareness and knowledge about a hazard. This can be expressed in several
ways including whether the risk is known or unknown (Slovic et al., 1984; Nighswonger Kraus &
Slovic, 1988), the level of familiarity with the risk (Renn, 1998) or whether the risk is new or old
(Sjöberg, 2000).
There seems to be a consensus on the fact that awareness and knowledge about a certain hazard
will affect the way in which the risk associated with it is perceived. This is considered natural since
increased knowledge about a hazard includes increased knowledge about the likelihood and
potential consequences related to the hazard. However, it is not considered that increased
awareness and knowledge necessarily leads to higher personal risk perception, i.e. results in a
person to consider him/herself more at risk, even if the “evidence” would say so. The popular and
much used phrase ‘people fear what they do not understand’1 provides a fitting initial thought in this
context and has proven accurate on many occasions. Whether people feel less afraid of what they
do understand naturally depends on the knowledge they gain. In the case of flood hazards in the
area studied in southern Sri Lanka it appears awareness has resulted in a lower risk perception, even
though experience and knowledge has made the local residents aware of the potentially devastating
consequences. This notion is also supported by research papers on the topic. Renn (1998) states that
familiarity with a certain type of risk is likely to increase the tolerance for it while Slovic et al. (1984)
found a correlation between hazards rated as “well known” and “controllable”.
1 Commonly used quote with debatable origin but is suggested to date back to ancient Rome.
32
How is it possible that an increased awareness and knowledge about a hazard can render lower risk
perception? Based on the interviews conducted it is evident that floods have become a part of
everyday life for the local residents. This is particularly true for the vast majority of respondents who
have been living in the area for a long time. The flood risk becomes normalised and no longer
shrouded in clouds of uncertainty, which likely takes away a considerable degree of worry and fear
associated with the risk. This normalisation of the flood risk might stem from years of adaptation
and ability to cope with the hazard but it can also pose a serious threat for the future.
Positive illusion is a psychological bias often associated with a decrease in personal risk perception. It
can be explained as a coping strategy that individuals use to give a sense of control over something
that is in fact not controllable and often result in a sense of false security (Johnson & Levin, 2009;
Luìs, et al., 2016). Subsequently, positive illusions might contribute to increased vulnerability since it
may compromise preparedness efforts. Johnson & Levin (2009) convey that positive illusions can
disappear once an individual is directly affected by the hazard in question and the risk consequently
goes from being hypothetical to real. However, that aspect is not quite applicable to the current
study since the risks associated with floods are not hypothetical to any of the interviewees seeing as
they all have experienced floods before. Therefore, it might not be a question of positive illusions
but rather a sense of confidence in one’s ability to manage the situation. In many cases it is likely a
correct sense of confidence when it comes to managing the small to medium floods which occur
annually. However, it may still also result in a sense of false security regarding the ability to cope
with bigger floods like the major one in 2003.
A likely outcome of normalising the risks associated with floods, whether it is due to experience and
adaptation or potential biases such as positive illusions, is a decrease in worry as mentioned earlier.
Could the absence of worry then be the missing link to increased risk perception and improved
preparedness? It is logical to think that someone who worries a lot about the risks associated with
floods would be more inclined to take action to reduce these risks. However, it might be that even if
an individual is worried he/she does not express an increased inclination towards risk reducing
measures due to real or perceived constraints to change. Perhaps it is then even more logical the
other way around: someone who is not worried about the risks likely don’t see any reason to take
risk reducing measures.
A study on flood risk perception by Raaijmakers et al. (2008) supports the idea that worry is a
potentially important aspect when it comes to perceived level of risk. The authors present three
factors that in their view dictate an individual’s level of flood risk perception. These factors are
awareness, worry and preparedness which are thought to be interconnected (Figure 19).
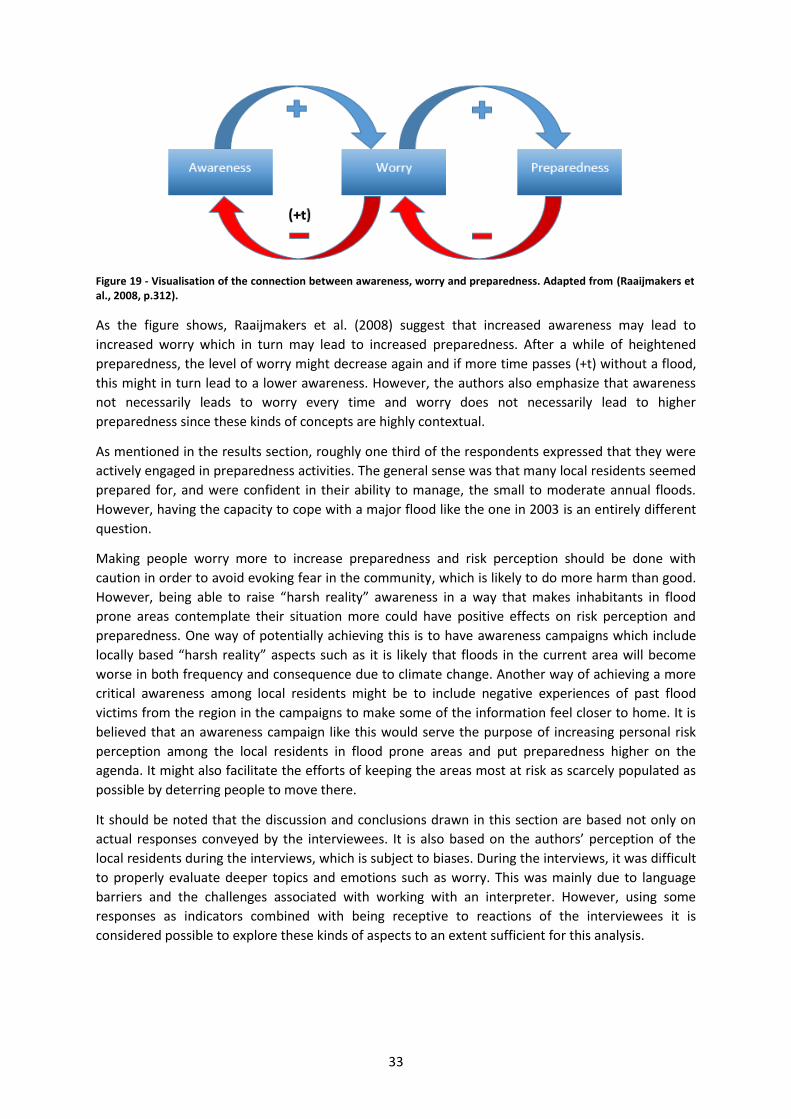
33
As the figure shows, Raaijmakers et al. (2008) suggest that increased awareness may lead to
increased worry which in turn may lead to increased preparedness. After a while of heightened
preparedness, the level of worry might decrease again and if more time passes (+t) without a flood,
this might in turn lead to a lower awareness. However, the authors also emphasize that awareness
not necessarily leads to worry every time and worry does not necessarily lead to higher
preparedness since these kinds of concepts are highly contextual.
As mentioned in the results section, roughly one third of the respondents expressed that they were
actively engaged in preparedness activities. The general sense was that many local residents seemed
prepared for, and were confident in their ability to manage, the small to moderate annual floods.
However, having the capacity to cope with a major flood like the one in 2003 is an entirely different
question.
Making people worry more to increase preparedness and risk perception should be done with
caution in order to avoid evoking fear in the community, which is likely to do more harm than good.
However, being able to raise “harsh reality” awareness in a way that makes inhabitants in flood
prone areas contemplate their situation more could have positive effects on risk perception and
preparedness. One way of potentially achieving this is to have awareness campaigns which include
locally based “harsh reality” aspects such as it is likely that floods in the current area will become
worse in both frequency and consequence due to climate change. Another way of achieving a more
critical awareness among local residents might be to include negative experiences of past flood
victims from the region in the campaigns to make some of the information feel closer to home. It is
believed that an awareness campaign like this would serve the purpose of increasing personal risk
perception among the local residents in flood prone areas and put preparedness higher on the
agenda. It might also facilitate the efforts of keeping the areas most at risk as scarcely populated as
possible by deterring people to move there.
It should be noted that the discussion and conclusions drawn in this section are based not only on
actual responses conveyed by the interviewees. It is also based on the authors’ perception of the
local residents during the interviews, which is subject to biases. During the interviews, it was difficult
to properly evaluate deeper topics and emotions such as worry. This was mainly due to language
barriers and the challenges associated with working with an interpreter. However, using some
responses as indicators combined with being receptive to reactions of the interviewees it is
considered possible to explore these kinds of aspects to an extent sufficient for this analysis.
Figure 19 - Visualisation of the connection between awareness, worry and preparedness. Adapted from (Raaijmakers et al., 2008, p.312).
34
6.2 - Risk trade-off All humans evaluate risk on a daily basis, either consciously or subconsciously. When going to work
in the morning there is a risk of crashing your car. When swimming there is a risk of drowning.
Smoking cigarettes increases the risk of cancer, but we still choose to engage in these activities. The
list is close to infinite and each and every one of us has to come to terms with how to deal with the
risks we choose to expose ourselves to.
All of the respondents mentioned the floods as a downside of living in the area and everyone had
experienced the seasonal floods and their consequences first-hand. It is easy to assume that the
people living in these areas would like to move somewhere else because of the floods. However,
that does not appear to be the case in this area. Many respondents did not wish to move when at
the same time expressing a good awareness regarding the flood risks. Based on the collected data,
this attitude can partially be explained by the benefits associated with staying, i.e. the benefits
appear to outweigh the risks.
This phenomenon is for example supported by Fischhoff et al. (1978) and Raaijmakers et al. (2008).
When an individual accepts the existence of a certain risk, the person can relate to it in two different
ways; it is either acceptably low, or too high. However, the acceptable level of risk is cannot be
determined in isolation as the risk tolerance heavily depends on the level of the perceived benefits
associated with the risk exposure in question. A perceived high risk can be acceptable if the
perceived benefits are large as well and the risk tolerance is therefore context dependent.
Applying this theory in the local context of the studied areas around Akuressa, it appears a risk
trade-off has taken place in many of the cases. First of all, there are those who clearly expressed an
unwillingness to move. Due to the many perceived benefits, they prefer staying in the area despite
of the risks associated with the floods. Secondly, there are those expressing a willingness to move.
However, some of these interviewees say they would be willing to move but as long as they find a
comparable place, and it consequently appears they are reluctant to trade the benefits in the area
for a lower risk exposure. Furthermore, it is likely decisions about not leaving the area are affected
by social aspects. Decisions affecting family relations can become collective, where the family is seen
as one unit, and it therefore becomes difficult to base decisions solely on a person’s individual
preferences.
At the same time, it is important to also consider the perceived risk in the area, as discussed in the
section above. The respondents are in general well aware of the situation expressing an ability to
cope with the floods and the perceived risk is, at least for the researchers, surprisingly low which
strengthens the unwillingness to relocate. This knowledge is important to consider when working
with disaster management to avoid simplified and incorrect assumptions about the situation of
those living in high risk areas which in turn may lead to non-functional solutions (Oliver-Smith,
1991).
6.3 - Officials contra local residents – differentiating views Based on the interviews held with local residents and government officials it appears to be a general
consensus regarding both the existing hazards in the area as well as the benefits of living there.
However, some of the data collected suggest that resources might not be spent in the most effective
way in terms of the implementation of risk reducing measures. In order to unlock the full potential
of risk reducing measures, an understanding of the target group is of high importance.
The importance of being aware of the local context and to make sure that risk reducing measures
are rooted locally in order to be successfully implemented are well documented (see, for example,
35
Quarantelli, 1997; Perry & Lindell, 2003; United Nations Development Programme, 2004; Coppola,
2011; Becker, 2014). One clear indication of a mismatch in terms of resources spent and actual
needs of the target group seems to be the establishment of government safe places. As presented in
the results section, the views of the relevant government institutions appear to be that the
implementation of safe places is a successful initiative and that most people evacuate to these
locations in case of floods. However, the data collected suggest otherwise. The fact that the vast
majority of interviewees who mentioned evacuation stated that they evacuate to family or friends is
believed to be a result of two main reasons.
Firstly, after conducting the interviews it became clear that family values are generally strong and
most of the respondents seemed inclined to live close to family. This means that in many cases the
distance to a member of the family or a friend, who lives in a safer area, is likely to be shorter
compared to the distance to one of the established safe places. Secondly, in the aftermath of the
initial emergency of disasters it is believed that people are generally more likely to seek support
from close ones rather than government officials or other strangers. Going to a safer place that
belongs to a family member or friend likely gives more than the sense of physical safety, it also
provides a better forum for social support in a more familiar environment.
It should be noted that the size of the selection of respondents is not considered large enough to
draw any conclusions regarding how many people that use the established safe places. However, if
the indications in this study would turn out to be applicable to a greater population, the established
safe places would form an example of misdirected use of funds and resources. This study does not
include any information regarding how much funds and resources it takes to establish and maintain
the governmental safe places though. Considering that they mostly consist of existing schools and
temples it might not be a big monetary investment, however it could potentially undermine
education and the social fabric in the community should the schools and temples be occupied with
evacuated people.
When it comes to proposed improvements to the flood situation, the results indicate that
government officials seem to have a better grasp of the associated complexity, which is expected
since it is included in their line of work. The majority of local residents wanted structural solutions
which might be easier to see direct benefit from, such as protective embankments and the
completion of the Nilwala Project. The government officials interviewed also expressed a will to see
the Nilwala Project completed but were more aware of different non-structural solutions such as
changing peoples’ perception of how to treat the river as well as policy changes. The Nilwala Project
was mentioned a lot, especially by the local residents, and hailed by many as the best solution.
Without evaluating that proposal properly it is difficult to tell if it actually is the best solution or if it
is being hailed as the best solution as a result of being an ongoing topic of discussion for roughly 30
years. Some of the local residents interviewed seemed to be stuck on the idea of the Nilwala Project,
which might get in the way of exploring other options.
Another aspect of the difference between the proposed improvements is that government officials
seemed to think more along the lines of sustainability. One government official expressed the view
that it is not possible to build away all problems and risks associated with floods, there is also a need
to change the mindset and behaviour of the people. Another one mentioned that it is very difficult
to find a solution that will benefit everyone. If flood protection measures are constructed at one
location that might lead to more severe floods somewhere else along the river, or even drought in
some areas.
36
In order to shift the public opinion more towards sustainable and ‘soft’ solutions such as keeping the
river clean and retaining unbuilt environment, information and communication is believed to be key.
This communication needs to be adapted to the specific situation and put into a context which is
relatable. Coppola (2011) describes the importance of contextual communication and conveying
possibilities and consequences of certain actions in relatable terms. Effective communication of
information is likely to be one of the most cost-effective improvements possible.
6.4 - Difficulties relocating Even though many wish to stay, there are still those who expressed a willingness to move but find it
difficult to do so. The identified main underlying factors for this are; a disbelief of finding another
place at all, finding an equivalent living situation in a new location and financial constraints.
When discussing options regarding moving it became apparent this is often conceived as difficult. It
is uncommon to rent a place to live, even more so in rural areas, and most people instead own their
house and land resulting in static housing system. This could also mean that the current place of
residence is more of an investment compared to if it would have been a rental house. Based on the
interviews, moving seems to be an unusual activity in general and it often seemed like interviewees
were not especially used to think along those lines. Even though expressing a willingness to move,
very few concrete stories about how this could be done were told and it generally felt like a remote
option. The same goes for the people expressing a wish to move given that the new place is
equivalent to the present one. Few could tell where such a place was to be found. There were also
those who expressed a willingness to move but other parts of the family wanted to stay. The family
bonds often appeared strong when family at the same time provide social security. Last but not
least, financial constraints were discussed. This factor can however be derived from many of the
other types of responses. With strong financial means it of course becomes easier to buy suitable
land and build a new house for example.
It is fair to assume most people would be willing to move if, for example, offered an equivalent living
place with the only difference of having no floods. Expressing a willingness to move, given those
conditions, is in many ways like saying “I’d rather not be exposed to the floods” which is not a
surprise. At the same time, none of those interviewed expressed or appeared to be forced to live in
the area. It has to be, to some extent, considered a choice to live in the area even though this
decision might be based on the lack of better alternatives. Due to these reasons, the discussion
regarding the subject of moving tends to become hypothetical.
To gain better knowledge about this it would been interesting to interview people who have made
the decision to leave the area. What factors were considered and how do they compare their
currently living situation with how they had it previously? Unfortunately, this project had no
resources for that.
6.5 - Sense of place Sense of place is probably something most can relate to in one way or another, for example a special
affection to your childhood home which many experience (Chawla, 1992). Some of the respondents
in the study have expressed a strong connection to the area. The most prominent reasons for this
connection was generational ties. Family history often played a big role, either that the house and
land had been inherited through generations or that other family members were living close by. In
addition, the respondents also expressed a strong connection to the geographical location and
community. Many identified themselves with the surrounding areas where they were either born or
had spent a substantial part of their life and considered it home.
37
Over the last decades there has been much research on sense of place and its significance in regards
to natural disasters and human behaviour. Bonaiuto et al. (2016) performed a review of 31 works on
the subject, identifying general trends in terms of the effect sense of place (referred to as place
attachment) have on for instance risk perception and risk coping. Based on the review, it is
suggested that individuals with a strong sense of place tends to have a well-developed awareness
regarding the risks associated with the area. At the same time a strong sense of place appears to, in
many cases, result in poor coping mechanisms as a result of low risk perception. This corresponds
well with the results obtained from the interviews conducted in the areas around Akuressa where
the local residents are well aware of the situation but at the same time seldom engage in
preparation efforts. Any theories as to why is not given and more research about the subject is likely
needed.
However, maybe it can be seen simply as a human coping mechanism. It is possible that an
individual with a strong personal bond to a certain area combined with a disbelief in finding a better
alternative subconsciously underestimates the risks associated with living there. That would justify
the decision of staying and likely also release both stress and worry associated with the knowledge
of living in a high-risk area.
Another interesting factor of living in disaster struck areas is the establishment of a particularly
strong sense of community (Cox & Perry, 2011). Residents are often eager to move back to their
community as soon as possible after a destructive event to start the rebuilding process and return to
normal. During that time, the people in the community come together to help each other and the
sense of community is strengthened (Silver & Grek-Martin, 2015). When already experiencing a
strong sense of place and connection to the community, the unwillingness to relocated might be
enhanced. This effect is likely even more apparent in areas such as Akuressa since seasonal floods
mean that the community gather in joint efforts annually.
6.6 - Comparison of the different interviewee categories location, age
group and gender Where applicable and possible, interviews with local residents were categorised into location (rural,
semi-rural or urban), age and gender and compared in an attempt to identify different trends based
on the given answers.
The most prominent difference from the dataset appears in the discussions regarding difficulties
with relocating and covers the subject of financial constraints. This was mentioned 5 times, however
only by males and it appears likely that men more often are responsible for the family economy.
Furthermore, rural respondents seem to find it difficult to move by expressing several different
difficulties. Urban respondents however did not mention a single difficulty. The data provides no
apparent explanation to this but it appears urban residents find it easier to relocate. One possible
explanation could be that they are not depending on land for cultivation to the same extent as rural
residents. Another factor could be traditions as well. The urban population is more likely to come
from a family who has taken part of the urbanisation process, with previous relocation experience
within the family. If a rural family has lived in the same area for generations, relocation might be
conceived as a more complicated task.
Regarding sense of place, the indicators are similar between respondents from different locations,
age groups and gender. Due to traditional reasons, the wife often moves to the husband’s house
after marriage, which has also been true in the majority of the interviews. Because of this, it was
expected that women would show a lower sense of place compared to the men but that was not the

38
case. The dataset provides no apparent reasons as to why, but it might be that the women in many
cases have not move especially far, maybe from the neighbouring town or similar. Another possible
reason could be that the interviewed women express the view of the household which to a greater
extent might correspond with the husband’s views instead of her own.
Lastly, urban residents valued the public services to a much greater extent than those living in rural
areas. This is not very surprising as these services are located in the town making it more accessible
for them. The rural residents on the other hand mentioned cultivation as one of the benefits of the
area which is also expected as farming is a more prominent part of in the rural life.
6.7 - Sources of uncertainty and error Even though efforts were made throughout the study to minimise the effects of uncertainties and
error, it has not been possible to fully avoid them. Given the fact that the people interviewed only
spoke Sinhalese the only realistic option to extract information from the area was to use a
translator. According to the authors, this is the most prominent source of error and uncertainty in
the study.
First of all, using a translator governs the way the interviews are conducted as it is not possible to
have a regular conversation where two parties are constantly engaged in either speaking or
listening. Instead, one of the three parties is always passive without the opportunity to ask quick
questions for clarifications if things are not understood. The dynamics of the conversations is simply
different and unfamiliar. Considering that the intention of using semi-structured interviews is to
have a relaxed conversation where the interviewee can tell his or her story, the error becomes more
apparent. A conversation without a translator is believed to have identified more areas of interest to
dig deeper into and allow for the conversation to develop in itself.
Using a different method with close-ended questions or a questionnaire could have been applied to
minimise this error. However, this would result in another error as the authors would affect the
interview subjects to a much greater extent by setting the agenda. This would make it more difficult
for the respondents to tell their own story and the results of the study would to a greater extent be
affected by the authors’ preconceived ideas. This wanted to be avoided.
Furthermore, having an interpreter decreased the level of control of the situation from the authors’
point of view. For example, questions should ideally be asked in a very similar way to each and every
respondent to produce comparable results. This was explained to the translator, but it has not been
possible to check if that was the case.
As discussed in previous chapters, the level of English differed considerably between authors and
translator and the communication had to be simplified. This sometimes resulted in the inability to
ask questions a certain way and it is obviously safe to assume the translation from Sinhalese to
English had to be simplified as well. Inevitably, detail and character in each individual interview were
lost due to this.
Last but not least, it is believed many of conversations were interpreted rather than translated, i.e.
conversations were not spelled out “word-by-word”. A perfect and constant translation most likely
requires years of practicing, even for a professional translator, which the project had no access to.
Instead, the translator listened to the respondent and later recounted the answer. This resulted in a
loss of control from the researchers’ perspectives with no ability to intervene to ask follow-up
questions. Furthermore, it cannot be ruled out that the translator summarises the answer and/or
interpret what has been said and consequently introduces his own thoughts and ideas when
responding (Freed, 1988).
39
Furthermore, the researchers cannot guarantee all answers are truthful. It cannot be ruled out that
the respondents gave answers to support special interest or drive certain agendas. It is possible that
answers were exaggerated in an attempt to direct funds to the research area or that the
respondents simply, with good intention, gave answers they thought were good or useful for the
study. The reasons could be many and can only be speculate about. At the same time, it is important
to emphasise no such indications have been identified.
6.8 – Validity & Generalisation Discussing the validity of the study is done through two different perspectives, namely internal and
external validity (Kapborg & Berterö, 2002). Internal validity requires the researchers to present
convincing and transparent evidence for the results and conclusions in the report. In other words,
the presented results and conclusions correspond to what was told by those interviewed. In this
report, that has been done by presenting quotes, figures and other sources of information allowing
the reader to explore the actual dataset from which interpretations and conclusions were drawn.
The study is considered to achieve internal validity. Some information and level of detail has likely
been lost as previously discussed, but the researchers are confident the results reflect the thoughts
of the interviewees in general terms.
External validity, however, is more difficult to achieve as it requires the results to be applicable in
other settings or locations. The results in this report focuses on why people live in the areas around
Akuressa which, of course, are influenced by the local context in terms of general conditions, habits,
culture etc. If applying these results elsewhere it is important to evaluate the prerequisites and
determine if the results are transferable (Kapborg & Berterö, 2002). The explanation as to why
people live in the areas around Akuressa has proven complex and several different reasons have
been identified as part of this study. Some of the more general concepts are likely applicable in
other areas as well, especially those well supported in the scientific literature such as sense of place,
risk trade-off and risk normalisation. Context specific reasons on the other hand, such as lack of land,
might very well be transferable to other settings as well but is of course heavily dependent on the
local situation.
Lastly, identifying possible interdependencies between the different reasons, and how they may
affect each other, has not been the main focus of this study. Therefore, it is important to not analyse
the factors as individual and isolated components but instead acknowledge them on the basis of
being a complex system.

40
41
7. Conclusion This study is based on data collected through semi-structured interviews in the areas around
Akuressa, Sri Lanka. The study was performed in order to answer three research questions. These
are presented below including their respective conclusions.
Why do people live in high-risk areas around Akuressa, Sri Lanka, according to the local residents
themselves?
Overall good living situation – Many of the respondents seemed happy with the overall
living situation. The annual floods were expressed as one of the few downsides. It was
however common for the local residents to mention several different benefits.
Consequently, it appears that risk trade-off reasoning has resulted in that perceived benefits
of living in the areas around Akuressa outweigh the perceived downsides associated with
the floods.
Sense of place – A strong sense of place was expressed both in terms of being born and
raised in the current location, the land and house being passed down through generations as
well as a preference of being close to family and relatives. Out of those who expressed their
unwillingness to relocate from their current location, almost half mentioned sense of place
as one of the major reasons.
Difficulties relocating – The respondents expressed difficulties associated with moving
somewhere else such as a disbelief of finding another place at all, financial constraints as
well as a disbelief of finding an equivalent living situation in a new location. One potential
reason behind these problems is identified as the static housing system. It is uncommon to
rent a place to live, even more so in rural areas, and most people instead own their house
and land. This means that the current place of residence is likely considered more of an
investment compared to a rental house.
Well adapted to the situation – Through interviews, informal discussions and field
observations it became evident that many local residents felt well adapted to the current
situation. There was an evident sense of inherent knowledge within many of the
interviewees and it is believed that the long-term exposure to floods has “forced” the
inhabitants of this region to find ways of living with this risk. However, this study identifies
that the long-term exposure seems to have normalised the risks associated with annual
floods, which might have a negative impact on their level of preparedness. The sense of
being well adapted to the situation is likely based on being just that to some extent but it
might also be a result of positive illusions regarding internal and/or external capacity to cope
with the hazard, something that is often associated with normalisation of a risk.
In order to explore if the views of the local residents were shared by government officials, six
interviews were held with officials from relevant sectors of government. The purpose of this part of
the study was to evaluate the second research question:
Why do people live in high-risk areas around Akuressa, Sri Lanka, according to government officials?
Responses from government officials corresponded well with what was expressed by the local
residents. The interviews revealed a consensus regarding several of the main reasons for living there
such as a strong sense of place, financial constraints regarding relocation and a lack of land. The view
of local residents being well adapted to the current location was also expressed as a reason to why
they live in the high-risk areas studied.

42
The third research question was constructed with the purpose of obtaining a deeper understanding
of why people live in the high-risk areas around Akuressa. In order to go beyond the more direct
reasons and explore the potential underlying factors, a third research question has been evaluated:
How do local residents and government officials perceive the risks in the areas around Akuressa, Sri
Lanka?
To answer how local residents and government officials perceive the risks in the areas around
Akuressa, their respective risk awareness was explored by looking at three different factors, namely
preparedness, response and proposed improvements.
Residents generally exhibited a high level of awareness, however this does not seem to have
resulted in high levels of preparedness. Only a few respondents mentioned preparedness efforts
such as raising the level of their house, storing food or monitoring the water level. This notion was
supported in the interviews with government officials as well, where it was expressed that some
residents act in seemingly ill-informed ways even though they exhibit a high level of awareness. This
study identifies risk normalisation as one potential reason for the level of preparedness as it likely
affects the local residents’ level of personal risk perception.
In terms of response during the floods, residents predominantly had life safety in focus, i.e.
evacuating. The majority of the residents said they evacuated to either non-affected family or
friends. At the same time, government officials communicated a different understanding believing
most residents evacuated to the safe places established by the Disaster Management Centre. This
was one of the most prominent discrepancies identified in the study. It may partially be explained by
the fact that family and friends live close-by compared to the designated safe places and that people
want to be close to their family and friends during the floods.
Lastly, there were differentiating views between residents and officials regarding proposed
improvements. Residents had a clear focus on structural options such as building dams, levees or
similar. Government officials, however, expressed a need for both structural and non-structural
improvements and generally exhibited a more complex understanding of the issues related to
improving the situation in the areas around Akuressa. In order to shift the public opinion more
towards sustainable and ‘soft’ solutions such as keeping the river clean and retaining unbuilt
environment, information and effective risk communication is believed to be of high importance.
The overall purpose of this thesis was to study reasons why people live in high-risk areas around
Akuressa, Sri Lanka. The aim was to look beyond the purely physical aspects of living with a high
level of hazard exposure and explore the underlying social mechanisms potentially dictating why
people live there. Many of the findings in this study are supported by existing literature and it is the
authors hope that this study will help shed more light on the complexity surrounding why people live
in high-risk areas.
43
8. Bibliography Adger, N. W. (2006). Vulnerability. Global Environmental Change, 16, 268-281.
Becker, P. (2014). Sustainability Science - Managing risk and resilience for sustainable development.
Elsevier.
Bernard, R. H. (2006). Research Methods in Anthropology - Qualitative and Quantitative Approaches.
Oxford: Rowman & Littlefield Publishers.
Bonaiuto, M., Alves, S., De Dominicis, S., & Petruccelli, I. (2016). Place attachment and natural hazard
risk: Research review and agenda. Journal of Environmental Psychology, 48, 33-53.
Charmaz, K. (2006). Constructing Grounded Theory - A practical guide through qualitative analysis.
London: SAGE Publications.
Chawla, L. (1992). Childhood Place Attachments. In I. Altman, & S. M. Low, Place Attachment (pp. 63-
86). New York: Springer US.
Coppola, D. P. (2011). Introduction to International Disaster Management. Burlington: Elsevier.
Cox, R. S., & Perry, K.-M. E. (2011). Like a Fish Out of Water: Reconsidering Disaster Recovery and the
Role of Place and Social Capital in Community Disaster Resilience. American Journal of
Community Psychology, 48, 395-411.
Dedering, U. (2012). Sri Lanka Districts Matara. Retrieved November 11, 2016, from Wikipedia
Commons: https://commons.wikimedia.org/wiki/File:Sri_Lanka_districts_Matara.svg
Enander, A. (2008). Human needs and behaviour in the event of emergencies and social crises. In L.
Fredholm, & A.-L. Göransson, Emergency Response Management in Today's Complex Society
(pp. 31-72). Karlstad: Swedish Rescue Services Agency.
Fischhoff, B., Slovic, P., & Lichtenstein, S. (1978). How Safe is Safe Enough? A Psychometric Study of
Attitudes Towards Technological Risks and Benefits. Policy Sciences, 9, 127-152.
Freed, A. (1988). Interviewing through an Interpreter. Social Work, 33(4), 315-319.
Höst, M., Regnell, B., & Runeson, P. (2006). Att genomföra examensarbete. (Swedish). Lund:
Studentlitteratur.
Johnson, D., & Levin, S. (2009). The tragedy of cognition: psychological biases and environmental
inaction. Current Science, 97(11), 1593-1603.
Kapborg, I., & Berterö, C. (2002). Using an interpreter in qualitative interviews: does it threaten
validity? Nursing Inquiry, 9(1), 52-56.
Longhurst, R. (2016). Semi-Structured Interviews and Focus Groups. In R. Rojek, Key Methods in
Geography (pp. 143-156). London: SAGE Publications.
Luìs, S., Pinho, L., Lima, M., Roseta-Palma, C., Cardoso Martins, F., & de Almeida, A. (2016). Is it all
about awareness? The normalization of coastal risk. Journal of Risk Research, 19(6), 810-826.
McEntire, D. A. (2005). Why Vulnerability Matters: Exploring the Merit of an Inclusive Disaster
Reduction Concept. Disaster Prevention and Management, 14(2), 206-222.
44
Ministry of Disaster Management Sri Lanka. (2012, 10 25). Hazard Profiles of Sri Lanka. Colombo:
Nanila Publication (Pvt) Ltd. Retrieved 10 03, 2016, from Hazard Profiles of Sri Lanka:
http://www.dmc.gov.lk/hazard/hazard/Report.html
Ministry of Policy Planning and Economic Affairs. (2012). Census of Population and Housing 2012 .
Department of Census and Statistics. Battaramulla: Ministry of Policy Planning and Economic
Affairs.
Ministry of Policy Planning and Economic Affairs. (2012). Census of Population and Housing Final
Report –Southern Province 2012. Department of Census of Population and Housing .
Battaramulla: Ministry of Policy Planning and Economic Affairs.
Nationalencyklopedin. (2016). Sri Lanka. (Swedish). Retrieved 10 24, 2016, from
Nationalencyklopedin: http://www.ne.se/uppslagsverk/encyklopedi/l%C3%A5ng/sri-
lanka#litteraturanvisning
Nighswonger Kraus, N., & Slovic, P. (1988). Taxonomic Analysis of Perceived Risk: Modeling
Individual and Group Perceptions Within Homogeneous Hazard Domains. Risk Analysis, 8(3),
435-455.
Oliver-Smith, A. (1991). Successes and Failures in Post-Disaster Resettlement. Disasters, 15(1), 12-23.
Perry, R. W., & Lindell, M. K. (2003). Preparedness for Emergency Response: Guidelines for the
Emergency Planning Process. Disasters, 27(4), 336-350.
Quarantelli, E. (1997). Ten Criteria for Evaluating the Management of Community Disasters.
Disasters, 21(1), 39-56.
Raaijmakers, R., Krywkow, J., & van der Veen, A. (2008). Flood risk perceptions and spatial multi-
criteria analysis: an exploratory research for hazard mitigation. Natural Hazards, 46, 307-
322.
Renn, O. (1998). The role of risk perception for risk management. Reliability Engineering and System
Safety, 59, 49-62.
Scolobig, A., De Marchi, B., & Borga, M. (2012). The missing link between flood risk awareness and
preparedness: findings from case studies in an Alpine Region. Natural Hazards, 63, 499-520.
Silver, A., & Grek-Martin, J. (2015). “Now we understand what community really means”:
Reconceptualizing the role of sense of place in the disaster recovery process. Journal of
Environmental Psychology, 42, 32-41.
Sjöberg, L. (2000). Factors in Risk Perception. Risk Analysis, 20(1), 1-11.
Slovic, P. (2001). The Risk Game. Journal of Hazardous Materials, 86, 17-24.
Slovic, P., Fischhoff, B., & Lichtenstein, S. (1984). Behavioral decision theory perspectives on risk and
safety. Acta Psychologica, 56, 183-203.
Smith, K. (2013). Environmental Hazards: Assessing Risk and Reducing Disaster (6th Edition ed.). New
York: Routledge.
Sooriyabandara, L. (2016, September 9). Chief Irrigation Engineer at Irrigation Department Beligaha.
(O. Nilsson, & J. Askman, Interviewers) Matara, Sri Lanka.
45
The World Bank. (2016). Sri Lanka. Retrieved 10 24, 2016, from The World Bank:
http://data.worldbank.org/country/sri-lanka
Turner II, B. L., Kasperson, R. E., Matson, P. A., McCarthy, J. J., Corell, R. W., Christensen, L., . . .
Schiller, A. (2003). A framework for vulnerability analysis in sustainability science.
Proceedings of the National Academy of Science, 100(14), 8074-8079.
United Nations Development Programme. (2004). Reducing Disaster Risk - A Challenge for
Development. New York: United Nations Development Programme.
United Nations Development Programme. (2015). Human Development Reports. Retrieved 10 24,
2016, from Human Development Reports Sri Lanka:
http://hdr.undp.org/en/countries/profiles/LKA
United Nations, Department of Field Support. (2008). United Nations Geospatial Information Section.
Retrieved 11 11, 2016, from United Nations:
http://www.un.org/Depts/Cartographic/english/htmain.htm
Wisner, B., Blaikie, P., Cannon, T., & Davis, I. (2003). At risk: Natural hazards, people's vulnerability
and disasters. New York: Routledge.
Zinn, J. O. (2008). Social Theories of Risk and Uncertainty: An Introduction. Oxford: Blackwell
Publishing Ltd.
Zubair, L. (2004). May 2003 Disaster in Sri Lanka and Cyclone 01-B in the Bay of Bengal. Natural
Hazards, 33, pp. 303-318.

I
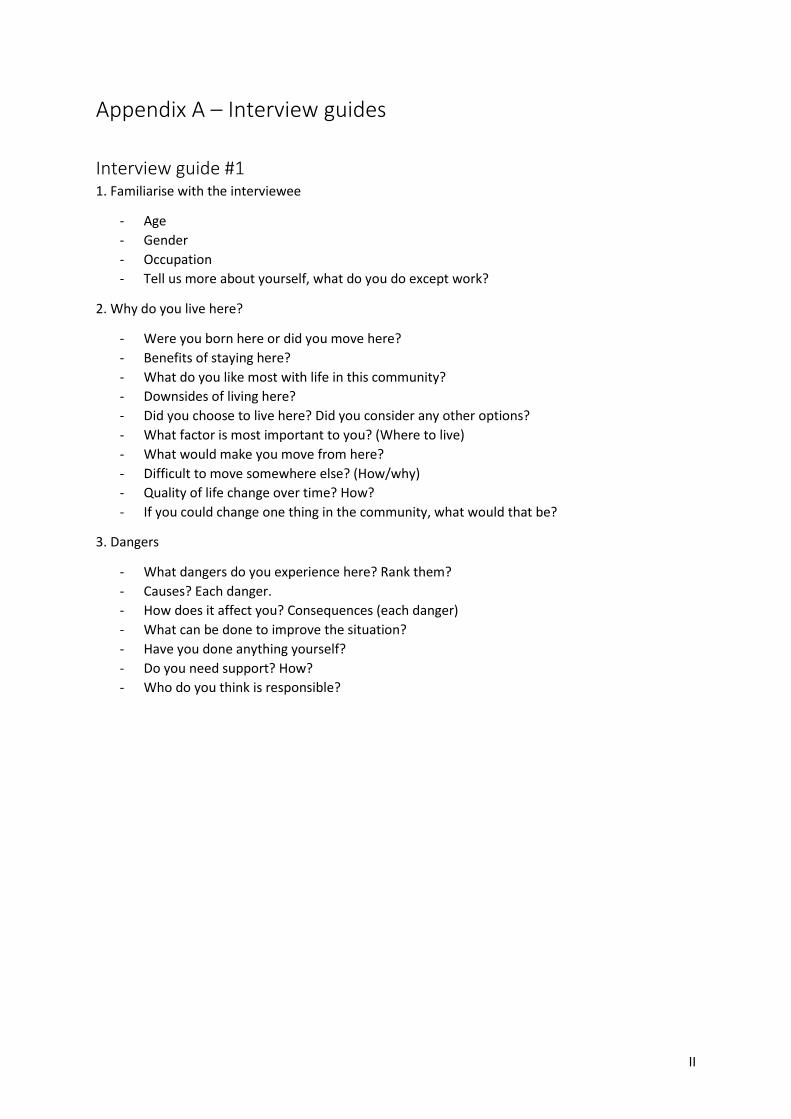
II
Appendix A – Interview guides
Interview guide #1 1. Familiarise with the interviewee
- Age
- Gender
- Occupation
- Tell us more about yourself, what do you do except work?
2. Why do you live here?
- Were you born here or did you move here?
- Benefits of staying here?
- What do you like most with life in this community?
- Downsides of living here?
- Did you choose to live here? Did you consider any other options?
- What factor is most important to you? (Where to live)
- What would make you move from here?
- Difficult to move somewhere else? (How/why)
- Quality of life change over time? How?
- If you could change one thing in the community, what would that be?
3. Dangers
- What dangers do you experience here? Rank them?
- Causes? Each danger.
- How does it affect you? Consequences (each danger)
- What can be done to improve the situation?
- Have you done anything yourself?
- Do you need support? How?
- Who do you think is responsible?
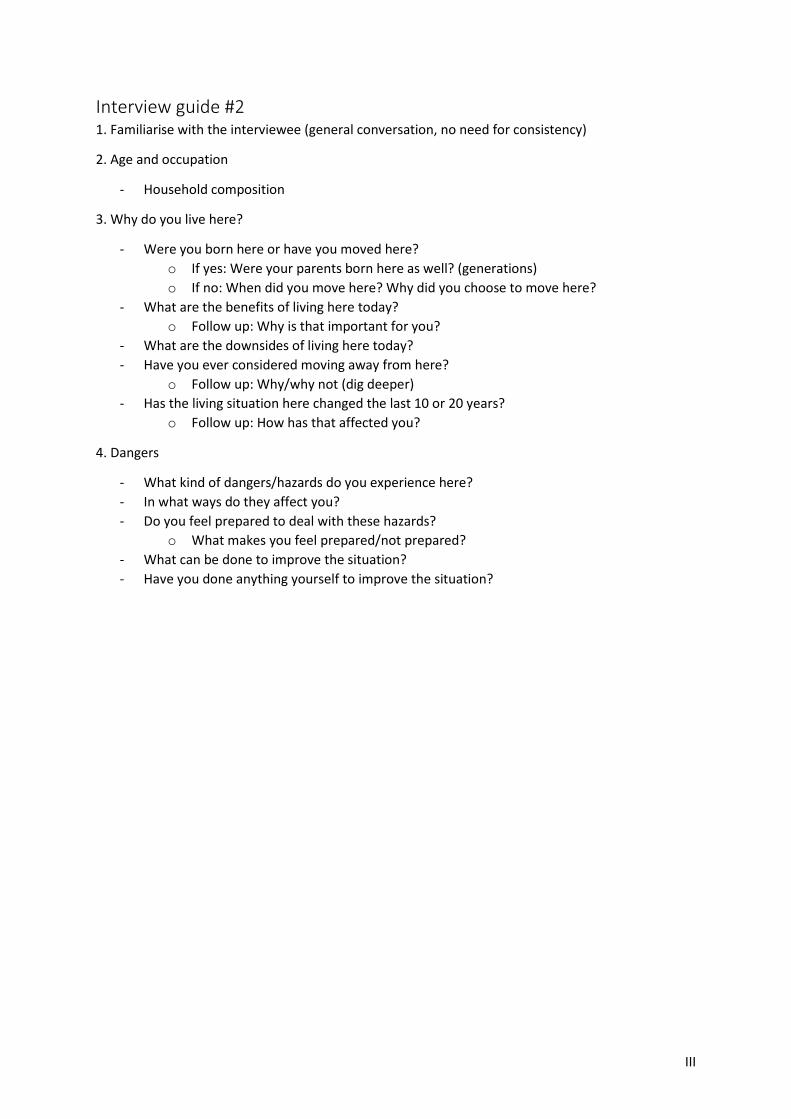
III
Interview guide #2 1. Familiarise with the interviewee (general conversation, no need for consistency)
2. Age and occupation
- Household composition
3. Why do you live here?
- Were you born here or have you moved here?
o If yes: Were your parents born here as well? (generations)
o If no: When did you move here? Why did you choose to move here?
- What are the benefits of living here today?
o Follow up: Why is that important for you?
- What are the downsides of living here today?
- Have you ever considered moving away from here?
o Follow up: Why/why not (dig deeper)
- Has the living situation here changed the last 10 or 20 years?
o Follow up: How has that affected you?
4. Dangers
- What kind of dangers/hazards do you experience here?
- In what ways do they affect you?
- Do you feel prepared to deal with these hazards?
o What makes you feel prepared/not prepared?
- What can be done to improve the situation?
- Have you done anything yourself to improve the situation?
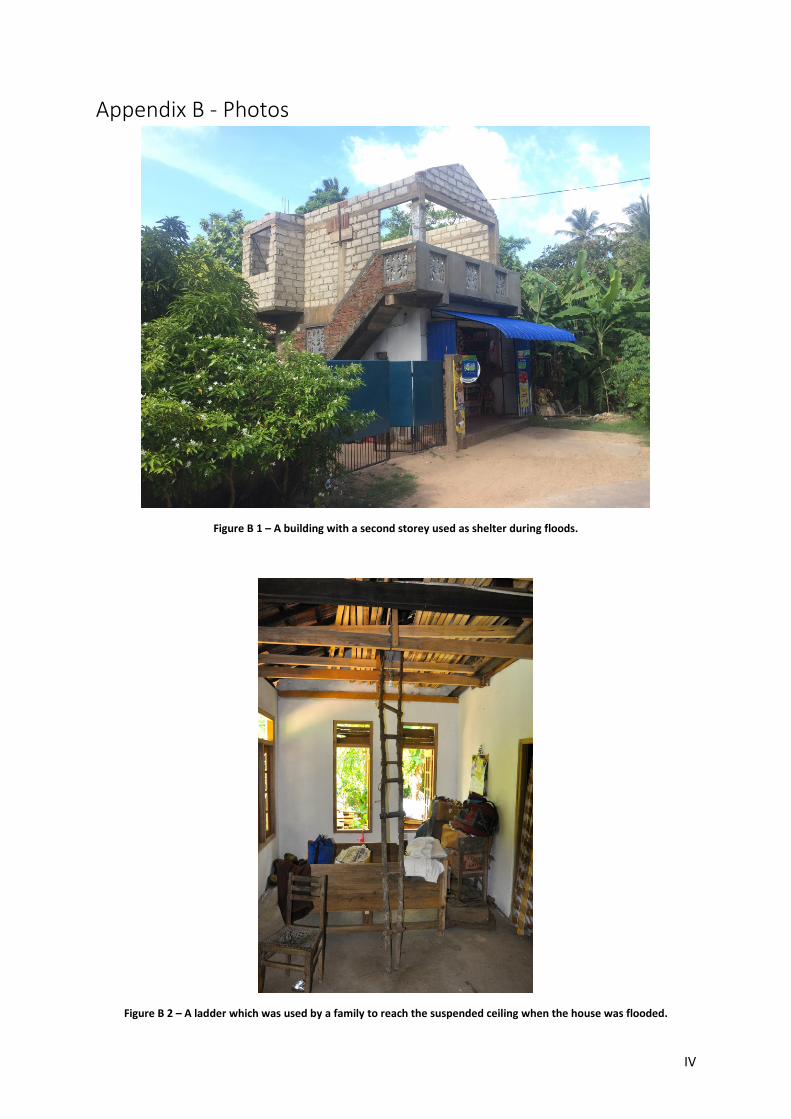
IV
Appendix B - Photos
Figure B 1 – A building with a second storey used as shelter during floods.
Figure B 2 – A ladder which was used by a family to reach the suspended ceiling when the house was flooded.
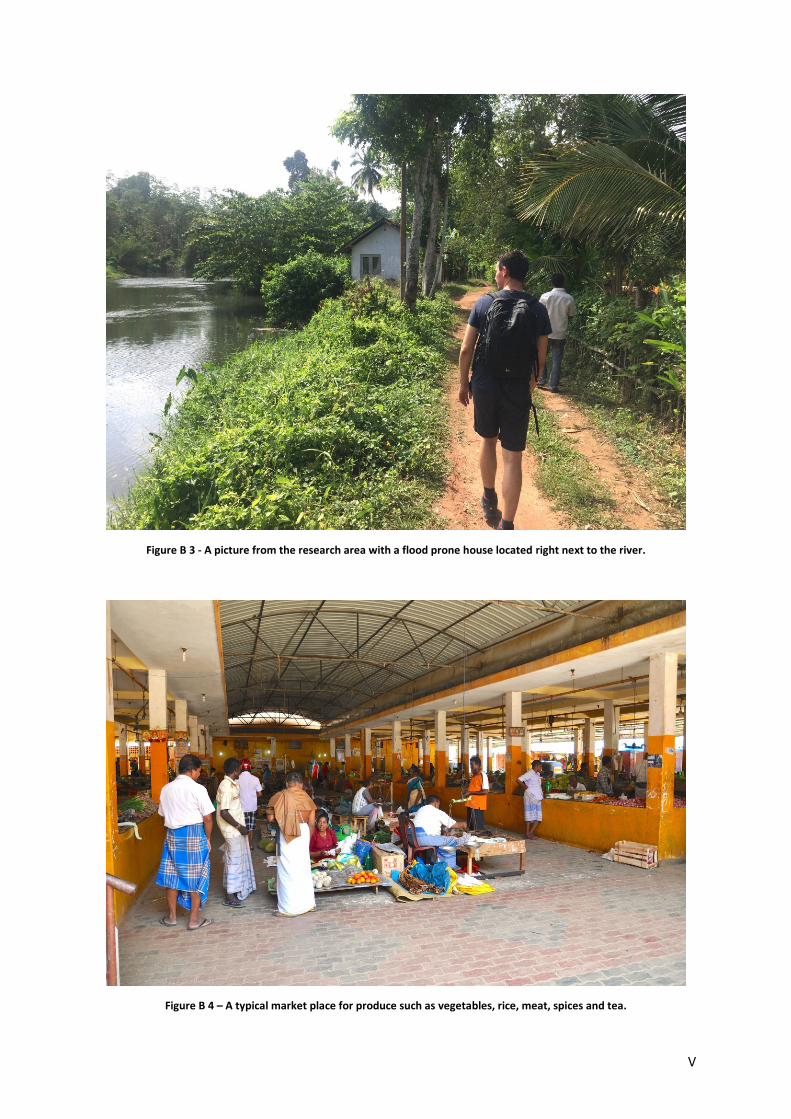
V
Figure B 3 - A picture from the research area with a flood prone house located right next to the river.
Figure B 4 – A typical market place for produce such as vegetables, rice, meat, spices and tea.
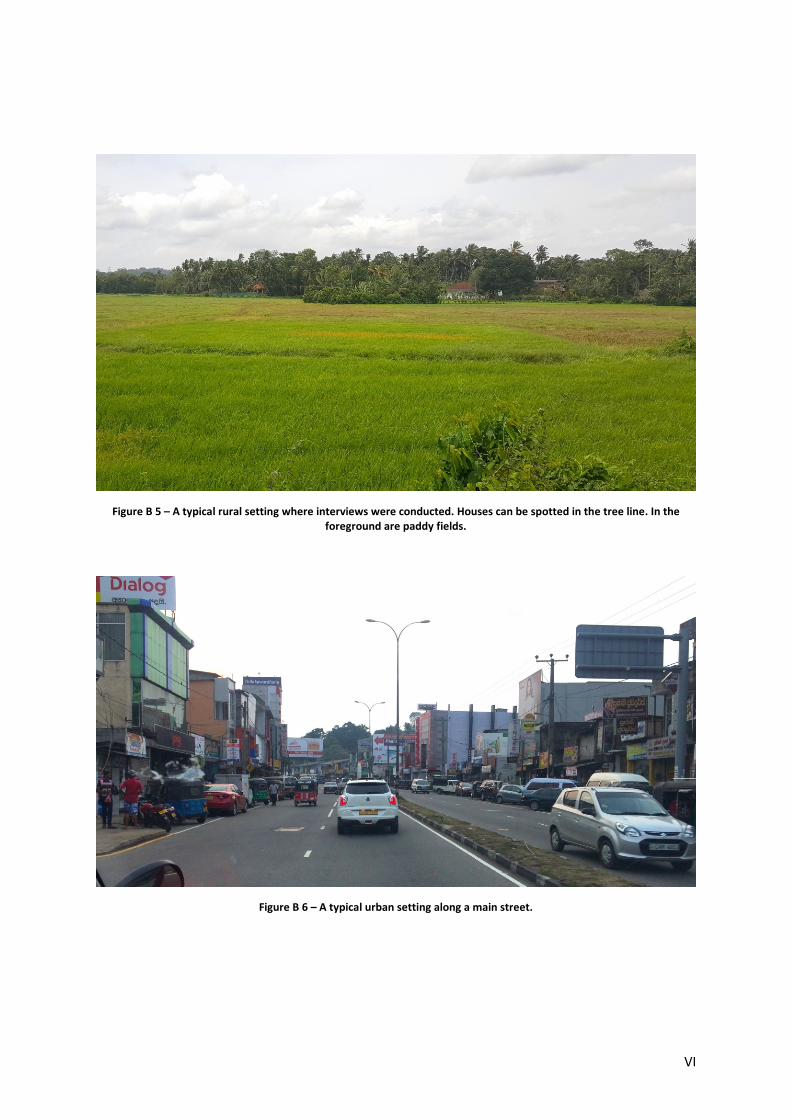
VI
Figure B 5 – A typical rural setting where interviews were conducted. Houses can be spotted in the tree line. In the foreground are paddy fields.
Figure B 6 – A typical urban setting along a main street.
Related Documents