Building Cities Like Startups: Innovation Districts, Rent Extraction, and the Remaking of Public Space by Carla Maria Kayanan A dissertation submitted in partial fulfillment of the requirements for the degree of Doctor of Philosophy (Urban and Regional Planning) in the University of Michigan 2019 Doctoral Committee: Associate Professor David Bieri, Virginia Polytechnic University, Co-Chair Professor Martin J. Murray, Co-Chair Associate Professor Scott Campbell Professor Robert Fishman

Welcome message from author
This document is posted to help you gain knowledge. Please leave a comment to let me know what you think about it! Share it to your friends and learn new things together.
Transcript

Building Cities Like Startups:
Innovation Districts, Rent Extraction, and the Remaking of Public Space
by
Carla Maria Kayanan
A dissertation submitted in partial fulfillment of the requirements for the degree of
Doctor of Philosophy (Urban and Regional Planning) in the University of Michigan
2019
Doctoral Committee: Associate Professor David Bieri, Virginia Polytechnic University, Co-Chair Professor Martin J. Murray, Co-Chair
Associate Professor Scott Campbell Professor Robert Fishman

ii
Dedication To Bryan, Benji, and Nena for reminding me that family and laughter are what matter most.

iii
Acknowledgements First and foremost, I am grateful to the members of my committee: Martin Murray, David
Bieri, Scott Campbell, and Robert Fishman. Thank you for reading through chapters and full
dissertation drafts, providing insightful comments and edits, and for pushing me to make broader
connections. I also owe thanks to professors Gerald (Jerry) Davis, Shobita Parathasarathy, Silvia
Lindtner, and Scott Campbell for their courses taught me the material critical to my research.
The Ewing Marion Kauffman Foundation funded a portion of my research in St. Louis,
Detroit, and Boston. I am thankful for their financial support. More importantly, the grant created
the opportunity to work closely with Joshua Drucker and Henry Renski. Our collaboration
enhanced my understanding of innovation districts and I attribute my growth as an economic
development scholar in large part to them.
Any insights gained on how economic developers, practitioners, and urban actors
understand innovation districts and work to build them in their jurisdictions is due to the
willingness of respondents across my case sites to open up their schedules to accommodate a
doctoral researcher. I thank them for giving me access to their minds and for embedding me
within their innovation ecosystem networks. I hope they will forgive my critical perspective
based on the understanding that, like them, I am also trying to create regional wealth and
prosperity, even if it is not of a growth-oriented variety. Thank you also to the startup
entrepreneurs who made time in their demanding 24-7 work days to help me understand the
challenges and anxieties they face on a daily basis as they labor to bring their products to the
market.

iv
I could not have completed this dissertation without the communities that support me
through sustained dialogue, readings of drafts, moral support, and friendships. I owe special
thanks to Patrick Cooper McCann, Jennifer Williams, Tao Rugkhapan, Danielle Rivera, Tom
Skuzinski, Ian Trivers, David Weinreich, and Sarah Mills for passing down their institutional
knowledge; to my cohort colleagues Devon McAslan, James Fishelson, and RJ Koscielniak for
collectively agreeing and then working to improve our doctoral program; and to Bri Guager, Joel
Batterman, Matan Singer, Jacob Yan, Eric Bettis, Naganika Sanga, Seulgi Son, Rob Pfaff,
Michael Borsellino, Pam Schaeffer, Taru, Tim Berke, Christine Hwang, Alex Judelsohn, and
Denis Teoman for maintaining and continuing our community strength. Thank you to Irene
Brisson, Niloufar Emami, Patrick Cooper McCann, Rob Pfaff, and Michael Abrahamson for
making PARG such an enjoyable and thought-provoking endeavor. Importantly, I could not have
made it through some of the more excruciating days without the love, support, energy, and cheer
of Bri Gauger and Rob Pfaff. What we have created at Taubman is special. May these
friendships follow us into the future.
There are two additional knowledge-generating spaces that brought forth strong
connections between my topic of study and my values and opened me up to a passionate
community of scholars. The first is Spaces of Struggle. Organizing Denver 2017 with Bri
Gauger, Sarah Gelbard, Julie Mah, Steve Sherman, and Raksha Vasudevan was an incredible
experience. Through this growing movement I had the opportunity to closely interact with
scholars I like and highly respect, such as Anthony Levenda, Kenton Card, Sam Stein, Dillon
Mahmoudi, Rachel Weber, Kian Goh, AbdouMaliq Simone, Anna Livia Brand, Libby Porter,
and Faranak Miraftab. Thank you, RJ, for initiating the conversation.
The second engagement that fostered a surprising amount of collaborations and a
meaningful relationship was the 2016 Vienna Smart Cities Summer School. I am grateful that

v
Oliver Frey accepted my application and that it paved the road for me to meet Harvey Molotch,
one of my heroes. Through this program I met Joseph Chambers and Christian Eichenmüller,
who helped deepen my understanding of Dublin’s innovation district. I owe a heartfelt thank you
to Christian for his role in my academic and personal development.
A dissertation is more than the solitary and endless hours writing and reading material
pertaining to my topic. I am thankful for the many Taubman faculty members who held office
hours with me—particularly Ana Paula Pimentel-Walker, Harley Etienne, Lan Deng, and Kim
Kinder—to the College for funding my doctoral research, and to the administrative staff for all
their hard work behind the scenes. I owe thanks to Ayeza Siddiqi, director of the UM Mentorship
program, and to the mentees I had the pleasure to meet through the program. Mentoring bright,
curious, and enthusiastic undergraduate students continuously reminded me why I chose to
pursue a doctorate degree.
Raising two young children while balancing the demands as a doctoral researcher was
never easy. I am indebted to the silent forces that helped see me through this process by
providing the financial, moral, and child-rearing support necessary to maintain a growing family:
Karen, Barry, John, Katy, Kelly, Michael, Clive, Levi, Michele, Brett, Bri, Jerry, Eric, Alex,
Bats, and most of all, my mother, Emma Kayanan. Last but not least, there is the community
closest to my heart: that of my dear Bryan and sweet children Benjamin and Natalie. I put you
through a lot and you still held me up. Thank you.
vi
Table of Contents Dedication ...................................................................................................................................... ii Acknowledgements ...................................................................................................................... iii List of Tables ............................................................................................................................... vii List of Figures ............................................................................................................................. viii List of Appendices ......................................................................................................................... x Abstract ......................................................................................................................................... xi Chapter 1: Introduction ............................................................................................................... 1 Chapter 2: Landscapes of Production ...................................................................................... 39 Chapter 3: Brookings Institution’s Innovation District Definition ........................................ 52 Chapter 4: Comparative Analysis ............................................................................................. 65 Chapter 5: What is at Stake? ................................................................................................... 134 Chapter 6: Conclusion .............................................................................................................. 145 Appendices ................................................................................................................................. 151 Bibliography .............................................................................................................................. 169

vii
List of Tables Table 1: Innovation District Case Sites .......................................................................................... 9 Table 2: Dublin and Boston Startup Cities Global Rankings ....................................................... 12 Table 3: Demographics of Silicon Docks compared to Dublin City .......................................... 135 Table 4: Demographics of Boston Innovation District compared to Boston City ...................... 135 Table 5: Demographics of Detroit Innovation District compared to Detroit City ...................... 135 Table 6: Demographics of Cortex Innovation Community compared to St. Louis City ............ 136 Table 7: Breakdown of interviews based on type of actors ........................................................ 154 Table 8: Categorization of actors ................................................................................................ 155 Table 9: List of people interviewed by employer ....................................................................... 155 Table 10: Themes from Detroit interviews ................................................................................. 160 Table 11: Themes from Dublin interviews ................................................................................. 160 Table 12: Themes from St. Louis interviews .............................................................................. 161 Table 13: Themes from Park Center interviews ......................................................................... 161 Table 14: Boston Innovation District demographics .................................................................. 163 Table 15: Detroit Innovation District demographics .................................................................. 163 Table 16: St. Louis innovation district demographics ................................................................ 164

viii
List of Figures Figure 1: Promotional brochure used for Detroit’s Innovation District ......................................... 1 Figure 2: Scaled comparison of innovation districts ....................................................................... 9 Figure 3: Silicon Docks ................................................................................................................ 14 Figure 4: Dublin Dockland Development Authority, 1997 boundary .......................................... 15 Figure 5: Strategic Development Zone, 2012 boundary ............................................................... 16 Figure 6: Construction of the Silicon Docks south of the Liffey river ......................................... 17 Figure 7: Construction of the Silicon Docks south of the Liffey river ......................................... 17 Figure 8: Boston’s Innovation District ......................................................................................... 18 Figure 9: Subdistricts of the Boston Innovation District .............................................................. 20 Figure 10: Urban fabric of Boston’s Innovation District waterfront development ...................... 21 Figure 11: Urban fabric of the Marine Industrial Park ................................................................. 22 Figure 12: Expansive parking lots in the Boston Innovation District ........................................... 22 Figure 13: Detroit Innovation District .......................................................................................... 23 Figure 14: Cortex Innovation Community .................................................................................... 27 Figure 15: Parking lots in the Cortex Innovation Community ..................................................... 29 Figure 16: View of IKEA from within the building overlooking expansive parking lots ............ 29 Figure 17: Grain elevator in the Cortex Innovation Community .................................................. 30 Figure 18: Park Center .................................................................................................................. 31 Figure 19: Map of counties of the Research Triangle Park .......................................................... 32 Figure 20: Lobby of the Frontier .................................................................................................. 33 Figure 21: Open workspace in the Frontier .................................................................................. 33 Figure 22: Outside view of the Frontier ........................................................................................ 34 Figure 23: Main entrance of the Frontier ...................................................................................... 35 Figure 24: Tech related companies before 2012 SDZ .................................................................. 72 Figure 25: Tech related companies after 2012 SDZ ..................................................................... 72 Figure 26: Industrial Development Authority Facebook marketing campaign billboard ............. 74 Figure 27: Industrial Development Authority Google marketing campaign billboard ................. 75 Figure 28: Detroit Innovation District asset inventory ................................................................. 88 Figure 29: Detroit Innovation District border disputes ................................................................. 90 Figure 30: Cortex planned development area ............................................................................... 98 Figure 31: Cortex Tax Increment Finance Plan .......................................................................... 104 Figure 32: Park Center envisioned by the RTP Foundation ....................................................... 106 Figure 33: Aerial view of Research Triangle Park ..................................................................... 106 Figure 34: Boston’s District Hall white board greeting, orienting, and directing people ........... 114 Figure 35: Front of District Hall ................................................................................................. 114 Figure 36: Height of District Hall in comparison to its surroundings ........................................ 115 Figure 37: Typical Program for Thursday’s Venture Café ......................................................... 121 Figure 38: Inside the CIC during the Thursday Venture Café nights ......................................... 122 Figure 39: Park Center master plan ............................................................................................ 124 Figure 40: Park Center machete .................................................................................................. 125 Figure 41: Park Center marketplace amenities ........................................................................... 126

ix
Figure 42: Material elements of the innovation district .............................................................. 130 Figure 43: Immaterial inputs for the innovation district ............................................................. 131 Figure 44: Image of Venture Café promotional web banner ...................................................... 142

x
List of Appendices Appendix A: Example interview guide ....................................................................................... 152 Appendix B: Interviews completed ............................................................................................ 154 Appendix C: Emergent themes from coding .............................................................................. 160 Appendix D: Demographics in innovation district cases across time ......................................... 163 Appendix E: Real estate price increases in US-based innovation district cases ......................... 165 Appendix F: Use of human subjects in doctoral research ........................................................... 168

xi
Abstract Across the globe, economic developers and policymakers are building “innovation
districts” –master planned developments with the aim of concentrating the actors, entities, inputs,
and physical infrastructure considered essential to process and product innovation. Promoters
have repeatedly hailed Barcelona’s “22@bcn” (est. 2000) and Boston’s “Seaport Innovation
District” (est. 2010) for their success in attracting talent, increasing jobs, scaling startups, and
transitioning regions into a high-tech economy. Built within the city and the urban-periphery
alike, innovation districts point to a new spatial layout for capitalist production.
This dissertation is an in-depth comparative case study of five innovation districts:
Boston, Detroit, Park Center (North Carolina), St. Louis, and Dublin (Ireland). I engage a
qualitative approach that includes on-site observations and semi-structured interviews with over
100 key supporters of innovation districts–from residents and workers to the university affiliates,
developers, incubator owners, venture capitalists, non-profit managers, private executives,
elected officials, and consultants driving growth decisions. In developing a more robust
definition of innovation districts than the strategy mobilized by growth coalitions, I situate the
emergence of innovation districts and their extractive logics along a historic trajectory of
capitalist production from manufacturing material goods to new forms of immaterial production.
Relying on content analysis of primary documents, maps, legal statues, and architectural
renditions, I document how the planning process for each innovation district encloses public
space and lived experience within that space, relinquishing it for private profit.
Through detailed case studies I argue that economic developers and policymakers
opportunistically used innovation district strategy to trigger real estate development after the
2008/2009 global financial crisis. The allure of the innovation district concept –that of an
entrepreneurial haven for science and design breakthroughs and the acceleration of discoveries to
the market—succeeded in selling the innovation district strategy for financial, political, and
popular backing during a time period of complete construction standstill. However, in places
with robust entrepreneurial ecosystems, supporters lost sight of the benefits of the innovation
district as a support for startups and entrepreneurs in favor of more established companies
seeking proximity to talent. Using census data, I trace the changing demographic makeup of each

xii
innovation district from its date of inception to its current state to demonstrate how innovation
district strategy contributes to the splintering of resources. Lastly, I conclude the dissertation
with a theoretical discussion gesturing how innovation districts might exacerbate issues of
precarity for the entrepreneur who sits at the center of this experimentation and is increasingly
interpellated by a state-led ideology that eagerly encourages self-provisioning.
1
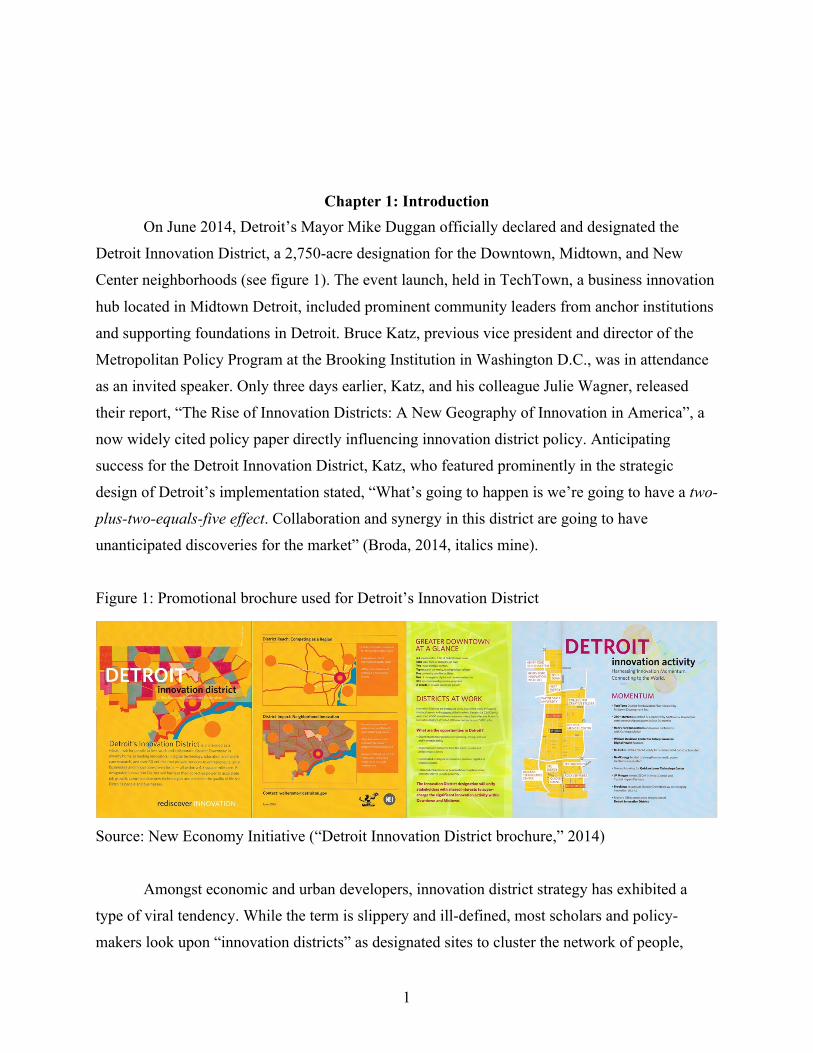
Chapter 1: Introduction On June 2014, Detroit’s Mayor Mike Duggan officially declared and designated the
Detroit Innovation District, a 2,750-acre designation for the Downtown, Midtown, and New
Center neighborhoods (see figure 1). The event launch, held in TechTown, a business innovation
hub located in Midtown Detroit, included prominent community leaders from anchor institutions
and supporting foundations in Detroit. Bruce Katz, previous vice president and director of the
Metropolitan Policy Program at the Brooking Institution in Washington D.C., was in attendance
as an invited speaker. Only three days earlier, Katz, and his colleague Julie Wagner, released
their report, “The Rise of Innovation Districts: A New Geography of Innovation in America”, a
now widely cited policy paper directly influencing innovation district policy. Anticipating
success for the Detroit Innovation District, Katz, who featured prominently in the strategic
design of Detroit’s implementation stated, “What’s going to happen is we’re going to have a two-
plus-two-equals-five effect. Collaboration and synergy in this district are going to have
unanticipated discoveries for the market” (Broda, 2014, italics mine).
Figure 1: Promotional brochure used for Detroit’s Innovation District
Source: New Economy Initiative (“Detroit Innovation District brochure,” 2014)
Amongst economic and urban developers, innovation district strategy has exhibited a
type of viral tendency. While the term is slippery and ill-defined, most scholars and policy-
makers look upon “innovation districts” as designated sites to cluster the network of people,

2
institutions, resources, and activities frequently cited as integral to the innovation process
(Audretsch, 2003; Feldman, 1994; Malecki, 2010; Shearmur, Carrincazeaux, & Doloreux, 2016).
Inspired by seeming successes in Barcelona (est. 2000) and Boston (est. 2010), economic
developers and policymakers enthusiastically promote innovation districts as a mechanism for
generating entrepreneurship, job growth, and urban redevelopment.
Within the urban sphere, key participants with a stake in innovation are designating
sections of the city, typically post-industrial sites, to create these live-work-play laboratories.
Similarly, outside of the urban sphere, individuals are revamping suburban office campuses and
research and science parks to replicate the density and connectivity of the city. The wide
promotion and adoption of this model points to the emergence of a new spatial form. Regardless
of location, this new productive utopia invokes the romantic ideal of the city and the
entrepreneur as catalytic to the innovation process. Today, in 2018, there are over 90 innovation
districts in the United States (Talkington, n.d.).1 The proliferation of this strategy is evidence that
urban and regional actors are investing considerable resources to build innovation districts.
This dissertation interrogates the rhetoric undergirding innovation district strategy to
contextualize why innovation districts elicit a feeling of “more than”, that is, a two-plus-two-
equals-five effect. In other words, what precisely is it about this particular economic
development strategy that facilitates its policy mobility (McCann, 2011; Temenos & McCann,
2013; K. Ward, 2017) and leads both its implementors and the public to see it as a panacea for
regional wealth and prosperity? In answering this question, I reach three conclusions, which
structure of the dissertation. First, though my analysis of innovation districts begins with the
definition and strategy formulated by Katz and his colleagues, I am not bound by it. Instead, I
develop a more nuanced definition of innovation districts and provide a critical analysis of
innovation district strategy that highlights detrimental aspects of this form of development that
current policy prescriptions omit. Second, I frame innovation districts along capitalist trajectories
in advanced Western economies. By reading their emergence from a perspective on the capitalist
production of space (see for example Gottdiener, 1994; Harvey, 2001; Lefebvre, 1992), I point to
the ways that innovation districts facilitate the extractive logics of capitalism through land rent
and people rent. I demonstrate how innovation district strategies leverage political mechanisms
to increase land values for investment capital and how this transformation succeeds in converting
public spaces into spaces of production. Lastly, I critique innovation district strategy for
1 These figures do not account for various cities around the globe in European, South American, and Asian countries.

3
opportunistically leveraging entrepreneurial activity to reinvigorate development and point to
ways that the strategy manifests in a normative stance on the responsibility of entrepreneurs to
foster regional wealth and competitiveness.
Innovation Districts: A Brief Definition
Innovation district strategies are modeled off the successes of Silicon Valley, which
represents the prime destination for entrepreneurs in search of venture capital funding and
expertise, as well as a tech-culture of embracing failure, willingness to experiment, and focus on
accelerating products to the market (Kenney, 2000; O’Mara, 2005; Rao, 2013; Saxenian, 1996).
However, to counter the negative externalities of Silicon Valley, that is, the lack of affordable
housing, traffic congestion, and the monotony and lack of “authenticity” of a suburban office
park (Packer, 2013; Saxenian, 1983; Zukin, 2009), innovation districts strategies leverage the
role of design to convert the designated space of the innovation district into an amenity-rich,
transit-oriented community attractive to younger, high-skilled workers and the firms that employ
them (Clark, Lloyd, Wong, & Jain, 2002; Florida, 2002; Lloyd, 2008). Innovation district
designs incorporate a density of entertainment, retail, and housing amenities in close proximity
to work, fiber optic cables embedded in the infrastructure to enable continuous public access to
wireless connectivity, and the physical structures that support entrepreneurial activity, such as
incubators and accelerators, research hospitals and universities, and legal and financial services.
In addition to the material elements, innovation district strategies highlight the importance of
networking opportunities to encourage spontaneous interactions. As a result, new staff positions
have emerged to program space and ensure constant networking and interaction. Collectively,
these new fixtures facilitate the around-the-clock work mentality made amenable by
sophistications in ICTs and mobile technologies (Davis, 2016; Kalleberg, Reskin, & Hudson,
2000; Mazmanian, Orlikowski, & Yates, 2013) and the belief that today’s innovation is best
supported by an open and connected environment (Chesbrough, 2003; Chesbrough,
Vanhaverbeke, & West, 2006).
Boosters publicly laud innovation districts as a tool to transition post-industrial
economies to a knowledge-based economy (Bell, 1973; Machlup, 1973; Porat & Rubin, 1977)
supportive of research heavy endeavors often associated with a hospital and/or a university
(Audretsch & Feldman, 1996; Feldman, 1984; Feldman & Bercovitz, 2006), creative workers
(Florida, 2002; Markusen & Schrock, 2006), service jobs for low-skilled workers (Sassen, 2001).
4
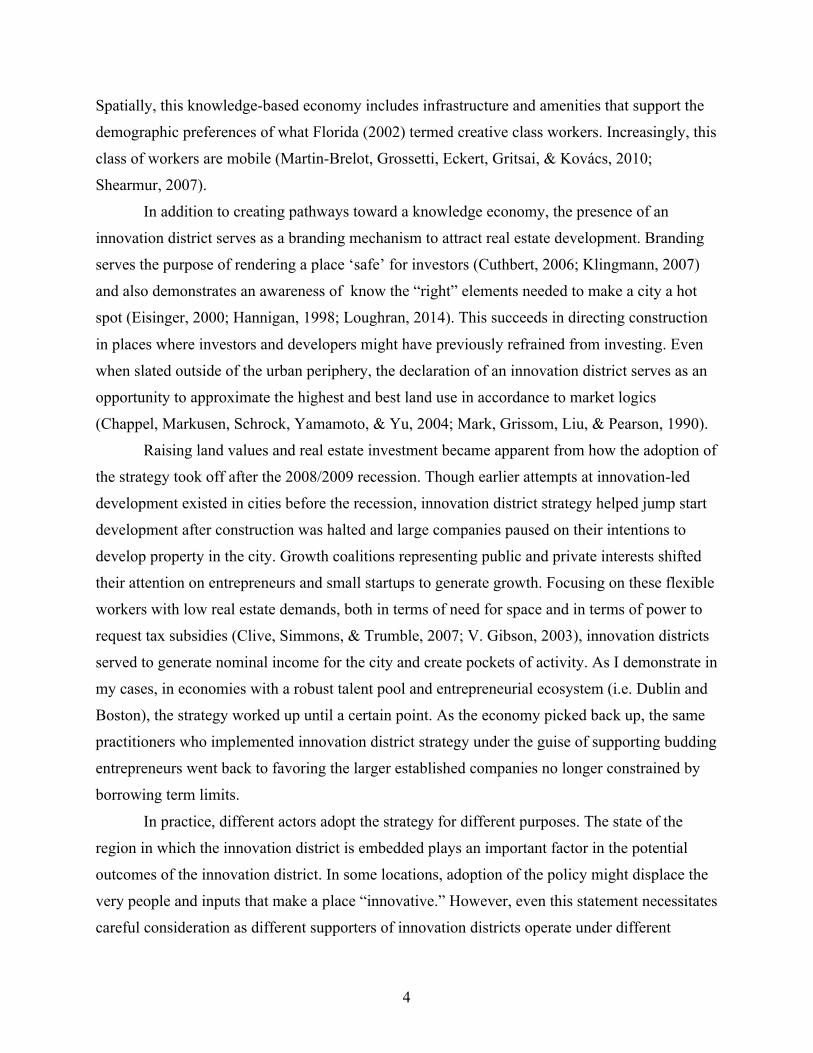
Spatially, this knowledge-based economy includes infrastructure and amenities that support the
demographic preferences of what Florida (2002) termed creative class workers. Increasingly, this
class of workers are mobile (Martin-Brelot, Grossetti, Eckert, Gritsai, & Kovács, 2010;
Shearmur, 2007).
In addition to creating pathways toward a knowledge economy, the presence of an
innovation district serves as a branding mechanism to attract real estate development. Branding
serves the purpose of rendering a place ‘safe’ for investors (Cuthbert, 2006; Klingmann, 2007)
and also demonstrates an awareness of know the “right” elements needed to make a city a hot
spot (Eisinger, 2000; Hannigan, 1998; Loughran, 2014). This succeeds in directing construction
in places where investors and developers might have previously refrained from investing. Even
when slated outside of the urban periphery, the declaration of an innovation district serves as an
opportunity to approximate the highest and best land use in accordance to market logics
(Chappel, Markusen, Schrock, Yamamoto, & Yu, 2004; Mark, Grissom, Liu, & Pearson, 1990).
Raising land values and real estate investment became apparent from how the adoption of
the strategy took off after the 2008/2009 recession. Though earlier attempts at innovation-led
development existed in cities before the recession, innovation district strategy helped jump start
development after construction was halted and large companies paused on their intentions to
develop property in the city. Growth coalitions representing public and private interests shifted
their attention on entrepreneurs and small startups to generate growth. Focusing on these flexible
workers with low real estate demands, both in terms of need for space and in terms of power to
request tax subsidies (Clive, Simmons, & Trumble, 2007; V. Gibson, 2003), innovation districts
served to generate nominal income for the city and create pockets of activity. As I demonstrate in
my cases, in economies with a robust talent pool and entrepreneurial ecosystem (i.e. Dublin and
Boston), the strategy worked up until a certain point. As the economy picked back up, the same
practitioners who implemented innovation district strategy under the guise of supporting budding
entrepreneurs went back to favoring the larger established companies no longer constrained by
borrowing term limits.
In practice, different actors adopt the strategy for different purposes. The state of the
region in which the innovation district is embedded plays an important factor in the potential
outcomes of the innovation district. In some locations, adoption of the policy might displace the
very people and inputs that make a place “innovative.” However, even this statement necessitates
careful consideration as different supporters of innovation districts operate under different
5
conceptions of the definition of “innovation” and thus implementation strategies compete for
different objectives.
Amongst the innovation district decision makers I interviewed there existed a
disagreement on the definition of “innovation”.2 Stakeholders harbored conflicting expectations
and misperceptions on what the innovation district represents. This discrepancy is evident in a
variety of ways, from a definitional understanding of innovation to issues of governance and
battles over the boundaries of the district. As a stand-alone concept, innovation refers to the
process that leads to a novel outcome, be it a new object or a new way of doing something that
did not previously exist (Benoit, 2008). Trying to understand the connection between the city and
innovation further complicates the definition of innovation. Within economic development
circles, the term innovation can take on a variety of meanings and encompass a broad range of
activities (Shearmur, 2012). This is evident in responses from respondents when asked to define
innovation and to discuss the purpose of an innovation district. For some respondents, the
definition is purposely broad to encompass a novel approach to problems in a wide variety of
sectors and/or situations:
Non-profit executive: “We look at innovation broadly” (personal communication,
2015).
Foundation head: “Innovation is about the birth of ideas, not limited to tech, [it is
about] moving forward powerful ideas” (personal communication, 2015).
2 The wide-spread use of the term has prompted rigorous scholarship. Combing through historical archives and texts that date back 2500, as well as cataloguing how often the term innovation appears in academic writing, scholar Benoit Godin (2008) deconstructs the term and concept of innovation. The impetus for the study was to examine the culture force of the term across time and the impact it had on social, political, and economic thought. His is a critical account of the term and a way to understand its normative application. Godin finds that for 2500 years innovation was pejorative and subversive. Individuals who sought to open new potentialities and challenge the status quo through political dispositions were considered innovators. To be called an innovator was an insult deriving from the inability of the individual to conform to cultural and religious mores. The emphasis on detracting from (religion) was acutely prescient during the Reformation where anyone introducing innovations to an established doctrine was considered a heretic. The role of time plays an important element across centuries. An innovation (as opposed to an innovator) that reformed earlier traditions and ways of life was considered a slow and gradual process; it denoted aspirations to return to earlier and purer orthodoxy. In this configuration, an innovation was not associated as something entirely new. In the 18th century that the term was tied to progress and modernity, thus also efficiency, and by the 20th century, as a result of the industrial revolution and tech innovation, the term is connected to economics. It is during this time period that the concept is instrumentalized as something that needs to be “done” by public policy and government agents. However, as we approach contemporary times, tracing the changing nature of innovation the concept, the term, the innovator versus the innovation, innovation studies, as well as terms connected to it, such as social innovation versus tech innovation, deconstructing the word in its ubiquity becomes challenging. It can be said that today to be an innovator is embraced, whereas historically, as Godin demonstrates, it was a term, or a practice, rejected by the populace.
6
Private company executive: “The ideal innovator is not restricted by any one
definition; innovation cannot be constrained within one demographic” (personal
communication, 2015).
For others, it is specifically and purposefully limited:
Tech consultant: “Innovation is the commercialization of a tech economy”
(personal communication, 2015).
State-level representative: “It is about entrepreneurs with a global orientation”
(personal communication, 2015).
Sometimes, it reflects the aims of the innovation district as a convener of people and ideas:
Economic developer: “Innovation is working together to solve problems to
challenges, solve problems in a new and different way, a new way of looking at
how to solve a problem” (personal communication, 2015).
University executive: “Innovation is about creativity; it fits with the creative class.
It is more interaction, more team sport than solo practice, [it is] collaboration”
(personal communication, 2015).
Or, the aim of the innovation district as a way to try out new policies that can later be deployed
to spaces outside of the district:
State-level consultant: “It isn’t just high tech, but perhaps innovative policies”
(personal communication, 2015).
Here we see the definition relating to a new way of solving problems:
Private company executive: “Innovation is the same as idea generation,
innovations are the things that change the landscape of a product of a service, the

7
way you do business, the way you experience things going forward” (personal
communication, 2015).
Non-profit executive: “Innovation is different from invention; [it is] making
something better and different” (personal communication, 2015).
The various definitions of innovation shape the aims, intentions, and outcomes of
innovation district strategy. For each of my case sites, a fixed or agreed upon definition for
innovation to direct the implementation of each respective innovation district and the economic
development policies never materialized. The ambiguity of the term purposely leaves open space
for interpretation. Individual actors can strategically position the definition of innovation and the
purpose of the district relative to their own personal interests so to marshal people and resources
to achieve particular goals. At the same time, the flexibility in how the term is interpreted and
how it is meant to indicate a welcoming of novel ideas or approaches is actually constrained in
practice because the lack of agreement keeps the strategy at a standstill.
Theories Introduced
Rather than provide full histories of each of my case sites, I break down the history and
the planning process for each innovation district into two thematic chapters. The first theme,
techniques of territory, details the planning, policy, and legal techniques used by supporters to
clear pathways and finance the development of each innovation district. This is the process of
extracting land rent. Following the work of scholars such as Elden (2006, 2007), Hannah (2009),
Mitchell (2002), and Scott (1999), I discuss the process of securing land as the process of
securing “calculable territory” (Hannah, 2009) and sovereignty over the territory (Elden, 2007).
This translation facilitates the investment of capital in what was earlier considered uninvestable
land allowing the innovation district to become a wayfinding mechanism for a certain
demographic, sector, and capitalist logic.
The second theme, facilitating production, discusses is the role of the innovation district
in concentrating a type of immaterial labor (Lazzarato, 1994). This is the process of extracting
people rent. Following the work of the Autonomist Marxists and scholarship on creative
workers, I discuss how entrepreneurs and their activities activate space, and through this, trigger
additional capital investments. My interest is in creating a link between the scholars writing on

8
power/knowledge relations – particularly emergent studies at the intersection of territory and
subjectivity (Elden, 2006, 2007; Hannah, 2009 ) to the scholars debating new forms of
subjectivity with my added focus on updating the work to the contemporary digital realities
(Lazzarato, 1994; Scholz, 2016; Terranova, 2000, 2004). I put these bodies of literature in
conversation with each other to derive perspectives on the emergence of innovation districts and
their effect on the people working within them.
Research Design
The factors that marked an innovation district for me and that qualified it for this study
were: 1) the use of political boundaries to enact innovation district strategy; 2) efforts by an
assemblage of actors –rather than one single entity—to implement an innovation district; 3) the
public declaration of master planning an innovation district. I selected cities that purposely
adopted the term ‘innovation district’ to guide their economic development strategy. This
decision removed other attempts to accommodate changing forms of production in the city –
attempts such as those seen in Austin, Texas, for example, or Denver, Colorado.3 The reason is
to analyze what the term ‘innovation’ does and to ask three questions: How do urban actors
define innovation? What forms of production are included in the term? How does a focus on
innovation drive their decisions?
Through a comparative case study of three primary cases (Detroit, Michigan; Dublin,
Ireland; and Park Center, North Carolina) and two supporting cases (St. Louis, Missouri and
Boston, Massachusetts), I empirically demonstrate how supporters and developers of innovation
districts conceive, build, and fill the innovation district. I ask and answer questions about how
specific ideas of innovation are generated in practice, how they are put to use, what effects the
produce, and what they end up doing.
3 In some instances, these places rebranded their strategy as an innovation district strategy.

9
Table 1: Innovation District Case Sites
Location Name Founding Acres Boston, Massachusetts U.S.A. Boston Innovation District 2010 1,000
Detroit, Michigan, U.S.A. Detroit Innovation District 2014 2,750
Dublin, Republic of Ireland Silicon Docks 2012 163
Research Triangle Park, Raleigh-Durham North Carolina
U.S.A. Park Center 2012 100
St. Louis, Missouri U.S.A. Cortex Innovation Community 2002 240
Figure 2: Scaled comparison of innovation districts

10
Many innovation districts are in the early stages of their development, if not existing
solely as aspirations and imaginaries. Case study qualitative research provides local context
where conventional economic evaluation of these spaces cannot. I opted to study them primarily
through interviews with stakeholders, residents, and supporters. What did they envision for the
innovation district? Who were they targeting? What models were they following? What would
the space look like in five years? Ten years? These were the types of questions I asked in my
interviews (for my interview guides see Appendix A).
From March 2015 – April 2017 I visited each case site, some twice, and interviewed over
150 individuals (for a list of the positions held by individuals interviewed see Appendix B). I
engaged in three levels of interview recruitment and observation. The first level required
identifying key players of growth coalitions and city administrators offering incentives for these
developments. These people were the ‘culturally specialized informants’ (Bernard, 2011)
intimately familiar with the history and politics of the local setting, also seen as the ‘informal
gatekeepers’ (Seidman, 2012) routinely providing neatly packaged answers to “outsiders” while
also protecting insiders from unwanted outside attention. Once I obtained their consent, I was
able to access the individuals in the second phase –the less public individuals working inside the
major anchor institutions and driving the majority of the decisions shaping innovation district
strategies. The third stage of the interview process involved interviewing workers and/or
residents of the innovation district.
I recorded and transcribed all interviews, coding and recoding based on emergent themes
that helped me derive a pattern recognition (Luker, 2008). I supplemented interviews and
triangulated findings with content analysis of architectural renderings, newspaper accounts,
Internet media sources, promotional material, webpages promoting the innovation districts, and
government documents regulating the planning, financing, and governance mechanism of each
innovation district. For the more advanced cases, I was able to find policies supporting their
development and marketing material promoting them. For others, I dealt mostly with
architectural renderings, site plans, and machetes. This content analysis helped me assess the
discourses surrounding innovation district strategies.
My research is grounded (Charmaz, 2006). I started researching innovation districts out
of curiosity of how they could succeed. I saw them as exclusionary and could not understand
how they would actually help to increase innovation output. My experience in each location, the
people I spoke with, the literature I read, and courses I took served to shape background and

11
disciplinary assumptions and pointed me in various directions. The placemaking, programming,
and branding, themes that consistently emerged from interviews (see #3 in the Appendix), led me
to draw parallels between innovation district designs and today’s big tech companies. From there
I started questioning the experience of the individuals working inside these companies and inside
the incubators. Interviewing them I grew to learn that there was both an excitement to work in
these places, but also negative aspects related to anxiety, stress, isolation, long hours, and the
disappointment of not having the necessary venture capital and mentorship supports available in
Silicon Valley—the latter sentiment was repeatedly expressed by the Dublin startup community
and this is relevant considering the marketing attempts by growth coalitions to brand Dublin as
the Silicon Valley of Europe.
I cannot categorize my cases along a continuum of failed innovation district versus
successful innovation district. As mentioned above, different actors adopt innovation districts for
different reasons. Therefore, measuring outcomes would require a comparison against initially
intended goals. To complicate matters, even amongst scholars of innovation, there is no agreed
upon decision on what constitutes as innovation nor what are the inputs of innovation (Benoit,
2008; Welz, 2003). As it relates to the innovation district, does innovation mean accelerating a
product to the market? Does it mean creating a space to try out innovative policies, such as form-
based codes in a city without prior experience using this type of zoning, or smart city
applications for city government and private corporations to collect data on the everyday
experiences of the people traversing through the space? Does an “innovation district” serve as a
code word for the transition into a new kind of economy with a new workforce and firm
organization structure scholars are still trying to understand?
Instead of categorizing each case as failed or successful, I use a different categorization:
strong market economies (Dublin and Boston), weak market economies (Detroit and St. Louis),
and non-city (Park Center). ‘Strong market economies’ stands for cities with a robust
entrepreneurial ecosystem. The cities of Dublin and Boston are replete with universities and have
an abundance of talent in the form of skilled tech workers. These cities do not struggle from
‘brain drain’ from university graduates leaving the city. In addition, though the cities do not
compare to the level of venture capital or C-suite experts (i.e., Chief Executive Officer, Chief
Financial Officer, Chief Operating Officer, Chief Technology Officer, Chief Innovation Officer4,
4 It has become common for tech companies and startups to develop a Chief Innovation Officer position. Interestingly, government offices are now also creating Chief Innovation Positions. This indicates how expertise from the technology sector is influencing government and governance (Shelton, Zook, & Wiig, 2015).
12
etc.) available for advice and for fostering networks available in Silicon Valley, funding is
available and a long history of firms in the city translates to ease of mentorship from founders
and executive managers.
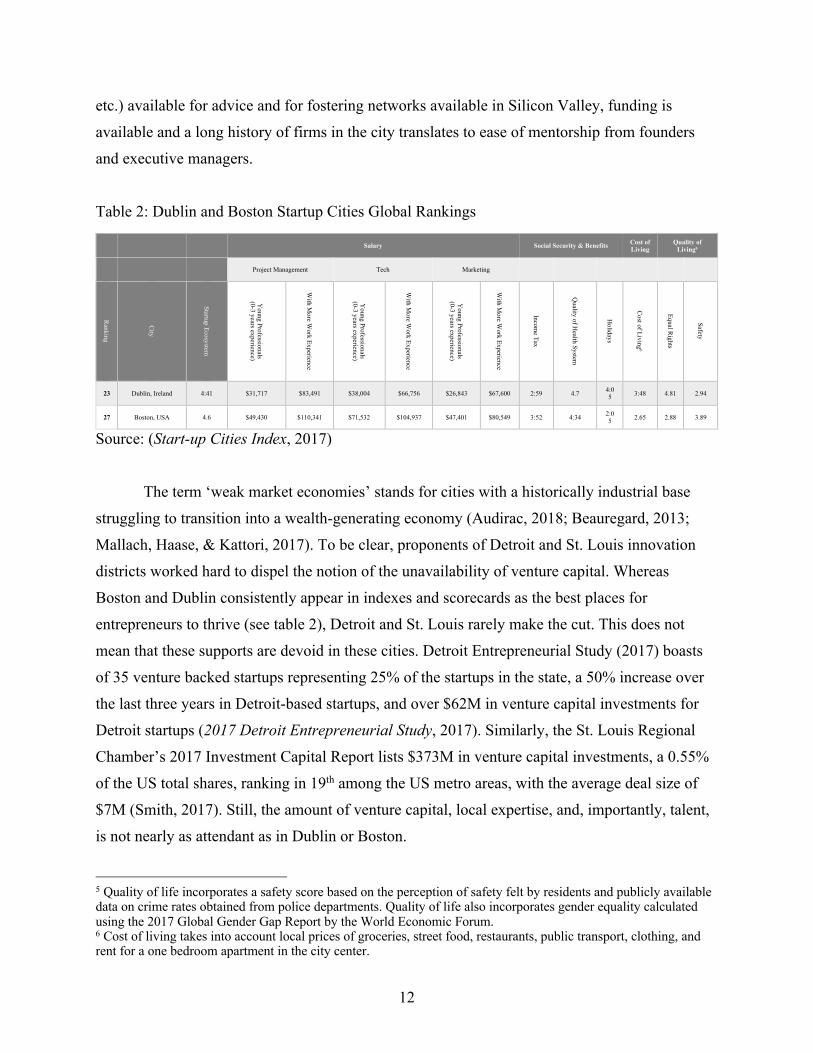
Table 2: Dublin and Boston Startup Cities Global Rankings
Salary Social Security & Benefits Cost of Living
Quality of Living5
Project Management Tech Marketing
Ranking
City
Startup Ecosystem
Young Professionals
(0- 3 years experience)
With M
ore Work Experience
Young Professionals
(0- 3 years experien ce)
With M
ore Work Experience
Young Professionals
(0- 3 years experience)
With M
ore Work Exp erience
Income Tax
Quality of H
ealth System
Holidays
Cost of Living6
Equal Rights
S afety
23 Dublin, Ireland 4:41 $31,717 $83,491 $38,004 $66,756 $26,843 $67,600 2:59 4.7 4:05 3:48 4.81 2.94
27 Boston, USA 4.6 $49,430 $110,341 $71,532 $104,937 $47,401 $80,549 3:52 4:34 2:05 2.65 2.88 3.89
Source: (Start-up Cities Index, 2017)
The term ‘weak market economies’ stands for cities with a historically industrial base
struggling to transition into a wealth-generating economy (Audirac, 2018; Beauregard, 2013;
Mallach, Haase, & Kattori, 2017). To be clear, proponents of Detroit and St. Louis innovation
districts worked hard to dispel the notion of the unavailability of venture capital. Whereas
Boston and Dublin consistently appear in indexes and scorecards as the best places for
entrepreneurs to thrive (see table 2), Detroit and St. Louis rarely make the cut. This does not
mean that these supports are devoid in these cities. Detroit Entrepreneurial Study (2017) boasts
of 35 venture backed startups representing 25% of the startups in the state, a 50% increase over
the last three years in Detroit-based startups, and over $62M in venture capital investments for
Detroit startups (2017 Detroit Entrepreneurial Study, 2017). Similarly, the St. Louis Regional
Chamber’s 2017 Investment Capital Report lists $373M in venture capital investments, a 0.55%
of the US total shares, ranking in 19th among the US metro areas, with the average deal size of
$7M (Smith, 2017). Still, the amount of venture capital, local expertise, and, importantly, talent,
is not nearly as attendant as in Dublin or Boston.
5 Quality of life incorporates a safety score based on the perception of safety felt by residents and publicly available data on crime rates obtained from police departments. Quality of life also incorporates gender equality calculated using the 2017 Global Gender Gap Report by the World Economic Forum. 6 Cost of living takes into account local prices of groceries, street food, restaurants, public transport, clothing, and rent for a one bedroom apartment in the city center.
13
The term ‘non-city’ is a term I use to categorize efforts of the Research Triangle
Foundation (Foundation), the non-profit governance organization of the Research Triangle Park
(RTP), to create an innovation district in a rural environment. Like Dublin and Boston, the
Raleigh-Durham-Chapel Hill Triangle area is a thriving entrepreneurial ecosystem. There is a
great abundance of talent, venture capital, and C-Suite expertise. In 2017, Triangle-based
companies raised $408M through 140 deals (2017 Innovators Report, 2018). In many respects,
the Triangle region suffers from the same negative agglomeration externalities as Dublin and
Boston, such as a lack of housing and massive traffic congestion (Rohe, 2012). However, there
are three specific reasons why I categorize Park Center as a non-city. First, Park Center sits on
land already managed by the Foundation (“Research Triangle Foundation Records, 1955 - 1999,”
n.d.). This means the Foundation did not have to resort to political mechanisms to acquire public
land for development. Second, though the Foundation adopted an existing building when IBM
moved their operations from the particular parcel of land on which Park Center is built (Terry,
2014), most of the Park Center is greenfield development. Third, I use the term non-city to point
to how a narrative on the contemporary inputs of innovation lead to urban-visions guiding
development on pastoral landscapes. This discourse is also evident from efforts to revamp
suburban office parks to prevent them from obsolescence (Spivack, 2017).
Importantly, the decision to bring in Dublin as a case is not to create a comparison
between national and international cases. Innovation district strategy and economic development
policies today are global phenomena that travel across national boundaries (McCann & Ward,
2011; Temenos & McCann, 2013; K. Ward, 2017). This is not to say that I do pay attention to
variations in local policies and differences in governance structures, but I do find the comparison
between weak market and strong market economies more compelling than national versus
international comparisons.
Case Sites Contextualized
To begin, it is helpful to provide a visual description of each case site and to provide a
brief history of important events leading up to the declaration of an innovation district.
Importantly, it helps to remember that, except for Park Center, the innovation districts in my case
sites are all situated over land previously occupied by industry. Innovation districts are bringing
forth new post-industrial landscapes and that often translates to two types of urban fabrics:

14
repurposed industrial infrastructure and new build, which often translates to high-rises with glass
facades built out of contemporary material.
Strong Market Economies
Silicon Docks, Dublin, Ireland
Figure 3: Silicon Docks
The Dublin Docklands, or ‘Silicon Docks’, the nickname used by major branding
mechanism to promote Dublin as the Silicon Valley of Europe is located to the East of Dublin’s
city center. Industrial architecture of harbor installations, warehouses and storage depots have
given way to material expressions of new economic, social and cultural realities. Class A office
buildings with expansive glass walls contorted to exposed steel frames, creatively refurbished
luxury offices, and open floor plans ripe with amenities dominate the cityscape. Coffee shops,
boutique condominiums, and neon light displays reflecting on the Liffey River illuminate the
night sky. The Silicon Docks is home to many notable global technology firms such as Google,
15
Facebook, Airbnb, and LinkedIn, to name a few, that established their Europe, Middle East, and
Africa headquarters in Dublin on account of their business-friendly tax policies.
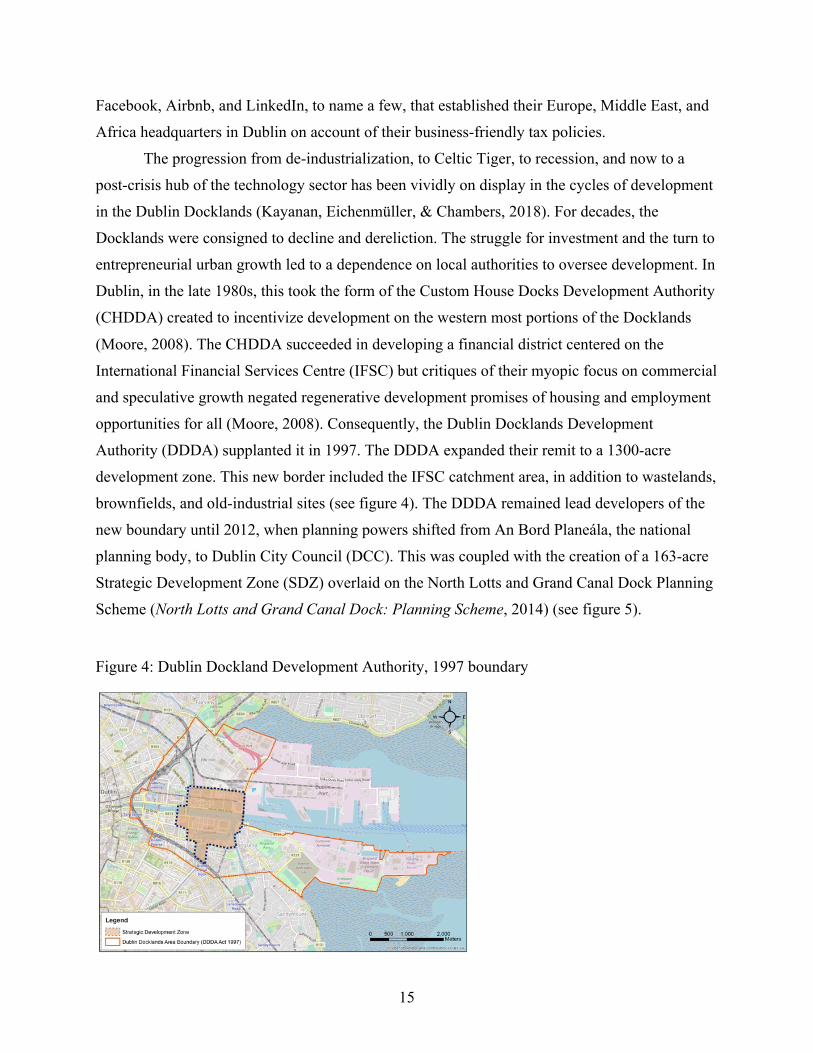
The progression from de-industrialization, to Celtic Tiger, to recession, and now to a
post-crisis hub of the technology sector has been vividly on display in the cycles of development
in the Dublin Docklands (Kayanan, Eichenmüller, & Chambers, 2018). For decades, the
Docklands were consigned to decline and dereliction. The struggle for investment and the turn to
entrepreneurial urban growth led to a dependence on local authorities to oversee development. In
Dublin, in the late 1980s, this took the form of the Custom House Docks Development Authority
(CHDDA) created to incentivize development on the western most portions of the Docklands
(Moore, 2008). The CHDDA succeeded in developing a financial district centered on the
International Financial Services Centre (IFSC) but critiques of their myopic focus on commercial
and speculative growth negated regenerative development promises of housing and employment
opportunities for all (Moore, 2008). Consequently, the Dublin Docklands Development
Authority (DDDA) supplanted it in 1997. The DDDA expanded their remit to a 1300-acre
development zone. This new border included the IFSC catchment area, in addition to wastelands,
brownfields, and old-industrial sites (see figure 4). The DDDA remained lead developers of the
new boundary until 2012, when planning powers shifted from An Bord Planeála, the national
planning body, to Dublin City Council (DCC). This was coupled with the creation of a 163-acre
Strategic Development Zone (SDZ) overlaid on the North Lotts and Grand Canal Dock Planning
Scheme (North Lotts and Grand Canal Dock: Planning Scheme, 2014) (see figure 5).
Figure 4: Dublin Dockland Development Authority, 1997 boundary
16
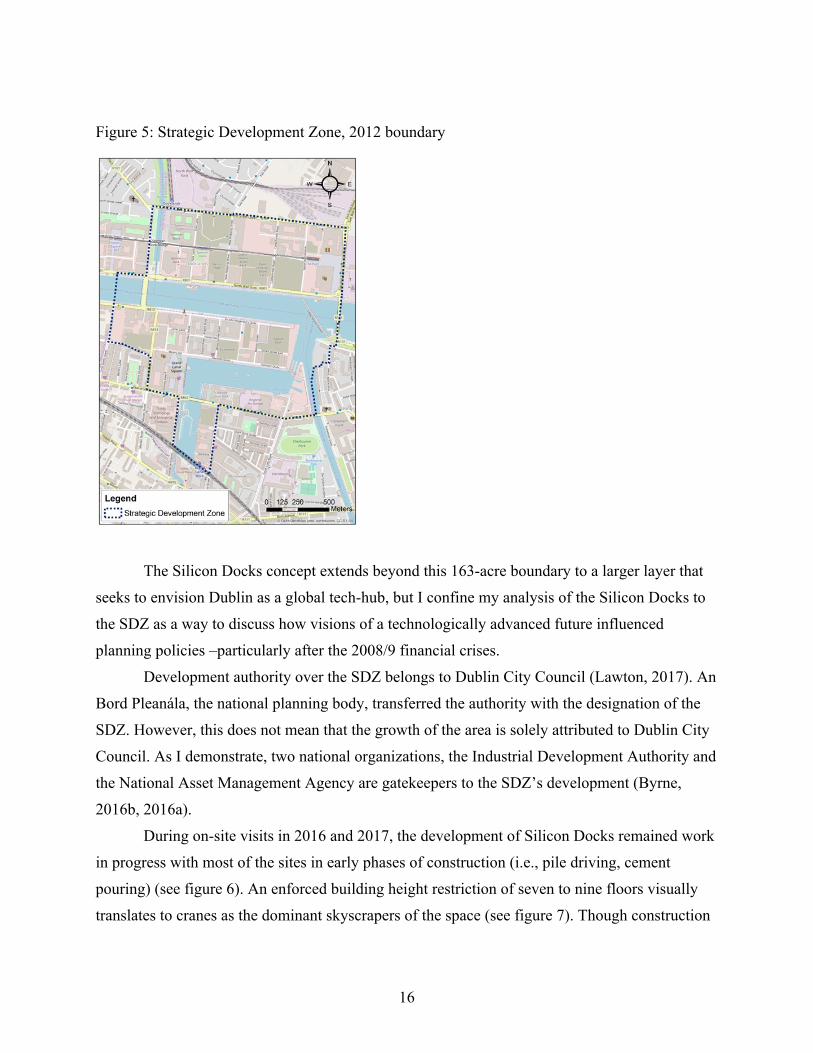
Figure 5: Strategic Development Zone, 2012 boundary
The Silicon Docks concept extends beyond this 163-acre boundary to a larger layer that
seeks to envision Dublin as a global tech-hub, but I confine my analysis of the Silicon Docks to
the SDZ as a way to discuss how visions of a technologically advanced future influenced
planning policies –particularly after the 2008/9 financial crises.
Development authority over the SDZ belongs to Dublin City Council (Lawton, 2017). An
Bord Pleanála, the national planning body, transferred the authority with the designation of the
SDZ. However, this does not mean that the growth of the area is solely attributed to Dublin City
Council. As I demonstrate, two national organizations, the Industrial Development Authority and
the National Asset Management Agency are gatekeepers to the SDZ’s development (Byrne,
2016b, 2016a).
During on-site visits in 2016 and 2017, the development of Silicon Docks remained work
in progress with most of the sites in early phases of construction (i.e., pile driving, cement
pouring) (see figure 6). An enforced building height restriction of seven to nine floors visually
translates to cranes as the dominant skyscrapers of the space (see figure 7). Though construction

17
remains on the rise, the idea of Silicon Docks is more established than the reality would suggest,
though the aesthetic in place foreshadows what is to come.
Figure 6: Construction of the Silicon Docks south of the Liffey river
Figure 7: Construction of the Silicon Docks south of the Liffey river

18
The Dublin case demonstrates that, at least in advanced capitalist economies, national
boundaries do not limit innovation-led development. A case outside of the United States
demonstrates the importance of calculable territory for the seamless flow of global networks
(Hannah, 2009). A second reason for including Dublin as a case site is because of their progress
in smart city infrastructure and governance. As I argue in the dissertation, calculable territory
clears pathways to track all human transactions and interactions within the ordered space.
Boston Innovation District, Boston, Massachusetts
Figure 8: Boston’s Innovation District
The Boston Innovation District is located on the South Boston Waterfront, on a peninsula
slightly south east of the financial district and the downtown. Over two decades in office,
Menino had exhibited the long-standing desire to “leave his fingerprints all over the Seaport”
(McMorrow, 2014). Prior to targeted development, marine industrial activity and ground floor

19
parking were the dominant fabric of the South Boston Waterfront. The completion of the Big Dig
and the extension of the Silver Line provided direct and quick access to prime real estate
opportunities in the South Boston Waterfront. Located between the downtown and Logan
International Airport, the South Boston Waterfront was an obvious place for the city to grow.
The city allocated billions of public dollars to open up the peninsula and connect it to the airport
prior. This brought forth a few prominent buildings such as the Institute of Contemporary Art,
the Boston Convention and Exhibition Center, the US District Court, and the World Trade
Center. Growth seemed promising until the recession froze all development. Menino needed a
new plan.
On January 4, 2010, kicking off his fifth term with a bold initiative, Boston’s Mayor
Menino delivered an inaugural address promising to unlock the potential of Boston by
converting the South Boston Waterfront into an innovation district (“The Honorable Thomas M.
Menino Inaugural Address,” 2010: p. 4). “A new approach is called for on the waterfront,” he
proclaimed, “one that is both more deliberate and more experimental. Together, we should
develop these thousand acres into a hub for knowledge workers and creative jobs…Years of
financial engineering left us with a sub-prime crisis in housing. It’s time to get
back to “engineering engineering” (ibid: p.4-5; emphasis in original).
Menino had approached his staff before announcing his intentions to build an innovation
district with the purpose of soliciting ‘big ideas’ to mark his final term (personal interview,
2016). Andrew Feiberg, then an advisor to the Mayor, now the COO and Co-Founder of a virtual
reality application, suggested the idea of an innovation district. Feiberg’s exposure with
Barcelona’s innovation district led him to proclaim that the environment for innovation-led
development was ripe in many respects: college graduates who wanted to stay in the Boston area
could not find jobs; budding entrepreneurs did not have space to locate their startup; and Venture
Café in Cambridge was running weekly events targeting entrepreneurs demonstrating a healthy
resurgence of energy. If MIT’s experience with Kendall Square and large-scale innovation
driven development exceeded expectations and was completely built out, why not direct
construction to the blanket of parking lots that covered much of the South Boston Waterfront?
(personal interview, 2016).
Feiberg’s idea was not a hard sell. Leveraging innovation-led development made sense.
The success Route 128, the Boston-Cambridge area has a long history of targeting science and
research development (Dorfman, 1983; Saxenia, 1996). More recently, Massachusetts Institute of
20
Technology’s involvement in Kendal Square development around their campus highlighted the
strengths of innovation- and transit-oriented-led development (Bertolini, 2000; Miara, 2012).
Seeking to replicate the Kendal Square model, in 2010 on the heels of the recession, Boston’s
late mayor Thomas Menino launched the Boston Innovation District, an initiative to redevelop a
1000-acre swath of land into an urban laboratory of innovation and knowledge production.
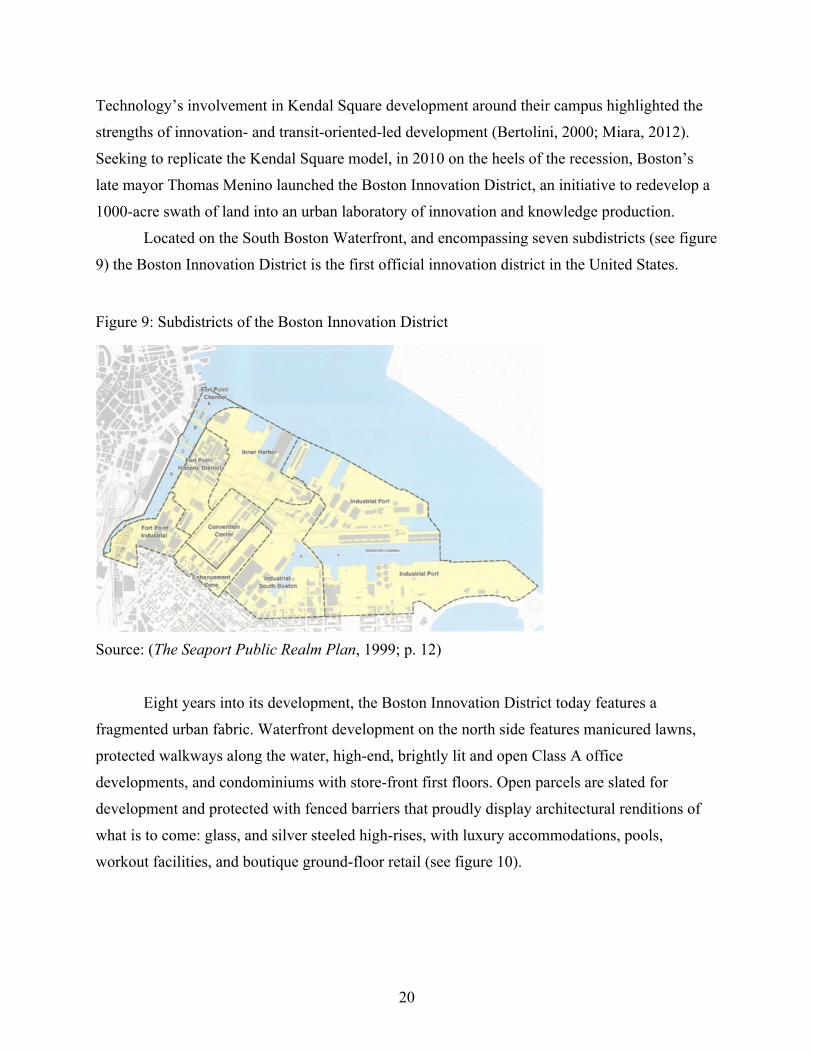
Located on the South Boston Waterfront, and encompassing seven subdistricts (see figure
9) the Boston Innovation District is the first official innovation district in the United States.
Figure 9: Subdistricts of the Boston Innovation District
Source: (The Seaport Public Realm Plan, 1999; p. 12)
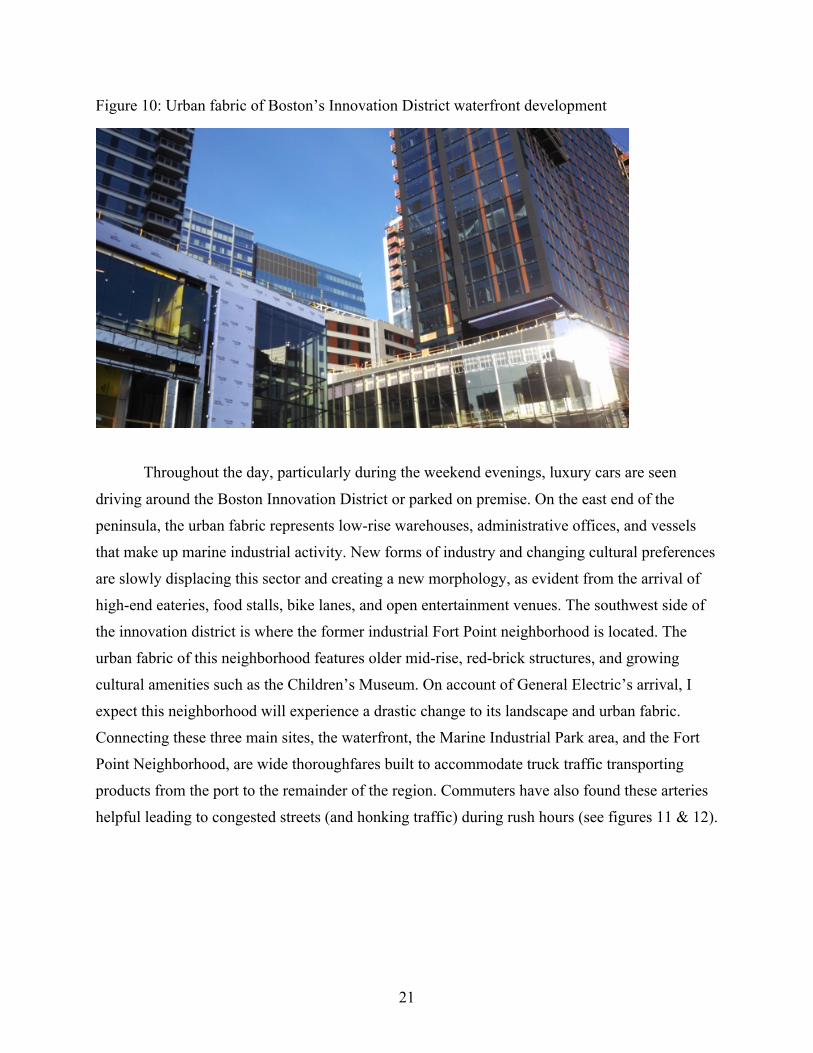
Eight years into its development, the Boston Innovation District today features a
fragmented urban fabric. Waterfront development on the north side features manicured lawns,
protected walkways along the water, high-end, brightly lit and open Class A office
developments, and condominiums with store-front first floors. Open parcels are slated for
development and protected with fenced barriers that proudly display architectural renditions of
what is to come: glass, and silver steeled high-rises, with luxury accommodations, pools,
workout facilities, and boutique ground-floor retail (see figure 10).
21
Figure 10: Urban fabric of Boston’s Innovation District waterfront development
Throughout the day, particularly during the weekend evenings, luxury cars are seen
driving around the Boston Innovation District or parked on premise. On the east end of the
peninsula, the urban fabric represents low-rise warehouses, administrative offices, and vessels
that make up marine industrial activity. New forms of industry and changing cultural preferences
are slowly displacing this sector and creating a new morphology, as evident from the arrival of
high-end eateries, food stalls, bike lanes, and open entertainment venues. The southwest side of
the innovation district is where the former industrial Fort Point neighborhood is located. The
urban fabric of this neighborhood features older mid-rise, red-brick structures, and growing
cultural amenities such as the Children’s Museum. On account of General Electric’s arrival, I
expect this neighborhood will experience a drastic change to its landscape and urban fabric.
Connecting these three main sites, the waterfront, the Marine Industrial Park area, and the Fort
Point Neighborhood, are wide thoroughfares built to accommodate truck traffic transporting
products from the port to the remainder of the region. Commuters have also found these arteries
helpful leading to congested streets (and honking traffic) during rush hours (see figures 11 & 12).

22
Figure 11: Urban fabric of the Marine Industrial Park
Figure 12: Expansive parking lots in the Boston Innovation District

23
Mayor Menino led initiatives for the Boston Innovation District using his power over the
Boston Redevelopment Authority and his favoritism for certain developers (McMorrow, 2014).
As I demonstrate, considering its central location, the South Boston Waterfront was always
slated for high-end and luxury development, which it prominently features today. A few years
after the crash, when development picked up, innovation district efforts for inclusive
development and affordable housing were discarded (Logan, 2017b).
As the first publicly declared innovation district in the United States, Boston’s Innovation
District is a strong case for my study. In addition, unlike the other cases, it is not anchored by a
university—though the region is replete with universities and is prominently featured as a region
with one of the largest concentration of knowledge workers (Berube & Holmes, 2016). Like
Dublin, Boston’s initial efforts focused on smaller scale startups but their prime location in the
heart of the city and quick real estate development interests shifted the strategy to benefit large
established corporations.
Weak Market Economies
Detroit Innovation District, Detroit, Michigan
Figure 13: Detroit Innovation District
24
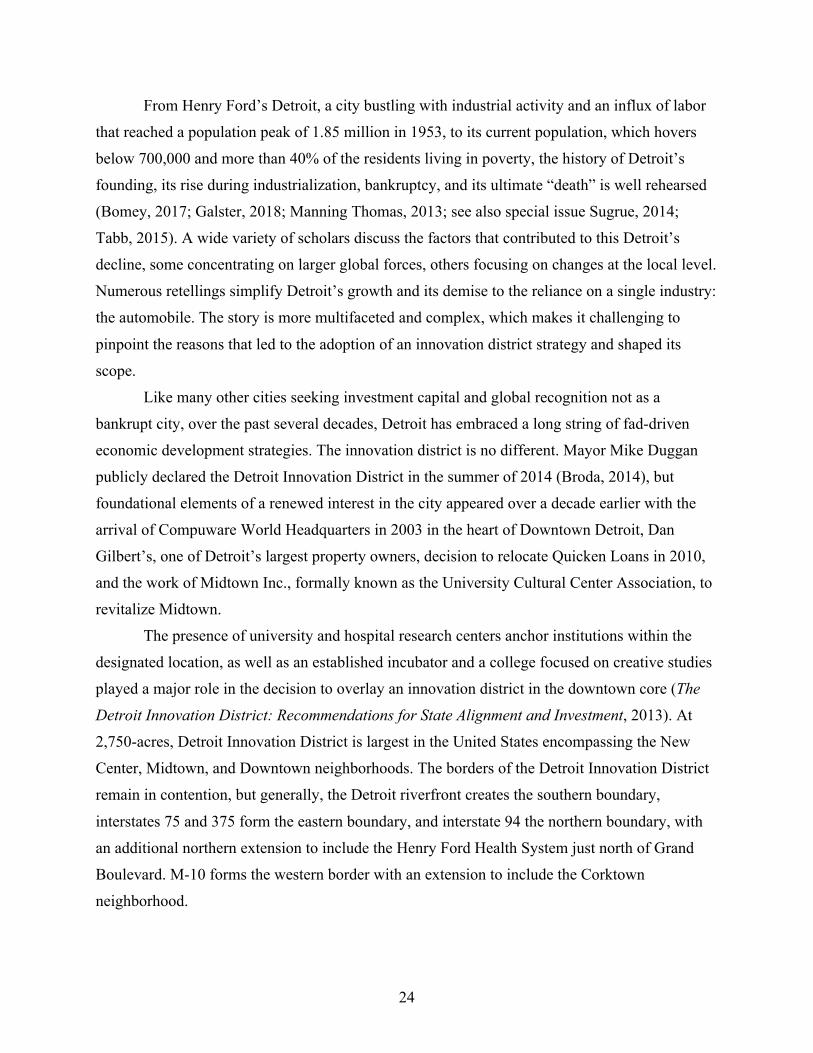
From Henry Ford’s Detroit, a city bustling with industrial activity and an influx of labor
that reached a population peak of 1.85 million in 1953, to its current population, which hovers
below 700,000 and more than 40% of the residents living in poverty, the history of Detroit’s
founding, its rise during industrialization, bankruptcy, and its ultimate “death” is well rehearsed
(Bomey, 2017; Galster, 2018; Manning Thomas, 2013; see also special issue Sugrue, 2014;
Tabb, 2015). A wide variety of scholars discuss the factors that contributed to this Detroit’s
decline, some concentrating on larger global forces, others focusing on changes at the local level.
Numerous retellings simplify Detroit’s growth and its demise to the reliance on a single industry:
the automobile. The story is more multifaceted and complex, which makes it challenging to
pinpoint the reasons that led to the adoption of an innovation district strategy and shaped its
scope.
Like many other cities seeking investment capital and global recognition not as a
bankrupt city, over the past several decades, Detroit has embraced a long string of fad-driven
economic development strategies. The innovation district is no different. Mayor Mike Duggan
publicly declared the Detroit Innovation District in the summer of 2014 (Broda, 2014), but
foundational elements of a renewed interest in the city appeared over a decade earlier with the
arrival of Compuware World Headquarters in 2003 in the heart of Downtown Detroit, Dan
Gilbert’s, one of Detroit’s largest property owners, decision to relocate Quicken Loans in 2010,
and the work of Midtown Inc., formally known as the University Cultural Center Association, to
revitalize Midtown.
The presence of university and hospital research centers anchor institutions within the
designated location, as well as an established incubator and a college focused on creative studies
played a major role in the decision to overlay an innovation district in the downtown core (The
Detroit Innovation District: Recommendations for State Alignment and Investment, 2013). At
2,750-acres, Detroit Innovation District is largest in the United States encompassing the New
Center, Midtown, and Downtown neighborhoods. The borders of the Detroit Innovation District
remain in contention, but generally, the Detroit riverfront creates the southern boundary,
interstates 75 and 375 form the eastern boundary, and interstate 94 the northern boundary, with
an additional northern extension to include the Henry Ford Health System just north of Grand
Boulevard. M-10 forms the western border with an extension to include the Corktown
neighborhood.

25
Detroit’s domination by the automobile industry and related spin-offs is as relevant today
as it was during the height of industrialization, though for different reasons. In the early 1900s,
General Motors, Ford, and Chrysler, the ‘Big Three’ formed Detroit’s economic base and had a
tremendous effect on the urban landscape (Ryan, 2008). The presence of the oligopolistic giant
automakers had a tremendous effect on the urban landscape. At the height of industrialization,
the automotive sector dominated the urban landscape with their superblock factories and
suburban-type housing for manufacturing labor (B. Ryan, 2012; B. Ryan & Campo, 2013).7 To
alleviate the increased presence of automobiles on the road, street facing store fronts were
pushed back to widen streets (Ryan, 2008). What was once a city with smaller parcels of land
and concentrated populations, was slowly consumed by the super-block factory footprints, roads,
highways, and parking lots that broke up the density and transit-oriented development on which
innovation district strategy depends.
The departure of automobile factories and operations from the city center is also an
important contribution to the challenges of implementing the Detroit Innovation District. The
large abandoned factories certainly affect density, but in addition, the outcome of companies
moving their operations away from downtown to the outskirts of the city (Garreau, 1992;
McCarthy, 1997), and later to greenfield sites in the suburbs (Hyde, 1982; Neill, 1995), resulted
in the decentralization of people and large demographic changes. Edge cities grew to become
self-sufficient, with commuters traveling between edge cities, rather than from the edge to the
core (McCarthy, 1997). Despite the slight resurgence of the central business district, this is a
pattern that persists today with commuters holding 70% of the jobs in Detroit (Detroit Future
City: 2012 Detroit Strategic Framework Plan, 2013). In addition, two of Michigan’s largest
research campuses, University of Michigan (Ann Arbor) and Michigan State University (East
Lansing) reside outside Detroit, meaning that any spin-offs from these universities are more
likely to remain in Ann Arbor or Lansing rather than relocating to Detroit.
Despite the loss of the automotive manufacturing and direct competition with other cities
and countries in the vehicle market, the automotive legacy continues with this sector seeking to
corner the market in automated vehicle technologies. In addition, the legacy of the automobile
industry remains present not only in the amount of blight caused by decentralization, not only in
7 Ryan and Campo (2013) argue for the importance of preserving the automobile heritage to ensure the city of Detroit and its inhabitants remain connected to their historic path. In this article, they state that the contemporary landscape is not reflective of its automotive past because many of the automobile factories have been demolished. I differ from this perspective in that I focus on the ways the automobile industry affected the density of the city, the creation of highways and parking lots.
26
the abandoned factories that take up massive amounts of space, or in their demise that left gaping
swaths of derelict land, but also in an innovation district strategy that captivates the imaginaries
of the Detroit stakeholders. The respondents I interviewed believe in the capacity to tap into the
innovative energy that existed in Henry Ford’s Detroit and to compete against other regions on
the cutting edge of autonomous vehicle technologies.
Detroit’s trajectory cannot be separated from the role of race in its formation and racism
in its decline (Benyon & Solomos, 1987; Darden, Hill, Thomas, & Thomas, 1987; Newman &
Safransky, 2014; Sugrue, 2014). During the decentralization of Detroit, racist policies preventing
African Americans from moving into the burgeoning white suburbs forced segregation and
resulted in the concentration of African Americans within the city center faced with employment,
housing, and police treatment discriminations (Neill, 1995; Sugrue, 2014; Vose, 1959). The 1967
rebellion, which killed 41 people and destroyed 1,300 buildings, further exacerbated white flight.
By the 1990s, 78% of Detroit’s population was African American (Neill, 1995). As of the US
Census 2010, African Americans make up 83% of Detroit’s population. However, in the Greater
Downtown, which encompasses the Detroit Innovation District, black residents account for 69%
of the population, down 5%, with whites accounting for 22%, up 3% from the 2000 Census (7.2
SQ MI: A Report on Greater Downtown Detroit, 2015). The increased racial diversity of the
Greater Downtown is not in itself negative, but it is necessary to question the reasons for the
decline in black residents and the connections between innovation district strategies that cater to
higher skill sets that black residents may not possess.
The Detroit Innovation District is an important case to draw comparisons between earlier
landscapes of productions and the efforts to convert a blighted landscape focused on
entertainment-led economic development strategies (i.e., stadiums, casinos, place-making) to
serve today’s contemporary form of production. That the Detroit Innovation District strategy is
no longer a leading economic development effort is not necessarily a negative conclusion of the
research. The experiences of the leaders guiding its implementation and the challenges they
faced speak to the importance of local context. The excitement for the innovation district strategy
held particular sway in Detroit as Katz and Wagner publicly featured the city’s innovative
potential in their national report, in addition to personally consulting Michigan and Detroit
leaders on the implementation of the Detroit Innovation District strategy. From the onset this
mounted the pressure to implement a successful strategy. At the same time, among locals there

27
existed a concerned undercurrent of an exclusionary strategy focused on a growing central
business district surrounded by severely declining neighborhoods.
Cortex Innovation Community, St. Louis, Missouri
Figure 14: Cortex Innovation Community
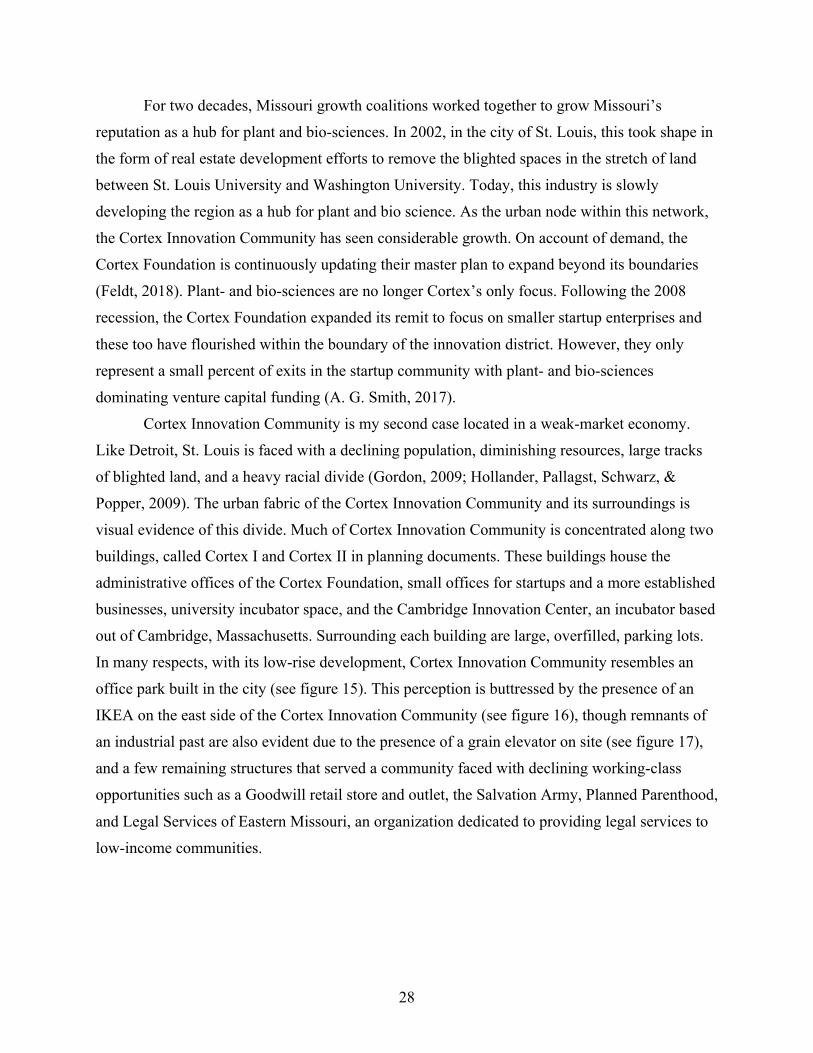
The St. Louis Cortex Innovation Community is a 240-acre development owned by
Cortex, a legal 501c3 (“Cortex Innovation Community,” n.d.). The Cortex Innovation
Community, located in Midtown, is made up of eight staff members and 18 board members
representing public and private institutions invested in the district. The board members represent
members from area universities, the Botanical Gardens, the Mayor’s office, and private
businesses. Cortex holds the designation Master Developer for the Cortex District through the
establishment of a tax increment finance boundary (St. Louis Innovation District Tax Increment
Financing (TIF) Redevelopment Plan, 2012).
28
For two decades, Missouri growth coalitions worked together to grow Missouri’s
reputation as a hub for plant and bio-sciences. In 2002, in the city of St. Louis, this took shape in
the form of real estate development efforts to remove the blighted spaces in the stretch of land
between St. Louis University and Washington University. Today, this industry is slowly
developing the region as a hub for plant and bio science. As the urban node within this network,
the Cortex Innovation Community has seen considerable growth. On account of demand, the
Cortex Foundation is continuously updating their master plan to expand beyond its boundaries
(Feldt, 2018). Plant- and bio-sciences are no longer Cortex’s only focus. Following the 2008
recession, the Cortex Foundation expanded its remit to focus on smaller startup enterprises and
these too have flourished within the boundary of the innovation district. However, they only
represent a small percent of exits in the startup community with plant- and bio-sciences
dominating venture capital funding (A. G. Smith, 2017).
Cortex Innovation Community is my second case located in a weak-market economy.
Like Detroit, St. Louis is faced with a declining population, diminishing resources, large tracks
of blighted land, and a heavy racial divide (Gordon, 2009; Hollander, Pallagst, Schwarz, &
Popper, 2009). The urban fabric of the Cortex Innovation Community and its surroundings is
visual evidence of this divide. Much of Cortex Innovation Community is concentrated along two
buildings, called Cortex I and Cortex II in planning documents. These buildings house the
administrative offices of the Cortex Foundation, small offices for startups and a more established
businesses, university incubator space, and the Cambridge Innovation Center, an incubator based
out of Cambridge, Massachusetts. Surrounding each building are large, overfilled, parking lots.
In many respects, with its low-rise development, Cortex Innovation Community resembles an
office park built in the city (see figure 15). This perception is buttressed by the presence of an
IKEA on the east side of the Cortex Innovation Community (see figure 16), though remnants of
an industrial past are also evident due to the presence of a grain elevator on site (see figure 17),
and a few remaining structures that served a community faced with declining working-class
opportunities such as a Goodwill retail store and outlet, the Salvation Army, Planned Parenthood,
and Legal Services of Eastern Missouri, an organization dedicated to providing legal services to
low-income communities.

29
Figure 15: Parking lots in the Cortex Innovation Community
Figure 16: View of IKEA from within the building overlooking expansive parking lots

30
Figure 17: Grain elevator in the Cortex Innovation Community
The Cortex Innovation Community case study provides a strong opportunity to analyze
longer attempts by growth coalitions to establish a space for knowledge production within the
urban sphere. This longer period affords the ability to document the various technical means
used by stakeholders for ownership over a territory. It also offers a comparison between a
focused strategy on a predetermined sector (i.e., plant and bio-sciences in St. Louis) versus
opting to refrain from determining the target sector (i.e., Boston).
The origin story, as told by the founders, as well as the current leadership of the Cortex
Innovation Community, prominently centers the development as mission driven (Smart People.
Cool Places. The Story of Cortex, 2017). It is not uncommon to read in media accounts or hear
from respondents in interviews that William Danforth, founder of the Cortex Innovation
Community, and John Dubinsky, president and first CEO of the Cortex Innovation Community,
are altruist visionaries primarily concerned about the welfare of St. Louis’ residents. One
interview respondent gloriously attributed the work of these leaders as ‘god’s work’ (Cortex
Innovation Community executive, personal interview, 2016). Undergirding the desperation for
such charitable work are divinations such as a comment from Robert Calcaterra, president and
CEO of Nidus Center for Scientific Enterprise in St. Louis County, commenting on the growing
plant and life science sector in St. Louis: "In the next century, the advances in the life sciences

31
area are going to be the most dramatic things to occur worldwide. There's a very dramatic impact
if you can feed people who are starving" (Goodman, 1999).
Since its inception, the Cortex Innovation Community has created jobs. However, the
question of who stands to benefit from the changes to the built environment development that
generates these jobs is important. The case of the Cortex Innovation Community demonstrates
what the powerful rhetoric of mission driven work combined with the imagery of a progressive
scientific future can do: it can completely transform a landscape for a particular demographic.
Non-city
Park Center, Research Triangle Park, North Carolina
Figure 18: Park Center

32
In early 2014, the Research Triangle Park Foundation, the non-profit charged with
managing North Carolina’s Research Triangle Park’s (RTP) strategy, acquired 100 acres of land
along the I-40 for $17 million and designated the space as Park Center. The goal of Park Center
is to accommodate 100,000 new jobs, build in $2 billion worth of residential and retail amenities,
and construct a rail path connecting Park Center to Raleigh, Durham, and Chapel Hill, the three
surrounding cities that make up Research Triangle Park (Kroll, 2014; Ohnesorge, 2014). The site
plan features an array of amenities to create the appearance of city life. These include street-level
retail and entertainment, designated open recreation spaces, and housing in walkable proximity
to work all within a pedestrian and bicycle friendly environment. Creating a density of people
within their physical environment is the primary focus.
Within the 100-acres, the Foundation intends to locate firms representing science and
technology, sectors that have always been associated with RTP, as well as firms representing the
arts and humanities. According to their website, “Creating a place where collaboration can occur
between industry and academia, nonprofits and corporate titans, entrepreneurs and government is
our goal. We want to create spaces for people to gather, meet, hang out and be inspired.”
(http://www.rtp.org/about-us/park-center/).
This comment contrasts with the initial ideology behind the development of RTP, which
is well detailed in many scholarly accounts (for a few examples, see O’Mara, 2005; Rohe, 2012;
Saxenia, 1996). In the late 1950s, RTP was conceived as a 7,000 acres science and research
campus overlaid on the seven counties that make up the Raleigh-Cary and Durham-Chapel Hill
metropolitan statistical areas in North Carolina (see figure 19).
Figure 19: Map of counties of the Research Triangle Park
Source: Research Triangle Region (“Counties,” 2018)

33
The layout and space between the various firms was purposely expansive in order to
prevent employees from competing firms from fraternizing with each other. In addition to
providing ample space for firms to develop their own campuses within RTP, zoning provision
established an eight-acre minimum lot size, building set-backs of at least 150 feet from the road,
and set-backs at least 100 feet from the side and back property lines (Rohe, 2012). The efforts of
the RTP Foundation are focused on changing the silo-like attitude of the science and research
park, the idea on which the RTP was originally designed, to a newly collaborative ideal that
includes targeted amenities to attract and retain entrepreneurs and young professionals (“Park
Center: This is not your grandfather’s RTP,” 2015).
The imagery of the future Park Center certainly features compact development,
consumption-led entertainment, and vibrancy in the urban design connecting buildings and
structures. In reality, because of its early stages, at the moment, Park Center exists as a single
building known as the Frontier. Essentially, the Frontier is a concept built into the basement of
an abandoned IBM building. It is open to the community, wired with high-speed connectivity,
and offers opportunity to rent space for those that want to establish a permanent residence for
their startup business. Though the inside of the Frontier is colorful and inviting (see figures 20 &
21), the outside of the building does not indicate the activity occurring inside (see figures 22 &
23). The surrounding fabric of the Frontier building resembles the older vision for Research
Triangle Park: manicured lawns, boxed, low-rise office buildings, and parking lots.
Figure 20: Lobby of the Frontier
Figure 21: Open workspace in the Frontier

34
Figure 22: Outside view of the Frontier

35
Figure 23: Main entrance of the Frontier
Park Center provides an opportunity to compare logics between urban and non-urban
redevelopment. What this brings to fore is the underlying operating perspective on the needs of
21st century industry at the cusp of automation and the growth of high-tech entrepreneurship.
However, the challenges posed by the urban sphere do not directly translate to the 7,000 acres of
land operated by a single 501c3 as a type of home owner’s association. Park Center is an
important case for a variety of reasons. Principally, it is interesting because of its historic
precedent and conscientious planning efforts by university, industry, and government relations to
embrace a new spatial logic for innovation capture. In addition, it is important because it is the
only case outside of the urban sphere and, as such, there are overlapping districts that make up
the 100-acre site. In many respects, the attempt to create a brand new concentrated urban-like
development where the arts and culture industries can intersect with science and research, a place

36
where residential, retail, and occupation are closely connected via public transportation mirrors
the rhetoric on agglomeration benefits of the city. Yet, Park Center is not an urban environment
in the traditional sense and, in fact, the innovation district strategy seeks to create an urban
environment with the balance of a pastoral environment to appease long-standing and in-coming
companies that still find that the spacious environment meets their needs and provides them with
space to grow (personal interview, 2015).
Unfortunately, during the on-site visits to Park Center and by the time of this writing, the
development of Park Center was still in early phases. For this case, I rely on interviews with the
Foundation members and neighboring supporters of the innovation district. However, beyond the
Frontier, an old IBM building converted into smaller offices and a ground floor open workspace
(Terry, 2014), there is little to observe in this case site. For this reason, much of my analysis of
Park Center is based on architectural renderings and images that portray the ambitions for a
future Park Center.
Conclusion
The changing landscape of the innovation district presents an ideal object of analysis to
assess the role the technology and economic development policy nexus play in reconceptualizing
relationships between urban form, technological innovation, and our daily social life. Anna
Klingman (2007) writes, architecture is not about where we work and live, but where we imagine
ourselves to be. If this is indeed the case, speaking with the individuals who are driving the
development of the innovation district and assessing the discourse around hopes and objectives
for the innovation district provides rich insight into the societal aspirations of contemporary
growth machines.
While the object of analysis is the innovation district, the changes I observe are not solely
confined to the space of the innovation district. There is a long history of enclosing public land
for private profit. With the shifting demographics in the urban core of a young, professional,
educated, and technologically-skilled individual and the ensuing development to accommodate
their work and living cultural preferences, the reality of growing private citadels becomes
starker. In the final chapter I document the changing demographics and the rise in real estate
prices within the spaces of all five innovation districts. As these urban laboratories concentrate
populations of constantly productive entrepreneurs and a wealthier residential class, difference
and diversity are slowly displaced. This is problematic for the prospect of innovation from the

37
perspective of the scholars who argue that innovation requires input from a wide variety of
sources and encounters with different forms of being (Benoit, 2008; Shearmur, 2012; Welz,
2003). But it is also problematic when the ordering of space is considered from the perspective
of Foucauldian biopolitics. Following this line of inquiry, I argue in the closing chapter that the
emergence of innovation districts points to a shifting of risk on to the entrepreneur. The thesis of
the entrepreneurial turn in relation to the built environment is present in Harvey’s (1989a) work,
particularly his highly cited piece, “From managerialism to entrepreneurialism: The
transformation in urban governance in late capitalism.” What innovation district strategy
demonstrates is an overreliance on the entrepreneur to accrue regional benefits. This is a
continuation of Harvey’s entrepreneurial turn from the state, to an assemblage of actors, to the
precarious entrepreneur. It is the entrepreneurs who are bearing the burden of an ideology on the
importance of innovation for regional wealth and the role of the entrepreneur as the catalytic
actor that stems from a group of individuals representing the state, the public, and the private
sector. 8
In all five cases, after the global financial crisis of 2008, entrepreneurs became the central
focus of innovation district strategies. When large development corporations halted construction
and firms froze moving considerations, mobile entrepreneurs and their minimal real estate
requirements proved to be the best candidates to generate some form of economic activity. Much
like the artists that started the first wave of development in documented studies of gentrification
8 The use of the term “precarity” elicits a longer literature on informal workers in the developing countries, care workers—primarily women, working-class women, and migrant workers for whom work has always been precarious (Kern, 2013; McDowell, 2009; McDowell, Batnitzky, & Dyer, 2009). My use of the term “precarity” is in reference to the middle-class workers of the tech economy, many of whom string along a series of tasks to make a living. In addition, scholars studying creative labor draw the connection between the rise of policy prescriptions that centered the creative worker as part of a state-led agenda to dismantle labor disputes and prevent the formation of unions (Gill & Pratt, 2008; McRobbie, 2002; Neilson & Rossiter, 2008). This scholarship is useful for my research in that it pinpoints and explains the role of culture as the raw material for contemporary production (Lloyd, 2002). However, research on innovation districts differs from this literature in that elements of affect and care work are not central to innovation district strategy. In using the term precarity I am signaling the precarious aspect of non-steady work. Within the past decade, the term precarity has been increasingly adopted in an attempt to explain effects of contemporary capitalism. However, it is important to stress that, as Rossiter and Neilsen (2008) argue, precarity has always been a component of the capitalist project. Within the ideology and the rhetoric that stems from it, it is important to disentangle fact from myth. In 1995, Zukin argued that the flexible workers in the cultural industries without a clear upward trajectory engaged this form of labor because “real identity comes from activity outside of the job” (13) Here, Zukin was referring to the willingness of individuals to take on these types of positions as it afforded them the opportunity to participate in the culture of the space, a line of argument closely associated with Florida’s (2002) economic development prescriptions. In my reading of the literature, the rise of policies that center the tech-worker are no so much a different strand of study as they are a continuation of this earlier literature on precarity. Ultimately, the transition from affect labor, to creative labor, to tech labor all point to what Lorey (2015) discusses as a governing logic of insecurity. The state, removed as a provider of welfare and support, in addition to the firm that can rely on contract labor instead of paying benefits to permanent employees, benefit from the individualized workforce less dependent on the state (McRobbie, 2016).

38
(see for example Lloyd’s (2010) work on the Wicker Park neighborhood of Chicago), this time
around it was the tech entrepreneurs who moved into the warehouses converted into incubators
and maker-spaces in Boston, Dublin, and Detroit. In St. Louis and Park Center, where the
innovation district strategy is primarily dominated by a governing 501c3 foundation, it was a
post-recession decision to switch the strategy from targeting large companies to concentrating on
smaller firms. The decision to focus on entrepreneurs and their startup companies translated to
active marketing strategies, which I document.
Innovation district strategy served to generate development activity when the economy
was at a standstill. Supporting my argument on entrepreneurs bearing the burden of risk, as the
market began to turn and banks started lending out money for development, the focus on
supporting entrepreneurs shifted to accommodate market logics and the desires of larger firms to
develop over the parcels of land used by entrepreneurs. In both Boston and Dublin, my strong
market economies, entrepreneurs can no longer afford to live in the innovation district. In
Boston, much of the startup activity is relocating to the abandoned buildings that the legal and
financial firms are leaving behind as they move their offices to the high-end Seaport Innovation
District, though branding efforts to call it an innovation district have ended (Martin, 2016;
McMorrow, 2012). In Dublin, the new space for startup activity is in Dublin 8, on the west side
of town. In addition, the Startup Commissioner position, a position created by Dublin City
Council in 2014 to create networking and support opportunities for entrepreneurs, was
eliminated in 2017 (Kennedy, 2018). Detroit, St. Louis, and Park Center continue to focus on
entrepreneurial activity within the space of the innovation district, but, except for Park Center,
these are weak market economies that continue to struggle with attracting investment capital. As
for Park Center, because it remains in young stages of development, there remains plenty of
space to grow and, thus there is no need at the moment to exclude entrepreneurs from their
strategy.

39
Chapter 2: Landscapes of Production The perpetual quest for process and product innovation is inexorably linked with distinct
spatial landscapes. My particular fascination with innovation districts is to interrogate underlying
economic structures in the production of their particular physical form. A landscape survey does
not reveal actual levels of activity, only the social aspirations we ascribed to them. Yet,
landscapes do represent the institutionalized production of certain kinds of ideas that
consequently affect structural change. This is true of today’s innovation district as well as earlier
landscapes of production.
It is not possible to fully understand contemporary attempts to create spaces for
innovation capture without first deconstructing the two most prominent landscapes of production
that came before: concentrated industrial districts and the decentralized research and corporate
campuses. This trajectory is based in countries of the advanced capitalist world, namely the
United States and Europe. There are of course nuanced variations between the transitions and not
all cities in the United States or Europe fall within such a clean typology. However, these two
periods of production share enough similar features to develop generalizations to describe their
spatial geographies.
My research begins with the industrial districts because the connection between the
productivity of this time period and its spatial layout features prominently in contemporary
economic development strategy for innovation districts. In other words, research and policy
continuously references the positive externalities on innovation as a result of the density,
diversity, and concentration of the industrial districts of the late 19th and early 20th century and
it is important to disentangle the reasons why.
Industrial Districts
The Industrial Revolution of the late-19th century and early-20th century had a
tremendous impact on the exponential growth of cities located along rail- and water-
transportation nodes (Hall, 1998). These arteries, which connected nodal cities, transported raw
materials and material goods. Cities experienced considerable population growth with the
expansion of factories and the demand for cheap unskilled labor. Our collective conscious of

40
how industrial districts looked ranges from the powerful photography of humans operating heavy
machinery (Seixas, 1987) to the haunting images of working class immigrants famously
portrayed by Jacob Riis (1890). The cramped living and working conditions of the
manufacturing era were products of the massive amount of manual labor required to maintain
factory productivity. Housing the influx of immigrants was challenging and in these densely
packed industrial cities, labor lived in cramped quarters alongside management and livestock,
and people resided in close proximity to work (Engels, 1892; Mumford, 1961).
Industrial capitalism, the main mode of production in western capitalist economies of this
time period, was marked by individual craft labor (Marx, 1977). This shift in relationship
between an individual and his means of production and the role of technology in achieving
additional surplus capital prompted the struggle between the factory worker and the capitalist,
the capital-labor relation (ibid). Innovations in technology were both in relation to the machinery
used in the factory space, as well as assembly line production and Taylorist principles of
scientific management to ensure a productive and compliant workforce (Braverman, 1998; Saval,
2014; Taylor, 1911).
This time period is important in marking an era of scholarship where the city and its
inputs are connected to economic growth—beginning with the work of Alfred Marshall (2007
[1890]) on attempts to explain agglomeration economies and urban externalities. Marshall
concentrated on the localization of industry from the economy of production as well as from the
perspective of the customer. The advantages of proximity, the availability of specialized
machinery, the skill and tacit knowledge spillovers, the flow of ideas, the availability of skilled
labor, and the growth of subsidiary trades were the factors that contributed to agglomerations.
These elements, Marshall theorized, led to industry remaining in one place for a long time (ibid.,
p 225). Disadvantages, such as a single-industry focus that over-exerts availably labor and can
depress a region if raw materials deplete or lack of demand are best countered in places were
supplementary industries cluster and there is a presence of diverse industries (ibid., 226).
Marshall attributes the localization of skilled artisans to the will of customers willing to travel for
expensive and choice objects, as opposed to shops that provide ordinary domestic needs that do
not need to congregate in one location (ibid., 227). What Marshall witnessed from his research in
Manchester, Leeds, Lyons, London, Paris, Philadelphia was that the clustering of industry,
customers, and skilled artisans also meant the growth of government, education, cultural
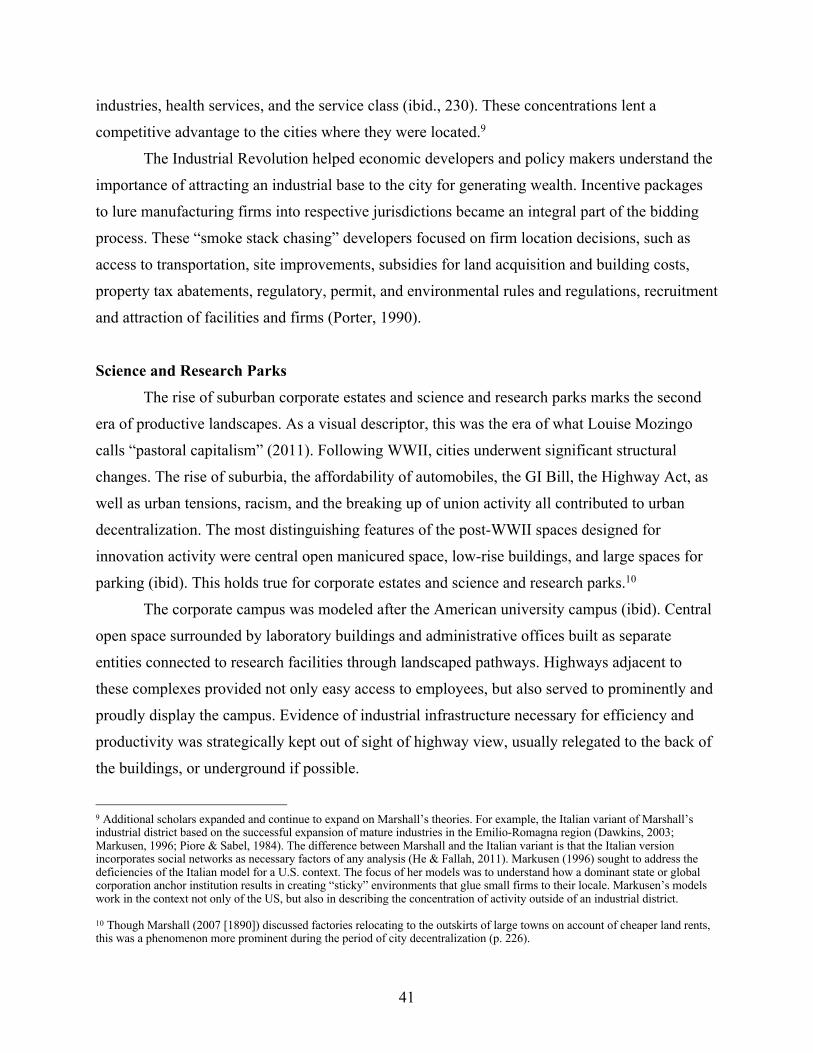
41
industries, health services, and the service class (ibid., 230). These concentrations lent a
competitive advantage to the cities where they were located.9
The Industrial Revolution helped economic developers and policy makers understand the
importance of attracting an industrial base to the city for generating wealth. Incentive packages
to lure manufacturing firms into respective jurisdictions became an integral part of the bidding
process. These “smoke stack chasing” developers focused on firm location decisions, such as
access to transportation, site improvements, subsidies for land acquisition and building costs,
property tax abatements, regulatory, permit, and environmental rules and regulations, recruitment
and attraction of facilities and firms (Porter, 1990).
Science and Research Parks
The rise of suburban corporate estates and science and research parks marks the second
era of productive landscapes. As a visual descriptor, this was the era of what Louise Mozingo
calls “pastoral capitalism” (2011). Following WWII, cities underwent significant structural
changes. The rise of suburbia, the affordability of automobiles, the GI Bill, the Highway Act, as
well as urban tensions, racism, and the breaking up of union activity all contributed to urban
decentralization. The most distinguishing features of the post-WWII spaces designed for
innovation activity were central open manicured space, low-rise buildings, and large spaces for
parking (ibid). This holds true for corporate estates and science and research parks.10
The corporate campus was modeled after the American university campus (ibid). Central
open space surrounded by laboratory buildings and administrative offices built as separate
entities connected to research facilities through landscaped pathways. Highways adjacent to
these complexes provided not only easy access to employees, but also served to prominently and
proudly display the campus. Evidence of industrial infrastructure necessary for efficiency and
productivity was strategically kept out of sight of highway view, usually relegated to the back of
the buildings, or underground if possible.
9 Additional scholars expanded and continue to expand on Marshall’s theories. For example, the Italian variant of Marshall’s industrial district based on the successful expansion of mature industries in the Emilio-Romagna region (Dawkins, 2003; Markusen, 1996; Piore & Sabel, 1984). The difference between Marshall and the Italian variant is that the Italian version incorporates social networks as necessary factors of any analysis (He & Fallah, 2011). Markusen (1996) sought to address the deficiencies of the Italian model for a U.S. context. The focus of her models was to understand how a dominant state or global corporation anchor institution results in creating “sticky” environments that glue small firms to their locale. Markusen’s models work in the context not only of the US, but also in describing the concentration of activity outside of an industrial district. 10 Though Marshall (2007 [1890]) discussed factories relocating to the outskirts of large towns on account of cheaper land rents, this was a phenomenon more prominent during the period of city decentralization (p. 226).

42
By the early 1950s, corporate estates built on 200 acres or more were the suburban
alternative to urban skyscrapers (ibid). The typical corporate estate featured the same layout as
the corporate park but extended over larger swaths of land. These complexes were not as
welcoming as their corporate park counterparts. Long winding driveways lined by greenery
ended in gated entrances. Landscaping strategically obscured the campuses from the general
public but was also used to conceal parking structures necessary to house hundreds of
employees.
What distinguished the science and research park from the corporate estate was the
presence of more than one corporation and the anchor of a research university (O’Mara, 2005).
Roots of the first science and research park are evident prior to WWII, but the first actual science
and research campus was the Stanford Industrial Park, built in 1951 in Palo Alto California with
Stanford University as its landowner and anchor (O’Mara, 2005; Saxenian, 1996). Almost a
decade later, a group of individuals in North Carolina organized themselves as a non-profit and
opened up the North Carolina Research Triangle Park to attract research and development
(R&D) and boost their southern economy, with the help of area universities.
Pastoral capitalism also describes an important element about the mode of production
during this time period. Whereas the manufacturing era was primarily fueled by the production
of goods, knowledge production as the dominant economic development paradigm started to be
the main focus (Castells, 1992; Krugman, 1991; Piore & Sabel, 1984). Scholars have termed this
paradigmatic shift in production by various terms such as cognitive-cultural capitalism (A. J.
Scott, 2014), cognitive capitalism (Boutang, 2011), creative economy (Florida, 2002; Markusen
& Schrock, 2006), and knowledge economy (Etkowitz & Leydesdorff, 1997). The transition
from industrial capitalism to the focus on knowledge production, does not mean that goods are
no longer produced, but that it becomes more cost effective to offshore manufacturing processes
and to focus on harnessing knowledge production (Moretti, 2013).11
Automobiles, airplanes, shipping containers, and the transport lines on which these
modes travel expanded the geographic range of industrial activity. Suppliers and other entities
are located on the outer periphery and connected to a central “hub” through ‘wheel spokes’ could
exist once the rural frontier was accessible for development (Markusen, 1996). Or, the Satellite
11 However, there are growing debates on the decline of material products and increased financial and regulatory tools that succeed in capturing rents despite the production of goods (see for example Birch, 1990, 2017). The rise of platforms also challenges traditional understandings on the production of goods (see for example Boutang, 2011; Langley & Leyshon, 2017), though the machinery used to create platforms are still tangible products.
43
Platform District model, which is a heterogeneous collection of branch locations with corporate
R&D headquarters located in different locations, can exist because of advances in methods of
communication where non-proximate headquarters can maintain close communication ties with
branch locations (ibid). The distance between headquarters and satellite entities demanded new
forms of command and control. The managerial capacities of the firm expanded, teams of
salaried employees were tasked with executive decisions, growing the bureaucratic arm of the
firm. This period of managerial capitalism prevailed for much of the 20th century (Chandler,
1977, 1984; Mozingo, 2011)
Debates on agglomeration economies within economic geography
Theories of cluster dynamics backed by empirical examples of spatial layouts informed
scholarship on the inputs of agglomeration economies (Asheim, Boschma, & Cooke, 2011;
Saxenian, 1996). The focus of much of this literature is on determining where, why, and how
certain regions witness concentration of economic and activity (Dawkins, 2003). For many
decades, economists and geographers dominated the field. Increasingly, other disciplines
engaged the discussion resulting in an ever-growing body of work incorporating a wide variety
of methodologies to understand the anchoring and concentration of certain activities.
The lack of definitional clarity on what constitutes as innovative complicates a simple
taxonomy of which concentrations classify as innovative and which do not. One critical question
to ask is what the role of innovation in the production of goods and services versus the
production of knowledge (Malecki, 2010). If the definition of innovation is not solely based on
product development but also on knowledge production, what types of knowledge processes are
considered innovative? The traditional linear view of innovation, (i.e., the transition from basic
research, to applied research, to development, to production) implies that tech progresses only in
a linear fashion (Godin, 2006; Kline, 1985; Massey, Quintas, & Wield, 1992). Therefore, the
final outcome, as measured by patents for example, is the only part of the chain that is valued.
This negates other measures of innovation such as tacit knowledge, for example, which is central
to innovation learning process (Malecki, 2010). The linear model, a model that centered research
and development on the university or laboratory is no longer applicable in an era where research
and development take place within dispersed networks. From this emerges the need for new
forms of acquiring, transmitting, and transforming knowledge (ibid).
44
The interjection of the creative industries as part of the innovative sector further
complicates the definition. By all means, creative activity can foster higher rates of creativity and
innovation (Scott, 2000) but what parts of the creative industry should be considered innovative?
One way to answer this question is to consider the various terms used by scholars to describe the
current economy and to see what sectors they included in their definition. For example, Florida’s
(2002) Creative Class index measures the concentration of scientists, engineers, professors, and
think thank employees. Scott’s (A. J. Scott, 2006; Storper & Scott, 2009) cognitive cultural
economy includes high-tech, neo-artisanal manufacturing, business and finance, and cultural-
products industries. Moretti’s (2013) innovation sector includes clean technology, information
technology, software, Internet services, life sciences, new materials such as nanotechnology,
digital entertainment, parts of finance and marketing. The increased focus on the creative
industries, especially the merge between creative industries and science and technology
industries forces a reconsideration of what constitutes an innovative sector.
Deciding which sectors are considered innovative is the first step, the second step is
determining how to measure their output. This is a challenging endeavor. Regional science has a
long history of tracking the role of science and technology industries because these sectors have
a proven record of driving long term growth (Spencer, 2015). Patents, patent citations, and
business starts are common indicators measured. Despite the healthy debate that exists on
measuring activity in these sectors (see for example Malecki, 2010; O hUallacháin, 2012),
methods for measuring science and high-tech activity are somewhat established and
standardized. The increased focus on the creative industries, especially the merge between
creative industries and science and technology industries poses new challenges. For one, the
creative industries rarely rely on patents and patent citations (Lee & Rodríguez-Pose, 2014;
Miles & Green, 2008). Secondly, the creative industries rely on different forms of knowledge
and transfer knowledge differently than the science and technology sectors (Drake, 2003;
Malecki, 2010).
Setting aside the differences between the sectors, innovation is also measured through a
region’s resiliency, that is, the ability to respond to rapid transitions in technologies, exogenous
economic shocks, and market fluctuations (J. Clark, Huang, & Walsh, 2010; Markusen, 1996).
Empirical data point to the resiliency advantages of a variety of innovative small firms over large
dominant firms. Marshall (1890) correctly identified the presence of small firms as a positive
externality for regional competitiveness. The presence of small firms is considered by some an

45
indicator of innovation because small firms represent the creation of new ideas, developments,
and entrepreneurial spin-offs (Jacobs, 1969). However, this does not mean that large firms
should not be considered innovative or that the presence of large firms indicates lack of
innovative activity in a region. Whereas some argue that large firms squelch diversity, cause
repetition, and result in lesser probability of entrepreneurial offspring into similar or non-related
sectors (ibid), others see them as advantageous to innovative growth in the service sector
(Moretti, 2013).
The above discussion serves to highlight the complication in defining innovation and in
measuring its activity. It remains an important area of research because innovation is recognized
as fundamental to our economic growth. As innovation demonstrates the tendency to concentrate
(i.e., it is not evenly distributed across the landscape) (Malecki, 2010), this has spatial
implications. The purpose of creating a taxonomy is to have a tidy framework to assess the
economic capacities of each model. However, the complication is that firms within clusters
mature (or fail to thrive) and shift from one taxonomy to another. In a study of 15 high-tech real
world clusters, He and Fallah (2011) find that clusters rarely feature any single type of typology.
One reason is that clusters mature and/or decline over time causing them to shift from one
typology category to another. Too, the make-up of local economies plays a larger role than the
scale of agglomeration (Lee & Rodríguez-Pose, 2014; Rodríguez-Pose, 1999). Existing or
institutionalized webs of social relations and business networks that cross cut at different scales
and reach are an important necessary for entrepreneurial activity to occur (Boschma, 2005;
Phillips & Wai-chung Yeung, 2003; Saxenian, 1996).
The role of proximity and constant interaction, though important for branding the
innovation district, might be less important in relation to innovative output. This line of argument
parallels the economic geography literature on the importance of clusters. Cluster thinking's
genesis comes from a critical school of urban and regional economic geography, for example,
Allen Scott (1988), Susan Christopherson and Michael Storper (1986) (both Scott and Storper
cited in Gibson & Brennan-Horley, 2016). These scholars were interested in innovation and
cultural/creative industries. They wanted to capture analytic insights of the post-Fordist era of
flexible accumulation and the emergence of new spatial configurations of production not in the
fading rust belt cities.
Scott recognized that innovation was unstable and unpredictable and continually evolving
and that frequent access to a large variety of skills was paramount to and encouraged

46
agglomeration. Face-to-face interaction and issues of proximity were of critical importance.
These factors were discussed early on by Alfred Marshall, but were later studied in greater detail
by French economists (Ferru & Rallet, 2016). Highly cited work in this vein is also the work of
Venables and Storper (Storper & Venables, 2004). The benefits of clustering vary depending on
the types of knowledge producers and recipients. Distance need not only be measured in physical
proximity. Two firms in close physical proximity may see diminishing benefits in proximity as
they mature or the industry life cycle progresses (Audretsch & Feldman, 1996).
Gibson and Brennan-Horley (2016) argue that the work of the critical scholars was later
co-opted in an unintentional way by neoliberal policy in the late 1990s and early 2000s (see
Gibson & Klocker, 2004 for a more in-depth critique). Michael Porter and Richard Florida were
amongst those that pushed the benefits of clustering and agglomeration and profited from it, and
these were shorn of much of their political grounding (Gibson & Brennan-Horley, 2016). The
focus was more on market forces and urban construction to generate economic activity.
Furthermore, cluster theory promotes an urban bias. This is a problem of the empirical
work that favors research in the city, but it is not the case that clustering does not exist outside of
the city. Innovation also occurs in peripheral regions (Shearmur, 2015). Based on work in
Darwin, Australia Gibson and Brennan-Horley (2016) empirically demonstrate that activity did
not simply cluster in the inner-city and that the suburbs were not merely dormitories for the
inner-city workers, but that mobility to the suburbs and beyond is vital to the functioning of the
innovation economy. Within the same study, empirical work in El Paso, Texas demonstrates the
global value chain of a local boot making industry. Acquisition of leather, marketing online or
in-person, expanding new markets all demonstrate an historical embeddedness forged earlier
during the mass manufacturing era. This, to them, demonstrates the importance of the imprint of
history in shaping a contemporary concentration of firms than the need to locate in close
proximity for subcontracting or networking purposes (ibid; pg 251). This resonates with Massey
(1995) on the importance of understanding the contemporary dynamics and how they intersect
with uneven geographies of growth and decline from earlier eras. The point is not to fully
discredit theories of cluster dynamics. Existing empirical work demonstrates that clustering
dynamics are at work. However, it is important to broaden the discussion to prevent factors
sometimes overlooked in the rush to embrace simplistic urban development policies (Shearmur,
2015).

47
Economic development policies
In terms of shifting economic development policies, it was not until the 1980s, when the
successes of the abovementioned efforts were taking effect, that economic developers recognized
the role of science and the importance of universities as anchors (Plosila, 2004). Gradually,
economic developers started to include access to talent, higher education, and the building of
entrepreneurial cultures into their incentive packages. This was also the time period where the
role of the state was significant in bridging science and technology efforts with state economic
development. In accordance, states created new agencies to house advisors in science and
technology or to institute an advisory board and a state science and engineering foundation.
Even the architecture of the post-WWII laboratory reveals that the suburbanization of
science created new ways of conceptualizing knowledge (Rankin, 2010). The role of the scientist
transitioned from an individual capable of producing pure knowledge to an individual charged
with knowledge production. The spatial layout of the laboratory, one that allowed for autonomy
yet always under the auspices of a managing body, was purposely structured to capture profit. At
the same time, corporate managers recognized capitalism’s dependence on the productive
capabilities of the individual. In other words, corporate managers did not want to stamp out
individuality and were cognizant of this in their design decision. The architecture of the suburban
laboratory and its campus had to create new spatial geographies that were different from the
university and different from the factory. The suburban campus demonstrated that traditional
planning knowledge had to be discarded to allow new innovative forms of design to emerge.
Whereas the corporate campuses and early science and research parks were spaces
designed only for firms and research institutions, residential and commercial amenities (both as
stand-alone restaurants and evening retreats and as the access to food and services) were not
incorporated. Landscape amenities such as playfields, allotment gardens, parks with pavilions
and clubhouses were used to for aesthetic and recreational purposes as well as to attract
employees and reduce labor turnover. These were included primarily to quell employee
dissatisfaction and keep disputes down to a minimum (Mozingo, 2011; Rankin, 2010). Adopting
the narrative that residential, commercial, and entertainment amenities are necessary in order to
attract and retain talent, are part of a more recent phenomenon entangled with today’s innovation
district. In comparison with how design is used in today’s landscapes of production, the design
of the industrial districts of this era was more a product of the economic activity than of active
48
design efforts (Biddulph, 2011; Gospodini, 2002; Knox, 2011). But the outcome for informing
design prescriptions is relevant in innovation district strategy.
Global Capitalism
More contemporary scholarship, still within economic geography, but increasingly in the
field of sociology and organizational studies, is grappling to understand the new mobile
workforce and changes to firm dynamics due to increases in ICTs (Davis, 2016; Mazmanian et
al., 2013). The onset of globalization brought about changes occurring at the global level. The
mobility of capital elevated the question on the role of place. A key debate on the role of place
surged in the 1980s and early 1990s with the introduction of Computer Mediated Networks
(Pratt, 2002) and Virtual Communities (Doheny-Farina, 1996; Rheingold, 1993). These new
technologies removed the spatial constraints on individuals and networks, meaning that larger
swaths of territories were accessible in near, or real-time communications, removing the need for
face-to-face meetings. New work arrangements such as ‘tele-cottaging’ (Toffler, 1984) and
virtual organizations (Castells, 1996) were postulated to replace the need for people in the
workplace, or even the need for many people together in one place at one time. From the
perspective of the firm, Amin and Thrift (2002) argued that cities no longer competed against
each other, but that footloose firms competed with each other. This was yet another reason for
local competition as place bound to be rendered obsolete.
However, scholars such as Sassen (2001) and Friedman (1986) demonstrated that though
ICTs did indeed cause a decentering of the local, certain cities in the global system emerged as
control nodes. In these ‘global cities,’ New York, London, and Tokyo in Sassen’s view, are
crucial for the production of knowledge. The global city is a strategic site where multiple global,
highly specialized information loops intersect and produce a dense, thick, “enabling
environment” for the production of higher order information. This leads to a growing demand for
professional talent. Because of the diversity of people in the city and concentrated pockets of
continuous wealth, global cities have niche markets, which open up opportunities for
entrepreneurship. Infrastructurally, cities provide the service inputs required of companies and
individuals. These also become increasingly specialized. Cities were also spaces for the influx of
both high and low skilled immigrants who provide the necessary labor for economic growth (A.
J. Scott, Agnew, Soja, & Storper, 2001). Furthermore, scholars such as Venables and Storper

49
(2004) quantitatively demonstrated the continued importance of face-to-face communication for
building trust, screening people, and rapid communications.
Cultural shifts were also occurring. People disenfranchised with the homogeneity of
suburban living and enticed by the lure of the city returned. Of course, many factors influenced
and facilitated these decisions. The city’s entrepreneurial approach to urban growth opened the
door for city actors to embrace place marketing as a way to break away from associations of an
industrial past (Eisenschitz, 2010; S. Ward, 1998). Transitioning the primary mode of economic
development to the suburbs brought about a set of challenges different from the unsanitary
conditions and backbreaking work of industrial districts. The decentralization of cities devastated
the fabric of inner cities and destroyed much of the American hinterlands, while accommodating
the needs of the Anglo-American bourgeoisie (Fishman, 1987). White-flight, drops in
employment figures, shortages of municipal services, were all examples of the overall
disinvestment and neglect of the once economically vibrant urban sphere. As local governments
looked to create pro-business friendly environments, it became necessary to portray an image of
a city as tame, sanitary, and welcoming as opposed to a pro-union, working class, city of grit.
The design of the post-industrial city relied increasingly on culture as a driver of economic
development to attract tourists and investment capital. The city began to resemble what scholars
have tried to capture through terms such as fantasy city (Hannigan, 1998), and city of leisure
(Mommaas, 2004), city as entertainment machine (Lloyd & Clark, 2001), or have also tried to
illuminate through processes such as the conversion of factory spaces to lofts (Zukin, 1989),
waterfront development (Harvey, 1989a; S. Ward, 1998), and “Disneyfication,” or themed
development (Zukin, 1993).
City leaders strategizing how to attract people back to the cities through branding
mechanisms demonstrates a shift from the focus on attracting firms to a focus on attracting
people. Though scholars were already discussing the importance of attracting young, skilled, and
educated individuals to the city, it was Richard Florida’s (2002) work on the creative class that
popularized the idea and influenced a myriad of policy prescriptions. Using a wide variety of
indexes [such as, explain further], Florida argued that cities exemplifying the three T’s
(technology, tolerance, and talent) were the most likely to succeed as vortexes for fresh talent.
Florida’s work triggered the response to a focus on attracting talent rather than attracting firms,
increasing the focus on a new way for cities to differentiate themselves. One option was focusing
on the creation of spaces of consumption. A second was to focus on spaces of production (Turok,

50
2009). Latching on to the idea of creating a competitive advantage by creating spaces of
production meant focusing on attracting talent. Placed with the emphasis on science and
technology policy, cities increasingly adapted government reports and policy statements to
reflect strategies incorporating higher levels of innovation, more investment in science and
technology, R&D, university connections and student graduates in science, technology, and
mathematics, in addition to a flexible business environment (ibid).
Today, the consequences on the sub-national level range from ‘austerity urbanism’ (Peck,
2012) to an intensification and expansion of inter-urban competitive logics. Spaces of exception
–special economic zones, strategic development zones, and incentivized tax structures designed
to attract FDI –are manifestations of such competition (Bach, 2011; Easterling, 2014). These
zones follow replicable global formulas for policy and infrastructure. “Spatial softwares” of free
trade and special economic zones, global technology parks, and other similar campuses of global
commerce, are designed as sociotechnical regimes, which prioritize free and unrestricted flow
and operation of capital. In line with methodically competitive agendas, these high-tech, capital-
intensive, low-tax enclaves are sites of exalted financial and economic activity. Aligned with
grandiose architecture, zones are not just collecting stations of global capital and not just areas of
good employment prospects, they also represent symbolical spaces where innovation and ideas
presumably lay the tracks for future development.
Mobile policies circulate the globe (see for example, McCann, 2011), particularly today
in relation to economic and smart cities development (Cook, 2008; Crivello, 2015; K. Ward,
2017; Wiig, 2015). The digital economy is an expansion of the cultural industries, they are part
of a process of economic experimentation with extracting value out of knowledge, culture, and
affect (Terranova, 2000). The focus on the tech sector emphasizes the work component in the
live-work-play configuration securing a continuous cycle of productivity through the creation of
seamlessly integrated environments (Stehlin, 2016). The literature on smart cities and urban
laboratories demonstrates what Lauermann (2016) discusses in relation to advanced forms of
entrepreneurial urbanism through the creation of spaces for experimentation. As digital labor
increases and sophistications in information and communication technologies shifts work away
from the firm in unbounded capacities, public spaces become sites of immaterial production, the
type more closely aligned with Boston’s Seaport Innovation District and Toronto’s recently
announced collaboration with Sidewalk Labs, a sister firm of Google. Latching on to the idea of
creating a competitive advantage by creating spaces of production engenders a talent-attraction

51
focus (Turok, 2009). Florida’s (2002) popularized prescriptions for attracting a creative class,
through what has largely amounted to a focus on placemaking, are evident in cities across the
globe (see for example Van Winden, 2014; Yigitcanlar & Bulu, 2015; Zimmerman, 2008), as are
efforts to adapt government reports and policy statements to incorporate higher levels of
innovation, more investment in science and technology, R&D, and university connections within
a flexible business environment.
A bi-product of the second industrial divide resulted in the move of headquarters away
from the city center to urban peripheries. In the wake of this massive shift of people, production,
and financial resources were the cities that left behind. The convergence of a few factors brought
renewed focus on the city. The first was the many efforts of local leaders seeking strategies to
revitalize communities. The second was a similar attitude, but at the state or federal level with
policy interventions to attract investment back into the city. The 1950s, for example, saw the
creation of place-based financial deregulatory tools for urban revitalization starting with Tax
Increment Finance (Briffault, 2014; Dye & Merriman, 2006) and moving on to federal programs
such as empowerment zones and enterprise communities (Boyle & Eisinger, 2001; Hall, 1982).
These economic development tools were created to bring development to underperforming
neighborhoods. Or, at the very least, to signal to the private market that targeted the government
supported development in these areas, often through tax and business incentive packages. These
policies shaped a neoliberal approach to urban development defined in economic development
by private sector growth, low taxes, heavy subsidies, low expenditures (see for example
Hackworth, 2007). Within the urban sphere, the rise of economic productivity focused less on
the manufacturing industries and more entrepreneurial management (Harvey, 1989a). It is
against this backdrop that innovation district strategy emerged.

52
Chapter 3: Brookings Institution’s Innovation District Definition It is important to recognize that a fixed definition for what an innovation district is does
not exist. This is because different cities and regions will have different goals and outcomes.
Still, the concept, popularized by Bruce Katz and supporters of the strategy (Katz & Bradley,
2013, Katz & Wagner, 2014, Storring & Walker, 2016), does have some fuzzy contours that can
be described.
Research and policy prescriptions on innovation districts, using Barcelona’s 22@bcn
innovation district and Boston’s Seaport Innovation District as a model, began at the Brookings
Institution under the direction of Bruce Katz. Katz first mentioned the concept of an innovation
district in his book, The Metropolitan Revolution (Katz & Bradley, 2013), though it was his co-
written report with Jennifer Wagner, The Rise of Innovation Districts: A New Geography of
Innovation (Katz & Wagner, 2014), that catalyzed the spread of the concept. Due to its wide-
reaching success, in 2015 the Brookings Institution and the Project for Public Places partnered to
create a dedicated research arm for the study of innovation districts: the Anne T. and Robert M.
Bass Initiative on Innovation and Placemaking (“Brookings announce the Anne T. and Robert
M. Bassa Initiative on Innovation and Placemaking,” 2015) In addition, the Bass Initiative is also
working closely with the Center for London, the only think tank in London, through the
Transatlantic Innovation Districts Partnership. The aim is to spread the concept in London and
across Europe (“Innovation Districts Homepage,” 2018).
It is helpful to quote at length Brooking’s full description of innovation districts and its
strategy on their homepage (“Innovation Districts Homepage,” 2018):
As part of the Bass Initiative, Brookings continues its work on innovation
districts, dense enclaves that merge the innovation and employment potential of
research-oriented anchor institutions, high-growth firms, and tech and creative
start-ups in well-designed, amenity-rich residential and commercial environments.
Innovation districts facilitate the creation and commercialization of new ideas and
support metropolitan economies by growing jobs in ways that leverage their

53
distinct economic attributes. These districts build on and revalue the intrinsic
qualities of cities: proximity, density, authenticity, and vibrant places. Given the
proximity of many districts to low-income neighborhoods and the large number of
sub-baccalaureate jobs many provide, their intentional development can be a tool
to help connect disadvantaged populations to employment and educational
opportunities.
I group the Brookings Institution’s definition of innovation districts and the strategy for their
development in the following categories:
1. Cultural preferences toward the built and social environment
2. Increased concentration around university and hospital research centers and anchors
3. Collaborative, cross-sector, high-tech, open nature of innovation
4. Economic development strategy focused on startups and entrepreneurship
5. Focus on design and place
6. Focus on growth
7. Existence of disadvantaged populations in the city
This categorization is based on Katz and his colleagues’ perspective on emergent trends. In
the next chapter, through the use of empirical examples I will discuss elements omitted from
Katz’s perspective. For now, I will contextualize, and critically comment, on Katz’s
prescriptions.
1. Cultural preferences toward the built and social environment
Cultural trends altering the location preferences of people and firms play a central role in
the emergence of innovation districts (Atkinson & Bridge, 2005; Barber, 2013; Moretti, 2013;
Storper, 2013). Cultural trends and demographic shifts, particularly the shrinking household size
that Fishman (2000) predicted would revitalize the city, resultant from people delaying marriage
and starting a family, families having fewer children, and a rejection of the mundanity and
homogeneity of the suburbs in search of more ‘authentic’ living experiences contributes to the
rise of younger, educated, tech-savvy knowledge workers relocating to the city. As part of the
‘authentic’ urban experience, these individuals are also opting to abandon their reliance on the

54
automobile and traverse the city using public transportation (The National Academies Press,
2004). Scholars back compact living as a benefit to the environment and thus position the
resurgence of the city through developments such as innovation districts as environmentally
friendly (Kenworthy, 2006). That cities, or at least particular locations within cities, are growing
in popularity among knowledge workers does translate to a focus on promoting the city as the
prime location for development. Changing cultural preferences also explain why office parks are
now revamping their obsolete models to incorporate urban-like amenities that cater to knowledge
workers (Spivack, 2017).
The factors listed above demonstrate choices people make to suite their cultural
preferences. They are, to use Tiebout’s (1956) phrasing for households making residential
choices based on public services, “voting with their feet”. However, it is also possible to explain
these trends from a less positive perspective, such as the inability to afford a car that would allow
one to commute from the suburbs, the lack of investment in regional transit forcing people to
locate closer to the jobs moving into the urban sphere, and a recession that might force cash-
strapped young families to remain in the city (Atkinson & Bridge, 2005; Peck, 2005). In other
words, it may be less that the emergence of innovation district is capturing changes in cultural
preferences, and more that individuals are limited in their choices.
2. Increased concentration around university and hospital research centers and anchors
Katz’s innovation district strategy builds off of the claim that cities in western capital
economies are seeing increased clustering around universities, medical centers, and anchors. The
population growth around these anchors correlates with the resurgence of knowledge workers in
the city. In other words, increased clustering around sectors might simply be a by-product of
increased population in cities.
More importantly, clustering around these anchor institutions is not a new trend. In the
1980s, after recognizing the benefits of clustered geographies such as the Research Triangle
Park, Silicon Valley, and Route 128, economic developers adopted strategies promoting
clustering around research centers such as universities and hospitals with a research arm as a way
for the market to absorb potential market spillovers (Feldman, 1984; Feldman & Bercovitz,
2006; Plosila, 2004). Clustering around universities as a way to absorb spillovers was further
incentivized by the passage of the Bayh-Dole Act (Mowery, Nelson, Sampat, & Ziedonis, 2001;
Shane, 2004). The Bayh-Dole Act, a US policy initiative with facilitates the transfer of

55
knowledge from the university to the private sector through patent rights, contributed to the rise
of entrepreneurial activity and the emergence of smaller R&D companies. Growth around these
areas can be attributed to economic development policies that focused on clustering growth in
close proximity to these spaces. What the emergence of innovation district strategy does point to
are more elaborate and collaborative forms of engagement and entrepreneurial governance
(Harvey, 1989a). Universities, the private sector, the public sector, foundations, and the civic
realm are working together to drive the growth direction of the city.
3. Collaborative, cross-sector, high-tech, open nature of innovation
The previous Cold War era that marked the rise of landscape buffers between the science
and technology firms contributed to a silo-like mentality. Cultural variations, particularly
between Rout 128 and Silicon Valley also demonstrated the relevance in a regional culture
shaping business organization (Saxenian, 1996). As the west coast model took over, other locals
worked to adopt the Silicon Valley mindset and move away from the strict hierarchical model of
the Route 128 or the siloed model of Research Triangle Park.
Sophistications in technology have diminished the need for large building footprints to
house oversized computers (Saval, 2014; Stringer & Ostafi, 2013). In addition, the affordability
of laptop computers allows a larger contingent of individuals to own the means to access the
market and in any location. Innovative firms and talent workers seek to congregate to share ideas
and practice “open innovation” (Chesbrough, 2003). Open innovation fosters the ability for
companies want to interact with researchers, inventors, entrepreneurs, and other firms to define
new products and identify new markets. It also creates opportunities for entrepreneurs benefit
from pooled resources.
Despite Chesborough’s (2003) insights on the growth open innovation as a contemporary
phenomenon, open innovation is not new. Open innovation was practiced even in the secluded
science and research parks (Turner, 2006). This history is not as prevalent. More prevalent are
the stories of cloistered workers separated from other companies. There is truth to this, for
example, in the zoning codes of the RTP, at the same time, we must also question to what extent
the zoning codes were used to increase the land mass of the companies in the RTP as a way to
attract more workers.
Open must also be deconstructed in terms of intellectual property regulations. How are
these changing with these new environments? Are firms also willing to be open with their IP or
56
is there still a proprietary element that is not discussed in the narrative. Take for example the
large tech campuses such as Google and Facebook. Though they champion the concept of open
innovation through the removal of cubicles and the flattening of the hierarchical structure, their
new campus are heavily protected and surveilled as are their employees (Lange, 2012). Thus,
open extends only as far as their campus walls. When supporters of innovation districts talk
about ‘open’ they refrain from interpreting the need for open collaboration by precarious
employees who are dependent on a network to string along a series of gigs. Finally, there are the
rhetorical elements espoused by growth coalitions to support the development of innovation
districts. It behooves individuals to claim that innovation today is cross-sector, high-tech, and
collaborative because it provides the rational for compact development. Particularly in the urban-
based innovation districts with restricted development boundaries, adopting a strategy that
ensures the cramming of people and firms can help increase the rent profit margin. It is also
necessary to question how open can be translated to profit making, particularly in relation to
smart city infrastructure and the ability to create a repository of all human transactions within the
space of the innovation district. What happens to any right for privacy?
While it may be true that companies want to interact with individuals and firms of the
knowledge economy to define new products and identify new markets, this does not necessarily
hold constant to the other anchors, such as the research hospital or the university. There may be
branches within these institutions created purposely to focus on research spillovers, but that does
not mean the entire university and hospital faculty and administrators agree with the direction of
the entrepreneurial management. Rather, as I discuss later, there is an active state ideology
pushing universities and hospitals in this direction.
From the perspective of the benefits derived by the entrepreneurs from the strategy, as
these individuals are not centralized and organized under umbrellas that provide skills and
training, they must seek these resources elsewhere. This has created an avenue for the growth of
accelerators and incubators (see for example Gandini, 2015; Mian, Lamine, & Fayolle, 2016;
Pauwels, Clarysse, Wright, & Van Hove, 2016; Phan, Siegel, & Wright, 2005). These places
charge entrepreneurs rent for the exchange of a working space and access to their services.
Another form of collaborative exchange that explains why innovation is deemed collaborative
and cross-sector is explained through the rise of the open source movement, which allowed
computer programmers to informally exchange information (DiBona & Ockman, 1999; Levy,
2001).

57
Leaps in innovation continue to transition the primary mode of production away from a
heavy manufacturing economy. Light manufacturing has increased in popularity and there are
signs of growing maker movements (Dougherty, 2012; van Holm, 2017). However, the
equipment for light industrial remains expensive for individuals to purchase. Places like
TechShop, which uses a gym-membership model for access to tech equipment, have grown in
popularity. The creation of large spaces housing light manufacturing equipment points to the
clustering of an activity and feed into the narrative that innovation is collaborative and cross-
sector.
4. Economic development strategy focused on startups and entrepreneurship
The Brookings Institution sees the strategy as an economic benefit based on their claim
that young, high-growth firms represent the lion’s share of new jobs within cities. This fact needs
to be put into a much larger context in order to understand how to problematize it. The
organization of the firm is undergoing changes. More work increases outside of firm walls. By
2050, more than 50% of the workforce will be contractual labor (Upwork & Union, 2017).
Importantly, too, it is necessary to consider what this fact means. Does each transaction count
towards a job? Are the jobs construction workers are taking as they rebuild the new landscape of
the city considered in this statistic? What is the time-span of these companies? Are they able to
scale and ‘graduate’ or is it more likely that they fail and take down every newly created job with
them? Is this statistic accurate because young high-growth firms are increasingly locating in the
urban sphere meaning that the loss of jobs in older firms is on account of those opportunities
being pushed out of the urban sphere?
5. Focus on design and place
The definition of innovation districts does not specify the need for an urban environment,
only the intrinsic qualities of cities. These are proximity, density, authenticity, and vibrancy and
come about through a reliance on a physical realm that strengthens proximity and knowledge
spillovers (Katz & Wagner, 2014). These positively spun urban characteristics are said to help
the commercialization of ideas and creation and expansion of firms and jobs due to the
collaboration that emerges from proximity. This same proximity presents denser residential and
employment patterns.

58
The goal of the innovation district is to create a convergence between the economic,
place, and human capital assets within a bounded space. Design is used to encourage face-to-face
collaboration and ideation and to attract the firms and talent of the knowledge economy. Density
and proximity, as discussed above, are seen as necessary for companies to interact with the new
innovation ecosystem. Leadership and ‘lighter, cheaper, quicker’ programming of space are key
elements to drive the success of the innovation district. On the whole, this strategy is seen as a
way to support the evolution of the region by fostering job creation, economic opportunities, and
revitalizing communities.
The key asset in the economic, place, and human capital equation is ‘place.’ Economic
development strategies previously considered these three assets, although not always in concert
with each other. For example, the role of the economic and human capital received attention in
the 1950s, beginning with principle models such as Silicon Valley, Route 128, and Research
Triangle Park, with the growth of research and development and the importance of university
connections, incubators, and entrepreneurial supports. Richard Florida’s (2002) prescriptions
were hugely influential in the connection between place and human capital. The economic assets,
in the case of Florida, were a positive spillover that occurred if the correct amenities were in
place to attract the right human capital. The combination of place and the economy were front
and center in tourist focused developments, stadium, museum, and convention center
development, as well as larger infrastructural projects such as airports, highway projects, and
regional transit that eased the flow between major nodes of production. Economic developers
focused on place with the hope of elevating the status of a city. Innovation district strategy brings
these three assets together and gives them equal emphasis. The debate is not focused on whether
the firm bring the people, the people bring the firms, or the place brings the people and firms, but
that all three are necessary for a region to thrive.
Innovation district strategy emphasizes the importance of design and positions it as a
disruptive aesthetic. Based on this new role of design, the Brookings Institution partnered with
the Project for Public Spaces to develop the Anne T. and Robert M. Bass Initiative on Innovation
and Placemaking as a collaboration to derive policy prescriptions for city building. Their
prescriptions favor open floor plans, greater amenities in the office, multi-use walkable
environment, reshaping the relationship between buildings occurring at the district scale,
breaking down of traditional boundaries, making process of innovation more porous between

59
public and private realms through wired public spaces, advanced shared work spaces, private
tech tested on public streets (Wagner & Watch, 2017).
Storper and Venables (2004) outlined the various reasons why the ability for face-to-face
remains important today. Their points are relevant, yet sophistications in ICTs continue to
advance increasingly making this line of argument less tenable. Among respondents, once cited
reason for the importance of proximity was proximity to venture capital. A venture capitalist is
less likely to commute over longer distances when investment opportunities exist within the
locality. Comments such as these were made when comparing one city to another, and not the
activity that exists at the metropolitan-scale.
6. Focus on growth
The innovation district is indeed a vehicle for revenue growth, particularly in terms of
taxes and consumer spending. The innovation district provides an excellent revenue opportunity
for development companies. In many respects, the slating of an innovation district, like economic
development zones and tax increment finance districts, demonstrate that the state is willing to
provide development incentives in a historically underperforming area. Thus, developers know
they will receive favorable subsidies. To develop in an urban innovation district means the land
is slated, even if not immediately, for high-end development such as boutique hotels, Class A
office suites, and condominiums. These will cater to a wealthier class of individuals. Ultimately,
revenue growth happens for the developers and current owners of the buildings within the
innovation district.
Revenue growth also happens in terms of taxes. Though, how much the firms end up
paying in taxes depends on what deals were cut with the local and state government to relocate to
the innovation district. As a destination spot with high-end boutiques, craft breweries, and
specialty grocery stores, in terms of consumption, the innovation district is also a site for revenue
growth. In terms of prosumption, agreeing that the individuals who live, work, and play in the
innovation district contribute to both the consumption and production of the space, then the
innovation district also succeeds in revenue growth from the activation of the space by these
individuals for branding purposes.
Making efficient use of existing infrastructure varies by case. In some situations, it is
possible to reuse warehouse remnants and outer shells of historic buildings. However, in
interviews developers expressed that older buildings were not well-equipped for the

60
infrastructure needs of high-tech (personal interview, 2016). In the case of Detroit, the existing
infrastructure served to undergird the need for an innovation district to demolish the buildings
with innovation district resources to build from scratch. Still in some other cases, existing
infrastructure and existing industries are slowly pushed out, as is the case of the maritime
industry in Boston’s Seaport Innovation District, and what I expect to be the case for the
warehouse spaces in Detroit and Boston. There is one case in Dublin where AirBnB remodeled
an old historic building protected by historic preservation restrictions. While I generally applaud
these developments, I agree with Balibrea’s (2001) point that preserving the token smokestack is
political strategy to node to the use of culture as a signpost to attract the individuals seeking a
more ‘authentic’ experience on their terms.
As an economic development strategy, Brookings claims that “innovation districts
represent a radical departure from traditional economic development because it isn’t just about
commercial aspects of development (housing, retail, sports stadiums) but also because they help
the city move up the value chain of global competitiveness by growing firms, networks, and
traded sectors that drive broad-based prosperity” (Katz & Wagner, 2014). What is also new,
Brookings states, is putting in tandem the economic, physical, and networking assets within a
supportive and risk-taking culture.
The rise of the innovation district is certainly not a radical departure, but a continuation.
Growth coalitions and supporters of innovation districts continue to leverage traditional
economic development policies in addition to the production element. Sport stadiums,
convention centers, and tourist development, have been developed in various cities under the
guise of assisting the competitiveness of cities. If innovation districts focused only on providing
the material for the production related aspects of development, they would not succeed. These
economic development strategies help to brand a city. The innovation district is one more
element. Innovation districts provide an opportunity to attract investment capital to a particular
area, rezone and redevelop derelict spaces of the city, and to spike real estate values. Housing is
also a major component of the innovation district. The inclusion of housing provides the
necessary factor for the innovation district to be considered a live-work-playground. The same
applies to retail. More importantly, it is not possible to separate one form of economic
development from the other. They concomitantly operate. Success in the commercial aspects of
development work to attract the inputs necessary for growing firms, building networks, and
usher the intermediaries to trade sectors. In fact, the most that the innovation district can do is

61
create a receptacle for these interactions to occur and the way to fill the receptacle with the right
people and firms is through the provision of the commercial aspects of development. It is true
that innovation district strategy engages science and technology policies to encourage the
colocation of research anchors with firms and entrepreneurs, but this is not radically new. These
economic development policies have existed since the 1980s when the success of Silicon Valley,
Research Triangle Park, and Route 128 reached a wider audience (Plosila, 2004).
7. Existence of disadvantaged populations in the city
Innovation district strategy purports to support the evolution of the city by fostering job
creation, economic opportunity, and revitalize communities. It might accomplish this. The
question, however, is for whom it opens these opportunities. Existing communities are
revitalized for young, educated, primarily white, and predominantly male individuals and high-
skilled job openings skew to this demographic. For individuals taking lower-income jobs,
whether it is the jobs in the service sector or the constant stream of temporary construction
contracts, the evolution of the city moves in the direction of becoming uncoupled (Mallach,
2015) so that low-income residents are pushed out of the city and removed from close proximity
to their jobs.
From this perspective, two issues arise. The first relates to issues of affordability. Despite
innovation district strategy stating the importance of affordable housing, in practice, this
condition is not necessarily met. For example, in Boston, developers are able to pay into a fund
rather than meet the required 20% affordable housing requirement. The city can then use the
money to fund development for affordable housing in any part of the city. In places like Detroit
and St. Louis, real estate prices for housing units continue to rise and the service workers who
are said to benefit from proximity to service jobs in the innovation district must commute. In
many respects, advantaged populations are the populations that are removed in order to make
place attractive for capital (Catungal, 2009; Donegan & Lowe, 2008; McCann, 2007).
The second problem relates to the elevated status of service jobs. Service jobs, such as
coffee barista, restaurant waiter, and bartenders are often filled by middle-class workers who can
eventually spin the skills learned from these jobs into transferable skills for higher-paid jobs
(McRobbie, 2016). This poses additional challenge for the lower-skilled workers who would
have benefitted from jobs in the service sector. Any additional jobs, janitorial, for example,
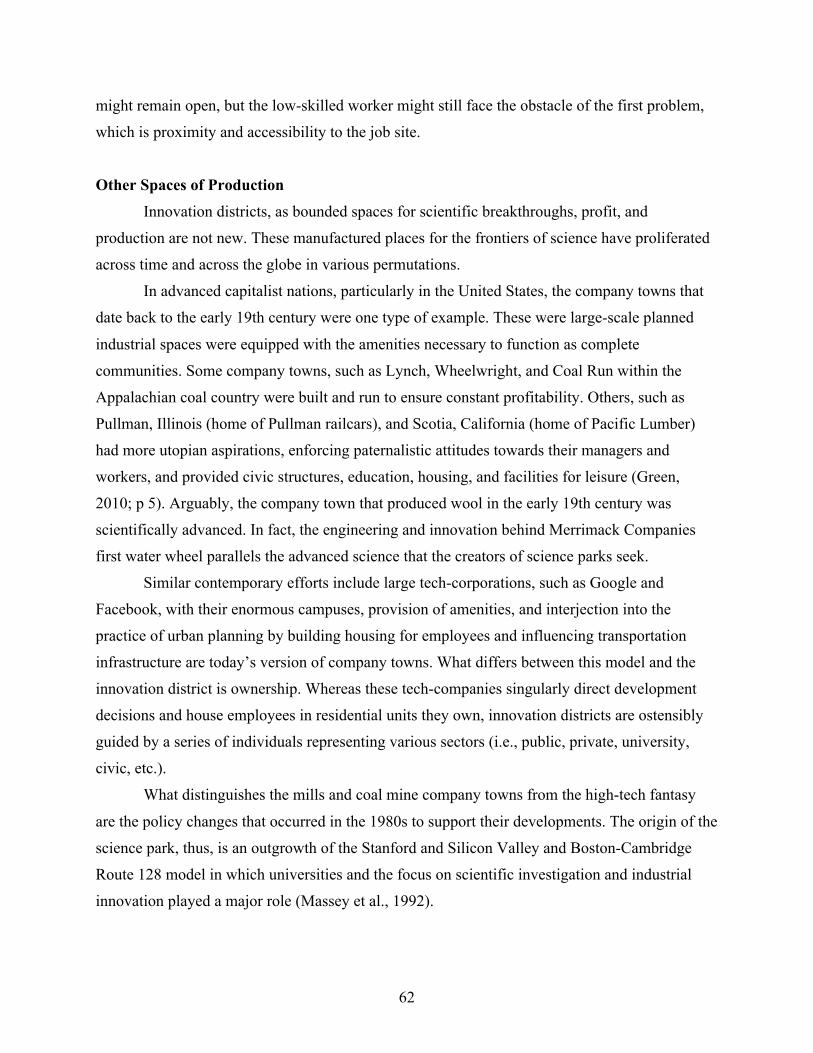
62
might remain open, but the low-skilled worker might still face the obstacle of the first problem,
which is proximity and accessibility to the job site.
Other Spaces of Production
Innovation districts, as bounded spaces for scientific breakthroughs, profit, and
production are not new. These manufactured places for the frontiers of science have proliferated
across time and across the globe in various permutations.
In advanced capitalist nations, particularly in the United States, the company towns that
date back to the early 19th century were one type of example. These were large-scale planned
industrial spaces were equipped with the amenities necessary to function as complete
communities. Some company towns, such as Lynch, Wheelwright, and Coal Run within the
Appalachian coal country were built and run to ensure constant profitability. Others, such as
Pullman, Illinois (home of Pullman railcars), and Scotia, California (home of Pacific Lumber)
had more utopian aspirations, enforcing paternalistic attitudes towards their managers and
workers, and provided civic structures, education, housing, and facilities for leisure (Green,
2010; p 5). Arguably, the company town that produced wool in the early 19th century was
scientifically advanced. In fact, the engineering and innovation behind Merrimack Companies
first water wheel parallels the advanced science that the creators of science parks seek.
Similar contemporary efforts include large tech-corporations, such as Google and
Facebook, with their enormous campuses, provision of amenities, and interjection into the
practice of urban planning by building housing for employees and influencing transportation
infrastructure are today’s version of company towns. What differs between this model and the
innovation district is ownership. Whereas these tech-companies singularly direct development
decisions and house employees in residential units they own, innovation districts are ostensibly
guided by a series of individuals representing various sectors (i.e., public, private, university,
civic, etc.).
What distinguishes the mills and coal mine company towns from the high-tech fantasy
are the policy changes that occurred in the 1980s to support their developments. The origin of the
science park, thus, is an outgrowth of the Stanford and Silicon Valley and Boston-Cambridge
Route 128 model in which universities and the focus on scientific investigation and industrial
innovation played a major role (Massey et al., 1992).
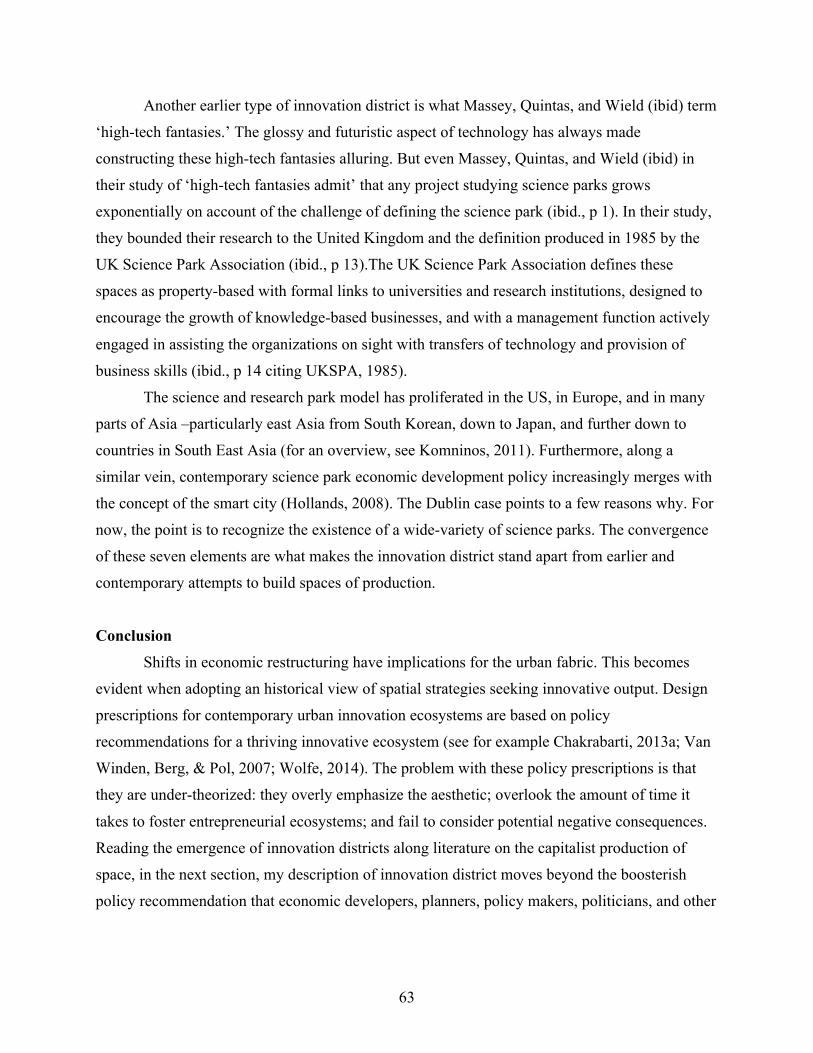
63
Another earlier type of innovation district is what Massey, Quintas, and Wield (ibid) term
‘high-tech fantasies.’ The glossy and futuristic aspect of technology has always made
constructing these high-tech fantasies alluring. But even Massey, Quintas, and Wield (ibid) in
their study of ‘high-tech fantasies admit’ that any project studying science parks grows
exponentially on account of the challenge of defining the science park (ibid., p 1). In their study,
they bounded their research to the United Kingdom and the definition produced in 1985 by the
UK Science Park Association (ibid., p 13).The UK Science Park Association defines these
spaces as property-based with formal links to universities and research institutions, designed to
encourage the growth of knowledge-based businesses, and with a management function actively
engaged in assisting the organizations on sight with transfers of technology and provision of
business skills (ibid., p 14 citing UKSPA, 1985).
The science and research park model has proliferated in the US, in Europe, and in many
parts of Asia –particularly east Asia from South Korean, down to Japan, and further down to
countries in South East Asia (for an overview, see Komninos, 2011). Furthermore, along a
similar vein, contemporary science park economic development policy increasingly merges with
the concept of the smart city (Hollands, 2008). The Dublin case points to a few reasons why. For
now, the point is to recognize the existence of a wide-variety of science parks. The convergence
of these seven elements are what makes the innovation district stand apart from earlier and
contemporary attempts to build spaces of production.
Conclusion
Shifts in economic restructuring have implications for the urban fabric. This becomes
evident when adopting an historical view of spatial strategies seeking innovative output. Design
prescriptions for contemporary urban innovation ecosystems are based on policy
recommendations for a thriving innovative ecosystem (see for example Chakrabarti, 2013a; Van
Winden, Berg, & Pol, 2007; Wolfe, 2014). The problem with these policy prescriptions is that
they are under-theorized: they overly emphasize the aesthetic; overlook the amount of time it
takes to foster entrepreneurial ecosystems; and fail to consider potential negative consequences.
Reading the emergence of innovation districts along literature on the capitalist production of
space, in the next section, my description of innovation district moves beyond the boosterish
policy recommendation that economic developers, planners, policy makers, politicians, and other

64
supporters adopt. The purpose is to contextualize why innovation districts are proliferating in this
particular time period.

65
Chapter 4: Comparative Analysis “It is by investigating the working methods and tools of architects—the lines drawn on plans,
master plans, maps and aerial photographs—that the equation setting material organization
against the abuse of power begins to unravel” (Weizman & Segal, 2003; p. 24).
In this section I detail the origin stories for the five innovation districts as told by the
stakeholders: the real estate developers, university heads, elected officials, representatives from
the public and private sectors, board members, and the entrepreneurs or digital workers residing
within the boundaries of each respective districts. I use examples from each of my cases to
document the various obstacles practitioners face in attempting to steer development in a
particular direction. Of importance is that consistently the protagonist in the narratives of the
stakeholders is the eager entrepreneur. Development narratives highlight the needs of the
entrepreneur and his–the tech-sector remains disproportionately male—high-tech playground. A
second note of importance is that it does not require extensive digging to uncover real estate
profit motives.
A study on the evolving landscapes of the city reveals how political economies of scale
under capitalism are socially produced and transformed. Like the production of space
(Gottdiener, 1994; Harvey, 2001; Lefebvre, 1992; Soja, 1980), landscapes are socially
constructed, constituted, and scaled in particular ways that reveal power dynamics (Cosgrove,
1998). Examining the tools used shape the landscape and the motivation behind innovation
district strategies demonstrates how architecture and urban planning are political practices
adhering to dominant forces (Balibrea, 2001; Monclús, 2003; Segal & Weizman, 2003).
The innovation district concept is by no means an innocent emergence. It is a strategic
development that enables the new world of work serves the logics of capital. Innovation districts
demonstrate how political economies of scale under capitalism are socially produced and
transformed (Brenner, Peck, & Theodore, 2010). They demonstrate the ability for capital to be
most productive, productive in the building of cityscapes, as well as productive of life through
the forming of subjectivities (Foucault, 2004; Lemke, 2001). A reading of innovation districts

66
from these perspectives suggests two emergent urban development trends: 1) techniques of
territory and 2) facilitating production.
Theme I: Techniques of Territory “You are lost if you forget the fruits of the earth belong to all and that the Earth belongs to no
one.” -Jean-Jacques Rousseau cited in Elden (2013)
One important contribution of this dissertation is detailing how the land is secured for
each case site and highlighting how political mechanisms to target development within a specific
area are strategically used to create territory. The use of the term “territory” is strategic. I
purposely use the term “territory” because it is the act of converting land into one that is owned
and managed by a now sovereign entity that converts land into territory (Elden, 2007, 2013). It is
from territory that governance is enacted. As territory, the innovation district is a site of political
contestation where sovereign authorities determine its ordering and the activity engaged within
its border (Lefebvre, 1992).
Whether or not the promise of the innovation district, a space for birthing inventions that
will accrue regional benefits to grow the economy, is a fantasy matters less than the fact that the
physical embodiment of the innovation district requires space and developmental control over
land. For this reason, innovation district strategy depends on political mechanisms to create a
bounded space for development. How the land and rights to development are secured matters.
The development of the innovation district is facilitated through regulatory tools that
allow for tax exemptions and tailored land use regulations. Each innovation district uses a
defined boundary to enact policy measures, though how the determination of the borders is
decided and the enforcement within the boundary varies. In addition, it is important to consider
the experts shaping the strategy in each respective location. Carefully considering the actors
involved allows us to parse who is crafting the rhetoric and how the rhetoric is strategically
mobilized. Though each of my cases demonstrates variance in the political mechanisms used to
isolate particular parcels of land for (re)development, one consistency across cases is the role of
real estate developers.
All four urban cases demonstrate how public land is converted into privately governed
territory, (Christophers, 2018). The conception of an innovation district begins when growth
coalitions want to derive more profit from land in accordance to its highest and best use (Finch &
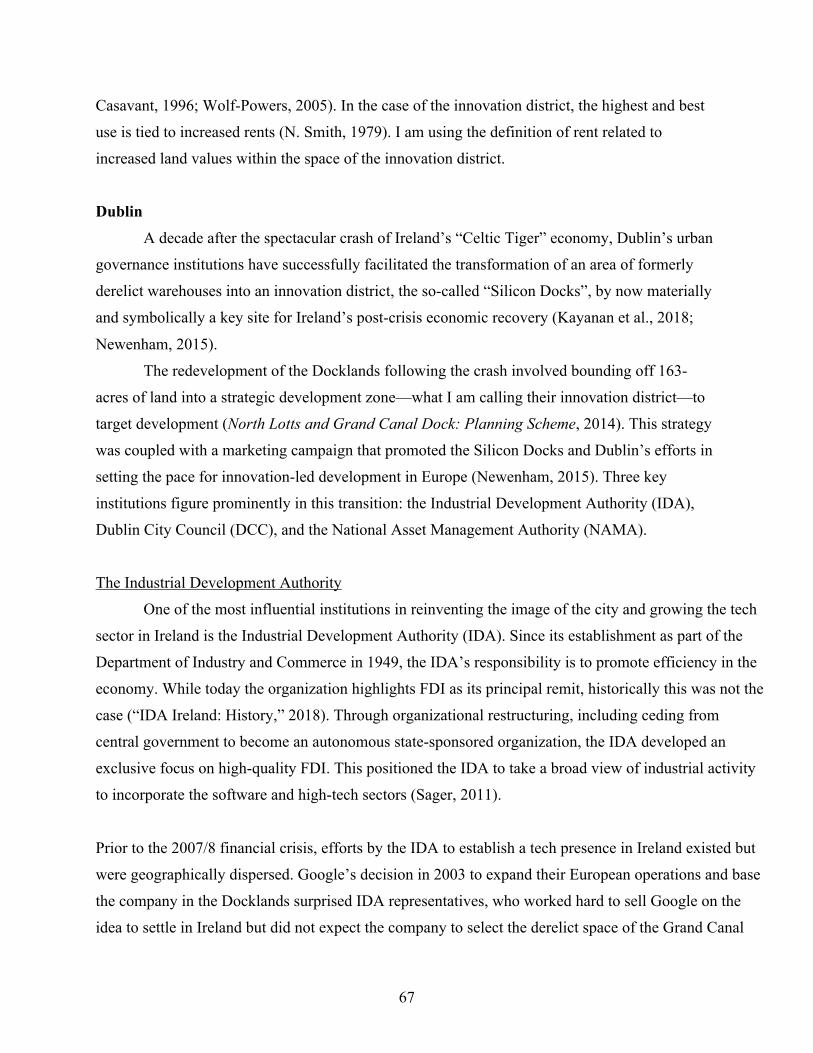
67
Casavant, 1996; Wolf-Powers, 2005). In the case of the innovation district, the highest and best
use is tied to increased rents (N. Smith, 1979). I am using the definition of rent related to
increased land values within the space of the innovation district.
Dublin
A decade after the spectacular crash of Ireland’s “Celtic Tiger” economy, Dublin’s urban
governance institutions have successfully facilitated the transformation of an area of formerly
derelict warehouses into an innovation district, the so-called “Silicon Docks”, by now materially
and symbolically a key site for Ireland’s post-crisis economic recovery (Kayanan et al., 2018;
Newenham, 2015).
The redevelopment of the Docklands following the crash involved bounding off 163-
acres of land into a strategic development zone—what I am calling their innovation district—to
target development (North Lotts and Grand Canal Dock: Planning Scheme, 2014). This strategy
was coupled with a marketing campaign that promoted the Silicon Docks and Dublin’s efforts in
setting the pace for innovation-led development in Europe (Newenham, 2015). Three key
institutions figure prominently in this transition: the Industrial Development Authority (IDA),
Dublin City Council (DCC), and the National Asset Management Authority (NAMA).
The Industrial Development Authority
One of the most influential institutions in reinventing the image of the city and growing the tech
sector in Ireland is the Industrial Development Authority (IDA). Since its establishment as part of the
Department of Industry and Commerce in 1949, the IDA’s responsibility is to promote efficiency in the
economy. While today the organization highlights FDI as its principal remit, historically this was not the
case (“IDA Ireland: History,” 2018). Through organizational restructuring, including ceding from
central government to become an autonomous state-sponsored organization, the IDA developed an
exclusive focus on high-quality FDI. This positioned the IDA to take a broad view of industrial activity
to incorporate the software and high-tech sectors (Sager, 2011).
Prior to the 2007/8 financial crisis, efforts by the IDA to establish a tech presence in Ireland existed but
were geographically dispersed. Google’s decision in 2003 to expand their European operations and base
the company in the Docklands surprised IDA representatives, who worked hard to sell Google on the
idea to settle in Ireland but did not expect the company to select the derelict space of the Grand Canal

68
Docks (Newenham, 2015; personal interview, 2016). Time and experience working with tech companies
finessed the IDA’s strategies. As it became evident that technology companies favored downtown
proximity and could claim prime real estate in the city, the IDA tailored its messaging to leverage the
emergence of the Docklands as an attractive site for potential suitors from the technology sector
(Kayanan et al., 2018).
Dublin City Council
Dublin City Council emerged as a critical institution with the dissolution of the DDDA and the
approved transfer planning power from An Bord Planeála to Dublin City Council, now established as the
Development Authority (North Lotts and Grand Canal Dock: Planning Scheme, 2014). This transfer of
master planning power was coupled with the designation of the innovation district and fast-track
provision. The fast-track provision streamlines development by ensuring a standard all firms must meet
and speeds up the process of eradicating blighted structures to make the space desirable for potential
new firms. It also strips locals of voicing discontent and appealing a plan beyond the initial two-week
opportunity allotted to approve the innovation district designation (Byrne, 2016b; Lawton, 2017).
The SDZ process in Dublin is a strategic deregulatory tool to encourage development in
particular parcels of land, which are projected to increase economic activity and generate employment
(Fox-Rogers, Murphy, & Grist, 2011; Sager, 2011). In Ireland, such governance techniques are
necessary due to local level constraints on authorities, particularly in relation to payment structures that
limit their funding sources to commercial rates and construction levies. Unless new techniques are
innovated, local authorities are limited in their ability to influence economic policy directions and must
instead heed to larger national objectives set by influential institutions (Bontje & Lawton, 2013).
However, local authorities can influence planning decisions through zoning and the formulation of
development plans (Lawton, Murhpy, & Redmond, 2010). Dublin City Council’s mobilization for the
SDZ strategy demonstrates the intent for the future development of the Dublin Docklands.
National Asset Management Authority
The National Asset Management Authority’s (NAMA) principle remit to clear the massive debt
accumulated during the financial crash is well documented (Byrne, 2016b, 2016a; Kitchin, O’Callaghan,
Boyle, Gleeson, & Keaveney, 2012; Williams, 2014). Set up in 2009 by the government – with
oversight from the Finance Minister – NAMA’s primary objective was the stabilization of the banking
sector. As an asset management company, NAMA offered the Irish banking sector, rocked by the

69
financial crisis, an expedient solution to address the crisis at the nexus of finance and real estate.
NAMA’s strategy included isolating problematic assets and replacing loans of a declining value with
government guaranteed securities. It also provided direct liquidity and facilitated the availability of
credit. NAMA’s attempts to revive the property market necessitated investment, however with Irish
developers and financial institutions still overstretched by the crisis, capital could only be attracted from
outside Ireland. Consequently, NAMA used its position to effect investment-friendly planning
provisions, especially in the Docklands. SDZ provisions broke up the Docklands into 20 development
blocks of which NAMA held interest in 15 blocks, representing 75% of developable land area of the
innovation district. This positioned NAMA as a key player in the courting of global capital towards the
Docklands. Its role as a dominant arbiter in Dublin’s urban development might be regarded as an
unintended, yet considerable consequence of the crisis (NAMA annual report and financial statement,
2017; NAMA annual report and financial statements, 2016).
The Silicon Docks
As discussed above, as the vested authority of the strategic development zone, again, what I am
calling their innovation district, DCC can implement policies to facilitate and massage development in
specific directions (North Lotts and Grand Canal Dock: Planning Scheme, 2014; personal interview,
2016). The branding of Silicon Docks and the rapid transfer of land worked in tandem with planning
tools and regulatory measures that facilitated the transformation of the space. The fast-track designation,
not coincidentally set up in 2012, provided the most noticeable formula for a new place-based
development strategy. Prior to the crash, entrepreneurial attempts to redevelop blighted land were
evident from the development of the International Financial Services Center (Moore, 2008). However,
post-crash, as banks were rescued, and debt was offloaded onto the public in the form of bailout loans
and austerity programs, economic aspirations needed to be rephrased and reformulated. The Silicon
Docks became this formula, and aspirations could now be ‘placed’ and put on display for everyone to
see. These new regulations allowed DCC to take over the planning apparatus, thereby giving it a more
interventionist role and adopting what Lauermann (2016) terms ‘municipal statecraft status.’
Writing the urban development policy that supports the construction of a ‘tech playground’
affords DCC the ability to engage in close collaborations with the private sector, inviting the latter to
shape location, construction, and design decisions while spinning these new collaborations as
experimental, cooperative, and beneficial to urban residents (Kayanan et al., 2018). DCC also succeeds
in intervening on a global level through the branding of Silicon Docks, which first appears as a label in

70
the master plan following the creation of the innovation district (Delaney, 2014). Signifying the intent to
create a competitive environment that resonates on a global scale, these branding techniques facilitate a
growth agenda under the guise of bottom-up, all-inclusive experimentation. As one academic explained,
the language behind the plan for the Docklands strongly defines the space as innovative:
If you look at all the economic development plans which designate Dublin as
exemplar in terms of how innovation can be used to provide [a] competitive
advantage for the city, and if you think that Dublin is a showcase for the country
and the Docklands is a showcase for Dublin, then if you put the pieces together, it
probably is understood very widely like that. – (university representative, personal
interview, 2016)
The special regulations of the innovation district, in tandem with branding efforts, and in
addition to the policies that promote local technology-related developments, designate the Silicon Docks
as a premium location for global players of the technology sector (Kelly, 2018; Newenham, 2015;
Sweeney, 2012). The concentration of these technology companies is encouraged by the DCC through
narrowing previous boundaries to a concentrated administrative delineation where tax exemptions and
land use regulations can be legally actuated. DCC’s adoption of this technology-focused urban
redevelopment strategy depoliticizes development through creating a space that is exempt from
surrounding forms of governance, potentially including existing formulas of tax, redistribution and
resource allocation policies. At the same time, the seductive appeal of an industry often affiliated with
revolutionary and disruptive power, protects DCC and respective technology firms from critical
scrutiny.
Reviving real estate: NAMA’s role in increasing rents
Since Google’s arrival in the Docklands the technology sector has steadily increased its footprint
in the Docklands. Much less affected by the global financial and economic crisis, the technology sector
was uniquely positioned to provide liquidity and contribute to NAMA’s efforts against the tandem of
asset price collapse and dried-up credit. NAMA consequently set itself the objective of ‘facilitating the
delivery of Grade A office accommodation in the Dublin Docklands SDZ’ (NAMA annual report and
financial statements, 2016).

71
Why would it do this? According to the NAMA Annual Report and Financial
Statements (ibid.): “Section 10 of the NAMA Act requires NAMA to obtain the
best achievable financial return for the State, deal expeditiously with the assets
acquired by it and to protect or otherwise enhance the value of those assets. That
is the core of NAMA’s mandate.”
Recognizing the mutually reinforcing cycle of credit and urban real estate, NAMA used its close
relationship with the IDA in order to identify suitable properties for FDI (NAMA annual report and
financial statements, 2016) and played a role in the appeal process of the innovation district in the
Dublin Docklands (Byrne, 2016b).
Emphasizing greater flexibility in terms of land use mix in the Docklands, NAMA’s subsidiaries
have successfully removed planning provisions aiming at reference to a dominance of residential
development and a 50:50 residential/commercial mix on the site (Byrne, 2016a). Once passed, planning
decisions within the SDZ cannot be contested so as to ensure ‘planning certainty’ (North Lotts and
Grand Canal Dock: Planning Scheme, 2014).
Besides building and selling Class A office space, another lucrative business is the construction
of student housing (Dublin Student Housing Report, 2017; GSA Annual Review, 2016). Culturally,
student housing with high turnover rates and tech-savvy, well-educated residents, contribute to the
Docklands’ modern urban imagination. Economically, building requirements for Class A office space
and student housing both follow fixed templates. This ensures a quick and painless transaction for
developers and international investors tied to global markets and transnational capital flows (real estate
developer, person interview, 2016).
The combination of NAMA’s attempts to kick-start Dublin’s property market and the presence
of a technology sector largely undisturbed by the crisis, amplified the transformation of the Docklands
into the ‘Silicon Docks’(Delaney, 2014; Newenham, 2015). Facebook, Google and other major tech
firms have repeatedly expanded their use in office space, delivering necessary liquidity and, in a very
literal sense, filling the void left by the crisis in the Dublin Docklands. In 2012, before the SDZ
boundary, 12 firms were in the general area, while in 2017, the SDZ features over 69 tech related
industries (see figures 24 & 25).

72
Figure 24: Tech related companies before 2012 SDZ
Figure 25: Tech related companies after 2012 SDZ
In line with these developments, institutions resources are allocated to attracting outside
investors rather than on local populations necessitating attention. In the varied interviews, critical
perspectives on technology sector-based growth strategies remained rare and, when present,
interviewees uttered critiques mostly in the context of Dublin’s housing crisis. Dublin is facing the
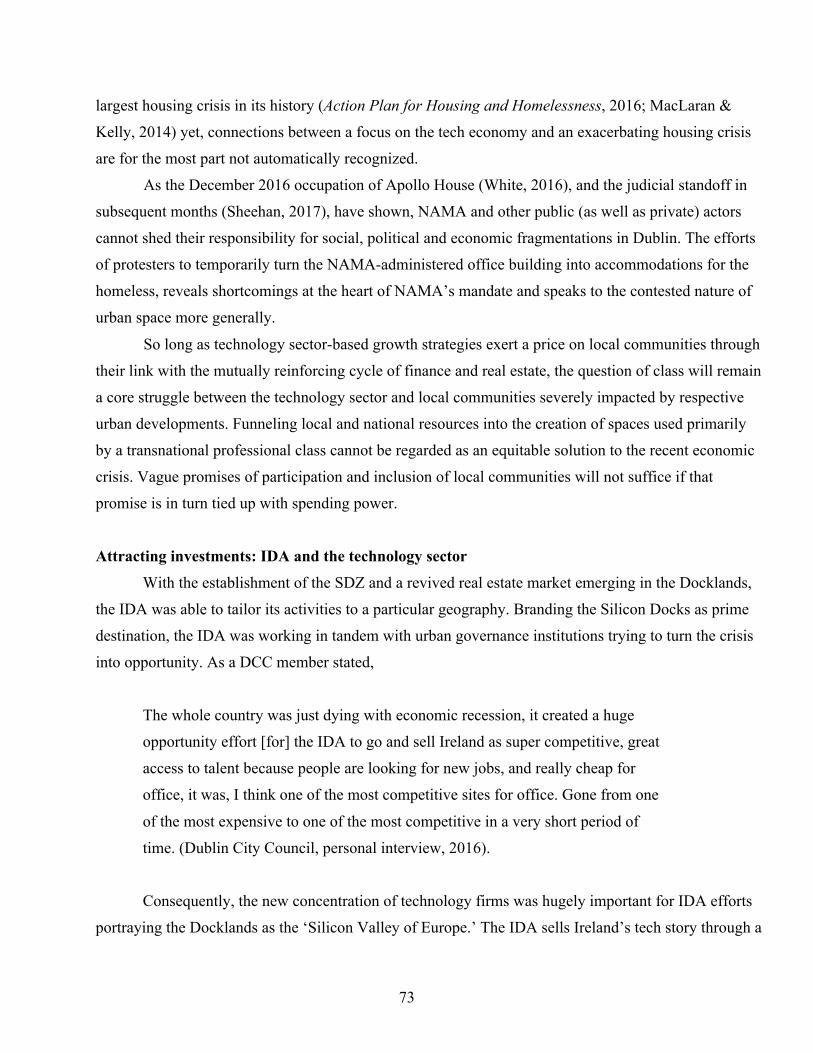
73
largest housing crisis in its history (Action Plan for Housing and Homelessness, 2016; MacLaran &
Kelly, 2014) yet, connections between a focus on the tech economy and an exacerbating housing crisis
are for the most part not automatically recognized.
As the December 2016 occupation of Apollo House (White, 2016), and the judicial standoff in
subsequent months (Sheehan, 2017), have shown, NAMA and other public (as well as private) actors
cannot shed their responsibility for social, political and economic fragmentations in Dublin. The efforts
of protesters to temporarily turn the NAMA-administered office building into accommodations for the
homeless, reveals shortcomings at the heart of NAMA’s mandate and speaks to the contested nature of
urban space more generally.
So long as technology sector-based growth strategies exert a price on local communities through
their link with the mutually reinforcing cycle of finance and real estate, the question of class will remain
a core struggle between the technology sector and local communities severely impacted by respective
urban developments. Funneling local and national resources into the creation of spaces used primarily
by a transnational professional class cannot be regarded as an equitable solution to the recent economic
crisis. Vague promises of participation and inclusion of local communities will not suffice if that
promise is in turn tied up with spending power.
Attracting investments: IDA and the technology sector
With the establishment of the SDZ and a revived real estate market emerging in the Docklands,
the IDA was able to tailor its activities to a particular geography. Branding the Silicon Docks as prime
destination, the IDA was working in tandem with urban governance institutions trying to turn the crisis
into opportunity. As a DCC member stated,
The whole country was just dying with economic recession, it created a huge
opportunity effort [for] the IDA to go and sell Ireland as super competitive, great
access to talent because people are looking for new jobs, and really cheap for
office, it was, I think one of the most competitive sites for office. Gone from one
of the most expensive to one of the most competitive in a very short period of
time. (Dublin City Council, personal interview, 2016).
Consequently, the new concentration of technology firms was hugely important for IDA efforts
portraying the Docklands as the ‘Silicon Valley of Europe.’ The IDA sells Ireland’s tech story through a

74
heavy investment in marketing material. During the height of the recession, the IDA spent €2 million on
a campaign to market Ireland as an innovation and technology hub. Two such targeted messages funded
by the IDA that ran in a variety of business publications in Europe include: ‘Facebook found a space for
people who think in a certain way. It’s called Ireland.’ ‘Google searched the planet for the perfect
location for their business. They came up with Ireland’ (Newenham, 2015).
Figure 26: Industrial Development Authority Facebook marketing campaign billboard
Source: McConnells advertising agency (McConnells, 2009)

75
Figure 27: Industrial Development Authority Google marketing campaign billboard
Source: McConnells advertising agency (McConnells, 2009)
The IDA is not the only institution selling this narrative. In 2011, as the country dealt with the
aftermath of the recession, Enterprise Ireland, a government agency formed as a split from the IDA in
1994 to focus on indigenous and start-up activity, approved €10 million for an international start-up fund
to encourage entrepreneurs to locate in Ireland. Expenses of this kind led one academic to claim,
They [entrepreneurs] were seen as really important in getting us out of the
economic crisis. It was that rhetoric going on that we needed start-up hubs. In a
country that had no money, there was a lot of investment in entrepreneurs and
start-ups. – (university representative, personal interview, 2016)

76
The focus on start-ups and entrepreneurs is easier to spin as a bottom-up narrative. The focus on
innovation and corresponding emphasis on openness and new forms of participation, lends to technology
sector legitimacy (Kayanan et al., 2018)– even while new forms of exclusion, marginalization and
economic segregation are manifesting in the city. So far, efforts to attract foreign capital remain
unimpeded by these considerations.
The willingness to re-embrace an agenda built on competitiveness and FDI certainly deserves
highlighting. Furthermore, there seems to be a complimentary logic between a ‘top-down’ approach
hinging on the belief in trickle-down economics, evidenced by continuous efforts to attract FDI, and the
‘bottom-up’ allure of technology as a participatory, inclusive, and future-oriented sector. One non-profit
director states it this way:
I don't think there is any backlash in the community if anything we're all anxious
for that to grow bigger faster. I don't think there are concerns about money being
funneled into it. I think there is awareness in the city being a tech city, there is
awareness of the economy being more and more driven by digital enterprise, and I
think people, particularly young people, but people in general are excited about
that. The more that we can be, you know, on the crest of the wave of new
innovation, and new types of jobs and education systems that are more integrated
and open, a society that is more diverse and welcoming, we're for all of that. –
(non-profit director, personal interview, 2016)
Whether top-down or bottom-up, the events mobilized between the end of the recession
and the contemporary have resulted in converting a waterfront location in Dublin into a highly
ordered and governed space. The additional layer of smart censors, a topic I cover in the next
theme, further contributes to a controlled governance of the territory of the Silicon Docks.
Boston
Like Dublin, Boston’s Seaport Innovation District, benefitted from a robust innovation
ecosystem that included a large pool of educated workers, a plethora of universities, anchor
institutions, venture capitalists, and what the startup industry calls C-Suite executive –corporate
executives well versed in the various stages of the firm cycle and management who can provide

77
mentorship and coaching services. Boston’s efforts to create an innovation district in the South
Boston Waterfront were quickly circumvented as soon as the real estate market bounced back.
Small startups in Boston are now more likely to take over spaces in the buildings in the financial
district that the financial and legal companies abandoned in their move to the luxurious South
Boston Waterfront (personal interview, 2016).
Today, the space of the Innovation District, more commonly called by other names rather
than the moniker used by Menino, is an enclave for the wealthy: “the empty nesters, investors,
and people who live there five months of the year” (architect, personal interview, 2016). Unlived
in condos that sell for an average of $2,117 per square feet are flipped for at least $500,000
above the original price (T. Logan, 2016a). Affordable housing is non-existent and rents have
skyrocketed (McMorrow, 2013). High-end boutiques and destination restaurants line the
waterfront and luxury vehicles navigate the streets.
Considering the connectedness of the peninsula and the superior opportunity for real
estate developers to command prices for waterfront property, high-end development was always
the intended land use purpose. Menino’s embrace of the innovation district concept and his
ironclad grasp of its branding served as a veil to trigger capital investment in the South Boston
Waterfront.
State of the land prior to the innovation district
The first step in uncovering the development outcome of the Boston Innovation District
is understanding the land use and planning mechanism that govern development on the South
Boston Waterfront. As a coastal city, urban planning in Boston has always been closely
intertwined with waterfront regulations. In 1991, the city of Boston developed a Municipal
Harbor Plan for the downtown, North End, and Charleston areas of the waterfront and this
document formed the basis for the South Boston Waterfront master plan. A second regulation
stemming from the Massachusetts Department of Environmental Protection Public Waterfront
Act, more commonly referred to as Chapter 91, is a public trust for access state tidelands and
waterways (Environmental Permitting in Massachusetts, 2003: p. 35-36). Any plans for the
South Boston Waterfront must adhere to Chapter 91, in addition to navigating the federally
owned land at the Marine Industrial Park, a 190-acre dock previously used as warehouse space
for the South Boston Army base. In 1983, the city created the Marine Industrial Park by
purchasing the Bronstein Industrial Center, a massive complex to store military supplies, and the

78
neighboring properties from the U.S. Army and Navy, to create the Marine Industrial Park (“The
Innovation and Design Building,” 2018).
Menino’s proposed Innovation District was a 1,000-acre boundary that included four
neighborhoods: Fort Point, Seaport Square, Fan Pier, and Marine Industrial Park. The Innovation
District was not the first time these 1,000 acres were cobbled together. In 1999, the Boston
Redevelopment Authority (BRA), under Menino’s orders and with the assistance of urban design
firm Copper, Robertson, the same designers for Australia’s Sydney waterfront and Battery Park
City in Manhattan, developed the Seaport Public Realm Plan. This was followed a year later by
the South Boston Waterfront Municipal Harbor Plan. Both of these documents to guide
development and land use on the 1,000 acres of the southern peninsula.
Menino was explicit in his desires for new development to create a vibrancy unlike the
after-hours dead zones typical of central business districts.12 Importantly for him, this would be
accomplished through the inclusion of housing. The Seaport Public Realm and the South Boston
Waterfront Municipal Harbor Plan outlined the importance of mixed-use construction that
fostered a vibrant 24-7 community. The plan outlines guidelines for housing, open space, and
height. Housing would be the dominant component comprising 40 percent of development
activity and was to be affordable to prevent housing prices from rising in the adjacent
neighborhoods. Punctuating this, Thomas O’Brien, director of the BRA, states, “The new
housing to be developed must also have a sizable affordable component, and the BRA will not
allow only the affluent to have the opportunity to live in this area” (The Seaport Public Realm
Plan, 1999: p. i).
Following the Seaport Public Realm and the South Boston Waterfront Municipal Harbor
Plan, a wide variety of planning documents were generated and approved by the BRA for
development of the Seaport, but none encompass the complete 1,000 acres of the Innovation
District. Rather, each neighborhood now has its own sub-plan that build on the maiden
documents: Fort Point District 100 Acre Master Plan (est. 2006), the Fan Pier Master Plan (est.
2007), the Seaport Square Master Plan (est. 2010), and the Boston Marine Industrial Park,
currently under progress.
12 In 1999, the term ‘innovation’ was not the buzzword it is today in 2018 and thus this term does not appear in these master plans in the same way the word and concept of a 24-7 neighborhood overtakes later planning documents. The main emphasis is development targeting residential, commercial office, hotel, retail, and tourist industries.

79
Open Access: The Big Dig
The single largest factor influencing development of the South Boston Waterfront was
the Central Artery/Tunnel Project, a megaproject referred to as the Big Dig. Listed as the most
expensive highway project in the United States, the Big Dig, was an infrastructure project that
connected central Boston to the South Boston Waterfront through the construction of two
underground tunnels (I-93 and I-90) and the extension of the Silver Line connecting the
peninsula to the airport. The Big Dig, which broke ground in 1982 and was completed in 2006,
was rife with cost overruns that inflated the project from $2.6B to $14.6B, continuously ran
behind schedule, and was fraught by the death of an individual due to a ceiling collapse (Flint,
2015).
A report commissioned by the Massachusetts Transit Authority listed the following
benefits for the South Boston Waterfront as a result from the Big Dig: an estimated $7 billion in
private investment, more than 43,000 jobs, 7,700 new housing units, 1,000 affordable housing
units, 10 million square feet in office and retail space, 2,600 hotel rooms, $5-6 million in from
construction worker wages spent in state income tax and sales revenue, and between 9-11
percent growth in property tax revenues (Daniel, 2006). Commenting on the report, Richard A.
Dimino, the president of the Artery Business Community, a coalition of business individuals
developed with the sole purpose of guiding Big Dig development, stated that the efforts of the
Big Dig, ''demonstrates a wonderful story about how Boston's new central highway system sets
the stage for economic growth going into the next millennium” (Daniel, 2006).13 Of course, this
could only happen “as long as development continues” (ibid). As a financial boondoggle, it was
imperative that the city and the state recoup investments from the project and the South Boston
Waterfront presented that opportunity.
Menino and the BRA
A second critical factor that influenced the development of the South Boston Waterfront
was Menino’s relationship to the BRA. When Mayor Marty Walsh took over as the Mayor of
13 The Artery Business Community, now known as A Better City (ABC), is a nonprofit with a governing board of business and institutional leaders. Recognizing the benefits that would result from the new connection, ABC banded together to represent the interests of the business community and to involve themselves as key intermediary between project officials and the City of Boston, convening meetings on everything from construction mitigation to the number of highway ramps that would serve the downtown (“Our Origins: The Artery Business Committee,” n.d.). To date, ABC continues to work with the Massachusetts Department of Transportation and the City of Boston and is in the process of working on a proposal for a long-term transportation plan that will alleviate some of the congestion issues already evident in the commute in and out of the South Boston Waterfront (Powers, 2013).
80
Boston, one of his first initiatives was to “clean out” the BRA and reconfigure the organization
under a new title, the Boston Planning and Development Agency. “Let’s face it. ‘Authority’ is so
authoritarian,” said Brian Golden, director of the Boston Planning and Development Agency
(cited in Clauss, 2016). And under Menino’s leadership, it certainly was.
Created in 1957, the BRA controlled all economic development planning and real estate
permitting in Boston. A board of five appointed by the Mayor run the organization, giving the
Mayor full reign over its powers. Past Mayors opportunistically used the BRA’s power of
eminent domain to raze neighborhoods and build signature sky-scrapers (McMorrow, 2014). The
BRA owns its own land, collects its own revenues, and manages its own budget (ibid).
Importantly, Menino used his power over the BRA to syphon development in the South Boston
Waterfront. Any new development in Boston requires approval by the organization. For the
Innovation District, development required a final sign-off by the Mayor himself. Furthermore,
Menino played favorites. He facilitated development in the Seaport for his friends while rejecting
applications from those not in his favor (Diesenhouse, 2015; McMorrow, 2014).
Existing Developments: The Cyber District and other failed attempts to attract tech
In 2010, when Menino declared the Innovation District, the peninsula was not completely
barren. Commonwealth Pier, a working port built at the start of the 1900s underwent renovations
in the 1980s and 1990s converting the port into the World Trade Center and the neighboring
Seaport Hotel.
Located farther east on the peninsula was the maritime activity of the Marine Industrial
Park. While much of the South Boston Waterfront was projected for luxury development, the
Marine Industrial Park was to be protected for marine activity. In the early 2000, development
favored the maritime industry with thirteen seafood processors, and marine industrial terminals,
dry docks, and warehouses located on-site. The Big Dig transformed the 35-60-minute commute
into a 10-minute commute for transporting seafood. The maritime industry looked forward to
freight rail service that would connect to the Marine Terminal. This was a center for skilled blue-
collar jobs and new innovations related to marine activity were occurring at the time.
Commenting on their spectacular fortune, fish purveyor Roger Berkowitz said, “We'll be able to
do things that we can't do at our other locations, like make chowder stock from fresh fish bones"
(Diesenhouse, 2003).

81
For a while in the mid-2000s Menino considered selling off the Marine Industrial Park
citing that there was not enough marine related activity to occupy the space. Under contention
was the Bronstein Industrial Center, a 1.4 million square foot horizontal building spanning
multiple blocks. Menino flipped back and forth on the appropriate use of this building. Initially,
when he wanted to sell off the massive parcel, he stated that the Bronstein building on site was
not suitable for industrial uses. The industrial sector wanted ground floor access, he opined, and
not a building with multiple floors. Yet later, when an opportunity arose for Cargo Ventures to
convert the building into office spaces, Menino rejected the proposal fearing that it would trigger
office development across the South Boston Waterfront and stating that the proposal suggested
using the building in a way that would not support industrial and blue-collar jobs (Palmer, 2008).
Perhaps, undergirding the uncertainty was the push-back Menino received from South Boston
politicians for not protecting blue-collar jobs. Regardless, as market forces take over the
peninsula it becomes evident that the South Boston politicians’ concerns are discounted.
Except for the uncertainty of the Marine Industrial Park, there was no reason to negate
that eventually high-end development would overtake the South Boston Waterfront. Speculations
on the benefits of the Big Dig had spurned development activity from private interests and from
Menino. Menino was concerned that private interests were dictating the growth direction
proposing high-rises and sport stadium developments. Considering that federal, state, and local
government coffers funded $20B to prime the peninsula (i.e., cleaning of the Boston Harbor and
construction of the Central Artery, the Silver Line Transitway, the Third Harbor Tunnel, and the
Boston Convention and Exhibition Center), Menino felt it imperative that a doctrine protecting
the public use of space and dictating private development was in order (The Seaport Public
Realm Plan, 1999: p. i). This order also functioned as a way for Menino to ensure he had the
final say on unfolding development.
In 1997 Menino began promoting the idea of creating a Cyber District in the South
Boston Waterfront. The Fort Point neighborhood, home to one of the largest arts communities in
Boston featuring an older brick urban fabric and warehouses that were turned into galleries in the
1970s, was starting to demonstrate the formation of a technology cluster. Dot-coms, new media,
technology companies, web design shops, and internet consultancies were moving in. Even a
Computer Museum was operating in the space. There was reason for Menino to be hopeful.
Development in Boston was flourishing. The office vacancy rate was 1.3 percent. Buildings in
the South Boston Waterfront were leasing for $42 – 47 a square foot in the area while in the

82
financial district they were around $65 a square foot and the city (Krasner, 2001). The eventual
completion of the Big Dig could only accelerate the development of the South Boston
Waterfront. It seemed an opportune time to push development in the South Boston Waterfront
until the tech bubble burst (Real estate consultant, personal interview, 2016). This was a definite
set-back for Menino’s vision.
The Institution of Contemporary Art (ICA) was also located on the peninsula. In 1999,
the Pritzker family of Chicago, who owned 21-acres of the South Boston Waterfront intended for
a $1B hotel, condominium, and office complex in Fan Pier, put out a bid for a cultural
component of their development on a donated .75-acre parcel of land. Of the three proposals
formally unveiled, Menino selected the ICA (Flint & Abraham, 1999). The ICA signed a 99-year
lease for $1-per year and worked out a massive fundraising campaign for construction (Leblanc,
2003). The 62,000-square-foot building designed by architects Diller Scofidio + Renfro opened
in 2004. The building, which features a large public patio with contemporary bleacher-like
seating prominently facing the water, is one of the few low-rise buildings on the site. Today it is
towered by glass high-rises.
In 2005, Fallon, president of Fallon Company, purchased the 21-acres of land from the
Pritzker family of Chicago for $115 M for a $3B for a mixed-use development of office
buildings, five-star hotels, luxury condominiums, and high-end retail. In 2006, John Hynes, a
Boston millionaire, purchased 23-acres of to develop luxury, shops, condominiums, mixed-use
development, and retail.
In 2008, the recession hits and City Hall halts all construction and marketing on the South
Boston Waterfront, once again challenging Menino’s visions of prosperity for the peninsula
(state representative, personal interview, 2016). Yet, Menino was persistent. In 2009 he founded
and chaired an organization called Boston World Partnership. The aim of the organization, run
by Brian McLaughlin, the former marketing director of the BRA, was to promote Boston’s
competitive advantage by connecting companies to an extensive network of “Connectors”
invested in retaining growth-minded businesses in Boston. Boston World Partners was initially
funded by $1M from the BRA and $400,000 in seed funding from Procter & Gamble (Psaty,
2010). Later, Boston World Partnerships received an additional $170,000 from a foundation run
by State Street Corporation and Fidelity Investments (Kirsner, 2010).
In 2009, Boston World Partnerships claimed responsibility in generating a lead between
the City and Retail Convergence, an e-commerce company, to convince the company to relocate

83
from Downtown Crossing to the Seaport (“Mayor Menino Welcomes 600 New Employees to
Fort Point Channel,” 2009). Boston World Partnerships calculated that their connection
translated to $14M in immediate salaries for the 100 new employees the company hired (Psaty,
2010). When these connections were brokered, Fidelity was active in the Seaport and Procter &
Gambel’s Gillette factory sat right on the edges of what was to become the innovation district
boundary. State Street Corporation, though not located in the Seaport at the time, moved there
soon after the announcement of the innovation district. These organizations had a vested interest
in the ongoing development of the South Boston Waterfront as, at this point, they were still
surrounded by parking lots and limited amenities.
Menino’s Innovation District: Setting the Plan in Motion
Whereas previous development was fragmented and saw a series of fits and starts, the
innovation district was Menino’s opportunity to build a neighborhood wholesale. Menino
achieved this concretely focusing on a handful of innovation related elements and then allowing
the market to take over.
After Menino publicly declared Boston’s Innovation District he insisted that the BRA and
all efforts moving forward brand the neighborhood with the new name (developer, personal
interview, 2016). The rebranding of the South Boston Waterfront is starkly evident in the
marketing materials that followed his announcement.
The initial master plan for the Seaport Square neighborhood was developed in 2008 by
the New York based firm Kohn Pedersen Fox Associates (KPF) with Hacin + Associates acting
as the local urban design consultant. Not once in the 1354 paged version of the 2008 master plan
available on the Boston Planning & Development Agency website does the word innovation
appear. However, in 2010, following on the heels of Menino’s public declaration of the
innovation district, Hacing + Associates in collaboration with the real estate agency, Boston
Global Investors, a new executive summary of the master plan is released. This document is rife
with innovation district rhetoric.
Adding to the momentum, Menino assigned his staff to continuously deliver
presentations on his Innovation District. These documents, too, are filled with the promise of
how space can fuel innovation (Hammar, 2010; consultant, personal interview, 2016).
Providing a base for MassChallenge, an incubator that began in 2009 and now has offices
across the globe, helped sell the brand of the South Boston Waterfront as a 1,000-acre cubicle for

84
innovation. When the recession hit, John Fallon could not advance on his $3B destination
neighborhood vision. When Menino received the tip that MassChallenge was looking for new
space, Menino negotiated with Fallon for free rent in the 14th floor of Fallon’s building on One
Marina Park Drive in Fan Pier (state representative, personal interview, 2016). Venture capital
firm, Spencer Trask & Co, and MassChallenge launched the start-up competition promising to
award $25,000 for a business willing to locate in the Seaport Innovation District. This activity
signaled that the new part of the city was going to be focused on innovation. It also signaled
flexibility in the space and growth in creating a cluster.
In an effort to include civic space to anchor the district, Menino commissioned the
development of District Hall. District Hall, a $7 million, 12,000-square-foot, free-standing public
innovation center, was built “to foster collaboration among the young businesses and
entrepreneurs” providing a “place or them to gather, innovate, and create jobs”(Farrell, 2013)
Unlike other innovation spaces in the district that are not easily accessible and guarded by
private security, one of the benefits of District Hall is that it is open to the public and contains
conference space, labs, and classrooms for budding entrepreneurs. The building was built by
Boston Global Investors a part of its 23-acre development and is leased to the city for $1 a year
for five years. After five years, the city could renew their lease (ibid.).
Three years into its development, Menino recognized the need to meet the demands for
affordable housing. To meet Menino’s vision for a 24-7 neighborhood inclusive of artists,
Menino created new zoning ordinances approved for the development of houses called
InnoHousing—much smaller in size than the average apartment and include shared kitchen and
communal living spaces. Menino approved a $150M housing development with micro-units, as
low as 300 sq ft dormitories with shared living spaces and elements for communal lifestyles
(Casey, 2010). West Coast development firm Gerding Edlen Cos, agreed to build these micro-
units stating of the neighborhood that the area is “a unique place where art, creativity, and
innovation all collide" ( Kelly Saito, president of Gerding Edlen, cited in Casey, 2011). The first
units were designated for the Fort Point Channel neighborhood. They cost $150M to build and
they replaced a 5-story warehouse. Of the 200 units to be built, 19 were to be rented below
market rates. “They were designed for a startup crowd but are actually targeting a richer
demographic, perhaps one that lives in the suburbs but may want a place to stay overnight now
and again” (non-profit executive, personal interview, 2016).

85
Larger space needs for larger companies
The innovation brand was a way to get momentum going. However, the reality of the
location and the amount of open and available land for development meant that the Seaport
required larger, more established legal and financial firms, such as those anchoring the district
today, to bankroll the development.
Large corporations wanted to be part of the energy and tap into innovation potential.
Many of these companies have internal entrepreneur programs with successful products sold
through their sales channels. They might not be innovative companies themselves, but they
outsource innovation. Autodesk and GE are examples of large corporations that want access to
what is happening in the marketplace in order to be more competitive and to retain their
employees. Some of them build entire floors for companies not in their competitive space (state
representative, personal interview, 2016).
In 2011, Vertex’s move to the South Boston Waterfront served as a signal that Menino’s
vision was coming to fruition. Vertex had recently received FDA approval for a new drug, which
shifted their status from a funky creative R&D lab in Kendall Square to a major pharmaceutical
company (Real estate consultant, personal interview, 2016). When Vertex had the opportunity to
build, they could not find enough space in Kendall Square. They wanted to demonstrate to the
world that they had a business model that could scale up. People taking off from Logan Airport
could see a shiny building with the Vertex logo (Real estate consultant, personal interview,
2016). Vertex received tax breaks for moving to the Seaport. Thus, when Menino declared the
innovation district there was not much money in city coffers for additional development (non-
profit executive, personal interview, 2016).
Moving to the innovation district served as a way for a company to rebrand their image.
In 2016, GE was looking for a flagship location that aligned with their Internet of Things
direction. However, moving to the South Boston Waterfront also made sense because there were
still large open parcels for an established company to build. GE could now reside within the
boundaries of a city as opposed to their prior suburban Connecticut location, breach a connection
to P&G, while also gaining direct access to talent. The deal was sweetened by $150M in state
and local incentives for its promise to bring 800 jobs (T. Logan, 2018).
Procter & Gamble, the parent company of Gillette, agreed to sell GE 2.5 acres of the 44-
acre Gillette campus for GE’s move to the Seaport. The company will rehab two empty brick
warehouses that used to house the New England Confectionary Company, and also construct a

86
new building. Since privately owned real estate does not qualify for state incentives, to secure
these benefits for GE, the BRA agreed to own the buildings and lease them out to GE. GE could
then occupy the buildings rent free for up to 20 years (T. Logan, 2016b).
When Jeff Immelt, the CEO of the GE, was asked why he decided to relocate the
company from the suburbs of Connecticut to the Seaport, he replied, "I want [employees] to walk
out of our office every day and be terrified. I want to be in the sea of ideas so paranoia reigns
supreme. To look out the window and see deer running across? I don't care about [that]" (cited in
T. Logan, 2016b). This comment demonstrates a shift from the ideal of a pastoral and secluded
environment to an open network.
Amazon also moved offices to the South Boston Waterfront. In May of 2018, Governor
Baker of Massachusetts said it would spend $20M to bring Amazon to the Seaport along with tax
breaks of up to $5M from the city of Boston. In exchange, Amazon agreed to create 2,900 full-
time corporate office jobs (T. Logan, 2018).
The market change led to a different type of development than what was initially
projected. Parcels in the Seaport are already claimed and built to the maximum amount. Now the
people scouting the place represent well established companies looking for new construction and
floor plans that are big and well laid out and conducive to new construction, rather than trying to
occupy smaller, multiple floor spaces (non-profit executive, personal interview, 2016).
By square footage the significant majority of the office, residential, and hotel are not
innovation economy. They are traditional business tenants, high-end condos, and high-end retail
(Real estate consultant, personal interview, 2016).
Today, it is almost impossible to find large parcels of land available. Whether that means
the larger companies will buy out a series of smaller companies to expand their operations
remains to be seen. Either way, companies needing larger footprints need to seek space
elsewhere. This also applies to the larger manufacturing companies that resided in the peninsula
before market forces took over but can no longer afford to renew their leases.
Detroit
The origins of the Detroit Innovation District strategy began at the state level. According
to individuals driving the development of the Detroit Innovation District, Bruce Katz played a
role in highlighting existing assets and resources that could be leveraged to create an innovation
district in 2008, years before the 2014 official announcement (personal interviews, 2015-2016).

87
In December of 2013, the Brookings Institution, in tandem with Business Leaders for Michigan,
a non-profit consulting and research arm of the state of Michigan; The Reinvestment Fund, a
community development institution with offices in Philadelphia and Baltimore; Public Sector
Consultants, a research and program management firm; and the Michigan Municipal League, a
non-profit business management consultant organization, collaborated to develop firm aims and
objectives for the district (Detroit Innovation District: Physical Place Working Group, 2014).
The committee agreed that Governor Snyder would formally declare the district,
determine a team to deploy the idea, and then officials in Lansing would step back to allow local
Detroit leaders to implement the district. The committee selected Detroit as the location for the
first innovation district because they feared that a faltering Detroit would negatively impact the
remainder of the state. As one individual on the advisory committee expressed, “Detroit has to
do well, or the rest of the state will not do well when it comes to international commerce” (real
estate company representative, personal interview, 2015).
The move of the innovation district strategy from the state level to the city level
implicated local Detroit foundations. Foundations in Detroit already had a rich history of funding
revitalization efforts in Downtown and Midtown. The New Economy Initiative (NEI), the
strategic grant-making branch of the Hudson-Webber Foundation, has been instrumental in this
respect investing over $50 million in the area since 2010 (Detroit Innovation District a New
Economic Development Designation, 2014; foundation head, personal interview, 2015). Under
the executive leadership of the mayor and with input from the NEI and Mass Economics, the
organization hired by the NEI to consult on the development of the Detroit Innovation District,
an advisory committee of 18 individuals was created as the public face and steward of the Detroit
Innovation District. This star-studded cast represents home grown entrepreneurial initiatives and
leaders of all the major public institutions and private corporations within the Detroit Innovation
District boundary. Three working groups sit below this advisory committee, each focused on a
specific area of development: 1) Physical Place, 2) Innovation and Commercialization, 3)
Building Detroit’s Knowledge Economy. These groups, made up of ten to twelve people, are
tasked with presenting concrete plans for their respective areas to the advisory committee.
By May 2014, the local Detroit committee had revised the state-level draft to adapt it to
local context. The overarching vision in this document is that the innovation district would raise
the status of Detroit to “be a globally recognized center of ideation, commercialization, and
talent that powers economic opportunity for the residents of the city and repositions Detroit’s

88
role in the national and global economies” (Lewis, Lynch, & Vey, 2014: p 8). This local draft
aims to provide a firm governance structure and leadership platform to target reform within the
district and calls for a Detroit Innovation District manager to oversee development in the district
and to formalize economic, physical, and networking asset development while having a direct
line to the Mayor, as the city is the lead actor in the Detroit Innovation District effort.
Highlighting how revamping buildings is based on tech imperatives, in February 2015 the
space commission presented to the Advisory Committee with the number one recommendation
to focus on updating the building infrastructure. The recommendation was based off of a study
that revealed only 4% of the buildings in the district were built after 1980 and the remainder are
not conducive to current technology needs. This statistic signaled the need to reinvest in the
infrastructure of the central business district. In addition, part of the work that emerged from
these early meetings was deriving an asset inventory for Detroit. The assets highlighted as part of
the Detroit Innovation District include (see figure 28).
Figure 28: Detroit Innovation District asset inventory
The concentration of these institutions in the downtown core and the inadequacy of the
“right” infrastructure to support a knowledge-based economy played a major role in the decision

89
to overlay an innovation district in the downtown neighborhoods (The Detroit Innovation
District: Recommendations for State Alignment and Investment, 2013). According to drafts for
the innovation district, the decision to focus on the New Center, Midtown, and Downtown
neighborhoods was also a result of the demographics. While most of Detroit was losing its
population, in the May 2014 draft outlining the innovation district strategy, the targeted area
comprised 3.1 percent of the city’s land area, a little over 3 percent of the city’s population
(22,018), 52 percent of the city’s employment base, and 9 percent of its business establishments
(4,700) (Lewis et al., 2014). Despite employment decline in the city, the Central Business
District demonstrates growth. Investments were also concentrating in that area with over $880
million invested in the Central Business District, Lafayette Park, and Rivertown areas between
2010 and 2012 (7.2 SQ MI Report: A Report on Greater Downtown Detroit, 2013).
Considering the upward trends in growth and investments already occurring in the
downtown, accelerating revitalization became the central justification in labeling the space an
innovation district. As one respondent at the state level stated when asked the purpose for an
innovation district in Detroit:
“[T]his should be something where we are unabashed and unafraid to say, we’re
gonna double down in this area because it is important, because we cannot fail.
And so, it doesn’t mean we’re screwing over the rest of the state, it doesn’t
mean we are not going to invest anywhere else, but we are absolutely going to
prioritize some commitments here” (consultant, personal interview, 2015).
Though the innovation district declaration ignited excitement for a future Detroit,
definitional issues of innovation quickly materialized in relation to what space the border would
encompass: Does Corktown, the neighborhood with a high concentration of makerspaces, qualify
as producing innovative activity? Is it contradictory to include Easternmarket, the public food
market that provides fresh produce to the city, as part of the innovation district? On one hand, the
crowds it generates displays the urban vibrancy innovation district strategy seeks to foster, on the
other hand, it is zoned for slaughtering animals, not necessarily an innovative activity. Also,
what is the relationship and responsibility of the innovation district, which encapsulates
Downtown and Midtown Detroit, to the remainder of the declining city?
Stakeholders harbor conflicting expectations and misperceptions on what the innovation
district represents. This discrepancy is evident in a variety of ways, from a definitional

90
understanding of innovation to issues of governance and battles over the boundaries of the
district.
Figure 29: Detroit Innovation District border disputes
In the 2014 public declaration of the Detroit Innovation District officials did not specify
the exact geographic boundaries of the district, preferring instead to name general areas it would
encompass. The Woodward Avenue corridor is highlighted as a focal point in all maps of the
innovation district. The main differences between the various iterations are the fluctuations with
the Corktown neighborhood line on the western border and the New Center neighborhood on the
northern border. In all maps, Eastern Market remains outside of the district (see figure 29).
Unlike the formerly bustling urban agriculture markets in Chicago and New York with
warehouse structures now converted into trendy lofts or office spaces, Detroit’s Eastern Market
maintains its economic vitality as an operating market in the heart of the city. Depending on
whom you ask, Eastern Market sits either on the periphery or within the boundaries of Detroit’s

91
Innovation District. This is an important distinction. Proponents for its inclusion argue that urban
agriculture is a growing sector with opportunities to demonstrate innovation through leadership
and new conceptions of agricultural production. In addition, as a popular destination for a diverse
array of people, Eastern Market epitomizes the type of spontaneous interaction innovation
district boosters proclaim as necessary for innovation. In fact, in 2013, MIT recognized Eastern
Market as a prime example of urban place-making (Silberberg, Lorah, Disbrow, & Muessig,
2013). However, opponents’ concerns center on the health and sanitation issues posed by an
industry that slaughters animals on site. This raises questions about the imaginary of innovation
and if agriculture and livestock too closely connote an antiquated model of production not
suitable for the tech economy.14
The concept of an urban laboratory–what an innovation district seeks to become,
mobilizes an aspirational imaginary of what form the district should assume and what activities it
should house (Karvonen & Van Heur, 2014). Spatially, a tension exists in determining the hard
lines between where the innovation district begins and where it ends. But this same tension is
evident in terms of the types of knowledge that can exist within the space. Here is where
individual sociotechnical imaginaries come into play. Whereby one individual adamantly
believes that it is incorrect to target specific sectors because it will limit the possibility for new
innovative and emergent sectors, another feels strongly that “[MSU’s] music school, isn’t
necessarily helping in the innovation space” (Foundation head, personal interview, 2015). When
asked what elements do not belong within the space, one respondent’s answer included the jail
residing in the Downtown15, heavy manufacturing, and a single-family house on 50 acres
enclosed by a white picket fence specifying:
“So I think that there are a number of different things and not all of them
negative, they just don’t belong in the area, if you define it as a dense, vital,
connected environment, just intuitively as you go through the list, you say, ‘ok,
14 Within the smart cities literature there is a strand focused on deconstructing future-oriented imaginaries. See for example Rabari & Storper (2015) and Shelton et al., (2015). For an excellent spatial discussion on ascribing problematic values to a space as a type of government rationality, see Huxley (2006). 15 On April 2016 Dan Gilbert unveiled a plan to build a soccer stadium at the 15-acre jail site in Downtown Detroit. This is not a formal plan since Wayne County still owns the site and expects to proceed with development of the jail. However, Gilbert’s influence in Detroit is significant. MLS Commissioner Dan Garber was present at the announcement, which was held at Rossetti Associates Inc.’s Detroit headquarters as they are the architectural firm behind the 500,000-square-foot soccer stadium and 500,000 squared-feet surrounding area design (Shea & Pinho, 2016).
92
this makes sense and this doesn’t” (private company executive, personal
interview, 2015).
Another respondent said, “I think that there are innovative things that are going on in the
craftsman side as well that probably don’t fit most people’s definitions, but they do from an asset
building perspective for us” (venture capitalist, personal interview, 2015).
Fundamentally, the disagreement is based on disagreements at the leadership level on the
role of the innovation district, as well as what constitutes as innovation. It is difficult, if not
impossible, to pin down innovation to any one location. A few elements remained consistent
regarding the understanding of what an innovation district would mean for Detroit. The first is
that the district would function as a special zone for funding priorities at the state, as well as
justification for federal asks for additional financial support in that concentrated area. It is also an
area where the Mayor would support and advance changes in zoning regulations. These priorities
highlight the preference for securing territory.
St. Louis
Detroit and St. Louis both share the complexities and challenges of shrinking
populations, struggling economies, and a diminishing resource base (Beauregard, 2013;
Hollander et al., 2009). In addition, both cities have a legacy of racial conflict and securing
housing for black populations (Farley, 2005; Sugrue, 2014). One major difference between the
Detroit Innovation District and St. Louis’ Cortex Innovation Community is the concentrated two-
decade long effort by the St. Louis growth machine to develop a regional strength in bioscience.
On account of this, the Cortex Innovation Community has undergone many iterations. Still,
mechanisms to secure territory were evident in the mid- to late-1990s and continue to the present
day with Cortex’s latest phase, what they are calling Cortex 3.0.
The origins of Cortex are fragmented with respondents pinpointing different start dates.
One reason for this is that the assembly of parcels and buildings that now form the Cortex
Innovation Community were added through a piecemeal process. Another major reason is due to
the way Cortex is conceived. Leadership views Cortex as an “idea, and organization, and a
place” (An ord. approving the development plan for Cortex West Redevelopment, 2006: p. 6). For
some, Cortex began when the idea of building a science park was conceived. For others, it is
when a group of leaders incorporated as Cortex. Still for others, it is when the purchase of a

93
building marked a physical location where Cortex could exist. Despite variations, the shared
commonality across origin stories is a culture of service, marked by powerful leadership, and
financial contributions.
The legally recognized beginning of Cortex is in 2002 when founding members from the
area institutions and civic realm incorporated as a tax-exempt 501(c)3 under the name the Center
of Research, Technology, and Entrepreneurial eXpertise, known as Cortex for its acronym.16
However, to begin in 2002 is to gloss over earlier efforts by the St. Louis growth coalitions to
develop a science-centric rhetoric that assisted in the clearing out of the large swath of land on
which Cortex both exists and owns.
Cortex stakeholders influential in its inception refer to four catalytic reports that cleared
the path for economic development policies focused on growing the plant and science sectors.
The first study was commissioned in the 1980s by the Science and Technology Committee of the
St. Louis Regional Chamber and Growth Association (RCGA). This report identified the land
between Washington University’s and Saint Louis University’s campuses as the ideal location
for the development of Technopolis, a high-service corridor to connect the campuses (Winter,
2006), but with the added emphasis on technology.17 The second report, a weeklong series of
articles published in the St. Louis Post-Dispatch in March of 1997 collectively called the Peirce
Report, elaborated on the idea of Technopolis envisioning it as a 1,000-acre urban research park
connecting the two campuses (ibid.). The Battelle Memorial Institute, an applied science and
technology development company based out of Ohio with an office in St. Louis, commissioned
the third and fourth reports. Both Battelle reports highlight St. Louis’ regional potential for
national recognition as a business hub for the plant and life sciences, designated by the name
BioBelt (Life Sciences & Missouri’s Economic Future: An Opportunity to Build “One
Missouri,” 2003).
The four reports influenced growth coalitions to target development in the land between
the WashU and SLU campuses and to focus on the plant and life science sector. However,
considering funding sources, some question the legitimacy of the reports wondering whether “the
reports are valid or simply a case of a hired consultant telling biotech boosters what they want to
16 The X in Cortex was later changed to ‘Exchange’ to give it its present name: Center for Research, Technology, and Entrepreneurial Exchange. At a later point, CORTEX changed its logo from the all-caps CORTEX to Cortex. For consistency, I use the contemporary spelling ‘Cortex’. 17 The concept of “technopolis”, high-technology based economic development, began in the 1960s and 1970s as a regional development strategy that aligned with the growth of suburban office and research parks. The strategy appeared around the globe in places such as Japan, Southern California. For a good review see Preer (1992).

94
hear” (Melcer, 2005). Bolstering this sentiment is the long-term management (1994 – 2011) of
the RGCA by Richard Fleming. Prior to his arrival in St. Louis, Fleming was involved in
Denver’s downtown revitalization. Fleming forced conversations on the economic development
of the region (Winter, 2006), first through the Peirce Report, and later by commissioning a trip
for Cortex leadership to visit the Massachusetts Institute of Technology (MIT), a university with
an established reputation for actively investing billions of dollars executing the reimagination of
its bordering neighborhood Kendall Square.
The concept of building a Technopolis in St. Louis caught on. The University of
Missouri-St. Louis was the first to attempt executing the Technopolis vision through an incubator
called the Center for Emerging Technologies (CET). A joint endeavor between the University of
Missouri-St. Louis and the Missouri Department of Economic Development founded the CET in
1996 as a 501(c)3 with representatives from the major institutions, government, and the private
sector. In 1998, spurred by the Technopolis concept and the growing interest in downtown
development (Winter, 2006), the leaders of the CET decide to relocate the incubator in the space
the RGCA reports pinpointed for Technopolis. Thus, the city of St. Louis, using the CET as the
legal entity, purchased an abandoned warehouse on Forest Park Avenue for $500,000. Using
$1.5M in tax increment financing, Paric Corporation gutted and remodeled the abandoned
warehouse (Kurtovic, 2013). In June of 1998, CET opened its doors for the first time at 4041
Forest Park Avenue. In multiple media reports celebrating the opening of the CET, Marcia
Mellitz, president of the CET, hails the foundational importance of CET as the first step in
achieving the Technopolis vision: “We haven't begun to tap the potential that is here," she said.
"It is well beyond a couple of buildings" (Goodman, 1999). The arrival of CET is the first
indication of escalating land prices in the section of land between the Washington University and
Saint Luis University campuses, an important fact that is later glossed over in a 2008 Missouri
Supreme Court decision to approve Cortex under Chapter 353 status, which bestows them with
the power of blight removal and eminent domain (Walter, 2008).
Financial Backing
Washington University was also heavily invested in the success of CET and the idea of
Technopolis. The CET board was comprised of representatives from Washington University.
Their interest was in the proximity of CET to their campus and the potential for their alumni to
use the CET as an incubator. Prior to the legal 2002 Cortex designation, William Danforth, then

95
Chancellor Emeritus of Washington University but still heavily invested in the university’s
success, asked John Dubinsky to oversee the development of Technopolis. Having held notable
executive positions as Chairman of the board of Barnes Jewish HealthCare, President and chief
executive of Westmoreland Associates LLC, presided over Mark Twain Bancshares and
Mercantile Bank, president emeritus of Firstar, in 2001Dubinsky agrees to Danforth’s request
(Tucci, 2002). By 2002, five are institutions (Washington University, the University of Missouri-
St. Louis, Sant Louis University, Barnes Jewish HealthCare, and the Missouri Botanical
Gardens) formed the anchor of Cortex, in addition to civic partners RCGA, Civic Progress, and
the City set up Cortex as an entity to develop a biotech corridor in midtown St. Louis. In May of
that same year, the Cortex backers publicly listed include: Harvey Harris, John Dubinsky, Lewis
Levey, William Danforth; Danforth Foundation, McDonnell family foundations, and Monsanto
Fund (Bolhafner, 2004).
By this point, Cortex comprised a group of individuals interested in growing the plant
and life science sectors but did not yet exist as a developer nor as a place. Shortly after
incorporating, Richard Fleming, of the RCGA, the same man who orchestrated funding the
Peirce Reports, bankrolled a trip for the Cortex leaders to visit Kendall Square in Cambridge,
Massachusetts (elected official, personal interview, June 17, 2016). It is at this meeting, which is
held at MIT, where Cortex leaders learned about the $600M contributed from MIT endowment
money to revitalize the area surrounding the MIT campus. In addition, they also learned about
the importance of university anchors and their role in funding innovation. This trip proved
catalytic in provoking the replication of the model in St. Louis (incubator executive, personal
interview, 2016; Smart People. Cool Places. The Story of Cortex, 2017).
For some, this trip, and the events that followed it, form the true beginning of Cortex. The
popular story is that upon returning from Massachusetts, Bill Danforth, convenes an impromptu
breakfast, held at the executive conference room of Barnes Jewish HealthCare, with a handful of
the most influential leaders in St. Louis. Danforth commanded a lot of respect in the community.
Of Danford’s leadership, one responded stated, “Bill is the kind of person you just don’t say ‘no’
to” (real estate developer, personal interview, 2016). As some insiders tell it, the night before the
breakfast, an unnamed source tipped off Danforth that a private developer wanted to acquire a
large track of derelict land on the Central West End (ibid.). Recognizing the importance of that
parcel of land, at 10 pm that same night, Danforth started a series of phone calls to invite key
96
individuals to an emergency breakfast. This was a breakfast purposely designed to raise enough
funds to purchase Cortex’s first official building.
Prominent individuals from the business community were present: the Mayor, university
and hospital executives, the heads of the Missouri Botanical Gardens and Civic Progress. At the
meeting, Danforth stressed the need to raise money to acquire the property. The trip participants
discussed findings from their trip to MIT and proposed the idea of assembling land to create a
district. Coming into the meeting, Danforth hoped to raise enough for the estimated assessed land
value of $60M. By the end of the breakfast meeting, Danford had raise $175,000 toward the
purchase of land (Smart People. Cool Places. The Story of Cortex, 2017).
Collecting $175,000 was only the beginning of how much money Cortex leadership
would secure for their vision, though now singularly called Cortex rather than Technopolis.
Following the catalytic breakfast, Cortex leaders held private individual meetings with leaders
from the five area institutions to procure funding with the agreement that after twenty years the
investment would be returned with interest. The first person they approached was Mark
Wrighton, Chancellor of Washington University. Wrighton, who was previously professor and
Provost at MIT, committed $15M to support the Cortex initiative. Once Washington University
demonstrated willingness to back the development, the other institutions agreed to follow suit.
Barnes Jewish HealthCare contributed $5M, Saint Louis University $5M, and the University of
Missouri-St. Louis contributed $4M. The Missouri Botanical Garden enthusiastically supported
the initiative but could not help in financing it.
Adding to the venture, in October 2003, the Missouri Finance Board voted to provide
$12M in tax credits over five years to buy land for Cortex, plus the Danforth Foundation, one
McDonnell family foundation, and Monsanto Fund pledge $2.5M.18 The $12M funding package
represented the first time the state of Missouri used public money to fund a project that extended
beyond a single building to creating a “long-term, revolving fund supporting a general idea in a
geographic zone” (Melcer, 2003; italics mine). As discussed in the next chapter, this is the power
of selling an idea, of selling something that moves beyond the tangibility of a material entity and
it succeeded in soliciting funds. It also releases any protection or potential public good over the
increased value of an area, which, prior to Cortex ownership, was public land. Slowly, over the
course of almost two decades, Cortex would take over the rights for eminent domain in 2006,
18 This was initially meant to fund BioGenerator’s proof-of-concept fund, but since Cortex decided to fund BioGenerator’s efforts, the $2.5M were instead used to acquire land through the use of tax credits
97
and then again in 2012 through a TIF designation giving them full control the area within the
legally approved Cortex boundary.
Securing Chapter 353 and its implications
Around 2003, media reporting on Cortex picks up. Whereas before, Cortex worked
behind the scenes as a group of individuals interested in the growth of St. Louis, 2003 marks the
period where the entity secures funding from federal, state, and local government coffers and
begins land acquisitions.
Having secured a sizeable sum of money and support from the City of St. Louis and
anchor institutions, Cortex was prepared to acquire land and develop it. To do so, Cortex decided
to seek Chapter 353 R.S.Mo 2000 status. The Urban Redevelopment Corporations Act,
commonly called Chapter 353, is a Missouri statute established in 1945. This statute allows
private developers to acquire and redevelop blighted land and authorizes the entity eminent
domain (Mo.Rev.Stat §§ 353.010-353.180 (1986 & Supp. 1988). On July 2, 2004, Cortex
incorporates under the legal title CORTEX West Redevelopment Corporation with Chapter 353
status (“Ordinance #66985,” 2006).19 On July 22, one year after becoming a legal redevelopment
corporation, the Board of Aldermen approves the ordinance finding and declares the parcel
Cortex is interested in developing as blighted as defined in Chapter 353 (“Ordinance #66847,”
2005). Soon after in September of 2005, CORTEX West Redevelopment Corporation submitted
their detailed development plan (“Ordinance #66985,” 2006). On January 4 of 2006, the
Planning Commission submitted a recommendation for approval of the plan based on findings
from an independent study and investigation that the area is indeed blighted and that the
redevelopment plan is both in the public interest and serving a public purpose. On February 16,
2006, the redevelopment plan is approved and Cortex, vested with full development authority, is
allowed to execute their plan.
Through its use of maps, geographical layout, and parcel inventory, the Cortex
development plan is certainly the type of plan an urban planner would comprehend. The Cortex
development plan outlines two redevelopment areas: CORTEX West and CORTEX East. The
CORTEX West 353 Redevelopment Area comprises of 180 acres between the Washington
University medical Center with Barnes Jewish Healthcare headquarters and flagship facilities
and the Frost Campus of Saint Louis University. The designated area extends from Newstead
19 Here I use the all caps CORTEX to match the legal documents submitted to the State of Missouri.
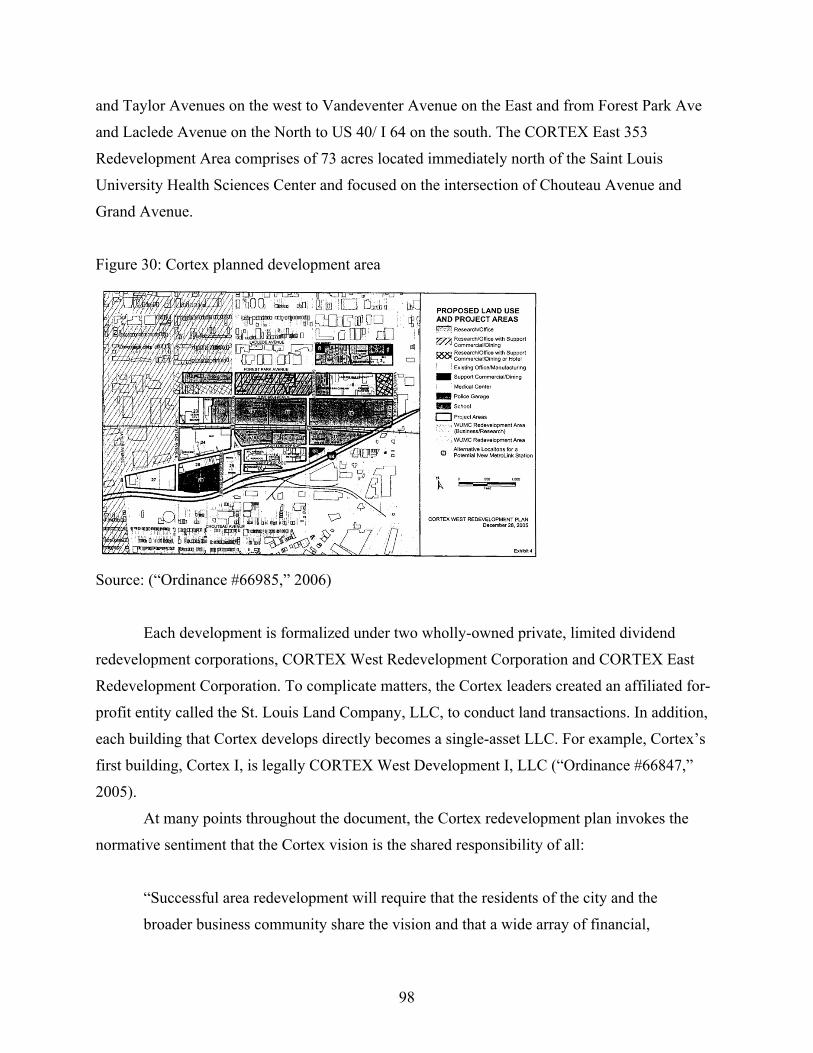
98
and Taylor Avenues on the west to Vandeventer Avenue on the East and from Forest Park Ave
and Laclede Avenue on the North to US 40/ I 64 on the south. The CORTEX East 353
Redevelopment Area comprises of 73 acres located immediately north of the Saint Louis
University Health Sciences Center and focused on the intersection of Chouteau Avenue and
Grand Avenue.
Figure 30: Cortex planned development area
Source: (“Ordinance #66985,” 2006)
Each development is formalized under two wholly-owned private, limited dividend
redevelopment corporations, CORTEX West Redevelopment Corporation and CORTEX East
Redevelopment Corporation. To complicate matters, the Cortex leaders created an affiliated for-
profit entity called the St. Louis Land Company, LLC, to conduct land transactions. In addition,
each building that Cortex develops directly becomes a single-asset LLC. For example, Cortex’s
first building, Cortex I, is legally CORTEX West Development I, LLC (“Ordinance #66847,”
2005).
At many points throughout the document, the Cortex redevelopment plan invokes the
normative sentiment that the Cortex vision is the shared responsibility of all:
“Successful area redevelopment will require that the residents of the city and the
broader business community share the vision and that a wide array of financial,
99
corporate, and public resources be committed to a process of redevelopment
designed to make sites available for new life sciences-related businesses and
institutions” (“Ordinance #66985,” 2006: p. 4).
The document claims that many of the existing parcels:
“[A]re in conflict with and stand in the way of efforts to take advantage of the
opportunity to capitalize on this key area adjacent to the Washington University
Medical Center and St. Louis University by attracting new jobs and employers
that will raise the city’s economic fortunes and generate revenues necessary to
provide the public services and facilities so desperately needed by its citizens”
(“Ordinance #66985,” 2006: p.8).
Justifying the need for eminent domain and the need to control development in the area,
Dubinsky argues it is best for Cortex to lay the first marks:
“CORTEX is viewed as a 20- to 25-year project…We hope to foster millions of
square feet of biotech space. We decided we were better off developing the first
building ourselves to set a quality standard and a tone for the entire development"
(Jackson, 2004).
Cortex does indeed set the tone. In terms of land use, the document states that the current
use of the land is for industrial, warehouse, and distribution uses, uses that do not align with the
new Cortex vision. The businesses that current use the land in this way, the document states,
“can prosper again if relocated to other areas of the city or region that can better accommodate
their operations” (“Ordinance #66985,” 2006: p.8). Accordingly, the redevelopment plan
proposes demolishing 52 structures. This includes the 43 dwelling units on site, 38 of which are
occupied. Of the 43 dwelling units, only five are deemed in poor exterior condition. The
remainder are either in fair condition (7) or good condition (31). Yet, the recommended action
for all 43 units is demolition (“Ordinance #66985,” 2006: p.16 & p.30).
Joe Stickler, president of St. Louis Metallizing Co, facing the ordinance that would force
his relocation, summarized the development as such, “The message is that they don't want me to

100
be here because I don't fit their bio, life-sciences criteria… What this is doing is grabbing land
from me so that somebody else can profit” (cited in Heisler, 2005). Bob Brauer, a business
owner of a heating and cooling equipment company whose business fells within the Cortex
boundary and was targeted for condemnation, expressed the following sentiment in a 2006 article
documenting Cortex securing Chapter 353 status, "I think all of us agree that bringing in new
jobs is a good thing for the city…We just don't think we should be the ones to pay for it," he
said. "Why should I, as a good corporate citizen, be subject to peril just because they want my
place?" (Heisler, 2006). Finally, another active building purchased by Cortex housed
Employment Connection, a non-profit organization that connects ex-offenders to employment
opportunities and provides services (Desloge, 2004). The tone set by Cortex on the type of
activity that will exist within the borders is clear.
In the 1990s, criticism of the lax blight requirements was prevalent with media reporting
on the displacement of residents and unjustified claims on the status of the buildings under
question. Chapter 353 was criticized for three main reasons. The first related to the
administration of the program and the inability for the government to ensure developer
compliance with redevelopment plans. The second was the failure to protect the residents and the
neighbors of the redevelopment area. The third was the questionable blight determination and the
use of Chapter 353 in areas that do not demonstrate blight (Shultz & Sapp, 1990).
In 2007, the Supreme Court of Missouri ruled over a case between Station Investments
#10 Redevelopment Corporation and CORTEX West Redevelopment Corporation. Station
Investments argued that the Cortex redevelopment plan was fatally deficient and that the findings
of blight were not supported by substantial evidence. In the Development Strategies, Inc. study, a
study conducted by a private company hired by Cortex to assess the land, the study concluded
that the total taxable assessed value of the area declined nearly ten percent in constant dollars and
that the assessed value of the area increased only seventeen percent. The 17% was compared to
34% increase for similar properties. The plaintiff argued that the 34% increase was derived from
commercial properties in the city. If the comparison would have been against other industrial
uses, then the 17% increase is substantial for the area. Barry Hogue, an expert hired to review the
blight study prepared by Development Strategies, Inc., stated that “if the area's assessed values
were compared with other industrial areas; it was outperforming the industrial properties within
the city as a whole” (Ahrens, 2008).

101
That this point was dismissed by the court demonstrates the power of the technological
vision in quieting dissent. What began as Technopolis and is now being fulfilled by Cortex. First
of all, CET’s arrival in 1998 had already begun to ‘prime the pump’ (Droog Jones & Beggs,
2005). Additionally, by 2003, residential rates in the city and inner suburbs were already on the
rise. The St. Louis Association of Realtors were reporting home sale prices up 35% since 2000
(“City to the Core,” 2003). Plus, in June of 2004 Cortex purchased sites at Markwort and
Laclede at rates at a slight premium to the market for $25 and $29 per sq ft. signifying their
recognition willingness to wager on the increased land value (Desloge, 2004). A report by the
Gundaker Commercial Group speculated that rentable space would be comparable to specialty-
use buildings in suburban markets (ibid.).
As it relates to the court case, Pacific Legal Foundation, the Show-Me-Institute, and the
Missouri Ombudsman submitted an amicus brief in support of the plaintiff. Their brief argues
that the site analysis compiled by the CORTEX West Redevelopment Corporation to give them
Chapter 353 status and the right to eminent domain was of a “Drive-By Blight” nature. They
contended that the Missouri Supreme Court should reject ‘windshield surveys,’ where a
consultant is hired to assess the state of blight from the comfort of their car (Sandefur, 2008):
“Given the fact that Missouri courts have refused for so long to enforce the
‘public use’ requirement in the state Constitution, the only hope Missouri home
and business owners have is that courts will at least require government to meet
high standards when the determination of ‘blight’ is concerned. If they do not, and
local bureaucrats can not only take property whenever it’s ‘blighted’ but also
determine without judicial oversight what property counts as blighted, then those
officials will have limitless power to redistribute property at will” (ibid.).
Ultimately, the case was disposed. The leaders guiding development decisions during this
time frame reiterated the benefit of Chapter 353. One real estate developer stating that Cortex
was respectful to the Alderman’s concerns about displacing individuals but that in many ways
they have more power than him (real estate developer, personal interview, June 14, 2016): “They
[Cortex] haven’t had to use eminent domain but the threat of it is powerful. They [Cortex] did
flash the threat of it, though they [Cortex] never actually used it” (ibid). Though Cortex did not

102
forcibly remove individuals, the redevelopment did displace the individuals residing in the 38
occupied units and businesses that did not meet the imagined definition of a tech utopia.
In terms of job growth, the redevelopment plan states that the first positions created will
be in construction. However, these jobs were never intended to be permanent. The aim of the
redevelopment is to create higher quality jobs and tax rates. “By an expanding and sustainable
base of high-quality permanent jobs. Likewise, a substantial new private investment in offices
and research and development facilities will increase the taxable wealth of the
community”(“Ordinance #66985,” 2006: p.9). Comments such as these demonstrate the targeted
demographic for the area and the tight control Cortex necessitates on the development process to
secure its vision. Of priming the pump Dubinsky said, "It's a free-market approach…We're
trying to prime the pump. We're not trying to control it" (cited in Melcer, 2004). Yet, this stands
diametrically opposed to actions taken to secure eminent domain and gain TIF status, as well as
entrenched connections with the private and public sector and funders with the ‘deep pockets’
Dubinsky credits (Kurtovic, 2013).
New Leadership, New Visions
“What drives Cortex is real estate development. The people who represented the institutions on
the board were the real estate people from the universities. The Chair of the board was a real
estate banker his entire career. The focus was always on the development of the built
environment” (CET executive, personal interview, 2016).20
From 2002 - 2010, Cortex was operating without a staff. Essentially, Cortex was a
bioresearch park with five founding partners and two buildings. With the recession halting
development, it became clear that the strategy for attracting large firms to build within the Cortex
boundary was no longer an effective or even viable solution (Cortex staff, personal interview,
2016). In 2010, Cortex engaged a national search to hire a CEO to manage operations. After
interviewing a sizeable population, Dennis Lower was hired. “Dennis was brought on to
configure a live-work-play environment as a way to attract more companies rather than just
provide buildings” (CET executive, personal interview, 2016). Lower brought with him the
20 Between 2010 and 2014 five employees were hired. The fifth employee, Phyllis Ellison hired in 2014, was the first person without a real estate background.
103
experience of having previously built two other research communities and he contributed his
background in assembling property, putting together deals, and bringing in partnerships.
To combat the halt in development on account of the recession, when Lower arrived he
shifted Cortex’s strategy to focus on the live-work-play model. Cortex was initially focused on
the suburban real estate model and looking only at bioscience. Lower suggested diversifying the
portfolio so to appeal to all technologies. In order to attract startup companies, he recognized the
importance of mixed-use development to create a seamless flow between existing incubators and
anchor institutions
To fund this idea, Lower applied for $158M in TIF funding over 25 years to fund $2.2B
in development under the creation of a new legal entity: Cortex Innovation District (St. Louis
Innovation District Tax Increment Financing (TIF) Redevelopment Plan, 2012).21 The TIF plan,
like the 2006 Cortex West Redevelopment Plan, was a long and detailed document submitted to
and approved by the City of St. Louis. The aim of the plan was to overlay most of the Chapter
353 boundary with a TIF in order to access funds for blight removal and redevelopment. The
plan list 17 objectives: concrete plans such as establishing new metro stop, creating new jobs,
building greenways and bicycle paths, to more ambiguous objectives such as removing blight to
enhance “public health, safety, welfare, or morals” of the area. Ultimately, the underlying
purpose of the 17 objectives is to “enhance the tax bases and the resulting tax revenues for the
City and all other taxing districts that extend into the Redevelopment Area” (St. Louis Innovation
District Tax Increment Financing (TIF) Redevelopment Plan, 2012: p.13-14).
21 This was the first mention of Cortex as an innovation district, though later Lower would replace the word ‘district’ with ‘community’, the name used today.
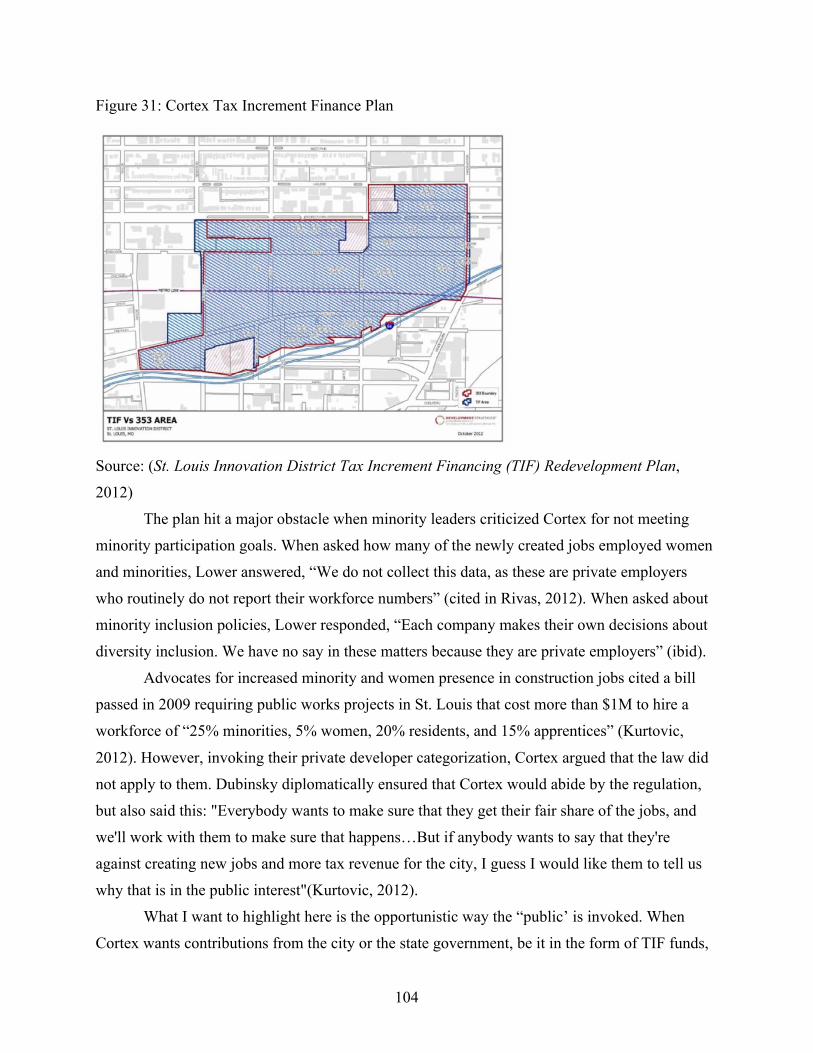
104
Figure 31: Cortex Tax Increment Finance Plan
Source: (St. Louis Innovation District Tax Increment Financing (TIF) Redevelopment Plan,
2012)
The plan hit a major obstacle when minority leaders criticized Cortex for not meeting
minority participation goals. When asked how many of the newly created jobs employed women
and minorities, Lower answered, “We do not collect this data, as these are private employers
who routinely do not report their workforce numbers” (cited in Rivas, 2012). When asked about
minority inclusion policies, Lower responded, “Each company makes their own decisions about
diversity inclusion. We have no say in these matters because they are private employers” (ibid).
Advocates for increased minority and women presence in construction jobs cited a bill
passed in 2009 requiring public works projects in St. Louis that cost more than $1M to hire a
workforce of “25% minorities, 5% women, 20% residents, and 15% apprentices” (Kurtovic,
2012). However, invoking their private developer categorization, Cortex argued that the law did
not apply to them. Dubinsky diplomatically ensured that Cortex would abide by the regulation,
but also said this: "Everybody wants to make sure that they get their fair share of the jobs, and
we'll work with them to make sure that happens…But if anybody wants to say that they're
against creating new jobs and more tax revenue for the city, I guess I would like them to tell us
why that is in the public interest"(Kurtovic, 2012).
What I want to highlight here is the opportunistic way the “public’ is invoked. When
Cortex wants contributions from the city or the state government, be it in the form of TIF funds,
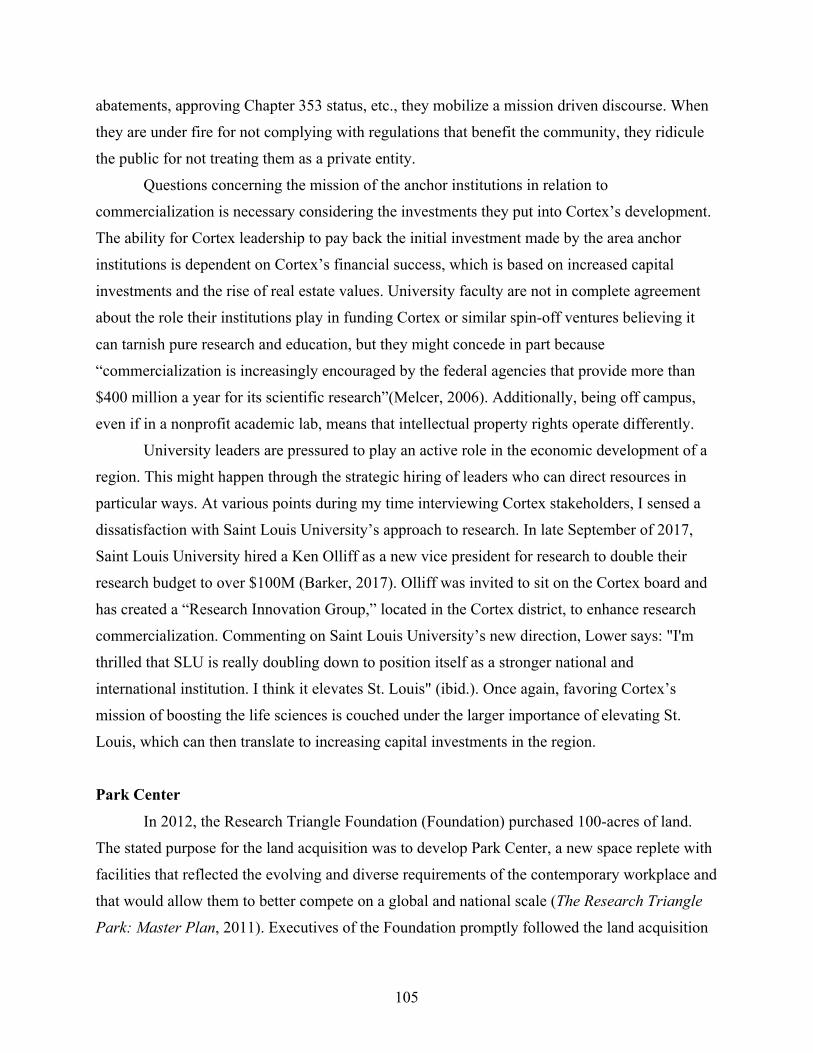
105
abatements, approving Chapter 353 status, etc., they mobilize a mission driven discourse. When
they are under fire for not complying with regulations that benefit the community, they ridicule
the public for not treating them as a private entity.
Questions concerning the mission of the anchor institutions in relation to
commercialization is necessary considering the investments they put into Cortex’s development.
The ability for Cortex leadership to pay back the initial investment made by the area anchor
institutions is dependent on Cortex’s financial success, which is based on increased capital
investments and the rise of real estate values. University faculty are not in complete agreement
about the role their institutions play in funding Cortex or similar spin-off ventures believing it
can tarnish pure research and education, but they might concede in part because
“commercialization is increasingly encouraged by the federal agencies that provide more than
$400 million a year for its scientific research”(Melcer, 2006). Additionally, being off campus,
even if in a nonprofit academic lab, means that intellectual property rights operate differently.
University leaders are pressured to play an active role in the economic development of a
region. This might happen through the strategic hiring of leaders who can direct resources in
particular ways. At various points during my time interviewing Cortex stakeholders, I sensed a
dissatisfaction with Saint Louis University’s approach to research. In late September of 2017,
Saint Louis University hired a Ken Olliff as a new vice president for research to double their
research budget to over $100M (Barker, 2017). Olliff was invited to sit on the Cortex board and
has created a “Research Innovation Group,” located in the Cortex district, to enhance research
commercialization. Commenting on Saint Louis University’s new direction, Lower says: "I'm
thrilled that SLU is really doubling down to position itself as a stronger national and
international institution. I think it elevates St. Louis" (ibid.). Once again, favoring Cortex’s
mission of boosting the life sciences is couched under the larger importance of elevating St.
Louis, which can then translate to increasing capital investments in the region.
Park Center
In 2012, the Research Triangle Foundation (Foundation) purchased 100-acres of land.
The stated purpose for the land acquisition was to develop Park Center, a new space replete with
facilities that reflected the evolving and diverse requirements of the contemporary workplace and
that would allow them to better compete on a global and national scale (The Research Triangle
Park: Master Plan, 2011). Executives of the Foundation promptly followed the land acquisition
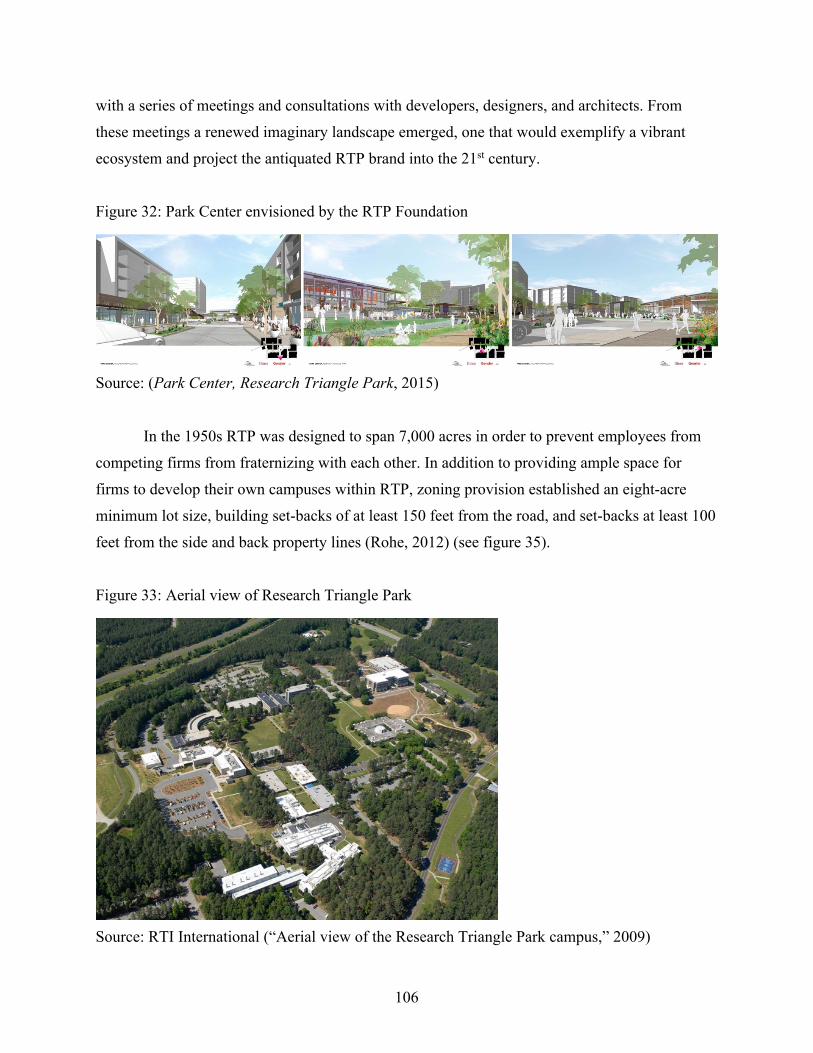
106
with a series of meetings and consultations with developers, designers, and architects. From
these meetings a renewed imaginary landscape emerged, one that would exemplify a vibrant
ecosystem and project the antiquated RTP brand into the 21st century.
Figure 32: Park Center envisioned by the RTP Foundation
Source: (Park Center, Research Triangle Park, 2015)
In the 1950s RTP was designed to span 7,000 acres in order to prevent employees from
competing firms from fraternizing with each other. In addition to providing ample space for
firms to develop their own campuses within RTP, zoning provision established an eight-acre
minimum lot size, building set-backs of at least 150 feet from the road, and set-backs at least 100
feet from the side and back property lines (Rohe, 2012) (see figure 35).
Figure 33: Aerial view of Research Triangle Park
Source: RTI International (“Aerial view of the Research Triangle Park campus,” 2009)

107
Today, the ambitions of the RTP Foundation focus on using design to distance
themselves from the silo-like attitude of the science and research park to a newly collaborative
phase that includes targeted amenities to attract and retain entrepreneurs and young professionals
(“Park Center: This is not your grandfather’s RTP,” 2015; RTP Foundation executive, personal
interview, 2016). To meet the conception of innovation’s inputs as collaborative, cross-sector,
and high-tech, the design aim of the innovation district is one that prioritizes an open and
convergent environment where face-to-face interaction is encouraged as a way to foster the
ideation and commercialization of ideas and products (Chesbrough, 2003; Storper & Venables,
2004).
The challenge for the Research Triangle Foundation in conceiving a new plan is ensuring
retention of existing tenants. The established corporations that populated the park 60 years ago
when it first opened were initially drawn to the Park because of the ability to purchase multi-acre
plots to build independent campuses and expand when necessary. Today, the Foundation wants
to attract tenants it never attracted before—smaller entrepreneurial firms and startups.22 The
increased spinoff potential from nearby universities creates a viable revenue stream for the
Foundation. By creating the right environment -the right stage set- the Foundation can divert the
burgeoning startups from locating in nearby Durham and Raleigh. In the past several years close
to 400 companies have started in Durham. The American Underground, a private ‘campus
community’ in downtown Durham that caters to entrepreneurs, startups, innovators, and
investors, has invested almost $1.5 billion in successful exits (Malizia, 2017).
Conclusion
In all five cases, innovation district stakeholders juxtaposed the inefficiency of the land
prior to its development with the envisioned potential for an innovation district. Various tools
were used to create a parcel of land for development. The Boston Innovation District, positioned
in close proximity to Boston’s financial district and across the bay from Logan International
airport, was prime real estate for the expansion of the city. The purpose of the Big Dig was to
connect the peninsula and open up space for boutique development. The recession seriously
halted construction. It was then that the Mayor pushed forward the idea of an innovation district.
22 Whereas Silicon Valley and Boston’s Route 128 succeed at attracting entrepreneurial ventures, Research Triangle Park never did. Only well established companies could afford to purchase and develop land in Research Triangle Park. Entrepreneurial ventures not only did not have the zoning for smaller lots that could accommodate them or short-term leases. The zoning requirements for Research Triangle Park specified that development was only allowed on 15% of the site (Malizia, 2017).

108
Cortex shares a similar story. At the heart of St. Louis there were 200 acres of blighted land
between Washington University’s campus and St. Louis University campus. City leaders first
pursued a Chapter 353 blight status on the targeted land for redevelopment and later a tax
increment finance district to gain development governance and secure public financial backing to
develop the land. The central business district of Detroit, hindered by countless blighted
structures, provoked stakeholders to continuously expand the border of the Detroit Innovation
District as a way to increase the area of land on which to project a new imaginary, and thus,
trigger development. Local Dublin growth coalitions, wanting to capitalize on the momentum of
the tech companies moving into the city, developed a strategic development zone to fast-track
development and turnover abandoned structures from the building boom into a thriving
innovation district. Finally, the Research Triangle Foundation, fearful of a max exodus of firms
moving to nearby cities, recognized the need to replicate the ‘feel’ of the city and its inputs in
order to cater to entrepreneurs in need of smaller real estate footprints –an effort they see as a
double benefit as it will help them derive more profit from their land. These are examples of
political mechanisms to derive territory.
The space of the innovation district functions as a fresh start (Bach, 2011). It moves
beyond the derelict structures of the past to present a city very much rooted in the present and
future seeking. In my case studies, growth coalitions describe the land slated for development as
wasted space that is not meeting its highest and best use. These ‘dead zones’ (Doron, 2008) are
“used and conjured by the hegemony for political, social, and economic ends” (ibid; 204).
Growth coalitions juxtaposition the imaginary of decay with a futuristic layer to elicit excitement
for development.23
In all four urban cases, the innovation district was slated on what was earlier industrial
land. But that does not mean that the space was inactive or dead, only that growth coalitions did
not feel the land was generating enough rents. Barcelona’s 22@bcn innovation district, the
model on which the innovation district is based, was also slated for the Poble Nou industrial
neighborhood. Scholars and activists documented the various artists factories and lofts located
within the space and their slow demise as the innovation district was built out. The same applies
to the maritime activity in the Silicon Docks and the Boston Innovation District, and the light-
manufacturing and low-income public service administration buildings in the Cortex Innovation
23 Various scholars have documented the mobilization of such imaginaries to funnel development. See for example Smith (1996) on development of Lower East Manhattan and Fainstein (2001) on the development of New York and London.

109
Community. The Detroit Innovation District, encompassing the entire Downtown, Midtown, and
New Center, was the only place in the city demonstrating growth. Yet, the presence of the many
blighted structures made the adoption of the narrative of dead space possible. As for Research
Triangle Park with its designer manicured landscapes, though terms such as ‘dead space’ do not
appear in public accounts or personal interviews, the space is construed as not meeting its
potential. More, in other words, can be extracted from the space.
At the local level, the innovation district is a bounded space visible in policy documents
through its boundary and legible to pedestrians through its architecture and design. As a ‘spatial
capital accumulation machine’ (Bach, 2011; pg 100), it has a designated physical area and within
this space it has special rules to govern the corporations that exist there, and by extension, the
workers that live there. However, the innovation district extends beyond the boundary –though
not necessarily to surrounding neighborhoods—as a space of flows, a permanently networked
society is shaped around a logic of flows, such as resources, information, technology, and images
(Castells, 1992).24 The space of flows is seen as a signature organization of power and efficiency
under capitalism that compresses time and place (Harvey, 1989b, 1999). The innovation district
elevates the geographically bound district and its concentration of firms and talent of a
knowledge economy, into a node in a global network. As a contemporary zone, a zone that
moves beyond the historic iteration of a zone, which was a space of exception that could attract
and shape investment (i.e., a colonial free port), to a contemporary space that can attract and
shape fantasies and aspirations of modernity, the zone becomes what Bach (2011) terms the ‘Ex-
City’. These spaces use the logic of exception to create the legal and political environment
necessary to their survival that “allows for the re-territorialization of capital in a manner
consonant with both the needs of nomadic capital and state development” (ibid: pg. 104). The
Ex-City is a space not wholly separate from the city, such as an offshore banking center, but
instead focuses on high-skilled workers to create direct linkages from the bounded space, to the
host city, state, and region.
24 As I demonstrate in the concluding chapter, what does extend beyond the border are the heightened real estate prices and lack of affordable housing.

110
Theme II: Facilitating Production Innovation district strategy places great emphasis on the role of urban design to create the
right environment attractive to knowledge workers while also supporting of the demands of high-
tech infrastructure. But the organization of work is undergoing structural changes. Many of the
changes are a direct result of sophistications in information and communication technologies
(ICT). Since the end of World War II, the boundary of the firm has become increasingly
permeable with the global scale of production and the extent of global supply chains (Davis,
Ross, Whitman, & Zald, 2006). The difference between then and now is that today the greatest
job growth is in jobs that move work beyond the walls of the firm (Kalleberg et al., 2000). The
rise of ICTs has enabled contracting out tasks to employees linked across countries and time
zones, resulting in firms hiring fewer people for full-time positions, while also challenging the
conception that work is performed on a fixed schedule in a fixed location (Davis, 2016). Work is
increasingly organized outside of employer-employee systems, beyond the traditional nine-five
workday, and occurs in new spaces such as home offices, coworking spaces, warehouses, and
public innovation centers (Garrett, Spreitzer, & Bacevice, n.d.). These rapid changes in the
organization and experience of work challenge preconceived conceptions of the “office.” As
such, designing for knowledge workers at the scale of a district requires sensitivity to new forms
of work.
Considering today’s growing mobile workforce (Martin-Brelot et al., 2010; Shearmur,
2007), the changing dynamics of the firm (Davis, 2016), and the shift in production toward
immaterial goods (Castells, 1996; Hardt & Negri, 2001), local actors are challenged in their
ability to claim ownership and rents over production. The innovation district mitigates this
challenge through two forms of extraction. The first is by increasing the value of the land. As the
land increases in value, rents proportionally increase. The designation of an innovation district
serves as a marker of incoming development paving the way for the future investment of
property. This follows the classic theory of land use and rent theorized by Ricardo and Marx
(Haila, 1990; Marx, 1992, 1993) and the role of prestige in the location of development in
relation to rent (Harvey, 2009).
More interesting, however, and what marks the difference between the innovation district
and earlier spatial iterations for innovation capture, is understanding how the innovation district
also serves as an extraction of rent in the form a new type of production, what Autonomous
Marxists Maurizio Lazarato (1994) defines as immaterial labor. Lazzarato introduced the concept

111
of immaterial labor as the labor that produces the informational and cultural content of the
commodity. An example might help demonstrate the point. Categorizing immaterial labor as a
contemporary form of capitalism, Boutang (2011) provides the example of the exchange value a
pair of Nike shoes can command over and above the expenditure of human labor. What is
immaterial is the added value the brand commands.
Using examples from my cases, I aim to extend the concept of the brand for the
innovation district by defining two components of the brand: the physical elements and the
immaterial elements. The physical elements of the built environment (i.e., the incubators, coffee
shops, anchor institutions, etc.) are an essential component of the innovation district.
Confirmation of the opening of a respected incubator company, such as the Cambridge
Innovation Center opening up in the Cortex Innovation Community, or that that a respected
architect is designing a structure in the district, such as Santiago Calatrava’s bridge in Dublin, all
bring a form of legitimacy that helps boost the physical element brand of the innovation district.
The immaterial elements (i.e., the appearance of a networked space buzzing with activity) are an
equally important component of innovation district strategy. Mayor Menino’s idea of creating a
line item in his budget to fund an innovation district manager in charge of enlivening the space
of the innovation district and ensuring constant connectivity is one example of efforts to program
the space of the innovation to create a type of “buzz” and increase the value of the innovation
district.25
Following Lazzarato and other Autonomist Marxists such as Terranova (2000) and Mario
Tronti, and Antonio Negri (Gill & Pratt, 2008), I conceive of the individual interactions to create
buzz as a form of labor. The term buzz here implies the type of vibrancy that exists in a space as
conceived by economic geographers as far back as Marshall (1890) in discussing the atmosphere
of the industrial districts. The form of labor I am discussing differs from feminist scholars who
argue that traditional conceptions of labor do not account for care work and affect (see for
example, Boserup, Tan, & Toulmin, 2013; Frederici, 2012; Reid, 1934). I am discussing a form
of labor that is facilitated in the built environment, in public space, through ICTs and mobile
technologies.
25 The idea of ‘buzz’ is ambiguous, yet it continuously appears in the literature on innovation ecosystems and cluster dynamics. Often there are variations in how the idea is expressed. Bell-Masterson and Stangler (2015) use the term ‘vibrancy’. Storper and Venables (2004) and Bathelt, Malmberg, and Maskell (2004) discuss it in relation to face-to-face contact and the knowledge exchange created from this activity. Even as far back as Alfred Marshall (1890) the concept of buzz is discussed as the ‘secret’ of industrial activity (cited in Storper & Venables, 2004:353). The growing recognition of its importance among practitioners and designers translates to policy prescriptions that attempt to build buzz into space.
112
To reiterate, there are two elements that facilitate the extraction of labor. The first is ICTs
and mobile technologies. These sophistications play an important role in allowing activity to
move beyond firm walls. The second is on the role of architectural and urban design. The activity
of the firm permeates the space outside of the firm as work moves beyond firm walls.
One need only look at the architectural renderings and master plans for each innovation
district to understand the importance of design in attracting investment capital. Design has a long
history in economic development of heightening the visibility of a location to attract investment
capital through tourist attraction, place marketing, and culture-led economic development
(Eisenschitz, 2010; Grodach & Loukaitou-Sideris, 2007; Klingmann, 2007). Well known
examples in the fields of architecture, urban planning, and design include the use of museums to
elevate the status of a city, such as the classical example of the Guggenheimin Bilbao
(Rodriguez, Martinez, & Guenaga, 2001), revitalizing a waterfront, such as the “Rousefication”
of Baltimore’s Inner Harbor (Levine, 1987), and multiple examples of stadium developments
(Chapin, 2004; Robertson, 1995).
Like city-wide economic development strategies, innovation district strategy also
incorporates design to boost the image of its location. Stakeholders of innovation districts hire
famous architects to create eye-catching buildings and reputable consultants to design
masterplans to rival the attempts of other cities with innovation districts. This is evident from the
recent announcement to build an overhead gondola connecting Boston’s Seaport Innovation
District to Boston’s financial district (Vaccaro & Logan, 2017), from activating Santiago
Calatrava’s harp shaped bridge at the heart of Dublin’s Silicon Docks as a playable instrument
(Lynch, 2014), from the Cortex Innovation District board contracting with the globally
recognized firm HOK to design their latest mixed-use expansion, and from Dan Gilbert, founder
of Quicken Loans and Rock Ventures in Detroit (Deem, 2018), decorating empty street level
storefronts to hide indications of decay (Gannes, 2015).
Efforts to use design to attract a certain demographic, control the space, and project
futuristic visions are not isolated to innovation district strategy. Indeed, the City Beautiful
movement is an example of scientific progress in urban design and development through its
focus on monument, ordered grid, and landscaping (Hall, 1998). The same applies to the heavily
landscaped corporate estates of the General Motors, Ford, and Deer companies following WWII
(Bethesda, Tumentang, Institutes, & Blvd, 2014). There is an abundant literature on designing
for worker productivity at the office/corporation scale. The convergence between factory design

113
and scientific management were of critical consideration (Braverman, 1998). Similarly, hiring
architects and designers to increase worker productivity, satisfaction, and comfort remain as
prevalent today as they were in the 1950s with the design of the office cubicle, the transition to
open floor plans, coffee-culture aesthetic, retrograde warehouse, and bright colorful designs
(Saval, 2014).
Innovation district strategy takes these design practices and scales them to the district
level. No longer is it about ensuring worker productivity within the confines of the office but
encouraging production spills beyond office walls into the urban realm (Stehlin, 2016). This
difference is critical as the productive expectations of the individual are now also managed by
the various stakeholders building innovation districts.
Contemporary tech giants such as Facebook and Google, like the powerful company
towns before them, moved beyond the internal design of their company operations to include
housing, transportation infrastructure, and recreation amenities (Streitfield, 2018). A few
company towns also incorporated civic amenities (Green, 2010). These examples demonstrate
how individual corporations used design to boost productivity and profit. What is different about
innovation districts is that similar design endeavors are used, but now the governance of the
innovation district occurs through an amalgamation of public, private, non-profit, and
educational institutions. This has implications for the public spaces engulfed within the border of
the innovation district and the people who inhabit them. Using my cases, I demonstrate the role
design plays in ensuring the space of the innovation district is continuously humming with
activity.
Boston: District Hall
Billing itself as a first public-private partnership focused on creating a civic space
targeting innovation, District Hall in Boston’s Seaport Innovation District is a dedicated civic
space where the innovation community can gather and exchange ideas, its homepage proudly
haling it as “a new home for innovation in Boston” (“District Hall Webpage,” 2018) (see figure
36).

114
Figure 34: Boston’s District Hall white board greeting, orienting, and directing people
Supporters of Boston’s Innovation District hail District Hall as widely successful. As the
first public innovation center in the United States, it put Boston on the map and today serves as a
model for the development of public innovation centers. It is an established template where gig
workers can constantly connect to the platform, where entrepreneurs can connect with other
startups for resources, and where the general public can continuously access Wi-Fi connectivity
(see figures 36 - 37).
Figure 35: Front of District Hall

115
Figure 36: Height of District Hall in comparison to its surroundings
District Hall, its name a prominent representation of civic centrality, serves as a branding
mechanism to heighten the reputation of the Boston Innovation District. In addition to its
monumentality, District Hall is a good example of the centrality of innovation in society, as well
as what design reveals about the new world of work. The trajectory, thus far, of District Hall,
also demonstrates the strength of the market in determining highest and best use land values.
The benefits provided by District Hall include social connectivity, blazing fast WiFi and
Internet access, and easy access to transportation (government official, personal interview,
2016). District Hall both serves as a space to congregates a nexus of activity in cheap space
while also marketing and framing the vision for the Boston Innovation District.
According to Hacin + Associates, the architect firm behind District Hall, the design of
District Hall seeks to convey the feeling of a “public library meeting a community center”
(designer, personal interview, 2016). Shaped by conversations with Kahn Pederson Fox, the lead
designers behind the Seaport Innovation District’s master plan, the design of District Hall
required flexibility to accommodate a number of possible eventualities. The aim was for the
architecture to provide a ‘hack aspect’ feeling, come across as an enclosed outdoor space,
capture people’s imagination in ways other spaces around town had not done, and had to be
correctly calibrated to the millennials.
Classrooms and assembly spaces line the front structure of the building leaving the back
structure available to accommodate an open floor plan co-working space. Clusters of two-person
or four-person tables, couches with low lying coffee tables, and a long rectangular table to

116
accommodate eight people is positioned in the center of the room. Additional workspaces line
windows that look out into the backyard. All the furniture is moveable and the plethora of floor
or wall electrical outlets ensure batteries are constantly charged. The walls are lined with
writeable material and the free Wi-Fi password (Innovation!) are there for convenience. Two
retail establishments located in the building serve to keep the space open for 16 hours per day:
Brew, a coffee shop that opens its business at 8 am and Gather, a full-service restaurant and bar
that closes its doors at 2 am.
District Hall’s BRA agreement states that the purpose of a public innovation center is to
make the city more competitive in attracting emerging innovations, businesses, and jobs to
Boston, retaining starts and innovations, and promoting innovation in existing Boston-based
businesses (District Hall 121B Agreement, 2013). Within the agreement, activities that qualify as
innovation related and are accepted on premise include:
• Storytelling, idea generation, research, design, product development/improvement,
demonstration, entrepreneurship, new business formation, access to business and market
opportunities;
• Create opportunities for conversation, mutual learning, interdisciplinary collaboration,
open-ended exploration, problem-solving, and networking;
• Improve access to and development of talent and access to capital;
• Create or improve opportunities for collaboration within or across the education,
business, government, and civil society sectors;
• Seek to improve the cultural, urban, physical, institutional, and policy environment for
innovation.
To date, District Hall has hosted events such as Rock Band competitions, parties on the
street, weddings and receptions, and galas (“District Hall Webpage,” 2018). That these events
meet the specifications for the use of space either points to the complication of pinning down the
inputs of innovation or it represents how public space is adapted to market demand.
Detroit
“Place-making is critical to create the culture and reviving the density for the people
doing the innovating. The innovating itself comes from the creativity of the individual

117
doing the work. But without the place-making they don’t want to be in that space to do
the work. So that is why you’re seeing growth in the region happen in areas that have
superior place-making” Foundation Head, personal interview, Detroit, 2015
“[T]he most important thing is not so much the development of the individual patent or
issue, but can the culture of the district be one where it is walkable, bikeable, and hyper
caffeinated? Cause that is where creativity happens.”
University Executive, personal interview, Detroit, 2015.
Many efforts to reverse decline in Detroit focus on remaking the built environment
though placemaking, many of which targeted the revitalization of the greater downtown.
Adopted tactics, such as waterfront redevelopment, casino construction, and sport-led
regeneration, are congruent with urban revitalization efforts to harness a tourist economy
(Eisenschitz, 2010; Grodach & Loukaitou-Sideris, 2007; Klingmann, 2007). In the 1970s,
beginning with the five-term tenure of Mayor Coleman Young and continued throughout Mayor
Dennis Archer’s two terms in office, revitalization was always closely tied with the physical
environment. When Young entered office in 1974, Detroit-based corporations were in the
process of building coalitions to address causes ailing the city. Two influential organizations
included the New Detroit Committee of 1967 and the Detroit Renaissance Inc., of 1973 (Benyon
& Solomos, 1987). Mayor Young leveraged support of the business community through these
coalitions, particularly under his initiative, Moving Detroit Forward: A Plan for Urban Economic
Revitalization (Manning Thomas, 1990). This bold initiative sought to finance $3 billion worth
of improvements through federal and state funds allocated over a five-year period (Neill, 1995).
From this fund, Detroit’s riverfront slowly developed through flagship projects such as the
Renaissance Center, a collection of towers for office, hotel, and retail use, funded through
private-public partnership with the Detroit Renaissance Inc.; the Joe Luis (Hockey) Arena; the
extension to Cobo Hall, Detroit’s convention center; and other smaller projects such as the Max
Fisher Riverfront Apartments and Hart Plaza. To connect the major riverfront establishments to
the entertainment neighborhood known as Greektown, Young secured funding for the Detroit
People Mover, a two-mile ring light railway (Eisinger, 2000).
During Mayor Young’s tenure, the Michigan legislature developed state-based
intervention approaches focused on targeting delineated boundaries. A series of public acts were
enacted to create boundaries with jurisdictional authorities (DiGaetano & Klemanski, 1999). PA

118
198 enacted the Plant Rehabilitation and Industrial Development District. PA 575 enacted
Downtown Development Districts, Development Authorities, and Tax Increment Finance
Districts (Bieri & Kayanan, 2014). Three additional legislative acts created the Economic
Development Corporation, the Downtown Development Corporation, and the Detroit Economic
Growth Corporation (DEGC). The establishment of the DEGC ushered in an era of project-led
approach to development with tax breaks and incentive packages (McCarthy, 2002). In 1994,
President Bill Clinton implemented empowerment zone policies specifically to address issues
that produce economic, environmental, and social improvements. That same year, under the
Dennis Archer Mayoral Administration, Detroit secured $100 million in federal funding over ten
years dedicated to increase economic development within a geographic span of 18 square miles,
an overlay that includes the property of the Big Three automakers, financial institutions, and an
additional 80 programs scattered across the space (Boyle & Eisinger, 2001).
These efforts contributed to the beautification of the downtown core, but they could not
stop population decline. Facing increased levels of poverty within the central city, higher taxes
were imposed to compensate for the eroding tax base. These were not sufficient to compensate
for the loss of population and income and resulted in a decline in services. This cycle of
disinvestment and Detroit’s ongoing borrowing practices to pay off debts reached its climax in
2013, the year Detroit filed for bankruptcy, the largest filing in US history. One direct connection
between bankruptcy and the strategic aims of the Detroit Innovation District was the focus
generated on blight removal. The final Plan of Adjustment prepared by Emergency Manager
Kevin Orr secured $1.4 billion for public services and blight removal (Bomey, Helms, &
Guillen, 2014). This reinvestment of unsecured debt funded Detroit’s Blight Removal Task
Force Plan, a multilevel strategy to address and/or demolish the 84,641 blighted structures and
vacant lots (Blight Removal Task Force Plan, 2014).
The re-envisioning and remapping of Detroit through the Blight Removal Task Force
Plan, as well as other extremely detailed documents, such as the Detroit Future City Strategic
Framework Plan (Detroit Future City: 2012 Detroit Strategic Framework Plan, 2013), build on
the momentum of collaboration and influenced the siting for the innovation district in a pre-
imagined boundary already targeting growth strategies and increased land values. The Detroit
Future City Strategic Framework influenced concentrating on the neighborhoods which were
ultimately included within the border of the Detroit Innovation District. Detroit Future City, an
extensive report that served for many years as a strategic framework for the city, divides the city

119
into five planning elements: economic growth, land use, city systems, neighborhoods, land and
building assets. The report does not remove the focus on manufacturing, but it does suggest
diversifying the economic base to include food processing sector, medical technology, education
and digital/creative industries, while emphasizing the need for targeted education and training
programs. Within the plan is a specific focus on increasing the value of land and investments in
the city in places with the highest potential of jobs. This undergirds reasoning to focus on the
central business district for the Detroit Innovation District but also leads to critiques that
economic development efforts target the downtown while the remainder of the city continues to
shrink (Moskowitz, 2015).
Stakeholders for Detroit’s Innovation District face the uphill battle of converting a
declining city into a thriving innovation district. Encompassing all the central business district
plus two residing neighborhoods, the 2,750-acre landscape of the innovation district features
large gaps between developments, derelict infrastructure, expansive parking lots, and wide
thoroughfares built to accommodate the heavy flow of daily suburban commuters. Not only must
stakeholders build the right infrastructure into the innovation district, they must also demonstrate
that the district is humming with activity. Only in this way, will the concept succeed in
rebranding Detroit as an attractive place to do business.
Guidelines for the Detroit Innovation District demonstrate recognition of steps to convert
a historically post-industrial economy into a tech-economy. Skills training, investment in
research and development, fostering university tech-transfers, and strengthening emerging
clusters are featured prominently in drafts circulated by the advisory committee and working
groups. However, the lack of density in the district overshadows these aims. Detroit’s lack of
basic infrastructure is a considerable obstacle for building a tech economy. Questioning the
feasibility of the successful implementation, one tech consultant expressed, “[I]t is possible to
discuss tech transfer failures from Wayne State University, but it is also necessary to discuss
basic city issues, safety issues, and car vehicle insurance issues” (2015, personal
communication). To date, Detroit Innovation District stakeholders do not distinguish between
investing in the tech economy versus investing in place. Instead, stakeholders latch on to this
economic development strategy to fund blight removal and rebrand Detroit.
Amongst stakeholders, there is an acute awareness of the passing of time and Detroit’s
inability to compete against other cities for global city status. The pressure to compete with other
cities is readily acknowledged in comments such as, “this is a war for talent” (economic

120
developer, 2015, personal interview) and, “they [city officials] need to be running but are
actually moving at a very slow pace” (venture capitalist, 2015, personal communication). The
result of this concern manifests into a focus on efforts that yield immediate results: namely,
placemaking. Highlighting the importance of placemaking, one executive for a private tech
company stated, “place-making should lead it [the innovation district strategy] because you can
do what they call ‘lighter, quicker, cheaper26.’ You can do things very quickly to change the
perception about Detroit, what is going in Detroit” (personal communication, 2015).
This sentiment on the importance of place-making and design is a reoccurring theme
amongst stakeholders and it translates to a problem of visibility and funding. If the Detroit
Innovation District Advisory Group and the sub-working groups cannot demonstrate they are
succeeding in implementing the strategy, then they can no longer secure funding. But, providing
evidence of innovation is tricky. Frequently, respondents describe implementing the innovation
layer as “squishy,” meaning not concrete enough to develop tangible measures. As expressed by
an executive of a foundation heavily involved in the implementation of the Detroit Innovation
District, “among government officials the strategy became about activating blighted areas and
less about the innovation piece for the city” (2015, personal communication). This switch is
justified by the fervent belief and blind faith in place-making as the primary tool to attract and
retain talent. In the eyes of the stakeholders, creating a welcoming, safe, but also “cool” place is
the first step in attracting talent and firms of the tech economy. As one respondent vehemently
argued:
“[P]eople aren’t going to decide to live here because it is an innovation district. I
mean, they are going to decide to live here cause it’s like a cool, classic, mixed-use
district. They want the bars and restaurants, they’re not moving here because there
is some worker space on the corner” (Planning and development nonprofit
executive, personal interview, 2015).
Based on the contemporary rhetoric on the inputs for innovation and based on current
forms of capitalist extraction, the Detroit Innovation District stakeholders are not misguided in
their assessments and in their faith of place-making impacts. If innovation requires an open,
networked, and activated environment, then design is one tool to achieve this. Local government,
26 The Project for Public Spaces adopted and popularized this phrase, which was originally coined by Eric Reynolds of the Urban Space Management firm. The phrase symbolizes an inexpensive and immediate solution to make public spaces more dynamic for everyday use.
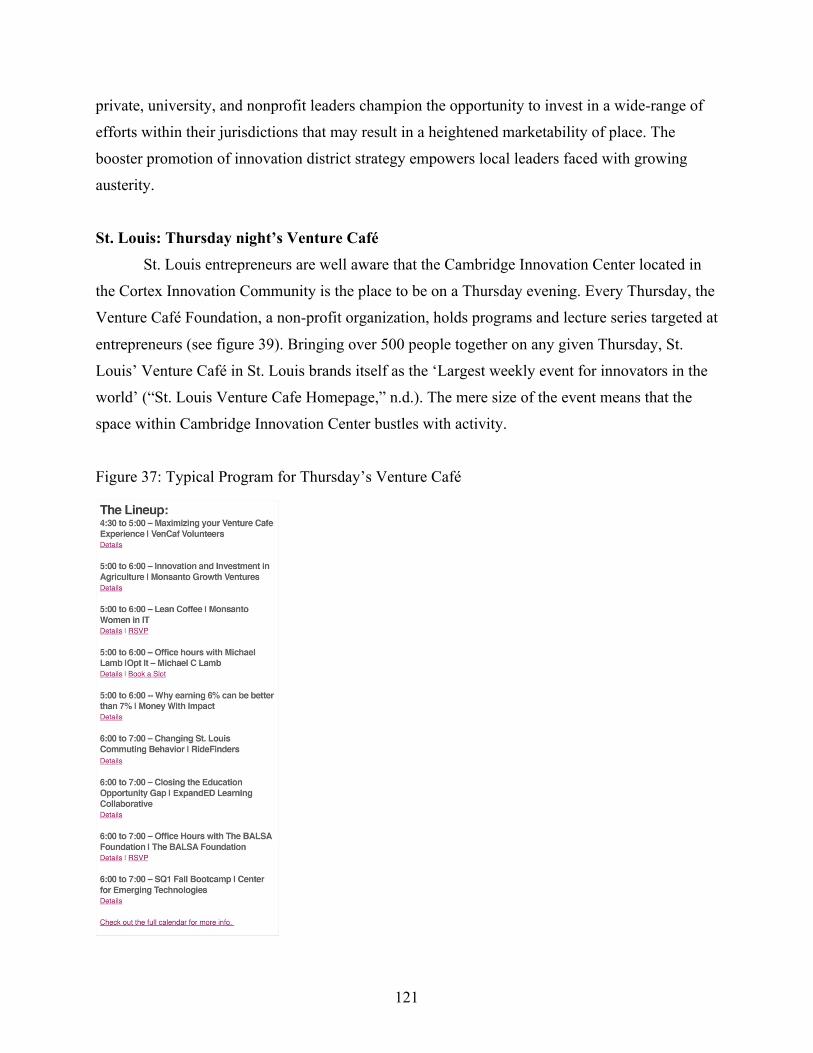
121
private, university, and nonprofit leaders champion the opportunity to invest in a wide-range of
efforts within their jurisdictions that may result in a heightened marketability of place. The
booster promotion of innovation district strategy empowers local leaders faced with growing
austerity.
St. Louis: Thursday night’s Venture Café
St. Louis entrepreneurs are well aware that the Cambridge Innovation Center located in
the Cortex Innovation Community is the place to be on a Thursday evening. Every Thursday, the
Venture Café Foundation, a non-profit organization, holds programs and lecture series targeted at
entrepreneurs (see figure 39). Bringing over 500 people together on any given Thursday, St.
Louis’ Venture Café in St. Louis brands itself as the ‘Largest weekly event for innovators in the
world’ (“St. Louis Venture Cafe Homepage,” n.d.). The mere size of the event means that the
space within Cambridge Innovation Center bustles with activity.
Figure 37: Typical Program for Thursday’s Venture Café

122
Venture Café is managed by Cambridge Innovation Center, a co-working and incubator
space headquartered in Cambridge, Massachusetts with additional locations in Boston, Miami,
Philadelphia, and Rotterdam.27 One executive for CIC discussed the role of Venture Café and
District Hall as providing the “glue.” The glue is an unmeasurable connection between humans
that is abetted by the surrounding physical infrastructure. Glue is functioning when a person can
show up, meet others, and get connected into the network of support. The rise in ubiquitous
technology and the reduced size of computers contributes to the ability to concentrate a large
amount of people within a closely confined space. This speaks generally to the overarching aim
of the innovation district, but it also applies to the incubators and accelerators that host
entrepreneurs in their buildings and provide them with administrative support.
The weekly Venture Cafés are entirely voluntary. At the same time, registration is
required to receive a free drink ticket and a name tag. Every week Venture Café staff send
reminders to people in the database to remind them of upcoming events. In addition, attendees
accrue points for each visit. This number is displayed prominently on a name badge and becomes
a point of conversation. The number also serves as a signal. If someone does not have a number
because it is their first time attending the event or if they have a low number this indicates others
to approach them to guide newbies through the networking process. Those that accumulated a
larger number are considered more experienced and are tapped by Venture Café staff (or social
contract) to mentor new attendees.
Figure 38: Inside the CIC during the Thursday Venture Café nights
Sources: St. Louis Venture Café website (“St. Louis Venture Cafe Homepage,” n.d.) and Crain’s
(Elder, 2016)
That the Thursday night Venture Café event draws such large numbers of people is
telling of the support structures entrepreneurs need to grow their business, and conversely then,
27 One executive from the CIC in Cambridge refuses to call the institution an incubator as “incubators are for babies” (personal interview, 2016). Despite this, the CIC operates in the exact manner as other incubators in its class.

123
the amount of risk they take on as individuals. Not only are entrepreneurs reliant on the
‘product,’ but they also need the tacit knowledge transmitted through connections and networks
and the support services incubators and accelerators provide.28 This demonstrates the amount of
risk individuals take on and is also indicative of the social pressure placed on individuals to
succeed as entrepreneurs.
Park Center, Stage Set
In a presentation on the master plan for Park Center, the Foundation, in conjunction with
Gensler (a global architecture, planning, design, and consulting firm), and Hines (a real estate
investor), profile the ideal resident of Park Center. Her name is Sarah:
“Sarah holds a master’s degree from Duke, she remained in the Research Triangle Park region for a professional position in life sciences. She lives in a townhouse
in Durham, a few miles from her office and prefers to bike to work. While her
current income limits potential spending, her career prospects and earning
potential are strong. She is health conscious, eating organic and exercising—after
work yoga classes keep her centered. As a young professional, she is often too
busy to prepare food at home and relies on healthy, prepared meals. The
competitive cost of living affords her discretionary income to spend on clothes,
share after work drinks with colleagues and go out with friends on the weekend”
(Park Center, Research Triangle Park, 2015, emphasis mine)
Sarah is a knowledge-worker and her imagined live-work-play lifestyle drives design
decisions for Park Center. Tellingly, the master plan for Park Center identifies the following 21st
Century space needs to attract and retain knowledge workers:
• Improved Park visibility within the region and clear entryways
• Creation of a vibrant central district
• Active retail focused on food and beverage
• High quality, attractive multifamily housing at key nodes
• More integral and defining university presence
28 The greatest difference between an incubator and an accelerator is the amount of time spent within the walls of the structure; an incubator will host startups during gestation periods and for longer periods of time, while an accelerator will host startups at later stages in the scaling cycle.

124
• Space for business support services
All these are presented in at a walkable scale and include street-level retail and
entertainment, designated open recreation spaces, and housing in walkable proximity to work
within a pedestrian and bicycle friendly environment. The primary focus is an urban fabric that
encourages a density of people within their physical environment. The master plan for Park
Center, in addition to two other neighborhoods that will be built after Park Center nods to
environmental sustainability by integrating a regional transit framework that includes commuter
and light rail transit to discourage an over reliance on vehicular transportation. It also seeks to
balance the connection between humans and nature by building in spaces for recreation, and
sustainability measures such as wetlands, carefully considered landscapes, and natural systems
(The Research Triangle Park: Master Plan, 2011).
Figure 39: Park Center master plan
Source: Park Center site plan (Surface, 2018)

125
Figure 40: Park Center machete
The Anne T and Robert M. Bass Initiative on Innovation and Placemaking, and
organization that has partnered with the Brookings Institution and the Project for Public Spaces
to derive a design companion for their innovation district recommendations, label this
aspirational type of environment a ‘social test bed’ (Eight Placemaking Principles for Innovation
Districts, 2016).
The concept of the social test bed, an entirely activated environment to foster innovation,
closely resembles what Autonomist Marxists call the ‘social factory’ (Negri, 1989; Terranova,
2000). The social factory shifts the centrality of the industrial factory and the form of production
created within the factory beyond the factory walls and into the fabric of our daily lives.
The idea of the social factory as of the all-encompassing space that incentivizes workers
to stay and work through play closely parallels the rhetoric undergirded in innovation district
strategy. The design for Park Center ensures seamless movement between work and play for an
affluent professional class through the inclusion of a horseshoes field, yoga garden, tai chi lawn,
outdoor alternative work charging stations, artisanal garden, and bbq pits. Example eating

126
options include an artisan creamery, gourmet grocery, a juice express, taqueria/Mexican, and
retro homestyle restaurants” (Park Center, Research Triangle Park, 2015:55) (see figure 28).
Figure 41: Park Center marketplace amenities
Source: Park Center Masterplan (Park Center, Research Triangle Park, 2015)
In addition to ensuring the right diversity of product is in place, land use changes will
also support linkages with local universities and international research centers and provide
commercialization support. Place is implicated in all these transactions. The master plan aims to
“Provide a distinctive, vibrant, mixed-use nexus for research in one or more areas of the park to
foster innovation, promote social interaction, and create signature destinations for the RTP” (The
Research Triangle Park: Master Plan, 2011:20). Theorizing the role of the brand, Klingman
(2007) states that the brand is not about perfecting the object, but of transforming the subject.
This transformation of the subject is of critical importance because it is a larger reason for the
existence of the innovation district. It is this transformation that the executive from the

127
Foundation emphasizes when discussing the importance of providing the right product to create
the stage:
“[W]hen we developed Park Center, we were looking at the structures for
innovation. But I think about the structures for these kinds of experiences as being
like the structure you create in the theater. It is a stage set. You want to make sure
that all the pieces of the stage set are there so that the actors can go out on to the
stage and make it a great experience. And if they own that experience then you
are going to hear about it” (foundation head, personal interview, 2016).
The stage set for Sarah, and similar Park Center employees, residents, and visitors, must
include the necessary elements to attract them and provide them with a unique experience. The
perpetuation of construing individuals and their simple interactions or being in space as
opportunistic catalysts for innovation and profit speaks to scholarship on the economization of
humans and the reduction of people to the financial (Brown, 2015; Murphy, 2017).
Dublin
“The success of Smart Dublin will depend on your input” (“Smart Docklands
Homepage,” 2018)
Embedded on the homepage of Smart Docklands is a 3:12 minute video magnificently
featuring the Silicon Docks. An inspirational instrumental score plays in the background
throughout the entirety of the clip while on the foreground a montage of colorful images with
captions that boast of the presence of global tech companies such as Google, Accenture, Yahoo,
Facebook, to name only a few; the co-location of workers, businesses, and residents; a vibrant
startup scene; multiple wireless connections to include Dark Fiber, Wi-Fi, 4G, Lora, NB-IoT,
SG, and Sigfox; a smart integrated transportation system; the concentration of people in the
square; and even a wake boarder doing a back roll off a ramp on the Liffey river. All this
activity, the video boasts, within the 1.25 mile sq walkable—or jogging, the video includes
between parentheses to appeal to the health-conscious city dweller—density of the Docklands. A
series of phrases appear on the screen throughout the video branding the Silicon Docks as “The
most connected district in the world,” connecting the world’s “most advanced city port” to the
home of “world leading tech companies” making it a testbed for “world leading connectivity”
(“Smart Docklands Homepage: The world’s most connected business and living district,” n.d.).

128
These superlatives are not exclusive to Dubliners. On February of 2018, Harvard’s
Technology and Entrepreneurship Center the Docklands convened the TECH Smart Cities
Innovation Accelerator, a three-day learning event. The event was held at the Silicon Docks,
selected as an exemplar model for innovation. This application-only ‘immersion accelerator’
brought together 23 Chief Technology Officers from across the globe. Together with Harvard
leadership, they derived the ‘Dublin Principles,’ an agreed upon definition of what a ‘Smart
District’ in a city should be and one that emphasizes the success of Smart Dublin efforts (2018
TECH Smart Cities Innovation Accelerator, 2018; Kelly, 2018; SmartCitiesWorld, 2018).
Urban governance institutions in Dublin have endorsed efforts to turn Dublin into a so-
called ‘Smart City’. The pilot, called Smart Arena, was a project led by Dublin City Council in
collaboration with representatives of area universities and tech companies such as Google, IBM,
and Cisco. Smart Arena is based on the premise that arenas are a microcosm of urban life.
During an event, the layout and management of an arena must facilitate ease of mobility amongst
large crowds, ensure safety and security of the customers, accommodate customer consumption
and waste disposal needs, and provide seamless, high-speed Wi-Fi access to all mobile carrying
individuals, while also serving as the source of entertainment. The arena environment was
envisioned as a ‘work bench,’ an optimal space to experiment with new technologies and data
tracking devices, which can later scale to the remainder of the city.
In 2018, Smart Arena strategy transferred over to the Silicon Docks (“Smart Docklands
webpage: Ecosystem,” 2018). Dublin City Council selected Silicon Docks in part because it
houses the largest concentration of tech companies and their employees in Dublin. More
importantly, Dublin City Council and corporate collaborators, operate on the collective
understanding that the culture of the people residing in the Docklands is such that they would
tolerate the nuisance of designing a space with urban interventions for cutting edge outcomes.
The overarching assumption is that the technologically literate demographic of the Silicon Docks
can withstand change and disruption. As an international trade consultant in Dublin put it:
“We’ll get them [infrastructure developments] sorted out on the small space where
there is a tech population and a community that would recognize a) the value of it
and b) probably tolerate any disruption to pavement being dug up to put a new cable
or whatever.” – (personal interview, September 7, 2016)

129
The demographics of Silicon Docks contribute to a collective understanding that the
innovation district stands as a separate entity from Dublin City. The potential for new
development to be met with critique and resistance is a hidden benefit of designated an exclusive
space for the people and the firms of the innovation sector. In fact, partners in the Smart
Docklands endeavor are primarily private companies heavily invested in prosumption activities.
Private partners include Accenture, Connect, Enable, Google, Huawai, Vodafone, Microsoft,
Deloitte, IBM, intel, AT&T, 3, Ericsson, Dell, and Cisco. All these companies stand to benefit
from data collected from users in space, in addition to using the Docklands as a test bed for their
innovations.
Dublin’s Smart City strategy resembles what Kitchin and Dodge (2011) have termed
code/space, that is: configurations in which software and the spatiality of everyday life become
mutually constituted. For example, in a recent event, Dublin City Council partnered up with
analytics company, ThinkSmarter, to embed a perimeter of the Docklands hosting Oktoberfest
with monitors to track the movement of over 66,000 visitors. As declared on the Smart
Docklands website, one benefit of this pilot project was the ability to “monitor dwell time” and
tackle “anti-social behavior” (“Smart Docklands webpage: Oktoberfest WiFi Analytics,” 2018).
The small concentrated space of the Silicon Docks, the branding mechanisms that promote the
district as a space of the future, and the constructed subjectivity of people’s responsibility in
participating in the project of future making all contribute in legitimizing smart city efforts. At
all points in the day, subjects are expected to conform to socially accepted behavior. Thus, not
only does policing (of the self and of the surveillance system) occur, but these companies can
also monitor consumer behavior and exploit that for profit. The concentration of space assists in
deriving data for analytics. That over 40,000 people work in the Silicon Docks and 26,000
individuals reside there is not lost on the tech companies involved in Smart Docklands
leadership.
The Smart Docklands initiatives do not conceal attempts to globally scale innovations
derived from their Silicon Docks real-life testbed. They position these potentialities as improving
the lives of those who live and work in the Docklands. A recent report by Mirvac, an Australian
property owner and manager, in partnership with WORKTECH Academy, a global knowledge
online network based out of the United Kingdom, highlights the rise of a new subjectivity in this
way, “[A]n alternative perspective is emerging which positions the users of the innovation
precinct as ‘creative citizens’, not just passive consumers of smart services…it must depend on

130
having active participants, not compliant observers” (pg 12). This sentiment mirrors the quote at
the start of this Dublin section, that is, that the success of the Smart Dublin initiative depends on
on the activity of individuals. Whether or not this activity is passive or active matters less than
having presence in place.
Discussion
Designing an innovation district, a space to house today’s tech workforce, requires two layers:
the material and the immaterial. What I label as material are the physical and tangible
infrastructural elements discussed by stakeholders as necessary for innovation. In interviews, the
following items were listed as the material elements of the innovation district.
Figure 42: Material elements of the innovation district

131
However, these material artifacts alone will not active the space. Activation depends on
interaction between the material infrastructure and the flow of activity. This additional layer is
the immaterial. Whereas earlier economic development efforts (i.e., Olympic bids, stadium
construction, convention centers, etc.) succeeded simply by providing the right product to secure
consumption from users, the innovation district depends on creating an activated environment to
foment the right experience.
Considerations of the innovation district must incorporate the amenities considered
essential for a supportive innovation ecosystem (i.e., incubators, residential amenities, boutique
hotels, and craft breweries) in addition to demonstrating the presence of buzz. Designing for
buzz is what distinguishes the way design is implicated to activate the environment to derive
profit from place and from the individuals within that space. In order for the design of the
innovation district to promote an experience, space must be activated in a particular manner.
Considering that the rhetoric for innovation today emphasizes the importance of collaboration,
openness, and interaction, then the existence of people in place is of critical importance. Below
are terms interviewees used to describe the immaterial layer of the innovation district:
Figure 43: Immaterial inputs for the innovation district
132
Importantly, this layer \ approaches the individuals’ needs and cognitive capital
differently from earlier productive landscapes. The landscape of the innovation district points to
the construction of the individual as a producer/consumer –what Toffler (1984) originally termed
a ‘prosumer.’ 29 For Toffler, the diffusion and access to technology shifted the power of the
production process into the hands of ordinary people.30 Optimistically, Toffler believed that the
prosumer would be the outcome and agent of a new civilization, what he termed the Third Wave.
Whereas the Second Wave, tied to the factory and the nation state, was characterized by
standardization, specialization, synchronization, concentration, maximization, and centralization,
Toffler conceive of the Third Wave as a disintegration of this through flexible work
arrangements, the ability to command where and work will take place through contractual work
with companies.31 These are the new work arrangements that innovation district strategy
attempts to accommodate so to further extract value from space and prosumers.32
Stakeholders building innovation districts base their decisions on the idea that innovation
requires a dynamic physical realm that encourages proximity and knowledge spillovers. It
follows that the innovation district must display this. If in the eyes of an entrepreneur the
innovation district does not provide the right product to scale a business or the right brand as a
networked and activated environment, then the innovation district will not sell.
The design of the innovation district demonstrates that tech culture is permeating the
urban realm through reconstructed landscapes that purposely employ design to create a seamless
flow of production and make the urban fabric of space a generator of innovation (Stehlin, 2016).
As discussed, work today occurs outside of the office more so than inside firm walls. The
innovation district aims to concentrate these flexible workers within the actual offices and firms,
29 The capitalist economy has always been dominated by prosumption (Ritzer & Jurgenson, 2010). Indeed, for Marx the Industrial Revolution’s pre-eminent economy was focused on production, though Marx did not negate that production involved consumption. The differences in contemporary capitalism are threefold. The first is that the rise of internet and Web 2.0 has increased the number of prosumers so that today there are more prosumers than consumers and producers; the second is that the consumer is now more conscious and consensual in their participation (Comor, 2011); and the third is that under ‘prosumer capitalism’ control and exploitation take on a different character and there is a trend toward unpaid labor (Ritzer & Jurgenson, 2010). 30 Though Toffler coined the term ‘prosumer,’ Marshall McLuhan and Barrington Nevitt’s Take Today (1972) was perhaps the first to connect the idea that consumers are becoming producers because of electric technologies. 31 Countless scholars have also documented this economic shift. For a select few see Scott (2008), Piore and Sable (1984), and Bell (1973). 32 Here, the work of digital scholars on prosumption is important. Digital scholars adapt the concept of the consumer, making its definition and application more robust by applying the term to Web 2.0 and the role of individual labor in platforms such as Facebook, Twitter, and YouTube (Fuchs, 2014; Scholz, 2016; Terranova, 2000). Through activity on platforms, the individual both produces the content for the platforms while also consuming the advertisements tailored to that individual based on their activity. In this way, the user is at once the producer and the consumer. Consumer scholars also leverage this concept, critiquing Toffler for neglecting to notice that the prosumer still acts within the confines of the market system and through the exchange of commodities, thus negating Toffler’s hope for change (Comor, 2011).

133
in addition to residential spaces, places of entertainment, and the public space of the plazas, the
streets, and the sidewalks. In this sense, the space of the innovation district is a social factory
(Gill & Pratt, 2008).
The role of technology in the growth of complex, networked, global supply chain
capitalism has resulted in the monitoring of workers and machines and in ensuring optimized
performance and production (Kanngieser, 2013). As a type of social factory, it is not illogical to
extend the management techniques outside of firm walls to ensure optimized performance and
production of the people in all domains of the innovation district. Further exacerbating this
constant production of work, advanced information communication technologies are
implemented for rapid and continuous information exchanges, amenities and housing
opportunities in proximity to work enforce the live-work-play mentality; place-making principles
are applied to manage (and blur) the public/private realm creating spaces where people can
comfortably extend networks and generate new insights outside of the office; and the rise of
smart city applications serve to track everyday people in public space.

134
Chapter 5: What is at Stake? “It becomes crucial to know what is being built in the city and how the newly built spaces are
endowed with hegemonic meaning, in order to understand how individuals and collectives are
ideologically interpellated as citizens” (Balibrea, 2001; pg 188).
Innovation districts contribute to the splintering of the city. This is evident primarily from
the changing demographics in the space of the innovation district. Following the work of
Foucauldian scholars such as Murphy (2017), Lindtner (2017), McRobbie (2016), and Brown
(2015), I demonstrate how an assemblage of actors, from the state level to local growth
coalitions, eagerly encourage ‘entrepreneurial living’ (Lindtner, 2017), a practice of self-
provisioning that shifts risk from the state to the individual and exacerbates issues of precarity
for the entrepreneur sitting squarely within the concentrated space of the live-work-laboratory.
Innovation Districts as Citadels
Innovation districts, particularly Park Center, are in early stages of implementation. It is
not possible to draw firm conclusions on their outcomes, not that measuring outcomes against
stated aims was ever the intention of my research. Despite this, it is possible to point to certain
trends that demonstrate a shift in demographics and a rise of land value and occupancy rents
within the space of the innovation district. Collectively, these data points support the claim I
make that the space of the innovation district is a citadel for a young, childless, educated,
professional, likely-white individual. Coupled with data on rising real estate prices in the area, it
becomes evident that the gap will widen between the individuals living and working in the space
of the innovation district and those who do not have the skills to work or finances to afford living
there.
The changing demographics within the space of the innovation district are consistent in
all four urban cases. Park Center remains in too early stages to track shifts in demographics (see
tables 5 - 8).
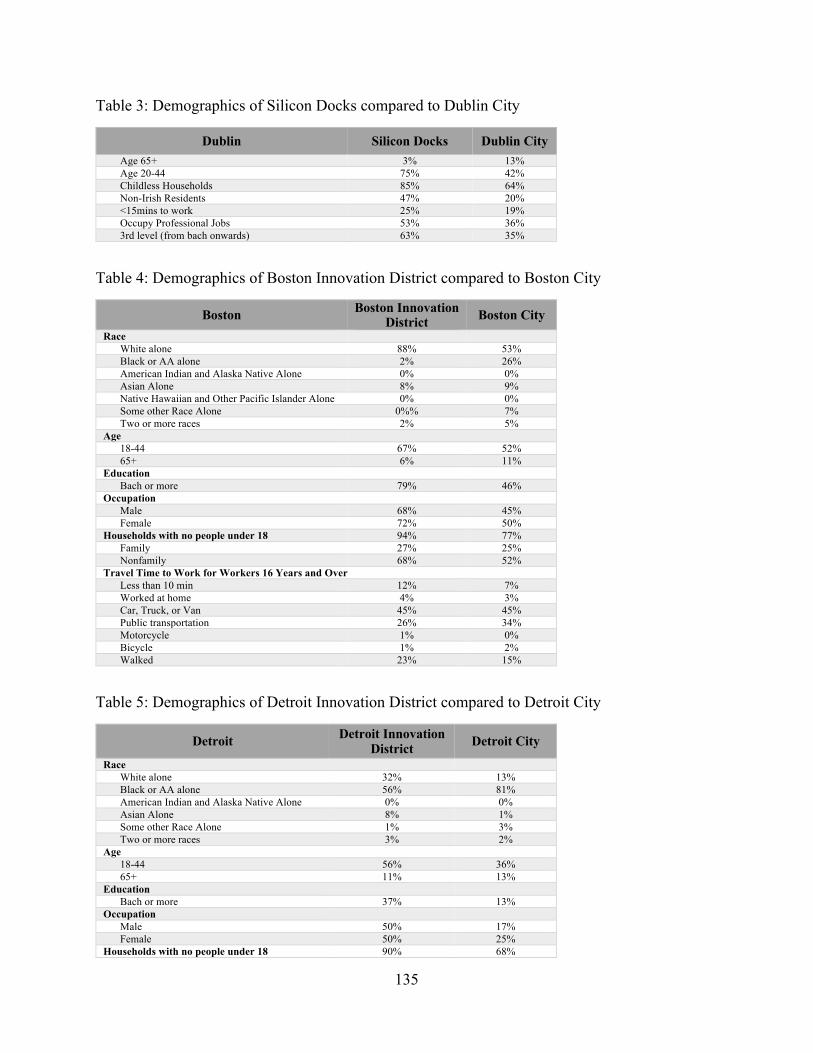
135
Table 3: Demographics of Silicon Docks compared to Dublin City
Dublin Silicon Docks Dublin City Age 65+ 3% 13% Age 20-44 75% 42% Childless Households 85% 64% Non-Irish Residents 47% 20% <15mins to work 25% 19% Occupy Professional Jobs 53% 36% 3rd level (from bach onwards) 63% 35%
Table 4: Demographics of Boston Innovation District compared to Boston City
Boston Boston Innovation District Boston City
Race White alone 88% 53% Black or AA alone 2% 26% American Indian and Alaska Native Alone 0% 0% Asian Alone 8% 9% Native Hawaiian and Other Pacific Islander Alone 0% 0% Some other Race Alone 0%% 7% Two or more races 2% 5%
Age 18-44 67% 52% 65+ 6% 11%
Education Bach or more 79% 46%
Occupation Male 68% 45% Female 72% 50%
Households with no people under 18 94% 77% Family 27% 25% Nonfamily 68% 52%
Travel Time to Work for Workers 16 Years and Over Less than 10 min 12% 7% Worked at home 4% 3% Car, Truck, or Van 45% 45% Public transportation 26% 34% Motorcycle 1% 0% Bicycle 1% 2% Walked 23% 15%
Table 5: Demographics of Detroit Innovation District compared to Detroit City
Detroit Detroit Innovation District Detroit City
Race White alone 32% 13% Black or AA alone 56% 81% American Indian and Alaska Native Alone 0% 0% Asian Alone 8% 1% Some other Race Alone 1% 3% Two or more races 3% 2%
Age 18-44 56% 36% 65+ 11% 13%
Education Bach or more 37% 13%
Occupation Male 50% 17% Female 50% 25%
Households with no people under 18 90% 68%
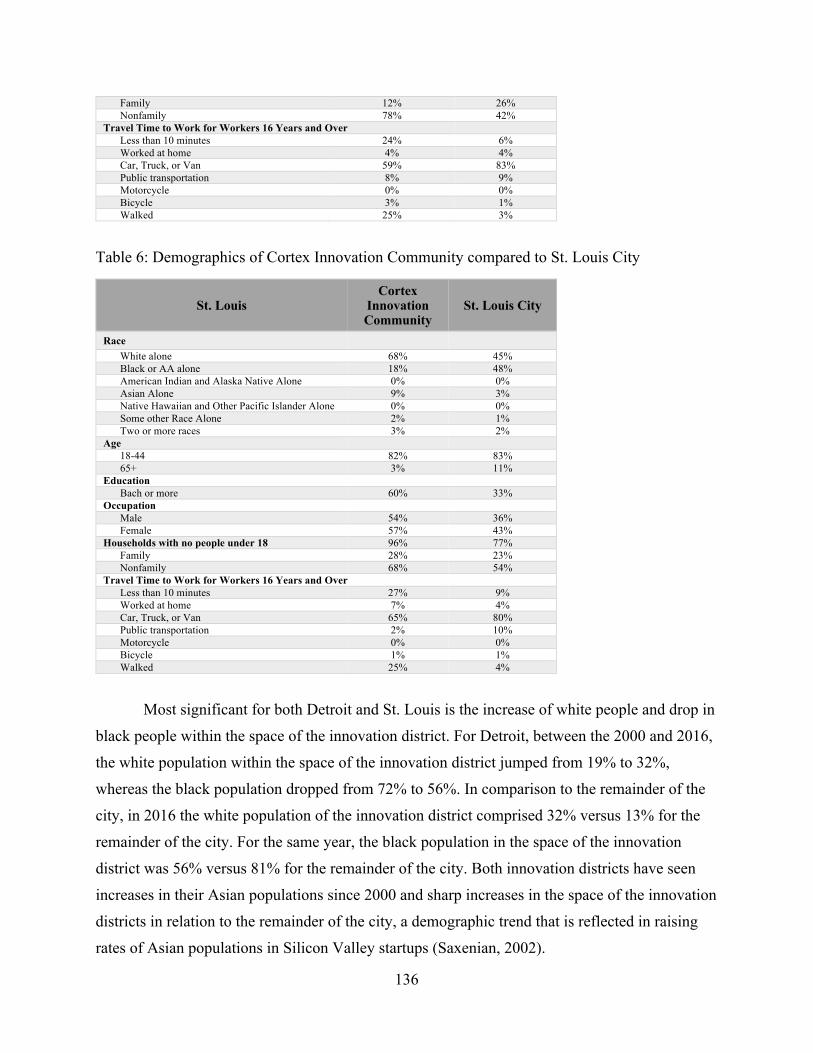
136
Family 12% 26% Nonfamily 78% 42%
Travel Time to Work for Workers 16 Years and Over Less than 10 minutes 24% 6% Worked at home 4% 4% Car, Truck, or Van 59% 83% Public transportation 8% 9% Motorcycle 0% 0% Bicycle 3% 1% Walked 25% 3%
Table 6: Demographics of Cortex Innovation Community compared to St. Louis City
St. Louis Cortex
Innovation Community
St. Louis City
Race
White alone 68% 45% Black or AA alone 18% 48% American Indian and Alaska Native Alone 0% 0% Asian Alone 9% 3% Native Hawaiian and Other Pacific Islander Alone 0% 0% Some other Race Alone 2% 1% Two or more races 3% 2%
Age 18-44 82% 83% 65+ 3% 11%
Education Bach or more 60% 33%
Occupation Male 54% 36% Female 57% 43%
Households with no people under 18 96% 77% Family 28% 23% Nonfamily 68% 54%
Travel Time to Work for Workers 16 Years and Over Less than 10 minutes 27% 9% Worked at home 7% 4% Car, Truck, or Van 65% 80% Public transportation 2% 10% Motorcycle 0% 0% Bicycle 1% 1% Walked 25% 4%
Most significant for both Detroit and St. Louis is the increase of white people and drop in
black people within the space of the innovation district. For Detroit, between the 2000 and 2016,
the white population within the space of the innovation district jumped from 19% to 32%,
whereas the black population dropped from 72% to 56%. In comparison to the remainder of the
city, in 2016 the white population of the innovation district comprised 32% versus 13% for the
remainder of the city. For the same year, the black population in the space of the innovation
district was 56% versus 81% for the remainder of the city. Both innovation districts have seen
increases in their Asian populations since 2000 and sharp increases in the space of the innovation
districts in relation to the remainder of the city, a demographic trend that is reflected in raising
rates of Asian populations in Silicon Valley startups (Saxenian, 2002).

137
The changing demographics in the Detroit Innovation District in relation to the rest of the
city shifted in expected ways. There are now more young, childless, educated, professionals in
the Detroit Innovation District. Of the people 16 years and over who work in the Detroit
Innovation District, there is an increase in proximity to work with more people commuting less
than ten minutes to reach their site of employment, a drop in commuting time with an car, truck,
or van, and an increase in bicyclists and walkers. Increasingly, more people are working from
home.
St. Louis is similar to Detroit in regard to an increase of younger people living in the
Cortex Innovation Community from 2000-2016, but the percentage of young people in the
Cortex Innovation Community is less than the total for the city of St. Louis. This is explained by
the availability of housing in the surrounding neighborhoods and the limited housing availability
within the Cortex Innovation Community—an issue the Cortex Foundation is seeking to address.
Still, of those living within the Cortex Innovation Community, more households are childless
(96%) than the rest of the city (77%), more educated (60%) than the rest of the city (33%), and
with people holding more professional jobs (54% male and 57% female) than the rest of the city
(36% male and 43% female). Both of these categories have seen an upward trend for the Cortex
Innovation Community since 2000. As it relates to commuting times, more people commute less
than 10 minutes to work, there is an increase in people working from home, and an increase in
bicyclers and walkers. Commuters using public transportation, cars, trucks, or vans has dropped
both over time and in relation to the remainder of the city.
Boston and Dublin’s innovation district demonstrate consistency in the growth of a
young, childless, educated, professional demographic living in close proximity to work. The
challenge with these two strong market economies is comparing racial demographics. Boston’s
Seaport Innovation District, like Detroit and St. Louis, represents a whiter, Asian, and less black
population than the remainder of the city. This last point raised harsh critique by Spotlight, the
Boston Globe’s investigative team, in a study on the absence of black people in the history of the
Seaport Innovation District—from development decisions, to leadership, to residential
accommodations (A. Ryan, 2017). Dublin’s most similar comparison is in relation to the increase
of non-Irish residents within the space of their innovation district. This reflects the presence of an
international professional class (Sassen, 2001) locating in Dublin to work in the multinational
corporations, many of which are concentrated in the Silicon Docks. For the tech-workers in
Dublin who can afford to live in the new condominiums, this concentration of expensive housing
138
and their places of employment contributes to an increase in the percentage of people who live in
close proximity to work.
In Boston’s Seaport Innovation District, modes of travel and commuting times have
fluctuated. Whereas since 2000, more people are commuting less than 10 minutes to work, more
people are walking, and more people are working from home, there have been less people using
public transportation and biking over time and in relation to the remainder of the city. Changes in
car, truck, or van use to arrive at work over time and in relation to the remainder of the city are
insignificant, though this is the predominant mode of transportation for almost 50% of the
individuals in the Seaport Innovation District and the remainder of the city. These commuting
trends reflect challenges the Massachusetts Department of Transportation faces in connecting a
peninsula with arteries for delivery truck traffic and existing dockland infrastructure, in addition
to congested public transportation lines, and main thoroughfares that once used to accommodate
the acres of parking lots for car commuters working in the financial district (Ramos, 2017;
Vaccaro & Logan, 2017).
The Brookings report on innovation districts discusses the proximity of innovation
districts to low-income neighborhoods as a “focus on expanding opportunities to disadvantaged
populations” (Katz & Wagner, 2014). Gesturing to side-by-side co-location invokes the image of
trickle-down economics, the image that benefits accrued within the bordered space of the
innovation district will spill-over to the remaining neighborhoods, already less fortunate for their
lack of inclusivity within the boundary. The problem is that real estate prices in close proximity
to the innovation district are rising. The low-income neighborhoods purported to house the
service labor are slowly becoming unaffordable to that demographic (see Appendix E).
What is evident in all five cases is the way innovation district strategy worked to target
development and create jobs for a particular demographic within its boundary. This strategy was
employed during a period of construction standstill due to the 2008 global housing crisis. There
were earlier attempts of innovation-led development in cities before the recession, but the
strategy worked well after the recession as a way to jump start development after construction
was halted and large companies paused on their intentions to develop property in the city. To
generate some form of growth, urban actors shifted their attention on entrepreneurs and small
startups. However, once the economy picked up, these same actors refocus the strategy on
attracting larger companies, which slowly start to displace the entrepreneurs who were once the
focal point of innovation district strategy.

139
Entrepreneurial Living and the Withdrawal of the State
In an opening letter in the 2016 report to President Obama from his Council of Advisors
on Science and Technology, the council writes:
Combined, the innovations that are increasingly within reach provide an
opportunity to revamp how cities operate at all levels and for all stakeholders.
Transforming cities around the world in this way is already a race―one that the
United States cannot afford to lose. It is generating demand for new products, new
companies, and new skilled jobs in the effort to produce the best urban
environments (v).
Earlier, in a 2013 State of the Union Address, Obama said:
‘‘We’re Americans. We are inventors. We are builders. We’re Thomas Edison
and we’re the Wright Brothers and we are Steven Jobs. That’s who we are. That’s
what we do. We invent stuff, we build it” (cited in Lindtner, 2017; “Remarks by
the President on Manufacturing and the Economy,” 2012)
The success stories of innovators are a continuous source of fascination for policymakers
and planning practitioners. Silicon Valley’s history of growing from an agricultural landscape to
the prime global destination for startups permeates as an exemplar beyond the boundaries of the
United States. This is physically evident from the various cluster developments across the globe,
many named aspirationally, such as Silicon Wadi, in Israel, Silicon Docks in Dublin, Silicon
Cape, in South Africa, Silicon Beach, in Melbourne, Silicon Alley in NYC, Silicon Gulf, in the
Philippines, and Silicon Fjord, in Norway to name only a select few (Kit, 2012; “List of
Technology Centers,” n.d.).
The allure of Silicon Valley and the mythical garage tinkerer turned millionaire is so
pervasive that it is actually influencing the way we build and govern our cities and citizens. Part
of what the allure embodies is a language of incentivizing risk, testing and scaling ideas, and
destigmatizing failure. It is also about the romanticized idea of the entrepreneur as renegade
savior, disrupting social conventions to break new ground. This ‘entrepreneurial turn’ is critical
to innovation district strategy. It is critical in terms of securing territory, funding, and attracting
140
bodies into the profession of entrepreneurship. Furthermore, this ideology perceives individuals
as market subjects (Murphy, 2017) and causes individuals to see themselves and each of their
interactions as market transactions resulting in an overall sense of ‘entrepreneurial living’
(Lindtner, 2017).
To begin explaining this, it is necessary to step back and discuss my use of the contested
term “neoliberalism”. Despite the pushback on the use of the term, I find it useful to extend the
concept here. Scholarship on neoliberalism is crudely tied to two strands of reasoning. David
Harvey (2005), exemplifying the orthodox view of neoliberalism, defined it as an institutional
framework characterized by strong private property rights, free markets, and free trade that
liberated entrepreneurial freedom. The second is rooted in Foucauldian theory that construes
neoliberalism as a governing rationality. The two strands for understanding neoliberalism are not
opposing lines of inquiry (for a good distinction between these strands of thought see Brown,
2015). Rather, both strands seek to explain contemporary capitalist processes and to understand
how different actors, policies, and institutions interact. Furthermore, in relation to outcomes of
neoliberal rationality, both formulations focus on growth, expansion of the market, and a
diminishing welfare state.
Whereas for some scholars a direct genealogy can be traced to either a Marxist or
Foucauldian understanding of neoliberalism, many scholars mobilize both. This ad hoc
borrowing plays a contributing factor in the critique on the adoption of a neoliberal framework as
an overused concept (Boas & Gans-Morse, 2009). At the same time, both frameworks are useful
for understanding the various permutations and configurations of neoliberalism as it is a loose
and shifting signifier with historical contingencies and spatial variances (Brenner et al., 2010;
Peck, 2010).
The type of entrepreneurial urbanism that Harvey (Harvey, 1989a) detailed is deeply
situated in the development of the innovation district. That is to say, the role of the growth
machine ( Logan & Molotch, 2007) remains in place, public private partnerships dominate
development (Sagalyn, 2007), tax exemptions and deregulatory mechanisms undergird the
financing of these spaces (Weber, 2002). What is categorized as an orthodox classification of
neoliberalism is deeply entrenched in the innovation district and this body of literature informs
my understanding of the macro level elements at play in innovation district strategy.
At the same time, it is also helpful to adopt the Foucauldian perspective. The Foucauldian
perspective of neoliberalism as an order of normative reason that takes shape as a governing

141
rationality extending a specific formulation of economic values, practices, and metrics to every
dimension of human life (see Brown, 2003, 2015). The techniques used in this “art of governing”
are implemented in a wide variety of ways with spatially distinct and contextually situated
expressions. What scholars building on the work of Foucault share is the inquiry of how
government is redesigned and reshaped through a retheorization of thinking through how to act.
This conduct of the self forms the basis of Foucauldian biopolitics and is demonstrated in
practice from its effect on democracy (Brown, 2015), creating a dialogue around a girl’s human
capital as a form of birth-control (Murphy, 2017), and issues of bio-life in genetics (Rajan,
2006), to name a few recent studies.33
The economization of life means that individuals are seen, and see themselves, as what
Foucault termed homo-economicus (Read, 2009). Homo-economicus, an entrepreneur of
himself, his/er own capital, his/er own producer, invests time on future returns. The creation of
homo-economicus and the management of this human capital is construed in particular ways by
local governments (Tadiar, 2013). This is a way for the state ideology to permeate and be
enforced at lower scales – to be governed at a distance (Rose, 1999).
The promise of the innovation district, both as a space for the invention of new products
and as a source of regional economic growth, is internalized by entrepreneurs. Entrepreneurs are
made to interpellate the ideology of entrepreneurship because their efforts contribute to raising
the value of the city and the welfare of the city. This is the act of subjectivity. Subjectivity is the
process of internalizing certain modes and values, the process of turning the self into a
productive individual (Rose, 1999). This is evident in campaigns created by innovation district
stakeholders to attract entrepreneurs. Furthermore, the idea of deriving a campaign focused on
attracting the entrepreneurs is based on an interpellated ideology that in innovators and
entrepreneurs as catalysts for positive change. One respondent in St. Louis explained that
entrepreneurs are best known for the ability to think outside the box and are thus post-race, post-
class, and post-gender (personal interview, 2016). As an example, the tagline on the homepage of
St. Louis’ Venture Café exemplifies the glorification of the entrepreneur and innovator: “The
future of the world is at stake: You can totally be part of the team that saves society” (St. Louis'
33 Harvey (2005) also defines neoliberalism, but he defines it from the perspective of the state. The state, under neoliberalism, liberates entrepreneurial freedom by removing restrictions on the market and increasing private property rights, free markets, free trade. At the other end of the continuum, Foucault’s definition of neoliberalism is liberated through the economizing individual. Both strands, however, define relations and reactions in relation to the market.

142
Venture Café homepage, “A Community of Colliders: Innovators Connecting to Innovators,”
n.d.).
Figure 44: Image of Venture Café promotional web banner
Source: St. Louis Venture Café homepage (“St. Louis Venture Cafe Homepage,” n.d.)
This focus on subjectivity suggests we are no longer in a Taylorist form of management
where managers controlled all aspects of production and complete control of the employee is no
longer the dominant logic in management. Instead, post-Taylorist production represents a type of
‘participative management’ where workers become active subjects in coordinating different
functions of production.34 This inculcation of individuals in the production process forces
individuals to control themselves in new ways so that command “arises from the subject itself”
(Lazzarato, 1994). Considering that a growing source of production today is immaterial, the
purpose of subjectivity of the individual is to actively produce the cultural content of a
commodity. If we extend the concept of the commodity to the innovation district, we see the
importance of individuals in the branding of the innovation district. The innovation district
serves as a ‘basin of immaterial labor’ (ibid.) where work permeates the entire space of the
innovation district.
34 In his Lectures at the College de France Foucault discusses the concept of the panopticon as a direct supervisory technique and this shift of that from total surveillance to subjective forms of surveillance.

143
Innovation districts represents a new era of economic development –one that moves
beyond state-science and technology-based strategies to individual-science and tech-startup
based strategies. Though the state is not removed, it is present in ways Block (2008) calls the
hidden development state or Mazzucato (2014) calls the entrepreneurial state. Whereas in earlier
iterations the state played a visible and prominent role in shaping economic development policies
through massive infrastructural development on which the industrial revolution hinged or
through a military industrial complex funding science and tech research and warfare, the position
of the state in the contemporary era is hidden. Though funding channels demonstrate that the
federal government continues to support small business development and research, today’s
entrepreneurs and tech firms work to distance themselves from a bureaucratic state to maintain
the image of efficiency (Mazzucato, 2014). The state takes on the management of human capital
to manage and ensure the success of the economy (Brown, 2015; p. 84). This ideology is evident
in from the tax exemptions received by firms in the innovation sector, to the marketing materials
used to attract innovators to the innovation district, to the growth of entrepreneurship studies in
universities, to name only a few examples.
The concept of the innovation district as a bottom-up and seemingly inclusive form of
development also coincides with austerity urbanism (Peck, 2012; Tonkiss, 2013). The focus on
self-entrepreneurship, particularly following the 2007/8 recession, provides the state temporarily
relief from direct provision of welfare. Innovation district strategy as an economic development
policy reliant on a ‘bootstrap mentality’ means that individual take on risk, a risk that was
previously mediated through the welfare state but not any longer. With the rise of the various
forms of contractual labor and the governance techniques inserted to ensure constant work-
readiness (Mitropolous, 2012), the post-Fordist workplace outsources risk to the individual. This
risk is taken on not only in the signing of the contract, but also in the time between the signing of
the contract when the individual is in a precarious state of employment. Within labor
outsourcing, the contracting out of services, and the rise of human capital theory, “workers are
constituted as entrepreneurs of their own productive, and indeed reproductive, capacity” (Cooper
& Waldby, 2014:15).
Another reason for the increase in this form of governance is due to the reorganization of
the firm and the increase in a mobile workforce. In other words, governance of individual
subjects increases in difficulty due to the shifting of people and firms. The inability of the
national boundary to contain people, that is, the flows that move beyond the nation-state

144
problematize issues of sovereignty. Creating a bounded territory, where individuals live-work-
and play while in the space, serves as a container. And though flows continue, tech workers are
often global nomads, governance is facilitated through governable subjects (Lindtner & Avle,
2017). The innovation district facilitates the process as a node within a global network where
individuals, determined by their purchasing power—these spaces are expensive—can travel from
one space to the next and still have similar experiences.35
In summary, the innovation district as a space formed to concentrate entrepreneurs assists
in perpetuating self-governance. The success of the strategy depends on the excitement of
budding entrepreneurs built on a narrative on the adventure of entrepreneurialism, inherently
attached to the image of a free-spirited, unhinged, risk-seeking individual. What is at stake for
this individual is the amount of precarity assumed. Neither the corporation nor the state provide a
safety net for the entrepreneur or the individuals that comprise the contractual workforce. This is
the reality faced at the scale of the individual. At a larger scale, what is at stake with innovation
district strategy is the emergence of a wealthy citadel amongst landscapes of disinvestment.
35 Foucault’s notion of governmentality works best through the production and the control of space (Discipline and Punish, 1977) Foucault used the prison to demonstrate its function in creating a certain type of individual. In the case of the innovation district, the use of design and brand assists in conscripting pre-established norms that are understood and acted upon by the subjects.

145
Chapter 6: Conclusion For decades, economic geographers have sought to derive a science on the inputs of
innovation and economic developers and policymakers have used some of this literature to
inform their strategies. Ultimately, despite attempts on both sides—theory and practice—there is
no agreed upon template for how to create a productive and wealth generating economy. Despite
this, innovation district strategy proliferates as an economic development tool to generate
regional wealth.
Based on a comparison of five innovation districts, in this dissertation I demonstrate that
within the rhetoric of the innovation district, that of an alleged openness for talented individuals
who will create new apps for the platform economy, entrepreneurs will ideate and scale, and
research laboratories will propel a healthier future, a narrowness exists. The compression of time
and space (Harvey, 1989b) amongst knowledge workers works best through the creation of a
seamless environment so that at all stages of the day individuals are encouraged to work. Social
events are programed to ensure continuous interaction with the end goal of spurring innovative
ideas. Public space is managed and programmed for additional spontaneous interactions. The
design of the innovation district recognizes and builds the amenities to meet the needs of the
target audience –the highly educated and skilled workforce—while at the same time, stripping
individuals of their freedom by creating an environment that demands constant productivity. This
is the logic of the innovation district and its relationship to a constant stream of individuals from
whom to derive productivity.
In practice, innovation district strategy in all five case sites suffers from a disagreement
on how to define innovation and, therefore, how to operate on a definition that guides the
strategy. Is it about accelerating products to the market? Is it about creating a space to try out
innovative policies, such as form-based codes, pink zones, and smart city applications? Is an
innovation district an attempt for cities to transition into a tech-economy based on a new
workforce economists, sociologists, and organizational scholars are trying to comprehend?
The ambiguity of the strategy has problematic outcomes for cities with both declining
and growing economies. Cities that have a robust entrepreneurial ecosystem can adapt this
strategy to extend their already existing ecosystem. In Dublin and in Boston, the shortage of

146
affordable space for entrepreneurs drove the decision to refurbish dilapidated post-industrial
infrastructure to accommodate small startups. Many of these small startups benefitted from
proximity to an established ecosystem where venture capital and C-suite mentorship was readily
available. However, a problem arises when larger companies also want to move into the new
innovation district—companies such as General Electric in Boston and Detroit, Facebook in
Dublin, an IKEA in St. Louis. These companies demand larger footprints to accommodate their
employees. The relocation of a large company to the heart of a city is not necessarily a bad
problem for urban actors and residents. The presence of large companies can generate non-
quantifiable benefits, such as brand recognition, cache, investment security. These elements
create path dependence for other firms and future employees. This was the case in Boston when
Vertex Pharmaceuticals, LogMeIn, and ZipCar all moved to the Boston Innovation District
(Kirsner, 2014). At the same time, these factors undergird decisions by urban actors and
politicians to favor established firms over continued support of smaller ventures.36 The pressure
to ensure the availability of flexible spaces for startups rather than price them out for the location
preferences of the larger corporations increases when considering the amount of jobs a larger
company may create and taxable income. In principle, larger companies will generate more
income for the city. It should be noted, however, that these gains are negated when governments
are overly generous with incentive packages and subsidies.37
Katz’s prescriptions for creating innovation districts refrains from asking and addressing
this tipping point. Economic developers and growth machine coalitions willingly embrace
innovation district strategy because of the opportunities it presents to transition into a tech
economy, create jobs, promote vibrancy, and, through spillovers, generate regional wealth.
Whether or not innovation district strategy will meet these objectives remains to be seen.
However, as I demonstrate in this dissertation, what is already evident is the role innovation
districts are playing in increasing land values that cater to a wealthier demographic and deriving
profit from the livelihoods of the people who live within its boundaries. In addition,
contextualizing the emergence of innovation districts from a neoliberal perspective, an
ideological apparatus stemming from growth coalitions is clear in the development of the tech
sector and, by extension, new landscapes of technology. The assemblage of actors that make up
36 Parallel arguments on the rent-gap theory and causes of gentrification (N. Smith, 2005, 2008) exist though rather than focusing on the tech sector, they examine creative workers (see for example (G. Evans, 2009; Lloyd, 2008; Zimmerman, 2008). 37 For an excellent example of how much public governments give in subsidies, see Good Jobs First Subsidy Tracker (Tracking Subsidies, Promoting Accountability in Economic Development, 2018).

147
the growth coalitions for each respective innovation district plays an important role in creating a
market driven ideology focused on entrepreneurship. This ideology originates from federal
policy championing the role of the entrepreneur and his/her responsibility to society and stems
down to local actors. Individuals are made to understand their connection as entrepreneurs and
the role they play in actualizing the growth objectives of the innovation district stakeholders.
Messaging of this sort operates on the tall tales of garage tinkers turned millionaires who create
job opportunities for the region and positively impact the community, the region, and society.
This is a message delivered by various actors at various scales, from the human resource and
marketing departments of global companies, to federal policy on entrepreneurship, to the
motivational speeches for innovators prominent in networking events for entrepreneurs and
innovators. What it also does is cause individuals to formulate him/herself as a human capital
agent focused on competition. The creation of the precarious market-subject is a governance
technique in this new state of insecurity (Lorey, 2015). As an established territory with
governance structure focused on entrepreneurship, the space of the innovation district is a great
place to practice this entrepreneurial ideology.
Innovation districts built in both the urban and non-urban sphere are changing
landscapes. These new landscapes will create challenges for urban residents at the individual
scale. The increased work demands due to mobile technologies allow workers to work
everywhere and all the time (Mazmanian et al., 2013). Innovation districts, through their
connected infrastructure and concentrated design, help accelerate continuous on-demand work.
My interest in this scholarship is the acceptance of an all-encompassing nature of labor that
extends beyond the 9 – 5 work day. This exemplifies the live-work-play mentality that
undergirds innovation district strategy. The benefit of alternative work arrangements provide
individuals with a sense of autonomy, but more and more scholars are reporting negative
consequences, such as elevated levels of stress and anger from always being ‘on,’ feelings of
loneliness resulting from the loss of a work community, and family conflicts due to blurring
boundaries between work and family life (Allen, Golden, & Shockley, 2015; Bloom, Liang,
Roberts, & Ying, 2015; Caillier, 2011; Rockman & Pratt, 2015; Schieman & Young, 2010).
My interest in focusing economic development practice on humans translates to seriously
interrogating how today’s tech-environments are affecting people. As I demonstrate in this
dissertation, innovation district strategy affects the way we conceive of the public good. This is
problematic when we enclose large tracks of public land to seemingly private ownership and

148
capital extraction. The processes of transforming public space into constant sites of production
through subversive tactics of command and control demand critical attention.
Sociologist Hans Joas (cited in Welz, 2003) argues that creative innovation happens
when established notions of action fail because they encounter resistance thus resulting in the
emergence of new forms. By extension then, fabricating spaces devoid of contact between
difference cultures (i.e., socio-economic status, mixed use, aging structures), may ultimately
deplete the conditions necessary for innovation production. Historic and seminal research on this
topic shows that the opposite is more important: creative activity requires physical structures that
are aging, mixed use, and can handle instability that is then conducive to change and innovation
(Jacobs, 1992; Stevens, 2015).
Such as in the practice of ecological conservation, neighborhoods should put efforts to
protect and maintain all typologies including informal economies and small bottom-up ventures
as part of an urban ecosystem. The eradication of such occupants to make way for larger
institutions and gentrification does not create a complete neighborhood viable for the productive
evolution of all economy types.38
My concerns with the contemporary focus on building a tech economy are manifold. The
first issue is that tech companies are fabled job creators (Davis, 2015). At the startup stage, tech
companies consist of a small team of people. If they are deemed high value, a larger company
quickly absorbs them (Jacobs, 1969). The second issue that concerns me in building a tech
economy is the massive changes to the built environment required to see it through. Policies
guiding the development of innovation ecosystems emphasize the importance of a dense,
walkable, amenity rich fabric within a tightly integrated contiguous space as the catalyst for
spontaneous and synergistic interactions. In and of itself, creating denser, more compact
developments might not be a bad form of development.39 In fact, the physical degradation to the
ecosystem as a result of the sprawl that epitomized much of the 1950s and beyond is an
argument in favor of urban concentration. However, my research demonstrates that the outcome
occurring in cities as a result of these developments is a segregation between the individuals,
institutions, and forms of knowledge and expertise that are considered innovative and those that
do not fit the definition.
38 Even the earliest documenters of new economic structuring foresaw the possibilities of inter and intra region divergence in spaces that seek to boost their economy by targeting knowledge based economies (Castells, 1992; Harvey, 1989a; Scott, 2008). 39 However, recent studies on density point to problems associated with issues of health (Feintzeig, 2014).
149
Finally, this dissertation uses innovation districts as a lens to study how advances in
technology shape economic development strategies. However, these changes are occurring
outside the space of the innovation district. Changes in the role technology plays in
reconceptualizing urban governance and the management of human capital bleed beyond the
boundary of the innovation district into all spaces of the city. The space of the innovation district
serves as a laboratory to experiment with these new forms of governance before extending the
policies to the remainder of the region (J. Evans & Karvonen, 2014). The innovation district is
one bounded space from which to draw observations on the extractive logics of contemporary
capitalism, but any other places to study these same phenomenon exit. In this way, the claims in
this dissertation can be made stronger by extending the study into places outside of the
innovation district.
There are other directions for research that would strengthen the claims I make in this
dissertation that I want to point out. In chapter 5, I gesture to studies on the mobile workforce
and growing health issues related to the pressure of non-stop performance and accommodating
work around the clock. This research would benefit from an ethnographic study of the lives of
the entrepreneurs working within the space of the innovation district or in similar fast-paced and
continuous work environments. Though I did hold interviews with some of the entrepreneurs of
the innovation district, a study dedicated solely to them and their livelihoods would be
informative.
Tracing the citizenship status of the people who live in the innovation district would
inform fluctuations in democracy and citizen participation in local politics. This assumption
stems from the idea that innovation districts function as a node along a globally interconnected
network of firms. As one Facebook employee relayed, Facebook strategically positions offices to
“follow the sun” so that at all times of the 24-hour day, at least one office is operating (personal
interview, 2017). This is particularly important for the employees who are responsible for
ensuring the acceptability of content on their platform. Though many of these employees are
rooted in one location, many of the managers do transition from one satellite to the next. In
addition, individuals use the satellites in one location as a way to move up the ladder, eventually
making it to a Dublin office or a, for a select few, Silicon Valley. The question that arises from
this constant stream of relocation is the rootedness of the innovation district. While it is place-
bound within a jurisdiction, inhabitants are less likely to be invested in local politics and

150
happenings. This has implications for any attempts to build communities and the role that local
coalitions can have on the welfare of non-transitory residents.
A follow-up study analyzing the performance of innovation districts ten to twenty years
from now would be informative. By then, provided the plans move forward as intended, Cortex
Innovation District will have completed Phase 3.0 and Park Center would be far beyond laying
underground tubes and piping. Likely, Detroit’s Innovation District and Boston’s Innovation
District would be less revealing considering that excitement for the Detroit Innovation District
declined before majority of the city knew about it and that the targeted activity for Boston’s
Innovation District has transitioned to the Financial District. As Dublin’s Silicon Docks stands to
benefit from the Brexit referendum, should the UK succeed in separating from the European
Union, many UK based foreign tech-companies might move their operations to nearby Dublin.
For now, these are the three future research engagements that come to mind.

151
Appendices

152
Appendix A: Example interview guide My interview guide is based off of Weiss’ (1994; p 49-50) example. He states that four to six areas of an interview guide can be covered adequately in a two-hour interview. My interview guide (below) consists of three sections. I hope to complete my guide in 45 minutes to one-hour interviews. My plan is to begin each interview by informing the respondent that I researched these developments while at the Brookings Institution and I continue to research them for my dissertation as a doctoral student in urban and regional planning at the University of Michigan. At the end of the interview I will ask the respondent if he/she would be willing to keep me abreast of any new developments and/or if it would be acceptable for me to sit in on meetings regarding the development of their innovation district. If I am invited to attend, I will participate only as an observer, and not as a collaborator. I will interview respondents in their offices (or in a nearby coffee shop if they have time and are willing to leave their offices), I will not pay the respondents, and I will request tape-recording the interviews. Interview Questions
1. History of innovation district a. When did R first hear about the innovation district concept? b. When did R first hear about the innovation district for their city/location? c. When and how did R and R’s organization become involved? d. Who determined what other organizations would be involved and which ones
would not? How was consensus on this issue reached? How did each invited organization respond? How was a point person for each organization selected? Were there any organizations that rejected participation? Where there any organizations that requested participation?
e. How is the innovation district financed? 2. Definition of innovation district
a. What was R’s initial thought when the leaders proposed an innovation district for their jurisdiction? What type of image developed? Is there a similar development R can point to that may be worth replicating or that at least points in the desired direction?
b. What are the necessary amenities for the innovation district to succeed?40 c. What does the “ideal” innovation district look like?41
40 Here I am looking for items such as schools (pre-K – research university-technical university), incubators or accelerators, parks, entertainment amenities, etc. 41 I am not looking for the outcomes of the innovation district. I am trying to gauge an idea of the aesthetic vision of the innovation district (i.e., ground plan, urban fabric, monuments, parks, wired technology, modern buildings, open public space, etc.)

153
d. What are R’s hopes for the innovation district?42 e. Does R have experience in other similar development projects?
3. Possible roadblocks to implementation of the innovation district a. What is currently happening with the development of the innovation district? b. What are the hurdles to implementation? c. Have there been any discrepancies in the visions for the innovation district
amongst the various stakeholders?
42 This question is based on an interest in whether or not the focus is district specific versus city/region specific; the creation of marketable products vs revitalizing the community; respective organization vs innovation district as an entity, etc. I recognize that these are hard binaries and that likely the answers will fall somewhere within the continuum.

154
Appendix B: Interviews completed Table 7: Breakdown of interviews based on type of actors
City Type of actor Total
Bos
ton
City government representative 5
Economic developer 0
Federal government representative 0
Non-profit representative 3
Private sector representative 7
State government representative 3
Tech entrepreneur 0
Det
roi t
City government representative 2
Economic developer 8
Federal government representative 0
Non-profit representative 12
Private sector representative 8
State government representative 3
Tech entrepreneur 2
Dub
lin
City government representative 6
Economic developer 0
Federal government representative 2
Non-profit representative 6
Private sector representative 11
State government representative 0
Tech entrepreneur 0
Park
Cen
ter
City government representative 0
Economic developer 1
Federal government representative 0
Non-profit representative 7
Private sector representative 0
State government representative 0
Tech entrepreneur 0
St. L
ouis
City government representative 4
Economic developer 0
Federal government representative 0
Non-profit representative 15
Private sector representative 12
State government representative 1

155
Tech entrepreneur 6 124
Table 8: Categorization of actors
Type of actor Categories B
oston
Detroit
Dublin
Park C
enter
St. Louis
City government representative elected officials, appointed public servants, government employees 5 2 6 0 4
Economic developer public and private interests 0 8 0 1 0
Federal government representative elected officials, appointed public servants, government employees 0 0 2 0 0
Non-profit representative Think tanks, universities, hospitals, foundations 3 12 6 7 15
Private sector representative Company executives & staff, consultants, real estate developers 7 8 11 0 12
State government representative elected officials, appointed public servants, government employees 3 3 0 0 1
Tech entrepreneur startup owners 0 2 0 0 0
TOTAL
18 35 25 8 32 Table 9: List of people interviewed by employer
City Type of actor Employer Boston City government representative Boston City
Boston City government representative Director of Strategic Partnerships, MassIT
Boston City government representative City of Boston
Boston City government representative New Urban Mechanics
Boston City government representative New Urban Mechanics
Boston Non-profit representative The Institute of Contemporary Art/Boston
Boston Non-profit representative Artists for Humanity Epicenter
Boston Non-profit representative Design Museum Foundation
Boston Private sector representative Space with a Soul/ CIC-Boston
Boston Private sector representative Hacin + Associates
Boston Private sector representative Drydock Center
Boston Private sector representative Boston Convention & Exhibition Center
Boston Private sector representative CIC
Boston Private sector representative Boston Convention & Exhibition Center
Boston Private sector representative Former Executive Director of Venture Café at the Cambridge Innovation Center and helped develop and run District Hall in the innovation district.

156
Boston State government representative Redgate
Boston State government representative MassChallenge
Boston State government representative Transit-Oriented Development Transportation, Americas
Detroit City government representative City of Detroit
Detroit City government representative City of Detroit
Detroit Economic developer Detroit Economic Growth Corporation
Detroit Economic developer Detroit Economic Growth Corporation
Detroit Economic developer Detroit Economic Growth Corporation
Detroit Economic developer Detroit Economic Growth Corporation
Detroit Economic developer Downtown Detroit Partnership
Detroit Economic developer Detroit Riverfront Conservancy
Detroit Economic developer Downtown Detroit Partnership
Detroit Economic developer TechTown, WSU
Detroit Non-profit representative Hudson Webber Foundation
Detroit Non-profit representative Henry Ford Health System
Detroit Non-profit representative Allied Media Projects
Detroit Non-profit representative University Research Corridor
Detroit Non-profit representative New Economy Initiative
Detroit Non-profit representative Henry Ford Health System
Detroit Non-profit representative Midtown, Inc.
Detroit Non-profit representative Hudson Webber Foundation
Detroit Non-profit representative Hudson Webber Foundation
Detroit Non-profit representative TechTown
Detroit Non-profit representative University of Michigan
Detroit Non-profit representative University of Michigan
Detroit Private sector representative TechTown
Detroit Private sector representative Rock Ventures
Detroit Private sector representative 313 Creative
Detroit Private sector representative Mass Economics
Detroit Private sector representative Rock Ventures
Detroit Private sector representative Invest Detroit
Detroit Private sector representative 313 Creative
Detroit Private sector representative Invest Detroit
Detroit State government representative Public Sector Consultants
Detroit State government representative Michigan State Housing Development Authority

157
Detroit State government representative Michigan Economic Development Corporation
Detroit Tech entrepreneur Utility Boost LLC
Detroit Tech entrepreneur Rocket Fiber
Dublin City government representative Dublin City Council
Dublin City government representative Dublin City Council
Dublin City government representative Dublin City Council
Dublin City government representative Master planner of Silicon Docks
Dublin City government representative Dublin City Council
Dublin City government representative Startup Commissioner
Dublin Federal government representative Public Affairs, American Chamber of Commerce
Dublin Federal government representative US Department of Commerce
Dublin Non-profit representative Maynooth University
Dublin Non-profit representative Maynooth University
Dublin Non-profit representative University College Dublin
Dublin Non-profit representative Maynooth University
Dublin Non-profit representative Maynooth University
Dublin Non-profit representative Trinity College
Dublin Private sector representative Ryan Academy
Dublin Private sector representative Liffey Trust
Dublin Private sector representative Guinness Enterprise Center
Dublin Private sector representative Inward Investment Consultant, Connect Ireland
Dublin Private sector representative Bennett Property Ltd
Dublin Private sector representative Facebook
Dublin Private sector representative Accenture
Dublin Private sector representative Salesforce
Dublin Private sector representative Facebook
Dublin Private sector representative Oracle
Dublin Private sector representative Facebook
General Non-profit representative Brookings Institution
Park Center Economic developer Durham Chamber of Commerce
Park Center Non-profit representative NC Justice Center
Park Center Non-profit representative Research Triangle Park Foundation
Park Center Non-profit representative Research Triangle Park Foundation
Park Center Non-profit representative Research Triangle Park Foundation
Park Center Non-profit representative Triangle J Council of Governments
Park Center Non-profit representative Research Triangle Park Foundation

158
St. Louis Non-profit representative Cortex
Park Center Non-profit representative University of North Carolina Chapel Hill
St. Louis City government representative Arch Grants
St. Louis City government representative St. Louis Development Corporation, St. Louis Economic Development Partnership
St. Louis City government representative St. Louis Development Corporation, St. Louis Economic Development Partnership
St. Louis City government representative St. Louis Alderman
St. Louis Non-profit representative Park Central Development
St. Louis Non-profit representative BJC Healthcare
St. Louis Non-profit representative Missouri Botanical Garden
St. Louis Non-profit representative Washington University
St. Louis Non-profit representative St. Louis University
St. Louis Non-profit representative St. Louis University
St. Louis Non-profit representative University of Missouri St. Louis
St. Louis Non-profit representative University of Missouri St. Louis
St. Louis Non-profit representative Washington University
St. Louis Non-profit representative Center for Emerging Technologies
St. Louis Non-profit representative Washington University, Center for Emerging Technologies
St. Louis Non-profit representative Washington University
St. Louis Non-profit representative St. Louis Community College
St. Louis Non-profit representative Washington University
St. Louis Private sector representative Enhanced Value Strategies
St. Louis Private sector representative BioSTL
St. Louis Private sector representative BioGenerator
St. Louis Private sector representative Cambridge Innovation Center (CIC)
St. Louis Private sector representative Capital Innovators
St. Louis Private sector representative TechShop
St. Louis Private sector representative Venture Café
St. Louis Private sector representative Venture Café
St. Louis Private sector representative Bayberry Group Inc.
St. Louis Private sector representative Express Scripts
St. Louis Private sector representative Lawrence Group

159
St. Louis Private sector representative Maritz
St. Louis State government representative Regional Chamber
St. Louis Tech entrepreneur Gateway VMS
St. Louis Tech entrepreneur Gateway VMS
St. Louis Tech entrepreneur IDEA Labs
St. Louis Tech entrepreneur Kypha
St. Louis Tech entrepreneur GlobalHack
St. Louis Tech entrepreneur Mission Center L3C

160
Appendix C: Emergent themes from coding Table 10: Themes from Detroit interviews
Main theme Sub-theme
Location specifics Brand Definition of innovation Brand Definition of placemaking Brand Exclusions Border Goals Brand Governance Border
Infrastructure Border Brand
Obstacles Border Brand
Origin stories Brand
Imagery
Brand Counter imaginary Cultural change Problem with prior system
Time
Legacy Border Brand
Table 11: Themes from Dublin interviews
Main theme Sub-theme
Aesthetics Benefits Boosterism Challenges Civic realm Cultural character Definition of innovation Desires Economic Development Expertise Flexibility Governance History Housing Imaginary International connections Location specifics Market fundamentalism Place-marketing Real estate Regionalism Shared responsibility Size Speed Splintering urbanism Technology Urban planning versus innovation US-centrism

161
Table 12: Themes from St. Louis interviews
Main theme Sub-theme
Anchor Benefits Boundaries Brand Challenge Contrast Definition of innovation Economic Development Finance Goals Governance History Location specifics Millennials Neighborhood Organization Placemaking Real Estate Reason for success Region Structure Technology
Table 13: Themes from Park Center interviews
Main theme Sub-theme
Border
Challenges
Housing Real estate Regionalism Non-city Structure Technology Metrics Flexibility Competition
Control
Covenants Finance Governance HOA Surveillance
Corporate culture Definition of innovation
Design
Accessibility Affordability Anchors Authentic experience Challenges Civic amenities Collaborative Connectivity Convergence Density Diversity Expenses Flexibility Housing Imaginary Inspiring Live-work-play Knowledge-based economy

162
Non-city Organic Brookings Placemaking Programming Technology
Economic Development
Brookings Network Leadership Live-work-play
Entrepreneurs Finance Growth Housing Imaginary
Location
Acquisitions Benefits of non-city Border Branding Centrality Diversity of choices Growth of region Real estate
Location specifics New working patterns
Obstacles Growth boundaries Space requirements Zoning
Partnerships
Planning
Business Civic amenities Economic development Planning Communications Finance Flexibility Governance Housing Timeline Transit
Real Estate Regionalism Small industries Speed Transit
Technology Skills Automation Strategy New working patterns
Travelling mobilities Katz New working patterns Travelling mobilities Katz
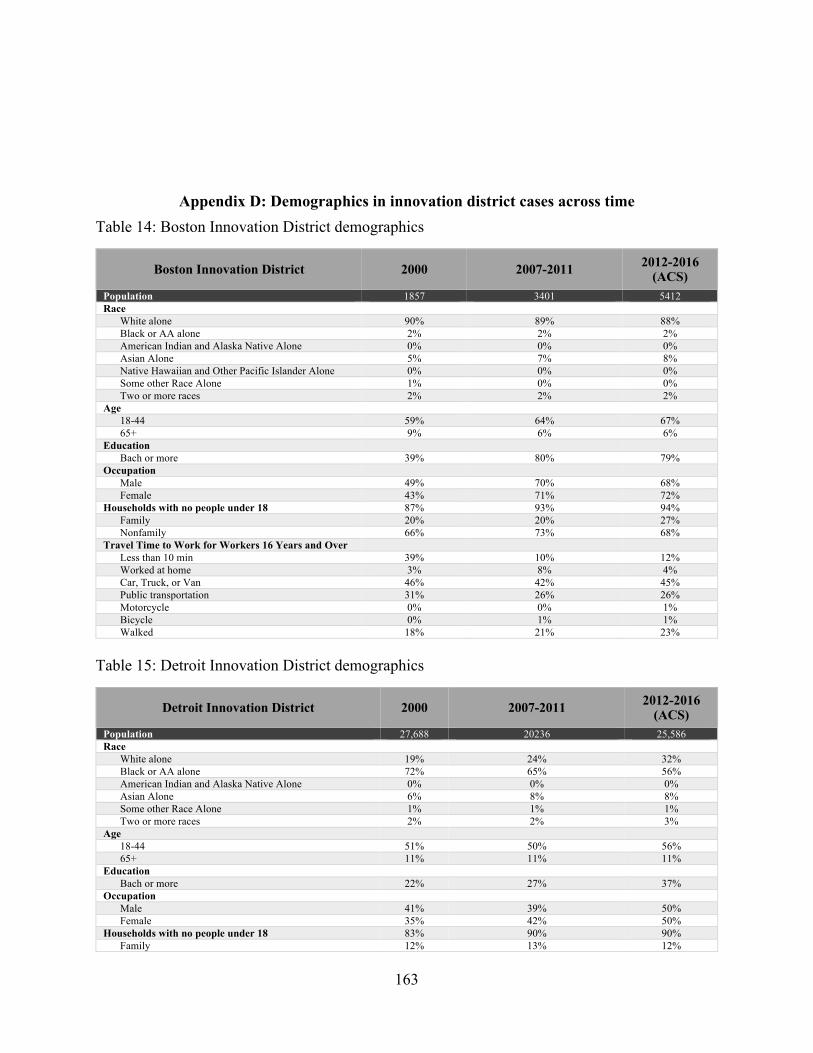
163
Appendix D: Demographics in innovation district cases across time Table 14: Boston Innovation District demographics
Boston Innovation District 2000 2007-2011 2012-2016 (ACS)
Population 1857 3401 5412 Race
White alone 90% 89% 88% Black or AA alone 2% 2% 2% American Indian and Alaska Native Alone 0% 0% 0% Asian Alone 5% 7% 8% Native Hawaiian and Other Pacific Islander Alone 0% 0% 0% Some other Race Alone 1% 0% 0% Two or more races 2% 2% 2%
Age 18-44 59% 64% 67% 65+ 9% 6% 6%
Education Bach or more 39% 80% 79%
Occupation Male 49% 70% 68% Female 43% 71% 72%
Households with no people under 18 87% 93% 94% Family 20% 20% 27% Nonfamily 66% 73% 68%
Travel Time to Work for Workers 16 Years and Over Less than 10 min 39% 10% 12% Worked at home 3% 8% 4% Car, Truck, or Van 46% 42% 45% Public transportation 31% 26% 26% Motorcycle 0% 0% 1% Bicycle 0% 1% 1% Walked 18% 21% 23%
Table 15: Detroit Innovation District demographics
Detroit Innovation District 2000 2007-2011 2012-2016 (ACS)
Population 27,688 20236 25,586 Race
White alone 19% 24% 32% Black or AA alone 72% 65% 56% American Indian and Alaska Native Alone 0% 0% 0% Asian Alone 6% 8% 8% Some other Race Alone 1% 1% 1% Two or more races 2% 2% 3%
Age 18-44 51% 50% 56% 65+ 11% 11% 11%
Education Bach or more 22% 27% 37%
Occupation Male 41% 39% 50% Female 35% 42% 50%
Households with no people under 18 83% 90% 90% Family 12% 13% 12%
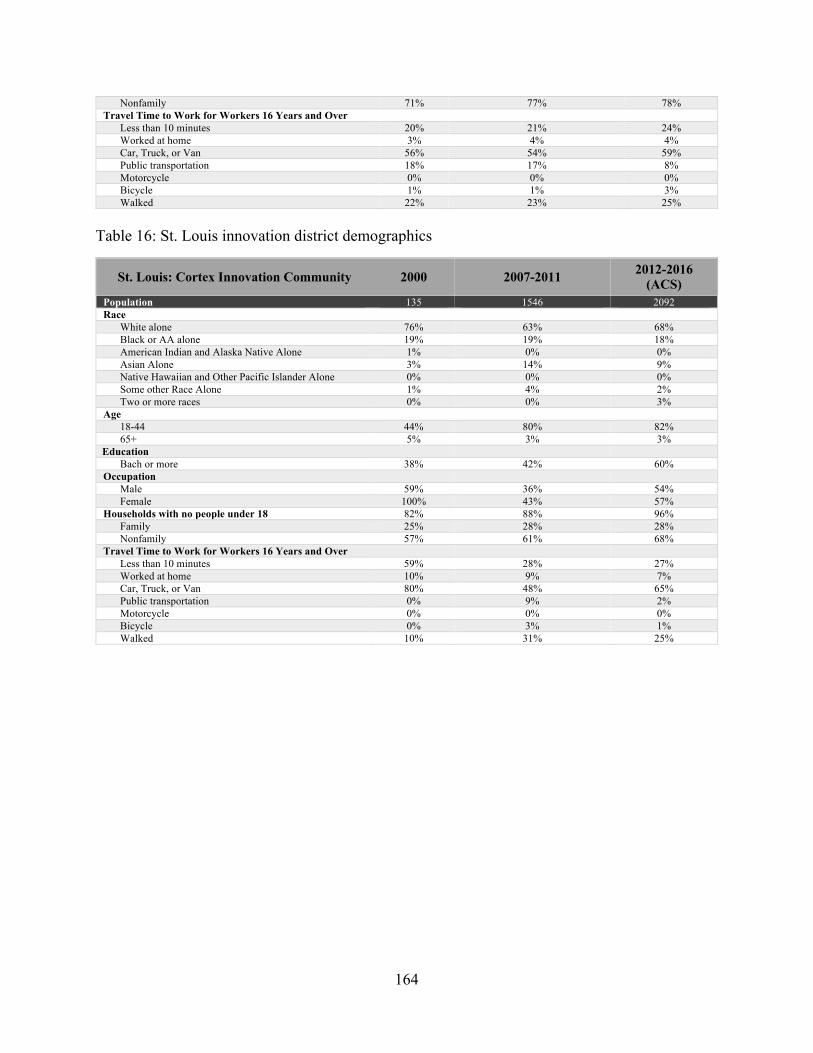
164
Nonfamily 71% 77% 78% Travel Time to Work for Workers 16 Years and Over
Less than 10 minutes 20% 21% 24% Worked at home 3% 4% 4% Car, Truck, or Van 56% 54% 59% Public transportation 18% 17% 8% Motorcycle 0% 0% 0% Bicycle 1% 1% 3% Walked 22% 23% 25%
Table 16: St. Louis innovation district demographics
St. Louis: Cortex Innovation Community 2000 2007-2011 2012-2016 (ACS)
Population 135 1546 2092 Race
White alone 76% 63% 68% Black or AA alone 19% 19% 18% American Indian and Alaska Native Alone 1% 0% 0% Asian Alone 3% 14% 9% Native Hawaiian and Other Pacific Islander Alone 0% 0% 0% Some other Race Alone 1% 4% 2% Two or more races 0% 0% 3%
Age 18-44 44% 80% 82% 65+ 5% 3% 3%
Education Bach or more 38% 42% 60%
Occupation Male 59% 36% 54% Female 100% 43% 57%
Households with no people under 18 82% 88% 96% Family 25% 28% 28% Nonfamily 57% 61% 68%
Travel Time to Work for Workers 16 Years and Over Less than 10 minutes 59% 28% 27% Worked at home 10% 9% 7% Car, Truck, or Van 80% 48% 65% Public transportation 0% 9% 2% Motorcycle 0% 0% 0% Bicycle 0% 3% 1% Walked 10% 31% 25%

165
Appendix E: Real estate price increases in US-based innovation district cases Boston Innovation District 2010 – 2018 Notes: The industrial category covers transactions in the Bronstein Center. This is a flexible interpretation of industrial use as the space has housed a wide variety of uses over time – from maritime related activities, to wet labs, to furniture maker spaces, to office uses for companies such as Reebok and Adobe. In 2010 four transactions were made. The sale of one office building at $208/sf, the refinancing of another office building, the sale of an apartment selling at $416,774 per unit, and the refinancing of an industrial building. One for an office building and one for an industrial building. In 2011,11 transactions occurred. Five industrial sales, one hotel sale, three development site sales, and one development site refinance. One office build sold for $28/sf. In 2012, 25 transactions occurred. Three industrial sales, five development site sales, two development site refinances, three office refinancings, nine office sales, one office transfer, two retail sales. For the office sales, the highest rate was $318/sf for a building built in 2010 and the lowest reported was $199/sf for a building remodeled in 1989. In 2013, 22 transactions occurred. Five development site sales, three development sites refinanced, four industrial sales, seven office sales, and three office refinances. For the office sales, the highest rate was $393/sq ft for a building remodeled in 2010 and the lowest reported was $137/sq ft for a building remodeled in 2009. In 2014, 17 transactions occurred. Five office site sales, three office sites refinanced, one industrial sale, one industrial refinance, two development site sales, four development sites refinanced, and one apartment sale. For the office sales, the highest rate was $994/sq ft for a new 2011 building and the lowest was $224/sq ft for a building remodeled in 2010. The apartment units sold at $224,719. In 2015, 27 transactions occurred. One retail site was sold, twelve office sales, four office builds refinanced, one industrial site refinanced, one hotel sale, one hotel refinance, four development site sales, two apartment sales, and one apartment refinanced. For the office sales, the highest rate was $514/sq ft for a building remodeled in 2010 and the lowest reported was $359/sq ft for a building remodeled in 2007. The apartment units sold for $644,957. In 2016, 14 transactions occurred. One retail refinanced, one retail sold, two office builds refinanced, six office sales, one industrial sale (the future site of the GE HQ sold for $522/sq ft), one hotel sale, and two development sites sales. For the office sales, the highest rate was

166
$1029/sq ft for a new 2015 building and the lowest was $479/sq ft for a building remodeled in 2008. In 2017, there were 18 transactions. A sale by WS Development for the assemblage of the future Boston Seaport sold for $5,601/sq ft. There were also six office sales, three office builds refinanced, two industrial sales, three hotels refinanced, one co-op refinanced (an artist building at 300 Summer Cooperative Corporation), one apartment refinance, and one apartment sale. For the office sales, the highest rate was $1,734/sq ft for a new 2016 building and the lowest was $561/sq ft for a building remodeled in 2012. The apartment units sold for $351,715. As of mid-July 2018, there were seven transactions. Two office sales, two office refinancings, one industrial refinancing, and one apartment sale. For the office sales, the highest rate (pending) was $1,162/sq ft for a new 2018 building and the lowest $578/sq ft for a building remodeled in 2012. The apartment units sold for $693,175. Cortex Innovation Community 2006 - 201743 2002 Cortex 501c3 established 2006 Chapter 353 established 2014 TIF established In 2006, two industrial sale transactions happened, one for $115/sq ft and the other for $33/sq ft. In 2007, one industrial sale and one office sale occurred. The rate for the office was $256/sq ft for a new building built in 2007 for Solae’s headquarters and the rate of the industrial site was $27/sq ft. In 2008, only one sale on for a development site occurred. In 2009 and 2010 no transactions occurred. In 2011, two office sales occurred. Rates were not reported. In 2012, two industrial sales occurred. The only reported rate was $171/sq ft thought the prices of the building (Cortex 1) was $26,000,000.00 In 2013, five transactions occurred. Two industrial sales, one office refinancing, and three industrial entity transactions with Wexford Science and Technology selling to BioMed Realty Trust. The industrial sale rate was $33/sq ft. In 2014, three development site sales occurred, all for the building of the future IKEA. All three sales totaled $15,303,030.00. In 2015, one industrial sale and one office sale occurred. The office rate was $346/sq ft for a building built in 1978. The highest rate for industrial uses was $43/sq ft. 43 The data for Real Capital Analytics on the Cortex Innovation Community border only reaches as far back as 2006 and ends in 2017.

167
In 2016, eight transactions occurred. Four industrial sales, one office refinancing, and three industrial entity transactions from BioMed Realty Trust to BioMed Realty. The highest rate for industrial uses was $246/sq ft. In 2017, two transactions occurred. One industrial sale and one office sale. Rates were not reported. Detroit Innovation District 2014 - 2018 In 2014, 24 transactions occurred. Fourteen office sales, four office refinancings, one development site transfer, one development site sale, three apartment refinancings, and one apartment sale. For the office sales, the highest rate was $129/sq ft for a building built in 2003 and the lowest reported was $12/sq ft for a building built in 1917. The highest apartment unit rate was $122,928. In 2015, 33 transactions occurred. Two retail sales, eighteen office sales, three office build refinancings, one office transfer, one hotel sale, one development site sale, four apartments refinanced, and three apartments sold. For the office sales, the highest rate was $120/sq ft for a building built in 1911 and the lowest reported was $16/sq ft for a building built in 1929 (the Fisher Buliding and Albert Kahn Building). The highest apartment units went for $206,667. In 2016, 26 transactions occurred. One retail sale, nine office sales, three office builds refinanced, one hotel sale, and three hotels refinanced, one sale of a development site, four apartments refinanced, and three apartments sold. For the office sales, the highest rate was $161/sq ft for a building built in 1989 and the lowest was $12/sq ft for a building built in 1920 (the former Wayne State Criminal Justice Building). The highest apartment units are rated at $332,143. In 2017, 32 transactions occurred. One retail sale, twelve office sales, five office builds refinanced, two industrial sales, one development site sale, five apartments refinanced, and six apartments sold. For the office sales, the highest rate was $124/sq ft for a building built in 1997 and the lowest reported was $59/sq ft. The highest apartment units (for a refinanced apartment) are rated at $152,756. As of March of 2018, 23 transactions occurred. Three retail sales, five office sales, five office builds refinanced, one industrial sale, two hotel sales, six apartment builds refinanced, and one apartment sale. For the office sales, the highest rate was $147/sq ft for a building built in 2004 and the lowest report was $29/sq ft for a building built in 1929. The highest apartment units (for a refinanced apartment) are rated at $83,333. Park Center Park Center only has a total of three transactions from 2013 – 2018. One office sale (2014), one retail sale (2013), and one hotel sale (2013). All are on existing buildings from the 70s and 80s. The office sold for $6,223,000.00, the retail space for $4,975,000.00, and the hotel for $6,750,000.00. As Park Center remains in a state of imagination, tracking transactions for the next decade will be more revealing.

168
Appendix F: Use of human subjects in doctoral research
169
Bibliography 2017 Detroit Entrepreneurial Study. (2017). Detroit. Retrieved from http://michiganvca.org/wp-
content/uploads/2017/06/2017-MVCA-Detroit-Entrepreneurial-Study2.pdf 2017 Innovators Report. (2018). Research Triangle Park. Retrieved from
https://cednc.org/innovatorsreport/ 2018 TECH Smart Cities Innovation Accelerator. (2018). Cambridge, MA. Retrieved from
www.theinnovatorsforum.org 7.2 SQ MI Report: A Report on Greater Downtown Detroit. (2013). Detroit. Retrieved from
http://detroitsevenpointtwo.com/ Action Plan for Housing and Homelessness. (2016). Dublin. Retrieved from
http://rebuildingireland.ie/Rebuilding Ireland_Action Plan.pdf Aerial view of the Research Triangle Park campus. (2009). Research Triangle Park: flickr.
Retrieved from https://www.flickr.com/photos/rti_international/6055640963 Ahrens, C. H. (2008). Missouri Courts ED90935. St. Louis. Retrieved from
https://www.courts.mo.gov/file/Opinion_ED90935.rtf Allen, T. D., Golden, T. D., & Shockley, K. M. (2015). How effective is telecommuting?
Assessing the status of our scientific findings. Psychological Science in the Public Interest, 16(2), 40–68.
Amin, A., & Thrift, N. (2002). Cities in a Distanciated Economy. In Cities: Reimagining the Urban (pp. 51–77). Blackwell Publishers Inc.
Asheim, B. T., Boschma, R., & Cooke, P. (2011). Constructing Regional Advantage: Platform Policies Based on Related Variety and Differentiated Knowledge Bases. Regional Studies, 45(7), 893–904.
Atkinson, R., & Bridge, G. (Eds.). (2005). Gentrification in a Global Perspective: The New Urban Colonialism. Routledge.
Audirac, I. (2018). Shrinking Cities: An Unfit Term for American Urban Policy? Cities, 75(May), 12–19.
Audretsch, D. B. (2003). Innovation and Spatial Externalities. International Regional Science Review, 26(2), 167–174.
Audretsch, D. B., & Feldman, M. (1996). R&D Spillovers and the Geography of Innovation and Production. The American Economic Review, 86(3), 630–640. Retrieved from http://www.jstor.org/stable/2118216
Bach, J. (2011). Modernity and the urban imagination in economic zones. Theory, Culture & Society, 28(5), 98–122.
Balibrea, M. P. (2001). Urbanism, culture and the post-industrial city: Challenging the “Barcelona model.” Journal of Spanish Cultural Studies, 2(2), 187–210.
Barber, B. R. (2013). If Mayors Ruled the World: Dysfunctional Nations, Rising Cities. Yale University Press .
Barker, J. (2017, September 17). SLU aims to double research budget as it transforms under new leaders. St. Louis Post Dispatch, p. D.1. St. Louis. Retrieved from http://proxy.lib.umich.edu/login?url=https://search.proquest.com/docview/1939486 726?accountid=14667

170
Bathelt, H., Malmberg, A., & Maskell, P. (2004). Clusters and knowledge: local buzz, global pipelines and the process of knowledge creation. Progress in Human Geography, 28(1), 31–56.
Beauregard, R. A. (2013). Shrinking Cities in the United States in Historical Perspective: A Research Note. In K. Pallagst, T. Wiechmann, & C. Martinez-Fernandez (Eds.), Shrinking Cities: International Perspectives and Policy Implications. Routledge.
Bell-Masterson, J., & Stangler, D. (2015). Measuring an Entrepreneurial Ecosystem. Kauffman Foundation Research Series on City, Metro, and Regional Entrepreneurship, (March).
Bell, D. (1973). The Coming of Post-Industrial Society: A Venture in Social Forecasting. Basic Books.
Benoit, G. (2008). Innovation: the History of a Category. Project on the Intellectual History of Innovation, Working Paper, 1. Retrieved from http://www.csiic.ca/PDF/IntellectualNo1.pdf
Benyon, J., & Solomos, J. (1987). The Roots of Urban Unrest. Scarman Centre. Bernard, H. R. (2011). Research methods in anthropology: Qualitative and quantitative
approaches (5th ed.). AltaMira Press. Bertolini, L. (2000). Planning in the borderless city: a conceptualisation and an application to the
case of station area redevelopment. Town Planning Review, 71(4), 455. Berube, A., & Holmes, N. (2016). The Metro Talent Competition: Attracting and Growing
Highly Educated Workers. Washington DC. Retrieved from https://www.brookings.edu/blog/the-avenue/2016/11/14/the-metro-talent-competition-attracting-and-growing-highly-educated-workers/
Bethesda, N., Tumentang, L., Institutes, N., & Blvd, E. (2014). The old suburban office park is the new American ghost.
Biddulph, M. (2011). Urban design, regeneration and the entrepreneurial city. Progress in Planning, 76(2), 63–103.
Bieri, D., & Kayanan, C. M. (2014). Improving TIF Transparency and Accountability: Towards a Consolidated View of TIF Activities in Michigan. East Lansing.
Birch, K. (1990). Technoscience rent: Towards a theory of rentiership. Birch, K. (2017). Rethinking Value in the Bio-economy: Finance, Assetization, and the
Management of Value. Science Technology and Human Values, 42(3), 460–490. Blight Removal Task Force Plan. (2014). Detroit. Retrieved from
http://www.timetoendblight.com Block, F. (2008). Swimming Against the Current: The Rise of a Hidden Developmental State in
the United States. Politics & Society, 36(X), 169–206. Bloom, N., Liang, J., Roberts, J., & Ying, Z. J. (2015). Does working from home work?
Evidence from a Chinese experiment. The Quarterly Journal of Economics, 130(1), 165–218.
Boas, T. C., & Gans-Morse, J. (2009). Neoliberalism: From new liberal philosophy to anti-liberal slogan. Studies in Comparative International Development, 44(2), 137–161.
Bolhafner, J. S. (2004, May 23). The Drawing Board; A Look at Some of the Projects Planned Across the Area. St. Louis Post Dispatch. St. Louis.
Bomey, N. (2017). Detroit Resurrected: To Bankruptcy and Back. W. W. Norton and Company. Bomey, N., Helms, M., & Guillen, J. (2014, November 7). Judge OKs bankruptcy plan; a
“miraculous” outcome. Detroit Free Press. Detroit. Retrieved from https://www.freep.com/story/news/local/detroit-bankruptcy/2014/11/07/rhodes-bankruptcy-decision/18648093/
Bontje, M., & Lawton, P. (2013). Mobile policies and shifting contexts: City-regional competitiveness strategies in Amsterdam and Dublin. Journal of Economic and Social
171
Geography, 104(4), 397–409. Boschma, R. (2005). Proximity and Innovation: A Critical Assessment. Regional Studies, 39(1),
61–74. Boserup, E., Tan, S. F., & Toulmin, C. (2013). Woman’s Role in Economic Development.
Routledge. Boutang, Y. M. (2011). Cognitive Capitalism. Polity Press. Boyle, R., & Eisinger, P. (2001). The U.S. Empowerment Zone Program The Evolution of a
National Urban Program and the Failure of Local Implementation in Detroit, Michigan. In EURA Conference Paper. Copenhagen. Retrieved from http://www.sbi.dk/eura/workshops/papers/workshop5/boyle.htm
Braverman, H. (1998). Labor and Monopoly Capital: The Degradation of Work in the 20th Century. Monthly Review Press; Anniversary edition.
Brenner, N., Peck, J., & Theodore, N. (2010). Variegated neoliberalization: geographies, modalities, pathways. Global Networks, 10(2), 182–222.
Briffault, R. (2014). The Most Popular Tool : Tax Increment and Financing of Local Government the Political Economy. Chicago Law Review, 77(1), 65–95.
Broda, N. (2014, June 12). Detroit launches Innovation District to spur job growth. Retrieved June 7, 2016, from http://www.crainsdetroit.com/article/20140612/NEWS/140619939/detroit-launches-innovation-district-to-spur-job-growth
Brookings announce the Anne T. and Robert M. Bassa Initiative on Innovation and Placemaking. (2015, October 8). Brookings Institution. Washington, D.C. Retrieved from https://www.brookings.edu/news-releases/brookings-announces-the-anne-t-and-robert-m-bass-initiative-on-innovation-and-placemaking/
Brown, W. (2003). Neo-liberalism and the End of Liberal Democracy. Theory & Event (Vol. 7). Brown, W. (2015). Undoing the demos: Neoliberalism’s stealth revolution. Zone Books. Byrne, M. (2016a). “Asset price urbanism” and financialization after the crisis: Ireland’s
National Asset Management Agency. International Journal of Urban and Regional Research, 40(1), 31–45.
Byrne, M. (2016b). Entrepreneurial urbanism after the crisis: Ireland’s “Bad Bank” and the redevelopment of Dublin’s Docklands. Antipode, 48(4), 899–918.
Caillier, J. G. (2011). The impact of teleworking on work motivation in a U.S. federal government agency. The American Review of Public Administration, 42(4), 461–480.
Casey, R. (2010, July 20). Proposals sought for industrial park. The Boston Globe, p. B.8. Boston. Retrieved from http://proxy.lib.umich.edu/login?url=https://search.proquest.com/docview/6137213 54?accountid=14667
Casey, R. (2011, October 20). West Coast firm takes on Fort Point. The Boston Globe, p. B.5. Boston. Retrieved from http://proxy.lib.umich.edu/login?url=https://search.proquest.com/docview/8990657 69?accountid=14667
Castells, M. (1992). The Informational City: Economic Restructuring and Urban Development. Wiley-Blackwell.
Castells, M. (1996). The Rise of the Network Society (The Information Age: Economy, Society, and Culture), Volume 1. Oxford: Blackwell Publishers.
Catungal, J. P. (2009). Contesting the creative city: Race, nation, multiculturalism. Leslie, Deborah, 40(5), 701–704.
Chakrabarti, V. (2013). A Country of Cities: A Manifesto for an Urban America. Metropolis

172
Books . Chandler, A. D. (1977). Visible Hand: The Managerial Revolution in American Business.
Cambridge, MA: Harvard University Press. Chandler, A. D. (1984). The Emergence of Managerial Capitalism. The Business History Review,
58(4), 473–503. Chapin, T. S. (2004). Sports Facilities as Urban Redevelopment Catalysts: Baltimore’s Camden
Yards and Cleveland’s Gateway. Journal of the American Planning Association, 70(2), 193–209.
Chappel, K., Markusen, A. R., Schrock, G., Yamamoto, D., & Yu, P. (2004). Gauging Metropolitan “High-Tech” and “I-Tech” Activity: Some Thoughts and Commentary. Economic Development Quarterly, 18(1), 10–29. http://doi.org/10.1177/0891242403259438
Charmaz, K. (2006). Constructing Grounded Theory: A Practical Guide through Qualitative Analysis. Sage.
Chesbrough, H. W. (2003). The Era of Open Innovation. MIT Sloan Management Review, 44(3), 35–41.
Chesbrough, H. W., Vanhaverbeke, W., & West, J. (Eds.). (2006). Open Innovation: Researching a New Paradigm. Oxford University Press.
Christophers, B. (2018, February 8). The biggest privatisation you’ve never heard of: land. The Guardian. London. Retrieved from https://www.theguardian.com/commentisfree/2018/feb/08/biggest-privatisation-land-margaret-thatcher-britain-housing-crisis
Christopherson, S., & Storper, M. (1986). The City as a Studio; the World as Back Lot: the Impact of Vertical Disintegration on the Location of the Motion Picture Industry. Environment and Planning D: Society and Space, 4, 305–320.
City to the Core. (2003, December). St. Louis Commerce Magazine. Clark, J., Huang, H. I., & Walsh, J. P. (2010). A typology of “innovation districts”: what it
means for regional resilience. Cambridge Journal of Regions, Economy and Society, 3(1), 121–137.
Clark, T., Lloyd, R., Wong, K. K., & Jain, P. (2002). Amenities Drive Urban Growth. Journal of Urban Affairs, 24(5), 493–515.
Clauss, K. S. (2016). BRA Changes Name to BPDA, Hopes You’ll Trust Them Now. Boston Magazine.
Clive, W. M., Simmons, J., & Trumble, N. (2007). The Future@ Work: Delivering Effective Corporate Real Estate. Facilities, 25(11/12), 463–472.
Comor, E. (2011). Contextualizing and Critiquing the Fantastic Prosumer: Power, Alienation and Hegemony. Critical Sociology, 37(3), 309–317.
Cook, I. R. (2008). Mobilizing urban policies: the policy transfer of US Business Improvement Districts to England and Wales. Urban Studies, 45(4), 773–795.
Cooper, M., & Waldby, C. (2014). Clinical Labor: Tissue Donors and Research Subject in the Global Bioeconomy. Duke University Press.
Cortex Innovation Community. (n.d.). Retrieved November 5, 2018, from https://cortexstl.com/ Cosgrove, D. (1998). Social Formation and Symbolic Landscape. University of Wisconsin Press. Counties. (2018). Retrieved December 15, 2018, from
https://www.researchtriangle.org/counties/rtp/ Crivello, S. (2015). Urban policy mobilities: the case of Turin as a smart city. European
Planning Studies, 23(5), 909–921. Cuthbert, A. R. (2006). The Form of Cities: Political Economy and Urban Design. Hoboken, NJ:
Wiley-Blackwell.

173
Daniel, M. (2006, February 15). Big Dig benefit: A quicker downtown trip Turnpike Authority report cites business gain. The Boston Globe. Boston. Retrieved from https://www.abettercity.org/docs/about_pr_big_dig_benefit021506.pdf
Darden, J., Hill, R., Thomas, J. M., & Thomas, R. (1987). Detroit: Race and Uneven Development. Philadelphia: Temple University Press.
Davis, G. F. (2015). Capital markets and job creation in the 21st century. Center for Effective Public Management. Washington DC.
Davis, G. F. (2016). The vanishing American corporation: Navigating the hazards of a new economy. Berrett-Koehler Publishers, Inc.
Davis, G. F., Ross, S. M., Whitman, M. V., & Zald, M. N. (2006). The Responsibility Paradox: Multinational Firms and Global Corporate Social Responsibility. Ross School of Business Paper, (1031). Retrieved from http://ssrn.com/abstract=899112
Dawkins, C. J. (2003). Regional Development Theory: Conceptual Foundations, Classic Works, and Recent Developments. Journal of Planning Literature, 18(2), 131–172.
Deem, J. (2018, May 10). Cortex Unveils New 4220 Duncan Building. NextSTL. St. Louis. Retrieved from https://nextstl.com/2018/05/cortex-unveils-new-4220-duncan-building/
Delaney, A. P. (2014). The Evolution of Silicon Docks: An Examination of the Factors that Influenced the Evolution of Silicon Docks within the Dublin Docklands. National University of Ireland, Maynooth.
Desloge, R. (2004, July 9). CORTEX buys Markwort complex for $3.2 million. St. Louis Business Journal, p. 4. St. Louis. Retrieved from http://proxy.lib.umich.edu/login?url=https://search.proquest.com/docview/2283587 62?accountid=14667
Detroit Future City: 2012 Detroit Strategic Framework Plan. (2013). Detroit. Detroit Innovation District: Physical Place Working Group. (2014). Detroit. Retrieved from
Interface Maps.pdf Detroit Innovation District a New Economic Development Designation. (2014). Detroit. Detroit Innovation District brochure. (2014). Detroit: New Economy Initiative. DiBona, C., & Ockman, S. (1999). Open Sources: Voices from the Open Source Revolution.
O’Reilly Media, Inc. Diesenhouse, S. (2003, September 27). New Wave of Business Marine Industrial Development is
Growing Along the Boston Waterfront. The Boston Globe, p. D.10. Boston. Retrieved from http://proxy.lib.umich.edu/login?url=https://search.proquest.com/docview/4048647 76?accountid=14667
Diesenhouse, S. (2015). Exclusive Q&A: Boston Global CEO on Lessons from $3.5B Seaport Project. Retrieved May 30, 2018, from https://www.bisnow.com/boston/news/commercial-real-estate/exclusive-john-hynes-iii-ceo-of-boston-global-investors-building-a-new-waterfront-51063
DiGaetano, A., & Klemanski, J. S. (1999). Power and City Governance: Comparative Perspectives on Urban Development. Minnesota University Press.
District Hall 121B Agreement (2013). USA. Retrieved from https://www.boston.gov/sites/default/files/imce-uploads/2017-07/innovation_center_agreement.pdf
District Hall Webpage. (2018). Retrieved May 30, 2018, from https://districthallboston.org/ Dodge, M., & Kitchin, R. (2011). Code/Space: Software and everday life. MIT Press. Doheny-Farina, S. (1996). The Wired Neighborhood. Yale University Press. Donegan, M., & Lowe, N. (2008). Inequality in the Creative City: Is There Still a Place for “Old-
Fashioned” Institutions. Economic Development Quarterly, 22(1), 46–62.
174
Dorfman, N. S. (1983). Route 128: The Development of a Regiona High Technology Economy. Research Policy, 12(6), 299–316.
Doron, G. M. (2008). Those Marvellous Empty Zones at the Edge of Cities. In M. Dehaene & L. DeCauter (Eds.), Heterotopia and the City: Public Space in a Postcivil Society (pp. 203–213). Routledge.
Dougherty, D. (2012). The Maker Movement. Innovations, 7(3), 11–14. Drake, G. (2003). “This place gives me space”: Place and creativity in the creative industries.
Geoforum, 34(4), 511–524. Droog Jones, P., & Beggs, B. J. (2005, June). Battelle Spotlights Rapid Emergence of BioBelt.
St. Louis Commerce Magazine, 32. Retrieved from http://proxy.lib.umich.edu/login?url=https://search.proquest.com/docview/2111424 02?accountid=14667
Dublin Student Housing Report. (2017). Dublin. Retrieved from https://kfcontent.blob.core.windows.net/research/1233/documents/en/dublin-student-housing-report-2017-4554.pdf
Dye, R. F., & Merriman, D. F. (2006). Tax Increment Financing: A Tool for Local Economic Development. Lincoln Land Lines, 18(1), 3–7.
Easterling, K. (2014). Extrastatecraft: The power of infrastructure space. Verso Books. Eight Placemaking Principles for Innovation Districts. (2016). Project for Public Spaces.
Retrieved from http://www.pps.org/blog/announcing-anne-t-robert-m-bass-initiative-innovation-placemaking/
Eisenschitz, A. (2010). Neo-liberalism and the future of place marketing. Place Branding and Public Diplomacy, 6(2), 79–86.
Eisinger, P. (2000). The Politics of Bread and Circuses: Building the City for the Visitor Class. Urban Affairs Review, 35(3), 316–333. http://doi.org/10.1177/107808740003500302
Elden, S. (2006). The State of Territory under Globalization. Thamyris/Intersecting, 12(12), 47–66.
Elden, S. (2007). Governmentality, calculation, territory. Environment and Planning D: Society and Space, 25(3), 562–580.
Elden, S. (2013). The Birth of Territory. The University of Chicago Press. Elder, R. (2016, October 3). Entrepreneurs to Spread the St. Louis Startup Story to Boston.
Crain’s. St. Louis. Retrieved from https://www.crains.com/article/news/entrepreneurs-spread-st-louis-startup-story-boston
Engels, F. (1892). The Condition of the Working-Class in England in 1844. London: Swann Sonnenschien and Co.
Environmental Permitting in Massachusetts. (2003). Boston. Retrieved from https://www.mass.gov/files/documents/2017/01/oj/ma-env-permit-guide-2003.pdf
Etkowitz, H., & Leydesdorff, L. (1997). Universities and the Global Knowledge Economy. London: Pinter.
Evans, G. (2009). Creative Cities, Creative Spaces and Urban Policy. Urban Studies, 46(5–6), 1003–1040.
Evans, J., & Karvonen, A. (2014). ‘Give Me a Laboratory and I Will Lower Your Carbon Footprint!’ — Urban Laboratories and the Governance of Low-Carbon Futures. International Journal of Urban and Regional Research, 38(2), 1468–2427.
Fainstein, S. S. (2001). The city buiders: Property development in New York and London, 1980-2000 (Second Edi). University Press of Kansas.
Farley, J. E. (2005). Race, Not Class: Explaining Racial Housing Segregation in the St. Louis Metropolitan Area, 2000. Sociological Focus, 38(2), 133–150.
175
Farrell, M. B. (2013, May 23). Menino savors preview of Innovation District hub. The Boston Globe, p. B.5. Boston. Retrieved from https://www.bostonglobe.com/business/2013/05/22/south-boston-district-hall-open-june/vbG3t2zKpGurkqqKYixLWM/story.html
Feintzeig, R. (2014, February 25). Study : Open Offices Are Making Us All Sick. Wall Street Journal. New York City. Retrieved from https://blogs.wsj.com/atwork/2014/02/25/study-open-offices-are-making-us-all-sick/
Feldman, M. (1984). The University and Economic Development: The Case of Johns Hopkins University and Baltimore. Economic Development Quarterly, 8(1), 67–76.
Feldman, M. (1994). The Geography of Innovation. Netherlands: Kluwer Academic Publishers. Feldman, M., & Bercovitz, J. (2006). Entpreneurial Universities and Technology Transfer. The
Journal of Technology Transfer, 31(1), 175–188. Feldt, B. (2018, April 13). Developer plans more buildings in St. Louis’ booming Cortex
innovation district. St. Louis Post Dispatch. St. Louis. Retrieved from https://www.stltoday.com/business/local/developer-plans-more-buildings-in-st-louis-booming-cortex- innovation/article_a5a0a77d-b077-51c6-8627-1df0e0fe49fb.html%0ADeveloper
Ferru, M., & Rallet, A. (2016). Proximity Dynamics and the Geography of Innovation: Diminishing Returns or Renewal? In Handbook on the Geographies of Innovation (pp. 100–122).
Finch, J. H., & Casavant, R. (1996). Highest and Best Use and the Special Purpose Property. The Appraisal Journal, 64(2), 195–198.
Fishman, R. (1987). Bourgeois Utopias: The Rise and Fall of Suburbia. New York: Basic Books, Inc.
Fishman, R. (2000). The American Metropolis and Century’s End: Past and Future Influences. Housing Policy Debate, 11(1), 199–213.
Flint, A. (2015, December). 10 years later, did the Big Dig deliver? The Boston Globe Magazine. Flint, A., & Abraham, Y. (1999, September 18). City unveils 3 plans for arts on pier. The Boston
Globe, p. A.1. Boston. Florida, R. (2002). The rise of the creative class: And how it’s transforming work, leisure,
community, and everyday life. Basic Books. Foucault, M. (2004). The Birth of Biopolitics: Lectures at the Collège de France 1978-1979. (M.
Senellart, Ed.). Palgrave Macmillan. Fox-Rogers, L., Murphy, E., & Grist, B. (2011). Legislative change in Ireland: a Marxist
political economy critique of planning law. Town Planning Review, 82(6), 639–668. Frederici, S. (2012). Revolution at Point Zero: Housework, Reproduction, and Feminist Struggle.
PM Press. Friedmann, J. (1986). The World City Hypothesis. Development and Change, 17(1), 69–83. Fuchs, C. (2014). Digital Labour and Karl Marx. Routledge. Galster, G. (2018). Driving Detroit: The Quest for Respect in the Motor City. University of
Pennsylvania Press. Gandini, A. (2015). The Rise of Coworking Spaces: A Literature Review. Ephemera: Theory &
Politics in Organization, 15(1), 193–205. Gannes, L. (2015, February). Detroit Is Dan Gilbert Territory. Recode. Retrieved from
https://www.recode.net/2015/2/10/11558808/detroit-is-dan-gilbert-territory Garreau, J. (1992). Edge City: Life on the New Frontier. Anchor Books. Garrett, L. E., Spreitzer, G. M., & Bacevice, P. A. (n.d.). Co-constructing a sense of community
at work : The emergence of community in coworking spaces. Organizational Studies (Vol.
176
0). Gibson, C., & Brennan-Horley, C. (2016). Putting the boot into creative cluster theory. In R.
Shearmur, C. Carrincazeaux, & D. Doloreux (Eds.), Handbook on the geographies of innovation (pp. 241–254). Cheltenham, Glos and Northampton, Massachusetts: Edward Elgar Publishing.
Gibson, C., & Klocker, N. (2004). Academic publishing as ‘creative’ industry, and recent discourses of ‘creative economies’: some critical reflections. Klocker, Natascha, 36(4), 423–434.
Gibson, V. (2003). Flexible Working Needs Flexible Space? Journal of Property Investment & Finance, 21(1), 12–22.
Gill, R., & Pratt, A. (2008). In the Social Factory?: Immaterial Labour, Precariousness and Cultural Work. Theory, Culture & Society, 25(8), 1–30.
Godin, B. (2006). The Linear Model of Innovation. Science, Technology, & Human Values, 31(6), 639–667.
Goodman, A. (1999, August 4). Technology Centers Could Determine St. Louis’ Future in Biotechnology. KRTBN Knight Ridder Tribune Business News. Washington, D.C.
Gordon, C. (2009). Mapping Decline: St. Louis and the Fate of the American City. University of Pennsylvania Press.
Gospodini, A. (2002). European Cities in Competition and the New ’ Uses ’ of Urban Design. Journal of Urban Design, 7(1), 59–73. http://doi.org/10.1080/13574800220129231
Gottdiener, M. (1994). The Social Production of Urban Space. University of Texas Press. Green, H. (2010). The Company Town: The Industrial Edens and Satanic Mills that Shaped the
American Economy. Basic Books. Grodach, C., & Loukaitou-Sideris, A. (2007). Cultural development strategies and urban
revitalization: A survey of US cities. International Journal of Cultural Policy, 13(4), 349–370.
GSA Annual Review. (2016). GSA Space to Grow. Retrieved from https://www.gsa-gp.com/annual-review-2016/
Hackworth, J. (2007). The Neoliberal City: Governance, Ideology, and Development in American Urbanism. Cornell University Press.
Haila, A. (1990). The theory of land rent at the crossroads. Environment and Planning D: Society and Space, 8(1), 275–296.
Hall, P. (1982). Enterprise zones: a justification. International Journal of Urban and Regional Research1, 6(3), 416–421.
Hall, P. (1998). Cities in Civilization. New York: Pantheon Books. Hammar, S. (2010). Boston Innovation District Vision 2010. In Boston Innovation District
Vision 2010. Boston: SlideShare. Hannah, M. G. (2009). Calculable territory and the West German census boycott movements of
the 1980s. Political Geography, 28(1), 66–75. http://doi.org/10.1016/j.polgeo.2008.12.001 Hannigan, J. (1998). Fantasy City: Pleasure and profit in the postmodern metropolis. London:
Routledge. Hardt, M., & Negri, A. (2001). Empire. Harvard University Press. Harvey, D. (1989a). From Managerialism to Entrepreneurialism: The Transformation in Urban
Governance in Late Capitalism. Geografiska Annaler. Series B, Human Geography, 71(1), 3–17.
Harvey, D. (1989b). The Condition of Postmodernity: An Enquiry into the Origins of Cultural Change. Oxford: Blackwell.
Harvey, D. (1999). Time-Space Compression and the Postmodern Condition. In W. Waters

177
(Ed.), Modernity: After Modernity (pp. 98–118). Routledge. Harvey, D. (2001). Spaces of Capital: Towards a Critical Geography. Routledge. Harvey, D. (2005). A brief history of neoliberalism. Oxford University Press. Harvey, D. (2009). Social Justice and the City. University of Georgia Press. He, J., & Fallah, M. H. (2011). The typology of technology clusters and its evolution - Evidence
from the hi-tech industries. Technological Forecasting and Social Change, 78(6), 945–952. Heisler, E. (2005, October 7). Plan for West Side biotech park runs into opposition. Knight
Ridder Tribune Business News, p. 1. Washington, D.C. Heisler, E. (2006, January 23). Some win, some lose in reshuffle of Cortex. Knight Ridder
Tribune Business News, p. 1. Washington, D.C. Retrieved from http://proxy.lib.umich.edu/login?url=https://search.proquest.com/docview/4630420 54?accountid=14667
Hollander, J., Pallagst, K., Schwarz, T., & Popper, F. (2009). Planning Shrinking Cities. Progress in Planning, 72(4), 223–232.
Hollands, R. G. (2008). Will the real smart city please stand up? Intelligent, progressive or entrepreneurial? City, 12(3), 303–320.
Huxley, M. (2006). Spatial rationalities: order, environment, evolution and government. Social & Cultural Geography, 7(5), 771–787.
Hyde, C. K. (1982). Detroit: An Industrial History Guide. Detroit: Wayne State University Press. IDA Ireland: History. (2018). Retrieved November 6, 2018, from
https://www.idaireland.com/about-ida/history Innovation Districts Homepage. (2018). Retrieved August 1, 2018, from
https://www.brookings.edu/innovation-districts/ Jackson, M. (2004, August 20). Balke Brown, Glarners pinched by CORTEX plans. St. Louis
Business Journal, p. 7. St. Louis. Retrieved from http://proxy.lib.umich.edu/login?url=https://search.proquest.com/docview/2283407 97?accountid=14667
Jacobs, J. (1969). The Economy of Cities. New York: Vintage. Jacobs, J. (1992). The Death and Life of Great American Cities . New York: Vintage Books. Jessop, B. (n.d.). From micro-powers to governmentality: Foucault’s work on statehood, state
formation, statecraft and state power. Political Geography, 26(1), 34–40. Kalleberg, A. L., Reskin, B. F., & Hudson, K. (2000). Bad jobs in America: Standard and
nonstandard employment relations and job quality in the United States. American Sociological Review, 65(2), 256–278.
Kanngieser, A. (2013). Tracking and tracing: Geographies of logistical governance and labouring bodies. Environment and Planning D: Society and Space, 31(4), 594–610.
Karvonen, A., & Van Heur, B. (2014). Urban Laboratories: Experiments in Reworking Cities. International Journal of Urban and Regional Research, 38(2), 379–392. Retrieved from
Katz, B., & Bradley, J. (2013). The metropolitan revolution: How cities and metros are fixing our broken politics and fragile economy. Brookings Institution Press.
Katz, B., & Wagner, J. (2014). The rise of innovation districts : A new geography of innovation in America. Metropolitan Policy Program at Brookings, May. Retrieved from http://www.brookings.edu/about/programs/metro/innovation-districts
Kayanan, C. M., Eichenmüller, C., & Chambers, J. (2018). Silicon slipways and slippery slopes: techno-rationality and the reinvigoration of neoliberal logics in the Dublin Docklands. Space and Polity, 22(1), 50–66.
Kelly, L. (2018, February 13). Dublin’s “Smart District” Docklands showcased to global CTOs at tech innovation event, pp. 1–4. Dublin. Retrieved from

178
https://www.independent.ie/business/irish/dublins-smart-district-docklands-showcased-to-global-ctos-at-tech-innovation-event-36599309.html
Kennedy, J. (2018). Niamh Bushnell to step down as Dublin commissioner for start-ups Future of commissioner ’ s office yet to be decided. Retrieved December 11, 2018, from https://www.siliconrepublic.com/start-ups/niamh-bushnell-dublin-start-up-commissioner
Kenney, M. (2000). Understanding Silicon Valley: The Anatomy of an Entrepreneurial Region. Stanford Business Books.
Kenworthy, J. (2006). The Eco-City: Ten Key Transport and Planning Dimensions for Sustainable City Development. Environment and Urbanization, 18(1), 67–85.
Kern, L. (2013). All Aboard? Women Working the Spaces of Gentrification in Toronto’s Junction. Gender, Place, & Culture, 20(4), 510–527.
Kirsner, S. (2010). New funding for Boston World Partnerships, non-profit that promotes doing business in Boston. Retrieved July 4, 2018, from http://archive.boston.com/business/technology/innoeco/2010/07/new_funding_for_boston_world_p.html
Kirsner, S. (2014, October 31). A leader sold on innovation. The Boston Globe, p. B.7. Boston. Retrieved from http://proxy.lib.umich.edu/login?url=https://search.proquest.com/docview/1618314 251?accountid=14667
Kit, E. (2012, July 24). The Silicon Valleys Of The World : The European Edition. Fast Company. Retrieved from https://www.fastcompany.com/1843422/silicon-valleys-world-european-edition
Kitchin, R., O’Callaghan, C., Boyle, M., Gleeson, J., & Keaveney, K. (2012). Placing neoliberalism: the rise and fall of Ireland’ s Celtic Tiger. Environment and Planning A, 44(6), 1302–1326.
Kline, S. J. (1985). Innovation Is Not a Linear Process. Research Management, 28(4), 36–45. Klingmann, A. (2007). Brandscapes: Architecture in the Experience Economy. Cambridge,
Massachusetts London, England: MIT Press. Knox, P. (2011). Cities and Design. Routledge. Komninos, N. (2011). Intelligent cities: Variable geometries of spatial intelligence. Intelligent
Buildings International, 3, 172–188. http://doi.org/10.1080/17508975.2011.579339 Krasner, J. (2001, April 2). A Channel Switch: Office Space Opens Up Dot-Com Devlation
Provides Room to Grow for Fort Point Survivors. The Boston Globe, p. C.1. Boston. Retrieved from http://proxy.lib.umich.edu/login?url=https://search.proquest.com/docview/4053877%0A72?accountid=14667
Kroll, D. (2014, February 4). 7 Reasons It’s Finally Time To Live In Research Triangle Park. Forbes. Retrieved from http://www.forbes.com/sites/davidkroll/2014/02/04/7-reasons-its-finally-time-to-live-in-research-triangle-park/
Krugman, P. R. (1991). Increasing returns and economic geography. Jounral of Political Economy, 99(3), 483–499. Retrieved from http://www.nber.org/papers/w3275
Kurtovic, A. (2012, November 16). Workforce rules entangle CORTEX. St. Louis Business Journal. St. Louis. Retrieved from https://www.bizjournals.com/stlouis/print-edition/2012/11/16/workforce-rules-entangle-cortex.html?page=all
Kurtovic, A. (2013, January 4). Walls are up, MoDOT excavating: CORTEX construction moving rapidly. St. Louis Business Journal. St. Louis. Retrieved from https://www.bizjournals.com/stlouis/blog/BizNext/2013/01/cortex-district-takes-shape-after-tif.html?page=all&r=full

179
Lange, A. (2012). The Dot-Com City: Silicon Valley Urbanism. Strelka Press. Langley, P., & Leyshon, A. (2017). Platform Capitalism: The intermediation and capitalization
of digital economic circulation. Finance and Society, 3(1), 11–31. Lauermann, J. (2016). Municipal statecraft: Revisiting the geographies of the entrepreneurial
city. Progress in Human Geography. http://doi.org/10.1177/0309132516673240 Lawton, P. (2017). Uneven development, suburban futures and the urban region: The case of an
Irish ‘sustainable new town.’ European Urban and Regional Studies, 0969776417694679. Lawton, P., Murhpy, E., & Redmond, D. (2010). Examining the role of “creative class” ideas in
urban and economic policy formation: the case of Dublin, Ireland. International Journal of Knowledge-Based Development, 1(4), 267–286.
Lazzarato, M. (1994). General Intellect: Towards an Inquiry into Immaterial Labor. In Immaterial Labour, Mass Intellectuality, New Constitution, Post-Fordism and All That (pp. 1–14). London: Red Notes.
Leblanc, S. (2003, December 1). A New Museum for Boston Harbor ; Institute of Contemporary Art Plans a Cantilevered, Water-Oriented Home. The Washington Post, p. C.08. Boston. Retrieved from http://proxy.lib.umich.edu/login?url=https://search.proquest.com/docview/4095626 41?accountid=14667
Lee, N., & Rodríguez-Pose, A. (2014). Creativity, cities, and innovation. Environment and Planning A, 46(5), 1139–1159.
Lefebvre, H. (1992). The Production of Space. Wiley-Blackwell. Lemke, T. (2001). “The birth of bio-politics”: Michel Foucault’s lecture at the Collège de France
on neo-liberal governmentality. Economy and Society, 30(2), 190–207. Levine, M. (1987). Downtown redevelopment as an urban growth strategy: A critical appraisal of
the Baltimore renaissance. Journal of Urban Affairs, 9(2), 103–123. Levy, S. (2001). Hackers: Heroes of the computer revolution. New York: Penguin Books. Lewis, P., Lynch, T., & Vey, J. (2014). The Detroit Innovation District: Building a Strong,
Inclusive Innovation Economy. Detroit. Life Sciences & Missouri’s Economic Future: An Opportunity to Build “One Missouri.” (2003).
Cleveland, OH. Retrieved from https://research.missouri.edu/about/files/Battelle.pdf Lindtner, S. (2017). Laboratory of the Precarious: Prototyping Entrepreneurial Living in
Shenzhen. Women’s Studies Quartely, 45(3/4), 287–305. Retrieved from http://eds.a.ebscohost.com/eds/detail/detail?vid=0&sid=a8a7796a-66f5-4dde-9eae-006455e7fb36%40sessionmgr4010&bdata=JnNpdGU9ZWRzLWxpdmUmc2NvcGU9c2l0ZQ%3D%3D#AN=125911767&db=asx
Lindtner, S., & Avle, S. (2017). Tinkering with Governance: Technopolitics and the Economization of Citizenship. Proc. ACM Hum.-Comput. Interact., 1(CSCW), 70:1--70:18.
List of Technology Centers. (n.d.). Retrieved November 3, 2018, from https://en.wikipedia.org/wiki/List_of_technology_centers#Places_with_%22Silicon%22_names
Lloyd, R. (2002). Neo-bohemia: Art and Neighborhood Redevelopment in Chicago. Journal of Urban Affairs, 24(5), 517–532.
Lloyd, R. (2008). Neo-Bohemia: Art and Neighborhood Redevelopment in Chicago. Cities and Society, 24(5), 215–229.
Lloyd, R. (2010). Neo-bohemia: Art and commerce in the postindustrial city. Routledge. Lloyd, R., & Clark, T. N. (2001). The City as Entertainment Machine. In K. F. Gotham (Ed.),
Critical Perspectives in Urban Redevelopment (Research in Urban Sociology, Volume 6) (pp. 357–378). Emerald Group Publishing Limited.

180
Logan, J. R., & Molotch, H. (2007). Urban fortunes: The political economy of place. University of California Press.
Logan, T. (2016a, January 25). Seaport’s newest high-end address already sees units resold. The Boston Globe, p. A.1. Boston. Retrieved from http://proxy.lib.umich.edu/login?url=https://search.proquest.com/docview/1759603 327?accountid=14667
Logan, T. (2016b, March 25). GE lands at Fort Point Channel. The Boston Globe, p. A.1. Boston. Retrieved from http://proxy.lib.umich.edu/login?url=https://search.proquest.com/docview/1775579 974?accountid=14667
Logan, T. (2017, June 26). City says developer’s plan for key part of Seaport gives short shrift to public. The Boston Globe. Boston. Retrieved from http://proxy.lib.umich.edu/login?url=https://search.proquest.com/docview/1913523 266?accountid=14667
Logan, T. (2018, May 2). The state will spend $20 million to bring Amazon to the Seaport. Here’s what that buys. The Boston Globe. Boston. Retrieved from http://proxy.lib.umich.edu/login?url=https://search.proquest.com/docview/2033406 328?accountid=14667
Lorey, I. (2015). State of Insecurity: Government of the Precarious. Verso. Loughran, K. (2014). Parks for Profit: The High Line, Growth Machines, and the Uneven
Development of Urban Public Spaces. City & Community, 13(1), 49–68. Luker, K. (2008). Salsa Dancing into the Social Sciences: Research in a Age of Info-Glut.
Cambridge, Massachusetts London, England: Harvard University Press. Lynch, P. (2014, September 4). Pythagoras would have approved of Dublin’s huge harp. The
Irish Times. Dublin. Retrieved from https://www.irishtimes.com/news/science/pythagoras-would-have-approved-of-dublin-s-huge-harp-1.1908734
Machlup, F. (1973). The Production and Distribution of Knowledge in the United States. Princeton University Press.
MacLaran, A., & Kelly, S. (Eds.). (2014). Neoliberal urban policy and the transformation of the city: Reshaping Dublin. Palgrave Macmillan.
Malecki, E. J. (2010). Everywhere? The geography of knowledge. Journal of Regional Science, 50(1), 493–513.
Malizia, E. E. (2017). From Factory Town to Vibrant Innovation Center: The Entrepreneurial Ecosystem in Durham, NC. Stanford.Edu. Durham. Retrieved from https://www.gsb.stanford.edu/faculty-research/centers-initiatives/ces
Mallach, A. (2015). The Uncoupling of the Economic City: Increasing Spatial and Economic Polarization in American Older Industrial Cities. Urban Affairs Review, 51(4), 443–473.
Mallach, A., Haase, A., & Kattori, K. (2017). The Shrinking City in Comparative Perspective: Contrasting Dynamics and Responses to Urban Shrinkage. Cities, 69(September), 102–108.
Manning Thomas, J. (1990). Planning an Industrial Decline Lessons from Postwar Detroit. Journal of the American Planning Association, 56(3), 297–310.
Manning Thomas, J. (2013). Redevelopment and Race: Planning a Finer City in Postwar Detroit. Wayne State University Press.
Mark, D., Grissom, T., Liu, C., & Pearson, T. (1990). Highest and Best Use: The Evolving Paradigm. Journal of Real Estate Research, 5(1), 17–32.
Markusen, A. R. (1996). Sticky places in slippery space : A typology of industrial districts. Economic Geography, 72(3), 293–313.
Markusen, A. R., & Schrock, G. (2006). The Artistic Dividend: Urban Artistic Specialisation and

181
Economic Development. Urban Studies, 43(10), 1661–1686. Marshall, A. (1890). Principles of economics. London: Macmillan and Co., Ltd. Martin-Brelot, H., Grossetti, M., Eckert, D., Gritsai, O., & Kovács, Z. (2010). The Spatial
Mobility of the “Creative Class”: A European Perspective. International Journal of Urban and Regional Research, 34(4), 854–870.
Martin, D. (2016, January 14). Nobody Calls It the ’ Innovation District ’ Anymore — Even the Mayor. BostInno, pp. 7–9. Boston. Retrieved from http://bostinno.streetwise.co/2016/01/14/boston-innovation-district-its-just-the-seaport-now/
Marx, K. (1977). Capital Volume One. Vintage Books Edition. Marx, K. (1992). Capital Volume II. Pengiun Classics. Marx, K. (1993). Capital Volume III. Pengiun Classics. Massey, D. (1995). Spatial Divisions of Labour: Social Structures and the Geography of
Production. Mcmillan International Higher Education. Massey, D., Quintas, P., & Wield, D. (1992). High tech fantasies: Science parks in society,
science and space. London: Routledge. http://doi.org/10.2307/2074551 Mayor Menino Welcomes 600 New Employees to Fort Point Channel. (2009, March 30). US
Fed News Service. Washington, D.C. Retrieved from http://proxy.lib.umich.edu/login?url=https://search.proquest.com/docview/4702634 89?accountid=14667
Mazmanian, M., Orlikowski, W. J., & Yates, J. (2013). The autonomy paradox: The implications of mobile email devices for knowledge professionals. Organizational Science, 24(5), 1337–1357.
Mazzucato, M. (2014). The Entrepreneurial State: Debunking Public vs. Private Sector Myths (2nd ed.). Anthem Press.
McCann, E. J. (2007). Inequality and Politics in the Creative City-Region: Questions of Libability and State Strategy. International Journal of Urban and Regional Research, 31(1), 188–196.
McCann, E. J. (2011). Urban policy mobilities and global circuits of knowledge: Toward a research agenda. Annals of Association of American Geographers, 101(1), 107–130.
McCann, E. J., & Ward, K. (2011). Mobile urbanism: Cities and policymaking in the global age. (E. J. McCann & K. Ward, Eds.) (Globalizat). University of Minnesota Press.
McCarthy, J. (1997). Revitalization of the core city: The case of Detroit. Cities, 14(1), 1–11. McCarthy, J. (2002). Entertainment-led regeneration: The case of Detroit. Cities, 19(2), 105–
111. McConnells. (2009). Clusters. Retrieved December 15, 2018, from
https://www.adsoftheworld.com/media/print/ida_ireland_clusters McDowell, L. (2009). Working Bodies: Interactive Service Employment and Workplace
Identities. Malden, MA: Wiley-Blackwell. McDowell, L., Batnitzky, A., & Dyer, S. (2009). Precarious Work and Economic Migration:
Emerging Immigrant Divisions of Labour in Greater London’s Service Sector. International Journal of Urban and Regional Research, 33(1), 3–25.
McLuhan, M., & Nevitt, B. (1972). Take Today: The Executive as Dropout. Hardcourt Brace Jovanovich.
McMorrow, P. (2012, December 25). Seaport is rising, but not from tech. The Boston Globe, p. A.19. Boston. Retrieved from http://proxy.lib.umich.edu/login?url=https://search.proquest.com/docview/1243205 361?accountid=14667
McMorrow, P. (2013, August 13). Priced out of the Innovation District. The Boston Globe, p.

182
A.13. Boston. Retrieved from http://www.bostonglobe.com/opinion/2013/08/13/innovation-priced-out-innovation-district/JOKWHHFEWQ23R0MPxxowxH/story.html
McMorrow, P. (2014, May). Mayor Marty Walsh is Cleaning House. Boston Magazine. Retrieved from https://www.bostonmagazine.com/news/2014/05/27/marty-walsh-and-the-boston-redevelopment-authority/
McRobbie, A. (2002). Holloway to Hollywood: Happiness at Work in the Cultural Economy? In P. Du Gay & M. Pryke (Eds.), Cultural Economy: Cultural Analysis and Commercial Life (pp. 97–114). Sage.
McRobbie, A. (2016). Be Creative: Making a Living in the New Culture Industries. (Polity, Ed.). Melcer, R. (2003, October 24). Tax Credits Clear Way for Biotech District. St. Louis Post
Dispatch, p. C.1. St. Louis. Retrieved from http://proxy.lib.umich.edu/login?url=https://search.proquest.com/docview/4023262 11?accountid=14667
Melcer, R. (2004, August 11). Midtown wet-lab facility gets $2.9 million grant. St. Louis Post Dispatch, p. C.1. St. Louis. Retrieved from http://proxy.lib.umich.edu/login?url=https://search.proquest.com/docview/4024793 92?account id=14667
Melcer, R. (2005, January 13). St. Louis biotech industry to rank among best in about 4 years, report reveals. Knight Ridder Tribune Business News, p. 1. Washington, D.C. Retrieved from http://proxy.lib.umich.edu/login?url=https://search.proquest.com/docview/4617150 44?accountid=14667
Melcer, R. (2006, May 17). Washington U. Researchers Work to Bring Ideas to Market. Knight Ridder Tribune Business News, p. 1. Washington, D.C. Retrieved from http://proxy.lib.umich.edu/login?url=https://search.proquest.com/docview/4655136 51?accountid=14667
Mian, S., Lamine, W., & Fayolle, A. (2016). Technology Business Incubation: An Overview of the State of Knowledge. Technovation, 50–51(April-May), 1–12.
Miara, J. (2012, February). The Reinvention of Kendall Square. Urban Land. Retrieved from https://urbanland.uli.org/development-business/the-reinvention-of-kendall-square/
Miles, I., & Green, L. (2008). Hidden innovation in the creative industries. London. Retrieved from http://www.nesta.org.uk/sites/default/files/hidden_innovation_creative_industries_report.pdf
Mitchell, T. (2002). Rule of Experts: Egypt, Techno-Politics, Modernity. University of California Press.
Mitropolous, A. (2012). Contract & Contagion: From Biopolitics to Oikonomia. Minor Compositions.
Mommaas, H. (2004). Cultural clusters and the post-industrial city: towards the remapping of urban cultural policy. Urban Studies. http://doi.org/10.1080/0042098042000178663
Monclús, F.-J. (2003). The Barcelona model: and an original formula? From ‘reconstruction’ to strategic urban projects (1979–2004). Planning Perspectives, 18(March 2015), 399–421.
Moore, N. (2008). Dublin Docklands reinvented: The post-industrial regeneration of a European city quarter. Four Courts Pr Ltd.
Moretti, E. (2013). The New Geography of Jobs. Mariner Books. Moskowitz, P. (2015, February 5). The two Detroits: a city both collapsing and gentrifying at the
same time. The Guardian. Detroit. Retrieved from https://www.theguardian.com/cities/2015/feb/05/detroit-city-collapsing-gentrifying
Mowery, D. C., Nelson, R. R., Sampat, B. N., & Ziedonis, A. A. (2001). The growth of patenting

183
and licensing by U.S. universities: an assessment of the effects of the Bayh-Dole act of 1980. Research Policy, 30(1), 99–119.
Mozingo, L. A. (2011). Pastoral Capitalism: A History of Suburban Corporate Landscapes. Cambridge, Massachusetts London, England: The MIT Press.
Mumford, L. (1961). The City in History: Its Origins, Its Transformations, and Its Prospects. San Diego, New York, London: Harcourt, Inc.
Murphy, M. (2017). The Economization of Life. Duke University Press. NAMA annual report and financial statement. (2017). Dublin. NAMA annual report and financial statements. (2016). Dublin. Retrieved from
https://www.nama.ie/about-us/publications/annual-reports/ Negri, A. (1989). The Politics of Subversion: A Manifesto for the Twenty-first Century.
Cambridge: Polity Press. Neill, W. J. (1995). Lipstick on the Gorilla: The Failure of Image-led Planning in Coleman
Young’s Detroit. International Journal of Urban and Regional Research, 19(4), 639–653. Neilson, B., & Rossiter, N. (2008). Precarity as a Political Concept. Theory, Culture & Society,
25(7–8), 51–72. Newenham, P. (Ed.). (2015). Silicon Docks: The rise of Dublin as a global tech hub. Liberties
Press. Newman, A., & Safransky, S. (2014). Remapping the Motor City and the Politics of Austerity.
Anthropology Now, 6(3), 17–28. http://doi.org/10.1080/19492901.2014.11728447 North Lotts and Grand Canal Dock: Planning Scheme. (2014). Dublin. Retrieved from
http://www.dublindocklands.ie/planning/docklands-sdz/sdz-scheme/north-lotts-and-grand-canal-dock-sdz-planning-scheme
O’Mara, M. P. (2005). Cities of knowledge: Cold war science and the search for the next Silicon Valley. Princeton University Press.
O hUallacháin, B. (2012). Inventive Megaregions of the United States: Technological Composition and Location. Economic Geography, 88(2), 165–195.
Ohnesorge, L. (2014, February 3). RTP Unveils Plans to Host 100,000 New Jobs. Triangle Business Journal. Retrieved from http://www.bizjournals.com/triangle/blog/2014/02/rtp-unveils-plan-to-create-100000-new.html
Ordinance #66847. (2005). St. Louis: City of St. Louis. Ordinance #66985. (2006). St. Louis, United States. Retrieved from https://www.stlouis-
mo.gov/government/city-laws/ordinances/ordinance.cfm?ord=66985 Our Origins: The Artery Business Committee. (n.d.). Packer, G. (2013, May). Change the World: Silicon Valley Transfers Its Slogans – and Its
Money – to the Realm of Politics. The New Yorker, 44–55. Retrieved from http://www.newyorker.com/reporting/2013/05/27/130527fa_fact_packer?printable=true¤tPage=all
Palmer, T. C. J. (2008, April 26). Cruise terminal plan runs aground. The Boston Globe, p. A.15. Boston. Retrieved from http://proxy.lib.umich.edu/login?url=https://search.proquest.com/docview/4051234 26?accountid=14667
Park Center, Research Triangle Park. (2015). Research Triangle Park. Park Center: This is not your grandfather’s RTP. (2015). Retrieved January 1, 2015, from
http://www.rtp.org/about-us/park-center/ Pauwels, C., Clarysse, B., Wright, M., & Van Hove, J. (2016). Understanding a New Generation
Incubation Model: The Accelerator. Technovation, 50–51(April-May), 13–24. Peck, J. (2005). Struggling with the Creative Class. International Journal of Urban and Regional
184
Research, 29(4), 740–770. Peck, J. (2010). Construction of neoliberal reason. Oxford University Press. Peck, J. (2012). Austerity urbanism: American cities under extreme economy. City, 16(6), 626–
655. Phan, P., Siegel, D., & Wright, M. (2005). Science Parks and Incubators: Observations,
Synthesis and Future Research. Journal of Business Venturing, 20(2), 165–182. Phillips, S.-A. M., & Wai-chung Yeung, H. (2003). A Place for R&D? The Singapore Science
Park. Urban Studies, 40(4), 707–732. http://doi.org/10.1080/0042098032000065263 Piore, M., & Sabel, C. (1984). The second industrial divide: Possibilities for prosperity. Basic
Books, Inc. Plosila, W. H. (2004). State science- and technology-based economic development policy :
History, trends and developments, and future directions. Economic Development Quarterly, 18(2), 113–126.
Porat, M. U., & Rubin, M. R. (1977). The Information Economy. Office of Telecommunications Special Publication (Vol. May). Washington DC.
Porter, M. E. (1990). The competitive advantage of nations. Free Press. Powers, M. (2013, October 3). Leaders eye long-term plan for Seaport traffic. Boston Globe.
Boston. Retrieved from https://www.bostonglobe.com/metro/2013/10/02/state-and-city-leaders-anticipate-long-term-plan-for-seaport-traffic-solutions/hCfd98M4EzT7FHAhPeEcyK/story.html
Pratt, A. (2002). Hot Jobs in Cool Places. The Material Cultures of New Media Product Spaces: The Case of South of the Market, San Francisco. Information, Communication & Society, 5(1), 27–50.
Preer, R. W. (1992). Emergence of Technopolis: Knowledge-Intensive Technologies and Regional Development. Greenwood Publishing Group, Inc.
Psaty, K. (2010). Boston World Partnership Business Development Non-Profit Announces New Funding. Retrieved July 4, 2018, from https://www.americaninno.com/boston/boston-world-partnerships-business-development-non-profit-announces-new-funding/
Rabari, C., & Storper, M. (2015). The digital skin of cities: urban theory and research in the age of the sensored and metered city, ubiquitous computing and big data. Cambridge Journal of Regions, Economy and Society, 8(1), 27–42.
Rajan, K. S. (2006). Biocapital: The Constitution of Postgenomic Life. Duke University Press. Ramos, D. (2017, March 10). Why does the parking-industrial complex keep getting its demands
met? The Boston Globe, p. K.3. Boston. Retrieved from http://proxy.lib.umich.edu/login?url=https://search.proquest.com/docview/1875891 610?accountid=14667
Rankin, W. J. (2010). The Epistemology of the Suburbs: Knowledge, Production, and Corporate Laboratory Design. Critical Inquiry, 36(4), 771–806.
Rao, A. (2013). A History of Silicon Valley: The Greatest Creation of Wealth in the History of the Planet (2nd ed.). CreateSpace Independent Publishing Platform.
Read, J. (2009). A Genealogy of Homo-Economicus: Neoliberalism and the Production of Subjectivity. Foucault Studies, 6(February), 25–36.
Reid, M. G. (1934). Economics of Household Production. Chapman & Hall. Remarks by the President on Manufacturing and the Economy. (2012). Washington DC.
Retrieved from https://obamawhitehouse.archives.gov/the-press-office/2012/03/09/remarks-president-manufacturing-and-economy
Research Triangle Foundation Records, 1955 - 1999. (n.d.). Retrieved November 5, 2018, from https://finding-aids.lib.unc.edu/05081/
185
Rheingold, H. (1993). The Virtual Community: Homesteading on the Electronic Frontier. Addison Wesley.
Riis, J. (1890). How the Other Half Lives (Second Edi). New York: Charles Scribner’s Sons. Ritzer, G., & Jurgenson, N. (2010). Production, Consumption, Prosumption: The nature of
capitalism in the age of the digital “prosumer.” Journal of Consumer Culture, 10(1), 13–36. Rivas, R. S. (2012, October 18). CORTEX admits no inclusion plan for 15k jobs. The St. Louis
American. St. Louis. Retrieved from http://www.stlamerican.com/news/local_news/article_6be8944e-18c7-11e2-ba0f-0019bb2963f4.html?mode=jqm
Robertson, K. A. (1995). Downtown redevelopment strategies in the United States: An end-of-the-century assessment. Journal of the American Planning Association, 61(4), 429–437.
Rockman, K. W., & Pratt, M. G. (2015). Contagious offsite work and the lonely office: The unintended consequences of distributed work. Academy of Management Discoveries, 1(2), 150–164.
Rodríguez-Pose, A. (1999). Innovation prone and innovation averse societies: economic performance in Europe. Growth and Change, 30(Winter), 75–105.
Rodriguez, A., Martinez, E., & Guenaga, G. (2001). Uneven Redevelopment: New Urban Policies and Socio-Spatial Fragmentation in Metropolitan Bilbao. European Urban and Regional Studies, 8(2), 161–178.
Rohe, W. M. (2012). The Research Triangle: From Tobacco Road to Global Prominence. University of Pennsylvania Press.
Rose, N. (1999). Powers of Freedom: Reframing Political Thought. Cambridge University Press. Ryan, A. (2017, December 11). A Brand New Boston, Even Whiter than the Old. The Boston
Globe, p. A.1. Boston. Retrieved from http://apps.bostonglobe.com/spotlight/boston-racism-image-reality/series/seaport/
Ryan, B. (2008). The restructuring of Detroit: City block form change in a shrinking city, 1900-2000. URBAN DESIGN International, 13(3), 156–168.
Ryan, B. (2012). Design After Decline: How America Rebuilds Shrinking Cities. Philadelphia: University of Pennsylvania Press.
Ryan, B., & Campo, D. (2013). Autopia’s end: The decline and fall of Detroit’s automotive manufacturing landscape. Journal of Planning History, 12(2), 95–132.
Sagalyn, L. B. (2007). Public/Private Development: Lessons from History, Research, and Practice. Journal of the American Planning Association, 73(1), 7–22.
Sager, T. (2011). Neo-liberal urban planning policies: A literature survey 1990-2010. Progress in Planning, 76(4), 147–199.
Sandefur, T. (2008). Missouri Should Put a Stop to “Drive-By Blight.” Retrieved June 11, 2018, from https://pacificlegal.org/missouri-should-put-a-stop-to-drive-by-blight/
Sassen, S. (2001). The Global City: New York, London, Tokyo. Princeton University Press. Saval, N. (2014). Cubed: A Secret History of the Workplance. Anchor Books. Saxenia, A. (1996). Regional Advantage: Culture and Competition in Silicon Valley and Route
128. Harvard University Press . Saxenian, A. (1983). The urban contradictions of Silicon Valley: regional growth and the
restructuring of the semiconductor industry. International Journal of Urban and Regional Research, 7(2), 237–262.
Saxenian, A. (1996). Regional advantage: Culture and competition in Silicon Valley and Route 128. Harvard University Press.
Saxenian, A. (2002). Silicon Valley’s New Immigrant High-Growth Entrepreneurs. Economic Development Quarterly, 16(1).

186
Schieman, S., & Young, M. (2010). Is there a downside to schedule control for the work-family interface? Journal of Family Issues, 31(10), 1391–1414.
Scholz, T. (2016). Uberworked and Underpaid: How Workers Are Disrupting the Digital Economy. Polity.
Scott, A. J. (1988). New Industrial Spaces. London: Pion. Scott, A. J. (2000). The cultural economy of cities: Essay on the geography of image-producing
industries. Sage Publications. Scott, A. J. (2006). Creative Cities: Conceptual Issues and Policy Questions. Journal of Urban
Affairs, 28(1), 1–17. Scott, A. J. (2008). Social Economy of the Metropolis: Cognitive-Cultural Capitalism and the
Global Resurgence of Cities. Oxford University Press. Scott, A. J. (2014). Beyond the Creative City: Cognitive–Cultural Capitalism and the New
Urbanism. Regional Studies, 00(April), 1–14. Scott, A. J., Agnew, J., Soja, E., & Storper, M. (2001). Global City-Regions. In A. J. Scott (Ed.),
Global City-Regions: Trends, Theory, Policy (pp. 11–30). Oxford University Press. Scott, J. C. (1999). Seeing like a State: How Certain Schemes to Improve the Human Condition
Have Failed. Yale University Press. Segal, R., & Weizman, E. (Eds.). (2003). A Civilian Occupation - The politics of Israeli
Architecture. London: Verso. Seidman, I. (2012). Interviewing as qualitative research: A guide for researchers in education
and the social sciences (4th ed.). Teachers College Press. Seixas, P. (1987). Lewis Hine: From “Social” to “Interpretive” Photographer. American
Quarterly, 39(3), 381–409. Shane, S. (2004). Encouraging university entrepreneurship? The effect of the Bayh-Dole Act on
university patenting in the United States. Journal of Business Venturing, 19(1), 127–151. Shea, B., & Pinho, K. (2016, April 27). Gilbert unveils billion-dollar plan for soccer stadium on
jail site. Crain’s Detroit Business. Detroit. Retrieved from http://www.crainsdetroit.com/article/20160427/NEWS/160429848/gilbert-unveils-billion-dollar-plan-for-soccer-stadium-on-jail-site
Shearmur, R. (2007). The New Knowledge Aristocracy: The Creative Class, Mobility, and Urban Growth. Work Organisation, Labour and Globalisation, 1(1), 31–47.
Shearmur, R. (2012). Are cities the font of innovation? A critical review of the literature on cities and innovation. Cities, 29, S9–S18.
Shearmur, R. (2015). Far from the Madding Crowd: Slow Innovators, Information Value, and the Geography of Innovation. Growth and Change, 46(3), 424–442.
Shearmur, R., Carrincazeaux, C., & Doloreux, D. (Eds.). (2016). Handbook on the Geographies of Innovation. Edward Elgar Publishing.
Sheehan, M. (2017, January 15). Millionaire made offer to Home Sweet Home activists to buy Apollo House for homeless. Irish Independent. Dublin.
Shelton, T., Zook, M., & Wiig, A. (2015). The “actually existing smart city.” Cambridge Journal of Regions Economy and Society, 8(1), 13–25. http://doi.org/10.1093/cjres/rsu026
Shultz, M. M., & Sapp, F. R. (1990). Urban Redevelopment and the Elimination of Blight: A Case Study of Missouri’s Chapter 353. Urban Law Annual; Journal of Urban and Contemporary Law, 37(3), 1–95. Retrieved from http://openscholarship.wustl.edu/law_urbanlaw
Silberberg, S., Lorah, K., Disbrow, R., & Muessig, A. (2013). Places in the Making: How Placemaking Builds Places and Communities. Retrieved from http://dusp.mit.edu/sites/dusp.mit.edu/files/attachments/project/Places in the Making MIT

187
DUSP 2013.pdf Smart Docklands Homepage. (2018). Retrieved May 30, 2018, from smartdocklands.ied Smart Docklands webpage: Ecosystem. (2018). Retrieved May 30, 2018, from
smartdublin.ie/ecosystem Smart Docklands webpage: Oktoberfest WiFi Analytics. (2018). Retrieved May 30, 2018, from
http://smartdocklands.ie/project/oktoberfest-wifi-analytics/ Smart People. Cool Places. The Story of Cortex. (2017). United States: Nine Network Public
Media. Retrieved from http://www.ninenet.org/cortex/ SmartCitiesWorld. (2018). Dublin Docklands models smart districts. Retrieved May 28, 2018,
from https://www.smartcitiesworld.net/news/news/-dublin-docklands-models-smart-districts-2614
Smith, A. G. (2017). 2017 Greater St. Louis Venture Capital Overview. St. Louis. Retrieved from http://www.stlregionalchamber.com/docs/default-document-library/stl-venture-capital-overview.pdf
Smith, N. (1979). Toward a Theory of Gentrification a Back to the City Movemebt by Capital, Not People. Journal of the American Planning Association, 45(4), 538–548.
Smith, N. (1996). Spaces of Vulnerability: The Space of Flows and the Politics of Scale. Critique of Anthropology, 16(1), 63–77.
Smith, N. (2005). The New Urban Frontier: Gentrification and the Revanchist City. Routledge. Smith, N. (2008). Uneven Development: Nature, Capital, and the Production of Space (3rd ed.).
University of Georgia Press. Soja, E. (1980). The Socio-Spatial Dialectic. Annals of the Association of American
Geographers, 70(2), 207–225. Retrieved from http://www.jstor.org/stable/2562950 Spencer, G. M. (2015). Knowledge Neighbourhoods: Urban Form and Evolutionary Economic
Geography. Regional Studies, 49(5), 883–898. Spivack, M. S. (2017, December 5). The Old Suburban Office Park Is Getting a Big Reboot. The
New York Times, p. Business Day. New York City. Retrieved from https://www.nytimes.com/2017/12/05/business/office-park-real-estate.html
St. Louis Innovation District Tax Increment Financing (TIF) Redevelopment Plan. (2012). St. Louis. Retrieved from http://stlouis-mo.gov/government/departments/sldc/documents/upload//CORTEX-TIF-St-Louis-Innovation-District-Redevelopment-Plan.pdf
St. Louis Venture Cafe Homepage. (n.d.). Retrieved May 31, 2018, from vencafstl.org Start-up Cities Index. (2017). Retrieved from https://www.nestpick.com/de/best-cities-for-
startup-employees/ Stehlin, J. (2016). The Post-Industrial “Shop Floor”: Emerging Forms of Gentrification in San
Francisco’s Innovation Economy. Antipode, 48(2), 474–493. Stevens, Q. (2015). Creative Milieux: How Urban Design Nurtures Creative Clusters. Journal of
Urban Design, 20(1), 1–7. Retrieved from http://dx.doi.org/10.1080/13574809.2015.981393 Storper, M. (2013). Keys to the City: How Economics, Institutions, Social Interaction, and
Politics Shape Development. Princeton Oxford: Princeton University Press. Storper, M., & Scott, A. J. (2009). Rethinking Human Capital, Creativity and Urban Growth.
Journal of Economic Geography, 9(2), 147–167. Storper, M., & Venables, A. J. (2004). Buzz: Face-to-face contact and the urban economy.
Journal of Economic Geography, 4(4), 351–370. http://doi.org/10.1093/jnlecg/lbh027 Storring, N., & Walker, M. (2016). 8 Placemaking Principles for Innovation Districts. Retrieved
August 6, 2018, from https://www.pps.org/article/eight-placemaking-principles-for-innovation-districts
188
Streitfield, D. (2018, March 21). Welcome to Zucktown. Where Everything Is Just Zucky. New York Times. New York. Retrieved from https://www.nytimes.com/2018/03/21/technology/facebook-zucktown-willow-village.html
Stringer, L., & Ostafi, J. (2013). The Scientific Workplace of the Future. Corporate Real Estate Journal, 3(1), 37–52.
Sugrue, T. (2014). The Origins of the Urban Crisis: Race and Inequality in Postwar Detroit - Updated Edition (Princeton). Princeton University Press.
Surface. (2018). Park Center Site Plan. Research Triangle Park: Research Triangle Park Foundation. Retrieved from https://www.rtp.org/about-us/park-center/
Sweeney, M. (2012). Space and the Geographical Imagination on the Dublin Docklands ’. In ECREA Media & The City-International Workshop, Universita Cattolica del sacro Cuore. Milan.
Tabb, W. K. (2015). If Detroit is Dead, Some Things Need to be Said at the Funeral. Journal of Urban Affairs, 37(1), 1–12.
Tadiar, N. (2013). Life-Times of Disposability within Global Neoliberalism. Social Tex, 31(2), 19–48.
Talkington, J. (n.d.). Innovation Districts: University Examples. Retrieved January 2, 2017, from http://innovationdistricts.blogspot.com/
Taylor, F. W. (1911). The principles of scientific management. New York and London: Harper & Borthers.
Temenos, C., & McCann, E. (2013). Geographies of Policy Mobilities. Geography Compass, 7(5), 344–357.
Terranova, T. (2000). Free Labor: Producing Culture for the Digital Economy. Social Text, 18(2 63), 33–58.
Terranova, T. (2004). Network Culture: Politics for the Information Age. London and Ann Arbor: Pluto Press.
Terry, J. (2014, February 3). Research Triangle Park Buys 100 Acres Along I-40, Intends to Build a “New Kind” of Place. Research Triangle Park. Research Triangle Park. Retrieved from https://www.rtp.org/research-triangle-park-buys-100-acres-along-40-intends-build-new-kind-place/
The Detroit Innovation District: Recommendations for State Alignment and Investment. (2013). Lansing.
The Honorable Thomas M. Menino Inaugural Address. (2010). Boston. Retrieved from https://www.cityofboston.gov/TridionImages/2010 Thomas M Menino Inaugural final_tcm1-4838.pdf
The Innovation and Design Building. (2018). Retrieved July 7, 2018, from https://idbldg.com/about
The National Academies Press. (2004). Transit-oriented Development in the United States: Experiences, Challenges, and Prospects. Washington DC.
The Research Triangle Park: Master Plan. (2011). Research Triangle Park. The Seaport Public Realm Plan. (1999). Boston. Retrieved from
http://www.bostonplans.org/getattachment/6add3767-6eb3-4a06-9d2d-03dd960391ad Tiebout, C. (1956). A Pure Theory of Local Expenditures. Journal of Political Economy1, 64(5),
416–424. Toffler, A. (1984). The Third Wave. Bantam. Tonkiss, F. (2013). Austerity Urbanism and the Makeshift City. City, 17(3), 312–324. Tracking Subsidies, Promoting Accountability in Economic Development. (2018). Washington
DC. Retrieved from https://www.goodjobsfirst.org/subsidy-tracker
189
Tucci, L. (2002, November 5). Biotech Corridor Gets Promise of New Name and Money. St. Louis Post Dispatch, p. C.1. St. Louis.
Turner, F. (2006). From Counterculture to Cyberculture: Stewart Brand, the Whole Earth Network, and the Rise of Digital Utopianism. Chicago: University of Chicago Press.
Turok, I. (2009). The distinctive city: Pitfalls in the pursuit of differential advantage. Environment and Planning A, 41(1), 13–30.
Upwork, & Union, F. (2017). Freelancing in America 2017. Retrieved from https://www.upwork.com/i/freelancing-in-america/2017/
Vaccaro, A., & Logan, T. (2017, August 25). One idea to beat Seaport traffic: Glide over it. The Boston Globe. Boston. Retrieved from https://www.bostonglobe.com/business/2017/08/25/one-idea-beat-traffic-seaport-just-over/LT0pDtC3ygn98khUbLsgGM/story.html
van Holm, E. J. (2017). Makerspaces and Local Economic Development. Economic Development Quarterly, 31(2), 164–173. http://doi.org/10.1177/0891242417690604
Van Winden, W. (2014). Urban Innovation Systems: What Makes them Tick? Routledge. Van Winden, W., Berg, L. Van Den, & Pol, P. (2007). European Cities in the Knowledge
Economy: Towards a Typology. Urban Studies, 44(3), 525–549. Vose, C. E. (1959). Caucasians Only: The Supreme Court, the Naacp, and the Restrictive
Covenant Cases. University of California Press. Wagner, J., & Watch, D. (2017). Innovation Spaces : The New Design of Work. Washington DC.
Retrieved from https://www.brookings.edu/wp-content/uploads/2017/04/cs_20170404_innovation_spaces_pdf.pdf
Walter, D. (2008, June 25). Missouri Court of Appeals Eastern District upholds eminent domain for biotech center. St. Louis Daily Record. St. Louis. Retrieved from http://proxy.lib.umich.edu/login?url=https://search.proquest.com/docview/3425651 71?accountid=14667
Ward, K. (2017). Policy mobilities, politics and place: The making of financial urban futures. European Urban and Regional Studies, 1–18. http://doi.org/10.1177/0969776417731405
Ward, S. (1998). Selling Places: The Marketing and Promotion of Towns and Cities, 1850 - 2000-Planning, History and Environment Series. Routledge.
Weber, R. (2002). Extracting Value from the City : Neoliberalism and Urban Redevelopment. Antipode, 34(3), 519–540.
Weizman, E., & Segal, R. (2003). Introduction. In R. Segal, D. Tartakover, & E. Weizman (Eds.), A Civilian Occupation: The Politics of Israeli Architecture (pp. 18–27). Verso.
Welz, G. (2003). The cultural swirl: anthropological perspectives on innovation. Global Networks, 3(3), 255–270.
White, G. (2016, December 16). Citizens take over NAMA-controlled property and set up rooms for homeless people. Irish Independent. Dublin. Retrieved from http://www.independent.ie/irish-news/citizens-take-over-namacontrolled-property-and-set-up-rooms-for-homeless-people-35299848.html
Wiig, A. (2015). IBM’s smart city as techno-utopian policy mobility. City, 19(2–3), 258–273. Williams, B. (2014). Bailing out the banks: The role of the National Asset Management Agency.
In A. MacLaran & S. Kelly (Eds.), Neoliberal Urban Policy and the Transformation of the City: Reshaping Dublin (pp. 139–154). Palgrave Macmillan.
Winter, W. E. (2006). Development decision-making in St. Louis, Missouri: Institutions, incentives and urban development. ProQuest Dissertations and Theses, 709. Retrieved from http://search.proquest.com/docview/304959958?accountid=26642%5Cnhttp://link.periodicos.capes.gov.br/sfxlcl41?url_ver=Z39.88-
190
2004&rft_val_fmt=info:ofi/fmt:kev:mtx:dissertation&genre=dissertations+%26+theses&sid=ProQ:ProQuest+Dissertations+%26+Theses+Global
Wolf-Powers, L. (2005). Up-Zoning New York City’s Mixed-Use Neighborhoods: Property-Led Economic Development and the Anatomy of a Planning Dilemma. Journal of Planning Education and Research, 24(4), 379–393.
Wolfe, D. (2014). Innovating in Urban Economies: Economic Transformation in Canadian City-Regions. Toronto, Buffalo, London: University of Toronto Press.
Yigitcanlar, T., & Bulu, M. (2015). Dubaization of Istanbul: insights from the knowledge-based urban development journey of an emerging local economy. Environment and Planning A, 47(1), 89–107.
Zimmerman, J. (2008). From brew town to cool town: Neoliberalism and the creative city development strategy in Milwaukee. Cities, 25, 230–242.
Zukin, S. (1989). Loft living: Culture and capital in urban change. Rutgers University Press. Zukin, S. (1993). Landscapes of Power: From Detroit to Disney World. University of California
Press. Zukin, S. (2009). Changing Landscapes of Power: Opulence and the Urge for Authenticity.
International Journal of Urban and Regional Research, 33(2), 543–553.
Related Documents