Gosford City Council and Department of Environment and Climate Change BRISBANE WATER ESTUARY PROCESSES STUDY ESTUARINE MORPHOLOGY AND SILTATION APPENDIX D 1 May 2007 LJ2255/R2313 Report Prepared for

Welcome message from author
This document is posted to help you gain knowledge. Please leave a comment to let me know what you think about it! Share it to your friends and learn new things together.
Transcript
Gosford City Council and Department of Environment and Climate
Change
BRISBANE WATER ESTUARY PROCESSES STUDY ESTUARINE MORPHOLOGY AND SILTATION
APPENDIX D
1 May 2007 LJ2255/R2313
Report Prepared for
BRISBANE WATER ESTUARY PROCESSES STUDY ESTUARINE MORPHOLOGY AND SILTATION APPENDIX D
Gosford City Council and Version 1 1 May 2007 Department of Environment and Climate Change Page i H:\Doc\2007\Reports.2007\Rep2313.doc Commercial in Confidence
Cardno Lawson Treloar Pty Ltd
ABN 55 001 882 873 Level 2, 910 Pacific Highway
Gordon New South Wales 2072 Australia
Telephone: 02 9499 3000 Facsimile: 02 9499 3033
International: +61 2 9499 3000 [email protected]
www.cardno.com.au
Report No. …. Document Control
Author Reviewer Version Date Name Initials Name Initials 1 1/5/2007 P.D. Treloar PDT D. R. Taylor DRT
“This document is produced by Cardno Lawson Treloar Pty Ltd solely for the benefit of and use by the client in accordance with the terms of the retainer. Cardno Lawson Treloar Pty Ltd does not and shall not assume any responsibility or liability whatsoever to any third party arising out of any use or reliance by any third party on the content of this document. It is the responsibility of the reader to verify the currency of the version number of this report. All subsequent releases will be made directly to the Client.
Controlled Document No (……….) Uncontrolled Document x
BRISBANE WATER ESTUARY PROCESSES STUDY ESTUARINE MORPHOLOGY AND SILTATION APPENDIX D
Gosford City Council and Version 1 1 May 2007 Department of Environment and Climate Change Page ii H:\Doc\2007\Reports.2007\Rep2313.doc Commercial in Confidence
TABLE OF CONTENTS
1. INTRODUCTION...............................................................................................................1
2. MORPHOLOGICAL SETTING..........................................................................................2
3. PHYSICAL PROCESSES .................................................................................................3
4. SILTATION MODEL..........................................................................................................5
5. SITE SPECIFIC INVESTIGATIONS ..................................................................................6 5.1 Ettalong Area............................................................................................................6
5.1.1 Shoreline Transport ......................................................................................6 5.1.2 Waterway Sediment Transport .....................................................................7
5.2 St Huberts Island Area .............................................................................................8 5.2.1 Site 1 ............................................................................................................8 5.2.2 Site 2 ............................................................................................................9
5.3 Siltation at Blackwall Road, Woy Woy .................................................................... 17 5.3.1 Site Visit and Site Details............................................................................ 17 5.3.2 Catchment Sediment Load ......................................................................... 18 5.3.3 Siltation Investigations ................................................................................ 19 5.3.4 Sediment Composition Investigation........................................................... 20 5.3.5 Conclusions................................................................................................ 21
5.4 Hardys Bay – Killcare ............................................................................................. 21 5.4.1 Historical Perspective ................................................................................. 21 5.4.2 Siltation Modelling ...................................................................................... 22
5.5 Correa Bay ............................................................................................................. 22 5.5.1 Historical Perspective ................................................................................. 22 5.5.2 Siltation Modelling ...................................................................................... 23
5.6 Point Claire............................................................................................................. 23 5.7 Booker Bay............................................................................................................. 23 5.8 Gosford Boat-Harbour Marina ................................................................................ 24
6. DETAILED FINE SILT MODELLING............................................................................... 25 6.1 Methodology........................................................................................................... 25 6.2 Sediment Parameters............................................................................................. 26 6.3 Results ................................................................................................................... 26
7. CONCLUDING REMARKS ............................................................................................. 28
8. REFERENCES................................................................................................................ 29
BRISBANE WATER ESTUARY PROCESSES STUDY ESTUARINE MORPHOLOGY AND SILTATION APPENDIX D
Gosford City Council and Version 1 1 May 2007 Department of Environment and Climate Change Page iii H:\Doc\2007\Reports.2007\Rep2313.doc Commercial in Confidence
LIST OF TABLES Table 5.1 Storm Event Sediment Transport Rates Table 5.2: Storm Event Beach Assessment Table 5.3: Sediment Size Sensitivity Analysis Table 5.4: Sediment Properties Summary Table 6.1: Annual Sediment Loads for Wet, Average and Dry Rainfall Conditions Table 6.2: Annual Sediment Loads for Wet, Average and Dry Rainfall Conditions LIST OF FIGURES Figure 1.1 Study Area Figure 2.1 Ettalong Locality Plan Figure 2.2 Revetment Walls Along Foreshore of "The Broadwater" Figure 2.3 Eroded Shoreline at Site 1 St Huberts Island Figure 2.4 Estuary Entrance Locality Plan Figure 2.5 Ettalong Foreshore Near Schnapper Road (June 2005) Figure 2.6 Tidal Levels and Current Speeds at Ettalong Beach Figure 2.7 Ettalong Point Nearshore Shoal Figure 5.1 Estuary Entrance Locality Plan Figure 5.2 Ettalong Foreshore Photographs Figure 5.3 Tidal Levels and Current Speeds at Ettalong Beach Figure 5.4 Ettalong Point Nearshore Shoal Figure 5.5 Ettalong Morphological Model System Figure 5.6a Average Suspended Sediment Transport Vectors (m3/s/m) 4-28 March 2004 Figure 5.6b Average Suspended Sediment Transport Vectors (m3/s/m) 4-28 March 2004 Figure.5.7a Average Suspended Sediment Transport Vectors (m3/s/m) 4-28 March 2004 Figure 5.7b Average Bedload Sediment Transport Vectors (m3/s/m) 4-28 March 2004 Figure 5.8a Bed Change - 4-28 March 2004 Figure 5.8b Bed Change - 4-28 March 2004 Figure 5.9 Section Lines Through Ettalong Shoals Figure 5.10 Section Profiles Through Ettalong Shoals Section 1 Figure 5.11 Section Profiles Through Ettalong Shoals Section 2 Figure 5.12 Section Profiles Through Ettalong Shoals Section 3 Figure 5.13 Section Profiles Through Ettalong Shoals Section 4 Figure 5.14 St.Huberts Island (1996 Aerial Photograph) Figure 5.15 Shoreline at Site Looking Eastward St.Huberts Island - Site 1 Figure 5.16 Shoreline at Site Looking Westward St.Huberts Island - Site 1 Figure 5.17 Shoreline Beyond Boat Ramp at No.4 St.Huberts Island - Site 1 Figure 5.18 Site Visit Photographs - Seawall, Fill and Adjoining Jetty Structure(44 Marina View
Pde) Figure 5.19 Site Visit Photographs - Shoreline Features, Adjoining Properties (42-46 Marina
View Pde) Figure 5.20 Swan Model Output – 20m/s NE wind case Figure 5.21 Sediment Transport Cross Sections - Site 2 St Huberts Island
BRISBANE WATER ESTUARY PROCESSES STUDY ESTUARINE MORPHOLOGY AND SILTATION APPENDIX D
Gosford City Council and Version 1 1 May 2007 Department of Environment and Climate Change Page iv H:\Doc\2007\Reports.2007\Rep2313.doc Commercial in Confidence
Figure 5.23 Accreting Foreshore Figure 6.1 Detailed Siltation Investigations Figure 6.2 Annual Fine Sediment Siltation Rate Fagans Bay - 1998 (High Rainfall) Figure 6.3 Annual Fine Sediment Siltation Rate Erina Creek Entrance - 1998 (High Rainfall) Figure 6.4 Annual Fine Sediment Siltation Rate Correa Bay (Woy Woy Creek Entrance - 1998
(High Rainfall) Figure 6.5 Annual Fine Sediment Siltation Rate Kincumber Creek Entrance - 1998 (High
Rainfall) Figure 6.6 Annual Fine Sediment Siltaton Rate Mudflat Creek Entrance - 1998 (High Rainfall) Figure 6.7 Annual Fine Sediment Siltation Rate Fagans Bay - 1995 (Average Rainfall) Figure 6.8 Annual Fine Sediment Siltation Rate Erina Creek Entrance - 1995 (Average
Rainfall Figure 6.9 Annual Fine Sediment Siltation Rate Correa Bay (Woy Woy Creek Entrance) -
1995 (Average Rainfall) Figure 6.10 Annual Fine Sediment Siltation Rate Kincumber Creek Entrance – 1995 (Average
Rainfall) Figure 6.11 Annual Fine Sediment Siltation Rate Mudflat Creek Entrance - 1995 (Average
Rainfall) Figure 6.12 Annual Fine Sediment Siltation Rate Fagans Bay - 2000 (Low Rainfall) Figure 6.13 Annual Fine Sediment Siltation Rate Erina Creek Entrance - 2000 (Low Rainfall) Figure 6.14 Annual Fine Sediment Siltation Rate Correa Bay (Woy Woy Creek Entrance) -
2000 (Low Rainfall) Figure 6.15 Annual Fine Sediment Siltation Rate Kincumber Creek Entrance - 2000 (Low
Rainfall) Figure 6.16 Annual Fine Sediment Siltation Rate Mudflat Creek Entrance - 2000 (Low Rainfall) APPENDICES APPENDIX 1 Historical Photographs and Sediment Data - St Huberts Island Area APPENDIX 2 Catchment Area and Sediment Data at 242 Blackwall Road, Woy Woy APPENDIX 3 Historical Photographs at 242 Blackwall Road, Woy Woy APPENDIX 4 Photographs at Mudflat Creek (Provided by Mr G Smith) APPENDIX 5 Brisbane Water Shoreline Sediment Data

BRISBANE WATER ESTUARY PROCESSES STUDY ESTUARINE MORPHOLOGY AND SILTATION APPENDIX D
Gosford City Council and Version 1 1 May 2007 Department of Environment and Climate Change Page 1 H:\Doc\2007\Reports.2007\Rep2313.doc Commercial in Confidence
1. INTRODUCTION This report forms Appendix D of the Brisbane Water Estuary Processes Study report. It was prepared by Cardno Lawson Treloar for Gosford City Council (GCC) and the Department of Environment and Climate Change (DECC). It describes the purpose, data, study approach and outcomes of a range of sediment transport and morphological investigations undertaken to develop an understanding of sediment processes and their temporal and spatial variations throughout the estuary. The basis for many of these analyses is drawn from the calibrated catchment runoff and estuarine hydrodynamics investigations undertaken for this study and reported in Appendices B and C, (Cardno Lawson Treloar 2007a and b). Details of those tasks have not been repeated herein. Other assessments have been based on historical survey data and photographic information. Figure 1.1 provides an overall plan of the study area.
BRISBANE WATER ESTUARY PROCESSES STUDY ESTUARINE MORPHOLOGY AND SILTATION APPENDIX D
Gosford City Council and Version 1 1 May 2007 Department of Environment and Climate Change Page 2 H:\Doc\2007\Reports.2007\Rep2313.doc Commercial in Confidence
2. MORPHOLOGICAL SETTING The nature of Brisbane Water sediments and the forcing environmental processes that move them vary widely from silica sand at Ettalong in a relatively exposed wave environment to catchment muds at Mudflat Creek in the north-eastern corner of Hardys Bay. The latter site is sheltered from swell and generally also from local sea, but is affected by catchment runoff. On the other hand, sandy beaches are found also at Green Point in an area exposed to local sea, but free from swell and local catchment flows. In other areas, such as The Rip, wave action is not particularly important, but very strong tidal currents that flow through this rocky constriction have scoured the seabed in the narrowest areas and formed nearby lateral shoals in more shallow areas and to the sides of the main flow-paths. The centre channel shoals at Ettalong are changing constantly, causing the need for NSW Maritime to shift the marker buoys defining the navigable waterway from Broken Bay into Brisbane Water. Significant changes to some shoreline areas are caused by storm waves and may threaten shoreline property, for example near Bangalow Street (on The Esplanade), and Schnapper Road at Ettalong, see Figure 2.1. The Bangalow Street area is the site for the proposed Ettalong Beach to Sydney Fast Ferry service terminal. The shoreline is protected by a rock revetment, but it is currently in a state of disrepair and it has been fenced to prevent public entry. The cause of this failure is likely to have been the lack of suitable filter layers. At Point Clare and Gosford, Figure 2.2, local sea erosion of the shoreline and the proximity of property have led to the need to construct revetments to prevent further damage to property. These shoreline wave processes have been addressed in Cardno Lawson Treloar (2007b), but other aspects will be discussed herein. Historically, the main creeks that flow to Brisbane Water have carried silt and mud, as well as some larger sand particles, nutrients and organic matter to the waterway; mainly during periods of high rainfall. Other debris includes road-base and glass. Where a creek (or perhaps now a drain) discharges to a relatively energetic area, such as near Beach Street at Ettalong, the higher waves or current speeds ‘winnow-out’ the finer particles, which are then transported to more tranquil areas of the estuary, leaving the beach in a more sandy state. At other sites such as Blackwall Road, Woy Woy, wave conditions are of much lower energy and fine silts accumulate in the region, see Section 5.3. There are also areas such as St Huberts Island that are ‘man-made’. This residential canal estate development was formed, circa 1971, by dredging sand from nearby areas and reclaiming a shallow shoaled area. The ‘works’ are generally surrounded by low seawalls and in some areas, also by narrow beaches. Where there are shoreline areas that are exposed to wave activity and have significant curvature, such as the shoreline at the north-east corner of Marina View Parade, there will be significant local erosion, see Figure 2.3. This photograph shows that make-shift local shoreline protection works have been undertaken to protect the seawall and property. Other man-made areas include the extensive shoreline revetments at Koolewong and Gosford, for example, and dredging near Rockwall Road circa 1960s to form Pelican Island as part of navigational channel dredging for the Blackwall Channel. Many older style dwellings around the foreshore are being replaced with newer, larger buildings. Most of these property owners are seeking to secure their investments (and the foreshore in front of those properties) by placing garden areas behind seawall type structures. It is understood that many of these are unapproved, with little or no habitat value. Seawalls can have a detrimental effect on public access to the foreshore, coastal sediment dynamics and seagrass areas near the shoreline. The Department of Natural Resources and Council are unable to monitor all of these activities.
BRISBANE WATER ESTUARY PROCESSES STUDY ESTUARINE MORPHOLOGY AND SILTATION APPENDIX D
Gosford City Council and Version 1 1 May 2007 Department of Environment and Climate Change Page 3 H:\Doc\2007\Reports.2007\Rep2313.doc Commercial in Confidence
3. PHYSICAL PROCESSES The movement and re-suspension of sediment particles commences when the fluid force on a particle is just larger than the resisting force related to the submerged particle weight and friction coefficient. In the case of fine silts that may settle near the mouths of creek entrances, cohesive forces are also important. Thus settled mud particles remain in a stable state on the seabed until they are disturbed by forces that exceed those needed to initiate sediment motion. These forces are caused by tidal and wind driven currents, as well as by wave action. Even quite small wind waves that break at the shoreline can cause sediment re-suspension. Once suspended, fine particles may be transported throughout the estuary. They ultimately settle in a more tranquil environment; in typically deeper areas, but notably not in The Rip area. Therefore, apart from areas protected from waves, such as inlets, long-term retention of silts in shallow areas is unlikely. The main parameters in the settlement and re-suspension processes are:-
ws setting velocity (m/s) τcd critical shear stress for deposition (N/m2) τce critical shear stress for erosion (N/m2) E an erosion coefficient (g/m2/s) – depends on sediment consolidation
Shear stresses are related to the water particle velocities. Muddy sediments that settle on the seabed gain strength quickly due to consolidation and bio-chemical reactions in the bed. Therefore the shear stress (or velocity) needed to keep the cohesive sediments in suspension τcd is always smaller than the shear stress needed to erode the sediments from the bed, τce. The parameter E is part of site specific calibration, when re-suspension is to be considered. Thus the following regimes may occur:-
τcd < τ < τce no deposition and no erosion, only pure horizontal transport τ ≤ τcd only deposition and horizontal transport τ > τce only erosion and horizontal transport
In reality, cohesive sediment transport is controlled by chemical and biological laws in addition to these physical processes. The transport is also dependent on the type of sediment and therefore analytical expressions that describe these processes are semi-empirical. Hence, much of this information has been obtained from laboratory and field experiments. Another important issue is salinity. Fine clay-particles have electrostatic properties and flocculate in saline water. The extent of flocculation depends upon the salinity and concentration of suspended particles. Where this is greater than about 0.3g/l, flocculation becomes important. Similar processes affect the re-suspension of cohesionless sediments (sand). However, in that case, there is much less consolidation and there are no biological effects. Hence the initiation of sand movement can be described by a current speed and/or wave orbital speed and sediment size, typically the particle diameter that describes the 50% passing dimension - D50. Often the seabed sediments may include sand and clay - even small proportions of clay reduce the sediment mobility. In a natural environment these processes develop a state of quasi-equilibrium. Full equilibrium can not be achieved because the hydro-met-ocean environment is changing constantly. However, where the form of the waterway is altered substantially by human activity, this quasi-equilibrium is disturbed.

BRISBANE WATER ESTUARY PROCESSES STUDY ESTUARINE MORPHOLOGY AND SILTATION APPENDIX D
Gosford City Council and Version 1 1 May 2007 Department of Environment and Climate Change Page 4 H:\Doc\2007\Reports.2007\Rep2313.doc Commercial in Confidence
The trend is then for the geomorphological processes to try and restore the seabed to a form consistent with the physiography of any altered waterway and the hydro-met-ocean environment. The rate of siltation will depend on the transport/suspension capacities of the tidal currents in the area. Progressive consolidation also occurs following settlement, the rate of consolidation being rapid immediately following settlement, and becoming progressively slower.
BRISBANE WATER ESTUARY PROCESSES STUDY ESTUARINE MORPHOLOGY AND SILTATION APPENDIX D
Gosford City Council and Version 1 1 May 2007 Department of Environment and Climate Change Page 5 H:\Doc\2007\Reports.2007\Rep2313.doc Commercial in Confidence
4. SILTATION MODEL The past ten years have seen the development of a hydrodynamic module within the Delft3D system, see Cardno Lawson Treloar 2007b, that is capable of sediment transport modelling and morphological updating while simultaneously performing the hydrodynamic simulation. This “online sediment version” works by treating sediment as another constituent (in addition to salinity and heat) allowing it to be calculated in three dimensions, and subsequently feeding the density effects of the sediment back into the flow simulation. This version includes linked hydrodynamics (including stream flows and sediment loads), wave processes, sediment transport and morphological changes. Note that the success of sediment transport modelling depends upon the model reproducing currents reliably in the estuary. Cardno Lawson Treloar 2007b demonstrates that that is the case for the Delft3D model developed for Brisbane Water. Generally this same model layout was used for morphological analyses, though reduced area sub-grid and location specific analyses were undertaken also. The model can handle both non-cohesive (sand) and cohesive (mud) sediments. Interaction with the bed for sand fractions is computed on the basis of the sediment pick-up functions of Leo van Rijn; bed and suspended load transport are included. For mud fractions the widely recognised sediment flux expressions of Partheniades and Krone are used (van Rijn, 1993). This version also includes the ability to model fixed, non-erodible areas; for example, the seabed at The Rip. To bridge the gap between morphological and hydrodynamic time-scales a morphological acceleration factor can be used. Significant is the inclusion of improved formulations that describe the effects of waves on the three-dimensional flow pattern. These features make the version particularly suitable for modelling morphological changes in areas with complex three-dimensional flow patterns, such as river bends, dredged trenches, coastal regions and estuaries, including lateral erosion. Five vertical layers were applied to the mud siltation analyses undertaken for this study. For the Ettalong area, where the sediments are predominantly sand, the model system was used in 2D because sand transport processes are generally formulated in terms of depth-averaged current speeds. There is conflict between the need to describe the overall regional current and suspended sediment structure that extends over many of kilometres, with related large grid sizes, and the need to resolve the details of seabed shoals and channels. Furthermore, it is generally best to set the boundaries of a morphological model where seabed changes may be expected to be small so that boundary assumptions do not have a significant effect on the outcomes. Hence, morphological models are often nested within a larger area hydrodynamic model. The following sections describe the sediment processes and morphological state of a range of selected areas. Similar processes will affect other areas that lie in similar environments.
BRISBANE WATER ESTUARY PROCESSES STUDY ESTUARINE MORPHOLOGY AND SILTATION APPENDIX D
Gosford City Council and Version 1 1 May 2007 Department of Environment and Climate Change Page 6 H:\Doc\2007\Reports.2007\Rep2313.doc Commercial in Confidence
5. SITE SPECIFIC INVESTIGATIONS
5.1 Ettalong Area This region of Brisbane Water lies between Broken Bay and Booker Bay, see Figure 5.1. Much of the regional seabed is formed of sandy shoals that are generally mobile and free from seabed flora, but there are also shoals that have extensive sea grass growth, for example, near Pretty Beach. The shoreline of Ettalong Beach, from north of Ettalong Point in the south to Schnapper Road in the north - near the ferry berth, has undergone beach erosion for many decades, at least from the mid-1940s (Public Works, 1992), see Figure 5.2, looking south along Ettalong Beach from near Schnapper Road. Beach re-nourishment was undertaken by dredging from the centre-channel shoals in the early 1980s (Public Works, 1981), and again in the 1990s, at a smaller scale, when sand became available from a construction site near Beach Street – GCC records. That recent re-nourishment sand also included material unsuitable for beach amenity. Public Works (1977) discusses a conceptual model of sediment transport within the Ettalong area. Generally it was considered that sand was transported northward from near Ettalong Point by longshore wave-caused transport to about Schnapper Road, where it moved offshore into the tidal shoal system to be transported downstream by ebb tidal currents to the Ettalong Point Shoal and eventually back onto the shoreline through onshore sediment transport caused by swell - general cycling of sand. The process was made more complex by offshore transport from the beach profile during storm events, with little, if any, onshore transport following storm abatement. 5.1.1 Shoreline Transport Lawson and Treloar (1996) investigated the longshore transport characteristics on Ettalong Beach. Figure 5.3, developed on a spring near the shoreline, shows that the highest tidal current speeds occur near high and low tide rather than near mean water level. Therefore, near high water, there is an upstream flowing tidal current, which, when combined with the higher waves possible at high water (local sea wave generation and swell propagation not as restricted by the shoals as is the case at low water), leads to an upstream transport of sand along the beach. Figure 5.4 shows small waves breaking on the Ettalong Point shoal, even when waves in Broken Bay are quite small. Sand transport along Ettalong Beach towards Booker Bay at low tide is less effective because of lower wave heights; also because wave incidence on the beach at low tide does not run up the beach face as high as it does at high tide, and hence is not as effective in removing sand from the back-beach area. This process of northward shoreline to transport is consistent with the conceptual model proposed by Public Works (1977). Lawson and Treloar (1999) estimated the average upstream longshore sediment transport rate caused by swell to be about 75m3/year - near Bangalow Street. This is consistent with the general rate of beach profile change at the site, but is a relatively small transportation rate. Local sea effects have not been quantified, but are expected to be small because of the short fetches. Shoreline sediment transport at Ettalong is dominated by the offshore transport that occurs during periods of higher water levels and waves. Unlike open coast beaches that are exposed to persistent swell, sand lost from the Ettalong Beach face by wave caused offshore transport is not transported back onshore to any significant extent. Hence the beach does not recover.

BRISBANE WATER ESTUARY PROCESSES STUDY ESTUARINE MORPHOLOGY AND SILTATION APPENDIX D
Gosford City Council and Version 1 1 May 2007 Department of Environment and Climate Change Page 7 H:\Doc\2007\Reports.2007\Rep2313.doc Commercial in Confidence
5.1.2 Waterway Sediment Transport Additional sediment transport investigations within the waterway have been undertaken using the Delft3D modelling system described in Cardno Lawson Treloar (2007b). A nested morphological model, see Figure 5.5, was set up within the whole-of-estuary 2D model and operated over a period from 4 to 28 March, 2004, thereby including a spring-neap period of 14 days after an initial seabed smoothing period from 4 to 14 March. This smoothing time is needed so that sediment transport ‘noise’ is removed from the modelling process; this noise arising from the initial model seabed form not being entirely compatible with the modelled forcing hydrodynamics. This overall simulation period was adopted because it was used also for a range of other simulations. Four simulations were undertaken – tides only, and then tides together with Hs of 1.5, 3 and 6m from the south-east at the model boundary seaward of Broken Bay. The lowest Hs case is equivalent to the annual median offshore wave height and the highest would occur every 1 to 2 years – based on analyses of long term offshore Botany Bay wave data. Note that these wave conditions were maintained over the full simulation period, the purpose being to test the influence of waves, not to undertake specific storm case simulations. Model grid sizes as small as 5m across the channel and 30m along the channel were adopted. A D50 particle size of 0.23mm was adopted on the basis of the range of sediment data presented in Lawson and Treloar (1996). Results have been presented in two ways. They are: - • A map showing the spatial variation of the average net rate of suspended sediment
transport over the period from 4 to 28 March 2004. The results sow that bed load transport is some orders of magnitude lower than suspended load transport, Figures 5.6 and 5.7.
• Changes in seabed level over the test period of two-weeks, Figure 5.8 – plan views • Changes in cross-section over the test period of two weeks, Figures 5.9 to . . . . . . Inspection of Figure 5.6 shows strong downstream sediment transport in the channel that lies close to Kourung Gourung and Wagstaff Points, particularly at Wagstaff Point. There is also distinct transport onto, but not off, Ettalong Point shoal and the central shoal at Ettalong. Some upstream transport on the Broken Bay side of Wagstaff Point can be seen. The grid size is not fine enough to resolve longshore transport along Ettalong Beach. Figure 5.8 shows very little apparent difference in siltation/erosion structure amongst the four cases considered, indicating that sediment transport in this region of the estuary is dominated by tidal flow and not wave processes. The results also indicate a tendency for the main flow-paths to be maintained, generally, and for the Ettalong Point Shoal to move south-west into Broken Bay. Figure 5.9 shows four selected cross-sections at Ettalong that were selected for further analysis; as shown in Figures 5.10 to 5.13. Looking first at cross-sections 3 and 4, one can see that there is virtually no difference amongst all of the test cases, the results show only that there has been some seabed smoothing. At Cross-section 1 there are some significant changes to the Ettalong Point Shoal; showing sand build-up on its western nearshore and a loss of sediment from the inner crest, together with some deepening of the central channel. There is also some build-up on the eastern shoal, varying in character from one simulation to another. The results at Cross-Section 2 show a general westward migration of the centre-channel Ettalong shoal and accumulation of sand north-west of Half-Tide Rocks.
BRISBANE WATER ESTUARY PROCESSES STUDY ESTUARINE MORPHOLOGY AND SILTATION APPENDIX D
Gosford City Council and Version 1 1 May 2007 Department of Environment and Climate Change Page 8 H:\Doc\2007\Reports.2007\Rep2313.doc Commercial in Confidence
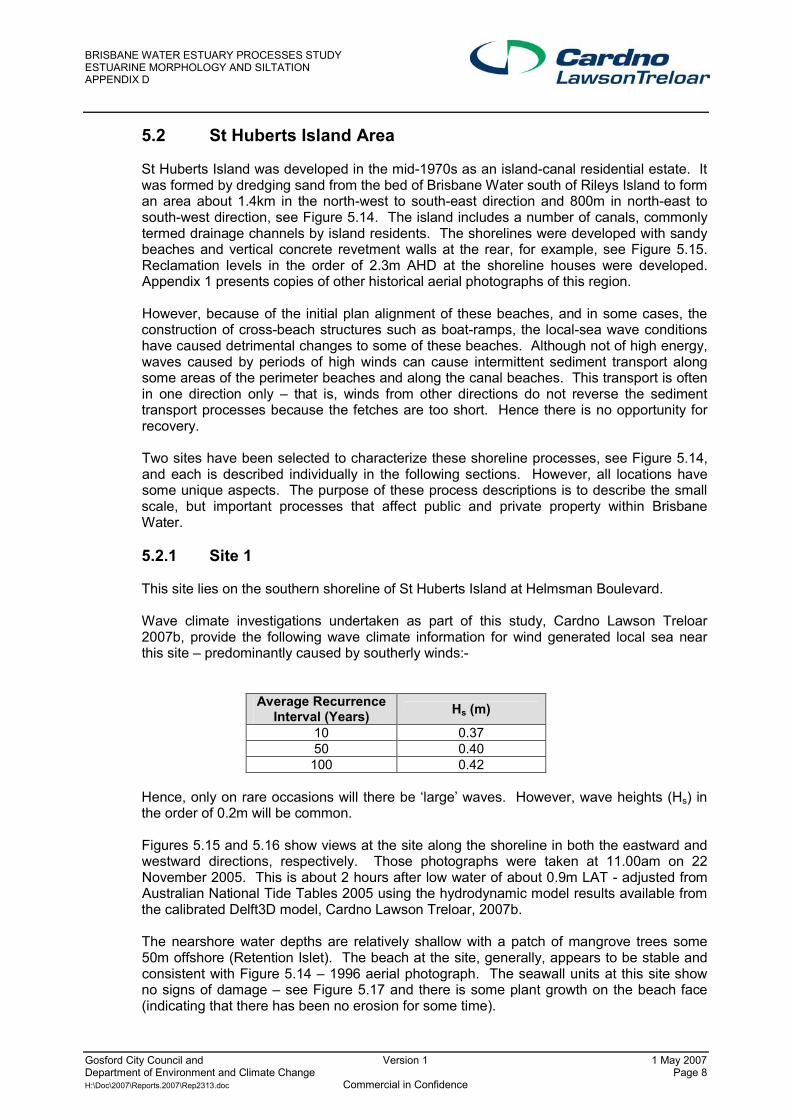
5.2 St Huberts Island Area St Huberts Island was developed in the mid-1970s as an island-canal residential estate. It was formed by dredging sand from the bed of Brisbane Water south of Rileys Island to form an area about 1.4km in the north-west to south-east direction and 800m in north-east to south-west direction, see Figure 5.14. The island includes a number of canals, commonly termed drainage channels by island residents. The shorelines were developed with sandy beaches and vertical concrete revetment walls at the rear, for example, see Figure 5.15. Reclamation levels in the order of 2.3m AHD at the shoreline houses were developed. Appendix 1 presents copies of other historical aerial photographs of this region. However, because of the initial plan alignment of these beaches, and in some cases, the construction of cross-beach structures such as boat-ramps, the local-sea wave conditions have caused detrimental changes to some of these beaches. Although not of high energy, waves caused by periods of high winds can cause intermittent sediment transport along some areas of the perimeter beaches and along the canal beaches. This transport is often in one direction only – that is, winds from other directions do not reverse the sediment transport processes because the fetches are too short. Hence there is no opportunity for recovery. Two sites have been selected to characterize these shoreline processes, see Figure 5.14, and each is described individually in the following sections. However, all locations have some unique aspects. The purpose of these process descriptions is to describe the small scale, but important processes that affect public and private property within Brisbane Water. 5.2.1 Site 1 This site lies on the southern shoreline of St Huberts Island at Helmsman Boulevard. Wave climate investigations undertaken as part of this study, Cardno Lawson Treloar 2007b, provide the following wave climate information for wind generated local sea near this site – predominantly caused by southerly winds:-
Average Recurrence Interval (Years) Hs (m)
10 0.37 50 0.40 100 0.42
Hence, only on rare occasions will there be ‘large’ waves. However, wave heights (Hs) in the order of 0.2m will be common. Figures 5.15 and 5.16 show views at the site along the shoreline in both the eastward and westward directions, respectively. Those photographs were taken at 11.00am on 22 November 2005. This is about 2 hours after low water of about 0.9m LAT - adjusted from Australian National Tide Tables 2005 using the hydrodynamic model results available from the calibrated Delft3D model, Cardno Lawson Treloar, 2007b. The nearshore water depths are relatively shallow with a patch of mangrove trees some 50m offshore (Retention Islet). The beach at the site, generally, appears to be stable and consistent with Figure 5.14 – 1996 aerial photograph. The seawall units at this site show no signs of damage – see Figure 5.17 and there is some plant growth on the beach face (indicating that there has been no erosion for some time).

BRISBANE WATER ESTUARY PROCESSES STUDY ESTUARINE MORPHOLOGY AND SILTATION APPENDIX D
Gosford City Council and Version 1 1 May 2007 Department of Environment and Climate Change Page 9 H:\Doc\2007\Reports.2007\Rep2313.doc Commercial in Confidence
Nevertheless, there is a distinct change in shoreline condition at the boat-ramp constructed a little further to the east, see Figure 5.13. This foreshore change would appear to suggest that there is a local eastward longshore sediment transport potential and that sand losses and subsequent seawall damage west of the boat-ramp would occur, should the boat-ramp be removed. Based on presently available data, the approximate 100-years ARI water level at this site is 1.6m AHD (this parameter may be revised by the current Brisbane Water Estuary Foreshore Flood Study), leaving aside any potential rise in mean sea level arising from climate change. Since the crest levels of the concrete revetment walls are about 1.7m AHD, there is some risk that they would be overtopped in a very severe storm accompanied by future high water levels in Brisbane Water. 5.2.2 Site 2 This site lies on the north-eastern shoreline of St Huberts Island on Marina View Parade. Figure 2.3 presents a general view of the canal at this location taken during low tide in June, 2004. Because of the significant beach erosion near this site, relative to the initial design shoreline, as well as the construction of works such as boat-ramps that affect coastal processes, this site has been examined in some detail in terms of Nos 42, 44 and 46 Marina View Parade. Recent works on the canal frontage of No. 44 include a substantial timber retaining wall (seawall) to a level of about 1m AHD located such that the associated backfill has provided a level grassed area in the order of 5m wide beyond the location of the original seawall. These features can be seen in Figure 5.18. Figure 5.19 (top view) describes the placement of assorted rubble on the back-beach area, and the construction of a makeshift groyne structure out into Marina Cove at the head of the canal, adjacent to No. 46 Marina View Parade. Some of these modifications to the canal environment will impact on sediment transport processes within Marina Cove. The owner’s (No. 46 Marina View Parade) assumed purpose in placing this rubble would have been most likely to prevent further loss of shoreline sand from the western side of his property. It was also confirmed during a site visit that the property at No. 42 Marina View Parade has also apparently undertaken similar, but less extensive measures to those at the 44 Marina Parade, adding fill beyond the property boundary and confined on the canal front by a low timber retaining wall. Figure 5.19 (lower view) illustrate these further works that extend beyond the property line. It is understood (pers. comm. P D Treloar – Mr Ron Spratt, St Huberts Island resident) that the property boundaries on St Huberts Island extend 0.1m beyond the seawalls in order to provide owner access to those walls. Mr Spratt also provided a copy of a report prepared by the St Huberts Island Drainage Reserves Task Group published in 1997. That document includes an analysis of responses from residents to a consultation questionnaire prepared by the Task Group. It also provides further documentation of shoreline erosion around St Huberts Island, which in some locations is quite severe. History Five historical aerial photographs taken over a period of 20 years (1982-2002) and covering the St Huberts Island area were obtained from the NSW Department of Information Technology and Management; see Figure 5.14, Appendix 1. These historical photographs have been inspected to make an assessment of shoreline erosion/accretion characteristics and other coastal processes on the island’s foreshore beaches, and in surrounding waterways, since the construction of the island for residential development in circa 1970.
BRISBANE WATER ESTUARY PROCESSES STUDY ESTUARINE MORPHOLOGY AND SILTATION APPENDIX D
Gosford City Council and Version 1 1 May 2007 Department of Environment and Climate Change Page 10 H:\Doc\2007\Reports.2007\Rep2313.doc Commercial in Confidence
Although these photographs are from high altitude, they do show a removal of sand from near No. 46 Marina View Parade since construction. This property is on the corner at the head of Marina Cove. Much of this sand has most likely been transported south-west further into the canal, initially as an evolving sand-spit that has become smaller in offshore extent as it moves along the shoreline. It appears that the movement of those sediments has slowed considerably since the initial changes and the most recent photograph (2002) shows that this sand spit may not be moving further and is basically stationary, but is of reduced offshore extent. Since the initial construction of St Huberts Island for residential use, the shoreline of Marina Cove has been subjected to the construction of a number of boat-ramp structures built by individual property owners. These boat ramps protrude from the backbeach area of the shoreline out into the canal to varying extents and are of varying deck levels. Together with other cross-beach hard structures constructed along the shoreline, such as stormwater drains, those works have created an effect, in the low wave environment of this area, equivalent to that seen within a groyne field on a shoreline affected by a higher energy wave climate. These features can be seen in the various figures included with this section of the report. This “groyne field” effect has created stable fillets of sediment around the hard structures and realigned the beach segments in between each structure pair to be generally normal to the mean local sea wave direction. Depending on the distance between consecutive structures along the shoreline, this process has the potential to create areas of localised erosion on the down-drift side of each structure in the back beach area. Beach alignment changes will have occurred following construction of new boat ramps over the time since the completion of the construction of the canal. The effect of the construction of boat-ramps on the property boundaries between Nos 46 and 44 Marina View Parade, and Nos 44 and 42 Marina View Parade will have contributed to reducing the sediment transport rate from the head of the canal south-west along the canal to an extent that appears to have effectively stopped the further south-westerly progress of this mass of sand. The other cause will have been the gradual reduction in wave energy as one moves south-west along the shoreline into Marina Cove. Sediment Transport Analyses Sediment transport at this site is caused mainly by local sea waves and the direction of those waves relative to the local shoreline. There is no recorded wave or sediment transport data at this site and hence it was necessary to undertake numerical wave and sediment transport modelling for this study, see also Cardno Lawson Treloar 2007b. This modelling task required reliable seabed contour data and a description of the shoreline features - that is, a hydrographic survey. General bathymetric data in the area of wave generation for this site was available from the hydrodynamic-modelling phase of this study. GCC undertook a more detailed hydrographic survey of the seabed in this area to better describe the nearshore bathymetry and structures, so that wave and sediment transport processes could be investigated in more detail. This level of bathymetric detail was necessary because of the small scale of these processes at this site. The additional survey work was undertaken by a registered surveyor (Hydrographic Surveys, 2004). A digital terrain map (DTM) of St Huberts Island and the surrounding waterways was developed using the most recent detailed hydrographic survey data available from the Brisbane Water Estuary Processes Study and this additional survey. Enhancement of this hydrographic survey data has been undertaken through use of an ortho-corrected aerial photograph to include features important to wave growth and propagation in the
BRISBANE WATER ESTUARY PROCESSES STUDY ESTUARINE MORPHOLOGY AND SILTATION APPENDIX D
Gosford City Council and Version 1 1 May 2007 Department of Environment and Climate Change Page 11 H:\Doc\2007\Reports.2007\Rep2313.doc Commercial in Confidence
surrounding area (including the location of oyster lease racks). This DTM was utilised to undertake wind/wave modelling to determine the local sea wave climate at the site.
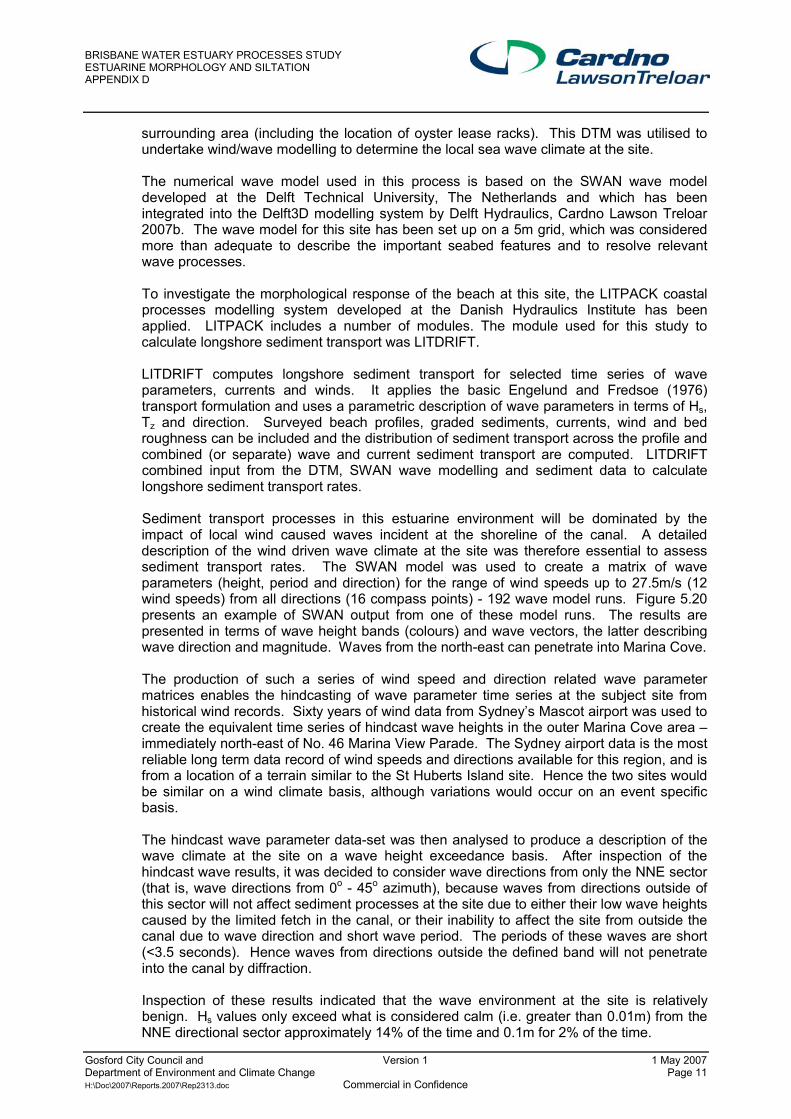
The numerical wave model used in this process is based on the SWAN wave model developed at the Delft Technical University, The Netherlands and which has been integrated into the Delft3D modelling system by Delft Hydraulics, Cardno Lawson Treloar 2007b. The wave model for this site has been set up on a 5m grid, which was considered more than adequate to describe the important seabed features and to resolve relevant wave processes. To investigate the morphological response of the beach at this site, the LITPACK coastal processes modelling system developed at the Danish Hydraulics Institute has been applied. LITPACK includes a number of modules. The module used for this study to calculate longshore sediment transport was LITDRIFT. LITDRIFT computes longshore sediment transport for selected time series of wave parameters, currents and winds. It applies the basic Engelund and Fredsoe (1976) transport formulation and uses a parametric description of wave parameters in terms of Hs, Tz and direction. Surveyed beach profiles, graded sediments, currents, wind and bed roughness can be included and the distribution of sediment transport across the profile and combined (or separate) wave and current sediment transport are computed. LITDRIFT combined input from the DTM, SWAN wave modelling and sediment data to calculate longshore sediment transport rates. Sediment transport processes in this estuarine environment will be dominated by the impact of local wind caused waves incident at the shoreline of the canal. A detailed description of the wind driven wave climate at the site was therefore essential to assess sediment transport rates. The SWAN model was used to create a matrix of wave parameters (height, period and direction) for the range of wind speeds up to 27.5m/s (12 wind speeds) from all directions (16 compass points) - 192 wave model runs. Figure 5.20 presents an example of SWAN output from one of these model runs. The results are presented in terms of wave height bands (colours) and wave vectors, the latter describing wave direction and magnitude. Waves from the north-east can penetrate into Marina Cove. The production of such a series of wind speed and direction related wave parameter matrices enables the hindcasting of wave parameter time series at the subject site from historical wind records. Sixty years of wind data from Sydney’s Mascot airport was used to create the equivalent time series of hindcast wave heights in the outer Marina Cove area – immediately north-east of No. 46 Marina View Parade. The Sydney airport data is the most reliable long term data record of wind speeds and directions available for this region, and is from a location of a terrain similar to the St Huberts Island site. Hence the two sites would be similar on a wind climate basis, although variations would occur on an event specific basis. The hindcast wave parameter data-set was then analysed to produce a description of the wave climate at the site on a wave height exceedance basis. After inspection of the hindcast wave results, it was decided to consider wave directions from only the NNE sector (that is, wave directions from 0o - 45o azimuth), because waves from directions outside of this sector will not affect sediment processes at the site due to either their low wave heights caused by the limited fetch in the canal, or their inability to affect the site from outside the canal due to wave direction and short wave period. The periods of these waves are short (<3.5 seconds). Hence waves from directions outside the defined band will not penetrate into the canal by diffraction. Inspection of these results indicated that the wave environment at the site is relatively benign. Hs values only exceed what is considered calm (i.e. greater than 0.01m) from the NNE directional sector approximately 14% of the time and 0.1m for 2% of the time.
BRISBANE WATER ESTUARY PROCESSES STUDY ESTUARINE MORPHOLOGY AND SILTATION APPENDIX D
Gosford City Council and Version 1 1 May 2007 Department of Environment and Climate Change Page 12 H:\Doc\2007\Reports.2007\Rep2313.doc Commercial in Confidence
Annual Sediment Transport Evaluation of an annual sediment transport rate at the updrift boundary of 44 Marina View Parade (Cross Section 1 (CS1) on Figure 5.21) was undertaken using the statistical representation of the wave climate discussed above. A shore normal beach profile at CS1 was created from the DTM established for the SWAN wave modelling. This digital beach profile and the sediment particle size data, presented in Appendix 2, formed the basis of the modelling using LITDRIFT to establish threshold values of wave heights from the NNE sector (N, NNE and NE directions) that would initiate sediment transport. Following the evaluation of these threshold values, LITDRIFT simulations were undertaken using wave heights greater than the threshold values for each of the three wave directions that would cause sediment transport at the site in order to assign sediment transport rates to specific wave conditions. The probability of encountering these specific wave conditions, calculated from the wave height exceedance data, was then used to evaluate the overall sediment transport rate at CS1 as a result of the wave climate by combining the individual condition results on the basis of their probabilities of occurrence. Annualisation of the sediment transport rate at CS1, calculated through the process described above, leads to a value of 0.3m3/year, which is very small. When considering the transport of sand within a section of shoreline in order to evaluate the effect on the shoreline, it is necessary to evaluate the difference in sediment transport rates between each end of the beach reach and not just the sediment transport rate at a cross section. This difference in the sediment transport is what causes the loss or gain of sediment within the beach reach and the consequent erosion or accretion of that section of shoreline. In this case it can be assumed that at a location at the head of the canal (No. 46 Marina View Parade) the net sediment transport rate towards CS1 will be zero. This is due to the orientation of the “headland” being directed into the NNE sector causing sediments to move away from the headland in both the WSW direction (into the canal) and the SSE direction (along the perimeter of the island). Additionally, that section of foreshore is relatively denuded of sand, see Figure 2.3, though that was not the case originally. The difference in sand transport calculated between the head of the canal and CS1 is then -0.3m3/year. This amounts to a recession of the shoreline over this 25m length of the canal frontage in the order of 0.02m/year, again very small. Wave heights at the downdrift cross sections CS2 and CS3 are gradually reduced in that direction from those experienced at the head of the canal and CS1 by the diffractive effect of the entrance to the canal. Consequently, sediment transport rates at these two locations will be reduced in comparison with CS1. This results in a small reduction in sediment transport rates in the downdrift direction and accretion of the shoreline is experienced in the beach compartments between CS1 and CS2, and to a lesser extent between CS2 and CS3. Storm Events Because the sediment transport rates calculated on a wave climate basis were of a very small magnitude, it is possible that shoreline changes observed in this location are predominantly due to storm events moving relatively significant volumes, but still small in an absolute sense, of sediment in short periods of time, with negligible movement occurring during “normal” wave conditions. Investigation of this phenomenon was undertaken through the simulation of a storm event. The condition chosen for this storm event simulation was a wind speed of 25m/s from the NNE sector. This wind speed is in the order of that experienced during the May 1974 storm (Foster et al, 1975). The duration of this indicative storm event was adopted as 6 hours – note that tide changes from high to low water over this period.

BRISBANE WATER ESTUARY PROCESSES STUDY ESTUARINE MORPHOLOGY AND SILTATION APPENDIX D
Gosford City Council and Version 1 1 May 2007 Department of Environment and Climate Change Page 13 H:\Doc\2007\Reports.2007\Rep2313.doc Commercial in Confidence
Sediment transport rates were calculated at the three cross section locations depicted in Figure 5.21. This involved using the SWAN wave model results for this particular wind condition and wave diffraction diagrams (Goda, 2000) to define the spatially varying storm wave conditions within the canal. Simulations were undertaken at three different water levels; Mean High Water Springs (MHWS), Mean Water Level (MWL) and Mean Low Water Springs (MLWS), to investigate the sensitivity of sediment transport rates to tidal influences over the course of the 6-hours event. Initial sensitivity tests indicated that winds from the NNE direction would provide the most significant sediment movements along the canal shoreline. The results for this particular wind direction are presented in Table 5.1 below.
Sediment Transport (m3) (6 hours) Water Level CS1 CS2 CS3 MHWS 9.2 6.5 5.1 MWL 6.9 5.5 4.3
MLWS 6.1 5.2 4.5
Average 7.4 5.7 4.6
Table 5.1: Storm Event Sediment Transport Rates
The impact on the shoreline is determined by the calculation of the sediment rate difference, as discussed above. Table 5.2 presents the average differences for each beach compartment between the cross shore profiles listed above together with the associated estimated shoreline change. The sediment transport rate at the head of the canal is zero, also discussed above.
Beach Compartment Canal Head - CS1 CS1 - CS2 CS2 - CS3
∆ Average Sediment Transport (m3) -7.4 1.7 1.1 ∆ Shoreline * (m) -0.46 0.11 0.07
* negative shoreline change indicates recession, positive indicates accretion
Table 5.2: Storm Event Beach Assessment A simulation was undertaken at a very high water level of 1.6m AHD (Australian Height Datum). This was the level observed in some locations in Brisbane Water during the May 1974 storm. However, this simulation proved not to produce the highest transport rate because the active beach-zone (that is, the cross shore zone within which sediment is transported), at this water level is lower than when water depths are a little more shallow. The sediment transport and wave processes are therefore complicated by the presence of stabilising and protective factors; such as structures, and paved or grassed areas. Sediment Size Sensitivity Investigation of the sensitivity of sediment transport rates to sediment grain size used in these calculations was addressed by modelling sediment transport rates for representative sediment sizes (D50) of 0.1 and 0.2 mm at profile CS1. The modelling procedures for these D50 values were similar to those outlined above for the D50 sediment size determined for the site and obtained through analysis of the sample taken from the site. The results of this assessment are presented as a sediment transport difference between the head of the
BRISBANE WATER ESTUARY PROCESSES STUDY ESTUARINE MORPHOLOGY AND SILTATION APPENDIX D
Gosford City Council and Version 1 1 May 2007 Department of Environment and Climate Change Page 14 H:\Doc\2007\Reports.2007\Rep2313.doc Commercial in Confidence
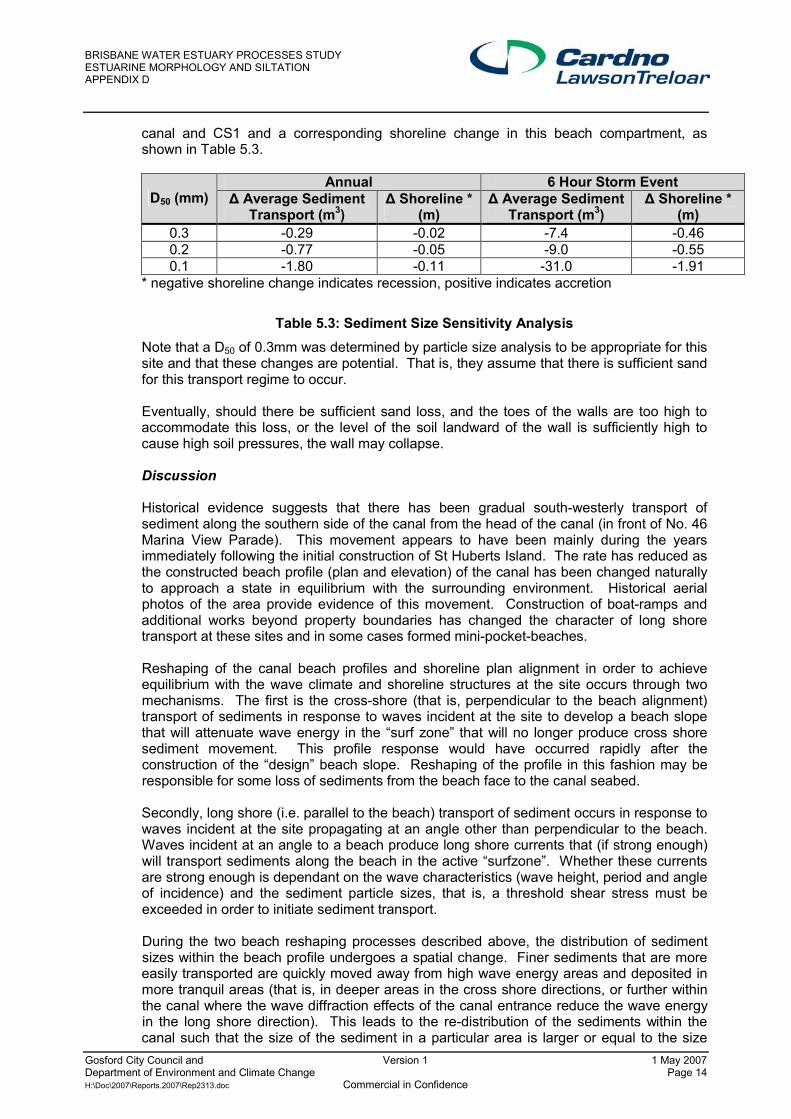
canal and CS1 and a corresponding shoreline change in this beach compartment, as shown in Table 5.3.
Annual 6 Hour Storm Event D50 (mm) ∆ Average Sediment
Transport (m3) ∆ Shoreline *
(m) ∆ Average Sediment
Transport (m3) ∆ Shoreline *
(m) 0.3 -0.29 -0.02 -7.4 -0.46 0.2 -0.77 -0.05 -9.0 -0.55 0.1 -1.80 -0.11 -31.0 -1.91
* negative shoreline change indicates recession, positive indicates accretion
Table 5.3: Sediment Size Sensitivity Analysis Note that a D50 of 0.3mm was determined by particle size analysis to be appropriate for this site and that these changes are potential. That is, they assume that there is sufficient sand for this transport regime to occur. Eventually, should there be sufficient sand loss, and the toes of the walls are too high to accommodate this loss, or the level of the soil landward of the wall is sufficiently high to cause high soil pressures, the wall may collapse. Discussion Historical evidence suggests that there has been gradual south-westerly transport of sediment along the southern side of the canal from the head of the canal (in front of No. 46 Marina View Parade). This movement appears to have been mainly during the years immediately following the initial construction of St Huberts Island. The rate has reduced as the constructed beach profile (plan and elevation) of the canal has been changed naturally to approach a state in equilibrium with the surrounding environment. Historical aerial photos of the area provide evidence of this movement. Construction of boat-ramps and additional works beyond property boundaries has changed the character of long shore transport at these sites and in some cases formed mini-pocket-beaches. Reshaping of the canal beach profiles and shoreline plan alignment in order to achieve equilibrium with the wave climate and shoreline structures at the site occurs through two mechanisms. The first is the cross-shore (that is, perpendicular to the beach alignment) transport of sediments in response to waves incident at the site to develop a beach slope that will attenuate wave energy in the “surf zone” that will no longer produce cross shore sediment movement. This profile response would have occurred rapidly after the construction of the “design” beach slope. Reshaping of the profile in this fashion may be responsible for some loss of sediments from the beach face to the canal seabed. Secondly, long shore (i.e. parallel to the beach) transport of sediment occurs in response to waves incident at the site propagating at an angle other than perpendicular to the beach. Waves incident at an angle to a beach produce long shore currents that (if strong enough) will transport sediments along the beach in the active “surfzone”. Whether these currents are strong enough is dependant on the wave characteristics (wave height, period and angle of incidence) and the sediment particle sizes, that is, a threshold shear stress must be exceeded in order to initiate sediment transport. During the two beach reshaping processes described above, the distribution of sediment sizes within the beach profile undergoes a spatial change. Finer sediments that are more easily transported are quickly moved away from high wave energy areas and deposited in more tranquil areas (that is, in deeper areas in the cross shore directions, or further within the canal where the wave diffraction effects of the canal entrance reduce the wave energy in the long shore direction). This leads to the re-distribution of the sediments within the canal such that the size of the sediment in a particular area is larger or equal to the size
BRISBANE WATER ESTUARY PROCESSES STUDY ESTUARINE MORPHOLOGY AND SILTATION APPENDIX D
Gosford City Council and Version 1 1 May 2007 Department of Environment and Climate Change Page 15 H:\Doc\2007\Reports.2007\Rep2313.doc Commercial in Confidence
that can effectively resist further movement through wave processes. The “construction” of beach areas without consideration of these processes may have been a factor in the consequent shoreline reshaping through sediment movements. The impact of sediment size on the rate of sediment transport can be seen by inspection of Table 5.3, which summarises the results of the sensitivity analysis undertaken. At the Marina View Parade site the reshaping of the canal by the above mechanisms has occurred through the removal of sediments from the relatively high wave energy area of the head of the southern side of the canal (in front of No. 46 Marina View Parade) and the transport of these sediments south-west along the canal foreshore. Because the outer end of the canal forms the shape of a point that is directed towards the direction from which the most significant waves approach, all sediment transport occurs away from this location. Consequently there is no supply of sediments to counter the removal of sediment from the outer end of the canal and erosion of the foreshore continues until such time as the remaining sediments at this location are large enough to withstand the forces imposed on them by waves (this can be achieved naturally if there is a underlying layer of large grained sediments or rocks, or artificially by the placement of rock as appears to have occurred in this case), or the profile becomes too deep for transport. The sediment eroded from the outer end of the canal will continue to move south-west at a reducing rate (due to the reduction in wave energy in that direction) as an evolving spit of sand, until a point within the canal where the wave climate reduces and sediment transport is no longer caused by this mechanism. Hence, the canal beach profile will approach an equilibrium state – in plan and section. This spit of sand is currently located adjacent to the property boundary between 42 and 44 Marina View Parade and appears to be relatively stable. Application of the hindcast wind/wave climate for the outer end of the canal, to the current beach form adjacent to the north eastern boundary of No. 44 Marina View Parade, and using the representative sediment grain size distribution for that location, produced minimal sediment transport from this profile on an annual basis. Beach profiles further to the south-west along the canal are subject to a reduced wave climate due to wave diffraction effects at the entrance to the canal and corresponding annual sediment transport volumes at these locations will be even smaller. This result supports the conclusion made from observation of aerial photographs of the canal that the beach profile along the canal is approaching or has reached an equilibrium state with the normal wave environment in the canal and hence sediment movements on a day to day basis have reduced significantly or do not occur at all. Although average sediment movements have apparently stabilised there is still the potential for storm wave events to produce pulses of sediment movements within the canal. Examination of a storm event from the north-north-east sector provided an indication of this potential. The sediment transport rates at profiles CS1 - CS3, indicated on Figure 5.21, were calculated for a 6 hour storm event. Assuming that there is no sediment transport at the outer end of the canal entrance, the difference in sediment transport over the 6 hour event, see Table 5.2, indicates a net erosion of 7.4m3 of sand between the outer end of the canal and Profile CS1, and the net deposition of 1.7 and 1.1m3 between profiles CS2 and CS3, respectively. This amounts to a change in width over the section between profiles of -0.6, 0.15 and 0.10 m. This is consistent with what was observed to have happened since the completion of the constructed canal with removal of sand from the outer end of the canal and deposition in the region of the property boundary between No’s 42 and 44 Marina View Parade.
BRISBANE WATER ESTUARY PROCESSES STUDY ESTUARINE MORPHOLOGY AND SILTATION APPENDIX D
Gosford City Council and Version 1 1 May 2007 Department of Environment and Climate Change Page 16 H:\Doc\2007\Reports.2007\Rep2313.doc Commercial in Confidence
The present situation is complicated by the presence of boat-ramps that have been built since the construction of the Marina Parade Canal. Construction of these ramps has been undertaken by the owners of individual properties. The construction of boat-ramps on the downdrift boundaries of No’s 44 and 46 Marina View Parade since the construction of the canal to its original design has had the effect of stabilising the south-westerly movements of sediment in this region. That is, those ramps now prevent much of the transport that could occur and hold sediment as shown in Figure 2.3, for example. Smaller boat-ramps and a concrete stormwater outlet further downdrift also contribute, with reducing impact, to this effect at updrift properties. These hard structures in the active beach profile have an impact on sediment transport similar to that seen within a groyne field in higher wave energy environments, albeit on a smaller scale. Sediment transport is restricted to that which can occur “offshore” of the toe of the structure or over the ramps, effectively restricting the movement of sediments that accumulate immediately updrift and downdrift of the structure to the area beyond the toe of the hard structure, thereby developing a stable area of sand. In this case an active beach profile beyond the toe of the two boat ramp structures at No’s 44 and 46 will only occur at low tides, thereby reducing the probability of sediment by-passing occurring and limiting it to the area offshore of the boat-ramp toe. When hard structures are constructed in an active beach profile, and the natural movement of sediment is restricted, there then exists the possibility of accelerated local erosion on the downdrift side of the structure. If the wave climate in this location is such that sediment transport can occur, then the lack of supply of sediments to this downdrift area caused by the structure leads to a deficit of sand and downdrift erosion occurs. This process is limited by the existence of any further downdrift structures, which may stabilise this area of beach profile, depending on the size of the structure and the distance between structures. The fillet of sediment that would have formed the beach profile adjacent to No. 44 Marina View Parade prior to the construction of the extended “seawall” and associated backfill would appear to have been stabilised between the two boat ramps as described above. The boat-ramp structure on the subject property has prevented any localised erosive impact that might have been caused by the boat-ramp on the updrift property and would have formed a stable beach between the two structures. Because the seawall and fill areas have been constructed above the level that remained within the beach profile that would have been effectively stabilised by the construction of the boat-ramps, the impact of this additional construction will have limited additional impact on the movement of sediment in this area, and consequently, on the properties downdrift. Localised scouring of sediments at the toe of the wall could occur during a rare wave event combined with high tides, but sediments moved in this manner would largely be contained within the stabilised beach area between the two boat-ramps. The presence of the seawall structure at this site during a wave event occurring at higher tides may affect adversely on the wave climate at locations on the opposite bank due to wave energy being reflected from the seawall. This may have the effect of accelerating sediment transport processes on the beaches adjacent to properties on the northern shoreline of Marina Cove, but this effect would be small – virtually unquantifiable. Any local erosion that occurs adjacent to the downdrift property (No. 42 Marina View Parade) would most likely be a consequence of the previous construction of the boat-ramp structure on the downdrift boundary of No. 44 causing a local area of sediment deficit that is not countered by the stabilising presence of structures further downdrift, they being of relatively small extent. At the outer end of the canal, on the foreshore adjacent to No. 46 Marina View Parade, assorted rubble material has been placed in an attempt to mitigate any further loss of
BRISBANE WATER ESTUARY PROCESSES STUDY ESTUARINE MORPHOLOGY AND SILTATION APPENDIX D
Gosford City Council and Version 1 1 May 2007 Department of Environment and Climate Change Page 17 H:\Doc\2007\Reports.2007\Rep2313.doc Commercial in Confidence
sediment from this location. Any further erosion at this location could cause the loss of property at No. 46 Marina View Parade. In addition to this rubble on the foreshore, a makeshift “groyne’ structure has been built through the placement of a line of rocks placed perpendicular to the shoreline at the updrift extremity of the canal. These sediment movement mitigation measures, possibly provided by the land owner at No. 46, have been successful in stabilising the area marginally, with the formation of a small fillet of sand in the area between the makeshift groyne and the boat ramp at the downdrift end of the property. 5.3 Siltation at Blackwall Road, Woy Woy There is a concern amongst residents along Blackwall Road, Woy Woy, who own boat-ramps in this part of Brisbane Water, that long term siltation of the estuary is reducing available water depths at those jetties and thereby reducing the amenity of the jetties. A site at 242 Blackwall Road, Woy Woy has been adopted for analysis. Some of the data used in this work was provided to Council by Mr R J D Stein who owns a jetty at this site. This analysis was based on the following tasks:-
• Site visit, • Assessment of historical catchment sediment loads using:
o The MUSIC model of the Brisbane Water catchment, o Revised Universal Soil Loss Equation (RUSLE),
• Investigation of the siltation rate near the drain using the Brisbane Water Delft3D model, and
• Sediment size and composition analyses from five sediment core sites surrounding the drain.
5.3.1 Site Visit and Site Details Figure 5.22 provides a locality plan of the drain investigated. It is located seaward of the property at 242 Blackwall Road. There are many other drains discharging to Brisbane Water. The catchment boundary for the drain is indicated in Appendix 2. The catchment area is approximately 9.5ha. Note that the estuary was dredged in this area circa 1961 – Blackwall Channel. It is understood that some of the spoil was used to form or enhance Pelican Island further to the north and offshore of Woy Woy. A site visit was undertaken by Cardno Lawson Treloar at 1530 on 21 June, 2005. GCC had recently (in the past two years) de-commissioned one 750mm stormwater drain that discharged to Brisbane Water after passing through an easement between Lots 9 and 10 of DP5480. It has been replaced by a larger drain having a slightly different alignment, but discharging at the same location near the landward end of the jetty. There is no significant alluvial fan formed by this drain, in the context of the catchment sediment load delivered to the estuary, though there is some small, but visible, local elevation of the seabed in the vicinity of the drain and jetty. As well as estuarine sediments, other debris such as glass and road-base can be identified in the sediments, in common with other sites such as Hardys Bay. It is understood also that the issue of siltation at the jetty, which belongs to 242 Blackwall Road, has been raised with Council by the property owner. This process is likely to be a matter of concern for other Brisbane Water jetty owners also. Siltation, if it has occurred specifically at this site, may have been caused by the historical silt/mud laden discharge from the catchment. Road reconstruction has recently been undertaken on Alpha Road on the catchment boundary and a swimming pool has been built in an adjoining catchment possibly causing some short-lived, increased sediment load to Brisbane Water.
BRISBANE WATER ESTUARY PROCESSES STUDY ESTUARINE MORPHOLOGY AND SILTATION APPENDIX D
Gosford City Council and Version 1 1 May 2007 Department of Environment and Climate Change Page 18 H:\Doc\2007\Reports.2007\Rep2313.doc Commercial in Confidence
Historical photographs of the jetty near the drain were provided to GCC and Cardno Lawson Treloar by Mr R J D Stein and are shown in Appendix 3. Two photographs from 1948 and six photographs from 2004 were included. It is difficult to compare the two sets of photographs because of the water level difference between them, albeit one may assume that the deck level of the jetty has not changed. The second 1948 photograph (top-right) clearly shows the intertidal flats east of the study site to be submerged. On the other hand, the 2004 photographs (particularly the third photograph down on the left hand side of the page), show these intertidal flats above the water level. It is unlikely that these intertidal shoal features have changed significantly between the two sets of photographs. Hence the inference is that the 1948 photographs were taken at a slightly higher water level. Near the study site, the near shore bathymetry is relatively flat; therefore the horizontal distance between the low water and high water levels can be relatively large. On the basis of these photographs, it was assessed that only about 0.1m to 0.3m of siltation is likely to have occurred over the intervening period of about 55 years. A survey of this region of Brisbane Water was undertaken by PWD in 1961 and Council re-surveyed some of the region in 2007 using five shore normal cross-sections. Comparison of these surveys provides a basis for assessing the extent and spatial variation of siltation. The survey shows depth reductions of about 0.44m to 0.66m near the jetty. Other cross-sections show a similar outcome, more so to the south of the jetty. However, the survey also shows that the waterway is now deeper a little further offshore and generally the volume of ‘deepening’ may be a little greater or similar to the volume of ‘shallowing’. It is understood that this area was dredged after the 1961 survey. The results show that there has been general, regional, near-shore siltation up to at least 50m south of the subject site. It is unclear whether or not the ‘deepened’ areas were dredged and may now be shallower than when dredged. However, the ‘deepened’ areas lie near the ends of jetties where it might be reasonable to undertake dredging for small craft navigation purposes. Dredged depths at low tide for navigation are commonly 1.5 to 2m at low tide, which is about 0.4m below AHD at Woy Woy. It is notable also that ‘siltation’ is least near the drain at this site. An assessment of the survey comparison is that it shows that there has been siltation along much of the nearby shoreline, but over a much wider area than the immediate drain and jetty and its mooring area. This sediment will have come naturally from the local catchments, but the rate is likely to have been increased during the early stages of European settlement. Nevertheless, it is likely to be lower now because development has slowed. Although the sediment load delivered by the nearby drain may be under-estimated in the calculations, see below, apart from large particles such as glass and road-base, which form only a minor proportion of the seabed sediments, the distribution of these fines is wide-spread and is not confined to the immediate discharge point and jetty. The site, like many others, is affected to varying degrees by silt loads delivered by many drains. 5.3.2 Catchment Sediment Load Brisbane Water MUSIC Model A MUSIC catchment response model of the Brisbane Water catchment has been developed by Cardno Lawson Treloar as part of the Brisbane Water Estuary Processes Study – Cardno Lawson Treloar 2007 a and b. The MUSIC model provides an estimate of the rainfall induced catchment sediment load. The Brisbane Water catchment has been divided into a number of sub-catchments according to topography and land-use. Model simulations have been undertaken for dry, average and wet rainfall years. The total sediment load from the larger MUSIC model sub-catchment, which encloses the study area catchment, was scaled by surface area to calculate the sediment load from the
BRISBANE WATER ESTUARY PROCESSES STUDY ESTUARINE MORPHOLOGY AND SILTATION APPENDIX D
Gosford City Council and Version 1 1 May 2007 Department of Environment and Climate Change Page 19 H:\Doc\2007\Reports.2007\Rep2313.doc Commercial in Confidence
drain catchment for this storm water outlet. The total annual sediment load from the study catchment was estimated to be 15,900kg per year. Assuming this material is fine silt and mud, then the estimated consolidated density of this material is between 400 and 500kg/m3 (van Rijn, 1993). The total consolidated volume of this material assuming, it settles on the seafloor, is between 32 to 40m3 per year. There will also be some larger foreign material. Revised Universal Soil Loss Equation (RUSLE) The sediment load from the study catchment was also estimated using the Revised Universal Soil Loss Equation (RUSLE). The equation includes:- • Catchment area, • Catchment slope, • Rainfall, • Soil type, and • Groundcover. Parameters appropriate to Woy Woy were adopted from Landcom, 2004. The estimated annual sediment load using RUSLE is 9400kg. Assuming a consolidated density of 400 to 500kg/m3, the total annual sediment volume transported to the estuary is between 19 and 24m3. Given the accuracy of this type of calculation, these two estimates are relatively similar. 5.3.3 Siltation Investigations The sediment loads derived from the MUSIC model and RUSLE provided estimates of the sediment load that is transported through the subject drain to Brisbane Water, but they do not describe the ultimate location where this material may settle to the seafloor. This location is governed by the hydrodynamic processes within the section of Brisbane Water into which this drain discharges. These hydrodynamic processes include:- • Currents (tidal and wind driven), • Wind waves, especially in shallow water, • Dispersion, • Drain discharge rate, • Buoyancy of drain discharge, and • Stratification within Brisbane Water. A Delft3D model of Brisbane Water has been developed as part of the Brisbane Water Estuary Processes Study – Cardno Lawson Treloar (2005b). This model has undergone hydrodynamic calibration and transport-dispersion verification. A model simulation of sediment discharge from the drain at 242 Blackwall Road was undertaken. The sediment load was calculated as the average of the MUSIC and RUSLE results, approximately 12,600kg per year. This load equates to a daily average of approximately 34.5kg. This load was applied to the model as part of a 1m3/s discharge into Brisbane Water with a sediment concentration of 0.40g/m3. The total simulation time was three days, which included two days to achieve hydrodynamic equilibrium followed by one day of sediment transport and morphological change. The purpose of this simulation was only to describe the typical fate of sediments discharging from the drain. Delft3D features a morphological scale factor which allows longer-term morphological changes to be investigated with relatively short duration hydrodynamic simulations. At each time step, the calculated bed changes are multiplied by the morphological scale factor and then these bed changes are applied to the bathymetry in the following time step. A
BRISBANE WATER ESTUARY PROCESSES STUDY ESTUARINE MORPHOLOGY AND SILTATION APPENDIX D
Gosford City Council and Version 1 1 May 2007 Department of Environment and Climate Change Page 20 H:\Doc\2007\Reports.2007\Rep2313.doc Commercial in Confidence
morphological scale factor of 90 was applied to this investigation which led to 90 days of equivalent morphological change at the completion of the simulation. Sediment parameters were derived from van Rijn (1993) and included:- • Dry bed density = 500kg/m3, • ws (sediment fall velocity) = 0.1mm/s, and • τdep (critical shear stress for deposition) = 0.1 N/m2. Sediment that settled to the seafloor was not re-suspended in this simulation; hence total initial sedimentation was estimated. The modelling result indicated that the drain sediment tends not to settle in the area immediately surrounding the drain. The maximum annual siltation rate near the drain was 1.75x10⁻⁴m, about 0.1m over 50 years. The material tended to settle over a relatively wide area and therefore depth of deposited sediment was very small. More dense, larger materials would deposit closer to the end of the drain. This limited simulation approach does not provide a definitive result, but does provide a realistic description of the initial silt deposition structure and order of siltation depth near this, and generally, other drains. 5.3.4 Sediment Composition Investigation Sediment data from five sites near the drain was collected at low tide on 20 July 2005 at 14:00. The sites are shown in Figure 5.22. Sites 1 and 4 are located approximately 50m north and 50m south of the drain, respectively. Their locations were chosen to determine sediment composition away from the immediate vicinity of the drain. Site 2 is located closest to the drain, whilst Sites 3 and 5 are slightly east of the drain. Appendix 2 presents a summary of the sediment samples and their MGA coordinates. Table 5.4 provides a summary of the sediment properties of the samples. Based on D50, the samples are classified as dark, medium grain sands, however, the presence of between 8-15% of fine material results in the samples displaying significant cohesive sediment behaviour.
Table 5.4: Sediment Properties Summary Sample D50 (µm) < 64µm (%) Shell
Content (%) Organic
Matter (%) 1 230 15 8.5 6.0 2 290 8 17.3 3.5 3 230 12 1.3 4.2 4 290 14 23.8 6.9 5 250 8 0.8 2.3
Photographs of the sediment samples, immediately after they were collected using a hand driven coring tube, are included in Appendix 2. Samples 1 to 4 appear as soft muds, which all have very similar composition. Sample 5 differs due to the increased sand content. The surface layer of Sample 5 resembled a mud, the mid-layer a sandy-silt, and the bottom layer of the sample appeared a silty-sand. Location 5 is closest to the tidal flow channel of Brisbane Water. Two other sediment samples were collected by SMEC (2006) (work undertaken for Mr R J D Stein), close to the jetty and were shown to include some large particles of glass and road-base.

BRISBANE WATER ESTUARY PROCESSES STUDY ESTUARINE MORPHOLOGY AND SILTATION APPENDIX D
Gosford City Council and Version 1 1 May 2007 Department of Environment and Climate Change Page 21 H:\Doc\2007\Reports.2007\Rep2313.doc Commercial in Confidence
Overall, the sediment data indicates that the sediment immediately near the drain is of similar composition to the surrounding shoreline sediment and that within the depths of the cores (0.5m), there are no sediment horizons. Given that the historical photographs appear to show only about 0.1m to 0.3m of likely change in bed level near the jetty, consistent with the model results, these samples show no siltation character changes since about the 1940’s, at least. 5.3.5 Conclusions The investigations that have been undertaken indicate that the drain near 242 Blackwall Road, Woy Woy, on its own, has not caused significant siltation near the jetty. It does appear that processes that control sediment deposition near the drain are the same as those for the nearby seabed. The sediment load calculated from the MUSIC model and RUSLE does not appear to settle only in the immediate vicinity of the drain. Instead, the morphological investigations indicate that the sediment load from the drain settles to the seafloor over a wide area, with some settlement near the jetty. The rate of sedimentation at any particular location is very small. The behaviour of discharge from other drains will be similar, with some settlement near this site from then. Removing the sediment load from the drain at 242 Blackwall Road, on its own, is unlikely to significantly change the siltation rate near the jetty. From time-to-time wave activity will re-suspend sediments in the shallow nearshore area – changes with tide level, leading to some re-suspension. 5.4 Hardys Bay – Killcare 5.4.1 Historical Perspective This area is affected by Mudflat Creek in the north (Killcare) and the smaller RSL creek at Hardys Bay. Concern has been raised by the KPW Youth and Community Association, amongst others, especially for Mudflat Creek, about ongoing siltation, see Appendix 4 – historical aerial photographs provided by Mr Graeme Smith in 2003. Amongst residents’ concerns are a reported deterioration in Hardys Bay and creek water quality and the increase in the extent of mangrove trees; the latter reportedly arising from increasing siltation rates and inter-tidal flat progradation. Mr Smith has also collated many statements from long term Hardys Bay residents whose responses generally support the view that there has been long term siltation that has reduced navigation into the lower reaches of Mudflat Creek. It is reported also that rainfall runoff transports terrestrial rubbish - glass and road-base to the shoreline of Hardys Bay – there is some visual evidence of this. Although there appears to be some suggestion amongst the residents that GCC has undertaken maintenance dredging, or at least relocated sediments by side-casting to provide navigational access, GCC appear to have no records of such activities. Aerial photographs, of varying quality and scales, from 1954 to the present time are available at irregular intervals. A review of the 1954 (quality too poor to report) and 1999 photographs shows that there was little or no change, if any, over that period in the visible extent of sand along the Killcare jetty. That location was selected for analysis because it is fixed, unchanged feature in both photographs. Other photographs providing better definition of shoaled areas and provided by Mr G Smith are presented in Appendix 4. They show that the course of Mudflat Creek through the entrance shoals has changed over that time and that the extent of bay siltation developed further westward about 30m to 40m over the period between 1976 and 2004. Note though that those are estimates only, the photographs being at different projections and tide levels. Hence there is some evidence that siltation of Hardys Bay near Mudflat Creek has occurred. The rate of this siltation is likely to have increased since European settlement
BRISBANE WATER ESTUARY PROCESSES STUDY ESTUARINE MORPHOLOGY AND SILTATION APPENDIX D
Gosford City Council and Version 1 1 May 2007 Department of Environment and Climate Change Page 22 H:\Doc\2007\Reports.2007\Rep2313.doc Commercial in Confidence
and more so with development in the Killcare Heights area which is quite steep. The rate has probably now stabilised because most of that development has been completed. Numerical catchment (MUSIC - Cardno Lawson Treloar 2007a) and siltation modelling has been undertaken for Brisbane Water as part of this overall study and is addressed below. Quantification of historical siltation rates is more difficult. It might be undertaken using deep cores (1m to 2m) and radio-isotope dating (Pb210 is recommended by ANSTO for periods up to 200 years). The process works downward through the core in a relative sense, that is, shells on the seabed, for example, are assumed to have been deposited in the last year or so and the analyses then depend on the relative Pb210 concentrations between the surface shells and those discovered in the core below. This is an expensive exercise and previous similar analyses are understood not to have been particularly successful – for example, Dee Why Lagoon (pers. comm. Louise Collier, Cardno Lawson Treloar). 5.4.2 Siltation Modelling Catchment and siltation modelling have been undertaken for Mudflat Creek as part of these investigations. Special consideration of catchment steepness was required in the determination of sediment yields for the wet, dry and average years. The catchment yield results were combined to provide average annual sediment loads. Section 6 contains a detailed description of the Delft3D siltation modelling undertaken for Mudflat Creek. Near the outlet to Mudflat Creek the siltation rate during normal rainfall years is approximately 10mm per year (see Figure 6.11). These investigations are based on the current catchment land use and do not necessarily reflect siltation rates which may have historically occurred following major land use changes in the catchment. The modelled siltation pattern at Mudflat Creek is very similar in character to the observed delta at the site. The shape of the delta at Mudflat Creek entrance indicates that the ambient hydrodynamics of Hardy’s Bay do resuspend catchment material deposited near the entrance. 5.5 Correa Bay 5.5.1 Historical Perspective Correa Bay lies in the south-western corner of Woy Woy Inlet. The Great Northern Railway passes along the southern shoreline of Correa Bay and a number of historical photographs along the bay and track have been collated by the Correa Bay Water Quality Management Committee (2000). The main creek entering Correa Bay is Woy Woy Creek which flows down from the very steep (≈1:15 on average) hinterland and then meets the much flatter terrain of Correa Bay. Hence any silt and sand sediments that are transported from the catchment will deposit near the creek entrance. The other creeks, Tip, Railway Tunnel and Everglades, are smaller and are believed by the Committee to be relatively unimportant as sediment sources to Correa Bay. However, it is believed that Woy Woy Creek, which flows by Bull’s Hill Quarry, is a continuing, significant source of sand. Other finer sediments would come from other parts of the catchment. The quarry is a large area of exposed land that, in places where the surface is not rock, provides an easily erodable sediment source. The Committee report (2000) provides photographs of sediment laden runoff from the quarry to Woy Woy Creek - predominantly of unknown particle size. Although the Creek flows over varying terrain, including waterfalls, there are continuous deposits of sand in the flatter reaches – sand can not be held on the bottom in steep areas. Hence it seems highly likely that catchment sediments continue to be delivered to Correa Bay.
BRISBANE WATER ESTUARY PROCESSES STUDY ESTUARINE MORPHOLOGY AND SILTATION APPENDIX D
Gosford City Council and Version 1 1 May 2007 Department of Environment and Climate Change Page 23 H:\Doc\2007\Reports.2007\Rep2313.doc Commercial in Confidence
The Committee report (2000) also provides figures showing their estimated bathymetric changes at some points near the mouth of Woy Woy Creek, based on interpretation of a 1901 survey and a survey undertaken for the Committee by a registered surveyor in 1999. These results show depth reductions in the order of up to 2m near the mouth of Woy Woy Creek with a very steep drop-off – typical of a sandy sediment laden flow entering a broader waterway where current speeds reduce rapidly - in a spatial sense.
5.5.2 Siltation Modelling Section 6 provides a detailed description of the Delft3D siltation modelling undertaken for Correa Bay. Modelled average siltation rates in Correa Bay are in the order of 2cm per decade. Near the outlet to Woy Woy Creek the siltation rate during average conditions is approximately 10mm per year (see Figure 6.9). These investigations are based on the current catchment land use and do not necessarily reflect siltation rates which may have historically occurred following major land use changes in the catchment. The detailed modelling suggests that siltation is concentrated near the entrance of Woy Woy Creek. At Correa Bay the average siltation rate is less than 2mm per year. 5.6 Point Claire Maintenance dredging was undertaken in 1995 to allow navigation for Royal Volunteer Coastal Patrol (RVCP) vessels and was funded by GCC and DNR. This work was required because longterm siltation had reduced water depths in the marked channel. No specific data on siltation rates is available for the Point Claire area. However, the catchment characteristics are similar to those near Blackwall Road, Woy Woy, see Section 5.6, where an analysis of available survey data indicates that siltation rates are likely to be in the order of 5mm/year, on average. There will be spatial variability in this parameter and also variability from one year to another. 5.7 Booker Bay This sandy embayment lies north of Ettalong and south of The Rip. Some recent applications have been made under the Crown Lands Act for property boundaries that are defined by the Mean High Water Mark to be extended seaward on the basis of gradual sediment accretion. A number of these applications have been granted. Many of these landowners have sought to protect this new boundary from pedestrian foreshore traffic by constructing sea walls - for example, 1 Petit Street, Booker Bay. This action is likely to restrict access along the foreshore at some future time if the accretionary character of the shoreline is reversed. The area was inspected on 8 October 2004 and sediment samples were taken at the six sites. The sampling locations and results of particle size analyses are presented in Appendix 5. Figure 5.23 shows the shoreline near Mareela Avenue and clearly shows a shoreline wall structure standing in the active coastal processes zone, together with wave caused erosion on the neighbouring property to the north. Generally, the problems in this area can be:- • Restriction of access along the beach, especially at high tide • A seawall can have a detrimental effect on the sediment dynamics of the foreshore
when it stands in the water for at least part of the time. Reflected waves can cause increased erosion at the shoreline. In some cases the MHWM and the low tide mark then occur at the structure
BRISBANE WATER ESTUARY PROCESSES STUDY ESTUARINE MORPHOLOGY AND SILTATION APPENDIX D
Gosford City Council and Version 1 1 May 2007 Department of Environment and Climate Change Page 24 H:\Doc\2007\Reports.2007\Rep2313.doc Commercial in Confidence
Shoaling has occurred at locations such as Andersons marina where it is not possible to use much of the jetty area granted under licence from the Crown. In these circumstances the owner of the facilities is likely to request GCC to undertake dredging to restore the facilities to a usable condition. 5.8 Gosford Boat-Harbour Marina Expressions of Interest have been sought by GCC from interested parties to construct and operate a boat harbour and marina in the Gosford waterfront area. In January 2003 GCC granted title to an area of submerged land bounded approximately by the public jetty, the railway bridge and the shoreline protection works at the head of Brisbane Water. However, GCC have advised that they will not take ownership of the site until the Karabee ferry has been removed. This vessel is an ex-Sydney harbour ferry which lies in a derelict state near the public wharf. It is understood that its removal is an urgent priority. Any development in this area will need assessment under RFI or WMA because it is on freehold land. In terms of estuarine sediments, the most important issues here are:- • Any dredging will need to consider possible sediment contamination and its release,
for example, TBT. • Because the sediments are fine silts, at least in the top layers, it is likely that dredging
may cause suspended sediment plumes • Marina facilities would need to consider longterm siltation rates in the order of 2 to
5mm/year • Disposal of the dredged spoil is a significant issue.
BRISBANE WATER ESTUARY PROCESSES STUDY ESTUARINE MORPHOLOGY AND SILTATION APPENDIX D
Gosford City Council and Version 1 1 May 2007 Department of Environment and Climate Change Page 25 H:\Doc\2007\Reports.2007\Rep2313.doc Commercial in Confidence
6. DETAILED FINE SILT MODELLING Detailed fine silt (cohesive sediment) modelling using the Delft3D model has been undertaken at five sites in Brisbane Water where catchment sediment loads may potentially cause noticeable siltation. Non-cohesive sediment modelling for the Ettalong area has been described in Section 5. The five sites are:- • Fagan’s Bay, including Narara Creek, • Erina Creek, • Mudflat Creek (Section 5.4). • Correa Bay (Section 5.5), • Kincumber Creek, and There are other sites in Brisbane Water which may be equally subject to catchment sediment loads and which may be considered in future studies. The five selected sites cover a range of land uses and catchment scales and processes would be similar at many other locations. Figure 6.1 describes the locations of the selected study sites. 6.1 Methodology Catchment modelling undertaken as part of this study investigated catchment sediment loads for three rainfall scenarios, Cardno Lawson Treloar – 2007a. The three selected annual periods represented high (upper 10% of historical average), normal (median) and low (lower 10%) rainfall conditions. For each year, the MUSIC model sediment loads were separated into summer (January to March, October to December) and winter (April to September) periods. Average sediment concentrations (g/L) and average discharge rates (m3/s) for each MUSIC output location, see Cardno Lawson Treloar – 2007a, were calculated for each period. These sediment loads were applied to the Deltf3D model over a 14-days spring-neap tide cycle. In order to calculate the morphological change over the 6-months period, a morphological scale factor of 13 was applied. This results in modelled bed changes at each time step being multiplied by a factor of 13. As a result, 14-days of sediment transport and deposition simulation can be applied to the estimation of 6-months of equivalent morphological change. The Delft3D model was run in 3D mode with the following layer thicknesses (sigma layers):- • Layer 1 (top) = 15% • Layer 2 = 20% • Layer 3 = 30% • Layer 4 = 20% • Layer 5 (bottom) = 15% Following several initial simulations, it became evident that the sediment loads from the MUSIC model were lower than one might expect from observations at Mudflat Creek. The simulated siltation rates from the Delft3D model at Mudflat Creek were approximately 50% lower than preliminary estimates of siltation volumes at Mudflat Creek based on aerial photography. MUSIC does not consider catchment slope in the generation of sediment loads. In general, steep catchments generate more sediment load than flatter catchments with similar land use. The catchment slopes of each catchment investigated in this study were compared. This analysis demonstrated that the catchment slopes for Mudflat Creek and Fagan’s Bay (excluding Narara Creek) were significantly steeper than those of other catchments. The catchments discharging into Correa Bay were also relatively steep. As a result, the following scaling factors were applied to the MUSIC catchment loads:-
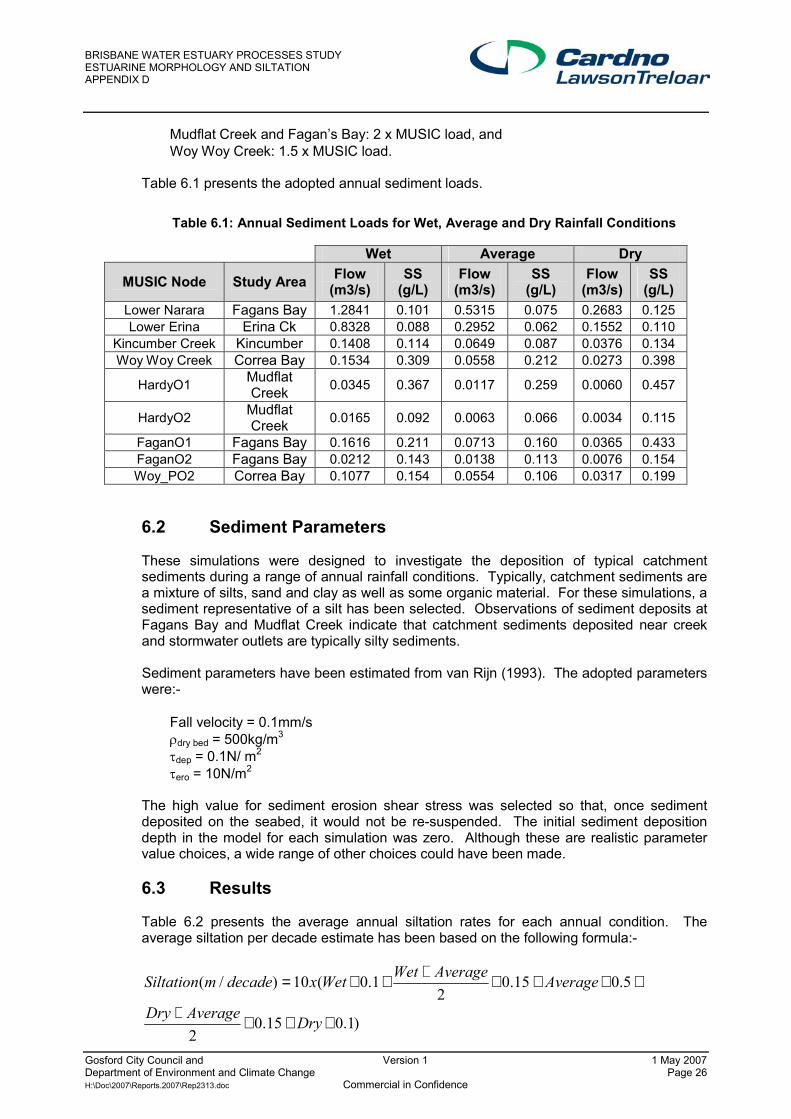
BRISBANE WATER ESTUARY PROCESSES STUDY ESTUARINE MORPHOLOGY AND SILTATION APPENDIX D
Gosford City Council and Version 1 1 May 2007 Department of Environment and Climate Change Page 26 H:\Doc\2007\Reports.2007\Rep2313.doc Commercial in Confidence
• Mudflat Creek and Fagan’s Bay: 2 x MUSIC load, and • Woy Woy Creek: 1.5 x MUSIC load. Table 6.1 presents the adopted annual sediment loads.
Table 6.1: Annual Sediment Loads for Wet, Average and Dry Rainfall Conditions
6.2 Sediment Parameters These simulations were designed to investigate the deposition of typical catchment sediments during a range of annual rainfall conditions. Typically, catchment sediments are a mixture of silts, sand and clay as well as some organic material. For these simulations, a sediment representative of a silt has been selected. Observations of sediment deposits at Fagans Bay and Mudflat Creek indicate that catchment sediments deposited near creek and stormwater outlets are typically silty sediments. Sediment parameters have been estimated from van Rijn (1993). The adopted parameters were:-
• Fall velocity = 0.1mm/s • ρdry bed = 500kg/m3 • τdep = 0.1N/ m2 • τero = 10N/m2 The high value for sediment erosion shear stress was selected so that, once sediment deposited on the seabed, it would not be re-suspended. The initial sediment deposition depth in the model for each simulation was zero. Although these are realistic parameter value choices, a wide range of other choices could have been made. 6.3 Results Table 6.2 presents the average annual siltation rates for each annual condition. The average siltation per decade estimate has been based on the following formula:-
+×+×++×= 5.015.021.0(10)/( AverageAverageWetWetxdecademSiltation
)1.015.02 ×+×+ DryAverageDry
Wet Average Dry MUSIC Node Study Area Flow
(m3/s) SS
(g/L) Flow
(m3/s) SS
(g/L) Flow
(m3/s) SS
(g/L) Lower Narara Fagans Bay 1.2841 0.101 0.5315 0.075 0.2683 0.125 Lower Erina Erina Ck 0.8328 0.088 0.2952 0.062 0.1552 0.110
Kincumber Creek Kincumber 0.1408 0.114 0.0649 0.087 0.0376 0.134 Woy Woy Creek Correa Bay 0.1534 0.309 0.0558 0.212 0.0273 0.398
HardyO1 Mudflat Creek 0.0345 0.367 0.0117 0.259 0.0060 0.457
HardyO2 Mudflat Creek 0.0165 0.092 0.0063 0.066 0.0034 0.115
FaganO1 Fagans Bay 0.1616 0.211 0.0713 0.160 0.0365 0.433 FaganO2 Fagans Bay 0.0212 0.143 0.0138 0.113 0.0076 0.154 Woy_PO2 Correa Bay 0.1077 0.154 0.0554 0.106 0.0317 0.199
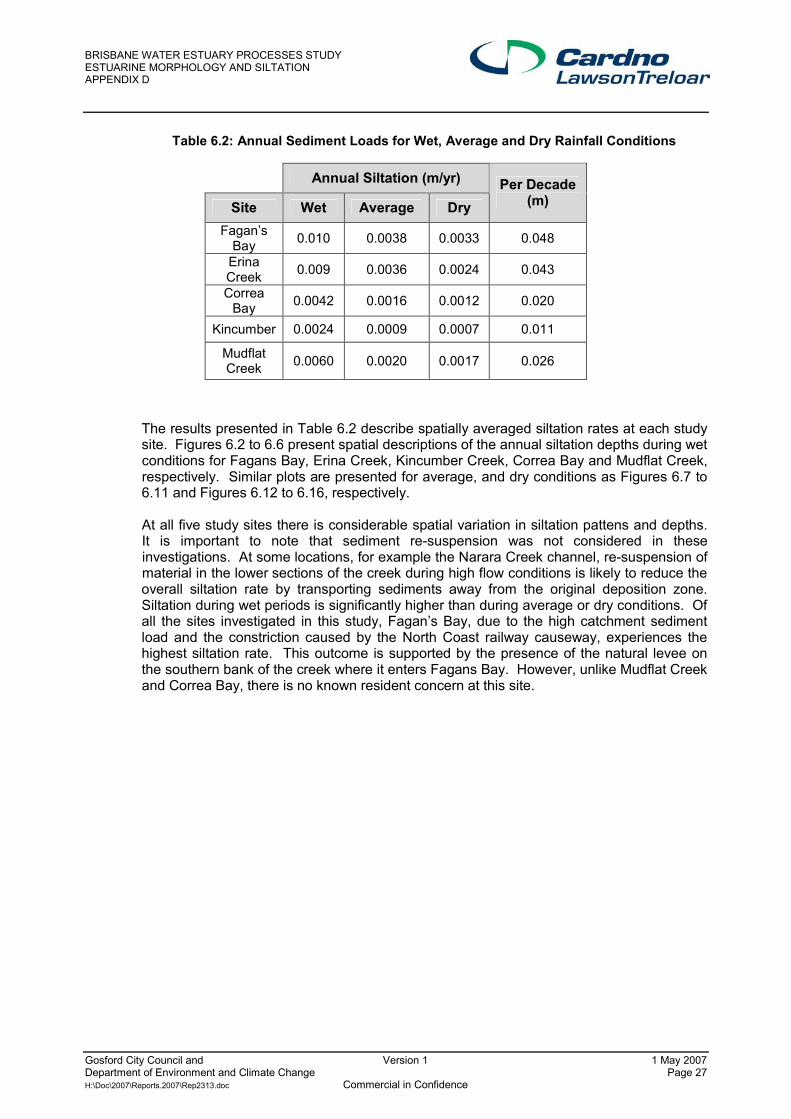
BRISBANE WATER ESTUARY PROCESSES STUDY ESTUARINE MORPHOLOGY AND SILTATION APPENDIX D
Gosford City Council and Version 1 1 May 2007 Department of Environment and Climate Change Page 27 H:\Doc\2007\Reports.2007\Rep2313.doc Commercial in Confidence
Table 6.2: Annual Sediment Loads for Wet, Average and Dry Rainfall Conditions
The results presented in Table 6.2 describe spatially averaged siltation rates at each study site. Figures 6.2 to 6.6 present spatial descriptions of the annual siltation depths during wet conditions for Fagans Bay, Erina Creek, Kincumber Creek, Correa Bay and Mudflat Creek, respectively. Similar plots are presented for average, and dry conditions as Figures 6.7 to 6.11 and Figures 6.12 to 6.16, respectively. At all five study sites there is considerable spatial variation in siltation pattens and depths. It is important to note that sediment re-suspension was not considered in these investigations. At some locations, for example the Narara Creek channel, re-suspension of material in the lower sections of the creek during high flow conditions is likely to reduce the overall siltation rate by transporting sediments away from the original deposition zone. Siltation during wet periods is significantly higher than during average or dry conditions. Of all the sites investigated in this study, Fagan’s Bay, due to the high catchment sediment load and the constriction caused by the North Coast railway causeway, experiences the highest siltation rate. This outcome is supported by the presence of the natural levee on the southern bank of the creek where it enters Fagans Bay. However, unlike Mudflat Creek and Correa Bay, there is no known resident concern at this site.
Annual Siltation (m/yr) Site Wet Average Dry
Per Decade (m)
Fagan’s Bay 0.010 0.0038 0.0033 0.048
Erina Creek 0.009 0.0036 0.0024 0.043 Correa
Bay 0.0042 0.0016 0.0012 0.020 Kincumber 0.0024 0.0009 0.0007 0.011
Mudflat Creek 0.0060 0.0020 0.0017 0.026
BRISBANE WATER ESTUARY PROCESSES STUDY ESTUARINE MORPHOLOGY AND SILTATION APPENDIX D
Gosford City Council and Version 1 1 May 2007 Department of Environment and Climate Change Page 28 H:\Doc\2007\Reports.2007\Rep2313.doc Commercial in Confidence
7. CONCLUDING REMARKS This appendix report has addressed a range of sand and silt based sediment issues at selected sites throughout the Brisbane Water estuary. It describes the physical processes and outcomes of historical data assessments as well as numerical modelling based studies. Selected site specific analyses have been undertaken to illustrate the overall characteristics, and the site specific details that must be considered when localised issues must be understood. The southern-most reaches, near Ettalong, are sandy and sand movement is characterised by shoals and channels that show continual movement. Sediment movement in these areas is characterised by tidal flow, with wave caused longshore transport at the shoreline and the Ettalong Point shoal. In the more protected areas that are influenced by muddy catchment loads, such as Mudflat Creek in Hardys Bay, there is some evidence of longterm siltation that is affecting the aesthetic and recreational qualities of the estuary. Other sites, such as Booker Bay, are presently showing some long term accretion. However, it is possible that this current trend may reverse, especially if there is a significant rise in mean sea level. Some owners are seeking to extend their boundaries. Akin within St Huberts Island, this area includes some non-approved shoreline structures.
BRISBANE WATER ESTUARY PROCESSES STUDY ESTUARINE MORPHOLOGY AND SILTATION APPENDIX D
Gosford City Council and Version 1 1 May 2007 Department of Environment and Climate Change Page 29 H:\Doc\2007\Reports.2007\Rep2313.doc Commercial in Confidence
8. REFERENCES Cardno Lawson Treloar (2007a): Brisbane Water Estuary Processes Study. Catchment Modelling – MUSIC, Appendix B. Report Prepared for Gosford City Council and Department of Natural Resources. Cardno Lawson Treloar (2007b): Brisbane Water Estuary Processes Study. Hydraulic Processes, Appendix C. Report Prepared for Gosford City Council and Department of Natural Resources. Correa Bay Water Quality Management Committee (2000): A Quantitative and Qualitative Study of the Environmental Status of Correa Bay and Its Catchment. Report Prepared for Gosford City Council. Engelund, F and Fredsoe, J (1976): A Sediment Transport Model for Straight Alluvial Channels. Nordic Hydrology, 7. Foster, D, Gordon, A D and Lawson, N V (1975): The Storms of May-June 1974, Sydney, NSW. Proceedings of the 2nd Australian Conference on Coastal and Ocean Engineering. Institution of Engineers, Australia. Goda, Y (2000): Random Seas and Design of Maritime Structures. Advanced Series on Ocean Engineering -Volume 15. World Scientific. Hydrographic Surveys (2004): Bathymetric Survey, Marina View Parade. Work undertaken for Lawson & Treloar Pty Ltd. Landcom (2004) “Soils and Construction - Managing Urban Stormwater- Volume 1”. Prepared for NSW Government, March 2004. Lawson and Treloar (1999): Proposed Fast Ferry Service from Ettalong Beach to Circular Quay. Coastal Processes Investigation. Report Prepared for Wales & Associates. Public Works, NSW (1977): Ettalong Beach Erosion Study and Management Programme. Public Works, NSW (1992): Photogrammetric Analysis: Report prepared by Coast and Rivers Branch. St Huberts Island Drainage Reserves Task Group (1997): Recommended Guide-Lines for Plan of Management for the Drainage Reserves of St Huberts Island. SMEC (2006): Geotechnical Assessment, 242 Blackwall Road, Woy Woy. Report Prepared for Mr R J D Stein. Smith, G (2003): Hardys Bay to Hardys Mangrove Swamp A Quick Transition by Sedimentation. Van Rijn, L (1993): Principles of Sediment Transport in Rivers, Estuaries and Coastal Seas. AQUA Publications.
BRISBANE WATER ESTUARY PROCESSES STUDY ESTUARINE MORPHOLOGY AND SILTATION APPENDIX D
Gosford City Council and Version 1 1 May 2007 Department of Environment and Climate Change H:\Doc\2007\Reports.2007\Rep2313.doc Commercial in Confidence
FIGURES
Figure 1.1 Study Area
Figure 2.1 Ettalong Locality Plan
Figure 2.2 Revetment Walls Along Foreshore of "The Broadwater"
Figure 2.3 Eroded Shoreline at Site 1 St Huberts Island
Figure 2.4 Estuary Entrance Locality Plan
Figure 2.5 Ettalong Foreshore Near Schnapper Road (June 2005)
Figure 2.6 Tidal Levels and Current Speeds at Ettalong Beach
Figure 2.7 Ettalong Point Nearshore Shoal
Figure 5.1 Estuary Entrance Locality Plan
Figure 5.2 Ettalong Foreshore Photographs
Figure 5.3 Tidal Levels and Current Speeds at Ettalong Beach
Figure 5.4 Ettalong Point Nearshore Shoal
Figure 5.5 Ettalong Morphological Model System
Figure 5.6a Average Suspended Sediment Transport Vectors (m3/s/m) 4-28 March 2004
Figure 5.6b Average Suspended Sediment Transport Vectors (m3/s/m) 4-28 March 2004
Figure.5.7a Average Suspended Sediment Transport Vectors (m3/s/m) 4-28 March 2004
Figure 5.7b Average Bedload Sediment Transport Vectors (m3/s/m) 4-28 March 2004
Figure 5.8a Bed Change - 4-28 March 2004
Figure 5.8b Bed Change - 4-28 March 2004
Figure 5.9 Section Lines Through Ettalong Shoals
Figure 5.10 Section Profiles Through Ettalong Shoals Section 1
Figure 5.11 Section Profiles Through Ettalong Shoals Section 2
Figure 5.12 Section Profiles Through Ettalong Shoals Section 3
Figure 5.13 Section Profiles Through Ettalong Shoals Section 4
Figure 5.14 St.Huberts Island (1996 Aerial Photograph)
Figure 5.15 Shoreline at Site Looking Eastward St.Huberts Island - Site 1
BRISBANE WATER ESTUARY PROCESSES STUDY ESTUARINE MORPHOLOGY AND SILTATION APPENDIX D
Gosford City Council and Version 1 1 May 2007 Department of Environment and Climate Change H:\Doc\2007\Reports.2007\Rep2313.doc Commercial in Confidence
Figure 5.16 Shoreline at Site Looking Westward St.Huberts Island - Site 1
Figure 5.17 Shoreline Beyond Boat Ramp at No.4 St.Huberts Island - Site 1
Figure 5.18 Site Visit Photographs - Seawall, Fill and Adjoining Jetty Structure(44 Marina View Pde)
Figure 5.19 Site Visit Photographs - Shoreline Features, Adjoining Properties (42-46 Marina View Pde)
Figure 5.20 Swan Model Output – 20m/s NE wind case
Figure 5.21 Sediment Transport Cross Sections - Site 2 St Huberts Island
Figure 5.23 Accreting Foreshore
Figure 6.1 Detailed Siltation Investigations
Figure 6.2 Annual Fine Sediment Siltation Rate Fagans Bay - 1998 (High Rainfall)
Figure 6.3 Annual Fine Sediment Siltation Rate Erina Creek Entrance - 1998 (High Rainfall)
Figure 6.4 Annual Fine Sediment Siltation Rate Correa Bay (Woy Woy Creek Entrance - 1998 (High Rainfall)
Figure 6.5 Annual Fine Sediment Siltation Rate Kincumber Creek Entrance - 1998 (High Rainfall)
Figure 6.6 Annual Fine Sediment Siltaton Rate Mudflat Creek Entrance - 1998 (High Rainfall)
Figure 6.7 Annual Fine Sediment Siltation Rate Fagans Bay - 1995 (Average Rainfall)
Figure 6.8 Annual Fine Sediment Siltation Rate Erina Creek Entrance - 1995 (Average Rainfall
Figure 6.9 Annual Fine Sediment Siltation Rate Correa Bay (Woy Woy Creek Entrance) - 1995 (Average Rainfall)
Figure 6.10 Annual Fine Sediment Siltation Rate Kincumber Creek Entrance – 1995 (Average Rainfall)
Figure 6.11 Annual Fine Sediment Siltation Rate Mudflat Creek Entrance - 1995 (Average Rainfall)
Figure 6.12 Annual Fine Sediment Siltation Rate Fagans Bay - 2000 (Low Rainfall)
Figure 6.13 Annual Fine Sediment Siltation Rate Erina Creek Entrance - 2000 (Low Rainfall)
Figure 6.14 Annual Fine Sediment Siltation Rate Correa Bay (Woy Woy Creek Entrance) - 2000 (Low Rainfall)
Figure 6.15 Annual Fine Sediment Siltation Rate Kincumber Creek Entrance - 2000 (Low Rainfall)

BRISBANE WATER ESTUARY PROCESSES STUDY ESTUARINE MORPHOLOGY AND SILTATION APPENDIX D
Gosford City Council and Version 1 1 May 2007 Department of Environment and Climate Change H:\Doc\2007\Reports.2007\Rep2313.doc Commercial in Confidence
Figure 6.16 Annual Fine Sediment Siltation Rate Mudflat Creek Entrance - 2000 (Low Rainfall)

BRISBANE WATER ESTUARY PROCESSES STUDY ESTUARINE MORPHOLOGY AND SILTATION APPENDIX D
Gosford City Council and Version 1 1 May 2007 Department of Environment and Climate Change H:\Doc\2007\Reports.2007\Rep2313.doc Commercial in Confidence
APPENDIX 1
Historical Aerial Photographs and Sediment Data – St Huberts Island Area
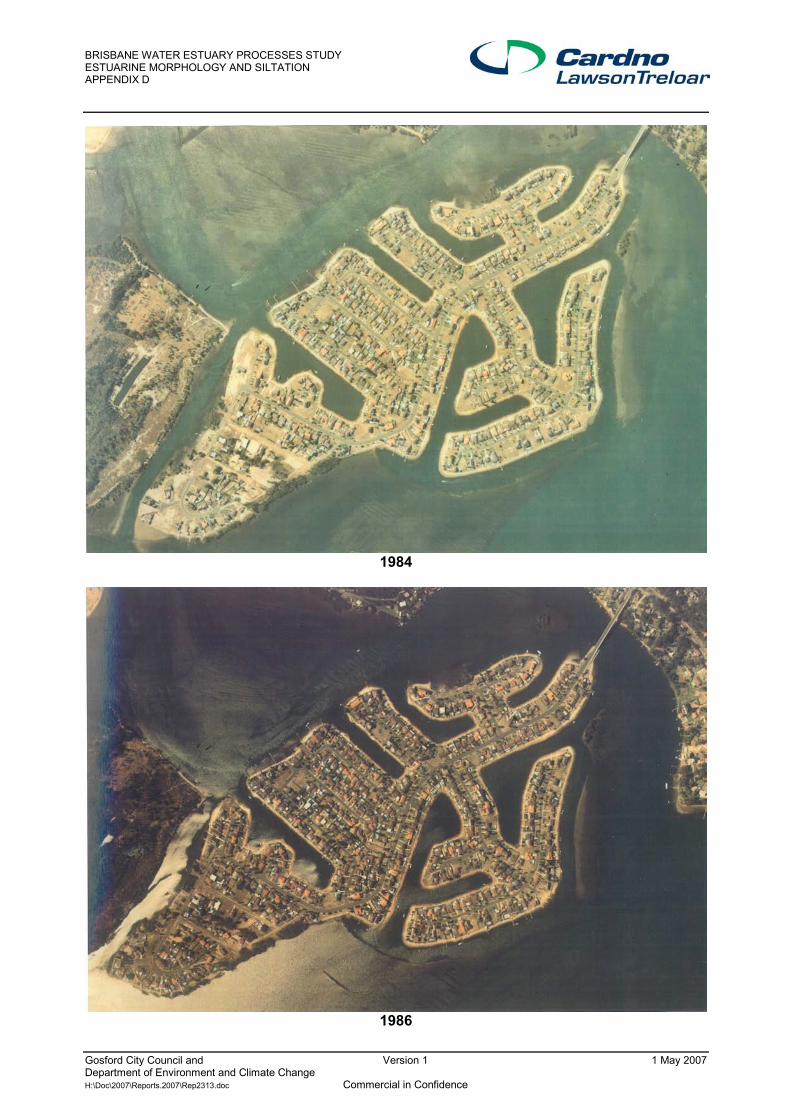
BRISBANE WATER ESTUARY PROCESSES STUDY ESTUARINE MORPHOLOGY AND SILTATION APPENDIX D
Gosford City Council and Version 1 1 May 2007 Department of Environment and Climate Change H:\Doc\2007\Reports.2007\Rep2313.doc Commercial in Confidence
1984
1986
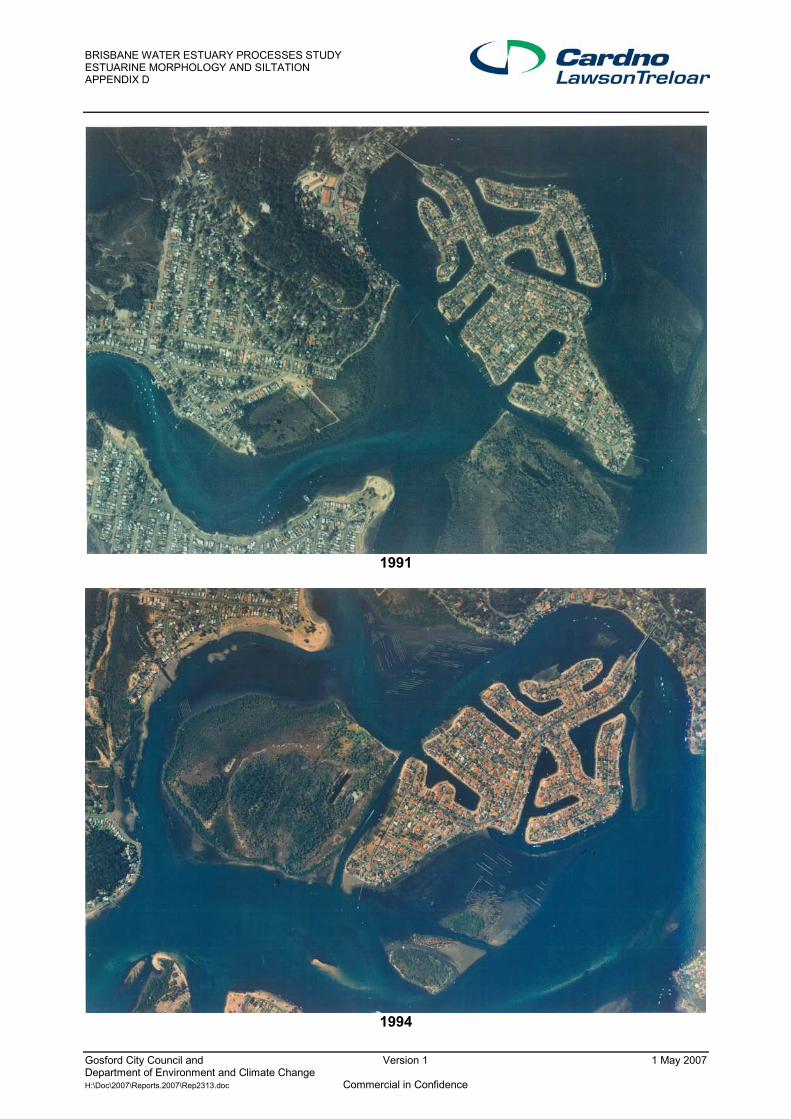
BRISBANE WATER ESTUARY PROCESSES STUDY ESTUARINE MORPHOLOGY AND SILTATION APPENDIX D
Gosford City Council and Version 1 1 May 2007 Department of Environment and Climate Change H:\Doc\2007\Reports.2007\Rep2313.doc Commercial in Confidence
1991
1994

BRISBANE WATER ESTUARY PROCESSES STUDY ESTUARINE MORPHOLOGY AND SILTATION APPENDIX D
Gosford City Council and Version 1 1 May 2007 Department of Environment and Climate Change H:\Doc\2007\Reports.2007\Rep2313.doc Commercial in Confidence

BRISBANE WATER ESTUARY PROCESSES STUDY ESTUARINE MORPHOLOGY AND SILTATION APPENDIX D
Gosford City Council and Version 1 1 May 2007 Department of Environment and Climate Change H:\Doc\2007\Reports.2007\Rep2313.doc Commercial in Confidence
APPENDIX 2
Catchment Area and Sediment Data at 242 Blackwall Road, Woy Woy
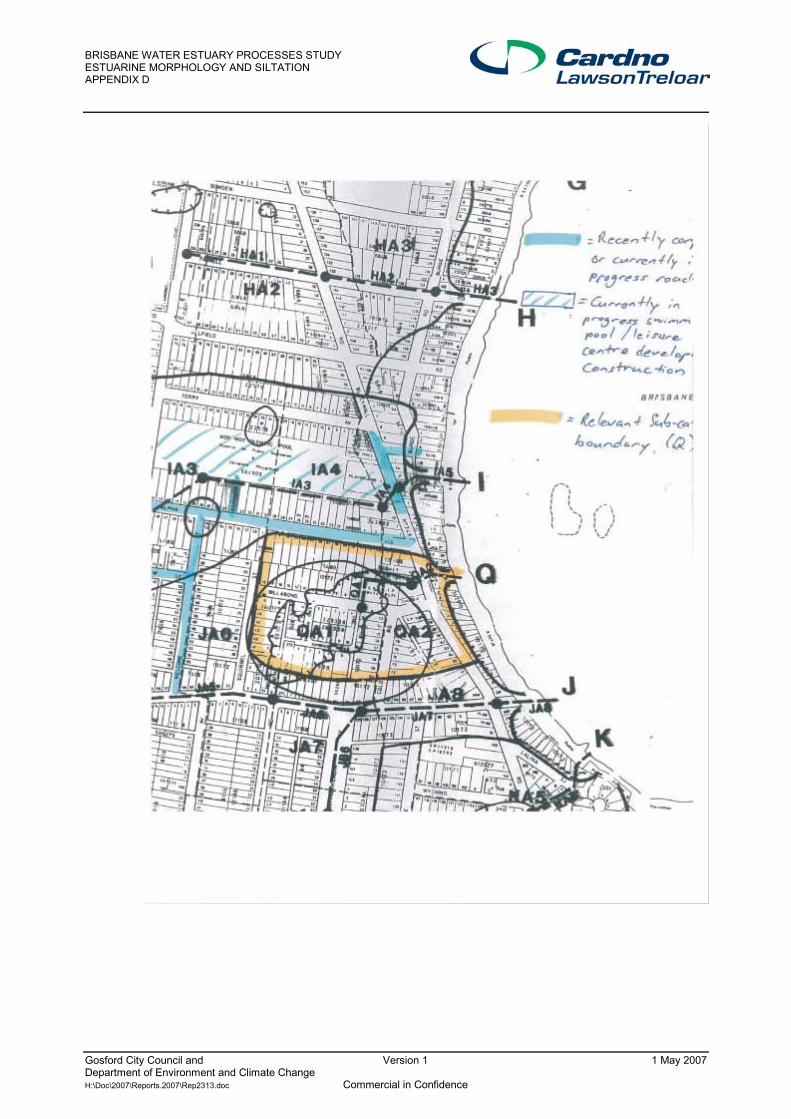
BRISBANE WATER ESTUARY PROCESSES STUDY ESTUARINE MORPHOLOGY AND SILTATION APPENDIX D
Gosford City Council and Version 1 1 May 2007 Department of Environment and Climate Change H:\Doc\2007\Reports.2007\Rep2313.doc Commercial in Confidence

BRISBANE WATER ESTUARY PROCESSES STUDY ESTUARINE MORPHOLOGY AND SILTATION APPENDIX D
Gosford City Council and Version 1 1 May 2007 Department of Environment and Climate Change H:\Doc\2007\Reports.2007\Rep2313.doc Commercial in Confidence

BRISBANE WATER ESTUARY PROCESSES STUDY ESTUARINE MORPHOLOGY AND SILTATION APPENDIX D
Gosford City Council and Version 1 1 May 2007 Department of Environment and Climate Change H:\Doc\2007\Reports.2007\Rep2313.doc Commercial in Confidence
BRISBANE WATER ESTUARY PROCESSES STUDY ESTUARINE MORPHOLOGY AND SILTATION APPENDIX D
Gosford City Council and Version 1 1 May 2007 Department of Environment and Climate Change H:\Doc\2007\Reports.2007\Rep2313.doc Commercial in Confidence
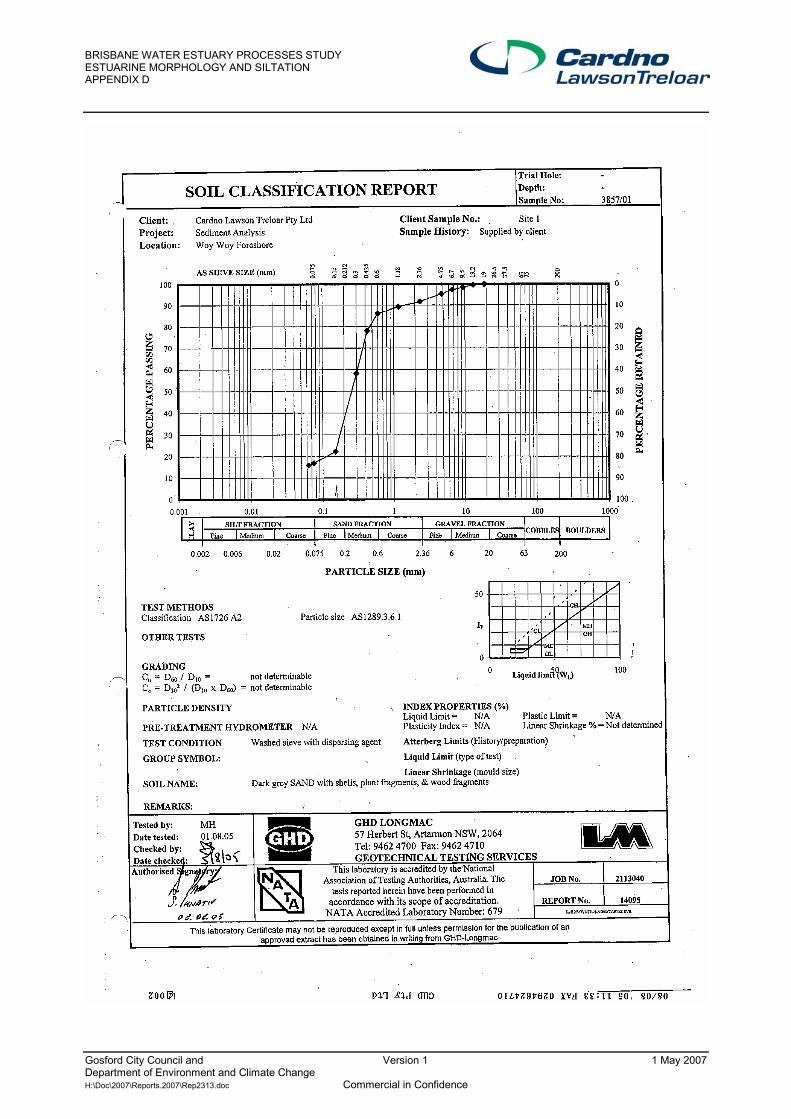
BRISBANE WATER ESTUARY PROCESSES STUDY ESTUARINE MORPHOLOGY AND SILTATION APPENDIX D
Gosford City Council and Version 1 1 May 2007 Department of Environment and Climate Change H:\Doc\2007\Reports.2007\Rep2313.doc Commercial in Confidence
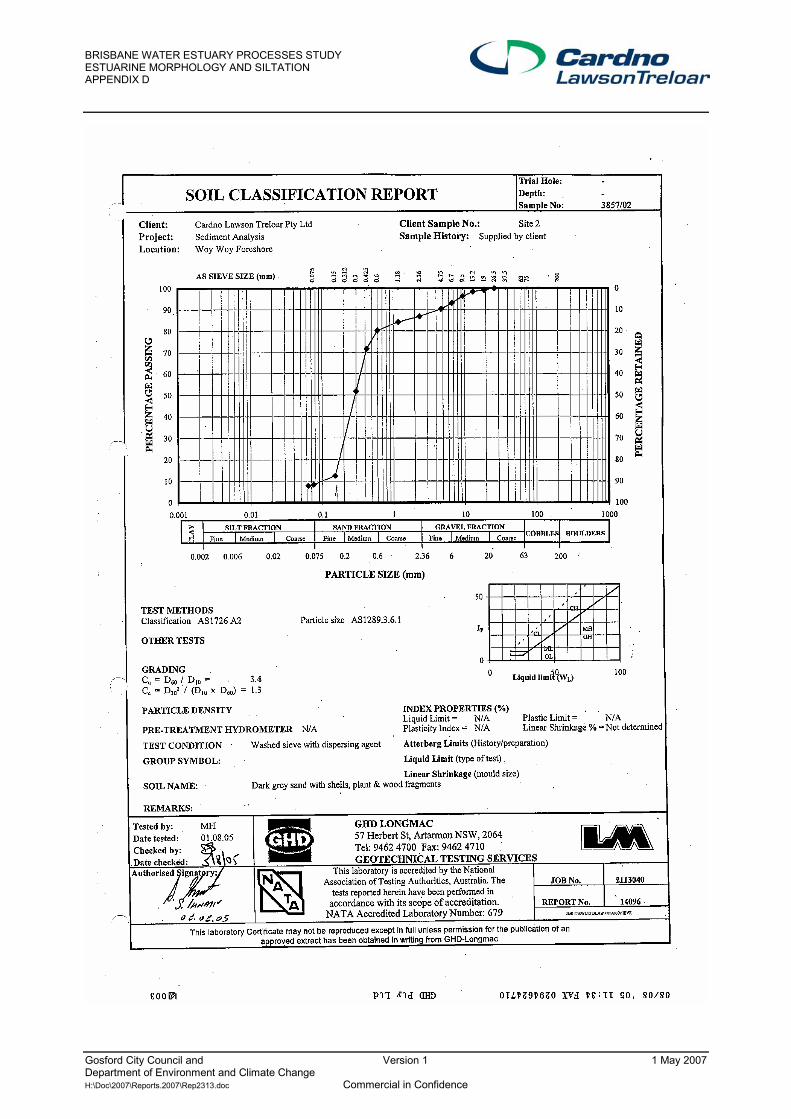
BRISBANE WATER ESTUARY PROCESSES STUDY ESTUARINE MORPHOLOGY AND SILTATION APPENDIX D
Gosford City Council and Version 1 1 May 2007 Department of Environment and Climate Change H:\Doc\2007\Reports.2007\Rep2313.doc Commercial in Confidence
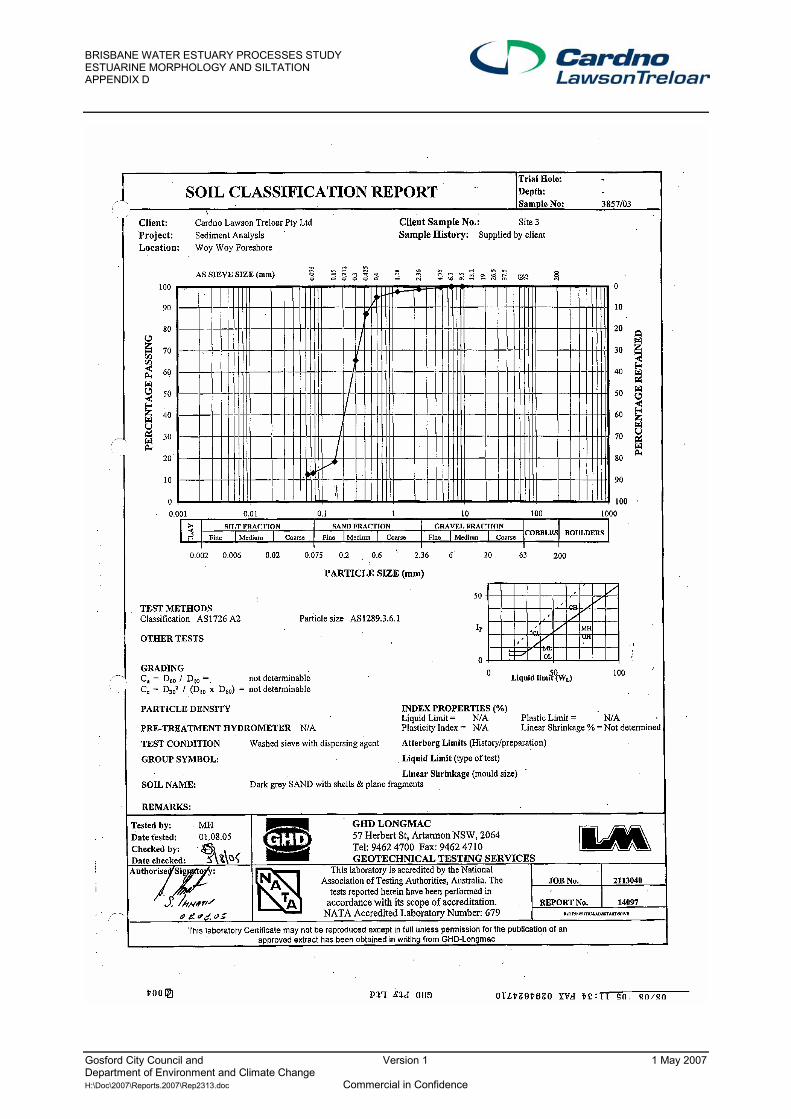
BRISBANE WATER ESTUARY PROCESSES STUDY ESTUARINE MORPHOLOGY AND SILTATION APPENDIX D
Gosford City Council and Version 1 1 May 2007 Department of Environment and Climate Change H:\Doc\2007\Reports.2007\Rep2313.doc Commercial in Confidence

BRISBANE WATER ESTUARY PROCESSES STUDY ESTUARINE MORPHOLOGY AND SILTATION APPENDIX D
Gosford City Council and Version 1 1 May 2007 Department of Environment and Climate Change H:\Doc\2007\Reports.2007\Rep2313.doc Commercial in Confidence

BRISBANE WATER ESTUARY PROCESSES STUDY ESTUARINE MORPHOLOGY AND SILTATION APPENDIX D
Gosford City Council and Version 1 1 May 2007 Department of Environment and Climate Change H:\Doc\2007\Reports.2007\Rep2313.doc Commercial in Confidence
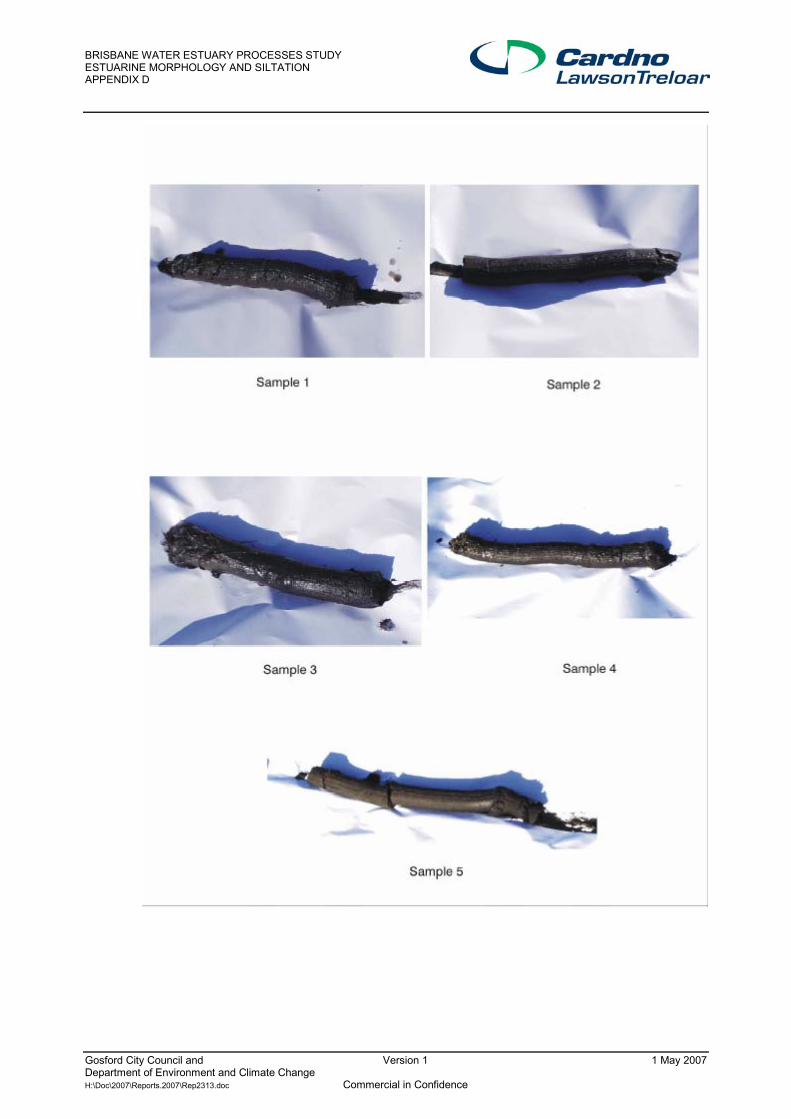
BRISBANE WATER ESTUARY PROCESSES STUDY ESTUARINE MORPHOLOGY AND SILTATION APPENDIX D
Gosford City Council and Version 1 1 May 2007 Department of Environment and Climate Change H:\Doc\2007\Reports.2007\Rep2313.doc Commercial in Confidence

BRISBANE WATER ESTUARY PROCESSES STUDY ESTUARINE MORPHOLOGY AND SILTATION APPENDIX D
Gosford City Council and Version 1 1 May 2007 Department of Environment and Climate Change H:\Doc\2007\Reports.2007\Rep2313.doc Commercial in Confidence
APPENDIX 3
Historical Photographs at 242 Blackwall Road, Woy Woy
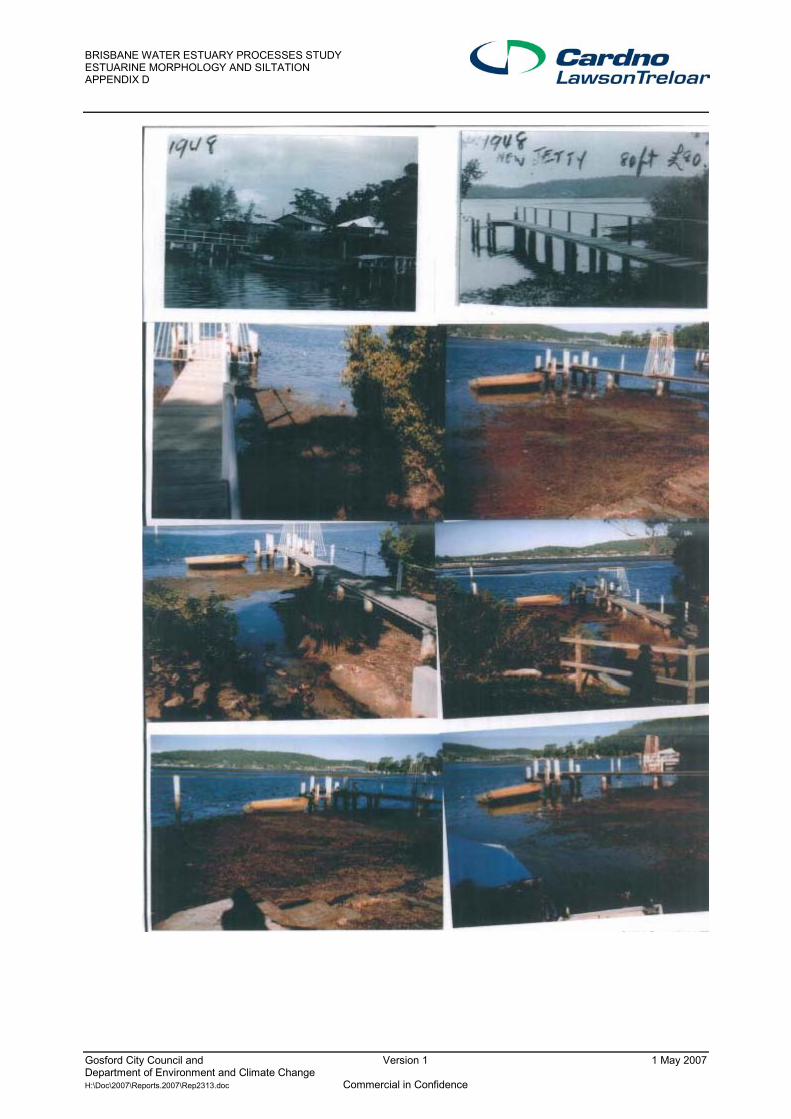
BRISBANE WATER ESTUARY PROCESSES STUDY ESTUARINE MORPHOLOGY AND SILTATION APPENDIX D
Gosford City Council and Version 1 1 May 2007 Department of Environment and Climate Change H:\Doc\2007\Reports.2007\Rep2313.doc Commercial in Confidence

BRISBANE WATER ESTUARY PROCESSES STUDY ESTUARINE MORPHOLOGY AND SILTATION APPENDIX D
Gosford City Council and Version 1 1 May 2007 Department of Environment and Climate Change H:\Doc\2007\Reports.2007\Rep2313.doc Commercial in Confidence
APPENDIX 4
Photographs at Mudflat Creek (Provided by Mr G Smith)
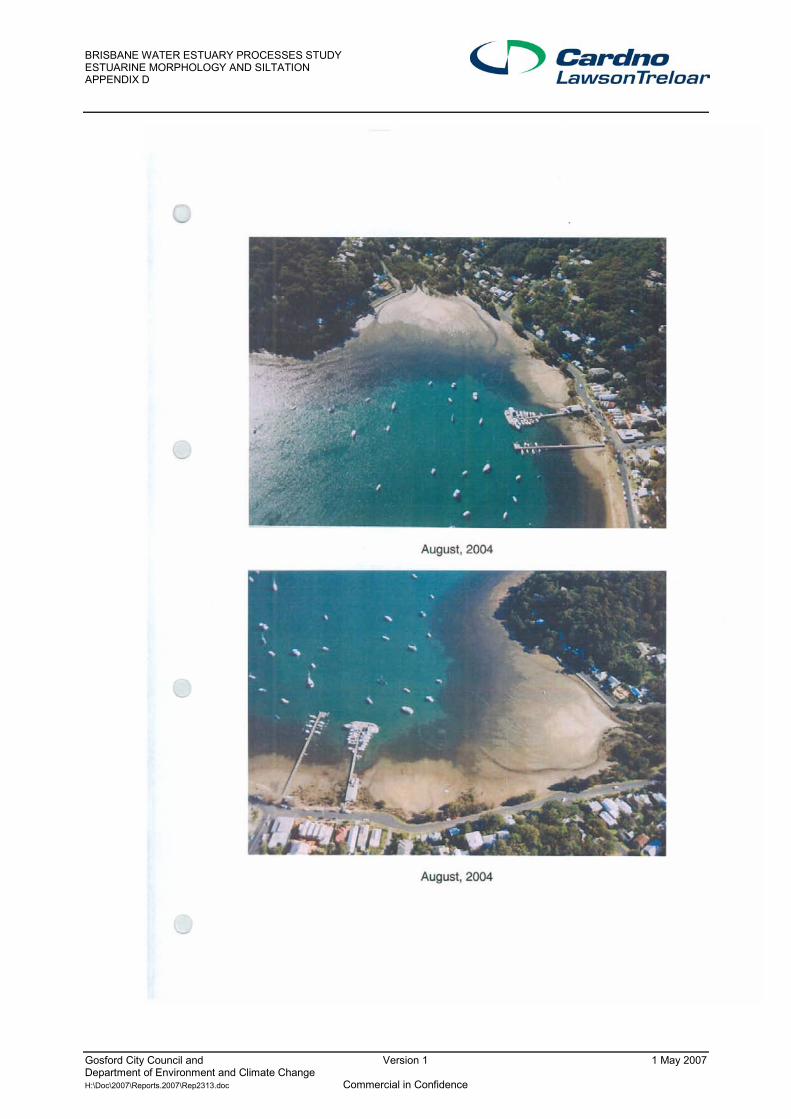
BRISBANE WATER ESTUARY PROCESSES STUDY ESTUARINE MORPHOLOGY AND SILTATION APPENDIX D
Gosford City Council and Version 1 1 May 2007 Department of Environment and Climate Change H:\Doc\2007\Reports.2007\Rep2313.doc Commercial in Confidence

BRISBANE WATER ESTUARY PROCESSES STUDY ESTUARINE MORPHOLOGY AND SILTATION APPENDIX D
Gosford City Council and Version 1 1 May 2007 Department of Environment and Climate Change H:\Doc\2007\Reports.2007\Rep2313.doc Commercial in Confidence

BRISBANE WATER ESTUARY PROCESSES STUDY ESTUARINE MORPHOLOGY AND SILTATION APPENDIX D
Gosford City Council and Version 1 1 May 2007 Department of Environment and Climate Change H:\Doc\2007\Reports.2007\Rep2313.doc Commercial in Confidence
Circa 2001

BRISBANE WATER ESTUARY PROCESSES STUDY ESTUARINE MORPHOLOGY AND SILTATION APPENDIX D
Gosford City Council and Version 1 1 May 2007 Department of Environment and Climate Change H:\Doc\2007\Reports.2007\Rep2313.doc Commercial in Confidence
APPENDIX 5
Brisbane Water Shoreline Sediment Data
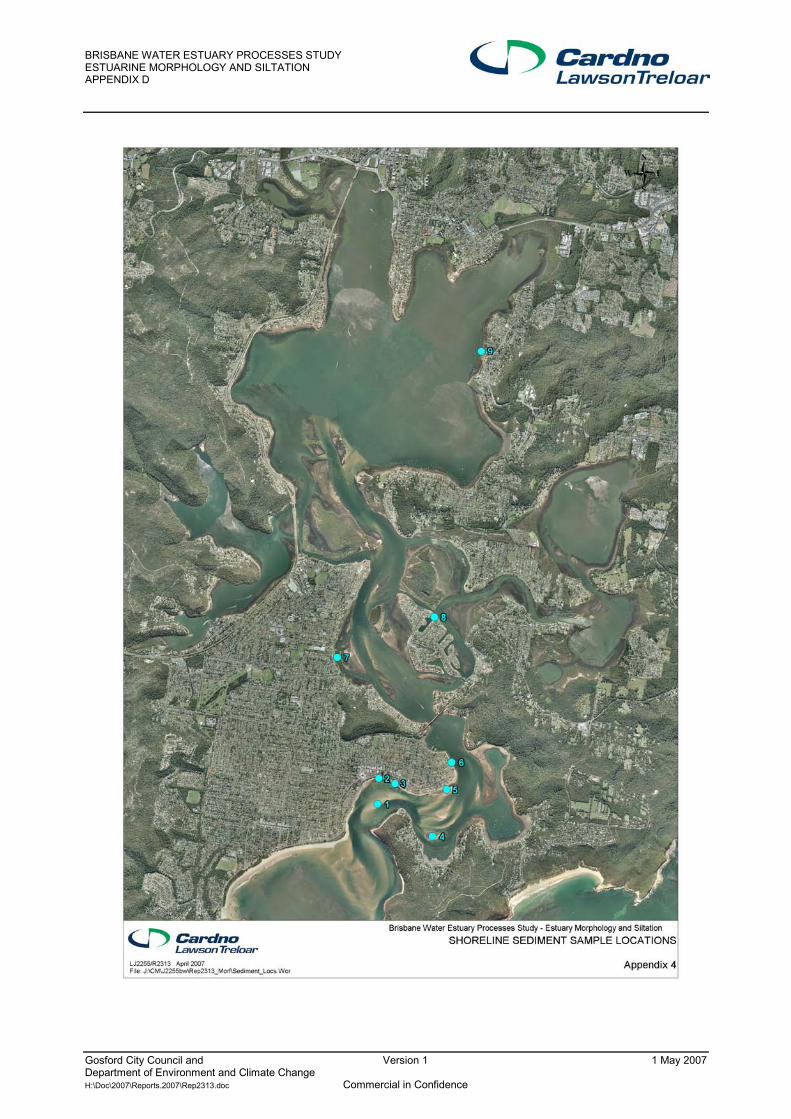
BRISBANE WATER ESTUARY PROCESSES STUDY ESTUARINE MORPHOLOGY AND SILTATION APPENDIX D
Gosford City Council and Version 1 1 May 2007 Department of Environment and Climate Change H:\Doc\2007\Reports.2007\Rep2313.doc Commercial in Confidence

BRISBANE WATER ESTUARY PROCESSES STUDY ESTUARINE MORPHOLOGY AND SILTATION APPENDIX D
Gosford City Council and Version 1 1 May 2007 Department of Environment and Climate Change H:\Doc\2007\Reports.2007\Rep2313.doc Commercial in Confidence

BRISBANE WATER ESTUARY PROCESSES STUDY ESTUARINE MORPHOLOGY AND SILTATION APPENDIX D
Gosford City Council and Version 1 1 May 2007 Department of Environment and Climate Change H:\Doc\2007\Reports.2007\Rep2313.doc Commercial in Confidence
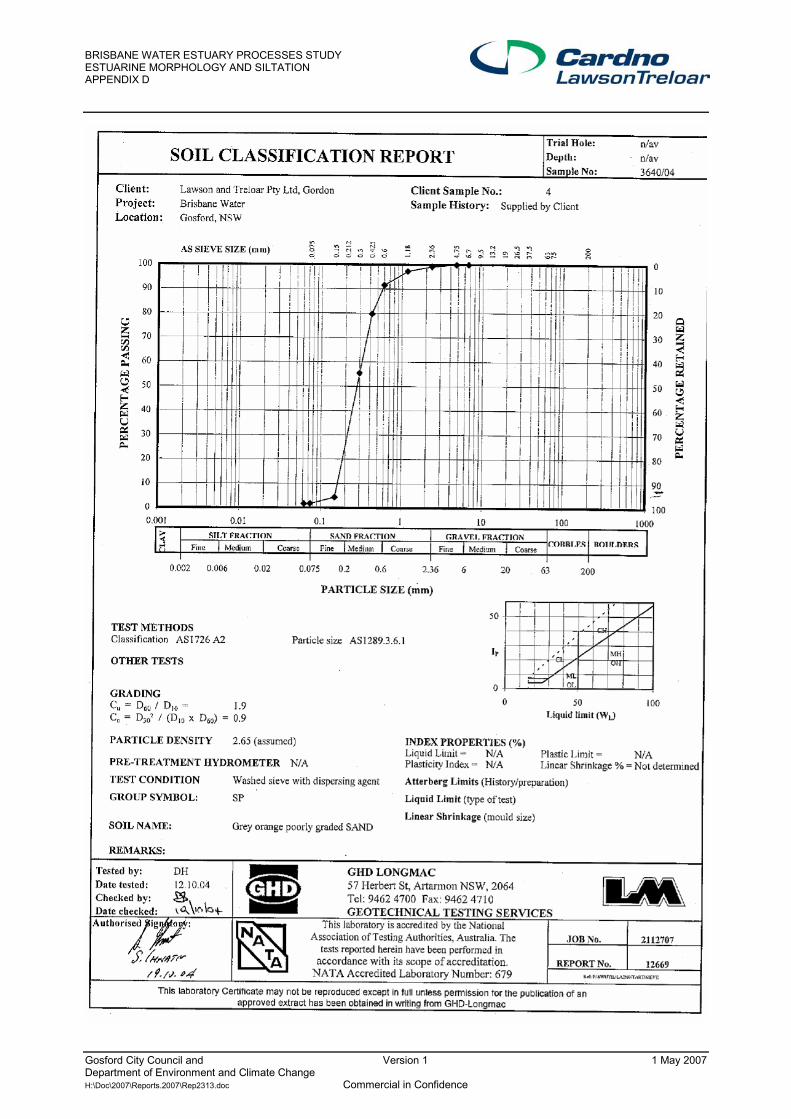
BRISBANE WATER ESTUARY PROCESSES STUDY ESTUARINE MORPHOLOGY AND SILTATION APPENDIX D
Gosford City Council and Version 1 1 May 2007 Department of Environment and Climate Change H:\Doc\2007\Reports.2007\Rep2313.doc Commercial in Confidence
Related Documents