J O U R N A L O F C O A S T A L S C I E N C E S ORIGINAL ARTICLE ` 1. Introduction Estuaries are very important even though their corresponding area is undersized in the world’s surface. Because of their nutrient rich waters, protected anchorages and the navigational access they provide a broad hinterland for the existence of a unique ecosystem. Estuarine and coastal environment are often complex and dynamic in nature (Morris et al. 1995). The hydrological impact of the sea on an estuary arises mainly through varying coastal water levels forcing water in and out of the estuarine mouth. This water level variation arises due to regular oscillations which are induced by tides, waves and other weather conditions. A large number of physico-chemical processes occur when river water mixes with seawater, which influences the water quality of the estuaries. This may have adverse impact on the biodiversity of the estuarine ecosystem. The processes governing the influx and efflux of water at an estuary mouth can be complex, in particular when the range of periods of the phenomena is considered (Schumann and Brink 2009). However, anthropogenic activities such as up-stream modification, construction of dams, barrages and bunds disturb the free flow of water thus affecting the ecological balance. Indiscriminate deforestation in the catchment areas, removal of vegetation along the river banks, landuse alteration and overgrazing has caused severe soil erosion and heavy siltation of estuaries. Studies on estuarine environment have been conducted by various researchers around the world (Pritchard 1952; Bowden 1960; Collar 1978; Dyer 1973; Breusers 1981). In India, studies on estuarine environment date back to the second half of this century. Observations on the Hydrobiology of the Hoogly estuary was conducted by Dutta et al. (1954) and Roy (1955). Chandramohan (1963) and Chandramohan and Rao (1972) conducted a detailed study on Godavary estuary. Investigations on various physical and biological aspects of Vellar estuary were made by Krishnamoorthy (1961) and Ramamoorthy et al. (1965). Jomon and Kurup (1989) investigated the stratification and salinity distribution in the Cochin estuary and the suspended sediment distribution was investigated by Gopinathan and Quasim (1971), Cheriyan (1973) and Raju et al. (1979). The physical aspects of Azhikode estuary was extensively studied by Revichandran et al. (1987) and Pylee et al. (1989). Vembar estuary is a small scale estuarine system, where river water flow is seasonal and the influx of sea water is often restricted by the sandy marine beach. However, underground movement of water through the sandy marine beach occurs by tidal cycles. This phenomenon can alter the chemistry of estuarine water as a result of sea water mixing. The sediment texture in the sandy marine beach also plays a vital role in the movement of sea water into the estuary through a tidal cycle. Scientific studies on the aspects of physico-chemical parameters and tidal ingress in the Vembar estuary have not been conducted so far. Therefore, the present study investigates the effect of tidal ingress on the estuarine water quality of Vembar through a sandy marine beach barrier. T. Simon Peter, N. Chandrasekar, S. Selvakumar, S. Kaliraj, N.S. Magesh*, Y. Srinivas Centre for Geotechnology, Manonmaniam Sundaranar University, Tirunelveli, Tamil Nadu 627 012, India An integrated study of tidal ingress has been carried out to decipher the cause of water quality variation in the Vembar estuary. The present research has been planned in such a way to fix 6 sampling station in the banks and one in the mouth of Vembar estuary. In contrast, tidal level fluctuations, temperature variation, water quality, beach profile and texture analysis of the monitoring stations were studied. The results reveal that the tidal fluctuations are high in the river mouth and it is controlled by sediment texture. The beach profile plays an important role in determining the water quality, in the sense it acts as a barrier between the river mouth and the open sea. But, the sandy beach permits water movement under the beach surface. Thus, increases the chance of seawater mixing. The grain size varies with respect to upstream stations, as clay content is found to be high in those stations. Higher clay content results in poor water transmittance. The temperature in the monitoring stations is influenced by local climatic conditions. The water quality in the study area is found to be quite interesting as station 2 and 4, which have high value except HCO3. This anomaly is due to the external disturbances due to saltpans and high evaporation rate. The effect of saline intrusion eventually degrades the quality of water in the Vembar estuary. This study is useful to understand the concept of tidal ingress in the estuarine channels and its effect on water quality. *Corresponding author, E-mail address: [email protected] Phone: +91 9944717646 © 2014 – Journal of Coastal Sciences. All rights reserved Tidal effects on estuarine water quality through a sandy marine beach: a case study in Vembar estuary, southeast coast of Tamil Nadu, India JOURNAL OF COASTAL SCIENCES Journal homepage: www.jcsonline.co.nr ISSN: 2348 – 6740 Volume 1 Issue No. 1 - 2014 Pages 6-14 Received 18 November 2013 Accepted 2 March 2014 Available online 6 March 2014 Keywords Tidal effects Water quality Sediment texture Sandy beach Vembar estuary GIS Southeast coast India ABSTRACT A RTICLE INFO

Welcome message from author
This document is posted to help you gain knowledge. Please leave a comment to let me know what you think about it! Share it to your friends and learn new things together.
Transcript

J O U R N A L O F C O A S T A L S C I E N C E S
6
O R I G I N A L A R T I C L E
`
1. Introduction
Estuaries are very important even though their corresponding area is undersized in the world’s surface. Because of their nutrient rich waters, protected anchorages and the navigational access they provide a broad hinterland for the existence of a unique ecosystem. Estuarine and coastal environment are often complex and dynamic in nature (Morris et al. 1995). The hydrological impact of the sea on an estuary arises mainly through varying coastal water levels forcing water in and out of the estuarine mouth. This water level variation arises due to regular oscillations which are induced by tides, waves and other weather conditions. A large number of physico-chemical processes occur when river water mixes with seawater, which influences the water quality of the estuaries. This may have adverse impact on the biodiversity of the estuarine ecosystem. The processes governing the influx and efflux of water at an estuary mouth can be complex, in particular when the range of periods of the phenomena is considered (Schumann and Brink 2009). However, anthropogenic activities such as up-stream modification, construction of dams, barrages and bunds disturb the free flow of water thus affecting the ecological balance. Indiscriminate deforestation in the catchment areas, removal of vegetation along the river banks, landuse alteration and overgrazing has caused severe soil erosion and heavy siltation of estuaries.
Studies on estuarine environment have been conducted by various researchers around the world (Pritchard 1952; Bowden 1960; Collar 1978; Dyer 1973; Breusers 1981). In India, studies on
estuarine environment date back to the second half of this century. Observations on the Hydrobiology of the Hoogly estuary was conducted by Dutta et al. (1954) and Roy (1955). Chandramohan (1963) and Chandramohan and Rao (1972) conducted a detailed study on Godavary estuary. Investigations on various physical and biological aspects of Vellar estuary were made by Krishnamoorthy (1961) and Ramamoorthy et al. (1965). Jomon and Kurup (1989) investigated the stratification and salinity distribution in the Cochin estuary and the suspended sediment distribution was investigated by Gopinathan and Quasim (1971), Cheriyan (1973) and Raju et al. (1979). The physical aspects of Azhikode estuary was extensively studied by Revichandran et al. (1987) and Pylee et al. (1989). Vembar estuary is a small scale estuarine system, where river water flow is seasonal and the influx of sea water is often restricted by the sandy marine beach. However, underground movement of water through the sandy marine beach occurs by tidal cycles. This phenomenon can alter the chemistry of estuarine water as a result of sea water mixing. The sediment texture in the sandy marine beach also plays a vital role in the movement of sea water into the estuary through a tidal cycle. Scientific studies on the aspects of physico-chemical parameters and tidal ingress in the Vembar estuary have not been conducted so far. Therefore, the present study investigates the effect of tidal ingress on the estuarine water quality of Vembar through a sandy marine beach barrier.
T. Simon Peter, N. Chandrasekar, S. Selvakumar, S. Kaliraj, N.S. Magesh*, Y. Srinivas
Centre for Geotechnology, Manonmaniam Sundaranar University, Tirunelveli, Tamil Nadu 627 012, India
An integrated study of tidal ingress has been carried out to decipher the cause of water quality variation in the Vembar
estuary. The present research has been planned in such a way to fix 6 sampling station in the banks and one in the
mouth of Vembar estuary. In contrast, tidal level fluctuations, temperature variation, water quality, beach profile and
texture analysis of the monitoring stations were studied. The results reveal that the tidal fluctuations are high in the
river mouth and it is controlled by sediment texture. The beach profile plays an important role in determining the
water quality, in the sense it acts as a barrier between the river mouth and the open sea. But, the sandy beach permits
water movement under the beach surface. Thus, increases the chance of seawater mixing. The grain size varies with
respect to upstream stations, as clay content is found to be high in those stations. Higher clay content results in poor
water transmittance. The temperature in the monitoring stations is influenced by local climatic conditions. The water
quality in the study area is found to be quite interesting as station 2 and 4, which have high value except HCO3. This
anomaly is due to the external disturbances due to saltpans and high evaporation rate. The effect of saline intrusion
eventually degrades the quality of water in the Vembar estuary. This study is useful to understand the concept of tidal
ingress in the estuarine channels and its effect on water quality.
*Corresponding author, E-mail address: [email protected] Phone: +91 9944717646 © 2014 – Journal of Coastal Sciences. All rights reserved
Tidal effects on estuarine water quality through a sandy marine beach:
a case study in Vembar estuary, southeast coast of Tamil Nadu, India
JOURNAL OF COASTAL SCIENCES
Journal homepage: www.jcsonline.co.nr
ISSN: 2348 – 6740 Volume 1 Issue No. 1 - 2014 Pages 6-14
Received
18 November 2013
Accepted
2 March 2014
Available online
6 March 2014
Keywords
Tidal effects
Water quality
Sediment texture
Sandy beach
Vembar estuary
GIS
Southeast coast
India
A B S T R A C T A R T I C L E I N F O
J O U R N A L O F C O A S T A L S C I E N C E S
7
O R I G I N A L A R T I C L E
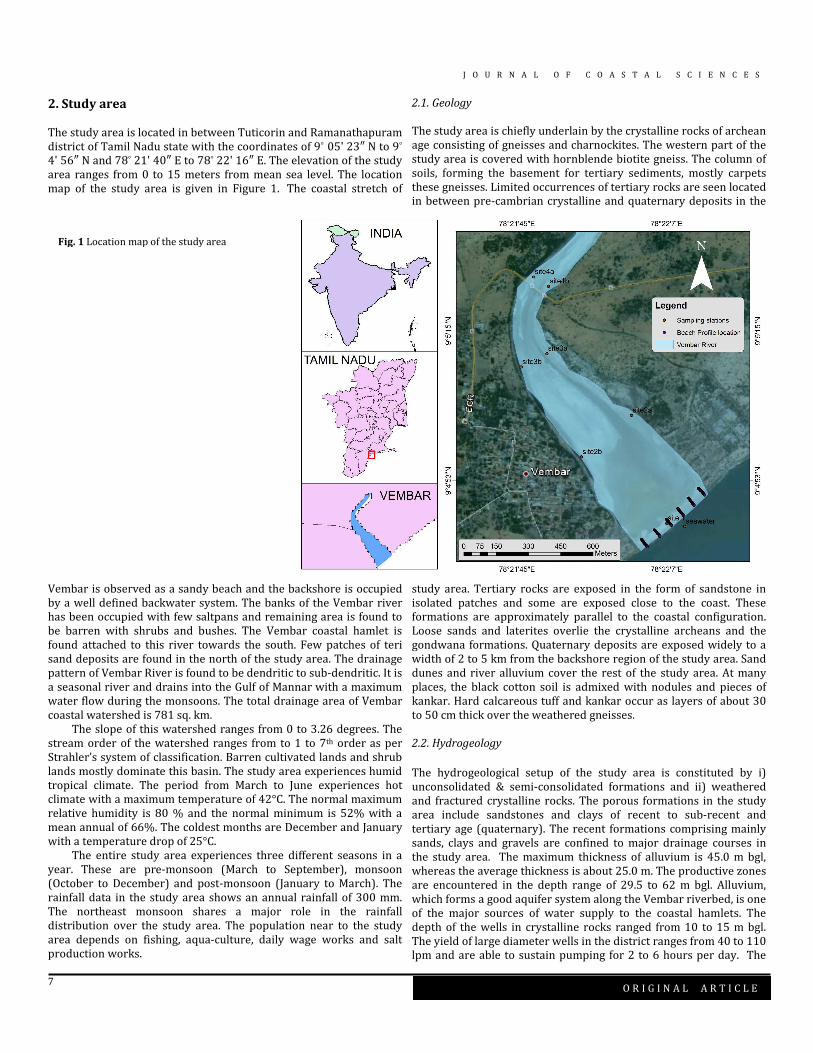
2. Study area The study area is located in between Tuticorin and Ramanathapuram district of Tamil Nadu state with the coordinates of 9° 05ʹ 23″ N to 9° 4ʹ 56″ N and 78° 21ʹ 40″ E to 78° 22ʹ 16″ E. The elevation of the study area ranges from 0 to 15 meters from mean sea level. The location map of the study area is given in Figure 1. The coastal stretch of
Vembar is observed as a sandy beach and the backshore is occupied by a well defined backwater system. The banks of the Vembar river has been occupied with few saltpans and remaining area is found to be barren with shrubs and bushes. The Vembar coastal hamlet is found attached to this river towards the south. Few patches of teri sand deposits are found in the north of the study area. The drainage pattern of Vembar River is found to be dendritic to sub-dendritic. It is a seasonal river and drains into the Gulf of Mannar with a maximum water flow during the monsoons. The total drainage area of Vembar coastal watershed is 781 sq. km. The slope of this watershed ranges from 0 to 3.26 degrees. The stream order of the watershed ranges from to 1 to 7th order as per Strahler’s system of classification. Barren cultivated lands and shrub lands mostly dominate this basin. The study area experiences humid tropical climate. The period from March to June experiences hot climate with a maximum temperature of 42°C. The normal maximum relative humidity is 80 % and the normal minimum is 52% with a mean annual of 66%. The coldest months are December and January with a temperature drop of 25°C. The entire study area experiences three different seasons in a year. These are pre-monsoon (March to September), monsoon (October to December) and post-monsoon (January to March). The rainfall data in the study area shows an annual rainfall of 300 mm. The northeast monsoon shares a major role in the rainfall distribution over the study area. The population near to the study area depends on fishing, aqua-culture, daily wage works and salt production works.
2.1. Geology
The study area is chiefly underlain by the crystalline rocks of archean age consisting of gneisses and charnockites. The western part of the study area is covered with hornblende biotite gneiss. The column of soils, forming the basement for tertiary sediments, mostly carpets these gneisses. Limited occurrences of tertiary rocks are seen located in between pre-cambrian crystalline and quaternary deposits in the
study area. Tertiary rocks are exposed in the form of sandstone in isolated patches and some are exposed close to the coast. These formations are approximately parallel to the coastal configuration. Loose sands and laterites overlie the crystalline archeans and the gondwana formations. Quaternary deposits are exposed widely to a width of 2 to 5 km from the backshore region of the study area. Sand dunes and river alluvium cover the rest of the study area. At many places, the black cotton soil is admixed with nodules and pieces of kankar. Hard calcareous tuff and kankar occur as layers of about 30 to 50 cm thick over the weathered gneisses. 2.2. Hydrogeology
The hydrogeological setup of the study area is constituted by i) unconsolidated & semi-consolidated formations and ii) weathered and fractured crystalline rocks. The porous formations in the study area include sandstones and clays of recent to sub-recent and tertiary age (quaternary). The recent formations comprising mainly sands, clays and gravels are confined to major drainage courses in the study area. The maximum thickness of alluvium is 45.0 m bgl, whereas the average thickness is about 25.0 m. The productive zones are encountered in the depth range of 29.5 to 62 m bgl. Alluvium, which forms a good aquifer system along the Vembar riverbed, is one of the major sources of water supply to the coastal hamlets. The depth of the wells in crystalline rocks ranged from 10 to 15 m bgl. The yield of large diameter wells in the district ranges from 40 to 110 lpm and are able to sustain pumping for 2 to 6 hours per day. The
Fig. 1 Location map of the study area
J O U R N A L O F C O A S T A L S C I E N C E S
8
O R I G I N A L A R T I C L E
specific capacity of large diameter wells tested in crystalline rocks ranges from 3.0 to 141 lpm/m of drawdown. The yield characteristics of wells vary considerably depending on the topographic set-up, lithology and nature of weathering. 2.3. Geomorphology
The study of coastal geomorphology reflects the various processes operating in an area. Therefore, it is important to understand the coastal landforms and related features. The application of remote sensing in the field of coastal landform mapping is proved to be an efficient tool for the preparation of geomorphological map. In the present study, the geomorphological features are mapped using Landsat ETM+ imageries with a spatial resolution of 30 meters. During the field survey, various features are identified and cross-checked with the imagery for ground truthing. The geomorphological map reveals that the study area has sandy beaches with a width of 25 meters and gently sloping towards sea. A well-defined beach ridge system is observed within 5 kms from the shore and has been well documented from the satellite imageries. However, the nature of the processes resulting in their nucleation and subsequent growth is to be understood. There are vegetated fore-dunes developed by the accretion on the adjacent sides of the river mouth. A prominent backwater zones are present in the study area, which contributes salinity to the alluvial aquifer systems. It is observed that the study area is mainly comprises of alluvial plains and water bodies in the form of irrigative ponds. Isolated patches of sand bars and sandy plains are present in the study area.
3. Methodology 3.1. Field survey
Robust field survey was carried out in the study area to understand the coastal geomorphology, beach processes, water quality, sediment texture, tidal level fluctuations in the estuarine mouth and nearby monitoring stations. After investigating the available literatures, other supplementary data were collected from government departments to execute the study. 3.2. Positioning
The positioning of sampling stations was recorded with the help of Garmin E-Trex hand held GPS, USA. A total of 4 stations were fixed for tidal level monitoring along the river banks and mouth. Moreover, water quality, and sediment texture are also monitored in the study area.
3.3. Beach profile measurement
In order to understand the change in beach configuration of the study region, profile measurements were made at six transects in the mouth of Vembar estuary. The data are taken carefully at the lowest low tide level so that maximum length of the beach cross section was exposed for the measurements. The stake and horizon method (La Ford and Prasada Rao 1954) was adopted to measure the sand level at each transect, with a firmly fixed reference point. The profile direction was usually perpendicular to the coast and in a fixed direction. The beach levels were taken at every 2m interval. In this method, the horizon is viewed through a slot in a rod of convenient length (1 m) and this line of collimation makes an intercept on the graduated stake held vertically at 2m distances. The sand level of the
beach was calculated after performing the necessary corrections with benchmark level.
3.4. Tidal level measurement
The influence of tide on the estuarine water level was measured using a Schlumberger data logger. Four monitoring wells consisting of 3.2 cm diameter PVC pipe with a 7.6 cm screen at the bottom were installed in shore and river banks for tidal level and temperature measurement (Urish and McKenna 2004). Water levels were measured by direct tape measurements and by pressure transducers placed in the monitoring wells, at different stations in the open salt water for tide measurements. The pressure transducers include atmospheric pressure compensation and were connected to a data logger for continuous data recording on hourly basis. Measurements of temperature and water level fluctuation were taken at 5 minute intervals.
3.5. Water sampling
Water samples were taken from the monitoring stations to study the tidal effect on the estuarine water quality and nearby dug wells. The samples were collected in 1 litre high density polyethylene (HDPE) bottles pre-washed with dilute hydrochloric acid and rinsed three times with the water sample before filling and labeled accordingly. The samples were stored at a temperature below 4°C prior to analysis in the laboratory. The collected water samples were analyzed for various physicochemical parameters as described by the American Public Health Association (APHA 1995). pH, EC, and TDS were analyzed using portable water quality analyzers. Chloride was determined by Argentometric titration using standard silver nitrate as reagent. Calcium, magnesium, and total hardness (TH) were estimated titrimetrically. Na and K in the water sample was analyzed using flame photometer (Model: DEEP VISION-381). HCO3 content was determined titrimetrically against standard hydrochloric acid solution (0.01 N). Sulphate was analyzed using a UV-VIS double beam spectrophotometer (Model: Model: DEEP VISION-1371). 3.6. Sediment sampling and texture analysis
The sediment samples were collected from the monitoring stations and are properly labeled and brought to the laboratory for texture studies. The repeated process of coning and quartering method was employed for 100 gm of sediment in each sample. The samples were air dried at 60°C in a hot air oven. The texture analysis was performed using modified pipette method (Indorante 1990). 10 g of sediment sample was placed in a petri-dish and dried at 60°C and cooled it under a dessicator and weighed the gravimetric water content (GWC).
After that, 5 g of air-dried sample is placed in a 50 ml centrifuge tube and 10 ml of DI water was added followed by 1 ml of 1M sodium acetate and centrifuged for 10 min at 1500 RPM until supernatant is clear. The sample was decanted and washed two more times with 40 ml distilled water. The sample was dried in a hot air oven at 50°C. Further, 40 ml of 0.5% SHMP solution was added into the tube and shaked overnight for 16 hours.
Three labeled dishes were pre-weighed and marked as silt+clay, clay and blank. 0.5% SHMP solution was added in a 100 ml graduated cylinder and a thermometer is dipped into the SHMP solution. The centrifuge tube was shaked thoroughly and time zero begins once shaking has stopped and settling begins. At a specified time (10.6 sec at 20°C) 2.5 ml sample was pipette out from the centrifuge tube and

J O U R N A L O F C O A S T A L S C I E N C E S
9
O R I G I N A L A R T I C L E
dispensed into “silt+clay” dish. The pipette sample must be taken below 2.5 cm from the liquid surface. 2.5 ml of SHMP solution was pipetted out and dispensed into the blank dish. These dishes were placed into a hot air oven at 105°C for 24 hours. At specified time (110.9 min at 20°C), another 2.5 ml of pipette sample was taken and dispensed into clay dish and the remaining samples were poured into a beaker and dried at 105°C for 24 hours under a hot air oven. Further, the dishes and beaker in a dessicator were cooled and weighed again for percentage calculation. 3.7. GIS interpolation of beach profile
The co-ordinate system of the sampling stations varies with respect to its geographical locations. In the present study, WGS_1984_UTM_Zone_44N co-ordinate system was selected because the study area falls in that particular zone. The profile thematic layer shape-files are projected accordingly and the processed shape-files are fed to IDW interpolation. An inverse distance weighted algorithm was used to interpolate the beach profile data spatially and to estimate values between the sampling locations. This data was spatially interpolated to create a raster surface. The general formula is
( ) ( )SS i
N
iiZZ ∑
=
∧=
10 λ
where ( )SZ0
∧
is the value to predict for location S 0 , N is the number of measured sample points surrounding the prediction location that will be used in the prediction, λi are the weights assigned to each measured point, and ( )S i
Z is the observed value at the location S i . Each estimated value in an IDW interpolation is a weighted average of the surrounding sample points.
Weights are computed by taking the inverse of the distance from an observation’s location to the location of the point being estimated. In a comparison of several different deterministic interpolation procedures, Burrough and McDonnell (1998) and Mathes and Rasmussen (2006) found that using IDW with a squared distance term yielded results most consistent with the original input data. A specific month data (January in this case) is placed in the Z value field to interpolate that month’s profile. A value of 2 is assigned in the power field which controls the significance of surrounding points on the interpolated value (Magesh et al. 2011).
4. Results and discussion The physical impact of the ocean on an estuary occurs primarily through changing coastal water levels forcing water in and out of the mouth. The most important of these water level variations comes from the regular oscillations due to the tides, weather, and wave-related changes.
The processes governing the influx and efflux of water at an estuary mouth can be complex, in particular when the range of periods of the phenomena is measured. Considering this point in view, the tidal level fluctuations in Vembar estuary was monitored in an hourly basis using sophisticated data logger procured from Schlumberger Inc. Moreover, water samples and sediments were taken from different locations in the study area to ascertain a systematic approach for monitoring the water quality as well as sediment texture in the study area.
4.1. Tidal level fluctuation
The experimental setup was deployed in 4 selected sites along the study area from 8 am to 5 pm in a day. The minute wise fluctuation
was recorded using an automatic data logger device. This device has VEMBAR11 - F9088 - [1/14/2012 7:01:42 AM - 1/14/2012 5:31:43 PM]
Pressure (cmH2O) Temperature (Celsius)
5:00 PM4:00 PM3:00 PM2:00 PM1:00 PM12:00 PM11:00 AM10:00 AM9:00 AM8:00 AM7:00 AM
Pre
ssure
(cm
H2O
)
1,044
1,042
1,040
1,038
1,036
1,034
1,032
Tem
pera
ture
(C
elsiu
s)
26.4
26.2
26
25.8
25.6
25.4
25.2
25
24.8
24.6
24.4
24.2
Fig. 2 Pressure and temperature fluctuation in site 1
VEMBAR21 - F9088 - [1/21/2012 7:00:00 AM - 1/21/2012 5:25:01 PM]
Pressure (cmH2O) Temperature (Celsius)
5:00 PM4:00 PM3:00 PM2:00 PM1:00 PM12:00 PM11:00 AM10:00 AM9:00 AM8:00 AM7:00 AM
Pre
ssure
(cm
H2O
)
1,033
1,032
1,031
1,030
1,029
1,028
1,027
1,026
1,025
1,024
Tem
pera
ture
(C
elsiu
s)
26.5
26.4
26.3
26.2
26.1
26
25.9
25.8
25.7
25.6
Fig. 3 Pressure and temperature fluctuation in site 2
VEMBAR31 - F9088 - [1/28/2012 7:00:00 AM - 1/28/2012 5:05:01 PM]
Pressure (cmH2O) Temperature (Celsius)
5:00 PM4:00 PM3:00 PM2:00 PM1:00 PM12:00 PM11:00 AM10:00 AM9:00 AM8:00 AM7:00 AM
Pre
ssure
(cm
H2O
)
1,035
1,034
1,033
1,032
1,031
1,030
1,029
1,028
1,027
Tem
pera
ture
(C
elsiu
s)
27.2
27.1
27
26.9
26.8
26.7
Fig. 4 Pressure and temperature fluctuation in site 3
VEMBAR31 - F9088 - [2/4/2012 7:00:00 AM - 2/4/2012 5:00:01 PM]
Pressure (cmH2O) Temperature (Celsius)
5:00 PM4:00 PM3:00 PM2:00 PM1:00 PM12:00 PM11:00 AM10:00 AM9:00 AM8:00 AM7:00 AM
Pre
ssure
(cm
H2O
)
1,056
1,054
1,052
1,050
1,048
1,046
Tem
pera
ture
(C
elsiu
s)
29
28.5
28
27.5
27
26.5
26
25.5
25
Fig. 5 Pressure and temperature fluctuation in site 4
the capability to monitor the pressure difference and the temperature change. The results reveal that high tide exhibits around 8 am and 5 pm and low tide is noticed around 2 pm in the estuarine mouth (Figure 2). This fluctuation is barely because of the medium of water transport. The sediment texture of this site is 99% sand, which allows seawater to easily pass through. However, in other sites (site

J O U R N A L O F C O A S T A L S C I E N C E S
10
O R I G I N A L A R T I C L E
no. 2, 3, 4) the fluctuations varies with respect to high tide and the level becomes almost stable. This may be due to the presence of clay as it is a poor medium for water transmittance. The hourly tidal fluctuations are shown in figure 2 to 5. The distribution of temperature in the study area is dependent on the temperature of the incoming river and seawater, the mixing processes, and on the exchange of heat through the surface. The effect of temperature will increase the density difference between river and seawater. In the Vembar estuary, it is seen that the distribution is controlled mostly by the local weather conditions. Surface temperature of the water chiefly depends on the incoming solar radiation; the estuary being a shallow one, the distribution appeared to be dominated by the diurnal effect rather than tidal effect. The study area experiences the tidal induced water table motion in the phreatic aquifer of the shoreline. The water table is observed as 2.78 mbgl from the monitoring well. This reveals that the tide-induced change in water level is around 0.68 meter. The hourly temperature distribution in the monitoring stations of Vembar estuary is shown in figure 2 to 5. 4.2. Estuarine water quality
The effect of tide on estuarine water quality has been studied in eight different locations with respect to the monitoring wells. The physico-chemical parameters like pH, EC, TDS, TH, Ca, Mg, Na, K, HCO3, SO4, and Cl were determined using standard analytical techniques and their spatial distribution was plotted in ArcGIS environment. The results reveal that high concentration of ions are generally seen in site 4 and 2 which resembles high evaporation area and nearby salt pan beds respectively (Table 1). The occurrence of HCO3 ion in the estuarine mouth is generally due to tidal fluctuations in this zone. The ion concentration drastically decreases with respect to distance from the coast. The effect of clay geochemistry plays an important role in minor fluctuation in water chemistry. The spatial distribution of water quality parameters reveals that tidal ingress into the estuarine channel has drastically affected the water quality of Vembar estuary. The distribution also reveals that high concentration of ions is higher in site 2a and it decreases with respect to upstream samples except some samples which have regional disturbances due to saltpans and high evaporation. A minor fluctuation in sample no. 3 is noticed in the spatial maps, this can be attributed to the effect of channel meandering, which results in historic deposition of ion in the banks. Figures 6 represent the spatial maps of different water quality parameters exist in the study area. The descriptions of these parameters are briefly discussed below.
4.2.1. pH
The pH in the study area ranges from 7.3 to 8 which indicates the water is slightly alkaline in nature. The pH of seawater observed in this site is 8 and it decreases with respect to upstream sampling stations. However, in station 4 there is a slight variation as the pH in this station becomes more alkaline than station 3 (Fig. 6A). This may be because of station 4 experiences higher evaporation rate than station 3. 4.2.2. Electrical Conductivity (EC)
The EC values in the study area ranges from 19618.4 to 74581.8 μmhos/cm at 25°C. The value of electrical conductivity may be an approximate index of the total content of dissolved substance in water. High EC is present in sample no. 2 and 4 with respect to sample 1 and 3 (Fig. 6b). This may be attributed to high saline input in the soil media nearby the monitoring station. 4.2.3. Total Dissolved Solids (TDS)
In the study area, the TDS value varies between a minimum of 12555.7 mg/l and a maximum of 47732.3 mg/l (Fig. 6c). High concentration of TDS in the water samples is due to leaching of salts from saline soil and by periodic saline intrusion by tidal effects, which may lead to increase in TDS values. 4.2.4. Total Hardness (TH)
The total hardness in the study area varies from 4057.49 to 15772.2 mg/l (Fig. 6d). The analytical result indicates the water in the study area is very hard. The hardness of the water is due to the presence of alkaline earths such as calcium and magnesium. High hardness in the water samples are observed in sample no. 2 and 4. Presence of salt layers in these sampling stations may be responsible to high TH. 4.2.5. Calcium (Ca)
Calcium is the most abundant elements in the natural surface and groundwater and exists mainly as bicarbonates and to a lesser degree in the form of sulfate and chloride. Ca2+ concentrations are varying from 88.2 to 424.8 mg/l (Fig. 6e). High calcium content in the samples is observed in station 2 and low in station 3.
Sample Site X Y pH EC TDS HCO3 Ca Mg Na K SO4 Cl TH
1 Seawater 78.3695 9.07934 8.1 45870.0 29356.8 79.3 340.7 2166.9 107.0 169.0 151.5 20235.0 9774.0
2 site 1 78.36875 9.079471 7.7 19610.0 12550.4 103.7 212.4 856.1 63.0 99.0 148.0 7810.0 4055.7
3 site2a 78.36728 9.083975 7.8 73105.0 46787.2 61.0 424.8 3572.6 135.0 173.0 153.5 30814.0 15772.8
4 site2b 78.36519 9.082245 7.8 74583.0 47733.1 62.7 412.6 3657.1 126.0 169.0 150.0 29871.0 14578.0
5 site3a 78.36375 9.086554 7.3 31192.0 19962.9 67.1 88.2 1121.2 85.0 117.0 148.8 12283.0 4837.1
6 site3b 78.36268 9.085999 7.3 38947.0 24926.1 68.4 92.4 1698.1 74.0 120.0 151.0 12547.0 4698.0
7 site4a 78.3632 9.089752 7.4 65370.0 41836.8 61.0 307.4 3364.2 126.0 173.0 150.5 34967.5 14621.3
8 site4b 78.36382 9.08936 7.4 62587.0 40055.7 62.1 314.6 3987.2 131.0 162.0 153.0 36478.0 14698.0
Table 1. Physico-chemical parameters of estuarine water in the study area

J O U R N A L O F C O A S T A L S C I E N C E S
11
O R I G I N A L A R T I C L E
Fig. 6 Spatial distribution of physico-chemical parameters in
the study area

J O U R N A L O F C O A S T A L S C I E N C E S
12
O R I G I N A L A R T I C L E
4.2.6. Magnesium (Mg)
The Mg content in the study area ranges from 856.48 to 3986.9 mg/l. It is observed that Mg2+ > Ca2+; this may due to the influence of seawater through tidal ingress. High value of Mg is observed in sample no. 2 and 4 and sample no. 1 and 3 indicates low Mg value (Fig. 6f). 4.2.7. Sodium (Na)
Sodium ranks sixth among the elements in order of abundance and is present in most of natural waters. Sodium is generally found in lower concentration than Ca2+ and Mg2+ in freshwater. However, in saline water this situation may change with respect to channel gradient and river flow. In the study area, Na values ranges from 63 to 134.9 mg/l (Fig 6g). 4.2.8. Potassium (K)
Potassium is a naturally occurring element; however, its concentration remains quite lower compared with Ca, and Mg. The concentration of K+ is observed between 99 and 172.9 mg/l from the analysed water samples (Fig. 6h). The rate of evaporation and saline soils nearby the monitoring wells of 2 and 4 are responsible for high K content in the water samples. 4.2.9. Bicarbonate (HCO3)
The value of HCO3 is observed from 61 to 103.6 mg/l (Fig. 6i), which is the dominant ion, occurring near the coast. The high value of HCO3 ion near to the estuarine mouth is quite normal because of saline water intrusion through tidal ingress. 4.2.10. Sulphate (SO4)
Sulfate is one of the major anion occurring in natural waters. The sulfate concentration in the study area ranges between 148 and 153.5 mg/l (Fig. 6j). It is observed that high concentration of SO4 is restricted to the eastern banks of Vembar estuary. This anomaly is because of the presence of salt pans in the eastern banks. 4.2.11. Chloride (Cl)
The origin of chloride in estuarine water may be from diverse sources such as weathering, leaching of sedimentary rocks and soils, intrusion of saltwater, windblown salt in precipitation, domestic and industrial waste discharges, municipal effluents, etc. In the study area, the concentration of chloride is between 7813.91 and 36476.5 mg/l (Fig. 6k). 4.3. Beach profile analysis
The spatial distribution beach profile in Vembar station reveals that a berm formation is observed in the month of January with a height of 2.05 meters and drastically a beach slope is observed towards the sea. The extent of low tide point is mapped with a negative value of -0.34 meters. A 3D view of beach profile is shown in figure 7. The figure reveals that patches of sand deposits in the berm are seen in the closed estuarine mouth. This feature prevents the tidal water to get directly mixed with estuarine water. However, the presence of sandy texture allows underground movement of seawater because of higher permeability.
Fig. 7 Beach profile map of the study area
4.4. Sediment texture
Grain-size distributions exert considerable influence on the geochemical composition and water permeability of estuarine sediments. In particular, the presence of fine-grained sediments leads to low permeability of water between the estuary and the monitoring wells. The grain-size composition (sand-silt-clay ratios) of the sediments taken from the monitoring stations has been plotted in a ternary diagram (Fig. 8) of Folk (1954). From the classification it is inferred that around 4 samples (2a, 2b, 3a, 3b) consist of clayey sand (cS), followed by Sandy clay (sC) 4a, 4b. Whereas, Sand contribute only one sample (1) which is near to the estuarine mouth (Table 2). This composition reveals that the estuarine system is essentially a low-energy environment. The occurrence of sand particles in the mouth of the estuary is due to the action of high tide, which eventually brings considerable volume of sand and gets deposited in the mouth. This phenomenon only happens when the river discharge is too low. Meanwhile, the riverine sediments contribute the high clay content in the upstream, which gets deposited in low energy condition.
Table 2. Grain size values in the study area (in %)
Station Sand Silt Clay
1 99 0.5 0.5
2a 77.9 3.3 18.8
2b 76.5 2.8 20.7
3a 78.8 6.4 14.8
3b 79.1 5.4 15.5
4a 23.1 1.3 75.6
4b 22.6 1.5 75.9

J O U R N A L O F C O A S T A L S C I E N C E S
13
O R I G I N A L A R T I C L E
Fig. 8 Ternary classification diagram of the sediment samples suggested by
Folk (1954) (S: sand, Z: silt, C: clay, M: mud, s: sandy, z: silty, c: clayey, m:
muddy)
5. Conclusions
The tidal influence on the estuarine water quality was elucidated from a detailed study, which includes hourly tidal observation, temperature difference, water quality, beach profile and sediment texture studies at four locations in the Vembar estuarine banks. Major contributing factors, which govern the estuarine water quality, are identified and their relative dominance is discussed. This study also highlights on the causative factors for fluctuations in water chemistry among sampling stations. Tides in the Vembar estuary are semidiurnal with maximum amplitude of 1 m during spring tides. Tidal fluctuations are experienced up to station 4 (1.5 kms) from the closed estuarine mouth. In the Vembar estuary, it is seen that the distribution of temperature is controlled by local weather conditions. A significant rise in temperature is observed during 9.00 am and becomes steady till 5.00 pm. Surface temperature of the water chiefly depends on the incoming solar radiation and so the diurnal effects dominate over the tidal effect. From the synoptic surveys carried out, it is observed that the entire reach is influenced by saline intrusion during the study period (January). But, the water quality fluctuations in station 2a, 2b and 4a, 4b indicates regional disturbances due to salt pans and high evaporation rate respectively. The soils in these sampling stations have high saline content. The entrance channel sediments are characterised by coarse-grained sand. The grain size decreases with respect to upstream, and the high clay content is observed in station 4. The ternary plot suggested by Folk reveals that clayey sand, sandy clay and sandy textures dominates the estuarine sediments. Riverine processes contribute high clay content in the upstream samples and high sand content in the estuarine mouth is supplied by tidal action of waves. The beach profile (sand beach) act as a barrier between the estuarine and the open sea. An increase in 1-meter high tide can cause drastic effect to the estuarine water quality, which considerably affects the nearby freshwater aquifers.
Acknowledgements The authors would like to thank the Department of Science and Technology (DST) (WAR for WATER scheme) Govt. of India, New
Delhi. This work forms a part of the major research project (Project No: DST/WAR-W/SWI/010/2010) granted to Prof. N. Chandrasekar.
References
APHA, 1995. Standard methods for the examination of water and wastewater,
19th edn. American Public Health Association, Washington
Bowden, K.F., 1960. Circulation and mixing in the Mersey estuary. I.A.S.H.
Committee on Surface water, Publ. 51, 352-360.
Breusers, H.W.C., Vanos, A.G., 1981. Physical mode1ing of Rotterdamse
waterweg, Proceedings American Society of Civil engineers. Journal of
Hydraulics Division 107, No.H.Y.11, 1351-1370.
Burrough, P.A., McDonnell, R.A., 1998. Principles of geographical information
systems for land resources assessment. Oxford University Press, New York
Chandramohan, P., 1963. Studies on zoop1ankton of the Godavari estuary.
Thesis for Ph.D, Andra University, Waltair.
Chandramohan, P., Rao,T.S.S., 1972. Tidal cycle studies in relation to
zoop1ankton distribution in the Godavari estuary. Proceedings of Indian
Academy of Science 74, 23-31.
Cheriyan, T., 1973. Studies on the size distribution and physical
parameters of the sediments of Cochin harbour. Proceedings of Indian
Academy of Geophysics Union 10, 225-230.
Collar, R.H.F., 1978. Estuary circulation: assessment and application.
Proceedings of the Royal Society of Edinburgh 76B, 37-54.
Dutta, N., Malhotra, J.C., Bose, B.B., 1954. Hydrography and seasonal
fluctuation of the plankton in the Hoogly estuary. I.P.F.C. 1-13.
Dyer, K.R., 1973. Estuaries: A Physical Introduction. John Wiley, Chichester,
Sussex.140pp.
Folk, R., 1954. The distinction between grain size and composition in
sedimentary rock nomenclature. Journal of Geology 62, 344-359.
Gopinathan, C.K., Qasim, S.Z., 1971. Silting in navigational channels of the
Cochin harbour area. Journal of Marine Biological Association of India
13(1), 14-26.
Indorante, S.J., Hammer, R.D., Koenig, P.G., Follmer, L.R., 1990. Particle-Size
Analysis by a Modified Pipette Procedure. Soil Science Society of America
Journal 54(2), 560-563.
Jomon, J., Kurup, P.G., 1989. Volume transport and estuarine features at
Cochin inlet. Mahasagar 22, 165-172.
Krishanmoorthy, K., 1961. Daily variation in marine plankton from Porto
Nova, S. India. Journal of Zoological Society of India 13,180-197.
Lafond, E.C., Prasada Rao, R., 1954. Beach erosion cycles near Waltair on the
Bay of Bengal. Andhra University Memoirs in Oceanography 1, 63–77.
Magesh, N.S., Chandrasekar, N., Vetha Roy, D., 2011. Spatial analysis of trace
element contamination in sediments of Tamiraparani estuary, southeast
coast of India. Estuarine, Coastal and Shelf Science 92, 618-628
Mathes, E.S., Rasmussen, T.C., 2006. Combining multivariate statistical
analysis with geographic information systems mapping: a tool for
delineating groundwater contamination. Hydrogeology Journal 14, 1493-
1507
Morris, A.W., Allen, J.I., Howland, R.J.M., Wood, R.G. 1995. The estuary plume
zone: source or sink for land derived nutrient discharges? Estuarine,
Coastal and Shelf Science 40, 387-402.
Pritchard, D.W. ,1952. Salinity Distribution and Circulation in the Chesapeake
Bay Estuarine System. Journal of Marine Research 11,106-123.
Pylee, A., Varma, U.P., Revichandran, C., 1989. Some aspects of circulation
and mixing in the lower reaches of Periyar, West coast of India.
Indian Journal of Marine Sciences 19(1), 32-35.
Raju, V.S.R., Varma, P.U., Py1ee, A., 1979. Hydrographic characteristics and
tidal prism at the Cochin harbour mouth. Indian Journal of Marine Sciences
8, 78-84.
Ramammorthy, V.D., Krishnamoorthy, K., Seshadri, R., 1965. Comparative
hydrographica1 studies of the near shore and estuarine waters of Porto
Novo, S. India. Journal of Annama1ai University 26,154-164.
Revichandran, C., Shyam, K.R., Varma, P.U., Pylee, A., 1987. Water and Salt
budget in the Azhikode estuary during Post monsoon season. Indian
Journal of Marine Sciences 16,223-226.
Roy, H.K., 1955. Plankton ecology of river Hoogly, West Bengal. Ecology (36)2,
169-175.
J O U R N A L O F C O A S T A L S C I E N C E S
14
O R I G I N A L A R T I C L E
Schumann, E.H., Brink, K.H., 2009. Tidal and subtidal water level fluctuations
in the Berg Estuary. Transactions of the Royal Society of South Africa 64(2),
181-188.
Urish, D.W., McKenna, T.E., 2004. Tidal effects on ground water discharge
through a sandy marine beach. Ground Water—Oceans Issue 42(7), 971–
982.
Related Documents