Blood Lipid and Lipoprotein Adaptations to Exercise A Quantitative Analysis J. Larry Durstine, 1 Peter W. Grandjean, 2 Paul G. Davis, 3 Michael A. Ferguson, 1 Nathan L. Alderson 1 and Katrina D. DuBose 1 1 Department of Exercise Science, University of South Carolina, Columbia, South Carolina, USA 2 Department of Health and Human Performance, Auburn University, Auburn, Alabama, USA 3 Department of Exercise and Sport Science, University of North Carolina – Greensboro, Greensboro, North Carolina, USA Contents Abstract . . . . . . . . . . . . . . . . . . . . . . . . . . . . . . . . . . . . . . . . . . . . . . . . . . . 1033 1. Cross-Sectional Findings . . . . . . . . . . . . . . . . . . . . . . . . . . . . . . . . . . . . . . . . . . . 1034 1.1 Total Cholesterol (TC) and Low-Density Lipoprotein–Cholesterol (LDL-C) Differences Between Active and Sedentary Groups . . . . . . . . . . . . . . . . . . . . . . . . . . . . . . . 1034 1.2 High-Density Lipoprotein–Cholesterol (HDL-C) and Triglyceride (TG) Differences Between Active and Sedentary Groups . . . . . . . . . . . . . . . . . . . . . . . . . . . . . . . 1037 1.3 Dose-Response Relationships Between Physical Activity and Blood Lipids . . . . . . . . . . . 1037 1.4 Characterising an Exercise Threshold for Modifying Blood Lipids . . . . . . . . . . . . . . . . . 1039 1.5 Summary of Cross-Sectional Findings . . . . . . . . . . . . . . . . . . . . . . . . . . . . . . . . 1039 2. Exercise Training Interventions . . . . . . . . . . . . . . . . . . . . . . . . . . . . . . . . . . . . . . . 1040 2.1 Changes in TC and LDL-C Levels . . . . . . . . . . . . . . . . . . . . . . . . . . . . . . . . . . . 1040 2.1.1 Characterising an Exercise Dose for Significant TC and LDL-C Changes . . . . . . . . . 1040 2.1.2 Factors Influencing TC and LDL-C Changes with Exercise Training . . . . . . . . . . . . . 1041 2.1.3 Summary of TC and LDL-C Changes with Exercise Training . . . . . . . . . . . . . . . . . 1042 2.2 Changes in HDL-C and TG Levels . . . . . . . . . . . . . . . . . . . . . . . . . . . . . . . . . . . 1042 2.2.1 Factors Influencing HDL-C and TG Changes with Exercise Training . . . . . . . . . . . . 1042 2.2.2 Quantification of HDL-C and TG Changes with Exercise Training . . . . . . . . . . . . . 1043 2.2.3 Characterising an Exercise Dose for Significant HDL-C Changes . . . . . . . . . . . . . 1044 2.2.4 Characterising an Exercise Dose for Significant TG Changes . . . . . . . . . . . . . . . . 1044 2.2.5 Summary of HDL-C and TG Changes with Exercise Training . . . . . . . . . . . . . . . . 1045 3. Conclusion . . . . . . . . . . . . . . . . . . . . . . . . . . . . . . . . . . . . . . . . . . . . . . . . . . 1045 Abstract Dose-response relationships between exercise training volume and blood lipid changes suggest that exercise can favourably alter blood lipids at low training volumes, although the effects may not be observable until certain exercise thres- holds are met. The thresholds established from cross-sectional literature occur at training volumes of 24 to 32km (15 to 20 miles) per week of brisk walking or jogging and elicit between 1200 to 2200 kcal/wk. This range of weekly energy expenditure is associated with 2 to 3 mg/dl increases in high-density lipoprotein– cholestrol (HDL-C) and triglyceride (TG) reductions of 8 to 20 mg/dl. Evidence REVIEW ARTICLE Sports Med 2001; 31 (15): 1033-1062 0112-1642/01/0015-1033/$22.00/0 © Adis International Limited. All rights reserved.

Welcome message from author
This document is posted to help you gain knowledge. Please leave a comment to let me know what you think about it! Share it to your friends and learn new things together.
Transcript
Blood Lipid and LipoproteinAdaptations to ExerciseA Quantitative Analysis
J. Larry Durstine,1 Peter W. Grandjean,2 Paul G. Davis,3 Michael A. Ferguson,1 Nathan L. Alderson1 and Katrina D. DuBose1
1 Department of Exercise Science, University of South Carolina, Columbia, South Carolina, USA2 Department of Health and Human Performance, Auburn University, Auburn, Alabama, USA3 Department of Exercise and Sport Science, University of North Carolina – Greensboro,
Greensboro, North Carolina, USA
Contents Abstract . . . . . . . . . . . . . . . . . . . . . . . . . . . . . . . . . . . . . . . . . . . . . . . . . . . 10331. Cross-Sectional Findings . . . . . . . . . . . . . . . . . . . . . . . . . . . . . . . . . . . . . . . . . . . 1034
1.1 Total Cholesterol (TC) and Low-Density Lipoprotein–Cholesterol (LDL-C) DifferencesBetween Active and Sedentary Groups . . . . . . . . . . . . . . . . . . . . . . . . . . . . . . . 1034
1.2 High-Density Lipoprotein–Cholesterol (HDL-C) and Triglyceride (TG) DifferencesBetween Active and Sedentary Groups . . . . . . . . . . . . . . . . . . . . . . . . . . . . . . . 1037
1.3 Dose-Response Relationships Between Physical Activity and Blood Lipids . . . . . . . . . . . 10371.4 Characterising an Exercise Threshold for Modifying Blood Lipids . . . . . . . . . . . . . . . . . 10391.5 Summary of Cross-Sectional Findings . . . . . . . . . . . . . . . . . . . . . . . . . . . . . . . . 1039
2. Exercise Training Interventions . . . . . . . . . . . . . . . . . . . . . . . . . . . . . . . . . . . . . . . 10402.1 Changes in TC and LDL-C Levels . . . . . . . . . . . . . . . . . . . . . . . . . . . . . . . . . . . 1040
2.1.1 Characterising an Exercise Dose for Significant TC and LDL-C Changes . . . . . . . . . 10402.1.2 Factors Influencing TC and LDL-C Changes with Exercise Training . . . . . . . . . . . . . 10412.1.3 Summary of TC and LDL-C Changes with Exercise Training . . . . . . . . . . . . . . . . . 1042
2.2 Changes in HDL-C and TG Levels . . . . . . . . . . . . . . . . . . . . . . . . . . . . . . . . . . . 10422.2.1 Factors Influencing HDL-C and TG Changes with Exercise Training . . . . . . . . . . . . 10422.2.2 Quantification of HDL-C and TG Changes with Exercise Training . . . . . . . . . . . . . 10432.2.3 Characterising an Exercise Dose for Significant HDL-C Changes . . . . . . . . . . . . . 10442.2.4 Characterising an Exercise Dose for Significant TG Changes . . . . . . . . . . . . . . . . 10442.2.5 Summary of HDL-C and TG Changes with Exercise Training . . . . . . . . . . . . . . . . 1045
3. Conclusion . . . . . . . . . . . . . . . . . . . . . . . . . . . . . . . . . . . . . . . . . . . . . . . . . . 1045
Abstract Dose-response relationships between exercise training volume and blood lipidchanges suggest that exercise can favourably alter blood lipids at low trainingvolumes, although the effects may not be observable until certain exercise thres-holds are met. The thresholds established from cross-sectional literature occur attraining volumes of 24 to 32km (15 to 20 miles) per week of brisk walking orjogging and elicit between 1200 to 2200 kcal/wk. This range of weekly energyexpenditure is associated with 2 to 3 mg/dl increases in high-density lipoprotein–cholestrol (HDL-C) and triglyceride (TG) reductions of 8 to 20 mg/dl. Evidence
REVIEW ARTICLE Sports Med 2001; 31 (15): 1033-10620112-1642/01/0015-1033/$22.00/0
© Adis International Limited. All rights reserved.
from cross-sectional studies indicates that greater changes in HDL-C levels canbe expected with additional increases in exercise training volume. HDL-C andTG changes are often observed after training regimens requiring energy expendituressimilar to those characterised from cross-sectional data. Training programmes thatelicit 1200 to 2200 kcal/wk in exercise are often effective at elevating HDL-C levelsfrom 2 to 8 mg/dl, and lowering TG levels by 5 to 38 mg/dl. Exercise trainingseldom alters total cholesterol (TC) and low-density lipoprotein–cholesterol (LDL-C). However, this range of weekly exercise energy expenditure is also associated withTC and LDL-C reductions when they are reported. The frequency and extent to whichmost of these lipid changes are reported are similar in both genders, with the exceptionof TG. Thus, for most individuals, the positive effects of regular exercise are exertedon blood lipids at low training volumes and accrue so that noticeable differencesfrequently occur with weekly energy expenditures of1200 to 2200 kcal/wk. It appearsthat weekly exercise caloric expenditures that meet or exceed the higher end of thisrange are more likely to produce the desired lipid changes. This amount of physicalactivity, performed at moderate intensities, is reasonable and attainable for mostindividuals and is within the American College of Sports Medicine’s currently rec-ommended range for healthy adults.
There is substantial, consistent and strong evi-dence that physical activity is a deterrent for de-veloping many forms of cardiovascular disease.[1]
Among its many benefits, habitual physical activityis thought to reduce cardiovascular disease risk, atleast in part, by its favourable influence on circulatingblood lipids and lipoproteins.[2,3] Cross-sectionalstudies support a significant incremental effect ofexercise on blood lipids and lipoproteins in bothmen and women. However, the varied exercise in-terventions, experimental designs and participantsample characteristics of longitudinal investigationshave hindered efforts to quantify the exercise doseneeded to change lipids and lipoprotein levels invarious subgroups of the general population. In ad-dition, some lipids and lipoproteins, such as high-density lipoprotein–cholesterol (HDL-C) and tri-glyceride (TG), are more amenable to exercise thanothers.[2,3] Thus, thresholds for an exercise effecton lipids and lipoproteins are hard to identify fromthe existing literature and at present, remain elu-sive. In this review, we will address the magnitudeand direction of lipid and lipoprotein responses toendurance exercise training and attempt to quantifythe amount of physical activity that may elicit sig-nificant changes in blood lipid and lipoprotein vari-ables.
1. Cross-Sectional Findings
1.1 Total Cholesterol (TC) and Low-DensityLipoprotein–Cholesterol (LDL-C) DifferencesBetween Active and Sedentary Groups
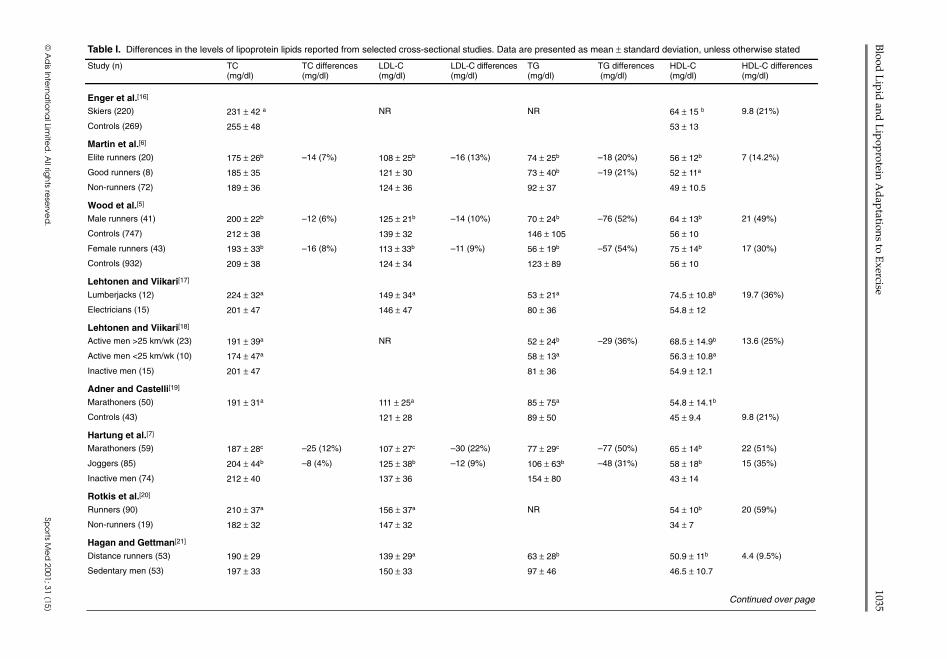
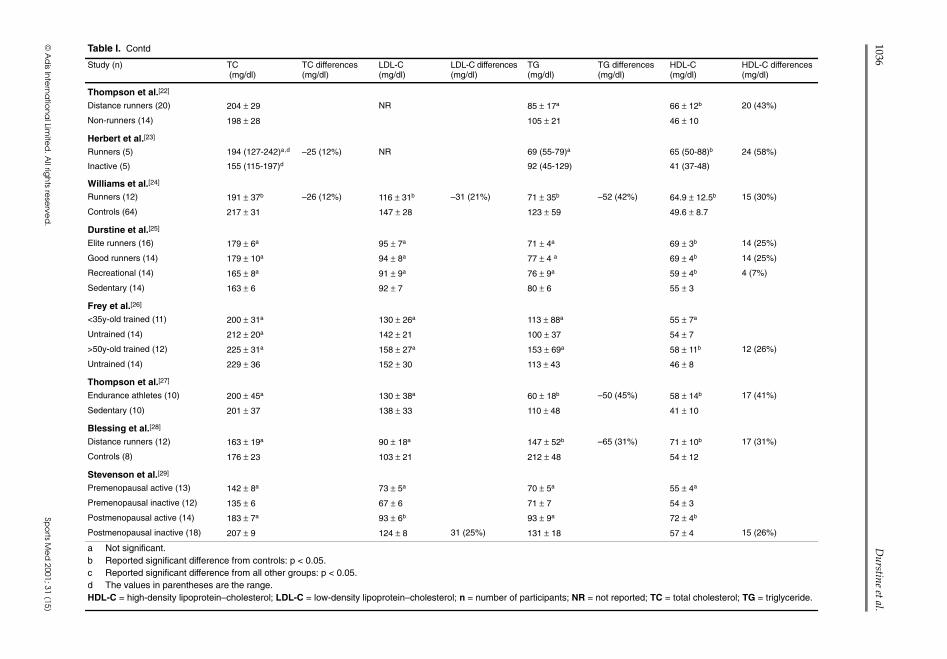
Reports from cross-sectional studies over thelast several decades provide compelling evidencefor the positive influence of physical activity andexercise on blood lipid and lipoprotein levels (tableI).[2,3] In general, blood lipid and lipoprotein pro-files of physically active groups reflect a reducedrisk for the development of cardiovascular diseasewhen compared with their inactive counterparts.[1,4]
Nonetheless, there is limited evidence to suggestthat those who are physically active exhibit lowerlevels of total cholesterol (TC) and low-densitylipoprotein–cholesterol (LDL-C) than those whoare less active.[5-10] In these studies, total and LDL-Cvalues were lower by 14 to 31 mg/dl (7 to 21%) inthe physically active groups, suggesting that regu-lar physical exertion has a dramatic influence onthese lipid variables. However, a well-recognisedproblem with observational studies is that, by de-sign, they do not account for confounding factors,such as group differences in bodyweight and bodyfat, caloric intake, nutrient composition of diets,
1034 Durstine et al.
Adis International Limited. All rights reserved. Sports Med 2001; 31 (15)
Blood
Lip
id and
Lip
oprotein A
dap
tations to Exercise
1035
© A
dis In
tern
atio
na
l Limite
d. A
ll righ
ts rese
rved
.Sp
orts M
ed
2001; 31 (15)
Table I. Differences in the levels of lipoprotein lipids reported from selected cross-sectional studies. Data are presented as mean ± standard deviation, unless otherwise stated
Study (n) TC(mg/dl)
TC differences(mg/dl)
LDL-C(mg/dl)
LDL-C differences(mg/dl)
TG(mg/dl)
TG differences(mg/dl)
HDL-C(mg/dl)
HDL-C differences(mg/dl)
Enger et al.[16]
Skiers (220) 231 ± 42 a NR NR 64 ± 15 b 9.8 (21%)
Controls (269) 255 ± 48 53 ± 13
Martin et al.[6]
Elite runners (20) 175 ± 26b –14 (7%) 108 ± 25b –16 (13%) 74 ± 25b –18 (20%) 56 ± 12b 7 (14.2%)
Good runners (8) 185 ± 35 121 ± 30 73 ± 40b –19 (21%) 52 ± 11a
Non-runners (72) 189 ± 36 124 ± 36 92 ± 37 49 ± 10.5
Wood et al.[5]
Male runners (41) 200 ± 22b –12 (6%) 125 ± 21b –14 (10%) 70 ± 24b –76 (52%) 64 ± 13b 21 (49%)
Controls (747) 212 ± 38 139 ± 32 146 ± 105 56 ± 10
Female runners (43) 193 ± 33b –16 (8%) 113 ± 33b –11 (9%) 56 ± 19b –57 (54%) 75 ± 14b 17 (30%)
Controls (932) 209 ± 38 124 ± 34 123 ± 89 56 ± 10
Lehtonen and Viikari[17]
Lumberjacks (12) 224 ± 32a 149 ± 34a 53 ± 21a 74.5 ± 10.8b 19.7 (36%)
Electricians (15) 201 ± 47 146 ± 47 80 ± 36 54.8 ± 12
Lehtonen and Viikari[18]
Active men >25 km/wk (23) 191 ± 39a NR 52 ± 24b –29 (36%) 68.5 ± 14.9b 13.6 (25%)
Active men <25 km/wk (10) 174 ± 47a 58 ± 13a 56.3 ± 10.8a
Inactive men (15) 201 ± 47 81 ± 36 54.9 ± 12.1
Adner and Castelli[19]
Marathoners (50) 191 ± 31a 111 ± 25a 85 ± 75a 54.8 ± 14.1b
Controls (43) 121 ± 28 89 ± 50 45 ± 9.4 9.8 (21%)
Hartung et al.[7]
Marathoners (59) 187 ± 28c –25 (12%) 107 ± 27c –30 (22%) 77 ± 29c –77 (50%) 65 ± 14b 22 (51%)
Joggers (85) 204 ± 44b –8 (4%) 125 ± 38b –12 (9%) 106 ± 63b –48 (31%) 58 ± 18b 15 (35%)
Inactive men (74) 212 ± 40 137 ± 36 154 ± 80 43 ± 14
Rotkis et al.[20]
Runners (90) 210 ± 37a 156 ± 37a NR 54 ± 10b 20 (59%)
Non-runners (19) 182 ± 32 147 ± 32 34 ± 7
Hagan and Gettman[21]
Distance runners (53) 190 ± 29 139 ± 29a 63 ± 28b 50.9 ± 11b 4.4 (9.5%)
Sedentary men (53) 197 ± 33 150 ± 33 97 ± 46 46.5 ± 10.7
Continued over page
© A
dis In
tern
atio
na
l Limite
d. A
ll righ
ts rese
rved
.Sp
orts M
ed
2001; 31 (15)
1036D
urstine et al.
Table I. Contd
Study (n) TC(mg/dl)
TC differences(mg/dl)
LDL-C(mg/dl)
LDL-C differences(mg/dl)
TG(mg/dl)
TG differences(mg/dl)
HDL-C(mg/dl)
HDL-C differences(mg/dl)
Thompson et al.[22]
Distance runners (20) 204 ± 29 NR 85 ± 17a 66 ± 12b 20 (43%)
Non-runners (14) 198 ± 28 105 ± 21 46 ± 10
Herbert et al.[23]
Runners (5) 194 (127-242)a,d –25 (12%) NR 69 (55-79)a 65 (50-88)b 24 (58%)
Inactive (5) 155 (115-197)d 92 (45-129) 41 (37-48)
Williams et al.[24]
Runners (12) 191 ± 37b –26 (12%) 116 ± 31b –31 (21%) 71 ± 35b –52 (42%) 64.9 ± 12.5b 15 (30%)
Controls (64) 217 ± 31 147 ± 28 123 ± 59 49.6 ± 8.7
Durstine et al.[25]
Elite runners (16) 179 ± 6a 95 ± 7a 71 ± 4a 69 ± 3b 14 (25%)
Good runners (14) 179 ± 10a 94 ± 8a 77 ± 4 a 69 ± 4b 14 (25%)
Recreational (14) 165 ± 8a 91 ± 9a 76 ± 9a 59 ± 4b 4 (7%)
Sedentary (14) 163 ± 6 92 ± 7 80 ± 6 55 ± 3
Frey et al.[26]
<35y-old trained (11) 200 ± 31a 130 ± 26a 113 ± 88a 55 ± 7a
Untrained (14) 212 ± 20a 142 ± 21 100 ± 37 54 ± 7
>50y-old trained (12) 225 ± 31a 158 ± 27a 153 ± 69a 58 ± 11b 12 (26%)
Untrained (14) 229 ± 36 152 ± 30 113 ± 43 46 ± 8
Thompson et al.[27]
Endurance athletes (10) 200 ± 45a 130 ± 38a 60 ± 18b –50 (45%) 58 ± 14b 17 (41%)
Sedentary (10) 201 ± 37 138 ± 33 110 ± 48 41 ± 10
Blessing et al.[28]
Distance runners (12) 163 ± 19a 90 ± 18a 147 ± 52b –65 (31%) 71 ± 10b 17 (31%)
Controls (8) 176 ± 23 103 ± 21 212 ± 48 54 ± 12
Stevenson et al.[29]
Premenopausal active (13) 142 ± 8a 73 ± 5a 70 ± 5a 55 ± 4a
Premenopausal inactive (12) 135 ± 6 67 ± 6 71 ± 7 54 ± 3
Postmenopausal active (14) 183 ± 7a 93 ± 6b 93 ± 9a 72 ± 4b
Postmenopausal inactive (18) 207 ± 9 124 ± 8 31 (25%) 131 ± 18 57 ± 4 15 (26%)
a Not significant.b Reported significant difference from controls: p < 0.05.c Reported significant difference from all other groups: p < 0.05.d The values in parentheses are the range.HDL-C = high-density lipoprotein–cholesterol; LDL-C = low-density lipoprotein–cholesterol; n = number of participants; NR = not reported; TC = total cholesterol; TG = triglyceride.
alcohol intake, smoking habits and other potential-ly lipid-altering lifestyle characteristics. When thesefactors are statistically controlled, the group dif-ferences in TC and LDL-C diminish and often areno longer significant.[8,11,12] Moreover, most cross-sectional studies indicate smaller, nonsignificantdifferences in TC and LDL-C levels between exer-cise-trained and inactive individuals.[3,13] In addi-tion, regression analyses of data from large-scaleepidemiological investigations have failed to con-sistently demonstrate a relationship between phys-ical activity, TC and LDL-C in normo- and hyper-lipidaemic groups.[14,15]
1.2 High-Density Lipoprotein–Cholesterol(HDL-C) and Triglyceride (TG) DifferencesBetween Active and Sedentary Groups
Observational data provide stronger evidence forlower TG and higher HDL-C levels in physicallyactive individuals.[2,3] TG levels are almost alwayslower in endurance athletes, aerobically trained,and physically active individuals when comparedwith sedentary controls.[2,3] Significant TG differ-ences between these groups range from 18 to 77mg/dl or 19 to 50% in over half of all cross-sectionalstudies reviewed.[5-10,12,18,21,24,27,28,30-33] Blood lev-els of HDL-C are 4 to 24 mg/dl higher in thosehaving physically demanding jobs and individualsengaged in endurance exercise compared with theirless active counterparts. [5-7,16-23,26-29,34] The rela-tive differences in HDL-C that exist between exer-cisers and their inactive peers range from 9 to 59%.
1.3 Dose-Response Relationships BetweenPhysical Activity and Blood Lipids
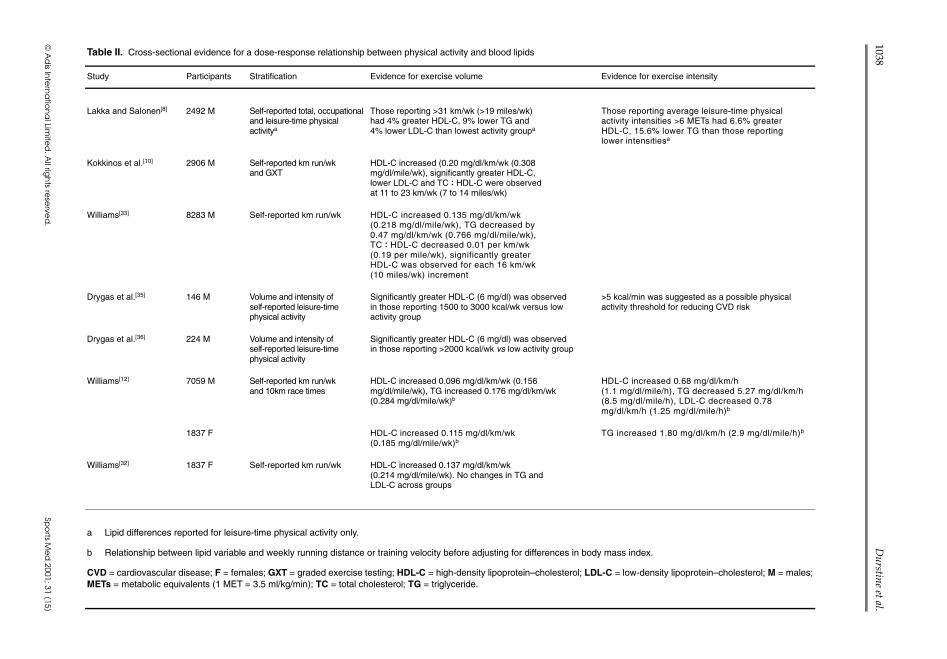
Several investigators have used cross-sectionaldesigns to quantify dose-response relationships be-tween the volume of exercise and changes in bloodlipid levels (table II).[8,10,12,32,33,35,36] Kokkinos etal.[10] compared the blood lipid levels of 2906middle-aged men who were partitioned into 6 groupsbased on their self-reported kilometres run per week.TG levels, HDL-C, and the TC : HDL-C ratio im-proved incrementally with training volume. HDL-Cincreased ~0.20 mg/dl/km (~0.31 mg/dl/mile) and
the relationships between kilometres run per weekand improvements in HDL-C, TG and theTC : HDL-C ratio were consistent across activity groups. Theseresults suggest that, although exercise may have aneffect on blood lipid levels at low exercise trainingvolumes, lipid and lipoprotein concentration dif-ferences between exercise and sedentary groups be-come significant in individuals running 11 to 23km(7 to 14 miles) per week (700 to 1500 kcal/wk).The differences between individuals running at thislevel and the sedentary group were ~3.5 mg/dl and–20 mg/dl for HDL-C and TG levels, respectively,and 0.59 for the TC : HDL-C ratio.
Using a similar cross-sectional design, Drygasand colleagues[35] found that significant HDL-C dif-ferences between male exercisers and those in thelowest activity category (~6 mg/dl) occurred with ex-ercise energy expenditures of 1500 to 3000 kcal/wk.Their results also indicated that further increasesin exercise volume can impart additional benefitson this lipid fraction, since the HDL-C differenceincreased by 3.5 mg/dl in those reporting exerciseenergy expenditures exceeding 3000 kcal/wk. In asubsequent study, these same investigators notedthat the threshold for significant HDL-C differencesbetween middle-aged male exercisers and seden-tary controls was 4 mg/dl and occurred at an exer-cise energy expenditure of 2000 kcal/wk.[36] Re-ports from the National Runner’s Health Study,which included 8283 men[33] and 1837 women[32]
showed patterns that were similar to those reportedby Kokkinos et al.[10] In men, HDL-C increased by0.135 mg/dl/km (0.218 mg/dl/mile), while TG andthe TC : HDL-C ratio decreased by 0.48 mg/dl and0.012 per kilometre, respectively.[32] Williams[32,33]
observed higher levels of HDL-C and lower TGlevels with each 16km (10-mile) increment in weeklyrunning distance in both men and women. How-ever, in men, differences in HDL-C (+1.5 mg/dl)and TG (–7 mg/dl) between the least active andnext exercise group were somewhat lower than thatreported by Kokkinos et al.[10] The relationship be-tween HDL-C and running distance in both pre- andpostmenopausal women were strikingly similar tothose observed in men; however, TG and the TC :HDL-C ratio were unchanged.[32] In women, each
Blood Lipid and Lipoprotein Adaptations to Exercise 1037
Adis International Limited. All rights reserved. Sports Med 2001; 31 (15)
© A
dis In
tern
atio
na
l Limite
d. A
ll righ
ts rese
rved
.Sp
orts M
ed
2001; 31 (15)
Table II. Cross-sectional evidence for a dose-response relationship between physical activity and blood lipids
Study Participants Stratification Evidence for exercise volume Evidence for exercise intensity
Lakka and Salonen[8] 2492 M Self-reported total, occupationaland leisure-time physicalactivitya
Those reporting >31 km/wk (>19 miles/wk)had 4% greater HDL-C, 9% lower TG and4% lower LDL-C than lowest activity groupa
Those reporting average leisure-time physicalactivity intensities >6 METs had 6.6% greaterHDL-C, 15.6% lower TG than those reportinglower intensitiesa
Kokkinos et al.[10] 2906 M Self-reported km run/wkand GXT
HDL-C increased (0.20 mg/dl/km/wk (0.308mg/dl/mile/wk), significantly greater HDL-C,lower LDL-C and TC : HDL-C were observedat 11 to 23 km/wk (7 to 14 miles/wk)
Williams[33] 8283 M Self-reported km run/wk HDL-C increased 0.135 mg/dl/km/wk(0.218 mg/dl/mile/wk), TG decreased by0.47 mg/dl/km/wk (0.766 mg/dl/mile/wk),TC : HDL-C decreased 0.01 per km/wk(0.19 per mile/wk), significantly greaterHDL-C was observed for each 16 km/wk(10 miles/wk) increment
Drygas et al.[35] 146 M Volume and intensity ofself-reported leisure-timephysical activity
Significantly greater HDL-C (6 mg/dl) was observedin those reporting 1500 to 3000 kcal/wk versus lowactivity group
>5 kcal/min was suggested as a possible physicalactivity threshold for reducing CVD risk
Drygas et al.[36] 224 M Volume and intensity ofself-reported leisure-timephysical activity
Significantly greater HDL-C (6 mg/dl) was observedin those reporting >2000 kcal/wk vs low activity group
Williams[12] 7059 M Self-reported km run/wkand 10km race times
HDL-C increased 0.096 mg/dl/km/wk (0.156mg/dl/mile/wk), TG increased 0.176 mg/dl/km/wk(0.284 mg/dl/mile/wk)b
HDL-C increased 0.68 mg/dl/km/h(1.1 mg/dl/mile/h), TG decreased 5.27 mg/dl/km/h(8.5 mg/dl/mile/h), LDL-C decreased 0.78mg/dl/km/h (1.25 mg/dl/mile/h)b
1837 F HDL-C increased 0.115 mg/dl/km/wk(0.185 mg/dl/mile/wk)b
TG increased 1.80 mg/dl/km/h (2.9 mg/dl/mile/h)b
Williams[32] 1837 F Self-reported km run/wk HDL-C increased 0.137 mg/dl/km/wk(0.214 mg/dl/mile/wk). No changes in TG andLDL-C across groups
a Lipid differences reported for leisure-time physical activity only.
b Relationship between lipid variable and weekly running distance or training velocity before adjusting for differences in body mass index.
CVD = cardiovascular disease; F = females; GXT = graded exercise testing; HDL-C = high-density lipoprotein–cholesterol; LDL-C = low-density lipoprotein–cholesterol; M = males;METs = metabolic equivalents (1 MET = 3.5 ml/kg/min); TC = total cholesterol; TG = triglyceride.
1038D
urstine et al.

16km (10-mile) increase in weekly running dis-tance was associated with a 2.1 mg/dl increase inHDL-C levels. These findings were supported in sep-arate investigations by Moore et al.[37] and Durstineet al.[25] Moore and colleagues[37] determined thatrunning distance was predictive of greater HDL-Clevels in inactive females, recreational joggers andlong-distance runners. In their study, the influenceof running distance on HDL-C remained significantafter adjusting for group differences in body fat. Dur-stine and co-workers,[25] demonstrated that HDL-Clevels were greater in female recreational runners andwere even higher in runners classified in the goodand elite groups versus age-matched sedentary con-trols. The time spent running each week was stronglyassociated with HDL-C levels, providing additionalevidence for a positive relationship between exercisevolume and favourable lipid and lipoprotein changes.
Interestingly, the studies by Williams,[12,32,33]
Kokkinos et al.,[9,10] and others[8,11,35] suggest thatalong with a training volume, the intensity of train-ing may be related to exercise-induced blood lipidand lipoprotein changes. Kokkinos et al.[9] found sig-nificantly better blood lipid and lipoprotein profilesin women who were able to achieve exercise inten-sities of 6 to 11 metabolic equivalents (1 MET =3.5 ml/kg/min) versus those exhibiting lower in-tensity levels (>6 METs). Williams[12] observed pre-dictive relationships between blood lipid and lipo-protein levels and increasing 10km run velocity,which was related to training intensity. However,results from these cross-sectional studies indicatedthat training volume, rather than training intensity,has the greatest influence on favourable blood lipidchanges. This is especially true for exercise-inducedchanges in HDL-C levels.[8,12]
1.4 Characterising an Exercise Threshold forModifying Blood Lipids
The statistical relationships between exercise andblood lipid and lipoprotein levels occur across ac-tivity levels in several of the cross-sectional studiesreviewed. These relationships demonstrate that theeffects of exercise on lipid and lipoprotein levelscan be initiated at low training volumes and willcontinue in a dose-response fashion with increas-
ing volume. With respect to gender and lipid andlipoprotein adaptations to exercise, men and womenmay respond similarly to exercise training, althoughthe sensitivity of the regression slopes for HDL-Cand TG imply that women may be more resistant toexercise-induced changes than men.[9,32,33] Arunningvolume of 11 to 23km (7 to 14 miles) has been pro-posed as a possible threshold for observing signif-icant HDL-C and TG concentration differences.[10,38]
However, this may be an underestimate of the re-quired exercise volume, since others have reportedthat significant HDL-C differences occur with en-ergy expenditures between 1500 and 3000 kcal/wk(~24 to 48 km/wk: ~15 to 30 miles/wk).[8,35] Morerecently, thresholds have been characterised with ca-loric expenditures of ≥2000 kcal/wk, which equatesto roughly 20 miles/wk of jogging or brisk walk-ing.[8,36] Although Williams[32,33] reported that sig-nificant differences in HDL-C and TG levels oc-cur in 16km (10-mile) increments in both men andwomen, the groups reporting the lowest amount ofphysical activity in these studies were already run-ning up to 16 km/wk (10 miles/wk). The next cat-egory of runners averaged between 16 to 32 km/wk(10 and 20 miles/wk). Therefore, a 24 to 32 km/wk(15 to 20 mile/wk), 1500 to 2200 kcal/wk thresholdfor significant HDL-C and TG changes comparesfavourably with the findings of Williams,[12,32,33] issupported by the current body of cross-sectional data,but is somewhat greater than what has been postu-lated as the threshold elsewhere.[38] At this point itshould be emphasised that walking and running arenot the only modes of physical activity in which fa-vourable lipid and lipoprotein changes occur. Manyinvestigators have reported similar relationships be-tween lipid levels and the volume of swimming, cy-cling and recreational sports participation.[8,35,36]
Thus, the volume of physical activity, in which a rel-atively large muscle mass is employed, relates to ca-loric expenditure and seems to be the stimulus foraltering blood lipids and lipoprotein levels.
1.5 Summary of Cross-Sectional Findings
Taken together, the cross-sectional data indi-cate that most sedentary individuals will experi-ence elevations of 3.5 to 6 mg/dl in HDL-C by
Blood Lipid and Lipoprotein Adaptations to Exercise 1039
Adis International Limited. All rights reserved. Sports Med 2001; 31 (15)
increasing their exercise energy expenditure to 1500to 2200 kcal/wk. Further increases in HDL-C of 1.5to 3 mg/dl can be expected for each 16 km/wk (10miles/wk) increment in running volume, whichequates to ~1100 kcal/wk of exercise energy ex-penditure. Differences in TG range from 7 to 20mg/dl at an energy expenditure of 1500 to 2200kcal/wk and further reductions of 3 to 8 mg/dl mayoccur for each 16km (10-mile) increase in trainingvolume. There is little support in the cross-sectionalliterature for significant differences in TC andLDL-C between active and inactive groups, inde-pendent of bodyweight and body fat differences.[8]
Causality can not be established from cross-sectional data and results from these observationalstudies may embellish the association between ex-ercise and blood lipid levels. Indeed, the greatestdisparities in blood lipids, and most often HDL-C,are generally reported when physiological differ-ences and the volume of physical activity betweengroups are extreme. The differences in blood lipidsand lipoprotein levels are often diminished or are nolonger observed when controlling for group char-acteristics that influence lipid levels,[8,11,12] and whenmore heterogeneous groups are compared.[39-42] Fur-thermore, blood lipid and lipoprotein level changesassociated with exercise training are not as frequentlyobserved and are generally more modest than thegroup differences reported between exercisers andnon-exercisers.[2,3] Therefore, it is important to ex-amine longitudinal training studies in order to de-termine the efficacy of threshold recommendationsfrom cross-sectional evidence.
2. Exercise Training Interventions
2.1 Changes in TC and LDL-C Levels
TC and LDL-C levels infrequently change withexercise training in either men or women.[2,3] Infact, lower TC and LDL-C levels result after exer-cise training in just over 25% of the publicationsreviewed (Appendix I). When exercise training hasbeen shown to alter TC levels, the reductions aresimilar in both men and women and range from 7to 27 mg/dl, or 4 to 20%. Likewise, lower LDL-Clevels ranging from 6 to 28 mg/dl (5 to 19%) have
been reported after exercise training in both genders.The adaptations reported with exercise training aresimilar to differences observed between exercisersand sedentary groups from the cross-sectional lit-erature. However, control groups were not includedin many of these training studies, and therefore, theeffects of exercise on TC and LDL-C levels may beoverstated.[43-51] Indeed, the extent to which exer-cise training lowers these lipid fractions is eithersomewhat lower (6 to 13 mg/dl or 4 to 7%)[52-56] orno longer significant[57-59] when the exercise effectis adjusted for the TC and LDL-C changes that oc-cur in control groups over the training period. Es-timates from a recent meta-analysis of randomisedcase-control studies suggest that exercise trainingmay only be expected to lower TC and LDL-C lev-els by ~4 mg/dl.[60]
2.1.1 Characterising an Exercise Dose forSignificant TC and LDL-C ChangesSignificant changes in TC and LDL-C levels are
generally not observed after exercise training witha few exceptions. Therefore, there is little evidenceto support a training threshold for lowering TC andLDL-C levels. When changes have been reported,they are often associated with exercise training pro-grammes in which participants expended more than1200 kcal/wk.[43,44,47,51,52,56,61-65] Endurance exer-cise programmes producing this level of caloric ex-penditure are most effective at lowering TC andLDL-C in previously untrained individuals, sincetrained individuals do not seem to respond, evenwith extreme increases in training volume.[58,66,67]
Some investigators have suggested that the differ-ent lipid responses to exercise in trained versus un-trained individuals may be caused by differencesin initial TC and LDL-C levels. They reason thatphysically inactive individuals who exhibit higherinitial TC or LDL-C levels may be expected to showgreater exercise-induced changes than those withlower baseline cholesterol levels.[68,69] However,baseline TC and LDL-C levels probably do not ex-ert a significant influence on cholesterol adapta-tions to exercise training, since similar reductionsin TC and LDL-C can occur in those with high[43,70]
or normal baseline cholesterol levels.[62,65] Further-more, in a recent meta-analysis of 31 randomised,
1040 Durstine et al.
Adis International Limited. All rights reserved. Sports Med 2001; 31 (15)

controlled exercise training studies, Halbert and co-workers[60] did not find a significant relationshipbetween baseline lipid levels and the changes inlipids that occur with exercise training.
2.1.2 Factors Influencing TC and LDL-C Changeswith Exercise TrainingWhen non-obese men and women are directly
compared, there is limited evidence to suggest thatwomen may be more resistant to exercise-inducedchanges in TC and LDL-C than their male counter-parts.[44,45] This seems to be the case when weeklycaloric expenditure meets or exceeds 1200 kcal.However, Shephard et al.[61] have reported just theopposite, and Brownell et al.[71] observed no gen-der differences after low-volume exercise traininginterventions. Others have shown that TC and LDL-C do not change in pre- and postmenopausal womenfollowing aerobic exercise training;[72] however, theuse of hormone replacement therapy may enhancethe lipid and lipoprotein adaptations to exercise inpostmenopausal women.[54]
Some investigators have suggested that theexercise-induced changes in TC and LDL-C arecaused by bodyweight and body fat reductions.[13]
This may be true for subsets of the population inwhich large bodyweight or fat losses are reported,such as in obese women.[50,73-76] However, the pres-ent exercise literature does not provide definitiveevidence that bodyweight and fat loss are requisitefor changing TC or LDL-C. First, there are severalexercise training studies in which TC and LDL-Cwere significantly reduced in the absence of body-weight and/or body fat changes.[45-47,52,62,65,77] Sec-ond, TC and LDL-C are often unchanged after ex-ercise training programmes in which bodyweightand body fat are significantly lowered.[59,67,78-89]
Third, when TC and LDL-C changes are reportedafter exercise training, they are of similar magni-tude with and without losses in bodyweight or bodyfat (Appendix I). However, lower TC and LDL-Clevels are more frequently observed when substan-tial bodyweight loss occurs through a combinationof diet and exercise.[59,74-76,90-93] However, it is un-clear as to whether the reductions in TC and LDL-Cafter these interventions are caused by greater ca-loric deficits and bodyweight loss than what is gen-
erally reported after exercise alone, or if a decreasein dietary saturated fat and cholesterol intake aremore strongly associated with these lipid changes.A conclusive position on these issues can not bemade from the current literature, as Schwartz[86]
observed decreases in TC and LDL-C with diet-induced, but not exercise-induced bodyweight loss.Nieman et al.[75] reported similar reductions in TCand LDL-C levels with diet alone or in combina-tion with exercise. On the other hand, Wood et al.[59]
and Coon et al.[94] found small, comparable, butnonsignificant reductions in TC and LDL-C levelsafter bodyweight loss by diet or by exercise.
It is difficult to evaluate the effects of exerciseintensity on TC and LDL-C changes, since mosttraining studies were conducted with intensities>60% of maximum heart rate or maximal oxygenuptake (V
.O2max). As such, most of the reductions
in TC and LDL-C that have been reported withexercise occur at these training intensities or greater.Despres and colleagues,[64] however, observed sig-nificant reductions in TC and LDL-C with a low-intensity/high-volume training regimen. Others havecompared the effects of training intensities, rang-ing from 40 to 85% of V
.O2max and did not find an
intensity effect on TC and LDL-C.[79,95-98] Stein etal.[99] and Tomiyasu et al.[48] reported greater re-ductions in TC and LDL-C levels with high- versusmoderate-intensity training; however, a failure tocontrol for the exercise volume in both of thesestudies makes their findings hard to interpret.
Resistance training does not seem to alter bloodlipid and lipoprotein levels.[100-104] Some investi-gators have reported lower TC and/or LDL-C levelsafter several weeks of resistance training.[55,105,106]
However, the sample sizes in these studies weresmall and, other than the results from Hurley etal.,[106] these findings have been generally limitedto females.[55,105] Resistance exercise, in general,may be less effective than endurance activities formodifying TC and LDL-C levels, since relativelyfewer calories are expended with resistance versusaerobic activity. In fact, the work of Blumenthal etal.[101] and Smutok et al.[100] have shown that lipidsand lipoproteins changes should not be expected
Blood Lipid and Lipoprotein Adaptations to Exercise 1041
Adis International Limited. All rights reserved. Sports Med 2001; 31 (15)
after low-volume exercise interventions of eitherresistance or aerobic activities.
2.1.3 Summary of TC and LDL-C Changes with Exercise TrainingIn summary, a careful evaluation of the literature
indicates that exercise training, more often than not,results in unaltered TC and LDL-C levels. In someinstances, regular exercise can produce smallchanges in TC and LDL-C of 4 to 7% in both menand women. Reductions in these lipid fractions oc-cur with greater frequency in previously sedentaryindividuals and when exercise caloric expenditureexceeds 1200 kcal/wk. At present, baseline levelsof TC and LDL-C, changes in bodyweight and bodyfat, and exercise intensity do not seem to be deter-minants for exercise-induced changes in TC andLDL-C levels.
2.2 Changes in HDL-C and TG Levels
Based on the frequency of reported changes inHDL-C and TG levels following exercise training,these lipid variables are more responsive to regularexercise than TC and LDL-C. Significantly greaterHDL-C and lower TG levels have been reportedafter exercise training in over half of the manu-scripts reviewed (Appendix I).[2,3] Therefore, reg-ular aerobic exercise is often cited as consistentlyimproving these lipid and lipoprotein levels. HDL-Cand TG changes, however, are not always observedafter exercise training interventions. Suggestedreasons for the disparate findings include differ-ences in exercise training regimens, baseline char-acteristics between study cohorts, and the extent towhich bodyweight or body fat changes with exer-cise training. Other factors, such as the influenceof alcohol, tobacco, lipid altering medications andthe level of dietary intervention or control, mayaffect HDL-C and TG adaptations to exercise train-ing.[3,13,68,107]
2.2.1 Factors Influencing HDL-C and TG Changes with Exercise TrainingIn a 1983 meta-analysis of longitudinal studies,
Tran et al.[69] reported that the changes in HDL-Clevels with exercise training were inversely relatedto baseline HDL-C levels. These findings suggested
that individuals with the lowest HDL-C levels wouldexhibit the greatest increases in HDL-C with exer-cise training. However, this notion does not seemto hold true in light of more recent findings. Forexample, Raz et al. [53] reported that aerobic exer-cise training was ineffective in modifying HDL-Clevels in young men with low initial HDL-C val-ues. Williams and colleagues[108] found that exer-cise training increased HDL-C to a lesser extent inmen with low versus normal baseline HDL-C lev-els. Others have demonstrated that HDL-C adaptsmost favourably to exercise training in men withnormal initial HDL-C values (>38 mg/dl) and isresistant to change in men with baseline HDL-Cvalues lower than 37 mg/dl.[81,109,110] To our knowl-edge, analogous studies have not been conductedwith women. However, elevations in HDL-C havebeen observed in women with moderate baselineHDL-C levels[82,111,112] and in those with high pre-existing HDL-C levels after large increases in ex-ercise training volume. [66,67] Therefore, it appearsthat exercise training may be most effective at elevat-ing HDL-C in those with normal or higher HDL-Clevels before undergoing an exercise programme.Present literature does not support the contentionthat baseline TG values influence TG adaptationsto exercise training in either gender.[60]
Inverse relationships have been established be-tween body mass index (BMI), percentage bodyfat, regional body fat measured at baseline and theextent to which HDL-C and TG levels change withexercise training.[86,94,110] Observations from thesestudies suggest that exercise-induced changes inHDL-C and TG are smaller in individuals with agreater BMI, body fat or with more central fat dis-tribution. These physical characteristics may beindicative of underlying metabolism that impedestraining-induced changes in these blood lipids. Forexample, unique metabolic characteristics relatedto HDL-C and TG metabolism have been observedin adipocytes of different fat depots and suggest amechanistic link between body fat, regional fat dis-tribution and HDL-C and TG adaptations to exer-cise training.[113-115]
Contrary to a commonly held notion, a reduc-tion in bodyweight or body fat is not requisite for
1042 Durstine et al.
Adis International Limited. All rights reserved. Sports Med 2001; 31 (15)
exercise to produce significant changes in HDL-Cand TG. In men, favourable changes in these lipidsoccur with equal frequency when bodyweight andbody fat are reduced[53,59,62-64,81,83,86,89,90,116,117] ornot altered with exercise.[48,52,99,109,118-125] In women,TG and HDL-C changes occur most often in theabsence of bodyweight and fat loss.[66,67,87,95,111,126]
Interestingly, when bodyweight loss is induced byeither dietary intervention, alone or in combinationwith exercise, HDL-C can increase,[76,108,127] how-ever, a majority of studies indicate that HDL-C willdecrease[74,75,91] or not change.[92,128] In fact, someinvestigators have suggested that exercise mayprevent a decrease in HDL-C when combined withdietary means of bodyweight or body fat reduc-tion.[75,91] Nevertheless, these studies provide evi-dence that bodyweight loss and body fat reductionare not necessary for exercise to have a beneficialeffect on HDL-C and TG levels, as changes in thesephysical characteristics do not seem to influencethe magnitude or direction of change in these lipidand lipoprotein fractions.
Several investigators have demonstrated that ex-ercise can alter HDL-C and TG levels to the sameextent in men and women.[49,97,129] However, fa-vourable changes in HDL-C and TG levels are re-ported less frequently in women (Appendix I).[130]
Reasons for less consistent findings in women arenot completely clear. Some physiologic and meta-bolic factors that can influence lipid metabolism,such as smaller muscle and greater fat mass, differ-ent fat distribution, menstrual cycle fluctuations,the use of oral contraceptives in premenopausalwomen, menopausal status, and the use of hormonereplacement therapy in postmenopausal women arethought to contribute to a greater variance in the lipidadaptations to exercise training in females.[54,72,131]
2.2.2 Quantification of HDL-C and TG Changeswith Exercise TrainingWhen HDL-C levels are significantly elevated
after exercise training, the increases are similar inboth men and women and generally range from 2 to8 mg/dl, or 4 to 22%. However, increases of 15 to 19mg/dl have been reported in both genders.[66,120,122]
Likewise, significant reductions in TG levels, rang-ing from 5 to 38 mg/dl or 4 to 37%, have been
reported for males after exercise training, but lessfrequently in females. In their recent meta-analysis,Halbert and co-workers[60] suggested that the ef-fects of exercise training on HDL-C and TG favouredthe more conservative ends of these ranges. Theseinvestigators estimated that exercise training in-creased HDL-C levels by 2 mg/dl and reduced TGvalues by 9 mg/dl. Although these estimates aremodest, they may represent a reduction in cardio-vascular disease risk of 2 to 4%.[132,133]
In both men and women, extreme increases inrunning volume have been effective at elevatingHDL-C by 6 to 17 mg/dl (10 to 29%).[48,66,67,119,134]
In men but not women, TG levels were also re-duced by 30 to 38 mg/dl, or 30 to 37%.[48,119] Alongwith greater exercise training volumes, the abso-lute and relative lipid changes are greater in thesestudies when compared with the rest of the train-ing literature, suggesting that there may be a dose-response effect of exercise on HDL-C and TG lev-els. However, most individuals would not adopt theexercise volumes or intensities utilised in these stud-ies as part of a permanent lifestyle practice. More-over, recommending training regimens similar tothe ones described in these investigations wouldnot be prudent for the general population, as theycan lead to an increased rate of injury and dropout.[135] Investigators who have addressed the dose-response issue with training volumes more likelyto be accepted by the general public have not founda relationship between increasing exercise frequency,volumes or intensities and changes in HDL-C orTG levels.[48,111,136] In addition, a preponderanceof training interventions that encompassed only afew weeks are of limited value because the fre-quency and intensity were not at a level that wouldproduce significant lipid changes. These issues allcontribute to the difficulty in quantifying an exer-cise training threshold for modifying HDL-C andTG levels. Thus, training threshold stimuli for al-tering these lipids and lipoproteins can be approx-imated, but not definitively established from theexercise training literature.
Blood Lipid and Lipoprotein Adaptations to Exercise 1043
Adis International Limited. All rights reserved. Sports Med 2001; 31 (15)
2.2.3 Characterising an Exercise Dose for Significant HDL-C ChangesIn men, significantly higher HDL-C levels are
observed consistently with moderate exercise train-ing programmes requiring ≥1200 kcal/wk. Althoughexceptions exist,[58,96,129,137,138] this energy expen-diture threshold was met in 21 out of the 25 studiesshowing significant increases in HDL-C levels (Ap-pendix I). Elevations in HDL-C are seldom reportedwith weekly training volumes eliciting less than1200 kcal.[46,99,116,139] Thus, a training volume of1200 kcal/wk or greater may be necessary to raiseHDL-C levels in men. Interestingly, a review of theexercise training literature indicated that the thresh-old for significant changes in HDL-C may be sim-ilar in both men and women. Changes in HDL-Care consistently shown in females when the weeklyexercise caloric expenditure meets or exceeds 1200kcal.[45,49,97,111,129] Training volumes that elicit 1000to 1200 kcal/wk in energy expenditure have alsobeen shown to elevate HDL-C levels in sedentaryand moderately fit women.[54,85,87,95,112,126] Yet, moreoften than not, weekly exercise energy expenditure inthe 1000 to 1200 kcal/wk range is not enough to ele-vate HDL-C levels in females.[51,72,73,101,136,138,140-145]
As with men, training volumes that require less than1000 kcal/wk are not enough to favourably improveHDL-C values.[55,71,78,80,104,146-149]
Currently, there is no evidence from the exer-cise training literature to support an exercise inten-sity threshold for producing HDL-C level changes.In many instances where exercise intensity was re-ported to influence HDL-C in males, investigatorsfailed to control for energy expenditure.[48,99,118]
As such, it can be argued that energy expenditureor training volume, rather than intensity, affectedthe results. When energy expenditure or trainingvolume is controlled, exercise intensity was notshown to influence HDL-C changes in men orwomen.[79,95,97,98,111]
2.2.4 Characterising an Exercise Dose for Significant TG ChangesIn an early training study, Holloszy and col-
leagues[150] determined that TG reductions attrib-uted to exercise training, are in fact an acute re-sponse to the last exercise session. Subsequent
research examining the effect of one exercise ses-sion on lipid metabolism has corroborated this ob-servation.[3] Therefore, the frequency and extent towhich TG level changes are reported after exercisetraining may be a function of when the final bloodsample was obtained relative to the last exercisesession, rather than a cumulative effect of the train-ing regimen. If exercise training imparts an effect onTGs, independent of the changes that occur from thelast exercise session, then the exercise volume thres-hold necessary for a TG level change may be sim-ilar to that necessary for HDL-C. For example, aweekly energy expenditure of ≥1200 kcal generallyproduces lower post-training TG levels in seden-tary and moderately fit men,[48,62,63,90,119,123-125,151]
with few exceptions.[44,58,83,120] Significant re-uctions in TG levels have occurred with weeklyexercise energy expenditures of 1000 to 1200kcal; [46,52,53,59,81,116,117,121,152] yet, this energy expen-diture does not consistently lower TG levels, as othershave reported no change in TG levels at similartraining volumes.[64,65,79,84,86,94,97,109,129,153,154] Othershave demonstrated that TG changes in men shouldnot be expected when exercise energy expenditureis lower than 1000 kcal/wk.[43,47,89,98-100,137,139,155]
An exercise threshold for lowering TG levels inwomen is not evident from the present training lit-erature. Many barriers contribute to the difficulty intrying to quantify a threshold stimulus. First, lowerTG levels are reported less frequently in women ver-sus men after exercise training.[56,73,85,87,117,126,149]
Second, when TG reductions occur, they are ob-served with training volumes eliciting 1000 to 3000kcal/wk and intensities ranging from 50 to 80% ofcardiovascular capacity.[73,85,117,126] These traininginterventions are similar in frequencies, volumesand intensities to those producing no change. Third,TGs are not altered when training volumes and in-tensities are increased to extreme levels,[66] indicat-ing that a dose-response relationship between ex-ercise training and TG changes may not exist forwomen. However, it should be emphasised that alack of evidence for a dose-response relationshipbetween exercise and TGs does not mean that ex-ercise has no effect on blood TG levels in women.Woods and Graham[149] have shown that measur-
1044 Durstine et al.
Adis International Limited. All rights reserved. Sports Med 2001; 31 (15)
able fluctuations in TG levels occur throughout themenstrual cycle, indicating that the menstrual phasein which blood samples were obtained may maskthe effects of exercise in premenopausal women.In addition, Binder’s group[54] determined that ex-ercise can attenuate the elevations in TG that mayaccompany hormone replacement therapy in post-menopausal women. Therefore, exercise can ben-eficially influence TG levels in women, whether ornot significant changes are observed with training.
2.2.5 Summary of HDL-C and TG Changes with Exercise TrainingIn summary, regular aerobic exercise can increase
HDL-C and TG levels in men and women. The effectof exercise on HDL-C is similar in both males andfemales; however, TG changes are more common-ly reported in males. The training effect is strongestin non-obese individuals with normal or elevatedHDL-C before the exercise intervention. In con-trast, baseline TG levels do not seem to impact TGresponses to exercise. In addition, changes in body-weight or body fat do not appear to be necessaryfor favourable exercise adaptations in these lipids.Regular exercise can raise HDL-C levels by 2 to 8mg/dl and lower TGs from 5 to 38 mg/dl in menand women. The training volumes that elicit energyexpenditures ≥1200 kcal/wk are most frequentlyassociated with elevations in HDL-C levels in bothgenders and reduced TG levels in men. At present,a threshold for lowering TGs in women can not beestablished from the exercise training literature.
3. Conclusion
Comparisons between sedentary and physicallyactive groups have been used to establish a positiveinfluence of physical activity on blood lipids. Physi-cally active individuals typically exhibit greaterHDL-C and lower TG levels versus their less ac-tive counterparts. In some instances, lower TC andLDL-C levels may also be observed in physicallyactive groups; however, this is not a consistent find-ing. Dose-response relationships between the amountof exercise and favourable blood lipid changes sug-gest that exercise can exert a positive influence onblood lipids at low training volumes, although the
effects may not be observable until certain exercisethresholds are met. The thresholds established fromcross-sectional literature appear to be similar in menand women and occur at training volumes of 24 to32 km/wk (15 to 20 miles/wk) of brisk walking orjogging and elicit between 1200 to 2200 kcal/wk.This range of weekly energy expenditure is asso-ciated with 2 to 3 mg/dl increases in HDL-C andTG reductions of 8 to 20 mg/dl.
Cross-sectional evidence also suggests that theselipid fractions are enhanced further with additionalincreases in exercise training volume. There is lim-ited support in the cross-sectional or interventionliterature for favourable changes in TC and LDL-Cwith exercise training. However, favourable changesin HDL-C and TGs are often observed after train-ing regimens requiring energy expenditures sim-ilar to those characterised from cross-sectional data.Training programmes that elicit 1200 to 2200 kcal/wkin exercise are often effective at elevating HDL-Clevels from 2 to 8 mg/dl and lowering TGs by 5 to38 mg/dl. This weekly exercise energy expenditureis also associated with TC and LDL-C reductions,when they are reported. The frequency and extentto which most of these lipid changes are reportedare similar in both genders, with the exception ofTG levels. Thus, for most individuals, the positiveeffects of regular exercise are exerted on blood lipidsat low training volumes and accrue so that notice-able differences frequently occur with weekly en-ergy expenditures of 1200 to 2200 kcal/wk. It ap-pears that weekly exercise caloric expenditures thatmeet or exceed the higher end of this range aremore likely to produce the desired lipid changes.This training volume threshold is slightly greaterthan what has been suggested previously for favoura-bly altering blood lipids. However, this amount ofphysical activity, performed at moderate intensi-ties, is reasonable and attainable for most individ-uals and is within the American College of SportsMedicine’s currently recommended range for healthyadults.
Acknowledgements
The authors have no conflicts of interest.
Blood Lipid and Lipoprotein Adaptations to Exercise 1045
Adis International Limited. All rights reserved. Sports Med 2001; 31 (15)
© A
dis In
tern
atio
na
l Limite
d. A
ll righ
ts rese
rved
.Sp
orts M
ed
2001; 31 (15)
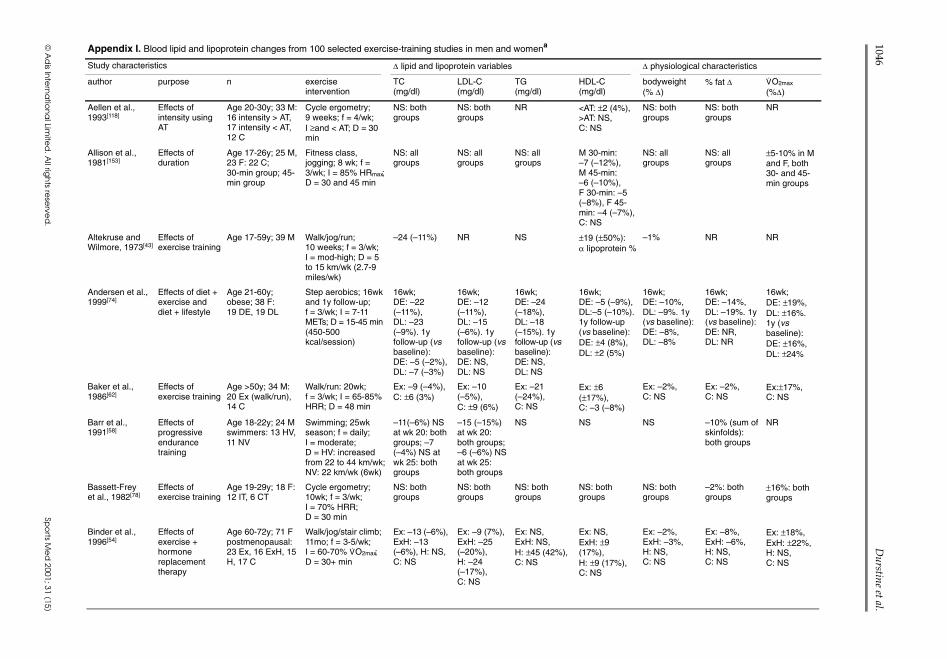
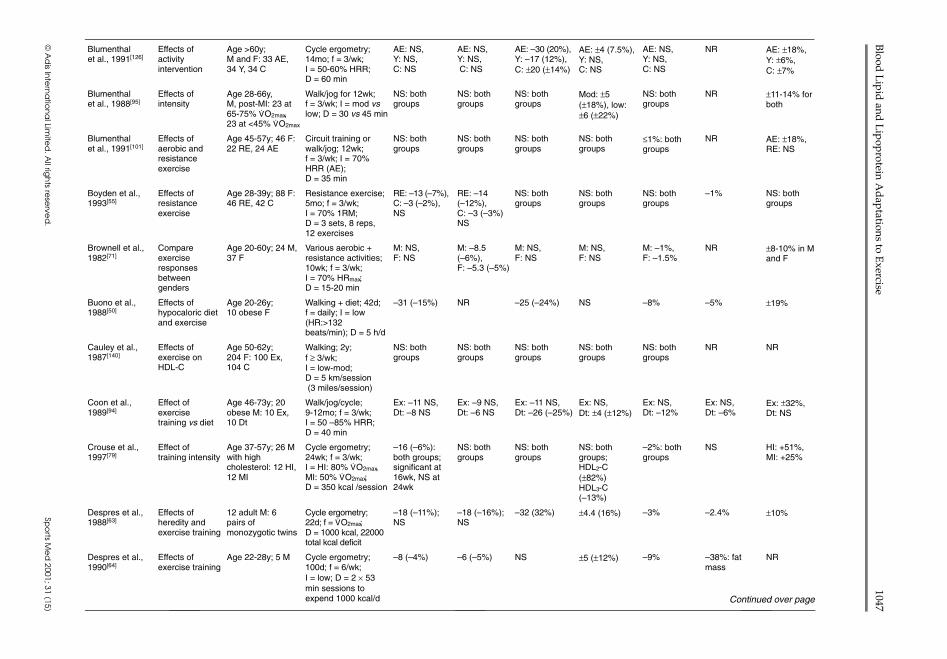
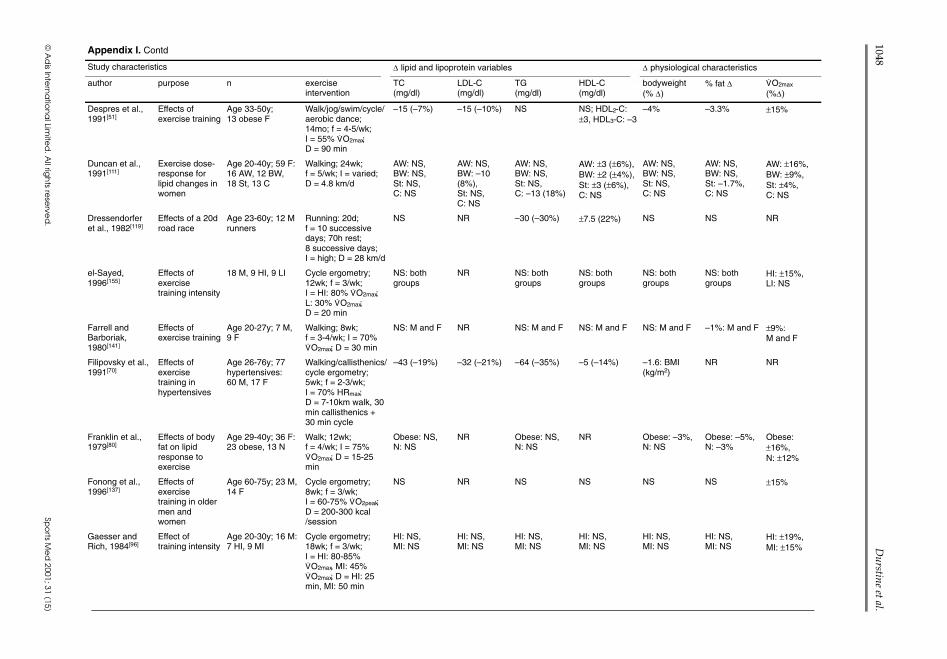
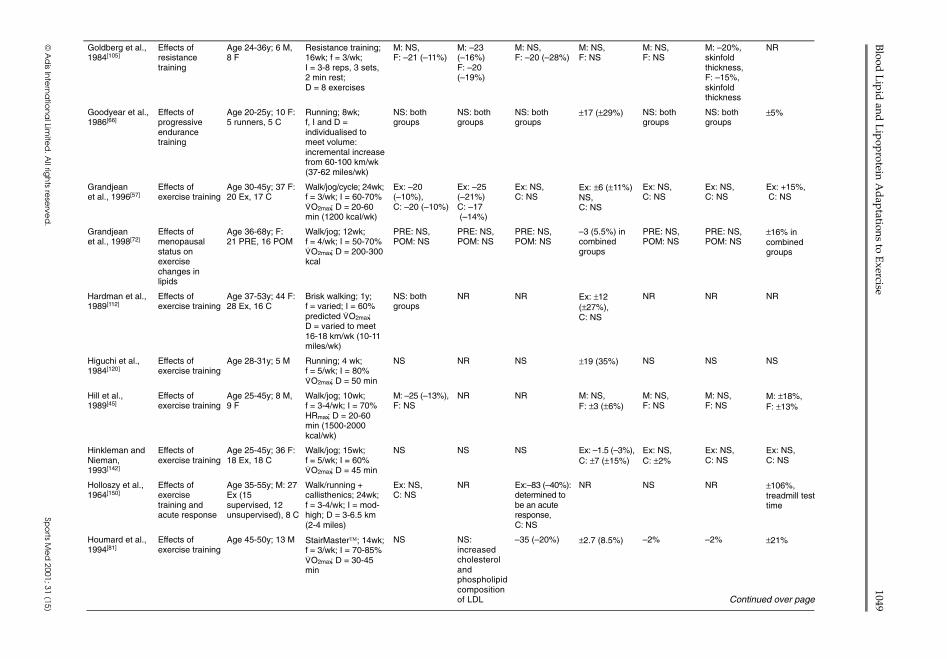
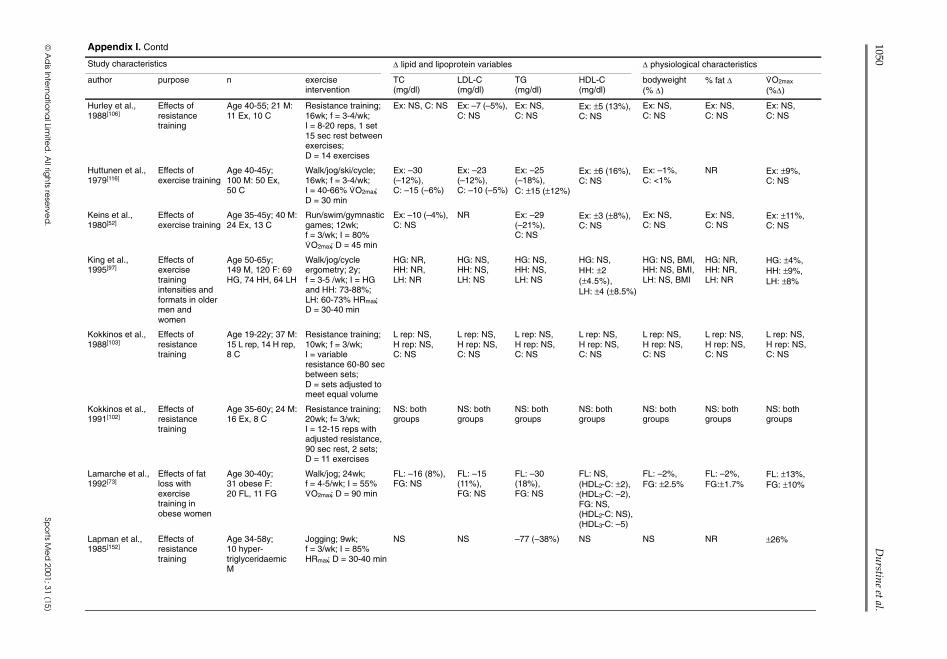
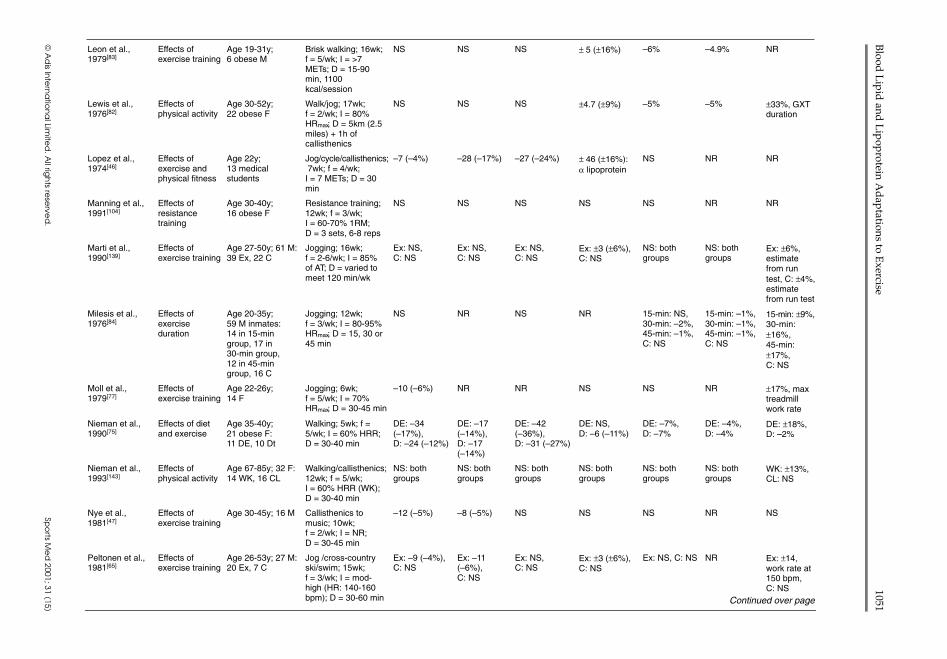
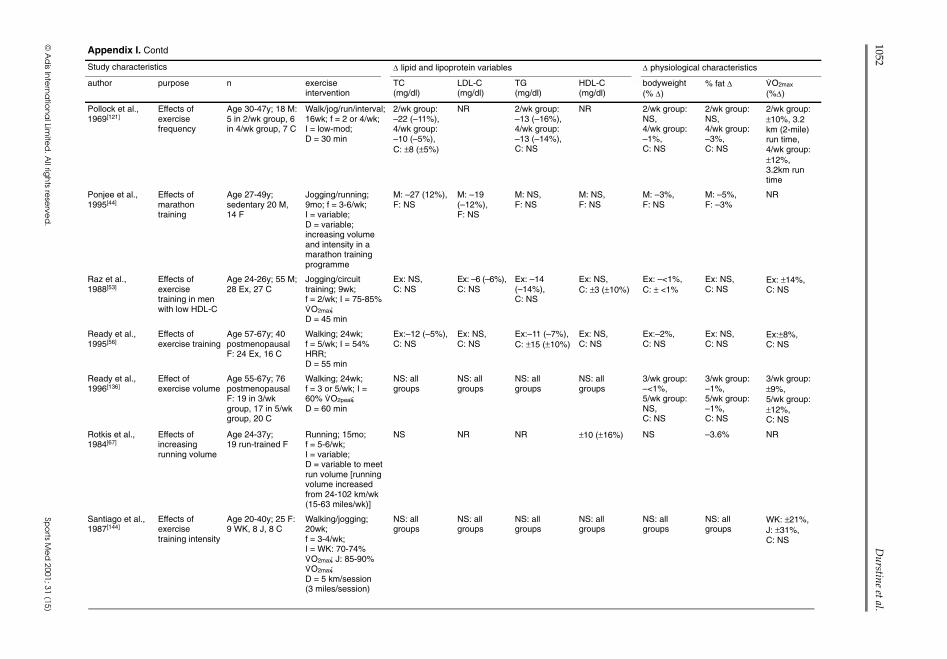
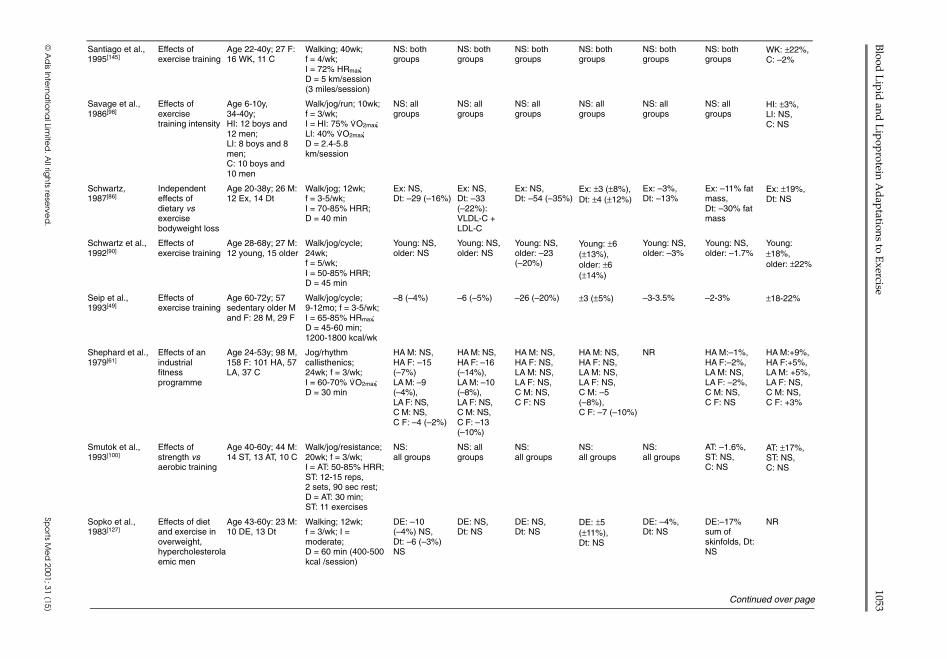
Appendix I. Blood lipid and lipoprotein changes from 100 selected exercise-training studies in men and womena
Study characteristics ∆ lipid and lipoprotein variables ∆ physiological characteristics
author purpose n exerciseintervention
TC(mg/dl)
LDL-C(mg/dl)
TG(mg/dl)
HDL-C(mg/dl)
bodyweight(% ∆)
% fat ∆ V.O2max
(%∆)
Aellen et al.,1993[118]
Effects ofintensity usingAT
Age 20-30y; 33 M:16 intensity > AT,17 intensity < AT,12 C
Cycle ergometry;9 weeks; f = 4/wk;I ≥and < AT; D = 30min
NS: bothgroups
NS: bothgroups
NR <AT: ±2 (4%),>AT: NS,C: NS
NS: bothgroups
NS: bothgroups
NR
Allison et al.,1981[153]
Effects ofduration
Age 17-26y; 25 M,23 F: 22 C;30-min group; 45-min group
Fitness class,jogging; 8 wk; f =3/wk; I = 85% HRmax;D = 30 and 45 min
NS: allgroups
NS: allgroups
NS: allgroups
M 30-min:–7 (–12%),M 45-min:–6 (–10%),F 30-min: –5(–8%), F 45-min: –4 (–7%),C: NS
NS: allgroups
NS: allgroups
±5-10% in Mand F, both30- and 45-min groups
Altekruse andWilmore, 1973[43]
Effects ofexercise training
Age 17-59y; 39 M Walk/jog/run;10 weeks; f = 3/wk;I = mod-high; D = 5to 15 km/wk (2.7-9miles/wk)
–24 (–11%) NR NS ±19 (±50%):α lipoprotein %
–1% NR NR
Andersen et al.,1999[74]
Effects of diet +exercise anddiet + lifestyle
Age 21-60y;obese; 38 F:19 DE, 19 DL
Step aerobics; 16wkand 1y follow-up;f = 3/wk; I = 7-11METs; D = 15-45 min(450-500kcal/session)
16wk;DE: –22(–11%),DL: –23(–9%). 1yfollow-up (vsbaseline):DE: –5 (–2%),DL: –7 (–3%)
16wk;DE: –12(–11%),DL: –15(–6%). 1yfollow-up (vsbaseline):DE: NS,DL: NS
16wk;DE: –24(–18%),DL: –18(–15%). 1yfollow-up (vsbaseline):DE: NS,DL: NS
16wk;DE: –5 (–9%),DL:–5 (–10%).1y follow-up(vs baseline):DE: ±4 (8%),DL: ±2 (5%)
16wk;DE: –10%,DL: –9%. 1y(vs baseline):DE: –8%,DL: –8%
16wk;DE: –14%,DL: –19%. 1y(vs baseline):DE: NR,DL: NR
16wk;DE: ±19%,DL: ±16%.1y (vsbaseline):DE: ±16%,DL: ±24%
Baker et al.,1986[62]
Effects ofexercise training
Age >50y; 34 M:20 Ex (walk/run),14 C
Walk/run: 20wk;f = 3/wk; I = 65-85%HRR; D = 48 min
Ex: –9 (–4%),C: ±6 (3%)
Ex: –10(–5%),C: ±9 (6%)
Ex: –21(–24%),C: NS
Ex: ±6(±17%),C: –3 (–8%)
Ex: –2%,C: NS
Ex: –2%,C: NS
Ex:±17%,C: NS
Barr et al.,1991[58]
Effects ofprogressiveendurancetraining
Age 18-22y; 24 Mswimmers: 13 HV,11 NV
Swimming; 25wkseason; f = daily;I = moderate;D = HV: increasedfrom 22 to 44 km/wk;NV: 22 km/wk (6wk)
–11(–6%) NSat wk 20: bothgroups; –7(–4%) NS atwk 25: bothgroups
–15 (–15%)at wk 20:both groups;–6 (–6%) NSat wk 25:both groups
NS NS NS –10% (sum ofskinfolds):both groups
NR
Bassett-Freyet al., 1982[78]
Effects ofexercise training
Age 19-29y; 18 F:12 IT, 6 CT
Cycle ergometry;10wk; f = 3/wk;I = 70% HRR;D = 30 min
NS: bothgroups
NS: bothgroups
NS: bothgroups
NS: bothgroups
NS: bothgroups
–2%: bothgroups
±16%: bothgroups
Binder et al.,1996[54]
Effects ofexercise +hormonereplacementtherapy
Age 60-72y; 71 Fpostmenopausal:23 Ex, 16 ExH, 15H, 17 C
Walk/jog/stair climb;11mo; f = 3-5/wk;I = 60-70% V
.O2max;
D = 30+ min
Ex: –13 (–6%),ExH: –13(–6%), H: NS,C: NS
Ex: –9 (7%),ExH: –25(–20%),H: –24(–17%),C: NS
Ex: NS,ExH: NS,H: ±45 (42%),C: NS
Ex: NS,ExH: ±9(17%),H: ±9 (17%),C: NS
Ex: –2%,ExH: –3%,H: NS,C: NS
Ex: –8%,ExH: –6%,H: NS,C: NS
Ex: ±18%,ExH: ±22%,H: NS,C: NS
1046D
urstine et al.
© A
dis In
tern
atio
na
l Limite
d. A
ll righ
ts rese
rved
.Sp
orts M
ed
2001; 31 (15)
Blumenthalet al., 1991[126]
Effects ofactivityintervention
Age >60y;M and F: 33 AE,34 Y, 34 C
Cycle ergometry;14mo; f = 3/wk;I = 50-60% HRR;D = 60 min
AE: NS,Y: NS,C: NS
AE: NS,Y: NS,C: NS
AE: –30 (20%),Y: –17 (12%),C: ±20 (±14%)
AE: ±4 (7.5%),Y: NS,C: NS
AE: NS,Y: NS,C: NS
NR AE: ±18%,Y: ±6%,C: ±7%
Blumenthalet al., 1988[95]
Effects ofintensity
Age 28-66y,M, post-MI: 23 at65-75% V
.O2max,
23 at <45% V.O2max
Walk/jog for 12wk;f = 3/wk; I = mod vslow; D = 30 vs 45 min
NS: bothgroups
NS: bothgroups
NS: bothgroups
Mod: ±5(±18%), low:±6 (±22%)
NS: bothgroups
NR ±11-14% forboth
Blumenthalet al., 1991[101]
Effects ofaerobic andresistanceexercise
Age 45-57y; 46 F:22 RE, 24 AE
Circuit training orwalk/jog; 12wk;f = 3/wk; I = 70%HRR (AE);D = 35 min
NS: bothgroups
NS: bothgroups
NS: bothgroups
NS: bothgroups
≤1%: bothgroups
NR AE: ±18%,RE: NS
Boyden et al.,1993[55]
Effects ofresistanceexercise
Age 28-39y; 88 F:46 RE, 42 C
Resistance exercise;5mo; f = 3/wk;I = 70% 1RM;D = 3 sets, 8 reps,12 exercises
RE: –13 (–7%),C: –3 (–2%),NS
RE: –14(–12%),C: –3 (–3%)NS
NS: bothgroups
NS: bothgroups
NS: bothgroups
–1% NS: bothgroups
Brownell et al.,1982[71]
Compareexerciseresponsesbetweengenders
Age 20-60y; 24 M,37 F
Various aerobic +resistance activities;10wk; f = 3/wk;I = 70% HRmax;D = 15-20 min
M: NS,F: NS
M: –8.5(–6%),F: –5.3 (–5%)
M: NS,F: NS
M: NS,F: NS
M: –1%,F: –1.5%
NR ±8-10% in Mand F
Buono et al.,1988[50]
Effects ofhypocaloric dietand exercise
Age 20-26y;10 obese F
Walking + diet; 42d;f = daily; I = low(HR:>132beats/min); D = 5 h/d
–31 (–15%) NR –25 (–24%) NS –8% –5% ±19%
Cauley et al.,1987[140]
Effects ofexercise onHDL-C
Age 50-62y;204 F: 100 Ex,104 C
Walking; 2y;f ≥ 3/wk;I = low-mod;D = 5 km/session(3 miles/session)
NS: bothgroups
NS: bothgroups
NS: bothgroups
NS: bothgroups
NS: bothgroups
NR NR
Coon et al.,1989[94]
Effect ofexercisetraining vs diet
Age 46-73y; 20obese M: 10 Ex,10 Dt
Walk/jog/cycle;9-12mo; f = 3/wk;I = 50 –85% HRR;D = 40 min
Ex: –11 NS,Dt: –8 NS
Ex: –9 NS,Dt: –6 NS
Ex: –11 NS,Dt: –26 (–25%)
Ex: NS,Dt: ±4 (±12%)
Ex: NS,Dt: –12%
Ex: NS,Dt: –6%
Ex: ±32%,Dt: NS
Crouse et al.,1997[79]
Effect oftraining intensity
Age 37-57y; 26 Mwith highcholesterol: 12 HI,12 MI
Cycle ergometry;24wk; f = 3/wk;I = HI: 80% V
.O2max,
MI: 50% V.O2max;
D = 350 kcal /session
–16 (–6%):both groups;significant at16wk, NS at24wk
NS: bothgroups
NS: bothgroups
NS: bothgroups;HDL2-C(±82%)HDL3-C(–13%)
–2%: bothgroups
NS HI: +51%,MI: +25%
Despres et al.,1988[63]
Effects ofheredity andexercise training
12 adult M: 6pairs ofmonozygotic twins
Cycle ergometry;22d; f = V
.O2max;
D = 1000 kcal, 22000total kcal deficit
–18 (–11%);NS
–18 (–16%);NS
–32 (32%) ±4.4 (16%) –3% –2.4% ±10%
Despres et al.,1990[64]
Effects ofexercise training
Age 22-28y; 5 M Cycle ergometry;100d; f = 6/wk;I = low; D = 2 × 53min sessions toexpend 1000 kcal/d
–8 (–4%) –6 (–5%) NS ±5 (±12%) –9% –38%: fatmass
NR
Continued over page
Blood
Lip
id and
Lip
oprotein A
dap
tations to Exercise
1047
© A
dis In
tern
atio
na
l Limite
d. A
ll righ
ts rese
rved
.Sp
orts M
ed
2001; 31 (15)
Appendix I. Contd
Study characteristics ∆ lipid and lipoprotein variables ∆ physiological characteristics
author purpose n exerciseintervention
TC(mg/dl)
LDL-C(mg/dl)
TG(mg/dl)
HDL-C(mg/dl)
bodyweight(% ∆)
% fat ∆ V.O2max
(%∆)
Despres et al.,1991[51]
Effects ofexercise training
Age 33-50y;13 obese F
Walk/jog/swim/cycle/aerobic dance;14mo; f = 4-5/wk;I = 55% V
.O2max;
D = 90 min
–15 (–7%) –15 (–10%) NS NS; HDL2-C:±3, HDL3-C: –3
–4% –3.3% ±15%
Duncan et al.,1991[111]
Exercise dose-response forlipid changes inwomen
Age 20-40y; 59 F:16 AW, 12 BW,18 St, 13 C
Walking; 24wk;f = 5/wk; I = varied;D = 4.8 km/d
AW: NS,BW: NS,St: NS,C: NS
AW: NS,BW: –10(8%),St: NS,C: NS
AW: NS,BW: NS,St: NS,C: –13 (18%)
AW: ±3 (±6%),BW: ±2 (±4%),St: ±3 (±6%),C: NS
AW: NS,BW: NS,St: NS,C: NS
AW: NS,BW: NS,St: –1.7%,C: NS
AW: ±16%,BW: ±9%,St: ±4%,C: NS
Dressendorferet al., 1982[119]
Effects of a 20droad race
Age 23-60y; 12 Mrunners
Running: 20d;f = 10 successivedays; 70h rest;8 successive days;I = high; D = 28 km/d
NS NR –30 (–30%) ±7.5 (22%) NS NS NR
el-Sayed,1996[155]
Effects ofexercisetraining intensity
18 M, 9 HI, 9 LI Cycle ergometry;12wk; f = 3/wk;I = HI: 80% V
.O2max;
L: 30% V.O2max;
D = 20 min
NS: bothgroups
NR NS: bothgroups
NS: bothgroups
NS: bothgroups
NS: bothgroups
HI: ±15%,LI: NS
Farrell andBarboriak,1980[141]
Effects ofexercise training
Age 20-27y; 7 M,9 F
Walking; 8wk;f = 3-4/wk; I = 70%V.O2max; D = 30 min
NS: M and F NR NS: M and F NS: M and F NS: M and F –1%: M and F ±9%:M and F
Filipovsky et al.,1991[70]
Effects ofexercisetraining inhypertensives
Age 26-76y; 77hypertensives:60 M, 17 F
Walking/callisthenics/cycle ergometry;5wk; f = 2-3/wk;I = 70% HRmax:D = 7-10km walk, 30min callisthenics +30 min cycle
–43 (–19%) –32 (–21%) –64 (–35%) –5 (–14%) –1.6: BMI(kg/m2)
NR NR
Franklin et al.,1979[80]
Effects of bodyfat on lipidresponse toexercise
Age 29-40y; 36 F:23 obese, 13 N
Walk; 12wk;f = 4/wk; I = 75%V.O2max; D = 15-25
min
Obese: NS,N: NS
NR Obese: NS,N: NS
NR Obese: –3%,N: NS
Obese: –5%,N: –3%
Obese:±16%,N: ±12%
Fonong et al.,1996[137]
Effects ofexercisetraining in oldermen andwomen
Age 60-75y; 23 M,14 F
Cycle ergometry;8wk; f = 3/wk;I = 60-75% V
.O2peak;
D = 200-300 kcal/session
NS NR NS NS NS NS ±15%
Gaesser andRich, 1984[96]
Effect oftraining intensity
Age 20-30y; 16 M:7 HI, 9 MI
Cycle ergometry;18wk; f = 3/wk;I = HI: 80-85%V.O2max, MI: 45%
V.O2max; D = HI: 25
min, MI: 50 min
HI: NS,MI: NS
HI: NS,MI: NS
HI: NS,MI: NS
HI: NS,MI: NS
HI: NS,MI: NS
HI: NS,MI: NS
HI: ±19%,MI: ±15%
1048D
urstine et al.
© A
dis In
tern
atio
na
l Limite
d. A
ll righ
ts rese
rved
.Sp
orts M
ed
2001; 31 (15)
Goldberg et al.,1984[105]
Effects ofresistancetraining
Age 24-36y; 6 M,8 F
Resistance training;16wk; f = 3/wk;I = 3-8 reps, 3 sets,2 min rest;D = 8 exercises
M: NS,F: –21 (–11%)
M: –23(–16%)F: –20(–19%)
M: NS,F: –20 (–28%)
M: NS,F: NS
M: NS,F: NS
M: –20%,skinfoldthickness,F: –15%,skinfoldthickness
NR
Goodyear et al.,1986[66]
Effects ofprogressiveendurancetraining
Age 20-25y; 10 F:5 runners, 5 C
Running; 8wk;f, I and D =individualised tomeet volume:incremental increasefrom 60-100 km/wk(37-62 miles/wk)
NS: bothgroups
NS: bothgroups
NS: bothgroups
±17 (±29%) NS: bothgroups
NS: bothgroups
±5%
Grandjeanet al., 1996[57]
Effects ofexercise training
Age 30-45y; 37 F:20 Ex, 17 C
Walk/jog/cycle; 24wk;f = 3/wk; I = 60-70%V.O2max; D = 20-60
min (1200 kcal/wk)
Ex: –20(–10%),C: –20 (–10%)
Ex: –25(–21%)C: –17(–14%)
Ex: NS,C: NS
Ex: ±6 (±11%)NS,C: NS
Ex: NS,C: NS
Ex: NS,C: NS
Ex: +15%,C: NS
Grandjeanet al., 1998[72]
Effects ofmenopausalstatus onexercisechanges inlipids
Age 36-68y; F:21 PRE, 16 POM
Walk/jog; 12wk;f = 4/wk; I = 50-70%V.O2max; D = 200-300
kcal
PRE: NS,POM: NS
PRE: NS,POM: NS
PRE: NS,POM: NS
–3 (5.5%) incombinedgroups
PRE: NS,POM: NS
PRE: NS,POM: NS
±16% incombinedgroups
Hardman et al.,1989[112]
Effects ofexercise training
Age 37-53y; 44 F:28 Ex, 16 C
Brisk walking; 1y;f = varied; I = 60%predicted V
.O2max;
D = varied to meet16-18 km/wk (10-11miles/wk)
NS: bothgroups
NR NR Ex: ±12(±27%),C: NS
NR NR NR
Higuchi et al.,1984[120]
Effects ofexercise training
Age 28-31y; 5 M Running; 4 wk;f = 5/wk; I = 80%V.O2max; D = 50 min
NS NR NS ±19 (35%) NS NS NS
Hill et al.,1989[45]
Effects ofexercise training
Age 25-45y; 8 M,9 F
Walk/jog; 10wk;f = 3-4/wk; I = 70%HRmax; D = 20-60min (1500-2000kcal/wk)
M: –25 (–13%),F: NS
NR NR M: NS,F: ±3 (±6%)
M: NS,F: NS
M: NS,F: NS
M: ±18%,F: ±13%
Hinkleman andNieman,1993[142]
Effects ofexercise training
Age 25-45y; 36 F:18 Ex, 18 C
Walk/jog; 15wk;f = 5/wk; I = 60%V.O2max; D = 45 min
NS NS NS Ex: –1.5 (–3%),C: ±7 (±15%)
Ex: NS,C: ±2%
Ex: NS,C: NS
Ex: NS,C: NS
Holloszy et al.,1964[150]
Effects ofexercisetraining andacute response
Age 35-55y; M: 27Ex (15supervised, 12unsupervised), 8 C
Walk/running +callisthenics; 24wk;f = 3-4/wk; I = mod-high; D = 3-6.5 km(2-4 miles)
Ex: NS,C: NS
NR Ex:–83 (–40%):determined tobe an acuteresponse,C: NS
NR NS NR ±106%,treadmill testtime
Houmard et al.,1994[81]
Effects ofexercise training
Age 45-50y; 13 M StairMaster; 14wk;f = 3/wk; I = 70-85%V.O2max; D = 30-45
min
NS NS:increasedcholesterolandphospholipidcompositionof LDL
–35 (–20%) ±2.7 (8.5%) –2% –2% ±21%
Continued over page
Blood
Lip
id and
Lip
oprotein A
dap
tations to Exercise
1049
© A
dis In
tern
atio
na
l Limite
d. A
ll righ
ts rese
rved
.Sp
orts M
ed
2001; 31 (15)
Appendix I. Contd
Study characteristics ∆ lipid and lipoprotein variables ∆ physiological characteristics
author purpose n exerciseintervention
TC(mg/dl)
LDL-C(mg/dl)
TG(mg/dl)
HDL-C(mg/dl)
bodyweight(% ∆)
% fat ∆ V.O2max
(%∆)
Hurley et al.,1988[106]
Effects ofresistancetraining
Age 40-55; 21 M:11 Ex, 10 C
Resistance training;16wk; f = 3-4/wk;I = 8-20 reps, 1 set15 sec rest betweenexercises;D = 14 exercises
Ex: NS, C: NS Ex: –7 (–5%),C: NS
Ex: NS,C: NS
Ex: ±5 (13%),C: NS
Ex: NS,C: NS
Ex: NS,C: NS
Ex: NS,C: NS
Huttunen et al.,1979[116]
Effects ofexercise training
Age 40-45y;100 M: 50 Ex,50 C
Walk/jog/ski/cycle;16wk; f = 3-4/wk;I = 40-66% V
.O2max;
D = 30 min
Ex: –30(–12%),C: –15 (–6%)
Ex: –23(–12%),C: –10 (–5%)
Ex: –25(–18%),C: ±15 (±12%)
Ex: ±6 (16%),C: NS
Ex: –1%,C: <1%
NR Ex: ±9%,C: NS
Keins et al.,1980[52]
Effects ofexercise training
Age 35-45y; 40 M:24 Ex, 13 C
Run/swim/gymnasticgames; 12wk;f = 3/wk; I = 80%V.O2max; D = 45 min
Ex: –10 (–4%),C: NS
NR Ex: –29(–21%),C: NS
Ex: ±3 (±8%),C: NS
Ex: NS,C: NS
Ex: NS,C: NS
Ex: ±11%,C: NS
King et al.,1995[97]
Effects ofexercisetrainingintensities andformats in oldermen andwomen
Age 50-65y;149 M, 120 F: 69HG, 74 HH, 64 LH
Walk/jog/cycleergometry; 2y;f = 3-5 /wk; I = HGand HH: 73-88%;LH: 60-73% HRmax;D = 30-40 min
HG: NR,HH: NR,LH: NR
HG: NS,HH: NS,LH: NS
HG: NS,HH: NS,LH: NS
HG: NS,HH: ±2(±4.5%),LH: ±4 (±8.5%)
HG: NS, BMI,HH: NS, BMI,LH: NS, BMI
HG: NR,HH: NR,LH: NR
HG: ±4%,HH: ±9%,LH: ±8%
Kokkinos et al.,1988[103]
Effects ofresistancetraining
Age 19-22y; 37 M:15 L rep, 14 H rep,8 C
Resistance training;10wk; f = 3/wk;I = variableresistance 60-80 secbetween sets;D = sets adjusted tomeet equal volume
L rep: NS,H rep: NS,C: NS
L rep: NS,H rep: NS,C: NS
L rep: NS,H rep: NS,C: NS
L rep: NS,H rep: NS,C: NS
L rep: NS,H rep: NS,C: NS
L rep: NS,H rep: NS,C: NS
L rep: NS,H rep: NS,C: NS
Kokkinos et al.,1991[102]
Effects ofresistancetraining
Age 35-60y; 24 M:16 Ex, 8 C
Resistance training;20wk; f= 3/wk;I = 12-15 reps withadjusted resistance,90 sec rest, 2 sets;D = 11 exercises
NS: bothgroups
NS: bothgroups
NS: bothgroups
NS: bothgroups
NS: bothgroups
NS: bothgroups
NS: bothgroups
Lamarche et al.,1992[73]
Effects of fatloss withexercisetraining inobese women
Age 30-40y;31 obese F:20 FL, 11 FG
Walk/jog; 24wk;f = 4-5/wk; I = 55%V.O2max; D = 90 min
FL: –16 (8%),FG: NS
FL: –15(11%),FG: NS
FL: –30(18%),FG: NS
FL: NS,(HDL2-C: ±2),(HDL3-C: –2),FG: NS,(HDL2-C: NS),(HDL3-C: –5)
FL: –2%,FG: ±2.5%
FL: –2%,FG:±1.7%
FL: ±13%,FG: ±10%
Lapman et al.,1985[152]
Effects ofresistancetraining
Age 34-58y;10 hyper-triglyceridaemicM
Jogging; 9wk;f = 3/wk; I = 85%HRmax; D = 30-40 min
NS NS –77 (–38%) NS NS NR ±26%
1050D
urstine et al.
© A
dis In
tern
atio
na
l Limite
d. A
ll righ
ts rese
rved
.Sp
orts M
ed
2001; 31 (15)
Leon et al.,1979[83]
Effects ofexercise training
Age 19-31y;6 obese M
Brisk walking; 16wk;f = 5/wk; I = >7METs; D = 15-90min, 1100kcal/session
NS NS NS ± 5 (±16%) –6% –4.9% NR
Lewis et al.,1976[82]
Effects ofphysical activity
Age 30-52y;22 obese F
Walk/jog; 17wk;f = 2/wk; I = 80%HRmax; D = 5km (2.5miles) + 1h ofcallisthenics
NS NS NS ±4.7 (±9%) –5% –5% ±33%, GXTduration
Lopez et al.,1974[46]
Effects ofexercise andphysical fitness
Age 22y;13 medicalstudents
Jog/cycle/callisthenics;7wk; f = 4/wk;I = 7 METs; D = 30min
–7 (–4%) –28 (–17%) –27 (–24%) ± 46 (±16%):α lipoprotein
NS NR NR
Manning et al.,1991[104]
Effects ofresistancetraining
Age 30-40y;16 obese F
Resistance training;12wk; f = 3/wk;I = 60-70% 1RM;D = 3 sets, 6-8 reps
NS NS NS NS NS NR NR
Marti et al.,1990[139]
Effects ofexercise training
Age 27-50y; 61 M:39 Ex, 22 C
Jogging; 16wk;f = 2-6/wk; I = 85%of AT; D = varied tomeet 120 min/wk
Ex: NS,C: NS
Ex: NS,C: NS
Ex: NS,C: NS
Ex: ±3 (±6%),C: NS
NS: bothgroups
NS: bothgroups
Ex: ±6%,estimatefrom runtest, C: ±4%,estimatefrom run test
Milesis et al.,1976[84]
Effects ofexerciseduration
Age 20-35y;59 M inmates:14 in 15-mingroup, 17 in30-min group,12 in 45-mingroup, 16 C
Jogging; 12wk;f = 3/wk; I = 80-95%HRmax; D = 15, 30 or45 min
NS NR NS NR 15-min: NS,30-min: –2%,45-min: –1%,C: NS
15-min: –1%,30-min: –1%,45-min: –1%,C: NS
15-min: ±9%,30-min:±16%,45-min:±17%,C: NS
Moll et al.,1979[77]
Effects ofexercise training
Age 22-26y;14 F
Jogging; 6wk;f = 5/wk; I = 70%HRmax; D = 30-45 min
–10 (–6%) NR NR NS NS NR ±17%, maxtreadmillwork rate
Nieman et al.,1990[75]
Effects of dietand exercise
Age 35-40y;21 obese F:11 DE, 10 Dt
Walking; 5wk; f =5/wk; I = 60% HRR;D = 30-40 min
DE: –34(–17%),D: –24 (–12%)
DE: –17(–14%),D: –17(–14%)
DE: –42(–36%),D: –31 (–27%)
DE: NS,D: –6 (–11%)
DE: –7%,D: –7%
DE: –4%,D: –4%
DE: ±18%,D: –2%
Nieman et al.,1993[143]
Effects ofphysical activity
Age 67-85y; 32 F:14 WK, 16 CL
Walking/callisthenics;12wk; f = 5/wk;I = 60% HRR (WK);D = 30-40 min
NS: bothgroups
NS: bothgroups
NS: bothgroups
NS: bothgroups
NS: bothgroups
NS: bothgroups
WK: ±13%,CL: NS
Nye et al.,1981[47]
Effects ofexercise training
Age 30-45y; 16 M Callisthenics tomusic; 10wk;f = 2/wk; I = NR;D = 30-45 min
–12 (–5%) –8 (–5%) NS NS NS NR NS
Peltonen et al.,1981[65]
Effects ofexercise training
Age 26-53y; 27 M:20 Ex, 7 C
Jog /cross-countryski/swim; 15wk;f = 3/wk; I = mod-high (HR: 140-160bpm); D = 30-60 min
Ex: –9 (–4%),C: NS
Ex: –11(–6%),C: NS
Ex: NS,C: NS
Ex: ±3 (±6%),C: NS
Ex: NS, C: NS NR Ex: ±14,work rate at150 bpm,C: NS
Continued over page
Blood
Lip
id and
Lip
oprotein A
dap
tations to Exercise
1051
© A
dis In
tern
atio
na
l Limite
d. A
ll righ
ts rese
rved
.Sp
orts M
ed
2001; 31 (15)
Appendix I. Contd
Study characteristics ∆ lipid and lipoprotein variables ∆ physiological characteristics
author purpose n exerciseintervention
TC(mg/dl)
LDL-C(mg/dl)
TG(mg/dl)
HDL-C(mg/dl)
bodyweight(% ∆)
% fat ∆ V.O2max
(%∆)
Pollock et al.,1969[121]
Effects ofexercisefrequency
Age 30-47y; 18 M:5 in 2/wk group, 6in 4/wk group, 7 C
Walk/jog/run/interval;16wk; f = 2 or 4/wk;I = low-mod;D = 30 min
2/wk group:–22 (–11%),4/wk group:–10 (–5%),C: ±8 (±5%)
NR 2/wk group:–13 (–16%),4/wk group:–13 (–14%),C: NS
NR 2/wk group:NS,4/wk group:–1%,C: NS
2/wk group:NS,4/wk group:–3%,C: NS
2/wk group:±10%, 3.2km (2-mile)run time,4/wk group:±12%,3.2km runtime
Ponjee et al.,1995[44]
Effects ofmarathontraining
Age 27-49y;sedentary 20 M,14 F
Jogging/running;9mo; f = 3-6/wk;I = variable;D = variable;increasing volumeand intensity in amarathon trainingprogramme
M: –27 (12%),F: NS
M: –19(–12%),F: NS
M: NS,F: NS
M: NS,F: NS
M: –3%,F: NS
M: –5%,F: –3%
NR
Raz et al.,1988[53]
Effects ofexercisetraining in menwith low HDL-C
Age 24-26y; 55 M;28 Ex, 27 C
Jogging/circuittraining; 9wk;f = 2/wk; I = 75-85%V.O2max;
D = 45 min
Ex: NS,C: NS
Ex: –6 (–6%),C: NS
Ex: –14(–14%),C: NS
Ex: NS,C: ±3 (±10%)
Ex: –<1%,C: ± <1%
Ex: NS,C: NS
Ex: ±14%,C: NS
Ready et al.,1995[56]
Effects ofexercise training
Age 57-67y; 40postmenopausalF: 24 Ex, 16 C
Walking; 24wk;f = 5/wk; I = 54%HRR;D = 55 min
Ex:–12 (–5%),C: NS
Ex: NS,C: NS
Ex:–11 (–7%),C: ±15 (±10%)
Ex: NS,C: NS
Ex:–2%,C: NS
Ex: NS,C: NS
Ex:±8%,C: NS
Ready et al.,1996[136]
Effect ofexercise volume
Age 55-67y; 76postmenopausalF: 19 in 3/wkgroup, 17 in 5/wkgroup, 20 C
Walking; 24wk;f = 3 or 5/wk; I =60% V
.O2peak;
D = 60 min
NS: allgroups
NS: allgroups
NS: allgroups
NS: allgroups
3/wk group:–<1%,5/wk group:NS,C: NS
3/wk group:–1%,5/wk group:–1%,C: NS
3/wk group:±9%,5/wk group:±12%,C: NS
Rotkis et al.,1984[67]
Effects ofincreasingrunning volume
Age 24-37y;19 run-trained F
Running; 15mo;f = 5-6/wk;I = variable;D = variable to meetrun volume [runningvolume increasedfrom 24-102 km/wk(15-63 miles/wk)]
NS NR NR ±10 (±16%) NS –3.6% NR
Santiago et al.,1987[144]
Effects ofexercisetraining intensity
Age 20-40y; 25 F:9 WK, 8 J, 8 C
Walking/jogging;20wk;f = 3-4/wk;I = WK: 70-74%V.O2max; J: 85-90%
V.O2max;
D = 5 km/session(3 miles/session)
NS: allgroups
NS: allgroups
NS: allgroups
NS: allgroups
NS: allgroups
NS: allgroups
WK: ±21%,J: ±31%,C: NS
1052D
urstine et al.
© A
dis In
tern
atio
na
l Limite
d. A
ll righ
ts rese
rved
.Sp
orts M
ed
2001; 31 (15)
Santiago et al.,1995[145]
Effects ofexercise training
Age 22-40y; 27 F:16 WK, 11 C
Walking; 40wk;f = 4/wk;I = 72% HRmax;D = 5 km/session(3 miles/session)
NS: bothgroups
NS: bothgroups
NS: bothgroups
NS: bothgroups
NS: bothgroups
NS: bothgroups
WK: ±22%,C: –2%
Savage et al.,1986[98]
Effects ofexercisetraining intensity
Age 6-10y,34-40y;HI: 12 boys and12 men;LI: 8 boys and 8men;C: 10 boys and10 men
Walk/jog/run; 10wk;f = 3/wk;I = HI: 75% V
.O2max;
LI: 40% V.O2max;
D = 2.4-5.8km/session
NS: allgroups
NS: allgroups
NS: allgroups
NS: allgroups
NS: allgroups
NS: allgroups
HI: ±3%,LI: NS,C: NS
Schwartz,1987[86]
Independenteffects ofdietary vsexercisebodyweight loss
Age 20-38y; 26 M:12 Ex, 14 Dt
Walk/jog; 12wk;f = 3-5/wk;I = 70-85% HRR;D = 40 min
Ex: NS,Dt: –29 (–16%)
Ex: NS,Dt: –33(–22%):VLDL-C +LDL-C
Ex: NS,Dt: –54 (–35%)
Ex: ±3 (±8%),Dt: ±4 (±12%)
Ex: –3%,Dt: –13%
Ex: –11% fatmass,Dt: –30% fatmass
Ex: ±19%,Dt: NS
Schwartz et al.,1992[90]
Effects ofexercise training
Age 28-68y; 27 M:12 young, 15 older
Walk/jog/cycle;24wk;f = 5/wk;I = 50-85% HRR;D = 45 min
Young: NS,older: NS
Young: NS,older: NS
Young: NS,older: –23(–20%)
Young: ±6(±13%),older: ±6(±14%)
Young: NS,older: –3%
Young: NS,older: –1.7%
Young:±18%,older: ±22%
Seip et al.,1993[49]
Effects ofexercise training
Age 60-72y; 57sedentary older Mand F: 28 M, 29 F
Walk/jog/cycle;9-12mo; f = 3-5/wk;I = 65-85% HRmax;D = 45-60 min;1200-1800 kcal/wk
–8 (–4%) –6 (–5%) –26 (–20%) ±3 (±5%) –3-3.5% –2-3% ±18-22%
Shephard et al.,1979[61]
Effects of anindustrialfitnessprogramme
Age 24-53y; 98 M,158 F: 101 HA, 57LA, 37 C
Jog/rhythmcallisthenics;24wk; f = 3/wk;I = 60-70% V
.O2max;
D = 30 min
HA M: NS,HA F: –15(–7%)LA M: –9(–4%),LA F: NS,C M: NS,C F: –4 (–2%)
HA M: NS,HA F: –16(–14%),LA M: –10(–8%),LA F: NS,C M: NS,C F: –13(–10%)
HA M: NS,HA F: NS,LA M: NS,LA F: NS,C M: NS,C F: NS
HA M: NS,HA F: NS,LA M: NS,LA F: NS,C M: –5(–8%),C F: –7 (–10%)
NR HA M:–1%,HA F:–2%,LA M: NS,LA F: –2%,C M: NS,C F: NS
HA M:+9%,HA F:+5%,LA M: +5%,LA F: NS,C M: NS,C F: +3%
Smutok et al.,1993[100]
Effects ofstrength vsaerobic training
Age 40-60y; 44 M:14 ST, 13 AT, 10 C
Walk/jog/resistance;20wk; f = 3/wk;I = AT: 50-85% HRR;ST: 12-15 reps,2 sets, 90 sec rest;D = AT: 30 min;ST: 11 exercises
NS:all groups
NS: allgroups
NS:all groups
NS:all groups
NS:all groups
AT: –1.6%,ST: NS,C: NS
AT: ±17%,ST: NS,C: NS
Sopko et al.,1983[127]
Effects of dietand exercise inoverweight,hypercholesterolaemic men
Age 43-60y: 23 M:10 DE, 13 Dt
Walking; 12wk;f = 3/wk; I =moderate;D = 60 min (400-500kcal /session)
DE: –10(–4%) NS,Dt: –6 (–3%)NS
DE: NS,Dt: NS
DE: NS,Dt: NS
DE: ±5(±11%),Dt: NS
DE: –4%,Dt: NS
DE:–17%sum ofskinfolds, Dt:NS
NR
Continued over page
Blood
Lip
id and
Lip
oprotein A
dap
tations to Exercise
1053
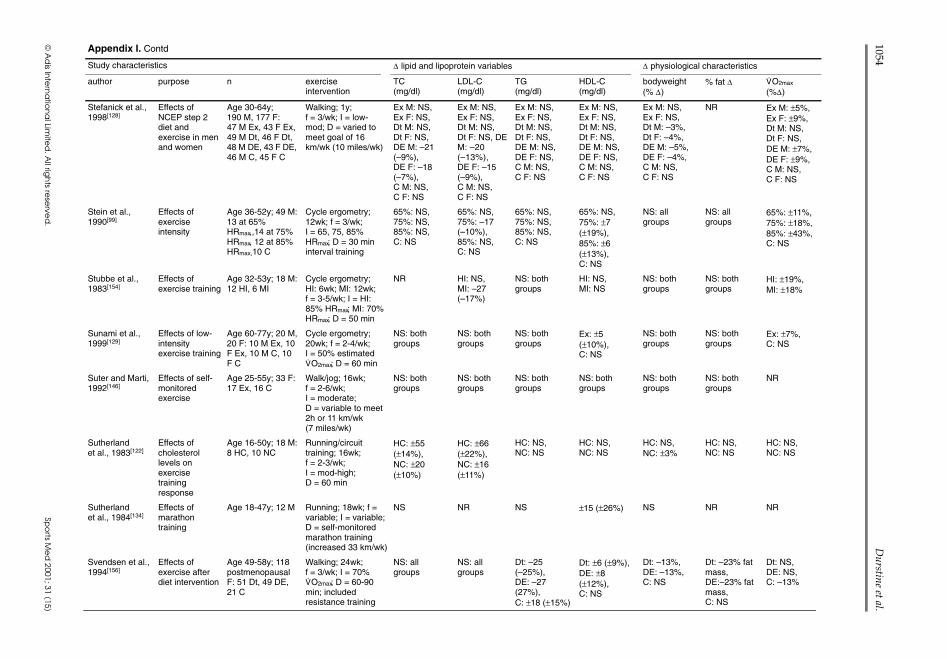
Appendix I. Contd
Study characteristics ∆ lipid and lipoprotein variables ∆ physiological characteristics
author purpose n exerciseintervention
TC(mg/dl)
LDL-C(mg/dl)
TG(mg/dl)
HDL-C(mg/dl)
bodyweight(% ∆)
% fat ∆ V.O2max
(%∆)
Stefanick et al.,1998[128]
Effects ofNCEP step 2diet andexercise in menand women
Age 30-64y;190 M, 177 F:47 M Ex, 43 F Ex,49 M Dt, 46 F Dt,48 M DE, 43 F DE,46 M C, 45 F C
Walking; 1y;f = 3/wk; I = low-mod; D = varied tomeet goal of 16km/wk (10 miles/wk)
Ex M: NS,Ex F: NS,Dt M: NS,Dt F: NS,DE M: –21(–9%),DE F: –18(–7%),C M: NS,C F: NS
Ex M: NS,Ex F: NS,Dt M: NS,Dt F: NS, DEM: –20(–13%),DE F: –15(–9%),C M: NS,C F: NS
Ex M: NS,Ex F: NS,Dt M: NS,Dt F: NS,DE M: NS,DE F: NS,C M: NS,C F: NS
Ex M: NS,Ex F: NS,Dt M: NS,Dt F: NS,DE M: NS,DE F: NS,C M: NS,C F: NS
Ex M: NS,Ex F: NS,Dt M: –3%,Dt F: –4%,DE M: –5%,DE F: –4%,C M: NS,C F: NS
NR Ex M: ±5%,Ex F: ±9%,Dt M: NS,Dt F: NS,DE M: ±7%,DE F: ±9%,C M: NS,C F: NS
Stein et al.,1990[99]
Effects ofexerciseintensity
Age 36-52y; 49 M:13 at 65%HRmax,,14 at 75%HRmax, 12 at 85%HRmax,10 C
Cycle ergometry;12wk; f = 3/wk;I = 65, 75, 85%HRmax; D = 30 mininterval training
65%: NS,75%: NS,85%: NS,C: NS
65%: NS,75%: –17(–10%),85%: NS,C: NS
65%: NS,75%: NS,85%: NS,C: NS
65%: NS,75%: ±7(±19%),85%: ±6(±13%),C: NS
NS: allgroups
NS: allgroups
65%: ±11%,75%: ±18%,85%: ±43%,C: NS
Stubbe et al.,1983[154]
Effects ofexercise training
Age 32-53y; 18 M:12 HI, 6 MI
Cycle ergometry;HI: 6wk; MI: 12wk;f = 3-5/wk; I = HI:85% HRmax; MI: 70%HRmax; D = 50 min
NR HI: NS,MI: –27(–17%)
NS: bothgroups
HI: NS,MI: NS
NS: bothgroups
NS: bothgroups
HI: ±19%,MI: ±18%
Sunami et al.,1999[129]
Effects of low-intensityexercise training
Age 60-77y; 20 M,20 F: 10 M Ex, 10F Ex, 10 M C, 10F C
Cycle ergometry;20wk; f = 2-4/wk;I = 50% estimatedV.O2max; D = 60 min
NS: bothgroups
NS: bothgroups
NS: bothgroups
Ex: ±5(±10%),C: NS
NS: bothgroups
NS: bothgroups
Ex: ±7%,C: NS
Suter and Marti,1992[146]
Effects of self-monitoredexercise
Age 25-55y; 33 F:17 Ex, 16 C
Walk/jog; 16wk;f = 2-6/wk;I = moderate;D = variable to meet2h or 11 km/wk(7 miles/wk)
NS: bothgroups
NS: bothgroups
NS: bothgroups
NS: bothgroups
NS: bothgroups
NS: bothgroups
NR
Sutherlandet al., 1983[122]
Effects ofcholesterollevels onexercisetrainingresponse
Age 16-50y; 18 M:8 HC, 10 NC
Running/circuittraining; 16wk;f = 2-3/wk;I = mod-high;D = 60 min
HC: ±55(±14%),NC: ±20(±10%)
HC: ±66(±22%),NC: ±16(±11%)
HC: NS,NC: NS
HC: NS,NC: NS
HC: NS,NC: ±3%
HC: NS,NC: NS
HC: NS,NC: NS
Sutherlandet al., 1984[134]
Effects ofmarathontraining
Age 18-47y; 12 M Running; 18wk; f =variable; I = variable;D = self-monitoredmarathon training(increased 33 km/wk)
NS NR NS ±15 (±26%) NS NR NR
Svendsen et al.,1994[156]
Effects ofexercise afterdiet intervention
Age 49-58y; 118postmenopausalF: 51 Dt, 49 DE,21 C
Walking; 24wk;f = 3/wk; I = 70%V.O2max; D = 60-90
min; includedresistance training
NS: allgroups
NS: allgroups
Dt: –25(–25%),DE: –27(27%),C: ±18 (±15%)
Dt: ±6 (±9%),DE: ±8(±12%),C: NS
Dt: –13%,DE: –13%,C: NS
Dt: –23% fatmass,DE:–23% fatmass,C: NS
Dt: NS,DE: NS,C: –13%
© A
dis In
tern
atio
na
l Limite
d. A
ll righ
ts rese
rved
.Sp
orts M
ed
2001; 31 (15)
1054D
urstine et al.
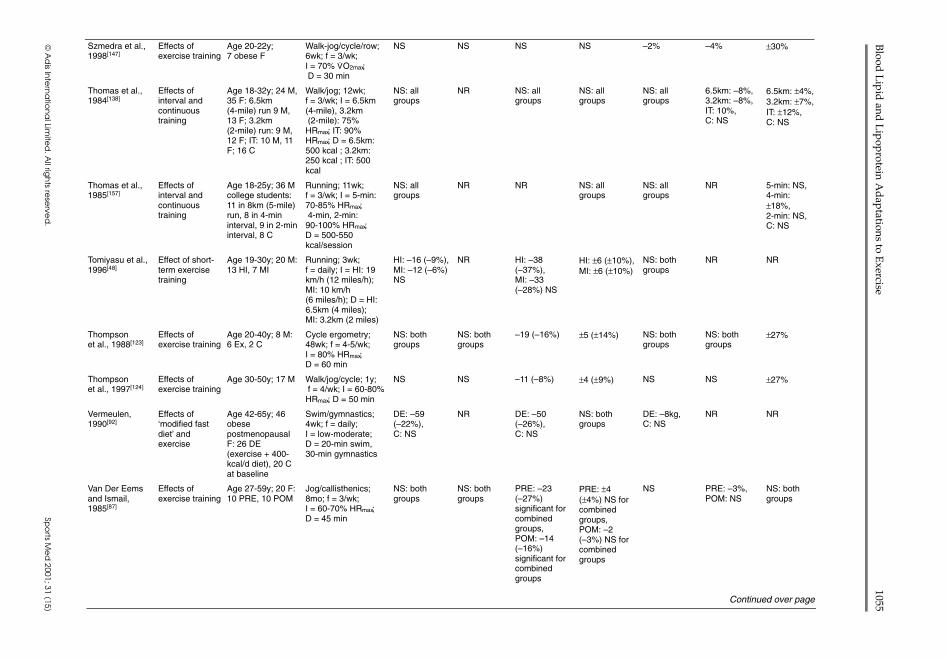
Szmedra et al.,1998[147]
Effects ofexercise training
Age 20-22y;7 obese F
Walk-jog/cycle/row;6wk; f = 3/wk;I = 70% V
.O2max;
D = 30 min
NS NS NS NS –2% –4% ±30%
Thomas et al.,1984[138]
Effects ofinterval andcontinuoustraining
Age 18-32y; 24 M,35 F: 6.5km(4-mile) run 9 M,13 F; 3.2km(2-mile) run: 9 M,12 F; IT: 10 M, 11F; 16 C
Walk/jog; 12wk;f = 3/wk; I = 6.5km(4-mile), 3.2km(2-mile): 75%HRmax; IT: 90%HRmax; D = 6.5km:500 kcal ; 3.2km:250 kcal ; IT: 500kcal
NS: allgroups
NR NS: allgroups
NS: allgroups
NS: allgroups
6.5km: –8%,3.2km: –8%,IT: 10%,C: NS
6.5km: ±4%,3.2km: ±7%,IT: ±12%,C: NS
Thomas et al.,1985[157]
Effects ofinterval andcontinuoustraining
Age 18-25y; 36 Mcollege students:11 in 8km (5-mile)run, 8 in 4-mininterval, 9 in 2-mininterval, 8 C
Running; 11wk;f = 3/wk; I = 5-min:70-85% HRmax;4-min, 2-min:90-100% HRmax;D = 500-550kcal/session
NS: allgroups
NR NR NS: allgroups
NS: allgroups
NR 5-min: NS,4-min:±18%,2-min: NS,C: NS
Tomiyasu et al.,1996[48]
Effect of short-term exercisetraining
Age 19-30y; 20 M:13 HI, 7 MI
Running; 3wk;f = daily; I = HI: 19km/h (12 miles/h);MI: 10 km/h(6 miles/h); D = HI:6.5km (4 miles);MI: 3.2km (2 miles)
HI: –16 (–9%),MI: –12 (–6%)NS
NR HI: –38(–37%),MI: –33(–28%) NS
HI: ±6 (±10%),MI: ±6 (±10%)
NS: bothgroups
NR NR
Thompsonet al., 1988[123]
Effects ofexercise training
Age 20-40y; 8 M:6 Ex, 2 C
Cycle ergometry;48wk; f = 4-5/wk;I = 80% HRmax;D = 60 min
NS: bothgroups
NS: bothgroups
–19 (–16%) ±5 (±14%) NS: bothgroups
NS: bothgroups
±27%
Thompsonet al., 1997[124]
Effects ofexercise training
Age 30-50y; 17 M Walk/jog/cycle; 1y;f = 4/wk; I = 60-80%HRmax; D = 50 min
NS NS –11 (–8%) ±4 (±9%) NS NS ±27%
Vermeulen,1990[92]
Effects of‘modified fastdiet’ andexercise
Age 42-65y; 46obesepostmenopausalF: 26 DE(exercise + 400-kcal/d diet), 20 Cat baseline
Swim/gymnastics;4wk; f = daily;I = low-moderate;D = 20-min swim,30-min gymnastics
DE: –59(–22%),C: NS
NR DE: –50(–26%),C: NS
NS: bothgroups
DE: –8kg,C: NS
NR NR
Van Der Eemsand Ismail,1985[87]
Effects ofexercise training
Age 27-59y; 20 F:10 PRE, 10 POM
Jog/callisthenics;8mo; f = 3/wk;I = 60-70% HRmax;D = 45 min
NS: bothgroups
NS: bothgroups
PRE: –23(–27%)significant forcombinedgroups,POM: –14(–16%)significant forcombinedgroups
PRE: ±4(±4%) NS forcombinedgroups,POM: –2(–3%) NS forcombinedgroups
NS PRE: –3%,POM: NS
NS: bothgroups
© A
dis In
tern
atio
na
l Limite
d. A
ll righ
ts rese
rved
.Sp
orts M
ed
2001; 31 (15)
Continued over page
Blood
Lip
id and
Lip
oprotein A
dap
tations to Exercise
1055
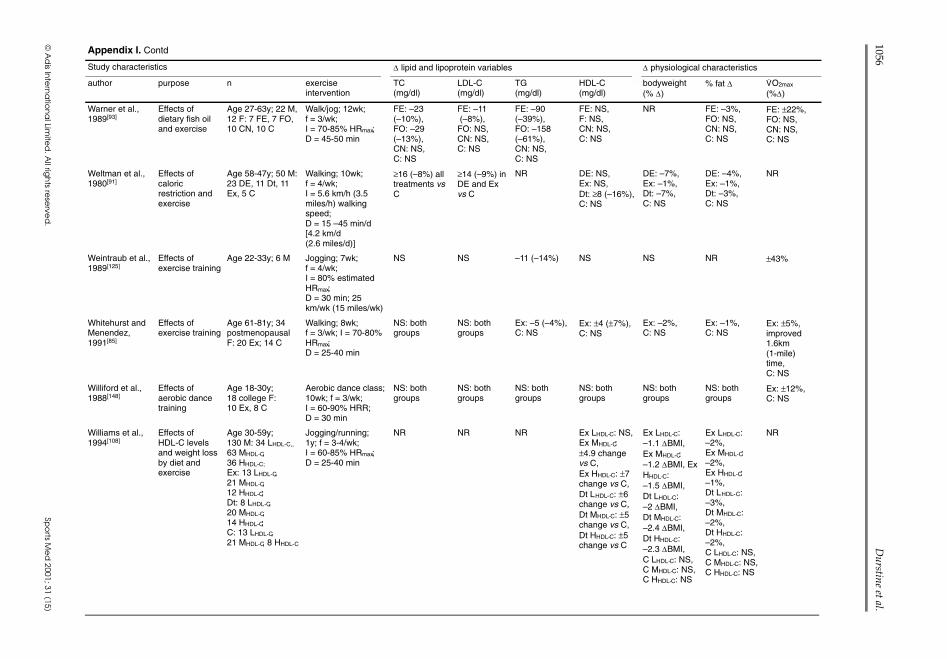
Appendix I. Contd
Study characteristics ∆ lipid and lipoprotein variables ∆ physiological characteristics
author purpose n exerciseintervention
TC(mg/dl)
LDL-C(mg/dl)
TG(mg/dl)
HDL-C(mg/dl)
bodyweight(% ∆)
% fat ∆ V.O2max
(%∆)
Warner et al.,1989[93]
Effects ofdietary fish oiland exercise
Age 27-63y; 22 M,12 F: 7 FE, 7 FO,10 CN, 10 C
Walk/jog; 12wk;f = 3/wk;I = 70-85% HRmax;D = 45-50 min
FE: –23(–10%),FO: –29(–13%),CN: NS,C: NS
FE: –11(–8%),FO: NS,CN: NS,C: NS
FE: –90(–39%),FO: –158(–61%),CN: NS,C: NS
FE: NS,F: NS,CN: NS,C: NS
NR FE: –3%,FO: NS,CN: NS,C: NS
FE: ±22%,FO: NS,CN: NS,C: NS
Weltman et al.,1980[91]
Effects ofcaloricrestriction andexercise
Age 58-47y; 50 M:23 DE, 11 Dt, 11Ex, 5 C
Walking; 10wk;f = 4/wk;I = 5.6 km/h (3.5miles/h) walkingspeed;D = 15 –45 min/d[4.2 km/d(2.6 miles/d)]
≥16 (–8%) alltreatments vsC
≥14 (–9%) inDE and Exvs C
NR DE: NS,Ex: NS,Dt: ≥8 (–16%),C: NS
DE: –7%,Ex: –1%,Dt: –7%,C: NS
DE: –4%,Ex: –1%,Dt: –3%,C: NS
NR
Weintraub et al.,1989[125]
Effects ofexercise training
Age 22-33y; 6 M Jogging; 7wk;f = 4/wk;I = 80% estimatedHRmax;D = 30 min; 25km/wk (15 miles/wk)
NS NS –11 (–14%) NS NS NR ±43%
Whitehurst andMenendez,1991[85]
Effects ofexercise training
Age 61-81y; 34postmenopausalF: 20 Ex; 14 C
Walking; 8wk;f = 3/wk; I = 70-80%HRmax;D = 25-40 min
NS: bothgroups
NS: bothgroups
Ex: –5 (–4%),C: NS
Ex: ±4 (±7%),C: NS
Ex: –2%,C: NS
Ex: –1%,C: NS
Ex: ±5%,improved1.6km(1-mile)time,C: NS
Williford et al.,1988[148]
Effects ofaerobic dancetraining
Age 18-30y;18 college F:10 Ex, 8 C
Aerobic dance class;10wk; f = 3/wk;I = 60-90% HRR;D = 30 min
NS: bothgroups
NS: bothgroups
NS: bothgroups
NS: bothgroups
NS: bothgroups
NS: bothgroups
Ex: ±12%,C: NS
Williams et al.,1994[108]
Effects ofHDL-C levelsand weight lossby diet andexercise
Age 30-59y;130 M: 34 LHDL-C,,
63 MHDL-C,36 HHDL-C;
Ex: 13 LHDL-C,21 MHDL-C,12 HHDL-C;Dt: 8 LHDL-C,20 MHDL-C,14 HHDL-C;C: 13 LHDL-C,21 MHDL-C, 8 HHDL-C
Jogging/running;1y; f = 3-4/wk;I = 60-85% HRmax;D = 25-40 min
NR NR NR Ex LHDL-C: NS,Ex MHDL-C:±4.9 changevs C,Ex HHDL-C: ±7change vs C,Dt LHDL-C: ±6change vs C,Dt MHDL-C: ±5change vs C,Dt HHDL-C: ±5change vs C
Ex LHDL-C:–1.1 ∆BMI,Ex MHDL-C:–1.2 ∆BMI, ExHHDL-C:–1.5 ∆BMI,Dt LHDL-C:–2 ∆BMI,Dt MHDL-C:–2.4 ∆BMI,Dt HHDL-C:–2.3 ∆BMI,C LHDL-C: NS,C MHDL-C: NS,C HHDL-C: NS
Ex LHDL-C:–2%,Ex MHDL-C:–2%,Ex HHDL-C:–1%,Dt LHDL-C:–3%,Dt MHDL-C:–2%,Dt HHDL-C:–2%,C LHDL-C: NS,C MHDL-C: NS,C HHDL-C: NS
NR
© A
dis In
tern
atio
na
l Limite
d. A
ll righ
ts rese
rved
.Sp
orts M
ed
2001; 31 (15)
1056D
urstine et al.
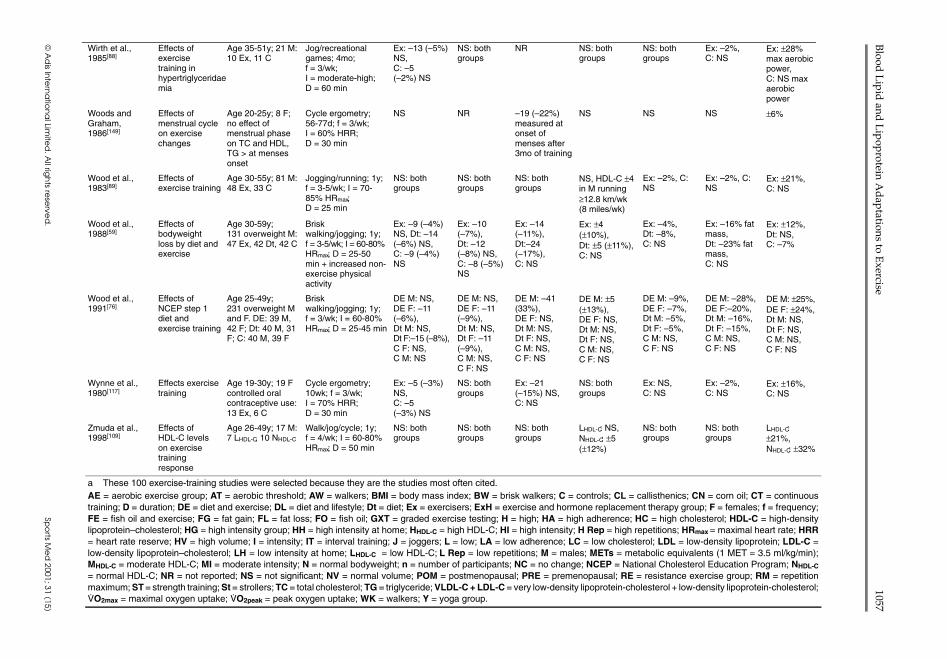
Wirth et al.,1985[88]
Effects ofexercisetraining inhypertriglyceridaemia
Age 35-51y; 21 M:10 Ex, 11 C
Jog/recreationalgames; 4mo;f = 3/wk;I = moderate-high;D = 60 min
Ex: –13 (–5%)NS,C: –5(–2%) NS
NS: bothgroups
NR NS: bothgroups
NS: bothgroups
Ex: –2%,C: NS
Ex: ±28%max aerobicpower,C: NS maxaerobicpower
Woods andGraham,1986[149]
Effects ofmenstrual cycleon exercisechanges
Age 20-25y; 8 F;no effect ofmenstrual phaseon TC and HDL,TG > at mensesonset
Cycle ergometry;56-77d; f = 3/wk;I = 60% HRR;D = 30 min
NS NR –19 (–22%)measured atonset ofmenses after3mo of training
NS NS NS ±6%
Wood et al.,1983[89]
Effects ofexercise training
Age 30-55y; 81 M:48 Ex, 33 C
Jogging/running; 1y;f = 3-5/wk; I = 70-85% HRmax;D = 25 min
NS: bothgroups
NS: bothgroups
NS: bothgroups
NS, HDL-C ±4in M running≥12.8 km/wk(8 miles/wk)
Ex: –2%, C:NS
Ex: –2%, C:NS
Ex: ±21%,C: NS
Wood et al.,1988[59]
Effects ofbodyweightloss by diet andexercise
Age 30-59y;131 overweight M:47 Ex, 42 Dt, 42 C
Briskwalking/jogging; 1y;f = 3-5/wk; I = 60-80%HRmax; D = 25-50min + increased non-exercise physicalactivity
Ex: –9 (–4%)NS, Dt: –14(–6%) NS,C: –9 (–4%)NS
Ex: –10(–7%),Dt: –12(–8%) NS,C: –8 (–5%)NS
Ex: –14(–11%),Dt:–24(–17%),C: NS
Ex: ±4(±10%),Dt: ±5 (±11%),C: NS
Ex: –4%,Dt: –8%,C: NS
Ex: –16% fatmass,Dt: –23% fatmass,C: NS
Ex: ±12%,Dt: NS,C: –7%
Wood et al.,1991[76]
Effects ofNCEP step 1diet andexercise training
Age 25-49y;231 overweight Mand F. DE: 39 M,42 F; Dt: 40 M, 31F; C: 40 M, 39 F
Briskwalking/jogging; 1y;f = 3/wk; I = 60-80%HRmax; D = 25-45 min
DE M: NS,DE F: –11(–6%),Dt M: NS,Dt F:–15 (–8%),C F: NS,C M: NS
DE M: NS,DE F: –11(–9%),Dt M: NS,Dt F: –11(–9%),C M: NS,C F: NS
DE M: –41(33%),DE F: NS,Dt M: NS,Dt F: NS,C M: NS,C F: NS
DE M: ±5(±13%),DE F: NS,Dt M: NS,Dt F: NS,C M: NS,C F: NS
DE M: –9%,DE F: –7%,Dt M: –5%,Dt F: –5%,C M: NS,C F: NS
DE M: –28%,DE F:–20%,Dt M: –16%,Dt F: –15%,C M: NS,C F: NS
DE M: ±25%,DE F: ±24%,Dt M: NS,Dt F: NS,C M: NS,C F: NS
Wynne et al.,1980[117]
Effects exercisetraining
Age 19-30y; 19 Fcontrolled oralcontraceptive use:13 Ex, 6 C
Cycle ergometry;10wk; f = 3/wk;I = 70% HRR;D = 30 min
Ex: –5 (–3%)NS,C: –5(–3%) NS
NS: bothgroups
Ex: –21(–15%) NS,C: NS
NS: bothgroups
Ex: NS,C: NS
Ex: –2%,C: NS
Ex: ±16%,C: NS
Zmuda et al.,1998[109]
Effects ofHDL-C levelson exercisetrainingresponse
Age 26-49y; 17 M:7 LHDL-C, 10 NHDL-C
Walk/jog/cycle; 1y;f = 4/wk; I = 60-80%HRmax; D = 50 min
NS: bothgroups
NS: bothgroups
NS: bothgroups
LHDL-C: NS,NHDL-C: ±5(±12%)
NS: bothgroups
NS: bothgroups
LHDL-C:±21%,NHDL-C: ±32%
a These 100 exercise-training studies were selected because they are the studies most often cited.AE = aerobic exercise group; AT = aerobic threshold; AW = walkers; BMI = body mass index; BW = brisk walkers; C = controls; CL = callisthenics; CN = corn oil; CT = continuoustraining; D = duration; DE = diet and exercise; DL = diet and lifestyle; Dt = diet; Ex = exercisers; ExH = exercise and hormone replacement therapy group; F = females; f = frequency;FE = fish oil and exercise; FG = fat gain; FL = fat loss; FO = fish oil; GXT = graded exercise testing; H = high; HA = high adherence; HC = high cholesterol; HDL-C = high-densitylipoprotein–cholesterol; HG = high intensity group; HH = high intensity at home; HHDL-C = high HDL-C; HI = high intensity; H Rep = high repetitions; HRmax = maximal heart rate; HRR= heart rate reserve; HV = high volume; I = intensity; IT = interval training; J = joggers; L = low; LA = low adherence; LC = low cholesterol; LDL = low-density lipoprotein; LDL-C =low-density lipoprotein–cholesterol; LH = low intensity at home; LHDL-C = low HDL-C; L Rep = low repetitions; M = males; METs = metabolic equivalents (1 MET = 3.5 ml/kg/min);MHDL-C = moderate HDL-C; MI = moderate intensity; N = normal bodyweight; n = number of participants; NC = no change; NCEP = National Cholesterol Education Program; NHDL-C
= normal HDL-C; NR = not reported; NS = not significant; NV = normal volume; POM = postmenopausal; PRE = premenopausal; RE = resistance exercise group; RM = repetitionmaximum; ST = strength training; St = strollers; TC = total cholesterol; TG = triglyceride; VLDL-C + LDL-C = very low-density lipoprotein-cholesterol + low-density lipoprotein-cholesterol;V.O2max = maximal oxygen uptake; V
.O2peak = peak oxygen uptake; WK = walkers; Y = yoga group.
Blood
Lip
id and
Lip
oprotein A
dap
tations to Exercise
1057
© A
dis In
tern
atio
na
l Limite
d. A
ll righ
ts rese
rved
.Sp
orts M
ed
2001; 31 (15)
References1. Fletcher G, Blair S, Blumenthal C, et al. Benefits and recom-
mendations for physical activity programs for all Americans:a statement for health professionals by the Committee on Ex-ercise and Cardiac Rehabilitation of the Council on ClinicalCardiology, American Heart Association. Circulation 1992;86: 340-4
2. Durstine JL, Crouse SF, Moffatt R. Lipids in exercise and sports.In: Driskell J, Wolinsky I, editors. Energy-yielding macronu-trients and energy metabolism in sports nutrition. Vol 1. BocaRaton (FL): CRC Press, 2000: 87-117
3. Durstine JL, Haskell W: Effects of exercise training on plasmalipids and lipoproteins. In: Holloszy J, editor. Exercise andsports science reviews. Philadelphia (PA): Williams and Wil-kins, 1994: 477-521
4. Pate R, Pratt M, Blair S. Physical activity and public health.JAMA 1995; 273: 402-7
5. Wood P, Haskell W, Stern M, et al. Plasma lipoprotein distribu-tions in male and female runners. Ann N Y Acad Sci 1977;301: 748-63
6. Martin R, Haskell W, Wood P. Blood chemistry and lipid pro-files of elite distance runners. Ann N Y Acad Sci 1977; 301:346-60
7. Hartung G, Foreyt J, Mitchell R, et al. Relation of diet to high-density-lipoprotein cholesterol in middle-aged marathon run-ners, joggers, and inactive men. N Engl J Med 1980; 302:357-61
8. Lakka T, Salonen J. Physical activity and serum lipids: a cross-sectional population study in Eastern Finnish men. Am JEpidemiol 1992; 136: 806-18
9. Kokkinos P, Holland J, Pittaras A, et al. Cardiorespiratory fit-ness and coronary heart disease risk factor association inwomen. J Am Coll Cardiol 1995; 26: 358-64
10. Kokkinos P, Holland J, Narayan P, et al. Miles run per week andhigh-density lipoprotein cholesterol levels in healthy middle-aged men: a dose-response relationship. Arch Intern Med1995; 155: 415-20
11. Leclerc S, Allard C, Talbot J, et al. High-density lipoproteincholesterol, habitual physical activity and physical fitness.Atherosclerosis 1985; 57: 43-51
12. Williams P. Relationships of heart disease risk factors to ex-ercise quantity and intensity. Arch Intern Med 1998; 158:237-45
13. Superko H. Exercise training, serum lipids and lipoproteinparticles: is there a change threshold? Med Sci Sports Exerc1991; 23: 677-85
14. Gordon D, Witztum D, Hunninghake D. Habitual physical ac-tivity and high-density lipoprotein cholesterol in men withprimary hypercholesterolemia. Circulation 1983; 67: 512-20
15. Gordon D, Probstfeld J, Rubenstein C. Coronary risk factorsand exercise test performance in asymptomatic hypercholes-terolemic men: application of proportional hazards analysis.Am J Epidemiol 1984; 120: 210-24
16. Enger S, Herbjornsen K, Erikssen J, et al. High density lipopro-teins (HDL) and physical activity: the influence of physicalexercise, age, and smoking on HDL-cholesterol and the HDL-/total cholesterol ratio. Scand J Clin Lab Invest 1977; 37:251-5
17. Lehtonen A, Viikari J. The effects of vigorous physical activityat work on serum lipids with a special reference to serumhigh-density lipoprotein cholesterol. Acta Physiol Scand 1978;104: 117-21
18. Lehtonen A, Viikari J. Serum triglycerides and cholesterol andserum high density lipoprotein cholesterol in highly physi-cally active men. Acta Med Scand 1978; 204: 111-4
19. Adner M, Castelli W. Elevated high-density lipoprotein levelsin marathon runners. JAMA 1980; 243: 534-6
20. Rotkis T, Cote R, Coyle E, et al. Relationship between highdensity lipoprotein cholesterol and weekly running mileage.J Cardiac Rehab 1982; 2: 109-12
21. Hagan R, Gettman L. Maximal aerobic power, body fat, andserum lipoproteins in male distance runners. J Cardiac Rehab1983; 3: 331-7
22. Thompson P, Lazarus B, Cullinane E, et al. Exercise, diet, orphysical characteristics as determinants of HDL-levels in en-durance athletes. Atherosclerosis 1983; 46: 333-9
23. Herbert P, Bernier D, Cullinane E, et al. High-density lipopro-tein metabolism in runners and sedentary men. JAMA 1984;252: 1034-7
24. Williams P, Krauss R, Wood P, et al. Lipoprotein subfractionsof runners and sedentary men. Metabolism 1986; 35: 45-52
25. Durstine JL, Pate R, Sparling P, et al. Lipid, lipoprotein and ironstatus of elite women distance runners. Int J Sports Med 1987;8: 119-23
26. Frey I, Berg A, Baumstark M, et al. Effects of age and physicalperformance capacity on distribution and composition of high-density lipoprotein subfractions in men. Eur J Appl Physiol1990; 60: 441-4
27. Thompson P, Cullinane E, Sady S, et al. High density lipopro-tein metabolism in endurance athletes and sedentary men. Cir-culation 1991; 84: 140-52
28. Blessing D, Warren B, Williford H, et al. Influence of sportparticipation on blood lipids and lipoproteins in competitivefemale athletes. Sports Med Train Rehab 1996; 7: 77-85
29. Stevenson E, DeSouza C, Jones P, et al. Physically active womendemonstrate less adverse age-related changes in plasma lipidsand lipoproteins. Am J Cardiol 1997; 80: 1360-3
30. Giada F, Baldo-Enzi G, Baiocchi M, et al. Specialized physicaltraining programs: effects on serum lipoprotein cholesterol,apoproteins A-I and B, and lipolytic enzyme activities. J SportsMed Phys Fitness 1991; 31: 196-203
31. Reaven P, McPhillips J, Barrett-Conner E, et al. Leisure timeexercise and lipid and lipoprotein levels in an older popula-tion. J Am Geriatr Soc 1990; 38: 847-54
32. Williams P. High-density lipoprotein cholesterol and other riskfactors for coronary heart disease in female runners. N EnglJ Med 1996; 334: 1298-303
33. Williams P. Relationship of distance run per week to coronaryheart disease risk factors in 8283 male runners: The NationalRunner’s Health Study. Arch Intern Med 1997; 157: 191-8
34. Williams P. High density lipoproteins and lipase activity in run-ners. Atherosclerosis 1993; 98: 251-4
35. Drygas W, Jegler A, Kunski H. Study on threshold dose of phys-ical activity in coronary heart disease prevention. Part 1. Re-lationship between leisure-time physical activity and coronaryrisk factors. Int J Sports Med 1988; 9: 275-8
36. Drygas W, Kostka T, Jegler A, et al. Long-term effects ofdifferent physical activity levels on coronary heart diseaserisk factors in middle-aged men. Int J Sports Med 2000; 21:235-41
37. Moore C, Hartung G, Mitchell R, et al. The relationship ofexercise and diet on high-density lipoprotein cholesterol lev-els in women. Metabolism 1983; 32: 189-95
1058 Durstine et al.
Adis International Limited. All rights reserved. Sports Med 2001; 31 (15)
38. Kokkinos P, Fernhall B. Physical activity and high density li-poprotein cholesterol levels: what is the relationship? SportsMed 1999; 28: 307-14
39. Ballor D, Poehlman E. Resting metabolic rate and coronaryheart disease risk factors in aerobically and resistance-trainedwomen. Am J Clin Nutr 1992; 56: 968-74
40. Berg A, Ringwald G, Deus B, et al. Physical performance andserum cholesterol fractions in healthy young men. Clin ChimActa 1980; 106: 325-30
41. Fanong T, Toth M, Katzel L, et al. Relationship between phys-ical activity and HDL-cholesterol in healthy older men andwomen: a cross-sectional and exercise intervention study.Atherosclerosis 1996; 127: 177-83
42. Toth M, Poehlman E. Resting metabolic rate and cardiovasculardisease risk in resistance- and aerobic-trained middle-agedwomen. Int J Obesity 1995; 19: 691-8
43. Altekruse E, Wilmore J. Changes in blood chemistries follow-ing a controlled exercise program. J Occup Med 1973; 15:110-3
44. Ponjee G, Janssen E, Hermans J, et al. Effect of long-term ex-ercise of moderate intensity on anthropometric values andserum lipids and lipoproteins. Eur J Clin Chem Clin Biochem1995; 33: 121-6
45. Hill J, Theil J, Heller P, et al. Differences in effects of aerobicexercise training on blood lipids in men and women. Am JCardiol 1989; 63: 254-6
46. Lopez A, Vial R, Balart L, et al. Effect of exercise and physicalfitness on serum lipids and lipoproteins. Atherosclerosis 1974;20: 1-9
47. Nye E, Carlson K, Kirstein P, et al. Changes in high densitylipoprotein subfractions and other lipoproteins induced byexercise. Clin Chim Acta 1981; 113: 51-7
48. Tomiyasu K, Ishikawa T, Ikewaki K, et al. Effects of exerciseon plasma lipases and cholesterol ester transfer protein activ-ities in normolipidemic male subjects. Nutr Metab Cardio-vasc Dis 1996; 6: 13-20
49. Seip R, Moulin P, Cocke T, et al. Exercise training decreasesplasma cholesterol ester transfer protein. Atheroscler Thromb1993; 13: 1359-67
50. Buono M, McKenzie T, McKenzie R. Effects of a diet andexercise program on blood lipids, cardiorespiratory function,and body composition in obese women. Clin Kinesiol 1988;42: 22-5
51. Despres J, Pouliot M-C, Moorjani S, et al. Loss of abdominalfat and metabolic response to exercise training in obesewomen. Am J Physiol 1991; 261: E159-67
52. Kiens B, Jorgenson I, Lewis S, et al. Increased plasma HDL-cholesterol and Apo A-I in sedentary middle-aged men afterphysical conditioning. J Clin Invest 1980; 10: 203-9
53. Raz I, Rosenblit H, Kark J. Effect of moderate exercise onserum lipids in young men with low high density lipoproteincholesterol. Arteriosclerosis 1988; 8: 245-51
54. Binder E, Birge S, Kohrt W. Effects of endurance exercise andhormone replacement therapy on serum lipids in older women.J Am Geriatr Soc 1996; 44: 231-6
55. Boyden T, Pamenter R, Going S, et al. Resistance exercise train-ing is associated with decreases in serum low-density lipopro-tein cholesterol levels in premenopausal women. Arch InternMed 1993; 153: 97-100
56. Ready E, Drinkwater D, Ducas J, et al. Walking program re-duces elevated cholesterol in women postmenopause. Can JCardiol 1995; 11: 905-12
57. Grandjean PW, Oden G, Crouse SF, et al. Lipid and lipoproteinchanges in women following 6 months of exercise training ina worksite fitness program. J Sports Med Phys Fitness 1996;36: 54-9
58. Barr S, Costill D, Fink W, et al. Effects of increased trainingvolume on blood lipids and lipoproteins in male collegiateswimmers. Med Sci Sports Exerc 1991; 23: 795-800
59. Wood P, Stefanick M, Dreon D, et al. Changes in plasma lipidsand lipoproteins in overweight men during weight loss throughdieting as compared with exercise. N Engl J Med 1988; 319:1173-9
60. Halbert J, Silagy C, Finucane P, et al. Exercise training andblood lipids in hyperlipidemic and normolipidemic adults: ameta-analysis of randomized controlled trials. Eur J Clin Nutr1999; 53: 514-22
61. Shephard R, Youldon P, Cox M, et al. Effects of a 6-monthindustrial fitness programme on serum lipid concentrations.Atherosclerosis 1979; 35: 277-86
62. Baker T, Allen D, Lei K, et al. Alterations in lipid and proteinprofiles of plasma lipoproteins in middle-aged men conse-quent to an aerobic exercise program. Metabolism 1986; 35:1037-43
63. Despres J-P, Moorjani S, Tremblay A, et al. Heredity and changesin plasma lipids and lipoproteins after short-term exercisetraining in men. Arteriosclerosis 1988; 8: 402-9
64. Despres J-P, Moorjani S, Lupien P, et al. Regional distributionof body fat, plasma lipoproteins, and cardiovascular disease.Arteriosclerosis 1990; 10: 497-511
65. Peltonen P, Marniemi J, Hietanen E, et al. Changes in serumlipids, lipoproteins, and heparin releasable lipolytic enzymesduring moderate physical training in man: a longitudinalstudy. Metabolism 1981; 30: 518-26
66. Goodyear L, Fronsoe M, Van Houten D, et al. Increased HDL-cholesterol following eight weeks of progressive endurancetraining in female runners. Ann Sports Med 1986; 3: 33-8
67. Rotkis T, Boyden T, Stanforth P, et al. Increased high-densitylipoprotein cholesterol in women after 10 weeks of training.J Cardiac Rehabil 1984; 4: 62-6
68. Haskell W. The influences of exercise training on plasma lipidsand lipoproteins in health and disease. Acta Med Scand 1986;711: S25-37
69. Tran Z, Weltman A, Glass G, et al. The effects of exercise onblood lipids and lipoproteins: a meta-analysis of studies. MedSci Sports Exerc 1983; 15: 393-402
70. Filipovsky J, Simon J, Chrastek J, et al. Changes in blood pres-sure and lipid pattern during a physical training course inhypertensive subjects. Cardiology 1991; 78: 31-8
71. Brownell K, Bachorik P, Ayerle R. Changes in lipid and lipo-protein levels in men and women after a program of moderateexercise. Circulation 1982; 65: 477-84
72. Grandjean PW, Crouse SF, O’Brien BC, et al. The effects ofmenopausal status and exercise training on serum lipids andthe activities of intravascular enzymes related to lipid trans-port. Metabolism 1998; 47: 377-83
73. Lamarche B, Despres J, Pouliot M-C, et al. Is body fat loss adeterminant factor in the improvement of carbohydrate andlipid metabolism following aerobic exercise training in obesewomen? Metabolism 1992; 41: 1249-56
74. Andersen R, Wadden T, Bartlett S, et al. Effects of lifestyleactivity vs structured aerobic exercise in obese women. JAMA1999; 281: 335-40
Blood Lipid and Lipoprotein Adaptations to Exercise 1059
Adis International Limited. All rights reserved. Sports Med 2001; 31 (15)
75. Nieman D, Haig J, Fairchild K, et al. Reducing-diet and exercise-training effects on serum lipids and lipoproteins in mildlyobese women. Am J Clin Nutr 1990; 52: 640-5
76. Wood P, Stefanick M, Williams P, et al. The effects on plasmalipoproteins of a prudent weight-reducing diet, with or with-out exercise, in overweight men and women. N Engl J Med1991; 325: 461-6
77. Moll M, Williams S, Lester R, et al. Cholesterol metabolism innon-obese women. Atherosclerosis 1979; 34: 159-66
78. Bassett-Frey M, Doerr B, Laubach L, et al. Exercise does notchange high-density lipoprotein cholesterol in women after10 weeks of training. Metabolism 1996; 31: 1142-6
79. Crouse SF, O’Brien BC, Grandjean PW, et al. Training intensity,blood lipids and apolipoproteins in men with high cholesterol.J Appl Physiol 1996; 82: 270-7
80. Franklin B, Buskirk E, Hodgson J, et al. Effects of physicalconditioning on cardiorespiratory function, body composition,and serum lipids in relatively normal-weight and obese middle-aged women. Int J Obes 1979; 3: 97-109
81. Houmard J, Bruno N, Bruner R, et al. Effects of exercise train-ing on the chemical composition of plasma LDL. AtherosclerThromb 1994; 14: 325-30
82. Lewis S, Haskell W, Wood P, et al. Effects of physical activityon weight reduction in obese middle-aged women. Am J ClinNutr 1976; 29: 151-6
83. Leon A, Conrad J, Hunninghake D, et al. Effects of a vigorouswalking program on body composition, carbohydrate and lipidmetabolism of obese young men. Am J Clin Nutr 1979; 32:1776-87
84. Milesis C, Pollock M, Bah M, et al. Effects of different dura-tions of physical training on cardiorespiratory function, bodycomposition, and serum lipids. Res Q 1976; 47: 716-25
85. Whitehurst M, Menendez E. Endurance training in older women.Phys Sports Med 1991; 19: 95-103
86. Schwartz R. The independent effects of dietary weight loss andaerobic training on high density lipoproteins and apolipopro-tein A-I concentrations in obese men. Metabolism 1987; 36:165-71
87. Van der Eems K, Ismail A. Relationships between age and se-lected serum lipids and lipoproteins in women before and aftera physical fitness programme. Br J Sports Med 1985; 6: 43-5
88. Wirth A, Diehm C, Hanel W, et al. Training-induced changes inserum lipids, fat tolerance, and adipose tissue metabolism inpatients with hypertriglyceridemia. Atherosclerosis 1985; 54:263-71
89. Wood P, Haskell W, Blair S, et al. Increased exercise level andplasma lipoprotein concentrations: a one year randomized,controlled study in sedentary middle-aged men. Metabolism1983; 32: 31-9
90. Schwartz R, Cain K, Shuman W, et al. Effect of intensive en-durance training on lipoprotein profiles in young and oldermen. Metabolism 1992; 41: 649-54
91. Weltman A, Matter S, Stamford B. Caloric restriction and /ormild exercise: effects on serum lipids and body composition.Am J Clin Nutr 1980; 33: 1002-9
92. Vermeulen A. Plasma lipid and lipoprotein levels in obese post-menopausal women: effects of a short-term low-protein dietand exercise. Maturitas 1990; 12: 121-6
93. Warner J, Ullrich I, Albrink M, et al. Combined effects of aer-obic exercise and omega-3 fatty acids in hyperlipidemic per-sons. Med Sci Sports Exerc 1989; 21: 498-505
94. Coon P, Bleecker E, Crinkwater D, et al. Effects of body com-position and exercise capacity on glucose tolerance, insulin,
and lipoprotein lipids in healthy older men: a cross-sectionaland longitudinal intervention study. Metabolism 1989; 38:1201-9
95. Blumenthal J, Rejeski J, Walsh-Riddle M, et al. Comparison ofhigh- and low-intensity exercise training early after acutemyocardial infarction. Am J Cardiol 1988; 61: 26-30
96. Gaesser G, Rich R. Effects of high- and low-intensity exercisetraining on aerobic capacity and blood lipids. Med Sci SportsExerc 1984; 16: 269-74
97. King A, Haskell W, Young D, et al. Long-term effects of varyingintensities and formats of physical activity on participationrates, fitness, and lipoproteins in men and women aged 50 to65. Circulation 1995; 91: 2596-604
98. Savage M, Petratis M, Thompson W, et al. Exercise trainingeffects on serum lipids of prepubescent boys and adult men.Med Sci Sports Exerc 1986; 18: 197-204
99. Stein R, Michielli D, Glantz M, et al. Effects of different exer-cise training intensities on lipoprotein cholesterol fractions inhealthy middle-aged men. Am Heart J 1990; 119: 277-83
100. Smutok A, Reece C, Kokkinos P, et al. Aerobic versus strengthtraining for risk factor intervention in middle-aged men athigh risk for coronary heart disease. Metabolism 1993; 42:177-84
101. Blumenthal J, Matthews K, Fredrikson M, et al. Effects of ex-ercise training on cardiovascular function and plasma lipid,lipoprotein, and apolipoprotein concentrations in premeno-pausal and postmenopausal women. Arterioscler Thromb1991; 11: 912-7
102. Kokkinos P, Hurley B, Smutok A, et al. Strength training doesnot improve lipoprotein-lipid profiles in men at risk for CHD.Med Sci Sports Exerc 1991; 23: 1134-9
103. Kokkinos P, Hurley B, Vaccaro P, et al. Effects of low- andhigh-repetition resistive training on lipoprotein-lipid profiles.Med Sci Sports Exerc 1988; 20: 50-4
104. Manning J, Dooly-Manning C, White K, et al. Effects of a re-sistive training program on lipoprotein-lipid levels in obesewomen. Med Sci Sports Exerc 1991; 23: 1222-6
105. Goldberg L, Elliot D, Schutz R, et al. Changes in lipid andlipoprotein levels after weight training. JAMA 1984; 252:504-6
106. Hurley B, Hagberg J, Goldberg A, et al. Resistive training canreduce coronary risk factors without altering V
.O2max or per-
cent body fat. Med Sci Sports Exerc 1988; 20: 150-4107. Goldberg L, Eliot D. The effect of exercise on lipid metabolism
in men and women. Sports Med 1987; 4: 307-21108. Williams P, Stefanick M, Vranizan K, et al. The effects of weight
loss by exercise or by dieting on plasma high density lipopro-tein (HDL) levels in men with low, intermediate, and normal-to-high HDL at baseline. Metabolism 1994; 43: 917-24
109. Zmuda J, Yurgalevitch S, Flynn M, et al. Exercise training haslittle effect on HDL levels and metabolism in men with ini-tially low HDL cholesterol. Atherosclerosis 1998; 137: 215-21
110. Nicklas B, Katzel L, Busby-Whitehead J, et al. Increases inhigh-density lipoprotein cholesterol with endurance exercisetraining are blunted in obese compared with lean men. Meta-bolism 1997; 46: 556-61
111. Duncan J, Gordon N, Scott C. Women walking for health andfitness: how much is enough? JAMA 1991; 266: 3295-9
112. Hardman A, Hudson A, Jones P, et al. Brisk walking and highdensity lipoprotein cholesterol concentration in previouslysedentary women. BMJ 1989; 299: 1204-5
1060 Durstine et al.
Adis International Limited. All rights reserved. Sports Med 2001; 31 (15)
113. Taskinen M-R, Nikkila E. High density lipoprotein subfractionsin relation to lipoprotein lipase activity of tissues in man -evidence for reciprocal regulation of HDL2 and HDL3 levelsby lipoprotein lipase. Clin Chem Acta 1981; 112: 325-32
114. Taskinen M-R, Nikkila E, Rehunen S, et al. Effect of acutevigorous exercise on lipoprotein lipase activity of adiposetissue and skeletal muscle in physically active men. Artery1980; 6: 471-83
115. Lithell H, Hellsing K, Lundquist G, et al. Lipoprotein lipaseactivity of human skeletal muscle and adipose tissue afterintensive physical exercise. Acta Physiol Scand 1979; 105:312-5
116. Huttunen J, Lansimies E, Voutilainen E, et al. Effect of moderatephysical exercise on serum lipoproteins: a controlled clinicaltrial with special reference to serum high-density lipoproteins.Circulation 1979; 60: 1220-9
117. Wynne T, Bassett-Frey M, Laubach L, et al. Effect of a control-led exercise program on serum lipoprotein levels in womenon oral contraceptives. Metabolism 1980; 29: 1267-71
118. Aellen R, Hollmann W, Boutellier U. Effects of aerobic andanaerobic training on plasma lipoproteins. Int J Sports Med1993; 14: 396-400
119. Dressendorfer R, Wade C, Hornick C, et al. High-density lipo-protein cholesterol in marathon runners during a 20-day roadrace. JAMA 1982; 247: 1715-7
120. Higuchi M, Hashimoto I, Yamakawa K, et al. Effect of exercisetraining on plasma high-density lipoprotein cholesterol levelat constant weight. Clin Physiol 1984; 4: 125-33
121. Pollock M, Tiffany J, Gettman L, et al. Effects of frequency oftraining on serum lipids, cardiovascular function and bodycomposition. In: Franks BD, editor. Exercise and fitness. Vol1. New York (NY): Athletic Institution, 1969: 161-77
122. Sutherland W, Nye E, Woodhouse S. Red blood cell cholesterollevels, plasma cholesterol esterification rate and serum lipidsand lipoproteins in men with hypercholesterolaemia and nor-mal men during 16 weeks physical training. Atherosclerosis1983; 47: 145-57
123. Thompson P, Cullinane E, Sady S, et al. Modest changes inhigh-density lipoprotein concentrations and metabolism withprolonged exercise training. Circulation 1988; 78: 25-34
124. Thompson P, Yurgalevitch S, Flynn M, et al. Effect of prolongedexercise training without weight loss on high-density lipopro-tein metabolism in overweight men. Metabolism 1997; 46:217-23
125. Weintraub M, Rosen Y, Otto R, et al. Physical exercise condi-tioning in the absence of weight loss reduces fasting and post-prandial triglyceride-rich lipoprotein levels. Circulation 1989;79: 1007-14
126. Blumenthal J, Emery C, Madden D. Effects of exercise trainingon cardiorespiratory function in men and women >60 yearsof age. Am J Cardiol 1991; 67: 633-9
127. Sopko G, Jacobs D, Jeffery R, et al. Effects of blood lipids andbody weight in high risk men of a practical exercise program.Atherosclerosis 1983; 49: 219-29
128. Stefanick M, Mackey S, Sheehan M, et al. Effects of diet andexercise in men and postmenopausal women with low levelsof HDL cholesterol and high levels of LDL cholesterol. NEngl J Med 1998; 339: 12-20
129. Sunami Y, Motoyama M, Kinoshita F, et al. Effect of low-in-tensity aerobic training on the high-density lipoprotein cho-lesterol concentration in healthy elderly subjects. Metabolism1999; 48: 984-8
130. Krummel D, Etherton T, Peterson S, et al. Effects of exerciseon plasma lipids and lipoproteins of women. Proc Soc Ex BiolMed 1993; 204: 123-37
131. Taylor P, Ward A. Women, high-density lipoprotein cholesterol,and exercise. Arch Intern Med 1993; 153: 1178-84
132. Gordon T, Castelli W, Hjortland M, et al. High density lipopro-tein as a protective factor against coronary heart disease. AmJ Med 1977; 62: 707-14
133. Gordon D, Knoke J, Probstfeld J, et al. High-density lipoproteincholesterol and coronary heart disease in hypercholesterol-emic men: the lipid research clinics coronary primary preven-tion trial. Circulation 1986; 74: 1217-25
134. Sutherland W, Woodhouse S, Nye E, et al. Post-heparin hepaticlipase activity and plasma high density lipoprotein levels inmen during physical training. Biochem Med 1984; 31: 31-5
135. Pollock M, Gaesser G, Butcher J, et al. The recommended quan-tity and quality of exercise for developing and maintainingcardiorespiratory and muscular fitness and flexibility in healthyadults. Med Sci Sports Exerc 1998; 30: 975-91
136. Ready E, Naimark B, Ducas J, et al. Influence of walking vol-ume on health benefits in women post-menopause. Med SciSports Exerc 1996; 28: 1097-105
137. Fonong T, Toth M, Ades P, et al. Relationship between physicalactivity and HDL-cholesterol in healthy older men and women:a cross-sectional and exercise intervention study. Atheroscle-rosis 1996; 127: 177-83
138. Thomas T, Adeniran S, Etheridge G. Effects of different runningprograms on V
.O2max , percent fat and plasma lipids. Can J
Appl Sport Sci 1984; 9: 55-62139. Marti B, Suter E, Riesen W, et al. Effects of long-term, self-
monitored exercise on the serum lipoprotein and apolipoprot-ein profile in middle-aged men. Atherosclerosis 1990; 81:19-31
140. Cauley J, Kriska A, Laporte R, et al. A two-year randomizedexercise trial in older women: effects on HDL cholesterol.Atherosclerosis 1987; 66: 247-58
141. Farrell P, Barboriak J. The time course of alterations in plasmalipid and lipoprotein concentrations during eight weeks ofendurance training. Atherosclerosis 1980; 37: 231-8
142. Hinkleman L, Nieman D. The effects of a walking program onbody composition and serum lipids and lipoproteins in over-weight women. J Sports Med Phys Fitness 1993; 33: 49-58
143. Nieman D, Warren B, O’Donnell K, et al. Physical activity andserum lipids and lipoproteins in elderly women. J Am GeriatrSoc 1993; 41: 1339-44
144. Santiago M, Alexander J, Stull G, et al. Physiologic responsesof sedentary women to a 20 week conditioning program ofwalking or jogging. Scand J Sports Sci 1987; 9: 33-9
145. Santiago M, Leon A, Serfass R. Failure of 40 weeks of briskwalking to alter blood lipids in normolipemic women. Can JAppl Physiol 1995; 20: 417-28
146. Suter E, Marti B. Little effect of long-term, self-monitored ex-ercise on serum lipid levels in middle-aged women. J SportsMed Phys Fitness 1992; 32: 400-11
147. Szmedra L, Lemura L, Shearn W. Exercise tolerance, body com-position and blood lipids in obese African-American womenfollowing short-term training. J Sports Med Phys Fitness 1998;38: 59-65
148. Williford H, Blessing D, Barksdale J, et al. The effects of aer-obic dance training on serum lipids, lipoproteins and cardio-vascular function. J Sports Med Phys Fitness 1988; 28: 151-7
Blood Lipid and Lipoprotein Adaptations to Exercise 1061
Adis International Limited. All rights reserved. Sports Med 2001; 31 (15)
149. Woods N, Graham T. Effect of menstrual cycle phase and exer-cise training on serum lipids. Can J Appl Physiol 1986; 11:88-93
150. Holloszy J, Skinner J, Toro G, et al. Effects of a six monthprogram of endurance exercise on lipids in middle aged men.Am J Cardiol 1964; 14: 753-60
151. Despres J-P, Tremblay A, Moorjani S, et al. Long-term exercisetraining with constant energy intake: effects on plasma lipo-protein levels. Int J Obesity 1990; 14: 85-94
152. Lapman R, Santinga J, Savage P, et al. Effects of exercise train-ing in glucose tolerance, in vivo insulin sensitivity, lipid andlipoprotein concentrations in middle-aged men with mildhypertriglyceridemia. Metabolism 1985; 34: 205-11
153. Allison T, Iammarino R, Metz K, et al. Failure of exercise toincrease high-density lipoprotein cholesterol. J Cardiac Rehab1981; 1: 257-65
154. Stubbe I, Hansson P, Ehle-Nilsson E. Plasma lipoproteins andlipolytic enzyme activities during endurance training in sed-
entary men: changes in high density lipoprotein subfractionand composition. Metabolism 1983; 32: 1120-8
155. el-Sayed M. Effects of high and low intensity aerobic condition-ing programs on blood fibrinolysis and lipid profile. BloodCoagul Fibrinolysis 1996; 7: 484-90
156. Svendsen O, Hassager C, Christiansen C. Six months follow-up onexercise added to a short-term diet in overweight postmeno-pausal women - effects on body composition, resting metabo-lic rate, cardiovascular risk factors and bone. Int J Obes 1994;18: 692-8
157. Thomas T, Adeniran S, Iltis P, et al. Effect of interval and con-tinuous running on HDL-cholesterol, apoproteins A-I and B,and LCAT. Can J Appl Sport Sci 1985; 10: 52-9
Correspondence and offprints: Professor J. Larry Durstine,Department of Exercise Science, University of South Caro-lina, 1300 Wheat Street, Columbia, SC 29208, USA.
1062 Durstine et al.
Adis International Limited. All rights reserved. Sports Med 2001; 31 (15)
Related Documents


![Low-Density Lipoprotein: Structure, Dynamics and … Lipoprotein: Structure, Dynamics and Lipid–ApoB-100 Interactions ... by Krisko and Etchebest [24]. For model S2, the first 2000](https://static.cupdf.com/doc/110x72/5b3456ac7f8b9a7e4b8bf789/low-density-lipoprotein-structure-dynamics-and-lipoprotein-structure-dynamics.jpg)
