Network-based Analysis of Genome Wide Association Data Provides Novel Candidate Genes for Lipid and Lipoprotein Traits* □ S Amitabh Sharma‡§¶§§, Natali Gulbahce§¶**, Samuel J. Pevzner¶¶, Jo ¨ rg Menche§¶, Claes Ladenvall‡, Lasse Folkersen‡‡, Per Eriksson‡‡, Marju Orho-Melander‡§§, and Albert-La ´ szlo ´ Baraba ´ si§¶ Genome wide association studies (GWAS) identify sus- ceptibility loci for complex traits, but do not identify par- ticular genes of interest. Integration of functional and network information may help in overcoming this limita- tion and identifying new susceptibility loci. Using GWAS and comorbidity data, we present a network-based ap- proach to predict candidate genes for lipid and lipoprotein traits. We apply a prediction pipeline incorporating inter- actome, co-expression, and comorbidity data to Global Lipids Genetics Consortium (GLGC) GWAS for four traits of interest, identifying phenotypically coherent modules. These modules provide insights regarding gene involve- ment in complex phenotypes with multiple susceptibility alleles and low effect sizes. To experimentally test our predictions, we selected four candidate genes and geno- typed representative SNPs in the Malmo ¨ Diet and Cancer Cardiovascular Cohort. We found significant associations with LDL-C and total-cholesterol levels for a synonymous SNP (rs234706) in the cystathionine beta-synthase (CBS) gene (p 1 10 5 and adjusted-p 0.013, respectively). Further, liver samples taken from 206 patients revealed that patients with the minor allele of rs234706 had signif- icant dysregulation of CBS (p 0.04). Despite the known biological role of CBS in lipid metabolism, SNPs within the locus have not yet been identified in GWAS of lipoprotein traits. Thus, the GWAS-based Comorbidity Module (GCM) approach identifies candidate genes missed by GWAS stud- ies, serving as a broadly applicable tool for the investigation of other complex disease phenotypes. Molecular & Cel- lular Proteomics 12: 10.1074/mcp.M112.024851, 3398–3408, 2013. Genome wide association studies (GWAS) 1 meta-analyses have pinpointed a number of new gene regions contributing to multifactorial diseases. GWAS typically find limited numbers of loci that contribute modestly to complex phenotypes (1), and GLGC meta-analysis of GWAS data has reached the limit of what can be expected (2) without the use of alternative strategies. Given that susceptibility loci for complex traits are unlikely to be randomly distributed in the genome (3), we might expect that the genes associated with a disease will be more likely to be present within the same pathways or func- tional groupings. In published cases, pathway based GWAS analysis provides an alternative approach to the dissection of complex disease traits (4, 5). In addition, nominal GWAS p values superimposed upon the human molecular network have been used to identify genes associated with multiple sclerosis (6), and the disease association protein–protein link evaluator (DAPPLE) has been used to find significant interac- tions among proteins encoded by genes in loci associated From the ‡Department of Clinical Sciences, Diabetes and Cardio- vascular Disease, Genetic Epidemiology, Lund University, University Hospital Malmo ¨ , Malmo ¨ , Sweden; §Center for Complex Network Re- search and Department of Physics, Northeastern University, Boston, Massachusetts 02115, USA; ¶Center for Cancer System Biology (CCSB) and Department of Cancer Biology, Dana-Farber Cancer Institute and Department of Genetics, Harvard Medical School, 44 Binney Street, Boston, Massachusetts; Department of Medicine, Brigham and Women’s Hospital, Harvard Medical School, 75 Francis Street, Boston, Massachusetts 02115; **Department of Cellular and Molecular Pharmacology, University of California 1700 4th Street, Byers Hall 308D, San Francisco, California 94158; ‡‡Atherosclerosis Research Unit, Department of Medicine, Karolinska Institute, Stock- holm, Sweden; ¶¶Department of Biomedical Engineering, Boston University, Boston, MA 02215; Boston University School of Medi- cine, Boston, MA 02118 Received October 10, 2012, and in revised form, July 22, 2013 Published, MCP Papers in Press, July 23, 2013, DOI 10.1074/ mcp.M112.024851 Author Contributions: A.S. and N.G. designed, interpreted and wrote the manuscript. C.L. helped in analysis of genome wide asso- ciation data for SNP annotation. J.M. and S.P. assisted in computing comparison analysis with different methods using GO terms, GWAS and functional data. L.F. and P.E. contributed data and analysis for CBS eQTL analysis. M.O.-M. has contributed in planning the project and helped in writing the final version of the manuscript. A.L.B. contributed in critical evaluation of the manuscript. All authors dis- cussed the results and commented on the manuscript. 1 The abbreviations used are: GWAS, Genome wide association studies; SNP, single nucleotide polymorphism; GO, Gene Ontology; GCM, GWAS-based-meta analysis Comorbid Module; GLGC, Global Lipids Genetics Consortium; MT, molecular triangulation; KEGG, Kyoto Encyclopaedia of Genes and Genome; BIGG, biochemically, genetically, and genomically structured genome scale metabolic net- work reconstruction; eQTL, Expression quantitative trait loci. Technological Innovation and Resources © 2013 by The American Society for Biochemistry and Molecular Biology, Inc. This paper is available on line at http://www.mcponline.org 3398 Molecular & Cellular Proteomics 12.11

Welcome message from author
This document is posted to help you gain knowledge. Please leave a comment to let me know what you think about it! Share it to your friends and learn new things together.
Transcript
Network-based Analysis of Genome WideAssociation Data Provides Novel CandidateGenes for Lipid and Lipoprotein Traits*□S
Amitabh Sharma‡§¶§§, Natali Gulbahce§¶**, Samuel J. Pevzner¶¶��, Jorg Menche§¶,Claes Ladenvall‡, Lasse Folkersen‡‡, Per Eriksson‡‡, Marju Orho-Melander‡§§,and Albert-Laszlo Barabasi§¶�
Genome wide association studies (GWAS) identify sus-ceptibility loci for complex traits, but do not identify par-ticular genes of interest. Integration of functional andnetwork information may help in overcoming this limita-tion and identifying new susceptibility loci. Using GWASand comorbidity data, we present a network-based ap-proach to predict candidate genes for lipid and lipoproteintraits. We apply a prediction pipeline incorporating inter-actome, co-expression, and comorbidity data to GlobalLipids Genetics Consortium (GLGC) GWAS for four traitsof interest, identifying phenotypically coherent modules.These modules provide insights regarding gene involve-ment in complex phenotypes with multiple susceptibilityalleles and low effect sizes. To experimentally test ourpredictions, we selected four candidate genes and geno-typed representative SNPs in the Malmo Diet and CancerCardiovascular Cohort. We found significant associations
with LDL-C and total-cholesterol levels for a synonymousSNP (rs234706) in the cystathionine beta-synthase (CBS)gene (p � 1 � 10�5 and adjusted-p � 0.013, respectively).Further, liver samples taken from 206 patients revealedthat patients with the minor allele of rs234706 had signif-icant dysregulation of CBS (p � 0.04). Despite the knownbiological role of CBS in lipid metabolism, SNPs within thelocus have not yet been identified in GWAS of lipoproteintraits. Thus, the GWAS-based Comorbidity Module (GCM)approach identifies candidate genes missed by GWAS stud-ies, serving as a broadly applicable tool for the investigationof other complex disease phenotypes. Molecular & Cel-lular Proteomics 12: 10.1074/mcp.M112.024851, 3398–3408,2013.
Genome wide association studies (GWAS)1 meta-analyseshave pinpointed a number of new gene regions contributing tomultifactorial diseases. GWAS typically find limited numbersof loci that contribute modestly to complex phenotypes (1),and GLGC meta-analysis of GWAS data has reached the limitof what can be expected (2) without the use of alternativestrategies. Given that susceptibility loci for complex traitsare unlikely to be randomly distributed in the genome (3), wemight expect that the genes associated with a disease will bemore likely to be present within the same pathways or func-tional groupings. In published cases, pathway based GWASanalysis provides an alternative approach to the dissection ofcomplex disease traits (4, 5). In addition, nominal GWAS pvalues superimposed upon the human molecular networkhave been used to identify genes associated with multiplesclerosis (6), and the disease association protein–protein linkevaluator (DAPPLE) has been used to find significant interac-tions among proteins encoded by genes in loci associated
From the ‡Department of Clinical Sciences, Diabetes and Cardio-vascular Disease, Genetic Epidemiology, Lund University, UniversityHospital Malmo, Malmo, Sweden; §Center for Complex Network Re-search and Department of Physics, Northeastern University, Boston,Massachusetts 02115, USA; ¶Center for Cancer System Biology(CCSB) and Department of Cancer Biology, Dana-Farber CancerInstitute and Department of Genetics, Harvard Medical School, 44Binney Street, Boston, Massachusetts; �Department of Medicine,Brigham and Women’s Hospital, Harvard Medical School, 75 FrancisStreet, Boston, Massachusetts 02115; **Department of Cellular andMolecular Pharmacology, University of California 1700 4th Street,Byers Hall 308D, San Francisco, California 94158; ‡‡AtherosclerosisResearch Unit, Department of Medicine, Karolinska Institute, Stock-holm, Sweden; ¶¶Department of Biomedical Engineering, BostonUniversity, Boston, MA 02215; ��Boston University School of Medi-cine, Boston, MA 02118
Received October 10, 2012, and in revised form, July 22, 2013Published, MCP Papers in Press, July 23, 2013, DOI 10.1074/
mcp.M112.024851Author Contributions: A.S. and N.G. designed, interpreted and
wrote the manuscript. C.L. helped in analysis of genome wide asso-ciation data for SNP annotation. J.M. and S.P. assisted in computingcomparison analysis with different methods using GO terms, GWASand functional data. L.F. and P.E. contributed data and analysis forCBS eQTL analysis. M.O.-M. has contributed in planning the projectand helped in writing the final version of the manuscript. A.L.B.contributed in critical evaluation of the manuscript. All authors dis-cussed the results and commented on the manuscript.
1 The abbreviations used are: GWAS, Genome wide associationstudies; SNP, single nucleotide polymorphism; GO, Gene Ontology;GCM, GWAS-based-meta analysis Comorbid Module; GLGC, GlobalLipids Genetics Consortium; MT, molecular triangulation; KEGG,Kyoto Encyclopaedia of Genes and Genome; BIGG, biochemically,genetically, and genomically structured genome scale metabolic net-work reconstruction; eQTL, Expression quantitative trait loci.
Technological Innovation and Resources© 2013 by The American Society for Biochemistry and Molecular Biology, Inc.This paper is available on line at http://www.mcponline.org
3398 Molecular & Cellular Proteomics 12.11
with other particular diseases (7) . Other approaches incorpo-rate heterogeneous molecular data such as linkage studies,cross species conservation measures, gene expression dataand protein–protein interactions to better understand GWASresults (8, 9). Integrating molecular network information, path-way analyses, and GWAS data thus holds promise for iden-tifying new susceptibility loci and improving the identificationof relevant candidate genes.
If a gene is involved in a specific functional process ordisease, its molecular network neighbors might also be sus-pected to have some role (3). In line with this “local” hypoth-esis, proteins involved in the same disease show a high pro-pensity to interact (10) or cluster together (11) with each other.Interactions between variations in multiple genes, each withstrong or modest effects, perturbing the same pathways ormodules, may govern complex traits (3, 6). The moleculartriangulation (MT) algorithm can be applied to rank seedgenes according to their common disease associated neigh-bors, assigning closer and more connected neighbors highervalues (12). Interactions between modestly associated MTgenes may be indicative of coherent disease pathways or ofgenes conferring susceptibility to disease in a coordinatedmanner. The jActiveModule method (13) combines seed genescores with biologically relevant interactions to identify net-work modules where perturbations causative of disease aremore likely to reside. Lastly, although not yet implemented atthe module level, phenotypic coherence between interactingpairs of genes has been quantified using the combination ofmolecular level gene to disease relationships and Medicarecomorbidity data (14, 15).
We believe that GWAS significant SNPs and variants rep-resenting potential candidate genes can use the above strat-egies to reveal more about the missing heritability of complexphenotypes. The most important risk factors for coronaryartery disease (CAD) include serum concentrations of totalcholesterol (TC), low-density lipoprotein cholesterol (LDL-C),high-density lipoprotein cholesterol (HDL-C) and triglycerides(TG). We present a GWAS-based meta-analysis ComorbidModule (GCM) approach that uses significant (p � 5 � 10�8)GWAS signals for these four traits in the context of molecularnetworks to prioritize modules of disease-associated candi-date genes. We evaluate our approach experimentallythrough allelic association and genotyping within the MalmoDiet and Cancer Cardiovascular Cohort (MDC-CC) for SNPsrepresenting top candidate genes.
MATERIALS AND METHODS
The GWAS Comorbid Module (GCM) approach to predict lipid/lipoprotein trait candidate genes involves the following steps:
(1) Mapping of GLGC GWAS meta-analysis SNPs to genes.(2) Construction of a human interactome, pooling protein interac-
tion data from different sources.(3) Identification of candidate genes associated with lipid/lipopro-
tein traits using molecular triangulation (MT).
(4) Identification of modules of seed and neighboring genes usingthe jActiveModule method (jAM).
(5) Selection of phenotypically coherent (GCM) modules of seedand candidate genes using comorbidity analyses.
(6) Validation of pipeline outputs (MT, jAM, and GCM) and compar-ison to other methods (CANDID and MetaRanker).
(7) Selection of SNPs representing GCM candidate genes for geno-typing in the MDC-CC.
In summary, we curate GWAS-based seed genes (p � 5 � 10�8),constructed an interactome, implement the MT method, filter MTcandidate genes by jActiveModule results, select phenotypically co-herent modules, validate the outputs of every step, and genotypeSNPs representing GCM candidate genes of interest for lipid andlipoprotein traits.
(1) Mapping of GLGC GWAS Meta-analysis SNPs to Genes—TheGLGC GWAS meta-analyses data is based on 46 lipid/lipoproteinGWAS involving over 100,000 individuals of European descent asascertained in the United States, Europe, or Australia (16). The GLGCconsortium contributed genome wide analysis data for analyses,including �2.6 million genotyped or imputed SNPs associated withfour traits (TC, LDL-C, HDL-C and TG). The entire set of HapMapphase III SNPs and pairwise LD estimates (Release 27) for the CEUpopulation was downloaded, and LD pruning and SNP to gene map-ping was performed as described previously (3). If a SNP could bemapped to more than one gene, all genes were included, and SNPslocated in gene desert regions were excluded from our analysis. To besure of the robustness of our results, we also annotated SNPs usingthe ProxyGeneLD tool (17) and found similar SNP to gene annota-tions. Genes representing SNPs with GWAS significant p values ofless than 5 � 10�8 were used as “seed” genes.
(2) Construction of a Human Interactome, Pooling Interaction DataFrom Different Sources—We created a human interactome consistingof proteomic, transcriptional, and metabolic interactions. Protein-protein interactions from three high-throughput yeast-two-hybrid da-tasets were combined with the binary subset of interactions reportedin the IntAct and MINT databases (18–22). Together, these data setsdescribe 15,315 interactions between 6101 gene-coding proteins. Forregulatory interactions, we used the TRANSFAC database version2008.2, which included 1340 links between 271 human transcriptionfactors and their 564 targets (23). Metabolic coupling interactionswere derived from the Kyoto Encyclopedia of Genes and Genomes(KEGG) and the Biochemically, Genetically, and Genomically struc-tured genome scale metabolic network reconstruction (BiGG) data-base as described in (15); 10,642 such metabolic links between 921enzymes were included. The union of these sets of interactionsyielded an interactome of 7117 (N) proteins and 21,964 (M) links, withan average shortest path length �l� of 4.52.
(3) Identification of Candidate Genes Associated With Lipid/Lipo-protein Traits Using Molecular Triangulation (MT)—MT begins withsets of seed (disease) genes known to be associated with phenotypesand suggests additional disease genes, typically network neighborsof multiple seed genes (12, 24). Here, we used the strengths of GWASsignals for lipoprotein traits and SNP to gene mappings to assignprimary evidence scores to seed genes. MT used these primaryevidence scores and the position of these seed genes within theinteractome to calculate secondary evidence scores for neighbors(12). To calculate the significance of the secondary evidence scores,we performed 1000 degree-preserving network randomizations. Thesignificance of the scores was then calculated as described by Ios-sifov et al. (supplementary material) (24). We applied Benjamini andHochberg false discovery rate (FDR) corrections with a 0.05 FDRthreshold to our predictions; this meant that we expected less than5% of our predictions to be false positives.
Network-based Analysis of Genome Wide Association Data
Molecular & Cellular Proteomics 12.11 3399
(4) Identification of Modules of Seed and Neighboring Genes Usingthe jActiveModule Method (jAM)—The MT method results in a largenumber of statistically significant predictions, but some of the pre-dictions may be artifacts of low or excessive connectivity (24). Toaddress this concern, we independently implemented the jActive-Module method to determine modules with maximal proportions ofthe lowest p value genes. Later we pruned the MT gene sets to onlyinclude genes that were within these modules.
The jActiveModule method uses GWAS association p values ofseed genes and interactome context to produce aggregated modulescores. The method compares real network modules to those derivedfrom to 10,000 matched randomized network Monte-Carlo simula-tions (13). To examine the effect of the GWAS signal strength distri-bution by itself, we compared the real module scores to distributionsbased on randomized gene to trait association p values. Matchednumbers of seed genes were chosen from the set annotated by NCBI(Ver. 36) and from the set described by the Online Mendelian Inher-itance in Man database (OMIM, December 2009 release). The differ-ences between outputs after either randomization strategy are de-scribed in supplementary material.
As additional controls for the jActiveModule results, we imple-mented the Molecular COmplex DEtection (MCODE) algorithm, theMarkov Clustering algorithm (MCL), and the Klein-Ravi Steiner treealgorithm with submodule detection using MCL (GenRev package(25)). Parameters for the MCL and MCODE algorithms were adoptedfrom a previous study (26). To compare the results from differentapproaches, we used the Jaccard similarity (J) between the sets ofseed genes (S) and putative module genes (T) determined using eachmethod:
J � �S�T� / �S�T� (Eq. I)
where, �S�T� is the intersection of sets S and T and �S�T� is the union).(5) Selection of Phenotypically Coherent (GCM) Modules of Seed
and Candidate Genes Using Comorbidity Analyses—To further rankthe modules, we used OMIM gene-disease associations to performanalyses of comorbidity based on the co-occurrence of ICD-9 codestaken from a 13 million patient Medicare data set (14). OMIM diseaseswere manually mapped to ICD9 codes so that interactions betweengenes could be supported by comorbidity between their associateddiseases. To quantify comorbidity, Relative Risk (RR) scores werecalculated for every pairwise combination of diseases associated withat least one of the genes in the module:
RR �C12 � npP1 � P2
(Eq. I)
C12 � number of patients who had both disease 1 and 2P1 � number of patients who had disease 1P2 � number of patients who had disease 2np � 13,039,018 (total number of patients)Lower and upper bounds (lb and ub) of 99% confidence intervals
were calculated according to the Katz et al. method (24):
lb � RR � exp� � 2.576 � �� (Eq. II)
ub � RR � exp�2.576 � �� (Eq. III)
where � is given by:
� � � 1C12
�1
P1 � P2�
1np
�1
np � np(Eq. IV)
The relative risk was taken to be significant when the 99% confi-dence interval did not include the expected value of one, which wouldindicate findings of no consequence. To summarize the pairwise
comorbidities for each module and rank them, we averaged thepairwise RR scores between associated ICD9 disease codes, creat-ing a module relative risk (mRR) score. A Mann-Whitney U test wasused to compare the observed mRR scores to those of 100 randomlyconstructed modules.
(6) Validation of Pipeline Outputs (MT, jActiveModule and GCM)and Comparison to Other Methods (CANDID and MetaRanker)—Wevalidated the MT, jActiveModule and GCM steps using data fromTeslovich et al. (1) as a benchmarking set. Several measures ofpredictive power were used: (1) precision [TP/(TPFP)], (2) specificity[TN/(TNFP)], and (3) accuracy [(TPTN)/(TPFPFNTN), whereTP is number of true positives or candidate genes correctly identifiedas disease genes, TN is number of true negatives or correctly iden-tified nondisease genes, FP is number of false positives or nondis-ease genes identified as candidate genes, and FN is number of falsenegatives of disease associated genes that were not identified ascandidates. We evaluated the functional coherence of candidategenes relative to seed genes by comparing their enrichment, as a set,for functional annotations. These allowed us to evaluate the consis-tency of candidate gene sets with respect to phenotypically similardiseases (27). After determining the GO biological process termsenriched within the sets of seed genes, we tested the enrichment ofthese terms in candidate genes.
To perform a comprehensive comparison of GCM to other meth-ods, we implemented MetaRanker (8) and CANDID (9). MetaRankerpredicts candidate genes by integrating complementary layers ofprotein interaction, linkage, GWAS, differential expression and dis-ease data. These five different data sources are integrated into asingle meta-evidence rank, quantifying the likelihood of genes beinginvolved in a disease of interest (8). CANDID is designed to rankcandidate genes by eight evaluation criteria, considering associatedpublications, protein domains, conservation, expression, interactions,linkages, SNP associations, and custom data (9). We compared thetop 200 MetaRanker and CANDID candidate genes to the outputs ofthe MT, jActiveModule and comorbidity analysis steps. We thenbenchmarked candidate gene sets sharing GO terms with the seedgenes, computing precision, specificity and accuracy as describedpreviously for the candidate genes from each step of the GCMmethod as well as the CANDID and MetaRanker outputs.
In addition, using GeneWanderer, we tested how parsimoniouslycandidate genes from the GCM approach were involved in obesity,which is known to be related to lipid/lipoprotein traits. GeneWandererwas provided with genomic locations 1Mb in either direction of SNPsrepresenting GCM genes and ranked candidate genes within thesewindows according to their single shortest path through the STRING(28) network to obesity genes.
(8) Selection of SNPs representing GCM candidate genes for geno-typing in the MDC-C—GCM genes with the strongest co-expressioncorrelations to the seed genes were selected for genotyping. Genomewide mRNA expression data of 79 human tissues were obtained fromthe Gene Expression Atlas (29). Spearman’s test was used to assesscorrelation between GCM gene and seed gene mRNA expression,with the criterion for significance set at Rho�0.5 and p � 0.05. Thesecond criteria considered was sequence conservation of the regionsin which SNPs were located, as alterations at conserved sites havemore drastic functional effects when changed (30) The third criteriaconsidered was the position of the SNPs relative to the candidategenes. Among conserved SNPs with GLGC GWAS p values �0.05,we used following hierarchy to rank importance for further genotyp-ing: coding�intronic�5UTR�3UTR�5upstream�3upstream (31).
Study Population: The Malmo Diet and Cancer Cardiovascular co-hort (MDC-CC)—The Malmo Diet and Cancer (MDC) study is a com-munity-based prospective cohort of 28,449 persons originally re-cruited for baseline examination between 1991 and 1996 (32, 33).
Network-based Analysis of Genome Wide Association Data
3400 Molecular & Cellular Proteomics 12.11
From this cohort, 6103 persons were randomly selected to participatein the Cardiovascular Cohort (MDC-CC), which seeks to investigaterisk factors for cardiovascular disease. All participants underwentquestioning regarding their medical history, a physical examination,and a laboratory assessment for cardiovascular risk factors. In fastingvenous blood samples, TC, HDL-C, and triglyceride levels weremeasured according to standard procedures by the Department ofClinical Chemistry at University Hospital Malmo. Levels of LDL-Cwere calculated according to Friedewald’s formula, with the assign-ment of missing values to subjects with a triglyceride level of morethan 4.5 mmol per liter. DNA was available from 5763 individuals forgenotyping, and of these individuals, lipid levels were available for5056 individuals that were not on lipid lowering medication. Theethics committee of Lund University approved the MDC-CC studyprotocols, and all participants provided written informed consent.
Genotyping—Genotyping of the selected SNPs was performedusing genomic DNA from 5763 individuals using the allelic discrimi-nation method using an ABI 7900 instrument (Applied Biosystems,Foster City, CA). Samples that were successfully genotyped for atleast 50% of the SNPs were included in further analyses (n � 5698).We confirmed that the genotypes were at Hardy-Weinberg equilib-rium. The overall genotyping success rate was 98.2%. For this epis-tasis analysis, we created a variable indicating how many risk alleles(increasing total cholesterol, LDL-cholesterol or triglycerides and/orlowering HDL cholesterol) each individual in the population cohortwas carrying, i.e. summing up the number of risk-alleles to a variable“risk-allele score.” For the four SNPs, the theoretical maximal numberof risk-alleles was eight (for individuals homozygous for risk alleles ofall four SNPs) and the minimum was zero. In MDC-CC cohort, indi-viduals ranged from zero to six risk alleles, and the risk-allele scorewas used as a variable in a linear regression analysis adjusting for ageand sex to analyze if the combined effect of the four SNPs resulted inan association with lipid levels.
Expression Quantitative Trait (eQTL) Analysis—RNA extracted fromthe livers of 206 patients patients undergoing aortic valve surgeryand/or surgery for aortic aneurysms (34) was hybridized to AffymetrixST 1.0 Exon arrays. DNA extracted from circulating blood cells washybridized to Illumina 610w-Quad BeadArrays. The association wastested using a linear additive model with corrections for age andgender. The average age of patients was 63.9 � 11.8 years, withaverage total cholesterol levels of 5.05 � 1.09 mM and average LDL-Clevels of 3.11 � 0.93 mM. None of the patients were known to haveliver disease.
Gene Set Enrichment for Biological Pathways—To find statisticallyover-represented Gene Ontology (GO) annotations for candidategenes at each of the analysis steps, we used the Biological NetworksGene Ontology tool (BiNGO) implemented in Cytoscape. Enrichmentanalyses were performed using a hyper-geometric test followed by aBenjamini and Hochberg multiple hypothesis correction with a 0.05FDR threshold (35). Odds ratios to measure the magnitudes of theenrichment were calculated using raw BiNGO outputs.
RESULTS
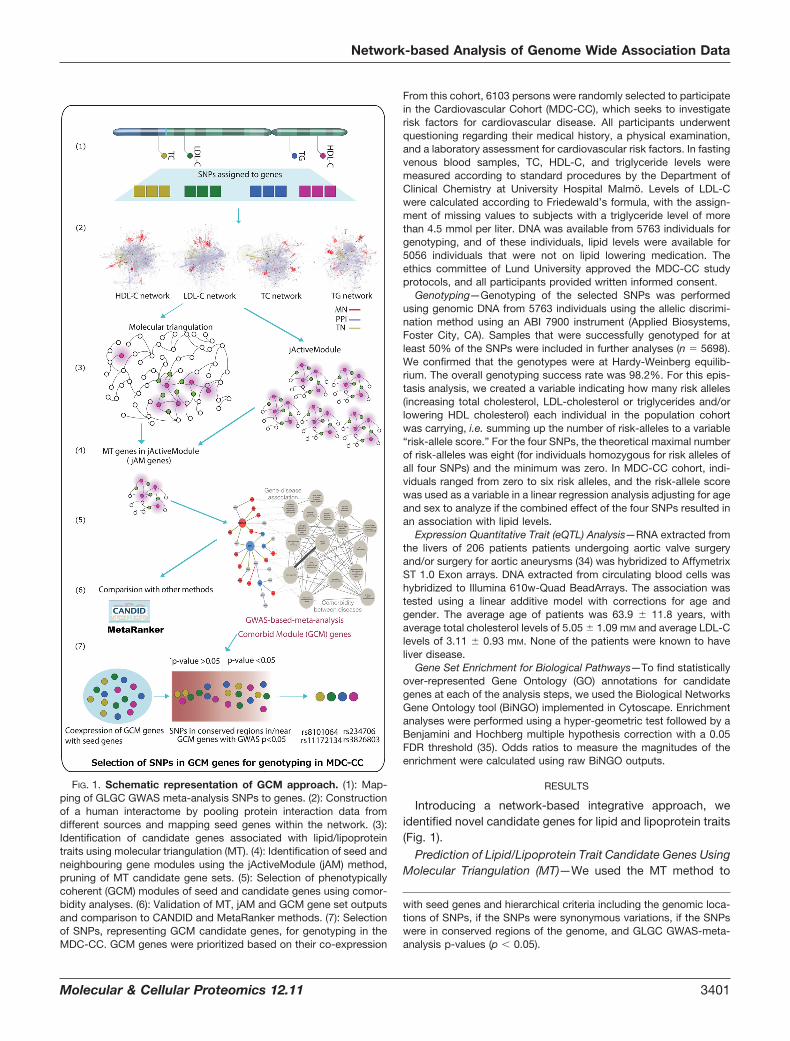
Introducing a network-based integrative approach, weidentified novel candidate genes for lipid and lipoprotein traits(Fig. 1).
Prediction of Lipid/Lipoprotein Trait Candidate Genes UsingMolecular Triangulation (MT)—We used the MT method to
FIG. 1. Schematic representation of GCM approach. (1): Map-ping of GLGC GWAS meta-analysis SNPs to genes. (2): Constructionof a human interactome by pooling protein interaction data fromdifferent sources and mapping seed genes within the network. (3):Identification of candidate genes associated with lipid/lipoproteintraits using molecular triangulation (MT). (4): Identification of seed andneighbouring gene modules using the jActiveModule (jAM) method,pruning of MT candidate gene sets. (5): Selection of phenotypicallycoherent (GCM) modules of seed and candidate genes using comor-bidity analyses. (6): Validation of MT, jAM and GCM gene set outputsand comparison to CANDID and MetaRanker methods. (7): Selectionof SNPs, representing GCM candidate genes, for genotyping in theMDC-CC. GCM genes were prioritized based on their co-expression
with seed genes and hierarchical criteria including the genomic loca-tions of SNPs, if the SNPs were synonymous variations, if the SNPswere in conserved regions of the genome, and GLGC GWAS-meta-analysis p-values (p � 0.05).
Network-based Analysis of Genome Wide Association Data
Molecular & Cellular Proteomics 12.11 3401

identify phenotypically related candidate genes (MT-genes)based on their proximity within the interactome to seed genesassociated with HDL-C, LDL-C, TG and TC traits (supplemen-tal Table S1). The MT method had an accuracy of 98% inclassifying true positives and true negatives for the four traits,with 33% precision and 98% specificity (Fig. 2).
Refinement of Candidate Gene Sets Using the jActiveMod-ules Method—Although direct interactions can be used toidentify candidate genes, modules in biological networks rep-resent connected components contributing to cellular func-tions in a coordinated manner. Disruptions of these modules,which include both identified and unidentified disease genes,result in disease phenotypes (36). To avoid method specificbiases, we implemented the jActiveModule algorithm in par-allel with MT and used the intersection of the two result setsto identify more cohesive modules of seed and MT genes.Comparision of MT and jAM genes, based on their degree ofconnectivity, indicated that only retaining genes within theintersection of the two groups removed a significant numberof the nodes having only one or greater than one hundredconnections. (p � 0.0017, odds ratio � 2.01, supplementryFig. S1). Furthermore, after the jActiveModule filtering step,precision increased from 33% to 44%, with 99% specificityand accuracy (Fig. 2).
The jActiveModule method uses GWAS association p val-ues of seed genes within the interactome context to produceaggregated module scores, and these scores determined theextent to which randomized inputs could create coherentmodules. Confirming the usefulness of the network contextusing randomized controls, the top 20 jActiveModule subnet-work scores were significantly higher than those from 100randomization controls for each of the four traits (p � 0.001,supplemental Fig. S2).
Compared with the Steiner tree-MCL approach (supple-mental Fig. S3), the jActiveModule algorithm identified mod-ules with greater percentages of seed genes. Gene sets iden-
tified by jActivemodule were smaller and localized more tightlyaround seed genes within the interactome. This was likelybecause of jActivemodule’s flexible search for multiple mod-ules, as opposed to the Steiner tree based method’s strategyof attempting to find a single module connecting all of theseed genes in the interactome (37). Comparison with conven-tional clustering methods such as MCL and MCODE suggestthat these methods are more suited to the identification ofindividual protein complexes (37) as well, while the jActive-Module method is more suited to the identification of multiplemodules of seed genes spread throughout the interactome.
Retention of Modules According to Comorbidity AnalysesUsing Medicare Data (GCM)—To determine those moduleswith the most phenotypically coherent associations, we quan-tified the strengths of comorbidities between diseases asso-ciated with their genes. We implemented mRR scores, asexplained in the methods section, because we believed thatco-occurring diseases might be driven by related molecularmachinery. We found 48 comorbid modules with mRR scoreshigher than one for HDL-C, (mean mRR score of 1.8, averageP�0.002), 15 modules for LDL-C, (mean mRR score of 2.9,average P�0.001), 15 modules for TC, (mean mRR score of2.8, average P�0.05 and 23 modules for TG, (mean mRRscore of 1.8, average P�0.001). (Table I). Filtering the mod-ules to only include thoses with above average mRR scores,precision increased from 44% to 55%, with 99% specificity
FIG. 2. Performance of CANDID, MetaRanker, MT, jActiveModule and GCM with respect to benchmarking dataset. The histogramsshow an increase in specificity, precision and accuracy with each of the steps.
TABLE IMean relative risk (mRR) scores of the network modules. TC trait hadthe highest mRR score among the four. mRR-score is given as
mean � S.D.
Trait Number of modules mRR-Score *p value
HDL-C 157 1.8 � 1.0 �0.002LDL-C 64 2.9 � 2.5 �0.001TC 89 2.8 � 2.4 0.03TG 85 1.8 � 0.6 �0.001
Network-based Analysis of Genome Wide Association Data
3402 Molecular & Cellular Proteomics 12.11

and accuracy (Fig. 2). ICD-9 codes associated with the re-tained GCM modules in all four of the primary traits includedlipid metabolism, carbohydrate and transport metabolism,amino acid transport metabolism, being overweight, essentialhypertension, cardiomyopathy, symptoms concerning nutri-tion, chronic ischemic heart disease, acute mycordial infrac-tion, and diabetes mellitus (supplemental Fig. S4).
In addition to highlighting the phenotypic cohesiveness ofthe final GCM gene sets using ICD9 codes, the progressivebenefit of the filtering steps was also quantified using GO termenrichment tests of the gene sets found at each step. Wefound that filtering MT genes by jActive module membershipand only retaining modules with the most significant comorbidi-ties yielded enrichments of progressively more specific GOterms annotating fewer genes (Fig. 3A). The cost of this was thatthe numbers of genes contributing to particular GO term enrich-ments decreased as genes were filtered away (Fig. 3B), and thatexcept for the TG set of genes, fewer GO terms were detected(Fig. 3C) This filtered subset of more specific GO terms, how-ever, displayed a trend of increasingly drastic effect size asmeasured by odds ratios of enrichment (Fig. 3D).
Validation of Pipeline Outputs (MT, jActiveModule andGCM) and Comparison to Other Methods (CANDID andMetaRanker)—Enrichment for GO term effect sizes (supple-mental Fig. S5) and functional coherence of candidate andseed gene sets (Fig. 2) for the MT, jActiveModule, and GCM
methods was greater than that of MetaRanker (8) andCANDID (9). Comparing overlaps between the candidate genesets (Fig. 4), we found that predictions from CANDID and Me-tRanker had 9% (p � 0.0001) overlap with each other. Eachstep in our method resulted in greater overlap with the consen-sus set of genes predicted by both CANDID and MetaRanker(supplemental Table S2). However, given that the maximumoverlap between any pairwise combination of the gene sets was15% (CANDID and MetaRanker versus TC-GCM), we were stillassured of the complementarity of each of the gene sets.
We further evaluated our results using DAPPLE (7) and GRAIL(38). DAPPLE looks for significant protein-protein interactionconnectivity among proteins encoded by genes in loci associ-ated with disease (7). GRAIL describes the degree of functionalconnectivity between regions using literature based relation-ships between genes (38). Our method had 31% similarity toDAPPLE prioritized candidate genes when the same seedgenes were used, and 18% similarity to GRAIL results.
Because of GeneWanderer’s top rating among networkbased approaches for gene prioritization (39), we used it torank GCM genes with respect to the polygenic trait of obesity.GeneWanderer identified 48 of the 51 GCM genes as highlyranked candidates in genomic locations related to obesity. Inour interactome, these 48 genes were immediate neighbors ofgenes within loci identified by GLGC GWAS (p � 0.0001)(supplemental Fig. S6).
Relevance of GCM Genes to Lipid Related Diseases Basedon Literature—Many of the GCM candidate genes associatedwith all four traits have been linked to lipid metabolism, car-diovascular disease and coronary artery disease (supplemen-tal Table S3). Retinoid x-receptor alpha (RXRA) variant
FIG. 3. GO term enrichments for gene sets. A, Mean numbers ofgenes, anywhere in the genome, associated with GO terms for whichsignificant enrichments were found. B, Mean numbers of genes,within the sets of genes being tested, found to be associated with GOterms for which the gene sets were enriched. C, Counts of GO termsfor which sets of candidate genes were enriched. D, Median oddsratios of GO term enrichment as a measure of enrichment effect size.
FIG. 4. Percentage of overlapping candidate genes betweenCANDID or MetaRanker and each of the GCM steps.
Network-based Analysis of Genome Wide Association Data
Molecular & Cellular Proteomics 12.11 3403

rs11185660 has been associated with low HDL-C and coro-nary heart disease (40, 41). TG and nonesterified fatty acid(NEFA) levels were increased in the livers and serum of cys-thathionine-beta-synthase (CBS) knock out mice (41). Dele-tion of the four and a half LIM domains 2 (FHL2) gene atten-uates the formation of atherosclerotic lesions normallypresent with a cholesterol-enriched diet (42).
Selection of SNPs for Genotyping in the MDC-CC—Be-cause we expected elements of phenotype-specific modulesto act cooperatively, we tested whether GCM genes wereco-expressed with seed genes. Most of the GCM genes(90%) were significantly co-expressed with at least one of theseed genes (supplemental Table S1). Within the HDL-C,LDL-C, TC and TG GCM gene sets, 19, 9, 13 and 12 geneswere co-expressed with seed genes having GWAS p values�0.05. As evolutionary conservation of genomic regions im-plies greater biological significance (30), we prioritized co-GCM genes represented by SNPs in evolutionarily conservedregions for further genotyping in MDC-CC cohort (Table III).The numbers of SNPs representing co-GCM genes in con-served regions for HDL-C, LDL-C, TC and TG traits were 11,4, 4, and 6, respectively (Table II). The SNPs with the lowestGLGC GWAS p values in each of these gene groups weregenotyped in the 5763 MDC-CC participants (Table III, TableIV).
Logistic regression analysis of the four SNPs revealed thatthe minor A-allele of the synonymous SNP rs234706 in CBS(Y233Y) was significantly associated with higher total choles-terol levels than the G-allele (p � 0.013 after Bonferroni cor-rection, Table IV). The A-allele also associated significantlywith higher LDL-C (p � 0.00001) and TG (p � 0.04) levels. Thethree other SNPs did not associate significantly with theirrespective traits. Despite this, we found that the combinedeffect of all four risk-alleles was nominally significant for anassociation with lower HDL-cholesterol and higher triglyceridelevels (p � 0.041 and 0.026, respectively, Supplemental Table4). No evidence for pairwise epistasis between the SNPs wasfound.
TABLE IIPrioritized co-GCM genes represented by SNPs in evolutionarily conserved regions for further genotyping in Malmö Diet and Cancer
Cardiovascular cohort (MDC-CC) cohort
Trait Gene SNPGLGCp-vlaue
Variant type/location DAPPLEGenewanderer
rankingGRAILp value
HDL-C INSR rs8101064 2.03E-05 INTRONIC ✓ 1 0.9ASCC2 rs140147 0.0006 SPLICE_SITE 3 0.99CYP3A4 rs12721617 0.002 INTRONIC 1 0.031APP rs380713 0.003 INTERGENIC 1 0.3SMURF2 rs6504248 0.006 INTERGENIC 1 0.96EHMT2 rs9267659 0.008 INTRONIC 7 4.92E-11SKIL rs6763533 0.009 INTRONIC 1 0.96PSMA1 rs12362721 0.02 INTRONIC 3 0.126TERT rs6554691 0.02 INTRONIC 1 0.636RALYL rs6473532 0.03 INTERGENIC NA 0.956FASN rs6502051 0.04 INTRONIC 1 0.45
LDL-C NDUFA4L2 rs11172134 0.0003 UPSTREAM ✓ NA 0.0006CDK5RAP2 rs3739822 0.0008 SYNONYMOUS_CODING ✓ 5 0.65ITGB3BP rs6588048 0.003 INTRONIC 3 0.98SH3GL3 rs8025427 0.03 INTRONIC 1 0.48
TC CBS rs234706 0.007 SYNONYMOUS_CODING 2 0.13ASAP1 rs7462286 0.02 INTRONIC ✓ 1 0.42ITSN1 rs9984662 0.03 3PRIME_UTR 13 NAEXOSC10 rs11583740 0.03 INTRONIC 5 0.75
TG DNM2 rs3826803 0.003 INTRONIC 5 0.85HNF4A rs3212198 0.003 INTRONIC 1 0.22PAFAH1B3 rs3826706 0.02 INTRONIC ✓ 5 0.7COPS6 rs2307345 0.02 INTRONIC 5 0.43ATP6V1E1 rs3532 0.02 3PRIME_UTR 3 0.86NR2F2 rs4310804 0.04 INTERGENIC 2 NA
TABLE IIICharacteristics of the subjects in the Malmö Diet and Cancer Cardio-
vascular cohort
Clinical character All (n � 5056)
Males/Females N (%) 2054 (40.6)/3002 (59.4)Age (years) 57.5 � 5.9Body mass index (kg/m2) 25.8 � 3.9HDL-cholesterol (mmol/l) 1.4 � 0.4LDL-cholesterol (mmol/l) 4.2 � 1.0Total cholesterol (mmol/l) 6.2 � 1.1Triglycerides (mmol/l) 1.4 � 0.8Diabetes N (%) 416 (8.2)
Network-based Analysis of Genome Wide Association Data
3404 Molecular & Cellular Proteomics 12.11

Expression of the CBS gene was associated with the di-rectly measured rs234705 SNP, which served as a perfectproxy for rs234706 (HapMap CEU LD of R2 � 1). The
rs234706 SNP was genotyped in the GLGC GWAS, and anassociation between CBS gene expression and the rs234706genotype was determined (43). The minor allele of SNP
FIG. 5. GCM module with CBS gene and the associated diseases. Combination schema including protein-protein interactions (purple),metabolic interactions (red), and transcriptional interactions (yellow), gene-disease associations (dashed black), and relative risk associationsbetween diseases greater with magnitude greater than 1 (black line). Seed genes (red ovals), CBS GCM genes (dark blue ovals) and diseases(gray) are linked within a highly interconnected module that includes Homocystinuria, venous embolism and thrombosis diseases associatedwith CBS gene in OMIM.
TABLE IVAssociation of selected GCM gene SNPs with their respective traits in MDC-CC. A synonmyous SNP (rs234706) in CBS gene was significantly
associated with the TC trait in MDC-CC
Trait N SNP (Chr) Gene Minor Allele (frequency, %) Beta (S.E.) p value
HDL-C 4916 rs8101064 (19) INSR T (3.9) �0.001 (0.001) 0.50LDL-C 4822 rs11172134 (12) NDUFA4L2 A (23.7) 0.003 (0.02) 0.91TC 4962 rs234706 (21) CBS A (45.9) 0.06 (0.02) 0.0032TG 4933 rs3826803 (19) DNM2 C (35.0) 0.004 (0.01) 0.68
Network-based Analysis of Genome Wide Association Data
Molecular & Cellular Proteomics 12.11 3405

rs234706 was significantly associated with mRNA levels ofCBS in the 206 liver biopsy samples (p � 0.04). In the diseaseto gene mappings, homocystinuria, venous embolisms, andthrombosis were associated with the CBS gene (Fig. 5). Co-agulation defects, Diabetes mellitus and Charcot-Marie-Toothdisease were associated with other genes in the CBS GCMmodule, and comorbidities were found between these dis-eases (with all disease pairs having RR �1, Fig. 5). We alsofound genes associated with homocystinuria and APOA1 as-sociated amyloidosis within the CBS GCM module. Thesecomorbid diseases have a RR score of 6.4, and the relation-ship between TC, CBS, homocystinuria, APOA1, and amyloi-dosis is supported by the observation that plasma cholesteroland APOA1 are significantly decreased in homozygous CBS-deficient mice (44).
DISCUSSION
Although the human interactome is far from complete,merging network topological features with heterogeneousGWAS data provides experimentally verifiable insights intocomplex biological traits. Unlike approaches that test genes inGWAS identified loci for overrepresentation in pathways (3),our approach uses network context to prioritize specific can-didate genes. The improvement in the precision of our pre-dictions, related to the high coverage of seed genes by ourmodules, is supported by coherent gene-disease and comor-bidity associations. This highlights how seemingly unrelateddiseases may be the product of complex combinations ofshared molecular mechanisms. We believe that this allows ourthree step procedure to compete with more established meth-ods such as CANDID and MetaRanker, and to capture addi-tional candidate genes missed by other methods (Table II).
The GCM approach prospectively allows us to use nomi-nally significant GWAS p values in the hunt for missing heri-tability while minimizing spurious hits. Many of our prioritizedcandidates for lipid traits are related to cardiovascular andcoronary artery disease in the literature (40, 42, 45) (supple-mental Table S3), providing a common sense measure of theusefulness of our raw data and methodology.
The significant association of the synonymous SNPrs234706 within the CBS gene to the TC and LDL-C traits,together with the association between the synonymous SNPand variable CBS mRNA levels in the liver (likely because oflinkage disequilibrium with the gene’s transcriptional regula-tory elements (46)) suggests that CBS expression levels arerelated to aberrant lipid profile traits in humans. It has beenshown that CBS knockout mice have altered distributions ofcholesterol and triglyceride lipoprotein fractions, and that mu-tations in the CBS gene cause altered lipoprotein metabolismas well as hyperhomocysteinemia (47). This finding demon-strates the usefulness of the GCM approach in selecting lipidand lipoprotein trait associated candidate genes.
Population level disease comorbidity between genes re-vealed interconnected complex phenotypes. Integrating lipid
interactome data with patient medical records uncovered mo-lecular associations for diseases unexpectedly comorbid withlipid related disorders. Despite the incompleteness of currentprotein-protein interactions and our incomplete knowledge ofdisease gene associations, the GCM method validated in oneof the four SNPs tested. This 25% validation success ratesurpasses that of other candidate gene prediction methods(8, 48, 49).
Although the GCM approach has been demonstrated usingGWAS of lipid traits, it can be used to interpret GWAS of othertraits as well. By capturing phenotypically coherent modulesof candidate and seed genes, the GCM approach providesinsights regarding involvement in complex phenotypes withmultiple susceptibility alleles and low effect sizes. In this way,GCM as well as other network-based approaches may be ofbroad use in dissecting complex diseases in the coming era ofsystems medicine.
Acknowledgments—The funders had no role in study design, datacollection and analysis, decision to publish, or preparation of themanuscript. We thank Sekar Kathiresan for providing access toGlobal Lipids Genetics Consortium, GLGC- GWAS data. We arethankful to Iossifov for providing the program to run molecular train-gulation algorithm.
* This study is supported by the Swedish Research Council, theSwedish Heart and Lung Foundation, the Region Skåne, the SkåneUniversity Hospital, the Novo Nordic Foundation, the Albert PåhlssonResearch Foundation, the Crafoord foundation equipment grant fromthe Knut and Alice Wallenberg Foundation and by Linneus for theLund University Diabetes Center (LUDC). MOM is a senior scientist atthe Swedish Research Council. This work was supported by NationalInstitutes of Health (NIH) grants P50-HG004233 CEGS.
□S This article contains supplemental Figs S1 to S6 and Tables S1to S4.
§§ To whom correspondence should be addressed: Lund Univer-sity, Skania University Hospital, CRC Entrance 72, Building 91 Floor12, SE-205 02 Malmo, Sweden. Tel.: 46 40 39 12 10; Fax: 46 4039 12 22; E-mail: [email protected], and [email protected].
Conflict of interest: The authors declare that they have no conflict ofinterest.
REFERENCES
1. Manolio, T. A., Collins, F. S., Cox, N. J., Goldstein, D. B., Hindorff, L. A.,Hunter, D. J., McCarthy, M. I., Ramos, E. M., Cardon, L. R., Chakravarti,A., Cho, J. H., Guttmacher, A. E., Kong, A., Kruglyak, L., Mardis, E.,Rotimi, C. N., Slatkin, M., Valle, D., Whittemore, A. S., Boehnke, M.,Clark, A. G., Eichler, E. E., Gibson, G., Haines, J. L., Mackay, T. F.,McCarroll, S. A., and Visscher, P. M. (2009) Finding the missing herita-bility of complex diseases. Nature 461, 747–753
2. Hegele, R. A. (2010) Genome-wide association studies of plasma lipids:have we reached the limit? Arterioscler. Thromb. Vasc. Biol. 30,2084–2086
3. Holmans, P., Green, E. K., Pahwa, J. S., Ferreira, M. A., Purcell, S. M., Sklar,P., Owen, M. J., O’Donovan, M. C., and Craddock, N. (2009) Geneontology analysis of GWA study data sets provides insights into thebiology of bipolar disorder. Am. J. Hum. Genet. 85, 13–24
4. Wang, K., Zhang, H., Kugathasan, S., Annese, V., Bradfield, J. P., Russell,R. K., Sleiman, P. M., Imielinski, M., Glessner, J., Hou, C., Wilson, D. C.,Walters, T., Kim, C., Frackelton, E. C., Lionetti, P., Barabino, A., VanLimbergen, J., Guthery, S., Denson, L., Piccoli, D., Li, M., Dubinsky, M.,Silverberg, M., Griffiths, A., Grant, S. F., Satsangi, J., Baldassano, R., and
Network-based Analysis of Genome Wide Association Data
3406 Molecular & Cellular Proteomics 12.11

Hakonarson, H. (2009) Diverse genome-wide association studies asso-ciate the IL12/IL23 pathway with Crohn Disease. Am. J. Hum. Genet. 84,399–405
5. Zhong, H., Yang, X., Kaplan, L. M., Molony, C., and Schadt, E. E. (2010)Integrating pathway analysis and genetics of gene expression for ge-nome-wide association studies. Am. J. Hum. Genet. 86, 581–591
6. Baranzini, S. E., Galwey, N. W., Wang, J., Khankhanian, P., Lindberg, R.,Pelletier, D., Wu, W., Uitdehaag, B. M., Kappos, L., Polman, C. H.,Matthews, P. M., Hauser, S. L., Gibson, R. A., Oksenberg, J. R., andBarnes, M. R. (2009) Pathway and network-based analysis of genome-wide association studies in multiple sclerosis. Hum. Mol. Genet. 18,2078–2090
7. Rossin, E. J., Lage, K., Raychaudhuri, S., Xavier, R. J., Tatar, D., Benita, Y.,Cotsapas, C., and Daly, M. J. (2011) Proteins encoded in genomicregions associated with immune-mediated disease physically interactand suggest underlying biology. PLoS Genet. 7, e1001273
8. Pers, T. H., Hansen, N. T., Lage, K., Koefoed, P., Dworzynski, P., Miller,M. L., Flint, T. J., Mellerup, E., Dam, H., Andreassen, O. A., Djurovic, S.,Melle, I., Børglum, A. D., Werge, T., Purcell, S., Ferreira, M. A., Kousk-oumvekaki, I., Workman, C. T., Hansen, T., Mors, O., and Brunak, S.(2011) Meta-analysis of heterogeneous data sources for genome-scaleidentification of risk genes in complex phenotypes. Genet. Epidemiol. 35,318–332
9. Hutz, J. E., Kraja, A. T., McLeod, H. L., and Province, M. A. (2008) CANDID:a flexible method for prioritizing candidate genes for complex humantraits. Genet. Epidemiol. 32, 779–790
10. Hartwell, L. H., Hopfield, J. J., Leibler, S., and Murray, A. W. (1999) Frommolecular to modular cell biology. Nature 402, C47–52
11. Goh, K. I., Cusick, M. E., Valle, D., Childs, B., Vidal, M., and Barabasi, A. L.(2007) The human disease network. Proc. Natl. Acad. Sci. U. S. A. 104,8685–8690
12. Krauthammer, M., Kaufmann, C. A., Gilliam, T. C., and Rzhetsky, A. (2004)Molecular triangulation: bridging linkage and molecular-network informa-tion for identifying candidate genes in Alzheimer’s disease. Proc. Natl.Acad. Sci. U. S. A.101, 15148–15153
13. Ideker, T., Ozier, O., Schwikowski, B., and Siegel, A. F. (2002) Discoveringregulatory and signalling circuits in molecular interaction networks.Bioinformatics 18, S233–240
14. Hidalgo, C. A., Blumm, N., Barabasi, A. L., and Christakis, N. A. (2009) Adynamic network approach for the study of human phenotypes. PLoSComput. Biol. 5, e1000353
15. Lee, D. S., Park, J., Kay, K. A., Christakis, N. A., Oltvai, Z. N., and Barabasi,A. L. (2008) The implications of human metabolic network topology fordisease comorbidity. Proc. Natl. Acad. Sci. U.S.A. 105, 9880–9885
16. Teslovich, T. M., Musunuru, K., Smith, A. V., Edmondson, A. C., Stylianou,I. M. Koseki, M., Pirruccello, J. P., Ripatti, S., Chasman, D. I., Willer, C. J.,Johansen, C. T., Fouchier, S. W., Isaacs, A., Peloso, G. M., Barbalic, M.,Ricketts, S. L., Bis, J. C., Aulchenko, Y. S., Thorleifsson, G., Feitosa,M. F., Chambers, J., Orho-Melander, M., Melander, O., Johnson, T., Li,X., Guo, X., Li, M., Shin, Cho, Y., Jin, Go, M., Jin, Kim, Y., Lee, J. Y., Park,T., Kim, K., Sim, X., Twee-Hee, Ong, R., Croteau-Chonka, D. C., Lange,L. A., Smith, J. D., Song, K., Hua, Zhao, J., Yuan, X., Luan, J., Lamina, C.,Ziegler, A., Zhang, W., Zee, R. Y., Wright, A. F., Witteman, J. C., Wilson,J. F., Willemsen, G., Wichmann, H. E., Whitfield, J. B., Waterworth, D. M.,Wareham, N. J., Waeber, G., Vollenweider, P., Voight, B. F., Vitart, V.,Uitterlinden, A. G., Uda, M., Tuomilehto, J., Thompson, J. R., Tanaka, T.,Surakka, I., Stringham, H. M., Spector, T. D., Soranzo, N., Smit, J. H.,Sinisalo, J., Silander, K., Sijbrands, E. J., Scuteri, A., Scott, J., Sch-lessinger, D., Sanna, S., Salomaa, V., Saharinen, J., Sabatti, C., Ruo-konen, A., Rudan, I., Rose, LM., Roberts, R., Rieder, M., Psaty, B. M.,Pramstaller, P. P., Pichler, I., Perola, M., Penninx, B. W., Pedersen, N. L.,Pattaro, C., Parker, A. N., Pare, G., Oostra, B. A., O’Donnell, C. J.,Nieminen, M. S., Nickerson, D. A., Montgomery, G. W., Meitinger, T.,McPherson, R., McCarthy, M. I., McArdle, W., Masson, D., Martin, N. G.,Marroni, F., Mangino, M., Magnusson, P. K., Lucas, G., Luben, R., Loos,R. J., Lokki, M. L., Lettre, G., Langenberg, C., Launer, L. J., Lakatta,E. G., Laaksonen, R., Kyvik, K. O., Kronenberg, F., Konig, I. R., Khaw,K. T., Kaprio, J., Kaplan, L. M., Johansson, A., Jarvelin, M. R., Janssens,A. C., Ingelsson, E., Igl, W., Kees, Hovingh, G., Hottenga, J. J., Hofman,A., Hicks, A. A., Hengstenberg, C., Heid, I. M., Hayward, C., Havulinna,A. S., Hastie, N. D., Harris, T. B., Haritunians, T., Hall, A. S., Gyllensten,
U., Guiducci, C., Groop, L. C., Gonzalez, E., Gieger, C., Freimer, N. B.,Ferrucci, L., Erdmann, J., Elliott, P., Ejebe, K. G., Doring, A., Dominiczak,A. F., Demissie, S., Deloukas, P., de, Geus, E. J., de, Faire, U., Crawford,G., Collins, F. S., Chen, Y. D., Caulfield, M. J., Campbell, H., Burtt, N. P.,Bonnycastle, L. L., Boomsma, D. I., Boekholdt, S. M., Bergman, R. N.,Barroso, I., Bandinelli, S., Ballantyne, C. M., Assimes, T. L., Querter-mous, T., Altshuler, D., Seielstad, M., Wong, T. Y., Tai, E. S., Feranil,A. B., Kuzawa, C. W., Adair, L. S., Taylor, H. A., Jr, Borecki, I. B., Gabriel,S. B., Wilson, J. G., Holm, H., Thorsteinsdottir, U., Gudnason, V., Krauss,R. M., Mohlke, K. L., Ordovas, J. M., Munroe, P. B., Kooner, J. S., Tall,A. R., Hegele, R. A., Kastelein, J. J., Schadt, E. E., Rotter, J. I., Boer-winkle, E., Strachan, D. P., Mooser, V., Stefansson, K., Reilly, M. P.,Samani, N. J., Schunkert, H., Cupples, L. A., Sandhu, M. S., Ridker,P. M., Rader, D. J., van, Duijn, C. M., Peltonen, L., Abecasis, G. R.,Boehnke, M., Kathiresan, S.). (2010) Biological, clinical and populationrelevance of 95 loci for blood lipids. Nature 466, 707–713
17. Hong, M. G., Pawitan, Y., Magnusson, P. K., and Prince, J. A. (2009)Strategies and issues in the detection of pathway enrichment in genome-wide association studies. Hum. Genet. 126, 289–301
18. Rual, J. F., Venkatesan, K., Hao, T., Hirozane-Kishikawa, T., Dricot, A., Li,N., Berriz, G. F., Gibbons, F. D., Dreze, M., Ayivi-Guedehoussou, N.,Klitgord, N., Simon, C., Boxem, M., Milstein, S., Rosenberg, J., Gold-berg, D. S., Zhang, L. V., Wong, S. L., Franklin, G., Li, S., Albala, J. S.,Lim, J., Fraughton, C., Llamosas, E., Cevik, S., Bex, C., Lamesch, P.,Sikorski, R. S., Vandenhaute, J., Zoghbi, H. Y., Smolyar, A., Bosak, S.,Sequerra, R., Doucette-Stamm, L., Cusick, M. E., Hill, D. E., Roth, F. P.,and Vidal, M. (2005) Towards a proteome-scale map of the humanprotein-protein interaction network. Nature 437, 1173–1178
19. Stelzl, U., Worm, U., Lalowski, M., Haenig, C., Brembeck, F. H., Goehler, H.,Stroedicke, M., Zenkner, M., Schoenherr, A., Koeppen, S., Timm, J.,Mintzlaff, S., Abraham, C., Bock, N., Kietzmann, S., Goedde, A., Toksoz,E., Droege, A., Krobitsch, S., Korn, B., Birchmeier, W., Lehrach, H., andWanker, E. E. (2005) A human protein-protein interaction network: aresource for annotating the proteome. Cell 122, 957–968
20. Venkatesan, K., Rual, J. F., Vazquez, A., Stelzl, U., Lemmens, I., Hirozane-Kishikawa, T., Hao, T., Zenkner, M., Xin, X., Goh, K. I., Yildirim, M. A.,Simonis, N., Heinzmann, K., Gebreab, F., Sahalie, J. M., Cevik, S.,Simon, C., de Smet, A. S., Dann, E., Smolyar, A., Vinayagam, A., Yu, H.,Szeto, D., Borick, H., Dricot, A., Klitgord, N., Murray, R. R., Lin, C.,Lalowski, M., Timm, J., Rau, K., Boone, C., Braun, P., Cusick, M. E.,Roth, F. P., Hill, D. E., Tavernier, J., Wanker, E. E., Barabasi, A. L., andVidal, M. (2009) An empirical framework for binary interactome mapping.Nat. Methods 6, 83–90
21. Ceol, A., Chatr Aryamontri, A., Licata, L., Peluso, D., Briganti, L., Perfetto,L., Castagnoli, L., and Cesareni, G. (2010) MINT, the molecular interac-tion database: 2009 update. Nucleic Acids Res. 38, D532–539
22. Aranda, B., Achuthan, P., Alam-Faruque, Y., Armean, I., Bridge, A., Derow,C., Feuermann, M., Ghanbarian, A. T., Kerrien, S., Khadake, J., Kersse-makers, J., Leroy, C., Menden, M., Michaut, M., Montecchi-Palazzi, L.,Neuhauser, S. N., Orchard, S., Perreau, V., Roechert, B., van Eijk, K., andHermjakob, H. (2010) The IntAct molecular interaction database in 2010.Nucleic Acids Res. 38, D525–531
23. Matys, V., Kel-Margoulis, O. V., Fricke, E., Liebich, I., Land, S., Barre-Dirrie,A., Reuter, I., Chekmenev, D., Krull, M., Hornischer, K., Voss, N., Steg-maier, P., Lewicki-Potapov, B., Saxel, H., Kel, A. E., and Wingender, E.(2006) TRANSFAC and its module TRANSCompel: transcriptional generegulation in eukaryotes. Nucleic Acids Res. 34, D108–110
24. Iossifov, I., Rodriguez-Esteban, R., Mayzus, I., Millen, K. J., and Rzhetsky,A. (2009) Looking at cerebellar malformations through text-mined inter-actomes of mice and humans. PLoS Comput. Biol. 5, e1000559
25. Zheng, S., and Zhao, Z. (2012) GenRev: Exploring functional relevance ofgenes in molecular networks. Genomics 99, 183–188
26. Sun, P. G., Gao, L., and Han, S. (2011) Prediction of human disease-relatedgene clusters by clustering analysis. Int. J. Biol. Sci. 7, 61–73
27. Schlicker, A., Lengauer, T., and Albrecht, M. (2010) Improving disease geneprioritization using the semantic similarity of Gene Ontology terms. Bioin-formatics 26, i561–567
28. Kohler, S., Bauer, S., Horn, D., and Robinson, P. N. (2008) Walking theinteractome for prioritization of candidate disease genes. Am. J. Hum.Genet. 82, 949–958
29. Su, A. I., Wiltshire, T., Batalov, S., Lapp, H., Ching, K. A., Block, D., Zhang,
Network-based Analysis of Genome Wide Association Data
Molecular & Cellular Proteomics 12.11 3407

J., Soden, R., Hayakawa, M., Kreiman, G., Cooke, M. P., Walker, J. R.,and Hogenesch, J. B. (2004) A gene atlas of the mouse and humanprotein-encoding transcriptomes. Proc. Natl. Acad. Sci. U.S.A. 101,6062–6067
30. Adzhubei, I. A., Schmidt, S., Peshkin, L., Ramensky, V. E., Gerasimova, A.,Bork, P., Kondrashov, A. S., and Sunyaev, S. R. (2010) A method andserver for predicting damaging missense mutations. Nat. Methods 7,248–249
31. Reumers, J., Conde, L., Medina, I., Maurer-Stroh, S., Van Durme, J.,Dopazo, J., Rousseau, F., and Schymkowitz, J. (2008) Joint annotation ofcoding and non-coding single nucleotide polymorphisms and mutationsin the SNPeffect and PupaSuite databases. Nucleic Acids Res. 36,D825–829
32. Berglund, G., Elmstahl, S., Janzon, L., and Larsson, S. A. (1993) The MalmoDiet and Cancer Study. Design and feasibility. J. Intern Med. 233, 45–51
33. Jerntorp, P., and Berglund, G. (1992) Stroke registry in Malmo, Sweden.Stroke 23, 357–361
34. Folkersen, L., Wagsater, D., Paloschi, V., Jackson, V., Petrini, J., Kurtovic,S., Maleki, S., Eriksson, M. J., Caidahl, K., Hamsten, A., Michel, J. B.,Liska, J., Gabrielsen, A., Franco-Cereceda, A., and Eriksson, P. (2011)Unraveling the divergent gene expression profiles in bicuspid and tricus-pid aortic valve patients with thoracic aortic dilatation - the ASAP study.Mol. Med. 17, 1365–1373
35. Maere, S., Heymans, K., and Kuiper, M. (2005) BiNGO: a Cytoscape pluginto assess overrepresentation of gene ontology categories in biologicalnetworks. Bioinformatics 21, 3448–3449
36. Barabasi, A. L., Gulbahce, N., and Loscalzo, J. (2011) Network medicine: anetwork-based approach to human disease. Nat. Rev. Genet. 12, 56–68
37. Scott, M. S., Perkins, T., Bunnell, S., Pepin, F., Thomas, D. Y., and Hallett,M. (2005) Identifying regulatory subnetworks for a set of genes. Mol. Cell.Proteomics 4, 683–692
38. Raychaudhuri, S., Plenge, R. M., Rossin, E. J., Ng, A. C., Purcell, S. M.,Sklar, P., Scolnick, E. M., Xavier, R. J., Altshuler, D., and Daly, M. J.(2009) Identifying relationships among genomic disease regions: predict-ing genes at pathogenic SNP associations and rare deletions. PLoSGenet. 5, e1000534
39. Navlakha, S., and Kingsford, C. (2010) The power of protein interactionnetworks for associating genes with diseases. Bioinformatics 26,1057–1063
40. Peloso, G. M., Demissie, S., Collins, D., Mirel, D. B., Gabriel, S. B., Cupples,L. A., Robins, S. J., Schaefer, E. J., and Brousseau, M. E. (2010) Com-mon genetic variation in multiple metabolic pathways influences suscep-
tibility to low HDL-cholesterol and coronary heart disease. J. Lipid Res.51, 3524–3532
41. Namekata, K., Enokido, Y., Ishii, I., Nagai, Y., Harada, T., and Kimura, H.(2004) Abnormal lipid metabolism in cystathionine beta-synthase-defi-cient mice, an animal model for hyperhomocysteinemia. J. Biol. Chem.279, 52961–52969
42. Chu, P. H., Yeh, H. I., Wu, H. H., Hong, R. C., Shiu, T. F., and Yang, C. M.(2010) Deletion of the FHL2 gene attenuates the formation of atheroscle-rotic lesions after a cholesterol-enriched diet. Life Sci. 86, 365–371
43. Folkersen, L., van’t Hooft, F., Chernogubova, E., Agardh, H. E., Hansson,G. K., Hedin, U., Liska, J., Syvanen, A. C., Paulsson-Berne, G., Franco-Cereceda, A., Hamsten, A., Gabrielsen, A., and Eriksson, P. (2010) As-sociation of genetic risk variants with expression of proximal genesidentifies novel susceptibility genes for cardiovascular disease. Circ.Cardiovasc Genet. 3, 365–373
44. Nuno-Ayala, M., Guillen, N., Navarro, M. A., Lou-Bonafonte, J. M., Arnal, C.,Gascon, S., Barranquero, C., Godino, J., Royo-Canas, M., Sarria, A. J.,Guzman, M. A., Hernandez, E., Bregante, M. A., Garcia-Gimeno, M. A.,and Osada, J. (2010) Cysteinemia, rather than homocysteinemia, isassociated with plasma apolipoprotein A-I levels in hyperhomocysteine-mia: lipid metabolism in cystathionine beta-synthase deficiency. Athero-sclerosis 212, 268–273
45. Palanker, L., Tennessen, J. M., Lam, G., and Thummel, C. S. (2009) Dro-sophila HNF4 regulates lipid mobilization and beta-oxidation. Cell Metab.9, 228–239
46. Aras, O., Hanson, N. Q., Yang, F., and Tsai, M. Y. (2000) Influence of699C–�T and 1080C–�T polymorphisms of the cystathionine beta-synthase gene on plasma homocysteine levels. Clin. Genet. 58, 455–459
47. Liao, D., Tan, H., Hui, R., Li, Z., Jiang, X., Gaubatz, J., Yang, F., Durante, W.,Chan, L., Schafer, A. I., Pownall, H. J., Yang, X., and Wang, H. (2006)Hyperhomocysteinemia decreases circulating high-density lipoproteinby inhibiting apolipoprotein A-I Protein synthesis and enhancing HDLcholesterol clearance. Circ. Res. 99, 598–606
48. Tremblay, K., Lemire, M., Potvin, C., Tremblay, A., Hunninghake, G. M.,Raby, B. A., Hudson, T. J., Perez-Iratxeta, C., Andrade-Navarro, M. A.,and Laprise, C. (2008) Genes to diseases (G2D) computational method toidentify asthma candidate genes. PLoS One 3, e2907
49. Erlich, Y., Edvardson, S., Hodges, E., Zenvirt, S., Thekkat, P., Shaag, A.,Dor, T., Hannon, G. J., and Elpeleg, O. (2011) Exome sequencing anddisease-network analysis of a single family implicate a mutation in KIF1Ain hereditary spastic paraparesis. Genome Res. 21, 658–664
Network-based Analysis of Genome Wide Association Data
3408 Molecular & Cellular Proteomics 12.11
Related Documents


![김동환 2009암학회워크샵.ppt [호환 모드]•Basic concepts of SNPs •Applications of SNPs into cancer research ... 21 SNPs a/w antileukemic drug disposition-> 63 SNPs a/w](https://static.cupdf.com/doc/110x72/601ede878cebc154024e5352/ee-2009oeoefppt-eeoe-abasic-concepts-of-snps-aapplications.jpg)