National Vital Statistics Reports, Vol. 67, No. 1, January 31, 2018 Births: Final Data for 2016 Supplemental tables I–1. Time of birth, by day of week of birth and by race and Hispanic origin of mother: United States, 2016 I–2. Births and seasonally adjusted birth rates, by month: United States, 2016 I–3. Births, by day of week and method of delivery: United States, 2016 I–4. Births, by attendant, place of delivery, and race and Hispanic origin of mother: United States, 2016 I–5. Births occurring at home: United States and each state, 2016 I–6. Mean age of mother, by live-birth order: United States, 2010–2016, and by race and Hispanic origin of mother, 2016 I–7. Births to unmarried women, by race and Hispanic origin of mother: United States, each state and territory, 2016 I–8. Educational attainment of mother, by age (years) and race and Hispanic origin of mother: United States, 2016 I–9. Maternal prepregnancy body mass index, by age (years) and race and Hispanic origin of mother: United States, 2016 I–10. Live births, by interval since last live birth and by age (years) and race and Hispanic origin of mother: United States, 2016 I–11. Mother received WIC food for herself during this pregnancy and infant was breastfed at discharge, by age (years) and race and Hispanic origin of mother: United States, 2016 I–12. Pregnancy risk factors, by age (years) and race and Hispanic origin of mother: United States, 2016 I–13. Infections present or treated during this pregnancy, by age (years) and race and Hispanic origin of mother: United States, 2016 I–14. External cephalic version, by age (years) and race and Hispanic origin of mother: United States, 2016 I–15. Characteristics of labor and delivery, by age (years) and race and Hispanic origin of mother: United States, 2016 I–16. Total cesarean delivery and low-risk cesarean delivery, by race and Hispanic origin of mother: United States, each state and territory, 2016 I–17. Method of delivery, by age (years) and race and Hispanic origin of mother: United States, 2016 I–18. Maternal morbidity, by age (years) and race and Hispanic origin of mother: United States, 2016 I–19. Preterm births, by race and Hispanic origin of mother: United States, each state and territory, 2016 I–20. Late preterm births, by race and Hispanic origin of mother: United States, each state and territory, 2016 I–21. Low birthweight births, by race and Hispanic origin of mother: United States, each state and territory, 2016 I–22. Very low birthweight births, by race and Hispanic origin of mother: United States, each state and territory, 2016 I–23. Twin and triplet or higher-order multiple births: United States and each state, 2014–2016 I–24. Abnormal conditions of the newborn, by age (years) and race and Hispanic origin of mother: United States, 2016 I–25. Congenital anomalies of the newborn, by age (years) of mother: United States, 2016 I–26. Births and birth rates, by bridged race: United States, 2010–2016 I–27. Birth rates, by age (years) and bridged race of mother: United States, 2010–2016

Welcome message from author
This document is posted to help you gain knowledge. Please leave a comment to let me know what you think about it! Share it to your friends and learn new things together.
Transcript
National Vital Statistics Reports, Vol. 67, No. 1, January 31, 2018
Births: Final Data for 2016
Supplemental tablesI–1. Time of birth, by day of week of birth and by race and Hispanic origin of mother: United States, 2016
I–2. Births and seasonally adjusted birth rates, by month: United States, 2016
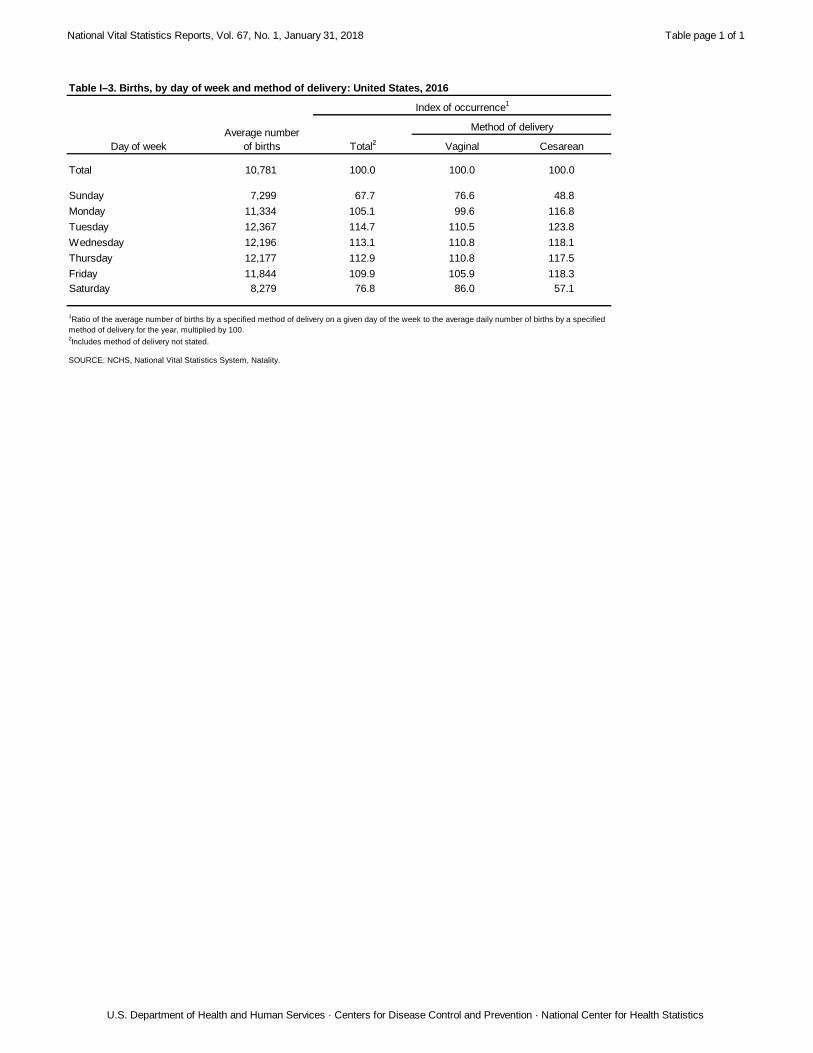
I–3. Births, by day of week and method of delivery: United States, 2016
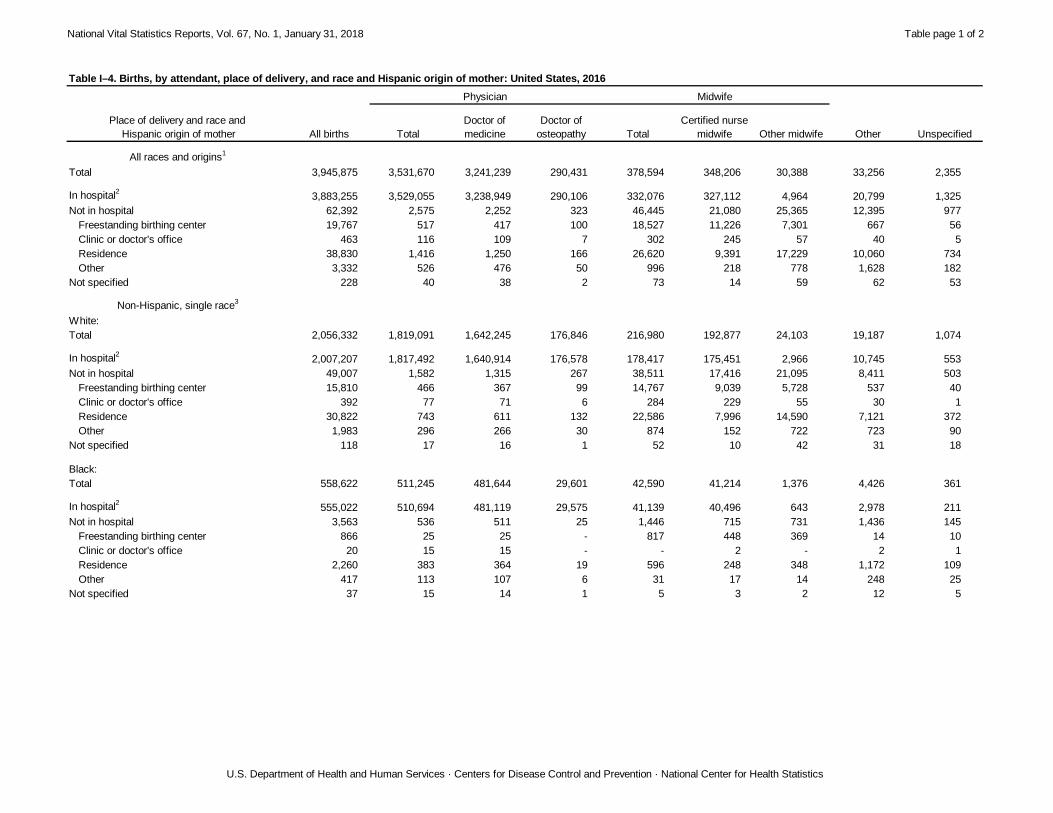
I–4. Births, by attendant, place of delivery, and race and Hispanic origin of mother: United States, 2016
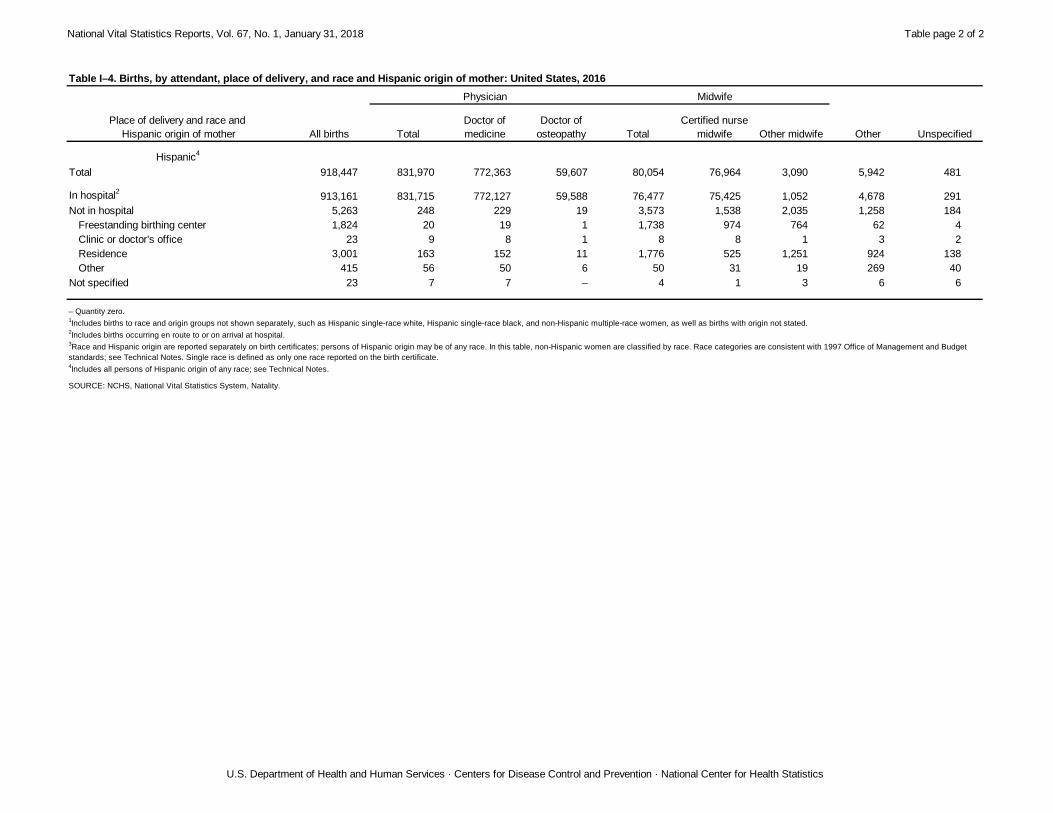
I–5. Births occurring at home: United States and each state, 2016
I–6. Mean age of mother, by live-birth order: United States, 2010–2016, and by race and Hispanic origin of mother, 2016
I–7. Births to unmarried women, by race and Hispanic origin of mother: United States, each state and territory, 2016
I–8. Educational attainment of mother, by age (years) and race and Hispanic origin of mother: United States, 2016
I–9. Maternal prepregnancy body mass index, by age (years) and race and Hispanic origin of mother: United States, 2016
I–10. Live births, by interval since last live birth and by age (years) and race and Hispanic origin of mother: United States, 2016
I–11. Mother received WIC food for herself during this pregnancy and infant was breastfed at discharge, by age (years) and race and Hispanic origin of mother: United States, 2016
I–12. Pregnancy risk factors, by age (years) and race and Hispanic origin of mother: United States, 2016
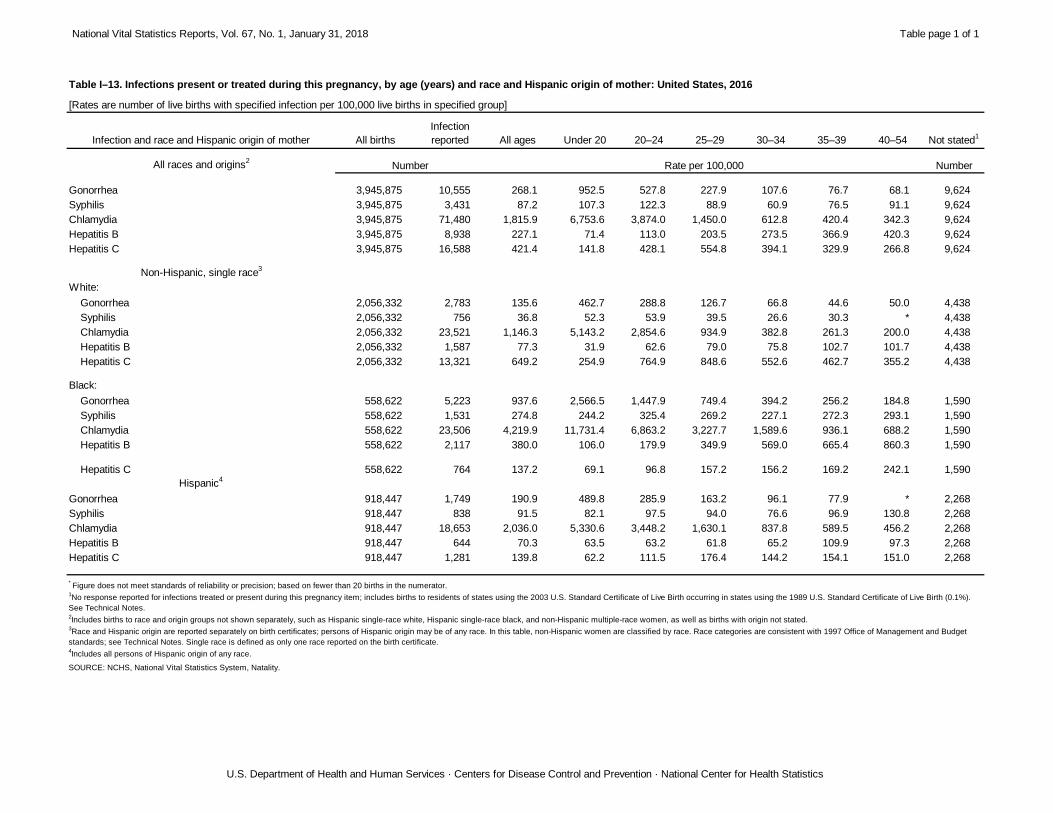
I–13. Infections present or treated during this pregnancy, by age (years) and race and Hispanic origin of mother: United States, 2016
I–14. External cephalic version, by age (years) and race and Hispanic origin of mother: United States, 2016
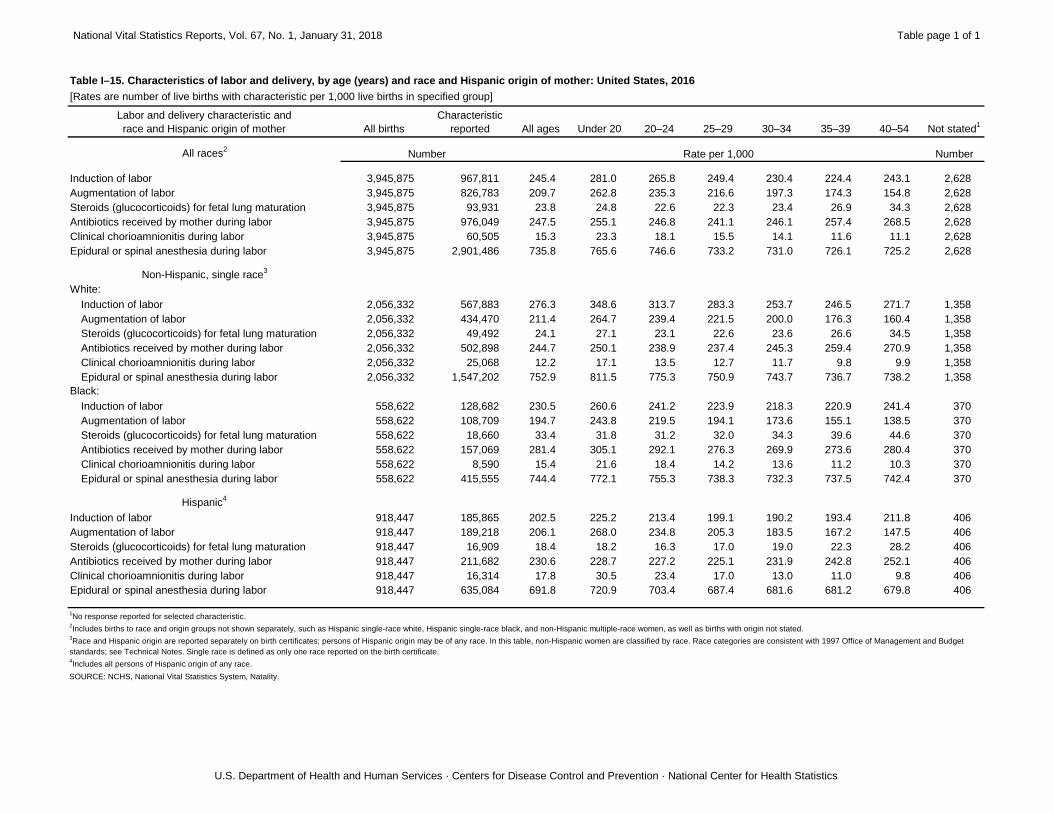
I–15. Characteristics of labor and delivery, by age (years) and race and Hispanic origin of mother: United States, 2016
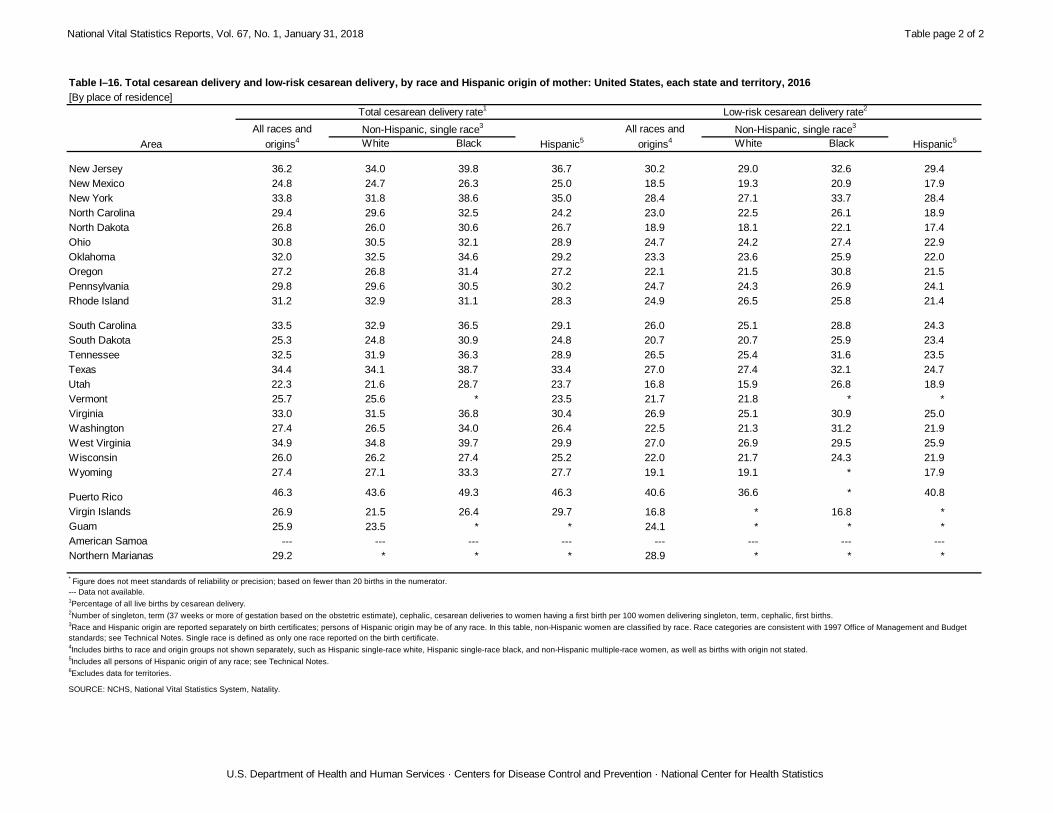
I–16. Total cesarean delivery and low-risk cesarean delivery, by race and Hispanic origin of mother: United States, each state and territory, 2016
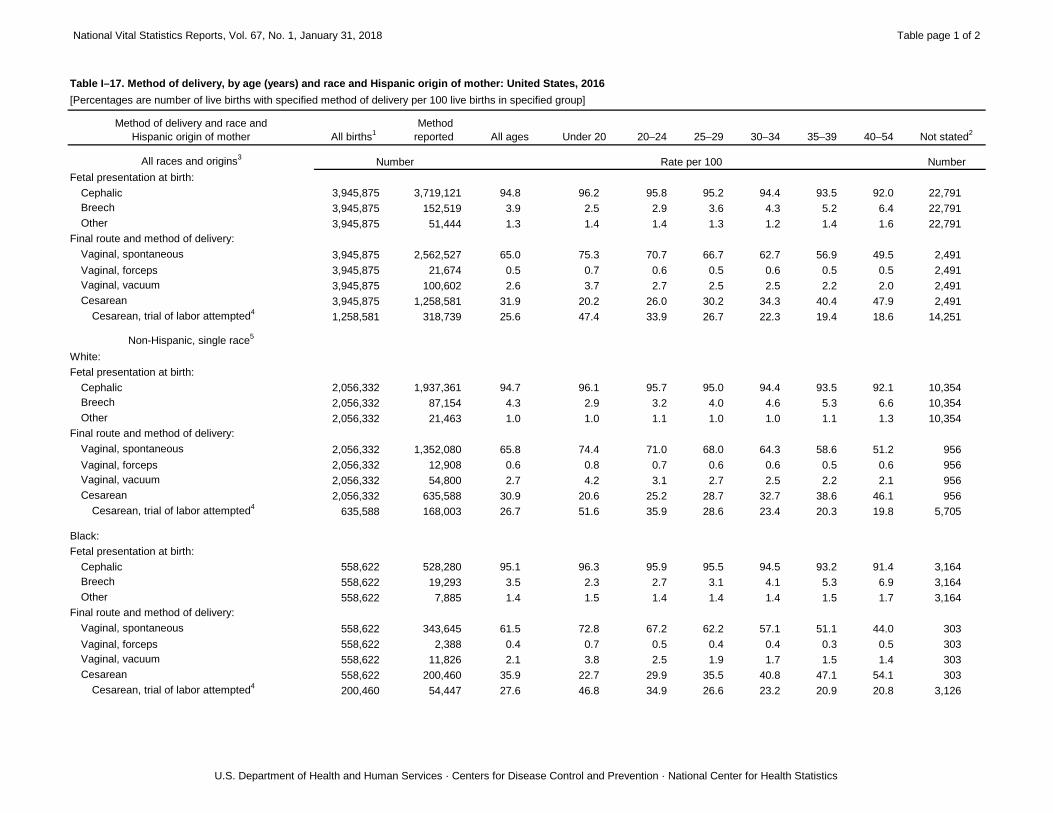
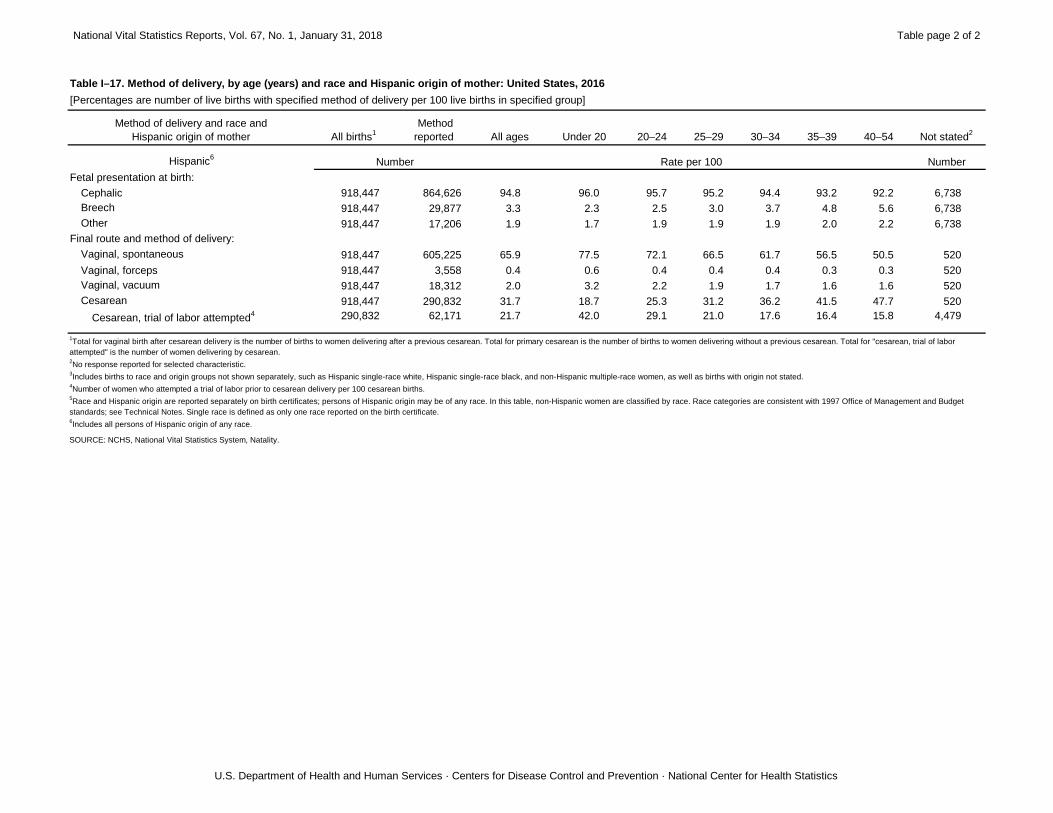
I–17. Method of delivery, by age (years) and race and Hispanic origin of mother: United States, 2016
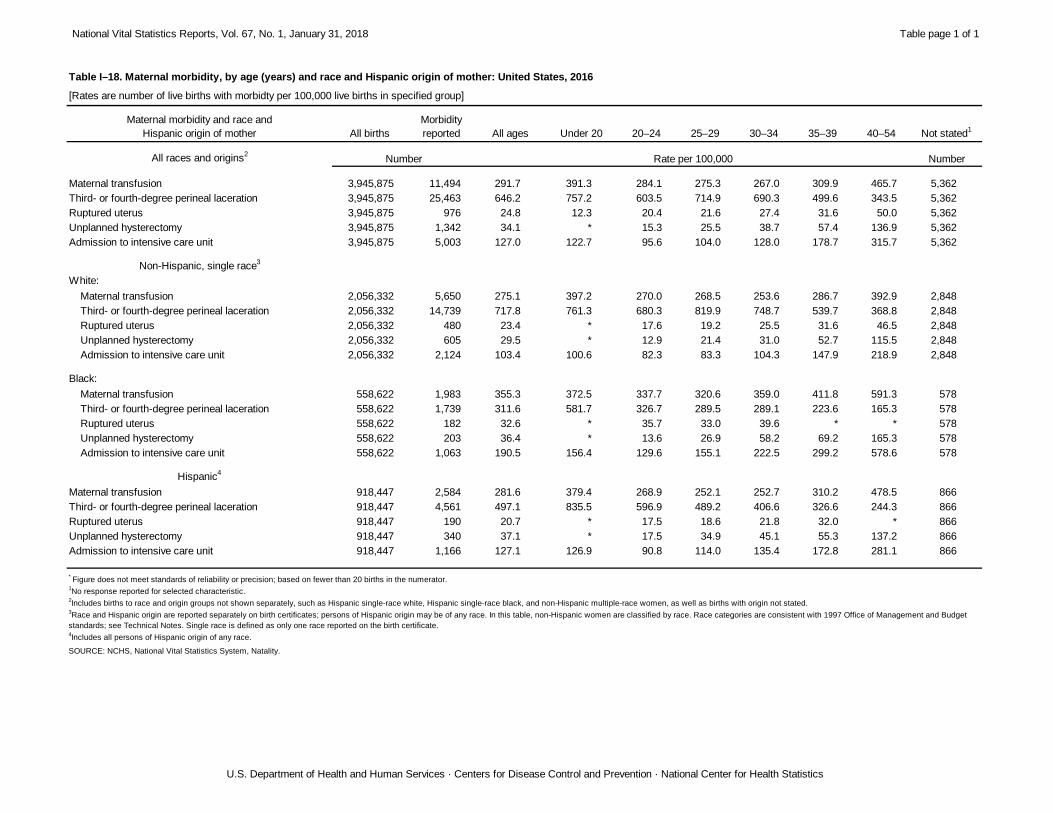
I–18. Maternal morbidity, by age (years) and race and Hispanic origin of mother: United States, 2016
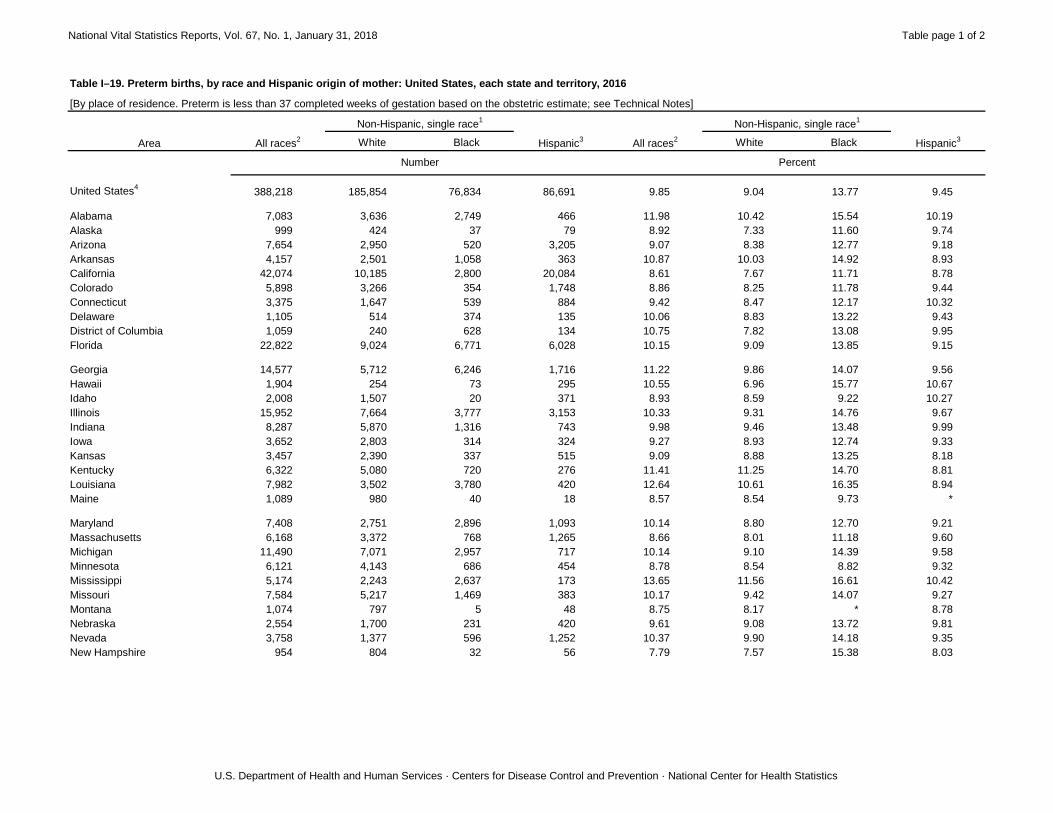
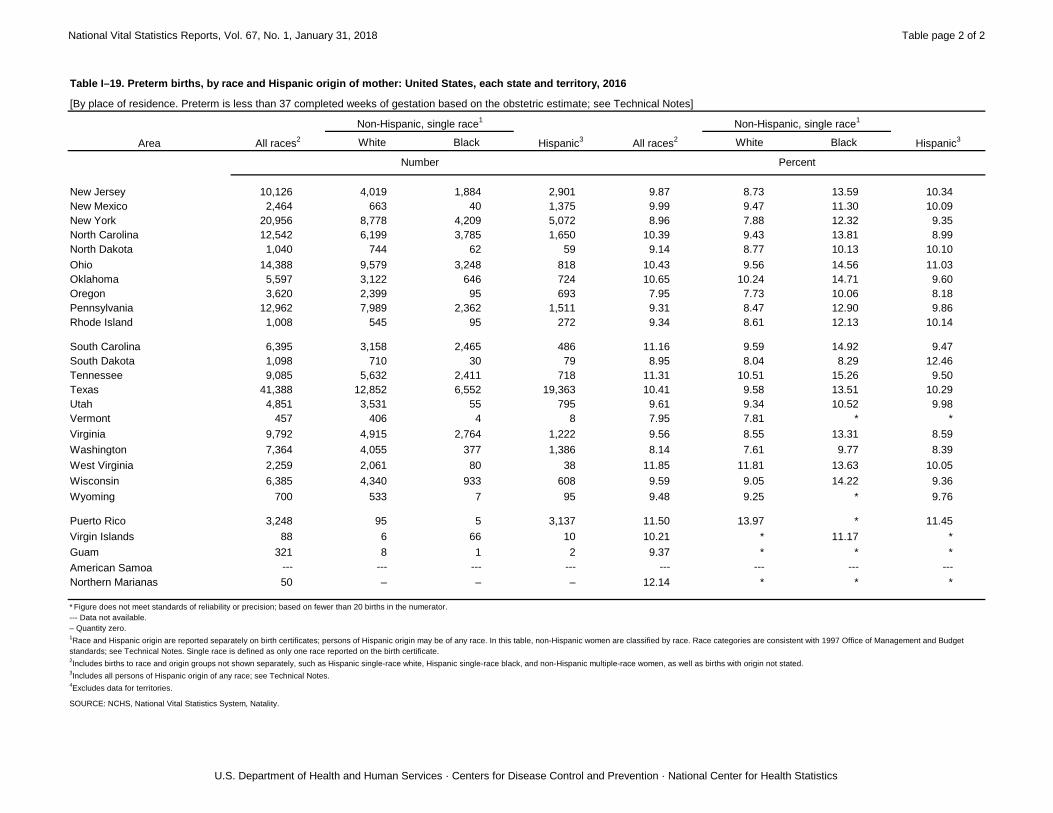
I–19. Preterm births, by race and Hispanic origin of mother: United States, each state and territory, 2016
I–20. Late preterm births, by race and Hispanic origin of mother: United States, each state and territory, 2016
I–21. Low birthweight births, by race and Hispanic origin of mother: United States, each state and territory, 2016
I–22. Very low birthweight births, by race and Hispanic origin of mother: United States, each state and territory, 2016
I–23. Twin and triplet or higher-order multiple births: United States and each state, 2014–2016
I–24. Abnormal conditions of the newborn, by age (years) and race and Hispanic origin of mother: United States, 2016
I–25. Congenital anomalies of the newborn, by age (years) of mother: United States, 2016
I–26. Births and birth rates, by bridged race: United States, 2010–2016
I–27. Birth rates, by age (years) and bridged race of mother: United States, 2010–2016
National Vital Statistics Reports, Vol. 67, No. 1, January 31, 2018
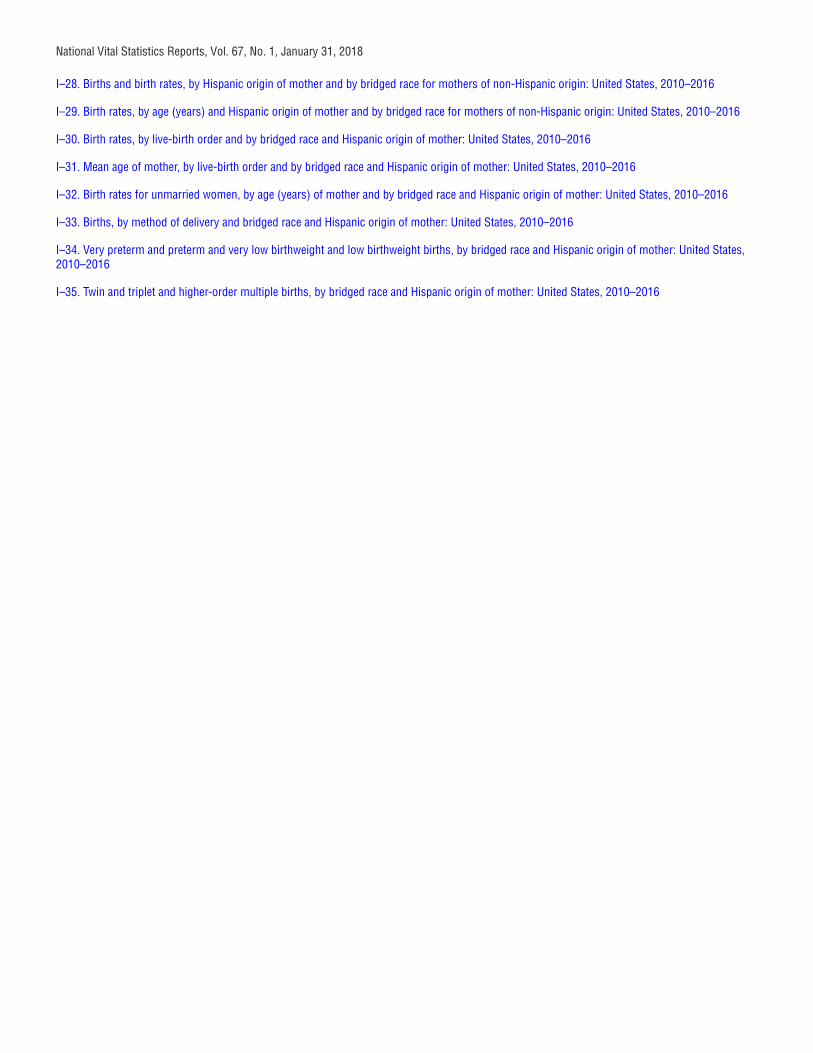
I–28. Births and birth rates, by Hispanic origin of mother and by bridged race for mothers of non-Hispanic origin: United States, 2010–2016
I–29. Birth rates, by age (years) and Hispanic origin of mother and by bridged race for mothers of non-Hispanic origin: United States, 2010–2016
I–30. Birth rates, by live-birth order and by bridged race and Hispanic origin of mother: United States, 2010–2016
I–31. Mean age of mother, by live-birth order and by bridged race and Hispanic origin of mother: United States, 2010–2016
I–32. Birth rates for unmarried women, by age (years) of mother and by bridged race and Hispanic origin of mother: United States, 2010–2016
I–33. Births, by method of delivery and bridged race and Hispanic origin of mother: United States, 2010–2016
I–34. Very preterm and preterm and very low birthweight and low birthweight births, by bridged race and Hispanic origin of mother: United States, 2010–2016
I–35. Twin and triplet and higher-order multiple births, by bridged race and Hispanic origin of mother: United States, 2010–2016
National Vital Statistics Reports, Vol. 67, No. 1, January 31, 2018 Table page 1 of 2
U.S. Department of Health and Human Services · Centers for Disease Control and Prevention · National Center for Health Statistics
Time of birth and race and
Hispanic origin of mother All births Sunday Monday Tuesday Wednesday Thursday Friday Saturday
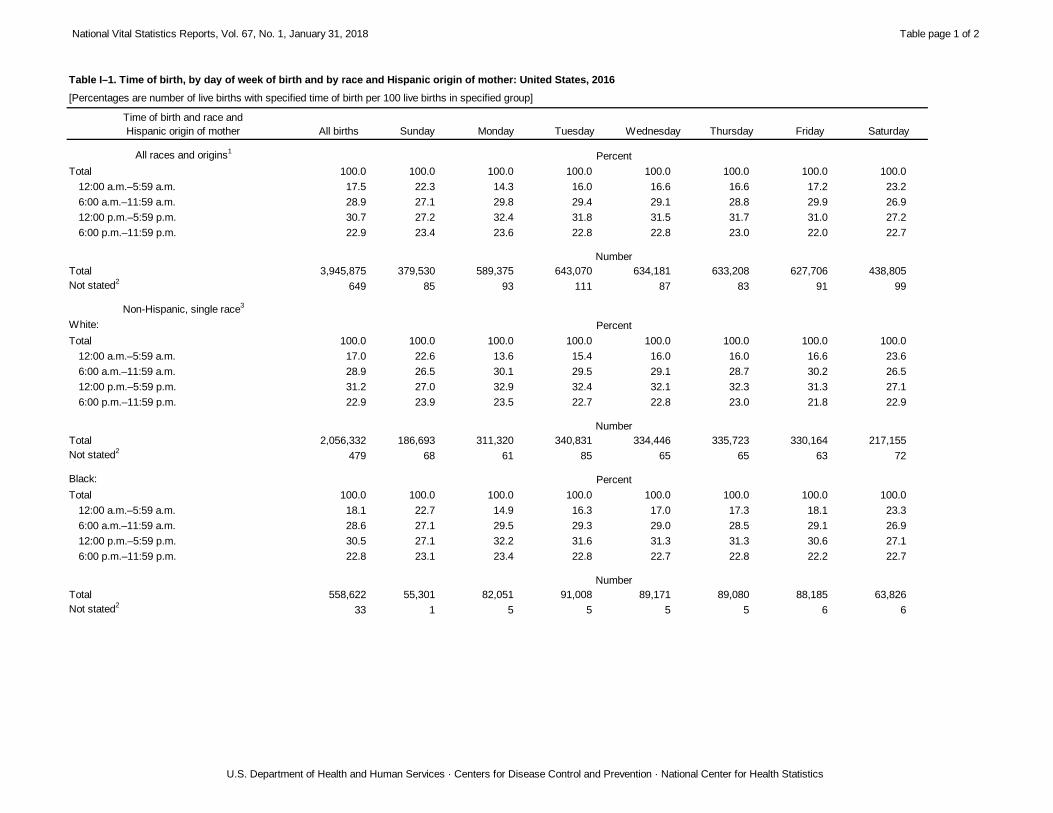
All races and origins1
Total 100.0 100.0 100.0 100.0 100.0 100.0 100.0 100.0
12:00 a.m.–5:59 a.m. 17.5 22.3 14.3 16.0 16.6 16.6 17.2 23.2
6:00 a.m.–11:59 a.m. 28.9 27.1 29.8 29.4 29.1 28.8 29.9 26.9
12:00 p.m.–5:59 p.m. 30.7 27.2 32.4 31.8 31.5 31.7 31.0 27.2
6:00 p.m.–11:59 p.m. 22.9 23.4 23.6 22.8 22.8 23.0 22.0 22.7
Total 3,945,875 379,530 589,375 643,070 634,181 633,208 627,706 438,805
Not stated2
649 85 93 111 87 83 91 99
Non-Hispanic, single race3
White:
Total 100.0 100.0 100.0 100.0 100.0 100.0 100.0 100.0
12:00 a.m.–5:59 a.m. 17.0 22.6 13.6 15.4 16.0 16.0 16.6 23.6
6:00 a.m.–11:59 a.m. 28.9 26.5 30.1 29.5 29.1 28.7 30.2 26.5
12:00 p.m.–5:59 p.m. 31.2 27.0 32.9 32.4 32.1 32.3 31.3 27.1
6:00 p.m.–11:59 p.m. 22.9 23.9 23.5 22.7 22.8 23.0 21.8 22.9
Total 2,056,332 186,693 311,320 340,831 334,446 335,723 330,164 217,155
Not stated2
479 68 61 85 65 65 63 72
Black:
Total 100.0 100.0 100.0 100.0 100.0 100.0 100.0 100.0
12:00 a.m.–5:59 a.m. 18.1 22.7 14.9 16.3 17.0 17.3 18.1 23.3
6:00 a.m.–11:59 a.m. 28.6 27.1 29.5 29.3 29.0 28.5 29.1 26.9
12:00 p.m.–5:59 p.m. 30.5 27.1 32.2 31.6 31.3 31.3 30.6 27.1
6:00 p.m.–11:59 p.m. 22.8 23.1 23.4 22.8 22.7 22.8 22.2 22.7
Total 558,622 55,301 82,051 91,008 89,171 89,080 88,185 63,826
Not stated2
33 1 5 5 5 5 6 6
Table I–1. Time of birth, by day of week of birth and by race and Hispanic origin of mother: United States, 2016
Percent
Number
Percent
Number
[Percentages are number of live births with specified time of birth per 100 live births in specified group]
Percent
Number
National Vital Statistics Reports, Vol. 67, No. 1, January 31, 2018 Table page 2 of 2
U.S. Department of Health and Human Services · Centers for Disease Control and Prevention · National Center for Health Statistics
Time of birth and race and
Hispanic origin of mother All births Sunday Monday Tuesday Wednesday Thursday Friday Saturday
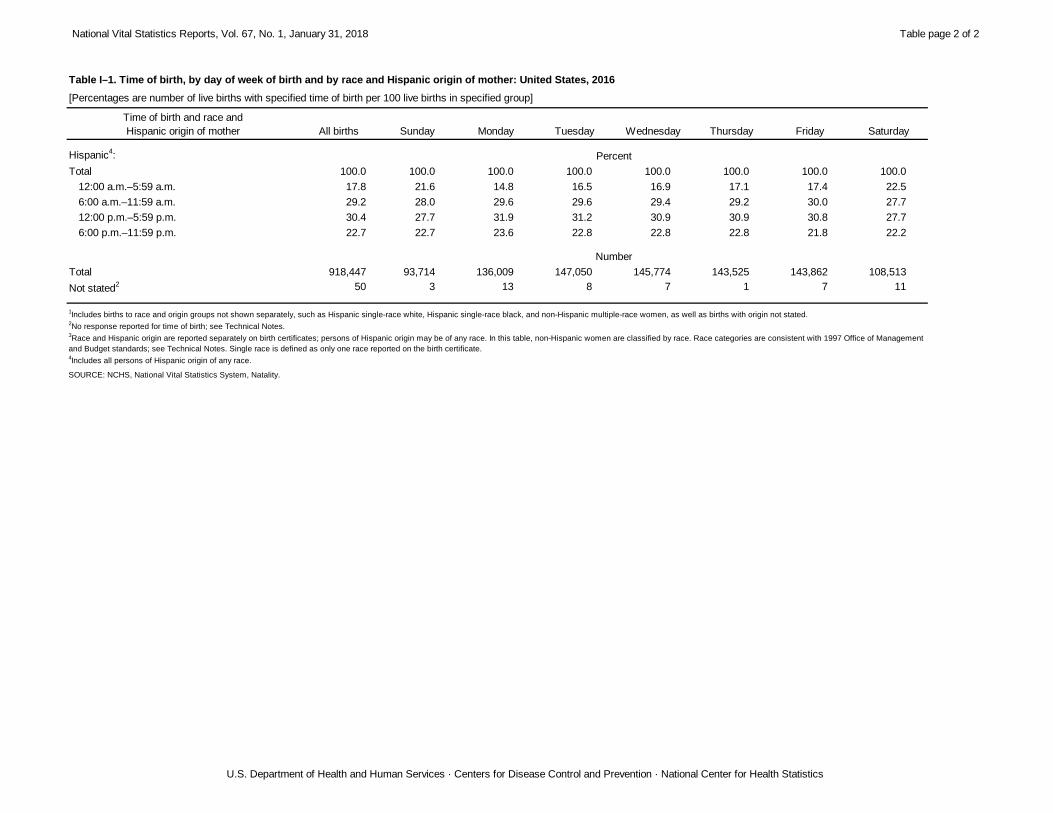
Table I–1. Time of birth, by day of week of birth and by race and Hispanic origin of mother: United States, 2016[Percentages are number of live births with specified time of birth per 100 live births in specified group]
Hispanic4:
Total 100.0 100.0 100.0 100.0 100.0 100.0 100.0 100.0
12:00 a.m.–5:59 a.m. 17.8 21.6 14.8 16.5 16.9 17.1 17.4 22.5
6:00 a.m.–11:59 a.m. 29.2 28.0 29.6 29.6 29.4 29.2 30.0 27.7
12:00 p.m.–5:59 p.m. 30.4 27.7 31.9 31.2 30.9 30.9 30.8 27.7
6:00 p.m.–11:59 p.m. 22.7 22.7 23.6 22.8 22.8 22.8 21.8 22.2
Total 918,447 93,714 136,009 147,050 145,774 143,525 143,862 108,513
Not stated2 50 3 13 8 7 1 7 11
SOURCE: NCHS, National Vital Statistics System, Natality.
1Includes births to race and origin groups not shown separately, such as Hispanic single-race white, Hispanic single-race black, and non-Hispanic multiple-race women, as well as births with origin not stated.
2No response reported for time of birth; see Technical Notes.
3Race and Hispanic origin are reported separately on birth certificates; persons of Hispanic origin may be of any race. In this table, non-Hispanic women are classified by race. Race categories are consistent with 1997 Office of Management
and Budget standards; see Technical Notes. Single race is defined as only one race reported on the birth certificate.4Includes all persons of Hispanic origin of any race.
Percent
Number
National Vital Statistics Reports, Vol. 67, No. 1, January 31, 2018 Table page 1 of 1
U.S. Department of Health and Human Services · Centers for Disease Control and Prevention · National Center for Health Statistics
Birth rate Fertility rate Birth rate Fertility rate
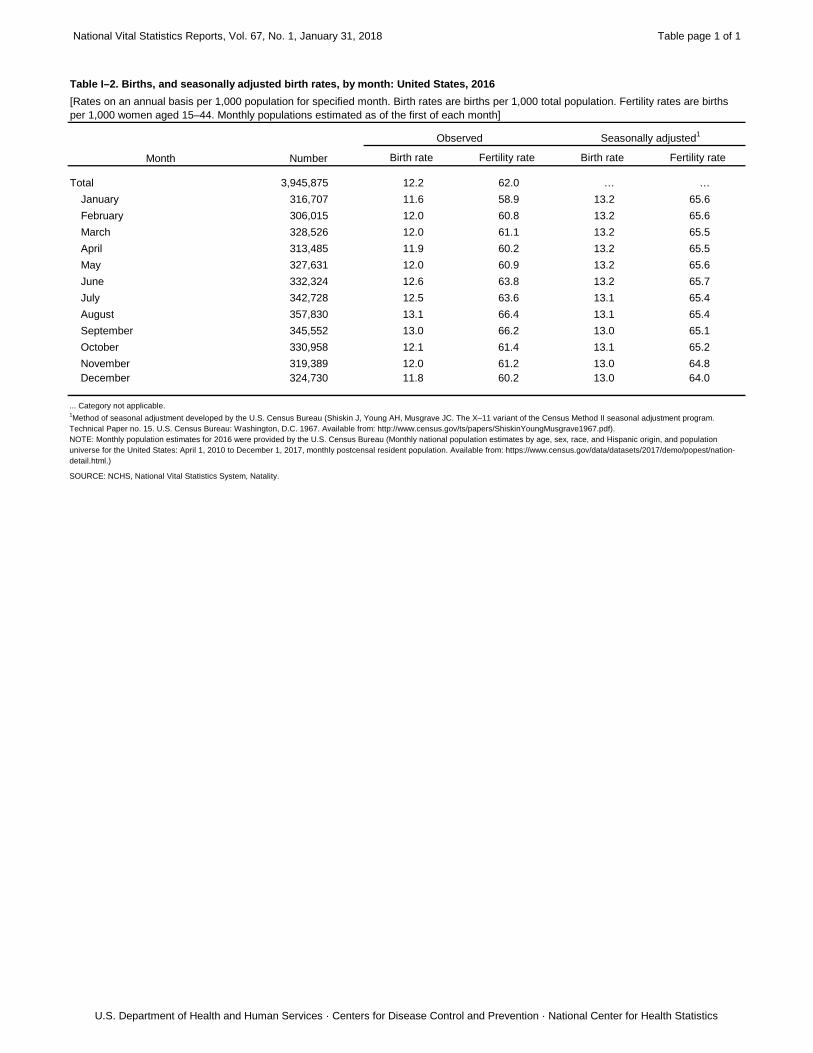
Total 3,945,875 12.2 62.0 … …
January 316,707 11.6 58.9 13.2 65.6
February 306,015 12.0 60.8 13.2 65.6
March 328,526 12.0 61.1 13.2 65.5
April 313,485 11.9 60.2 13.2 65.5
May 327,631 12.0 60.9 13.2 65.6
June 332,324 12.6 63.8 13.2 65.7
July 342,728 12.5 63.6 13.1 65.4
August 357,830 13.1 66.4 13.1 65.4
September 345,552 13.0 66.2 13.0 65.1
October 330,958 12.1 61.4 13.1 65.2
November 319,389 12.0 61.2 13.0 64.8
December 324,730 11.8 60.2 13.0 64.0
SOURCE: NCHS, National Vital Statistics System, Natality.
Table I–2. Births, and seasonally adjusted birth rates, by month: United States, 2016[Rates on an annual basis per 1,000 population for specified month. Birth rates are births per 1,000 total population. Fertility rates are births
per 1,000 women aged 15–44. Monthly populations estimated as of the first of each month]
Month
Observed Seasonally adjusted1
Number
... Category not applicable.1Method of seasonal adjustment developed by the U.S. Census Bureau (Shiskin J, Young AH, Musgrave JC. The X–11 variant of the Census Method II seasonal adjustment program.
Technical Paper no. 15. U.S. Census Bureau: Washington, D.C. 1967. Available from: http://www.census.gov/ts/papers/ShiskinYoungMusgrave1967.pdf).
NOTE: Monthly population estimates for 2016 were provided by the U.S. Census Bureau (Monthly national population estimates by age, sex, race, and Hispanic origin, and population
universe for the United States: April 1, 2010 to December 1, 2017, monthly postcensal resident population. Available from: https://www.census.gov/data/datasets/2017/demo/popest/nation-
detail.html.)
National Vital Statistics Reports, Vol. 67, No. 1, January 31, 2018 Table page 1 of 1
U.S. Department of Health and Human Services · Centers for Disease Control and Prevention · National Center for Health Statistics
Vaginal Cesarean
Total 10,781 100.0 100.0 100.0
Sunday 7,299 67.7 76.6 48.8
Monday 11,334 105.1 99.6 116.8
Tuesday 12,367 114.7 110.5 123.8
Wednesday 12,196 113.1 110.8 118.1
Thursday 12,177 112.9 110.8 117.5
Friday 11,844 109.9 105.9 118.3
Saturday 8,279 76.8 86.0 57.1
SOURCE: NCHS, National Vital Statistics System, Natality.
1Ratio of the average number of births by a specified method of delivery on a given day of the week to the average daily number of births by a specified
method of delivery for the year, multiplied by 100.2Includes method of delivery not stated.
Table I–3. Births, by day of week and method of delivery: United States, 2016
Index of occurrence1
Method of delivery
Day of week
Average number
of births Total2
National Vital Statistics Reports, Vol. 67, No. 1, January 31, 2018 Table page 1 of 2
U.S. Department of Health and Human Services · Centers for Disease Control and Prevention · National Center for Health Statistics
All races and origins1
Total 3,945,875 3,531,670 3,241,239 290,431 378,594 348,206 30,388 33,256 2,355
In hospital2
3,883,255 3,529,055 3,238,949 290,106 332,076 327,112 4,964 20,799 1,325
Not in hospital 62,392 2,575 2,252 323 46,445 21,080 25,365 12,395 977
Freestanding birthing center 19,767 517 417 100 18,527 11,226 7,301 667 56
Clinic or doctor's office 463 116 109 7 302 245 57 40 5
Residence 38,830 1,416 1,250 166 26,620 9,391 17,229 10,060 734
Other 3,332 526 476 50 996 218 778 1,628 182
Not specified 228 40 38 2 73 14 59 62 53
Non-Hispanic, single race3
White:
Total 2,056,332 1,819,091 1,642,245 176,846 216,980 192,877 24,103 19,187 1,074
In hospital2
2,007,207 1,817,492 1,640,914 176,578 178,417 175,451 2,966 10,745 553
Not in hospital 49,007 1,582 1,315 267 38,511 17,416 21,095 8,411 503
Freestanding birthing center 15,810 466 367 99 14,767 9,039 5,728 537 40
Clinic or doctor's office 392 77 71 6 284 229 55 30 1
Residence 30,822 743 611 132 22,586 7,996 14,590 7,121 372
Other 1,983 296 266 30 874 152 722 723 90
Not specified 118 17 16 1 52 10 42 31 18
Black:
Total 558,622 511,245 481,644 29,601 42,590 41,214 1,376 4,426 361
In hospital2
555,022 510,694 481,119 29,575 41,139 40,496 643 2,978 211
Not in hospital 3,563 536 511 25 1,446 715 731 1,436 145
Freestanding birthing center 866 25 25 - 817 448 369 14 10
Clinic or doctor's office 20 15 15 - - 2 - 2 1
Residence 2,260 383 364 19 596 248 348 1,172 109
Other 417 113 107 6 31 17 14 248 25
Not specified 37 15 14 1 5 3 2 12 5
Table I–4. Births, by attendant, place of delivery, and race and Hispanic origin of mother: United States, 2016
Certified nurse
midwife Other midwife
Place of delivery and race and
Hispanic origin of mother All births
Physician Midwife
Other UnspecifiedTotal
Doctor of
medicine
Doctor of
osteopathy Total
National Vital Statistics Reports, Vol. 67, No. 1, January 31, 2018 Table page 2 of 2
U.S. Department of Health and Human Services · Centers for Disease Control and Prevention · National Center for Health Statistics
Table I–4. Births, by attendant, place of delivery, and race and Hispanic origin of mother: United States, 2016
Certified nurse
midwife Other midwife
Place of delivery and race and
Hispanic origin of mother All births
Physician Midwife
Other UnspecifiedTotal
Doctor of
medicine
Doctor of
osteopathy Total
Hispanic4
Total 918,447 831,970 772,363 59,607 80,054 76,964 3,090 5,942 481
In hospital2
913,161 831,715 772,127 59,588 76,477 75,425 1,052 4,678 291
Not in hospital 5,263 248 229 19 3,573 1,538 2,035 1,258 184
Freestanding birthing center 1,824 20 19 1 1,738 974 764 62 4
Clinic or doctor's office 23 9 8 1 8 8 1 3 2
Residence 3,001 163 152 11 1,776 525 1,251 924 138
Other 415 56 50 6 50 31 19 269 40
Not specified 23 7 7 – 4 1 3 6 6
SOURCE: NCHS, National Vital Statistics System, Natality.
– Quantity zero.1Includes births to race and origin groups not shown separately, such as Hispanic single-race white, Hispanic single-race black, and non-Hispanic multiple-race women, as well as births with origin not stated.
2Includes births occurring en route to or on arrival at hospital.
3Race and Hispanic origin are reported separately on birth certificates; persons of Hispanic origin may be of any race. In this table, non-Hispanic women are classified by race. Race categories are consistent with 1997 Office of Management and Budget
standards; see Technical Notes. Single race is defined as only one race reported on the birth certificate.4Includes all persons of Hispanic origin of any race; see Technical Notes.
National Vital Statistics Reports, Vol. 67, No. 1, January 31, 2018 Table page 1 of 2
U.S. Department of Health and Human Services · Centers for Disease Control and Prevention · National Center for Health Statistics
Area Number Percent
United States 38,830 1.0
Alabama 183 0.3
Alaska 246 2.2
Arizona 775 0.9
Arkansas 349 0.9
California 3,553 0.7
Colorado 944 1.4
Connecticut 237 0.7
Delaware 62 0.6
District of Columbia 18 *
Florida 2,052 0.9
Georgia 765 0.6
Hawaii 249 1.4
Idaho 467 2.1
Illinois 840 0.5
Indiana 1,367 1.6
Iowa 565 1.4
Kansas 467 1.2
Kentucky 716 1.3
Louisiana 188 0.3
Maine 262 2.1
Maryland 465 0.6
Massachusetts 444 0.6
Michigan 1,388 1.2
Minnesota 899 1.3
Mississippi 148 0.4
Missouri 1,179 1.6
Montana 289 2.4
Nebraska 93 0.3
Nevada 480 1.3
New Hampshire 144 1.2
New Jersey 404 0.4
New Mexico 285 1.2
New York 2,330 1.0
North Carolina 604 0.5
North Dakota 137 1.2
Ohio 1,498 1.1
Oklahoma 571 1.1
Oregon 1,012 2.2
Pennsylvania 2,641 1.9
Rhode Island 49 0.5
Table I–5. Births occurring at home: United States and each state, 2016[By place of residence]
National Vital Statistics Reports, Vol. 67, No. 1, January 31, 2018 Table page 2 of 2
U.S. Department of Health and Human Services · Centers for Disease Control and Prevention · National Center for Health Statistics
Area Number Percent
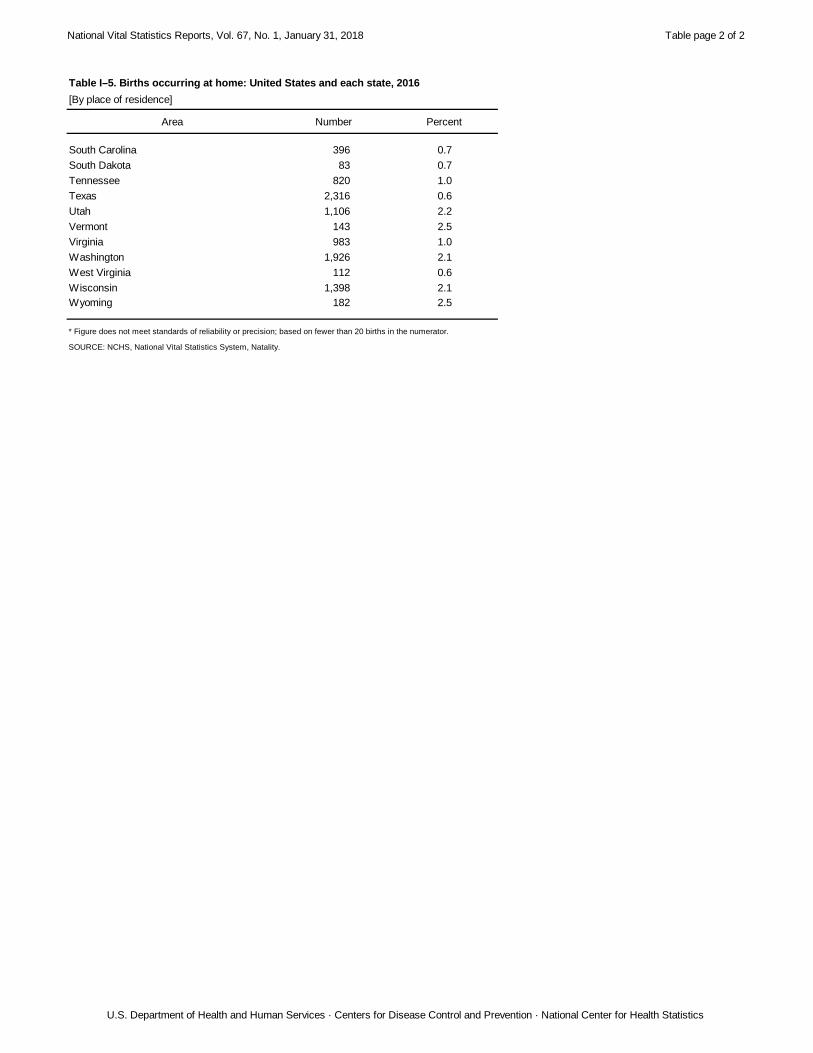
Table I–5. Births occurring at home: United States and each state, 2016[By place of residence]
South Carolina 396 0.7
South Dakota 83 0.7
Tennessee 820 1.0
Texas 2,316 0.6
Utah 1,106 2.2
Vermont 143 2.5
Virginia 983 1.0
Washington 1,926 2.1
West Virginia 112 0.6
Wisconsin 1,398 2.1
Wyoming 182 2.5
* Figure does not meet standards of reliability or precision; based on fewer than 20 births in the numerator.
SOURCE: NCHS, National Vital Statistics System, Natality.
National Vital Statistics Reports, Vol. 67, No. 1, January 31, 2018 Table page 1 of 1
U.S. Department of Health and Human Services · Centers for Disease Control and Prevention · National Center for Health Statistics
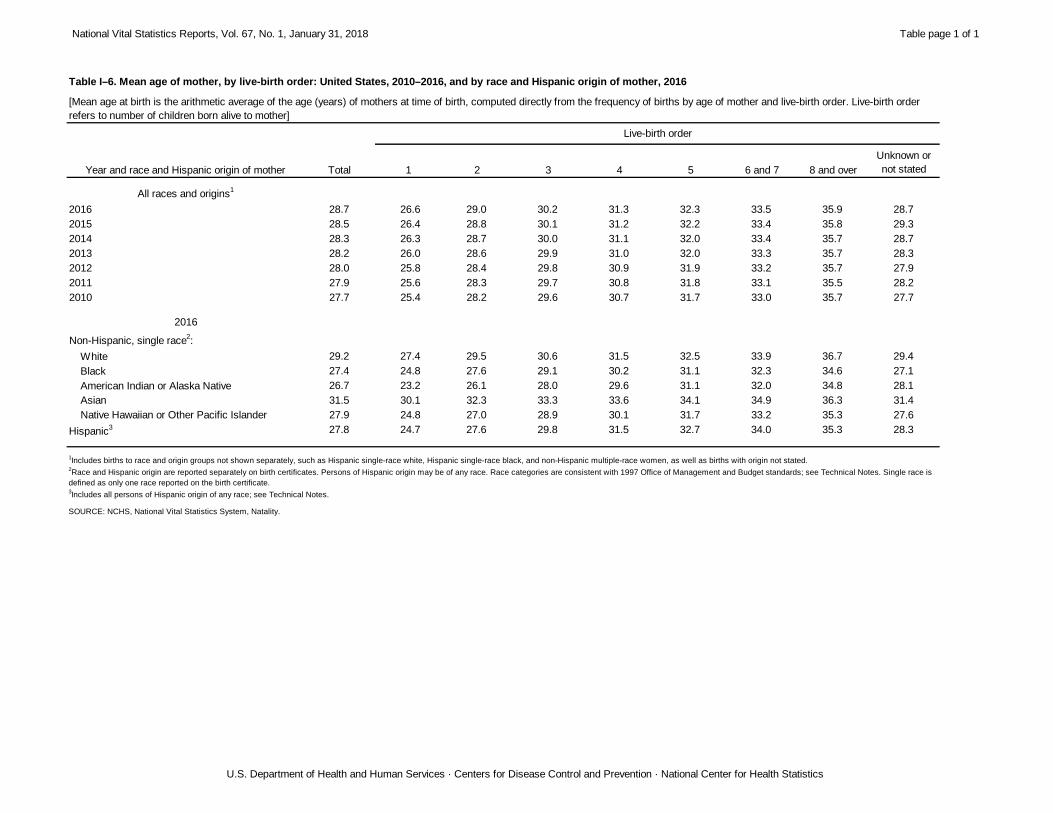
1 2 3 4 5 6 and 7 8 and over
Unknown or
not stated
All races and origins1
2016 28.7 26.6 29.0 30.2 31.3 32.3 33.5 35.9 28.7
2015 28.5 26.4 28.8 30.1 31.2 32.2 33.4 35.8 29.3
2014 28.3 26.3 28.7 30.0 31.1 32.0 33.4 35.7 28.7
2013 28.2 26.0 28.6 29.9 31.0 32.0 33.3 35.7 28.3
2012 28.0 25.8 28.4 29.8 30.9 31.9 33.2 35.7 27.9
2011 27.9 25.6 28.3 29.7 30.8 31.8 33.1 35.5 28.2
2010 27.7 25.4 28.2 29.6 30.7 31.7 33.0 35.7 27.7
2016
Non-Hispanic, single race2:
White 29.2 27.4 29.5 30.6 31.5 32.5 33.9 36.7 29.4
Black 27.4 24.8 27.6 29.1 30.2 31.1 32.3 34.6 27.1
American Indian or Alaska Native 26.7 23.2 26.1 28.0 29.6 31.1 32.0 34.8 28.1
Asian 31.5 30.1 32.3 33.3 33.6 34.1 34.9 36.3 31.4
Native Hawaiian or Other Pacific Islander 27.9 24.8 27.0 28.9 30.1 31.7 33.2 35.3 27.6
Hispanic3 27.8 24.7 27.6 29.8 31.5 32.7 34.0 35.3 28.3
SOURCE: NCHS, National Vital Statistics System, Natality.
Table I–6. Mean age of mother, by live-birth order: United States, 2010–2016, and by race and Hispanic origin of mother, 2016
1Includes births to race and origin groups not shown separately, such as Hispanic single-race white, Hispanic single-race black, and non-Hispanic multiple-race women, as well as births with origin not stated.
2Race and Hispanic origin are reported separately on birth certificates. Persons of Hispanic origin may be of any race. Race categories are consistent with 1997 Office of Management and Budget standards; see Technical Notes. Single race is
defined as only one race reported on the birth certificate.3Includes all persons of Hispanic origin of any race; see Technical Notes.
Live-birth order
Year and race and Hispanic origin of mother Total
[Mean age at birth is the arithmetic average of the age (years) of mothers at time of birth, computed directly from the frequency of births by age of mother and live-birth order. Live-birth order
refers to number of children born alive to mother]
National Vital Statistics Reports, Vol. 67, No. 1, January 31, 2018 Table page 1 of 2
U.S. Department of Health and Human Services · Centers for Disease Control and Prevention · National Center for Health Statistics
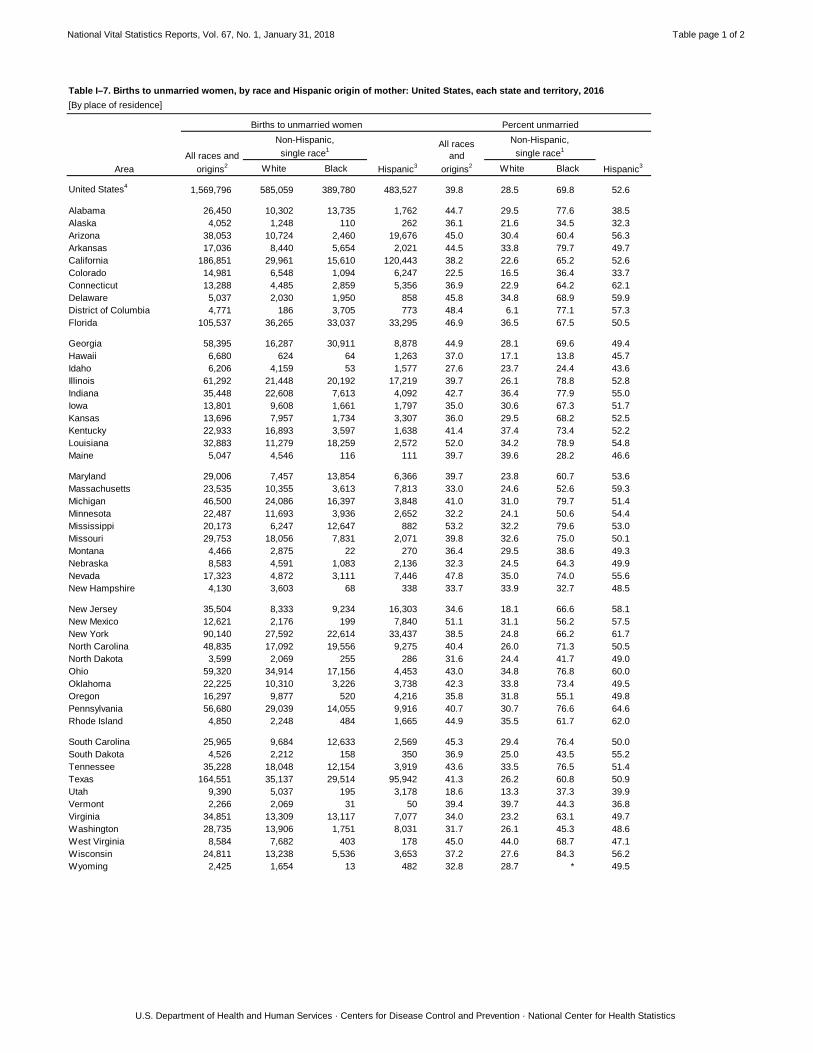
White Black White Black
United States4
1,569,796 585,059 389,780 483,527 39.8 28.5 69.8 52.6
Alabama 26,450 10,302 13,735 1,762 44.7 29.5 77.6 38.5
Alaska 4,052 1,248 110 262 36.1 21.6 34.5 32.3
Arizona 38,053 10,724 2,460 19,676 45.0 30.4 60.4 56.3
Arkansas 17,036 8,440 5,654 2,021 44.5 33.8 79.7 49.7
California 186,851 29,961 15,610 120,443 38.2 22.6 65.2 52.6
Colorado 14,981 6,548 1,094 6,247 22.5 16.5 36.4 33.7
Connecticut 13,288 4,485 2,859 5,356 36.9 22.9 64.2 62.1
Delaware 5,037 2,030 1,950 858 45.8 34.8 68.9 59.9
District of Columbia 4,771 186 3,705 773 48.4 6.1 77.1 57.3
Florida 105,537 36,265 33,037 33,295 46.9 36.5 67.5 50.5
Georgia 58,395 16,287 30,911 8,878 44.9 28.1 69.6 49.4
Hawaii 6,680 624 64 1,263 37.0 17.1 13.8 45.7
Idaho 6,206 4,159 53 1,577 27.6 23.7 24.4 43.6
Illinois 61,292 21,448 20,192 17,219 39.7 26.1 78.8 52.8
Indiana 35,448 22,608 7,613 4,092 42.7 36.4 77.9 55.0
Iowa 13,801 9,608 1,661 1,797 35.0 30.6 67.3 51.7
Kansas 13,696 7,957 1,734 3,307 36.0 29.5 68.2 52.5
Kentucky 22,933 16,893 3,597 1,638 41.4 37.4 73.4 52.2
Louisiana 32,883 11,279 18,259 2,572 52.0 34.2 78.9 54.8
Maine 5,047 4,546 116 111 39.7 39.6 28.2 46.6
Maryland 29,006 7,457 13,854 6,366 39.7 23.8 60.7 53.6
Massachusetts 23,535 10,355 3,613 7,813 33.0 24.6 52.6 59.3
Michigan 46,500 24,086 16,397 3,848 41.0 31.0 79.7 51.4
Minnesota 22,487 11,693 3,936 2,652 32.2 24.1 50.6 54.4
Mississippi 20,173 6,247 12,647 882 53.2 32.2 79.6 53.0
Missouri 29,753 18,056 7,831 2,071 39.8 32.6 75.0 50.1
Montana 4,466 2,875 22 270 36.4 29.5 38.6 49.3
Nebraska 8,583 4,591 1,083 2,136 32.3 24.5 64.3 49.9
Nevada 17,323 4,872 3,111 7,446 47.8 35.0 74.0 55.6
New Hampshire 4,130 3,603 68 338 33.7 33.9 32.7 48.5
New Jersey 35,504 8,333 9,234 16,303 34.6 18.1 66.6 58.1
New Mexico 12,621 2,176 199 7,840 51.1 31.1 56.2 57.5
New York 90,140 27,592 22,614 33,437 38.5 24.8 66.2 61.7
North Carolina 48,835 17,092 19,556 9,275 40.4 26.0 71.3 50.5
North Dakota 3,599 2,069 255 286 31.6 24.4 41.7 49.0
Ohio 59,320 34,914 17,156 4,453 43.0 34.8 76.8 60.0
Oklahoma 22,225 10,310 3,226 3,738 42.3 33.8 73.4 49.5
Oregon 16,297 9,877 520 4,216 35.8 31.8 55.1 49.8
Pennsylvania 56,680 29,039 14,055 9,916 40.7 30.7 76.6 64.6
Rhode Island 4,850 2,248 484 1,665 44.9 35.5 61.7 62.0
South Carolina 25,965 9,684 12,633 2,569 45.3 29.4 76.4 50.0
South Dakota 4,526 2,212 158 350 36.9 25.0 43.5 55.2
Tennessee 35,228 18,048 12,154 3,919 43.6 33.5 76.5 51.4
Texas 164,551 35,137 29,514 95,942 41.3 26.2 60.8 50.9
Utah 9,390 5,037 195 3,178 18.6 13.3 37.3 39.9
Vermont 2,266 2,069 31 50 39.4 39.7 44.3 36.8
Virginia 34,851 13,309 13,117 7,077 34.0 23.2 63.1 49.7
Washington 28,735 13,906 1,751 8,031 31.7 26.1 45.3 48.6
West Virginia 8,584 7,682 403 178 45.0 44.0 68.7 47.1
Wisconsin 24,811 13,238 5,536 3,653 37.2 27.6 84.3 56.2
Wyoming 2,425 1,654 13 482 32.8 28.7 * 49.5
[By place of residence]
Table I–7. Births to unmarried women, by race and Hispanic origin of mother: United States, each state and territory, 2016
Area
Births to unmarried women Percent unmarried
All races and
origins2
Non-Hispanic,
single race1
Hispanic3
All races
and
origins2
Non-Hispanic,
single race1
Hispanic3
National Vital Statistics Reports, Vol. 67, No. 1, January 31, 2018 Table page 2 of 2
U.S. Department of Health and Human Services · Centers for Disease Control and Prevention · National Center for Health Statistics
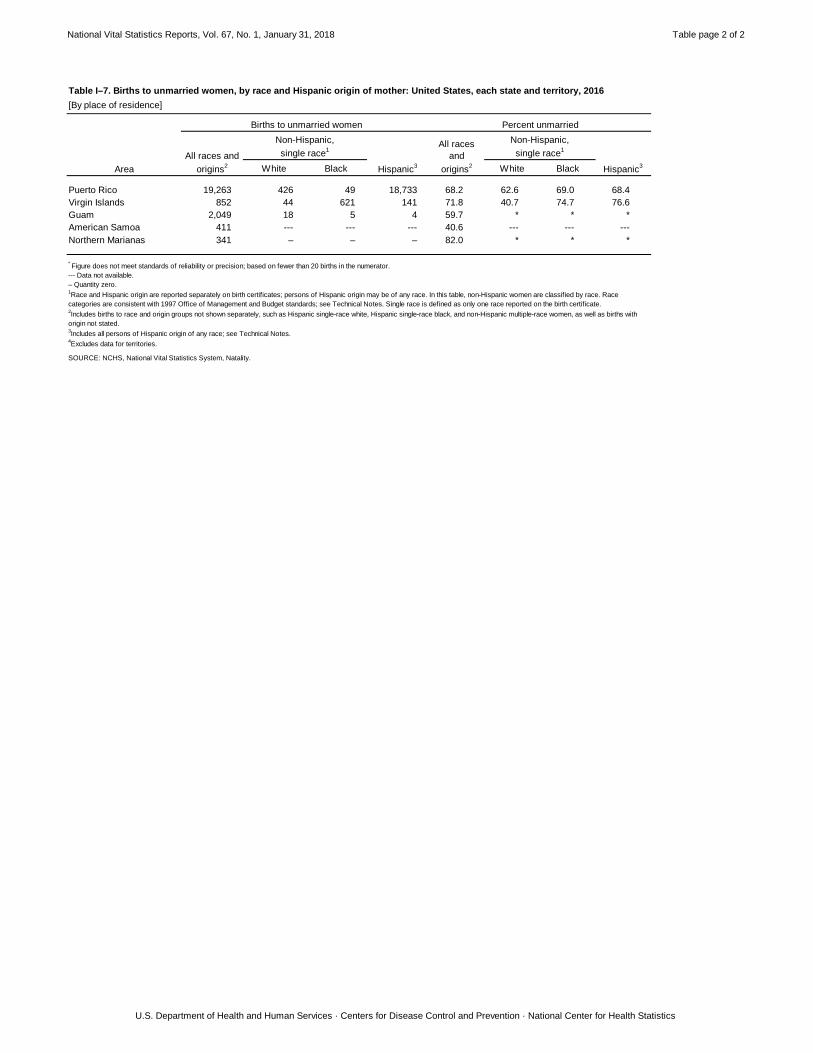
White Black White Black
[By place of residence]
Table I–7. Births to unmarried women, by race and Hispanic origin of mother: United States, each state and territory, 2016
Area
Births to unmarried women Percent unmarried
All races and
origins2
Non-Hispanic,
single race1
Hispanic3
All races
and
origins2
Non-Hispanic,
single race1
Hispanic3
Puerto Rico 19,263 426 49 18,733 68.2 62.6 69.0 68.4
Virgin Islands 852 44 621 141 71.8 40.7 74.7 76.6
Guam 2,049 18 5 4 59.7 * * *
American Samoa 411 --- --- --- 40.6 --- --- ---
Northern Marianas 341 – – – 82.0 * * *
SOURCE: NCHS, National Vital Statistics System, Natality.
* Figure does not meet standards of reliability or precision; based on fewer than 20 births in the numerator.
--- Data not available.
– Quantity zero.1Race and Hispanic origin are reported separately on birth certificates; persons of Hispanic origin may be of any race. In this table, non-Hispanic women are classified by race. Race
categories are consistent with 1997 Office of Management and Budget standards; see Technical Notes. Single race is defined as only one race reported on the birth certificate.2Includes births to race and origin groups not shown separately, such as Hispanic single-race white, Hispanic single-race black, and non-Hispanic multiple-race women, as well as births with
origin not stated.3Includes all persons of Hispanic origin of any race; see Technical Notes.
4Excludes data for territories.
National Vital Statistics Reports, Vol. 67, No. 1, January 31, 2018 Table page 1 of 2
U.S. Department of Health and Human Services · Centers for Disease Control and Prevention · National Center for Health Statistics
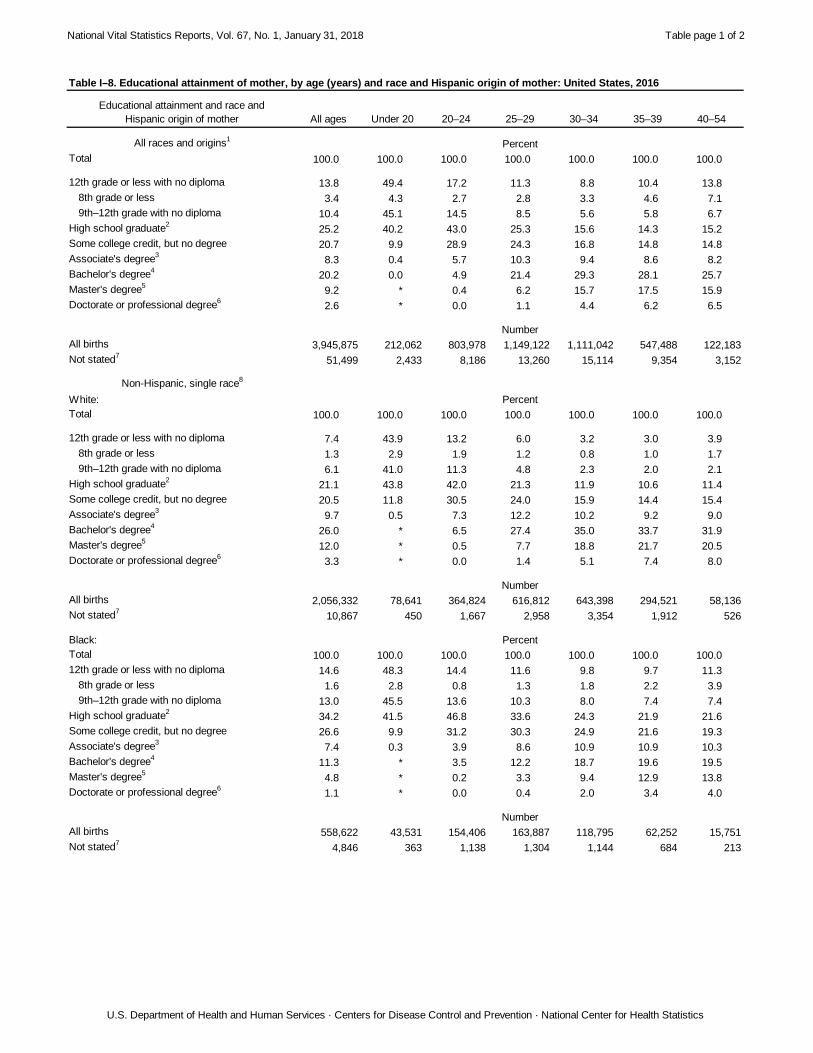
Educational attainment and race and
Hispanic origin of mother All ages Under 20 20–24 25–29 30–34 35–39 40–54
All races and origins1
Total 100.0 100.0 100.0 100.0 100.0 100.0 100.0
12th grade or less with no diploma 13.8 49.4 17.2 11.3 8.8 10.4 13.8
8th grade or less 3.4 4.3 2.7 2.8 3.3 4.6 7.1
9th–12th grade with no diploma 10.4 45.1 14.5 8.5 5.6 5.8 6.7
High school graduate2
25.2 40.2 43.0 25.3 15.6 14.3 15.2
Some college credit, but no degree 20.7 9.9 28.9 24.3 16.8 14.8 14.8
Associate's degree3
8.3 0.4 5.7 10.3 9.4 8.6 8.2
Bachelor's degree4
20.2 0.0 4.9 21.4 29.3 28.1 25.7
Master's degree5
9.2 * 0.4 6.2 15.7 17.5 15.9
Doctorate or professional degree6
2.6 * 0.0 1.1 4.4 6.2 6.5
All births 3,945,875 212,062 803,978 1,149,122 1,111,042 547,488 122,183
Not stated7
51,499 2,433 8,186 13,260 15,114 9,354 3,152
Non-Hispanic, single race8
White:
Total 100.0 100.0 100.0 100.0 100.0 100.0 100.0
12th grade or less with no diploma 7.4 43.9 13.2 6.0 3.2 3.0 3.9
8th grade or less 1.3 2.9 1.9 1.2 0.8 1.0 1.7
9th–12th grade with no diploma 6.1 41.0 11.3 4.8 2.3 2.0 2.1
High school graduate2
21.1 43.8 42.0 21.3 11.9 10.6 11.4
Some college credit, but no degree 20.5 11.8 30.5 24.0 15.9 14.4 15.4
Associate's degree3
9.7 0.5 7.3 12.2 10.2 9.2 9.0
Bachelor's degree4
26.0 * 6.5 27.4 35.0 33.7 31.9
Master's degree5
12.0 * 0.5 7.7 18.8 21.7 20.5
Doctorate or professional degree6
3.3 * 0.0 1.4 5.1 7.4 8.0
All births 2,056,332 78,641 364,824 616,812 643,398 294,521 58,136
Not stated7
10,867 450 1,667 2,958 3,354 1,912 526
Black:
Total 100.0 100.0 100.0 100.0 100.0 100.0 100.0
12th grade or less with no diploma 14.6 48.3 14.4 11.6 9.8 9.7 11.3
8th grade or less 1.6 2.8 0.8 1.3 1.8 2.2 3.9
9th–12th grade with no diploma 13.0 45.5 13.6 10.3 8.0 7.4 7.4
High school graduate2
34.2 41.5 46.8 33.6 24.3 21.9 21.6
Some college credit, but no degree 26.6 9.9 31.2 30.3 24.9 21.6 19.3
Associate's degree3
7.4 0.3 3.9 8.6 10.9 10.9 10.3
Bachelor's degree4
11.3 * 3.5 12.2 18.7 19.6 19.5
Master's degree5
4.8 * 0.2 3.3 9.4 12.9 13.8
Doctorate or professional degree6
1.1 * 0.0 0.4 2.0 3.4 4.0
All births 558,622 43,531 154,406 163,887 118,795 62,252 15,751
Not stated7
4,846 363 1,138 1,304 1,144 684 213
Percent
Number
Table I–8. Educational attainment of mother, by age (years) and race and Hispanic origin of mother: United States, 2016
Percent
Number
Percent
Number
National Vital Statistics Reports, Vol. 67, No. 1, January 31, 2018 Table page 2 of 2
U.S. Department of Health and Human Services · Centers for Disease Control and Prevention · National Center for Health Statistics
Educational attainment and race and
Hispanic origin of mother All ages Under 20 20–24 25–29 30–34 35–39 40–54
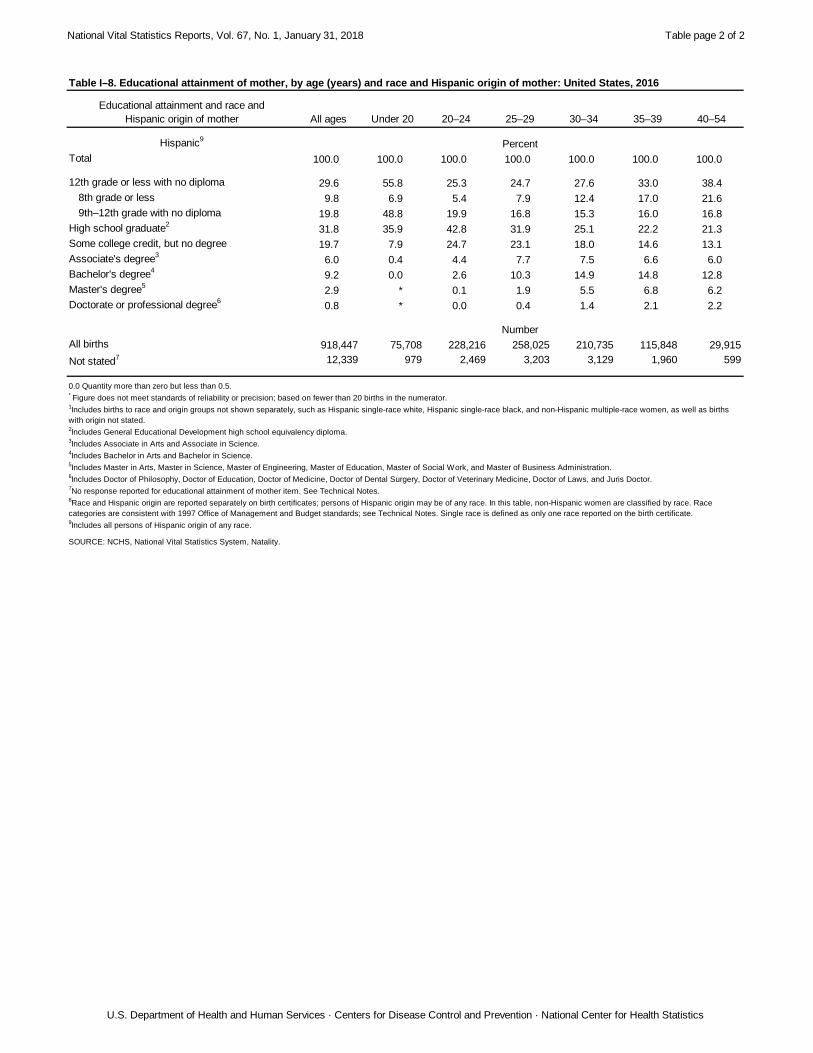
Table I–8. Educational attainment of mother, by age (years) and race and Hispanic origin of mother: United States, 2016
Hispanic9
Total 100.0 100.0 100.0 100.0 100.0 100.0 100.0
12th grade or less with no diploma 29.6 55.8 25.3 24.7 27.6 33.0 38.4
8th grade or less 9.8 6.9 5.4 7.9 12.4 17.0 21.6
9th–12th grade with no diploma 19.8 48.8 19.9 16.8 15.3 16.0 16.8
High school graduate2
31.8 35.9 42.8 31.9 25.1 22.2 21.3
Some college credit, but no degree 19.7 7.9 24.7 23.1 18.0 14.6 13.1
Associate's degree3
6.0 0.4 4.4 7.7 7.5 6.6 6.0
Bachelor's degree4
9.2 0.0 2.6 10.3 14.9 14.8 12.8
Master's degree5
2.9 * 0.1 1.9 5.5 6.8 6.2
Doctorate or professional degree6
0.8 * 0.0 0.4 1.4 2.1 2.2
All births 918,447 75,708 228,216 258,025 210,735 115,848 29,915
Not stated7 12,339 979 2,469 3,203 3,129 1,960 599
Percent
Number
0.0 Quantity more than zero but less than 0.5. * Figure does not meet standards of reliability or precision; based on fewer than 20 births in the numerator.
1Includes births to race and origin groups not shown separately, such as Hispanic single-race white, Hispanic single-race black, and non-Hispanic multiple-race women, as well as births
with origin not stated.2Includes General Educational Development high school equivalency diploma.
3Includes Associate in Arts and Associate in Science.
4Includes Bachelor in Arts and Bachelor in Science.
5Includes Master in Arts, Master in Science, Master of Engineering, Master of Education, Master of Social Work, and Master of Business Administration.
6Includes Doctor of Philosophy, Doctor of Education, Doctor of Medicine, Doctor of Dental Surgery, Doctor of Veterinary Medicine, Doctor of Laws, and Juris Doctor.
7No response reported for educational attainment of mother item. See Technical Notes.
8Race and Hispanic origin are reported separately on birth certificates; persons of Hispanic origin may be of any race. In this table, non-Hispanic women are classified by race. Race
categories are consistent with 1997 Office of Management and Budget standards; see Technical Notes. Single race is defined as only one race reported on the birth certificate.9Includes all persons of Hispanic origin of any race.
SOURCE: NCHS, National Vital Statistics System, Natality.
National Vital Statistics Reports, Vol. 67, No. 1, January 31, 2018 Table page 1 of 1
U.S. Department of Health and Human Services · Centers for Disease Control and Prevention · National Center for Health Statistics
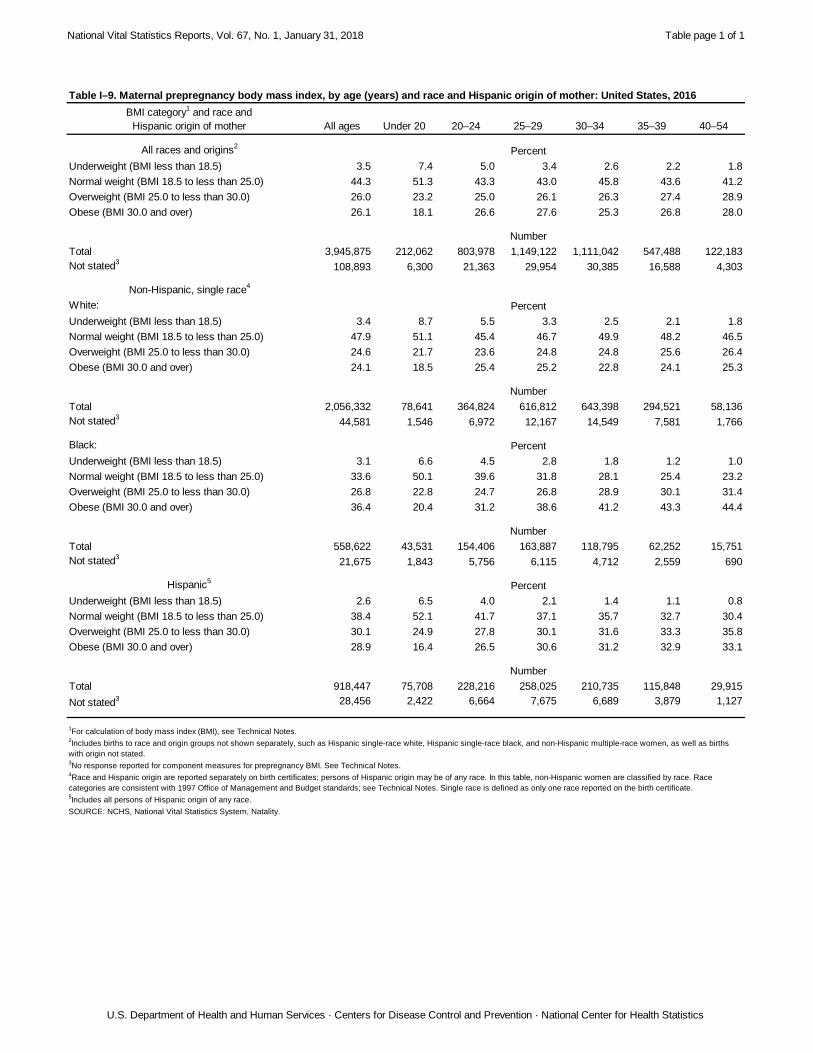
BMI category1 and race and
Hispanic origin of mother All ages Under 20 20–24 25–29 30–34 35–39 40–54
All races and origins2
Underweight (BMI less than 18.5) 3.5 7.4 5.0 3.4 2.6 2.2 1.8
Normal weight (BMI 18.5 to less than 25.0) 44.3 51.3 43.3 43.0 45.8 43.6 41.2
Overweight (BMI 25.0 to less than 30.0) 26.0 23.2 25.0 26.1 26.3 27.4 28.9
Obese (BMI 30.0 and over) 26.1 18.1 26.6 27.6 25.3 26.8 28.0
Total 3,945,875 212,062 803,978 1,149,122 1,111,042 547,488 122,183
Not stated3
108,893 6,300 21,363 29,954 30,385 16,588 4,303
Non-Hispanic, single race4
White:
Underweight (BMI less than 18.5) 3.4 8.7 5.5 3.3 2.5 2.1 1.8
Normal weight (BMI 18.5 to less than 25.0) 47.9 51.1 45.4 46.7 49.9 48.2 46.5
Overweight (BMI 25.0 to less than 30.0) 24.6 21.7 23.6 24.8 24.8 25.6 26.4
Obese (BMI 30.0 and over) 24.1 18.5 25.4 25.2 22.8 24.1 25.3
Total 2,056,332 78,641 364,824 616,812 643,398 294,521 58,136
Not stated3
44,581 1,546 6,972 12,167 14,549 7,581 1,766
Black:
Underweight (BMI less than 18.5) 3.1 6.6 4.5 2.8 1.8 1.2 1.0
Normal weight (BMI 18.5 to less than 25.0) 33.6 50.1 39.6 31.8 28.1 25.4 23.2
Overweight (BMI 25.0 to less than 30.0) 26.8 22.8 24.7 26.8 28.9 30.1 31.4
Obese (BMI 30.0 and over) 36.4 20.4 31.2 38.6 41.2 43.3 44.4
Total 558,622 43,531 154,406 163,887 118,795 62,252 15,751
Not stated3
21,675 1,843 5,756 6,115 4,712 2,559 690
Hispanic5
Underweight (BMI less than 18.5) 2.6 6.5 4.0 2.1 1.4 1.1 0.8
Normal weight (BMI 18.5 to less than 25.0) 38.4 52.1 41.7 37.1 35.7 32.7 30.4
Overweight (BMI 25.0 to less than 30.0) 30.1 24.9 27.8 30.1 31.6 33.3 35.8
Obese (BMI 30.0 and over) 28.9 16.4 26.5 30.6 31.2 32.9 33.1
Total 918,447 75,708 228,216 258,025 210,735 115,848 29,915
Not stated3 28,456 2,422 6,664 7,675 6,689 3,879 1,127
Percent
Table I–9. Maternal prepregnancy body mass index, by age (years) and race and Hispanic origin of mother: United States, 2016
Percent
Number
Percent
Number
SOURCE: NCHS, National Vital Statistics System, Natality.
Number
Percent
Number
1For calculation of body mass index (BMI), see Technical Notes.
2Includes births to race and origin groups not shown separately, such as Hispanic single-race white, Hispanic single-race black, and non-Hispanic multiple-race women, as well as births
with origin not stated.3No response reported for component measures for prepregnancy BMI. See Technical Notes.
4Race and Hispanic origin are reported separately on birth certificates; persons of Hispanic origin may be of any race. In this table, non-Hispanic women are classified by race. Race
categories are consistent with 1997 Office of Management and Budget standards; see Technical Notes. Single race is defined as only one race reported on the birth certificate.5Includes all persons of Hispanic origin of any race.
National Vital Statistics Reports, Vol. 67, No. 1, January 31, 2018 Table page 1 of 2
U.S. Department of Health and Human Services · Centers for Disease Control and Prevention · National Center for Health Statistics
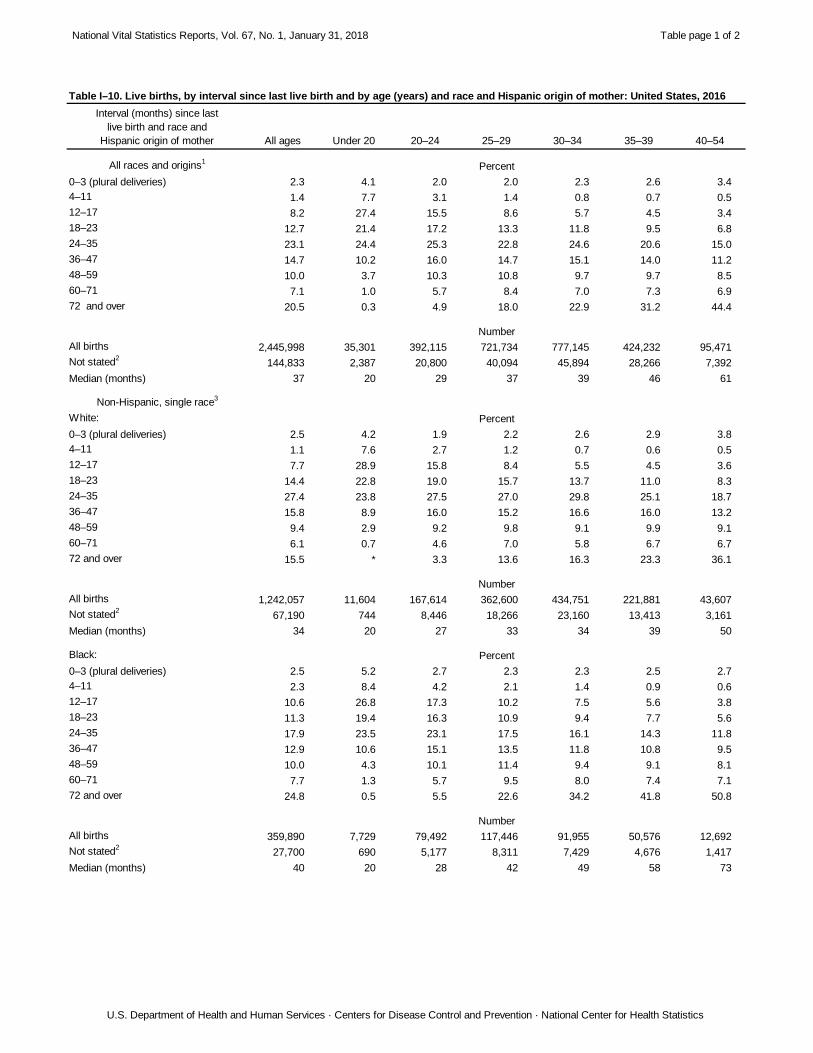
Interval (months) since last
live birth and race and
Hispanic origin of mother All ages Under 20 20–24 25–29 30–34 35–39 40–54
All races and origins1
0–3 (plural deliveries) 2.3 4.1 2.0 2.0 2.3 2.6 3.4
4–11 1.4 7.7 3.1 1.4 0.8 0.7 0.5
12–17 8.2 27.4 15.5 8.6 5.7 4.5 3.4
18–23 12.7 21.4 17.2 13.3 11.8 9.5 6.8
24–35 23.1 24.4 25.3 22.8 24.6 20.6 15.0
36–47 14.7 10.2 16.0 14.7 15.1 14.0 11.2
48–59 10.0 3.7 10.3 10.8 9.7 9.7 8.5
60–71 7.1 1.0 5.7 8.4 7.0 7.3 6.9
72 and over 20.5 0.3 4.9 18.0 22.9 31.2 44.4
All births 2,445,998 35,301 392,115 721,734 777,145 424,232 95,471
Not stated2
144,833 2,387 20,800 40,094 45,894 28,266 7,392
Median (months) 37 20 29 37 39 46 61
Non-Hispanic, single race3
White:
0–3 (plural deliveries) 2.5 4.2 1.9 2.2 2.6 2.9 3.8
4–11 1.1 7.6 2.7 1.2 0.7 0.6 0.5
12–17 7.7 28.9 15.8 8.4 5.5 4.5 3.6
18–23 14.4 22.8 19.0 15.7 13.7 11.0 8.3
24–35 27.4 23.8 27.5 27.0 29.8 25.1 18.7
36–47 15.8 8.9 16.0 15.2 16.6 16.0 13.2
48–59 9.4 2.9 9.2 9.8 9.1 9.9 9.1
60–71 6.1 0.7 4.6 7.0 5.8 6.7 6.7
72 and over 15.5 * 3.3 13.6 16.3 23.3 36.1
All births 1,242,057 11,604 167,614 362,600 434,751 221,881 43,607
Not stated2
67,190 744 8,446 18,266 23,160 13,413 3,161
Median (months) 34 20 27 33 34 39 50
Black:
0–3 (plural deliveries) 2.5 5.2 2.7 2.3 2.3 2.5 2.7
4–11 2.3 8.4 4.2 2.1 1.4 0.9 0.6
12–17 10.6 26.8 17.3 10.2 7.5 5.6 3.8
18–23 11.3 19.4 16.3 10.9 9.4 7.7 5.6
24–35 17.9 23.5 23.1 17.5 16.1 14.3 11.8
36–47 12.9 10.6 15.1 13.5 11.8 10.8 9.5
48–59 10.0 4.3 10.1 11.4 9.4 9.1 8.1
60–71 7.7 1.3 5.7 9.5 8.0 7.4 7.1
72 and over 24.8 0.5 5.5 22.6 34.2 41.8 50.8
All births 359,890 7,729 79,492 117,446 91,955 50,576 12,692
Not stated2
27,700 690 5,177 8,311 7,429 4,676 1,417
Median (months) 40 20 28 42 49 58 73
Number
Table I–10. Live births, by interval since last live birth and by age (years) and race and Hispanic origin of mother: United States, 2016
Percent
Number
Percent
Number
Percent
National Vital Statistics Reports, Vol. 67, No. 1, January 31, 2018 Table page 2 of 2
U.S. Department of Health and Human Services · Centers for Disease Control and Prevention · National Center for Health Statistics
Interval (months) since last
live birth and race and
Hispanic origin of mother All ages Under 20 20–24 25–29 30–34 35–39 40–54
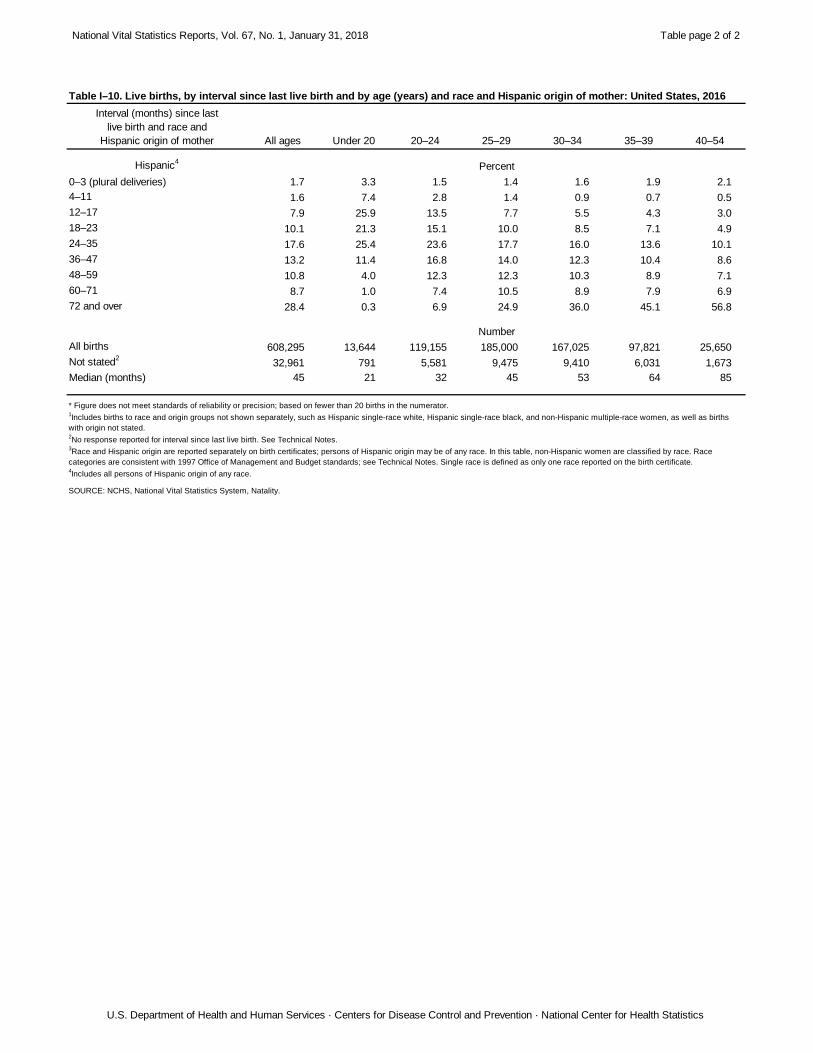
Table I–10. Live births, by interval since last live birth and by age (years) and race and Hispanic origin of mother: United States, 2016
Hispanic4
0–3 (plural deliveries) 1.7 3.3 1.5 1.4 1.6 1.9 2.1
4–11 1.6 7.4 2.8 1.4 0.9 0.7 0.5
12–17 7.9 25.9 13.5 7.7 5.5 4.3 3.0
18–23 10.1 21.3 15.1 10.0 8.5 7.1 4.9
24–35 17.6 25.4 23.6 17.7 16.0 13.6 10.1
36–47 13.2 11.4 16.8 14.0 12.3 10.4 8.6
48–59 10.8 4.0 12.3 12.3 10.3 8.9 7.1
60–71 8.7 1.0 7.4 10.5 8.9 7.9 6.9
72 and over 28.4 0.3 6.9 24.9 36.0 45.1 56.8
All births 608,295 13,644 119,155 185,000 167,025 97,821 25,650
Not stated2
32,961 791 5,581 9,475 9,410 6,031 1,673
Median (months) 45 21 32 45 53 64 85
SOURCE: NCHS, National Vital Statistics System, Natality.
Percent
* Figure does not meet standards of reliability or precision; based on fewer than 20 births in the numerator. 1Includes births to race and origin groups not shown separately, such as Hispanic single-race white, Hispanic single-race black, and non-Hispanic multiple-race women, as well as births
with origin not stated.2No response reported for interval since last live birth. See Technical Notes.
3Race and Hispanic origin are reported separately on birth certificates; persons of Hispanic origin may be of any race. In this table, non-Hispanic women are classified by race. Race
categories are consistent with 1997 Office of Management and Budget standards; see Technical Notes. Single race is defined as only one race reported on the birth certificate.4Includes all persons of Hispanic origin of any race.
Number
National Vital Statistics Reports, Vol. 67, No. 1, January 31, 2018 Table page 1 of 1
U.S. Department of Health and Human Services · Centers for Disease Control and Prevention · National Center for Health Statistics
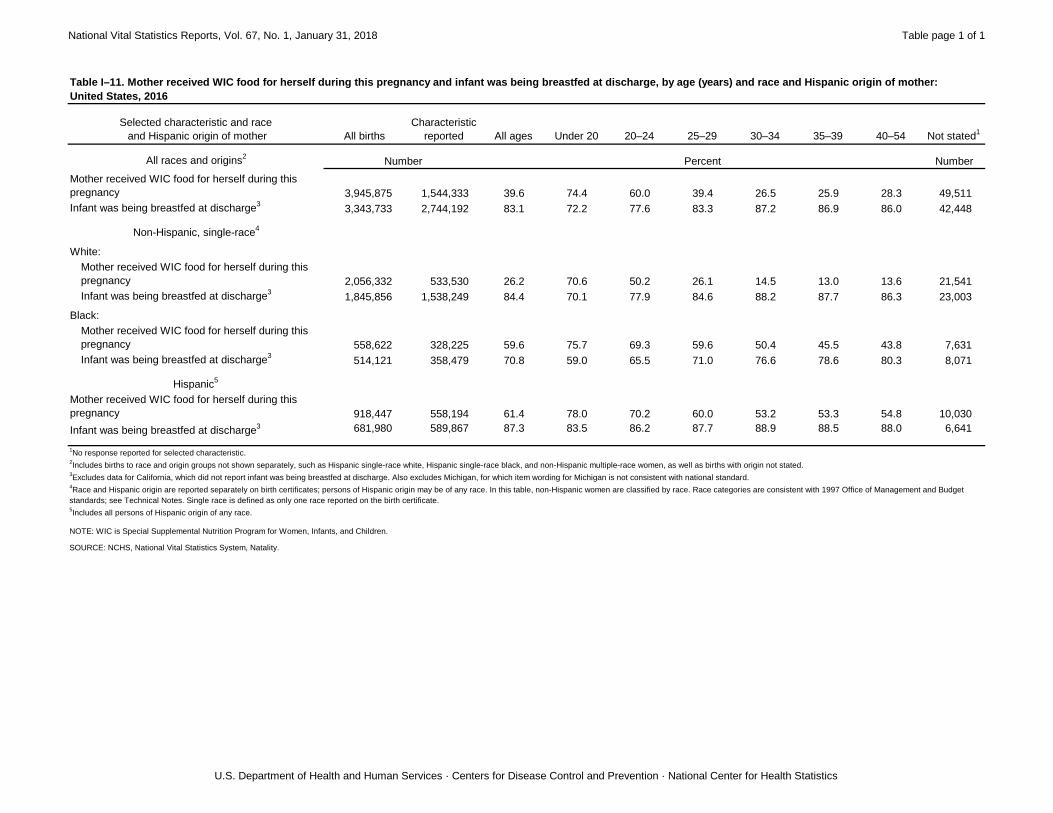
Selected characteristic and race
and Hispanic origin of mother All births
Characteristic
reported All ages Under 20 20–24 25–29 30–34 35–39 40–54 Not stated1
All races and origins2
Number
Mother received WIC food for herself during this
pregnancy 3,945,875 1,544,333 39.6 74.4 60.0 39.4 26.5 25.9 28.3 49,511
Infant was being breastfed at discharge3
3,343,733 2,744,192 83.1 72.2 77.6 83.3 87.2 86.9 86.0 42,448
Non-Hispanic, single-race4
White:
Mother received WIC food for herself during this
pregnancy 2,056,332 533,530 26.2 70.6 50.2 26.1 14.5 13.0 13.6 21,541
Infant was being breastfed at discharge3
1,845,856 1,538,249 84.4 70.1 77.9 84.6 88.2 87.7 86.3 23,003
Black:
Mother received WIC food for herself during this
pregnancy 558,622 328,225 59.6 75.7 69.3 59.6 50.4 45.5 43.8 7,631
Infant was being breastfed at discharge3
514,121 358,479 70.8 59.0 65.5 71.0 76.6 78.6 80.3 8,071
Hispanic5
Mother received WIC food for herself during this
pregnancy 918,447 558,194 61.4 78.0 70.2 60.0 53.2 53.3 54.8 10,030
Infant was being breastfed at discharge3 681,980 589,867 87.3 83.5 86.2 87.7 88.9 88.5 88.0 6,641
Table I–11. Mother received WIC food for herself during this pregnancy and infant was being breastfed at discharge, by age (years) and race and Hispanic origin of mother:United States, 2016
Percent
SOURCE: NCHS, National Vital Statistics System, Natality.
Number
NOTE: WIC is Special Supplemental Nutrition Program for Women, Infants, and Children.
1No response reported for selected characteristic.
2Includes births to race and origin groups not shown separately, such as Hispanic single-race white, Hispanic single-race black, and non-Hispanic multiple-race women, as well as births with origin not stated.
3Excludes data for California, which did not report infant was being breastfed at discharge. Also excludes Michigan, for which item wording for Michigan is not consistent with national standard.
4Race and Hispanic origin are reported separately on birth certificates; persons of Hispanic origin may be of any race. In this table, non-Hispanic women are classified by race. Race categories are consistent with 1997 Office of Management and Budget
standards; see Technical Notes. Single race is defined as only one race reported on the birth certificate.5Includes all persons of Hispanic origin of any race.
National Vital Statistics Reports, Vol. 67, No. 1, January 31, 2018 Table page 1 of 2
U.S. Department of Health and Human Services · Centers for Disease Control and Prevention · National Center for Health Statistics
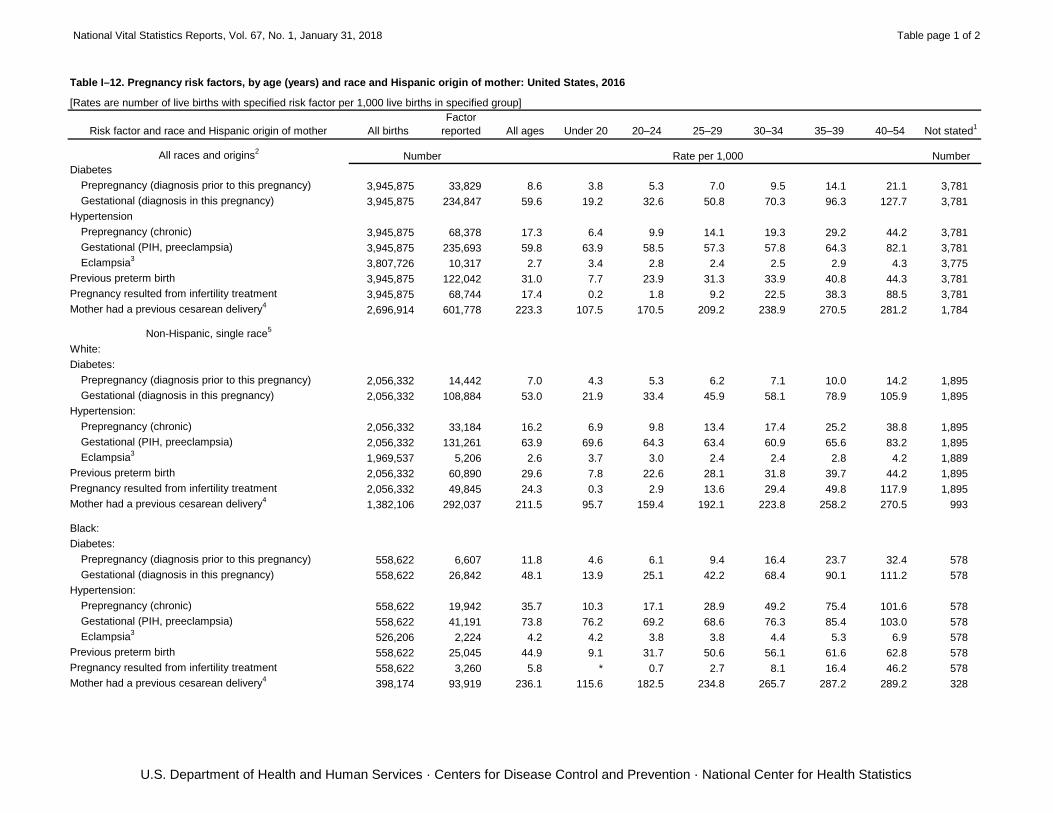
Risk factor and race and Hispanic origin of mother All births
Factor
reported All ages Under 20 20–24 25–29 30–34 35–39 40–54 Not stated1
All races and origins2
Number
Diabetes
Prepregnancy (diagnosis prior to this pregnancy) 3,945,875 33,829 8.6 3.8 5.3 7.0 9.5 14.1 21.1 3,781
Gestational (diagnosis in this pregnancy) 3,945,875 234,847 59.6 19.2 32.6 50.8 70.3 96.3 127.7 3,781
Hypertension
Prepregnancy (chronic) 3,945,875 68,378 17.3 6.4 9.9 14.1 19.3 29.2 44.2 3,781
Gestational (PIH, preeclampsia) 3,945,875 235,693 59.8 63.9 58.5 57.3 57.8 64.3 82.1 3,781
Eclampsia3
3,807,726 10,317 2.7 3.4 2.8 2.4 2.5 2.9 4.3 3,775
Previous preterm birth 3,945,875 122,042 31.0 7.7 23.9 31.3 33.9 40.8 44.3 3,781
Pregnancy resulted from infertility treatment 3,945,875 68,744 17.4 0.2 1.8 9.2 22.5 38.3 88.5 3,781
Mother had a previous cesarean delivery4
2,696,914 601,778 223.3 107.5 170.5 209.2 238.9 270.5 281.2 1,784
Non-Hispanic, single race5
White:
Diabetes:
Prepregnancy (diagnosis prior to this pregnancy) 2,056,332 14,442 7.0 4.3 5.3 6.2 7.1 10.0 14.2 1,895
Gestational (diagnosis in this pregnancy) 2,056,332 108,884 53.0 21.9 33.4 45.9 58.1 78.9 105.9 1,895
Hypertension:
Prepregnancy (chronic) 2,056,332 33,184 16.2 6.9 9.8 13.4 17.4 25.2 38.8 1,895
Gestational (PIH, preeclampsia) 2,056,332 131,261 63.9 69.6 64.3 63.4 60.9 65.6 83.2 1,895
Eclampsia3
1,969,537 5,206 2.6 3.7 3.0 2.4 2.4 2.8 4.2 1,889
Previous preterm birth 2,056,332 60,890 29.6 7.8 22.6 28.1 31.8 39.7 44.2 1,895
Pregnancy resulted from infertility treatment 2,056,332 49,845 24.3 0.3 2.9 13.6 29.4 49.8 117.9 1,895
Mother had a previous cesarean delivery4
1,382,106 292,037 211.5 95.7 159.4 192.1 223.8 258.2 270.5 993
Black:
Diabetes:
Prepregnancy (diagnosis prior to this pregnancy) 558,622 6,607 11.8 4.6 6.1 9.4 16.4 23.7 32.4 578
Gestational (diagnosis in this pregnancy) 558,622 26,842 48.1 13.9 25.1 42.2 68.4 90.1 111.2 578
Hypertension:
Prepregnancy (chronic) 558,622 19,942 35.7 10.3 17.1 28.9 49.2 75.4 101.6 578
Gestational (PIH, preeclampsia) 558,622 41,191 73.8 76.2 69.2 68.6 76.3 85.4 103.0 578
Eclampsia3
526,206 2,224 4.2 4.2 3.8 3.8 4.4 5.3 6.9 578
Previous preterm birth 558,622 25,045 44.9 9.1 31.7 50.6 56.1 61.6 62.8 578
Pregnancy resulted from infertility treatment 558,622 3,260 5.8 * 0.7 2.7 8.1 16.4 46.2 578
Mother had a previous cesarean delivery4
398,174 93,919 236.1 115.6 182.5 234.8 265.7 287.2 289.2 328
Rate per 1,000
Table I–12. Pregnancy risk factors, by age (years) and race and Hispanic origin of mother: United States, 2016
Number
[Rates are number of live births with specified risk factor per 1,000 live births in specified group]
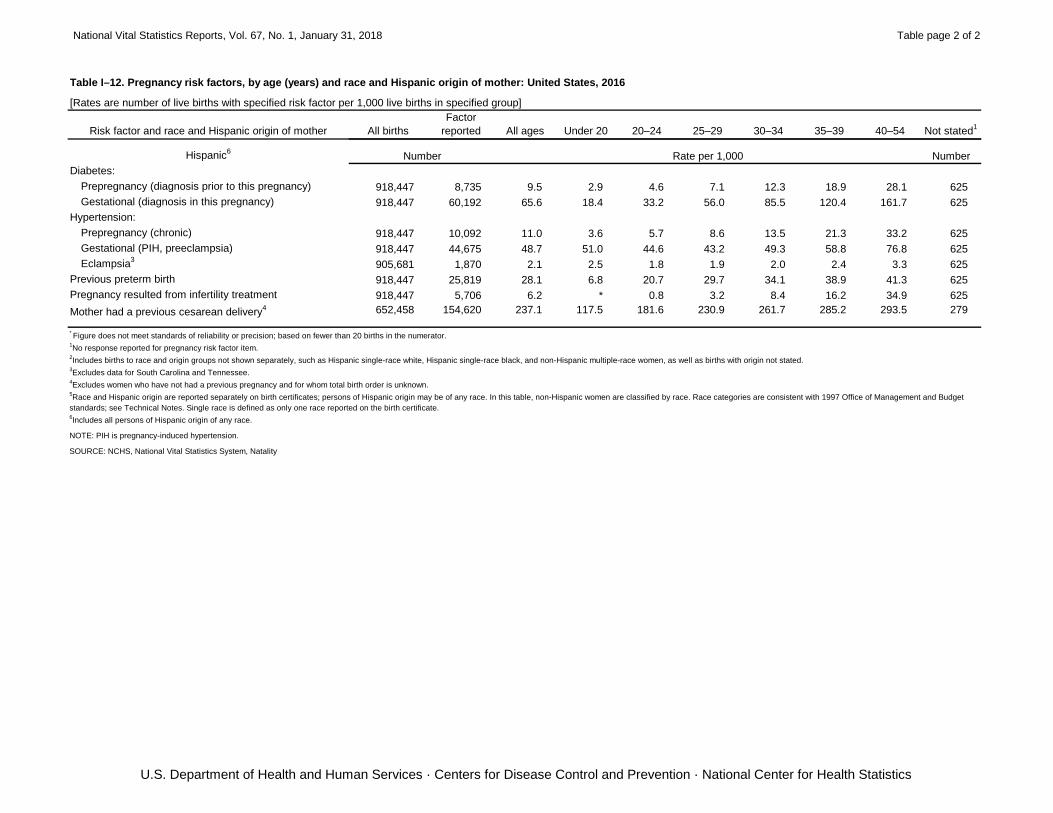
National Vital Statistics Reports, Vol. 67, No. 1, January 31, 2018 Table page 2 of 2
U.S. Department of Health and Human Services · Centers for Disease Control and Prevention · National Center for Health Statistics
Risk factor and race and Hispanic origin of mother All births
Factor
reported All ages Under 20 20–24 25–29 30–34 35–39 40–54 Not stated1
Table I–12. Pregnancy risk factors, by age (years) and race and Hispanic origin of mother: United States, 2016
[Rates are number of live births with specified risk factor per 1,000 live births in specified group]
Hispanic6
Number
Diabetes:
Prepregnancy (diagnosis prior to this pregnancy) 918,447 8,735 9.5 2.9 4.6 7.1 12.3 18.9 28.1 625
Gestational (diagnosis in this pregnancy) 918,447 60,192 65.6 18.4 33.2 56.0 85.5 120.4 161.7 625
Hypertension:
Prepregnancy (chronic) 918,447 10,092 11.0 3.6 5.7 8.6 13.5 21.3 33.2 625
Gestational (PIH, preeclampsia) 918,447 44,675 48.7 51.0 44.6 43.2 49.3 58.8 76.8 625
Eclampsia3
905,681 1,870 2.1 2.5 1.8 1.9 2.0 2.4 3.3 625
Previous preterm birth 918,447 25,819 28.1 6.8 20.7 29.7 34.1 38.9 41.3 625
Pregnancy resulted from infertility treatment 918,447 5,706 6.2 * 0.8 3.2 8.4 16.2 34.9 625
Mother had a previous cesarean delivery4 652,458 154,620 237.1 117.5 181.6 230.9 261.7 285.2 293.5 279
* Figure does not meet standards of reliability or precision; based on fewer than 20 births in the numerator.
1No response reported for pregnancy risk factor item.
2Includes births to race and origin groups not shown separately, such as Hispanic single-race white, Hispanic single-race black, and non-Hispanic multiple-race women, as well as births with origin not stated.
3Excludes data for South Carolina and Tennessee.
4Excludes women who have not had a previous pregnancy and for whom total birth order is unknown.
5Race and Hispanic origin are reported separately on birth certificates; persons of Hispanic origin may be of any race. In this table, non-Hispanic women are classified by race. Race categories are consistent with 1997 Office of Management and Budget
standards; see Technical Notes. Single race is defined as only one race reported on the birth certificate.6Includes all persons of Hispanic origin of any race.
SOURCE: NCHS, National Vital Statistics System, Natality
Number Rate per 1,000
NOTE: PIH is pregnancy-induced hypertension.
National Vital Statistics Reports, Vol. 67, No. 1, January 31, 2018 Table page 1 of 1
U.S. Department of Health and Human Services · Centers for Disease Control and Prevention · National Center for Health Statistics
Infection and race and Hispanic origin of mother All births
Infection
reported All ages Under 20 20–24 25–29 30–34 35–39 40–54 Not stated1
All races and origins2
Number
Gonorrhea 3,945,875 10,555 268.1 952.5 527.8 227.9 107.6 76.7 68.1 9,624
Syphilis 3,945,875 3,431 87.2 107.3 122.3 88.9 60.9 76.5 91.1 9,624
Chlamydia 3,945,875 71,480 1,815.9 6,753.6 3,874.0 1,450.0 612.8 420.4 342.3 9,624
Hepatitis B 3,945,875 8,938 227.1 71.4 113.0 203.5 273.5 366.9 420.3 9,624
Hepatitis C 3,945,875 16,588 421.4 141.8 428.1 554.8 394.1 329.9 266.8 9,624
Non-Hispanic, single race3
White:
Gonorrhea 2,056,332 2,783 135.6 462.7 288.8 126.7 66.8 44.6 50.0 4,438
Syphilis 2,056,332 756 36.8 52.3 53.9 39.5 26.6 30.3 * 4,438
Chlamydia 2,056,332 23,521 1,146.3 5,143.2 2,854.6 934.9 382.8 261.3 200.0 4,438
Hepatitis B 2,056,332 1,587 77.3 31.9 62.6 79.0 75.8 102.7 101.7 4,438
Hepatitis C 2,056,332 13,321 649.2 254.9 764.9 848.6 552.6 462.7 355.2 4,438
Black:
Gonorrhea 558,622 5,223 937.6 2,566.5 1,447.9 749.4 394.2 256.2 184.8 1,590
Syphilis 558,622 1,531 274.8 244.2 325.4 269.2 227.1 272.3 293.1 1,590
Chlamydia 558,622 23,506 4,219.9 11,731.4 6,863.2 3,227.7 1,589.6 936.1 688.2 1,590
Hepatitis B 558,622 2,117 380.0 106.0 179.9 349.9 569.0 665.4 860.3 1,590
Hepatitis C 558,622 764 137.2 69.1 96.8 157.2 156.2 169.2 242.1 1,590
Hispanic4
Gonorrhea 918,447 1,749 190.9 489.8 285.9 163.2 96.1 77.9 * 2,268
Syphilis 918,447 838 91.5 82.1 97.5 94.0 76.6 96.9 130.8 2,268
Chlamydia 918,447 18,653 2,036.0 5,330.6 3,448.2 1,630.1 837.8 589.5 456.2 2,268
Hepatitis B 918,447 644 70.3 63.5 63.2 61.8 65.2 109.9 97.3 2,268
Hepatitis C 918,447 1,281 139.8 62.2 111.5 176.4 144.2 154.1 151.0 2,268
Rate per 100,000
Table I–13. Infections present or treated during this pregnancy, by age (years) and race and Hispanic origin of mother: United States, 2016
* Figure does not meet standards of reliability or precision; based on fewer than 20 births in the numerator.
1No response reported for infections treated or present during this pregnancy item; includes births to residents of states using the 2003 U.S. Standard Certificate of Live Birth occurring in states using the 1989 U.S. Standard Certificate of Live Birth (0.1%).
See Technical Notes.2Includes births to race and origin groups not shown separately, such as Hispanic single-race white, Hispanic single-race black, and non-Hispanic multiple-race women, as well as births with origin not stated.
3Race and Hispanic origin are reported separately on birth certificates; persons of Hispanic origin may be of any race. In this table, non-Hispanic women are classified by race. Race categories are consistent with 1997 Office of Management and Budget
standards; see Technical Notes. Single race is defined as only one race reported on the birth certificate.4Includes all persons of Hispanic origin of any race.
[Rates are number of live births with specified infection per 100,000 live births in specified group]
SOURCE: NCHS, National Vital Statistics System, Natality.
Number
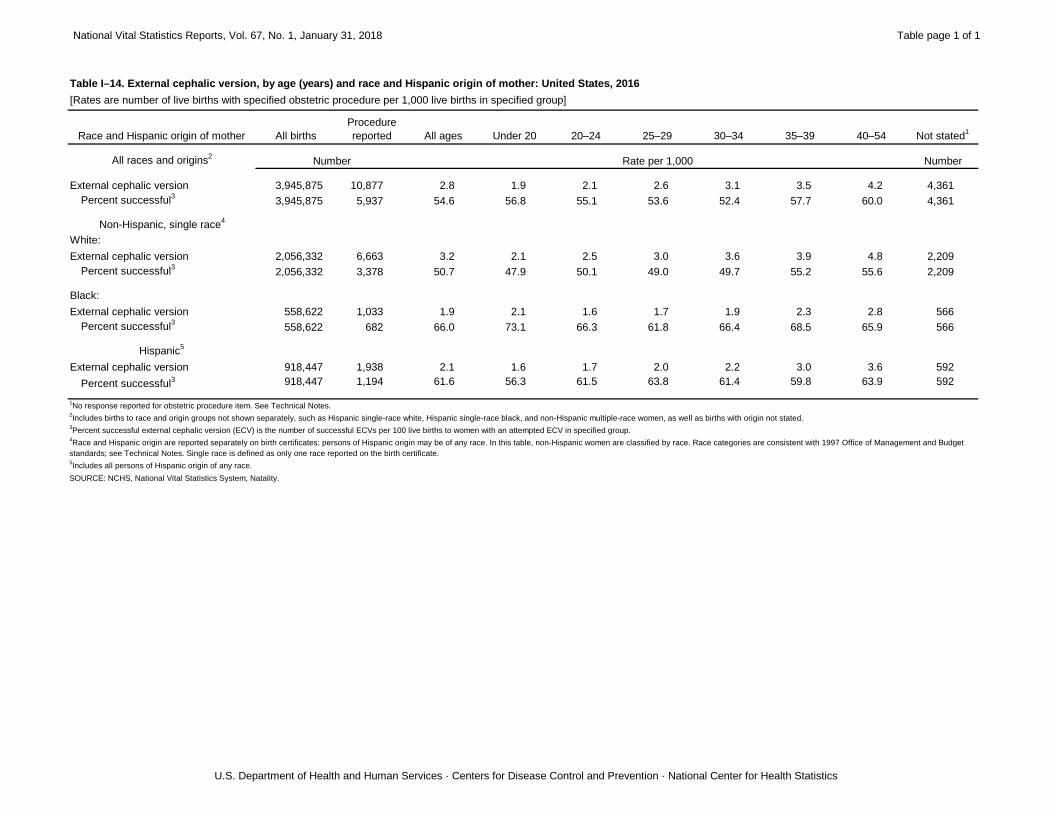
National Vital Statistics Reports, Vol. 67, No. 1, January 31, 2018 Table page 1 of 1
U.S. Department of Health and Human Services · Centers for Disease Control and Prevention · National Center for Health Statistics
Race and Hispanic origin of mother All births
Procedure
reported All ages Under 20 20–24 25–29 30–34 35–39 40–54 Not stated1
All races and origins2
Number
External cephalic version 3,945,875 10,877 2.8 1.9 2.1 2.6 3.1 3.5 4.2 4,361
Percent successful3
3,945,875 5,937 54.6 56.8 55.1 53.6 52.4 57.7 60.0 4,361
Non-Hispanic, single race4
White:
External cephalic version 2,056,332 6,663 3.2 2.1 2.5 3.0 3.6 3.9 4.8 2,209
Percent successful3
2,056,332 3,378 50.7 47.9 50.1 49.0 49.7 55.2 55.6 2,209
Black:
External cephalic version 558,622 1,033 1.9 2.1 1.6 1.7 1.9 2.3 2.8 566
Percent successful3
558,622 682 66.0 73.1 66.3 61.8 66.4 68.5 65.9 566
Hispanic5
External cephalic version 918,447 1,938 2.1 1.6 1.7 2.0 2.2 3.0 3.6 592
Percent successful3 918,447 1,194 61.6 56.3 61.5 63.8 61.4 59.8 63.9 592
SOURCE: NCHS, National Vital Statistics System, Natality.
Table I–14. External cephalic version, by age (years) and race and Hispanic origin of mother: United States, 2016
Rate per 1,000
1No response reported for obstetric procedure item. See Technical Notes.
2Includes births to race and origin groups not shown separately, such as Hispanic single-race white, Hispanic single-race black, and non-Hispanic multiple-race women, as well as births with origin not stated.
3Percent successful external cephalic version (ECV) is the number of successful ECVs per 100 live births to women with an attempted ECV in specified group.
4Race and Hispanic origin are reported separately on birth certificates; persons of Hispanic origin may be of any race. In this table, non-Hispanic women are classified by race. Race categories are consistent with 1997 Office of Management and Budget
standards; see Technical Notes. Single race is defined as only one race reported on the birth certificate.5Includes all persons of Hispanic origin of any race.
[Rates are number of live births with specified obstetric procedure per 1,000 live births in specified group]
Number
National Vital Statistics Reports, Vol. 67, No. 1, January 31, 2018 Table page 1 of 1
U.S. Department of Health and Human Services · Centers for Disease Control and Prevention · National Center for Health Statistics
Labor and delivery characteristic and
race and Hispanic origin of mother All births
Characteristic
reported All ages Under 20 20–24 25–29 30–34 35–39 40–54 Not stated1
All races2
Number
Induction of labor 3,945,875 967,811 245.4 281.0 265.8 249.4 230.4 224.4 243.1 2,628
Augmentation of labor 3,945,875 826,783 209.7 262.8 235.3 216.6 197.3 174.3 154.8 2,628
Steroids (glucocorticoids) for fetal lung maturation 3,945,875 93,931 23.8 24.8 22.6 22.3 23.4 26.9 34.3 2,628
Antibiotics received by mother during labor 3,945,875 976,049 247.5 255.1 246.8 241.1 246.1 257.4 268.5 2,628
Clinical chorioamnionitis during labor 3,945,875 60,505 15.3 23.3 18.1 15.5 14.1 11.6 11.1 2,628
Epidural or spinal anesthesia during labor 3,945,875 2,901,486 735.8 765.6 746.6 733.2 731.0 726.1 725.2 2,628
Non-Hispanic, single race3
White:
Induction of labor 2,056,332 567,883 276.3 348.6 313.7 283.3 253.7 246.5 271.7 1,358
Augmentation of labor 2,056,332 434,470 211.4 264.7 239.4 221.5 200.0 176.3 160.4 1,358
Steroids (glucocorticoids) for fetal lung maturation 2,056,332 49,492 24.1 27.1 23.1 22.6 23.6 26.6 34.5 1,358
Antibiotics received by mother during labor 2,056,332 502,898 244.7 250.1 238.9 237.4 245.3 259.4 270.9 1,358
Clinical chorioamnionitis during labor 2,056,332 25,068 12.2 17.1 13.5 12.7 11.7 9.8 9.9 1,358
Epidural or spinal anesthesia during labor 2,056,332 1,547,202 752.9 811.5 775.3 750.9 743.7 736.7 738.2 1,358
Black:
Induction of labor 558,622 128,682 230.5 260.6 241.2 223.9 218.3 220.9 241.4 370
Augmentation of labor 558,622 108,709 194.7 243.8 219.5 194.1 173.6 155.1 138.5 370
Steroids (glucocorticoids) for fetal lung maturation 558,622 18,660 33.4 31.8 31.2 32.0 34.3 39.6 44.6 370
Antibiotics received by mother during labor 558,622 157,069 281.4 305.1 292.1 276.3 269.9 273.6 280.4 370
Clinical chorioamnionitis during labor 558,622 8,590 15.4 21.6 18.4 14.2 13.6 11.2 10.3 370
Epidural or spinal anesthesia during labor 558,622 415,555 744.4 772.1 755.3 738.3 732.3 737.5 742.4 370
Hispanic4
Induction of labor 918,447 185,865 202.5 225.2 213.4 199.1 190.2 193.4 211.8 406
Augmentation of labor 918,447 189,218 206.1 268.0 234.8 205.3 183.5 167.2 147.5 406
Steroids (glucocorticoids) for fetal lung maturation 918,447 16,909 18.4 18.2 16.3 17.0 19.0 22.3 28.2 406
Antibiotics received by mother during labor 918,447 211,682 230.6 228.7 227.2 225.1 231.9 242.8 252.1 406
Clinical chorioamnionitis during labor 918,447 16,314 17.8 30.5 23.4 17.0 13.0 11.0 9.8 406
Epidural or spinal anesthesia during labor 918,447 635,084 691.8 720.9 703.4 687.4 681.6 681.2 679.8 406
SOURCE: NCHS, National Vital Statistics System, Natality.
Rate per 1,000
Table I–15. Characteristics of labor and delivery, by age (years) and race and Hispanic origin of mother: United States, 2016
1No response reported for selected characteristic.
2Includes births to race and origin groups not shown separately, such as Hispanic single-race white, Hispanic single-race black, and non-Hispanic multiple-race women, as well as births with origin not stated.
3Race and Hispanic origin are reported separately on birth certificates; persons of Hispanic origin may be of any race. In this table, non-Hispanic women are classified by race. Race categories are consistent with 1997 Office of Management and Budget
standards; see Technical Notes. Single race is defined as only one race reported on the birth certificate.4Includes all persons of Hispanic origin of any race.
[Rates are number of live births with characteristic per 1,000 live births in specified group]
Number
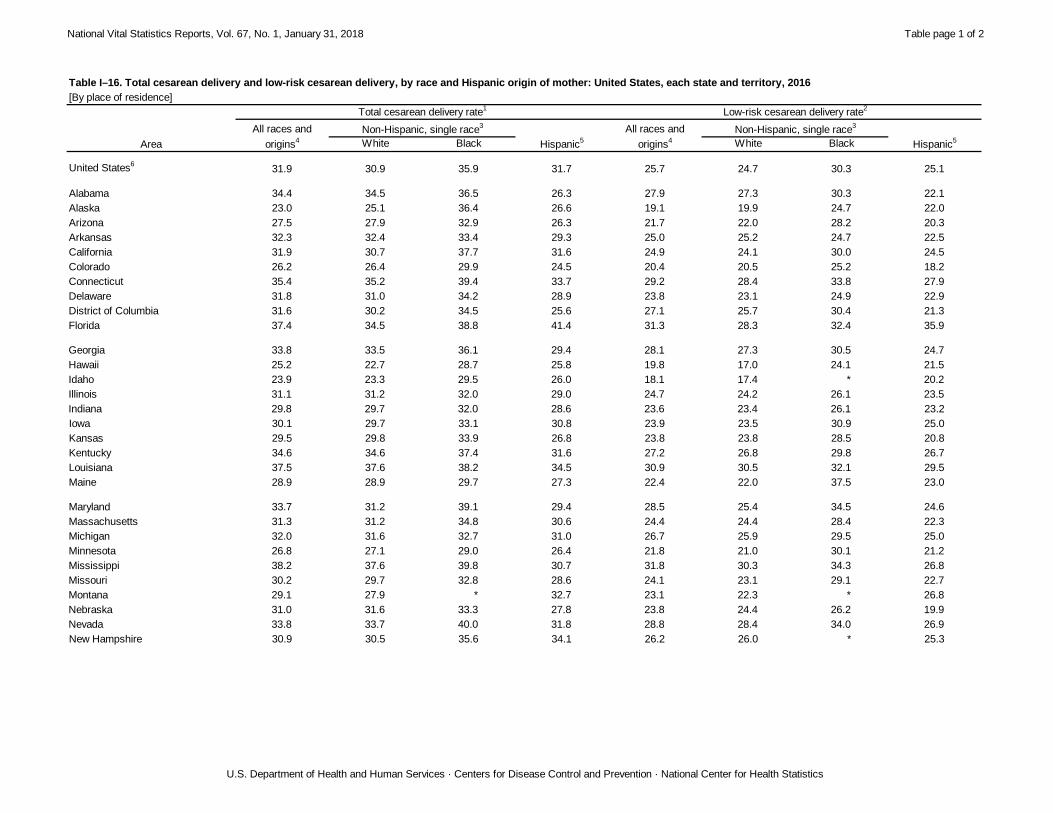
National Vital Statistics Reports, Vol. 67, No. 1, January 31, 2018 Table page 1 of 2
U.S. Department of Health and Human Services · Centers for Disease Control and Prevention · National Center for Health Statistics
White Black White Black
United States6
31.9 30.9 35.9 31.7 25.7 24.7 30.3 25.1
Alabama 34.4 34.5 36.5 26.3 27.9 27.3 30.3 22.1
Alaska 23.0 25.1 36.4 26.6 19.1 19.9 24.7 22.0
Arizona 27.5 27.9 32.9 26.3 21.7 22.0 28.2 20.3
Arkansas 32.3 32.4 33.4 29.3 25.0 25.2 24.7 22.5
California 31.9 30.7 37.7 31.6 24.9 24.1 30.0 24.5
Colorado 26.2 26.4 29.9 24.5 20.4 20.5 25.2 18.2
Connecticut 35.4 35.2 39.4 33.7 29.2 28.4 33.8 27.9
Delaware 31.8 31.0 34.2 28.9 23.8 23.1 24.9 22.9
District of Columbia 31.6 30.2 34.5 25.6 27.1 25.7 30.4 21.3
Florida 37.4 34.5 38.8 41.4 31.3 28.3 32.4 35.9
Georgia 33.8 33.5 36.1 29.4 28.1 27.3 30.5 24.7
Hawaii 25.2 22.7 28.7 25.8 19.8 17.0 24.1 21.5
Idaho 23.9 23.3 29.5 26.0 18.1 17.4 * 20.2
Illinois 31.1 31.2 32.0 29.0 24.7 24.2 26.1 23.5
Indiana 29.8 29.7 32.0 28.6 23.6 23.4 26.1 23.2
Iowa 30.1 29.7 33.1 30.8 23.9 23.5 30.9 25.0
Kansas 29.5 29.8 33.9 26.8 23.8 23.8 28.5 20.8
Kentucky 34.6 34.6 37.4 31.6 27.2 26.8 29.8 26.7
Louisiana 37.5 37.6 38.2 34.5 30.9 30.5 32.1 29.5
Maine 28.9 28.9 29.7 27.3 22.4 22.0 37.5 23.0
Maryland 33.7 31.2 39.1 29.4 28.5 25.4 34.5 24.6
Massachusetts 31.3 31.2 34.8 30.6 24.4 24.4 28.4 22.3
Michigan 32.0 31.6 32.7 31.0 26.7 25.9 29.5 25.0
Minnesota 26.8 27.1 29.0 26.4 21.8 21.0 30.1 21.2
Mississippi 38.2 37.6 39.8 30.7 31.8 30.3 34.3 26.8
Missouri 30.2 29.7 32.8 28.6 24.1 23.1 29.1 22.7
Montana 29.1 27.9 * 32.7 23.1 22.3 * 26.8
Nebraska 31.0 31.6 33.3 27.8 23.8 24.4 26.2 19.9
Nevada 33.8 33.7 40.0 31.8 28.8 28.4 34.0 26.9
New Hampshire 30.9 30.5 35.6 34.1 26.2 26.0 * 25.3
Table I–16. Total cesarean delivery and low-risk cesarean delivery, by race and Hispanic origin of mother: United States, each state and territory, 2016
Low-risk cesarean delivery rate2
All races and
origins4
Hispanic5
Area
Total cesarean delivery rate1
Non-Hispanic, single race3
Non-Hispanic, single race3All races and
origins4
Hispanic5
[By place of residence]
National Vital Statistics Reports, Vol. 67, No. 1, January 31, 2018 Table page 2 of 2
U.S. Department of Health and Human Services · Centers for Disease Control and Prevention · National Center for Health Statistics
White Black White Black
Table I–16. Total cesarean delivery and low-risk cesarean delivery, by race and Hispanic origin of mother: United States, each state and territory, 2016
Low-risk cesarean delivery rate2
All races and
origins4
Hispanic5
Area
Total cesarean delivery rate1
Non-Hispanic, single race3
Non-Hispanic, single race3All races and
origins4
Hispanic5
[By place of residence]
New Jersey 36.2 34.0 39.8 36.7 30.2 29.0 32.6 29.4
New Mexico 24.8 24.7 26.3 25.0 18.5 19.3 20.9 17.9
New York 33.8 31.8 38.6 35.0 28.4 27.1 33.7 28.4
North Carolina 29.4 29.6 32.5 24.2 23.0 22.5 26.1 18.9
North Dakota 26.8 26.0 30.6 26.7 18.9 18.1 22.1 17.4
Ohio 30.8 30.5 32.1 28.9 24.7 24.2 27.4 22.9
Oklahoma 32.0 32.5 34.6 29.2 23.3 23.6 25.9 22.0
Oregon 27.2 26.8 31.4 27.2 22.1 21.5 30.8 21.5
Pennsylvania 29.8 29.6 30.5 30.2 24.7 24.3 26.9 24.1
Rhode Island 31.2 32.9 31.1 28.3 24.9 26.5 25.8 21.4
South Carolina 33.5 32.9 36.5 29.1 26.0 25.1 28.8 24.3
South Dakota 25.3 24.8 30.9 24.8 20.7 20.7 25.9 23.4
Tennessee 32.5 31.9 36.3 28.9 26.5 25.4 31.6 23.5
Texas 34.4 34.1 38.7 33.4 27.0 27.4 32.1 24.7
Utah 22.3 21.6 28.7 23.7 16.8 15.9 26.8 18.9
Vermont 25.7 25.6 * 23.5 21.7 21.8 * *
Virginia 33.0 31.5 36.8 30.4 26.9 25.1 30.9 25.0
Washington 27.4 26.5 34.0 26.4 22.5 21.3 31.2 21.9
West Virginia 34.9 34.8 39.7 29.9 27.0 26.9 29.5 25.9
Wisconsin 26.0 26.2 27.4 25.2 22.0 21.7 24.3 21.9
Wyoming 27.4 27.1 33.3 27.7 19.1 19.1 * 17.9
Puerto Rico 46.3 43.6 49.3 46.3 40.6 36.6 * 40.8
Virgin Islands 26.9 21.5 26.4 29.7 16.8 * 16.8 *
Guam 25.9 23.5 * * 24.1 * * *
American Samoa --- --- --- --- --- --- --- ---
Northern Marianas 29.2 * * * 28.9 * * *
SOURCE: NCHS, National Vital Statistics System, Natality.
* Figure does not meet standards of reliability or precision; based on fewer than 20 births in the numerator.
--- Data not available.1Percentage of all live births by cesarean delivery.
2Number of singleton, term (37 weeks or more of gestation based on the obstetric estimate), cephalic, cesarean deliveries to women having a first birth per 100 women delivering singleton, term, cephalic, first births.
3Race and Hispanic origin are reported separately on birth certificates; persons of Hispanic origin may be of any race. In this table, non-Hispanic women are classified by race. Race categories are consistent with 1997 Office of Management and Budget
standards; see Technical Notes. Single race is defined as only one race reported on the birth certificate.4Includes births to race and origin groups not shown separately, such as Hispanic single-race white, Hispanic single-race black, and non-Hispanic multiple-race women, as well as births with origin not stated.
5Includes all persons of Hispanic origin of any race; see Technical Notes.
6Excludes data for territories.
National Vital Statistics Reports, Vol. 67, No. 1, January 31, 2018 Table page 1 of 2
U.S. Department of Health and Human Services · Centers for Disease Control and Prevention · National Center for Health Statistics
Method of delivery and race and
Hispanic origin of mother All births1
Method
reported All ages Under 20 20–24 25–29 30–34 35–39 40–54 Not stated2
All races and origins3
Number
Fetal presentation at birth:
Cephalic 3,945,875 3,719,121 94.8 96.2 95.8 95.2 94.4 93.5 92.0 22,791
Breech 3,945,875 152,519 3.9 2.5 2.9 3.6 4.3 5.2 6.4 22,791
Other 3,945,875 51,444 1.3 1.4 1.4 1.3 1.2 1.4 1.6 22,791
Final route and method of delivery:
Vaginal, spontaneous 3,945,875 2,562,527 65.0 75.3 70.7 66.7 62.7 56.9 49.5 2,491
Vaginal, forceps 3,945,875 21,674 0.5 0.7 0.6 0.5 0.6 0.5 0.5 2,491
Vaginal, vacuum 3,945,875 100,602 2.6 3.7 2.7 2.5 2.5 2.2 2.0 2,491
Cesarean 3,945,875 1,258,581 31.9 20.2 26.0 30.2 34.3 40.4 47.9 2,491
Cesarean, trial of labor attempted4
1,258,581 318,739 25.6 47.4 33.9 26.7 22.3 19.4 18.6 14,251
Non-Hispanic, single race5
White:
Fetal presentation at birth:
Cephalic 2,056,332 1,937,361 94.7 96.1 95.7 95.0 94.4 93.5 92.1 10,354
Breech 2,056,332 87,154 4.3 2.9 3.2 4.0 4.6 5.3 6.6 10,354
Other 2,056,332 21,463 1.0 1.0 1.1 1.0 1.0 1.1 1.3 10,354
Final route and method of delivery:
Vaginal, spontaneous 2,056,332 1,352,080 65.8 74.4 71.0 68.0 64.3 58.6 51.2 956
Vaginal, forceps 2,056,332 12,908 0.6 0.8 0.7 0.6 0.6 0.5 0.6 956
Vaginal, vacuum 2,056,332 54,800 2.7 4.2 3.1 2.7 2.5 2.2 2.1 956
Cesarean 2,056,332 635,588 30.9 20.6 25.2 28.7 32.7 38.6 46.1 956
Cesarean, trial of labor attempted4
635,588 168,003 26.7 51.6 35.9 28.6 23.4 20.3 19.8 5,705
Black:
Fetal presentation at birth:
Cephalic 558,622 528,280 95.1 96.3 95.9 95.5 94.5 93.2 91.4 3,164
Breech 558,622 19,293 3.5 2.3 2.7 3.1 4.1 5.3 6.9 3,164
Other 558,622 7,885 1.4 1.5 1.4 1.4 1.4 1.5 1.7 3,164
Final route and method of delivery:
Vaginal, spontaneous 558,622 343,645 61.5 72.8 67.2 62.2 57.1 51.1 44.0 303
Vaginal, forceps 558,622 2,388 0.4 0.7 0.5 0.4 0.4 0.3 0.5 303
Vaginal, vacuum 558,622 11,826 2.1 3.8 2.5 1.9 1.7 1.5 1.4 303
Cesarean 558,622 200,460 35.9 22.7 29.9 35.5 40.8 47.1 54.1 303
Cesarean, trial of labor attempted4
200,460 54,447 27.6 46.8 34.9 26.6 23.2 20.9 20.8 3,126
Table I–17. Method of delivery, by age (years) and race and Hispanic origin of mother: United States, 2016[Percentages are number of live births with specified method of delivery per 100 live births in specified group]
Rate per 100Number
National Vital Statistics Reports, Vol. 67, No. 1, January 31, 2018 Table page 2 of 2
U.S. Department of Health and Human Services · Centers for Disease Control and Prevention · National Center for Health Statistics
Method of delivery and race and
Hispanic origin of mother All births1
Method
reported All ages Under 20 20–24 25–29 30–34 35–39 40–54 Not stated2
Table I–17. Method of delivery, by age (years) and race and Hispanic origin of mother: United States, 2016[Percentages are number of live births with specified method of delivery per 100 live births in specified group]
Hispanic6
Number
Fetal presentation at birth:
Cephalic 918,447 864,626 94.8 96.0 95.7 95.2 94.4 93.2 92.2 6,738
Breech 918,447 29,877 3.3 2.3 2.5 3.0 3.7 4.8 5.6 6,738
Other 918,447 17,206 1.9 1.7 1.9 1.9 1.9 2.0 2.2 6,738
Final route and method of delivery:
Vaginal, spontaneous 918,447 605,225 65.9 77.5 72.1 66.5 61.7 56.5 50.5 520
Vaginal, forceps 918,447 3,558 0.4 0.6 0.4 0.4 0.4 0.3 0.3 520
Vaginal, vacuum 918,447 18,312 2.0 3.2 2.2 1.9 1.7 1.6 1.6 520
Cesarean 918,447 290,832 31.7 18.7 25.3 31.2 36.2 41.5 47.7 520
Cesarean, trial of labor attempted4 290,832 62,171 21.7 42.0 29.1 21.0 17.6 16.4 15.8 4,479
1Total for vaginal birth after cesarean delivery is the number of births to women delivering after a previous cesarean. Total for primary cesarean is the number of births to women delivering without a previous cesarean. Total for "cesarean, trial of labor
attempted" is the number of women delivering by cesarean.2No response reported for selected characteristic.
3Includes births to race and origin groups not shown separately, such as Hispanic single-race white, Hispanic single-race black, and non-Hispanic multiple-race women, as well as births with origin not stated.
4Number of women who attempted a trial of labor prior to cesarean delivery per 100 cesarean births.
5Race and Hispanic origin are reported separately on birth certificates; persons of Hispanic origin may be of any race. In this table, non-Hispanic women are classified by race. Race categories are consistent with 1997 Office of Management and Budget
standards; see Technical Notes. Single race is defined as only one race reported on the birth certificate.6Includes all persons of Hispanic origin of any race.
SOURCE: NCHS, National Vital Statistics System, Natality.
Number Rate per 100
National Vital Statistics Reports, Vol. 67, No. 1, January 31, 2018 Table page 1 of 1
U.S. Department of Health and Human Services · Centers for Disease Control and Prevention · National Center for Health Statistics
Maternal morbidity and race and
Hispanic origin of mother All births
Morbidity
reported All ages Under 20 20–24 25–29 30–34 35–39 40–54 Not stated1
All races and origins2
Number
Maternal transfusion 3,945,875 11,494 291.7 391.3 284.1 275.3 267.0 309.9 465.7 5,362
Third- or fourth-degree perineal laceration 3,945,875 25,463 646.2 757.2 603.5 714.9 690.3 499.6 343.5 5,362
Ruptured uterus 3,945,875 976 24.8 12.3 20.4 21.6 27.4 31.6 50.0 5,362
Unplanned hysterectomy 3,945,875 1,342 34.1 * 15.3 25.5 38.7 57.4 136.9 5,362
Admission to intensive care unit 3,945,875 5,003 127.0 122.7 95.6 104.0 128.0 178.7 315.7 5,362
Non-Hispanic, single race3
White:
Maternal transfusion 2,056,332 5,650 275.1 397.2 270.0 268.5 253.6 286.7 392.9 2,848
Third- or fourth-degree perineal laceration 2,056,332 14,739 717.8 761.3 680.3 819.9 748.7 539.7 368.8 2,848
Ruptured uterus 2,056,332 480 23.4 * 17.6 19.2 25.5 31.6 46.5 2,848
Unplanned hysterectomy 2,056,332 605 29.5 * 12.9 21.4 31.0 52.7 115.5 2,848
Admission to intensive care unit 2,056,332 2,124 103.4 100.6 82.3 83.3 104.3 147.9 218.9 2,848
Black:
Maternal transfusion 558,622 1,983 355.3 372.5 337.7 320.6 359.0 411.8 591.3 578
Third- or fourth-degree perineal laceration 558,622 1,739 311.6 581.7 326.7 289.5 289.1 223.6 165.3 578
Ruptured uterus 558,622 182 32.6 * 35.7 33.0 39.6 * * 578
Unplanned hysterectomy 558,622 203 36.4 * 13.6 26.9 58.2 69.2 165.3 578
Admission to intensive care unit 558,622 1,063 190.5 156.4 129.6 155.1 222.5 299.2 578.6 578
Hispanic4
Maternal transfusion 918,447 2,584 281.6 379.4 268.9 252.1 252.7 310.2 478.5 866
Third- or fourth-degree perineal laceration 918,447 4,561 497.1 835.5 596.9 489.2 406.6 326.6 244.3 866
Ruptured uterus 918,447 190 20.7 * 17.5 18.6 21.8 32.0 * 866
Unplanned hysterectomy 918,447 340 37.1 * 17.5 34.9 45.1 55.3 137.2 866
Admission to intensive care unit 918,447 1,166 127.1 126.9 90.8 114.0 135.4 172.8 281.1 866
Rate per 100,000
Table I–18. Maternal morbidity, by age (years) and race and Hispanic origin of mother: United States, 2016
* Figure does not meet standards of reliability or precision; based on fewer than 20 births in the numerator.
1No response reported for selected characteristic.
2Includes births to race and origin groups not shown separately, such as Hispanic single-race white, Hispanic single-race black, and non-Hispanic multiple-race women, as well as births with origin not stated.
3Race and Hispanic origin are reported separately on birth certificates; persons of Hispanic origin may be of any race. In this table, non-Hispanic women are classified by race. Race categories are consistent with 1997 Office of Management and Budget
standards; see Technical Notes. Single race is defined as only one race reported on the birth certificate.4Includes all persons of Hispanic origin of any race.
SOURCE: NCHS, National Vital Statistics System, Natality.
Number
[Rates are number of live births with morbidty per 100,000 live births in specified group]
National Vital Statistics Reports, Vol. 67, No. 1, January 31, 2018 Table page 1 of 2
U.S. Department of Health and Human Services · Centers for Disease Control and Prevention · National Center for Health Statistics
White Black White Black
United States4
388,218 185,854 76,834 86,691 9.85 9.04 13.77 9.45
Alabama 7,083 3,636 2,749 466 11.98 10.42 15.54 10.19
Alaska 999 424 37 79 8.92 7.33 11.60 9.74
Arizona 7,654 2,950 520 3,205 9.07 8.38 12.77 9.18
Arkansas 4,157 2,501 1,058 363 10.87 10.03 14.92 8.93
California 42,074 10,185 2,800 20,084 8.61 7.67 11.71 8.78
Colorado 5,898 3,266 354 1,748 8.86 8.25 11.78 9.44
Connecticut 3,375 1,647 539 884 9.42 8.47 12.17 10.32
Delaware 1,105 514 374 135 10.06 8.83 13.22 9.43
District of Columbia 1,059 240 628 134 10.75 7.82 13.08 9.95
Florida 22,822 9,024 6,771 6,028 10.15 9.09 13.85 9.15
Georgia 14,577 5,712 6,246 1,716 11.22 9.86 14.07 9.56
Hawaii 1,904 254 73 295 10.55 6.96 15.77 10.67
Idaho 2,008 1,507 20 371 8.93 8.59 9.22 10.27
Illinois 15,952 7,664 3,777 3,153 10.33 9.31 14.76 9.67
Indiana 8,287 5,870 1,316 743 9.98 9.46 13.48 9.99
Iowa 3,652 2,803 314 324 9.27 8.93 12.74 9.33
Kansas 3,457 2,390 337 515 9.09 8.88 13.25 8.18
Kentucky 6,322 5,080 720 276 11.41 11.25 14.70 8.81
Louisiana 7,982 3,502 3,780 420 12.64 10.61 16.35 8.94
Maine 1,089 980 40 18 8.57 8.54 9.73 *
Maryland 7,408 2,751 2,896 1,093 10.14 8.80 12.70 9.21
Massachusetts 6,168 3,372 768 1,265 8.66 8.01 11.18 9.60
Michigan 11,490 7,071 2,957 717 10.14 9.10 14.39 9.58
Minnesota 6,121 4,143 686 454 8.78 8.54 8.82 9.32
Mississippi 5,174 2,243 2,637 173 13.65 11.56 16.61 10.42
Missouri 7,584 5,217 1,469 383 10.17 9.42 14.07 9.27
Montana 1,074 797 5 48 8.75 8.17 * 8.78
Nebraska 2,554 1,700 231 420 9.61 9.08 13.72 9.81
Nevada 3,758 1,377 596 1,252 10.37 9.90 14.18 9.35
New Hampshire 954 804 32 56 7.79 7.57 15.38 8.03
Number Percent
Area
Table I–19. Preterm births, by race and Hispanic origin of mother: United States, each state and territory, 2016
All races2
Hispanic3
All races2
Hispanic3
[By place of residence. Preterm is less than 37 completed weeks of gestation based on the obstetric estimate; see Technical Notes]
Non-Hispanic, single race1
Non-Hispanic, single race1
National Vital Statistics Reports, Vol. 67, No. 1, January 31, 2018 Table page 2 of 2
U.S. Department of Health and Human Services · Centers for Disease Control and Prevention · National Center for Health Statistics
White Black White Black
Number Percent
Area
Table I–19. Preterm births, by race and Hispanic origin of mother: United States, each state and territory, 2016
All races2
Hispanic3
All races2
Hispanic3
[By place of residence. Preterm is less than 37 completed weeks of gestation based on the obstetric estimate; see Technical Notes]
Non-Hispanic, single race1
Non-Hispanic, single race1
New Jersey 10,126 4,019 1,884 2,901 9.87 8.73 13.59 10.34
New Mexico 2,464 663 40 1,375 9.99 9.47 11.30 10.09
New York 20,956 8,778 4,209 5,072 8.96 7.88 12.32 9.35
North Carolina 12,542 6,199 3,785 1,650 10.39 9.43 13.81 8.99
North Dakota 1,040 744 62 59 9.14 8.77 10.13 10.10
Ohio 14,388 9,579 3,248 818 10.43 9.56 14.56 11.03
Oklahoma 5,597 3,122 646 724 10.65 10.24 14.71 9.60
Oregon 3,620 2,399 95 693 7.95 7.73 10.06 8.18
Pennsylvania 12,962 7,989 2,362 1,511 9.31 8.47 12.90 9.86
Rhode Island 1,008 545 95 272 9.34 8.61 12.13 10.14
South Carolina 6,395 3,158 2,465 486 11.16 9.59 14.92 9.47
South Dakota 1,098 710 30 79 8.95 8.04 8.29 12.46
Tennessee 9,085 5,632 2,411 718 11.31 10.51 15.26 9.50
Texas 41,388 12,852 6,552 19,363 10.41 9.58 13.51 10.29
Utah 4,851 3,531 55 795 9.61 9.34 10.52 9.98
Vermont 457 406 4 8 7.95 7.81 * *
Virginia 9,792 4,915 2,764 1,222 9.56 8.55 13.31 8.59
Washington 7,364 4,055 377 1,386 8.14 7.61 9.77 8.39
West Virginia 2,259 2,061 80 38 11.85 11.81 13.63 10.05
Wisconsin 6,385 4,340 933 608 9.59 9.05 14.22 9.36
Wyoming 700 533 7 95 9.48 9.25 * 9.76
Puerto Rico 3,248 95 5 3,137 11.50 13.97 * 11.45
Virgin Islands 88 6 66 10 10.21 * 11.17 *
Guam 321 8 1 2 9.37 * * *
American Samoa --- --- --- --- --- --- --- ---
Northern Marianas 50 – – – 12.14 * * *
SOURCE: NCHS, National Vital Statistics System, Natality.
* Figure does not meet standards of reliability or precision; based on fewer than 20 births in the numerator.
--- Data not available.
– Quantity zero.1Race and Hispanic origin are reported separately on birth certificates; persons of Hispanic origin may be of any race. In this table, non-Hispanic women are classified by race. Race categories are consistent with 1997 Office of Management and Budget
standards; see Technical Notes. Single race is defined as only one race reported on the birth certificate.2Includes births to race and origin groups not shown separately, such as Hispanic single-race white, Hispanic single-race black, and non-Hispanic multiple-race women, as well as births with origin not stated.
3Includes all persons of Hispanic origin of any race; see Technical Notes.
4Excludes data for territories.
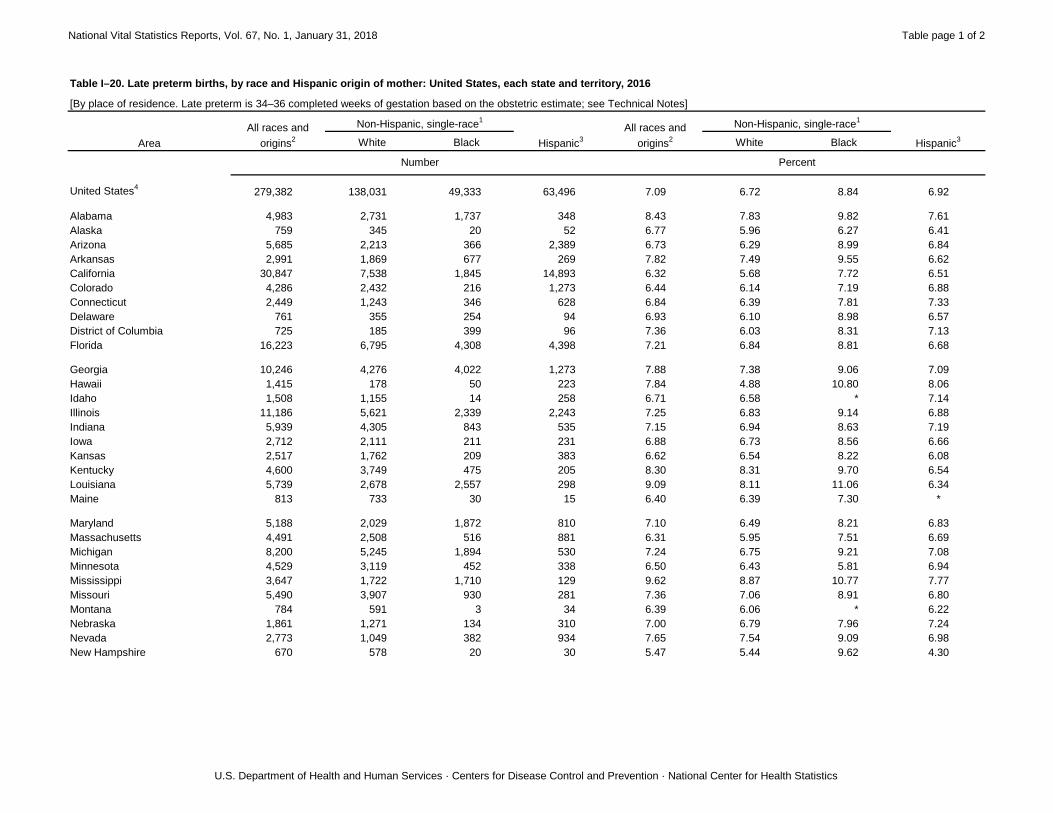
National Vital Statistics Reports, Vol. 67, No. 1, January 31, 2018 Table page 1 of 2
U.S. Department of Health and Human Services · Centers for Disease Control and Prevention · National Center for Health Statistics
White Black White Black
United States4
279,382 138,031 49,333 63,496 7.09 6.72 8.84 6.92
Alabama 4,983 2,731 1,737 348 8.43 7.83 9.82 7.61
Alaska 759 345 20 52 6.77 5.96 6.27 6.41
Arizona 5,685 2,213 366 2,389 6.73 6.29 8.99 6.84
Arkansas 2,991 1,869 677 269 7.82 7.49 9.55 6.62
California 30,847 7,538 1,845 14,893 6.32 5.68 7.72 6.51
Colorado 4,286 2,432 216 1,273 6.44 6.14 7.19 6.88
Connecticut 2,449 1,243 346 628 6.84 6.39 7.81 7.33
Delaware 761 355 254 94 6.93 6.10 8.98 6.57
District of Columbia 725 185 399 96 7.36 6.03 8.31 7.13
Florida 16,223 6,795 4,308 4,398 7.21 6.84 8.81 6.68
Georgia 10,246 4,276 4,022 1,273 7.88 7.38 9.06 7.09
Hawaii 1,415 178 50 223 7.84 4.88 10.80 8.06
Idaho 1,508 1,155 14 258 6.71 6.58 * 7.14
Illinois 11,186 5,621 2,339 2,243 7.25 6.83 9.14 6.88
Indiana 5,939 4,305 843 535 7.15 6.94 8.63 7.19
Iowa 2,712 2,111 211 231 6.88 6.73 8.56 6.66
Kansas 2,517 1,762 209 383 6.62 6.54 8.22 6.08
Kentucky 4,600 3,749 475 205 8.30 8.31 9.70 6.54
Louisiana 5,739 2,678 2,557 298 9.09 8.11 11.06 6.34
Maine 813 733 30 15 6.40 6.39 7.30 *
Maryland 5,188 2,029 1,872 810 7.10 6.49 8.21 6.83
Massachusetts 4,491 2,508 516 881 6.31 5.95 7.51 6.69
Michigan 8,200 5,245 1,894 530 7.24 6.75 9.21 7.08
Minnesota 4,529 3,119 452 338 6.50 6.43 5.81 6.94
Mississippi 3,647 1,722 1,710 129 9.62 8.87 10.77 7.77
Missouri 5,490 3,907 930 281 7.36 7.06 8.91 6.80
Montana 784 591 3 34 6.39 6.06 * 6.22
Nebraska 1,861 1,271 134 310 7.00 6.79 7.96 7.24
Nevada 2,773 1,049 382 934 7.65 7.54 9.09 6.98
New Hampshire 670 578 20 30 5.47 5.44 9.62 4.30
Number Percent
Area
Table I–20. Late preterm births, by race and Hispanic origin of mother: United States, each state and territory, 2016
All races and
origins2
Hispanic3
All races and
origins2
Hispanic3
[By place of residence. Late preterm is 34–36 completed weeks of gestation based on the obstetric estimate; see Technical Notes]
Non-Hispanic, single-race1
Non-Hispanic, single-race1
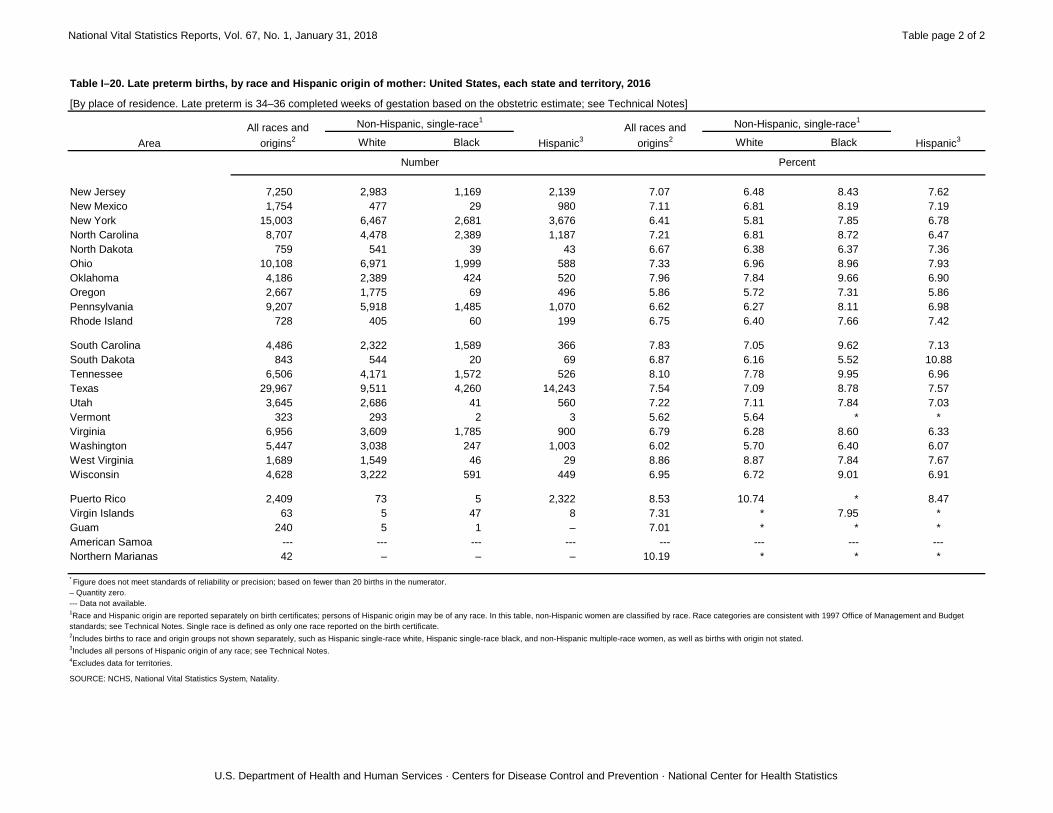
National Vital Statistics Reports, Vol. 67, No. 1, January 31, 2018 Table page 2 of 2
U.S. Department of Health and Human Services · Centers for Disease Control and Prevention · National Center for Health Statistics
White Black White Black
Number Percent
Area
Table I–20. Late preterm births, by race and Hispanic origin of mother: United States, each state and territory, 2016
All races and
origins2
Hispanic3
All races and
origins2
Hispanic3
[By place of residence. Late preterm is 34–36 completed weeks of gestation based on the obstetric estimate; see Technical Notes]
Non-Hispanic, single-race1
Non-Hispanic, single-race1
New Jersey 7,250 2,983 1,169 2,139 7.07 6.48 8.43 7.62
New Mexico 1,754 477 29 980 7.11 6.81 8.19 7.19
New York 15,003 6,467 2,681 3,676 6.41 5.81 7.85 6.78
North Carolina 8,707 4,478 2,389 1,187 7.21 6.81 8.72 6.47
North Dakota 759 541 39 43 6.67 6.38 6.37 7.36
Ohio 10,108 6,971 1,999 588 7.33 6.96 8.96 7.93
Oklahoma 4,186 2,389 424 520 7.96 7.84 9.66 6.90
Oregon 2,667 1,775 69 496 5.86 5.72 7.31 5.86
Pennsylvania 9,207 5,918 1,485 1,070 6.62 6.27 8.11 6.98
Rhode Island 728 405 60 199 6.75 6.40 7.66 7.42
South Carolina 4,486 2,322 1,589 366 7.83 7.05 9.62 7.13
South Dakota 843 544 20 69 6.87 6.16 5.52 10.88
Tennessee 6,506 4,171 1,572 526 8.10 7.78 9.95 6.96
Texas 29,967 9,511 4,260 14,243 7.54 7.09 8.78 7.57
Utah 3,645 2,686 41 560 7.22 7.11 7.84 7.03
Vermont 323 293 2 3 5.62 5.64 * *
Virginia 6,956 3,609 1,785 900 6.79 6.28 8.60 6.33
Washington 5,447 3,038 247 1,003 6.02 5.70 6.40 6.07
West Virginia 1,689 1,549 46 29 8.86 8.87 7.84 7.67
Wisconsin 4,628 3,222 591 449 6.95 6.72 9.01 6.91
Puerto Rico 2,409 73 5 2,322 8.53 10.74 * 8.47
Virgin Islands 63 5 47 8 7.31 * 7.95 *
Guam 240 5 1 – 7.01 * * *
American Samoa --- --- --- --- --- --- --- ---
Northern Marianas 42 – – – 10.19 * * *
SOURCE: NCHS, National Vital Statistics System, Natality.
* Figure does not meet standards of reliability or precision; based on fewer than 20 births in the numerator.
– Quantity zero.
--- Data not available.1Race and Hispanic origin are reported separately on birth certificates; persons of Hispanic origin may be of any race. In this table, non-Hispanic women are classified by race. Race categories are consistent with 1997 Office of Management and Budget
standards; see Technical Notes. Single race is defined as only one race reported on the birth certificate.2Includes births to race and origin groups not shown separately, such as Hispanic single-race white, Hispanic single-race black, and non-Hispanic multiple-race women, as well as births with origin not stated.
3Includes all persons of Hispanic origin of any race; see Technical Notes.
4Excludes data for territories.
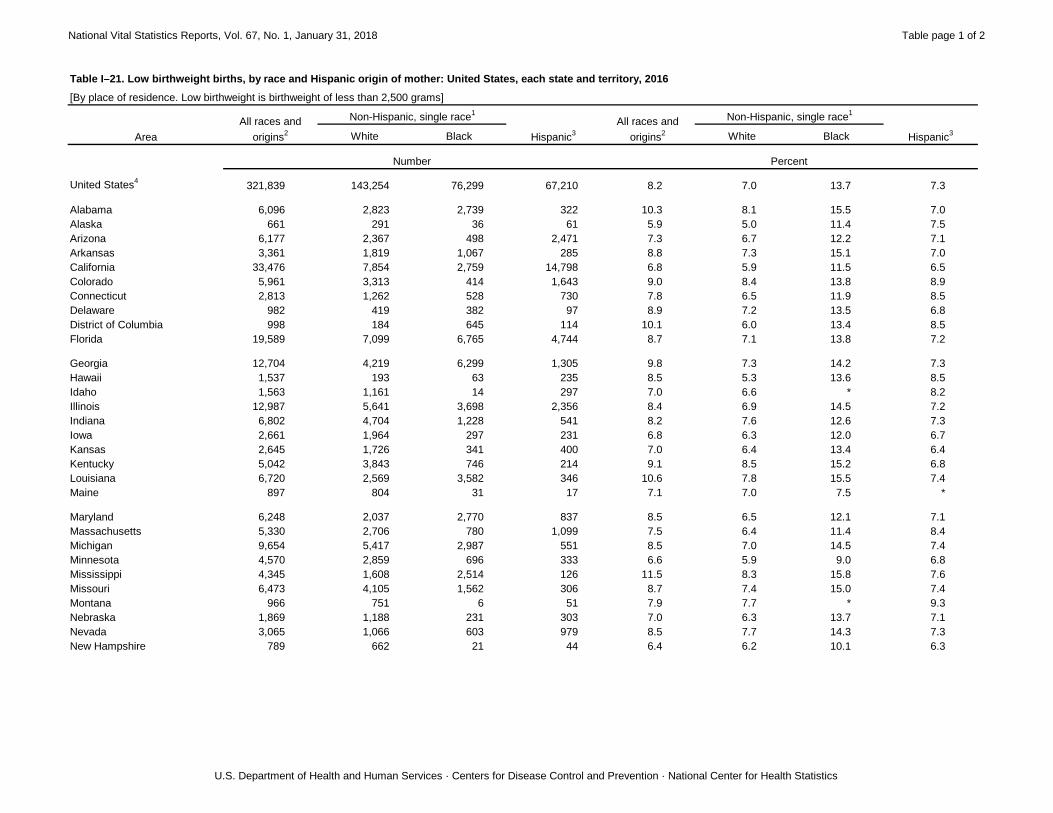
National Vital Statistics Reports, Vol. 67, No. 1, January 31, 2018 Table page 1 of 2
U.S. Department of Health and Human Services · Centers for Disease Control and Prevention · National Center for Health Statistics
White Black White Black
United States4
321,839 143,254 76,299 67,210 8.2 7.0 13.7 7.3
Alabama 6,096 2,823 2,739 322 10.3 8.1 15.5 7.0
Alaska 661 291 36 61 5.9 5.0 11.4 7.5
Arizona 6,177 2,367 498 2,471 7.3 6.7 12.2 7.1
Arkansas 3,361 1,819 1,067 285 8.8 7.3 15.1 7.0
California 33,476 7,854 2,759 14,798 6.8 5.9 11.5 6.5
Colorado 5,961 3,313 414 1,643 9.0 8.4 13.8 8.9
Connecticut 2,813 1,262 528 730 7.8 6.5 11.9 8.5
Delaware 982 419 382 97 8.9 7.2 13.5 6.8
District of Columbia 998 184 645 114 10.1 6.0 13.4 8.5
Florida 19,589 7,099 6,765 4,744 8.7 7.1 13.8 7.2
Georgia 12,704 4,219 6,299 1,305 9.8 7.3 14.2 7.3
Hawaii 1,537 193 63 235 8.5 5.3 13.6 8.5
Idaho 1,563 1,161 14 297 7.0 6.6 * 8.2
Illinois 12,987 5,641 3,698 2,356 8.4 6.9 14.5 7.2
Indiana 6,802 4,704 1,228 541 8.2 7.6 12.6 7.3
Iowa 2,661 1,964 297 231 6.8 6.3 12.0 6.7
Kansas 2,645 1,726 341 400 7.0 6.4 13.4 6.4
Kentucky 5,042 3,843 746 214 9.1 8.5 15.2 6.8
Louisiana 6,720 2,569 3,582 346 10.6 7.8 15.5 7.4
Maine 897 804 31 17 7.1 7.0 7.5 *
Maryland 6,248 2,037 2,770 837 8.5 6.5 12.1 7.1
Massachusetts 5,330 2,706 780 1,099 7.5 6.4 11.4 8.4
Michigan 9,654 5,417 2,987 551 8.5 7.0 14.5 7.4
Minnesota 4,570 2,859 696 333 6.6 5.9 9.0 6.8
Mississippi 4,345 1,608 2,514 126 11.5 8.3 15.8 7.6
Missouri 6,473 4,105 1,562 306 8.7 7.4 15.0 7.4
Montana 966 751 6 51 7.9 7.7 * 9.3
Nebraska 1,869 1,188 231 303 7.0 6.3 13.7 7.1
Nevada 3,065 1,066 603 979 8.5 7.7 14.3 7.3
New Hampshire 789 662 21 44 6.4 6.2 10.1 6.3
Table I–21. Low birthweight births, by race and Hispanic origin of mother: United States, each state and territory, 2016
All races and
origins2
Hispanic3
All races and
origins2
Hispanic3
Non-Hispanic, single race1
Non-Hispanic, single race1
Number Percent
Area
[By place of residence. Low birthweight is birthweight of less than 2,500 grams]
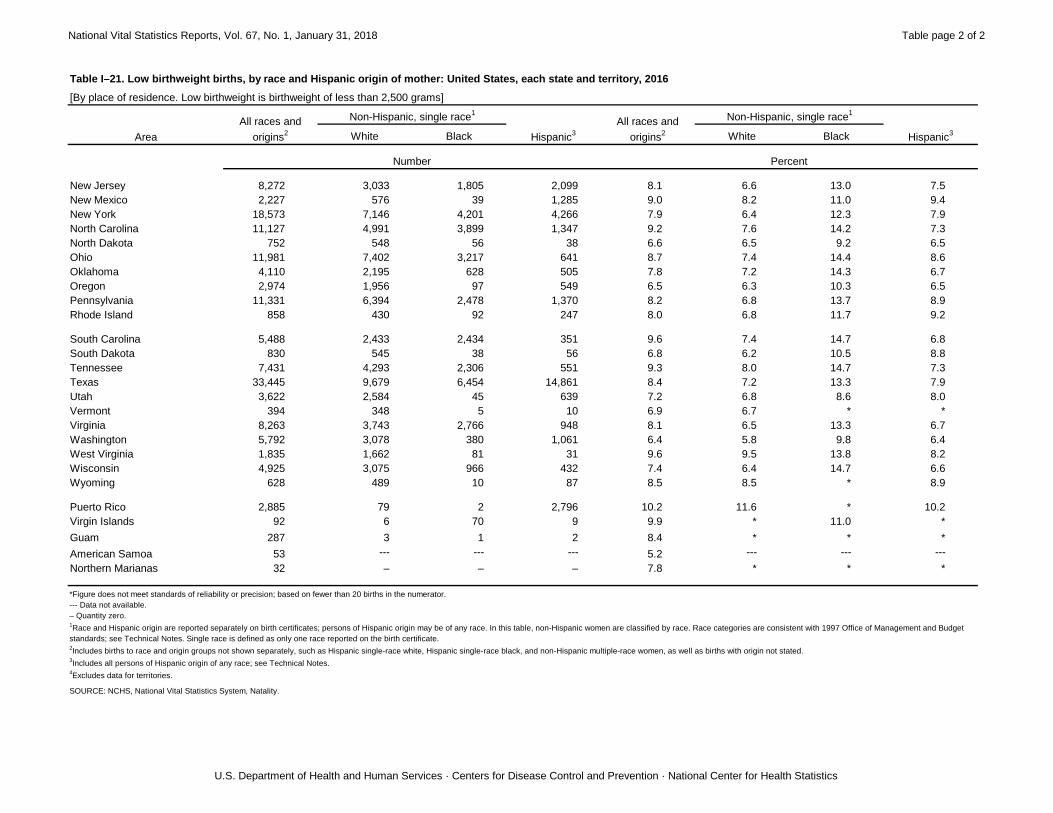
National Vital Statistics Reports, Vol. 67, No. 1, January 31, 2018 Table page 2 of 2
U.S. Department of Health and Human Services · Centers for Disease Control and Prevention · National Center for Health Statistics
White Black White Black
Table I–21. Low birthweight births, by race and Hispanic origin of mother: United States, each state and territory, 2016
All races and
origins2
Hispanic3
All races and
origins2
Hispanic3
Non-Hispanic, single race1
Non-Hispanic, single race1
Number Percent
Area
[By place of residence. Low birthweight is birthweight of less than 2,500 grams]
New Jersey 8,272 3,033 1,805 2,099 8.1 6.6 13.0 7.5
New Mexico 2,227 576 39 1,285 9.0 8.2 11.0 9.4
New York 18,573 7,146 4,201 4,266 7.9 6.4 12.3 7.9
North Carolina 11,127 4,991 3,899 1,347 9.2 7.6 14.2 7.3
North Dakota 752 548 56 38 6.6 6.5 9.2 6.5
Ohio 11,981 7,402 3,217 641 8.7 7.4 14.4 8.6
Oklahoma 4,110 2,195 628 505 7.8 7.2 14.3 6.7
Oregon 2,974 1,956 97 549 6.5 6.3 10.3 6.5
Pennsylvania 11,331 6,394 2,478 1,370 8.2 6.8 13.7 8.9
Rhode Island 858 430 92 247 8.0 6.8 11.7 9.2
South Carolina 5,488 2,433 2,434 351 9.6 7.4 14.7 6.8
South Dakota 830 545 38 56 6.8 6.2 10.5 8.8
Tennessee 7,431 4,293 2,306 551 9.3 8.0 14.7 7.3
Texas 33,445 9,679 6,454 14,861 8.4 7.2 13.3 7.9
Utah 3,622 2,584 45 639 7.2 6.8 8.6 8.0
Vermont 394 348 5 10 6.9 6.7 * *
Virginia 8,263 3,743 2,766 948 8.1 6.5 13.3 6.7
Washington 5,792 3,078 380 1,061 6.4 5.8 9.8 6.4
West Virginia 1,835 1,662 81 31 9.6 9.5 13.8 8.2
Wisconsin 4,925 3,075 966 432 7.4 6.4 14.7 6.6
Wyoming 628 489 10 87 8.5 8.5 * 8.9
Puerto Rico 2,885 79 2 2,796 10.2 11.6 * 10.2
Virgin Islands 92 6 70 9 9.9 * 11.0 *
Guam 287 3 1 2 8.4 * * *
American Samoa 53 --- --- --- 5.2 --- --- ---
Northern Marianas 32 – – – 7.8 * * *
SOURCE: NCHS, National Vital Statistics System, Natality.
*Figure does not meet standards of reliability or precision; based on fewer than 20 births in the numerator.
--- Data not available.
– Quantity zero.1Race and Hispanic origin are reported separately on birth certificates; persons of Hispanic origin may be of any race. In this table, non-Hispanic women are classified by race. Race categories are consistent with 1997 Office of Management and Budget
standards; see Technical Notes. Single race is defined as only one race reported on the birth certificate.2Includes births to race and origin groups not shown separately, such as Hispanic single-race white, Hispanic single-race black, and non-Hispanic multiple-race women, as well as births with origin not stated.
3Includes all persons of Hispanic origin of any race; see Technical Notes.
4Excludes data for territories.
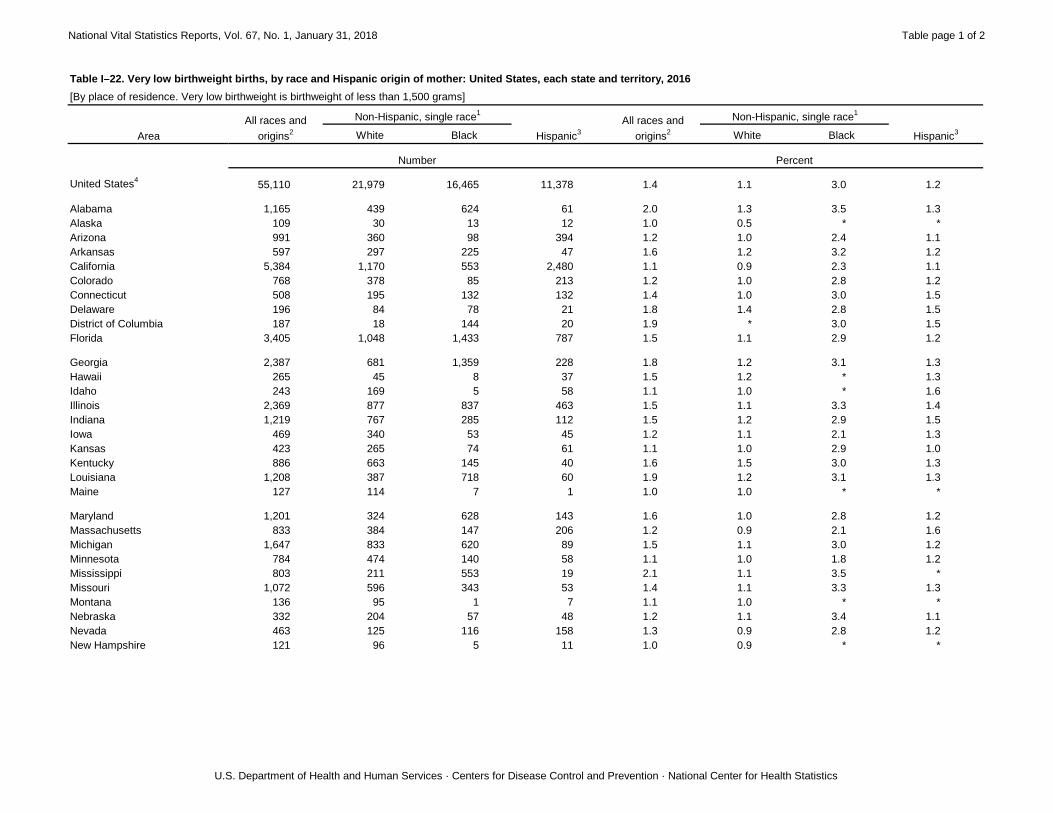
National Vital Statistics Reports, Vol. 67, No. 1, January 31, 2018 Table page 1 of 2
U.S. Department of Health and Human Services · Centers for Disease Control and Prevention · National Center for Health Statistics
White Black White Black
United States4
55,110 21,979 16,465 11,378 1.4 1.1 3.0 1.2
Alabama 1,165 439 624 61 2.0 1.3 3.5 1.3
Alaska 109 30 13 12 1.0 0.5 * *
Arizona 991 360 98 394 1.2 1.0 2.4 1.1
Arkansas 597 297 225 47 1.6 1.2 3.2 1.2
California 5,384 1,170 553 2,480 1.1 0.9 2.3 1.1
Colorado 768 378 85 213 1.2 1.0 2.8 1.2
Connecticut 508 195 132 132 1.4 1.0 3.0 1.5
Delaware 196 84 78 21 1.8 1.4 2.8 1.5
District of Columbia 187 18 144 20 1.9 * 3.0 1.5
Florida 3,405 1,048 1,433 787 1.5 1.1 2.9 1.2
Georgia 2,387 681 1,359 228 1.8 1.2 3.1 1.3
Hawaii 265 45 8 37 1.5 1.2 * 1.3
Idaho 243 169 5 58 1.1 1.0 * 1.6
Illinois 2,369 877 837 463 1.5 1.1 3.3 1.4
Indiana 1,219 767 285 112 1.5 1.2 2.9 1.5
Iowa 469 340 53 45 1.2 1.1 2.1 1.3
Kansas 423 265 74 61 1.1 1.0 2.9 1.0
Kentucky 886 663 145 40 1.6 1.5 3.0 1.3
Louisiana 1,208 387 718 60 1.9 1.2 3.1 1.3
Maine 127 114 7 1 1.0 1.0 * *
Maryland 1,201 324 628 143 1.6 1.0 2.8 1.2
Massachusetts 833 384 147 206 1.2 0.9 2.1 1.6
Michigan 1,647 833 620 89 1.5 1.1 3.0 1.2
Minnesota 784 474 140 58 1.1 1.0 1.8 1.2
Mississippi 803 211 553 19 2.1 1.1 3.5 *
Missouri 1,072 596 343 53 1.4 1.1 3.3 1.3
Montana 136 95 1 7 1.1 1.0 * *
Nebraska 332 204 57 48 1.2 1.1 3.4 1.1
Nevada 463 125 116 158 1.3 0.9 2.8 1.2
New Hampshire 121 96 5 11 1.0 0.9 * *
PercentNumber
Table I–22. Very low birthweight births, by race and Hispanic origin of mother: United States, each state and territory, 2016
All races and
origins2
Hispanic3
All races and
origins2
Hispanic3
Non-Hispanic, single race1
Non-Hispanic, single race1
Area
[By place of residence. Very low birthweight is birthweight of less than 1,500 grams]
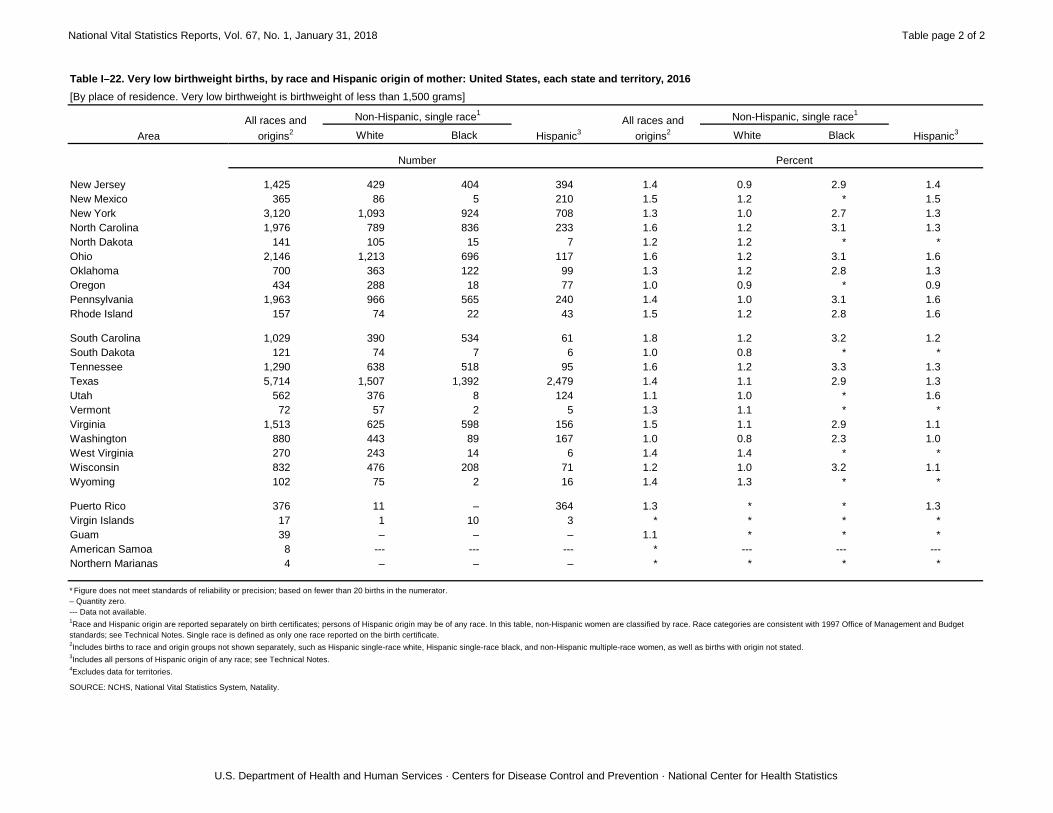
National Vital Statistics Reports, Vol. 67, No. 1, January 31, 2018 Table page 2 of 2
U.S. Department of Health and Human Services · Centers for Disease Control and Prevention · National Center for Health Statistics
White Black White Black
PercentNumber
Table I–22. Very low birthweight births, by race and Hispanic origin of mother: United States, each state and territory, 2016
All races and
origins2
Hispanic3
All races and
origins2
Hispanic3
Non-Hispanic, single race1
Non-Hispanic, single race1
Area
[By place of residence. Very low birthweight is birthweight of less than 1,500 grams]
New Jersey 1,425 429 404 394 1.4 0.9 2.9 1.4
New Mexico 365 86 5 210 1.5 1.2 * 1.5
New York 3,120 1,093 924 708 1.3 1.0 2.7 1.3
North Carolina 1,976 789 836 233 1.6 1.2 3.1 1.3
North Dakota 141 105 15 7 1.2 1.2 * *
Ohio 2,146 1,213 696 117 1.6 1.2 3.1 1.6
Oklahoma 700 363 122 99 1.3 1.2 2.8 1.3
Oregon 434 288 18 77 1.0 0.9 * 0.9
Pennsylvania 1,963 966 565 240 1.4 1.0 3.1 1.6
Rhode Island 157 74 22 43 1.5 1.2 2.8 1.6
South Carolina 1,029 390 534 61 1.8 1.2 3.2 1.2
South Dakota 121 74 7 6 1.0 0.8 * *
Tennessee 1,290 638 518 95 1.6 1.2 3.3 1.3
Texas 5,714 1,507 1,392 2,479 1.4 1.1 2.9 1.3
Utah 562 376 8 124 1.1 1.0 * 1.6
Vermont 72 57 2 5 1.3 1.1 * *
Virginia 1,513 625 598 156 1.5 1.1 2.9 1.1
Washington 880 443 89 167 1.0 0.8 2.3 1.0
West Virginia 270 243 14 6 1.4 1.4 * *
Wisconsin 832 476 208 71 1.2 1.0 3.2 1.1
Wyoming 102 75 2 16 1.4 1.3 * *
Puerto Rico 376 11 – 364 1.3 * * 1.3
Virgin Islands 17 1 10 3 * * * *
Guam 39 – – – 1.1 * * *
American Samoa 8 --- --- --- * --- --- ---
Northern Marianas 4 – – – * * * *
SOURCE: NCHS, National Vital Statistics System, Natality.
* Figure does not meet standards of reliability or precision; based on fewer than 20 births in the numerator.
– Quantity zero.
--- Data not available.1Race and Hispanic origin are reported separately on birth certificates; persons of Hispanic origin may be of any race. In this table, non-Hispanic women are classified by race. Race categories are consistent with 1997 Office of Management and Budget
standards; see Technical Notes. Single race is defined as only one race reported on the birth certificate.2Includes births to race and origin groups not shown separately, such as Hispanic single-race white, Hispanic single-race black, and non-Hispanic multiple-race women, as well as births with origin not stated.
3Includes all persons of Hispanic origin of any race; see Technical Notes.
4Excludes data for territories.
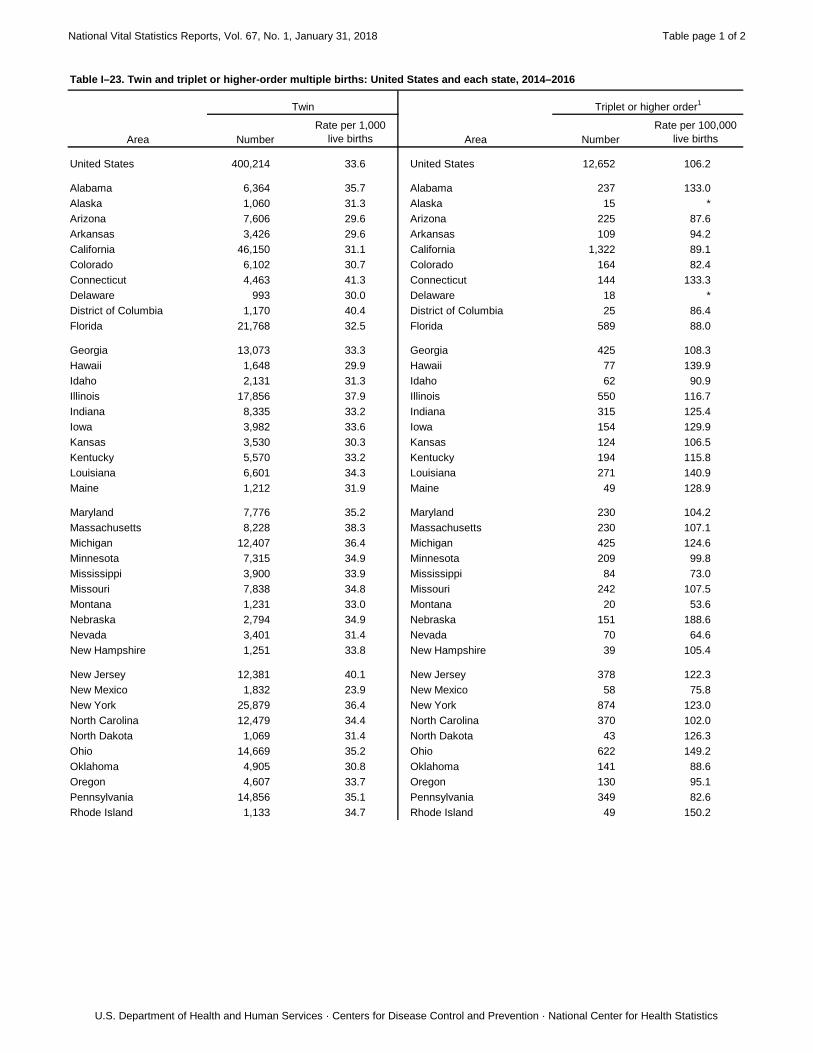
National Vital Statistics Reports, Vol. 67, No. 1, January 31, 2018 Table page 1 of 2
U.S. Department of Health and Human Services · Centers for Disease Control and Prevention · National Center for Health Statistics
Number
Rate per 1,000
live births Number
Rate per 100,000
live births
United States 400,214 33.6 United States 12,652 106.2
Alabama 6,364 35.7 Alabama 237 133.0
Alaska 1,060 31.3 Alaska 15 *
Arizona 7,606 29.6 Arizona 225 87.6
Arkansas 3,426 29.6 Arkansas 109 94.2
California 46,150 31.1 California 1,322 89.1
Colorado 6,102 30.7 Colorado 164 82.4
Connecticut 4,463 41.3 Connecticut 144 133.3
Delaware 993 30.0 Delaware 18 *
District of Columbia 1,170 40.4 District of Columbia 25 86.4
Florida 21,768 32.5 Florida 589 88.0
Georgia 13,073 33.3 Georgia 425 108.3
Hawaii 1,648 29.9 Hawaii 77 139.9
Idaho 2,131 31.3 Idaho 62 90.9
Illinois 17,856 37.9 Illinois 550 116.7
Indiana 8,335 33.2 Indiana 315 125.4
Iowa 3,982 33.6 Iowa 154 129.9
Kansas 3,530 30.3 Kansas 124 106.5
Kentucky 5,570 33.2 Kentucky 194 115.8
Louisiana 6,601 34.3 Louisiana 271 140.9
Maine 1,212 31.9 Maine 49 128.9
Maryland 7,776 35.2 Maryland 230 104.2
Massachusetts 8,228 38.3 Massachusetts 230 107.1
Michigan 12,407 36.4 Michigan 425 124.6
Minnesota 7,315 34.9 Minnesota 209 99.8
Mississippi 3,900 33.9 Mississippi 84 73.0
Missouri 7,838 34.8 Missouri 242 107.5
Montana 1,231 33.0 Montana 20 53.6
Nebraska 2,794 34.9 Nebraska 151 188.6
Nevada 3,401 31.4 Nevada 70 64.6
New Hampshire 1,251 33.8 New Hampshire 39 105.4
New Jersey 12,381 40.1 New Jersey 378 122.3
New Mexico 1,832 23.9 New Mexico 58 75.8
New York 25,879 36.4 New York 874 123.0
North Carolina 12,479 34.4 North Carolina 370 102.0
North Dakota 1,069 31.4 North Dakota 43 126.3
Ohio 14,669 35.2 Ohio 622 149.2
Oklahoma 4,905 30.8 Oklahoma 141 88.6
Oregon 4,607 33.7 Oregon 130 95.1
Pennsylvania 14,856 35.1 Pennsylvania 349 82.6
Rhode Island 1,133 34.7 Rhode Island 49 150.2
Table I–23. Twin and triplet or higher-order multiple births: United States and each state, 2014–2016
Area
Twin
Area
Triplet or higher order1
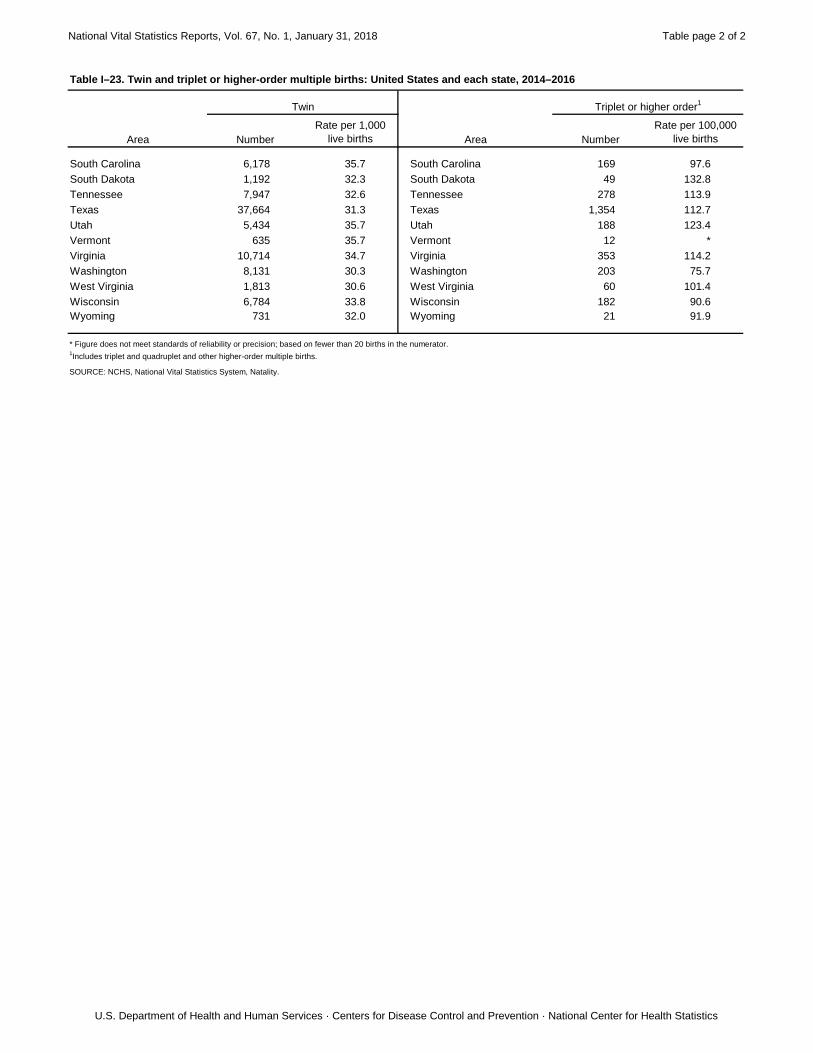
National Vital Statistics Reports, Vol. 67, No. 1, January 31, 2018 Table page 2 of 2
U.S. Department of Health and Human Services · Centers for Disease Control and Prevention · National Center for Health Statistics
Number
Rate per 1,000
live births Number
Rate per 100,000
live births
Table I–23. Twin and triplet or higher-order multiple births: United States and each state, 2014–2016
Area
Twin
Area
Triplet or higher order1
South Carolina 6,178 35.7 South Carolina 169 97.6
South Dakota 1,192 32.3 South Dakota 49 132.8
Tennessee 7,947 32.6 Tennessee 278 113.9
Texas 37,664 31.3 Texas 1,354 112.7
Utah 5,434 35.7 Utah 188 123.4
Vermont 635 35.7 Vermont 12 *
Virginia 10,714 34.7 Virginia 353 114.2
Washington 8,131 30.3 Washington 203 75.7
West Virginia 1,813 30.6 West Virginia 60 101.4
Wisconsin 6,784 33.8 Wisconsin 182 90.6
Wyoming 731 32.0 Wyoming 21 91.9
SOURCE: NCHS, National Vital Statistics System, Natality.
* Figure does not meet standards of reliability or precision; based on fewer than 20 births in the numerator.1Includes triplet and quadruplet and other higher-order multiple births.
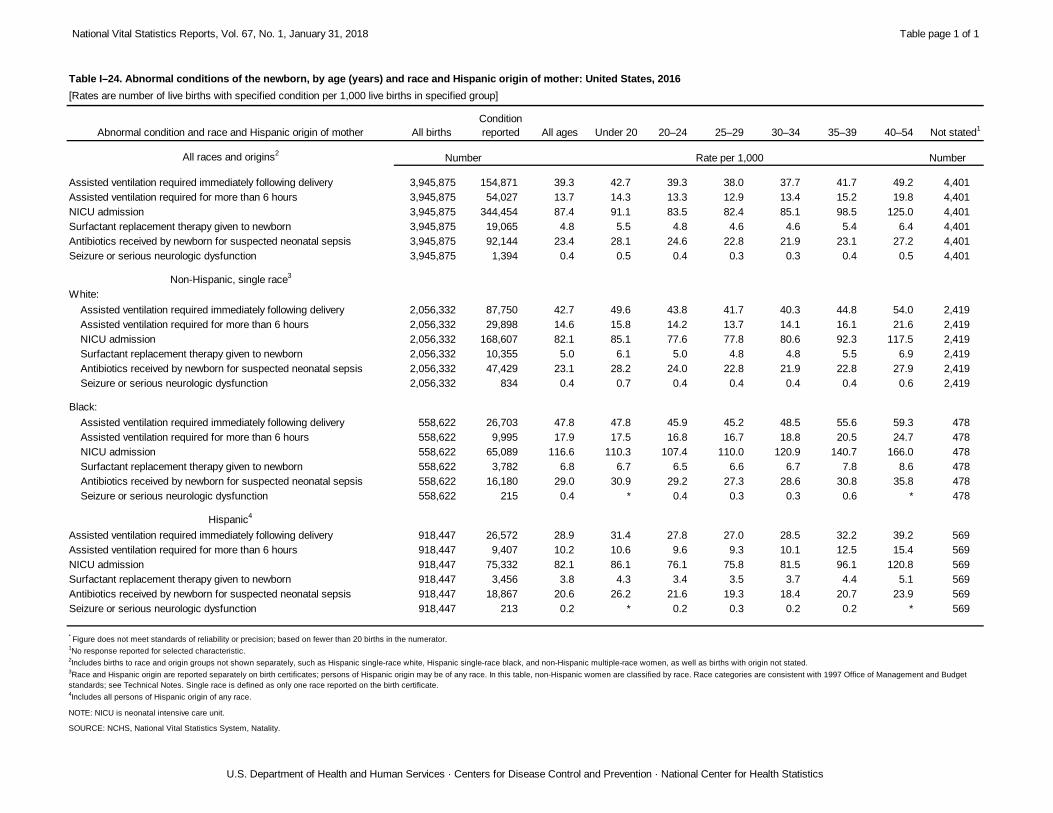
National Vital Statistics Reports, Vol. 67, No. 1, January 31, 2018 Table page 1 of 1
U.S. Department of Health and Human Services · Centers for Disease Control and Prevention · National Center for Health Statistics
Abnormal condition and race and Hispanic origin of mother All births
Condition
reported All ages Under 20 20–24 25–29 30–34 35–39 40–54 Not stated1
All races and origins2
Number
Assisted ventilation required immediately following delivery 3,945,875 154,871 39.3 42.7 39.3 38.0 37.7 41.7 49.2 4,401
Assisted ventilation required for more than 6 hours 3,945,875 54,027 13.7 14.3 13.3 12.9 13.4 15.2 19.8 4,401
NICU admission 3,945,875 344,454 87.4 91.1 83.5 82.4 85.1 98.5 125.0 4,401
Surfactant replacement therapy given to newborn 3,945,875 19,065 4.8 5.5 4.8 4.6 4.6 5.4 6.4 4,401
Antibiotics received by newborn for suspected neonatal sepsis 3,945,875 92,144 23.4 28.1 24.6 22.8 21.9 23.1 27.2 4,401
Seizure or serious neurologic dysfunction 3,945,875 1,394 0.4 0.5 0.4 0.3 0.3 0.4 0.5 4,401
Non-Hispanic, single race3
White:
Assisted ventilation required immediately following delivery 2,056,332 87,750 42.7 49.6 43.8 41.7 40.3 44.8 54.0 2,419
Assisted ventilation required for more than 6 hours 2,056,332 29,898 14.6 15.8 14.2 13.7 14.1 16.1 21.6 2,419
NICU admission 2,056,332 168,607 82.1 85.1 77.6 77.8 80.6 92.3 117.5 2,419
Surfactant replacement therapy given to newborn 2,056,332 10,355 5.0 6.1 5.0 4.8 4.8 5.5 6.9 2,419
Antibiotics received by newborn for suspected neonatal sepsis 2,056,332 47,429 23.1 28.2 24.0 22.8 21.9 22.8 27.9 2,419
Seizure or serious neurologic dysfunction 2,056,332 834 0.4 0.7 0.4 0.4 0.4 0.4 0.6 2,419
Black:
Assisted ventilation required immediately following delivery 558,622 26,703 47.8 47.8 45.9 45.2 48.5 55.6 59.3 478
Assisted ventilation required for more than 6 hours 558,622 9,995 17.9 17.5 16.8 16.7 18.8 20.5 24.7 478
NICU admission 558,622 65,089 116.6 110.3 107.4 110.0 120.9 140.7 166.0 478
Surfactant replacement therapy given to newborn 558,622 3,782 6.8 6.7 6.5 6.6 6.7 7.8 8.6 478
Antibiotics received by newborn for suspected neonatal sepsis 558,622 16,180 29.0 30.9 29.2 27.3 28.6 30.8 35.8 478
Seizure or serious neurologic dysfunction 558,622 215 0.4 * 0.4 0.3 0.3 0.6 * 478
Hispanic4
Assisted ventilation required immediately following delivery 918,447 26,572 28.9 31.4 27.8 27.0 28.5 32.2 39.2 569
Assisted ventilation required for more than 6 hours 918,447 9,407 10.2 10.6 9.6 9.3 10.1 12.5 15.4 569
NICU admission 918,447 75,332 82.1 86.1 76.1 75.8 81.5 96.1 120.8 569
Surfactant replacement therapy given to newborn 918,447 3,456 3.8 4.3 3.4 3.5 3.7 4.4 5.1 569
Antibiotics received by newborn for suspected neonatal sepsis 918,447 18,867 20.6 26.2 21.6 19.3 18.4 20.7 23.9 569
Seizure or serious neurologic dysfunction 918,447 213 0.2 * 0.2 0.3 0.2 0.2 * 569
Rate per 1,000
SOURCE: NCHS, National Vital Statistics System, Natality.
Table I–24. Abnormal conditions of the newborn, by age (years) and race and Hispanic origin of mother: United States, 2016
* Figure does not meet standards of reliability or precision; based on fewer than 20 births in the numerator.
1No response reported for selected characteristic.
2Includes births to race and origin groups not shown separately, such as Hispanic single-race white, Hispanic single-race black, and non-Hispanic multiple-race women, as well as births with origin not stated.
3Race and Hispanic origin are reported separately on birth certificates; persons of Hispanic origin may be of any race. In this table, non-Hispanic women are classified by race. Race categories are consistent with 1997 Office of Management and Budget
standards; see Technical Notes. Single race is defined as only one race reported on the birth certificate.4Includes all persons of Hispanic origin of any race.
[Rates are number of live births with specified condition per 1,000 live births in specified group]
NOTE: NICU is neonatal intensive care unit.
Number
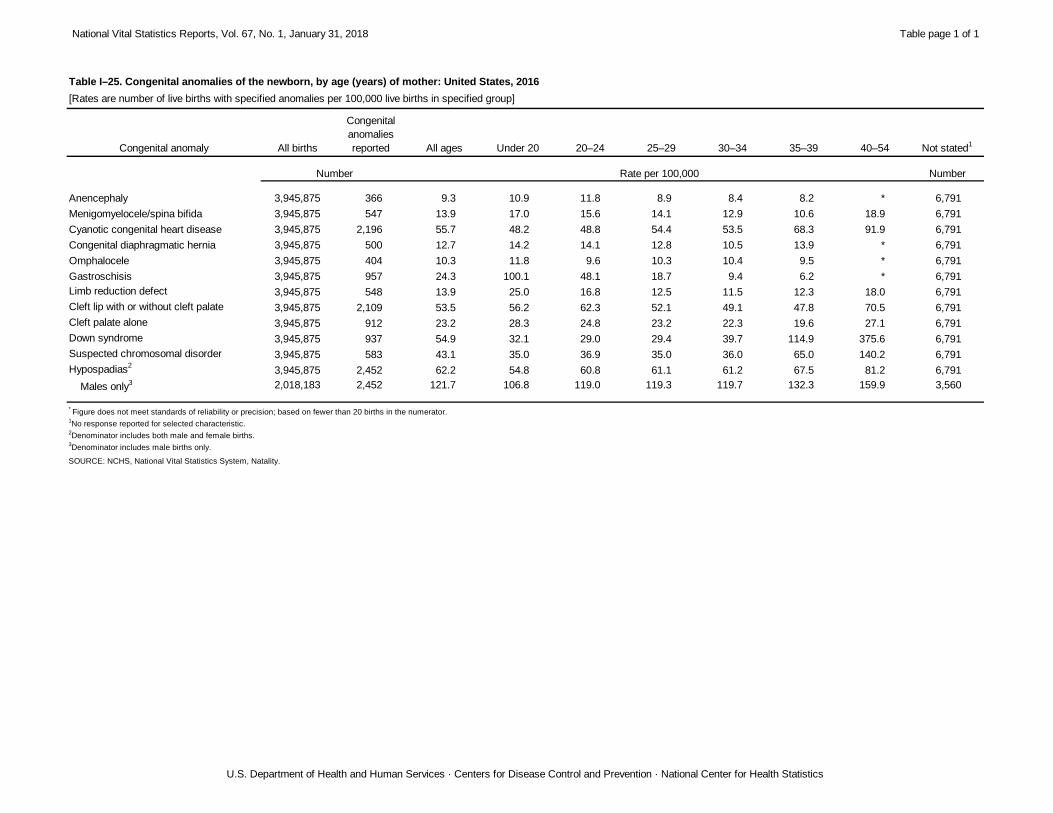
National Vital Statistics Reports, Vol. 67, No. 1, January 31, 2018 Table page 1 of 1
U.S. Department of Health and Human Services · Centers for Disease Control and Prevention · National Center for Health Statistics
Congenital anomaly All births
Congenital
anomalies
reported All ages Under 20 20–24 25–29 30–34 35–39 40–54 Not stated1
Number
Anencephaly 3,945,875 366 9.3 10.9 11.8 8.9 8.4 8.2 * 6,791
Menigomyelocele/spina bifida 3,945,875 547 13.9 17.0 15.6 14.1 12.9 10.6 18.9 6,791
Cyanotic congenital heart disease 3,945,875 2,196 55.7 48.2 48.8 54.4 53.5 68.3 91.9 6,791
Congenital diaphragmatic hernia 3,945,875 500 12.7 14.2 14.1 12.8 10.5 13.9 * 6,791
Omphalocele 3,945,875 404 10.3 11.8 9.6 10.3 10.4 9.5 * 6,791
Gastroschisis 3,945,875 957 24.3 100.1 48.1 18.7 9.4 6.2 * 6,791
Limb reduction defect 3,945,875 548 13.9 25.0 16.8 12.5 11.5 12.3 18.0 6,791
Cleft lip with or without cleft palate 3,945,875 2,109 53.5 56.2 62.3 52.1 49.1 47.8 70.5 6,791
Cleft palate alone 3,945,875 912 23.2 28.3 24.8 23.2 22.3 19.6 27.1 6,791
Down syndrome 3,945,875 937 54.9 32.1 29.0 29.4 39.7 114.9 375.6 6,791
Suspected chromosomal disorder 3,945,875 583 43.1 35.0 36.9 35.0 36.0 65.0 140.2 6,791
Hypospadias2
3,945,875 2,452 62.2 54.8 60.8 61.1 61.2 67.5 81.2 6,791
Males only3 2,018,183 2,452 121.7 106.8 119.0 119.3 119.7 132.3 159.9 3,560
Table I–25. Congenital anomalies of the newborn, by age (years) of mother: United States, 2016[Rates are number of live births with specified anomalies per 100,000 live births in specified group]
* Figure does not meet standards of reliability or precision; based on fewer than 20 births in the numerator.
1No response reported for selected characteristic.
2Denominator includes both male and female births.
3Denominator includes male births only.
SOURCE: NCHS, National Vital Statistics System, Natality.
Number Rate per 100,000
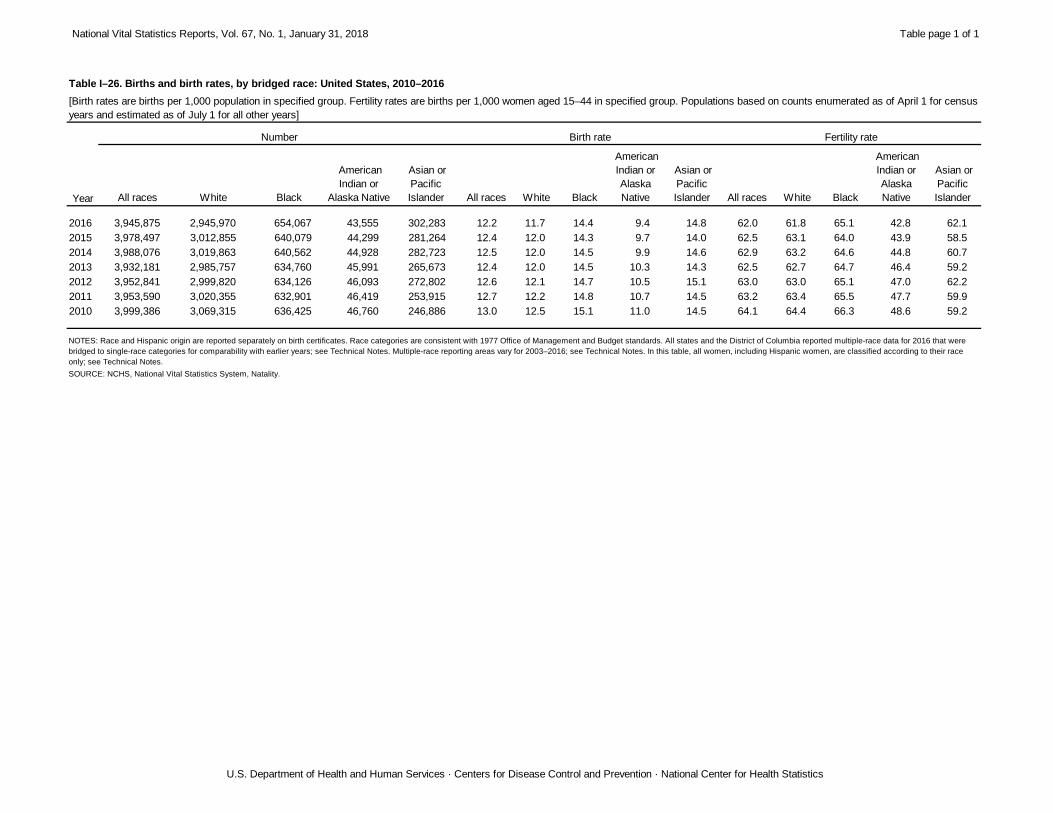
National Vital Statistics Reports, Vol. 67, No. 1, January 31, 2018 Table page 1 of 1
U.S. Department of Health and Human Services · Centers for Disease Control and Prevention · National Center for Health Statistics
All races White Black
American
Indian or
Alaska Native
Asian or
Pacific
Islander All races White Black
American
Indian or
Alaska
Native
Asian or
Pacific
Islander All races White Black
American
Indian or
Alaska
Native
Asian or
Pacific
Islander
2016 3,945,875 2,945,970 654,067 43,555 302,283 12.2 11.7 14.4 9.4 14.8 62.0 61.8 65.1 42.8 62.1
2015 3,978,497 3,012,855 640,079 44,299 281,264 12.4 12.0 14.3 9.7 14.0 62.5 63.1 64.0 43.9 58.5
2014 3,988,076 3,019,863 640,562 44,928 282,723 12.5 12.0 14.5 9.9 14.6 62.9 63.2 64.6 44.8 60.7
2013 3,932,181 2,985,757 634,760 45,991 265,673 12.4 12.0 14.5 10.3 14.3 62.5 62.7 64.7 46.4 59.2
2012 3,952,841 2,999,820 634,126 46,093 272,802 12.6 12.1 14.7 10.5 15.1 63.0 63.0 65.1 47.0 62.2
2011 3,953,590 3,020,355 632,901 46,419 253,915 12.7 12.2 14.8 10.7 14.5 63.2 63.4 65.5 47.7 59.9
2010 3,999,386 3,069,315 636,425 46,760 246,886 13.0 12.5 15.1 11.0 14.5 64.1 64.4 66.3 48.6 59.2
SOURCE: NCHS, National Vital Statistics System, Natality.
NOTES: Race and Hispanic origin are reported separately on birth certificates. Race categories are consistent with 1977 Office of Management and Budget standards. All states and the District of Columbia reported multiple-race data for 2016 that were
bridged to single-race categories for comparability with earlier years; see Technical Notes. Multiple-race reporting areas vary for 2003–2016; see Technical Notes. In this table, all women, including Hispanic women, are classified according to their race
only; see Technical Notes.
Fertility rate
[Birth rates are births per 1,000 population in specified group. Fertility rates are births per 1,000 women aged 15–44 in specified group. Populations based on counts enumerated as of April 1 for census
years and estimated as of July 1 for all other years]
Table I–26. Births and birth rates, by bridged race: United States, 2010–2016
Birth rate
Year
Number
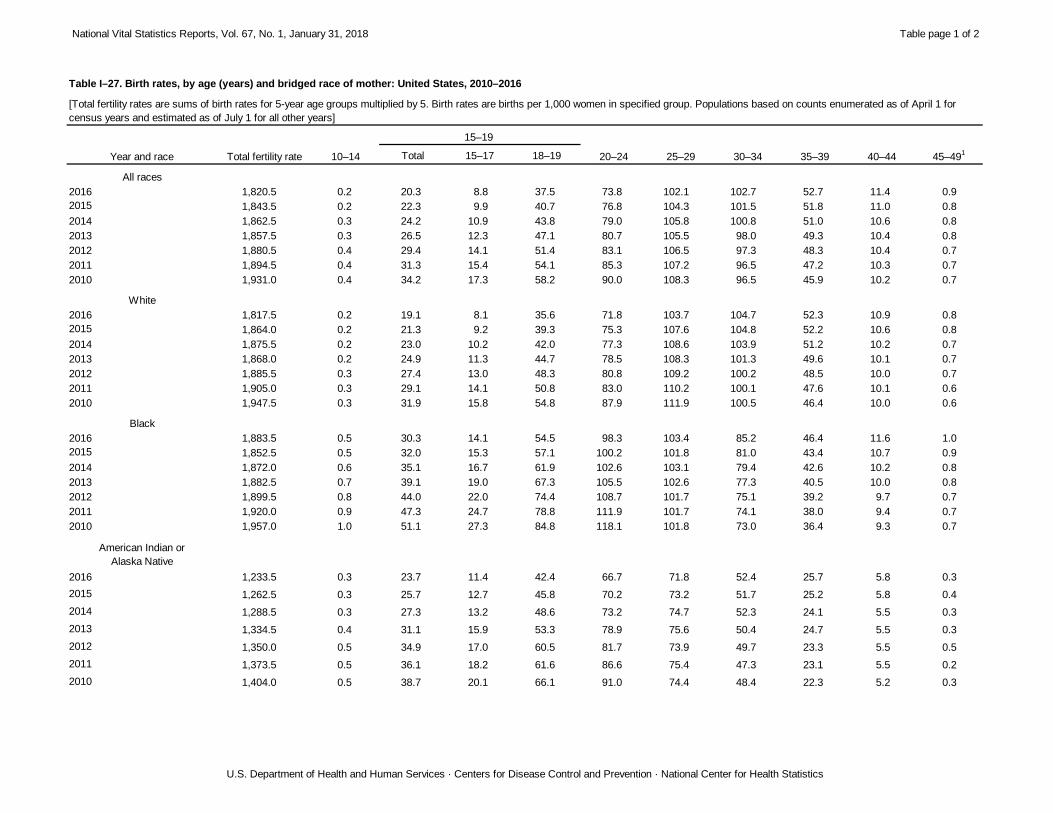
National Vital Statistics Reports, Vol. 67, No. 1, January 31, 2018 Table page 1 of 2
U.S. Department of Health and Human Services · Centers for Disease Control and Prevention · National Center for Health Statistics
Total 15–17 18–19
All races
2016 1,820.5 0.2 20.3 8.8 37.5 73.8 102.1 102.7 52.7 11.4 0.9
2015 1,843.5 0.2 22.3 9.9 40.7 76.8 104.3 101.5 51.8 11.0 0.8
2014 1,862.5 0.3 24.2 10.9 43.8 79.0 105.8 100.8 51.0 10.6 0.8
2013 1,857.5 0.3 26.5 12.3 47.1 80.7 105.5 98.0 49.3 10.4 0.8
2012 1,880.5 0.4 29.4 14.1 51.4 83.1 106.5 97.3 48.3 10.4 0.7
2011 1,894.5 0.4 31.3 15.4 54.1 85.3 107.2 96.5 47.2 10.3 0.7
2010 1,931.0 0.4 34.2 17.3 58.2 90.0 108.3 96.5 45.9 10.2 0.7
White
2016 1,817.5 0.2 19.1 8.1 35.6 71.8 103.7 104.7 52.3 10.9 0.8
2015 1,864.0 0.2 21.3 9.2 39.3 75.3 107.6 104.8 52.2 10.6 0.8
2014 1,875.5 0.2 23.0 10.2 42.0 77.3 108.6 103.9 51.2 10.2 0.7
2013 1,868.0 0.2 24.9 11.3 44.7 78.5 108.3 101.3 49.6 10.1 0.7
2012 1,885.5 0.3 27.4 13.0 48.3 80.8 109.2 100.2 48.5 10.0 0.7
2011 1,905.0 0.3 29.1 14.1 50.8 83.0 110.2 100.1 47.6 10.1 0.6
2010 1,947.5 0.3 31.9 15.8 54.8 87.9 111.9 100.5 46.4 10.0 0.6
Black
2016 1,883.5 0.5 30.3 14.1 54.5 98.3 103.4 85.2 46.4 11.6 1.0
2015 1,852.5 0.5 32.0 15.3 57.1 100.2 101.8 81.0 43.4 10.7 0.9
2014 1,872.0 0.6 35.1 16.7 61.9 102.6 103.1 79.4 42.6 10.2 0.8
2013 1,882.5 0.7 39.1 19.0 67.3 105.5 102.6 77.3 40.5 10.0 0.8
2012 1,899.5 0.8 44.0 22.0 74.4 108.7 101.7 75.1 39.2 9.7 0.7
2011 1,920.0 0.9 47.3 24.7 78.8 111.9 101.7 74.1 38.0 9.4 0.7
2010 1,957.0 1.0 51.1 27.3 84.8 118.1 101.8 73.0 36.4 9.3 0.7
American Indian or
Alaska Native
2016 1,233.5 0.3 23.7 11.4 42.4 66.7 71.8 52.4 25.7 5.8 0.3
2015 1,262.5 0.3 25.7 12.7 45.8 70.2 73.2 51.7 25.2 5.8 0.4
2014 1,288.5 0.3 27.3 13.2 48.6 73.2 74.7 52.3 24.1 5.5 0.3
2013 1,334.5 0.4 31.1 15.9 53.3 78.9 75.6 50.4 24.7 5.5 0.3
2012 1,350.0 0.5 34.9 17.0 60.5 81.7 73.9 49.7 23.3 5.5 0.5
2011 1,373.5 0.5 36.1 18.2 61.6 86.6 75.4 47.3 23.1 5.5 0.2
2010 1,404.0 0.5 38.7 20.1 66.1 91.0 74.4 48.4 22.3 5.2 0.3
Year and race Total fertility rate
Table I–27. Birth rates, by age (years) and bridged race of mother: United States, 2010–2016
30–34 25–29 10–14
[Total fertility rates are sums of birth rates for 5-year age groups multiplied by 5. Birth rates are births per 1,000 women in specified group. Populations based on counts enumerated as of April 1 for
census years and estimated as of July 1 for all other years]
40–44 45–491
35–39
15–19
20–24
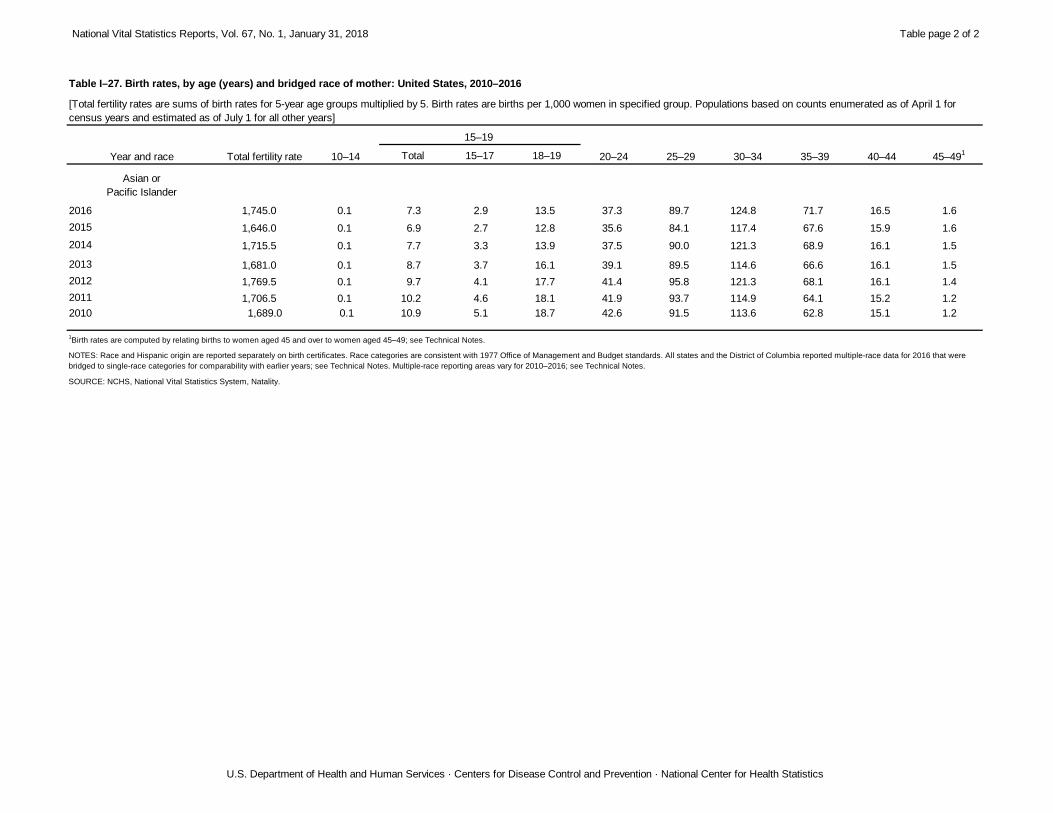
National Vital Statistics Reports, Vol. 67, No. 1, January 31, 2018 Table page 2 of 2
U.S. Department of Health and Human Services · Centers for Disease Control and Prevention · National Center for Health Statistics
Total 15–17 18–19 Year and race Total fertility rate
Table I–27. Birth rates, by age (years) and bridged race of mother: United States, 2010–2016
30–34 25–29 10–14
[Total fertility rates are sums of birth rates for 5-year age groups multiplied by 5. Birth rates are births per 1,000 women in specified group. Populations based on counts enumerated as of April 1 for
census years and estimated as of July 1 for all other years]
40–44 45–491
35–39
15–19
20–24
Asian or
Pacific Islander
2016 1,745.0 0.1 7.3 2.9 13.5 37.3 89.7 124.8 71.7 16.5 1.6
2015 1,646.0 0.1 6.9 2.7 12.8 35.6 84.1 117.4 67.6 15.9 1.6
2014 1,715.5 0.1 7.7 3.3 13.9 37.5 90.0 121.3 68.9 16.1 1.5
2013 1,681.0 0.1 8.7 3.7 16.1 39.1 89.5 114.6 66.6 16.1 1.5
2012 1,769.5 0.1 9.7 4.1 17.7 41.4 95.8 121.3 68.1 16.1 1.4
2011 1,706.5 0.1 10.2 4.6 18.1 41.9 93.7 114.9 64.1 15.2 1.2
2010 1,689.0 0.1 10.9 5.1 18.7 42.6 91.5 113.6 62.8 15.1 1.2
SOURCE: NCHS, National Vital Statistics System, Natality.
NOTES: Race and Hispanic origin are reported separately on birth certificates. Race categories are consistent with 1977 Office of Management and Budget standards. All states and the District of Columbia reported multiple-race data for 2016 that were
bridged to single-race categories for comparability with earlier years; see Technical Notes. Multiple-race reporting areas vary for 2010–2016; see Technical Notes.
1Birth rates are computed by relating births to women aged 45 and over to women aged 45–49; see Technical Notes.
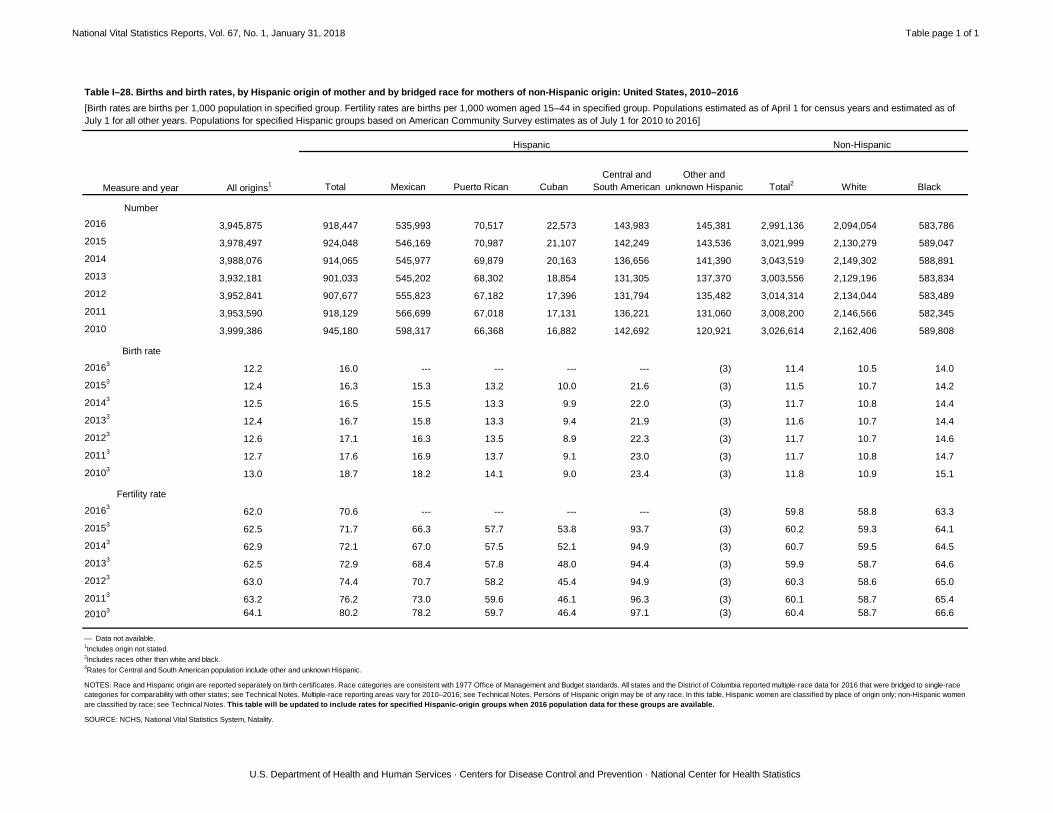
National Vital Statistics Reports, Vol. 67, No. 1, January 31, 2018 Table page 1 of 1
U.S. Department of Health and Human Services · Centers for Disease Control and Prevention · National Center for Health Statistics
Total Mexican Puerto Rican Cuban
Central and
South American
Other and
unknown Hispanic Total2
White Black
Number
2016 3,945,875 918,447 535,993 70,517 22,573 143,983 145,381 2,991,136 2,094,054 583,786
2015 3,978,497 924,048 546,169 70,987 21,107 142,249 143,536 3,021,999 2,130,279 589,047
2014 3,988,076 914,065 545,977 69,879 20,163 136,656 141,390 3,043,519 2,149,302 588,891
2013 3,932,181 901,033 545,202 68,302 18,854 131,305 137,370 3,003,556 2,129,196 583,834
2012 3,952,841 907,677 555,823 67,182 17,396 131,794 135,482 3,014,314 2,134,044 583,489
2011 3,953,590 918,129 566,699 67,018 17,131 136,221 131,060 3,008,200 2,146,566 582,345
2010 3,999,386 945,180 598,317 66,368 16,882 142,692 120,921 3,026,614 2,162,406 589,808
Birth rate
20163
12.2 16.0 --- --- --- --- (3) 11.4 10.5 14.0
20153
12.4 16.3 15.3 13.2 10.0 21.6 (3) 11.5 10.7 14.2
20143
12.5 16.5 15.5 13.3 9.9 22.0 (3) 11.7 10.8 14.4
20133
12.4 16.7 15.8 13.3 9.4 21.9 (3) 11.6 10.7 14.4
20123
12.6 17.1 16.3 13.5 8.9 22.3 (3) 11.7 10.7 14.6
20113
12.7 17.6 16.9 13.7 9.1 23.0 (3) 11.7 10.8 14.7
20103
13.0 18.7 18.2 14.1 9.0 23.4 (3) 11.8 10.9 15.1
Fertility rate
20163
62.0 70.6 --- --- --- --- (3) 59.8 58.8 63.3
20153
62.5 71.7 66.3 57.7 53.8 93.7 (3) 60.2 59.3 64.1
20143
62.9 72.1 67.0 57.5 52.1 94.9 (3) 60.7 59.5 64.5
20133
62.5 72.9 68.4 57.8 48.0 94.4 (3) 59.9 58.7 64.6
20123
63.0 74.4 70.7 58.2 45.4 94.9 (3) 60.3 58.6 65.0
20113
63.2 76.2 73.0 59.6 46.1 96.3 (3) 60.1 58.7 65.4
20103 64.1 80.2 78.2 59.7 46.4 97.1 (3) 60.4 58.7 66.6
SOURCE: NCHS, National Vital Statistics System, Natality.
--- Data not available.1Includes origin not stated.
2Includes races other than white and black.
3Rates for Central and South American population include other and unknown Hispanic.
Table I–28. Births and birth rates, by Hispanic origin of mother and by bridged race for mothers of non-Hispanic origin: United States, 2010–2016
NOTES: Race and Hispanic origin are reported separately on birth certificates. Race categories are consistent with 1977 Office of Management and Budget standards. All states and the District of Columbia reported multiple-race data for 2016 that were bridged to single-race
categories for comparability with other states; see Technical Notes. Multiple-race reporting areas vary for 2010–2016; see Technical Notes. Persons of Hispanic origin may be of any race. In this table, Hispanic women are classified by place of origin only; non-Hispanic women
are classified by race; see Technical Notes. This table will be updated to include rates for specified Hispanic-origin groups when 2016 population data for these groups are available.
Hispanic Non-Hispanic
[Birth rates are births per 1,000 population in specified group. Fertility rates are births per 1,000 women aged 15–44 in specified group. Populations estimated as of April 1 for census years and estimated as of
July 1 for all other years. Populations for specified Hispanic groups based on American Community Survey estimates as of July 1 for 2010 to 2016]
All origins1
Measure and year
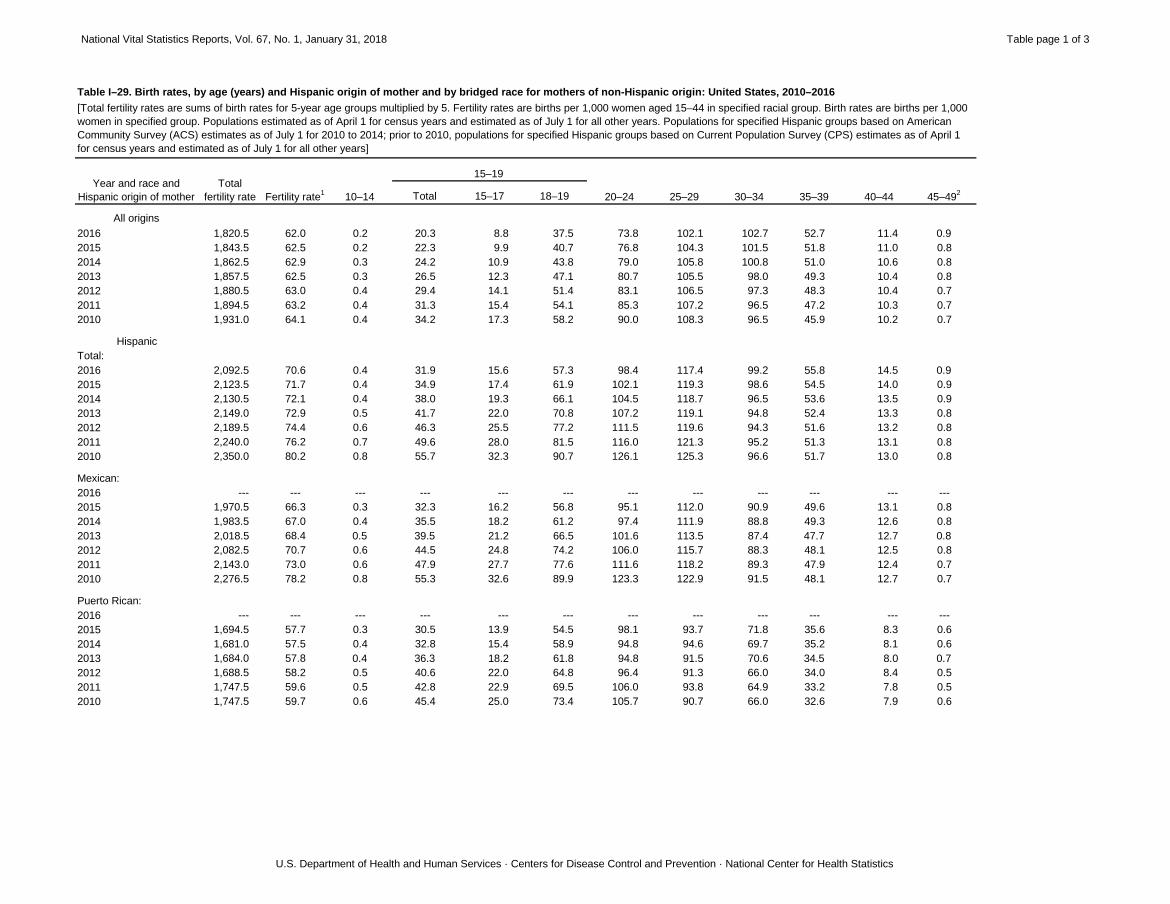
National Vital Statistics Reports, Vol. 67, No. 1, January 31, 2018 Table page 1 of 3
U.S. Department of Health and Human Services · Centers for Disease Control and Prevention · National Center for Health Statistics
Total 15–17 18–19
All origins
2016 1,820.5 62.0 0.2 20.3 8.8 37.5 73.8 102.1 102.7 52.7 11.4 0.9
2015 1,843.5 62.5 0.2 22.3 9.9 40.7 76.8 104.3 101.5 51.8 11.0 0.8
2014 1,862.5 62.9 0.3 24.2 10.9 43.8 79.0 105.8 100.8 51.0 10.6 0.8
2013 1,857.5 62.5 0.3 26.5 12.3 47.1 80.7 105.5 98.0 49.3 10.4 0.8
2012 1,880.5 63.0 0.4 29.4 14.1 51.4 83.1 106.5 97.3 48.3 10.4 0.7
2011 1,894.5 63.2 0.4 31.3 15.4 54.1 85.3 107.2 96.5 47.2 10.3 0.7
2010 1,931.0 64.1 0.4 34.2 17.3 58.2 90.0 108.3 96.5 45.9 10.2 0.7
Hispanic
Total:
2016 2,092.5 70.6 0.4 31.9 15.6 57.3 98.4 117.4 99.2 55.8 14.5 0.9
2015 2,123.5 71.7 0.4 34.9 17.4 61.9 102.1 119.3 98.6 54.5 14.0 0.9
2014 2,130.5 72.1 0.4 38.0 19.3 66.1 104.5 118.7 96.5 53.6 13.5 0.9
2013 2,149.0 72.9 0.5 41.7 22.0 70.8 107.2 119.1 94.8 52.4 13.3 0.8
2012 2,189.5 74.4 0.6 46.3 25.5 77.2 111.5 119.6 94.3 51.6 13.2 0.8
2011 2,240.0 76.2 0.7 49.6 28.0 81.5 116.0 121.3 95.2 51.3 13.1 0.8
2010 2,350.0 80.2 0.8 55.7 32.3 90.7 126.1 125.3 96.6 51.7 13.0 0.8
Mexican:
2016 --- --- --- --- --- --- --- --- --- --- --- ---
2015 1,970.5 66.3 0.3 32.3 16.2 56.8 95.1 112.0 90.9 49.6 13.1 0.8
2014 1,983.5 67.0 0.4 35.5 18.2 61.2 97.4 111.9 88.8 49.3 12.6 0.8
2013 2,018.5 68.4 0.5 39.5 21.2 66.5 101.6 113.5 87.4 47.7 12.7 0.8
2012 2,082.5 70.7 0.6 44.5 24.8 74.2 106.0 115.7 88.3 48.1 12.5 0.8
2011 2,143.0 73.0 0.6 47.9 27.7 77.6 111.6 118.2 89.3 47.9 12.4 0.7
2010 2,276.5 78.2 0.8 55.3 32.6 89.9 123.3 122.9 91.5 48.1 12.7 0.7
Puerto Rican:
2016 --- --- --- --- --- --- --- --- --- --- --- ---
2015 1,694.5 57.7 0.3 30.5 13.9 54.5 98.1 93.7 71.8 35.6 8.3 0.6
2014 1,681.0 57.5 0.4 32.8 15.4 58.9 94.8 94.6 69.7 35.2 8.1 0.6
2013 1,684.0 57.8 0.4 36.3 18.2 61.8 94.8 91.5 70.6 34.5 8.0 0.7
2012 1,688.5 58.2 0.5 40.6 22.0 64.8 96.4 91.3 66.0 34.0 8.4 0.5
2011 1,747.5 59.6 0.5 42.8 22.9 69.5 106.0 93.8 64.9 33.2 7.8 0.5
2010 1,747.5 59.7 0.6 45.4 25.0 73.4 105.7 90.7 66.0 32.6 7.9 0.6
Table I–29. Birth rates, by age (years) and Hispanic origin of mother and by bridged race for mothers of non-Hispanic origin: United States, 2010–2016
Year and race and
Hispanic origin of mother
Total
fertility rate Fertility rate1
30–34
[Total fertility rates are sums of birth rates for 5-year age groups multiplied by 5. Fertility rates are births per 1,000 women aged 15–44 in specified racial group. Birth rates are births per 1,000
women in specified group. Populations estimated as of April 1 for census years and estimated as of July 1 for all other years. Populations for specified Hispanic groups based on American
Community Survey (ACS) estimates as of July 1 for 2010 to 2014; prior to 2010, populations for specified Hispanic groups based on Current Population Survey (CPS) estimates as of April 1
for census years and estimated as of July 1 for all other years]
20–24 25–29 45–492
10–14 40–44
15–19
35–39
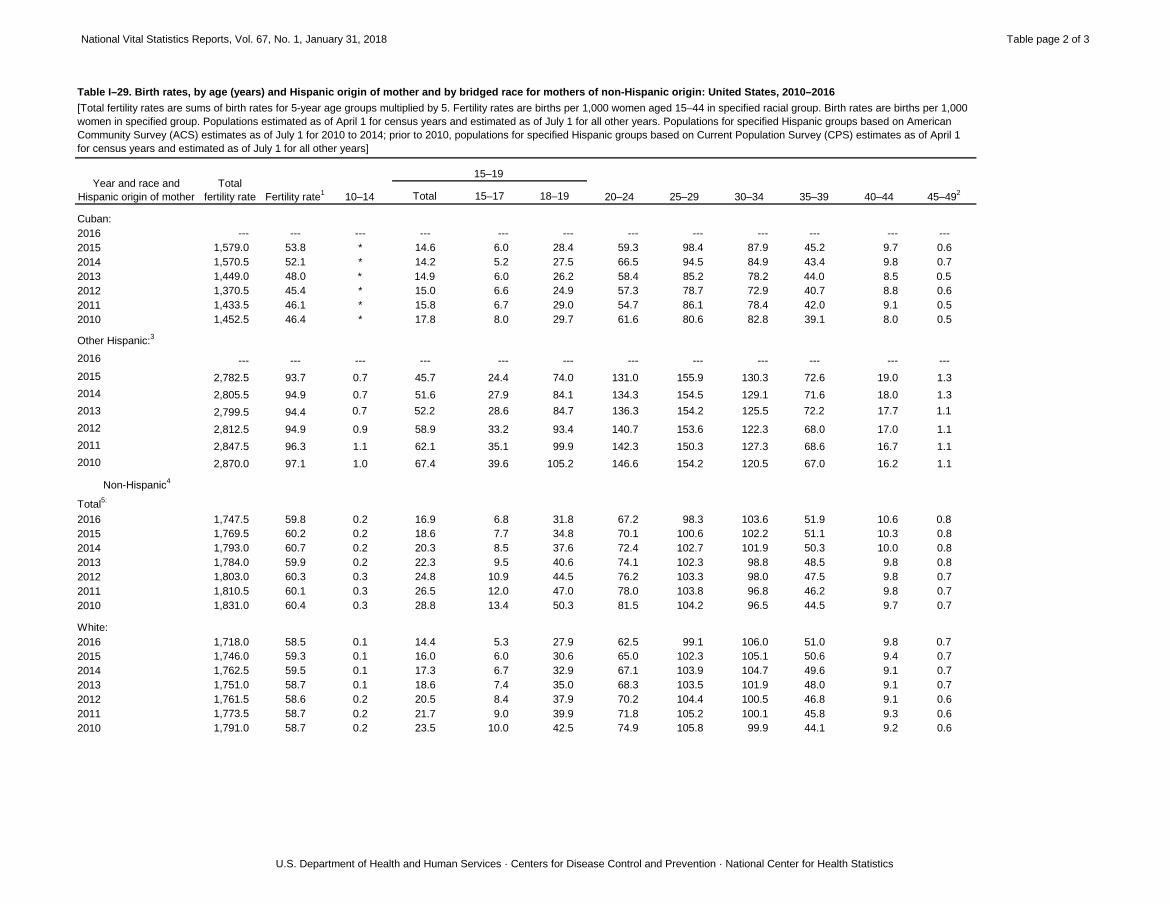
National Vital Statistics Reports, Vol. 67, No. 1, January 31, 2018 Table page 2 of 3
U.S. Department of Health and Human Services · Centers for Disease Control and Prevention · National Center for Health Statistics
Total 15–17 18–19
Table I–29. Birth rates, by age (years) and Hispanic origin of mother and by bridged race for mothers of non-Hispanic origin: United States, 2010–2016
Year and race and
Hispanic origin of mother
Total
fertility rate Fertility rate1
30–34
[Total fertility rates are sums of birth rates for 5-year age groups multiplied by 5. Fertility rates are births per 1,000 women aged 15–44 in specified racial group. Birth rates are births per 1,000
women in specified group. Populations estimated as of April 1 for census years and estimated as of July 1 for all other years. Populations for specified Hispanic groups based on American
Community Survey (ACS) estimates as of July 1 for 2010 to 2014; prior to 2010, populations for specified Hispanic groups based on Current Population Survey (CPS) estimates as of April 1
for census years and estimated as of July 1 for all other years]
20–24 25–29 45–492
10–14 40–44
15–19
35–39
Cuban:
2016 --- --- --- --- --- --- --- --- --- --- --- ---
2015 1,579.0 53.8 * 14.6 6.0 28.4 59.3 98.4 87.9 45.2 9.7 0.6
2014 1,570.5 52.1 * 14.2 5.2 27.5 66.5 94.5 84.9 43.4 9.8 0.7
2013 1,449.0 48.0 * 14.9 6.0 26.2 58.4 85.2 78.2 44.0 8.5 0.5
2012 1,370.5 45.4 * 15.0 6.6 24.9 57.3 78.7 72.9 40.7 8.8 0.6
2011 1,433.5 46.1 * 15.8 6.7 29.0 54.7 86.1 78.4 42.0 9.1 0.5
2010 1,452.5 46.4 * 17.8 8.0 29.7 61.6 80.6 82.8 39.1 8.0 0.5
Other Hispanic:3
2016 --- --- --- --- --- --- --- --- --- --- --- ---
2015 2,782.5 93.7 0.7 45.7 24.4 74.0 131.0 155.9 130.3 72.6 19.0 1.3
2014 2,805.5 94.9 0.7 51.6 27.9 84.1 134.3 154.5 129.1 71.6 18.0 1.3
2013 2,799.5 94.4 0.7 52.2 28.6 84.7 136.3 154.2 125.5 72.2 17.7 1.1
2012 2,812.5 94.9 0.9 58.9 33.2 93.4 140.7 153.6 122.3 68.0 17.0 1.1
2011 2,847.5 96.3 1.1 62.1 35.1 99.9 142.3 150.3 127.3 68.6 16.7 1.1
2010 2,870.0 97.1 1.0 67.4 39.6 105.2 146.6 154.2 120.5 67.0 16.2 1.1
Non-Hispanic4
Total5:
2016 1,747.5 59.8 0.2 16.9 6.8 31.8 67.2 98.3 103.6 51.9 10.6 0.8
2015 1,769.5 60.2 0.2 18.6 7.7 34.8 70.1 100.6 102.2 51.1 10.3 0.8
2014 1,793.0 60.7 0.2 20.3 8.5 37.6 72.4 102.7 101.9 50.3 10.0 0.8
2013 1,784.0 59.9 0.2 22.3 9.5 40.6 74.1 102.3 98.8 48.5 9.8 0.8
2012 1,803.0 60.3 0.3 24.8 10.9 44.5 76.2 103.3 98.0 47.5 9.8 0.7
2011 1,810.5 60.1 0.3 26.5 12.0 47.0 78.0 103.8 96.8 46.2 9.8 0.7
2010 1,831.0 60.4 0.3 28.8 13.4 50.3 81.5 104.2 96.5 44.5 9.7 0.7
White:
2016 1,718.0 58.5 0.1 14.4 5.3 27.9 62.5 99.1 106.0 51.0 9.8 0.7
2015 1,746.0 59.3 0.1 16.0 6.0 30.6 65.0 102.3 105.1 50.6 9.4 0.7
2014 1,762.5 59.5 0.1 17.3 6.7 32.9 67.1 103.9 104.7 49.6 9.1 0.7
2013 1,751.0 58.7 0.1 18.6 7.4 35.0 68.3 103.5 101.9 48.0 9.1 0.7
2012 1,761.5 58.6 0.2 20.5 8.4 37.9 70.2 104.4 100.5 46.8 9.1 0.6
2011 1,773.5 58.7 0.2 21.7 9.0 39.9 71.8 105.2 100.1 45.8 9.3 0.6
2010 1,791.0 58.7 0.2 23.5 10.0 42.5 74.9 105.8 99.9 44.1 9.2 0.6
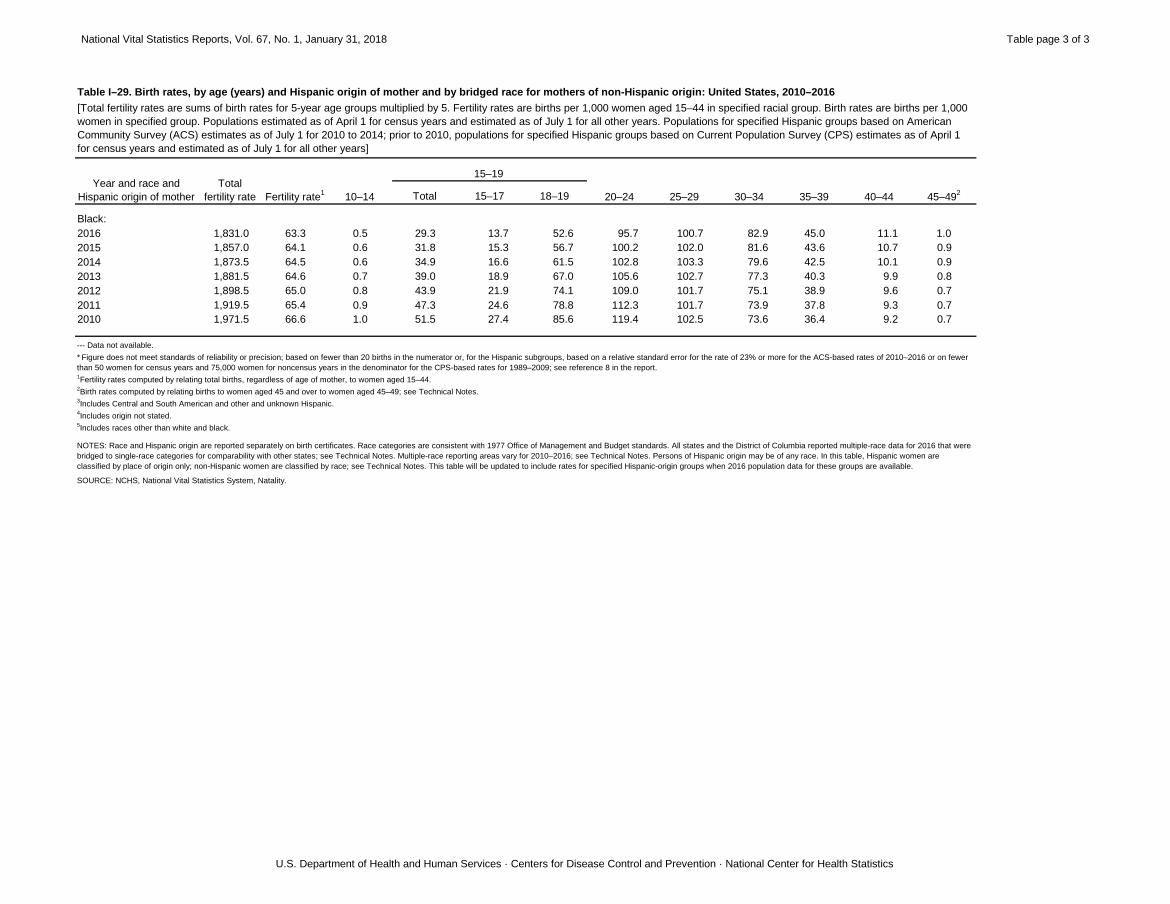
National Vital Statistics Reports, Vol. 67, No. 1, January 31, 2018 Table page 3 of 3
U.S. Department of Health and Human Services · Centers for Disease Control and Prevention · National Center for Health Statistics
Total 15–17 18–19
Table I–29. Birth rates, by age (years) and Hispanic origin of mother and by bridged race for mothers of non-Hispanic origin: United States, 2010–2016
Year and race and
Hispanic origin of mother
Total
fertility rate Fertility rate1
30–34
[Total fertility rates are sums of birth rates for 5-year age groups multiplied by 5. Fertility rates are births per 1,000 women aged 15–44 in specified racial group. Birth rates are births per 1,000
women in specified group. Populations estimated as of April 1 for census years and estimated as of July 1 for all other years. Populations for specified Hispanic groups based on American
Community Survey (ACS) estimates as of July 1 for 2010 to 2014; prior to 2010, populations for specified Hispanic groups based on Current Population Survey (CPS) estimates as of April 1
for census years and estimated as of July 1 for all other years]
20–24 25–29 45–492
10–14 40–44
15–19
35–39
Black:
2016 1,831.0 63.3 0.5 29.3 13.7 52.6 95.7 100.7 82.9 45.0 11.1 1.0
2015 1,857.0 64.1 0.6 31.8 15.3 56.7 100.2 102.0 81.6 43.6 10.7 0.9
2014 1,873.5 64.5 0.6 34.9 16.6 61.5 102.8 103.3 79.6 42.5 10.1 0.9
2013 1,881.5 64.6 0.7 39.0 18.9 67.0 105.6 102.7 77.3 40.3 9.9 0.8
2012 1,898.5 65.0 0.8 43.9 21.9 74.1 109.0 101.7 75.1 38.9 9.6 0.7
2011 1,919.5 65.4 0.9 47.3 24.6 78.8 112.3 101.7 73.9 37.8 9.3 0.7
2010 1,971.5 66.6 1.0 51.5 27.4 85.6 119.4 102.5 73.6 36.4 9.2 0.7
SOURCE: NCHS, National Vital Statistics System, Natality.
NOTES: Race and Hispanic origin are reported separately on birth certificates. Race categories are consistent with 1977 Office of Management and Budget standards. All states and the District of Columbia reported multiple-race data for 2016 that were
bridged to single-race categories for comparability with other states; see Technical Notes. Multiple-race reporting areas vary for 2010–2016; see Technical Notes. Persons of Hispanic origin may be of any race. In this table, Hispanic women are
classified by place of origin only; non-Hispanic women are classified by race; see Technical Notes. This table will be updated to include rates for specified Hispanic-origin groups when 2016 population data for these groups are available.
--- Data not available.
* Figure does not meet standards of reliability or precision; based on fewer than 20 births in the numerator or, for the Hispanic subgroups, based on a relative standard error for the rate of 23% or more for the ACS-based rates of 2010–2016 or on fewer
than 50 women for census years and 75,000 women for noncensus years in the denominator for the CPS-based rates for 1989–2009; see reference 8 in the report.1Fertility rates computed by relating total births, regardless of age of mother, to women aged 15–44.
2Birth rates computed by relating births to women aged 45 and over to women aged 45–49; see Technical Notes.
3Includes Central and South American and other and unknown Hispanic.
4Includes origin not stated.
5Includes races other than white and black.
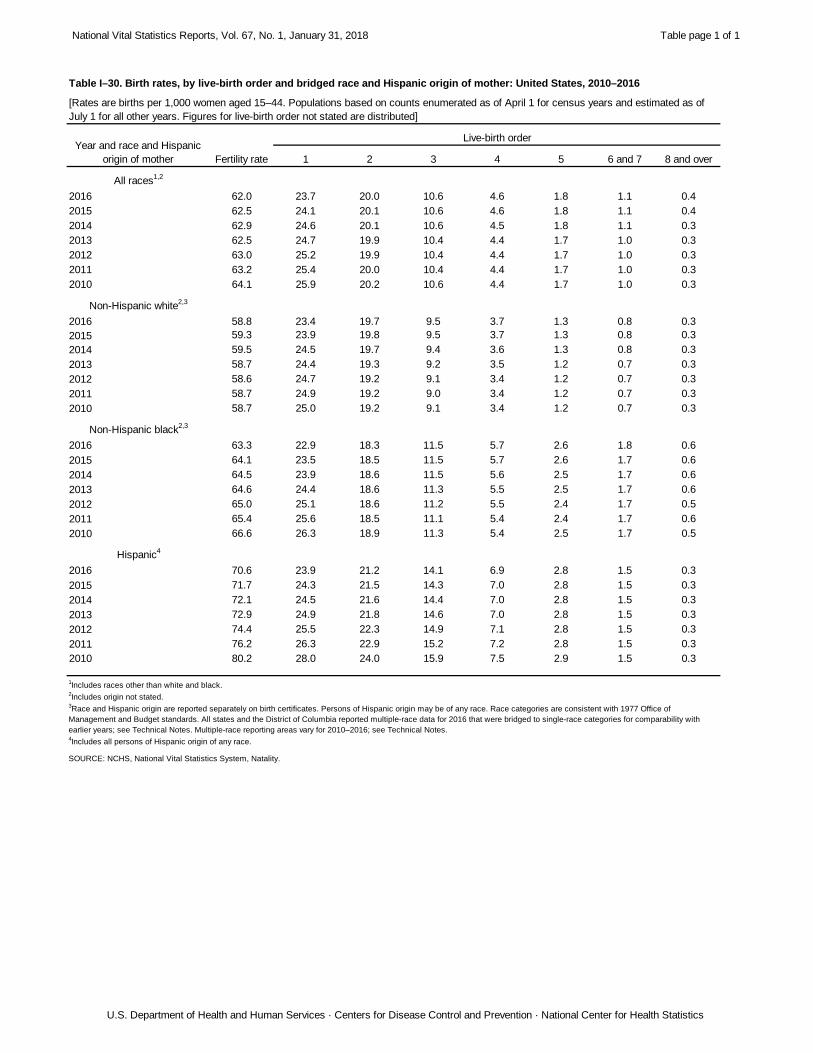
National Vital Statistics Reports, Vol. 67, No. 1, January 31, 2018 Table page 1 of 1
U.S. Department of Health and Human Services · Centers for Disease Control and Prevention · National Center for Health Statistics
1 2 3 4 5 6 and 7 8 and over
All races1,2
2016 62.0 23.7 20.0 10.6 4.6 1.8 1.1 0.4
2015 62.5 24.1 20.1 10.6 4.6 1.8 1.1 0.4
2014 62.9 24.6 20.1 10.6 4.5 1.8 1.1 0.3
2013 62.5 24.7 19.9 10.4 4.4 1.7 1.0 0.3
2012 63.0 25.2 19.9 10.4 4.4 1.7 1.0 0.3
2011 63.2 25.4 20.0 10.4 4.4 1.7 1.0 0.3
2010 64.1 25.9 20.2 10.6 4.4 1.7 1.0 0.3
Non-Hispanic white2,3
2016 58.8 23.4 19.7 9.5 3.7 1.3 0.8 0.3
2015 59.3 23.9 19.8 9.5 3.7 1.3 0.8 0.3
2014 59.5 24.5 19.7 9.4 3.6 1.3 0.8 0.3
2013 58.7 24.4 19.3 9.2 3.5 1.2 0.7 0.3
2012 58.6 24.7 19.2 9.1 3.4 1.2 0.7 0.3
2011 58.7 24.9 19.2 9.0 3.4 1.2 0.7 0.3
2010 58.7 25.0 19.2 9.1 3.4 1.2 0.7 0.3
Non-Hispanic black2,3
2016 63.3 22.9 18.3 11.5 5.7 2.6 1.8 0.6
2015 64.1 23.5 18.5 11.5 5.7 2.6 1.7 0.6
2014 64.5 23.9 18.6 11.5 5.6 2.5 1.7 0.6
2013 64.6 24.4 18.6 11.3 5.5 2.5 1.7 0.6
2012 65.0 25.1 18.6 11.2 5.5 2.4 1.7 0.5
2011 65.4 25.6 18.5 11.1 5.4 2.4 1.7 0.6
2010 66.6 26.3 18.9 11.3 5.4 2.5 1.7 0.5
Hispanic4
2016 70.6 23.9 21.2 14.1 6.9 2.8 1.5 0.3
2015 71.7 24.3 21.5 14.3 7.0 2.8 1.5 0.3
2014 72.1 24.5 21.6 14.4 7.0 2.8 1.5 0.3
2013 72.9 24.9 21.8 14.6 7.0 2.8 1.5 0.3
2012 74.4 25.5 22.3 14.9 7.1 2.8 1.5 0.3
2011 76.2 26.3 22.9 15.2 7.2 2.8 1.5 0.3
2010 80.2 28.0 24.0 15.9 7.5 2.9 1.5 0.3
SOURCE: NCHS, National Vital Statistics System, Natality.
Table I–30. Birth rates, by live-birth order and bridged race and Hispanic origin of mother: United States, 2010–2016
Live-birth orderYear and race and Hispanic
origin of mother Fertility rate
[Rates are births per 1,000 women aged 15–44. Populations based on counts enumerated as of April 1 for census years and estimated as of
July 1 for all other years. Figures for live-birth order not stated are distributed]
1Includes races other than white and black.
2Includes origin not stated.
3Race and Hispanic origin are reported separately on birth certificates. Persons of Hispanic origin may be of any race. Race categories are consistent with 1977 Office of
Management and Budget standards. All states and the District of Columbia reported multiple-race data for 2016 that were bridged to single-race categories for comparability with
earlier years; see Technical Notes. Multiple-race reporting areas vary for 2010–2016; see Technical Notes.4Includes all persons of Hispanic origin of any race.
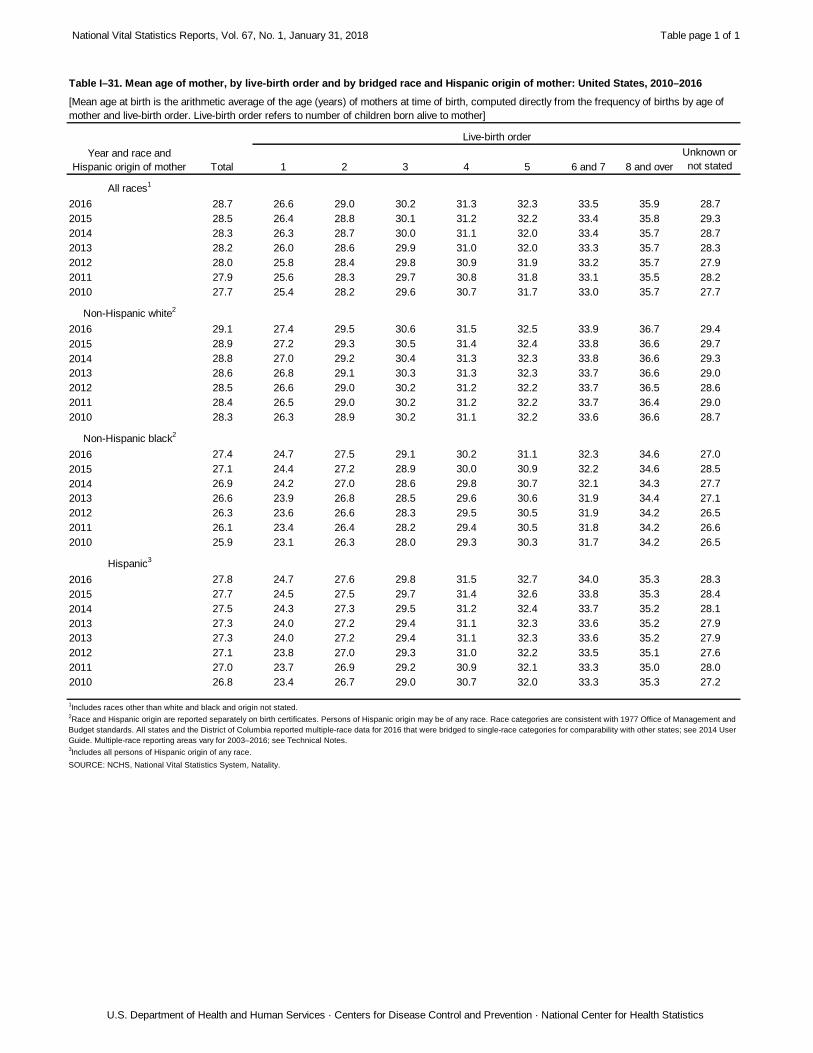
National Vital Statistics Reports, Vol. 67, No. 1, January 31, 2018 Table page 1 of 1
U.S. Department of Health and Human Services · Centers for Disease Control and Prevention · National Center for Health Statistics
1 2 3 4 5 6 and 7 8 and over
Unknown or
not stated
All races1
2016 28.7 26.6 29.0 30.2 31.3 32.3 33.5 35.9 28.7
2015 28.5 26.4 28.8 30.1 31.2 32.2 33.4 35.8 29.3
2014 28.3 26.3 28.7 30.0 31.1 32.0 33.4 35.7 28.7
2013 28.2 26.0 28.6 29.9 31.0 32.0 33.3 35.7 28.3
2012 28.0 25.8 28.4 29.8 30.9 31.9 33.2 35.7 27.9
2011 27.9 25.6 28.3 29.7 30.8 31.8 33.1 35.5 28.2
2010 27.7 25.4 28.2 29.6 30.7 31.7 33.0 35.7 27.7
Non-Hispanic white2
2016 29.1 27.4 29.5 30.6 31.5 32.5 33.9 36.7 29.4
2015 28.9 27.2 29.3 30.5 31.4 32.4 33.8 36.6 29.7
2014 28.8 27.0 29.2 30.4 31.3 32.3 33.8 36.6 29.3
2013 28.6 26.8 29.1 30.3 31.3 32.3 33.7 36.6 29.0
2012 28.5 26.6 29.0 30.2 31.2 32.2 33.7 36.5 28.6
2011 28.4 26.5 29.0 30.2 31.2 32.2 33.7 36.4 29.0
2010 28.3 26.3 28.9 30.2 31.1 32.2 33.6 36.6 28.7
Non-Hispanic black2
2016 27.4 24.7 27.5 29.1 30.2 31.1 32.3 34.6 27.0
2015 27.1 24.4 27.2 28.9 30.0 30.9 32.2 34.6 28.5
2014 26.9 24.2 27.0 28.6 29.8 30.7 32.1 34.3 27.7
2013 26.6 23.9 26.8 28.5 29.6 30.6 31.9 34.4 27.1
2012 26.3 23.6 26.6 28.3 29.5 30.5 31.9 34.2 26.5
2011 26.1 23.4 26.4 28.2 29.4 30.5 31.8 34.2 26.6
2010 25.9 23.1 26.3 28.0 29.3 30.3 31.7 34.2 26.5
Hispanic3
2016 27.8 24.7 27.6 29.8 31.5 32.7 34.0 35.3 28.3
2015 27.7 24.5 27.5 29.7 31.4 32.6 33.8 35.3 28.4
2014 27.5 24.3 27.3 29.5 31.2 32.4 33.7 35.2 28.1
2013 27.3 24.0 27.2 29.4 31.1 32.3 33.6 35.2 27.9
2013 27.3 24.0 27.2 29.4 31.1 32.3 33.6 35.2 27.9
2012 27.1 23.8 27.0 29.3 31.0 32.2 33.5 35.1 27.6
2011 27.0 23.7 26.9 29.2 30.9 32.1 33.3 35.0 28.0
2010 26.8 23.4 26.7 29.0 30.7 32.0 33.3 35.3 27.2
SOURCE: NCHS, National Vital Statistics System, Natality.
Table I–31. Mean age of mother, by live-birth order and by bridged race and Hispanic origin of mother: United States, 2010–2016
1Includes races other than white and black and origin not stated.
2Race and Hispanic origin are reported separately on birth certificates. Persons of Hispanic origin may be of any race. Race categories are consistent with 1977 Office of Management and
Budget standards. All states and the District of Columbia reported multiple-race data for 2016 that were bridged to single-race categories for comparability with other states; see 2014 User
Guide. Multiple-race reporting areas vary for 2003–2016; see Technical Notes.3Includes all persons of Hispanic origin of any race.
Live-birth order
Year and race and
Hispanic origin of mother Total
[Mean age at birth is the arithmetic average of the age (years) of mothers at time of birth, computed directly from the frequency of births by age of
mother and live-birth order. Live-birth order refers to number of children born alive to mother]
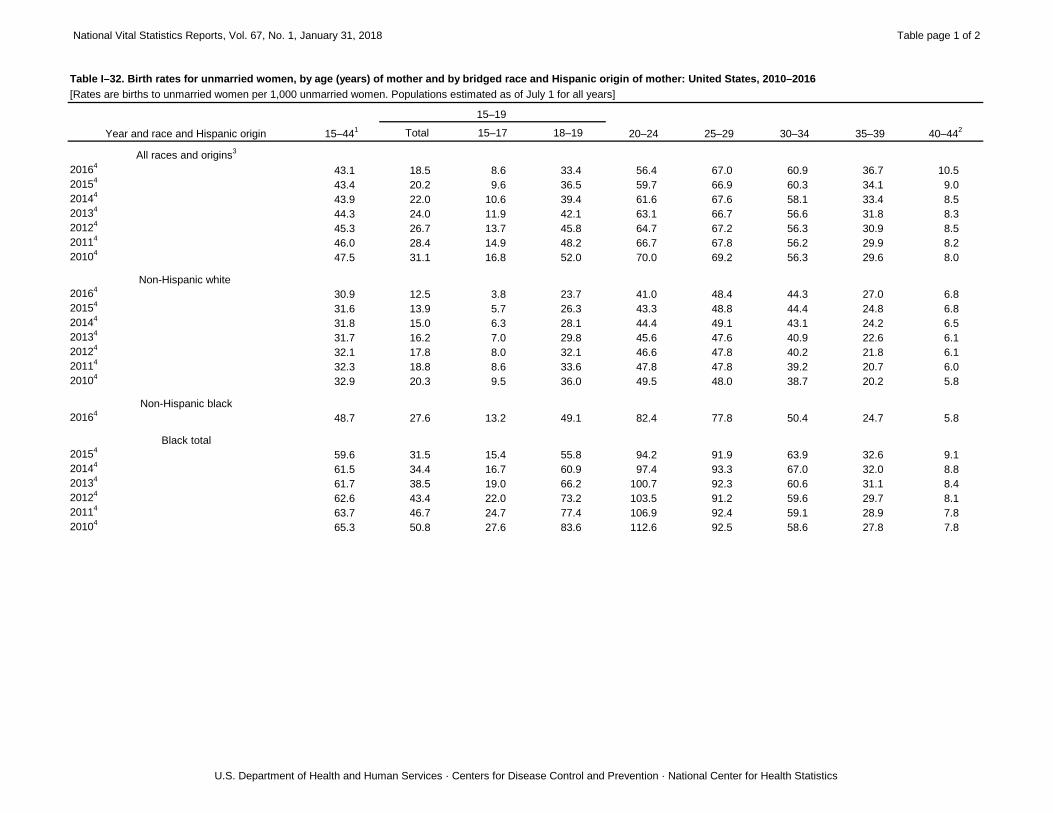
National Vital Statistics Reports, Vol. 67, No. 1, January 31, 2018 Table page 1 of 2
U.S. Department of Health and Human Services · Centers for Disease Control and Prevention · National Center for Health Statistics
Total 15–17 18–19
All races and origins3
20164
43.1 18.5 8.6 33.4 56.4 67.0 60.9 36.7 10.5
20154
43.4 20.2 9.6 36.5 59.7 66.9 60.3 34.1 9.0
20144
43.9 22.0 10.6 39.4 61.6 67.6 58.1 33.4 8.5
20134
44.3 24.0 11.9 42.1 63.1 66.7 56.6 31.8 8.3
20124
45.3 26.7 13.7 45.8 64.7 67.2 56.3 30.9 8.5
20114
46.0 28.4 14.9 48.2 66.7 67.8 56.2 29.9 8.2
20104
47.5 31.1 16.8 52.0 70.0 69.2 56.3 29.6 8.0
Non-Hispanic white
20164
30.9 12.5 3.8 23.7 41.0 48.4 44.3 27.0 6.8
20154
31.6 13.9 5.7 26.3 43.3 48.8 44.4 24.8 6.8
20144
31.8 15.0 6.3 28.1 44.4 49.1 43.1 24.2 6.5
20134
31.7 16.2 7.0 29.8 45.6 47.6 40.9 22.6 6.1
20124
32.1 17.8 8.0 32.1 46.6 47.8 40.2 21.8 6.1
20114
32.3 18.8 8.6 33.6 47.8 47.8 39.2 20.7 6.0
20104
32.9 20.3 9.5 36.0 49.5 48.0 38.7 20.2 5.8
Non-Hispanic black
20164
48.7 27.6 13.2 49.1 82.4 77.8 50.4 24.7 5.8
Black total
20154
59.6 31.5 15.4 55.8 94.2 91.9 63.9 32.6 9.1
20144
61.5 34.4 16.7 60.9 97.4 93.3 67.0 32.0 8.8
20134
61.7 38.5 19.0 66.2 100.7 92.3 60.6 31.1 8.4
20124
62.6 43.4 22.0 73.2 103.5 91.2 59.6 29.7 8.1
20114
63.7 46.7 24.7 77.4 106.9 92.4 59.1 28.9 7.8
20104
65.3 50.8 27.6 83.6 112.6 92.5 58.6 27.8 7.8
Table I–32. Birth rates for unmarried women, by age (years) of mother and by bridged race and Hispanic origin of mother: United States, 2010–2016
15–19
15–441
20–24 35–39
[Rates are births to unmarried women per 1,000 unmarried women. Populations estimated as of July 1 for all years]
40–442
25–29 30–34 Year and race and Hispanic origin
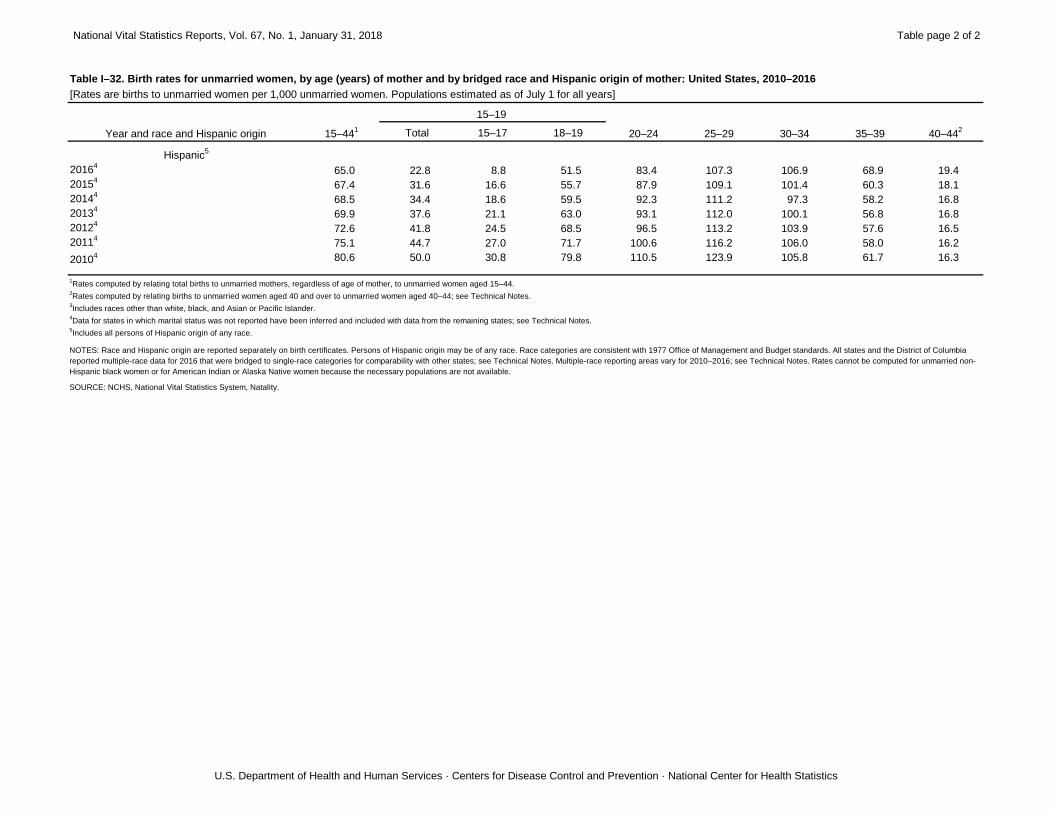
National Vital Statistics Reports, Vol. 67, No. 1, January 31, 2018 Table page 2 of 2
U.S. Department of Health and Human Services · Centers for Disease Control and Prevention · National Center for Health Statistics
Total 15–17 18–19
Table I–32. Birth rates for unmarried women, by age (years) of mother and by bridged race and Hispanic origin of mother: United States, 2010–2016
15–19
15–441
20–24 35–39
[Rates are births to unmarried women per 1,000 unmarried women. Populations estimated as of July 1 for all years]
40–442
25–29 30–34 Year and race and Hispanic origin
Hispanic5
20164
65.0 22.8 8.8 51.5 83.4 107.3 106.9 68.9 19.4
20154
67.4 31.6 16.6 55.7 87.9 109.1 101.4 60.3 18.1
20144
68.5 34.4 18.6 59.5 92.3 111.2 97.3 58.2 16.8
20134
69.9 37.6 21.1 63.0 93.1 112.0 100.1 56.8 16.8
20124
72.6 41.8 24.5 68.5 96.5 113.2 103.9 57.6 16.5
20114
75.1 44.7 27.0 71.7 100.6 116.2 106.0 58.0 16.2
20104 80.6 50.0 30.8 79.8 110.5 123.9 105.8 61.7 16.3
NOTES: Race and Hispanic origin are reported separately on birth certificates. Persons of Hispanic origin may be of any race. Race categories are consistent with 1977 Office of Management and Budget standards. All states and the District of Columbia
reported multiple-race data for 2016 that were bridged to single-race categories for comparability with other states; see Technical Notes. Multiple-race reporting areas vary for 2010–2016; see Technical Notes. Rates cannot be computed for unmarried non-
Hispanic black women or for American Indian or Alaska Native women because the necessary populations are not available.
1Rates computed by relating total births to unmarried mothers, regardless of age of mother, to unmarried women aged 15–44.
2Rates computed by relating births to unmarried women aged 40 and over to unmarried women aged 40–44; see Technical Notes.
3Includes races other than white, black, and Asian or Pacific Islander.
4Data for states in which marital status was not reported have been inferred and included with data from the remaining states; see Technical Notes.
5Includes all persons of Hispanic origin of any race.
SOURCE: NCHS, National Vital Statistics System, Natality.
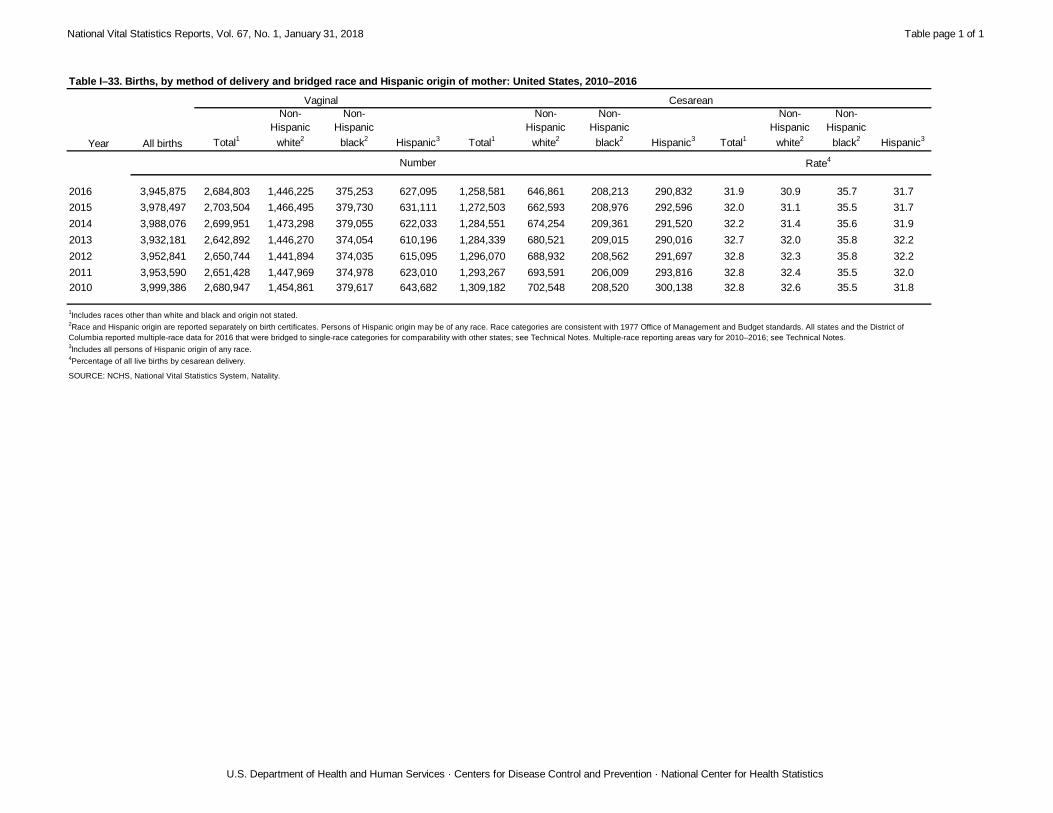
National Vital Statistics Reports, Vol. 67, No. 1, January 31, 2018 Table page 1 of 1
U.S. Department of Health and Human Services · Centers for Disease Control and Prevention · National Center for Health Statistics
Total1
Non-
Hispanic
white2
Non-
Hispanic
black2
Hispanic3
Total1
Non-
Hispanic
white2
Non-
Hispanic
black2
Hispanic3
Total1
Non-
Hispanic
white2
Non-
Hispanic
black2
Hispanic3
2016 3,945,875 2,684,803 1,446,225 375,253 627,095 1,258,581 646,861 208,213 290,832 31.9 30.9 35.7 31.7
2015 3,978,497 2,703,504 1,466,495 379,730 631,111 1,272,503 662,593 208,976 292,596 32.0 31.1 35.5 31.7
2014 3,988,076 2,699,951 1,473,298 379,055 622,033 1,284,551 674,254 209,361 291,520 32.2 31.4 35.6 31.9
2013 3,932,181 2,642,892 1,446,270 374,054 610,196 1,284,339 680,521 209,015 290,016 32.7 32.0 35.8 32.2
2012 3,952,841 2,650,744 1,441,894 374,035 615,095 1,296,070 688,932 208,562 291,697 32.8 32.3 35.8 32.2
2011 3,953,590 2,651,428 1,447,969 374,978 623,010 1,293,267 693,591 206,009 293,816 32.8 32.4 35.5 32.0
2010 3,999,386 2,680,947 1,454,861 379,617 643,682 1,309,182 702,548 208,520 300,138 32.8 32.6 35.5 31.8
SOURCE: NCHS, National Vital Statistics System, Natality.
1Includes races other than white and black and origin not stated.
2Race and Hispanic origin are reported separately on birth certificates. Persons of Hispanic origin may be of any race. Race categories are consistent with 1977 Office of Management and Budget standards. All states and the District of
Columbia reported multiple-race data for 2016 that were bridged to single-race categories for comparability with other states; see Technical Notes. Multiple-race reporting areas vary for 2010–2016; see Technical Notes.3Includes all persons of Hispanic origin of any race.
4Percentage of all live births by cesarean delivery.
Table I–33. Births, by method of delivery and bridged race and Hispanic origin of mother: United States, 2010–2016
Year
Vaginal Cesarean
Number Rate4
All births
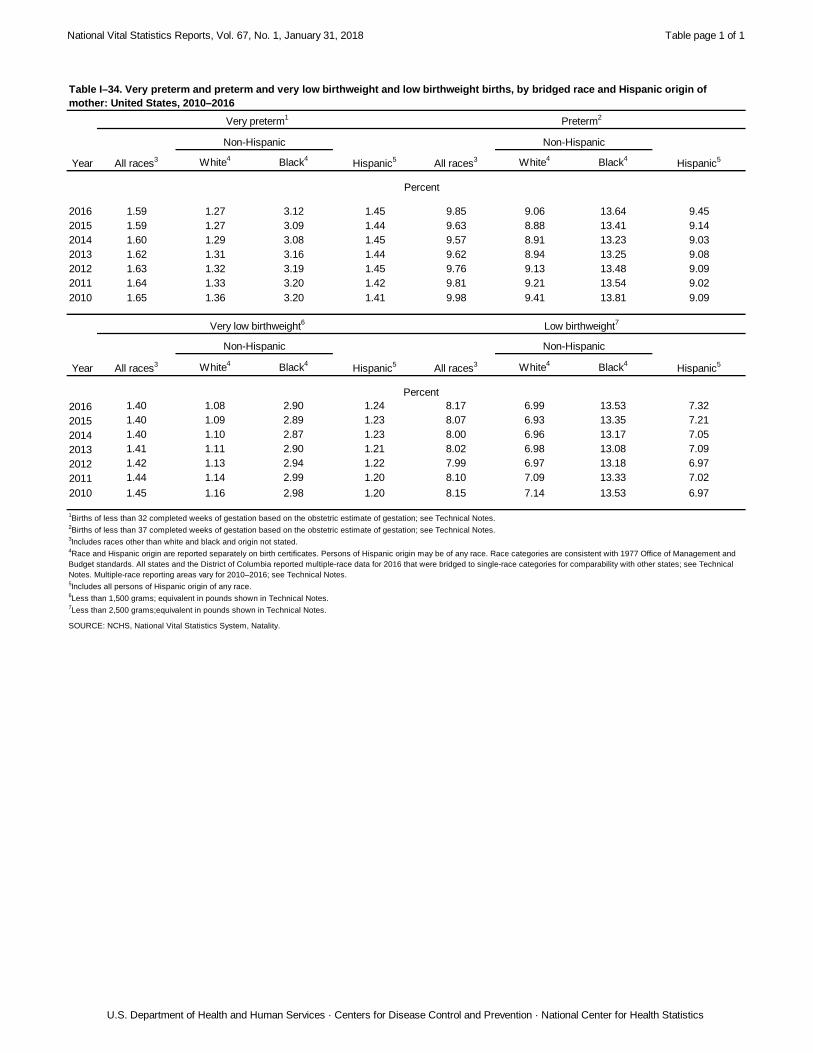
National Vital Statistics Reports, Vol. 67, No. 1, January 31, 2018 Table page 1 of 1
U.S. Department of Health and Human Services · Centers for Disease Control and Prevention · National Center for Health Statistics
White4
Black4
White4
Black4
2016 1.59 1.27 3.12 1.45 9.85 9.06 13.64 9.45
2015 1.59 1.27 3.09 1.44 9.63 8.88 13.41 9.14
2014 1.60 1.29 3.08 1.45 9.57 8.91 13.23 9.03
2013 1.62 1.31 3.16 1.44 9.62 8.94 13.25 9.08
2012 1.63 1.32 3.19 1.45 9.76 9.13 13.48 9.09
2011 1.64 1.33 3.20 1.42 9.81 9.21 13.54 9.02
2010 1.65 1.36 3.20 1.41 9.98 9.41 13.81 9.09
White4
Black4
White4
Black4
2016 1.40 1.08 2.90 1.24 8.17 6.99 13.53 7.32
2015 1.40 1.09 2.89 1.23 8.07 6.93 13.35 7.21
2014 1.40 1.10 2.87 1.23 8.00 6.96 13.17 7.05
2013 1.41 1.11 2.90 1.21 8.02 6.98 13.08 7.09
2012 1.42 1.13 2.94 1.22 7.99 6.97 13.18 6.97
2011 1.44 1.14 2.99 1.20 8.10 7.09 13.33 7.02
2010 1.45 1.16 2.98 1.20 8.15 7.14 13.53 6.97
Table I–34. Very preterm and preterm and very low birthweight and low birthweight births, by bridged race and Hispanic origin of mother: United States, 2010–2016
Very preterm1
Preterm2
Non-Hispanic Non-Hispanic
Year All races3
Hispanic5
All races3
Hispanic5
SOURCE: NCHS, National Vital Statistics System, Natality.
Percent
Percent
Non-Hispanic
Very low birthweight6
1Births of less than 32 completed weeks of gestation based on the obstetric estimate of gestation; see Technical Notes.
2Births of less than 37 completed weeks of gestation based on the obstetric estimate of gestation; see Technical Notes.
3Includes races other than white and black and origin not stated.
4Race and Hispanic origin are reported separately on birth certificates. Persons of Hispanic origin may be of any race. Race categories are consistent with 1977 Office of Management and
Budget standards. All states and the District of Columbia reported multiple-race data for 2016 that were bridged to single-race categories for comparability with other states; see Technical
Notes. Multiple-race reporting areas vary for 2010–2016; see Technical Notes. 5Includes all persons of Hispanic origin of any race.
6Less than 1,500 grams; equivalent in pounds shown in Technical Notes.
7Less than 2,500 grams;equivalent in pounds shown in Technical Notes.
Low birthweight7
Non-Hispanic
Year All races3
Hispanic5
All races3
Hispanic5
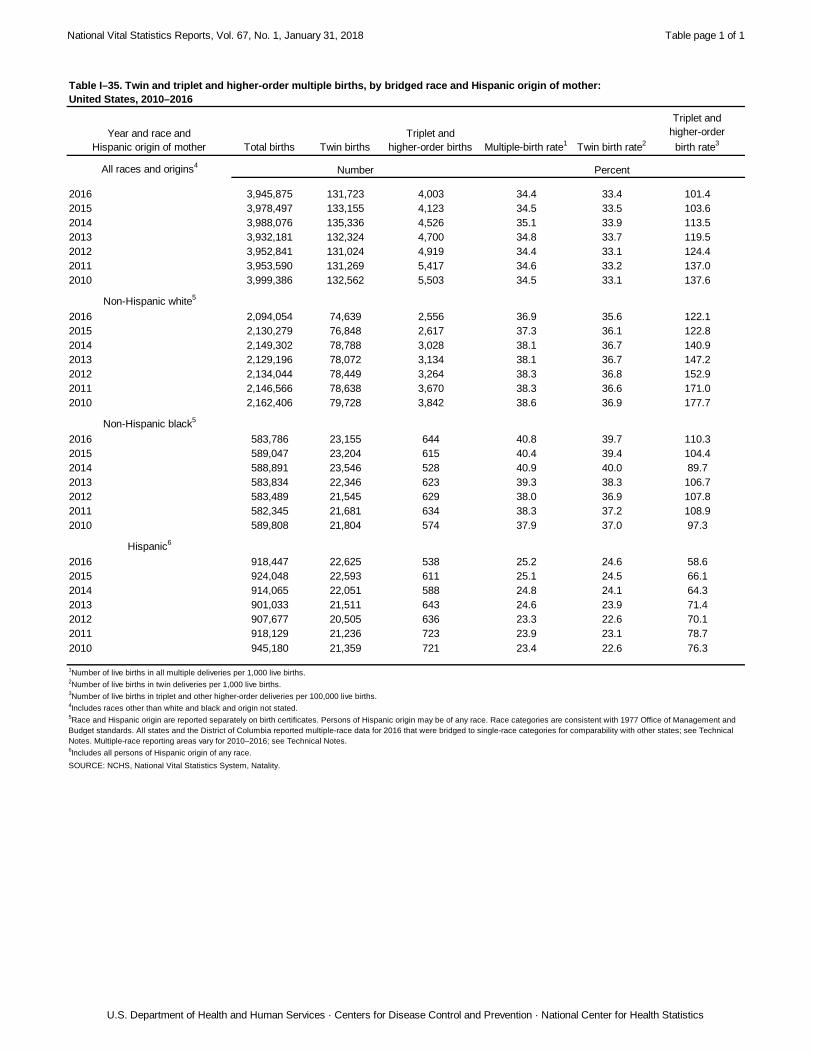
National Vital Statistics Reports, Vol. 67, No. 1, January 31, 2018 Table page 1 of 1
U.S. Department of Health and Human Services · Centers for Disease Control and Prevention · National Center for Health Statistics
Year and race and
Hispanic origin of mother Total births Twin births
Triplet and
higher-order births Multiple-birth rate1
Twin birth rate2
Triplet and
higher-order
birth rate3
All races and origins4
2016 3,945,875 131,723 4,003 34.4 33.4 101.4
2015 3,978,497 133,155 4,123 34.5 33.5 103.6
2014 3,988,076 135,336 4,526 35.1 33.9 113.5
2013 3,932,181 132,324 4,700 34.8 33.7 119.5
2012 3,952,841 131,024 4,919 34.4 33.1 124.4
2011 3,953,590 131,269 5,417 34.6 33.2 137.0
2010 3,999,386 132,562 5,503 34.5 33.1 137.6
Non-Hispanic white5
2016 2,094,054 74,639 2,556 36.9 35.6 122.1
2015 2,130,279 76,848 2,617 37.3 36.1 122.8
2014 2,149,302 78,788 3,028 38.1 36.7 140.9
2013 2,129,196 78,072 3,134 38.1 36.7 147.2
2012 2,134,044 78,449 3,264 38.3 36.8 152.9
2011 2,146,566 78,638 3,670 38.3 36.6 171.0
2010 2,162,406 79,728 3,842 38.6 36.9 177.7
Non-Hispanic black5
2016 583,786 23,155 644 40.8 39.7 110.3
2015 589,047 23,204 615 40.4 39.4 104.4
2014 588,891 23,546 528 40.9 40.0 89.7
2013 583,834 22,346 623 39.3 38.3 106.7
2012 583,489 21,545 629 38.0 36.9 107.8
2011 582,345 21,681 634 38.3 37.2 108.9
2010 589,808 21,804 574 37.9 37.0 97.3
Hispanic6
2016 918,447 22,625 538 25.2 24.6 58.6
2015 924,048 22,593 611 25.1 24.5 66.1
2014 914,065 22,051 588 24.8 24.1 64.3
2013 901,033 21,511 643 24.6 23.9 71.4
2012 907,677 20,505 636 23.3 22.6 70.1
2011 918,129 21,236 723 23.9 23.1 78.7
2010 945,180 21,359 721 23.4 22.6 76.3
Table I–35. Twin and triplet and higher-order multiple births, by bridged race and Hispanic origin of mother: United States, 2010–2016
1Number of live births in all multiple deliveries per 1,000 live births.
2Number of live births in twin deliveries per 1,000 live births.
3Number of live births in triplet and other higher-order deliveries per 100,000 live births.
4Includes races other than white and black and origin not stated.
5Race and Hispanic origin are reported separately on birth certificates. Persons of Hispanic origin may be of any race. Race categories are consistent with 1977 Office of Management and
Budget standards. All states and the District of Columbia reported multiple-race data for 2016 that were bridged to single-race categories for comparability with other states; see Technical
Notes. Multiple-race reporting areas vary for 2010–2016; see Technical Notes. 6Includes all persons of Hispanic origin of any race.
SOURCE: NCHS, National Vital Statistics System, Natality.
Number Percent
Related Documents