Vital Statistics Rapid Release Report No. 007 May 2019 Births: Provisional Data for 2018 Brady E. Hamilton, Ph.D., Joyce A. Martin, M.P.H., Michelle J.K. Osterman, M.H.S., and Lauren M. Rossen, Ph.D., Division of Vital Statistics, National Center for Health Statistics U.S. Department of Health and Human Services • Centers for Disease Control and Prevention • National Center for Health Statistics • National Vital Statistics System NCHS reports can be downloaded from: https://www.cdc.gov/nchs/products/index.htm. Abstract Objectives—This report presents provisional 2018 data on U.S. births. Births are shown by age and race and Hispanic origin of mother. Data on prenatal care, cesarean delivery, preterm births, and low birthweight are also presented. Methods—Data are based on 99.73% of 2018 births. Records for the states with less than 100% of records received are weighted to independent control counts of all births received in state vital statistics offices in 2018. Comparisons are made with final 2017 data and earlier years. Results—The provisional number of births for the United States in 2018 was 3,788,235, down 2% from 2017 and the lowest number of births in 32 years. The general fertility rate was 59.0 births per 1,000 women aged 15–44, down 2% from 2017 and another record low for the United States. The total fertility rate declined 2% to 1,728.0 births per 1,000 women in 2018, another record low for the nation. Birth rates declined for nearly all age groups of women under 35, but rose for women in their late 30s and early 40s. The birth rate for teenagers aged 15–19 was down 7% in 2018 to 17.4 births per 1,000 women; rates declined for both younger (aged 15–17) and older (aged 18–19) teenagers. The cesarean delivery rate decreased to 31.9% in 2018; the low-risk cesarean delivery rate decreased to 25.9%. The preterm birth rate rose for the fourth year in a row to 10.02% in 2018; the 2018 rate of low birthweight was unchanged from 2017 (8.28%). Keywords: birth rates • maternal and infant health • vital statistics Introduction This report from the National Center for Health Statistics (NCHS) is part of the National Vital Statistics System Rapid Release, Quarterly Provisional Estimates data series. This series provides timely vital statistics for public health surveillance based on provisional data received and processed by NCHS as of a specified date. Estimates (quarterly and 12-month period ending with each quarter) for selected key vital statistics indicators are presented and released online through Quarterly Provisional Estimates. The series also includes reports that provide additional information on specific topics to help readers understand and interpret provisional natality and mortality data. Using provisional birth data for the 12 months of 2018 (1), this report supplements the Quarterly Provisional Estimates for 2018 by including topics not shown in the quarterly estimates (i.e., the timing of prenatal care and low birthweight rate) and also presenting more detail (by race and Hispanic origin of the mother and by state of residence) for selected topics than is shown in the quarterly estimates. This report replaces the preliminary report series in order to provide a consistent set of quarterly and annual releases (2). Findings from this report will be compared with final birth data for 2018 to assess the accuracy of the estimates. 0 10 20 30 40 50 60 70 0 1 2 3 4 5 6 1991 1995 2000 2005 2010 2015 2018 Rate per 1,000 females aged 15–19 Number of births (hundred thousands) Number Rate Figure 1. Number of live births and birth rates for females aged 15–19: United States, final 1991–2017 and provisional 2018 SOURCE: NCHS, National Vital Statistics System, Natality.

Welcome message from author
This document is posted to help you gain knowledge. Please leave a comment to let me know what you think about it! Share it to your friends and learn new things together.
Transcript

Vital Statistics Rapid ReleaseReport No. 007 May 2019
Births: Provisional Data for 2018Brady E. Hamilton, Ph.D., Joyce A. Martin, M.P.H., Michelle J.K. Osterman, M.H.S., and Lauren M. Rossen, Ph.D., Division of Vital Statistics, National Center for Health Statistics
U.S. Department of Health and Human Services • Centers for Disease Control and Prevention • National Center for Health Statistics • National Vital Statistics System NCHS reports can be downloaded from: https://www.cdc.gov/nchs/products/index.htm.
AbstractObjectives—This report presents
provisional 2018 data on U.S. births. Births are shown by age and race and Hispanic origin of mother. Data on prenatal care, cesarean delivery, preterm births, and low birthweight are also presented.
Methods—Data are based on 99.73% of 2018 births. Records for the states with less than 100% of records received are weighted to independent control counts of all births received in state vital statistics offices in 2018. Comparisons are made with final 2017 data and earlier years.
Results—The provisional number of births for the United States in 2018 was 3,788,235, down 2% from 2017 and the lowest number of births in 32 years. The general fertility rate was 59.0 births per 1,000 women aged 15–44, down 2% from 2017 and another record low for the United States. The total fertility rate declined 2% to 1,728.0 births per 1,000 women in 2018, another record low for the nation. Birth rates declined for nearly all age groups of women under 35, but rose for women in their late 30s and early 40s. The birth rate for teenagers aged 15–19 was down 7% in 2018 to 17.4 births per 1,000 women; rates declined for both younger (aged 15–17) and older (aged 18–19) teenagers. The cesarean delivery rate decreased to 31.9% in 2018; the low-risk cesarean delivery rate decreased to 25.9%. The preterm birth rate rose for the fourth year in a row to 10.02% in 2018; the 2018 rate of low birthweight was unchanged from 2017 (8.28%).
Keywords: birth rates • maternal and infant health • vital statistics
Introduction This report from the National Center
for Health Statistics (NCHS) is part of the National Vital Statistics System Rapid Release, Quarterly Provisional Estimates data series. This series provides timely vital statistics for public health surveillance based on provisional data received and processed by NCHS as of a specified date. Estimates (quarterly and 12-month period ending with each quarter) for selected key vital statistics indicators are presented and released online through Quarterly Provisional Estimates. The series also includes reports that provide additional information on specific topics to
help readers understand and interpret provisional natality and mortality data.
Using provisional birth data for the 12 months of 2018 (1), this report supplements the Quarterly Provisional Estimates for 2018 by including topics not shown in the quarterly estimates (i.e., the timing of prenatal care and low birthweight rate) and also presenting more detail (by race and Hispanic origin of the mother and by state of residence) for selected topics than is shown in the quarterly estimates.
This report replaces the preliminary report series in order to provide a consistent set of quarterly and annual releases (2). Findings from this report will be compared with final birth data for 2018 to assess the accuracy of the estimates.
0
10
20
30
40
50
60
70
0
1
2
3
4
5
6
1991 1995 2000 2005 2010 2015 2018
Rate per 1,000 fem
ales aged 15–19
Num
ber o
f birt
hs (h
undr
ed th
ousa
nds) Number
Rate
Figure 1. Number of live births and birth rates for females aged 15–19: United States, final 1991–2017 and provisional 2018
SOURCE: NCHS, National Vital Statistics System, Natality.
U.S. Department of Health and Human Services • Centers for Disease Control and Prevention • National Center for Health Statistics • National Vital Statistics System2
Vital Statistics Surveillance Report
Statistics in the provisional reports for 2016 and 2017 and preliminary reports for 1995–2015 have been shown to track well with the final statistics for the year (2,3).
This report presents provisional data on births and birth rates and selected maternal and infant health characteristics for the United States in 2018.
MethodsFindings are based on all birth records
received and processed by NCHS for calendar year 2018 as of February 14, 2019; these records represent nearly 100% (99.73%) of registered births occurring in 2018. Comparisons in this report are based on the final data for 2017 and earlier years (3). Changes and differences presented in this report are statistically significant at the 0.05 level, unless noted otherwise.
Starting in 2016, all 50 states, the District of Columbia, Puerto Rico, Guam, Northern Marianas, and U.S. Virgin Islands reported data based on the 2003 U.S. Certificate of Live Birth (4). American Samoa continued to report based on the 1989 birth certificate revision. The 2003 revised birth certificate specifies the reporting of race in accordance with the revised standards issued by the Office of Management and Budget (OMB) in 1997 (5). These standards allow for the reporting of a minimum of five race categories—American Indian or Alaska Native (AIAN), Asian, black or African American, Native Hawaiian or Other Pacific Islander (NHOPI), and white—either by single race (i.e., reported alone) or in combination (i.e., more than one race or multiple races) (5). The race and Hispanic-origin groups shown in this report follow the 1997 standards and differ from the bridged-race categories shown in previous reports based on data from 2015 and earlier (6). The new categories are: non-Hispanic single-race white, non-Hispanic single-race black, non-Hispanic single-race AIAN, non-Hispanic single-race Asian, non-Hispanic single-race NHOPI, and
Number
Rate
1990 1995 2000 2005 2010 2015 2018
Rate per 1,000 w
omen aged 15–44
Num
ber o
f birt
hs (m
illio
ns)
Figure 2. Number of live births and general fertility rates: United States, final 1990–2017 and provisional 2018
SOURCE: NCHS, National Vital Statistics System, Natality.
0
55
60
70
80
90
100
0
2.5
3.0
3.5
4.0
4.5
5.0
Hispanic. For brevity, text references to non-Hispanic white or non-Hispanic black women omit the term “single-race.” For more information on differences between single- and bridged-race groups, see Technical Notes.
Population estimates by age, sex, and race and Hispanic origin for 2018 were not available as of the preparation of this report. Accordingly, birth and fertility rates by race and Hispanic origin could not be shown (but numbers and percentages of births by race and Hispanic origin are shown). Rates by race and Hispanic origin and information on births to unmarried women (see Technical Notes) will be presented in the 2018 final birth report.
ResultsBirths and birth rates
Key findings, illustrated in Tables 1 and 2 and Figures 1 and 2, are listed below.
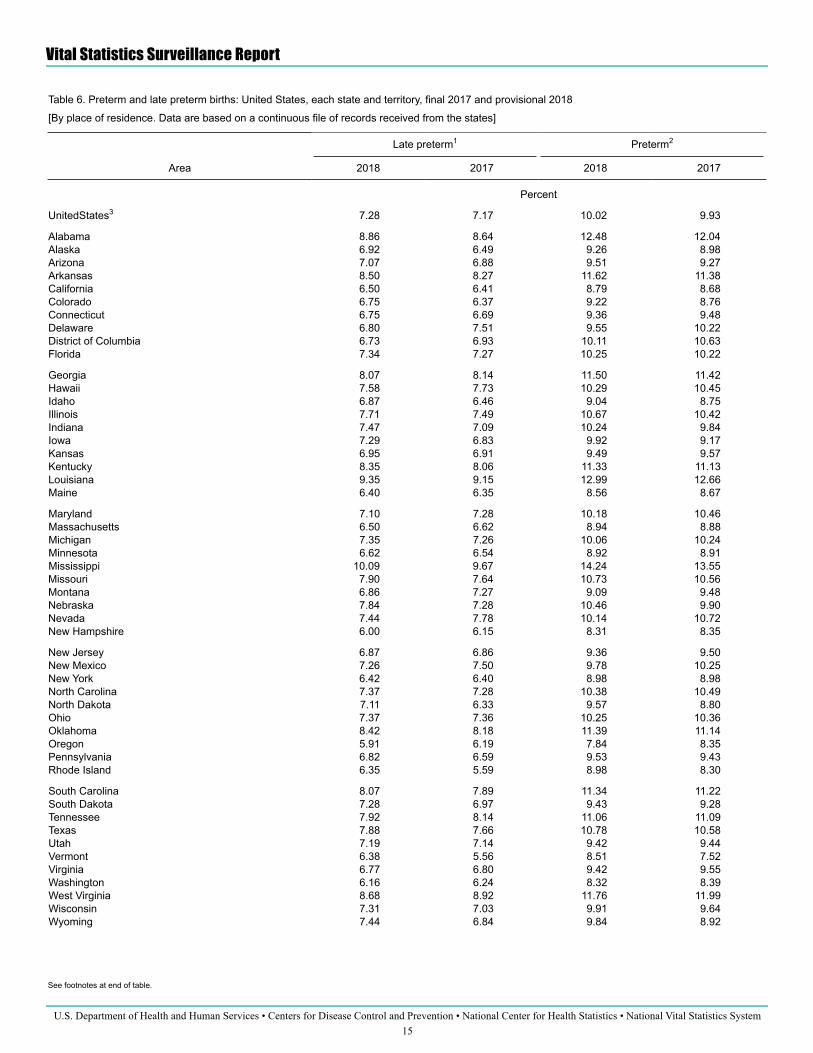
■ The provisional number of births for the United States in 2018 was 3,788,235, down 2% from the number in 2017 (3,855,500) (Tables 1 and 2
and Figure 2). This is the fourth year that the number of births has declined after the increase in 2014, and the lowest number of births in 32 years (1986) (3,6,7).
■ Among the three largest race and Hispanic-origin groups, the provisional number of births declined 1% for Hispanic women and 2% for non-Hispanic white and non-Hispanic black women from 2017 to 2018 (Table 2) (for the number of births in 2017, see reference 3). The number of births declined 3% for non-Hispanic Asian and non-Hispanic AIAN women, but was essentially unchanged for non-Hispanic NHOPI women from 2017 to 2018.
■ The provisional general fertility rate (GFR) for the United States in 2018 was 59.0 births per 1,000 women aged 15–44, down 2% from the rate in 2017 (60.3), another record low for the nation (Table 1 and Figure 2) (3,6,7). From 2014 to 2018, the GFR has declined by an average of 2% per year.
■ The provisional total fertility rate (TFR) for the United States in 2018 was 1,728.0 births per 1,000 women, down 2% from the rate in 2017 (1,765.5), a record low for the nation

U.S. Department of Health and Human Services • Centers for Disease Control and Prevention • National Center for Health Statistics • National Vital Statistics System3
Vital Statistics Surveillance Report
■ The TFR in 2018 was again below replacement—the level at which a given generation can exactly replace itself (2,100 births per 1,000 women). The rate has generally been below replacement since 1971 and consistently below replacement for the last decade (3,6,7).
Maternal age ■ Provisional birth rates declined for
women aged 15–34 from 2017 to 2018, but rose for women aged 35–44 (Table 1).
■ The provisional birth rate for teenagers in 2018 was 17.4 births per 1,000 women aged 15–19, down 7% from 2017 (18.8) and another record low for this age group (Table 1 and Figure 1) (3,6–8). The rate has declined by 58%, or nearly 8% per year, since 2007 (41.5), the most recent period of continued decline, and 72% (or nearly 5% per year) since 1991, the most recent peak. The number of births to females aged 15–19 was 179,607 in 2018 (Table 1), down 8% from 2017 and down 60% (or 8% per year) from 2007 (444,899) (3,6–8).
■ The provisional birth rates for teenagers aged 15–17 and 18–19 in 2018 were 7.2 and 32.3 births per 1,000 women, respectively, down by 9% and 8% from 2017, again reaching record lows for both groups (3,6–8).
■ The provisional birth rate for females aged 10–14 was 0.2 births per 1,000 in 2018, unchanged since 2015.
■ The provisional birth rate for women aged 20–24 in 2018 was 67.9 births per 1,000 women, down 4% from 2017 (71.0), again reaching another record low for this age group (Table 1) (3,6,7). This rate has declined by an average of 4% per year since 2007. The number of births to women in their early 20s fell by 5% from 2017 to 2018 (Table 1).
■ The provisional birth rate for women aged 25–29 was 95.2 births per 1,000 women, down 3% from 2017 (98.0), another record low for this age group as well (3,6,7). The number of births to women in their late 20s fell 2% from 2017 to 2018.
■ The provisional birth rate for women aged 30–34 in 2018 was 99.6 births per 1,000 women, down 1% from 2017 (100.3) (Table 1) (3,6,7). The number of births to women in their early 30s was essentially unchanged from 2017 to 2018.
■ The provisional birth rate for women aged 35–39 was 52.6 births per 1,000 women, up 1% from 2017 (52.3). The number of births to women in their late 30s increased by 2% from 2017 to 2018.
■ The provisional birth rate for women aged 40–44 in 2018 was 11.8 births per 1,000 women, up 2% from 2017 (11.6). The rate for this age group has generally risen since 1982 by 3% per year (3,6). The number of births to these women increased by 2% from 2017 to 2018.
■ The provisional birth rate for women aged 45–49 (which includes births to women aged 50 and over) was 0.9 births per 1,000 women, unchanged since 2015. The number of births to women in this age group rose 3% from 2017 to 2018 (Table 1).
Maternal and infant health characteristics
Key findings, illustrated in Tables 3–6 and Figure 3, are listed below.
Prenatal care ■ The percentage of women receiving
first trimester prenatal care in 2018 was 77.5%, up from 77.3% in 2017 (Table 3). The percentage of women receiving late (beginning in the third trimester) or no prenatal care decreased in 2018 to 6.2% from 6.3% in 2017. For prenatal care initiation by state, see Table 4.
■ The percentage of first trimester prenatal care ranged from 50.9% for non-Hispanic NHOPI women to 82.5% for non-Hispanic white women (see Table 3). First trimester care increased for non-Hispanic white (82.4% to 82.5%), non-Hispanic black (66.6% to 67.1%), non-Hispanic Asian (81.1% to 81.8%), and Hispanic (72.3% to 72.7%) women from 2017 to 2018, and decreased for non-Hispanic AIAN (63.4% to 62.5%) and non-Hispanic NHOPI (52.5% to 50.9%) women.
■ Late or no care ranged from 4.5% (non-Hispanic white) to 20.4% (non-Hispanic NHOPI) (Table 3). Late or no care increased from 2017 to 2018 for non-Hispanic AIAN women (12.6% to 13.2%), decreased for non-Hispanic black (10.2% to 9.9%) and non-Hispanic Asian (5.1% to 4.9%) women, and remained essentially unchanged for non-Hispanic white, non-Hispanic NHOPI, and Hispanic women.
Cesarean delivery ■ In 2018, the overall cesarean delivery
rate decreased to 31.9% (from 32.0% in 2017) (Tables 3 and 5), returning to the lowest rate since 2009 (the rate peaked in 2009 at 32.9%) after an uptick in 2017 (3). See Table 5 for state-specific rates.
■ The cesarean delivery rate ranged from 28.7% of births for non-Hispanic AIAN women to 36.1% for non-Hispanic black women (see Table 3). From 2017 to 2018, cesarean delivery decreased for non-Hispanic white (30.9% to 30.8%) and Hispanic (31.8% to 31.7%) women; rates for non-Hispanic black, non-Hispanic AIAN, non-Hispanic Asian, and non-Hispanic NHOPI women were essentially unchanged.
■ The low-risk cesarean delivery rate also decreased in 2018 to 25.9% of births from 26.0% in 2017. Low-risk cesarean is cesarean delivery among nulliparous (first birth), term (37 completed weeks or more based on the obstetric estimate), singleton (one fetus), vertex (head-first) births.
(3,6.7). The TFR estimates the number of births that a hypothetical group of 1,000 women would have over their lifetimes, based on the age-specific birth rate in a given year.

U.S. Department of Health and Human Services • Centers for Disease Control and Prevention • National Center for Health Statistics • National Vital Statistics System4
Vital Statistics Surveillance Report
■ Low-risk cesarean ranged from 22.3% for non-Hispanic AIAN women to 30.4% for non-Hispanic black women (Table 3). Low-risk cesarean rates decreased from 2017 to 2018 for Hispanic women (25.6% to 25.4%), but were essentially unchanged for other race and Hispanic-origin groups.
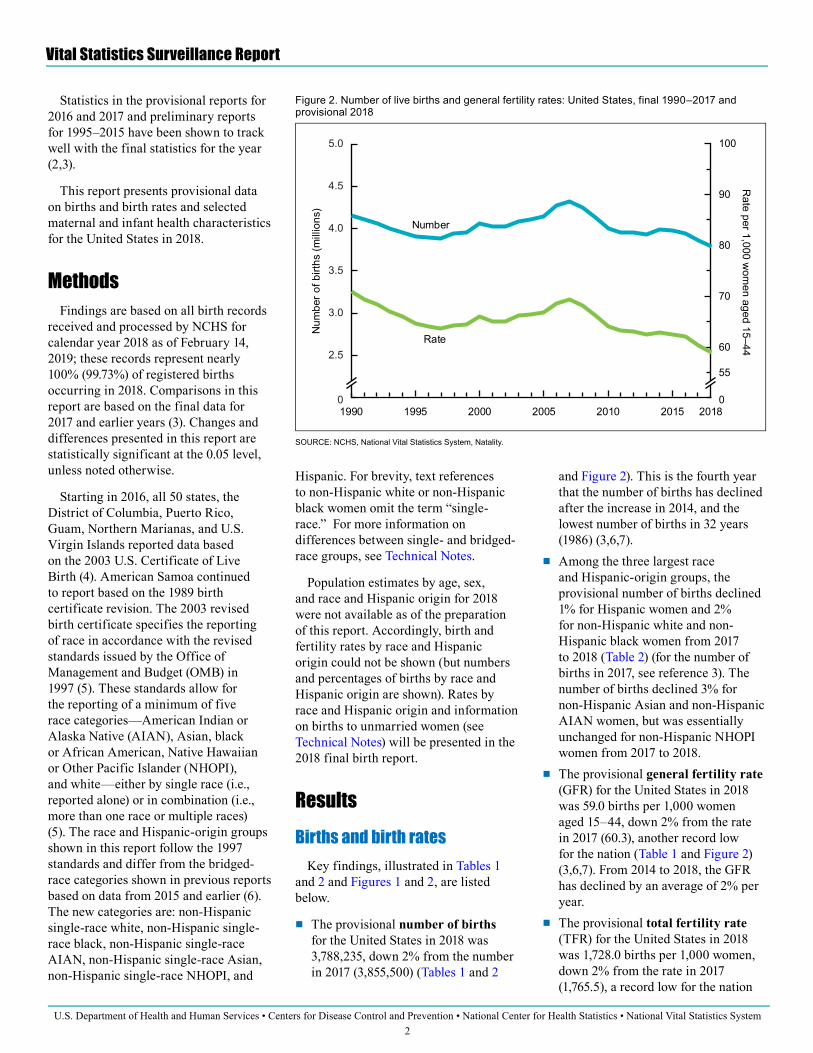
Preterm birth ■ The preterm birth rate rose for
the fourth year in a row to 10.02% in 2018, from 9.93% in 2017 (3) (Table 3). The percentage of infants born preterm (births at less than 37 completed weeks of gestation) fell 8% from 2007 (the most recent year for which national data are available based on the obstetric estimate of gestation) to 2014, but has risen 5% from 2014 (9.57%) to 2018 (3). See Table 6 for state-specific rates.
■ The rise in the overall preterm rate from 2017 to 2018 is due to the increase in late preterm births (34–36 completed weeks of gestation) (Table 3), which rose 2% from 7.17% of births to 7.28%. The percentage of infants born early preterm (less than 34 weeks) declined to 2.74% from 2.76%.
■ Preterm rates increased for births to non-Hispanic black (13.93% to 14.12%) and Hispanic (9.62% to 9.72%) women from 2017 to 2018; increases for both groups were among late preterm births. The increase in the total preterm rate among births to non-Hispanic white women (9.05% to 9.09%) was not statistically significant; the late preterm birth rate rose (6.76% to 6.83%), and the early preterm rate declined (2.30% to 2.26%) for this group.
Low birthweight ■ The low birthweight rate (LBW)
was unchanged in 2018 from 2017 at 8.28% (Table 3). The 2017–2018 LBW rate (the percentage of infants born at less than 2,500 grams or 5lb, 8 oz per 100 births) is similar to the highest level ever reported (8.26% in 2006) (9). Following a downward trend from 2007 to 2014, the LBW rate has risen 3%.
■ The rate of moderately low birthweight (1,500–2,499 grams) was essentially stable at 6.90% for 2018 compared with 6.87% in 2017; the percentage of very low birthweight infants (less than 1,500 grams) declined slightly from 1.41% to 1.37% (Table 3).
■ LBW declined among births to non-Hispanic white women (7.00% to 6.91%) but rose among births to
Figure 3. Preterm birth rates: United States, final 2014 and 2017 and provisional 2018, and by race and Hispanic origin of mother, final 2017 and provisional 2018
NOTE: Preterm is less than 37 weeks, late preterm is 34 to 36 weeks, and early preterm is less than 34 weeks of gestation.SOURCE: NCHS, National Vital Statistics System, Natality.
0
3
6
9
12
15
201820172018201720182017201820172014
Late pretermEarly preterm
All births Non-Hispanic white Non-Hispanic black Hispanic
Perc
ent
Race and Hispanic origin of mother
2.75 2.76 2.74 2.30 2.26
4.87 4.89
2.56 2.55
6.82 7.17 7.28
6.76 6.83
9.05 9.099.06 9.23
13.93 14.12
7.05 7.17
9.62 9.729.93 10.029.57

U.S. Department of Health and Human Services • Centers for Disease Control and Prevention • National Center for Health Statistics • National Vital Statistics System5
Vital Statistics Surveillance Report
non-Hispanic black women (13.89% to 14.06%). The rate of births to Hispanic women was 7.48% in 2018, a nonstatistically significant increase from 2017 (7.43%), but a record high for this group since national data became available in 1993 (6).
References
Hyattsville, MD: National Center for Health Statistics. 2015. Available from: https://www.cdc.gov/nchs/data/nvsr/nvsr64/nvsr64_05.pdf.
14. U.S. Census Bureau. Population Division. Annual estimates ofthe resident population by single year of age and sex for the United States: April 1, 2010 to July 1, 2018 (NC– EST2018–AGESEX–RES). Available from: https://www2. census.gov/programs-surveys/popest/technical-documentation/file-layouts/2010-2018/nc-est2018-agesex-res.csv.
15. Parker JD, Talih M, Malec DJ, Beresovsky V, Carroll M, Gonzalez Jr. JF, et al. National Center for Health Statistics data presentation standards for proportions. National Center for Health Statistics. Vital Health Stat 2(175). 2017. Available from: https://www.cdc.gov/nchs/data/series/sr_02/sr02_175.pdf.
16. Hamilton BE, Martin JA, Osterman MJK, Driscoll AK, Rossen LM. Births: Provisional data for 2016. Vital Statistics Rapid Release; no 2. Hyattsville, MD: National Center for Health Statistics. June 2017. Available from: https://www.cdc. gov/nchs/data/vsrr/report002.pdf.
1. Rossen LM, Osterman MJK, Hamilton BE, Martin JA. Quarterly provisional estimates for selected birth indicators, 2017-Quarter 4, 2018. National Center for Health Statistics. National Vital Statistics System, Vital Statistics Rapid Release Program. 2019. Available from: https://www.cdc.gov/nchs/ products/vsrr/natality.htm.
2. Hamilton BE, Martin JA, Osterman MJK, Driscoll AK, Rossen LM. Births: Provisional data for 2017. National Center for Health Statistics. May 2018. Available from: https://www.cdc.gov/nchs/data/vsrr/ report004.pdf.
3. Martin JA, Hamilton BE, Osterman MJK, Driscoll AK, Drake P. Births: Final data for 2017. National Vital Statistics Reports; vol 67 no 8. Hyattsville, MD: National Center for Health Statistics. 2018. Available from: https://www.cdc.gov/nchs/ data/nvsr/nvsr67/nvsr67_08-508.pdf.
4. National Center for Health Statistics. U.S. Standard Certificate of Live Birth. 2003. Available from: https://www.cdc.gov/nchs/data/dvs/ birth11-03final-ACC.pdf.
5. U.S. Office of Management and Budget. Revisions to the standards for the classification of federal data on race and ethnicity. Fed Regist 62(210):58782–90. 1997. Available from: https://obamawhitehouse. archives.gov/omb/fedreg_ 1997standards.
6. Martin JA, Hamilton BE, Osterman MJK, Driscoll AK, Mathews TJ. Births: Final data for 2015. National Vital Statistics Reports; vol 66 no 1. Hyattsville, MD: National Center
for Health Statistics. 2017. Available from: https://www.cdc.gov/nchs/ data/nvsr/nvsr66/nvsr66_01.pdf.
7. National Center for Health Statistics. Vital statistics of the United States, 2003. Volume I, Natality. 2003. Available from: https://www.cdc. gov/nchs/products/vsus/vsus_1980_ 2003.htm.
8. Ventura SJ, Hamilton BE, Mathews TJ. National and state patterns of teen births in the United States, 1940–2013. National Vital Statistics Reports; vol 63 no 4. Hyattsville, MD: National Center for Health Statistics. 2014. Available from: https://www.cdc.gov/nchs/data/nvsr/ nvsr63/nvsr63_04.pdf.
9. Martin JA, Hamilton BE, Sutton PD, Ventura SJ, Menacker F, Kirmeyer S, Mathews TJ. Births: Final data for 2006. National Vital Statistics Reports; vol 57 no 07. Hyattsville, MD: National Center for Health Statistics. 2019. Available from: https://www.cdc.gov/nchs/data/nvsr/ nvsr57/nvsr57_07.pdf.
10. National Center for Health Statistics. User guide to the 2017 natality public use file. Available from: ftp:// ftp.cdc.gov/pub/Health_Statistics/ NCHS/Dataset_Documentation/ DVS/natality/UserGuide2017.pdf.
11. Rossen LM, Osterman MJK, Hamilton BE, Martin JA. Quarterly provisional estimates - technical notes - natality, 2017-quarter 4, 2018. Available from: https://www. cdc.gov/nchs/products/vsrr/natality-technical-notes.htm.
12. National Center for Health Statistics. Report of the Panel to Evaluate the U.S. Standard Certificates. 2000. Available from: https://www.cdc. gov/nchs/data/dvs/panelreport_acc. pdf.
13. Martin JA, Osterman MJK, Kirmeyer SE, Gregory ECW. Measuring gestational age in vital statistics data: Transitioning to the obstetric estimate. National Vital Statistics Reports; vol 64 no 5.

U.S. Department of Health and Human Services • Centers for Disease Control and Prevention • National Center for Health Statistics • National Vital Statistics System6
Vital Statistics Surveillance Report
List of Detailed TablesReport tables1. Births and birth rates, by age of
mother: United States, final 2017 and provisional 2018 . . . . . . . . . . . . . . . . . . . . 7
2. Births, by race and Hispanic origin of mother: United States and each state and territory, provisional 2018 . . . . . . . . . 8
3. Selected maternal and birth characteristics, by race and Hispanic origin of mother: United States, final 2017 and provisional 2018 . . . . . . . . . . . 10
4. Prenatal care beginning in the first trimester and late or no prenatal care: United States, each state and territory, final 2017 and provisional 2018 . . . . . . . . . . . . . . . . . . . . . . . . . . . . 11
5. Births, by total cesarean delivery and low-risk cesarean delivery: United States, each state and territory, final 2017 and provisional 2018 . . . . . . . . . . . 13
6. Preterm and late preterm births: United States, each state and territory, final 2017 and provisional 2018 . . . . . . . 15

U.S. Department of Health and Human Services • Centers for Disease Control and Prevention • National Center for Health Statistics • National Vital Statistics System7
Vital Statistics Surveillance Report
Table 1. Births and birth rates, by age of mother: United States, final 2017 and provisional 2018
[Data for 2018 are based on a continuous file of records received from the states. Figures for 2018 are based on weighted data rounded to the nearest individual, so categories may not add to totals. Rates are per 1,000 women in specified age group. Rates for all ages are the total number of births (regardless of the age of the mother) per 1,000 women aged 15–44]
Age of mother (years)
2018 2017
Number Rate Number Rate
All ages 3,788,235 59.0 3,855,500 60.3
10–14 1,731 0.2 1,917 0.215–19 179,607 17.4 194,377 18.8
15–17 44,221 7.2 48,547 7.918–19 135,386 32.3 145,830 35.1
20–24 725,157 67.9 764,780 71.025–29 1,098,330 95.2 1,123,577 98.030–34 1,089,980 99.6 1,091,917 100.335–39 566,519 52.6 554,796 52.340–44 117,339 11.8 114,813 11.645–541 9,572 0.9 9,323 0.9
1The birth rate for women in this age group is computed by relating the number of births to women aged 45 and over to women aged 45–49 because most of the births in this group are to women aged 45–49.
NOTE: For information on the relative standard errors of the data and further discussion, see Technical Notes in this report.
SOURCE: NCHS, National Vital Statistics System, Natality.

U.S. Department of Health and Human Services • Centers for Disease Control and Prevention • National Center for Health Statistics • National Vital Statistics System8
Vital Statistics Surveillance Report
See footnotes at end of table.
Table 2. Births, by race and Hispanic origin of mother: United States and each state and territory, provisional 2018
[By place of residence. Data are based on a continuous file of records received from the states. Figures are based on weighted data rounded to the nearest individual, so categories may not add to totals]
AreaAll races and
origins1
Non-Hispanic, single race
Hispanic3White2 Black2
American Indian or Alaska
Native2 Asian2
Native Hawaiian or Other Pacific
Islander2
United States4 3,788,235 1,953,054 551,450 29,048 241,201 9,446 886,375
Alabama 57,745 33,762 17,597 148 903 45 4,404Alaska 10,076 5,053 280 1,869 641 299 807Arizona 80,702 32,797 4,304 4,155 2,907 248 34,076Arkansas 36,996 23,587 6,960 220 775 501 4,097California 454,526 121,271 22,412 1,382 68,849 1,705 212,384Colorado 62,873 36,455 3,031 352 2,496 155 17,816Connecticut 34,723 18,485 4,423 38 2,233 5 8,762Delaware 10,615 5,167 2,771 10 634 4 1,710District of Columbia 9,209 3,038 4,251 15 444 2 1,296Florida 221,532 95,860 48,172 261 6,996 152 67,200
Georgia 126,152 55,659 43,735 102 5,769 104 17,438Hawaii 16,964 3,286 424 33 4,366 1,706 2,579Idaho 21,398 16,568 233 220 348 65 3,550Illinois 144,787 77,225 24,476 97 9,453 32 30,359Indiana 81,585 59,460 10,243 73 2,382 59 7,866Iowa 37,754 29,298 2,616 152 1,176 149 3,694Kansas 36,257 25,320 2,574 151 1,228 66 5,977Kentucky 53,806 43,214 4,946 68 1,144 78 3,220Louisiana 59,517 30,422 22,066 298 1,156 32 4,710Maine 12,308 11,019 546 96 202 3 224
Maryland 71,080 29,585 21,892 83 4,928 31 12,470Massachusetts 69,133 39,657 6,823 53 6,182 23 13,812Michigan 109,782 74,545 20,552 412 4,392 33 7,134Minnesota 67,327 46,004 8,207 982 5,297 57 4,991Mississippi 36,999 18,604 15,792 221 411 17 1,662Missouri 73,222 53,669 10,570 140 1,699 199 4,409Montana 11,509 9,223 58 1,160 111 15 558Nebraska 25,416 17,601 1,734 317 924 23 4,138Nevada 35,659 13,007 4,563 280 2,612 339 13,304New Hampshire 11,992 10,314 241 7 472 6 745
New Jersey 101,313 45,549 13,863 40 11,473 27 27,642New Mexico 23,007 6,448 386 2,588 409 13 12,757New York 226,175 110,799 33,154 395 24,376 50 51,746North Carolina 118,930 63,496 27,668 1,447 4,833 151 18,359North Dakota 10,636 7,816 609 828 250 16 635Ohio 135,112 97,345 22,185 96 4,286 73 7,426Oklahoma 49,792 28,439 4,134 4,558 1,307 213 7,546Oregon 42,152 28,237 958 388 2,260 309 7,989Pennsylvania 135,551 90,833 17,721 74 6,204 54 15,804Rhode Island 10,506 6,009 777 36 516 5 2,751
South Carolina 56,662 31,885 16,678 106 1,173 50 5,255South Dakota 11,889 8,476 416 1,645 224 7 661Tennessee 80,678 53,207 15,910 79 1,877 69 7,822Texas 376,945 125,140 47,789 717 19,842 486 178,274Utah 47,210 34,304 521 418 1,131 468 8,132Vermont 5,431 4,934 118 11 152 1 121Virginia 99,787 54,754 20,845 157 7,625 103 14,400Washington 86,061 48,997 3,922 1,165 8,728 1,159 16,072West Virginia 18,110 16,510 623 13 176 2 375Wisconsin 64,088 45,646 6,621 677 3,155 29 6,365Wyoming 6,557 5,073 57 212 72 7 851

U.S. Department of Health and Human Services • Centers for Disease Control and Prevention • National Center for Health Statistics • National Vital Statistics System9
Vital Statistics Surveillance Report
Table 2. Births, by race and Hispanic origin of mother: United States and each state and territory, provisional 2018—Con.
[By place of residence. Data are based on a continuous file of records received from the states. Figures are based on weighted data rounded to the nearest individual, so categories may not add to totals]
AreaAll races and
origins1
Non-Hispanic, single race
Hispanic3White2 Black2
American Indian or Alaska
Native2 Asian2
Native Hawaiian or Other Pacific
Islander2
Puerto Rico 21,366 480 49 3 30 – 20,781Virgin Islands --- --- --- --- --- --- ---Guam 3,164 170 23 6 720 2,094 25American Samoa --- --- --- --- --- --- ---Northern Marianas 475 10 – – 120 337 –
– Quantity zero.--- Data not available.1Includes births to race and origin groups not shown separately, such as Hispanic white, Hispanic black, and non-Hispanic multiple-race women, and births with origin not stated.2Race and Hispanic origin are reported separately on birth certificates; persons of Hispanic origin may be of any race. In this table, non-Hispanic women are classified by race. Race categories are consistent with the 1997 Office of Management and Budget standards; see Technical Notes in this report. Single race is defined as only one race reported on the birth certificate.3Includes all persons of Hispanic origin of any race; see Technical Notes.4Excludes data for the territories.
NOTE: For information on the relative standard errors of the data and further discussion, see Technical Notes.
SOURCE: NCHS, National Vital Statistics System, Natality.

U.S. Department of Health and Human Services • Centers for Disease Control and Prevention • National Center for Health Statistics • National Vital Statistics System10
Vital Statistics Surveillance Report
Table 3. Selected maternal and birth characteristics, by race and Hispanic origin of mother: United States, final 2017 and provisional 2018
[Data for 2018 are based on a continuous file of records received from the states. Figures for 2018 are based on weighted data rounded to the nearest individual]
CharacteristicAll races and
origins1
Non-Hispanic, single race
Hispanic3White2 Black2
American Indian or Alaska Native2 Asian2
Native Hawaiian or Other Pacific
Islander2
Prenatal care Percent
First trimester care:2018 77.5 82.5 67.1 62.5 81.8 50.9 72.72017 77.3 82.4 66.6 63.4 81.1 52.5 72.3
Late4 or nocare:2018 6.2 4.5 9.9 13.2 4.9 20.4 7.72017 6.3 4.5 10.2 12.6 5.1 19.6 7.7
Cesarean delivery
Total5:2018 31.9 30.8 36.1 28.7 33.1 31.0 31.72017 32.0 30.9 36.0 28.5 33.2 31.0 31.8
Low-risk6:2018 25.9 24.9 30.4 22.3 27.6 26.4 25.42017 26.0 24.9 30.4 22.8 27.8 26.8 25.6
Gestational age7
Preterm (less than 37 weeks):2018 10.02 9.09 14.12 11.53 8.56 11.81 9.722017 9.93 9.05 13.93 11.86 8.53 10.54 9.62
Late preterm (34–36 weeks):2018 7.28 6.83 9.23 8.36 6.45 8.23 7.172017 7.17 6.76 9.06 8.77 6.34 7.86 7.05
Early preterm (less than 34 weeks):2018 2.74 2.26 4.89 3.17 2.11 3.58 2.552017 2.76 2.30 4.87 3.09 2.19 2.68 2.56
Birthweight
Low birth weight (less than 2,500 grams):2018 8.28 6.91 14.06 8.00 8.57 8.94 7.482017 8.28 7.00 13.89 8.25 8.52 7.74 7.43
Moderately lowbirth weight (1,500–1,499 grams):2018 6.90 5.90 11.14 6.65 7.47 7.46 6.242017 6.87 5.94 10.94 6.84 7.39 6.59 6.18
Very low birth weight (less than1,500 grams):2018 1.37 1.01 2.92 1.35 1.10 1.47 1.242017 1.41 1.05 2.95 1.41 1.13 1.15 1.26
1Includes births to race and origin groups not shown separately, such as Hispanic white, Hispanic black, and non-Hispanic multiple-race women, and births with origin not stated.2Race and Hispanic origin are reported separately on birth certificates; persons of Hispanic origin may be of any race. In this table, non-Hispanic women are classified by race. Race categories are consistent with the 1997 Office of Management and Budget standards; see Technical Notes in this report. Single race is defined as only one race reported on the birth certificate.3Includes all persons of Hispanic origin of any race; see Technical Notes. 4Late care is beginning in the third trimester.5All births by cesarean delivery per 100 live births.6Low-risk cesarean is defined as singleton, term (37 weeks or more of gestation based on obstetric estimate; see Technical Notes), vertex (not breech), cesarean deliveries to women having a first birth per 100 women delivering singleton, term, vertex first births.7Completed weeks of gestation based on the obstetric estimate; see Technical Notes.
NOTE: For information on the relative standard errors of the data and further discussion, see Technical Notes.
SOURCE: NCHS, National Vital Statistics System, Natality.

U.S. Department of Health and Human Services • Centers for Disease Control and Prevention • National Center for Health Statistics • National Vital Statistics System11
Vital Statistics Surveillance Report
Table 4. Prenatal care beginning in the first trimester and late or no prenatal care: United States, each state and territory, final 2017 and provisional 2018
[By place of residence. Data are based on a continuous file of records received from the states]
Area
Prenatal care initiation
First trimester Late1 or no care
2018 2017 2018 2017
Percent
United States2 77.5 77.3 6.2 6.3
Alabama 70.7 71.5 8.0 7.5Alaska 75.7 75.8 5.8 5.8Arizona 72.5 72.6 9.4 9.0Arkansas 70.4 70.2 9.4 10.0California 85.7 85.2 3.7 3.8Colorado 79.2 78.7 5.9 6.0Connecticut 84.0 84.4 3.6 3.3Delaware 77.9 78.9 7.0 6.7District of Columbia 70.6 70.2 7.4 9.1Florida 72.8 73.7 7.8 7.6
Georgia 74.4 74.8 8.7 8.5Hawaii 72.5 76.5 10.8 7.1Idaho 81.1 79.5 4.4 4.2Illinois 77.6 77.0 6.1 6.0Indiana 72.8 73.1 6.4 6.3Iowa 81.6 80.9 4.1 4.4Kansas 83.4 83.2 4.0 3.8Kentucky 79.0 78.8 5.7 5.5Louisiana 77.0 77.1 6.5 6.1Maine 83.4 84.2 4.8 3.6
Maryland 74.6 73.8 6.6 6.9Massachusetts 83.4 82.7 4.7 5.0Michigan 79.9 80.4 4.8 4.9Minnesota 82.6 82.1 3.5 3.8Mississippi 78.3 78.5 4.8 4.8Missouri 75.4 76.6 6.4 5.6Montana 77.5 77.4 6.4 6.0Nebraska 78.8 77.2 4.7 5.4Nevada 74.7 74.0 8.7 8.9New Hampshire 85.7 85.7 3.7 3.7
New Jersey 76.6 76.3 6.0 5.8New Mexico 70.1 69.8 11.3 11.5New York 80.9 80.6 4.9 5.0North Carolina 74.5 74.8 6.9 6.5North Dakota 80.2 79.3 5.9 5.6Ohio 76.6 75.6 6.1 6.3Oklahoma 75.1 74.2 6.9 7.0Oregon 82.4 81.4 4.7 4.5Pennsylvania 77.5 76.9 6.3 6.6Rhode Island 84.6 83.6 1.6 2.0
South Carolina 74.3 73.2 7.2 6.6South Dakota 77.5 76.0 5.6 6.1Tennessee 75.7 74.8 6.2 7.7Texas 69.3 68.2 9.5 10.2Utah 82.2 83.4 4.4 3.7Vermont 89.3 90.1 1.9 1.7Virginia 78.6 79.0 5.0 4.8Washington 78.5 78.5 5.8 6.1West Virginia 78.9 77.5 6.7 6.7Wisconsin 82.8 82.6 4.0 4.1Wyoming 76.4 78.1 6.9 6.2
See footnotes at end of table.

U.S. Department of Health and Human Services • Centers for Disease Control and Prevention • National Center for Health Statistics • National Vital Statistics System12
Vital Statistics Surveillance Report
Table 4. Prenatal care beginning in the first trimester and late or no prenatal care: United States, each state and territory, final 2017 and provisional 2018—Con.
[By place of residence. Data are based on a continuous file of records received from the states]
Area
Prenatal care initiation
First trimester Late1 or no care
2018 2017 2018 2017
Percent
Puerto Rico 79.8 81.5 3.6 3.3Virgin Islands --- --- --- ---Guam 60.7 59.3 12.8 13.8American Samoa --- --- --- ---Northern Marianas 52.9 52.2 16.6 17.2
--- Data not available. 1Care beginning in the third trimester.2Excludes data for the territories.
NOTE: For information on the relative standard errors of the data and further discussion, see Technical Notes in this report.
SOURCE: NCHS, National Vital Statistics System, Natality.

U.S. Department of Health and Human Services • Centers for Disease Control and Prevention • National Center for Health Statistics • National Vital Statistics System13
Vital Statistics Surveillance Report
Table 5. Births, by total cesarean delivery and low-risk cesarean delivery: United States, each state and territory, final 2017 and provisional 2018
[By place of residence. Data are based on a continuous file of records received from the states]
Area
Total cesarean Low-risk cesarean1
2018 2017 2018 2017
Percent
United States2 31.9 32.0 25.9 26.0
Alabama 34.7 35.1 28.6 28.2Alaska 22.4 22.5 16.7 19.2Arizona 27.5 26.9 21.3 20.6Arkansas 34.8 33.5 28.4 26.6California 30.9 31.4 24.0 24.4Colorado 26.1 26.5 21.2 21.6Connecticut 34.8 34.8 29.4 28.2Delaware 31.3 31.8 24.0 24.9District of Columbia 31.6 32.2 28.0 28.7Florida 36.8 37.2 30.4 31.0
Georgia 34.0 34.2 27.9 27.9Hawaii 26.9 25.9 22.4 20.7Idaho 24.0 23.7 18.5 18.1Illinois 31.2 31.1 25.2 25.1Indiana 29.8 29.7 23.5 23.4Iowa 29.9 29.7 23.4 24.0Kansas 29.7 30.0 24.2 23.8Kentucky 34.4 35.2 27.8 28.3Louisiana 37.0 37.5 29.2 30.4Maine 30.4 29.9 25.0 23.8
Maryland 33.9 33.9 28.2 28.2Massachusetts 31.5 31.6 25.4 25.7Michigan 32.2 31.9 27.3 26.6Minnesota 27.0 27.4 22.9 23.4Mississippi 38.3 37.8 31.2 30.8Missouri 30.0 30.1 23.9 23.8Montana 28.1 28.5 22.7 23.8Nebraska 29.9 30.4 22.5 24.9Nevada 33.8 34.1 28.0 28.6New Hampshire 31.7 31.0 27.1 25.2
New Jersey 34.8 35.9 27.7 29.3New Mexico 25.3 24.7 19.6 18.3New York 33.9 34.1 28.9 29.0North Carolina 29.4 29.4 23.3 23.2North Dakota 26.5 28.3 19.3 22.2Ohio 30.8 30.3 25.4 24.3Oklahoma 32.8 32.2 24.6 24.8Oregon 28.0 28.1 23.8 22.6Pennsylvania 30.1 30.5 25.1 25.7Rhode Island 32.2 31.5 27.8 25.4
South Carolina 33.5 33.5 26.9 27.0South Dakota 24.6 24.5 18.7 17.8Tennessee 32.4 32.4 26.4 26.9Texas 35.0 35.0 28.7 28.6Utah 22.7 22.8 18.3 17.7Vermont 25.9 25.7 20.3 19.9Virginia 32.4 32.6 26.0 26.4Washington 27.9 27.7 23.1 23.1West Virginia 34.2 35.2 27.4 27.6Wisconsin 26.6 26.4 22.3 21.6Wyoming 27.4 26.4 20.4 21.2
See footnotes at end of table.

U.S. Department of Health and Human Services • Centers for Disease Control and Prevention • National Center for Health Statistics • National Vital Statistics System14
Vital Statistics Surveillance Report
Table 5. Births, by total cesarean delivery and low-risk cesarean delivery: United States, each state and territory, final 2017 and provisional 2018—Con.
[By place of residence. Data are based on a continuous file of records received from the states]
Area
Total cesarean Low-risk cesarean1
2018 2017 2018 2017
Percent
Puerto Rico 46.4 46.8 41.5 41.2Virgin Islands --- --- --- ---Guam 25.4 25.4 23.2 20.3American Samoa --- --- --- ---Northern Marianas 30.4 20.8 32.6 17.3
--- Data not available.1Defined as singleton, term (37 weeks or more of gestation based on obstetric estimate; see Technical Notes in this report), vertex (not breech), cesarean deliveries to women having a first birth per 100 women delivering singleton, term, vertex first births.2Excludes data for the territories.
NOTE: For information on the relative standard errors of the data and further discussionm, see Technical Notes.
SOURCE: NCHS, National Vital Statistics System, Natality.
U.S. Department of Health and Human Services • Centers for Disease Control and Prevention • National Center for Health Statistics • National Vital Statistics System15
Vital Statistics Surveillance Report
Table 6. Preterm and late preterm births: United States, each state and territory, final 2017 and provisional 2018
[By place of residence. Data are based on a continuous file of records received from the states]
Area
Late preterm1 Preterm2
2018 2017 2018 2017
Percent
UnitedStates3 7.28 7.17 10.02 9.93
Alabama 8.86 8.64 12.48 12.04Alaska 6.92 6.49 9.26 8.98Arizona 7.07 6.88 9.51 9.27Arkansas 8.50 8.27 11.62 11.38California 6.50 6.41 8.79 8.68Colorado 6.75 6.37 9.22 8.76Connecticut 6.75 6.69 9.36 9.48Delaware 6.80 7.51 9.55 10.22District of Columbia 6.73 6.93 10.11 10.63Florida 7.34 7.27 10.25 10.22
Georgia 8.07 8.14 11.50 11.42Hawaii 7.58 7.73 10.29 10.45Idaho 6.87 6.46 9.04 8.75Illinois 7.71 7.49 10.67 10.42Indiana 7.47 7.09 10.24 9.84Iowa 7.29 6.83 9.92 9.17Kansas 6.95 6.91 9.49 9.57Kentucky 8.35 8.06 11.33 11.13Louisiana 9.35 9.15 12.99 12.66Maine 6.40 6.35 8.56 8.67
Maryland 7.10 7.28 10.18 10.46Massachusetts 6.50 6.62 8.94 8.88Michigan 7.35 7.26 10.06 10.24Minnesota 6.62 6.54 8.92 8.91Mississippi 10.09 9.67 14.24 13.55Missouri 7.90 7.64 10.73 10.56Montana 6.86 7.27 9.09 9.48Nebraska 7.84 7.28 10.46 9.90Nevada 7.44 7.78 10.14 10.72New Hampshire 6.00 6.15 8.31 8.35
New Jersey 6.87 6.86 9.36 9.50New Mexico 7.26 7.50 9.78 10.25New York 6.42 6.40 8.98 8.98North Carolina 7.37 7.28 10.38 10.49North Dakota 7.11 6.33 9.57 8.80Ohio 7.37 7.36 10.25 10.36Oklahoma 8.42 8.18 11.39 11.14Oregon 5.91 6.19 7.84 8.35Pennsylvania 6.82 6.59 9.53 9.43Rhode Island 6.35 5.59 8.98 8.30
South Carolina 8.07 7.89 11.34 11.22South Dakota 7.28 6.97 9.43 9.28Tennessee 7.92 8.14 11.06 11.09Texas 7.88 7.66 10.78 10.58Utah 7.19 7.14 9.42 9.44Vermont 6.38 5.56 8.51 7.52Virginia 6.77 6.80 9.42 9.55Washington 6.16 6.24 8.32 8.39West Virginia 8.68 8.92 11.76 11.99Wisconsin 7.31 7.03 9.91 9.64Wyoming 7.44 6.84 9.84 8.92
See footnotes at end of table.

U.S. Department of Health and Human Services • Centers for Disease Control and Prevention • National Center for Health Statistics • National Vital Statistics System16
Vital Statistics Surveillance Report
Table 6. Preterm and late preterm births: United States, each state and territory, final 2017 and provisional 2018—Con.
[By place of residence. Data are based on a continuous file of records received from the states]
Area
Late preterm1 Preterm2
2018 2017 2018 2017
Percent
Puerto Rico 8.85 8.36 11.89 11.45Virgin Islands --- --- --- ---Guam 7.99 8.31 9.98 10.29American Samoa --- --- --- ---Northern Marianas 7.16 6.41 10.53 7.80
--- Data not available.1Births at 34–36 completed weeks of gestation based on the obstetric estimate; see Technical Notes in this report.2Births less than 37 completed weeks of gestation based on the obstetric estimate; see Technical Notes.3Excludes data for the territories.
NOTE: For information on the relative standard errors of the data and further discussion, see Technical Notes.
SOURCE: NCHS, National Vital Statistics System, Natality.

U.S. Department of Health and Human Services • Centers for Disease Control and Prevention • National Center for Health Statistics • National Vital Statistics System17
Vital Statistics Surveillance Report
Technical NotesNature and source of data
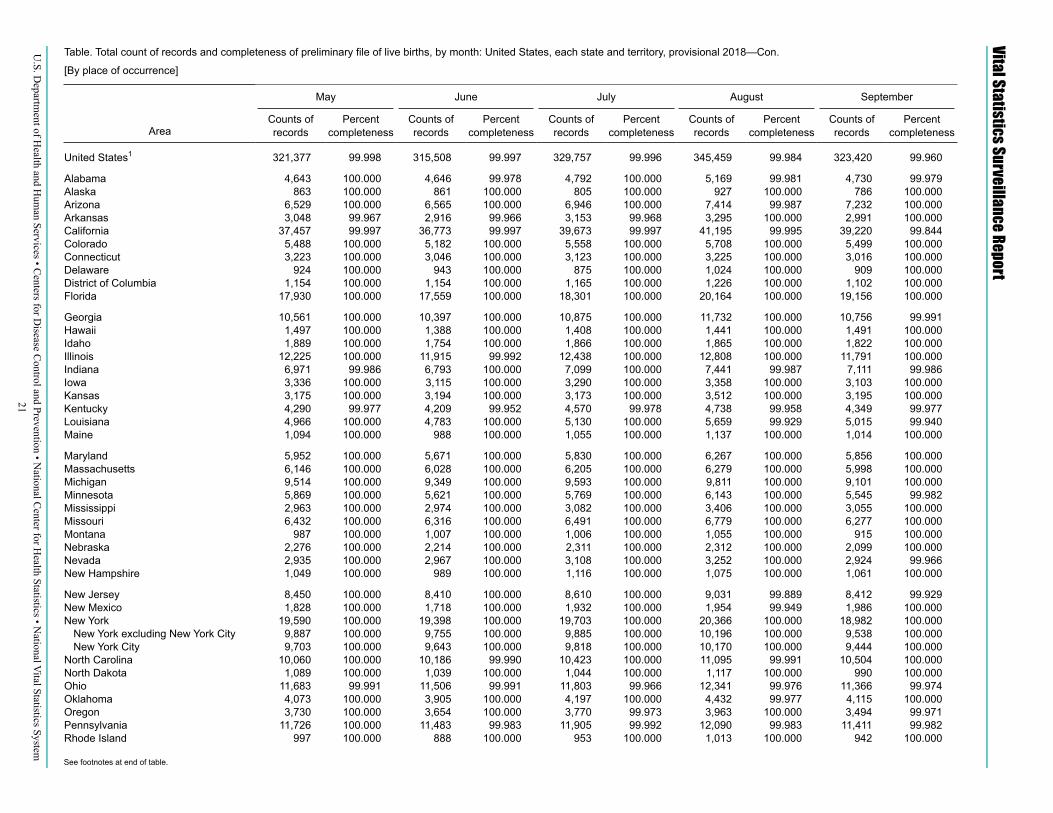
Provisional data for 2018 are based on nearly all births for that year (U.S. total is 99.73%) (see Table in Technical Notes); the total level for each state and the District of Columbia was at or above 98.06%. Provisional 2018 data are based on the continuous receipt and processing of statistical records through February 14, 2019, by the National Center for Health Statistics (NCHS). NCHS receives the data from the state’s vital registration systems through the Vital Statistics Cooperative Program. In this report, U.S. totals include only events occurring within the 50 states and the District of Columbia. Data for Puerto Rico, Guam, and Northern Marianas are included in tables showing data by state, but are not included in U.S. totals (Tables 2,4–6, and Table in Technical Notes). Data for American Samoa and the U.S. Virgin Islands were not available as of the release of the 2018 provisional birth file. Accordingly, data for these territories are not included in this report. Detailed information on reporting completeness and reporting criteria may be found elsewhere (2,10).
The production of the 2018 provisional estimates shown in this report is part of the National Vital Statistics System Rapid Release, Quarterly Provisional Estimates series and includes birth data for the 12 months (ending with quarter 4) of 2018 (1). Except for small changes in record weights (see next paragraph), the same processing procedure was used for provisional data as was used for the preliminary data of prior years.
For preliminary estimates, records in the file had been weighted to independent counts of births occurring in each state for the entire year. For the 2016–2018 provisional data, records in the file were weighted, when necessary, to independent counts of births occurring in each state by month of the year. Except for small changes in record weights, provisional data follow the same processing procedure as used
for preliminary data; thus provisional data are essentially consistent with preliminary data. Detailed information on weighting and the reliability of estimates is available elsewhere (11).
2003 U.S. Standard Certificate of Live Birth
This report includes 2018 data on select items collected from the 2003 revision of the U.S. Standard Certificate of Live Birth (described in detail elsewhere, 3,4,10–12). All 50 states, the District of Columbia, Puerto Rico, Guam, Northern Marianas, and the U.S. Virgin Islands implemented the revised birth certificate as of January 1, 2016.
Age of mother, method of delivery, and birthweight
For information on age of mother and other items presented in this report, see ‘‘User Guide to the 2017 Natality Public Use File’’ (10).
Hispanic origin and raceHispanic origin
Hispanic origin and race are reported separately on the birth certificate. Data shown by Hispanic origin include all persons of Hispanic origin of any race. Data for non-Hispanic persons are shown separately for each single-race group.
Items asking for the Hispanic origin of the mother have been included on the birth certificates of all states and the District of Columbia, the U.S. Virgin Islands, and Guam since 1993, on the birth certificate of Puerto Rico starting in 2005, and on the birth certificate of Northern Marianas starting in 2010 (10). American Samoa does not collect this information.
RaceThis report also presents national
data on race categories based on the 1997 Office of Management and Budget
(OMB) standards (5). The 2003 revision of the U.S. Standard Certificate of Live Birth allows the reporting of five race categories either alone (i.e., single race) or in combination (i.e., more than one race or multiple races) for each parent (4), in accordance with the 1997 revised OMB standards (5). The five categories for race specified in the revised standards are: American Indian or Alaska Native (AIAN), Asian, black or African American, Native Hawaiian or Other Pacific Islander, and white; see ‘‘User Guide to the 2017 Natality Public Use File’’ (10).
Starting in 2016, all states and the District of Columbia, in addition to Puerto Rico, U.S. Virgin Islands, Guam, and Northern Marianas, reported race according to the 1997 revised OMB standards; data from American Samoa still follow 1977 OMB standards (3,10). Prior to 2016, the multiple-race reporting states varied widely, increasing from 6 states in 2003 to the 50 states and the District of Columbia and all territories except American Samoa in 2016 (see “2003 U.S. Standard Certificates of Live Birth” section above).
Information detailing the processing and tabulation of data by race is presented elsewhere (10).
Gestational ageBeginning with the 2014 data year,
NCHS transitioned to a new standard for estimating the gestational age of the newborn. The new measure—the obstetric estimate of gestation at delivery (OE)—replaces the measure based on the date of the last normal menses (LMP) (13). National data based on OE data are available only from data year 2007 forward. Gestational age estimates differ somewhat between the OE-and LMP-based measures (13).
Population denominatorsU.S. national birth and fertility rates
for 2018 shown in this report are based on population estimates derived from the 2010 census as of July 1, 2018 (14).

U.S. Department of Health and Human Services • Centers for Disease Control and Prevention • National Center for Health Statistics • National Vital Statistics System18
Vital Statistics Surveillance Report
Postcensal population estimates by age, sex, and race and Hispanic origin for 2018 at the national and state levels were not available as of the preparation of this report. Accordingly, birth and fertility rates by race and Hispanic origin and fertility rates by state could not be shown in this report. These rates will be shown in the 2018 final birth report scheduled for release in Fall 2019.
Computing rates and percentages
In computing birth rates, age of mother is imputed if it is not stated (less than 1% for 2018).
Percentages were computed using only events for which the characteristic is reported. The “not stated” category is subtracted from the total before the percentage is computed for timing of prenatal care, method of delivery, gestational age, and birthweight.
An asterisk (*) indicates that a figure does not meet standards of reliability. In this report, four criteria determine whether a figure meets these standards:
1. The state-specific sample is complete enough to provide reliable estimates. For example, a criterion of at least 85% of a state’s records for the total 12-month period is used as a basis for providing state-specific estimates (see Table in Technical Notes).
2. Reporting for any particular variable is at least 80% complete. (In this report, no data were suppressed based on this criterion.)
3. A rate is based on at least 20 births in the numerator.
4. A proportion (or percentage) is shown if the denominator size is at least 30 events and the absolute width of the confidence interval (CI) is greater than 0.00 and less than or equal to 0.05, or if the width is between 0.5 and 0.30, the relative CI is less than or equal to 130%.
Rates based on fewer than 20 births have a relative standard error (RSE) of about 23% or more and, therefore, are considered highly variable. However, some birth rates (based on data files that are less than 100% complete and based on 20 to 31 births) may have RSEs of 23% or more but are still shown instead of asterisks. As a result, caution should be exercised in analyzing rates based on 20 to 31 events. Additional information on random variation in numbers of events, rates, ratios, and percentages may be found in “Reliability of estimates.”
The standards for presenting proportions (and percentages) used in this report are based on the standards detailed in “National Center for Health Statistics Data Presentation Standards for Proportions” (15).
Reliability of estimatesFor information and discussion on
reliability of provisional natality data, see “Births: Provisional Data for 2016” (16).

U.S. D
epartment of H
ealth and Hum
an Services • Centers for D
isease Control and Prevention • N
ational Center for H
ealth Statistics • National V
ital Statistics System19
Vital Statistics Surveillance ReportTable. Total count of records and completeness of preliminary file of live births, by month: United States, each state and territory, provisional 2018
[By place of occurrence]
Area
Total January February March April
Counts of records
Percent completeness
Counts of records
Percent completeness
Counts of records
Percent completeness
Counts of records
Percent completeness
Counts of records
Percent completeness
United States1 3,797,987 99.734 315,593 100.000 284,912 99.999 316,781 99.998 299,063 99.997
Alabama 56,491 99.988 4,817 100.000 4,232 100.000 4,648 100.000 4,294 100.000Alaska 9,950 100.000 806 100.000 749 100.000 885 100.000 828 100.000Arizona 81,795 99.993 6,828 99.985 6,275 100.000 6,728 99.985 6,236 99.984Arkansas 35,826 99.983 2,979 100.000 2,701 100.000 2,972 100.000 2,742 99.964California 455,695 98.058 38,259 100.000 34,542 100.000 37,873 99.997 35,645 99.997Colorado 63,458 100.000 5,236 100.000 4,825 100.000 5,324 100.000 5,099 100.000Connecticut 36,150 100.000 2,900 100.000 2,606 100.000 3,026 100.000 2,917 100.000Delaware 10,954 100.000 896 100.000 824 100.000 960 100.000 858 100.000District of Columbia 13,464 100.000 1,121 100.000 1,014 100.000 1,071 100.000 1,039 100.000Florida 221,761 99.998 19,093 100.000 16,629 100.000 18,578 100.000 16,866 100.000
Georgia 127,032 99.991 10,597 100.000 9,730 99.990 10,620 100.000 9,710 99.990Hawaii 17,010 100.000 1,412 100.000 1,276 100.000 1,411 100.000 1,413 100.000Idaho 21,120 100.000 1,705 100.000 1,548 100.000 1,794 100.000 1,736 100.000Illinois 141,040 99.996 11,524 100.000 10,685 100.000 12,032 100.000 11,416 100.000Indiana 82,092 99.985 6,687 100.000 6,269 100.000 7,041 100.000 6,523 100.000Iowa 37,613 99.976 3,122 100.000 2,827 100.000 3,151 99.968 3,066 100.000Kansas 37,765 100.000 3,063 100.000 2,868 100.000 3,158 100.000 3,007 100.000Kentucky 51,488 99.934 4,345 100.000 3,881 100.000 4,321 100.000 3,968 100.000Louisiana 59,717 99.896 5,205 100.000 4,541 100.000 4,813 100.000 4,503 100.000Maine 11,995 100.000 951 100.000 819 100.000 1,020 100.000 955 100.000
Maryland 68,155 100.000 5,651 100.000 4,938 100.000 5,471 100.000 5,492 100.000Massachusetts 69,837 100.000 5,639 100.000 5,127 100.000 5,878 100.000 5,664 100.000Michigan 108,835 100.000 8,876 100.000 8,097 100.000 9,267 100.000 8,847 100.000Minnesota 66,395 99.994 5,407 100.000 4,895 100.000 5,640 100.000 5,467 100.000Mississippi 36,137 99.994 3,066 100.000 2,790 100.000 2,918 100.000 2,687 100.000Missouri 74,043 99.915 6,162 100.000 5,535 100.000 6,058 100.000 5,800 100.000Montana 11,502 100.000 983 100.000 908 100.000 1,004 100.000 926 100.000Nebraska 25,808 100.000 1,976 100.000 2,007 100.000 2,178 100.000 1,984 100.000Nevada 35,363 99.983 2,884 100.000 2,635 100.000 2,912 100.000 2,745 100.000New Hampshire 11,974 99.992 962 100.000 859 100.000 987 100.000 994 100.000
New Jersey 98,875 99.491 7,998 100.000 7,274 100.000 8,339 100.000 7,965 100.000New Mexico 21,685 99.931 1,788 100.000 1,656 100.000 1,766 100.000 1,683 99.881New York 226,833 99.957 19,127 100.000 16,814 100.000 18,717 100.000 18,049 100.000
New York excluding New York City 112,543 100.000 9,233 100.000 8,212 100.000 9,327 100.000 9,088 100.000New York City 114,290 99.914 9,894 100.000 8,602 100.000 9,390 100.000 8,961 100.000
North Carolina 120,780 99.995 9,940 100.000 8,813 100.000 10,009 100.000 9,399 100.000North Dakota 12,216 100.000 996 100.000 928 100.000 1,038 100.000 977 100.000Ohio 135,719 99.982 11,060 100.000 10,302 100.000 11,392 99.991 10,784 99.991Oklahoma 48,336 99.983 4,143 100.000 3,638 100.000 4,042 100.000 3,735 100.000Oregon 42,678 99.984 3,552 100.000 3,145 100.000 3,657 100.000 3,423 100.000Pennsylvania 134,893 99.918 11,065 100.000 9,922 100.000 11,381 99.991 10,700 100.000Rhode Island 11,063 100.000 883 100.000 858 100.000 941 100.000 936 100.000
See footnotes at end of table.

U.S. D
epartment of H
ealth and Hum
an Services • Centers for D
isease Control and Prevention • N
ational Center for H
ealth Statistics • National V
ital Statistics System20
Vital Statistics Surveillance ReportTable. Total count of records and completeness of preliminary file of live births, by month: United States, each state and territory, provisional 2018—Con.
[By place of occurrence]
Area
Total January February March April
Counts of records
Percent completeness
Counts of records
Percent completeness
Counts of records
Percent completeness
Counts of records
Percent completeness
Counts of records
Percent completeness
South Carolina 53,045 99.998 4,487 100.000 3,904 100.000 4,364 100.000 4,180 100.000South Dakota 12,571 99.968 1,051 100.000 917 100.000 1,093 100.000 1,053 100.000Tennessee 86,411 99.994 7,161 100.000 6,484 99.985 7,267 100.000 6,802 100.000Texas 385,229 99.972 32,593 100.000 29,145 100.000 31,363 100.000 29,426 100.000Utah 48,209 99.998 3,771 100.000 3,594 100.000 4,032 100.000 4,005 100.000Vermont 5,326 100.000 416 100.000 371 100.000 479 100.000 411 100.000Virginia 99,048 99.979 8,207 100.000 7,381 100.000 8,295 99.988 7,975 100.000Washington 85,816 99.997 7,022 100.000 6,388 100.000 7,330 100.000 6,974 100.000West Virginia 18,883 99.354 1,618 100.000 1,502 100.000 1,598 99.937 1,414 99.929Wisconsin 63,922 100.000 5,064 100.000 4,773 100.000 5,430 100.000 5,248 100.000Wyoming 5,984 100.000 499 100.000 471 100.000 509 100.000 497 100.000
Puerto Rico 21,426 100.000 1,778 100.000 1,575 100.000 1,585 100.000 1,608 100.000Virgin Islands 1,197 --- 131 --- 86 --- 121 --- 84 ---Guam 3,175 100.000 283 100.000 236 100.000 260 100.000 241 100.000American Samoa 977 --- 75 --- 89 --- 100 --- 70 ---Northern Marianas2 1,263 86.540 107 100.000 102 100.000 108 100.000 98 100.000
See footnotes at end of table.
U.S. D
epartment of H
ealth and Hum
an Services • Centers for D
isease Control and Prevention • N
ational Center for H
ealth Statistics • National V
ital Statistics System21
Vital Statistics Surveillance ReportTable. Total count of records and completeness of preliminary file of live births, by month: United States, each state and territory, provisional 2018—Con.
[By place of occurrence]
Area
May June July August September
Counts of records
Percent completeness
Counts of records
Percent completeness
Counts of records
Percent completeness
Counts of records
Percent completeness
Counts of records
Percent completeness
United States1 321,377 99.998 315,508 99.997 329,757 99.996 345,459 99.984 323,420 99.960
Alabama 4,643 100.000 4,646 99.978 4,792 100.000 5,169 99.981 4,730 99.979Alaska 863 100.000 861 100.000 805 100.000 927 100.000 786 100.000Arizona 6,529 100.000 6,565 100.000 6,946 100.000 7,414 99.987 7,232 100.000Arkansas 3,048 99.967 2,916 99.966 3,153 99.968 3,295 100.000 2,991 100.000California 37,457 99.997 36,773 99.997 39,673 99.997 41,195 99.995 39,220 99.844Colorado 5,488 100.000 5,182 100.000 5,558 100.000 5,708 100.000 5,499 100.000Connecticut 3,223 100.000 3,046 100.000 3,123 100.000 3,225 100.000 3,016 100.000Delaware 924 100.000 943 100.000 875 100.000 1,024 100.000 909 100.000District of Columbia 1,154 100.000 1,154 100.000 1,165 100.000 1,226 100.000 1,102 100.000Florida 17,930 100.000 17,559 100.000 18,301 100.000 20,164 100.000 19,156 100.000
Georgia 10,561 100.000 10,397 100.000 10,875 100.000 11,732 100.000 10,756 99.991Hawaii 1,497 100.000 1,388 100.000 1,408 100.000 1,441 100.000 1,491 100.000Idaho 1,889 100.000 1,754 100.000 1,866 100.000 1,865 100.000 1,822 100.000Illinois 12,225 100.000 11,915 99.992 12,438 100.000 12,808 100.000 11,791 100.000Indiana 6,971 99.986 6,793 100.000 7,099 100.000 7,441 99.987 7,111 99.986Iowa 3,336 100.000 3,115 100.000 3,290 100.000 3,358 100.000 3,103 100.000Kansas 3,175 100.000 3,194 100.000 3,173 100.000 3,512 100.000 3,195 100.000Kentucky 4,290 99.977 4,209 99.952 4,570 99.978 4,738 99.958 4,349 99.977Louisiana 4,966 100.000 4,783 100.000 5,130 100.000 5,659 99.929 5,015 99.940Maine 1,094 100.000 988 100.000 1,055 100.000 1,137 100.000 1,014 100.000
Maryland 5,952 100.000 5,671 100.000 5,830 100.000 6,267 100.000 5,856 100.000Massachusetts 6,146 100.000 6,028 100.000 6,205 100.000 6,279 100.000 5,998 100.000Michigan 9,514 100.000 9,349 100.000 9,593 100.000 9,811 100.000 9,101 100.000Minnesota 5,869 100.000 5,621 100.000 5,769 100.000 6,143 100.000 5,545 99.982Mississippi 2,963 100.000 2,974 100.000 3,082 100.000 3,406 100.000 3,055 100.000Missouri 6,432 100.000 6,316 100.000 6,491 100.000 6,779 100.000 6,277 100.000Montana 987 100.000 1,007 100.000 1,006 100.000 1,055 100.000 915 100.000Nebraska 2,276 100.000 2,214 100.000 2,311 100.000 2,312 100.000 2,099 100.000Nevada 2,935 100.000 2,967 100.000 3,108 100.000 3,252 100.000 2,924 99.966New Hampshire 1,049 100.000 989 100.000 1,116 100.000 1,075 100.000 1,061 100.000
New Jersey 8,450 100.000 8,410 100.000 8,610 100.000 9,031 99.889 8,412 99.929New Mexico 1,828 100.000 1,718 100.000 1,932 100.000 1,954 99.949 1,986 100.000New York 19,590 100.000 19,398 100.000 19,703 100.000 20,366 100.000 18,982 100.000
New York excluding New York City 9,887 100.000 9,755 100.000 9,885 100.000 10,196 100.000 9,538 100.000New York City 9,703 100.000 9,643 100.000 9,818 100.000 10,170 100.000 9,444 100.000
North Carolina 10,060 100.000 10,186 99.990 10,423 100.000 11,095 99.991 10,504 100.000North Dakota 1,089 100.000 1,039 100.000 1,044 100.000 1,117 100.000 990 100.000Ohio 11,683 99.991 11,506 99.991 11,803 99.966 12,341 99.976 11,366 99.974Oklahoma 4,073 100.000 3,905 100.000 4,197 100.000 4,432 99.977 4,115 100.000Oregon 3,730 100.000 3,654 100.000 3,770 99.973 3,963 100.000 3,494 99.971Pennsylvania 11,726 100.000 11,483 99.983 11,905 99.992 12,090 99.983 11,411 99.982Rhode Island 997 100.000 888 100.000 953 100.000 1,013 100.000 942 100.000
See footnotes at end of table.

U.S. D
epartment of H
ealth and Hum
an Services • Centers for D
isease Control and Prevention • N
ational Center for H
ealth Statistics • National V
ital Statistics System22
Vital Statistics Surveillance ReportTable. Total count of records and completeness of preliminary file of live births, by month: United States, each state and territory, provisional 2018—Con.
[By place of occurrence]
Area
May June July August September
Counts of records
Percent completeness
Counts of records
Percent completeness
Counts of records
Percent completeness
Counts of records
Percent completeness
Counts of records
Percent completeness
South Carolina 4,465 99.978 4,202 100.000 4,479 100.000 4,840 100.000 4,561 100.000South Dakota 1,115 100.000 1,089 100.000 1,082 100.000 1,076 100.000 1,041 100.000Tennessee 7,283 100.000 7,064 100.000 7,524 100.000 7,846 100.000 7,336 100.000Texas 31,753 100.000 31,900 100.000 33,484 99.994 35,113 99.929 33,556 99.905Utah 4,201 100.000 4,147 99.976 4,334 100.000 4,419 100.000 3,995 100.000Vermont 432 100.000 454 100.000 498 100.000 512 100.000 418 100.000Virginia 8,384 99.988 8,296 100.000 8,582 100.000 8,960 100.000 8,648 99.988Washington 7,354 100.000 7,308 100.000 7,794 100.000 7,773 100.000 7,147 100.000West Virginia 1,707 100.000 1,581 100.000 1,646 99.939 1,753 99.715 1,518 99.012Wisconsin 5,505 100.000 5,478 100.000 5,685 100.000 5,837 100.000 5,385 100.000Wyoming 566 100.000 485 100.000 503 100.000 511 100.000 494 100.000
Puerto Rico 1,632 100.000 1,674 100.000 1,765 100.000 1,988 100.000 1,989 100.000Virgin Islands 84 --- 80 --- 85 --- 85 --- 119 ---Guam 253 100.000 288 100.000 255 100.000 252 100.000 250 100.000American Samoa 90 --- 66 --- 82 --- 81 --- 93 ---Northern Marianas2 92 100.000 117 100.000 117 100.000 122 100.000 113 100.000
See footnotes at end of table.

U.S. D
epartment of H
ealth and Hum
an Services • Centers for D
isease Control and Prevention • N
ational Center for H
ealth Statistics • National V
ital Statistics System23
Vital Statistics Surveillance ReportTable. Total count of records and completeness of preliminary file of live births, by month: United States, each state and territory, provisional 2018—Con.
[By place of occurrence]
Area
October November December
Counts of records
Percent completeness
Counts of records
Percent completeness
Counts of records
Percent completeness
United States1 327,436 99.641 308,881 98.996 309,800 98.190
Alabama 4,918 100.000 4,727 100.000 4,875 99.918Alaska 870 100.000 765 100.000 805 100.000Arizona 7,242 99.986 6,880 100.000 6,920 99.986Arkansas 3,157 100.000 2,865 99.965 3,007 99.967California 39,393 97.324 38,146 92.348 37,519 87.188Colorado 5,365 100.000 5,103 100.000 5,071 100.000Connecticut 3,199 100.000 2,968 100.000 2,901 100.000Delaware 941 100.000 882 100.000 918 100.000District of Columbia 1,224 100.000 1,117 100.000 1,077 100.000Florida 19,718 100.000 18,482 100.000 19,285 99.979
Georgia 10,886 100.000 10,308 99.951 10,860 99.963Hawaii 1,451 100.000 1,390 100.000 1,432 100.000Idaho 1,781 100.000 1,661 100.000 1,699 99.882Illinois 11,935 100.000 11,187 99.982 11,084 99.973Indiana 6,949 99.971 6,529 100.000 6,679 99.895Iowa 3,261 99.969 3,020 99.901 2,964 99.865Kansas 3,237 100.000 3,047 100.000 3,136 100.000Kentucky 4,376 99.931 4,191 99.952 4,250 99.482Louisiana 5,189 99.942 5,028 99.841 4,885 99.099Maine 1,049 100.000 959 100.000 954 100.000
Maryland 5,995 100.000 5,420 99.982 5,612 100.000Massachusetts 5,978 100.000 5,625 100.000 5,270 100.000Michigan 9,218 100.000 8,458 100.000 8,704 100.000Minnesota 5,447 99.963 5,288 99.981 5,304 100.000Mississippi 3,071 100.000 3,053 100.000 3,072 99.935Missouri 6,287 99.952 5,938 99.983 5,968 99.011Montana 908 100.000 886 100.000 917 100.000Nebraska 2,221 100.000 2,099 100.000 2,131 100.000Nevada 3,069 99.935 2,940 100.000 2,992 99.900New Hampshire 1,038 100.000 961 100.000 883 99.887
New Jersey 8,415 99.346 7,863 98.652 8,108 95.979New Mexico 1,875 99.947 1,717 99.942 1,782 99.439New York 19,349 99.990 18,362 100.000 18,376 99.478
New York excluding New York City 9,554 100.000 8,982 100.000 8,886 100.000New York City 9,795 99.980 9,380 100.000 9,490 98.988
North Carolina 10,505 99.990 9,819 99.990 10,027 99.980North Dakota 1,016 100.000 1,008 100.000 974 100.000Ohio 11,638 99.974 10,876 99.972 10,968 99.954Oklahoma 4,190 100.000 3,931 99.949 3,935 99.873Oregon 3,586 99.972 3,385 99.970 3,319 99.910Pennsylvania 11,682 99.957 10,604 99.934 10,924 99.167Rhode Island 955 100.000 856 100.000 841 100.000
See footnotes at end of table.
U.S. D
epartment of H
ealth and Hum
an Services • Centers for D
isease Control and Prevention • N
ational Center for H
ealth Statistics • National V
ital Statistics System24
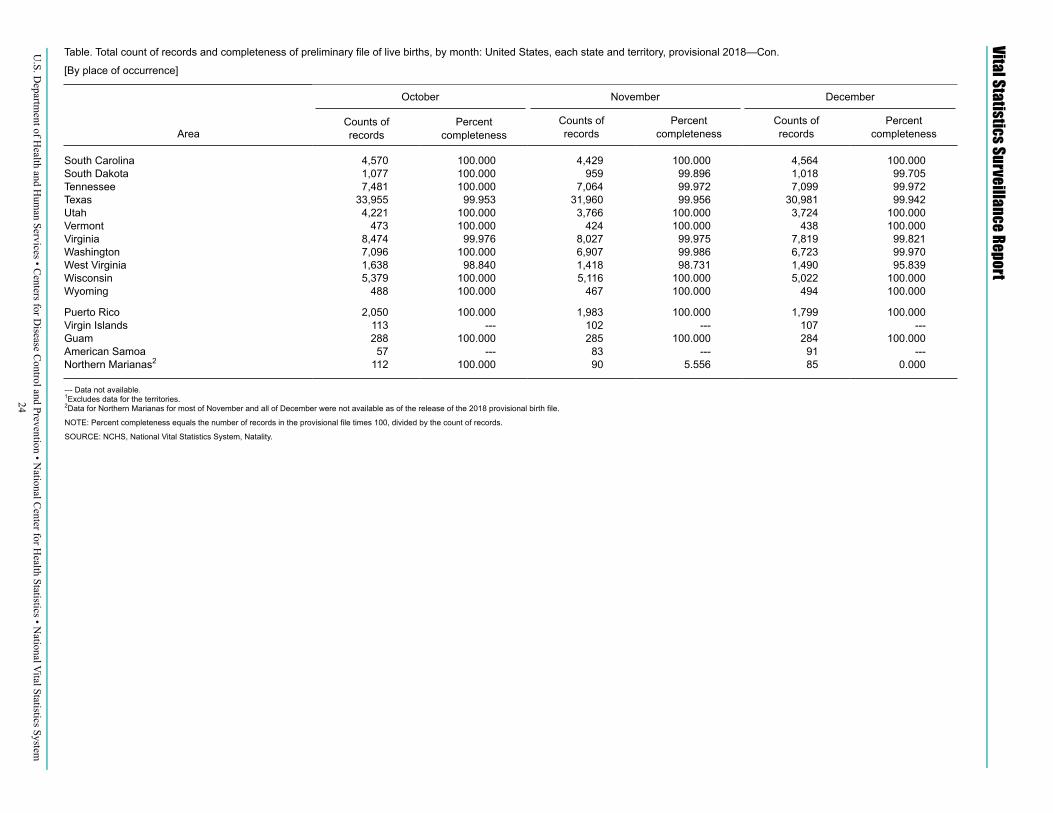
Vital Statistics Surveillance ReportTable. Total count of records and completeness of preliminary file of live births, by month: United States, each state and territory, provisional 2018—Con.
[By place of occurrence]
Area
October November December
Counts of records
Percent completeness
Counts of records
Percent completeness
Counts of records
Percent completeness
South Carolina 4,570 100.000 4,429 100.000 4,564 100.000South Dakota 1,077 100.000 959 99.896 1,018 99.705Tennessee 7,481 100.000 7,064 99.972 7,099 99.972Texas 33,955 99.953 31,960 99.956 30,981 99.942Utah 4,221 100.000 3,766 100.000 3,724 100.000Vermont 473 100.000 424 100.000 438 100.000Virginia 8,474 99.976 8,027 99.975 7,819 99.821Washington 7,096 100.000 6,907 99.986 6,723 99.970West Virginia 1,638 98.840 1,418 98.731 1,490 95.839Wisconsin 5,379 100.000 5,116 100.000 5,022 100.000Wyoming 488 100.000 467 100.000 494 100.000
Puerto Rico 2,050 100.000 1,983 100.000 1,799 100.000Virgin Islands 113 --- 102 --- 107 ---Guam 288 100.000 285 100.000 284 100.000American Samoa 57 --- 83 --- 91 ---Northern Marianas2 112 100.000 90 5.556 85 0.000
--- Data not available.1Excludes data for the territories.2Data for Northern Marianas for most of November and all of December were not available as of the release of the 2018 provisional birth file.
NOTE: Percent completeness equals the number of records in the provisional file times 100, divided by the count of records.
SOURCE: NCHS, National Vital Statistics System, Natality.

U.S. Department of Health and Human Services • Centers for Disease Control and Prevention • National Center for Health Statistics • National Vital Statistics System25
Vital Statistics Surveillance Report
AcknowledgmentsThis report was prepared in the
Division of Vital Statistics (DVS) under the general direction of Steven Schwartz, Director; Paul Sutton, Acting Chief, Reproductive Statistics Branch (RSB); and Joyce Martin, Team Leader, RSB Birth Team. Rajesh Virkar, Chief of Information Technology Branch (ITB), and Steve J. Steimel, Annie S. Liu, Jasmine N. Mickens, and Legesse Alemu provided computer programming support and statistical tables. Steve J. Steimel and Annie S. Liu of ITB prepared the natality file. The Registration Methods and Data Acquisition, Classification and Evaluation Branch staff of DVS evaluated the quality of and acceptance procedures for the state data files on which this report is based. Anne K. Driscoll of RSB provided content review.
Suggested citation
Hamilton BE, Martin JA, Osterman MJK, Rossen LM. Births: Provisional data for 2018. Vital Statistics Rapid Release; no 7. Hyattsville, MD: National Center for Health Statistics. May 2019.
Copyright information
All material appearing in this report is in the public domain and may be reproduced or copied without permission; citation as to source, however, is appreciated.
National Center for Health Statistics
Jennifer H. Madans, Ph.D., Acting Director Amy M. Branum, Ph.D., Acting Associate Director for Science
Division of Vital Statistics
Steven Schwartz, Ph.D., Director Hanyu Ni, Ph.D., M.P.H., Associate Director for Science
CS304462
Related Documents