E. Altman et al. (Eds.): Bionetics 2009, LNICST 39, pp. 77–87, 2010. © Institute for Computer Sciences, Social-Informatics and Telecommunications Engineering 2010 BIONETS Economics and Business Simulation: An Alternative Approach to Quantifying the Added Value for Distributed Mobile Communications and Exchanges Silvia Elaluf-Calderwood and Paolo Dini Department of Media and Communications The London School of Economics and Political Science Houghton Street, London WC2A 2AE {s.m.elaluf-calderwood,p.dini}@lse.ac.uk Abstract. This article presents current research work on the development of BEBS (BIONETS Economic and Business Simulation Model). This model is used to illustrate how in pervasive agent-based networks dynamic agents en- gage in distributed mobile communication exchanges that carry a potential, non-quantified value to be determined. This value can be monetised either as advertisement or as share of revenue profit for an external content or service provider wishing to distribute information over the network. The strength of the simulation model is to enable different ways in which the value of communica- tion events can be quantified and that are not normally considered in conven- tional business approaches. Our simulation can therefore facilitate the explora- tion and development of alternative business models based on heterodox economic perspectives such as the economics of sharing, gift economy, and economic sociology applied to mobile networks. Keywords: social networking economics, alternative business models, token exchange, economics of sharing, mobile networks. 1 Introduction “There is no recipe for the successful use of social tools. Instead, every working sys- tem is a mix of social and technological factors” [21] The use of mobile devices and the ‘Web 2.0’ phenomenon have opened virtual and real windows for ubiquitous and seamless social communications [1], which are para- doxically both continuous and fragmented [25]. Although many research efforts have focused on understanding the social aspects of networking using mobile devices [3], the understanding of how these networks can be valued in terms of money is an unfin- ished research topic. Social networking draws its foundation from Granovetter’s the- ory built around the concept of “the strength of weak ties” [11]. The brilliance of this theory helps understand how some individuals can be nodes of convergence for many other individuals that otherwise would have nothing in common [2].

Welcome message from author
This document is posted to help you gain knowledge. Please leave a comment to let me know what you think about it! Share it to your friends and learn new things together.
Transcript

E. Altman et al. (Eds.): Bionetics 2009, LNICST 39, pp. 77–87, 2010. © Institute for Computer Sciences, Social-Informatics and Telecommunications Engineering 2010
BIONETS Economics and Business Simulation: An Alternative Approach to Quantifying the Added Value for Distributed Mobile Communications and
Exchanges
Silvia Elaluf-Calderwood and Paolo Dini
Department of Media and Communications The London School of Economics and Political Science
Houghton Street, London WC2A 2AE {s.m.elaluf-calderwood,p.dini}@lse.ac.uk
Abstract. This article presents current research work on the development of BEBS (BIONETS Economic and Business Simulation Model). This model is used to illustrate how in pervasive agent-based networks dynamic agents en-gage in distributed mobile communication exchanges that carry a potential, non-quantified value to be determined. This value can be monetised either as advertisement or as share of revenue profit for an external content or service provider wishing to distribute information over the network. The strength of the simulation model is to enable different ways in which the value of communica-tion events can be quantified and that are not normally considered in conven-tional business approaches. Our simulation can therefore facilitate the explora-tion and development of alternative business models based on heterodox economic perspectives such as the economics of sharing, gift economy, and economic sociology applied to mobile networks.
Keywords: social networking economics, alternative business models, token exchange, economics of sharing, mobile networks.
1 Introduction
“There is no recipe for the successful use of social tools. Instead, every working sys-tem is a mix of social and technological factors” [21]
The use of mobile devices and the ‘Web 2.0’ phenomenon have opened virtual and real windows for ubiquitous and seamless social communications [1], which are para-doxically both continuous and fragmented [25]. Although many research efforts have focused on understanding the social aspects of networking using mobile devices [3], the understanding of how these networks can be valued in terms of money is an unfin-ished research topic. Social networking draws its foundation from Granovetter’s the-ory built around the concept of “the strength of weak ties” [11]. The brilliance of this theory helps understand how some individuals can be nodes of convergence for many other individuals that otherwise would have nothing in common [2].

78 S. Elaluf-Calderwood and P. Dini
In many ways the use of mobile devices has taken the lead role in introducing new social organizational forms [19]. The combination of mobile devices with networking tools such as Facebook, Twitter, Hi5, and other similar web-based applications – col-lectively referred to as Web 2.0 – has created a chorus of approval from social experts [18, 24] for the apparent success of social networking as a means to achieve a ubiqui-tous connected society. Analogies can be made on mobile phone use spread to the study the fundamental spreading patterns characterizing a mobile virus outbreak [14]. Social networking in fact shifts the generation of media from the technology to the user and the content users generate [2, 12].
This shift has been accelerated by the rapid evolution of mobile devices that are adopted by users, because these devices have features that can perform and enhance seamless communications. Users are eager to transfer and exchange many forms of data on the virtual networks accessed through mobile devices [20]. Some of these communication exchanges open up new social networks; others reinforce already ex-isting ones [26].
Although this exchange of data (e.g. user profiles, video files, music files, docu-ments, games, etc) benefits social networking, in economic terms the increase in vol-ume of data transferred has a cost that operators quantify. The emergence of pervasive and interconnected computing devices that give rise to a dynamic network topology in which distributed content can become focalized and spontaneously shared brings new opportunities for economic exchange. The patterns of communication are based on social networking and bio-inspired models such as epidemic spreading and gossiping metaphors [10, 13], where trust is all-important and reputation keeps local trust values above other values in the network [4]. Thus, social networking and mobile applica-tions have created a new real and virtual space in which the traditional models of revenue might need to be re-thought [16, 17].
Telecom operators are the main referees when applying a distribution model to de-termine these costs. However in pervasive and distributed agent networks a signifi-cant volume of data transactions is distributed by and between nodes and not neces-sarily linked primarily to the telecom operator’s backbone. As users turn to providing more and more content, agent networks become an interesting case of study from an economic point of view. The value or cost for these distributed communication ex-changes are not well quantified under current business models.
Current business models base their revenue calculations on conventional adver-tisement. The fact that this is an emergent technology is responsible for the dearth of economic studies looking into this subject. There is a wide berth between theory and applications. Current attempts to estimate these values have been undertaken by e.g. charities trying to estimate the value of using social networking for their campaigns [9]; others rely on models in which each user assigns the relative value to the commu-nications within the network, as Twitter users discuss [17, 20, 23].
In this paper, the BIONETS network provides the context in which potential value of exchange are discussed. For this purpose Benkler’s [5, 6] proposal about value-added distribution and the emergence of sharing as a mode of production is used as the basis for the simulation developed, while focusing on the economics of sharing for the distribution of content. The idea behind the simulation is to provide a benchmark-ing tool that can support the development of distributed applications over a discon-nected network of mobile devices and sensors within the context of the BIONETS EU

BIONETS Economics and Business Simulation 79
project. In particular, we aim to probe our assumptions about where the value of such communications is, through different scenarios and models for its quantification.
2 Bionets Communication Exchanges
A network such as BIONETS, where the emphasis on communication exchanges and engagements is influenced by an evolutionary bio-inspired framework, that is node-based and distributed, is an ideal environment where to try to determine the values of communication exchanges and how to quantify them. In many ways the BIONETS case fits the requirements as many of its processes are seen as an industrial mutation that incessantly revolutionizes the economic structure from within, incessantly de-stroying the old one, incessantly creating a new one [8, 20].
Figure 1 shows the actors found in the BIONETS architecture. The actors aim to facilitate communication exchanges of diverse types, and consider for those five main components:
1. Technology expressed by the boundaries determined by device manufacturers and network equipment vendors.
2. Services: the discussion in this document focuses on value-added services, content and applications that users or other network devices can access through the BIO-NETS mobile network: the symbiotic relationship between content providers (indi-vidual or networked), application providers, and payment agents/or exchange agents.
3. Network, U-nodes, T-nodes that effectively work at the nuclear level as mobile network operator or ISP.
4. Regulation, protecting the privacy of users, regulating the market and legislation and other requirements for service provision
5. Users demand determines the success or failure or evolution of BIONETS services or applications.
Fig. 1. BIONETS Networks
[

80 S. Elaluf-Calderwood and P. Dini
3 Distributed Mobile Networks: Economic Paradigms
In the context of BIONETS there are a number of economic paradigms that need fur-ther explanation in order to understand the working model for BEBS. At the core of the work on usage scenarios presented by several BIONETS partners there are two main networks of interaction in which business models might develop. The first net-work is a self-contained, ‘disconnected’ and distributed BIONETS network of nodes (actors) able to exchange data with each other using the token values of alternative trading systems – where no actual money changes hands – whilst the other network is that used by the telecom operators, in which economic revenues are based on more conventional business models. Both models are depicted in Figure 1.
Neither of these networks has an exchange rate to convert the services or transmis-sions within the distributed BIONETS network into revenue, nor within the conven-tional telecom network. The decision to build a computing model using a modelling tool to illustrate alternative business models is a way of evaluating how these ex-change rates could be calculated.
The economic principles of the model are based on the use cases developed by BIONETS researchers, which can be grouped at an abstract modelling level as the ability of each node or actor to transmit (send or receive) up to five types of data (this can be changed in the model), assigning to each of these transmissions a token value for the desirability of this transaction. The data transmitted can be for example either environmental variables such as the ones presented in the Digital City scenario [7], with services that for example allow real-time access to Digital Maps or music ex-changes, or a combination of all of these.
A generic model in this case tries to express the added value of the exchanges that occur in the node-based networks that are traded, for either other tokens or real mone-tary value, by the actors or users of the network.
For example, consider the situation in a metro station in which any agent in a cer-tain area within the station can run BIONETS applications. Each agent can receive or send data based on their needs. Assume that at some point in time there is a number of people waiting on the platforms for trains to arrive; whilst waiting, some if not all of those people might use their mobile devices locally. Each of those devices is an agent in the business model being simulated. As agents discover other agents they might start exchanges of data that result in economic transactions based on agreed token values or evolving token values. A historical record of such transactions could be stored in an individual virtual account for each agent, thereby making possible a valuation of the desire or ability to exchange data successfully.
One type of exchange could be the case of an agent broadcasting to other agents within range a message or data file containing some kind of advertisement; all the other users within range might choose to accept or reject the sender's file; if, however, an agent decides to accept the sender's file, the sender is credited with a token value paid into their virtual account. This could be the case for a localized advertisement used to reach a small network of users: the eagerness of users or agents to accept the advert could ultimately be converted into real monetary units for the sender by, for example, the telecom operator providing the permanent network.
Over time the number of agents in the metro station changes; at some times there will be peaks of data exchange and/or number of agents, and at other times minimum

BIONETS Economics and Business Simulation 81
or no exchange of data or no agents at all. There is a dynamic cycle, based on agents entering and leaving the metro station, wishing to exchange or trade information. Some of the evolving, bio-inspired applications from BIONETS will merge then with social networking behaviour to express over time the changing nature of these trans-actions.
Conventional business models cannot effectively allocate value to this type of agent network in which the exchange of data is or can be considered separate from the backbone telecom network, as is the case for example with Bluetooth. One of the aims of the modelling is to illustrate how alternative economic models can actually build up enough subjective or token-based value to make it worthwhile to develop an exchange rate for its conversion into real money.
This can be done by evaluating the total of the exchanges in the metro station, in terms of both the number of tokens and the volume of data transferred, against the telecom’s valuation of volume data transfer per minute. This will allow for example potential marketing companies and telecom providers to estimate, based on the poten-tial number of users or actors accepting a broadcast message in the metro station, the cost of advertising localised and perhaps focus-orientated advertisements.
In this way an exchange rate of sorts is established between the advertisers and telecom network providers, based on allowing marketing companies access to these networks, and a pay-off for the telecom providers who always maintain an external connection to the metro stations.
There are many cases that could be illustrated using this type of modelling, and the complexity of each model will depend on many factors; since BEBS aims to illustrate the potential of alternative economic models running on top of the BIONETS infrastruc-ture, heuristic choices have been applied to the model, as explained in the section below.
4 BEBS Model Fundamentals
The model fundamentals are based on representing the type of exchanges illustrated in Figure 1. The modelling assumptions are: 1. The simulation focuses on the assessment and evaluation of the self-contained eco-
nomic model proposed in the figure, by assigning to each data exchange or storage a token value to be summed over a certain time period for both the overall network and individual nodes.
2. Each node will have the same set of attributes. The number of attributes has been limited for the simulation to five. See list in point 5 below.
3. Each node will be both a supplier and a consumer of communication requests. 4. A node can have a limited number of connections to other nodes based on its trans-
mission capacity. 5. Attribute list (the token value of storage is for all the files hosted at any time in a
node; it is a unique value representing the operational cost of storing data):
Node stores transmission data, token value = 1, protocol (none) Node distributes transmission data, token value = 2, protocol UDP Node stores non-transmission data, token value = 3, protocol (none) Node distributes non-transmission data, token value = 4, protocol TCP Node can send and receive streaming services, token value = 5, protocol VoIP
82 S. Elaluf-Calderwood and P. Dini
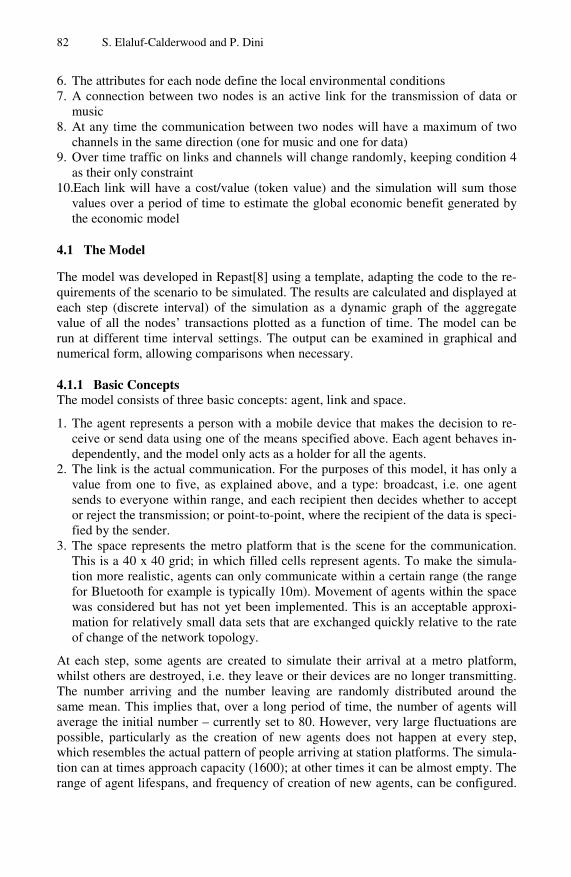
6. The attributes for each node define the local environmental conditions 7. A connection between two nodes is an active link for the transmission of data or
music 8. At any time the communication between two nodes will have a maximum of two
channels in the same direction (one for music and one for data) 9. Over time traffic on links and channels will change randomly, keeping condition 4
as their only constraint 10.Each link will have a cost/value (token value) and the simulation will sum those
values over a period of time to estimate the global economic benefit generated by the economic model
4.1 The Model
The model was developed in Repast[8] using a template, adapting the code to the re-quirements of the scenario to be simulated. The results are calculated and displayed at each step (discrete interval) of the simulation as a dynamic graph of the aggregate value of all the nodes’ transactions plotted as a function of time. The model can be run at different time interval settings. The output can be examined in graphical and numerical form, allowing comparisons when necessary.
4.1.1 Basic Concepts The model consists of three basic concepts: agent, link and space.
1. The agent represents a person with a mobile device that makes the decision to re-ceive or send data using one of the means specified above. Each agent behaves in-dependently, and the model only acts as a holder for all the agents.
2. The link is the actual communication. For the purposes of this model, it has only a value from one to five, as explained above, and a type: broadcast, i.e. one agent sends to everyone within range, and each recipient then decides whether to accept or reject the transmission; or point-to-point, where the recipient of the data is speci-fied by the sender.
3. The space represents the metro platform that is the scene for the communication. This is a 40 x 40 grid; in which filled cells represent agents. To make the simula-tion more realistic, agents can only communicate within a certain range (the range for Bluetooth for example is typically 10m). Movement of agents within the space was considered but has not yet been implemented. This is an acceptable approxi-mation for relatively small data sets that are exchanged quickly relative to the rate of change of the network topology.
At each step, some agents are created to simulate their arrival at a metro platform, whilst others are destroyed, i.e. they leave or their devices are no longer transmitting. The number arriving and the number leaving are randomly distributed around the same mean. This implies that, over a long period of time, the number of agents will average the initial number – currently set to 80. However, very large fluctuations are possible, particularly as the creation of new agents does not happen at every step, which resembles the actual pattern of people arriving at station platforms. The simula-tion can at times approach capacity (1600); at other times it can be almost empty. The range of agent lifespans, and frequency of creation of new agents, can be configured.

BIONETS Economics and Business Simulation 83
If new agents are created at every step, the number of agents will tend to be even over time. If however there are a number of steps between the creation of agents, there will be greater fluctuations.
A link has a lifespan and a random value within a configurable range. The value is added to the agent only when the link dies naturally. If an agent is destroyed, any links that have not reached their natural lifespan will be destroyed and their value will not be realised. This represents the case where someone is transmitting some data, but leaves (e.g. gets on a train) before finishing the transmission, and the partial transmis-sion is then useless.
In the case of point-to-point transmissions, the value is added to the sender and to the receiver, whilst for broadcast transmissions it is the receiver who gets the value. This is because point-to-point transmissions are typically part of two-way communi-cation, which have value for sender and receiver, whilst in the case of broadcast data the recipients do not respond.
4.1.2 Visualising the Model BEBS has used the Repast built-in user interface facility for graphical emulation in 2D – topological format – of the agent network and transaction model. A graph and table of the total value of the system are also shown (see Figure 2). The agents are shown as squares and the links represented by lines between them. The colour of the line represents the value and type.
4.1.3 Parameter Inputs The aim of the model is to see how the total value of the system changes over time. It is run with various sets of parameters presented here in a vector form (parameter, name, usage in model):
4.1.4 Simulation Outputs BEBS provides the following simulation outputs:
1. A graphical display of the nodes and their generation 2. A graphical display of the nodes' attributes and their properties 3. A display of the simulation running over time, showing links and active channels
of transmission 4. The value of a transaction over the simulation period and a selected time, calcu-
lated for each actor 5. Overall value of the network over a certain period of time
The model generates an initial number of agents, whose lifespan is allocated at birth as a random number of steps between the minimum and maximum values set. Agents that die are not immediately replaced. Instead, new agents are generated at a random step interval. The number created is approximately the sum of dead agents since the last generation, but varies between 0 and the double of this number, such that the av-erage number replaced is equal to the average number leaving.
Say, for example, agents are replaced at step 9, 5 agents die at step 10, 6 at step 11 and 10 and step 12, then are replaced again at step 13. That means that 21 die in this time. The number of agents replaced is then a random number between 0 and 42. The reasoning behind this is that, in a network, the people represented by agents tend to

84 S. Elaluf-Calderwood and P. Dini
arrive in groups but leave individually; the distribution however can be distributed mirroring an epidemiological model [14].
With every step, each agent makes a link with a random value from 1-5 to another agent. If the agent is within a given distance, the link is accepted; if not, the link is not made. It is possible to receive any number of incoming links. Furthermore, one agent broadcasts a link with a value of 1 to all the other agents in its vicinity, which they may accept or reject.
Figure 2 illustrates a stage in the simulation run in BEBS. The green dots are the nodes or agents exchanging information. The links have different colours depending on the type of communication exchange. The broadcasting of some type of communi-cation is shown by the links in blue: one agent sends to many a message, the number of agents accepting the message increases the value of the node sender. In the follow-ing section a summary of the main ways this programme can be used are presented.
Fig. 2. Communication Exchanges in BEBS
4.2 Results
The simulation illustrates how transactions change over time and shows changes in the number of agents located in a certain area exchanging data. While currently it is not possible to attach real values to these exchanges, the flexibility of the program al-lows it to be executed many times, based on values that can be calibrated according to expectations determined by the agents. This will only be possible when there are run-ning applications in BIONETS that are able to collect data about the eagerness and volume of transmissions within nodes.
Some interesting findings were obtained when running the simulation on trials us-ing values we selected. Figure 2 shows how the program works and comments about results.
In Figure 2 the aim of the simulation is to measure the change in total value over time, and to see patterns in the variations where different parameters are employed. The total value on the y-axis is plotted against time on the x-axis . As time varies, the scale of both axes increases whilst the intervals reduce, so that the graph remains the same size. In order to compare graph shapes, a fixed number of steps can be run.

BIONETS Economics and Business Simulation 85
Also in the figure the value of the nodes on a certain time are saved on a .csv file that can be automatically imported by Microsoft Excel or any spreadsheet package. The most interesting configurable parameters are the maximum and minimum life-span of a link and agent. Lifespans can be fixed within a wide or narrow range. Con-sidering first a narrow range for both link and agent, link lifespans that are short rela-tive to the agent lifespan tend to give a higher total value, since a larger number of short-lived links can be formed within the lifespan of the agent. Long agent and short link lifespans tend to lead to very gradual changes in value, since only a small propor-tion of the agents expire at any given moment. Considering now the range, a wide range of link lifespans with a narrow range of agent lifespans tends to lead to small and regular fluctuations in total value, but around a fairly steady and predictable mean. A wide range of agent lifespans, however, has the effect of radically destabilis-ing the model. There are likely to be long periods where the total value is static, but with sudden, irregular peaks which can be very high relative to the average.
5 Remarks on BEBS
In principle this is a first attempt to develop a quantification of business models for the BIONETS infrastructure. The aim is to be able to provide, in the longer term, a model that can be interfaced with the computational output from the infrastructure development, feeding in this way real data collected in transactions that will occur when there are applications available to be deployed using the outputs from the BIO-NETS computational and scientific research. This is a novel approach that could be developed further and merged or integrated with the work completed by other part-ners in the BIONETS project. In doing so, this simulation can be a powerful tool to il-lustrate the economic benefits for actors derived from the exchange type of business model in any future BIONETS-enabled environment.
Until now the value of these trading networks has not been tested in mobile envi-ronments, and depending on their growth and sustainability some of these networks may in future evolve to have significant value, which will make them attractive to conventional sources of funding. E.g.: record companies releasing songs over metro stations, broadcasting companies (TV, film) distributing total or partial media files as teasers for users to develop interest in the content, users who can dedicate their re-sources to collect environmental variables that can be used later to tailor services or activities in a location according to user demand.
There are not many research computer models especially created to recreate social networks’ economic behaviour, such as the ability to exchange information over dis-tributed networks and allocate token values to the exchange transactions. The simula-tion is aimed for a business model that is not centralized; hence this piece of work contributes to enhance the understanding of these types of networks, examples of this type of work can be found in the work of Harwood [12]. BEBS future enhancements will aim to increase the metrics been calibrated based in use cases, and consideritng the type of communications to be exchanged.
The added value of this type of networks seems to be subtle [24]. The added value is what makes these networks an interesting opportunity for alternative business mod-els based on individual allocation of access to more data. It is able to view more data
86 S. Elaluf-Calderwood and P. Dini
on the user, some of which may be intentionally obscured from the public or strang-ers. This allows users to network with a specific user in a more intimate and personal setting. Furthermore, it facilitates the creation of greater communication options, which, depending on the social site, opens up new avenues of communication. This adds a greater level of interactivity: you can connect with the person who added you through private/direct messages, instead of the highly visible public channel.
Since users are able to recommended content, when someone adds someone else as a friend (and vice versa), activity or actions on the site may be recommended or ‘pushed’ towards the other user in some part of their administrative panel or profile. This means that users achieve greater automatic visibility whenever they use the so-cial networking tool. And finally there is a great social verification, emerging from the auxiliary advantage of having many fans on social media networking tools. This social verification arises especially when there is some kind of self-ranking from the users according to the number of followers/subscribers using the tool. Popular and visible users tend to accumulate friends more easily than unknown users, and poten-tially be hubs for data distribution.
Overall what is more important is the fact that there is a value to this trading that can, with calibration estimates, make a strong case for the implementation of applica-tions and systems in which the sustainability of alternative business models can be as-sessed, and their viability and economic profitability verified, since the investment for establishing such networks is practically null from the point of view of traditional telecoms.
After releasing the software JNLP application on the project’s website (www.bionets.eu), the source code has been made available on Sourceforge. Further testing is currently been completed.
References
1. Agar, J.: Constant Touch: A Global History of the Mobile Phone. Icons Book Ltd., London (2004)
2. Barabasi, A.L.: Linked: The New Science of Networks. Perseus Publishing Books, Cam-bridge (2002)
3. Baka, V., Scott, S.V.: From Studying Communities To Focusing On Temporary Collec-tives: Research-In-Progress on Web 2.0 in the Travel Sector. Information Systems Work-ing Papers. London, Department of Management, London School of Economics and Po-litical Science: 12 (2008)
4. Bala, V., Goyal, S.: Learning from neighbours. Review of Economic Studies 65(3), 595–621 (1998)
5. Benkler, Y.: Sharing nicely. The Yale Law Journal 114, 273–358 (2005) 6. Benkler, Y.: The Wealth of Networks: How Social Production Transforms Markets and
Freedom. Yale University Press, New Haven (2006) 7. BIONETS, Multiple authors Application Scenarios – Round II. Internal Document (2007) 8. BIONETS, Multiple authors ID3.3.2 Economics for BIONETS Business Models (2007) 9. Frogloop (2009, 2007). Is it Worth it? An ROI Calculator for Social Network Campaigns."
Retrieved (February 2009), http://www.frogloop.com/care2blog/2007/7/ 17/is-it-worth-it-an-roi-calculator-for-social-network-campaign.html

BIONETS Economics and Business Simulation 87
10. Goldbeck, J., Hendler, J.: Inferring Trust Relationships in Web-Based Social Networks. ACM Transaction on Internet Technology 6(4) (2006)
11. Granovetter, M.: The Strength of Weak Ties: A network theory revisited. In: Marsden, P.V., Lin, N. (eds.) Social Structure and Network Analysis, Beverly Hills, USA, pp. 105–130. SAGE, Thousand Oaks (1982)
12. Harwood, R. (2008, December 02, 2008). Nesta Connect: Connecting Dots and Valuing Networks, http://blogs.nesta.org.uk/connect/2008/12/connecting-dots-and-valuing-networks.html (retrieved January 17, 2009)
13. Jelasity, M.: Engineering emergence through gossip. In: Proceedings of the Joint Sympo-sium on Socially-Inspired Computing Hatfield, UK, University of Hertfordshire (2005)
14. Gonzales, M.C., Babarasi, A.-L.: Complex networks - From data to Models. Nature Phys-ics 3 (2009)
15. Law, A.M., David, K.W.: Simulation Modeling & Analysis, 3rd edn. McGraw Hill Inter-national Editions, Singapore (2000)
16. Maki. The Value of Friends in Social Media Websites (2009), http://www.doshdosh.com/ the-value-of-friends-in-social-media-websites/ (retrieved January 2009)
17. Priscilla. Does effort = effect? (2007), http://www.solidariti.com/article/Doesefforteffect/ (retrieved February 2009)
18. Quiggin, J.: Why do social networks work? (2006), http://crookedtimber.org/2006/05/60/ why-do-social-networks-work (retrieved January 2009)
19. Rheingold, H.: Smart Mobs. Perseus Publishing, Cambridge (2002) 20. Schrock, A.: Examining social media usage: Technology clusters and social network site
membership. First Monday 14 (2009) 21. Schumpeter, J.A.: The economy as a whole - seventh chapter of the theory of economic
development. Industry and Innovation 9(1/2) (2002) 22. Shirky, C.: Here Comes Everybody: The Power of Organizing Without Organizations. Al-
len Lanes for Penguin Books, London (2008) 23. Twitter. Twitter Value (2009) (retrieved February 2009), http://tweetvalue.com 24. Van Buskirk, E.: 5 Ways the Cellphone Will Change How You Listen to Music (January
16, 2009), http://blog.wired.com/business/2009/01/six-ways-cellph.html (retrieved January 2009)
25. Weinberger, D.: Everything is Miscellaneous - The Power of the New Digital Disorder. Times Books, New York (2007)
26. Wiredset. Types of Engagement (2006), http://wiredset.com/archives/2006/11/20_engagement.html (retrieved February 2009)
Related Documents