Accelerating Sustainable Water Services Delivery (ASWSD) Safe Drinking Water Project BASELINE SURVEY WATER, HEALTH AND DEVELOPMENT THREE SITE RURAL COMMUNITIES IN THE AMATHOLE DISTRICT MUNICIPALITY Submitted by Date distributed January 2011 Contact: David Hemson, Project Manager Tel: 031 242 5612 Cell: 084 595 0376 Fax: 031 242 5401 e-mail: [email protected] Contact: Kombi Sausi Tel: 031 242 5538 Cell: 083 669 4635 Fax: 031 242 5401 e-mail: [email protected]

Welcome message from author
This document is posted to help you gain knowledge. Please leave a comment to let me know what you think about it! Share it to your friends and learn new things together.
Transcript

Accelerating Sustainable Water Services Delivery (ASWSD) Safe Drinking Water Project
BASELINE SURVEY WATER, HEALTH AND DEVELOPMENT
THREE SITE RURAL COMMUNITIES IN THE
AMATHOLE DISTRICT MUNICIPALITY
Submitted by
Date distributed January 2011
Contact: David Hemson, Project Manager Tel: 031 242 5612 Cell: 084 595 0376 Fax: 031 242 5401 e-mail: [email protected]
Contact: Kombi Sausi Tel: 031 242 5538 Cell: 083 669 4635 Fax: 031 242 5401 e-mail: [email protected]

1
Acronyms ASWSD Accelerating Sustainable Water Service Delivery CHW Community Health Worker CSIR Council for Scientific and Industrial Research CWS Communal Water Station DBSA Development Bank of Southern Africa DHS Demographic and Health Survey DST Department of Science and Technology DWA Department of Water Affairs HSRC Human Sciences Research Council IDT Independent Development Trust Lppd Litres per person per day ORT Oral Rehydration Therapy PLWHA People Living With HIV and AIDS PRA Participatory Rural Appraisal RRA Rapid Rural Assessment RWH Rain Water Harvesting SANS South African National Standard eg SANS 241 Standards WPLG White Paper on Local Government WRC Water Research Council

2
1. Table of contents
Acronyms...................................................................................................................1 1. Table of contents............................................................................................2 2. Index of tables:...............................................................................................4
Section I: Introduction and project background.........................................................6 3. Project objectives ...........................................................................................8
Project structure .............................................................................................9 Setting and selection criteria ........................................................................10
4. Beneficiary communities .............................................................................11 Local governance context ............................................................................12 Rural settlement and geographical considerations.......................................12 Objectives of baseline study ........................................................................14
5. Survey design...............................................................................................14 Impact evaluation.........................................................................................15 Challenges in hygiene assessment ...............................................................16 Ethical clearance ..........................................................................................17 Training of field workers and conduct of survey.........................................17
Section II: The baseline survey................................................................................18 6. Demographics ..............................................................................................19
Beneficiary population.................................................................................19 Size of households .......................................................................................20 Demographics of poverty.............................................................................21
7. Access and availability of water ..................................................................24 Household investment in improving sources ...............................................25 Rainwater harvesting ...................................................................................26 Water sources at the three sites ....................................................................28 Times and distances to and from water sources...........................................31 Components of water usage .........................................................................34 Assessing components of water usage.........................................................37
8. Quantity and quality of drinking water ........................................................38 Attitudes to collecting water ........................................................................40
9. Hygiene and hand-washing..........................................................................44 Hand-washing ..............................................................................................45
10. Quality of water .......................................................................................47 11. Water related disease ...............................................................................51 12. Household sanitation, hygiene and children’s health ..............................55
Child health ..................................................................................................56 Homestead environment ..............................................................................57
13. Access to hygiene promotion...................................................................58 14. Findings....................................................................................................61
Water sources...............................................................................................61 Rainwater harvesting ...................................................................................62 Time and distance to water sources .............................................................62 Water quantity and per capita water use ......................................................63 Household size and water use ......................................................................64 Water quality................................................................................................64 Water related disease ...................................................................................65 Water treatment............................................................................................66

3
Environmental hygiene ................................................................................66 15. Discussion ................................................................................................66
Water and PLWHA......................................................................................67 16. Conclusions..............................................................................................68 17. Bibliography ............................................................................................69

4
2. Index of tables: Table 1. Site selection criteria................................................................................10 Table 2. Demographics of sites..............................................................................20 Table 3. Mean size of households ..........................................................................21 Table 4. Percentile range of per capita income per month, Amathole DM ...........22 Table 5. Ownership of domestic assets ..................................................................23 Table 6. Type of water source................................................................................24 Table 7. Rainwater harvesting tanks, households ..................................................27 Table 8. Rainwater harvesting: barrels ..................................................................28 Table 9. Water sources, Ntilini ..............................................................................29 Table 10. Water sources, Mbelu ..............................................................................29 Table 11. Water sources, Cwebe..............................................................................30 Table 12. Distance to and from water source, categories ........................................31 Table 13. Distance to water source, RDP and beyond.............................................32 Table 14. Time to and from water source ................................................................33 Table 15. Time to and from water by site ................................................................33 Table 16. Time and distance, distance by time categories.......................................34 Table 17. Time taken at three sites, time categories ................................................34 Table 18. Water use per capita and time from water source....................................36 Table 19. Round trip and water use .........................................................................36 Table 20. Key factors: water use, draw-off, time taken...........................................37 Table 21. Attitudes to collecting water ....................................................................40 Table 22. Household daily collection by site...........................................................41 Table 23. Household daily collection by size of household ....................................41 Table 24. Per capita water use by categories ...........................................................41 Table 25. Mean water use by site (lppd) ..................................................................42 Table 26. Water use by size of household (lppd).....................................................42 Table 27. Water use by income group (lppd)...........................................................43 Table 28. Water use and income group....................................................................43 Table 29. Assessing “sufficient” water for various activities ..................................44 Table 30. Assessment of hand-washing facilities and activities ..............................45 Table 31. Attitudes to water related activities and schooling ..................................46 Table 32. Assessment of water quality ....................................................................47 Table 33. Water quality assessment: Samples from Mbashe River .........................48 Table 34. Treatment of drinking water ....................................................................48 Table 35. Methods of treating water ........................................................................49 Table 36. Methods of filling containers ...................................................................49 Table 37. Container practices...................................................................................50 Table 38. Cleanliness of containers .........................................................................50 Table 39. Diarrhea in household ..............................................................................51 Table 40. Incidence of diarrhea, age group..............................................................52 Table 41. Incidence of diarrhea, by household size .................................................52 Table 42. Type and symptoms of diarrhea...............................................................52 Table 43. Incidence of diarrhea by income groups..................................................53 Table 44. Incidence of diarrhea over the past two weeks ........................................53 Table 45. Knowledge of Oral Rehydration Therapy................................................54

5
Table 46. Preventative measures against diarrhea ...................................................55 Table 47. Alternatives to household toilet ...............................................................56 Table 48. Use of toilets, small children ...................................................................56 Table 49. Assessment of children’s health...............................................................57 Table 50. Yard swept clean (children’s faeces) .......................................................57 Table 51. Disposal of rubbish ..................................................................................58 Table 52. Where do you usually access health care? ...............................................58 Table 53. Source of information on water and hygiene...........................................59 Table 54. Participation in discussions on hygiene promotion .................................59 Table 55. Assessment of learning ............................................................................60 Table 56. House visit by Community Health Worker .............................................60 Table 57. Advice received from CHW ....................................................................60 Table 58. Assessment of CHW................................................................................61

6
Section I: Introduction and project background The provision of safe drinking water can have a decisive effect on the improvement of the lives and health of rural people. In South Africa the cholera epidemic of 2000-01 had a considerable impact on public consciousness as 117,147 people were infected in five provinces and 265 died in communities in which safe drinking water was not available (Hemson et al, 2006). For a period it expanded through settlements at great speed until it was gradually brought under control. This epidemic highlighted the contrast between the water resources available to people particularly those in rural areas and the constitutional rights to sufficient water and a safe environment. The Bill of Rights in the Constitution of the Republic of South Africa, 1996, guarantees the right to “sufficient water” and to “an environment that is not harmful”.1 Communities such as those afflicted in the cholera epidemic continue to be vulnerable as challenges are experienced in reaching the Millennium Development Goals and national targets for universal access to safe drinking water and improved sanitation. Figure: Mean annual rainfall, Eastern Cape
Source: Department of Environment. http://www.environment.gov.za/enviro-info/prov/ec/ecrain.jpg The Accelerating Sustainable Water Service Delivery (ASWSD) Project responds to this need and has the objective of providing safe drinking water to communities in the Eastern Cape. Although the first project sites are located in areas which can have rain throughout the year in the well watered south eastern coastland of Africa, there is an
= 1 Constitution of South Africa, 1996, Bill of Rights, Clause 24 and 27.

7
acute shortage of safe drinking water and a history of outbreaks of cholera, typhoid and other water-related disease. The Eastern Cape generally has a mean annual rainfall of 552 mm with a maximum value of 1,722mm and a minimum of 96mm.2 Despite recent experience of drought, the rainfall in the mountains of the Drakensberg and hills of the Transkei feeds a number of major rivers. Most of the sites for the intervention are within the coastal belt of high rainfall marked dark blue on the map, but are vulnerable to water related disease. An important aspect of this Project is the assessment of the impact of all aspects of the Project – that of social mobilization and of the implementation of water infrastructure -- on the lives and conditions of the beneficiary communities. The improvement in the lives of the people through the technological and social interventions justifies the expenditure and helps the implementing agencies and the Department of Science and Technology (DST) to assess the value of the Project activities in achieving the goal of safe drinking water. Its results will also provide a measure of the degree of change leading to the identification of those fields in which there has been greatest or the least progress. The monitoring and evaluation of social environment and conditions is being undertaken by the HSRC. The scientific credibility of impact evaluation is based in its method. The impact evaluation begins with the baseline study of conditions prior to implementation and, if possible, to followed by a survey of impact which measures conditions at the conclusion of the project. The comparative assessment of conditions before and after the project provides the basis for drawing conclusions on impact.3 The pre-intervention conditions at each project site constitute the control or baseline and the post-intervention sites the treatment; the difference between the two constituting the impact. The ASWSD Project which aims to provide safe drinking water to poor communities in remote rural areas is being implemented in three villages in each of two Eastern Cape District Municipalities; the Amathole District Municipality and the Amatole District Municipality. The background is that both these municipalities have experienced the ravages of cholera in a period over 2002 and 2003 (as the epidemic was declining nationally) and are still vulnerable to such epidemics.4 The purpose of the project is to provide speedy protective measures against water related diseases which have made incursions into similar vulnerable communities lacking both safe drinking water and improved sanitation. The implementation of the infrastructure is preceded by social mobilization, training and hygiene promotion. The impact of the social aspects and of the improved water quality available from the safe drinking water provided through Project on the lives and health of the people is being monitored and evaluated. The evaluation is being
= 2 For further details of mean average precipitation see http://www.environment.gov.za/enviro-info/prov/rain.htm and http://www.iwmi.cgiar.org/assessment/files_new/research_projects/River_Basin_Development_and_Management/MAP_Atlas.pdf. 3 The pre-post assessment is a necessary but not sufficient methodology for assessing Project impact, a fuller discussion of method is provided below. 4 A review of the cholera epidemic in the Eastern Cape is made in Jeenes and Steele (2010). The data on the cholera epidemic in the Eastern Cape situates the OR Tambo DM as the location for an overwhelming number of the cases occurring in the Eastern Cape and also includes the Amathole District Municipality.

8
undertaken by baseline surveys of the three communities in each Municipality before the implementation of the technology. This baseline study of the three villages in the Amathole District Municipality represents the situation measured against the key indicators of access to water, health, knowledge, attitudes and practices before implementation. This will be followed by a survey of the community post-implementation, the “impact survey” and the differences between the results of the two surveys will indicate the impact of the technology which will provide better access to safe drinking water. This baseline study undertakes an analysis of the basic demographics, access to water sources, water use, hygiene conditions, and hygiene promotion at these sites. It further identifies key features in findings and discusses conclusions. These original conditions are set out to be contrasted with those achieved through the intervention.
3. Project objectives The Safe Drinking Water Project of the ASWSD has as its objective providing poor rural communities in remote areas with safe drinking water from existing local water sources. This objective will be met through technological innovation through the implementation of the Communal Water Station the concept of which is spelt out in the original proposal: that of “a single low-cost, low tech treatment facility (communal water station) at the water source”.5 The concept here is to provide safe water quality to rural communities at the existing water sources as quickly and readily as possible and to improve water quality at traditional water sources rather than aim at wider reticulation. The view in the proposal is: Traditionally villagers have been using historical paths to their water source, in the case of a river or dam. The rationale behind treating water at the source, allows villagers to maintain their usual access paths, but now the water they access will be treated at the site and safe drinking water can then be carried away for cooking and drinking purposes.6 This concept builds on the assumption of a single main water source for each community and sets out a simple approach to water purification; it does not mention the reticulation of water from the water purification plant to water points closer to community households. In the OR Tambo DM there have been considerable changes in the design to include larger numbers of households though reticulation to bring taps closer to households in each of the three villages. This has not been the case in the Amathole District Municipality project in which there is a mixture of smaller and larger communities with rivers generally the prime water source and more limited reticulation as part of the design. The project design provides for the linking of social and technical aspects for greater impact. An important activity is that of social mobilisation leading to the training of Task Teams who conduct community-led hygiene promotion to encourage new = 5 Proposal. Improving Access to Safe Drinking Water in Amathole District Municipality. Accelerating Sustainable Water Services Delivery through Technological Innovation (ASWSD) Initiative, introduction. 6 Proposal. Improving Access to Safe Drinking Water in Amathole District Municipality. Accelerating Sustainable Water Services Delivery through Technological Innovation (ASWSD) Initiative, p9.

9
hygiene practices and avoid the recontamination of safe drinking water. A key issue in water projects is ensuring safe water from source to point of use. Where interventions have focused solely on the provision of safe drinking water at source, it has been found that by the time the water had been transported to the household and was ready for use, it was no longer safe. Water collected for domestic use may become re-contaminated by contaminated containers or unsafe storage and handling practices at the household level (Sobsey, 2007, 2). Effective hygiene promotion should minimize this problem.
Project structure
The ASWSD Project has a fairly developed structure which involves the two statutory scientific bodies, the HSRC and the CSIR, as project managers of the Project. The direction and oversight to the Project is provided by the National Task Team which is made up of key national Departments such as the Department of Water Affairs, the Department of Science and Technology, and a wide range of agencies concerned with the improvement of water service delivery.
Figure 1. Structure of the ASWSD Project
The two scientific bodies (the HSRC and CSIR) report to the National Project Steering Committee convened by the DST; the HSRC takes responsibility for the Project OR Tambo DM and the CSIR for the Project in the Amathole District Municipality. The responsibilities are also cross-cutting; the CSIR, for example, advises on the design of the project and undertakes scientific studies of groundwater,
TIERS OF GOVERNANCE: ASWSD
NATIONAL TASK TEAM: OVERSIGHT 12 stakeholders including WRC, IDT, DBSA, Umgeni, scientific bodies etc.
National Project Steering Committee: Operational review DST, CSIR, and
HSRC, Convened by DST
ADM Municipal Project Steering Committee 1
CSIR, District Municipality, HSRC
OR Tambo Municipal Project Steering Committee 2
HSRC, District Municipality, CSIR
Task Team, Site 3
Task Team, Site 1
Task Team, Site 2
Task Team, Site 3
Task Team, Site 1
Task Team, Site 2

10
etc, while the HSRC takes responsibility for the social mobilization, training and hygiene promotion in both municipalities.
Setting and selection criteria
The implementation areas for this project include traditional communities in remote villages. These sites are located remote areas poorly served with road infrastructure in the former homeland areas of the Eastern Cape which, despite the outstandingly beautiful landscape, are the place of poverty. The selection of each potential site was undertaken on the basis of the following criteria: Table 1. Site selection criteria
Criterion Rationale 1 Confirmed river access and
sufficient flow for Communal Water Station
Without sufficient flow the Communal Water Station would not be able to operate effectively and provide sufficient safe drinking water.
2 Village beyond range of regional schemes
The site should meet the need of rural communities without an immediate prospect for inclusion in a wider scheme.
3 Confirmed unsafe river water An assessment of unsafe drinking water would raise the profile of need.
4 Boreholes in village An aspect of the project has been the rehabilitation of boreholes through better management.
5 No plan or design for delivery The ASWSD should not compete with or complement other potential projects.
6 Prior registration of needs by community
A community mobilized to express its needs would be an advantage.
7 History of water-related disease / outbreaks
Confirmed water related disease would support the prioritization of a site.
8 Relatively small size e.g. 120 households for first villages
The project wanted to build up expertise and limit the scale of intervention.
9 No previous water implementation which has failed
Rehabilitation of previous failed schemes is not regarded as the objective of the Project.
10 Alternative source of water available
It was a consideration that there should be a prime water source to improve rather than a series of alternative sources.
The selection criteria were established in discussion with the municipality prior to the launch of the project in Amathole District Municipality in February 2009. While Cwebe was decided on by the Municipality as the launch site for the project, joint visits by the Amathole District Municipality, CSIR and HSRC personnel were made in subsequently to the other communities suggested by officials of the District Municipality. The suitability of each site was assessed according to these criteria.

11
These practical criteria were explored in interaction with the political considerations of the district municipalities. The criterion of prior expression of need is an important consideration at the political level; for the ward councilor, ward committees, local municipality, etc. This was the dominant issue in the immediate site decisions linked to the launch of the Project in February 2009. After this visits an assessment was written up and discussed with the District Municipality. Eventually agreement was reached that the following three sites: Cwebe, Ntilini and Mbelu most adequately met the requirements and the two additional sites were approved. Although all the sites could be characterized as scattered communities they also possess a certain homogeneity linked to common residence, traditional authority and familial relations.
4. Beneficiary communities An important issue during the initial engagement with communities has been the defining of the boundaries of beneficiary areas. These boundaries are the subject of much discussion as the outer limits of project sites are not necessarily the same as those of villages, hamlets or traditional communities. The inclusion of the cluster of households potentially benefitting from the project was keenly debated during the first community engagements by the Project team. While the original concept utilized emphasized a more limited scale, the underlying political logic was to spread the range of beneficiaries as widely as possible. The available resources would thus benefit the maximum number of residents. This was an issue only at Cwebe which is an extensive settlement, while Mbelu and Ntilini were more readily accommodated. The desire to spread the benefit of Safe Drinking Water to the maximum number of people was tempered by the limits set by the concept of the technology. The type of technology and funding available closely affects numbers and outer limits of potential beneficiaries, while the communal, traditional, and political boundaries had also to be taken into account. Technology has been the decisive element defining boundaries; the original concept of the Communal Water Station drawing its water resources directly from the river with restricted reticulation implied that only those households closest to the river would be direct beneficiaries; although the other households in a community would benefit only indirectly from the social mobilization, hygiene promotion, water filters and other aspects of the project.7 The boundaries of the sites were established through discussion with local leadership – the conceptual framework of the project initially was for little or no reticulation from the water source, simply the pumping and treatment from a substantial body of water. The interests of local leadership are, however, to expand the range of beneficiaries. The villages did not necessarily correspond to the boundaries of traditional communities or fall neatly within wards of local municipalities. These dimensions = 7 The original proposal was for borehole rehabilitation; although unfortunately most communities did not have boreholes and, instead, improved groundwater management has been proposed and plans have been developed by the CSIR.

12
were noted in the site visits and were later the subject of continuing debate – in the context of a Communal Water Station dependent on a prime water source with limited reticulation the number of direct beneficiaries could be relatively limited.
Local governance context
As is indicated in the Project Structure the District Municipalities have a key role in the implementation of this project. The Water Services Act defines the municipality as the water service authority8 and water service provider unless this is otherwise specified. The Project Managers thus need to engage with the District Municipalities through the Steering Committee and maintain day-to-day communications with municipal officials during the implementation and close-out phases. In South Africa, in addition to the District Municipal Councils which in rural areas often cover wide-ranging areas, there is also the layer of local councils. These generally, however, do not have authority in relation to water services. There is often a wide gap geographically between the district municipal officials and the most remote communities. This is made up, in part, by the political representatives of these communities – the ward councilors – some of whom sit both on the local and district councils. The Project officials made every effort to work closely with these Ward Councillors particularly in the training and development of a local leadership to ensure communications with the municipality and a successful transition from project to municipal facility. In addition to the political representatives in the former homeland areas, there are traditional leaders. These often have long-standing authority as the representatives of leading families in the area, are recognized and paid as government officials, and judge local cases in the tribal court.
Rural settlement and geographical considerations
All the sites are located in fairly remote rural areas. A rural society is not easily defined except by way of contrast to urban society, and is characterized by less concentrated settlements on open land and the production of foodstuffs, fibres and raw materials. The proportion of people to the land is often used as the sole differentiating criteria and statistical criteria to make the distinction are often fairly arbitrary and specifically national in character. In South Africa there are specific and very distinct socio-types of rural society; firstly the traditional areas which are characterized by African traditional society and communal ownership of the land, and secondly the commercial farmlands which produce most of South Africa’s food and have been historically characterized by white ownership. In this study we focus on the first socio-type of traditional or tribal areas which were described as “homelands” during the past white minority rule as the “home” for the
= 8 Water Services Act, No. 108 of 1997; the “water service authority” means “any municipality, including a district or rural council” (1.xx) and overwhelmingly water service providers are the same municipality. Municipalities thus have full responsibility for water services and are generally also the providers. http://www.dwaf.gov.za/Documents/Legislature/a108-97.pdf
13
black majority. In South Africa the geography of rural settlement is related to the political interventions of the apartheid era as much as to traditional practice. There are two predominant types of dense rural settlement classified in the White Paper on Local Government (1998). Firstly there are “betterment” settlements, which are features of the former homeland areas. These have been described as dense, planned settlements, with populations of over 5,000 people constructed by rural settlement planning which clustered households away from fields and grazing lands with the stated intention of improving livestock management and agriculture. This “betterment” was often unpopular and enforced against much resistance but subsequently communities have generally not reverted to original traditional layout. Secondly there are informal settlements, which are unplanned and largely unserviced, with populations of over 5,000 people. Some are close to urban areas, or are located in rural areas with a minimal local economic base (WPLG, 1998, 3.2). The remote rural areas involved in this project encompass two other less dense settlements also mentioned in the White Paper. Firstly there are villages, or smaller rural settlements with populations of more than 500, but less than 5,000 people. These are often unplanned traditional settlements or resettlement areas. Secondly reference is made to dispersed or scattered settlements, which are mostly unplanned homestead settlements with a population of less than 500 people. Extensive settlements in commercial farming areas, some located on communal land and others on privately owned land, also fall within this category (WPLG, 1998, 3.2). Although these classifications are useful, they do not entirely capture the social setting of the communities assessed and selected for participation in the Project. While the communities can be viewed as villages as they are clusters of dwellings in a rural area at a lower level of concentration than a town and they could be more appropriately described termed “hamlets”. The term “village” evokes a greater sense of social cohesion and planning than is visibly apparent. The schools tend to be the locus of communal activity and the other centre of social activity are the shops. The households in each community tend to cluster along the roads and are generally separated from the fields; features characteristic of the “betterment” planning even if these villages were not directly subject to such social reorganization in their history. The three sites are often shaped at a level of demarcation lower than that of a village such as hamlet (although the term is not widely used in South Africa). They do not have definite well delineated boundaries, but the limits of the project area have been shaped through discussion of the technology available and the existing geographic and socio-political demarcations accepted by the people and political and traditional leadership as the boundaries for the intervention. The settlement and layout of communities has been identified as important to the project in working to set out boundaries of villages, areas and sub-areas. A rapid rural assessment (RRA) procedure was utilized in breaking down the wider locality into areas and sub-areas to bring local knowledge to bear. This is particularly important in gathering data on the number of households and their location particularly when satellite maps are often out of date. Residence in one of the areas making up the village was also an important criterion in deciding on membership of the Task Teams.

14
Objectives of baseline study
The objectives of this baseline survey are: To explore baseline socio-economic conditions in the selected communities and accessibility of water in the types of water sources, quantity and quality of water available and levels of water use. In undertaking this assessment the following aspects have been identified: The specific relations between water and health and to identify the existing household responses to the threat of unsafe water to maintain the health of family members. An assessment of existing barriers to infection transmission from water source to point of use; three are measured in this study; toilets, hand-washing at critical times, container hygiene, and water treatment. These required facilities available and in use. The coping mechanisms in conditions of un-developed water sources in water use, hygiene, support from clinics, hygiene information and promotion.
5. Survey design The evaluation of impact relates to the key objectives and activities of the Project. Evaluation has been designed to follow three stages: a preparatory phase of the selection of sites, social mobilization, hygiene promotion, followed by an implementation phase in which the infrastructure is installed and brought into operation, and concluded by a close-out phase during which a sustainability report is compiled and the results assessed. The fieldwork of the baseline survey was timed to be undertaken as early as possible; to precede social mobilization and hygiene promotion to ensure that respondents were not influenced by the activities of the Project itself. The impact evaluation involves the assessment of the intervention activities on the social fabric of the community and well being of the individuals. The assessment itself includes the processes of identifying key factors, monitoring and measuring these, analysing, and reporting and managing the intended and unintended social consequences. The monitoring and evaluation follows these phases and is designed to assess the impact of the social and technical interventions. There is a growing realization internationally that social mobilization and hygiene promotion is essential to the sustainability of water projects. A number of studies have concluded that there can be surprisingly little impact from the implementation of technology alone; without social

15
mobilization and hygiene promotion. The practice in many water projects is to focus solely on the improvement of water supply often without associated sanitation and hygiene promotion. The result subsequently may demonstrate little impact on the improved health conditions of beneficiaries which is assumed and not directly assessed. A recent study of a major programme in India has found that despite a significant increase in the number of households using piped water and pit latrines “no changes in hygiene-related behaviour had occurred” (Pattanayak, 2010). Although socially marginal households had benefitted more as intended, the economic burden of disease in the beneficiary communities had not been eased. A key issue in water projects is ensuring safe water from source to point of use. Where interventions have focused solely on the provision of safe drinking water at source, it has been found that by the time the water had been transported to the household and was ready for use, it was no longer safe. Water collected for domestic use may become re-contaminated by contaminated containers or unsafe storage and handling practices at the household level (Sobsey, 2007, 2). For these reasons a broad view of the social context and a careful scrutiny of all the factors involved in technology transfer and hygiene promotion need to be made to ensure adequate and continuing impact from interventions.
Impact evaluation
Impact evaluation assesses the changes, both intended and unintended, that can be attributed to a particular intervention, such as a project, program or policy. In planning for the Project provision was made for impact evaluation to establish the change in conditions and in people’s lives brought about by the intervention. Initially it was suggested that evaluation should be conducted ex-ante retrospectively at the conclusion of the project but for difference-in-difference assessment to be undertaken, community surveys would be needed both to provide the baseline information on the three communities in the OR Tambo District Council and then thereafter. The differences would arise from comparison of conditions before and after the intervention. While those conditions particularly related to access, household conditions, hygiene and sanitation could be related to the Project they would not, however, not be exclusively linked to the Project There is a wide field of possible factors in the environment broadly conceived which could lead to possible impacts independently from the ASWSD, for example such as the new interventions from the clinic, national campaigns conducted over the radio and television, improved school tuition on hygiene, or changed climate conditions. The method would, however, ensure that adopted to ensure that the intervention itself is separately assessed. The goal of the survey is the assessment of the reduction in the vulnerability of people in remote rural areas to water-related disease through the provision of project-related safe drinking water and improved hygienic practices. The fundamental question is “to what extent did the project increase the availability of safe drinking water and reduce water-related disease?” The potentially associated questions include the contribution of hygiene promotion, communication, greater integration with health services, and the achievement of improved practices as well as the implementation of the technology to the impact assessed. The key issue in asking this question is, however,

16
“compared to what?” The answer to each question should be compared to the previous conditions at each site and similar villages in the vicinity. The latter comparison would ensure that extraneous influences other than the Project intervention itself do not affect the outcomes. In impact evaluation the central problem is that of confounding the attribution of outcomes. A confounding variable is an unforeseen, and unaccounted-for variable that jeopardizes reliability and validity of an experiment's outcome. Confounding An epidemiological study might well find that television ownership was associated with reduced incidence of diarrhoea, but of course this does not mean that televisions prevent the disease. Rather, people who own TVs are likely to be richer and better-educated than their neighbours, and these and other factors help to protect them from illness, causing an apparent association. This is called confounding and is a major problem in health impact studies. For example, people who own latrines may have less diarrhoeal disease, but this does not necessarily prove that the latrines are the cause. It is not sufficient simply to observe that, for example, that health conditions improved by a certain amount over the life of the program, since that increase might have occurred in the absence of the program. This increase might be about the same as the change in the entire country. In order to assess the impact of the program, it is desired to compare the outcome measures under the program to what would have occurred in the absence of the program. The purpose of the impact evaluation is to assess the effect of the project in all its dimensions – the social mobilization, hygiene promotion, improvement of ground water facilities, and implementation of the technology, across a period of time; before and after implementation. An experimental design involving the randomization of sites has not been able to be followed as this was beyond the scope and budget of the project.
Challenges in hygiene assessment
There is a challenge in measuring a number of the key indicators of health and hygiene including the framing questions dealing with human intimacy which are not readily resolved. Detailed observation rather than survey questions will establish greater certainty particularly in relation to hand-washing frequency, use of soap and the activity being undertaken at critical times. Observation which involves more detailed training and deployment of fieldworkers, however, inevitably includes a smaller sample than the population of the village for these reasons and is intrusive. Questions relating to use of toilets and hand-washing invites responses often evoke the adoption of a norm or standard rather than one reflecting actual practice. For example, a routine response to a question of hand-washing, which is known to be a standard which all individuals should adopt, is to respond positively irrespective of the actual practice. The framing of the questions in the survey has been carefully

17
prepared in an attempt to defuse normative responses and to get responses closer to practice. The method of impact evaluation has been designed around a community survey to provide a review of conditions both pre and post implementation. The questions have been has been designed to capture key indicators which studies of health and hygiene have concluded are key variables such as hand-washing itself, disposal of children’s faeces, etc (Environmental Health Project: 2004). The survey questionnaire provides comprehensive coverage of the health and hygiene issues promoted. It includes the following sections: household and demographic information; dwelling structures, poverty, access and availability of water, water sources, water use and containers, attitudes to personal and household hygiene; hand-washing and hand-washing facilities, quality of water, disinfection of drinking water, storage of water, treatment of diarrhea, incidence and types of diarrhea, household and personal hygiene, toilets and sanitation, health promotion and access to health services. The results are further explored in the aspects of hygiene in particular hand-washing, treatment of water, household hygiene and access to hygiene promotion. All aspects of personal and household hygiene are reviewed in relation to water related disease which is a key indicator of water quality and personal and household hygiene.
Ethical clearance
Ethical clearance was applied for and received from the HSRC’s Ethics Committee. A copy of the statement of the purpose of the research and explaining the confidentiality of their responses was made available to the respondents. Permission to interview was requested prior to the household survey being undertaken and agreement confirmed in writing. Respondents had the right to refuse the interview and, if they encountered a question which caused discomfort or unhappiness, were provided with the name and number of the project leader if they wished to communicate.
Training of field workers and conduct of survey
The fieldwork faced two challenges. Firstly there were not funds available to employ and undertake the logistics for experienced and qualified fieldworkers. Such fieldworkers would inevitably be from urban centres and would involve the expenses of accommodation and transport as well as costs of their training. In addition there are time considerations as the sites are by their original selection at a considerable distance from centres where accommodation is available. This would limit the time available for the actual interviews. For these reasons it was decided to select individual fieldworkers from amongst the more educated members of the community and train them on site. This training was conducted by the HSRC survey team over two days with the use of a fieldworker and supervisor manual. Training was provided in the general principles of survey methods

18
(non-intrusive behaviour, care in framing the question exactly in translation, careful recording of distances and times, etc). The questionnaire itself was thoroughly reviewed, translations rehearsed and the questions rehearsed in pairs. Interviewing and the use of the questionnaire were practiced between the fieldworkers, problems encountered and resolved. When fieldwork was initiated, the first five interviews were carefully monitored and the questionnaires checked. In the training and supervision of the first questionnaires close attention was given to distances and times. Clocks were provided to measure the time taken by those collecting water in the round trip to and from the water source. Training was also provided to make accurate estimates of distances to and from the water source by comparative references and by counting paces. Field exercises involving the fieldworkers and the HSRC team were carried out to check procedures. Members of the research team accompanied field workers during the first few interviews and reviewed the results on the subsequent day. Despite this strong emphasis on appropriate methods there were particular challenges in measuring times and distances accurately.9 In part because the dimensions of the community and their boundaries were not known, a full census of the site population was undertaken rather than a sample. All households identified within the implementation site were interviewed although there was changes in the final boundaries which led to some changes during the survey. The survey was undertaken on the basis of the observed distribution of households in the areas from satellite maps and local appraisal. Since there was some uncertainty about the exact number of households within the site area, during the social mobilization there were preliminary steps taken with Participatory Rural Appraisal (PRA) techniques to assess the number of households and their distribution throughout the area of the project site. After the selection of Task Team members by communities one of the first activities undertaken was to map out the community, areas and sub-areas and to work out the number of households by each sub-area. Since community members have a good idea of their neighbours and the local boundaries of sub-areas this was fairly readily undertaken. The results were checked and rechecked against what maps were available (such as those on Google Earth)10 to ensure consistency. This data then laid the basis for the baseline survey of the community which was to follow on the basis of a census while the impact survey will be conducted on the basis of a sample of households in the site area.
Section II: The baseline survey In this section of the survey the design of the survey, method and associated issues, and procedures in the survey are discussed. This is then followed by the presentation
= 9 The tendency was for early care in recording and checking to drop off over time; subsequent checking revealed difficulties. Special attention in the post-survey period was then given to re-surveying times and distances to achieve the required accuracy. 10 Unfortunately the satellite maps of the sites were undated and often constructed many years previously and did not always reflect current conditions.

19
of demographics, access to water sources, the number and types of water sources, times and distances, water use and associated questions. Hygiene and health issues are then explored and the survey concludes with a review of responses to health promotion by local institutions and the messages communicated. The key concept in the project is accessibility which in water supply is defined as including the degree to which as many people as possible can access safe and sufficient water. Accessibility of a source of water includes the dimensions of reliable supply, distance from households, safe and acceptable water and the form of service provided. In this study the baseline conditions of the three original communities in the Amathole District Municipality are presented and analysed. The necessary preliminary work in impact evaluation is to capture the original conditions of access to water sources in undeveloped environment. These results then will be contrasted with the results of the combined social and technological intervention. An unusual focus of this project is on sites in which water resources are entirely underdeveloped and the study provides original data on such communities. This baseline study is being pursued in the knowledge that the final impact of a project may only be known over a longer period of time than at the completion of the social mobilization and technological implementation. Despite this, significant changes should also be discernible in the short term. (see DelayImpact file)
6. Demographics The demographic details of the population on the three sites will include the following characteristics such as household and population numbers, distribution, household size, density, and statistics relating to household and per capita income.
Beneficiary population
In the Amathole District Municipality the discussion of the technological design of the project involving limited reticulation from the Communal Water Station led to a division being made between “direct” and “indirect” beneficiaries. The direct beneficiaries would be those in the immediate vicinity of the Station itself or of standpipes and “indirect” beneficiaries would not necessarily access the standpipes but would benefit from the social mobilization itself, the hygiene promotion, provision of water filters, and eventual improvement of ground water supply. During the engineering design phase there were, unlike the OR Tambo DM, no changes made to expand the design to include more people or more direct beneficiaries. Some changes were apparent, however, over time. In Cwebe, for instance, although the areas and numbers of people appeared clear from the inception, over time additional areas (in particular those on the other side of the Nokrweqe River) were

20
included after the conclusion of the survey. This has created some discrepancies subsequent to the survey in the numbers benefitting at each site. The numbers presented below are drawn from the original surveys. Table 2. Demographics of sites
Site Number of households Population Cwebe 466 81.5 Mbelu 41 7.2 Ntilini 65 11.4 Total 551 100 The site communities are themselves made up of “sub-areas” (areas recognized by the people as forming components of the site) often set out by breaks in contiguity established by natural barriers such as valleys and hills. These sub-areas have been useful in the development of community leadership to ensure that every part of the community has been constituted into the Task Team to represent the community as a whole.
Size of households
The size of households is an important aspect of demographics and service delivery; for instance, larger households may be disadvantaged by having the same level of access as smaller. A multiplicity of small households may increase requirements of reticulation and increase cost. The numbers of family members in the 551 households involved in the original conception of the sites and the household are almost exactly equally distributed between those which are sized between 1-5 members, 49.1% of the total, and those which are of a size 6 members and above 50.9%.
Figure 2. Household sizes, households by size, %
Size of households
14
39
8074 70
61
77
42 45
2311 13
5 4 8 3 20
20
40
60
80
100
1 2 3 4 5 6 7 8 9 10 11 12 13 14 15 16 17
Number in household
No
of H
H
The size of households rises consistently to those with 3 members and thereafter fluctuates with a further peak at 7 members before declining fairly consistently to a

21
maximum number of 17 in the household. 5.2% of the site population is in households sized 12 and above. It is significant that there are a significant number of households having between 1 and 3 members, a statistic which does not conform to a view of uniformly large families in rural communities. The average size of households in rural areas is some matter of some debate as the assumption is that there are considerably larger numbers of household members on average living in rural areas. The average size of households is an important quantum in planning. Table 3. Mean size of households
Site Mean N Std. Deviation Ntilini 6.97 62 3.866 Mbelu 6.75 40 3.425 Cwebe 5.82 460 2.825 Total 6.01 562 3.024
The Department of Water Affairs usually works with a figure of 6 members per household11; and (unlike the OR Tambo DM sites) in the three sites of the Amathole District Municipality the mean size of the households almost exactly conforms to this norm at 6.01 members. There is not great variance between the different sites, with Ntilini having the largest mean size of household with 6.97 members and Cwebe the smallest size of household with a mean of 5.82 members. These figures can be contrasted with those of the 2001 Census which is the most recent authoritative source on household size: although it did not separately analyse rural households, the figures for the average size of African households was 3.9 members while that of rural provinces such as Limpopo was established as 4.3 members.12 A key issue in the analysis of impact of the water project is the number of children under five years old. The distribution of the under fives is found to be fairly evenly distributed between the larger and smaller households.
Demographics of poverty
There are three indicators of poverty established through the survey, firstly the income category as self-described by respondents, secondly responses to questions of hunger, and finally the ownership of personal and household items. The latter can serve as reference points to the ownership of household items common to most South African households. The people living in these relatively remote sites can be characterized as forming part of the rural poor. It is this characteristic and the remoteness of the population from the anticipated planned provision of water infrastructure which is precisely the reason for these sites being chosen. In these rural communities there are very few possibilities
= 11 Information provided by the Consulting Engineer for the OR Tambo District Municipality. 12 Census in Brief, Tables 3.5 and 3.6.

22
for employment and the tendency is for those who are better educated and capable to seek work outside these communities, often in the major metropoles. Despite this tendency there is a high proportion of youth who have completed their secondary education13 who living in these areas and not employed. A high proportion of households in the site areas are living below the poverty level which has been estimated at a per capita income of R322 in 2006.14 Table 4. Percentile range of per capita income per month, Amathole DM
Percentiles Cut-off point
Monthly per capita income
10% 45 20% 72 30% 86 40% 111 50% 143 60% 167 70% 200 80% 257 90% 333 N, households 547
The distribution of household by per capita income provides the broad location of these communities within the benchmarks of income poverty. An analysis of per capita incomes by percentiles finds that about 90% of the households are located below this national income poverty figure. Only the highest 10% of these communities can be regarded as potentially within range of this figure i.e. an approximation at or above R333 per capita income per month. Assessing these figures from the perspective of deep poverty, that of per capita income of $1 per day, the cut off point is about at the range of R200 per month15 This places about 70% of the community in these circumstances. The alternative figure of $2 a day is entered at a cut-off point of R420 a month: only slightly proportion of the upper 10% could be within this range.
Figure 3. Monthly per capita income and family size, %
= 13 “Completion” does not imply that they have matric or school leaving certificates qualifying them for further education, but rather that they do not intend to study further at school. 14 PCAS,2006, page 10. A current figure needs to be adjusted for subsequent increases in Consumer Price Index. 15 This is an approximation to the $1 a day index and is not undertaken by calculating the purchasing power parity in 2000 prices. This means that the figures should not be used in comparison with those based on the purchasing power parity. The current exchange rate of R7 to the US dollar has been used.

23
Per capita income and household size
0%
20%
40%
60%
80%
100%
1 to 5 43.5% 22.1% 53.5% 58.2% 68.8% 84.8%
6 and above 56.5% 77.9% 46.5% 41.8% 31.3% 15.2%
R50 and below R51 to R100 R101 to R200 R201 to R300 R301 to R400 R401 and above
An examination of per capita income figures indicate that there is an inverse relationship between per capita income and family size. Among the smaller households (sized 1-5 members) there is a rising proportion of households with higher incomes while there is a declining proportion of larger households (sized 6 or more members) in the higher per capita income categories. Take for example the larger sized households, 6 and above. There are 56.5% within the lowest category of monthly income (R50 and below), while in the highest category (R401 and above) there only 15.2% in that bracket. From the lowest to the highest category there is a steady reduction in the proportion of larger households. An indication of the standard of living is the access to durable household items. The following: ownership of a radio, television, fridge and bicycle, were selected as indicating aspects of rural assets. Taking all sites the data indicates that 40% of households owned a radio, 10% a television, 12% a fridge and 5% a bicycle. In a society in which most urban households would have a radio and television, the picture is one of considerable asset poverty and a low level of access to electronic media. Table 5. Ownership of domestic assets
Number of items Households
possessing, %None 55%1 34%2 7%3 3%4 1%Total 100%
Taking another perspective on the ownership of assets, 55% of the households did not own any, 34% owned one, and only 1% owned all four. A significant proportion of those households with children (33.9%) stated that a child had gone to bed hungry during the past week. Among these households reporting a

24
child had gone to bed hungry, 33.5% had 5 members or smaller and 66.5% had 6 or more family members. Without making a more extended comparative analysis, most of the households are found in an income category of $1 a day, most do not own common household durables, and a third with children report that their children have gone to bed hungry.
7. Access and availability of water These sites were deliberately selected to be dependent on natural water sources and not to have had a previous intervention to improve access to water sources. These communities have village water sources which are entirely underdeveloped although individual households have made and are making attempts to improve their domestic access and storage. There is evidence of considerable interest in improved water sources and the use of rainwater harvesting. This section examines the accessibility of household water and includes the hydrological setting in terms of types of sources, the geographical setting including the time and distance from households, and makes some comments on seasonal variance. The survey instrument has a set of questions which explore the relationship between households and water sources, the use of rainwater harvesting, and the quality and quantity of drinking water. Table 6. Type of water source
Source N Percent Spring 318 56% Stream 24 4% River 221 39% Well 0 0% Rainwater harvesting 3 1% Dam / pool 2 0% 568 100%
In the table the type of water source is affected by the choice of community. The highest proportion of households access water from springs or fountains (56%), the next most used water source is the river (39%), followed by stream (4%)16 and rainwater harvesting. This distribution seems to indicate the kinds of water sources available in areas of high rainfall; with a preponderance of water sources being springs which are generally more accessible than rivers. Although only a small minority, the households reporting the use of rainwater harvesting are indicating their ability to take advantage of high rainfall in the areas. = 16

25
The first appearance of each of the communities is of the households fairly distant from a prime water source such as a river. The scattered nature of the communities does, however, imply that in an area of high rainfall such as the Eastern Cape there are several water sources available to households but at various distances and with varying volume available. The survey data has revealed a wide range of water sources accessed by households; in Ntilini 2 sources were identified, in Mbelu 2 sources, while in the much larger area of Cwebe there were 27 sources. The difference in the number of water sources is explained by the type of villages selected as preference was given to communities near major bodies of water. The number of water sources appears to be linked to the extent of the community and to the accessibility to a major water source such as a river. In the traditional areas of the eastern coastline of Southern Africa each water sources is named which makes it easier for the community to make reference to and describe the water sources.17 While these names generally appear unique, some are linked to place and clan names. The survey requested the designation of water sources as either spring or ground water or wells; but the distinction between springs, streams, rivers, wells proved difficult for the fieldworkers to make. It was difficult for untrained persons to distinguish between, for instance, a spring and undeveloped natural well or a stream and a river. This was also proved to be a challenge for seasoned researchers as it was often not clear whether, for example, a small water source among rocks was a pool in a dried stream (surface water) or water seeping from rocks. The use of classificatory terminology is also often imprecise. Although the term “river” is used by fieldworkers to classify sources of flowing water, it may have been more appropriate to have used the term “stream” as some of the water sources classified as rivers are not considerable bodies of flowing water.18 In all three sites there are, however, major rivers such as the Bhula and Mbashe.
Household investment in improving sources
During site visits it was found that the water sources were not all totally undeveloped. These communities, apparently with the assistance of developmental agencies some time ago, have made some investment in the development of water sources. A number of springs have been improved in the past by agencies which have built structures with brick and concrete around the source or spring to provide protection. Other water sources have been improved by stones being placed to help provide sure footing to those accessing water or deepening the pool from which water could be drawn. Not all these improvements have worked as the construction of concrete structures around the eyes of springs have impaired flow while the simplest improvements have made access a little easier. Surprisingly, none of the protected springs was found to be functioning as intended; it appears that the eye of the spring had been obstructed and
= 17 This practice appears to be specific to Nguni communities as it is not reported by researchers in the water sector in Lesotho. 18 The data was checked and advantage taken of the naming of specific water sources to check the classification made of type of water source.

26
water now seeps under and around the structures rather than through the intended pipe. The greatest investment in improving water sources has, however, not been spring protection but rainwater harvesting which is discussed further below.
Rainwater harvesting
Rainwater harvesting (RWH) is often proposed as providing a water source which is closely accessible to the household and, in high rainfall areas, providing a reasonable supply of water for domestic purposes. Rainwater harvesting, particularly in poor rural areas, is described as a household response to the lack of water and often undertaken without the technical knowledge or external assistance (Houston and Still, 2001). Those advocating rainwater harvesting point to: the simplicity in construction and maintenance, a strong sense of ownership which improves sustainability, and the easing of the burden of water collection on women and children (Houston and Still, 2001: 24). Rainwater harvesting also has the advantage that water quality can be easily maintained and potential infection is limited because a single water source is used by a limited number of people. On the project sites most household investment has been made in RWH; providing evidence that people prefer to access water, if they can, from the very nearest source. Rainwater harvesting involves a range of investments from that of a simple water barrel to the 2.5 kiloletre green polyethylene tanks using a rotational moulding process to provide a robust “Jojo”. The use of RWH has been utilized in a different context to that of domestic water use in rural development. The Department of Agriculture in the Eastern Cape, for instance, utilizes RWH to augment water supply to gardens as a communal water supply for agricultural purposes in the Massive Food Programme. Possibly because RWH for domestic water use is tied to households and not to communal facilities and because of the definition of water service as piped water within 200 metres of the household, it is difficult for municipalities to include infrastructure in the roll-out of water delivery. The level of the necessary household investment rises from the purchase of some guttering and a water barrel to provide a rudimentary level of RWH to the installation of full guttering to corrugated iron roofs leading to 2.5 kilolitre tanks. A 1 kiloltre Jojo cost in the region of R1,200 plus transport and a 2.5 Jojo costs in the region of R2,000 plus transport cost to the place of operation. In addition there is the cost of guttering and attachment to the rainwater tank providing a cost estimate of R2,500 for the 1 kilolitre tank and R3,500 for the 2.5 kilolitre tank. A set of questions probed the use of rainwater harvesting and a fairly high proportion of the households in the communities in which the question was asked indicated some form of RWH.
27
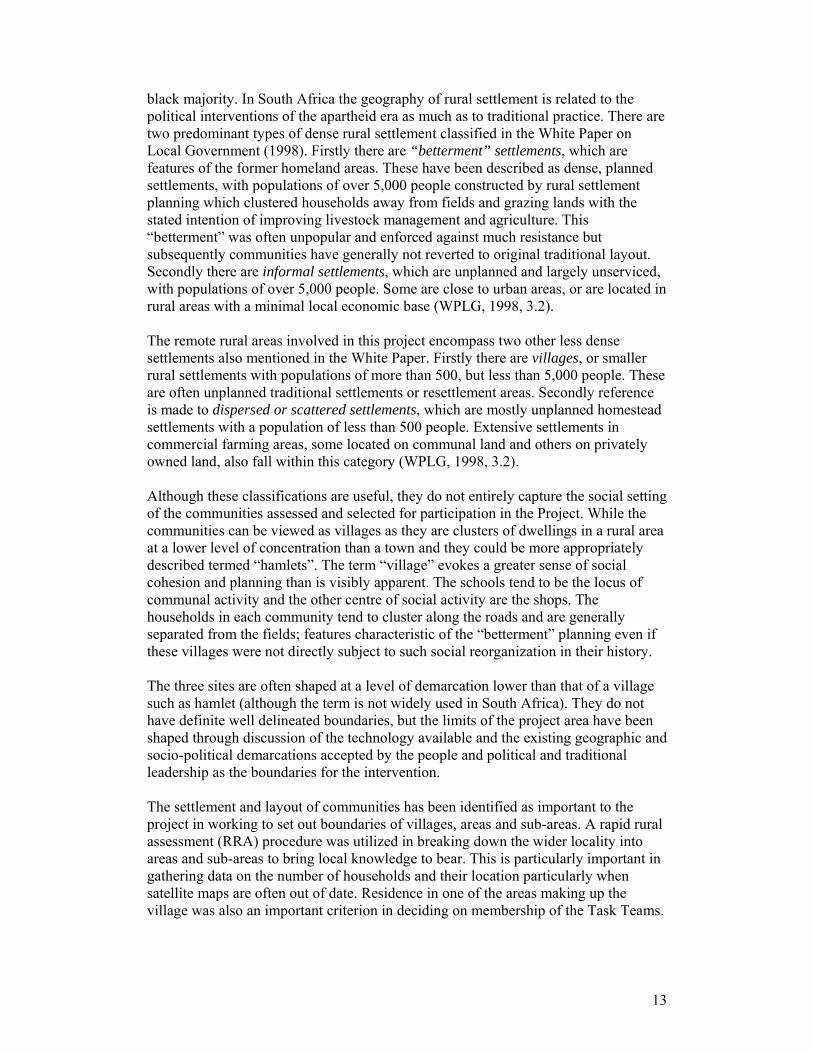
Rainwater harvesting with water barrels is common. Although it is not particularly efficient as rainwater is often blown from the open barrel it is relatively cheap.
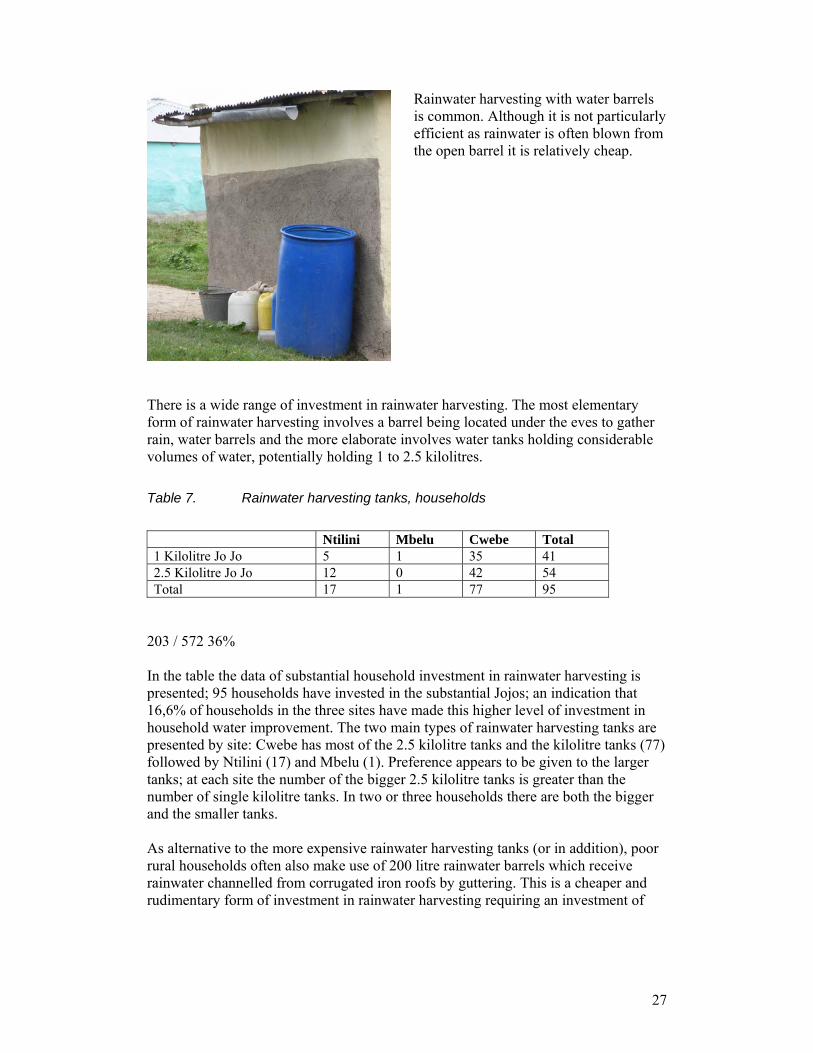
There is a wide range of investment in rainwater harvesting. The most elementary form of rainwater harvesting involves a barrel being located under the eves to gather rain, water barrels and the more elaborate involves water tanks holding considerable volumes of water, potentially holding 1 to 2.5 kilolitres. Table 7. Rainwater harvesting tanks, households
Ntilini Mbelu Cwebe Total 1 Kilolitre Jo Jo 5 1 35 41 2.5 Kilolitre Jo Jo 12 0 42 54 Total 17 1 77 95
203 / 572 36% In the table the data of substantial household investment in rainwater harvesting is presented; 95 households have invested in the substantial Jojos; an indication that 16,6% of households in the three sites have made this higher level of investment in household water improvement. The two main types of rainwater harvesting tanks are presented by site: Cwebe has most of the 2.5 kilolitre tanks and the kilolitre tanks (77) followed by Ntilini (17) and Mbelu (1). Preference appears to be given to the larger tanks; at each site the number of the bigger 2.5 kilolitre tanks is greater than the number of single kilolitre tanks. In two or three households there are both the bigger and the smaller tanks. As alternative to the more expensive rainwater harvesting tanks (or in addition), poor rural households often also make use of 200 litre rainwater barrels which receive rainwater channelled from corrugated iron roofs by guttering. This is a cheaper and rudimentary form of investment in rainwater harvesting requiring an investment of

28
approximately R300.19 This method is often far less effective than the more developed rainwater tank systems as the guttering is often blown away from the mouth of the barrel resulting in the water spilling on to the ground potentially eroding house foundations. Table 8. Rainwater harvesting: barrels
Ntilini Mbelu Cwebe 1 200l Barrel 29 22 85 136 2 200l Barrels 17 9 46 72 46 31 131 208
Despite these disadvantages, the use of barrels is common with some households having more than one barrel; in the three communities these are used by 36.4% of the households. In Cwebe there are almost double the number of barrels than the rainwater tanks (131 barrels vs 77 tanks) in Ntilini about triple the number (46 barrels vs 17 tanks) and in Mbelu more than 30 times the number (31 barrels vs 1 tanks). It appears that the number of barrels utilized by households in a community reflects a proportion of the investment in tanks: where there are fewer tanks a greater number of barrels are utilized. The barrels appear to be something of a proxy for the more expensive rainwater tanks. This investment in RWH is said to be made by more prosperous households, although this is not confirmed in statistical analysis. In discussion with the councillor in Mnxekazi20 it was mentioned that those migrants retiring to their rural home tended to make the investment. These households are regarded as better-off and, during times of drought, they are approached to assist neighbours with the provision of drinking water. Households with Jojo tanks tend to also have more than one method of RWH; to combine both the tanks and water barrels to maximize the possibility of water collection. Rainwater harvesting appears to be the greatest single investment made by households without reticulated water. The advantages are that in a region of high rainfall relatively safe water is readily accessed at the household itself; this saves time and energy utilized in trips to an undeveloped water source.
Water sources at the three sites
Altogether across the three communities, in the survey 29 significant water sources were identified by households. This appears a great number of water sources for fairly small communities and is not necessarily the total number of water sources accessed by the community. Since the surveys were conducted largely during the rainy season
= 19 In Mount Frere these blue 200 litre barrels with a lid which could be closed tightly were sold on the street for about R160 in 2009. 20 Early January 2009.

29
some lesser sources either marginal in use or at the fringe of each community may not have been located. In the ground water protection study conducted by the CSIR these water sources were systematically positioned, categorized and water quality samples taken. From this analysis some points will be made in the discussion of perceptions of water quality. In the section which follows the water sources at each site are presented along with the population accessing each source as a proportion of the whole. Table 9. Water sources, Ntilini
Order Name of water source Pop accessing water Percentage 1 Qombe River 17 4% 2 Mbashe River 415 96% Total population accessing
these water sources 432 100%
In Ntilini there are just two water sources; one very dominant source and a very secondary source. The Mbashe River provides for 415 people and the Qombe River for a further 17. The single prime source could provide for all this community and is the water source for the Communal Water Station. Table 10. Water sources, Mbelu
Order Name of water source Pop accessing water Percentage 1 Mbanyana River 122 45% 2 Mbashe River 148 55% Total population accessing
these water sources 270 100%
In Mbelu there are two main water sources providing for 270 people. Again the Mbashe River is the prime water source followed by the Mbanyana River.

30
Table 11. Water sources, Cwebe
Order Name of water source Pop accessing water Percentage 1 Empilisweni 663 26% 2 Gume 319 12% 3 Nokrweqe River 175 7% 4 Bhula River 166 6% 5 Emthonjeni 165 6% 6 Matshaweni 155 6% 7 Kofini River 129 5% 8 Edikeni 122 5% 9 Entlonyane 113 4% 10 Emkhobeni 89 3% 11 Ndakuxelela 82 3% 12 Maqanyeni 64 3% 13 Magolomi River 64 3% 14 Dyivini 58 2% 15 Emasiminini 44 2% 16 Dumba 41 2% 17 Sundwini River 33 1% 18 Kujuku 28 1% 19 Mxebenzi River 17 1% 20 Mchathazi 10 0% 21 Embini 9 0% 22 Empitsini 9 0% 23 Chankcele 7 0% 24 Kumbzmbo 6 0% 25 Emqkwayini 5 0% 26 Ntombizimbini 4 0% 27 Boya Benyathi 2 0% Total population accessing
these water sources 2579 98%
In Cwebe there 27 water sources which provide an extraordinarily wide range of sources and provide for 2,579 people. The first two sources provide for some 38% (982) of the total; thereafter the other 25 water sources show a wide range of users. There are quite a number of water sources which provide for the needs of a small number of households; for example, 17 of the water sources provide for fewer than 100 people and 7 for 10 people or less. The considerably greater number of water sources can be explained as the Cwebe site is a considerably wider area and has a greater population in comparison to the two other sites. The general picture is of two types of water communities – two river-dependent villages and a single multi-source village. The one type has strong dependence on major bodies of flowing water and the other type is characterized by an extraordinarily wide range of water sources in which strong bodies of flowing water have a lesser part.

31
Times and distances to and from water sources
Obtaining water for domestic use in East Africa often comes at a significant cost to the drawers, usually women and children, in terms of the time spent in collection, the physical effort required and the negative health effects which may result. Women and children continue to walk to and from the source, carrying water on their heads or backs using jerrycans or sufuria (large metal cooking pots). As a result, they are prone to experiencing health problems such as headaches, general fatigue and pains in the chest, neck, back and waist. In the context of broader development issues, the time and energy that women and children have to give to water, means less time available for other more economically productive and personally rewarding activities. Apart from sheer physical exhaustion and the ever-present danger of injury from carrying heavy loads, The distance to water is one of the main constraints facing rural households in accessing greater quantities or in seeking better quality water. Collecting water comes at a significant cost to those collecting water (predominantly women and girls) in the time taken, physical effort and potential negative health effects. Water collectors are prone to health problems such as general fatigue, headaches, and pains in the chest, neck, back and waist. There is also an opportunity cost here; of foregone time in other economic or personally rewarding activities. The human effort taken in collecting and carrying water over considerable distances limits the volume of water available to the household and the possibility of having adequate supply to sustain health. In addition, distance may also impact on the access to better quality water if sources providing better quality water are only available at greater distances from the household. The distance of the households surveyed to and from the water source is shown in the table below. Table 12. Distance to and from water source, categories
Metres, round trip Frequency Valid Percent Less than 200m 15 3 200 - 499m 60 11.9 500 - 999m 122 24.1 1000 - 1499m 102 20.2 1500 - 1999m 88 17.4 2km or greater 119 23.5 Total 506 100
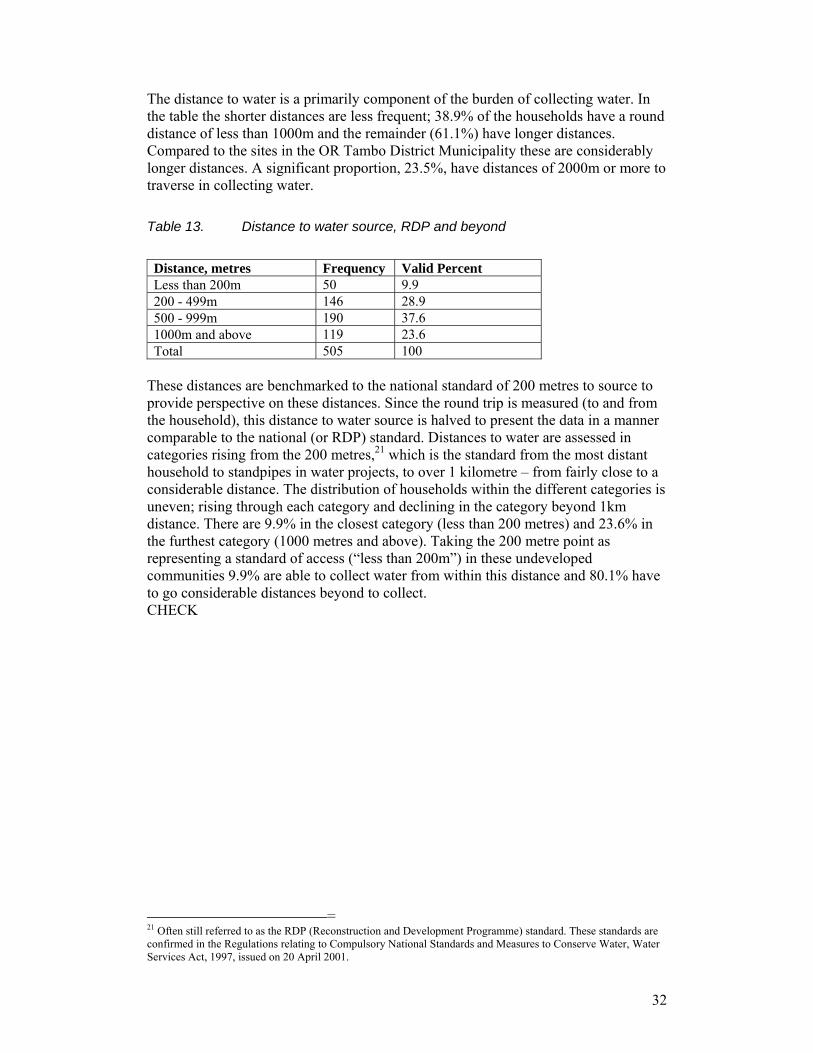
32
The distance to water is a primarily component of the burden of collecting water. In the table the shorter distances are less frequent; 38.9% of the households have a round distance of less than 1000m and the remainder (61.1%) have longer distances. Compared to the sites in the OR Tambo District Municipality these are considerably longer distances. A significant proportion, 23.5%, have distances of 2000m or more to traverse in collecting water. Table 13. Distance to water source, RDP and beyond
Distance, metres Frequency Valid Percent Less than 200m 50 9.9 200 - 499m 146 28.9 500 - 999m 190 37.6 1000m and above 119 23.6 Total 505 100
These distances are benchmarked to the national standard of 200 metres to source to provide perspective on these distances. Since the round trip is measured (to and from the household), this distance to water source is halved to present the data in a manner comparable to the national (or RDP) standard. Distances to water are assessed in categories rising from the 200 metres,21 which is the standard from the most distant household to standpipes in water projects, to over 1 kilometre – from fairly close to a considerable distance. The distribution of households within the different categories is uneven; rising through each category and declining in the category beyond 1km distance. There are 9.9% in the closest category (less than 200 metres) and 23.6% in the furthest category (1000 metres and above). Taking the 200 metre point as representing a standard of access (“less than 200m”) in these undeveloped communities 9.9% are able to collect water from within this distance and 80.1% have to go considerable distances beyond to collect. CHECK
= 21 Often still referred to as the RDP (Reconstruction and Development Programme) standard. These standards are confirmed in the Regulations relating to Compulsory National Standards and Measures to Conserve Water, Water Services Act, 1997, issued on 20 April 2001.

33
Table 14. Time to and from water source
Time category Frequency Valid Percent Less than 19 min 179 35.3 20 - 29 min 136 26.8 30 - 49 min 92 18.1 50 min and more 100 19.7 Total 507 100.0
Times and distances in water collection are related but not directly proportional. While distance to and from the water source is closely related to the time taken in collecting water, time and distance are not necessarily fixed in a finite ratio. Where there is a considerable volume or flow of water available at a source these times can be minimal, but where water is scarce queuing and scooping can take time. Many of the springs examined at the various sites have a fairly slow flow of water into a small pool and at key collecting times, either early or late in the day, queues develop. Often those collecting at such sources make an attempt to avoid the upwelling of muddy particles in the water and scoop very carefully. All this takes time and can make an irregular relationship between distance and time. The time taken in collecting water not only includes the time taken walking to and from the source but also include queuing for water, scooping and filling the container. These additional components are not significant where water sources are reliable and water flows strongly but can be considerable when they are crowded. Although further distances take longer, in addition to walking to and from the water source these other aspects have to be considered. Queuing for water could be a major factor in the differing times taken to and from water sources. With reference to the time categories, in the three sites the largest proportion (35.3%) are found in the lowest time category of time (less than 19 minute) to and from the water source with 25.5% in the longest time category of 50 minutes and more. Table 15. Time to and from water source by site
Site Minutes Mean
N Std. Deviation
Ntilini 45.19 59 16.568 Mbelu 88.08 25 74.78 Cwebe 29.91 423 30.164 34.56 507 35.046
In the table above the mean time at the three sites is presented; the least time taken to and from the water source is in Cwebe (30 minutes) and the greatest in Mbelu (88 minutes). There is considerable difference in these mean times by site with households in Mbelu taking about double the time of households in Ntilini and about treble the time of household in Cwebe.
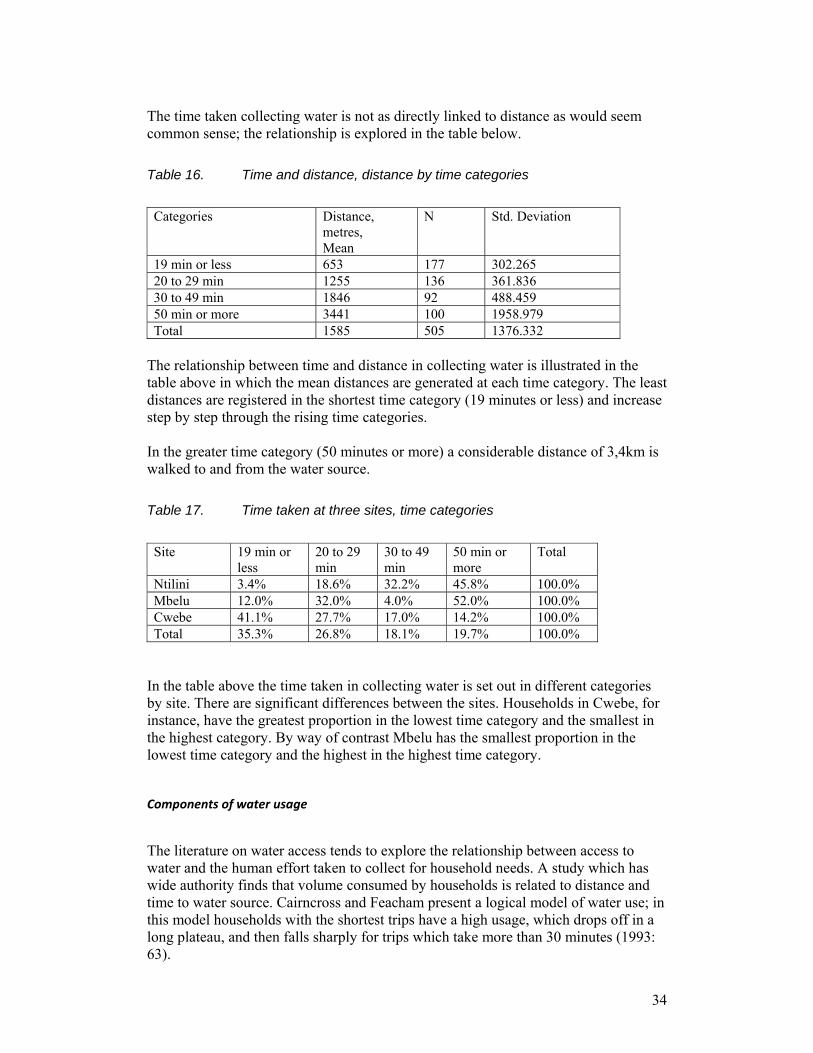
34
The time taken collecting water is not as directly linked to distance as would seem common sense; the relationship is explored in the table below. Table 16. Time and distance, distance by time categories
Categories Distance,
metres, Mean
N Std. Deviation
19 min or less 653 177 302.265 20 to 29 min 1255 136 361.836 30 to 49 min 1846 92 488.459 50 min or more 3441 100 1958.979 Total 1585 505 1376.332
The relationship between time and distance in collecting water is illustrated in the table above in which the mean distances are generated at each time category. The least distances are registered in the shortest time category (19 minutes or less) and increase step by step through the rising time categories. In the greater time category (50 minutes or more) a considerable distance of 3,4km is walked to and from the water source. Table 17. Time taken at three sites, time categories
Site 19 min or
less 20 to 29 min
30 to 49 min
50 min or more
Total
Ntilini 3.4% 18.6% 32.2% 45.8% 100.0% Mbelu 12.0% 32.0% 4.0% 52.0% 100.0% Cwebe 41.1% 27.7% 17.0% 14.2% 100.0% Total 35.3% 26.8% 18.1% 19.7% 100.0%
In the table above the time taken in collecting water is set out in different categories by site. There are significant differences between the sites. Households in Cwebe, for instance, have the greatest proportion in the lowest time category and the smallest in the highest category. By way of contrast Mbelu has the smallest proportion in the lowest time category and the highest in the highest time category.
Components of water usage
The literature on water access tends to explore the relationship between access to water and the human effort taken to collect for household needs. A study which has wide authority finds that volume consumed by households is related to distance and time to water source. Cairncross and Feacham present a logical model of water use; in this model households with the shortest trips have a high usage, which drops off in a long plateau, and then falls sharply for trips which take more than 30 minutes (1993: 63).

35
Figure 4. Time and use of water sources
0
20
40
60
80
100
120
1 2 3 4 5 6 7 8 9 10 11 12 13 14 15 16 17 18 19 20 21 22 23 24 25 26 27 28 29 30 31
Water source
Time to water source
HH accessing source
1 2 3
4
A limited review is made here of access to water sources before more exacting examination of the relationship between time and per capita water use. In the figure above the relationship between time taken and number of households accessing 31 water sources is explored. The time to water source (as the means in minutes) and number of households making use of the water source are presented after being sorted by an index of usage. This coefficient of usage (minutes to water source divided by the number of households using the source) was used to rank the data for each water source: those water sources most accessed by households are located to the left of the graph and those least accessed to the right. The figure shows the results. If universal preference was given alone to time to water source the closest water sources would be the most accessed by households. A general relationship appears with most households preferring those water sources which require the least time with usage falling away with longer times. There are a number of exceptions. For example, a greater number of households access water sources 1-4 which are among the closest water sources. There are four points which run counter to the trend and whose explanation may illuminate the proceses. In the first, Mbashe River, which serves both the Ntilini and Mbelu communities, the larger numbers prepared to undertake greater time to the water source can be explained by the lack of alternative sources and the ready availability of water from this large body of water. The second, Edikeni in Cwebe is a popular spring with strong flow. The third Entlonyane, also in Cwebe, used by the Xeni community is a preferred spring also which does not stop flowing during the dry season. It has an outstanding taste and attracts people from both sides of the river. The fourth, the Mbanyana River is one of the few substantial bodies of water for the households living in the upper ranges of the Mkhameso area.of Mbelu.
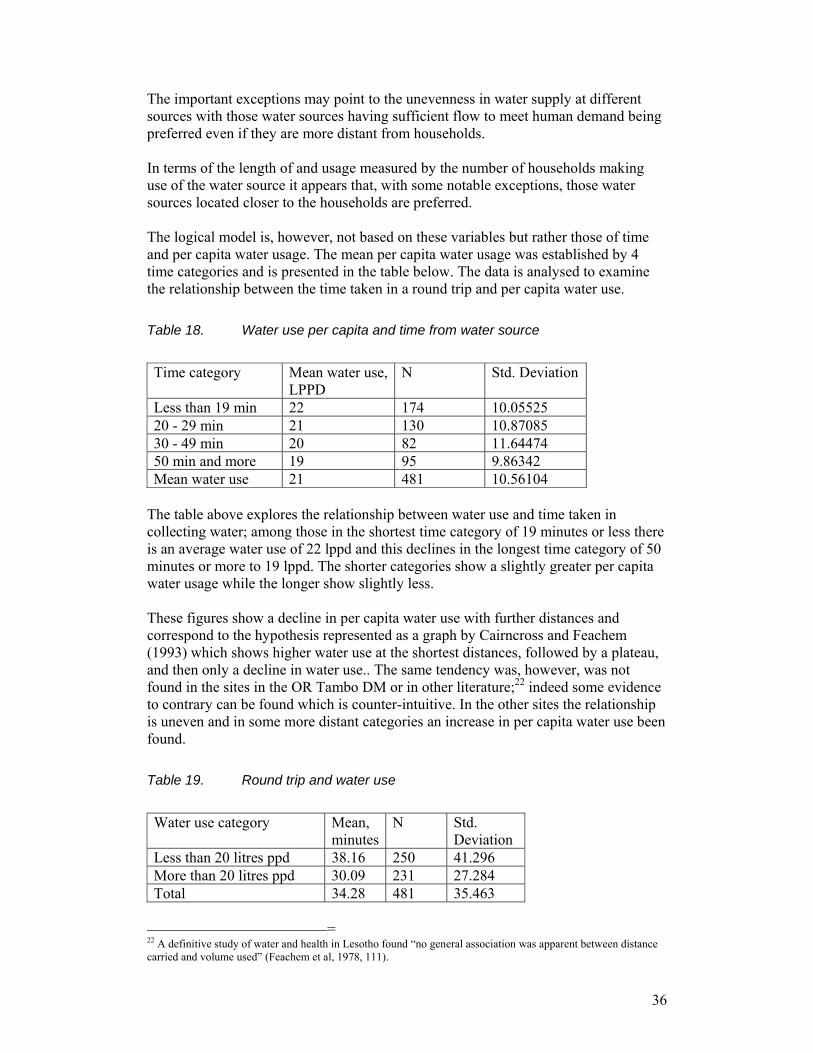
36
The important exceptions may point to the unevenness in water supply at different sources with those water sources having sufficient flow to meet human demand being preferred even if they are more distant from households. In terms of the length of and usage measured by the number of households making use of the water source it appears that, with some notable exceptions, those water sources located closer to the households are preferred. The logical model is, however, not based on these variables but rather those of time and per capita water usage. The mean per capita water usage was established by 4 time categories and is presented in the table below. The data is analysed to examine the relationship between the time taken in a round trip and per capita water use. Table 18. Water use per capita and time from water source
Time category Mean water use,
LPPD N Std. Deviation
Less than 19 min 22 174 10.05525 20 - 29 min 21 130 10.87085 30 - 49 min 20 82 11.64474 50 min and more 19 95 9.86342 Mean water use 21 481 10.56104
The table above explores the relationship between water use and time taken in collecting water; among those in the shortest time category of 19 minutes or less there is an average water use of 22 lppd and this declines in the longest time category of 50 minutes or more to 19 lppd. The shorter categories show a slightly greater per capita water usage while the longer show slightly less. These figures show a decline in per capita water use with further distances and correspond to the hypothesis represented as a graph by Cairncross and Feachem (1993) which shows higher water use at the shortest distances, followed by a plateau, and then only a decline in water use.. The same tendency was, however, was not found in the sites in the OR Tambo DM or in other literature;22 indeed some evidence to contrary can be found which is counter-intuitive. In the other sites the relationship is uneven and in some more distant categories an increase in per capita water use been found. Table 19. Round trip and water use
Water use category Mean,
minutesN Std.
Deviation Less than 20 litres ppd 38.16 250 41.296 More than 20 litres ppd 30.09 231 27.284 Total 34.28 481 35.463
= 22 A definitive study of water and health in Lesotho found “no general association was apparent between distance carried and volume used” (Feachem et al, 1978, 111).

37
The table above indicates that those households with members consuming less than 20 litres of water a day had spent more time (an average of 38 minutes) collecting water than those consuming more than 20 litres of water per day (an average of 30 minutes). The data seems to indicate a relationship between time and water use but of uncertain significance. As will be discussed below the determinant of per capita water use is largely that of household size rather than distance. The general picture, however, is that the more distant water sources are less used by households.
Assessing components of water usage
The relationship between distance, character of the water source, and water use appears to be more complex than anticipated. Although in general households prefer closer water sources, those collecting may be driven to access more distance sources because of insufficient flow or very poor quality at nearer sources. Table 20. Key factors: water use, draw-off, time taken
Water Source N Volume
collected, Mean, litres
Draw-off, litres, day
Time to and from source, Mean Minutes
LPPD, Mean, litres
1 2 3 4 5 Emasiminini 125 108 15,625 15 24 Mchathazi 125 92 15,625 46 19 Matshaweni 122 86 14,938 25 19 Empilisweni 120 88 14,344 40 19 Bhula River 118 94 13,988 16 21 Mxebenzi River 115 88 13,225 11 13 Nokrweqe River 111 96 12,227 25 16 Emkhobeni 107 104 11,410 39 17 Gume 105 119 10,971 23 22
The key data in relation to the 9 most important water sources providing water to 100 or so households in the three sites is presented in the table above. The “draw-off” (or total volume drawn from a water source) is established by multiplying average water use by the number of households accessing the source. The factors identified as significant here include the number of households collecting at this source, the volume collected, the total “draw-off”, the minutes to and from the water source, and the per capita water use. The number of households collecting water at these sources in Column 1 ranges from 125 using the Emasiminini spring to 105 at Gume. The volume of water collected by

38
the households at each of these water sources is in Column 2 and appears within a narrow range with a mean of 97 litres. The total “draw-off” in Column 3 expresses the total volume of water collected daily by all the households using this source; this ranges from 5,0 kilolitres drawn from Mtyubeni to 2,3 kilolitres drawn from Bandayo. In the next Column 4 the time to and from the water sources is presented and ranges from 69 minutes in Dywaba to 15 minutes at Ntsunguzini. Finally in Column 5 the per capita water use of water is presented ranging from 15 litres per person per day in Elityeni and Mtyubeni to 32 lires per person per day in Dywaba. From the data presented it appears that those water sources which have a high draw-off attract households from further distance. At the Dywaba water source, for instance, those collecting water from this source were prepared to spend 69 minutes to draw just under 100 litres per day which would probably involve four trips a day. One of the closest water sources, Mtyubeni reflects households collecting water from this source in 15 minutes time to collect a similar volume. The general picture from a review of the data presented in this table is of fairly consistent household daily collection from the water source, but a wide range of per capita water use. The per capita water usage of 20.9 litres per person per day is slightly higher than that reported in the rural contexts of other African countries where per capita water use of 18.8 litres is reported in rural communities in East African countries (Thompson et al. 2001, Figure 2.1).
8. Quantity and quality of drinking water The volumes of water necessary for the household are collected at a considerable burden in physical effort, potential negative health effects, time spent, and lost opportunities for other activities. In this section the attitudes to collecting water are examined to in terms of the aspects of this burden. In this section the quantity and quality of drinking water accessed by households is discussed. This assessment includes the distance and time to water sources, the number of trips, and the household and per capita water use. These elements are important indicators of the environment for personal hygiene and of health; some health specialists argue that that the volume of water is the primary factor followed by quality issues. This argument for greater volume as the first priority in rural water supply is made most strongly in a study of access to water in East Africa where it is concluded that “increasing the quantity of water used per capita is more important for a household’s health and well being than improving its quality.” (Thompson, 2001, 83) Taken in an international context where the priority is generally being given to quality issues such as water safety this appears a strong statement as it potentially opens a casual attitude to maintaining water quality. This is supported by studies which conclude that improved water quality alone, without improved hygiene and higher levels of water use, does not lead to the reduction of endemic paediatric diarrhea.

39
Although it is not exhaustively concluded, there is research which supports the argument for greater quantities of water as a matter of policy. The study of water use in Eastern Africa logically relates the maintenance of personal and household hygiene to the volume of water used: “If a household has only a small quantity of water to use, it is probable that all aspects of hygiene, from bathing to laundry, to washing of hands, food, and dishes, will suffer.” (Thompson, 2001, 83) It is argued that the availability of per capita volumes of water above the necessary minimum consumption in drinking and cooking leads to greater use in bathing (and, presumably, hand-washing). In a comparative study of households with lower and higher water use quoted (Cairncross and Cuff, 1987) it was found that the additional water available to households with higher water volumes were used in bathing adults and children. The argument is that the multiple transmission routes of faecal-oral diseases are more likely to be “water-washed” (caused by poor personal hygiene resulting from inadequate water availability23) than “waterborne” (caused by pathogenic microorganisms in contaminated fresh water). Since there are multiple water-wash transmission routes (through hands, food, water containers and dishes, as well as drinking water) cleanliness of the person and environment is critical. This is easiest achieved if there is sufficient water available for the task. If a household has only a small quantity of water to use, it is likely that all aspects of hygiene – from bathing and laundry to washing of hands, food, and dishes – will suffer. Page 7 Thompson The per capita water use in a household provides the indication that there is sufficient water available for personal and domestic hygiene. It appears that the first priority in water use is given to drinking and cooking and secondly that sufficient volume is allocated to body washing and hand-washing only when this priority is met. It appears that at levels of per capita use of about 20 litres that a ratio is established between use in drinking and cooking to use in hygiene of 1:4.24 Where there are lower levels of per capita water use this proportion appears to decline disproportionately. The higher the water use the greater the volume of water allocated to personal hygiene. The argument has been driven further to the conclusion that an increase in water quantity would have a greater impact than improvement in water quality. This is the perspective adopted by Esrey (1996) who states that an adequate water supply makes it feasible for improved hygiene levels to be achieved. From his study of child development he concluded that the impact of better water quality is only felt when there is sufficient water and sanitation. Furthermore, an increase in the quantity of water has a greater health impact than improved water quality , because an adequate water supply makes it possible (or at least more feasible) for people to adopt safe hygiene behaviour. Since a primary cause of contamination of water is inadequate or improper disposal of human and animal excreta, better water quality only improves health when sanitation is improved as well and when the quantity of water is sufficient (Esrey 1996).
= 23 White et al, 1972: 165. 24 Calculated from the data on pages 27-28 in Thompson et al, 2001.

40
In the following section the data on household and per capita water use is presented; firstly the volume of water daily collected by households and secondly per capita use is considered.
Attitudes to collecting water
Table 21. Attitudes to collecting water
0%
10%
20%
30%
40%
50%
60%
Agree 29% 50% 40%
Disagree 54% 30% 42%
Neither nor 15% 16% 13%
Not too heavy Time collecting Alw ays available
Questions were asked of the attitudes to the collection of water and assessment of the water source. In the table above the results are presented: among the respondents 54% disagreed with the statement, “Our family does not carry heavy water containers over long distances”; i.e. felt that the work was onerous. In response to the statement, “Our family spends a lot of time collecting water”, to time spent collecting water the greatest proportion of respondents (50%) agreed that they spent a lot of time collecting water. Finally a minority agreed with the statement “Our family always has water available” while most (42%) disagreed. Assessing these statements, the largest proportion of respondents (about 60% of those expressing either agreement or disagreement) locate themselves in a group which could be characterised as find water collection a real burden and not having sufficient water available. A significant minority, however, find that water collection and availability is acceptable. These results can be summed up as follows: most respondents felt that water collection was a heavy and time-consuming activity. Despite the effort involved the water was not always available as required. These assessments relate to accessibility and the quantitative aspects of water availability.

41
Table 22. Household daily collection by site
Site Litres
Mean N Std. Deviation
Ntilini 88 63 30.07288 Mbelu 106 40 40.62315 Cwebe 105 413 34.27445 Total 103 516 34.72802
In the table above the volume of water collected by households is presented by the three sites. There is little variation between the mean for all areas,103 litres, and the volume collected at each site which ranges from 88 in Jali to 106 in Mbelu. Table 23. Household daily collection by size of household
Household size Mean N Std. Deviation 1 to 5 93 251 29.58175 6 and above 113 265 36.48032 Total 103 516 34.72802
An important issue in the understanding of domestic water use is the volume of water collected by the household. In the table above the data on collection is presented by household size. Those households with 6 or more members only collected slightly more water daily, 113 litres per person per day, than households with 5 or less members at 93 litres per person per day. Despite the consistency in collection of water at the household level there is a considerable variance at the individual level. In the section which follows water use per person per day is presented. Table 24. Per capita water use by categories
Volume water used lppd No of
households Percentage Accumulated
percentage 4-9.9 litres 60 11.7 11.7 10-14.99 litres 108 21.1 32.7 15-19.99 litres 99 19.3 52.0 20-24.99 litres 48 9.4 61.4 25-29.99 litres 108 21.1 82.5 30-34.99 litres 48 9.4 91.8 > 35 litres 42 8.2 100 Total 513

42
The figures show a surprising range of water use; while 11.7% of the site households consume less than 10l, at the opposite end of the scale 8.2% consume 35l or more. There are health and hygiene implications for those who do not access sufficient water. Taking a bucket of water (roughly 20 litres)25 as the minimum water use recommended for personal hygiene and health (Gleick, 1996), the table indicates that 52.0% of the members of households at the sites receive this minimum amount or more and 48.0% do not. Analysis of the data on water use indicates a minimum of 4.69 litres per person per day and a maximum of 100 lppd with a mean of 23.775 lppd. Table 25. Mean water use by site (lppd)
Site Mean N Std. Deviation Ntilini 16.6 62 10.58202 Mbelu 20.7 40 12.90922 Cwebe 21.5 411 10.38383 Total 20.9 513 10.72073
Water use by households is disaggregated by site. In the table above, Nilini is shown to have the lowest mean water use of 16.6lppd and Cwebe the highest mean water usage of 21.5lppd. There appear similarities in water usage by site in Mbelu and Cwebe but not with Ntilini in which households have a considerably lower per capita water usage. A low standard deviation indicates that the data points tend to be very close to the mean, whereas high standard deviation indicates that the data is spread out over a large range of values. The little range of water usage across households has an important impact on individual water use. The total volume of water accessed by the household was divided by the number of people in the household. The water usage is further analysed by household size: a division is made between smaller (with 1-5 members) and larger households (with 6 or more members). Table 26. Water use by size of household (lppd)
HHsize5 Mean N Std. Deviation 1 to 5 28.1 227 10.50276 6 and above 14.7 224 5.00394 Total 21.6 451 10.61803
= 25 The Compulsory national standards and measures to conserve water regulations set out in terms of the Water Services Act 108/1997, set out a national minimum quantity of potable water of 25 litres per person per day or 6 kilolitres per household per month, 3(b).

43
The individual water use by household size is shown in the table above. The water usage in the smaller household is 28.1 lppd compared to the larger household of 14.7lppd; this implies that individuals in the smaller households consumed just under twice the amount of water as in the larger. This significant difference can be explained by the fairly similar volumes of water collected which are then apportioned to the members of the household. The larger families tend to collect only slightly larger volumes than the smaller and, with the assumption of even distribution of water within the household,26 the gulf between larger and smaller households is readily explicable. It appears that individual water use is closely aligned to household size. The relationship between income is explored below. Table 27. Water use by income group (lppd)
OneDD Mean,
lppd N Std. Deviation
Less than $1 a day 18.2426 348 8.75964 $1 or more 26.1624 159 12.22139 Total 20.7263 507 10.62014
In the table above, the relationship between per capita income and per capita water use is presented. A division is made between households with members receiving less than a United States dollar a day27 and those receiving more. Those households with members receiving more than $1 are shown to have an individual water use considerably greater (at 26.1 lppd) than those in households which do not (at 18.3 lppd). Households with greater income may have more activities requiring the use of water such as cooking regularly, gardening, than those with lower income. Table 28. Water use and income group
Category Less
than $1 a day
$1 or more
Total
Less than 20 litres ppd 215 52 267 Equal or > 20 litres ppd 133 107 240 Total 348 159 507 38.2% 67.3%
The significant influence of income on water use is further illustrated by a cross tabulation of households with members consuming a per capita greater and less than 20 litres per day and income. There is a significant increase in water usage by better off households with members receiving $1 a day or more. Of the poorer households
= 26 This assumption may well not be valid and it has been suggested that adult usage and adult equivalent ratios should be established. There is, unfortunately, no such study ready to hand. 27 The dollar value in rand is not established through purchasing power parity (PPP) to ensure the rand will purchase the same volume of goods and services as the USD. Rather it was calculated using the current exchange rate of R7 to the USD.

44
38.2% have a per capita water use equal to or more than 20 lppd while 67.3% of the better off households are in this bracket. The variables affecting the volume of water used from the analysis undertaken are those of time to water (although this is of uncertain significance), of family size (with larger families having a lower level of usage) and of per capita income (with households with higher income having higher water usage).
9. Hygiene and hand-washing Hygienic practices are heavily dependent on having sufficient water. Hand washing and body washes require considerable volume of water for hygiene not to be compromised. The question of households and individuals accessing sufficient water for the range of individual and households activities dependent on water availability is probed by a series of questions which explore attitudes. Table 29. Assessing “sufficient” water for various activities
0%
20%
40%
60%
80%
Agree 24% 41% 32% 16% 24% 22% 29% 18%
Disagree 67% 46% 56% 69% 51% 58% 53% 61%
Drink Wash hands Body wash Keep healthy Clean house Sick Clothes Garden
In the table the attitudes (in a Likert scale ranging from strongly agree to strongly disagree) to statements about the family are presented. In the first question, for example, which states “Our family drinks, prepared food, and cooks with safe water”, the responses are captured. To simplify the analysis the responses have been aggregated to “agree” or “disagree” and the “neither/nor” responses which constituted a relatively small number were dropped. The table indicates a general perception of insufficient quantities of water to undertake many activities linked to personal and household hygiene. In relation to most questions disagreement is expressed with the notion that there is sufficient water for necessary hygienic or productive activities. The respondents indicate there is insufficient water to drink, wash hands and to do a body wash (67%, 46% and 56% respectively). Disagreement that there is sufficient water is registered in relation to other activities including keeping healthy (69%), cleaning the house (51%), to treat

45
sick adults and keep them clean (58%), washing clothes (53%) and maintaining a garden (61%). The general picture emerging is of individuals feeling they have just sufficient water to wash themselves but insufficient water to care for others and keep their surroundings clean.
Hand‐washing
The assessment of hand-washing is not easily undertaken through a survey. Since hand-washing has strong normative associations of social and moral rules, few people will readily and honestly report that they do not wash hands, for instance, after using a toilet. A high level of accuracy depends on the close observation of individual members of the household28 which limits the scope of research to small-scale studies. In a survey of households involved in the baseline study the scale is greater, the interviewers requiring greater training and limited focus, and the costs proportionately higher. A method was developed which combined both a question about facilities which was regarded as posing less normative issues, observation of these facilities, and responses to broad questions. Table 30. Assessment of hand-washing facilities and activities
0%10%20%30%40%50%60%70%80%90%
Yes 59% 55% 18% 24% 40% 36%
No 39% 43% 81% 74% 58% 62%
Facility Flowing water Soap Wash thoroughly Dry hands Clean towel
The table and graphic above presents data from interviews and observation \to the assessment of hand-washing facilities and activities. The data combines both the responses relating to facilities and practices. From the table and graphic it appears there are mixed views about the availability of facilities and the adherence to good practices. Most respondents felt a separate hand-washing facility such as a washing basin dedicated to the function was available in
= 28 This is the method undertaken in a study of handwasing practices in Phiri in Soweto. See Haffejee, Farhaad, Mickey Chopra and David Sanders, 2007, Hand-washing and paying for water in South Africa. Municipal Services Project, Occasional Papers No 13.

46
59% of the households. Equally most felt there is a greater proportion of households in which flowing water is used to wash hands (55%) but this is largely without the use of soap as only 18% of households were reported to have this available. In the activity of hand-washing itself, 74% of households were reported not to wash hands thoroughly, slightly less do not dry their hands (58%), and almost all do not have a clean towel (62%). The general picture presented here is of inadequate facilities, particularly in the availability of soap for hand-washing, and fairly cursory practices. In the hygiene promotion hand-washing with facilities and improved practice is strongly presented and developed. Table 31. Attitudes to water related activities and schooling
0%
10%
20%
30%
40%
50%
60%
70%
Agree 44% 33% 65% 52% 27%
Disagree 25% 34% 8% 12% 40%
Do not miss school At tend regularly Bath before school Hygiene educat ion No worms
The notion of social setting and sufficiency is further explored in relation to children and schooling, an important factor in assessing the impact of access to water (WaterAid indicators). One of the principal concerns with difficult access to water and undeveloped sources with poor water quality is of the impact on children and their development; particularly impact on girl children. A key concern is that the challenges of collecting water may lead to children missing classes, being late, or not attending regularly. Additional questions relate to the morale of school children, their hygiene education, and whether their health and performance is affected by parasites. Respondents indicated that children did not generally miss school for reasons related to water collection or illness with diarrhea: 44% agreed that their children did not generally miss school for these reasons. On the other hand a lower proportion (33%) felt that their children attended school regularly – on this indicator there more disagreement and uncertainty. A high proportion of respondents (65%) felt that children were able to wash and be presentable before leaving for school. Most respondents (52%) felt that their children were receiving adequate hygiene education at school, although a significant proportion were either unsure or disagreed. Finally a minority of respondents (32%) felt that school children in their household did not

47
suffer worm infestations; however, 40% disagreed and 27% were unsure (i.e. a majority felt that worm infections were a problem for school children).29. A study of the burden of water collection on children found that negative indicators were not associated with collection itself but with the amount of time spent collecting water. Those spending most time were prone to missing school, reporting above average fatigue and other symptoms, and being “age-grade inappropriate” i.e. older than the average age for their grade (Hemson, 2007).
10. Quality of water Perceptions of the quality of water supplies are a guide to the potential reaction of respondents in undertaking to protect their health and that of their household members. If water quality is perceived to be reasonably good and levels of diarrhea low there is less interest in water treatment and commitment to engage in new activities such as scooping, sieving, sedimentation, filtration and disinfection to achieve safe drinking water. The emphasis may, however, be directed to the accessibility and quantity of water. Introduction: Increasing awareness that water quality at the point of use may deteriorate from point of access (bolivian study, Table 32. Assessment of water quality
0%
20%
40%
60%
80%
Poor 74% 66% 57% 64%
Satisfactory 16% 13% 19% 19%
Very good 10% 20% 23% 17%
Safe Clear Taste Smell
`
Respondents were asked their assessment of the water quality they access (“very good”, “satisfactory” or “poor”); in relation to its safety, clarity, taste and smell. In relation to water quality issues there is a generally negative appraisal; 74% make a “poor” appraisal of its safety, 66% make a “poor” appraisal of its clarity, 57% make a “poor” appraisal of taste and 64% make a make a “poor” appraisal of its smell. There are low levels of positive appraisal. = 29 Alternation between negative and positive questions has been utilized in eliciting accurate responses during interviews. Such alternation requires respondents to consider each question carefully rather than provide a standard response to each. Such a procedure does, however, involve a double negative which presents some difficulty in analysis.

48
The greatest negative appraisal is that made of water safety with only 26% considering their water safety satisfactory or very good. Table 33. Water quality assessment: samples from Mbashe River
Sample Description Mbelu Ntilini
SANS 241 Standard
Turbidity NTU 126 80 <1 Total Coliform count/100mℓ 51,000 1,600 100 Faecal Coliform count/100mℓ 35,000 810 0 E coli count/100mℓ 0 567 0 Streptococci count/100mℓ 1000 320 0
CSIR Groundwater Survey Ref 14, 17 In the table above, the focus is on the Mbashe river water at two sites namely Mbelu and Ntilini, the above table providing the baseline of the water quality at these sites. The result from the table is based on assessment of current drinking water in the both villages. The counts are shown against categories and the right column shows South African Nation Standard (SANS) for drinking water quality. The turbidity is a measure of the clarity of water, according to SANS the standard for drinking water is <1: in Mbelu the count is 126 times higher than standard and in Ntilini it is 80 times higher than the standard. Total Coliform count in Mbelu is 51,000 and in Ntilini the count is 1,600; both above the standard which is 100. In Mbelu the Faecal Coliform count is 35,000 while in Ntilini it is 810; the standard is 0. The count for E coli in Mbelu is 0 while in Ntilini it is 567; the standard is 0. In Mbelu the Streptocicci count is 1000 and in Ntilini it is 320; both are higher than the standard of 0. Based on the above figures it appears that Mbashe River is quite contaminated and well below the national standard on some of the most important indicators. The presence of streptococci is regarded as particularly dangerous to human health although these do not have a long life. Mbelu which is downstream has water with a higher level of contaminated than Ntilini; there could be activities upstream contributing to this contamination. Table 34. Treatment of drinking water
Frequency of treatment N % Always 98 36% Last few days 6 2% Sometimes 121 44% Only sick person or the baby 22 8% Don’t treat water 26 10% N 273 100%

49
The survey was designed to explore the issues of water and container hygiene to monitor practices which could lead to contamination of water. The questions of treatment of water relate to the practice and methods involved. In the table above a minority of respondents (10%) indicate that they do not treat water. Of the remaining 83%, the majority indicate that they always treat the water but a considerable proportion (44%) indicates that they do sometimes. The question is further explored in the methods of water treatment applied; the question allowed for a number of types of water treatment to be mentioned ranging from careful scooping to boiling water. These different methods invited and recorded as “mentions” will be greater than the total number of respondents as respondents have the opportunity of naming more than one method. Table 35. Methods of treating water
Water treatment No % of methods
mentioned Scoop carefully with scoop with handle 173 22% Sieve it through cloth 115 15% Sedimentation 132 17% Filtering through cloth 72 9% Disinfect: Add jik 178 23% Disinfect: Boil 113 14% Total mentions 783 100%
In the table above the methods of water treatment are examined; this provides some additional insight into the way in which respondents have conceptualized “treatment”. The survey questions allowed for the capturing of a number of methods of water treatment mentioned (as “mentions”). If water treatment was routinely practiced there would be a high proportion of the 572 respondents reporting positively on each item. The most common method of treating water mentioned by 23% is to use Jik to disinfect water; the next most mentioned method (22%) was to use a scoop with a handle to carefully skim turbid water to avoid suspended particles. The next ranked method is that of sedimentation (17%) followed by the precursory sieving of water through a cloth (15%). Other methods reported are boiling (14%) and finally the more deliberate filtering through a cloth (9%). This variety of methods extends considerably the notion of treatment; each activity contributing to a lesser or greater extent to the improvement of water quality. The issue of the potential recontamination of water through equipment used is explored in the practices in container hygiene. Table 36. Methods of filling containers
Method of filling No % Scoop without handle 240 41%

50
Scoop with handle 252 43% Tip container into water 90 15% Other (specify) 3 1% Total number of methods mentioned 585 100%
The practices used in filling containers at the water source are also important in assessing potential water contamination. In the table above the responses to questions on the methods of filling a container are mentioned; these responses are greater than the total number of respondents as two or more methods could be mentioned. Most respondents mention filling a container using a scoop with a handle (55%); this avoids contaminating the water by hand contact. The next most mentioned method is a scoop without a handle (28%) followed by tipping the container into the water (16%). The latter two methods involve the potential contamination of water in the container from hand contact. Table 37. Container practices
Method of cleaning container No % of methods
mentioned Rinse outside only 78 14% Rinse inside-out 49 9% Wash with disinfectant soap / Jik solution 51 9% Wash with soap inside-out 341 60% Wash with soap and sand inside-out 31 5% Wash with sand only inside-out 7 1% Don’t wash 9 2% Other, specify 1 0% Total 567 100%
In the table above the responses to the question of methods of cleaning containers are presented. The overwhelming majority (96%) of respondents report that the containers in their household are cleaned and the most common practice is washing inside-out with soap (66%). This practice is followed by rinsing inside-out (18%) and a number of less significant activities such as using sand or disinfectant. The use of sand encourages particles to lodge in the scratch marks made by the sand. If these figures of washing practices are continuously undertaken and uniformly maintained the containers should be clean. Table 38. Cleanliness of containers
Examination of container No % Biofilm 40 7% Loose particles 244 44% Clean 276 49% 560 100%

51
In the table above the results of the interviewer examining containers used for drinking water are presented. Of the 345 containers examined, 44% were found to be clean, 28% having loose particles, and a further 28% having a layer of biofilm on the inner surface. The indications are that the cleaning of containers may not in practice have been at the level reported.
11. Water related disease As mentioned in the introduction there is a history of cholera and continued infection in the Eastern Cape including in the Amathole District Municipality (Jeenes and Steele, 2010). As in the KwaZulu-Natal province the disease spreads rapidly with the rainy season during the end of year and Christmas season and continued through the summer months before declining during the winter dry season. Although it was difficult to establish conclusively, there were reports30 that this epidemic either spread to the villages included as sites or to areas nearby. More recently there has been an outbreak of typhoid in Hobeni which borders on the Cwebe site. Whatever the case there has been a history of water-related disease which indicates continued vulnerability. The critical test of improved water supply and practices is the effect on incidence of diarrhea. While there are a range of possible diarrheal diseases, an issue which is explored below, respondents were asked of the incidence of diarrhea in the household in the previous two weeks. Table 39. Diarrhea in household
FrequencyValid Percent
No diarrhea in HH 451 80.8 Incidence of diarrhea in HH 107 19.2 Total 558 100
In the survey, 107 households reported there had been a family member with diarrhea in the previous two weeks; this provides an incidence of 19.2%.
= 30 In interviews with councilors and traditional leaders, although documentation could not be found of the epidemic involving the sites.

52
Table 40. Incidence of diarrhea, age group
Age group No % Infant (<1) 18 21% Under 5 14 16% 5 to 18 22 26% 18 and over 32 37% 86 100%
In the table above the incidence of diarrhea is presented by age group and although it is recognized that the population is not evenly distributed through these groups this is how the incidence is reported. Of the 86 cases for which age related data was provided, the majority (37%) were in the 18 years and over age group followed those aged between 5 to18 years (26%). Infants (aged below 12 months) had an incidence of 21% and those under five had 16%. While the small size of the reported cases of diarrhea compromises a more rounded analysis, a cross-tabulation of the households reporting diarrhea and household size has been undertaken. Table 41. Incidence of diarrhea, by household size
Size of household 1 to 5 6 and above Total No 227 221 448 Yes 44 63 107 Total 271 284 555
In the table there are 107 cases are reported of which 44 appear in the smaller households and 63 cases in the larger households. Since households are more or less evenly divided the difference appears significant. Table 42. Type and symptoms of diarrhea

53
Type of diarrhea No % Very watery stools and discomfort 16 15% Acute / very bad watery stools 51 49% Acute / very bad diarrhoea with blood 18 17% Diarrhea with dehydration and malnutrition 20 19% 105 100%
In the table above the respondent’s experience of diarrhea in the household is captured. Of the 105 respondents most (49%) reported an experience of diarrhea as acute with very watery stools. The most acute form of diarrhea with the longest duration is associated with dehydration and malnutrition is reported by 19%, and is followed by very watery stools and discomfort (15%). Diarrhea with blood (which approximates to the definition of typhoid) is reported by 17%. The experience of diarrhea as reported by respondents appears in the upper range between “light” incidence and “severity”. Studies of diarrhea and cholera have established a close association between the prevalence of these water related diseases and income (for example, Hemson 2006). The multiple variables associated with income which have the combined impact of reducing water related disease are, however, difficult to separate and relate to varying outcomes. Table 43. Incidence of diarrhea by income groups
Income range No
incidence Incidence in family
Percentage of total incidents
R50 and below 58 7 65 12% R51 to R100 115 29 144 26% R101 to R200 123 45 168 30% R201 to R300 55 10 65 12% R301 to R400 44 4 48 9% R401 and above 42 4 46 8% 453 101 554 100%
In the table above the data on the incidence of diarrhea is cross-tabulated against monthly per capita income. The data indicates that the incidence is greatest in the lower income groups, but these categories also include the larger numbers of households. Table 44. Incidence of diarrhea over the past two weeks
Per capita income Less
than $1 $1 or greater

54
No incidence 296 140 436 Incidence in family 85 19 104 381 159 540
The following table which simplifies the income categories into those families with members receiving less or more than $1 a day presents the results. The incidence of diarrhea is larger in the poorer than in the better off households – although there is a greater number of households in the poorer section of the community the incidence of diarrhea is four times greater.31 In previous studies undertaken by the author it was found that there was a close link between the incidence of cholera in affected communities in Northern KZN and the level of per capita income (Hemson et al, 2006). Although income can be regarded as an indicator which aggregates a number of other indicators e.g. characteristics of family composition, educational levels, family size, access to household items, and other components; “poverty” is a compound of these variables even when each variable does not have significance in relation to the outcome. The survey explored the knowledge and use of oral rehydration therapy. Since a critical aspect of the impact of disease is its management, a question is posed in the survey about the knowledge of ORT (Oral Rehydration Therapy) which is regarded by the World Health Organisation as the most appropriate and successful method of management. In only severe cases of diarrhea is a regime of antibiotics advocated. Respondents were asked to mention spontaneously what treatment they know of and would adopt. Table 45. Knowledge of Oral Rehydration Therapy
Treatment of diarrhea through ORT No % Disinfect water, boiling or Jik 45 25% Salt and sugar 33 19% Salt and sugar / proportion 64 36% Salt, sugar, bicarbonate 36 20% 178 100%
In the table above the responses to the question on knowledge of treatment are presented; 178 of 572 of those interviewed responded to the question. A high proportion of respondents (31.1%) mentioned ORT as a method of treating diarrhea. The majority (36%) of these, however, showed knowledge of ratio of salt and sugar (1:8, 1 teaspoon salt to 8 teaspoons of sugar) in a litre of water. This is followed by those who mentioned disinfecting water by boiling or with Jik alone (25%). Other forms of ORT mentioned included salt and sugar without reference to their proportions (19%) and others (20%) added bicarbonate of soda which is advised as well as the correct proportion of salt and sugar. Combining the various descriptions of
= 31 Found to be significant at .005 when Chi Squared test was undertaken.

55
ORT, 75% of respondents responded showed knowledge of the components of ORT although not necessarily of the proportions. Unfortunately the analysis is made of under a third of all respondents; a possible indication of the uncertainty of respondents to this question. The question on ORT is a difficult one as a direct question on the subject could lead to prompting respondents. The range of responses and the high level of interviewees familiar with ORT and mentioning the correct proportion of salt and sugar shows the effect which has been attained by campaigns advocating ORT which have been conducted over the past period, possibly for as long as 20 years in South Africa. Table 46. Preventative measures against diarrhea
Measure Number Percentage
of total mentions
Treat drinking water 386 19% Caregiver wash hands 437 22% People wash hands before eating 449 22% People wash hands after toilet 427 21% Have proper toilets 168 8% Other 165 8% Total mentions 2032 100%
In the table above the data is presented on the responses to a range of questions probing a range of possible measures which could be considered as preventative of diarrhea. In the responses to the appropriate preventative measures against diarrhea priority is given in about equivalent proportions (of just over 20% each) to hand-washing by care-givers, before eating, and after using the toilet (or at the sites, the bush). Combined the various measures including hand-washing amount to 65% of the total. Water treatment, the provision of toilets and other measures record 19%, 8% and 8% respectively.
12. Household sanitation, hygiene and children’s health Although the project is focused on the accelerated provision of safe drinking water the question of personal hygiene or more broadly sanitation draws on the question of access to toilets. The health of households and under-five mortality has been linked presence or absence of toilets and to their type.32 In addition there is the question of open defaecation which leads to water runoff compromising water quality of water sources which (although not specifically the subject of research) is a logical
= 32 Demographic and Health Survey. 1996. Infant and child mortality, Table 6.5 Infant and child mortality by environmental factors.

56
conclusion. Improved sanitation has an important role in maintaining health and living conditions by improving the environment, the quality of water, and personal hygiene. In the three sites there is a fairly low level of toilets available in the community, of the 440 respondents to the question, 412 or 94% stated that their household did not have a toilet. A question was asked of alternatives facilities are available to having a toilet and the responses are presented below. Table 47. Alternatives to household toilet
Alternative No A neighbour’s toilet 40 8% A bucket 8 2% The bush 444 90% Other, please specify… 492 100% 40 8%
Those households who stated they did not have toilets responded to a range of alternatives. The overwhelming majority (94%) mentioned “the bush”, followed by neighbour’s toilet, bucket and other. The responses show that there are relatively few alternatives to having a toilet than using open spaces for defaecation. Even where there are toilets these are not necessarily used by all members of the family and particularly not by small children. Table 48. Use of toilets, small children
Use of toilets Frequency Percent No 385 91% Yes 39 9% Total 424 100%
In the table above the responses to the question whether small children use toilets is presented. The question is related more broadly to access to toilets which are available only to a minority. Despite this the very low proportion of respondents (9%) reporting that small children use toilets indicates that adequate sanitation is not generally available to children. There are two conditioning factors here; firstly that there can be hazards in children using pit latrines which can have seats too wide for their safety and secondly that there is often the expectation that toilets are for adults. The result is that most small children have to have recourse to open defaecation.
Child health

57
In the survey instrument questions are posed on child health to situate water-related disease to other potential diseases affecting children under five. Table 49. Assessment of children’s health
Our children / my child (under 5 or infant) generally: No Per cent Have a persistent cough or problems breathing 182 21% Suffer from fatigue / tiredness 104 12% Often have flu or colds 233 26% Have worms 262 30% Have bilharzia (red urine) 105 12% 886 100%
Of the 886 “mentions” in the assessment of the health of children in the household, the highest category is having worms (30%), followed by flu or colds (26%), and persistent cough (21%). Fatigue and bilharzia were mentioned by 12% each.
Homestead environment
There were a number of questions relating to homestead environment including the sweeping clean of the yard, evidence of the yard being clear of faeces, and the disposal of rubbish. Table 50. Yard swept clean (children’s faeces)
Indication Frequency Percent No 260 77% Yes 76 23% Total 336 100%
In the table above the responses to the question on the yard being clear of faeces is presented. The assessment involved the question and the interviewers’ observation of the yard. Of the 336 households for which data is available, 77% of the yards were assessed as swept clean and 37% not. The difficulty both in sweeping the yard and assessing whether the yard has been swept is that in the three sites the grass often extends close to the house and animal faeces appear to be accepted rather than regarded as unhygienic. A further question was posed about the safe disposal of rubbish.

58
Table 51. Disposal of rubbish
Methods of disposal No % Dig a pit cover rubbish 47 10% Burn rubbish 336 68% Let it stand outside yard 110 22% Other 1 0% 494 100%
The responses to the question of the disposal of rubbish are presented in the table above. Of the 494 respondents most burn rubbish (68%), followed by using a pit and covering rubbish (10%), or letting it stand outside the yard (22%). The preferred method of disposing of rubbish effectively and without danger to health is to use a pit and cover rubbish but most households do not follow this procedure and only 10% do.
13. Access to hygiene promotion Hygiene promotion is an important aspect of the social mobilization undertaken by the Project to ensure that technological changes are accompanied by improved practices to ensure their effectiveness and sustainability. The model to be adopted is of community-led hygiene promotion in which community leadership is trained to undertake demonstrations of hygiene practices and to follow through with house visits. To assess the change brought through community mobilization it is important that the original conditions in the communities are measured before the hygiene promotion intervention. A number of questions on the access to health services, knowledge, and assessment of this knowledge are included in the instrument and presented here. Table 52. Where do you usually access health care?
Agency N Percent Clinic 507 89% Private doctor 28 5% Hospital 35 6% Other 2 0% 572 100%
In South Africa health promotion is often closely linked to the agency at which patients receive care. The Community Health Workers (CHW), for instance, are oriented to the community through the clinic sister in charge to the tasks and priorities in the neighbouring communities making up the clinic catchment area. The overwhelming majority of respondents in the three sites (89%) access the clinics as their primary source of health care followed by small proportions utilizing private doctors and hospitals.

59
In South Africa’s rural areas a system of health and hygiene promotion is ducted through the clinics themselves with supplementary assistance by CHW and other health auxiliaries who operate under the supervision of the Sister in Charge. The strategy is for CHW to help free time for clinic staff by assisting particularly in house visits during campaigns and in support of health programmes.33 Table 53. Source of information on water and hygiene
Source of information N PercentCommunity Health Worker (CHW) 34 14% Nurse at clinic 119 51% Task Team member 38 16% Other 44 19% 235 100%
The questions in the survey were designed to assess the prevailing levels of communication of health and hygiene messages before the social intervention. The source of information on water and hygiene issues included individuals and practitioners available to rural communities. Of the 235 respondents who reported discussion the highest proportion (51%) had had information from a nurse at the clinic, followed by “other” person (19%), a Task Team member (16%) and a Community Health Worker (14%). Although the survey was managed to be in the field before the hygiene promotion campaign in each community the high proportion of respondents reporting discussions with Task Team members was probably inevitable since the purpose of the Project had to be explained at public meetings. Table 54. Participation in discussions on hygiene promotion
Category N Percent
Community meetings 71 481 15% Discussion with neighbours 9 416 100%
Two subsequent questions were designed to capture the level of public discussion; either at a community meeting or participation in a smaller group discussion. A small proportion (15%) reported that they had participated in a community meeting on the subject of hygiene and health promotion. Considerably fewer respondents had had community (2%) had participated in the more intimate discussions in smaller group meetings with neighbours which are targeted in the social mobilization conducted through the Project. = 33 A policy document on Community Health Workers at a national level is not readily available, but the KZN Health Department sets out basic objectives and operational procedures which are probably similar to other provinces. http://www.kznhealth.gov.za/chw.htm

60
Table 55. Assessment of learning
Experience N Percent Not learn anything new 41 19% Learnt something 64 30% Learnt much 76 36% Other 30 14% 211 100%
Of the minority of respondents participating in the learning experience in a community or small group meeting (211 out of a potential of 572 respondents), most felt they had either learnt “much” (36%) or “something” (30%) but a sizeable proportion, (19%), felt they had not learnt anything new. Table 56. House visit by Community Health Worker
N Percent No 454 88% Yes 64 12% Total 518 100%
Despite the high proportion of households making use of clinic facilities and the visible activities of the CHW in the communities, a surprisingly low number report having house visits from CHW; only 12% report having had house visits. This may indicate that the CHW have a wide area of responsibility in the clinic catchment area or that they are being deployed to specific households where there is a definite need. Whatever the case, since house visits are the dominant mode of providing health extension services the impact appears low. Table 57. Advice received from CHW
Advice the following N Percent Disinfecting water 12 12% Toilet / sanitation 27 27% Good hygienic practice 24 24% Common illness 19 19% Nutrition education 11 11% Other 7 7% 100 100%
The table above presents data on the type of advice received in health promotion. Of those who responded, the highest proportion received advice on the sanitation (27%), followed by good hygienic practices (24%), and common illnesses (19%). Overall the results indicate a low level of messages received from the CHW, particularly when compared to the OR Tambo DM sites.

61
The design of the program of hygiene promotion includes improved access to community health advice through community meetings and household visits. Close liaison is planned between the Project health promotion team and the local clinic and health workers to ensure that advice is provided on water, sanitation and hygiene issues at the most appropriate level. The subsequent impact survey should enable an assessment of interventions to take place. Table 58. Assessment of CHW
Category N Percent Excellent 93 18% Satisfactory 74 14% Poor 164 31% Don't know 195 37% 526 100%
The view from the sites in relation to the current engagement with CHWs is not encouraging. A high proportion of those surveyed responded with either no knowledge of the CHWs (37%), an assessment as “poor” (31%), with satisfactory or excellent forming only 32% of the responses.
14. Findings There are a number of findings relevant to the objectives of the project which are reflected on here.
Water sources
There are two sources at Mbelu and Ntilini and a number of water sources at Cwebe. The abundance of sources at Cwebe is related to the high rainfall area and the hilly nature of the terrain which results in a number of rocky outcrops from which underground water flows. The rainfall also feeds wetlands and water holes at which the water wells. The concept of the Communal Water Station relied on the assumption that there are well established routes to single water source the flow of which could be purified and stored. This concept fits better with Mbelu and Ntilini which access water from the Mbashe River. Residents, and fieldworkers conducting the survey, generally find it difficult to distinguish between groundwater and surface water sources. These water sources are undeveloped and no sources which could be considered as “rudimentary” i.e. such as a well or a protected spring. As anticipated by the selection of the sites, the water sources are virtually all undeveloped apart from minimal community improvements such as placing stepping

62
stones around existing springs. Virtually all villages in South Africa show evidence of some attempt by government or NGOs historically to improve water sources. Spring protection has been the main intervention to ensure no disturbance and pollution from animals and to direct the flow into a storage tank with protruding pipe to make the water more directly accessible. In examples encountered at the three sites there appear to have been design or construction faults as the water is not flowing from storage area through the pipes as intended and instead is seeping out from around the built structure. Unfortunately at the three sites the previous improvements to water sources appear to have hindered rather than helped: all spring protection measures inspected are currently not operating as intended and present a disappointing record of intervention. There was no evidence of wells having been constructed at these sites or other rudimentary measures. It appears that instead of assisting by providing a chamber to accumulate water, the spring protection structures have obstructed the flow from the eye of the spring. Unfortunately the protective fences which were once erected have now disappeared. The access of livestock; cattle, goats and sheep, has the led to the degradation of the water source and polluting the water.
Rainwater harvesting
The biggest single investment by households is undoubtedly in rainwater harvesting. This ranges from the fairly rudimentary use of gutters to direct water from the roof to rainwater barrels to more effective use of guttering into 2.5 kilolitre polyethylene tanks. The Eastern Cape is a high rainfall area and 36% of households (which is somewhat lower than in the sites of the OR Tambo District Municipality) in the survey have invested in one or another form of rainwater harvesting. It was also mentioned that those households which have these tanks are approached during the dry season by neighbours to assist them with drinking water. The commitment to rainwater harvesting can be explained through its advantages in reliability and access. With sparing use at times, the 2.5 kilolitre tanks can provide drinking water for a considerable period of time from a source which is at the household itself. According to informants with the most developed system the large tanks supply sufficient drinking water to last through the dry season.34 The water barrels do not provide storage over time but help provide ready access to water in the household during the wet season.
Time and distance to water sources
From the analysis there is a less robust relationship between time and distance found than anticipated which points to the time taken in queuing at water sources and drawing water from springs possibly with a weak flow. This time would be
= 34 Discussion with community member who has more than one 2.5kl tank in Mnxekazi.

63
substantially reduced by the ready availability of water at the Communal Water Station and requires further examination in a subsequent impact survey. The times and distances to and from the water source are somewhat less than anticipated. The initial appearance of the each of each of the sites was of communities very distant from a strongly flowing body of water and the initial assumption was that the focus of the community would be on such a source. Since the households within the site communities are widely dispersed, this would have dictated considerable distances and times to the prime water source. Instead a considerable range of water sources has been found reasonably close to households and most of these were stated to be providing water during the both the dry and wet season, although not with the same volume. The availability of a variety of water sources at each site reduces the distances and times otherwise needed to reach a considerable body of water such as a river. In contrast to the OR Tambo DM, however, there are fewer households close to a water source and 90.9% of households have to collect from a distance of 200 metres or beyond, a benchmark established in South Africa in access to a water source. In those communities accessing the river as a water source the round trip is considerably greater; on average in Ntilini it is 45 minutes and Mbelu it is 88 minutes. Although these times are not short, by comparison with other studies of communities with undeveloped water sources (Thompson et al, 2001), they do not appear as great as could have been expected. A somewhat similar situation is reported in a study of Lesotho community water sources in the 1970s (Feachem et al, 1978, 111) where a contrast is made the relatively short distances to sources in well-watered Lesotho and much longer distances in arid regions. There is evidence that the time taken in collecting water may involve considerably more than the walk to and from the water source. The slow flow of water at springs, water holes in river beds and natural wells can involve women and girls queuing and filling containers by scooping from water sources which can take considerable time. Those accessing river water have longer distances but do not have these same constraints.
Water quantity and per capita water use
The data on household water use indicates a fairly consistent volume of water collected daily by households at the different sites. Approximately 100 litres is collected daily by the households with the smaller households of 5 and less members collecting slightly less and the large of 6 or more members collecting slightly more than this mean. Given the considerable range in size of household this is a surprising consistency and has the result of considerably lower per capita water use among members of the larger households. The households in the survey show a considerable range of per capita water use, but almost half of those surveyed have a volume of water use which is equal or greater than 20 litres per capita per day – the equivalent of a bucket of water for each person and a little less than the national standard of 25 litres per capita per day.

64
Counter-intuitively, water use does not seem to be significantly related to time: taken although it could be expected that those closest to the water source would have the highest per capita water usage and those furthest the lowest per capita water usage. An association is found in this data but not that of the OR Tambo DM sites which, surprisingly, show a counter-trend. The explanation for the lack of a more definite and distinctive relationship may be that water sources generally closer to households may not have the necessary flow to provide for a large number of households drawing on its resources. Greater volumes of water for household consumption may be available further from the homesteads. The relationship between volume and time to water source needs to be further examined.
Household size and water use
These findings imply that those households more distant from significant water sources have to spend considerably more time and effort in water collection but the norm (that households collect about the same volume of water) appears to be stable. Although there are some differences in water use by time and distance, the biggest difference in per capita daily water use is indicated by family size. A significant difference has been found in water use between households of different sizes. The differences are astonishing – individuals in large households of 5 members or more have a per capita water use which is just over half that of smaller households. In part this is an arithmetic differentiation: since larger and smaller households collect about the same volume of water daily the per capita distribution within larger families is substantially reduced. It would have been anticipated that larger households would have more potential drawers of water to collect a greater volume and would have made up the difference in per capita water use but this is not the case. From responses to questions relating to water collection it is clear that attitudes to sufficiency dominate community perceptions of water. The broad responses indicated an attitude that household supply was sufficient for body washing and hand-washing but insufficient for many household needs. These attitudes, however, do not seem to have affected the norm of about 100 litres collected by each household.
Water quality
The negative assessment of water quality in terms of safety, taste, colour and smell are what is often visually evident during inspections. Springs are mentally associated with pristine and undisturbed water; but the springs (widely defined) in the Eastern Cape sites are often turbid after cattle have trampled through the water collection point and left muddy.

65
While some water sources have clear water, in most sources the water is turbid and the surroundings contaminated with animal faeces and rubbish such as discarded soap powder containers. Soapy water may intrude into the area around the source used for drinking water. Since the water sources are not fenced off they are used mutually by animals and people – the animals often wading into the water source itself, stirring up the sediment and defaecating nearby, or even in the water itself. The low coverage of toilets and the reported use of the bush also implies that the runoff towards the surface water sources is highly contaminated. This visual appraisal of the water sources is confirmed in the groundwater survey of the water sources in the villages included in the survey. The survey of ground and surface water sources was conducted by the CSIR and samples were taken from each of the water sources and tested. The conclusions were that the water quality in virtually all the water sources was “unsafe” as not meeting the standard for water quality. In most cases the water quality was well below the minimum levels set by the South African water quality standard SANS 241.
Water related disease
Despite their being a history of water-related disease in District Municipality, there does not appear to be a high level of incidence at the time of the survey which was conducted largely during the dry season. This was not the optimum timing to ensure sufficient cases to pursue analysis. The indication from the people is that water-related disease, particularly diarrhea is not perceived as a major health threat in the communities. In addition to the survey and discussions with the Task Team members and the people themselves, interviews were also conducted with health workers in or nearby the communities. The report from clinics in the area, particularly in Hobeni near Cwebe, is that there is not a high level of children under five years suffering from dehydration associated with diarrhea reported in recent times. Statistics are collected by clinics on this incidence on a monthly basis on their catchment areas and are publicly displayed. Unfortunately, the records are not always consistent or available on the specific areas under study. The general impression from discussion with informed individuals in the community, health workers, and the sister in charge of clinics is that there is not a particularly high level of incidence of the life-threatening dehydration of under fives. It appears that the incidents of diarrhea are being treated by ORT methods in the household and largely do not result in visits to the clinics which are often some distance from the households. The use of the Oral Rehydration Therapy (ORT) technique may, in part, be related to the low level reporting on the incidence of diarrhea. ORT has been widely advocated for possibly the last two decades in rural communities in South Africa and may have empowered rural women in managing the disease. Certainly there is a high level of knowledge of ORT reported and this may have led respondents to treat diarrhea befoe it reached the level of dehydration.

66
Water treatment
The figures on household water treatment which show various levels of treatment activities need to be assessed carefully. While there is a reasonably high level of treatment reported in responses, this covers a wide range of activities ranging from careful scooping of water to lower turbidity to boiling water. The level of water treatment – defined here as comprehensive treatment including the use of Jik or boiling of water -- is reported to be low. Residents mention the difficulty in getting the necessary chemicals (Jik is not visibly evident in local shops) and the time taken in boiling water. Despite this, the practice of boiling water itself is the preferred method of treatment.
Environmental hygiene
Observation of aspects of hygiene of the household, the yard, the drinking water container, and interior of the houses and associated questions are covered in the survey instrument. The questions of hygiene raise normative questions and the responses can be difficult to assess. Despite this there is valuable material for further assessment and to contrast with the impact survey. A clean environment, in the rural setting free of human and animal waste, is important particularly for children’s health. The response to keeping the yard swept and clear of faeces indicated a high level of practice which, unfortunately, was not always evident. In particular rural households are tolerant of animal faeces in the yards. In relation to container hygiene if the responses on washing practices were continuously undertaken and uniformly maintained the containers should be clean. The field workers’ observation of container hygiene does, however, indicate a variance between claimed practices and an examination of the containers. Research has concluded that dirty containers can lead to the recontamination of water, or in the case of untreated water, degrading further the quality of drinking water.
15. Discussion One of the issues which could have been more deeply explored is that of households alternating water sources between summer (wet) and winter (dry) seasons. This question was explored in discussion with the community but generally the response in relation to most water sources was that these had water available throughout the year. During the dry season, however, it became clear that a number of households shifted water sources to access sufficient water. The study of these shifts on a relatively small scale requires close contact and observation of communities to record. Some of the findings and conclusions have a direct bearing on the design of the project. The wide range of water sources, for instance, provides the input for ideas of enhancement of the existing water sources to improve existing access. It firstly appears to demonstrate that the improvement of access to water from the primary

67
source will have to be on a small scale and benefitting few or require extensive reticulation. The baseline study has included some analysis of the investment communities and people make independently of state provision. It showed a high preference among residents of remote rural communities for rain water harvesting which was not unexpected given the visible evidence of RWH in the three sites.
Water and PLWHA
South Africa is the midst of the pandemic of HIV/AIDS with high levels of infection reported in the adult population at a country level and this has important implications for household water management and the maintenance of hygiene. One of the characteristics of the developed phase of AIDS is that of diarrhea – a symptom and aspect of the disease which can be reduced or better managed with sufficient resources and knowledgeable care. Despite the importance of this issue for improved water and personal hygiene, the implications of water and care issues related to HIV/AIDS this was a difficult issue to address. Access to water sources is primarily a household issue and in a survey direct questions on the health status of individual members would pose both methodological and ethical constraints. Instead it was decided that in discussions with the community in preparing the hygiene promotion the issue of the relationship between water issues and HIV/AIDS would be raised and discussed informally. In early discussion with members of the community the impact of HIV/AIDS was presented as an aspect of the migratory life cycle. Younger work-seekers are portrayed as going to find work in the industrial centres far from the village, setting up another home, becoming infected, and returning to the village when they are very sick. The advance of AIDS is associated with diarrhea which “becomes increasingly severe and persistent”. Diarrhea impedes the absorption of nutrition and antiretroviral medicines and needs to be carefully managed to ensure the use of safe drinking water and hygienic practices (USAID, 2009: 2). The promotion of these practices prolongs life and improves the quality of life for PLWHA and also helps safeguard family members and caregivers. The special needs of those households affected with HIV/AIDS (in particular improved water quality, but also of sufficient quantity for adequate hygiene) was raised in the material used in hygiene promotion. While this was effectively communicated in the health clubs and house visits and an attempt was made to engage the community in wider discussion of the issues these initiatives did not lead on to the anticipated result. Only in the case of a young health professional was it found possible to explore these issues; this person confirmed that the demanding conditions on women in the household of PLWHA and the need for supportive intervention. Since the stigma associated with HIV/AIDS is still the dominant social aspect of the disease, it was not found possible to make a more rounded assessment of social aspect

68
of the disease. The results of the research from the survey and observations is thus not as strong on this key issue as it could be.
16. Conclusions This baseline study provides useful interpretation of the conditions of communities with undeveloped water resources in South Africa. The relationship between the settlement types represented and water sources in remote rural areas is explored and preliminary analysis undertaken of key trends in water use, distance to water, household hygiene and access to health services. The study of these communities poses useful questions as to the adaptation of human society to the terrain of hilly terrain in a region of relatively high rainfall and with significant water sources. The emphasis in this baseline study has been on comprehensively identifying the conditions of people before the intervention. Although vigorous action was taken to avoid “contamination” (in this case the impact of project activities being felt before the survey) there is some evidence of the Task Team training affecting some of the responses on knowledge of hygienic practices. The conditions of water usage appear fairly stable at some levels: Through their own efforts households are working to provide themselves with access at minimum standards. Despite the lack of a developed water supply, the mean household water the usage of water at the different sites appears broadly comparable. About half the households collect 20 litres per person per day although only about 10% are within the range of 200 metres from a water source; both of these are reference points to the standards in water regulations. Possibly most the two most surprising conclusions are that time to water source only has a slight and possibly insignificant relationship despite much greater energy being required to access more distant sources. The pattern of norms and practices, however, does not work in favour of larger households. This strata has considerably lower per capita levels of water use because it appears that a similar number of trips are made daily as smaller sized households. The lower per capita water use in large households has also been found in other studies (for example, Thompson et al, 2001: 27). It could have been imagined that larger households would have more individuals to call on for collection but this does not appear to be the case. The improvement of the health of rural communities depends both on an increase in the quantity and quality of water. Without sufficient quantity of water hygienic practices cannot readily be maintained and the very poor quality of water leaves communities vulnerable to epidemics such as that of cholera. The Project is intended to deal primarily with water quality but should also lead to an increase in the quantity of water used as safe drinking water will be more readily accessible.
69
17. Bibliography
Accessibility, Use and Health in Muthara, Kenya. Master of Science in Environmental Engineering, Michigan Technological University.
Bennett, J. Thetard, R, Msauli, D and Rohde D. 2001. Strengthening community participation in health. Ideas from Eastern Cape. Eastern Cape Department of Health, USAID, and MSH
Boone, C, P. Glick and D. Sahn. July 2010. Household Water Supply Choice and Time Allocated to Water Collection: Evidence from Madagascar. www.cfnpp.cornell.edu/images/wp238.pdf
Cairncross, S and R Feachem. 1993. Environmental Health Engineering in the Tropics; an Introductory Text. 2nd Edition. Chichester: John Wiley and Sons.
Cairncross, S and Shordt, K. January 2004. It does last! Some findings from a multi-country study of hygiene sustainability. Waterlines. 22(3): 4-7.
Cairncross, S and V. Valdanis. July 2004. Water supply, sanitation and hygiene promotion. Working Paper No 28. Disease Control Priorities Project. files.dcp2.org/pdf/DCP/DCP41.pdf
Collinson, Mark A., Stephen M. Tollman, and Kathleen Kahn. 2007. Migration, settlement change and health in post-apartheid South Africa: Triangulating health and demographic surveillance with national census data. Scand J Public Health Suppl. 2007 August; 69: 77–84. http://www.ncbi.nlm.nih.gov/pmc/articles/PMC2830108/
CSIR. 30 June 2010. Groundwater Protection Plan for OR Tambo District Municipality. Accelerating Sustainable Water Service Delivery in the Amathole and OR Tambo District Municipalities in the Eastern Cape.
CSIR. 30 June 2010. Groundwater Protection Plan, OR Tambo DM.
DEAT. Settlement types. http://soer.deat.gov.za/284.html (accessed 12 September 2010).
DWAF. 20 April 2001. Regulations Relating To Compulsory National Standards And Measures To Conserve Water. Water Services Act, 1997.
DWAF. Water Services Act, 1997. 8 June 2001. Regulations Relating to Compulsory National Standards and Measures to Conserve Water, Gazette No 22355, Notice No 509. http://www.dwa.gov.za/dir_ws/wsnis/default.asp?nStn=reporttree&curPerspectiveID=2&RDCatID=2#
Environmental Health Project. August 2004. Assessing Hygiene Improvement Guidelines for Household and Community Levels. Strategic Report 8
Esrey S 1996, Water, Waste and Well-being: A Multi-Country Study, American Journal of Epidemiology 143 (6): 608-623.
Genthe, B. Strauss, N. Seager, J. Vundule, C. Maforah, F. and Kfir R. 1997.

70
Gilman R. H. And Skillicorn, P.. 1985. Boiling of drinking-water: can a fuel-scarce community afford it? Bulletin ofthe WorldHealth Organization, 63 (1): 157 – 163.
Gleick, Peter H.. 1996. Basic water requirements for human activities: Meeting basic needs. Water International, 21 (1996) 83-92. www.bvsde.paho.org/bvsacd/cd17/basic_wate.pdf
Hemson, D., Dube, B., Mbele, T., Nnadozie, R. & Ngcobo, D. 2006. Still paying the price: revisiting the cholera epidemic of 2000-2001 in South Africa. (Occasional Papers, No. 10). Grahamstown: Municipal Services Project. http://www.municipalservicesproject.org/publications/msp-publications
Hemson, David. 2007. “The toughest of Chores”: policy and practice in children collecting water in South Africa. Policy Futures in Education, 5, 3: 315-326.
Houston, P and Still, D. August 2001. An Overview of Rainwater Harvesting in South Africa. www.pid.co.za/files/Rain%20Water%20Harvesting.pdf
Hutton, G., L. Haller, and J. Bartram. 2006. Economic and Health Effects of Increasing Coverage of Low-cost Water and Sanitation Interventions. New York: UNDP Human Development Report Office, Occasional Paper 2006/33.
Jalan, J., and M. Ravalion. 2003. “Does Piped Water Reduce Diarrhea for Children in Rural India?” Journal of Econometrics, vol.112, pp.153-73.
Jeenes, Ken and Leslie Steel. 2010. Providing Water and Sanitation. FHISER, Fort Hare Institute of Social and Economic Research. The Eastern Cape Basic Service Delivery and Socio-Economic Trends Series. http://www.ecprov.gov.za/modules/documents/download_doc.php?id=319.
Kennedy, Paul M. 2006. An Analysis of the Relationship Between Water
Kosek, M., C. Bern, and R.L. Guerrant. 2003. “The Global Burden of Diarrhoeal Disease, as Estimates from Studies Published between 1992 and 2000, Bulletin of the World Health Organization, vol.81, pp. 197-204.
Kremer, Michael & Jessica Leino & Edward Miguel & Alix Peterson Zwane, 2009. “Spring Cleaning: Rural Water Impacts, Valuation and Property Rights Institutions,” NBER Working Papers 15280, National Bureau of Economic Research, Inc.
Momba, M.N.B. and P. Kaleni. 2002. Regrowth and survival of indicator micro-organisms on the surfaces of household containers used for the storage of drinking water in rural communities of South Africa. Water Research 36: 3023-3028.
OR Tambo Municipality Integrated Development Plan (IDP) 2010/2011 Review. http://www.ortambodm.org.za/files/PDF/IDP%202010-11.pdf.
Pattanayak, Subhrendu K, Christine Poulos,Jui-Chen Yang & Sumeet Patil. 2010. How valuable are environmental health interventions? Evaluation of water and sanitation programmes in India. Bull World Health Organ 2010;88:535–542. http://www.who.int/water_sanitation_health/dwq/wsh0207/en/
PCAS. 2006. A Nation in the Making: A discussion document on macro-social trends in South Africa. www.info.gov.za/otherdocs/2006/socioreport.pdf
Rao, S, M. Gokhale and A. Kanade. 2007. Energy costs of daily activities for women in rural India. Public Health Nutrition: 11(2), 142–150.

71
Reed, B.J. n.d. “Minimum Water Quantity Needed for Domestic Uses.” New Delhi: World Health Organization, Regional Office for Southeast Asia, Technical Note No. 9.
Simpson-Herbert, M.. 1983. Methods for Gathering Socio-Cultural Data for Water Supply and Sanitation Projects. Washington, DC: UNDP/World Bank, Technology Advisory Group.
Sobsey, Mark D. WHO/SDE/WSH/02.07 report: Managing water in the home: accelerated health gains from improved water supply. http://www.who.int/water_sanitation_health/dwq/wsh0207/en/
Statssa. 2003. Census 2001: Investigation into appropriate definitions of urban and rural areas for South Africa: Discussion document/ Statistics South Africa. Pretoria: Statistics South Africa, 2003. Report No. 03-02-20 (2001) www.statssa.gov.za/census01/html/UrbanRural.pdf
The effect of type of water supply on water quality in a developing community in South Africa. Water Science and Technology Vol 35 No 11-12 pp 35–40.
Thompson, John et al. 2001. Drawers of Water II: 30 years of change in domestic water use & environmental health in East Africa. Summary. IIED. http://pubs.iied.org/pdfs/9049IIED.pdf
UNESCO. 2009. Water in a changing world: United Nations World Water Development Report, 3. http://www.unesco.org/pv_obj_cache/pv_obj_id_1AED0292857E053C6C5C17DE35B242FA2355DC01/filename/WWDR3_Water_in_a_Changing_World.pdf
USAID. 2009. Programming guidance for integrating water, sanitation, and hygiene improvement into HIV/AIDS programs. Hygiene Improvement Project. http://www.aed.org/Publications/upload/Programming-Guidance-for-Integrating-Water-Sanitation-HIV.pdf
van der Waal, C. S. 1991. District development and closer settlement economy in Gazankulu. Development Southern Africa, 1470-3637, Volume 8, Issue 3, 1991, Pages 343 – 356.
Van Koppen, B., Smits, S. and Mikhail M.. 2009. “Homestead- and Community-Scale Multiple-Use Water Services: Unlocking New Investment Opportunities to Achieve Millenium Challenge Goals,” Irrigation and Drainage, vol. 58, pp. S73-S86.
Waddington, H., and B. Snilstveit. 2009. “Effectiveness and Sustainability of Water, Sanitation, and Hygiene Interventions in Combating Diarrhoea,” Journal of Development Effectiveness, vol.1, no.3, pp.295-335.
WEDC. Nd. Technical Brief: Water – quality or quantity? www.lboro.ac.uk/.../technical-briefs/52-water-quality-or-quantity.pdf
White Paper on Local Government. 1998. Department of Constitutional and Local Affairs. www.info.gov.za/view/DownloadFileAction?id=108131
White, G.F, Bradley, D.F, and White, A.U. 1972. Drawers of Water: Domestic Water Use in. East Africa. Chicago & London: University of Chicago Press.
Whittington, Dale & Mu, Xinming & Roche, Robert, 1990. “Calculating the value of time spent collecting water: Some estimates for Ukunda, Kenya,” World Development, Elsevier, vol. 18(2), pages 269-280, February.

72
WHO/SDE/WSH/02.07 report: Managing water in the home: accelerated health gains from improved water supply prepared by Professor Mark D. Sobsey http://www.who.int/water_sanitation_health/dwq/wsh0207/en/
Related Documents