Khan, Muhammad Ali (2022) The impact of service recovery on Consumer- Based Brand Equity (CBBE). PhD thesis. https://theses.gla.ac.uk/82711/ Copyright and moral rights for this work are retained by the author A copy can be downloaded for personal non-commercial research or study, without prior permission or charge This work cannot be reproduced or quoted extensively from without first obtaining permission in writing from the author The content must not be changed in any way or sold commercially in any format or medium without the formal permission of the author When referring to this work, full bibliographic details including the author, title, awarding institution and date of the thesis must be given Enlighten: Theses https://theses.gla.ac.uk/ [email protected]

Welcome message from author
This document is posted to help you gain knowledge. Please leave a comment to let me know what you think about it! Share it to your friends and learn new things together.
Transcript
Khan, Muhammad Ali (2022) The impact of service recovery on Consumer-
Based Brand Equity (CBBE). PhD thesis.
https://theses.gla.ac.uk/82711/
Copyright and moral rights for this work are retained by the author
A copy can be downloaded for personal non-commercial research or study,
without prior permission or charge
This work cannot be reproduced or quoted extensively from without first
obtaining permission in writing from the author
The content must not be changed in any way or sold commercially in any
format or medium without the formal permission of the author
When referring to this work, full bibliographic details including the author,
title, awarding institution and date of the thesis must be given
Enlighten: Theses
https://theses.gla.ac.uk/
The impact of Service Recovery on Consumer-Based
Brand Equity (CBBE)
by
Muhammad Ali Khan
Submitted in fulfilment of the requirements for the Degree of Doctor of Philosophy
Adam Smith Business School
College of Social Sciences
University of Glasgow
January 2022
2
Abstract
The current thesis contributes to service marketing and branding literature by
investigating the impact of service recovery (customer participation in service
recovery and firm recovery) on Consumer-Based Brand Equity (CBBE) and
perceived justice. This thesis examines the mediating role of perceived justice
between service recovery and CBBE. It further identifies the moderating role of
service failure severity on the relationships between service recovery, perceived
justice and CBBE. Finally, this thesis investigates the occurrence of the service
recovery paradox with respect to the dimensions of CBBE.
The theoretical development involves a systematic literature review of service
recovery literature which set the parameters to review the branding literature. A total
of five research questions are developed to fulfil the research gaps which are
identified from the literature review. For the empirical investigation, this research
uses an exploratory sequential mixed-method research design to answer the
research questions (RQs). The first empirical phase is carried out through a
qualitative study. There are 24 Semi-structured interviews conducted for qualitative
data collection. The second phase is quantitative and includes a 3 (customer
participation in service recovery vs firm recovery vs no recovery) X 2 (low service
failure severity vs high service failure severity) factorial scenario-based experiment
undertaken by 322 participants. RQ1 is answered in the qualitative phase, whereas
RQ2, RQ3, RQ4 and RQ5 are answered in the quantitative phase.
The findings of the qualitative phase suggest that perceived quality, perceived value,
brand reputation, brand trust, and brand loyalty are the dimensions of CBBE, which
have the tendency to decline after a service failure but may increase after a
successful service recovery (RQ1). The positive impact of service recovery on these
dimensions of CBBE, perceived justice and overall brand equity is confirmed in the
quantitative phase (RQ2). The quantitative findings suggest that perceived justice is
a critical mediator between service recovery and CBBE (RQ3). Further, it is
concluded that service failure severity is a significant moderator among the
relationships except in the case of service recovery and brand reputation (RQ4).
Finally, the findings suggest that brand loyalty is the only dimension of CBBE which
may produce a service recovery paradox (RQ5).
3
Contents
Abstract ................................................................................. 2
Contents ................................................................................ 3
List of Tables ......................................................................... 8
List of Figures ..................................................................... 10
Acknowledgements ............................................................ 11
Author’s Declaration........................................................... 12
Abbreviations ...................................................................... 13
Chapter 1 Introduction ....................................................... 14
1.1 Research Focus........................................................................................... 14
1.1.1 Research Purpose and objectives ........................................................ 18
1.2 Methodology ................................................................................................ 19
1.3 Expected contributions ................................................................................ 19
1.4 Thesis structure ........................................................................................... 21
Chapter 2 Literature Review .............................................. 24
2.1 Introduction .................................................................................................. 24
2.2 Search, inclusion and exclusion process of service recovery research
articles ............................................................................................................... 25
2.3 Service failure .............................................................................................. 26
2.3.1 Consequences of service failure ........................................................... 30
2.4 Service Recovery ......................................................................................... 33
2.4.1 Firm Recovery ...................................................................................... 34
2.4.2 Customer participation in service recovery (CPSR) .............................. 43
2.4.4 Customers’ evaluation of service recovery process .............................. 51
2.4.5 The role of service failure severity in service recovery frameworks ...... 58
2.4.6 Service recovery paradox ..................................................................... 59
2.5 Brand equity ................................................................................................ 61
2.5.1 Perspectives of brand equity ................................................................. 62
2.5.2 Definition of consumer-based brand equity ........................................... 65
2.5.3 Brand equity measurement ................................................................... 69
2.6 Gaps and research questions ...................................................................... 77

4
2.6.1 Gap: 1 Dimensions of CBBE which tend to fluctuate within service
failure and recovery process .......................................................................... 77
2.6.2 Gap:2 Service recovery and post-recovery outcomes .......................... 77
2.6.3 Gap: 3 Mediating role of perceived justice ............................................ 79
2.6.4 Gap:4 Moderating role of service failure severity .................................. 79
2.6.5 Gap:5 Service recovery Paradox .......................................................... 80
2.7 Summary ..................................................................................................... 81
Chapter 3 Analytical Approach.......................................... 83
3.1 Introduction .................................................................................................. 83
3.2 The Research Paradigm .............................................................................. 83
3.3 Exploratory Sequential mixed-method research design............................... 85
3.3.1 Qualitative research design .................................................................. 87
3.3.2 Quantitative research design ................................................................ 90
3.4 Summary ..................................................................................................... 92
Chapter 4 Qualitative Methodology................................... 94
4.1 Introduction .................................................................................................. 94
4.2 Semi-Structured Interviews .......................................................................... 94
4.2.1 Interview Guide ..................................................................................... 94
4.3 Recruitment of participants .......................................................................... 96
4.4 Procedure .................................................................................................... 97
4.5 Characteristics of participants ...................................................................... 99
4.6 Data analysis approach ............................................................................. 102
4.7 Rigour and trustworthiness in the qualitative study .................................... 104
4.8 Summary of the Chapter ............................................................................ 105
Chapter 5 Qualitative Analysis ........................................ 107
5.1 Introduction ................................................................................................ 107
5.2 Theme 1: Service Recovery ...................................................................... 107
5.2.1 Firm Recovery .................................................................................... 107
5.2.2 Customer Participation in service recovery ......................................... 109
5.3 Theme 2: Perceived Justice ...................................................................... 113
5.3.1 Distributive Justice .............................................................................. 113
5.3.2 Procedural Justice .............................................................................. 115
5.3.3 Interactional Justice ............................................................................ 117
5.3.4 Informational Justice ........................................................................... 118
5.4 Theme 3: Dimensions of CBBE which tend to fluctuate ............................. 120
5.4.1 Perceived Quality ................................................................................ 121

5
5.4.2 Perceived Value .................................................................................. 123
5.4.3 Brand Reputation ................................................................................ 125
5.4.4 Brand Trust ......................................................................................... 127
5.4.5 Brand Loyalty ...................................................................................... 129
5.5 Theme 4: Service failure severity............................................................... 132
5.6 Theme 5: Failure attribution ....................................................................... 134
5.7 Findings related to the context ................................................................... 135
5.8 Findings related to service failure typologies ............................................. 136
5.10 Summary ................................................................................................. 139
Chapter 6 Conceptual Framework and Research
Hypothesis ......................................................................... 140
6.1 Introduction ................................................................................................ 140
6.2 Overall logic ............................................................................................... 140
6.3 Research Hypotheses ............................................................................... 146
6.3.1 Service recovery and Perceived Justice ............................................. 146
6.3.2 Service recovery and Overall brand equity ......................................... 147
6.3.3 Service recovery and Perceived quality .............................................. 148
6.3.4 Service recovery and Perceived value ................................................ 149
6.3.5 Service recovery and Brand reputation ............................................... 150
6.3.6 Service recovery and Brand trust ........................................................ 151
6.3.7 Service recovery and Brand loyalty .................................................... 152
6.3.8 Mediating role of perceived justice ...................................................... 153
6.3.9 Moderating role of Service failure severity .......................................... 155
6.3.10 Service Recovery Paradox ............................................................... 157
6.4 Summary ................................................................................................... 160
Chapter 7 Quantitative Methodology .............................. 161
7.1 Introduction ................................................................................................ 161
7.2 Experimental research design ................................................................... 161
7.2.1 Approach to experimental manipulation .............................................. 162
7.3 Development of Research Instruments ...................................................... 163
7.3.1 Development of the questionnaires .................................................... 163
7.3.2 Development of hypothetical text scenarios ........................................ 176
7.3.3 Structure of the questionnaires ........................................................... 179
7.4 Pre-testing and pilot testing ....................................................................... 181
7.4.1 Pre-test ............................................................................................... 181
7.4.2 Pilot test .............................................................................................. 184

6
7.5 Data Collection .......................................................................................... 185
7.5.1 Administration of the questionnaires ................................................... 185
7.6 Sampling .................................................................................................... 188
7.7 Data screening and Data quality ................................................................ 192
7.8 Approach to data analysis ......................................................................... 196
7.9 Summary ................................................................................................... 200
Chapter 8 Hypothesis Testing ......................................... 201
8.1 Introduction ................................................................................................ 201
8.2 Pre-Test Results ........................................................................................ 201
8.2.1 Realism checks ................................................................................... 201
8.2.2 Manipulation checks ........................................................................... 202
8.3 Assessment of Conceptual Relationships .................................................. 203
8.3.1 Assessment of Measurement Model ................................................... 203
8.3.2 Factorial ANOVAs ................................................................................... 211
8.3.3 Mediation Analysis .................................................................................. 216
8.3.4 Paradox Hypotheses .............................................................................. 218
8.4 Summary ................................................................................................... 222
Chapter 9 Discussion ....................................................... 223
9.1 Introduction ................................................................................................ 223
9.2 Discussion ................................................................................................. 223
9.2.1 RQ1: What are the dimensions of CBBE which tend to fluctuate within
the context of service failure and recovery?................................................. 223
9.2.2 RQ2: What is the impact of service recovery (Firm recovery and
Customer participation in service recovery) on post-recovery outcomes? ... 228
9.2.3 RQ3: What is the mediating role of perceived justice between service
recovery and CBBE? ................................................................................... 233
9.2.5 RQ4: What is the moderating role of service failure severity? ............ 239
9.2.4 RQ5: Which dimensions of CBBE produce service recovery paradox?
..................................................................................................................... 242
9.3 Summary ................................................................................................... 248
Chapter 10 Conclusion ..................................................... 250
10.1 Introduction .............................................................................................. 250
10.2 Theoretical Contributions ......................................................................... 250
10.3 Methodological Contributions .................................................................. 253
10.4 Practical Contributions ............................................................................. 254
10.5 Limitations and Future Research directions ............................................. 258
10.6 Summary ................................................................................................. 260

7
Appendices ........................................................................ 261
Appendix A Interview Guide ............................................................................ 261
Appendix B Thematic Analysis Example ......................................................... 263
Appendix C Questionnaire Stage 1 ................................................................. 265
Appendix D Questionnaire Stage 2 ................................................................. 267
Appendix E Normality Assessment .................................................................. 272
Appendix F Mediation ...................................................................................... 275
References ......................................................................... 277
8
List of Tables Table 2.1 Inclusion and Exclusion Criteria ........................................................................................ 26
Table 2.2 Existing Classifications of Service Failures ...................................................................... 29
Table 2.3 Service failure consequences discussed in the literature ................................................. 32
Table 2.4 Definitions of Service recovery ......................................................................................... 36
Table 2.5 Definitions of service recovery actions.............................................................................. 38
Table 2.6 Service Recovery actions discussed in the literature ....................................................... 42
Table 2.7 Existing research on customer participation in service recovery ...................................... 47
Table 2.8 Definitions of Customer Participation in Service Recovery .............................................. 51
Table 2.9 Perceived Justice utilised in service recovery frameworks ............................................... 56
Table 2.10 Studies Investigating Service Recovery Paradox ........................................................... 60
Table 2.11 Brand Equity Perspectives .............................................................................................. 65
Table 2.12 Dimensions used in brand equity literature ..................................................................... 74
Table 4.1 Interviewees’ characteristics ........................................................................................... 100
Table 5.1 Theme = 1 Summary of findings ..................................................................................... 113
Table 5.2 Theme – 2 Summary of findings ..................................................................................... 120
Table 5.3 Theme – 3 Summary of Findings .................................................................................... 132
Table 5.4 Theme – 4 Summary of the findings ............................................................................... 134
Table 5.5 Theme – 5 Summary of finings ....................................................................................... 135
Table 5.6 Service failure Typologies ............................................................................................... 138
Table 6.1 Identification of the Fluctuating Dimensions of CBBE .................................................... 143
Table 6.2 Summary of Hypotheses ................................................................................................. 159
Table 7.1 Scales of Distributive Justice .......................................................................................... 165
Table 7.2 Scales of Informational Justice ....................................................................................... 166
Table 7.3 Scales of Interactional Justice ........................................................................................ 167
Table 7.4 Scales of Procedural Justice ........................................................................................... 168
Table 7.5 Scales of Perceived Quality ............................................................................................ 169
Table7.6 Scales of Perceived Value ............................................................................................... 170
Table 7.7 Scales of Brand Reputation ............................................................................................ 171
Table 7.8 Scales of Brand Trust ..................................................................................................... 171
Table7.9 Scales of Brand Loyalty ................................................................................................... 172
Table 7.10 Scales of Overall Brand Equity ..................................................................................... 173
Table 7.11 Summary of scales adapted from literature .................................................................. 174
Table 7.12 Factorial design ............................................................................................................. 181
Table 7.13 The process of Pre-tests and corrective actions ........................................................... 183
Table 7.14 Sample Profile ............................................................................................................... 191
Table 7.15 Summary of analysis techniques .................................................................................. 199
Table 8.1 Summary of analysis techniques .................................................................................... 202
Table 8.2 Factor Loadings .............................................................................................................. 204
Table 8.3 Reliability ......................................................................................................................... 207
Table 8.4 Convergent Validity ......................................................................................................... 208
Table 8.5 Discriminant Validity (Fornell-Larcker) ............................................................................ 209

9
Table 8.6 Discriminant Validity (HTMT) .......................................................................................... 210
Table 8.7 Factorial ANOVA (Means and Standard Deviations) ...................................................... 214
Table 8.8 Factorial ANOVAs Results .............................................................................................. 215
Table 8.9 Mediation Analysis Results ............................................................................................. 217
Table 8.10 Service Recovery Paradox Analysis ............................................................................. 221
Table 9.1 Results of Hypothesis 1 -7 .............................................................................................. 233
Table 9.2 Results of Hypothesis 8-13 ............................................................................................. 239
Table 9.3 Results of Hypothesis 14-20 ........................................................................................... 242
Table 9.4 Results of hypothesis 21a-24e ........................................................................................ 248
10
List of Figures
Figure 2.1 Service failure depiction ................................................................................................... 26
Figure 3.1 Graphical Representation of Research Design ............................................................... 87
Figure 4.1 Structure of Semi-Structured interview guide .................................................................. 96
Figure 5.1 Firm-wise depiction of incidents ..................................................................................... 135
Figure 5.2 Sector-wise depiction of incidents ................................................................................. 136
Figure 6.1 Conceptual Framework .................................................................................................. 145
Figure 8.1 Service recovery and Perceived Justice ........................................................................ 215
Figure 8.2 Service Recovery and Overall Brand Equity ................................................................. 215
Figure 8.3 Service Recovery and Perceived Quality ...................................................................... 215
Figure 8.4 Service Recovery and Perceived Value ........................................................................ 216
Figure 8.5 Service Recovery and Brand Reputation ...................................................................... 216
Figure 8.6 Service Recovery and Brand Trust ................................................................................ 216
Figure 8.7 Service Recovery and Brand Loyalty ............................................................................ 216
11
Acknowledgements
Many people supported me in this journey. First of all, I would like to thank my
parents, who supported me financially, emotionally and through their prayers. Thank
you, Abu jee and Ami jee.
I would like to thank my supervisors. I was indeed lucky to have Prof. Cleopatra
Veloutsou and Dr Kalliopi Chatzipanagiotou as my supervisors. They were always
there to guide me and make me believe that I can do it!
I would like to thank my Colleagues and friends. Sergio, Alexandra, Yanna, Xi,
Yunjie, Xinyu, Nadia, Victoria, you are wonderful people, and I will always remember
that we went through this together. A special thanks to Dr. Polymeros Chrysochou
for his guidance.
Finally, thanks to my lovely wife, Fizah. You made it possible! You were there
through my thick and thin with all your love and care. You were there to pick me up
in my lows. The completion of my PhD could not have been possible without you.

12
Author’s Declaration
I declare that, except where explicit reference is made to the contribution of others, this
thesis is the result of my own work and has not been submitted for any other degree at
the University of Glasgow or any other institution.
Signatures:
Print Name: Muhammad Ali Khan
13
Abbreviations
ANOVA - Analysis of Variance
AVE - Average Variance Extract
BL- Brand Loyalty
BR - Brand Reputation
BT - Brand Trust
CBBE - Consumer-Based Brand Equity
CMV - Common Method Variance
CPSR - Customer Participation in Service Recovery
CR - Construct Reliability
FR - Firm Recovery
PLS - Partial Least Squares
PQ - Perceived Quality
ProA - Prolific Academic
PV- Perceived Value
RQ – Research Question
SEM - Structural Equation Modeling
UK – United Kingdom
USA- United States of America

14
Chapter 1 Introduction
1.1 Research Focus
Brands are valuable assets (Sinclair and Keller, 2014) for firms in all sectors, and in
services, the firm itself is the primary brand (Berry, 2000). Firms aim to maintain
high levels of consumer-based brand equity (Veloutsou et al., 2020), that is the set
of perceptions, attitudes, knowledge, and behaviours on the part of customers
(Christodoulides and de Chernatony, 2010) and creates positive long-term
cognitive, emotional and behavioural consumer-brand bonds (González-Mansilla et
al., 2019). Typically, brands with high brand equity enjoy price premium (Rambocas
et al., 2018), secure competitive advantage (Moise et al., 2019) and gain lifetime
value (Stahl et al., 2012). Therefore, firms consider CBBE a predominant indicator
to measure the strength of their brands (Veloutsou et al., 2020).
One of the major threats to service brands is the inevitability of service failures (Li
et al., 2020; Ma and Zhong, 2021), that occur when firms are unable to meet the
customers' expectations (Bell and Zemke, 1987). Service failures result in
detrimental effects on brands. In particular, service brands lose billions annually
due to service failures (Wolter et al., 2019). For example, in the UK alone, firms lose
£15.3 billion each year due to poor service experience and defections. Similarly,
service failures cost firms around $200 billion per year in the USA (CCMC, 2017).
Specifically, the restaurant industry in the UK contracted -3.1% to £18.8bn in the
year (McAllister, 2021). According to the MCA (2019) UK restaurant market report,
unmet customers' expectation is the key reason for the decline in the UK's
restaurant industry. In addition to financial related consequences, service failures
effect negatively on the brand facets. The undesirable service failure outcomes are
evident when consumers generate negative brand perceptions, in the shape of
negative brand image and low perceived value (Sajtos et al., 2010). Customers also
shed negative emotions such as dissatisfaction (Barakat et al., 2015; Byun and
Jang, 2019) and breach of trust (Basso and Pizzutti, 2016). Service firms also face
negative behavioural consequences such as negative word of mouth (Israeli, Lee
and Bolden, 2019; Swanson and Hsu, 2009) and a decline in brand loyalty (Cantor
and Li, 2019; Mattila et al., 2014). Hence, the inability of the service brands to avoid
service failures in the first place is resulting in substantial losses.
15
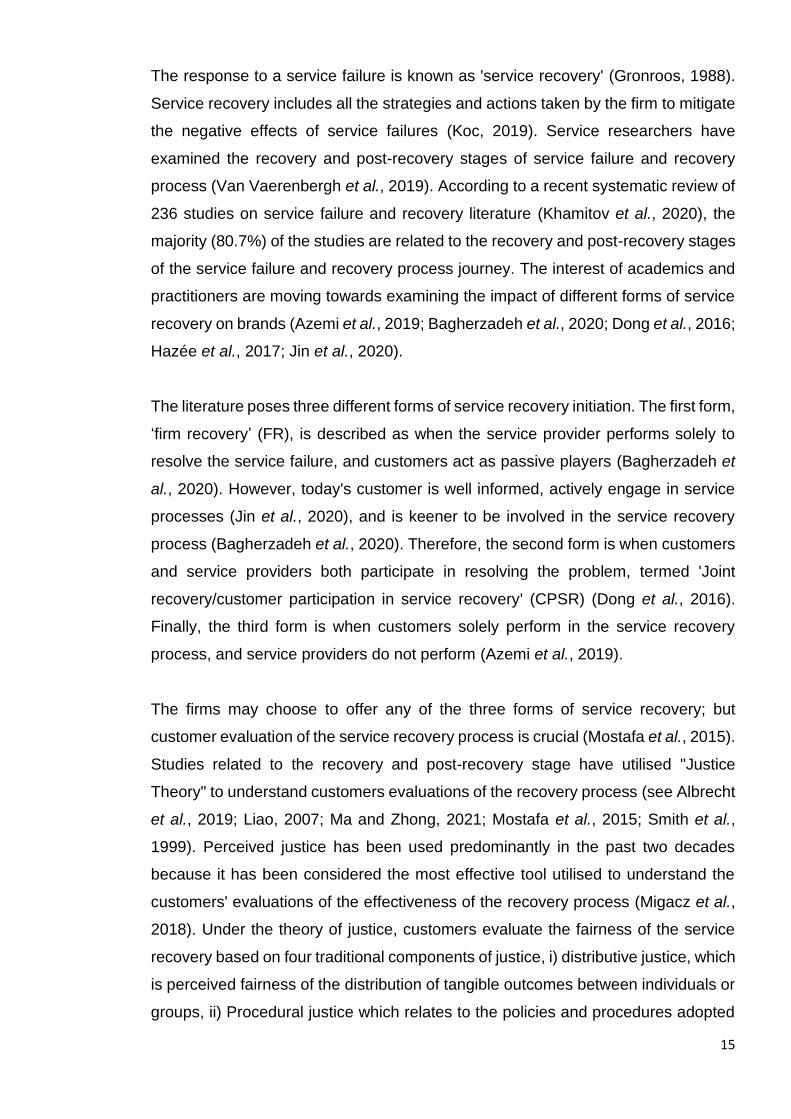
The response to a service failure is known as 'service recovery' (Gronroos, 1988).
Service recovery includes all the strategies and actions taken by the firm to mitigate
the negative effects of service failures (Koc, 2019). Service researchers have
examined the recovery and post-recovery stages of service failure and recovery
process (Van Vaerenbergh et al., 2019). According to a recent systematic review of
236 studies on service failure and recovery literature (Khamitov et al., 2020), the
majority (80.7%) of the studies are related to the recovery and post-recovery stages
of the service failure and recovery process journey. The interest of academics and
practitioners are moving towards examining the impact of different forms of service
recovery on brands (Azemi et al., 2019; Bagherzadeh et al., 2020; Dong et al., 2016;
Hazée et al., 2017; Jin et al., 2020).
The literature poses three different forms of service recovery initiation. The first form,
‘firm recovery’ (FR), is described as when the service provider performs solely to
resolve the service failure, and customers act as passive players (Bagherzadeh et
al., 2020). However, today's customer is well informed, actively engage in service
processes (Jin et al., 2020), and is keener to be involved in the service recovery
process (Bagherzadeh et al., 2020). Therefore, the second form is when customers
and service providers both participate in resolving the problem, termed 'Joint
recovery/customer participation in service recovery' (CPSR) (Dong et al., 2016).
Finally, the third form is when customers solely perform in the service recovery
process, and service providers do not perform (Azemi et al., 2019).
The firms may choose to offer any of the three forms of service recovery; but
customer evaluation of the service recovery process is crucial (Mostafa et al., 2015).
Studies related to the recovery and post-recovery stage have utilised "Justice
Theory" to understand customers evaluations of the recovery process (see Albrecht
et al., 2019; Liao, 2007; Ma and Zhong, 2021; Mostafa et al., 2015; Smith et al.,
1999). Perceived justice has been used predominantly in the past two decades
because it has been considered the most effective tool utilised to understand the
customers' evaluations of the effectiveness of the recovery process (Migacz et al.,
2018). Under the theory of justice, customers evaluate the fairness of the service
recovery based on four traditional components of justice, i) distributive justice, which
is perceived fairness of the distribution of tangible outcomes between individuals or
groups, ii) Procedural justice which relates to the policies and procedures adopted

16
by the service firms to solve the problem iii) interactional justice is the perceived
fairness of the treatment of customers by the service employees (Tax et al., 1998).
Iv) Informational justice is the perceived fairness of the adequacy, accuracy and
relevancy of the information provided by the service provider during the service
recovery process. (Colquitt, 2001; McQuilken et al., 2020). Perceived justice and its
dimensions are key to understanding customers' evaluations of service recovery,
which further leads to examining the effects on service brands (Albrecht et al., 2019;
Mostafa et al., 2015; Smith et al., 1999; Tax et al., 1998). Therefore, perceived
justice acts as a powerful tool in understanding customers’ evaluations and as a
strong predictor of branding outcomes (Albrecht et al., 2019; Liao, 2007).
The linkage between service recovery and branding literature is with respect to
utilisation of several brand facets as the outcomes of service recovery. The studies
document that service recovery works as a toolkit for the service firms, creating a
positive influence on service brands by improving the levels of brand loyalty (Yani-
de-Soriano et al., 2019), brand trust (Lopes and da Silva, 2015), brand image
(Mostafa et al., 2015) and positive word of mouth (Migacz et al., 2018). Further, in
the case of effective service recovery, it can produce a paradox such that the post-
recovery levels of brand image (Andreassen, 2001), satisfaction (Michel and
Meuter, 2008), Word of Mouth (Lin et al., 2011) and loyalty (Smith and Bolton, 1998),
may increase the pre-failure levels. Consequently, the literature suggests that brand
facets tend to decline after a service failure, whereas after service recovery may
have a positive influence on the brand facets.
The pattern of declining after a service failure and rising after service recovery
suggests that brand facets fluctuate during service failure and recovery process.
The term “fluctuate” (verb) or “fluctuation” (noun) is known as the fall and rise in a
number or amount (Lexico, 2021). In the current study, fluctuate or fluctuation
means the variation of the pattern of CBBE dimensions such that after a service
failure, the levels of the CBBE dimensions decline; however, after an effective
service recovery, the levels of the CBBE improve if the consumers experience a
successful service recovery. Despite the signals from the literature that demonstrate
the criticality of consumer-based brand equity within the phenomenon of service
recovery, no empirical evidence is found to investigate the impact of service
recovery on consumer-based brand equity. Specifically, it is still unknown that which
17
of the CBBE dimensions tend to fluctuate (decline after a service failure and improve
after service recovery) during a service failure and recovery process. It is also
surprising that key dimensions of CBBE, such as perceived quality and perceived
value, has been largely overlooked in the literature as an outcome of service
recovery (Mostafa et al., 2015; del Río-Lanza et al., 2009; Roggeveen et al., 2012;
Smith et al., 1999). The overlooked linkage between service recovery and
consumer-based brand equity is also deficient in examining perceived justice as a
key mediator between service recovery and consumer-based brand equity and the
moderating role of service failure severity between the relationship of service
recovery and post-recovery outcomes. The investigation of the relationship between
service recovery and CBBE is warranted because CBBE is considered the most
frequent indicator of identifying the brand's strength (Veloutsou et al., 2020). Since
service failures are known to dilute the brand equity (Bambauer-Sachse and
Mangold, 2011; Casidy and Shin, 2015), the effect of service recovery on brand
equity is required to uncover the horizons towards its ability to influence the service
brands in a positive direction.
Besides the overlooked linkage, both the pieces of literature (service recovery and
CBBE) represent several deficiencies independently. Firstly, service recovery
literature has primarily focused on the impact of 'firm recovery' (del Río-Lanza et al.,
2009; Smith et al., 1999; You et al., 2020), whereas investigations of the impact of
'customer participation in service recovery' on brand facets are scant (Dong et al.,
2008; Hazée et al., 2017). Secondly, the investigations related to the service
recovery paradox are largely focused on customer satisfaction and overlooks other
critical brand-related facets such as perceived quality, perceived value, brand
reputation and brand trust (see Azemi et al., 2019; Boshoff, 1997; Karande et al.,
2007; Smith and Bolton, 1998; Tax et al., 1998).
Regarding the branding literature, it is enriched with the studies that document its
dimensions (see Baalbaki and Guzmán, 2016; Christodoulides et al., 2006; Pappu
et al., 2005; Yoo and Donthu, 2001). However, no evidence is found as to which of
the dimensions are more vulnerable to affect when brands are exposed with
unpleasant situations such as service failure. It is important for the firms because
brands spend lavishly and devote maximum efforts to maintain a place in the minds
of the consumers (Ahmad and Guzmán, 2020). The hard-earned position is at stake

18
when brands face service failures (Casidy and Shin, 2015). Identifying the
dimensions of CBBE, which tend to fluctuate within service failure and recovery is
required to let the managers know the vulnerable aspects of the brand that require
exceptional attention. Therefore, it is crucial to understand the impact of service
recovery on CBBE with the dimensions that fluctuate in a service failure and
recovery process.
1.1.1 Research Purpose and objectives The study aims to explore the impact of service recovery on perceived justice,
dimensions of CBBE, which tend to fluctuate within the service recovery process,
and overall brand equity. In order to achieve the stated aim, the study attempts to
identify CBBE dimensions that are vulnerable to fluctuate in the service failure and
recovery process. The current study answers the recent calls from the literature,
which mentioned that i) examining the influence of service recovery, which includes
customer participation in service recovery (CPSR) and firm Recovery (FR) on
various brand-related outcomes (Israeli, Lee and Bolden, 2019; Van Vaerenbergh
and Orsingher, 2016) ii) utilise service failure severity as a moderator in the study
(Mostafa et al., 2015) iii) the brand-related outcomes should be examined twice,
pre-failure and post-recovery, to examine whether paradox occurs or not (Gohary,
Hamzelu and Pourazizi, 2016; Ok et al., 2007).
The four main objectives of this research are:
1) to identify the dimensions of CBBE which fluctuate in the service failure and
recovery process
2) to investigate the impact of service recovery (customer participation of service
recovery and firm recovery) on perceived justice, the dimensions of CBBE, which
tend to fluctuate within the service recovery process and overall brand equity
3) to examine the mediating role of perceived justice between service recovery, the
dimensions of CBBE, which tend to fluctuate within the service recovery process
and overall brand equity
4) to examine the moderating role of service failure severity
5) to explore the occurrence of the service recovery paradox concerning the CBBE
dimensions.
19
1.2 Methodology
The current thesis utilises a systematic approach to review the service failure and
recovery literature. The traditional ways of synthesizing literature lack rigour and are
unorganized (Tranfield et al., 2003). Whereas collating literature in a systematic way
helps the researcher get an in-depth understanding of the concepts and identify key
areas requiring further investigation (Siddaway et al., 2019). The service recovery
literature mainly falls into three different disciplines marketing, tourism and
management science. Therefore, a systematic literature review is undertaken to
collect and synthesise the literature in an organized manner.
An exploratory sequential mixed method design is adopted to achieve the research
objectives of this study. The design includes two phases which are sequential and
are executed one after the other. In the current thesis, the qualitative phase
precedes the quantitative phase. Semi-structured interviews are utilised as a data
collection tool in the qualitative phase, whereas an experimental approach was used
to collect data for the quantitative phase. For the qualitative data analysis, thematic
analysis was used to analyse the qualitative data. On the other hand, Factorial
ANOVA, PLS-SEM and Paired sample t-tests were conducted to analyse the
quantitative data.
The methodology chosen for the current thesis is in line with the research objectives.
The qualitative approach with semi-structured interviews is adopted to explore the
dimensions of CBBE, which fluctuate in the service failure and recovery process.
The qualitative research also informs the quantitative phase, thereby assisting the
fulfilment of the next three objectives. Finally, the experimental approach is taken to
fulfil the next three objectives.
1.3 Expected contributions
The current thesis expects to make several theoretical and practical contributions to
the service marketing and brand management scholarship. First, this research aims
to contribute to the existing knowledge of service recovery and brand equity by
investigating the influence of Service recovery (CPSR and FR) on brand equity and
its dimensions. In doing so, this study will be the first to examine brand equity as an
outcome of service recovery. Extant research has investigated brand equity as a

20
mediator (Harun et al., 2019), as a driver of evaluations of service encounters (Brady
et al., 2008), and as a moderator between service recovery and post-recovery
outcomes (Hazée et al., 2017; Huang, 2011). However, much uncertainty still exists
about the relation between service recovery and brand equity.
Secondly, this study will contribute to the knowledge of customer participation in
service recovery. Existing research examines the instances when customers’
participation in service recovery is effective (Xu, Marshall, et al., 2014) and how it
influences recovery satisfaction (Gohary, Hamzelu, Pourazizi, et al., 2016; Kim and
Baker, 2020a), repurchase intentions (Hazée et al., 2017; Vázquez-Casielles et al.,
2017), intentions to future co-creation (Gohary, Hamzelu and Alizadeh, 2016);
however, existing research has not dealt with the role of customer participation in
service recovery in enhancing CBBE. Therefore, the current study seeks to remedy
this problem by examining the role of CPSR in enhancing CBBE.
Thirdly, this study aims to identify the dimensions of CBBE that tend to fluctuate in
service failure and recovery process. There has been little agreement on the
dimensions of CBBE (Ahmad and Guzmán, 2020; Veloutsou et al., 2020).
Specifically, the literature lacks finding out the dimensions that fluctuate during the
service failure and recovery process. Although existing research has examined the
impact of service failure and recovery on brand-related outcomes, which are also
considered as dimensions of CBBE, such as brand loyalty (Cantor and Li, 2019;
Yani-de-Soriano et al., 2019), brand trust (Basso and Pizzutti, 2016; Pacheco et al.,
2019) and brand image (Mostafa et al., 2015), it has not examined that which
dimensions tend to fluctuate in the service failure and recovery process. Therefore,
the study aims to enrich the literature by the identification of the CBBE dimensions
which tend to fluctuate during service failure and recovery process.
Additionally, this study intends to examine the mediating role of perceived justice
between service recovery and CBBE. The existing research has investigated the
mediating role of perceived justice between service recovery and recovery
outcomes such as repurchase intentions (Roggeveen et al., 2012) and recovery
satisfaction (Liao, 2007). However, the evidence for the intervening role of perceived
justice between the relationship of service recovery and CBBE dimensions and
overall brand equity is yet to be discovered.

21
This research also aims to contribute knowledge by identifying the service recovery
paradox concerning the dimensions of CBBE, which tend to fluctuate within service
failure and recovery process. Existing research has examined paradoxes
concerning customer satisfaction (Azemi et al., 2019; Michel and Meuter, 2008),
loyalty (Gohary, Hamzelu and Pourazizi, 2016; Smith and Bolton, 1998), image
(Andreassen, 2001), and repurchase intentions (Soares et al., 2017; Voorhees et
al., 2006). However, there is a general lack of research on the existence of the
service recovery paradox for other brand-related outcomes, such as the dimensions
of CBBE.
Finally, this study will guide managers on mending the standard procedure to
incorporate customers' suggestions in recovering from service failure. This study
will help managers understand the positive outcomes (such as positive influence on
CBBE) of customer participation in the service recovery. On the other hand, this
study will also examine the effect of firm-initiated service recovery measures that
managers can undertake without involving customers in the recovery. Firm-initiated
service recovery will also allow managers to maintain standard practices and
policies to increase service recovery efficiency and reduce recovery costs (Min et
al., 2020).
1.4 Thesis structure
This thesis consists of 10 chapters. The structure of the thesis is as follows. Chapter
2 describes the existing literature related to service failure, service recovery and
brand equity. A systematic review approach is undertaken to review the literature
on service failure and service recovery. The generated research gaps and research
questions from the literature review are demonstrated at the end of this chapter.
Chapter 3 presents the analytical approach adopted for the current thesis. An overall
plan of the methodology is discussed. It includes the justification of the researcher’s
philosophical stance explained in the section of the research paradigm. The
research paradigm is followed by the description and justification of the research
design adopted to answer the research questions.
22
Chapter 4 outlines the qualitative methodology utilised for the qualitative phase of
the study. This chapter starts with an explanation of the research design adopted
for the qualitative investigation. The purpose and objectives of the qualitative phase
follow the research design. Next, the explanation of the qualitative method is
presented, followed by the method of recruiting participants. The method of
qualitative data analysis follows it. Finally, it is explained how qualitative data quality
is not compromised by adopting the recommended guidelines.
Chapter 5 explains the findings of the qualitative study. The qualitative findings are
relevant in addressing the RQ1 related to identifying the dimensions of CBBE, which
tend to fluctuate within service failure and recovery process. The chapter utilised the
quotes from the semi-structured interviews to generate the qualitative findings.
Chapter 6 presents the conceptual model of the thesis and the relevant hypothesis.
The conceptual model, which is developed based on the key insights of the literature
review and the qualitative findings, represent the proposed theoretical relationships
among the constructs. Based on the proposed relationships, relevant research
hypotheses are developed to answer research questions 2, 3, 4 and 5.
Chapter 7 delineates the methodology utilised for the Quantitative phase of this
thesis. At the beginning of the chapter, the quantitative research design, its purpose
and objectives are explained. Next, the experimental method is presented by
explaining the approach to manipulation, controls, and development of hypothetical
scenarios. The process of questionnaire development, selection of definitions and
selection of measurements follows it. The next parts of this chapter include the
approach to pre-testing and pilot testing. It is then followed by explaining how the
questionnaire is administered and what was the sampling approach. This chapter
also includes the approaches taken to screen the data and enhance the quality of
the data. Finally, the approach to the data analysis is described.
Chapter 8 outlines the quantitative analysis. The chapter consists of four main
sections. The first section of the chapter delineates the pre-test results, including
the manipulation and realism checks for the experiment. The second section
presents the assessment of the measurement model. The last three sections report
the results of the hypotheses, which are related to RQ2, RQ3, RQ4 and RQ5.
23
Chapter 9 includes the discussion on the findings of the study generated from the
qualitative and quantitative studies. The discussion is based on the comparison
between the current study’s findings and the existing research. The correspondence
and disagreement of the current study's findings with the literature review are also
mentioned in this chapter. The discussion chapter is divided based on the research
questions of this thesis.
Chapter 10 concludes the thesis by explaining key contributions. The chapter
consists of theoretical, methodological and practical contributions. At the end of the
chapter, key limitations and future research avenues are presented.
24
Chapter 2 Literature Review
2.1 Introduction
This chapter reviews the past literature concerning the topics of service recovery
and brand equity. The literature review reveals what is known about service
recovery and its related sub-topics of service failure, perceived justice, and
customer participation in service recovery. It also presents the extant knowledge
about brand equity literature, including its conceptualisations, perspectives, and
measurement.
The structure of this chapter contains three main sections. The first section includes
the analysis of service recovery literature. This section starts with the search,
inclusion and exclusion process of articles related to service recovery. It is then
followed by analysing the definitions, typologies, and consequences of service
failures. Next, service recovery is analysed concerning its two forms, firm recovery
(FR) and customer participation in service recovery (CPSR). This section includes
the definitions of both forms, different terminologies used for ‘customer participation
in service recovery’ and types of recovery actions taken by firms. The concepts of
perceived justice, service recovery paradox and service failure severity are
discussed at the end of this section.
The second section contains an analysis of brand equity literature. The section
illustrates the different perspectives of brand equity discussed in the literature. First,
different definitions of consumer-based brand equity are analysed. It is then followed
by the measurement approaches of brand equity. It also represents different
dimensions utilised to capture consumer-based brand equity.
Finally, the third section of this chapter includes the potential research gaps
generated from the literature review of service recovery and brand equity. The
research gaps further contribute to identifying relevant research questions.
25
2.2 Search, inclusion and exclusion process of service
recovery research articles
Doing a literature review is getting increasingly complex because business research
is witnessing knowledge production at a very high pace (Snyder, 2019). The
traditional ways of synthesising literature are often less organised and lack rigour
(Tranfield et al., 2003). Whereas synthesising literature in an organised way helps
the researcher understand the concepts and identify key areas requiring further
investigation (Siddaway et al., 2019), especially when the research area is diverse
and undertaken in different disciplines (Snyder, 2019). The concept of service
recovery gained much popularity in the last two decades and have been examined
extensively. The service recovery literature mainly falls in three different disciplines,
marketing, tourism and management science. Therefore, it was essential to collect
and synthesise the literature in an organised manner.
The review of service recovery literature was conducted in three business research
disciplines, Marketing, Tourism and Management Science. The research articles
were collected from the databases of business source premier (EBSCOhost) and
Emerald. After an extensive discussion with two academic experts, the collection of
articles was conducted using suitable inclusion and exclusion criteria. The final
sample of two fifty-three, forty-one, and seventeen articles from the marketing,
tourism, and management science disciplines were analysed, respectively. Table
2.1 elaborates the criteria used for the inclusion and exclusion of articles.
26
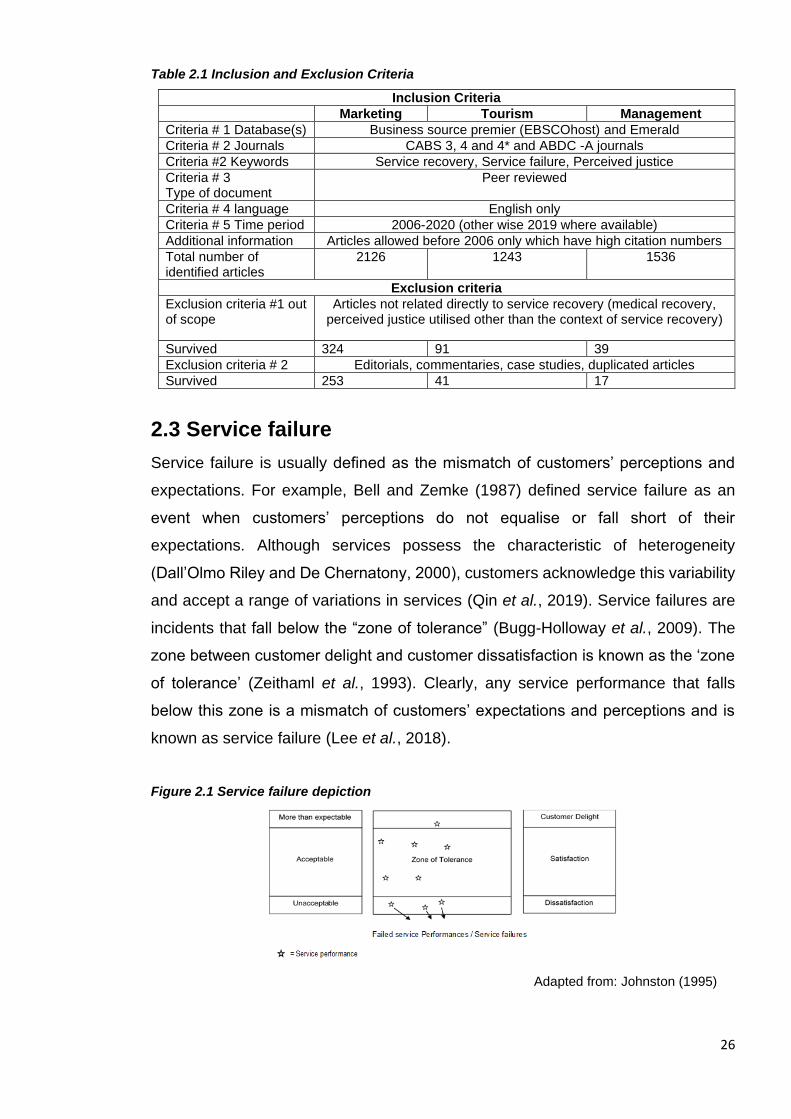
Table 2.1 Inclusion and Exclusion Criteria
Inclusion Criteria
Marketing Tourism Management
Criteria # 1 Database(s) Business source premier (EBSCOhost) and Emerald
Criteria # 2 Journals CABS 3, 4 and 4* and ABDC -A journals
Criteria #2 Keywords Service recovery, Service failure, Perceived justice
Criteria # 3 Type of document
Peer reviewed
Criteria # 4 language English only
Criteria # 5 Time period 2006-2020 (other wise 2019 where available)
Additional information Articles allowed before 2006 only which have high citation numbers
Total number of identified articles
2126 1243 1536
Exclusion criteria
Exclusion criteria #1 out of scope
Articles not related directly to service recovery (medical recovery, perceived justice utilised other than the context of service recovery)
Survived 324 91 39
Exclusion criteria # 2 Editorials, commentaries, case studies, duplicated articles
Survived 253 41 17
2.3 Service failure
Service failure is usually defined as the mismatch of customers’ perceptions and
expectations. For example, Bell and Zemke (1987) defined service failure as an
event when customers’ perceptions do not equalise or fall short of their
expectations. Although services possess the characteristic of heterogeneity
(Dall’Olmo Riley and De Chernatony, 2000), customers acknowledge this variability
and accept a range of variations in services (Qin et al., 2019). Service failures are
incidents that fall below the “zone of tolerance” (Bugg-Holloway et al., 2009). The
zone between customer delight and customer dissatisfaction is known as the ‘zone
of tolerance’ (Zeithaml et al., 1993). Clearly, any service performance that falls
below this zone is a mismatch of customers’ expectations and perceptions and is
known as service failure (Lee et al., 2018).
Figure 2.1 Service failure depiction
Adapted from: Johnston (1995)

27
The review of the literature demonstrates that the definitions of service failure are
built on three key insights: 1) occurs when service providers fail to match their actual
performance with the perceived performance by the customers (Bell and Zemke,
1987; Bhandari et al., 2007), 2) service failures are negative events that leave the
customers dissatisfied and prone to more negative consequences (Bitner, 1990;
Chen and Kim, 2019; Maxham III, 2001), 3) service failures may occur before, during
or after an experience of the service (Bhandari et al., 2007; Maxham III, 2001) 4)
service failures may take various forms/types (Bhandari et al., 2007; Jin et al., 2019;
Smith et al., 1999). Hence, a complete definition of service failure demonstrates all
or most of the above-mentioned features.
The service failure literature recognises several types of service failures (Khamitov
et al., 2020). The categorisations of service failures acknowledge that the mismatch
of customers’ expectations and actual performance of the service provider may
occur at any stage of the service provision process (Akinci and Aksoy, 2019; Jin et
al., 2020). Identifying the type of failure is critical for the service providers to address
the service problem effectively (Gonzalez et al., 2014). However, the three most
frequent perspectives on service failure typologies, Bitner et al. (1990), Keaveney
(1995) and Smith et al. (1999), are commonly accepted in the literature.
The first perspective on the categorisation is contributed by Bitner et al. (1990). The
three major categories in this perspective are i) failures in service system delivery’
ii) non-fulfilment of customer needs and requests iii) unsolicited or unwanted
behaviour of the service employees towards customers. The second perspective
related to the categorisation found in the literature is contributed by Keaveney
(1995). According to him, two categories of service failure are important to consider,
i) Core service failures ii) Service encounter failures. The third perspective
concerning the categorisation of service failures is found in the study by Smith et al.
(1999). Their classification is widely accepted in the service failure and recovery
literature (see table 2.2). According to them, service failure can be divided into two
main categories, outcome failures and process failures. The details with examples
are demonstrated in the following table 2.2
Out of the three perspectives discussed, typologies suggested by Smith et al. (1999)
is most widely accepted in the service failure research. Smith et al. (1999) claim that
28
the loss is utilitarian or economic in case of outcome failures, such as loss in terms
of money or time. On the other hand, in the process failures, the loss is considered
symbolic, psychological, or social, such as loss of self-esteem or status denigration.
Moreover, outcome failures can also occur due to external factors. For example, the
weather was not conducive, whereas process failures are mostly due to internal
factors (Varela-Neira et al., 2010a). For example, the employee ignored the
customer's requests because he was not trained well (Ashill et al., 2005).
The differentiation between service failure typologies is also understood based on
the service's technical and functional deficiencies. For example, the core service
failures suggested by Keaveney (1995) correspond to the fallacies found in the
technical quality of the service (cold food served or inaccurate billing). The service
encounter failure is associated with the functional quality (the serving waiter is rude)
because it damages service delivery precision (Chen et al., 2018; Coulter, 2009).
Similarly, Israeli et al. (2019) suggest that outcome service failures are considered
the technical errors of the service and process service failures are the service's
functional errors.

29
Table 2.2 Existing Classifications of Service Failures
Source Categorisation Examples Representative studies following the
categorisation
Bitner et al. 1990
i) Failures in service system delivery
a) The gym facilities are closed b) The train is 2 hours late c) Overcooked food is served at the restaurant (Akinci and Aksoy, 2019; Albrecht et al., 2019;
Chang, 2006; Forbes, 2008; Forbes et al., 2005; Gonzalez et al., 2010, 2014; Gruber and Frugone, 2011; Jung and Seock, 2017; Kelley et al., 1993; Mostafa et al., 2014; Silva et al., 2020; Surachartkumtonkun et al., 2015; Tsai and Su, 2009)
ii) Non-fulfilment of customer need and requests
a) Special assistance is not provided at the airport. b) The restaurant does not fulfil the request of the customer
to change his table. c) The restaurant staff couldn’t deal with the people
quarrelling with each other
iii) Unsolicited or unwanted behaviour of the service employees towards customer
a) The waiter communicated impolitely with the customers b) The receptionist ignored what the customer said.
Keaveney, 1995
i) Core service failures
a) The flight is cancelled/delayed b) There is too much salt in the food served at the restaurant c) An incomplete order is served at the coffee shop
(Chen et al., 2018; Chuang et al., 2012; Coulter, 2009; Dutta et al., 2007; Kanuri and Andrews, 2019; Suh et al., 2013; Swanson and Hsu, 2009)
ii) Encounter service failures
a) The flight attendant is not friendly in her attitude b) The waitress ignores the customer who is calling him to
take the order. c) The plumber does not know how to fix the water leakage d) The barber is talking on the phone and not paying
attention to the haircut
Smith et al. 1999
i) Outcome Failures
a) The restaurant is out of an entrée mentioned on the menu b) A wrong order is served at the coffee shop c) The reserved car is not available at the car rental services
(Bahmani et al., 2020; Bolton and Mattila, 2015; Choi and Choi, 2014; Karabas et al., 2019; Kasabov and Hain, 2014; Kim and Baker, 2020a; Lin, 2009; Mattila and Ro, 2008; Ok et al., 2007; Shapiro and Nieman‐Gonder, 2006; Van Vaerenbergh et al., 2014, 2018; Varela-Neira et al., 2010a)
ii) Process Failures
a) The flight is delayed b) The waiter is rude in his behaviour c) The preference for a king-size bed in a hotel room is not
fulfilled
30
Identifying the service failure types is critical for service firms as it sets the basis for
developing relevant service recovery mechanisms for different types of service
failures (Singhal et al., 2013). Although the service failure typologies by Smith et al.
(1999) is widely accepted, it has compounded several types of service failures into
two broad categories. Similarly, Keaveney (1995) has combined several service
failures into two main types, core service failure and service encounter failure. On
the other hand, Bitner (1990) suggest a comprehensive service failure typology
which includes three major and twelve sub-categories. Confusion regarding the
usage of the above perspectives is found in the literature. An example of ‘delay in
service’ is mentioned as ‘process failure’ in the studies (Varela-Neira et al., 2010a),
which utilised Smith’s perspective, whereas the same example is labelled as a ‘core
service failure’ in the studies which have considered Keaveney’s perspective
(Coulter, 2009). The explanation of smith’s ‘process failure’ and Keaveney’s core
service failure are different. Furthermore, the research suggests that different
service failure types have different implications, resulting in various adverse
consequences, and service providers have to respond differently to each failure
(Chuang et al., 2012; Forbes et al., 2005; Luo and Mattila, 2020). Therefore, a clear
division of the service failure types is still warranted.
2.3.1 Consequences of service failure
Service failures bring various detrimental consequences (Akinci and Aksoy, 2019).
The adverse effects of the service failure bring out negative emotional reactions
(anger, frustration, revenge) among customers harmful to the service firm (DeWitt
et al., 2008; Radu et al., 2020). Service failures urge the customers to engage in
post-failure negative behaviour and react in various ways, including the termination
of the relationship with the service provider (Bergel and Brock, 2018). The Negative
customers’ experiences with service providers play a catalytic role in impairing the
relationship between the service firm and its customers (Béal et al., 2019).
Undesirable service incidents leave a long-lasting impression on the financial health
by adversely affecting the profitability of the service firm (Hedrick et al., 2007).
Although service failures are inevitable, these negative instances are undesirable
for a service brand because even a brand with high brand equity suffers the damage
caused by the service failure (Hogreve et al., 2019).
31
Extant literature related to service failure consequences may be divided into three
categories (see table 2.3). The first category discusses the cognitive consequences
of service failures. The literature suggests that customers engage in the cognitive
process after a service failure and negatively perceive the service firm and its
employees. For example, Sajtos et al. (2010) found that service failures generate
negative perceptions about the firm in the customers' minds and hence the negative
brand image is formed. According to them, the effect of service failure on the service
brands is easily identified due to the depletion of the brand's image.
The second category of service failure consequences discusses the emotional
reactions of the consumer after a service failure, for example, anger (Baker et al.,
2008; Folkes et al., 1987; Luo and Mattila, 2020), regret (Bonifield and Cole, 2007)
and dissatisfaction (Barakat et al., 2015; Byun and Jang, 2019) and breach of trust
(Basso and Pizzutti, 2016; Weun et al., 2004). Customers indulge in intense
emotions after not receiving the level of service they expect. Among the several
negative emotions discussed in the literature, anger and dissatisfaction are
considered as most critical. Anger is considered an immediate reaction towards the
firm or its employees due to a failed service (Luo and Mattila, 2020). Similarly,
dissatisfaction is considered a default emotional reaction due to service failure
(Barakat et al., 2015). Service customers spend money, time and effort to receive
an optimum level of service experience; however, a service failure results in
tarnishing their expectations, and they feel emotionally drained (Chen and
Tussyadiah, 2021; Maher and Sobh, 2014).
Finally, the third category of service failure consequences involves the behavioural
responses of customers rendered due to service failure. The literature has mainly
discussed the complaining behaviour of customers by relying on the complaining
behaviour models (Day and Landon, 1977; Hirschman, 1970; Singh, 1988). One of
the most detrimental consequences of service failure is when customers start
spreading negative word of mouth (NWoM) (Huang and Philp, 2020; Walker, 2012;
Ozanne et al., 2019). One of the reasons behind spreading negative word of mouth
is consumers' psychological fulfilment of consumers (Chawdhary and Dall’Olmo
Riley, 2015; Ozanne et al., 2019). Similarly, customers reduce their future
purchases from the service firm (Hess Jr, 2008; Sarkar et al., 2021), resulting in a

32
decline in their loyalty towards the brand (Cantor and Li, 2019; Mattila et al., 2014).
See table 2.3 for a detailed explanation of the three categories.
Table 2.3 Service failure consequences discussed in the literature
Year
Cognitive Emotional Behavioural
Bra
nd
Im
ag
e
Perc
eiv
ed
Valu
e
Neg
ati
ve
Em
oti
on
s
Bra
nd
Tru
st
Bra
nd
Hate
Dis
sati
sfa
cti
on
Fo
rgiv
en
ess
Avo
idan
ce
Bra
nd
Lo
ya
lty
Bra
nd
Sw
itch
ing
Inte
nti
on
to
Co
mp
lain
N
eg
ati
ve
Wo
M/
eW
oM
B
eh
avio
ura
l/
Rep
urc
ha
se
Inte
nti
on
s
Reven
ge
In
ten
tio
ns
Reta
liati
on
Folkes et al., 1987 1987 X X X
Bejou and Palmer, 1998 1998 X
Smith and Bolton, 1998 1998 X
Weun et al., 2004 2004 X X X X
Wang and Huff, 2007 2007 X X X
Hess, 2008 2008 X X
Baker et al., 2008 2008 X
Grégoire et al., 2009 2009 X X
Matos et al., 2009 2009 X X
Swanson and Hsu, 2009 2009 X X
Sajtos et al., 2010 2010 X X X X
Varela-Neira et al., 2010 2010 X
Walker, 2012 2012 X X
Suh et al., 2013 2013 X X
Koppitsch et al., 2013 2013 X X
Du et al., 2014 2014 X X
Maher and Sobh, 2014 2014 X X
Mattila et al., 2014 2014 X
Barakat et al., 2015 2015 X X X
Sengupta et al., 2015 2015 X
Casidy and Shin, 2015 2015 X
Bougoure et al., 2016 2016 X
Sembada et al., 2016 2016 X X
Basso and Pizzutti, 2016 2016 X
Albrecht et al., 2017 2017 X X
Israeli et al., 2019 2019 X
Radu et al., 2019 2019 X X
Suri et al., 2019 2019 X
Byun and Jang, 2019 2019 X X
Cantor and Li, 2019 2019 X
Hur and Jang, 2019 2019 X Kamble and Walvekar, 2019 2019 X
Min and Kim, 2019 2019 X X
Ozanne et al., 2019 2019 X
Walker, 2019 2019 X
Huang and Philp, 2020 2020 X
Li et al., 2020 2020 X
Lu et al., 2020 2020 X X
Luo and Mattila, 2020 2020 X X X X
Torres et al., 2020 2020 X X X
Chen et al., 2021 2021 X X X X X
Sarkar et al., 2021 2021 X X X X

33
2.4 Service Recovery
“To err is human; to recover, divine” Hart et al. (1990, p.156) revised the old saying
with the addition of recovering the errors/ mistakes caused in a service process.
Service recovery is known as the reaction to service failures to mitigate the
customers' negative responses (Barusman and Virgawenda, 2019). Service
recovery has been viewed as part and parcel of service failures, and failures are
unavoidable in the service business (Dong et al., 2016). Early research has
acknowledged that service failures' inevitability is due to the variable nature of
service and operational dependency on customers in a service process
(Parasuraman et al., 1991; Tax et al., 1998). The foundation of service recovery
literature suggests that “errors are inevitable, but dissatisfied customers are not”
(Hart et al., 1990, p.148). Firms attempt to alleviate the negative consequences by
responding to service failures. The service recovery process is considered a
‘moment of truth’ in which a service firm has the only chance to satisfy its customers
and allay negative consequences (Lopes and da Silva, 2015). Therefore, service
recovery is considered a second service encounter of a firm with a customer and a
final chance for service firms to satisfy the customers (Kenesei and Bali, 2020).
One of the prominent segregations in service recovery literature is based on service
recovery forms. Firstly, one of the forms is known as ‘firm recovery’, in which the
firm resolves the service problems, and customers play a passive in the service
recovery process (Bagherzadeh et al., 2020). The majority of the literature has
investigated ‘firm recovery’ and the effect of firm recovery on various outcomes
(Khamitov et al., 2020). The researchers have attempted to assist service managers
by recommending different combinations of firm recovery strategies/actions which
may be suitable to adopt after a service failure (Liao, 2007; Mostafa et al., 2015;
Smith et al., 1999; Smith and Bolton, 2002; You et al., 2020).
Secondly, service recovery research has introduced service recovery in which
customers participate in the service recovery process along with the service firm
and is known as customer participation in service recovery’ (Dong et al., 2016).
Customers do not play a passive role in the service recovery process but are actively
involved in the process (Kim and Baker, 2020a). The research on customer
participation in service recovery is scant, whereas; service recovery research is
overwhelmed with ‘firm recovery’ research.

34
2.4.1 Firm Recovery
2.4.1.1 Definition of firm recovery
The majority of service recovery articles that have not acknowledged customer
participation in service recovery have defined service recovery as a response that
the service firm entirely provides to solve the problem (Andreassen, 2001; Gronroos,
1988; Harun et al., 2019; Jung and Seock, 2017; Zemke and Bell, 1990). An early
definition by Gronroos (1988) reported that service recovery is the response in the
form of corrective actions taken by the service providers after a service failure. The
majority of the researchers have adopted/adapted Gronroos (1988) notion to define
service recovery (See table 2.4). Later, the definitions describe the meaning along
with the purpose of service recovery. For example, Zemke and Bell (1990)
suggested service recovery as a planned process to bring back dissatisfied
customers into a satisfying state. Similarly, Jung and Seock (2017, p.23) defined
firm recovery as “the effort of a service provider to resolve a problem caused by a
service failure and restore customer satisfaction”. The mentioned definitions
complemented the earlier definition by stating the purpose of service recovery and
suggesting it as a response by the service firm.
Another perspective about service recovery states that service recovery responds
to a service failure to protect the relationship between a firm and its customers (Hart
et al., 1990). According to this definition, the primary motive behind initiating service
recovery is to retain customers, as service recovery is considered worthless if it
cannot safeguard customers' loyalty (Etemad-Sajadi and Bohrer, 2019). Similarly,
(Barusman and Virgawenda, 2019, p.286) state that “service recovery is a
systematic effort by a company after a service failure to correct a problem and
maintain the customer’s goodwill”. Andreassen (2001) defines service recovery as
a constituent of all the actions taken in response to a service failure to return the
customer from a dissatisfied state to a satisfied state. Along with satisfying the
customers and maintaining loyalty, the definitions suggest that service recovery is
a process that is carried out to prevent: negative customers’ feelings (such as
anger, regret, frustration and disappointment) and negative word of mouth (Jin et
al., 2020; Koc, 2019). More recently, Harun et al. (2019, p.623) summarized that
“Service recovery is the service provider's response to lessen the negative
outcomes of service failure and please the consumer”.

35
Service recovery research which acknowledges the forms of service recovery,
‘customer participation in service recovery and firm recovery’ has differentiated the
definitions of the two forms by mentioning the different levels of customers’
participation in the service recovery process (Balaji et al., 2018; Dong et al., 2008;
Kim and Baker, 2020a; Wei et al., 2019). For example, Dong et al. (2008, p.126)
defined that “firm recovery is when recovery efforts are delivered entirely or mostly
by the organisation and its employees”. In the same vein, Kim and Baker (2020)
stated that the firm or its employees perform all or most of the recovery efforts to
resolve the problem in firm recovery. On other occasions, the authors mentioned
that there is no customer involvement in firm recovery. For example, Balaji et al.
(2018) defined firm recovery as when customers do not participate in the recovery
process, but it is considered as the sole responsibility of the service firm and its
employees to recover from the service failure. More recently, Bagherzadeh et al.
(2020) also stated that there is zero level participation of customers in case of firm
recovery. Overall, the key point in defining firm recovery is to indicate that it includes
reactive measures from the firm after a service failure, and customers are merely
the recipients of the recovery.
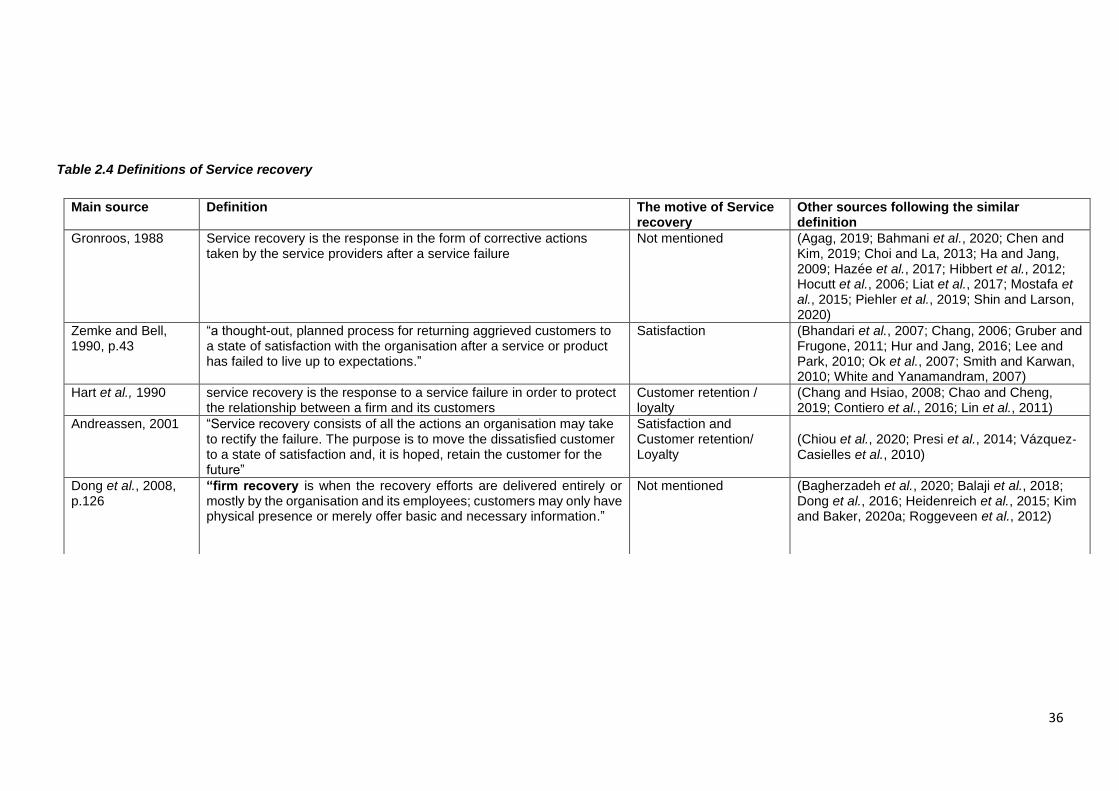
36
Table 2.4 Definitions of Service recovery
Main source Definition The motive of Service recovery
Other sources following the similar definition
Gronroos, 1988 Service recovery is the response in the form of corrective actions taken by the service providers after a service failure
Not mentioned (Agag, 2019; Bahmani et al., 2020; Chen and Kim, 2019; Choi and La, 2013; Ha and Jang, 2009; Hazée et al., 2017; Hibbert et al., 2012; Hocutt et al., 2006; Liat et al., 2017; Mostafa et al., 2015; Piehler et al., 2019; Shin and Larson, 2020)
Zemke and Bell, 1990, p.43
“a thought-out, planned process for returning aggrieved customers to a state of satisfaction with the organisation after a service or product has failed to live up to expectations.”
Satisfaction (Bhandari et al., 2007; Chang, 2006; Gruber and Frugone, 2011; Hur and Jang, 2016; Lee and Park, 2010; Ok et al., 2007; Smith and Karwan, 2010; White and Yanamandram, 2007)
Hart et al., 1990 service recovery is the response to a service failure in order to protect the relationship between a firm and its customers
Customer retention / loyalty
(Chang and Hsiao, 2008; Chao and Cheng, 2019; Contiero et al., 2016; Lin et al., 2011)
Andreassen, 2001 “Service recovery consists of all the actions an organisation may take to rectify the failure. The purpose is to move the dissatisfied customer to a state of satisfaction and, it is hoped, retain the customer for the future”
Satisfaction and Customer retention/ Loyalty
(Chiou et al., 2020; Presi et al., 2014; Vázquez‐Casielles et al., 2010)
Dong et al., 2008, p.126
“firm recovery is when the recovery efforts are delivered entirely or mostly by the organisation and its employees; customers may only have physical presence or merely offer basic and necessary information.”
Not mentioned (Bagherzadeh et al., 2020; Balaji et al., 2018; Dong et al., 2016; Heidenreich et al., 2015; Kim and Baker, 2020a; Roggeveen et al., 2012)

37
2.4.1.2 Service recovery actions /firm recovery actions
The definitions of service recovery suggest that it is a process that involves several
actions/strategies adopted by service firms in response to service failure(s) (see
table 2.5). The are several actions/strategies mentioned in the early literature of
service recovery that firms may adopt to counter the service failure. For example,
the variety of service recovery actions ranges from doing nothing (Duffy et al., 2006)
to adopt twelve different actions (Kelley et al., 1993). Bell and Zemke (1987)
presented that effective service recovery may include five actions: apology,
compensation (monetary), quick response, being empathetic during the resolution
of the problem, and following up with the customer after the problem has been
resolved. According to Bitner (1990), apology, compensation and explanation are
enough to respond to a service failure. However, later on, Kelley et al. (1993)
questioned the generalizability of Bitner's (1990) findings and suggested a wide set
of 12 recovery actions, including; amending the failure, involvement of managerial
staff, giving compensation, giving discounts to customers, offering reduction,
redoing of the service or replacement of a tangible item, apologising, reimbursement
of the cost, customer initiated correction, rectification for dissatisfaction, and/or
doing nothing.
The literature has acknowledged that different service recovery actions are effective
for different service failures and can influence various positive outcomes. For
example, Smith et al. (1999) summarised that firms might provide service recovery
in the shape of four different actions, including; apology, compensation, speed of
response and initiation. They found that providing an apology after a core service
failure is ineffective but may work after an interactional failure. However,
compensation and quick response are effective in response to a core service failure.
Later, Davidow (2003) claimed that a service firm could choose six courses, namely,
apology, credibility, attentiveness, redress, quick response and facilitation, to rectify
a service failure. However, his study's empirical results recommended that among
the six actions, attentiveness is most influential in affecting customers repurchase
intention, satisfaction, and word of mouth. According to Liao (2007), solving the
problem and courtesy are helpful with other traditional actions such as apology,
compensation, explanation and speed of response. However, apology, speed of
response and compensation are more effective in major failures and in the situations
of repeated failures.
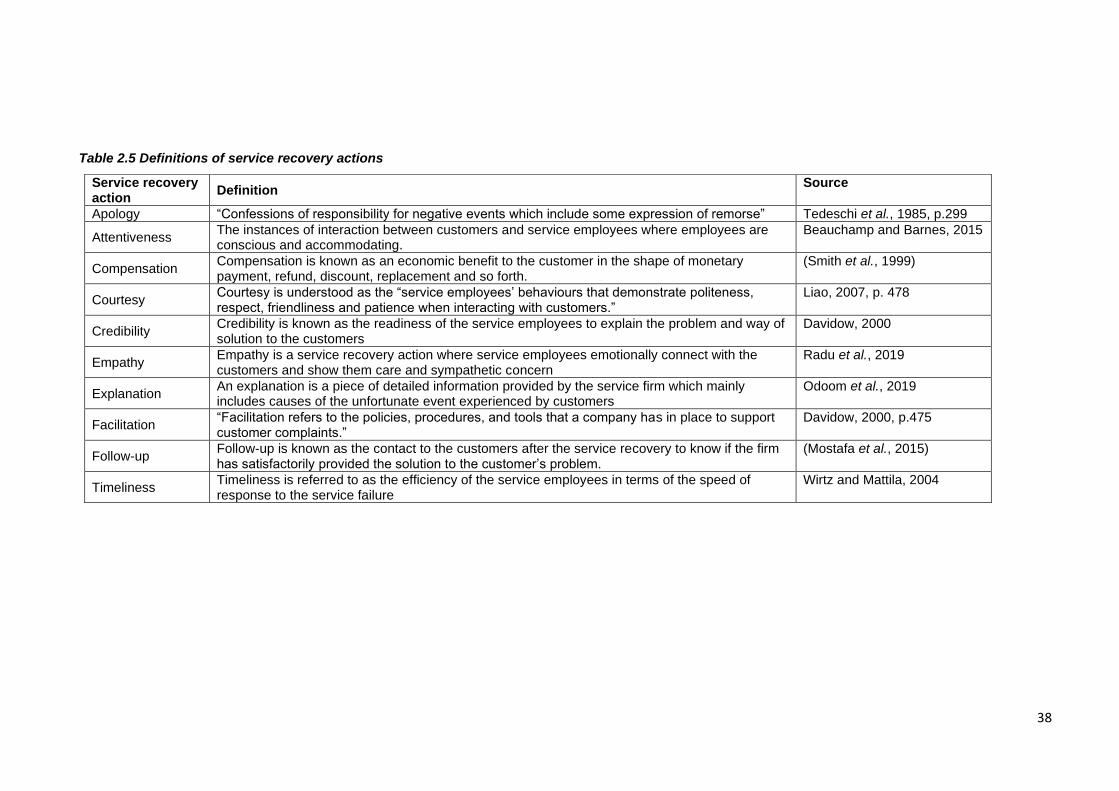
38
Table 2.5 Definitions of service recovery actions
Service recovery action
Definition Source
Apology “Confessions of responsibility for negative events which include some expression of remorse” Tedeschi et al., 1985, p.299
Attentiveness The instances of interaction between customers and service employees where employees are conscious and accommodating.
Beauchamp and Barnes, 2015
Compensation Compensation is known as an economic benefit to the customer in the shape of monetary payment, refund, discount, replacement and so forth.
(Smith et al., 1999)
Courtesy Courtesy is understood as the “service employees’ behaviours that demonstrate politeness, respect, friendliness and patience when interacting with customers.”
Liao, 2007, p. 478
Credibility Credibility is known as the readiness of the service employees to explain the problem and way of solution to the customers
Davidow, 2000
Empathy Empathy is a service recovery action where service employees emotionally connect with the customers and show them care and sympathetic concern
Radu et al., 2019
Explanation An explanation is a piece of detailed information provided by the service firm which mainly includes causes of the unfortunate event experienced by customers
Odoom et al., 2019
Facilitation “Facilitation refers to the policies, procedures, and tools that a company has in place to support customer complaints.”
Davidow, 2000, p.475
Follow-up Follow-up is known as the contact to the customers after the service recovery to know if the firm has satisfactorily provided the solution to the customer’s problem.
(Mostafa et al., 2015)
Timeliness Timeliness is referred to as the efficiency of the service employees in terms of the speed of response to the service failure
Wirtz and Mattila, 2004
39
To date, there is no agreement in the literature regarding the most effective strategy
or strategies to counter service failure. Many studies have come up with a different
set of service recovery actions (see table 2.6). However, Mostafa et al. (2014)
contributed to the literature by presenting a customer recovery toolbox, known as
the Customer Recovery (CURE) scale, which includes nine courses of action that a
company can adapt and prioritise accordingly service failure. The actions include an
apology, speed of response, facilitation, compensation, problem–solving, effort,
explanation, follow-up and courtesy. The authors claim that the CURE scale is, first
of its kind presented in service recovery literature, more accurate, suitable and
applicable in real-world service failure and recovery situations. However, a follow-
up study by Mostafa et al. (2015) contradicted the previous set of recovery actions
and reduced the set by presenting seven recovery actions, apology, compensation,
problem-solving, speed of response follow-up, explanation and courtesy. According
to their study, out of all the actions, problem-solving and follow-up (from service
providers) are the most effective service recovery actions.
The literature suggests that a service provider must use a combination of service
recovery strategies because a single recovery action may be ineffective in restoring
customer satisfaction (Smith et al., 1999). The most successful combination of
service recovery actions includes apology and compensation. For example, Casidy
and Shin (2015) contributed that customers are more willing to forgive and less likely
to spread negative word of mouth after receiving a combination of apology and
compensation. Similarly, Ketron and Mai (2020) suggested that apology and
compensation are the primary service recovery actions that a firm may undertake to
respond to a service failure. Sharifi et al. (2017) concluded that apology and
compensation are effective if utilised appropriately. According to them, an apology
should be the foremost response from the service employee, followed by
compensation to mitigate negative responses and generate positive customer
evaluations. Therefore, the literature has prioritised apology and compensation as
an effective service recovery actions combination (see table 2.6).
Apology
An apology is an indispensable response from service firms after a service failure
(Roschk and Gelbrich, 2014). Providing an apology to aggrieved customers is
considered a default response by service employees (Sharifi and Spassova, 2020).

40
It is a message which contains regret and remorse over the incurred loss of the
victim, and it is communicated by the service provider (Basso and Pizzutti, 2016).
An apology's success depends on its elements and the timing of its provision
(Davidow, 2003; Min et al., 2020; Roschk and Kaiser, 2013). For example, Roschk
and Kaiser (2013) suggested that apology is not only about its presence but also
how it has been delivered is of utmost importance. Further, they viewed apology as
a combination of empathy, intensity and timing. On the other hand, Davidow (2003)
considers that an apology is not effective without the presence of courtesy and
respect as its ingredients. More recently, Min et al. (2020) highlight the importance
of the timing of the apology. They concluded that an apology is more effective; i) if
it is provided after listening to the customers' grievances completely, and ii) if it
includes remorse, acceptance of the mistake and empathy. Hence, the mere
presence of an apology is less effective, and instead of mitigating, it can further
enhance negative consequences regarding service failure, for example, resulting in
faulty service recovery, also known as double deviation (Lee and Park, 2010).
An apology with appropriate ingredients contributes to positive consequences. For
example, regaining customers' trust even in double deviation scenarios(Basso and
Pizzutti, 2016) . Furthermore, an apology plays a critical role in achieving the main
goal of service recovery, which is the restoration of satisfaction (Baker et al., 2008;
Tax et al., 1998), as it is an immediate response fulfilling the minimum requirement
of reaction after a service failure (Hart et al., 1990). Moreover, positive impact on
loyalty (Miller et al., 2000) and positive word of mouth (Davidow, 2000) are also
considered fruitful consequences of an effective apology.
An apology is also considered a form of psychological compensation that the service
firms give to the grieved customers to restore their psychological state and self-
esteem (Azemi et al., 2019; Smith et al., 1999). Customers feel psychologically
disgruntled over losing their mental and other costs related to time and money
(Bitner et al., 1990). Service firms then apologise to the customer over the service
mishap, which shows that the organization has recognized the customer's agony
and is willing to rectify it (Mostafa et al., 2015). Customers expect that the service
provider accepts the service failure's responsibility and admits the guilt, which is
crucial in providing psychological compensation (Min et al., 2020).

41
Compensation
Compensation is identified as an economic recovery tool and is also termed as
tangible compensation (Bambauer-Sachse and Rabeson, 2015). Tangible
compensation provides economic benefits to the customers, such as; discounts,
coupons, free merchandise, refunds, and replacement of tangible goods or redo of
the service performance (Baker and Meyer, 2014; Smith et al., 1999; Stakhovych
and Tamaddoni, 2020). Therefore, an apology given by the service provider over a
service failure is considered ineffective till it is followed by some form of financial
compensation (Basso and Pizzutti, 2016).
It becomes indispensable for service firms to compensate for customers' economic
losses to mitigate negative consequences and generate positive outcomes
(Stakhovych and Tamaddoni, 2020). Generation of positive outcomes after service
failure through tangible compensation is well recognised in the literature. For
example, utilising compensation as a service recovery strategy; increases customer
satisfaction (Sharifi et al., 2017; Wirtz and Mattila, 2004), generates positive word
of mouth (Jung and Seock, 2017; Liu et al., 2019; Tsai et al., 2014) assists in
customer retention (Bambauer-Sachse and Rabeson, 2015; Stakhovych and
Tamaddoni, 2020), influences positively on customer affection (Choi and Choi,
2014) and brand image (Mostafa et al., 2015).
Compensation alone does the job well for a service firm to mitigate negative
consequences and generate positive outcomes (Stakhovych and Tamaddoni,
2020). Customers who receive tangible compensation (discount, money, and so on)
tend to retain this benefit in their minds longer than the benefit they receive as a
psychological compensation (apology) (Chebat and Slusarczyk, 2005). However,
the duo's romance (apology and compensation) is considered the most effective
combination in mitigating the negative consequences of service failures (Suri et al.,
2019). For example, Bougoure et al. (2016) affirm that compensation only becomes
the most effective service recovery strategy if combined with an apology. Similarly,
Casidy and Shin (2015) investigated 332 airline passengers. They concluded that
customers are more willing to forgive and less likely to spread negative word of
mouth after receiving a combination of apology and compensation.

42
Table 2.6 Service Recovery actions discussed in the literature
Main studies
Apo
logy
Atte
ntive
ness
Com
pensation
Court
esy
Cre
dib
ility
Em
path
y
Expla
natio
n
Facili
tation
Follo
w-u
p
Tim
elin
ess
Initia
tion
Pro
ble
m-
solv
ing
Redre
ss
Context
Smith et al., 1999 X X X X Restaurant, Hotel
Davidow, 2000 X X X X X X Diverse (Respondent Choice)
Smith and Bolton, 2002 X X X X Restaurant, Hotel
Wirtz and Mattila, 2004 X X X Restaurant
Liao, 2007 X X X X Diverse (Respondent Choice)
Joireman et al., 2013 X X Airline
Roschk and Kaiser, 2013 X Restaurant
Beauchamp and Barnes, 2015 X X X Diverse (Respondent Choice)
Mostafa et al., 2015 X X X X X X X Mobile phone company
McQuilken et al., 2017 X Restaurant
Jung and Seock, 2017 X X Online retailer
Rasoulian et al., 2017 X X Public Traded firms
Sharifi et al., 2017 X X Restaurant, Hotel
Sengupta et al., 2018 X Retail Store
Karabas et al., 2019 X Restaurant
Liu et al., 2019 X X Hotel
Odoom et al., 2019 X X X X Diverse (Respondent Choice)
Radu et al., 2019 X X Diverse (Respondent Choice)
Pulga et al., 2019 X Retail Bank
Ketron and Mai, 2020 X X Transportation App
Min et al., 2020 X Hotel
Stakhovych and Tamaddoni, 2020 X Retail store
43
2.4.2 Customer participation in service recovery (CPSR)
‘Customer participation in service recovery’ is rooted in the concept of customer
participation in ‘services’, where customers are involved in service production and/
or service delivery (Dong and Sivakumar, 2017, p.2). Customer participation in
services is defined as “the degree to which the customer is involved in producing
and delivering the service” (Dabholkar, 1990, p.484). Customers' role in a service
process was considered unfavourable until Lovelock and Young (1979) presented
the potential benefits of involving customers in a service delivery process. Later, the
research by Zeithaml et al. (1985) highlighted the importance of binding customer
participation with one of the characteristics of services. The service characteristic of
inseparability obligates customers to participate in the production and or delivery of
services (Zeithaml et al., 1985). Customer participation in services provides a win-
win situation for the service consumer and service provider (Hsieh and Yeh, 2018;
Vázquez-Casielles et al., 2017). Firstly, from service providers’ point of view, it
reduces the burden of service firms because service consumers perform specific
activities in a service consumption and delivery process beyond financial
transactions (Bagherzadeh et al., 2020). Secondly, from the consumer’s point of
view, as service consumers become co-creators of the service, an added value is
created in the service consumption process (Vargo and Lusch, 2004).
The literature on customer participation progressed in three different streams. The
first stream primarily portrays the economic benefits that service firms can gain by
utilising customers in various activities of service delivery and consumption (Allen
et al., 2016; Betzing et al., 2020; Heinonen et al., 2013; Mills and Morris, 1986). The
second stream centres on managing the customers as partial company employees
(Auh et al., 2019; Bendapudi and Leone, 2003; Claycomb et al., 2001; Hsieh et al.,
2004; Joo, 2020). The studies in this stream capitalised on the notion of customer
socialisation. For example, Claycomb et al. (2001) suggested that active
participation of the customers enhances the socialisation between customers and
employees and as a result, service quality and customer satisfaction is increased
(Dong et al., 2008). The third stream of customer participation research suggests
that added value is created in the process of service consumption and delivery by
considering customers as “co-creators” of the service (Brodie et al., 2019; Fan et
al., 2020; Payne et al., 2008; Plé, 2016; Vargo and Lusch, 2004, 2006).
44
The third stream studies are theoretically supported by the service-dominant (S-D)
logic introduced by Vargo and Lusch (2004). S-D Logic revolves around the premise
of “exchange” and presents the theoretical knowledge of value creation through
customer participation in the service process (Vargo and Lusch, 2004, 2008, 2016).
One of S-D logic's primary foundational premises states that “the customer is always
a co-creator of value” (Vargo and Lusch, 2008, p.2). Participation from the customer
can appear at any point or many points of the value network (Dong et al., 2008;
Vargo and Lusch, 2016). Therefore, it suggests that if customer participation is
missed in the initial engagement between the service provider and the consumer,
both parties may have a chance to exchange specialised skills and knowledge in
the second engagement (during the service recovery process). The premise of
exchange and value creation may be compromised if customers are kept out of the
service recovery process.
Customer participation in the service recovery (CPSR) emerges from one of the
customer participation themes, theoretically supported by the S-D logic (Skourtis et
al., 2019). Customer participation in service recovery refers to when customers are
involved in the service recovery process to collaborate with the service provider in
reaching a mutually agreed solution to service failure (Bagherzadeh et al., 2020).
Therefore, the integration of customers’ resources with service firms' resources (to
maximise the value) indicates that customer participation in service recovery is
rooted in S-D logic (Hazée et al., 2017).
The concept of CPSR is relatively newer, and research related to this concept is
scant (Kim and Baker, 2020a). The majority of the service recovery literature has
focused on firm recovery (Israeli, Lee and Karpinski, 2019; Muhammad and Gul-E-
Rana, 2020; del Río-Lanza et al., 2009; Smith et al., 1999). The major part of firm
recovery research has presented the customers as passive recipients in service
recovery. On the other hand, modern logic suggests that customers are active
participants of the process, share resources and, as a result, co-create value (Vargo
and Lusch, 2016). Building on the SD logic, there is a growing body of literature
focusing on the role of customers in the service recovery process in recent years.
The growing body of literature attempts to revitalise service recovery literature by
focusing on the effects of customer participation in service recovery (see table 2.7).

45
The focus on CPSR was initiated by introducing the concept known as “recovery
voice” by Karande et al. (2007). “Recovery voice” is conceptualised as an
opportunity for the customers to express their suggestions to solve the problem in a
service recovery process (Karande et al., 2007; Van Vaerenbergh et al., 2018).
Though the scope of the concept is limited to customers' verbal participation, the
introduction of the concept provided a lead for the researchers to refine the concept.
Dong et al. (2008) formally introduced the concept of “customer participation in
service recovery”. The concept embraces that customers can be involved in a
service recovery process. They classified ‘customer participation in service
recovery’ into three distinct types, i) Firm recovery (zero to no involvement of the
customer), ii) Joint recovery (both customer and firm are involved), and iii) Customer
Recovery (only the customer is involved and no involvement of the firm). Though
the investigation proved to be groundbreaking in the area of ‘customer participation
in service recovery, it seems that the understanding of Dong et al. (2008) about the
concept is questionable and limited. Firstly, this examination was limited to self-
service technologies (SST) context and avenues to non-self-service contexts
remained open. Secondly, the term “participation” connotates “the act of taking part
in an activity or an event” (Lexico, n.d.). The interpretation of the meaning suggests
that participation indicates a “share” of one’s actions with someone. It does not imply
a sole performance. Therefore, according to the interpretation, only “Joint recovery”
seems to align with the concept of customer participation in service recovery.
Roggeveen et al. (2012) extended the research on ‘customer participation in service
recovery’ by examining the role of CPSR in a non-SST context. The investigation
included four different studies which identified different situations where CPSR is
and is not suitable. Moreover, the authors investigated the effects of CPSR when
service failure is not co-created. The findings advocate the effectiveness of CPSR
by proving that CPSR is cost-efficient in comparison to compensation. The elevated
levels of recovery satisfaction and repurchase intentions verified the usefulness of
engaging customers in a service recovery process. Therefore, the first three
noticeable studies related to CPSR (Dong et al., 2008; Karande et al., 2007;
Roggeveen et al., 2012) provided a solid foundation for future studies to investigate
deeper.

46
Further research in the area of ‘customer participation in service recovery’,
demonstrates delving efforts but holds mixed findings related to customer
participation in service recovery. Primarily, the literature offers multiple benefits of
engaging customers in the service recovery process, namely: cost-efficiency
(Roggeveen et al., 2012; Xu, Marshall, et al., 2014), elevation in the level of recovery
satisfaction (Cheung and To, 2016; Gohary, Hamzelu and Alizadeh, 2016; Jin et al.,
2019), improvement in overall satisfaction (Vázquez-Casielles et al., 2017),
increased repurchase intentions (Guo, Xiao, et al., 2016; Hazée et al., 2017; Kim
and Baker, 2020a), positive influence on customer trust (Busser and Shulga, 2019),
increase in the positive word of mouth (Bagherzadeh et al., 2020; Vázquez-
Casielles et al., 2017) and intentions of future customer participation in service
production or delivery (Dong et al., 2016; Gohary, Hamzelu and Alizadeh, 2016; Wei
et al., 2019). On the other hand, research indicates that customer participation in
service recovery is not always favourable. For example, if the magnitude of
customer participation in initial service provision is low, then customer participation
in service recovery is not suitable (Heidenreich et al., 2015). Also, CPSR is not
favourable for firms having high brand equity (Hazée et al., 2017).
The literature review suggests that customers may participate at different stages
during the service recovery process in various ways (Van Vaerenbergh et al., 2018).
For example, customers may get involved at the ‘start’ of the service recovery
process by informing the service provider about the problem and requirements of
the solution (Jin et al., 2019; Karande et al., 2007). Customers may also participate
‘during’ the recovery process either by reproducing the whole service with the help
of the service provider (Roggeveen et al., 2012) by evaluating alternative solutions
to the problem (Bagherzadeh et al., 2020; Wei et al., 2019), and by selecting the
recovery outcome (deciding on compensation alternatives (Guo et al., 2016).
Different ways of customer participation strengthen the sense of empowerment in
customers and reduce their psychological costs (Hazée et al., 2017). The area of
research regarding the effectiveness of different types of customer participation is
shallow; however, a sole study by Guo et al. (2016) has found complementary
effects of different types of customer participation. The involvement of customers in
the service recovery process plays a critical role in resolving the problem because
customers gain the liberty of ensuring that the solution is best suited to them (Kim
and Baker, 2020a).

47
Table 2.7 Existing research on customer participation in service recovery
Author(s) Terminology used Positive impact Non-significant impact / Negative impact / Lesser impact/ No impact
Karande et al. 2007 Recovery voice • Post failure overall satisfaction N.A
Dong et al., 2008 Customer participation in service recovery
• Intention towards future co-creation,
• Role Clarity,
• Perceived value for future co-creation,
• Satisfaction with service recovery,
• Ability in future co-creation
Non-significant impact
• Customer’s ability in future co-creation
Roggeveen et al., 2012
Customer co-creation of the recovery
• Recovery Process satisfaction (only if the service failure severity is high)
• Repurchase intentions
Negative impact (when the service failure severity is low)
• Recovery process satisfaction
Xu et al., 2014 Co-recovery
• Perceived Justice
• Satisfaction with recovery
• Repurchase intention
Lesser impact (when the customer initiates the co-recovery)
• Perceived Justice,
• Satisfaction with recovery,
• Repurchase intention
Heidenreich et al., 2015
Co-creation during service recovery
• Customer satisfaction
Lesser impact (when failure attributed towards the firm)
• Post-recovery satisfaction
Dong et al., 2016 Customer participation in service recovery
• Satisfaction with recovery
• Intention for future co-production N.A.
(Gohary, Hamzelu, Pourazizi, et al., 2016)
Co-creation in service recovery
• Emotions
• Post-recovery satisfaction
• Perceived value
• Intention to reuse
• Intention to future co-creation
N.A
Gohary, Hamzelu and Alizadeh, 2016
Co-creation in service recovery
• Post-recovery satisfaction
N.A.
Guo et al., 2016 Co-creation of service recovery
• Outcome favourability
• Relationship-based self-esteem
• Repurchase intentions
N.A
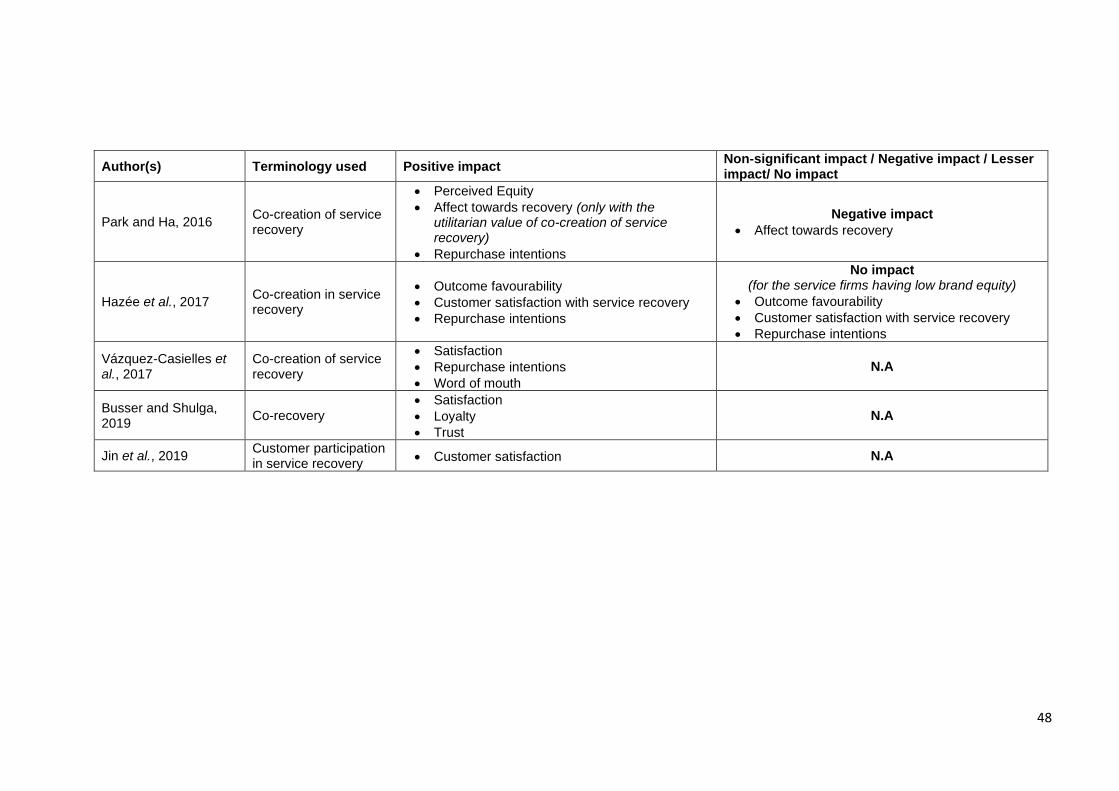
48
Author(s) Terminology used Positive impact Non-significant impact / Negative impact / Lesser impact/ No impact
Park and Ha, 2016 Co-creation of service recovery
• Perceived Equity
• Affect towards recovery (only with the utilitarian value of co-creation of service recovery)
• Repurchase intentions
Negative impact
• Affect towards recovery
Hazée et al., 2017 Co-creation in service recovery
• Outcome favourability
• Customer satisfaction with service recovery
• Repurchase intentions
No impact (for the service firms having low brand equity)
• Outcome favourability
• Customer satisfaction with service recovery
• Repurchase intentions
Vázquez-Casielles et al., 2017
Co-creation of service recovery
• Satisfaction
• Repurchase intentions
• Word of mouth
N.A
Busser and Shulga, 2019
Co-recovery
• Satisfaction
• Loyalty
• Trust
N.A
Jin et al., 2019 Customer participation in service recovery
• Customer satisfaction N.A
49
2.4.3.1 Terminologies
The usage of different terminologies is prevalent in labelling customer participation
in service recovery. The main terms used are: i) Customer participation in service
recovery (Balaji et al., 2018; Dong et al., 2008) ii) Co-creation of service recovery
(Gohary, Hamzelu, Pourazizi, et al., 2016; Kim and Baker, 2020a; Roggeveen et al.,
2012) iii) Joint Recovery (Dong et al., 2016; Jin et al., 2019) and iv) Co-recovery
(Skourtis et al., 2019; Xu, Marshall, et al., 2014). Although the confusion of using
different terms is critiqued in the literature (Dong and Sivakumar, 2017; Grönroos
and Voima, 2013), various terminologies are still present in the literature. However,
the service recovery literature review suggests that the concept's connotation does
not differ significantly by the usage of different terminologies.
The current research prefered “customer participation in service recovery (CPSR)”
as a suitable term. The term is chosen after scrutinising the supporting arguments
by Dong and Sivakumar (2017). For example, i) customer participation is a broader
term that captures the essence of other related terms (co-creation, co-recovery,
Joint recovery), hence results in less confusion, ii) the term customer participation
is not limited to a certain level of participation; instead it can depict passive or active
participation, iii) finally, customer participation is a simple term which can be easily
visualised by the majority readers including even those who are not very familiar
with the various terminologies used in the literature.
2.4.3.2 Definition of customer participation in service recovery
The concept of customer participation in service recovery is relatively new, and
research related to this notion is limited (Kim and Baker, 2020a). Researchers have
made efforts in defining the concept by capitalising on the service co-creation
literature (Dong et al., 2008). However, the difference between the two concepts
required distinctive conceptualisations to understand both concepts better. Co-
creation of services occurs in the primary engagement between customers and
service providers, whereas; customer participation in service recovery occurs after
customers experience a service failure and the service provider intends to recover
(Dong et al., 2016). Therefore, researchers have defined CPSR for a better
understanding (Dong et al., 2008; Park and Ha, 2016; Roggeveen et al., 2012; Xu,
Marshall, et al., 2014). The review of limited literature suggests that presented
definitions hold three different viewpoints (see table 2.8).

50
The first viewpoint suggests that customer participation is “the degree to which the
customer is involved in taking actions to respond to a service failure” (Dong et al.,
2008, p.126). This perspective focuses on the “extent” to which the customers are
engaged in a service recovery process (Jin et al., 2019). Customer participation is
described as the extent of customers’ engagement in a service recovery because
Dong et al. (2008) classifies customer participation into three different levels, i) Firm
recovery (no involvement of customers or a very low level of involvement) ii) Joint
Recovery (customer and service provider both participate in the service recovery
process) and iii) Customer recovery (when there is no involvement from the service
provider and solely customer recovers the service). Under this perspective, only the
type “joint recovery” is relevant to the concept of CPSR, which clearly articulates
that customer and firm both play a sufficient role in service recovery whereas; the
other two types (Firm recovery and customer recovery) represent role dominance
of either the firm or the customer.
The second perspective carries the definition suggested by Roggeveen et al. (2012),
which indicates that CPSR is not only referred to as the activity of working together,
but it represents the abilities of the customer(s) and service provider(s) to design or
tailor the features of the service recovery. Designing service recovery content with
the service provider helps the customer mitigate the negative experience of service
failure (Wei et al., 2019). This viewpoint suggests that customers are not considered
merely as the firm's employees but play a role in the service recovery process to
ensure a sense of gratification (Kim and Baker, 2020a).
The third perspective suggests that CPSR is “a process of creating a solution
through interactions between a service company and its customers” (Xu et al., 2014,
p.371). The definition centres on the notion that a solution to the problem is
achievable with the help of interactions between customers and service providers.
The definition is vague regarding the term “interactions”, as it does not specify if the
interaction is only verbal or customers also perform any physical activity. In the
same vein, Park and Ha (2016) describe that CPSR is a course of interactions and
conversations between customers and service providers to reach a solution that
satisfies the customers. Although these definitions suggest the role of customers in

51
the service recovery process through communicating with service providers, these
do not reflect that customers play a part in performing physical activities.
Table 2.8 Definitions of Customer Participation in Service Recovery
Although the three main definitions have a different plot, there is a consensus that
customers play some part in the service recovery process. The point of difference
between the second (Roggeveen et al., 2012) and third (Xu, Marshall, et al., 2014)
stance is the description of the participation’s approach taken by the customers in a
service recovery process. In contrast, the first stance (Dong et al., 2008) is different
from the other two, based on the role of the customers in a service recovery process.
Roggeveen’s stance is more comprehensive than the other two because it clearly
explains the nature of CPSR. The definition explicitly suggests participation and
implicitly suggests the degree of customers’ participation in a service recovery
process.
2.4.4 Customers’ evaluation of service recovery process
Customers’ evaluation of ‘firm recovery’ and ‘customer participation in service
recovery’ is crucial to mitigate service failures' negative consequences (del Río-
Lanza et al., 2009). Customers cognitive evaluation of the service recovery process
is key to assess the effectiveness of service recovery. Customers' perceptions of
fairness in service recovery are the basis of service recovery evaluation (Mostafa et
al., 2015). In this regard, the service literature has predominantly utilised perceived
Terminology
used
Definition Perspective Source References
following the
definition
Customer
participation
“the degree to which the
customer is involved in
taking actions to respond to
a service failure” (p.126)
Degree of
participation
Dong et al.
2008
(Balaji et al.,
2018; Dong et al.,
2016; Jin et al.,
2019)
Customer Co-
creation of
the recovery
“ability to shape or
personalise the content of
the recovery through joint
collaboration with the
service provider” (p.772)
Personalisation Roggeveen
et al., 2012
(Bagherzadeh et
al., 2020; Hazée
et al., 2017; Kim
and Baker,
2020a; Wei et al.,
2019)
Co-recovery “a process of creating a
solution through interactions
between a service company
and its customers” (p.371)
Interaction Xu et al.,
2014
(Gohary,
Hamzelu and
Alizadeh, 2016;
Park and Ha,
2016; Skourtis et
al., 2019)
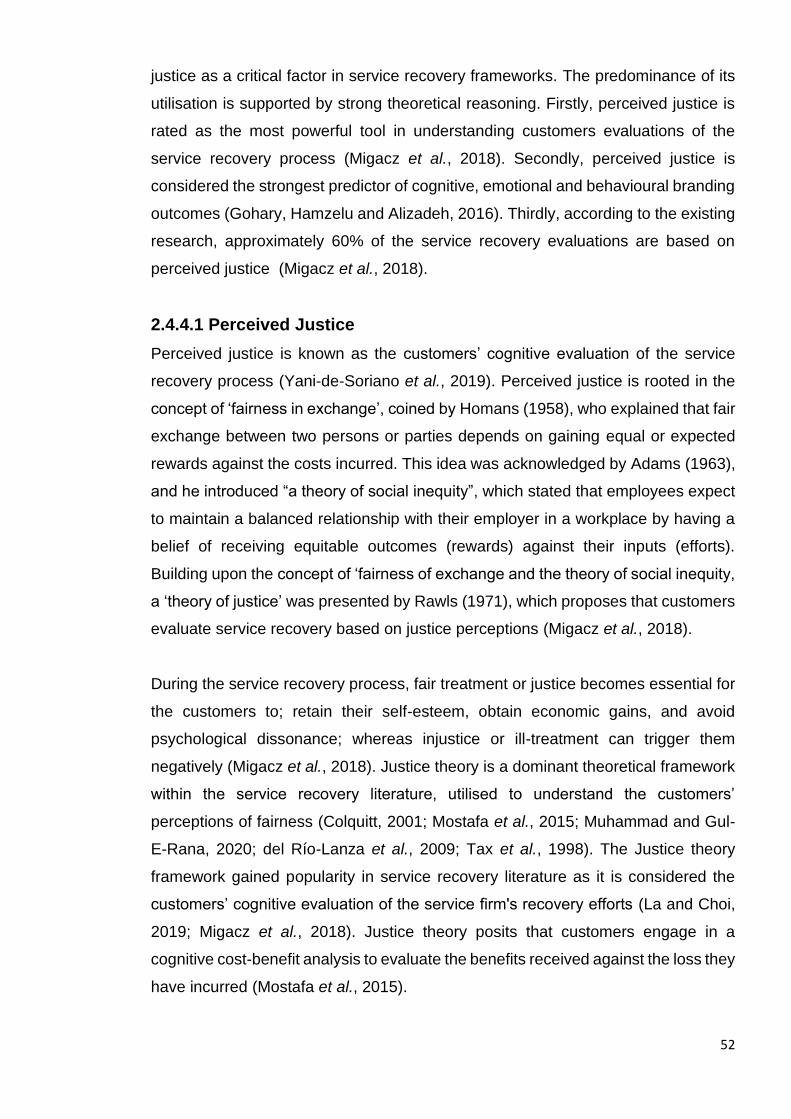
52
justice as a critical factor in service recovery frameworks. The predominance of its
utilisation is supported by strong theoretical reasoning. Firstly, perceived justice is
rated as the most powerful tool in understanding customers evaluations of the
service recovery process (Migacz et al., 2018). Secondly, perceived justice is
considered the strongest predictor of cognitive, emotional and behavioural branding
outcomes (Gohary, Hamzelu and Alizadeh, 2016). Thirdly, according to the existing
research, approximately 60% of the service recovery evaluations are based on
perceived justice (Migacz et al., 2018).
2.4.4.1 Perceived Justice
Perceived justice is known as the customers’ cognitive evaluation of the service
recovery process (Yani-de-Soriano et al., 2019). Perceived justice is rooted in the
concept of ‘fairness in exchange’, coined by Homans (1958), who explained that fair
exchange between two persons or parties depends on gaining equal or expected
rewards against the costs incurred. This idea was acknowledged by Adams (1963),
and he introduced “a theory of social inequity”, which stated that employees expect
to maintain a balanced relationship with their employer in a workplace by having a
belief of receiving equitable outcomes (rewards) against their inputs (efforts).
Building upon the concept of ‘fairness of exchange and the theory of social inequity,
a ‘theory of justice’ was presented by Rawls (1971), which proposes that customers
evaluate service recovery based on justice perceptions (Migacz et al., 2018).
During the service recovery process, fair treatment or justice becomes essential for
the customers to; retain their self-esteem, obtain economic gains, and avoid
psychological dissonance; whereas injustice or ill-treatment can trigger them
negatively (Migacz et al., 2018). Justice theory is a dominant theoretical framework
within the service recovery literature, utilised to understand the customers’
perceptions of fairness (Colquitt, 2001; Mostafa et al., 2015; Muhammad and Gul-
E-Rana, 2020; del Río-Lanza et al., 2009; Tax et al., 1998). The Justice theory
framework gained popularity in service recovery literature as it is considered the
customers’ cognitive evaluation of the service firm's recovery efforts (La and Choi,
2019; Migacz et al., 2018). Justice theory posits that customers engage in a
cognitive cost-benefit analysis to evaluate the benefits received against the loss they
have incurred (Mostafa et al., 2015).

53
Traditionally, the justice theory entails that customers evaluate service firm’s actions
through three dimensions of justice, i) Distributive Justice which is the perceived
fairness of the outcomes received against the costs incurred because of the service
failure, ii) Interactional Justice which is the perceived fairness of interpersonal
treatment of customers by service employees and iii) Procedural Justice which is
perceived fairness of the policies and procedures adopted by the service firm in the
service recovery process (Chen and Kim, 2019; Tax et al., 1998). However, Colquitt
contributed to the literature by the addition of informational justice. The aspect of
‘explanation/information’ related to interactional justice can be included in
informational justice. Informational justice is referred to as the perceived fairness of
the authenticity, completeness and relevancy of the information received by the
customers from the service employees (Bradley and Sparks, 2009; Colquitt, 2001).
Although usage of informational justice as a fourth dimension is scant in service
recovery literature, customers perceived fairness evaluation remains incomplete
without the inclusion of informational justice in the service recovery frameworks
(Gohary et al., 2016). The evidence is found in the literature that studies have
treated perceived justice both as a single global construct (Balaji et al., 2018; DeWitt
et al., 2008; Liao, 2007) and as a multidimensional construct (Migacz et al., 2018;
Muhammad and Gul-E-Rana, 2020; del Río-Lanza et al., 2009).
The dimensions of perceived justice are separated based on distinct elements. For
example, distributive justice entails tangible assets such as financial compensation,
refunds, discounts, complimentary gifts, replacements of tangible items in service
or redo of a service (Choi and Choi, 2014; Sharifi and Spassova, 2020). Interactional
justice relates to the aspects of apology, empathy, politeness, and courtesy
rendered by the service firm’s employees (Chen and Kim, 2019; Mostafa et al.,
2015). The conceptualization of procedural justice includes timeliness, flexibility,
and consistency of the policies and procedures (Barusman and Virgawenda, 2019;
Chalmers, 2016). Finally, authenticity, completeness and relevancy of
information/explanation are considered critical components of informational justice
(Colquitt, 2001; Gohary, Hamzelu and Alizadeh, 2016). The constituency of the
justice dimensions with the mentioned aspect is, however, inconsistent; for example,
some studies consider apology as a distributive justice element instead of an
element of interactional justice (Crisafulli and Singh, 2016; Tax et al., 1998).
Similarly, studies that consider informational justice as a fourth dimension consider

54
information, explanation, and truthfulness as informational justice traits (Chalmers,
2016; Maxham III and Netemeyer, 2002; Wang and Chang, 2013). Clearly, every
dimension holds different elements which justify the distinction among perceived
justice dimensions.
Service recovery frameworks have utilised perceived justice in different roles. For
example, perceived justice has performed as an independent (Chen and Kim, 2019;
del Río-Lanza et al., 2009; Tax et al., 1998), mediator (Albrecht et al., 2019; Mostafa
et al., 2015; Smith et al., 1999), moderator (Lee et al., 2020), and dependant variable
(Bae et al., 2020). Regardless of the role, studies have conflicting findings
concerning perceived justice. For example, Tax et al. (1998) found that all
dimensions of perceived justice impact post-recovery outcomes independently,
whereas; Martínez‐Tur et al. (2006) suggested that only distributive justice
influences recovery satisfaction. Similarly, Balaji et al. (2018) concluded no
significant relationship between perceived justice and satisfaction if the customers
are more cynical. Others demonstrated inconsistencies regarding perceived justice
dimensions' effectiveness (Bae et al., 2020; del Río-Lanza et al., 2009; Urueña and
Hidalgo, 2016). Within the case of mediation role; perceived justice has been utilised
in between the relationship of service recovery strategies and post-recovery
outcomes (Albrecht et al., 2019; Mostafa et al., 2015; Roggeveen et al., 2012).
Perceived justice serves as a critical vehicle for service recovery frameworks to
predict post-recovery behavioural and emotional outcomes (Albrecht et al., 2019;
Chebat and Slusarczyk, 2005; Gohary, Hamzelu and Alizadeh, 2016; Mostafa et al.,
2015; Muhammad and Gul-E-Rana, 2020; del Río-Lanza et al., 2009; Tax et al.,
1998). Studies have suggested that perceived justice is the most powerful predictor
of satisfaction and other outcomes with service recovery (see table 2.9). Since
satisfaction with service recovery is episodic and presents only the immediate
fulfilment of customers, studies have also investigated the impact of perceived
justice on overall satisfaction. (Liao, 2007; Maxham III and Netemeyer, 2002;
Muhammad and Gul-E-Rana, 2020), Customer trust (Mohd-Any et al., 2019; Tax et
al., 1998; Wang and Chang, 2013), and customer loyalty (Barusman and
Virgawenda, 2019; Choi and Choi, 2014; Urueña and Hidalgo, 2016). Regarding
emotional outcomes, literature has typically focused on the relationship between
perceived justice and customer positive and negative emotions (Chebat and

55
Slusarczyk, 2005; Chen and Kim, 2019; del Río-Lanza et al., 2009). The
relationships between perceived justice and the above-mentioned outcomes
sometimes lead to other behavioural outcomes, mainly word of mouth (Chen and
Kim, 2019; Gohary, Hamzelu and Alizadeh, 2016) and repurchase intentions (Lin et
al., 2011; Migacz et al., 2018). Table 2.9 details the usage of perceived justice in
service recovery frameworks.

56
Table 2.9 Perceived Justice utilised in service recovery frameworks
Studies
Perceived Justice
Role Outcomes Main findings related to Perceived Justice and its dimensions
DJ
IJ
PJ
Inf
J
Tax et al., 1998 X X X Independent - Recovery Satisfaction - Trust - Commitment
All dimensions of justice strongly impact recovery satisfaction, and further recovery satisfaction positively influences trust and commitment.
Smith et al., 1999 X X X
Mediator - Recovery Satisfaction Distributive justice has the strongest positive impact on recovery
satisfaction
Maxham III and Netemeyer, 2002
X X X
Independent
- Recovery Satisfaction - Overall Satisfaction - WOM intent - Repurchase intent
Interactional and procedural justice have a stronger effect on outcomes.
Chebat and Slusarczyk, 2005
X X
Independent - Emotions - Exit and Loyalty
Interactional Justice is considered the most influential dimension of perceived justice
Liao, 2007 X X X
Mediator
- Satisfaction - Repurchase intention
Perceived Justice as a single construct mediate the relationship between service recovery strategies and customer satisfaction and also plays a mediating role between service recovery strategies and repurchase intent
Varela-Neira et al., 2008 X X X
Mediator - Satisfaction Procedural Justice and Interactional Justice are more influential and
have a stronger impact on customer satisfaction
del Río-Lanza et al., 2009 X X X
Independent - Negative emotions - Recovery Satisfaction
Procedural Justice resulted in the strongest dimension to influence satisfaction and customer negative emotions
Roggeveen et al., 2012 X X X
Mediator - Repurchase intention - Recovery satisfaction
Perceived justice (equity) performed as a successful mediator between co-created service recovery and post-recovery evaluations
Urueña and Hidalgo, 2016 X X X
Independent - Recovery Satisfaction
Emotions - Trust and Loyalty
Procedural Justice and Interactional Justice are considered as key dimensions to affect customer loyalty
Choi and Choi, 2014
X X X
Independent
- Customer Affection - Customer Loyalty - Positive WOM
Interactional Justice and Procedural Justice positively affect customer affection; whereas, distributive justice does not significantly impact. Distributive justice is only effective in influencing customer affection when the magnitude of failure is high.
57
Studies
Perceived Justice
Role Outcomes Main findings related to Perceived Justice and its dimensions
DJ
IJ
PJ
Inf
J
Mostafa et al., 2015 X X X
Mediator - Recovery Satisfaction - Corporate Image
Only interactional justice has positive direct effects on corporate image. Distributive and procedural justice affects corporate image indirectly
Gohary, Hamzelu and Alizadeh, 2016
X X X X
Independent
- Recovery Satisfaction - Positive WOM - Customer Loyalty - Repurchase Intention - Future Co-Creation
Tendency
Perceived Justice is positively related to recovery satisfaction. Informational Justice holds a key position in an online context because customers are more satisfied when managers explain in detail the reasons for failure and also how the decisions about recovery outcomes (distribution of benefits) are taken
Balaji et al., 2018 X X X
Independent - Negative inferred
motive - Customer Satisfaction
Perceived Justice does not have a positive impact on customer satisfaction in the case of cynical customers.
Migacz et al., 2018 X X X
Independent - Recovery Satisfaction - Negative WOM - Repurchase intention
All dimensions of perceived justice have a positive impact on recovery satisfaction. Distributive justice has a stronger impact than procedural and interactional justice.
Albrecht et al., 2019 X
Mediator - Recovery Satisfaction Distributive justice acts successfully as a mediator between
compensation and recovery satisfaction
Chen and Kim, 2019 X X X
Independent - Emotions - Overall satisfaction - WOM intention
No significant relationship between perceived justice dimensions and emotions
Bae et al., 2020 X X X
Dependant Passive complainers perceive better distributive and interactional
justice than active complainers
Muhammad and Gul-E-Rana, 2020
X X X Independent
- Customer forgiveness - Relationship
satisfaction
Insignificant impact of procedural justice on satisfaction
Lee et al., 2020 X X
Moderator - Repurchase intention Perceived Justice positively moderates the relationship between
brand equity and repurchase intentions Note:Dj= Distributiuve Justice , IJ= Interactional Justice, PJ= Procedural Justice, Inf J=Informtional Justice
X = Perceived Justice is utilised as a single construct (second-order construct)
X = Individual dimensions are utlised

58
2.4.5 The role of service failure severity in service recovery
frameworks
The evaluations of service recovery efforts have been mainly affected by the nature
and intensity of the service failure/service failure severity (Chao and Cheng, 2019).
Service failure severity is known as the intensity of the service failure perceived by
the customers (Sengupta et al., 2015). Several studies have taken service failure
severity into account and demonstrated failure severity as a critical factor in shaping
recovery satisfaction and other service recovery outcomes (Choi and Choi, 2014;
Liu et al., 2019; Mattila, 1999; Shams et al., 2020; Weun et al., 2004). According to
Mattila (1999), it is challenging for service firms to recover from a serious service
failure, leaving them dissatisfied. After experiencing severe service failure,
customers raise their expectations of service recovery efforts, and failure of meeting
their expectations leads to dissatisfaction (Matikiti et al., 2019). Thus, identifying the
intensity of the failure is critical in the recovery process (Chao and Cheng, 2019).
The importance of service failure severity among service recovery frameworks is
well recognized for two decades (Liao, 2007; Liu et al., 2019; Magnini et al., 2007;
Matikiti et al., 2019; Roggeveen et al., 2012; Sembada et al., 2016; Smith et al.,
1999). Service failure severity has played several roles in the frameworks such as;
a control variable (Liao, 2007), a moderator (Magnini et al., 2007; Roggeveen et al.,
2012; Smith et al., 1999), a dependent variable (Sembada et al., 2016). Moreover,
a large number of investigations (Barakat et al., 2015; Cambra-Fierro et al., 2013;
Chuang et al., 2012; Weun et al., 2004) have empirically tested its main effects.
Service failure severity becomes critical for service firms, as it negatively influences
branding outcomes even in the presence of service recovery efforts (Barakat et al.,
2015).
The determination of service failure severity is essential before applying service
recovery as different intensity levels of service failures have different implications
(Shams et al., 2020). The literature has mentioned two levels of service failure
severity, high and low (Liu et al., 2019). High severity failures are high in their
intensity and represent a major loss (financial, psychological, emotional, physical),
whereas low severity failures are low in their intensity and represent a minor loss
(financial, psychological, emotional, physical) of the consumers (Cantor and Li,
2019). Researchers have mentioned different implications and have recommended
59
different recovery strategies for both levels of service failure severity. For example,
Choi and Choi (2014) concluded that a mere apology is more appropriate for a low-
severity service failure, whereas financial compensation is necessary for high
severity service failure. On the other hand, Liu et al. (2019) discouraged service
managers from recovering customers who have experienced high severity service
failures instead be responsive to customers who have faced low severity failures.
They reasoned that this implication is due to incurring high costs with no possibility
of recovering customers who experience high severity failures. Hence, identification
of the magnitude of the failure is critical.
2.4.6 Service recovery paradox
The service recovery paradox (SRP) phenomenon is that through service recovery,
firms can achieve higher levels of consumer outcomes after service failure and
recovery compared to a situation where there is no service failure and recovery
(Khamitov et al., 2020). The paradox suggests that customers feel more content
and happy with the firm after experiencing service failure and recovery rather than
before it (Matos et al., 2007). SRP is considered a ‘blessing in disguise’ where
service failures are considered an opportunity for firms to deliver excellent service
recovery and create more goodwill (Michel and Meuter, 2008).
The literature has examined various service recovery outcomes as a subject of a
paradox, for example, satisfaction (Azemi et al., 2019; Boshoff, 1997; Karande et
al., 2007), repurchase intent (Maxham III, 2001; Soares et al., 2017), corporate
image (Andreassen, 2001), word of mouth (Lin et al., 2011; Maxham III, 2001) and
loyalty (Kim and Baker, 2020c; Smith and Bolton, 1998). Satisfaction has been used
more frequently in studies investigating the service recovery paradox (see table
2.10) because satisfaction is considered as a key outcome to examine the
effectiveness of service recovery efforts. The studies investigating the phenomenon
of service recovery paradox with satisfaction and other outcomes signify its
significance for the firms to avail the undesirable situation to their advantage (Matos
et al., 2007).
Despite its significance, there are mixed findings related to the occurrence of the
service recovery paradox. For example, Smith and Bolton (1998) examined
restaurant and hotel consumers. They found that consumers have higher ratings of

60
cumulative satisfaction and loyalty after experiencing a service recovery than the
ratings before service failure and recovery. Similarly, Heidenreich et al. (2015) also
found evidence of the service recovery paradox when customers participate in the
service recovery process. More recently, Azemi et al. (2019) suggest that the
chances of service recovery paradox are prominent if customers participate in
service recovery and if the customers are provided with timely compensation. A few
other studies show partial support of service recovery paradox occurrence (Hocutt
et al., 2006; Karande et al., 2007). In contrast, some studies exposit that the service
recovery paradox does not occur. For example, Maxham III (2001) launched a pre-
test post-test between-subject design and found no support of a service recovery
paradox in the context of a haircut service. Lin et al. (2011) also suggest that the
service recovery paradox does not appear, and ratings of satisfaction, word of
mouth, and repurchase intention remain lower after service recovery compared to
before service failure. It is suggested that the variation in the findings are due to the
severity of service failure (Gruber and Frugone, 2011; Weun et al., 2004).
Table 2.10 Studies Investigating Service Recovery Paradox
Studies
Service recovery Paradox with respect to
Paradox occurrence
Corp
ora
te
Imag
e
Em
otio
ns
Loyalty
Repurc
hase
Inte
ntio
n
Satisfa
ctio
n
Word
of
mouth
Boshoff, 1997 X Yes
Smith and Bolton, 1998 X X Yes
Tax et al., 1998 X Yes
McCollough, 2000 X No
Andreassen, 2001 X X No
Maxham III, 2001 X X X No
Maxham III and Netemeyer, 2002 X Yes
Weun et al., 2004 X Yes
Hocutt et al., 2006 X Yes
Kau and Wan‐Yiun Loh, 2006 X No
Voorhees et al., 2006 X Yes
Magnini et al., 2007 X Yes
Ok et al., 2007 X Yes
Ringberg et al., 2007 X Yes
Michel and Meuter, 2008 X Yes
Du et al., 2011 X No
Lin et al., 2011 X X X No
Singhal et al., 2013 X Yes
Heidenreich et al., 2015 X Yes
Weitzl and Hutzinger, 2017 X Yes
Soares et al., 2017 X Yes
Azemi et al., 2019 X Yes

61
2.5 Brand equity
Firms are competing viciously (Lappeman et al., 2020) to gain a competitive
advantage and a healthy financial position; consequently, branding has risen as a
central approach for service brand managers (Girard et al., 2017). Brands are the
most valuable treasure nowadays, so the firms prioritise developing strong brands
and improving their value (Moise et al., 2019). The need for a key marketing
performance indicator is critical, which is brand equity in this case (Christodoulides
et al., 2015). The race of achieving high brand equity is continuing because brand
equity drives a firm towards business success by gaining a sustainable competitive
advantage and a healthy financial position (Chatzipanagiotou et al., 2016; Ou et al.,
2020).
Over the past 30 years, brand equity has emerged to be a significant area in
branding among academics because of its various benefits to firms and to
consumers (Aaker, 1991; Baalbaki and Guzmán, 2016; Chatzipanagiotou et al.,
2016; Christodoulides and de Chernatony, 2010; Farquhar, 1989; Keller, 1993;
Veloutsou et al., 2020; Yoo and Donthu, 2001). The concept gained prominence in
the late 1980s after Farquhar (1989, p.24) explained brand equity as “added value
with which a given brand endows a product”. Since then, numerous researchers
have documented brand equity as a source of several benefits for brands and
consumers. For example, brands with high brand equity can gain price premiums
from the customers (Keller, 1993; Rambocas et al., 2018), have higher market share
(Agarwal and Rao, 1996), secure cash flows and competitive advantage
(Christodoulides et al., 2015; Moise et al., 2019), create obstacles for competition
to enter a market (Baalbaki and Guzmán, 2016; González-Mansilla et al., 2019)
resulting in a higher long-term and short-term performance (Christodoulides and de
Chernatony, 2010), allow customers to make confident purchase decisions (Aaker,
1996), gain lifetime value (Stahl et al., 2012) and help consumers in the information
processing during the pre-purchase evaluation of products or services (French and
Smith, 2013; Yang, Sonmez, et al., 2019). Clearly, brands with high brand equity
are beneficial for all parties involved.
According to Christodoulides et al. (2006), brand equity is also significant for
services where customers seek intangible benefits. Specifically, the level of
perceived risks in service purchase is high because service failures are inevitable
62
within the service industry. Within service recovery literature, brand equity is shown
to play a buffering role in reducing these perceived risks (Hogreve et al., 2019).
Brady et al. (2008) found that, in cases of service failure followed by a service
recovery, firms with high brand equity show more favourable consumer outcomes
than firms having low brand equity. Brand equity has also been investigated as a
moderator between service recovery and various consumer outcomes. For
example, Huang (2011) investigated the moderating role of brand equity within the
service recovery framework and found that firms with high brand equity have an
overall advantage over firms having low brand equity to increase recovery
satisfaction and behavioural intentions after service recovery. More recently, Hazée
et al. (2017) suggest that brand equity plays a moderating role in the direct
relationship of co-creating a service recovery and outcome favorability. The
influential effect is visible because the Brand equity of a service provider builds on
customers' perceptions of service quality and can be seen as customers' differential
reaction to a specific brand owing to brand knowledge (Harun et al., 2019).
Therefore, it is evident from extant research that brand equity is equally important
in the service industry.
2.5.1 Perspectives of brand equity
Brand equity has been analysed from a variety of perspectives. For example,
common perspectives include; financial perspective(Lim et al., 2020; Schultz, 2016;
Simon and Sullivan, 1993), employee perspective (King and Grace, 2010; Lee et
al., 2019; Poulis and Wisker, 2016), employer perspective (Benraiss-Noailles and
Viot, 2020; Jiang and Iles, 2011; Theurer et al., 2018) and consumer perspective
(Baalbaki and Guzmán, 2016; Chatzipanagiotou et al., 2019; Christodoulides and
de Chernatony, 2010; Veloutsou et al., 2020; Yoo and Donthu, 2001). The
segregation of the perspectives is based on the viewpoint’s of different entities
involved (firm, consumer, employee and employer) and benefits yielded from brand
equity (See table 2.11).
The first perspective relates to the financial value generated by the brand equity to
the firm and is termed as Financial-Based Brand Equity (FBBE) (Wang, 2010). In
accounting terms, brand equity results from the difference between a firm’s tangible
asset value and a firm’s financial market value (Simon and Sullivan, 1993). This
perspective is inclined towards estimating the brand value for accounting purposes
63
(Tuominen, 1999). It also characterises brand equity as a source of future profits or
cash flows gained through different marketing efforts (Ambler, 2003). FBBE
considers its financial market value to measure its brand strength (Lim et al., 2020).
However, financial valuation is the forecast which can be volatile (Feldwick, 1996).
Although FBBE is inclined to estimate the brand value for accounting purposes
(Tuominen, 1999), a limitation of this perspective is that it does not consider
intangible assets such as human resources while measuring the brand's financial
value (Baalbaki and Guzmán, 2016).
The second perspective is known as Employee-based brand equity, which
considers the importance of human resources. This perspective emphasises that
role of employees cannot be neglected as a driver of brand success because
employees are part of stakeholder groups (Supornpraditchai et al., 2007). It is
explained as the brand's added value to a firm in terms of its employees' positive
attitudes and behaviours (King et al., 2012). Employee based brand equity is
essential nowadays because organizations have gone beyond using only
instrumental attributes of a job for organizational attraction because nowadays, the
firm attraction is predicted by perceived innovations and competence (Poulis and
Wisker, 2016). Therefore, to ensure that employees carry out their tasks
successfully and follow the firms’ requirements, the firms need to instil effective
internal brand management and build employee-based brand equity (Boukis and
Christodoulides, 2020; King and Grace, 2010).
The third perspective relates to employer branding. Firms consider employer
branding as an effective tool to acquire and retain employees (Biswas and Suar,
2016). In this regard, associations and awareness of current and potential
employees towards the employer brand is considered as Employer Brand Equity
(Biswas and Suar, 2016). Employer-based brand equity is essential to communicate
a firm's offerings to its current and potential employees (Theurer et al., 2018). The
three main benefits sought through employer-based brand equity include promoting
the firm as a distinctive employer among its competition in front of potential
employees, improving employees’ engagement, and retaining the talent pool (Jiang
and Iles, 2011). The trio: i) Level of awareness, ii) overall beliefs or opinions held by
public and, iii) actual perceptions held by the public, impact employer brand equity
and leads to organizational attractiveness as an outcome (Theurer et al., 2018).

64
Finally, the fourth perspective of brand equity is from the consumers’ perspective
(Jiao et al., 2018). This perspective takes the roots of cognitive psychology and
explains brand equity in terms of the value of a brand held in consumers’ minds,
commonly known as consumer-based brand equity (CBBE) (Krautz, 2017). The
occurrence of CBBE is identified with the presence of positive attitudes, favourable
behaviours, strong brand awareness and associations, which further result in
strengthening the earning power of a brand (Christodoulides and de Chernatony,
2010). These determinants are shaped with the help of customer experiences with
the brand over time (Mohan et al., 2017). In other words, this perspective reflects
that the power of the brand resides in consumers' minds, and its understanding from
consumers’ point of view will enrich the firms to develop successful marketing
activities (Stahl et al., 2012).
Among the four perspectives of brand equity, the most researched perspective in
the branding literature is consumer-based brand equity (Alvarado-Karste and
Guzmán, 2020). Although all brand equity perspectives have relevance and are
complementary to each other, consumer-based brand equity is the most common
indicator of brand equity (Veloutsou et al., 2020). The perspectives of brand equity
differ in their scope and benefits (Baalbaki and Guzmán, 2016). For example,
consumer-based brand equity depicts the strength of the brands in consumers'
minds which allows the firms to charge premium prices, gain a competitive
advantage and increase customer retention (Moise et al., 2019; Rambocas et al.,
2018). In contrast, the scope of employee-based brand equity and employer-based
brand equity is limited to its current and potential employees’ response towards the
firm's internal marketing or towards the firm as a beneficial place to work (Biswas
and Suar, 2016; King et al., 2012). Similarly, financial-based brand equity represents
the financial value of a brand, which is usually used in accounting by financial
accountants. Keeping in view that different stakeholders contribute to shaping the
brand's value, the primary source of brand equity is the consumer (Mohan et al.,
2017). Therefore, CBBE is relevant in most investigations where the purpose is to
examine how the consumers’ perceptions, associations, attitudes and behaviours
impact brand equity.
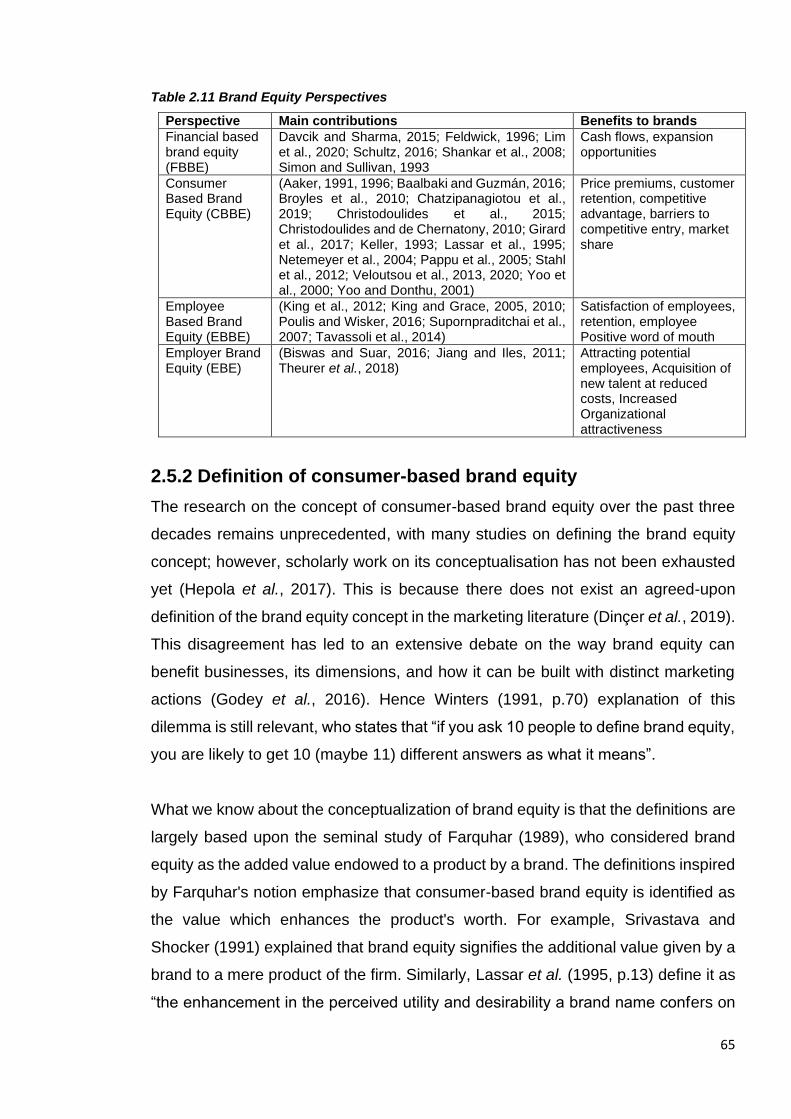
65
Table 2.11 Brand Equity Perspectives
Perspective Main contributions Benefits to brands
Financial based brand equity (FBBE)
Davcik and Sharma, 2015; Feldwick, 1996; Lim et al., 2020; Schultz, 2016; Shankar et al., 2008; Simon and Sullivan, 1993
Cash flows, expansion opportunities
Consumer Based Brand Equity (CBBE)
(Aaker, 1991, 1996; Baalbaki and Guzmán, 2016; Broyles et al., 2010; Chatzipanagiotou et al., 2019; Christodoulides et al., 2015; Christodoulides and de Chernatony, 2010; Girard et al., 2017; Keller, 1993; Lassar et al., 1995; Netemeyer et al., 2004; Pappu et al., 2005; Stahl et al., 2012; Veloutsou et al., 2013, 2020; Yoo et al., 2000; Yoo and Donthu, 2001)
Price premiums, customer retention, competitive advantage, barriers to competitive entry, market share
Employee Based Brand Equity (EBBE)
(King et al., 2012; King and Grace, 2005, 2010; Poulis and Wisker, 2016; Supornpraditchai et al., 2007; Tavassoli et al., 2014)
Satisfaction of employees, retention, employee Positive word of mouth
Employer Brand Equity (EBE)
(Biswas and Suar, 2016; Jiang and Iles, 2011; Theurer et al., 2018)
Attracting potential employees, Acquisition of new talent at reduced costs, Increased Organizational attractiveness
2.5.2 Definition of consumer-based brand equity
The research on the concept of consumer-based brand equity over the past three
decades remains unprecedented, with many studies on defining the brand equity
concept; however, scholarly work on its conceptualisation has not been exhausted
yet (Hepola et al., 2017). This is because there does not exist an agreed-upon
definition of the brand equity concept in the marketing literature (Dinçer et al., 2019).
This disagreement has led to an extensive debate on the way brand equity can
benefit businesses, its dimensions, and how it can be built with distinct marketing
actions (Godey et al., 2016). Hence Winters (1991, p.70) explanation of this
dilemma is still relevant, who states that “if you ask 10 people to define brand equity,
you are likely to get 10 (maybe 11) different answers as what it means”.
What we know about the conceptualization of brand equity is that the definitions are
largely based upon the seminal study of Farquhar (1989), who considered brand
equity as the added value endowed to a product by a brand. The definitions inspired
by Farquhar's notion emphasize that consumer-based brand equity is identified as
the value which enhances the product's worth. For example, Srivastava and
Shocker (1991) explained that brand equity signifies the additional value given by a
brand to a mere product of the firm. Similarly, Lassar et al. (1995, p.13) define it as
“the enhancement in the perceived utility and desirability a brand name confers on
66
a product”. A more comprehensive definition in this respect states that “the brand
has an economic function, the value of a brand (brand equity) derives from its
capacity to generate an exclusive, positive and prominent meaning in the minds of
a large number of consumers” (Kapferer, 1997, p.25).
Further explanation is included in this notion by mentioning competitors as a
reference point. Such as, Boo et al. (2009, p.220) explained that brand equity is “the
overall utility that customers place in a brand compared to its competitors”. Though
Farquhar's (1989) conceptualisation of brand equity is not only from the perspective
of consumers but also from firm and trade, there is no agreement in the literature as
to whether brand equity refers to the value of the brand itself or the value of the
brand name (Ishaq and Di Maria, 2020). Hence, Farquhar's (1989)
conceptualisation of brand equity is general and abstract.
The principle conceptualizations considered in brand equity literature emerge from
the studies of Aaker (1991) and Keller (1993). Aaker (1991, p.15) defined brand
equity as “a set of brand assets and liabilities linked to a brand, its name and symbol,
that add to or subtract from the value provided by a product or service to a firm
and/or to that firm’s customers”. The assets (brand awareness, brand associations,
perceived quality, brand loyalty, and other proprietary assets) are represented as
the source of long-term competitive advantage because they reflect the value of the
brand and are not easily duplicated (Ruan et al., 2020). Several researchers have
accepted Aaker (1991) conceptualisation by recognising its multi-dimensional
nature and considering it to be directly related to other marketing concepts (Cobb-
Walgren et al., 1995; Foroudi et al., 2018; Jung and Sung, 2008). In an attempt to
further broaden the Aaker (1991) conceptualisation of brand equity, Park and
Srinivasan (1994) defined brand equity as the residual of the difference between
overall consumer’s brand preference and the preference made based on multiple
attributes of the brand over other brands. They elaborated that brand associations
aid brand equity through attribute-based assistance (brand building activities shape
consumers’ preference over other brands) and non-attribute-based assistance
(overall brand preference over other brands). A similar perspective was followed by
Lassar et al. (1995), who concluded that there are five necessary ingredients to be
included while defining brand equity: i) consumer perceptions ii) global value of a
brand which emanates from iii) brand name iv) to be always viewed in relation to
67
competition and v) positive impact of brand equity on the financial health of a brand.
Despite its prevalent acceptance, Aaker (1991) conceptualisation of brand equity
ignores the consumer mental processes that signify strong brand equity.
Brand equity is also defined from a cognitive psychology perspective as Keller
(1993, p.8) defined it as “the differential effect of brand knowledge on consumer
response to the marketing of the brand”. The definition poses that there will be a
difference in consumers' reactions (due to variations in brand knowledge) towards
marketing activities of a brand compared to an unnamed or unknown brand. Recent
scholars who follow Keller's (1993) conceptualization endorse that consumers'
brand knowledge and responses are the main components of brand equity
(Alvarado-Karste and Guzmán, 2020; Biedenbach et al., 2019; Heitmann et al.,
2020). To summarise, Keller (1993) conceptualisation of brand equity highlights the
significance of brand knowledge in the long-run success of a brand.
Some marketing scholars conceptualized brand equity based on Aaker (1991) and
Keller (1993) frameworks. For example, Yoo and Donthu (2001, p.1)“define brand
equity as the difference between consumers’ responses to a focal brand and an
unbranded product when both have the same level of marketing stimuli, and product
attributes”. A key aspect of Yoo and Donthu (2001) conceptualisation of brand
equity explains that the different responses towards a brand may be credited
towards the privilege of having a brand name. Similarly, Vázquez et al. (2002)
illustrate that brand equity is the overall utility, including both: functional utilities
(which fulfil practical needs) and symbolic utilities (emotional evaluation) a
consumer attaches with a brand during consumption. On another occasion, Brady
et al. (2008) stressed that consumers' perceptions are not limited to the mere
familiarity of the brand but having cognitions of the superiority of the brand over
other brands explains brand equity. However, only positive cognitions will help the
brand be considered superior over other brands. This view is also supported by
Broyles et al. (2009), who highlighted that positive interactions of consumers with
the brand develop certain perceptions and attachments, which assist in developing
a value of the brand, which is considered brand equity.
Another viewpoint conceptualises brand equity as the power of the brand through
which a brand enjoys dominance. Mahajan et al. (1994, p.222) define brand equity
68
as “The power that a brand may command in a market by means of its name, symbol
or logo”. The power of the brand also results in improving the financial health of the
firms. For example, more recently, Ishaq and Di Maria (2020) suggest that brand
equity is the power and reputation in the minds of the consumers, which impacts the
brand's financial performance. Chatzipanagiotou et al. (2016) denote the ‘power’ as
the brand's strength, which is indicated by the customer’s repurchase intentions and
overall preference.
Given the definitions discussed above, different conceptualisations hold distinct
expositions of brand equity. Three main groups of definitions can be categorized
based on three critical aspects found in the definitions. First aspect roots in the
information economics perspective that brand equity is the added value given to a
product (Aaker, 1991; Boo et al., 2009; Choi and Seo, 2019; Farquhar, 1989). The
second aspect comes from the roots of cognitive psychology, that consumer-based
brand equity is the differential effect due to the difference in brand knowledge
(Biedenbach et al., 2019; Keller, 1993). The third aspect describes brand equity as
the brand's overall strength, which brings several benefits, like customer retention
and charging price premiums (Ishaq and Di Maria, 2020; Mahajan et al., 1994).
A comprehensive definition is found in the study by Christodoulides and de
Chernatony (2010, p.248). The definition included elements from both economic
utility and cognitive psychology perspectives. They stated that CBBE is “a set of
perceptions, attitudes, knowledge, and behaviours on the part of consumers that
results in increased utility and allows a brand to earn greater volume or greater
margins than it could without the brand name”. Strong brands have high CBBE as
they typically have a high recognition and recall, clear and well-established brand
associations, and strong brand differentiation (Wang and Ding, 2017; Wolter et al.,
2016). Similarly, strong brands evoke strong emotional reactions in customers
(Alvarez and Fournier, 2016) and enjoy high acceptance by the consumers (Wang
and Ding, 2017; Wymer and Casidy, 2019). This is because brands with high CBBE
result in a more positive attitude and behaviours (Chatzipanagiotou et al., 2019).
According to Christodoulides and de Chernatony (2010), brands with high CBBE
affect consumer choices as they tend to be more acceptable to consumers.
Furthermore, consumers are more willing to forgive these brands in case of service
failures; thus, they are less affected by negative incidents (Brady et al., 2008).

69
Overall, there seems to be some evidence to indicate that Christodoulides and de
Chernatony (2010) conceptualisation of CBBE is exhaustive, comprehensive, and
widely recognised.
2.5.3 Brand equity measurement
In recent years, there has been an increasing interest in measuring brand equity
using different perspectives and contexts (Baalbaki and Guzmán, 2016).
Investigating different brand equity measures is a continuing concern within the
marketing domain as brand equity has become part of a set of marketing
performance indicators (Ambler, 2003; Christodoulides and de Chernatony, 2010).
Owing to this, Keller and Lehmann (2006) identified the measurement of brand
equity as an important research topic. Though measuring brand equity is a
challenging task (Brunetti et al., 2019; Christodoulides et al., 2015), recently
scholars have examined the several approaches to CBBE’s measurement, including
direct, indirect, and practitioner approaches (Baalbaki and Guzmán, 2016;
Chatzipanagiotou et al., 2016; Malhotra et al., 1996).
The direct approach attempts to gauge CBBE by examining the actual impact of
brand knowledge on customer preferences (Park and Srinivasan, 1994), utilities
(Erdem and Swait, 1998), or response to different marketing stimuli (Baalbaki and
Guzmán, 2016). On the other hand, the indirect approach operationalises CBBE
through potential sources of CBBE in the form of demonstrable dimensions of CBBE
(Veloutsou et al., 2020) and by identifying and tracking customers’ brand knowledge
structure (Baalbaki and Guzmán, 2016). Specifically, the indirect approach
operationalises CBBE as a multifaceted and multidimensional construct that is
measured through multiple dimensions (Veloutsou et al., 2020).
2.5.3.1 Direct approaches
The direct approach to measure CBBE mainly consists of unidimensional measures
which assess CBBE based on various attributes constituting its meaning (Filieri et
al., 2019). Thus, scholars following the direct approach use a multiattribute
framework to measure CBBE (Jourdan, 2002; Park and Srinivasan, 1994;
Srinivasan, 1979). For instance, Srinivasan (1979) assesses CBBE by comparing
actual choice preferences and consumer preferences measured through conjoint
analysis. However, this method is limited by its ability to provide only segment-level
70
estimates of brand equity that do not reveal brand value sources (Baalbaki and
Guzmán, 2016). Similarly, Park and Srinivasan (1994) used a survey-based method
for capturing CBBE in a product category. They divide brand equity measures into
attribute-based and non-attribute-based components. However, they do not specify
the constituents of the non-attribute-based part of CBBE for deeper understanding
and insight. Park and Srinivasan (1994) measure of CBBE was improved by
Jourdan (2002), who established the construct validity of this measure and used an
experimental design to unravel the role of the error component in the measurement
of CBBE. Though Jourdan (2002) approach has some advantages over earlier direct
measures of CBBE, the complexity of experimental design makes it impractical and
difficult to use.
Several other studies have attempted to measure CBBE using a direct approach
through the information economics paradigm. For example, they are considering the
total utility of brand (Swait et al., 1993), customer surveys and financial measures
(Shankar et al., 2008), or by assessing the additional profit gained by a product
which is branded in comparison to a non-branded product (Ferjani et al., 2009).
Leuthesser et al. (1995) used the methods of ‘partialling out’ and ‘double centering’
to measure CBBE by controlling consumers biased personal evaluations of a brand
on several attributes. Though Leuthesser et al. (1995) direct approach to assessing
CBBE controls consumers’ predispositions, it does not guide the underlying
dimensions of CBBE, is complex, and assesses CBBE on the aggregate level rather
than at the dimension level. Similarly, (Kamakura and Russell (1993) employ a
segment-wise logit model to examine consumers’ actual purchase behaviour by
using real purchase data from supermarket checkout counters to estimate Brand
Value. This measurement is also limited because it only assesses CBBE at an
aggregate level using available scanner data.
2.5.3.2 Indirect approaches
Indirect approaches to the measurement of CBBE take an overall picture of the
brand and assess CBBE through multiple dimensions and/or behavioural outcomes
(Christodoulides et al., 2015). Most authors that have adopted the indirect approach
have developed scales to capture CBBE at different levels and in different contexts
(Baalbaki and Guzmán, 2016; de Chernatony et al., 2004; Christodoulides et al.,
2006; Filieri et al., 2019; Lassar et al., 1995; Nath and Bawa, 2011; Vázquez et al.,

71
2002; Yoo and Donthu, 2001). Adopting an indirect approach stems from the fact
that it operationalises CBBE through its demonstrable facets and offers more
guidance to practitioners (Christodoulides and de Chernatony, 2010; Veloutsou et
al., 2020), and works better for diagnosing brand health (Chatzipanagiotou et al.,
2016).
Much of the current studies that use the indirect approach follow Aaker (1991)
operationalisation of CBBE, which identifies brand loyalty, brand awareness, brand
association, and perceived quality as key facets of CBBE (Buil et al., 2008;
Christodoulides et al., 2015; Marques et al., 2020; Pappu et al., 2005; Washburn
and Plank, 2002). Traditionally, it has been argued that Aaker (1991) CBBE
dimensions give the idea that the better the brand knowledge in consumers’
memory, the favourable will be the consumer behaviour towards the brand, which
will lead to higher brand equity. Following this premise, brand awareness which is
the consumers’ ability to recognise and recall a brand, represents the key dimension
of CBBE (Marques et al., 2020). On the other hand, the brand association dimension
of CBBE constitutes the way people think about a brand abstractly (Vogel et al.,
2019). Similarly, the perceived quality dimension of CBBE reflects consumers’
evaluations of the product’s features and performance (Brunetti et al., 2019; Filieri
et al., 2019; Muniz et al., 2019). Finally, the brand loyalty dimension of CBBE
manifests consumers’ attachment to and intention to repurchase the same brand
(Liu and Jiang, 2020; Retamosa et al., 2019). Though Aaker (1991) dimensions of
CBBE have been subsequently operationalised by different scholars (Nath and
Bawa, 2011; Pappu et al., 2005; Yoo and Donthu, 2001) in different contexts (de
Chernatony et al., 2004), they are not void of criticism (Christodoulides et al., 2015).
The literature suggests modifications in the structure of CBBE with regards to its
dimensions. For example, Lassar et al. (1995) used survey data and proposed five
dimensions of CBBE, including performance, value, social image, trustworthiness
and commitment. However, the operationalisation of CBBE does not include loyalty
as a dimension which is a behavioural facet of CBBE. On the other hand, Vázquez
et al. (2002) developed a scale of CBBE that consists of four basic dimensions,
including product functional utility, product symbolic utility, brand name functional
utility and brand name symbolic utility. This operationalisation is further improved by
Kocak et al. (2007) using a sample of Turkish consumers. They modified the scale

72
and reduced the number of items from 22 to 16 as appropriate for a different cultural
setting.
Some scholars have attempted to formulate CBBE measurement with respect to the
specific context. To illustrate, de Chernatony et al. (2004) developed a CBBE scale
using 600 consumers of financial services brands and identified satisfaction, loyalty
and reputation as dimensions of CBBE. Later, Christodoulides et al. (2006) measure
CBBE in an online context and investigate the ways that the Internet has enabled
consumers to become co-creators of brand value. Boo et al. (2009) mentioned that
evaluating a tourist brand is a complex phenomenon; hence they put forward a
model of CBBE suitable for tourist destinations. They used destination brand
awareness, destination brand image, destination brand loyalty, destination brand
quality and destination brand value to measure CBBE.
A broader perspective has been adopted by Yoo and Donthu (2001), who argue that
CBBE can be measured with both the unidimensional (direct) measure and
multidimensional measure. They developed a multi-dimensional measure of CBBE
that draws on the theoretical dimensions of CBBE proposed by Aaker (1991) and
Keller (1993). Yoo and Donthu (2001) CBBE scale consisted of dimensions,
including brand awareness/associations, perceived quality, and brand loyalty. They
further proposed a 4-item unidimensional measure of CBBE, which they termed as
“overall brand equity”. Their scale has several advantages over the predecessors,
such as a culturally valid scale applicable to various product categories, with greater
parsimony and ease of administration.
Considering the fragmentation of dimensionality and measurement of CBBE,
Veloutsou et al. (2013) suggested multiple measures to capture CBBE, which can
be summed up in four broad categories, i) Consumers’ understanding of brand
characteristics (Awareness, Associations, Strong and Distinct personality, Heritage)
ii) consumers’ affective response towards the brand (Consumer-brand relationships,
Brand identification, Trust) iii) Consumers’ brand evaluation (Reputation,
Leadership, Quality, Uniqueness (or differentiation), Relevance) and iv) Consumers’
behaviour towards the brand (Willing to pay a price premium, Willingness to
sacrifice, Word-of-mouth (WOM) recommendation, Brand usage, Acceptance of
brand extensions). Furthermore, they indicated that while measuring CBBE,
73
managers may pick and choose measures from each of the four categories
according to their suitability because measuring CBBE through every dimension is
impracticable. In the same vein, Chatzipanagiotou et al. (2016) asserted that CBBE
is an evolving process rather than a static construct. In the pursuit of their claim,
they used complexity and configural theory to decode the complexity of the CBBE
process and summarised that this dynamic process consists of three blocks,
namely, i) Brand building (Imagery aspects –Brand heritage, brand nostalgic, brand
personality | Functional aspects – Perceived quality, brand competitive advantage,
brand leadership) ii) Brand understanding (awareness, associations, reputation,
and self-connection) and iii) Brand relationships (Brand trust, Brand intimacy, Brand
Relevance, Brand partner Quality).
More recently, scholars acknowledge the need to develop new scales which are
robust and not reliant on traditional approaches to measuring CBBE. For example,
Baalbaki and Guzmán (2016) contributed to the literature with a new scale of CBBE,
which constitutes brand preference, quality, sustainability and social influence.
According to them, the set of 4 dimensions is more accurate and robust in measuring
CBBE, and it assists the firms in comprehending consumers’ perceptions towards
the brand. Similarly, Filieri et al. (2019) developed a “culturally contextualized” scale
to measure brand equity and found ‘brand mianzi’ as a new dimension along with
awareness, perceived quality and brand loyalty. According to Filieri et al. (2019,
p.381), brand mianzi “implies consciousness of glory and shame, and it represents
the reputation of an individual’s reputation and social position in others’ eyes”.They
consider it as the second most important dimension after brand loyalty in the context
of Chinese culture. Clearly, to date, scholars have little agreement with respect to
specific dimensions while capturing CBBE. Table 2.12 presents a list of various
dimensions which are considered to capture CBBE.

74
Table 2.12 Dimensions used in brand equity literature
Dimensions Studies
Quantitative / Mixed method Developed Scale Conceptual
Administrative staff Retamosa et al., 2019
Attachment Lassar et al., 1995
Attribute-based brand equity Park and Srinivasan, 1994
Brand associations Atilgan et al., 2009; Buil et al., 2008; Cobb-Walgren et al., 1995; Girard et al., 2017; Jung and Sung, 2008; Marques et al., 2020; Park and Srinivasan, 1994; Shekhar Kumar et al., 2013; Vogel et al., 2019; Washburn and Plank, 2002
Nath and Bawa, 2011; Pappu et al., 2005; Yoo and Donthu, 2001
Aaker, 1991; Keller, 1993
Brand Attitude Im et al., 2012
Brand awareness Atilgan et al., 2009; Brunetti et al., 2019; Buil et al., 2008; Cobb-Walgren et al., 1995; Davis et al., 2009; Filieri et al., 2019; Im et al., 2012; Jung and Sung, 2008; Kayaman and Arasli, 2007; Kim and Kim, 2004; Kimpakorn and Tocquer, 2010; Lin and Chung, 2019; Liu et al., 2020, 2017; Marques et al., 2020; Muniz et al., 2019; Rios and Riquelme, 2008; Šerić et al., 2017; Shekhar Kumar et al., 2013; Vogel et al., 2019; Washburn and Plank, 2002
Filieri et al., 2019; Pappu et al., 2005; Yoo and Donthu, 2001
Aaker, 1991; Berry, 2000; Keller, 1993
Brand familiarity Rego et al., 2009 Nath and Bawa, 2011
Brand image Brunetti et al., 2019; Davis et al., 2009; Im et al., 2012; Kayaman and Arasli, 2007; Kim and Kim, 2004; Lin and Chung, 2019; Liu, Zhang, et al., 2020; Liu et al., 2017; Muniz et al., 2019; Retamosa et al., 2019; Vogel et al., 2019
Brand intangible value Kamakura and Russell, 1993
Brand Loyalty Atilgan et al., 2009; Brunetti et al., 2019; Buil et al., 2008; Camarero et al., 2012; Im et al., 2012; Jung and Sung, 2008; Kayaman and Arasli, 2007; Kim and Kim, 2004; Kumar et al., 2013; Lin and Chung, 2019; Liu, Zhang, et al., 2020; Liu et al., 2017; Muniz et al., 2019; Retamosa et al., 2019; Rios and Riquelme, 2008; Vogel et al., 2019; Washburn and Plank, 2002
de Chernatony et al., 2004; Filieri et al., 2019; Nath and Bawa, 2011; Yoo and Donthu, 2001
Brand Meaning Berry, 2000
Brand name utility Kocak et al., 2007 Vázquez et al., 2002

75
Dimensions Studies
Quantitative / Mixed method Developed Scale Conceptual
Brand performance Lassar et al., 1995
Brand personality Buil et al., 2008; Retamosa et al., 2019
Brand recognition Camarero et al., 2012
Brand trust Atilgan et al., 2009; Kimpakorn and Tocquer, 2010; Retamosa et al., 2019; Rios and Riquelme, 2008; Shekhar Kumar et al., 2013
Christodoulides et al., 2006 Blackston, 1992
Community Retamosa et al., 2019
Differentiation, Kimpakorn and Tocquer, 2010
Emotional connection Christodoulides et al., 2006
Facilities and equipment Retamosa et al., 2019
Fulfilment Christodoulides et al., 2006
Imagery Broyles et al., 2010
Mianzi Filieri et al., 2019
Non-attribute based brand equity
Park and Srinivasan, 1994
Online experience Christodoulides et al., 2006
Organisational associations (Buil et al., 2008)
Perceived quality Atilgan et al., 2009; Broyles et al., 2010; Brunetti et al., 2019; Buil et al., 2008; Cobb-Walgren et al., 1995; Im et al., 2012; Jung and Sung, 2008; Kamakura and Russell, 1993; Kayaman and Arasli, 2007; Kim and Kim, 2004; Kimpakorn and Tocquer, 2010; Liu et al., 2017; Marques et al., 2020; Muniz et al., 2019; Rego et al., 2009; Shekhar Kumar et al., 2013; Vogel et al., 2019; Washburn and Plank, 2002
Baalbaki and Guzmán, 2016; Filieri et al., 2019; Nath and Bawa, 2011; Netemeyer et al., 2004; Pappu et al., 2005; Yoo and Donthu, 2001
Aaker, 1991
Perceived performance Broyles et al., 2010
Perceived value / perceived value for the cost
Buil et al., 2008; Camarero et al., 2012; Rios and Riquelme, 2008 Netemeyer et al., 2004
Preference Baalbaki and Guzmán, 2016
Product utility Kocak et al., 2007 Vázquez et al., 2002
Purchase consideration Rego et al., 2009
Reputation de Chernatony et al., 2004
Resonance Broyles et al., 2010

76
Dimensions Studies
Quantitative / Mixed method Developed Scale Conceptual
Responsive service nature Christodoulides et al., 2006
Satisfaction de Chernatony et al., 2004 Blackston, 1992
Service quality Gil-Saura et al., 2017
Shared values Retamosa et al., 2019
Social image Lassar et al., 1995
Social influence Baalbaki and Guzmán, 2016
Study programme Retamosa et al., 2019
Sustainability Baalbaki and Guzmán, 2016
Teaching staff Retamosa et al., 2019
Trustworthiness Lassar et al., 1995
Uniqueness Camarero et al., 2012; Rego et al., 2009 Netemeyer et al., 2004
Willingness to pay a price premium for a brand
Netemeyer et al., 2004

77
2.6 Gaps and research questions
2.6.1 Gap: 1 Dimensions of CBBE which tend to fluctuate within
service failure and recovery process
The first gap stems from the confusion about the dimensions of CBBE. In the past
two decades, several studies have sought to determine the dimensions that capture
CBBE. These studies exposit several facets as dimensions of CBBE, such as brand
awareness, loyalty, brand associations, brand image, perceived quality, and so forth
(see Table 2.12). To date, there has been little agreement on the dimensionality of
CBBE (Veloutsou et al., 2013). The research related to different contexts and having
different investigation objectives have measured CBBE with varying dimensions.
This is because the dimensions of CBBE may vary with the context. However,
previous research does not indicate a suitable set of dimensions of CBBE which
tend to fluctuate (the consumer assessment levels of dimensions, decline after a
service failure, and improve after service recovery) within the service failure and
recovery process. Though the early research has examined the effect of service
failure on branding outcomes such as; brand image (Sajtos et al., 2010),
dissatisfaction (Hess, 2008; Suri et al., 2019), brand trust (Basso and Pizzutti, 2016;
Weun et al., 2004) and brand loyalty (Cantor and Li, 2019; Kamble and Walvekar,
2019). Similarly, studies have examined the impact of service recovery on brand
loyalty (Choi and Choi, 2014; Gohary, Hamzelu and Alizadeh, 2016; Urueña and
Hidalgo, 2016), brand trust (Busser and Shulga, 2019; Mohd-Any et al., 2019; Tax
et al., 1998) and image (Mostafa et al., 2015). it has not investigated the effect of
service recovery on the dimensions of CBBE that tend to fluctuate in the service
failure and recovery process. Therefore, the evidence warrants developing a holistic
model to investigate the impact of service failure and recovery on CBBE, including
the dimensions of CBBE which tend to fluctuate within service failure and recovery
process. The first research question generated from this research gap is:
RQ1: What are the dimensions of CBBE which tend to fluctuate within the
context of service failure and recovery?
2.6.2 Gap:2 Service recovery and post-recovery outcomes
Second, the analysis of extant literature reveals that limited efforts have been made
in connecting service recovery and CBBE research. For example, investigators have
78
examined the role of brand equity as a mediator (Harun et al., 2019), as a driver of
evaluations of service encounters (Brady et al., 2008), and as a buffer in case of
service failure (Hogreve et al., 2019). Other studies have examined the moderating
role of brand equity between service recovery and post-recovery outcomes, such as
recovery satisfaction, behavioural outcomes (Huang, 2011), and outcome
favourability (Hazée et al., 2017). What is not yet clear is the impact of service
recovery on brand equity, as no previous study has investigated CBBE as an
outcome of service recovery. Brand equity is one of the key indicators of brand
health (Aaker, 1991), which can help in attaining several benefits for a firm, such as;
gaining price premiums from the customers, acquiring higher market share,
securing cash flows and attaining competitive advantage (Agarwal and Rao, 1996;
Christodoulides et al., 2015; Keller, 1993; Moise et al., 2019; Rambocas et al.,
2018). Investigating the impact of service recovery on CBBE will allow firms in
understanding the return on service recovery expenditures in terms of their positive
impact on CBBE.
Within service recovery literature, the majority of the research focused on examining
the impact of firm-recovery on post-recovery outcomes (Mostafa et al., 2015; del
Río-Lanza et al., 2009; Smith et al., 1999; You et al., 2020), whereas customers’
participation in service recovery has largely been ignored (Hazée et al., 2017). While
marketing scholars have been studying service recovery issues for the past three
decades (Khamitov et al., 2020), customers’ participation in service recovery has
emerged as a new research stream only recently. Though the research on customer
participation in service recovery is growing, the current literature is dominated by
two theoretical issues. Firstly, the findings regarding the effectiveness of customer
participation are mixed (Dong et al., 2008; Jin et al., 2019; Kim and Baker, 2020a;
Park and Ha, 2016). Secondly, much uncertainty still exists about the relationship
of customers’ participation in service recovery with CBBE, which restrains the
marketers in involving customers in service recovery initiatives. The formulated
research question to fill this gap is:
RQ2: What is the impact of service recovery (Firm recovery and Customer
Participation in Service Recovery) on post-recovery outcomes?
79
2.6.3 Gap: 3 Mediating role of perceived justice
Third, perceived justice is increasingly recognised as a key mediatory between
service recovery actions and their outcomes (Liao, 2007; Smith et al., 1999; Yani-
de-Soriano et al., 2019). Individuals feeling that they are treated with respect,
dignity, and sensitivity as a result of service recovery constitute perceived justice
(Colquitt, 2001). These feelings act as a litmus test of successful service recovery
(Waqas et al., 2014). Although some research has been carried out on the mediating
role of perceived justice (Yani-de-Soriano et al., 2019), there is no examination of
the intervening effect of perceived justice between service recovery and CBBE.
Examining the mediating role of perceived justice is important as it underlies the
determination of when service recovery improves evaluations (Mostafa et al., 2015).
Extant research suggests that perceived justice is the most powerful predictor of
satisfaction and other outcomes with service recovery (Van Vaerenbergh et al.,
2019). When consumers receive a recovery, they view; the outcomes, recovery
process, and interaction with employees as more just (Morgeson III et al., 2020). If
service firms can enhance the perceptions of justice, consumers would believe that
the outcome of service recovery is fair (Harun et al., 2019). The perception of
fairness will further result in positive outcomes, including recovery satisfaction
(Albrecht et al., 2019; Smith et al., 1999), customer trust (Busser and Shulga, 2019;
Tax et al., 1998), and customer loyalty (Choi and Choi, 2014; Etemad-Sajadi and
Bohrer, 2019), corporate image (Mostafa et al., 2015), word of mouth (Migacz et al.,
2018) and repurchase intentions (Bae et al., 2020; Maxham III and Netemeyer,
2002; Muhammad and Gul-E-Rana, 2020). Despite the plethora of studies on the
mediating role of perceived justice, little is known about the intervening role of
perceived justice between service recovery and CBBE. Hence, the third research
question of this thesis is as follows:
RQ3: What is the mediating role of perceived justice between service recovery
and CBBE?
2.6.4 Gap:4 Moderating role of service failure severity
Although service failure severity is utilised as a critical influencing factor in the
relationship between firm recovery and post-recovery outcomes (Choi and Choi,
2014; La and Choi, 2019; Magnini et al., 2007; Weun et al., 2004), very little
80
evidence is found in relation to its utilisation as a moderating factor in the
relationships between customer participation in service recovery and post-recovery
outcomes (Roggeveen et al., 2012). Also, in conjunction with the fact that there is
no single study available which has investigated the impact of service recovery on
consumer-based brand equity, the moderating role of service failure severity stands
missing by default.
The identification of the moderating role of service failure severity becomes
imperative because varying levels of the intensity of the service failure severity may
influence customer evaluation of the service recovery process (Choi and Choi,
2014). Also, service failure severity influences how the customers assess the
service brand after receiving service recovery. For instance, a service failure with
high severity is often responsible for customer dissatisfaction with the brand, even
in the presence of service recovery (La and Choi, 2019). Therefore the role of
service failure severity in service recovery frameworks is significant. This suggests
the fourth research question of the study:
RQ4: What is the moderating role of service failure severity in the
relationships of service recovery with post-recovery outcomes?
2.6.5 Gap:5 Service recovery Paradox
Studies of service failure and recovery show the importance of examining the
phenomenon of service recovery paradox (Andreassen, 2001; Hocutt et al., 2006;
Michel and Meuter, 2008; Soares et al., 2017). To illustrate, the service recovery
paradox builds on the idea that a good service recovery will reap more benefits or
positive outcomes than if the service failure had never occurred (Weitzl and
Hutzinger, 2017). The literature on the service recovery paradox reveals two critical
issues. Firstly, the findings concerning the occurrence of the service recovery
paradox are mixed, as illustrated in table 2.10. Secondly, studies have largely
remained in finding out the occurrence of paradox concerning customer satisfaction
(Azemi et al., 2019; Michel and Meuter, 2008; Tax et al., 1998). On a few occasions,
the service recovery paradox has been investigated concerning Loyalty (Smith and
Bolton, 2002; Weitzl and Hutzinger, 2017), Image (Andreassen, 2001), repurchase
intentions (Soares et al., 2017; Voorhees et al., 2006).
81
Systematic research into the existence of the service recovery paradox concerning
dimensions of CBBE such as brand trust, brand reputation and so forth is still
warranted. Thus, a lack of research on the service recovery paradox for brand-
related outcomes warrants examining brand-related outcomes before a service
failure and after service recovery. This will show if customers exhibit higher ratings
of brand-related outcomes after a service failure is successfully rectified than before
the failure occurred. This poses the fifth research question, which is:
RQ5: Which dimensions of CBBE produce service recovery paradox?
2.7 Summary This chapter has reviewed the key topics of service failure, service recovery
(including firm recovery and customer participation in service recovery), and brand
equity, critical to the current thesis. It has discussed different typologies of service
failure, which prompt the service firms to initiate service recovery.
Variation in service failure typologies warranted an in-depth review of the literature
to identify the most appropriate and acceptable categorisation of service failure.
Further, it was revealed that service firms take several recovery actions to address
service failures. Among several service recovery actions, apology and
compensation are considered the most common adopted service recovery
strategies. The analysis revealed that service recovery literature had focused more
on investigating firm recovery, whereas customer participation in service recovery
is considerably a new avenue within service recovery literature and has mixed
findings.
The literature review confirmed that findings related to the concept of service
recovery paradox are best mixed and mostly utilised satisfaction as the subject of
recovery paradox. Finally, service failure severity is considered as a key moderator
within service recovery frameworks.
This chapter also presented that the concept of brand equity is well recognized
among marketing researchers but still hold disagreements regarding its
conceptualization and dimensions of Consumer-based brand equity. Also, it was
revealed that few attempts are made in connecting service recovery and consumer-
82
based brand equity. Finally, the literature analysis review helped the researcher
identify research gaps, which then generated five main research questions to be
addressed.

83
Chapter 3 Analytical Approach
3.1 Introduction
This chapter includes the overall plan of the methodology, which was adopted to
collect primary data develop the conceptual framework and answer the formulated
research questions. The chapter begins with the overarching system of beliefs
(research paradigm) reflected in every aspect of the chosen methodology. The
philosophical stance of the researcher is described and justified under the section
of the research paradigm. Following the research paradigm, this chapter describes
the overall research design of the current research, which delineates the required
methods of primary data collection. In the end, the chapter summary is explained.
3.2 The Research Paradigm
A research paradigm is understood as a pattern, a set of standards, a framework, a
worldview, philosophical stance by various authors. For example, Kuhn (1977)
suggested that a research paradigm is a pattern that may include several concepts,
variables and methodological approaches to investigate the solutions to a problem.
According to Chalmers (1982, p.90), “the paradigm sets the standards for legitimate
work within the science it governs”. Similarly, Guba and Lincoln (1994, p.105)
described it as “a basic system or worldview that guides the investigator”. The
worldview or framework constitutes shared beliefs and assumptions of conducting
research held by the community of researchers.
In order to situate the current study within a research paradigm, it is pertinent to
comprehend the composition of a research paradigm and its types. Guba and
Lincoln (1994) explained that the nature of a research paradigm is well understood
with the help of the investigator’s answers, regarding; i) Ontology (the nature of
reality, existence or being), ii) Epistemology (the relationship between the
investigator and what can be investigated), iii) Axiology (role of ethical and aesthetic
values) and iv) Methodology (the plan of investigation which a researcher believes
can be investigated) of a research paradigm. Hence, the differentiation among
research paradigms is based on the different nature of its elements.

84
Research pertinent to philosophy entails varying types of research paradigms such
that there is no consensus on an agreed set (Burrell and Morgan, 1979; Creswell
and Creswell, 2018; Denzin and Lincoln, 2011; Guba, 1990; Guba and Lincoln,
1994). For instance, Guba and Lincoln (1994) depicted four competing paradigms:
Positivism, Post-positivism, Critical theory, and Constructivism. Denzin and Lincoln
(2011) complemented the categorisation by presenting participatory research as a
fifth research paradigm. Creswell and Creswell (2018) highlighted Positivism,
Constructivism, transformative and pragmatism as significant. Although there is no
agreement, management researchers primarily acknowledge four research
paradigms, i) positivism, ii) post-positivism (critical realism), iii) interpretivism, and
iv) pragmatism (Wahyuni, 2012). The difference among paradigms is usually
identified with the help of different ontological and epistemological stances
(Saunders et al., 2019)
The current research project adopted a pragmatic worldview that originated from the
work done in the late 19th century by Charles sanders pierce, William James and
John Dewey. Pragmatism “arises out of actions, situations and consequences
rather than antecedent conditions (as in post-positivism)” (Creswell and Creswell,
2018, p.11). Although pragmatism does not appreciate the traditional way of
understanding the philosophical view through ontological and epistemological
stances as other paradigms do (Morgan, 2014), researchers have outlined the
paradigm by explaining its ontological, epistemological, axiological and
methodological stances. The ontological stance of the current study is that the reality
is viewed as per the appropriate answers to the research questions (Wahyuni,
2012). The epistemological stance is that the legitimacy of the knowledge and
appropriateness of theories are only considered upon successful actions (Saunders
et al., 2019). The axiological assumption of the current study is that values are not
constant but tentative, which may develop as the result of experiences, and an
ethical code of conduct is the one that is suitable for the community at large (Morgan,
2014). Considering that interpretation of reality can be made in different ways, a
pragmatist may adopt a range of methods to provide practical solutions and may
follow any appropriate method to answer the research questions (Saunders et al.,
2019).

85
The nature of this study and its research questions justify the suitability of the
pragmatic philosophical stance. In line with pragmatism, the current research aims
to contribute by providing practical solutions for the practice. The researcher
believes the notion that reality is what works at the time, which contrasts the idea of
duality that reality is independent of an individual’s view and as well as it can be
influenced (Creswell and Creswell, 2018). The researcher holds a flexible approach
to find the answers to the research questions and does not bound the investigation
with a single research method (Saunders et al., 2019). Similar to the notion that “The
pragmatist researchers look to what and how to research based on the intended
consequences where they want to go with it” (Creswell and Creswell, 2018, p.11),
the research questions of this research project reflect that the study is not only
limited to explore (how) new knowledge but also to reveal the objective (what)
knowledge (Morgan, 2014)
Aligned to pragmatism, this study's research questions seek to find a practical
solution to the research problem with an approach of ‘what works well’ (Creswell
and Creswell, 2018). The nature of research questions 2, 3, 4 and 5 was causal
and aimed to reveal external knowledge independent of the researcher’s conscious
awareness (Hair, Bush, et al., 2006). On the other hand, the first research question
seeks to explore the dimensions of consumer-based brand equity, which tend to
fluctuate within the service failure and recovery process. The exploratory aspect
helped to uncover the consumers’ assessment of different aspects of the brand,
whereas explanatory research may produce more objective and generalisable
results which may be suitable for the service managers (Edvardsson et al., 2011).
Therefore, to reach a concrete, practical solution, the notion of what works best
seemed suitable, and a pragmatic research paradigm was chosen to answer the
research questions.
3.3 Exploratory Sequential mixed-method research
design
The current research project adopted a framework or a plan that delineates the
methods, procedures, techniques and steps to gather the required information and
provide a solution to the research questions (Malhotra and Birks, 2007). Several
factors can influence the choice of an appropriate research design, including the

86
purpose of the research, the nature of research questions, and the investigator's
philosophical stance (Blaikie and Priest, 2019; Zikmund and Carr, 2003). An
exploratory sequential mixed-method research design was adopted in the current
case because the researcher was not committed to any single reality and believed
in whatever was appropriate to find answers to the research questions. Within the
mixed methods research design, the researcher has the liberty to utilise quantitative
and qualitative research to answer the research questions (Saunders et al., 2019).
Quantitative and qualitative research is combined in various ways within the mixed-
method design. Exploratory sequential mixed methods design seemed suitable for
current research, which initiated a qualitative phase and is then followed by a
quantitative phase (Creswell and Creswell, 2018). It is useful, to begin with, a
qualitative phase when it is required to gain an insight into the issue and understand
the phenomenon of which the researcher is unsure (Saunders et al., 2019). Given
that there is little agreement on the types and nature of service failure, and not a
single study was found in the literature which identified the dimensions of consumer-
based brand equity which tend to fluctuate within a service failure and recovery
process, it was ideal to begin with, exploratory research. Qualitative research
assisted the researcher in building a conceptual framework that delineated the
causal relationships among constructs by developing hypotheses. Quantitative
research was followed to test the causal relationships and to generalise the findings
to a larger sample of the population (Bell et al., 2018). Thus, a sequence was
followed to elaborate qualitative research findings via implementing a quantitative
phase (Creswell et al., 2007). The illustration of exploratory sequential mixed
method design is in figure 3.1

87
Figure 3.1 Graphical Representation of Research Design
Adapted from : (Creswell and Creswell, 2018)
The exploratory sequential mixed methods design was undertaken for the current
study because it produces robust results compared to a single method (Davis,
2000). As a first step, the qualitative investigation assisted in the identification of
variables relationships and the development of a the conceptual model (Creswell
and Creswell, 2018). In the second step, data was collected to test the proposed
relationships through quantitative examination. The idea of collecting different kinds
of data allowed the researcher to interpret and verify the findings from two different
procedures. Therefore, the accuracy of the findings of a single phenomenon
improved with the execution of mixed methods (Skourtis et al., 2019).
3.3.1 Qualitative research design
A qualitative research design incorporates the purpose of the research, methods of
collecting the data from individuals or groups, analysing and presenting the
interpretative analysis in a meaningful way. Qualitative research adopts a
Qualitative Phase
•The data was collected through semi-structured interviews
•Thematic Analysis was used to analyse the data
•Detailed explanation is found in chapter 4 and 5
Quantitative Phase
•The data was collected through scanerio based experiements
•Factorial ANOVAs, PLS-SEM and Paired sample t-tests were undertaken to analyse the data
•Detailed explanation is found in chapter 7 and 8
Interpretation of Results
•Discussion on:
•The impact of service recovery on the dimennsions of CBBE which tend to fluctuateand perceived justice
•Mediating role of perceived justice
•Moderating role of service failure severity
•Occurence/nonoccurence of service recovery paradox
•Detailed explanation is found in chapter 9
88
naturalistic approach since the aim is to explore, understand and gain insight into
the research problem by building trust and encouraging participation (Saunders et
al., 2019). A collection of empirical material, including observations, personal
experiences, stories, pictures, and words, enriches the researcher's understanding
(Guba and Lincoln, 1994). Qualitative research design may utilise a single or more
than one of the following techniques such as In-depth interviews, semi-structured
interviews, focus groups, observation method, ethnography, netnography etc., to
collect empirical material (Saunders et al., 2019). Finally, the qualitative research
design contains various analytical methods to analyse the collected data and
prepare a meaningful report (Bell et al., 2018). The main analytical techniques
include; Content Analysis (Krippendorff, 2018), Discourse analysis (Phillips and
Hardy, 2002), Grounded theory method Glaser and (Charmaz, 2006; Glaser and
Strauss, 1967), Narrative analysis (Riessman, 1993), Thematic analysis (Braun and
Clarke, 2006), and or Template analysis (King, 1998).
An extensive range of qualitative research designs is available in the literature, but
the current qualitative study adopted Phenomenology (Creswell et al., 2007).
Phenomenology is a clear and straight description of the lived experience(s);
consequently, it reflects the conscious mind and attempts to avoid subconscious
prejudices while investigating social behaviours (Goulding, 2005). Phenomenology
is useful in understanding the real-life experiences of individuals and the effects of
these experiences (Sokolowski, 2000). Experience is understood here as a
phenomenon that may be a state of feeling or when an individual undergoes a
process (Moustakas, 1994). Therefore, phenomenology seemed a suitable
qualitative design because the researcher was interested in exploring consumers’
experiences who went through a service failure and recovery process(es).
Phenomenology is usually considered as a similar research design to Narrative
research, yet both are different in many aspects (Klenke, 2008). The choice of
phenomenology over narrative research as a qualitative research design is due to
three reasons. Firstly, narrative research aims to explore the real-life experience of
one or a very small group of individuals. In contrast, phenomenology is designed to
interpret the life experiences of several induvial (Creswell and Poth, 2016). To
appropriately answer the research questions, it is necessary to identify specific
information such as the critical type of service failure, the service industry that is
89
vulnerable to service failures, and common service recovery responses from the
service companies. It seemed suitable to explore this information from several
individuals rather than from a single individual. Secondly, the research focus of the
narrative inquiry is to explore the ‘life’ of an individual through the narratives
(Andrews et al., 2013) whereas, phenomenology intends to grasp the ‘essence’ of
the experiences of several individuals. It is aligned with the objectives of the
qualitative phase to understand the phenomenon of service recovery and how it
affects the service brand. Finally, phenomenology seemed an appropriate research
design because it comprehensively reports how the phenomenon was experienced,
what consequences it has brought and explores the common characterises of
several experiences rather than just telling the stories and their consequences
around an individual’s life (Creswell and Poth, 2016).
3.3.1.1 Purpose and objectives of qualitative research
The qualitative phase was designed to fulfil the exploratory purpose of this research
project. An exploratory study is valuable in gaining an in-depth insight into the
research problem by understanding the actual perspectives (Bell et al., 2018). The
flexibility of asking open questions allowed the researcher to explore the actual
service failure and recovery process within the service industry. It has also helped
the researcher in clarifying the consumers’ assessment of a service brand by
identifying the vulnerable dimensions of consumer-based brand equity. Although the
purpose of the qualitative phase was not intended to provide conclusive findings, it
informed the quantitative phase to map out the causal relationships to be tested in
a wide-scale survey (Creswell and Creswell, 2018; Hair, Bush, et al., 2006). More
specifically, the objectives of the qualitative phase were to understand and explore:
1: the nature of the service failure and recovery process:
This objective has allowed the researcher to explore the critical service failures
happening in the service industries, the intensity of service failures which is critical,
actual service recovery responses from service firms, desired service recovery
responses from the service firms and the service industry, which is deemed as
critical in relation to service failure and recovery process.
2: the dimensions of consumer-based brand equity which tend to fluctuate within
service failure and recovery
90
This objective was aimed to recognise the dimensions of consumer-based brand
equity which fluctuate during service failure and recovery such that the consumer
assessment levels for these dimensions decline after service failure and escalate
after service recovery.
3: inform the quantitative phase
Finally, this objective was to develop a conceptual framework to illustrate and test
the causal relationships among different constructs (service recovery, perceived
justice, service failure severity, consumer-based brand equity and its dimensions)
in the quantitative phase. Moreover, to assist in developing reality-based scenarios
to be utilised in performing experiments in the quantitative phase.
3.3.2 Quantitative research design
Quantitative research designs seek to test objective theories by investigating the
relationships among different variables (Creswell and Creswell, 2018). Unlike
qualitative research, a considerably large amount of data is collected, the variables
are measured numerically and finally, data analysis is done through statistical
software (Bell et al., 2018). The researcher may utilise single or multiple methods
for data collection depending on the requirements of the study (Saunders et al.,
2019). The variables are measured on instruments so that the data may be collected
into numbers and then analysed in a meaningful manner by applying statistical
procedures.
The current study has adopted an experimental research design from the three main
quantitative research designs, descriptive, correlational, and experimental
(Stangor, 2014). A descriptive research design seeks to explain the current state of
the variables. Similarly, a correlational design does not explain the causal
relationships but simply identifies the association of variables. On the other hand,
experimental designs manipulate one or more independent variables, investigate
the impact on one or more dependant variables and prove causation rather than just
identifying the patterns in the data (Bryman and Bell, 2011). Further, in marketing
research the causation is probabilistic. (Malhotra and Birks, 2007). Causal
relationships can only be identified by adopting experimental research designs
(Saunders et al., 2019). This project entailed causal research questions. For
example, research questions 2, 3, 4 and 5 are related to investigating the cause and
effect relationship. As the research hypotheses of this study aimed to test the causal
91
relationships, the experimental research design was preferred over other research
designs.
Service failure and recovery literature have extensively incorporated experimental
designs to infer cause and effect relationships among variables (Bae et al., 2020;
Bambauer-Sachse and Rabeson, 2015; Hocutt et al., 2006; Ma and Zhong, 2021;
Radu et al., 2020; Smith and Bolton, 1998). According to Vaerenbergh et al. (2019),
service recovery literature has relied heavily on experimental designs (55.7% of
studies). This became evident when the reviewed literature for the current research
project showed that the majority (75% of studies) had utilised experimental design.
In contrast, the rest has relied upon conceptual investigations, surveys and other
qualitative methods. Researchers’ dependence on experimental design is due to its
suitability in fulfilling the purpose of their studies by measuring customers’
perceptions of a service firm after they experience service failure and recovery
(Crisafulli and Singh, 2016).
3.3.2.1 Purpose and objectives of quantitative research The quantitative phase was implemented to fulfil the explanatory purpose of this
research project. In pursuit of achieving the purpose highly structured approach was
followed as compared to the qualitative phase. Clearly defined hypotheses were
developed with the help of the literature and qualitative findings to identify cause
and effect relationships among variables. The testing of cause and effect
relationships assisted in explaining the reasons and consequences of the real
service failure and recovery experiences encountered by consumers. Specifically,
the quantitative phase was implemented to achieve the following objectives:
(1): to test the causal relationships
This objective was established to investigate the causal link among service
recovery, perceived justice, consumer-based brand equity and its dimensions which
tend to fluctuate within service failure and recovery process. Moreover, this objective
assisted in confirming the vulnerable dimensions of consumer-based brand equity
when consumers go through a service failure and recovery process. Hypotheses 1
to 7 are tested in chapter 8 to achieve this objective.

92
(2): to test the mediation
The objective assisted in explaining the mediating role of perceived justice between
the causal relationship of service recovery, dimensions of consumer-based brand
equity which tend to fluctuate and overall brand equity. Hypotheses 8 -13 are tested
in chapter 8 to achieve this objective.
(3): to test the moderation
This objective was to test the the moderating role of service failure severity in the
relationship between service recovery and post-recovery outcomes. Hypothesis 14
-20 are tested to achieve this objective.
(4). to test the occurrence of service recovery paradox
This objective was developed to detect the occurrence of service recovery paradox.
The objective assisted in identifying whether the pre-failure recovery levels of the
dimensions of CBBE which tend to fluctuate, are higher than post-failure recovery
levels. Hypotheses 21 -24 are tested in chapter 8 to achieve this objective.
(5). generalise the findings on a larger scale
This objective explains that the research project aimed to generalise the findings by
utilising a more substantial sample representative of the population. The aim was to
build on the qualitative findings and then produce a more accurate and generalised
conclusion through a quantitative phase (Creswell and Creswell, 2018).
3.4 Summary
This chapter has presented the research paradigm and the overall design to be
adopted by the research project. According to the nature of the research questions
and the research project, the researcher views match with the pragmatic worldview.
This research project has utilised a combination of qualitative and quantitative
research by adopting an exploratory sequential mixed-methods design.
This chapter has delineated the explanation of various decisions regarding the
qualitative part of the exploratory mixed-method design. Phenomenology is deemed
an appropriate qualitative research design for the current research.

93
The purpose and objectives of the qualitative study are presented. The main
objective of the qualitative study includes the identification of the dimensions of
CBBE which tend to fluctuate within service failure and recovery process. Qualitative
research will utilise semi-structured interviews as a data collection tool to explore
the nature of service failure and recovery process and understand the consumers’
assessment of the service brand. It will also help in developing the conceptual model
to be tested in the quantitative phase.
Quantitative research will be followed to test the causal relationships and generalise
the qualitative findings to a larger population sample. The data will be collected
through scenario-based experiments and surveys. Scenarios used in the
experiments will be developed based on qualitative findings. The following chapters
present the Quantitative and Qualitative phases in more detail.

94
Chapter 4 Qualitative Methodology
4.1 Introduction
This chapter presents the methodological approach, which was adopted for the first
phase of exploratory mixed-method designs. This chapter explains how the primary
data was collected and analysed. The procedure of recruiting and the characteristics
of the study participants are also explained. Finally, the methods to ensure rigour
and trustworthiness of the qualitative data are described before the chapter
summary.
4.2 Semi-Structured Interviews
Interpretative methods are appropriate to get an insight into the real experiences of
consumers with the firms (Fournier, 1998) 8. A semi-structured interview technique
was used to collect data in the qualitative phase. According to Easterby-Smith et al.
(2015), semi-structured interviews are deemed a suitable technique for a research
design that aims to obtain assistance in understanding the relationship of different
variables and further develop a conceptual framework to guide the quantitative
phase. Semi-structured interviews provide control to the interviewer to formulate
questions and sequence the interviews to get relevant information (Bell et al., 2018).
Interviews can gather comprehensive explanations of the phenomenon in the form
of feelings, emotions, reactions, and variant thought processes (Strauss and Corbin,
1998). Particularly when the researcher is interested in gathering a range of service
failure and recovery experiences to understand the phenomenon and its probable
consequences on the service brand (Hedrick et al., 2007).
4.2.1 Interview Guide
A semi-structured interview is assisted by a list of relevant questions known as an
interview guide (Bell et al., 2018). The interview guide for the current research was
developed after a rigorous process. It took 5 weeks and 7 drafts before the final
version of the interview guide is selected (see appendix A). The interview guide was
finalised after incorporating valuable feedback of two academic marketing experts.
Before finalizing the interview guide, it was pre-tested with four informants in order
to make sure the flow and clarity of the questions. The guide was based on the
literature review of service failure, service recovery, service failure and recovery
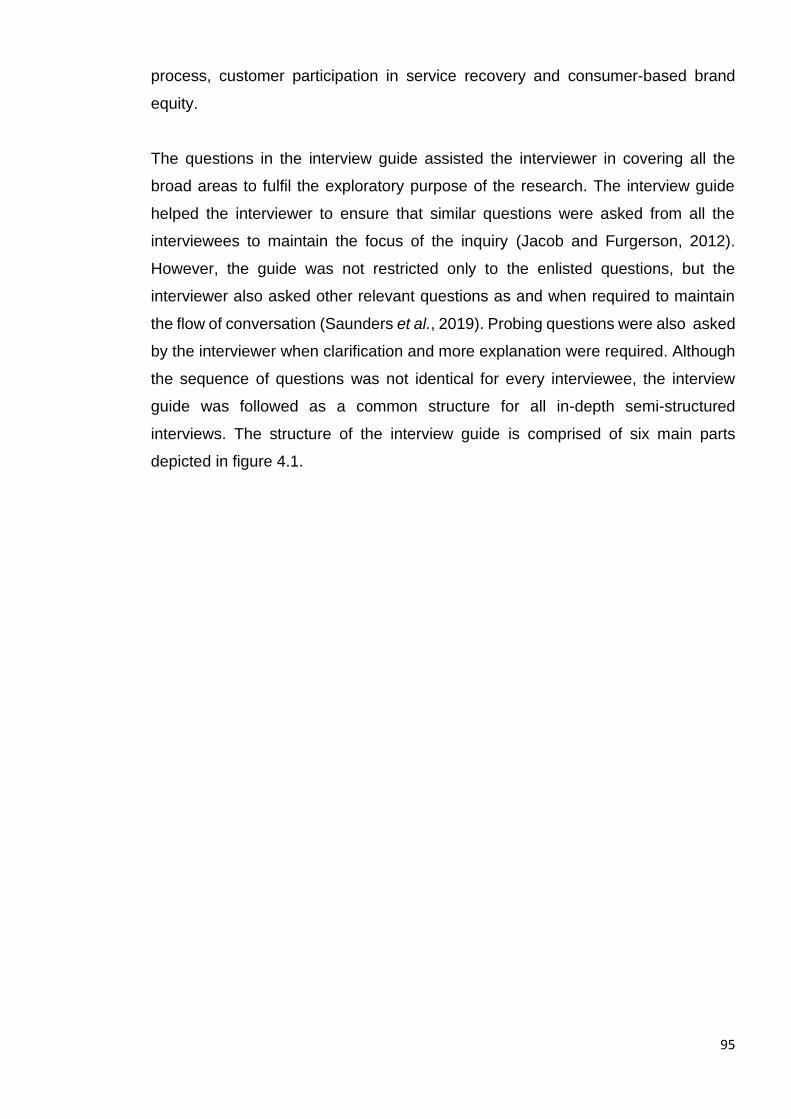
95
process, customer participation in service recovery and consumer-based brand
equity.
The questions in the interview guide assisted the interviewer in covering all the
broad areas to fulfil the exploratory purpose of the research. The interview guide
helped the interviewer to ensure that similar questions were asked from all the
interviewees to maintain the focus of the inquiry (Jacob and Furgerson, 2012).
However, the guide was not restricted only to the enlisted questions, but the
interviewer also asked other relevant questions as and when required to maintain
the flow of conversation (Saunders et al., 2019). Probing questions were also asked
by the interviewer when clarification and more explanation were required. Although
the sequence of questions was not identical for every interviewee, the interview
guide was followed as a common structure for all in-depth semi-structured
interviews. The structure of the interview guide is comprised of six main parts
depicted in figure 4.1.

96
Figure 4.1 Structure of Semi-Structured interview guide
4.3 Recruitment of participants
The recruitment of participants was carried out through purposive and snowball
sampling. Purposive sampling was chosen because the phenomenological design
requires to collect data from the individuals who have lived the experience
(Goulding, 2005). In the current case, the researcher was interested in the
individuals who have gone through the service failure and recovery process.
Therefore, purposive sampling helped the researcher to ensure that the selected
individuals were relevant to the exploratory inquiry (Bell et al., 2018). The following
criteria was set for the participants to participate in the study:
a) all the participants must be 18 years or older
• to help in building rapport and to make the interviewer and interviewee comfortable
1. Warm up
- Include warm-up questions
• to explore indepth informaton about the real service experiences
• to identify the nature and criticality of service failures
2. Service Experience
- Questions related to the Informants' service failure and recovery experience
• to identify the reactions of informants after service failure
• to understand the informants' assesment of the brand after service failure
3. Assesment of service brand
- Questions related to how informants' assses the brand after service failure
• to understand the service recovery mechanism adopted by the service firms
4. Firm's Response to service failure
- Questions related to the response of the service firm after service failure
• to identify the reactions of informants after service recovery
• to understand the informants' assesment of the brand after service recovery
5. Assesment of service brand
- Questions related to how informants' asses the brand after service recovery
• to reconfirm if the informants want to share any additional information
• to record the demographic infromation
6. Closure
- Questions related to if the informants have missed anything and demographics
Objectives

97
b) have been living in the U.K. for more than two years
c) have undergone a service failure and recovery process with a service firm in
the past six months to avoid recall bias.
d) have at least consumed the service once from the service firm before they
went through the service failure and recovery process.
The selected participants were then requested to assist the researcher in identifying
additional individuals to be a part of the study. Using the existing participants to
contact future subjects is known as snowball sampling (Bell et al., 2018). Snowball
sampling was utilised because it was challenging for the researcher to identify a
unique set of individuals (Saunders et al., 2019). This technique acquires referrals
from referrals and increases the likelihood of obtaining the individuals who fulfil the
above criteria (Malhotra and Birks, 2007).
Purposive and snowball sampling poses a shortcoming of the representativeness of
the population (Saunders et al., 2019). The initial group of participants is most likely
to refer very similar individuals to themselves, creating a bias. However, within the
qualitative designs, generalizability is not as threatening as in quantitative designs
(Bell et al., 2018). Similarly, the current research aimed to provide preliminary
insights from qualitative study and generalisable findings through quantitative study
(Creswell and Creswell, 2018). Additionally, extra attention was given regarding
informants’ gender, age, occupation, and ethnicity to ensure diversity and further
address the limitations of the snowball technique. Hence, the limitations of sampling
techniques did not affect the objectives of the research project.
4.4 Procedure
The procedure of conducting interviews started with contacting potential
interviewees. The researcher attained ethics approval from the University of
Glasgow ethics committee before contacting the prospective individuals (application
no. 400170225). Participants were contacted via email or through a letter. A
complete introduction of the researcher, formal request to participate in the interview
and additional documents were given to the individuals. Other documentation
included a plain language statement and a consent form to be signed by individuals.
A plain language statement clearly described the research project and the nature of

98
participation in a simple language. A consent form was given to obtain an agreement
of participation before the interview.
Interviews were conducted face-to-face and through a virtual medium. Skype was
used as a virtual tool to overcome the geographical barrier and maximize
recruitment (Deakin and Wakefield, 2014). Although skype interviews lack
opportunities to build rapport, intimacy and trust through handshaking and offering
drinks (Mirick and Wladkowski, 2019), it was appreciated by the participants (such
as housewives and retired people) who wanted to participate from their comfort
zone. Face-to-face interviews were conducted in a meeting room in the Adam Smith
Business School, University of Glasgow. It was ensured that the audio recording
device (for face-to-face interviews) and software (for skype interviews) is working
properly before the start of the interview. In the case of face-to-face interviews, drink,
tea or coffee was offered to each participant. The medium of language used in both
forms of interviews was in English.
The interview started by introducing the nature and general purpose of the research.
Interviewees were reminded of the audio recording of the interviews. A signed
consent form was obtained from those interviewees who did not submit the form
earlier. Participants were told that all the data would be kept confidential, and their
identity will not be disclosed. The interviewer followed the structure of the interview
guide; however, the order of the questions varied from participant to participant and
according to the nature of their lived experiences. The interviews lasted for an
average time of 47 minutes. It was ensured that guidelines from the University of
Glasgow ethics committee were appropriately followed during the process.
The recordings of the interviews were securely kept in a password-protected
computer at the University of Glasgow. The interviews were transcribed verbatim by
the researcher. The researcher did not hire any professional transcriber or use
transcription software to ensure confidentiality and to build a closer connection with
the data. Follow-up with 8 participants was done in order to clarify language issues
in some parts of the interviews. The process of transcription was completed in 7
weeks, which also included follow-up interviews. The transcriptions of the interviews
produced between 2170 to 11214 words each and 124406 words in total. A total of

99
1113 minutes of recording was obtained for all interviews, with an average of 46
minutes of each interview.
4.5 Characteristics of participants
A total of 24 interviews were conducted over a period of 15 weeks, and the process
of data collection was stopped once the saturation was achieved (Saunders et al.,
2019). All participants were from the U.K., residing in the country for more than two
years. The condition of more than two years was put to make sure that participants
were aware of the customs, way of living and know what to expect from the
environment (Marx, 2011). There was diversity among the participants regarding
their gender, age, occupation and ethnicity. Fourteen of the interviewees were
female, and 10 were male. The average age of the participants was 37 years, 39 for
females and 35 for males. The age of the youngest participant was 19, whereas the
age of the oldest participant was 80 years. The majority of the participants (17)
belonged to the white-British ethnic group, while others belonged to white-Irish,
white polish, Asian Pakistani and Asian Indian ethnic groups.
The participants shared 51 different incidents (average of 2 incidents per informant)
of service failure and recovery with various service firms in total. The lowest number
of experiences shared is one, and the highest is four by an individual. The majority
(26) of the incidents were related to high contact companies where the consumers'
interaction with the service firm is high. The participants shared incidents with 20
different service companies (airlines and restaurants were recorded as having
frequent service failures), indicating that service failures are inevitable and might
happen in various service companies. Core service failures were deemed as the
most frequent among various types of service failures. The detailed characteristics
of informants are mentioned in Table 4.1.
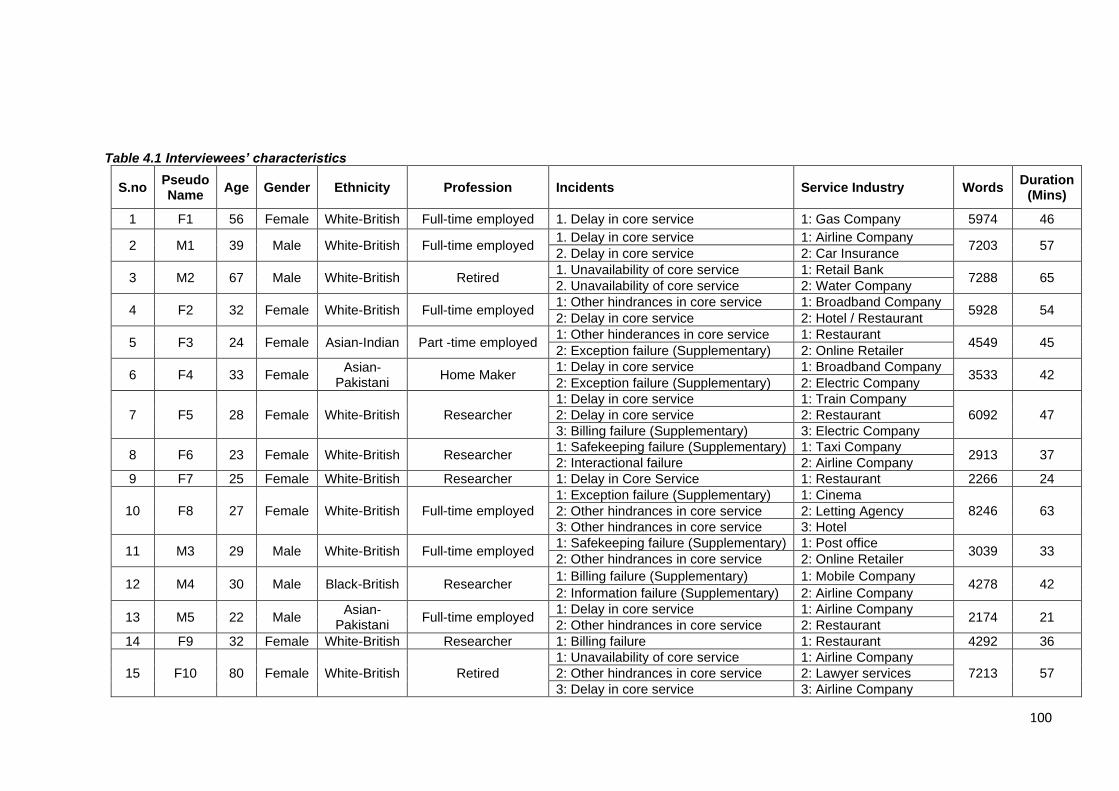
100
Table 4.1 Interviewees’ characteristics
S.no Pseudo Name
Age Gender Ethnicity Profession Incidents Service Industry Words Duration
(Mins)
1 F1 56 Female White-British Full-time employed 1. Delay in core service 1: Gas Company 5974 46
2 M1 39 Male White-British Full-time employed 1. Delay in core service 1: Airline Company
7203 57 2. Delay in core service 2: Car Insurance
3 M2 67 Male White-British Retired 1. Unavailability of core service 1: Retail Bank
7288 65 2. Unavailability of core service 2: Water Company
4 F2 32 Female White-British Full-time employed 1: Other hindrances in core service 1: Broadband Company
5928 54 2: Delay in core service 2: Hotel / Restaurant
5 F3 24 Female Asian-Indian Part -time employed 1: Other hinderances in core service 1: Restaurant
4549 45 2: Exception failure (Supplementary) 2: Online Retailer
6 F4 33 Female Asian-
Pakistani Home Maker
1: Delay in core service 1: Broadband Company 3533 42
2: Exception failure (Supplementary) 2: Electric Company
7 F5 28 Female White-British Researcher
1: Delay in core service 1: Train Company
6092 47 2: Delay in core service 2: Restaurant
3: Billing failure (Supplementary) 3: Electric Company
8 F6 23 Female White-British Researcher 1: Safekeeping failure (Supplementary) 1: Taxi Company
2913 37 2: Interactional failure 2: Airline Company
9 F7 25 Female White-British Researcher 1: Delay in Core Service 1: Restaurant 2266 24
10 F8 27 Female White-British Full-time employed
1: Exception failure (Supplementary) 1: Cinema
8246 63 2: Other hindrances in core service 2: Letting Agency
3: Other hindrances in core service 3: Hotel
11 M3 29 Male White-British Full-time employed 1: Safekeeping failure (Supplementary) 1: Post office
3039 33 2: Other hindrances in core service 2: Online Retailer
12 M4 30 Male Black-British Researcher 1: Billing failure (Supplementary) 1: Mobile Company
4278 42 2: Information failure (Supplementary) 2: Airline Company
13 M5 22 Male Asian-
Pakistani Full-time employed
1: Delay in core service 1: Airline Company 2174 21
2: Other hindrances in core service 2: Restaurant
14 F9 32 Female White-British Researcher 1: Billing failure 1: Restaurant 4292 36
15 F10 80 Female White-British Retired
1: Unavailability of core service 1: Airline Company
7213 57 2: Other hindrances in core service 2: Lawyer services
3: Delay in core service 3: Airline Company

101
S.no Pseudo Name
Age Gender Ethnicity Profession Incidents Service Industry Words Duration
(Mins)
16 F11 22 Female White-British Student
1: Exception Failure 1: Airline Company
6846 53 2: Other hindrances in core service 2: Letting Agency
3: Billing failure (Supplementary) 3: Online Retailer
17 M6 21 Male White-British Student 1: Interactional failure 1: Retail Bank
6394 41 2: Other hindrances in core service 2: Letting Agency
18 M7 33 Male White-British Full-time employed 1: Delay in core service 1: Restaurant 4006 39
19 M8 25 Male White-British Researcher
1: Interactional failure 1: Restaurant
4969 40 2: Delay in core service 2: Airline Company
3: Billing failure 3: Mobile Company
20 M9 43 Male Asian-
Pakistani Part-time employed 1: Delay in core service 1: Airline Company 4040 37
21 F12 53 Female White-Polish Retired
1: Payment failure 1: Electric company
4812 58 2: Order Taking failure 2: Online retailing
3: Unavailability of core service 3: City Council services
22 F13 69 Female White-Irish Retired
1: Unavailability of core service 1: Broadband Company
11214 110 2: Payment failure 2: Gas Company
3: Payment failure 3: Water Company
4: Unavailability of core service 4: Housing Association
23 F14 31 Female White-British Entrepreneur
1: Unavailability of core service 1: Airline Company
4567 40 2: Interactional failure 2: Broadband Company
3: Unavailability of core service 3: Restaurant
24 M10 42 Male White-British Entrepreneur 1: Safekeeping failure (Supplementary) 1: Car Repair Workshop 2570 26
Total 124406 1113
102
4.6 Data analysis approach
Thematic analysis was chosen as the technique to analyse the qualitative data. This
method is extensively utilised by qualitative researchers in the social sciences
(Saunders et al., 2019). Thematic analysis is considered a primary technique for
qualitative researchers and is defined as “a method of identifying, analysing and
reporting patterns (themes) within data” (Braun and Clarke, 2006, p.79). The
researcher attempted to closely investigate the qualitative data sets to find patterns
and themes which are helpful to answer the exploratory research questions (Guest
et al., 2011).
Thematic analysis was considered a suitable approach for analysing the qualitative
data for various reasons. Firstly, the flexible nature of the thematic analysis is
aligned with the pragmatic philosophical stance of this research project. Secondly,
the thematic analysis contains a flexible nature related to samples, research
questions, data collection procedures and interpretation (Clarke and Braun, 2017).
For example, thematic analysis can provide meaningful analysis for small and large
qualitative data sets (Braun and Clarke, 2006). Thirdly, although thematic analysis
adopts a flexible approach, it follows a systematic pattern to analyse the data
aligned to phenomenology, which also analyses qualitative data in systemic steps.
Fourthly, compared to other analytical methods, thematic analysis is not restricted
to a certain theoretical framework and is appropriate for various frameworks (Braun
and Clarke, 2006). Finally, thematic analysis is useful in an exploratory study to
interpret the lived experiences of individuals in a systematic yet flexible way
(Saunders et al., 2019).
In contrast to other qualitative data analysis techniques such as grounded theory,
content analysis, discourse analysis, interpretative phenomenological analysis,
thematic analysis is not appreciated as a technique that has an identifiable legacy
or that is considered as a distinctive analysis method among a group of qualitative
data analysis techniques (Bell et al., 2018). However, a few differences between
thematic analysis and other techniques highlight its distinctive position in the cluster
of qualitative data analysis techniques. A key difference is that thematic analysis is
a method rather than a methodology like grounded theory and other techniques
(Guest et al., 2011). Unlike grounded theory, the purpose of thematic analysis is not
to develop a theory, but it can generate interpretations of the data through
103
meaningful patterns which are conceptually informed (Nowell et al., 2017). In
comparison to interpretative phenomenology analysis (IPA), which focuses both on
the patterns in the data and the characteristics of individuals (Eatough and Smith,
2008), the thematic analysis focuses only on the meaningful patterns of the data
(Braun and Clarke, 2006). Similarly, thematic analysis is not interested in the in-
depth analysis of the language as the case in discourse analysis (Johnstone, 2018);
instead, it utilises language as constitutive of meaning (Clarke and Braun, 2017).
In terms of the analytical procedure, thematic analysis is similar to other qualitative
analysis techniques in using themes and codes, but the process of identifying and
reporting is different. For example, after familiarising with data, the researcher
allocates shortcodes across the entire dataset in thematic analysis, whereas in IPA,
brief commentaries (initial notes) are done on the data. Further, in thematic analysis,
the researcher develops the themes after coding the entire data set (Guest et al.,
2011), whereas, in IPA, the researcher codes the data item and provides a theme
at the same time (Smith and Shinebourne, 2012). In thematic analysis, the focus of
identifying themes is not only by the frequency but themes may be nominated by
the researcher's judgment (Braun and Clarke, 2006). In contrast, the focus of
qualitative researchers is to count the occurrences of codes (Saunders et al., 2019).
Therefore, the analysis outcome is more detailed and nuanced in the case of
thematic analysis (Guest et al., 2011), whereas a more descriptive interpretation of
the qualitative data is provided in the content analysis (Vaismoradi et al., 2013).
The six-phase approach by Braun and Clarke (2006) was adopted in conducting the
thematic analysis. The interview transcripts were read and re-read several times to
get closer to the data. The process of familiarizing with the data took one and a half
weeks. The researcher made notes and highlighted points of interest during this
phase. After this phase, the researcher started delineating codes to the chunks of
the data, which seemed relevant to answer the research questions. In the third
phase, the researcher clustered similar codes to present a meaningful pattern.
Following the clustering, similar codes were converted into themes and subthemes.
“A theme captures something important about the data about the research question
and represent some level of patterned response or meaning within the data set”
(Braun and Clarke, 2006, p.82). The next step involved reviewing themes to see
whether the themes are eligible for being a theme or to be merged into another

104
theme. Similarly, some themes were converted into subthemes, and a few were
discarded for not having enough data or seemed insignificant. In the fifth phase of
thematic analysis, the researcher finalised the themes which seemed meaningful
and were not overlapping with each other. Finally, a detailed report of the qualitative
analysis was produced, including the vivid use of data extracts in support of the
finalised themes.
The procedure included inductive and deductive approaches in coding and finalising
the themes because “no theme can be entirely inductive or data-driven” (Joffe and
Yardley, 2004, p.58). The researcher used the inductive approach to identify the
vulnerable aspects of the service brand. On the other hand, the deductive approach
was followed to code the service failure and recovery outcomes concerning fairness.
Therefore, the analysis used a combination of deductive and inductive approaches
because otherwise, it may become challenging for the scope of the analysis
(Saunders et al., 2019).
4.7 Rigour and trustworthiness in the qualitative study
Qualitative data results are deemed valueless and present a fictitious story without
rigour and trustworthiness (Morse et al., 2002). Rigour in qualitative research is
referred to as the quality of being accurate, vigilant, and detailed yet relevant, while
trustworthiness is the quality of being truthful and authentic in the qualitative
research process (Cypress, 2017). The challenges to highlight rigour and
trustworthiness in qualitative research surpass the challenges faced in quantitative
research (Guba, 1981). Unlike quantitative research, qualitative inquiry lack in
producing concrete numbers, p values, and Cronbach alpha are to express the
rigour and trustworthiness of its data (Morse et al., 2002). Beyond this, rigour and
trustworthiness enable the data and method to be independent so that coherent and
believable conclusions may be drawn if the same data is analysed by other
qualitative researchers (Mays and Pope, 1995).
The current study addressed rigour and trustworthiness by following the criteria
developed by Guba (1981). The four aspects are credibility, transferability,
dependability and confirmability in qualitative inquiries (Guba and Lincoln, 1994).
The four aspect criteria are considered similar to validity (internal and external),
reliability and objectivity in quantitative research (Morse, 2015). Although it is not

105
clear to achieve maximum rigour by fulfilling all the aspects, at least two aspects
should be met to achieve rigour and trustworthiness in a study (Creswell and Poth,
2016). Therefore, the criteria are “used as a set of guidelines rather than another
orthodoxy” (Morse et al., 2002, p.14).
The credibility of the study was enhanced by adopting a trustworthy and widely used
semi-structured interviewing technique as a tool of data collection tool (Bell et al.,
2018). Further, the researcher arranged follow up interviews with the participants to
ensure the accuracy of the transcription. Debriefing sessions with two marketing
academics were held to prevent bias and assist the researcher in finding new
patterns in the data (Morse, 2015). In order to seek validity, qualitative data
collection was followed by quantitative data collection to support, strengthen and
enhance the qualitative findings. Further, to obtain transferability or external validity,
purposive sampling was used (Guba, 1981). A total of 124406 words were produced
through the interview transcriptions, representing thick and rich qualitative data set
to achieve transferability.
Confirmability and neutrality were attained by ensuring that the process of data
collection and data analysis were not maligned with anticipation. Instead, both
represented a pure reflection of the participant’s experiences (Barbour, 2001). The
researcher took a one-week relaxation break to begin the qualitative phase with a
neutral mindset (Morse, 2015). Moreover, much attention was given to the
development of the interview guide, which took seven weeks, including seven
extensive meetings with supervisors. The interview guide was finalised after revising
seven drafts. During the whole process, it was ensured that the interview guide is
free of leading questions and does not include any bias (Gioia et al., 2013).
4.8 Summary of the Chapter
This chapter has presented the method of qualitative data collection. The primary
data collection was done with the help of 24 semi-structured interviews. The
individuals were recruited by utilising purposive and snowball sampling techniques.
The procedure of potential participants was initiated by contacting the potential
interviewees. The interviews were undertaken face-to-face and via skype. 24
interviews were completed in 7 weeks which produced 124406 words in total. 51
incidents of service failure and recovery were recorded.
106
Thematic analysis was utilised to analyse the qualitative data. Finally, following the
criteria presented by Guba (1981), the researcher ensured the credibility,
transferability, dependability and confirmability of the qualitative results.
107
Chapter 5 Qualitative Analysis
5.1 Introduction
This chapter presents the findings of the qualitative study. The chapter is divided
into two sections. In the first section, data related to 3 central themes are presented.
Firstly, data related to the central theme of service recovery and its two emerged
sub-themes (firm recovery and customer participation in service recovery) are
presented. Then, Perceived Justice and its sub-themes are outlined. It is followed
by 5 CBBE dimensions are reported, which may fluctuate during the service failure
and recovery process. The second section of the chapter includes the findings
related to Service failure Typologies, Service failure severity, failure attributions, and
findings related to critical service context. A chapter summary is given at the end,
which presents the key highlights of the chapter.
5.2 Theme 1: Service Recovery
Service recovery is considered as the remedy which customers receive for the
service failure they experience with a service firm (Bahmani et al., 2020). Service
recovery is understood as the actions or efforts rendered by the firm in response to
a service failure. When a service firm or its employees are solely responsible for
resolving the service failure, it is termed firm recovery. Whereas, when customers
participate with the service firm/firm’s employees to resolve the service problem, it
is known as customer participation in service recovery. In line with the literature, the
qualitative analysis revealed that the service recovery process might also involve
customers other than the sole efforts of the firm. The next section discusses the two
forms of service recovery through which the firm attempts to resolve the service
failure. Table 5.1 summarises the theme and subthemes.
5.2.1 Firm Recovery
Firm recovery emerged as a major sub-theme of service recovery in the data.
Traditionally, the firms do not involve customers in the service recovery process and
attempt to resolve the service failure itself (Bagherzadeh et al., 2020). All the
informants proclaimed different ways the firm attempted to resolve their problem
without the involvement of customers. The informants shared that the first response
by firms to a service failure is an apology because it is considered as the most
108
effective recovery strategy to allay the immediate customers’ negative reactions
after service failure (Azemi et al., 2019). For example, a female informant who was
annoyed with the noise of ongoing construction work beside her window of the room
shared that
“he did apologise immediately as soon as he heard that you are very right
that there is work going on” (F8iii, 27)
Similarly, another informant who experienced a drainage issue just outside her
home shared that she e-mailed the issue to two service firm representatives to
resolve the problem. She said that:
“I got a response half an hour later from both, Apologising on mishandling
apologising for everything” (F13iv, 69)
Besides apology, informants shared their experiences where the firm handled the
post-service failure situation by compensating them. Mostly, the informants
suggested that firms gave monetary compensation to them for the loss they incurred
in the service experience. The qualitative data revealed that customers received
monetary compensation in money, a refund, or a discount. For example, an
informant shared an experience with a broadband company where the speed of the
internet was not as it was agreed with both parties. She said that upon realising the
mistake, the company compensated her for her loss and told that:
“They gave me I think it was like a 100 pound or 50-pound goodwill gesture
on my account, which was good.” (F2i, 32)
The informants also suggested that they got a refund of their money as
compensation. An informant shared that she was overcharged by an electricity
supplier about which she informed the firm, and they refunded her money. She said
that:
“It was pretty quick, few days it took and it was sorted, and I got my full refund
back” (F12ii, 53)
109
On some occasions, the evidence of receiving a combination of an apology and
compensation is observed in the qualitative data analysis. It was observed that firms
offer apology and compensation as a combination to mitigate the negative
consequences after a service failure. the informant experienced a problem with a
utility provider, and as a result, he received monetary compensation with an
apology. He shared that:
“I think eventually although it was very nice to get 50 pounds compensation
and an apology you know” (M2ii, 67)
The informants shared that firms also used other strategies such as explaining the
problem and recovery process in detail, showing care, empathising and following up
with them. For example, an informant (F12ii, 53) said that after a complete resolution
of her problem of incorrect order delivery, the online retailer e-mailed to follow up on
her. She proclaimed that the firm’s representative reassured her that everything is
fine and that she is satisfied or not. However, the qualitative analysis shows that
service firms utilise apology and compensation as their main recovery strategies.
The significance and frequent usage of apology and compensation are also
observed in the literature (Ketron and Mai, 2020; Odoom et al., 2019; Sharifi et al.,
2017).
5.2.2 Customer Participation in service recovery
Customer participation in service recovery is when customers are considered as
active participants and are involved in taking actions in resolving a service failure
(Balaji et al., 2018). The qualitative data analysis reveals that when customers
experience service failure, the service firms involve the customers in the service
recovery process in different ways. It is observed through the qualitative analysis
that customers participate in the recovery process by providing details about the
unpleasant service incident experienced by the service provider. The provision of
information by the customers is observed as the first step towards customer
participation in resolving a problem. Information provision is essential to make the
service provider aware of the problem (Cheung and To, 2016).
110
When asked about their role in resolving the problem, most informants mentioned
that the initial step of their participation was by informing about the problem to the
service provider. For instance, an informant (F5ii, 28), referring to an incident of
delay in services at a restaurant, mentioned her role in resolving the problem by
making the service employees aware of the situation:
“I just voiced that our food has not arrived and then it was a delay, going to
the till, and telling what is not going right” (F5ii, 28).
In addition, an in-depth analysis of the data also reveals that informants valued
participation through information sharing by expressing its significance. For
instance, one of the informants discussed his experience of a delayed local flight
and mentioned the importance of sharing the information with the service employees
to have a better result:
“they asked me to provide them the information, you know basic stuff like my
flight number and a receipt from my ticket, and I think this sort of participation
is helpful as a first step to have a better solution” (M1i, 39).
The informants further revealed that they were actively engaged in the process of
resolving the problem. The analysis confirmed the literature, which suggested that
the involvement of customers enhances the efficiency of the process and results in
favourable consumer evaluations (Dong et al., 2008, 2016). For instance, an
informant (F1, 56) who shared a negative experience with her Gas company
highlighted the benefits of involvement in the process. She mentioned the merits in
terms of having a quick resolution through engaging actively:
“I think it does help in resolving the problem quickly because if you are
unhappy with something, you should really try and take measures to fix things
yourself” (F1, 56)
On another occasion, an informant (M1i, 39) considered his involvement of filling
out a form on an Airline company website being efficient to reach a solution:
111
“I didn’t mind being sent to the website and putting in the information myself
that seemed efficient” (M1i, 39)
In addition to efficiency, informants also revealed that this way of participation helps
them recognise that the journey towards resolution has initiated. For example, an
interviewee (F2i, 32) who had a service failure with her Broadband company said
that she got pacified when she was involved in the process and realised that things
have started:
“I think generally speaking it’s good that they do involve customer, it makes
a customer think that something has started” (F2i, 32).
The qualitative data further reveals that firms also involve aggrieved customers in
the service recovery process by providing them with an opportunity to choose the
best alternative as a solution to the service failure which they have experienced.
The involvement of customers at this level provides a degree of perceived control,
empowers them, and gives a sense of responsibility to decide a solution that works
best (Hazée et al., 2017; Xu, Marshall, et al., 2014). For instance, while telling her
experience of dining at a restaurant, one of the informants (F3i, 24) expressed the
pleasure of being asked to choose the best possible option for her. She said that:
“I felt more satisfied and empowered because I had the option to actually pick
again” (F3i, 24).
The data revealed that customers who did not participate in the recovery process
were expecting to be involved. For instance, an informant said that he was expecting
the Airline to involve him in the decision-making process, and as a result, he would
have positively assessed the Airline company (M9, 43):
“It’s like asking someone that yes we have made a mistake, and now we want
to make it up by empowering you to decide what you want in return;
obviously, I wouldn’t have asked for too much, but this could have
represented a better image of the company, I would have said that they are
compassionate, kind and caring” (M9, 43)

112
In contrast, interviewees also expressed displeasure with being involved in the
recovery process by providing information to the service employees. They
considered it as a cost and an unsuitable way of solving the problem. It was evident
from the extracted quotes that consumers felt discomfort when they participated in
the service recovery process. For example, an interviewee (F5ii, 28) expressed her
displeasure over costing her energy and time to inform about the service failure to
the service provider:
“They should have realised it themselves that the table is not properly served
and I think in this particular scenario It costed me since I had to leave my
friends and go to the till it definitely affected the purpose of ours to relax and
talk about different other things rather than chasing the employees” (F5ii, 28)
The informants view participation as a time-consuming activity for them. Several
informants disliked the idea of being involved in the process and considered it as a
wastage of time (F5i, 28):
“I had to actively do something on my own and waste more of my time kind
of doing that” (F5i, 28)
Furthermore, in contrast to informants’ views about the pacification of their negative
emotions through involvement in the process, it was suggested that it develops
frustration among consumers. The data evidence that the development of negative
emotions is because consumers expect service providers to rectify their mistakes.
An informant (M6i, 21) described his negative emotional development over his
involvement in rectifying the problem:
“It was a little bit frustrating because it’s after all they made a mistake and yet
they were forcing me to rectify the situation when it really should have been
them, and that really really irked me” (M6i, 21)
The data analysis suggests a linkage between customer participation in service
recovery and consumers’ evaluation of recovery efforts. Customers prefer to
participate in a service recovery process because it gives them a sense of
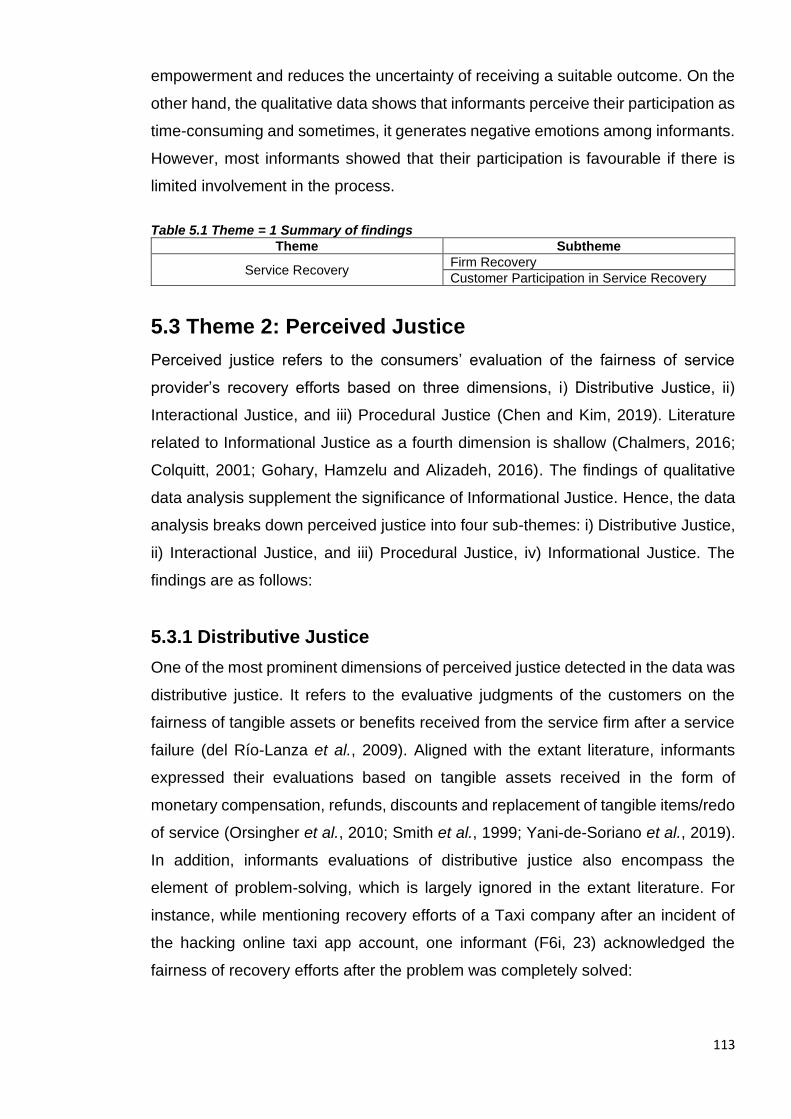
113
empowerment and reduces the uncertainty of receiving a suitable outcome. On the
other hand, the qualitative data shows that informants perceive their participation as
time-consuming and sometimes, it generates negative emotions among informants.
However, most informants showed that their participation is favourable if there is
limited involvement in the process.
Table 5.1 Theme = 1 Summary of findings
Theme Subtheme
Service Recovery Firm Recovery
Customer Participation in Service Recovery
5.3 Theme 2: Perceived Justice
Perceived justice refers to the consumers’ evaluation of the fairness of service
provider’s recovery efforts based on three dimensions, i) Distributive Justice, ii)
Interactional Justice, and iii) Procedural Justice (Chen and Kim, 2019). Literature
related to Informational Justice as a fourth dimension is shallow (Chalmers, 2016;
Colquitt, 2001; Gohary, Hamzelu and Alizadeh, 2016). The findings of qualitative
data analysis supplement the significance of Informational Justice. Hence, the data
analysis breaks down perceived justice into four sub-themes: i) Distributive Justice,
ii) Interactional Justice, and iii) Procedural Justice, iv) Informational Justice. The
findings are as follows:
5.3.1 Distributive Justice
One of the most prominent dimensions of perceived justice detected in the data was
distributive justice. It refers to the evaluative judgments of the customers on the
fairness of tangible assets or benefits received from the service firm after a service
failure (del Río-Lanza et al., 2009). Aligned with the extant literature, informants
expressed their evaluations based on tangible assets received in the form of
monetary compensation, refunds, discounts and replacement of tangible items/redo
of service (Orsingher et al., 2010; Smith et al., 1999; Yani-de-Soriano et al., 2019).
In addition, informants evaluations of distributive justice also encompass the
element of problem-solving, which is largely ignored in the extant literature. For
instance, while mentioning recovery efforts of a Taxi company after an incident of
the hacking online taxi app account, one informant (F6i, 23) acknowledged the
fairness of recovery efforts after the problem was completely solved:

114
“The fair thing was that they solved the problem and is if they settled
everything back to zero” (F6i, 23)
Another interviewee (M2i, 67) alluded to the significance of problem-solving and
considered the response from the service provider unfair even after he was given
monetary compensation, but his problem was not properly solved:
“They are very quick in giving you financial compensation, but it was no good,
my objective wasn’t achieved, and I don’t think it solved my problem because
I would have expected them to have enough stationary at their disposal so
that every need of the customer is met” (M2i, 67)
In addition, the most prominent aspect on which consumers evaluated the recovery
efforts of being fair or unfair was monetary compensation. A variety of perspectives
were shared related to the reception of money, free services, discounts and refunds.
Out of many, one of the informants evaluated the fairness of recovery efforts by an
airline company after a delayed flight. He mentioned that :
“So I had to stay in that country, but luckily the airline provided a hotel for me
for free” (M4ii, 30)
Informants also evaluated the recovery efforts in terms of the tangible assets
received by the firm. For instance, in case of a retail bank services failure, an
interviewee evaluated the recovery efforts as fair when he was given an amount of
money:
“…they just gave like a goodwill gesture deposited like an extra 25 pounds in
the account and just like apologised” (M6i, 21)
In addition, evaluations of consumers related to distributive justice also
encompassed the replacement of the tangible item or redo of service. For example,
when an informant’s food was replaced with fresh food:
115
“I spoke with the manager and told them the issues, and then manager
brought out fresher food warm food, and we were not charged for the meal”
(M5ii, 22)
In this regard, distributive justice consists of monetary compensation and includes
aspects of problem-solving and replacement or redo of service. The analysis also
revealed that it might result in consumer delight and further positive emotions after
reception of the mentioned benefits.
5.3.2 Procedural Justice
Informants mentioned the aspects of convenience, consistency, flexibility, and quick
procedures while evaluating the firm's recovery efforts, which aligns with the
literature related to procedural justice (Barusman and Virgawenda, 2019; Maxham
III and Netemeyer, 2002; del Río-Lanza et al., 2009). The sub-theme of procedural
justice refers to the firm's fairness of procedures and policies after a service failure.
In addition, new insights emerged as informants frequently alluded to the
evaluations based on follow-up and reassurance provided by the service providers,
which has a dearth of literature. For instance, one of the interviewees expected the
follow-up from the company to ensure the safety of future use of the mobile
application:
“By assurance, I mean they should have made me feel more at ease to use
[company name app] again that it is safe and what possible approaches or
ways could I use if this happens again and guarantees the safety of my e-
mail account” (F6i, 23)
Similarly, another informant valued the follow-up by the company and noted it as a
fair response:
“They took down the information, and they went, and I think they did a little
bit of follow up which was fair” (M1i, 39)
Furthermore, the data has evidenced that the most significant element of
consumers’ judgement of the procedures and policies of the service firm in the
recovery process is the timeliness of the response. For instance, one of the
116
informants said that an electric company overcharged her; however, the response
was quick enough to be considered as fair:
“I contact them one day, and I got a reply back on the next day, so it was a
quick procedure and pretty fair enough” (F12i, 53)
In contrast, informants viewed the delay of the response as a negative evaluation of
procedural justice. One of the interviewees mentioned:
“For the fact we have to wait for ages to actually get to see someone, I had
to wait by 25 minutes before I was eventually met with someone” (M6i, 21)
The convenience of the recovery process was another element highlighted by the
informants. They valued the simple and easy steps involved in the recovery
mechanisms of firms. One of the benefits of convenient procedures was conveyed
by an informant who had a service failure with an Airline company. She mentioned:
“The procedure was easy; I e-mailed them immediately, they have the e-mail
address on the customer website, which saved my time” (F6ii, 23)
Contrary to that, informants mentioned negative evaluations of complex procedural
mechanisms. Specifically, they have to go through several steps to resolve the
problem incurred during the service experience. For instance, an interviewee
mentioned her discomfort by explaining that :
“If you complain to the CEO, then you get a resolution, but why do I have to
go that far? Why can’t the channels in between resolve that?” (F2i, 32)
Similarly, another informant expressed her anxiety over complicated procedures of
an Airline company to recover a flight delay failure. She mentioned:
“…and they kept moving us from one place to another, and we were just
running around like a headless chicken from here to there, just trying to find
out help” (F14i, 31).
117
The data suggest that quick resolution to the service problem is a prime element
considered by the consumers who have experienced service failure. However, other
factors such as convenient procedural mechanisms and one window solutions are
also considered by consumers while evaluating service recovery efforts. Another
important finding of the data reveals that consumers also evaluate procedural justice
based on follow-up by the service firm. It was evident from the data that service firms
had followed up the informants in only two incidents out of 51. Other informants
reported that they were expecting the firms to follow up on them to reassure them
that the problem was completely resolved.
5.3.3 Interactional Justice
The interactional evaluation became apparent through the informants’ statements
regarding the behaviour and interaction of the service employees during the service
recovery process. A major aspect of this evaluation is recognised as to whether the
service providers give a verbal or written apology. This was evident with the
repetitive usage of the words such as ‘apology’, ‘apologised’ and ‘sorry’ by the
informants. Furthermore, politeness and courteousness are also detected as
aspects of interactional justice. In contrast, negative evaluation of the interaction
was identified with the keywords ‘rude’ ‘impolite’ ‘non-professional’ ‘aggressive’.
The data confirms the literature that apology, politeness and courteousness are
important elements of interactional justice (Chen and Kim, 2019; Mostafa et al.,
2015; Smith et al., 1999). An unanticipated insight emerged when informants
evaluated the interaction of employees based on their acceptance of mistake or the
contrary, blaming it on the consumers. For example, an informant negatively
evaluated the interaction with the restaurant when they tried to blame him for their
fault:
“They started to blame me, and I even gave them a bigger dose and then
they backed off.” (M8i, 25)
In contrast to negative evaluations on blaming the consumers for the service failure,
informants positively evaluated the interaction based on the acceptance of mistakes
by the service providers. They considered the gesture of acceptance of mistake as
fair:
118
“As a company, they are fair; they admitted that the fault existed, they
admitted that the fault was out of their hands” (F13i, 69)
In addition to the new insights, ‘apology’ was registered as the most common
element of interactional evaluation by the informants. It was observed from the data
analysis that apology is considered as foremost and indispensable aspect by the
informants to be present during the interaction with the service employees:
“I think first of all they would have said ‘we are really really sorry oh my
goodness how that happened?’ immediately that would have been the first
thing” (F9, 32)
Another informant considered the interaction as fair because she got an apology
from the service provider for overcharging her in her electricity bill:
“They didn’t tell me that they increased my price and when I contacted them
about it, they apologised, they did apologise, which is fair enough” (F12i, 53)
In addition to apology and acceptance of mistake, informants seemed to evaluate
the interaction on the aspects of how attentive the service employee was in listening
to them (F3i, 24; M4i, 30; M1i, 39) and how polite/impolite the service employees
while interacting with the informants (F11i, 22; M6ii, 21; M10, 42). In this regard,
qualitative research findings highlight the significance of several touchpoints of
interaction that are considered sensitive to the consumers while they are evaluating
the interactional aspect of the response of the service firm.
5.3.4 Informational Justice
Another dimension of justice that transpired during the qualitative data collection is
labelled as informational justice. This was registered when the informants suggested
their evaluation on the basis of the amount of explanation they received from the
service providers. It was observed from the data that informants are evaluating the
response based on the ‘adequacy’ of information, accuracy, relevancy, and
truthfulness of the information provided by the service employees. Extant literature
has treated the aspect of explanation within the dimension of interactional justice

119
(Chebat and Slusarczyk, 2005; Lin et al., 2011; Migacz et al., 2018). However,
Colquitt (2001), Gohary et al. (2016) and Chalmers, (2016) are few exceptions who
have mentioned explanation as an element of a separate dimension of perceived
justice.
The findings of the data are in line with the latter group of studies that acknowledged
the separate recognition of informational justice. The data analysis supplements the
scarce literature related to informational justice. Informants evaluated the aspect of
information or explanation independently of the interaction they had with service
employees. For instance, (M5ii, 22) evaluated the interaction with the service
employees as fair but evaluated the firm negatively on not providing the explanation:
“I didn’t mind the interaction I had with them; it was professional; however,
there was a lack of information regarding why it had happened” (M5ii, 22)
Similarly, several informants were found to expect the cause of failure to be part of
the information while evaluating the response by service providers. This reflects that
service consumers do not always evaluate informational fairness on the information
of the solution they are going to receive but also interested in evaluating the
information related to the cause of the failure (Chalmers, 2016). To affirm this, the
statement of (M2ii, 67) also mentions the significance of receiving information
regarding the cause of failure:
“If you are not informed that why is it happened, then you make such
speculations which are I think not good for the service company” (M2ii, 67)
In addition, the informants evaluate the recovery efforts in terms of accuracy and
relevance of the information. For example, (F11i, 22). wanted to reschedule the
flight but was unable to do that online and, in response, was given irrelevant
information, which caused more trouble for her. She mentioned that:
“I just hoped that they would explain it better and apply it more to my problem
because I don’t know if they obviously expect people to go into the chat rooms
having not thought everything” (F11i, 22)
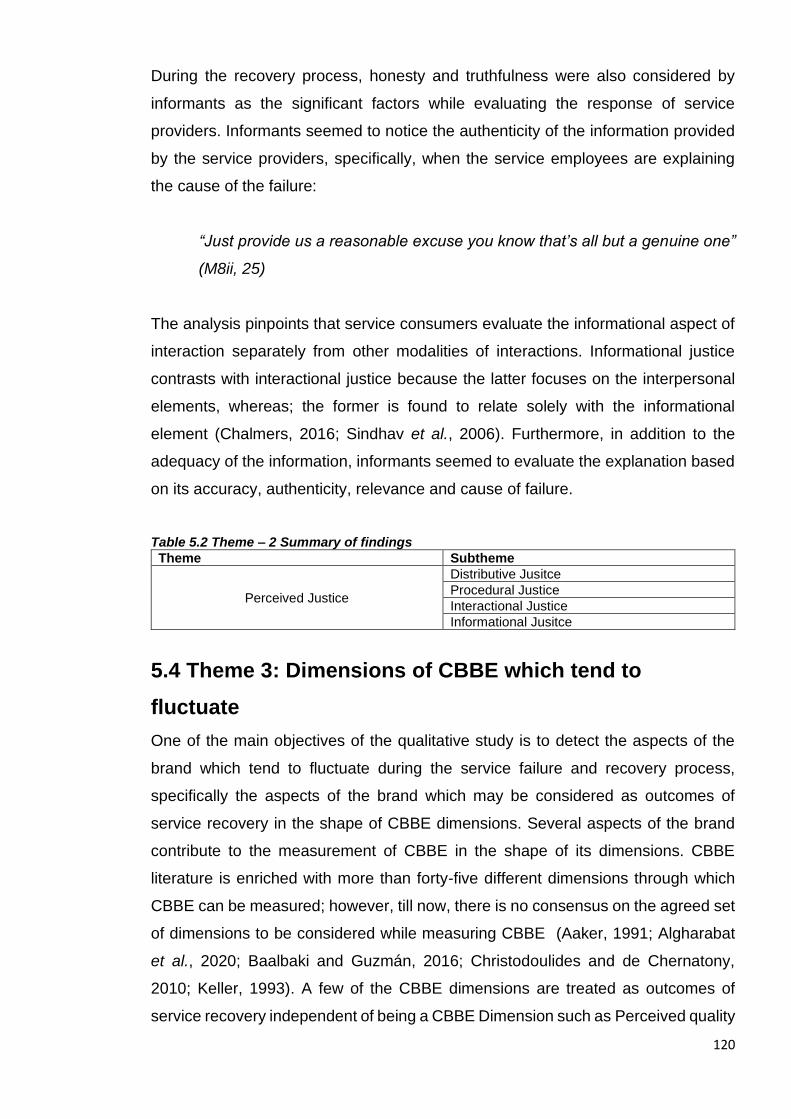
120
During the recovery process, honesty and truthfulness were also considered by
informants as the significant factors while evaluating the response of service
providers. Informants seemed to notice the authenticity of the information provided
by the service providers, specifically, when the service employees are explaining
the cause of the failure:
“Just provide us a reasonable excuse you know that’s all but a genuine one”
(M8ii, 25)
The analysis pinpoints that service consumers evaluate the informational aspect of
interaction separately from other modalities of interactions. Informational justice
contrasts with interactional justice because the latter focuses on the interpersonal
elements, whereas; the former is found to relate solely with the informational
element (Chalmers, 2016; Sindhav et al., 2006). Furthermore, in addition to the
adequacy of the information, informants seemed to evaluate the explanation based
on its accuracy, authenticity, relevance and cause of failure.
Table 5.2 Theme – 2 Summary of findings
Theme Subtheme
Perceived Justice
Distributive Jusitce
Procedural Justice
Interactional Justice
Informational Jusitce
5.4 Theme 3: Dimensions of CBBE which tend to
fluctuate
One of the main objectives of the qualitative study is to detect the aspects of the
brand which tend to fluctuate during the service failure and recovery process,
specifically the aspects of the brand which may be considered as outcomes of
service recovery in the shape of CBBE dimensions. Several aspects of the brand
contribute to the measurement of CBBE in the shape of its dimensions. CBBE
literature is enriched with more than forty-five different dimensions through which
CBBE can be measured; however, till now, there is no consensus on the agreed set
of dimensions to be considered while measuring CBBE (Aaker, 1991; Algharabat
et al., 2020; Baalbaki and Guzmán, 2016; Christodoulides and de Chernatony,
2010; Keller, 1993). A few of the CBBE dimensions are treated as outcomes of
service recovery independent of being a CBBE Dimension such as Perceived quality

121
(Aurier and Siadou‐Martin, 2007), Brand Trust (Lopes and da Silva, 2015) and
Brand Image (Mostafa et al., 2015). However, to the best of the researcher’s
knowledge, CBBE has never been investigated as an outcome within service
recovery literature.
In pursuit of exploring the relationships and detecting the brand aspects that tend to
fluctuate, informants were allowed to elaborate on their assessment of the service
brand. Informants were asked to assess the service brand at two different stages
within their service failure and recovery stories, i) Post-failure assessment:
assessment of service brand immediately after service failure /before service
recovery and ii) Post recovery assessment: assessment of service brand after
service recovery. This allowed the researcher to divide the extracted quotes related
to aspects of brand into two distinct categories, post-failure assessment and post-
recovery assessment. Therefore, in pursuit of the objectives of the current study,
only those aspects of the brand are considered which are affected at both stages of
informants’ assessments, post-failure and post-recovery assessments. It was
further observed from the data analysis that post-failure assessments of consumers
have a negative valence, whereas post-recovery assessments demonstrated both
directions, positive and negative assessment of a service brand. Within the CBBE
dimensions theme, five distinct sub-themes emerged i) Perceived Quality ii)
Perceived value iii) Brand Reputation iv) Brand Trust and v) Brand Loyalty.
5.4.1 Perceived Quality
Interviewees further reported their perceptions towards the quality of the service
brand after a service failure and then their assessments after the service failure was
recovered. The significance of perceived service quality is well documented in the
literature. However, very little literature has entertained brand perceived quality
within service failure and recovery literature (Aurier and Siadou-Martin, 2007). The
emergence of this sub-theme supplements the scarce literature. Investigating
perceived quality is essential for service managers because of its role as a key
source of value and satisfaction (Darley and Luethge, 2019).
Post failure assessments
Informants’ assessment of brand after a service failure showed that brand perceived
quality is harmed. Statements from interviewees were collated into sub-theme of

122
brand perceived quality with the help of repeat usage of keywords such as;
‘(in)competency’ ‘(lack of) quality,‘(poor) performance’, and (non)professionalism
etc. For instance, a 33-year-old homemaker living in London was upset because her
name was added to the electricity bill, causing her further problems. She perceived
the electric company as incompetent:
"They were very incompetent, I think so there is not enough training of their
employees because they were not able to add a name into an account, which
is very simple" (F4ii, 33)
In addition to competence, informants showed their reservations towards the service
brand via questioning the professionalism of the service employees. After having a
severe delay in flight (M5i, 22) was agitated and alluded to negative remarks on the
professionalism of the Airline Company. He mentioned:
"I felt that the service was poor because we were not told why the flight was
delayed, and I felt that it was very unprofessional that the flight was delayed"
(M5i, 22)
Post recovery assessments
Qualitative data analysis reveals that informants showed positive assessments
towards brand perceived quality after the service brand made ample efforts to
resolve their problems. One of the informants (F12ii, 53) positively assesses the
quality of the service brand after she was refunded and followed up by the online
retailer. She suggested:
"They e-mailed again to me to reassure that everything is fine and whether I
have got the refund and also asked for the feedback that how they dealt with
the matter, so you know this tells you the good quality of the service provider"
(F12ii, 53)
In addition, informants were also seemed to have enhanced perceptions of brand
quality when their problem was handled quickly. (M4ii, 30) seemed to have an elated
perception of brand quality after receiving a speedy recovery by his Airline preceding
a flight delay. He said that:

123
"Again, the momentum to which they swiftly resolved the issue was very
impressive for me" (M4ii, 30)
In contrast to having positive perceptions of perceived brand quality, interviewees
showed negative perceptions after unsatisfactory service recovery efforts. After a
flight delay, one of the informants was charged over a call to the helpline. He said
that:
"…perception of quality went several levels down, now I don’t expect much
from budget airlines, this is why they are called budget airlines" (M1i, 39)
The evidence collected from qualitative data analysis shows that service consumers
tend to have negative perceptions of brand quality after they experience a service
failure. Specifically, service consumers downgraded the quality of the brand when
service failure reflected signs of misrepresentation, incompetence, and
unprofessionalism. Similarly, the same was observed in the case of inappropriate
service recovery efforts. However, an appropriate service recovery effort showed
that consumers perceived the quality positively.
5.4.2 Perceived Value
The qualitative data revealed that consumers ‘perceived value’ fluctuate in the
service failure and recovery process. Perceived value is usually cosidered as the
“value for money or tradeoff between expected benefits and cost” (Dall’Olmo Riley
et al., 2015, p.887). Consumers perceive that the costs (monetary, time and effort)
they incurred to consume the service does not result in the expected benefits after
a service failure. However, after service recovery, the informants shared favourable
views towards perceived value. In the literature, perceived value is understood as
the value for money consumers receive after they incur the cost, mostly in monetary
terms (Pandža Bajs, 2015; Wiedmann et al., 2018).
Post failure assessments
A negative impact on ‘Perceived value’ was observed initially, with the informants
were price sensitive, especially in the case of students, medium and low-income
informants. If an economic loss is experienced due to the service failure, the

124
informants shared negative opinions about their perceived value towards the service
brand. For example, a university who was also a part-time employee experienced a
service failure at a restaurant. She was served burnt food for her lunch. She said
that:
"I am a student, and every penny is of utmost importance that’s why I chose
the seller because it was a value for money purchase, but then I mean I could
see my money wasted in that way" (F3ii, 24)
Another informant who paid more to get a high-speed internet ended up getting a
standard internet speed. She shared that:
"I probably still would have been paying for the less speed, a total loss on
value for money, I would say" (F2i, 32)
The data evidenced that full-time employed consumers are also value hunters, and
when they do not get the value for money or lose it due to a service failure, they
loudly share it. During the interviews, an airline consumer shared that he usually
consumer budget airlines for travelling. However, a severe delay in his flight made
him think differently:
"Yea, I always hunt for value, but I wasn’t expecting much from their service
on board, I also didn’t expect them to be exact on timings, but I didn’t expect
that long delay as well, so surely I paid more than what I lost" (M1i, 39)
Post recovery assessments
An appropriate response from the service firms after a service failure results in
favourable customer opinions about the service brand (Mostafa et al., 2015). The
qualitative study explored that when customers receive service recovery, they
consider it worth their costs. For example, an informant who was overcharged by
the mobile company was responded with suitable actions. The company solved the
problem, apologised and returned the overcharged amount. He said that:
125
" So they told me that the bill for the following month would be minus for what
would be overcharged me for the previous month. So that was worth of what
costed me" (M4i, 30)
Similarly, an interviewee who was a regular cinema-goer shared that after she had
an interactional failure with the firm, the manager compensated her with what she
perceived as a value for the cost she paid. She shared that:
“I find that a good reward for the irritation I went through, it was very positive
because I hadn’t asked for any gesture of goodwill or anything like that, I just
wanted her to apologise (laughing) for blaming her customer” (F8i, 27)
The service managers who are unable to provide an adequate level of service face
challenges in the form of negative consequences for their brands. A fifty-six-year-
old school teacher was not even satisfied with the service recovery of the firm and
still perceived that she gained less than what she costed to consume the service:
"its quite a high insurance policy that we have for these things, and the reason
that we take that out is, so that if something goes wrong, then it gets fixed
quickly, but here I think we paid much more than what we got in return" (F1,
56)
5.4.3 Brand Reputation
Brand reputation refers to the aggregate of consumers perceptions of a brand
developed over time after having multiple interactions with the brand (Veloutsou
and Moutinho, 2009; Walker, 2010). This sub-theme emerged when informants
discussed the effect service failure and service recovery had on their overall
perception of the firm. In literature, the absence of brand reputation as an outcome
of service failure and recovery is surprising because the effect on brand reputation
was frequently evidenced throughout the interviews.
Post-failure assessments
It was revealed that brand reputation is downgraded after a service failure. One of
the informants explained her experience with the online retailer regarding an error
in the bill. She mentioned:
126
"My overall perception about them decreased a bit yeah because it just it
became an ordeal to have to try and exchange" (F11iii, 22)
A few of the informants even used a 1-10 scale to elaborate their responses related
to how their overall estimation of the company has dropped due to the service
failure. For instance, (M4i, 30) mentioned an incident with his mobile phone
company and alluded to how he estimated the reputation of the service brand:
"I would say that they must have dropped their reputation to 4 out of 10
because as a well-established company which had been operating in the UK
for many years, I expected better from them but they performed opposite to
their reputation" (M4i, 30)
Another informant (M7, 33) elaborated the reasons for the dilution of the service
brand reputation. He experienced a severe delay in serving the food at a restaurant
and proclaimed that:
"They might be thinking that they can do whatever they want to do and people
will come eventually because of the taste of the food, but I think this is wrong
and kind of blackmailing, they might not be losing customers initially, but they
are certainly losing their reputation and they might not survive for long" (M7,
33)
Post-recovery Evaluations
After service recovery, it was observed through the interviews that informants
frequently mentioned the effects on their overall perceptions of the service brand. It
seemed that those informants who received a suitable response from the firm
against the service failure rated the brand's reputation as high. (M8iii, 25) rated his
mobile phone operator very high because the billing issue was resolved according
to what he desired. He mentioned:
"My overall perception towards the company was that they were an excellent
company! Just the fact that they have excellent customer service, putting the

127
customer at first, giving the customer the options of providing the solutions
that’s the important thing providing solutions and no blame games" (M8iii, 25)
Similarly, (F13i, 69) was very impressed with the honesty and adequacy of the
information followed up with compensation provided by her broadband company.
She alluded that:
"They kept me informed that was important. And they did what they had to
do, so that was a happy bonding and then gave me three months free
services and also saying we are sorry, that put my overall estimation of that
company right up" (F13, 69)
Contrary to having a positive influence on the overall estimation of the service brand,
brand reputation was seemed to decline when service firms couldn’t do well in
responding to a service failure. Specifically when the service providers are not
honest with the aggrieved consumers. For example, after the delay in resolution to
the problem and then misrepresentation by her Gas company employees, (F1, 56)
got upset and mentioned:
"They are misrepresenting themselves, and due to that, they have gone more
down in my estimation" (F1, 56)
Hence, the possibility of fluctuation concerning the overall perceptions of the service
consumers seemed to be present within the service failure and recovery process. It
is also well noted that in addition to the suitable resolution of the problem, the service
providers' honesty and adequacy play an important role in improving the reputation
of the service brand and vice versa.
5.4.4 Brand Trust
One of the most prominent aspects of the brand, which seemed to fluctuate during
service failure and service recovery, is brand trust. After experiencing a service
failure, there is a probability of trust deficit development which may affect the brand’s
strength in weakening the relationship (Li et al., 2017). On the contrary, when
consumers can interact with service providers during service recovery, the
probability of restoring trust increases (Basso and Pizzutti, 2016). Similar findings
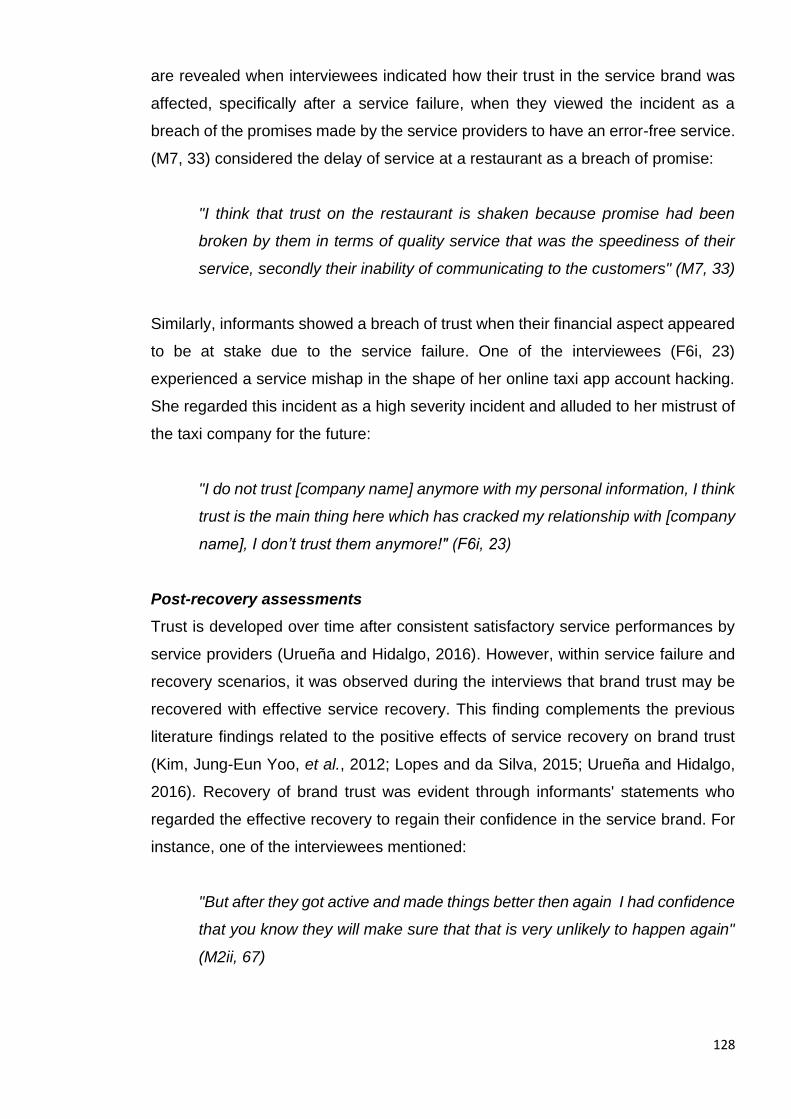
128
are revealed when interviewees indicated how their trust in the service brand was
affected, specifically after a service failure, when they viewed the incident as a
breach of the promises made by the service providers to have an error-free service.
(M7, 33) considered the delay of service at a restaurant as a breach of promise:
"I think that trust on the restaurant is shaken because promise had been
broken by them in terms of quality service that was the speediness of their
service, secondly their inability of communicating to the customers" (M7, 33)
Similarly, informants showed a breach of trust when their financial aspect appeared
to be at stake due to the service failure. One of the interviewees (F6i, 23)
experienced a service mishap in the shape of her online taxi app account hacking.
She regarded this incident as a high severity incident and alluded to her mistrust of
the taxi company for the future:
"I do not trust [company name] anymore with my personal information, I think
trust is the main thing here which has cracked my relationship with [company
name], I don’t trust them anymore!" (F6i, 23)
Post-recovery assessments
Trust is developed over time after consistent satisfactory service performances by
service providers (Urueña and Hidalgo, 2016). However, within service failure and
recovery scenarios, it was observed during the interviews that brand trust may be
recovered with effective service recovery. This finding complements the previous
literature findings related to the positive effects of service recovery on brand trust
(Kim, Jung-Eun Yoo, et al., 2012; Lopes and da Silva, 2015; Urueña and Hidalgo,
2016). Recovery of brand trust was evident through informants' statements who
regarded the effective recovery to regain their confidence in the service brand. For
instance, one of the interviewees mentioned:
"But after they got active and made things better then again I had confidence
that you know they will make sure that that is very unlikely to happen again"
(M2ii, 67)
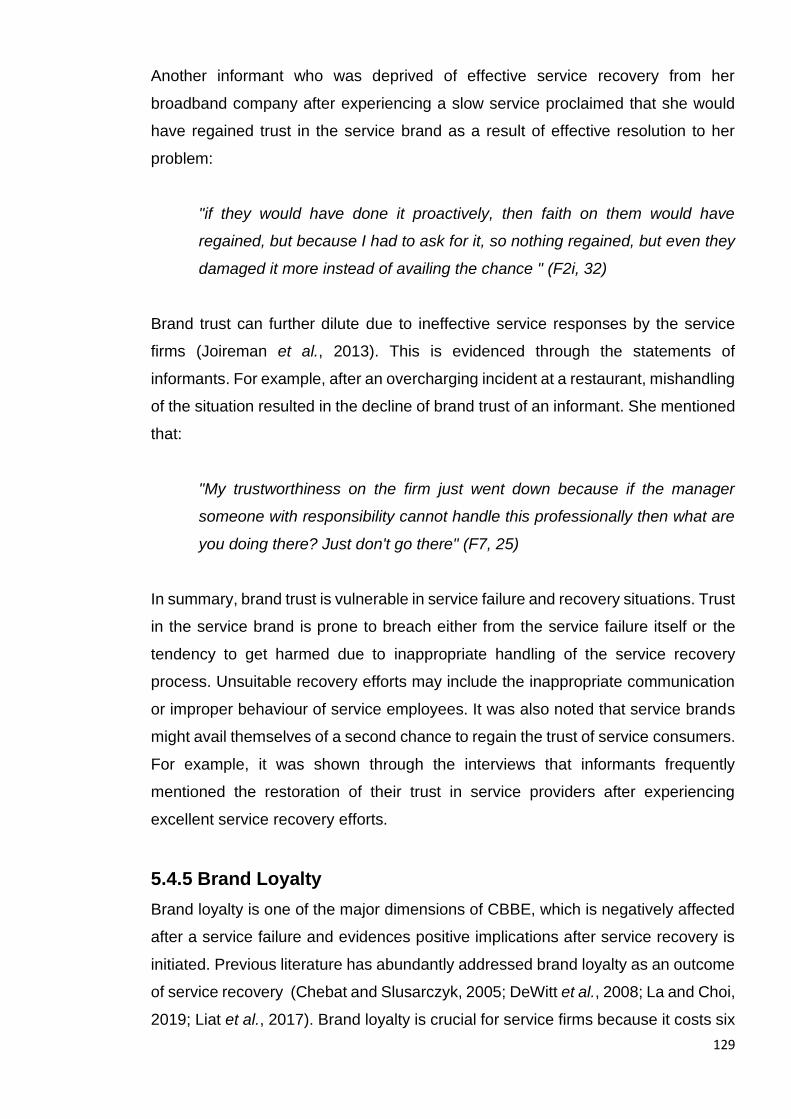
129
Another informant who was deprived of effective service recovery from her
broadband company after experiencing a slow service proclaimed that she would
have regained trust in the service brand as a result of effective resolution to her
problem:
"if they would have done it proactively, then faith on them would have
regained, but because I had to ask for it, so nothing regained, but even they
damaged it more instead of availing the chance " (F2i, 32)
Brand trust can further dilute due to ineffective service responses by the service
firms (Joireman et al., 2013). This is evidenced through the statements of
informants. For example, after an overcharging incident at a restaurant, mishandling
of the situation resulted in the decline of brand trust of an informant. She mentioned
that:
"My trustworthiness on the firm just went down because if the manager
someone with responsibility cannot handle this professionally then what are
you doing there? Just don't go there" (F7, 25)
In summary, brand trust is vulnerable in service failure and recovery situations. Trust
in the service brand is prone to breach either from the service failure itself or the
tendency to get harmed due to inappropriate handling of the service recovery
process. Unsuitable recovery efforts may include the inappropriate communication
or improper behaviour of service employees. It was also noted that service brands
might avail themselves of a second chance to regain the trust of service consumers.
For example, it was shown through the interviews that informants frequently
mentioned the restoration of their trust in service providers after experiencing
excellent service recovery efforts.
5.4.5 Brand Loyalty
Brand loyalty is one of the major dimensions of CBBE, which is negatively affected
after a service failure and evidences positive implications after service recovery is
initiated. Previous literature has abundantly addressed brand loyalty as an outcome
of service recovery (Chebat and Slusarczyk, 2005; DeWitt et al., 2008; La and Choi,
2019; Liat et al., 2017). Brand loyalty is crucial for service firms because it costs six
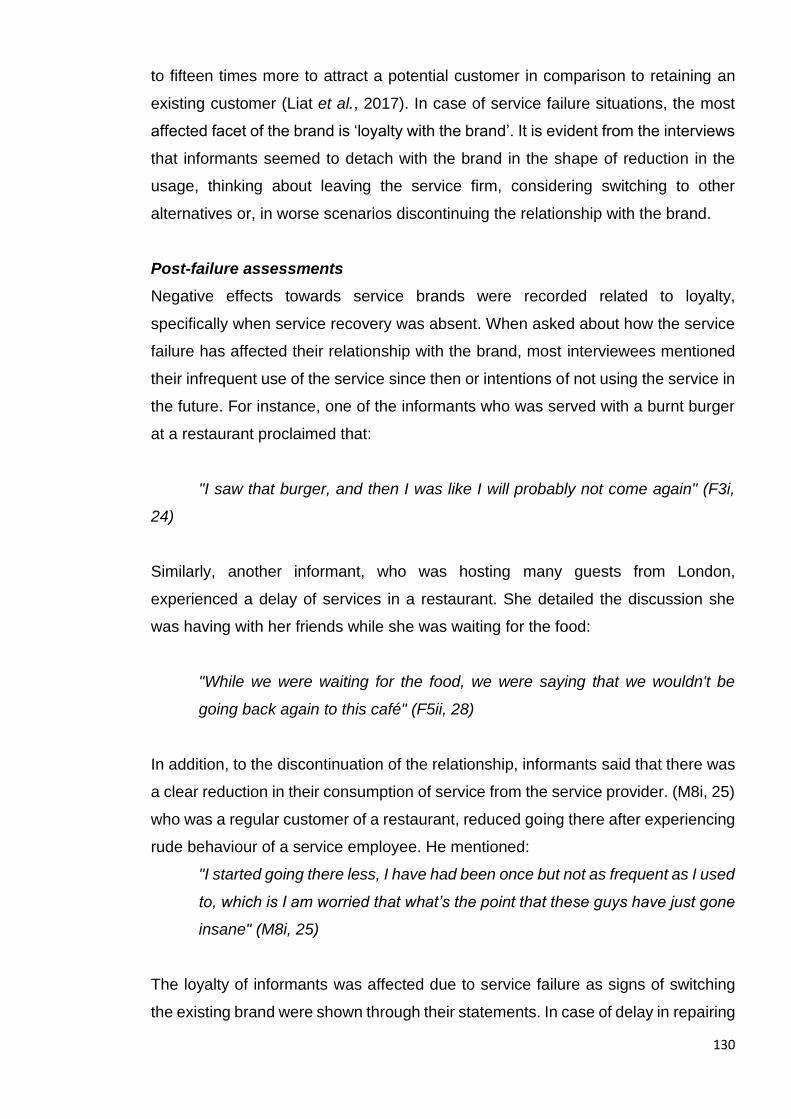
130
to fifteen times more to attract a potential customer in comparison to retaining an
existing customer (Liat et al., 2017). In case of service failure situations, the most
affected facet of the brand is ‘loyalty with the brand’. It is evident from the interviews
that informants seemed to detach with the brand in the shape of reduction in the
usage, thinking about leaving the service firm, considering switching to other
alternatives or, in worse scenarios discontinuing the relationship with the brand.
Post-failure assessments
Negative effects towards service brands were recorded related to loyalty,
specifically when service recovery was absent. When asked about how the service
failure has affected their relationship with the brand, most interviewees mentioned
their infrequent use of the service since then or intentions of not using the service in
the future. For instance, one of the informants who was served with a burnt burger
at a restaurant proclaimed that:
"I saw that burger, and then I was like I will probably not come again" (F3i,
24)
Similarly, another informant, who was hosting many guests from London,
experienced a delay of services in a restaurant. She detailed the discussion she
was having with her friends while she was waiting for the food:
"While we were waiting for the food, we were saying that we wouldn't be
going back again to this café" (F5ii, 28)
In addition, to the discontinuation of the relationship, informants said that there was
a clear reduction in their consumption of service from the service provider. (M8i, 25)
who was a regular customer of a restaurant, reduced going there after experiencing
rude behaviour of a service employee. He mentioned:
"I started going there less, I have had been once but not as frequent as I used
to, which is I am worried that what’s the point that these guys have just gone
insane" (M8i, 25)
The loyalty of informants was affected due to service failure as signs of switching
the existing brand were shown through their statements. In case of delay in repairing

131
the fridge freezer, (F1, 56) indicated her indecisiveness over staying with the gas
company. As she recalled and stated:
"…when we had that incident with the fridge freezer, I was not so sure that
we would keep the insurance with these electrical goods, maybe just go to
have a look into some other companies" (F1, 56)
Post-recovery assessments
Positive statements related to the loyalty of informants to the brands were recorded
during the interviews after they received the desired response from service
providers. Informants showed their intent of staying with the company, the main
reason being the excellent response to failure by the service providers. This
reflected that brand loyalty towards the service brand is affected by service recovery
(La and Choi 2019). Although (F6ii, 23) experienced rude behaviour from a staff
member of her Airline, she preferred to continue her relationship with the brand
because she admired the firm's response to the incident. She alluded that:
"I will still go with the [company name] to travel with because they at least
know how to win back their customers" (F6ii, 23)
Another informant expressed her joy over getting reimbursed for the service failure
and mentioned staying with her broadband company:
"My broadband company reimbursed me for three months, and I was quite
happy, and I stayed with them, it was [company name] by the way" (F13i, 69)
On the other hand, the service firms which failed to recover the problems faced by
the informants seemed to incur the cost of losing them as consumers. Another
informant expressed displeasure on the poor response by her broadband company.
"All of these factors were basically pushed me to discontinue, and probably
because of these reasons, I say it was a severe failure" (F4i, 33)
Qualitative data analysis showed the fluctuation of brand loyalty during service
failure and recovery. Informants seemed to discontinue or reduce their consumption
of services after a service failure. It reflected that after a service failure, brand loyalty
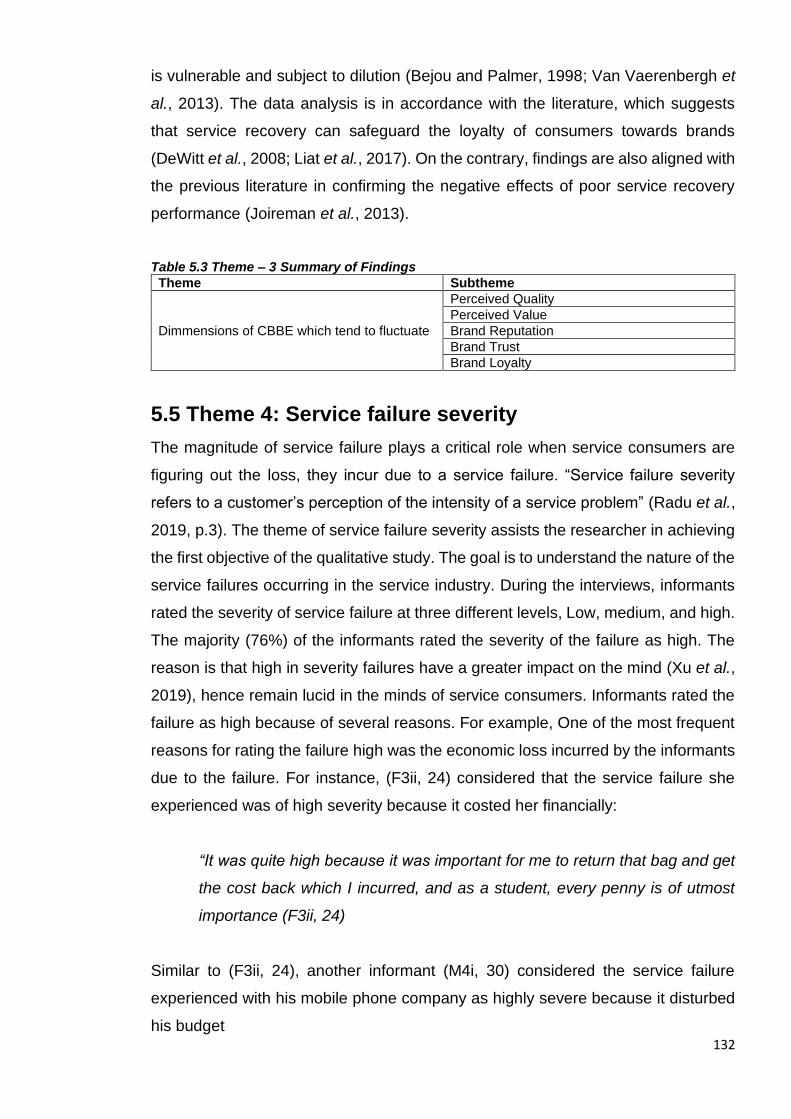
132
is vulnerable and subject to dilution (Bejou and Palmer, 1998; Van Vaerenbergh et
al., 2013). The data analysis is in accordance with the literature, which suggests
that service recovery can safeguard the loyalty of consumers towards brands
(DeWitt et al., 2008; Liat et al., 2017). On the contrary, findings are also aligned with
the previous literature in confirming the negative effects of poor service recovery
performance (Joireman et al., 2013).
Table 5.3 Theme – 3 Summary of Findings
Theme Subtheme
Dimmensions of CBBE which tend to fluctuate
Perceived Quality
Perceived Value
Brand Reputation
Brand Trust
Brand Loyalty
5.5 Theme 4: Service failure severity
The magnitude of service failure plays a critical role when service consumers are
figuring out the loss, they incur due to a service failure. “Service failure severity
refers to a customer’s perception of the intensity of a service problem” (Radu et al.,
2019, p.3). The theme of service failure severity assists the researcher in achieving
the first objective of the qualitative study. The goal is to understand the nature of the
service failures occurring in the service industry. During the interviews, informants
rated the severity of service failure at three different levels, Low, medium, and high.
The majority (76%) of the informants rated the severity of the failure as high. The
reason is that high in severity failures have a greater impact on the mind (Xu et al.,
2019), hence remain lucid in the minds of service consumers. Informants rated the
failure as high because of several reasons. For example, One of the most frequent
reasons for rating the failure high was the economic loss incurred by the informants
due to the failure. For instance, (F3ii, 24) considered that the service failure she
experienced was of high severity because it costed her financially:
“It was quite high because it was important for me to return that bag and get
the cost back which I incurred, and as a student, every penny is of utmost
importance (F3ii, 24)
Similar to (F3ii, 24), another informant (M4i, 30) considered the service failure
experienced with his mobile phone company as highly severe because it disturbed
his budget

133
“It was obviously crucial though for me economically because that affects my
budget per month” (M4i, 30)
In addition to economic loss, informants rated their failure high in severity because
of their time and energy costs. (F14i, 31) suggested the value of time for her to reach
her holiday destination. However, the flight delay resulted in increasing her time and
energy cost. Views from (F4ii, 33) further added that the intensity of the failure was
high not only because it costed her in terms of time and energy but also affected
other important tasks. In her case, she wanted her name to be added to an electricity
bill to apply for a Visa. But delay in the process resulted in the delay of her visa. She
mentioned:
“Well, this was very taxing. I mean mind taxing and cost of my energy, and
otherwise, also it cost a long delay and other things that I was supposed to
do so I think it was a severe failure in front of my eyes” (F4ii, 33)
Reasons for low and medium severity failures were either low economic loss, less
time and energy cost, or when the service failure is not attributed to the firm. For
instance (F11ii, 22) perceived a low magnitude of the failure because she attributed
the responsibility towards herself:
“This time, I think the radiator leaked because I think I didn’t follow the
technician’s advice, so I won’t rate it a high severity failure [laughing]”
(F11ii,22)
The severity of service failure was also rated as medium by a few informants. A
female informant who was not happy with the cinema because her access to watch
3D movies was restricted because the cinema did not send her a new card. She
rated this incident as a medium severity failure and stated that:
"I won’t rate it high it was neither a less severe nor a high severity failure "
(F8i, 27)
The qualitative data analysis related to service failure severity suggested that
majority consumers consider the intensity of service failure at two levels, high and

134
low. However, a few informants considered the failure incidents as having medium
severity. Therefore, it was concluded that the intensity of the failure perceived by
consumers may be at three levels.
Table 5.4 Theme – 4 Summary of the findings
Themes Sub-themes
Failure Severity
High level severity
Medium level severity
Low level severity
5.6 Theme 5: Failure attribution
The data collected through the semi-structured interviews evidenced the
significance of failure attribution while customers evaluate the service recovery effort
of the firm. Previous literature has given ample importance to the concept of failure
attribution while investigating service failure and recovery (see Bambauer-Sachse
and Mangold, 2011; Dong et al., 2008; Matikiti et al., 2019; Nikbin et al., 2015).
Failure attribution is referred to as “an individual’s effort to allocate some
responsibility for a given event” (Nikbin et al., 2015, p 608). The qualitative data
analysis showed that 50 out of 51 service failure incidents were attributed to the
service firm. This confirms the previous findings, which claimed that consumers tend
to attribute the failure towards firms to maintain their self-esteem (Huang, 2008; Van
Vaerenbergh et al., 2013). Informants seemed to show displeasure after feeling that
the failure is attributed to themselves. An informant was unhappy with the restaurant
staff; she mentioned:
"first of all, I was really crossed because they were making me pay when they
missed my order and made me feel like it was my fault" (F9, 32)
Previous literature has treated failure attribution as a moderating factor between
service recovery efforts and evaluations by the service consumers. Specifically,
studies related to customer participation in service recovery has documented its
significant moderating role (see Dong et al., 2008, 2016; Roggeveen et al., 2012).
The influence of failure attribution is critical between service recovery and
consumers evaluations of the recovery efforts because it results in different
consequences. Interview data showed that when the service failure is attributed to
the consumer, one of the interviewees labelled the service failure as less severe

135
and had positive evaluations of the service recovery efforts of the firm. She alluded
that:
“This time, I think the radiator leaked because I think I didn’t follow the
technician’s advice, so I won’t rate it a high severity failure [laughing]”
(F11ii,22)
Table 5.5 Theme – 5 Summary of finings
Theme Subthemes
Failure Attribution Attributed to the Firm
Attributed to the Customer
5.7 Findings related to the context
Interviewees shared multiple incidents of service failure and recovery during the
interviews. The researcher divided the incidents into ten different service sectors.
Although the literature suggests that service failures are more common in an online
setting (East et al., 2012), the current study findings suggest otherwise. .It was
evident through the analysis that most of the incidents fall into the Transport and
Hospitality service sector, 24% and 20% respectively. According to different service
industries, the researcher further divided the incidents to have a deeper insight and
identify the specific critical industries within the broad service sectors. In total, 20
different service firms were mentioned in 51 incidents. It is found that the maximum
number of reported incidents are from Airline companies (Transport) (20%) and
Restaurants (Hospitality) (18%).
Figure 5.1 Firm-wise depiction of incidents
18%
8%
20%
0%
5%
10%
15%
20%
25%
Firms

136
Figure 5.2 Sector-wise depiction of incidents
5.8 Findings related to service failure typologies
In order to detect the critical service failure typology, the researcher divided the
reported service failures into different service failure typologies. Previous literature
hinges on three different views of service failure typologies (Bitner et al., 1990;
Keaveney, 1995; Smith et al., 1999). However, the major drawbacks of extant
typologies are that they are too general and lack precision. Traces of confusion are
found in literature where the same example of service failure is treated in different
types of failures (Forbes, 2008; Migacz et al., 2018; Tsai and Su, 2009). The
qualitative data revealed numerous types of service failures experienced by the
informants. Therefore, to overcome this problem, service failures were distributed
among three main types, i) Core service failures, ii) Supplementary service failures,
and iii) Interactional failures, which are more comprehensive and clearer. Further
classification and description of these types with examples are as follows in Table
5.1.
The classification of reported service failures according to the above-mentioned
service failure typologies showed that the majority of informants had experienced
Core service failures (59%). It was further analysed through the qualitative data that
within the Core Service failures type, ‘delay in core service’ frequently appeared
(47%) as a subtype of Core service failure. It seems from the data that informants
view ‘delay of core service’ as a critical service failure type and require an immediate
and suitable response to recover their loss.
20%
24%
16%
0%
5%
10%
15%
20%
25%
30%
Sectors

137
Further investigation of qualitative data revealed that the Core service failure sub-
type ‘delay in core service’ is frequent in the Airline industry (43%) and restaurant
industry (29%). This finding complements Adams, (2018) report, which suggested
that the UK remained second-worst in flight delays. In this regard, qualitative
findings related to services context and service failure typologies suggest that Core
service failures, specifically delay in core service, is most frequent among the
reported incidents. Furthermore, Airline companies and restaurants are more
susceptible to produce a delay in core service in the shape of flight delays and delay
in serving food. Service consumers expect an immediate and satisfactory response
from the firms in this regard.

138
Table 5.6 Service failure Typologies
Core service failures: all the failures related to the main service for which the customer is consuming the services
Sub-type of Failure
Explanation Extracted Example from data Informant Firm
Unavailability of core service
Core service was not delivered to the consumer Banker’s draft was unavailable at a branch of retail bank
M2i, 67 Retail Bank
Internet connection was unavailable F13i, 69 Broadband Company
Delay in core service
The delivery of core service is delayed, and the consumer has to wait longer than the expected
Air flight was delayed by 8 hours M7, 33 Airline company
Food was served late F5ii, 28 Restaurant
Other hindrance(s) in core service
Delivery or quality of core service is affected by any hindrance (other than delay and bad interaction)
The room at a hotel was not clean F8, 27 Hotel
Heating of the house was not working M5ii, 22 Letting Agency
Supplementary Service failures: All the failures related to services that are secondary and help the consumer to consume core service
Information failures
Incorrect information provided by the service provider
Misinformation regarding luggage collection for a connecting flight
M4ii, 30 Airline Company
Order taking failures
The service provider takes incorrect order Incorrect order was taken, and as a result, incorrect order delivered
F12ii, 56 Online retailer
Billing failures Incorrect billing by the service provider Overcharged the informant with an extra mobile phone bill
M8iii, 25 Mobile phone company
Overcharged by an online retailer F11iii, 22 Online Retailer
Payment failures Failures related to the payment process of a service
Bill payment method was not working F13iii, 69 Water company
Direct debit problem with the electric company
F12i, 53 Electric Company
Safekeeping failures
Failures related to the possessions of service customers
The car speedometer was damaged during the repair
M10, 42 Car repair workshop
Mobile taxi application login was hacked F6i, 23 Taxi Company
Exceptions failures
Failures related to all exceptions provided outside normal delivery of services
Additional name on the electricity bill was taking long
F4i, 33 Electricity Company
Problem with the return of the product F3ii, 24 Online retailer
Interactional Failures: All the failures related to the interaction of service employee(s) with Consumer(s)
Interactional failures
Referred as inappropriate interaction of service employee(s) with the consumer(s) including rude, ignorant, and impolite interaction
Member of Airline staff interacted rudely with the informant
F6ii, 23 Airline Company
The frontline staff was rude M6i, 21 Retail Bank
139
5.10 Summary
Results from the qualitative study are presented in this chapter. The study's findings
are based on 24 semi-structured interviews with service consumers who
experienced a service failure and recovery situation. 51 different incidents of service
failure and recovery associated with different service sectors and firms are reported
by the informants.
This chapter is divided into two sections. The first section explored the role of service
recovery, evaluations of service consumers, and dimensions of CBBE, which tend
to fluctuate. This section identified that service firms involve customers in service
recovery process by discussing them the solution of the problem, asking them to fill
out forms for reimbursement and by providing them with the options of the
compensation. It was further identified that customers evaluate the service recovery
on the basis of the levels of fairness they have received. Finally, this section has
presented that perceived quality, perceived value, brand reputation, brand trust and
brand loyalty are the facets of the brand which tend to fluctuate in ‘service failure
and recovery process’.
The second section consists of information regarding Critical service context, critical
type of service failure, the role of failure attribution and service failure severity. The
informants frequently report incidents related to airline (20%) and restaurant (18%)
industries. Several types of service failure are identified which have distinct
characteristics. Among the types, core service failure (59%) is identified as the most
common service failure type. The majority (47%) of the reported incidents contain
‘delay of core service’ as a type of service failure. 76% of service failure experiences
by interviewees are considered highly severe. Within the category of core service
failures, ‘delay in core service.’
140
Chapter 6 Conceptual Framework and Research
Hypothesis
6.1 Introduction
The chapter includes the conceptual model and research hypotheses developed
with the assistance of literature review (see Chapter 2) and qualitative data analysis
(see Chapter 4). Firstly, the overall logic of the conceptual model is presented, which
includes the core concepts of the model. The overall logic includes the process of
the development of a conceptual framework with the help of two bodies of literature
and the results of the qualitative study. It is then followed by a graphical
representation of the relationships. Next, the development of relevant hypotheses
is discussed. Finally, a chapter summary is present at the end of this chapter.
6.2 Overall logic
In pursuit of addressing the research questions 2,3, 4 and 5 (see section 2.6 in
chapter 2), the proposed conceptual model is developed. The model assists the
researcher to formulate and test the hypothesis. The hypotheses are related to
service recovery, service failure severity, perceived justice and Consumer-based
brand equity (CBBE).
The starting point of the current study’s conceptual model is ‘service recovery’,
which is defined as the reaction to service failures to mitigate the customers'
negative responses (Barusman and Virgawenda, 2019). Service recovery is always
followed by a service failure and the current study defines service failure as the
mismatch of customers’ expectations and service performance (Bell and Zemke,
1987). Service firms address the challenge of service failures by employing effective
service recovery. The current conceptual model recognises two main forms of
service recovery which are exercised by the firms to mitigate the negative
consequences of service failures. Firstly, firm recovery which is defined as the
response to a service failure that the service firm entirely provides to solve the
problem (Balaji et al., 2018; Dong et al., 2008). Secondly, Customer participation in
service recovery is known as the ability of the customer(s) and service provider(s)
to design or tailor the features of the service recovery (Roggeveen et al., 2012).

141
Service-Dominant Logic (Lusch and Vargo, 2006; Vargo and Lusch, 2004) suggests
that integration of customers’ and firms’ resources (knowledge and skills) assist in
value maximisation. When customers participate in service recovery’, the value
maximisation results in further benefits for both customers and firms (Bagherzadeh
et al., 2020; Dong et al., 2008, 2016). Firms may exercise any of the two forms to
tackle the service failure situation (Roggeveen et al., 2012); however, the
effectiveness of the service recovery depends on the consumer
assessment/evaluation of service recovery (Yani-de-Soriano et al., 2019).
The second block of the conceptual model discusses the cognitive evaluation of
customers about the service recovery. According to the justice theory (Rawls, 1971),
consumers engage themselves in a cognitive evaluation process to identify whether
the service recovery efforts are just or unjust (DeWitt et al., 2008; Migacz et al.,
2018). The current research utilises perceived justice to identify the effectiveness of
service recovery. Perceived justice is defined as the degree of fairness that
customers perceive from the service firm concerning the service recovery process.
The existing literature usually considers three dimensions of perceived justice which
are Distributive justice, Interactional Justice, Procedural Justice. The current
conceptual framework includes the fourth dimension Informational Justice which is
largely overlooked (see table 2.9). Informational justice as a separate dimension is
critical in comprehending the cognitive evaluation of service consumers, especially
when they assess the service firms on the basis of the explanation it has provided
to them (Colquitt, 2001). Further, the presence of perceived justice is crucial in
influencing the brand-related outcomes (Chen and Kim, 2019; Gohary, Hamzelu and
Alizadeh, 2016; Mostafa et al., 2015; Tax et al., 1998). Therefore, the current study
has utilised perceived justice as a mediator between service recovery
The third block of the conceptual model consists of the CBBE dimensions, which
tend to fluctuate during service failure and recovery process. The construct of overall
brand equity is also present in the fourth block to test service recovery’s influence
on CBBE other than the dimensions, which tend to fluctuate. In this study, the term
‘fluctuate’ is understood as when the consumer assessment about the CBBE
dimensions declines after a service failure; however, they improve after service
recovery. The literature has overlooked investigating CBBE as an outcome of
service recovery, which is a powerful indicator of the brand's strength (Veloutsou et

142
al., 2020). Specifically, the dimensions of CBBE are still unknown, which tend to
fluctuate in a service failure and recovery process. The inclusion and selection of
dimensions of CBBE, which tend to fluctuate, are influenced by the two bodies of
literature (service and branding) and the findings of the qualitative studies (see table
6.1). The identified dimensions which tend to fluctuate within service failure and
recovery process are Perceived Quality, Perceived Value, Brand Reputation, Brand
trust and Brand Loyalty.
Finally, the fourth block contains service failure severity which is the magnitude or
intensity of the service failure perceived by the customers. Service failure severity
is usually explained through its two levels, high severity and low severity failure
(Choi and Choi, 2014). Previous literature has documented that service failure
severity plays a key role in influencing the relationships of service recovery with
branding outcomes (Liao, 2007; Matikiti et al., 2019; Smith et al., 1999). The effect
of effective service recovery may diminish with the presence of high severity
(Barakat et al., 2015).
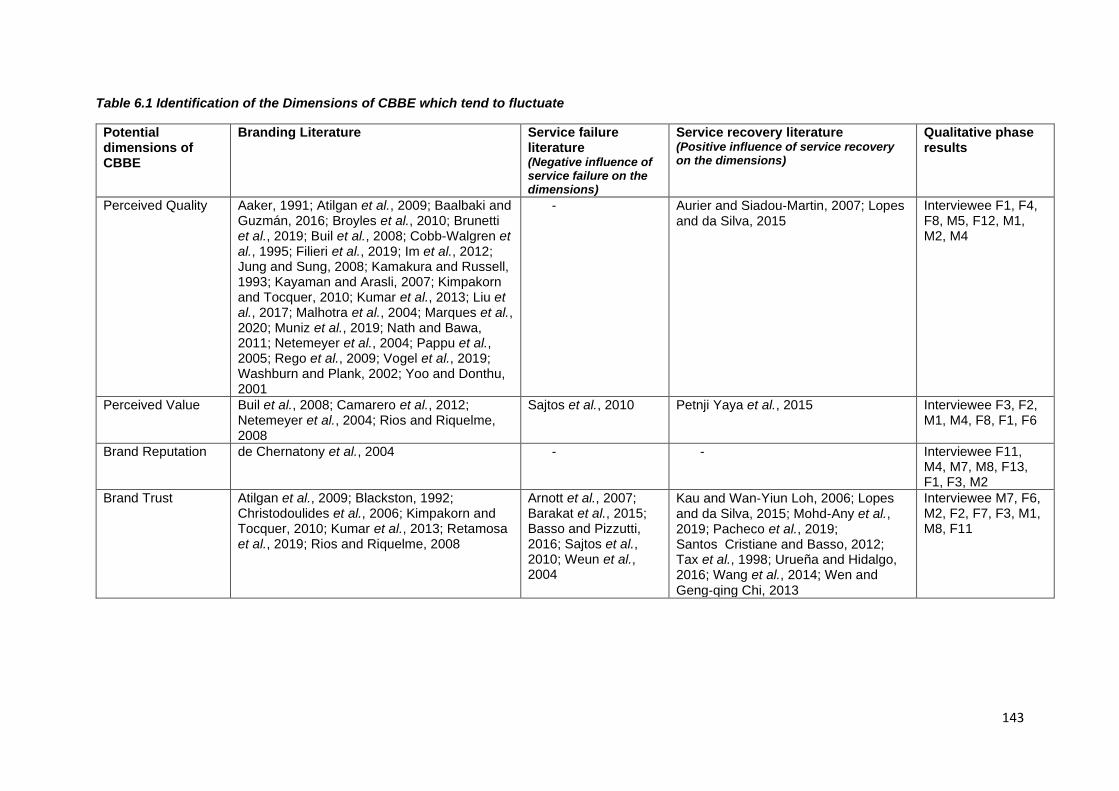
143
Table 6.1 Identification of the Dimensions of CBBE which tend to fluctuate
Potential dimensions of CBBE
Branding Literature Service failure literature (Negative influence of service failure on the dimensions)
Service recovery literature (Positive influence of service recovery on the dimensions)
Qualitative phase results
Perceived Quality Aaker, 1991; Atilgan et al., 2009; Baalbaki and Guzmán, 2016; Broyles et al., 2010; Brunetti et al., 2019; Buil et al., 2008; Cobb-Walgren et al., 1995; Filieri et al., 2019; Im et al., 2012; Jung and Sung, 2008; Kamakura and Russell, 1993; Kayaman and Arasli, 2007; Kimpakorn and Tocquer, 2010; Kumar et al., 2013; Liu et al., 2017; Malhotra et al., 2004; Marques et al., 2020; Muniz et al., 2019; Nath and Bawa, 2011; Netemeyer et al., 2004; Pappu et al., 2005; Rego et al., 2009; Vogel et al., 2019; Washburn and Plank, 2002; Yoo and Donthu, 2001
- Aurier and Siadou‐Martin, 2007; Lopes and da Silva, 2015
Interviewee F1, F4, F8, M5, F12, M1, M2, M4
Perceived Value Buil et al., 2008; Camarero et al., 2012; Netemeyer et al., 2004; Rios and Riquelme, 2008
Sajtos et al., 2010 Petnji Yaya et al., 2015 Interviewee F3, F2, M1, M4, F8, F1, F6
Brand Reputation de Chernatony et al., 2004 - - Interviewee F11, M4, M7, M8, F13, F1, F3, M2
Brand Trust Atilgan et al., 2009; Blackston, 1992; Christodoulides et al., 2006; Kimpakorn and Tocquer, 2010; Kumar et al., 2013; Retamosa et al., 2019; Rios and Riquelme, 2008
Arnott et al., 2007; Barakat et al., 2015; Basso and Pizzutti, 2016; Sajtos et al., 2010; Weun et al., 2004
Kau and Wan‐Yiun Loh, 2006; Lopes and da Silva, 2015; Mohd-Any et al., 2019; Pacheco et al., 2019; Santos Cristiane and Basso, 2012; Tax et al., 1998; Urueña and Hidalgo, 2016; Wang et al., 2014; Wen and Geng‐qing Chi, 2013
Interviewee M7, F6, M2, F2, F7, F3, M1, M8, F11

144
Potential dimensions of CBBE
Branding Literature Service failure literature (Negative influence of service failure on the dimensions)
Service recovery literature (Positive influence of service recovery on the dimensions)
Qualitative phase results
Brand Loyalty Atilgan et al., 2009; Brunetti et al., 2019; Buil et al., 2008; Camarero et al., 2012; de Chernatony et al., 2004; Filieri et al., 2019; Im et al., 2012; Jung and Sung, 2008; Kayaman and Arasli, 2007; Kim and Kim, 2004; Kumar et al., 2013; Lin and Chung, 2019; Muniz et al., 2019; Nath and Bawa, 2011; Retamosa et al., 2019; Rios and Riquelme, 2008; Vogel et al., 2019; Washburn and Plank, 2002; Yoo and Donthu, 2001)
Bejou and Palmer, 1998; Cantor and Li, 2019; Kamble and Walvekar, 2019; Mattila et al., 2014; Sajtos et al., 2010; Weun et al., 2004
Casidy and Shin, 2015; Chebat and Slusarczyk, 2005; Choi and La, 2013; Choi and Choi, 2014b; DeWitt et al., 2008; Gohary, Hamzelu and Alizadeh, 2016; Jones and Farquhar, 2007; Joosten et al., 2017; Karatepe, 2006; Kau and Wan‐Yiun Loh, 2006; Lopes and da Silva, 2015; Matikiti et al., 2019; Mohd-Any et al., 2019
Interviewee F3, F5, M8, F1, F6, F13, F4, F11, F14, M4, M2
Brand awareness Aaker, 1991; Atilgan et al., 2009; Berry, 2000; Brunetti et al., 2019; Buil et al., 2008; Cobb-Walgren et al., 1995; Davis et al., 2009; Filieri et al., 2019; Im et al., 2012; Jung and Sung, 2008; Kayaman and Arasli, 2007; Keller, 1993; Kim and Kim, 2004; Kimpakorn and Tocquer, 2010; Kumar et al., 2013; Lin and Chung, 2019; Marques et al., 2020; Muniz et al., 2019; Pappu et al., 2005; Rios and Riquelme, 2008; Šerić et al., 2017; Vogel et al., 2019; Washburn and Plank, 2002; Yoo and Donthu, 2001
- - -
Brand personality Buil et al., 2008; Retamosa et al., 2019 - - -
Preference Baalbaki and Guzmán, 2016 - - -
Sustainability Baalbaki and Guzmán, 2016 - - -
Uniqueness Camarero et al., 2012; Netemeyer et al., 2004; Rego et al., 2009
- - Interviewee F5, M2, M7, F9 (Only post-failure)

145
Figure 6.1 Conceptual Framework
146
6.3 Research Hypotheses
6.3.1 Service recovery and Perceived Justice
Perceived justice is referred to as the customers' cognitive evaluation of service
recovery process. Current research has utilised perceived justice as a single global
construct (second-order construct) (Balaji et al., 2018; Liao, 2007; Roggeveen et al.,
2012) according to the requirement and scope of the study. The dimensions which
constitute perceived justice are distributive justice, informational justice,
interactional justice and procedural justice. Distributive justice is conceptualised as
the perceived fairness of the final outcome of service recovery received by the
consumers against the loss experienced due to the service failure (Chen and Kim,
2019; Gelbrich and Roschk, 2011). Informational justice is conceptualized as
perceived fairness of the authenticity, relevancy and completeness of the
information received by the consumers from service employees during the service
recovery process against the loss after a service failure (Bradley and Sparks, 2009).
Interactional justice is defined as the perceived fairness of the interpersonal
treatment which consumers receive from the service employees during the service
recovery process after the loss experienced due to the service failure (Gohary,
Hamzelu and Alizadeh, 2016; Karam et al., 2019). Finally, procedural justice is
conceptualised as consumers’ perceived fairness of the appropriateness, flexibility,
adequacy and timeliness of the methods adopted in the service recovery process
by the service firm after they experienced the loss due to the service failure” (Chen
and Kim, 2019; Vázquez‐Casielles et al., 2010).
Findings from the literature (Albrecht et al., 2019; Jung and Seock, 2017; Liao, 2007;
Mostafa et al., 2015; Roggeveen et al., 2012; Smith et al., 1999; Tax et al., 1998)
and qualitative analysis indicates that CPSR and FR play an important role in
enhancing the customer fairness evaluations. However, this relationship is
influenced by service failure severity (Roggeveen et al., 2012; Sreejesh et al., 2019).
Customers who take effort and time to file a complaint in case of a service failure
expect the service recovery in the form of correcting a mistake, which further
develops perceptions of justice and fairness (McColl-Kennedy et al., 2003).
According to service recovery literature, initiatives taken by the service provider to
recover from service failure associate with the four dimensions of perceived justice
147
(Jin et al., 2019; Mostafa et al., 2015). For example, Mostafa et al. (2015)
investigated a positive relationship between firm initiated service recovery strategies
(apology, compensation, problem-solving, speed of response, Follow-up,
explanation, courtesy) and perceived justice dimensions. Similarly, Jung and Seock
(2017) supported that firm recovery leads to enhancing justice perceptions. They
eluded that apology and compensation act as effective firm recovery strategies to
impact perceived justice. Therefore, based on both the findings from the interviews
and the extant literature, it can be hypothesized that:
H1: Service recovery (a. Customer participation in service recovery, b. Firm
Recovery) positively influences perceived justice
6.3.2 Service recovery and Overall brand equity
The current study conceptualises overall brand equity as the brand's overall
strength, which is primarily indicated by its overall prestige, dominance, admiration,
and personal liking by the consumers (Chatzipanagiotou et al., 2019). Overall brand
equity is influenced by effective service provision (White et al., 2013). In case of
service failures, service provision is incomplete unless the aggrieved customers are
provided with effective service recovery. A service failure experience can generate
detrimental effects for the brand (Hwang et al., 2020) such that the brand equity may
dilute as a result (Bambauer-Sachse and Rabeson, 2015; Beverland et al., 2010;
Ward and Ostrom, 2006). In such cases, it is important to initiate service recovery
as it safeguards the brand-customer relationship (Chen and Tussyadiah, 2021) and
may help in maintaining brand equity (Harun et al., 2019; Lassar et al., 1995; Singhal
et al., 2013). Ringberg et al. (2007) also supported this assertion, suggesting that
positive experiences build goodwill, thus mitigating the effect of a poor service
experience on the brand. According to Harun et al. (2019), effective service recovery
can create positive perceptions in the consumers’ minds, which in return create a
sense in consumers that the service provider cares about them, thereby creating a
strong bond with customers. In other words, an appropriate recovery strategy
(Harrison-Walker, 2019b) may result in creating brand equity where customers act
as the promoter and conduct self-motivated campaigns promoting the service brand
(Singhal et al., 2013). Thus, whenever customers are provided with effective service
recovery, it will positively impact the overall brand equity of the brand.

148
Hazée et al. (2017) assert that when customers are involved in service recovery,
consumers perceive that they received the most favourable solution for the service
failure, which influences satisfaction with service recovery and thus benefiting the
firms with low levels of brand equity. According to González-Mansilla et al. (2019),
customer participation can influence brand equity for service brands. Because when
customers are involved, they perceived higher psychological value (Franke et al.,
2010) and feelings of ownership of the brand (Fuchs et al.,2010). Therefore, based
on the findings from the interviews and the existing literature, it can be hypothesised
that:
H2: Service recovery (a. Customer participation in service recovery, b. Firm
Recovery) positively influences overall brand equity
6.3.3 Service recovery and Perceived quality
Perceived quality is defined as “the consumer’s judgment about a product’s overall
excellence or superiority against other brands” (Zeithaml, 1988, p.3). Customers
perceived quality is the result of the difference between the expected quality before
purchase or consumption of service and the actual quality experienced during or
after consuming the service (Swaid and Wigand, 2012). Customers buying
behaviour is dependent on several factors, and perceived quality is one of the most
critical among these factors (Dettori et al., 2020). Due to the intangible nature of
services (Zeithaml et al., 1993), perceived quality plays a critical role in consumers'
buying decisions (Assaker et al., 2020). Therefore, investigation of perceived quality
is essential for service managers because of its role as a key source of value and
satisfaction (Oliver, 1999).
Previous studies have reported a relationship between service recovery actions and
service quality perceptions. For example, early research by Kloppenborg and
Gourdin (1992) found evidence that service recovery in the context of the airline
industry plays an important role in service quality evaluations. Similarly, Boshoff
(1997) has demonstrated that outcomes of service recovery include improved
service quality perceptions. In the same vein, Gil et al. (2006) show that the quality
of service perceived by customers will increase if the customer is loyal and/or if the
customer experiences a recovery encounter during the visit. Aurier and Siadou‐
Martin, (2007) have investigated the impact of service recovery on perceived quality
149
and found a positive relationship. However, Lopes and Silva (2015) found an
insignificant relationship between service recovery and perceived quality. Evidence
also suggests that involving customers in the co-creation of services influence
perceived quality of service (Söderlund and Sagfossen, 2017). Specifically, Grott et
al. (2019) suggested that customers enjoy the co-creation of service activities,
resulting in high-quality service perceptions. Therefore, drawing from both the
findings from the qualitative research and the existing service recovery literature, it
can be hypothesised that:
H3: Service recovery (a. Customer participation in service recovery, b. Firm
Recovery) positively influences perceived quality
6.3.4 Service recovery and Perceived value
Extant service marketing literature recognises perceived value as a key concept that
captures overall evaluation of customers regarding what they received and what
they have costed in a service experience (Bae et al., 2020; Dall’Olmo Riley et al.,
2015; Helkkula and Kelleher, 2010; Loureiro et al., 2019). This research project
defines perceived value as the benefit which customers perceive against the costs,
they incur of the whole service experience. Although the service firm can create and
communicate service value to customers, the customers can interpret the value
based on the perception of dynamic situational value creation processes, which is
specific (Helkkula and Kelleher, 2010). Customer perceived value is linked with the
service attributes (Levy, 2014) and how customers give meaning to their
experiences with the service (Bae et al., 2020; Brown, 2006). According to Helkkula
and Kelleher (2010), positive service experiences and perceived positive value are
connected, whereas negative service experiences are linked to the negative
perceived value of service.
In the context of service failure and recovery, when service recovery is undertaken
in the form of compensation, it will lead to more favourable evaluations as customers
perceive that they have immediately received the value from the compensation
(Hoffman et al., 1995). In the same vein, Yaya et al. (2015) found that service
recovery was positively related to perceived value. This assertion is similar to
Boshoff (2005), who showed that a successful service recovery results in improved
perceptions of the service firm’s competence and eventually to perceived value. In

150
customer participation. Prebensen and Xie (2017) found that co-creation leads to
enhanced perceived value. The qualitative findings support the literature findings,
especially in the case with the price-sensitive informants. Their opinions related to
the perceived value were positive after receiving service recovery. Hence, based
on the findings of qualitative research and literature review, it can be hypothesised
that:
H4: Service recovery (a. Customer participation in service recovery, b. Firm
Recovery) positively influences perceived value
6.3.5 Service recovery and Brand reputation
Brand reputation is known as “an aggregate and compressed set of public
judgments about the brand” (Veloutsou and Delgado-Ballester, 2018, p.257). A
strong brand reputation is essential for the brand's success and is earned over time
by the firm (Veloutsou and Moutinho, 2009). Brand reputation has remained the
reason for consumers’ service choice, positive attitudes, repurchase intentions and
building trust (Hess, 2008). This is because brand reputation is developed due to
consistent, credible actions of the firm towards its consumers (Sengupta et al.,
2015). The firm's reputation depends on how the service firm is handling its
customers and how well it is taking care of them (La and Choi, 2019). Reputation is
fragile and can be damaged by negative incidents(Chao and Cheng, 2019; Nguyen
and Leblanc, 2001). However, a good brand reputation can safeguard a firm in
service failure situations and act as a shield or buffer to reduce the negative
consequences after negative encounters (Sengupta et al., 2015).
The focus of the investigation of brand reputation within the service recovery
framework has been limited to act as a moderator (see Hess, 2008; Sengupta et al.,
2015). Hess (2008) found that brand reputation acted successfully in between the
relationship of service failure severity and customer satisfaction, whereas Sengupta
et al. (2015) investigated its moderating role between customer coping strategies
and customer outcomes (satisfaction and negative word of mouth). Their
investigation also supported the moderation role of brand reputation. Though there
is little empirical evidence of service recovery actions’ influence on brand reputation,
it can be inferred from the closely related studies that service recovery will positively
influence brand reputation. For example, Liat et al. (2017) showed that service

151
recovery positively influences brand associations in the context of high contact
services. In the same line, some scholars investigated that customer participation
in service recovery enhances brand reputation. Specifically, Foroudi et al. (2019)
found that students’ participation positively impacted the university's brand
reputation. Further, the qualitative analysis suggests that informants shared positive
opinions about the brand's reputation after they explained their service recovery
experience with the firm.Hence, based on the literature review and findings of semi-
structured interviews, it can be hypothesised that:
H5: Service recovery (a. Customer participation in service recovery, b. Firm
Recovery) positively influences brand reputation
6.3.6 Service recovery and Brand trust
The current study conceptualises brand trust as consumers' belief in the firm’s
reliability and integrity (Morgan and Hunt, 1994). Trust is the foundation of long-term
relationships and is considered the most powerful tool available to the service firm
in relationship marketing (Chao and Cheng, 2019; DeWitt et al., 2008). Trust is
denoted by the belief of customers that service provider actions are in favour of their
interests (Wang and Chang, 2013). Further, it enables the customers to economize
their service transactions by reducing their cognitive, emotional and social energy
(Soares et al., 2017). Trust is developed over time with the efforts of service
providers in providing satisfaction to customers, which then enables them to
perceive that the service provider is reliable and honest (Urueña and Hidalgo, 2016).
However, violation of trust can occur only after a single negative incident
experienced by a customer, depending on the nature of the incident and situation
(Wang and Chang, 2013). The violation of trust can lead to a breach of the customer
relationship; therefore, as an immediate reaction, firms should imbed service
recovery and restore customer trust (Basso and Pizzutti, 2016).
The literature and the findings from the qualitative phase of this study indicate that
CPSR and FR play an important role in enhancing customer trust in the service
provider. For example, Chao and Cheng (2019) investigated trust as the outcome
of service recovery and found that service recovery results in customers' satisfaction
with the recovery, which further enhances customers’ trust in the firm. Similarly,
Cantor and Li (2019) utilised trust as one of the dimensions of relationship quality

152
and found a positive relationship between service recovery, recovery satisfaction
and relationship quality (including trust). Basso and Pizzutti (2016) found that
customer trust can be recovered after a double deviation scenario by utilising
effective service recovery. On the other hand, the literature also suggests that
customer participation in services helps service brands build and maintain trusting
relationships between customers and service providers (Iglesias et al., 2013; da
Silveira et al., 2013). In customer participation in service recovery, Busser and
Shulga (2019) report a positive influence of customer participation in service
recovery on brand trust. Thus, based on both the findings from the qualitative study
and the extant literature, it can be hypothesised that:
H6: Service recovery (a. Customer participation in service recovery, b. Firm
Recovery) positively influences brand trust
6.3.7 Service recovery and Brand loyalty
Brand loyalty is defined as A deeply held faithfulness to the brand in terms of overall
support and to rebuy or re-patronise consistently in the future (Oliver, 1999). Brand
loyalty has been regarded as one of the essential assets of services brands (Agag,
2019; Barusman and Virgawenda, 2019). In case of service failure, service firms
take necessary actions to maintain customer loyalty by recovering from service
failure (La and Choi, 2019). Conteiro et al. (2016) assert that service recovery
initiatives contribute towards enhancing customer loyalty. Maintaining customer
loyalty is crucial for firms because the expense of acquiring new customers exceeds
in comparison to retaining existing customers (Dickinger and Bauernfeind, 2009). In
the development of long-term relationships, firms tend to focus on loyal customers,
which contribute to the firm's financial health (Reichheld, 2003). Moreover, loyal
customers' probability of shedding negative behaviours is less in service failure
situations because loyal customers tend to preserve the firm's personal relationship
even in bad times (Kamble and Walvekar, 2019; Komunda and Osarenkhoe, 2012).
A plethora of service literature has investigated the relationship between service
recovery and customer loyalty in different contexts (Barusman and Virgawenda,
2019; Cambra-Fierro et al., 2013; Chandrashekaran et al., 2007; Chebat and
Slusarczyk, 2005; DeWitt et al., 2008; Joosten et al., 2017; Kamble and Walvekar,
2019; Morgeson III et al., 2020). The evidence from the literature suggests that both
153
forms of loyalty (attitudinal and behavioural loyalty) are influenced by service
recovery efforts (Cambra-Fierro et al., 2013; DeWitt et al., 2008). Researchers have
investigated direct (Akinci et al., 2010; Barusman and Virgawenda, 2019; Kamble
and Walvekar, 2019; Morgeson III et al., 2020) and indirect (Agag, 2019; DeWitt et
al., 2008; Kau and Wan‐Yiun Loh, 2006; La and Choi, 2019) effects of service
recovery on customer loyalty. According to Barusman and Virgawenda (2019),
service recovery has a significant positive relationship with brand loyalty. More
recently, Morgeson III et al. (2020) suggested that the positive relationship between
service recovery and loyalty is stronger in economies growing faster and having
more competition. Loyalty has remained one of the major focuses for the
researchers investigating within the context of high contact services such as; retail
banking, restaurants, hotels and airlines (DeWitt et al., 2008; Liat et al., 2017;
Nikbin, Iranmanesh, et al., 2015). However, service recovery strategies have also
positively influenced customer loyalty within the context of low contact services
(Akinci et al., 2010; Barusman and Virgawenda, 2019; Cambra-Fierro et al., 2013).
Existing literature on customer participation highlights the significance of allowing
customers to participate in service processes for maintaining customer loyalty
(Cossío-Silva et al., 2016). These studies show that customers’ skills and values
can influence the overall value creation process (Saarijärvi et al., 2013). If the
service co-creation processes satisfy customers, they will increase their purchase
frequency while reducing the search for competitive offerings (Yang et al., 2014).
Thus, the co-creation of services has positive implications for customer loyalty. As
Busser and Shulga (2019) suggested, customer participation in service recovery
has an essential role in value co-creation and positively influences brand loyalty.
Based on the qualitative findings and literature, it can be hypothesized as:
H7: Service recovery (a. Customer participation in service recovery, b. Firm
Recovery) positively influences brand loyalty
6.3.8 Mediating role of perceived justice
The literature evidence that perceived justice plays a central role in the service
recovery frameworks. Firstly, perceived justice is utilised to examine the customers'
cognitive evaluations about the service recovery process (Liao, 2007; Liu et al.,
2021; Smith et al., 1999; Tax et al., 1998; Yao et al., 2019). Secondly, perceived

154
justice is understood as an appropriate phenomenon to explain further brand-related
outcomes, for example, brand loyalty (Chebat and Slusarczyk, 2005; Choi and Choi,
2014; Yani-de-Soriano et al., 2019), brand image (Mostafa et al., 2015), brand
reputation (Ziaullah et al., 2017), brand trust ((Liu et al., 2021; Mohd-Any et al., 2019;
Urueña and Hidalgo, 2016), perceived quality (Aurier and Siadou‐Martin, 2007),
satisfaction (Varela-Neira et al., 2008), repurchase intentions (Liao, 2007; Maxham
III and Netemeyer, 2002; Roggeveen et al., 2012), and word of mouth (Lee et al.,
2020; Migacz et al., 2018). Therefore, extant research has treated perceived justice
as a mediator in their frameworks (Albrecht et al., 2019; Gelbrich et al., 2015; Liao,
2007; Qin et al., 2019; Roschk and Gelbrich, 2017; Varela-Neira et al., 2008; Yao
et al., 2019).
Liao (2007) explained the mediating role of perceived justice in her service recovery
framework. The results of her study showed that service recovery strategies
influence customer satisfaction and then repurchase intentions through successful
mediation of perceived justice. Similarly, Mostafa et al. (2015) posited a positive
relationship between service recovery efforts and dimensions of perceived justice,
which then enhances the firm's brand image. Varela-Neira et al. (2008) presented
the justice dimensions as the mediator between customer emotions created by
service failure and overall satisfaction. According to Roschk and Gelbrich (2017),
perceived justice is a key mediator when examining the relationship between
recovery and recovery satisfaction. Similar findings of perceived justice being a key
mediator in the service recovery frameworks have been utilised in recent studies
(Albrecht et al., 2019; Qin et al., 2019). Therefore, based on the literature findings
the current study hypothesise that:
H8: Perceived justice mediates the relationship between service recovery (a.
Customer participation in service recovery, b. Firm Recovery) and overall brand
equity
H9: Perceived justice mediates the relationship between service recovery (a.
Customer participation in service recovery, b. Firm Recovery) and perceived quality
H10: Perceived justice mediates the relationship between service recovery (a.
Customer participation in service recovery, b. Firm Recovery) and perceived value
H11: Perceived justice mediates the relationship between service recovery (a.
Customer participation in service recovery, b. Firm Recovery) and brand reputation
155
H12: Perceived justice mediates the relationship between service recovery (a.
Customer participation in service recovery, b. Firm Recovery) and brand trust
H13: Perceived justice mediates the relationship between service recovery (a.
Customer participation in service recovery, b. Firm Recovery) and brand loyalty
6.3.9 Moderating role of Service failure severity Service failure severity is a crucial factor that affects the relationship between
service recovery and its outcomes (Chao and Cheng, 2019). Consequently, service
failure severity is either held constant (Albrecht et al., 2019; Weun et al., 2004) or
utilised as a moderator (La and Choi, 2019; Roggeveen et al., 2012) among the
relationships. Roggeveen et al. (2012) investigated the moderating role of service
failure severity between customer participation in service recovery and perceived
justice. They found that service recovery's effect on perceived justice differs due to
the severity of the failure. The literature suggests that customers tend to have
different levels of reactions depending on the magnitude of the service failure
severity (Israeli, Lee and Bolden, 2019). Liao (2007) found that service recovery
initiatives result in positive outcomes; however, these positive outcomes depended
on service failure severity.
The influence of service recovery on brand equity may depend on service failure
severity. According to Cantor and Li (2019), failure severity can change customer
expectations and, consequently, modify customer’s evaluation of service recovery
efforts. The more severe the service failure, the greater the customer’s perceived
loss (Lin, 2011). Similarly, studies suggest that service failure severity can influence
the evaluation of a service provider after a service failure and their future relationship
with the service brand (Balaji and Sarkar, 2013). Service failure severity also
negatively influences brand-related outcomes such as customer loyalty (Wang et
al., 2011), brand trust (Sengupta et al., 2015), word of mouth (Chang et al., 2015),
and satisfaction (Weun et al., 2004).
The severity of service failure is considered a critical factor in service recovery
frameworks. For example, the relationship between service recovery and brand
loyalty is influenced by service failure severity (La and Choi, 2019). Wang et al.
(2011) found that the levels of brand loyalty may differ due to the levels of failure
severity. Similarly, Cantor and Li (2019) suggest that failure severity negatively

156
relates to brand loyalty. In this study, the researcher assumes that failure severity
is a critical factor influencing the proposed relationships.
It is important to consider the influence of service failure severity while discussing
the relationship between service recovery and branding outcomes. This is because
past research has suggested that service failure severity should be taken into
account when discussing service recovery to ensure the integrity of the study
findings (Riaz and Khan, 2016). Extant service recovery literature suggests that
service failure severity will be a key factor that will decide how customers evaluate
the efforts of a service provider and how they asses the brand (Balaji and Sarkar,
2013; Lin et al., 2011; Riaz and Khan, 2016). La and Choi (2019) assert that when
the severity of service failure increases, customers are more critical of service
recovery efforts, and thus service recovery efforts are more likely to impact customer
perceptions. Therefore on the basis of the literature review findings, the following
hypotheses relate to the moderating role of service failure severity
H14: The relationship between service recovery (a. Customer participation in
service recovery, b. Firm Recovery) and perceived justice is moderated by service
failure severity
H15: The relationship between service recovery (a. Customer participation in
service recovery, b. Firm Recovery) and overall brand equity is moderated by
service failure severity
H16: The relationship between service recovery (a. Customer participation in
service recovery, b. Firm Recovery) and perceived quality is moderated by service
failure severity
H17: The relationship between service recovery (a. Customer participation in
service recovery, b. Firm Recovery) and perceived value is moderated by service
failure severity
H18: The relationship between service recovery (a. Customer participation in
service recovery, b. Firm Recovery) and brand reputation is moderated by service
failure severity
H19: The relationship between service recovery (a. Customer participation in
service recovery, b. Firm Recovery) and brand trust is moderated by service failure
severity

157
H20: The relationship between service recovery (a. Customer participation in
service recovery, b. Firm Recovery) and brand loyalty is moderated by service
failure severity
6.3.10 Service Recovery Paradox
The phenomenon of service recovery paradox suggests that there will be a higher
level of customer-related outcomes after a service failure and recovery than a
situation where no service failure and recovery happened (Khamitov et al., 2020).
When customers believe that the service recovery efforts are effective, they show
higher satisfaction ratings after a service failure and recovery than before a negative
service encounter (De Matos et al., 2009). Extant literature related to service
recovery paradox has utilised ‘satisfaction’ as a focal measure to identify whether a
paradox exists or not (Azemi et al., 2019; Boshoff, 1997; Heidenreich et al., 2015;
McCollough, 2000; Ok et al., 2007; Singhal et al., 2013). Boshoff (1997) suggests
that customers show higher ratings of post-recovery satisfaction as compared to
pre-failure ratings when immediate monetary compensation is provided as a form of
service recovery. Similarly, Azemi et al. (2019) found that immediate compensation
and customer participation in service recovery leads to service recovery paradox.
The literature also suggests that the service recovery paradox exists for several
brand-related outcomes other than satisfaction, for example, brand image
(Andreassen, 2001), word of mouth (Lin et al., 2011; Maxham III, 2001), loyalty
(Gohary, Hamzelu and Pourazizi, 2016; Smith and Bolton, 1998; Weitzl and
Hutzinger, 2017) and repurchase intentions (Gohary, Hamzelu and Pourazizi, 2016;
Maxham III, 2001; Soares et al., 2017; Weitzl and Hutzinger, 2017).
The existence of paradox occurs if service recovery has a positive relationship with
its outcomes. For example, Smith and Bolton (1998) suggest that the service
recovery paradox exists in case of customer loyalty as customers who receive
satisfactory service recovery after a service failure will demonstrate higher levels of
satisfaction and enhanced re-patronage intentions that would not be achieved if
there was no service failure and recovery. Similarly, Weitzl and Hutzinger (2017)
found that service recovery can lead to more favourable reactions such as
repurchase intention as compared to a situation when customers do not complain
at all. Andreassen (2001) found that service firms will try to delight complaining
customers by offering outstanding service recovery to improve the perceptions of
158
the service firm beyond the pre-failure perceptions. Similarly, Gohary et al. (2016)
claim that the service recovery paradox occurs when value is created for the
customers in the service recovery process. More recently, Azemi et al. (2019)
asserted that value creation is done by involving customers in the recovery process,
which may lead to a recovery paradox.
The studies provide evidence that the existence of the service recovery paradox is
specific under certain conditions. There are mainly six main conditions found in
which there are chances of service recovery paradox to occur, i) service failure
severity is low (Magnini et al., 2007) ii) the failure is not attributed to the firm but to
an external cause (Magnini et al., 2007) iii) service failure is caused by customers
themselves (Hocutt and Stone, 1998) iv) service recovery is provided immediately
(Boshoff, 1997) v) service recovery is highly effective (Hocutt et al., 2006) and vI)
customers participate in service recovery (Azemi et al., 2019; Heidenreich et al.,
2015). On the other hand, a few studies suggest that although an effective service
recovery can mitigate the negative effects of a service failure, it can produce a
service recovery paradox under any condition (Kau and Wan‐Yiun Loh, 2006; Lin et
al., 2011; Maxham III, 2001). Therefore, considering the findings from the literature,
the study hypothesises that:
H21: If a firm exercises service recovery (customer participation in service recovery)
after a low severity service failure, the customer’s post-recovery ratings in terms of
a) perceived quality b) perceived value c) brand reputation d) brand trust e) brand
loyalty will be higher than customer’s pre-failure evaluations.
H22: If a firm exercises service recovery (customer participation in service recovery)
after a high severity service failure, the customer’s post-recovery ratings in terms of
a) perceived quality b) perceived value c) brand reputation d) brand trust e) brand
loyalty will be higher than customer’s pre-failure evaluations.
H23: If a firm exercises service recovery (firm recovery) after a low severity service
failure, the customer’s post-recovery ratings in terms of a) perceived quality b)
perceived value c) brand reputation d) brand trust e) brand loyalty will be higher than
customer’s pre-failure evaluations.
H24: If a firm exercises service recovery (firm recovery) after a high severity service
failure, the customer’s post-recovery ratings in terms of a) perceived quality b)
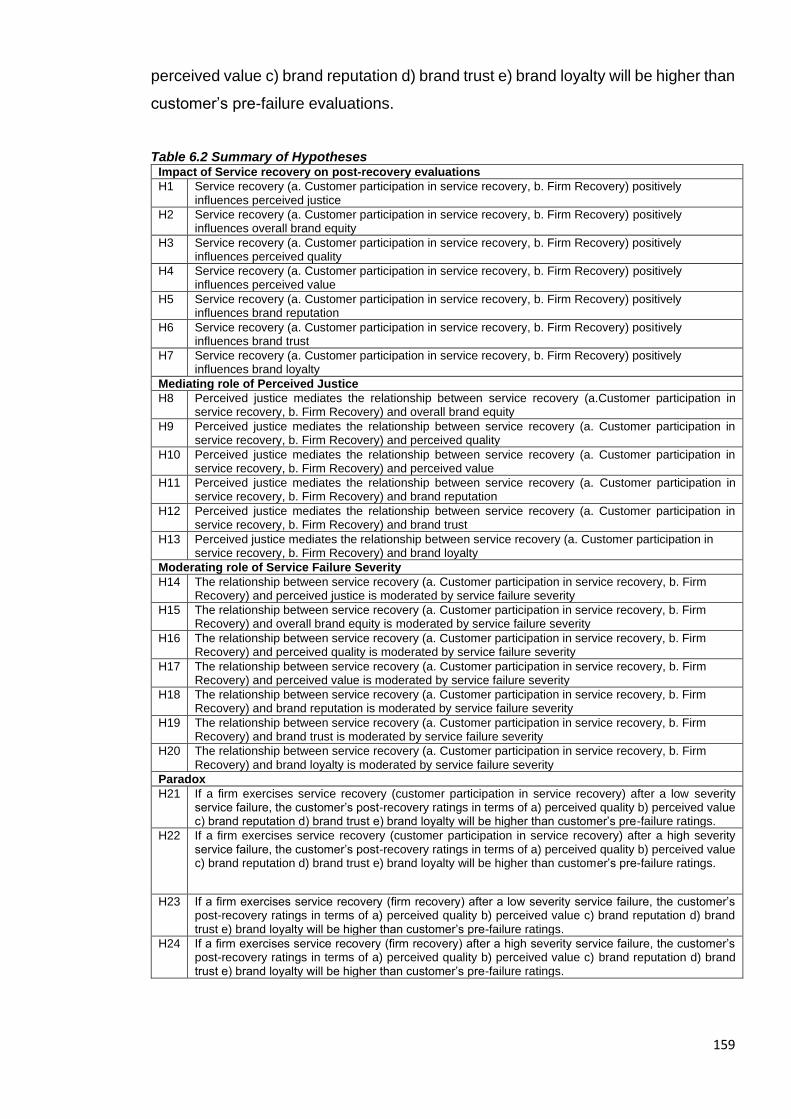
159
perceived value c) brand reputation d) brand trust e) brand loyalty will be higher than
customer’s pre-failure evaluations.
Table 6.2 Summary of Hypotheses Impact of Service recovery on post-recovery evaluations
H1 Service recovery (a. Customer participation in service recovery, b. Firm Recovery) positively influences perceived justice
H2 Service recovery (a. Customer participation in service recovery, b. Firm Recovery) positively influences overall brand equity
H3 Service recovery (a. Customer participation in service recovery, b. Firm Recovery) positively influences perceived quality
H4 Service recovery (a. Customer participation in service recovery, b. Firm Recovery) positively influences perceived value
H5 Service recovery (a. Customer participation in service recovery, b. Firm Recovery) positively influences brand reputation
H6 Service recovery (a. Customer participation in service recovery, b. Firm Recovery) positively influences brand trust
H7 Service recovery (a. Customer participation in service recovery, b. Firm Recovery) positively influences brand loyalty
Mediating role of Perceived Justice
H8 Perceived justice mediates the relationship between service recovery (a.Customer participation in service recovery, b. Firm Recovery) and overall brand equity
H9 Perceived justice mediates the relationship between service recovery (a. Customer participation in service recovery, b. Firm Recovery) and perceived quality
H10 Perceived justice mediates the relationship between service recovery (a. Customer participation in service recovery, b. Firm Recovery) and perceived value
H11 Perceived justice mediates the relationship between service recovery (a. Customer participation in service recovery, b. Firm Recovery) and brand reputation
H12 Perceived justice mediates the relationship between service recovery (a. Customer participation in service recovery, b. Firm Recovery) and brand trust
H13 Perceived justice mediates the relationship between service recovery (a. Customer participation in service recovery, b. Firm Recovery) and brand loyalty
Moderating role of Service Failure Severity
H14 The relationship between service recovery (a. Customer participation in service recovery, b. Firm Recovery) and perceived justice is moderated by service failure severity
H15 The relationship between service recovery (a. Customer participation in service recovery, b. Firm Recovery) and overall brand equity is moderated by service failure severity
H16 The relationship between service recovery (a. Customer participation in service recovery, b. Firm Recovery) and perceived quality is moderated by service failure severity
H17 The relationship between service recovery (a. Customer participation in service recovery, b. Firm Recovery) and perceived value is moderated by service failure severity
H18 The relationship between service recovery (a. Customer participation in service recovery, b. Firm Recovery) and brand reputation is moderated by service failure severity
H19 The relationship between service recovery (a. Customer participation in service recovery, b. Firm Recovery) and brand trust is moderated by service failure severity
H20 The relationship between service recovery (a. Customer participation in service recovery, b. Firm Recovery) and brand loyalty is moderated by service failure severity
Paradox
H21 If a firm exercises service recovery (customer participation in service recovery) after a low severity service failure, the customer’s post-recovery ratings in terms of a) perceived quality b) perceived value c) brand reputation d) brand trust e) brand loyalty will be higher than customer’s pre-failure ratings.
H22 If a firm exercises service recovery (customer participation in service recovery) after a high severity service failure, the customer’s post-recovery ratings in terms of a) perceived quality b) perceived value c) brand reputation d) brand trust e) brand loyalty will be higher than customer’s pre-failure ratings.
H23 If a firm exercises service recovery (firm recovery) after a low severity service failure, the customer’s post-recovery ratings in terms of a) perceived quality b) perceived value c) brand reputation d) brand trust e) brand loyalty will be higher than customer’s pre-failure ratings.
H24 If a firm exercises service recovery (firm recovery) after a high severity service failure, the customer’s post-recovery ratings in terms of a) perceived quality b) perceived value c) brand reputation d) brand trust e) brand loyalty will be higher than customer’s pre-failure ratings.
160
6.4 Summary
This chapter has presented the conceptual model and research hypotheses
developed from literature review and qualitative data analysis. At first, the chapter
presented the overall logic of the conceptual model and the proposed relationships.
Next, a figure of the conceptual model represents the graphical representation of
the relationships. It is then followed by three sets of hypotheses. Firstly, the research
hypotheses related to the impact of service recovery (Customer participation in
service recovery and Firm Recovery) on perceived justice and Consumer-based
brand equity (CBBE) are presented. Secondly, the hypotheses related to the
mediating role of perceived justice between service recovery and CBBE are
presented.
Finally, the hypotheses to investigate the service recovery paradox with respect to
the dimensions of CBBE are discussed. A total of 24 main hypotheses are
generated, and their summary is given in table 6.2. The proposed hypotheses will
be tested in chapter 8.
161
Chapter 7 Quantitative Methodology
7.1 Introduction
This chapter entails the steps involved in the second phase (Quantitative
methodology) of the exploratory mixed-method design. The chapter describes the
detailed characteristics of the experimental research design, which include the
approach to the experimental manipulation and development of hypothetical
scenarios. Further, the development of the questionnaire is described in two
sections. Firstly, the process of reviewing and selecting the appropriate scales and
definitions of the constructs is detailed, and then the structure of the questionnaire
is depicted. The next part of the chapter includes the sampling approach,
characteristics of the sample. Finally, data screening and approach to quantitative
data analysis is explained.
7.2 Experimental research design
The quantitative phase of this research project has utilised two of the experimental
designs suggested by Malhotra and Birks (2007) to test the hypothesis. According
to them, experimental designs can be classified into pre-experimental, true
Experimental, quasi-experimental and statistical designs. The classification is
subdivided into further designs under the four main experimental designs. To test
the hypotheses 21a -24e, the current study has implemented a one-group pretest-
posttest design from pre-experimental designs and adopted factorial designs from
statistical experimental designs to test the hypothesis from 1-7 and hypothesis 14-
20. One group pretest-posttest experiment involved two stages of data collection to
analyse the dimensions of CBBE which tend to fluctuate. The factorial design was
a 3 (service recovery: Customer participation in service recovery vs Firm recovery
vs no recovery) x 2 (Service failure severity: high vs low) between-subject design.
Major features of the experimental design include manipulation, control and
randomisation (Bell et al., 2018). Manipulation occurs when the researcher
purposefully change or alter the independent variables to explain the causal effect
on dependant variables (Allen, 2017). The manipulation of independent variables is
also termed as ‘treatment’. Service recovery and service failure severity were
manipulated for the current research. Control in an experiment is designed to reduce
the effect of other variables on the relationship between independent and dependant

162
variables. One of the ways of controlling this effect is randomisation. Randomisation
occurs when participants of the experiment are assigned to different treatment
groups. The following sections contain more detail on manipulation, control and
randomisation.
7.2.1 Approach to experimental manipulation
A pre-requisite of every experimental process is selecting and designing the
manipulations so that the experimenter may investigate the changes in the
dependent variable due to the independent variables (Malhotra and Birks, 2007).
The selection of experimental manipulation is based on the study’s conceptual
framework, developed after scrutinising the literature review and qualitative phase.
The current experimental study aimed to manipulate service recovery and service
failure severity to examine the change in the dependant variables.
Service recovery was manipulated at three different levels, i) Firm recovery: the
remedy is solely provided by the firm without involving the customer(s) ii) Customer
participation in service recovery: the remedy is co-created as a result of the joint
efforts of a service provider and customer(s) iii) No service recovery: no remedy is
provided for the unpleasant situation. On the other hand, service failure severity was
conceptualised as the customer’s perceived seriousness of the problem. Service
failure severity was manipulated at two levels, i) high: the customer’s perceived
seriousness of the problem is high. ii) low: the level of customer’s perceived
seriousness of the problem is low.
Experimental research contains different approaches to manipulate independent
variables such as designing task/role-playing activity, creating hypothetical text
scenarios, audio recordings, visuals and using confederates (Allen, 2017). Current
research has utilised hypothetical text scenarios to manipulate service recovery and
service failure severity. The preference of hypothetical scenarios over other
approaches was due to four main reasons. Firstly, this approach is extensively used
in experimental research related to service failure and recovery and is considered
most dependable (Van Vaerenbergh et al., 2019). Secondly, scenario-based
experiments are easily manageable in depicting service failure and recovery
scenarios considering limited resources in hand (Ha and Jang, 2009). Thirdly, the
usage of scenarios eliminates the problems linked with ethical issues and

163
managerial undesirability of imposing negative service failure incidents on
customers (Abbasi, 2020). Finally, exposing respondents to hypothetical text
scenarios can reduce memory bias that is present otherwise when respondents are
asked to recall past incidents (Hwang and Mattila, 2020; Smith et al., 1999). Hence,
to design the manipulations for service recovery and service failure severity, the
development of multiple hypothetical scenarios was considered as the initial step of
the experimental process.
7.3 Development of Research Instruments
The data collection was carried out with the help of questionnaires (Saunders et al.,
2019). Two questionnaires were developed because the study had two stages of
data collection as mentioned in section 7.4. The questionnaire for the first stage of
quantitative data collection included the measures of the dimensions of CBBE. In
contrast, the questionnaire for the second stage of quantitative data collection was
a scenario-based questionnaire which included hypothetical text scenarios along
with the measurement items of the dimensions of CBBE, overall brand equity and
perceived justice. The following sections explain the development of questionnaires
along with the development of hypothetical scenarios.
7.3.1 Development of the questionnaires
A questionnaire is an organised framework that comprises several questions and
scales to collect primary data from the respondents (Bell et al., 2018). It is an
appropriate tool to gather peoples’ attitudes, behaviours and perceptions towards
the subject of investigation (Punch, 2003). The questionnaire was an integral part
of the current experimental research study. The questionnaire was utilised to gather
people's perceptions towards a service brand before and after they were exposed
to the experimental treatments. The questionnaire enabled the researcher to collect
the data in a formalised and coherent manner to prepare it for suitable quantitative
analysis (Malhotra, 2006). The development of an organised and purposeful
questionnaire went through different stages, which are mentioned below. The
following section explains the rationale for selecting the scales to measure the
variables. The selected measures were then utilised to structure the questionnaires
and for the data collection of stage 1 and stage 2. The structures of the
questionnaires are explained in section 7.5.3.
164
7.3.1.1 Selection of measures
The conceptual framework of this research project was considered a referral point
in developing the questionnaire (DeVellis, 2016). The process of questionnaire
development began with carefully defining the constructs. It was made sure that
definitions are relevant to the literature, clearly differentiate from the related
constructs and include unambiguous terms (MacKenzie, 2003). The definitions
included the conceptual themes of the constructs rather than just explaining the
ingredients of the definition (Summers, 2019). Therefore, the constructs were not
defined based on their antecedents and consequences.
After defining the constructs, the next step was to select appropriate measures from
the relevant literature (Blaikie and Priest, 2019). Relevant literature was reviewed to
select suitable scales for the measurement of constructs. The scales were adapted
and adopted from the existing literature since the scope of the study was not to
develop a new scale for any construct. The following rationale was used as a
guideline in selecting and evaluating the scales:
a) all the significant elements of the definition are manifested in the chosen scale
(MacKenzie, 2003)
b) multi-item scales were used because it was not intended to use a small sample
size, not intended to have homogenous items, and not expected to have a small
effect size (Diamantopoulos et al., 2012).
c) a minimum of three or above item scale was chosen “to provide minimum
coverage of constructs theoretical domain” (Hair et al., 2014, p.608)
d) it was made sure that the items (questions) of the chosen scale: contain clear
words, are specific, and are not double-barrelled (Bell et al., 2018; MacKenzie,
2003; Weijters et al., 2013).
e) the reliability and validity values of the chosen scales were above-accepted
threshold values (Hair et al., 2014)
Service recovery and branding literature were reviewed to adopt and or adapt
appropriate scales that match the criteria mentioned above. Although existing
research contains original scales for the constructs mentioned in the conceptual
framework, it also contains scales that contain the items adopted and or adapted
from two or more developed scales (Chao and Cheng, 2019; Foroudi et al., 2018;

165
del Río-Lanza et al., 2009). Hence, those scales represent a redeveloped form.
Given this, the researcher has reviewed both the original and redeveloped scales
utilised in service recovery and branding literature. The following sections explain
the rationale of the selected scales.
Distributive justice
The measurement scales for distributive justice available in the literature were
grouped into two different categories for a better understanding. The first category
was termed as compensation focused, in which the scales focused on measuring
distributive justice in terms of tangible compensation (payment, refund, discount). In
contrast, the second category of scales attempted to measure distributive justice as
an outcome of the service recovery and was termed as outcome-focused.
The scale of Smith et al. (1999) from the second category was chosen to measure
distributive justice from this category because the scale is relevant to the chosen
definition of the construct. The scale was adapted, and the reverse items were
converted into straight statements to avoid reverse item bias (Netemeyer et al.,
2003; Weijters et al., 2013).
Table 7.1 Scales of Distributive Justice
Distributive Justice:
Count Categories Authors
11 Compensation focused: Scales measuring distributive justice while considering it as fair compensation (payment)
(Balaji et al., 2018; Barakat et al., 2015; Blodgett et al., 1997; Chen and Kim, 2019; Crisafulli and Singh, 2016; Gelbrich et al., 2015; del Río-Lanza et al., 2009; Schoefer and Diamantopoulos, 2008; Varela-Neira et al., 2008; Vázquez‐Casielles et al., 2010; Wang and Chang, 2013)
23 Outcome focused: Scales measuring distributive justice while considering it as a fair outcome (accumulated response) after a service failure
(Bugg-Holloway et al., 2009; Cambra-Fierro et al., 2013; Cheung and To, 2016; Choi and Choi, 2014; DeWitt et al., 2008; Gohary, Hamzelu and Alizadeh, 2016; Gohary, Hamzelu, Pourazizi, et al., 2016; Huang, 2011; Joosten et al., 2017; Karatepe, 2006b; Kau and Wan‐Yiun Loh, 2006; Kim, Jung-Eun Yoo, et al., 2012; Lopes and da Silva, 2015; Martínez‐Tur et al., 2006; Maxham III and Netemeyer, 2002; Mostafa et al., 2015; Namkung and Jang, 2010; Ozkan-Tektas and Basgoze, 2017; Roggeveen et al., 2012; Roschk et al., 2013; Santos Cristiane and Basso, 2012; Shin et al., 2018; Sindhav et al., 2006; Smith et al., 1999; Tax et al., 1998; Tsai et al., 2014; Wirtz and McColl-Kennedy, 2010; Xu, Marshall, et al., 2014)
Informational Justice
The literature which incorporates informational justice relies heavily on the scale
given by Colquitt (2001a) for its measurement (Bradley and Sparks, 2009; Kim et

166
al., 2019; Liao and Rupp, 2005). The features of the scale attempt to measure the
level of communication in terms of explanation and information provided by the
service employee. Out of 19 reviewed scales, four scales did not adapt or adopt
Colquitt (2001) measurement scale (see table 7.2).
Although the items of those scales also reflected on measuring informational justice
based on the quality and quantity of explanation provided by service employees, the
number of items in the scales were not enough to cover the theoretical domain of
informational justice. Therefore, the current study adapted four items from Colquitt
(2001) scale to measure informational justice. The scale is in accordance with the
chosen definition of the construct, and items of the scale are comprehensive.
The items were converted to declarative statements from the statements ending
with a question mark. One item which was measuring the aspect of ‘timeliness’ was
dropped because ‘timeliness’ was considered as an aspect of procedural justice’s
theoretical domain.
Table 7.2 Scales of Informational Justice
Informational Justice:
Count Categories Authors
15 Scales adopting or adapting scale: Scales measuring informational Colquitt 2001 justice based on items related to information and explanation using Colquitt’s scale
(Ambrose et al., 2007; Colquitt, 2001; Gohary, Hamzelu and Alizadeh, 2016; Gupta and Kumar, 2013; Judge and Colquitt, 2004; Kernan and Hanges, 2002; Kim, 2009; Kim et al., 2010; Liao, 2007; Loi et al., 2009; Mattila, 2006; McQuilken et al., 2017; Shin et al., 2015; Sindhav et al., 2006; Wang et al., 2009)
4 Others: Scales not utilising the scale Colquitt 2001 also measuring informational justice based on items related to information and explanation but not using Colquitt’s scale
(Bradley and Sparks, 2012, 2009; Liao and Rupp, 2005; Varela-Neira et al., 2010b; Yang, Wang, et al., 2019)
Interactional Justice
The measurement scales were grouped into three distinct categories before
choosing an appropriate scale. The first category of scales focused on measuring
interactional justice based on the personal treatment of the customer and termed as
personal treatment.
The emphasis of the second category is to measure how the problem was treated.
Finally, the third category of scales includes the items which aim to measure
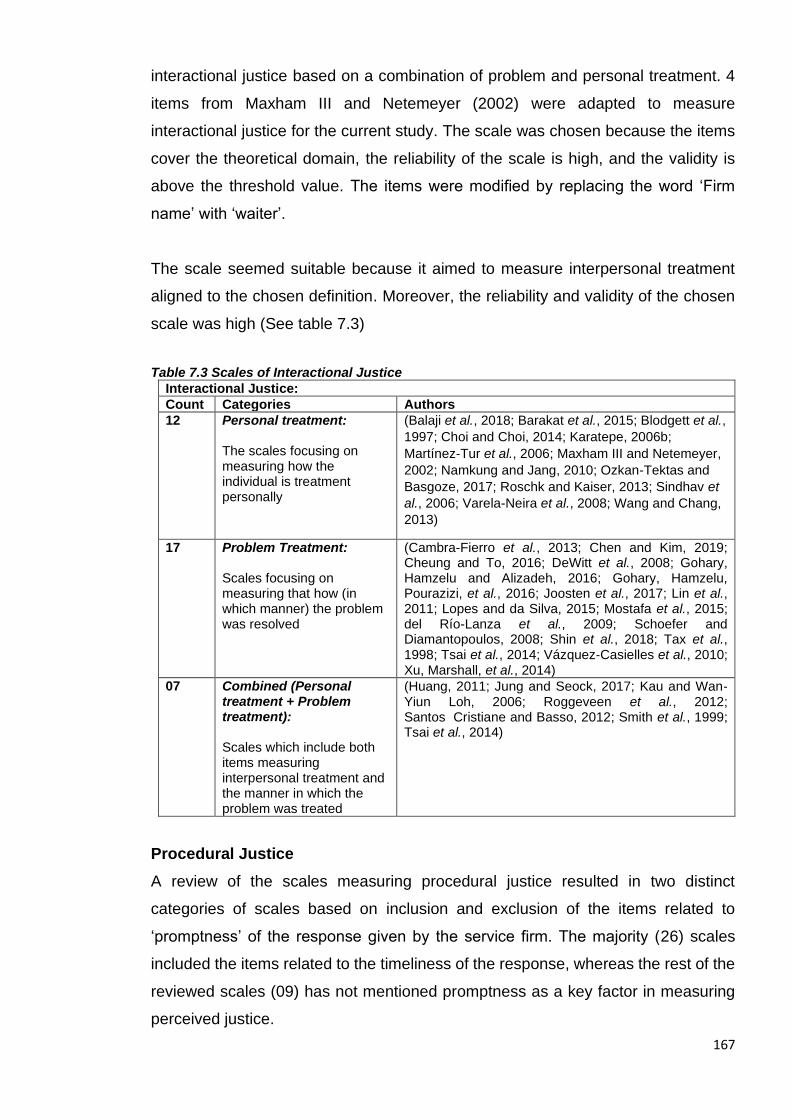
167
interactional justice based on a combination of problem and personal treatment. 4
items from Maxham III and Netemeyer (2002) were adapted to measure
interactional justice for the current study. The scale was chosen because the items
cover the theoretical domain, the reliability of the scale is high, and the validity is
above the threshold value. The items were modified by replacing the word ‘Firm
name’ with ‘waiter’.
The scale seemed suitable because it aimed to measure interpersonal treatment
aligned to the chosen definition. Moreover, the reliability and validity of the chosen
scale was high (See table 7.3)
Table 7.3 Scales of Interactional Justice
Interactional Justice:
Count Categories Authors
12 Personal treatment: The scales focusing on measuring how the individual is treatment personally
(Balaji et al., 2018; Barakat et al., 2015; Blodgett et al.,
1997; Choi and Choi, 2014; Karatepe, 2006b;
Martínez‐Tur et al., 2006; Maxham III and Netemeyer,
2002; Namkung and Jang, 2010; Ozkan-Tektas and
Basgoze, 2017; Roschk and Kaiser, 2013; Sindhav et
al., 2006; Varela-Neira et al., 2008; Wang and Chang,
2013)
17 Problem Treatment: Scales focusing on measuring that how (in which manner) the problem was resolved
(Cambra-Fierro et al., 2013; Chen and Kim, 2019; Cheung and To, 2016; DeWitt et al., 2008; Gohary, Hamzelu and Alizadeh, 2016; Gohary, Hamzelu, Pourazizi, et al., 2016; Joosten et al., 2017; Lin et al., 2011; Lopes and da Silva, 2015; Mostafa et al., 2015; del Río-Lanza et al., 2009; Schoefer and Diamantopoulos, 2008; Shin et al., 2018; Tax et al., 1998; Tsai et al., 2014; Vázquez‐Casielles et al., 2010; Xu, Marshall, et al., 2014)
07 Combined (Personal treatment + Problem treatment): Scales which include both items measuring interpersonal treatment and the manner in which the problem was treated
(Huang, 2011; Jung and Seock, 2017; Kau and Wan‐Yiun Loh, 2006; Roggeveen et al., 2012; Santos Cristiane and Basso, 2012; Smith et al., 1999; Tsai et al., 2014)
Procedural Justice
A review of the scales measuring procedural justice resulted in two distinct
categories of scales based on inclusion and exclusion of the items related to
‘promptness’ of the response given by the service firm. The majority (26) scales
included the items related to the timeliness of the response, whereas the rest of the
reviewed scales (09) has not mentioned promptness as a key factor in measuring
perceived justice.

168
Five items from Vázquez‐Casielles et al. (2010) were chosen and modified to
measure procedural justice. The scale is chosen because the scale includes the
factor of promptness. Promptness is considered as a key factor when measuring
procedural justice (del Río-Lanza et al., 2009). Further, the scale includes the items
to measure the appropriateness and adequacy of the service recovery procedure.
Finally, the items have clarity, and there are no double-barreled or reverse items in
the scale. Further, the items reflect the theoretical domain of the construct. The
modification included the replacement of the word “firm” with “restaurant” as per the
suitability.
Table 7.4 Scales of Procedural Justice
Perceived Quality
The scales measuring perceived quality were categorised into four different
categories. The first category of scales focused only to measure the quality of the
service or product. In contrast, the rest of the categories include items attempting to
measure perceived quality based on multiple traits such as reliability, competence
and performance.
The current study adapted four items from Netemeyer et al. (2004). The word ‘brand
name’ was replaced with ‘restaurant’ to adjust it with the study. The scale was
chosen because it is aligned with the chosen definition, and it covers the complete
Procedural Justice:
Count Categories Authors
26 Promptness of
response:
Prompt response is
considered as a key
measurement aspect to
measure procedural
justice
(Balaji et al., 2018; Barakat et al., 2015; Blodgett et al., 1997;
Cambra-Fierro et al., 2013; Cheung and To, 2016; Choi and
Choi, 2014; Crisafulli and Singh, 2016; DeWitt et al., 2008;
Gohary, Hamzelu and Alizadeh, 2016; Huang, 2011;
Karatepe, 2006b; Lin et al., 2011; Lopes and da Silva, 2015;
Maxham III and Netemeyer, 2002; Mostafa et al., 2015;
Namkung and Jang, 2010; Ozkan-Tektas and Basgoze,
2017; del Río-Lanza et al., 2009; Ro and Olson, 2014;
Roschk and Kaiser, 2013; Santos Cristiane and Basso,
2012; Smith et al., 1999; Tax et al., 1998; Vázquez‐Casielles
et al., 2010; Wang and Chang, 2013; Xu, Marshall, et al.,
2014)
9 Promptness
excluded:
Promptness is not
considered in
measuring promptness
(Chen and Kim, 2019; Gohary, Hamzelu and Alizadeh, 2016;
Joosten et al., 2017; Jung and Seock, 2017; Martínez‐Tur et
al., 2006; Roggeveen et al., 2012; Sindhav et al., 2006; Tsai
et al., 2014; Varela-Neira et al., 2008)
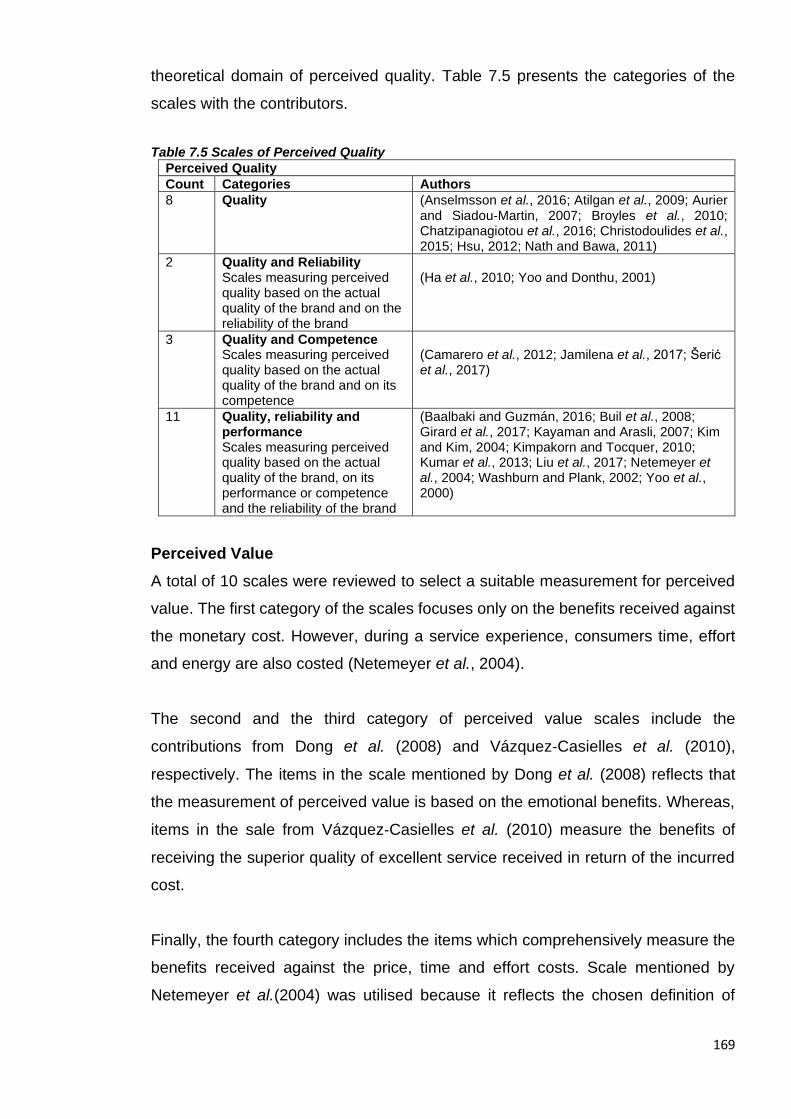
169
theoretical domain of perceived quality. Table 7.5 presents the categories of the
scales with the contributors.
Table 7.5 Scales of Perceived Quality
Perceived Quality
Count Categories Authors
8 Quality
(Anselmsson et al., 2016; Atilgan et al., 2009; Aurier and Siadou‐Martin, 2007; Broyles et al., 2010; Chatzipanagiotou et al., 2016; Christodoulides et al., 2015; Hsu, 2012; Nath and Bawa, 2011)
2 Quality and Reliability Scales measuring perceived quality based on the actual quality of the brand and on the reliability of the brand
(Ha et al., 2010; Yoo and Donthu, 2001)
3 Quality and Competence Scales measuring perceived quality based on the actual quality of the brand and on its competence
(Camarero et al., 2012; Jamilena et al., 2017; Šerić et al., 2017)
11 Quality, reliability and performance Scales measuring perceived quality based on the actual quality of the brand, on its performance or competence and the reliability of the brand
(Baalbaki and Guzmán, 2016; Buil et al., 2008; Girard et al., 2017; Kayaman and Arasli, 2007; Kim and Kim, 2004; Kimpakorn and Tocquer, 2010; Kumar et al., 2013; Liu et al., 2017; Netemeyer et al., 2004; Washburn and Plank, 2002; Yoo et al., 2000)
Perceived Value
A total of 10 scales were reviewed to select a suitable measurement for perceived
value. The first category of the scales focuses only on the benefits received against
the monetary cost. However, during a service experience, consumers time, effort
and energy are also costed (Netemeyer et al., 2004).
The second and the third category of perceived value scales include the
contributions from Dong et al. (2008) and Vázquez‐Casielles et al. (2010),
respectively. The items in the scale mentioned by Dong et al. (2008) reflects that
the measurement of perceived value is based on the emotional benefits. Whereas,
items in the sale from Vázquez‐Casielles et al. (2010) measure the benefits of
receiving the superior quality of excellent service received in return of the incurred
cost.
Finally, the fourth category includes the items which comprehensively measure the
benefits received against the price, time and effort costs. Scale mentioned by
Netemeyer et al.(2004) was utilised because it reflects the chosen definition of

170
perceived value and the scale has high reliability and validity. Table 7.6 presents
the categories of the reviewed scales.
Table7.6 Scales of Perceived Value Perceived Value
Count Categories Authors
4 Benefits against the monetary cost Items of the scale focusing benefits received against the monetary cost
(Buil et al., 2008; Girard et al., 2017; Rios and Riquelme, 2008; Santos Cristiane and Basso, 2012)
1 Emotional benefits Items of the scale focusing on the emotional costs and benefits
(Dong et al., 2008)
2 Performance / Quality Received Scale focusing on quality and performance benefits received against the cost incurred
(Vázquez‐Casielles et al., 2010)
3 Comprehensive Scales including items that measure Perceived value comprehensively
(Agarwal and Teas, 2001; Li et al., 2017; Netemeyer et al., 2004)
Brand Reputation
A total of 7 different scales of brand reputation were reviewed. 3 item scale from
Morgan-Thomas and Veloutsou (2013) was adapted to measure brand reputation.
Although the scale contained only three items, it was in line with the chosen
definition and scale items captured the theoretical domain of brand reputation.
Other scales attempt to measure brand reputation based on the items related to
reliability and performance of the brand, which overlapped with the measurement of
brand trust and perceived quality. Scales from Walsh and Beatty (2007) and Walsh
et al. (2009) were not considered because the scales cover a broad theoretical
domain of brand reputation, which is not reflected in the chosen definition.
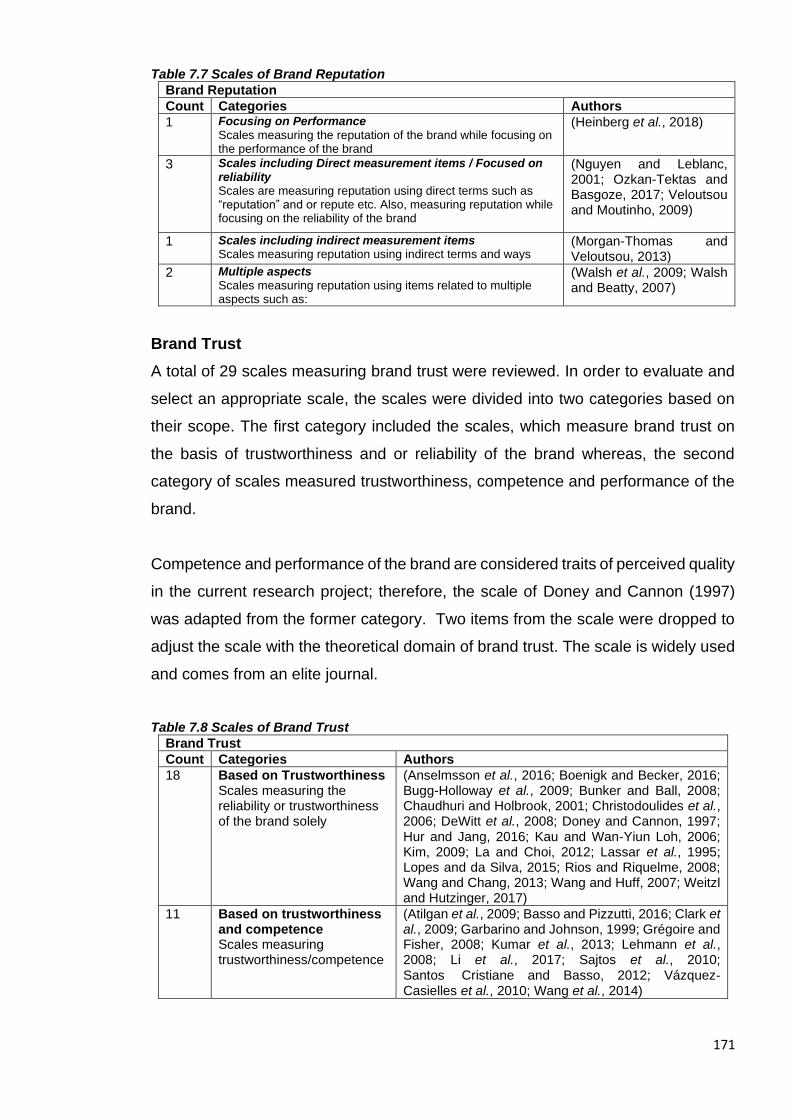
171
Table 7.7 Scales of Brand Reputation
Brand Reputation
Count Categories Authors
1 Focusing on Performance Scales measuring the reputation of the brand while focusing on the performance of the brand
(Heinberg et al., 2018)
3 Scales including Direct measurement items / Focused on reliability Scales are measuring reputation using direct terms such as “reputation” and or repute etc. Also, measuring reputation while focusing on the reliability of the brand
(Nguyen and Leblanc, 2001; Ozkan-Tektas and Basgoze, 2017; Veloutsou and Moutinho, 2009)
1 Scales including indirect measurement items Scales measuring reputation using indirect terms and ways
(Morgan-Thomas and Veloutsou, 2013)
2 Multiple aspects Scales measuring reputation using items related to multiple aspects such as:
(Walsh et al., 2009; Walsh and Beatty, 2007)
Brand Trust
A total of 29 scales measuring brand trust were reviewed. In order to evaluate and
select an appropriate scale, the scales were divided into two categories based on
their scope. The first category included the scales, which measure brand trust on
the basis of trustworthiness and or reliability of the brand whereas, the second
category of scales measured trustworthiness, competence and performance of the
brand.
Competence and performance of the brand are considered traits of perceived quality
in the current research project; therefore, the scale of Doney and Cannon (1997)
was adapted from the former category. Two items from the scale were dropped to
adjust the scale with the theoretical domain of brand trust. The scale is widely used
and comes from an elite journal.
Table 7.8 Scales of Brand Trust
Brand Trust
Count Categories Authors
18 Based on Trustworthiness Scales measuring the reliability or trustworthiness of the brand solely
(Anselmsson et al., 2016; Boenigk and Becker, 2016; Bugg-Holloway et al., 2009; Bunker and Ball, 2008; Chaudhuri and Holbrook, 2001; Christodoulides et al., 2006; DeWitt et al., 2008; Doney and Cannon, 1997; Hur and Jang, 2016; Kau and Wan‐Yiun Loh, 2006; Kim, 2009; La and Choi, 2012; Lassar et al., 1995; Lopes and da Silva, 2015; Rios and Riquelme, 2008; Wang and Chang, 2013; Wang and Huff, 2007; Weitzl and Hutzinger, 2017)
11 Based on trustworthiness and competence Scales measuring trustworthiness/competence
(Atilgan et al., 2009; Basso and Pizzutti, 2016; Clark et al., 2009; Garbarino and Johnson, 1999; Grégoire and Fisher, 2008; Kumar et al., 2013; Lehmann et al., 2008; Li et al., 2017; Sajtos et al., 2010; Santos Cristiane and Basso, 2012; Vázquez‐Casielles et al., 2010; Wang et al., 2014)
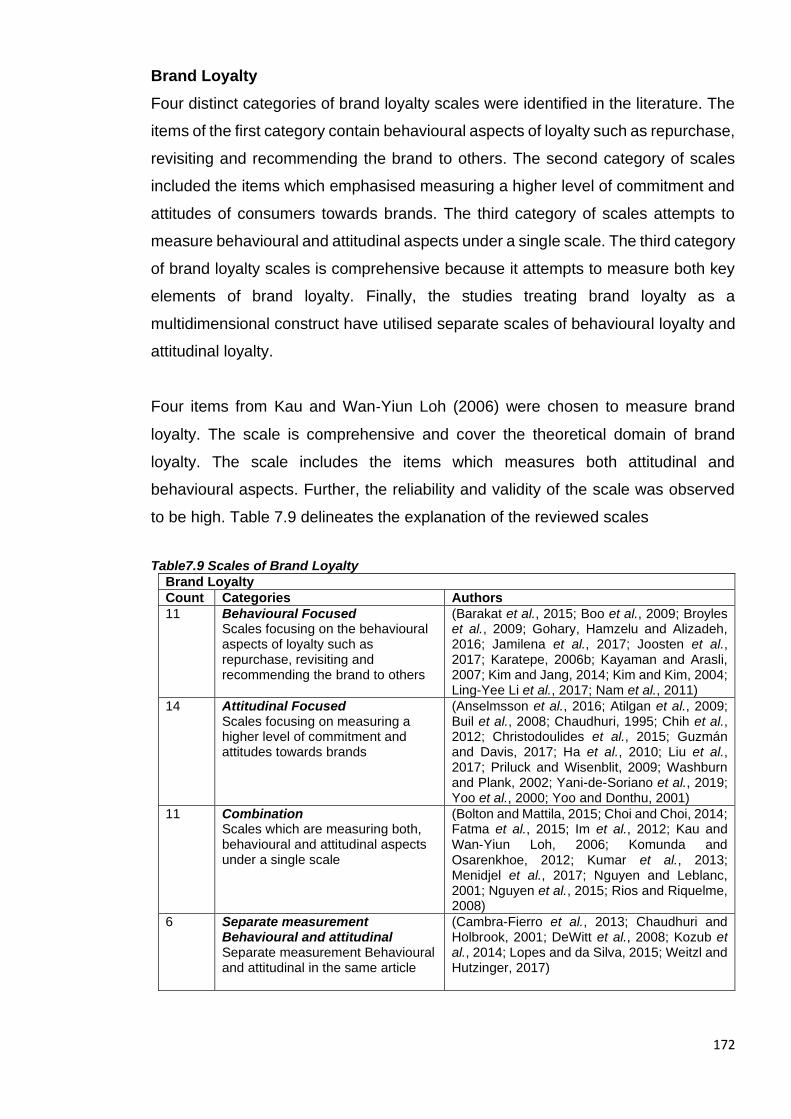
172
Brand Loyalty
Four distinct categories of brand loyalty scales were identified in the literature. The
items of the first category contain behavioural aspects of loyalty such as repurchase,
revisiting and recommending the brand to others. The second category of scales
included the items which emphasised measuring a higher level of commitment and
attitudes of consumers towards brands. The third category of scales attempts to
measure behavioural and attitudinal aspects under a single scale. The third category
of brand loyalty scales is comprehensive because it attempts to measure both key
elements of brand loyalty. Finally, the studies treating brand loyalty as a
multidimensional construct have utilised separate scales of behavioural loyalty and
attitudinal loyalty.
Four items from Kau and Wan‐Yiun Loh (2006) were chosen to measure brand
loyalty. The scale is comprehensive and cover the theoretical domain of brand
loyalty. The scale includes the items which measures both attitudinal and
behavioural aspects. Further, the reliability and validity of the scale was observed
to be high. Table 7.9 delineates the explanation of the reviewed scales
Table7.9 Scales of Brand Loyalty
Brand Loyalty
Count Categories Authors
11 Behavioural Focused Scales focusing on the behavioural aspects of loyalty such as repurchase, revisiting and recommending the brand to others
(Barakat et al., 2015; Boo et al., 2009; Broyles et al., 2009; Gohary, Hamzelu and Alizadeh, 2016; Jamilena et al., 2017; Joosten et al., 2017; Karatepe, 2006b; Kayaman and Arasli, 2007; Kim and Jang, 2014; Kim and Kim, 2004; Ling-Yee Li et al., 2017; Nam et al., 2011)
14 Attitudinal Focused Scales focusing on measuring a higher level of commitment and attitudes towards brands
(Anselmsson et al., 2016; Atilgan et al., 2009; Buil et al., 2008; Chaudhuri, 1995; Chih et al., 2012; Christodoulides et al., 2015; Guzmán and Davis, 2017; Ha et al., 2010; Liu et al., 2017; Priluck and Wisenblit, 2009; Washburn and Plank, 2002; Yani-de-Soriano et al., 2019; Yoo et al., 2000; Yoo and Donthu, 2001)
11 Combination Scales which are measuring both, behavioural and attitudinal aspects under a single scale
(Bolton and Mattila, 2015; Choi and Choi, 2014; Fatma et al., 2015; Im et al., 2012; Kau and Wan‐Yiun Loh, 2006; Komunda and Osarenkhoe, 2012; Kumar et al., 2013; Menidjel et al., 2017; Nguyen and Leblanc, 2001; Nguyen et al., 2015; Rios and Riquelme, 2008)
6 Separate measurement Behavioural and attitudinal Separate measurement Behavioural and attitudinal in the same article
(Cambra-Fierro et al., 2013; Chaudhuri and Holbrook, 2001; DeWitt et al., 2008; Kozub et al., 2014; Lopes and da Silva, 2015; Weitzl and Hutzinger, 2017)
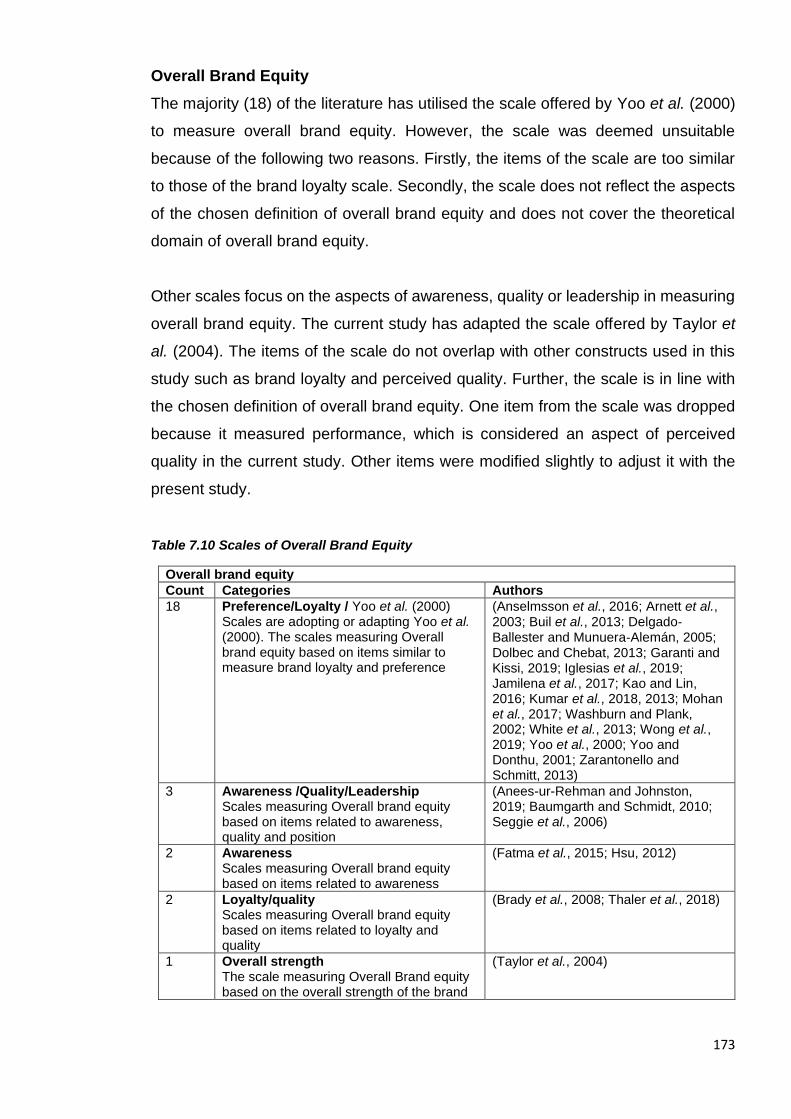
173
Overall Brand Equity
The majority (18) of the literature has utilised the scale offered by Yoo et al. (2000)
to measure overall brand equity. However, the scale was deemed unsuitable
because of the following two reasons. Firstly, the items of the scale are too similar
to those of the brand loyalty scale. Secondly, the scale does not reflect the aspects
of the chosen definition of overall brand equity and does not cover the theoretical
domain of overall brand equity.
Other scales focus on the aspects of awareness, quality or leadership in measuring
overall brand equity. The current study has adapted the scale offered by Taylor et
al. (2004). The items of the scale do not overlap with other constructs used in this
study such as brand loyalty and perceived quality. Further, the scale is in line with
the chosen definition of overall brand equity. One item from the scale was dropped
because it measured performance, which is considered an aspect of perceived
quality in the current study. Other items were modified slightly to adjust it with the
present study.
Table 7.10 Scales of Overall Brand Equity
Overall brand equity
Count Categories Authors
18 Preference/Loyalty / Yoo et al. (2000) Scales are adopting or adapting Yoo et al. (2000). The scales measuring Overall brand equity based on items similar to measure brand loyalty and preference
(Anselmsson et al., 2016; Arnett et al., 2003; Buil et al., 2013; Delgado‐Ballester and Munuera‐Alemán, 2005; Dolbec and Chebat, 2013; Garanti and Kissi, 2019; Iglesias et al., 2019; Jamilena et al., 2017; Kao and Lin, 2016; Kumar et al., 2018, 2013; Mohan et al., 2017; Washburn and Plank, 2002; White et al., 2013; Wong et al., 2019; Yoo et al., 2000; Yoo and Donthu, 2001; Zarantonello and Schmitt, 2013)
3 Awareness /Quality/Leadership Scales measuring Overall brand equity based on items related to awareness, quality and position
(Anees-ur-Rehman and Johnston, 2019; Baumgarth and Schmidt, 2010; Seggie et al., 2006)
2 Awareness Scales measuring Overall brand equity based on items related to awareness
(Fatma et al., 2015; Hsu, 2012)
2 Loyalty/quality Scales measuring Overall brand equity based on items related to loyalty and quality
(Brady et al., 2008; Thaler et al., 2018)
1 Overall strength The scale measuring Overall Brand equity based on the overall strength of the brand
(Taylor et al., 2004)

174
Table 7.11 Summary of scales adapted from literature
Construct Items Source (Adapted from)
Reliability of the original scale
α CR AVE
Distributive Justice
The outcome I received was fair Smith et al., 1999 0.88
-.0.93
- - I got what I deserved
In resolving the problem, the restaurant gave me what I needed
The outcome I received was right
Informational Justice
The waiter was open in his communications with me (Colquitt, 2001)
0.90 - -
The waiter explained the procedures thoroughly
The explanations of the waiter regarding the procedures were reasonable
The waiter seemed to tailor his communications to my specific needs
I was pleased with the manner the restaurant dealt with the problem
Interactional Justice
In dealing with my problem, the waiter treated me in a courteous manner. Maxham III and Netemeyer, 2002
- 0.94 0.77
During his effort to resolve my problem, the waiter showed a real interest in trying to be fair
The waiter got input from me before handling the problem
While attempting to fix my problem, the waiter considered my views
Procedural Justice
I think my problem was resolved in the right way Vázquez‐Casielles, et al., 2010
0.89 0.91 0.68
I think the restaurant has appropriate policies and practices for dealing with problems
Despite the trouble caused by the problem, the restaurant was able to respond adequately
The restaurant proved flexible in solving the problem
The restaurant tried to solve the problem as quickly as possible
Perceived Quality
Compared to other restaurants, this restaurant is excellent Netemeyer et al., 2004
>0.75 - >0.5 This restaurant is superior to other similar restaurants
This restaurant consistently performs better than all other restaurants
I can always count on this restaurant for consistent performance
Perceived Value What I get from this restaurant is worth the cost Netemeyer et al., 2004
>0.75 - >0.5
All the things considered (price, time and effort), services of this restaurant are a good buy
Compared to other restaurants, this restaurant is a good value for the money
When I use the services of this restaurant, I feel I am getting my money's worth
This restaurant is well known 0.73 - -

175
Construct Items Source (Adapted from)
Reliability of the original scale
α CR AVE
Brand Reputation
It is one of the leading restaurants Morgan-Thomas and Veloutsou, 2013 It is easily recognizable
Brand Trust The restaurant keeps promises it makes to customers Doney and Cannon, 1997
0.94 - -
The restaurant is always honest with me
I believe the information that this restaurant provides me
When making important decisions, this restaurant considers my welfare as well as its own
This restaurant keeps my best interests in mind
This restaurant is Honest
Brand Loyalty
I will continue to stay with this restaurant Kau and Loh, 2006
0.79 - - I would not change this restaurant service provider in future
In the near future, I intend to use more of the services provided by this restaurant
I consider myself to be a faithful customer of this restaurant
Overall Brand Equity
This restaurant is superior to other restaurants Taylor et al., 2004
0.89 - -
The restaurant I am evaluating fits my personality
The restaurant I am evaluating is well regarded by my colleagues
I have positive personal feelings toward the restaurant I am evaluating
After consuming services from the restaurant, I am evaluating, I have grown fond of it
176
7.3.2 Development of hypothetical text scenarios
A hypothetical scenario describes an event or sequence of events (Kim and Jang,
2014). A total of 6 hypothetical scenarios were used in this study, representing a 3
(service recovery type: Customer Participation in service recovery vs Firm recovery
vs no recovery) x 2 (Service failure severity: high vs low) factorial design. The
detailed scenarios are mentioned in Appendix D. In order to depict naturally
occurring service failure and recovery episodes within the service industry, major
assistance was taken from the qualitative phase to develop hypothetical scenarios.
The nature and content of the hypothetical scenario were based on the information
gathered from 51 incidents shared by the participants of the qualitative phase. The
final versions of the scenarios were finalised after numerous revisions and nine
meetings with the two marketing academics. Scenarios contain characteristic
elements to shape a story in a way that may seem realistic. Carroll (2000) has
mentioned three main characteristic elements, i) setting, ii) Actors or Agents and iii)
the Plot.
i) The setting of the scenario
The scenario setting is the most important element because the following elements
are selected according to the setting (Carroll, 2000). The current study considers
setting as a service firm of a particular service industry. The literature suggested
that most studies have utilised Airline (Etemad-Sajadi and Bohrer, 2019; Hogreve
et al., 2017; Hwang et al., 2020; Sindhav et al., 2006) and restaurant firms(Abbasi,
2020; Azab and Clark, 2017; Bambauer-Sachse and Rabeson, 2015; Parsa et al.,
2021) as the study setting because of the high frequency and criticality of failures.
The qualitative phase provided similar findings regarding the frequency and
criticality of service failures in airline and restaurant firms.
The restaurant setting was preferred over the Airline setting because of the following
reasons. Firstly, UK customers are automatically covered by the EU law against
airline service failures (Citizensadvice, 2019); thus, it was difficult to record
customer’s perceptions towards the service recovery provided by the airline
companies. Secondly, consumer spending of 88 billion British pounds in restaurants
in a single year (Statista, 2019). Thirdly, 83% of people eat out or buy food to take
away at least once a month, and 43% do the same at least twice a week (Statista,
177
2019). These statistics show the significance of this sector, which captures a
handsome share from the UK customers’ pockets. Fourthly, even though there is a
decent consumer expenditure on restaurants and higher visit frequency, more than
1400 restaurants were shut down in the single year of 2018 due to distancing from
consumers expectations (Neate, 2019), which signals challenges in the restaurant
industry. Finally, restaurants are considered as more applicable in-service recovery
research because restaurants are more vulnerable to dissatisfying encounters than
other services (Bambauer-Sachse and Rabeson, 2015).
ii) Actors
The scenario building process considers actors as the imaginative characters
depicted in the scenarios who perform certain activities to create a sequence of
events (Lindorfer, 2016). The primary actor of the scenario is the person whose
perceptions are subject to investigation; therefore reader of the scenario
(respondents) was given the role of a restaurant customer. It is typical to include
more than one actor in the scenario to develop a naturally looking scenario
smoothly. Customers usually have encounters with front line employees who deliver
a pleasurable and convenient service experience to the customers (Lucia-Palacios
et al., 2020). Therefore, a waiter was introduced as the second actor in the scenario,
considered a frontline employee of a restaurant.
iii) Plot
A plot is a combination of “sequences of actions and events, things that actors do,
things that happen to them, changes in the circumstances of the setting, and so
forth” (Carroll, 2000, p.47). The four main components of the plot in the current
scenario are service failure type, the intensity of service failure, failure attribution
and nature of the service recovery. Delay in core service (a type of core service
delay) was chosen as a service problem in the scenarios. Qualitative findings
supported the choice of this service failure type. The majority of the respondents
shared incidents where they experienced a delay in the core service and considered
it critical. Therefore, a delay in serving food by the restaurant was mentioned in the
scenario.
The intensity of service failure and failure attribution are considered two critical
factors influencing the relationship between service recovery and customers’

178
evaluation (Abbasi, 2020; Albrecht et al., 2019). Since failure severity is also
considered as a factor in the factorial design, it was introduced in the scenarios at
two levels, high and low. After scrutiny of the qualitative findings, a 45 minutes delay
from the normal serving time (15 minutes) was considered as a high failure severity,
whereas a 10 minutes delay from the standard serving time (15minutes) was
regarded as low failure severity. On the other hand, failure attribution also plays a
vital role in evaluating the firm’s response to service recovery. For example, the
qualitative findings suggested that 50 out of 51 incidents mentioned that the service
firm was solely responsible for the failure. Therefore, to maintain the naturality,
failure was attributed to the restaurant by mentioning that the delay was because of
the recent change in the food preparation method.
Finally, to conclude the scenario, service recovery was mentioned in the scenario.
Service recovery was considered as a factor in the factorial design and aimed to
manipulate at three levels, Customer Participation in service recovery, firm recovery
and no recovery. Firm recovery may involve a single or a combination of strategies
to respond to a service failure. Service recovery literature and qualitative findings
suggested that apology and compensation are the most common strategies adopted
by service firms((Fang et al., 2013; Odoom et al., 2019; Sharifi et al., 2017; Smith
et al., 1999). ‘Explanation’ (service recovery strategy) was mentioned as an
expected response strategy by the informants. Therefore, firm recovery scenarios
mentioned that waiter apologised and explained the cause of the failure. Moreover,
it was mentioned in the firm recovery scenarios that a complimentary dessert was
given as compensation. On the other hand, ‘customer participation in service
recovery’ scenarios mentioned that the customer was involved in the process of the
service recovery process by providing information of the failure, discussing his / her
requirements with the waiter, filling out a comment card and choosing compensation
from two options given by the waiter. Finally, the ‘no recovery’ scenarios do not
contain any such information that describes any service failure remedy.
7.3.2.1 Control via scenarios The attractiveness of written scenarios is that the researcher can control extraneous
factors by explaining the story in detail. Service recovery literature has mentioned
that other than service failure severity (Albrecht et al., 2019; Radu et al., 2019;
Roggeveen et al., 2012), failure attribution is one of the main extraneous factors

179
which may influence the relationship of service recovery and customers’ post-
recovery outcomes (Abbasi, 2020; Bambauer-Sachse and Rabeson, 2015; Van
Vaerenbergh et al., 2014). Therefore, failure attribution was controlled in the
scenarios by explicitly mentioning that the failure is attributed to the restaurant. It
was also mentioned in the scenario that the restaurant was not busy as it was a
weekday so that the readers would not attribute it to external factors. The pre-
consumption mood of the customers can also impact the relationships (Yang and
Hanks, 2016). It was controlled in the scenario by mentioning that the customer had
a long day at work and was feeling hungry (the reader of the scenario).
7.3.3 Structure of the questionnaires
7.3.3.1 Questionnaire for data collection stage 1
The first questionnaire initiated with a welcome note which mentioned: i) a brief
about the survey, ii) introduction of the researcher, iii) the average completion time,
iv) data protection policy and v) hyperlink for plain language statement (document
containing detailed information about the research) to achieve a reasonable
response rate (Dillman et al., 2014). The statements related to participating,
archiving the data and opting out of the survey were given at the bottom of this first
part.
The following part of the questionnaire began by instructing the respondents to think
of a middle-range restaurant where they usually visit and then type the restaurant's
name. The instructions were the same for all the respondents. After mentioning the
instructions, respondents' perceptions of the restaurant were recorded with the help
of the chosen scales of overall brand equity and the dimensions of consumer-based
brand equity. Four attention filter questions were included in the questionnaire to
maintain the data quality (Smith et al., 2016). The attention check questions were:
1) Obama was the first president of the USA, 2) The spellings of the word ‘Prolific’
starts with the letter ‘Z’ 3) Please select neither agree nor disagree for this statement
4) It is important that you pay attention to this study, please select ‘Strongly
Disagree’. The responses of all the items in this section were recorded on a widely
used Likert response scale introduced by Likert (1932). The seven-point response
option was utilised because it is considered suitable for the precision of
measurement (Simms et al., 2019).
180
The final part of the questionnaire was aimed to record the demographic information
of the sample. The demographic information explicitly presents the profile of the
respondent. This information is considered key data in a research project because
the sample profile assists in evaluating the representation of the population (Bell et
al., 2018). The questions included in this section were about the age, gender,
occupation, education, employment status, and ethnicity to record the explicit
demographic information of the respondents (Hair, Bush, et al., 2006). The question
related to the ‘length of the stay in the UK’ was asked to ensure that the final set of
the sample was residing in the UK for more than two years. Demographic
information was collected at the end of the survey to engage respondents in the
survey, build rapport and prevent unnecessary interruptions triggered by personal
questions (Lavrakas, 2008). See Appendix C for a detailed version of the
questionnaire.
7.3.3.2 Questionnaire for data collection stage 2
The second questionnaire was a scenario-based questionnaire. It consisted of four
sections. The first section of the scenario-based questionnaire began with a
welcome note. In this section, the respondents were briefed about the nature of the
study. It was mentioned that this was the second part of the study. Further, the
average completion time, data protection policy and hyperlink to the plain language
statement were given. The options of giving consent or discontinuing the survey
were given at the end of this section as per the guidelines of the University’s ethics
committee.
The second section of the scenario-based questionnaire consisted of six
hypothetical scenarios. Each respondent was exposed to one of the six hypothetical
scenarios randomly. The manipulations in the scenarios had a 3 X 2 combination,
which made a total of six different scenarios. Table 7.12 represents the 3 x 2
combination. Respondents were randomly assigned to one of the six hypothetical
scenarios to avoid selection bias and control for the lurking variables (Bulpitt, 1996;
Cox, 2009). Before exposing to one of the scenarios, every respondent was shown
a page of important points. The instructions were: to read the upcoming hypothetical
scenario by considering themselves in the scenario, to consider the same restaurant
in mind while reading the scenario which they entered in the first questionnaire. The
restaurant name which they entered in the first questionnaire was reminded
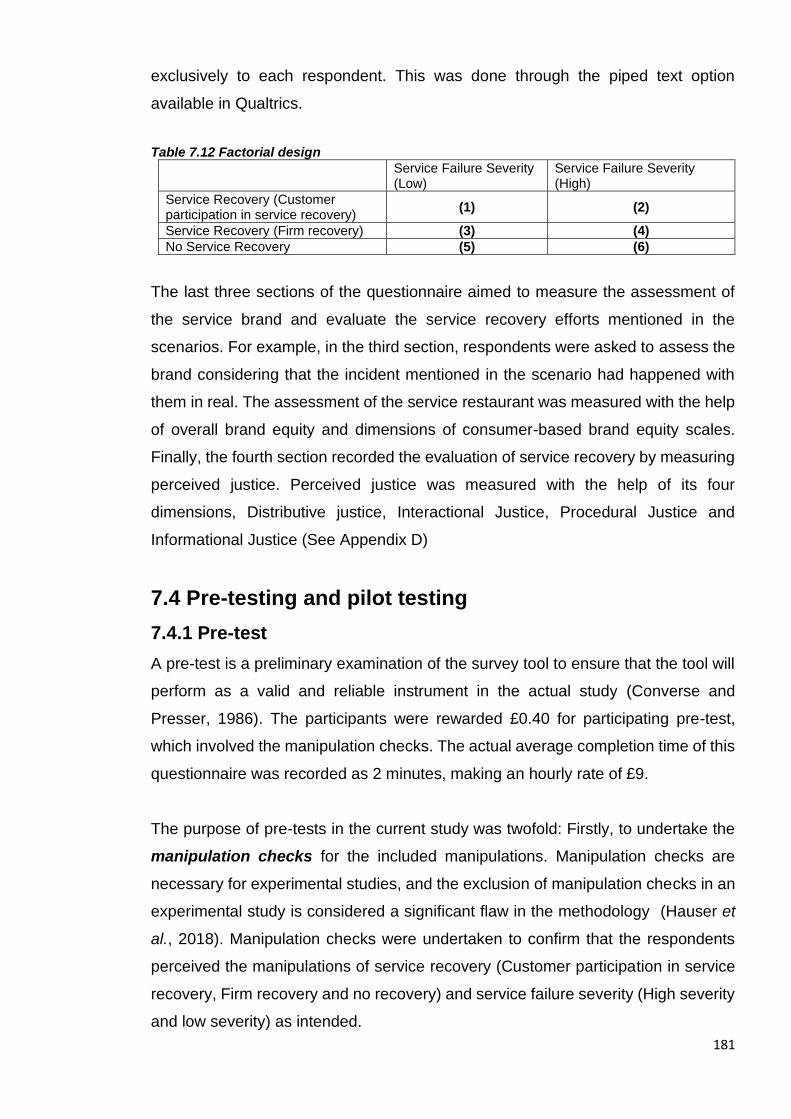
181
exclusively to each respondent. This was done through the piped text option
available in Qualtrics.
Table 7.12 Factorial design
Service Failure Severity (Low)
Service Failure Severity (High)
Service Recovery (Customer participation in service recovery)
(1) (2)
Service Recovery (Firm recovery) (3) (4)
No Service Recovery (5) (6)
The last three sections of the questionnaire aimed to measure the assessment of
the service brand and evaluate the service recovery efforts mentioned in the
scenarios. For example, in the third section, respondents were asked to assess the
brand considering that the incident mentioned in the scenario had happened with
them in real. The assessment of the service restaurant was measured with the help
of overall brand equity and dimensions of consumer-based brand equity scales.
Finally, the fourth section recorded the evaluation of service recovery by measuring
perceived justice. Perceived justice was measured with the help of its four
dimensions, Distributive justice, Interactional Justice, Procedural Justice and
Informational Justice (See Appendix D)
7.4 Pre-testing and pilot testing
7.4.1 Pre-test
A pre-test is a preliminary examination of the survey tool to ensure that the tool will
perform as a valid and reliable instrument in the actual study (Converse and
Presser, 1986). The participants were rewarded £0.40 for participating pre-test,
which involved the manipulation checks. The actual average completion time of this
questionnaire was recorded as 2 minutes, making an hourly rate of £9.
The purpose of pre-tests in the current study was twofold: Firstly, to undertake the
manipulation checks for the included manipulations. Manipulation checks are
necessary for experimental studies, and the exclusion of manipulation checks in an
experimental study is considered a significant flaw in the methodology (Hauser et
al., 2018). Manipulation checks were undertaken to confirm that the respondents
perceived the manipulations of service recovery (Customer participation in service
recovery, Firm recovery and no recovery) and service failure severity (High severity
and low severity) as intended.

182
The manipulation check items for service recovery were: i) I was given the
opportunity to participate in the resolution process by choosing compensation type
between options, ii) I participated in the resolution process by discussing my
requirements in detail with the waiter, iii) I participated in the resolution process by
filling out a comment card during the resolution process, iv) I did not participate in
the resolution of the problem other than asking the waiter about the reason for the
delay, v) The firm itself provided the compensation without my input, vi) The firm did
not apologise for the delay in service, vii) The firm did not provide compensation for
the delay of service. There were four manipulation check items for service failure
severity adapted from Roschk and Kaiser (2013). The items are as follows: i) The
occurred problem for you as a customer is significant, ii) The occurred problem for
you as a customer causes a lot of inconvenience, iii) The occurred problem for you
as a customer is serious, iv) The occurred problem for you as a customer is a major
problem.
Secondly, pre-tests were conducted to check the realism of hypothetical scenarios.
Realism checks in an experiment to ensure ecological validity (Kim et al., 2012).
The realism of the scenarios was measured with the items adapted from McColl-
Kennedy et al. (2003), . i) The incident described in the scenario was likely to occur
in real life, ii) The incident described in the scenario was likely to occur in real life.)
on a 7-point Likert scale (1= extremely disagree -7 = extremely agree).
The process of pre-testing the instrument was iterative as recommended by
(Converse and Presser, 1986). A total of three pre-tests were conducted with small
samples to ensure that manipulations would work as intended and scenarios are
closer to reality. The manipulations check for service failure severity did not work as
expected in the first two attempts of the pre-tests. The results of an experimental
study are considered misleading if the manipulation checks don’t work as expected
(Hauser et al., 2018). Therefore, corrective actions were undertaken after each pre-
test until the results of manipulations came as expected. The corrective actions were
taken after the consultation with three marketing academics. Table 7.13 details the
process of pre-tests and the corrective actions.

183
Table 7.13 The process of Pre-tests and corrective actions
Pre-test Results Problems Corrective action
Realism Check Manipulation check
Pre-test Attempt-1 90
All scenarios were perceived to happen in reality. Mean values of all scenarios > 4 (exceeded mid-point)
Service Failure Severity
There was no statistical difference between service failure severity (low) and Service failure severity (High) Scenarios.
All other manipulation checks worked as intended
Service failure Severity Manipulation was unsuccessful in Scenarios with Low severity. Respondents perceived high severity failures in all scenarios
Manipulation Items for Service Failure Severity were revised Also Added a rating scale item to measure the severity
Pre-test Attempt-2 90
All scenarios were perceived to happen in reality. Mean values of all scenarios > 4 (exceeded mid-point)
Service Failure Severity There was no statistical difference between service failure severity (low) and Service failure severity (High) Scenarios. All other manipulation checks worked as intended
Service failure Severity Manipulation was unsuccessful in Scenarios with Low severity. Respondents perceived high severity failures in all scenarios
Revised the Scenarios. The type of service failure was changed. The problem in core service was replaced with a delay in core service. Because the problem of overcooked food was perceived as high severity failure in all scenarios, it was replaced with a Delay of serving time. Benchmark serving time was also mentioned).
Pre-test Attempt -3 Actual 90
Mean values of all scenarios > 4. (exceeded mid-point)
All manipulation checks worked as intended
No problem occurred No corrective action taken

184
7.4.2 Pilot test
The pilot tests are conducted before actual data collection to identify and eliminate
potential issues in the data collection instrument (Saunders et al., 2019). The
success of the questions asked in the survey can only be evaluated with the help of
piloting the survey (Bell and Waters, 2014). The pilot test was carried out in January
2020. The pilot study instrument was designed on Qualtrics, and a web link was
generated to share with the potential participants. A convenient sample of
participants was recruited via Prolific Academic (ProA), a crowdsourcing platform.
According to the study's design, the data was collected in two stages with two
different questionnaires. The participants were rewarded £0.40 for the first
questionnaire and £1 for the scenario-based questionnaire.
The recommendations regarding the sample size for the pilot study vary in the
literature. For example, Fink (2015) suggested that suitable sample size for a pilot
study should not fall below 10. Similarly, Hill (1998) recommended that anything
between 10 to 30 responses (as a final sample size for a pilot study) is deemed
appropriate. Browne (1995) claimed that the sample size should be 30 or greater
for a meaningful analysis. According to Johanson and Brooks (2010) good sample
size is between 24 to 36. However, they mentioned that at least N=12 per group is
recommended where more than one groups are under investigation. Therefore, to
gain a meaningful statistical analysis, 120 participants were recruited. The analysis
for the pilot study was done on a final sample of 108 (18 per group) because 10
participants did not participate in the second phase of the data collection, and 2
participants did not pass the filter questions.
The preliminary analysis included the reliability tests of the adapted scales. Along
with the reliability analysis, the researcher was able to identify the total time spent
on the questionnaires. The identification of the time spent in filling the questionnaires
assisted the researcher to a) mention an approximate completion time for the actual
survey, b) allocate a reasonable reward for the respondents for actual data
collection. Since this study involved two stages of data collection from the same
respondents, the retention rate was crucial (Teague et al., 2018). The pilot study
suggested that there is a retention rate of 90% for the sample.
185
7.5 Data Collection In order to achieve the fourth objective of this study which was to identify the
occurrence of the service recovery paradox for the dimensions of CBBE, which tend
to fluctuate, the data collection was undertaken in two stages. The identification of
the service recovery paradox was only possible if the data were collected at two
different time intervals from the same respondents (see Gohary et al., 2016; Ok et
al., 2007). For this purpose, a longitudinal design was deemed appropriate.
The first stage of the quantitative data collection was regarded as the pre-failure and
recovery stage in which the respondents were not exposed to the ‘service failure
and recovery’ scenarios. The objective of the first stage was to measure the baseline
of the dimensions of consumer-based brand equity which tend to fluctuate within
service failure and recovery process (without being manipulated). The questionnaire
was launched in the pre-treatment stage, where respondents were not exposed to
manipulated stimuli (Malhotra and Birks, 2007).
The second stage of the quantitative data collection was regarded as the post-
recovery stage, which was undertaken to measure the post-failure and recovery
ratings of dimensions of CBBE after respondents were exposed randomly to the
manipulations. Further, it measured perceived justice and overall brand equity.
Responses from the same respondents as of the first stage were recorded. The
execution of data collection through two different questionnaires at two different time
points was undertaken to eliminate the factor of respondent fatigue (Ben-Nun, 2008;
Hochheimer et al., 2016). The structure of the questionnaires is detailed in section
7.5.3.
7.5.1 Administration of the questionnaires An ethical approval from the ethics committee was obtained before administering
the questionnaires (application no. 400180275). The questionnaires were
administered on Qualtrics, an online service to administer surveys, publish them
online via a weblink, and store the responses for the quantitative analysis
(Barnhoorn et al., 2015). Qualtrics was chosen to administer the questionnaires
because of four main reasons. Firstly, Qualtrics only required basic knowledge and
expertise to administer online surveys. Secondly, the user-friendly nature of the
service allowed the researcher to invest minimal effort and time to administer and
186
publish the questionnaires (Molnar, 2019). Thirdly, and most importantly, Qualtrics
is known for creating experiments that involve randomisation (Mutter et al., 2020).
In the survey flow option, the researcher utilised the ‘randomizer’ element to expose
respondents to one of the six treatments randomly. Finally, Qualtrics creates a
dedicated web link for the questionnaires, distributed electronically via email, social
media or any other suitable crowdsourcing platform.
A crowdsourcing platform was utilised to recruit respondents for participation in the
research study. Crowdsourcing platforms have become more common among
academic researchers in recent years (Hogreve et al., 2019; Palan and Schitter,
2018; Papen et al., 2020). According to Wright and Goodman (2019), over 15000
peer-reviewed articles have utilised crowdsourcing platforms to recruit participants
in the past ten years. These platforms allow researchers to recruit participants at
any point in time against monetary compensation (Goodman and Paolacci, 2017).
Several advantages of crowdsourcing platforms over other mediums is documented
in the literature. For example, four major advantages over traditional recruitment
methods are 1) more representative sample of the population than a student pool
from universities (Paolacci and Chandler, 2014) 2) the recruitment of the sample is
quicker (Buhrmester et al., 2018), 3) recruitment of participants is cost-effective
(Goodman and Paolacci, 2017), 4) the data collected through crowdsourcing
platforms is of better quality and more reliable than traditional data collection
mediums (Kees et al., 2017).
Researchers utilise crowdsourcing platforms to recruit participants.The current
research study has utilised Prolific Academic (ProA) to recruit participants. ProA is
an online crowdsourcing platform that caters to academic researchers to recruit
participants for their research against cash incentives (Palan and Schitter, 2018).
ProA was preferred over other crowdsourcing platforms. Firstly, the pre-screening
options in ProA allowed the researcher to only invite the participants with preferred
demographic requirements, such as participants over the age of 18 and must be UK
residents. The condition for participants to be residents of the UK was set because
the qualitative study sample was from the UK, and a quantitative study was
designed based on the findings of the qualitative study. The researcher also
restricted the participants who already participated in the pre-tests or in the main
study to enhance credibility (Goodman and Paolacci, 2017). Secondly, the data

187
quality of ProA is considered better than CrowdFlower and not significantly different
from MTurk (Peer et al., 2017). In order to enhance the data quality, a pre-screened
of participants having a 99% and above approval rate was enabled. Thirdly, ProA is
better at recruiting participants from the UK because most ProA participants are
from the UK (Goodman and Paolacci, 2017; Prolific, 2020a). Fourthly, the
participants on ProA are more honest and naïve (Peer et al., 2017). ProA does not
contain the problem of super-worker, as is the case in MTurk, where 5% of the
MTurk workers fill in 40% of the surveys (Prolific, 2020b; Robinson et al., 2019).
Finally, ProA is flexible in conducting studies with more than one data collection
phase from the same sample of participants.
The execution of surveys started by launching the survey link provided by Qualtrics
on the ProA platform. ProA demands the researchers to include a brief description
of the study on the launching/invitation page. The description included the
information related to the type of the study, estimated duration and payment. It was
mentioned in the first questionnaire that the study comprised of two parts, and only
those respondents would be invited for the second part who complete the first part
successfully. It was mentioned that the study includes filters to ensure that questions
are not answered randomly. The respondents were clarified with the terms of
payment before they opted in for the survey. The data of the first phase was
completed in two days. After the completion of the first stage, the responses were
scrutinised to check the quality of the data. Firstly, the responses to the attention
check questions were analysed to ensure that participants had paid attention while
filling out the survey. The data of the respondents who answered the attention
checks wrongly was excluded from the final analysis. Secondly, the data of the
participants living in the UK for less than two years were excluded from the final
analysis. The exclusion was done to ensure the quality of the data related to the
population representation.
The second stage of the data collection was launched the next day after completing
the first stage. Participants who completed the first phase were invited to participate
in the second stage. The participants were briefed about the second stage before
they opted in for the survey. A unique web survey link was generated for the
respondents, which carried some of their responses (the restaurant name they
188
entered) from the first stage. This was done to maintain the link between the two
parts of the study through Qualtrics.
The surveys' participants were rewarded more than the enforced minimum hourly
reward of 5.00 GBP set by ProA (Prolific, 2019a). Lower rewards decrease the
attractiveness of the study, and respondents quit halfway or at the start (Horton et
al., 2011). On the other hand, overcompensation may diminish data quality by
attracting scammers (Bohannon, 2011). The researcher attempted to set an optimal
spot for the payment to maintain the data quality (Oppenlaender et al., 2020).
Different rate of rewards was set for the two phases of data collection. The first
phase of the data collection took place in the first week of January 2020. The
average completion time recorded was 3 minutes, and participants were rewarded
£0.45. The second phase of the data collection was also carried out in the first week
of January 2020. The average completion time was approximately 9 minutes, and
respondents were paid £1.15. The studies having more than one data collection
stage from the same respondents often face the problem of retention (Teague et al.,
2018). Therefore, the reward for the second stage of the study was considerably
higher than the first phase (Capaldi and Patterson, 1987).
7.6 Sampling
Sampling is selecting a group of participants from a larger group of participants,
which is commonly referred to as population (Bell et al., 2018). The population is the
full set of cases or elements grouped by some common characteristic (Hair, Bush,
et al., 2006). Investigating the research problem by utilising all the target population
members is called the census (Hair, Bush, et al., 2006). The population considered
for the current study were all the restaurant-goers living in the UK. Therefore, it was
impracticable for the researcher to do the census due to the budget and time
constraints (Saunders et al., 2019). On the other hand, the overall accuracy of the
results is expected when sampling is utilised instead of the census (Barnett, 2002).
Collecting data from a smaller group let the researchers screen the data in detail
and perform pilot or pre-testing before the final analysis to increase the accuracy
(Saunders et al., 2019). Hence, the current study has utilised a sample drawn from
the population for the analysis.
189
Several methods of drawing a sample from the population are grouped under two
primary techniques: probability and non-probability sampling (Malhotra and Birks,
2007). Probability sampling is a process of random selection where every individual
or unit holds an equal and known chance of being selected (Bell et al., 2018). On
the other hand, non-probability sampling is based on non-random selection, where
the chance of selection is not equal or known (Hair, Bush, et al., 2006). The pre-
requisite of probability sampling is a sampling frame, a complete list of all the
individuals (cases) of the population from which the sample is drawn (Saunders et
al., 2019). However, an existing sampling frame is equipped with problems of
inaccuracy, incompleteness, and dated information and creating a sampling frame
requires cost and time (Edwards et al., 2007). Considering the factors of time and
cost, it was not possible for the researcher to gain the sampling frame of the
population. Further, the conditions where census or attaining the sampling frame is
difficult, a non-probability technique is suitable (Malhotra et al., 1996). Therefore, a
non-probability convenience sampling technique was utilised to draw the sample
from the target population.
Several types of convenience samples (such as student samples, professional
panels, online panels and crowdsourcing panels) are widely used in marketing
research and considered appropriate (Kees et al., 2017; Zikmund et al., 2017).
Convenience samples are easy to obtain and are less costly (except professional
panel data) than obtaining other kinds of samples (Saunders et al., 2019). Although
convenience samples (specifically student samples) are often criticised because
these samples lack external validity, crowdsourcing panels overcome this problem
by obtaining a diverse convenience sample (Kees et al., 2017). There are over
100,000 participants available on ProA having diverse nationalities, age groups,
ethnicities, employment statuses and education levels (Palan and Schitter, 2018;
Prolific, 2019b) a). Further, the majority (61.52%) of the participants available on
ProA are non-student. Therefore, the ProA crowdsourcing platform was considered
appropriate to obtain a diverse convenience sample.
The determination of a suitable sample size for non-probability samples does not
rely on specific formulas, as in the case with probability samples. The sample size
is determined according to the resources in hand, or it relies on the institutive
judgement of the researcher or rules of thumb proclaimed by researchers (Hair and
190
Lukas, 2014). Researchers have suggested different minimum sample sizes to get
a meaningful statistical inference in the literature. For example, Gorsuch (1983)
suggested that a minimum of 100 cases should be utilised while performing factor
analysis. Similarly, Kline (2015) recommended that N be at least 100 to obtain
meaningful results from statistical analysis. On the other hand, according to Comrey
and Lee (1992), a sample size of 100 is poor, and a sample size of 1000 or more
is considered excellent. Alternative notion selects sample size through the ratio of
cases per item of the questionnaire. For instance, Everitt (1975) suggested a ratio
of 10 cases per item of the questionnaire, whereas, according to Gorsuch 1983
sample size should be determined based on the ratio of 5 cases per item. The
current study has adopted the approach of 5 cases per item and utilised a final
sample of 322 responses for the analysis after data screening. The first stage of the
data collection recorded 334responses. The same respondents were contacted in
the second stage. However, 4% of the respondents did not responded the second
stage. Therefore, 12 responses were excluded from the final sample size which is
322 respondents.
The demographic profile of the final sample is presented in table 7.14. The table
includes information about age, gender, income, occupation, ethnicity, and the
length of the stay of individuals in the UK.
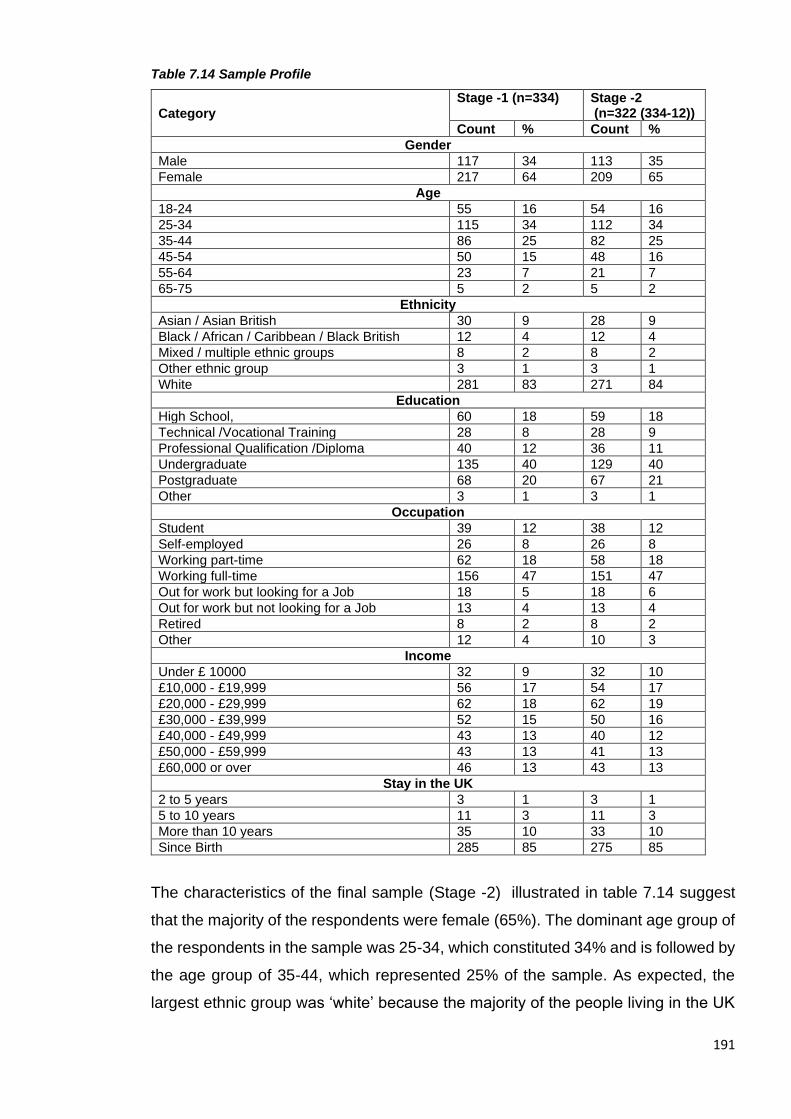
191
Table 7.14 Sample Profile
Category
Stage -1 (n=334) Stage -2 (n=322 (334-12))
Count % Count %
Gender
Male 117 34 113 35
Female 217 64 209 65
Age
18-24 55 16 54 16
25-34 115 34 112 34
35-44 86 25 82 25
45-54 50 15 48 16
55-64 23 7 21 7
65-75 5 2 5 2
Ethnicity
Asian / Asian British 30 9 28 9
Black / African / Caribbean / Black British 12 4 12 4
Mixed / multiple ethnic groups 8 2 8 2
Other ethnic group 3 1 3 1
White 281 83 271 84
Education
High School, 60 18 59 18
Technical /Vocational Training 28 8 28 9
Professional Qualification /Diploma 40 12 36 11
Undergraduate 135 40 129 40
Postgraduate 68 20 67 21
Other 3 1 3 1
Occupation
Student 39 12 38 12
Self-employed 26 8 26 8
Working part-time 62 18 58 18
Working full-time 156 47 151 47
Out for work but looking for a Job 18 5 18 6
Out for work but not looking for a Job 13 4 13 4
Retired 8 2 8 2
Other 12 4 10 3
Income
Under £ 10000 32 9 32 10
£10,000 - £19,999 56 17 54 17
£20,000 - £29,999 62 18 62 19
£30,000 - £39,999 52 15 50 16
£40,000 - £49,999 43 13 40 12
£50,000 - £59,999 43 13 41 13
£60,000 or over 46 13 43 13
Stay in the UK
2 to 5 years 3 1 3 1
5 to 10 years 11 3 11 3
More than 10 years 35 10 33 10
Since Birth 285 85 275 85
The characteristics of the final sample (Stage -2) illustrated in table 7.14 suggest
that the majority of the respondents were female (65%). The dominant age group of
the respondents in the sample was 25-34, which constituted 34% and is followed by
the age group of 35-44, which represented 25% of the sample. As expected, the
largest ethnic group was ‘white’ because the majority of the people living in the UK
192
have a White ethnic background (Statista, 2020). Over 60% of the sample has a
minimum of undergraduate-level education. Almost half (47%) of the participants
were working full-time, and the second majority were working part-time (18%). 46%
of the participants have an income of less than £40,000, whereas the rest are
earning more than £40,000 annually. The majority (19%) of the participants were in
the bracket of £20,000 - £29,999. As required and expected, most participants
(86%) were residing in the UK since birth. The participants living in the UK for less
than two years were screened out before the final analysis.
7.7 Data screening and Data quality
The examination of the data before any analysis is essential to obtain accurate
results (Hair et al., 2014). Data screening allows the researcher to ensure that the
data is not erroneous, incomplete and unsuitable for quantitative analysis
(Hutcheson and Sofroniou, 1999). The researchers usually overlook data
examination. The compromised effort and time are devoted to the analysis;
however, the time and effort spent at this stage is an investment to gain accurate
results. Therefore, this section involves the common issues related to data
screening and data quality checks, examining the data for the erroneous entries,
identifying missing data, identifying the outliers, issues related to the normality of
the data, multicollinearity, assessment of common method variance and
assessment of non-response bias.
The SPSS (Statistical Package for the Social Sciences) data file was downloaded
from Qualtrics. The file was thoroughly examined to see if the data has any
erroneous entries. The labelling of the variables was modified as per the
convenience of the researcher. There was no missing data in the SPSS file because
the Qualtrics survey design did not allow the respondents to continue unless they
answered all the questions on a particular page (Qualtrics, 2020). The respondents
were also briefed that only the fully completed questionnaires will be approved and
rewarded. The participants who did not respond to the second questionnaire were
screened out because paired sample t-test required the data from stages. 4 % of
the participants did not fill in the second questionnaire.

193
The next step was to deal with the issue of outliers in the data. The presence of
outliers in large quantities can distort the interpretations and cause inaccurate
results (Malhotra and Birks, 2007). The presence of univariate (differences on one
variable) and multivariate (differences on two or more than two variables) was
examined before the analysis of the data (Hair et al., 2014). The detection of
univariate outliers was done by calculating and assessing the standardised Z-
values. Hair et al. (2014) suggested that if the z -value exceeds ± 2.5, it should be
treated as an outlier. On the other hand, Tabachnick and Fidell (2013) suggested
that values greater than 3.29 should be treated as outliers. According to the
suggested ranges, very few univariate outliers were detected in the data, but most
values fell under the recommended range, as indicated by Tabachnick and Fidell
(2013). Additionally, box plots were utilised to detect univariate outliers and the
analysis detected few outliers in the data. Multivariate outliers were addressed with
the help of the Mahalanobis D² measure. Although this method provides an overall
assessment, it assists the researcher to determine the multidimensional position of
all the variables relative to a mean (Hair et al., 2014). The recommended value for
the observations to be called an outlier is below 0.001 significance level (Prykhodko
et al., 2018). The current data showed only 1 % of the observations, which were
less than the threshold value. Hair et al. (2014) suggested that outliers must be kept
in the data if they are in a very small number and represent the population. The
utilisation of pre-screeners increased the probability that participants would
represent the target population. Therefore, the researcher decided to keep the
outliers in the data for the final analysis.
The third step in the data screening was to examine the normality of the collected
data. Normality or Normal distribution of the data means that the values of the
variables are clustered around a central value and make a symmetrical pattern,
commonly known as a bell-shaped curve (Saunders et al., 2019). Following Hair et
al. (2014) recommendations, the assumption of normality was assessed by utilising
skewness and kurtosis statistics. According to Fabrigar et al. (1999), the data is
normally distributed if the values lie within the range of ± 2 for skewness and ± 7
for kurtosis. Appendix E shows that all the values lie within the recommended range;
hence the data is normally distributed.

194
The fourth check was of the multicollinearity shown if there are high correlations
among constructs (Grewal et al., 2004). An assessment of squared multiple
correlations was undertaken, showing that all the values of squared multiple
correlations were lower than 1.0. Thus, multicollinearity was not an issue in the data.
Variance inflation factor (VIF) can also help in detecting multicollinearity (Thompson
et al., 2017). VIF value exceeding 10 indicates the existence of multicollinearity in
data (Lin, 2008; Miles, 2005). Similarly, multicollinearity can also be detected by
examining the tolerance value (Thompson et al., 2017). A tolerance value less than
0.1 indicates the existence of multicollinearity (Miles, 2005). In this study, VIF
statistics and tolerance values were calculated using linear regression analysis with
focal constructs as the independent variables and a random dependent variable.
The result showed that the tolerance values were greater than 0.1. Similarly, VIFs
were less than 10, which showed an absence of multicollinearity in the data (Lin,
2008).
The fifth step was the assessment of common method variance (CMV). Common
method variance (CMV/ common method bias) has been extensively discussed in
the literature (Bagozzi, Yi and Phillips, 1991; Hair, Black, et al., 2006; Harman,
1976). This is because CMV can result in systematic measurement errors (Chang
et al., 2010) and thus can have a negative influence on the findings of a study
(Craighead et al., 2011). According to Fuller et al. (2016), it is important to control
for the existence of CMV to ensure the validity of research findings.
In the current study, Podsakoff et al.'s (2003) measures of controlling CMV were
followed to ensure the absence of CMV. Firstly, measured variables were worded
in a way not to enhance socially desirable responses. Secondly, the online survey
also assisted in reducing the social desirability bias. Thirdly, vague and ambiguous
terms, double-barrelled items, and complicated words were avoided in the research
instrument. Fourth, items were sequenced in a way not to imply causal relationships
between different constructs. Fifth, all respondents were ensured anonymity by not
collecting their personal information. Similarly, respondents were told that there
were no wrong or right responses to the questions. Finally, items were not directing
answers in a certain way by giving hidden cues to select an answer and were not
ambiguous. CMV can inflate the internal consistency among the variables by
enhancing the correlations (Chang et al., 2010). One way to assess the CMV is
195
Harman’s Single Factor Test (Malhotra et al., 2006; Podsakoff et al., 2003). In this
procedure, all the items are run through exploratory factor analysis by assuming that
a single factor will emerge from an unrotated factor solution which will account for
the majority of the variance (Malhotra et al., 2006). In this study, CMV was examined
by running a single-factor exploratory factor analysis for all six conditions separately.
Principal axis factoring was used to extract the unrotated factor (Podsakoff et al.,
2003). The number of factors to be extracted was set to 1 (Malhotra et al., 2006).
The result showed that CMV did not exist in all six conditions as the first factor
accounted for a total variance of 39.22% for the first condition, 43.39% for the
second condition, 34.32% for the third condition, 40.92% for the fourth condition,
37.40% for the fifth condition, and 36.89% for the sixth condition.
Another way CMV can be ruled out in the data is by ensuring the construct validity
of the measures (Conway and Lance, 2010). In other words, achieving the
satisfactory level of internal consistency of measures, factor loadings, convergent
and discriminant validity can rule out substantial method effects (Feldt and Brennan,
1989; Messick, 1989). The result of the assessment of the measurement model
shows that all criteria of construct validity were achieved, including factor loadings,
internal consistency of measures, convergent validity, and discriminant validity, thus
showing that CMV did not exist in this study (See Chapter 8 for details).
Finally, scholars must ensure the generalisability of the research (Mentzer, 2008).
One way to ensure that the research sample represents the population of interest is
the absence of non-response bias (Armstrong and Overton, 1977). Researchers
must assess the non-response bias to show the robustness of the sampling
procedure used in the study (Clottey and Grawe, 2014). Non-response bias results
from the respondents who answer a survey being different from members of the
population who did not answer, in a way relevant to the research (Dillman, 2007).
One way to examine the non-response bias is to compare the early and late
respondents, assuming that the respondents who answered the survey later should
represent the characteristics of non-respondents (Armstrong and Overton, 1977).
However, studies have strongly criticised such assessment of non-response bias
and have strongly warned against using this procedure. To illustrate, Curtin et al.
(2005) assert that non-response bias results from a respondent refusal to answer
196
the survey rather than the researcher’s ability to reach the respondent. Similarly,
Hulland et al. (2018) the comparison of early and late respondents would not provide
relevant information that may allay the concerns related to non-response bias.
The identification of careless respondents is recommended with the help of
employing strict methods such as including attention checks in the surveys (Abbey
and Meloy, 2017; Van Dam et al., 2010). The incorrect answers to the attention
checks show that the respondent(s) is(are) not paying attention. The inclusion of
these responses will increase the chances of systematic error and should be
removed from the data set (Hulland et al., 2018). Hence the same technique was
utilised in this research project.
7.8 Approach to data analysis
Manipulation and realism check analysis was performed before performing the main
data analysis on the data collected from the pre-test. Firstly, descriptive statistics
were carried out for a realism check of six hypothetical scenarios. The threshold
Mean value was set as 3.5 because the responses were recorded on a 7-point Likert
scale (1=strongly disagree -7 strongly disagree). Similarly, the means of
manipulation items for every treatment group were calculated. The manipulation
checks were considered successful if the mean values exceeded the threshold
value of 3.5. Additionally, an independent sample t-test and one-way ANOVA were
carried out to confirm the manipulation checks of service failure severity and service
recovery, respectively. An independent sample t-test was performed for the
manipulation check of service failure severity because it contained two independent
levels (Low and High). A one-way ANOVA is conducted to examine the differences
in the means between two or more groups (Sekaran and Bougie, 2016). Service
recovery had three independent levels (Customer participation in service recovery,
Firm recovery, no recovery); therefore, one-way ANOVA was deemed suitable to
check the manipulation for service recovery.
Different data analysis approaches were undertaken for the main analysis of the
current study. Firstly, Paired sample t-test was chosen to test the hypotheses 21 -
24. A Paired sample t-test is utilised to compare the mean differences of two sets of
responses collected from the same set of respondents at different time intervals
(Malhotra and Birks, 2007). According to Diamantopoulos and Schlegelmilch

197
(2000), paired sample t-test is most appropriate if the data is collected twice from
the same group of respondents and is measured on an interval or ratio scale. In
order to identify the vulnerability dimensions of CBBE due to a service failure
recovery process, the data was collected twice (before and after the manipulations
were exposed) from the same group of respondents.
Secondly, Factorial ANOVAs were undertaken to test the hypotheses 1 to 7 and
Hypothesis 14-20. ANOVA is the Analysis of variance utilised when the investigation
requires the mean difference of three or more groups (Saunders et al., 2019). The
current study requires investigating the difference between six different groups as
described above in Table 7.12. ANOVA is appropriate when the study includes
multiple independent variables, whereas factorial ANOVA is when at least two
independent variables have more than one level (Malhotra and Birks, 2006). This
research includes service recovery and service failure severity as two factors having
more than one level. Factorial ANOVA is common in experimental studies.
Specifically, the studies related to service recovery have used this technique
extensively (Busser and Shulga, 2019; Hazée et al., 2017; Jin et al., 2019).
Considering the viability and usage in service recovery literature, Factorial ANOVA
was used to test the hypotheses.
Finally, Structural equation modelling (SEM) was used to test the relationships
illustrated in figure 6.1 (see chapter 6). SEM is a well-known technique utilised in
service and branding literature to examine the relationships of multiple independent
and multiple dependant variables (Guzmán and Davis, 2017; Sarkar and
Bhattacharjee, 2017; Shams et al., 2020; Yani-de-Soriano et al., 2019). The current
study aimed to test the relationships between multiple dependant and independent
variables simultaneously, and SEM is considered suitable to perform the required
nature of analysis (Menidjel et al., 2017). Further, the mediation hypotheses 8-13,
are carried out through SEM because it handles the complex mediation hypotheses
in a single analysis (MacKinnon, 2008). Therefore, SEM was deemed appropriate
to test the final set of hypotheses.
There are two types of SEM commonly used by social science researchers,
Covariance-Based SEM (CB-SEM) and Partial-Least Square SEM (PLS-SEM)
(Sarstedt et al., 2016). The current study utilised PLS-SEM to test the hypotheses.

198
In social science research, CB-SEM is more prevalent than PLS-SEM, but the latter
is considered as an alternative to the former in achieving the same objectives with
some advantages (Rigdon et al., 2017). According to Reinartz et al. (2009), if the
sample size is small, PLS-SEM produces more accurate statistical analysis than
CB-SEM. Similarly, Sarstedt et al. (2016) suggest that the bias is low in PLS-SEM
when the sample size is small. On the other hand, some scholars criticise PLS-SEM
for its accuracy and richness in rigour. For example, Goodhue et al. (2012) and
Dijkstra and Henseler (2015) describe that PLS-SEM holds lesser statistical power
and lower accuracy of results than CB-SEM regardless of the size of the sample
under investigation. However, Hair et al. (2011) viewed these criticisms as
unfortunate and short-sighted. According to Hair et al. (2016), PLS-SEM is a liberal
technique that can provide more robust results of the structural model; whereas CB-
SEM is a conservative technique that cannot provide robust estimations if the
required assumptions (such as multivariate normality of data and minimum sample
size) are not met.
Additionally, PLS-SEM is considered a preferred approach among marketing
researchers in recent years (Bacile et al., 2020; Hazée et al., 2017; Wiedmann et
al., 2018). Specifically, PLS-SEM is preferred over CB-SEM in studies that adopt
experimental designs (Cantor and Li, 2019; Crisafulli and Singh, 2016; Hazée et al.,
2017; Jerger and Wirtz, 2017). The reason for the preference is that experimental
data does not usually meet CB-SEM assumptions (Hazée et al., 2017). Moreover,
the analysis of experimental data is more simplified in PLS-SEM than CB-SEM
(Bagozzi, Yi and Singh, 1991). Therefore, PLS-SEM was preferred over CB-SEM,
and SMART PLS 3.0 software was utilised for the current analysis (Ringle et al.,
2015).
The evaluation of PLS-SEM model analysis is recommended according to the
procedures specifically designed for PLS-SEM (Shmueli et al., 2016). The current
study followed the guidelines provided by Hair et al. (2019) while using PLS-SEM.
According to them, the evaluation of PLS-SEM model analysis goes through a two-
stage process, i) measurement model assessment and ii) structural model
assessment. The fulfilment of measurement model assessment criteria is a pre-
requisite to structural model assessment (Hair Jr et al., 2016). Therefore,
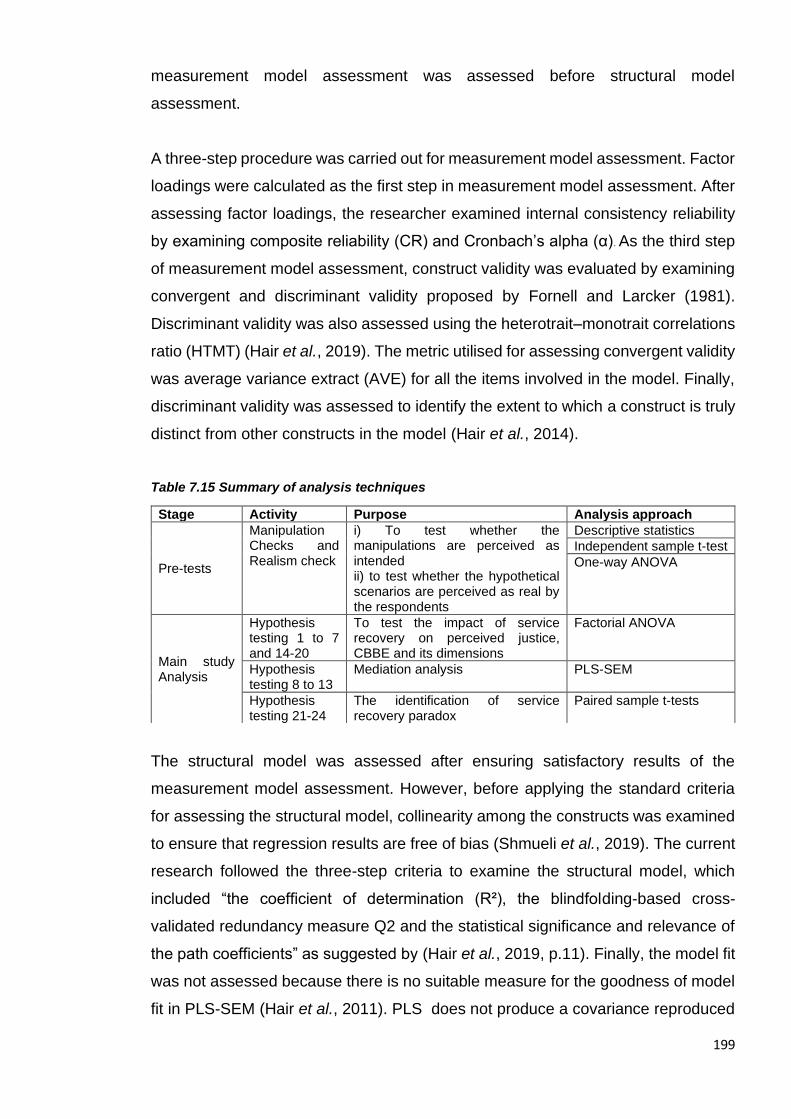
199
measurement model assessment was assessed before structural model
assessment.
A three-step procedure was carried out for measurement model assessment. Factor
loadings were calculated as the first step in measurement model assessment. After
assessing factor loadings, the researcher examined internal consistency reliability
by examining composite reliability (CR) and Cronbach’s alpha (α). As the third step
of measurement model assessment, construct validity was evaluated by examining
convergent and discriminant validity proposed by Fornell and Larcker (1981).
Discriminant validity was also assessed using the heterotrait–monotrait correlations
ratio (HTMT) (Hair et al., 2019). The metric utilised for assessing convergent validity
was average variance extract (AVE) for all the items involved in the model. Finally,
discriminant validity was assessed to identify the extent to which a construct is truly
distinct from other constructs in the model (Hair et al., 2014).
Table 7.15 Summary of analysis techniques
The structural model was assessed after ensuring satisfactory results of the
measurement model assessment. However, before applying the standard criteria
for assessing the structural model, collinearity among the constructs was examined
to ensure that regression results are free of bias (Shmueli et al., 2019). The current
research followed the three-step criteria to examine the structural model, which
included “the coefficient of determination (R²), the blindfolding-based cross-
validated redundancy measure Q2 and the statistical significance and relevance of
the path coefficients” as suggested by (Hair et al., 2019, p.11). Finally, the model fit
was not assessed because there is no suitable measure for the goodness of model
fit in PLS-SEM (Hair et al., 2011). PLS does not produce a covariance reproduced
Stage Activity Purpose Analysis approach
Pre-tests
Manipulation Checks and Realism check
i) To test whether the manipulations are perceived as intended ii) to test whether the hypothetical scenarios are perceived as real by the respondents
Descriptive statistics
Independent sample t-test
One-way ANOVA
Main study Analysis
Hypothesis testing 1 to 7 and 14-20
To test the impact of service recovery on perceived justice, CBBE and its dimensions
Factorial ANOVA
Hypothesis testing 8 to 13
Mediation analysis PLS-SEM
Hypothesis testing 21-24
The identification of service recovery paradox
Paired sample t-tests
200
matrix as in the case with AMOS, hence fit indexes are not produced (Londoño et
al., 2016). A detailed analysis process with results is described in the next section
of the thesis.
7.9 Summary
This chapter detailed the second phase, quantitative of the exploratory mixed-
method design. The current study adopted one-group pretest-posttest design from
pre-experimental designs and adopted factorial designs from statistical
experimental designs. Two different questionnaires were developed, the first
questionnaire was developed to measure dimensions of CBBE before the
respondents were exposed to the experimental manipulations. The second
questionnaire was a scenario-based questionnaire that measured post-recovery
ratings of dimensions of CBBE, overall brand equity, and perceived justice.
The development of the questionnaires included the explanation of the selection of
the measures with justification. The structure of the first questionnaire consists of
three sections. The second questionnaire contains four sections. Hypothetical
scenarios are presented before the constructs which are measured via chosen
scales.
The data collection carried out at two different time points to achive the objective of
identification of service recovery paradox and to reduce respondent fatigue. The
questionnaires were designed on Qualtrics and hosted on ProA. A total of 322 was
selected as a final sample after data screening. The characteristics of the sample
are also presented in this chapter.
The latter part of the chapter explains the preparation of the data for the analysis.
Data screening methods were implied to prepare the data for the analysis. Firstly,
univariate and multivariate outliers were identified. Secondly, the normality of the
data was assessed using skewness and kurtosis statistics. The final section of the
chapter explained the methodology implied for the analysis of the quantitative data.
Descriptive statistics, independent sample t-test and one-way ANOVA were used
for manipulation and realism checks. Whereas, Paired sample t-test, Factorial
ANOVA and PLS-SEM techniques were utilised to test the hypotheses.
201
Chapter 8 Hypothesis Testing
8.1 Introduction
This chapter presents the results of the pre-test and the results produced by the
hypothesis testing. Firstly, the results of pre-tests which include findings of realism
and manipulation checks, are described. It is followed by the assessment of the
measurement model. Next, the hypothesis testing results are demonstrated in three
different sections. The first section shows the hypotheses results, which are
produced using factorial ANOVAs. The second section demonstrates the mediation
hypothesis results generated with the help of PLS-SEM. The third section of
hypothesis testing includes the results of hypotheses produced via paired sample t-
tests related to investigating the occurrence of the service recovery paradox. Finally,
a chapter summary concludes the chapter.
8.2 Pre-Test Results
Before commencing the main analysis, a series of pre-tests was undertaken to i)
check the realism of the hypothetical scenarios and ii) check if the manipulations
work as intended. The process of pre-testing was repetitive. There were three pre-
tests taken before the actual data collection for the study. The results of the first two
pre-tests were discouraging concerning the manipulation checks. Therefore,
corrective actions were taken (see section 7.5.1, Chapter 7). In the third attempt, all
the manipulation checks and realism checks worked as intended. The results are
described below.
8.2.1 Realism checks
The factorial 3 x 2 design contains six hypothetical scenarios. Descriptive analysis
was performed to check the realism of the six hypothetical scenarios. In this regard,
the respondents answered two questions, “The incident described in the scenario
was likely to occur in real life” and “The incident described in the scenario was likely
to occur in real life”. The answers were recorded on a 7-point Likert scale (1=
extremely disagree -7 = extremely agree). The respondents confirmed in all the six
conditions that the hypothetical scenarios were highly realistic and such incidents
might happen in real life (see table 8.1). The perceived realism was higher than the
scale midpoint of 3.5. The differences among all the six conditions were not
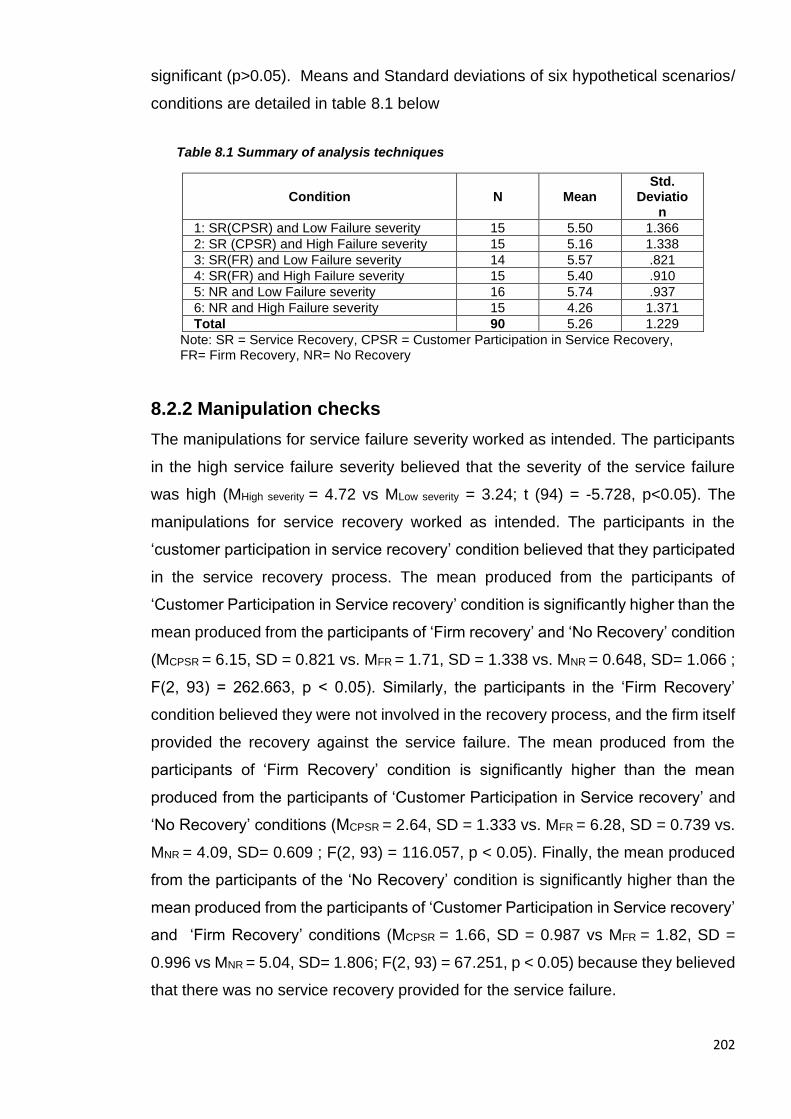
202
significant (p>0.05). Means and Standard deviations of six hypothetical scenarios/
conditions are detailed in table 8.1 below
Table 8.1 Summary of analysis techniques
Condition N Mean Std.
Deviation
1: SR(CPSR) and Low Failure severity 15 5.50 1.366
2: SR (CPSR) and High Failure severity 15 5.16 1.338
3: SR(FR) and Low Failure severity 14 5.57 .821
4: SR(FR) and High Failure severity 15 5.40 .910
5: NR and Low Failure severity 16 5.74 .937
6: NR and High Failure severity 15 4.26 1.371
Total 90 5.26 1.229
Note: SR = Service Recovery, CPSR = Customer Participation in Service Recovery, FR= Firm Recovery, NR= No Recovery
8.2.2 Manipulation checks
The manipulations for service failure severity worked as intended. The participants
in the high service failure severity believed that the severity of the service failure
was high (MHigh severity = 4.72 vs MLow severity = 3.24; t (94) = -5.728, p<0.05). The
manipulations for service recovery worked as intended. The participants in the
‘customer participation in service recovery’ condition believed that they participated
in the service recovery process. The mean produced from the participants of
‘Customer Participation in Service recovery’ condition is significantly higher than the
mean produced from the participants of ‘Firm recovery’ and ‘No Recovery’ condition
(MCPSR = 6.15, SD = 0.821 vs. MFR = 1.71, SD = 1.338 vs. MNR = 0.648, SD= 1.066 ;
F(2, 93) = 262.663, p < 0.05). Similarly, the participants in the ‘Firm Recovery’
condition believed they were not involved in the recovery process, and the firm itself
provided the recovery against the service failure. The mean produced from the
participants of ‘Firm Recovery’ condition is significantly higher than the mean
produced from the participants of ‘Customer Participation in Service recovery’ and
‘No Recovery’ conditions (MCPSR = 2.64, SD = 1.333 vs. MFR = 6.28, SD = 0.739 vs.
MNR = 4.09, SD= 0.609 ; F(2, 93) = 116.057, p < 0.05). Finally, the mean produced
from the participants of the ‘No Recovery’ condition is significantly higher than the
mean produced from the participants of ‘Customer Participation in Service recovery’
and ‘Firm Recovery’ conditions (MCPSR = 1.66, SD = 0.987 vs MFR = 1.82, SD =
0.996 vs MNR = 5.04, SD= 1.806; F(2, 93) = 67.251, p < 0.05) because they believed
that there was no service recovery provided for the service failure.

203
8.3 Assessment of Conceptual Relationships
This phase of the study was undertaken to analyse the data collected to examine
the effect of Service recovery (CPSR and FR) on CBBE and its dimensions. Data
analysis was initiated in three phases. The first phase relates to assessing construct
validity and reliability, which was undertaken by examining the measurement model.
In the second phase, the assessment of the causal relationship between Service
recovery and post-recovery outcomes was undertaken. Finally, in the third phase
structural model was examined to assess the mediating role of perceived justice
between Service recovery and CBBE (Bagozzi and Yi, 2012; Lacobucci, 2009).
Before the commencement of data analysis, data were assessed for assumptions
of multivariate analysis, including missing values, outliers, normality, and sample
size. Data met all assumptions of multivariate data analysis (See section 7.9,
Chapter 7)
8.3.1 Assessment of Measurement Model
This study followed Hair et al.'s (2019) criteria of assessing reflective measure
model where an assessment of factor loadings was undertaken. It includes an
examination of internal consistency reliability, convergent validity, and discriminant
validity of constructs.
8.3.1.1 Factor Loadings
The first step to assess the measurement model is to examine the factor loadings
of all measured variables. An initial examination of indicator loadings showed that
one item of overall brand equity was less than the threshold value of 0.70 and thus
was dropped from the subsequent data analysis. Table 8.2 shows that factor
loadings of all measured variables were significant (t-statistics > 1.96) and greater
than the threshold value of 0.70 and thus retained for further analysis. Hair et al.
(2019) suggest that factor loadings should exceed the value of 0.708, which will
indicate that the focal construct explains the variance of more than 50 percent in the
indicator variable. Therefore, a factor loading of 0.70 or higher indicates that
measured variables are strongly related to their specified latent variables, which also
suggests a satisfactory achievement of construct validity (Hair et al., 2013).

204
Table 8.2 Factor Loadings
Construct Item Loadings T-value
Perceived
Quality
PQ1 - Compared to other restaurants, this restaurant is excellent. 0.912 79.844
PQ2 - This restaurant is superior than other similar restaurants. 0.899 78.305
PQ3 - This restaurant consistently performs better than all other restaurants. 0.915 71.997
PQ4 - I can always count on this restaurant for consistent performance. 0.873 41.959
Perceived
Value
PV1 - What I get from this restaurant is worth the cost. 0.926 84.634
PV2 - All the things considered (price, time and effort), services of this restaurant are a good buy. 0.938 115.308
PV3- Compared to other restaurants, this restaurant is a good value for the money. 0.909 63.463
PV4 - When I use services of this restaurant, I feel I am getting my money’s worth. 0.936 87.801
Brand Reputation
BR1 - This restaurant is well known. 0.858 10.683
BR2 - It is one of the leading restaurants. 0.757 20.352
BR3 - It is easily recognizable. 0.911 10.612
Brand Trust BT1 - This restaurant keeps promises it makes to customers. 0.866 45.306
BT2 - This restaurant is always honest with me. 0.869 47.139
BT3 - I believe the information that this restaurant provides me. 0.876 47.952
BT4 - When making important decisions, this restaurant considers my welfare as well as its own. 0.836 39.593
BT5 - This restaurant keeps my best interests in mind. 0.883 52.198
BT6 - This restaurant is honest. 0.898 57.217
Brand Loyalty
BL1 - I will continue to stay with this restaurant. 0.926 100.705
BL2 - I would not change this restaurant service provider in future. 0.881 34.916
BL3 - In the near future, I intend to use more of the services provided by this restaurant. 0.841 43.718
BL4 - I consider myself to be a faithful customer of this restaurant. 0.863 46.694
Overall brand equity
OBE1 - This restaurant is superior than other restaurants. 0.839 50.08
OBE2 - The restaurant I am evaluating fits my personality. 0.8 29.065
OBE3 - I have positive personal feelings toward the restaurant I am evaluating. 0.905 66.763
OBE4 - After consuming services from the restaurant I am evaluating, I have grown fond of it. 0.919 87.997
Distributive Justice
DJ1- The outcome I received was fair. 0.946 145.106
DJ2- I got what I deserved. 0.929 109.395
DJ3- In resolving the problem, the restaurant gave me what I needed. 0.953 148.312
DJ4- The outcome I received was right.
0.971 255.239
Informational Justice
InfJ1 - The waiter was open in his communications with me. 0.869 63.903
InfJ2 - The waiter explained the procedures thoroughly. 0.884 42.528
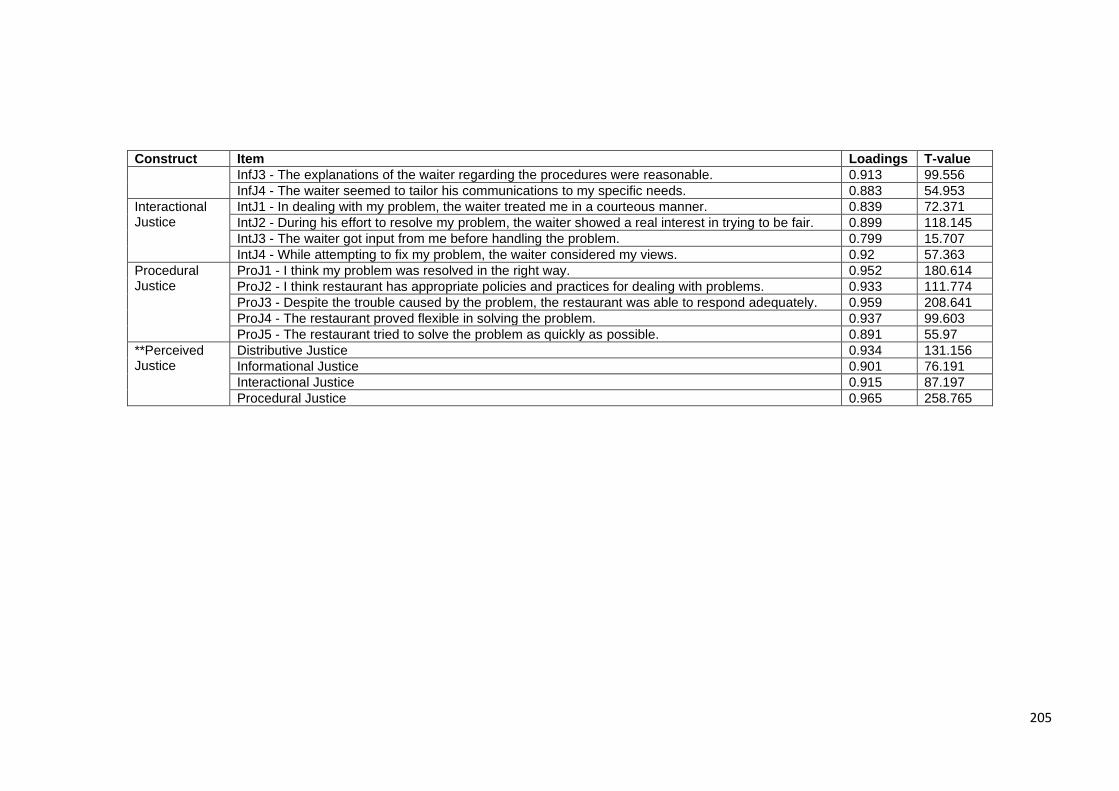
205
Construct Item Loadings T-value
InfJ3 - The explanations of the waiter regarding the procedures were reasonable. 0.913 99.556
InfJ4 - The waiter seemed to tailor his communications to my specific needs. 0.883 54.953
Interactional Justice
IntJ1 - In dealing with my problem, the waiter treated me in a courteous manner. 0.839 72.371
IntJ2 - During his effort to resolve my problem, the waiter showed a real interest in trying to be fair. 0.899 118.145
IntJ3 - The waiter got input from me before handling the problem. 0.799 15.707
IntJ4 - While attempting to fix my problem, the waiter considered my views. 0.92 57.363
Procedural Justice
ProJ1 - I think my problem was resolved in the right way. 0.952 180.614
ProJ2 - I think restaurant has appropriate policies and practices for dealing with problems. 0.933 111.774
ProJ3 - Despite the trouble caused by the problem, the restaurant was able to respond adequately. 0.959 208.641
ProJ4 - The restaurant proved flexible in solving the problem. 0.937 99.603
ProJ5 - The restaurant tried to solve the problem as quickly as possible. 0.891 55.97
**Perceived Justice
Distributive Justice 0.934 131.156
Informational Justice 0.901 76.191
Interactional Justice 0.915 87.197
Procedural Justice 0.965 258.765

206
8.3.1.2 Assessment of Internal Consistency Reliability
It is essential to ensure the reliability of the construct to establish the construct
validity (Iacobucci and Duhachek, 2003). Reliability is “the degree to which
measures are free from error and therefore yield consistent results" (Peter, 1979).
In other words, reliability shows how consistent are multiple items of a construct with
each other (Hair et al., 2013). Furthermore, construct validity is ensured after
establishing reliability (Peterson, 1994). One of the key indicators of construct
reliability is Cronbach’s alpha (Cronbach, 1951), a measure of internal consistency
of multi-item constructs (Peterson, 1994). According to Churchill (1979), the first
measure of the quality of a scale should be the coefficient alpha. Nunnally and
Bernstein (1994) assert that a construct should have a minimum of 0.90 Cronbach’s
alpha value; however, an alpha value of 0.95 should be desirable. Cronbach’s alpha
value of greater than 0.80 is deemed very good, and an alpha value in the range of
0.70 is considered acceptable; however, a Cronbach’s alpha below 0.60 is not
acceptable and deemed poor (Sekaran and Bougie, 2016). According to Saunders
et al. (2016), a coefficient alpha value of 0.7 or above shows that all measured
variables capture the same construct. On the other hand, a coefficient value of 0.6
or less shows unsatisfactory internal consistency of items (Malhotra and Birks,
2006). Therefore, a higher Cronbach’s alpha value would represent a better scale
(Hair, Black, et al., 2006). Table 8.3 shows the values of Cronbach’s alpha for all
the multi-item constructs were greater than 0.7 which indicates that all of the
constructs had an acceptable coefficient alpha value and thus satisfactory internal
consistency reliability.
Composite reliability (CR) is another measure of the internal consistency of items
(Hair et al., 2016). A higher value of composite reliability will indicate a higher
internal consistency of the items (Hair et al., 2019). A composite reliability value in
the range of 0.70 to 0.95 shows an acceptable level of internal consistency of
measures (Hair et al., 2016). Table 8.3 presents the composite reliability values for
all constructs greater than 0.70, thus indicating an acceptable level of internal
consistency of the measures.
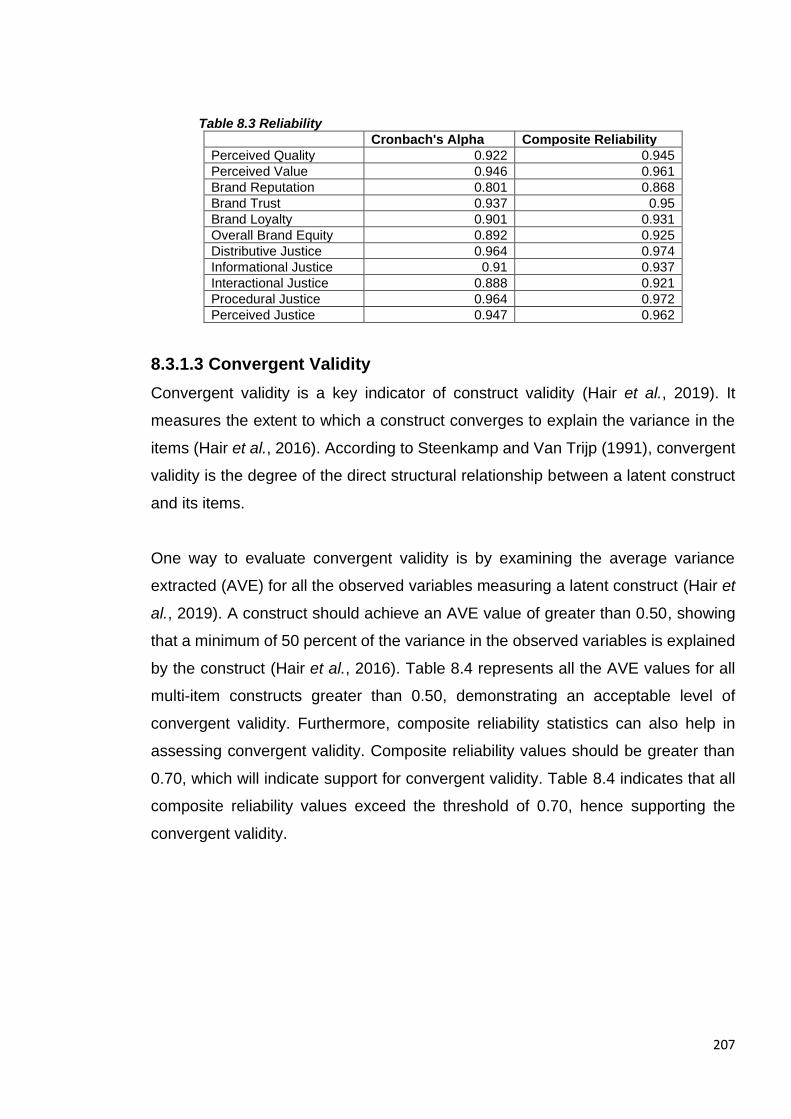
207
Table 8.3 Reliability
Cronbach's Alpha Composite Reliability
Perceived Quality 0.922 0.945
Perceived Value 0.946 0.961
Brand Reputation 0.801 0.868
Brand Trust 0.937 0.95
Brand Loyalty 0.901 0.931
Overall Brand Equity 0.892 0.925
Distributive Justice 0.964 0.974
Informational Justice 0.91 0.937
Interactional Justice 0.888 0.921
Procedural Justice 0.964 0.972
Perceived Justice 0.947 0.962
8.3.1.3 Convergent Validity
Convergent validity is a key indicator of construct validity (Hair et al., 2019). It
measures the extent to which a construct converges to explain the variance in the
items (Hair et al., 2016). According to Steenkamp and Van Trijp (1991), convergent
validity is the degree of the direct structural relationship between a latent construct
and its items.
One way to evaluate convergent validity is by examining the average variance
extracted (AVE) for all the observed variables measuring a latent construct (Hair et
al., 2019). A construct should achieve an AVE value of greater than 0.50, showing
that a minimum of 50 percent of the variance in the observed variables is explained
by the construct (Hair et al., 2016). Table 8.4 represents all the AVE values for all
multi-item constructs greater than 0.50, demonstrating an acceptable level of
convergent validity. Furthermore, composite reliability statistics can also help in
assessing convergent validity. Composite reliability values should be greater than
0.70, which will indicate support for convergent validity. Table 8.4 indicates that all
composite reliability values exceed the threshold of 0.70, hence supporting the
convergent validity.
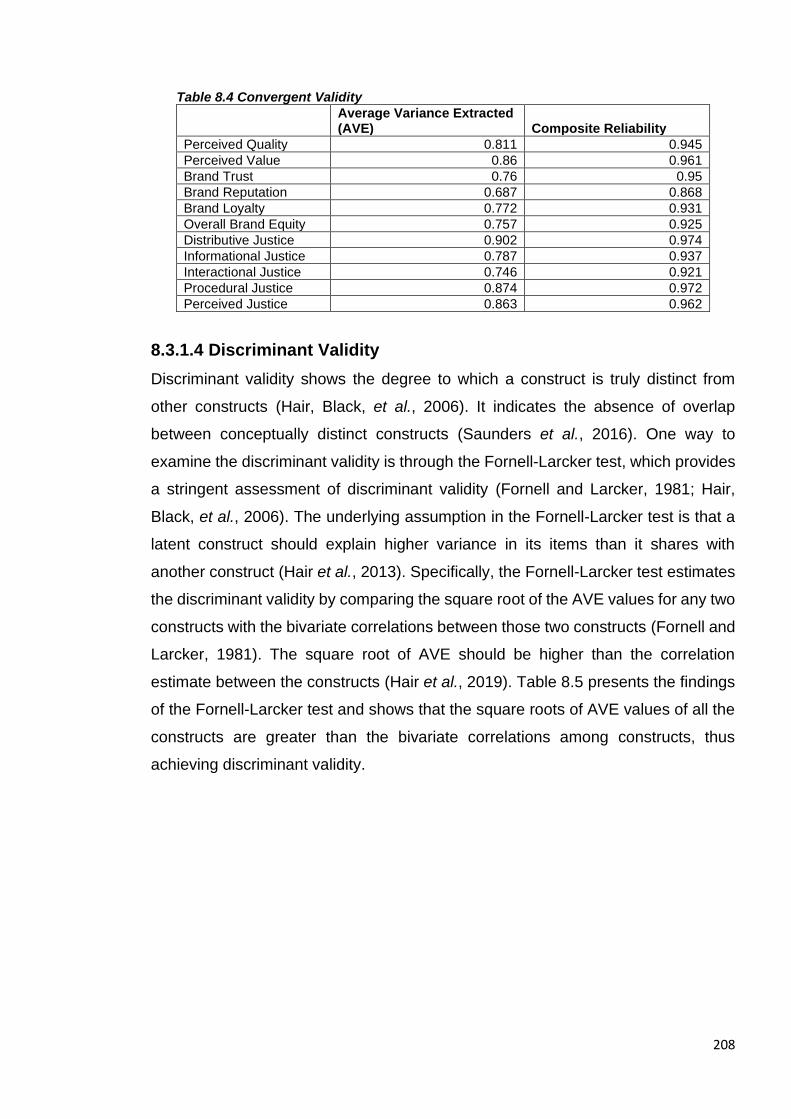
208
Table 8.4 Convergent Validity
Average Variance Extracted (AVE) Composite Reliability
Perceived Quality 0.811 0.945
Perceived Value 0.86 0.961
Brand Trust 0.76 0.95
Brand Reputation 0.687 0.868
Brand Loyalty 0.772 0.931
Overall Brand Equity 0.757 0.925
Distributive Justice 0.902 0.974
Informational Justice 0.787 0.937
Interactional Justice 0.746 0.921
Procedural Justice 0.874 0.972
Perceived Justice 0.863 0.962
8.3.1.4 Discriminant Validity
Discriminant validity shows the degree to which a construct is truly distinct from
other constructs (Hair, Black, et al., 2006). It indicates the absence of overlap
between conceptually distinct constructs (Saunders et al., 2016). One way to
examine the discriminant validity is through the Fornell-Larcker test, which provides
a stringent assessment of discriminant validity (Fornell and Larcker, 1981; Hair,
Black, et al., 2006). The underlying assumption in the Fornell-Larcker test is that a
latent construct should explain higher variance in its items than it shares with
another construct (Hair et al., 2013). Specifically, the Fornell-Larcker test estimates
the discriminant validity by comparing the square root of the AVE values for any two
constructs with the bivariate correlations between those two constructs (Fornell and
Larcker, 1981). The square root of AVE should be higher than the correlation
estimate between the constructs (Hair et al., 2019). Table 8.5 presents the findings
of the Fornell-Larcker test and shows that the square roots of AVE values of all the
constructs are greater than the bivariate correlations among constructs, thus
achieving discriminant validity.

209
Table 8.5 Discriminant Validity (Fornell-Larcker) 1 2 3 4 5 6 7 8 9 10
1. Brand Loyalty 0.878
2. Brand Reputation 0.329 0.829
3. Brand Trust 0.793 0.334 0.872
4. Perceived Quality 0.814 0.406 0.751 0.901
5. Perceived Value 0.795 0.291 0.747 0.805 0.927
6. Overall Brand Equity 0.801 0.411 0.764 0.826 0.788 0.870
7. Distributive Justice 0.652 0.218 0.638 0.575 0.66 0.613 0.950
8. Informational Justice 0.582 0.268 0.65 0.532 0.595 0.549 0.745 0.887
9. Interactional Justice 0.528 0.204 0.577 0.515 0.587 0.521 0.776 0.825 0.864
10. Procedural Justice 0.656 0.24 0.657 0.592 0.681 0.617 0.930 0.803 0.839 0.945
Henseler et al. (2015) proposed the heterotrait-monotrait ratio of correlations
(HTMT) as a novel approach to assess discriminant validity in variance-based SEM.
The HTMT measure of discriminant validity is defined as the mean score of the
correlations between measured variables across constructs relative to the mean of
the average correlations for the measured variables measuring the same construct
(Hair et al., 2019). Discriminant validity issues arise when there are high values of
HTMT (Hair et al., 2019). According to Henseler et al. (2015), a conceptually
different construct should have an HTMT value of 0.85 or lower; however, for a
conceptually similar construct HTMT value of around 0.90 is acceptable. There is a
lack of discriminant validity if the HTMT value is greater than 0.90 (Hair et al., 2016).
Hence, HTMT values should be lower than 0.90 for conceptually similar constructs
and lower than 0.85 for conceptually different constructs. Table 8.6 presents the
result of the examination of discriminant validity through the HTMT criterion. Table
8.6 shows that most of the values of HTMT are lower than 0.85; however, the HTMT
value between procedural justice and distributive justice was higher than 0.90.
Similarly, the HTMT value between overall brand equity and perceived quality was
higher than 0.90. To assess if these HTMT values are indicating a discriminant
validity issue, a bootstrap confidence interval was driven with 5000 subsamples to
assess the confidence interval for true HTMT population value. The result indicated
that none of the confidence intervals contained the value of 1, thus providing
evidence that all constructs were empirically distinct (Hair et al., 2016; Voorhees et
al., 2016). Furthermore, distributive justice and procedural justice are conceptually
similar constructs for which an HTMT value of greater than 0.90 was expected.
Similarly, perceived quality is a dimension of brand equity, thus a conceptually
similar construct to overall brand equity.
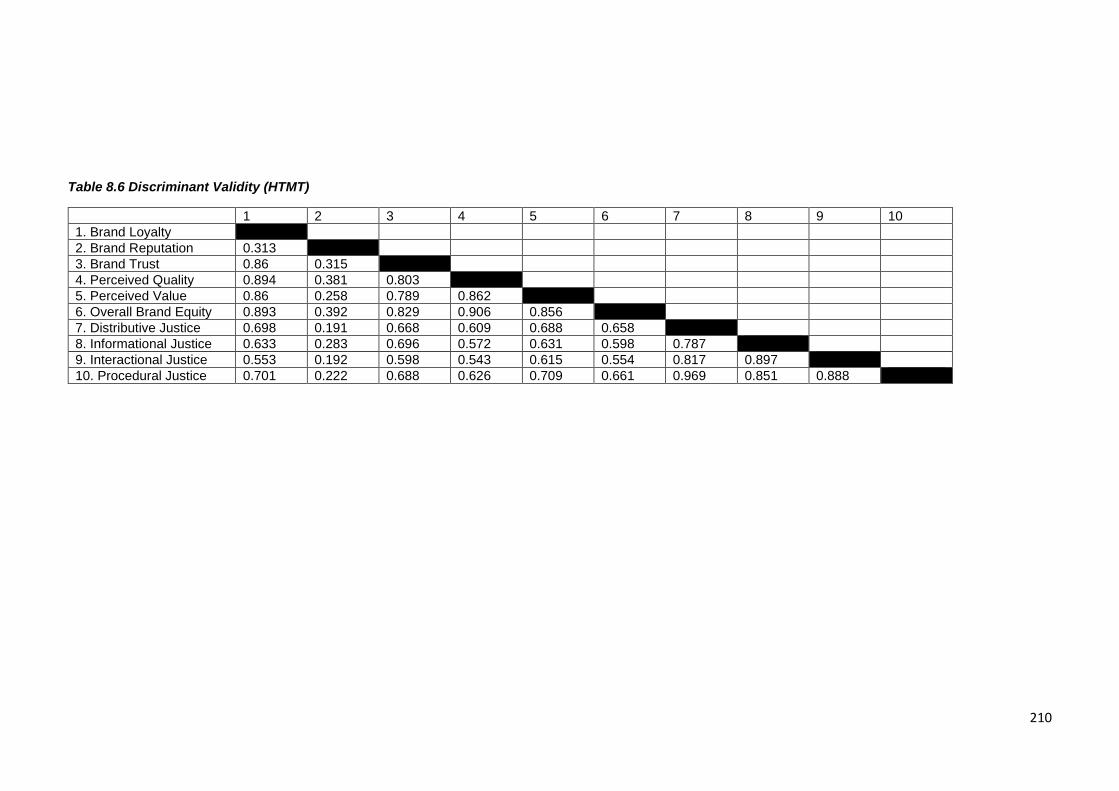
210
Table 8.6 Discriminant Validity (HTMT)
1 2 3 4 5 6 7 8 9 10
1. Brand Loyalty
2. Brand Reputation 0.313
3. Brand Trust 0.86 0.315
4. Perceived Quality 0.894 0.381 0.803
5. Perceived Value 0.86 0.258 0.789 0.862
6. Overall Brand Equity 0.893 0.392 0.829 0.906 0.856
7. Distributive Justice 0.698 0.191 0.668 0.609 0.688 0.658
8. Informational Justice 0.633 0.283 0.696 0.572 0.631 0.598 0.787
9. Interactional Justice 0.553 0.192 0.598 0.543 0.615 0.554 0.817 0.897
10. Procedural Justice 0.701 0.222 0.688 0.626 0.709 0.661 0.969 0.851 0.888

211
8.3.2 Factorial ANOVAs
In order to test Hypotheses 1 to 7 and Hypotheses 4-20, factorial two-way ANOVAs
were run. The results of all hypotheses were encouraging, and hence all hypotheses
were accepted except the main effects of service recovery on brand reputation were
significant. However, the interaction effect of service recovery and service failure
severity on brand reputation was insignificant. The effect sizes of the relationships
are benchmarked against the range provided by Cohen (1969, p.278-280) which
states that values of η² can be interpreted as of .0099 (small), 0588 (medium), and
.1379 (Large). The summary of the hypotheses results is described in table 8.7 and
table 8.8.
Impact of service recovery on post recovery outcomes and the moderating
role of service failure severity
In support of hypothesis 1, the study found that there was a significant main effect
of service recovery, F(2, 316) = 263.928, p = 0.000, indicating that the service
recovery (MCPSR=5.61, SDCPSR=0.819; MFR=5.65, SDFR=0.754) leads to higher
perceived justice compared to when there is no service recovery (MNR=3.47,
SDNR=1.140). η² = 0.626. The result shows that there is large effect size and the
association between the variables is strong. In support of h14, the interaction was
significant, F(2, 316) = 17.762, p = 0.000, η² = 0.101, indicating that there was a
combined effect of service recovery and service failure severity on perceived justice
(see figure 8.1). Further, the pairwise comparison analysis suggests that the impact
of CPSR and FR on perceived justice is not significantly different.
In support of hypothesis 2, the study found that there was a significant main effect
of service recovery, F(2, 316) = 28.690, p = 0.000, indicating that the service
recovery (MCPSR=5.07, SDCPSR=0.825; MFR=5.17, SDFR=0.879) leads to higher
Overall Brand Equity compared to when there is no service recovery (MNR=4.36,
SDNR=1.111). The effect size in this case is large as indicated by η² = 0.154. In
support of h15, the interaction was significant, F(2, 316) = 13.571, p = 0.000, η² =
0.079, indicating a combined effect of service recovery and service failure severity
on overall brand equity (see figure 8.2). In addition, the impact of CPSR and FR on
overall brand equity is not significantly different.
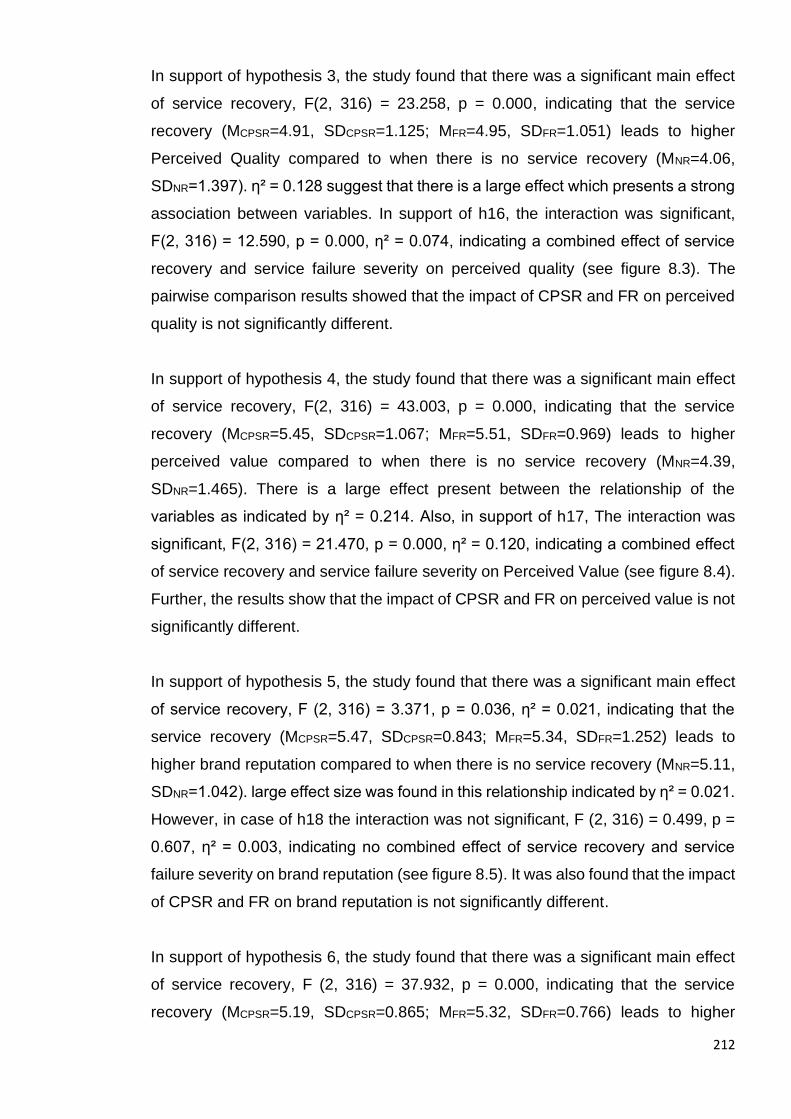
212
In support of hypothesis 3, the study found that there was a significant main effect
of service recovery, F(2, 316) = 23.258, p = 0.000, indicating that the service
recovery (MCPSR=4.91, SDCPSR=1.125; MFR=4.95, SDFR=1.051) leads to higher
Perceived Quality compared to when there is no service recovery (MNR=4.06,
SDNR=1.397). η² = 0.128 suggest that there is a large effect which presents a strong
association between variables. In support of h16, the interaction was significant,
F(2, 316) = 12.590, p = 0.000, η² = 0.074, indicating a combined effect of service
recovery and service failure severity on perceived quality (see figure 8.3). The
pairwise comparison results showed that the impact of CPSR and FR on perceived
quality is not significantly different.
In support of hypothesis 4, the study found that there was a significant main effect
of service recovery, F(2, 316) = 43.003, p = 0.000, indicating that the service
recovery (MCPSR=5.45, SDCPSR=1.067; MFR=5.51, SDFR=0.969) leads to higher
perceived value compared to when there is no service recovery (MNR=4.39,
SDNR=1.465). There is a large effect present between the relationship of the
variables as indicated by η² = 0.214. Also, in support of h17, The interaction was
significant, F(2, 316) = 21.470, p = 0.000, η² = 0.120, indicating a combined effect
of service recovery and service failure severity on Perceived Value (see figure 8.4).
Further, the results show that the impact of CPSR and FR on perceived value is not
significantly different.
In support of hypothesis 5, the study found that there was a significant main effect
of service recovery, F (2, 316) = 3.371, p = 0.036, η² = 0.021, indicating that the
service recovery (MCPSR=5.47, SDCPSR=0.843; MFR=5.34, SDFR=1.252) leads to
higher brand reputation compared to when there is no service recovery (MNR=5.11,
SDNR=1.042). large effect size was found in this relationship indicated by η² = 0.021.
However, in case of h18 the interaction was not significant, F (2, 316) = 0.499, p =
0.607, η² = 0.003, indicating no combined effect of service recovery and service
failure severity on brand reputation (see figure 8.5). It was also found that the impact
of CPSR and FR on brand reputation is not significantly different.
In support of hypothesis 6, the study found that there was a significant main effect
of service recovery, F (2, 316) = 37.932, p = 0.000, indicating that the service
recovery (MCPSR=5.19, SDCPSR=0.865; MFR=5.32, SDFR=0.766) leads to higher
213
Brand Trust compared to when there is no service recovery (MNR=4.33,
SDNR=1.315). The effect size in this case indicated by η² = 0.194. In support of h19,
the interaction was significant, F (2, 316) = 14.298, p = 0.000, η² = 0.083, indicating
a combined effect of service recovery and service failure severity on Brand Trust
(see figure 8.6). In the pairwise comparison, it was found that the impact of CPSR
and FR on brand trust is not significantly different
In support of hypothesis 7, the study found that there was a significant main effect
of service recovery, F (2, 316) = 36.485, p = 0.000, indicating that the service
recovery (MCPSR=5.17, SDCPSR=1.10; MFR=5.40, SDFR=0.905) leads to higher brand
loyalty compared to when there is no service recovery (MNR=4.30, SDNR=1.342).
There is a strong association between the variables as the effect size is large, η² =
0.188. In support of h20, the interaction was significant, F (2, 316) = 16.176, p =
0.000, η² = 0.093, indicating a combined effect of service recovery and service
failure severity on Brand Loyalty (see figure 8.7). It was also found that the impact
of CPSR and FR on brand loyalty is not significantly different.

214
Table 8.7 Factorial ANOVA (Means and Standard Deviations)
Note: SR = Service Recovery, CPSR = Customer Participation in Service Recovery, FR= Firm Recovery, NR= No Recovery, SFS= Service Failure Severity, PJ = Perceived Justice, OBE = Overall Brand Equity, Perceived Quality, PV= Perceived Value, BR= Brand Reputation, BT = Brand Trust, PQ=, BL= Brand Loyalty
DVs NR
SR (CPSR)
SR (FR)
SFS (Low) N=56
SFS (High) N=53
Total N=109
SFS (Low) N=56
SFS (High) N=51
Total N=107
SFS (Low) N=55
SFS (High) N=51
Total N-106
Mean
SD Mean SD Mean SD Mean SD Mean SD Mean SD Mean SD Mean SD Mean SD
PJ 4.20 0.958 2.17 0.748 3.47 1.140 5.83 0.662 5.39 0.915 5.619 0.819 5.81 0.691 5.49 0.792 5.65 0.754
OBE 4.97 0.871 3.70 0.958 4.36 1.111 5.13 0.818 5.00 0.836 5.071 0.825 5.30 0.705 5.03 1.02 5.17 0.879
PQ 4.84 1.087 3.24 1.207 4.06 1.397 5.15 0.917 4.64 1.273 4.91 1.125 5.03 0.962 4.87 1.14 4.95 1.051
PV 5.38 0.873 3.34 1.218 4.39 1.465 5.70 0.819 5.19 1.242 5.45 1.067 5.72 0.775 5.29 1.108 5.51 0.969
BR 5.29 0.997 4.92 1.065 5.11 1.042 5.52 0.854 5.43 0.836 5.479 0.843 5.41 1.131 5.26 1.378 5.34 1.252
BT 5.02 1.055 3.60 1.165 4.33 1.315 5.28 0.783 5.09 0.945 5.194 0.865 5.48 0.701 5.15 0.801 5.32 0.766
BL 5.11 0.958 3.43 0.958 4.30 1.342 5.343 1.030 4.90 1.153 5.172 1.100 5.536 0.676 5.25 1.089 5.40 0.905

215
Table 8.8 Factorial ANOVAs Results
Figure 8.1 Service recovery and Perceived Justice
Figure 8.2 Service Recovery and Overall Brand Equity
Perceived justice Effect F (1, 316) p η² R Squared Results
H1: Main effect SR 263.928 0.000 0.626 0.666
Supported
H14: Interaction effect SR x SFS 17.762 0.000 0.101 Supported
Overall Brand Equity Effect F (1, 316) P η² R Squared Results
H2: Main effect SR 28.690 0.000 0.154 0.269
Supported
H15: Interaction effect SR x SFS 13.571 0.000 0.079 Supported
Perceived Quality Effect F (1, 316) p η² R Squared Results
H3: Main effect SR 23.258 .000 .128 0.256
Supported
H16: Interaction effect SR x SFS 12.590 .000 .074 Supported
Perceived Value Effect F (1, 316) p η² R Squared Results
H4: Main effect SR 43.003 .000 .214 0.392
Supported
H17: Interaction effect SR x SFS 21.470 .000 .120 Supported
Brand Reputation Effect F (1, 316) p η² R Squared Results
H5: Main effect SR 3.371 .036 .021
0.033
Supported
H18: Interaction effect SR x SFS 0.499 .607 .003 Not Supported
Brand Trust Effect F (1, 316) p η² R Squared Results
H6: Main effect SR 37.932 .000 .194 0.311
Supported
H19: Interaction Effect SR x SFS 14.298 .000 .083 Supported
Brand Loyalty Effect F (1, 316) p η² R Squared Results
H7: Main effect SR 36.485 .000 .188 0.322
Supported
H20: Interaction effect SR x SFS 16.176 .000 .093 Supported
Figure 8.3 Service Recovery and Perceived Quality

216
Figure 8.4 Service Recovery and Perceived Value
Figure 8.5 Service Recovery and Brand Reputation
Figure 8.6 Service Recovery and Brand Trust
Figure 8.7 Service Recovery and Brand Loyalty
8.3.3 Mediation Analysis
This section presents the result of mediation analysis taken to address the
intervening role of perceived justice between service recovery and CBBE, thus
examining H8a-H13b. According to Baron and Kenny (1986, p. 1173), mediation of
a construct shows that “the generative mechanism through which an independent
focal variable can influence a dependent variable of interest”. In other words, Baron
and Kenny (1986) assert that a given construct may function as a mediator to the

217
extent that it accounts for the relation between the predictor and the criterion
variable.
The mediation role of perceived justice was examined by testing the significance of
each indirect effect between Service recovery and the dimensions of CBBE, using
a bootstrapping with a sample drawing of 5000. The bootstrapping process is
considered a better choice than the traditional Sobel test as it does not impose the
assumption of normality (Cambra-Fierro et al., 2016). The mediation results are
presented in Table 8.9, results that didn’t include zero with a 95% confidence
interval.
Table 8.9 Mediation Analysis Results
Mediation
Hypothesis (β) T-Value Significance (p)
Result
H8 a SR (CPSR) → PJ →PQ 0.121 4.1 0.000 Supported
b SR (FR) → PJ → PQ 0.136 4.851 0.000 Supported
H9 a SR (CPSR) → PJ → PV 0.119 4.148 0.000 Supported
b SR (FR) → PJ → PV 0.134 4.761 0.000 Supported
H10 a SR (CPSR) → PJ → BR 0.053 2.491 0.006 Supported
b SR (FR) → PJ → BR 0.059 2.571 0.005 Supported
H11 a SR (CPSR) → PJ → BT 0.136 4.315 0.000 Supported
b SR (FR) → PJ → BT 0.153 4.999 0.000 Supported
H12 a SR (CPSR) → PJ → BL 0.123 4.043 0.000 Supported
b SR (FR) → PJ → BL 0.138 4.866 0.000 Supported
H13 a SR (CPSR) → PJ → OBE 0.113 4.026 0.000 Supported
b SR (FR) → PJ → OBE 0.126 4.668 0.000 Supported
Note: SR = Service Recovery, CPSR = Customer Participation in Service Recovery, FR= Firm Recovery, PJ= Perceived Justice, PQ = Perceived Quality, PV = Perceived Value, BR = Brand Reputation, BT = Brand Trust, , BL = Brand Loyalty, OBE = Overall Brand Equity
The results indicate that perceived justice intervenes between service recovery
(CPSR, FR) and: (i) perceived quality, (ii) perceived value, (iii) brand reputation, (iv)
brand trust (v) brand loyalty, and (vi) overall brand equity. Table 8.9 indicates that
all hypotheses related to mediating effect of perceived justice are supported as there
is a significant (p < 0.05) mediating effect of perceived justice between service
recovery (CPSR and FR) and all brand-related outcomes.
Full mediation is supported when the indirect effect of the independent variable on
the dependent variable through the mediator is significant while the direct effect is
insignificant. On the other hand, partial mediation is supported if both the direct and
indirect effects of the independent variable on the dependent variable are significant
(Baron and Kenny, 1986). The direct effect of service recovery (CPSR, SR) on all

218
brand-related outcomes, including brand loyalty, brand reputation, brand trust,
perceived quality, perceived value, and overall brand equity, is significant (cf.
Appendix F). This result indicates a partial mediation of perceived justice between
service recovery (CPSR and FR) and dimensions of CBBE.
8.3.4 Paradox Hypotheses
Paired sample t-tests were performed to test the occurrence of the service recovery
paradox. This was done by employing paired t-tests between pre-failure and post-
service recovery samples of the four conditions, i) SR(CPSR) and SFS Low, ii)
SR(FR) and SFS High, iii) SR(FR) and SFS Low, iv) SR(FR) and SFS high. The
computed results are shown in Table 8.10. however, before the main analysis, it
was made sure that there is no issue related to the sampling distribution of the four
groups. This was done by utilising one-way ANOVA for the pre-failure data. It was
found that there was no significant difference among the groups with respect to the
dimensions of CBBE.
Hypotheses 21a -21e
The results showed that perceived quality’s post-recovery rating (MPQ = 5.15, SD =
0.917) is not significantly higher than pre-failure ratings (MPQ = 5.31, SD = 0.889), t
(55) = 1.323, p >0.05). Similarly, perceived value’s post-recovery rating (MPV = 5.69,
SD = 0.819) is not significantly higher than pre-failure rating (MPV = 5.75, SD =
0.790), t (55) = 0.558, p >0.05). The post-recovery rating of brand reputation ((MBR
= 5.52, SD = 0.854) is not significantly higher than pre-failure rating (MBR = 5.41, SD
= 0.996), t (55) = -1.149, p >0.05). In case of brand trust, it was found that post-
recovery rating (MBT = 5.28, SD = 0.783) is not higher than pre-failure rating (MBT =
5.24, SD = 0.752), t (55) = -0.394, p >0.05). Similarly, Post-recovery (MBL = 5.343,
SD = 1.030) rating of brand loyalty is also not higher than pre failure rating (MBL =
5.28, SD = 0.842), t (55) = -0.432, p>0.05). The above results demonstrate that
there is no paradox found, hence hypotheses 21a – 21 e are not supported.
Hypotheses 22a -22e
The results demonstrate that perceived quality’s post-recovery rating (MPQ = 4.647,
SD = 1.273) is not higher than pre-failure ratings (MPQ = 5.024, SD = 0.943), t (50)
= 2.475, p >0.05). Perceived value’s post-recovery rating (MPV = 5.196, SD = 1.242)
is not significantly higher than pre-failure rating (MPV = 5.779, SD = 0.914), t (50) =

219
4.152, p >0.05). The post-recovery rating of brand reputation (MBR = 5.43, SD =
0.836) is not higher than pre-failure rating (MBR = 5.26, SD = 1.207), t (50) = -1.223,
p >0.05). In case of brand trust, it was found that post-recovery rating (MBT = 5.09,
SD = 0.945) is not higher than pre-failure (MBT = 5.33, SD = 0.763), t (50) = 2.414,
p >0.05). Similarly, Post-recovery (MBL = 4.99, SD = 1.153) rating of brand loyalty is
also not higher than pre failure rating (MBL = 5.11, SD = 0.978), t (50) = 0.959,
p>0.05). The above results demonstrate that there is no paradox founds, hence
hypotheses 22a – 22e are not supported.
Hypothesis 23a – 23e
The results showed that perceived quality’s post-recovery rating (MPQ = 5.031,
SD=0.962) is not significantly higher than pre-failure rating (MPQ = 5.004, SD =
0.979), t (54) = -0.283, p >0.05). The post-recovery rating of perceived value (MPV =
5.72, SD = 0.775) is not higher than pre-failure rating (MPV = 5.73, SD = 0.928), t
(54) = 0.184, p >0.05). In case of brand reputation, it was found that post-recovery
rating ((MBR = 5.41, SD = 1.131) is not significantly higher than pre-failure rating
(MBR = 5.35, SD = 1.108), t (54) = -0.793, p >0.05). Similarly, Post-recovery (MBT =
5.48, SD = 0.701) rating of brand trust is also not higher than pre failure rating (MBT
= 5.52, SD = 0.563), t (54) = 0.421, p >0.05). The above results demonstrate that
there is no paradox founds, hence hypotheses 23b – 23e are not supported.
However, brand loyalty’s post-recovery rating (MBL = 5.53, SD = .676) is significantly
higher than pre-failure ratings (MBL = 5.08, SD = 0.939),t(55) = -3.793, p<0.05.
therefore, Hypothesis 23e is accepted.
.
Hypothesis 24a -24e
The results showed that perceived quality’s post-recovery rating (MPQ = 4.87, SD =
1.143) is not significantly higher than pre-failure rating (MPQ = 5.18, SD = 1.080), t
(50) = 2.886, p >0.05). The post-recovery rating of perceived value (MPV = 5.29,
SD = 1.108) is not higher than pre-failure rating (MPV = 5.45, SD = 1.214), t (50) =
1.677, p >0.05). In case of brand reputation, it was found that post-recovery rating
(MBR = 5.26, SD = 1.378) is not higher than pre-failure rating (MBR = 5.22, SD =
1.430), t (50) = -0.441, p >0.05). Similarly, post-recovery rating of brand trust (MBT
= 5.15, SD = 0.801) is also not higher than pre failure rating (MBT = 5.40, SD =
0.678), t (50) = 2.513, p >0.05). The above results demonstrate that there is no
paradox found, hence hypotheses 24b – 24e are not supported. However, brand

220
loyalty’s post-recovery rating (MBL = 5.25, SD = 1.089) is significantly higher than
pre-failure ratings (MBL = 4.90, SD = 1.258), t (50) = -2.228, p<0.05. therefore,
Hypothesis 24e is accepted.

221
Table 8.10 Service Recovery Paradox Analysis
Conditions Hypothesis Pre-Failure Phase Post-Recovery Phase
Difference T-value P-value Result
Means S.D. Means S.D. N DF
Customer participation in
service recovery and low service failure severity
21a Perceived Quality 5.31250 0.889650 5.15625 0.917708
56 55
.156250 1.323 > 0.05 Not supported
21b Perceived Value 5.75893 0.790518 5.69643 0.819804 .062500 .558 > 0.05 Not supported
21c Brand Reputation 5.4107 0.99695 5.5238 0.85483 -.11310 -1.149 > 0.05 Not supported
21d Brand Trust 5.24405 0.752749 5.28571 0.783488 -.041667 -.394 > 0.05 Not supported
21e Brand Loyalty 5.28571 0.842654 5.34375 1.030845 -.058036 -.432 > 0.05 Not supported
Customer participation in
service recovery and high service failure severity
22a Perceived Quality 5.02451 0.943736 4.64706 1.273947
51 50
.377451 2.475 > 0.05 Not supported
22b Perceived Value 5.77941 0.914668 5.19608 1.242290 .583333 4.152 > 0.05 Not supported
22c Brand Reputation 5.2614 1.20796 5.4314 0.83611 -.16993 -1.223 > 0.05 Not supported
22d Brand Trust 5.33007 0.763392 5.09477 0.945313 .235294 2.414 > 0.05 Not supported
22e Brand Loyalty 5.11275 0.978920 4.99020 1.153214 .122549 .959 > 0.05 Not supported
Firm recovery and low service failure
severity
23a Perceived Quality 5.00455 .979525 5.03182 .962316
55 54
-.027273 -.283 > 0.05 Not supported
23b Perceived Value 5.73636 .928482 5.72273 .775303 .013636 .184 > 0.05 Not supported
23c Brand Reputation 5.3576 1.10899 5.4182 1.13169 -.06061 -.793 > 0.05 Not supported
23d Brand Trust 5.52121 .563877 5.48788 .701889 .033333 .421 > 0.05 Not supported
23e Brand Loyalty 5.08636 .939388 5.53636 .676008 -.450000 -3.793 .000 Supported
Firm recovery and high service failure
severity
24a Perceived Quality 5.18137 1.080600 4.87255 1.143867
51 50
.308824 2.886 > 0.05 Not supported
24b Perceived Value 5.45588 1.214193 5.29412 1.108722 .161765 1.677 > 0.05 Not supported
24c Brand Reputation 5.2222 1.43088 5.2614 1.37810 -.03922 -.441 > 0.05 Not supported
24d Brand Trust 5.40523 .678442 5.15033 .801564 .254902 2.513 > 0.05 Not supported
24e Brand Loyalty 4.90196 1.258052 5.25980 1.089680 -.357843 -2.228 0.030 Supported
222
8.4 Summary
This chapter has presented the results of the hypothesis formulated in chapter 6. At
first, the results of pre-tests are presented. The results of realism and manipulation
checks are presented in the section of pre-test results. After that, the results of the
assessment of the measurement model are presented. The results show that the
factor loadings of all measured variables were significant. Next, the results of internal
consistency and reliability are presented, which are as per the recommendations. It is then
followed by convergent and discriminant validity results, which are also as per the
recommendations.
The results of the hypotheses are divided into three sections based on the analysis
undertaken for hypothesis testing. The first section described the results of the hypotheses
related to the impact of service recovery on post-recovery evaluations (hypotheses 1-7).
This section also provided the results of the hypotheses related to the moderating role of
service failure severity (hypotheses 14-20). All hypothesis were supported apart from
hypothesis 18, which was not supported.
The second section demonstrated the results of the hypotheses (H8a-H13b) related to the
mediating role of perceived justice between service recovery and CBBE. All the
hypotheses were supported, which meant that perceived justice mediates the
relationships.
Finally, the third section of the hypotheses related to the investigation of the occurrence
of the service recovery paradox(H21a-H24e). Apart from hypotheses 23e and 24e, which
were supported, all the other hypotheses were not supported.
223
Chapter 9 Discussion
9.1 Introduction
This chapter includes a discussion of the findings in the context of previous literature.
The current chapter answers five research questions that were generated in chapter
2. Findings from qualitative and quantitative studies assisted in answering the
research questions. The chapter starts with the discussion of RQ1, which is related to
identifying CBBE dimensions that tend to fluctuate within the service failure and
recovery framework. It is then followed by the answer to RQ2, where the impact of
service recovery on post-recovery outcomes is discussed. Next, the answer to RQ3 is
discussed, where the mediating role of perceived justice between service recovery
and CBBE is elaborated. RQ4 delineates the discussion on the moderating role of
service failure severity. Finally, the answer to RQ5 is described, which is related to the
service recovery paradox. A chapter summary is presented at the end of this chapter.
9.2 Discussion
The findings of this study are discussed according the relevant research questions
and research hypothesis. Following sections contain the discussion of the five
research questions of current study.
9.2.1 RQ1: What are the dimensions of CBBE which tend to
fluctuate within the context of service failure and recovery?
Qualitative research (semi-structured interviews) was undertaken to answer the RQ1.
Initially, the findings from qualitative research found that customers frequently
experience service failures followed by service recoveries which become the reasons
for offsetting the CBBE dimensions. There are two forms of service recovery identified
in the qualitative research, which corroborates the previous literature. For example,
one way to render service recovery is 'firm recovery' which is when service employees
make sole efforts to resolve service failures without involving customers in the service
recovery process (Mostafa et al., 2015; del Río-Lanza et al., 2009; You et al., 2020).
Another way to recovery from service failure is customer participation in service
recovery, where customers participate with the service firm/firm's employees to

224
recover from the service failure (Bagherzadeh et al., 2020; Dong et al., 2008, 2016;
Roggeveen et al., 2012).
The current study then explored the insights related to the CBBE dimensions that tend
to fluctuate within service failure and recovery. Till date, there is not a single effort to
investigate CBBE as an outcome of service recovery or which identifies the
dimensions of CBBE which tend to fluctuate within service failure and recovery
process, to be investigated in the context of service failure and recovery. Therefore,
the lack of evidence warranted the exploring oscillation in CBBE facets due to service
failure and recovery. The qualitative findings suggested that five CBBE dimensions
fluctuate during a service failure and recovery interaction, perceived quality, perceived
value, brand reputation, brand trust, and brand loyalty. The dimensions emerged when
informants were asked to share their brand assessment at two different occasions, i)
post-failure and post-recovery. It was found that the ratings of the CBBE dimensions
decline after the customers experience a service failure and are negatively valenced.
Such findings support the stream of literature investigating the impact of service failure
on brand-related outcomes (Bejou and Palmer, 1998; Bougoure et al., 2016; Sajtos et
al., 2010; Sarkar et al., 2021; Weun et al., 2004). On the other hand, positive
customers' opinions towards the CBBE dimensions were collated after receiving
service recovery either in the form of frim recovery (DeWitt et al., 2008; Ma and Zhong,
2021; Smith et al., 1999; You et al., 2020) or customer participation in service recovery
(Dong et al., 2008; Jin et al., 2020; Roggeveen et al., 2012; Xu, Marshall, et al., 2014).
Findings of qualitative study shows that interviewees develop negative perceptions of
quality after a service failure. This result may be explained by the fact that consumers
attribute service failure incidents with poor quality service, incompetency, poor
performance, and unprofessionalism (Xu et al., 2019). The findings of the qualitative
study also reveal that informants positively evaluated the service brand perceived
quality after the service brand made efforts to resolve the problems. In accordance
with the present results, previous studies have demonstrated that service failure
incidents harm consumers' perception of quality (Anderson et al., 2009; Xu et al.,
2019). This finding also corroborates the ideas of Gil et al. (2006), who suggested that
in the context of hotel services, the quality of service perceived by customers will

225
increase if the customer is loyal and/or if the customer experiences a recovery
encounter during the visit.
The findings align with Aurier and Siadou‐Martin (2007) examination, which proved
that service recovery improves the perceived quality of a restaurant. Specifically, the
perceived quality related to the core service and the interaction of the employees. The
observed increase in perceived service quality could be attributed to positive service
experiences and effective recovery, giving rise to optimistic scripts and expected
service delivery (Zeithaml et al., 1993). The oscillating nature of perceived quality
between a service failure and recovery indicates the fluctuation in customer service
quality perceptions during a service failure and recovery effort.
Another important finding was that consumers' perceived value fluctuated during a
service failure and recovery process. The qualitative data analysis suggests that
consumers' perceptions of value diminished after a service failure. One of the most
important factors identified as the basis of their choice of the service brand was the
perceived value. Therefore, post-failure, the consumers shared that the loss they
incurred was in terms of the perceived value. This finding corroborates the ideas of
Buttle and Burton (2002), who suggested that consumers will feel that service failure
increases the overall cost and thus perceive a decrease in the value they get for their
money. The observed diminishing pattern of perceived value might be explained by
the fact that consumers equate their costs to buy a service with benefits received and
perceive an inequality. In contrast, the data analysis suggests that consumers'
perceptions of the value for the cost incurred improved after service recovery. The
present findings seem to be consistent with other research, which found that an
appropriate service recovery results in favourable customer opinions about the service
brand (Mostafa et al., 2015). The findings also support the investigation by Yaya et al.
(2015), who found that an effective service recovery that includes compensation, care,
and easy procedures positively impacts the perceived value. Therefore, a decrease in
perceived value after a service failure and a subsequent increase in perceived value
after a service recovery indicates a fluctuating pattern of perceived value where varies
between service failure and recovery.

226
Brand reputation is another dimension of CBBE that fluctuates during service failure
and recovery incidents. Brand reputation is the aggregate of consumers perceptions
of a brand created over time due to multiple interactions with the brand (Veloutsou
and Moutinho, 2009; Walker, 2010). The qualitative data analysis reveals that brand
reputation is downgraded after a service failure. This finding of the current study is
consistent with those of Cantor and Li (2019), who asserted that service failures lead
to negative perceptions of service firms. The result also shows that service recovery
positively influences brand reputation as interview participants frequently indicated
positive perceptions of the service brand after a service recovery. This result is
consistent with the studies that suggest that service recovery can enhance long-term
positive perceptions of a service brand (Mostafa et al., 2015). An oscillating trend of
overall perceptions of the service brand reveals a fluctuation concerning the brand
reputation within the service failure and recovery incident. In other words, a service
failure can negatively affect brand reputation, whereas a recovery mechanism can
mitigate the negative effects of a service failure by restoring or enhancing the brand
reputation.
The qualitative study results also indicate that one of the key facets of CBBE that
fluctuates during service failure and recovery is brand trust. The analysis of qualitative
data suggests that customers' trust in a brand declines after a service failure. This
finding agrees with Weun et al.'s (2004) findings, which showed that brands suffer
from trust deficits after experiencing a service failure, which weakens the brands'
relationship with their customers. This finding also corroborates Barakat et al. (2015),
who found that ineffective service responses by the service firms can dilute brand trust.
One reason for loss of trust in a brand after a service failure is that customers may
view the service failure incident as a breach of the promise made by the service brand
for providing a good quality service. Qualitative findings suggest that customers felt
betrayed by the firm and believed that the service brand broke the promise of an
optimum service experience.
The results of the qualitative study also show that brand trust may be recovered with
effective service recovery. The present findings seem to be consistent with other
research, which found service recovery restores brand trust (Kim, Jung-Eun Yoo, et
al., 2012; Lopes and da Silva, 2015; Mohd-Any et al., 2019; Urueña and Hidalgo,
227
2016). A possible explanation for this might be that effective recovery results in
regaining consumers' confidence in the service brand. Another possible explanation
for this is that when consumers can get involved in the service recovery process
through their interaction with service providers, there are greater chances of restoring
the brand trust (Basso and Pizzutti, 2016). The results of observation of brand trust
after a service failure and recovery indicate a fluctuating pattern of trust where brand
trust decreases after a service failure but gets restored after an excellent service
recovery.
Finally, the results of qualitative study show that service failure and recovery cause a
change in the customers' ratings of brand loyalty. Qualitative research findings reveal
that service customers detach with the service brand to reduce the usage of the brand,
think about leaving the service firm, intend to switch to competitive brands or break
the relationship with the service brand in extreme cases. This finding resonates well
with the findings of the literature on service failure and recovery (Bejou and Palmer,
1998; Cantor and Li, 2019; Kamble and Walvekar, 2019; Wang et al., 2011). For
example, Wang et al. (2011) showed customer loyalty declines due to service failure.
Similarly, this study's result provides support for Kamble and Walvekar (2019), who
assert that there is a negative relationship between customer loyalty and service
failure in the context of e-tailing. A possible reason for the decline in brand loyalty after
a service failure incident can be reduced post-failure customer satisfaction (Torres et
al., 2020; Weun et al., 2004). Customers feel that they are deceived when they
experience a service failure, resulting in dissatisfaction with the service firm (Barakat
et al., 2015). Thus, dissatisfied customers become disloyal to the brand after a service
failure incident.
The findings of semi-structured interviews showed that customers intend to stay with
the service firm once a service recovery is initiated after a service failure. This result
indicates that brand loyalty is enhanced after a service recovery. This finding further
supports the idea of La and Choi (2019), who found that brand loyalty towards the
service brand is influenced by service recovery. Qualitative data analysis thus reveals
a fluctuating pattern in brand loyalty during service failure and recovery. Service failure
causes a dilution in brand loyalty (Bejou and Palmer, 1998; Cantor and Li, 2019;
Mattila et al., 2014), whereas service recovery acts as a safeguard against such
228
dilution and thus enhances brand loyalty (DeWitt et al., 2008; Kim and Baker, 2020a;
Liat et al., 2017).
9.2.2 RQ2: What is the impact of service recovery (Firm recovery
and Customer participation in service recovery) on post-recovery
outcomes?
9.2.2.1 Service recovery and Perceived Justice
The second research question in this research was related to the impact of service
recovery on post-recovery outcomes, including perceived justice and CBBE. On the
question of the effect of service recovery on perceived justice, this study found that
Service recovery (CPSR and FR) enhance perceived justice. Consequently, the
results provided support for the hypothesis 1.
The findings observed in this study mirror those of the previous studies that have
examined the effect of service recovery on perceived justice. For example, this finding
agrees with Smith et al., (1999) findings which showed that actions taken by a service
provider to recover from service failure could enhance customers' perceptions of
fairness by setting things right. This also accords with other earlier studies, which
showed that there is a positive relationship between service recovery measures
(including speed of response, compensation, apology, explanation, and courtesy) and
perceived justice dimensions such as distributive, procedural, interactional and
informational justice (Blodgett et al., 1997; Karatepe, 2006b; Liao, 2007; Tax et al.,
1998). The findings also corroborate with Mostafa et al.'s (2015) investigation, which
found a positive association between service recovery and the dimensions of
perceived justice. The findings of this study suggest that the sufficiency of the service
recovery efforts make the customers believe that they have received an equitable
response against their loss.
9.2.2.2 Service recovery and Overall brand equity
Next, the present study was designed to determine the effect of Service recovery
(CPSR and FR) on CBBE. The results of this study indicate that both the CPSR and
FR influence overall brand equity. This finding corroborates the ideas of (Ringberg et
229
al. (2007), who suggested that positive customer experiences build goodwill, thus
mitigating the effect of a poor service experience on the brand. These results are
consistent with those of other studies and suggest that an appropriate recovery
strategy has the potential of creating brand equity in which customers themselves act
as the promoter of the service brand and conduct self-motivated campaigns promoting
the service brand (Berry et al., 1990; Dorsch et al., 1998; Singhal et al., 2013).
The positive association between service recovery and overall brand equity may be
explained by the fact that effective service recovery can create positive brand
perceptions in the consumers' mind consequently developing a sense in consumers
that the service provider cares about them, thereby creating a strong bond with
customers (Harun et al., 2019). Specifically, when service consumers are allowed to
participate in the service recovery process, they perceive higher psychological value
(Franke et al., 2010) and feelings of ownership of the brand (Fuchs et al., 2010), which
can influence brand equity (González-Mansilla et al., 2019).
9.2.2.3 Service recovery and Perceived Quality
Another important finding was that CPSR and FR affect perceived quality. These
results match those observed in earlier studies. For instance, Kloppenborg and
Gourdin (1992) showed that service recovery plays a key role in service quality
evaluations in the context of airline services. Similarly, Boshoff (1997) found that
service recovery initiatives can improve service quality perceptions.
The current study's findings describe that the response to service failure is evaluated
positively by the consumers as they perceive the quality of the service positively.
Furthermore, the results show that the positive impact of service recovery on
perceived quality is possible when firms successfully make the customers believe
about four things. i) ‘the tangibles they receive against the loss they incur, ii) the
amount of information they receive, iii) the interaction of the employees and iv) the
convenience in recovery procedures’ equates or surpasses the loss they incurred.
Similar expositions are presented by Aurier and Siadou-Martin, (2007), who showed
that perceived quality is enhanced due to service recovery by explaining that the levels
of all three quality components, outcome quality, interaction quality and environment
quality improve. The current study's findings are also consistent with those of
230
Söderlund and Sagfossen (2017), who found that involving customers in service
processes influences the perceived quality of the service. A possible explanation for
these results may be that consumers’ satisfactory experience with service recovery
leads to high-quality service performance perceptions.
9.2.2.4 Service recovery and Perceived Value
The current study found that Service recovery (CPSR and FR) has a significant
positive effect on perceived value. It is encouraging to compare this figure with
Helkkula and Kelleher (2010), who found that satisfactory service interactions are
related to positive perceived value, whereas unsatisfactory service encounters are
linked to the negative perceived value of service. This finding also corroborates the
ideas of Boshoff (2005), who suggested that a satisfactory service recovery leads to
improved perceptions of the service firm’s competence and eventually to perceived
value.
An examination of perceived value within the service failure and recovery is relevant
because the perceived value is the overall assessment by the customers where they
weigh what they have received against what they have costed (Zeithaml, 1988). As
customers lose in case of service failure and gain in the shape of service recovery.
Coelho et al. (2020) suggest that customers' experience with the brand impacts the
perceived value. After the experience, customers engage in a mental process to
examine what benefits they have received after sacrificing their money, time and effort
(Netemeyer et al., 2004).
Another explanation is that customers’ physical and cognitive participation in the
service recovery process diverts the post-failure psychological tension created by the
service failure (Prebensen and Xie, 2017). Therefore, some authors have speculated
that a positive relationship between service recovery and perceived value can be partly
due to customers’ overall evaluation of what they received and what they gave during
service recovery (Loureiro et al., 2019; Mcdougall and Levesque, 2000; Yaya et al.,
2015).
9.2.2.5 Service recovery and Brand Reputation
This study also set out to assess the impact of service recovery (CPSR and FR) on
brand reputation. The findings of the current study report that service recovery (CPSR

231
and FR) positively influence brand reputation. The current finding corroborates the
ideas of Sengupta et al. (2015), who suggested that consistent, credible actions of the
firm towards its consumers can develop a brand reputation. Similarly, this finding is in
agreement with Liat et al.'s (2017) findings which showed that service recovery leads
to positive brand associations. In the case of CPSR, the findings resonate with the
findings by Foroudi et al. (2019), who found that students' participation in the service
processes had a positive impact on the brand reputation of the university.
Generating positive associations about the firm is because customers believe that the
firm has not left them alone and provided a satisfactory solution to their problem
(Mostafa et al., 2015). Therefore, the positive interaction between the firm and the
customers in the shape of service recovery results in increasing the repository of
positive associations held by the customers in their memories. A possible explanation
for this result may be the ability of service recovery measures to enhance customer
satisfaction and associate service brands with attributes such as consistent, credible
brands (Sengupta et al., 2015).
9.2.2.6 Service recovery and Brand Trust
The results of this study indicate that CPSR and FR influence brand trust. It is
encouraging to compare this result with Joireman et al. (2013), who assert that firms
should be cautious in undertaking an effective service recovery process as regaining
trust will be more challenging if service recovery fails. The current study's findings are
also consistent with those of Basso and Pizzutti (2016) who showed that when
customers have the opportunity to interact with service providers, the probability of
restoring trust increases. The positive influence of service recovery on trust reflects
that customers trust the firm, which initiates an immediate response to the service
failure. As building a trust based relationship brings several long-term benefits to the
firms which include quality assurance, low risks and customers’ confidence (Dall’Olmo
Riley and De Chernatony, 2000).
Pacheco et al. (2019), suggests that in case of service failure, which leads to breach
of trust, the restoration of trust can happen if the firm realises the mistake immediately
and initiate suitable recovery at once. Moreover, the current study suggests that when
the service recovery included the empathetic behaviour of employees and convenient
232
procedures, it assists in creating a positive influence on brand trust. Mohd-Any et al.
(2019) found that after a service failure, the accommodating interaction of employees
and convenient service recovery procedures can restore the trust of customers among
customers.
9.2.2.7 Service recovery and Brand Loyalty
This study found that service recovery (CPSSR and FR) positively influence brand
loyalty. Consequently, the results provided support for hypotheses 7. The findings of
the current study are consistent with those of Chebat and Slusarczyk (2005), who
showed that service firms take necessary actions after a service failure to maintain
customer loyalty by recovering from service failure. This finding also corroborates the
ideas of Contiero et al. (2016), who suggested that service recovery initiatives
contribute towards enhancing customer loyalty. A possible explanation for this might
be that when customers experience an effective recovery, they tend to have positive
emotions towards the service brand, which lead to a positive attitude towards the
service provider (attitudinal loyalty) and increases the likelihood of future patronage
(behavioural loyalty) (DeWitt et al., 2008).
Concerning CPSR, the study found a positive influence on customers loyalty. This
finding agrees with Yang et al.'s (2014) findings, showing that if the customers'
participation satisfies the customers, they will increase their purchase frequency while
reducing the search for competitive offerings. The support of the study's finding is
gained as one of the most recent studies by Kim and Baker (2020) concluded that
after customers are more willing to revisit and show loyal behaviour towards a service
firm if they have received the service recovery.

233
Table 9.1 Results of Hypothesis 1 -7
Impact of Service recovery on post-recovery outcomes Result
H1 Service recovery (a. Customer participation in service recovery, b. Firm Recovery) positively influences perceived justice
Supported
H2 Service recovery (a. Customer participation in service recovery, b. Firm Recovery) positively influences overall brand equity
Supported
H3 Service recovery (a. Customer participation in service recovery, b. Firm Recovery) positively influences perceived quality
Supported
H4 Service recovery (a. Customer participation in service recovery, b. Firm Recovery) positively influences perceived value
Supported
H5 Service recovery (a. Customer participation in service recovery, b. Firm Recovery) positively influences brand reputation
Supported
H6 Service recovery (a. Customer participation in service recovery, b. Firm Recovery) positively influences brand trust
Supported
H7 Service recovery (a. Customer participation in service recovery, b. Firm Recovery) positively influences brand loyalty
Supported
9.2.3 RQ3: What is the mediating role of perceived justice between
service recovery and CBBE?
The third question in this study sought to determine the mediating role of perceived
justice between service recovery and CBBE. Very little was found in the literature on
perceived justice as a mediator between service recovery and CBBE. Though extant
research has recognized perceived justice within their frameworks in between service
recovery actions and their outcomes (Liao, 2007; Mostafa et al., 2015; Roggeveen et
al., 2012; Smith et al., 1999; Yani-de-Soriano et al., 2019), no study has examined
how service recovery is related to CBBE through the mediation of perceived justice.
Thus, following the approach of Liao (2007), this study takes a theory-based approach
and offers an integrated model of service recovery influencing customer evaluations
of brand-related factors through perceived justice after undertaking a service recovery.
9.2.3.1 Mediating role of perceived justice between service recovery and
overall brand equity
It was hypothesised that perceived justice mediates the relationship between service
recovery and overall brand equity. The results of this study confirm the mediating role
of perceived justice between service recovery and overall brand equity. It is
encouraging to compare this finding with that found by Liao (2007), who showed that
perceived justice mediates the relationship between service recovery and its
outcomes. This result also agrees with the findings of other studies, in which it has
been shown that positive perceived justice may reduce negative emotions after a

234
service failure and, in turn, may lead to positive outcomes after a service recovery
(Blodgett et al., 1993; Nazifi et al., 2020; Ozkan-Tektas and Basgoze, 2017).
There are several possible explanations for this result. Firstly, customers’ perception
of fairness of service recovery measures determines the outcome of service recovery
(Mostafa et al., 2015). Secondly, there is a strong association between perceived
justice and customers’ willingness to do business with the service brand again and
their satisfaction with service recovery (Petzer et al., 2017; Sharifi and Spassova,
2020; Smith and Bolton, 1998). In other words, customers will deem a service brand
superior to competitors if they develop a perception of fairness of service recovery
measures. Moreover, customer perceptions of fairness of service recovery measures
will develop customers’ belief that the service brand is trustworthy (Kelley and Davis,
1994) and shows concern for the customers (Harun et al., 2019). Hence, the current
finding supports the conceptual premise that if customers perceive their participation
in service recovery and firm recovery as fair, they will positively evaluate the service
brand.
9.2.3.2 Mediating role of perceived justice between service recovery and
Perceived quality
On the mediating role of perceived justice between service recovery and perceived
quality, this study found that service recovery affects consumers’ perception of service
quality through perceived justice. Firms must enhance perceived justice through an
effective service recovery to enhance the perceived quality of service after a service
failure and recovery. The present findings seem to be consistent with other research,
which found that perceived justice plays a key role in enhancing customers’
perceptions of service quality (Aurier and Siadou-Martin, 2007; Berry, 1995; Chi et al.,
2020; Roy et al., 2016). Aurier and Siadou-Martin’s (2007) findings showed a
significant effect of perceived justice dimensions on service quality. Similarly,
Andaleeb and Basu (1994) showed that perceived fairness is an important driver of
service quality evaluation. Further, Roy et al. (2016) presented perceived justice as a
key mediator between service recovery and perceived quality. In other words,
consumers’ perceptions of justice and fairness will be enhanced by an effective service
recovery, and consequently, such perceptions will influence customers’ perceptions of
service quality (Brady and Cronin, 2001).
235
It seems possible that this result is because perceived justice and perceived quality
are closely related, such that both are considered inseparable (Berry, 1995). More
specifically, the customers keenly observe and evaluate the activities which a firm
performs to resolve the service failure (Chi et al., 2020). These customer evaluations
are based on the premise of competence of the firm and abilities of the firm employees
to handle the service failure situation (Aurier and Siadou-Martin, 2007). The current
study contains the scenarios that explained that service employees readily admit the
mistake, apologise, and explain on the spot, which demonstrated the situation
handling skills of the restaurant employees. Hence, the current finding supports the
conceptual premise that if customers perceive their participation in service recovery
and firm recovery as fair, they will perceive the service brand as of high quality.
9.2.3.3 Mediating role of perceived justice between service recovery and
Perceived value
Another interesting finding was that perceived justice mediates the relationship
between service recovery and perceived value. The findings of the current study are
consistent with those of Kuo et al. (2013). They stated that perceived value results
from an evaluation of the relative benefits and costs or sacrifices associated with the
offering. If customers perceive that they have received justice after a service recovery,
they may perceive high value from buying the service (Oliver and Swan, 1989). The
current study’s findings are similar to that of Daskin and Kasim (2016). They claimed
that perceived value is promoted after the service firm and its employees successfully
provide effective service recovery. The findings from the qualitative study also suggest
that the consumers’ who receive service recovery perceive that the service response
is just. Further, they perceive that the trade-off between what they have received in
return for what they have given is positive.
A possible explanation for this might be that customers perceived value originates from
the service act itself that is satisfactory (Zauner et al., 2015). Another reason could be
that frontline employees’ performances at service encounters make a real difference
in customer perceived value. For instance, according to Daskin and Kasim (2016),
apologetic and caring behaviour makes the customers believe that the firm and
employees are rewarding against the service failure. Hence, their perceived value
236
towards the service brand enhances. Furthermore, other service recovery elements
are important in assessing service recovery, such as the convenience of the overall
process and the time needed for delivery of the service (Odoom et al., 2019), which
provides weight to the customers’ gains after a service recovery. This assessment will
constitute perceived justice that influences the perceived value of overall service
transactions (Aurier and Siadou-Martin, 2007). The promotion of perceived value is
critical for the service brands in today’s competitive environment because it is a source
of differentiation for the service brands (Slack et al., 2020). Thus, the current finding
supports the conceptual premise that if customers perceive the service recovery as
fair, they will perceive that they are getting high value from the service.
9.2.3.4 Mediating role of perceived justice between service recovery and Brand
Reputation
In this study, perceived justice was found to mediate the relationship between service
recovery and brand reputation. The findings of the current study are consistent with
those of Kim (2009), who showed that perceived justice plays a key role in managing
the reputation of a service firm. This finding further supports the idea of Shin et al.
(2018), who assert that outcomes of perceived justice have been seen as increasingly
important for firms concerned with enhancing their reputation. It has been speculated
that perceived justice can influence how customers perceive a service firm based on
experience or impressions, and these perceptions lead to associations that contribute
to a total picture of the service firm (Mostafa et al., 2015).
The mediating role of perceived justice between service recovery and brand reputation
may also be explained by the fact that actions of service employees, such as treating
their customers fairly, can lead to positive brand associations held by the customers
(Brown et al., 2006; Nguyen and Leblanc, 2002; Yani-de-Soriano et al., 2019). The
expected levels of perceived justice make the customers believe that the firm's
employees are well trained and resonate with the ideas of the service brand and thus
assist in managing the firm's reputation. These associations over a long period of time
make brand reputation (Keller, 2020; Walker, 2010). In other words, CPSR and FR
can enhance brand reputation if customers perceive the service recovery as fair.

237
9.2.3.5 Mediating role of perceived justice between service recovery and Brand
Trust
Another interesting finding was that perceived justice mediates the effect of Service
recovery (CPSR and FR) on brand trust. In other words, service recovery can enhance
brand trust by enhancing consumers’ perceptions of the fairness of service recovery.
The findings observed in this study mirror those of the previous studies that have
examined the role of perceived justice in influencing customers’ trust (Babin et al.,
2021; Liu et al., 2021; Mohd-Any et al., 2019). In other words, perceived justice can
positively influence consumer attitude where consumers perceive the service firm as
fair in treating them after a service failure which exerts an impact on customers’ trust
(Liu et al., 2021). Within the service recovery process, customers usually value more
on the firm's verbal assurances and consider it an element of interactional justice,
which further improves the confidence and reliance on the firm (Mohd-Any et al.,
2019). As Wang and Chen (2011) suggested, when customers perceive that the
justice levels are adequate, their trust levels increase.
There are several possible explanations for this result. Firstly, service recovery
enhances consumers’ fairness levels. In turn, it increases the belief of consumers in
the service firm as a reliable, honest, and benevolent brand that enhances their trust
in the service firm (Liu et al., 2021). Secondly, an effective service recovery that
includes explaining the failure and recovery process reduces the uncertainty levels
among customers (Bradley and Sparks, 2012; Gohary, Hamzelu and Alizadeh, 2016).
The reduction in anxiety leads to a positive evaluation of service recovery response,
consequently increasing the consumer’s trust in service brands (Santos and Basso,
2012). Further, a service recovery that is equipped with an apology (Min et al., 2020),
compensation (Albrecht et al., 2019), and proper explanation (Gohary, Hamzelu and
Alizadeh, 2016) enhance consumers’ perceptions of the service firm competency,
which lead to perceived justice and subsequently increasing consumer trust in the
service firm (Urueña and Hidalgo, 2016). Therefore, service firms should enhance
consumers’ confidence in firms’ service recovery procedures and outcomes,
enhancing consumers’ perceptions of justice and fairness and consequently winning
the customers’ trust.
238
9.2.3.6 Mediating role of perceived justice between service recovery and Brand
Loyalty
The result of hypothesis testing confirms the mediating role of perceived justice
between service recovery (CPSR and FR) and brand loyalty. This finding confirms the
association between service recovery and brand loyalty through perceived justice.
This finding is in agreement with Karatepe (2006) findings which showed that a high
level of distributive, procedural, and interactional justice lead to high levels of
consumer loyalty. It is also encouraging to compare this result with that found by De
Ruyter and Wetzels (2000), who found that effective service recoveries provided by
the service firm lead to consumers’ perceptions of fair treatment, which subsequently
enhances customer loyalty to the service brand. The findings related to the
involvement of customers in service recovery processes allow the customers to have
cognitive, behavioural and decisional control on the solution of the problems. Joosten
et al. (2017) confirmed that perceived justice is enhanced when customers exercise
control over the service recovery process. Further, they elaborate that elevated levels
of perceived justice may result in customer loyalty. The current study’s findings also
resonate with Roggeveen et al.'s (2012) investigations, where they found perceived
justice as a key mediator between customer participation in service recovery and its
outcomes (recovery satisfaction and repurchase intentions).
Several possible explanations can support this finding. Firstly, when service firms
demonstrate fairness in recovering from service failures and show concern for the
customers, they are likely to perceive it as fair and enhance customer loyalty with their
brands (Kim and Baker, 2020b). Secondly, service recovery enhances consumers’
perceptions of fairness of the service recovery outcomes, which increases consumers’
satisfaction with the service firm, and these highly satisfied customers become loyal
to the service firm (Cantor and Li, 2019; Smith and Bolton, 1998). This finding shows
that when effective service recovery is provided, it leads to customers’ perceptions of
fairness, allowing customers to develop better impressions of the service firms’ future
behaviours and performances, which subsequently enhances consumer loyalty to the
service firm (Liu et al., 2021). The current finding supports the conceptual premise that
if customers perceive the co-created service recovery and firm recovery as fair, they
will become loyal to the service brand.

239
Table 9.2 Results of Hypothesis 8-13
Mediating role of perceived justice Result H8 Perceived justice mediates the relationship between service recovery (a.Customer
participation in service recovery, b. Firm Recovery) and overall brand equity Supported
H9 Perceived justice mediates the relationship between service recovery (a. Customer participation in service recovery, b. Firm Recovery) and perceived quality
Supported
H10 Perceived justice mediates the relationship between service recovery (a. Customer participation in service recovery, b. Firm Recovery) and perceived value
Supported
H11 Perceived justice mediates the relationship between service recovery (a. Customer participation in service recovery, b. Firm Recovery) and brand reputation
Supported
H12 Perceived justice mediates the relationship between service recovery (a. Customer participation in service recovery, b. Firm Recovery) and brand trust
Supported
H13 Perceived justice mediates the relationship between service recovery (a. Customer participation in service recovery, b. Firm Recovery) and brand loyalty
Supported
9.2.5 RQ4: What is the moderating role of service failure severity?
In accordance with the present results, previous studies also have demonstrated that
though service recovery measures can affect customer's perception of justice, this
relationship may get distorted if service failure severity is considered (Albrecht et al.,
2019). Similarly, Liao (2007) found that the impact of service recovery on customer
evaluations of service recovery is influenced by severity of the failure. The observed
relationship between service recovery and perceived justice might be explained so
that when customers are treated with respect, sensitivity, and dignity after a service
failure, they will perceive the service recovery as fair and just (Colquitt, 2001). The
intensity of service failure induces strong emotional reactions in customers (Sarkar et
al., 2021), sometimes ignoring the service firm's efforts to recover from the failure.
Thus, results in the decline of perceived justice levels. It can thus be suggested that
service recovery (CPSR and FR) can enhance perceived justice; however, this
relationship will vary with the severity of service failure. For example, the link between
service recovery and perceived justice may be stronger for low service failure severity
incidents than high failure severity cases.
This study also shows that service failure severity moderates the relationship between
service recovery and overall brand equity. The present findings seem to be consistent
with other research, which found service failure severity can affect the evaluation of a
service provider after a service failure and their future relationship with the service
brand (Balaji and Sarkar, 2013). This result may be explained by the fact that service
failure severity can change customer expectations and subsequently influence
customer's evaluation of service recovery efforts. Higher service failure severity
240
generates a greater perception of loss (Lin, 2011). It can thus be suggested that CPSR
and FR can enhance overall brand equity; however, this relationship will vary with the
severity of service failure. For example, the link between service recovery and overall
brand equity may be stronger for low service failure severity incidents than high failure
severity cases.
Another important finding was that the severity of service failure moderated CPSR and
FR effect on perceived quality. This result corroborates the findings of a great deal of
the previous work in this field. For instance, past research has found that service failure
severity is an important factor that can decide how customers evaluate the efforts of a
service provider (Balaji and Sarkar, 2013; Lin, 2011; Riaz and Khan, 2016). The
results, thus, indicate that CPSR and FR can enhance perceived quality; however, this
relationship will vary with the severity of service failure.
This study also shows that service failure severity moderates the influence of service
recovery on perceived value. These results are consistent with those of other studies
and suggest that when the severity of service failure increases, customers are more
critical of service recovery efforts, and thus service recovery efforts are more likely to
impact customer perceptions (Abney et al., 2017; La and Choi, 2019; Weun et al.,
2004). Customers feel shattered after poor service experiences. The intensity of the
failure enlarges their service recovery expectations (Xu et al., 2019). Therefore, any
mismatch to the customer expectations leads to impact the post-recovery outcomes.
It can thus be suggested that CPSR and FR can enhance perceived value; however,
this relationship will vary with the severity of service failure.
One unanticipated finding is that the severity of service failure does not moderate
CPSR and FR impact on brand reputation. The findings of the current study are
consistent with those of Choi and Choi (2014) who found that service failure severity
did not affect the relationship between service recovery initiatives such as interactional
and procedural justice and customers’ perceptions of brands. This finding is in
agreement with Weun et al. (2004) findings which showed that service failure severity
did not moderate the relationship between justice recovery and consumer-related
outcomes. The results suggest that the influence of the process of service recovery
on post-recovery reputation is stable across varying levels of service failure severity.

241
This result may be explained by the fact that a brand with high reputation is considered
a strong brand and this brand strength provides a critical buffering from service failure
severity (Sengupta et al., 2015).
Although, these results are consistent with studies (Choi and Choi, 2014; Weun et al.,
2004), they do not support other previous research. For instance, this finding is not
consistent with Cantor and Li (2019) findings that showed that service failure's severity
has negative implications for the positive outcome of service recovery actions. This
result is also not in agreement with La and Choi (2019), who asserted that the influence
of service recovery on the evaluations or inferences about the service firm could be
affected by the magnitude of a service failure. The disagreement between current
study’s findings and some of the previous research could be attributed to the context
of the study and outcome variables. To illustrate, this study examined the moderating
role of service failure severity for brand reputation as the outcome variable which
explains this study’s different findings from some of the extant research.
The current study also found that service failure severity moderates the influence of
service recovery on brand trust. A decrease in the brand trust after a service recovery
due to high service failure severity in this study corroborates earlier findings, showing
that customers tend to act differently depending on the magnitude of the service failure
severity (Israeli, Lee and Karpinski, 2019). This also accords with Liao (2007) finding
that shows that service recovery initiatives result in positive outcomes; however, these
positive outcomes were dependent on the severity of service failure. It can thus be
suggested that CPSR and FR can enhance brand trust; however, this relationship will
vary with the severity of service failure.
Finally, the results of the current study also indicate that magnitude of service failure
may disrupt the relationship of service recovery with loyalty. These results match those
observed in earlier studies that show that service failure's severity has negative
implications for outputs of service recovery measures such as customer satisfaction
(Roggeveen et al., 2012; Smith et al., 1999; Wang et al., 2011). Similar to the current
findings, Roggeveen et al. (2012) suggested that customers become more interested
in receiving a solution to the service failure when they experience a high severity
failure. Furthermore, their findings claimed that altering levels of post-recovery
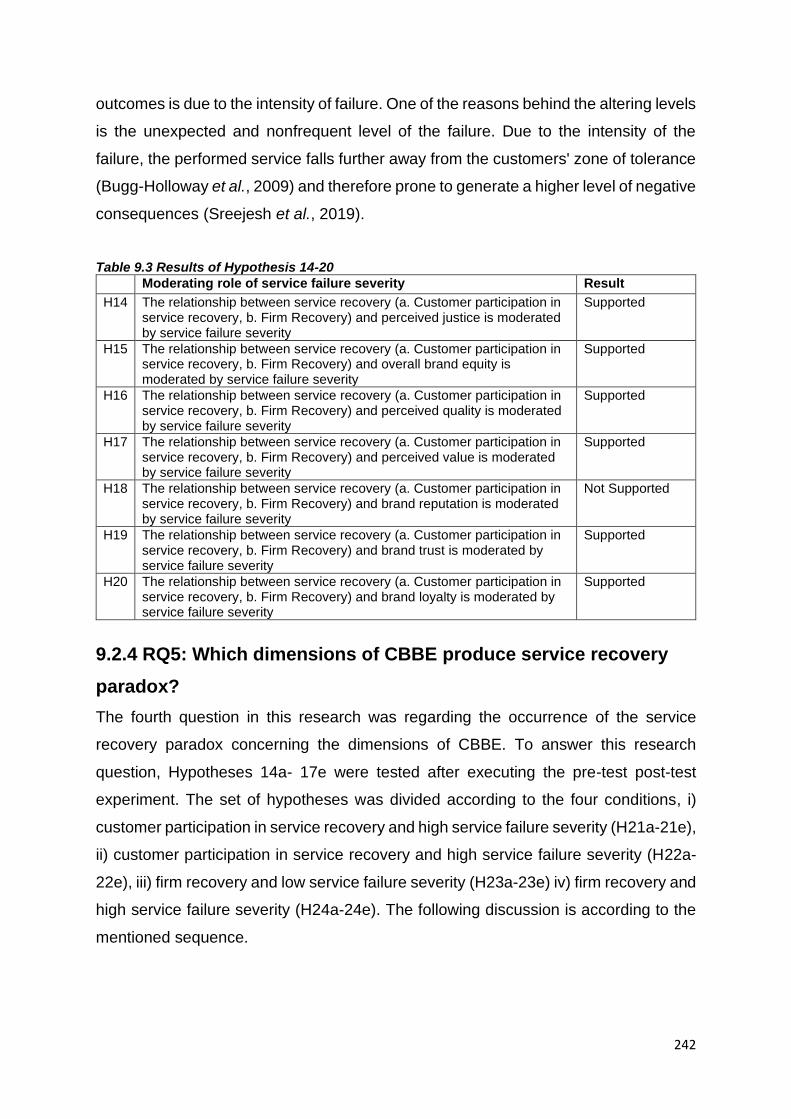
242
outcomes is due to the intensity of failure. One of the reasons behind the altering levels
is the unexpected and nonfrequent level of the failure. Due to the intensity of the
failure, the performed service falls further away from the customers' zone of tolerance
(Bugg-Holloway et al., 2009) and therefore prone to generate a higher level of negative
consequences (Sreejesh et al., 2019).
Table 9.3 Results of Hypothesis 14-20
Moderating role of service failure severity Result
H14 The relationship between service recovery (a. Customer participation in service recovery, b. Firm Recovery) and perceived justice is moderated by service failure severity
Supported
H15 The relationship between service recovery (a. Customer participation in service recovery, b. Firm Recovery) and overall brand equity is moderated by service failure severity
Supported
H16 The relationship between service recovery (a. Customer participation in service recovery, b. Firm Recovery) and perceived quality is moderated by service failure severity
Supported
H17 The relationship between service recovery (a. Customer participation in service recovery, b. Firm Recovery) and perceived value is moderated by service failure severity
Supported
H18 The relationship between service recovery (a. Customer participation in service recovery, b. Firm Recovery) and brand reputation is moderated by service failure severity
Not Supported
H19 The relationship between service recovery (a. Customer participation in service recovery, b. Firm Recovery) and brand trust is moderated by service failure severity
Supported
H20 The relationship between service recovery (a. Customer participation in service recovery, b. Firm Recovery) and brand loyalty is moderated by service failure severity
Supported
9.2.4 RQ5: Which dimensions of CBBE produce service recovery
paradox?
The fourth question in this research was regarding the occurrence of the service
recovery paradox concerning the dimensions of CBBE. To answer this research
question, Hypotheses 14a- 17e were tested after executing the pre-test post-test
experiment. The set of hypotheses was divided according to the four conditions, i)
customer participation in service recovery and high service failure severity (H21a-21e),
ii) customer participation in service recovery and high service failure severity (H22a-
22e), iii) firm recovery and low service failure severity (H23a-23e) iv) firm recovery and
high service failure severity (H24a-24e). The following discussion is according to the
mentioned sequence.

243
9.2.4.1 Customer participation in service recovery and Low service failure
severity
Unexpectedly, the results did not detect any evidence for the service recovery paradox
when customers participate in service recovery and experience a low service failure
severity context. The observed difference between pre-failure levels and post-
recovery levels of the dimensions of CBBE (brand loyalty, brand reputation, brand
trust, perceived quality and perceived value) in this study were not significant. These
results match those observed in earlier studies. For instance, McCollough (2000)
found that no service recovery paradox emerges based on the strength of recovery
performance alone. Similarly, Andreassen (2001) findings challenge the existence of
the service recovery paradox. This study findings also corroborate the findings of Kau
and Loh (2006), who showed that there is a lack of support of the recovery paradox
effect.
The explanation for the lack of a recovery paradox is the delay of service. Although
the delay mentioned in the scenario is short, the findings from the interviews
suggested that a delay in serving the food generates long term negative
consequences, which may diminish the effects of service recovery. As McCollough
(2000), no service recovery effort can completely mitigate the harm caused by the
failure. The paradox may occur if the response is overwhelming and unexpected
(Gohary, Hamzelu and Pourazizi, 2016). However, the restaurant customers might
perceive free dessert or discounts as an expected service recovery response.
Therefore, the recovery actions fail to exceed the pre-failure levels of customers
concerning the dimensions of CBBE.
According to Khamitov et al. (2020), the service recovery paradox exists when the
service recovery actions can completely alleviate the negative effects of service
failure. Given the current results, the positive impact of customer participation in
service recovery is observed. However, the positive impact does not support the levels
of CBBE dimensions to exceed their pre-failure levels. Another explanation in this
regard is that customers are provided with compensation and according to Kelly et al.
(1993), service recovery, which involves correction and additional compensation
beyond the correction of the failure, are rated less favourable than recovery measures
244
that simply correct the problem. Thus, in case of customer participation in service
recovery and low service failure severity
9.2.4.2 Customer participation in service recovery and high service failure
severity
The results related to hypotheses 15a -15e were not supported. It was found that the
post-recovery customers’ levels of brand loyalty, brand trust, brand reputation,
perceived quality and perceived value did not exceed their pre-failure levels. Hence
failed to produce any paradox when customers participate in service recovery and the
service failure severity is high. The current finding is consistent with Du et al.'s (2011)
findings, showing that customers’ negative emotions could be mitigated during service
recovery efforts; however, customers’ negative feelings cannot be completely restored
to their initial levels. Findings of the current study conflict with the findings of Gohary,
Hamzelu and Pourazizi (2016) who suggests that who suggested that the recovery
paradox only exist if the value is created in the service recovery by involving customers
in the service recovery process. Similarly, the findings contradict Azemi et al. (2019),
who states that one of the conditions of recovery paradox occurrence is when
customers participate in service recovery.
A possible explanation for current results may be that the service recovery paradox
exists when the initial service is not severely dissatisfying, and the service recovery
exceeds the expectation and provides experiences that are better than just a satisfying
level of initial service encounter (Michel and Meuter, 2008). The nonexistence of
recovery paradox might be due to the high severity of service failure. As Magnini et
al. (2007), states that the service recovery paradox may only exist when the service
failure is not serious; consumers do not blame the service provider and do not believe
the service failure occur in the future. Thus, it can be suggested that customers
develop some basic expectations of how a service provider should deal with a service
failure and react when the service recovery falls below the expected level (Priluck and
Lala, 2009). Thus, for a severe service failure, customers participation in service
recovery may not assist in producing a service recovery paradox.
245
9.2.4.3 Firm recovery and low service failure severity
Another important finding was that the service recovery paradox existed for firm
recovery when service failure severity was low. More specifically, the customers’ post-
recovery levels of brand loyalty exceeded pre-failure levels in case of firm recovery.
These results match those observed in earlier studies. For instance, Smith and Bolton
(1998) found empirical support for the existence of the service recovery paradox in a
way that loyalty was enhanced due to a highly satisfactory recovery. Similarly, Weitzl
and Hutzinger (2017) showed that service recovery perceived as appropriate can lead
to more favourable reactions such as increased repurchase intentions compared to a
situation no complaint is made.
This result may be explained by the fact that in normal circumstances (in case of no
failure), customers receive equivalent treatment as compared to other customers from
the restaurant. However, after a service failure, the customer gains attention and extra
care from the service provider (Hwang and Mattila, 2020; Mostafa et al., 2015) as in
the scenario given in the current study explains that the firm took care of the customer
by providing apology, explanation and complimentary dessert as compensation.
Therefore, a highly satisfactory recovery can increase cumulative satisfaction, which
further leads to higher levels of loyalty (Smith and Bolton, 1998). The post-recovery
levels of customers loyalty increase because of the presence of functional and
symbolic elements of service recovery. As Yani-de-Soriano et al. (2019) explained,
satisfied customers are more willing to purchase again and stay loyal to the service
brand in the long run after the service recovery. Thus, for a low severity service, the
firms have an opportunity to increase the levels of brand loyalty more than pre-failure.
Surprisingly, this study could not find evidence of service recovery paradox for other
dimensions of CBBE in the low service failure severity context when firms undertake
service recovery. The observed difference between pre-failure state and post-recovery
state for CBBE dimensions, including perceived quality, perceived value brand
reputation, and brand trust in this study, was not significant. The observed absence of
service recovery paradox could be attributed to the characteristic of service failure
(Azemi et al., 2019) as the service failure may have perceived as unexpected by the
customers, and even service recovery doesn’t improve the post-recovery outcomes to
the extent that the levels surpass the pre-failure levels. Therefore, for low severity
246
service failure, firm recovery might not produce a service recovery paradox for CBBE
dimensions other than brand loyalty. It is encouraging to compare this figure with that
found by Kau and Loh (2006), who found that no service recovery paradox exists as
customer satisfaction and other outcomes cannot be brought to pre-service failure
level even if the service recovery is successful. This finding also supports previous
research by McCollough (2000), and Andreassen (2001) found that no service
recovery paradox occurs in case of low severe failure expectations.
9.2.4.5 Firm recovery and high service failure severity
In case, where customers receive recovery from the firm and service failure severity
was high, an interesting finding was that brand loyalty enhanced from pre-failure and
recovery phase when a firm-initiated service recovery in case of high service failure
severity. Thus, there existed a service recovery paradox for firm recovery when service
failure was high. These findings further support the ideas of Azemi et al. (2019), who
explained that if the firm promptly responds to the service failure and provides
compensation to the customers, the service recovery paradox occurs. The reasons for
the recovery paradox occurrence provided by Azemi et al. (2019) are found in the
hypothetical scenario given to the respondents of this study. For example, in the
scenario, it was mentioned that after a service delay of 1 hour, the firm provides
immediate apology, explanation and prompt compensation in the shape of a
complimentary dessert. The provision of a complimentary dessert might have triggered
the respondents to rate the brand loyalty levels higher than what they rated in the pre-
failure phase.
The explanation of the results also gets support from the literature. For example, one
of the most frequent positive outcomes of service recovery mentioned in the previous
studies is that customers intend to stick with the firm and show positive signs of buying
from the service brand frequently in the future (Bahmani et al., 2020; Jin et al., 2020;
Matikiti et al., 2019; Mohd-Any et al., 2019). Bahmani et al. (2020) suggested that
customers in the hospitality industry are more willing to stick with the firm and purchase
more if provided with compensation. Qualitative findings also suggest that upon
receiving a satisfactory service recovery, the interviewees seemed delighted and
showed positive opinions about revisiting the service brand in future. In other words,
customers must receive satisfactory recovery after every failure incident which may
247
result in long-term customer commitment. Thus, for a high severity service failure, a
prompt action in the shape of verbal apology and compensation by the firm creates a
service recovery paradox for brand loyalty.
Contrary to expectations, this study did not find any evidence of service recovery
paradox for other CBBE dimensions in the high service failure severity context when
firms undertake service recovery. The current study's findings are consistent with the
previous studies that did not find any paradox (Andreassen, 2001; Du et al., 2011; Kau
and Loh, 2006; Lin et al., 2011; McCollough, 2000). For example, Kau and Loh (2006)
showed no service recovery paradox exists as customer satisfaction and other
outcomes could not surpass the pre-service failure level even if the service recovery
was successful. On the other hand, according to Du et al. (2011), customers develop
negative feelings towards the brand after a service failure, and the negative feelings
restrict the customers’ post-recovery levels (of brand-related outcomes) to exceed the
pre-failure levels. The evidence of generating strong negative feelings is also recorded
in the qualitative data analysis, which seemed to affect the informants in the long run
and thus, some of them were not fully satisfied with the service recovery efforts.
Another explanation to the results is that these results are because the service
recovery paradox may only exist when the service failure is not serious, consumers
do not blame the service provider and do not believe the service failure occurs in the
future (Magnini et al., 2007). Thus, it can be suggested that customers develop some
basic expectations of how a service provider should deal with the high severity of
service failure and react when the service recovery falls below the expected level
(Priluck and Lala, 2009). Therefore, for a high severity service failure, firm-based
recovery might not produce a service recovery paradox for the CBBE dimensions,
including brand reputation, perceived quality, perceived value, and brand trust.

248
Table 9.4 Results of hypothesis 21a-24e
Paradox hypotheses Result
H21a-e If a firm exercises service recovery (CPSR) after a low severity service failure, the customer’s post-recovery ratings in terms of a) perceived quality b) perceived value c) brand reputation d) brand trust e) brand loyalty ratings will be higher than customer’s pre-failure ratings.
Not Supported
H22a-e If a firm exercises service recovery (CPSR) after a high severity service failure, the customer’s post-recovery ratings in terms of a) perceived quality b) perceived value c) brand reputation d) brand trust e) brand loyalty ratings will be higher than customer’s pre-failure ratings.
Not Supported
H23a-d If a firm exercises service recovery (FR) after a low severity service failure, the customer’s post-recovery ratings in terms of a) perceived quality b) perceived value c) brand reputation d) brand trust ratings will be higher than customer’s pre-failure ratings.
Not Supported
H23e If a firm exercises service recovery (FR) after a low severity service failure, the customer’s post-recovery ratings in terms of brand loyalty ratings will be higher than customer’s pre-failure ratings
Supported
H24a-d If a firm exercises service recovery (FR) after a low severity service failure, the customer’s post-recovery ratings in terms of a) perceived quality b) perceived value c) brand reputation d) brand trust ratings will be higher than customer’s pre-failure ratings.
Not supported
H24e If a firm exercises service recovery (FR) after a low severity service failure, the customer’s post-recovery ratings in terms of brand loyalty ratings will be higher than customer’s pre-failure ratings
Supported
9.3 Summary
This chapter has discussed the findings of the five research questions which were
developed in chapter 2. The discussion is done in the light of quantitative and
qualitative analysis. The consistency and contradiction of current findings with the
existing literature are discussed.
In relation to RQ1, the current study found that brand loyalty, brand reputation, brand
trust, perceived quality and perceived value fluctuate during a service failure and
recovery process. The qualitative findings demonstrate that the mentioned dimensions
of CBBE decline after a service failure but have the tendency to improve after service
recovery. Thus, contributing to the literature by identifying the vulnerable factors
related to CBBE.
In response to RQ2, service recovery (CPSR and FR) positively impacts post-recovery
outcomes, including perceived justice and CBBE. In the qualitative study, the
dimensions that tend to fluctuate within service failure and recovery process were
taken in the quantitative study. The impact of service recovery on these dimensions
249
was examined. All post-recovery outcomes utilised in this study were impacted
positively by Service recovery. Regarding RQ3, perceived justice was a key mediator
between service recovery (CPSR and FR) and CBBE. The discussion of RQ4 is
regarding the moderating role of service failure severity which was found to be a
significant moderator in the framework.
Finally, the chapter includes the discussion related to the answer to RQ5. Service
recovery paradox regarding brand loyalty occurs regardless of the intensity of service
failure but only if the firm initiates the service recovery. No evidence of service recovery
is found in cases when customers participate in service recovery. Thus, contributing
the literature in examining CBBE dimensions as the subject of the recovery paradox.

250
Chapter 10 Conclusion
10.1 Introduction
The chapter of the conclusion includes the key contributions of the current thesis. It
also highlights the limitations and potential areas for future research. The chapter
starts by describing the theoretical contribution of this research. Next, the
methodological contributions are discussed. The managerial implications then follow
it. Finally, limitations and future research areas are presented.
10.2 Theoretical Contributions
The current thesis contributes in several ways to the literature on service recovery and
brand equity. Firstly, this work contributes to existing knowledge of service recovery
and brand equity by providing evidence of the positive influence of Service recovery
(CPSR and FR) in enhancing brand equity. This study has demonstrated, for the first
time, that brand equity can be an outcome of service recovery. Existing research has
examined brand equity as a mediator (Harun et al., 2019), as a driver of evaluations
of service encounters (Brady et al., 2008), and as a moderator between service
recovery and post-recovery outcomes (Hazée et al., 2017; Huang, 2011). To the
researcher’s best knowledge, the current study is the first to empirically examine brand
equity as an outcome of service recovery initiatives. Specifically, this study revealed
that both CPSR and FR result in enhanced brand equity. In other words, the empirical
findings in this study provide a new understanding of how recovering from service
failure builds goodwill, thus mitigating the effect of a poor service experience on the
brand and consequently enhancing brand equity.
Secondly, the contribution of this study relates to the knowledge of customer
participation in service recovery. Although the current study is in agreement with the
previous research, which identifies service recovery as a firm-initiated phenomenon
(Bahmani et al., 2020; Chen and Kim, 2019; Chen et al., 2018; del Río-Lanza et al.,
2009; Smith et al., 1999), it extends the growing body of knowledge related to the
customer participation in service recovery (Bagherzadeh et al., 2020; Dong et al.,
2016; Gohary, Hamzelu, Pourazizi, et al., 2016; Hazée et al., 2017; Roggeveen et al.,
2012; Van Vaerenbergh et al., 2019). The previous research investigates the

251
instances when customers’ participation in service recovery is appropriate (Xu,
Marshall, et al., 2014) and how it affects recovery satisfaction (Gohary, Hamzelu,
Pourazizi, et al., 2016; Kim and Baker, 2020a), repurchase intentions (Hazée et al.,
2017; Vázquez-Casielles et al., 2017), intentions to future co-creation (Gohary,
Hamzelu, Pourazizi, et al., 2016). However, these studies do not examine the role of
customer participation in service recovery in enhancing perceived justice and other
brand-related outcomes. The current findings contribute by examining the influence of
customer participation in service recovery on perceived justice, overall brand equity,
brand loyalty, brand reputation, brand trust, perceived quality and perceived value.
This answers the call for empirical research into the different mechanisms underlying
the effects of service recovery on customer evaluations (Van Vaerenbergh et al.,
2019).
The third contribution of the current study is that it attempts to enhance our
understanding of the dimensions of CBBE, which tend to fluctuate within service failure
and recovery process. The existing studies have examined the impact of service
recovery primarily on brand loyalty (DeWitt et al., 2008; Yani-de-Soriano et al., 2019),
brand trust (Pacheco et al., 2019; Urueña and Hidalgo, 2016), positive emotions
(Gohary, Hamzelu, Pourazizi, et al., 2016; Kozub et al., 2014), positive word of mouth
(Akinci and Aksoy, 2019; Davidow, 2003), repurchase intentions(Basso and Pizzutti,
2016; Hwang et al., 2020; Maxham III and Netemeyer, 2002). However, the presence
of the dependant outcomes originates from the literature. Whereas, in the current
study, the qualitative analysis identified the CBBE dimensions that tend to fluctuate in
service failure and recovery process. The levels of the CBBE dimensions decline after
a service failure, but when service recovery is initiated, the level of dimensions seems
to enhance. The findings related to the enhancing levels of CBBE dimensions were
further confirmed in the quantitative phase.
The fourth contribution is related to the comparison of the impacts of CPSR and FR
on post-recovery outcomes. The existing literature on CPSR suggests promising
results regarding the preference of CPSR over FR (Hazée et al., 2017; Karande et al.,
2007; Roggeveen et al., 2012). However, the results of the current study suggest that
the impacts of CPSR and FR on post-recovery outcomes (perceived justice,
252
dimensions of CBBE which tend to fluctuate, and overall brand equity) are not
statistically different.
A fifth significant theoretical contribution concerns the mediating role of perceived
justice between service recovery and brand-related outcomes. Though some research
has been carried out on the mediating role of perceived justice (Liao, 2007;
Roggeveen et al., 2012), there is no scientific understanding of the mediating effect of
perceived justice between service recovery and CBBE in the literature. Current
research advances this literature by revealing that perceived justice intervenes
between service recovery and brand-related outcomes, including overall brand equity,
brand loyalty, brand reputation, brand trust, perceived quality and perceived value. In
other words, this is the first study reporting an increase in CBBE and its dimensions
by enhancing customers perception of fairness of service recovery through both firm
recovery and customers participation in service recovery.
The current findings also add to a growing body of literature on dimensions of
perceived justice. Most of the research on service recovery considers perceived justice
consisting of three dimensions: distributive, procedural, and interactional justice (Choi
and Choi, 2014; Maxham III and Netemeyer, 2002; Muhammad and Gul-E-Rana,
2020; Roggeveen et al., 2012). A review of the literature revealed that informational
justice is neglected in extant service research. Only a few studies exist that have
examined the role of informational justice in enhancing post-recovery outcomes
(Chalmers, 2016; Gohary, Hamzelu and Alizadeh, 2016; Nikbin et al., 2013). However,
to the best of the researcher’s knowledge, no study has examined the role of
informational justice in enhancing CBBE and its dimensions. The present study
provides evidence with respect to perceived justice components (including
informational justice) that determine the factor structure of perceived justice and
consequently play the intervening role between service recovery and brand-related
outcomes.
The thesis contributes to the body of knowledge by identifying that brand loyalty is the
only dimension that may produce a service recovery paradox if the service recovery
is provided by the firm. Previous research has examined the occurrence of service
recovery paradox concerning customer satisfaction (Azemi et al., 2019; Michel and

253
Meuter, 2008; Tax et al., 1998), loyalty (Gohary, Hamzelu and Pourazizi, 2016; Smith
and Bolton, 1998; Weitzl and Hutzinger, 2017), image (Andreassen, 2001), and
repurchase intentions (Gohary, Hamzelu and Pourazizi, 2016; Soares et al., 2017;
Voorhees et al., 2006). In the current study, none of the other dimensions of CBBE
produces a service recovery paradox apart from brand loyalty. However, to the best
of the researcher’s knowledge, this is the first study that investigates the service
recovery paradox concerning brand reputation, brand trust, perceived quality, and
perceived value.
Finally, this research extends our knowledge about service failure typologies. It is a
significant contribution as it provides a more inclusive set of failure typologies as
compared to the existing typologies. Existing research is built on three different
perspectives of service failure typologies, the first by Bitner et al. (1990), which
includes system delivery failure, nonfulfillment of customers’ requests, and
unsolicited/unwanted behaviour. The second by Keaveney (1995) consists of core
service and encounter failure. the third by Smith et al. (1999) includes outcome and
process service failures. However, the major flaws of extant failure typologies are that
they are too general in nature and lack precision. Traces of confusion are found in
literature where the same example of service failure is treated in different types of
failures (Forbes, 2008; Migacz et al., 2018; Tsai and Su, 2009). The empirical findings
in this study provide a new understanding of typologies of service failure that can be
divided into three main types and nine subtypes, which clearly segregate the types
based on their distinct characteristics. By segregating and dividing into subtypes, it
further clarifies the different nature of the failure type, and thus its effects on brands
could be examined separately. The detailed description can be found in section 5.7
and Table 5.1 in chapter 5.
10.3 Methodological Contributions
The current thesis provides key methodological contributions related to i) the
development of hypothetical scenarios which were aimed to be closer to reality and ii)
minimisation of the impact of deceitful and biased responses collected in the
quantitative phase to enhance the validity and reliability of the findings.

254
Firstly, this study is the first of its kind within service recovery and branding literature,
which explains the key ingredients to build hypothetical scenarios. The three key
ingredients are i) the setting, ii) the actors or agents iii) the plot. A detailed description
of the key ingredients is described in chapter 7, section 7.4.2. an addition to the
methodological contribution is that qualitative analysis is utilised to select the setting,
the actors, and the plot to develop the hypothetical scenario closer to reality.
Secondly, deceitful responses are part and parcel when the data is collected through
crowdsourcing platforms—uninterested respondents who want to participate merely
to get a financial reward to produce biased responses. However, there are techniques
available to control this biasness. The current study utilised the attention check
technique, which minimised these kinds of responses. Finally, the current study
adopted a holistic approach which included a systematic literature review, semi-
structured interviews and scenario-based experiments to answer the research
questions. The adoption of this holistic approach enhanced the validity and reliability
of the current study’s findings.
10.4 Practical Contributions
The findings of this study provide several valuable guidelines to service marketers on
how to enhance overall brand equity, perceived quality, perceived value, brand
reputation, brand trust, and brand loyalty by utilising the mechanism of service
recovery. Specifically, this study provides insight into enabling customer participation
in service recovery to overcome the negative effects of service failure. Understanding
the effect of service recovery on brand-related outcomes and the mechanism of
initiating service recovery (CPSR and FR) are crucial for service marketers
responsible for managing service brands. The current study has direct implications for
managing service brands’ health and growth in service failure situations by addressing
these unavoidable service issues (Israeli, Lee and Bolden, 2019). In other words, this
thesis has several managerial implications and address important issues of service
brand management (Roggeveen et al., 2012).
The first set of managerial guidelines concerns the participation of customers in
recovering from service failures. This study discovered that customer participation in
255
service recovery enhances perceived justice, overall brand equity, brand loyalty, brand
trust, perceived quality, perceived value, and brand reputation. Therefore, service
firms should find ways to involve customers in initiating and implementing the recovery
effectively. This can be done by training service employees (Karatepe et al., 2019) to
enable customers’ participation in the recovery. Involving customers in service
recovery will allow service employees to understand customers’ wants and needs,
leading to recovery from service failure effectively (Xu, Tronvoll, et al., 2014). For
example, a service employee can ask the customer point-blank what can be done to
resolve the service failure.
Allowing customers to participate in service recovery will make them feel more
empowered and in control (Guo, Lotz, et al., 2016), which might develop positive brand
associations, including increased perceived quality, perceived value, and reputation.
Customer perceptions are one of the keys in differentiating a service from its
competition (De Chernatony and Dall’Olmo Riley, 1999) and will lead to enhanced
behavioural and emotional responses such as brand loyalty (DeWitt et al., 2008; La
and Choi, 2019; Yani-de-Soriano et al., 2019) and brand trust (Basso and Pizzutti,
2016; Urueña and Hidalgo, 2016). Thus, training service employees in ways to involve
customers in service recovery will enable them to execute effective co-created service
recovery, which may act as a cost-effective service recovery procedure. Service
managers should enhance their employees understanding of scenarios where
customers participation in service recovery is required and consequently involve
customers in service recovery co-creation to generate positive outcomes for the
service brand (Bagherzadeh et al., 2020).
Customer participation in service recovery will also allow flexibility in solving the
service issue (Roggeveen et al., 2012). Service managers should see if they can mend
the standard procedure to incorporate customers' suggestions in recovering from
service failure while also not damaging the brand reputation. Customer participation
in the service recovery can also make consumers realise that they are getting a
solution in the right way (Hazée et al., 2017). Thus, it is necessary to apologise, explain
the reason for service failure, and provide alternatives for compensation for the
customer to choose. In other words, consumers expect to be listened by the service

256
firm and encounter a well-balanced service recovery mechanism in terms of process
and outcomes.
The findings of this study highlight the importance of the perception of fairness in
service recovery situations. Managers are advised to be careful while planning and
executing the service recovery. First, to enhance the perceptions of fairness of service
recovery, service managers should make sure that an immediate apology is given to
the customer regardless of the source of service failure (Min et al., 2020). Second,
managers should pay complete attention and carefully listen to customers while they
are explaining the problems they encountered with the service(Beauchamp and
Barnes, 2015). After listening to customers' complaints, managers should explain why
the service failure happened (Mostafa et al., 2015). Third, service managers should
also explain how the problem will be resolved. However, managers should be careful
not to create unrealistic expectations from the service firm in terms of service recovery.
Finally, managers should offer compensation to customers to pacify them in addition
to correcting or reperforming the flawed service (Kenesei and Bali, 2020; Liu et al.,
2019). Enhancing perceptions of fairness will lead to an increase in overall brand
equity, brand loyalty, brand trust, perceived quality, perceived value, and brand
reputation. Therefore, service firms should undertake service recovery, which is
perceived as fair and just by the customer.
Another managerial implication from the study concerns firm recovery measures.
Managers can undertake service recovery without involving customers in the recovery
(Liao, 2007; Min et al., 2020; Mostafa et al., 2015). Service managers can use such
service recovery mechanisms to affect post-failure consumer behaviour. Specifically,
the current study's findings suggest that firm recovery can enhance overall brand
equity, brand loyalty, brand trust, perceived quality, perceived value, and brand
reputation. Firm recovery will also allow managers in maintaining standard practices
and policies, which will increase the service recovery efficiency and reduce the cost of
recovery (Min et al., 2020). Incorporating standard service recovery procedures and
policies will enable consumers in knowing beforehand what to expect from the service
provider regarding resolving their complaints. This can also develop the perception in
service consumers that the service firm cares for the customers and is eager to recover
from service failure (Mostafa et al., 2015). In other words, service employees should

257
take recovery actions quickly to mitigate the negative effects of service failure, leading
to positive brand-related outcomes. This may also create brand associations such as
consumer-friendly, responsible, and empathetic service brands.
This study also presents a typology of a service failure, which managers can use to
understand the types of failures in a service setting. Specifically, this study divides
service failures into core service failures, supplementary service failures, and
interactional service failures. The study explains the characteristics of each type of
service failure with examples. Understanding service failure types will allow managers
to identify the most critical type of service failure for their service setting (Singhal et
al., 2013). Managers will be able to develop a codebook of recovery mechanisms that
suggest the type of actions employees may take when a certain type of failure occurs.
Furthermore, it will assist the service brand managers in placing potential failure points
and types of service failures in their service blueprint (see Shostack, 1984). It will allow
the service firms to have developed service recovery mechanisms and improve
employees’ readiness through training, empowerment, and motivation beforehand.
The findings of the moderation analysis suggest service failure severity plays an
important role in the effect of service recovery on outcomes, including perceived
justice and brand-related outcomes. Specifically, the findings guide managers that
when the service failure is of high severity, the impact of service recovery on its
outcomes will diminish. This suggests that managers may need to avoid high severity
service failures, and if a high severity service failure occurs, managers need to offer
substantial monetary compensation in addition to sincere apologies, quick response
to a service failure, or other non-monetary compensation. In other words, service
managers need to use every possible way to enhance customers affection and reduce
their negative feelings. Similarly, suppose the service failure is of low severity. In that
case, service managers can enhance perceptions of procedural and interactional
justice that may enhance customers’ positive feelings and reduce negative feelings
(Choi and Choi, 2014). Thus, the findings offer service managers a guide to select the
optimum way to recover from service failure of any magnitude.
Finally, the results of this study are broadly indicative of the existence of the service
recovery paradox in the case of firm recovery. Specifically, the findings suggest that a

258
successful service recovery in response to a service failure may enhance brand loyalty
to higher levels than initial levels of loyalty prior to the service failure. In other words,
service failures may provide an opportunity to service firms to enhance brand loyalty
beyond the initial level of brand loyalty by undertaking an efficient and effective firm
recovery without involving the customers in service recovery measures.
10.5 Limitations and Future Research directions
Despite the valuable contributions that this study brings to the service marketing and
branding literature, the findings of this study are subject to several limitations, which
have revealed questions in need of further investigation. First, data were collected
using scenario-based experiments, which may restrict the generalisability of the
findings. In other words, the data collection procedure limits the external validity of the
results of this study. Although data collection can be more robust if the experimental
data were collected in a real-life setting, ethical concerns regarding exposing
consumers to service delays make it infeasible to collect data in a real-life setting.
However, these study findings are supplemented with semi-structured interviews,
which enhances the external validity of the results. What is now needed is a similar
study involving service consumers in a lab setting which will evaluate the validity of
the current study’s result and may find some new interesting relationships. Future
research might also use a survey approach to replicate the study findings.
Second, this study utilised ‘delay in core service’ as the type of service failure.
Although it is one of the most frequently occurring service failures in the service
industry (Mohd-Any et al., 2019), other critical service failure types such as
unavailability of core service and other hindrances in core service failure may reveal
different outcomes of service recovery initiatives (Hwang and Mattila, 2020; Sharifi et
al., 2017). More research is needed to better understand the influence of CPSR and
FR on brand-related outcomes by using service failure types other than ‘delay in core
service’. Furthermore, the service delay in this study’s context was caused by the
service firm rather than the uncontrollable external factors, including power outages or
inclement weather. Hence, the positive effect of service recovery in the current study’s
setting might be limited to the situations where the failure is not caused by external
environmental factors. Service failures caused by environmental factors and
259
customers themselves may cause different reactions against service recovery.
Therefore, further research is required to extend current research findings to other
service failures which can be attributed to external factors or to the customers.
Third, this study examined service failure severity as a moderator. However, failure
attribution is another factor that may influence the relationship of service recovery with
its outcomes. Failure attribution is found to be a critical external factor that may
influence consumer behaviour when service recovery is initiated (Dong et al., 2016;
Matikiti et al., 2019; Moliner-Velázquez et al., 2015). Future research might examine
the outcome of service recovery by including failure attribution as a moderator at three
levels. i) failure attributed to the firm, ii) failure attributed to customers, iii) failure
attributed to external factors.
Another limitation of this study is that the service industry chosen for the current study
was a restaurant. Although the restaurant industry is among those which suffer from
frequent service failures (Bambauer-Sachse and Rabeson, 2015; Hwang and Mattila,
2020), other service industries could have been an interesting context of the study.
Therefore, future research should include the airlines, telecommunication companies,
or hotels as the context of the study. Future research can also focus on conducting
comparative studies between different service sectors. All in all, there are a number of
contexts and factors in the service sector that are worthy of further examination.
The current investigation was limited by the sampling procedure employed for the data
collection of the quantitative phase. More specifically, data were collected using
convenience sampling using Prolific Academic (ProA), a crowdsourcing platform.
Though Prolific is accepted as a reliable source of data collection (Hogreve et al.,
2019; Sharifi and Spassova, 2020), the sampling procedure generated a non-random
sample of respondents that limits the generalisability of this study results. More
research is needed to better understand the results of this study by collecting data
from a naturalistic setting.
Finally, the sample was nationally representative of the UK but would tend to miss
people from other cultures and geographic areas. In other words, selecting a sample
from the UK does not allow drawing inferences that are generalisable to other cultures
and regions, thus limiting the cross-cultural validity of this study findings. Future

260
research should be conducted by collecting data from other geographic regions,
including the USA, Middle East, China, India, etc. Differences in cultures determine
the personality traits that influence consumer choices (Shavitt and Barnes, 2020).
Thus, conducting similar research in other regions would confirm this study results and
provide evidence of external validity.
10.6 Summary
The chapter started by describing the contributions. The key theoretical contributions
include the enhancement in the literature of service recovery and CBBE. The
contributions included identifying CBBE dimensions that fluctuate in service failure and
recovery process, the positive impact of service recovery on CBBE dimensions and
overall brand equity, the occurrence of paradox with only brand loyalty, and the
mediating role of perceived justice between service recovery and CBBE.
With regards to the methodological contributions, this study provided key insights
about how to develop hypothetical scenarios in an experiment. Next, the study
provided recommendations for service managers concerning the criticality of service
recovery in influencing the overall strength of the brand. Finally, the chapter identified
limitations and the areas which need further investigation.
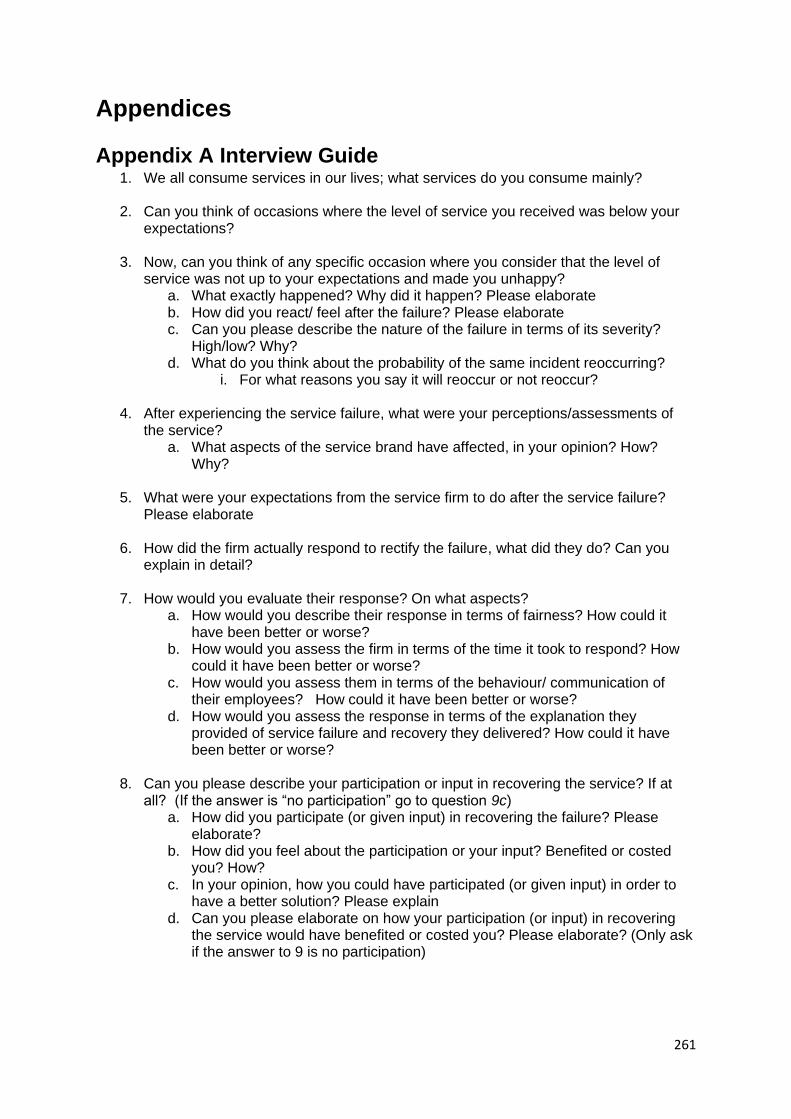
261
Appendices
Appendix A Interview Guide 1. We all consume services in our lives; what services do you consume mainly?
2. Can you think of occasions where the level of service you received was below your
expectations?
3. Now, can you think of any specific occasion where you consider that the level of service was not up to your expectations and made you unhappy?
a. What exactly happened? Why did it happen? Please elaborate b. How did you react/ feel after the failure? Please elaborate c. Can you please describe the nature of the failure in terms of its severity?
High/low? Why? d. What do you think about the probability of the same incident reoccurring?
i. For what reasons you say it will reoccur or not reoccur?
4. After experiencing the service failure, what were your perceptions/assessments of the service?
a. What aspects of the service brand have affected, in your opinion? How? Why?
5. What were your expectations from the service firm to do after the service failure?
Please elaborate
6. How did the firm actually respond to rectify the failure, what did they do? Can you explain in detail?
7. How would you evaluate their response? On what aspects? a. How would you describe their response in terms of fairness? How could it
have been better or worse? b. How would you assess the firm in terms of the time it took to respond? How
could it have been better or worse? c. How would you assess them in terms of the behaviour/ communication of
their employees? How could it have been better or worse? d. How would you assess the response in terms of the explanation they
provided of service failure and recovery they delivered? How could it have been better or worse?
8. Can you please describe your participation or input in recovering the service? If at all? (If the answer is “no participation” go to question 9c)
a. How did you participate (or given input) in recovering the failure? Please elaborate?
b. How did you feel about the participation or your input? Benefited or costed you? How?
c. In your opinion, how you could have participated (or given input) in order to have a better solution? Please explain
d. Can you please elaborate on how your participation (or input) in recovering the service would have benefited or costed you? Please elaborate? (Only ask if the answer to 9 is no participation)

262
9. After experiencing service recovery/ receiving the response from the service firm what were your perceptions/assessment about the service? How it changed if at all? Why or why not?

263
Appendix B Thematic Analysis Example
Theme Sub-theme Quote
Dimensions of CBBE
Brand Reputation
Post-failure Assessment
"My overall perception about them decreased a bit yeah because it just it became an ordeal to have to try and exchange" (F11iii, 22)
Declin
e
"I would say that they must have dropped their reputation to 4 out of 10 because as a well-established company which had been operating in the UK for many years, I expected better from them but they performed opposite to their reputation" (M4i, 30)
"They might be thinking that they can do whatever they want to do and people will come eventually because of the taste of the food but I think this is wrong and kind of blackmailing, they might not be losing customers initially, but they are certainly losing their reputation and they might not survive for long" (M7, 33)
Post-Recovery Assessment
"My overall perceptions towards the company was that they were an excellent company! Just the fact that they have excellent customer service, putting the customer at first, giving customer the options of providing the solutions that’s the important thing providing solutions and no blame games" (M8iii, 25)
Esc
ala
tio
n
"They kept me informed that was important. And they did what they had to do, so that was a happy bonding and then gave me 3 months free services and also saying we are sorry, that put my overall estimation of that company right up" (F13, 69)
"They are misrepresenting themselves and due to that they have gone more
down in my estimation" (F1, 56)
Declin
e
Brand Perceived Quality
Post-Failure Assessment
"They were very incompetent, I think so there is not enough training of their employees because they were not able to add a name into an account, which is very simple" (F4ii, 33)
Declin
e

264
"I felt that the service was poor because we were not told why the flight was delayed and I felt that it was very unprofessional that the flight was delayed" (M5i, 22)
Post-Recovery Assessment
"They emailed again to me to reassure that everything is fine and whether I have got the refund and also asked for the feedback that how they dealt with the matter, so you know this tells you the good quality of the service provider" (F12ii, 53)
Esc
ala
tio
n
"Again the momentum to which they swiftly resolved the issue was very impressive for me" (M4ii, 30)
"…perception of quality went several levels down, now I don’t expect much
from budget airlines, this is why they are called budget airlines" (M1i, 39)
Declin
e
Brand Trust
Post-Failure Assessment
"I think that trust on the restaurant is shaken because promise had been broken by them in terms of quality service that was their speediness of their service, secondly their inability of communicating to the customers" (M7, 33)
Declin
e
"I do not trust [company name] anymore with my personal information, I think trust is the main thing here which has cracked my relationship with [company name], I don’t trust them anymore!" (F6i, 23)
Post-Recovery Assessment
"But after they got active and made things better then again I had confidence that you know they will make sure that that is very unlikely to happen again" (M2ii, 67)
Esc
ala
tio
n
"if they would have done it proactively then faith on them would have regained but because I had to ask for it so nothing regained but even they damaged it more instead of availing the chance " (F2i, 32)
"My trustworthiness on the firm just went down because if the manager someone with responsibility cannot handle this professionally then what are you doing there? Just don't go there" (F7, 25)
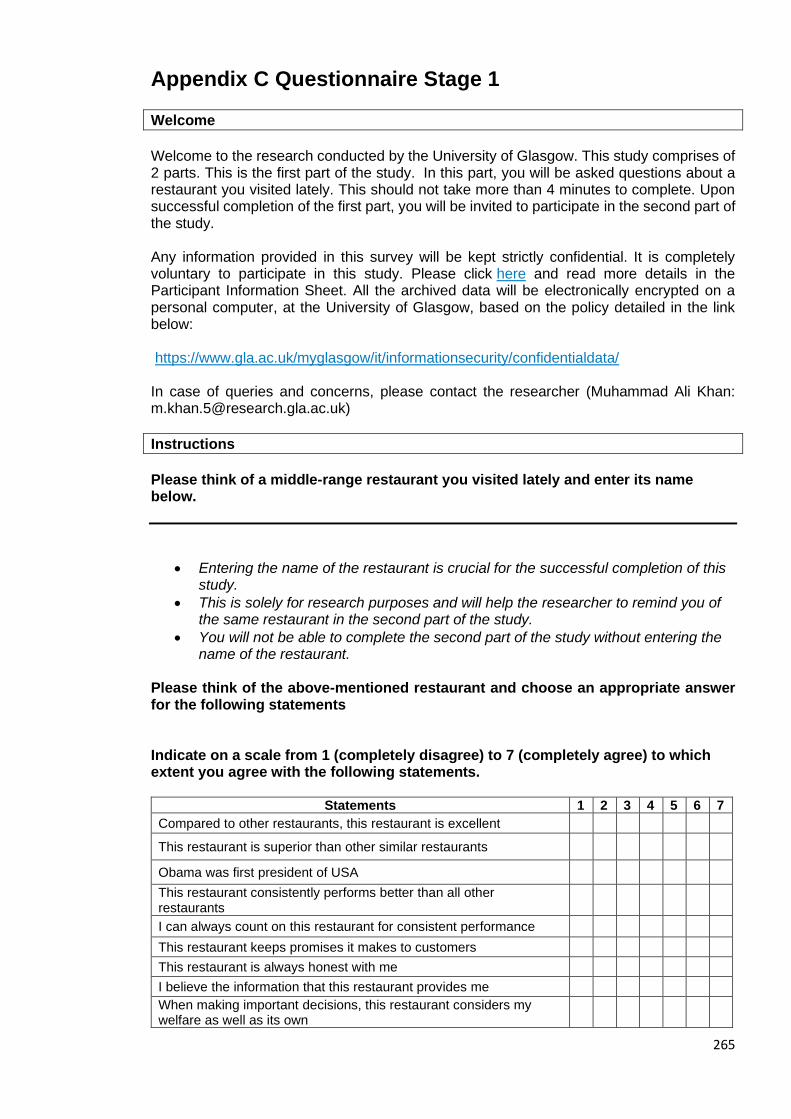
265
Appendix C Questionnaire Stage 1
Welcome
Welcome to the research conducted by the University of Glasgow. This study comprises of 2 parts. This is the first part of the study. In this part, you will be asked questions about a restaurant you visited lately. This should not take more than 4 minutes to complete. Upon successful completion of the first part, you will be invited to participate in the second part of the study. Any information provided in this survey will be kept strictly confidential. It is completely voluntary to participate in this study. Please click here and read more details in the Participant Information Sheet. All the archived data will be electronically encrypted on a personal computer, at the University of Glasgow, based on the policy detailed in the link below: https://www.gla.ac.uk/myglasgow/it/informationsecurity/confidentialdata/ In case of queries and concerns, please contact the researcher (Muhammad Ali Khan: [email protected])
Instructions
Please think of a middle-range restaurant you visited lately and enter its name below.
• Entering the name of the restaurant is crucial for the successful completion of this study.
• This is solely for research purposes and will help the researcher to remind you of the same restaurant in the second part of the study.
• You will not be able to complete the second part of the study without entering the name of the restaurant.
Please think of the above-mentioned restaurant and choose an appropriate answer for the following statements Indicate on a scale from 1 (completely disagree) to 7 (completely agree) to which extent you agree with the following statements.
Statements 1 2 3 4 5 6 7
Compared to other restaurants, this restaurant is excellent
This restaurant is superior than other similar restaurants
Obama was first president of USA
This restaurant consistently performs better than all other restaurants
I can always count on this restaurant for consistent performance
This restaurant keeps promises it makes to customers
This restaurant is always honest with me
I believe the information that this restaurant provides me
When making important decisions, this restaurant considers my welfare as well as its own

266
Statements 1 2 3 4 5 6 7
This restaurant keeps my best interests in mind
This restaurant is honest
I will continue to stay with this restaurant
I would not change this restaurant service provider in future
In the near future, I intend to use more of the services provided by this restaurant
I consider myself to be a faithful customer of this restaurant
This restaurant is well known
It is one of the leading restaurants
It is easily recognizable
The spellings of the word ‘Prolific’ starts with letter Z.
What I get from this restaurant is worth the cost
All the things considered (price, time and effort), services of this restaurant are a good buy
Compared to other restaurants, this restaurant is a good value for the money
When I use services of this restaurant, I feel I am getting my money’s worth
Demographics
1. What is your gender?
☐ Male ☐ Female ☐ Prefer not to say
2. What is your age?
☐ 18-24 ☐ 25-34 ☐ 35-44 ☐ 45-54 ☐ 55-64 ☐ 65-75
☐ Over 75
3. What is your ethnicity?
☐ White ☐ Mixed / multiple ethnic groups ☐ Asian / Asian British ☐ Black
/ African / Caribbean / Black British ☐ Other ethnic group
4. What is your highest level of qualification obtained?
☐High school ☐Technical / vocational training ☐ Professional qualification / diploma
☐Undergraduate ☐Postgraduate ☐ other (please specify) ____________
5. What is your employment status?
☐ Student ☐ Self-employed ☐ Working full-time ☐ Working part-time ☐ Out
of work but looking for a job ☐ Out of work and not looking for a job
☐Retired ☐ Other (please specify) ____________
6. What is your Household income?
☐ Below £10K ☐ £10000 - £24999 ☐ £25000 - £49999
☐ £50000 - £74999 ☐ £75000 - £99999 ☐ £100000 or more
☐ Prefer not to say
End of the Survey
Thank you very much for completing the first Phase of the survey! You will be invited to take part in the second phase soon.
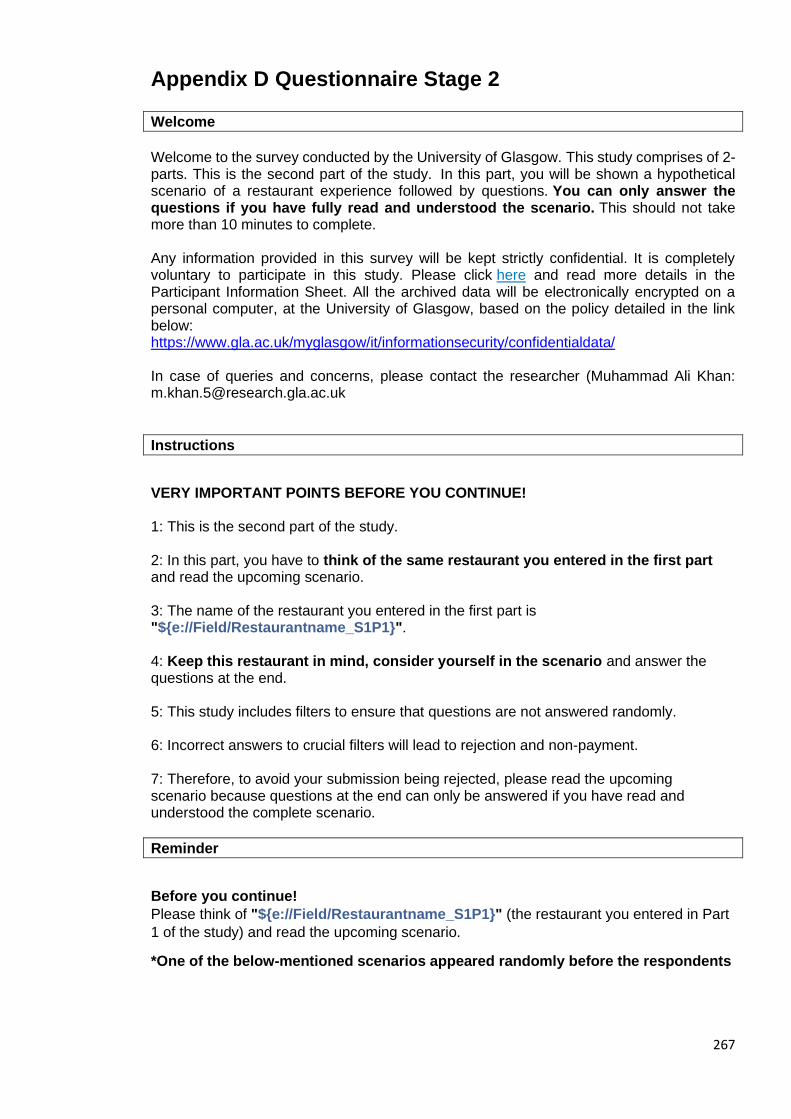
267
Appendix D Questionnaire Stage 2
Welcome
Welcome to the survey conducted by the University of Glasgow. This study comprises of 2-parts. This is the second part of the study. In this part, you will be shown a hypothetical scenario of a restaurant experience followed by questions. You can only answer the questions if you have fully read and understood the scenario. This should not take more than 10 minutes to complete. Any information provided in this survey will be kept strictly confidential. It is completely voluntary to participate in this study. Please click here and read more details in the Participant Information Sheet. All the archived data will be electronically encrypted on a personal computer, at the University of Glasgow, based on the policy detailed in the link below: https://www.gla.ac.uk/myglasgow/it/informationsecurity/confidentialdata/ In case of queries and concerns, please contact the researcher (Muhammad Ali Khan: [email protected]
Instructions
VERY IMPORTANT POINTS BEFORE YOU CONTINUE! 1: This is the second part of the study. 2: In this part, you have to think of the same restaurant you entered in the first part and read the upcoming scenario. 3: The name of the restaurant you entered in the first part is "${e://Field/Restaurantname_S1P1}". 4: Keep this restaurant in mind, consider yourself in the scenario and answer the questions at the end. 5: This study includes filters to ensure that questions are not answered randomly. 6: Incorrect answers to crucial filters will lead to rejection and non-payment. 7: Therefore, to avoid your submission being rejected, please read the upcoming scenario because questions at the end can only be answered if you have read and understood the complete scenario.
Reminder
Before you continue!
Please think of "${e://Field/Restaurantname_S1P1}" (the restaurant you entered in Part
1 of the study) and read the upcoming scenario.
*One of the below-mentioned scenarios appeared randomly before the respondents

268
Scenario 1 (CPSR and Service failure severity is low)
Dinner at ${e://Field/Restaurantname_S1P1}
After a long day at work, you feel hungry, and you decide to go out for dinner. You go to ${e://Field/Restaurantname_S1P1}. It is not busy because it is a weekday. You order a starter and a main. You finish the starter and wait for the main. You wait for 25 minutes before your main is served, whereas the usual serving time is 15 minutes. You inform the waiter about the problem and ask him about the reason for the delay. He acknowledges the mistake straight away and apologises for the delay in serving the main. He explains that the problem occurred due to a recent change in the preparation method of the food you ordered. You and the waiter then discuss in detail about your requirements. Specifically, you discuss about your preferences of serving time. The waiter provides you with a comment card. He asks you to mention the details of the problem on the comment card to claim compensation. After you finish your main, the waiter comes back and offers you alternative options for compensation against the delay you experienced. The options are: a. Free dessert of your choice within an amount of £8
OR b. £5 discount on your bill
Scenario 2 (CPSR and Service failure severity is High)
Dinner at ${e://Field/Restaurantname_S1P1}
After a long day at work, you feel hungry, and you decide to go out for dinner. You go to ${e://Field/Restaurantname_S1P1}. It is not busy because it is a weekday. You order a starter and a main. You finish the starter and wait for the main. You wait for 1 hour before your main is served, whereas the usual serving time is 15 minutes. You inform the waiter about the problem and ask him about the reason for the delay. He acknowledges the mistake straight away and apologises for the delay in serving the main. He explains that the problem occurred due to a recent change in the preparation method of the food you ordered. You and the waiter then discuss in detail about your requirements. Specifically, you discuss about your preferences of serving time. The waiter provides you with a comment card. He asks you to mention the details of the problem on the comment card to claim compensation. After you finish your main, the waiter comes back and offers you alternative options for compensation against the delay you experienced. The options are: a. Free dessert of your choice within an amount of £8
OR b. £5 discount on your bill
Scenario 3 (FR and Service failure severity is Low)
Dinner at ${e://Field/Restaurantname_S1P1}
After a long day at work, you feel hungry, and you decide to go out for dinner. You go to
269
${e://Field/Restaurantname_S1P1}. It is not busy because it is a weekday. You order a starter and a main. You finish the starter and wait for the main. You wait for 25 minutes before your main is served, whereas the usual serving time is 15 minutes. You inform the waiter about the problem and ask him about the reason for the delay. He acknowledges the mistake straight away and apologises for the delay in serving the main. He explains that the problem occurred due to a recent change in the preparation method of the food you ordered. After you finish your main, the waiter brings a complimentary dessert as compensation against the delay you experienced.
Scenario 4 (FR and Service failure severity is High)
Dinner at ${e://Field/Restaurantname_S1P1}
After a long day at work, you feel hungry, and you decide to go out for dinner. You go to ${e://Field/Restaurantname_S1P1}. It is not busy because it is a weekday. You order a starter and a main. You finish the starter and wait for the main. You wait for 1 hour before your main is served, whereas the usual serving time is 15 minutes. You inform the waiter about the problem and ask him about the reason for the delay. He acknowledges the mistake straight away and apologises for the delay in serving the main. He explains that the problem occurred due to a recent change in the preparation method of the food you ordered. After you finish your main, the waiter brings a complimentary dessert as compensation against the delay you experienced.
Scenario 5 (NR and Service failure severity is Low)
After a long day at work, you feel hungry, and you decide to go out for dinner. You go to ${e://Field/Restaurantname_S1P1}. It is not busy because it is a weekday. You order a starter and a main. You finish the starter and wait for the main. You wait for 25 minutes before your main is served, whereas the usual serving time is 15 minutes. You inform the waiter and ask him about the reason for the delay. He tells you that this is due to a recent change in the preparation method of the food you ordered. The restaurant does not replace the food and does not offer any compensation. After you finish your main, the waiter brings you the bill, you pay and leave the restaurant.
Scenario 6 (NR and Service failure severity is High)
Dinner at ${e://Field/Restaurantname_S1P1}.
After a long day at work, you feel hungry, and you decide to go out for dinner. You go to ${e://Field/Restaurantname_S1P1}. It is not busy because it is a weekday. You order a
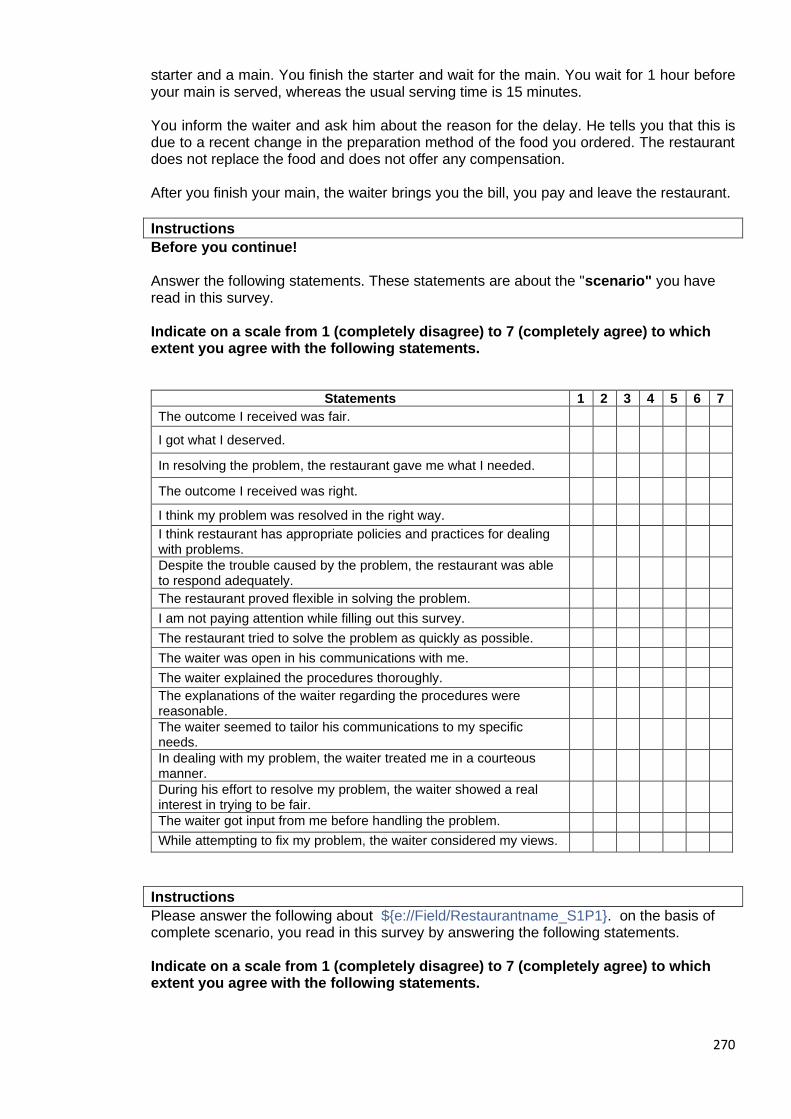
270
starter and a main. You finish the starter and wait for the main. You wait for 1 hour before your main is served, whereas the usual serving time is 15 minutes. You inform the waiter and ask him about the reason for the delay. He tells you that this is due to a recent change in the preparation method of the food you ordered. The restaurant does not replace the food and does not offer any compensation. After you finish your main, the waiter brings you the bill, you pay and leave the restaurant.
Instructions
Before you continue! Answer the following statements. These statements are about the "scenario" you have read in this survey. Indicate on a scale from 1 (completely disagree) to 7 (completely agree) to which extent you agree with the following statements.
Statements 1 2 3 4 5 6 7
The outcome I received was fair.
I got what I deserved.
In resolving the problem, the restaurant gave me what I needed.
The outcome I received was right.
I think my problem was resolved in the right way.
I think restaurant has appropriate policies and practices for dealing with problems.
Despite the trouble caused by the problem, the restaurant was able to respond adequately.
The restaurant proved flexible in solving the problem.
I am not paying attention while filling out this survey.
The restaurant tried to solve the problem as quickly as possible.
The waiter was open in his communications with me.
The waiter explained the procedures thoroughly.
The explanations of the waiter regarding the procedures were reasonable.
The waiter seemed to tailor his communications to my specific needs.
In dealing with my problem, the waiter treated me in a courteous manner.
During his effort to resolve my problem, the waiter showed a real interest in trying to be fair.
The waiter got input from me before handling the problem.
While attempting to fix my problem, the waiter considered my views.
Instructions
Please answer the following about ${e://Field/Restaurantname_S1P1}. on the basis of complete scenario, you read in this survey by answering the following statements. Indicate on a scale from 1 (completely disagree) to 7 (completely agree) to which extent you agree with the following statements.

271
Statements 1 2 3 4 5 6 7
I will continue to stay with this restaurant.
I would not change this restaurant service provider in future.
In the near future, I intend to use more of the services provided by this restaurant.
I consider myself to be a faithful customer of this restaurant.
What I get from this restaurant is worth the cost.
All the things considered (price, time and effort), services of this restaurant are a good buy.
I am responding to this survey in year 2018.
Compared to other restaurants, this restaurant is a good value for the money.
When I use services of this restaurant, I feel I am getting my money’s worth.
Compared to other restaurants, this restaurant is excellent.
This restaurant is superior than other similar restaurants.
The scenario I read at the beginning was about hospital services.
This restaurant consistently performs better than all other restaurants.
I can always count on this restaurant for consistent performance.
This restaurant keeps promises it makes to customers.
This restaurant is always honest with me.
I believe the information that this restaurant provides me
When making important decisions, this restaurant considers my welfare as well as its own.
This restaurant keeps my best interests in mind.
This restaurant is honest.
This restaurant is superior than other restaurants.
The restaurant I am evaluating fits my personality.
The restaurant I am evaluating is well regarded by my colleagues.
I have positive personal feelings toward the restaurant I am evaluating.
After consuming services from the restaurant, I am evaluating, I have grown fond of it.
It is one of the leading restaurants.
It is easily recognizable.
This restaurant is well known.
End of the survey
Thank you for participating in this survey!

272
Appendix E Normality Assessment
Stage -1
Items Mean Standard Deviation
Skewness Kurtosis
Perceived Quality 1 5.13 1.161 -0.473 0.057
Perceived Quality 2 5.05 1.205 -0.532 0.070
Perceived Quality 3 4.71 1.213 -0.348 0.240
Perceived Quality 4 5.58 1.117 -0.989 1.128
Perceived Value 1 5.82 0.960 -1.059 2.173
Perceived Value 2 5.45 1.157 -0.742 0.338
Perceived Value 3 5.68 1.041 -1.055 1.611
Perceived Value 4 5.82 0.960 -1.059 2.173
Brand Reputation 1 5.59 1.346 -1.025 0.717
Brand Reputation 2 4.74 1.472 -0.597 -0.138
Brand Reputation 3 5.51 1.298 -1.047 0.908
Brand Trust 1 5.45 0.850 -0.405 -0.263
Brand Trust 2 5.58 0.851 -0.514 -0.142
Brand Trust 3 5.78 0.835 -0.722 1.225
Brand Trust 4 4.87 1.070 -0.005 -0.213
Brand Trust 5 4.96 1.110 -0.409 0.086
Brand Trust 6 5.53 0.861 -0.317 -0.458
Brand Loyalty 1 5.74 0.955 -0.898 1.419
Brand Loyalty 2 4.85 1.354 -0.301 -0.751
Brand Loyalty 3 4.76 1.303 -0.187 -0.411
Brand Loyalty 4 4.97 1.339 -0.468 -0.245
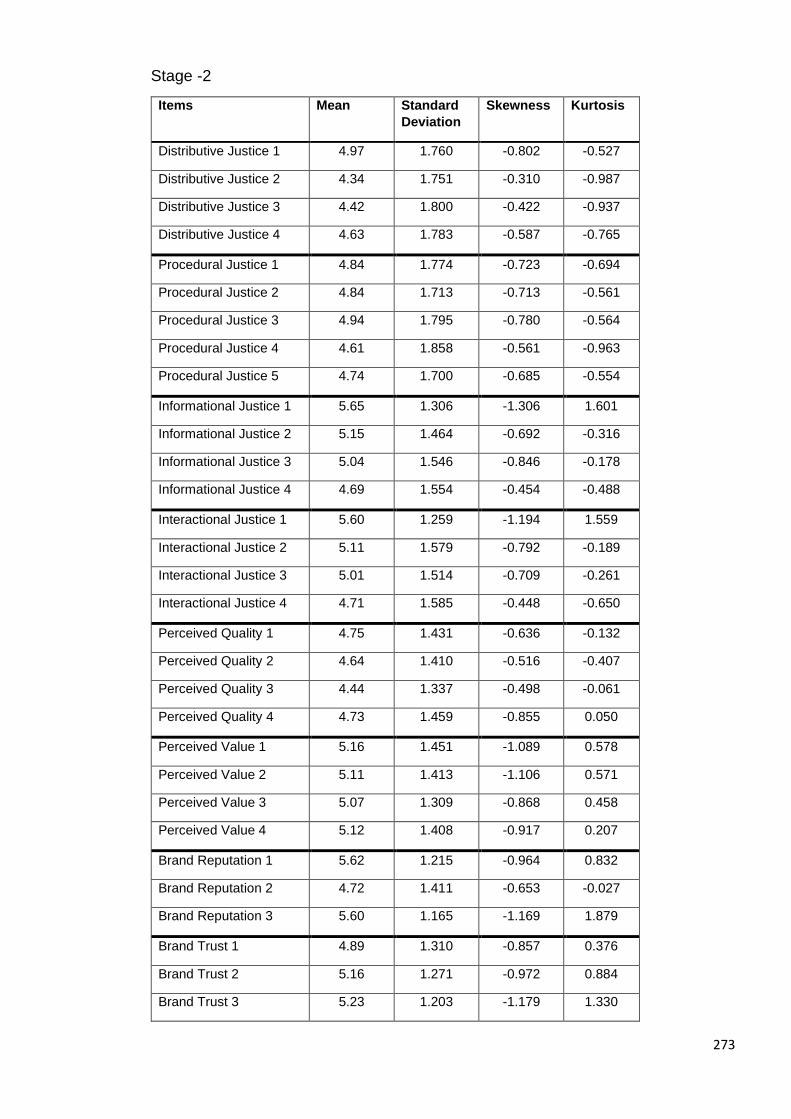
273
Stage -2
Items Mean Standard
Deviation
Skewness Kurtosis
Distributive Justice 1 4.97 1.760 -0.802 -0.527
Distributive Justice 2 4.34 1.751 -0.310 -0.987
Distributive Justice 3 4.42 1.800 -0.422 -0.937
Distributive Justice 4 4.63 1.783 -0.587 -0.765
Procedural Justice 1 4.84 1.774 -0.723 -0.694
Procedural Justice 2 4.84 1.713 -0.713 -0.561
Procedural Justice 3 4.94 1.795 -0.780 -0.564
Procedural Justice 4 4.61 1.858 -0.561 -0.963
Procedural Justice 5 4.74 1.700 -0.685 -0.554
Informational Justice 1 5.65 1.306 -1.306 1.601
Informational Justice 2 5.15 1.464 -0.692 -0.316
Informational Justice 3 5.04 1.546 -0.846 -0.178
Informational Justice 4 4.69 1.554 -0.454 -0.488
Interactional Justice 1 5.60 1.259 -1.194 1.559
Interactional Justice 2 5.11 1.579 -0.792 -0.189
Interactional Justice 3 5.01 1.514 -0.709 -0.261
Interactional Justice 4 4.71 1.585 -0.448 -0.650
Perceived Quality 1 4.75 1.431 -0.636 -0.132
Perceived Quality 2 4.64 1.410 -0.516 -0.407
Perceived Quality 3 4.44 1.337 -0.498 -0.061
Perceived Quality 4 4.73 1.459 -0.855 0.050
Perceived Value 1 5.16 1.451 -1.089 0.578
Perceived Value 2 5.11 1.413 -1.106 0.571
Perceived Value 3 5.07 1.309 -0.868 0.458
Perceived Value 4 5.12 1.408 -0.917 0.207
Brand Reputation 1 5.62 1.215 -0.964 0.832
Brand Reputation 2 4.72 1.411 -0.653 -0.027
Brand Reputation 3 5.60 1.165 -1.169 1.879
Brand Trust 1 4.89 1.310 -0.857 0.376
Brand Trust 2 5.16 1.271 -0.972 0.884
Brand Trust 3 5.23 1.203 -1.179 1.330
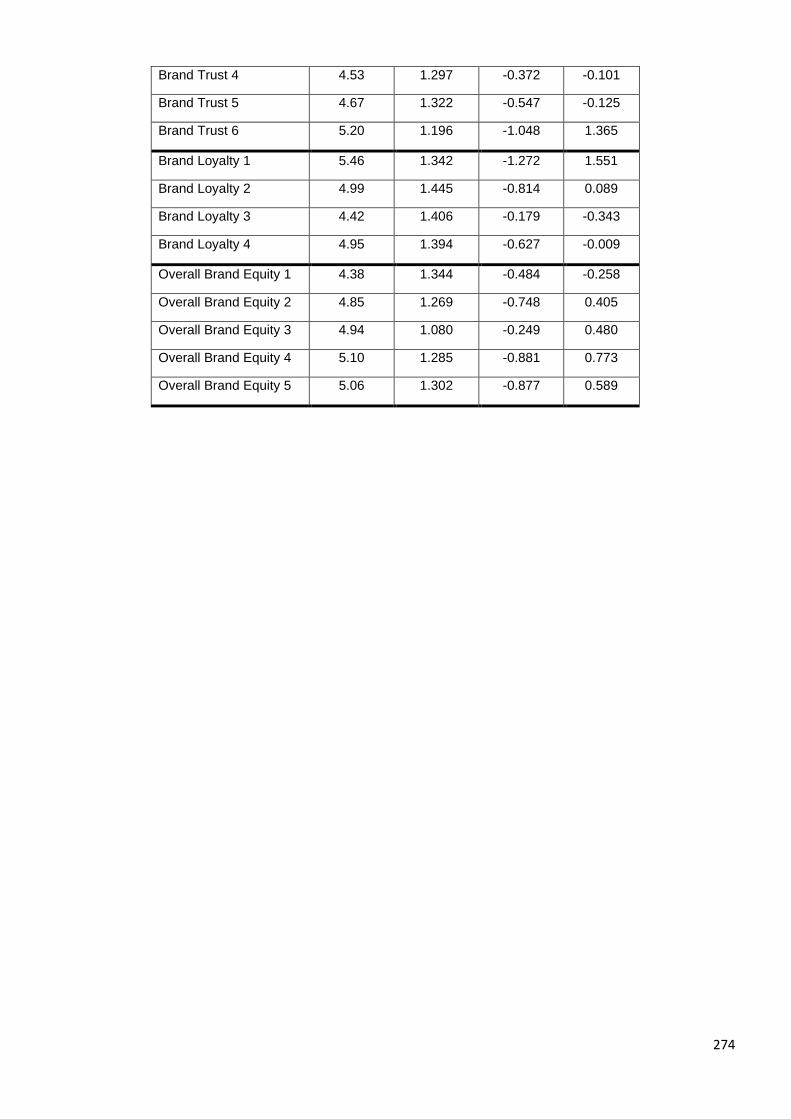
274
Brand Trust 4 4.53 1.297 -0.372 -0.101
Brand Trust 5 4.67 1.322 -0.547 -0.125
Brand Trust 6 5.20 1.196 -1.048 1.365
Brand Loyalty 1 5.46 1.342 -1.272 1.551
Brand Loyalty 2 4.99 1.445 -0.814 0.089
Brand Loyalty 3 4.42 1.406 -0.179 -0.343
Brand Loyalty 4 4.95 1.394 -0.627 -0.009
Overall Brand Equity 1 4.38 1.344 -0.484 -0.258
Overall Brand Equity 2 4.85 1.269 -0.748 0.405
Overall Brand Equity 3 4.94 1.080 -0.249 0.480
Overall Brand Equity 4 5.10 1.285 -0.881 0.773
Overall Brand Equity 5 5.06 1.302 -0.877 0.589
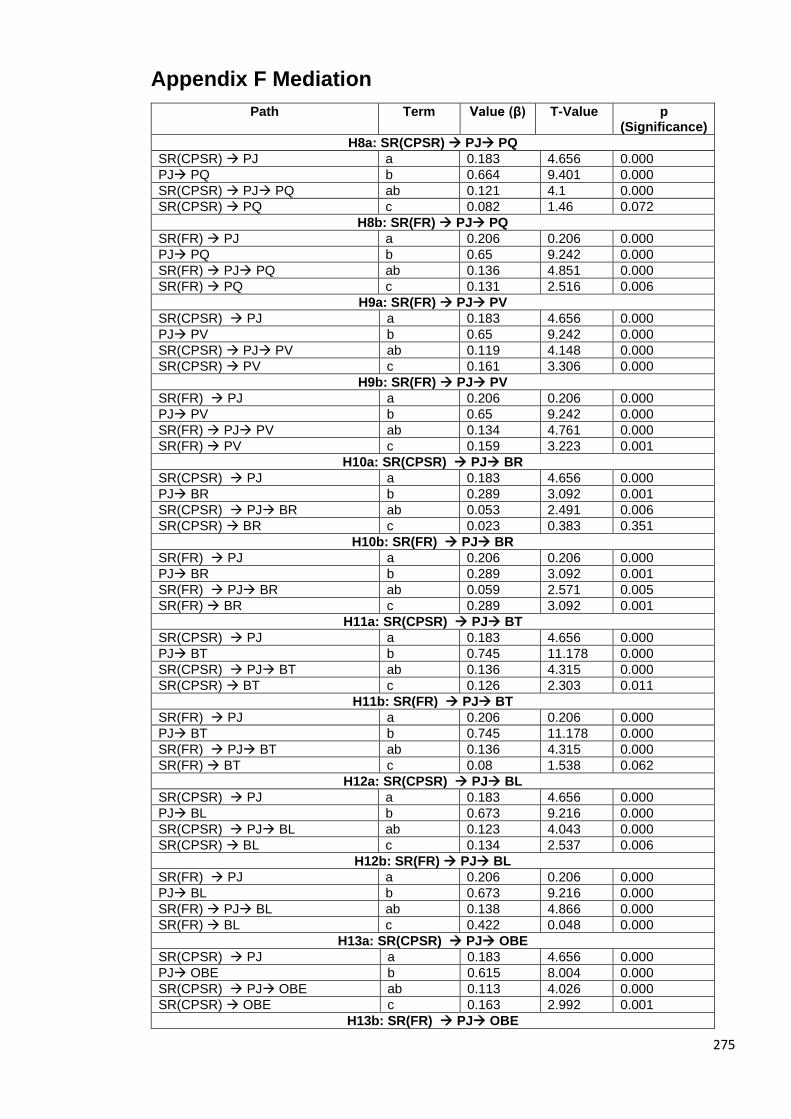
275
Appendix F Mediation
Path Term Value (β) T-Value p (Significance)
H8a: SR(CPSR) → PJ→ PQ
SR(CPSR) → PJ a 0.183 4.656 0.000
PJ→ PQ b 0.664 9.401 0.000
SR(CPSR) → PJ→ PQ ab 0.121 4.1 0.000
SR(CPSR) → PQ c 0.082 1.46 0.072
H8b: SR(FR) → PJ→ PQ
SR(FR) → PJ a 0.206 0.206 0.000
PJ→ PQ b 0.65 9.242 0.000
SR(FR) → PJ→ PQ ab 0.136 4.851 0.000
SR(FR) → PQ c 0.131 2.516 0.006
H9a: SR(FR) → PJ→ PV
SR(CPSR) → PJ a 0.183 4.656 0.000
PJ→ PV b 0.65 9.242 0.000
SR(CPSR) → PJ→ PV ab 0.119 4.148 0.000
SR(CPSR) → PV c 0.161 3.306 0.000
H9b: SR(FR) → PJ→ PV
SR(FR) → PJ a 0.206 0.206 0.000
PJ→ PV b 0.65 9.242 0.000
SR(FR) → PJ→ PV ab 0.134 4.761 0.000
SR(FR) → PV c 0.159 3.223 0.001
H10a: SR(CPSR) → PJ→ BR
SR(CPSR) → PJ a 0.183 4.656 0.000
PJ→ BR b 0.289 3.092 0.001
SR(CPSR) → PJ→ BR ab 0.053 2.491 0.006
SR(CPSR) → BR c 0.023 0.383 0.351
H10b: SR(FR) → PJ→ BR
SR(FR) → PJ a 0.206 0.206 0.000
PJ→ BR b 0.289 3.092 0.001
SR(FR) → PJ→ BR ab 0.059 2.571 0.005
SR(FR) → BR c 0.289 3.092 0.001
H11a: SR(CPSR) → PJ→ BT
SR(CPSR) → PJ a 0.183 4.656 0.000
PJ→ BT b 0.745 11.178 0.000
SR(CPSR) → PJ→ BT ab 0.136 4.315 0.000
SR(CPSR) → BT c 0.126 2.303 0.011
H11b: SR(FR) → PJ→ BT
SR(FR) → PJ a 0.206 0.206 0.000
PJ→ BT b 0.745 11.178 0.000
SR(FR) → PJ→ BT ab 0.136 4.315 0.000
SR(FR) → BT c 0.08 1.538 0.062
H12a: SR(CPSR) → PJ→ BL
SR(CPSR) → PJ a 0.183 4.656 0.000
PJ→ BL b 0.673 9.216 0.000
SR(CPSR) → PJ→ BL ab 0.123 4.043 0.000
SR(CPSR) → BL c 0.134 2.537 0.006
H12b: SR(FR) → PJ→ BL
SR(FR) → PJ a 0.206 0.206 0.000
PJ→ BL b 0.673 9.216 0.000
SR(FR) → PJ→ BL ab 0.138 4.866 0.000
SR(FR) → BL c 0.422 0.048 0.000
H13a: SR(CPSR) → PJ→ OBE
SR(CPSR) → PJ a 0.183 4.656 0.000
PJ→ OBE b 0.615 8.004 0.000
SR(CPSR) → PJ→ OBE ab 0.113 4.026 0.000
SR(CPSR) → OBE c 0.163 2.992 0.001
H13b: SR(FR) → PJ→ OBE
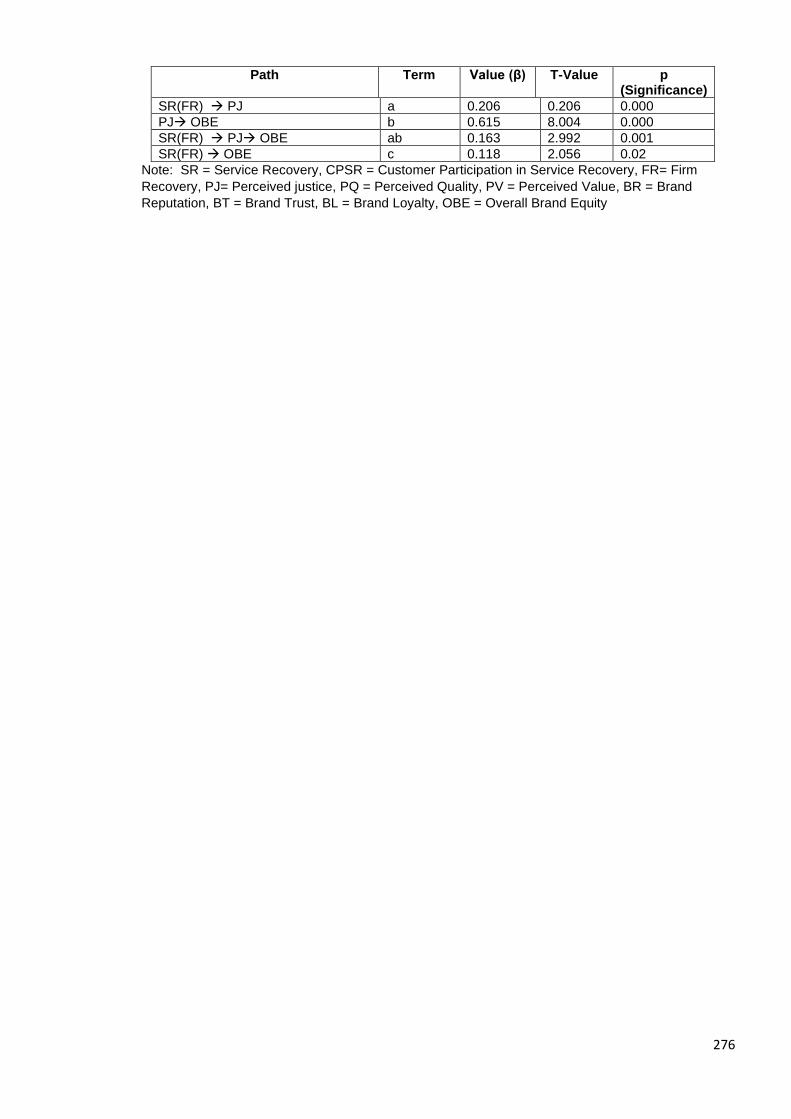
276
Path Term Value (β) T-Value p (Significance)
SR(FR) → PJ a 0.206 0.206 0.000
PJ→ OBE b 0.615 8.004 0.000
SR(FR) → PJ→ OBE ab 0.163 2.992 0.001
SR(FR) → OBE c 0.118 2.056 0.02
Note: SR = Service Recovery, CPSR = Customer Participation in Service Recovery, FR= Firm
Recovery, PJ= Perceived justice, PQ = Perceived Quality, PV = Perceived Value, BR = Brand
Reputation, BT = Brand Trust, BL = Brand Loyalty, OBE = Overall Brand Equity

277
References
Aaker, D.A. (1991), Managing Brand Equity, Free Press, New York.
Aaker, D.A. (1996), Building Strong Brands, Free Press, New York.
Abbasi, M. (2020), “The effect of complete versus partial observations on service evaluations”, European Journal of Marketing, Vol. 54 No. 4, pp. 935–954.
Abbey, J.D. and Meloy, M.G. (2017), “Attention by design: Using attention checks to detect inattentive respondents and improve data quality”, Journal of Operations Management, Vol. 53–56, pp. 63–70.
Abney, A.K., Pelletier, M.J., Ford, T.-R.S. and Horky, A.B. (2017), “# IHateYourBrand: adaptive service recovery strategies on Twitter”, Journal of Services Marketing, Vol. 31 No. 3, pp. 281–294.
Adams, C. (2018), “1.3 MILLION PASSENGERS DELAYED LAST YEAR – AND EASYJET, RYANAIR AND BRITISH AIRWAYS WERE THE WORST CULPRITS”, Independant, available at: https://www.independent.co.uk/travel/news-and-advice/easyjet-ryanair-british-airways-which-flight-delays-2018-uk-airports-a8530726.html (accessed 2 January 2019).
Adams, J.S. (1963), “Towards an understanding of inequity”, The Journal of Abnormal and Social Psychology, Vol. 67 No. 5, p. 422.
Agag, G. (2019), “E-commerce ethics and its impact on buyer repurchase intentions and loyalty: An empirical study of small and medium Egyptian businesses”, Journal of Business Ethics, Vol. 154 No. 2, pp. 389–410.
Agarwal, M.K. and Rao, V.R. (1996), “An empirical comparison of consumer-based measures of brand equity”, Marketing Letters, Vol. 7 No. 3, pp. 237–247.
Agarwal, S. and Teas, R.K. (2001), “Perceived value: mediating role of perceived risk”, Journal of Marketing Theory and Practice, Vol. 9 No. 4, pp. 1–14.
Ahmad, F. and Guzmán, F. (2020), “Brand equity, online reviews, and message trust: the moderating role of persuasion knowledge”, Journal of Product & Brand Management, Vol. 29 No. 2, pp. 549–564.
Akinci, S. and Aksoy, S. (2019), “The impact of service recovery evaluation on word-of-mouth intention: A moderated mediation model of overall satisfaction, household income and gender”, Tourism Management Perspectives, Vol. 31, pp. 184–194.
Akinci, S., Atilgan-Inan, E. and Aksoy, S. (2010), “Re-assessment of E-S-Qual and E-RecS-Qual in a pure service setting”, Journal of Business Research, Vol. 63 No. 3, pp. 232–240.
Alavi, S., Habel, J., Schwenke, M. and Schmitz, C. (2020), “Price negotiating for services: elucidating the ambivalent effects on customers’ negotiation aspirations”, Journal of the Academy of Marketing Science, Vol. 48 No. 2, pp. 165–185.
Albrecht, A.K., Schaefers, T., Walsh, G. and Beatty, S.E. (2019), “The effect of

278
compensation size on recovery satisfaction after group service failures: the role of group versus individual service recovery”, Journal of Service Research, Vol. 22 No. 1, pp. 60–74.
Albrecht, A.K., Walsh, G. and Beatty, S.E. (2017), “Perceptions of group versus individual service failures and their effects on customer outcomes: The role of attributions and customer entitlement”, Journal of Service Research, Vol. 20 No. 2, pp. 188–203.
Algharabat, R., Rana, N.P., Alalwan, A.A., Baabdullah, A. and Gupta, A. (2020), “Investigating the antecedents of customer brand engagement and consumer-based brand equity in social media”, Journal of Retailing and Consumer Services, Vol. 53.
Allen, B.J., Dholakia, U.M. and Basuroy, S. (2016), “The economic benefits to retailers from customer participation in proprietary web panels”, Journal of Retailing, Vol. 92 No. 2, pp. 147–161.
Allen, M. (2017), The SAGE Encyclopedia of Communication Research Methods, SAGE Publications.
Alvarado-Karste, D. and Guzmán, F. (2020), “The effect of brand identity-cognitive style fit and social influence on consumer-based brand equity”, Journal of Product & Brand Management, Vol. 28 No. 7, pp. 971–984.
Alvarez, C. and Fournier, S. (2016), “Consumers’ relationships with brands”, Current Opinion in Psychology, Vol. 10, pp. 129–135.
Ambler, T. (2003), Marketing and the Bottom Line: The Marketing Metrics to Pump up Cash Flow, Pearson Education.
Ambrose, M., Hess, R.L. and Ganesan, S. (2007), “The relationship between justice and attitudes: An examination of justice effects on event and system-related attitudes”, Organizational Behavior and Human Decision Processes, Vol. 103 No. 1, pp. 21–36.
Andaleeb, S.S. and Basu, A.K. (1994), “Technical complexity and consumer knowledge as moderators of service quality evaluation in the automobile service industry”, Journal of Retailing, Vol. 70 No. 4, pp. 367–381.
Anderson, S.W., Baggett, L.S. and Widener, S.K. (2009), “The Impact of Service Operations Failures on Customer Satisfaction: Evidence on How Failures and Their Source Affect What Matters to Customers”, Manufacturing & Service Operations Management, Vol. 11 No. 1, pp. 52–69.
Andreassen, T.W. (2001), “From disgust to delight: do customers hold a grudge?”, Journal of Service Research, Vol. 4 No. 1, pp. 39–49.
Andrews, M., Squire, C. and Tamboukou, M. (2013), Doing Narrative Research, Sage.
Anees-ur-Rehman, M. and Johnston, W.J. (2019), “How multiple strategic orientations impact brand equity of B2B SMEs”, Journal of Strategic Marketing, Vol. 27 No. 8, pp. 730–750.
Anselmsson, J., Bondesson, N. and Melin, F. (2016), “Customer-based brand equity and human resource management image: Do retail customers really care about HRM and the employer brand?”, European Journal of Marketing,
279
Vol. 50 No. 7/8, pp. 1185–1208.
Armstrong, J.S. and Overton, T.S. (1977), “Estimating Nonresponse Bias in Mail Surveys”, Journal of Marketing Research, Vol. 14 No. 3, pp. 396–402.
Arnett, D.B., Laverie, D.A. and Meiers, A. (2003), “Developing parsimonious retailer equity indexes using partial least squares analysis: a method and applications”, Journal of Retailing, Vol. 79 No. 3, pp. 161–170.
Arnott, D.C., Wilson, D., Wang, S. and Huff, L.C. (2007), “Explaining buyers’ responses to sellers’ violation of trust”, European Journal of Marketing.
Ashill, N.J., Carruthers, J. and Krisjanous, J. (2005), “Antecedents and outcomes of service recovery performance in a public health‐care environment”, Journal of Services Marketing, Vol. 19 No. 5, pp. 293–308.
Assaker, G., O’Connor, P. and El-Haddad, R. (2020), “Examining an integrated model of green image, perceived quality, satisfaction, trust, and loyalty in upscale hotels”, Journal of Hospitality Marketing and Management, Routledge, Vol. 29 No. 8, pp. 934–955.
Atilgan, E., Akinci, S., Aksoy, S. and Kaynak, E. (2009), “Customer-based brand equity for global brands: A multinational approach”, Journal of Euromarketing, Vol. 18 No. 2, pp. 115–132.
Auh, S., Menguc, B., Katsikeas, C.S. and Jung, Y.S. (2019), “When Does Customer Participation Matter? An Empirical Investigation of the Role of Customer Empowerment in the Customer Participation–Performance Link”, Journal of Marketing Research, Vol. 56 No. 6, pp. 1012–1033.
Aurier, P. and Siadou-Martin, B. (2007), “Perceived justice and consumption experience evaluations: A qualitative and experimental investigation”, International Journal of Service Industry Management, Vol. 18 No. 5, pp. 450–471.
Aurier, P. and Siadou‐Martin, B. (2007), “Perceived justice and consumption experience evaluations: A qualitative and experimental investigation”, International Journal of Service Industry Management, Emerald Group Publishing Limited, Vol. 18 No. 5, pp. 450–471.
Azab, C. and Clark, T. (2017), “Speak my language or look like me?–Language and ethnicity in bilingual customer service recovery”, Journal of Business Research, Vol. 72, pp. 57–68.
Azemi, Y., Ozuem, W., Howell, K.E. and Lancaster, G. (2019), “An exploration into the practice of online service failure and recovery strategies in the Balkans”, Journal of Business Research, Vol. 94, pp. 420–431.
Baalbaki, S. and Guzmán, F. (2016), “A consumer-perceived consumer-based brand equity scale”, Journal of Brand Management, Vol. 23 No. 3, pp. 229–251.
Babin, B.J., Zhuang, W. and Borges, A. (2021), “Managing service recovery experience: Effects of the forgiveness for older consumers”, Journal of Retailing and Consumer Services, Vol. 58, p. 102222.
Bacile, T.J., Krallman, A., Wolter, J.S. and Beachum, N.D. (2020), “The value disruption of uncivil other-customers during online service recovery”, Journal

280
of Services Marketing, Vol. 34 No. 4, pp. 483–498.
Bae, G., Lee, S. and Kim, D.-Y. (2020), “Interactions between Service Recovery Efforts and Customer Characteristics: Apology, Compensation, and Empowerment”, Journal of Quality Assurance in Hospitality & Tourism, pp. 1–27.
Bagherzadeh, R., Rawal, M., Wei, S. and Saavedra Torres, J.L. (2020), “The journey from customer participation in service failure to co-creation in service recovery”, Journal of Retailing and Consumer Services, Vol. 54, p. 102058.
Bagozzi, R.P. and Yi, Y. (2012), “Specification, evaluation, and interpretation of structural equation models”, Journal of the Academy of Marketing Science, Vol. 40 No. 1, pp. 8–34.
Bagozzi, R.P., Yi, Y. and Phillips, L.W. (1991), “Assessing construct validity in organizational research”, Administrative Science Quarterly, Vol. 36 No. 3, pp. 421–458.
Bagozzi, R.P., Yi, Y. and Singh, S. (1991), “On the use of structural equation models in experimental designs: Two extensions”, International Journal of Research in Marketing, Vol. 8 No. 2, pp. 125–140.
Bahmani, N., Jin, Z. and Ghose, S. (2020), “Fixing another firm’s mistake: how should recovering firms react?”, Journal of Consumer Marketing, Emerald Publishing Limited, Vol. 37 No. 1, pp. 65–76.
Baker, T. and Meyer, T. (2014), “Explanation information and source in service recovery initiatives”, Journal of Services Marketing, Vol. 28 No. 4, pp. 311–318.
Baker, T.L., Meyer, T. and Johnson, J.D. (2008), “Individual differences in perceptions of service failure and recovery: the role of race and discriminatory bias”, Journal of the Academy of Marketing Science, Vol. 36 No. 4, pp. 552–564.
Balaji, M.S., Jha, S., Sengupta, A.S. and Krishnan, B.C. (2018), “Are cynical customers satisfied differently? Role of negative inferred motive and customer participation in service recovery”, Journal of Business Research, Vol. 86, pp. 109–118.
Balaji, M.S. and Sarkar, A. (2013), “Does successful recovery mitigate failure severity?: A study of the behavioral outcomes in Indian context”, International Journal of Emerging Markets, Vol. 8 No. 1, pp. 65–81.
Bambauer-Sachse, S. and Mangold, S. (2011), “Brand equity dilution through negative online word-of-mouth communication”, Journal of Retailing and Consumer Services, Vol. 18 No. 1, pp. 38–45.
Bambauer-Sachse, S. and Rabeson, L.E. (2015), “Service recovery for moderate and high involvement services”, Journal of Services Marketing, Vol. 29 No. 5, pp. 331–343.
Barakat, L.L., Ramsey, J.R., Lorenz, M.P. and Gosling, M. (2015), “Severe service failure recovery revisited: Evidence of its determinants in an emerging market context”, International Journal of Research in Marketing, Vol. 32 No. 1, pp. 113–116.

281
Barbour, R.S. (2001), “Checklists for improving rigour in qualitative research: a case of the tail wagging the dog?”, Bmj, Vol. 322 No. 7294, pp. 1115–1117.
Barnett, V. (2002), Sample Survey Principles and Methods, Arnold.
Barnhoorn, J.S., Haasnoot, E., Bocanegra, B.R. and van Steenbergen, H. (2015), “QRTEngine: An easy solution for running online reaction time experiments using Qualtrics”, Behavior Research Methods, Vol. 47 No. 4, pp. 918–929.
Baron, R.M. and Kenny, D.A. (1986), “The moderator–mediator variable distinction in social psychological research: Conceptual, strategic, and statistical considerations.”, Journal of Personality and Social Psychology, American Psychological Association, Vol. 51 No. 6, p. 1173.
Barusman, A.R.P. and Virgawenda, T.M.B. (2019), “Supply Chain Strategy and Service Recovery as an Antecedent of Customer Loyalty for Insurance Company”, International Journal of Supply Chain Management, Vol. 8 No. 5, pp. 285–293.
Basso, K. and Pizzutti, C. (2016), “Trust recovery following a double deviation”, Journal of Service Research, Vol. 19 No. 2, pp. 209–223.
Baumgarth, C. and Schmidt, M. (2010), “How strong is the business-to-business brand in the workforce? An empirically-tested model of ‘internal brand equity’in a business-to-business setting”, Industrial Marketing Management, Vol. 39 No. 8, pp. 1250–1260.
Béal, M., Sabadie, W. and Grégoire, Y. (2019), “The effects of relationship length on customer profitability after a service recovery”, Marketing Letters, Vol. 30 No. 3–4, pp. 293–305.
Beauchamp, M.B. and Barnes, D.C. (2015), “Delighting baby boomers and millennials: factors that matter most”, Journal of Marketing Theory and Practice, Vol. 23 No. 3, pp. 338–350.
Bejou, D. and Palmer, A. (1998), “Service failure and loyalty: an exploratory empirical study of airline customers”, Journal of Services Marketing, Vol. 12 No. 1, pp. 7–22.
Bell, C.R. and Zemke, R.E. (1987), “Service breakdown: the road to recovery”, Management Review, Vol. 76 No. 10, p. 32.
Bell, E., Bryman, A. and Harley, B. (2018), Business Research Methods, Oxford university press.
Bell, J. and Waters, S. (2014), Doing Your Research Project: A Guide for First-Time Researchers, McGraw-Hill Education (UK).
Ben-Nun, P. (2008), “Respondent fatigue”, Encyclopedia of Survey Research Methods, Vol. 2, pp. 742–743.
Bendapudi, N. and Leone, R.P. (2003), “Psychological implications of customer participation in co-production”, Journal of Marketing, Vol. 67 No. 1, pp. 14–28.
Benraiss-Noailles, L. and Viot, C. (2020), “Employer brand equity effects on employees well-being and loyalty”, Journal of Business Research, Vol. 126, pp. 605–613.
Bergel, M. and Brock, C. (2018), “The impact of switching costs on customer

282
complaint behavior and service recovery evaluation”, Journal of Service Theory and Practice, Vol. 28 No. 4, pp. 458–483.
Berry, L.L. (1995), On Great Service: A Framework for Action, Simon and Schuster.
Berry, L.L. (2000), “Cultivating service brand equity”, Journal of the Academy of Marketing Science, Vol. 28 No. 1, pp. 128–137.
Berry, L.L., Zeithaml, V.A. and Parasuraman, A. (1990), “Five imperatives for improving service quality”, MIT Sloan Management Review, Vol. 31 No. 4, p. 29.
Betzing, J.H., Kurtz, M. and Becker, J. (2020), “Customer Participation in Virtual Communities for Local High Streets”, Journal of Retailing and Consumer Services, Vol. 54, p. 102025.
Beverland, M.B., Kates, S.M., Lindgreen, A. and Chung, E. (2010), “Exploring consumer conflict management in service encounters”, Journal of the Academy of Marketing Science, Vol. 38 No. 5, pp. 617–633.
Bhandari, M.S., Tsarenko, Y. and Polonsky, M.J. (2007), “A proposed multi-dimensional approach to evaluating service recovery”, Journal of Services Marketing, Vol. 21 No. 3, pp. 174–185.
Biedenbach, G., Hultén, P. and Tarnovskaya, V. (2019), “B2B brand equity: investigating the effects of human capital and relational trust”, Journal of Business & Industrial Marketing, Vol. 34 No. 1, pp. 1–11.
Biswas, M.K. and Suar, D. (2016), “Antecedents and consequences of employer branding”, Journal of Business Ethics, Vol. 136 No. 1, pp. 57–72.
Bitner, M.J. (1990), “Evaluating service encounters: the effects of physical surroundings and employee responses”, Journal of Marketing, Vol. 54 No. 2, pp. 69–82.
Bitner, M.J., Booms, B.H. and Tetreault, M.S. (1990), “The service encounter: diagnosing favorable and unfavorable incidents”, Journal of Marketing, Vol. 54 No. 1, pp. 71–84.
Blackston, M. (1992), “Observations: building brand equity by managing the brand’s relationships”, Journal of Advertising Research, Vol. 32 No. 3, pp. 79–83.
Blaikie, N. and Priest, J. (2019), Designing Social Research: The Logic of Anticipation, John Wiley & Sons.
Blodgett, J.G., Granbois, D.H. and Walters, R.G. (1993), “The effects of perceived justice on complainants’ negative word-of-mouth behavior and repatronage intentions”, Journal of Retailing, Vol. 69 No. 4, pp. 399–428.
Blodgett, J.G., Hill, D.J. and Tax, S.S. (1997), “The effects of distributive, procedural, and interactional justice on postcomplaint behavior”, Journal of Retailing, Vol. 73 No. 2, pp. 185–210.
Bo Edvardsson, Bard Tronvoll and Ho¨ykinpuro, R. (2011), “Complex service recoveryprocesses: how to avoid triple deviation”, Managing Service Quality: An International Journal, Vol. 21 No. 4, pp. 331–349.

283
Boenigk, S. and Becker, A. (2016), “Toward the Importance of Nonprofit Brand Equity”, Nonprofit Management and Leadership, Vol. 27 No. 2, pp. 181–198.
Bohannon, J. (2011), “Social science for pennies”, American Association for the Advancement of Science.
Bolton, L.E. and Mattila, A.S. (2015), “How does corporate social responsibility affect consumer response to service failure in buyer–seller relationships?”, Journal of Retailing, Vol. 91 No. 1, pp. 140–153.
Bonifield, C. and Cole, C. (2007), “Affective responses to service failure: Anger, regret, and retaliatory versus conciliatory responses”, Marketing Letters, Vol. 18 No. 1–2, pp. 85–99.
Boo, S., Busser, J. and Baloglu, S. (2009), “A model of customer-based brand equity and its application to multiple destinations”, Tourism Management, Vol. 30 No. 2, pp. 219–231.
Boshoff, C. (1997), “An experimental study of service recovery options”, International Journal of Service Industry Management, Vol. 8 No. 2, pp. 110–130.
Boshoff, C. (2005), “A re-assessment and refinement of RECOVSAT: An instrument to measure satisfaction with transaction-specific service recovery”, Managing Service Quality: An International Journal, Vol. 15 No. 5, pp. 410–425.
Bougoure, U.S., Russell-Bennett, R., Fazal-E-Hasan, S. and Mortimer, G. (2016), “The impact of service failure on brand credibility”, Journal of Retailing and Consumer Services, Vol. 31, pp. 62–71.
Boukis, A. and Christodoulides, G. (2020), “Investigating key antecedents and outcomes of employee‐based brand equity”, European Management Review, Vol. 17 No. 1, pp. 41–55.
Bradley, G. and Sparks, B. (2012), “Explanations: if, when, and how they aid service recovery”, Journal of Services Marketing, Vol. 26 No. 1, pp. 41–51.
Bradley, G.L. and Sparks, B.A. (2009), “Dealing with service failures: The use of explanations”, Journal of Travel & Tourism Marketing, Vol. 26 No. 2, pp. 129–143.
Brady, M.K. and Cronin, J.J. (2001), “Some new thoughts on conceptualizing perceived service quality: A hierarchical approach”, Journal of Marketing, Vol. 65 No. 3, pp. 34–49.
Brady, M.K., Cronin Jr, J.J., Fox, G.L. and Roehm, M.L. (2008), “Strategies to offset performance failures: The role of brand equity”, Journal of Retailing, Vol. 84 No. 2, pp. 151–164.
Braun, V. and Clarke, V. (2006), “Using thematic analysis in psychology”, Qualitative Research in Psychology, Vol. 3 No. 2, pp. 77–101.
Brodie, R.J., Fehrer, J.A., Jaakkola, E. and Conduit, J. (2019), “Actor engagement in networks: Defining the conceptual domain”, Journal of Service Research, Vol. 22 No. 2, pp. 173–188.
Brown, S. (2006), “Recycling Postmodern Marketing”, The Marketing Review, Vol. 6 No. 3, pp. 211–230.
284
Brown, T.J., Dacin, P.A., Pratt, M.G. and Whetten, D.A. (2006), “Identity, intended image, construed image, and reputation: An interdisciplinary framework and suggested terminology”, Journal of the Academy of Marketing Science, Vol. 34 No. 2, pp. 99–106.
Browne, R.H. (1995), “On the use of a pilot sample for sample size determination”, Statistics in Medicine, Vol. 14 No. 17, pp. 1933–1940.
Broyles, S.A., Leingpibul, T., Ross, R.H. and Foster, B.M. (2010), “Brand equity’s antecedent/consequence relationships in cross-cultural settings”, Journal of Product & Brand Management, Vol. 19 No. 3, pp. 159–169.
Broyles, S.A., Schumann, D.W. and Leingpibul, T. (2009), “Examining brand equity antecedent/consequence relationships”, Journal of Marketing Theory and Practice, Vol. 17 No. 2, pp. 145–162.
Brunetti, F., Confente, I. and Kaufmann, H.R. (2019), “The human dimension of a brand influences brand equity: an empirical examination in the context of a luxury and a convenience brand”, Journal of Brand Management, Vol. 26 No. 6, pp. 634–645.
Bryman, A. and Bell, E. (2011), “Ethics in business research”, Business Research Methods, Vol. 7 No. 5, pp. 23–56.
Bugg-Holloway, B., Wang, S. and Beatty, S.E. (2009), “Betrayal? Relationship quality implications in service recovery”, Journal of Services Marketing, Vol. 23 No. 6, pp. 385–396.
Buhrmester, M.D., Talaifar, S. and Gosling, S.D. (2018), “An evaluation of Amazon’s Mechanical Turk, its rapid rise, and its effective use”, Perspectives on Psychological Science, Vol. 13 No. 2, pp. 149–154.
Buil, I., de Chernatony, L. and Martinez, E. (2008), “A cross-national validation of the consumer-based brand equity scale”, Journal of Product & Brand Management, Vol. 17 No. 6, pp. 384–392.
Buil, I., Martínez, E. and De Chernatony, L. (2013), “The influence of brand equity on consumer responses”, Journal of Consumer Marketing, Vol. 30 No. 1, pp. 62–74.
Bulpitt, C.J. (1996), “The Advantages and Disadvantages of Randomised Controlled Trials”, Randomised Controlled Clinical Trials, Springer, pp. 379–385.
Bunker, M.P. and Ball, D. (2008), “Causes and consequences of grudge‐holding in service relationships”, Journal of Services Marketing, Vol. 22 No. 1, pp. 37–47.
Burrell, G. and Morgan, G. (1979), “Sociological Paradigms and Organisational”, Analysis. London: Heinemann.
Busser, J.A. and Shulga, L. V. (2019), “Role of commercial friendship, initiation and co-creation types”, Journal of Service Theory and Practice, Vol. 29 No. 4, pp. 488–512.
Buttle, F. and Burton, J. (2002), “Does service failure influence customer loyalty?”, Journal of Consumer Behaviour: An International Research Review, Wiley Online Library, Vol. 1 No. 3, pp. 217–227.

285
Byun, J. and Jang, S. (2019), “Can signaling impact customer satisfaction and behavioral intentions in times of service failure?: evidence from open versus closed kitchen restaurants”, Journal of Hospitality Marketing and Management, Routledge, Vol. 28 No. 7, pp. 785–806.
Camarero, C., Garrido-Samaniego, M.J. and Vicente, E. (2012), “Determinants of brand equity in cultural organizations: the case of an art exhibition”, The Service Industries Journal, Vol. 32 No. 9, pp. 1527–1549.
Cambra-Fierro, J., Berbel-Pineda, J.M., Ruiz-Benítez, R. and Vázquez-Carrasco, R. (2013), “Analysis of the moderating role of the gender variable in service recovery processes”, Journal of Retailing and Consumer Services, Vol. 20 No. 4, pp. 408–418.
Cambra-Fierro, J., Melero-Polo, I. and Sese, F.J. (2016), “Can complaint-handling efforts promote customer engagement?”, Service Business, Vol. 10 No. 4, pp. 847–866.
Cantor, V.J.M. and Li, R.C. (2019), “Matching service failures and recovery options toward satisfaction”, The Service Industries Journal, Taylor & Francis, Vol. 39 No. 13–14, pp. 901–924.
Capaldi, D. and Patterson, G.R. (1987), “An approach to the problem of recruitment and retention rates for longitudinal research”, Behavioral Assessment, Vol. 9 No. 2, pp. 169–177.
Carroll, J.M. (2000), Making Use: Scenario-Based Design of Human-Computer Interactions, MIT press.
Casidy, R. and Shin, H. (2015), “The effects of harm directions and service recovery strategies on customer forgiveness and negative word-of-mouth intentions”, Journal of Retailing and Consumer Services, Vol. 27 No. 6, pp. 103–112.
CCMC. (2017), “When will we ever learn: why the revolution in corporate complaint-handling has failed so far and how businesses can turn this around”, available at: https://www.customercaremc.com/wp-content/uploads/2017/03/Why-Revolution-in-Corporate-Complaint-Handling-Has-Failed-WP0417.pdf (accessed 2 January 2021).
Chalmers, A.F. (1982), What Is the Thing Called Science?, 2nd ed., Open University Press, Bukingham.
Chalmers, S. (2016), “Ethical fairness in financial services complaint handling”, International Journal of Bank Marketing, Emerald Group Publishing Limited, Vol. 34 No. 4, pp. 570–586.
Chandrashekaran, M., Rotte, K., Tax, S.S. and Grewal, R. (2007), “Satisfaction strength and customer loyalty”, Journal of Marketing Research, Vol. 44 No. 1, pp. 153–163.
Chang, C. (2006), “When service fails: The role of the salesperson and the customer”, Psychology & Marketing, Vol. 23 No. 3, pp. 203–224.
Chang, H.-S. and Hsiao, H.-L. (2008), “Examining the casual relationship among service recovery, perceived justice, perceived risk, and customer value in the hotel industry”, The Service Industries Journal, Vol. 28 No. 4, pp. 513–528.

286
Chang, H.H., Tsai, Y.C., Wong, K.H., Wang, J.W. and Cho, F.J. (2015), “The effects of response strategies and severity of failure on consumer attribution with regard to negative word-of-mouth”, Decision Support Systems, Vol. 71, pp. 48–61.
Chang, S.-J., Van Witteloostuijn, A. and Eden, L. (2010), “From the editors: Common method variance in international business research”, Journal of International Business Studies, Springer, No. 41, pp. 178–184.
Chao, C.-M. and Cheng, B.-W. (2019), “Does service recovery affect satisfaction and loyalty? An empirical study of medical device suppliers”, Total Quality Management & Business Excellence, Vol. 30 No. 11–12, pp. 1350–1366.
Charmaz, K. (2006), Constructing Grounded Theory: A Practical Guide through Qualitative Analysis, sage.
Chatzipanagiotou, K., Christodoulides, G. and Veloutsou, C. (2019), “Managing the consumer-based brand equity process: A cross-cultural perspective”, International Business Review, Vol. 28 No. 2, pp. 328–343.
Chatzipanagiotou, K., Veloutsou, C. and Christodoulides, G. (2016), “Decoding the complexity of the consumer-based brand equity process”, Journal of Business Research, Vol. 69 No. 11, pp. 5479–5486.
Chaudhuri, A. (1995), “Brand equity or double jeopardy?”, Journal of Product & Brand Management, Vol. 4 No. 1, pp. 26–32.
Chaudhuri, A. and Holbrook, M.B. (2001), “The chain of effects from brand trust and brand affect to brand performance: the role of brand loyalty”, Journal of Marketing, Vol. 65 No. 2, pp. 81–93.
Chawdhary, R. and Dall’Olmo Riley, F. (2015), “Investigating the consequences of word of mouth from a WOM sender’s perspective in the services context”, Journal of Marketing Management, Routledge, Vol. 31 No. 9, pp. 1018–1039.
Chebat, J.-C. and Slusarczyk, W. (2005), “How emotions mediate the effects of perceived justice on loyalty in service recovery situations: an empirical study”, Journal of Business Research, Vol. 58 No. 5, pp. 664–673.
Chen, N., Mohanty, S., Jiao, J. and Fan, X. (2021), “To err is human: Tolerate humans instead of machines in service failure”, Journal of Retailing and Consumer Services, Vol. 59, p. 102363.
Chen, P. and Kim, Y.G. (2019), “Role of the perceived justice of service recovery: A comparison of first-time and repeat visitors”, Tourism and Hospitality Research, Vol. 19 No. 1, pp. 98–111.
Chen, T., Ma, K., Bian, X., Zheng, C. and Devlin, J. (2018), “Is high recovery more effective than expected recovery in addressing service failure?—A moral judgment perspective”, Journal of Business Research, Vol. 82, pp. 1–9.
Chen, Y. and Tussyadiah, I.P. (2021), “Service failure in peer-to-peer accommodation”, Annals of Tourism Research, Vol. 88, p. 103156.
De Chernatony, L. and Dall’Olmo Riley, F. (1999), “Experts’ views about defining services brands and the principles of services branding”, Journal of Business Research, Vol. 46 No. 2, pp. 181–192.
de Chernatony, L., Harris, F. and Christodoulides, G. (2004), “Developing a brand
287
performance measure for financial services brands”, The Service Industries Journal, Vol. 24 No. 2, pp. 15–33.
Cheung and To, W.M. (2016), “A customer-dominant logic on service recovery and customer satisfaction”, Management Decision, Vol. 54 No. 10, pp. 2524–2543.
Chi, C.G.Q., Wen, B. and Ouyang, Z. (2020), “Developing relationship quality in economy hotels: the role of perceived justice, service quality, and commercial friendship”, Journal of Hospitality Marketing and Management, Routledge, Vol. 29 No. 8, pp. 1027–1051.
Chih, W.-H., Wang, K.-Y., Hsu, L.-C. and Cheng, I.-S. (2012), “From disconfirmation to switching: an empirical investigation of switching intentions after service failure and recovery”, The Service Industries Journal, Vol. 32 No. 8, pp. 1305–1321.
Chiou, M.-R., Chao, S.-L. and Hsieh, H.-Y. (2020), “The Moderating Role of Service Recovery on Customer Loyalty in the Context of Cruise Passengers”, Maritime Policy & Management, pp. 1–17.
Choi, B. and Choi, B.-J. (2014), “The effects of perceived service recovery justice on customer affection, loyalty, and word-of-mouth”, European Journal of Marketing, Vol. 48 No. 1/2, pp. 108–131.
Choi, B. and La, S. (2013), “The impact of corporate social responsibility (CSR) and customer trust on the restoration of loyalty after service failure and recovery”, Journal of Services Marketing, Vol. 27 No. 3, pp. 223–233.
Choi, J. and Seo, S. (2019), “When a stigmatized brand is doing good: the role of complementary fit and brand equity in cause-related marketing”, International Journal of Contemporary Hospitality Management, Vol. 31 No. 9, pp. 3447–3464.
Christodoulides, G., Cadogan, J.W. and Veloutsou, C. (2015), “Consumer-based brand equity measurement: lessons learned from an international study”, International Marketing Review, Vol. 32 No. 3/4, pp. 307–328.
Christodoulides, G. and de Chernatony, L. (2010), “Consumer-based brand equity conceptualization and measurement: A literature review”, International Journal of Research in Marketing, Vol. 52 No. 1, pp. 43–66.
Christodoulides, G., De Chernatony, L., Furrer, O., Shiu, E. and Abimbola, T. (2006), “Conceptualising and measuring the equity of online brands”, Journal of Marketing Management, Vol. 22 No. 7–8, pp. 799–825.
Chuang, S.-C., Cheng, Y.-H., Chang, C.-J. and Yang, S.-W. (2012), “The effect of service failure types and service recovery on customer satisfaction: a mental accounting perspective”, The Service Industries Journal, Vol. 32 No. 2, pp. 257–271.
Churchill, G.A. (1979), “A Paradigm for Developing Better Measures of Marketing Constructs”, Journal of Marketing Research, Vol. 16 No. 1, p. 64.
Citizensadvice. (2019), “Claim compensation if your flight’s delayed or cancelled”, available at: https://www.citizensadvice.org.uk/consumer/holiday-cancellations-and-compensation/if-your-flights-delayed-or-cancelled/ (accessed 2 May 2020).

288
Clark, M.N., Adjei, M.T. and Yancey, D.N. (2009), “The impact of service fairness perceptions on relationship quality”, Services Marketing Quarterly, Vol. 30 No. 3, pp. 287–302.
Clarke, V. and Braun, V. (2017), “Commentary: Thematic Analysis ‘”, Journal of Positive Psychology, Vol. 12 No. 3, pp. 297–298.
Claycomb, C., Lengnick-Hall, C.A. and Inks, L.W. (2001), “The customer as a productive resource: a pilot study and strategic implications”, Journal of Business Strategies, Vol. 18 No. 1, pp. 47–69.
Clottey, T.A. and Grawe, S.J. (2014), “Non-response bias assessment in logistics survey research: Use fewer tests?”, International Journal of Physical Distribution and Logistics Management, Vol. 44 No. 5, pp. 412–426.
Cobb-Walgren, C.J., Ruble, C.A. and Donthu, N. (1995), “Brand equity, brand preference, and purchase intent”, Journal of Advertising, Vol. 24 No. 3, pp. 25–40.
Coelho, F.J.F., Bairrada, C.M. and de Matos Coelho, A.F. (2020), “Functional brand qualities and perceived value: The mediating role of brand experience and brand personality”, Psychology and Marketing, Vol. 37 No. 1, pp. 41–55.
Cohen, J. (1969), Statistical Power Analysis for the Behavioural Sciences, Academic Press, New York.
Colquitt, J.A. (2001), “On the dimensionality of organizational justice: a construct validation of a measure”, Journal of Applied Psychology, Vol. 86 No. 3, p. 386.
Comrey, A.L. and Lee, H.B. (1992), “A First Course in Factor Analysis, 2nd Edn. Hillsdale, NJ: L”, Erlbaum Associates.
Contiero, E., Ponsignon, F., Smart, P.A. and Vinelli, A. (2016), “Contingencies and characteristics of service recovery system design: Insights from retail banking”, International Journal of Operations & Production Management, Vol. 36 No. 11, pp. 1644–1667.
Converse, J.M. and Presser, S. (1986), Survey Questions: Handcrafting the Standardized Questionnaire, Sage.
Conway, J.M. and Lance, C.E. (2010), “What reviewers should expect from authors regarding common method bias in organizational research”, Journal of Business and Psychology, Springer, Vol. 25 No. 3, pp. 325–334.
Cossío-Silva, F.J., Revilla-Camacho, M.Á., Vega-Vázquez, M. and Palacios-Florencio, B. (2016), “Value co-creation and customer loyalty”, Journal of Business Research, Vol. 69 No. 5, pp. 1621–1625.
Coulter, K.S. (2009), “Enough is enough! Or is it? Factors that impact switching intentions in extended travel service transactions”, Journal of Travel & Tourism Marketing, Vol. 26 No. 2, pp. 144–155.
Cox, D.R. (2009), “Randomization in the design of experiments”, International Statistical Review, Vol. 77 No. 3, pp. 415–429.
Craighead, C.W., Ketchen, D.J., Dunn, K.S. and Hult, G.T.M. (2011), “Addressing common method variance: guidelines for survey research on information technology, operations, and supply chain management”, IEEE Transactions on Engineering Management, Vol. 58 No. 3, pp. 578–588.

289
Creswell, J.W. and Creswell, J.D. (2018), Research Design: Qualitative, Quantitative, and Mixed Methods Approaches, Fifth., SAGE, Los Angeles.
Creswell, J.W., Hanson, W.E., Clark Plano, V.L. and Morales, A. (2007), “Qualitative research designs: Selection and implementation”, The Counseling Psychologist, Vol. 35 No. 2, pp. 236–264.
Creswell, J.W. and Poth, C.N. (2016), Qualitative Inquiry and Research Design: Choosing among Five Approaches, Sage publications.
Crisafulli, B. and Singh, J. (2016), “Service guarantee as a recovery strategy: The impact of guarantee terms on perceived justice and firm motives”, Journal of Service Management, Vol. 27 No. 2, pp. 117–143.
Cronbach, L.J. (1951), “Coefficient alpha and the internal structure of tests”, Psychometrika, Vol. 16 No. 3, pp. 297–334.
Cypress, B.S. (2017), “Rigor or reliability and validity in qualitative research: Perspectives, strategies, reconceptualization, and recommendations”, Dimensions of Critical Care Nursing, Vol. 36 No. 4, pp. 253–263.
Dabholkar, P.A. (1990), “How to improve perceived service quality by increasing customer participation”, Proceedings of the 1990 Academy of Marketing Science (AMS) Annual Conference, Springer, pp. 483–487.
Dall’Olmo Riley, F. and De Chernatony, L. (2000), “The service brand as relationships builder”, British Journal of Management, Vol. 11 No. 2, pp. 137–150.
Dall’Olmo Riley, F., Pina, J.M. and Bravo, R. (2015), “The role of perceived value in vertical brand extensions of luxury and premium brands”, Journal of Marketing Management, Routledge, Vol. 31 No. 7–8, pp. 881–913.
Van Dam, N.T., Earleywine, M. and Borders, A. (2010), “Measuring mindfulness? An Item Response Theory analysis of the Mindful Attention Awareness Scale”, Personality and Individual Differences, Vol. 49 No. 7, pp. 805–810.
Darley, W.K. and Luethge, D.J. (2019), “Service value and retention: Does gender matter?”, Journal of Retailing and Consumer Services, Vol. 48, pp. 178–185.
Daskin, M. and Kasim, A. (2016), “Exploring the impact of service recovery on customer affection, perceived value, and sabotaging behaviour: Does gender make a difference?”, International Journal of Services and Operations Management, Vol. 23 No. 4, pp. 467–485.
Davcik, N.S. and Sharma, P. (2015), “Impact of product differentiation, marketing investments and brand equity on pricing strategies: A brand level investigation”, European Journal of Marketing, Vol. 49 No. 5/6, pp. 760–781.
Davidow, M. (2000), “The bottom line impact of organizational responses to customer complaints”, Journal of Hospitality & Tourism Research, Vol. 24 No. 4, pp. 473–490.
Davidow, M. (2003), “Organizational responses to customer complaints: What works and what doesn’t”, Journal of Service Research, Vol. 5 No. 3, pp. 225–250.
Davis. (2000), “Brand asset management”, Driving Profitable Growth through Your Brands. San Francisco.

290
Davis, Golicic, S.L. and Marquardt, A. (2009), “Measuring brand equity for logistics services”, The International Journal of Logistics Management, Vol. 20 No. 2, pp. 201–212.
Day, R.L. and Landon, E.L. (1977), “Toward a theory of consumer complaining behavior”, Consumer and Industrial Buying Behavior, Vol. 95 No. 1, pp. 425–437.
Deakin, H. and Wakefield, K. (2014), “Skype interviewing: Reflections of two PhD researchers”, Qualitative Research, Vol. 14 No. 5, pp. 603–616.
Delgado‐Ballester, E. and Munuera‐Alemán, J.L. (2005), “Does brand trust matter to brand equity?”, Journal of Product & Brand Management, Vol. 14 No. 3, pp. 187–196.
Denzin, N.K. and Lincoln, Y.S. (2011), The Sage Handbook of Qualitative Research, sage.
Dettori, A., Floris, M. and Dessì, C. (2020), “Customer-perceived quality, innovation and tradition: some empirical evidence”, TQM Journal, Vol. 32 No. 6, pp. 1467–1486.
DeVellis, R.F. (2016), Scale Development: Theory and Applications, Vol. 26, Sage publications.
DeWitt, T., Nguyen, D.T. and Marshall, R. (2008), “Exploring customer loyalty following service recovery: The mediating effects of trust and emotions”, Journal of Service Research, Vol. 10 No. 3, pp. 269–281.
Diamantopoulos, A., Sarstedt, M., Fuchs, C., Wilczynski, P. and Kaiser, S. (2012), “Guidelines for choosing between multi-item and single-item scales for construct measurement: a predictive validity perspective”, Journal of the Academy of Marketing Science, Vol. 40 No. 3, pp. 434–449.
Diamantopoulos, A. and Schlegelmilch, B.B. (2000), Taking the Fear out of Data Analysis: A Step-by-Step Approach, Cengage Learning EMEA.
Dickinger, A. and Bauernfeind, U. (2009), “AN ANALYSIS OF CORPORATE E‐MAIL COMMUNICATION AS PART OF AIRLINES’SERVICE RECOVERY STRATEGY”, Journal of Travel & Tourism Marketing, Vol. 26 No. 2, pp. 156–168.
Dijkstra, T.K. and Henseler, J. (2015), “Consistent partial least squares path modeling”, Mis Quarterly, Vol. 39 No. 2, pp. 297–316.
Dillman, D.A. (2007), Mail and Internet Surveys: The Tailored Design Method--2007 Update with New Internet, Visual, and Mixed-Mode Guide, John Wiley & Sons.
Dillman, D.A., Smyth, J.D. and Christian, L.M. (2014), Internet, Phone, Mail, and Mixed-Mode Surveys: The Tailored Design Method, John Wiley & Sons.
Dinçer, H., Bozaykut-Buk, T., Emir, Ş., Yuksel, S. and Ashill, N. (2019), “Using the fuzzy multicriteria decision making approach to evaluate brand equity: a study of privatized firms”, Journal of Product & Brand Management, Vol. 29 No. 3, pp. 335–354.
Dolbec, P.-Y. and Chebat, J.-C. (2013), “The impact of a flagship vs. a brand store on brand attitude, brand attachment and brand equity”, Journal of Retailing,
291
Vol. 89 No. 4, pp. 460–466.
Doney, P.M. and Cannon, J.P. (1997), “An examination of the nature of trust in buyer–seller relationships”, Journal of Marketing, Vol. 61 No. 2, pp. 35–51.
Dong, B., Evans, K.R. and Zou, S. (2008), “The effects of customer participation in co-created service recovery”, Journal of the Academy of Marketing Science, Vol. 36 No. 1, pp. 123–137.
Dong, B. and Sivakumar, K. (2017), “Customer participation in services : domain , scope , and boundaries”, Journal of the Academy of Marketing Science, pp. 944–965.
Dong, B., Sivakumar, K., Evans, K.R. and Zou, S. (2016), “Recovering coproduced service failures: Antecedents, consequences, and moderators of locus of recovery”, Journal of Service Research, Vol. 19 No. 3, pp. 291–306.
Dorsch, M.J., Swanson, S.R. and Kelley, S.W. (1998), “The role of relationship quality in the stratification of vendors as perceived by customers”, Journal of the Academy of Marketing Science, Vol. 26 No. 2, pp. 128–142.
Du, J., Fan, X. and Feng, T. (2011), “Multiple emotional contagions in service encounters”, Journal of the Academy of Marketing Science, Vol. 39 No. 3, pp. 449–466.
Du, J., Fan, X. and Feng, T. (2014), “Group emotional contagion and complaint intentions in group service failure: The role of group size and group familiarity”, Journal of Service Research, Vol. 17 No. 3, pp. 326–338.
Duffy, J.A.M., Miller, J.M. and Bexley, J.B. (2006), “Banking customers’ varied reactions to service recovery strategies”, International Journal of Bank Marketing, Vol. 24 No. 2, pp. 112–132.
Dutta, K., Venkatesh, U. and Parsa, H.G. (2007), “Service failure and recovery strategies in the restaurant sector: An Indo-US comparative study”, International Journal of Contemporary Hospitality Management, Vol. 19 No. 5, pp. 351–363.
East, R., Grandcolas, U., Dall’Olmo Riley, F. and Lomax, W. (2012), “Reasons for switching service providers”, Australasian Marketing Journal, Australian and New Zealand Marketing Academy., Vol. 20 No. 2, pp. 164–170.
Easterby-Smith, M., Thorpe, R. and Jackson, P.R. (2015), Management and Business Research, Sage.
Eatough, V. and Smith, J.A. (2008), “Interpretative phenomenological analysis”, The Sage Handbook of Qualitative Research in Psychology, Vol. 179, p. 194.
Edwards, T., Tregaskis, O., Edwards, P., Ferner, A., Marginson, P., Arrowsmith, J., Adam, D., et al. (2007), “Charting the Contours of Multinationals in Britain: Methodological challenges arising in survey-based research”, Warwick Papers in Industrial Relations, Vol. 86, pp. 1–32.
Erdem, T. and Swait, J. (1998), “Brand equity as a signaling phenomenon”, Journal of Consumer Psychology, Vol. 7 No. 2, pp. 131–157.
Etemad-Sajadi, R. and Bohrer, L. (2019), “The impact of service recovery output/process on customer satisfaction and loyalty: The case of the airline industry”, Tourism and Hospitality Research, Vol. 19 No. 2, pp. 259–266.
292
Everitt, B.S. (1975), “Multivariate analysis: The need for data, and other problems”, The British Journal of Psychiatry, Vol. 126 No. 3, pp. 237–240.
Fabrigar, L.R., Wegener, D.T., MacCallum, R.C. and Strahan, E.J. (1999), “Evaluating the use of exploratory factor analysis in psychological research”, Psychological Methods, Vol. 4 No. 3, p. 272.
Fan, D.X.F., Hsu, C.H.C. and Lin, B. (2020), “Tourists’ experiential value co-creation through online social contacts: Customer-dominant logic perspective”, Journal of Business Research, Vol. 108, pp. 163–173.
Fang, Z., Luo, X. and Jiang, M. (2013), “Quantifying the dynamic effects of service recovery on customer satisfaction: evidence from Chinese mobile phone markets”, Journal of Service Research, Vol. 16 No. 3, pp. 341–355.
Farquhar, P.H. (1989), “Managing brand equity”, Marketing Research, Vol. 1 No. 3, pp. 24–33.
Fatma, M., Rahman, Z. and Khan, I. (2015), “Building company reputation and brand equity through CSR: the mediating role of trust”, International Journal of Bank Marketing, Vol. 33 No. 6, pp. 840–856.
Feldt, L.S. and Brennan, R.L. (1989), “Reliability”, in Linn, R.L. (Ed.), Educational Measurement, American Council on Education and National Council on Measurement in Education, Washington, DC, pp. 105–146.
Feldwick, P. (1996), “Do we really need ‘brand equity’?”, Journal of Brand Management, Vol. 4 No. 1, pp. 9–28.
Ferjani, M., Jedidi, K. and Jagpal, S. (2009), “A conjoint approach for consumer-and firm-level brand valuation”, Journal of Marketing Research, Vol. 46 No. 6, pp. 846–862.
Filieri, R., Lin, Z., D’Antone, S. and Chatzopoulou, E. (2019), “A cultural approach to brand equity: the role of brand mianzi and brand popularity in China”, Journal of Brand Management, Vol. 26 No. 4, pp. 376–394.
Fink, A. (2015), How to Conduct Surveys: A Step-by-Step Guide, Sage Publications.
Folkes, V.S., Koletsky, S. and Graham, J.L. (1987), “A field study of causal inferences and consumer reaction: the view from the airport”, Journal of Consumer Research, Vol. 13 No. 4, pp. 534–539.
Forbes, L.P. (2008), “When something goes wrong and no one is around: non‐internet self‐service technology failure and recovery”, Journal of Services Marketing, Vol. 22 No. 4, pp. 316–327.
Forbes, L.P., Kelley, S.W. and Hoffman, K.D. (2005), “Typologies of e‐commerce retail failures and recovery strategies”, Journal of Services Marketing, Vol. 19 No. 5, pp. 280–292.
Fornell, C. and Larcker, D.F. (1981), “Evaluating structural equation models with unobservable variables and measurement error”, Journal of Marketing Research, Vol. 18 No. 1, pp. 39–50.
Foroudi, P., Jin, Z., Gupta, S., Foroudi, M.M. and Kitchen, P.J. (2018), “Perceptional components of brand equity: Configuring the Symmetrical and Asymmetrical Paths to brand loyalty and brand purchase intention”, Journal of

293
Business Research, Vol. 89, pp. 462–474.
Foroudi, P., Yu, Q., Gupta, S. and Foroudi, M.M. (2019), “Enhancing university brand image and reputation through customer value co-creation behaviour”, Technological Forecasting and Social Change, Vol. 138, pp. 218–227.
Fournier, S. (1998), “Consumers and their brands: Developing relationship theory in consumer research”, Journal of Consumer Research, Vol. 24 No. 4, pp. 343–373.
Franke, N., Schreier, M. and Kaiser, U. (2010), “The ‘I designed it myself’ effect in mass customization”, Management Science, Vol. 56 No. 1, pp. 125–140.
French, A. and Smith, G. (2013), “Measuring brand association strength: a consumer based brand equity approach”, European Journal of Marketing, Vol. 47 No. 8, pp. 1356–1367.
Fuchs, C., Prandelli, E. and Schreier, M. (2010), “The psychological effects of empowerment strategies on consumers’ product demand”, Journal of Marketing, Vol. 74 No. 1, pp. 65–79.
Fuller, C.M., Simmering, M.J., Atinc, G., Atinc, Y. and Babin, B.J. (2016), “Common methods variance detection in business research”, Journal of Business Research, Vol. 69 No. 8, pp. 3192–3198.
Garanti, Z. and Kissi, P.S. (2019), “The effects of social media brand personality on brand loyalty in the Latvian banking industry”, International Journal of Bank Marketing, Vol. 37 No. 6, pp. 1480–1503.
Garbarino, E. and Johnson, M.S. (1999), “The different roles of satisfaction, trust, and commitment in customer relationships”, Journal of Marketing, Vol. 63 No. 2, pp. 70–87.
Gelbrich, K., Gäthke, J. and Grégoire, Y. (2015), “How much compensation should a firm offer for a flawed service? An examination of the nonlinear effects of compensation on satisfaction”, Journal of Service Research, Vol. 18 No. 1, pp. 107–123.
Gelbrich, K. and Roschk, H. (2011), “A meta-analysis of organizational complaint handling and customer responses”, Journal of Service Research, Vol. 14 No. 1, pp. 24–43.
Gil-Saura, I., Šerić, M., Ruiz-Molina, M.E. and Berenguer-Contrí, G. (2017), “The causal relationship between store equity and loyalty: Testing two alternative models in retailing”, Journal of Brand Management, Vol. 24 No. 2, pp. 193–208.
Gil, S.M., Hudson, S. and Quintana, T.A. (2006), “The influence of service recovery and loyalty on perceived service quality: A study of hotel customers in Spain”, Journal of Hospitality and Leisure Marketing, Vol. 14 No. 2, pp. 47–68.
Gioia, D.A., Corley, K.G. and Hamilton, A.L. (2013), “Seeking qualitative rigor in inductive research: Notes on the Gioia methodology”, Organizational Research Methods, Vol. 16 No. 1, pp. 15–31.
Girard, T., Trapp, P., Pinar, M., Gulsoy, T. and Boyt, T.E. (2017), “Consumer-based brand equity of a private-label brand: Measuring and examining

294
determinants”, Journal of Marketing Theory and Practice, Vol. 25 No. 1, pp. 39–56.
Glaser, B. and Strauss, A. (1967), “Grounded theory: The discovery of grounded theory”, Sociology The Journal Of The British Sociological Association, Vol. 12, pp. 27–49.
Godey, B., Manthiou, A., Pederzoli, D., Rokka, J., Aiello, G., Donvito, R. and Singh, R. (2016), “Social media marketing efforts of luxury brands: Influence on brand equity and consumer behavior”, Journal of Business Research, Vol. 69 No. 12, pp. 5833–5841.
Gohary, A., Hamzelu, B. and Alizadeh, H. (2016), “Please explain why it happened! How perceived justice and customer involvement affect post co-recovery evaluations: A study of Iranian online shoppers”, Journal of Retailing and Consumer Services, Vol. 31, pp. 127–142.
Gohary, A., Hamzelu, B. and Pourazizi, L. (2016), “A little bit more value creation and a lot of less value destruction! Exploring service recovery paradox in value context: A study in travel industry”, Journal of Hospitality and Tourism Management, Vol. 29, pp. 189–203.
Gohary, A., Hamzelu, B., Pourazizi, L. and Hanzaee, K.H. (2016), “Understanding effects of co-creation on cognitive, affective and behavioral evaluations in service recovery: An ethnocultural analysis”, Journal of Retailing and Consumer Services, Vol. 31, pp. 182–198.
González-Mansilla, Ó., Berenguer-Contri, G. and Serra-Cantallops, A. (2019), “The impact of value co-creation on hotel brand equity and customer satisfaction”, Tourism Management, Vol. 75, pp. 51–65.
Gonzalez, G.R., Hoffman, K.D. and Ingram, T.N. (2014), “The sales recovery audit: Learning to walk the talk”, Industrial Marketing Management, Vol. 43 No. 1, pp. 146–154.
Gonzalez, G.R., Hoffman, K.D., Ingram, T.N. and LaForge, R.W. (2010), “Sales organization recovery management and relationship selling: a conceptual model and empirical test”, Journal of Personal Selling & Sales Management, Vol. 30 No. 3, pp. 223–237.
Goodhue, D.L., Lewis, W. and Thompson, R. (2012), “Does PLS have advantages for small sample size or non-normal data?”, Mis Quarterly, Vol. 36 No. 3, pp. 981–1001.
Goodman, J.K. and Paolacci, G. (2017), “Crowdsourcing consumer research”, Journal of Consumer Research, Vol. 44 No. 1, pp. 196–210.
Gorsuch, R.L. (1983), Factor Analysis, 2nd ed., Hillsdale, NJ: Lawrence Erlbaum Associates.
Goulding, C. (2005), “Grounded theory, ethnography and phenomenology: A comparative analysis of three qualitative strategies for marketing research”, European Journal of Marketing, Vol. 39 No. 3–4, pp. 294–308.
Grégoire, Y. and Fisher, R.J. (2008), “Customer betrayal and retaliation: when your best customers become your worst enemies”, Journal of the Academy of Marketing Science, Vol. 36 No. 2, pp. 247–261.

295
Grégoire, Y., Tripp, T.M. and Legoux, R. (2009), “When customer love turns into lasting hate: The effects of relationship strength and time on customer revenge and avoidance”, Journal of Marketing, Vol. 73 No. 6, pp. 18–32.
Grewal, R., Cote, J.A. and Baumgartner, H. (2004), “Multicollinearity and measurement error in structural equation models: Implications for theory testing”, Marketing Science, Vol. 23 No. 4, pp. 519–529.
Gronroos, C. (1988), “Service quality: The six criteria of good perceived service”, Review of Business, Vol. 9 No. 3, pp. 10–13.
Grönroos, C. and Voima, P. (2013), “Critical service logic: making sense of value creation and co-creation”, Journal of the Academy of Marketing Science, Vol. 41 No. 2, pp. 133–150.
Grott, E.M., Cambra-Fierro, J., Perez, L. and Yani-de-Soriano, M. (2019), “How cross-culture affects the outcomes of co-creation”, European Business Review, Vol. 31 No. 4, pp. 544–566.
Gruber, T. and Frugone, F. (2011), “Uncovering the desired qualities and behaviours of general practitioners (GPs) during medical (service recovery) encounters”, Journal of Service Management, Vol. 22 No. 4, pp. 491–521.
Guba, E.G. (1981), “Criteria for assessing the trustworthiness of naturalistic inquiries”, Ectj, Vol. 29 No. 2, p. 75.
Guba, E.G. (1990), “The alternative paradigm dialog”, in Guba, E.G. (Ed.), The Paradigm Dialog, Sage, Newbury Park, CA.
Guba, E.G. and Lincoln, Y.S. (1994), “Competing paradigms in qualitative research”, Handbook of Qualitative Research, Vol. 2 No. 163–194, p. 105.
Guest, G., MacQueen, K.M. and Namey, E.E. (2011), Applied Thematic Analysis, Sage Publications.
Guo, L., Lotz, S.L., Tang, C. and Gruen, T.W. (2016), “The role of perceived control in customer value cocreation and service recovery evaluation”, Journal of Service Research, Vol. 19 No. 1, pp. 39–56.
Guo, Z., Xiao, L., Van Toorn, C., Lai, Y. and Seo, C. (2016), “Promoting online learners’ continuance intention: An integrated flow framework”, Information & Management, Vol. 53 No. 2, pp. 279–295.
Gupta, V. and Kumar, S. (2013), “Impact of performance appraisal justice on employee engagement: a study of Indian professionals”, Employee Relations, Vol. 35 No. 1, pp. 61–78.
Guzmán, F. and Davis, D. (2017), “The impact of corporate social responsibility on brand equity: consumer responses to two types of fit”, Journal of Product & Brand Management, Vol. 26 No. 5, pp. 435–446.
Ha, H.-Y., Janda, S. and Muthaly, S. (2010), “Development of brand equity: evaluation of four alternative models”, The Service Industries Journal, Vol. 30 No. 6, pp. 911–928.
Ha, J. and Jang, S.S. (2009), “Perceived justice in service recovery and behavioral intentions: The role of relationship quality”, International Journal of Hospitality Management, Vol. 28 No. 3, pp. 319–327.

296
Hair, J., Bush, R.P. and Ortinau, D.J. (2006), Marketing Research: Within a Changing Information Environment, McGraw-Hill.
Hair, J.F., Black, W.C., Babin, B.J. and Anderson, R.E. (2014), Multivariate Data Analysis, Seventh., Pearson, Harlow.
Hair, J.F., Black, W.C., Babin, B.J., Anderson, R.E. and Tatham, R.L. (2006), “Multivariate data analysis 6th ed”, Uppersaddle River: Pearson Prentice Hall.
Hair, J.F., Black, W.C., Babin, B.J., Anderson, R.E. and Tatham, R.L. (2013), Multivariate Data Analysis, Vol. 5, Pearson, Essex, England.
Hair, J.F., Hult, G.T.M., Ringle, C.M., Sarstedt, M., Ringle, C.M. and Hair, J.F. (2016), Partial Least Squares Structural Equation Modeling, edited by Homburg, C., Klarmann, M. and Vomberg, A.Handbook of Market Research, Springer, Thousand Oaks, CA.
Hair, J.F. and Lukas, B. (2014), Marketing Research, McGraw-Hill Education Australia.
Hair, J.F., Ringle, C.M. and Sarstedt, M. (2011), “PLS-SEM: Indeed a silver bullet”, Journal of Marketing Theory and Practice, Vol. 19 No. 2, pp. 139–152.
Hair, J.F., Risher, J.J., Sarstedt, M. and Ringle, C.M. (2019), “When to use and how to report the results of PLS-SEM”, European Business Review, Vol. 31 No. 1, pp. 2–24.
Hair Jr, J.F., Hult, G.T.M., Ringle, C. and Sarstedt, M. (2016), A Primer on Partial Least Squares Structural Equation Modeling (PLS-SEM), Sage publications.
Harman, H.H. (1976), Modern Factor Analysis, University of Chicago press, Chicago.
Harrison-Walker, L.J. (2019a), “The effect of consumer emotions on outcome behaviors following service failure”, Journal of Services Marketing, Vol. 33 No. 3, pp. 285–302.
Harrison-Walker, L.J. (2019b), “The critical role of customer forgiveness in successful service recovery”, Journal of Business Research, Vol. 95, pp. 376–391.
Hart, C.W., Heskett, J.L. and Sasser, J.W.E. (1990), “The profitable art of service recovery”, Harvard Business Review, Vol. 68 No. 4, pp. 148–156.
Harun, A., Rokonuzzaman, M., Prybutok, G. and Prybutok, V.R. (2019), “Determinants of banking consumers’ engagement in post service failure positive word-of-mouth: Examining mediating mechanisms”, International Journal of Bank Marketing, Vol. 37 No. 2, pp. 621–645.
Hauser, D.J., Ellsworth, P.C. and Gonzalez, R. (2018), “Are manipulation checks necessary?”, Frontiers in Psychology, Vol. 9, p. 998.
Hazée, S., Van Vaerenbergh, Y. and Armirotto, V. (2017), “Co-creating service recovery after service failure: The role of brand equity”, Journal of Business Research, Vol. 74, pp. 101–109.
Hedrick, N., Beverland, M. and Minahan, S. (2007), “An exploration of relational customers’ response to service failure”, Journal of Services Marketing, Vol. 21 No. 1, pp. 64–72.
297
Heidenreich, S., Wittkowski, K., Handrich, M. and Falk, T. (2015), “The dark side of customer co-creation: exploring the consequences of failed co-created services”, Journal of the Academy of Marketing Science, Vol. 43 No. 3, pp. 279–296.
Heinberg, M., Ozkaya, H.E. and Taube, M. (2018), “Do corporate image and reputation drive brand equity in India and China?-Similarities and differences”, Journal of Business Research, Vol. 86, pp. 259–268.
Heinonen, K., Helkkula, A., Holmlund‐Rytkönen, M., Mustak, M., Jaakkola, E. and Halinen, A. (2013), “Customer participation and value creation: a systematic review and research implications”, Managing Service Quality: An International Journal, Vol. 23 No. 4, pp. 341–359.
Heitmann, M., Landwehr, J.R., Schreiner, T.F. and van Heerde, H.J. (2020), “Leveraging Brand Equity for Effective Visual Product Design”, Journal of Marketing Research, Vol. 57 No. 2, pp. 257–277.
Helkkula, A. and Kelleher, C. (2010), “Circularity of customer service experience and customer perceived value”, Journal of Customer Behaviour, Vol. 9 No. 1, pp. 37–53.
Henseler, J., Ringle, C.M. and Sarstedt, M. (2015), “A new criterion for assessing discriminant validity in variance-based structural equation modeling”, Journal of the Academy of Marketing Science, Vol. 43 No. 1, pp. 115–135.
Hepola, J., Karjaluoto, H. and Hintikka, A. (2017), “The effect of sensory brand experience and involvement on brand equity directly and indirectly through consumer brand engagement”, Journal of Product & Brand Management, Vol. 26 No. 3, pp. 282–293.
Hess Jr, R.L. (2008), “The impact of firm reputation and failure severity on customers’ responses to service failures”, Journal of Services Marketing, Vol. 22 No. 5, pp. 385–398.
Hibbert, S.A., Piacentini, M.G. and Hogg, M.K. (2012), “Service recovery following dysfunctional consumer participation”, Journal of Consumer Behaviour, Vol. 11 No. 4, pp. 329–338.
Hill, R. (1998), “What sample size is ‘enough’ in internet survey research”, Interpersonal Computing and Technology: An Electronic Journal for the 21st Century, Vol. 6 No. 3–4, pp. 1–12.
Hirschman, A.O. (1970), Exit, Voice, and Loyalty: Responses to Decline in Firms, Organizations, and States, Vol. 25, Harvard university press.
Hochheimer, C.J., Sabo, R.T., Krist, A.H., Day, T., Cyrus, J. and Woolf, S.H. (2016), “Methods for evaluating respondent attrition in web-based surveys”, Journal of Medical Internet Research, Vol. 18 No. 11, p. e301.
Hocutt, M.A., Bowers, M.R. and Donavan, D.T. (2006), “The art of service recovery: fact or fiction?”, Journal of Services Marketing, Vol. 20 No. 3, pp. 199–207.
Hocutt, M.A. and Stone, T.H. (1998), “The impact of employee empowerment on the quality of a service recovery effort”, Journal of Quality Management, Vol. 3 No. 1, pp. 117–132.

298
Hoffman, K.D., Kelley, S.W. and Rotalsky, H.M. (1995), “Hoffman_Kelley_Rotalsky_1995”, Vol. 9 No. 2, pp. 49–61.
Hogreve, J., Bilstein, N. and Hoerner, K. (2019), “Service recovery on stage: effects of social media recovery on virtually present others”, Journal of Service Research, Vol. 22 No. 4, pp. 421–439.
Hogreve, J., Bilstein, N. and Mandl, L. (2017), “Unveiling the recovery time zone of tolerance: when time matters in service recovery”, Journal of the Academy of Marketing Science, Vol. 45 No. 6, pp. 866–883.
Homans, G.C. (1958), “Social behavior as exchange”, American Journal of Sociology, Vol. 63 No. 6, pp. 597–606.
Horton, J.J., Rand, D.G. and Zeckhauser, R.J. (2011), “The online laboratory: Conducting experiments in a real labor market”, Experimental Economics, Vol. 14 No. 3, pp. 399–425.
Hsieh, A.T., Yen, C.H. and Chin, K.C. (2004), “Participative customers as partial employees and service provider workload”, International Journal of Service Industry Management, Vol. 15 No. 2, pp. 187–199.
Hsieh, Y.-H. and Yeh, S.-Y. (2018), “Modeling dynamic service recovery strategies: a signaling game approach”, Kybernetes, Vol. 47 No. 5, pp. 888–919.
Hsu, K.-T. (2012), “The advertising effects of corporate social responsibility on corporate reputation and brand equity: Evidence from the life insurance industry in Taiwan”, Journal of Business Ethics, Vol. 109 No. 2, pp. 189–201.
Huang, B. and Philp, M. (2020), “When AI-based services fail: examining the effect of the self-AI connection on willingness to share negative word-of-mouth after service failures”, Service Industries Journal, Taylor & Francis, Vol. 0 No. 0, pp. 1–23.
Huang, M. (2011), “Re‐examining the effect of service recovery: the moderating role of brand equity”, Journal of Services Marketing, Vol. 25 No. 7, pp. 509–516.
Huang, W. (2008), “The impact of other‐customer failure on service satisfaction”, International Journal of Service Industry Management, Vol. 19 No. 4, pp. 521–536.
Hulland, J., Baumgartner, H. and Smith, K.M. (2018), “Marketing survey research best practices: evidence and recommendations from a review of JAMS articles”, Journal of the Academy of Marketing Science, Journal of the Academy of Marketing Science, Vol. 46 No. 1, pp. 92–108.
Hur, J. and Jang, S. (2016), “Toward service recovery strategies: The role of consumer-organization relationship norms”, Journal of Services Marketing, Vol. 30 No. 7, pp. 724–735.
Hur, J.Y. (Christine) and Jang, S.C. (Shawn). (2019), “Is consumer forgiveness possible?: Examining rumination and distraction in hotel service failures”, International Journal of Contemporary Hospitality Management, Vol. 31 No. 4, pp. 1567–1587.
Hutcheson, G.D. and Sofroniou, N. (1999), The Multivariate Social Scientist:

299
Introductory Statistics Using Generalized Linear Models, Sage.
Hwang, Y., Gao, L. and Mattila, A.S. (2020), “What recovery options to offer for loyalty reward program members: Dollars vs. Miles?”, International Journal of Hospitality Management, Vol. 87, p. 102496.
Hwang, Y. and Mattila, A.S. (2020), “The impact of customer compassion on face-to-face and online complaints”, Journal of Hospitality Marketing & Management, Vol. 29 No. 7, pp. 848–868.
Iacobucci, D. (2009), “Everything you always wanted to know about SEM (structural equations modeling) but were afraid to ask”, Journal of Consumer Psychology, Vol. 19 No. 4, pp. 673–680.
Iacobucci, D. and Duhachek, A. (2003), “Advancing alpha: Measuring reliability with confidence”, Journal of Consumer Psychology, Vol. 13 No. 4, pp. 478–487.
Iglesias, O., Ind, N. and Alfaro, M. (2013), “The organic view of the brand: A brand value co-creation model”, Journal of Brand Management, Vol. 20 No. 8, pp. 670–688.
Iglesias, O., Markovic, S. and Rialp, J. (2019), “How does sensory brand experience influence brand equity? Considering the roles of customer satisfaction, customer affective commitment, and employee empathy”, Journal of Business Research, Vol. 96, pp. 343–354.
Im, H.H., Kim, S.S., Elliot, S. and Han, H. (2012), “Conceptualizing destination brand equity dimensions from a consumer-based brand equity perspective”, Journal of Travel & Tourism Marketing, Vol. 29 No. 4, pp. 385–403.
Ishaq, M.I. and Di Maria, E. (2020), “Sustainability countenance in brand equity: a critical review and future research directions”, Journal of Brand Management, Vol. 27 No. 1, pp. 15–34.
Israeli, A.A., Lee, S.A. and Bolden, E.C. (2019), “The impact of escalating service failures and internet addiction behavior on young and older customers’ negative eWOM”, Journal of Hospitality and Tourism Management, Vol. 39, pp. 150–157.
Israeli, A.A., Lee, S.A. and Karpinski, A.C. (2019), “The relationship between Internet addiction and negative eWOM”, Service Industries Journal, Taylor & Francis, Vol. 39 No. 13–14, pp. 943–965.
Jacob, S.A. and Furgerson, S.P. (2012), “Writing interview protocols and conducting interviews: Tips for students new to the field of qualitative research”, Qualitative Report, Vol. 17, pp. 1–10.
Jamilena, D.M.F., María, D., Peña, P., Isabel, A., Molina, R. and Ángel, M. (2017), “The effect of value-creation on consumer-based destination brand equity”, Journal of Travel Research, Vol. 56 No. 8, pp. 1011–1031.
Jean Harrison-Walker, L. (2012), “The role of cause and affect in service failure”, Journal of Services Marketing, Vol. 26 No. 2, pp. 115–123.
Jerger, C. and Wirtz, J. (2017), “Service employee responses to angry customer complaints: The roles of customer status and service climate”, Journal of Service Research, Vol. 20 No. 4, pp. 362–378.
300
Jiang, T. and Iles, P. (2011), “Employer-brand equity, organizational attractiveness and talent management in the Zhejiang private sector, China”, Journal of Technology Management in China, Vol. 6 No. 1, pp. 97–110.
Jiao, Y., Ertz, M., Jo, M.-S. and Sarigollu, E. (2018), “Social value, content value, and brand equity in social media brand communities: A comparison of Chinese and US consumers”, International Marketing Review, Vol. 35 No. 1, pp. 18–41.
Jin, D., DiPietro, R.B. and Fan, A. (2020), “The impact of customer controllability and service recovery type on customer satisfaction and consequent behavior intentions”, Journal of Hospitality Marketing & Management, Vol. 29 No. 1, pp. 65–87.
Jin, D., Nicely, A., Fan, A. and Adler, H. (2019), “Joint effect of service recovery types and times on customer satisfaction in lodging”, Journal of Hospitality and Tourism Management, Vol. 38, pp. 149–158.
Joffe, H. and Yardley, L. (2004), “4. CONTENT AND THEMATIC”, Research Methods for Clinical and Health Psychology, p. 56.
Johanson, G.A. and Brooks, G.P. (2010), “Initial scale development: sample size for pilot studies”, Educational and Psychological Measurement, Vol. 70 No. 3, pp. 394–400.
Johnston, R. (1995), “The zone of tolerance Exploring the relationship between service transactions and satisfaction with the overall service”, International Journal of Service Industry Management, Vol. 6 No. 2, pp. 46–61.
Johnstone, B. (2018), Discourse Analysis, John Wiley & Sons.
Joireman, J., Grégoire, Y., Devezer, B. and Tripp, T.M. (2013), “When do customers offer firms a ‘second chance’ following a double deviation? The impact of inferred firm motives on customer revenge and reconciliation”, Journal of Retailing, Vol. 89 No. 3, pp. 315–337.
Jones, H. and Farquhar, J.D. (2007), “Putting it right: service failure and customer loyalty in UK banks”, International Journal of Bank Marketing, Vol. 25 No. 3, pp. 161–172.
Joo, J. (2020), “Customers’ psychological ownership toward the third place”, Service Business, pp. 1–28.
Joosten, H., Bloemer, J. and Hillebrand, B. (2017), “Consumer control in service recovery: beyond decisional control”, Journal of Service Management, Vol. 28 No. 3, pp. 499–519.
Jourdan, P. (2002), “Measuring brand equity: Proposal for conceptual and methodological improvements”, ACR North American Advances.
Judge, T.A. and Colquitt, J.A. (2004), “Organizational justice and stress: the mediating role of work-family conflict”, Journal of Applied Psychology, Vol. 89 No. 3, p. 395.
Jung, J. and Sung, E. (2008), “Consumer-based brand equity: Comparisons among Americans and South Koreans in the USA and South Koreans in Korea”, Journal of Fashion Marketing and Management: An International Journal, Vol. 12 No. 1, pp. 24–35.

301
Jung, N.Y. and Seock, Y.-K. (2017), “Effect of service recovery on customers’ perceived justice, satisfaction, and word-of-mouth intentions on online shopping websites”, Journal of Retailing and Consumer Services, Vol. 37, pp. 23–30.
Kamakura, W.A. and Russell, G.J. (1993), “Measuring brand value with scanner data”, International Journal of Research in Marketing, Vol. 10 No. 1, pp. 9–22.
Kamble, A.A. and Walvekar, S. (2019), “Relationship between customer loyalty and service failure, service recovery and switching costs in online retailing”, International Journal of Business Information Systems, Inderscience Publishers (IEL), Vol. 32 No. 1, pp. 56–72.
Kanuri, V.K. and Andrews, M. (2019), “The Unintended Consequence of Price-Based Service Recovery Incentives”, Journal of Marketing, Vol. 83 No. 5, pp. 57–77.
Kao, T.-W.D. and Lin, W.T. (2016), “The relationship between perceived e-service quality and brand equity: A simultaneous equations system approach”, Computers in Human Behavior, Vol. 57, pp. 208–218.
Kapferer, J.-N. (1997), “Strategic Brand Management: New Approaches to Creating and Evaluating Brand Equity”, Kogan Page London UK.
Karabas, I., Joireman, J. and Kim, S. (2019), “Why and when witnessing uncivil behavior leads observers to punish frontline employees and leave the firm”, International Journal of Hospitality Management, Vol. 82, pp. 91–100.
Karam, E.P., Hu, J., Davison, R.B., Juravich, M., Nahrgang, J.D., Humphrey, S.E. and Scott DeRue, D. (2019), “Illuminating the ‘Face’of Justice: A Meta‐Analytic Examination of Leadership and Organizational Justice”, Journal of Management Studies, Vol. 56 No. 1, pp. 134–171.
Karande, K., Magnini, V.P. and Tam, L. (2007), “Recovery voice and satisfaction after service failure: an experimental investigation of mediating and moderating factors”, Journal of Service Research, Vol. 10 No. 2, pp. 187–203.
Karatepe, O.M. (2006a), “The effects of selected antecedents on the service recovery performance of frontline employees”, The Service Industries Journal, Vol. 26 No. 1, pp. 39–57.
Karatepe, O.M. (2006b), “Customer complaints and organizational responses: the effects of complainants’ perceptions of justice on satisfaction and loyalty”, International Journal of Hospitality Management, Vol. 25 No. 1, pp. 69–90.
Karatepe, O.M., Ozturk, A. and Kim, T.T. (2019), “Servant leadership , organisational trust , and bank employee outcomes”, Taylor & Francis, Vol. 39 No. 2, pp. 86–108.
Kasabov, E. and Hain, T. (2014), “Cross-generational perceptions and reactions during service recovery”, The Service Industries Journal, Vol. 34 No. 1, pp. 71–87.
Kau, A. and Wan‐Yiun Loh, E. (2006), “The effects of service recovery on consumer satisfaction: a comparison between complainants and non‐complainants”, Journal of Services Marketing, Emerald Group Publishing Limited, Vol. 20 No. 2, pp. 101–111.
302
Kayaman, R. and Arasli, H. (2007), “Customer based brand equity: evidence from the hotel industry”, Managing Service Quality: An International Journal, Vol. 17 No. 1, pp. 92–109.
Keaveney, S.M. (1995), “Customer switching behavior in service industries: An exploratory study”, Journal of Marketing, Vol. 59 No. 2, pp. 71–82.
Kees, J., Berry, C., Burton, S. and Sheehan, K. (2017), “An analysis of data quality: Professional panels, student subject pools, and Amazon’s Mechanical Turk”, Journal of Advertising, Vol. 46 No. 1, pp. 141–155.
Keller, K.L. (1993), “Conceptualizing, measuring, and managing customer-based brand equity”, The Journal of Marketing, Vol. 57 No. 1, pp. 1–22.
Keller, K.L. (2020), “Leveraging secondary associations to build brand equity: theoretical perspectives and practical applications”, International Journal of Advertising, Vol. 39 No. 4, pp. 448–465.
Keller, K.L. and Lehmann, D.R. (2006), “Brands and branding: Research findings and future priorities”, Marketing Science, Vol. 25 No. 6, pp. 740–759.
Kelley, S.W., Hoffman, K.D. and Davis, M.A. (1993), “A typology of retail failures and recoveries”, Journal of Retailing, Vol. 69 No. 4, p. 429.
Kenesei, Z. and Bali, Z. (2020), “Overcompensation as a service recovery strategy: the financial aspect of customers’ extra effort”, Service Business, Vol. 14, pp. 187–216.
Kernan, M.C. and Hanges, P.J. (2002), “Survivor reactions to reorganization: Antecedents and consequences of procedural, interpersonal, and informational justice”, Journal of Applied Psychology, Vol. 87 No. 5, p. 916.
Ketron, S. and Mai, S. (2020), “Blame and service recovery strategies in lateral exchange markets”, Journal of Strategic Marketing, pp. 1–19.
Khamitov, M., Grégoire, Y. and Suri, A. (2020), “A systematic review of brand transgression, service failure recovery and product-harm crisis: integration and guiding insights”, Journal of the Academy of Marketing Science, Vol. 48 No. 3, pp. 519–542.
Kim, B., Kim, S. and Heo, C.Y. (2019), “Consequences of customer dissatisfaction in upscale and budget hotels: Focusing on dissatisfied customers’ attitude toward a hotel”, International Journal of Hospitality & Tourism Administration, Vol. 20 No. 1, pp. 15–46.
Kim, H.-S. (2009), “Examining the role of informational justice in the wake of downsizing from an organizational relationship management perspective”, Journal of Business Ethics, Vol. 88 No. 2, p. 297.
Kim, J.-H. and Jang, S.S. (2014), “A scenario-based experiment and a field study: A comparative examination for service failure and recovery”, International Journal of Hospitality Management, Vol. 41, pp. 125–132.
Kim, K. and Baker, M.A. (2020a), “Paying it forward: The influence of other customer service recovery on future co-creation”, Journal of Business Research, Vol. 121, pp. 604–615.
Kim, K. and Baker, M.A. (2020b), “The Customer Isn ’ t Always Right : The Implications of Illegitimate Complaints”, Cornell Hospitality Quarterly, Vol. 6
303
No. 2, pp. 113–127.
Kim, M.G., Wang, C. and Mattila, A.S. (2010), “The relationship between consumer complaining behavior and service recovery: An integrative review”, International Journal of Contemporary Hospitality Management, Vol. 22 No. 7, pp. 975–991.
Kim, T., Jung-Eun Yoo, J. and Lee, G. (2012), “Post-recovery customer relationships and customer partnerships in a restaurant setting”, International Journal of Contemporary Hospitality Management, Vol. 24 No. 3, pp. 381–401.
Kim, W., Ok, C. and Canter, D.D. (2012), “Moderating role of a priori customer–firm relationship in service recovery situations”, The Service Industries Journal, Vol. 32 No. 1, pp. 59–82.
Kim, W.G. and Kim, H.-B. (2004), “Measuring customer-based restaurant brand equity”, Cornell Hotel and Restaurant Administration Quarterly, Vol. 45 No. 2, pp. 115–131.
Kim, Y.S. and Baker, M.A. (2020c), “Customers’ reactions to other customer caused service failures: the effects of tie strength on customer loyalty”, Journal of Hospitality Marketing and Management, Routledge, Vol. 29 No. 6, pp. 682–701.
Kimpakorn, N. and Tocquer, G. (2010), “Service brand equity and employee brand commitment”, Journal of Services Marketing, Vol. 24 No. 5, pp. 378–388.
King, C. and Grace, D. (2005), “Exploring the role of employees in the delivery of the brand: a case study approach”, Qualitative Market Research: An International Journal, Vol. 8 No. 3, pp. 277–295.
King, C. and Grace, D. (2010), “Building and measuring employee-based brand equity”, European Journal of Marketing, Vol. 44 No. 7/8, pp. 938–971.
King, C., Grace, D. and Funk, D.C. (2012), “Employee brand equity: Scale development and validation”, Journal of Brand Management, Vol. 19 No. 4, pp. 268–288.
King, N. (1998), “Template analysis”, Qualitative Methods and Analysis in Organizational Research: A Practical Guide, In G. Symo., Sage Publications Ltd, London, pp. 118–134.
Klenke, K. (2008), Qualitative Research in the Study of Leadership, Emerald group publishing.
Kline, R.B. (2015), Principles and Practice of Structural Equation Modeling, Guilford publications.
Kloppenborg, T.J. and Gourdin, K.N. (1992), “Up in the Air About Quality”, Quality Progress, Vol. 25 No. 2, pp. 31–35.
Koc, E. (2019), “Service failures and recovery in hospitality and tourism: A review of literature and recommendations for future research”, Journal of Hospitality Marketing & Management, Vol. 28 No. 5, pp. 513–537.
Kocak, A., Abimbola, T. and Özer, A. (2007), “Consumer brand equity in a cross-cultural replication: An evaluation of a scale”, Journal of Marketing Management, Vol. 23 No. 1–2, pp. 157–173.
304
Komunda, M. and Osarenkhoe, A. (2012), “Remedy or cure for service failure? Effects of service recovery on customer satisfaction and loyalty”, Business Process Management Journal, Vol. 18 No. 1, pp. 82–103.
Koppitsch, S., Folkes, V.S., MacInnis, D. and Porath, C. (2013), “The way a salesperson manages service providers influences customers’ anger about problems”, Journal of Personal Selling & Sales Management, Vol. 33 No. 1, pp. 67–77.
Kozub, K.R., O’Neill, M.A. and Palmer, A.A. (2014), “Emotional antecedents and outcomes of service recovery”, Journal of Services Marketing, Vol. 28 No. 3, pp. 233–243.
Krautz, C. (2017), “A Cross-Cultural Study of Collective Brand Perceptions Within The Brand Equity Framework”, Journal of Marketing Theory and Practice, Vol. 25 No. 3, pp. 274–290.
Krippendorff, K. (2018), Content Analysis: An Introduction to Its Methodology, Sage publications.
Kuhn, T.S. (1977), “Second Thoughts on Paradigms. The Essential Tension”, Selected Studies in Scientific Tradition and Change. TS Kuhn. Chicago, Il/London, Chicago University Press.
Kumar, R.S., Dash, S. and Malhotra, N.K. (2018), “The impact of marketing activities on service brand equity: The mediating role of evoked experience”, European Journal of Marketing, Vol. 52 No. 3/4, pp. 596–618.
Kumar, R.S., Dash, S. and Purwar, C.P. (2013), “The nature and antecedents of brand equity and its dimensions”, Marketing Intelligence & Planning, Vol. 31 No. 2, pp. 141–159.
Kuo, N. Te, Chang, K.C., Cheng, Y.S. and Lai, C.H. (2013), “How Service Quality Affects Customer Loyalty in the Travel Agency: The Effects of Customer Satisfaction, Service Recovery, and Perceived Value”, Asia Pacific Journal of Tourism Research, Vol. 18 No. 7, pp. 803–822.
La, S. and Choi, B. (2012), “The role of customer affection and trust in loyalty rebuilding after service failure and recovery”, The Service Industries Journal, Vol. 32 No. 1, pp. 105–125.
La, S. and Choi, B. (2019), “Perceived justice and CSR after service recovery”, Journal of Services Marketing, Vol. 33 No. 2, pp. 206–219.
Lappeman, J., Clark, R., Evans, J. and Sierra-Rubia, L. (2020), “The effect of nWOM firestorms on South African retail banking”, International Journal of Bank Marketing, Vol. 39 No. 3, pp. 455–477.
Lassar, W., Mittal, B. and Sharma, A. (1995), “Measuring customer-based brand equity”, Journal of Consumer Marketing, Vol. 12 No. 4, pp. 11–19.
Lavrakas, P.J. (2008), Encyclopedia of Survey Research Methods, Sage Publications.
Lee, E.-J. and Park, J. (2010), “Service failures in online double deviation scenarios: justice theory approach”, Managing Service Quality: An International Journal, Vol. 20 No. 1, pp. 46–69.
Lee, J.L.-M., Siu, N.Y.-M. and Zhang, T.J.-F. (2018), “The Mediating Role of
305
Postrecovery Satisfaction in the Relationship between Justice Perceptions and Customer Attitudes”, Services Marketing Quarterly, Vol. 39 No. 1, pp. 22–34.
Lee, J.L.-M., Siu, N.Y.-M. and Zhang, T.J.-F. (2020), “Does Brand Equity Always Work? A Study of the Moderating Effect of Justice Perceptions and Consumer Attribution Towards Chinese Consumers”, Journal of International Consumer Marketing, Vol. 32 No. 1, pp. 69–81.
Lee, Y.-H., Hsiao, C., Chan, H.-Y. and Lee, I.-C. (2019), “Explorations of employee-based brand equity in the banking industry from a perceived-leadership perspective”, International Journal of Bank Marketing, Vol. 38 No. 2, pp. 425–455.
Lehmann, D.R., Keller, K.L. and Farley, J.U. (2008), “The structure of survey-based brand metrics”, Journal of International Marketing, Vol. 16 No. 4, pp. 29–56.
Leuthesser, L., Kohli, C.S. and Harich, K.R. (1995), “Brand equity: the halo effect measure”, European Journal of Marketing, Vol. 29 No. 4, pp. 57–66.
Lexico. (2021), “No Title”, available at: https://www.lexico.com/definition/fluctuate (accessed 30 December 2021).
Lexico. (n.d.). “Participation - Meaning of participation in English”, Oxford Dictionaries. (n.D)., available at: https://www.lexico.com/definition/participation.
Li, C.J., Li, F., Fan, P. and Chen, K. (2020), “Voicing out or switching away? A psychological climate perspective on customers’ intentional responses to service failure”, International Journal of Hospitality Management, Vol. 85, p. 102361.
Li, L.-Y.E., Liu, B.S.-C. and Luk, S.T.K. (2017), “Customer Participation Behavior in High-Versus Low-Contact Services: The Multiple Roles of Customer Trust”, Journal of Global Marketing, Vol. 30 No. 5, pp. 322–341.
Liao, H. (2007), “Do it right this time: The role of employee service recovery performance in customer-perceived justice and customer loyalty after service failures”, Journal of Applied Psychology, Vol. 92 No. 2, p. 475.
Liao, H. and Rupp, D.E. (2005), “The impact of justice climate and justice orientation on work outcomes: a cross-level multifoci framework”, Journal of Applied Psychology, Vol. 90 No. 2, p. 242.
Liat, C.B., Mansori, S., Chuan, G.C. and Imrie, B.C. (2017), “Hotel Service Recovery and Service Quality: Influences of Corporate Image and Generational Differences in the Relationship between Customer Satisfaction and Loyalty”, Journal of Global Marketing, Vol. 30 No. 1, pp. 42–51.
Likert, R. (1932), “A technique for the measurement of attitudes”, Archives of Psychology.
Lim, J.-S., Pham, P. and Heinrichs, J.H. (2020), “Impact of social media activity outcomes on brand equity”, Journal of Product & Brand Management, Vol. 29 No. 7, pp. 927–937.
Lin, F.-J. (2008), “Solving multicollinearity in the process of fitting regression model

306
using the nested estimate procedure”, Quality & Quantity, Vol. 42 No. 3, pp. 417–426.
Lin, H.-H., Wang, Y.-S. and Chang, L.-K. (2011), “Consumer responses to online retailer’s service recovery after a service failure: A perspective of justice theory”, Managing Service Quality: An International Journal, Vol. 21 No. 5, pp. 511–534.
Lin, M.S. and Chung, Y.K. (2019), “Understanding the impacts of corporate social responsibility and brand attributes on brand equity in the restaurant industry”, Tourism Economics, Vol. 25 No. 4, pp. 639–658.
Lin, W.-B. (2009), “Exploration of lead factors affecting service recovery”, The Service Industries Journal, Vol. 29 No. 11, pp. 1529–1546.
Lin, W.B. (2011), “Construction of a service failure severity and recovery model”, Expert Systems with Applications, Vol. 38 No. 10, pp. 12221–12230.
Lindorfer, M. (2016), “Methodological guideline for scenario building process”, available at: http://eulac-focus.net/assets/dms/WP6_Dl_05_D6 2_v2_1_Final.pdf.
Ling-Yee Li, E., Liu, B.S.-C. and Luk, S.T.K. (2017), “Customer participation behavior in high-versus low-contact services: the multiple roles of customer trust”, Journal of Global Marketing, Vol. 30 No. 5, pp. 322–341.
Liu, A.X., Hsu, C.H.C. and Fan, D.X.F. (2020), “From brand identity to brand equity: a multilevel analysis of the organization–employee bidirectional effects in upscale hotels”, International Journal of Contemporary Hospitality Management, Vol. 32 No. 7, pp. 2285–2304.
Liu, C.-H. and Jiang, J.-F. (2020), “Assessing the moderating roles of brand equity, intellectual capital and social capital in Chinese luxury hotels”, Journal of Hospitality and Tourism Management, Vol. 43, pp. 139–148.
Liu, C., Zhang, Y. and Zhang, J. (2020), “The impact of self-congruity and virtual interactivity on online celebrity brand equity and fans’ purchase intention”, Journal of Product & Brand Management, Vol. 29 No. 6, pp. 783–801.
Liu, H., Jayawardhena, C., Dibb, S. and Ranaweera, C. (2019), “Examining the trade-off between compensation and promptness in eWOM-triggered service recovery: A restorative justice perspective”, Tourism Management, Vol. 75, pp. 381–392.
Liu, M.T., Wong, I.A., Tseng, T.-H., Chang, A.W.-Y. and Phau, I. (2017), “Applying consumer-based brand equity in luxury hotel branding”, Journal of Business Research, Vol. 81, pp. 192–202.
Liu, Y., Cheng, P. and Ouyang, Z. (2021), “How trust mediate the effects of perceived justice on loyalty: A study in the context of automotive recall in China”, Journal of Retailing and Consumer Services, Vol. 58, p. 102322.
Loi, R., Yang, J. and Diefendorff, J.M. (2009), “Four-factor justice and daily job satisfaction: A multilevel investigation”, Journal of Applied Psychology, Vol. 94 No. 3, p. 770.
Londoño, J.C., Elms, J. and Davies, K. (2016), “Conceptualising and measuring consumer-based brand–retailer–channel equity”, Journal of Retailing and

307
Consumer Services, Vol. 29, pp. 70–81.
Lopes, E.L. and da Silva, M.A. (2015), “The effect of justice in the history of loyalty: A study in failure recovery in the retail context”, Journal of Retailing and Consumer Services, Vol. 24, pp. 110–120.
Loureiro, S.M.C., Stylos, N. and Miranda, F.J. (2019), “Exploring how mindfulness may enhance perceived value of travel experience”, The Service Industries Journal, Vol. 40 No. 11–12, pp. 800–824.
Lovelock, C.H. and Young, R.F. (1979), “Look to consumers to increase productivity”, Harvard Business Review, Vol. 57 No. 3, pp. 168–178.
Lu, L., Mody, M. and Andajigarmaroudi, S. (2020), “Exploring guest response towards service failure in home-sharing: service presence and consumption motivation”, International Journal of Hospitality Management, Vol. 87, p. 102498.
Lucia-Palacios, L., Pérez-López, R. and Polo-Redondo, Y. (2020), “How situational circumstances modify the effects of frontline employees’ competences on customer satisfaction with the store”, Journal of Retailing and Consumer Services, Vol. 52, p. 101905.
Luo, A. and Mattila, A.S. (2020), “Discrete emotional responses and face-to-face complaining: The joint effect of service failure type and culture”, International Journal of Hospitality Management, Vol. 90, p. 102613.
Lusch, R.F. and Vargo, S.L. (2006), “Service-dominant logic: reactions, reflections and refinements”, Marketing Theory, Vol. 6 No. 3, pp. 281–288.
Ma, K. and Zhong, X. (2021), “Moral judgment and perceived justice in service recovery”, Marketing Intelligence and Planning, Vol. 39 No. 4, pp. 574–588.
MacKenzie, S.B. (2003), “The dangers of poor construct conceptualization”, Journal of the Academy of Marketing Science, Vol. 31 No. 3, pp. 323–326.
MacKinnon, D.P. (2008), Introduction to Statistical Mediation Analysis, Routledge.
Magnini, V.P., Ford, J.B., Markowski, E.P. and Honeycutt Jr, E.D. (2007), “The service recovery paradox: justifiable theory or smoldering myth?”, Journal of Services Marketing, Vol. 21 No. 3, pp. 213–225.
Mahajan, V., Rao, V.R. and Srivastava, R.K. (1994), “An approach to assess the importance of brand equity in acquisition decisions”, Journal of Product Innovation Management, Vol. 11 No. 3, pp. 221–235.
Maher, A.A. and Sobh, R. (2014), “The role of collective angst during and after a service failure”, Journal of Services Marketing, Vol. 28 No. 3, pp. 223–232.
Malhotra, N. (2006), “Questionnaire design and scale development”, The Handbook of Marketing Research: Uses, Misuses, and Future Advances, pp. 83–94.
Malhotra, N. and Birks, D. (2007), Marketing Research: An Applied Approach: 3rd European Edition, Pearson education.
Malhotra, N.K., Agarwal, J. and Peterson, M. (1996), “Methodological issues in cross‐cultural marketing research A state-of-the-art review”, International Marketing Review, Vol. 13 No. 5, pp. 7–43.
308
Malhotra, N.K. and Birks, D. (2006), Marketing Research: An Applied Perspective, London, Harlow, England.
Malhotra, N.K., Kim, S.S. and Agarwal, J. (2004), “Internet users’ information privacy concerns (IUIPC): The construct, the scale, and a causal model”, Information Systems Research, Vol. 15 No. 4, pp. 336–355.
Malhotra, N.K., Kim, S.S. and Patil, A. (2006), “Common method variance in IS research: A comparison of alternative approaches and a reanalysis of past research”, Management Science, Vol. 52 No. 12, pp. 1865–1883.
Marques, C., da Silva, R.V., Davcik, N.S. and Faria, R.T. (2020), “The role of brand equity in a new rebranding strategy of a private label brand”, Journal of Business Research, Vol. 117, pp. 497–507.
Martínez‐Tur, V., Peiró, J.M., Ramos, J. and Moliner, C. (2006), “Justice perceptions as predictors of customer satisfaction: the impact of distributive, procedural, and interactional justice”, Journal of Applied Social Psychology, Vol. 36 No. 1, pp. 100–119.
Marx, E. (2011), Breaking through Culture Shock: What You Need to Succeed in International Business, Nicholas Brealey Publishing.
Matikiti, R., Roberts-Lombard, M. and Mpinganjira, M. (2019), “Customer attributions of service failure and its impact on commitment in the airline industry: an emerging market perspective”, Journal of Travel & Tourism Marketing, Vol. 36 No. 4, pp. 403–414.
De Matos, C.A., Rossi, C.A.V., Veiga, R.T. and Vieira, V.A. (2009), “Consumer reaction to service failure and recovery: the moderating role of attitude toward complaining”, Journal of Services Marketing, Vol. 23 No. 7, pp. 462–475.
Matos, C.A., Henrique, J.L. and Alberto Vargas Rossi, C. (2007), “Service recovery paradox: a meta-analysis”, Journal of Service Research, Vol. 10 No. 1, pp. 60–77.
Mattila, A., Hanks, L. and Wang, C. (2014), “Others service experiences: emotions, perceived justice, and behavior”, European Journal of Marketing, Vol. 48 No. 3/4, pp. 552–571.
Mattila, A.S. (1999), “An examination of factors affecting service recovery in a restaurant setting”, Journal of Hospitality & Tourism Research, Vol. 23 No. 3, pp. 284–298.
Mattila, A.S. (2006), “The power of explanations in mitigating the ill-effects of service failures”, Journal of Services Marketing, Vol. 20 No. 7, pp. 422–428.
Mattila, A.S. and Ro, H. (2008), “Discrete negative emotions and customer dissatisfaction responses in a casual restaurant setting”, Journal of Hospitality & Tourism Research, Vol. 32 No. 1, pp. 89–107.
Maxham III, J.G. (2001), “Service recovery’s influence on consumer satisfaction, positive word-of-mouth, and purchase intentions”, Journal of Business Research, Vol. 54 No. 1, pp. 11–24.
Maxham III, J.G. and Netemeyer, R.G. (2002), “Modeling customer perceptions of complaint handling over time: the effects of perceived justice on satisfaction and intent”, Journal of Retailing, Vol. 78 No. 4, pp. 239–252.

309
Mays, N. and Pope, C. (1995), “Qualitative research: rigour and qualitative research”, Bmj, Vol. 311 No. 6997, pp. 109–112.
MCA. (2019), “MCA UK Restaurant Market Report”, available at: https://www.mca-insight.com/ (accessed 4 April 2021).
McAllister, J. (2021), “UK restaurant market facing fastest decline in seven years”, BigHospitality, available at: https://www.bighospitality.co.uk/Article/2019/09/24/UK-restaurant-market-facing-fastest-decline-in-seven-years-according-to-MCA-Insight.
McColl-Kennedy, J.R., Daus, C.S. and Sparks, B.A. (2003), “The role of gender in reactions to service failure and recovery”, Journal of Service Research, Vol. 6 No. 1, pp. 66–82.
McCollough, M.A. (2000), “The effect of perceived justice and attributions regarding service failure and recovery on post-recovery customer satisfaction and service quality attitudes”, Journal of Hospitality & Tourism Research, Vol. 24 No. 4, pp. 423–447.
Mcdougall, G.H. g. and Levesque, T. (2000), “Customer satisfaction with services: putting perceived value into the equation”, Journal of Services Marketing, Vol. 14 No. 5, pp. 392–410.
McQuilken, L., Robertson, N., Abbas, G. and Polonsky, M. (2020), “Frontline health professionals’ perceptions of their adaptive competences in service recovery”, Journal of Strategic Marketing, Vol. 28 No. 1, pp. 70–94.
McQuilken, L., Robertson, N. and Polonsky, M. (2017), “Recovering from other-customer-caused failure: The effect on focal customer complaining”, Journal of Hospitality Marketing & Management, Vol. 26 No. 1, pp. 83–104.
Menidjel, C., Benhabib, A. and Bilgihan, A. (2017), “Examining the moderating role of personality traits in the relationship between brand trust and brand loyalty”, Journal of Product & Brand Management, Vol. 26 No. 6, pp. 631–649.
Messick, S. (1989), “Validity”, in Linn, R.L. (Ed.), Educational Measurement, American Council on Education and National Council on Measurement in Education, Washington, DC, pp. 13–103.
Michel, S. and Meuter, M.L. (2008), “The service recovery paradox: true but overrated?”, International Journal of Service Industry Management, Vol. 19 No. 4, pp. 441–457.
Migacz, S.J., Zou, S. and Petrick, J.F. (2018), “The ‘Terminal’ effects of service failure on airlines: Examining service recovery with justice theory”, Journal of Travel Research, Vol. 57 No. 1, pp. 83–98.
Miles, J. (2005), “Tolerance and variance inflation factor”, edited by Everitt, B.S. and Howell, D.Encyclopedia of Statistics in Behavioral Science, John Wiley, Chichester, p. 2055.
Miller, J.L., Craighead, C.W. and Karwan, K.R. (2000), “Service recovery: A framework and empirical investigation”, Journal of Operations Management, Vol. 18 No. 4, pp. 387–400.
Mills, P.K. and Morris, J.H. (1986), “Clients as ‘partial’ employees of service organizations: Role development in client participation”, Academy of
310
Management Review, Vol. 11 No. 4, pp. 726–735.
Min, H. (Kelly) and Kim, H.J. (2019), “When service failure is interpreted as discrimination: Emotion, power, and voice”, International Journal of Hospitality Management, Vol. 82, pp. 59–67.
Min, K.S., Jung, J.M., Ryu, K., Haugtvedt, C., Mahesh, S. and Overton, J. (2020), “Timing of apology after service failure: the moderating role of future interaction expectation on customer satisfaction”, Marketing Letters, Vol. 31, pp. 217–230.
Mirick, R.G. and Wladkowski, S.P. (2019), “Skype in Qualitative Interviews: Participant and Researcher Perspectives”, The Qualitative Report, Vol. 24 No. 12, pp. 3061–3072.
Mohan, M., Jiménez, F.R., Brown, B.P. and Cantrell, C. (2017), “Brand skill: linking brand functionality with consumer-based brand equity”, Journal of Product & Brand Management, Vol. 26 No. 5, pp. 477–491.
Mohd-Any, A.A., Mutum, D.S., Ghazali, E.M. and Mohamed-Zulkifli, L. (2019), “To fly or not to fly? An empirical study of trust, post-recovery satisfaction and loyalty of Malaysia Airlines passengers”, Journal of Service Theory and Practice, Vol. 29 No. 5/6, pp. 661–690.
Moise, M.S., Gil-Saura, I., Šerić, M. and Molina, M.E.R. (2019), “Influence of environmental practices on brand equity, satisfaction and word of mouth”, Journal of Brand Management, Vol. 26 No. 6, pp. 646–657.
Moliner-Velázquez, B., Ruiz-Molina, M.-E. and Fayos-Gardó, T. (2015), “Satisfaction with service recovery: moderating effect of age in word-of-mouth”, Journal of Consumer Marketing, Vol. 32 No. 6, pp. 470–484.
Molnar, A. (2019), “SMARTRIQS: A Simple Method Allowing Real-Time Respondent Interaction in Qualtrics Surveys”, Journal of Behavioral and Experimental Finance, Vol. 22, pp. 161–169.
Morgan-Thomas, A. and Veloutsou, C. (2013), “Beyond technology acceptance: Brand relationships and online brand experience”, Journal of Business Research, Vol. 66 No. 1, pp. 21–27.
Morgan, D.L. (2014), “Pragmatism as a paradigm for social research”, Qualitative Inquiry, Vol. 20 No. 8, pp. 1045–1053.
Morgan, R.M. and Hunt, S.D. (1994), “The commitment-trust theory of relationship marketing”, Journal of Marketing, Vol. 58 No. 3, pp. 20–38.
Morgeson III, F. V, Hult, G.T.M., Mithas, S., Keiningham, T. and Fornell, C. (2020), “Turning Complaining Customers into Loyal Customers: Moderators of the Complaint Handling–Customer Loyalty Relationship”, Journal of Marketing, Vol. 84 No. 5, pp. 79–99.
Morse, J.M. (2015), “Critical analysis of strategies for determining rigor in qualitative inquiry”, Qualitative Health Research, Vol. 25 No. 9, pp. 1212–1222.
Morse, J.M., Barrett, M., Mayan, M., Olson, K. and Spiers, J. (2002), “Verification strategies for establishing reliability and validity in qualitative research”, International Journal of Qualitative Methods, Vol. 1 No. 2, pp. 13–22.

311
Mostafa, R., Lages, C.R. and Sääksjärvi, M. (2014), “The CURE scale: a multidimensional measure of service recovery strategy”, Journal of Services Marketing Journal of Services Marketing Iss Journal of Services Marketing An International Journal, Vol. 28 No. 4, pp. 300–310.
Mostafa, R.B., Lages, C.R., Shabbir, H.A. and Thwaites, D. (2015), “Corporate image: A service recovery perspective”, Journal of Service Research, Vol. 18 No. 4, pp. 468–483.
Moustakas, C. (1994), Phenomenological Research Methods, Sage publications.
Muhammad, L. and Gul-E-Rana. (2020), “Mediating role of customer forgiveness between perceived justice and satisfaction”, Journal of Retailing and Consumer Services, Vol. 52, p. 101886.
Muniz, F., Guzmán, F., Paswan, A.K. and Crawford, H.J. (2019), “The immediate effect of corporate social responsibility on consumer-based brand equity”, Journal of Product & Brand Management, Vol. 28 No. 7, pp. 864–879.
Mutter, E.R., Oettingen, G. and Gollwitzer, P.M. (2020), “An online randomised controlled trial of mental contrasting with implementation intentions as a smoking behaviour change intervention”, Psychology & Health, Vol. 35 No. 3, pp. 318–345.
Nam, J., Ekinci, Y. and Whyatt, G. (2011), “Brand equity, brand loyalty and consumer satisfaction”, Annals of Tourism Research, Vol. 38 No. 3, pp. 1009–1030.
Namkung, Y. and Jang, S.C. (2010), “Effects of perceived service fairness on emotions, and behavioral intentions in restaurants”, European Journal of Marketing, Vol. 44 No. 9/10, pp. 1233–1259.
Nath, P. and Bawa, A. (2011), “Measurement of brand equity of services-Scale construction and validation”, Journal of Services Research, Vol. 11 No. 2, p. 134.
Nazifi, A., Gelbrich, K., Grégoire, Y., Koch, S., El-Manstrly, D. and Wirtz, J. (2020), “Proactive handling of flight overbooking: how to reduce negative eWOM and the costs of bumping customers”, Journal of Service Research, Vol. 24 No. 2, pp. 206–225.
Netemeyer, R.G., Bearden, W.O. and Sharma, S. (2003), Scaling Procedures: Issues and Applications, Sage Publications.
Netemeyer, R.G., Krishnan, B., Pullig, C., Wang, G., Yagci, M., Dean, D., Ricks, J., et al. (2004), “Developing and validating measures of facets of customer-based brand equity”, Journal of Business Research, Vol. 57 No. 2, pp. 209–224.
Nguyen, N. and Leblanc, G. (2001), “Corporate image and corporate reputation in customers’ retention decisions in services”, Journal of Retailing and Consumer Services, Vol. 8 No. 4, pp. 227–236.
Nguyen, N. and Leblanc, G. (2002), “Contact personnel, physical environment and the perceived corporate image of intangible services by new clients”, International Journal of Service Industry Management, Vol. 13 No. 3–4, pp. 242–262.
312
Nguyen, T.D., Dadzie, C., Davari, A. and Guzman, F. (2015), “Intellectual capital through the eyes of the consumer”, Journal of Product & Brand Management, Vol. 26 No. 6, pp. 554 –566.
Nikbin, D., Iranmanesh, M., Hyun, S.S., Baharun, R. and Kim, I. (2015), “The role of airline travelers’ pre-recovery emotions during the service recovery process”, Journal of Travel & Tourism Marketing, Vol. 32 No. 6, pp. 677–691.
Nikbin, D., Ismail, I. and Marimuthu, M. (2013), “The relationship between informational justice, recovery satisfaction, and loyalty: the moderating role of failure attributions”, Service Business, Vol. 7 No. 3, pp. 419–435.
Nikbin, D., Marimuthu, M., Hyun, S.S. and Ismail, I. (2015), “Relationships of perceived justice to service recovery, service failure attributions, recovery satisfaction, and loyalty in the context of airline travelers”, Asia Pacific Journal of Tourism Research, Vol. 20 No. 3, pp. 239–262.
Nowell, L.S., Norris, J.M., White, D.E. and Moules, N.J. (2017), “Thematic analysis: Striving to meet the trustworthiness criteria”, International Journal of Qualitative Methods, Vol. 16, pp. 1–13.
Nunnally, J.C. and Bernstein, I.H. (1994), Psychometric Theory (McGraw-Hill Series in Psychology), Vol. 3, McGraw-Hill New York.
Odoom, R., Agbemabiese, G.C. and Hinson, R.E. (2019), “Service recovery satisfaction in offline and online experiences”, Marketing Intelligence & Planning, Vol. 38 No. 1, pp. 1–14.
Ok, C., Back, K.-J. and Shanklin, C.W. (2007), “Mixed findings on the service recovery paradox”, The Service Industries Journal, Vol. 27 No. 6, pp. 671–686.
Oliver, R.L. (1999), “Whence consumer loyalty?”, The Journal of Marketing, Vol. 63, pp. 33–44.
Oppenlaender, J., Milland, K., Visuri, A., Ipeirotis, P. and Hosio, S. (2020), “Creativity on Paid Crowdsourcing Platforms”, Proceedings of the 2020 CHI Conference on Human Factors in Computing Systems, pp. 1–14.
Orsingher, C., Valentini, S. and de Angelis, M. (2010), “A meta-analysis of satisfaction with complaint handling in services”, Journal of the Academy of Marketing Science, Vol. 38 No. 2, pp. 169–186.
Ou, J., Wong, I.A., Prentice, C. and Liu, M.T. (2020), “Customer engagement and its outcomes: the cross-level effect of service environment and brand equity”, Journal of Hospitality & Tourism Research, Vol. 44 No. 2, pp. 377–402.
Ozanne, M., Tews, M.J. and Mattila, A.S. (2019), “Are tattoos still a taboo?: The effect of employee tattoos on customers’ service failure perceptions”, International Journal of Contemporary Hospitality Management, Vol. 31 No. 2, pp. 874–889.
Ozkan-Tektas, O. and Basgoze, P. (2017), “Pre-recovery emotions and satisfaction: A moderated mediation model of service recovery and reputation in the banking sector”, European Management Journal, Vol. 35 No. 3, pp. 388–395.
Pacheco, N.A., Pizzutti, C., Basso, K. and Van Vaerenbergh, Y. (2019), “Trust

313
recovery tactics after double deviation: better sooner than later?”, Journal of Service Management, Vol. 30 No. 1, pp. 2–22.
Palan, S. and Schitter, C. (2018), “Prolific. ac—A subject pool for online experiments”, Journal of Behavioral and Experimental Finance, Vol. 17, pp. 22–27.
Pandža Bajs, I. (2015), “Tourist perceived value, relationship to satisfaction, and behavioral intentions: The example of the Croatian tourist destination Dubrovnik”, Journal of Travel Research, Vol. 54 No. 1, pp. 122–134.
Paolacci, G. and Chandler, J. (2014), “Inside the Turk: Understanding Mechanical Turk as a participant pool”, Current Directions in Psychological Science, Vol. 23 No. 3, pp. 184–188.
Papen, M.C., Siems, F.U. and Kunz, W.H. (2020), “The Influence of Childhood Engagement in the Context of Hospitality Service Failure Evaluation”, Journal of Hospitality and Tourism Research, Vol. 44 No. 2, pp. 403–425.
Pappu, R., Quester, P.G. and Cooksey, R.W. (2005), “Consumer-based brand equity: improving the measurement–empirical evidence”, Journal of Product & Brand Management, Vol. 14 No. 3, pp. 143–154.
Parasuraman, A., Berry, L.L. and Zeithaml, V.A. (1991), “Understanding customer expectations of service”, Sloan Management Review, Vol. 32 No. 3, pp. 39–48.
Park, C.S. and Srinivasan, V. (1994), “A survey-based method for measuring and understanding brand equity and its extendibility”, Journal of Marketing Research, Vol. 31 No. 2, pp. 271–288.
Park, J. and Ha, S. (2016), “Co-creation of service recovery: Utilitarian and hedonic value and post-recovery responses”, Journal of Retailing and Consumer Services, Vol. 28 No. 2016, pp. 310–316.
Parsa, H.G., Kreeger, J.C., van der Rest, J.P., Xie, L.K. and Lamb, J. (2021), “Why Restaurants Fail? Part V: Role of Economic Factors, Risk, Density, Location, Cuisine, Health Code Violations and GIS Factors”, International Journal of Hospitality and Tourism Administration, Routledge, Vol. 22 No. 2, pp. 142–167.
Payne, A.F., Storbacka, K. and Frow, P. (2008), “Managing the co-creation of value”, Journal of the Academy of Marketing Science, Vol. 36 No. 1, pp. 83–96.
Peer, E., Brandimarte, L., Samat, S. and Acquisti, A. (2017), “Beyond the Turk: Alternative platforms for crowdsourcing behavioral research”, Journal of Experimental Social Psychology, Vol. 70, pp. 153–163.
Peter, J.P. (1979), “Reliability: A review of psychometric basics and recent marketing practices”, Journal of Marketing Research, Vol. 16 No. 1, pp. 6–17.
Peterson, R.A. (1994), “A meta-analysis of Cronbach’s coefficient alpha”, Journal of Consumer Research, Vol. 21 No. 2, pp. 381–391.
Petnji Yaya, L.H., Marimon, F. and Casadesus, M. (2015), “The mechanisms through which certain variables influence customer loyalty: The mediating roles of perceived value and satisfaction”, Human Factors and Ergonomics In

314
Manufacturing, Vol. 25 No. 6, pp. 627–637.
Petzer, D.J., De Meyer-Heydenrych, C.F. and Svensson, G. (2017), “Perceived justice, service satisfaction and behavior intentions following service recovery efforts in a South African retail banking context”, International Journal of Bank Marketing, Vol. 35 No. 2, pp. 241–253.
Phillips, N. and Hardy, C. (2002), Discourse Analysis: Investigating Processes of Social Construction, Vol. 50, Sage Publications.
Piehler, R., Schade, M., Hanisch, I. and Burmann, C. (2019), “Reacting to negative online customer reviews”, Journal of Service Theory and Practice, Vol. 29 No. 4, pp. 401–414.
Plé, L. (2016), “Studying customers’ resource integration by service employees in interactional value co-creation”, Journal of Services Marketing, Vol. 30 No. 2, pp. 152–164.
Podsakoff, P.M., MacKenzie, S.B., Lee, J.-Y. and Podsakoff, N.P. (2003), “Common method biases in behavioral research: a critical review of the literature and recommended remedies”, Journal of Applied Psychology, Vol. 88 No. 5, p. 879.
Poulis, A. and Wisker, Z. (2016), “Modeling employee-based brand equity (EBBE) and perceived environmental uncertainty (PEU) on a firm’s performance”, Journal of Product & Brand Management, Vol. 25 No. 5, pp. 490–503.
Prebensen, N.K. and Xie, J. (2017), “Efficacy of co-creation and mastering on perceived value and satisfaction in tourists’ consumption”, Tourism Management, Vol. 60, pp. 166–176.
Presi, C., Saridakis, C. and Hartmans, S. (2014), “User-generated content behaviour of the dissatisfied service customer”, European Journal of Marketing, Vol. 48 No. 9/10, pp. 1600–1625.
Priluck, R. and Lala, V. (2009), “The impact of the recovery paradox on retailer-customer relationships”, Managing Service Quality, Vol. 19 No. 1, pp. 42–59.
Priluck, R. and Wisenblit, J. (2009), “The impact of exchange lineage on customers’ responses to service debacles and subsequent recovery”, Services Marketing Quarterly, Vol. 30 No. 4, pp. 365–376.
Prolific. (2019a), “Wondering how much to pay your participants? Here are some useful considerations.”, available at: https://researcher-help.prolific.co/hc/en-gb/articles/360009500733-Deciding-on-a-Reward.
Prolific. (2019b), “Explore our participant pool demographics”, available at: https://www.prolific.co/demographics/.
Prolific. (2020a), “Representative Samples on Prolific”, available at: https://researcher-help.prolific.co/hc/en-gb/articles/360019236753-Representative-Samples-on-Prolific.
Prolific. (2020b), “Prolific vs. MTurk: How are we different?”, available at: https://www.prolific.co/prolific-vs-mturk/.
Prykhodko, S., Prykhodko, N., Makarova, L. and Pukhalevych, A. (2018), “Application of the squared mahalanobis distance for detecting outliers in multivariate non-Gaussian data”, 2018 14th International Conference on

315
Advanced Trends in Radioelecrtronics, Telecommunications and Computer Engineering (TCSET), IEEE, pp. 962–965.
Punch, K.F. (2003), Survey Research: The Basics, Sage.
Qin, J., Xu, F. and Wang, R. (2019), “Pre-service recovery: impact on customer satisfaction and acceptable waiting time”, The Service Industries Journal, pp. 1–21.
Qualtrics. (2020), “Validation ”, available at: https://www.qualtrics.com/support/survey-platform/survey-module/editing-questions/validation/.
Radu, A., Surachartkumtonkun, J., Weaven, S. and Thaichon, P. (2020), “Examining antecedents of reconciliation following service failure and recovery”, Journal of Strategic Marketing, Vol. 28 No. 5, pp. 417–433.
Radu, A.G., Arli, D., Surachartkumtonkun, J., Weaven, S. and Wright, O. (2019), “Empathy and apology: the effectiveness of recovery strategies”, Marketing Intelligence & Planning, Vol. 28 No. 5, pp. 417–433.
Rambocas, M., Kirpalani, V.M. and Simms, E. (2018), “Brand equity and customer behavioral intentions: a mediated moderated model”, International Journal of Bank Marketing, Vol. 36 No. 1, pp. 19–40.
Rasoulian, S., Grégoire, Y., Legoux, R. and Sénécal, S. (2017), “Service crisis recovery and firm performance: insights from information breach announcements”, Journal of the Academy of Marketing Science, Vol. 45 No. 6, pp. 789–806.
Rawls, J. (1971), “A theory of justice (cambridge”, Mass.: Harvard University.
Rego, L.L., Billett, M.T. and Morgan, N.A. (2009), “Consumer-based brand equity and firm risk”, Journal of Marketing, Vol. 73 No. 6, pp. 47–60.
Reichheld, F.F. (2003), “The one number you need to grow”, Harvard Business Review, Vol. 81 No. 12, pp. 46–55.
Reinartz, W., Haenlein, M. and Henseler, J. (2009), “An empirical comparison of the efficacy of covariance-based and variance-based SEM”, International Journal of Research in Marketing, Vol. 26 No. 4, pp. 332–344.
Retamosa, M., Millán, Á. and Moital, M. (2019), “Does the type of degree predict different levels of satisfaction and loyalty? A brand equity perspective”, Corporate Reputation Review, Vol. 23, pp. 57–77.
Riaz, Z. and Khan, M.I. (2016), “Impact of service failure severity and agreeableness on consumer switchover intention: Mediating role of consumer forgiveness”, Asia Pacific Journal of Marketing and Logistics, Vol. 28 No. 3, pp. 420–434.
Riessman, C.K. (1993), Narrative Analysis, Vol. 30, Sage.
Rigdon, E.E., Sarstedt, M. and Ringle, C.M. (2017), “On comparing results from CB-SEM and PLS-SEM: Five perspectives and five recommendations”, Marketing Zfp, Vol. 39 No. 3, pp. 4–16.
Ringberg, T., Odekerken-Schröder, G. and Christensen, G.L. (2007), “A cultural models approach to service recovery”, Journal of Marketing, Vol. 71 No. 3, pp.
316
194–214.
Ringle, C.M., Wende, S. and Becker, J.-M. (2015), “SmartPLS 3. Boenningstedt, Germany: SmartPLS GmbH”.
del Río-Lanza, A.B., Vázquez-Casielles, R. and Díaz-Martín, A.M. (2009), “Satisfaction with service recovery: Perceived justice and emotional responses”, Journal of Business Research, Vol. 62 No. 8, pp. 775–781.
Rios, R.E. and Riquelme, H.E. (2008), “Brand equity for online companies”, Marketing Intelligence & Planning, Vol. 26 No. 7, pp. 719–742.
Ro, H. and Olson, E.D. (2014), “The effects of social justice and stigma-consciousness on gay customers’ service recovery evaluation”, Journal of Business Research, Vol. 67 No. 6, pp. 1162–1169.
Robinson, J., Rosenzweig, C., Moss, A.J. and Litman, L. (2019), “Tapped out or barely tapped? Recommendations for how to harness the vast and largely unused potential of the Mechanical Turk participant pool”, PloS One, Vol. 14 No. 12.
Roggeveen, A.L., Tsiros, M. and Grewal, D. (2012), “Understanding the co-creation effect: when does collaborating with customers provide a lift to service recovery?”, Journal of the Academy of Marketing Science, Vol. 40 No. 6, pp. 771–790.
da Rosa Pulga, A.A., Basso, K., Viacava, K.R., Pacheco, N.A., Ladeira, W.J. and Dalla Corte, V.F. (2019), “The link between social interactions and trust recovery in customer–business relationships”, Journal of Consumer Behaviour, Vol. 18 No. 6, pp. 496–504.
Roschk, H. and Gelbrich, K. (2014), “Identifying appropriate compensation types for service failures: A meta-analytic and experimental analysis”, Journal of Service Research, Vol. 17 No. 2, pp. 195–211.
Roschk, H. and Gelbrich, K. (2017), “Compensation revisited: A social resource theory perspective on offering a monetary resource after a service failure”, Journal of Service Research, Vol. 20 No. 4, pp. 393–408.
Roschk, H. and Kaiser, S. (2013), “The nature of an apology: An experimental study on how to apologize after a service failure”, Marketing Letters, Vol. 24 No. 3, pp. 293–309.
Roschk, H., Müller, J. and Gelbrich, K. (2013), “Age matters: How developmental stages of adulthood affect customer reaction to complaint handling efforts”, Journal of Retailing and Consumer Services, Vol. 20 No. 2, pp. 154–164.
Roy, S.K., Lassar, W.M. and Shekhar, V. (2016), “Convenience and satisfaction: mediation of fairness and quality”, Service Industries Journal, Taylor & Francis, Vol. 36 No. 5–6, pp. 239–260.
Ruan, W.-Q., Zhang, S.-N., Liu, C.-H. and Li, Y.-Q. (2020), “A new path for building hotel brand equity: the impacts of technological competence and service innovation implementation through perceived value and trust”, Journal of Hospitality Marketing & Management, Vol. 29 No. 8, pp. 911–933.
De Ruyter, K. and Wetzels, M. (2000), “Customer equity considerations in service recovery: A cross-industry perspective”, International Journal of Service

317
Industry Management, Vol. 11 No. 1, pp. 91–108.
Saarijärvi, H., Kannan, P.K. and Kuusela, H. (2013), “Value co-creation: theoretical approaches and practical implications”, European Business Review, Vol. 25 No. 1, pp. 6–19.
Saavedra Torres, J.L., Rawal, M. and Bagherzadeh, R. (2020), “Role of brand attachment in customers’ evaluation of service failure”, Journal of Product and Brand Management, Vol. 3, pp. 377–391.
Sajtos, L., Brodie, R.J. and Whittome, J. (2010), “Impact of service failure: The protective layer of customer relationships”, Journal of Service Research, Vol. 13 No. 2, pp. 216–229.
Santos Cristiane, P. dos and Basso, K. (2012), “Do ongoing relationships buffer the effects of service recovery on customers’ trust and loyalty?”, International Journal of Bank Marketing, Vol. 30 No. 3, pp. 168–192.
Sarkar, A., Sarkar, J.G. and S, S. (2021), “Managing customers’ undesirable responses towards hospitality service brands during service failure: The moderating role of other customer perception”, International Journal of Hospitality Management, Vol. 94, p. 102873.
Sarkar, S. and Bhattacharjee, T. (2017), “Impact of voluntary disclosures on corporate brand equity”, Corporate Reputation Review, Vol. 20 No. 2, pp. 125–136.
Sarstedt, M., Hair, J.F., Ringle, C.M., Thiele, K.O. and Gudergan, S.P. (2016), “Estimation issues with PLS and CBSEM: Where the bias lies!”, Journal of Business Research, Vol. 69 No. 10, pp. 3998–4010.
Saunders, M., Lewis, P. and Thornhill, A. (2019), Research Methods for Business Students, Eighth., Pearson, Essex, England.
Saunders, M.N.K., Lewis, P. and Thornhill, A. (2016), Research Methods for Business Students, 7/E, Pearson Education , London.
Schoefer, K. and Diamantopoulos, A. (2008), “The role of emotions in translating perceptions of (in) justice into postcomplaint behavioral responses”, Journal of Service Research, Vol. 11 No. 1, pp. 91–103.
Schultz, D. (2016), “Market brand equity: lost in terminology and techniques?”, Journal of Product & Brand Management, Vol. 25 No. 6, pp. 507–515.
Seggie, S.H., Kim, D. and Cavusgil, S.T. (2006), “Do supply chain IT alignment and supply chain interfirm system integration impact upon brand equity and firm performance?”, Journal of Business Research, Vol. 59 No. 8, pp. 887–895.
Sekaran, U. and Bougie, R. (2016), Research Methods for Business: A Skill Building Approach, John Wiley & Sons.
Sembada, A., Tsarenko, Y. and Tojib, D. (2016), “The positive effects of customers’ power on their behavioral responses after service failure”, Journal of Service Research, Vol. 19 No. 3, pp. 337–351.
Sengupta, A.S., Balaji, M.S. and Krishnan, B.C. (2015), “How customers cope with service failure? A study of brand reputation and customer satisfaction”, Journal of Business Research, Vol. 68 No. 3, pp. 665–674.
318
Sengupta, S., Ray, D., Trendel, O. and Vaerenbergh, Y. Van. (2018), “The effects of apologies for service failures in the global online retail”, International Journal of Electronic Commerce, Vol. 22 No. 3, pp. 419–445.
Šerić, M., Gil-Saura, I. and Mikulić, J. (2017), “Customer-based brand equity building: Empirical evidence from Croatian upscale hotels”, Journal of Vacation Marketing, Vol. 23 No. 2, pp. 133–144.
Shams, G., Rehman, M.A., Samad, S. and Rather, R.A. (2020), “The impact of the magnitude of service failure and complaint handling on satisfaction and brand credibility in the banking industry”, Journal of Financial Services Marketing, Vol. 25, pp. 25–34.
Shankar, V., Azar, P. and Fuller, M. (2008), “Practice Prize Paper—BRAN* EQT: A Multicategory Brand Equity Model and Its Application at Allstate”, Marketing Science, Vol. 27 No. 4, pp. 567–584.
Shapiro, T. and Nieman‐Gonder, J. (2006), “Effect of communication mode in justice‐based service recovery”, Managing Service Quality: An International Journal, Vol. 16 No. 2, pp. 124–144.
Sharifi, S. and Spassova, G. (2020), “In the eye of the beholder: How self-construal influences service evaluations following observations of others’ service experiences”, European Journal of Marketing, Vol. 54 No. 5, pp. 1087–1116.
Sharifi, S.S., Palmeira, M., Ma, J. and Spassova, G. (2017), “The impact of service failure and recovery on target and observing customers: A comparative study”, Journal of Hospitality Marketing & Management, Vol. 26 No. 8, pp. 889–910.
Shavitt, S. and Barnes, A.J. (2020), “Culture and the Consumer Journey”, Journal of Retailing, New York University, Vol. 96 No. 1, pp. 40–54.
Shin, H., Casidy, R. and Mattila, A.S. (2018), “Service Recovery, Justice Perception, and Forgiveness: The ‘Other Customers’ Perspectives”, Services Marketing Quarterly, Vol. 39 No. 1, pp. 1–21.
Shin, H. and Larson, L.R.L. (2020), “The bright and dark sides of humorous response to online customer complaint”, European Journal of Marketing, Vol. 54 No. 8, pp. 2013–2047.
Shin, J., Seo, M.-G., Shapiro, D.L. and Taylor, M.S. (2015), “Maintaining employees’ commitment to organizational change: The role of leaders’ informational justice and transformational leadership”, The Journal of Applied Behavioral Science, Vol. 51 No. 4, pp. 501–528.
Shmueli, G., Ray, S., Estrada, J.M.V. and Chatla, S.B. (2016), “The elephant in the room: Predictive performance of PLS models”, Journal of Business Research, Vol. 69 No. 10, pp. 4552–4564.
Shmueli, G., Sarstedt, M., Hair, J.F., Cheah, J.-H., Ting, H., Vaithilingam, S. and Ringle, C.M. (2019), “Predictive model assessment in PLS-SEM: guidelines for using PLSpredict”, European Journal of Marketing, Vol. 53 No. 11, pp. 2322–2347.
Shostack, L. (1984), “Designing services that deliver”, Harvard Business Review, Vol. 62 No. 1, pp. 133–139.

319
Siddaway, A.P., Wood, A.M. and Hedges, L. V. (2019), “How to do a systematic review: a best practice guide for conducting and reporting narrative reviews, meta-analyses, and meta-syntheses”, Annual Review of Psychology, Vol. 70, pp. 747–770.
Silva, G.M., Coelho, F., Lages, C.R. and Reis, M. (2020), “Employee adaptive and proactive service recovery: a configurational perspective”, European Journal of Marketing, Vol. 54 No. 7, pp. 1581–1607.
da Silveira, C., Lages, C. and Simões, C. (2013), “Reconceptualizing brand identity in a dynamic environment”, Journal of Business Research, Vol. 66 No. 1, pp. 28–36.
Simms, L.J., Zelazny, K., Williams, T.F. and Bernstein, L. (2019), “Does the number of response options matter? Psychometric perspectives using personality questionnaire data”, Psychological Assessment, Vol. 31 No. 4, pp. 1–10.
Simon, C.J. and Sullivan, M.W. (1993), “The measurement and determinants of brand equity: A financial approach”, Marketing Science, Vol. 12 No. 1, pp. 28–52.
Sinclair, R.N. and Lane Keller, K. (2014), “A case for brands as assets: Acquired and internally developed”, Journal of Brand Management, Vol. 21 No. 4, pp. 286–302.
Sindhav, B., Holland, J., Rodie, A.R., Adidam, P.T. and Pol, L.G. (2006), “The impact of perceived fairness on satisfaction: are airport security measures fair? Does it matter?”, Journal of Marketing Theory and Practice, Vol. 14 No. 4, pp. 323–335.
Singh, J. (1988), “Consumer complaint intentions and behavior: definitional and taxonomical issues”, Journal of Marketing, Vol. 52 No. 1, pp. 93–107.
Singhal, S., Krishna, A. and Lazarus, D. (2013), “Service Failure Magnitude and Paradox: A Banking Perspective”, Journal of Relationship Marketing, Vol. 12 No. 3, pp. 191–203.
Skourtis, G., Décaudin, J., Assiouras, I. and Karaosmanoglu, E. (2019), “Does the Co‐Creation of Service Recovery Create Value for Customers? The Underlying Mechanism of Motivation and the Role of Operant Resources”, European Management Review, Vol. 16 No. 4, pp. 997–1013.
Slack, N., Singh, G. and Sharma, S. (2020), “Impact of perceived value on the satisfaction of supermarket customers: developing country perspective”, International Journal of Retail and Distribution Management, Vol. 48 No. 11, pp. 1235–1254.
Smith, A.K. and Bolton, R.N. (1998), “An experimental investigation of customer reactions to service failure and recovery encounters: paradox or peril?”, Journal of Service Research, Vol. 1 No. 1, pp. 65–81.
Smith, A.K. and Bolton, R.N. (2002), “The effect of customers’ emotional responses to service failures on their recovery effort evaluations and satisfaction judgments”, Journal of the Academy of Marketing Science, Vol. 30 No. 1, pp. 5–23.
Smith, A.K., Bolton, R.N. and Wagner, J. (1999), “A model of customer satisfaction
320
with service encounters involving failure and recovery”, Journal of Marketing Research, Vol. 36 No. 3, pp. 356–372.
Smith, J.A. and Shinebourne, P. (2012), Interpretative Phenomenological Analysis, American Psychological Association.
Smith, J.S. and Karwan, K.R. (2010), “Empirical profiles of service recovery systems: the maturity perspective”, Journal of Service Research, Vol. 13 No. 1, pp. 111–125.
Smith, S.M., Roster, C.A., Golden, L.L. and Albaum, G.S. (2016), “A multi-group analysis of online survey respondent data quality: Comparing a regular USA consumer panel to MTurk samples”, Journal of Business Research, Vol. 69 No. 8, pp. 3139–3148.
Snyder, H. (2019), “Literature review as a research methodology: An overview and guidelines”, Journal of Business Research, Vol. 104, pp. 333–339.
Soares, R.R., Zhang, T.T., Proença, J.F. and Kandampully, J. (2017), “Why are Generation Y consumers the most likely to complain and repurchase?”, Journal of Service Management, Vol. 28 No. 3, pp. 520–540.
Söderlund, M. and Sagfossen, S. (2017), “The consumer experience: The impact of supplier effort and consumer effort on customer satisfaction”, Journal of Retailing and Consumer Services, Vol. 39, pp. 219–229.
Sokolowski, R. (2000), Introduction to Phenomenology, Cambridge university press.
Sreejesh, S., Anusree, M.R. and Ponnam, A. (2019), “Can online service recovery interventions benignly alter customers’ negative review evaluations? Evidence from the hotel industry”, Journal of Hospitality Marketing and Management, Routledge, Vol. 28 No. 6, pp. 711–742.
Srinivasan, V. (1979), “Network models for estimating brand-specific effects in multi-attribute marketing models”, Management Science, Vol. 25 No. 1, pp. 11–21.
Srivastava, R.K. and Shocker, A.D. (1991), Brand Equity: A Perspective on Its Meaning and Measurement, Marketing Science Institute.
Stahl, F., Heitmann, M., Lehmann, D.R. and Neslin, S.A. (2012), “The impact of brand equity on customer acquisition, retention, and profit margin”, Journal of Marketing, Vol. 76 No. 4, pp. 44–63.
Stakhovych, S. and Tamaddoni, A. (2020), “Mix&Match: A Resource-Based Complaint Recovery Framework for Tangible Compensation”, Journal of Service Research, Vol. 23 No. 3, pp. 337–352.
Stangor, C. (2014), Research Methods for the Behavioral Sciences, Nelson Education.
Statista. (2019), “Restaurant industry in the United Kingdom (UK) - Statistics & Facts”, Statista Research Department, available at: https://www.statista.com/topics/3131/restaurant-industry-in-the-united-kingdom-uk/#dossierSummary__chapter1.
Statista. (2020), “Ethnicity in the United Kingdom as of 2011”, available at: https://www.statista.com/statistics/270386/ethnicity-in-the-united-kingdom/.

321
Steenkamp, J.-B.E.M. and Van Trijp, H.C.M. (1991), “The use of LISREL in validating marketing constructs”, International Journal of Research in Marketing, Vol. 8 No. 4, pp. 283–299.
Strauss, A. and Corbin, J. (1998), Basics of Qualitative Research Techniques, Sage publications Thousand Oaks, CA.
Suh, M., Greene, H., Rho, T. and Qi, Q. (2013), “The role of relationships in service failure: A cross-cultural study—United States, China, and Korea”, Services Marketing Quarterly, Vol. 34 No. 3, pp. 191–204.
Summers, J.O. (2019), “Guidelines for conducting research and publishing in marketing: From conceptualization through the review process”, How to Get Published in the Best Marketing Journals, Edward Elgar Publishing.
Supornpraditchai, T., Miller, K., Lings, I.N. and Jonmundsson, J.B. (2007), “Employee-based brand equity: antecedents and consequences”, Australian and New Zealand Marketing Academy Conference, Otago University.
Surachartkumtonkun, J., McColl-Kennedy, J.R. and Patterson, P.G. (2015), “Unpacking customer rage elicitation: A dynamic model”, Journal of Service Research, Vol. 18 No. 2, pp. 177–192.
Suri, A., Huang, B. and Sénécal, S. (2019), “I can forgive you, but I can’t forgive the firm: An examination of service failures in the sharing economy”, Journal of Marketing Theory and Practice, Vol. 27 No. 4, pp. 355–370.
Swaid, S.I. and Wigand, R.T. (2012), “The effect of perceived site-to-store service quality on perceived value and loyalty intentions in multichannel retailing”, International Journal of Management, Vol. 29 No. 3, p. 301.
Swait, J., Erdem, T., Louviere, J. and Dubelaar, C. (1993), “The equalization price: A measure of consumer-perceived brand equity”, International Journal of Research in Marketing, Vol. 10 No. 1, pp. 23–45.
Swanson, S.R. and Hsu, M.K. (2009), “Critical incidents in tourism: Failure, recovery, customer switching, and word‐of‐mouth behaviors”, Journal of Travel & Tourism Marketing, Vol. 26 No. 2, pp. 180–194.
Tabachnick, B.G. and Fidell, L.S. (2013), “Using Multivariate Statistics, 6th Edn, New International Edition”, Harlow: Pearson Education Limited.
Tavassoli, N.T., Sorescu, A. and Chandy, R. (2014), “Employee-based brand equity: Why firms with strong brands pay their executives less”, Journal of Marketing Research, Vol. 51 No. 6, pp. 676–690.
Tax, S.S., Brown, S.W. and Chandrashekaran, M. (1998), “Customer evaluations of service complaint experiences: implications for relationship marketing”, Journal of Marketing, Vol. 62 No. 2, pp. 60–76.
Taylor, S.A., Celuch, K. and Goodwin, S. (2004), “The importance of brand equity to customer loyalty”, Journal of Product & Brand Management, Vol. 13 No. 4, pp. 217–227.
Teague, S., Youssef, G.J., Macdonald, J.A., Sciberras, E., Shatte, A., Fuller-Tyszkiewicz, M., Greenwood, C., et al. (2018), “Retention strategies in longitudinal cohort studies: a systematic review and meta-analysis”, BMC Medical Research Methodology, Vol. 18 No. 1, p. 151.

322
Tedeschi, J.T., Norman, N. and Schlenker, B.R. (1985), “The self and social life”, McGraw-Hill, USA, Vol. 293, p. 322.
Thaler, V.S., Herbst, U. and Merz, M.A. (2018), “A real product scandal’s impact on a high-equity brand: a new approach to assessing scandal impact”, Journal of Product & Brand Management, Vol. 27 No. 4, pp. 427–439.
Theurer, C.P., Tumasjan, A., Welpe, I.M. and Lievens, F. (2018), “Employer Branding: A Brand Equity‐based Literature Review and Research Agenda”, International Journal of Management Reviews, Vol. 20 No. 1, pp. 155–179.
Thompson, C.G., Kim, R.S., Aloe, A.M. and Becker, B.J. (2017), “Extracting the variance inflation factor and other multicollinearity diagnostics from typical regression results”, Basic and Applied Social Psychology, Vol. 39 No. 2, pp. 81–90.
Tranfield, D., Denyer, D. and Smart, P. (2003), “Towards a methodology for developing evidence‐informed management knowledge by means of systematic review”, British Journal of Management, Vol. 14 No. 3, pp. 207–222.
Tsai, C.-C., Yang, Y.-K. and Cheng, Y.-C. (2014), “Does relationship matter?–Customers’ response to service failure”, Managing Service Quality, Vol. 24 No. 2, pp. 139–159.
Tsai, C.-T. and Su, C.-S. (2009), “Service failures and recovery strategies of chain restaurants in Taiwan”, The Service Industries Journal, Vol. 29 No. 12, pp. 1779–1796.
Tuominen, P. (1999), “Managing brand equity”, Lta, Vol. 1 No. 99, pp. 65–100.
Urueña, A. and Hidalgo, A. (2016), “Successful loyalty in e-complaints: FsQCA and structural equation modeling analyses”, Journal of Business Research, Vol. 69 No. 4, pp. 1384–1389.
Van Vaerenbergh, Y., Hazée, S. and Costers, A. (2018), “Customer participation in service recovery: a meta-analysis”, Marketing Letters, Vol. 29 No. 4, pp. 465–483.
Van Vaerenbergh, Y. and Orsingher, C. (2016), “Service recovery: An integrative framework and research agenda”, Academy of Management Perspectives, Vol. 30 No. 3, pp. 328–346.
Van Vaerenbergh, Y., Orsingher, C., Vermeir, I. and Larivière, B. (2014), “A meta-analysis of relationships linking service failure attributions to customer outcomes”, Journal of Service Research, Vol. 17 No. 4, pp. 381–398.
Van Vaerenbergh, Y., Varga, D., De Keyser, A. and Orsingher, C. (2019), “The service recovery journey: Conceptualization, integration, and directions for future research”, Journal of Service Research, Vol. 22 No. 2, pp. 103–119.
Van Vaerenbergh, Y., Vermeir, I. and Larivière, B. (2013), “Service recovery’s impact on customers next-in-line”, Managing Service Quality, Vol. 23 No. 6, pp. 495–512.
Vaismoradi, M., Turunen, H. and Bondas, T. (2013), “Content analysis and thematic analysis: Implications for conducting a qualitative descriptive study”, Nursing & Health Sciences, Vol. 15 No. 3, pp. 398–405.

323
Vallaster, C. and von Wallpach, S. (2013), “An online discursive inquiry into the social dynamics of multi-stakeholder brand meaning co-creation”, Journal of Business Research, Vol. 66 No. 9, pp. 1505–1515.
Varela-Neira, C., Vázquez-Casielles, R. and Iglesias-Argüelles, V. (2008), “The influence of emotions on customer’s cognitive evaluations and satisfaction in a service failure and recovery context”, The Service Industries Journal, Vol. 28 No. 4, pp. 497–512.
Varela-Neira, C., Vázquez-Casielles, R. and Iglesias, V. (2010a), “The effects of customer age and recovery strategies in a service failure setting”, Journal of Financial Services Marketing, Vol. 15 No. 1, pp. 32–48.
Varela-Neira, C., Vázquez-Casielles, R. and Iglesias, V. (2010b), “Explaining customer satisfaction with complaint handling”, International Journal of Bank Marketing, Vol. 28 No. 2, pp. 88–112.
Vargo, S.L. and Lusch, R.F. (2004), “Evolving to a new dominant logic for marketing”, Journal of Marketing, Vol. 68 No. 1, pp. 1–17.
Vargo, S.L. and Lusch, R.F. (2006), “Service-dominant logic”, The Service-Dominant Logic of Marketing: Dialog, Debate, and Directions.
Vargo, S.L. and Lusch, R.F. (2008), “Service-dominant logic: continuing the evolution”, Journal of the Academy of Marketing Science, Vol. 36 No. 1, pp. 1–10.
Vargo, S.L. and Lusch, R.F. (2016), “Institutions and axioms: an extension and update of service-dominant logic”, Journal of the Academy of Marketing Science, Vol. 44 No. 1, pp. 5–23.
Vázquez-Casielles, R., Iglesias, V. and Varela-Neira, C. (2017), “Co-creation and service recovery process communication: effects on satisfaction, repurchase intentions, and word of mouth”, Service Business, Vol. 11 No. 2, pp. 321–343.
Vázquez‐Casielles, R., Suarez Alvarez, L. and Diaz Martin, A.M. (2010), “Perceived justice of service recovery strategies: Impact on customer satisfaction and quality relationship”, Psychology & Marketing, Vol. 27 No. 5, pp. 487–509.
Vázquez, R., Del Rio, A.B. and Iglesias, V. (2002), “Consumer-based brand equity: development and validation of a measurement instrument”, Journal of Marketing Management, Vol. 18 No. 1–2, pp. 27–48.
Veloutsou, C., Chatzipanagiotou, K. and Christodoulides, G. (2020), “The consumer-based brand equity deconstruction and restoration process: Lessons from unliked brands”, Journal of Business Research, Vol. 111, pp. 41–51.
Veloutsou, C., Christodoulides, G. and de Chernatony, L. (2013), “A taxonomy of measures for consumer-based brand equity: drawing on the views of managers in Europe”, Journal of Product & Brand Management, Vol. 22 No. 3, pp. 238–248.
Veloutsou, C. and Delgado-Ballester, E. (2018), “New challenges in brand management”, Spanish Journal of Marketing-ESIC, Vol. 22 No. 3, pp. 255–272.
324
Veloutsou, C. and Moutinho, L. (2009), “Brand relationships through brand reputation and brand tribalism”, Journal of Business Research, Vol. 62 No. 3, pp. 314–322.
Vogel, A.T., Cook, S.C. and Watchravesringkan, K. (2019), “Luxury brand dilution: Investigating the impact of renting by Millennials on brand equity”, Journal of Brand Management, Vol. 26 No. 4, pp. 473–482.
Voorhees, C.M., Brady, M.K., Calantone, R. and Ramirez, E. (2016), “Discriminant validity testing in marketing: an analysis, causes for concern, and proposed remedies”, Journal of the Academy of Marketing Science, Springer, Vol. 44 No. 1, pp. 119–134.
Voorhees, C.M., Brady, M.K. and Horowitz, D.M. (2006), “A voice from the silent masses: an exploratory and comparative analysis of noncomplainers”, Journal of the Academy of Marketing Science, Vol. 34 No. 4, pp. 514–527.
Wahyuni, D. (2012), “The research design maze: Understanding paradigms, cases, methods and methodologies”, Journal of Applied Management Accounting Research, Vol. 10 No. 1, pp. 69–80.
Walker, K. (2010), “A systematic review of the corporate reputation literature: Definition, measurement, and theory”, Corporate Reputation Review, Vol. 12 No. 4, pp. 357–387.
Walsh, G. and Beatty, S.E. (2007), “Customer-based corporate reputation of a service firm: scale development and validation”, Journal of the Academy of Marketing Science, Vol. 35 No. 1, pp. 127–143.
Walsh, G., Mitchell, V., Jackson, P.R. and Beatty, S.E. (2009), “Examining the antecedents and consequences of corporate reputation: A customer perspective”, British Journal of Management, Vol. 20 No. 2, pp. 187–203.
Wang, C., Mattila, A.S. and Bartlett, A. (2009), “An examination of explanation typology on perceived informational fairness in the context of air travel”, Journal of Travel & Tourism Marketing, Vol. 26 No. 8, pp. 795–805.
Wang, E.S.-T. and Chang, S.-Y. (2013), “Creating positive word-of-mouth promotion through service recovery strategies”, Services Marketing Quarterly, Vol. 34 No. 2, pp. 103–114.
Wang, E.S.T. and Chen, L.S.L. (2011), “The influence of perceived justice of service recovery on affective and cognitive trust”, International Journal of Services and Standards, Vol. 7 No. 3–4, pp. 278–290.
Wang, H.D. (2010), “Corporate social performance and financial‐based brand equity”, Journal of Product & Brand Management, Vol. 19 No. 5, pp. 335–345.
Wang, K.-Y., Hsu, L.-C. and Chih, W.-H. (2014), “Retaining customers after service failure recoveries: a contingency model”, Managing Service Quality, Emerald Group Publishing Limited, Vol. 24 No. 4, pp. 318–338.
Wang, L. and Ding, Y. (2017), “An exemption for strong brands: the influence of brand community rejection on brand evaluation”, European Journal of Marketing, Vol. 51 No. 5/6, pp. 1029–1048.
Wang, S. and Huff, L.C. (2007), “Explaining buyers’ responses to sellers’ violation of trust”, European Journal of Marketing, Vol. 41 No. 9/10, pp. 1033–1052.

325
Wang, Y.S., Wu, S.C., Lin, H.H. and Wang, Y.Y. (2011), “The relationship of service failure severity, service recovery justice and perceived switching costs with customer loyalty in the context of e-tailing”, International Journal of Information Management, Vol. 31 No. 4, pp. 350–359.
Waqas, M., Ali, H. and Khan, M.A. (2014), “An investigation of effects of justice recovery dimensions on students’ satisfaction with service recovery in higher education environment”, International Review on Public and Nonprofit Marketing, Vol. 11 No. 3, pp. 263–284.
Ward, J.C. and Ostrom, A.L. (2006), “Complaining to the masses: The role of protest framing in customer-created complaint web sites”, Journal of Consumer Research, The University of Chicago Press, Vol. 33 No. 2, pp. 220–230.
Washburn, J.H. and Plank, R.E. (2002), “Measuring brand equity: An evaluation of a consumer-based brand equity scale”, Journal of Marketing Theory and Practice, Vol. 10 No. 1, pp. 46–62.
Wei, S., Ang, T. and Anaza, N.A. (2019), “Recovering co-created service failures: the missing link of perceived justice and ethicalness”, Journal of Services Marketing, Emerald Publishing Limited, Vol. 33 No. 7, pp. 921–935.
Weijters, B., Baumgartner, H. and Schillewaert, N. (2013), “Reversed item bias: An integrative model”, Psychological Methods, Vol. 18 No. 3, p. 320.
Weitzl, W. and Hutzinger, C. (2017), “The effects of marketer-and advocate-initiated online service recovery responses on silent bystanders”, Journal of Business Research, Vol. 80, pp. 164–175.
Wen, B. and Geng‐qing Chi, C. (2013), “Examine the cognitive and affective antecedents to service recovery satisfaction: A field study of delayed airline passengers”, International Journal of Contemporary Hospitality Management, Vol. 25 No. 3, pp. 306–327.
Weun, S., Beatty, S.E. and Jones, M.A. (2004), “The impact of service failure severity on service recovery evaluations andpost-recovery relationships”, Journal of Services Marketing, Vol. 18 No. 2, pp. 133–146.
White, L. and Yanamandram, V. (2007), “A model of customer retention of dissatisfied business services customers”, Managing Service Quality: An International Journal, Vol. 17 No. 3, pp. 298–316.
White, R.C., Joseph-Mathews, S. and Voorhees, C.M. (2013), “The effects of service on multichannel retailers’ brand equity”, Journal of Services Marketing, Vol. 27 No. 4, pp. 259–270.
Wiedmann, K.-P., Labenz, F., Haase, J. and Hennigs, N. (2018), “The power of experiential marketing: exploring the causal relationships among multisensory marketing, brand experience, customer perceived value and brand strength”, Journal of Brand Management, Vol. 25 No. 2, pp. 101–118.
Winters, L.C. (1991), “Brand equity measures: some recent advances”, Marketing Research, Vol. 3 No. 4, p. 70.
Wirtz, J. and Mattila, A.S. (2004), “Consumer responses to compensation, speed of recovery and apology after a service failure”, International Journal of Service Industry Management, Vol. 15 No. 2, pp. 150–166.
326
Wirtz, J. and McColl-Kennedy, J.R. (2010), “Opportunistic customer claiming during service recovery”, Journal of the Academy of Marketing Science, Vol. 38 No. 5, pp. 654–675.
Wolter, J.S., Bacile, T.J., Smith, J.S. and Giebelhausen, M. (2019), “The entitlement/forgiveness conflict of self-relevant and self-neutral relationships during service failure and recovery”, Journal of Business Research, Vol. 104, pp. 233–246.
Wolter, J.S., Brach, S., Cronin Jr, J.J. and Bonn, M. (2016), “Symbolic drivers of consumer–brand identification and disidentification”, Journal of Business Research, Vol. 69 No. 2, pp. 785–793.
Wong, I.A., Xu, S., Chan, S.H.G. and He, M. (2019), “A cross-level investigation of the role of human resources practices: does brand equity matter?”, Tourism Management, Vol. 75, pp. 418–426.
Wright, S.A. and Goodman, J.K. (2019), “Perceptions and Usage in Marketing Academia”, Handbook of Research Methods in Consumer Psychology, p. 338.
Wymer, W. and Casidy, R. (2019), “Exploring brand strength’s nomological net and its dimensional dynamics”, Journal of Retailing and Consumer Services, Vol. 49, pp. 11–22.
Xu, X., Liu, W. and Gursoy, D. (2019), “The impacts of service failure and recovery efforts on airline customers’ emotions and satisfaction”, Journal of Travel Research, Vol. 58 No. 6, pp. 1034–1051.
Xu, Y., Marshall, R., Edvardsson, B. and Tronvoll, B. (2014), “Show you care: initiating co-creation in service recovery”, Journal of Service Management, Vol. 25 No. 3, pp. 369–387.
Xu, Y., Tronvoll, B. and Edvardsson, B. (2014), “Recovering service failure through resource integration”, The Service Industries Journal, Vol. 34 No. 16, pp. 1253–1271.
Yang, C. -C., Chen, P. -S., & Chien, Y.-H. (2014), “Customer expertise, affective commitment, customer participation, and loyalty in B&B services”, International Journal of Organizational Innovation, Vol. 6 No. 4, pp. 174–183.
Yang, D., Sonmez, M., Gonzalez, M., Liu, Y. and Yoder, C.Y. (2019), “Consumer-based brand equity and consumer-based brand performance: evidence from smartphone brands in the USA”, Journal of Brand Management, Vol. 26 No. 6, pp. 717–732.
Yang, Q., Wang, Q. and Zhao, X. (2019), “Improving relationship performance on platforms: the role of platform technology usage in promoting justice”, Journal of Business & Industrial Marketing, Vol. 34 No. 5, pp. 965–976.
Yang, W. and Hanks, L. (2016), “Preconsumption mood, causal explanations, and postrecovery reactions”, Journal of Hospitality Marketing & Management, Vol. 25 No. 1, pp. 69–90.
Yani-de-Soriano, M., Hanel, P.H.P., Vazquez-Carrasco, R., Cambra-Fierro, J., Wilson, A. and Centeno, E. (2019), “Investigating the role of customers’ perceptions of employee effort and justice in service recovery: A cross-cultural perspective”, European Journal of Marketing, Vol. 53 No. 4, pp. 708–732.
327
Yao, S., Wang, X., Yu, H. and Guchait, P. (2019), “Effectiveness of error management training in the hospitality industry: Impact on perceived fairness and service recovery performance”, International Journal of Hospitality Management, Vol. 79, pp. 78–88.
Yoo, B. and Donthu, N. (2001), “Developing and validating a multidimensional consumer-based brand equity scale”, Journal of Business Research, Vol. 52 No. 1, pp. 1–14.
Yoo, B., Donthu, N. and Lee, S. (2000), “An examination of selected marketing mix elements and brand equity”, Journal of the Academy of Marketing Science, Vol. 28 No. 2, pp. 195–211.
You, Y., Yang, X., Wang, L. and Deng, X. (2020), “When and Why Saying ‘Thank You’ Is Better Than Saying ‘Sorry’ in Redressing Service Failures: The Role of Self-Esteem”, Journal of Marketing, Vol. 84 No. 2, pp. 133–150.
Zarantonello, L. and Schmitt, B.H. (2013), “The impact of event marketing on brand equity: The mediating roles of brand experience and brand attitude”, International Journal of Advertising, Vol. 32 No. 2, pp. 255–280.
Zauner, A., Koller, M. and Hatak, I. (2015), “Customer perceived value—Conceptualization and avenues for future research”, Cogent Psychology, Cogent, Vol. 2 No. 1, pp. 1–17.
Zeithaml, V.A. (1988), “Consumer perceptions of price, quality, and value: a means-end model and synthesis of evidence”, The Journal of Marketing, Vol. 52 No. 3, pp. 2–22.
Zeithaml, V.A., Berry, L.L. and Parasuraman, A. (1993), “The nature and determinants of customer expectations of service”, Journal of the Academy of Marketing Science, Vol. 21 No. 1, pp. 1–12.
Zeithaml, V.A., Parasuraman, A. and Berry, L.L. (1985), “Problems and strategies in services marketing”, Journal of Marketing, Vol. 49 No. 2, pp. 33–46.
Zemke, R.E. and Bell, C.R. (1990), “Service recovery: Doing it right the second time”, Training, Vol. 27 No. 42.
Ziaullah, M., Feng, Y. and Akhter, S.N. (2017), “How does justice matter in online retailers’ reputation and purchase intentions: an empirical study of China”, Behaviour and Information Technology, Taylor & Francis, Vol. 36 No. 1, pp. 85–94.
Zikmund, W.G. and Carr, G. (2003), “Business Research Methods. 7th”, Oklahoma, EUA: Thomson.
Zikmund, W.G., D’Alessandro, S., Winzar, H., Lowe, B. and Babin, B. (2017), Marketing Research: Asia-Pacific Edition, Cengage AU.
Related Documents


![Welcome to Enlighten: Theses - Enlighten: Thesestheses.gla.ac.uk/71878/1/10394171.pdf · 2019. 5. 10. · [Chronicle of the EOKA struggle 1955-1959] (Athens: [n. pub.], 1971); Georgios](https://static.cupdf.com/doc/110x72/612d4a4a1ecc5158694218df/welcome-to-enlighten-theses-enlighten-2019-5-10-chronicle-of-the-eoka.jpg)


