Applied Engineering in Agriculture Vol. 25(3): 335‐346 E 2009 American Society of Agricultural and Biological Engineers ISSN 0883-8542 335 QUANTITATIVE EVALUATION OF AN ON‐HIGHWAY TRUCKING FLEET TO COMPARE #2ULSD AND B20 FUELS AND THEIR IMPACT ON OVERALL FLEET PERFORMANCE C. R. McKinley, J. H. Lumkes Jr. ABSTRACT. A study was performed on 20 Class‐8 trucks paired by make, model, mileage, and drive cycles. Ten trucks were operated using #2 Ultra‐Low Sulfur Diesel and 10 using a 20% soy methyl ester blend (B20). All trucks were equipped with data collection units that monitored engine information including fuel consumption, idle time, truck speed, engine load, and engine speed. Data collection occurred over a continuous span of 12 months. In addition to operating data, laboratory‐based fuel and engine oil testing was performed to quantify the analytical differences between the two fuel types. Cetane number, energy content, density, kinematic viscosity, and lubricity was measured for both fuels and at every oil service interval engine oil samples were evaluated based on fuel dilution, soot content, wear metals, contaminant metals, viscosity, oxidation, and acid/base number. Operational and maintenance issues such as cold start reliability, fuel filter service intervals, and general engine maintenance was also analyzed for each fleet. Statistical analysis was performed to determine significant differences in the performance of engines on these #2ULSD and B20 fuels. At the conclusion of the study minimal differences were found with most comparisons, the exceptions primarily found in differences between the engine oil samples based on the two fuel types used in the study. These differences included viscosity, acid/base number, oxidation, and lead wear which indicated slightly higher oil degradation levels with B20 use. Keywords. Biodiesel, Biofuel, B20, Fleet, Diesel, Renewable fuel, Alternative fuel, Class 8 truck, Fuel economy, Oil analysis, Filter plugging. he concept of using biodiesel in compression ignition engines has been around for the past century. Yet, it has only been within the past decade that biodiesel consumption has seen a reasonable amount of growth. With the recent legislation mandates, production facility investments, and `home‐grown' advertisements, biodiesel has become a viable alternative to petroleum derived diesel fuel. Consumers are requesting less expensive, renewable energy sources to fuel their vehicles, power their cities and homes, and transport goods to and from their businesses. The increase in fuel prices has stirred up consumer vulnerability concerns of being significantly dependent on a sole energy form – petroleum derived fuel. One of the main benefits of biodiesel expansion is that it contributes to energy security by lessening the demand on imported oil. The Renewable Fuel Standard, Section 202 of the Energy Independence and Security Act of 2007, mandates that 11.1 billion gal (42.0 billion L) of renewable fuels are to be consumed in the year 2009 with increasing annual increments through 2022 when 36 billion gal (136 billion L) of renewable fuels are to be consumed Submitted for review in November 2008 as manuscript number PM 7798; approved for publication by the Power & Machinery Division of ASABE in February 2009. The authors are Cody R. McKinley, ASABE Member Engineer, Graduate Student, and John H. Lumkes, ASABE Member Engineer, Professor, Department of Agricultural and Biological Engineering, Purdue University, West Lafayette, Indiana. Corresponding author: John H. Lumkes, Department of Agricultural and Biological Engineering, 225 S. University St., Purdue University, West Lafayette, IN 47907; phone: 574‐595‐0060; fax: 765‐496‐1115; e‐mail: [email protected]. (Energy, 2007). Of particular note, the minimum requirement for biomass‐based diesel, namely biodiesel, is set for 0.5 billion gal (1.9 billion L) in 2009 and increases to 1 billion gal (3.8 billion L) in 2012. Diesel engine original equipment manufacturers (OEMs) are beginning to understand that more and more of their customers are going to run blends of biodiesel, from 1% to 100%, in their diesel engines. As of January 2008, the majority of diesel engine OEMs have announced the approval of various levels of biodiesel. Nineteen current engine manufacturers have approved biodiesel blends ranging from B5 to B100 for various engine applications (NBB, 2008). There are five foreign automotive companies producing diesel engines for passenger car or light duty applications that have plans to release their vehicles into the U.S. market in the near future, but have not yet announced a release for biodiesel. The fuel injection equipment (FIE) manufacturers released a common position statement indicating release of their injection equipment for admixtures up to a maximum of 5% fatty acid methyl ester, meeting the EN14214 standard, with unadulterated diesel fuel, meeting the EN590 standard. The final product, B5, must also comply with EN590 (FIE Manufacturers, 2004). One major concern about the use of biodiesel is in regard the quality of the fuel. BQ9000 is a cooperative and voluntary national biodiesel accreditation program for both producers and marketers of biodiesel that was established to help assure that biodiesel fuel is produced to and maintained at the industry standard, ASTM D6751 for B100 and to promote the commercial success and public acceptance of biodiesel. ASTM has recently announced a new specification release, ASTM D7467, for B6‐B20 finished fuel blends which identifies T

Welcome message from author
This document is posted to help you gain knowledge. Please leave a comment to let me know what you think about it! Share it to your friends and learn new things together.
Transcript
Applied Engineering in Agriculture
Vol. 25(3): 335‐346 � 2009 American Society of Agricultural and Biological Engineers ISSN 0883-8542 335
QUANTITATIVE EVALUATION OF AN ON‐HIGHWAY TRUCKING
FLEET TO COMPARE #2ULSD AND B20 FUELS AND THEIR
IMPACT ON OVERALL FLEET PERFORMANCE
C. R. McKinley, J. H. Lumkes Jr.
ABSTRACT. A study was performed on 20 Class‐8 trucks paired by make, model, mileage, and drive cycles. Ten trucks wereoperated using #2 Ultra‐Low Sulfur Diesel and 10 using a 20% soy methyl ester blend (B20). All trucks were equipped withdata collection units that monitored engine information including fuel consumption, idle time, truck speed, engine load, andengine speed. Data collection occurred over a continuous span of 12 months. In addition to operating data, laboratory‐basedfuel and engine oil testing was performed to quantify the analytical differences between the two fuel types. Cetane number,energy content, density, kinematic viscosity, and lubricity was measured for both fuels and at every oil service interval engineoil samples were evaluated based on fuel dilution, soot content, wear metals, contaminant metals, viscosity, oxidation, andacid/base number. Operational and maintenance issues such as cold start reliability, fuel filter service intervals, and generalengine maintenance was also analyzed for each fleet. Statistical analysis was performed to determine significant differencesin the performance of engines on these #2ULSD and B20 fuels. At the conclusion of the study minimal differences were foundwith most comparisons, the exceptions primarily found in differences between the engine oil samples based on the two fueltypes used in the study. These differences included viscosity, acid/base number, oxidation, and lead wear which indicatedslightly higher oil degradation levels with B20 use.
Keywords. Biodiesel, Biofuel, B20, Fleet, Diesel, Renewable fuel, Alternative fuel, Class 8 truck, Fuel economy, Oil analysis,Filter plugging.
he concept of using biodiesel in compressionignition engines has been around for the pastcentury. Yet, it has only been within the past decadethat biodiesel consumption has seen a reasonable
amount of growth. With the recent legislation mandates,production facility investments, and `home‐grown'advertisements, biodiesel has become a viable alternative topetroleum derived diesel fuel. Consumers are requesting lessexpensive, renewable energy sources to fuel their vehicles,power their cities and homes, and transport goods to and fromtheir businesses. The increase in fuel prices has stirred upconsumer vulnerability concerns of being significantlydependent on a sole energy form – petroleum derived fuel.One of the main benefits of biodiesel expansion is that itcontributes to energy security by lessening the demand onimported oil. The Renewable Fuel Standard, Section 202 ofthe Energy Independence and Security Act of 2007,mandates that 11.1 billion gal (42.0 billion L) of renewablefuels are to be consumed in the year 2009 with increasingannual increments through 2022 when 36 billion gal(136 billion L) of renewable fuels are to be consumed
Submitted for review in November 2008 as manuscript number PM7798; approved for publication by the Power & Machinery Division ofASABE in February 2009.
The authors are Cody R. McKinley, ASABE Member Engineer,Graduate Student, and John H. Lumkes, ASABE Member Engineer,Professor, Department of Agricultural and Biological Engineering, PurdueUniversity, West Lafayette, Indiana. Corresponding author: John H.Lumkes, Department of Agricultural and Biological Engineering, 225 S.University St., Purdue University, West Lafayette, IN 47907; phone:574‐595‐0060; fax: 765‐496‐1115; e‐mail: [email protected].
(Energy, 2007). Of particular note, the minimum requirementfor biomass‐based diesel, namely biodiesel, is set for0.5 billion gal (1.9 billion L) in 2009 and increases to 1billion gal (3.8 billion L) in 2012.
Diesel engine original equipment manufacturers (OEMs)are beginning to understand that more and more of theircustomers are going to run blends of biodiesel, from 1% to100%, in their diesel engines. As of January 2008, themajority of diesel engine OEMs have announced theapproval of various levels of biodiesel. Nineteen currentengine manufacturers have approved biodiesel blendsranging from B5 to B100 for various engine applications(NBB, 2008). There are five foreign automotive companiesproducing diesel engines for passenger car or light dutyapplications that have plans to release their vehicles into theU.S. market in the near future, but have not yet announced arelease for biodiesel. The fuel injection equipment (FIE)manufacturers released a common position statementindicating release of their injection equipment for admixturesup to a maximum of 5% fatty acid methyl ester, meeting theEN14214 standard, with unadulterated diesel fuel, meetingthe EN590 standard. The final product, B5, must also complywith EN590 (FIE Manufacturers, 2004). One major concernabout the use of biodiesel is in regard the quality of the fuel.
BQ9000 is a cooperative and voluntary national biodieselaccreditation program for both producers and marketers ofbiodiesel that was established to help assure that biodieselfuel is produced to and maintained at the industry standard,ASTM D6751 for B100 and to promote the commercialsuccess and public acceptance of biodiesel. ASTM hasrecently announced a new specification release, ASTMD7467, for B6‐B20 finished fuel blends which identifies
T
336 APPLIED ENGINEERING IN AGRICULTURE
numerous testing specifications that the biodiesel blend mustmeet in order to be considered an acceptable quality fuel. Thespecification was established through combined efforts andinputs of engine manufacturers, petroleum and biodieselproducers, government representatives, researchers, andacademics. BQ9000 and the ASTM D7467 standard havebeen implemented to help augment the availability of highquality biodiesel blends in the marketplace.
A significant amount of research has been done on thevarious aspects of operating a compression ignition enginewith various blends of biodiesel and certain general trendshave emerged from this research. Torque and horsepowervalues of an engine tend to decrease slightly with anincreasing amount of biodiesel and fuel economy is directlyproportional to the volumetric lower heating value of thefuel, which typically decreases with increasing amounts ofbiodiesel (Graboski and McCormick, 1998). Exhaust gasemissions CO, total hydrocarbon (THC), and particulatematter (PM), tend to decrease with increasing amounts ofbiodiesel while levels of NOx tend to increase slightly (USEPA 2002). Blends of biodiesel in diesel fuel, even as littleas 2%, can significantly increase the lubricity of the fuel(Schumacher 2005a). Biodiesel tends to be incompatiblewith older seal materials, especially nitrile, causing them toswell and/or fail, but the fluorinated elastomers that mostengine manufacturers have been using in their engines for thelast decade are able to tolerate this fuel (Graboski andMcCormick, 1998).
A variety of extended use biodiesel fleet studies have beenreported since the 1990s. Malcosky and Wald (1997) studied10 Navistar‐International dump truck/snow plows for9 months; five operating on B20 and another five on #2 dieselfuel as a baseline. This study focused on collecting andanalyzing detailed operational and reliability data. The B20fleet accumulated over 97,000 km (60,000 miles) andconsumed 33,300 L (8,800 gal) of fuel at the time of thereport. This study indicated that proper fuel blendingtechniques were important for obtaining homogenous 20%blends of biodiesel. Operation of the B20 fleet wasaccomplished without encountering any major problems andno significant differences in engine power or visible smokewere observed between the two fleets.
Peterson et al. (1999) reported a 161,000‐km(100,000‐mile) operation of an on‐the‐road pickup truck witha 5.9‐L Cummins engine operating with a 20% rapeseedmethyl ester (RME) blend. The truck used a significantnumber of fuel filters to continuously solve a power lossproblem due to filter plugging over the duration of the study.Engine oil analysis and teardown analysis indicated noabnormal wear or performance and no unusual deteriorationof the engine components.
Four road maintenance trucks with Cummins M11 dieselengines operated on B20 for 17 months in Minnesota (Bickeland Strebig, 2000). Two identical trucks operated on 100%diesel fuel for a baseline comparison. Nearly 95,000 L(25,000 gal) of B20 were consumed over the course of thestudy and the B20 trucks had the same fuel consumption rateas the baseline trucks. Special care was taken to make certainall fuel was mixed with cold flow improvers, #1 diesel fueland additives, to ensure continuous cold weather operation.No unusual engine wear or fuel dilution was detected from oilsamples that were collected every 8,000 km (5,000 miles).
Chase et al. (2000) demonstrated the use of a 50% blendof hydrogenated soy ethyl ester (HySEE) with 50% #2 dieselfuel for over 322,000 km (200,000 miles) in a heavy dutyClass 8 truck with a Caterpillar 3406E engine. Over144,000 L (38,000 gal) of B50 were consumed during thestudy. No accelerated engine degradation was detected fromthe engine oil analysis and extensive inspection of enginecomponents upon completion of the study showed acceptablewear.
Fraer et al. (2005) reported on the operation of four 1993Ford cargo vans and four 1996 Mack tractors, two of eachrunning on B20 and two on #2 diesel, belonging to the UnitedStates Postal Service (USPS). After four years of operationand more than 965,000 km (600,000 miles) accumulated withB20 vehicles, the engines and fuel systems were analyzed tocompare wear characteristics. No differences in wear werediscovered during the engine teardown and little differencewas found in operational and maintenance costs between thetwo groups that could be attributed to the fuel type. The Macktractors operating on B20 were, however, found to havesignificant problems with the biodiesel blend, resulting inrepeated fuel filter plugging. These tractors also requiredinjector nozzle replacement which may have been attributedto out‐of‐specification fuel.
Proc et al. (2006) studied nine identical in‐use 40‐ftpassenger transit buses powered by Cummins ISM engines,five of which operated on B20 and the other four on #2 dieselfuel, for a period of two years. There was no differencebetween the average on‐road fuel economy between the twofleets, but lab testing indicated a 2% average reduction in fueleconomy for the B20 vehicles. Laboratory emissions testingindicated reductions in all measured pollutants whichincluded THC, CO, PM, and even NOx. Occasional fuel filterplugging events that occurred for the B20 fueled busses werelikely the result of out‐of‐specification biodiesel. The engineand fuel system maintenance costs were found to be nearlyidentical for the two groups. Engine oil analysis indicated noadditional wear metals and significantly lower soot levelsfrom the B20 fueled busses.
While a number of biodiesel fleet studies have beenpublished over the past few years, there have been very fewquantitative studies of in‐use Class 8 over‐the‐road truckscomparing B20 and #2 ultra low sulfur diesel (#2ULSD).This study evaluates the performance of #2ULSD and B20 inrelatively new model year, electronically injected enginesand compares the differences in the two fleets in terms of fueleconomy, fuel properties and fuel quality, engine oil analysis,and general service and operation for a fleet of Class 8over‐the‐road trucks.
Results from a similar study performed with 10 Class 8trucks with C‐13 Caterpillar engines operating on B20 andanother matching 10 units operating on #2ULSD have shownslightly lower, but not statistically significant, fuel economywith the B20 fleet (Heck, 2007). A noticeable differencebetween the two groups was the significant number ofadditional fuel filters that needed replaced in the B20 groupdue to premature filter plugging. The blending procedure forthe biodiesel was changed and the number of filter pluggingincidents decreased significantly. Research was performedon various blends of B20 with #1 diesel and commercial coldflow additives in an attempt to further reduce the number ofplugged fuel filters.
337Vol. 25(3): 335‐346
FLEET INFORMATIONTwenty Class 8 trucks were evaluated during the calendar
year of 2007 to quantify the differences between #2ULSDand B20. Ten of the trucks operated with #2ULSD and10 unmodified trucks of identical make and model operatedwith B20. The biodiesel used in the B20 fuel was a soy methylester (SME). The trucks that operated with #2ULSD areidentified numerically throughout this report (1, 2, 3, etc.)and the trucks that operated with B20 are identified in thesame numerical fashion, but with the letter B following thetruck number (eg. 1B, 2B, 3B etc.) A detailed description ofeach truck and can be found in table 1.
Trucks returned to the fleet transportation center on a dailybasis to ensure they were being fueled with consistent fuelthroughout the study. All trucks were equipped with Fuller10‐speed FR14210B transmissions and 11R 22.5 tires. Thetrucks that were analyzed in this study were not only identicalby model year, manufacturer, transmission, and tire size, butthey were also paired based upon their similarities withrespect to loading conditions, driving cycle, and tripdistances. This was done to eliminate as many externalvariables as possible so that the focus could remain on thedependant variable at hand; fuel type. Vehicle speed, load,and engine speed data was provided in a histogram formatthrough vehicle data collection units. This data wasdownloaded weekly for all 20 trucks from mid‐August untillate‐December. Since the vehicle speed, load, and enginespeed data were given in a histogram format their averageswere calculated by summing the average value of the binrange multiplied by the percent of vehicle on time for thatparticular week. Averages for vehicle idle time, vehiclespeed, engine load, and engine speed were calculated fromthis data (table 2). This data demonstrates the paired natureof the driving cycles and load conditions for the two fleets.Each truck operated on a freeway driving cycle andaccumulated approximately 4,800 km (3,000 miles) perweek. The #2ULSD fleet accumulated 2,453,607 km(1,524,601 miles) and the B20 fleet accumulated 2,433,713km (1,512,239 miles) over the 2007 calendar year.
FUEL ECONOMYThe fuel economy data was collected using a remote
vehicle tracking and diagnostic management system. Datawas collected from the engine electronic control module(ECM) via this management system and recorded for
Table 2. Average vehicle operating parameters (Aug‐Dec).
Average Parameters #2ULSD Fleet B20 Fleet P‐Value[a]
Number of observations 212 213 N/A
Idle time (%) 17.6% 17.7% 0.9065
Vehicle speed (MPH) 45.1 44.7 0.3275
Engine load (%) 38.5 38.0 0.2175
Engine speed (RPM) 1290 1283 0.3760[a] Based on two‐tailed, unpaired t‐tests.
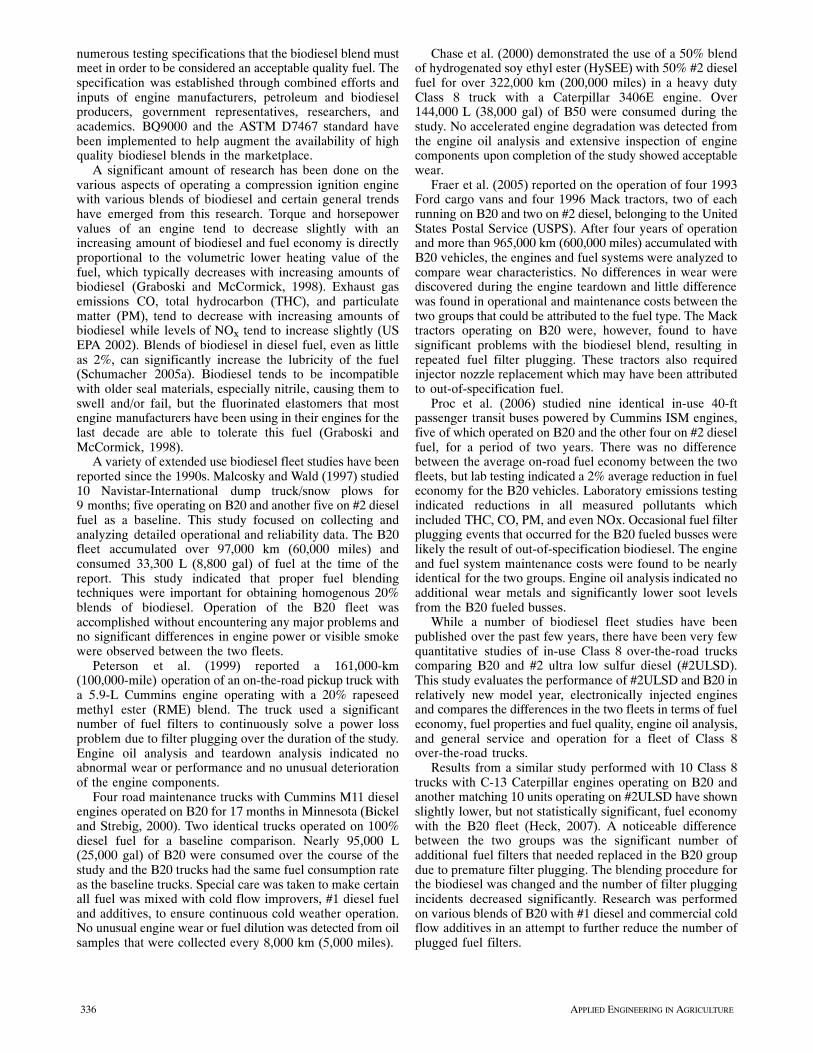
12 months during 2007. Additional data such as percentidle time, vehicle speed, engine speed, and engine load werecollected through the same remote data system, but only forthe second half of the year (August – December). It has beensuggested that the fuel economy data as indicated by theECM may be slightly lower than the actual fuel economyuntil a truck has accumulated approximately 233,000 km(145,000 miles) (Cummins Inc., 2007). However, the trucksthat were monitored that started the study under 233,000 km(145,000 miles) should exhibit only minor errors (<3%) infuel economy and any error should have been almostidentical for each fleet. The trucks all surpassed 233,000 km(145,000 miles) within the first few months of the study. Forverification purposes, the fuel economy of six trucks (4‐B20and 2‐#2ULSD) was measured by recording the volume offuel consumed and distance driven over five consecutive fueltank fill‐ups and then compared with the ECM‐derived fueleconomy for the same period. The average differencebetween the manually determined fuel economy and theECM fuel economy was 1.16% which is less than 0.04 km/L(0.1 mpg). Average fuel economy data for both fleets can befound in figure 1. The average fuel economy for the B20 fleetover the 12‐month period was 2.96 km/L (6.97 mpg) with astandard deviation of 0.20 km/L (0.46 mpg), while theaverage fuel economy for the #2ULSD fleet was 2.94 km/L(6.91 mpg) with a standard deviation of 0.17 km/L(0.41 mpg). The fuel economy data was statisticallyanalyzed by an unpaired, two‐tailed t‐test at a 95%confidence interval (��= 0.05) and the difference in fueleconomy was not found to be statistically significant(P‐value of 0.379). Other fleet analysis studies have shownsimilar fuel economy results (Bickel and Strebig, 2000; Procet al., 2006).
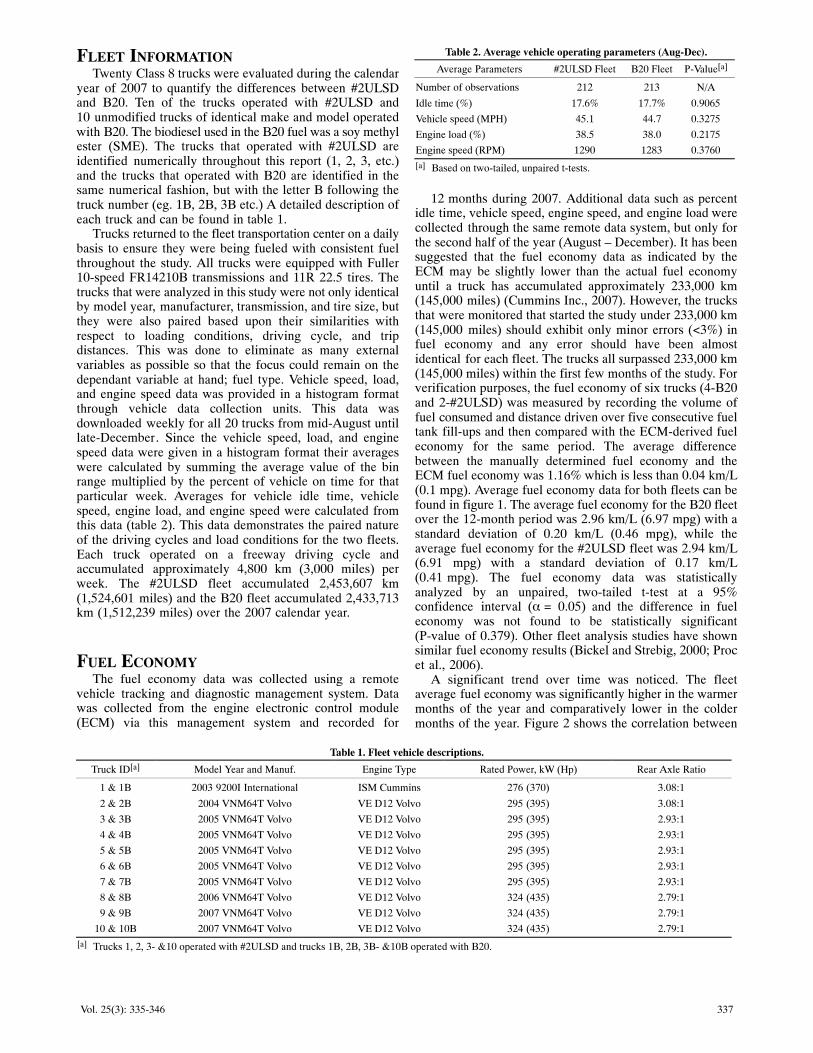
A significant trend over time was noticed. The fleetaverage fuel economy was significantly higher in the warmermonths of the year and comparatively lower in the coldermonths of the year. Figure 2 shows the correlation between
Table 1. Fleet vehicle descriptions.
Truck ID[a] Model Year and Manuf. Engine Type Rated Power, kW (Hp) Rear Axle Ratio
1 & 1B 2003 9200I International ISM Cummins 276 (370) 3.08:1
2 & 2B 2004 VNM64T Volvo VE D12 Volvo 295 (395) 3.08:1
3 & 3B 2005 VNM64T Volvo VE D12 Volvo 295 (395) 2.93:1
4 & 4B 2005 VNM64T Volvo VE D12 Volvo 295 (395) 2.93:1
5 & 5B 2005 VNM64T Volvo VE D12 Volvo 295 (395) 2.93:1
6 & 6B 2005 VNM64T Volvo VE D12 Volvo 295 (395) 2.93:1
7 & 7B 2005 VNM64T Volvo VE D12 Volvo 295 (395) 2.93:1
8 & 8B 2006 VNM64T Volvo VE D12 Volvo 324 (435) 2.79:1
9 & 9B 2007 VNM64T Volvo VE D12 Volvo 324 (435) 2.79:1
10 & 10B 2007 VNM64T Volvo VE D12 Volvo 324 (435) 2.79:1[a] Trucks 1, 2, 3‐ &10 operated with #2ULSD and trucks 1B, 2B, 3B‐ &10B operated with B20.
338 APPLIED ENGINEERING IN AGRICULTURE
monthly fleet fuel economy (all 20 trucks) and ambient airtemperature which was obtained from a weather stationlocated near the fleet transportation center. The monthlyaverage ambient air temperature was determined by takingthe mean of the daily high and low temperatures over theentire month.
For every 5.6°C (10°F) increase in ambient airtemperature, fuel economy for these particular trucksincreased by 0.06 km/L (0.13 mpg), or approximately 2%. A12% increase in total fleet average fuel economy was seenfrom the coldest month to the warmest month of the study.This was most likely due to the reduction in aerodynamicdrag from the lower density ambient air in the warmermonths. Results similar to this have been reported in previousstudies (Wood and Bauer, 2003; Cummins Inc., 2007).
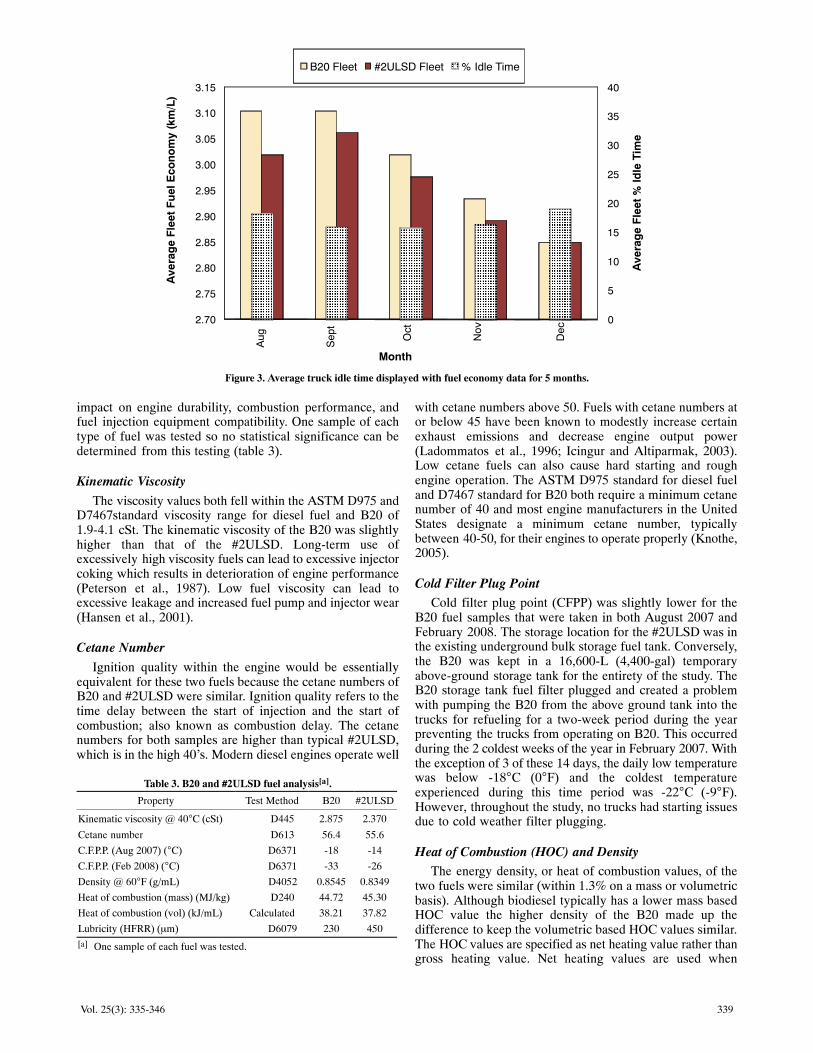
Much of the weather dependency has historically beenattributed to increased engine idle time as roughly 1.9 to
4.5 L (0.5 to 1.2 gal) of fuel are consumed for every hour ofidle time for heavy duty truck engines depending heavily onthe accessories that are being powered during idle and theengine idle speed (Pekula et al., 2003). However, it can beseen in figure 3 that although the average percent idle timefor the entire fleet stayed almost constant from the months ofSeptember to November there was still a significant decreasein fuel economy. While overall fuel economy will decreasewith an increased percentage of idle time, this figuredemonstrates that the majority of the fluctuation in fueleconomy throughout this study was caused by ambient airtemperature rather than engine idle time.
FUEL ANALYSIS
Laboratory analysis was performed on both B20 and#2ULSD fuel samples. Tests were chosen based on theanalytical fuel properties that have the most significant
Figure 1. Average fleet fuel economy for the 2007 calendar year.
Figure 2. Linear relationship between fuel economy and ambient air temperature.
339Vol. 25(3): 335‐346
ÕÕÕÕÕÕÕÕÕÕÕÕÕÕÕÕÕÕÕÕÕÕÕÕÕÕÕÕÕÕÕÕÕÕÕÕÕÕÕÕÕÕÕÕÕÕÕÕÕÕÕÕÕÕÕÕÕÕÕÕÕÕÕÕÕÕÕÕÕÕÕÕÕÕÕÕÕÕÕÕÕÕÕÕÕÕÕÕÕÕÕÕÕÕÕÕÕÕÕÕÕÕÕÕÕÕÕÕÕÕÕÕÕÕÕÕÕÕÕÕÕÕÕÕÕÕÕÕÕÕÕÕÕÕÕÕÕÕÕÕÕÕÕÕÕÕÕÕÕÕÕÕÕÕÕÕÕÕÕÕÕÕÕÕÕÕÕÕÕÕÕÕÕÕÕÕÕÕÕÕÕÕÕÕÕÕÕÕÕÕÕÕÕÕÕÕÕÕÕÕÕÕÕÕÕÕÕÕÕÕÕÕÕÕÕÕÕÕÕÕÕÕÕÕÕÕÕÕÕÕÕÕÕÕÕÕÕÕÕÕÕÕÕÕÕÕÕÕÕÕÕÕÕÕÕÕÕÕÕÕÕÕÕÕÕÕÕÕÕÕÕÕÕÕÕÕÕÕÕÕÕÕÕÕÕÕÕÕÕÕÕÕÕÕÕÕÕÕÕÕÕÕÕÕÕÕÕÕÕÕÕÕÕÕÕÕÕÕÕÕÕÕÕÕÕÕÕÕÕÕÕÕÕÕÕÕÕÕÕÕÕÕÕÕÕÕÕÕÕÕ
ÄÄÄÄÄÄÄÄÄÄÄÄÄÄÄÄÄÄÄÄÄÄÄÄÄÄÄÄÄÄÄÄÄÄÄÄÄÄÄÄÄÄÄÄÄÄÄÄÄÄÄÄÄÄÄÄÄÄÄÄÄÄÄÄÄÄÄÄÄÄÄÄÄÄÄÄÄÄÄÄÄÄÄÄÄÄÄÄÄÄÄÄÄÄÄÄ
ÄÄÄÄÄÄÄÄÄÄÄÄ
ÄÄÄÄÄÄÄÄÄÄ
ÄÄÄÄÄÄÄÄÄÄ
ÄÄÄÄÄÄÄÄÄÄ
ÄÄÄÄÄÄÄÄÄÄÄÄ 0
5
10
15
20
25
30
35
40
2.70
2.75
2.80
2.85
2.90
2.95
3.00
3.05
3.10
3.15
Aug
Sep
t
Oct
Nov
Dec
Ave
rag
e F
leet
% Id
le T
ime
Ave
rag
e F
leet
Fu
el E
con
om
y (k
m/L
)
Month
B20 Fleet #2ULSD FleetÄ
% Idle Time
Figure 3. Average truck idle time displayed with fuel economy data for 5 months.
impact on engine durability, combustion performance, andfuel injection equipment compatibility. One sample of eachtype of fuel was tested so no statistical significance can bedetermined from this testing (table 3).
Kinematic Viscosity
The viscosity values both fell within the ASTM D975 andD7467standard viscosity range for diesel fuel and B20 of1.9‐4.1 cSt. The kinematic viscosity of the B20 was slightlyhigher than that of the #2ULSD. Long‐term use ofexcessively high viscosity fuels can lead to excessive injectorcoking which results in deterioration of engine performance(Peterson et al., 1987). Low fuel viscosity can lead toexcessive leakage and increased fuel pump and injector wear(Hansen et al., 2001).
Cetane Number
Ignition quality within the engine would be essentiallyequivalent for these two fuels because the cetane numbers ofB20 and #2ULSD were similar. Ignition quality refers to thetime delay between the start of injection and the start ofcombustion; also known as combustion delay. The cetanenumbers for both samples are higher than typical #2ULSD,which is in the high 40's. Modern diesel engines operate well
Table 3. B20 and #2ULSD fuel analysis[a].
Property Test Method B20 #2ULSD
Kinematic viscosity @ 40°C (cSt) D445 2.875 2.370
Cetane number D613 56.4 55.6
C.F.P.P. (Aug 2007) (°C) D6371 ‐18 ‐14
C.F.P.P. (Feb 2008) (°C) D6371 ‐33 ‐26
Density @ 60°F (g/mL) D4052 0.8545 0.8349
Heat of combustion (mass) (MJ/kg) D240 44.72 45.30
Heat of combustion (vol) (kJ/mL) Calculated 38.21 37.82
Lubricity (HFRR) (μm) D6079 230 450[a] One sample of each fuel was tested.
with cetane numbers above 50. Fuels with cetane numbers ator below 45 have been known to modestly increase certainexhaust emissions and decrease engine output power(Ladommatos et al., 1996; Icingur and Altiparmak, 2003).Low cetane fuels can also cause hard starting and roughengine operation. The ASTM D975 standard for diesel fueland D7467 standard for B20 both require a minimum cetanenumber of 40 and most engine manufacturers in the UnitedStates designate a minimum cetane number, typicallybetween 40‐50, for their engines to operate properly (Knothe,2005).
Cold Filter Plug Point
Cold filter plug point (CFPP) was slightly lower for theB20 fuel samples that were taken in both August 2007 andFebruary 2008. The storage location for the #2ULSD was inthe existing underground bulk storage fuel tank. Conversely,the B20 was kept in a 16,600‐L (4,400‐gal) temporaryabove‐ground storage tank for the entirety of the study. TheB20 storage tank fuel filter plugged and created a problemwith pumping the B20 from the above ground tank into thetrucks for refueling for a two‐week period during the yearpreventing the trucks from operating on B20. This occurredduring the 2 coldest weeks of the year in February 2007. Withthe exception of 3 of these 14 days, the daily low temperaturewas below ‐18°C (0°F) and the coldest temperatureexperienced during this time period was ‐22°C (‐9°F).However, throughout the study, no trucks had starting issuesdue to cold weather filter plugging.
Heat of Combustion (HOC) and Density
The energy density, or heat of combustion values, of thetwo fuels were similar (within 1.3% on a mass or volumetricbasis). Although biodiesel typically has a lower mass basedHOC value the higher density of the B20 made up thedifference to keep the volumetric based HOC values similar.The HOC values are specified as net heating value rather thangross heating value. Net heating values are used when
340 APPLIED ENGINEERING IN AGRICULTURE
discussing internal combustion (IC) engines because netassumes that the latent heat of vaporization of water is notrecovered, which is representative of what happens in an ICengine.
Lubricity
Lubricity testing was performed per ASTM D6079 via ahigh frequency reciprocating rig (HFRR) test. The wear scardiameter (WSD) for the B20 was almost half of that for the#2ULSD fuel. The long hydrocarbons and polarity ofbiodiesel make it a good candidate for improving thelubrication properties of #2ULSD. The maximum allowablewear scar diameter per ASTM D975 and ASTM D7467 is520 μm, while fuel injection manufacturer, Bosch,recommends the use of a fuel with a WSD ≤ 460 μm (RobertBosch GmbH, 2004). While no short‐term effects werewitnessed, long‐term benefits on the fuel injection equipmentmay be observed with the increased lubricity of B20.
Fuel Quality
Another set of fuel tests were performed on a B20 sampleto determine the quality of the fuel and to see how itcompared to some of the recently proposed ASTM B6‐B20specifications. Supplementary quality tests that are notspecified in the D7467 standard were performed on thissample as well. This fuel sample was sent to the NationalRenewable Energy Laboratory (NREL) and the results fromthis testing can be found in table 4.
The B20 fuel sample that was submitted to NREL met thespecifications that were tested as set forth by the ASTMD7467 limits for B6‐B20. The biodiesel concentration for theB20 sample was 18.3%. It was expected that the B20 used inthis study would consistently be near a 20% biodiesel blendbecause the fuel supplier used rack‐injection blendingtechniques rather than the splash blending method, whichtends to produce less consistent biodiesel blends(McCormick et al., 2005). It is also important to note that allof the biodiesel used to blend the B20 came from a BQ9000certified supplier.
ENGINE OIL ANALYSISEngine lubricating oil is an important component to both
the immediate operability of an internal combustion engineas well as the lasting durability and longevity of the engine.Engine lube oil not only protects vital components fromwearing, but also reduces friction and keeps internal engineparts within their operational temperature limits. Unburntfuel and combustion by‐products can seep past the piston
Table 4. B20 fuel quality results.
Property Test Method ValueD7467Limit[a]
Cloud point (°C) D2500 ‐18.2 Report[b]
Ash (mass %) D482 <0.001 0.01 max
Sulfur (ppm) D5453 7.9 15 max
Particulate contamination (ppm) D6217 0.6 --
Karl Fisher water (ppm) D6304 109 --
Acid value (mg KOH/g) D664 0.09 0.3 max
Ca (ppb) D7111 106 --
K (ppb) <500 --
Mg (ppb) <100 --
Na (ppb) <500 --
Flash point (°C) 60.6 52 min
Oxidation stability (h) EN14112 6.1 6 min
Interfacial tension (mN/m) D971 10.64 --
Derived cetane number D6890 52.3 --
Biodiesel concentration (%) D7371 18.3 6 to 20[a] Denotes an additional quality test, but no limit specified in ASTM
D7467.[b] Cloud point to be reported by fuel manufacturer.
compression and oil rings and into the crankcase resulting indegradation of the engine oil. Oil samples were studied inorder to determine the effects of the two fuel types on oilprotection and degradation levels (table 5). Engine oilanalysis was performed at each oil change interval, whichoccurred at 48,300 km (30,000 miles). The analysis includedpercent fuel dilution, percent soot content, wear metaldetection, additive and contaminant metal detection, oilviscosity, acid and base numbers, and oxidation and nitrationvalues. A total of 54 used oil samples were collected andmeasured for the B20 fleet and the same was done for 57 usedoil samples from the #2ULSD fleet. Chevron Delo 400Multigrade SAE 15W‐40 engine oil was used in both fleets.
PHYSICAL AND CHEMICAL ANALYSISNo statistical significance was found with the fuel
dilution, soot content, and nitration values for the two fleets.This indicates that the fuel type did not have an impact onthese particular properties. However, recent studies haveshown that the typical detection methods for percent fueldilution for diesel fuel may not work as well with biodieselblended fuels (Fang et al., 2006; Andreae et al., 2007).Therefore, the fuel dilution testing may not be as accurate asanticipated.
There were significant differences in the oil samples forviscosity, acid and base numbers, and oxidation values. Thekinematic viscosity value for new Delo 400 is around 15.1 cSt
Table 5. Physical and chemical properties of engine oil samples.
% Fuel DilutionASTM E2412[a]
% Soot ContentASTM E2412[a]
Viscosity (cSt)ASTM D445
Acid #ASTM D4739
Base #ASTM D4739
OxidationASTM E2412[a]
NitrationASTM E2412[a]
Fuel type #2ULSD B20 #2ULSD B20 #2ULSD B20 #2ULSD B20 #2ULSD B20 #2ULSD B20 #2ULSD B20
Avg. value 0.62 0.54 0.48 0.43 13.8 13.1 3.40 3.79 6.43 6.00 11.0 15.0 16.8 17.5
Std. dev. 0.34 0.21 0.30 0.28 0.64 0.53 0.91 1.08 0.95 1.12 3.21 4.37 4.61 4.52
P‐value[b] 0.1601 0.3579 < 0.0001 0.0441 0.0314 < 0.0001 0.4243
Stat. diff.?[c] No No Yes Yes Yes Yes No[a] ASTM E2412 ‐ Standard practice for condition monitoring of used lubricants by trend analysis using fourier transform infrared (FT‐IR) spectrometry.[b] Based on two‐tailed, unpaired t‐tests; 54 samples from B20 fleet and 57 samples from #2ULSD fleet.[c] Statistical difference at a 95% confidence interval (α = 0.05).
341Vol. 25(3): 335‐346
at 100°C. The average viscosity of the B20 fleet oil sampleswas lower than that of the #2ULSD by 0.7 cSt. The #2ULSDfleet average indicated an 8.6% viscosity reduction from theoriginal value while the B20 average showed a 13.2%reduction. The three most common causes for a decrease inengine oil viscosity are fuel dilution, breakdown of viscosityindex (VI) improver additive, and overheating (Mayer,2006b). Fuel dilution and VI additive breakdown are the twomost likely explanations for the decrease in oil viscosity forthis study. However, these lower viscosity levels were stillwithin the acceptable range for engine oil viscosity. For thisparticular engine oil, a viscosity under 11 cSt is consideredabnormal and engine wear may be expedited once this pointhas been reached. Gateau (2006) reported viscosity valuesthat were lower by a similar quantity for a 12‐year evaluationof heavy duty trucks operating on 50% rapeseed oil methylester (RME). Oil change intervals were 30,000 km(18,641 mi) for Gateau's study.
Acid and base numbers of the oil samples were affected byfuel type. The B20 fleet oil samples, on average, had higheracid numbers (AN) and lower base numbers (BN) than the#2ULSD fleet oil samples. The base number is a directmeasurement of the alkaline reserve of the oil. When the acidnumber of the oil sample is higher than the base number theoil is no longer capable of neutralizing acids. Modern dieselengine oils typically have a starting BN between 8 and 13.The starting BN for Delo 400 Multigrade SAE 15W‐40 is12.2. It is recommended that diesel engine oil be changedwhen the BN is half of the new oil (Mayer, 2006a; PolarisLaboratories, 2008b). This general guideline would indicatethat the oil is to be changed when the base number reaches 6.1or below; the average for the B20 samples was 6.0.
Oxidation measures the breakdown of the engine oil dueto age and operating conditions. Oxidation values of the oilsamples were significantly larger for the B20 fleet (15 vs. 11);however, only engine oil oxidation values of 25 or higherindicate abnormal oxidation. The oxygen content inbiodiesel could possibly have an impact on the oxidation ofengine oil due to fuel dilution in the B20 oil samples. Engineoil analysis in Bickel and Strebig (2000) also found that therewere several instances when trucks operating on B20 had“slightly high” values for fuel oxidation, while none wereobserved in their baseline trucks which operated on #2 dieselfuel.
Zinc dialkyldithiophosphate (ZDDP) is the source of zincand phosphorus in engine oil. ZDDP is a polar additive thatis responsible for bonding to the metallic surfaces in anengine to form a protective layer against wear. It has beenclaimed that the polar nature of biodiesel may attractavailable ZDDP molecules leaving less available to bond to
the metallic wear surfaces in the engine (PolarisLaboratories, 2008a). The initial values for zinc andphosphorus content in fresh Chevron Delo 400 oil are 1480and 1360 ppm, respectively. Additive metal data can befound in table 7. The fuel type effects found with zinc andphosphorus could be due to biodiesel's tendency to bond toZDDP. However, the difference in zinc and phosphorus forthese two fleets was minimal and could have possibly beencaused by the imprecision of the detection equipment orminor variations in the oil manufacturing process. Still, newdiesel engines using post‐injection regeneration strategiesfor diesel particulate filters (DPF) could see higher fueldilution rates and this could potentially have adverseconsequences on the effectiveness of ZDDP when usingbiodiesel blends (Fang et al., 2007).
Contaminant metals, silicon, sodium, and potassium werealso monitored and no statistical significance was foundbetween the two fleets for any of these metals. The high levelsof sodium and potassium, as indicated by the large standarddeviations, came from one particular make and model year.
ELEMENTAL ANALYSISElemental analysis was performed in accordance to the
ASTM D5185 standard for determination of additiveelements, wear metals, and contaminants in used lubricatingoils by inductively‐coupled plasma atomic emissionspectrometry (ICP‐AES). Wear metal data can be found intable 6, contaminant metal data in table 7, and typical metalsource data in table 8. Of the five metals analyzed, lead wasthe only one significantly affected by fuel type (p < 0.001).There were two trucks in the B20 fleet, 1B and 2B, thataccounted for the majority of the lead wear. These trucks hadaccumulated over 804,000 km (500,000 miles) at the time ofsampling and it is likely that the lead contamination camefrom a rod or main bearing starting to wear. It is difficult tosay whether or not the fuel type had an impact on this wearor if it was just normal bearing wear. As stated earlier, it isimportant that the base number of the oil remain higher thanthe acid number because acidic substances are especiallyharmful to soft metals such as lead. In samples where the acidnumber was greater than the base number (four samples forthe #2ULSD fleet and five samples for the B20 fleet), theaverage lead contamination was 22 ppm. Schumacher et al.(2005b) and Agarwal et al. (2003) both describe studies inwhich many of the engine oil wear metals for vehiclesoperating on biodiesel blends were found to be significantlyless than those for vehicles operating on diesel fuel. Thisparticular make and model had critical levels of sodium andpotassium in both the #2ULSD and B20 fleets. The largest
Table 6. Wear metal analysis of engine oil samples.
Wear Metals (ppm)[a]
Iron Lead Copper Aluminum Chromium
Fuel type #2ULSD B20 #2ULSD B20 #2ULSD B20 #2ULSD B20 #2ULSD B20
Avg. value 22.8 22.1 1.3 7.8 3.4 3.7 6.4 6.3 0.14 0.06
Std. dev. 10.7 8.6 2.3 13.8 3.9 2.8 2.9 2.9 0.35 0.23
P‐Value[b] 0.7152 0.0006 0.6436 0.8748 0.1557
Stat. Diff.?[c] No Yes No No No[a] ASTM D5185 ‐ Determination of wear metals by inductively‐coupled plasma atomic emission spectrometry (ICP‐AES).[b] Based on two‐tailed, unpaired t‐tests; 54 samples from B20 fleet and 57 samples from #2ULSD fleet.[c] Statistical difference at a 95% confidence interval (α = 0.05).
342 APPLIED ENGINEERING IN AGRICULTURE
Table 7. Additive and contaminant metal analysis of engine oil samples.
Additive Metals (ppm)[a] Contaminant Metals (ppm)[a]
Zinc Phosphorus Silicon Sodium Potassium
Fuel type #2ULSD B20 #2ULSD B20 #2ULSD B20 #2ULSD B20 #2ULSD B20
Avg. value 1494 1436 1304 1259 6.5 5.1 38.5 12.1 26.6 11.4
Std. dev. 126 108 108 93 7.0 1.6 105.5 17.4 55.8 19.9
P‐value[b] 0.0111 0.0224 0.1557 0.0726 0.0623
Stat. diff.?[c] Yes Yes No No No
contaminant source of sodium and potassium was most likelyengine coolant. Engine coolant contamination issues areindependent of fuel type and are typically related to damagedhead gaskets, cylinder heads, liner seals, injector cups, orlube coolers.
A summary table of typical wear metal and contaminantmetal sources from heavy duty diesel engines can be foundin table 8.
SERVICE, OPERATION, AND MAINTENANCEAs stated previously, this particular fleet used a 16,600‐L
(4,400‐gal) aboveground tank for B20 storage during thetesting period. The #2ULSD was stored in the pre‐existingbelowground fuel tank. For two weeks during the month ofFebruary the B20 would not flow from the above groundstorage tank into the truck fuel tanks due to supply filterplugging. The substance plugging the filter was a viscous,off‐white, hazy compound similar to that described in Heck(2007). On these particular mornings, however, the trucksthat already had the B20 in their tanks did not have problemsstarting. Once the ambient temperature warmed slightly thetank supply filter was replaced and the B20 fleet resumedbeing fueled with B20. Bickel and Strebig (2000)encountered no problems transferring B20 from anunderground tank to service vehicles for two winters inMinnesota. This may indicate that the storage method playeda significant role in the everyday operability of trucks usingthe B20 fuel.
Fuel filter usage was monitored throughout the study todetermine the impact of the fuels on filter service life. Inorder to properly study filter usage it was necessary to lookat the previous year's filter service records for comparison.The two fleets were operating solely on #2 low‐sulfur diesel(#2LSD ‐ 500 ppm sulfur) until September 2006. At this pointthe B20 fleet started operating on biodiesel blended with#2ULSD to compose B20 and the #2ULSD fleet startedoperating on #2ULSD (15 ppm sulfur). During the first threequarters of 2006 the filter usage for each fleet was relatively
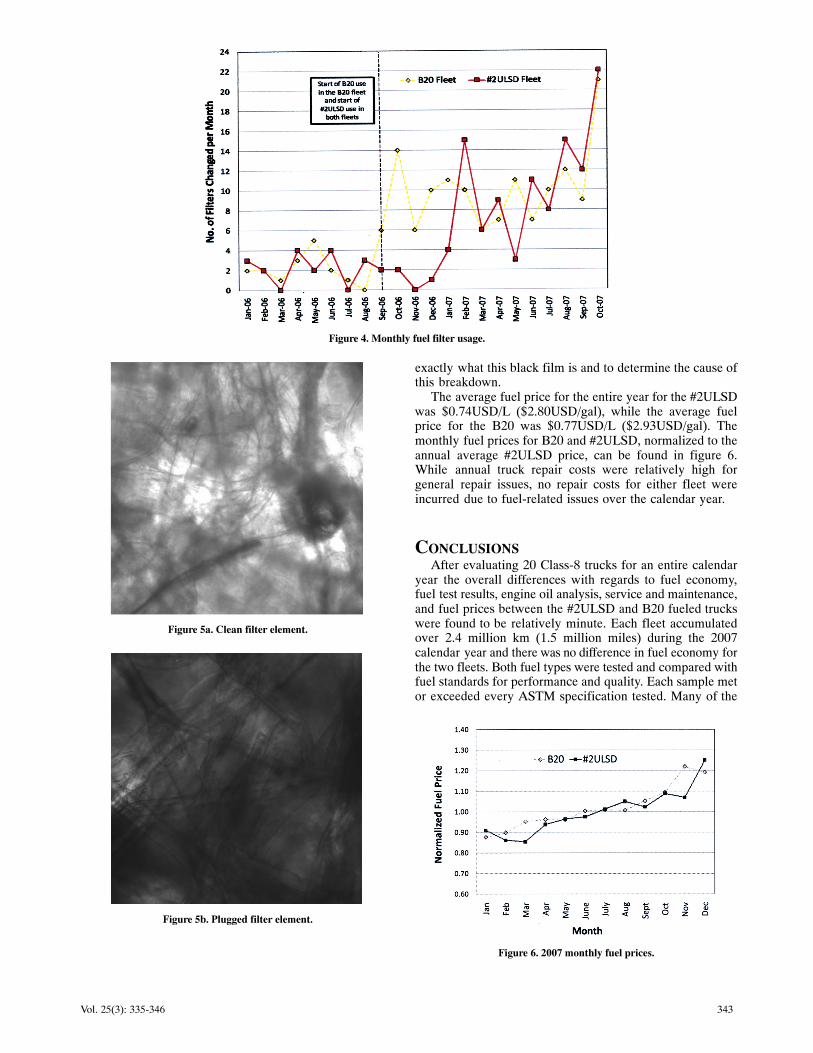
constant. The B20 fleet used only 2.75 filters per month onaverage for all 10 trucks and the #2ULSD fleet used 2.5 filtersper month on average. This equates to approximately72,000 km (45,000 miles) for fuel filter service life. A majorincrease in filter usage was found in the month of October2006. The spike in filter usage in October 2006 for the B20fleet was most likely caused by the solvent nature of B20cleaning out the residue in the truck fuel tanks. If this was theonly fuel change made it would be expected that the filterusage would decrease back to normal after the first couple offilter replacements. However, the filter usage remainedunusually high and, not long after, a major increase in filterusage was found with the #2ULSD fleet starting in January2007. Fuel filter usage increased to over 10 filters per monthon average during 2007. This equates to approximately18,000 km (11,000 miles) for fuel filter service life, or a 75%reduction from early 2006 filter life. A history of fuel filterusage for both fleets can be found in figure 4.
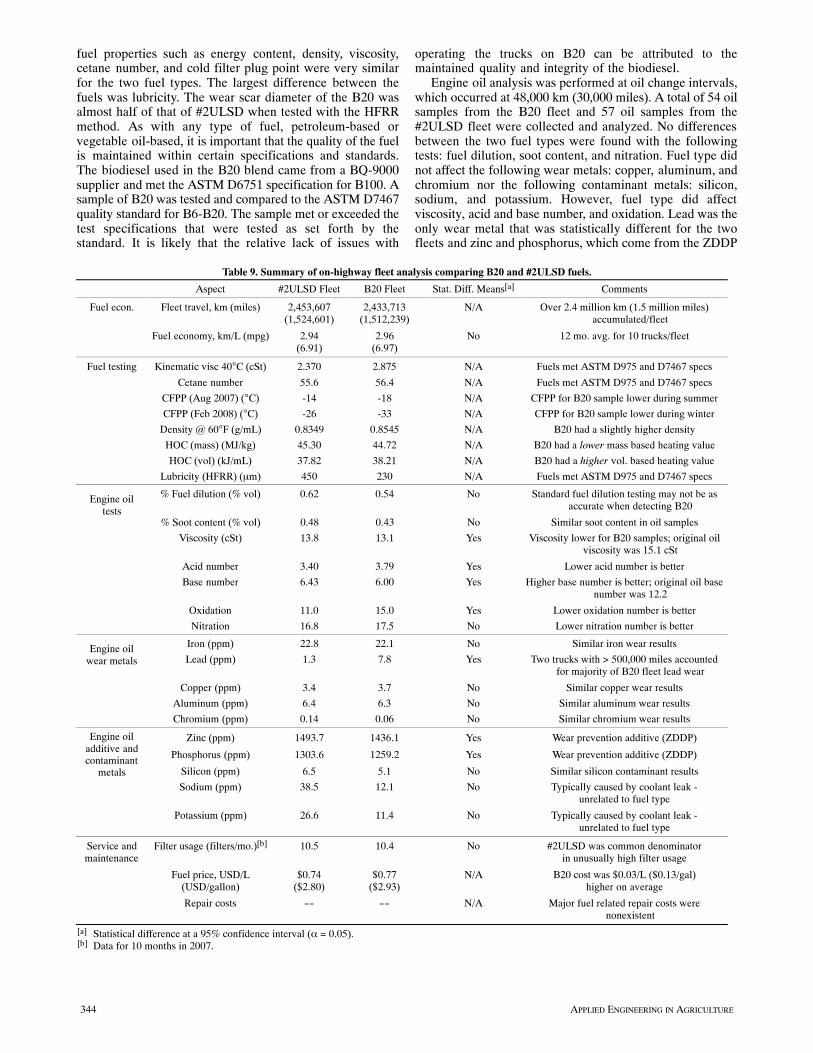
The substance that caused the engine filter plugging wasidentical for both fleets, yet much different from thesubstance that caused the supply filter plugging on the B20storage tank in February. A thin, black film coated the enginefilter elements increasingly with mileage. Microscopicpictures of a clean filter element section and a dirty filterelement section can be seen in figures 5a and 5b. The picturesshown are from a Fleetgaurd #FF5369 filter with a 20‐micronrating at a 300X magnification level. Elemental analysis wasperformed on this black substance and was found to contain83.24% carbon, 13.41% hydrogen, and 0.40% nitrogen. Thecommon denominator for both fleets was the introduction of#2ULSD and, therefore, is likely the cause of the excessivefuel filter plugging issue. It is possible that a component ofthe #2ULSD is breaking down and falling out of solution,particularly when the fuel is introduced to the hightemperatures and pressures, around 1,800 bar (26,000 psi), ofthe common rail injection systems and then recirculated backto tank. Excess fuel is recirculated back to tank to help withlubrication and cooling of the high pressure pump andinjectors. Further investigation is needed to understand
Table 8. Typical sources of wear and contaminant metals.
Metal Typical Sources
Wear metals[a] Iron Cylinder liner, iron pistons, gears, oil pump
Lead Rod and main bearings, bushings
Copper Rod and main bearings, bushings, lube oil coolers
Aluminum Engine piston, rod and main bearings
Chromium Piston rings, cylinder liners, exhaust valves
Contaminant metals[a] Silicon Dirt, grease, seals and gasket material, and lube oil additive
Sodium Engine coolant leak, salt water contamination
Potassium Engine coolant leak, lube oil additive, new coating on bearings[a] Wear and contaminant metal source information obtained from Mayer 2006b and Polaris Laboratories ‐ Wear Metal Guide.
343Vol. 25(3): 335‐346
Figure 4. Monthly fuel filter usage.
Figure 5a. Clean filter element.
Figure 5b. Plugged filter element.
exactly what this black film is and to determine the cause ofthis breakdown.
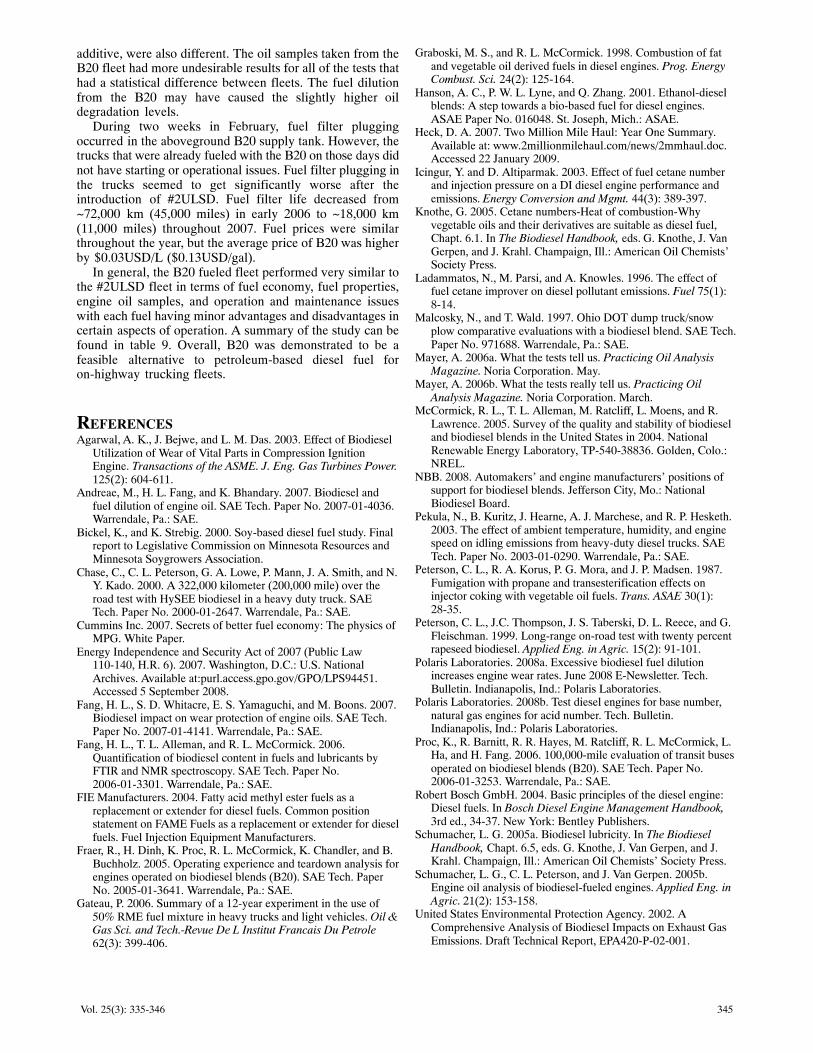
The average fuel price for the entire year for the #2ULSDwas $0.74USD/L ($2.80USD/gal), while the average fuelprice for the B20 was $0.77USD/L ($2.93USD/gal). Themonthly fuel prices for B20 and #2ULSD, normalized to theannual average #2ULSD price, can be found in figure 6.While annual truck repair costs were relatively high forgeneral repair issues, no repair costs for either fleet wereincurred due to fuel‐related issues over the calendar year.
CONCLUSIONSAfter evaluating 20 Class‐8 trucks for an entire calendar
year the overall differences with regards to fuel economy,fuel test results, engine oil analysis, service and maintenance,and fuel prices between the #2ULSD and B20 fueled truckswere found to be relatively minute. Each fleet accumulatedover 2.4 million km (1.5 million miles) during the 2007calendar year and there was no difference in fuel economy forthe two fleets. Both fuel types were tested and compared withfuel standards for performance and quality. Each sample metor exceeded every ASTM specification tested. Many of the
Figure 6. 2007 monthly fuel prices.
344 APPLIED ENGINEERING IN AGRICULTURE
fuel properties such as energy content, density, viscosity,cetane number, and cold filter plug point were very similarfor the two fuel types. The largest difference between thefuels was lubricity. The wear scar diameter of the B20 wasalmost half of that of #2ULSD when tested with the HFRRmethod. As with any type of fuel, petroleum‐based orvegetable oil‐based, it is important that the quality of the fuelis maintained within certain specifications and standards.The biodiesel used in the B20 blend came from a BQ‐9000supplier and met the ASTM D6751 specification for B100. Asample of B20 was tested and compared to the ASTM D7467quality standard for B6‐B20. The sample met or exceeded thetest specifications that were tested as set forth by thestandard. It is likely that the relative lack of issues with
operating the trucks on B20 can be attributed to themaintained quality and integrity of the biodiesel.
Engine oil analysis was performed at oil change intervals,which occurred at 48,000 km (30,000 miles). A total of 54 oilsamples from the B20 fleet and 57 oil samples from the#2ULSD fleet were collected and analyzed. No differencesbetween the two fuel types were found with the followingtests: fuel dilution, soot content, and nitration. Fuel type didnot affect the following wear metals: copper, aluminum, andchromium nor the following contaminant metals: silicon,sodium, and potassium. However, fuel type did affectviscosity, acid and base number, and oxidation. Lead was theonly wear metal that was statistically different for the twofleets and zinc and phosphorus, which come from the ZDDP
Table 9. Summary of on‐highway fleet analysis comparing B20 and #2ULSD fuels.
Aspect #2ULSD Fleet B20 Fleet Stat. Diff. Means[a] Comments
Fuel econ. Fleet travel, km (miles) 2,453,607(1,524,601)
2,433,713(1,512,239)
N/A Over 2.4 million km (1.5 million miles)accumulated/fleet
Fuel economy, km/L (mpg) 2.94(6.91)
2.96(6.97)
No 12 mo. avg. for 10 trucks/fleet
Fuel testing Kinematic visc 40°C (cSt) 2.370 2.875 N/A Fuels met ASTM D975 and D7467 specs
Cetane number 55.6 56.4 N/A Fuels met ASTM D975 and D7467 specs
CFPP (Aug 2007) (°C) ‐14 ‐18 N/A CFPP for B20 sample lower during summer
CFPP (Feb 2008) (°C) ‐26 ‐33 N/A CFPP for B20 sample lower during winter
Density @ 60°F (g/mL) 0.8349 0.8545 N/A B20 had a slightly higher density
HOC (mass) (MJ/kg) 45.30 44.72 N/A B20 had a lower mass based heating value
HOC (vol) (kJ/mL) 37.82 38.21 N/A B20 had a higher vol. based heating value
Lubricity (HFRR) (μm) 450 230 N/A Fuels met ASTM D975 and D7467 specs
Engine oiltests
% Fuel dilution (% vol) 0.62 0.54 No Standard fuel dilution testing may not be asaccurate when detecting B20
% Soot content (% vol) 0.48 0.43 No Similar soot content in oil samples
Viscosity (cSt) 13.8 13.1 Yes Viscosity lower for B20 samples; original oilviscosity was 15.1 cSt
Acid number 3.40 3.79 Yes Lower acid number is better
Base number 6.43 6.00 Yes Higher base number is better; original oil basenumber was 12.2
Oxidation 11.0 15.0 Yes Lower oxidation number is better
Nitration 16.8 17.5 No Lower nitration number is better
Engine oilwear metals
Iron (ppm) 22.8 22.1 No Similar iron wear results
Lead (ppm) 1.3 7.8 Yes Two trucks with > 500,000 miles accountedfor majority of B20 fleet lead wear
Copper (ppm) 3.4 3.7 No Similar copper wear results
Aluminum (ppm) 6.4 6.3 No Similar aluminum wear results
Chromium (ppm) 0.14 0.06 No Similar chromium wear results
Engine oiladditive andcontaminant
metals
Zinc (ppm) 1493.7 1436.1 Yes Wear prevention additive (ZDDP)
Phosphorus (ppm) 1303.6 1259.2 Yes Wear prevention additive (ZDDP)
Silicon (ppm) 6.5 5.1 No Similar silicon contaminant results
Sodium (ppm) 38.5 12.1 No Typically caused by coolant leak ‐unrelated to fuel type
Potassium (ppm) 26.6 11.4 No Typically caused by coolant leak ‐unrelated to fuel type
Service andmaintenance
Filter usage (filters/mo.)[b] 10.5 10.4 No #2ULSD was common denominatorin unusually high filter usage
Fuel price, USD/L(USD/gallon)
$0.74($2.80)
$0.77($2.93)
N/A B20 cost was $0.03/L ($0.13/gal)higher on average
Repair costs -- -- N/A Major fuel related repair costs werenonexistent
[a] Statistical difference at a 95% confidence interval (α = 0.05).[b] Data for 10 months in 2007.
345Vol. 25(3): 335‐346
additive, were also different. The oil samples taken from theB20 fleet had more undesirable results for all of the tests thathad a statistical difference between fleets. The fuel dilutionfrom the B20 may have caused the slightly higher oildegradation levels.
During two weeks in February, fuel filter pluggingoccurred in the aboveground B20 supply tank. However, thetrucks that were already fueled with the B20 on those days didnot have starting or operational issues. Fuel filter plugging inthe trucks seemed to get significantly worse after theintroduction of #2ULSD. Fuel filter life decreased from~72,000 km (45,000 miles) in early 2006 to ~18,000 km(11,000 miles) throughout 2007. Fuel prices were similarthroughout the year, but the average price of B20 was higherby $0.03USD/L ($0.13USD/gal).
In general, the B20 fueled fleet performed very similar tothe #2ULSD fleet in terms of fuel economy, fuel properties,engine oil samples, and operation and maintenance issueswith each fuel having minor advantages and disadvantages incertain aspects of operation. A summary of the study can befound in table 9. Overall, B20 was demonstrated to be afeasible alternative to petroleum‐based diesel fuel foron‐highway trucking fleets.
REFERENCESAgarwal, A. K., J. Bejwe, and L. M. Das. 2003. Effect of Biodiesel
Utilization of Wear of Vital Parts in Compression IgnitionEngine. Transactions of the ASME. J. Eng. Gas Turbines Power.125(2): 604‐611.
Andreae, M., H. L. Fang, and K. Bhandary. 2007. Biodiesel andfuel dilution of engine oil. SAE Tech. Paper No. 2007‐01‐4036.Warrendale, Pa.: SAE.
Bickel, K., and K. Strebig. 2000. Soy‐based diesel fuel study. Finalreport to Legislative Commission on Minnesota Resources andMinnesota Soygrowers Association.
Chase, C., C. L. Peterson, G. A. Lowe, P. Mann, J. A. Smith, and N.Y. Kado. 2000. A 322,000 kilometer (200,000 mile) over theroad test with HySEE biodiesel in a heavy duty truck. SAETech. Paper No. 2000‐01‐2647. Warrendale, Pa.: SAE.
Cummins Inc. 2007. Secrets of better fuel economy: The physics ofMPG. White Paper.
Energy Independence and Security Act of 2007 (Public Law110‐140, H.R. 6). 2007. Washington, D.C.: U.S. NationalArchives. Available at:purl.access.gpo.gov/GPO/LPS94451.Accessed 5 September 2008.
Fang, H. L., S. D. Whitacre, E. S. Yamaguchi, and M. Boons. 2007.Biodiesel impact on wear protection of engine oils. SAE Tech.Paper No. 2007‐01‐4141. Warrendale, Pa.: SAE.
Fang, H. L., T. L. Alleman, and R. L. McCormick. 2006.Quantification of biodiesel content in fuels and lubricants byFTIR and NMR spectroscopy. SAE Tech. Paper No.2006‐01‐3301. Warrendale, Pa.: SAE.
FIE Manufacturers. 2004. Fatty acid methyl ester fuels as areplacement or extender for diesel fuels. Common positionstatement on FAME Fuels as a replacement or extender for dieselfuels. Fuel Injection Equipment Manufacturers.
Fraer, R., H. Dinh, K. Proc, R. L. McCormick, K. Chandler, and B.Buchholz. 2005. Operating experience and teardown analysis forengines operated on biodiesel blends (B20). SAE Tech. PaperNo. 2005‐01‐3641. Warrendale, Pa.: SAE.
Gateau, P. 2006. Summary of a 12‐year experiment in the use of50% RME fuel mixture in heavy trucks and light vehicles. Oil &Gas Sci. and Tech.‐Revue De L Institut Francais Du Petrole62(3): 399‐406.
Graboski, M. S., and R. L. McCormick. 1998. Combustion of fatand vegetable oil derived fuels in diesel engines. Prog. EnergyCombust. Sci. 24(2): 125‐164.
Hanson, A. C., P. W. L. Lyne, and Q. Zhang. 2001. Ethanol‐dieselblends: A step towards a bio‐based fuel for diesel engines.ASAE Paper No. 016048. St. Joseph, Mich.: ASAE.
Heck, D. A. 2007. Two Million Mile Haul: Year One Summary.Available at: www.2millionmilehaul.com/news/2mmhaul.doc.Accessed 22 January 2009.
Icingur, Y. and D. Altiparmak. 2003. Effect of fuel cetane numberand injection pressure on a DI diesel engine performance andemissions. Energy Conversion and Mgmt. 44(3): 389‐397.
Knothe, G. 2005. Cetane numbers‐Heat of combustion‐Whyvegetable oils and their derivatives are suitable as diesel fuel,Chapt. 6.1. In The Biodiesel Handbook, eds. G. Knothe, J. VanGerpen, and J. Krahl. Champaign, Ill.: American Oil Chemists'Society Press.
Ladammatos, N., M. Parsi, and A. Knowles. 1996. The effect offuel cetane improver on diesel pollutant emissions. Fuel 75(1):8‐14.
Malcosky, N., and T. Wald. 1997. Ohio DOT dump truck/snowplow comparative evaluations with a biodiesel blend. SAE Tech.Paper No. 971688. Warrendale, Pa.: SAE.
Mayer, A. 2006a. What the tests tell us. Practicing Oil AnalysisMagazine. Noria Corporation. May.
Mayer, A. 2006b. What the tests really tell us. Practicing OilAnalysis Magazine. Noria Corporation. March.
McCormick, R. L., T. L. Alleman, M. Ratcliff, L. Moens, and R.Lawrence. 2005. Survey of the quality and stability of biodieseland biodiesel blends in the United States in 2004. NationalRenewable Energy Laboratory, TP‐540‐38836. Golden, Colo.:NREL.
NBB. 2008. Automakers' and engine manufacturers' positions ofsupport for biodiesel blends. Jefferson City, Mo.: NationalBiodiesel Board.
Pekula, N., B. Kuritz, J. Hearne, A. J. Marchese, and R. P. Hesketh.2003. The effect of ambient temperature, humidity, and enginespeed on idling emissions from heavy‐duty diesel trucks. SAETech. Paper No. 2003‐01‐0290. Warrendale, Pa.: SAE.
Peterson, C. L., R. A. Korus, P. G. Mora, and J. P. Madsen. 1987.Fumigation with propane and transesterification effects oninjector coking with vegetable oil fuels. Trans. ASAE 30(1):28‐35.
Peterson, C. L., J.C. Thompson, J. S. Taberski, D. L. Reece, and G.Fleischman. 1999. Long‐range on‐road test with twenty percentrapeseed biodiesel. Applied Eng. in Agric. 15(2): 91‐101.
Polaris Laboratories. 2008a. Excessive biodiesel fuel dilutionincreases engine wear rates. June 2008 E‐Newsletter. Tech.Bulletin. Indianapolis, Ind.: Polaris Laboratories.
Polaris Laboratories. 2008b. Test diesel engines for base number,natural gas engines for acid number. Tech. Bulletin.Indianapolis, Ind.: Polaris Laboratories.
Proc, K., R. Barnitt, R. R. Hayes, M. Ratcliff, R. L. McCormick, L.Ha, and H. Fang. 2006. 100,000‐mile evaluation of transit busesoperated on biodiesel blends (B20). SAE Tech. Paper No.2006‐01‐3253. Warrendale, Pa.: SAE.
Robert Bosch GmbH. 2004. Basic principles of the diesel engine:Diesel fuels. In Bosch Diesel Engine Management Handbook,3rd ed., 34‐37. New York: Bentley Publishers.
Schumacher, L. G. 2005a. Biodiesel lubricity. In The BiodieselHandbook, Chapt. 6.5, eds. G. Knothe, J. Van Gerpen, and J.Krahl. Champaign, Ill.: American Oil Chemists' Society Press.
Schumacher, L. G., C. L. Peterson, and J. Van Gerpen. 2005b.Engine oil analysis of biodiesel‐fueled engines. Applied Eng. inAgric. 21(2): 153‐158.
United States Environmental Protection Agency. 2002. AComprehensive Analysis of Biodiesel Impacts on Exhaust GasEmissions. Draft Technical Report, EPA420‐P‐02‐001.

346 APPLIED ENGINEERING IN AGRICULTURE
Wood, R. M., and S. X. S. Bauer. 2003. Simple and low‐costaerodynamic drag reduction devices for tractor‐trailer trucks.SAE Tech. Paper No. 2003‐01‐3377. Warrendale, Pa.: SAE.
Related Documents