i Assessing Ecosystem Service Benefits from Military Installations Final Project Report SERDP Project Number: RC18-1604 Report prepared by: Oregon State University, Duke University and University of California at Santa Barbara July 26, 2019 Principal Investigator: James Kagan, Institute for Natural Resources, Oregon State University Project Participants and Contributors: Mark Borsuk, Department of Civil and Environmental Engineering, Duke University Ryan Calder, Department of Civil and Environmental Engineering, Duke University Megan Creutzburg, Institute for Natural Resources, Oregon State University Sara Mason, Nicholas Institute for Environmental Policy Solutions, Duke University Lydia Olander, Nicholas Institute for Environmental Policy Solutions, Duke University Andrew Plantinga, Bren School of Environmental Science & Management, University of California Santa Barbara Celine Robinson, Department of Civil and Environmental Engineering, Duke University

Welcome message from author
This document is posted to help you gain knowledge. Please leave a comment to let me know what you think about it! Share it to your friends and learn new things together.
Transcript
i
Assessing Ecosystem Service Benefits from Military Installations
Final Project Report
SERDP Project Number: RC18-1604
Report prepared by:
Oregon State University, Duke University and University of California at Santa Barbara
July 26, 2019
Principal Investigator:
James Kagan, Institute for Natural Resources, Oregon State University
Project Participants and Contributors:
Mark Borsuk, Department of Civil and Environmental Engineering, Duke University
Ryan Calder, Department of Civil and Environmental Engineering, Duke University
Megan Creutzburg, Institute for Natural Resources, Oregon State University
Sara Mason, Nicholas Institute for Environmental Policy Solutions, Duke University
Lydia Olander, Nicholas Institute for Environmental Policy Solutions, Duke University
Andrew Plantinga, Bren School of Environmental Science & Management, University of
California Santa Barbara
Celine Robinson, Department of Civil and Environmental Engineering, Duke University
ii
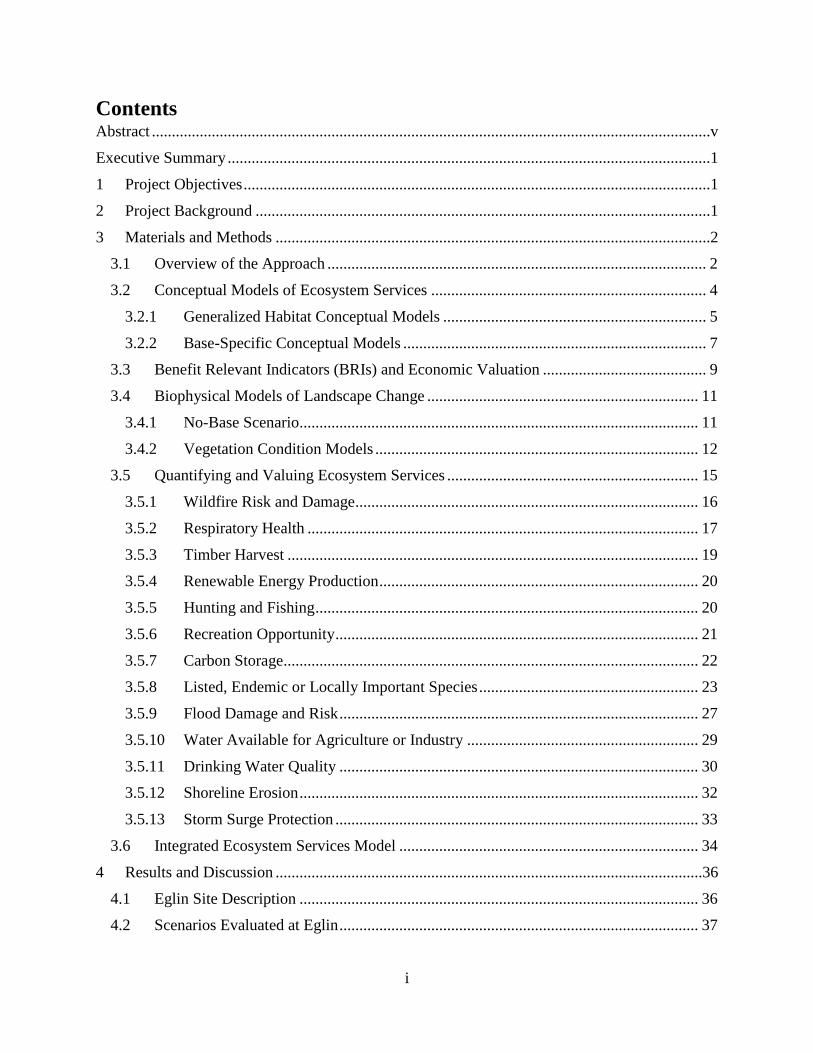
REPORT DOCUMENTATION PAGE Form Approved
OMB No. 0704-0188 Public reporting burden for this collection of information is estimated to average 1 hour per response, including the time for reviewing instructions, searching existing data sources, gathering and maintaining the data
needed, and completing and reviewing this collection of information. Send comments regarding this burden estimate or any other aspect of this collection of information, including suggestions for reducing this
burden to Department of Defense, Washington Headquarters Services, Directorate for Information Operations and Reports (0704-0188), 1215 Jefferson Davis Highway, Suite 1204, Arlington, VA 22202-4302.
Respondents should be aware that notwithstanding any other provision of law, no person shall be subject to any penalty for failing to comply with a collection of information if it does not display a currently valid
OMB control number. PLEASE DO NOT RETURN YOUR FORM TO THE ABOVE ADDRESS.
1. REPORT DATE (DD-MM-YYYY) 26-07-2019
2. REPORT TYPE Final project report
3. DATES COVERED (From - To) July 2018 – July 2019
4. TITLE AND SUBTITLE
5a. CONTRACT NUMBER
Assessing Ecosystem Services from Military Installations
5b. GRANT NUMBER
5c. PROGRAM ELEMENT NUMBER
6. AUTHOR(S)
James Kagan, Mark Borsuk, Ryan Calder, Megan Creutzburg, Sara Mason,
Lydia Olander, Andrew Plantinga, Celine Robinson
5d. PROJECT NUMBER
RC18-1604
5e. TASK NUMBER
5f. WORK UNIT NUMBER
7. PERFORMING ORGANIZATION NAME(S) AND ADDRESS(ES) 8. PERFORMING ORGANIZATION
REPORT NUMBER
Oregon State University
Duke University
UC Santa Barbara
1500 SW Jefferson Way Corvallis,
OR 97331
2138 Campus Drive
Durham, NC 27708
Santa Barbara, CA 93106
9. SPONSORING / MONITORING AGENCY NAME(S) AND ADDRESS(ES) 10. SPONSOR/MONITOR’S ACRONYM(S) Strategic Environmental Research and
Development Program
4800 Mark Center Drive SERDP
11. SPONSOR/MONITOR’S REPORT
NUMBER(S)
12. DISTRIBUTION / AVAILABILITY STATEMENT
Approved for public release; distribution is unlimited
13. SUPPLEMENTARY NOTES 14. ABSTRACT
Military bases provide substantial ecosystem services to local communities and other members of the public. This project
conceptualizes and quantifies ecosystem services provided by U.S. military bases developing an integrated modeling
platform called MoTIVES (Model-based Tracking and Integrated Valuation of Ecosystem Services). MoTIVES manages
probabilistic simulations of biophysical and economic models for relevant ecosystem services provided by alternative base
management scenarios, and then assigns values where valuation is possible. The project demonstrated a proof of concept at
Eglin Air Force Base, showing that current management provides approximately $110 million in ecosystem services per
year, $40 million more than a scenario where no base was present, and $90 million more than a scenario where no base
management was occurring.
15. SUBJECT TERMS
16. SECURITY CLASSIFICATION OF:
17. LIMITATION
OF ABSTRACT
18. NUMBER
OF PAGES
19a. NAME OF RESPONSIBLE
PERSON a. REPORT
b. ABSTRACT
c. THIS PAGE
19b. TELEPHONE NUMBER (include area code)
Standard Form 298 (Rev. 8-98) Prescribed by ANSI Std. Z39.18
i
Contents Abstract ............................................................................................................................................v
Executive Summary .........................................................................................................................1
1 Project Objectives .....................................................................................................................1
2 Project Background ..................................................................................................................1
3 Materials and Methods .............................................................................................................2
3.1 Overview of the Approach ............................................................................................... 2
3.2 Conceptual Models of Ecosystem Services ..................................................................... 4
3.2.1 Generalized Habitat Conceptual Models .................................................................. 5
3.2.2 Base-Specific Conceptual Models ............................................................................ 7
3.3 Benefit Relevant Indicators (BRIs) and Economic Valuation ......................................... 9
3.4 Biophysical Models of Landscape Change .................................................................... 11
3.4.1 No-Base Scenario.................................................................................................... 11
3.4.2 Vegetation Condition Models ................................................................................. 12
3.5 Quantifying and Valuing Ecosystem Services ............................................................... 15
3.5.1 Wildfire Risk and Damage ...................................................................................... 16
3.5.2 Respiratory Health .................................................................................................. 17
3.5.3 Timber Harvest ....................................................................................................... 19
3.5.4 Renewable Energy Production ................................................................................ 20
3.5.5 Hunting and Fishing ................................................................................................ 20
3.5.6 Recreation Opportunity ........................................................................................... 21
3.5.7 Carbon Storage........................................................................................................ 22
3.5.8 Listed, Endemic or Locally Important Species ....................................................... 23
3.5.9 Flood Damage and Risk .......................................................................................... 27
3.5.10 Water Available for Agriculture or Industry .......................................................... 29
3.5.11 Drinking Water Quality .......................................................................................... 30
3.5.12 Shoreline Erosion .................................................................................................... 32
3.5.13 Storm Surge Protection ........................................................................................... 33
3.6 Integrated Ecosystem Services Model ........................................................................... 34
4 Results and Discussion ...........................................................................................................36
4.1 Eglin Site Description .................................................................................................... 36
4.2 Scenarios Evaluated at Eglin .......................................................................................... 37
ii
4.3 Proof of Concept: Eglin Air Force Base Results............................................................ 37
4.3.1 Vegetation Condition .............................................................................................. 37
4.3.2 Flood exposure and protection ................................................................................ 38
4.3.3 Monetized ecosystem services ................................................................................ 39
4.3.4 Habitat of critical species ........................................................................................ 41
4.3.5 Comparison of scenarios ......................................................................................... 42
5 Conclusions and Implications for Future Research and Implementation ...............................43
5.1 Evaluation of the Approach............................................................................................ 43
5.2 Additional Research Needs to Improve This Approach................................................. 44
5.3 Pilot Base Application .................................................................................................... 45
5.4 Feasibility Assessment of Future Expansion of this Work ............................................ 46
6 Literature Cited .......................................................................................................................48
7 Appendices .............................................................................................................................52
7.1 Appendix 1. Generalized habitat conceptual models ..................................................... 52
7.2 Appendix 2. Military base-specific conceptual models. ................................................ 60
7.3 Appendix 3. Methodology for Economic Valuation of Services at Eglin AFB ............. 64
List of Tables
Table 1. Potential benefit relevant indicators (BRIs) and economic values for ecosystem services provided
by military bases.
Table 2. Summary of potential approaches for benefit-relevant indicators and economic valuation for a
range of ecosystem services that may be provided at military bases.
Table 3. Species modeled as a function of vegetation condition in the STSM state classes, consisting of
vegetation age (early, mid, late), and structure (open and closed canopy).
Table 4. Modeled valuations of future flood risks by scenario.
Table 5. Monetized modeled ecosystem service values under three scenarios.
Table 6. Species habitat modeled ecosystem service values under three scenarios.
Table 7. Modeled net benefits of current management compared to counterfactual no-
management and no-base scenarios.
iii
List of Figures
Figure 1. General structure of an ecosystem services conceptual model.
Figure 2. Schematic diagram of the major components of the MoTIVES integrated model for Eglin Air
Force Base.
Figure 3. Generalized habitat conceptual model for a fire-maintained forest type.
Figure 4. Military base-specific conceptual model for Eglin Air Force Base.
Figure 5. Conceptual diagram of the longleaf pine STSM used for Eglin Air Force Base.
Figure 6: The effects of cascading variability and uncertainty in integrated economic valuation of
ecosystem services associated with management decisions.
Figure 7: Map of Eglin Air Force Base and surrounding landmarks.
Figure 8. Projected longleaf pine forest condition classes at Eglin Air Force Base across the current
management, no management and no base scenarios in years 2031-2035.
Figure 9. Monetized ecosystem services.
Figure 10. Projected habitat area available for key species.
List of Acronyms
BRI: benefit-relevant indicator
CMECS: Coastal and Marine Ecosystem Classification System
CMAQ: Community Multiscale Air Quality
FEMA: Federal Emergency Management Agency
DEM: digital elevation model
DOD: Department of Defense
FNAI: Florida Natural Areas Inventory
LULC: land use and land cover
INRMP: Integrated Natural Resources Management Plan
InVEST: Integrated Valuation of Ecoystem Services and Tradeoffs
LiDAR: Light Detection and Ranging
MTBS: Monitoring Trends in Burn Severity
MoTIVES: Model-based Tracking and Integrated Valuation of Ecosystem Services
NOAA: National Oceanic and Atmospheric Administration
NWI: National Wetlands Inventory
iv
NVCS: National Vegetation Classification System
RCW: red-cockaded woodpecker
SERDP: Strategic Environmental Research and Development Program
STSM: state-and-transition simulation model
SWMM: Storm Water Management Model
USGS: United States Geological Survey
USFS: United States Forest Service
USFWS: United States Fish and Wildlife Service
Keywords
Bayesian modeling, Benefit-relevant indicators, Ecosystem services, Eglin Air Force Base,
Integrated modeling
Acknowledgements
Our team would like to acknowledge the major assistance we received from many people critical
to the successful completion of our project. In particular, Brett Williams, the Eglin Wildland
Support Module Lead provided access to data, information and valuable time and expertise
assuring that we understood as much as possible about the how Eglin is managed. Brett and
Bruce Hagedorn were both willing to help address all of our questions.
Equally important to the project success was the help provided by Dan Hipes and Jon Otting at
the Florida Natural Areas Inventory of Florida State University, who provided us with data,
helped with the analysis linking forest states to Eglin threatened and endangered species, and,
because of their expertise and experience with Eglin species, were able to help us solve many of
the complex questions that arise in a project involving multiple models.
At Fort Hood, we received data and guidance from Amber Dankert, Virginia Sanders, and David
Preston from the base, and Charlotte Reemts of The Nature Conservancy provided time and
information from her work at the base to help understand the relationship between habitats,
endangered birds and management at the base.
v
Abstract
Introduction and objectives: The United States military operates many military bases in
extremely diverse geographic contexts. Many of these bases feature large areas of land that
are undeveloped or sparsely developed in comparison to surroundings, providing a wide range of
important functions such as flood protection, habitat for plant and wildlife species, recreational
opportunities, and carbon sequestration. Therefore, military bases provide substantial ecosystem
services, primarily to residents and users of nearby land. This project develops methods to
conceptualize and quantify ecosystem services provided by U.S. military bases.
Technical approach: We developed conceptual ecosystem service models and related benefit-
relevant indicators to visualize and quantify the potential services provided by military bases. We
then developed an integrated modeling platform called MoTIVES (Model-based Tracking and
Integrated Valuation of Ecosystem Services) to quantify and evaluate ecosystem services
provided by alternative base management strategies. This platform manages probabilistic
simulations of biophysical and economic models for relevant ecosystem services. These
biophysical and economic models in turn leverage the latest scientific understanding of how
management influences environmental endpoints and, where possible, how these endpoints are
valued economically.
Results: This report presents conceptual ecosystem service models developed for a number of
habitat types and four military bases. We provide a proof of concept for MoTIVES by
quantifying ecosystem services at Eglin Air Force Base in Florida and outlining how this model
can be adapted to other sites. At Eglin, we simulated changes in carbon storage, species habitat,
flooding, timber harvest, and hunting/fishing across three scenarios: 1) continuation of current
management, 2) no natural resource management, and 3) no base.
Our simulations show that current natural resource management at Eglin provides important and
valuable services, particularly in providing flood protection and habitat for red-cockaded
woodpecker. The subset of services we modeled total over $110M in value each year. Net
benefits of the current management approach at Eglin is associated with net benefits that are
greater than alternative scenarios for land use: net benefits are $40M per year greater than a
hypothetical scenario in which the base does not exist and $90M per year greater than a scenario
in which base management activities are discontinued. In comparison with these alternative land-
use scenarios, current management practices provide more habitat area for 10 out of 12 other at-
risk species in the longleaf pine ecosystem (including all pond and beach species), which could
not be valued monetarily. Other services provided by Eglin, such as shoreline protection, were
not modeled for this pilot case study, but also provide value.
Benefits: MoTIVES provides relatable estimates of ecosystem service value for individual sites
that are readily understandable. We also demonstrate how use of an integrated modeling
framework improves confidence in overall valuations by tracking interrelated values and
uncertainties. Our approach is modular and easily transferable to very different contexts,
including military bases throughout the U.S. Finally, including uncertainties and complex
environmental phenomena enhances the realism and credibility of our valuations.
1
Executive Summary
Objectives
This project addresses the following three objectives from the SERDP Statement of Need:
1. Define and delineate the biological, physical and chemical services provided, including
natural and nature-based features that provide benefit.
2. Understand cumulative effects, feedbacks and compensatory behavior of complex
systems related to management of natural ecosystems and biological diversity.
3. Examine models that incorporate economic concepts and that may improve decision-
making to evaluate trade-offs.
To meet these objectives, we are developing an integrative ecosystem services model called
MoTIVES (Model-based Tracking and Integrated Valuation of Ecosystem Services) that
can be applied to any military base or DOD facility to estimate the impact of base management
on the provision of ecosystem services while accounting for interactions, offsets, and co-benefits
among services.
Approach
Ecosystem services are the benefits that nature provides to people. Often, the existence of
healthy natural systems and species is of sufficient importance to decision makers that no further
information is needed, but in many cases, it can be more impactful and informative to quantify
the specific benefits that nature is providing. To this end, we are developing the integrated
ecosystem services model MoTIVES so that it can be applied to any military base or DOD
facility at which natural resource management is being undertaken or considered. The model
encompasses a wide range of habitats and management activities and will produce an assessment
of a wide range of ecosystem services while accounting for interactions among habitats and
services. To date, we have developed methods for evaluating two scenarios relative to a
baseline of current management: (1) a no management scenario to assess how ecosystem
services would differ if the base did not conduct any natural resource management, and (2) a no
base scenario to assess how ecosystem service provision would differ if the base did not exist.
We developed and piloted our conceptual models at four bases: Eglin Air Force Base in Florida,
Fort Hood Army Base in Texas, Camp Lejeune Marine Base in North Carolina, and Joint Base
Lewis–McChord in Washington. We then applied this approach using more specific data and
relevant ecosystem services to Eglin Air Force Base, as an example of how it could be applied
elsewhere.
The development of our integrated ecosystem services modeling approach involved:
1. Creating a set of generalized ecosystem service conceptual models as the foundation for
a modeling framework that links management actions to ecosystem services while
identifying potential interactions,
2. Selecting and applying biophysical ecological models (terrestrial, aquatic, and flood
models) that characterize ecological state, condition, and function under the various
scenarios of interest,
2
3. Translating ecological state, condition, and function to benefit relevant indicators
(BRIs) of ecosystem service provision,
4. Estimating the economic value of the BRI levels whenever appropriate using approaches
including benefits transfer and direct estimation,
5. Joining the components above into the integrated ecosystem services model
(MoTIVES) to quantitatively and holistically account for cumulative effects, co-benefits,
feedbacks, and compensatory behavior.
Conceptual models
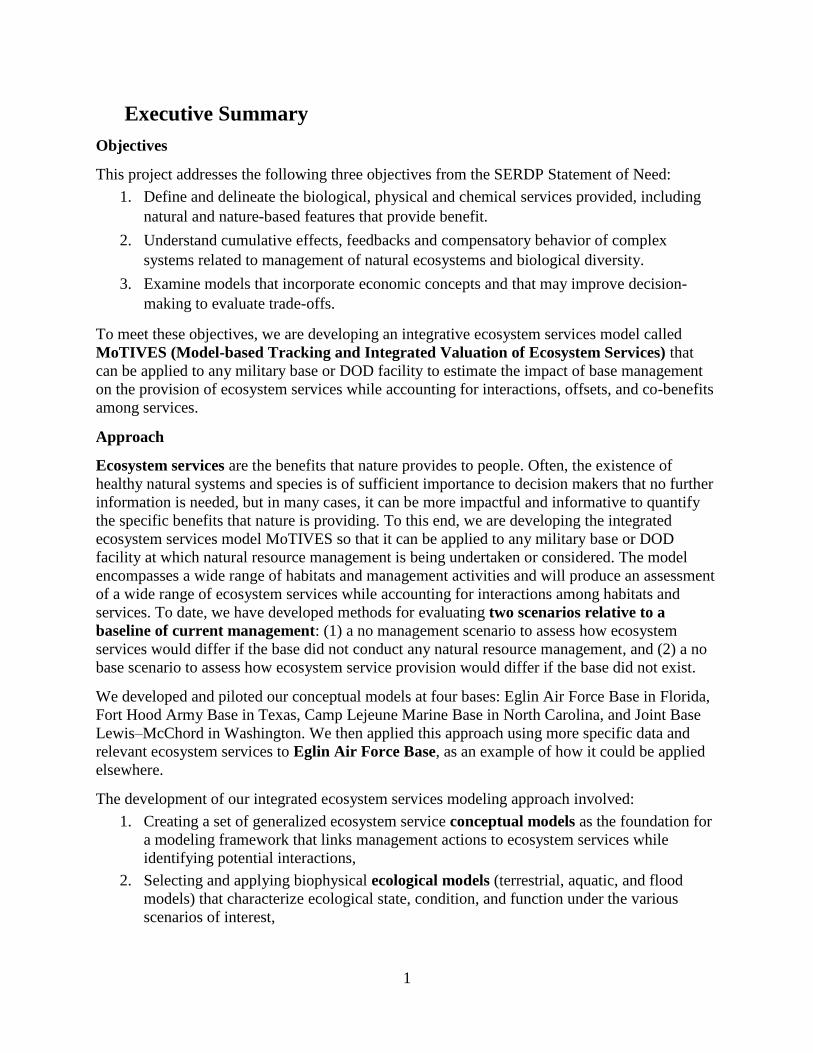
Ecosystem service conceptual models visually display how a base management action can
cause changes to biophysical aspects of an ecosystem and how these changes translate to benefit
relevant indicators and, when applicable, their economic values (Figure 1). Such conceptual
models form the basis of our subsequent quantitative modeling. Because there are common
habitat types that occur across DOD lands and there are often a defined set of management
actions being taken within these habitats, we determined that we could formulate a limited set of
generalized habitat conceptual models to be adapted and applied to any military base to then
create a base-specific model. These base-specific models are then used as the framework for
quantitative estimates of ecosystem services under specific base-relevant scenarios. Thus the
conceptual framework creates consistency in ecosystem service assessment across bases,
displaying how different elements of the system interact and providing a visual summary of the
relevant ecosystem services being quantified at each base.
Figure E1. General structure of an ecosystem services conceptual model. The actual conceptual models
include a detailed representation of each of the four stages shown here.
Generalized habitat conceptual models: Eight generalized habitat conceptual models
have been created to reflect common ecosystem service flows on military bases. These models
illustrate how management actions on bases result in changes to ecosystem services being
provided by specific terrestrial and aquatic habitat types that occur on bases all over the U.S.,
including: 1) fire-maintained forests, 2) forests not maintained by fire, 3) fire-maintained
grasslands, 4) grasslands not maintained by fire, 5) deserts, 6) rivers, streams, and riparian areas,
7) lakes, ponds, and wetlands, and 8) estuaries, saltmarsh, bays, and shorelines.
Base-specific conceptual models: Generalized habitat models are adapted and combined
to create base-specific conceptual models that reflect the ecosystem service changes resulting
from management at a particular base. Since the generalized models include potential ecosystem
service outcomes, some outcomes may not be applicable to a particular base of interest.
Therefore, to build a base-specific model, the user selects only the habitat models relevant for the
base and removes irrelevant components. Once each relevant habitat model has been adapted to
reflect the base-specific context, the resulting connected habitat models represent the integrative
conceptual modeling framework to be used to quantify the base total ecosystem service flows.
3
Quantitative predictive model MoTIVES
Ecological models are used to represent the biophysical connections between management
actions and changes to ecosystem type, condition, function or extent. Following are the two
classes of ecological models being used:
Terrestrial Vegetation Condition Models: State-and-transition simulation models
(STSMs) describe the primary states of vegetation composition and structure, and how individual
states change over time under various disturbances (e.g., wildfire) or with management. We used
STSMs to project the effects of management actions such as prescribed burning and timber
harvest, disturbances such as wildfire and floods, and other processes on future vegetation
condition using the open source ST-Sim software. STSMs provide outputs describing the amount
of area occupied by each vegetation condition on a base under a set of management actions.
These area estimates can then be tied to certain ecosystem services that are dependent on
vegetation condition.
Aquatic Models: A series of models are available to model how management, wetlands,
riparian vegetation, streams and other water bodies, soils and other factors influence the type and
amount of aquatic ecosystem services provided by a base. These include flood risk and flood
amelioration, provision of water for drinking, livestock, irrigation or industrial use, and reduction
of sedimentation and nutrients, and habitat for valuable aquatic species. For this project we
included a flood risk model (HAZUS) to calculate the flood hazard, or the annual chance of
inundation at specific flood depths associated with inland flood risk as a function of local
elevation and land use characteristics. Flood events are valued economically within HAZUS
using data from the U.S. Census. In some cases, high resolution aquatic data sources specific to
military installations can be used to parameterize models or provide economic valuation for
services provided on the base.
Services were quantified using metrics referred to as benefit relevant indicators (BRIs). BRIs
are the hand-off between ecological function and social impact, connecting the supply of benefits
and the reception of those benefits by people. For example, water storage capacity of a wetland is
an ecological indicator, but the reduction in flooding risk to the downstream community resulting
from that wetland is a BRI. In some cases, these BRIs can be extended to a monetary value, but
in others monetary valuation is not possible or appropriate. When possible, we assign economic
valuation to these BRIs using literature or base-specific data.
For final evaluation, the various steps and components described above were joined into a single
integrated ecosystem services model called MoTIVES (Model-based Tracking and Integrated
Valuation of Ecosystem Services). This has the advantage over parallel assessment of individual
ecosystem services in that it allows for quantitative and holistic consideration of interactions,
including co-benefits and offsets. This is especially important when accounting for uncertainty or
potential site-to-site variability in assessment results. Changes in individual habitats and
ecosystem services may be positively or negatively related to one another at any particular base.
These relations may counterbalance one another, resulting in a smaller change than expected, or
may reinforce one another, resulting in a larger-than-expected change. Representing such
relations and interactions in an integrated model provides a more robust and realistic comparison
of ecosystem service differences between evaluated scenarios.
4
Proof of Concept: Eglin Air Force Base
Eglin Air Force Base is the largest forested military base in the United States, supporting the
largest remaining mature longleaf pine (Pinus palustris) forest in the world, habitat for 24 listed
threatened or endangered species, and extensive freshwater and estuarine wetlands, ponds and
riparian meadows. The base has a number of coastal streams and bays that support at-risk fish,
along with desirable fishing locals. The base allows access for fishing and boating in all
appropriate areas. Much of the eastern portions of Santa Rosa Island, a Gulf of Mexico barrier
island, is part of Eglin, supporting turtle nesting, habitat for endangered shorebirds and a sand
adapted threatened lichen, along with providing protection from storm surges and coastal
flooding to the communities of Fort Walton Beach and Navarre. The base supports recreation,
hunting, and fishing, while providing the necessary infrastructure for its primary training
mission.
We used the MoTIVES model to evaluate three scenarios for Eglin Air Force Base:
Current management scenario: The baseline scenario of current management assumes
that current natural resource management on the base would continue at current rates,
primarily consisting of widespread use of prescribed burning to create the open
conditions favorable to longleaf pine and associated wildlife species.
No-management scenario: In this scenario, we assumed that the base continued all
military operations but did not (currently or historically) manage for natural resources,
with no prescribed fire or other management activity specific to natural resources.
No-base scenario: To assess the total ecosystem services being provided by the base, we
created a counterfactual scenario in which the base does not exist, and based projections
on land use and land cover consistent with surrounding areas.
Annualized results from these scenarios were calculated for the future time period of 2020-2035.
Results for these analysis were reported for 1) vegetation condition, 2) flood exposure and
protection, 3) summarized for all monetized ecosystem services and 4) for habitat for at risk
species.
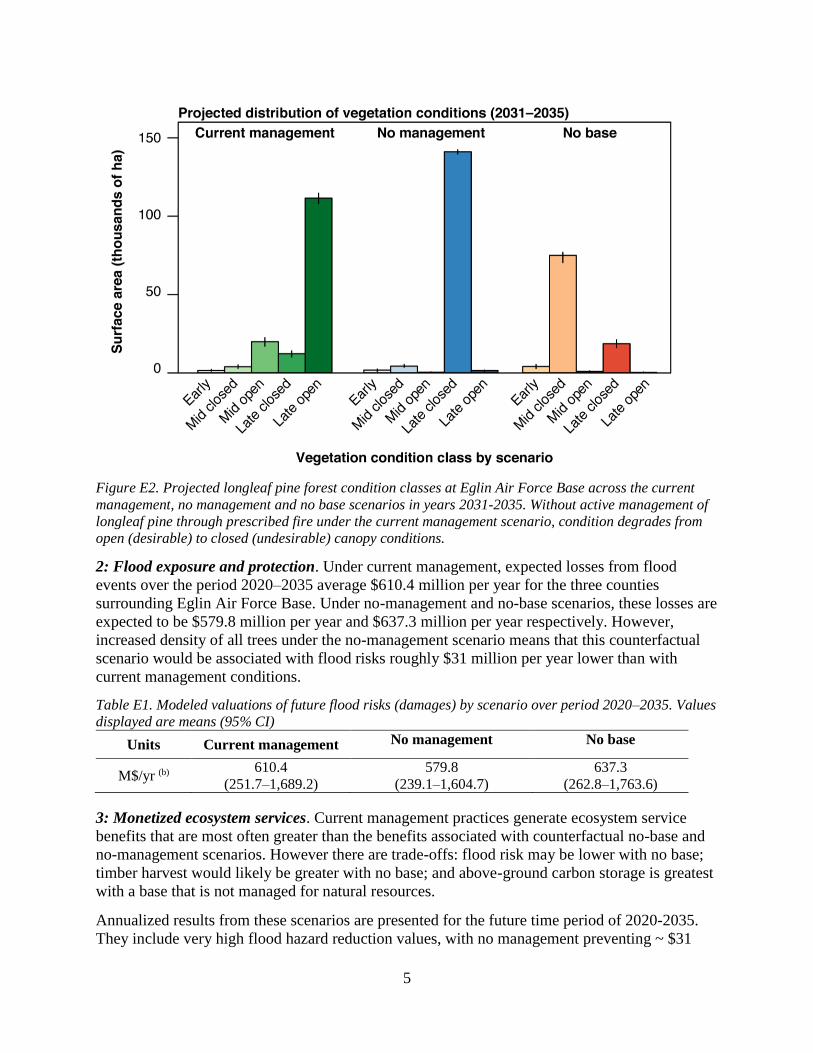
1: Vegetation condition. Currently, late open conditions cover roughly half of the forested area
at Eglin (roughly 77,000 ha). Under the current management scenario (consisting of continuing
large-scale prescribed burning), the area of late open forest is expected to increase to
roughly 115,000 hectares, covering the majority of the base (Figure E2). Conversely,
under the no management scenario (without any prescribed burning either currently or
historically), the base would likely contain very little (<5%) older, open longleaf pine and largely
consist of older, closed forest. Closed canopy forests burn rarely, tend to become invaded by
sand pine, and provide low quality wildlife habitat. Under the no base scenario, we expect
~50,000 hectares of conversion from forest to other land use types, and of the remaining forest,
very little is projected to remain in late open conditions due to frequent clear-cutting and dense
replanting on private timberlands.
5
Figure E2. Projected longleaf pine forest condition classes at Eglin Air Force Base across the current
management, no management and no base scenarios in years 2031-2035. Without active management of
longleaf pine through prescribed fire under the current management scenario, condition degrades from
open (desirable) to closed (undesirable) canopy conditions.
2: Flood exposure and protection. Under current management, expected losses from flood
events over the period 2020–2035 average $610.4 million per year for the three counties
surrounding Eglin Air Force Base. Under no-management and no-base scenarios, these losses are
expected to be $579.8 million per year and $637.3 million per year respectively. However,
increased density of all trees under the no-management scenario means that this counterfactual
scenario would be associated with flood risks roughly $31 million per year lower than with
current management conditions.
Table E1. Modeled valuations of future flood risks (damages) by scenario over period 2020–2035. Values
displayed are means (95% CI)
Units Current management No management No base
M$/yr (b) 610.4
(251.7–1,689.2)
579.8
(239.1–1,604.7)
637.3
(262.8–1,763.6)
3: Monetized ecosystem services. Current management practices generate ecosystem service
benefits that are most often greater than the benefits associated with counterfactual no-base and
no-management scenarios. However there are trade-offs: flood risk may be lower with no base;
timber harvest would likely be greater with no base; and above-ground carbon storage is greatest
with a base that is not managed for natural resources.
Annualized results from these scenarios are presented for the future time period of 2020-2035.
They include very high flood hazard reduction values, with no management preventing ~ $31
6
million in flood damage than current management, and ~$57 million more than a no base
scenario. Because these represent risk probabilities, they were treated separately. All other
services that could be valued in dollars were compared, with the results shown in Figure E2.
Table E2. Modeled ecosystem service values under three scenarios. Values displayed are means (95%
confidence interval in parentheses where modeled probabilistically)
Current
management No management No base
Monetized services in millions of dollars/year(a)
Timber harvest 1.0 0 39
(24–48)
Recreational hunting 36 0 0
Recreational fishing 11 0 0
Carbon storage 1.6
(0.7–3.5)
3.1
(1.4–6.7)
1.2
(0.6–2.6)
Red-cockaded
woodpecker value
56
(35–70)
30
(18–36)
11
(6.8–14)
Total monetized
services(b)
109
(87–123)
33
(20–40)
51.2
(32–63)
(a) Annualized net present value over period 2020–2035 assuming a 5% discount rate (b) Total adjusts for correlated uncertainties and may not equal arithmetic sum of individual services
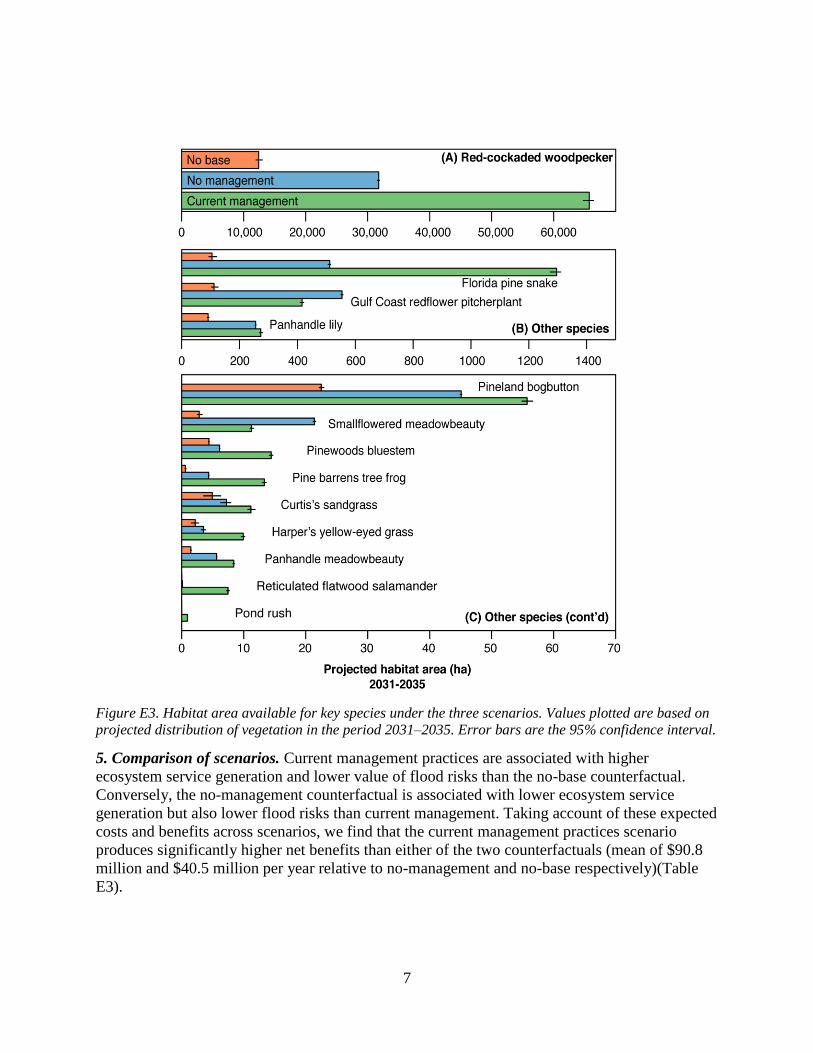
4: Habitat of critical species. Eglin Air Force Base is home to a number of threatened,
endangered, and endemic species, many of which rely almost entirely on the base for their
survival. Thirteen of these species were modeled under the three scenarios as part of this study.
Current management practices produce the greatest area of suitable habitat for most of these
species, including sufficient amounts to preclude federal listing for a number of them. The
exceptions were the Gulf Coast redflower pitcherplant and smallflowered meadowbeauty. For
these two species, the no-management scenario provides slightly more area of suitable habitat.
The no-base scenario severely reduces available habitat for all species. Figure E3 shows the
comparison between the predicted species habitat areas.
7
Figure E3. Habitat area available for key species under the three scenarios. Values plotted are based on
projected distribution of vegetation in the period 2031–2035. Error bars are the 95% confidence interval.
5. Comparison of scenarios. Current management practices are associated with higher
ecosystem service generation and lower value of flood risks than the no-base counterfactual.
Conversely, the no-management counterfactual is associated with lower ecosystem service
generation but also lower flood risks than current management. Taking account of these expected
costs and benefits across scenarios, we find that the current management practices scenario
produces significantly higher net benefits than either of the two counterfactuals (mean of $90.8
million and $40.5 million per year relative to no-management and no-base respectively)(Table
E3).
8
Table E3. Modeled net benefits of current management compared to counterfactual no-management and
no-base scenarios. Values displayed are means (95% CI)
Current management service provision improvement over
Units No management No base
M$/yr (a) 90.8
(66.5–127.1)
40.5
(9.2–69.6) (a) Annualized net present value over period 2020–2035 assuming a 5% discount rate and accounting for correlated
uncertainties across individual services
Recommendations for Additional Research Needs
Aquatic ecosystem services. Because the most important services provided by Eglin Air Force
Base were linked to the management of terrestrial ecosystems, in our pilot study we were not
able to take advantage of some of the models and tools related to aquatic ecosystem services. At
other bases, where aquatic systems and services are important, other models should be
incorporated. The InVEST models have been tested and are simple to apply in many areas.
Water quality improvements. Similarly, research into water quality improvement related to both
the ecosystem processes of nutrient removal, and the value of removed N and P for anything but
waste water treatment would improve our model outputs.
Research into valuing species existence. Tradeoffs are most easily evaluated if different services
can be measured in similar units, which is why economic valuation is so useful. Yet many base
management activities on the pilot bases are focused on management of threatened, endangered
or endemic species, as they provide critical habitat for them. The conservation or expansion of
populations of at risk species represent important management outcomes.
More comprehensive assessment of economic values. We estimated economic values for many
BRIs, but future research is needed to provide a more comprehensive assessment. Economic
values for market goods are readily estimated because these goods have observable prices. For
example, we computed economic values for timber and flood damage using market data on
stumpage and real estate prices. Valuation of non-market goods is also possible using techniques
such as the contingent valuation method. Non-market benefits quantified for Eglin include
species preservation and carbon storage.
Conclusions
Since ecosystem services have become widely recognized as a useful tool for assessing the
success of natural resource management actions, quantifying and reporting on these services is
becoming part of good resource management practice. Our approach can help DOD natural
resource managers show how they are enhancing the production of services, and how the
existence of the base itself provides substantial ecosystem services benefits to people.
Our approach is unique in a number of ways. First, we use conceptual models as an intuitive
transferable foundation for building base specific models across habitat types and management
strategies. Second, we develop an assemblage of multiple models in an interactive probabilistic
platform that can address trade-offs and interactions. Third, we explicitly use benefit relevant
indicators (BRIs) as an alternative or additional measure to economic valuation.
9
Due to its modular framework, we have been able to take advantage of previous ecological
assessment work available at many bases, but also have methods that apply where previous
ecological modeling has not occurred. We have identified national models and datasets available
for the contiguous 48 states. To use the approach in other regions, additional data and models
would need to be identified. The methodology can be readily transferred to any large base
anticipated to generate ecosystem services.
Ecosystem service outputs in the model are estimated in dollar values when possible, and also in
valued benefits (benefit relevant indicators). Often benefit relevant indicators are more
meaningful for stakeholders and are useful to communicate in addition to dollar values when
both are available. Because most bases provide a diverse array of ecosystem services, and
because some management decisions can reduce some services while increasing others, our
methods combine this complex assemblage into a single, Bayesian model (MoTIVES) to
integrate outputs and allow an evaluation of alternative management scenarios. This makes it
possible for natural resource managers to evaluate how management for a particular habitat
condition to support species or training will impact values for other services. Additionally, these
management scenarios allow a comparison of different management choices as well as providing
essential baseline comparisons needed to measure some ecosystem services such as flooding
prevention.
The MoTIVES structure also allows it to take advantage of a broad array of available ecosystem
assessment tools, broadening the ability to use the best data or model available for a particular
base. A distinguishing feature of MoTIVES is the fact that it explicitly considers uncertainty in
all aspects of the model and translates this uncertainty to model endpoints using Monte Carlo
simulation. By using simulation to explore the range of possible consequences of management
on ecosystem service values, we decrease the likelihood of later surprises or missed
opportunities. This approach makes conclusions robust to questions about confidence in
numerical answers. For example, despite wide confidence intervals, we are able to say with
>95% confidence that net benefits of current management practices at Eglin Air Force Base are
greater under current management than under plausible alternative scenarios considered.
The results from Eglin Air Force base show that current management provides very significant
ecosystem service values, estimated at approximately $110 million dollars a year, much more
than the same base not managed, or the same area if it had not become a base. It appears likely
that similar results would result from this analysis at Fort Hood and most of the other large
military installations.

1
1 Project Objectives
The objectives of this research are:
1. To develop a model that will provide a transferable and consistent foundation for
assessing ecosystem service benefits from military installations including an
understanding of cumulative effects, trade-offs, and uncertainty, and;
2. To provide a proof of concept for this model in an example military installation.
General conceptual models were developed for selected pilot inland and coastal bases that
addressed all ongoing management activities, including training requirements, land stewardship,
legal drivers, and coordination within and beyond installation boundaries. We explored how
these generalized models could be specified to the needs of any individual base and form the
foundation for qualitative assessments, quantitative models, and valuation. Starting with these
conceptual models, we evaluated and compared available methods to include cumulative effects
and interactions, while generating quantitative outputs of what is valued by people and, where
possible, what those economic values are. The project proposes a transferable framework and
design for an integrative modeling tool called MoTIVES (Model-based Tracking and Integrated
Valuation of Ecosystem Services) to incorporate ecosystem services and benefits into decision
making for large military installations in the U.S.
This project addresses the following three objectives from the SERDP Statement of Need:
1. Define and delineate the biological, physical and chemical services provided, including
natural and nature-based features that provide benefit.
2. Understand cumulative effects, feedbacks and compensatory behavior of complex
systems related to management of natural ecosystems and biological diversity.
3. Examine models that incorporate economic concepts and that may improve decision-
making to evaluate trade-offs.
2 Project Background
Ecosystem services are the benefits nature provides to people such as recreational opportunities
(e.g., fishing, boating, hiking, birdwatching), protection from natural disasters (e.g., flood
protection, reduced risk of wildfire), provision of goods (timber, fish/shellfish, and contributions
to crop production), as well as the sense of place, spiritual connection, and mental health benefits
of being in nature and knowing it is there and healthy (Kumar 2010, MEA 2005). While the
existence of healthy natural systems and species is often of sufficient importance to decision
makers and the public that no further information is needed, in other cases it can be impactful to
quantify the range of specific benefits that nature is providing. For example, it can be more
meaningful to talk about whether people are allowed to swim in the water or whether it is healthy
to eat shellfish from the water, than it is to talk about dissolved oxygen or pollutant levels.
Information on the reduced risk of flooding provided by an upstream wetland can be meaningful
to communities and their insurance companies (Watson et al. 2016). The knowledge that
reducing wildfire within hundreds of miles can reduce negative respiratory health outcomes can
be meaningful to vulnerable people (Liu et al. 2015). And knowing that recreational fish catch is
declining in an area even though it appears healthy can also expand the information we have
2
available to manage these systems. In some cases, knowing these relationships can form the basis
of conservation and management partnerships when one entity (a federal agency) is providing
service to private landowners. For example, in Denver, the USFS is being paid via municipal
water fees to manage their upstream forests to reduce wildfire and extreme sedimentation events
that have huge costs for municipal water treatment.
In this project we are developing an integrated ecosystem services modeling framework that can
be applied to any military base or DOD facility where natural resource management is ongoing.
It can encompass a wide range of habitats and management actions that are typical of bases, and
it will produce an assessment for a wide range of ecosystem services. For this initial modeling
framework we have developed methods for evaluating two specific types of scenarios, in
comparison to current conditions:
No management scenario: In this scenario, we assume that the base continues all
military operations but does not (currently or historically) manage for natural resources,
with no prescribed fire or other management activity specific to natural resources.
No base scenario: To assess the total ecosystem services being provided by the base, we
created a counterfactual scenario in which the base does not exist and based projections
on land use and land cover consistent with surrounding areas.
In this limited scope and duration project, we have developed a set of generic models and
methods to be applied generally to any military base. We piloted our conceptual modeling
approach at four bases, Eglin Air Force Base in Florida, Fort Hood Army Base in Texas, Camp
Lejeune Marine Base in North Carolina, and Joint Base Lewis–McChord in Washington. We
then applied the quantitative predictive model (MoTIVES) using specific data and relevant
ecosystem services to Eglin Air Force Base, as an example of how it could be applied elsewhere.
3 Materials and Methods
3.1 Overview of the Approach
Our multi-step approach is as follows:
Step 1. Develop ecosystem services conceptual models for general habitat and management
and facility types and then adapt them to individual bases and management actions. The
project team first developed generalized habitat conceptual models for management of major
habitat types (e.g., fire maintained forests, deserts, etc.). These generalized models can be
combined to represent habitats for specific bases to form base-specific conceptual models of base
management activities (e.g., prescribed fire, endangered species protections, training activities).
These conceptual models incorporate ecosystem services and benefit-relevant indicators that
include training requirements, land stewardship, and when possible legal drivers such as
compliance with regulations or laws protecting natural resources. The modeling framework
provided a foundation for predictive modeling of different management and regulatory scenarios,
as well as modeling of cumulative effects and feedbacks.
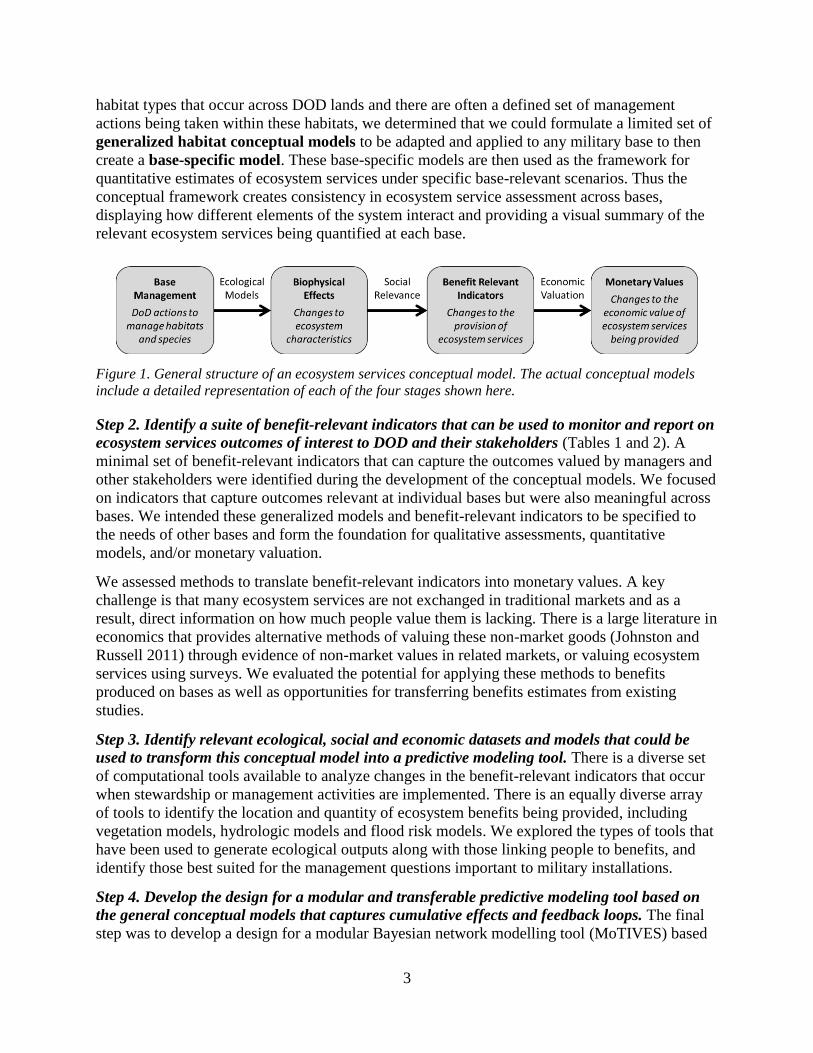
Ecosystem service conceptual models visually display how a base management action can
cause changes to biophysical aspects of an ecosystem and how these changes translate to benefit
relevant indicators and, when applicable, their economic values (Figure 1). Such conceptual
models form the basis of our subsequent quantitative modeling. Because there are common
3
habitat types that occur across DOD lands and there are often a defined set of management
actions being taken within these habitats, we determined that we could formulate a limited set of
generalized habitat conceptual models to be adapted and applied to any military base to then
create a base-specific model. These base-specific models are then used as the framework for
quantitative estimates of ecosystem services under specific base-relevant scenarios. Thus the
conceptual framework creates consistency in ecosystem service assessment across bases,
displaying how different elements of the system interact and providing a visual summary of the
relevant ecosystem services being quantified at each base.
Figure 1. General structure of an ecosystem services conceptual model. The actual conceptual models
include a detailed representation of each of the four stages shown here.
Step 2. Identify a suite of benefit-relevant indicators that can be used to monitor and report on
ecosystem services outcomes of interest to DOD and their stakeholders (Tables 1 and 2). A
minimal set of benefit-relevant indicators that can capture the outcomes valued by managers and
other stakeholders were identified during the development of the conceptual models. We focused
on indicators that capture outcomes relevant at individual bases but were also meaningful across
bases. We intended these generalized models and benefit-relevant indicators to be specified to
the needs of other bases and form the foundation for qualitative assessments, quantitative
models, and/or monetary valuation.
We assessed methods to translate benefit-relevant indicators into monetary values. A key
challenge is that many ecosystem services are not exchanged in traditional markets and as a
result, direct information on how much people value them is lacking. There is a large literature in
economics that provides alternative methods of valuing these non-market goods (Johnston and
Russell 2011) through evidence of non-market values in related markets, or valuing ecosystem
services using surveys. We evaluated the potential for applying these methods to benefits
produced on bases as well as opportunities for transferring benefits estimates from existing
studies.
Step 3. Identify relevant ecological, social and economic datasets and models that could be
used to transform this conceptual model into a predictive modeling tool. There is a diverse set
of computational tools available to analyze changes in the benefit-relevant indicators that occur
when stewardship or management activities are implemented. There is an equally diverse array
of tools to identify the location and quantity of ecosystem benefits being provided, including
vegetation models, hydrologic models and flood risk models. We explored the types of tools that
have been used to generate ecological outputs along with those linking people to benefits, and
identify those best suited for the management questions important to military installations.
Step 4. Develop the design for a modular and transferable predictive modeling tool based on
the general conceptual models that captures cumulative effects and feedback loops. The final
step was to develop a design for a modular Bayesian network modelling tool (MoTIVES) based
4
on the generalized ecosystem services conceptual model frameworks and incorporating the
ecological, social, and economic data and models identified in previous steps. Consistent with
the conceptual modeling, Bayesian networks start with a graphical representation of the
human/natural system being considered. Key variables are represented by nodes, and relations
between nodes are represented by arrows. While Bayesian networks may be visually similar to
flow charts or process diagrams, they are distinct in representing probabilistic dependence
relations, rather than workflow or movement of materials and energy (Mavrommati et al. 2016).
Research goals: An important research aim of this project going forward will be to assess the
transferability of the modules in our pilot models, given the diversity of facilities and associated
natural resources. Another key research aim will be to develop and demonstrate methods for
incorporating cumulative effects and feedbacks into the Bayesian network models. Such dynamic
Bayesian networks have been developed in the academic literature but have only rarely been
implemented in management practice.
The project has demonstrated a method to create a transferable framework and the design for a
predictive modeling tool for incorporating ecosystem services and benefits into decision making
for most of the large military installations in the United States (Figure 2). Developing a
generalized model that can capture a broad range of overlapping actions in a specified location
such as land stewardship actions, regulatory driven management, and off-site coordination,
which are all relevant to DOD base management, remains a challenge. But this is a challenge we
think now has a strategy and methodology for a solution, that allows stewardship and land use to
be balanced.
In order to test the approach we develop here, we chose to pilot MoTIVES at Eglin Air Force
base. Using the steps outlined above we developed a conceptual model for Eglin AFB, including
only those services relevant at that site to act as a framework for applying only the relevant
quantification tools and combining their results within MoTIVES. MoTIVES was applied to
provide a scenario analysis that presents results comparing the ecosystem services outcomes of
current ecosystem management of Eglin to a no management and no base scenario.
3.2 Conceptual Models of Ecosystem Services
As outlined in Step 1 of our approach, we began by building ecosystem services conceptual
models. These conceptual models visually display how a management action causes changes to
biophysical aspects of an ecological system and how those changes cascade to affect ecosystem
services and, when appropriate, their economic values. Conceptual models form the basis of our
quantitative modeling framework. Because there are common habitats that occur across DOD
lands and there are a defined set of environmental management actions being taken within these
habitats, we determined that it was possible to develop a set of generalized habitat-based
ecosystem services conceptual models that could be adapted and applied to any military base,
creating base-specific models. These base-specific models are then used as a framework for
subsequent Bayesian network modeling that applies quantitative methods to produce estimates
for ecosystem services outcomes. This conceptual framework is important as it helps to create
consistency in modeling across bases, displays how different elements of the system are
interacting, and provides a visual summary of the relevant ecosystem services being quantified at
each base.
5
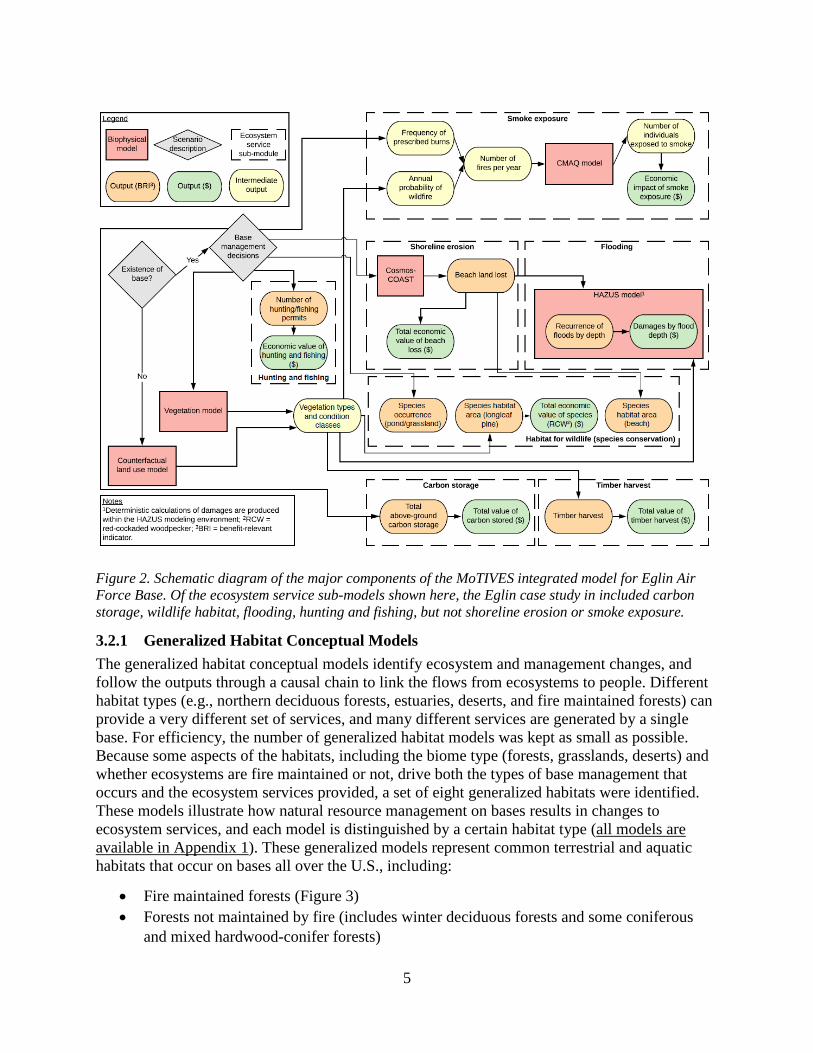
Figure 2. Schematic diagram of the major components of the MoTIVES integrated model for Eglin Air
Force Base. Of the ecosystem service sub-models shown here, the Eglin case study in included carbon
storage, wildlife habitat, flooding, hunting and fishing, but not shoreline erosion or smoke exposure.
3.2.1 Generalized Habitat Conceptual Models
The generalized habitat conceptual models identify ecosystem and management changes, and
follow the outputs through a causal chain to link the flows from ecosystems to people. Different
habitat types (e.g., northern deciduous forests, estuaries, deserts, and fire maintained forests) can
provide a very different set of services, and many different services are generated by a single
base. For efficiency, the number of generalized habitat models was kept as small as possible.
Because some aspects of the habitats, including the biome type (forests, grasslands, deserts) and
whether ecosystems are fire maintained or not, drive both the types of base management that
occurs and the ecosystem services provided, a set of eight generalized habitats were identified.
These models illustrate how natural resource management on bases results in changes to
ecosystem services, and each model is distinguished by a certain habitat type (all models are
available in Appendix 1). These generalized models represent common terrestrial and aquatic
habitats that occur on bases all over the U.S., including:
Fire maintained forests (Figure 3)
Forests not maintained by fire (includes winter deciduous forests and some coniferous
and mixed hardwood-conifer forests)
6
Fire-maintained savannas, shrublands and prairies
Savannas, shrublands and prairies not maintained by fire (alpine, tundra)
Deserts
Rivers, streams and riparian habitats
Lakes, ponds, aquatic beds and wetland habitats
Estuaries, saltmarsh, bays and shorelines, marine habitats
These generalized habitat conceptual models provided a template, making it easier to quickly
generate base specific models while assuring that all of the major ecosystem services and their
causal chains were identified.
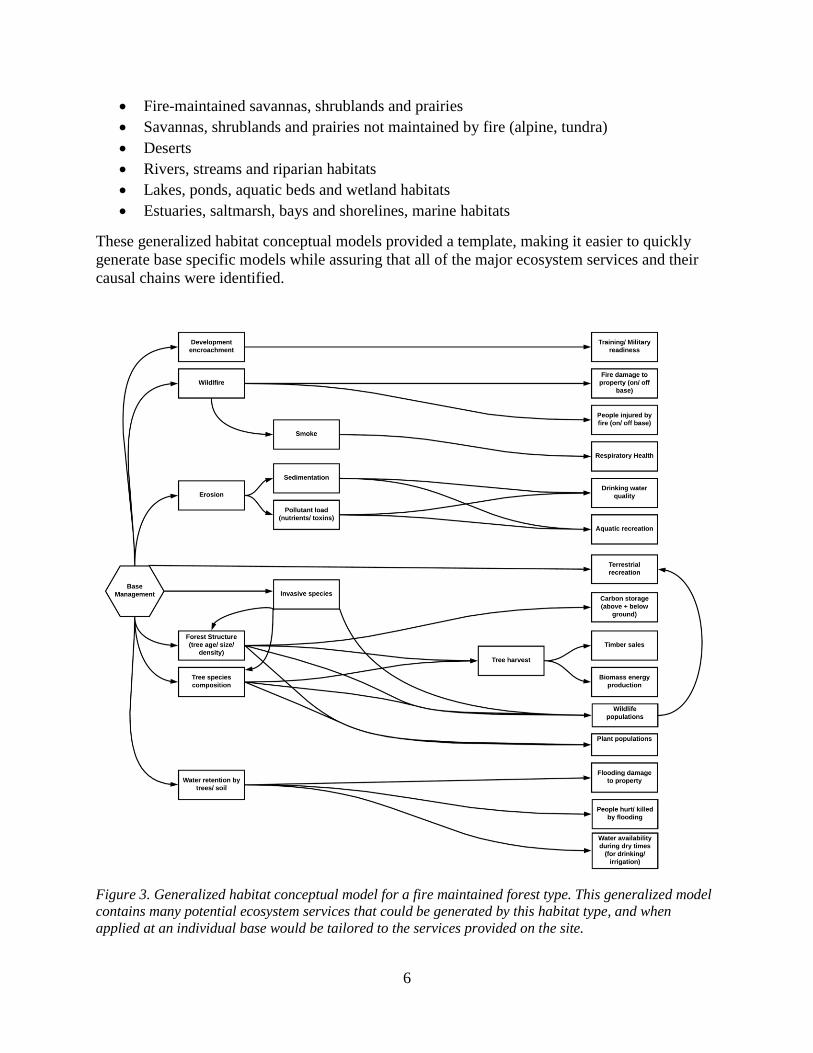
Figure 3. Generalized habitat conceptual model for a fire maintained forest type. This generalized model
contains many potential ecosystem services that could be generated by this habitat type, and when
applied at an individual base would be tailored to the services provided on the site.
7
However, when creating the base specific models, to be able to measure and value ecosystem
services provided by the habitats, it is necessary to translate the generalized habitats into the
specific vegetation types found at each base. To do this we identified a standard set of ecosystem
types to use as the basis of our models.
In the process of identifying terrestrial ecosystems types to use for individual base analysis, it
quickly became clear that the vegetation and habitat classifications individual bases used in their
INRMPs to name and map these terrestrial and aquatic vegetation vary widely across the
country. Installations often use the classification used by the state natural heritage program or the
state fish and wildlife agency, federal classifications from the U.S. Fish and Wildlife Service
(USFWS), NOAA Fisheries, the U.S. Geological Survey (USGS), and the U.S. Forest Service
(USFS), or a combination of sources. For this project, to assure the framework could be used at
all the bases, the team chose to crosswalk the habitats mapped at each base to a consistent
hierarchical level in the National Vegetation Classification System (NVCS).
The NVCS classification was developed by the USGS and is maintained by NatureServe, and
includes seven hierarchical levels, ranging from broad formations (e.g. forests, grasslands,
shrublands) down to local plant associations (e.g. longleaf pine/wiregrass (Pinus
palustris/Aristida stricta) or Douglas-fir – Pacific Madrone / salal (Pseudotsuga menziesii-
Arbutus menziesii/Gaultheria shallon) forest). The macrogroup level in the NVCS was selected
as the most appropriate level to link to BRIs because they are broad enough to represent similar
ecosystems across the country, but fine enough to characterize the ecological functions and flows
in a meaningful and measurable way. They also can be linked easily to the Ecological Systems
Classification also developed by the USGS and NatureServe, which is the basis for the
vegetation maps produced by the USGS, USFS, and the LANDFIRE project.
For marine and estuarine habitats, we used the Coastal and Marine Ecosystem Classification
System (CMECS), which is the only comprehensive coastal and marine habitat classification in
the U.S. The CMECS includes an aquatic setting and a biotic component, the latter used at the
class level. Our team used the aquatic component at the system level, (Marine, Estuarine, Marine
Nearshore and Marine Offshore) for the generic habitat models, and for use in the individual
base models, the 11 biotic classes developed in the CMCS classification. For freshwater wetland
habitats we could choose to use either the Cowarden classes (Forested, Shrub-Scrub, and
Emergent wetlands) used in the National Wetlands Inventory (NWI) of the USFWS, or the
NVCS macrogroup classification, depending on which wetlands classification was used by
individual bases in their wetland maps. Lastly, for other aquatics, we used just two categories: 1)
Rivers, streams and riparian habitat and 2) Lakes, Ponds and aquatic bed habitats.
3.2.2 Base-Specific Conceptual Models
Generalized habitat models can be adapted and combined to create unique base-specific models
that reflect the service changes resulting from management on that base, across all the habitat
types present. To build a particular base model, the user should select the habitat models relevant
for the base and then remove all irrelevant pathways and outcomes from each habitat model.
Generalized models have been built to include all potential ecosystem services outcomes,
therefore some outcomes may not be applicable to the base of interest. To create a base-specific
conceptual model, specific causal chains from the generalized conceptual models not relevant to
the base if they are not produced or not used would be removed. Once each habitat model has
been adapted to accurately reflect the base’s context, these models should be overlaid to create a
8
base model that displays all relevant habitats and services. This then represents the quantitative
modeling framework that can be used to quantify total service flows for the base (Figure 4).
The conceptual models reflect ways in which management decisions alter the individual
ecosystems at the base, how these changes impact potential useful environmental outputs and
then how these outputs are used. Often, the individual ecosystems managed are terrestrial
ecosystems, which are usually described as a terrestrial or aquatic habitat type. Since actions
specified in the Integrated Natural Resources Management Plan (INRMP) for each base are often
organized by these habitat types, and vegetation maps are developed using habitat classifications,
these are the best tools to use for analyzing the effects of management.
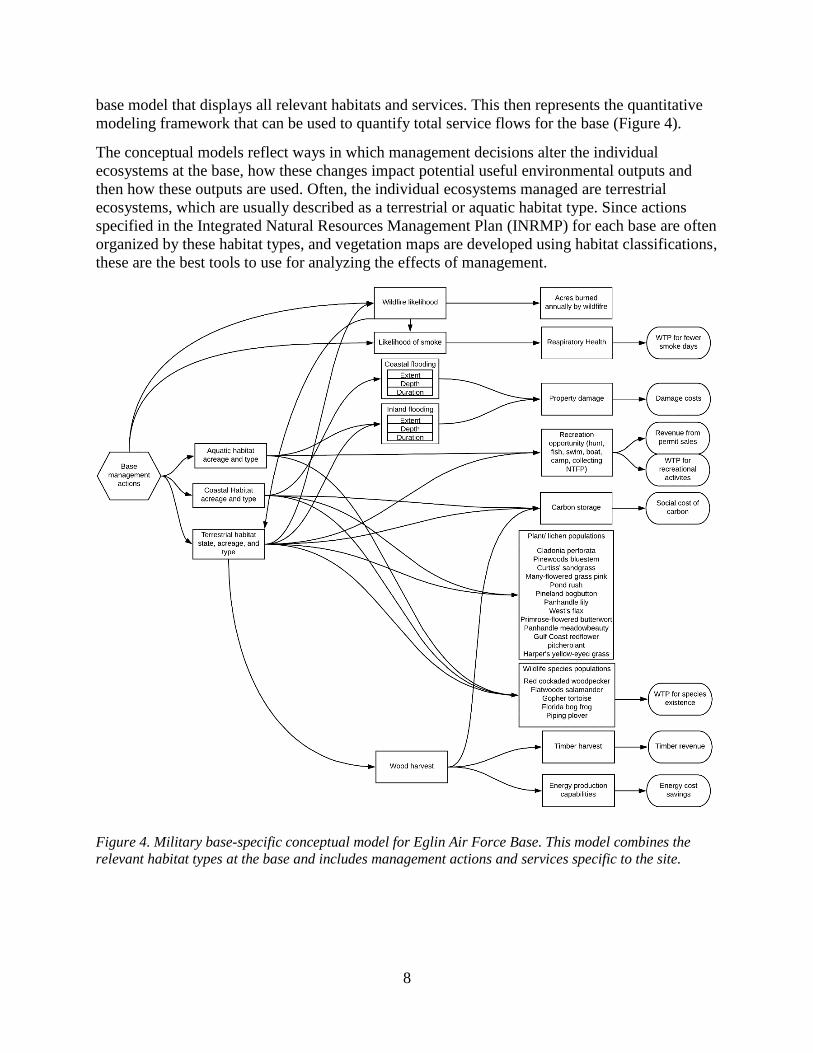
Figure 4. Military base-specific conceptual model for Eglin Air Force Base. This model combines the
relevant habitat types at the base and includes management actions and services specific to the site.
9
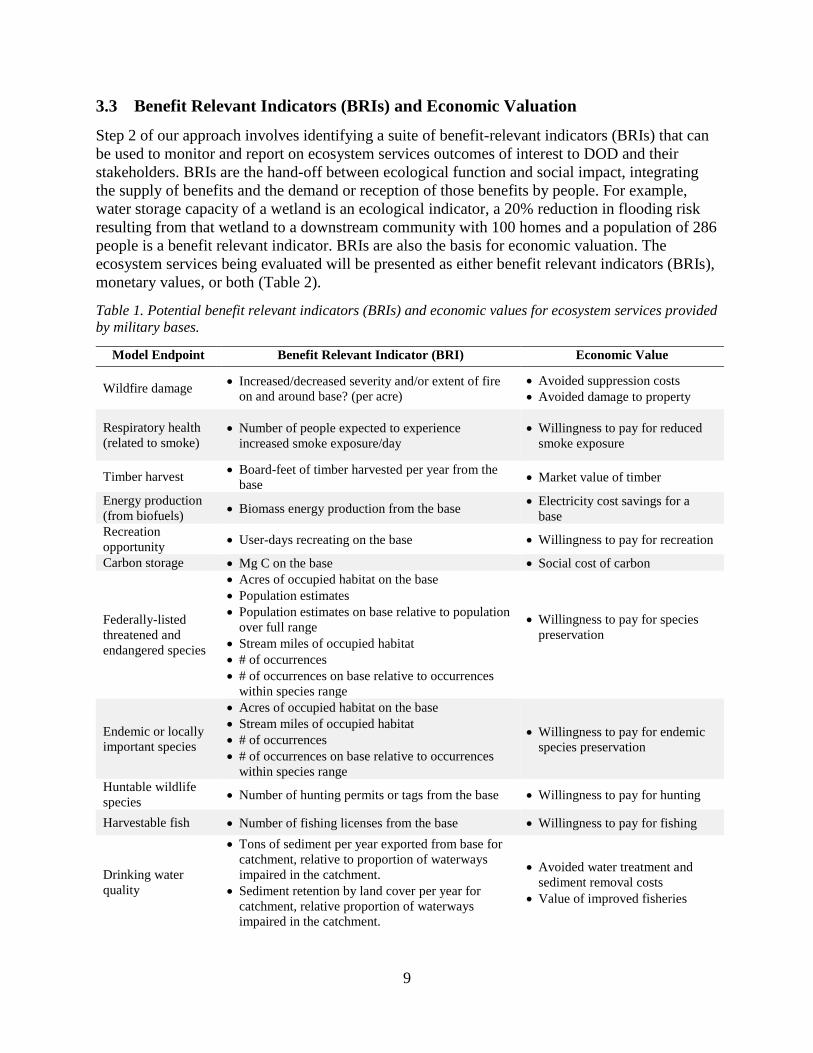
3.3 Benefit Relevant Indicators (BRIs) and Economic Valuation
Step 2 of our approach involves identifying a suite of benefit-relevant indicators (BRIs) that can
be used to monitor and report on ecosystem services outcomes of interest to DOD and their
stakeholders. BRIs are the hand-off between ecological function and social impact, integrating
the supply of benefits and the demand or reception of those benefits by people. For example,
water storage capacity of a wetland is an ecological indicator, a 20% reduction in flooding risk
resulting from that wetland to a downstream community with 100 homes and a population of 286
people is a benefit relevant indicator. BRIs are also the basis for economic valuation. The
ecosystem services being evaluated will be presented as either benefit relevant indicators (BRIs),
monetary values, or both (Table 2).
Table 1. Potential benefit relevant indicators (BRIs) and economic values for ecosystem services provided
by military bases.
Model Endpoint Benefit Relevant Indicator (BRI) Economic Value
Wildfire damage Increased/decreased severity and/or extent of fire
on and around base? (per acre)
Avoided suppression costs
Avoided damage to property
Respiratory health
(related to smoke) Number of people expected to experience
increased smoke exposure/day
Willingness to pay for reduced
smoke exposure
Timber harvest Board-feet of timber harvested per year from the
base Market value of timber
Energy production
(from biofuels) Biomass energy production from the base
Electricity cost savings for a
base
Recreation
opportunity User-days recreating on the base Willingness to pay for recreation
Carbon storage Mg C on the base Social cost of carbon
Federally-listed
threatened and
endangered species
Acres of occupied habitat on the base
Population estimates
Population estimates on base relative to population
over full range
Stream miles of occupied habitat
# of occurrences
# of occurrences on base relative to occurrences
within species range
Willingness to pay for species
preservation
Endemic or locally
important species
Acres of occupied habitat on the base
Stream miles of occupied habitat
# of occurrences
# of occurrences on base relative to occurrences
within species range
Willingness to pay for endemic
species preservation
Huntable wildlife
species Number of hunting permits or tags from the base Willingness to pay for hunting
Harvestable fish Number of fishing licenses from the base Willingness to pay for fishing
Drinking water
quality
Tons of sediment per year exported from base for
catchment, relative to proportion of waterways
impaired in the catchment.
Sediment retention by land cover per year for
catchment, relative proportion of waterways
impaired in the catchment.
Avoided water treatment and
sediment removal costs
Value of improved fisheries
10
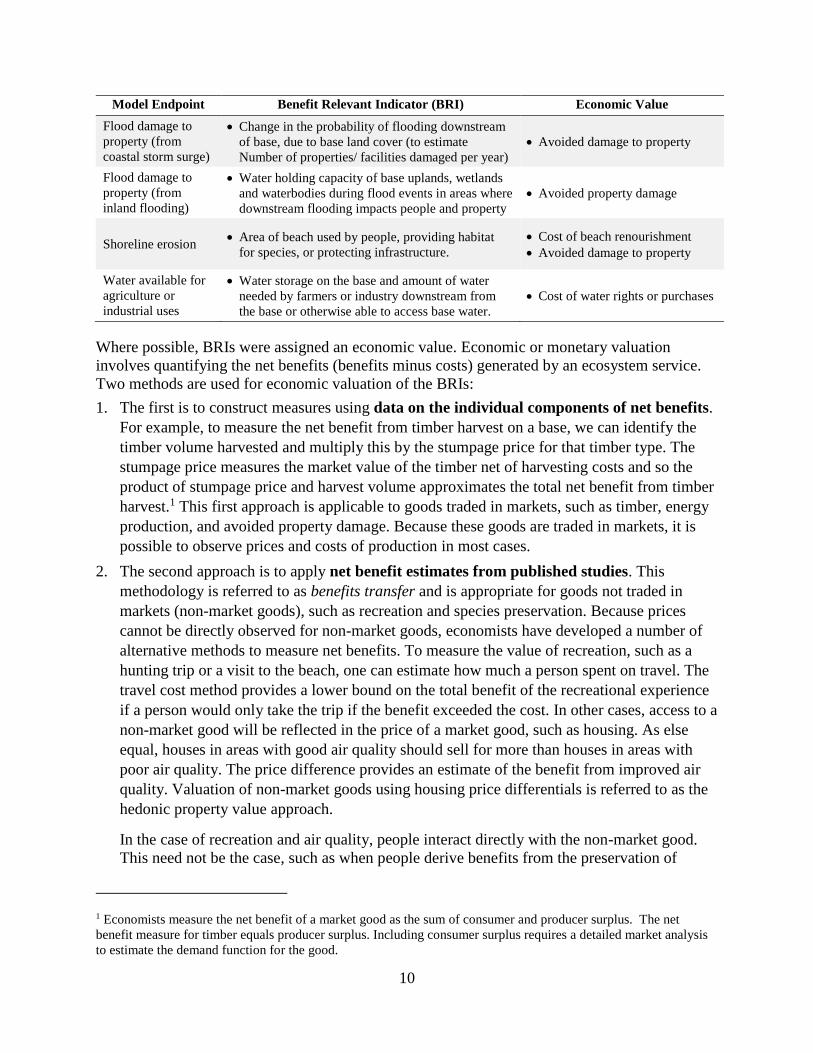
Model Endpoint Benefit Relevant Indicator (BRI) Economic Value
Flood damage to
property (from
coastal storm surge)
Change in the probability of flooding downstream
of base, due to base land cover (to estimate
Number of properties/ facilities damaged per year)
Avoided damage to property
Flood damage to
property (from
inland flooding)
Water holding capacity of base uplands, wetlands
and waterbodies during flood events in areas where
downstream flooding impacts people and property
Avoided property damage
Shoreline erosion Area of beach used by people, providing habitat
for species, or protecting infrastructure.
Cost of beach renourishment
Avoided damage to property
Water available for
agriculture or
industrial uses
Water storage on the base and amount of water
needed by farmers or industry downstream from
the base or otherwise able to access base water.
Cost of water rights or purchases
Where possible, BRIs were assigned an economic value. Economic or monetary valuation
involves quantifying the net benefits (benefits minus costs) generated by an ecosystem service.
Two methods are used for economic valuation of the BRIs:
1. The first is to construct measures using data on the individual components of net benefits.
For example, to measure the net benefit from timber harvest on a base, we can identify the
timber volume harvested and multiply this by the stumpage price for that timber type. The
stumpage price measures the market value of the timber net of harvesting costs and so the
product of stumpage price and harvest volume approximates the total net benefit from timber
harvest.1 This first approach is applicable to goods traded in markets, such as timber, energy
production, and avoided property damage. Because these goods are traded in markets, it is
possible to observe prices and costs of production in most cases.
2. The second approach is to apply net benefit estimates from published studies. This
methodology is referred to as benefits transfer and is appropriate for goods not traded in
markets (non-market goods), such as recreation and species preservation. Because prices
cannot be directly observed for non-market goods, economists have developed a number of
alternative methods to measure net benefits. To measure the value of recreation, such as a
hunting trip or a visit to the beach, one can estimate how much a person spent on travel. The
travel cost method provides a lower bound on the total benefit of the recreational experience
if a person would only take the trip if the benefit exceeded the cost. In other cases, access to a
non-market good will be reflected in the price of a market good, such as housing. As else
equal, houses in areas with good air quality should sell for more than houses in areas with
poor air quality. The price difference provides an estimate of the benefit from improved air
quality. Valuation of non-market goods using housing price differentials is referred to as the
hedonic property value approach.
In the case of recreation and air quality, people interact directly with the non-market good.
This need not be the case, such as when people derive benefits from the preservation of
1 Economists measure the net benefit of a market good as the sum of consumer and producer surplus. The net
benefit measure for timber equals producer surplus. Including consumer surplus requires a detailed market analysis
to estimate the demand function for the good.
11
endangered species. Even if they never interact with the species, people may derive an
existence value simply from the knowledge that the species is preserved. To measure benefits
in this case, economists often use survey methods to elicit hypothetical willingness to pay for
the non-market good. One common approach is referred to as the contingent valuation
method.
Hundreds of studies have been conducted to estimate benefits from recreation, species
preservation, and other non-market goods. Benefits transfer involves applying benefit
estimates from one or more studies to a new setting, making adjustments for the factors such
as demographic characteristics of the population. The USGS Benefit Transfer Toolkit
(https://my.usgs.gov/benefit-transfer/) summarizes benefits estimates from a large number of
U.S. studies on recreation and species preservation, and water quality. Estimates can be
tailored to specific regions, recreational activities types, and land ownership.
3.4 Biophysical Models of Landscape Change
Step 3 of our approach (Identify relevant ecological, social and economic datasets and models
that could be used to transform the conceptual model into a predictive modeling tool) involves
identifying ecological datasets and models that provide ways to quantitatively assess how
military base management affects changes in habitat type and landcover that are represented in
our conceptual models. Once a base-specific conceptual model framework for a particular base
has been created, quantitative methods must be applied to approximate the flows of ecosystem
services through the system (Duggan et al. 2015). The first step requires quantifying the varied
biophysical effects of habitat condition, which is affected by base management actions or the
mere existence of a base. These models are used to quantify the connections between habitat
type, condition, or extent and other ecological outcomes at each base. Three types of biophysical
models were used to quantify landscape change, and to compare with change anticipated with the
current management plan:
1. Current Management: Vegetation condition models to quantify changes in condition
classes based on current management practices over the next 20 years.
2. No Management: Vegetation condition models to quantify changes in condition classes
based on the military not managing the base for anything but training between base
establishment and 20 years from now.
3. No Base: Land use land cover (LULC) change model of major ecosystem types assuming
there were no military base, and evaluation of services provided by this alternative
landscape.
Below, we describe the ecological models that were selected for quantifying landscape change.
Each model includes a description of its relevant application, and then an explanation of how the
model was applied at our pilot site, Eglin Air Force Base. Other biophysical models, such as
those related to water, recreational, or attributes not directly linked to terrestrial land cover, are
included below under the section for the relevant ecosystem service.
3.4.1 No-Base Scenario
To quantify ecosystem services produced by a base as compared to a scenario where no base
exists requires developing a plausible estimate of what this land would be if it were not a base (a
12
plausible counterfactual). To develop this, a modeling technique was used that uses existing land
use and cover around the base.
To generate infilled maps of potential land use / land cover patterns which are consistent with the
surrounding area, we employed the direct sampling algorithm (Mariethoz and Renard, 2010;
Meerschman et al., 2013), a probabilistic approach in which we subsample from training data to
generate a plausible counterfactual. In effect, this algorithm samples from a conditional
distribution over possible infills by identifying existing patches of training data which are
consistent with the partial observation.
In practical terms, the direct sampling approach requires iteratively matching partially-filled
regions with completely filled regions which are close matches. This matching process is
achieved by defining a distance function between image subregions and searching for a
sufficiently close match in the existing data. In this instance, we used the edit distance, defined
as the number of entries in each pair of compared patches which differ in their values.
A key advantage of this approach is that it allows us to sample from high-dimensional
distributions over the geometry and prevalence of different land use / land cover patches without
enumerating an explicit probability model as done when employing universal kriging or Markov
random fields. The resulting output is either a map, or a set of probable land use / land cover
values, which can be averaged over a number of runs. These values were used as the starting
current conditions of a no base scenario to determine ecosystem service values using our
biophysical models and BRIs. Because of how differently public and private forest lands are
managed in the US, the forested lands in the Counterfactual No-Base scenario were separated
into public and private forest classes, using the direct sampling approach to other land use / land
cover classes.
3.4.2 Vegetation Condition Models
3.4.2.1 Terrestrial Vegetation Models
Terrestrial ecosystems are comprised of complex vegetation communities that are shaped by
climate, external events such as windstorms and fire, plant and animal species interactions, and
management such as fire management or timber harvest. For instance, a longleaf forest can be
composed of 500-year old, widely spaced large longleaf pines with a native wiregrass understory
that is maintained by frequent ground fires and provides high quality habitat for many species.
Alternatively, this same forest type can be a 50-year old, closed canopy forest of slash and sand
pine with a thick, fire resistant understory. These forests can also be harvested for timber, leaving
few or no mature trees. These three very different conditions or “states” of the same forest type
each provide very different services.
State-and-transition models characterize dynamic vegetation systems by combinations of
vegetation composition and structure (boxes), and transitions that cause change such as
disturbances (e.g., wildfire) or management activities (e.g., prescribed fire) (arrows). These
models can be parameterized with probability values for each transition type to form state-and-
transition simulation models (STSMs) that project changes in vegetation condition over time
(Daniel et al. 2016). We used STSMs to project the effects of vegetation succession and growth,
disturbances such as wildfire and insect outbreaks, and management actions such as prescribed
fire and timber harvest on future vegetation condition. The LANDFIRE Project has developed
STSMs describing historic conditions for all the terrestrial ecosystem types in the U.S., along
13
with maps of biophysical settings, existing condition maps, and other data on fire risk and fuels.
These STSMs can be modified to capture current conditions and incorporate the effects of
management actions. The open source ST-Sim software then simulates future conditions through
Monte Carlo simulations. Where ecosystem services are tied to vegetation condition, these future
outputs can then be used to measure the available services provided under a certain scenario or
suite of management actions.
While STSMs are the tool we used to characterize changes in services tied to terrestrial
vegetation condition, the MoTIVES integrated ecosystem services modeling framework is
general enough that if a military installation has access to alternative or more complex vegetation
models linking management to ecological outcomes, these can be used to replace STSMs. For
example, the Landis-II forest landscape model (Scheller et al. 2007) has been applied at Fort
Lewis-McChord in Washington and Fort Bragg in North Carolina. Landis is a complex forest
vegetation model which requires more calibration than STSMs, but which generates more
sophisticated outputs related to forest species composition, carbon, timber, and species habitat.
STSMs provide outputs describing the amount of area occupied by each state or vegetation
condition type on a bases under a set of management actions. These area estimates can be tied to
certain ecosystem services such as species habitat that is dependent on vegetation condition, and
thus can be used to derive a subset of the BRIs provided on a base. When run under alternative
management scenarios (e.g., no management or current management), outcomes can be
compared to determine the value of management on the base.
Although they are useful for comparing management scenarios and require minimal
parametrization, STSMs are very generic models that simplify complex vegetation communities
into a few states. Information required to parameterize these models often comes from expert
judgment, as data are usually not available to define transition probabilities across large
landscapes. Linking vegetation states to conditions such as wildlife habitat or carbon is similarly
difficult to define quantitatively and often relies on expert judgment.
3.4.2.1.1 Longleaf Pine Vegetation Condition Model for Eglin Air Force Base
Most of the land base on Eglin consists of sandhill and flatwood longleaf pine forests or
woodlands, covering more than three quarters of the base (148,600 hectares). The longleaf pine
ecosystem has been well studied, and vegetation dynamics of the longleaf pine ecosystem were
simulated using a STSM adapted from Costanza et al (2015) (Figure 5). This STSM captures
growth and succession, wildfire, prescribed fire and other management activities under
contemporary conditions, modified from a LANDFIRE model representing historic conditions.
The STSM contains five state classes varying in age and stand closure. As described in the
vegetation modeling section, the STSM simulates change over time based on transition
probabilities of different events, including management such as prescribed fire. Modifications
were made to the model to adapt it to Eglin, including reducing wildfire to 10% of historic
probabilities based on fire data supplied by the base, reducing the effectiveness of prescribed fire
in closed stands based on discussions with the Eglin fire ecologist, and eliminating management
practices not used at Eglin (e.g., clearcutting, conversion from plantations). Due to the relatively
small size of most riparian forests at Eglin, these were not modeled using STSMs.
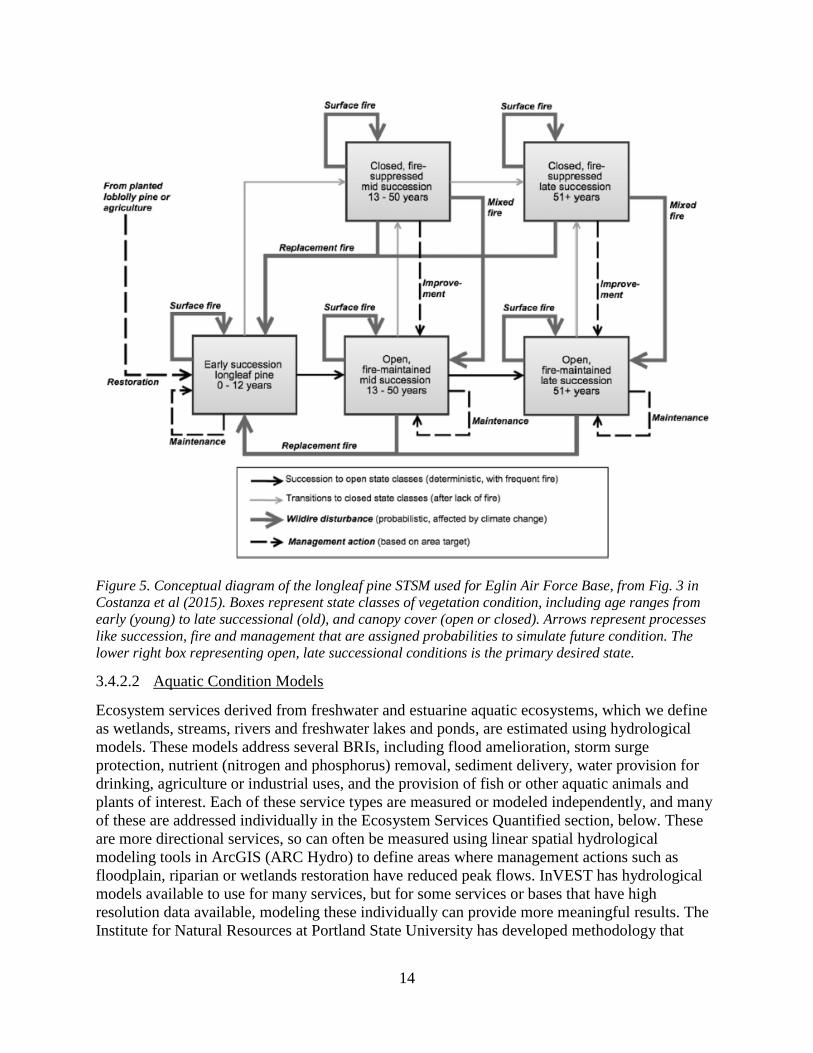
14
Figure 5. Conceptual diagram of the longleaf pine STSM used for Eglin Air Force Base, from Fig. 3 in
Costanza et al (2015). Boxes represent state classes of vegetation condition, including age ranges from
early (young) to late successional (old), and canopy cover (open or closed). Arrows represent processes
like succession, fire and management that are assigned probabilities to simulate future condition. The
lower right box representing open, late successional conditions is the primary desired state.
3.4.2.2 Aquatic Condition Models
Ecosystem services derived from freshwater and estuarine aquatic ecosystems, which we define
as wetlands, streams, rivers and freshwater lakes and ponds, are estimated using hydrological
models. These models address several BRIs, including flood amelioration, storm surge
protection, nutrient (nitrogen and phosphorus) removal, sediment delivery, water provision for
drinking, agriculture or industrial uses, and the provision of fish or other aquatic animals and
plants of interest. Each of these service types are measured or modeled independently, and many
of these are addressed individually in the Ecosystem Services Quantified section, below. These
are more directional services, so can often be measured using linear spatial hydrological
modeling tools in ArcGIS (ARC Hydro) to define areas where management actions such as
floodplain, riparian or wetlands restoration have reduced peak flows. InVEST has hydrological
models available to use for many services, but for some services or bases that have high
resolution data available, modeling these individually can provide more meaningful results. The
Institute for Natural Resources at Portland State University has developed methodology that
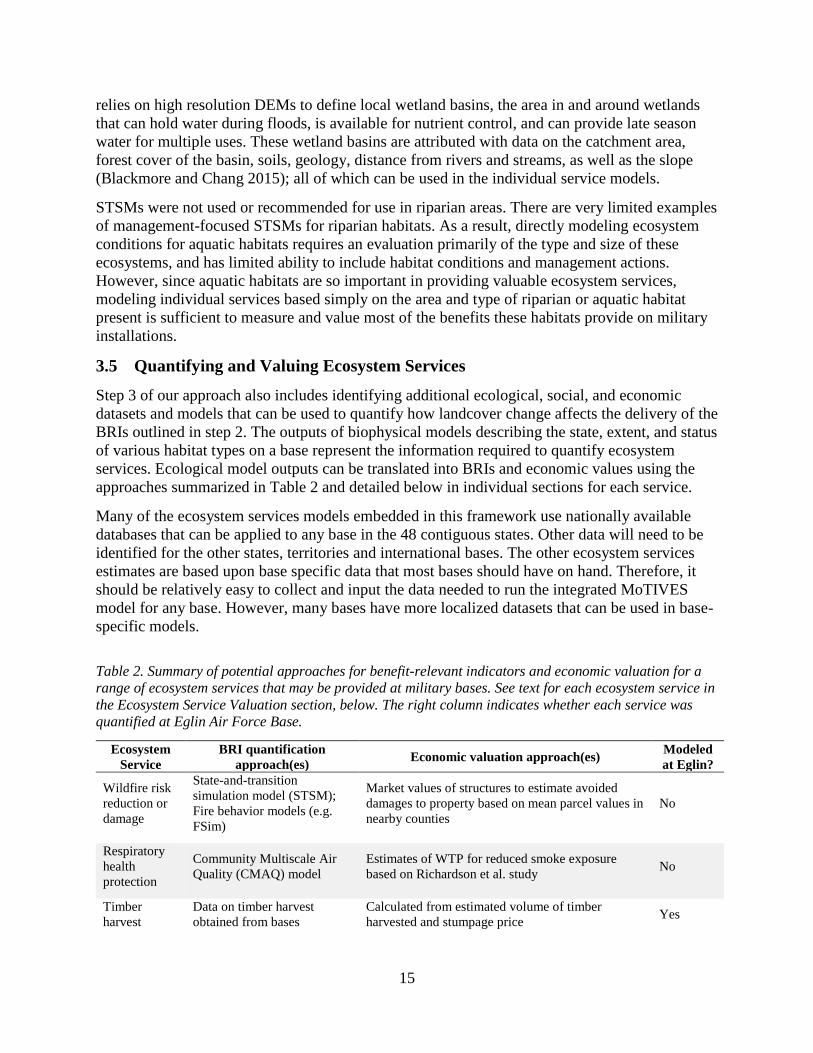
15
relies on high resolution DEMs to define local wetland basins, the area in and around wetlands
that can hold water during floods, is available for nutrient control, and can provide late season
water for multiple uses. These wetland basins are attributed with data on the catchment area,
forest cover of the basin, soils, geology, distance from rivers and streams, as well as the slope
(Blackmore and Chang 2015); all of which can be used in the individual service models.
STSMs were not used or recommended for use in riparian areas. There are very limited examples
of management-focused STSMs for riparian habitats. As a result, directly modeling ecosystem
conditions for aquatic habitats requires an evaluation primarily of the type and size of these
ecosystems, and has limited ability to include habitat conditions and management actions.
However, since aquatic habitats are so important in providing valuable ecosystem services,
modeling individual services based simply on the area and type of riparian or aquatic habitat
present is sufficient to measure and value most of the benefits these habitats provide on military
installations.
3.5 Quantifying and Valuing Ecosystem Services
Step 3 of our approach also includes identifying additional ecological, social, and economic
datasets and models that can be used to quantify how landcover change affects the delivery of the
BRIs outlined in step 2. The outputs of biophysical models describing the state, extent, and status
of various habitat types on a base represent the information required to quantify ecosystem
services. Ecological model outputs can be translated into BRIs and economic values using the
approaches summarized in Table 2 and detailed below in individual sections for each service.
Many of the ecosystem services models embedded in this framework use nationally available
databases that can be applied to any base in the 48 contiguous states. Other data will need to be
identified for the other states, territories and international bases. The other ecosystem services
estimates are based upon base specific data that most bases should have on hand. Therefore, it
should be relatively easy to collect and input the data needed to run the integrated MoTIVES
model for any base. However, many bases have more localized datasets that can be used in base-
specific models.
Table 2. Summary of potential approaches for benefit-relevant indicators and economic valuation for a
range of ecosystem services that may be provided at military bases. See text for each ecosystem service in
the Ecosystem Service Valuation section, below. The right column indicates whether each service was
quantified at Eglin Air Force Base.
Ecosystem
Service
BRI quantification
approach(es) Economic valuation approach(es)
Modeled
at Eglin?
Wildfire risk
reduction or
damage
State-and-transition
simulation model (STSM);
Fire behavior models (e.g.
FSim)
Market values of structures to estimate avoided
damages to property based on mean parcel values in
nearby counties
No
Respiratory
health
protection
Community Multiscale Air
Quality (CMAQ) model
Estimates of WTP for reduced smoke exposure
based on Richardson et al. study No
Timber
harvest
Data on timber harvest
obtained from bases
Calculated from estimated volume of timber
harvested and stumpage price Yes
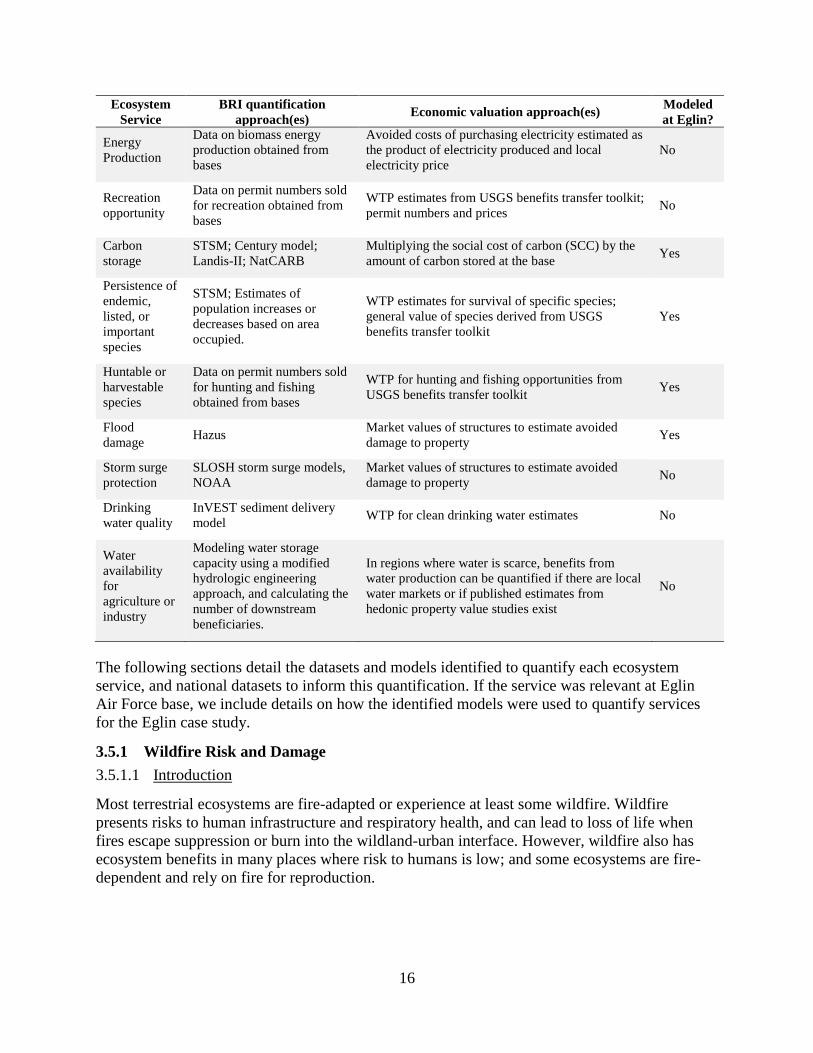
16
Ecosystem
Service
BRI quantification
approach(es) Economic valuation approach(es)
Modeled
at Eglin?
Energy
Production
Data on biomass energy
production obtained from
bases
Avoided costs of purchasing electricity estimated as
the product of electricity produced and local
electricity price
No
Recreation
opportunity
Data on permit numbers sold
for recreation obtained from
bases
WTP estimates from USGS benefits transfer toolkit;
permit numbers and prices No
Carbon
storage
STSM; Century model;
Landis-II; NatCARB
Multiplying the social cost of carbon (SCC) by the
amount of carbon stored at the base Yes
Persistence of
endemic,
listed, or
important
species
STSM; Estimates of
population increases or
decreases based on area
occupied.
WTP estimates for survival of specific species;
general value of species derived from USGS
benefits transfer toolkit
Yes
Huntable or
harvestable
species
Data on permit numbers sold
for hunting and fishing
obtained from bases
WTP for hunting and fishing opportunities from
USGS benefits transfer toolkit Yes
Flood
damage Hazus
Market values of structures to estimate avoided
damage to property Yes
Storm surge
protection
SLOSH storm surge models,
NOAA
Market values of structures to estimate avoided
damage to property No
Drinking
water quality
InVEST sediment delivery
model WTP for clean drinking water estimates No
Water
availability
for
agriculture or
industry
Modeling water storage
capacity using a modified
hydrologic engineering
approach, and calculating the
number of downstream
beneficiaries.
In regions where water is scarce, benefits from
water production can be quantified if there are local
water markets or if published estimates from
hedonic property value studies exist
No
The following sections detail the datasets and models identified to quantify each ecosystem
service, and national datasets to inform this quantification. If the service was relevant at Eglin
Air Force base, we include details on how the identified models were used to quantify services
for the Eglin case study.
3.5.1 Wildfire Risk and Damage
3.5.1.1 Introduction
Most terrestrial ecosystems are fire-adapted or experience at least some wildfire. Wildfire
presents risks to human infrastructure and respiratory health, and can lead to loss of life when
fires escape suppression or burn into the wildland-urban interface. However, wildfire also has
ecosystem benefits in many places where risk to humans is low; and some ecosystems are fire-
dependent and rely on fire for reproduction.
17
3.5.1.2 National Datasets or Models Available
Wildfire monitoring via satellites is carried out across the US by multiple agencies. The
Monitoring Trends in Burn Severity (MTBS) program monitors wildfire perimeters and
estimates burn severity within wildfire areas, which can be viewed through an interactive map or
downloaded. Other sources of national data include the GeoMAC Wildland Fire Support web
portal and National Interagency Fire Center. Many state forestry or natural resource agencies
also track fire starts, even if fires are not large enough to be mapped using satellites.
There are many modeling platforms that simulate wildfire behavior and effects. A variety of
landscape simulation models such as ST-Sim and LANDIS-II have been used to simulate
landscape effects of wildfire, along with other processes such as vegetation succession and
management activities. More detailed fire behavior modes such as FSim (Finney et al. 2011) and
FARSITE can simulate the behavior and severity of a wildfire without accounting for changing
vegetation condition or management actions. The LANDFIRE program also has developed
models and maps of fire risk and fuels across the country, which are readily available online.
3.5.1.3 Generation of BRIs and Economic Values
Market values of structures are used to estimate the avoided damage to property from wildfires.
Average property values in an area are estimated by local assessors and available in a national
proprietary database from CoreLogic. In some cases, management of bases will resulted in
avoided wildfire suppression costs. Regional estimates of suppression costs can be derived from
Situation Reports to the National Wildfire Coordinating Group.
3.5.1.4 Models and Data Used at Eglin Air Force Base
Most military bases have high-quality, accurate records of wildfire within the military
installation. At Eglin, base natural resource personnel provided records of acres burned on the
base over the last 20 years. The average over the recorded period was considered the current
level of wildfire on the base and used to adjust the probability of wildfire in the vegetation
condition models. Over the period of 2009-2018, an average of 3206 ha burned in wildfires per
year at Eglin (not including prescribed fire, which far exceeded this total).
3.5.2 Respiratory Health
3.5.2.1 Introduction
Wildfire smoke is a major source of air pollution in many areas of the country, particularly in fire
maintained or fire prone ecosystems of the southeast, south central and western U.S. where many
military bases occur. Because fires can be so damaging to people, their property, and the fiber,
fuel, livestock forage, or wood products they can generate, wildfires have been suppressed
wherever possible for almost 100 years. As a result, many of the forests have had excessive fuels
build up, increasing the potential for catastrophic damages as were seen in California in 2018,
and massive wildfires, such as those in British Columbia, Idaho and Washington that created air
quality problems in all of the major metropolitan areas along the west coast. The combination of
fuels removals, thinning, and prescribed burns are used by managers to reduce the wildfire risk,
as well as to reduce the fire damages and smoke released from wildfires that occur.
Prescribed burns can reduce the risks of wildfire on the base and the risk of property damage
from wildfires. However, the constituents of the smoke from both prescribed burns and wildfires,
18
including carbon monoxide, nitrogen oxides, volatile organic compounds, particulate matter,
sulfur dioxide, and ammonia, can cause respiratory issues for residents of the communities
surrounding the base. The risk of smoke-related respiratory impacts can be valued using the
reported willingness to pay to reduce exposure to poor air quality days from the smoke.
3.5.2.2 National Datasets or Models Available
Some of same national datasets as listed under the Wildfire Risk and Damage section, above, are
relevant to respiratory health associated with wildfires and prescribed fires. Other resources such
as the National Oceanic and Atmospheric Administration (NOAA) Smoke Forecasting System
may also be used, but limited options are available for longer-term modeling as needed for
scenario analysis.
3.5.2.3 Generation of BRIs and Economic Values
Recent research has suggested a value of $84.42 per person per day impacted by wildfire smoke
(2012 $) (Richardson et al. 2012). Past work suggested a range of $36 to $129 for a variety of
related symptoms such ranging from mild cough to severe asthma, though this work was not
specific to the context of wildfires and related smoke exposure (1997 $) (Johnson et al. 1997).
We would then actualize these values to 2018 $ and consider a triangular distribution (min:
56.32; max: 201.82; mode: 92.33) of dollars per person per day of smoke exposure.
3.5.2.4 Models and Data Used at Eglin Air Force Base
Wildfires and prescribed burns impact an uncertain number of people as a function of local
population density and smoke plume shape and direction. Plume characteristics in turn depend
on meteorological variables which vary throughout the year. We consider the number of people
impacted by a given fire to be a randomly distributed variable calculated by simulating fires
throughout the year and overlaying plume shape with local Census data (United States Census
Bureau 2018). We consider impacted populations to be those exceeding EPA reference doses for
particulate matter (US EPA 2016). To predict the extent and composition of potential smoke
plumes, we will use the BlueSky framework and the Community Multiscale Air Quality
(CMAQ) model (US EPA 2019). The BlueSky framework establishes emissions based on
vegetation-specific emission factors. For these, we use the values from the STSM model of
vegetation condition.
We consider the valuation described in Section 3.5.2.3: 56.32 (range: 92.33–201.82) $/exposed
person/day.
By running these numerical models within a probabilistic environment, we can characterize
ranges of impacts over meteorological conditions and explore sensitivity in valued outcomes to
underlying physical parameters. For example, past work has suggested that CMAQ may
underestimate plume height and overestimate impacts (Liu et al. 2010). Our analysis can
quantify the implications for ecosystem service valuations of such model uncertainties. While the
Community Multiscale Air Quality (CMAQ) model (US EPA 2019) was identified for use at
Eglin, but the limited project timeline did not allow the team to parameterize and run the model
and include the results in the final report.
19
3.5.3 Timber Harvest
3.5.3.1 Introduction
Many of the forested bases have programs to manage the forest resources, either to restore
ecosystems supporting at-risk species or wildlife, to maintain conditions suitable for training, or
to provide timber to support local mills and generate revenue. Many types of timber products
result in trees being cut and sold, providing jobs for the community, material to generate wood
products, paper or biofuel. All of these are ecosystem services which can be measured and
valued.
3.5.3.2 National Datasets or Models Available
A variety of landscape simulation models such as ST-Sim and LANDIS-II have been used to
simulate scenarios of varying timber harvest across large forested areas, along with other
processes such as vegetation succession and wildfire. Other simulation models such as the Forest
Vegetation Simulator model tree growth and harvest prescriptions at the stand scale.
Almost all forested bases have vegetation maps, and many have detailed Light Detection and
Ranging (LiDAR) maps, which together generate comprehensive information on the cover and
size of the forest resources at the bases. In addition, all bases track timber sales and permits to
remove trees and forest products, as well as the income generated.
3.5.3.3 Generation of BRIs and Economic Values
Net benefits from timber harvests are estimated as the product of timber volume and stumpage
price. A stumpage price measures the market value of timber net of harvesting costs. Region-
and species-specific estimates are available from U.S. Forest Service and state-level reports as
well as proprietary databases (e.g., TimberMart-South).
3.5.3.4 Models and Data Used at Eglin Air Force Base
At Eglin, timber harvest was simulated in the STSM as a restoration activity, but not for revenue
generation. Instead, records from the base were used to determine the volume of timber being
harvested under current base management. The no management scenario assumes that no timber
management or timber sales would occur at the base, so no timber value is generated.
For the no base scenario, the forest landcover was identified as either private or public forest
lands. The majority of lands were privately owned, managed as industrial private timberlands,
while the small areas of public forest lands were assumed to be parks or natural areas with no
management. The amount and value of the timber generated by the private industrial forest lands
was determined based on Susaeta and Gong (2019), who provide a methodology for estimating
the income generated by intensive loblolly pine timber production on longleaf pine habitat in the
southeastern U.S. The paper notes that timber production varies extensively based on the site
productivity as defined by the site index, which ranged from 19 for the least productive longleaf
pine sites, to 35 for the most productive. We used a moderate site index of 27, as the soils are
quite sandy, typical of longleaf sandhills,
20
3.5.4 Renewable Energy Production
3.5.4.1 Introduction
Bioenergy and solar power are produced at many bases, while wind energy is generated at a few.
All of the energy generated reduces the power needs for base operations, and at a few bases in
desert ecosystems solar power produced by bases can provide power needed for nearby
communities. Because of the significant benefits of increased renewable energy production,
these are important ecosystem services, which can be readily measured.
3.5.4.2 National Datasets or Models Available
The same models used to describe tree growth and forest management can be used to model the
generation of materials to use in bioenergy facilities. Currently, models to evaluate the potential
of lands to generate solar or wind power have been developed locally, but due to tradeoffs
related to competition for other land uses, or impacts to birds and wildlife, these are not available
nationally or even regionally.
3.5.4.3 Generation of BRIs and Economic Values
The benefit of bioenergy generated on a base is the avoided costs of purchasing electricity from
the grid. The benefit can be estimated as the product of electricity produced and the local
electricity price, which is available from https://www.electricitylocal.com/states/.
3.5.4.4 Models and Data Used at Eglin Air Force Base
All bases generating bioenergy or solar energy track the amount of the energy produced, and the
benefits in energy savings or sales that result from this generation. At Eglin, a bioenergy facility
is currently under construction, but since it is not operational yet we did not include it in any of
our scenarios.
3.5.5 Hunting and Fishing
3.5.5.1 Introduction
Hunting and fishing recreational opportunities are provided by many military installations, and
are often easily tracked and valued. All of the four bases evaluated in this study allowed some
access for both hunting and fishing, and the INRMP or management documents indicated
extensive use, in spite of permit requirements and their associated costs.
3.5.5.2 National Datasets or Models Available
In general, hunting and fishing are managed by state fish and wildlife agencies. Federal agencies
that manage lands generally work with their state agency to track hunting and fishing, and often
to establish license fees. Individual states and bases all post these fees, and most track usage.
3.5.5.3 Generation of BRIs and Economic Values
Willingness to pay estimates are available from published studies on the value of hunting and
fishing and assembled in the USGS Benefits Transfer Toolkit. These estimates can be applied to
specific locations of bases and recreational activities. Alternatively, data on the number of
hunting and fishing permits issued, the cost of each of these obtained from reasonably up-to-date
21
INRMPs for most bases, which can be used directly as a measure of the willingness to pay for
this type of recreation.
Regardless of whether the USGS Benefits Transfer Toolkit, or actual information from INRMP
or base natural resources management staff, the base information needed is the number and cost
individual permits issued each year. The value of these permits is the lower bound value, and
does provide an estimate of the revenue provided to the base. It can also be used to provide an
indication of the number of recreational days spent on the base hunting and fishing, which can be
multiplied times the Benefits Transfer value for these activities and translated into a willingness
to pay. If both the permits and willingness to pay are used, it is important to disaggregate them
into relevant types of recreation, such as permit revenue and where possible estimate willingness
to pay for hunting different species or fishing.
3.5.5.4 Models and Data Used at Eglin Air Force Base
Hunting opportunities are permitted activities, and every base tracks the number of permits and
the income these permits generates. This information is usually included in base INRMP
documents. At Eglin, we estimated the annual value of deer hunting and fishing from base
records. In 2018, approximately 8700 hunting and 6600 fishing permits were sold. We used the
number of permits as a proxy for the number of individuals who hunted and fished. The permits
alone generated approximately $262,680 per year to support base management, based on an
average hunting permit cost of $26.40 and fishing permit cost of $5.00.
Florida deer hunters spend an average of 22 days per year hunting, and fishers spend an average
of 19 days per year according to U.S. Fish and Wildlife data. A study by Aiken (2009) finds a
willingness to pay of $207 per person per day for deer hunting in Florida and $86 per person per
day for fishing. This translates into total annual benefits of $40 million for hunting and $11
million for fishing at Eglin.
Only the special use permits and camping permits are not specifically designed to support
hunting and fishing, and it is likely that some of the camping that occurs is hunting or fishing
related. As a result, these benefits are quite a bit more easily measured and valued then is beach
use, hiking or bird watching.
3.5.6 Recreation Opportunity
3.5.6.1 Introduction
Other recreation opportunities besides hunting and fishing (see above) are often supported by
military installations, including hiking, horseback riding, wildlife viewing, boating and
bicycling. Coastal bases often provide opportunities for swimming, sun bathing, and other beach
activities.
3.5.6.2 National Datasets or Models Available
Every state generates a state comprehensive outdoor recreation plan which describes the state’s
plan for meeting its outdoor recreation needs. These reports often include information on the
values and benefits of outdoor recreation, and often consider military bases as recreational lands,
as Florida’s SCORP plan does with Eglin.
22
3.5.6.3 Generation of BRIs and Economic Values for Recreation
Willingness to pay estimates are available from published studies on the value of recreational
activities and assembled in the USGS Benefits Transfer Toolkit. These estimates will be applied
to specific locations of bases and recreational activities.
3.5.6.4 Models and Data Used at Eglin Air Force Base
Almost all bases track and permit recreational uses. The major recreation activities on many
bases are hunting and fishing, which can be tracked and valued based on permits and tags
provided (see section above). Other recreation types, particularly activities such as biking,
hiking, bird watching, swimming, canoeing or kayaking can be more difficult to monitor and
value. However, we were unable to quantify these non-hunting or fishing recreational activities
at Eglin under the time constraints of this project.
3.5.7 Carbon Storage
3.5.7.1 Introduction
Many military bases provide broad areas with natural vegetation, which may provide substantial
carbon storage potential. Carbon can be stored in live vegetation, dead vegetation and soils, and
carbon storage potential varies widely across vegetation types and climate zones. Carbon storage
can also vary with management actions and vegetation condition – for instance, old, structurally
complex forests store more carbon than young stands. In many ecosystems there is a trade-off
between long-term carbon storage in the ecosystem and removal of carbon from management
activities such as timber harvest, or disturbances such as wildfire. Carbon storage is one benefit
of intact natural ecosystems that is important to quantify for military bases.
3.5.7.2 National Datasets and Models Available
A number of maps and models are available to estimate carbon storage across large landscapes.
Some of these estimate ecosystem total carbon storage, including above-ground, below-ground,
live and dead pools of carbon, and others estimate only above-ground carbon. Nation-wide
efforts such as the NATCARB project from the US Department of Energy and LandCarbon
project from the USGS provide nationally consistent maps of carbon storage based primarily on
broad approximations of land use/land cover or vegetation type. Nationally, the InVEST has
developed a carbon storage and sequestration model tying land use maps and other carbon pools
to estimate the amount of carbon stored in an area at any given time for both terrestrial carbon
and blue carbon in marine and coastal systems. For terrestrial habitat types, LANDFIRE also has
data and models with links to above ground carbon outputs. However, these approximations
generally do not account for growth, and compare changes based largely on land use changes.
The CENTURY model can be used to simulate changes in above- and below-ground carbon, and
forms the basis for some of the other landscape-scale models that simulate soil carbon (e.g. some
modules of Landis-II model). Since the largest terrestrial carbon stores tend to occur in forests,
much of the focus of carbon modeling has been directed to reforestation, forest management, or
protection. LiDAR can be used to determine detailed structural attributes of forested vegetation,
and is increasingly available across the country. For some regions (e.g., the Pacific Northwest),
maps of forest structure based on imputation of US Forest Service forest inventory data are
available and account for detailed differences in forest structure and composition (Ohmann and
Gregory, 2002; Bell et al. 2018).
23
All of these models are limited by the quality of the data that informs the model, as well as be
research that reflects growth rates of different vegetation types, particularly forests, in varied
locations. There are very few studies that characterize how soil carbon levels vary with
management, and since the few studies that measure carbon indicate that there may be as much
or more carbon in the soils than is found in the canopy, not including this information decreases
the utility of the analysis. In addition, most models have limited ability to predict above ground
biomass increases over time, using linear growth rates to calculate change over time, rather than
the more complex curves that reflect actual increases of carbon for regenerating forests. More
generalized carbon maps or models will be sufficient for assessing tradeoffs in more generalized
scenarios (e.g., presence of a base vs no base) but may not be optimal for assessing the impacts
of base management, which largely changes the composition and structure of the vegetation.
3.5.7.3 Generation of BRIs and Economic Values
Carbon dioxide (CO2) is a global pollutant, which implies that the value of reducing atmospheric
concentrations of CO2 is the same regardless of where carbon storage occurs. Global damages of
carbon emissions have been valued using the “Social Cost of Carbon” (SCC), which we adopt to
value the benefits of carbon sequestration at Eglin. The U.S. Interagency Working Group on
Social Cost of Greenhouse Gases has estimated the SCC at $12 (95% confidence interval: $1–
$43) per metric ton of CO2 for the year 2020 and assuming a discount rate of 5%. We adopt this
valuation to quantify the benefits of carbon sequestration at Eglin.
3.5.7.4 Models and Data Used at Eglin Air Force Base
Many bases have a relatively recent LiDAR dataset which provides detailed information on
vegetation structure that is more convertible to above ground carbon and will reflect changes to
vegetation structure and composition based on management. At Eglin, we used the STSM
vegetation condition models to determine the structure and composition of longleaf pine forests
across the base under each scenario, and used published literature (Becker 2011, Samuelson et al
2014) to estimate the carbon storage in each model state based on stand age and structure. We
only captured change in above-ground carbon storage at Eglin.
As mentioned above, the vast majority of carbon in longleaf pine is stored underground in soils,
but we did not have good information on how soil carbon would change under varying land uses
in the no base scenario, so we did not include soil carbon in the analysis. Recent studies
(Samuelson et al. 2017) provide details on above ground and soil carbon for military bases in
longleaf pine habitats in the southeastern under various conditions. These studies have generated
complex models which, in a longer term project, could be incorporated into MoTIVES by linking
them into our STSM models. We also did not capture “blue carbon” at Eglin, carbon that is
stored in coastal and wetland habitats. See the section above for more information on models that
can capture these carbon stores, such as InVEST.
3.5.8 Listed, Endemic or Locally Important Species
3.5.8.1 Introduction
Management to protect or restore habitat for at-risk species is an important part of the natural
resources management plans at many bases. Military installations often provide critical habitat
for threatened and endangered species and the large buffers needed to protect surrounding
communities from live fire training often also provide important habitat for a variety of plant and
24
animal species. Bases often occur in areas that would otherwise be developed for housing,
agriculture or industry, making them refuges for declining species. The US values endangered
species sufficiently to have created strong laws to assure their protection and to allocate
resources for their recovery. As a result, most bases have permanent biologists to monitor
populations of at-risk species and assure there is biology expertise available to help make natural
resources management decisions.
Additionally, many more common species have significant value to people in communities near
the bases, as many military bases allow for hunting, fishing and recreation to occur in non-
sensitive areas. As bases almost always require permits for hunting and fishing, and often charge
for these permits, for this project, species value is measured by the actual revenues obtained from
those hunting and fishing on each bases. This also applies to use of fungi, or the rare allowable
collection of common plants for various uses.
3.5.8.2 National Datasets or Models Available
Information on listed, threatened and endangered species, and other at-risk species, is often
available from state natural heritage programs or the state of fish and wildlife departments.
NatureServe (http://www.natureserve.org) is a national non-profit organization that has
integrated this information across the country, and can provide national scale data if needed to
work across multiple states. NatureServe has worked with the DOD, and is currently undertaking
an effort in partnership with ESRI and The Nature Conservancy to create more accurate species
distribution models for all at-risk species in the U.S. These models, or the individual maps of at-
risk and threatened and endangered species occurrences, both can serve as the needed base data
for this ecosystem service assessment.
If population numbers of species are tracked by base, these numbers can be used to both report
on the productivity of existing management and to link species numbers to existing habitat
conditions. However, models are needed to identify how well the base would supports
populations of the species of interest at each base without any base management, or if the area
had never been a base. There are a few bases in which at-risk species have been studied
sufficiently that a population viability model or an occupancy model has been developed. Where
they exist, they can be used as a source of information for at-risk species production at the base,
and tied directly to management scenarios.
Most rare, endemic or threatened and endangered species found on bases will not have
occupancy or inductive habitat suitability models available, but will be inventoried and mapped
on the base. The observations or occurrences developed from these inventories can be used to
measure to the contribution any base makes to the relative viability of each species, based on the
percentage of occurrences for each species on and off the base. Assessing the actual “existence”
value for a rare or threatened species or for biodiversity overall is difficult, but has been the
focus of research (Richardson and Loomis 2009).
There are many important wildlife species that have not been well studied and are not able to be
linked to a specific STSM state. For these species, basic deductive models developed by the
USGS Gap Analysis Program are available to provide an estimate of where the species are likely
to occur. These models, which have been developed for all terrestrial wildlife species occurring
in the conterminous U.S., are a simple, presence or absence model based on a wildlife habitat
relationship. For habitats, these models use the “Ecological Systems” vegetation classification,
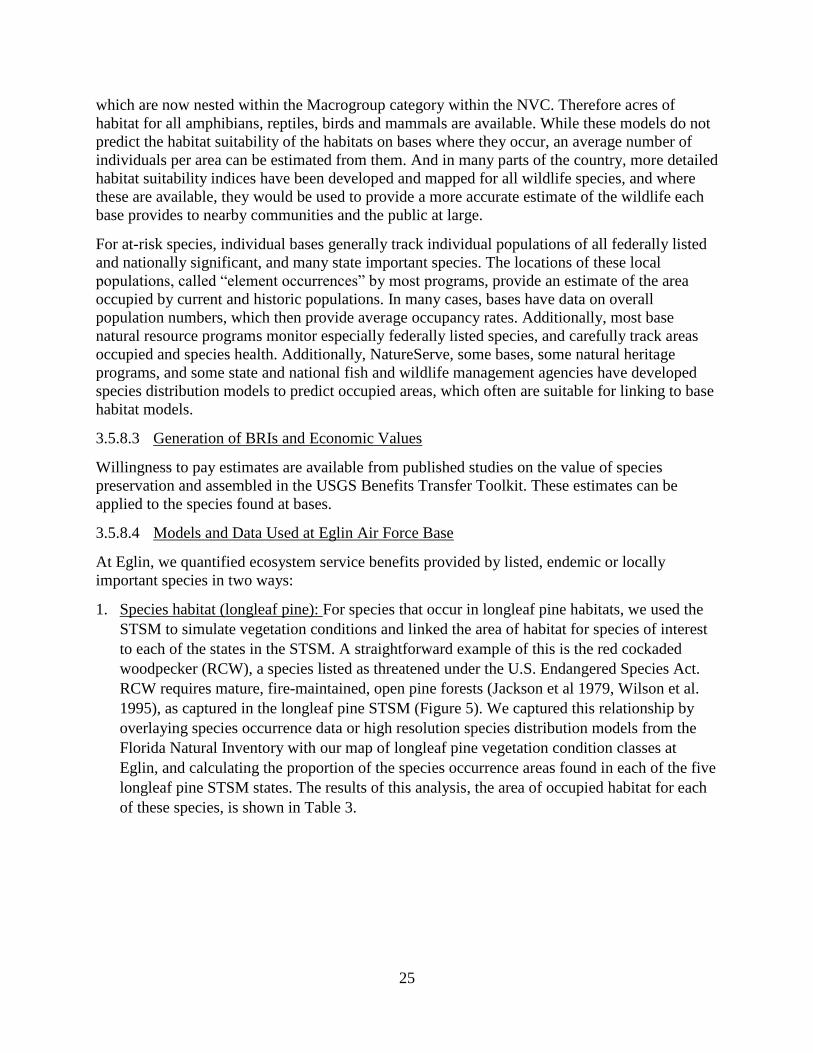
25
which are now nested within the Macrogroup category within the NVC. Therefore acres of
habitat for all amphibians, reptiles, birds and mammals are available. While these models do not
predict the habitat suitability of the habitats on bases where they occur, an average number of
individuals per area can be estimated from them. And in many parts of the country, more detailed
habitat suitability indices have been developed and mapped for all wildlife species, and where
these are available, they would be used to provide a more accurate estimate of the wildlife each
base provides to nearby communities and the public at large.
For at-risk species, individual bases generally track individual populations of all federally listed
and nationally significant, and many state important species. The locations of these local
populations, called “element occurrences” by most programs, provide an estimate of the area
occupied by current and historic populations. In many cases, bases have data on overall
population numbers, which then provide average occupancy rates. Additionally, most base
natural resource programs monitor especially federally listed species, and carefully track areas
occupied and species health. Additionally, NatureServe, some bases, some natural heritage
programs, and some state and national fish and wildlife management agencies have developed
species distribution models to predict occupied areas, which often are suitable for linking to base
habitat models.
3.5.8.3 Generation of BRIs and Economic Values
Willingness to pay estimates are available from published studies on the value of species
preservation and assembled in the USGS Benefits Transfer Toolkit. These estimates can be
applied to the species found at bases.
3.5.8.4 Models and Data Used at Eglin Air Force Base
At Eglin, we quantified ecosystem service benefits provided by listed, endemic or locally
important species in two ways:
1. Species habitat (longleaf pine): For species that occur in longleaf pine habitats, we used the
STSM to simulate vegetation conditions and linked the area of habitat for species of interest
to each of the states in the STSM. A straightforward example of this is the red cockaded
woodpecker (RCW), a species listed as threatened under the U.S. Endangered Species Act.
RCW requires mature, fire-maintained, open pine forests (Jackson et al 1979, Wilson et al.
1995), as captured in the longleaf pine STSM (Figure 5). We captured this relationship by
overlaying species occurrence data or high resolution species distribution models from the
Florida Natural Inventory with our map of longleaf pine vegetation condition classes at
Eglin, and calculating the proportion of the species occurrence areas found in each of the five
longleaf pine STSM states. The results of this analysis, the area of occupied habitat for each
of these species, is shown in Table 3.
26
Table 3. Species modeled as a function of vegetation condition in the STSM state classes, consisting of
vegetation age (early, mid, late), and structure (open and closed canopy). Habitat provided by condition class (ha)
Common Name Scientific Name Early Mid-
closed
Mid-
open
Late-
closed
Late-
open
Reticulated flatwoods
salamander Ambystoma bishopi 0 0 1 1 5
Red-cockaded woodpecker Dryobates borealis 1,797 527 8,534 7,119 38,576
Pineland bogbutton Lachnocaulon digynum 0 0 0 1 9
Gulf Coast redflower
pitcherplant
Sarracenia rubra ssp.
gulfensis 2 4 4 59 169
Panhandle lily Lilium iridollae 0 0 0 5 6
Harper's yellow-eyed grass Xyris scabrifolia 0 0 1 1 9
Pond rush Cladium mariscoides 0 0 0 0 1
Curtiss' sandgrass Calamovilfa curtissii 2 1 2 10 34
Panhandle meadowbeauty Rhexia salicifolia 6 0 1 1 6
West's flax Linum westii 0 1 0 1 1
pinewoods bluestem Andropogon arctatus 0 0 0 0 5
2. Species habitat (beach): For species not tied to longleaf pine habitat, there was no ecosystem
model analogous to the STSM to simulate effects of management on species persistence. For
these species, we made simple assumptions about whether or a not a species was likely to persist
under the three management scenarios. Because nesting turtles and the endangered sand lichen
are rarely ever survive long-term without active protection, both the no management and no base
scenarios assume that no management of natural resources occur, and these species disappear.
The assumption for the current management is that Eglin managers continue to restrict visitation
when turtles nest, and maintain habitat for the lichen, and that the amount of habitat remains
constant over time. In this case, broad generalizations about presence or absence of a species
were deemed appropriate.
3. Species occurrence (pond and grassland): At Eglin, we were only able to provide a monetary
valuation for red-cockaded woodpeckers (RCWs), although many other species occur on the
base and the base provides important habitat. A study by Reaves et al. (1999) found a willingness
to pay of $22.36 per year per household to ensure the survival of RCW in South Carolina.
Chadwick (2005) estimates the South Carolina population of RCWs at 669 in 2000. This implies
an annual per individual per household value of about $0.03. Transferred to the 7.5 million
households in Florida, this yields an annual value of $251,036 per individual species member.
We assumed that this willingness to pay was for an individual RCW over its lifetime. To assess
an annual value, we assumed an average lifespan of 7 years for the species, based on Wilson et
al. (1995), which reduces the annual value to $35,862. While this number seems high, the fact
that the productivity of RCW at Eglin is a major factor likely to lead to the delisting of at least
the Florida population of RCW is evidence that the value of this regulatory relief to other private
forest landowners would be at least this high.
27
3.5.9 Flood Damage and Risk
3.5.9.1 Introduction
Inland and coastal flooding can cause significant financial losses and deaths. Annual flood risk is
a function of random meteorological events (e.g., precipitation duration and intensity, strong
winds at high tide, etc.) and local physical attributes (e.g., ground cover, land use, topography).
Vegetated coastal environments can dissipate kinetic energy from storm surges, reducing wave
height and insulating inland properties from flood risks (Shepard et al. 2011). Additionally,
vegetation offers enhanced drainage and buffering capacity, relative to paved or developed
surfaces, to reduce inland flood risks (Wheater and Evans 2009). Our framework calculates and
values flood hazards for each scenario. This valuation accounts for the probability distribution of
flood events of various magnitudes.
Every year, damage from floods causes major impacts to communities across the country.
Measuring overall flood risk and economic impacts can be extremely complex (Koks et al 2015).
However, as aquatic ecosystems producing floods generally have linear and directional flows, we
have chosen to evaluate changes in peak flows produced by management on bases, combined
with some measure of the value of this protect to the beneficiaries of these reduced flows (Jones
et al. 2018). In each base, areas in which riparian, wetland and aquatic habitats have been
restored or enhanced are analyzed using the data the set of actions in an area. The data attributed
for each wetland basin is combined with climate and storm information to estimate the amount of
flood reduction provided by accumulated base actions. Vulnerable properties downstream from
bases or the cost of past flood damage would be used to assess the value of this flood reduction.
3.5.9.2 National Datasets or Models Available
In general, flood hazards can be evaluated using statistical models based on past occurrence of
floods or physical-process models, which calculate flood risks mechanistically as a function of
relevant physical characteristics of the site under study. Examples of these are the Storm Water
Management Model (SWMM) developed by the EPA, site-specific models developed for unique
geographies, and the Hazus Flood Model (FEMA 2018). We have elected to use the Hazus Flood
Model because it supports user inputs through a GIS interface (ABS Consulting 2011) and
directly interfaces with national databases to produce site-specific risk estimates based on local
hydrologic and land-use variables. Therefore, the model developed here can easily be adapted to
characterize risks under alternative scenarios (e.g., different land use assumptions) at the same
site or to characterize risks at different sites in a way that is straightforward and user-friendly
compared to alternative approaches.
FEMA flood risk maps are available nationally and provide data on vulnerable properties or
communities located downstream from military installations. The wetlands, water bodies, and
upland vegetation on bases provide water-holding capacity reducing downstream flood damage.
The water holding capacity of habitats can be modeled as described below.
3.5.9.2.1 Wetland Flood Attenuation
Wetlands have been demonstrated to capture water in ways that reduce flooding (Acreman and
Holden 2013). Flood attenuation benefits of individual wetlands can be estimated by 1) modeling
wetland water storage using a modified hydrologic engineering approach that incorporates
spatially-accurate, high-resolution elevation, wetlands and streams data, 2) calculating the
number of downstream beneficiaries, and 3) combining the two values per wetland.
28
Following the above approach, water storage capacity per wetland can be generated from the
following variables: catchment runoff rate, wetland water residence time, and distance to the
nearest stream. Wetland catchments can be derived using ESRI’s ArcHydro toolset to model
water flow and accumulation across the project area while assuming that wetland polygons
behave as sinks (or modified sinks in the cases where streams intersect wetlands). Key data
sources for deriving wetland catchments include a high-resolution LIDAR-derived digital
elevation model (DEM), stream hydrography that match the DEM, and spatially-accurate
wetland polygons.
Once wetland catchments have been created, catchment runoff rates (i.e., the potential amount of
overland water flow into a wetland over a given time) can be calculated using a modified version
of the Rational Method (Novotny 2003, LMNO, Ltd. 2015). Instead of the runoff coefficients
usually associated with the Rational Method (which are solely based on ground cover type),
runoff curve numbers (NRCS 1986) per wetland catchment can be chosen based on the most
prevalent hydrologic soil complex and ground cover types. Next, wetland water residence time
can be calculated from wetland volume and catchment runoff. Wetland volume is estimated by
multiplying wetland area by an average wetland depth that is assigned by Cowardin code (e.g., a
palustrine wetland with an aquatic bed is assumed to have a greater water storage volume than a
palustrine emergent wetland) and a correction factor to account for sloping edges. Finally,
wetland distance to the nearest stream can be determined using the Flow Distance tool from the
ArcGIS Hydrology toolset, a process that incorporates the streams data and flow direction
dataset generated while deriving wetland catchments.
Given a dearth of readily available high-resolution spatial data of human populations (e.g.,
number of residents per structure), tax lots can be used as a proxy for wetland flood attenuation
beneficiaries. The number of tax lots located in floodplains (of various temporal/spatial
resolutions) downstream of each wetland can be calculated to derive the total number of
beneficiaries per wetland. Relating this number to each wetland’s water storage capacity would
yield a final measure of wetland attenuation benefits provisioned per wetland.
3.5.9.2.2 Riparian Flood Attenuation
Modeling potential flood attenuation benefits of riparian areas would follow a similar procedure
to that used for wetlands; however, the process of identifying riparian areas that should be treated
as individual units (rather than long contiguous reaches across varied terrain) and modeling the
catchments that feed them needs to be carefully considered. Most states environmental quality
agencies have developed stream water quality assessment units, which are often attributed with
current water quality information, and can be tied to restoration actions.
Much of the base data required for these models, including high resolution DEMs, updated
stream and wetland spatial data, and high quality vegetation and climate data, is available from
most bases. However, these data need to be developed individually. Alternatively, FEMA
floodplain maps are available at almost all bases, although the resolution of these vary widely
nationally.
3.5.9.3 Generation of BRIs and Economic Values
Market values of structures are used to estimate the avoided damage to property from floods.
Average property values in an area are estimated by local assessors and available in a national
proprietary database from CoreLogic.
29
3.5.9.4 Models and Data Used at Eglin Air Force Base
At Eglin Air Force Base, flood risk was modeled for the three scenarios. Ground elevation and
flood regions for analysis are derived from digital elevation maps (USGS 2018) and Flood
Insurance Rate Maps (FEMA 2019). Default values for a variety of flood analysis parameters
(e.g., stream drainage area, velocity, and flow regulation) were used in the present analysis as a
proof of concept. A full-scale characterization of ecosystem services across bases will present
sensitivity analysis for key parameters as part of the overall uncertainty analysis. Similarly, in
this draft, we have presented interim deterministic results for the economic value of flood risks
for each scenario. MoTIVES characterizes the propagation the influence of various uncertain
variables through model sub-modules including flood damages.
HAZUS measures the flood hazard, or the annual chance of inundation at specific flood depths.
Inland flood risk (recurrence period of certain flood depths) is calculated as a function of local
riverine discharge, frequency, and surrounding topology. Coastal flood risk (recurrence period of
wave heights and flood depth) is calculated as a function of local elevation, shoreline
characteristics, and regional wave parameters. Corresponding losses are calculated as a function
of buildings, facilities, and other assets in the study area, which must be specified. The HAZUS
General Building Stock provides census block level data based on the 2010 census and specifies
the location, size, and data on the replacement cost for buildings nationwide. In future studies,
building data can be integrated with the Army Core of Engineers building data to improve the
accuracy of site-specific data (Shultz 2017).
At Eglin, results were calculated by deriving a relationship between the economic damage of a
flood event and its occurrence probability using HAZUS. 1,000 hypothetical timelines were
simulated, where each timeline sees a randomly generated sequence of flood events. These
hypothetical timelines were in turn valued (according to a 5% discount rate), and the distribution
of the economic values is recorded. Topographic and hydrologic parameters corresponding to the
current-management scenario were used to run HAZUS simulations and calculate damage
estimates for various flood events. For each flood event, HAZUS returned economic valuations
for multiple land-use categories (e.g., residential, agricultural). To calculate economic values for
the no-base scenario, we scaled the valuations of flood events simulated for current-management
by land-use characteristics. For the no-management scenario, we took account of the expected
higher infiltration of older growth forests. In the setting of a full project execution, we plan to
use available time and computational resources to simulate each scenario independently in
HAZUS in order to also account for varying hydrologic and topographic parameters not
accounted for in the present proof-of-concept.
3.5.10 Water Available for Agriculture or Industry
3.5.10.1 Introduction
In many parts of the country, particularly the western and southeastern states, water resources are
limited, creating competition for water. Some lands, particularly wetlands, rivers, streams and
floodplains, have sufficient water holding capacity that they provide additional downstream
water at low flows. Restoration of these habitats will increase these downstream flows, often
making water available to farmers, industrial users, and water treatment plants, reducing costs or
making agriculture possible. In assessing flood risk, the water holding capacity information for
wetlands and streams provides the exact data needed to measure the ability of these habitats to
30
provide additional water to these users. While groundwater is often a source of agricultural and
industrial water, links between land management and volume of these water sources have not
been clearly developed.
3.5.10.2 National Datasets or Models Available
Most states have water rights information available from the state Water Resources,
Environmental Protection or similar agency. Some have excellent maps of over-allocated
streams, rivers and lakes, information needed to map the BRI. Unfortunately, this type of data is
not available nationally.
3.5.10.3 Generation of BRIs and Economic Values
In regions with plentiful water supplies, water pricing is typically used to recover the costs of
infrastructure for conveyance. In cases where water is not a scarce resource, additional water
production on a base is not a quantifiable benefit. In regions where water is scarce, benefits from
water production can be quantified in some cases if there are local water markets or using
published estimates from hedonic property value studies (e.g., Buck et al. 2014). No water
availability estimates were produced for Eglin.
3.5.10.4 Models and Data Used at Eglin Air Force Base
Eglin does not provide significant water for agriculture or industry, and thus this service was not
included in the model.
3.5.11 Drinking Water Quality
3.5.11.1 Introduction
Providing clean drinking water for communities is an important ecosystem service provided by
many public lands in the country. There are two primary sources of drinking water, groundwater
or above ground (stream and water body). Some habitats, particularly wetlands and riparian
floodplains, have the ability to improve water quality. They do this by some combination of
providing shade, if excessive temperature is a problem, as it is in the west; by removing
excessive nutrients, particularly nitrogen and phosphorus; or by preventing excessive
sedimentation. Land managers can either protect or restore these habitats, leading to additional
provision of ecosystem services.
3.5.11.2 National Datasets or Models Available
Multiple approaches are available to model drinking water quality, which generally correspond
to the source of drinking water, and the factors that impair water quality from lakes and streams.
For groundwater, most states have maps of groundwater resources, as well as locations where
communities access aquifers for their drinking water. Aquifer recharge areas are often mapped
and linked to drinking water availability.
Most data and models for drinking water are focused on streams and waterbody impacts,
particularly sedimentation, nutrient control, and temperature control; each which are modeled
separately.
31
3.5.11.2.1 InVEST Sediment Model
The InVEST sediment delivery model calculates annual sediment delivery to waterways based
on soil loss from each pixel draining to a waterway and a sediment delivery ratio representing the
proportion of that soil loss that will reach the waterway (Sharp et al. 2018). Annual soil loss is
calculated from the revised universal soil loss equation, based on rainfall, soil, slope, and
management factors (a C factor reflecting the effect of land management practices on erosion
rates, and a P factor that reflects the effect of cropping practices on water runoff). The sediment
delivery ratio is calculated from a connectivity index for each pixel, which is based on upslope
and downslope topography and land cover factors. Sediment export from a given pixel to the
waterway is the annual soil loss multiplied by the sediment delivery ratio, and total catchment
sediment export (or sediment delivery to the waterway) is the sum of exports for all pixels in the
catchment. Both are reported in tons of sediment per hectare per year.
The model automatically calculates sediment retention, defined as the sediment loss avoided by
the current land cover compared to bare ground. Analysis of sediment retention under different
scenarios can be accomplished by running the model with different land use/land cover input
layers or by changing the management factors for each land use type. Valuation of the difference
in sediment delivery between scenarios is possible using avoided cost, replacement cost, or
willingness to pay methods, depending on how sedimentation affects the end user of the water
(Sharp et al. 2018). Due to limitations described in more detail below, valuation should only be
done when the model has been calibrated to the specific context.
Data required to run the InVEST model include digital elevation model, rainfall erosivity index,
soil erodibility, and land use/land cover rasters, all of which are readily available in the United
States. A table identifying C and P management factors by land use type is also required; these
must be estimated from literature. The InVEST user’s guide provides references that may be
useful for estimating these factors (Sharp et al. 2018). An optional drainage layer can be used to
identify pixels artificially connected to streams; this is most likely to be relevant in developed
areas. Several model parameters are also required: a threshold flow accumulation (determined by
comparison with a known stream network for the study area), the maximum sediment delivery
ratio (representing the fraction of topsoil particles finer than 1000 um, 0.8 is the default), and the
k and IC calibration parameters (it is recommended to use the default values for initial analysis
and to adjust the k parameter if needed to calibrate to observed data). Model outputs can be
compared with observations from sediment accumulation in a reservoir or with a time series of
total suspended solids concentrations (concentration data first need to be converted to annual
sediment loads using other software, as in Hamel et al. 2015).
Several important limitations constrain the usefulness of the InVEST model for valuation based
on absolute sediment delivery. Because soil loss is calculated from the revised universal soil loss
equation, which only represents rill and inter-rill erosion processes, other types of erosion,
including gully, streambank, and mass erosion, are not included in the sediment yield estimates
(Sharp et al. 2018). Therefore, sediment delivery will be underestimated in areas where other
types of erosion make up a large proportion of the total sediment budget. The model is very
sensitive to the k parameter, which is not physically based; calibration studies have found that k
parameters vary widely by individual location (Hamel et al. 2015). A recent assessment of six
applications of the InVEST model found that it performed better than global statistical models of
sediment delivery, even without calibration, but that calibration was very important for reducing
model bias (Hamel et al. 2017). Uncalibrated model results should be used with caution, and
32
valuation is only recommended when the model has been calibrated (Hamel et al. 2017, Sharp et
al. 2018).
3.5.11.2.2 Nutrient Removal Model
Wetlands and riparian floodplain vegetation have been demonstrated to remove nutrients
(Verhoeven et al. 2006), and are often constructed to address wastewater treatment plants
(Vymazal, 2007). Modeling nutrient removal as an ecosystem service requires and assessment of
three factors. First, that nutrient removal is necessary at the wetlands or streams potentially
providing the service; second, the capacity of the habitats to remove N or P, and lastly the
downstream drinking water use. The first of these are modeled from agricultural and residential
P and N loading accumulated from upstream areas. The second from a combination of the water
holding capacity, runoff curve numbers, soils and the vegetation present. These can provide
results for individual wetlands or combined results for watersheds or managed areas, however
the science behind the model results needs additional work (Thorslund et al. 2017).
3.5.11.3 Generation of BRIs and Economic Values
Estimates for the generation of BRIs and values are available from published studies on WTP for
clean drinking water (Johnston and Thomassin 2010, Polyzou et al. 2011).
3.5.11.4 Models and Data Used at Eglin Air Force Base
Most military bases have well mapped wetlands and riparian habitats, high resolution DEMs and
high quality soils data available to determine if and where drinking water protection is needed.
However, because no drinking water is being generated by Eglin streams, we did not model
drinking water at the base and did not attach an economic value.
3.5.12 Shoreline Erosion
3.5.12.1 Introduction
Management to protect shoreline erosion is an important feature of a natural resource
management plan at military bases. Many methods are currently available to address shoreline
erosion, with most methods intended to protect beachfront property at risk. The four major
categories of methods to address erosion are: 1) Manage land use 2) Vegetate 3) Harden and, 4)
re-nourish or trap sand.
Military bases are known to use a combination of various methods to protect shorelines with the
most common methods being to either re-nourish the sand or harden the shoreline by using
seawalls. Depending on the geomorphology of the coast however, seawall construction is not
always possible and other management actions are required to protect the shoreline. For
example, the Naval Air Station Key West is located entirely on low-lying keys and is thus
unprotectable by seawalls or levees. Training and operations can significantly be impacted by sea
level rise and alternate management actions like more frequent re-nourishment or vegetation may
be necessary to protect the shoreline.
3.5.12.2 National Datasets or Models Available
Cosmos-COAST is a hybrid physics based numerical model to simulate long-term shoreline
evolution. The model by itself is a numerical combination of a set of ordinary and partial
differential equations representing several physical processes. Its main governing equation is a
33
partial differential equation composed of three process based models – 1) alongshore transport
one-line model, 2) a cross shore equilibrium shoreline model, and 3) a sea level driven shoreline
erosion model. Various management actions can be implemented as scenarios within the model
to evaluate their impacts on storm surge protection and future shoreline erosion. These can
include building of sea-walls and determining the rate of future re-nourishments. Other inputs to
the model include scenarios of future sea level rise, wave conditions and other physical
characteristics that determine the beach slope in addition to historical shoreline observations.
Currently this model has been applied to coasts in southern California but its structure makes it
usable to other regions of the world as long data for input variables is available. Usable outputs
of the model are future shoreline projections from which estimates of average beach width can
be obtained.
3.5.12.3 Generation of BRIs and Economic Values
Willingness to pay measures can be developed for tourism, recreation, education as well as
research. These measures are likely to scale with the beach width and can be related to the
management actions being implemented at the beach. The BRI in this case would be the area of
the beach restored and that is used by people for tourism, recreation, education, or research.
Additionally, beaches provide wildlife protection. Willingness to pay estimates are available
from published studies on values associated with preserving various species. These can be found
in the USGS Benefit Transfer Toolkit and applied to the particular species found at the shoreline.
The BRIs can be generated by evaluating the area of wildlife habitat protected on restoration as
an outcome of the management action undertaken.
Market values of structures can also be used to estimate the avoided damage to property from
shoreline erosion. Average property values in an area are estimated by local assessors and
available in a national proprietary database from CoreLogic.
3.5.12.4 Models and Data Used at Eglin Air Force Base
To characterize shoreline erosion at Eglin, we modeled beach erosion and nourishment as a
dynamic capital accumulation problem (Smith et al 2009) in which benefits are derived as a function of beach width. The model assumes a linear background erosion rate plus an
exponentially decaying rate at which the proportion of the nourished width erodes. This is due to
the along-shore (lateral) and cross-shore movement of sand due to wave action. Hence, over
time, sand is not only spread across the shore but also towards the shelf/ocean floor. McNamara et al (2015) expand upon the model of Smith et al (2009), adding the possibility of storms that
remove the entire nourished portion of the beach with a Poisson-distributed probability.
3.5.13 Storm Surge Protection
3.5.13.1 Introduction
Management to protect shoreline erosion is an important feature of a natural resource
management plan at military bases. Many methods are currently available to address shoreline
erosion, with most methods intended to protect beachfront property at risk. The four major
categories of methods to address erosion are: 1) Manage land use 2) Vegetate 3) Harden and, 4)
re-nourish or trap sand.
Military bases are known to use a combination of various methods to protect shorelines with the
most common methods being to either re-nourish the sand or harden the shoreline by using
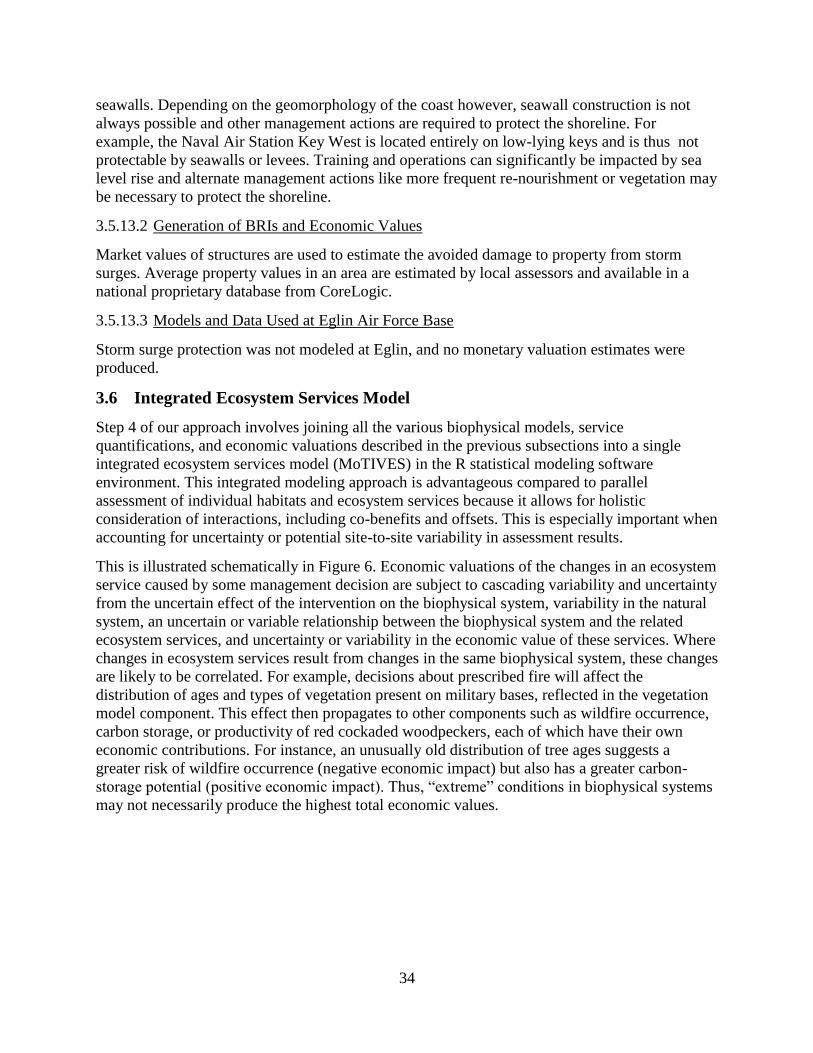
34
seawalls. Depending on the geomorphology of the coast however, seawall construction is not
always possible and other management actions are required to protect the shoreline. For
example, the Naval Air Station Key West is located entirely on low-lying keys and is thus not
protectable by seawalls or levees. Training and operations can significantly be impacted by sea
level rise and alternate management actions like more frequent re-nourishment or vegetation may
be necessary to protect the shoreline.
3.5.13.2 Generation of BRIs and Economic Values
Market values of structures are used to estimate the avoided damage to property from storm
surges. Average property values in an area are estimated by local assessors and available in a
national proprietary database from CoreLogic.
3.5.13.3 Models and Data Used at Eglin Air Force Base
Storm surge protection was not modeled at Eglin, and no monetary valuation estimates were
produced.
3.6 Integrated Ecosystem Services Model
Step 4 of our approach involves joining all the various biophysical models, service
quantifications, and economic valuations described in the previous subsections into a single
integrated ecosystem services model (MoTIVES) in the R statistical modeling software
environment. This integrated modeling approach is advantageous compared to parallel
assessment of individual habitats and ecosystem services because it allows for holistic
consideration of interactions, including co-benefits and offsets. This is especially important when
accounting for uncertainty or potential site-to-site variability in assessment results.
This is illustrated schematically in Figure 6. Economic valuations of the changes in an ecosystem
service caused by some management decision are subject to cascading variability and uncertainty
from the uncertain effect of the intervention on the biophysical system, variability in the natural
system, an uncertain or variable relationship between the biophysical system and the related
ecosystem services, and uncertainty or variability in the economic value of these services. Where
changes in ecosystem services result from changes in the same biophysical system, these changes
are likely to be correlated. For example, decisions about prescribed fire will affect the
distribution of ages and types of vegetation present on military bases, reflected in the vegetation
model component. This effect then propagates to other components such as wildfire occurrence,
carbon storage, or productivity of red cockaded woodpeckers, each of which have their own
economic contributions. For instance, an unusually old distribution of tree ages suggests a
greater risk of wildfire occurrence (negative economic impact) but also has a greater carbon-
storage potential (positive economic impact). Thus, “extreme” conditions in biophysical systems
may not necessarily produce the highest total economic values.
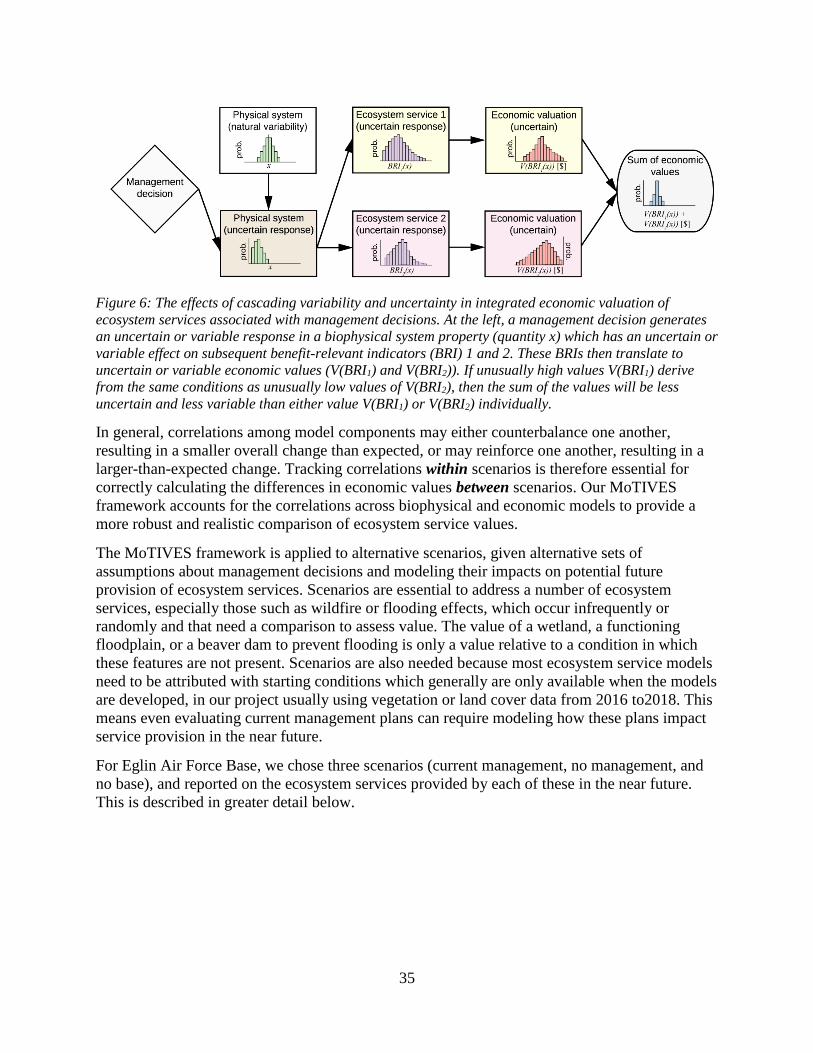
35
Figure 6: The effects of cascading variability and uncertainty in integrated economic valuation of
ecosystem services associated with management decisions. At the left, a management decision generates
an uncertain or variable response in a biophysical system property (quantity x) which has an uncertain or
variable effect on subsequent benefit-relevant indicators (BRI) 1 and 2. These BRIs then translate to
uncertain or variable economic values (V(BRI1) and V(BRI2)). If unusually high values V(BRI1) derive
from the same conditions as unusually low values of V(BRI2), then the sum of the values will be less
uncertain and less variable than either value V(BRI1) or V(BRI2) individually.
In general, correlations among model components may either counterbalance one another,
resulting in a smaller overall change than expected, or may reinforce one another, resulting in a
larger-than-expected change. Tracking correlations within scenarios is therefore essential for
correctly calculating the differences in economic values between scenarios. Our MoTIVES
framework accounts for the correlations across biophysical and economic models to provide a
more robust and realistic comparison of ecosystem service values.
The MoTIVES framework is applied to alternative scenarios, given alternative sets of
assumptions about management decisions and modeling their impacts on potential future
provision of ecosystem services. Scenarios are essential to address a number of ecosystem
services, especially those such as wildfire or flooding effects, which occur infrequently or
randomly and that need a comparison to assess value. The value of a wetland, a functioning
floodplain, or a beaver dam to prevent flooding is only a value relative to a condition in which
these features are not present. Scenarios are also needed because most ecosystem service models
need to be attributed with starting conditions which generally are only available when the models
are developed, in our project usually using vegetation or land cover data from 2016 to2018. This
means even evaluating current management plans can require modeling how these plans impact
service provision in the near future.
For Eglin Air Force Base, we chose three scenarios (current management, no management, and
no base), and reported on the ecosystem services provided by each of these in the near future.
This is described in greater detail below.
36
4 Results and Discussion
In this section we present a proof of concept for Eglin Air Force Base. We obtained data from
Fort Hood and demonstrated that the methods and models can be applied to any base where
current management can be mapped and modeled, and management goals can be identified.
However, the results and discussion is limited to the results of the Eglin models.
4.1 Eglin Site Description
At 188,000 hectares (464,000 acres), Eglin Air Force Base is the largest forested military base in
the United States. It is located on the Gulf Coast of Florida in four counties, between Pensacola
and Panama City, about 150 miles west of Tallahassee (Figure 7). The base supports the largest
remaining mature longleaf pine (Pinus palustris) forest in the world, made up of both sandhill
and flatwood habitats. It also includes much of a barrier island, major rivers and streams. The
base provides important habitat for more than eight federally listed and sixteen state listed
threatened or endangered species.
Figure 7: Map of Eglin Air Force Base and surrounding landmarks from the Eglin INRMP.
According to the 2017 Eglin INRMP, management “integrates and prioritizes wildlife, fire and
forest management activities to protect and effectively manage the Complex’s aquatic and
terrestrial environments”. Management includes a major program to use prescribed and wild fires
to restore and maintain the extensive longleaf pine forests, and to recover species that have
become threatened and endangered, while assuring that rare and endemic species found primarily
on the base do not require endangered species act. This program provides wood to produce
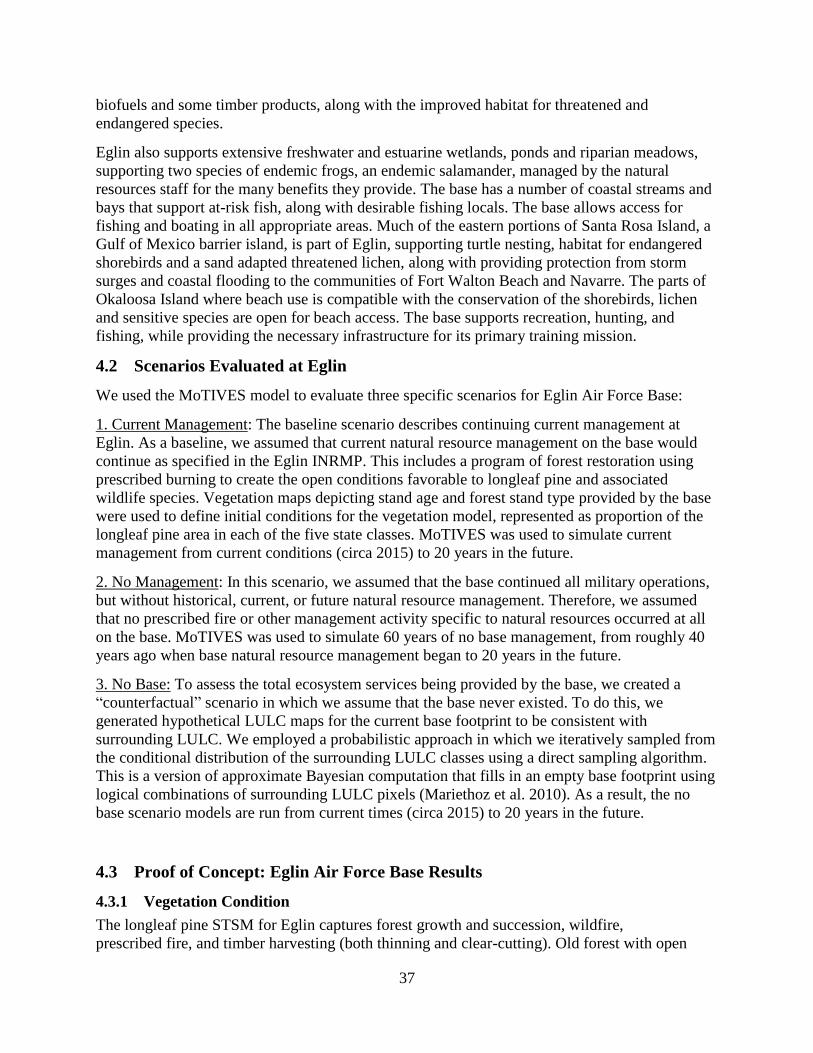
37
biofuels and some timber products, along with the improved habitat for threatened and
endangered species.
Eglin also supports extensive freshwater and estuarine wetlands, ponds and riparian meadows,
supporting two species of endemic frogs, an endemic salamander, managed by the natural
resources staff for the many benefits they provide. The base has a number of coastal streams and
bays that support at-risk fish, along with desirable fishing locals. The base allows access for
fishing and boating in all appropriate areas. Much of the eastern portions of Santa Rosa Island, a
Gulf of Mexico barrier island, is part of Eglin, supporting turtle nesting, habitat for endangered
shorebirds and a sand adapted threatened lichen, along with providing protection from storm
surges and coastal flooding to the communities of Fort Walton Beach and Navarre. The parts of
Okaloosa Island where beach use is compatible with the conservation of the shorebirds, lichen
and sensitive species are open for beach access. The base supports recreation, hunting, and
fishing, while providing the necessary infrastructure for its primary training mission.
4.2 Scenarios Evaluated at Eglin
We used the MoTIVES model to evaluate three specific scenarios for Eglin Air Force Base:
1. Current Management: The baseline scenario describes continuing current management at
Eglin. As a baseline, we assumed that current natural resource management on the base would
continue as specified in the Eglin INRMP. This includes a program of forest restoration using
prescribed burning to create the open conditions favorable to longleaf pine and associated
wildlife species. Vegetation maps depicting stand age and forest stand type provided by the base
were used to define initial conditions for the vegetation model, represented as proportion of the
longleaf pine area in each of the five state classes. MoTIVES was used to simulate current
management from current conditions (circa 2015) to 20 years in the future.
2. No Management: In this scenario, we assumed that the base continued all military operations,
but without historical, current, or future natural resource management. Therefore, we assumed
that no prescribed fire or other management activity specific to natural resources occurred at all
on the base. MoTIVES was used to simulate 60 years of no base management, from roughly 40
years ago when base natural resource management began to 20 years in the future.
3. No Base: To assess the total ecosystem services being provided by the base, we created a
“counterfactual” scenario in which we assume that the base never existed. To do this, we
generated hypothetical LULC maps for the current base footprint to be consistent with
surrounding LULC. We employed a probabilistic approach in which we iteratively sampled from
the conditional distribution of the surrounding LULC classes using a direct sampling algorithm.
This is a version of approximate Bayesian computation that fills in an empty base footprint using
logical combinations of surrounding LULC pixels (Mariethoz et al. 2010). As a result, the no
base scenario models are run from current times (circa 2015) to 20 years in the future.
4.3 Proof of Concept: Eglin Air Force Base Results
4.3.1 Vegetation Condition
The longleaf pine STSM for Eglin captures forest growth and succession, wildfire,
prescribed fire, and timber harvesting (both thinning and clear-cutting). Old forest with open

38
canopy conditions (referred to as late open) generally provide the high quality wildlife habitat for
many wildlife species, and must be maintained through prescribed burning. Currently, late open
conditions cover roughly half of the forested area at Eglin (roughly 77,000 ha). Under the current
management scenario (consisting of continuing large-scale prescribed burning), the area of late
open forest is expected to increase to roughly 115,000 hectares, covering the majority of the base
(Figure 8). Conversely, under the no management scenario (without any prescribed
burning either currently or historically), the base would likely contain very little (<5%) older,
open longleaf pine and largely consist of older, closed forest. Closed canopy forests burn rarely,
tend to become invaded by sand pine, and provide low quality wildlife habitat. Under the no base
scenario, we expect ~50,000 hectares of conversion from forest to other land use types, and of
the remaining forest, very little is projected to remain in late open conditions due to frequent
clear-cutting and dense replanting on private timberlands (Figure 8). Estimates for the types
of management occurring on private timberlands and timber values were based on Susaeta and
Gong (2019).
Figure 8. Projected longleaf pine forest condition classes at Eglin Air Force Base across the current
management, no management and no base scenarios in years 2031-2035. Without active management of
longleaf pine through prescribed fire under the current management scenario, condition degrades from
open (desirable) to closed (undesirable) canopy conditions.
4.3.2 Flood exposure and protection
Table 4 displays the results of flood risk simulations for each of the three scenarios. Under
current management, expected losses from flood events over the period 2020–2035 average
$610.4 million per year for the three counties surrounding Eglin Air Force Base. Under no-
management and no-base scenarios, these losses are expected to be $579.8 million per year and
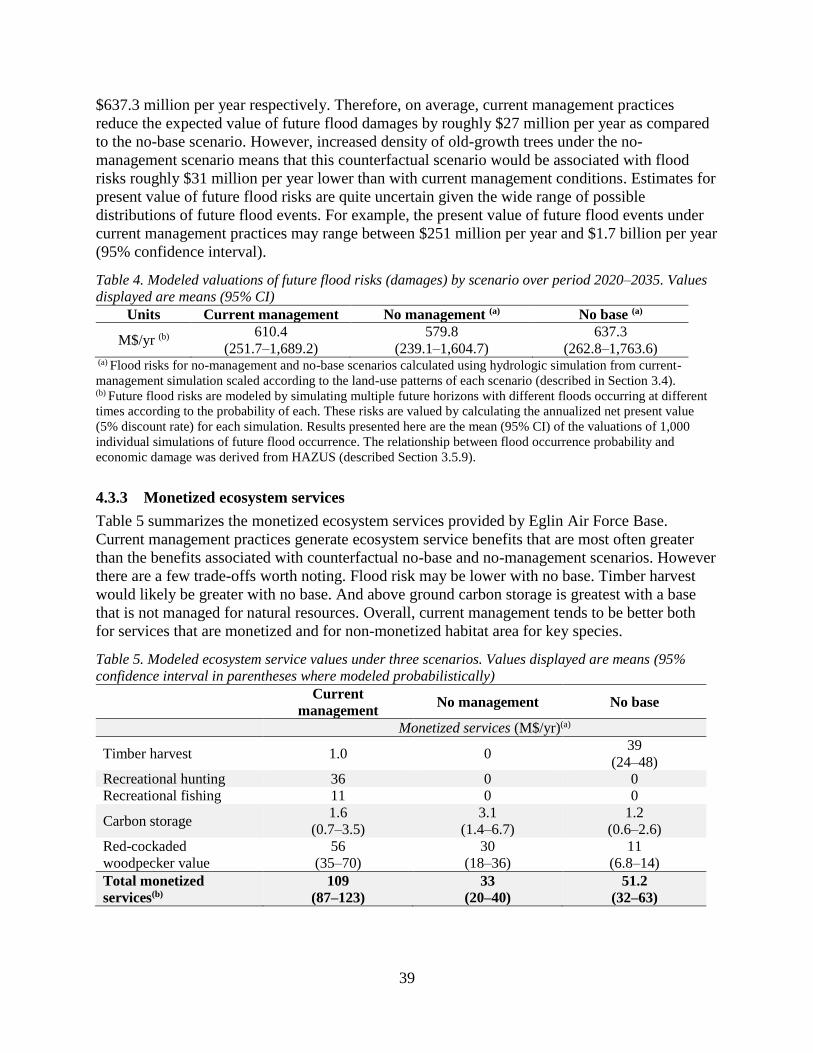
39
$637.3 million per year respectively. Therefore, on average, current management practices
reduce the expected value of future flood damages by roughly $27 million per year as compared
to the no-base scenario. However, increased density of old-growth trees under the no-
management scenario means that this counterfactual scenario would be associated with flood
risks roughly $31 million per year lower than with current management conditions. Estimates for
present value of future flood risks are quite uncertain given the wide range of possible
distributions of future flood events. For example, the present value of future flood events under
current management practices may range between $251 million per year and $1.7 billion per year
(95% confidence interval).
Table 4. Modeled valuations of future flood risks (damages) by scenario over period 2020–2035. Values
displayed are means (95% CI)
Units Current management No management (a) No base (a)
M$/yr (b) 610.4
(251.7–1,689.2)
579.8
(239.1–1,604.7)
637.3
(262.8–1,763.6) (a) Flood risks for no-management and no-base scenarios calculated using hydrologic simulation from current-
management simulation scaled according to the land-use patterns of each scenario (described in Section 3.4). (b) Future flood risks are modeled by simulating multiple future horizons with different floods occurring at different
times according to the probability of each. These risks are valued by calculating the annualized net present value
(5% discount rate) for each simulation. Results presented here are the mean (95% CI) of the valuations of 1,000
individual simulations of future flood occurrence. The relationship between flood occurrence probability and
economic damage was derived from HAZUS (described Section 3.5.9).
4.3.3 Monetized ecosystem services
Table 5 summarizes the monetized ecosystem services provided by Eglin Air Force Base.
Current management practices generate ecosystem service benefits that are most often greater
than the benefits associated with counterfactual no-base and no-management scenarios. However
there are a few trade-offs worth noting. Flood risk may be lower with no base. Timber harvest
would likely be greater with no base. And above ground carbon storage is greatest with a base
that is not managed for natural resources. Overall, current management tends to be better both
for services that are monetized and for non-monetized habitat area for key species.
Table 5. Modeled ecosystem service values under three scenarios. Values displayed are means (95%
confidence interval in parentheses where modeled probabilistically)
Current
management No management No base
Monetized services (M$/yr)(a)
Timber harvest 1.0 0 39
(24–48)
Recreational hunting 36 0 0
Recreational fishing 11 0 0
Carbon storage 1.6
(0.7–3.5)
3.1
(1.4–6.7)
1.2
(0.6–2.6)
Red-cockaded
woodpecker value
56
(35–70)
30
(18–36)
11
(6.8–14)
Total monetized
services(b)
109
(87–123)
33
(20–40)
51.2
(32–63)
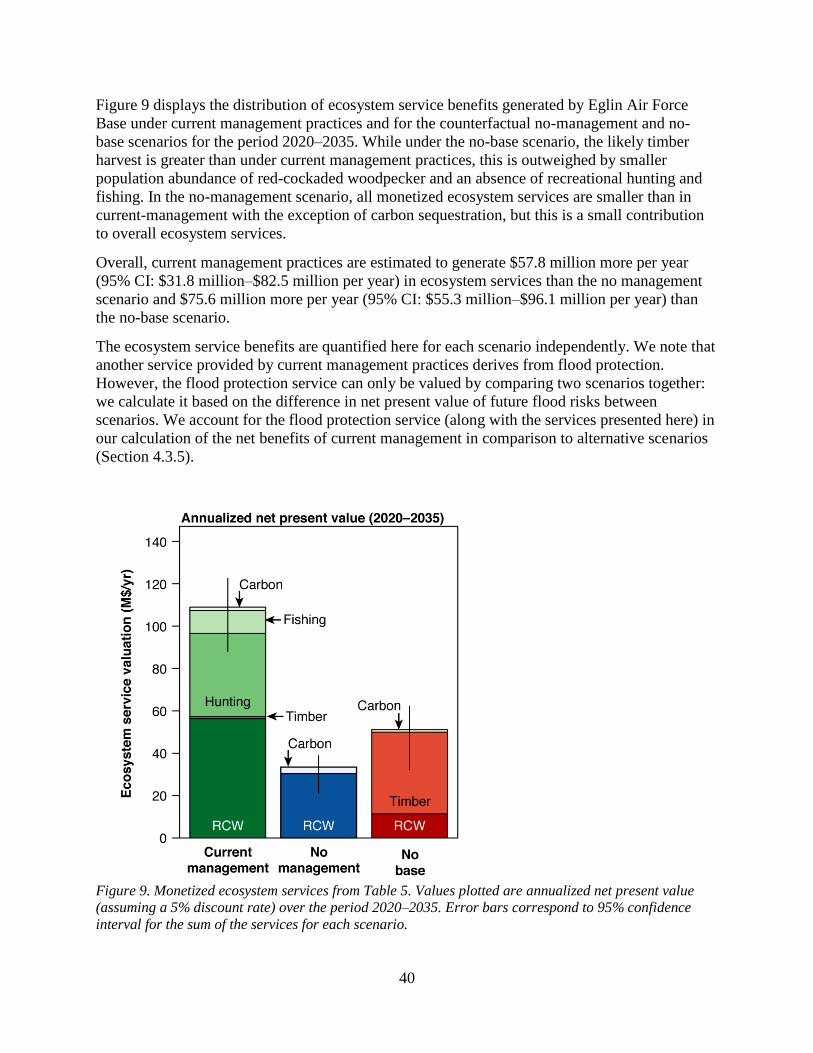
40
Figure 9 displays the distribution of ecosystem service benefits generated by Eglin Air Force
Base under current management practices and for the counterfactual no-management and no-
base scenarios for the period 2020–2035. While under the no-base scenario, the likely timber
harvest is greater than under current management practices, this is outweighed by smaller
population abundance of red-cockaded woodpecker and an absence of recreational hunting and
fishing. In the no-management scenario, all monetized ecosystem services are smaller than in
current-management with the exception of carbon sequestration, but this is a small contribution
to overall ecosystem services.
Overall, current management practices are estimated to generate $57.8 million more per year
(95% CI: $31.8 million–$82.5 million per year) in ecosystem services than the no management
scenario and $75.6 million more per year (95% CI: $55.3 million–$96.1 million per year) than
the no-base scenario.
The ecosystem service benefits are quantified here for each scenario independently. We note that
another service provided by current management practices derives from flood protection.
However, the flood protection service can only be valued by comparing two scenarios together:
we calculate it based on the difference in net present value of future flood risks between
scenarios. We account for the flood protection service (along with the services presented here) in
our calculation of the net benefits of current management in comparison to alternative scenarios
(Section 4.3.5).
Figure 9. Monetized ecosystem services from Table 5. Values plotted are annualized net present value
(assuming a 5% discount rate) over the period 2020–2035. Error bars correspond to 95% confidence
interval for the sum of the services for each scenario.
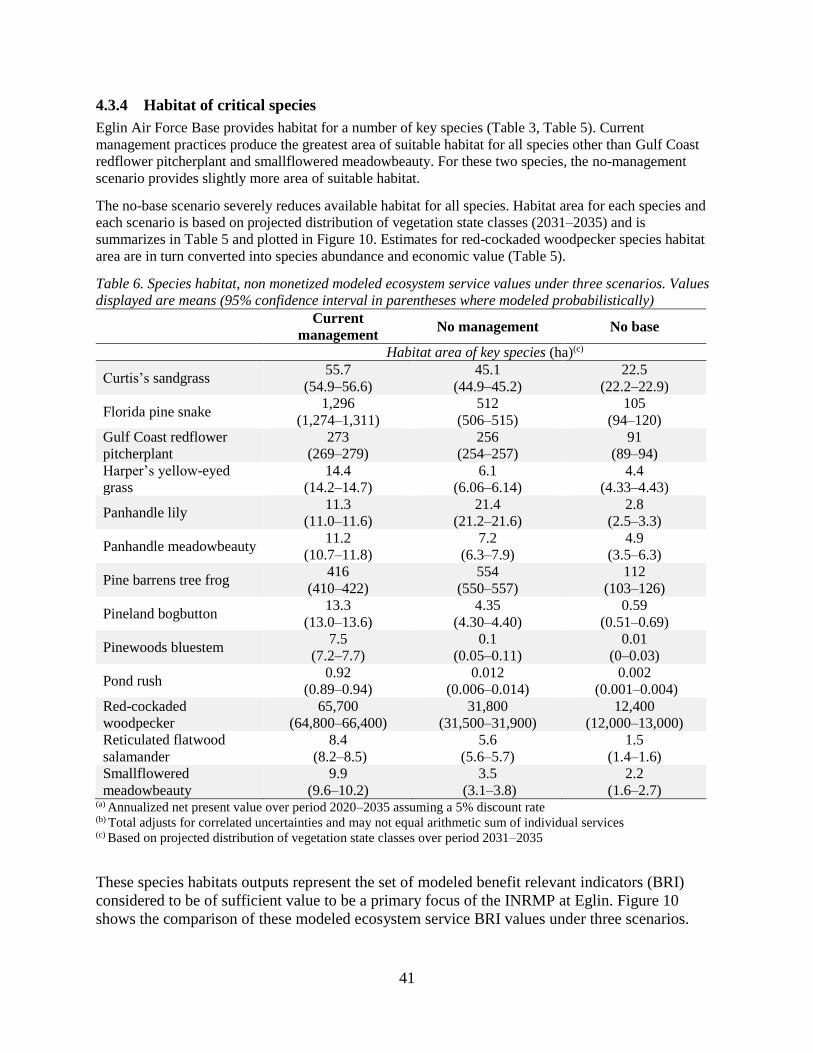
41
4.3.4 Habitat of critical species
Eglin Air Force Base provides habitat for a number of key species (Table 3, Table 5). Current
management practices produce the greatest area of suitable habitat for all species other than Gulf Coast
redflower pitcherplant and smallflowered meadowbeauty. For these two species, the no-management
scenario provides slightly more area of suitable habitat.
The no-base scenario severely reduces available habitat for all species. Habitat area for each species and
each scenario is based on projected distribution of vegetation state classes (2031–2035) and is
summarizes in Table 5 and plotted in Figure 10. Estimates for red-cockaded woodpecker species habitat
area are in turn converted into species abundance and economic value (Table 5).
Table 6. Species habitat, non monetized modeled ecosystem service values under three scenarios. Values
displayed are means (95% confidence interval in parentheses where modeled probabilistically)
Current
management No management No base
Habitat area of key species (ha)(c)
Curtis’s sandgrass 55.7
(54.9–56.6)
45.1
(44.9–45.2)
22.5
(22.2–22.9)
Florida pine snake 1,296
(1,274–1,311)
512
(506–515)
105
(94–120)
Gulf Coast redflower
pitcherplant
273
(269–279)
256
(254–257)
91
(89–94)
Harper’s yellow-eyed
grass
14.4
(14.2–14.7)
6.1
(6.06–6.14)
4.4
(4.33–4.43)
Panhandle lily 11.3
(11.0–11.6)
21.4
(21.2–21.6)
2.8
(2.5–3.3)
Panhandle meadowbeauty 11.2
(10.7–11.8)
7.2
(6.3–7.9)
4.9
(3.5–6.3)
Pine barrens tree frog 416
(410–422)
554
(550–557)
112
(103–126)
Pineland bogbutton 13.3
(13.0–13.6)
4.35
(4.30–4.40)
0.59
(0.51–0.69)
Pinewoods bluestem 7.5
(7.2–7.7)
0.1
(0.05–0.11)
0.01
(0–0.03)
Pond rush 0.92
(0.89–0.94)
0.012
(0.006–0.014)
0.002
(0.001–0.004)
Red-cockaded
woodpecker
65,700
(64,800–66,400)
31,800
(31,500–31,900)
12,400
(12,000–13,000)
Reticulated flatwood
salamander
8.4
(8.2–8.5)
5.6
(5.6–5.7)
1.5
(1.4–1.6)
Smallflowered
meadowbeauty
9.9
(9.6–10.2)
3.5
(3.1–3.8)
2.2
(1.6–2.7) (a) Annualized net present value over period 2020–2035 assuming a 5% discount rate (b) Total adjusts for correlated uncertainties and may not equal arithmetic sum of individual services (c) Based on projected distribution of vegetation state classes over period 2031–2035
These species habitats outputs represent the set of modeled benefit relevant indicators (BRI)
considered to be of sufficient value to be a primary focus of the INRMP at Eglin. Figure 10
shows the comparison of these modeled ecosystem service BRI values under three scenarios.
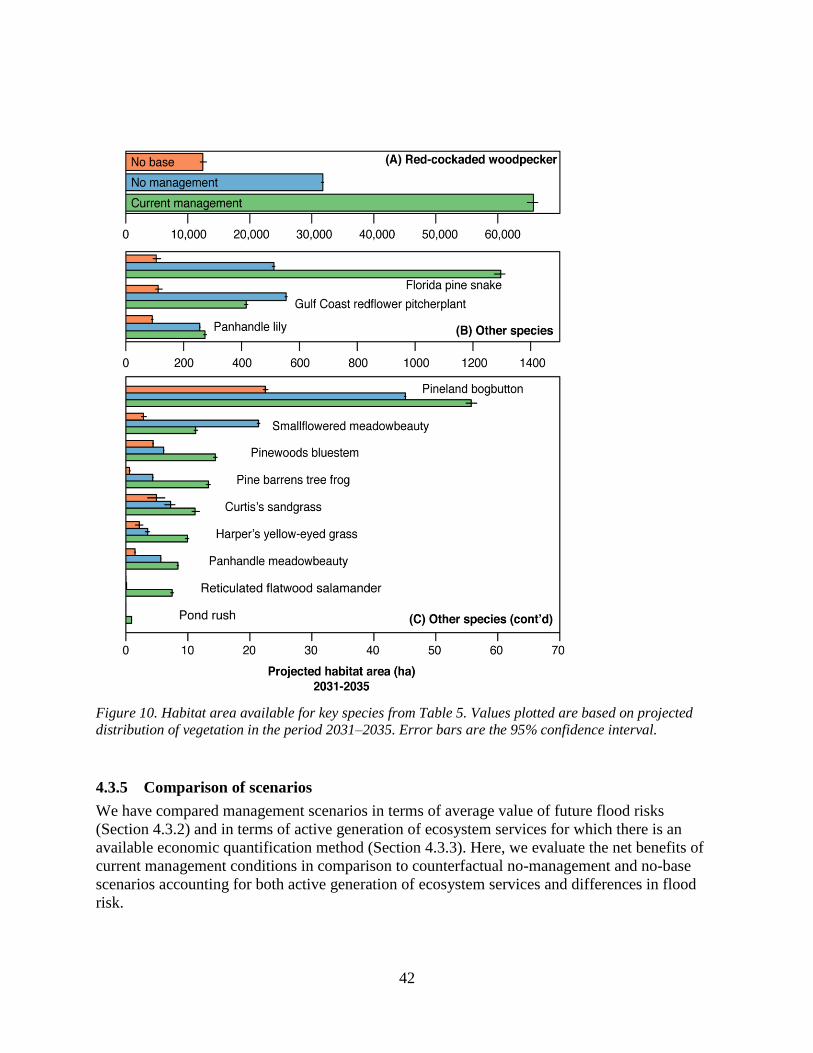
42
Figure 10. Habitat area available for key species from Table 5. Values plotted are based on projected
distribution of vegetation in the period 2031–2035. Error bars are the 95% confidence interval.
4.3.5 Comparison of scenarios
We have compared management scenarios in terms of average value of future flood risks
(Section 4.3.2) and in terms of active generation of ecosystem services for which there is an
available economic quantification method (Section 4.3.3). Here, we evaluate the net benefits of
current management conditions in comparison to counterfactual no-management and no-base
scenarios accounting for both active generation of ecosystem services and differences in flood
risk.
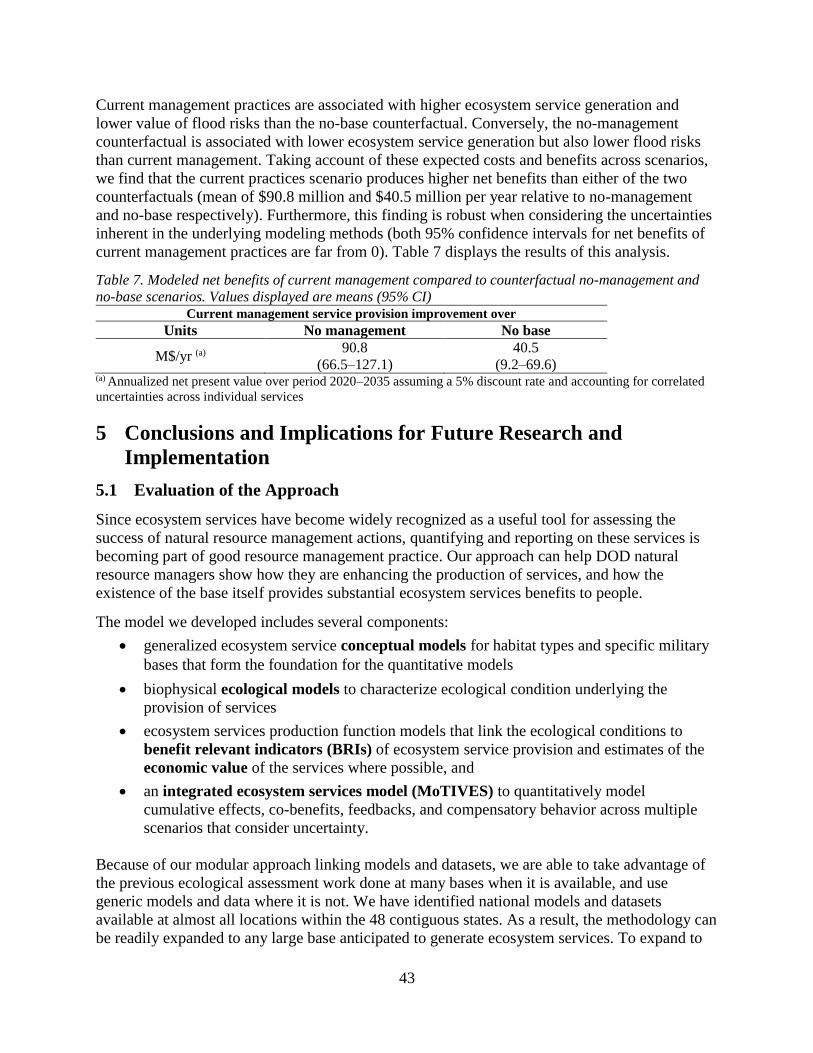
43
Current management practices are associated with higher ecosystem service generation and
lower value of flood risks than the no-base counterfactual. Conversely, the no-management
counterfactual is associated with lower ecosystem service generation but also lower flood risks
than current management. Taking account of these expected costs and benefits across scenarios,
we find that the current practices scenario produces higher net benefits than either of the two
counterfactuals (mean of $90.8 million and $40.5 million per year relative to no-management
and no-base respectively). Furthermore, this finding is robust when considering the uncertainties
inherent in the underlying modeling methods (both 95% confidence intervals for net benefits of
current management practices are far from 0). Table 7 displays the results of this analysis.
Table 7. Modeled net benefits of current management compared to counterfactual no-management and
no-base scenarios. Values displayed are means (95% CI) Current management service provision improvement over
Units No management No base
M$/yr (a) 90.8
(66.5–127.1)
40.5
(9.2–69.6) (a) Annualized net present value over period 2020–2035 assuming a 5% discount rate and accounting for correlated
uncertainties across individual services
5 Conclusions and Implications for Future Research and
Implementation
5.1 Evaluation of the Approach
Since ecosystem services have become widely recognized as a useful tool for assessing the
success of natural resource management actions, quantifying and reporting on these services is
becoming part of good resource management practice. Our approach can help DOD natural
resource managers show how they are enhancing the production of services, and how the
existence of the base itself provides substantial ecosystem services benefits to people.
The model we developed includes several components:
generalized ecosystem service conceptual models for habitat types and specific military
bases that form the foundation for the quantitative models
biophysical ecological models to characterize ecological condition underlying the
provision of services
ecosystem services production function models that link the ecological conditions to
benefit relevant indicators (BRIs) of ecosystem service provision and estimates of the
economic value of the services where possible, and
an integrated ecosystem services model (MoTIVES) to quantitatively model
cumulative effects, co-benefits, feedbacks, and compensatory behavior across multiple
scenarios that consider uncertainty.
Because of our modular approach linking models and datasets, we are able to take advantage of
the previous ecological assessment work done at many bases when it is available, and use
generic models and data where it is not. We have identified national models and datasets
available at almost all locations within the 48 contiguous states. As a result, the methodology can
be readily expanded to any large base anticipated to generate ecosystem services. To expand to
44
bases outside the 48 states or in other countries new data and models would need to be collated
and incorporated.
Ecosystem services are expressed as benefit relevant indicators (BRIs) whenever possible. BRIs
link the ecological changes in systems to the benefits received by people, often including metrics
that include the number of people or properties affected. We convert the BRIs from physical
units to dollars values when the economic data is available. BRIs tend to be intuitive measures
that communicate well to stakeholders and decision makers. Although useful on their own,
expressing BRIs in dollars terms allows direct comparison of different ecosystem services.
Because bases provide a diverse array of ecosystem services, and because some management
decisions can reduce some services while increasing others, our methods combine this complex
assemblage of models into a single, Bayesian model (MoTIVES) to integrate outputs and allow
an evaluation of trade-offs and co-benefits. It also allows us to run different management
scenarios and cumulative effects. MoTIVES structure also allows it to take advantage of a broad
array of available ecosystem assessment tools, broadening the ability to use the best data or
model available for a particular base. MoTIVES can also be used with spatially explicit data to
help managers target those areas providing the largest or most valuable services, and to direct
potentially damaging training activities to those providing the fewest benefits.
A distinguishing feature of our approach is the fact that we explicitly consider uncertainty in all
aspects of the model related to ecosystem outputs and benefit relevant indicators, and translate
this uncertainty to model endpoints using Monte Carlo simulation. Predicting the response of a
natural system to management actions is a highly uncertain task and the actual outcome can
never be perfectly known in advance. Regardless of the quality of the biophysical or economic
models used, there will always be residual uncertainty due to natural variability, measurement
error in underlying data, or misspecification of ecological processes. This means that most
models underrepresent the natural dynamics and variation in a system, leading to management
actions that have unanticipated consequences. By using simulation to explore the range of
possible consequences of management for ecosystem service values, we decrease the likelihood
of later surprises or missed opportunities.
5.2 Additional Research Needs to Improve This Approach
Because the most important services provided by Eglin Air Force Base were linked to the
management of terrestrial ecosystems, in our pilot study we were not able to take advantage of
some of the models and tools related to aquatic ecosystem services. At other bases, where
aquatic systems and services are important, other models should be incorporated. The InVEST
models have been tested and are simple to apply in many areas. For example, in the MoTIVES
framework, InVEST can be useful in exploring management tradeoffs between sediment removal
and other terrestrial land management decisions. We acknowledge that the InVEST model is
simplified and more detailed hydrological models may give better results. However, the detailed
hydrologic models have only been piloted in a few small watersheds, and only the flood control
models have been carefully tested. These more intensive and time consuming models could be
useful for bases because each individual wetland or stream segment on a base can be assessed for
the specific services they provide. Including this aquatic detail in MoTIVES would allow base
natural resources staff to target restoration and conservation considering both terrestrial and
aquatic systems.
45
Similarly, research into water quality improvement related to both the ecosystem processes of
nutrient removal, and the value of removed N and P for anything but waste water treatment
would improve our model outputs. Research is underway a to develop high resolution decision
support tools for assessing the value of nutrients that individual wetlands, stream segments and
floodplain vegetation can remove or prevent these from reaching downstream streams (Kadlec
2006). Access to high resolution, Lidar based DEMs, hydrologic modeling tools, along with data
linking wetland basin size, condition and vegetation to sediment removal, makes assessment of
BRIs for nutrients possible for bases where water provision is important. Fortunately, the ability
of MoTIVES to provide information on uncertainty allows our methods to be useful with
whatever are the best available data and models.
Tradeoffs are most easily evaluated if different services can be measured in similar units, which
is why economic valuation is so useful. Yet many base management activities on the pilot bases
are focused on management of threatened, endangered or endemic species, as they provide
critical habitat for them. The conservation or expansion of populations of at risk species
represent important management outcomes. We provide estimates of the existence values
associated with species conservation for a single species only (red cockaded woodpecker),
although we recognize that the values obtained depend critically on how estimates from focused
studies are transferred to larger human populations. Research into valuing species existence
would significantly improve any methods to evaluate this important ecosystem service (Olander
et al. 2017).
We estimated economic values for many BRIs, but future research is needed to provide a more
comprehensive assessment. Economic values for market goods are readily estimated because
these goods have observable prices. For example, we computed economic values for timber and
flood damage using market data on stumpage and real estate prices. Valuation of non-market
goods is also possible using techniques such as the contingent valuation method. Non-market
benefits quantified for Eglin include species preservation and carbon storage. Economic values
were not provided because:
1. preliminary analysis indicated negligible benefits,
2. economic value estimates were available but could not be linked to BRIs, or
3. economic value estimates were unavailable.
An example of the first case is respiratory health protection, which we determined to be a
negligible impact. Drinking water quality is an example of the second case. There are
willingness-to-pay estimates for clean drinking water, but the output from a sediment delivery
model (soil loss) is not what is directly valued in the economic studies. In the third case, there
are endemic species found at Eglin for which contingent valuation estimates are unavailable.
Future research can address these last two cases by developing ways to align model outputs with
available economic estimates or to develop new estimates to match the BRIs produced by the
models.
5.3 Pilot Base Application
Eglin Air Force Base served as a useful pilot because it provides many important services, and
because many of these services exist primarily as a result of two decades of intensive
management by Eglin staff. This intense management is coincident with very high quality data,
allowing more accurate predictions of services such as carbon, endangered species, and stream
46
water quality improvement. And the scenario evaluation demonstrates how important base
management has been and will be in relation to the value of services provided, both when
compared to the no base scenario and the no management scenario. The initial pilot studies
indicate that there appear to be no limitations as to where our approach can be applied. However,
the time and cost to implement this at another base will depend on several factors, including the
availability of ecosystem process models for the primary ecosystems at the base, quality of data
related to ongoing base management, and usable valuation protocols for the services of interest.
Although we did not apply MoTIVES at Fort Hood, our work there was important for
understanding how variation in management, habitats and data would affect the time, cost and
effectiveness of implementing this methodology across all of the large bases. Unlike Eglin, Fort
Hood occurs in an ecological transition including prairies typical of the Midwest, oak-juniper
woodlands typical of Texas, and some shrublands characteristic of the southwest; requiring
multiple habitat models each linking to different ecosystem services. At Fort Hood the team was
able to compare national, regional and local vegetation datasets to evaluate if they would be
suitable for use in our models – and they generally were. Although the local datasets were much
more useful for identification of ecosystems states, and to assess the values of benefit relevant
indicators for the relevant services.
5.4 Feasibility Assessment of Future Expansion of this Work
Our approach can be applied widely, although the time and cost to implement it at any given
base will depend on a number of factors. These include:
1. The availability of ecosystem process models for the primary ecosystems at the base. The
primary ecosystem type at Eglin AFB, longleaf pine, happens to both be a well-studied
ecosystem type and one that dominates at least ten other large bases from Virginia south
to Florida and west to Mississippi. Existing models are available for many ecosystem
types in the western US, particularly where the USFS has developed and used STSMs for
their forest planning, locations of the Integrated Landscape Assessment Project. Models
are also available at Fort Lewis and Fort Bragg and the forested landscapes in the upper
Midwest and New England where other models such as Landis have been developed and
applied.
2. The availability of base-specific ecosystem and use data. Our methodology requires an
understanding the natural resources management objectives of each base. The team found
that implementing this project was much more straightforward when working at military
installations with INRMP documents produced within the last five years. These tended to
include comprehensive information on recreational, hunting, livestock and other uses,
endangered species management, and other relevant information.
3. The availability of state, university or other partners with expertise on natural systems at
the base. For bases with this information available, it was possible to apply models
without a major time commitment from base staff, which is important if the methodology
is to be more widely implemented. For bases with older or out of date INRMP
documents, the involvement of base staff is critical. In addition, where threatened and
endangered species are an issue, the availability of state Natural Heritage Program or
state Fish and Wildlife agency staff with experience at the base can significantly reduce
the effort required while improving the results.
47
Based on the initial project, it is clearly feasible to apply this methodology across bases in the
US. Although we did not apply MoTIVES at Fort Hood, our work there was important for
understanding how variation in management, habitats and data would affect the time, cost and
effectiveness of implementing this methodology across all of the large bases. Unlike Eglin, Fort
Hood occurs in an ecological transition, including prairies typical of the Midwest, oak-juniper
woodlands typical of Texas, and some shrublands characteristic of the southwest, requiring
multiple habitat models each linked to different ecosystem services. At Fort Hood, the team was
able to compare national, regional and local vegetation datasets to evaluate whether they would
be suitable for use in our models, and they generally were. While the local datasets were much
more useful for identification of ecosystems states, and would therefore come up with more
accurate estimates of the services provided, available data will work in MoTIVES and provide
reasonable estimates of the value of the ecosystem services any base provides.
Our proposal to move this process forward would be for Duke University to take the lead on this
effort, working with researchers at the University of California Santa Barbara. The most efficient
way to complete this work would be to employ PhD students and Post-Doctoral researchers over
a four-year time period, which would cost approximately $2.8 million. The project would both
address the key research questions listed above and implement this methodology at 12-16
geographically large or ecologically significant bases in the country, selected jointly between
DOD and our project team. Any bases, both international and domestic, could be evaluated.
However, our initial recommendations as to the most important places to do this work include
the following 20 bases located in the conterminous United States:
Fort Hood, Texas (to be completed)
Joint Base Lewis – McChord, Washington (to be completed)
Camp Lejeune, North Carolina (to be completed)
Dugway Proving Ground, Utah
Camp Pendleton, California
Fort Benning, Georgia
Fort Bragg, North Carolina
Fort Campbell, Kentucky and Tennessee
Fort Huachuca, Arizona
Fort Jackson, South Carolina
Fort Knox, Tennessee
Fort McCoy, Wisconsin
Fort Pickett, Virginia
Fort Stewart, Georgia
Nellis AFB, Nevada
Pacific Fleet Training Center, Arizona
Twentynine Palms, California
Vandenberg AFB, California
White Sands Missile Range, New Mexico
Yakima Firing Center, Washington
48
6 Literature Cited
ABS Consulting (2011). “Flood Information Tool User Manual”. Arlington, VA.
Acreman, M. and J. Holden (2013). “How wetlands affect floods” in Wetlands 33 (5): 773-786.
Aiken, R. 2009. “Net economic values of wildlife-related recreation in 2006: Addendum to the 2006
National Survey of Fishing, Hunting, and Wildlife-Associated Recreation.” Report 2006-5.
Washington, DC: U.S. Fish and Wildlife Service
Becker, Kathryn E. (2011). “Variability of carbon stock in Florida flatwoods ecosystems undergoing
restoration and management” (MS Thesis). Orlando, FL: University of Central Florida.
Bell, D.M., M.J. Gregory, V. Kane, J. Kane, R.E. Kennedy, H.M. Roberts, M. Simpson and Z. Yang
(2018). “Multiscale divergence between Landsat- and LIDAR-based biomass mapping explained by
regional variation in canopy cover and composition” in Carbon Balance and Management Vol.
13(15).
Blackmore, D.S. and H. Chang (2015). “A Geospatial tool for wetland prioritization at the watershed
scale” (Report to U.S. EPA). Portland, OR: Institute for Natural Resources, Portland State University.
Available: https://pdxscholar.library.pdx.edu/naturalresources_pub/31/
Buck, S., M. Auffhammer, and D. Sunding (2014). “Land Markets and the Value of Water: Hedonic
analysis using repeat sales of farmland.” in American Journal of Agricultural Economics Vol. 96(4):
953-969.
Costanza, J.K., A.J. Terando, A.J. McKerrow, and J.A. Collazo (2015). Modeling climate change,
urbanization, and fire effects on Pinus palustris ecosystems of the southeastern U.S. 2015. Journal of
Environmental management 151: 186-199.
Chadwick, N. (2005). “Red-cockaded woodpecker”. Charleston, SC: South Carolina Department of
Natural Resources, US Fish & Wildlife Service. Available:
http://www.dnr.sc.gov/cwcs/pdf/Redcockadedwoodpecker.pdf
Daniel, C.J., L. Frid, B.M. Sleeter and M.J Fortin (2016). “State-and-transition simulation models: a
framework for forecasting landscape change” in Methods in Ecology and Evolution, Vol. 7(11):1413-
1423.
Duggan, J.M, B.A. Eichelberger, S. Ma, J.J. Lawler and G. Ziv (2015). “Informing management of rare
species with an approach combining scenario modeling and spatially explicit risk assessment” in
Ecosystem Health and Sustainability, Vol. 1(6): 1-18.
Eglin Air Force Base (2013). “Final Environmental Impact Assessment for Integrated Natural Resources
Management Plan Activities” https://apps.dtic.mil/dtic/tr/fulltext/u2/a616715.pdf
Federal Emergency Management Agency (FEMA) (2018). “Hazus Flood Model User Guidance.”
Washington, DC.
Federal Emergency Management Agency (FEMA) (2019). “FEMA Flood Map Service Center.”
Retrieved 2019-05-16 from https://msc.fema.gov/portal/home.
Finney, M.A., C.W. McHugh, I.C. Grenfell, K.L. Riley, and K.C. Short (2011). “A Simulation of wildfire
risk components for the continental United States” in Stochastic Environmental Research and Risk
Assessment Vol. 25(7): 973-1000.
Galik, C.S., R.C. Abt, G. Latta, A. Méley and J.D. Henderson (2016). “Meeting renewable energy and
land use objectives through public–private biomass supply partnerships” in Applied Energy, Vol. 172:
264-274.
Hamel, P., R. Chaplin-Kramer, S. Sim and C. Mueller (2015). “A New approach to modeling the
sediment retention service (InVEST 3.0): case study of the Cape Fear catchment, North Carolina,
USA” in Science of The Total Environment, Vol. 524:166-177.
Hamel, P., K. Falinski, R. Sharp, D.A. Auerbach, M. Sánchez-Canales and P.J. Dennedy-Frank (2017).
“Sediment delivery modeling in practice: comparing the effects of watershed characteristics and data
resolution across hydroclimatic regions” in Science of the Total Environment, Vol. 580: 1381-1388.
Jackson, J.A., M.R. Lennartz, and R.G. Hooper (1979). “Tree age and cavity initiation by red-cockaded
woodpeckers” in Journal of Forestry, Vol 77(2): 102-103.
49
Johnson, F.R., E.E. Fries and H.S. Banzhaf (1997). “Valuing morbidity: an integration of the willingness-
to-pay and health-status index literatures” in Journal of Health Economics, 16(6), 641-665.
Johnston, R.J. and M. Russell (2011). “An Operational structure for clarity in ecosystem service values”
in Ecological Economics, Vol. 70(12):2243‐2249.
Johnston, R.J. and P.J. Thomassin (2010). “Willingness to pay for water quality improvements in the
United States and Canada: considering possibilities for international meta-analysis and benefit
transfer” in Agricultural and Resource Economics Review, Vol 39(1): 114-131.
Jones, C.N., G.R. Evenson, D.L McLaughlin, M.K Vanderhoof, M.W. Lang, G.W. McCarty, H.E.
Golden, C.R. Lane, and L.C. Alexander (2018). “Estimating restorable wetland water storage at
landscape scales” in Hydrological Processes, Vol. 32:305-313.
Kadlec, R.H (2006). “Free surface wetlands for phosphorus removal: the position of the Everglades
Nutrient Removal Project” in Ecological Engineering, Vol. 27(4): 361-379.
Koks, E.E., M. Bočkarjova, H. de Moel, and J.C.J.H. Aerts (2015). “Integrated direct and indirect flood
risk modeling: development and sensitivity analysis” in Risk Analysis, Vol. 35(5): 882-900.
Kumar, P. (Ed.) (2010). The Economics of Ecosystems and Biodiversity: Ecological and Economic
Foundations. Abingdon-on-Thames, UK: Routledge.
Liu, Y., G.L. Achtemeier, S.L. Goodrick and W. A. Jackson (2010). “Important parameters for smoke
plume rise simulation with Daysmoke” in Atmospheric Pollution Research 1(4): 250-259.
Liu, J.C., G. Pereira, S.A. Uhl, M.A. Bravo and M.L. Bell (2015). “A systematic review of the physical
health impacts from non-occupational exposure to wildfire smoke” in Environmental Research, Vol.
136: 120-132
LMNO Engineering, Research, and Software, Ltd. (LMNO) (2015). “Rational Equation Calculator”
retrieved 2019-05-16 from https://www.lmnoeng.com/Hydrology/rational.php.
Mariethoz, G., and P. Renard, (2010). “Reconstruction of incomplete data sets or images using direct
sampling” in Mathematical Geosciences, Vol. 42: 245–268.
Mariethoz, G., P. Renard, and J. Straubhaar (2010). “Direct sampling method to perform multiple‐point
geostatistical simulations” in Water Resources Research., 46(11).
Mavrommati, G., M.E. Borsuk and R.B. Howarth (2016). “A Novel deliberative multicriteria evaluation
approach to ecosystem service valuation” in Ecology and Society, Vol. 22(2):39.
McNamara, D.E., S. Gopalakrishnan, M.D. Smith and A.B. Murray (2015). “Climate adaptation and
policy-induced inflation of coastal property value” in Plos One 10(3): e0121278.
Meerschman, E., G. Pirot, G. Mariethoz, J. Straubhaar, M. Van Meirvenne and P. Renard (2013). “A
Practical guide to performing multiple-point statistical simulations with the direct sampling
algorithm” in Computers & Geosciences, Vol. 52: 307–324.
Natural Resources Conservation Service (NRCS) (1986). Urban Hydrology for Small Watersheds
(Technical Release 55). Washington, D.C. Available:
https://www.nrcs.usda.gov/Internet/FSE_DOCUMENTS/stelprdb1044171.pdf.
Novotny, V (2003). Water Quality: Diffuse Pollution and Watershed Management (Second Edition). New
York: John Wiley & Sons, Inc.
Ohmann, J.L. and M.J. Gregory (2002). “Predictive mapping of forest composition and structure with
direct gradient analysis and nearest-neighbor imputation in coastal Oregon, USA” in Canadian
Journal of Forest Research, Vol. 32(4): 725-741.
Olander, L., S. Polasky, J.S. Kagan, R.J. Johnston, L. Wainger, D. Saah, L. Maguire, J. Boyd, and D.
Yoskowitz (2017). “So you want your research to be relevant? Building the bridge between
ecosystem services research and practice” in Ecosystem Services, Vol. 26(A): 170-182.
Polyzou, E., N. Jones, K.I. Evangelinos, and C.P. Halvadakis (2011). “Willingness to pay for drinking
water quality improvement and the influence of social capital” in Journal of Socio-Economics, Vol.
40(1): 74-80.
Reaves, D.W., R.A. Kramer and T.P. Holmes (1999). “Does question format matter? Valuing an
endangered species” in Environmental and Resource Economics, Vol. 14: 365-383.
50
Richardson, L. and J. Loomis (2009). “The Total economic value of threatened, endangered and rare
species: An updated meta-analysis” in Ecological Economics, Vol 68(5): 1535-1548.
Richardson, L.A., P.A. Champ and J.B. Loomis (2012). “The Hidden cost of wildfires: economic
valuation of health effects of wildfire smoke exposure in southern California” in Journal of Forest
Economics, Vol. 18(1), 14-35.
Samuelson, L.J., T.A. Stokes, J.R. Butnor, K.H. Johnsen, C.A. Gonzalez-Benecke, P.H. Anderson, J.
Jackson, L. Ferrari, T.A. Martin, and W.P. Cropper, Jr (2014). “Ecosystem carbon stocks in Pinus
palustris forests” in Canadian Journal of Forest Research, Vol. 44: 476–486.
Samuelson, L.J., T.A. Stokes, J.R. Butnor, K.H. Johnsen, C.A. Gonzalez-Benecke, T.A. Martin, W.P.
Cropper, Jr, P.H. Anderson, M.R. Ramirez, and J.C. Lewis (2017). “Ecosystem carbon density and
allocation across a chronosequence of longleaf pine forests” in Ecological Applications, Vol. 27:
244–259.
Scheller, R.M., J.B. Domingo, B.R. Sturtevant, J.S. Williams, A. Rudy, E.J. Gustafson and D.J.
Mladenoff (2007). “Design, development, and application of LANDIS‐II, a spatial landscape
simulation model with flexible temporal and spatial resolution” in Ecological Modelling, Vol. 201:
409– 419.
Sharp, R., H.T. Tallis,T. Ricketts, A.D. Guerry, S.A. Wood, R. Chaplin-Kramer, E. Nelson, D. Ennaanay,
S. Wolny, N. Olwero, K. Vigerstol, D. Pennington, G. Mendoza, J. Aukema, J. Foster, J. Forrest, D.
Cameron, K. Arkema, E. Lonsdorf, C. Kennedy, G. Verutes, C.K. Kim, G. Guannel, M. Papenfus, J.
Toft, M. Marsik, J. Bernhardt, R. Griffin, K. Glowinski, N. Chaumont, A. Perelman, M. Lacayo, L.
Mandle, P. Hamel, A.L. Vogl, L. Rogers, W. Bierbower, D. Denu and J. Douglass (2018). “InVEST
3.6.0 user’s guide.” (Collaborative publication by The Natural Capital Project, Stanford University,
the University of Minnesota, The Nature Conservancy, and the World Wildlife Fund). Stanford, CA:
Stanford University.
Shepard, C.C., C.M. Crain and M.W. Beck (2011). “The Protective role of coastal marshes: a systematic
review and meta-analysis” in PLoS One 6(11): e27374.
Shultz, S. (2017). “Accuracy of HAZUS General Building Stock Data” in Natural Hazards Review, Vol.
18(4): 04017012.
Smith, M.D., J.M. Slott, D. McNamara and A.B. Murray (2009). “Beach nourishment as a dynamic
capital accumulation problem” in Journal of Environmental Economics and Management, Vol. 58(1):
58-71.
Susaeta, A. and P. Gong (2019). “Economic viability of longleaf pine management in the southeastern
United States” in Forest Policy and Economics, Vol. 100, 14-23.
Stevens, T.H., J. Echeverria, R.J. Glass, T. Hager and T.A. More (1991). “Measuring the existence value
of wildlife: what do CVM estimates really show?” in Land Economics, Vol. 67(4): 390-400.
Thorslund, J., J. Jarsjö, F. Jaramillo, J.W. Jawitz, S. Manzoni, N.B. Basu, S.R. Chalov, M.J. Cohen, I.F.
Creed, R. Goldenberg, A. Hylin, Z. Kalantari, A.D. Koussis, S.W. Lyon, K. Mazih, J. Mård, K.
Persson, J. Pietron, C. Prieto, A. Quin, K. Van Meter, and G. Destouni (2017). “Wetlands as large-
scale nature-based solutions: status and challenges for research, engineering and management” in
Ecological Engineering, Vol. 108: 489-497.
United States Census Bureau (2018). “S0101 – Age and Sex.” American Community Survey: 2013-2017
American Community Survey 5-Year Estimates.
United States Environmental Protection Agency (US EPA) (2016). “Particulate Matter (PM) Standards:
Table of Historical PM NAAQS.” Retrieved 2019-05-31 from
https://www3.epa.gov/ttn/naaqs/standards/pm/s_pm_history.html.
United States Environmental Protection Agency (US EPA) (2019). “Community Multiscale Air Quality
Modeling System (CMAQ): About CMAQ.” Retrieved 2019-05-31 from
https://www.epa.gov/cmaq/cmaq-models-0.
United States Geological Survey (USGS) 2018. “Wetland Restoration in the San Francisco Bay Delta and
Pacific Northwest.” Retrieved 2019-01-24 from https://www.usgs.gov/centers/werc/science/wetland-
restoration-san-francisco-bay-delta-and-pacific-northwest.
51
United States Department of the Interior, U.S. Fish and Wildlife Service, U.S. Department of Commerce
and U.S. Census Bureau (2011). National Survey of Fishing, Hunting, and Wildlife-Associated
Recreation. Washington, D.C.
Verhoeven, J.T.A., B. Arheimer, C. Yin, and M.M. Hefting (2006). “Regional and global concerns over
wetlands and water quality” in Trends in Ecology and Evolution, Vol. 21(2): 96-103.
Vymazal, J (2007). “Removal of nutrients in various types of constructed wetlands” in Science of the
Total Environment, Vol. 380: 48-65.
Watson, K.B., T. Ricketts, G. Galford and S. Polasky (2016). “Quantifying flood mitigation services: the
economic value of Otter Creek wetlands and floodplains to Middlebury, VT” in Ecological
Economics 130: 16-24.
Wheater, H. and E. Evans (2009). “Land use, water management and future flood risk” in Land Use
Policy, Vol. 26: S251-S64.
Wilson, C.W. R.E. Masters and G.A. Bukenholfer (1995). “Breeding bird response to pine-grassland
community restoration for red-cockaded woodpeckers” in Journal of Wildlife Management, Vol. 59
(1): 55-67.
Withers, P.J.A. and H.P. Jarvie (2008). “Delivery and cycling of phosphorus in rivers: a review” in
Science of the Total Environment, Vol. 400(1-3): 379-395.
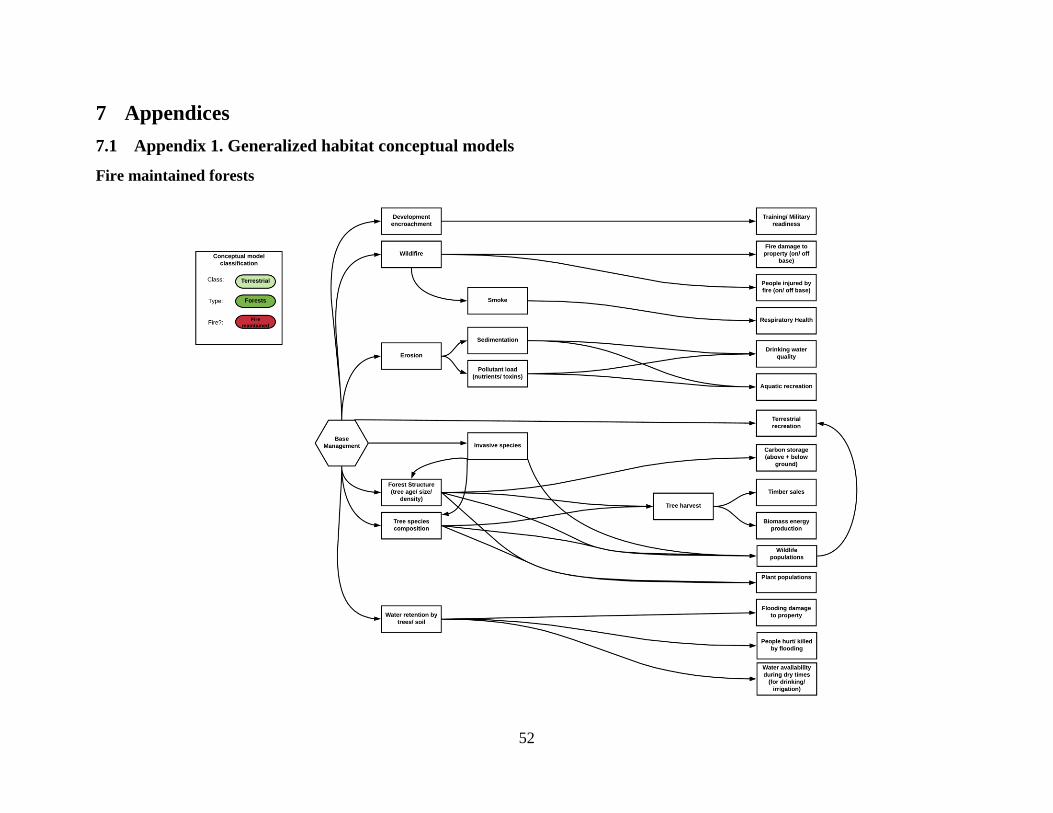
52
7 Appendices
7.1 Appendix 1. Generalized habitat conceptual models
Fire maintained forests
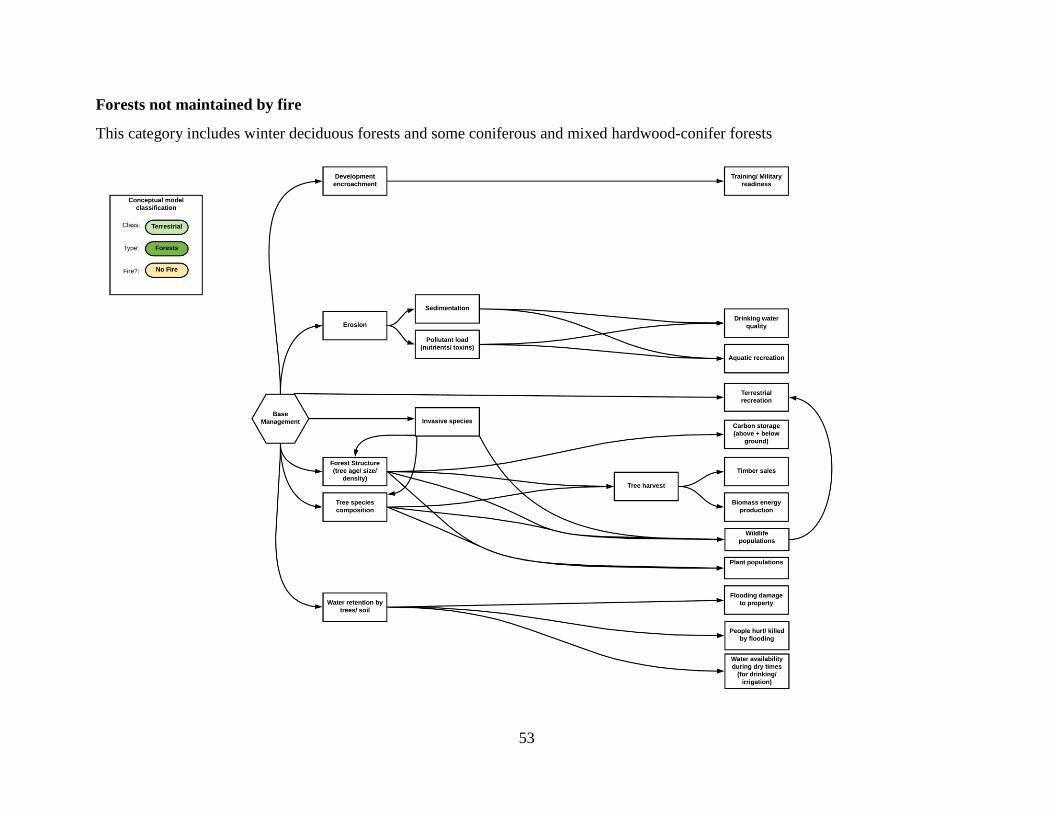
53
Forests not maintained by fire
This category includes winter deciduous forests and some coniferous and mixed hardwood-conifer forests
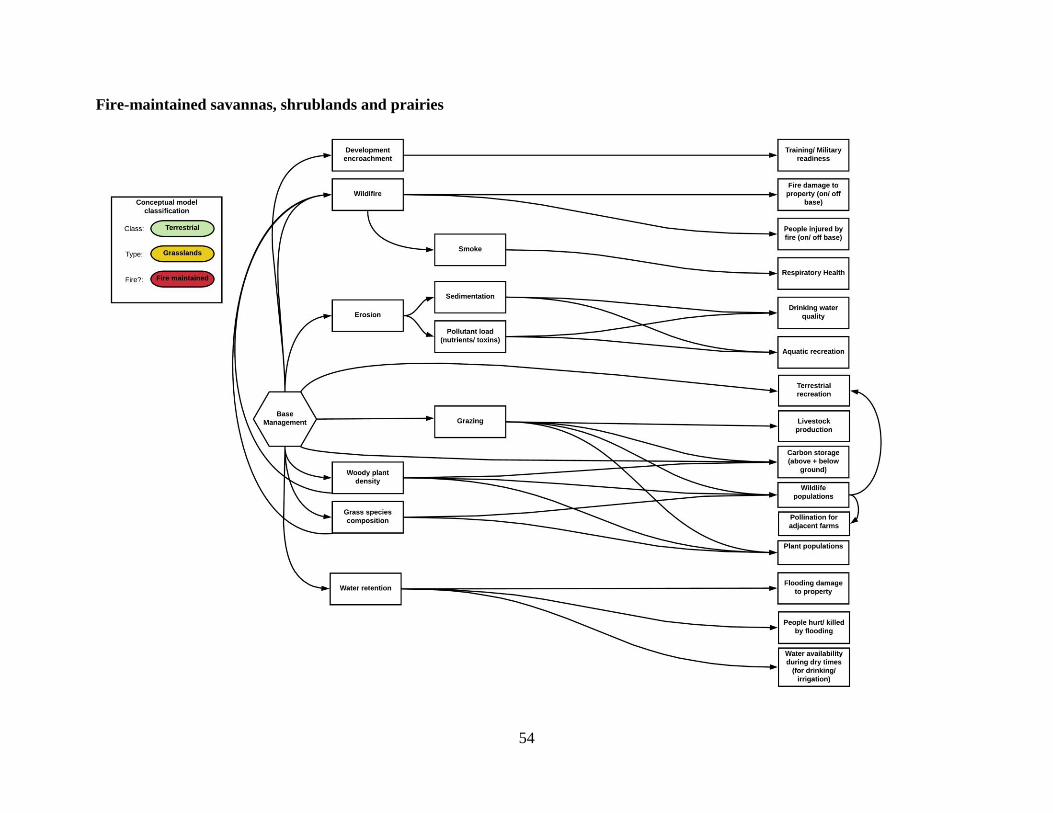
54
Fire-maintained savannas, shrublands and prairies
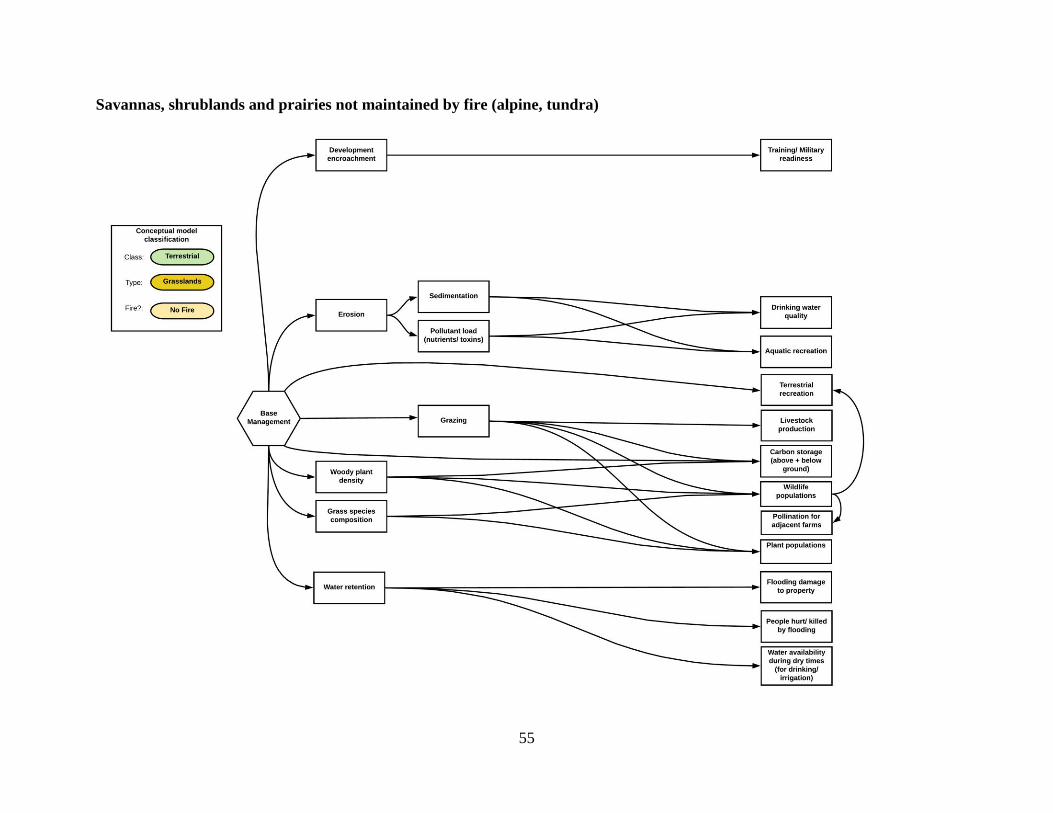
55
Savannas, shrublands and prairies not maintained by fire (alpine, tundra)
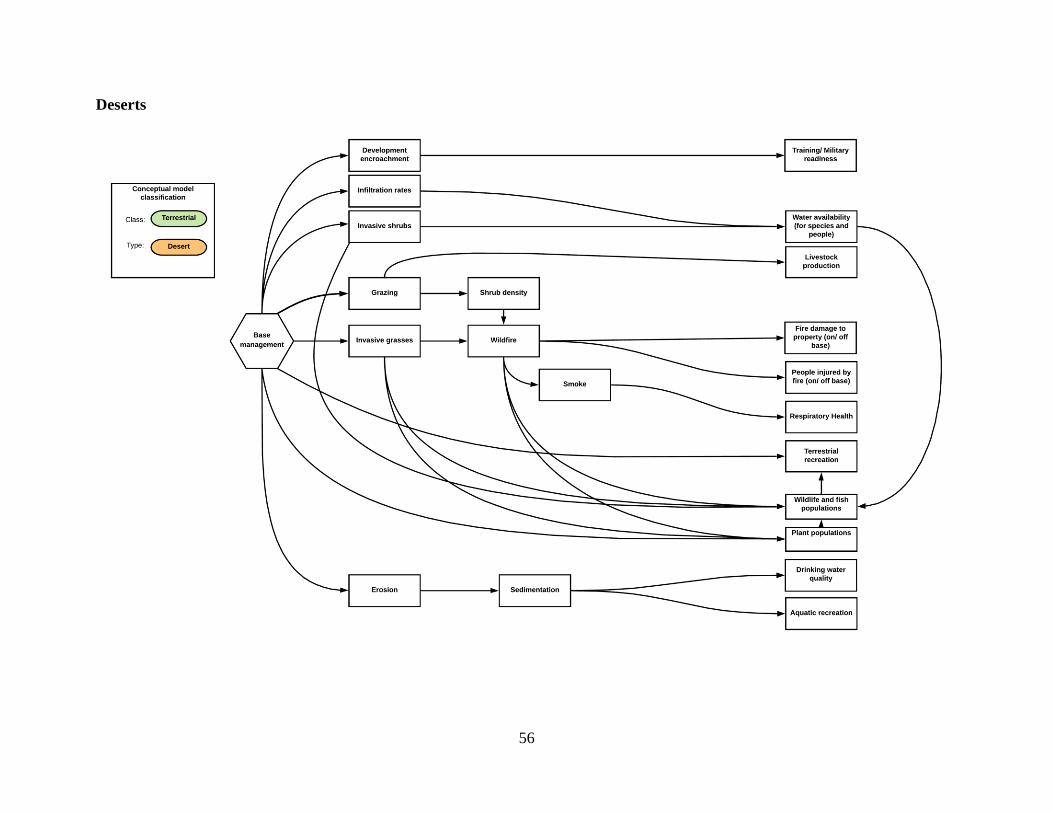
56
Deserts
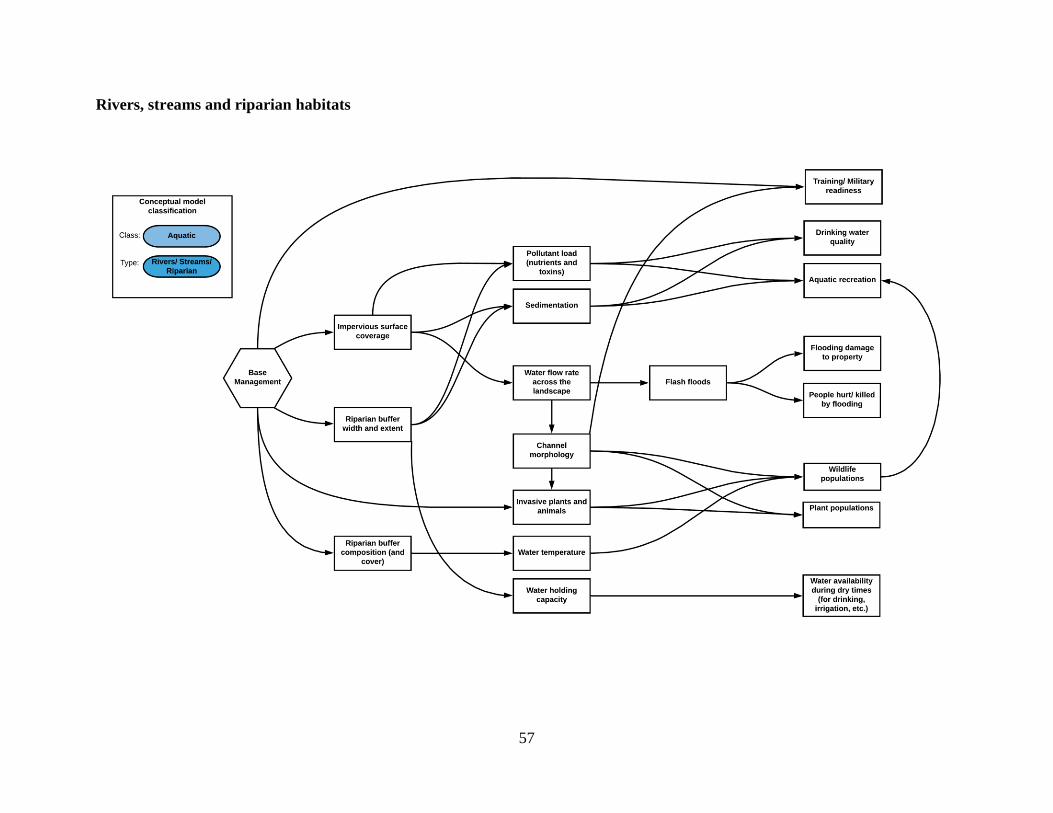
57
Rivers, streams and riparian habitats
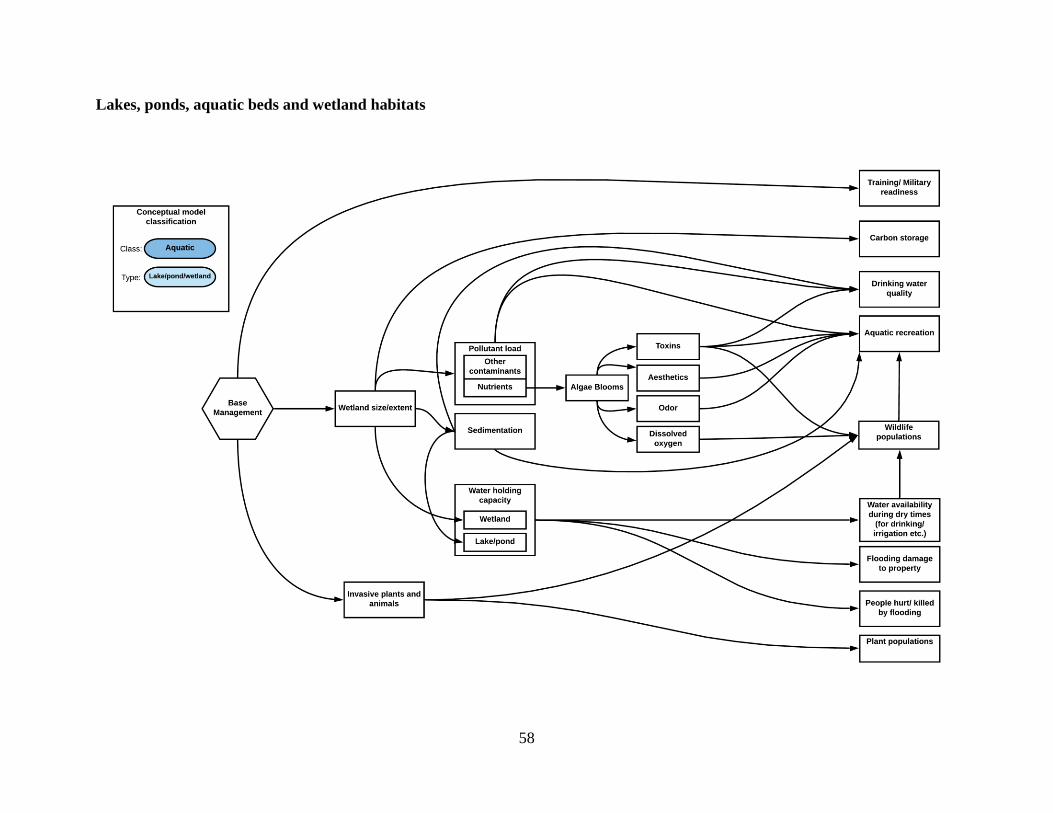
58
Lakes, ponds, aquatic beds and wetland habitats
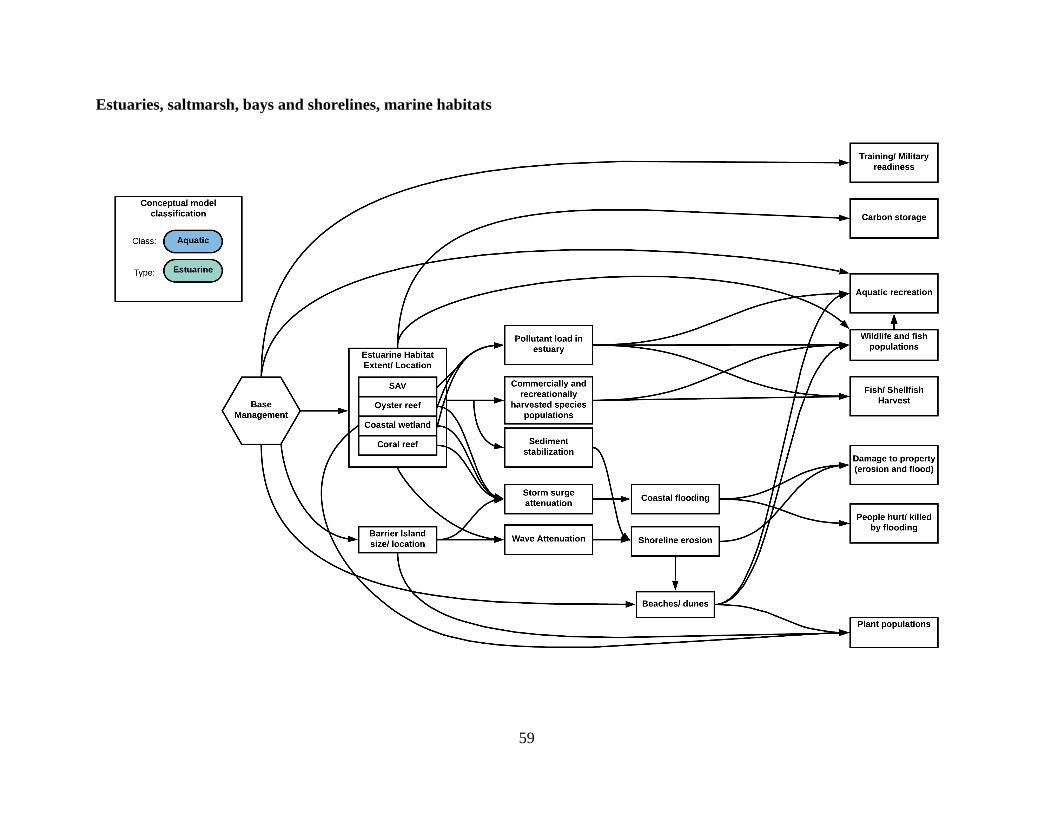
59
Estuaries, saltmarsh, bays and shorelines, marine habitats
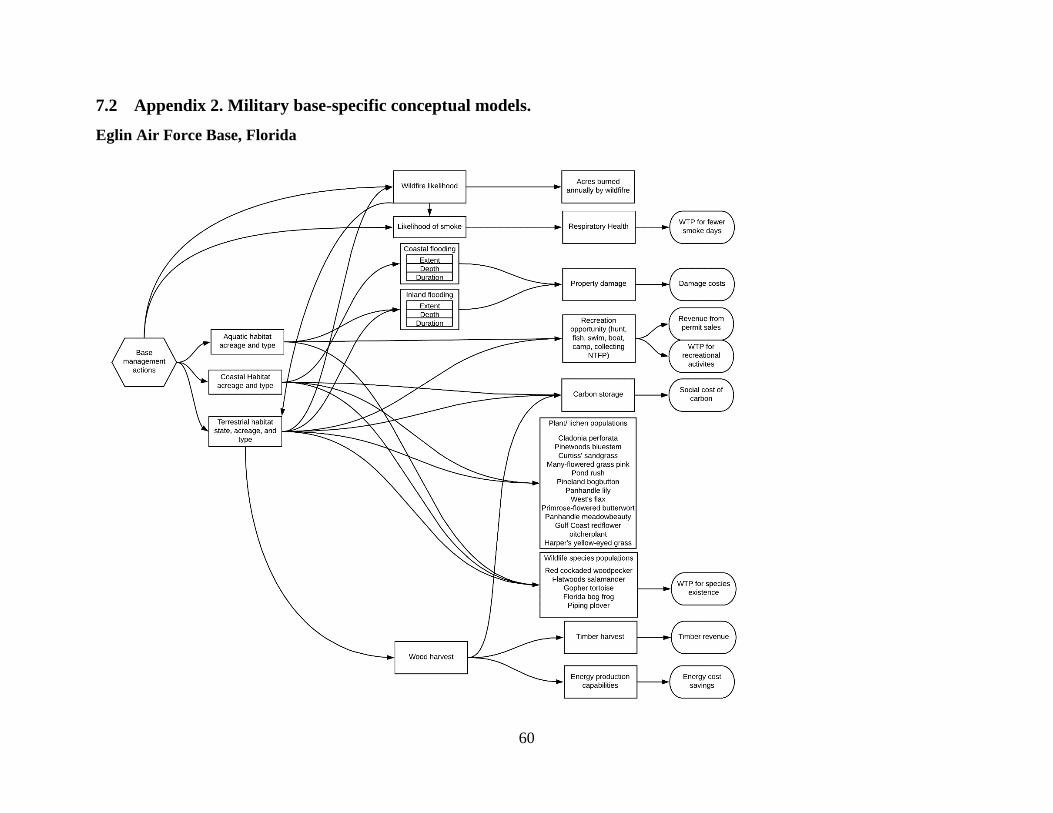
60
7.2 Appendix 2. Military base-specific conceptual models.
Eglin Air Force Base, Florida
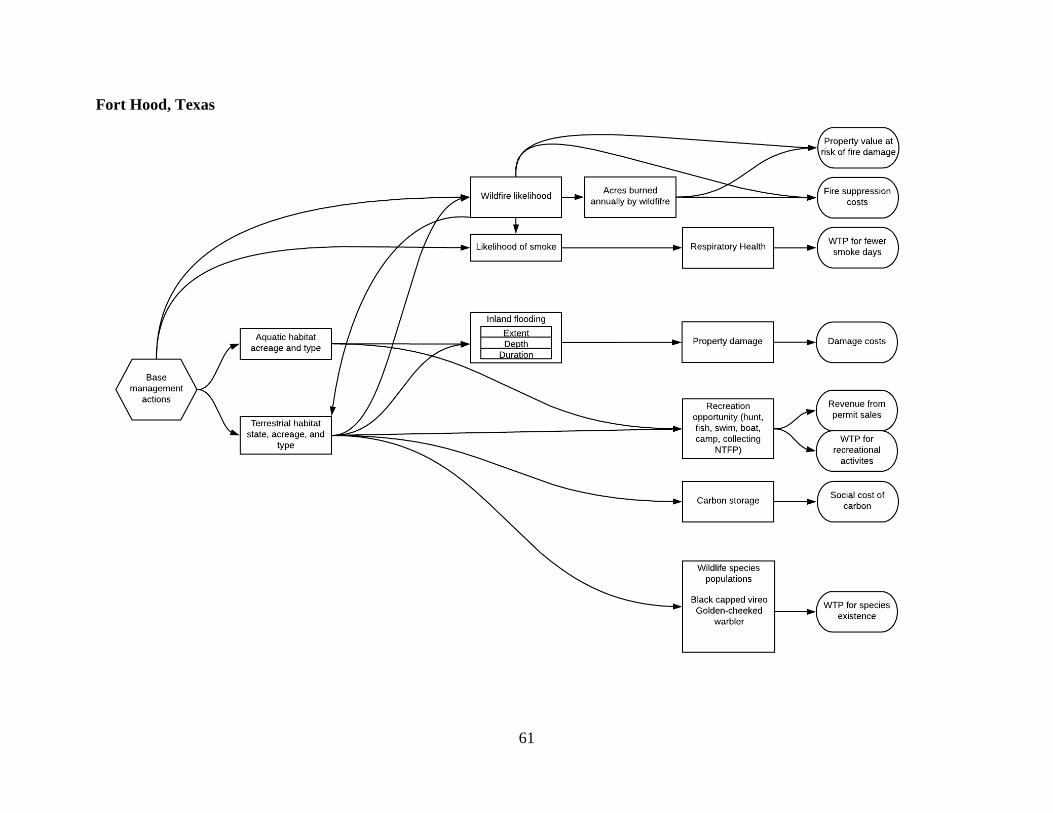
61
Fort Hood, Texas
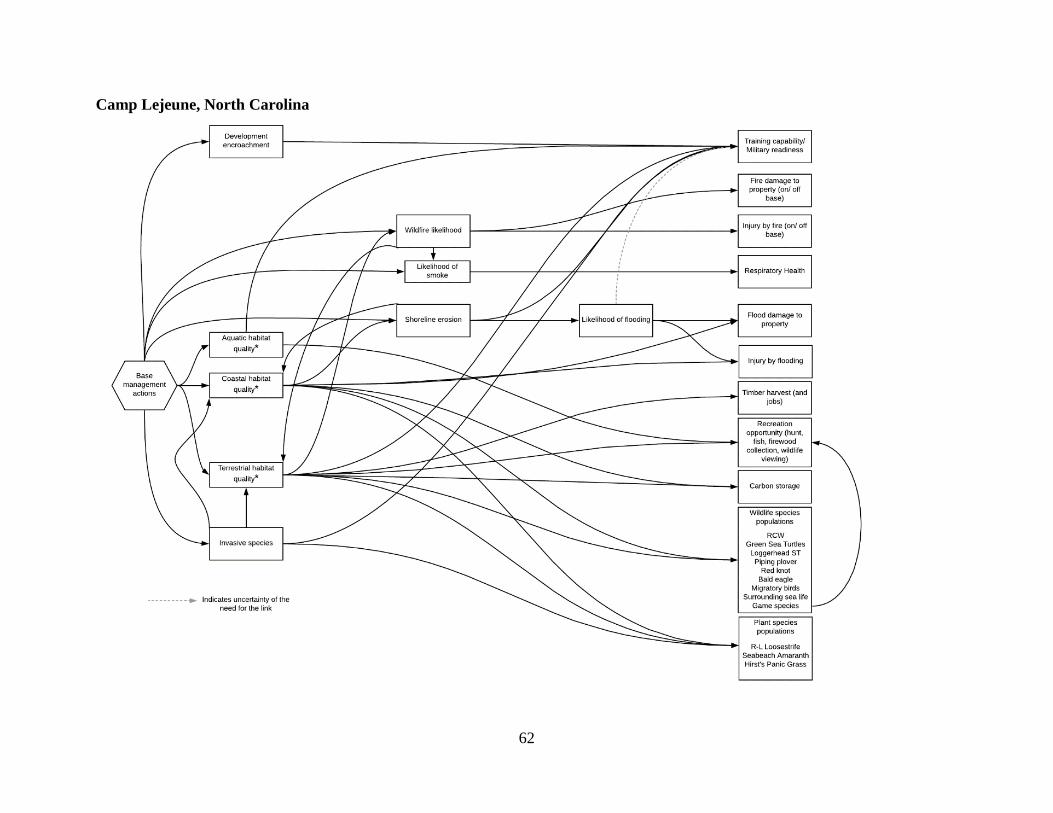
62
Camp Lejeune, North Carolina
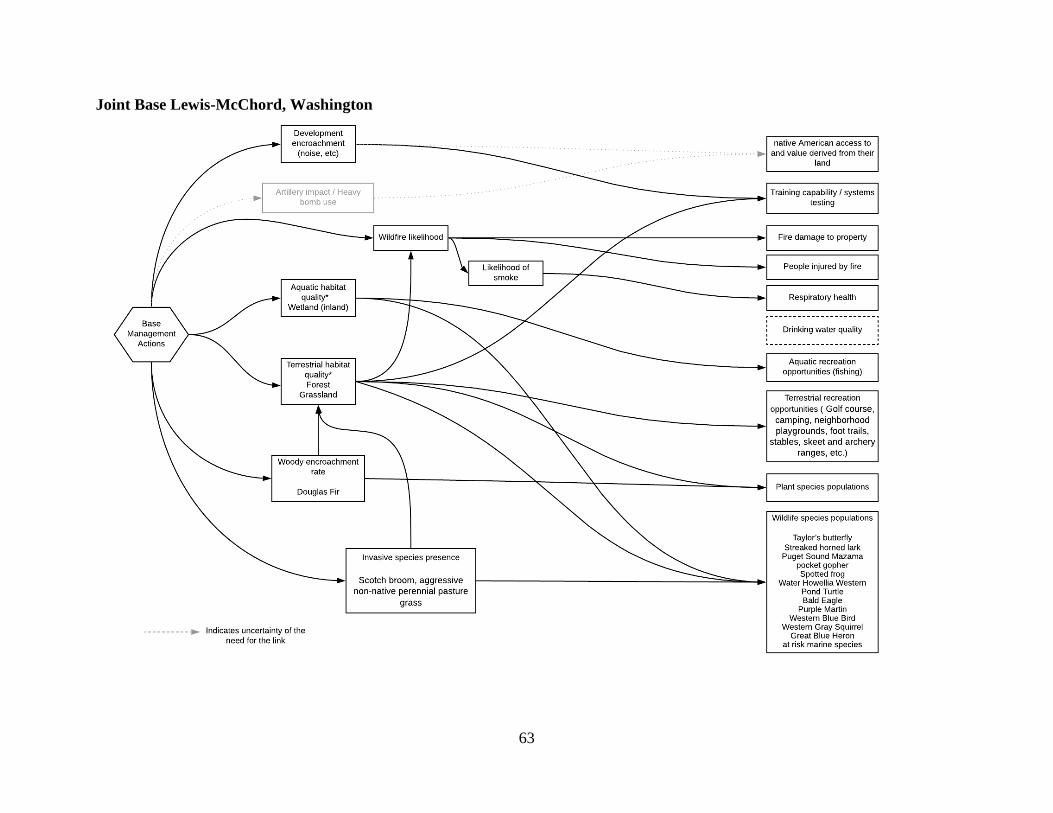
63
Joint Base Lewis-McChord, Washington
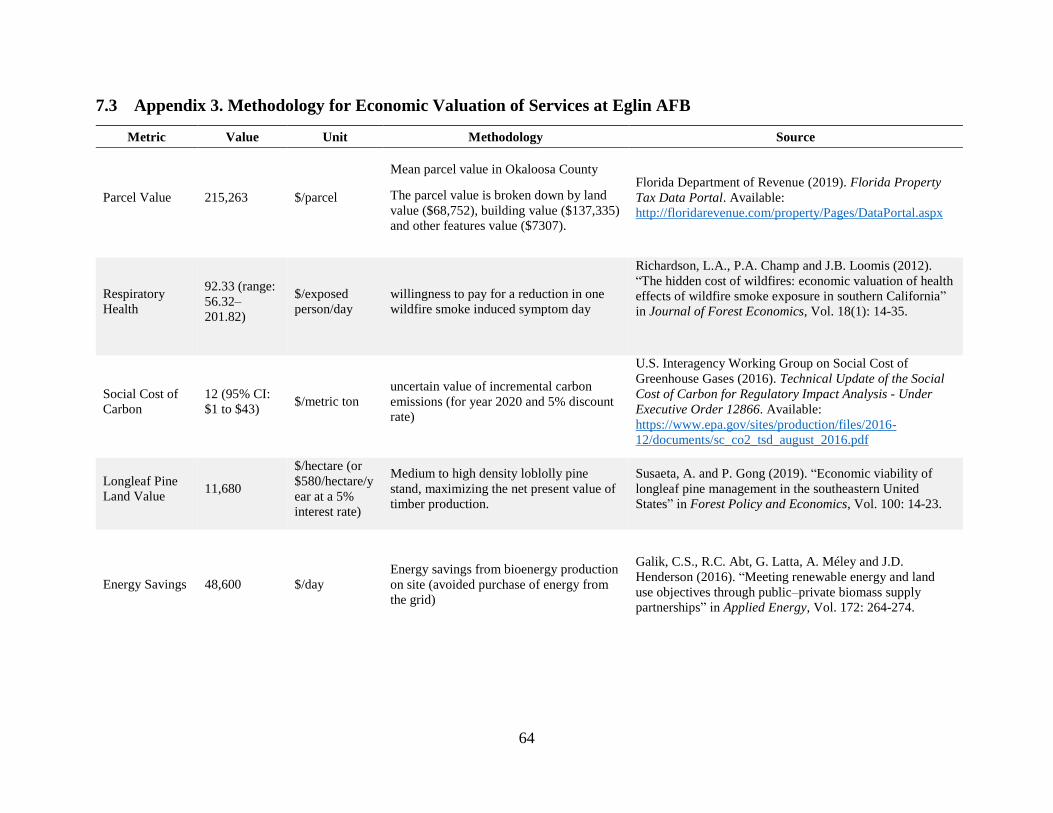
64
7.3 Appendix 3. Methodology for Economic Valuation of Services at Eglin AFB
Metric Value Unit Methodology Source
Parcel Value 215,263 $/parcel
Mean parcel value in Okaloosa County
The parcel value is broken down by land
value ($68,752), building value ($137,335)
and other features value ($7307).
Florida Department of Revenue (2019). Florida Property
Tax Data Portal. Available:
http://floridarevenue.com/property/Pages/DataPortal.aspx
Respiratory
Health
92.33 (range:
56.32–
201.82)
$/exposed
person/day
willingness to pay for a reduction in one
wildfire smoke induced symptom day
Richardson, L.A., P.A. Champ and J.B. Loomis (2012).
“The hidden cost of wildfires: economic valuation of health
effects of wildfire smoke exposure in southern California”
in Journal of Forest Economics, Vol. 18(1): 14-35.
Social Cost of
Carbon
12 (95% CI:
$1 to $43) $/metric ton
uncertain value of incremental carbon
emissions (for year 2020 and 5% discount
rate)
U.S. Interagency Working Group on Social Cost of
Greenhouse Gases (2016). Technical Update of the Social
Cost of Carbon for Regulatory Impact Analysis Under
Executive Order 12866. Available:
https://www.epa.gov/sites/production/files/2016-
12/documents/sc_co2_tsd_august_2016.pdf
Longleaf Pine
Land Value 11,680
$/hectare (or
$580/hectare/y
ear at a 5%
interest rate)
Medium to high density loblolly pine
stand, maximizing the net present value of
timber production.
Susaeta, A. and P. Gong (2019). “Economic viability of
longleaf pine management in the southeastern United
States” in Forest Policy and Economics, Vol. 100: 14-23.
Energy Savings 48,600 $/day
Energy savings from bioenergy production
on site (avoided purchase of energy from
the grid)
Galik, C.S., R.C. Abt, G. Latta, A. Méley and J.D.
Henderson (2016). “Meeting renewable energy and land
use objectives through public–private biomass supply
partnerships” in Applied Energy, Vol. 172: 264-274.
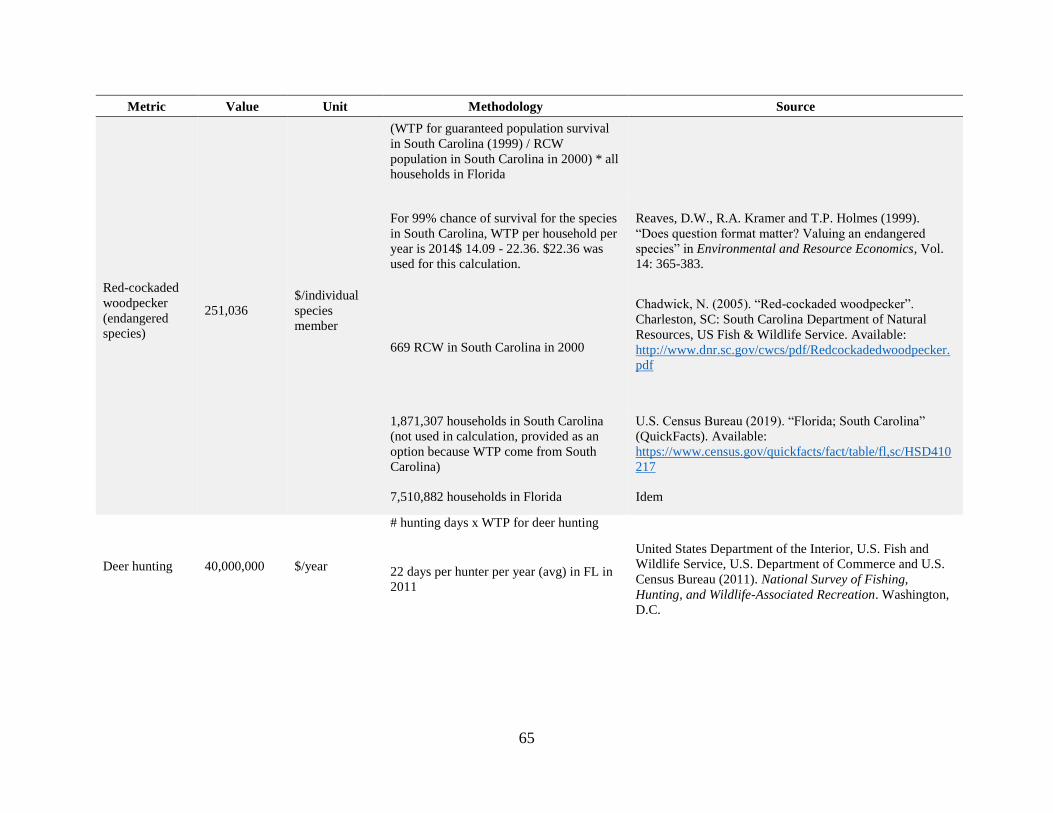
65
Metric Value Unit Methodology Source
Red-cockaded
woodpecker
(endangered
species)
251,036
$/individual
species
member
(WTP for guaranteed population survival
in South Carolina (1999) / RCW
population in South Carolina in 2000) * all
households in Florida
For 99% chance of survival for the species
in South Carolina, WTP per household per
year is 2014$ 14.09 - 22.36. $22.36 was
used for this calculation.
Reaves, D.W., R.A. Kramer and T.P. Holmes (1999).
“Does question format matter? Valuing an endangered
species” in Environmental and Resource Economics, Vol.
14: 365-383.
669 RCW in South Carolina in 2000
Chadwick, N. (2005). “Red-cockaded woodpecker”.
Charleston, SC: South Carolina Department of Natural
Resources, US Fish & Wildlife Service. Available:
http://www.dnr.sc.gov/cwcs/pdf/Redcockadedwoodpecker.
1,871,307 households in South Carolina
(not used in calculation, provided as an
option because WTP come from South
Carolina)
U.S. Census Bureau (2019). “Florida; South Carolina”
(QuickFacts). Available:
https://www.census.gov/quickfacts/fact/table/fl,sc/HSD410
217
7,510,882 households in Florida Idem
Deer hunting 40,000,000 $/year
# hunting days x WTP for deer hunting
22 days per hunter per year (avg) in FL in
2011
United States Department of the Interior, U.S. Fish and
Wildlife Service, U.S. Department of Commerce and U.S.
Census Bureau (2011). National Survey of Fishing,
Hunting, and Wildlife-Associated Recreation. Washington,
D.C.
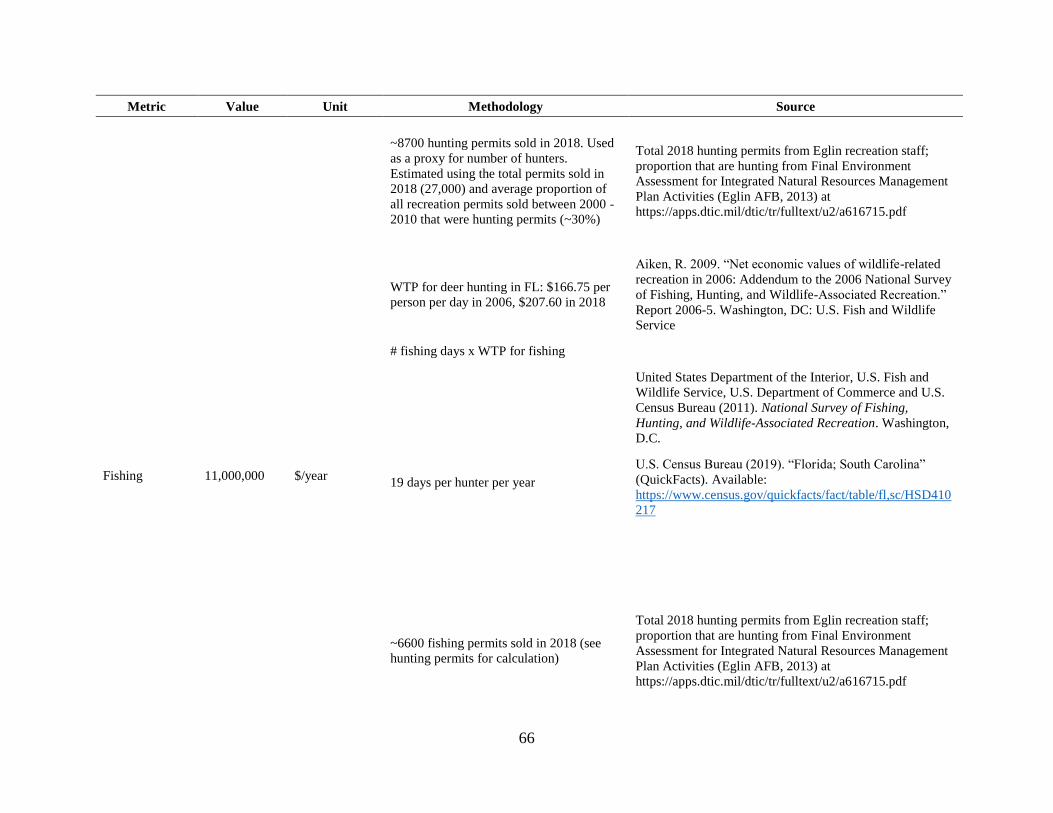
66
Metric Value Unit Methodology Source
~8700 hunting permits sold in 2018. Used
as a proxy for number of hunters.
Estimated using the total permits sold in
2018 (27,000) and average proportion of
all recreation permits sold between 2000 -
2010 that were hunting permits (~30%)
Total 2018 hunting permits from Eglin recreation staff;
proportion that are hunting from Final Environment
Assessment for Integrated Natural Resources Management
Plan Activities (Eglin AFB, 2013) at
https://apps.dtic.mil/dtic/tr/fulltext/u2/a616715.pdf
Fishing 11,000,000 $/year
WTP for deer hunting in FL: $166.75 per
person per day in 2006, $207.60 in 2018
Aiken, R. 2009. “Net economic values of wildlife-related
recreation in 2006: Addendum to the 2006 National Survey
of Fishing, Hunting, and Wildlife-Associated Recreation.”
Report 2006-5. Washington, DC: U.S. Fish and Wildlife
Service
# fishing days x WTP for fishing
19 days per hunter per year
United States Department of the Interior, U.S. Fish and
Wildlife Service, U.S. Department of Commerce and U.S.
Census Bureau (2011). National Survey of Fishing,
Hunting, and Wildlife-Associated Recreation. Washington,
D.C.
U.S. Census Bureau (2019). “Florida; South Carolina”
(QuickFacts). Available:
https://www.census.gov/quickfacts/fact/table/fl,sc/HSD410
217
~6600 fishing permits sold in 2018 (see
hunting permits for calculation)
Total 2018 hunting permits from Eglin recreation staff;
proportion that are hunting from Final Environment
Assessment for Integrated Natural Resources Management
Plan Activities (Eglin AFB, 2013) at
https://apps.dtic.mil/dtic/tr/fulltext/u2/a616715.pdf
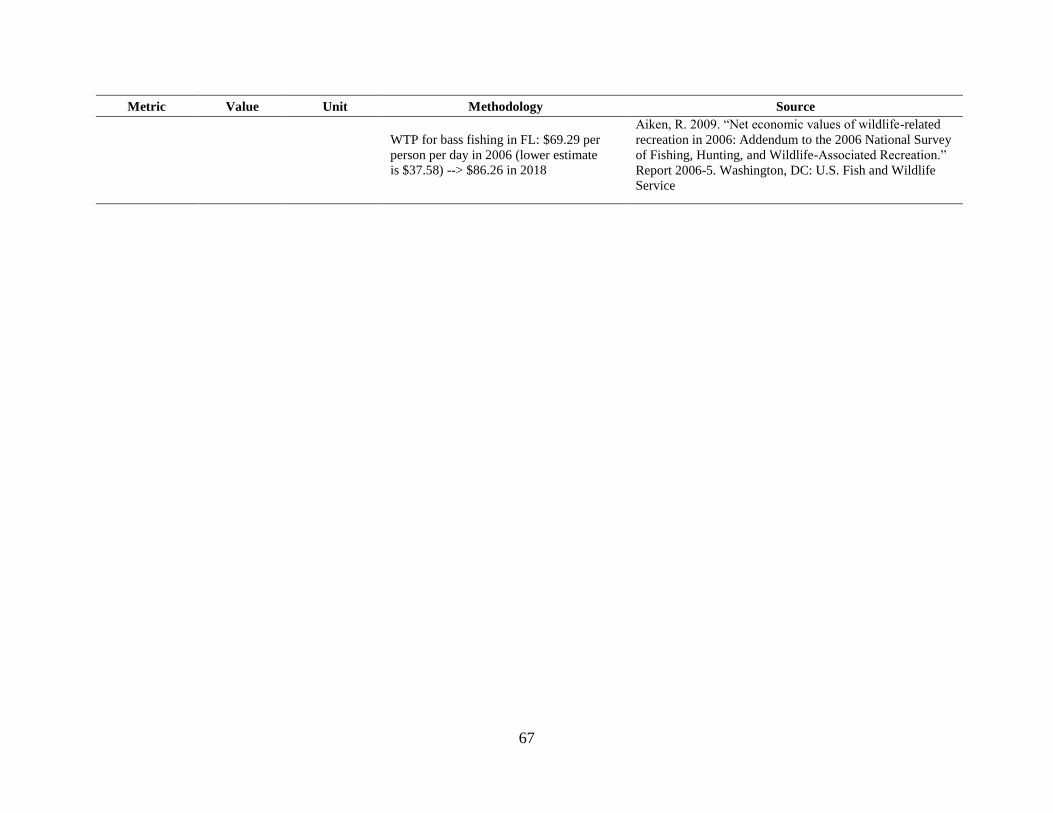
67
Metric Value Unit Methodology Source
WTP for bass fishing in FL: $69.29 per
person per day in 2006 (lower estimate
is $37.58) --> $86.26 in 2018
Aiken, R. 2009. “Net economic values of wildlife-related
recreation in 2006: Addendum to the 2006 National Survey
of Fishing, Hunting, and Wildlife-Associated Recreation.”
Report 2006-5. Washington, DC: U.S. Fish and Wildlife
Service
Related Documents