Marine Science 2011; 1(1): 22-29 DOI: 10.5923/j.ms.20110101.03 Assessing the Physico-Chemical Parameters of Sediment Ecosystem of Vasai Creek at Mumbai, India Pravin U. Singare 1,* , Manisha P. Trivedi 1,2 , Ravindra M. Mishra 1,2 1 Department of Chemistry, Bhavan’s College, Munshi Nagar, Andheri (West), Mumbai, 400058, India 2 Department of Chemistry, Shri. Jagdishprasad Jhabarmal Tibrewala University, Jhunjhunu, Rajasthan, 333001, India Abstract The present study is concerned with the pollution load monitoring along Vasai Creek of Mumbai with reference to the physico-chemical parameters of sediments. The study was carried for a span of two years from 2009-11 at four sam- pling stations namely Vasai bundar, Bhayandar west side below Railway Bridge, Bhayandar east side near Retibundar and Ghodbundar site along the flow of Vasai Creek. It was observed that most of the physico-chemical parameters like electrical conductivity, chloride, sulfate, sulfide and phosphate content in the sediment samples were higher during the assessment year 2010-11 as compared to that during the year 2009-10. However the pH values recorded during the year 2009-10 were higher than that recorded during the year 2010-11. The results of present investigation suggest that the present increasing pollution load along the Vasai Creek may affect sediment dwelling organisms and fish resulting in decrease survival, reduced growth, or impaired reproduction and lowered species diversity. Keywords Sediments, Physico-Chemical Parameters, pH, Electrical Conductivity, Sulfate, Sulfide, Chloride, Phosphate, Vasai Creek, Mumbai, India 1. Introduction Aquatic ecosystems are affected by several health stress- ors that significantly deplete biodiversity. In the future, the loss of biodiversity and its effects are predicted to be greater for aquatic ecosystems than for terrestrial ecosystems[1]. Sediments form a natural buffer and filter system in the material cycles of waters. Sediment in our rivers is an im- portant habitat as well as a main nutrient source for aquatic organisms. Sediment strata serve as an important habitat for the benthic macro invertebrates whose metabolic activities contribute to aquatic productivity[2]. Sediment is also the major site for organic matter decomposition which is largely carried out by bacteria. Important macro-nutrients are con- tinuously being interchanged between sediment and over- lying water[2]. Furthermore, sediments have an impact on ecological quality because of their quality, or their quantity, or both[3]. It is observed that continuous accumulation of pollutants due to biological and geochemical mechanisms, and cause toxic effect on sediment dwelling organisms and fish, resulting in decrease survival, reduced growth, or im- paired reproduction and lowered species diversity[4,5]. Aquatic systems are subjected to strong variations of flow rate, substance input and transport, and sedimentation. * Corresponding author: [email protected] (Pravin U. Singare) Published online at http://journal.sapub.org/ms Copyright © 2011 Scientific & Academic Publishing. All Rights Reserved Sediment analysis is increasingly important in evaluating qualities of the total ecosystem of a body of water, in addi- tion to the water sample analysis practiced for years[6-14]. In comparison to water testing, sediment testing reflects the long term quality situation independent of current in- puts[15,16]. In water testing it is not possible to clearly di- vide between true suspension substances and temporary suspension substances stirred-up from the sediments. Sedi- ment testing is not, or only minimally, affected by other influences. The suspended and precipitated (non-floating) substances and organic substances in waters are capable of adhering pollutant particles (adsorption). The sediments, both suspended and precipitated substances stored on the water bottom, form a reservoir for many pollutants and trace substances of low solubility and low degree of degradabil- ity[17-19]. Pollutants are conserved in sediments over long periods of time according to their chemical persistence and the physical-chemical and biochemical characteristics of the substrata. This can allow conclusions to be drawn regarding sources of contamination. Since sediments act as a sinks and sources of contaminants in aquatic systems, chemical analysis for characterization of sediments also provides environmentally significant information about natural and anthropogenic influence on the water bodies[20-25]. Extensive surveillance, monitoring, and research activities are required to assess the extent and severity of sediment contamination, to evaluate the effects of contaminated sediments on freshwater and marine environment, and to prepare a plan for appropriate remedial action. Therefore we

Welcome message from author
This document is posted to help you gain knowledge. Please leave a comment to let me know what you think about it! Share it to your friends and learn new things together.
Transcript

Marine Science 2011; 1(1): 22-29 DOI: 10.5923/j.ms.20110101.03
Assessing the Physico-Chemical Parameters of Sediment Ecosystem of Vasai Creek at Mumbai, India
Pravin U. Singare1,*, Manisha P. Trivedi1,2, Ravindra M. Mishra1,2
1Department of Chemistry, Bhavan’s College, Munshi Nagar, Andheri (West), Mumbai, 400058, India 2Department of Chemistry, Shri. Jagdishprasad Jhabarmal Tibrewala University, Jhunjhunu, Rajasthan, 333001, India
Abstract The present study is concerned with the pollution load monitoring along Vasai Creek of Mumbai with reference to the physico-chemical parameters of sediments. The study was carried for a span of two years from 2009-11 at four sam-pling stations namely Vasai bundar, Bhayandar west side below Railway Bridge, Bhayandar east side near Retibundar and Ghodbundar site along the flow of Vasai Creek. It was observed that most of the physico-chemical parameters like electrical conductivity, chloride, sulfate, sulfide and phosphate content in the sediment samples were higher during the assessment year 2010-11 as compared to that during the year 2009-10. However the pH values recorded during the year 2009-10 were higher than that recorded during the year 2010-11. The results of present investigation suggest that the present increasing pollution load along the Vasai Creek may affect sediment dwelling organisms and fish resulting in decrease survival, reduced growth, or impaired reproduction and lowered species diversity.
Keywords Sediments, Physico-Chemical Parameters, pH, Electrical Conductivity, Sulfate, Sulfide, Chloride, Phosphate, Vasai Creek, Mumbai, India
1. Introduction Aquatic ecosystems are affected by several health stress-
ors that significantly deplete biodiversity. In the future, the loss of biodiversity and its effects are predicted to be greater for aquatic ecosystems than for terrestrial ecosystems[1]. Sediments form a natural buffer and filter system in the material cycles of waters. Sediment in our rivers is an im-portant habitat as well as a main nutrient source for aquatic organisms. Sediment strata serve as an important habitat for the benthic macro invertebrates whose metabolic activities contribute to aquatic productivity[2]. Sediment is also the major site for organic matter decomposition which is largely carried out by bacteria. Important macro-nutrients are con-tinuously being interchanged between sediment and over-lying water[2]. Furthermore, sediments have an impact on ecological quality because of their quality, or their quantity, or both[3]. It is observed that continuous accumulation of pollutants due to biological and geochemical mechanisms, and cause toxic effect on sediment dwelling organisms and fish, resulting in decrease survival, reduced growth, or im-paired reproduction and lowered species diversity[4,5]. Aquatic systems are subjected to strong variations of flow rate, substance input and transport, and sedimentation.
* Corresponding author: [email protected] (Pravin U. Singare) Published online at http://journal.sapub.org/ms Copyright © 2011 Scientific & Academic Publishing. All Rights Reserved
Sediment analysis is increasingly important in evaluating qualities of the total ecosystem of a body of water, in addi-tion to the water sample analysis practiced for years[6-14]. In comparison to water testing, sediment testing reflects the long term quality situation independent of current in-puts[15,16]. In water testing it is not possible to clearly di-vide between true suspension substances and temporary suspension substances stirred-up from the sediments. Sedi-ment testing is not, or only minimally, affected by other influences. The suspended and precipitated (non-floating) substances and organic substances in waters are capable of adhering pollutant particles (adsorption). The sediments, both suspended and precipitated substances stored on the water bottom, form a reservoir for many pollutants and trace substances of low solubility and low degree of degradabil-ity[17-19]. Pollutants are conserved in sediments over long periods of time according to their chemical persistence and the physical-chemical and biochemical characteristics of the substrata. This can allow conclusions to be drawn regarding sources of contamination. Since sediments act as a sinks and sources of contaminants in aquatic systems, chemical analysis for characterization of sediments also provides environmentally significant information about natural and anthropogenic influence on the water bodies[20-25].
Extensive surveillance, monitoring, and research activities are required to assess the extent and severity of sediment contamination, to evaluate the effects of contaminated sediments on freshwater and marine environment, and to prepare a plan for appropriate remedial action. Therefore we

Marine Science 2011; 1(1): 22-29 23
carried out a study to understand the physico-chemical properties of sediments samples collected along Vasai Creek of Mumbai which is subjected to heavy pollution load. It is expected that the pollution data generated from such regular scientific study will help to implement compatitable policies and programmes to gauge the extent of pollution. The pol-lution data of the present study is also expected to help in rational planning of pollution control strategies and their prioritization; assessment of nature and extent of pollution control needed; evaluation of effectiveness of pollution control measures already is existence; evaluation of water quality trend over a period of time; assessment of assimila-tive capacity of a water body thereby reducing cost on pol-lution control; understand the environmental fate of different pollutants and also in assessment of creek water fitness for different uses.
2. Materials and Methods 2.1. Area of Study
Vasai Creek is an estuarine creek, one of the two main distributaries of the Ulhas Creek in Maharashtra state of western India. The Ulhas Creek splits at the northeast corner of Salsette Island into its two main distributaries, Vasai Creek and Thane Creek. Vasai Creek which lies between latitude 19.315°N longitude 72.875°E, forms the northern boundary of Salsette Island, and empties west into the Ara-bian Sea. The Creek receives domestic raw sewage as well as industrial waste water effluent from surrounding habitation and nearby industrial belt. The activities like cattle washing, cloth washing, and religious activities like immersion of idols of Lord Ganesha and Deity Durga during Ganesh fes-tival and Navratri festival is also a major source of pollution of creek water.
2.2. Climatic Conditions Climate is subtropical, with mild winters and warm
summers. The weather is typical coastal sultry and humid. The average rainfall of records from 1500 mm to 2000 mm. The place experiences the onset of the monsoon in the month of June and experiences monsoon till the end of September. The average temperature recorded in varies from 25 to 37 degrees.
2.3. Requirements The chemicals and reagent used for analysis were of
analytical reagent grade. The procedure for calculating the different parameters were conducted in the laboratory. The laboratory apparatus were soaked in nitric acid before analysis and then rinsed thoroughly with tap water and de-ionised distilled water to ensure any traces of cleaning reagents were removed. Finally, it is dried and stored in a clean place[26]. The pipettes and burette were rinsed with the same solution before final use.
2.4. Sediment Sampling, Preparation and Analyses
The sediment samples were collected randomly four times in a month in morning, afternoon and evening session from four different sampling stations namely Vasai Bundar (S-1) , Bhayandar west side of Railway Bridge (S-2), Bhayandar east side near Reti Bundar (S-3), and Ghodbundar site (S-4) along the Vasai Creek (Figure 1). The samples were col-lected and subsequently analysed for a span of two years starting from October 2009 to September 2011. The sam-pling was done in three shifts i.e. morning shift between 07:00 a.m. to 09:00 a.m., afternoon shift between 02:00 p.m. to 04:00 p.m. and evening shift between 07:00 p.m. to 09:00 p.m. Sediment samples were collected by hand-pushing plastic core tubes (7 cm diameter) as far as possible into the sediment. The sediment cores retrieved in the field were sliced on arrival at the lab at 1-cm depth intervals for the first 15 cm, 2-cm depth intervals from 15–25 cm, and then every 5 cm for the deeper sections of the cores. The sediments were kept cool in icebox during the transportation to the labora-tory[27,28]. They were then ground manually to a fine powder in an alumina mortar; it is passed through a 2-mm mesh screen and stored in polyethylene bags based on method used by for further analysis.
Figure 1. Geographical map showing sampling stations along Vasai Creek of Mumbai.
2.5. Physico-Chemical Study
The present study provides a detailed description of the physico-chemical criteria of sediment samples collected from four different sampling stations along Vasai Creek. The samples collected were analysed for pH, electrical conduc-tivity, chloride, sulfate, sulfide and phosphate content. The standard techniques and methods were followed for physical and chemical analysis of sediment samples[29,30].
2.6. Quality Control/Assurance
Sediment samples were collected with plastic-made im-plements to avoid contamination. Samples were kept in
S 1
S-2 S-3
S-4

24 Pravin U. Singare et al.: Assessing the Physico-Chemical Parameters of Sediment Ecosystem of Vasai Creek at Mumbai, India
polythene bags that were free from heavy metals and or-ganics and well covered while transporting from field to the laboratory to avoid contamination from the environment. All reagents were standardised against primary standards to determine their actual concentrations. All instruments used were calibrated before use. Tools and work surfaces were carefully cleaned for each sample during grinding to avoid cross contamination. Duplicate samples were analysed to check precision of the analytical method and instrument.
3. Results and Discussion The experimental data on physico-chemical properties of
sediment samples collected from four different sampling stations along the Vasai Creek of Mumbai are presented in Tables 1-4.
Table 1. Physico-Chemical Properties of Sediment Samples Collected at Sampling Station S-1.
Phys
-ic
o-Ch
emic
al
Prop
ertie
s
pH
Elec
trica
l Con
duct
ivity
µm
hos.c
m-1
Chl
orid
e m
g/L
Sulfa
te
mg/
L
Sulfi
de
mg/
L
Phos
phat
e m
g/L
Month- Year
Oct-09 6.5 88 123 154 22 0.14
Nov-09 5.6 72 141 148 25 0.1
Dec-09 7.3 99 168 153 20 0.13
Jan-10 4.9 101 116 164 19 0.18
Feb-10 6.8 121 132 176 24 0.15
Mar-10 7.5 89 149 169 17 0.09
April-10 5.9 95 158 201 19 0.08
May-10 5.5 83 111 234 20 0.11
June.-10 6.2 100 98 256 22 0.09
July-10 6.8 105 126 185 21 0.15
Aug-10 6.4 134 135 189 18 0.16
Sept-10 6.2 128 117 258 24 0.14
Oct-10 5.1 198 201 301 33 0.18
Nov-10 5.9 276 214 345 32 0.1
Dec-10 7.1 187 177 256 30 0.05
Jan-11 7 110 228 170 28 0
Feb-11 3.2 156 254 201 29 0.1
Mar-11 2.9 200 241 276 25 0.19
April-11 2.8 245 225 342 27 0.24
May-11 3.2 228 200 380 25 0.26
June-11 3.5 301 265 352 30 0.2
July-11 2.8 299 289 348 32 0.19
Aug-11 1.1 287 278 333 33 0.22
Sept-11 1.4 265 264 329 35 0.21
Average 5.1 165 184 247 25 0.14
Table 2. Physico-Chemical Properties of Sediment Samples Collected at Sampling Station S-2.
Phys
-ic
o-C
hem
ical
Pr
oper
ties
pH
Elec
trica
l Con
duc-
tivity
µm
hos.c
m-1
Chl
orid
e m
g/L
Sulfa
te
mg/
L
Sulfi
de
mg/
L
Phos
phat
e m
g/L
Month- Year
Oct-09 8.4 87 567 221 5 0.09 Nov-09 8.2 78 672 198 9 0.13 Dec-09 8.9 99 779 234 3 0.18 Jan-10 7.6 90 865 218 6 0.11 Feb-10 7.7 130 832 223 10 0.08 Mar-10 8 199 754 205 11 0.07 April-10 8.5 201 798 198 8 0.07 May-10 6.9 222 801 187 9 0.06 June.-10 7.6 204 763 234 15 0.05 July-10 7.8 209 834 256 12 0 Aug-10 8 215 852 276 11 0.03 Sept-10 7.9 220 887 320 10 0.07 Oct-10 6.1 345 1032 389 18 0.05 Nov-10 5.7 456 541 298 23 0.04 Dec-10 6.4 289 265 163 17 0.01 Jan-11 7.3 120 182 58 15 0 Feb-11 7.1 187 664 286 21 0.01 Mar-11 7.5 245 891 356 24 0.09 April-11 6.2 200 1599 498 20 0.14 May-11 5.9 120 2780 580 20 0.21 June-11 5.9 156 1978 559 18 0.24 July-11 5.5 188 1865 534 17 0.2 Aug-11 5.4 311 1432 576 21 0.19 Sept-11 5.3 378 1297 589 22 0.17 Average 7.1 206 997 319 14 0.10
Table 3. Physico-Chemical Properties of Sediment Samples Collected at Sampling Station S-3.
Phys
i-co
-Che
mic
al
Prop
ertie
s
pH
Elec
trica
l Con
duc-
tivity
µm
hos.c
m-1
Chl
orid
e m
g/L
Sulfa
te
mg/
L
Sulfi
de
mg/
L
Phos
phat
e m
g/L
Month- Year Oct-09 7.7 201 55 86 15 0.11 Nov-09 7.1 234 48 67 19 0.23 Dec-09 7.5 243 67 56 13 0.19 Jan-10 7.6 276 89 45 12 0.31 Feb-10 8 287 101 49 16 0.18 Mar-10 8.1 299 123 51 14 0.15 April-10 7.8 347 99 45 17 0.1 May-10 7.5 251 95 63 18 0.09 June.-10 7.6 256 78 99 11 0.07 July-10 8 267 70 105 13 0.1 Aug-10 8.2 288 68 116 15 0.34 Sept-10 8.5 300 87 78 19 0.59 Oct-10 7.1 393 123 101 17 1.03 Nov-10 5.8 456 147 115 20 0.71 Dec-10 6.7 301 195 65 25 0.12 Jan-11 7.5 110 180 26 20 0 Feb-11 7 177 205 59 29 0.07 Mar-11 6.9 245 265 187 34 0.09 April-11 6.5 266 274 299 40 0.25 May-11 6.2 220 200 390 36 0.82 June-11 5.9 286 225 250 43 0.56 July-11 5.8 300 232 366 41 0.65 Aug-11 6 315 243 401 45 0.78 Sept-11 5.9 387 256 373 39 0.89 Average 7.1 279 147 146 24 0.35
Marine Science 2011; 1(1): 22-29 25
Table 4. Physico-Chemical Properties of Sediment Samples Collected at Sampling Station S-4.
Phys
-ic
o-Ch
emic
al
Prop
ertie
s
pH
Elec
trica
l Con
duct
ivity
µm
hos.c
m-1
Chl
orid
e m
g/L
Sulfa
te
mg/
L
Sulfi
de
mg/
L
Phos
phat
e m
g/L
Month- Year
Oct-09 6.5 114 154 108 23 0.05 Nov-09 6.1 143 138 134 21 0.03 Dec-09 6.2 128 187 126 20 0.04 Jan-10 6.3 134 199 121 18 0.02 Feb-10 6.9 150 123 99 16 ND Mar-10 7 142 145 87 19 ND April-10 5.9 129 141 111 21 0.01 May-10 6.3 135 152 119 22 0.03 June.-10 6.6 141 151 114 20 0.04 July-10 6.5 150 138 134 19 0.05 Aug-10 6 118 139 140 18 0.07 Sept-10 6.7 135 152 154 15 0.06 Oct-10 5.9 178 189 203 33 0.11 Nov-10 6.1 199 254 234 19 0.12 Dec-10 6.6 145 167 171 23 0.09 Jan-11 7.5 110 120 118 15 0 Feb-11 5.5 176 156 231 24 0.1 Mar-11 5.1 256 201 376 29 0.09 April-11 4.2 250 234 499 37 0.07 May-11 4.7 200 275 550 35 0.08 June-11 3.9 276 287 529 43 0.09 July-11 3.5 300 299 503 46 0.11 Aug-11 3 315 301 567 51 0.12 Sept-11 3.2 322 256 497 55 0.1 Average 5.7 181 190 247 27 0.07
pH is a measure of the acidity or alkalinity of water and is one of the stable measurements. pH is a simple parameter but is extremely important, since most of the chemical reactions in aquatic environment are controlled by any change in its value. Anything either highly acidic or alkaline would kill marine life. Aquatic organisms are sensitive to pH changes and biological treatment requires pH control or monitoring. Surface waters having a pH values below six can be haz-ardous to aquatic life. Thus, pH is having primary impor-tance in deciding the quality of waste water effluent. Waters with pH value of about 10 are exceptional and may reflect contamination by strong base such as NaOH and Ca(OH)2[31].In the present investigation, the biyearly av-erage pH values of effluent samples collected from different sampling stations vary between minimum of 5.1 in the samples collected at S-1 sampling station to maximum of 7.1 at S-2 and S-3 sampling stations (Tables 1,2 and 3). It was observed that at all the four sampling stations; the pH of sediment samples in 2009-10 was higher than that collected in 2010-11 (Figure 2).
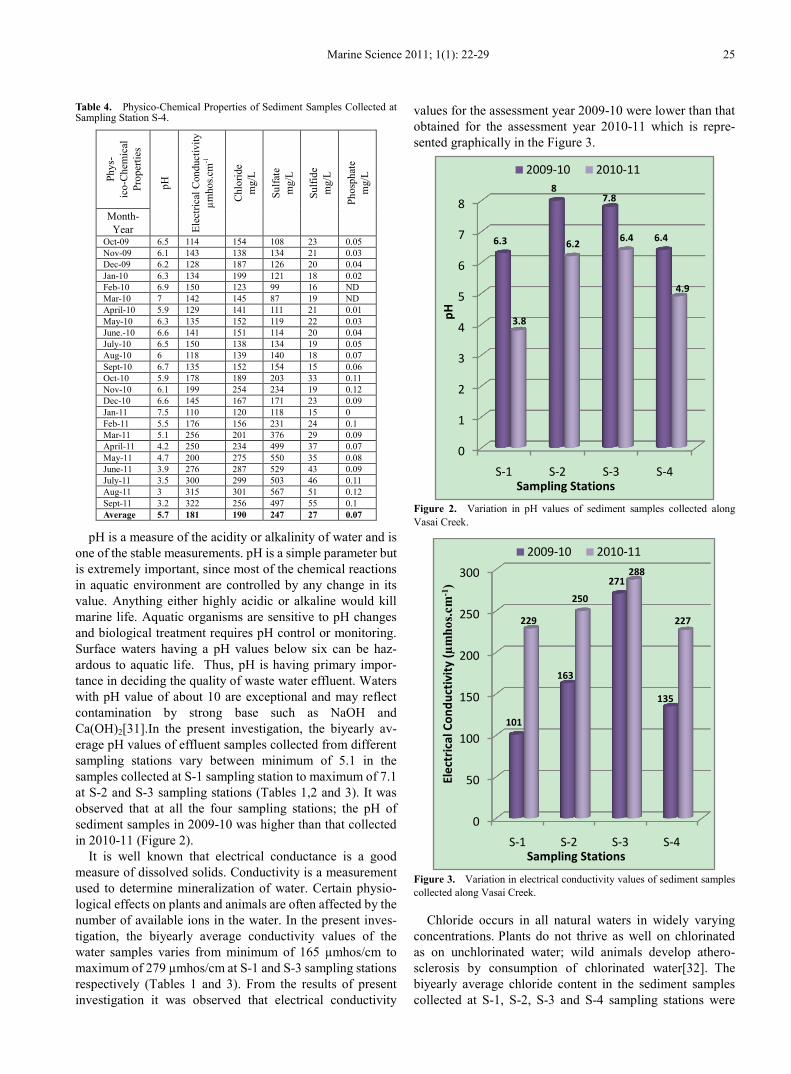
It is well known that electrical conductance is a good measure of dissolved solids. Conductivity is a measurement used to determine mineralization of water. Certain physio-logical effects on plants and animals are often affected by the number of available ions in the water. In the present inves-tigation, the biyearly average conductivity values of the water samples varies from minimum of 165 µmhos/cm to maximum of 279 µmhos/cm at S-1 and S-3 sampling stations respectively (Tables 1 and 3). From the results of present investigation it was observed that electrical conductivity
values for the assessment year 2009-10 were lower than that obtained for the assessment year 2010-11 which is repre-sented graphically in the Figure 3.
Figure 2. Variation in pH values of sediment samples collected along Vasai Creek.
Figure 3. Variation in electrical conductivity values of sediment samples collected along Vasai Creek.
Chloride occurs in all natural waters in widely varying concentrations. Plants do not thrive as well on chlorinated as on unchlorinated water; wild animals develop athero-sclerosis by consumption of chlorinated water[32]. The biyearly average chloride content in the sediment samples collected at S-1, S-2, S-3 and S-4 sampling stations were
0
1
2
3
4
5
6
7
8
S-1 S-2 S-3 S-4
6.3
87.8
6.4
3.8
6.26.4
4.9
pH
Sampling Stations
2009-10 2010-11
0
50
100
150
200
250
300
S-1 S-2 S-3 S-4
101
163
271
135
229
250
288
227
Elec
tric
al C
ondu
ctiv
ity
(µm
hos.c
m-1
)
Sampling Stations
2009-10 2010-11

26 Pravin U. Singare et al.: Assessing the Physico-Chemical Parameters of Sediment Ecosystem of Vasai Creek at Mumbai, India
found to be 184 mg/L, 997 mg/L, 147 mg/L and 190 mg/L respectively (Tables 1-4). It was observed that the average chloride content for the assessment year 2010-11 was more than that obtained for the year 2009-10 (Figure 4).
Figure 4. Variation in chloride content of sediment samples collected along Vasai Creek.
The sulfate pollution can be the result of prolonged high atmospheric deposition, sulfate containing fertilizers, and, probably the most important cause at many locations, oxi-dation of pyrite deposits in the deeper subsoil[33,34]. Sul-fates can interfere with the disinfection efficiency by scav-enging residual chlorine in the distribution system[35]. Sul-fate reducing bacteria produce hydrogen sulfide and lower the aesthetic quality of the water by imparting an unpleasant taste and odour and increases corrosion of metal and con-crete pipes[36]. Sulfates can affect industrial water supplies due to formation of hard scales in boilers and heat exchang-ers. High amount of sulfates in wastewater may lead to problems due to the formation of hydrogen sulfide gas[37]. High sulfate loads in polluted rivers and groundwater have led to increased sulphur fluxes and concentrations in fens and marshes, e.g. in New York[38]. In freshwater wetland sys-tems, it may lead to suppressed growth and development, iron chlorosis, leaf necrosis, suppressed flowering, black and flaccid roots, root decay and even the death of the whole plant[39,40]. In the present investigation, the biyearly av-erage concentration of sulfate in sediment samples collected at S-1, S-2, S-3 and S-4 sampling station was found to be 247 mg/L, 319 mg/L, 146 mg/L and 247 mg/L respectively. Similarly the sulfide concentration were found to be 25 mg/L, 14 mg/L, 24 mg/L and 27 mg/L respectively (Tables 1-4). It is important here to note that these pollutants which are accumulated in the sediments will get released in creek water under certain conditions. As a result the sulfate and sulfide
concentration in water may increase above the permissible limit of 200 mg/L and 2 mg/L respectively set for inland surface water[41]. The results also indicate increase in av-erage sulfate and sulfide concentration for the assessment year 2010-11 as compared to 2009-10 (Figures 5 and 6).
Figure 5. Variation in sulfate content of sediment samples collected along Vasai Creek.
Figure 6. Variation in sulfide content of sediment samples collected along Vasai Creek.
Phosphorus pollution accelerates a process called eutro-phication, which is essentially the process of a rivers bio-logical death due to depleted bioavailable oxygen. Algal blooms caused by excess phosphorus impact fisheries be-cause the blooms favour the survival of less desirable fish
0
200
400
600
800
1000
1200
1400
S-1 S-2 S-3 S-4
131
784
82152
236
1211
212 228
Chl
orid
e (m
g/L)
Sampling Stations
2009-10 2010-11
0
50
100
150
200
250
300
350
400
450
S-1 S-2 S-3 S-4
191
231
72
121
303
407
219
373
Sulfa
te (m
g/L
)
Sampling Stations
2009-10 2010-11
0
5
10
15
20
25
30
35
S-1 S-2 S-3 S-4
21
9
15
19
30
20
3234
Sulfi
de (m
g/L)
Sampling Stations
2009-10 2010-11

Marine Science 2011; 1(1): 22-29 27
over more desirable commercial and recreation species. Phosphorus pollution caused enormous blooms of the Blue-Green Algae, a form of cyanobacteria, which produces toxins that damage aquatic ecosystems, fisheries, and water quality. Excess amounts of phosphorus and nitrogen cause rapid growth of phytoplankton, creating dense populations, or blooms. These blooms become so dense that they reduce the amount of sunlight available to submerged aquatic vegetation. Without sufficient light, plants cannot photo-synthesize and produce the food they need to survive. The loss of sunlight can kill aquatic grasses. The results of pre-sent study indicates that the biyearly average phosphate level was low (0.07 mg/L) only at S-4 sampling station, while at S-1, S-2 and S-3 sampling stations the phosphate concentra-tion was found to be relatively high of 0.14 mg/L, 0.10 mg/L and 0.35 mg/L. The phosphate pollutants will settle down and get accumulated in bottom sediments, under certain conditions they may get released back to surface water. Such release of phosphate pollutants may result in increase in the phosphate concentration above the permissible limit of 5 mg/L set for inland surface water[41]. The graphical repre-sentation showing average phosphate concentration in sediment samples collected at different sampling stations indicates higher concentration of phosphates during the assessment year 2010-11 as compared to 2009-10 (Figure 7).
Figure 7. Variation in phosphate content of sediment samples collected along Vasai Creek.
4. Conclusions Around the world as countries are struggling to arrive at an
effective regulatory regime to control the discharge of in-dustrial effluents into their ecosystems, Indian economy holds a double edged sword of economic growth and eco-system collapse. The present experimental data indicates increasingly high level of pollution along the Vasai creek of Mumbai. The experimental data suggests a need to imple-
ment common objectives, compatible policies and pro-grammes for improvement in the industrial and domestic waste water treatment methods. It also suggests a need of consistent, internationally recognized data driven strategy to assess the quality of waste water effluent and generation of international standards for evaluation of contamination lev-els. The existing situation if mishandled can cause irrepara-ble ecological harm in the long-term well masked by short term economic prosperity.
ACKNOWLEDGEMENTS The authors are extremely thankful to SAP Productions
for developing and maintaining the manuscript template.
REFERENCES [1] Sala O.E., Chapin III F.S., Armesto J.J., Berlow E., Bloom-
field J., Dirzo R., Huber-Sanwald E., Huenneke L.F., Jackson R.B., Kinzig A., Leemans R., Lodge D.M., Mooney H.A., Oesterheld M., Poff N.L., Sykes M.T., Walker B.H., Walker M. and Wall D.H. (2000), Global biodiversity scenarios for the year 2100, Science, 287(5459), 1770–1774.
[2] Abowei, J.F.N. and Sikoki, F.D. 2005, Water Pollution Management and Control, Double Trust Publications Com-pany, Port Harcourt; ISBN: 978-30380-20-16, pp: 236.
[3] Stronkhorst J., Brils J., Batty J., Coquery M., Gardner M., Mannio J., O'Donnell C., Steenwijk J. and Frintrop P., 2004, Discussion document on Sediment Monitoring Guidance for the EU Water Framework Directive., Version 2. EU Water Framework Directive expert group on Analysis and Moni-toring of Priority Substances. May 25th, 2004
[4] Mucha, A.P., Vasconcelos, M.T.S.D., and Bordalo, A.A., 2003, Macrobenthic community in the Douuro Estuary: rela-tion with trace metals and natural sediment characteristics., Environmental Pollution, 121(2), pp.169 –180.
[5] Praveena, S. M., Ahmed, A., Radojevic, M., Abdullah, M. H., Aris, A. Z., 2007, Factor-cluster analysis and enrichment study of mangrove sediments-an example from Mengkabong, Sabah., Malaysian J. Anal. Sci., 11(2), pp. 421-430
[6] Lokhande, R.S., Singare, P.U., and Pimple, D.S., 2011, Pol-lution in Water of Kasardi River Flowing Along Taloja In-dustrial Area of Mumbai, India,. World Environment (In Press).
[7] Lokhande, R.S., Singare, P.U., and Pimple, D.S., 2011, Toxicity Study of Heavy Metals Pollutants in Waste Water Effluent Samples Collected From Taloja Industrial Estate of Mumbai, India., Resources and Environment (In Press).
[8] Lokhande, R.S., Singare, P.U., and Pimple, D.S., 2011, Study on Physico-Chemical Parameters of Waste Water Ef-fluents from Taloja Industrial Area of Mumbai, India. Inter-national Journal of Ecology (In Press)
[9] Singare, P.U, Lokhande, R.S., and Bhanage, S.V. 2011, Study of water pollution due to Heavy metals in Kukshet lakes of Nerul, Navi Mumbai, India. International Journal of
0
0.05
0.1
0.15
0.2
0.25
0.3
0.35
0.4
0.45
0.5
S-1 S-2 S-3 S-4
0.13
0.08
0.21
0.04
0.16
0.11
0.5
0.09
Phos
phat
e (m
g/L)
Sampling Stations
2009-10 2010-11

28 Pravin U. Singare et al.: Assessing the Physico-Chemical Parameters of Sediment Ecosystem of Vasai Creek at Mumbai, India
Global Environmental Issues, 11(1), pp.79–90.
[10] P.U. Singare, Lokhande, R.S., and Jagtap, A.G., 2011, Water pollution by discharge effluents from Gove Industrial Area of Maharashtra, India: Dispersion of heavy metals and their Toxic effects., International Journal of Global Environmental Issues, 11(1), pp.28–36.
[11] Singare, P.U., Lokhande, R.S. and Naik, K.U., 2011, Impact Assessment of Pollution in some Lake water Located at and around Thane City of Maharashtra, India: Physico chemical properties and Toxic effects of Heavy metal content., Inter-disciplinary Environmental Review, 12 (3), pp.215-230.
[12] Singare, P.U., Lokhande, R.S., and Bhanage, S.V., 2011, Water pollution study of the Shirvane and Nerul lakes si-tuated at Nerul, Navi Mumbai, India., Interdisciplinary En-vironmental Review, 12(1),pp.1-11.
[13] Singare, P.U., Lokhande, R.S., and Jagtap, A.G., 2010, Study of Physico-chemical quality of the Industrial Waste Water Effluent from Gove Industrial Area of Bhiwandi City of Maharashtra, India., Interdisciplinary Environmental Review, 11(4), pp.263-273.
[14] Singare, P.U., Lokhande, R.S., and Naik, K.U., 2010, A Case Study of Some Lakes Located at and Around Thane City of Maharashtra, India, with Special Reference to Physi-co-Chemical Properties and Heavy Metal content of Lake Water., Interdisciplinary Environmental Review, 11(1), pp.90-107.
[15] Hodson P.V., 1986, Water quality criteria and the need for biochemical monitoring of contaminant effects on aquatic ecosystem. In: Water Quality Management: Freshwater Eco-toxicity in Australia, Hart, B.T. (ed.), Melbourne Water Studies Center, pp. 7-21.
[16] Haslam S.M., 1990, River pollution: An ecological perspec-tive, Belhaven Press. London, pp.253.
[17] Biney C., Amazu A.T., Calamari D., Kaba N., Mbome I.L., Naeve H., Ochumba P.B.O., Osibanjo O., Radegonde V., and Saad M.A.H., 1994, Review of heavy metals in the African aquatic environment., Ecotoxicology and Environmental Safety, 31, pp. 134-159.
[18] Barbour M.T., Gerritsen J., Snyder B.D., and Stribling J.B., 1998, USEPA Rapid Bioassessment Protocols for Use in Streams and Wadeable Rivers. Periphyton, Benthic Ma-croinvertebrates, and Fish., Second Edition. EPA/841-B-98-010. U.S. Environmental ProtectionAgency; Office of Water; Washington, D.C.
[19] Barbour M.T., Gerritsen J., Snyder B.D., and Stribling J.B.,1999, Rapid bioassessment protocols for use in and wa-deable rivers—Periphyton, benthic macroinvertebrates, and fish (2d ed.): U.S. Environmental Protection Agency, Office of Water, EPA 841–B—99–002.
[20] Lokhande, R.S., Singare, P.U., and Pimple, D.S., 2011, Quantification Study of Toxic Heavy Metals Pollutants in Sediment Samples Collected from Kasardi River Flowing along the Taloja Industrial Area of Mumbai, India., The New York Science Journal 4(9), pp.66-71.
[21] Singare, P.U., 2011, Distribution Behaviour of Trace and Toxic Metals in Soil and Sediment along the Thane Creek Near Mumbai, India., Interdisciplinary Environmental Re-view, 12(4), pp. 298–312.
[22] Singare, P.U., Lokhande, R.S., and Bhattacharjee, S.S., 2011, Physico-Chemical Analysis of the Sediment Samples col-lected from Thane Creek of Maharashtra, India., Interdiscip-linary Environmental Review, 12(2), 95-107.
[23] Menounou, N., Presley, B.J., 2003, Mercury and Other Trace Elements in Sediment Cores from Central Texas Lakes., Arch. Environ. Contam. Toxicol. 45(1), 11–29.
[24] Spooner, D.R., Maher, W., and Otway, N., 2003, Trace Metal Concentrations in Sediments and Oysters of Botany Bay, NSW,Australia., Arch. Environ.Contam. Toxicol. 45(1), 92–101.
[25] Sahu, S.K., Ajmal, P.Y., Pandit, G.G., and Puranik, V.D., 2009, Vertical distribution of polychlorinated biphenyl con-geners in sediment core from Thane Creek area of Mumbai, India., Journal of hazardous materials, 164(2-3), 1573-1579.
[26] Radojevic, M., and Bashkin, V. N., 1999, Practical Envi-ronmental Analysis. Royal Society of Chemistry, Cambridge, New York.
[27] Al-Shiwafi, N., Rushdi, A. I., and Ba-Issa, A., 2005, Trace Metals in Surface Seawaters and Sediments from Various Habitats of the Red Sea Coast of Yemen., Environmental Geology. 48(4-5), pp.590-598.
[28] Jung, H., Yun, S., Mayer, B., Kim, S., Park S., and Lee, P., 2005, Transport and Sediment-Water Partitioning Of Trace Metals in Acid Mine Drainage: An Example from the Abandoned Kwangyang Au-Ag Mine Area, South Korea., Environmental Geology. 48(4-5), pp.437-449.
[29] APHA, AWWA and WEF, 1998, Standard methods for the examination of water and wastewater., 20th edition, Clesceri, L.S. Greenberg, A.E. and Eaton, A.D. (Eds.), American Pub-lic Health Association, American Water Work Association, Water Environment Federation, Washington DC
[30] Jackson, M.L., 1973, Soil Chemical Analysis., Prentice-Hall of India Private Limited, New Delhi.
[31] Langmuir, D., 1997, Aqueous Environmental Chemistry., Prentice-Hall, Inc., New Jersey.
[32] Hattersley, J.G., 2000, The Negative Health Effects of Chlo-rine., The Journal of Orthomolecular Medicine.15(2), pp.89-95.
[33] akashima, T., Fukunishi, N., Nishiki, T., and Konishi, Y., 2002, Anaerobic oxidation of dissolved hydrogen sulfide in continuous culture of the chemoautotrophic bacterium Thi-obacillus denitrificans., Kagaku Kogaku Ronbunshu, 28(1), pp.25–30.
[34] Lucassen, E.C.H.E.T., Smolders, A.J.P., Van der Salm, A.L., and Roelofs, J.G.M., 2004, High groundwater nitrate con-centrations inhibit eutrophication of sulfate-rich freshwater wetlands., Biogeochemistry, 67(2), pp.249–267.
[35] Faust, S.D., and Osman, A., 1983, Chemistry of water treatment., Butterworth Publishers, Woburn, MA.
[36] Singh, G., and Bhatnagar, M., 1989, Inhibition of bacterial activity in acid mine drainage., International Journal of Mine Water, 7(4), pp.13-26.
[37] Hammarstrom, J.M., Seal, R.R., Meier, A.L., and Kornfeld, J.M., 2005, Secondary sulfate minerals associated with acid drainage in the eastern US: recycling of metals and acidity in

Marine Science 2011; 1(1): 22-29 29
surficial environments., Chemical Geology, 215(1-4), pp.407-431.
[38] Boomer, K.M.B., and Bedford, B.L., 2008, Influence of nested groundwater systems on reduction-oxidation and al-kalinity gradients with implications for plant nutrient availa-bility in four New York fens., Journal of Hydrology, 351(1-2), pp.107–125.
[39] Armstrong, J., Afreen-Zobayed, F., and Armstrong, W., 1996, Phragmites die-back: sulfide- and acetic acid induced bud and root death, lignifications, andblockages within aeration and vascular systems., New Phytologist, 134(4), pp.601–614.
[40] Van der Welle, M.E.W., Smolders, A.J.P., Den Camp, H.J.M.O., Roelofs, J.G.M., and Lamers, L.P.M., 2007, Bio-geochemical interactions between iron and sulfate in fresh-water wetlands and their implications for interspecific com-petition between aquatic macrophytes., Freshwater Biology. 52(3), pp.434–447.
[41] The Environment (Protection) Rules 1986 Available on In-ternet: cpcb.nic.in/GeneralStandards.pdf
Related Documents